UNITED STATES
SECURITIES AND EXCHANGE COMMISSION
Washington, D.C. 20549
FORM N-CSR
CERTIFIED SHAREHOLDER REPORT OF REGISTERED
MANAGEMENT INVESTMENT COMPANIES
Investment Company Act file number 811-21864
WisdomTree Trust
(Exact name of registrant as specified in charter)
245 Park Avenue, 35th Floor
New York, NY 10167
(Address of principal executive offices) (Zip code)
The Corporation Trust Company
1209 Orange Street
Wilmington, DE 19801
(Name and address of agent for service)
Registrant’s telephone number, including area code: (866) 909-9473
Date of fiscal year end: March 31
Date of reporting period: March 31, 2016
Form N-CSR is to be used by management investment companies to file reports with the Commission not later than 10 days after the transmission to stockholders of any report that is required to be transmitted to stockholders under Rule 30e-1 under the Investment Company Act of 1940 (17 CFR 270.30e-1). The Commission may use the information provided on Form N-CSR in its regulatory, disclosure review, inspection, and policymaking roles.
A registrant is required to disclose the information specified by Form N-CSR, and the Commission will make this information public. A registrant is not required to respond to the collection of information contained in Form N-CSR unless the Form displays a currently valid Office of Management and Budget (“OMB”) control number. Please direct comments concerning the accuracy of the information collection burden estimate and any suggestions for reducing the burden to Secretary, Securities and Exchange Commission, 100 F Street, NE, Washington, DC 20549. The OMB has reviewed this collection of information under the clearance requirements of 44 U.S.C. § 3507.
Item 1. Reports to Stockholders.
The Report to Shareholders is attached herewith.


WisdomTree Trust
Developed World ex-U.S. and Currency Hedged Equity Funds
Annual Report
March 31, 2016
WisdomTree Australia Dividend Fund (AUSE)
WisdomTree Europe Hedged Equity Fund (HEDJ)
WisdomTree Europe Hedged SmallCap Equity Fund (EUSC)
WisdomTree Europe Quality Dividend Growth Fund (EUDG)
(formerly, WisdomTree Europe Dividend Growth Fund)
WisdomTree Europe SmallCap Dividend Fund (DFE)
WisdomTree Germany Hedged Equity Fund (DXGE)
WisdomTree Global ex-U.S. Hedged Dividend Fund (DXUS)
WisdomTree Global ex-U.S. Hedged Real Estate Fund (HDRW)
WisdomTree International Dividend ex-Financials Fund (DOO)
WisdomTree International Equity Fund (DWM)
(formerly, WisdomTree DEFA Fund)
WisdomTree International Hedged Equity Fund (HDWM)
WisdomTree International Hedged Quality Dividend Growth Fund (IHDG)
(formerly, WisdomTree International Hedged Dividend Growth Fund)
WisdomTree International Hedged SmallCap Dividend Fund (HDLS)
WisdomTree International High Dividend Fund (DTH)
(formerly, WisdomTree DEFA Equity Income Fund)
WisdomTree International LargeCap Dividend Fund (DOL)
WisdomTree International MidCap Dividend Fund (DIM)
WisdomTree International SmallCap Dividend Fund (DLS)
WisdomTree Japan Hedged Capital Goods Fund (DXJC)
WisdomTree Japan Hedged Equity Fund (DXJ)
WisdomTree Japan Hedged Financials Fund (DXJF)
WisdomTree Japan Hedged Health Care Fund (DXJH)
WisdomTree Japan Hedged Quality Dividend Growth Fund (JHDG)
(formerly, WisdomTree Japan Hedged Dividend Growth Fund)
WisdomTree Japan Hedged Real Estate Fund (DXJR)
WisdomTree Japan Hedged SmallCap Equity Fund (DXJS)
WisdomTree Japan Hedged Tech, Media and Telecom Fund (DXJT)
WisdomTree Japan Quality Dividend Growth Fund (JDG)
(formerly, WisdomTree Japan Dividend Growth Fund)
WisdomTree Japan SmallCap Dividend Fund (DFJ)
WisdomTree Korea Hedged Equity Fund (DXKW)
WisdomTree United Kingdom Hedged Equity Fund (DXPS)
Table of Contents
“WisdomTree” is a registered mark of WisdomTree Investments, Inc. and is licensed for use by the WisdomTree Trust.
Management’s Discussion of Funds’ Performance
(unaudited)
Market Environment Overview
The international equity markets, measured by the MSCI EAFE Index, a broad measure of equity performance for the developed world outside the U.S. and Canada, returned -8.27% in the 12-month period that ended March 31, 2016 (the “period”), which lagged the S&P 500 Index by 10.05%. Measured in local currency, the MSCI EAFE Index returned -11.17% over the period, lagging the return of the S&P 500 Index by 12.95%. It is important to note that when foreign currencies weaken or strengthen relative to the U.S. dollar, there is also an impact on the returns experienced by U.S. investors who invest overseas. Over the period, international equity markets experienced several central bank policy actions which lead to significant volatility in various currencies relative to the U.S. dollar. In particular, the British pound, Japanese yen, and euro (which account for about 75% of the MSCI EAFE Index’s currency exposure) all experienced volatility over the period. In the case of the euro and Japanese yen, the fluctuations were mostly attributable to central bank policy decisions. In the case of the British pound, speculation of Great Britain’s exit from the European Union or “Brexit” weighed on the currency late in the period.
Ultimately, international equities struggled to gain traction over the period as fears of recession in multiple domiciles continued to dominate equity performance. In the Eurozone, economic concerns over slumping growth figures and suppressed inflation led investors to pull money from the region throughout the period. The European Central Bank expanded its monetary easing with a focus on lending as a means of spurring growth in addition to increased asset purchasing programs. Similarly, Japan also experienced similar outflows as the Bank of Japan also expanded its monetary policy in an attempt to generate growth and inflation. Conversely, the United States Federal Reserve raised the federal funds rate by 25 basis points thus beginning a gradual tightening cycle and helping to make U.S. equities relatively attractive over the period.
In local currency terms, defensive sectors like Consumer Staples, Telecommunication Services, and Utilities were the best performing portions of the MSCI EAFE Index while the Financials and Materials sectors lagged most significantly over the period. The aforementioned defensive sectors benefited as investors sought safety in an otherwise volatile market environment. Financials and Materials sectors lagged due to concerns of slowing global growth and the bear market in commodities.
WisdomTree Funds’ Performance Overview
The following table reflects the WisdomTree Funds’ performance versus capitalization-weighted benchmark indexes:
| | | | | | | | | | | | |
| Ticker | | WisdomTree Fund | | 1-Year
NAV Return | | Performance Benchmark | | 1-Year
Return | | | Difference |
AUSE | | WisdomTree Australia Dividend Fund | | -7.17% | | MSCI Pacific ex-Japan Value/MSCI Australia Spliced Index | | | -10.82% | | | 3.65% |
HEDJ | | WisdomTree Europe Hedged Equity Fund | | -13.85% | | MSCI EAFE Local Currency/MSCI EMU Local Currency Spliced Index | | | -13.61% | | | -0.24% |
EUSC | | WisdomTree Europe Hedged SmallCap Equity Fund | | -3.79% | | MSCI European Economic and Monetary Union (EMU) Small Cap Local Currency Index | | | -2.82% | | | -0.97% |
EUDG | | WisdomTree Europe Quality Dividend Growth Fund | | -1.83% | | MSCI Europe Index | | | -8.44% | | | 6.61% |
DFE | | WisdomTree Europe SmallCap Dividend Fund | | 5.25% | | MSCI Europe Small Cap Index | | | 4.74% | | | 0.51% |
DXGE | | WisdomTree Germany Hedged Equity Fund | | -14.44% | | MSCI Germany Local Currency Index | | | -16.74% | | | 2.30% |
DXUS | | WisdomTree Global ex-U.S. Hedged Dividend Fund1 | | -12.02% | | MSCI AC World ex-USA Local Currency Index | | | -11.81% | | | -0.21% |
HDRW | | WisdomTree Global ex-U.S. Hedged Real Estate Fund2 | | -1.06% | | Dow Jones Global ex-U.S. Select Real Estate Securities Index (USD) Hedged | | | -1.79% | | | 0.73% |
| | | | |
| WisdomTree Developed World ex-U.S. and Currency Hedged Equity Funds | | | 1 | |
Management’s Discussion of Funds’ Performance
(unaudited) (continued)
| | | | | | | | | | | | |
| Ticker | | WisdomTree Fund | | 1-Year
NAV Return | | Performance Benchmark | | 1-Year
Return | | | Difference |
DOO | | WisdomTree International Dividend ex-Financials Fund | | -8.83% | | MSCI EAFE Value Index | | | -12.82% | | | 3.99% |
DWM | | WisdomTree International Equity Fund | | -8.15% | | MSCI EAFE Index | | | -8.27% | | | 0.12% |
HDWM | | WisdomTree International Hedged Equity Fund3 | | -7.16% | | MSCI EAFE Local Currency Index | | | -9.12% | | | 1.96% |
IHDG | | WisdomTree International Hedged Quality Dividend Growth Fund | | -1.73% | | MSCI EAFE Local Currency Index | | | -11.17% | | | 9.44% |
HDLS | | WisdomTree International Hedged SmallCap Dividend Fund1 | | -5.66% | | MSCI EAFE Small Cap Local Currency Index | | | -5.09% | | | -0.57% |
DTH | | WisdomTree International High Dividend Fund | | -9.60% | | MSCI EAFE Value Index | | | -12.82% | | | 3.22% |
DOL | | WisdomTree International LargeCap Dividend Fund | | -10.49% | | MSCI EAFE Index | | | -8.27% | | | -2.22% |
DIM | | WisdomTree International MidCap Dividend Fund | | -2.12% | | MSCI EAFE Mid Cap Index | | | -1.86% | | | -0.26% |
DLS | | WisdomTree International SmallCap Dividend Fund | | 2.26% | | MSCI EAFE Small Cap Index | | | 3.20% | | | -0.94% |
DXJC | | WisdomTree Japan Hedged Capital Goods Fund | | -20.72% | | MSCI Japan Local Currency Index | | | -12.90% | | | -7.82% |
DXJ | | WisdomTree Japan Hedged Equity Fund | | -15.64% | | MSCI Japan/MSCI Japan Local Currency Spliced Index | | | -12.90% | | | -2.74% |
DXJF | | WisdomTree Japan Hedged Financials Fund | | -24.30% | | MSCI Japan Local Currency Index | | | -12.90% | | | -11.40% |
DXJH | | WisdomTree Japan Hedged Health Care Fund | | 6.16% | | MSCI Japan Local Currency Index | | | -12.90% | | | 19.06% |
JHDG | | WisdomTree Japan Hedged Quality Dividend Growth Fund4 | | -11.73% | | JPX-Nikkei 400 Local Currency Index | | | -14.67% | | | 2.94% |
DXJR | | WisdomTree Japan Hedged Real Estate Fund | | -2.21% | | MSCI Japan Local Currency Index | | | -12.90% | | | 10.69% |
DXJS | | WisdomTree Japan Hedged SmallCap Equity Fund | | -3.83% | | MSCI Japan Small Cap Local Currency Index | | | -2.52% | | | -1.31% |
DXJT | | WisdomTree Japan Hedged Tech, Media and Telecom Fund | | -12.99% | | MSCI Japan Local Currency Index | | | -12.90% | | | -0.09% |
JDG | | WisdomTree Japan Quality Dividend Growth Fund5 | | -6.07% | | JPX-Nikkei 400 Index | | | -9.86% | | | 3.79% |
DFJ | | WisdomTree Japan SmallCap Dividend Fund | | 3.51% | | MSCI Japan Small Cap Index | | | 4.02% | | | -0.51% |
DXKW | | WisdomTree Korea Hedged Equity Fund | | 0.17% | | MSCI Korea Local Currency Index | | | -3.01% | | | 3.18% |
DXPS | | WisdomTree United Kingdom Hedged Equity Fund | | -5.15% | | MSCI United Kingdom Local Currency Index | | | -5.85% | | | 0.70% |
| 1 | Total returns shown are for the period June 4, 2015 (commencement of operations) through March 31, 2016. |
| 2 | Total returns shown are for the period October 29, 2015 (commencement of operations) through March 31, 2016. |
| 3 | Total returns shown are for the period July 9, 2015 (commencement of operations) through March 31, 2016. |
| 4 | Total returns shown are for the period April 9, 2015 (commencement of operations) through March 31, 2016. |
| 5 | Total returns shown are for the period May 28, 2015 (commencement of operations) through March 31, 2016. |
WisdomTree’s international dividend-weighted funds are designed to track indexes based on the dividend stream generated by the companies included in the index. The dividend stream is defined as the sum of all dividends paid over the prior 12 months for each company. The first is aggregate exposure to one or more sectors or countries. The second is stock selection within each sector or country. Both of these are determined as part of WisdomTree’s rules-based index methodology. These exposures are not subjectively determined. Rather, they are objectively determined at the Index rebalancing dates based on the dividend stream.
| | |
| 2 | | WisdomTree Developed World ex-U.S. and Currency Hedged Equity Funds |
Management’s Discussion of Funds’ Performance
(unaudited) (concluded)
WisdomTree’s best performing Fund for the full period was the WisdomTree Japan Hedged Health Care Fund (DXJH), returning 6.16% over the period. This strategy had three major drivers contributing to its more than 19.00% outperformance versus the MSCI Japan Local Currency Index. The first driver was a more accommodating regulatory landscape as Japanese authorities sought to deregulate the industry. Second, Health Care, considered a defensive sector, benefited as investors sought safety from the volatility of the broader Japanese equity markets over the period. Lastly, Japan’s demographics became an area of focus with an aging population in need of greater medical care. Another relative outperformer was the WisdomTree Europe SmallCap Dividend Fund (DFE) which benefited from its selection and underweight to Financials.
The WisdomTree quality dividend growth suite performed favorably over the period with the WisdomTree Europe Quality Dividend Growth Fund (EUDG) and WisdomTree International Hedged Quality Dividend Growth Fund (IHDG) both outperforming their respective benchmarks by 6.61% and 9.44%, respectively. Given the volatile environment for equities over the period, the fundamental screens for “return on equity” and “return on assets” helped these Funds outperform their respective benchmarks. For IHDG, an overweight to the United Kingdom and underweight to Financials added to the performance. The quality methodology helps the portfolio tilt away from more leveraged companies which explains the underweight in Financials that is again found in EUDG as a major contributor to the return over the period.
Fund returns are shown at NAV. Please see Performance Summaries on the subsequent pages for more complete performance information. Please see pages 33 through 36 for the list of index descriptions.
Fund performance assumes reinvestment of dividends and capital gain distributions. An index is a statistical measure of a specified financial market or sector. An index does not actually hold a portfolio of securities, incur expenses or pay any transaction costs. Therefore, index returns do not reflect deductions for fees or expenses and an index is not available for direct investment. In comparison, the Funds’ performance is negatively impacted by these deductions. Fund returns do not reflect brokerage commissions or taxes on transactions in Fund shares or taxes that a shareholder would pay on Fund distributions. Past performance is no guarantee of future results. For the most recent month-end performance information visit www.wisdomtree.com.
| | | | |
| WisdomTree Developed World ex-U.S. and Currency Hedged Equity Funds | | | 3 | |
Performance Summary (unaudited)
WisdomTree Australia Dividend Fund (AUSE)
Sector Breakdown† as of 3/31/16
| | | | |
| |
| Sector | | % of Net Assets | |
Financials | | | 22.3% | |
Materials | | | 15.2% | |
Consumer Discretionary | | | 14.9% | |
Industrials | | | 14.6% | |
Consumer Staples | | | 9.7% | |
Healthcare | | | 7.8% | |
Energy | | | 6.6% | |
Telecommunication Services | | | 3.0% | |
Information Technology | | | 2.8% | |
Utilities | | | 2.3% | |
Other Assets less Liabilities‡ | | | 0.8% | |
Total | | | 100.0% | |
| † | The Fund’s sector breakdown is expressed as a percentage of net assets and may change over time. In addition, a sector may be comprised of several industries. It does not include derivatives (if any). |
| ‡ | Other assets includes investment of cash collateral for securities on loan (if any). |
Top Ten Holdings* as of 3/31/16
| | | | |
| |
| Description | | % of Net Assets | |
Insurance Australia Group Ltd. | | | 3.6% | |
CIMIC Group Ltd. | | | 3.6% | |
Woodside Petroleum Ltd. | | | 3.3% | |
Fortescue Metals Group Ltd. | | | 2.9% | |
Westpac Banking Corp. | | | 2.7% | |
Suncorp Group Ltd. | | | 2.7% | |
Treasury Wine Estates Ltd. | | | 2.4% | |
Wesfarmers Ltd. | | | 2.3% | |
Commonwealth Bank of Australia | | | 2.3% | |
AGL Energy Ltd. | | | 2.3% | |
| * | The ten largest holdings are subject to change, and there are no guarantees the Fund will remain invested in any particular company. Excludes investment of cash collateral for securities on loan (if any). |
The WisdomTree Australia Dividend Fund (the ‘‘Fund’’) seeks to track the price and yield performance, before fees and expenses, of the WisdomTree Australia Dividend Index.
The Fund returned -7.17% at net asset value (“NAV”) for the fiscal year ending March 31, 2016 (for more complete performance information please see the table below). The Fund benefited the most from its investment in the Consumer Discretionary sector. The Fund’s position in the Energy sector created the greatest drag on performance.
The following performance table is provided for comparative purposes and represents the period noted. The Fund’s per share NAV is the value of one share of the Fund and is calculated by dividing the value of total assets less total liabilities by the number of shares outstanding. The NAV return is based on the NAV of the Fund and the market price return is based on the market price per share of the Fund. The price used to calculate market price returns is the mid-point of the highest bid and lowest offer for Fund shares as of the close of trading on the exchange where Fund shares are listed. NAV and market price returns assume that dividends and capital gain distributions have been reinvested in the Fund at NAV and market price, respectively. As with other ETFs, NAV returns and market price returns may differ because of factors such as the supply and demand for Fund shares and investors’ assessments of the underlying value of the Fund’s portfolio securities.
An index is a statistical measure of a specified financial market or sector. An index does not actually hold a portfolio of securities, incur expenses or pay any transaction costs. Therefore, index returns do not reflect deductions for fees or expenses and the index is not available for direct investment. In comparison, the Fund’s performance is negatively impacted by these deductions. Fund returns do not reflect brokerage commissions or taxes a shareholder would pay on the sale of Fund shares or on Fund distributions. As of the Fund’s current prospectus dated August 1, 2015, as revised November 12, 2015, the Fund’s annual expense ratio was 0.58%.
Performance as of 3/31/16
| | | | | | | | | | | | | | | | |
| | | Average Annual Total Return | |
| | | 1 Year | | | 3 Year | | | 5 Year | | | Since
Inception1 | |
Fund NAV Returns | | | -7.17 | % | | | -5.41 | % | | | -0.40 | % | | | 5.25 | % |
Fund Market Price Returns | | | -7.09 | % | | | -5.91 | % | | | -0.61 | % | | | 5.12 | % |
WisdomTree Pacific ex-Japan Equity Income/Australia Dividend Spliced Index2 | | | -6.75 | % | | | -5.11 | % | | | -0.13 | % | | | 5.72 | % |
MSCI Pacific ex-Japan Value/MSCI Australia Spliced Index3 | | | -10.82 | % | | | -5.34 | % | | | -0.38 | % | | | 4.57 | % |
| 1 | Total returns are calculated based on the commencement of Fund trading on the NYSE Arca, Inc. on June 16, 2006. |
| 2 | WisdomTree Pacific ex-Japan Equity Income Index through June 17, 2011; WisdomTree Australia Dividend Index thereafter. |
| 3 | MSCI Pacific ex-Japan Value Index through June 17, 2011; MSCI Australia Index thereafter. |
Performance is historical and does not guarantee future results. Current performance may be lower or higher than quoted. Investment returns and the principal value of an investment will fluctuate so that an investor’s shares, when redeemed, may be worth more or less than their original cost. Performance data for the most recent month-end is available at www.wisdomtree.com. WisdomTree shares are bought and sold at market price (not NAV) and are not individually redeemed from the Fund. Fund NAV returns are calculated using the Fund’s daily 4:00 p.m. NAV. Market price returns reflect the midpoint of the bid/ask spread as of the close of trading on the exchange where Fund shares are listed. Market price returns do not represent the returns you would receive if you traded shares at other times. The returns do not reflect the deduction of taxes that a shareholder would pay on Fund distributions or on the redemption of Fund shares. Total returns for a period of less than one year are cumulative.
| | |
| 4 | | WisdomTree Developed World ex-U.S. and Currency Hedged Equity Funds |
Performance Summary (unaudited)
WisdomTree Europe Hedged Equity Fund (HEDJ)
Sector Breakdown† as of 3/31/16
| | | | |
| |
| Sector | | % of Net Assets | |
Consumer Staples | | | 21.4% | |
Industrials | | | 20.4% | |
Consumer Discretionary | | | 18.8% | |
Healthcare | | | 10.2% | |
Financials | | | 9.2% | |
Materials | | | 7.5% | |
Information Technology | | | 6.5% | |
Telecommunication Services | | | 4.8% | |
Energy | | | 1.5% | |
Utilities | | | 0.2% | |
Other Assets less Liabilities‡ | | | -0.5% | |
Total | | | 100.0% | |
| † | The Fund’s sector breakdown is expressed as a percentage of net assets and may change over time. In addition, a sector may be comprised of several industries. It does not include derivatives (if any). |
| ‡ | Other assets includes investment of cash collateral for securities on loan (if any). |
Top Ten Holdings* as of 3/31/16
| | | | |
| |
| Description | | % of Net Assets | |
Anheuser-Busch InBev N.V. | | | 6.3% | |
Siemens AG, Registered Shares | | | 5.4% | |
Unilever N.V., CVA | | | 4.9% | |
Telefonica S.A. | | | 4.8% | |
Daimler AG, Registered Shares | | | 4.4% | |
Sanofi | | | 3.9% | |
Banco Santander S.A. | | | 3.8% | |
Banco Bilbao Vizcaya Argentaria S.A. | | | 3.4% | |
SAP SE | | | 3.1% | |
Bayer AG, Registered Shares | | | 3.0% | |
| * | The ten largest holdings are subject to change, and there are no guarantees the Fund will remain invested in any particular company. Excludes investment of cash collateral for securities on loan (if any). |
The WisdomTree Europe Hedged Equity Fund (the ‘‘Fund’’) seeks to track the price and yield performance, before fees and expenses, of the WisdomTree Europe Hedged Equity Index.
The Fund returned -13.85% at net asset value (“NAV”) for the fiscal year ending March 31, 2016 (for more complete performance information please see the table below). The Fund benefited the most from its position in the Netherlands. The Fund’s position in Spain created the greatest drag on performance. During the fiscal year, the Fund utilized forward foreign currency contracts as hedges to offset euro currency exposure from positions in European equities. The Fund’s use of forward foreign currency contracts detracted from performance as a result of the U.S. dollar weakening against the euro during the period.
The following performance table is provided for comparative purposes and represents the period noted. The Fund’s per share NAV is the value of one share of the Fund and is calculated by dividing the value of total assets less total liabilities by the number of shares outstanding. The NAV return is based on the NAV of the Fund and the market price return is based on the market price per share of the Fund. The price used to calculate market price returns is the mid-point of the highest bid and lowest offer for Fund shares as of the close of trading on the exchange where Fund shares are listed. NAV and market price returns assume that dividends and capital gain distributions have been reinvested in the Fund at NAV and market price, respectively. As with other ETFs, NAV returns and market price returns may differ because of factors such as the supply and demand for Fund shares and investors’ assessments of the underlying value of the Fund’s portfolio securities.
An index is a statistical measure of a specified financial market or sector. An index does not actually hold a portfolio of securities, incur expenses or pay any transaction costs. Therefore, index returns do not reflect deductions for fees or expenses and the index is not available for direct investment. In comparison, the Fund’s performance is negatively impacted by these deductions. Fund returns do not reflect brokerage commissions or taxes a shareholder would pay on the sale of Fund shares or on Fund distributions. As of the Fund’s current prospectus dated August 1, 2015, as revised November 12, 2015, the Fund’s annual expense ratio was 0.58%.
Performance as of 3/31/16
| | | | | | | | | | | | | | | | |
| | | Average Annual Total Return | |
| | | 1 Year | | | 3 Year | | | 5 Year | | | Since
Inception1 | |
Fund NAV Returns | | | -13.85 | % | | | 7.33 | % | | | 6.53 | % | | | 6.06 | % |
Fund Market Price Returns | | | -14.19 | % | | | 6.96 | % | | | 6.31 | % | | | 6.01 | % |
WisdomTree DEFA International Hedged Equity/Europe Hedged Equity Spliced Index2 | | | -13.45 | % | | | 7.72 | % | | | 6.90 | % | | | 6.55 | % |
MSCI EAFE Local Currency/MSCI EMU Local Currency Spliced Index3 | | | -13.61 | % | | | 8.86 | % | | | 6.14 | % | | | 5.84 | % |
| 1 | Total returns are calculated based on the commencement of Fund trading on the NYSE Arca, Inc. on December 31, 2009. |
| 2 | WisdomTree DEFA International Hedged Equity Index through August 29, 2012; WisdomTree Europe Hedged Equity Index thereafter. |
| 3 | MSCI EAFE Local Currency Index through August 29, 2012; MSCI EMU Local Currency Index thereafter. |
Performance is historical and does not guarantee future results. Current performance may be lower or higher than quoted. Investment returns and the principal value of an investment will fluctuate so that an investor’s shares, when redeemed, may be worth more or less than their original cost. Performance data for the most recent month-end is available at www.wisdomtree.com. WisdomTree shares are bought and sold at market price (not NAV) and are not individually redeemed from the Fund. Fund NAV returns are calculated using the Fund’s daily 4:00 p.m. NAV. Market price returns reflect the midpoint of the bid/ask spread as of the close of trading on the exchange where Fund shares are listed. Market price returns do not represent the returns you would receive if you traded shares at other times. The returns do not reflect the deduction of taxes that a shareholder would pay on Fund distributions or on the redemption of Fund shares. Total returns for a period of less than one year are cumulative.
| | | | |
| WisdomTree Developed World ex-U.S. and Currency Hedged Equity Funds | | | 5 | |
Performance Summary (unaudited)
WisdomTree Europe Hedged SmallCap Equity Fund (EUSC)
Sector Breakdown† as of 3/31/16
| | | | |
| |
| Sector | | % of Net Assets | |
Industrials | | | 24.5% | |
Financials | | | 20.4% | |
Consumer Discretionary | | | 14.5% | |
Materials | | | 9.0% | |
Consumer Staples | | | 7.3% | |
Information Technology | | | 6.0% | |
Healthcare | | | 6.0% | |
Utilities | | | 5.7% | |
Telecommunication Services | | | 4.5% | |
Energy | | | 2.3% | |
Other Assets less Liabilities‡ | | | -0.2% | |
Total | | | 100.0% | |
| † | The Fund’s sector breakdown is expressed as a percentage of net assets and may change over time. In addition, a sector may be comprised of several industries. It does not include derivatives (if any). |
| ‡ | Other assets includes investment of cash collateral for securities on loan (if any). |
Top Ten Holdings* as of 3/31/16
| | | | |
| |
| Description | | % of
Net Assets | |
Elisa Oyj | | | 2.2% | |
bpost S.A. | | | 2.0% | |
Nokian Renkaat Oyj | | | 1.6% | |
Hochtief AG | | | 1.5% | |
Banca Mediolanum SpA | | | 1.5% | |
Freenet AG | | | 1.4% | |
Lagardere SCA | | | 1.2% | |
Cofinimmo S.A. | | | 1.2% | |
Hera SpA | | | 1.2% | |
Eiffage S.A. | | | 1.2% | |
| * | The ten largest holdings are subject to change, and there are no guarantees the Fund will remain invested in any particular company. Excludes investment of cash collateral for securities on loan (if any). |
The WisdomTree Europe Hedged SmallCap Equity Fund (the ‘‘Fund’’) seeks to track the price and yield performance, before fees and expenses, of the WisdomTree Europe Hedged SmallCap Equity Index.
The Fund returned -3.79% at net asset value (“NAV”) for the fiscal year ending March 31, 2016 (for more complete performance information please see the table below). The Fund benefited the most from its position in Germany. The Fund’s position in Spain created the greatest drag on performance. During the fiscal year, the Fund utilized forward foreign currency contracts as hedges to offset euro currency exposure from positions in European equities. The Fund’s use of forward foreign currency contracts detracted from performance as a result of the U.S. dollar weakening against the euro during the period.
The following performance table is provided for comparative purposes and represents the period noted. The Fund’s per share NAV is the value of one share of the Fund and is calculated by dividing the value of total assets less total liabilities by the number of shares outstanding. The NAV return is based on the NAV of the Fund and the market price return is based on the market price per share of the Fund. The price used to calculate market price returns is the mid-point of the highest bid and lowest offer for Fund shares as of the close of trading on the exchange where Fund shares are listed. NAV and market price returns assume that dividends and capital gain distributions have been reinvested in the Fund at NAV and market price, respectively. As with other ETFs, NAV returns and market price returns may differ because of factors such as the supply and demand for Fund shares and investors’ assessments of the underlying value of the Fund’s portfolio securities.
An index is a statistical measure of a specified financial market or sector. An index does not actually hold a portfolio of securities, incur expenses or pay any transaction costs. Therefore, index returns do not reflect deductions for fees or expenses and the index is not available for direct investment. In comparison, the Fund’s performance is negatively impacted by these deductions. Fund returns do not reflect brokerage commissions or taxes a shareholder would pay on the sale of Fund shares or on Fund distributions. As of the Fund’s current prospectus dated August 1, 2015, as revised November 12, 2015, the Fund’s annual expense ratio was 0.58%.
Performance as of 3/31/16
| | | | | | | | |
| | | Average Annual Total Return | |
| | | 1 Year | | | Since
Inception1 | |
Fund NAV Returns | | | -3.79 | % | | | 0.33 | % |
Fund Market Price Returns | | | -3.99 | % | | | -0.65 | % |
WisdomTree Europe Hedged SmallCap Equity Index | | | -3.71 | % | | | 0.37 | % |
MSCI European Economic and Monetary Union (EMU) Small Cap Local Currency Index | | | -2.82 | % | | | 1.40 | % |
| 1 | Total returns are calculated based on the commencement of Fund trading on the NYSE Arca, Inc. on March 4, 2015. |
Performance is historical and does not guarantee future results. Current performance may be lower or higher than quoted. Investment returns and the principal value of an investment will fluctuate so that an investor’s shares, when redeemed, may be worth more or less than their original cost. Performance data for the most recent month-end is available at www.wisdomtree.com. WisdomTree shares are bought and sold at market price (not NAV) and are not individually redeemed from the Fund. Fund NAV returns are calculated using the Fund’s daily 4:00 p.m. NAV. Market price returns reflect the midpoint of the bid/ask spread as of the close of trading on the exchange where Fund shares are listed. Market price returns do not represent the returns you would receive if you traded shares at other times. The returns do not reflect the deduction of taxes that a shareholder would pay on Fund distributions or on the redemption of Fund shares. Total returns for a period of less than one year are cumulative.
| | |
| 6 | | WisdomTree Developed World ex-U.S. and Currency Hedged Equity Funds |
Performance Summary (unaudited)
WisdomTree Europe Quality Dividend Growth Fund (EUDG)
(formerly, WisdomTree Europe Dividend Growth Fund)
Sector Breakdown† as of 3/31/16
| | | | |
| |
| Sector | | % of Net Assets | |
Consumer Staples | | | 21.8% | |
Industrials | | | 19.9% | |
Consumer Discretionary | | | 19.2% | |
Healthcare | | | 18.6% | |
Information Technology | | | 8.6% | |
Materials | | | 6.1% | |
Financials | | | 3.2% | |
Telecommunication Services | | | 2.1% | |
Energy | | | 0.2% | |
Other Assets less Liabilities‡ | | | 0.3% | |
Total | | | 100.0% | |
| † | The Fund’s sector breakdown is expressed as a percentage of net assets and may change over time. In addition, a sector may be comprised of several industries. It does not include derivatives (if any). |
| ‡ | Other assets includes investment of cash collateral for securities on loan (if any). |
Top Ten Holdings* as of 3/31/16
| | | | |
| |
| Description | | % of Net Assets | |
Roche Holding AG, Genusschein | | | 6.1% | |
Anheuser-Busch InBev N.V. | | | 4.5% | |
British American Tobacco PLC | | | 4.3% | |
Novo Nordisk A/S, Class B | | | 3.1% | |
Bayer AG, Registered Shares | | | 2.9% | |
SAP SE | | | 2.8% | |
Unilever N.V., CVA | | | 2.4% | |
Daimler AG, Registered Shares | | | 2.2% | |
Diageo PLC | | | 2.1% | |
Telefonaktiebolaget LM Ericsson, Class B | | | 1.9% | |
| * | The ten largest holdings are subject to change, and there are no guarantees the Fund will remain invested in any particular company. Excludes investment of cash collateral for securities on loan (if any). |
The WisdomTree Europe Quality Dividend Growth Fund (the ‘‘Fund’’) seeks to track the price and yield performance, before fees and expenses, of the WisdomTree Europe Quality Dividend Growth Index. Prior to March 31, 2016, the WisdomTree Europe Quality Dividend Growth Index was named the WisdomTree Europe Dividend Growth Index.
The Fund returned -1.83% at net asset value (“NAV”) for the fiscal year ending March 31, 2016 (for more complete performance information please see the table below). The Fund benefited the most from its position in the Netherlands. The Fund’s position in Germany created the greatest drag on performance.
The following performance table is provided for comparative purposes and represents the period noted. The Fund’s per share NAV is the value of one share of the Fund and is calculated by dividing the value of total assets less total liabilities by the number of shares outstanding. The NAV return is based on the NAV of the Fund and the market price return is based on the market price per share of the Fund. The price used to calculate market price returns is the mid-point of the highest bid and lowest offer for Fund shares as of the close of trading on the exchange where Fund shares are listed. NAV and market price returns assume that dividends and capital gain distributions have been reinvested in the Fund at NAV and market price, respectively. As with other ETFs, NAV returns and market price returns may differ because of factors such as the supply and demand for Fund shares and investors’ assessments of the underlying value of the Fund’s portfolio securities.
An index is a statistical measure of a specified financial market or sector. An index does not actually hold a portfolio of securities, incur expenses or pay any transaction costs. Therefore, index returns do not reflect deductions for fees or expenses and the index is not available for direct investment. In comparison, the Fund’s performance is negatively impacted by these deductions. Fund returns do not reflect brokerage commissions or taxes a shareholder would pay on the sale of Fund shares or on Fund distributions. As of the Fund’s current prospectus dated August 1, 2015, as revised November 12, 2015, the Fund’s annual expense ratio was 0.58%.
Performance as of 3/31/16
| | | | | | | | |
| | | Average Annual Total Return | |
| | | 1 Year | | | Since
Inception1 | |
Fund NAV Returns | | | -1.83 | % | | | -4.33 | % |
Fund Market Price Returns | | | -2.55 | % | | | -4.79 | % |
WisdomTree Europe Quality Dividend Growth Index | | | -1.15 | % | | | -3.82 | % |
MSCI Europe Index | | | -8.44 | % | | | -8.26 | % |
| 1 | Total returns are calculated based on the commencement of Fund trading on the NYSE Arca, Inc. on May 7, 2014. |

Performance is historical and does not guarantee future results. Current performance may be lower or higher than quoted. Investment returns and the principal value of an investment will fluctuate so that an investor’s shares, when redeemed, may be worth more or less than their original cost. Performance data for the most recent month-end is available at www.wisdomtree.com. WisdomTree shares are bought and sold at market price (not NAV) and are not individually redeemed from the Fund. Fund NAV returns are calculated using the Fund’s daily 4:00 p.m. NAV. Market price returns reflect the midpoint of the bid/ask spread as of the close of trading on the exchange where Fund shares are listed. Market price returns do not represent the returns you would receive if you traded shares at other times. The returns do not reflect the deduction of taxes that a shareholder would pay on Fund distributions or on the redemption of Fund shares. Total returns for a period of less than one year are cumulative.
| | | | |
| WisdomTree Developed World ex-U.S. and Currency Hedged Equity Funds | | | 7 | |
Performance Summary (unaudited)
WisdomTree Europe SmallCap Dividend Fund (DFE)
Sector Breakdown† as of 3/31/16
| | | | |
| |
| Sector | | % of Net Assets | |
Industrials | | | 25.0% | |
Financials | | | 20.0% | |
Consumer Discretionary | | | 16.1% | |
Information Technology | | | 12.6% | |
Materials | | | 8.0% | |
Consumer Staples | | | 7.3% | |
Healthcare | | | 4.0% | |
Utilities | | | 3.1% | |
Energy | | | 2.7% | |
Telecommunication Services | | | 0.6% | |
Investment Company | | | 0.2% | |
Other Assets less Liabilities‡ | | | 0.4% | |
Total | | | 100.0% | |
| † | The Fund’s sector breakdown is expressed as a percentage of net assets and may change over time. In addition, a sector may be comprised of several industries. It does not include derivatives (if any). |
| ‡ | Other assets includes investment of cash collateral for securities on loan (if any). |
Top Ten Holdings* as of 3/31/16
| | | | |
| |
| Description | | % of Net Assets | |
Cofinimmo S.A. | | | 2.0% | |
Cembra Money Bank AG | | | 1.3% | |
Leroy Seafood Group ASA | | | 1.2% | |
Iren SpA | | | 1.1% | |
ERG SpA | | | 1.1% | |
Ratos AB, Class B | | | 1.1% | |
Kemira Oyj | | | 1.0% | |
Peab AB | | | 1.0% | |
Modern Times Group MTG AB, Class B | | | 1.0% | |
Tieto Oyj | | | 1.0% | |
| * | The ten largest holdings are subject to change, and there are no guarantees the Fund will remain invested in any particular company. Excludes investment of cash collateral for securities on loan (if any). |
The WisdomTree Europe SmallCap Dividend Fund (the ‘‘Fund’’) seeks to track the price and yield performance, before fees and expenses, of the WisdomTree Europe SmallCap Dividend Index.
The Fund returned 5.25% at net asset value (“NAV”) for the fiscal year ending March 31, 2016 (for more complete performance information please see the table below). The Fund benefited the most from its position in Sweden. The Fund’s position in France created the greatest drag on performance.
The following performance table is provided for comparative purposes and represents the period noted. The Fund’s per share NAV is the value of one share of the Fund and is calculated by dividing the value of total assets less total liabilities by the number of shares outstanding. The NAV return is based on the NAV of the Fund and the market price return is based on the market price per share of the Fund. The price used to calculate market price returns is the mid-point of the highest bid and lowest offer for Fund shares as of the close of trading on the exchange where Fund shares are listed. NAV and market price returns assume that dividends and capital gain distributions have been reinvested in the Fund at NAV and market price, respectively. As with other ETFs, NAV returns and market price returns may differ because of factors such as the supply and demand for Fund shares and investors’ assessments of the underlying value of the Fund’s portfolio securities.
An index is a statistical measure of a specified financial market or sector. An index does not actually hold a portfolio of securities, incur expenses or pay any transaction costs. Therefore, index returns do not reflect deductions for fees or expenses and the index is not available for direct investment. In comparison, the Fund’s performance is negatively impacted by these deductions. Fund returns do not reflect brokerage commissions or taxes a shareholder would pay on the sale of Fund shares or on Fund distributions. As of the Fund’s current prospectus dated August 1, 2015, as revised November 12, 2015, the Fund’s annual expense ratio was 0.58%.
Performance as of 3/31/16
| | | | | | | | | | | | | | | | |
| | | Average Annual Total Return | |
| | | 1 Year | | | 3 Year | | | 5 Year | | | Since
Inception1 | |
Fund NAV Returns | | | 5.25 | % | | | 13.89 | % | | | 8.79 | % | | | 5.88 | % |
Fund Market Price Returns | | | 5.02 | % | | | 13.99 | % | | | 8.73 | % | | | 5.73 | % |
WisdomTree Europe SmallCap Dividend Index | | | 6.00 | % | | | 15.10 | % | | | 9.59 | % | | | 6.44 | % |
MSCI Europe Small Cap Index | | | 4.74 | % | | | 10.70 | % | | | 6.90 | % | | | 5.99 | % |
| 1 | Total returns are calculated based on the commencement of Fund trading on the NYSE Arca, Inc. on June 16, 2006. |
Performance is historical and does not guarantee future results. Current performance may be lower or higher than quoted. Investment returns and the principal value of an investment will fluctuate so that an investor’s shares, when redeemed, may be worth more or less than their original cost. Performance data for the most recent month-end is available at www.wisdomtree.com. WisdomTree shares are bought and sold at market price (not NAV) and are not individually redeemed from the Fund. Fund NAV returns are calculated using the Fund’s daily 4:00 p.m. NAV. Market price returns reflect the midpoint of the bid/ask spread as of the close of trading on the exchange where Fund shares are listed. Market price returns do not represent the returns you would receive if you traded shares at other times. The returns do not reflect the deduction of taxes that a shareholder would pay on Fund distributions or on the redemption of Fund shares. Total returns for a period of less than one year are cumulative.
| | |
| 8 | | WisdomTree Developed World ex-U.S. and Currency Hedged Equity Funds |
Performance Summary (unaudited)
WisdomTree Germany Hedged Equity Fund (DXGE)
Sector Breakdown† as of 3/31/16
| | | | |
| |
| Sector | | % of Net Assets | |
Consumer Discretionary | | | 21.8% | |
Industrials | | | 18.6% | |
Financials | | | 15.4% | |
Materials | | | 15.0% | |
Healthcare | | | 10.0% | |
Information Technology | | | 6.5% | |
Consumer Staples | | | 5.4% | |
Telecommunication Services | | | 4.3% | |
Utilities | | | 2.6% | |
Other Assets less Liabilities‡ | | | 0.4% | |
Total | | | 100.0% | |
| † | The Fund’s sector breakdown is expressed as a percentage of net assets and may change over time. In addition, a sector may be comprised of several industries. It does not include derivatives (if any). |
| ‡ | Other assets includes investment of cash collateral for securities on loan (if any). |
Top Ten Holdings* as of 3/31/16
| | | | |
| |
| Description | | % of Net Assets | |
Daimler AG, Registered Shares | | | 4.5% | |
Bayerische Motoren Werke AG | | | 4.5% | |
Muenchener Rueckversicherungs - Gesellschaft AG, Registered Shares | | | 4.5% | |
Bayer AG, Registered Shares | | | 4.4% | |
SAP SE | | | 4.4% | |
BASF SE | | | 4.4% | |
Siemens AG, Registered Shares | | | 4.4% | |
Deutsche Telekom AG, Registered Shares | | | 4.3% | |
Allianz SE, Registered Shares | | | 4.2% | |
Deutsche Post AG, Registered Shares | | | 3.5% | |
| * | The ten largest holdings are subject to change, and there are no guarantees the Fund will remain invested in any particular company. Excludes investment of cash collateral for securities on loan (if any). |
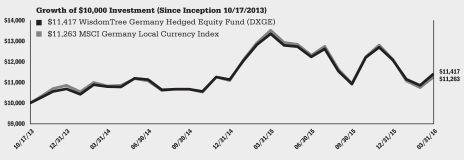
The WisdomTree Germany Hedged Equity Fund (the ‘‘Fund’’) seeks to track the price and yield performance, before fees and expenses, of the WisdomTree Germany Hedged Equity Index.
The Fund returned -14.44% at net asset value (“NAV”) for the fiscal year ending March 31, 2016 (for more complete performance information please see the table below). The Fund benefited the most from its position in the Information Technology sector. The Fund’s position in the Consumer Discretionary sector created the greatest drag on performance. During the fiscal year, the Fund utilized forward foreign currency contracts as hedges to offset euro currency exposure from positions in German equities. The Fund’s use of forward foreign currency contracts detracted from performance as a result of the U.S. dollar weakening against the euro during the period.
The following performance table is provided for comparative purposes and represents the period noted. The Fund’s per share NAV is the value of one share of the Fund and is calculated by dividing the value of total assets less total liabilities by the number of shares outstanding. The NAV return is based on the NAV of the Fund and the market price return is based on the market price per share of the Fund. The price used to calculate market price returns is the mid-point of the highest bid and lowest offer for Fund shares as of the close of trading on the exchange where Fund shares are listed. NAV and market price returns assume that dividends and capital gain distributions have been reinvested in the Fund at NAV and market price, respectively. As with other ETFs, NAV returns and market price returns may differ because of factors such as the supply and demand for Fund shares and investors’ assessments of the underlying value of the Fund’s portfolio securities.
An index is a statistical measure of a specified financial market or sector. An index does not actually hold a portfolio of securities, incur expenses or pay any transaction costs. Therefore, index returns do not reflect deductions for fees or expenses and the index is not available for direct investment. In comparison, the Fund’s performance is negatively impacted by these deductions. Fund returns do not reflect brokerage commissions or taxes a shareholder would pay on the sale of Fund shares or on Fund distributions. As of the Fund’s current prospectus dated August 1, 2015, as revised November 12, 2015, the Fund’s annual expense ratio was 0.48%.
Performance as of 3/31/16
| | | | | | | | |
| | | Average Annual Total Return | |
| | | 1 Year | | | Since
Inception1 | |
Fund NAV Returns | | | -14.44 | % | | | 5.54 | % |
Fund Market Price Returns | | | -14.80 | % | | | 4.92 | % |
WisdomTree Germany Hedged Equity Index | | | -14.30 | % | | | 5.72 | % |
MSCI Germany Local Currency Index | | | -16.74 | % | | | 4.96 | % |
| 1 | Total returns are calculated based on the commencement of Fund trading on the NASDAQ on October 17, 2013. |
Performance is historical and does not guarantee future results. Current performance may be lower or higher than quoted. Investment returns and the principal value of an investment will fluctuate so that an investor’s shares, when redeemed, may be worth more or less than their original cost. Performance data for the most recent month-end is available at www.wisdomtree.com. WisdomTree shares are bought and sold at market price (not NAV) and are not individually redeemed from the Fund. Fund NAV returns are calculated using the Fund’s daily 4:00 p.m. NAV. Market price returns reflect the midpoint of the bid/ask spread as of the close of trading on the exchange where Fund shares are listed. Market price returns do not represent the returns you would receive if you traded shares at other times. The returns do not reflect the deduction of taxes that a shareholder would pay on Fund distributions or on the redemption of Fund shares. Total returns for a period of less than one year are cumulative.
| | | | |
| WisdomTree Developed World ex-U.S. and Currency Hedged Equity Funds | | | 9 | |
Performance Summary (unaudited)
WisdomTree Global ex-U.S. Hedged Dividend Fund (DXUS)
Sector Breakdown† as of 3/31/16
| | | | |
| |
| Sector | | % of Net Assets | |
Financials | | | 23.0% | |
Consumer Discretionary | | | 11.2% | |
Consumer Staples | | | 10.9% | |
Industrials | | | 10.7% | |
Telecommunication Services | | | 9.5% | |
Energy | | | 8.7% | |
Healthcare | | | 8.5% | |
Materials | | | 6.3% | |
Information Technology | | | 5.9% | |
Utilities | | | 4.3% | |
Investment Company | | | 1.5% | |
Other Assets less Liabilities‡ | | | -0.5% | |
Total | | | 100.0% | |
| † | The Fund’s sector breakdown is expressed as a percentage of net assets and may change over time. In addition, a sector may be comprised of several industries. It does not include derivatives (if any). |
| ‡ | Other assets includes investment of cash collateral for securities on loan (if any). |
Top Ten Holdings* as of 3/31/16
| | | | |
| |
| Description | | % of Net Assets | |
Toyota Motor Corp. | | | 1.8% | |
iPath MSCI India Index ETN | | | 1.5% | |
Nestle S.A., Registered Shares | | | 1.5% | |
Roche Holding AG, Genusschein | | | 1.3% | |
GlaxoSmithKline PLC | | | 1.2% | |
BP PLC | | | 1.2% | |
Novartis AG, Registered Shares | | | 1.2% | |
Royal Dutch Shell PLC, Class A | | | 1.1% | |
HSBC Holdings PLC | | | 1.1% | |
TOTAL S.A. | | | 1.0% | |
| * | The ten largest holdings are subject to change, and there are no guarantees the Fund will remain invested in any particular company. Excludes investment of cash collateral for securities on loan (if any). |
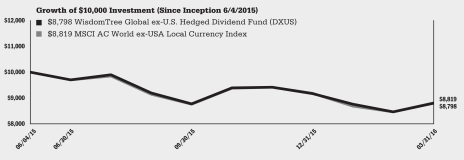
The WisdomTree Global ex-U.S. Hedged Dividend Fund (the ‘‘Fund’’) seeks to track the price and yield performance, before fees and expenses, of the WisdomTree Global ex-U.S. Hedged Dividend Index.
The Fund returned -12.02% at net asset value (“NAV”) from Fund inception on June 4, 2015 to March 31, 2016 (for more complete performance information please see the table below). The Fund benefited the most from its position in Taiwan. The Fund’s position in Japan created the greatest drag on performance. During the fiscal period, the Fund utilized forward foreign currency contracts as hedges to offset applicable international currency exposure from positions in international equities. The Fund’s use of forward foreign currency contracts contributed positively to performance as a result of the overall appreciation in the U.S. dollar against applicable international currencies during the period.
The following performance table is provided for comparative purposes and represents the period noted. The Fund’s per share NAV is the value of one share of the Fund and is calculated by dividing the value of total assets less total liabilities by the number of shares outstanding. The NAV return is based on the NAV of the Fund and the market price return is based on the market price per share of the Fund. The price used to calculate market price returns is the mid-point of the highest bid and lowest offer for Fund shares as of the close of trading on the exchange where Fund shares are listed. NAV and market price returns assume that dividends and capital gain distributions have been reinvested in the Fund at NAV and market price, respectively. As with other ETFs, NAV returns and market price returns may differ because of factors such as the supply and demand for Fund shares and investors’ assessments of the underlying value of the Fund’s portfolio securities.
An index is a statistical measure of a specified financial market or sector. An index does not actually hold a portfolio of securities, incur expenses or pay any transaction costs. Therefore, index returns do not reflect deductions for fees or expenses and the index is not available for direct investment. In comparison, the Fund’s performance is negatively impacted by these deductions. Fund returns do not reflect brokerage commissions or taxes a shareholder would pay on the sale of Fund shares or on Fund distributions. As of the Fund’s current prospectus dated June 1, 2015, the Fund’s annual expense ratio was 0.44%.
Performance as of 3/31/16
| | | | |
| | | Cumulative Total Return | |
| | | Since
Inception1 | |
Fund NAV Returns | | | -12.02 | % |
Fund Market Price Returns | | | -12.29 | % |
WisdomTree Global ex-U.S. Hedged Dividend Index | | | -11.60 | % |
MSCI AC World ex-USA Local Currency Index | | | -11.81 | % |
| 1 | Total returns are calculated based on the commencement of Fund trading on the NYSE Arca, Inc. on June 4, 2015. |
Performance is historical and does not guarantee future results. Current performance may be lower or higher than quoted. Investment returns and the principal value of an investment will fluctuate so that an investor’s shares, when redeemed, may be worth more or less than their original cost. Performance data for the most recent month-end is available at www.wisdomtree.com. WisdomTree shares are bought and sold at market price (not NAV) and are not individually redeemed from the Fund. Fund NAV returns are calculated using the Fund’s daily 4:00 p.m. NAV. Market price returns reflect the midpoint of the bid/ask spread as of the close of trading on the exchange where Fund shares are listed. Market price returns do not represent the returns you would receive if you traded shares at other times. The returns do not reflect the deduction of taxes that a shareholder would pay on Fund distributions or on the redemption of Fund shares. Total returns for a period of less than one year are cumulative.
| | |
| 10 | | WisdomTree Developed World ex-U.S. and Currency Hedged Equity Funds |
Performance Summary (unaudited)
WisdomTree Global ex-U.S. Hedged Real Estate Fund (HDRW)
Industry Breakdown† as of 3/31/16
| | | | |
| |
| Industry | | % of Net Assets | |
Real Estate Management & Development | | | 52.8% | |
Real Estate Investment Trusts (REITs) | | | 47.7% | |
Other Assets less Liabilities‡ | | | -0.5% | |
Total | | | 100.0% | |
| † | The Fund’s industry breakdown is expressed as a percentage of net assets and may change over time. It does not include derivatives (if any). |
| ‡ | Other assets includes investment of cash collateral for securities on loan (if any). |
Top Ten Holdings* as of 3/31/16
| | | | |
| |
| Description | | % of Net Assets | |
Evergrande Real Estate Group Ltd. | | | 3.9% | |
Sun Hung Kai Properties Ltd. | | | 3.5% | |
Unibail-Rodamco SE | | | 3.5% | |
Scentre Group | | | 2.9% | |
Country Garden Holdings Co., Ltd. | | | 2.1% | |
China Overseas Land & Investment Ltd. | | | 2.1% | |
Wharf Holdings Ltd. (The) | | | 2.0% | |
Link REIT | | | 1.7% | |
Westfield Corp. | | | 1.7% | |
Henderson Land Development Co., Ltd. | | | 1.5% | |
| * | The ten largest holdings are subject to change, and there are no guarantees the Fund will remain invested in any particular company. Excludes investment of cash collateral for securities on loan (if any). |
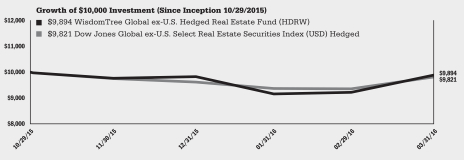
The WisdomTree Global ex-U.S. Hedged Real Estate Fund (the ‘‘Fund’’) seeks to track the price and yield performance, before fees and expenses, of the WisdomTree Global ex-U.S. Hedged Real Estate Index.
The Fund returned -1.06% at net asset value (“NAV”) from Fund inception October 29, 2015 to March 31, 2016 (for more complete performance information please see the table below). The Fund benefited the most from its position in Australia. The Fund’s position in Hong Kong created the greatest drag on performance. During the fiscal period, the Fund utilized forward foreign currency contracts as hedges to offset currency exposure from positions in international equities. The Fund’s use of forward foreign currency contracts detracted from performance as a result of the overall depreciation in the U.S. dollar against applicable international currencies during the period.
The following performance table is provided for comparative purposes and represents the period noted. The Fund’s per share NAV is the value of one share of the Fund and is calculated by dividing the value of total assets less total liabilities by the number of shares outstanding. The NAV return is based on the NAV of the Fund and the market price return is based on the market price per share of the Fund. The price used to calculate market price returns is the mid-point of the highest bid and lowest offer for Fund shares as of the close of trading on the exchange where Fund shares are listed. NAV and market price returns assume that dividends and capital gain distributions have been reinvested in the Fund at NAV and market price, respectively. As with other ETFs, NAV returns and market price returns may differ because of factors such as the supply and demand for Fund shares and investors’ assessments of the underlying value of the Fund’s portfolio
An index is a statistical measure of a specified financial market or sector. An index does not actually hold a portfolio of securities, incur expenses or pay any transaction costs. Therefore, index returns do not reflect deductions for fees or expenses and the index is not available for direct investment. In comparison, the Fund’s performance is negatively impacted by these deductions. Fund returns do not reflect brokerage commissions or taxes a shareholder would pay on the sale of Fund shares or on Fund distributions. As of the Fund’s current prospectus dated October 23, 2015, the Fund’s net and gross annual expense ratios were 0.43% and 0.58%, respectively. WisdomTree Asset Management, Inc. has contractually agreed to limit the management fee to 0.43% through July 31, 2017, unless earlier terminated by the Board of Trustees of the Trust for any reason at any time.
Performance as of 3/31/16
| | | | |
| | | Cumulative Total Return | |
| | | Since
Inception1 | |
Fund NAV Returns | | | -1.06 | % |
Fund Market Price Returns | | | -1.10 | % |
WisdomTree Global ex-U.S. Hedged Real Estate Index | | | -0.97 | % |
Dow Jones Global ex-U.S. Select Real Estate Securities Index (USD) Hedged | | | -1.79 | % |
| 1 | Total returns are calculated based on the commencement of Fund trading on the BATS Exchange, Inc. on October 29, 2015. |
Performance is historical and does not guarantee future results. Current performance may be lower or higher than quoted. Investment returns and the principal value of an investment will fluctuate so that an investor’s shares, when redeemed, may be worth more or less than their original cost. Performance data for the most recent month-end is available at www.wisdomtree.com. WisdomTree shares are bought and sold at market price (not NAV) and are not individually redeemed from the Fund. Fund NAV returns are calculated using the Fund’s daily 4:00 p.m. NAV. Market price returns reflect the midpoint of the bid/ask spread as of the close of trading on the exchange where Fund shares are listed. Market price returns do not represent the returns you would receive if you traded shares at other times. The returns do not reflect the deduction of taxes that a shareholder would pay on Fund distributions or on the redemption of Fund shares. Total returns for a period of less than one year are cumulative.
| | | | |
| WisdomTree Developed World ex-U.S. and Currency Hedged Equity Funds | | | 11 | |
Performance Summary (unaudited)
WisdomTree International Dividend ex-Financials Fund (DOO)
Sector Breakdown† as of 3/31/16
| | | | |
| |
| Sector | | % of Net Assets | |
Utilities | | | 15.1% | |
Telecommunication Services | | | 14.3% | |
Industrials | | | 12.8% | |
Energy | | | 12.8% | |
Consumer Staples | | | 11.9% | |
Materials | | | 8.7% | |
Healthcare | | | 8.7% | |
Consumer Discretionary | | | 8.3% | |
Information Technology | | | 6.5% | |
Investment Company | | | 0.1% | |
Other Assets less Liabilities‡ | | | 0.8% | |
Total | | | 100.0% | |
| † | The Fund’s sector breakdown is expressed as a percentage of net assets and may change over time. In addition, a sector may be comprised of several industries. It does not include derivatives (if any). |
| ‡ | Other assets includes investment of cash collateral for securities on loan (if any). |
Top Ten Holdings* as of 3/31/16
| | | | |
| |
| Description | | % of Net Assets | |
Snam SpA | | | 2.5% | |
Woodside Petroleum Ltd. | | | 2.3% | |
Eni SpA | | | 2.0% | |
Kuehne + Nagel International AG, Registered Shares | | | 1.9% | |
TeliaSonera AB | | | 1.8% | |
Fortum Oyj | | | 1.8% | |
TOTAL S.A. | | | 1.7% | |
EDP-Energias de Portugal S.A. | | | 1.7% | |
Orange S.A. | | | 1.6% | |
Wesfarmers Ltd. | | | 1.6% | |
| * | The ten largest holdings are subject to change, and there are no guarantees the Fund will remain invested in any particular company. Excludes investment of cash collateral for securities on loan (if any). |
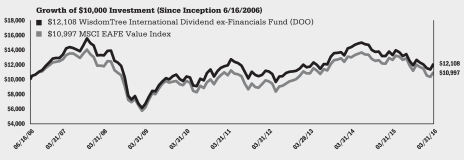
The WisdomTree International Dividend ex-Financials Fund (the ‘‘Fund’’) seeks to track the price and yield performance, before fees and expenses, of the WisdomTree International Dividend ex-Financials Index.
The Fund returned -8.83% at net asset value (“NAV”) for the fiscal year ending March 31, 2016 (for more complete performance information please see the table below). The Fund benefited the most from its position in Italy. The Fund’s position in the United Kingdom created the greatest drag on performance.
The following performance table is provided for comparative purposes and represents the period noted. The Fund’s per share NAV is the value of one share of the Fund and is calculated by dividing the value of total assets less total liabilities by the number of shares outstanding. The NAV return is based on the NAV of the Fund and the market price return is based on the market price per share of the Fund. The price used to calculate market price returns is the mid-point of the highest bid and lowest offer for Fund shares as of the close of trading on the exchange where Fund shares are listed. NAV and market price returns assume that dividends and capital gain distributions have been reinvested in the Fund at NAV and market price, respectively. As with other ETFs, NAV returns and market price returns may differ because of factors such as the supply and demand for Fund shares and investors’ assessments of the underlying value of the Fund’s portfolio securities.
An index is a statistical measure of a specified financial market or sector. An index does not actually hold a portfolio of securities, incur expenses or pay any transaction costs. Therefore, index returns do not reflect deductions for fees or expenses and the index is not available for direct investment. In comparison, the Fund’s performance is negatively impacted by these deductions. Fund returns do not reflect brokerage commissions or taxes a shareholder would pay on the sale of Fund shares or on Fund distributions. As of the Fund’s current prospectus dated August 1, 2015, as revised November 12, 2015, the Fund’s annual expense ratio was 0.58%.
Performance as of 3/31/16
| | | | | | | | | | | | | | | | |
| | | Average Annual Total Return | |
| | | 1 Year | | | 3 Year | | | 5 Year | | | Since
Inception1 | |
Fund NAV Returns | | | -8.83 | % | | | 1.16 | % | | | 0.34 | % | | | 1.97 | % |
Fund Market Price Returns | | | -9.25 | % | | | 1.01 | % | | | 0.17 | % | | | 1.82 | % |
WisdomTree International Dividend Top 100/International Dividend ex-Financials Spliced Index2 | | | -8.53 | % | | | 1.47 | % | | | 0.51 | % | | | 2.16 | % |
MSCI EAFE Value Index | | | -12.82 | % | | | 0.59 | % | | | 0.82 | % | | | 0.97 | % |
| 1 | Total returns are calculated based on the commencement of Fund trading on the NYSE Arca, Inc. on June 16, 2006. |
| 2 | WisdomTree International Dividend Top 100 Index through May 7, 2009; WisdomTree International Dividend ex-Financials Index thereafter. |
Performance is historical and does not guarantee future results. Current performance may be lower or higher than quoted. Investment returns and the principal value of an investment will fluctuate so that an investor’s shares, when redeemed, may be worth more or less than their original cost. Performance data for the most recent month-end is available at www.wisdomtree.com. WisdomTree shares are bought and sold at market price (not NAV) and are not individually redeemed from the Fund. Fund NAV returns are calculated using the Fund’s daily 4:00 p.m. NAV. Market price returns reflect the midpoint of the bid/ask spread as of the close of trading on the exchange where Fund shares are listed. Market price returns do not represent the returns you would receive if you traded shares at other times. The returns do not reflect the deduction of taxes that a shareholder would pay on Fund distributions or on the redemption of Fund shares. Total returns for a period of less than one year are cumulative.
| | |
| 12 | | WisdomTree Developed World ex-U.S. and Currency Hedged Equity Funds |
Performance Summary (unaudited)
WisdomTree International Equity Fund (DWM)
(formerly, WisdomTree DEFA Fund)
Sector Breakdown† as of 3/31/16
| | | | |
| |
| Sector | | % of Net Assets | |
Financials | | | 22.2% | |
Consumer Staples | | | 12.4% | |
Industrials | | | 12.4% | |
Consumer Discretionary | | | 11.2% | |
Telecommunication Services | | | 9.0% | |
Healthcare | | | 8.9% | |
Energy | | | 8.4% | |
Materials | | | 5.9% | |
Utilities | | | 5.7% | |
Information Technology | | | 3.2% | |
Investment Company | | | 0.1% | |
Other Assets less Liabilities‡ | | | 0.6% | |
Total | | | 100.0% | |
| † | The Fund’s sector breakdown is expressed as a percentage of net assets and may change over time. In addition, a sector may be comprised of several industries. It does not include derivatives (if any). |
| ‡ | Other assets includes investment of cash collateral for securities on loan (if any). |
Top Ten Holdings* as of 3/31/16
| | | | |
| |
| Description | | % of Net Assets | |
Nestle S.A., Registered Shares | | | 1.5% | |
GlaxoSmithKline PLC | | | 1.5% | |
BP PLC | | | 1.5% | |
China Mobile Ltd. | | | 1.4% | |
HSBC Holdings PLC | | | 1.4% | |
Royal Dutch Shell PLC, Class A | | | 1.4% | |
TOTAL S.A. | | | 1.3% | |
Novartis AG, Registered Shares | | | 1.2% | |
British American Tobacco PLC | | | 1.2% | |
Anheuser-Busch InBev N.V. | | | 1.1% | |
| * | The ten largest holdings are subject to change, and there are no guarantees the Fund will remain invested in any particular company. Excludes investment of cash collateral for securities on loan (if any). |
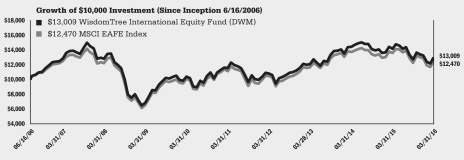
The WisdomTree International Equity Fund (the ‘‘Fund’’) seeks to track the price and yield performance, before fees and expenses, of the WisdomTree International Equity Index. Prior to March 31, 2016, the WisdomTree International Equity Index was named the WisdomTree DEFA Index.
The Fund returned -8.15% at net asset value (“NAV”) for the fiscal year ending March 31, 2016 (for more complete performance information please see the table below). The Fund benefited the most from its position in Ireland. The Fund’s position in the United Kingdom created the greatest drag on performance.
The following performance table is provided for comparative purposes and represents the period noted. The Fund’s per share NAV is the value of one share of the Fund and is calculated by dividing the value of total assets less total liabilities by the number of shares outstanding. The NAV return is based on the NAV of the Fund and the market price return is based on the market price per share of the Fund. The price used to calculate market price returns is the mid-point of the highest bid and lowest offer for Fund shares as of the close of trading on the exchange where Fund shares are listed. NAV and market price returns assume that dividends and capital gain distributions have been reinvested in the Fund at NAV and market price, respectively. As with other ETFs, NAV returns and market price returns may differ because of factors such as the supply and demand for Fund shares and investors’ assessments of the underlying value of the Fund’s portfolio securities.
An index is a statistical measure of a specified financial market or sector. An index does not actually hold a portfolio of securities, incur expenses or pay any transaction costs. Therefore, index returns do not reflect deductions for fees or expenses and the index is not available for direct investment. In comparison, the Fund’s performance is negatively impacted by these deductions. Fund returns do not reflect brokerage commissions or taxes a shareholder would pay on the sale of Fund shares or on Fund distributions. As of the Fund’s current prospectus dated August 1, 2015, as revised November 12, 2015, the Fund’s annual expense ratio was 0.48%.
Performance as of 3/31/16
| | | | | | | | | | | | | | | | |
| | | Average Annual Total Return | |
| | | 1 Year | | | 3 Year | | | 5 Year | | | Since
Inception1 | |
Fund NAV Returns | | | -8.15 | % | | | 2.50 | % | | | 2.40 | % | | | 2.72 | % |
Fund Market Price Returns | | | -8.63 | % | | | 2.16 | % | | | 2.25 | % | | | 2.67 | % |
WisdomTree International Equity Index | | | -8.02 | % | | | 2.60 | % | | | 2.47 | % | | | 3.04 | % |
MSCI EAFE Index | | | -8.27 | % | | | 2.23 | % | | | 2.29 | % | | | 2.28 | % |
| 1 | Total returns are calculated based on the commencement of Fund trading on the NYSE Arca, Inc. on June 16, 2006. |
Performance is historical and does not guarantee future results. Current performance may be lower or higher than quoted. Investment returns and the principal value of an investment will fluctuate so that an investor’s shares, when redeemed, may be worth more or less than their original cost. Performance data for the most recent month-end is available at www.wisdomtree.com. WisdomTree shares are bought and sold at market price (not NAV) and are not individually redeemed from the Fund. Fund NAV returns are calculated using the Fund’s daily 4:00 p.m. NAV. Market price returns reflect the midpoint of the bid/ask spread as of the close of trading on the exchange where Fund shares are listed. Market price returns do not represent the returns you would receive if you traded shares at other times. The returns do not reflect the deduction of taxes that a shareholder would pay on Fund distributions or on the redemption of Fund shares. Total returns for a period of less than one year are cumulative.
| | | | |
| WisdomTree Developed World ex-U.S. and Currency Hedged Equity Funds | | | 13 | |
Performance Summary (unaudited)
WisdomTree International Hedged Equity Fund (HDWM)
Sector Breakdown† as of 3/31/16
| | | | |
| |
| Sector | | % of Net Assets | |
Financials | | | 22.5% | |
Industrials | | | 12.6% | |
Consumer Staples | | | 12.6% | |
Consumer Discretionary | | | 11.3% | |
Healthcare | | | 9.0% | |
Telecommunication Services | | | 8.9% | |
Energy | | | 8.6% | |
Utilities | | | 5.9% | |
Materials | | | 5.5% | |
Information Technology | | | 3.3% | |
Other Assets less Liabilities‡ | | | -0.2% | |
Total | | | 100.0% | |
| † | The Fund’s sector breakdown is expressed as a percentage of net assets and may change over time. In addition, a sector may be comprised of several industries. It does not include derivatives (if any). |
| ‡ | Other assets includes investment of cash collateral for securities on loan (if any). |
Top Ten Holdings* as of 3/31/16
| | | | |
| |
| Description | | % of Net Assets | |
Nestle S.A., Registered Shares | | | 1.7% | |
GlaxoSmithKline PLC | | | 1.6% | |
BP PLC | | | 1.5% | |
HSBC Holdings PLC | | | 1.5% | |
China Mobile Ltd. | | | 1.5% | |
Roche Holding AG, Genusschein | | | 1.4% | |
Royal Dutch Shell PLC, Class A | | | 1.3% | |
TOTAL S.A. | | | 1.3% | |
Toyota Motor Corp. | | | 1.3% | |
Anheuser-Busch InBev N.V. | | | 1.2% | |
| * | The ten largest holdings are subject to change, and there are no guarantees the Fund will remain invested in any particular company. Excludes investment of cash collateral for securities on loan (if any). |
The WisdomTree International Hedged Equity Fund (the ‘‘Fund’’) seeks to track the price and yield performance, before fees and expenses, of the WisdomTree International Hedged Equity Index.
The Fund returned -7.16% at net asset value (“NAV”) from Fund inception on July 9, 2015 to March 31, 2016 (for more complete performance information please see the table below). The Fund benefited the most from its position in New Zealand. The Fund’s position in Japan created the greatest drag on performance. During the fiscal period, the Fund utilized forward foreign currency contracts as hedges to offset applicable international currency exposure from positions in international equities. The Fund’s use of forward foreign currency contracts detracted from performance as a result of the overall depreciation in the U.S. dollar against applicable international currencies during the period.
The following performance table is provided for comparative purposes and represents the period noted. The Fund’s per share NAV is the value of one share of the Fund and is calculated by dividing the value of total assets less total liabilities by the number of shares outstanding. The NAV return is based on the NAV of the Fund and the market price return is based on the market price per share of the Fund. The price used to calculate market price returns is the mid-point of the highest bid and lowest offer for Fund shares as of the close of trading on the exchange where Fund shares are listed. NAV and market price returns assume that dividends and capital gain distributions have been reinvested in the Fund at NAV and market price, respectively. As with other ETFs, NAV returns and market price returns may differ because of factors such as the supply and demand for Fund shares and investors’ assessments of the underlying value of the Fund’s portfolio securities.
An index is a statistical measure of a specified financial market or sector. An index does not actually hold a portfolio of securities, incur expenses or pay any transaction costs. Therefore, index returns do not reflect deductions for fees or expenses and the index is not available for direct investment. In comparison, the Fund’s performance is negatively impacted by these deductions. Fund returns do not reflect brokerage commissions or taxes a shareholder would pay on the sale of Fund shares or on Fund distributions. As of the Fund’s current prospectus dated June 24, 2015, the Fund’s annual expense ratio was 0.35%.
Performance as of 3/31/16
| | | | |
| | | Cumulative Total Return | |
| | | Since
Inception1 | |
Fund NAV Returns | | | -7.16 | % |
Fund Market Price Returns | | | -7.65 | % |
WisdomTree International Hedged Equity Index | | | -7.12 | % |
MSCI EAFE Local Currency Index | | | -9.12 | % |
| 1 | Total returns are calculated based on the commencement of Fund trading on the NYSE Arca, Inc. on July 9, 2015. |
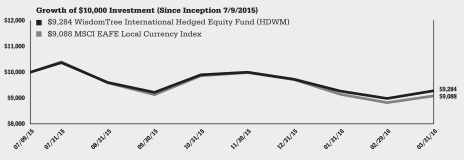
Performance is historical and does not guarantee future results. Current performance may be lower or higher than quoted. Investment returns and the principal value of an investment will fluctuate so that an investor’s shares, when redeemed, may be worth more or less than their original cost. Performance data for the most recent month-end is available at www.wisdomtree.com. WisdomTree shares are bought and sold at market price (not NAV) and are not individually redeemed from the Fund. Fund NAV returns are calculated using the Fund’s daily 4:00 p.m. NAV. Market price returns reflect the midpoint of the bid/ask spread as of the close of trading on the exchange where Fund shares are listed. Market price returns do not represent the returns you would receive if you traded shares at other times. The returns do not reflect the deduction of taxes that a shareholder would pay on Fund distributions or on the redemption of Fund shares. Total returns for a period of less than one year are cumulative.
| | |
| 14 | | WisdomTree Developed World ex-U.S. and Currency Hedged Equity Funds |
Performance Summary (unaudited)
WisdomTree International Hedged Quality Dividend Growth Fund (IHDG)
(formerly, WisdomTree International Hedged Dividend Growth Fund)
Sector Breakdown† as of 3/31/16
| | | | |
| |
| Sector | | % of Net Assets | |
Consumer Staples | | | 22.6% | |
Consumer Discretionary | | | 18.9% | |
Industrials | | | 16.5% | |
Healthcare | | | 14.0% | |
Telecommunication Services | | | 9.8% | |
Information Technology | | | 7.9% | |
Financials | | | 5.5% | |
Materials | | | 3.3% | |
Utilities | | | 1.7% | |
Other Assets less Liabilities‡ | | | -0.2% | |
Total | | | 100.0% | |
| † | The Fund’s sector breakdown is expressed as a percentage of net assets and may change over time. In addition, a sector may be comprised of several industries. It does not include derivatives (if any). |
| ‡ | Other assets includes investment of cash collateral for securities on loan (if any). |
Top Ten Holdings* as of 3/31/16
| | | | |
| |
| Description | | % of Net Assets | |
British American Tobacco PLC | | | 5.2% | |
Roche Holding AG, Genusschein | | | 4.7% | |
Telstra Corp., Ltd. | | | 3.9% | |
Unilever N.V., CVA | | | 3.4% | |
Japan Tobacco, Inc. | | | 2.9% | |
Novo Nordisk A/S, Class B | | | 2.9% | |
Unilever PLC | | | 2.8% | |
Reckitt Benckiser Group PLC | | | 2.6% | |
SAP SE | | | 2.6% | |
Industria de Diseno Textil S.A. | | | 2.3% | |
| * | The ten largest holdings are subject to change, and there are no guarantees the Fund will remain invested in any particular company. Excludes investment of cash collateral for securities on loan (if any). |
The WisdomTree International Hedged Quality Dividend Growth Fund (the ‘‘Fund’’) seeks to track the price and yield performance, before fees and expenses, of the WisdomTree International Hedged Quality Dividend Growth Index. Prior to March 31, 2016, the WisdomTree International Hedged Quality Dividend Growth Index was named the WisdomTree International Hedged Dividend Growth Index.
The Fund returned -1.73% at net asset value (“NAV”) for the fiscal year ending March 31, 2016 (for more complete performance information please see the table below). The Fund benefited the most from its position in the United Kingdom. The Fund’s position in Sweden created the greatest drag on performance. During the fiscal year, the Fund utilized forward foreign currency contracts as hedges to offset applicable international currency exposure from positions in international equities. The Fund’s use of forward foreign currency contracts detracted from performance as a result of the overall depreciation in the U.S. dollar against applicable international currencies during the period.
The following performance table is provided for comparative purposes and represents the period noted. The Fund’s per share NAV is the value of one share of the Fund and is calculated by dividing the value of total assets less total liabilities by the number of shares outstanding. The NAV return is based on the NAV of the Fund and the market price return is based on the market price per share of the Fund. The price used to calculate market price returns is the mid-point of the highest bid and lowest offer for Fund shares as of the close of trading on the exchange where Fund shares are listed. NAV and market price returns assume that dividends and capital gain distributions have been reinvested in the Fund at NAV and market price, respectively. As with other ETFs, NAV returns and market price returns may differ because of factors such as the supply and demand for Fund shares and investors’ assessments of the underlying value of the Fund’s portfolio securities.
An index is a statistical measure of a specified financial market or sector. An index does not actually hold a portfolio of securities, incur expenses or pay any transaction costs. Therefore, index returns do not reflect deductions for fees or expenses and the index is not available for direct investment. In comparison, the Fund’s performance is negatively impacted by these deductions. Fund returns do not reflect brokerage commissions or taxes a shareholder would pay on the sale of Fund shares or on Fund distributions. As of the Fund’s current prospectus dated August 1, 2015, as revised November 12, 2015, the Fund’s annual expense ratio was 0.58%.
Performance as of 3/31/16
| | | | | | | | |
| | | Average Annual Total Return | |
| | | 1 Year | | | Since
Inception1 | |
Fund NAV Returns | | | -1.73 | % | | | 5.56 | % |
Fund Market Price Returns | | | -2.20 | % | | | 4.95 | % |
WisdomTree International Hedged Quality Dividend Growth Index | | | -1.26 | % | | | 6.15 | % |
MSCI EAFE Local Currency Index | | | -11.17 | % | | | 2.26 | % |
| 1 | Total returns are calculated based on the commencement of Fund trading on the NYSE Arca, Inc. on May 7, 2014. |
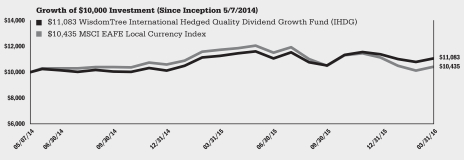
Performance is historical and does not guarantee future results. Current performance may be lower or higher than quoted. Investment returns and the principal value of an investment will fluctuate so that an investor’s shares, when redeemed, may be worth more or less than their original cost. Performance data for the most recent month-end is available at www.wisdomtree.com. WisdomTree shares are bought and sold at market price (not NAV) and are not individually redeemed from the Fund. Fund NAV returns are calculated using the Fund’s daily 4:00 p.m. NAV. Market price returns reflect the midpoint of the bid/ask spread as of the close of trading on the exchange where Fund shares are listed. Market price returns do not represent the returns you would receive if you traded shares at other times. The returns do not reflect the deduction of taxes that a shareholder would pay on Fund distributions or on the redemption of Fund shares. Total returns for a period of less than one year are cumulative.
| | | | |
| WisdomTree Developed World ex-U.S. and Currency Hedged Equity Funds | | | 15 | |
Performance Summary (unaudited)
WisdomTree International Hedged SmallCap Dividend Fund (HDLS)
Sector Breakdown† as of 3/31/16
| | | | |
| |
| Sector | | % of Net Assets | |
Industrials | | | 24.1% | |
Consumer Discretionary | | | 19.6% | |
Financials | | | 17.8% | |
Information Technology | | | 9.4% | |
Consumer Staples | | | 8.2% | |
Materials | | | 8.0% | |
Healthcare | | | 5.1% | |
Utilities | | | 3.3% | |
Energy | | | 2.5% | |
Telecommunication Services | | | 1.1% | |
Investment Company | | | 0.2% | |
Other Assets less Liabilities‡ | | | 0.7% | |
Total | | | 100.0% | |
| † | The sector information shown is that of the Underlying Fund. The Underlying Fund’s sector breakdown is expressed as a percentage of net assets and may change over time. In addition, a sector may be comprised of several industries. It does not include derivatives (if any). |
| ‡ | Other assets of the Underlying Fund includes investment of cash collateral for securities on loan (if any). |
Top Ten Holdings* as of 3/31/16
| | | | |
| |
| Description | | % of Net Assets | |
Salmar ASA | | | 0.8 | % |
Cofinimmo S.A. | | | 0.6 | % |
Meridian Energy Ltd. | | | 0.5 | % |
Genesis Energy Ltd. | | | 0.5 | % |
Nexity S.A. | | | 0.5 | % |
Fisher & Paykel Healthcare Corp., Ltd. | | | 0.4 | % |
NCC AB, Class B | | | 0.4 | % |
Air New Zealand Ltd. | | | 0.4 | % |
Kesko Oyj, Class B | | | 0.4 | % |
Ladbrokes PLC | | | 0.4 | % |
| * | The ten largest holdings shown is that of the Underlying Fund and are subject to change, and there are no guarantees the Underlying Fund will remain invested in any particular company. Excludes the Underlying Fund’s investment of cash collateral for securities on loan (if any). |
The WisdomTree International Hedged SmallCap Dividend Fund (the ‘‘Fund’’) seeks to track the price and yield performance, before fees and expenses, of the WisdomTree International Hedged SmallCap Dividend Index. The Fund implemented its strategy during the period by investing in an underlying fund, the WisdomTree International SmallCap Dividend Fund (the “Underlying Fund”).
The Fund returned -5.66% at net asset value (“NAV”) from Fund inception on June 4, 2015 to March 31, 2016 (for more complete performance information please see the table below). The Fund benefited the most from its exposure to Sweden through its investment in the Underlying Fund. The Fund’s exposure in the United Kingdom through its investment in the Underlying Fund created the greatest drag on performance. During the fiscal period, the Fund utilized forward foreign currency contracts as hedges to offset applicable international currency exposure from positions in international equities held in the Underlying Fund. The Fund’s use of forward foreign currency contracts detracted from performance as a result of the overall depreciation in the U.S. dollar against applicable international currencies during the period.
The following performance table is provided for comparative purposes and represents the period noted. The Fund’s per share NAV is the value of one share of the Fund and is calculated by dividing the value of total assets less total liabilities by the number of shares outstanding. The NAV return is based on the NAV of the Fund and the market price return is based on the market price per share of the Fund. The price used to calculate market price returns is the mid-point of the highest bid and lowest offer for Fund shares as of the close of trading on the exchange where Fund shares are listed. NAV and market price returns assume that dividends and capital gain distributions have been reinvested in the Fund at NAV and market price, respectively. As with other ETFs, NAV returns and market price returns may differ because of factors such as the supply and demand for Fund shares and investors’ assessments of the underlying value of the Fund’s portfolio securities.
An index is a statistical measure of a specified financial market or sector. An index does not actually hold a portfolio of securities, incur expenses or pay any transaction costs. Therefore, index returns do not reflect deductions for fees or expenses and the index is not available for direct investment. In comparison, the Fund’s performance is negatively impacted by these deductions. Fund returns do not reflect brokerage commissions or taxes a shareholder would pay on the sale of Fund shares or on Fund distributions. As of the Fund’s current prospectus dated June 1, 2015, the Fund’s net and gross annual expense ratio was 0.58% and 1.16%, respectively. The prospectus expense ratio includes 0.58% of acquired fund fees and expenses (“AFFEs”). The prospectus expense ratio may not correlate to the expense ratio in the Fund’s financial highlights and financial statements because the financial highlights and financial statements reflect only the operating expenses of the Fund and do not include AFFEs, which are fees and expenses incurred indirectly by the Fund through its investments in certain underlying investment companies. WisdomTree Asset Management, Inc. has contractually agreed to waive a portion of its management fee in an amount equal to the AFFEs attributable to the Fund’s investments in the Underlying Fund through July 31, 2018, unless earlier terminated by the Board of Trustees of WisdomTree Trust for any reason at any time.
Performance as of 3/31/16
| | | | |
| | | Cumulative Total Return | |
| | | Since
Inception1 | |
Fund NAV Returns | | | -5.66 | % |
Fund Market Price Returns | | | -5.46 | % |
WisdomTree International Hedged SmallCap Dividend Index | | | -5.23 | % |
MSCI EAFE Small Cap Local Currency Index | | | -5.09 | % |
| 1 | Total returns are calculated based on the commencement of Fund trading on the NYSE Arca, Inc. on June 4, 2015. |
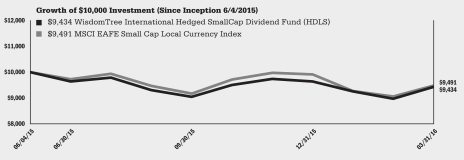
Performance is historical and does not guarantee future results. Current performance may be lower or higher than quoted. Investment returns and the principal value of an investment will fluctuate so that an investor’s shares, when redeemed, may be worth more or less than their original cost. Performance data for the most recent month-end is available at www.wisdomtree.com. WisdomTree shares are bought and sold at market price (not NAV) and are not individually redeemed from the Fund. Fund NAV returns are calculated using the Fund’s daily 4:00 p.m. NAV. Market price returns reflect the midpoint of the bid/ask spread as of the close of trading on the exchange where Fund shares are listed. Market price returns do not represent the returns you would receive if you traded shares at other times. The returns do not reflect the deduction of taxes that a shareholder would pay on Fund distributions or on the redemption of Fund shares. Total returns for a period of less than one year are cumulative.
| | |
| 16 | | WisdomTree Developed World ex-U.S. and Currency Hedged Equity Funds |
Performance Summary (unaudited)
WisdomTree International High Dividend Fund (DTH)
(formerly, WisdomTree DEFA Equity Income Fund)
Sector Breakdown† as of 3/31/16
| | | | |
| |
| Sector | | % of Net Assets | |
Financials | | | 23.1% | |
Telecommunication Services | | | 12.5% | |
Consumer Staples | | | 11.9% | |
Energy | | | 11.8% | |
Industrials | | | 10.7% | |
Utilities | | | 8.3% | |
Healthcare | | | 7.8% | |
Consumer Discretionary | | | 6.5% | |
Materials | | | 5.3% | |
Information Technology | | | 1.4% | |
Investment Company | | | 0.0% | |
Other Assets less Liabilities‡ | | | 0.7% | |
Total | | | 100.0% | |
| † | The Fund’s sector breakdown is expressed as a percentage of net assets and may change over time. In addition, a sector may be comprised of several industries. It does not include derivatives (if any). |
| ‡ | Other assets includes investment of cash collateral for securities on loan (if any). |
Top Ten Holdings* as of 3/31/16
| | | | |
| |
| Description | | % of Net Assets | |
Nestle S.A., Registered Shares | | | 2.9% | |
China Mobile Ltd. | | | 2.5% | |
TOTAL S.A. | | | 2.2% | |
GlaxoSmithKline PLC | | | 2.2% | |
BP PLC | | | 2.1% | |
Novartis AG, Registered Shares | | | 2.1% | |
Royal Dutch Shell PLC, Class A | | | 2.0% | |
British American Tobacco PLC | | | 1.8% | |
HSBC Holdings PLC | | | 1.7% | |
Vodafone Group PLC | | | 1.5% | |
| * | The ten largest holdings are subject to change, and there are no guarantees the Fund will remain invested in any particular company. Excludes investment of cash collateral for securities on loan (if any). |
The WisdomTree International High Dividend Fund (the ‘‘Fund’’) seeks to track the price and yield performance, before fees and expenses, of the WisdomTree International High Dividend Index. Prior to March 31, 2016, the WisdomTree International High Dividend Index was named the WisdomTree DEFA Equity Income Index.
The Fund returned -9.60% at net asset value (“NAV”) for the fiscal year ending March 31, 2016 (for more complete performance information please see the table below). The Fund benefited the most from its position in Japan. The Fund’s position in Australia created the greatest drag on performance.
The following performance table is provided for comparative purposes and represents the period noted. The Fund’s per share NAV is the value of one share of the Fund and is calculated by dividing the value of total assets less total liabilities by the number of shares outstanding. The NAV return is based on the NAV of the Fund and the market price return is based on the market price per share of the Fund. The price used to calculate market price returns is the mid-point of the highest bid and lowest offer for Fund shares as of the close of trading on the exchange where Fund shares are listed. NAV and market price returns assume that dividends and capital gain distributions have been reinvested in the Fund at NAV and market price, respectively. As with other ETFs, NAV returns and market price returns may differ because of factors such as the supply and demand for Fund shares and investors’ assessments of the underlying value of the Fund’s portfolio securities.
An index is a statistical measure of a specified financial market or sector. An index does not actually hold a portfolio of securities, incur expenses or pay any transaction costs. Therefore, index returns do not reflect deductions for fees or expenses and the index is not available for direct investment. In comparison, the Fund’s performance is negatively impacted by these deductions. Fund returns do not reflect brokerage commissions or taxes a shareholder would pay on the sale of Fund shares or on Fund distributions. As of the Fund’s current prospectus dated August 1, 2015, as revised November 12, 2015, the Fund’s annual expense ratio was 0.58%.
Performance as of 3/31/16
| | | | | | | | | | | | | | | | |
| | | Average Annual Total Return | |
| | | 1 Year | | | 3 Year | | | 5 Year | | | Since
Inception1 | |
Fund NAV Returns | | | -9.60 | % | | | 1.37 | % | | | 1.56 | % | | | 1.68 | % |
Fund Market Price Returns | | | -10.12 | % | | | 0.92 | % | | | 1.31 | % | | | 1.54 | % |
WisdomTree International High Dividend Index | | | -9.44 | % | | | 1.65 | % | | | 1.75 | % | | | 2.24 | % |
MSCI EAFE Value Index | | | -12.82 | % | | | 0.59 | % | | | 0.82 | % | | | 0.97 | % |
| 1 | Total returns are calculated based on the commencement of Fund trading on the NYSE Arca, Inc. on June 16, 2006. |
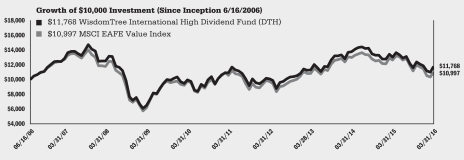
Performance is historical and does not guarantee future results. Current performance may be lower or higher than quoted. Investment returns and the principal value of an investment will fluctuate so that an investor’s shares, when redeemed, may be worth more or less than their original cost. Performance data for the most recent month-end is available at www.wisdomtree.com. WisdomTree shares are bought and sold at market price (not NAV) and are not individually redeemed from the Fund. Fund NAV returns are calculated using the Fund’s daily 4:00 p.m. NAV. Market price returns reflect the midpoint of the bid/ask spread as of the close of trading on the exchange where Fund shares are listed. Market price returns do not represent the returns you would receive if you traded shares at other times. The returns do not reflect the deduction of taxes that a shareholder would pay on Fund distributions or on the redemption of Fund shares. Total returns for a period of less than one year are cumulative.
| | | | |
| WisdomTree Developed World ex-U.S. and Currency Hedged Equity Funds | | | 17 | |
Performance Summary (unaudited)
WisdomTree International LargeCap Dividend Fund (DOL)
Sector Breakdown† as of 3/31/16
| | | | |
| |
| Sector | | % of Net Assets | |
Financials | | | 21.9% | |
Consumer Staples | | | 14.3% | |
Telecommunication Services | | | 11.0% | |
Healthcare | | | 10.7% | |
Energy | | | 10.6% | |
Consumer Discretionary | | | 9.3% | |
Industrials | | | 8.8% | |
Utilities | | | 5.5% | |
Materials | | | 4.6% | |
Information Technology | | | 2.4% | |
Investment Company | | | 0.3% | |
Other Assets less Liabilities‡ | | | 0.6% | |
Total | | | 100.0% | |
| † | The Fund’s sector breakdown is expressed as a percentage of net assets and may change over time. In addition, a sector may be comprised of several industries. It does not include derivatives (if any). |
| ‡ | Other assets includes investment of cash collateral for securities on loan (if any). |
Top Ten Holdings* as of 3/31/16
| | | | |
| |
| Description | | % of Net Assets | |
Nestle S.A., Registered Shares | | | 2.3% | |
GlaxoSmithKline PLC | | | 2.1% | |
BP PLC | | | 2.0% | |
China Mobile Ltd. | | | 2.0% | |
Royal Dutch Shell PLC, Class A | | | 1.9% | |
HSBC Holdings PLC | | | 1.8% | |
TOTAL S.A. | | | 1.8% | |
Anheuser-Busch InBev N.V. | | | 1.8% | |
British American Tobacco PLC | | | 1.7% | |
Novartis AG, Registered Shares | | | 1.6% | |
| * | The ten largest holdings are subject to change, and there are no guarantees the Fund will remain invested in any particular company. Excludes investment of cash collateral for securities on loan (if any). |
The WisdomTree International LargeCap Dividend Fund (the ‘‘Fund’’) seeks to track the price and yield performance, before fees and expenses, of the WisdomTree International LargeCap Dividend Index.
The Fund returned -10.49% at net asset value (“NAV”) for the fiscal year ending March 31, 2016 (for more complete performance information please see the table below). The Fund benefited the most from its position in Belgium. The Fund’s position in the United Kingdom created the greatest drag on performance.
The following performance table is provided for comparative purposes and represents the period noted. The Fund’s per share NAV is the value of one share of the Fund and is calculated by dividing the value of total assets less total liabilities by the number of shares outstanding. The NAV return is based on the NAV of the Fund and the market price return is based on the market price per share of the Fund. The price used to calculate market price returns is the mid-point of the highest bid and lowest offer for Fund shares as of the close of trading on the exchange where Fund shares are listed. NAV and market price returns assume that dividends and capital gain distributions have been reinvested in the Fund at NAV and market price, respectively. As with other ETFs, NAV returns and market price returns may differ because of factors such as the supply and demand for Fund shares and investors’ assessments of the underlying value of the Fund’s portfolio securities.
An index is a statistical measure of a specified financial market or sector. An index does not actually hold a portfolio of securities, incur expenses or pay any transaction costs. Therefore, index returns do not reflect deductions for fees or expenses and the index is not available for direct investment. In comparison, the Fund’s performance is negatively impacted by these deductions. Fund returns do not reflect brokerage commissions or taxes a shareholder would pay on the sale of Fund shares or on Fund distributions. As of the Fund’s current prospectus dated August 1, 2015, as revised November 12, 2015, the Fund’s annual expense ratio was 0.48%.
Performance as of 3/31/16
| | | | | | | | | | | | | | | | |
| | | Average Annual Total Return | |
| | | 1 Year | | | 3 Year | | | 5 Year | | | Since
Inception1 | |
Fund NAV Returns | | | -10.49 | % | | | 1.09 | % | | | 1.47 | % | | | 2.03 | % |
Fund Market Price Returns | | | -11.16 | % | | | 0.70 | % | | | 1.33 | % | | | 1.87 | % |
WisdomTree International LargeCap Dividend Index | | | -10.26 | % | | | 1.42 | % | | | 1.70 | % | | | 2.35 | % |
MSCI EAFE Index | | | -8.27 | % | | | 2.23 | % | | | 2.29 | % | | | 2.28 | % |
| 1 | Total returns are calculated based on the commencement of Fund trading on the NYSE Arca, Inc. on June 16, 2006. |
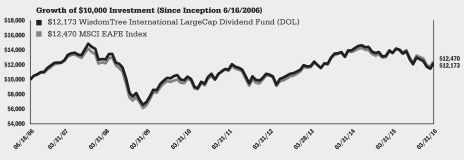
Performance is historical and does not guarantee future results. Current performance may be lower or higher than quoted. Investment returns and the principal value of an investment will fluctuate so that an investor’s shares, when redeemed, may be worth more or less than their original cost. Performance data for the most recent month-end is available at www.wisdomtree.com. WisdomTree shares are bought and sold at market price (not NAV) and are not individually redeemed from the Fund. Fund NAV returns are calculated using the Fund’s daily 4:00 p.m. NAV. Market price returns reflect the midpoint of the bid/ask spread as of the close of trading on the exchange where Fund shares are listed. Market price returns do not represent the returns you would receive if you traded shares at other times. The returns do not reflect the deduction of taxes that a shareholder would pay on Fund distributions or on the redemption of Fund shares. Total returns for a period of less than one year are cumulative.
| | |
| 18 | | WisdomTree Developed World ex-U.S. and Currency Hedged Equity Funds |
Performance Summary (unaudited)
WisdomTree International MidCap Dividend Fund (DIM)
Sector Breakdown† as of 3/31/16
| | | | |
| |
| Sector | | % of Net Assets | |
Financials | | | 22.2% | |
Industrials | | | 22.2% | |
Consumer Discretionary | | | 15.4% | |
Materials | | | 8.9% | |
Consumer Staples | | | 8.3% | |
Utilities | | | 6.5% | |
Healthcare | | | 4.5% | |
Information Technology | | | 4.4% | |
Telecommunication Services | | | 4.1% | |
Energy | | | 3.1% | |
Other Assets less Liabilities‡ | | | 0.4% | |
Total | | | 100.0% | |
| † | The Fund’s sector breakdown is expressed as a percentage of net assets and may change over time. In addition, a sector may be comprised of several industries. It does not include derivatives (if any). |
| ‡ | Other assets includes investment of cash collateral for securities on loan (if any). |
Top Ten Holdings* as of 3/31/16
| | | | |
| |
| Description | | % of Net Assets | |
Insurance Australia Group Ltd. | | | 0.8% | |
Bezeq Israeli Telecommunication Corp., Ltd. | | | 0.8% | |
Suncorp Group Ltd. | | | 0.7% | |
Terna Rete Elettrica Nazionale SpA | | | 0.6% | |
Bouygues S.A. | | | 0.6% | |
Veolia Environnement S.A. | | | 0.6% | |
WM Morrison Supermarkets PLC | | | 0.6% | |
Hannover Rueck SE | | | 0.6% | |
Proximus SADP | | | 0.6% | |
CNP Assurances | | | 0.6% | |
| * | The ten largest holdings are subject to change, and there are no guarantees the Fund will remain invested in any particular company. Excludes investment of cash collateral for securities on loan (if any). |
The WisdomTree International MidCap Dividend Fund (the ‘‘Fund’’) seeks to track the price and yield performance, before fees and expenses, of the WisdomTree International MidCap Dividend Index.
The Fund returned -2.12% at net asset value (“NAV”) for the fiscal year ending March 31, 2016 (for more complete performance information please see the table below). The Fund benefited the most from its position in Finland. The Fund’s position in Hong Kong created the greatest drag on performance.
The following performance table is provided for comparative purposes and represents the period noted. The Fund’s per share NAV is the value of one share of the Fund and is calculated by dividing the value of total assets less total liabilities by the number of shares outstanding. The NAV return is based on the NAV of the Fund and the market price return is based on the market price per share of the Fund. The price used to calculate market price returns is the mid-point of the highest bid and lowest offer for Fund shares as of the close of trading on the exchange where Fund shares are listed. NAV and market price returns assume that dividends and capital gain distributions have been reinvested in the Fund at NAV and market price, respectively. As with other ETFs, NAV returns and market price returns may differ because of factors such as the supply and demand for Fund shares and investors’ assessments of the underlying value of the Fund’s portfolio securities.
An index is a statistical measure of a specified financial market or sector. An index does not actually hold a portfolio of securities, incur expenses or pay any transaction costs. Therefore, index returns do not reflect deductions for fees or expenses and the index is not available for direct investment. In comparison, the Fund’s performance is negatively impacted by these deductions. Fund returns do not reflect brokerage commissions or taxes a shareholder would pay on the sale of Fund shares or on Fund distributions. As of the Fund’s current prospectus dated August 1, 2015, as revised November 12, 2015, the Fund’s annual expense ratio was 0.58%.
Performance as of 3/31/16
| | | | | | | | | | | | | | | | |
| | | Average Annual Total Return | |
| | | 1 Year | | | 3 Year | | | 5 Year | | | Since
Inception1 | |
Fund NAV Returns | | | -2.12 | % | | | 5.77 | % | | | 4.10 | % | | | 4.55 | % |
Fund Market Price Returns | | | -2.63 | % | | | 5.49 | % | | | 4.06 | % | | | 4.43 | % |
WisdomTree International MidCap Dividend Index | | | -2.14 | % | | | 6.11 | % | | | 4.16 | % | | | 4.67 | % |
MSCI EAFE Mid Cap Index | | | -1.86 | % | | | 5.96 | % | | | 4.27 | % | | | 3.44 | % |
| 1 | Total returns are calculated based on the commencement of Fund trading on the NYSE Arca, Inc. on June 16, 2006. |
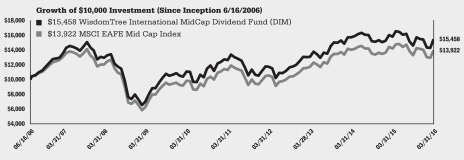
Performance is historical and does not guarantee future results. Current performance may be lower or higher than quoted. Investment returns and the principal value of an investment will fluctuate so that an investor’s shares, when redeemed, may be worth more or less than their original cost. Performance data for the most recent month-end is available at www.wisdomtree.com. WisdomTree shares are bought and sold at market price (not NAV) and are not individually redeemed from the Fund. Fund NAV returns are calculated using the Fund’s daily 4:00 p.m. NAV. Market price returns reflect the midpoint of the bid/ask spread as of the close of trading on the exchange where Fund shares are listed. Market price returns do not represent the returns you would receive if you traded shares at other times. The returns do not reflect the deduction of taxes that a shareholder would pay on Fund distributions or on the redemption of Fund shares. Total returns for a period of less than one year are cumulative.
| | | | |
| WisdomTree Developed World ex-U.S. and Currency Hedged Equity Funds | | | 19 | |
Performance Summary (unaudited)
WisdomTree International SmallCap Dividend Fund (DLS)
Sector Breakdown† as of 3/31/16
| | | | |
| |
| Sector | | % of Net Assets | |
Industrials | | | 24.1% | |
Consumer Discretionary | | | 19.6% | |
Financials | | | 17.8% | |
Information Technology | | | 9.4% | |
Consumer Staples | | | 8.2% | |
Materials | | | 8.0% | |
Healthcare | | | 5.1% | |
Utilities | | | 3.3% | |
Energy | | | 2.5% | |
Telecommunication Services | | | 1.1% | |
Investment Company | | | 0.2% | |
Other Assets less Liabilities‡ | | | 0.7% | |
Total | | | 100.0% | |
| † | The Fund’s sector breakdown is expressed as a percentage of net assets and may change over time. In addition, a sector may be comprised of several industries. It does not include derivatives (if any). |
| ‡ | Other assets includes investment of cash collateral for securities on loan (if any). |
Top Ten Holdings* as of 3/31/16
| | | | |
| |
| Description | | % of Net Assets | |
Salmar ASA | | | 0.8% | |
Cofinimmo S.A. | | | 0.6% | |
Meridian Energy Ltd. | | | 0.5% | |
Genesis Energy Ltd. | | | 0.5% | |
Nexity S.A. | | | 0.5% | |
Fisher & Paykel Healthcare Corp., Ltd. | | | 0.4% | |
NCC AB, Class B | | | 0.4% | |
Air New Zealand Ltd. | | | 0.4% | |
Kesko Oyj, Class B | | | 0.4% | |
Ladbrokes PLC | | | 0.4% | |
| * | The ten largest holdings are subject to change, and there are no guarantees the Fund will remain invested in any particular company. Excludes investment of cash collateral for securities on loan (if any). |
The WisdomTree International SmallCap Dividend Fund (the ‘‘Fund’’) seeks to track the price and yield performance, before fees and expenses, of the WisdomTree International SmallCap Dividend Index.
The Fund returned 2.26% at net asset value (“NAV”) for the fiscal year ending March 31, 2016 (for more complete performance information please see the table below). The Fund benefited the most from its position in Sweden. The Fund’s position in Australia created the greatest drag on performance.
The following performance table is provided for comparative purposes and represents the period noted. The Fund’s per share NAV is the value of one share of the Fund and is calculated by dividing the value of total assets less total liabilities by the number of shares outstanding. The NAV return is based on the NAV of the Fund and the market price return is based on the market price per share of the Fund. The price used to calculate market price returns is the mid-point of the highest bid and lowest offer for Fund shares as of the close of trading on the exchange where Fund shares are listed. NAV and market price returns assume that dividends and capital gain distributions have been reinvested in the Fund at NAV and market price, respectively. As with other ETFs, NAV returns and market price returns may differ because of factors such as the supply and demand for Fund shares and investors’ assessments of the underlying value of the Fund’s portfolio securities.
An index is a statistical measure of a specified financial market or sector. An index does not actually hold a portfolio of securities, incur expenses or pay any transaction costs. Therefore, index returns do not reflect deductions for fees or expenses and the index is not available for direct investment. In comparison, the Fund’s performance is negatively impacted by these deductions. Fund returns do not reflect brokerage commissions or taxes a shareholder would pay on the sale of Fund shares or on Fund distributions. As of the Fund’s current prospectus dated August 1, 2015, as revised November 12, 2015, the Fund’s annual expense ratio was 0.58%.
Performance as of 3/31/16
| | | | | | | | | | | | | | | | |
| | | Average Annual Total Return | |
| | | 1 Year | | | 3 Year | | | 5 Year | | | Since
Inception1 | |
Fund NAV Returns | | | 2.26 | % | | | 5.58 | % | | | 5.83 | % | | | 5.13 | % |
Fund Market Price Returns | | | 2.13 | % | | | 5.50 | % | | | 5.85 | % | | | 5.05 | % |
WisdomTree International SmallCap Dividend Index | | | 2.83 | % | | | 6.27 | % | | | 6.27 | % | | | 5.60 | % |
MSCI EAFE Small Cap Index | | | 3.20 | % | | | 7.29 | % | | | 5.58 | % | | | 4.28 | % |
| 1 | Total returns are calculated based on the commencement of Fund trading on the NYSE Arca, Inc. on June 16, 2006. |
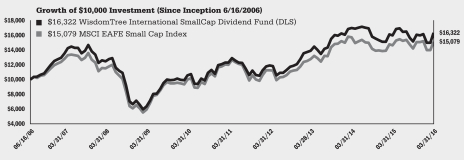
Performance is historical and does not guarantee future results. Current performance may be lower or higher than quoted. Investment returns and the principal value of an investment will fluctuate so that an investor’s shares, when redeemed, may be worth more or less than their original cost. Performance data for the most recent month-end is available at www.wisdomtree.com. WisdomTree shares are bought and sold at market price (not NAV) and are not individually redeemed from the Fund. Fund NAV returns are calculated using the Fund’s daily 4:00 p.m. NAV. Market price returns reflect the midpoint of the bid/ask spread as of the close of trading on the exchange where Fund shares are listed. Market price returns do not represent the returns you would receive if you traded shares at other times. The returns do not reflect the deduction of taxes that a shareholder would pay on Fund distributions or on the redemption of Fund shares. Total returns for a period of less than one year are cumulative.
| | |
| 20 | | WisdomTree Developed World ex-U.S. and Currency Hedged Equity Funds |
Performance Summary (unaudited)
WisdomTree Japan Hedged Capital Goods Fund (DXJC)
Industry Breakdown† as of 3/31/16
| | | | |
| |
| Industry | | % of Net Assets | |
Automobiles | | | 30.8% | |
Machinery | | | 28.0% | |
Auto Components | | | 16.9% | |
Electrical Equipment | | | 8.3% | |
Metals & Mining | | | 5.9% | |
Building Products | | | 5.8% | |
Construction & Engineering | | | 1.8% | |
Chemicals | | | 1.8% | |
Other Assets less Liabilities‡ | | | 0.7% | |
Total | | | 100.0% | |
| † | The Fund’s industry breakdown is expressed as a percentage of net assets and may change over time. It does not include derivatives (if any). |
| ‡ | Other assets includes investment of cash collateral for securities on loan (if any). |
Top Ten Holdings* as of 3/31/16
| | | | |
| |
| Description | | % of Net Assets | |
Toyota Motor Corp. | | | 9.0% | |
Honda Motor Co., Ltd. | | | 7.7% | |
FANUC Corp. | | | 4.3% | |
Bridgestone Corp. | | | 3.7% | |
Mitsubishi Electric Corp. | | | 3.6% | |
Nissan Motor Co., Ltd. | | | 3.5% | |
Fuji Heavy Industries Ltd. | | | 3.5% | |
Daikin Industries Ltd. | | | 3.4% | |
Denso Corp. | | | 3.2% | |
Nidec Corp. | | | 2.9% | |
| * | The ten largest holdings are subject to change, and there are no guarantees the Fund will remain invested in any particular company. Excludes investment of cash collateral for securities on loan (if any). |
The WisdomTree Japan Hedged Capital Goods Fund (the ‘‘Fund’’) seeks to track the price and yield performance, before fees and expenses, of the WisdomTree Japan Hedged Capital Goods Index.
The Fund returned -20.72% at net asset value (“NAV”) for the fiscal year ending March 31, 2016 (for more complete performance information please see the table below). The Fund benefited the most from its position in Daikin Industries Ltd. The Fund’s position in Toyota Motor Corp. created the greatest drag on performance. During the fiscal year, the Fund utilized forward foreign currency contracts as hedges to offset Japanese yen currency exposure from positions in Japanese equities. The Fund’s use of forward foreign currency contracts detracted from performance as a result of the U.S. dollar weakening against the Japanese yen during the period.
The following performance table is provided for comparative purposes and represents the period noted. The Fund’s per share NAV is the value of one share of the Fund and is calculated by dividing the value of total assets less total liabilities by the number of shares outstanding. The NAV return is based on the NAV of the Fund and the market price return is based on the market price per share of the Fund. The price used to calculate market price returns is the mid-point of the highest bid and lowest offer for Fund shares as of the close of trading on the exchange where Fund shares are listed. NAV and market price returns assume that dividends and capital gain distributions have been reinvested in the Fund at NAV and market price, respectively. As with other ETFs, NAV returns and market price returns may differ because of factors such as the supply and demand for Fund shares and investors’ assessments of the underlying value of the Fund’s portfolio securities.
An index is a statistical measure of a specified financial market or sector. An index does not actually hold a portfolio of securities, incur expenses or pay any transaction costs. Therefore, index returns do not reflect deductions for fees or expenses and the index is not available for direct investment. In comparison, the Fund’s performance is negatively impacted by these deductions. Fund returns do not reflect brokerage commissions or taxes a shareholder would pay on the sale of Fund shares or on Fund distributions. As of the Fund’s current prospectus dated August 1, 2015, as revised November 12, 2015, the Fund’s annual expense ratio was 0.48%.
Performance as of 3/31/16
| | | | | | | | |
| | | Average Annual Total Return | |
| | | 1 Year | | | Since
Inception1 | |
Fund NAV Returns | | | -20.72 | % | | | 1.33 | % |
Fund Market Price Returns | | | -20.78 | % | | | 2.09 | % |
WisdomTree Japan Hedged Capital Goods Index | | | -20.33 | % | | | 2.05 | % |
MSCI Japan Local Currency Index | | | -12.90 | % | | | 7.91 | % |
| 1 | Total returns are calculated based on the commencement of Fund trading on the NYSE Arca, Inc. on April 8, 2014. |
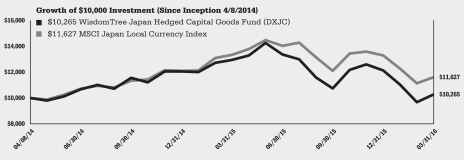
Performance is historical and does not guarantee future results. Current performance may be lower or higher than quoted. Investment returns and the principal value of an investment will fluctuate so that an investor’s shares, when redeemed, may be worth more or less than their original cost. Performance data for the most recent month-end is available at www.wisdomtree.com. WisdomTree shares are bought and sold at market price (not NAV) and are not individually redeemed from the Fund. Fund NAV returns are calculated using the Fund’s daily 4:00 p.m. NAV. Market price returns reflect the midpoint of the bid/ask spread as of the close of trading on the exchange where Fund shares are listed. Market price returns do not represent the returns you would receive if you traded shares at other times. The returns do not reflect the deduction of taxes that a shareholder would pay on Fund distributions or on the redemption of Fund shares. Total returns for a period of less than one year are cumulative.
| | | | |
| WisdomTree Developed World ex-U.S. and Currency Hedged Equity Funds | | | 21 | |
Performance Summary (unaudited)
WisdomTree Japan Hedged Equity Fund (DXJ)
Sector Breakdown† as of 3/31/16
| | | | |
| |
| Sector | | % of Net Assets | |
Consumer Discretionary | | | 24.3% | |
Industrials | | | 23.1% | |
Information Technology | | | 13.4% | |
Consumer Staples | | | 10.7% | |
Healthcare | | | 9.1% | |
Financials | | | 8.8% | |
Materials | | | 8.5% | |
Telecommunication Services | | | 0.8% | |
Energy | | | 0.5% | |
Other Assets less Liabilities‡ | | | 0.8% | |
Total | | | 100.0% | |
| † | The Fund’s sector breakdown is expressed as a percentage of net assets and may change over time. In addition, a sector may be comprised of several industries. It does not include derivatives (if any). |
| ‡ | Other assets includes investment of cash collateral for securities on loan (if any). |
Top Ten Holdings* as of 3/31/16
| | | | |
| |
| Description | | % of Net Assets | |
Japan Tobacco, Inc. | | | 5.4% | |
Toyota Motor Corp. | | | 4.5% | |
Canon, Inc. | | | 3.8% | |
Mitsubishi UFJ Financial Group, Inc. | | | 3.6% | |
Nissan Motor Co., Ltd. | | | 2.9% | |
Takeda Pharmaceutical Co., Ltd. | | | 2.9% | |
Honda Motor Co., Ltd. | | | 2.8% | |
Mizuho Financial Group, Inc. | | | 2.8% | |
FANUC Corp. | | | 2.4% | |
Mitsui & Co., Ltd. | | | 2.2% | |
| * | The ten largest holdings are subject to change, and there are no guarantees the Fund will remain invested in any particular company. Excludes investment of cash collateral for securities on loan (if any). |
The WisdomTree Japan Hedged Equity Fund (the ‘‘Fund’’) seeks to track the price and yield performance, before fees and expenses, of the WisdomTree Japan Hedged Equity Index. The Fund seeks to provide Japanese equity returns while mitigating or ‘‘hedging’’ against fluctuations between the value of the Japanese yen and the U.S. dollar.
The Fund returned -15.64% at net asset value (“NAV”) for the fiscal year ending March 31, 2016 (for more complete performance information please see the table below). The Fund benefited the most from its position in the Consumer Staples sector. The Fund’s position in the Consumer Discretionary sector created the greatest drag on performance. During the fiscal year, the Fund utilized forward foreign currency contracts as hedges to offset Japanese yen currency exposure from positions in Japanese equities. The Fund’s use of forward foreign currency contracts detracted from performance as a result of the U.S. dollar weakening against the Japanese yen during the period.
The following performance table is provided for comparative purposes and represents the period noted. The Fund’s per share NAV is the value of one share of the Fund and is calculated by dividing the value of total assets less total liabilities by the number of shares outstanding. The NAV return is based on the NAV of the Fund and the market price return is based on the market price per share of the Fund. The price used to calculate market price returns is the mid-point of the highest bid and lowest offer for Fund shares as of the close of trading on the exchange where Fund shares are listed. NAV and market price returns assume that dividends and capital gain distributions have been reinvested in the Fund at NAV and market price, respectively. As with other ETFs, NAV returns and market price returns may differ because of factors such as the supply and demand for Fund shares and investors’ assessments of the underlying value of the Fund’s portfolio securities.
An index is a statistical measure of a specified financial market or sector. An index does not actually hold a portfolio of securities, incur expenses or pay any transaction costs. Therefore, index returns do not reflect deductions for fees or expenses and the index is not available for direct investment. In comparison, the Fund’s performance is negatively impacted by these deductions. Fund returns do not reflect brokerage commissions or taxes a shareholder would pay on the sale of Fund shares or on Fund distributions. As of the Fund’s current prospectus dated August 1, 2015, as revised November 12, 2015, the Fund’s annual expense ratio was 0.48%.
Performance as of 3/31/16
| | | | | | | | | | | | | | | | |
| | | Average Annual Total Return | |
| | | 1 Year | | | 3 Year | | | 5 Year | | | Since
Inception1 | |
Fund NAV Returns | | | -15.64 | % | | | 7.37 | % | | | 8.39 | % | | | 1.58 | % |
Fund Market Price Returns | | | -16.05 | % | | | 6.97 | % | | | 8.33 | % | | | 1.56 | % |
WisdomTree Japan Dividend/Japan Hedged Equity Spliced Index2 | | | -14.80 | % | | | 8.32 | % | | | 8.93 | % | | | 1.81 | % |
MSCI Japan/MSCI Japan Local Currency Spliced Index3 | | | -12.90 | % | | | 10.21 | % | | | 10.57 | % | | | 2.34 | % |
| 1 | Total returns are calculated based on the commencement of Fund trading on the NYSE Arca, Inc. on June 16, 2006. |
| 2 | WisdomTree Japan Dividend Index through March 31, 2010; WisdomTree Japan Hedged Equity Index thereafter. |
| 3 | MSCI Japan Index through March 31, 2010; MSCI Japan Local Currency Index thereafter. |
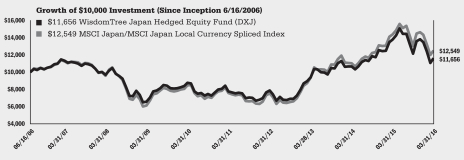
Performance is historical and does not guarantee future results. Current performance may be lower or higher than quoted. Investment returns and the principal value of an investment will fluctuate so that an investor’s shares, when redeemed, may be worth more or less than their original cost. Performance data for the most recent month-end is available at www.wisdomtree.com. WisdomTree shares are bought and sold at market price (not NAV) and are not individually redeemed from the Fund. Fund NAV returns are calculated using the Fund’s daily 4:00 p.m. NAV. Market price returns reflect the midpoint of the bid/ask spread as of the close of trading on the exchange where Fund shares are listed. Market price returns do not represent the returns you would receive if you traded shares at other times. The returns do not reflect the deduction of taxes that a shareholder would pay on Fund distributions or on the redemption of Fund shares. Total returns for a period of less than one year are cumulative.
| | |
| 22 | | WisdomTree Developed World ex-U.S. and Currency Hedged Equity Funds |
Performance Summary (unaudited)
WisdomTree Japan Hedged Financials Fund (DXJF)
Industry Breakdown† as of 3/31/16
| | | | |
| |
| Industry | | % of Net Assets | |
Banks | | | 56.5% | |
Insurance | | | 25.0% | |
Capital Markets | | | 8.6% | |
Diversified Financial Services | | | 4.7% | |
Consumer Finance | | | 4.0% | |
Other Assets less Liabilities‡ | | | 1.2% | |
Total | | | 100.0% | |
| † | The Fund’s industry breakdown is expressed as a percentage of net assets and may change over time. It does not include derivatives (if any). |
| ‡ | Other assets includes investment of cash collateral for securities on loan (if any). |
Top Ten Holdings* as of 3/31/16
| | | | |
| |
| Description | | % of Net Assets | |
Sumitomo Mitsui Financial Group, Inc. | | | 10.1% | |
Mitsubishi UFJ Financial Group, Inc. | | | 9.4% | |
Tokio Marine Holdings, Inc. | | | 7.6% | |
MS&AD Insurance Group Holdings, Inc. | | | 4.6% | |
Dai-ichi Life Insurance Co., Ltd. (The) | | | 4.3% | |
Mizuho Financial Group, Inc. | | | 3.7% | |
Sompo Japan Nipponkoa Holdings, Inc. | | | 3.6% | |
Nomura Holdings, Inc. | | | 3.5% | |
Sumitomo Mitsui Trust Holdings, Inc. | | | 3.4% | |
Daiwa Securities Group, Inc. | | | 2.8% | |
| * | The ten largest holdings are subject to change, and there are no guarantees the Fund will remain invested in any particular company. Excludes investment of cash collateral for securities on loan (if any). |
The WisdomTree Japan Hedged Financials Fund (the ‘‘Fund’’) seeks to track the price and yield performance, before fees and expenses, of the WisdomTree Japan Hedged Financials Index.
The Fund returned -24.30% at net asset value (“NAV”) for the fiscal year ending March 31, 2016 (for more complete performance information please see the table below). The Fund benefited the most from its position in Japan Exchange Group, Inc. The Fund’s position in Mitsubishi UFJ Financial Group, Inc. created the greatest drag on performance. During the fiscal year, the Fund utilized forward foreign currency contracts as hedges to offset Japanese yen currency exposure from positions in Japanese equities. The Fund’s use of forward foreign currency contracts detracted from performance as a result of the U.S. dollar weakening against the Japanese yen during the period.
The following performance table is provided for comparative purposes and represents the period noted. The Fund’s per share NAV is the value of one share of the Fund and is calculated by dividing the value of total assets less total liabilities by the number of shares outstanding. The NAV return is based on the NAV of the Fund and the market price return is based on the market price per share of the Fund. The price used to calculate market price returns is the mid-point of the highest bid and lowest offer for Fund shares as of the close of trading on the exchange where Fund shares are listed. NAV and market price returns assume that dividends and capital gain distributions have been reinvested in the Fund at NAV and market price, respectively. As with other ETFs, NAV returns and market price returns may differ because of factors such as the supply and demand for Fund shares and investors’ assessments of the underlying value of the Fund’s portfolio securities.
An index is a statistical measure of a specified financial market or sector. An index does not actually hold a portfolio of securities, incur expenses or pay any transaction costs. Therefore, index returns do not reflect deductions for fees or expenses and the index is not available for direct investment. In comparison, the Fund’s performance is negatively impacted by these deductions. Fund returns do not reflect brokerage commissions or taxes a shareholder would pay on the sale of Fund shares or on Fund distributions. As of the Fund’s current prospectus dated August 1, 2015, as revised November 12, 2015, the Fund’s annual expense ratio was 0.48%.
Performance as of 3/31/16
| | | | | | | | |
| | | Average Annual Total Return | |
| | | 1 Year | | | Since
Inception1 | |
Fund NAV Returns | | | -24.30 | % | | | -2.38 | % |
Fund Market Price Returns | | | -24.60 | % | | | -1.72 | % |
WisdomTree Japan Hedged Financials Index | | | -23.05 | % | | | -1.00 | % |
MSCI Japan Local Currency Index | | | -12.90 | % | | | 7.91 | % |
| 1 | Total returns are calculated based on the commencement of Fund trading on the NYSE Arca, Inc. on April 8, 2014. |
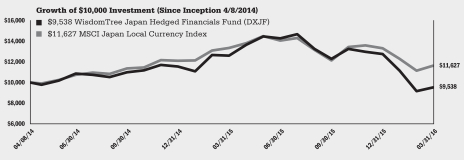
Performance is historical and does not guarantee future results. Current performance may be lower or higher than quoted. Investment returns and the principal value of an investment will fluctuate so that an investor’s shares, when redeemed, may be worth more or less than their original cost. Performance data for the most recent month-end is available at www.wisdomtree.com. WisdomTree shares are bought and sold at market price (not NAV) and are not individually redeemed from the Fund. Fund NAV returns are calculated using the Fund’s daily 4:00 p.m. NAV. Market price returns reflect the midpoint of the bid/ask spread as of the close of trading on the exchange where Fund shares are listed. Market price returns do not represent the returns you would receive if you traded shares at other times. The returns do not reflect the deduction of taxes that a shareholder would pay on Fund distributions or on the redemption of Fund shares. Total returns for a period of less than one year are cumulative.
| | | | |
| WisdomTree Developed World ex-U.S. and Currency Hedged Equity Funds | | | 23 | |
Performance Summary (unaudited)
WisdomTree Japan Hedged Health Care Fund (DXJH)
Industry Breakdown† as of 3/31/16
| | | | |
| |
| Industry | | % of Net Assets | |
Pharmaceuticals | | | 63.4% | |
Health Care Equipment & Supplies | | | 22.4% | |
Food & Staples Retailing | | | 6.1% | |
Health Care Providers & Services | | | 5.3% | |
Health Care Technology | | | 1.8% | |
Biotechnology | | | 0.5% | |
Other Assets less Liabilities‡ | | | 0.5% | |
Total | | | 100.0% | |
| † | The Fund’s industry breakdown is expressed as a percentage of net assets and may change over time. It does not include derivatives (if any). |
| ‡ | Other assets includes investment of cash collateral for securities on loan (if any). |
Top Ten Holdings* as of 3/31/16
| | | | |
| |
| Description | | % of Net Assets | |
Takeda Pharmaceutical Co., Ltd. | | | 8.7% | |
Astellas Pharma, Inc. | | | 8.7% | |
Ono Pharmaceutical Co., Ltd. | | | 7.4% | |
Otsuka Holdings Co., Ltd. | | | 6.8% | |
Hoya Corp. | | | 6.0% | |
Eisai Co., Ltd. | | | 5.5% | |
Daiichi Sankyo Co., Ltd. | | | 5.2% | |
Shionogi & Co., Ltd. | | | 4.8% | |
Terumo Corp. | | | 4.4% | |
Olympus Corp. | | | 4.1% | |
| * | The ten largest holdings are subject to change, and there are no guarantees the Fund will remain invested in any particular company. Excludes investment of cash collateral for securities on loan (if any). |
The WisdomTree Japan Hedged Health Care Fund (the ‘‘Fund’’) seeks to track the price and yield performance, before fees and expenses, of the WisdomTree Japan Hedged Health Care Index.
The Fund returned 6.16% at net asset value (“NAV”) for the fiscal year ending March 31, 2016 (for more complete performance information please see the table below). The Fund benefited the most from its position in ONO Pharmaceutical Co., Ltd. The Fund’s position in Astellas Pharma, Inc. created the greatest drag on performance. During the fiscal year, the Fund utilized forward foreign currency contracts as hedges to offset Japanese yen currency exposure from positions in Japanese equities. The Fund’s use of forward foreign currency contracts detracted from performance as a result of the U.S. dollar weakening against the Japanese yen during the period.
The following performance table is provided for comparative purposes and represents the period noted. The Fund’s per share NAV is the value of one share of the Fund and is calculated by dividing the value of total assets less total liabilities by the number of shares outstanding. The NAV return is based on the NAV of the Fund and the market price return is based on the market price per share of the Fund. The price used to calculate market price returns is the mid-point of the highest bid and lowest offer for Fund shares as of the close of trading on the exchange where Fund shares are listed. NAV and market price returns assume that dividends and capital gain distributions have been reinvested in the Fund at NAV and market price, respectively. As with other ETFs, NAV returns and market price returns may differ because of factors such as the supply and demand for Fund shares and investors’ assessments of the underlying value of the Fund’s portfolio securities.
An index is a statistical measure of a specified financial market or sector. An index does not actually hold a portfolio of securities, incur expenses or pay any transaction costs. Therefore, index returns do not reflect deductions for fees or expenses and the index is not available for direct investment. In comparison, the Fund’s performance is negatively impacted by these deductions. Fund returns do not reflect brokerage commissions or taxes a shareholder would pay on the sale of Fund shares or on Fund distributions. As of the Fund’s current prospectus dated August 1, 2015, as revised November 12, 2015, the Fund’s annual expense ratio was 0.48%.
Performance as of 3/31/16
| | | | | | | | |
| | | Average Annual Total Return | |
| | | 1 Year | | | Since
Inception1 | |
Fund NAV Returns | | | 6.16 | % | | | 25.74 | % |
Fund Market Price Returns | | | 5.86 | % | | | 26.62 | % |
WisdomTree Japan Hedged Health Care Index | | | 6.52 | % | | | 26.55 | % |
MSCI Japan Local Currency Index | | | -12.90 | % | | | 7.91 | % |
| 1 | Total returns are calculated based on the commencement of Fund trading on the NYSE Arca, Inc. on April 8, 2014. |
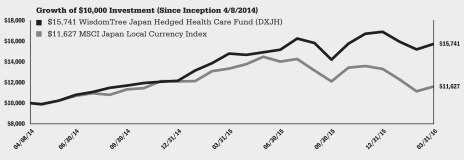
Performance is historical and does not guarantee future results. Current performance may be lower or higher than quoted. Investment returns and the principal value of an investment will fluctuate so that an investor’s shares, when redeemed, may be worth more or less than their original cost. Performance data for the most recent month-end is available at www.wisdomtree.com. WisdomTree shares are bought and sold at market price (not NAV) and are not individually redeemed from the Fund. Fund NAV returns are calculated using the Fund’s daily 4:00 p.m. NAV. Market price returns reflect the midpoint of the bid/ask spread as of the close of trading on the exchange where Fund shares are listed. Market price returns do not represent the returns you would receive if you traded shares at other times. The returns do not reflect the deduction of taxes that a shareholder would pay on Fund distributions or on the redemption of Fund shares. Total returns for a period of less than one year are cumulative.
| | |
| 24 | | WisdomTree Developed World ex-U.S. and Currency Hedged Equity Funds |
Performance Summary (unaudited)
WisdomTree Japan Hedged Quality Dividend Growth Fund (JHDG)
(formerly, WisdomTree Japan Hedged Dividend Growth Fund)
Sector Breakdown† as of 3/31/16
| | | | |
| |
| Sector | | % of Net Assets | |
Consumer Discretionary | | | 23.5% | |
Industrials | | | 21.6% | |
Information Technology | | | 12.6% | |
Consumer Staples | | | 12.2% | |
Telecommunication Services | | | 11.4% | |
Materials | | | 6.7% | |
Healthcare | | | 6.3% | |
Financials | | | 4.8% | |
Other Assets less Liabilities‡ | | | 0.9% | |
Total | | | 100.0% | |
| † | The Fund’s sector breakdown is expressed as a percentage of net assets and may change over time. In addition, a sector may be comprised of several industries. It does not include derivatives (if any). |
| ‡ | Other assets includes investment of cash collateral for securities on loan (if any). |
Top Ten Holdings* as of 3/31/16
| | | | |
| |
| Description | | % of Net Assets | |
NTT DOCOMO, Inc. | | | 6.6 | % |
Japan Tobacco, Inc. | | | 5.5 | % |
Toyota Motor Corp. | | | 3.9 | % |
Canon, Inc. | | | 3.9 | % |
KDDI Corp. | | | 3.9 | % |
Nissan Motor Co., Ltd. | | | 2.8 | % |
Honda Motor Co., Ltd. | | | 2.8 | % |
FANUC Corp. | | | 2.4 | % |
Mitsui & Co., Ltd. | | | 2.2 | % |
Bridgestone Corp. | | | 2.0 | % |
| * | The ten largest holdings are subject to change, and there are no guarantees the Fund will remain invested in any particular company. Excludes investment of cash collateral for securities on loan (if any). |
The WisdomTree Japan Hedged Quality Dividend Growth Fund (the ‘‘Fund’’) seeks to track the price and yield performance, before fees and expenses, of the WisdomTree Japan Hedged Quality Dividend Growth Index.
The Fund returned -11.73% at net asset value (“NAV”) from Fund inception on April 9, 2015 to March 31, 2016 (for more complete performance information please see the table below). The Fund benefited the most from its position in the Telecommunication Services sector. The Fund’s position in the Consumer Discretionary sector created the greatest drag on performance. During the fiscal period, the Fund utilized forward foreign currency contracts as hedges to offset Japanese yen currency exposure from positions in Japanese equities. The Fund’s use of forward foreign currency contracts detracted from performance as a result of the U.S. dollar weakening against the Japanese yen during the period.
The following performance table is provided for comparative purposes and represents the period noted. The Fund’s per share NAV is the value of one share of the Fund and is calculated by dividing the value of total assets less total liabilities by the number of shares outstanding. The NAV return is based on the NAV of the Fund and the market price return is based on the market price per share of the Fund. The price used to calculate market price returns is the mid-point of the highest bid and lowest offer for Fund shares as of the close of trading on the exchange where Fund shares are listed. NAV and market price returns assume that dividends and capital gain distributions have been reinvested in the Fund at NAV and market price, respectively. As with other ETFs, NAV returns and market price returns may differ because of factors such as the supply and demand for Fund shares and investors’ assessments of the underlying value of the Fund’s portfolio securities.
An index is a statistical measure of a specified financial market or sector. An index does not actually hold a portfolio of securities, incur expenses or pay any transaction costs. Therefore, index returns do not reflect deductions for fees or expenses and the index is not available for direct investment. In comparison, the Fund’s performance is negatively impacted by these deductions. Fund returns do not reflect brokerage commissions or taxes a shareholder would pay on the sale of Fund shares or on Fund distributions. As of the Fund’s current prospectus dated August 1, 2015, as revised November 12, 2015, the Fund’s net and gross annual expense ratios were 0.43% and 0.48%, respectively. WisdomTree Asset Management, Inc. has contractually agreed to limit the management fee to 0.43% through July 31, 2016, unless earlier terminated by the Board of Trustees of the Trust for any reason at any time.
Performance as of 3/31/16
| | | | |
| | | Cumulative Total Return | |
| | | Since
Inception1 | |
Fund NAV Returns | | | -11.73 | % |
Fund Market Price Returns | | | -12.13 | % |
WisdomTree Japan Hedged Quality Dividend Growth Index | | | -11.18 | % |
JPX-Nikkei 400 Local Currency Index | | | -14.67 | % |
| 1 | Total returns are calculated based on the commencement of Fund trading on the NYSE Arca, Inc. on April 9, 2015. |
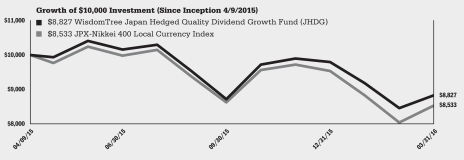
Performance is historical and does not guarantee future results. Current performance may be lower or higher than quoted. Investment returns and the principal value of an investment will fluctuate so that an investor’s shares, when redeemed, may be worth more or less than their original cost. Performance data for the most recent month-end is available at www.wisdomtree.com. WisdomTree shares are bought and sold at market price (not NAV) and are not individually redeemed from the Fund. Fund NAV returns are calculated using the Fund’s daily 4:00 p.m. NAV. Market price returns reflect the midpoint of the bid/ask spread as of the close of trading on the exchange where Fund shares are listed. Market price returns do not represent the returns you would receive if you traded shares at other times. The returns do not reflect the deduction of taxes that a shareholder would pay on Fund distributions or on the redemption of Fund shares. Total returns for a period of less than one year are cumulative.
| | | | |
| WisdomTree Developed World ex-U.S. and Currency Hedged Equity Funds | | | 25 | |
Performance Summary (unaudited)
WisdomTree Japan Hedged Real Estate Fund (DXJR)
Industry Breakdown† as of 3/31/16
| | | | |
| |
| Industry | | % of Net Assets | |
Real Estate Management & Development | | | 37.9% | |
Real Estate Investment Trusts (REITs) | | | 32.0% | |
Construction & Engineering | | | 13.4% | |
Household Durables | | | 8.3% | |
Building Products | | | 3.9% | |
Transportation Infrastructure | | | 2.6% | |
Construction Materials | | | 1.5% | |
Other Assets less Liabilities‡ | | | 0.4% | |
Total | | | 100.0% | |
| † | The Fund’s industry breakdown is expressed as a percentage of net assets and may change over time. It does not include derivatives (if any). |
| ‡ | Other assets includes investment of cash collateral for securities on loan (if any). |
Top Ten Holdings* as of 3/31/16
| | | | |
| |
| Description | | % of Net Assets | |
Mitsubishi Estate Co., Ltd. | | | 8.1% | |
Mitsui Fudosan Co., Ltd. | | | 8.1% | |
Daiwa House Industry Co., Ltd. | | | 5.9% | |
Sumitomo Realty & Development Co., Ltd. | | | 4.6% | |
Daito Trust Construction Co., Ltd. | | | 4.0% | |
Sekisui House Ltd. | | | 3.5% | |
Nippon Building Fund, Inc. | | | 2.7% | |
Taisei Corp. | | | 2.6% | |
Japan Real Estate Investment Corp. | | | 2.4% | |
Obayashi Corp. | | | 2.4% | |
| * | The ten largest holdings are subject to change, and there are no guarantees the Fund will remain invested in any particular company. Excludes investment of cash collateral for securities on loan (if any). |
The WisdomTree Japan Hedged Real Estate Fund (the ‘‘Fund’’) seeks to track the price and yield performance, before fees and expenses, of the WisdomTree Japan Hedged Real Estate Index.
The Fund returned -2.21% at net asset value (“NAV”) for the fiscal year ending March 31, 2016 (for more complete performance information please see the table below). The Fund benefited the most from its position in Daiwa House Industry Co., Ltd. The Fund’s position in Mitsubishi Estate Co., Ltd. created the greatest drag on performance. During the fiscal year, the Fund utilized forward foreign currency contracts as hedges to offset Japanese yen currency exposure from positions in Japanese equities. The Fund’s use of forward foreign currency contracts detracted from performance as a result of the U.S. dollar weakening against the Japanese yen during the period.
The following performance table is provided for comparative purposes and represents the period noted. The Fund’s per share NAV is the value of one share of the Fund and is calculated by dividing the value of total assets less total liabilities by the number of shares outstanding. The NAV return is based on the NAV of the Fund and the market price return is based on the market price per share of the Fund. The price used to calculate market price returns is the mid-point of the highest bid and lowest offer for Fund shares as of the close of trading on the exchange where Fund shares are listed. NAV and market price returns assume that dividends and capital gain distributions have been reinvested in the Fund at NAV and market price, respectively. As with other ETFs, NAV returns and market price returns may differ because of factors such as the supply and demand for Fund shares and investors’ assessments of the underlying value of the Fund’s portfolio securities.
An index is a statistical measure of a specified financial market or sector. An index does not actually hold a portfolio of securities, incur expenses or pay any transaction costs. Therefore, index returns do not reflect deductions for fees or expenses and the index is not available for direct investment. In comparison, the Fund’s performance is negatively impacted by these deductions. Fund returns do not reflect brokerage commissions or taxes a shareholder would pay on the sale of Fund shares or on Fund distributions. As of the Fund’s current prospectus dated August 1, 2015, as revised November 12, 2015, the Fund’s annual expense ratio was 0.48%.
Performance as of 3/31/16
| | | | | | | | |
| | | Average Annual Total Return | |
| | | 1 Year | | | Since
Inception1 | |
Fund NAV Returns | | | -2.21 | % | | | 9.59 | % |
Fund Market Price Returns | | | -2.33 | % | | | 10.45 | % |
WisdomTree Japan Hedged Real Estate Index | | | -1.72 | % | | | 10.47 | % |
MSCI Japan Local Currency Index | | | -12.90 | % | | | 7.91 | % |
| 1 | Total returns are calculated based on the commencement of Fund trading on the NYSE Arca, Inc. on April 8, 2014. |
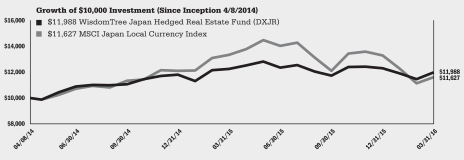
Performance is historical and does not guarantee future results. Current performance may be lower or higher than quoted. Investment returns and the principal value of an investment will fluctuate so that an investor’s shares, when redeemed, may be worth more or less than their original cost. Performance data for the most recent month-end is available at www.wisdomtree.com. WisdomTree shares are bought and sold at market price (not NAV) and are not individually redeemed from the Fund. Fund NAV returns are calculated using the Fund’s daily 4:00 p.m. NAV. Market price returns reflect the midpoint of the bid/ask spread as of the close of trading on the exchange where Fund shares are listed. Market price returns do not represent the returns you would receive if you traded shares at other times. The returns do not reflect the deduction of taxes that a shareholder would pay on Fund distributions or on the redemption of Fund shares. Total returns for a period of less than one year are cumulative.
| | |
| 26 | | WisdomTree Developed World ex-U.S. and Currency Hedged Equity Funds |
Performance Summary (unaudited)
WisdomTree Japan Hedged SmallCap Equity Fund (DXJS)
Sector Breakdown† as of 3/31/16
| | | | |
| |
| Sector | | % of Net Assets | |
Industrials | | | 24.3% | |
Consumer Discretionary | | | 23.5% | |
Materials | | | 12.2% | |
Information Technology | | | 11.8% | |
Consumer Staples | | | 11.1% | |
Financials | | | 9.9% | |
Healthcare | | | 4.8% | |
Energy | | | 0.9% | |
Utilities | | | 0.5% | |
Other Assets less Liabilities‡ | | | 1.0% | |
Total | | | 100.0% | |
| † | The Fund’s sector breakdown is expressed as a percentage of net assets and may change over time. In addition, a sector may be comprised of several industries. It does not include derivatives (if any). |
| ‡ | Other assets includes investment of cash collateral for securities on loan (if any). |
Top Ten Holdings* as of 3/31/16
| | | | |
| |
| Description | | % of Net Assets | |
Park24 Co., Ltd. | | | 0.9% | |
Benesse Holdings, Inc. | | | 0.9% | |
Matsui Securities Co., Ltd. | | | 0.8% | |
Heiwa Corp. | | | 0.8% | |
Daiichikosho Co., Ltd. | | | 0.6% | |
Canon Marketing Japan, Inc. | | | 0.6% | |
Kaneka Corp. | | | 0.6% | |
Coca-Cola West Co., Ltd. | | | 0.5% | |
Nippon Paper Industries Co., Ltd. | | | 0.5% | |
DIC Corp. | | | 0.5% | |
| * | The ten largest holdings are subject to change, and there are no guarantees the Fund will remain invested in any particular company. Excludes investment of cash collateral for securities on loan (if any). |
The WisdomTree Japan Hedged SmallCap Equity Fund (the ‘‘Fund’’) seeks to track the price and yield performance, before fees and expenses, of the WisdomTree Japan Hedged SmallCap Equity Index.
The Fund returned -3.83% at net asset value (“NAV”) for the fiscal year ending March 31, 2016 (for more complete performance information please see the table below). The Fund benefited the most from its position in the Consumer Staples sector. The Fund’s position in the Financials sector created the greatest drag on performance. During the fiscal year, the Fund utilized forward foreign currency contracts as hedges to offset Japanese yen currency exposure from positions in Japanese equities. The Fund’s use of forward foreign currency contracts detracted from performance as a result of the U.S. dollar weakening against the Japanese yen during the period.
The following performance table is provided for comparative purposes and represents the period noted. The Fund’s per share NAV is the value of one share of the Fund and is calculated by dividing the value of total assets less total liabilities by the number of shares outstanding. The NAV return is based on the NAV of the Fund and the market price return is based on the market price per share of the Fund. The price used to calculate market price returns is the mid-point of the highest bid and lowest offer for Fund shares as of the close of trading on the exchange where Fund shares are listed. NAV and market price returns assume that dividends and capital gain distributions have been reinvested in the Fund at NAV and market price, respectively. As with other ETFs, NAV returns and market price returns may differ because of factors such as the supply and demand for Fund shares and investors’ assessments of the underlying value of the Fund’s portfolio securities.
An index is a statistical measure of a specified financial market or sector. An index does not actually hold a portfolio of securities, incur expenses or pay any transaction costs. Therefore, index returns do not reflect deductions for fees or expenses and the index is not available for direct investment. In comparison, the Fund’s performance is negatively impacted by these deductions. Fund returns do not reflect brokerage commissions or taxes a shareholder would pay on the sale of Fund shares or on Fund distributions. As of the Fund’s current prospectus dated August 1, 2015, as revised November 12, 2015, the Fund’s annual expense ratio was 0.58%.
Performance as of 3/31/16
| | | | | | | | |
| | | Average Annual Total Return | |
| | | 1 Year | | | Since
Inception1 | |
Fund NAV Returns | | | -3.83 | % | | | 11.43 | % |
Fund Market Price Returns | | | -4.46 | % | | | 10.91 | % |
WisdomTree Japan Hedged SmallCap Equity Index | | | -3.04 | % | | | 12.57 | % |
MSCI Japan Small Cap Local Currency Index | | | -2.52 | % | | | 13.66 | % |
| 1 | Total returns are calculated based on the commencement of Fund trading on the NASDAQ on June 28, 2013. |
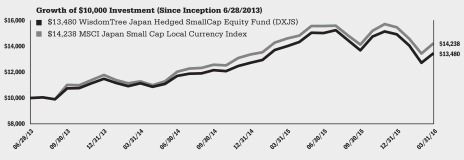
Performance is historical and does not guarantee future results. Current performance may be lower or higher than quoted. Investment returns and the principal value of an investment will fluctuate so that an investor’s shares, when redeemed, may be worth more or less than their original cost. Performance data for the most recent month-end is available at www.wisdomtree.com. WisdomTree shares are bought and sold at market price (not NAV) and are not individually redeemed from the Fund. Fund NAV returns are calculated using the Fund’s daily 4:00 p.m. NAV. Market price returns reflect the midpoint of the bid/ask spread as of the close of trading on the exchange where Fund shares are listed. Market price returns do not represent the returns you would receive if you traded shares at other times. The returns do not reflect the deduction of taxes that a shareholder would pay on Fund distributions or on the redemption of Fund shares. Total returns for a period of less than one year are cumulative.
| | | | |
| WisdomTree Developed World ex-U.S. and Currency Hedged Equity Funds | | | 27 | |
Performance Summary (unaudited)
WisdomTree Japan Hedged Tech, Media and Telecom Fund (DXJT)
Industry Breakdown† as of 3/31/16
| | | | |
| |
| Industry | | % of Net Assets | |
Electronic Equipment, Instruments & Components | | | 25.5% | |
Wireless Telecommunication Services | | | 21.6% | |
Technology Hardware, Storage & Peripherals | | | 13.7% | |
Household Durables | | | 11.7% | |
IT Services | | | 7.0% | |
Media | | | 4.9% | |
Semiconductors & Semiconductor Equipment | | | 4.1% | |
Software | | | 3.4% | |
Leisure Products | | | 2.6% | |
Internet Software & Services | | | 2.5% | |
Internet & Catalog Retail | | | 2.1% | |
Trading Companies & Distributors | | | 0.1% | |
Communications Equipment | | | 0.1% | |
Commercial Services & Supplies | | | 0.1% | |
Other Assets less Liabilities‡ | | | 0.6% | |
Total | | | 100.0% | |
| † | The Fund’s industry breakdown is expressed as a percentage of net assets and may change over time. It does not include derivatives (if any). |
| ‡ | Other assets includes investment of cash collateral for securities on loan (if any). |
Top Ten Holdings* as of 3/31/16
| | | | |
| |
| Description | | % of Net Assets | |
SoftBank Group Corp. | | | 8.2% | |
KDDI Corp. | | | 8.0% | |
Canon, Inc. | | | 5.7% | |
NTT DOCOMO, Inc. | | | 5.3% | |
Sony Corp. | | | 5.3% | |
Murata Manufacturing Co., Ltd. | | | 4.5% | |
Keyence Corp. | | | 4.3% | |
Hitachi Ltd. | | | 4.1% | |
Panasonic Corp. | | | 3.7% | |
FUJIFILM Holdings Corp. | | | 3.3% | |
| * | The ten largest holdings are subject to change, and there are no guarantees the Fund will remain invested in any particular company. Excludes investment of cash collateral for securities on loan (if any). |
The WisdomTree Japan Hedged Tech, Media and Telecom Fund (the ‘‘Fund’’) seeks to track the price and yield performance, before fees and expenses, of the WisdomTree Japan Hedged Tech, Media and Telecom Index.
The Fund returned -12.99% at net asset value (“NAV”) for the fiscal year ending March 31, 2016 (for more complete performance information please see the table below). The Fund benefited the most from its position in NTT DOCOMO, Inc. The Fund’s position in Hitachi Ltd. created the greatest drag on performance. During the fiscal year, the Fund utilized forward foreign currency contracts as hedges to offset Japanese yen currency exposure from positions in Japanese equities. The Fund’s use of forward foreign currency contracts detracted from performance as a result of the U.S. dollar weakening against the Japanese yen during the period.
The following performance table is provided for comparative purposes and represents the period noted. The Fund’s per share NAV is the value of one share of the Fund and is calculated by dividing the value of total assets less total liabilities by the number of shares outstanding. The NAV return is based on the NAV of the Fund and the market price return is based on the market price per share of the Fund. The price used to calculate market price returns is the mid-point of the highest bid and lowest offer for Fund shares as of the close of trading on the exchange where Fund shares are listed. NAV and market price returns assume that dividends and capital gain distributions have been reinvested in the Fund at NAV and market price, respectively. As with other ETFs, NAV returns and market price returns may differ because of factors such as the supply and demand for Fund shares and investors’ assessments of the underlying value of the Fund’s portfolio securities.
An index is a statistical measure of a specified financial market or sector. An index does not actually hold a portfolio of securities, incur expenses or pay any transaction costs. Therefore, index returns do not reflect deductions for fees or expenses and the index is not available for direct investment. In comparison, the Fund’s performance is negatively impacted by these deductions. Fund returns do not reflect brokerage commissions or taxes a shareholder would pay on the sale of Fund shares or on Fund distributions. As of the Fund’s current prospectus dated August 1, 2015, as revised November 12, 2015, the Fund’s annual expense ratio was 0.48%.
Performance as of 3/31/16
| | | | | | | | |
| | | Average Annual Total Return | |
| | | 1 Year | | | Since
Inception1 | |
Fund NAV Returns | | | -12.99 | % | | | 7.58 | % |
Fund Market Price Returns | | | -13.11 | % | | | 8.31 | % |
WisdomTree Japan Hedged Tech, Media and Telecom Index | | | -13.05 | % | | | 7.86 | % |
MSCI Japan Local Currency Index | | | -12.90 | % | | | 7.91 | % |
| 1 | Total returns are calculated based on the commencement of Fund trading on the NYSE Arca, Inc. on April 8, 2014. |
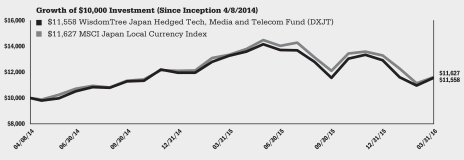
Performance is historical and does not guarantee future results. Current performance may be lower or higher than quoted. Investment returns and the principal value of an investment will fluctuate so that an investor’s shares, when redeemed, may be worth more or less than their original cost. Performance data for the most recent month-end is available at www.wisdomtree.com. WisdomTree shares are bought and sold at market price (not NAV) and are not individually redeemed from the Fund. Fund NAV returns are calculated using the Fund’s daily 4:00 p.m. NAV. Market price returns reflect the midpoint of the bid/ask spread as of the close of trading on the exchange where Fund shares are listed. Market price returns do not represent the returns you would receive if you traded shares at other times. The returns do not reflect the deduction of taxes that a shareholder would pay on Fund distributions or on the redemption of Fund shares. Total returns for a period of less than one year are cumulative.
| | |
| 28 | | WisdomTree Developed World ex-U.S. and Currency Hedged Equity Funds |
Performance Summary (unaudited)
WisdomTree Japan Quality Dividend Growth Fund (JDG)
(formerly, WisdomTree Japan Dividend Growth Fund)
Sector Breakdown† as of 3/31/16
| | | | |
| |
| Sector | | % of Net Assets | |
Consumer Discretionary | | | 23.1% | |
Industrials | | | 21.4% | |
Consumer Staples | | | 12.7% | |
Information Technology | | | 12.6% | |
Telecommunication Services | | | 11.4% | |
Healthcare | | | 6.6% | |
Materials | | | 6.6% | |
Financials | | | 4.6% | |
Other Assets less Liabilities‡ | | | 1.0% | |
Total | | | 100.0% | |
| † | The Fund’s sector breakdown is expressed as a percentage of net assets and may change over time. In addition, a sector may be comprised of several industries. It does not include derivatives (if any). |
| ‡ | Other assets includes investment of cash collateral for securities on loan (if any). |
Top Ten Holdings* as of 3/31/16
| | | | |
| |
| Description | | % of Net Assets | |
NTT DOCOMO, Inc. | | | 6.7% | |
Japan Tobacco, Inc. | | | 5.4% | |
Toyota Motor Corp. | | | 4.0% | |
KDDI Corp. | | | 3.9% | |
Canon, Inc. | | | 3.9% | |
Nissan Motor Co., Ltd. | | | 2.8% | |
Honda Motor Co., Ltd. | | | 2.7% | |
FANUC Corp. | | | 2.4% | |
Mitsui & Co., Ltd. | | | 2.1% | |
Bridgestone Corp. | | | 2.0% | |
| * | The ten largest holdings are subject to change, and there are no guarantees the Fund will remain invested in any particular company. Excludes investment of cash collateral for securities on loan (if any). |
The WisdomTree Japan Quality Dividend Growth Fund (the ‘‘Fund’’) seeks to track the price and yield performance, before fees and expenses, of the WisdomTree Japan Quality Dividend Growth Index. Prior to March 31, 2016, the WisdomTree Japan Quality Dividend Growth Index was named the WisdomTree Japan Dividend Growth Index.
The Fund returned -6.07% at net asset value (“NAV”) from Fund inception on May 28, 2015 to March 31, 2016 (for more complete performance information please see the table below). The Fund benefited the most from its position in the Telecommunication Services sector. The Fund’s position in the Industrials sector created the greatest drag on performance.
The following performance table is provided for comparative purposes and represents the period noted. The Fund’s per share NAV is the value of one share of the Fund and is calculated by dividing the value of total assets less total liabilities by the number of shares outstanding. The NAV return is based on the NAV of the Fund and the market price return is based on the market price per share of the Fund. The price used to calculate market price returns is the mid-point of the highest bid and lowest offer for Fund shares as of the close of trading on the exchange where Fund shares are listed. NAV and market price returns assume that dividends and capital gain distributions have been reinvested in the Fund at NAV and market price, respectively. As with other ETFs, NAV returns and market price returns may differ because of factors such as the supply and demand for Fund shares and investors’ assessments of the underlying value of the Fund’s portfolio securities.
An index is a statistical measure of a specified financial market or sector. An index does not actually hold a portfolio of securities, incur expenses or pay any transaction costs. Therefore, index returns do not reflect deductions for fees or expenses and the index is not available for direct investment. In comparison, the Fund’s performance is negatively impacted by these deductions. Fund returns do not reflect brokerage commissions or taxes a shareholder would pay on the sale of Fund shares or on Fund distributions. As of the Fund’s current prospectus dated August 1, 2015, as revised November 12, 2015, the Fund’s net and gross annual expense ratios were 0.43% and 0.48%, respectively. WisdomTree Asset Management, Inc. has contractually agreed to limit the management fee to 0.43% through July 31, 2016, unless earlier terminated by the Board of Trustees of the Trust for any reason at any time.
Performance as of 3/31/16
| | | | |
| | | Cumulative Total Return | |
| | | Since
Inception1 | |
Fund NAV Returns | | | -6.07 | % |
Fund Market Price Returns | | | -6.81 | % |
WisdomTree Japan Quality Dividend Growth Index | | | -5.62 | % |
JPX-Nikkei 400 Index | | | -9.86 | % |
| 1 | Total returns are calculated based on the commencement of Fund trading on the NYSE Arca, Inc. on May 28, 2015. |
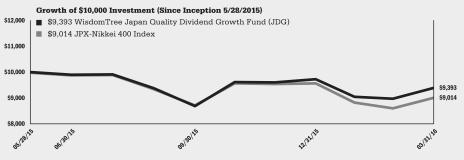
Performance is historical and does not guarantee future results. Current performance may be lower or higher than quoted. Investment returns and the principal value of an investment will fluctuate so that an investor’s shares, when redeemed, may be worth more or less than their original cost. Performance data for the most recent month-end is available at www.wisdomtree.com. WisdomTree shares are bought and sold at market price (not NAV) and are not individually redeemed from the Fund. Fund NAV returns are calculated using the Fund’s daily 4:00 p.m. NAV. Market price returns reflect the midpoint of the bid/ask spread as of the close of trading on the exchange where Fund shares are listed. Market price returns do not represent the returns you would receive if you traded shares at other times. The returns do not reflect the deduction of taxes that a shareholder would pay on Fund distributions or on the redemption of Fund shares. Total returns for a period of less than one year are cumulative.
| | | | |
| WisdomTree Developed World ex-U.S. and Currency Hedged Equity Funds | | | 29 | |
Performance Summary (unaudited)
WisdomTree Japan SmallCap Dividend Fund (DFJ)
Sector Breakdown† as of 3/31/16
| | | | |
| |
| Sector | | % of Net Assets | |
Industrials | | | 24.0% | |
Consumer Discretionary | | | 23.6% | |
Materials | | | 12.1% | |
Information Technology | | | 11.9% | |
Consumer Staples | | | 11.0% | |
Financials | | | 10.1% | |
Healthcare | | | 5.0% | |
Energy | | | 0.9% | |
Utilities | | | 0.3% | |
Other Assets less Liabilities‡ | | | 1.1% | |
Total | | | 100.0% | |
| † | The Fund’s sector breakdown is expressed as a percentage of net assets and may change over time. In addition, a sector may be comprised of several industries. It does not include derivatives (if any). |
| ‡ | Other assets includes investment of cash collateral for securities on loan (if any). |
Top Ten Holdings* as of 3/31/16
| | | | |
| |
| Description | | % of Net Assets | |
Park24 Co., Ltd. | | | 0.9% | |
Matsui Securities Co., Ltd. | | | 0.9% | |
Benesse Holdings, Inc. | | | 0.9% | |
Heiwa Corp. | | | 0.8% | |
Kaneka Corp. | | | 0.6% | |
Daiichikosho Co., Ltd. | | | 0.6% | |
Canon Marketing Japan, Inc. | | | 0.5% | |
Coca-Cola West Co., Ltd. | | | 0.5% | |
Mitsubishi Gas Chemical Co., Inc. | | | 0.5% | |
Denka Co., Ltd. | | | 0.5% | |
| * | The ten largest holdings are subject to change, and there are no guarantees the Fund will remain invested in any particular company. Excludes investment of cash collateral for securities on loan (if any). |
The WisdomTree Japan SmallCap Dividend Fund (the ‘‘Fund’’) seeks to track the price and yield performance, before fees and expenses, of the WisdomTree Japan SmallCap Dividend Index.
The Fund returned 3.51% at net asset value (“NAV”) for the fiscal year ending March 31, 2016 (for more complete performance information please see the table below). The Fund benefited the most from its position in the Consumer Staples sector. The Fund’s position in the Financials sector created the greatest drag on performance.
The following performance table is provided for comparative purposes and represents the period noted. The Fund’s per share NAV is the value of one share of the Fund and is calculated by dividing the value of total assets less total liabilities by the number of shares outstanding. The NAV return is based on the NAV of the Fund and the market price return is based on the market price per share of the Fund. The price used to calculate market price returns is the mid-point of the highest bid and lowest offer for Fund shares as of the close of trading on the exchange where Fund shares are listed. NAV and market price returns assume that dividends and capital gain distributions have been reinvested in the Fund at NAV and market price, respectively. As with other ETFs, NAV returns and market price returns may differ because of factors such as the supply and demand for Fund shares and investors’ assessments of the underlying value of the Fund’s portfolio securities.
An index is a statistical measure of a specified financial market or sector. An index does not actually hold a portfolio of securities, incur expenses or pay any transaction costs. Therefore, index returns do not reflect deductions for fees or expenses and the index is not available for direct investment. In comparison, the Fund’s performance is negatively impacted by these deductions. Fund returns do not reflect brokerage commissions or taxes a shareholder would pay on the sale of Fund shares or on Fund distributions. As of the Fund’s current prospectus dated August 1, 2015, as revised November 12, 2015, the Fund’s annual expense ratio was 0.58%.
Performance as of 3/31/16
| | | | | | | | | | | | | | | | |
| | | Average Annual Total Return | |
| | | 1 Year | | | 3 Year | | | 5 Year | | | Since
Inception1 | |
Fund NAV Returns | | | 3.51 | % | | | 6.03 | % | | | 7.07 | % | | | 2.55 | % |
Fund Market Price Returns | | | 3.03 | % | | | 5.73 | % | | | 7.05 | % | | | 2.65 | % |
WisdomTree Japan SmallCap Dividend Index | | | 3.48 | % | | | 6.71 | % | | | 7.67 | % | | | 3.18 | % |
MSCI Japan Small Cap Index | | | 4.02 | % | | | 7.19 | % | | | 7.64 | % | | | 1.75 | % |
| 1 | Total returns are calculated based on the commencement of Fund trading on the NYSE Arca, Inc. on June 16, 2006. |
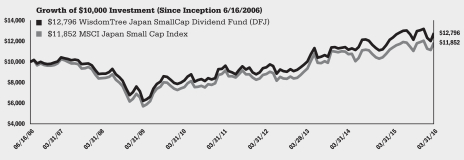
Performance is historical and does not guarantee future results. Current performance may be lower or higher than quoted. Investment returns and the principal value of an investment will fluctuate so that an investor’s shares, when redeemed, may be worth more or less than their original cost. Performance data for the most recent month-end is available at www.wisdomtree.com. WisdomTree shares are bought and sold at market price (not NAV) and are not individually redeemed from the Fund. Fund NAV returns are calculated using the Fund’s daily 4:00 p.m. NAV. Market price returns reflect the midpoint of the bid/ask spread as of the close of trading on the exchange where Fund shares are listed. Market price returns do not represent the returns you would receive if you traded shares at other times. The returns do not reflect the deduction of taxes that a shareholder would pay on Fund distributions or on the redemption of Fund shares. Total returns for a period of less than one year are cumulative.
| | |
| 30 | | WisdomTree Developed World ex-U.S. and Currency Hedged Equity Funds |
Performance Summary (unaudited)
WisdomTree Korea Hedged Equity Fund (DXKW)
Sector Breakdown† as of 3/31/16
| | | | |
| |
| Sector | | % of Net Assets | |
Materials | | | 26.2% | |
Information Technology | | | 25.8% | |
Consumer Discretionary | | | 18.8% | |
Energy | | | 11.0% | |
Industrials | | | 10.6% | |
Consumer Staples | | | 6.3% | |
Healthcare | | | 0.4% | |
Other Assets less Liabilities‡ | | | 0.9% | |
Total | | | 100.0% | |
| † | The Fund’s sector breakdown is expressed as a percentage of net assets and may change over time. In addition, a sector may be comprised of several industries. It does not include derivatives (if any). |
| ‡ | Other assets includes investment of cash collateral for securities on loan (if any). |
Top Ten Holdings* as of 3/31/16
| | | | |
| |
| Description | | % of Net Assets | |
Samsung Electronics Co., Ltd. | | | 9.5% | |
S-Oil Corp. | | | 5.6% | |
SK Innovation Co., Ltd. | | | 5.4% | |
LG Chem Ltd. | | | 5.4% | |
Lotte Chemical Corp. | | | 5.2% | |
Hyundai Motor Co. | | | 5.0% | |
Amorepacific Corp. | | | 4.9% | |
Kia Motors Corp. | | | 4.9% | |
Hyundai Steel Co. | | | 4.4% | |
LG Display Co., Ltd. | | | 4.4% | |
| * | The ten largest holdings are subject to change, and there are no guarantees the Fund will remain invested in any particular company. Excludes investment of cash collateral for securities on loan (if any). |
The WisdomTree Korea Hedged Equity Fund (the ‘‘Fund’’) seeks to track the price and yield performance, before fees and expenses, of the WisdomTree Korea Hedged Equity Index.
The Fund returned 0.17% at net asset value (“NAV”) for the fiscal year ending March 31, 2016 (for more complete performance information please see the table below). The Fund benefited the most from its position in the Materials sector. The Fund’s position in the Information Technology sector created the greatest drag on performance. During the fiscal year, the Fund utilized forward foreign currency contracts as hedges to offset South Korean won currency exposure from positions in Korean equities. The Fund’s use of forward foreign currency contracts contributed positively to performance as a result of the U.S. dollar strengthening against the South Korean won during the period.
The following performance table is provided for comparative purposes and represents the period noted. The Fund’s per share NAV is the value of one share of the Fund and is calculated by dividing the value of total assets less total liabilities by the number of shares outstanding. The NAV return is based on the NAV of the Fund and the market price return is based on the market price per share of the Fund. The price used to calculate market price returns is the mid-point of the highest bid and lowest offer for Fund shares as of the close of trading on the exchange where Fund shares are listed. NAV and market price returns assume that dividends and capital gain distributions have been reinvested in the Fund at NAV and market price, respectively. As with other ETFs, NAV returns and market price returns may differ because of factors such as the supply and demand for Fund shares and investors’ assessments of the underlying value of the Fund’s portfolio securities.
An index is a statistical measure of a specified financial market or sector. An index does not actually hold a portfolio of securities, incur expenses or pay any transaction costs. Therefore, index returns do not reflect deductions for fees or expenses and the index is not available for direct investment. In comparison, the Fund’s performance is negatively impacted by these deductions. Fund returns do not reflect brokerage commissions or taxes a shareholder would pay on the sale of Fund shares or on Fund distributions. As of the Fund’s current prospectus dated August 1, 2015, as revised November 12, 2015, the Fund’s annual expense ratio was 0.58%.
Performance as of 3/31/16
| | | | | | | | |
| | | Average Annual Total Return | |
| | | 1 Year | | | Since Inception1 | |
Fund NAV Returns | | | 0.17 | % | | | -5.12 | % |
Fund Market Price Returns | | | 0.54 | % | | | -4.92 | % |
WisdomTree Korea Hedged Equity Index | | | 2.09 | % | | | -3.94 | % |
MSCI Korea Local Currency Index | | | -3.01 | % | | | -2.24 | % |
| 1 | Total returns are calculated based on the commencement of Fund trading on the NASDAQ on November 7, 2013. |
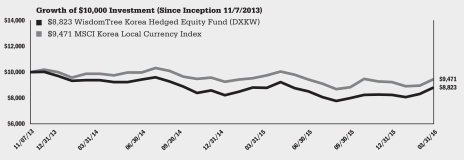
Performance is historical and does not guarantee future results. Current performance may be lower or higher than quoted. Investment returns and the principal value of an investment will fluctuate so that an investor’s shares, when redeemed, may be worth more or less than their original cost. Performance data for the most recent month-end is available at www.wisdomtree.com. WisdomTree shares are bought and sold at market price (not NAV) and are not individually redeemed from the Fund. Fund NAV returns are calculated using the Fund’s daily 4:00 p.m. NAV. Market price returns reflect the midpoint of the bid/ask spread as of the close of trading on the exchange where Fund shares are listed. Market price returns do not represent the returns you would receive if you traded shares at other times. The returns do not reflect the deduction of taxes that a shareholder would pay on Fund distributions or on the redemption of Fund shares. Total returns for a period of less than one year are cumulative.
| | | | |
| WisdomTree Developed World ex-U.S. and Currency Hedged Equity Funds | | | 31 | |
Performance Summary (unaudited)
WisdomTree United Kingdom Hedged Equity Fund (DXPS)
Sector Breakdown† as of 3/31/16
| | | | |
| |
| Sector | | % of Net Assets | |
Consumer Staples | | | 26.0% | |
Energy | | | 16.1% | |
Financials | | | 12.4% | |
Healthcare | | | 11.0% | |
Telecommunication Services | | | 7.9% | |
Materials | | | 7.0% | |
Industrials | | | 6.4% | |
Utilities | | | 5.6% | |
Consumer Discretionary | | | 5.5% | |
Information Technology | | | 1.4% | |
Other Assets less Liabilities‡ | | | 0.7% | |
Total | | | 100.0% | |
| † | The Fund’s sector breakdown is expressed as a percentage of net assets and may change over time. In addition, a sector may be comprised of several industries. It does not include derivatives (if any). |
| ‡ | Other assets includes investment of cash collateral for securities on loan (if any). |
Top Ten Holdings* as of 3/31/16
| | | | |
| |
| Description | | % of Net Assets | |
British American Tobacco PLC | | | 6.7% | |
Royal Dutch Shell PLC, Class B | | | 6.1% | |
GlaxoSmithKline PLC | | | 5.8% | |
Vodafone Group PLC | | | 5.3% | |
Royal Dutch Shell PLC, Class A | | | 5.1% | |
SABMiller PLC | | | 5.0% | |
AstraZeneca PLC | | | 4.6% | |
BP PLC | | | 4.5% | |
National Grid PLC | | | 4.3% | |
Imperial Brands PLC | | | 4.2% | |
| * | The ten largest holdings are subject to change, and there are no guarantees the Fund will remain invested in any particular company. Excludes investment of cash collateral for securities on loan (if any). |
The WisdomTree United Kingdom Hedged Equity Fund (the ‘‘Fund’’) seeks to track the price and yield performance, before fees and expenses, of the WisdomTree United Kingdom Hedged Equity Index.
The Fund returned -5.15% at net asset value (“NAV”) for the fiscal year ending March 31, 2016 (for more complete performance information please see the table below). The Fund benefited the most from its position in the Consumer Staples sector. The Fund’s position in the Financials sector created the greatest drag on performance. During the fiscal year, the Fund utilized forward foreign currency contracts as hedges to offset British pound currency exposure from positions in United Kingdom equities. The Fund’s use of forward foreign currency contracts contributed positively to performance as a result of the U.S. dollar strengthening against the British pound during the period.
The following performance table is provided for comparative purposes and represents the period noted. The Fund’s per share NAV is the value of one share of the Fund and is calculated by dividing the value of total assets less total liabilities by the number of shares outstanding. The NAV return is based on the NAV of the Fund and the market price return is based on the market price per share of the Fund. The price used to calculate market price returns is the mid-point of the highest bid and lowest offer for Fund shares as of the close of trading on the exchange where Fund shares are listed. NAV and market price returns assume that dividends and capital gain distributions have been reinvested in the Fund at NAV and market price, respectively. As with other ETFs, NAV returns and market price returns may differ because of factors such as the supply and demand for Fund shares and investors’ assessments of the underlying value of the Fund’s portfolio securities.
An index is a statistical measure of a specified financial market or sector. An index does not actually hold a portfolio of securities, incur expenses or pay any transaction costs. Therefore, index returns do not reflect deductions for fees or expenses and the index is not available for direct investment. In comparison, the Fund’s performance is negatively impacted by these deductions. Fund returns do not reflect brokerage commissions or taxes a shareholder would pay on the sale of Fund shares or on Fund distributions. As of the Fund’s current prospectus dated August 1, 2015, as revised November 12, 2015, the Fund’s annual expense ratio was 0.48%.
Performance as of 3/31/16
| | | | | | | | |
| | | Average Annual Total Return | |
| | | 1 Year | | | Since Inception1 | |
Fund NAV Returns | | | -5.15 | % | | | 3.04 | % |
Fund Market Price Returns | | | -6.21 | % | | | 2.42 | % |
WisdomTree United Kingdom Hedged Equity Index | | | -4.65 | % | | | 3.70 | % |
MSCI United Kingdom Local Currency Index | | | -5.85 | % | | | 2.99 | % |
| 1 | Total returns are calculated based on the commencement of Fund trading on the NASDAQ on June 28, 2013. |
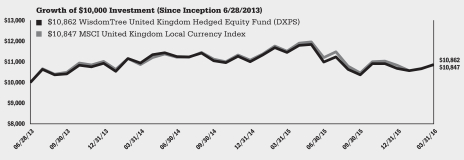
Performance is historical and does not guarantee future results. Current performance may be lower or higher than quoted. Investment returns and the principal value of an investment will fluctuate so that an investor’s shares, when redeemed, may be worth more or less than their original cost. Performance data for the most recent month-end is available at www.wisdomtree.com. WisdomTree shares are bought and sold at market price (not NAV) and are not individually redeemed from the Fund. Fund NAV returns are calculated using the Fund’s daily 4:00 p.m. NAV. Market price returns reflect the midpoint of the bid/ask spread as of the close of trading on the exchange where Fund shares are listed. Market price returns do not represent the returns you would receive if you traded shares at other times. The returns do not reflect the deduction of taxes that a shareholder would pay on Fund distributions or on the redemption of Fund shares. Total returns for a period of less than one year are cumulative.
| | |
| 32 | | WisdomTree Developed World ex-U.S. and Currency Hedged Equity Funds |
Description of Indexes (unaudited)
Below are descriptions of each Index referenced in this report:
The Dow Jones Global ex-U.S. Select Real Estate Securities Index (USD) Hedged is a float-adjusted market capitalization weighted index that defines and measures the investable universe of publicly traded real estate securities in countries outside the U.S. The USD-hedged version of this index is designed to hedge against U.S. dollar risk.
The JPX-Nikkei 400 Index is a free-float adjusted market capitalization index composed of Japanese companies whose main market is the TSE First Section, Second Section, Mothers or JASDAQ market (in principal).
The JPX-Nikkei 400 Local Currency Index is a free-float adjusted market capitalization index composed of Japanese companies whose main market is the TSE First Section, Second Section, Mothers or JASDAQ market (in principal), calculated in local currency.
The MSCI AC World ex-USA Local Currency Index is a float-adjusted market capitalization index that is designed to measure the combined equity market performance of developed and emerging market countries, excluding the United States, in local currency.
The MSCI Australia Index is comprised of large- and mid-capitalization segments of the Australia market.
The MSCI EAFE Index is a market cap-weighted index composed of companies representative of the developed market structure of 21 developed countries in Europe, Australasia and Japan.
The MSCI EAFE Local Currency Index is a free float-adjusted market capitalization weighted index that is designed to measure developed market equity performance, excluding the U.S. and Canada which is calculated in local currency.
The MSCI EAFE Mid Cap Index is a free float-adjusted market capitalization index that is designed to measure the performance of mid-capitalization equities in the developed markets excluding the U.S. & Canada.
The MSCI EAFE Small Cap Index is comprised of small-capitalization stocks in the MSCI EAFE Index.
The MSCI EAFE Small Cap Local Currency Index is a free float-adjusted market capitalization equity index that is designed to measure the performance of small-cap stocks within the developed equity market, excluding the U.S. and Canada, calculated in local currency.
The MSCI EAFE Value Index is comprised of value stocks in the MSCI EAFE Index.
The MSCI Europe Index is a free float-adjusted market capitalization index that is designed to measure the performance of large- and mid-cap stocks within 15 developed market European countries.
The MSCI Europe Small Cap Index is comprised of small-capitalization stocks in the MSCI Europe Index.
The MSCI European Economic and Monetary Union (EMU) Local Currency Index is a free float-adjusted market capitalization weighted index that is designed to measure the equity market performance of the developed market countries within the EMU. The securities are priced in local currency terms with no conversion into U.S. dollars.
The MSCI European Economic and Monetary Union (EMU) Small Cap Local Currency Index is a free float-adjusted market capitalization weighted index that is designed to measure the equity market performance of small-cap stocks from developed market countries within the EMU. The securities are priced in local currency terms with no conversion into U.S. dollars.
The MSCI Germany Local Currency Index is a capitalization weighted index that measures the performance of the Germany equity market and provides local currency returns, which are not translated back to U.S. dollars.
The MSCI Japan Index is a capitalization weighted index that is comprised of stocks in Japan.
| | | | |
| WisdomTree Developed World ex-U.S. and Currency Hedged Equity Funds | | | 33 | |
Description of Indexes (unaudited) (continued)
The MSCI Japan Local Currency Index is a free float-adjusted market capitalization index that is designed to measure developed market equity performance in Japan and calculated in local currency.
The MSCI Japan Small Cap Index is comprised of small cap stocks in the MSCI Japan Index.
The MSCI Japan Small Cap Local Currency Index is a free float-adjusted market capitalization index that is designed to measure the performance of small cap stocks within Japan and calculated in local currency.
The MSCI Pacific ex-Japan Index is a subset of the MSCI EAFE Index that is comprised of stocks in Australia, Hong Kong, Singapore and New Zealand.
The MSCI Pacific ex-Japan Value Index is comprised of value stocks in the MSCI Pacific ex-Japan Index.
The MSCI Korea Local Currency Index is a free float-adjusted market capitalization weighted index designed to measure the performance of the South Korean equity market and provides local currency returns, which are not translated back to U.S. dollars.
The MSCI United Kingdom Local Currency Index is a capitalization weighted index that measures the performance of the British equity market and provides local currency returns, which are not translated back to U.S. dollars.
The S&P 500® Index is a capitalization-weighted index of 500 stocks selected by Standard & Poor’s Index Committee, designed to represent the performance of the leading industries in the United States economy.
The WisdomTree Australia Dividend Index is comprised of dividend-paying companies incorporated in Australia.
The WisdomTree DEFA International Hedged Equity Index is comprised of dividend-paying companies in the industrialized world, excluding Canada and the United States, and is designed to neutralize exposure to fluctuations between the value of the U.S. dollar and non-U.S. currencies reflected in the index. This index is based on the WisdomTree International Equity Index.
The WisdomTree Europe Hedged Equity Index is designed to provide exposure to European equities while at the same time neutralizing exposure to fluctuations between the Euro and the U.S. dollar.
The WisdomTree Europe Hedged SmallCap Equity Index is a dividend weighted index designed to provide exposure to small cap equity securities within Europe, while at the same time neutralizing exposure to fluctuations between the value of the euro and the U.S. dollar.
The WisdomTree Europe Quality Dividend Growth Index is a fundamentally weighted index that measures the performance of dividend-paying common stocks with growth characteristics selected from the WisdomTree International Equity Index.
The WisdomTree Europe SmallCap Dividend Index is comprised of the small-capitalization segment of the European dividend-paying market.
The WisdomTree Germany Hedged Equity Index is designed to provide exposure to Germany equity markets while at the same time neutralizing exposure to fluctuations of the Euro movements relative to the U.S. dollar. In this sense, the Index “hedges” against fluctuations in the relative value of the Euro against the U.S. dollar.
The WisdomTree Global ex-U.S. Hedged Dividend Index measures the performance of dividend-paying companies in the developed and emerging markets outside of the United States while at the same time neutralizing exposure to fluctuations of foreign currency movements relative to the U.S. dollar.
The WisdomTree Global ex-US Hedged Real Estate Index is a fundamentally weighted index that measures the performance of companies from developed and emerging markets outside of the United States that are classified as being part of the “Global Real Estate.”
| | |
| 34 | | WisdomTree Developed World ex-U.S. and Currency Hedged Equity Funds |
Description of Indexes (unaudited) (continued)
The WisdomTree International Dividend ex-Financials Index is comprised of high dividend-yielding international stocks outside the financial sector.
The WisdomTree International Dividend Top 100 Index is comprised of the 100 highest dividend-yielding companies in the WisdomTree International LargeCap Dividend Index.
The WisdomTree International Equity Index is comprised of dividend-paying companies in the industrialized world, excluding Canada and the United States.
The WisdomTree International Hedged Equity Index is a fundamentally weighted Index that measures the performance of dividend-paying companies in the industrialized world, excluding Canada and the United States, that pay regular cash dividends and that meet other liquidity and capitalization requirements while at the same time neutralizing exposure to fluctuations of the foreign currencies relative to the U.S. dollar.
The WisdomTree International Hedged Quality Dividend Growth Index is designed to provide exposure to the developed market companies while at the same time neutralizing exposure to fluctuations between the value of foreign currencies and the U.S. dollar.
The WisdomTree International Hedged SmallCap Dividend Index is a fundamentally weighted index that measures the performance of the small-capitalization segment of the dividend-paying market in the industrialized world outside the U.S. and Canada while at the same time neutralizing exposure to fluctuations of the foreign currencies relative to the U.S. dollar.
The WisdomTree International High Dividend Index is comprised of companies with high dividend yields selected from the WisdomTree International Equity Index.
The WisdomTree International LargeCap Dividend Index is comprised of the large-capitalization segment of the dividend-paying market in the industrialized world outside the U.S. and Canada.
The WisdomTree International MidCap Dividend Index is comprised of the mid-capitalization segment of the dividend-paying market in the industrialized world outside the U.S. and Canada.
The WisdomTree International SmallCap Dividend Index is comprised of the small-capitalization segment of the dividend-paying market in the industrialized world outside the U.S. and Canada.
The WisdomTree Japan Dividend Index is comprised of dividend-paying companies incorporated in Japan, listed on the Tokyo Stock Exchange and that meet other requirements necessary to be included in the WisdomTree International Equity Index.
The WisdomTree Japan Hedged Capital Goods Index is designed to provide exposure to Japanese capital goods companies while at the same time neutralizing exposure to fluctuations between the Yen and the U.S. dollar.
The WisdomTree Japan Hedged Equity Index is designed to provide exposure to Japanese equity markets while at the same time neutralizing exposure to fluctuations of the Japanese Yen movements relative to the U.S. dollar. This index is based on the WisdomTree Japan Dividend Index.
The WisdomTree Japan Hedged Financials Index is designed to provide exposure to Japanese financial companies while at the same time neutralizing exposure to fluctuations between the Yen and the U.S. dollar.
The WisdomTree Japan Hedged Health Care Index is designed to provide exposure to Japanese health care companies while at the same time neutralizing exposure to fluctuations between the Yen and the U.S. dollar.
WisdomTree Japan Hedged Quality Dividend Growth Index is a fundamentally weighted index that measures the performance of dividend-paying common stocks with growth characteristics selected from the WisdomTree International Equity Index while at the same time neutralizing exposure to fluctuations between the Yen and the U.S. dollar.
| | | | |
| WisdomTree Developed World ex-U.S. and Currency Hedged Equity Funds | | | 35 | |
Description of Indexes (unaudited) (continued)
The WisdomTree Japan Hedged Real Estate Index is designed to provide exposure to Japanese real estate companies while at the same time neutralizing exposure to fluctuations between the Yen and the U.S. dollar.
The WisdomTree Japan Hedged SmallCap Equity Index is designed to provide exposure to the small-capitalization segment of the Japanese equity markets while at the same time neutralizing exposure to fluctuations of the Japanese Yen movements relative to the U.S. dollar.
The WisdomTree Japan Hedged Tech, Media and Telecom Index is designed to provide exposure to Japanese tech, media, and telecom companies while at the same time neutralizing exposure to fluctuations between the Yen and the U.S. dollar.
WisdomTree Japan Quality Dividend Growth Index is a fundamentally weighted index that measures the performance of dividend-paying common stocks with growth characteristics selected from the WisdomTree International Equity index.
The WisdomTree Japan SmallCap Dividend Index is comprised of dividend-paying small-capitalization companies in Japan.
The WisdomTree Korea Hedged Equity Index is designed to provide exposure to Korean equity markets while at the same time neutralizing exposure to fluctuations of the Korean Won movements relative to the U.S. dollar.
The WisdomTree Pacific ex-Japan Dividend Index is comprised of dividend-paying companies incorporated in the Pacific region, excluding Japan.
The WisdomTree Pacific ex-Japan Equity Income Index is comprised of companies with high dividend yields selected from the WisdomTree Pacific ex-Japan Dividend Index.
The WisdomTree United Kingdom Hedged Equity Index is designed to provide exposure to United Kingdom equity markets while at the same time neutralizing exposure to fluctuations of the British Pound movements relative to the U.S. dollar.
The Global Industry Classification Standard (“GICS”) was developed by and is the exclusive property and a service mark of MSCI Inc. (“MSCI”) and Standard & Poor’s (“S&P”), a division of The McGraw-Hill Companies, Inc. and is licensed for use by WisdomTree Investments, Inc. Neither MSCI, S&P nor any other party involved in making or compiling the GICS or any GICS classifications makes any express or implied warranties or representations with respect to such standard or classification (or the results to be obtained by the use thereof), and all such parties hereby expressly disclaim all warranties of originality, accuracy, completeness, merchantability and fitness for a particular purpose with respect to any such standard or classification. Without limiting any of the foregoing, in no event shall MSCI, S&P, any of their affiliates or any third party involved in making or compiling the GICS or any GICS classifications have any liability for any direct, indirect, special, punitive, consequential or any other damages (including lost profits) even if notified of the possibility of such damages.
Neither MSCI nor any other party involved in or related to compiling, computing or creating the MSCI data makes any express or implied warranties or representations with respect to such data (or the results to be obtained by the use thereof), and all such parties hereby expressly disclaim all warranties of originality, accuracy, completeness, merchantability or fitness for a particular purpose with respect to any such data. Without limiting any of the foregoing, in no event shall MSCI, any of its affiliates or any third party involved in or related to compiling, computing or creating the data have any liability for any direct, indirect, special, punitive, consequential or any other damages (including lost profits) even if notified of the possibility of such damages. No further distribution or dissemination of the MSCI data is permitted without MSCI’s express written consent.
WisdomTree Investments and WisdomTree Asset Management (together, “WisdomTree”) and the Funds make no representation or warranty, express or implied, to the owners of shares of the Funds or any member of the public regarding the advisability of investing in securities generally or in the Funds particularly or the ability of the underlying Indexes to track the performance of their underlying securities. WisdomTree Investments is the licensor of certain trademarks, service marks and trade names of the Funds. WisdomTree Investments has no obligation to take the needs of the
| | |
| 36 | | WisdomTree Developed World ex-U.S. and Currency Hedged Equity Funds |
Description of Indexes (unaudited) (concluded)
Funds or the owners of shares of the Funds into consideration in determining, composing, or calculating the underlying WisdomTree Indexes of the applicable Funds. WisdomTree Investments is not responsible for, and has not participated in, the determination of the timing of, prices of, or quantities of shares of the Funds to be issued or in the determination or calculation of the equation by which the shares of the Funds are redeemable. WisdomTree and the Funds do not guarantee the accuracy, completeness, or performance of the underlying Indexes or the data included therein and shall have no liability in connection with the underlying Indexes or their calculation.
Index performance information assumes the reinvestment of net dividends and excludes management fees, transaction costs and expenses. You cannot directly invest in an index.
| | | | |
| WisdomTree Developed World ex-U.S. and Currency Hedged Equity Funds | | | 37 | |
Shareholder Expense Examples (unaudited)
As a shareholder of a WisdomTree Fund, you incur two types of cost: (1) transaction costs, including brokerage commissions on purchases and sales of your Fund shares and (2) ongoing costs, including management fees and other Fund expenses. The following example is intended to help you understand your ongoing costs (in dollars and cents) of investing in a Fund and to compare these costs with the ongoing costs of investing in other funds.
The example is based on an investment of $1,000 invested at the beginning of the period and held for the entire period from October 1, 2015 to March 31, 2016.
Actual expenses
The first line under each Fund in the table on the next page provides information about actual account values and actual expenses. You may use the information in this line, together with the amount you invested, to estimate the expenses that you paid over the period. Simply divide your account value by $1,000 (for example, an $8,600 account value divided by $1,000 = 8.6), then multiply the result by the number in the first line for your Fund under the heading entitled “Expenses Paid During the Period 10/1/15 to 3/31/16” to estimate the expenses you paid on your account during the period.
Hypothetical example for comparison purposes
The second line under each Fund in the table on the next page provides information about hypothetical account values and hypothetical expenses based on each Fund’s actual expense ratio and an assumed rate of return of 5% per year before expenses, which is not the Fund’s actual return. The hypothetical account values and expenses may not be used to estimate the actual ending account balance or expenses you paid for the period. You may use this information to compare the ongoing costs of investing in your Fund and other funds. To do so, compare this 5% hypothetical example with the 5% hypothetical examples that appear in the shareholder reports of the other funds.
Please note that the expenses shown in the table are meant to highlight your ongoing costs only and do not reflect any transactional costs, such as brokerage commissions paid on purchases and sales of Fund shares. Therefore, the second line under each Fund in the table is useful in comparing ongoing Fund costs only and will not help you determine the relative total costs of owning different funds. In addition, if these transactional costs were included, your costs would have been higher.
| | |
| 38 | | WisdomTree Developed World ex-U.S. and Currency Hedged Equity Funds |
Shareholder Expense Examples (unaudited) (continued)
| | | | | | | | | | | | | | | | |
| | | Beginning
Account Value
10/1/15 | | | Ending
Account Value
3/31/16 | | | Annualized
Expense Ratio
Based on the
Period
10/1/15 to
3/31/16 | | | Expenses Paid
During the
Period†
10/1/15 to
3/31/16 | |
WisdomTree Australia Dividend Fund | | | | | | | | | | | | | | | | |
Actual | | $ | 1,000.00 | | | $ | 1,170.40 | | | | 0.58 | % | | $ | 3.15 | |
Hypothetical (5% return before expenses) | | $ | 1,000.00 | | | $ | 1,022.10 | | | | 0.58 | % | | $ | 2.93 | |
WisdomTree Europe Hedged Equity Fund | | | | | | | | | | | | | | | | |
Actual | | $ | 1,000.00 | | | $ | 1,026.50 | | | | 0.58 | % | | $ | 2.94 | |
Hypothetical (5% return before expenses) | | $ | 1,000.00 | | | $ | 1,022.10 | | | | 0.58 | % | | $ | 2.93 | |
WisdomTree Europe Hedged SmallCap Equity Fund | | | | | | | | | | | | | | | | |
Actual | | $ | 1,000.00 | | | $ | 1,044.40 | | | | 0.58 | % | | $ | 2.96 | |
Hypothetical (5% return before expenses) | | $ | 1,000.00 | | | $ | 1,022.10 | | | | 0.58 | % | | $ | 2.93 | |
WisdomTree Europe Quality Dividend Growth Fund | | | | | | | | | | | | | | | | |
Actual | | $ | 1,000.00 | | | $ | 1,053.20 | | | | 0.58 | % | | $ | 2.98 | |
Hypothetical (5% return before expenses) | | $ | 1,000.00 | | | $ | 1,022.10 | | | | 0.58 | % | | $ | 2.93 | |
WisdomTree Europe SmallCap Dividend Fund | | | | | | | | | | | | | | | | |
Actual | | $ | 1,000.00 | | | $ | 1,065.10 | | | | 0.58 | % | | $ | 2.99 | |
Hypothetical (5% return before expenses) | | $ | 1,000.00 | | | $ | 1,022.10 | | | | 0.58 | % | | $ | 2.93 | |
WisdomTree Germany Hedged Equity Fund | | | | | | | | | | | | | | | | |
Actual | | $ | 1,000.00 | | | $ | 1,045.30 | | | | 0.48 | % | | $ | 2.45 | |
Hypothetical (5% return before expenses) | | $ | 1,000.00 | | | $ | 1,022.60 | | | | 0.48 | % | | $ | 2.43 | |
WisdomTree Global ex-U.S. Hedged Dividend Fund | | | | | | | | | | | | | | | | |
Actual | | $ | 1,000.00 | | | $ | 1,002.10 | | | | 0.44 | % | | $ | 2.20 | |
Hypothetical (5% return before expenses) | | $ | 1,000.00 | | | $ | 1,022.80 | | | | 0.44 | % | | $ | 2.23 | |
WisdomTree Global ex-U.S. Hedged Real Estate Fund | | | | | | | | | | | | | | | | |
Actual1 | | $ | 1,000.00 | | | $ | 989.40 | | | | 0.43 | %* | | $ | 1.81 | |
Hypothetical (5% return before expenses) | | $ | 1,000.00 | | | $ | 1,022.85 | | | | 0.43 | %* | | $ | 2.17 | |
WisdomTree International Dividend ex-Financials Fund | | | | | | | | | | | | | | | | |
Actual | | $ | 1,000.00 | | | $ | 1,019.40 | | | | 0.58 | % | | $ | 2.93 | |
Hypothetical (5% return before expenses) | | $ | 1,000.00 | | | $ | 1,022.10 | | | | 0.58 | % | | $ | 2.93 | |
WisdomTree International Equity Fund | | | | | | | | | | | | | | | | |
Actual | | $ | 1,000.00 | | | $ | 1,022.60 | | | | 0.48 | % | | $ | 2.43 | |
Hypothetical (5% return before expenses) | | $ | 1,000.00 | | | $ | 1,022.60 | | | | 0.48 | % | | $ | 2.43 | |
WisdomTree International Hedged Equity Fund | | | | | | | | | | | | | | | | |
Actual | | $ | 1,000.00 | | | $ | 1,006.00 | | | | 0.35 | % | | $ | 1.76 | |
Hypothetical (5% return before expenses) | | $ | 1,000.00 | | | $ | 1,023.25 | | | | 0.35 | % | | $ | 1.77 | |
WisdomTree International Hedged Quality Dividend Growth Fund | | | | | | | | | | | | | | | | |
Actual | | $ | 1,000.00 | | | $ | 1,051.50 | | | | 0.58 | % | | $ | 2.97 | |
Hypothetical (5% return before expenses) | | $ | 1,000.00 | | | $ | 1,022.10 | | | | 0.58 | % | | $ | 2.93 | |
WisdomTree International Hedged SmallCap Dividend Fund | | | | | | | | | | | | | | | | |
Actual | | $ | 1,000.00 | | | $ | 1,042.90 | | | | 0.00 | %** | | $ | 0.00 | |
Hypothetical (5% return before expenses) | | $ | 1,000.00 | | | $ | 1,025.00 | | | | 0.00 | %** | | $ | 0.00 | |
WisdomTree International High Dividend Fund | | | | | | | | | | | | | | | | |
Actual | | $ | 1,000.00 | | | $ | 1,017.50 | | | | 0.58 | % | | $ | 2.93 | |
Hypothetical (5% return before expenses) | | $ | 1,000.00 | | | $ | 1,022.10 | | | | 0.58 | % | | $ | 2.93 | |
WisdomTree International LargeCap Dividend Fund | | | | | | | | | | | | | | | | |
Actual | | $ | 1,000.00 | | | $ | 1,007.50 | | | | 0.48 | % | | $ | 2.41 | |
Hypothetical (5% return before expenses) | | $ | 1,000.00 | | | $ | 1,022.60 | | | | 0.48 | % | | $ | 2.43 | |
WisdomTree International MidCap Dividend Fund | | | | | | | | | | | | | | | | |
Actual | | $ | 1,000.00 | | | $ | 1,060.70 | | | | 0.58 | % | | $ | 2.99 | |
Hypothetical (5% return before expenses) | | $ | 1,000.00 | | | $ | 1,022.10 | | | | 0.58 | % | | $ | 2.93 | |
| | | | |
| WisdomTree Developed World ex-U.S. and Currency Hedged Equity Funds | | | 39 | |
Shareholder Expense Examples (unaudited) (concluded)
| | | | | | | | | | | | | | | | |
| | | Beginning
Account Value
10/1/15 | | | Ending
Account Value
3/31/16 | | | Annualized
Expense Ratio
Based on the
Period
10/1/15 to
3/31/16 | | | Expenses Paid
During the
Period†
10/1/15 to
3/31/16 | |
WisdomTree International SmallCap Dividend Fund | | | | | | | | | | | | | | | | |
Actual | | $ | 1,000.00 | | | $ | 1,078.10 | | | | 0.58 | % | | $ | 3.01 | |
Hypothetical (5% return before expenses) | | $ | 1,000.00 | | | $ | 1,022.10 | | | | 0.58 | % | | $ | 2.93 | |
WisdomTree Japan Hedged Capital Goods Fund | | | | | | | | | | | | | | | | |
Actual | | $ | 1,000.00 | | | $ | 955.50 | | | | 0.48 | % | | $ | 2.35 | |
Hypothetical (5% return before expenses) | | $ | 1,000.00 | | | $ | 1,022.60 | | | | 0.48 | % | | $ | 2.43 | |
WisdomTree Japan Hedged Equity Fund | | | | | | | | | | | | | | | | |
Actual | | $ | 1,000.00 | | | $ | 957.70 | | | | 0.48 | % | | $ | 2.35 | |
Hypothetical (5% return before expenses) | | $ | 1,000.00 | | | $ | 1,022.60 | | | | 0.48 | % | | $ | 2.43 | |
WisdomTree Japan Hedged Financials Fund | | | | | | | | | | | | | | | | |
Actual | | $ | 1,000.00 | | | $ | 775.20 | | | | 0.48 | % | | $ | 2.13 | |
Hypothetical (5% return before expenses) | | $ | 1,000.00 | | | $ | 1,022.60 | | | | 0.48 | % | | $ | 2.43 | |
WisdomTree Japan Hedged Health Care Fund | | | | | | | | | | | | | |
Actual | | $ | 1,000.00 | | | $ | 1,106.10 | | | | 0.48 | % | | $ | 2.53 | |
Hypothetical (5% return before expenses) | | $ | 1,000.00 | | | $ | 1,022.60 | | | | 0.48 | % | | $ | 2.43 | |
WisdomTree Japan Hedged Quality Dividend Growth Fund | | | | | | | | | | | | | | | | |
Actual | | $ | 1,000.00 | | | $ | 1,013.70 | | | | 0.43 | %*** | | $ | 2.16 | |
Hypothetical (5% return before expenses) | | $ | 1,000.00 | | | $ | 1,022.85 | | | | 0.43 | %*** | | $ | 2.17 | |
WisdomTree Japan Hedged Real Estate Fund | | | | | | | | | | | | | | | | |
Actual | | $ | 1,000.00 | | | $ | 1,020.50 | | | | 0.48 | % | | $ | 2.42 | |
Hypothetical (5% return before expenses) | | $ | 1,000.00 | | | $ | 1,022.60 | | | | 0.48 | % | | $ | 2.43 | |
WisdomTree Japan Hedged SmallCap Equity Fund | | | | | | | | | | | | | | | | |
Actual | | $ | 1,000.00 | | | $ | 983.70 | | | | 0.58 | % | | $ | 2.88 | |
Hypothetical (5% return before expenses) | | $ | 1,000.00 | | | $ | 1,022.10 | | | | 0.58 | % | | $ | 2.93 | |
WisdomTree Japan Hedged Tech, Media and Telecom Fund | | | | | | | | | | | | | | | | |
Actual | | $ | 1,000.00 | | | $ | 999.60 | | | | 0.48 | % | | $ | 2.40 | |
Hypothetical (5% return before expenses) | | $ | 1,000.00 | | | $ | 1,022.60 | | | | 0.48 | % | | $ | 2.43 | |
WisdomTree Japan Quality Dividend Growth Fund | | | | | | | | | | | | | | | | |
Actual | | $ | 1,000.00 | | | $ | 1,080.40 | | | | 0.43 | %*** | | $ | 2.24 | |
Hypothetical (5% return before expenses) | | $ | 1,000.00 | | | $ | 1,022.85 | | | | 0.43 | %*** | | $ | 2.17 | |
WisdomTree Japan SmallCap Dividend Fund | | | | | | | | | | | | | | | | |
Actual | | $ | 1,000.00 | | | $ | 1,053.10 | | | | 0.58 | % | | $ | 2.98 | |
Hypothetical (5% return before expenses) | | $ | 1,000.00 | | | $ | 1,022.10 | | | | 0.58 | % | | $ | 2.93 | |
WisdomTree Korea Hedged Equity Fund | | | | | | | | | | | | | | | | |
Actual | | $ | 1,000.00 | | | $ | 1,102.60 | | | | 0.58 | % | | $ | 3.05 | |
Hypothetical (5% return before expenses) | | $ | 1,000.00 | | | $ | 1,022.10 | | | | 0.58 | % | | $ | 2.93 | |
WisdomTree United Kingdom Hedged Equity Fund | | | | | | | | | | | | | | | | |
Actual | | $ | 1,000.00 | | | $ | 1,047.10 | | | | 0.48 | % | | $ | 2.46 | |
Hypothetical (5% return before expenses) | | $ | 1,000.00 | | | $ | 1,022.60 | | | | 0.48 | % | | $ | 2.43 | |
| † | Expenses are calculated using each Fund’s annualized expense ratio, multiplied by the average account value for the period, multiplied by 183/366 (to reflect the one-half year period). |
| * | WisdomTree Asset Management, Inc. has contractually agreed to limit the management fee to 0.43% through July 31, 2017, unless earlier terminated by the Board of Trustees of the WisdomTree Trust for any reason. |
| ** | WisdomTree Asset Management, Inc. has contractually agreed to waive a portion of its management fee in an amount equal to the AFFEs attributable to the Fund’s investments in the Underlying Fund through July 31, 2018, unless earlier terminated by the Board of Trustees of the WisdomTree Trust for any reason. |
| *** | WisdomTree Asset Management, Inc. has contractually agreed to limit the management fee to 0.43% through July 31, 2016, unless earlier terminated by the Board of Trustees of the WisdomTree Trust for any reason. |
| 1 | Fund commenced operations on October 29, 2015. Actual expenses are calculated using the Fund’s annualized expense ratio, multiplied by the average account value for the period, multiplied by 155/366 (to reflect the period since commencement of operations). |
| | |
| 40 | | WisdomTree Developed World ex-U.S. and Currency Hedged Equity Funds |
Schedule of Investments
WisdomTree Australia Dividend Fund (AUSE)
March 31, 2016
| | | | | | | | |
| Investments | | Shares | | | Value | |
| | | | | | | | |
| COMMON STOCKS – 99.2% | | | | | | | | |
| Australia – 99.2% | | | | | | | | |
| Banks – 9.5% | | | | | | | | |
Australia & New Zealand Banking Group Ltd. | | | 39,058 | | | $ | 704,864 | |
Commonwealth Bank of Australia | | | 13,663 | | | | 787,429 | |
National Australia Bank Ltd. | | | 38,732 | | | | 781,810 | |
Westpac Banking Corp. | | | 39,738 | | | | 927,752 | |
| | | | | | | | |
| Total Banks | | | | | | | 3,201,855 | |
| Beverages – 4.4% | | | | | | | | |
Coca-Cola Amatil Ltd. | | | 100,189 | | | | 681,302 | |
Treasury Wine Estates Ltd. | | | 108,397 | | | | 803,825 | |
| | | | | | | | |
| Total Beverages | | | | | | | 1,485,127 | |
| Biotechnology – 1.1% | | | | | | | | |
CSL Ltd. | | | 3,809 | | | | 297,227 | |
Sirtex Medical Ltd. | | | 4,087 | | | | 90,922 | |
| | | | | | | | |
| Total Biotechnology | | | | | | | 388,149 | |
| Capital Markets – 1.7% | | | | | | | | |
Macquarie Group Ltd. | | | 11,410 | | | | 580,081 | |
| Chemicals – 2.7% | | | | | | | | |
Incitec Pivot Ltd. | | | 163,832 | | | | 402,029 | |
Orica Ltd. | | | 44,752 | | | | 529,119 | |
| | | | | | | | |
| Total Chemicals | | | | | | | 931,148 | |
| Commercial Services & Supplies – 4.6% | | | | | | | | |
Brambles Ltd. | | | 49,898 | | | | 465,214 | |
Downer EDI Ltd. | | | 172,182 | | | | 508,612 | |
Recall Holdings Ltd. | | | 68,353 | | | | 394,354 | |
Spotless Group Holdings Ltd. | | | 206,777 | | | | 200,419 | |
| | | | | | | | |
| Total Commercial Services & Supplies | | | | | | | 1,568,599 | |
| Construction & Engineering – 3.6% | | | | | | | | |
CIMIC Group Ltd. | | | 45,331 | | | | 1,212,111 | |
| Construction Materials – 3.4% | | | | | | | | |
Adelaide Brighton Ltd. | | | 172,744 | | | | 673,718 | |
Boral Ltd. | | | 98,323 | | | | 467,424 | |
| | | | | | | | |
| Total Construction Materials | | | | | | | 1,141,142 | |
| Containers & Packaging – 1.7% | | | | | | | | |
Amcor Ltd. | | | 52,143 | | | | 575,593 | |
| Diversified Telecommunication Services – 3.0% | | | | | | | | |
Telstra Corp., Ltd. | | | 183,550 | | | | 752,573 | |
TPG Telecom Ltd. | | | 29,849 | | | | 260,382 | |
| | | | | | | | |
| Total Diversified Telecommunication Services | | | | | | | 1,012,955 | |
| Food & Staples Retailing – 4.4% | | | | | | | | |
Wesfarmers Ltd. | | | 24,699 | | | | 787,537 | |
Woolworths Ltd. | | | 41,876 | | | | 711,910 | |
| | | | | | | | |
| Total Food & Staples Retailing | | | | | | | 1,499,447 | |
| Food Products – 0.9% | | | | | | | | |
GrainCorp Ltd. Class A | | | 51,190 | | | | 296,909 | |
| Health Care Equipment & Supplies – 2.3% | | | | | | | | |
Ansell Ltd. | | | 18,056 | | | | 240,151 | |
Cochlear Ltd. | | | 6,819 | | | | 536,616 | |
| | | | | | | | |
| Total Health Care Equipment & Supplies | | | | | | | 776,767 | |
| | | | | | | | |
| Health Care Providers & Services – 4.3% | | | | | | | | |
Healthscope Ltd. | | | 98,187 | | | | 200,911 | |
Primary Health Care Ltd. | | | 162,265 | | | | 468,083 | |
Ramsay Health Care Ltd. | | | 5,273 | | | | 248,892 | |
Sonic Healthcare Ltd. | | | 38,310 | | | | 553,446 | |
| | | | | | | | |
| Total Health Care Providers & Services | | | | | | | 1,471,332 | |
| Hotels, Restaurants & Leisure – 10.1% | | | | | | | | |
Aristocrat Leisure Ltd. | | | 60,048 | | | | 475,777 | |
Crown Resorts Ltd. | | | 49,723 | | | | 476,588 | |
Domino’s Pizza Enterprises Ltd. | | | 6,770 | | | | 299,345 | |
Flight Centre Travel Group Ltd.(a) | | | 17,113 | | | | 569,087 | |
Star Entertainment Grp Ltd. (The) | | | 99,866 | | | | 436,348 | |
Tabcorp Holdings Ltd. | | | 165,500 | | | | 544,890 | |
Tatts Group Ltd. | | | 206,865 | | | | 601,515 | |
| | | | | | | | |
| Total Hotels, Restaurants & Leisure | | | | | | | 3,403,550 | |
| Insurance – 9.1% | | | | | | | | |
AMP Ltd. | | | 139,538 | | | | 621,496 | |
Insurance Australia Group Ltd. | | | 282,391 | | | | 1,212,139 | |
QBE Insurance Group Ltd. | | | 39,616 | | | | 332,478 | |
Suncorp Group Ltd. | | | 98,149 | | | | 899,218 | |
| | | | | | | | |
| Total Insurance | | | | | | | 3,065,331 | |
| Internet Software & Services – 1.9% | | | | | | | | |
carsales.com Ltd.(a) | | | 69,985 | | | | 633,111 | |
| IT Services – 0.9% | | | | | | | | |
Computershare Ltd. | | | 42,690 | | | | 321,168 | |
| Media – 3.1% | | | | | | | | |
Fairfax Media Ltd. | | | 965,377 | | | | 638,650 | |
REA Group Ltd. | | | 9,789 | | | | 406,856 | |
| | | | | | | | |
| Total Media | | | | | | | 1,045,506 | |
| Metals & Mining – 7.4% | | | | | | | | |
Alumina Ltd. | | | 163,788 | | | | 163,792 | |
BHP Billiton Ltd. | | | 39,398 | | | | 510,974 | |
Fortescue Metals Group Ltd.(a) | | | 496,693 | | | | 974,307 | |
Iluka Resources Ltd. | | | 56,359 | | | | 284,403 | |
Rio Tinto Ltd. | | | 17,514 | | | | 575,147 | |
| | | | | | | | |
| Total Metals & Mining | | | | | | | 2,508,623 | |
| Multi-Utilities – 2.3% | | | | | | | | |
AGL Energy Ltd. | | | 55,315 | | | | 782,939 | |
| Multiline Retail – 1.8% | | | | | | | | |
Harvey Norman Holdings Ltd. | | | 167,194 | | | | 604,485 | |
| Oil, Gas & Consumable Fuels – 6.6% | | | | | | | | |
Caltex Australia Ltd. | | | 14,764 | | | | 386,372 | |
Origin Energy Ltd. | | | 75,481 | | | | 295,544 | |
Santos Ltd. | | | 132,854 | | | | 411,858 | |
Woodside Petroleum Ltd. | | | 56,320 | | | | 1,124,695 | |
| | | | | | | | |
| Total Oil, Gas & Consumable Fuels | | | | | | | 2,218,469 | |
| Professional Services – 2.3% | | | | | | | | |
ALS Ltd. | | | 136,077 | | | | 417,662 | |
Seek Ltd. | | | 28,567 | | | | 355,558 | |
| | | | | | | | |
| Total Professional Services | | | | | | | 773,220 | |
See Notes to Financial Statements.
| | | | |
| WisdomTree Developed World ex-U.S. and Currency Hedged Equity Funds | | | 41 | |
Schedule of Investments (concluded)
WisdomTree Australia Dividend Fund (AUSE)
March 31, 2016
| | | | | | | | |
| Investments | | Shares | | | Value | |
| | | | | | | | |
| Real Estate Management & Development – 2.1% | | | | | |
LendLease Group | | | 65,341 | | | $ | 697,155 | |
| Road & Rail – 3.1% | | | | | | | | |
Asciano Ltd. | | | 85,522 | | | | 589,458 | |
Aurizon Holdings Ltd. | | | 152,307 | | | | 463,962 | |
| | | | | | | | |
| Total Road & Rail | | | | | | | 1,053,420 | |
| Transportation Infrastructure – 0.9% | | | | | | | | |
Qube Holdings Ltd.(a) | | | 172,118 | | | | 312,468 | |
TOTAL COMMON STOCKS
(Cost: $36,886,257) | | | | | | | 33,560,660 | |
| RIGHTS – 0.0% | | | | | | | | |
| Australia – 0.0% | | | | | | | | |
Qube Holdings Ltd., expiring 4/1/16*
(Cost $0) | | | 37,094 | | | | 8,846 | |
| INVESTMENT OF CASH COLLATERAL FOR SECURITIES LOANED – 4.9% | |
| United States – 4.9% | | | | | | | | |
State Street Navigator Securities Lending Prime Portfolio, 0.50%(b) | | | | | | | | |
| (Cost: $1,647,113)(c) | | | 1,647,113 | | | | 1,647,113 | |
TOTAL INVESTMENTS IN SECURITIES – 104.1% (Cost: $38,533,370) | | | | | | | 35,216,619 | |
Liabilities in Excess of Cash, Foreign Currency and Other Assets – (4.1)% | | | | | | | (1,399,747 | ) |
| | | | | | | | |
| NET ASSETS – 100.0% | | | | | | $ | 33,816,872 | |
| * | Non-income producing security. |
| (a) | Security, or portion thereof, was on loan at March 31, 2016 (See Note 2). |
| (b) | Rate shown represents annualized 7-day yield as of March 31, 2016. |
| (c) | At March 31, 2016, the total market value of the Fund’s securities on loan was $1,786,687 and the total market value of the collateral held by the Fund was $1,890,391. The total market value of the collateral includes non-cash U.S. Government securities collateral having a value of $243,278. |
See Notes to Financial Statements.
| | |
| 42 | | WisdomTree Developed World ex-U.S. and Currency Hedged Equity Funds |
Schedule of Investments
WisdomTree Europe Hedged Equity Fund (HEDJ)
March 31, 2016
| | | | | | | | |
| Investments | | Shares | | | Value | |
| | | | | | | | |
| COMMON STOCKS – 100.5% | | | | | | | | |
| Austria – 0.4% | | | | | | | | |
Andritz AG(a) | | | 543,833 | | | $ | 29,904,838 | |
Lenzing AG | | | 166,617 | | | | 13,209,150 | |
RHI AG | | | 306,197 | | | | 5,991,076 | |
Schoeller-Bleckmann Oilfield Equipment AG(a) | | | 169,039 | | | | 10,307,550 | |
| | | | | | | | |
| Total Austria | | | | | | | 59,412,614 | |
| Belgium – 8.1% | | | | | | | | |
Anheuser-Busch InBev N.V. | | | 6,985,712 | | | | 869,692,442 | |
Bekaert S.A. | | | 472,485 | | | | 19,224,305 | |
Delhaize Group | | | 651,660 | | | | 68,133,502 | |
Melexis N.V. | | | 172,982 | | | | 9,422,418 | |
Solvay S.A. | | | 717,424 | | | | 72,066,228 | |
UCB S.A. | | | 897,694 | | | | 68,784,344 | |
| | | | | | | | |
| Total Belgium | | | | | | | 1,107,323,239 | |
| Finland – 4.3% | | | | | | | | |
Amer Sports Oyj | | | 703,506 | | | | 20,482,940 | |
Cargotec Oyj Class B(a) | | | 445,177 | | | | 14,402,294 | |
Huhtamaki Oyj(a) | | | 616,607 | | | | 22,927,626 | |
Kemira Oyj(a) | | | 1,903,579 | | | | 21,280,091 | |
Kone Oyj Class B | | | 4,567,380 | | | | 220,473,639 | |
Konecranes Oyj(a) | | | 681,547 | | | | 16,294,268 | |
Metso Oyj(a) | | | 1,680,642 | | | | 40,161,250 | |
Nokia Oyj | | | 23,060,518 | | | | 137,305,814 | |
Valmet Oyj(a) | | | 1,336,136 | | | | 14,738,714 | |
Wartsila Oyj Abp | | | 1,696,300 | | | | 76,876,186 | |
| | | | | | | | |
| Total Finland | | | | | | | 584,942,822 | |
| France – 27.0% | | | | | | | | |
Air Liquide S.A. | | | 1,672,535 | | | | 188,478,217 | |
Airbus Group SE | | | 4,499,906 | | | | 299,211,220 | |
Arkema S.A. | | | 468,664 | | | | 35,237,694 | |
BioMerieux | | | 93,517 | | | | 10,726,003 | |
Bourbon S.A.(a) | | | 461,835 | | | | 6,915,376 | |
Bureau Veritas S.A.(a) | | | 2,161,185 | | | | 48,208,907 | |
Casino Guichard Perrachon S.A.(a) | | | 848,819 | | | | 48,731,169 | |
Christian Dior SE | | | 669,757 | | | | 121,657,574 | |
Cie Generale des Etablissements Michelin | | | 1,081,812 | | | | 110,863,851 | |
Danone S.A. | | | 3,601,678 | | | | 256,559,414 | |
Dassault Systemes | | | 388,310 | | | | 30,855,445 | |
Edenred | | | 1,821,368 | | | | 35,429,481 | |
Essilor International S.A. | | | 456,484 | | | | 56,466,252 | |
Hermes International | | | 174,906 | | | | 61,677,785 | |
Imerys S.A.(a) | | | 387,304 | | | | 27,050,493 | |
Ingenico Group S.A. | | | 113,366 | | | | 13,041,355 | |
IPSOS | | | 235,479 | | | | 5,509,025 | |
Kering | | | 670,855 | | | | 120,098,731 | |
L’Oreal S.A. | | | 1,952,314 | | | | 350,288,522 | |
Legrand S.A. | | | 1,307,424 | | | | 73,368,927 | |
LVMH Moet Hennessy Louis Vuitton SE | | | 2,205,590 | | | | 378,263,866 | |
Pernod Ricard S.A. | | | 956,744 | | | | 106,845,294 | |
Publicis Groupe S.A. | | | 870,792 | | | | 61,235,540 | |
Rallye S.A.(a) | | | 513,729 | | | | 8,933,511 | |
| | | | | | | | |
Remy Cointreau S.A.(a) | | | 258,632 | | | | 19,664,000 | |
Rubis SCA | | | 308,946 | | | | 24,844,844 | |
Safran S.A. | | | 1,838,041 | | | | 128,772,352 | |
Saft Groupe S.A. | | | 61,597 | | | | 1,866,429 | |
Sanofi | | | 6,605,821 | | | | 533,410,454 | |
Schneider Electric SE | | | 3,727,318 | | | | 235,904,321 | |
SCOR SE | | | 2,091,794 | | | | 74,371,592 | |
Societe BIC S.A. | | | 213,170 | | | | 32,113,757 | |
Sodexo S.A. | | | 701,961 | | | | 75,784,421 | |
Technicolor S.A. Registered Shares | | | 919,153 | | | | 5,750,343 | |
Technip S.A. | | | 925,155 | | | | 51,353,045 | |
Teleperformance | | | 215,260 | | | | 18,951,850 | |
Valeo S.A. | | | 275,162 | | | | 42,895,144 | |
Zodiac Aerospace | | | 311,100 | | | | 6,242,994 | |
| | | | | | | | |
| Total France | | | | | | | 3,707,579,198 | |
| Germany – 26.5% | | | | | | | | |
adidas AG | | | 1,178,485 | | | | 138,323,146 | |
Bayer AG Registered Shares | | | 3,548,234 | | | | 417,682,373 | |
Bayerische Motoren Werke AG | | | 4,233,472 | | | | 389,317,387 | |
Brenntag AG | | | 719,734 | | | | 41,172,696 | |
Daimler AG Registered Shares | | | 7,805,790 | | | | 599,262,337 | |
Duerr AG | | | 175,382 | | | | 13,804,099 | |
Fresenius Medical Care AG & Co. KGaA | | | 849,189 | | | | 75,325,281 | |
Fresenius SE & Co. KGaA | | | 1,122,626 | | | | 82,143,148 | |
GEA Group AG | | | 757,061 | | | | 37,096,497 | |
Hannover Rueck SE | | | 1,005,502 | | | | 117,331,999 | |
HeidelbergCement AG | | | 562,187 | | | | 48,208,196 | |
Hochtief AG | | | 407,690 | | | | 49,965,938 | |
Infineon Technologies AG | | | 4,510,820 | | | | 64,279,541 | |
K+S AG Registered Shares(a) | | | 1,472,015 | | | | 34,496,459 | |
Krones AG | | | 127,981 | | | | 15,437,250 | |
LANXESS AG | | | 244,539 | | | | 11,770,790 | |
Linde AG | | | 756,461 | | | | 110,382,366 | |
Merck KGaA | | | 1,150,088 | | | | 96,078,865 | |
MTU Aero Engines AG | | | 260,483 | | | | 25,020,098 | |
NORMA Group SE | | | 151,424 | | | | 8,494,897 | |
OSRAM Licht AG | | | 444,744 | | | | 22,960,948 | |
SAP SE | | | 5,178,933 | | | | 419,607,717 | |
Siemens AG Registered Shares | | | 7,012,011 | | | | 744,318,856 | |
Software AG | | | 479,427 | | | | 18,769,211 | |
Symrise AG | | | 477,654 | | | | 32,114,340 | |
Wacker Chemie AG(a) | | | 171,596 | | | | 15,123,242 | |
| | | | | | | | |
| Total Germany | | | | | | | 3,628,487,677 | |
| Ireland – 1.1% | | | | | | | | |
CRH PLC | | | 4,946,840 | | | | 139,971,029 | |
Glanbia PLC | | | 868,333 | | | | 17,751,797 | |
| | | | | | | | |
| Total Ireland | | | | | | | 157,722,826 | |
| Italy – 1.8% | | | | | | | | |
DiaSorin SpA | | | 243,311 | | | | 14,071,207 | |
Interpump Group SpA | | | 727,167 | | | | 10,648,069 | |
Luxottica Group SpA | | | 3,198,451 | | | | 176,772,626 | |
Moncler SpA | | | 446,944 | | | | 7,563,332 | |
Parmalat SpA | | | 2,307,508 | | | | 6,394,997 | |
See Notes to Financial Statements.
| | | | |
| WisdomTree Developed World ex-U.S. and Currency Hedged Equity Funds | | | 43 | |
Schedule of Investments (continued)
WisdomTree Europe Hedged Equity Fund (HEDJ)
March 31, 2016
| | | | | | | | |
| Investments | | Shares | | | Value | |
| | | | | | | | |
Piaggio & C. SpA(a) | | | 1,757,532 | | | $ | 3,735,215 | |
Salini Impregilo SpA | | | 2,219,513 | | | | 9,393,624 | |
Salvatore Ferragamo SpA(a) | | | 844,034 | | | | 21,602,463 | |
| | | | | | | | |
| Total Italy | | | | | | | 250,181,533 | |
| Netherlands – 9.2% | | | | | | | | |
Akzo Nobel N.V. | | | 1,452,398 | | | | 99,139,343 | |
Arcadis N.V. | | | 429,015 | | | | 8,012,813 | |
ASM International N.V. | | | 324,913 | | | | 14,575,079 | |
ASML Holding N.V. | | | 926,975 | | | | 94,309,573 | |
BE Semiconductor Industries N.V. | | | 712,588 | | | | 19,561,803 | |
Boskalis Westminster | | | 1,264,361 | | | | 49,772,547 | |
Corbion N.V. | | | 277,034 | | | | 6,588,539 | |
Gemalto N.V. | | | 92,239 | | | | 6,829,061 | |
Heineken Holding N.V. | | | 1,109,885 | | | | 86,737,926 | |
Heineken N.V. | | | 2,626,067 | | | | 238,355,488 | |
Koninklijke Ahold N.V. | | | 7,160,652 | | | | 161,321,708 | |
Koninklijke DSM N.V. | | | 1,764,632 | | | | 97,196,236 | |
Koninklijke Philips N.V. | | | 8,830,637 | | | | 251,926,122 | |
Koninklijke Vopak N.V. | | | 825,444 | | | | 41,166,896 | |
Wolters Kluwer N.V. | | | 2,247,724 | | | | 89,853,736 | |
| | | | | | | | |
| Total Netherlands | | | | | | | 1,265,346,870 | |
| Portugal – 0.6% | | | | | | | | |
Galp Energia, SGPS, S.A. | | | 6,786,491 | | | | 85,455,718 | |
| Spain – 14.5% | | | | | | | | |
Abengoa S.A. Class B(a) | | | 9,321,301 | | | | 2,772,366 | |
Acerinox S.A.(a) | | | 2,571,488 | | | | 29,830,865 | |
ACS Actividades de Construccion y Servicios S.A. | | | 3,961,209 | | | | 118,221,599 | |
Banco Bilbao Vizcaya Argentaria S.A. | | | 70,363,326 | | | | 468,426,532 | |
Banco Santander S.A. | | | 118,741,589 | | | | 524,198,829 | |
Grifols S.A.(a) | | | 1,845,462 | | | | 41,155,654 | |
Mapfre S.A. | | | 37,754,255 | | | | 81,700,449 | |
Obrascon Huarte Lain S.A.(a) | | | 927,400 | | | | 5,927,698 | |
Prosegur Cia de Seguridad S.A. | | | 3,719,557 | | | | 20,981,184 | |
Tecnicas Reunidas S.A.(a) | | | 525,769 | | | | 14,813,745 | |
Telefonica S.A.(a) | | | 58,752,218 | | | | 659,602,424 | |
Viscofan S.A.(a) | | | 302,883 | | | | 18,172,172 | |
| | | | | | | | |
| Total Spain | | | | | | | 1,985,803,517 | |
| Switzerland – 0.5% | | | | | | | | |
STMicroelectronics N.V.(a) | | | 12,202,428 | | | | 67,746,538 | |
| United Kingdom – 6.5% | | | | | | | | |
CNH Industrial N.V. | | | 10,072,978 | | | | 68,585,036 | |
RELX N.V. | | | 8,351,635 | | | | 146,040,050 | |
Unilever N.V. CVA | | | 14,939,893 | | | | 670,520,268 | |
| | | | | | | | |
| Total United Kingdom | | | | | | | 885,145,354 | |
TOTAL COMMON STOCKS (Cost: $15,157,424,646) | | | | | | | 13,785,147,906 | |
| | | | | | | | |
| INVESTMENT OF CASH COLLATERAL FOR SECURITIES LOANED – 2.1% | |
| United States – 2.1% | | | | | | | | |
State Street Navigator Securities Lending Prime Portfolio, 0.50%(b) | | | | | | | | |
| (Cost: $291,263,715)(c) | | | 291,263,715 | | | | 291,263,715 | |
TOTAL INVESTMENTS IN SECURITIES – 102.6% (Cost: $15,448,688,361) | | | | 14,076,411,621 | |
Liabilities in Excess of Cash, Foreign Currency and Other Assets – (2.6)% | | | | | | | (359,458,614 | ) |
| | | | | | | | |
| NET ASSETS – 100.0% | | | | | | $ | 13,716,953,007 | |
| (a) | Security, or portion thereof, was on loan at March 31, 2016 (See Note 2). |
| (b) | Rate shown represents annualized 7-day yield as of March 31, 2016. |
| (c) | At March 31, 2016, the total market value of the Fund’s securities on loan was $276,592,888 and the total market value of the collateral held by the Fund was $291,272,582. The total market value of the collateral includes non-cash U.S. Government securities collateral having a value of $8,867. |
CVA – Certificaten Van Aandelen (Certificate of Stock)
| | | | | | | | | | | | | | | | | | | | |
| FINANCIAL DERIVATIVE INSTRUMENTS | |
| FORWARD CONTRACTS | |
Settlement
Date | | Contracts
To Deliver | | | In
Exchange For | | | Unrealized
Gain (Loss) | |
4/4/2016 | | | EUR | | | | 787,461,615 | | | | USD | | | | 858,357,572 | | | $ | (38,994,700 | ) |
4/4/2016 | | | EUR | | | | 262,363,488 | | | | USD | | | | 286,119,190 | | | | (12,857,252 | ) |
4/4/2016 | | | EUR | | | | 787,034,896 | | | | USD | | | | 858,357,572 | | | | (38,508,431 | ) |
4/4/2016 | | | EUR | | | | 788,909,839 | | | | USD | | | | 858,357,572 | | | | (40,645,024 | ) |
4/4/2016 | | | EUR | | | | 788,359,162 | | | | USD | | | | 858,357,572 | | | | (40,017,500 | ) |
4/4/2016 | | | EUR | | | | 786,747,788 | | | | USD | | | | 858,357,572 | | | | (38,181,258 | ) |
4/4/2016 | | | EUR | | | | 788,047,935 | | | | USD | | | | 858,357,572 | | | | (39,662,841 | ) |
4/4/2016 | | | EUR | | | | 788,022,614 | | | | USD | | | | 858,357,572 | | | | (39,633,986 | ) |
4/4/2016 | | | EUR | | | | 789,229,004 | | | | USD | | | | 858,357,572 | | | | (41,008,728 | ) |
4/4/2016 | | | EUR | | | | 789,045,468 | | | | USD | | | | 858,357,589 | | | | (40,799,563 | ) |
4/4/2016 | | | EUR | | | | 788,978,728 | | | | USD | | | | 858,357,572 | | | | (40,723,526 | ) |
4/4/2016 | | | EUR | | | | 788,333,820 | | | | USD | | | | 858,357,572 | | | | (39,988,622 | ) |
4/4/2016 | | | EUR | | | | 788,907,664 | | | | USD | | | | 858,357,572 | | | | (40,642,545 | ) |
4/4/2016 | | | EUR | | | | 789,241,340 | | | | USD | | | | 858,357,572 | | | | (41,022,786 | ) |
4/4/2016 | | | EUR | | | | 789,234,809 | | | | USD | | | | 858,357,572 | | | | (41,015,344 | ) |
4/4/2016 | | | EUR | | | | 789,225,375 | | | | USD | | | | 858,357,572 | | | | (41,004,593 | ) |
4/4/2016 | | | EUR | | | | 789,229,004 | | | | USD | | | | 858,357,572 | | | | (41,008,728 | ) |
4/4/2016 | | | EUR | | | | 262,775,526 | | | | USD | | | | 286,119,190 | | | | (13,326,790 | ) |
4/4/2016 | | | USD | | | | 57,675,209 | | | | EUR | | | | 53,212,490 | | | | 2,963,111 | |
4/4/2016 | | | USD | | | | 37,614,267 | | | | EUR | | | | 34,217,154 | | | | 1,377,907 | |
4/4/2016 | | | USD | | | | 20,060,942 | | | | EUR | | | | 18,134,431 | | | | 604,158 | |
4/4/2016 | | | USD | | | | 100,304,712 | | | | EUR | | | | 90,212,788 | | | | 2,497,315 | |
4/4/2016 | | | USD | | | | 50,152,356 | | | | EUR | | | | 45,260,469 | | | | 1,424,233 | |
4/4/2016 | | | USD | | | | 145,441,832 | | | | EUR | | | | 128,750,262 | | | | 1,275,592 | |
4/4/2016 | | | USD | | | | 36,970,000 | | | | EUR | | | | 32,820,824 | | | | 430,986 | |
4/4/2016 | | | USD | | | | 22,568,560 | | | | EUR | | | | 20,095,345 | | | | 331,101 | |
4/4/2016 | | | USD | | | | 190,578,953 | | | | EUR | | | | 170,502,154 | | | | 3,716,861 | |
4/4/2016 | | | USD | | | | 358,589,345 | | | | EUR | | | | 321,151,725 | | | | 7,379,262 | |
4/4/2016 | | | USD | | | | 32,599,031 | | | | EUR | | | | 29,138,668 | | | | 605,953 | |
4/4/2016 | | | USD | | | | 55,167,592 | | | | EUR | | | | 48,576,705 | | | | 188,016 | |
4/4/2016 | | | USD | | | | 3,990,000 | | | | EUR | | | | 3,501,474 | | | | 107 | |
4/4/2016 | | | USD | | | | 791,894,205 | | | | EUR | | | | 694,948,842 | | | | 35,090 | |
4/4/2016 | | | USD | | | | 791,894,205 | | | | EUR | | | | 694,826,889 | | | | (103,882 | ) |
4/4/2016 | | | USD | | | | 791,894,205 | | | | EUR | | | | 694,522,193 | | | | (451,097 | ) |
4/4/2016 | | | USD | | | | 791,894,205 | | | | EUR | | | | 694,644,039 | | | | (312,247 | ) |
4/4/2016 | | | USD | | | | 791,894,205 | | | | EUR | | | | 694,461,287 | | | | (520,504 | ) |
See Notes to Financial Statements.
| | |
| 44 | | WisdomTree Developed World ex-U.S. and Currency Hedged Equity Funds |
Schedule of Investments (concluded)
WisdomTree Europe Hedged Equity Fund (HEDJ)
March 31, 2016
| | | | | | | | | | | | | | | | | | | | |
Settlement
Date | | Contracts
To Deliver | | | In
Exchange For | | | Unrealized
Gain (Loss) | |
4/4/2016 | | | USD | | | | 791,894,205 | | | | EUR | | | | 694,035,237 | | | $ | (1,006,009 | ) |
4/4/2016 | | | USD | | | | 791,894,205 | | | | EUR | | | | 694,339,505 | | | | (659,280 | ) |
4/4/2016 | | | USD | | | | 791,894,205 | | | | EUR | | | | 694,918,349 | | | | 343 | |
4/4/2016 | | | USD | | | | 659,911,837 | | | | EUR | | | | 579,069,659 | | | | (32,722 | ) |
4/4/2016 | | | USD | | | | 659,911,837 | | | | EUR | | | | 579,124,034 | | | | 29,242 | |
4/4/2016 | | | USD | | | | 791,894,205 | | | | EUR | | | | 694,704,979 | | | | (242,804 | ) |
4/4/2016 | | | USD | | | | 791,894,205 | | | | EUR | | | | 694,826,889 | | | | (103,882 | ) |
4/4/2016 | | | USD | | | | 791,894,205 | | | | EUR | | | | 694,918,349 | | | | 343 | |
4/4/2016 | | | USD | | | | 791,894,205 | | | | EUR | | | | 694,918,349 | | | | 343 | |
4/4/2016 | | | USD | | | | 527,929,470 | | | | EUR | | | | 463,278,900 | | | | 228 | |
4/4/2016 | | | USD | | | | 791,894,206 | | | | EUR | | | | 695,131,852 | | | | 243,639 | |
4/4/2016 | | | USD | | | | 791,894,205 | | | | EUR | | | | 694,918,349 | | | | 343 | |
4/4/2016 | | | USD | | | | 3,040,000 | | | | EUR | | | | 2,667,853 | | | | 153 | |
4/4/2016 | | | USD | | | | 3,990,000 | | | | EUR | | | | 3,501,474 | | | | 107 | |
4/4/2016 | | | USD | | | | 263,964,735 | | | | EUR | | | | 231,639,450 | | | | 114 | |
4/4/2016 | | | USD | | | | 3,990,000 | | | | EUR | | | | 3,501,557 | | | | 201 | |
4/4/2016 | | | USD | | | | 3,990,000 | | | | EUR | | | | 3,501,434 | | | | 61 | |
5/3/2016 | | | EUR | | | | 136,469,882 | | | | USD | | | | 155,640,489 | | | | (7,155 | ) |
5/3/2016 | | | EUR | | | | 694,363,858 | | | | USD | | | | 791,894,205 | | | | (46,820 | ) |
5/3/2016 | | | EUR | | | | 694,236,024 | | | | USD | | | | 791,894,205 | | | | 98,978 | |
5/3/2016 | | | EUR | | | | 693,883,203 | | | | USD | | | | 791,894,205 | | | | 501,380 | |
5/3/2016 | | | EUR | �� | | | 694,052,877 | | | | USD | | | | 791,894,205 | | | | 307,862 | |
5/3/2016 | | | EUR | | | | 693,442,680 | | | | USD | | | | 791,894,205 | | | | 1,003,808 | |
5/3/2016 | | | EUR | | | | 693,740,351 | | | | USD | | | | 791,894,205 | | | | 664,306 | |
5/3/2016 | | | EUR | | | | 693,934,887 | | | | USD | | | | 791,894,205 | | | | 442,433 | |
5/3/2016 | | | EUR | | | | 694,339,505 | | | | USD | | | | 791,894,205 | | | | (19,045 | ) |
5/3/2016 | | | EUR | | | | 578,592,410 | | | | USD | | | | 659,911,837 | | | | 11,324 | |
5/3/2016 | | | EUR | | | | 694,535,595 | | | | USD | | | | 791,894,206 | | | | (242,691 | ) |
5/3/2016 | | | EUR | | | | 694,114,321 | | | | USD | | | | 791,894,205 | | | | 237,784 | |
5/3/2016 | | | EUR | | | | 462,888,944 | | | | USD | | | | 527,929,470 | | | | (8,067 | ) |
5/3/2016 | | | EUR | | | | 694,332,199 | | | | USD | | | | 791,894,205 | | | | (10,713 | ) |
5/3/2016 | | | EUR | | | | 694,332,199 | | | | USD | | | | 791,894,205 | | | | (10,713 | ) |
5/3/2016 | | | EUR | | | | 694,238,458 | | | | USD | | | | 791,894,205 | | | | 96,202 | |
5/3/2016 | | | EUR | | | | 578,642,129 | | | | USD | | | | 659,911,837 | | | | (45,382 | ) |
5/3/2016 | | | EUR | | | | 694,336,461 | | | | USD | | | | 791,894,205 | | | | (15,573 | ) |
5/3/2016 | | | EUR | | | | 231,443,458 | | | | USD | | | | 263,964,735 | | | | (2,876 | ) |
5/3/2016 | | | EUR | | | | 136,470,361 | | | | USD | | | | 155,640,489 | | | | (7,701 | ) |
5/3/2016 | | | EUR | | | | 136,476,105 | | | | USD | | | | 155,640,489 | | | | (14,252 | ) |
5/3/2016 | | | EUR | | | | 103,978,605 | | | | USD | | | | 118,583,232 | | | | (7,219 | ) |
5/3/2016 | | | EUR | | | | 136,468,327 | | | | USD | | | | 155,640,489 | | | | (5,381 | ) |
5/3/2016 | | | USD | | | | 15,846,209 | | | | EUR | | | | 13,894,443 | | | | 784 | |
| | | | | | | | | | | | | | | | | | | $ | (646,448,562 | ) |
| | |
| CURRENCY LEGEND |
| EUR | | – Euro |
| USD | | – U.S. dollar |
See Notes to Financial Statements.
| | | | |
| WisdomTree Developed World ex-U.S. and Currency Hedged Equity Funds | | | 45 | |
Schedule of Investments
WisdomTree Europe Hedged SmallCap Equity Fund (EUSC)
March 31, 2016
| | | | | | | | |
| Investments | | Shares | | | Value | |
| | | | | | | | |
| COMMON STOCKS – 100.2% | | | | | | | | |
| Austria – 3.9% | | | | | | | | |
Austria Technologie & Systemtechnik AG | | | 12,494 | | | $ | 183,664 | |
Lenzing AG | | | 8,849 | | | | 701,536 | |
Oesterreichische Post AG | | | 56,751 | | | | 2,310,682 | |
POLYTEC Holding AG | | | 52,361 | | | | 451,687 | |
RHI AG | | | 26,468 | | | | 517,875 | |
Schoeller-Bleckmann Oilfield Equipment AG | | | 8,226 | | | | 501,600 | |
Semperit AG Holding | | | 12,224 | | | | 473,615 | |
Telekom Austria AG | | | 115,996 | | | | 714,715 | |
UNIQA Insurance Group AG | | | 239,094 | | | | 1,682,983 | |
Vienna Insurance Group AG Wiener Versicherung Gruppe | | | 105,678 | | | | 2,239,913 | |
Wienerberger AG | | | 25,704 | | | | 494,432 | |
Zumtobel Group AG | | | 7,877 | | | | 132,175 | |
| | | | | | | | |
| Total Austria | | | | 10,404,877 | |
| Belgium – 8.9% | | | | | | | | |
Ackermans & van Haaren N.V. | | | 9,855 | | | | 1,399,853 | |
Barco N.V. | | | 7,334 | | | | 529,195 | |
Bekaert S.A. | | | 39,514 | | | | 1,607,732 | |
bpost S.A. | | | 188,185 | | | | 5,235,707 | |
Cie d’Entreprises CFE | | | 9,570 | | | | 907,665 | |
Cofinimmo S.A. | | | 26,420 | | | | 3,247,032 | |
D’ieteren S.A./N.V. | | | 26,287 | | | | 1,108,348 | |
Econocom Group S.A./N.V. | | | 47,402 | | | | 491,554 | |
Elia System Operator S.A./N.V. | | | 34,711 | | | | 1,729,144 | |
Euronav N.V. | | | 47,472 | | | | 486,384 | |
EVS Broadcast Equipment S.A. | | | 20,488 | | | | 758,431 | |
Exmar N.V. | | | 57,085 | | | | 479,948 | |
Kinepolis Group N.V. | | | 11,127 | | | | 483,417 | |
Melexis N.V. | | | 15,997 | | | | 871,365 | |
Ontex Group N.V. | | | 10,075 | | | | 330,824 | |
Umicore S.A. | | | 51,212 | | | | 2,553,191 | |
Warehouses De Pauw | | | 17,090 | | | | 1,627,129 | |
| | | | | | | | |
| Total Belgium | | | | 23,846,919 | |
| Finland – 13.5% | | | | | | | | |
Aktia Bank Oyj | | | 42,910 | | | | 480,180 | |
Amer Sports Oyj | | | 47,893 | | | | 1,394,429 | |
Aspo Oyj | | | 25,523 | | | | 216,100 | |
Atria Oyj | | | 22,585 | | | | 224,939 | |
Cargotec Oyj Class B(a) | | | 21,239 | | | | 687,121 | |
Caverion Corp. | | | 67,103 | | | | 650,736 | |
Citycon Oyj | | | 391,159 | | | | 988,663 | |
Cramo Oyj(a) | | | 27,104 | | | | 559,352 | |
Elisa Oyj(a) | | | 152,873 | | | | 5,952,636 | |
F-Secure Oyj(a) | | | 75,412 | | | | 226,011 | |
Huhtamaki Oyj | | | 42,108 | | | | 1,565,724 | |
Kemira Oyj | | | 148,575 | | | | 1,660,919 | |
Kesko Oyj Class B | | | 59,310 | | | | 2,623,041 | |
Konecranes Oyj(a) | | | 51,142 | | | | 1,222,691 | |
Metsa Board Oyj | | | 142,469 | | | | 954,622 | |
Metso Oyj(a) | | | 117,099 | | | | 2,798,242 | |
Nokian Renkaat Oyj | | | 122,954 | | | | 4,346,283 | |
| | | | | | | | |
Orion Oyj Class B | | | 81,577 | | | | 2,700,520 | |
PKC Group Oyj(a) | | | 17,757 | | | | 314,857 | |
Ramirent Oyj | | | 136,785 | | | | 896,272 | |
Sanoma Oyj(a) | | | 159,580 | | | | 781,953 | |
Technopolis Oyj | | | 96,649 | | | | 413,012 | |
Tieto Oyj | | | 67,895 | | | | 1,773,315 | |
Tikkurila Oyj | | | 37,174 | | | | 676,092 | |
Uponor Oyj(a) | | | 46,992 | | | | 683,295 | |
Valmet Oyj(a) | | | 79,023 | | | | 871,691 | |
YIT Oyj | | | 73,668 | | | | 417,559 | |
| | | | | | | | |
| Total Finland | | | | 36,080,255 | |
| France – 16.9% | | | | | | | | |
Alten S.A. | | | 16,654 | | | | 1,023,677 | |
Altran Technologies S.A. | | | 57,197 | | | | 793,879 | |
Arkema S.A. | | | 38,898 | | | | 2,924,645 | |
Assystem | | | 17,116 | | | | 464,208 | |
BioMerieux | | | 8,204 | | | | 940,964 | |
Bourbon S.A.(a) | | | 63,970 | | | | 957,867 | |
Eiffage S.A. | | | 41,820 | | | | 3,216,780 | |
Elior(b) | | | 37,062 | | | | 813,849 | |
Eurazeo S.A. | | | 25,828 | | | | 1,748,868 | |
Faurecia | | | 22,843 | | | | 866,694 | |
Gaztransport Et Technigaz S.A. | | | 25,844 | | | | 846,998 | |
Havas S.A. | | | 145,695 | | | | 1,169,991 | |
Ipsen S.A. | | | 26,988 | | | | 1,552,164 | |
IPSOS | | | 27,018 | | | | 632,085 | |
Korian S.A. | | | 31,134 | | | | 918,545 | |
Lagardere SCA | | | 122,595 | | | | 3,262,069 | |
Metropole Television S.A. | | | 117,180 | | | | 2,139,859 | |
Neopost S.A. | | | 62,226 | | | | 1,309,702 | |
Nexity S.A. | | | 55,844 | | | | 2,914,259 | |
Orpea | | | 12,325 | | | | 1,027,810 | |
Plastic Omnium S.A. | | | 42,840 | | | | 1,475,534 | |
Rallye S.A.(a) | | | 43,008 | | | | 747,889 | |
Remy Cointreau S.A. | | | 18,377 | | | | 1,397,218 | |
Rubis SCA | | | 25,755 | | | | 2,071,168 | |
Saft Groupe S.A. | | | 12,130 | | | | 367,547 | |
SEB S.A. | | | 17,203 | | | | 1,787,072 | |
Societe Television Francaise 1 | | | 78,734 | | | | 1,021,029 | |
Sopra Steria Group | | | 5,769 | | | | 682,717 | |
Tarkett S.A. | | | 33,713 | | | | 1,058,407 | |
Technicolor S.A. Registered Shares | | | 65,223 | | | | 408,044 | |
Teleperformance | | | 15,637 | | | | 1,376,708 | |
Vicat S.A. | | | 22,166 | | | | 1,439,779 | |
Wendel S.A. | | | 16,263 | | | | 1,772,820 | |
| | | | | | | | |
| Total France | | | | 45,130,845 | |
| Germany – 17.2% | | | | | | | | |
Aareal Bank AG | | | 38,783 | | | | 1,258,679 | |
alstria office REIT-AG* | | | 112,041 | | | | 1,618,936 | |
AURELIUS SE & Co. KGaA | | | 11,826 | | | | 720,983 | |
Aurubis AG | | | 17,499 | | | | 872,020 | |
BayWa AG(a) | | | 18,688 | | | | 633,021 | |
Bechtle AG | | | 7,807 | | | | 807,622 | |
See Notes to Financial Statements.
| | |
| 46 | | WisdomTree Developed World ex-U.S. and Currency Hedged Equity Funds |
Schedule of Investments (continued)
WisdomTree Europe Hedged SmallCap Equity Fund (EUSC)
March 31, 2016
| | | | | | | | |
| Investments | | Shares | | | Value | |
| | | | | | | | |
Bertrandt AG | | | 4,581 | | | $ | 526,465 | |
Carl Zeiss Meditec AG Bearer Shares | | | 30,184 | | | | 933,513 | |
CompuGroup Medical SE | | | 13,150 | | | | 556,696 | |
CTS Eventim AG & Co. KGaA | | | 25,017 | | | | 890,167 | |
DMG MORI AG | | | 25,006 | | | | 1,166,040 | |
Drillisch AG(a) | | | 41,519 | | | | 1,705,397 | |
Duerr AG | | | 13,706 | | | | 1,078,782 | |
ElringKlinger AG | | | 29,046 | | | | 797,199 | |
Freenet AG | | | 120,860 | | | | 3,620,818 | |
Fuchs Petrolub SE | | | 24,611 | | | | 955,229 | |
Gerresheimer AG | | | 9,385 | | | | 737,184 | |
Gerry Weber International AG(a) | | | 35,537 | | | | 499,318 | |
Hamburger Hafen und Logistik AG | | | 39,922 | | | | 588,681 | |
Hochtief AG | | | 33,145 | | | | 4,062,207 | |
Indus Holding AG | | | 13,517 | | | | 667,579 | |
Jenoptik AG | | | 22,828 | | | | 365,492 | |
KION Group AG* | | | 24,276 | | | | 1,417,489 | |
Krones AG | | | 8,658 | | | | 1,044,340 | |
KUKA AG(a) | | | 4,022 | | | | 421,799 | |
LANXESS AG | | | 17,943 | | | | 863,679 | |
LEG Immobilien AG* | | | 31,615 | | | | 2,984,828 | |
Leoni AG(a) | | | 14,273 | | | | 493,230 | |
MLP AG | | | 108,327 | | | | 350,952 | |
MTU Aero Engines AG | | | 16,846 | | | | 1,618,104 | |
NORMA Group SE | | | 10,721 | | | | 601,449 | |
Pfeiffer Vacuum Technology AG | | | 6,607 | | | | 742,135 | |
Rheinmetall AG | | | 5,269 | | | | 421,621 | |
RHOEN-KLINIKUM AG | | | 49,646 | | | | 1,547,302 | |
Sixt SE | | | 13,463 | | | | 725,819 | |
Software AG | | | 34,199 | | | | 1,338,865 | |
STADA Arzneimittel AG | | | 26,819 | | | | 1,066,142 | |
Stroeer SE & Co KGaA(a) | | | 10,392 | | | | 654,282 | |
Suedzucker AG | | | 126,704 | | | | 2,237,255 | |
Takkt AG | | | 27,530 | | | | 529,556 | |
TLG Immobilien AG | | | 21,803 | | | | 475,794 | |
VTG AG | | | 13,516 | | | | 413,933 | |
Wacker Neuson SE | | | 37,454 | | | | 596,677 | |
Wirecard AG(a) | | | 9,891 | | | | 375,334 | |
| | | | | | | | |
| Total Germany | | | | 45,982,613 | |
| Ireland – 2.4% | | | | | | | | |
C&C Group PLC | | | 233,572 | | | | 1,056,683 | |
Fyffes PLC | | | 212,051 | | | | 335,883 | |
Glanbia PLC | | | 38,538 | | | | 787,853 | |
Irish Continental Group PLC | | | 99,219 | | | | 616,205 | |
Kingspan Group PLC | | | 27,567 | | | | 733,517 | |
Origin Enterprises PLC | | | 65,216 | | | | 499,410 | |
Paddy Power Betfair PLC | | | 18,145 | | | | 2,535,018 | |
| | | | | | | | |
| Total Ireland | | | | 6,564,569 | |
| Italy – 21.0% | | | | | | | | |
A2A SpA | | | 1,959,877 | | | | 2,552,752 | |
ACEA SpA | | | 77,227 | | | | 1,183,655 | |
Anima Holding SpA(b) | | | 128,792 | | | | 943,699 | |
Ansaldo STS SpA | | | 66,854 | | | | 799,165 | |
| | | | | | | | |
Ascopiave SpA | | | 348,400 | | | | 909,968 | |
Astaldi SpA(a) | | | 52,574 | | | | 243,477 | |
ASTM SpA | | | 76,318 | | | | 882,727 | |
Azimut Holding SpA | | | 82,812 | | | | 1,910,961 | |
Banca Generali SpA | | | 68,432 | | | | 2,015,827 | |
Banca IFIS SpA | | | 35,338 | | | | 1,172,243 | |
Banca Mediolanum SpA | | | 501,206 | | | | 4,003,758 | |
Banca Popolare di Milano SCARL | | | 2,090,193 | | | | 1,463,666 | |
Banca Popolare di Sondrio SCARL | | | 135,864 | | | | 477,167 | |
Brembo SpA | | | 21,345 | | | | 1,105,512 | |
Cementir Holding SpA | | | 56,993 | | | | 285,374 | |
Credito Emiliano SpA | | | 138,743 | | | | 951,000 | |
Danieli & C. Officine Meccaniche SpA RSP | | | 19,824 | | | | 310,619 | |
Datalogic SpA | | | 18,122 | | | | 354,164 | |
Davide Campari-Milano SpA | | | 132,051 | | | | 1,321,956 | |
De’ Longhi SpA | | | 57,972 | | | | 1,321,240 | |
DiaSorin SpA | | | 16,213 | | | | 937,633 | |
Ei Towers SpA | | | 12,059 | | | | 673,075 | |
ERG SpA | | | 132,270 | | | | 1,802,711 | |
Falck Renewables SpA | | | 326,966 | | | | 359,367 | |
FinecoBank Banca Fineco SpA | | | 339,565 | | | | 2,863,441 | |
Hera SpA | | | 1,080,608 | | | | 3,233,676 | |
Immobiliare Grande Distribuzione SIIQ SpA | | | 719,660 | | | | 656,071 | |
Industria Macchine Automatiche SpA | | | 21,594 | | | | 1,268,514 | |
Interpump Group SpA | | | 29,235 | | | | 428,095 | |
Intesa Sanpaolo SpA RSP | | | 538,736 | | | | 1,403,414 | |
Iren SpA | | | 999,310 | | | | 1,793,554 | |
MARR SpA | | | 51,635 | | | | 1,041,480 | |
Moncler SpA | | | 37,873 | | | | 640,899 | |
Parmalat SpA | | | 260,977 | | | | 723,268 | |
Piaggio & C. SpA(a) | | | 182,327 | | | | 387,493 | |
Prysmian SpA | | | 85,192 | | | | 1,932,874 | |
RAI Way SpA(b) | | | 159,587 | | | | 858,367 | |
Recordati SpA | | | 102,819 | | | | 2,577,684 | |
Salini Impregilo SpA | | | 102,676 | | | | 434,555 | |
Salvatore Ferragamo SpA(a) | | | 48,286 | | | | 1,235,847 | |
Societa Cattolica di Assicurazioni SCRL | | | 178,796 | | | | 1,222,482 | |
Societa Iniziative Autostradali e Servizi SpA | | | 153,389 | | | | 1,573,151 | |
Tod’s SpA(a) | | | 14,973 | | | | 1,068,112 | |
Unipol Gruppo Finanziario SpA | | | 337,733 | | | | 1,368,576 | |
UnipolSai SpA | | | 364,128 | | | | 843,993 | |
Vittoria Assicurazioni SpA | | | 41,651 | | | | 405,338 | |
Zignago Vetro SpA | | | 57,508 | | | | 378,782 | |
| | | | | | | | |
| Total Italy | | | | | | | 56,321,382 | |
| Netherlands – 4.1% | | | | | | | | |
Aalberts Industries N.V. | | | 38,275 | | | | 1,329,861 | |
Accell Group | | | 22,190 | | | | 472,986 | |
Arcadis N.V. | | | 41,240 | | | | 770,249 | |
ASM International N.V. | | | 18,959 | | | | 850,471 | |
BE Semiconductor Industries N.V. | | | 47,434 | | | | 1,302,147 | |
Beter Bed Holding N.V. | | | 14,114 | | | | 353,840 | |
BinckBank N.V. | | | 72,479 | | | | 540,987 | |
Brunel International N.V. | | | 42,450 | | | | 895,159 | |
Corbion N.V. | | | 16,085 | | | | 382,540 | |
See Notes to Financial Statements.
| | | | |
| WisdomTree Developed World ex-U.S. and Currency Hedged Equity Funds | | | 47 | |
Schedule of Investments (concluded)
WisdomTree Europe Hedged SmallCap Equity Fund (EUSC)
March 31, 2016
| | | | | | | | |
| Investments | | Shares | | | Value | |
| | | | | | | | |
Euronext N.V.(b) | | | 30,771 | | | $ | 1,279,526 | |
NSI N.V. | | | 184,302 | | | | 876,629 | |
TKH Group N.V. CVA | | | 23,850 | | | | 1,022,719 | |
TNT Express N.V. | | | 96,727 | | | | 869,237 | |
| | | | | | | | |
| Total Netherlands | | | | | | | 10,946,351 | |
| Portugal – 3.2% | | | | | | | | |
Altri, SGPS, S.A. | | | 99,131 | | | | 433,220 | |
CTT-Correios de Portugal S.A. | | | 137,851 | | | | 1,299,119 | |
NOS, SGPS S.A. | | | 218,251 | | | | 1,457,429 | |
Portucel S.A. | | | 435,125 | | | | 1,586,710 | |
REN – Redes Energeticas Nacionais, SGPS, S.A. | | | 404,417 | | | | 1,328,180 | |
Semapa-Sociedade de Investimento e Gestao | | | 70,352 | | | | 929,968 | |
Sonae, SGPS, S.A.(a) | | | 1,168,624 | | | | 1,410,277 | |
| | | | | | | | |
| Total Portugal | | | | | | | 8,444,903 | |
| Spain – 9.1% | | | | | | | | |
Abengoa S.A. Class B(a) | | | 678,364 | | | | 201,761 | |
Acerinox S.A.(a) | | | 155,687 | | | | 1,806,066 | |
Atresmedia Corp. de Medios de Comunicaion S.A.(a) | | | 66,754 | | | | 732,550 | |
Bolsas y Mercados Espanoles SHMSF S.A.(a) | | | 80,761 | | | | 2,609,085 | |
Cia de Distribucion Integral Logista Holdings S.A. | | | 75,731 | | | | 1,713,904 | |
Cie Automotive S.A. | | | 34,584 | | | | 624,652 | |
Distribuidora Internacional de Alimentacion S.A.* | | | 278,731 | | | | 1,450,290 | |
Duro Felguera S.A.(a) | | | 237,435 | | | | 413,971 | |
Ebro Foods S.A.(a) | | | 99,482 | | | | 2,174,903 | |
Ence Energia y Celulosa S.A. | | | 174,544 | | | | 589,743 | |
Faes Farma S.A. | | | 196,229 | | | | 619,408 | |
Grupo Catalana Occidente S.A. | | | 55,812 | | | | 1,586,835 | |
Indra Sistemas S.A.*(a) | | | 126,753 | | | | 1,476,914 | |
Mediaset Espana Comunicacion S.A. | | | 70,094 | | | | 807,143 | |
Obrascon Huarte Lain S.A.(a) | | | 83,868 | | | | 536,062 | |
Papeles y Cartones de Europa S.A. | | | 59,364 | | | | 378,492 | |
Prosegur Cia de Seguridad S.A. | | | 250,160 | | | | 1,411,096 | |
Tecnicas Reunidas S.A.(a) | | | 35,394 | | | | 997,240 | |
Viscofan S.A. | | | 19,619 | | | | 1,177,088 | |
Zardoya Otis S.A.(a) | | | 261,709 | | | | 3,050,899 | |
| | | | | | | | |
| Total Spain | | | | | | | 24,358,102 | |
TOTAL COMMON STOCKS (Cost: $262,953,222) | | | | | | | 268,080,816 | |
| INVESTMENT OF CASH COLLATERAL FOR SECURITIES LOANED – 7.1% | |
| United States – 7.1% | | | | | | | | |
State Street Navigator Securities Lending Prime Portfolio, 0.50%(c) | | | | | | | | |
| (Cost: $19,074,318)(d) | | | 19,074,318 | | | | 19,074,318 | |
TOTAL INVESTMENTS IN SECURITIES – 107.3% (Cost: $282,027,540) | | | | | | | 287,155,134 | |
Liabilities in Excess of Cash, Foreign Currency and Other Assets – (7.3)% | | | | | | | (19,447,318 | ) |
| | | | | | | | |
| NET ASSETS – 100.0% | | | | | | $ | 267,707,816 | |
| * | Non-income producing security. |
| (a) | Security, or portion thereof, was on loan at March 31, 2016 (See Note 2). |
| (b) | This security is exempt from registration under rule 144A of the Securities Act of 1933. This security may be sold in transactions that are exempt from registration, normally to qualified institutional buyers. |
| (c) | Rate shown represents annualized 7-day yield as of March 31, 2016. |
| (d) | At March 31, 2016, the total market value of the Fund’s securities on loan was $24,062,711 and the total market value of the collateral held by the Fund was $25,361,032. The total market value of the collateral includes non-cash U.S. Government securities collateral having a value of $6,286,714. |
CVA – Certificaten Van Aandelen (Certificate of Stock)
RSP – Risparmio Italian Savings Shares
| | | | | | | | | | | | | | | | | | | | |
| FINANCIAL DERIVATIVE INSTRUMENTS | |
| FORWARD CONTRACTS | |
Settlement
Date | | Contracts
To Deliver | | | In
Exchange For | | | Unrealized
Gain (Loss) | |
4/4/2016 | | | EUR | | | | 49,167,831 | | | | USD | | | | 53,476,654 | | | $ | (2,552,572 | ) |
4/4/2016 | | | EUR | | | | 49,169,865 | | | | USD | | | | 53,476,654 | | | | (2,554,890 | ) |
4/4/2016 | | | EUR | | | | 37,462,725 | | | | USD | | | | 40,744,122 | | | | (1,946,544 | ) |
4/4/2016 | | | EUR | | | | 49,168,735 | | | | USD | | | | 53,476,654 | | | | (2,553,603 | ) |
4/4/2016 | | | EUR | | | | 49,168,961 | | | | USD | | | | 53,476,654 | | | | (2,553,860 | ) |
4/4/2016 | | | USD | | | | 53,476,654 | | | | EUR | | | | 46,929,105 | | | | 1,431 | |
4/4/2016 | | | USD | | | | 40,744,122 | | | | EUR | | | | 35,756,360 | | | | 2,056 | |
4/4/2016 | | | USD | | | | 53,476,654 | | | | EUR | | | | 46,929,105 | | | | 1,431 | |
4/4/2016 | | | USD | | | | 53,476,654 | | | | EUR | | | | 46,930,217 | | | | 2,698 | |
4/4/2016 | | | USD | | | | 53,476,654 | | | | EUR | | | | 46,928,570 | | | | 821 | |
5/3/2016 | | | EUR | | | | 37,758,855 | | | | USD | | | | 43,062,388 | | | | (2,622 | ) |
5/3/2016 | | | EUR | | | | 49,557,757 | | | | USD | | | | 56,519,383 | | | | (2,598 | ) |
5/3/2016 | | | EUR | | | | 49,557,931 | | | | USD | | | | 56,519,383 | | | | (2,797 | ) |
5/3/2016 | | | EUR | | | | 49,557,192 | | | | USD | | | | 56,519,383 | | | | (1,954 | ) |
5/3/2016 | | | EUR | | | | 49,560,017 | | | | USD | | | | 56,519,383 | | | | (5,175 | ) |
| | | | | | | | | | | | | | | | | | | $ | (12,168,178 | ) |
| | |
| CURRENCY LEGEND |
EUR | | – Euro |
USD | | – U.S. dollar |
See Notes to Financial Statements.
| | |
| 48 | | WisdomTree Developed World ex-U.S. and Currency Hedged Equity Funds |
Schedule of Investments
WisdomTree Europe Quality Dividend Growth Fund (EUDG)
March 31, 2016
| | | | | | | | |
| Investments | | Shares | | | Value | |
| | | | | | | | |
| COMMON STOCKS – 99.7% | | | | | | | | |
| Austria – 0.2% | | | | | | | | |
Vienna Insurance Group AG Wiener Versicherung Gruppe | | | 1,321 | | | $ | 27,999 | |
| Belgium – 5.8% | | | | | | | | |
Ackermans & van Haaren N.V. | | | 191 | | | | 27,131 | |
Anheuser-Busch InBev N.V. | | | 6,467 | | | | 805,115 | |
bpost S.A. | | | 2,620 | | | | 72,894 | |
Melexis N.V. | | | 336 | | | | 18,302 | |
UCB S.A. | | | 1,025 | | | | 78,539 | |
Umicore S.A. | | | 676 | | | | 33,702 | |
| | | | | | | | |
| Total Belgium | | | | | | | 1,035,683 | |
| Denmark – 4.7% | | | | | | | | |
Chr Hansen Holding A/S | | | 605 | | | | 40,679 | |
Coloplast A/S Class B | | | 1,680 | | | | 127,505 | |
Novo Nordisk A/S Class B | | | 10,348 | | | | 562,196 | |
Novozymes A/S Class B | | | 1,026 | | | | 46,200 | |
Pandora A/S | | | 318 | | | | 41,708 | |
SimCorp A/S | | | 311 | | | | 14,375 | |
| | | | | | | | |
| Total Denmark | | | | | | | 832,663 | |
| Finland – 2.5% | | | | | | | | |
Elisa Oyj(a) | | | 2,507 | | | | 97,619 | |
Huhtamaki Oyj | | | 846 | | | | 31,457 | |
Kone Oyj Class B | | | 4,306 | | | | 207,857 | |
Konecranes Oyj(a) | | | 820 | | | | 19,604 | |
Metsa Board Oyj | | | 3,105 | | | | 20,805 | |
Uponor Oyj | | | 543 | | | | 7,896 | |
Wartsila Oyj Abp | | | 1,458 | | | | 66,076 | |
| | | | | | | | |
| Total Finland | | | | | | | 451,314 | |
| France – 11.7% | | | | | | | | |
Airbus Group SE | | | 3,949 | | | | 262,580 | |
Alten S.A. | | | 444 | | | | 27,291 | |
Arkema S.A. | | | 633 | | | | 47,594 | |
BioMerieux | | | 161 | | | | 18,466 | |
Bureau Veritas S.A. | | | 2,730 | | | | 60,897 | |
Carrefour S.A. | | | 3,137 | | | | 86,438 | |
Cie Generale des Etablissements Michelin | | | 815 | | | | 83,521 | |
Dassault Systemes | | | 560 | | | | 44,498 | |
Essilor International S.A. | | | 617 | | | | 76,322 | |
Gaztransport Et Technigaz S.A. | | | 549 | | | | 17,993 | |
Hermes International | | | 153 | | | | 53,953 | |
Ingenico Group S.A. | | | 198 | | | | 22,777 | |
L’Oreal S.A. | | | 1,628 | | | | 292,099 | |
LVMH Moet Hennessy Louis Vuitton SE | | | 1,678 | | | | 287,781 | |
Plastic Omnium S.A. | | | 295 | | | | 10,161 | |
Publicis Groupe S.A. | | | 700 | | | | 49,225 | |
Renault S.A. | | | 983 | | | | 97,814 | |
Schneider Electric SE | | | 4,438 | | | | 280,884 | |
Societe BIC S.A. | | | 259 | | | | 39,018 | |
Sodexo S.A. | | | 566 | | | | 61,106 | |
Tarkett S.A. | | | 437 | | | | 13,719 | |
Teleperformance | | | 281 | | | | 24,740 | |
Thales S.A. | | | 1,085 | | | | 95,204 | |
| | | | | | | | |
Valeo S.A. | | | 229 | | | | 35,699 | |
| | | | | | | | |
| Total France | | | | | | | 2,089,780 | |
| Germany – 14.1% | | | | | | | | |
adidas AG | | | 793 | | | | 93,077 | |
Aurubis AG | | | 319 | | | | 15,897 | |
Axel Springer SE | | | 745 | | | | 40,215 | |
Bayer AG Registered Shares | | | 4,339 | | | | 510,768 | |
Beiersdorf AG | | | 475 | | | | 42,946 | |
Brenntag AG | | | 763 | | | | 43,648 | |
Continental AG | | | 528 | | | | 120,336 | |
Daimler AG Registered Shares | | | 5,160 | | | | 396,141 | |
Duerr AG | | | 252 | | | | 19,835 | |
Evonik Industries AG | | | 4,112 | | | | 123,542 | |
Fielmann AG | | | 508 | | | | 38,612 | |
Fresenius Medical Care AG & Co. KGaA | | | 965 | | | | 85,598 | |
Fresenius SE & Co. KGaA | | | 1,276 | | | | 93,366 | |
GEA Group AG | | | 928 | | | | 45,473 | |
Hugo Boss AG | | | 30 | | | | 1,970 | |
Infineon Technologies AG | | | 5,616 | | | | 80,028 | |
LANXESS AG | | | 251 | | | | 12,082 | |
MTU Aero Engines AG | | | 269 | | | | 25,838 | |
ProSiebenSat.1 Media SE | | | 1,467 | | | | 75,537 | |
RHOEN-KLINIKUM AG | | | 944 | | | | 29,421 | |
SAP SE | | | 6,197 | | | | 502,094 | |
Symrise AG | | | 570 | | | | 38,323 | |
United Internet AG Registered Shares | | | 1,072 | | | | 53,879 | |
Wacker Chemie AG | | | 259 | | | | 22,826 | |
| | | | | | | | |
| Total Germany | | | | | | | 2,511,452 | |
| Ireland – 0.2% | | | | | | | | |
Paddy Power Betfair PLC | | | 305 | | | | 42,611 | |
| Italy – 2.7% | | | | | | | | |
Anima Holding SpA(b) | | | 2,345 | | | | 17,182 | |
Atlantia SpA | | | 7,599 | | | | 211,031 | |
DiaSorin SpA | | | 415 | | | | 24,000 | |
Industria Macchine Automatiche SpA | | | 398 | | | | 23,380 | |
Luxottica Group SpA | | | 1,991 | | | | 110,039 | |
Prysmian SpA | | | 1,381 | | | | 31,333 | |
Recordati SpA | | | 1,937 | | | | 48,561 | |
Salvatore Ferragamo SpA | | | 517 | | | | 13,232 | |
| | | | | | | | |
| Total Italy | | | | | | | 478,758 | |
| Netherlands – 3.0% | | | | | | | | |
Aalberts Industries N.V. | | | 685 | | | | 23,800 | |
ASML Holding N.V. | | | 965 | | | | 98,178 | |
Euronext N.V.(b) | | | 563 | | | | 23,411 | |
Heineken Holding N.V. | | | 972 | | | | 75,962 | |
Heineken N.V. | | | 1,706 | | | | 154,845 | |
Koninklijke Ahold N.V. | | | 4,299 | | | | 96,852 | |
Wolters Kluwer N.V. | | | 1,511 | | | | 60,403 | |
| | | | | | | | |
| Total Netherlands | | | | | | | 533,451 | |
| Norway – 1.8% | | | | | | | | |
Kongsberg Gruppen ASA | | | 1,099 | | | | 18,070 | |
Telenor ASA | | | 10,256 | | | | 166,030 | |
See Notes to Financial Statements.
| | | | |
| WisdomTree Developed World ex-U.S. and Currency Hedged Equity Funds | | | 49 | |
Schedule of Investments (continued)
WisdomTree Europe Quality Dividend Growth Fund (EUDG)
March 31, 2016
| | | | | | | | |
| Investments | | Shares | | | Value | |
| | | | | | | | |
Veidekke ASA | | | 1,604 | | | $ | 21,817 | |
Yara International ASA | | | 3,079 | | | | 115,920 | |
| | | | | | | | |
| Total Norway | | | | | | | 321,837 | |
| Portugal – 0.3% | | | | | | | | |
Jeronimo Martins, SGPS, S.A. | | | 2,438 | | | | 39,951 | |
NOS, SGPS S.A. | | | 2,493 | | | | 16,648 | |
| | | | | | | | |
| Total Portugal | | | | | | | 56,599 | |
| Spain – 3.8% | | | | | | | | |
Abertis Infraestructuras S.A. | | | 10,151 | | | | 167,152 | |
Amadeus IT Holding S.A. Class A | | | 2,549 | | | | 109,479 | |
Distribuidora Internacional de Alimentacion S.A.* | | | 4,717 | | | | 24,543 | |
Industria de Diseno Textil S.A. | | | 9,100 | | | | 306,586 | |
Prosegur Cia de Seguridad S.A. | | | 4,502 | | | | 25,395 | |
Zardoya Otis S.A. | | | 4,074 | | | | 47,493 | |
| | | | | | | | |
| Total Spain | | | | | | | 680,648 | |
| Sweden – 8.7% | | | | | | | | |
Alfa Laval AB | | | 2,847 | | | | 46,673 | |
Assa Abloy AB Class B | | | 3,784 | | | | 74,777 | |
Atlas Copco AB Class A | | | 5,450 | | | | 137,348 | |
Atlas Copco AB Class B | | | 2,818 | | | | 66,533 | |
Axfood AB | | | 1,420 | | | | 26,275 | |
BillerudKorsnas AB | | | 1,627 | | | | 26,633 | |
Boliden AB | | | 2,550 | | | | 40,861 | |
Electrolux AB Series B | | | 1,285 | | | | 33,858 | |
Getinge AB Class B(a) | | | 941 | | | | 21,718 | |
Hennes & Mauritz AB Class B | | | 7,995 | | | | 266,970 | |
Hexagon AB Class B | | | 1,201 | | | | 46,815 | |
Hexpol AB | | | 1,728 | | | | 19,237 | |
Holmen AB Class B | | | 855 | | | | 28,033 | |
Intrum Justitia AB | | | 696 | | | | 24,589 | |
Loomis AB Class B | | | 564 | | | | 15,967 | |
Modern Times Group MTG AB Class B | | | 632 | | | | 18,960 | |
NCC AB Class B | | | 1,099 | | | | 40,087 | |
Sandvik AB | | | 11,154 | | | | 115,576 | |
SKF AB Class B(a) | | | 2,909 | | | | 52,606 | |
Tele2 AB Class B | | | 6,011 | | | | 55,834 | |
Telefonaktiebolaget LM Ericsson Class B | | | 32,965 | | | | 330,597 | |
Trelleborg AB Class B | | | 1,768 | | | | 35,025 | |
Wihlborgs Fastigheter AB | | | 1,050 | | | | 22,330 | |
| | | | | | | | |
| Total Sweden | | | | | | | 1,547,302 | |
| Switzerland – 14.9% | | | | | | | | |
ABB Ltd. Registered Shares* | | | 15,470 | | | | 302,728 | |
Actelion Ltd. Registered Shares* | | | 345 | | | | 51,769 | |
Adecco S.A. Registered Shares* | | | 1,315 | | | | 86,028 | |
Cie Financiere Richemont S.A. Registered Shares | | | 1,794 | | | | 119,050 | |
Galenica AG Registered Shares | | | 35 | | | | 52,848 | |
Geberit AG Registered Shares | | | 253 | | | | 94,923 | |
Georg Fischer AG Registered Shares | | | 33 | | | | 26,775 | |
Partners Group Holding AG | | | 243 | | | | 98,073 | |
Roche Holding AG Bearer Shares | | | 1,188 | | | | 299,590 | |
Roche Holding AG Genusschein | | | 4,399 | | | | 1,087,290 | |
Schindler Holding AG Registered Shares | | | 266 | | | | 48,914 | |
| | | | | | | | |
Sonova Holding AG Registered Shares | | | 346 | | | | 44,368 | |
Straumann Holding AG Registered Shares | | | 94 | | | | 32,539 | |
Syngenta AG Registered Shares | | | 763 | | | | 318,697 | |
| | | | | | | | |
| Total Switzerland | | | | 2,663,592 | |
| United Kingdom – 25.3% | | | | | | | | |
ARM Holdings PLC | | | 3,206 | | | | 46,725 | |
Ashmore Group PLC(a) | | | 12,009 | | | | 49,641 | |
Ashtead Group PLC | | | 1,770 | | | | 21,980 | |
Babcock International Group PLC | | | 2,575 | | | | 35,141 | |
BBA Aviation PLC | | | 8,315 | | | | 23,950 | |
Bellway PLC | | | 645 | | | | 24,317 | |
Berkeley Group Holdings PLC | | | 1,431 | | | | 66,187 | |
Big Yellow Group PLC | | | 1,804 | | | | 20,082 | |
Bodycote PLC | | | 2,959 | | | | 25,667 | |
Booker Group PLC | | | 7,539 | | | | 18,670 | |
Bovis Homes Group PLC | | | 1,033 | | | | 13,830 | |
British American Tobacco PLC | | | 12,969 | | | | 762,390 | |
Britvic PLC | | | 1,809 | | | | 18,474 | |
Burberry Group PLC | | | 1,746 | | | | 34,255 | |
Capita PLC | | | 4,089 | | | | 61,240 | |
Carillion PLC | | | 6,634 | | | | 28,043 | |
Carnival PLC | | | 800 | | | | 43,142 | |
Compass Group PLC | | | 7,146 | | | | 126,127 | |
Croda International PLC | | | 996 | | | | 43,505 | |
Daily Mail & General Trust PLC Class A Non-Voting Shares | | | 1,677 | | | | 16,776 | |
Derwent London PLC | | | 437 | | | | 19,798 | |
Diageo PLC | | | 13,906 | | | | 376,057 | |
easyJet PLC | | | 2,748 | | | | 59,996 | |
Essentra PLC | | | 1,618 | | | | 19,244 | |
Foxtons Group PLC | | | 2,415 | | | | 5,649 | |
Fresnillo PLC | | | 908 | | | | 12,431 | |
Galliford Try PLC | | | 916 | | | | 18,893 | |
Go-Ahead Group PLC | | | 432 | | | | 16,454 | |
Halma PLC | | | 2,450 | | | | 32,097 | |
Hargreaves Lansdown PLC | | | 3,859 | | | | 74,545 | |
Hays PLC | | | 7,748 | | | | 13,475 | |
Howden Joinery Group PLC | | | 2,949 | | | | 20,265 | |
IG Group Holdings PLC | | | 4,570 | | | | 52,548 | |
IMI PLC | | | 2,620 | | | | 35,868 | |
Inchcape PLC | | | 2,293 | | | | 23,845 | |
Inmarsat PLC | | | 4,440 | | | | 62,827 | |
Interserve PLC | | | 2,039 | | | | 12,713 | |
Intertek Group PLC | | | 859 | | | | 39,101 | |
ITV PLC | | | 12,443 | | | | 43,137 | |
James Fisher & Sons PLC | | | 440 | | | | 8,341 | |
Johnson Matthey PLC | | | 824 | | | | 32,498 | |
Jupiter Fund Management PLC | | | 4,443 | | | | 26,138 | |
London Stock Exchange Group PLC | | | 1,073 | | | | 43,491 | |
Melrose Industries PLC | | | 1,255 | | | | 6,431 | |
Merlin Entertainments PLC(b) | | | 3,054 | | | | 20,345 | |
Michael Page International PLC | | | 2,281 | | | | 13,993 | |
Moneysupermarket.com Group PLC | | | 5,823 | | | | 26,590 | |
N Brown Group PLC | | | 1,832 | | | | 8,605 | |
See Notes to Financial Statements.
| | |
| 50 | | WisdomTree Developed World ex-U.S. and Currency Hedged Equity Funds |
Schedule of Investments (concluded)
WisdomTree Europe Quality Dividend Growth Fund (EUDG)
March 31, 2016
| | | | | | | | |
| Investments | | Shares | | | Value | |
| | | | | | | | |
Next PLC | | | 739 | | | $ | 57,357 | |
Reckitt Benckiser Group PLC | | | 3,229 | | | | 312,342 | |
RELX N.V. | | | 5,363 | | | | 93,780 | |
RELX PLC | | | 5,154 | | | | 95,857 | |
Renishaw PLC | | | 485 | | | | 12,792 | |
Sage Group PLC (The) | | | 8,088 | | | | 73,120 | |
Senior PLC | | | 5,759 | | | | 18,881 | |
Sky PLC | | | 8,885 | | | | 130,769 | |
Smith & Nephew PLC | | | 4,839 | | | | 79,844 | |
Spirax-Sarco Engineering PLC | | | 416 | | | | 21,764 | |
St. James’s Place PLC | | | 4,203 | | | | 55,486 | |
Taylor Wimpey PLC | | | 28,844 | | | | 78,894 | |
Travis Perkins PLC | | | 1,171 | | | | 30,750 | |
Unilever N.V. CVA | | | 9,577 | | | | 429,827 | |
Unilever PLC | | | 7,284 | | | | 330,044 | |
Vesuvius PLC | | | 3,923 | | | | 18,703 | |
Whitbread PLC | | | 570 | | | | 32,443 | |
William Hill PLC | | | 4,558 | | | | 21,422 | |
WS Atkins PLC | | | 793 | | | | 15,615 | |
| | | | | | | | |
| Total United Kingdom | | | | | | | 4,515,207 | |
TOTAL COMMON STOCKS (Cost: $18,546,340) | | | | | | | 17,788,896 | |
| INVESTMENT OF CASH COLLATERAL FOR SECURITIES LOANED – 1.3% | |
| United States – 1.3% | | | | | | | | |
State Street Navigator Securities Lending Prime Portfolio, 0.50%(c) | | | | | | | | |
| (Cost: $238,241)(d) | | | 238,241 | | | | 238,241 | |
TOTAL INVESTMENTS IN SECURITIES – 101.0% (Cost: $18,784,581) | | | | | | | 18,027,137 | |
Liabilities in Excess of Cash, Foreign Currency and
Other Assets – (1.0)% | | | | | | | (173,426 | ) |
| | | | | | | | |
| NET ASSETS – 100.0% | | | $ | 17,853,711 | |
| * | Non-income producing security. |
| (a) | Security, or portion thereof, was on loan at March 31, 2016 (See Note 2). |
| (b) | This security is exempt from registration under rule 144A of the Securities Act of 1933. This security may be sold in transactions that are exempt from registration, normally to qualified institutional buyers. |
| (c) | Rate shown represents annualized 7-day yield as of March 31, 2016. |
| (d) | At March 31, 2016, the total market value of the Fund’s securities on loan was $226,763 and the total market value of the collateral held by the Fund was $238,241. |
| CVA | – Certificaten Van Aandelen (Certificate of Stock) |
See Notes to Financial Statements.
| | | | |
| WisdomTree Developed World ex-U.S. and Currency Hedged Equity Funds | | | 51 | |
Schedule of Investments
WisdomTree Europe SmallCap Dividend Fund (DFE)
March 31, 2016
| | | | | | | | |
| Investments | | Shares | | | Value | |
| | | | | | | | |
| COMMON STOCKS – 99.4% | | | | | | | | |
| Austria – 1.8% | | | | | | | | |
Austria Technologie & Systemtechnik AG | | | 85,746 | | | $ | 1,260,483 | |
CAT Oil AG | | | 89,344 | | | | 738,341 | |
Lenzing AG | | | 56,313 | | | | 4,464,412 | |
POLYTEC Holding AG(a) | | | 120,657 | | | | 1,040,835 | |
RHI AG | | | 155,538 | | | | 3,043,269 | |
Schoeller-Bleckmann Oilfield Equipment AG(a) | | | 55,325 | | | | 3,373,572 | |
Semperit AG Holding | | | 53,819 | | | | 2,085,202 | |
Wienerberger AG | | | 153,369 | | | | 2,950,147 | |
Zumtobel Group AG | | | 41,658 | | | | 699,016 | |
| | | | | | | | |
| Total Austria | | | | 19,655,277 | |
| Belgium – 5.5% | | | | | | | | |
Barco N.V. | | | 42,897 | | | | 3,095,291 | |
Bekaert S.A.(a) | | | 255,991 | | | | 10,415,672 | |
Cofinimmo S.A. | | | 180,215 | | | | 22,148,517 | |
Econocom Group S.A./N.V. | | | 279,560 | | | | 2,899,012 | |
Euronav N.V. | | | 291,195 | | | | 2,983,496 | |
EVS Broadcast Equipment S.A. | | | 89,582 | | | | 3,316,173 | |
Exmar N.V.(a) | | | 289,765 | | | | 2,436,229 | |
Kinepolis Group N.V. | | | 76,980 | | | | 3,344,424 | |
Recticel S.A. | | | 284,155 | | | | 1,876,797 | |
Warehouses De Pauw | | | 93,238 | | | | 8,877,138 | |
| | | | | | | | |
| Total Belgium | | | | 61,392,749 | |
| Denmark – 3.5% | | | | | | | | |
Alm Brand A/S | | | 307,611 | | | | 2,258,403 | |
Dfds A/S | | | 172,039 | | | | 6,262,710 | |
Matas A/S | | | 212,359 | | | | 4,303,729 | |
NKT Holding A/S | | | 28,720 | | | | 1,659,605 | |
Rockwool International A/S Class B | | | 15,357 | | | | 2,442,858 | |
Royal Unibrew A/S | | | 199,290 | | | | 9,632,322 | |
Schouw & Co. | | | 77,119 | | | | 4,824,398 | |
SimCorp A/S | | | 104,364 | | | | 4,823,959 | |
Spar Nord Bank A/S | | | 325,855 | | | | 3,115,034 | |
| | | | | | | | |
| Total Denmark | | | | 39,323,018 | |
| Finland – 6.8% | | | | | | | | |
Aspo Oyj | | | 76,247 | | | | 645,573 | |
Atria Oyj | | | 71,910 | | | | 716,200 | |
Bittium Oyj(a) | | | 197,589 | | | | 1,443,293 | |
Caverion Corp. | | | 365,074 | | | | 3,540,332 | |
Cramo Oyj(a) | | | 149,884 | | | | 3,093,195 | |
F-Secure Oyj(a) | | | 435,192 | | | | 1,304,278 | |
HKScan Oyj Class A | | | 194,481 | | | | 720,268 | |
Kemira Oyj | | | 1,041,417 | | | | 11,641,991 | |
Konecranes Oyj(a) | | | 290,197 | | | | 6,937,963 | |
Metsa Board Oyj | | | 930,741 | | | | 6,236,483 | |
PKC Group Oyj(a) | | | 103,044 | | | | 1,827,115 | |
Raisio Oyj Class V | | | 496,205 | | | | 2,448,401 | |
Ramirent Oyj | | | 675,403 | | | | 4,425,521 | |
Sanoma Oyj(a) | | | 767,950 | | | | 3,763,007 | |
Technopolis Oyj(a) | | | 520,019 | | | | 2,222,205 | |
Tieto Oyj | | | 412,270 | | | | 10,767,873 | |
| | | | | | | | |
Tikkurila Oyj | | | 171,488 | | | | 3,118,891 | |
Uponor Oyj | | | 254,040 | | | | 3,693,910 | |
Valmet Oyj | | | 465,705 | | | | 5,137,121 | |
YIT Oyj(a) | | | 420,819 | | | | 2,385,254 | |
| | | | | | | | |
| Total Finland | | | | 76,068,874 | |
| France – 3.7% | | | | | | | | |
Albioma S.A. | | | 137,583 | | | | 2,132,246 | |
Alten S.A. | | | 102,006 | | | | 6,270,039 | |
Altran Technologies S.A. | | | 359,289 | | | | 4,986,833 | |
Assystem | | | 28,491 | | | | 772,713 | |
Haulotte Group S.A. | | | 30,007 | | | | 478,723 | |
IPSOS | | | 149,026 | | | | 3,486,459 | |
Jacquet Metal Service | | | 87,053 | | | | 1,254,896 | |
Lectra | | | 103,830 | | | | 1,512,124 | |
Neopost S.A. | | | 425,397 | | | | 8,953,542 | |
Saft Groupe S.A. | | | 73,290 | | | | 2,220,734 | |
Sopra Steria Group | | | 35,880 | | | | 4,246,122 | |
Tarkett S.A. | | | 155,257 | | | | 4,874,234 | |
| | | | | | | | |
| Total France | | | | 41,188,665 | |
| Germany – 8.4% | | | | | | | | |
Adler Modemaerkte AG | | | 130,164 | | | | 1,243,141 | |
alstria office REIT-AG* | | | 576,015 | | | | 8,323,129 | |
AURELIUS SE & Co. KGaA | | | 88,567 | | | | 5,399,571 | |
BayWa AG(a) | | | 89,680 | | | | 3,037,743 | |
Bechtle AG | | | 48,016 | | | | 4,967,178 | |
Bertrandt AG | | | 26,312 | | | | 3,023,871 | |
Borussia Dortmund GmbH & Co. KGaA(a) | | | 324,992 | | | | 1,488,786 | |
CANCOM SE | | | 28,315 | | | | 1,415,042 | |
Carl Zeiss Meditec AG Bearer Shares | | | 200,572 | | | | 6,203,171 | |
CompuGroup Medical SE | | | 89,432 | | | | 3,786,041 | |
Deutz AG | | | 196,691 | | | | 932,420 | |
Elmos Semiconductor AG | | | 54,664 | | | | 747,509 | |
ElringKlinger AG | | | 180,773 | | | | 4,961,509 | |
Gerresheimer AG | | | 53,749 | | | | 4,221,942 | |
Gerry Weber International AG(a) | | | 221,380 | | | | 3,110,535 | |
GFT Technologies SE | | | 53,748 | | | | 1,366,762 | |
Grammer AG | | | 38,880 | | | | 1,552,472 | |
Hamburger Hafen und Logistik AG | | | 191,125 | | | | 2,818,288 | |
Indus Holding AG | | | 76,575 | | | | 3,781,895 | |
Jenoptik AG | | | 109,993 | | | | 1,761,063 | |
MLP AG | | | 534,081 | | | | 1,730,285 | |
NORMA Group SE | | | 60,819 | | | | 3,411,950 | |
Pfeiffer Vacuum Technology AG | | | 33,427 | | | | 3,754,704 | |
QSC AG(a) | | | 909,187 | | | | 1,170,753 | |
RIB Software AG(a) | | | 68,614 | | | | 713,867 | |
SHW AG(a) | | | 12,921 | | | | 365,600 | |
Sixt SE | | | 73,637 | | | | 3,969,928 | |
Stroeer SE & Co KGaA(a) | | | 66,057 | | | | 4,158,960 | |
Takkt AG | | | 139,344 | | | | 2,680,367 | |
TLG Immobilien AG | | | 140,065 | | | | 3,056,553 | |
VTG AG(a) | | | 80,204 | | | | 2,456,281 | |
Wacker Neuson SE | | | 209,393 | | | | 3,335,822 | |
| | | | | | | | |
| Total Germany | | | | 94,947,138 | |
See Notes to Financial Statements.
| | |
| 52 | | WisdomTree Developed World ex-U.S. and Currency Hedged Equity Funds |
Schedule of Investments (continued)
WisdomTree Europe SmallCap Dividend Fund (DFE)
March 31, 2016
| | | | | | | | |
| Investments | | Shares | | | Value | |
| | | | | | | | |
| Ireland – 2.6% | | | | | | | | |
C&C Group PLC | | | 1,474,424 | | | $ | 6,670,317 | |
Fyffes PLC | | | 857,543 | | | | 1,358,327 | |
Greencore Group PLC | | | 945,030 | | | | 5,093,593 | |
Hibernia REIT PLC | | | 1,161,227 | | | | 1,722,906 | |
IFG Group PLC | | | 581,406 | | | | 1,404,588 | |
Irish Continental Group PLC | | | 668,453 | | | | 4,151,461 | |
Origin Enterprises PLC | | | 397,146 | | | | 3,041,257 | |
Total Produce PLC | | | 1,013,555 | | | | 1,836,445 | |
UDG Healthcare PLC | | | 531,009 | | | | 4,457,200 | |
| | | | | | | | |
| Total Ireland | | | | 29,736,094 | |
| Italy – 10.2% | | | | | | | | |
Amplifon SpA | | | 264,385 | | | | 2,295,754 | |
Ansaldo STS SpA | | | 408,743 | | | | 4,886,067 | |
Ascopiave SpA | | | 1,721,440 | | | | 4,496,143 | |
Astaldi SpA(a) | | | 279,208 | | | | 1,293,049 | |
ASTM SpA | | | 358,353 | | | | 4,144,868 | |
Banca IFIS SpA | | | 245,994 | | | | 8,160,190 | |
Banca Popolare di Sondrio SCARL | | | 871,564 | | | | 3,061,015 | |
Banco di Desio e della Brianza SpA | | | 455,623 | | | | 1,269,976 | |
BI Esse SpA | | | 74,420 | | | | 1,211,868 | |
Brunello Cucinelli SpA(a) | | | 42,801 | | | | 811,598 | |
Cairo Communication SpA(a) | | | 246,924 | | | | 1,323,060 | |
Cementir Holding SpA | | | 352,246 | | | | 1,763,761 | |
Danieli & C. Officine Meccaniche SpA | | | 34,956 | | | | 735,736 | |
Danieli & C. Officine Meccaniche SpA RSP | | | 177,935 | | | | 2,788,031 | |
Datalogic SpA | | | 136,825 | | | | 2,674,011 | |
Ei Towers SpA | | | 74,678 | | | | 4,168,166 | |
ERG SpA | | | 872,207 | | | | 11,887,330 | |
Esprinet SpA | | | 118,718 | | | | 1,074,164 | |
Falck Renewables SpA | | | 2,156,339 | | | | 2,370,024 | |
Immobiliare Grande Distribuzione SIIQ SpA | | | 4,751,641 | | | | 4,331,788 | |
Industria Macchine Automatiche SpA | | | 123,512 | | | | 7,255,568 | |
Interpump Group SpA | | | 183,295 | | | | 2,684,030 | |
Iren SpA | | | 7,027,978 | | | | 12,613,759 | |
Italmobiliare SpA RSP | | | 38,259 | | | | 1,191,535 | |
MARR SpA | | | 300,174 | | | | 6,054,523 | |
Moleskine SpA | | | 918,228 | | | | 1,948,336 | |
Piaggio & C. SpA(a) | | | 1,142,389 | | | | 2,427,876 | |
RAI Way SpA(b) | | | 957,322 | | | | 5,149,127 | |
Societa Cattolica di Assicurazioni SCRL | | | 1,139,117 | | | | 7,788,488 | |
Trevi Finanziaria Industriale SpA(a) | | | 781,695 | | | | 1,336,171 | |
Vittoria Assicurazioni SpA | | | 194,082 | | | | 1,888,760 | |
| | | | | | | | |
| Total Italy | | | | 115,084,772 | |
| Netherlands – 3.5% | | | | | | | | |
Accell Group | | | 121,914 | | | | 2,598,633 | |
BE Semiconductor Industries N.V. | | | 327,144 | | | | 8,980,682 | |
Beter Bed Holding N.V. | | | 88,144 | | | | 2,209,780 | |
BinckBank N.V. | | | 443,480 | | | | 3,310,159 | |
Brunel International N.V. | | | 221,543 | | | | 4,671,762 | |
Corbion N.V. | | | 100,625 | | | | 2,393,106 | |
IMCD Group N.V. | | | 36,915 | | | | 1,382,726 | |
Kendrion N.V. | | | 63,750 | | | | 1,572,793 | |
| | | | | | | | |
NSI N.V. | | | 960,755 | | | | 4,569,816 | |
TKH Group N.V. CVA | | | 146,052 | | | | 6,262,897 | |
Wessanen | | | 146,252 | | | | 1,585,951 | |
| | | | | | | | |
| Total Netherlands | | | | 39,538,305 | |
| Norway – 5.7% | | | | | | | | |
ABG Sundal Collier Holding ASA | | | 4,410,415 | | | | 3,348,636 | |
American Shipping Co. ASA* | | | 244,119 | | | | 817,542 | |
Austevoll Seafood ASA | | | 634,673 | | | | 5,217,804 | |
Borregaard ASA | | | 333,896 | | | | 2,240,439 | |
Entra ASA(b) | | | 677,819 | | | | 6,392,006 | |
Leroy Seafood Group ASA | | | 293,792 | | | | 13,888,188 | |
Norway Royal Salmon ASA | | | 141,135 | | | | 1,868,434 | |
Protector Forsikring ASA | | | 366,935 | | | | 3,338,293 | |
Selvaag Bolig ASA | | | 614,335 | | | | 1,879,121 | |
SpareBank 1 Nord Norge | | | 600,169 | | | | 2,721,032 | |
SpareBank 1 SMN | | | 617,374 | | | | 3,937,310 | |
SpareBank 1 SR-Bank ASA | | | 682,656 | | | | 3,350,864 | |
Spectrum ASA | | | 77,148 | | | | 251,836 | |
Tomra Systems ASA | | | 403,121 | | | | 4,203,619 | |
Veidekke ASA | | | 434,428 | | | | 5,908,799 | |
XXL ASA(b) | | | 429,152 | | | | 5,240,363 | |
| | | | | | | | |
| Total Norway | | | | 64,604,286 | |
| Portugal – 2.2% | | | | | | | | |
Altri, SGPS, S.A. | | | 592,926 | | | | 2,591,191 | |
CTT-Correios de Portugal S.A. | | | 867,631 | | | | 8,176,626 | |
REN – Redes Energeticas Nacionais, SGPS, S.A. | | | 2,889,079 | | | | 9,488,269 | |
Semapa-Sociedade de Investimento e Gestao | | | 360,298 | | | | 4,762,702 | |
| | | | | | | | |
| Total Portugal | | | | 25,018,788 | |
| Spain – 2.8% | | | | | | | | |
Abengoa S.A. Class A(a) | | | 369,034 | | | | 294,373 | |
Cie Automotive S.A. | | | 231,762 | | | | 4,186,056 | |
Duro Felguera S.A.(a) | | | 1,218,068 | | | | 2,123,716 | |
Ence Energia y Celulosa S.A. | | | 1,045,863 | | | | 3,533,728 | |
Faes Farma S.A. | | | 1,214,248 | | | | 3,832,840 | |
Indra Sistemas S.A.*(a) | | | 807,459 | | | | 9,408,435 | |
Laboratorios Farmaceuticos Rovi S.A. | | | 91,577 | | | | 1,541,347 | |
Obrascon Huarte Lain S.A.(a) | | | 461,008 | | | | 2,946,643 | |
Papeles y Cartones de Europa S.A. | | | 430,386 | | | | 2,744,049 | |
Pescanova S.A.*† | | | 3,781 | | | | 0 | |
Tubacex S.A.(a) | | | 414,691 | | | | 978,202 | |
| | | | | | | | |
| Total Spain | | | | 31,589,389 | |
| Sweden – 14.3% | | | | | | | | |
Acando AB | | | 1,081,517 | | | | 2,641,523 | |
AddTech AB Class B(a) | | | 97,120 | | | | 1,341,784 | |
AF AB Class B | | | 252,240 | | | | 4,636,135 | |
Avanza Bank Holding AB | | | 75,442 | | | | 3,368,819 | |
B&B Tools AB Class B | | | 87,006 | | | | 1,604,524 | |
Betsson AB* | | | 227,586 | | | | 3,537,301 | |
Bilia AB Class A | | | 269,570 | | | | 6,051,999 | |
Bufab AB | | | 216,611 | | | | 1,456,240 | |
Bulten AB(a) | | | 119,971 | | | | 1,102,525 | |
See Notes to Financial Statements.
| | | | |
| WisdomTree Developed World ex-U.S. and Currency Hedged Equity Funds | | | 53 | |
Schedule of Investments (continued)
WisdomTree Europe SmallCap Dividend Fund (DFE)
March 31, 2016
| | | | | | | | |
| Investments | | Shares | | | Value | |
| | | | | | | | |
Byggmax Group AB | | | 373,664 | | | $ | 3,433,946 | |
Clas Ohlson AB Class B | | | 258,944 | | | | 4,951,006 | |
Com Hem Holding AB | | | 372,974 | | | | 3,443,707 | |
Duni AB | | | 161,037 | | | | 2,676,766 | |
Granges AB | | | 218,299 | | | | 1,898,439 | |
Gunnebo AB | | | 219,281 | | | | 1,171,237 | |
Haldex AB(a) | | | 132,428 | | | | 1,167,997 | |
Hemfosa Fastigheter AB | | | 168,095 | | | | 1,850,627 | |
HIQ International AB* | | | 452,147 | | | | 2,788,724 | |
Holmen AB Class B | | | 302,272 | | | | 9,910,802 | |
Husqvarna AB Class A | | | 180,917 | | | | 1,328,976 | |
Indutrade AB | | | 100,877 | | | | 6,199,430 | |
Inwido AB | | | 139,789 | | | | 1,724,364 | |
KappAhl AB | | | 352,068 | | | | 1,402,765 | |
KNOW IT AB | | | 224,120 | | | | 1,824,654 | |
Kungsleden AB | | | 648,177 | | | | 4,597,454 | |
Lifco AB Class B | | | 162,144 | | | | 4,360,269 | |
Lindab International AB | | | 184,516 | | | | 1,476,046 | |
Loomis AB Class B | | | 210,932 | | | | 5,971,467 | |
Mekonomen AB(a) | | | 138,495 | | | | 3,433,887 | |
Modern Times Group MTG AB Class B(a) | | | 366,755 | | | | 11,002,605 | |
Mycronic AB | | | 166,690 | | | | 1,506,167 | |
NetEnt AB* | | | 83,168 | | | | 4,702,803 | |
New Wave Group AB Class B(a) | | | 235,295 | | | | 1,015,866 | |
Nobia AB | | | 461,345 | | | | 4,831,583 | |
Nolato AB Class B | | | 133,790 | | | | 3,754,576 | |
Nordnet AB Class B | | | 528,435 | | | | 2,261,918 | |
Peab AB | | | 1,250,535 | | | | 11,068,115 | |
Platzer Fastigheter Holding AB Class B(a) | | | 204,133 | | | | 1,120,545 | |
Ratos AB Class B | | | 1,847,468 | | | | 11,861,881 | |
Scandi Standard AB | | | 243,207 | | | | 1,770,044 | |
Semcon AB(a) | | | 78,312 | | | | 375,780 | |
Skandinaviska Enskilda Banken AB Class C(a) | | | 131,793 | | | | 1,368,864 | |
SkiStar AB | | | 116,848 | | | | 1,679,203 | |
Svenska Handelsbanken AB Class B(a) | | | 149,166 | | | | 2,081,078 | |
Thule Group AB (The)(b) | | | 135,566 | | | | 1,872,944 | |
Wihlborgs Fastigheter AB | | | 325,287 | | | | 6,917,670 | |
| | | | | | | | |
| Total Sweden | | | | 160,545,055 | |
| Switzerland – 3.3% | | | | | | | | |
Ascom Holding AG Registered Shares | | | 144,911 | | | | 2,731,315 | |
Cembra Money Bank AG* | | | 203,818 | | | | 14,302,271 | |
EFG International AG* | | | 367,184 | | | | 2,108,821 | |
Gategroup Holding AG* | | | 51,004 | | | | 2,290,160 | |
Implenia AG Registered Shares | | | 69,512 | | | | 4,376,937 | |
Kudelski S.A. Bearer Shares | | | 155,246 | | | | 2,658,627 | |
Mobilezone Holding AG Registered Shares | | | 164,206 | | | | 2,486,281 | |
Swissquote Group Holding S.A. Registered Shares | | | 55,125 | | | | 1,375,750 | |
Tecan Group AG Registered Shares | | | 19,670 | | | | 3,000,874 | |
U-Blox AG* | | | 8,975 | | | | 1,731,927 | |
| | | | | | | | |
| Total Switzerland | | | | 37,062,963 | |
| United Arab Emirates – 0.0% | | | | | | | | |
Gulf Marine Services PLC | | | 332,509 | | | | 314,229 | |
| | | | | | | | |
| United Kingdom – 25.1% | | | | | | | | |
A.G.Barr PLC | | | 189,188 | | | $ | 1,441,175 | |
Abcam PLC | | | 229,193 | | | | 1,943,573 | |
Acacia Mining PLC | | | 310,513 | | | | 1,255,443 | |
Assura PLC | | | 2,365,812 | | | | 1,805,603 | |
AVEVA Group PLC | | | 74,865 | | | | 1,694,755 | |
BGEO Group PLC | | | 103,439 | | | | 3,015,086 | |
Big Yellow Group PLC | | | 394,079 | | | | 4,386,843 | |
Bodycote PLC | | | 621,308 | | | | 5,389,291 | |
Bovis Homes Group PLC | | | 318,994 | | | | 4,270,835 | |
Brammer PLC | | | 319,154 | | | | 799,320 | |
Brewin Dolphin Holdings PLC | | | 727,797 | | | | 2,713,486 | |
Capital & Regional PLC | | | 1,348,917 | | | | 1,260,219 | |
Card Factory PLC | | | 526,422 | | | | 2,474,168 | |
Central Asia Metals PLC(a) | | | 501,222 | | | | 1,188,670 | |
Chesnara PLC | | | 470,705 | | | | 2,232,596 | |
Cineworld Group PLC | | | 629,296 | | | | 4,861,618 | |
Communisis PLC | | | 549,674 | | | | 375,272 | |
Computacenter PLC | | | 184,775 | | | | 2,230,848 | |
Concentric AB | | | 153,005 | | | | 1,736,398 | |
Costain Group PLC | | | 277,104 | | | | 1,415,891 | |
Countrywide PLC | | | 466,764 | | | | 2,586,913 | |
Cranswick PLC | | | 95,233 | | | | 2,919,616 | |
Crest Nicholson Holdings PLC | | | 508,629 | | | | 4,115,825 | |
Dairy Crest Group PLC | | | 438,992 | | | | 3,902,507 | |
De La Rue PLC | | | 447,322 | | | | 2,873,923 | |
Debenhams PLC | | | 3,860,899 | | | | 4,173,051 | |
Dechra Pharmaceuticals PLC | | | 145,692 | | | | 2,525,401 | |
Devro PLC | | | 382,138 | | | | 1,616,159 | |
Dignity PLC | | | 35,335 | | | | 1,259,010 | |
Diploma PLC | | | 185,836 | | | | 1,984,568 | |
Domino’s Pizza Group PLC | | | 320,287 | | | | 4,640,313 | |
E2V Technologies PLC | | | 513,493 | | | | 1,586,793 | |
Electrocomponents PLC | | | 1,736,889 | | | | 6,026,383 | |
Elementis PLC | | | 637,493 | | | | 2,193,547 | |
EMIS Group PLC | | | 118,268 | | | | 1,723,664 | |
esure Group PLC | | | 1,303,346 | | | | 5,123,473 | |
FDM Group Holdings PLC | | | 162,222 | | | | 1,347,674 | |
Fenner PLC | | | 918,190 | | | | 1,788,213 | |
Fidessa Group PLC | | | 99,374 | | | | 3,487,915 | |
Foxtons Group PLC | | | 474,319 | | | | 1,109,530 | |
Galliford Try PLC | | | 201,053 | | | | 4,146,769 | |
GAME Digital PLC(a) | | | 379,914 | | | | 682,563 | |
Genus PLC | | | 68,318 | | | | 1,501,378 | |
Go-Ahead Group PLC | | | 103,619 | | | | 3,946,687 | |
Greggs PLC | | | 185,978 | | | | 2,905,618 | |
Halfords Group PLC | | | 473,728 | | | | 2,697,002 | |
Hargreaves Services PLC | | | 268,001 | | | | 687,578 | |
Helical Bar PLC | | | 225,446 | | | | 1,250,769 | |
Hill & Smith Holdings PLC | | | 178,718 | | | | 2,319,548 | |
Home Retail Group PLC | | | 1,536,842 | | | | 3,662,361 | |
HomeServe PLC | | | 651,522 | | | | 4,032,279 | |
Hunting PLC | | | 365,820 | | | | 1,683,852 | |
Interserve PLC | | | 383,112 | | | | 2,388,706 | |
See Notes to Financial Statements.
| | |
| 54 | | WisdomTree Developed World ex-U.S. and Currency Hedged Equity Funds |
Schedule of Investments (continued)
WisdomTree Europe SmallCap Dividend Fund (DFE)
March 31, 2016
| | | | | | | | |
| Investments | | Shares | | | Value | |
| | | | | | | | |
ITE Group PLC | | | 890,992 | | | $ | 1,882,515 | |
J D Wetherspoon PLC(a) | | | 161,188 | | | | 1,629,837 | |
James Fisher & Sons PLC | | | 60,346 | | | | 1,144,039 | |
James Halstead PLC | | | 260,058 | | | | 1,514,749 | |
JD Sports Fashion PLC | | | 154,713 | | | | 2,503,875 | |
John Menzies PLC | | | 219,786 | | | | 1,499,728 | |
Just Retirement Group PLC | | | 827,904 | | | | 1,878,925 | |
Kcom Group PLC | | | 1,560,210 | | | | 2,410,676 | |
Keller Group PLC | | | 126,392 | | | | 1,561,395 | |
Kier Group PLC | | | 189,923 | | | | 3,507,746 | |
Ladbrokes PLC | | | 5,594,293 | | | | 9,383,470 | |
Laird PLC | | | 741,410 | | | | 4,060,045 | |
Lavendon Group PLC | | | 302,789 | | | | 584,254 | |
Lookers PLC | | | 577,091 | | | | 1,313,853 | |
Low & Bonar PLC | | | 700,578 | | | | 624,303 | |
LSL Property Services PLC | | | 248,287 | | | | 1,025,981 | |
Marshalls PLC | | | 420,821 | | | | 2,153,252 | |
Marston’s PLC | | | 2,025,448 | | | | 4,424,988 | |
McBride PLC* | | | 827,921 | | | | 1,933,703 | |
McColl’s Retail Group PLC | | | 504,364 | | | | 1,190,685 | |
Mediclinic International PLC | | | 129,065 | | | | 1,662,126 | |
Mitie Group PLC | | | 1,021,961 | | | | 3,774,982 | |
Morgan Advanced Materials PLC | | | 628,325 | | | | 2,051,824 | |
N Brown Group PLC | | | 946,646 | | | | 4,446,487 | |
NCC Group PLC | | | 315,129 | | | | 1,134,602 | |
NMC Health PLC | | | 109,367 | | | | 1,661,532 | |
Northgate PLC | | | 186,427 | | | | 1,080,381 | |
Nostrum Oil & Gas PLC(a) | | | 433,436 | | | | 1,482,687 | |
Novae Group PLC | | | 210,825 | | | | 2,658,990 | |
Numis Corp. PLC | | | 311,956 | | | | 896,749 | |
OneSavings Bank PLC | | | 256,039 | | | | 1,224,720 | |
Oxford Instruments PLC | | | 50,729 | | | | 488,516 | |
Pan African Resources PLC(a) | | | 8,249,983 | | | | 1,600,790 | |
PayPoint PLC | | | 194,264 | | | | 2,088,533 | |
Pendragon PLC | | | 2,901,261 | | | | 1,522,044 | |
Photo-Me International PLC | | | 641,487 | | | | 1,638,871 | |
Polar Capital Holdings PLC | | | 282,322 | | | | 1,464,871 | |
Polypipe Group PLC | | | 295,913 | | | | 1,357,608 | |
Premier Farnell PLC | | | 1,568,286 | | | | 2,541,495 | |
Rank Group PLC | | | 771,062 | | | | 2,814,948 | |
Redde PLC | | | 1,215,245 | | | | 2,916,942 | |
Restaurant Group PLC (The) | | | 352,902 | | | | 1,991,369 | |
Ricardo PLC | | | 85,606 | | | | 1,029,857 | |
RPS Group PLC | | | 597,324 | | | | 1,781,458 | |
Safestore Holdings PLC | | | 445,718 | | | | 2,150,596 | |
Savills PLC | | | 278,240 | | | | 3,039,349 | |
Schroders PLC Non-Voting Shares | | | 128,332 | | | | 3,729,611 | |
Senior PLC | | | 541,014 | | | | 1,773,704 | |
Shanks Group PLC | | | 1,080,463 | | | | 1,288,948 | |
SIG PLC | | | 935,151 | | | | 1,962,375 | |
Soco International PLC | | | 1,439,219 | | | | 3,278,714 | |
Speedy Hire PLC | | | 462,269 | | | | 259,123 | |
Spirent Communications PLC | | | 1,374,945 | | | | 1,739,063 | |
St. Ives PLC | | | 577,209 | | | | 1,879,095 | |
| | | | | | | | |
St. Modwen Properties PLC | | | 194,837 | | | | 847,119 | |
SThree PLC | | | 215,527 | | | | 971,925 | |
Synthomer PLC | | | 657,271 | | | | 3,441,526 | |
Ted Baker PLC | | | 50,606 | | | | 1,980,601 | |
Telecom Plus PLC(a) | | | 297,746 | | | | 3,939,283 | |
Trinity Mirror PLC | | | 524,756 | | | | 991,815 | |
TT electronics PLC | | | 283,934 | | | | 608,067 | |
Tullett Prebon PLC | | | 782,851 | | | | 3,956,174 | |
Tyman PLC(a) | | | 332,169 | | | | 1,414,376 | |
U & I Group PLC | | | 289,672 | | | | 776,484 | |
UK Mail Group PLC | | | 75,394 | | | | 314,255 | |
Ultra Electronics Holdings PLC | | | 127,348 | | | | 3,303,823 | |
Unite Group PLC (The) | | | 328,761 | | | | 3,007,642 | |
Vesuvius PLC | | | 790,946 | | | | 3,770,854 | |
WS Atkins PLC | | | 164,714 | | | | 3,243,385 | |
Xaar PLC | | | 102,828 | | | | 720,499 | |
Xchanging PLC | | | 250,328 | | | | 687,211 | |
Zoopla Property Group PLC(b) | | | 278,075 | | | | 999,193 | |
| | | | | | | | |
| Total United Kingdom | | | | | | | 282,995,889 | |
TOTAL COMMON STOCKS (Cost: $1,134,538,065) | | | | | | | 1,119,065,491 | |
| EXCHANGE-TRADED FUND – 0.2% | | | | | | | | |
| United States – 0.2% | | | | | | | | |
WisdomTree International MidCap Dividend Fund(a)(c) | | | | | | | | |
| (Cost: $2,673,076) | | | 52,240 | | | | 2,908,723 | |
| INVESTMENT OF CASH COLLATERAL FOR SECURITIES LOANED – 4.7% | |
| United States – 4.7% | | | | | | | | |
State Street Navigator Securities Lending Prime Portfolio, 0.50%(d) | | | | | | | | |
| (Cost: $52,561,886)(e) | | | 52,561,886 | | | | 52,561,886 | |
TOTAL INVESTMENTS IN SECURITIES – 104.3% (Cost: $1,189,773,027) | | | | 1,174,536,100 | |
Liabilities in Excess of Cash, Foreign Currency and Other Assets – (4.3)% | | | | | | | (48,601,319 | ) |
| | | | | | | | |
| NET ASSETS – 100.0% | | | | | | $ | 1,125,934,781 | |
| * | Non-income producing security. |
| † | Security is being fair valued by a valuation committee under the direction of the Board of Trustees. The aggregate value of fair valued securities is $0, which represents 0.0% of net assets. |
| (a) | Security, or portion thereof, was on loan at March 31, 2016 (See Note 2). |
| (b) | This security is exempt from registration under rule 144A of the Securities Act of 1933. This security may be sold in transactions that are exempt from registration, normally to qualified institutional buyers. |
| (c) | Affiliated company (See Note 3). |
| (d) | Rate shown represents annualized 7-day yield as of March 31, 2016. |
| (e) | At March 31, 2016, the total market value of the Fund’s securities on loan was $49,720,141 and the total market value of the collateral held by the Fund was $52,783,466. The total market value of the collateral includes non-cash U.S. Government securities collateral having a value of $221,580. |
CVA – Certificaten Van Aandelen (Certificate of Stock)
RSP – Risparmio Italian Savings Shares
See Notes to Financial Statements.
| | | | |
| WisdomTree Developed World ex-U.S. and Currency Hedged Equity Funds | | | 55 | |
Schedule of Investments (concluded)
WisdomTree Europe SmallCap Dividend Fund (DFE)
March 31, 2016
| | | | | | | | | | | | | | | | | | | | |
| FINANCIAL DERIVATIVE INSTRUMENTS | |
| FORWARD CONTRACTS | |
Settlement
Date | | Contracts
To Deliver | | | In
Exchange For | | | Unrealized
Gain (Loss) | |
4/1/2016 | | | CHF | | | | 2,800 | | | | DKK | | | | 19,082 | | | $ | (5 | ) |
4/1/2016 | | | EUR | | | | 4,429 | | | | DKK | | | | 33,000 | | | | 1 | |
4/1/2016 | | | EUR | | | | 1,380 | | | | NOK | | | | 13,000 | | | | (2 | ) |
4/1/2016 | | | EUR | | | | 261,150 | | | | SEK | | | | 2,410,000 | | | | (309 | ) |
4/1/2016 | | | GBP | | | | 132,000 | | | | DKK | | | | 1,247,834 | | | | 1,136 | |
4/1/2016 | | | GBP | | | | 606 | | | | DKK | | | | 5,700 | | | | 1 | |
4/1/2016 | | | GBP | | | | 600 | | | | NOK | | | | 7,116 | | | | (2 | ) |
4/1/2016 | | | USD | | | | 14,490 | | | | GBP | | | | 10,035 | | | | (66 | ) |
4/1/2016 | | | USD | | | | 24,000 | | | | NOK | | | | 199,356 | | | | 102 | |
| | | | | | | | | | | | | | | | | | | $ | 856 | |
| | |
| CURRENCY LEGEND |
CHF | | – Swiss franc |
DKK | | – Danish krone |
EUR | | – Euro |
GBP | | – British pound |
NOK | | – Norwegian krone |
SEK | | – Swedish krona |
USD | | – U.S. dollar |
See Notes to Financial Statements.
| | |
| 56 | | WisdomTree Developed World ex-U.S. and Currency Hedged Equity Funds |
Schedule of Investments
WisdomTree Germany Hedged Equity Fund (DXGE)
March 31, 2016
| | | | | | | | |
| Investments | | Shares | | | Value | |
| COMMON STOCKS – 99.6% | | | | | | | | |
| Germany – 99.6% | | | | | | | | |
| Aerospace & Defense – 0.9% | | | | | | | | |
MTU Aero Engines AG | | | 19,141 | | | $ | 1,838,545 | |
| Air Freight & Logistics – 3.5% | | | | | | | | |
Deutsche Post AG Registered Shares | | | 253,729 | | | | 7,060,726 | |
| Auto Components – 2.7% | | | | | | | | |
Continental AG | | | 22,300 | | | | 5,082,395 | |
ElringKlinger AG | | | 8,083 | | | | 221,847 | |
Leoni AG(a) | | | 4,603 | | | | 159,065 | |
| | | | | | | | |
| Total Auto Components | | | | | | | 5,463,307 | |
| Automobiles – 12.1% | | | | | | | | |
Bayerische Motoren Werke AG | | | 97,358 | | | | 8,953,210 | |
Daimler AG Registered Shares | | | 117,270 | | | | 9,002,996 | |
Volkswagen AG | | | 43,042 | | | | 6,256,140 | |
| | | | | | | | |
| Total Automobiles | | | | | | | 24,212,346 | |
| Capital Markets – 0.1% | | | | | | | | |
AURELIUS SE & Co. KGaA | | | 3,687 | | | | 224,781 | |
| Chemicals – 12.3% | | | | | | | | |
BASF SE | | | 116,628 | | | | 8,811,502 | |
Evonik Industries AG | | | 114,448 | | | | 3,438,504 | |
Fuchs Petrolub SE | | | 34,771 | | | | 1,349,570 | |
K+S AG Registered Shares(a) | | | 83,967 | | | | 1,967,754 | |
LANXESS AG | | | 31,146 | | | | 1,499,201 | |
Linde AG | | | 26,450 | | | | 3,859,569 | |
Symrise AG | | | 30,045 | | | | 2,020,030 | |
Wacker Chemie AG | | | 18,416 | | | | 1,623,054 | |
| | | | | | | | |
| Total Chemicals | | | | | | | 24,569,184 | |
| Construction & Engineering – 1.5% | | | | | | | | |
Hochtief AG | | | 23,790 | | | | 2,915,670 | |
| Construction Materials – 1.1% | | | | | | | | |
HeidelbergCement AG | | | 26,778 | | | | 2,296,245 | |
| Diversified Financial Services – 1.9% | | | | | | | | |
Deutsche Boerse AG | | | 45,814 | | | | 3,915,030 | |
| Diversified Telecommunication Services – 4.3% | | | | | | | | |
Deutsche Telekom AG Registered Shares | | | 484,057 | | | | 8,701,607 | |
| Electrical Equipment – 1.0% | | | | | | | | |
OSRAM Licht AG | | | 37,084 | | | | 1,914,548 | |
| Food & Staples Retailing – 1.5% | | | | | | | | |
METRO AG | | | 94,465 | | | | 2,931,245 | |
| Food Products – 1.0% | | | | | | | | |
Suedzucker AG | | | 115,213 | | | | 2,034,355 | |
| Health Care Equipment & Supplies – 0.1% | | | | | | | | |
Carl Zeiss Meditec AG Bearer Shares | | | 8,572 | | | | 265,110 | |
| Health Care Providers & Services – 3.1% | | | | | | | | |
Fresenius Medical Care AG & Co. KGaA | | | 33,268 | | | | 2,950,959 | |
Fresenius SE & Co. KGaA | | | 43,434 | | | | 3,178,089 | |
| | | | | | | | |
| Total Health Care Providers & Services | | | | | | | 6,129,048 | |
| Health Care Technology – 0.1% | | | | | | | | |
CompuGroup Medical SE | | | 4,262 | | | $ | 180,429 | |
| Hotels, Restaurants & Leisure – 1.1% | | | | | | | | |
TUI AG | | | 138,043 | | | | 2,157,465 | |
| Household Products – 1.7% | | | | | | | | |
Henkel AG & Co. KGaA | | | 34,214 | | | | 3,367,444 | |
| Industrial Conglomerates – 4.5% | | | | | | | | |
Indus Holding AG | | | 3,706 | | | | 183,032 | |
Rheinmetall AG | | | 1,538 | | | | 123,070 | |
Siemens AG Registered Shares | | | 82,533 | | | | 8,760,806 | |
| | | | | | | | |
| Total Industrial Conglomerates | | | | | | | 9,066,908 | |
| Insurance – 12.5% | | | | | | | | |
Allianz SE Registered Shares | | | 52,231 | | | | 8,508,364 | |
Hannover Rueck SE | | | 34,698 | | | | 4,048,908 | |
Muenchener Rueckversicherungs – Gesellschaft AG Registered Shares | | | 43,869 | | | | 8,935,881 | |
Talanx AG* | | | 104,692 | | | | 3,580,248 | |
| | | | | | | | |
| Total Insurance | | | | | | | 25,073,401 | |
| Internet & Catalog Retail – 0.1% | | | | | | | | |
Takkt AG | | | 7,988 | | | | 153,654 | |
| IT Services – 0.2% | | | | | | | | |
Bechtle AG | | | 2,181 | | | | 225,621 | |
Wirecard AG(a) | | | 2,435 | | | | 92,401 | |
| | | | | | | | |
| Total IT Services | | | | | | | 318,022 | |
| Life Sciences Tools & Services – 0.1% | | | | | | | | |
Gerresheimer AG | | | 2,672 | | | | 209,884 | |
| Machinery – 5.8% | | | | | | | | |
DMG MORI AG | | | 23,164 | | | | 1,080,147 | |
Duerr AG | | | 19,632 | | | | 1,545,210 | |
GEA Group AG | | | 46,509 | | | | 2,278,972 | |
KION Group AG* | | | 33,039 | | | | 1,929,166 | |
Krones AG | | | 2,730 | | | | 329,297 | |
KUKA AG(a) | | | 1,373 | | | | 143,990 | |
MAN SE | | | 37,100 | | | | 4,021,419 | |
NORMA Group SE | | | 3,501 | | | | 196,406 | |
Wacker Neuson SE | | | 12,231 | | | | 194,851 | |
| | | | | | | | |
| Total Machinery | | | | | | | 11,719,458 | |
| Media – 1.4% | | | | | | | | |
Axel Springer SE | | | 45,266 | | | | 2,443,482 | |
CTS Eventim AG & Co. KGaA | | | 7,923 | | | | 281,920 | |
Stroeer SE & Co KGaA(a) | | | 2,836 | | | | 178,555 | |
| | | | | | | | |
| Total Media | | | | | | | 2,903,957 | |
| Metals & Mining – 1.6% | | | | | | | | |
Aurubis AG | | | 29,926 | | | | 1,491,289 | |
Salzgitter AG | | | 2,277 | | | | 64,570 | |
ThyssenKrupp AG | | | 75,848 | | | | 1,578,260 | |
| | | | | | | | |
| Total Metals & Mining | | | | | | | 3,134,119 | |
| Multi-Utilities – 2.6% | | | | | | | | |
E.ON SE | | | 540,361 | | | | 5,195,856 | |
See Notes to Financial Statements.
| | | | |
| WisdomTree Developed World ex-U.S. and Currency Hedged Equity Funds | | | 57 | |
Schedule of Investments (concluded)
WisdomTree Germany Hedged Equity Fund (DXGE)
March 31, 2016
| | | | | | | | |
| Investments | | Shares | | | Value | |
| Personal Products – 1.2% | | | | | | | | |
Beiersdorf AG | | | 27,371 | | | $ | 2,474,665 | |
| Pharmaceuticals – 6.6% | | | | | | | | |
Bayer AG Registered Shares | | | 75,446 | | | | 8,881,169 | |
Merck KGaA | | | 39,658 | | | | 3,313,047 | |
STADA Arzneimittel AG | | | 26,161 | | | | 1,039,984 | |
| | | | | | | | |
| Total Pharmaceuticals | | | | | | | 13,234,200 | |
| Road & Rail – 0.1% | | | | | | | | |
Sixt SE | | | 3,733 | | | | 201,254 | |
| Semiconductors & Semiconductor Equipment – 1.4% | |
Infineon Technologies AG | | | 195,516 | | | | 2,786,118 | |
| Software – 5.0% | | | | | | | | |
SAP SE | | | 109,242 | | | | 8,851,009 | |
Software AG | | | 28,419 | | | | 1,112,583 | |
| | | | | | | | |
| Total Software | | | | | | | 9,963,592 | |
| Specialty Retail – 1.1% | | | | | | | | |
Fielmann AG | | | 29,895 | | | | 2,272,260 | |
| Textiles, Apparel & Luxury Goods – 3.3% | | | | | | | | |
adidas AG | | | 37,997 | | | | 4,459,849 | |
Gerry Weber International AG(a) | | | 11,509 | | | | 161,709 | |
Hugo Boss AG | | | 30,352 | | | | 1,993,631 | |
| | | | | | | | |
| Total Textiles, Apparel & Luxury Goods | | | | | | | 6,615,189 | |
| Thrifts & Mortgage Finance – 0.8% | | | | | | | | |
Aareal Bank AG | | | 49,759 | | | | 1,614,898 | |
| Trading Companies & Distributors – 1.2% | | | | | | | | |
BayWa AG(a) | | | 5,124 | | | | 173,566 | |
Brenntag AG | | | 38,734 | | | | 2,215,795 | |
| | | | | | | | |
| Total Trading Companies & Distributors | | | | | | | 2,389,361 | |
| Transportation Infrastructure – 0.1% | | | | | | | | |
Hamburger Hafen und Logistik AG | | | 12,319 | | | | 181,653 | |
TOTAL COMMON STOCKS
(Cost: $219,608,846) | | | | | | | 199,685,534 | |
| INVESTMENT OF CASH COLLATERAL FOR SECURITIES LOANED – 0.4% | |
| United States – 0.4% | | | | | | | | |
State Street Navigator Securities Lending Prime Portfolio, 0.50%(b) | | | | | | | | |
| (Cost: $897,196)(c) | | | 897,196 | | | | 897,196 | |
TOTAL INVESTMENTS IN SECURITIES – 100.0% (Cost: $220,506,042) | | | | | | | 200,582,730 | |
Liabilities in Excess of Cash, Foreign Currency and
Other Assets – (0.0)% | | | | | | | (81,508 | ) |
| | | | | | | | |
| NET ASSETS – 100.0% | | | | | | $ | 200,501,222 | |
| * | Non-income producing security. |
| (a) | Security, or portion thereof, was on loan at March 31, 2016 (See Note 2). |
| (b) | Rate shown represents annualized 7-day yield as of March 31, 2016. |
| (c) | At March 31, 2016, the total market value of the Fund’s securities on loan was $870,057 and the total market value of the collateral held by the Fund was $913,054. The total market value of the collateral includes non-cash U.S. Government securities collateral having a value of $15,858. |
| | | | | | | | | | | | | | | | |
| FINANCIAL DERIVATIVE INSTRUMENTS | |
| FORWARD CONTRACTS | |
Settlement
Date | | Contracts
To Deliver | | | In
Exchange For | | | Unrealized
Gain (Loss) | |
4/4/2016 | | EUR | | | 29,220,727 | | | USD | | | 31,780,200 | | | $ | (1,518,294 | ) |
4/4/2016 | | EUR | | | 38,352,238 | | | USD | | | 41,711,510 | | | | (1,992,801 | ) |
4/4/2016 | | EUR | | | 38,350,651 | | | USD | | | 41,711,510 | | | | (1,990,993 | ) |
4/4/2016 | | EUR | | | 38,351,356 | | | USD | | | 41,711,510 | | | | (1,991,797 | ) |
4/4/2016 | | EUR | | | 38,351,532 | | | USD | | | 41,711,510 | | | | (1,991,997 | ) |
4/4/2016 | | USD | | | 2,426,146 | | | EUR | | | 2,230,656 | | | | 115,799 | |
4/4/2016 | | USD | | | 3,639,219 | | | EUR | | | 3,325,975 | | | | 150,898 | |
4/4/2016 | | USD | | | 2,426,146 | | | EUR | | | 2,193,156 | | | | 73,066 | |
4/4/2016 | | USD | | | 39,928,293 | | | EUR | | | 35,039,572 | | | | 1,068 | |
4/4/2016 | | USD | | | 30,421,557 | | | EUR | | | 26,697,450 | | | | 1,535 | |
4/4/2016 | | USD | | | 39,928,293 | | | EUR | | | 35,040,402 | | | | 2,015 | |
4/4/2016 | | USD | | | 39,928,293 | | | EUR | | | 35,039,572 | | | | 1,068 | |
4/4/2016 | | USD | | | 39,928,293 | | | EUR | | | 35,039,172 | | | | 613 | |
5/3/2016 | | EUR | | | 37,215,560 | | | USD | | | 42,443,416 | | | | (1,951 | ) |
5/3/2016 | | EUR | | | 28,355,139 | | | USD | | | 32,337,845 | | | | (1,969 | ) |
5/3/2016 | | EUR | | | 37,215,691 | | | USD | | | 42,443,416 | | | | (2,100 | ) |
5/3/2016 | | EUR | | | 37,217,257 | | | USD | | | 42,443,416 | | | | (3,887 | ) |
5/3/2016 | | EUR | | | 37,215,136 | | | USD | | | 42,443,416 | | | | (1,467 | ) |
| | | | | | | | | | | | | | | $ | (9,151,194 | ) |
| | |
| CURRENCY LEGEND |
EUR | | – Euro |
| USD | | – U.S. dollar |
See Notes to Financial Statements.
| | |
| 58 | | WisdomTree Developed World ex-U.S. and Currency Hedged Equity Funds |
Schedule of Investments
WisdomTree Global ex-U.S. Hedged Dividend Fund (DXUS)
March 31, 2016
| | | | | | | | |
| Investments | | Shares | | | Value | |
| COMMON STOCKS – 99.0% | | | | | | | | |
| Australia – 4.1% | | | | | | | | |
Amcor Ltd. | | | 497 | | | $ | 5,486 | |
AMP Ltd. | | | 1,294 | | | | 5,763 | |
Asciano Ltd. | | | 323 | | | | 2,226 | |
Australia & New Zealand Banking Group Ltd. | | | 900 | | | | 16,242 | |
BHP Billiton Ltd. | | | 1,283 | | | | 16,640 | |
Commonwealth Bank of Australia | | | 476 | | | | 27,433 | |
CSL Ltd. | | | 65 | | | | 5,072 | |
Incitec Pivot Ltd. | | | 779 | | | | 1,912 | |
Macquarie Group Ltd. | | | 103 | | | | 5,237 | |
National Australia Bank Ltd. | | | 846 | | | | 17,077 | |
QBE Insurance Group Ltd. | | | 355 | | | | 2,979 | |
Rio Tinto Ltd. | | | 163 | | | | 5,353 | |
Telstra Corp., Ltd. | | | 3,186 | | | | 13,063 | |
Wesfarmers Ltd. | | | 408 | | | | 13,009 | |
Westpac Banking Corp. | | | 988 | | | | 23,067 | |
Woodside Petroleum Ltd. | | | 461 | | | | 9,206 | |
Woolworths Ltd. | | | 262 | | | | 4,454 | |
| | | | | | | | |
| Total Australia | | | | | | | 174,219 | |
| Austria – 0.2% | | | | | | | | |
Andritz AG(a) | | | 54 | | | | 2,970 | |
OMV AG | | | 133 | | | | 3,747 | |
| | | | | | | | |
| Total Austria | | | | | | | 6,717 | |
| Belgium – 1.1% | | | | | | | | |
Anheuser-Busch InBev N.V. | | | 330 | | | | 41,083 | |
Colruyt S.A. | | | 37 | | | | 2,159 | |
Solvay S.A. | | | 44 | | | | 4,420 | |
| | | | | | | | |
| Total Belgium | | | | | | | 47,662 | |
| Brazil – 0.6% | | | | | | | | |
Ambev S.A. | | | 1,989 | | | | 10,562 | |
Banco do Brasil S.A. | | | 999 | | | | 5,573 | |
BB Seguridade Participacoes S.A. | | | 650 | | | | 5,447 | |
Vale S.A. | | | 1,366 | | | | 5,840 | |
| | | | | | | | |
| Total Brazil | | | | | | | 27,422 | |
| Canada – 6.6% | | | | | | | | |
Agrium, Inc.(a) | | | 57 | | | | 5,053 | |
Alimentation Couche-Tard, Inc. Class B | | | 19 | | | | 849 | |
AltaGas Ltd.(a) | | | 115 | | | | 2,970 | |
Bank of Montreal | | | 203 | | | | 12,378 | |
Bank of Nova Scotia (The) | | | 387 | | | | 18,990 | |
Barrick Gold Corp. | | | 193 | | | | 2,632 | |
BCE, Inc. | | | 352 | | | | 16,108 | |
Brookfield Asset Management, Inc. Class A | | | 105 | | | | 3,667 | |
Canadian Imperial Bank of Commerce | | | 143 | | | | 10,726 | |
Canadian National Railway Co. | | | 105 | | | | 6,588 | |
Canadian Natural Resources Ltd. | | | 368 | | | | 9,995 | |
Canadian Tire Corp. Ltd. Class A | | | 26 | | | | 2,718 | |
Cenovus Energy, Inc. | | | 97 | | | | 1,267 | |
Crescent Point Energy Corp.(a) | | | 639 | | | | 8,883 | |
Empire Co., Ltd. | | | 28 | | | | 487 | |
Enbridge, Inc. | | | 238 | | | | 9,303 | |
Encana Corp. | | | 672 | | | $ | 4,115 | |
Gildan Activewear, Inc. | | | 79 | | | | 2,419 | |
Goldcorp, Inc. | | | 539 | | | | 8,780 | |
Great-West Lifeco, Inc. | | | 372 | | | | 10,279 | |
Imperial Oil Ltd. | | | 125 | | | | 4,193 | |
Intact Financial Corp. | | | 36 | | | | 2,531 | |
Inter Pipeline Ltd. | | | 225 | | | | 4,653 | |
Magna International, Inc. | | | 107 | | | | 4,619 | |
Manulife Financial Corp. | | | 555 | | | | 7,887 | |
Metro, Inc. | | | 30 | | | | 1,045 | |
Onex Corp. | | | 15 | | | | 918 | |
Pembina Pipeline Corp. | | | 235 | | | | 6,379 | |
Potash Corp. of Saskatchewan, Inc. | | | 330 | | | | 5,641 | |
Power Financial Corp.(a) | | | 207 | | | | 5,196 | |
Rogers Communications, Inc. Class B | | | 179 | | | | 7,196 | |
Royal Bank of Canada | | | 418 | | | | 24,183 | |
Shaw Communications, Inc. Class B | | | 202 | | | | 3,918 | |
Sun Life Financial, Inc. | | | 162 | | | | 5,248 | |
Suncor Energy, Inc. | | | 407 | | | | 11,381 | |
TELUS Corp. | | | 175 | | | | 5,720 | |
Thomson Reuters Corp. | | | 237 | | | | 9,642 | |
Toronto-Dominion Bank (The) | | | 588 | | | | 25,485 | |
TransCanada Corp.(a) | | | 283 | | | | 11,172 | |
| | | | | | | | |
| Total Canada | | | | | | | 285,214 | |
| Chile – 0.2% | | | | | | | | |
Empresa Nacional de Electricidad S.A. | | | 738 | | | | 1,028 | |
Empresas CMPC S.A. | | | 338 | | | | 790 | |
Empresas COPEC S.A. | | | 291 | | | | 2,790 | |
Enersis Americas S.A. | | | 10,373 | | | | 2,878 | |
S.A.C.I. Falabella | | | 139 | | | | 972 | |
| | | | | | | | |
| Total Chile | | | | | | | 8,458 | |
| China – 4.1% | | | | | | | | |
Bank of China Ltd. Class H | | | 16,000 | | | | 6,642 | |
Bank of Communications Co., Ltd. Class H | | | 6,000 | | | | 3,945 | |
Belle International Holdings Ltd. | | | 5,000 | | | | 2,894 | |
China Communications Construction Co., Ltd. Class H | | | 1,000 | | | | 1,195 | |
China Construction Bank Corp. Class H | | | 68,500 | | | | 43,715 | |
China Mobile Ltd. | | | 3,500 | | | | 39,009 | |
China Overseas Land & Investment Ltd. | | | 2,000 | | | | 6,330 | |
China Petroleum & Chemical Corp. Class H | | | 10,000 | | | | 6,562 | |
China Resources Power Holdings Co., Ltd. | | | 2,000 | | | | 3,739 | |
China Unicom Hong Kong Ltd. | | | 6,000 | | | | 7,921 | |
CITIC Ltd. | | | 4,000 | | | | 6,085 | |
CNOOC Ltd. | | | 15,000 | | | | 17,714 | |
Great Wall Motor Co., Ltd. Class H | | | 1,500 | | | | 1,218 | |
Industrial & Commercial Bank of China Ltd. Class H | | | 26,000 | | | | 14,548 | |
Lenovo Group Ltd. | | | 6,000 | | | | 4,672 | |
Ping An Insurance Group Co. of China Ltd. Class H | | | 1,000 | | | | 4,783 | |
Want Want China Holdings Ltd.(a) | | | 8,000 | | | | 5,931 | |
| | | | | | | | |
| Total China | | | | | | | 176,903 | |
| Czech Republic – 0.0% | | | | | | | | |
Komercni Banka AS | | | 8 | | | | 1,769 | |
See Notes to Financial Statements.
| | | | |
| WisdomTree Developed World ex-U.S. and Currency Hedged Equity Funds | | | 59 | |
Schedule of Investments (continued)
WisdomTree Global ex-U.S. Hedged Dividend Fund (DXUS)
March 31, 2016
| | | | | | | | |
| Investments | | Shares | | | Value | |
| Denmark – 1.6% | | | | | | | | |
AP Moeller – Maersk A/S Class B | | | 4 | | | $ | 5,255 | |
Chr Hansen Holding A/S | | | 122 | | | | 8,203 | |
Coloplast A/S Class B | | | 107 | | | | 8,121 | |
Danske Bank A/S | | | 402 | | | | 11,375 | |
Novo Nordisk A/S Class B | | | 492 | | | | 26,730 | |
Pandora A/S | | | 33 | | | | 4,328 | |
Vestas Wind Systems A/S | | | 70 | | | | 4,947 | |
| | | | | | | | |
| Total Denmark | | | | | | | 68,959 | |
| Finland – 0.8% | | | | | | | | |
Fortum Oyj | | | 515 | | | | 7,811 | |
Kone Oyj Class B | | | 163 | | | | 7,868 | |
Nokia Oyj | | | 608 | | | | 3,620 | |
Sampo Oyj Class A | | | 186 | | | | 8,847 | |
UPM-Kymmene Oyj | | | 293 | | | | 5,316 | |
| | | | | | | | |
| Total Finland | | | | | | | 33,462 | |
| France – 8.1% | | | | | | | | |
Accor S.A. | | | 73 | | | | 3,098 | |
Air Liquide S.A. | | | 59 | | | | 6,649 | |
Airbus Group SE | | | 193 | | | | 12,833 | |
AXA S.A. | | | 774 | | | | 18,249 | |
BNP Paribas S.A. | | | 195 | | | | 9,828 | |
Bouygues S.A. | | | 173 | | | | 7,068 | |
Cap Gemini S.A. | | | 39 | | | | 3,670 | |
Carrefour S.A. | | | 167 | | | | 4,602 | |
Casino Guichard Perrachon S.A. | | | 80 | | | | 4,593 | |
Christian Dior SE | | | 30 | | | | 5,449 | |
Cie de Saint-Gobain | | | 195 | | | | 8,606 | |
Credit Agricole S.A. | | | 450 | | | | 4,881 | |
Danone S.A. | | | 125 | | | | 8,904 | |
Electricite de France S.A. | | | 653 | | | | 7,340 | |
Engie S.A. | | | 1,113 | | | | 17,300 | |
Hermes International | | | 7 | | | | 2,468 | |
Iliad S.A. | | | 2 | | | | 515 | |
Kering | | | 31 | | | | 5,550 | |
L’Oreal S.A. | | | 75 | | | | 13,457 | |
Legrand S.A. | | | 94 | | | | 5,275 | |
LVMH Moet Hennessy Louis Vuitton SE | | | 78 | | | | 13,377 | |
Natixis S.A. | | | 802 | | | | 3,955 | |
Orange S.A. | | | 901 | | | | 15,807 | |
Orpea | | | 24 | | | | 2,001 | |
Pernod Ricard S.A. | | | 40 | | | | 4,467 | |
Publicis Groupe S.A. | | | 39 | | | | 2,743 | |
Renault S.A. | | | 81 | | | | 8,060 | |
Rubis SCA | | | 11 | | | | 885 | |
Safran S.A. | | | 85 | | | | 5,955 | |
Sanofi | | | 340 | | | | 27,454 | |
Schneider Electric SE | | | 177 | | | | 11,202 | |
SCOR SE | | | 50 | | | | 1,778 | |
Societe Generale S.A. | | | 192 | | | | 7,106 | |
Suez Environnement Co. | | | 194 | | | | 3,564 | |
Teleperformance | | | 25 | | | | 2,201 | |
TOTAL S.A. | | | 979 | | | | 44,692 | |
Unibail-Rodamco SE | | | 30 | | | $ | 8,266 | |
Veolia Environnement S.A. | | | 199 | | | | 4,801 | |
Vinci S.A. | | | 174 | | | | 12,981 | |
Vivendi S.A. | | | 741 | | | | 15,605 | |
Wendel S.A. | | | 15 | | | | 1,635 | |
| | | | | | | | |
| Total France | | | | | | | 348,870 | |
| Germany – 6.9% | | | | | | | | |
adidas AG | | | 47 | | | | 5,517 | |
Allianz SE Registered Shares | | | 175 | | | | 28,507 | |
BASF SE | | | 296 | | | | 22,364 | |
Bayer AG Registered Shares | | | 193 | | | | 22,719 | |
Bayerische Motoren Werke AG | | | 201 | | | | 18,484 | |
Beiersdorf AG | | | 20 | | | | 1,808 | |
Brenntag AG | | | 61 | | | | 3,490 | |
Continental AG | | | 33 | | | | 7,521 | |
Daimler AG Registered Shares | | | 319 | | | | 24,490 | |
Deutsche Boerse AG | | | 52 | | | | 4,444 | |
Deutsche Post AG Registered Shares | | | 423 | | | | 11,771 | |
Deutsche Telekom AG Registered Shares | | | 1,339 | | | | 24,070 | |
E.ON SE | | | 853 | | | | 8,202 | |
Evonik Industries AG | | | 145 | | | | 4,356 | |
Fresenius Medical Care AG & Co. KGaA | | | 43 | | | | 3,814 | |
GEA Group AG | | | 60 | | | | 2,940 | |
Hannover Rueck SE | | | 31 | | | | 3,617 | |
Henkel AG & Co. KGaA | | | 27 | | | | 2,657 | |
LEG Immobilien AG* | | | 56 | | | | 5,287 | |
Linde AG | | | 1 | | | | 146 | |
MAN SE | | | 9 | | | | 976 | |
METRO AG | | | 148 | | | | 4,593 | |
Muenchener Rueckversicherungs – Gesellschaft AG Registered Shares | | | 73 | | | | 14,870 | |
ProSiebenSat.1 Media SE | | | 99 | | | | 5,098 | |
SAP SE | | | 189 | | | | 15,313 | |
Siemens AG Registered Shares | | | 301 | | | | 31,951 | |
Symrise AG | | | 39 | | | | 2,622 | |
Telefonica Deutschland Holding AG | | | 440 | | | | 2,387 | |
Volkswagen AG | | | 99 | | | | 14,390 | |
| | | | | | | | |
| Total Germany | | | | | | | 298,404 | |
| Hong Kong – 1.7% | | | | | | | | |
AIA Group Ltd. | | | 1,400 | | | | 7,933 | |
BOC Hong Kong Holdings Ltd. | | | 2,500 | | | | 7,461 | |
CLP Holdings Ltd. | | | 500 | | | | 4,522 | |
Hang Lung Properties Ltd. | | | 1,000 | | | | 1,911 | |
Hang Seng Bank Ltd. | | | 500 | | | | 8,838 | |
Hong Kong Exchanges and Clearing Ltd. | | | 300 | | | | 7,225 | |
MTR Corp., Ltd. | | | 1,500 | | | | 7,426 | |
New World Development Co., Ltd. | | | 4,000 | | | | 3,811 | |
Power Assets Holdings Ltd. | | | 500 | | | | 5,115 | |
Sun Hung Kai Properties Ltd. | | | 1,000 | | | | 12,228 | |
Wharf Holdings Ltd. (The) | | | 1,000 | | | | 5,466 | |
| | | | | | | | |
| Total Hong Kong | | | | | | | 71,936 | |
See Notes to Financial Statements.
| | |
| 60 | | WisdomTree Developed World ex-U.S. and Currency Hedged Equity Funds |
Schedule of Investments (continued)
WisdomTree Global ex-U.S. Hedged Dividend Fund (DXUS)
March 31, 2016
| | | | | | | | |
| Investments | | Shares | | | Value | |
| Hungary – 0.1% | | | | | | | | |
OTP Bank PLC | | | 98 | | | $ | 2,462 | |
| Indonesia – 0.4% | | | | | | | | |
Astra International Tbk PT | | | 9,100 | | | | 4,976 | |
Bank Rakyat Indonesia Persero Tbk PT | | | 4,400 | | | | 3,791 | |
Telekomunikasi Indonesia Persero Tbk PT | | | 25,400 | | | | 6,369 | |
| | | | | | | | |
| Total Indonesia | | | | | | | 15,136 | |
| Ireland – 0.5% | | | | | | | | |
CRH PLC | | | 466 | | | | 13,185 | |
Kerry Group PLC Class A | | | 42 | | | | 3,919 | |
Smurfit Kappa Group PLC | | | 144 | | | | 3,717 | |
| | | | | | | | |
| Total Ireland | | | | | | | 20,821 | |
| Israel – 0.5% | | | | | | | | |
Bezeq Israeli Telecommunication Corp., Ltd. | | | 2,772 | | | | 6,249 | |
Teva Pharmaceutical Industries Ltd. | | | 274 | | | | 14,773 | |
| | | | | | | | |
| Total Israel | | | | | | | 21,022 | |
| Italy – 1.7% | | | | | | | | |
Assicurazioni Generali SpA | | | 283 | | | | 4,202 | |
Atlantia SpA | | | 265 | | | | 7,359 | |
Banca Popolare dell’Emilia Romagna SC | | | 195 | | | | 930 | |
Enel SpA | | | 2,820 | | | | 12,526 | |
Eni SpA | | | 1,500 | | | | 22,734 | |
Intesa Sanpaolo SpA | | | 2,537 | | | | 7,037 | |
Luxottica Group SpA | | | 95 | | | | 5,251 | |
Mediobanca SpA | | | 187 | | | | 1,349 | |
Snam SpA | | | 2,149 | | | | 13,481 | |
| | | | | | | | |
| Total Italy | | | | | | | 74,869 | |
| Japan – 18.8% | | | | | | | | |
Aeon Co., Ltd. | | | 300 | | | | 4,340 | |
Aisin Seiki Co., Ltd. | | | 100 | | | | 3,772 | |
Asahi Glass Co., Ltd. | | | 1,000 | | | | 5,481 | |
Asahi Group Holdings Ltd. | | | 100 | | | | 3,120 | |
Asahi Kasei Corp. | | | 1,000 | | | | 6,770 | |
Astellas Pharma, Inc. | | | 600 | | | | 7,989 | |
Bridgestone Corp. | | | 300 | | | | 11,224 | |
Canon, Inc. | | | 800 | | | | 23,880 | |
Central Japan Railway Co. | | | 100 | | | | 17,710 | |
Chugai Pharmaceutical Co., Ltd. | | | 100 | | | | 3,101 | |
Chugoku Electric Power Co., Inc. (The) | | | 200 | | | | 2,705 | |
Dai-ichi Life Insurance Co., Ltd. (The) | | | 300 | | | | 3,637 | |
Daiichi Sankyo Co., Ltd. | | | 300 | | | | 6,680 | |
Daikin Industries Ltd. | | | 100 | | | | 7,484 | |
Daiwa House Industry Co., Ltd. | | | 300 | | | | 8,451 | |
Daiwa Securities Group, Inc. | | | 1,000 | | | | 6,160 | |
Denso Corp. | | | 300 | | | | 12,075 | |
Dentsu, Inc. | | | 100 | | | | 5,027 | |
East Japan Railway Co. | | | 100 | | | | 8,642 | |
Eisai Co., Ltd. | | | 100 | | | | 6,023 | |
FANUC Corp. | | | 100 | | | | 15,557 | |
Fuji Heavy Industries Ltd. | | | 200 | | | | 7,073 | |
FUJIFILM Holdings Corp. | | | 200 | | | | 7,920 | |
Fujitsu Ltd. | | | 1,000 | | | | 3,707 | |
Hitachi Ltd. | | | 2,000 | | | $ | 9,371 | |
Honda Motor Co., Ltd. | | | 500 | | | | 13,728 | |
Hoya Corp. | | | 100 | | | | 3,809 | |
Isuzu Motors Ltd. | | | 500 | | | | 5,169 | |
ITOCHU Corp. | | | 800 | | | | 9,865 | |
Japan Airlines Co., Ltd. | | | 200 | | | | 7,335 | |
Japan Tobacco, Inc. | | | 700 | | | | 29,209 | |
JFE Holdings, Inc. | | | 400 | | | | 5,395 | |
JX Holdings, Inc. | | | 1,500 | | | | 5,789 | |
Kao Corp. | | | 100 | | | | 5,341 | |
KDDI Corp. | | | 900 | | | | 24,070 | |
Kirin Holdings Co., Ltd. | | | 500 | | | | 7,020 | |
Komatsu Ltd. | | | 300 | | | | 5,114 | |
Kubota Corp. | | | 400 | | | | 5,468 | |
Kyocera Corp. | | | 100 | | | | 4,410 | |
Lawson, Inc. | | | 100 | | | | 8,381 | |
LIXIL Group Corp. | | | 100 | | | | 2,042 | |
Makita Corp. | | | 100 | | | | 6,210 | |
Marubeni Corp. | | | 800 | | | | 4,057 | |
Mitsubishi Chemical Holdings Corp. | | | 700 | | | | 3,659 | |
Mitsubishi Corp. | | | 600 | | | | 10,175 | |
Mitsubishi Electric Corp. | | | 1,000 | | | | 10,494 | |
Mitsubishi Heavy Industries Ltd. | | | 1,000 | | | | 3,720 | |
Mitsubishi Tanabe Pharma Corp. | | | 300 | | | | 5,224 | |
Mitsubishi UFJ Financial Group, Inc. | | | 3,500 | | | | 16,240 | |
Mitsui & Co., Ltd. | | | 1,000 | | | | 11,522 | |
Mizuho Financial Group, Inc. | | | 8,600 | | | | 12,862 | |
MS&AD Insurance Group Holdings, Inc. | | | 100 | | | | 2,790 | |
Murata Manufacturing Co., Ltd. | | | 100 | | | | 12,073 | |
Nagoya Railroad Co., Ltd. | | | 1,000 | | | | 4,680 | |
Nippon Steel & Sumitomo Metal Corp. | | | 300 | | | | 5,771 | |
Nippon Telegraph & Telephone Corp. | | | 700 | | | | 30,193 | |
Nissan Motor Co., Ltd. | | | 1,700 | | | | 15,753 | |
Nitto Denko Corp. | | | 100 | | | | 5,567 | |
Nomura Holdings, Inc. | | | 1,000 | | | | 4,474 | |
Nomura Research Institute Ltd. | | | 200 | | | | 6,744 | |
NSK Ltd. | | | 300 | | | | 2,749 | |
NTT Data Corp. | | | 100 | | | | 5,027 | |
NTT DOCOMO, Inc. | | | 1,800 | | | | 40,878 | |
Omron Corp. | | | 100 | | | | 2,981 | |
Osaka Gas Co., Ltd. | | | 1,000 | | | | 3,847 | |
Otsuka Holdings Co., Ltd. | | | 200 | | | | 7,274 | |
Panasonic Corp. | | | 500 | | | | 4,598 | |
Recruit Holdings Co., Ltd. | | | 100 | | | | 3,056 | |
Resona Holdings, Inc. | | | 900 | | | | 3,216 | |
Ricoh Co., Ltd. | | | 500 | | | | 5,098 | |
Secom Co., Ltd. | | | 100 | | | | 7,443 | |
Seiko Epson Corp. | | | 300 | | | | 4,853 | |
Sekisui House Ltd. | | | 500 | | | | 8,450 | |
Seven & I Holdings Co., Ltd. | | | 100 | | | | 4,264 | |
Shin-Etsu Chemical Co., Ltd. | | | 100 | | | | 5,182 | |
Shionogi & Co., Ltd. | | | 100 | | | | 4,713 | |
SoftBank Group Corp. | | | 100 | | | | 4,774 | |
Sompo Japan Nipponkoa Holdings, Inc. | | | 100 | | | | 2,836 | |
See Notes to Financial Statements.
| | | | |
| WisdomTree Developed World ex-U.S. and Currency Hedged Equity Funds | | | 61 | |
Schedule of Investments (continued)
WisdomTree Global ex-U.S. Hedged Dividend Fund (DXUS)
March 31, 2016
| | | | | | | | |
| Investments | | Shares | | | Value | |
Sumitomo Chemical Co., Ltd. | | | 1,000 | | | $ | 4,529 | |
Sumitomo Corp. | | | 700 | | | | 6,966 | |
Sumitomo Electric Industries Ltd. | | | 300 | | | | 3,654 | |
Sumitomo Mitsui Financial Group, Inc. | | | 500 | | | | 15,179 | |
Sumitomo Mitsui Trust Holdings, Inc. | | | 1,000 | | | | 2,933 | |
Takeda Pharmaceutical Co., Ltd. | | | 300 | | | | 13,709 | |
Tokio Marine Holdings, Inc. | | | 200 | | | | 6,762 | |
Tokyo Electron Ltd. | | | 100 | | | | 6,527 | |
Tokyo Gas Co., Ltd. | | | 1,000 | | | | 4,668 | |
Toray Industries, Inc. | | | 1,000 | | | | 8,534 | |
Toyota Motor Corp. | | | 1,500 | | | | 79,434 | |
Toyota Tsusho Corp. | | | 100 | | | | 2,263 | |
Trend Micro, Inc. | | | 100 | | | | 3,666 | |
West Japan Railway Co. | | | 100 | | | | 6,183 | |
Yahoo Japan Corp.(a) | | | 2,000 | | | | 8,523 | |
| | | | | | | | |
| Total Japan | | | | | | | 807,021 | |
| Malaysia – 0.3% | | | | | | | | |
Genting Bhd | | | 2,100 | | | | 5,275 | |
Public Bank Bhd | | | 200 | | | | 963 | |
Sime Darby Bhd | | | 3,200 | | | | 6,520 | |
| | | | | | | | |
| Total Malaysia | | | | | | | 12,758 | |
| Mexico – 0.9% | | | | | | | | |
Alfa S.A.B. de C.V. Class A | | | 1,795 | | | | 3,633 | |
America Movil S.A.B. de C.V. Series L | | | 7,518 | | | | 5,891 | |
Coca-Cola Femsa S.A.B. de C.V. Series L | | | 150 | | | | 1,257 | |
Fomento Economico Mexicano S.A.B. de C.V. | | | 429 | | | | 4,175 | |
Grupo Financiero Banorte S.A.B. de C.V. Class O | | | 200 | | | | 1,137 | |
Grupo Mexico S.A.B. de C.V. Series B | | | 2,504 | | | | 6,086 | |
Grupo Televisa S.A.B. Series CPO | | | 150 | | | | 833 | |
Telesites S.A.B. de C.V.* | | | 1 | | | | 1 | |
Wal-Mart de Mexico S.A.B. de C.V. Series V | | | 6,046 | | | | 14,464 | |
| | | | | | | | |
| Total Mexico | | | | | | | 37,477 | |
| Netherlands – 1.8% | | | | | | | | |
Aegon N.V. | | | 893 | | | | 4,919 | |
Akzo Nobel N.V. | | | 66 | | | | 4,505 | |
ASML Holding N.V. | | | 75 | | | | 7,630 | |
Boskalis Westminster | | | 68 | | | | 2,677 | |
Heineken Holding N.V. | | | 42 | | | | 3,282 | |
Heineken N.V. | | | 101 | | | | 9,167 | |
ING Groep N.V. CVA | | | 984 | | | | 11,920 | |
Koninklijke Ahold N.V. | | | 245 | | | | 5,520 | |
Koninklijke DSM N.V. | | | 81 | | | | 4,461 | |
Koninklijke KPN N.V. | | | 1,291 | | | | 5,418 | |
Koninklijke Philips N.V. | | | 334 | | | | 9,529 | |
Steinhoff International Holdings N.V. | | | 608 | | | | 4,004 | |
Wolters Kluwer N.V. | | | 159 | | | | 6,356 | |
| | | | | | | | |
| Total Netherlands | | | | | | | 79,388 | |
| New Zealand – 0.0% | | | | | | | | |
Spark New Zealand Ltd. | | | 394 | | | | 998 | |
| Norway – 0.4% | | | | | | | | |
DNB ASA | | | 316 | | | | 3,738 | |
Statoil ASA | | | 722 | | | | 11,374 | |
Telenor ASA | | | 215 | | | $ | 3,481 | |
| | | | | | | | |
| Total Norway | | | | | | | 18,593 | |
| Philippines – 0.2% | | | | | | | | |
Philippine Long Distance Telephone Co. | | | 215 | | | | 9,245 | |
| Poland – 0.1% | | | | | | | | |
Bank Pekao S.A. | | | 92 | | | | 4,071 | |
Powszechny Zaklad Ubezpieczen S.A. | | | 93 | | | | 890 | |
| | | | | | | | |
| Total Poland | | | | | | | 4,961 | |
| Portugal – 0.1% | | | | | | | | |
EDP-Energias de Portugal S.A. | | | 1,425 | | | | 5,076 | |
| Russia – 0.8% | | | | | | | | |
Gazprom PAO ADR | | | 1,878 | | | | 8,100 | |
Lukoil PJSC ADR | | | 159 | | | | 6,108 | |
Magnit PJSC GDR Reg S | | | 32 | | | | 1,278 | |
MMC Norilsk Nickel PJSC ADR | | | 504 | | | | 6,507 | |
Mobile TeleSystems PJSC ADR | | | 482 | | | | 3,899 | |
Rosneft OAO GDR Reg S | | | 1,255 | | | | 5,700 | |
Sberbank of Russia PJSC ADR | | | 160 | | | | 1,114 | |
| | | | | | | | |
| Total Russia | | | | | | | 32,706 | |
| Singapore – 0.8% | | | | | | | | |
CapitaLand Ltd. | | | 800 | | | | 1,824 | |
DBS Group Holdings Ltd. | | | 400 | | | | 4,569 | |
Global Logistic Properties Ltd. | | | 1,200 | | | | 1,715 | |
Keppel Corp., Ltd. | | | 700 | | | | 3,031 | |
Oversea-Chinese Banking Corp., Ltd. | | | 100 | | | | 656 | |
Singapore Airlines Ltd. | | | 100 | | | | 848 | |
Singapore Exchange Ltd. | | | 700 | | | | 4,133 | |
Singapore Technologies Engineering Ltd. | | | 1,400 | | | | 3,358 | |
Singapore Telecommunications Ltd. | | | 4,300 | | | | 12,198 | |
United Overseas Bank Ltd. | | | 300 | | | | 4,204 | |
| | | | | | | | |
| Total Singapore | | | | | | | 36,536 | |
| South Africa – 1.1% | | | | | | | | |
Barclays Africa Group Ltd.(a) | | | 302 | | | | 3,071 | |
Bidvest Group Ltd. (The) | | | 133 | | | | 3,373 | |
FirstRand Ltd. | | | 1,445 | | | | 4,752 | |
MTN Group Ltd. | | | 520 | | | | 4,780 | |
Nedbank Group Ltd.(a) | | | 167 | | | | 2,205 | |
Remgro Ltd. | | | 45 | | | | 765 | |
Sanlam Ltd. | | | 805 | | | | 3,749 | |
Sasol Ltd. | | | 235 | | | | 7,055 | |
Standard Bank Group Ltd. | | | 492 | | | | 4,432 | |
Tiger Brands Ltd. | | | 131 | | | | 2,897 | |
Vodacom Group Ltd. | | | 785 | | | | 8,568 | |
| | | | | | | | |
| Total South Africa | | | | | | | 45,647 | |
| South Korea – 3.2% | | | | | | | | |
Hana Financial Group, Inc. | | | 152 | | | | 3,296 | |
Hyundai Mobis Co., Ltd. | | | 21 | | | | 4,572 | |
Hyundai Motor Co. | | | 84 | | | | 11,202 | |
Industrial Bank of Korea | | | 264 | | | | 2,828 | |
Kangwon Land, Inc. | | | 68 | | | | 2,432 | |
KB Financial Group, Inc. | | | 118 | | | | 3,286 | |
See Notes to Financial Statements.
| | |
| 62 | | WisdomTree Developed World ex-U.S. and Currency Hedged Equity Funds |
Schedule of Investments (continued)
WisdomTree Global ex-U.S. Hedged Dividend Fund (DXUS)
March 31, 2016
| | | | | | | | |
| Investments | | Shares | | | Value | |
Kia Motors Corp. | | | 127 | | | $ | 5,364 | |
Korea Electric Power Corp. | | | 103 | | | | 5,422 | |
KT&G Corp. | | | 77 | | | | 7,407 | |
LG Chem Ltd. | | | 19 | | | | 5,441 | |
LG Display Co., Ltd. | | | 185 | | | | 4,303 | |
NAVER Corp. | | | 1 | | | | 557 | |
POSCO | | | 58 | | | | 11,132 | |
Samsung Electronics Co., Ltd. | | | 37 | | | | 42,448 | |
Samsung Fire & Marine Insurance Co., Ltd. | | | 19 | | | | 4,901 | |
Samsung Life Insurance Co., Ltd. | | | 55 | | | | 5,651 | |
Shinhan Financial Group Co., Ltd. | | | 153 | | | | 5,418 | |
SK Hynix, Inc. | | | 136 | | | | 3,348 | |
SK Telecom Co., Ltd. | | | 39 | | | | 7,111 | |
| | | | | | | | |
| Total South Korea | | | | | | | 136,119 | |
| Spain – 2.2% | | | | | | | | |
Abertis Infraestructuras S.A. | | | 115 | | | | 1,894 | |
Amadeus IT Holding S.A. Class A | | | 89 | | | | 3,822 | |
Banco Bilbao Vizcaya Argentaria S.A. | | | 840 | | | | 5,592 | |
Banco Popular Espanol S.A. | | | 1,077 | | | | 2,807 | |
Banco Santander S.A. | | | 4,095 | | | | 18,078 | |
Bankinter S.A. | | | 117 | | | | 828 | |
CaixaBank S.A. | | | 940 | | | | 2,781 | |
Endesa S.A. | | | 297 | | | | 5,710 | |
Ferrovial S.A. | | | 178 | | | | 3,831 | |
Gas Natural SDG S.A. | | | 327 | | | | 6,622 | |
Iberdrola S.A. | | | 1,040 | | | | 6,946 | |
Industria de Diseno Textil S.A. | | | 330 | | | | 11,118 | |
Red Electrica Corp. S.A. | | | 36 | | | | 3,130 | |
Repsol S.A. | | | 596 | | | | 6,737 | |
Telefonica S.A. | | | 1,384 | | | | 15,538 | |
| | | | | | | | |
| Total Spain | | | | | | | 95,434 | |
| Sweden – 2.2% | | | | | | | | |
Atlas Copco AB Class B | | | 704 | | | | 16,622 | |
Hennes & Mauritz AB Class B | | | 404 | | | | 13,490 | |
Nordea Bank AB | | | 1,620 | | | | 15,587 | |
Swedbank AB Class A | | | 500 | | | | 10,787 | |
Telefonaktiebolaget LM Ericsson Class B | | | 1,558 | | | | 15,625 | |
TeliaSonera AB | | | 2,655 | | | | 13,811 | |
Volvo AB Class B | | | 923 | | | | 10,145 | |
| | | | | | | | |
| Total Sweden | | | | | | | 96,067 | |
| Switzerland – 8.0% | | | | | | | | |
ABB Ltd. Registered Shares* | | | 884 | | | | 17,299 | |
Adecco S.A. Registered Shares* | | | 62 | | | | 4,056 | |
Baloise Holding AG Registered Shares | | | 17 | | | | 2,169 | |
Cie Financiere Richemont S.A. Registered Shares | | | 115 | | | | 7,631 | |
Clariant AG Registered Shares* | | | 170 | | | | 3,089 | |
Credit Suisse Group AG Registered Shares* | | | 183 | | | | 2,601 | |
Givaudan S.A. Registered Shares | | | 5 | | | | 9,847 | |
Kuehne + Nagel International AG Registered Shares | | | 60 | | | | 8,565 | |
Nestle S.A. Registered Shares | | | 855 | | | | 64,148 | |
Novartis AG Registered Shares | | | 691 | | | | 50,293 | |
Partners Group Holding AG | | | 14 | | | | 5,650 | |
Roche Holding AG Bearer Shares | | | 23 | | | | 5,800 | |
Roche Holding AG Genusschein | | | 232 | | | $ | 57,343 | |
SGS S.A. Registered Shares | | | 5 | | | | 10,609 | |
STMicroelectronics N.V. | | | 911 | | | | 5,058 | |
Swatch Group AG (The) Registered Shares | | | 76 | | | | 5,139 | |
Swiss Life Holding AG Registered Shares* | | | 9 | | | | 2,403 | |
Swiss Re AG | | | 283 | | | | 26,271 | |
Swisscom AG Registered Shares | | | 19 | | | | 10,367 | |
Syngenta AG Registered Shares | | | 33 | | | | 13,784 | |
UBS Group AG Registered Shares | | | 945 | | | | 15,285 | |
Zurich Insurance Group AG* | | | 79 | | | | 18,421 | |
| | | | | | | | |
| Total Switzerland | | | | | | | 345,828 | |
| Taiwan – 2.6% | | | | | | | | |
Chunghwa Telecom Co., Ltd. | | | 4,000 | | | | 13,609 | |
E.Sun Financial Holding Co., Ltd. | | | 15,000 | | | | 8,389 | |
First Financial Holding Co., Ltd. | | | 27,000 | | | | 13,339 | |
Hon Hai Precision Industry Co., Ltd. | | | 3,400 | | | | 8,959 | |
Hua Nan Financial Holdings Co., Ltd. | | | 25,000 | | | | 12,429 | |
SinoPac Financial Holdings Co., Ltd. | | | 14,000 | | | | 4,328 | |
Taishin Financial Holding Co., Ltd. | | | 23,000 | | | | 8,111 | |
Taiwan Cooperative Financial Holding Co., Ltd. | | | 26,000 | | | | 11,633 | |
Taiwan Semiconductor Manufacturing Co., Ltd. | | | 6,000 | | | | 30,201 | |
| | | | | | | | |
| Total Taiwan | | | | | | | 110,998 | |
| Thailand – 0.3% | | | | | | | | |
Advanced Info Service PCL NVDR | | | 400 | | | | 2,070 | |
CP ALL PCL NVDR | | | 2,500 | | | | 3,251 | |
PTT PCL NVDR | | | 700 | | | | 5,571 | |
| | | | | | | | |
| Total Thailand | | | | | | | 10,892 | |
| Turkey – 0.2% | | | | | | | | |
Akbank TAS | | | 1,183 | | | | 3,369 | |
Turkiye Garanti Bankasi AS | | | 1,294 | | | | 3,787 | |
| | | | | | | | |
| Total Turkey | | | | | | | 7,156 | |
| United Kingdom – 15.8% | | | | | | | | |
Aberdeen Asset Management PLC | | | 1,011 | | | | 4,031 | |
Associated British Foods PLC | | | 103 | | | | 4,958 | |
AstraZeneca PLC | | | 430 | | | | 24,119 | |
Aviva PLC | | | 1,144 | | | | 7,500 | |
BAE Systems PLC | | | 1,660 | | | | 12,144 | |
Barclays PLC | | | 34 | | | | 73 | |
BHP Billiton PLC | | | 1,246 | | | | 14,019 | |
BP PLC | | | 10,136 | | | | 51,012 | |
British American Tobacco PLC | | | 590 | | | | 34,683 | |
BT Group PLC | | | 1,876 | | | | 11,878 | |
Carnival PLC | | | 83 | | | | 4,476 | |
Centrica PLC | | | 2,190 | | | | 7,167 | |
Compass Group PLC | | | 464 | | | | 8,190 | |
Diageo PLC | | | 690 | | | | 18,660 | |
easyJet PLC | | | 69 | | | | 1,506 | |
GlaxoSmithKline PLC | | | 2,584 | | | | 52,441 | |
HSBC Holdings PLC | | | 7,352 | | | | 45,850 | |
Imperial Brands PLC | | | 336 | | | | 18,656 | |
ITV PLC | | | 1,283 | | | | 4,448 | |
J Sainsbury PLC | | | 1,141 | | | | 4,531 | |
See Notes to Financial Statements.
| | | | |
| WisdomTree Developed World ex-U.S. and Currency Hedged Equity Funds | | | 63 | |
Schedule of Investments (continued)
WisdomTree Global ex-U.S. Hedged Dividend Fund (DXUS)
March 31, 2016
| | | | | | | | |
| Investments | | Shares | | | Value | |
John Wood Group PLC | | | 452 | | | $ | 3,995 | |
Kingfisher PLC | | | 878 | | | | 4,754 | |
Legal & General Group PLC | | | 2,337 | | | | 7,900 | |
Lloyds Banking Group PLC | | | 9,463 | | | | 9,252 | |
Marks & Spencer Group PLC | | | 841 | | | | 4,910 | |
National Grid PLC | | | 1,528 | | | | 21,681 | |
Next PLC | | | 6 | | | | 466 | |
Old Mutual PLC | | | 1,632 | | | | 4,529 | |
Pearson PLC | | | 267 | | | | 3,358 | |
Pennon Group PLC | | | 291 | | | | 3,392 | |
Prudential PLC | | | 542 | | | | 10,135 | |
Reckitt Benckiser Group PLC | | | 156 | | | | 15,090 | |
RELX N.V. | | | 340 | | | | 5,945 | |
RELX PLC | | | 422 | | | | 7,849 | |
Rio Tinto PLC | | | 659 | | | | 18,522 | |
Royal Dutch Shell PLC Class A | | | 1,933 | | | | 46,787 | |
Royal Dutch Shell PLC Class B | | | 1,386 | | | | 33,866 | |
SABMiller PLC | | | 310 | | | | 18,963 | |
Segro PLC | | | 115 | | | | 678 | |
Sky PLC | | | 524 | | | | 7,712 | |
Smith & Nephew PLC | | | 302 | | | | 4,983 | |
Smiths Group PLC | | | 296 | | | | 4,578 | |
SSE PLC | | | 484 | | | | 10,379 | |
Standard Life PLC | | | 898 | | | | 4,596 | |
Taylor Wimpey PLC | | | 2,594 | | | | 7,095 | |
Unilever N.V. CVA | | | 562 | | | | 25,223 | |
Unilever PLC | | | 385 | | | | 17,445 | |
United Utilities Group PLC | | | 331 | | | | 4,391 | |
Vodafone Group PLC | | | 10,533 | | | | 33,488 | |
WM Morrison Supermarkets PLC(a) | | | 1,768 | | | | 5,049 | |
| | | | | | | | |
| Total United Kingdom | | | | | | | 677,353 | |
TOTAL COMMON STOCKS
(Cost: $4,613,778) | | | | | | | 4,254,558 | |
| EXCHANGE-TRADED NOTE – 1.5% | |
| United States – 1.5% | | | | | | | | |
iPath MSCI India Index ETN* | | | | | | | | |
| (Cost: $72,187) | | | 1,063 | | | | 66,746 | |
| INVESTMENT OF CASH COLLATERAL FOR SECURITIES LOANED – 1.0% | |
| United States – 1.0% | | | | | | | | |
State Street Navigator Securities Lending Prime Portfolio, 0.50%(b) | | | | | | | | |
| (Cost: $41,257)(c) | | | 41,257 | | | | 41,257 | |
TOTAL INVESTMENTS IN SECURITIES – 101.5% (Cost: $4,727,222) | | | | | | | 4,362,561 | |
Liabilities in Excess of Cash, Foreign Currency and
Other Assets – (1.5)% | | | | | | | (64,033 | ) |
| | | | | | | | |
| NET ASSETS – 100.0% | | | | | | $ | 4,298,528 | |
| * | Non-income producing security. |
| (a) | Security, or portion thereof, was on loan at March 31, 2016 (See Note 2). |
| (b) | Rate shown represents annualized 7-day yield as of March 31, 2016. |
| (c) | At March 31, 2016, the total market value of the Fund’s securities on loan was $56,482 and the total market value of the collateral held by the Fund was $60,329. The total market value of the collateral includes non-cash U.S. Government securities collateral having a value of $19,072. |
ADR – American Depositary Receipt
CVA – Certificaten Van Aandelen (Certificate of Stock)
ETN – Exchange-Traded Note
GDR – Global Depositary Receipt
NVDR – Non-Voting Depositary Receipt
Reg S – Regulation S provides an exclusion from the registration requirements of the Securities Act of 1933. These securities may be resold in transactions exempt from registration, normally to qualified institutional buyers.
| | | | | | | | | | | | | | | | | | | | |
| FINANCIAL DERIVATIVE INSTRUMENTS | |
| FORWARD CONTRACTS | |
Settlement
Date | | Contracts
To Deliver | | | In
Exchange For | | | Unrealized
Gain (Loss) | |
4/4/2016 | | | AUD | | | | 46,935 | | | | USD | | | | 33,474 | | | $ | (2,631 | ) |
4/4/2016 | | | AUD | | | | 46,934 | | | | USD | | | | 33,474 | | | | (2,630 | ) |
4/4/2016 | | | AUD | | | | 46,938 | | | | USD | | | | 33,474 | | | | (2,633 | ) |
4/4/2016 | | | AUD | | | | 35,760 | | | | USD | | | | 25,504 | | | | (2,004 | ) |
4/4/2016 | | | AUD | | | | 46,937 | | | | USD | | | | 33,474 | | | | (2,632 | ) |
4/4/2016 | | | CHF | | | | 70,681 | | | | USD | | | | 71,077 | | | | (2,730 | ) |
4/4/2016 | | | CHF | | | | 70,682 | | | | USD | | | | 71,077 | | | | (2,731 | ) |
4/4/2016 | | | CHF | | | | 70,677 | | | | USD | | | | 71,077 | | | | (2,725 | ) |
4/4/2016 | | | CHF | | | | 53,854 | | | | USD | | | | 54,157 | | | | (2,079 | ) |
4/4/2016 | | | CHF | | | | 70,680 | | | | USD | | | | 71,077 | | | | (2,729 | ) |
4/4/2016 | | | CZK | | | | 8,789 | | | | USD | | | | 353 | | | | (17 | ) |
4/4/2016 | | | CZK | | | | 8,789 | | | | USD | | | | 353 | | | | (17 | ) |
4/4/2016 | | | CZK | | | | 8,787 | | | | USD | | | | 353 | | | | (17 | ) |
4/4/2016 | | | CZK | | | | 6,771 | | | | USD | | | | 272 | | | | (13 | ) |
4/4/2016 | | | CZK | | | | 8,788 | | | | USD | | | | 353 | | | | (17 | ) |
4/4/2016 | | | DKK | | | | 96,269 | | | | USD | | | | 14,039 | | | | (686 | ) |
4/4/2016 | | | DKK | | | | 96,269 | | | | USD | | | | 14,039 | | | | (686 | ) |
4/4/2016 | | | DKK | | | | 96,266 | | | | USD | | | | 14,039 | | | | (685 | ) |
4/4/2016 | | | DKK | | | | 73,355 | | | | USD | | | | 10,697 | | | | (523 | ) |
4/4/2016 | | | DKK | | | | 96,278 | | | | USD | | | | 14,039 | | | | (687 | ) |
4/4/2016 | | | EUR | | | | 193,086 | | | | USD | | | | 210,003 | | | | (10,028 | ) |
4/4/2016 | | | EUR | | | | 193,082 | | | | USD | | | | 210,003 | | | | (10,024 | ) |
4/4/2016 | | | EUR | | | | 193,087 | | | | USD | | | | 210,003 | | | | (10,029 | ) |
4/4/2016 | | | EUR | | | | 147,118 | | | | USD | | | | 160,004 | | | | (7,644 | ) |
4/4/2016 | | | EUR | | | | 193,090 | | | | USD | | | | 210,003 | | | | (10,033 | ) |
4/4/2016 | | | GBP | | | | 95,367 | | | | USD | | | | 132,914 | | | | (4,157 | ) |
4/4/2016 | | | GBP | | | | 95,369 | | | | USD | | | | 132,914 | | | | (4,159 | ) |
4/4/2016 | | | GBP | | | | 95,362 | | | | USD | | | | 132,914 | | | | (4,149 | ) |
4/4/2016 | | | GBP | | | | 72,658 | | | | USD | | | | 101,268 | | | | (3,164 | ) |
4/4/2016 | | | GBP | | | | 95,365 | | | | USD | | | | 132,914 | | | | (4,154 | ) |
4/4/2016 | | | HUF | | | | 73,686 | | | | USD | | | | 258 | | | | (9 | ) |
4/4/2016 | | | HUF | | | | 73,673 | | | | USD | | | | 258 | | | | (9 | ) |
4/4/2016 | | | HUF | | | | 73,667 | | | | USD | | | | 258 | | | | (9 | ) |
4/4/2016 | | | HUF | | | | 57,399 | | | | USD | | | | 201 | | | | (7 | ) |
4/4/2016 | | | HUF | | | | 73,667 | | | | USD | | | | 258 | | | | (9 | ) |
4/4/2016 | | | ILS | | | | 18,532 | | | | USD | | | | 4,752 | | | | (177 | ) |
4/4/2016 | | | ILS | | | | 18,531 | | | | USD | | | | 4,752 | | | | (177 | ) |
4/4/2016 | | | ILS | | | | 18,528 | | | | USD | | | | 4,752 | | | | (176 | ) |
4/4/2016 | | | ILS | | | | 14,124 | | | | USD | | | | 3,622 | | | | (135 | ) |
4/4/2016 | | | ILS | | | | 18,530 | | | | USD | | | | 4,752 | | | | (177 | ) |
4/4/2016 | | | NOK | | | | 32,409 | | | | USD | | | | 3,717 | | | | (201 | ) |
4/4/2016 | | | NOK | | | | 32,410 | | | | USD | | | | 3,717 | | | | (201 | ) |
4/4/2016 | | | NOK | | | | 32,412 | | | | USD | | | | 3,717 | | | | (202 | ) |
4/4/2016 | | | NOK | | | | 24,720 | | | | USD | | | | 2,835 | | | | (154 | ) |
4/4/2016 | | | NOK | | | | 32,411 | | | | USD | | | | 3,717 | | | | (202 | ) |
4/4/2016 | | | NZD | | | | 438 | | | | USD | | | | 288 | | | | (16 | ) |
4/4/2016 | | | NZD | | | | 438 | | | | USD | | | | 288 | | | | (16 | ) |
See Notes to Financial Statements.
| | |
| 64 | | WisdomTree Developed World ex-U.S. and Currency Hedged Equity Funds |
Schedule of Investments (continued)
WisdomTree Global ex-U.S. Hedged Dividend Fund (DXUS)
March 31, 2016
| | | | | | | | | | | | | | | | | | | | |
Settlement
Date | | Contracts
To Deliver | | | In
Exchange For | | | Unrealized
Gain (Loss) | |
4/4/2016 | | | NZD | | | | 438 | | | | USD | | | | 288 | | | $ | (16 | ) |
4/4/2016 | | | NZD | | | | 334 | | | | USD | | | | 220 | | | | (12 | ) |
4/4/2016 | | | NZD | | | | 438 | | | | USD | | | | 288 | | | | (16 | ) |
4/4/2016 | | | PHP | | | | 501,241 | | | | USD | | | | 10,508 | | | | (383 | ) |
4/4/2016 | | | PLN | | | | 3,732 | | | | USD | | | | 933 | | | | (70 | ) |
4/4/2016 | | | PLN | | | | 3,732 | | | | USD | | | | 933 | | | | (70 | ) |
4/4/2016 | | | PLN | | | | 3,733 | | | | USD | | | | 933 | | | | (70 | ) |
4/4/2016 | | | PLN | | | | 2,856 | | | | USD | | | | 714 | | | | (53 | ) |
4/4/2016 | | | PLN | | | | 3,732 | | | | USD | | | | 933 | | | | (70 | ) |
4/4/2016 | | | SEK | | | | 169,292 | | | | USD | | | | 19,734 | | | | (1,149 | ) |
4/4/2016 | | | SEK | | | | 169,294 | | | | USD | | | | 19,734 | | | | (1,149 | ) |
4/4/2016 | | | SEK | | | | 169,280 | | | | USD | | | | 19,734 | | | | (1,147 | ) |
4/4/2016 | | | SEK | | | | 129,001 | | | | USD | | | | 15,038 | | | | (875 | ) |
4/4/2016 | | | SEK | | | | 169,061 | | | | USD | | | | 19,734 | | | | (1,120 | ) |
4/4/2016 | | | TRY | | | | 4,003 | | | | USD | | | | 1,341 | | | | (80 | ) |
4/4/2016 | | | TRY | | | | 4,001 | | | | USD | | | | 1,341 | | | | (79 | ) |
4/4/2016 | | | TRY | | | | 4,002 | | | | USD | | | | 1,341 | | | | (79 | ) |
4/4/2016 | | | TRY | | | | 3,058 | | | | USD | | | | 1,025 | | | | (60 | ) |
4/4/2016 | | | TRY | | | | 4,016 | | | | USD | | | | 1,341 | | | | (84 | ) |
4/4/2016 | | | USD | | | | 33,474 | | | | AUD | | | | 43,516 | | | | 1 | |
4/4/2016 | | | USD | | | | 33,474 | | | | AUD | | | | 43,516 | | | | 1 | |
4/4/2016 | | | USD | | | | 25,504 | | | | AUD | | | | 33,156 | | | | 1 | |
4/4/2016 | | | USD | | | | 33,474 | | | | AUD | | | | 43,515 | | | | — | |
4/4/2016 | | | USD | | | | 33,474 | | | | AUD | | | | 43,516 | | | | 1 | |
4/4/2016 | | | USD | | | | 71,077 | | | | CHF | | | | 68,065 | | | | (1 | ) |
4/4/2016 | | | USD | | | | 71,077 | | | | CHF | | | | 68,065 | | | | (2 | ) |
4/4/2016 | | | USD | | | | 71,077 | | | | CHF | | | | 68,067 | | | | — | |
4/4/2016 | | | USD | | | | 54,157 | | | | CHF | | | | 51,866 | | | | 2 | |
4/4/2016 | | | USD | | | | 71,077 | | | | CHF | | | | 68,065 | | | | (2 | ) |
4/4/2016 | | | USD | | | | 353 | | | | CZK | | | | 8,379 | | | | — | |
4/4/2016 | | | USD | | | | 272 | | | | CZK | | | | 6,457 | | | | — | |
4/4/2016 | | | USD | | | | 353 | | | | CZK | | | | 8,379 | | | | — | |
4/4/2016 | | | USD | | | | 353 | | | | CZK | | | | 8,379 | | | | — | |
4/4/2016 | | | USD | | | | 353 | | | | CZK | | | | 8,379 | | | | — | |
4/4/2016 | | | USD | | | | 14,039 | | | | DKK | | | | 91,789 | | | | — | |
4/4/2016 | | | USD | | | | 14,039 | | | | DKK | | | | 91,786 | | | | — | |
4/4/2016 | | | USD | | | | 14,039 | | | | DKK | | | | 91,782 | | | | (1 | ) |
4/4/2016 | | | USD | | | | 10,697 | | | | DKK | | | | 69,943 | | | | 1 | |
4/4/2016 | | | USD | | | | 14,039 | | | | DKK | | | | 91,791 | | | | 1 | |
4/4/2016 | | | USD | | | | 210,003 | | | | EUR | | | | 184,291 | | | | 6 | |
4/4/2016 | | | USD | | | | 16,959 | | | | EUR | | | | 14,900 | | | | 21 | |
4/4/2016 | | | USD | | | | 160,004 | | | | EUR | | | | 140,417 | | | | 8 | |
4/4/2016 | | | USD | | | | 210,003 | | | | EUR | | | | 184,291 | | | | 6 | |
4/4/2016 | | | USD | | | | 210,003 | | | | EUR | | | | 184,295 | | | | 11 | |
4/4/2016 | | | USD | | | | 210,003 | | | | EUR | | | | 184,289 | | | | 3 | |
4/4/2016 | | | USD | | | | 132,914 | | | | GBP | | | | 92,477 | | | | 4 | |
4/4/2016 | | | USD | | | | 132,914 | | | | GBP | | | | 92,477 | | | | 4 | |
4/4/2016 | | | USD | | | | 101,268 | | | | GBP | | | | 70,461 | | | | 5 | |
4/4/2016 | | | USD | | | | 132,914 | | | | GBP | | | | 92,475 | | | | — | |
4/4/2016 | | | USD | | | | 132,914 | | | | GBP | | | | 92,478 | | | | 4 | |
4/4/2016 | | | USD | | | | 258 | | | | HUF | | | | 71,134 | | | | — | |
4/4/2016 | | | USD | | | | 201 | | | | HUF | | | | 55,422 | | | | — | |
4/4/2016 | | | USD | | | | 258 | | | | HUF | | | | 71,136 | | | | — | |
4/4/2016 | | | USD | | | | 258 | | | | HUF | | | | 71,132 | | | | — | |
4/4/2016 | | | USD | | | | 258 | | | | HUF | | | | 71,137 | | | | — | |
4/4/2016 | | | USD | | | | 4,752 | | | | ILS | | | | 17,866 | | | | — | |
4/4/2016 | | | USD | | | | 4,752 | | | | ILS | | | | 17,866 | | | | — | |
4/4/2016 | | | USD | | | | 4,752 | | | | ILS | | | | 17,865 | | | | — | |
4/4/2016 | | | USD | | | | 3,622 | | | | ILS | | | | 13,618 | | | | — | |
4/4/2016 | | | USD | | | | 4,752 | | | | ILS | | | | 17,866 | | | $ | — | |
4/4/2016 | | | USD | | | | 3,717 | | | | NOK | | | | 30,745 | | | | — | |
4/4/2016 | | | USD | | | | 3,717 | | | | NOK | | | | 30,745 | | | | — | |
4/4/2016 | | | USD | | | | 3,717 | | | | NOK | | | | 30,744 | | | | — | |
4/4/2016 | | | USD | | | | 2,835 | | | | NOK | | | | 23,451 | | | | — | |
4/4/2016 | | | USD | | | | 3,717 | | | | NOK | | | | 30,746 | | | | — | |
4/4/2016 | | | USD | | | | 288 | | | | NZD | | | | 415 | | | | — | |
4/4/2016 | | | USD | | | | 220 | | | | NZD | | | | 317 | | | | — | |
4/4/2016 | | | USD | | | | 288 | | | | NZD | | | | 415 | | | | — | |
4/4/2016 | | | USD | | | | 288 | | | | NZD | | | | 415 | | | | — | |
4/4/2016 | | | USD | | | | 288 | | | | NZD | | | | 415 | | | | — | |
4/4/2016 | | | USD | | | | 10,889 | | | | PHP | | | | 501,241 | | | | 2 | |
4/4/2016 | | | USD | | | | 933 | | | | PLN | | | | 3,473 | | | | — | |
4/4/2016 | | | USD | | | | 933 | | | | PLN | | | | 3,473 | | | | — | |
4/4/2016 | | | USD | | | | 714 | | | | PLN | | | | 2,658 | | | | — | |
4/4/2016 | | | USD | | | | 933 | | | | PLN | | | | 3,473 | | | | — | |
4/4/2016 | | | USD | | | | 933 | | | | PLN | | | | 3,472 | | | | — | |
4/4/2016 | | | USD | | | | 19,734 | | | | SEK | | | | 159,982 | | | | — | |
4/4/2016 | | | USD | | | | 19,734 | | | | SEK | | | | 159,982 | | | | 1 | |
4/4/2016 | | | USD | | | | 19,734 | | | | SEK | | | | 159,978 | | | | — | |
4/4/2016 | | | USD | | | | 15,038 | | | | SEK | | | | 121,921 | | | | 2 | |
4/4/2016 | | | USD | | | | 19,734 | | | | SEK | | | | 159,979 | | | | — | |
4/4/2016 | | | USD | | | | 1,341 | | | | TRY | | | | 3,779 | | | | — | |
4/4/2016 | | | USD | | | | 1,341 | | | | TRY | | | | 3,779 | | | | — | |
4/4/2016 | | | USD | | | | 1,341 | | | | TRY | | | | 3,779 | | | | — | |
4/4/2016 | | | USD | | | | 1,341 | | | | TRY | | | | 3,779 | | | | — | |
4/4/2016 | | | USD | | | | 1,025 | | | | TRY | | | | 2,889 | | | | — | |
4/5/2016 | | | BRL | | | | 16,848 | | | | USD | | | | 4,197 | | | | (556 | ) |
4/5/2016 | | | BRL | | | | 16,848 | | | | USD | | | | 4,196 | | | | (556 | ) |
4/5/2016 | | | BRL | | | | 16,848 | | | | USD | | | | 4,195 | | | | (557 | ) |
4/5/2016 | | | BRL | | | | 12,839 | | | | USD | | | | 3,199 | | | | (423 | ) |
4/5/2016 | | | BRL | | | | 16,848 | | | | USD | | | | 4,195 | | | | (557 | ) |
4/5/2016 | | | CAD | | | | 73,909 | | | | USD | | | | 54,559 | | | | (2,583 | ) |
4/5/2016 | | | CAD | | | | 73,909 | | | | USD | | | | 54,559 | | | | (2,582 | ) |
4/5/2016 | | | CAD | | | | 73,903 | | | | USD | | | | 54,559 | | | | (2,578 | ) |
4/5/2016 | | | CAD | | | | 56,313 | | | | USD | | | | 41,572 | | | | (1,966 | ) |
4/5/2016 | | | CAD | | | | 73,905 | | | | USD | | | | 54,559 | | | | (2,580 | ) |
4/5/2016 | | | CLP | | | | 1,115,667 | | | | USD | | | | 1,599 | | | | (69 | ) |
4/5/2016 | | | CLP | | | | 1,115,667 | | | | USD | | | | 1,600 | | | | (68 | ) |
4/5/2016 | | | CLP | | | | 1,115,667 | | | | USD | | | | 1,600 | | | | (67 | ) |
4/5/2016 | | | CLP | | | | 850,033 | | | | USD | | | | 1,219 | | | | (51 | ) |
4/5/2016 | | | CLP | | | | 1,115,667 | | | | USD | | | | 1,597 | | | | (71 | ) |
4/5/2016 | | | HKD | | | | 386,468 | | | | USD | | | | 49,704 | | | | (121 | ) |
4/5/2016 | | | HKD | | | | 386,454 | | | | USD | | | | 49,704 | | | | (119 | ) |
4/5/2016 | | | HKD | | | | 386,459 | | | | USD | | | | 49,704 | | | | (120 | ) |
4/5/2016 | | | HKD | | | | 294,436 | | | | USD | | | | 37,871 | | | | (89 | ) |
4/5/2016 | | | HKD | | | | 386,436 | | | | USD | | | | 49,704 | | | | (117 | ) |
4/5/2016 | | | IDR | | | | 183,434,832 | | | | USD | | | | 13,578 | | | | (229 | ) |
4/5/2016 | | | JPY | | | | 18,859,616 | | | | USD | | | | 167,276 | | | | (528 | ) |
4/5/2016 | | | JPY | | | | 18,859,800 | | | | USD | | | | 167,276 | | | | (530 | ) |
4/5/2016 | | | JPY | | | | 18,859,867 | | | | USD | | | | 167,276 | | | | (531 | ) |
4/5/2016 | | | JPY | | | | 14,370,136 | | | | USD | | | | 127,452 | | | | (407 | ) |
4/5/2016 | | | JPY | | | | 18,860,000 | | | | USD | | | | 167,276 | | | | (532 | ) |
4/5/2016 | | | KRW | | | | 46,688,961 | | | | USD | | | | 37,716 | | | | (3,110 | ) |
4/5/2016 | | | KRW | | | | 51,207,249 | | | | USD | | | | 41,370 | | | | (3,408 | ) |
4/5/2016 | | | KRW | | | | 52,713,344 | | | | USD | | | | 42,586 | | | | (3,509 | ) |
4/5/2016 | | | MXN | | | | 129,646 | | | | USD | | | | 7,147 | | | | (417 | ) |
4/5/2016 | | | MXN | | | | 129,637 | | | | USD | | | | 7,147 | | | | (417 | ) |
4/5/2016 | | | MXN | | | | 129,647 | | | | USD | | | | 7,147 | | | | (417 | ) |
See Notes to Financial Statements.
| | | | |
| WisdomTree Developed World ex-U.S. and Currency Hedged Equity Funds | | | 65 | |
Schedule of Investments (continued)
WisdomTree Global ex-U.S. Hedged Dividend Fund (DXUS)
March 31, 2016
| | | | | | | | | | | | | | | | | | | | |
Settlement
Date | | Contracts
To Deliver | | | In
Exchange For | | | Unrealized
Gain (Loss) | |
4/5/2016 | | | MXN | | | | 98,811 | | | | USD | | | | 5,448 | | | $ | (317 | ) |
4/5/2016 | | | MXN | | | | 129,643 | | | | USD | | | | 7,147 | | | | (417 | ) |
4/5/2016 | | | MYR | | | | 46,026 | | | | USD | | | | 10,907 | | | | (828 | ) |
4/5/2016 | | | SGD | | | | 9,767 | | | | USD | | | | 6,939 | | | | (314 | ) |
4/5/2016 | | | SGD | | | | 9,767 | | | | USD | | | | 6,939 | | | | (314 | ) |
4/5/2016 | | | SGD | | | | 9,767 | | | | USD | | | | 6,939 | | | | (314 | ) |
4/5/2016 | | | SGD | | | | 7,441 | | | | USD | | | | 5,287 | | | | (239 | ) |
4/5/2016 | | | SGD | | | | 9,767 | | | | USD | | | | 6,939 | | | | (314 | ) |
4/5/2016 | | | THB | | | | 397,752 | | | | USD | | | | 11,142 | | | | (152 | ) |
4/5/2016 | | | USD | | | | 4,749 | | | | BRL | | | | 16,848 | | | | 4 | |
4/5/2016 | | | USD | | | | 4,750 | | | | BRL | | | | 16,848 | | | | 3 | |
4/5/2016 | | | USD | | | | 4,745 | | | | BRL | | | | 16,848 | | | | 8 | |
4/5/2016 | | | USD | | | | 3,621 | | | | BRL | | | | 12,839 | | | | 1 | |
4/5/2016 | | | USD | | | | 4,754 | | | | BRL | | | | 16,848 | | | | (2 | ) |
4/5/2016 | | | USD | | | | 54,559 | | | | CAD | | | | 70,569 | | | | — | |
4/5/2016 | | | USD | | | | 54,559 | | | | CAD | | | | 70,569 | | | | 1 | |
4/5/2016 | | | USD | | | | 41,572 | | | | CAD | | | | 53,773 | | | | 2 | |
4/5/2016 | | | USD | | | | 54,559 | | | | CAD | | | | 70,572 | | | | 2 | |
4/5/2016 | | | USD | | | | 54,559 | | | | CAD | | | | 70,570 | | | | 1 | |
4/5/2016 | | | USD | | | | 1,673 | | | | CLP | | | | 1,115,667 | | | | (5 | ) |
4/5/2016 | | | USD | | | | 1,668 | | | | CLP | | | | 1,115,667 | | | | — | |
4/5/2016 | | | USD | | | | 1,664 | | | | CLP | | | | 1,115,667 | | | | 3 | |
4/5/2016 | | | USD | | | | 1,271 | | | | CLP | | | | 850,033 | | | | — | |
4/5/2016 | | | USD | | | | 1,668 | | | | CLP | | | | 1,115,667 | | | | — | |
4/5/2016 | | | USD | | | | 49,704 | | | | HKD | | | | 385,541 | | | | 1 | |
4/5/2016 | | | USD | | | | 37,871 | | | | HKD | | | | 293,778 | | | | 4 | |
4/5/2016 | | | USD | | | | 49,704 | | | | HKD | | | | 385,551 | | | | 3 | |
4/5/2016 | | | USD | | | | 49,704 | | | | HKD | | | | 385,532 | | | | — | |
4/5/2016 | | | USD | | | | 49,704 | | | | HKD | | | | 385,543 | | | | 2 | |
4/5/2016 | | | USD | | | | 13,808 | | | | IDR | | | | 183,434,832 | | | | (1 | ) |
4/5/2016 | | | USD | | | | 167,276 | | | | JPY | | | | 18,799,764 | | | | (4 | ) |
4/5/2016 | | | USD | | | | 167,276 | | | | JPY | | | | 18,799,313 | | | | (8 | ) |
4/5/2016 | | | USD | | | | 167,276 | | | | JPY | | | | 18,800,534 | | | | 3 | |
4/5/2016 | | | USD | | | | 127,452 | | | | JPY | | | | 14,324,661 | | | | 2 | |
4/5/2016 | | | USD | | | | 167,276 | | | | JPY | | | | 18,801,538 | | | | 12 | |
4/5/2016 | | | USD | | | | 32,927 | | | | KRW | | | | 37,652,388 | | | | (3 | ) |
4/5/2016 | | | USD | | | | 32,922 | | | | KRW | | | | 37,652,388 | | | | 3 | |
4/5/2016 | | | USD | | | | 32,927 | | | | KRW | | | | 37,652,388 | | | | (3 | ) |
4/5/2016 | | | USD | | | | 32,919 | | | | KRW | | | | 37,652,390 | | | | 6 | |
4/5/2016 | | | USD | | | | 7,147 | | | | MXN | | | | 122,500 | | | | — | |
4/5/2016 | | | USD | | | | 7,147 | | | | MXN | | | | 122,492 | | | | — | |
4/5/2016 | | | USD | | | | 5,448 | | | | MXN | | | | 93,387 | | | | 1 | |
4/5/2016 | | | USD | | | | 7,147 | | | | MXN | | | | 122,496 | | | | — | |
4/5/2016 | | | USD | | | | 7,147 | | | | MXN | | | | 122,502 | | | | — | |
4/5/2016 | | | USD | | | | 11,738 | | | | MYR | | | | 46,026 | | | | (3 | ) |
4/5/2016 | | | USD | | | | 6,939 | | | | SGD | | | | 9,344 | | | | — | |
4/5/2016 | | | USD | | | | 6,939 | | | | SGD | | | | 9,344 | | | | — | |
4/5/2016 | | | USD | | | | 5,287 | | | | SGD | | | | 7,120 | | | | 1 | |
4/5/2016 | | | USD | | | | 6,939 | | | | SGD | | | | 9,344 | | | | — | |
4/5/2016 | | | USD | | | | 6,939 | | | | SGD | | | | 9,344 | | | | — | |
4/5/2016 | | | USD | | | | 11,295 | | | | THB | | | | 397,752 | | | | (2 | ) |
4/6/2016 | | | INR | | | | 4,215,753 | | | | USD | | | | 61,001 | | | | (2,542 | ) |
4/6/2016 | | | USD | | | | 63,500 | | | | INR | | | | 4,215,753 | | | | 42 | |
4/7/2016 | | | TWD | | | | 3,551,218 | | | | USD | | | | 106,308 | | | | (4,010 | ) |
4/7/2016 | | | USD | | | | 55,171 | | | | TWD | | | | 1,775,609 | | | | (11 | ) |
4/7/2016 | | | USD | | | | 55,177 | | | | TWD | | | | 1,775,609 | | | | (18 | ) |
4/7/2016 | | | USD | | | | 9,269 | | | | ZAR | | | | 136,413 | | | | — | |
4/7/2016 | | | USD | | | | 7,064 | | | | ZAR | | | | 103,968 | | | | 1 | |
4/7/2016 | | | USD | | | | 9,269 | | | | ZAR | | | | 136,407 | | | | — | |
4/7/2016 | | | USD | | | | 9,269 | | | | ZAR | | | | 136,401 | | | | 1 | |
4/7/2016 | | | USD | | | | 9,269 | | | | ZAR | | | | 136,400 | | | | (1 | ) |
4/7/2016 | | | ZAR | | | | 147,364 | | | | USD | | | | 9,269 | | | | (744 | ) |
4/7/2016 | | | ZAR | | | | 147,207 | | | | USD | | | | 9,269 | | | | (734 | ) |
4/7/2016 | | | ZAR | | | | 112,181 | | | | USD | | | | 7,064 | | | | (559 | ) |
4/7/2016 | | | ZAR | | | | 147,348 | | | | USD | | | | 9,269 | | | | (743 | ) |
4/7/2016 | | | ZAR | | | | 147,329 | | | | USD | | | | 9,269 | | | | (742 | ) |
5/3/2016 | | | AUD | | | | 46,795 | | | | USD | | | | 35,948 | | | | (1 | ) |
5/3/2016 | | | AUD | | | | 46,794 | | | | USD | | | | 35,948 | | | | — | |
5/3/2016 | | | AUD | | | | 46,796 | | | | USD | | | | 35,948 | | | | (2 | ) |
5/3/2016 | | | AUD | | | | 35,660 | | | | USD | | | | 27,393 | | | | (2 | ) |
5/3/2016 | | | AUD | | | | 46,796 | | | | USD | | | | 35,948 | | | | (1 | ) |
5/3/2016 | | | CHF | | | | 68,375 | | | | USD | | | | 71,487 | | | | (2 | ) |
5/3/2016 | | | CHF | | | | 52,098 | | | | USD | | | | 54,467 | | | | (4 | ) |
5/3/2016 | | | CHF | | | | 68,373 | | | | USD | | | | 71,487 | | | | 1 | |
5/3/2016 | | | CHF | | | | 68,378 | | | | USD | | | | 71,487 | | | | (6 | ) |
5/3/2016 | | | CHF | | | | 68,373 | | | | USD | | | | 71,487 | | | | — | |
5/3/2016 | | | CZK | | | | 9,583 | | | | USD | | | | 404 | | | | — | |
5/3/2016 | | | CZK | | | | 9,583 | | | | USD | | | | 404 | | | | — | |
5/3/2016 | | | CZK | | | | 9,584 | | | | USD | | | | 404 | | | | — | |
5/3/2016 | | | CZK | | | | 7,403 | | | | USD | | | | 312 | | | | — | |
5/3/2016 | | | CZK | | | | 9,585 | | | | USD | | | | 404 | | | | — | |
5/3/2016 | | | DKK | | | | 93,730 | | | | USD | | | | 14,346 | | | | (2 | ) |
5/3/2016 | | | DKK | | | | 93,717 | | | | USD | | | | 14,346 | | | | — | |
5/3/2016 | | | DKK | | | | 93,720 | | | | USD | | | | 14,346 | | | | — | |
5/3/2016 | | | DKK | | | | 71,424 | | | | USD | | | | 10,932 | | | | (1 | ) |
5/3/2016 | | | DKK | | | | 93,725 | | | | USD | | | | 14,346 | | | | (1 | ) |
5/3/2016 | | | EUR | | | | 193,670 | | | | USD | | | | 220,876 | | | | (10 | ) |
5/3/2016 | | | EUR | | | | 147,564 | | | | USD | | | | 168,290 | | | | (10 | ) |
5/3/2016 | | | EUR | | | | 193,679 | | | | USD | | | | 220,876 | | | | (20 | ) |
5/3/2016 | | | EUR | | | | 193,671 | | | | USD | | | | 220,876 | | | | (11 | ) |
5/3/2016 | | | EUR | | | | 193,668 | | | | USD | | | | 220,876 | | | | (8 | ) |
5/3/2016 | | | HUF | | | | 81,670 | | | | USD | | | | 296 | | | | — | |
5/3/2016 | | | HUF | | | | 81,677 | | | | USD | | | | 296 | | | | — | |
5/3/2016 | | | HUF | | | | 81,675 | | | | USD | | | | 296 | | | | — | |
5/3/2016 | | | HUF | | | | 62,648 | | | | USD | | | | 227 | | | | — | |
5/3/2016 | | | HUF | | | | 81,691 | | | | USD | | | | 296 | | | | — | |
5/3/2016 | | | ILS | | | | 16,990 | | | | USD | | | | 4,521 | | | | — | |
5/3/2016 | | | ILS | | | | 16,991 | | | | USD | | | | 4,521 | | | | (1 | ) |
5/3/2016 | | | ILS | | | | 16,992 | | | | USD | | | | 4,521 | | | | (1 | ) |
5/3/2016 | | | ILS | | | | 12,948 | | | | USD | | | | 3,445 | | | | (1 | ) |
5/3/2016 | | | ILS | | | | 16,991 | | | | USD | | | | 4,521 | | | | (1 | ) |
5/3/2016 | | | NOK | | | | 32,629 | | | | USD | | | | 3,944 | | | | — | |
5/3/2016 | | | NOK | | | | 32,627 | | | | USD | | | | 3,944 | | | | — | |
5/3/2016 | | | NOK | | | | 32,626 | | | | USD | | | | 3,944 | | | | — | |
5/3/2016 | | | NOK | | | | 24,878 | | | | USD | | | | 3,007 | | | | — | |
5/3/2016 | | | NOK | | | | 32,628 | | | | USD | | | | 3,944 | | | | — | |
5/3/2016 | | | NZD | | | | 433 | | | | USD | | | | 300 | | | | — | |
5/3/2016 | | | NZD | | | | 336 | | | | USD | | | | 233 | | | | — | |
5/3/2016 | | | NZD | | | | 433 | | | | USD | | | | 300 | | | | — | |
5/3/2016 | | | NZD | | | | 433 | | | | USD | | | | 300 | | | | — | |
5/3/2016 | | | NZD | | | | 433 | | | | USD | | | | 300 | | | | — | |
5/3/2016 | | | PHP | | | | 484,654 | | | | USD | | | | 10,512 | | | | (4 | ) |
5/3/2016 | | | SEK | | | | 163,871 | | | | USD | | | | 20,234 | | | | (1 | ) |
5/3/2016 | | | SEK | | | | 163,874 | | | | USD | | | | 20,234 | | | | (1 | ) |
5/3/2016 | | | SEK | | | | 163,864 | | | | USD | | | | 20,234 | | | | — | |
5/3/2016 | | | SEK | | | | 124,876 | | | | USD | | | | 15,418 | | | | (2 | ) |
5/3/2016 | | | SEK | | | | 163,868 | | | | USD | | | | 20,234 | | | | (1 | ) |
5/3/2016 | | | TRY | | | | 4,332 | | | | USD | | | | 1,524 | | | | (1 | ) |
See Notes to Financial Statements.
| | |
| 66 | | WisdomTree Developed World ex-U.S. and Currency Hedged Equity Funds |
Schedule of Investments (concluded)
WisdomTree Global ex-U.S. Hedged Dividend Fund (DXUS)
March 31, 2016
| | | | | | | | | | | | | | | | | | | | |
Settlement
Date | | Contracts
To Deliver | | | In
Exchange For | | | Unrealized
Gain (Loss) | |
5/3/2016 | | | TRY | | | | 4,330 | | | | USD | | | | 1,524 | | | $ | — | |
5/3/2016 | | | TRY | | | | 3,305 | | | | USD | | | | 1,163 | | | | — | |
5/3/2016 | | | TRY | | | | 4,331 | | | | USD | | | | 1,524 | | | | — | |
5/3/2016 | | | TRY | | | | 4,331 | | | | USD | | | | 1,524 | | | | — | |
5/4/2016 | | | BRL | | | | 20,118 | | | | USD | | | | 5,626 | | | | (4 | ) |
5/4/2016 | | | BRL | | | | 15,331 | | | | USD | | | | 4,290 | | | | — | |
5/4/2016 | | | BRL | | | | 20,118 | | | | USD | | | | 5,632 | | | | 2 | |
5/4/2016 | | | BRL | | | | 20,118 | | | | USD | | | | 5,630 | | | | — | |
5/4/2016 | | | BRL | | | | 20,118 | | | | USD | | | | 5,628 | | | | (2 | ) |
5/4/2016 | | | CAD | | | | 76,890 | | | | USD | | | | 59,445 | | | | (4 | ) |
5/4/2016 | | | CAD | | | | 76,887 | | | | USD | | | | 59,445 | | | | (1 | ) |
5/4/2016 | | | CAD | | | | 58,587 | | | | USD | | | | 45,294 | | | | (3 | ) |
5/4/2016 | | | CAD | | | | 76,889 | | | | USD | | | | 59,445 | | | | (2 | ) |
5/4/2016 | | | CAD | | | | 76,890 | | | | USD | | | | 59,445 | | | | (3 | ) |
5/4/2016 | | | CLP | | | | 1,132,115 | | | | USD | | | | 1,692 | | | | 4 | |
5/4/2016 | | | CLP | | | | 1,132,115 | | | | USD | | | | 1,688 | | | | — | |
5/4/2016 | | | CLP | | | | 1,132,115 | | | | USD | | | | 1,683 | | | | (5 | ) |
5/4/2016 | | | CLP | | | | 1,132,115 | | | | USD | | | | 1,688 | | | | — | |
5/4/2016 | | | CLP | | | | 862,564 | | | | USD | | | | 1,286 | | | | — | |
5/4/2016 | | | GBP | | | | 95,085 | | | | USD | | | | 136,671 | | | | (7 | ) |
5/4/2016 | | | GBP | | | | 72,448 | | | | USD | | | | 104,133 | | | | (6 | ) |
5/4/2016 | | | GBP | | | | 95,081 | | | | USD | | | | 136,671 | | | | (1 | ) |
5/4/2016 | | | GBP | | | | 95,085 | | | | USD | | | | 136,671 | | | | (7 | ) |
5/4/2016 | | | GBP | | | | 95,085 | | | | USD | | | | 136,671 | | | | (7 | ) |
5/4/2016 | | | HKD | | | | 405,114 | | | | USD | | | | 52,238 | | | | (3 | ) |
5/4/2016 | | | HKD | | | | 308,705 | | | | USD | | | | 39,804 | | | | (5 | ) |
5/4/2016 | | | HKD | | | | 405,096 | | | | USD | | | | 52,238 | | | | (1 | ) |
5/4/2016 | | | HKD | | | | 405,127 | | | | USD | | | | 52,238 | | | | (5 | ) |
5/4/2016 | | | HKD | | | | 405,157 | | | | USD | | | | 52,238 | | | | (9 | ) |
5/4/2016 | | | IDR | | | | 183,934,366 | | | | USD | | | | 13,793 | | | | (13 | ) |
5/4/2016 | | | INR | | | | 4,381,481 | | | | USD | | | | 65,719 | | | | (60 | ) |
5/4/2016 | | | KRW | | | | 38,578,666 | | | | USD | | | | 33,704 | | | | (12 | ) |
5/4/2016 | | | KRW | | | | 38,578,666 | | | | USD | | | | 33,708 | | | | (7 | ) |
5/4/2016 | | | KRW | | | | 38,578,666 | | | | USD | | | | 33,710 | | | | (5 | ) |
5/4/2016 | | | KRW | | | | 38,578,668 | | | | USD | | | | 33,701 | | | | (15 | ) |
5/4/2016 | | | MXN | | | | 131,309 | | | | USD | | | | 7,640 | | | | (1 | ) |
5/4/2016 | | | MXN | | | | 100,071 | | | | USD | | | | 5,822 | | | | (1 | ) |
5/4/2016 | | | MXN | | | | 131,300 | | | | USD | | | | 7,640 | | | | — | |
5/4/2016 | | | MXN | | | | 131,307 | | | | USD | | | | 7,640 | | | | — | |
5/4/2016 | | | MXN | | | | 131,321 | | | | USD | | | | 7,640 | | | | (1 | ) |
5/4/2016 | | | PLN | | | | 3,869 | | | | USD | | | | 1,039 | | | | — | |
5/4/2016 | | | PLN | | | | 3,870 | | | | USD | | | | 1,039 | | | | — | |
5/4/2016 | | | PLN | | | | 2,950 | | | | USD | | | | 792 | | | | — | |
5/4/2016 | | | PLN | | | | 3,869 | | | | USD | | | | 1,039 | | | | — | |
5/4/2016 | | | PLN | | | | 3,869 | | | | USD | | | | 1,039 | | | | — | |
5/5/2016 | | | MYR | | | | 46,304 | | | | USD | | | | 11,812 | | | | (5 | ) |
5/5/2016 | | | SGD | | | | 10,330 | | | | USD | | | | 7,669 | | | | (2 | ) |
5/5/2016 | | | SGD | | | | 10,329 | | | | USD | | | | 7,669 | | | | (1 | ) |
5/5/2016 | | | SGD | | | | 7,874 | | | | USD | | | | 5,846 | | | | (1 | ) |
5/5/2016 | | | SGD | | | | 10,330 | | | | USD | | | | 7,669 | | | | (2 | ) |
5/5/2016 | | | SGD | | | | 10,330 | | | | USD | | | | 7,669 | | | | (2 | ) |
5/5/2016 | | | TWD | | | | 1,811,935 | | | | USD | | | | 56,333 | | | | (25 | ) |
5/5/2016 | | | TWD | | | | 1,811,934 | | | | USD | | | | 56,332 | | | | (25 | ) |
5/9/2016 | | | JPY | | | | 19,016,991 | | | | USD | | | | 169,355 | | | | (16 | ) |
5/9/2016 | | | JPY | | | | 19,017,211 | | | | USD | | | | 169,355 | | | | (18 | ) |
5/9/2016 | | | JPY | | | | 14,488,612 | | | | USD | | | | 129,033 | | | | (7 | ) |
5/9/2016 | | | JPY | | | | 19,017,448 | | | | USD | | | | 169,355 | | | | (20 | ) |
5/9/2016 | | | JPY | | | | 19,018,024 | | | | USD | | | | 169,355 | | | | (25 | ) |
5/9/2016 | | | THB | | | | 405,772 | | | | USD | | | | 11,518 | | | | 7 | |
5/9/2016 | | | ZAR | | | | 154,378 | | | | USD | | | | 10,423 | | | | (1 | ) |
5/9/2016 | | | ZAR | | | | 154,360 | | | | USD | | | | 10,423 | | | | — | |
5/9/2016 | | | ZAR | | | | 154,368 | | | | USD | | | | 10,423 | | | | — | |
5/9/2016 | | | ZAR | | | | 117,643 | | | | USD | | | | 7,942 | | | | (1 | ) |
5/9/2016 | | | ZAR | | | | 154,479 | | | | USD | | | | 10,423 | | | | (8 | ) |
| | | | | | | | | | | | | | | | | | | $ | (148,325 | ) |
| | |
| CURRENCY LEGEND |
| AUD | | – Australian dollar |
| BRL | | – Brazilian real |
| CAD | | – Canadian dollar |
| CHF | | – Swiss franc |
| CLP | | – Chilean peso |
| CZK | | – Czech koruna |
| DKK | | – Danish krone |
| EUR | | – Euro |
| GBP | | – British pound |
| HKD | | – Hong Kong dollar |
| HUF | | – Hungary forint |
| IDR | | – Indonesian rupiah |
| ILS | | – Israeli New shekel |
| INR | | – Indian rupee |
| JPY | | – Japanese yen |
| KRW | | – South Korean won |
| MXN | | – Mexican peso |
| MYR | | – Malaysian ringgit |
| NOK | | – Norwegian krone |
| NZD | | – New Zealand dollar |
| PHP | | – Philippine peso |
| PLN | | – Polish zloty |
| SEK | | – Swedish krona |
| SGD | | – Singapore dollar |
| THB | | – Thai baht |
| TRY | | – Turkish New lira |
| TWD | | – New Taiwan dollar |
| USD | | – U.S. dollar |
| ZAR | | – South African rand |
See Notes to Financial Statements.
| | | | |
| WisdomTree Developed World ex-U.S. and Currency Hedged Equity Funds | | | 67 | |
Schedule of Investments
WisdomTree Global ex-U.S. Hedged Real Estate Fund (HDRW)
March 31, 2016
| | | | | | | | |
| Investments | | Shares | | | Value | |
| COMMON STOCKS – 100.5% | | | | | | | | |
| Australia – 13.4% | | | | | | | | |
Abacus Property Group | | | 1,665 | | | $ | 3,817 | |
BWP Trust | | | 2,288 | | | | 6,019 | |
Charter Hall Group | | | 1,484 | | | | 5,297 | |
Charter Hall Retail REIT | | | 1,770 | | | | 6,250 | |
Cromwell Property Group | | | 9,260 | | | | 7,408 | |
Dexus Property Group | | | 3,711 | | | | 22,666 | |
Goodman Group | | | 4,805 | | | | 24,654 | |
GPT Group (The) | | | 5,969 | | | | 22,958 | |
Growthpoint Properties Australia Ltd. | | | 2,263 | | | | 5,466 | |
Investa Office Fund | | | 2,238 | | | | 7,214 | |
LendLease Group | | | 1,775 | | | | 18,938 | |
Mirvac Group | | | 14,550 | | | | 21,658 | |
Scentre Group | | | 20,392 | | | | 69,648 | |
Stockland | | | 10,561 | | | | 34,690 | |
Vicinity Centres | | | 11,804 | | | | 28,966 | |
Westfield Corp. | | | 5,288 | | | | 40,637 | |
| | | | | | | | |
| Total Australia | | | | | | | 326,286 | |
| Austria – 0.2% | | | | | | | | |
CA Immobilien Anlagen AG* | | | 197 | | | | 3,878 | |
| Belgium – 1.0% | | | | | | | | |
Befimmo S.A. | | | 89 | | | | 5,726 | |
Cofinimmo S.A. | | | 108 | | | | 13,274 | |
Warehouses De Pauw | | | 63 | | | | 5,998 | |
| | | | | | | | |
| Total Belgium | | | | | | | 24,998 | |
| Brazil – 0.4% | | | | | | | | |
BR Malls Participacoes S.A. | | | 1,296 | | | | 5,394 | |
Multiplan Empreendimentos Imobiliarios S.A. | | | 299 | | | | 4,530 | |
| | | | | | | | |
| Total Brazil | | | | | | | 9,924 | |
| Canada – 7.1% | | | | | | | | |
Allied Properties Real Estate Investment Trust | | | 232 | | | | 6,272 | |
Artis Real Estate Investment Trust | | | 718 | | | | 7,122 | |
Boardwalk Real Estate Investment Trust | | | 133 | | | | 5,325 | |
Brookfield Asset Management, Inc. Class A | | | 991 | | | | 34,608 | |
Canadian Apartment Properties REIT | | | 354 | | | | 7,904 | |
Canadian Real Estate Investment Trust | | | 243 | | | | 8,467 | |
Cominar Real Estate Investment Trust | | | 1,008 | | | | 13,404 | |
Dream Office Real Estate Investment Trust | | | 835 | | | | 13,395 | |
First Capital Realty, Inc. | | | 697 | | | | 11,112 | |
Granite Real Estate Investment Trust | | | 211 | | | | 6,103 | |
H&R Real Estate Investment Trust | | | 1,290 | | | | 20,934 | |
RioCan Real Estate Investment Trust | | | 1,275 | | | | 26,221 | |
Smart Real Estate Investment Trust | | | 485 | | | | 12,723 | |
| | | | | | | | |
| Total Canada | | | | | | | 173,590 | |
| Chile – 0.1% | | | | | | | | |
Parque Arauco S.A. | | | 1,682 | | | | 3,092 | |
| China – 15.8% | | | | | | | | |
China Jinmao Holdings Group Ltd. | | | 44,000 | | | | 12,253 | |
China Overseas Land & Investment Ltd. | | | 16,000 | | | | 50,641 | |
China Resources Land Ltd. | | | 12,200 | | | | 31,300 | |
China South City Holdings Ltd. | | | 40,000 | | | $ | 8,251 | |
China Vanke Co., Ltd. Class H | | | 3,500 | | | | 8,583 | |
CIFI Holdings Group Co., Ltd. | | | 44,000 | | | | 10,551 | |
Country Garden Holdings Co., Ltd. | | | 130,000 | | | | 51,621 | |
Dalian Wanda Commercial Properties Co., Ltd. Class H(a) | | | 1,000 | | | | 5,924 | |
Evergrande Real Estate Group Ltd.(b) | | | 124,000 | | | | 95,759 | |
Guorui Properties Ltd. | | | 6,000 | | | | 2,096 | |
KWG Property Holding Ltd. | | | 15,500 | | | | 10,191 | |
Logan Property Holdings Co., Ltd. | | | 12,000 | | | | 4,471 | |
Longfor Properties Co., Ltd. | | | 15,000 | | | | 21,388 | |
Poly Property Group Co., Ltd. | | | 10,000 | | | | 2,733 | |
Shenzhen Investment Ltd. | | | 26,000 | | | | 10,324 | |
Shimao Property Holdings Ltd. | | | 17,500 | | | | 25,901 | |
Shui On Land Ltd. | | | 20,500 | | | | 5,524 | |
Sino-Ocean Land Holdings Ltd. | | | 28,500 | | | | 13,485 | �� |
Sunac China Holdings Ltd. | | | 12,000 | | | | 8,076 | |
Yuexiu Property Co., Ltd. | | | 38,000 | | | | 5,487 | |
| | | | | | | | |
| Total China | | | | | | | 384,559 | |
| Finland – 0.5% | | | | | | | | |
Citycon Oyj | | | 2,691 | | | | 6,802 | |
Sponda Oyj | | | 1,208 | | | | 5,093 | |
| | | | | | | | |
| Total Finland | | | | | | | 11,895 | |
| France – 8.8% | | | | | | | | |
Fonciere Des Regions | | | 255 | | | | 24,133 | |
Gecina S.A. | | | 198 | | | | 27,301 | |
ICADE | | | 311 | | | | 23,858 | |
Klepierre | | | 704 | | | | 33,775 | |
Mercialys S.A. | | | 397 | | | | 9,227 | |
Nexity S.A. | | | 231 | | | | 12,055 | |
Unibail-Rodamco SE | | | 306 | | | | 84,316 | |
| | | | | | | | |
| Total France | | | | | | | 214,665 | |
| Germany – 2.8% | | | | | | | | |
alstria office REIT-AG* | | | 275 | | | | 3,973 | |
Deutsche Euroshop AG | | | 118 | | | | 5,551 | |
Deutsche Wohnen AG Bearer Shares | | | 474 | | | | 14,762 | |
LEG Immobilien AG* | | | 124 | | | | 11,707 | |
TAG Immobilien AG(b) | | | 440 | | | | 5,962 | |
Vonovia SE | | | 734 | | | | 26,452 | |
| | | | | | | | |
| Total Germany | | | | | | | 68,407 | |
| Hong Kong – 18.5% | | | | | | | | |
Champion REIT | | | 22,000 | | | | 11,203 | |
Fortune Real Estate Investment Trust | | | 8,000 | | | | 8,571 | |
Hang Lung Group Ltd. | | | 3,000 | | | | 8,606 | |
Hang Lung Properties Ltd. | | | 14,000 | | | | 26,749 | |
Henderson Land Development Co., Ltd. | | | 6,000 | | | | 36,859 | |
Hui Xian REIT | | | 19,000 | | | | 9,121 | |
Hysan Development Co., Ltd. | | | 3,000 | | | | 12,783 | |
Joy City Property Ltd. | | | 12,000 | | | | 1,826 | |
Link REIT | | | 7,000 | | | | 41,513 | |
New World Development Co., Ltd. | | | 35,000 | | | | 33,346 | |
Sino Land Co., Ltd. | | | 18,000 | | | | 28,497 | |
See Notes to Financial Statements.
| | |
| 68 | | WisdomTree Developed World ex-U.S. and Currency Hedged Equity Funds |
Schedule of Investments (continued)
WisdomTree Global ex-U.S. Hedged Real Estate Fund (HDRW)
March 31, 2016
| | | | | | | | |
| Investments | | Shares | | | Value | |
Sun Hung Kai Properties Ltd. | | | 7,000 | | | $ | 85,599 | |
Swire Pacific Ltd. Class A | | | 3,000 | | | | 32,295 | |
Swire Properties Ltd. | | | 12,800 | | | | 34,572 | |
Wharf Holdings Ltd. (The) | | | 9,000 | | | | 49,197 | |
Wheelock & Co., Ltd. | | | 5,000 | | | | 22,336 | |
Yuexiu Real Estate Investment Trust | | | 16,000 | | | | 8,890 | |
| | | | | | | | |
| Total Hong Kong | | | | | | | 451,963 | |
| Indonesia – 0.3% | | | | | | | | |
Bumi Serpong Damai Tbk PT | | | 14,200 | | | | 1,965 | |
Lippo Karawaci Tbk PT | | | 45,800 | | | | 3,610 | |
Summarecon Agung Tbk PT | | | 18,500 | | | | 2,211 | |
| | | | | | | | |
| Total Indonesia | | | | | | | 7,786 | |
| Ireland – 0.1% | | | | | | | | |
Green REIT PLC | | | 839 | | | | 1,349 | |
| Israel – 0.7% | | | | | | | | |
Azrieli Group Ltd. | | | 180 | | | | 7,062 | |
Gazit-Globe Ltd. | | | 690 | | | | 6,293 | |
Melisron Ltd. | | | 120 | | | | 4,319 | |
| | | | | | | | |
| Total Israel | | | | | | | 17,674 | |
| Italy – 0.2% | | | | | | | | |
Beni Stabili SpA SIIQ | | | 5,114 | | | | 3,843 | |
| Japan – 4.7% | | | | | | | | |
Aeon Mall Co., Ltd. | | | 100 | | | | 1,483 | |
Daito Trust Construction Co., Ltd. | | | 200 | | | | 28,435 | |
Daiwa House Industry Co., Ltd. | | | 1,000 | | | | 28,169 | |
Hulic Co., Ltd. | | | 400 | | | | 3,829 | |
Mitsubishi Estate Co., Ltd. | | | 1,000 | | | | 18,600 | |
Mitsui Fudosan Co., Ltd. | | | 1,000 | | | | 24,983 | |
Nomura Real Estate Holdings, Inc. | | | 200 | | | | 3,701 | |
NTT Urban Development Corp. | | | 300 | | | | 2,939 | |
Tokyu Fudosan Holdings Corp. | | | 200 | | | | 1,360 | |
| | | | | | | | |
| Total Japan | | | | | | | 113,499 | |
| Malaysia – 1.2% | | | | | | | | |
IGB Real Estate Investment Trust | | | 6,500 | | | | 2,549 | |
IOI Properties Group Bhd | | | 6,900 | | | | 4,085 | |
KLCCP Stapled Group | | | 4,400 | | | | 8,075 | |
SP Setia Bhd Group | | | 4,200 | | | | 3,370 | |
Sunway Bhd | | | 4,900 | | | | 3,944 | |
Sunway Real Estate Investment Trust | | | 11,900 | | | | 4,880 | |
UEM Sunrise Bhd | | | 9,300 | | | | 2,717 | |
| | | | | | | | |
| Total Malaysia | | | | | | | 29,620 | |
| Mexico – 1.7% | | | | | | | | |
Concentradora Fibra Danhos S.A. de C.V. | | | 1,693 | | | | 3,553 | |
Fibra Uno Administracion S.A. de C.V. | | | 11,262 | | | | 26,391 | |
Macquarie Mexico Real Estate Management S.A. de C.V.* | | | 3,591 | | | | 4,880 | |
PLA Administradora Industrial S de RL de C.V.* | | | 2,891 | | | | 5,403 | |
| | | | | | | | |
| Total Mexico | | | | | | | 40,227 | |
| Netherlands – 0.6% | | | | | | | | |
Eurocommercial Properties N.V. CVA | | | 140 | | | | 6,562 | |
Wereldhave N.V. | | | 131 | | | | 7,337 | |
| | | | | | | | |
| Total Netherlands | | | | | | | 13,899 | |
| New Zealand – 0.2% | | | | | | | | |
Kiwi Property Group Ltd. | | | 4,308 | | | $ | 4,322 | |
| Norway – 0.2% | | | | | | | | |
Entra ASA(a) | | | 529 | | | | 4,989 | |
| Philippines – 0.9% | | | | | | | | |
Ayala Land, Inc. | | | 11,900 | | | | 9,110 | |
Robinsons Land Corp. | | | 3,700 | | | | 2,242 | |
SM Prime Holdings, Inc. | | | 20,500 | | | | 9,773 | |
| | | | | | | | |
| Total Philippines | | | | | | | 21,125 | |
| Singapore – 7.9% | | | | | | | | |
Ascendas Real Estate Investment Trust | | | 11,116 | | | | 19,729 | |
Ascott Residence Trust | | | 7,800 | | | | 6,198 | |
CapitaLand Commercial Trust Ltd. | | | 14,000 | | | | 15,283 | |
CapitaLand Ltd. | | | 9,300 | | | | 21,202 | |
CapitaLand Mall Trust | | | 14,400 | | | | 22,350 | |
City Developments Ltd. | | | 1,400 | | | | 8,494 | |
Frasers Centrepoint Trust | | | 3,900 | | | | 5,792 | |
Global Logistic Properties Ltd. | | | 8,100 | | | | 11,579 | |
Keppel REIT | | | 11,900 | | | | 8,793 | |
Mapletree Commercial Trust | | | 9,500 | | | | 9,947 | |
Mapletree Greater China Commercial Trust | | | 13,800 | | | | 9,787 | |
Mapletree Industrial Trust | | | 9,800 | | | | 11,608 | |
Mapletree Logistics Trust | | | 13,400 | | | | 10,050 | |
SPH REIT | | | 7,100 | | | | 5,088 | |
Starhill Global REIT | | | 10,800 | | | | 6,256 | |
Suntec Real Estate Investment Trust | | | 11,500 | | | | 14,305 | |
UOL Group Ltd. | | | 1,400 | | | | 6,238 | |
| | | | | | | | |
| Total Singapore | | | | | | | 192,699 | |
| South Africa – 2.3% | | | | | | | | |
Fortress Income Fund Ltd. | | | 3,197 | | | | 7,782 | |
Fortress Income Fund Ltd. Class A | | | 4,047 | | | | 4,323 | |
Growthpoint Properties Ltd. | | | 9,817 | | | | 16,399 | |
Hyprop Investments Ltd. | | | 816 | | | | 6,528 | |
Redefine Properties Ltd. | | | 17,121 | | | | 13,945 | |
Resilient REIT Ltd. | | | 871 | | | | 8,027 | |
| | | | | | | | |
| Total South Africa | | | | | | | 57,004 | |
| Sweden – 1.5% | | | | | | | | |
Atrium Ljungberg AB Class B | | | 220 | | | | 3,813 | |
Castellum AB | | | 423 | | | | 6,736 | |
Fabege AB | | | 334 | | | | 5,649 | |
Hemfosa Fastigheter AB | | | 246 | | | | 2,708 | |
Hufvudstaden AB Class A | | | 464 | | | | 7,366 | |
Kungsleden AB | | | 297 | | | | 2,107 | |
Wallenstam AB Class B | | | 502 | | | | 4,347 | |
Wihlborgs Fastigheter AB | | | 171 | | | | 3,637 | |
| | | | | | | | |
| Total Sweden | | | | | | | 36,363 | |
| Switzerland – 1.3% | | | | | | | | |
PSP Swiss Property AG Registered Shares | | | 134 | | | | 12,943 | |
Swiss Prime Site AG Registered Shares* | | | 220 | | | | 19,481 | |
| | | | | | | | |
| Total Switzerland | | | | | | | 32,424 | |
See Notes to Financial Statements.
| | | | |
| WisdomTree Developed World ex-U.S. and Currency Hedged Equity Funds | | | 69 | |
Schedule of Investments (continued)
WisdomTree Global ex-U.S. Hedged Real Estate Fund (HDRW)
March 31, 2016
| | | | | | | | |
| Investments | | Shares | | | Value | |
| Taiwan – 0.8% | | | | | | | | |
Highwealth Construction Corp. | | | 6,000 | | | $ | 8,762 | |
Ruentex Development Co., Ltd. | | | 8,000 | | | | 10,129 | |
| | | | | | | | |
| Total Taiwan | | | | | | | 18,891 | |
| Thailand – 1.2% | | | | | | | | |
Central Pattana PCL NVDR | | | 5,100 | | | | 7,466 | |
Land & Houses PCL NVDR | | | 64,100 | | | | 16,307 | |
Pruksa Real Estate PCL NVDR | | | 8,700 | | | | 6,677 | |
| | | | | | | | |
| Total Thailand | | | | | | | 30,450 | |
| Turkey – 0.4% | | | | | | | | |
Emlak Konut Gayrimenkul Yatirim Ortakligi AS | | | 9,506 | | | | 9,689 | |
| United Kingdom – 5.7% | | | | | | | | |
Big Yellow Group PLC | | | 374 | | | | 4,163 | |
British Land Co. PLC (The) | | | 2,553 | | | | 25,704 | |
Capital & Counties Properties PLC | | | 288 | | | | 1,365 | |
Countrywide PLC | | | 556 | | | | 3,082 | |
Derwent London PLC | | | 96 | | | | 4,349 | |
Foxtons Group PLC | | | 829 | | | | 1,939 | |
Great Portland Estates PLC | | | 422 | | | | 4,416 | |
Hammerson PLC | | | 2,191 | | | | 18,218 | |
Hansteen Holdings PLC(b) | | | 2,228 | | | | 3,407 | |
Intu Properties PLC | | | 3,842 | | | | 17,284 | |
Land Securities Group PLC | | | 1,545 | | | | 24,449 | |
Londonmetric Property PLC | | | 2,041 | | | | 4,653 | |
Savills PLC | | | 298 | | | | 3,255 | |
Segro PLC | | | 2,002 | | | | 11,806 | |
Shaftesbury PLC | | | 417 | | | | 5,460 | |
Unite Group PLC (The) | | | 403 | | | | 3,687 | |
Workspace Group PLC | | | 187 | | | | 2,105 | |
| | | | | | | | |
| Total United Kingdom | | | | | | | 139,342 | |
TOTAL COMMON STOCKS
(Cost: $2,466,941) | | | | | | | 2,448,452 | |
| EXCHANGE-TRADED NOTE – 0.0% | |
| United States – 0.0% | | | | | | | | |
iPath MSCI India Index ETN*
| | | | | | | | |
| (Cost: $509) | | | 8 | | | | 502 | |
| INVESTMENT OF CASH COLLATERAL FOR SECURITIES LOANED – 0.4% | |
| United States – 0.4% | | | | | | | | |
State Street Navigator Securities Lending Prime Portfolio, 0.50%(c) | | | | | | | | |
| (Cost: $9,894)(d) | | | 9,894 | | | | 9,894 | |
TOTAL INVESTMENTS IN SECURITIES – 100.9%
(Cost: $2,477,344) | | | | | | | 2,458,848 | |
Liabilities in Excess of Cash, Foreign Currency and Other Assets – (0.9)% | | | | | | | (21,946 | ) |
| | | | | | | | |
| NET ASSETS – 100.0% | | | | | | $ | 2,436,902 | |
| * | Non-income producing security. |
| (a) | This security is exempt from registration under rule 144A of the Securities Act of 1933. This security may be sold in transactions that are exempt from registration, normally to qualified institutional buyers. |
| (b) | Security, or portion thereof, was on loan at March 31, 2016 (See Note 2). |
| (c) | Rate shown represents annualized 7-day yield as of March 31, 2016. |
| (d) | At March 31, 2016, the total market value of the Fund’s securities on loan was $89,965 and the total market value of the collateral held by the Fund was $96,637. The total market value of the collateral includes non-cash U.S. Government securities collateral having a value of $86,743. |
CVA – Certificaten Van Aandelen (Certificate of Stock)
ETN – Exchange-Traded Note
NVDR – Non-Voting Depositary Receipt
| | | | | | | | | | | | | | | | | | | | |
| FINANCIAL DERIVATIVE INSTRUMENTS | |
| FORWARD CONTRACTS | |
Settlement
Date | | Contracts
To Deliver | | | In
Exchange For | | | Unrealized
Gain (Loss) | |
4/4/2016 | | | AUD | | | | 89,310 | | | | USD | | | | 63,698 | | | $ | (5,004 | ) |
4/4/2016 | | | AUD | | | | 89,315 | | | | USD | | | | 63,698 | | | | (5,008 | ) |
4/4/2016 | | | AUD | | | | 89,314 | | | | USD | | | | 63,698 | | | | (5,007 | ) |
4/4/2016 | | | AUD | | | | 89,319 | | | | USD | | | | 63,698 | | | | (5,011 | ) |
4/4/2016 | | | AUD | | | | 68,053 | | | | USD | | | | 48,536 | | | | (3,814 | ) |
4/4/2016 | | | CHF | | | | 6,407 | | | | USD | | | | 6,443 | | | | (247 | ) |
4/4/2016 | | | CHF | | | | 6,407 | | | | USD | | | | 6,443 | | | | (248 | ) |
4/4/2016 | | | CHF | | | | 6,407 | | | | USD | | | | 6,443 | | | | (248 | ) |
4/4/2016 | | | CHF | | | | 6,407 | | | | USD | | | | 6,443 | | | | (247 | ) |
4/4/2016 | | | CHF | | | | 4,885 | | | | USD | | | | 4,912 | | | | (189 | ) |
4/4/2016 | | | EUR | | | | 60,206 | | | | USD | | | | 65,482 | | | | (3,126 | ) |
4/4/2016 | | | EUR | | | | 60,208 | | | | USD | | | | 65,482 | | | | (3,128 | ) |
4/4/2016 | | | EUR | | | | 60,207 | | | | USD | | | | 65,482 | | | | (3,127 | ) |
4/4/2016 | | | EUR | | | | 60,207 | | | | USD | | | | 65,482 | | | | (3,127 | ) |
4/4/2016 | | | EUR | | | | 45,873 | | | | USD | | | | 49,893 | | | | (2,382 | ) |
4/4/2016 | | | GBP | | | | 19,554 | | | | USD | | | | 27,252 | | | | (853 | ) |
4/4/2016 | | | GBP | | | | 19,554 | | | | USD | | | | 27,252 | | | | (852 | ) |
4/4/2016 | | | GBP | | | | 19,552 | | | | USD | | | | 27,252 | | | | (851 | ) |
4/4/2016 | | | GBP | | | | 19,554 | | | | USD | | | | 27,252 | | | | (852 | ) |
4/4/2016 | | | GBP | | | | 14,897 | | | | USD | | | | 20,764 | | | | (648 | ) |
4/4/2016 | | | ILS | | | | 12,923 | | | | USD | | | | 3,314 | | | | (124 | ) |
4/4/2016 | | | ILS | | | | 12,924 | | | | USD | | | | 3,314 | | | | (124 | ) |
4/4/2016 | | | ILS | | | | 12,924 | | | | USD | | | | 3,314 | | | | (124 | ) |
4/4/2016 | | | ILS | | | | 12,922 | | | | USD | | | | 3,314 | | | | (123 | ) |
4/4/2016 | | | ILS | | | | 9,860 | | | | USD | | | | 2,529 | | | | (94 | ) |
4/4/2016 | | | NOK | | | | 8,615 | | | | USD | | | | 988 | | | | (54 | ) |
4/4/2016 | | | NOK | | | | 8,615 | | | | USD | | | | 988 | | | | (54 | ) |
4/4/2016 | | | NOK | | | | 8,615 | | | | USD | | | | 988 | | | | (54 | ) |
4/4/2016 | | | NOK | | | | 8,615 | | | | USD | | | | 988 | | | | (54 | ) |
4/4/2016 | | | NOK | | | | 6,583 | | | | USD | | | | 755 | | | | (41 | ) |
4/4/2016 | | | NZD | | | | 1,299 | | | | USD | | | | 855 | | | | (47 | ) |
4/4/2016 | | | NZD | | | | 1,299 | | | | USD | | | | 855 | | | | (47 | ) |
4/4/2016 | | | NZD | | | | 1,299 | | | | USD | | | | 855 | | | | (47 | ) |
4/4/2016 | | | NZD | | | | 1,299 | | | | USD | | | | 855 | | | | (47 | ) |
4/4/2016 | | | NZD | | | | 991 | | | | USD | | | | 652 | | | | (36 | ) |
4/4/2016 | | | PHP | | | | 918,166 | | | | USD | | | | 19,249 | | | | (702 | ) |
4/4/2016 | | | SEK | | | | 62,462 | | | | USD | | | | 7,281 | | | | (424 | ) |
4/4/2016 | | | SEK | | | | 62,465 | | | | USD | | | | 7,281 | | | | (424 | ) |
4/4/2016 | | | SEK | | | | 62,461 | | | | USD | | | | 7,281 | | | | (424 | ) |
4/4/2016 | | | SEK | | | | 62,457 | | | | USD | | | | 7,281 | | | | (423 | ) |
4/4/2016 | | | SEK | | | | 47,622 | | | | USD | | | | 5,551 | | | | (323 | ) |
4/4/2016 | | | TRY | | | | 5,218 | | | | USD | | | | 1,749 | | | | (103 | ) |
4/4/2016 | | | TRY | | | | 5,220 | | | | USD | | | | 1,749 | | | | (103 | ) |
4/4/2016 | | | TRY | | | | 5,221 | | | | USD | | | | 1,749 | | | | (104 | ) |
4/4/2016 | | | TRY | | | | 5,219 | | | | USD | | | | 1,749 | | | | (103 | ) |
4/4/2016 | | | TRY | | | | 3,982 | | | | USD | | | | 1,334 | | | | (79 | ) |
4/4/2016 | | | USD | | | | 63,698 | | | | AUD | | | | 82,807 | | | | 2 | |
4/4/2016 | | | USD | | | | 63,698 | | | | AUD | | | | 82,807 | | | | 2 | |
See Notes to Financial Statements.
| | |
| 70 | | WisdomTree Developed World ex-U.S. and Currency Hedged Equity Funds |
Schedule of Investments (continued)
WisdomTree Global ex-U.S. Hedged Real Estate Fund (HDRW)
March 31, 2016
| | | | | | | | | | | | | | | | | | | | |
Settlement
Date | | Contracts
To Deliver | | | In
Exchange For | | | Unrealized
Gain (Loss) | |
4/4/2016 | | | USD | | | | 63,698 | | | | AUD | | | | 82,810 | | | $ | 3 | |
4/4/2016 | | | USD | | | | 48,536 | | | | AUD | | | | 63,092 | | | | (2 | ) |
4/4/2016 | | | USD | | | | 63,698 | | | | AUD | | | | 82,808 | | | | 2 | |
4/4/2016 | | | USD | | | | 6,443 | | | | CHF | | | | 6,170 | | | | — | |
4/4/2016 | | | USD | | | | 4,912 | | | | CHF | | | | 4,704 | | | | — | |
4/4/2016 | | | USD | | | | 6,443 | | | | CHF | | | | 6,170 | | | | — | |
4/4/2016 | | | USD | | | | 6,443 | | | | CHF | | | | 6,170 | | | | — | |
4/4/2016 | | | USD | | | | 6,443 | | | | CHF | | | | 6,170 | | | | — | |
4/4/2016 | | | USD | | | | 65,482 | | | | EUR | | | | 57,465 | | | | 2 | |
4/4/2016 | | | USD | | | | 65,482 | | | | EUR | | | | 57,465 | | | | 2 | |
4/4/2016 | | | USD | | | | 65,482 | | | | EUR | | | | 57,466 | | | | 3 | |
4/4/2016 | | | USD | | | | 49,893 | | | | EUR | | | | 43,785 | | | | 2 | |
4/4/2016 | | | USD | | | | 65,482 | | | | EUR | | | | 57,464 | | | | 1 | |
4/4/2016 | | | USD | | | | 27,252 | | | | GBP | | | | 18,961 | | | | 1 | |
4/4/2016 | | | USD | | | | 27,252 | | | | GBP | | | | 18,961 | | | | 1 | |
4/4/2016 | | | USD | | | | 27,252 | | | | GBP | | | | 18,961 | | | | 1 | |
4/4/2016 | | | USD | | | | 20,764 | | | | GBP | | | | 14,447 | | | | 1 | |
4/4/2016 | | | USD | | | | 27,252 | | | | GBP | | | | 18,961 | | | | 1 | |
4/4/2016 | | | USD | | | | 3,314 | | | | ILS | | | | 12,459 | | | | — | |
4/4/2016 | | | USD | | | | 3,314 | | | | ILS | | | | 12,460 | | | | — | |
4/4/2016 | | | USD | | | | 3,314 | | | | ILS | | | | 12,460 | | | | — | |
4/4/2016 | | | USD | | | | 2,529 | | | | ILS | | | | 9,509 | | | | — | |
4/4/2016 | | | USD | | | | 3,314 | | | | ILS | | | | 12,460 | | | | — | |
4/4/2016 | | | USD | | | | 988 | | | | NOK | | | | 8,172 | | | | — | |
4/4/2016 | | | USD | | | | 988 | | | | NOK | | | | 8,173 | | | | — | |
4/4/2016 | | | USD | | | | 988 | | | | NOK | | | | 8,172 | | | | — | |
4/4/2016 | | | USD | | | | 755 | | | | NOK | | | | 6,245 | | | | — | |
4/4/2016 | | | USD | | | | 988 | | | | NOK | | | | 8,172 | | | | — | |
4/4/2016 | | | USD | | | | 855 | | | | NZD | | | | 1,231 | | | | — | |
4/4/2016 | | | USD | | | | 855 | | | | NZD | | | | 1,231 | | | | — | |
4/4/2016 | | | USD | | | | 855 | | | | NZD | | | | 1,231 | | | | — | |
4/4/2016 | | | USD | | | | 652 | | | | NZD | | | | 939 | | | | — | |
4/4/2016 | | | USD | | | | 855 | | | | NZD | | | | 1,231 | | | | — | |
4/4/2016 | | | USD | | | | 19,947 | | | | PHP | | | | 918,166 | | | | 4 | |
4/4/2016 | | | USD | | | | 7,281 | | | | SEK | | | | 59,025 | | | | — | |
4/4/2016 | | | USD | | | | 7,281 | | | | SEK | | | | 59,026 | | | | — | |
4/4/2016 | | | USD | | | | 7,281 | | | | SEK | | | | 59,027 | | | | — | |
4/4/2016 | | | USD | | | | 7,281 | | | | SEK | | | | 59,031 | | | | 1 | |
4/4/2016 | | | USD | | | | 5,551 | | | | SEK | | | | 45,005 | | | | 1 | |
4/4/2016 | | | USD | | | | 1,749 | | | | TRY | | | | 4,929 | | | | — | |
4/4/2016 | | | USD | | | | 1,749 | | | | TRY | | | | 4,929 | | | | — | |
4/4/2016 | | | USD | | | | 1,749 | | | | TRY | | | | 4,929 | | | | — | |
4/4/2016 | | | USD | | | | 1,749 | | | | TRY | | | | 4,929 | | | | — | |
4/4/2016 | | | USD | | | | 1,334 | | | | TRY | | | | 3,760 | | | | — | |
4/5/2016 | | | BRL | | | | 6,396 | | | | USD | | | | 1,593 | | | | (211 | ) |
4/5/2016 | | | BRL | | | | 6,396 | | | | USD | | | | 1,591 | | | | (213 | ) |
4/5/2016 | | | BRL | | | | 6,396 | | | | USD | | | | 1,593 | | | | (211 | ) |
4/5/2016 | | | BRL | | | | 6,396 | | | | USD | | | | 1,593 | | | | (212 | ) |
4/5/2016 | | | BRL | | | | 4,875 | | | | USD | | | | 1,215 | | | | (160 | ) |
4/5/2016 | | | CAD | | | | 45,114 | | | | USD | | | | 33,303 | | | | (1,576 | ) |
4/5/2016 | | | CAD | | | | 45,114 | | | | USD | | | | 33,303 | | | | (1,576 | ) |
4/5/2016 | | | CAD | | | | 45,111 | | | | USD | | | | 33,303 | | | | (1,574 | ) |
4/5/2016 | | | CAD | | | | 45,111 | | | | USD | | | | 33,303 | | | | (1,574 | ) |
4/5/2016 | | | CAD | | | | 34,374 | | | | USD | | | | 25,375 | | | | (1,201 | ) |
4/5/2016 | | | CLP | | | | 370,468 | | | | USD | | | | 531 | | | | (23 | ) |
4/5/2016 | | | CLP | | | | 370,468 | | | | USD | | | | 531 | | | | (23 | ) |
4/5/2016 | | | CLP | | | | 370,468 | | | | USD | | | | 531 | | | | (22 | ) |
4/5/2016 | | | CLP | | | | 370,468 | | | | USD | | | | 531 | | | | (23 | ) |
4/5/2016 | | | CLP | | | | 282,265 | | | | USD | | | | 405 | | | | (17 | ) |
4/5/2016 | | | HKD | | | | 1,251,956 | | | | USD | | | | 161,021 | | | | (385 | ) |
4/5/2016 | | | HKD | | | | 1,251,914 | | | | USD | | | | 161,021 | | | | (380 | ) |
4/5/2016 | | | HKD | | | | 1,252,000 | | | | USD | | | | 161,021 | | | | (391 | ) |
4/5/2016 | | | HKD | | | | 1,251,973 | | | | USD | | | | 161,021 | | | | (387 | ) |
4/5/2016 | | | HKD | | | | 953,971 | | | | USD | | | | 122,687 | | | | (302 | ) |
4/5/2016 | | | IDR | | | | 101,978,603 | | | | USD | | | | 7,548 | | | | (127 | ) |
4/5/2016 | | | JPY | | | | 2,649,744 | | | | USD | | | | 23,502 | | | | (74 | ) |
4/5/2016 | | | JPY | | | | 2,649,690 | | | | USD | | | | 23,502 | | | | (74 | ) |
4/5/2016 | | | JPY | | | | 2,649,770 | | | | USD | | | | 23,502 | | | | (74 | ) |
4/5/2016 | | | JPY | | | | 2,649,779 | | | | USD | | | | 23,502 | | | | (75 | ) |
4/5/2016 | | | JPY | | | | 2,019,076 | | | | USD | | | | 17,908 | | | | (57 | ) |
4/5/2016 | | | MXN | | | | 138,181 | | | | USD | | | | 7,618 | | | | (444 | ) |
4/5/2016 | | | MXN | | | | 138,195 | | | | USD | | | | 7,618 | | | | (445 | ) |
4/5/2016 | | | MXN | | | | 138,190 | | | | USD | | | | 7,618 | | | | (445 | ) |
4/5/2016 | | | MXN | | | | 138,191 | | | | USD | | | | 7,618 | | | | (445 | ) |
4/5/2016 | | | MXN | | | | 105,328 | | | | USD | | | | 5,806 | | | | (339 | ) |
4/5/2016 | | | MYR | | | | 113,652 | | | | USD | | | | 26,932 | | | | (2,046 | ) |
4/5/2016 | | | SGD | | | | 54,099 | | | | USD | | | | 38,431 | | | | (1,743 | ) |
4/5/2016 | | | SGD | | | | 54,096 | | | | USD | | | | 38,431 | | | | (1,741 | ) |
4/5/2016 | | | SGD | | | | 54,095 | | | | USD | | | | 38,431 | | | | (1,741 | ) |
4/5/2016 | | | SGD | | | | 54,091 | | | | USD | | | | 38,431 | | | | (1,738 | ) |
4/5/2016 | | | SGD | | | | 41,222 | | | | USD | | | | 29,283 | | | | (1,329 | ) |
4/5/2016 | | | THB | | | | 1,029,328 | | | | USD | | | | 28,833 | | | | (392 | ) |
4/5/2016 | | | USD | | | | 1,803 | | | | BRL | | | | 6,396 | | | | 1 | |
4/5/2016 | | | USD | | | | 1,803 | | | | BRL | | | | 6,396 | | | | 1 | |
4/5/2016 | | | USD | | | | 1,805 | | | | BRL | | | | 6,396 | | | | (1 | ) |
4/5/2016 | | | USD | | | | 1,374 | | | | BRL | | | | 4,875 | | | | 1 | |
4/5/2016 | | | USD | | | | 1,804 | | | | BRL | | | | 6,396 | | | | — | |
4/5/2016 | | | USD | | | | 33,303 | | | | CAD | | | | 43,076 | | | | — | |
4/5/2016 | | | USD | | | | 33,303 | | | | CAD | | | | 43,077 | | | | 2 | |
4/5/2016 | | | USD | | | | 33,303 | | | | CAD | | | | 43,077 | | | | 1 | |
4/5/2016 | | | USD | | | | 25,375 | | | | CAD | | | | 32,822 | | | | 1 | |
4/5/2016 | | | USD | | | | 33,303 | | | | CAD | | | | 43,076 | | | | 1 | |
4/5/2016 | | | USD | | | | 555 | | | | CLP | | | | 370,468 | | | | (2 | ) |
4/5/2016 | | | USD | | | | 554 | | | | CLP | | | | 370,468 | | | | — | |
4/5/2016 | | | USD | | | | 554 | | | | CLP | | | | 370,468 | | | | — | |
4/5/2016 | | | USD | | | | 554 | | | | CLP | | | | 370,468 | | | | — | |
4/5/2016 | | | USD | | | | 422 | | | | CLP | | | | 282,265 | | | | (1 | ) |
4/5/2016 | | | USD | | | | 161,021 | | | | HKD | | | | 1,248,998 | | | | 4 | |
4/5/2016 | | | USD | | | | 161,021 | | | | HKD | | | | 1,249,092 | | | | 16 | |
4/5/2016 | | | USD | | | | 161,021 | | | | HKD | | | | 1,249,030 | | | | 8 | |
4/5/2016 | | | USD | | | | 122,687 | | | | HKD | | | | 951,723 | | | | 12 | |
4/5/2016 | | | USD | | | | 161,021 | | | | HKD | | | | 1,249,005 | | | | 5 | |
4/5/2016 | | | USD | | | | 7,676 | | | | IDR | | | | 101,978,603 | | | | — | |
4/5/2016 | | | USD | | | | 23,502 | | | | JPY | | | | 2,641,335 | | | | (1 | ) |
4/5/2016 | | | USD | | | | 23,502 | | | | JPY | | | | 2,641,450 | | | | — | |
4/5/2016 | | | USD | | | | 17,908 | | | | JPY | | | | 2,012,744 | | | | — | |
4/5/2016 | | | USD | | | | 23,502 | | | | JPY | | | | 2,641,272 | | | | (1 | ) |
4/5/2016 | | | USD | | | | 23,502 | | | | JPY | | | | 2,641,584 | | | | 2 | |
4/5/2016 | | | USD | | | | 7,618 | | | | MXN | | | | 130,573 | | | | — | |
4/5/2016 | | | USD | | | | 7,618 | | | | MXN | | | | 130,564 | | | | — | |
4/5/2016 | | | USD | | | | 7,618 | | | | MXN | | | | 130,584 | | | | 1 | |
4/5/2016 | | | USD | | | | 5,806 | | | | MXN | | | | 99,523 | | | | 1 | |
4/5/2016 | | | USD | | | | 7,618 | | | | MXN | | | | 130,575 | | | | — | |
4/5/2016 | | | USD | | | | 28,985 | | | | MYR | | | | 113,652 | | | | (8 | ) |
4/5/2016 | | | USD | | | | 38,431 | | | | SGD | | | | 51,753 | | | | 2 | |
4/5/2016 | | | USD | | | | 38,431 | | | | SGD | | | | 51,751 | | | | — | |
4/5/2016 | | | USD | | | | 38,431 | | | | SGD | | | | 51,753 | | | | 1 | |
See Notes to Financial Statements.
| | | | |
| WisdomTree Developed World ex-U.S. and Currency Hedged Equity Funds | | | 71 | |
Schedule of Investments (continued)
WisdomTree Global ex-U.S. Hedged Real Estate Fund (HDRW)
March 31, 2016
| | | | | | | | | | | | | | | | | | | | |
Settlement
Date | | Contracts
To Deliver | | | In
Exchange For | | | Unrealized
Gain (Loss) | |
4/5/2016 | | | USD | | | | 29,283 | | | | SGD | | | | 39,437 | | | $ | 3 | |
4/5/2016 | | | USD | | | | 38,431 | | | | SGD | | | | 51,756 | | | | 4 | |
4/5/2016 | | | USD | | | | 29,230 | | | | THB | | | | 1,029,328 | | | | (5 | ) |
4/6/2016 | | | CNY | | | | 61,381 | | | | USD | | | | 9,335 | | | | (158 | ) |
4/6/2016 | | | INR | | | | 40,653 | | | | USD | | | | 588 | | | | (25 | ) |
4/6/2016 | | | USD | | | | 9,493 | | | | CNY | | | | 61,381 | | | | — | |
4/6/2016 | | | USD | | | | 612 | | | | INR | | | | 40,653 | | | | — | |
4/7/2016 | | | TWD | | | | 572,971 | | | | USD | | | | 17,152 | | | | (647 | ) |
4/7/2016 | | | USD | | | | 8,901 | | | | TWD | | | | 286,485 | | | | (2 | ) |
4/7/2016 | | | USD | | | | 8,903 | | | | TWD | | | | 286,486 | | | | (3 | ) |
4/7/2016 | | | USD | | | | 10,285 | | | | ZAR | | | | 151,365 | | | | — | |
4/7/2016 | | | USD | | | | 10,285 | | | | ZAR | | | | 151,353 | | | | (1 | ) |
4/7/2016 | | | USD | | | | 10,285 | | | | ZAR | | | | 151,375 | | | | 1 | |
4/7/2016 | | | USD | | | | 7,838 | | | | ZAR | | | | 115,360 | | | | 1 | |
4/7/2016 | | | USD | | | | 10,285 | | | | ZAR | | | | 151,351 | | | | (1 | ) |
4/7/2016 | | | ZAR | | | | 163,343 | | | | USD | | | | 10,285 | | | | (814 | ) |
4/7/2016 | | | ZAR | | | | 163,508 | | | | USD | | | | 10,285 | | | | (825 | ) |
4/7/2016 | | | ZAR | | | | 163,517 | | | | USD | | | | 10,285 | | | | (826 | ) |
4/7/2016 | | | ZAR | | | | 163,499 | | | | USD | | | | 10,285 | | | | (825 | ) |
4/7/2016 | | | ZAR | | | | 124,610 | | | | USD | | | | 7,838 | | | | (629 | ) |
5/3/2016 | | | AUD | | | | 87,997 | | | | USD | | | | 67,600 | | | | (2 | ) |
5/3/2016 | | | AUD | | | | 87,999 | | | | USD | | | | 67,600 | | | | (3 | ) |
5/3/2016 | | | AUD | | | | 88,000 | | | | USD | | | | 67,600 | | | | (4 | ) |
5/3/2016 | | | AUD | | | | 67,046 | | | | USD | | | | 51,509 | | | | 2 | |
5/3/2016 | | | AUD | | | | 87,999 | | | | USD | | | | 67,600 | | | | (3 | ) |
5/3/2016 | | | CHF | | | | 6,460 | | | | USD | | | | 6,754 | | | | — | |
5/3/2016 | | | CHF | | | | 6,460 | | | | USD | | | | 6,754 | | | | — | |
5/3/2016 | | | CHF | | | | 6,460 | | | | USD | | | | 6,754 | | | | — | |
5/3/2016 | | | CHF | | | | 4,926 | | | | USD | | | | 5,150 | | | | — | |
5/3/2016 | | | CHF | | | | 6,460 | | | | USD | | | | 6,754 | | | | — | |
5/3/2016 | | | EUR | | | | 62,971 | | | | USD | | | | 71,817 | | | | (3 | ) |
5/3/2016 | | | EUR | | | | 62,972 | | | | USD | | | | 71,817 | | | | (4 | ) |
5/3/2016 | | | EUR | | | | 62,971 | | | | USD | | | | 71,817 | | | | (4 | ) |
5/3/2016 | | | EUR | | | | 47,981 | | | | USD | | | | 54,720 | | | | (3 | ) |
5/3/2016 | | | EUR | | | | 62,970 | | | | USD | | | | 71,817 | | | | (2 | ) |
5/3/2016 | | | ILS | | | | 13,826 | | | | USD | | | | 3,679 | | | | — | |
5/3/2016 | | | ILS | | | | 13,826 | | | | USD | | | | 3,679 | | | | — | |
5/3/2016 | | | ILS | | | | 10,539 | | | | USD | | | | 2,804 | | | | — | |
5/3/2016 | | | ILS | | | | 13,827 | | | | USD | | | | 3,679 | | | | (1 | ) |
5/3/2016 | | | ILS | | | | 13,826 | | | | USD | | | | 3,679 | | | | — | |
5/3/2016 | | | NOK | | | | 8,836 | | | | USD | | | | 1,068 | | | | — | |
5/3/2016 | | | NOK | | | | 8,835 | | | | USD | | | | 1,068 | | | | — | |
5/3/2016 | | | NOK | | | | 6,767 | | | | USD | | | | 818 | | | | — | |
5/3/2016 | | | NOK | | | | 8,836 | | | | USD | | | | 1,068 | | | | — | |
5/3/2016 | | | NOK | | | | 8,835 | | | | USD | | | | 1,068 | | | | — | |
5/3/2016 | | | NZD | | | | 1,297 | | | | USD | | | | 899 | | | | — | |
5/3/2016 | | | NZD | | | | 1,297 | | | | USD | | | | 899 | | | | — | |
5/3/2016 | | | NZD | | | | 1,297 | | | | USD | | | | 899 | | | | — | |
5/3/2016 | | | NZD | | | | 993 | | | | USD | | | | 688 | | | | — | |
5/3/2016 | | | NZD | | | | 1,297 | | | | USD | | | | 899 | | | | — | |
5/3/2016 | | | PHP | | | | 976,807 | | | | USD | | | | 21,187 | | | | (8 | ) |
5/3/2016 | | | SEK | | | | 61,713 | | | | USD | | | | 7,620 | | | | — | |
5/3/2016 | | | SEK | | | | 61,714 | | | | USD | | | | 7,620 | | | | — | |
5/3/2016 | | | SEK | | | | 61,717 | | | | USD | | | | 7,620 | | | | (1 | ) |
5/3/2016 | | | SEK | | | | 47,057 | | | | USD | | | | 5,810 | | | | (1 | ) |
5/3/2016 | | | SEK | | | | 61,712 | | | | USD | | | | 7,620 | | | | — | |
5/3/2016 | | | TRY | | | | 5,670 | | | | USD | | | | 1,995 | | | | (1 | ) |
5/3/2016 | | | TRY | | | | 5,669 | | | | USD | | | | 1,995 | | | | — | |
5/3/2016 | | | TRY | | | | 4,325 | | | | USD | | | | 1,522 | | | | — | |
5/3/2016 | | | TRY | | | | 5,670 | | | | USD | | | | 1,995 | | | | (1 | ) |
5/3/2016 | | | TRY | | | | 5,669 | | | | USD | | | | 1,995 | | | | — | |
5/4/2016 | | | BRL | | | | 7,426 | | | | USD | | | | 2,077 | | | | (1 | ) |
5/4/2016 | | | BRL | | | | 5,658 | | | | USD | | | | 1,582 | | | | (1 | ) |
5/4/2016 | | | BRL | | | | 7,426 | | | | USD | | | | 2,078 | | | | — | |
5/4/2016 | | | BRL | | | | 7,426 | | | | USD | | | | 2,078 | | | | — | |
5/4/2016 | | | BRL | | | | 7,426 | | | | USD | | | | 2,079 | | | | 1 | |
5/4/2016 | | | CAD | | | | 46,768 | | | | USD | | | | 36,157 | | | | (2 | ) |
5/4/2016 | | | CAD | | | | 46,767 | | | | USD | | | | 36,157 | | | | (2 | ) |
5/4/2016 | | | CAD | | | | 46,768 | | | | USD | | | | 36,157 | | | | (2 | ) |
5/4/2016 | | | CAD | | | | 35,634 | | | | USD | | | | 27,549 | | | | (2 | ) |
5/4/2016 | | | CAD | | | | 46,768 | | | | USD | | | | 36,157 | | | | (2 | ) |
5/4/2016 | | | CLP | | | | 385,857 | | | | USD | | | | 577 | | | | 1 | |
5/4/2016 | | | CLP | | | | 385,857 | | | | USD | | | | 575 | | | | — | |
5/4/2016 | | | CLP | | | | 385,857 | | | | USD | | | | 575 | | | | — | |
5/4/2016 | | | CLP | | | | 385,857 | | | | USD | | | | 575 | | | | — | |
5/4/2016 | | | CLP | | | | 293,990 | | | | USD | | | | 439 | | | | 1 | |
5/4/2016 | | | GBP | | | | 20,354 | | | | USD | | | | 29,256 | | | | (1 | ) |
5/4/2016 | | | GBP | | | | 20,354 | | | | USD | | | | 29,256 | | | | (2 | ) |
5/4/2016 | | | GBP | | | | 20,354 | | | | USD | | | | 29,256 | | | | (1 | ) |
5/4/2016 | | | GBP | | | | 15,511 | | | | USD | | | | 22,294 | | | | (1 | ) |
5/4/2016 | | | GBP | | | | 20,354 | | | | USD | | | | 29,256 | | | | (1 | ) |
5/4/2016 | | | HKD | | | | 1,344,395 | | | | USD | | | | 173,355 | | | | (10 | ) |
5/4/2016 | | | HKD | | | | 1,344,439 | | | | USD | | | | 173,355 | | | | (16 | ) |
5/4/2016 | | | HKD | | | | 1,024,399 | | | | USD | | | | 132,080 | | | | (20 | ) |
5/4/2016 | | | HKD | | | | 1,344,478 | | | | USD | | | | 173,355 | | | | (21 | ) |
5/4/2016 | | | HKD | | | | 1,344,538 | | | | USD | | | | 173,355 | | | | (28 | ) |
5/4/2016 | | | IDR | | | | 104,444,796 | | | | USD | | | | 7,832 | | | | (7 | ) |
5/4/2016 | | | INR | | | | 52,249 | | | | USD | | | | 784 | | | | (1 | ) |
5/4/2016 | | | MXN | | | | 143,563 | | | | USD | | | | 8,353 | | | | (1 | ) |
5/4/2016 | | | MXN | | | | 143,553 | | | | USD | | | | 8,353 | | | | — | |
5/4/2016 | | | MXN | | | | 109,408 | | | | USD | | | | 6,365 | | | | (1 | ) |
5/4/2016 | | | MXN | | | | 143,575 | | | | USD | | | | 8,353 | | | | (1 | ) |
5/4/2016 | | | MXN | | | | 143,576 | | | | USD | | | | 8,353 | | | | (1 | ) |
5/5/2016 | | | CNY | | | | 58,128 | | | | USD | | | | 8,971 | | | | (7 | ) |
5/5/2016 | | | MYR | | | | 116,171 | | | | USD | | | | 29,635 | | | | (11 | ) |
5/5/2016 | | | SGD | | | | 54,654 | | | | USD | | | | 40,578 | | | | (6 | ) |
5/5/2016 | | | SGD | | | | 54,659 | | | | USD | | | | 40,578 | | | | (9 | ) |
5/5/2016 | | | SGD | | | | 54,657 | | | | USD | | | | 40,578 | | | | (8 | ) |
5/5/2016 | | | SGD | | | | 41,646 | | | | USD | | | | 30,917 | | | | (8 | ) |
5/5/2016 | | | SGD | | | | 54,659 | | | | USD | | | | 40,578 | | | | (10 | ) |
5/5/2016 | | | TWD | | | | 300,366 | | | | USD | | | | 9,338 | | | | (4 | ) |
5/5/2016 | | | TWD | | | | 300,367 | | | | USD | | | | 9,338 | | | | (4 | ) |
5/9/2016 | | | JPY | | | | 2,695,089 | | | | USD | | | | 24,001 | | | | (2 | ) |
5/9/2016 | | | JPY | | | | 2,694,978 | | | | USD | | | | 24,001 | | | | (1 | ) |
5/9/2016 | | | JPY | | | | 2,695,120 | | | | USD | | | | 24,001 | | | | (3 | ) |
5/9/2016 | | | JPY | | | | 2,053,646 | | | | USD | | | | 18,289 | | | | (1 | ) |
5/9/2016 | | | JPY | | | | 2,695,235 | | | | USD | | | | 24,001 | | | | (4 | ) |
5/9/2016 | | | THB | | | | 1,071,918 | | | | USD | | | | 30,427 | | | | 18 | |
5/9/2016 | | | ZAR | | | | 174,210 | | | | USD | | | | 11,762 | | | | (1 | ) |
5/9/2016 | | | ZAR | | | | 174,190 | | | | USD | | | | 11,762 | | | | — | |
5/9/2016 | | | ZAR | | | | 174,228 | | | | USD | | | | 11,762 | | | | (2 | ) |
5/9/2016 | | | ZAR | | | | 132,745 | | | | USD | | | | 8,962 | | | | (1 | ) |
5/9/2016 | | | ZAR | | | | 174,325 | | | | USD | | | | 11,762 | | | | (9 | ) |
| | | | | | | | | | | | | | | | | | | $ | (76,953 | ) |
See Notes to Financial Statements.
| | |
| 72 | | WisdomTree Developed World ex-U.S. and Currency Hedged Equity Funds |
Schedule of Investments (concluded)
WisdomTree Global ex-U.S. Hedged Real Estate Fund (HDRW)
March 31, 2016
| | |
| CURRENCY LEGEND |
| AUD | | – Australian dollar |
| BRL | | – Brazilian real |
| CAD | | – Canadian dollar |
| CHF | | – Swiss franc |
| CLP | | – Chilean peso |
| CNY | | – Chinese yuan |
| EUR | | – Euro |
| GBP | | – British pound |
| HKD | | – Hong Kong dollar |
| IDR | | – Indonesian rupiah |
| ILS | | – Israeli New shekel |
| INR | | – Indian rupee |
| JPY | | – Japanese yen |
| MXN | | – Mexican peso |
| MYR | | – Malaysian ringgit |
| NOK | | – Norwegian krone |
| NZD | | – New Zealand dollar |
| PHP | | – Philippine peso |
| SEK | | – Swedish krona |
| SGD | | – Singapore dollar |
| THB | | – Thai baht |
| TRY | | – Turkish New lira |
| TWD | | – New Taiwan dollar |
| USD | | – U.S. dollar |
| ZAR | | – South African rand |
See Notes to Financial Statements.
| | | | |
| WisdomTree Developed World ex-U.S. and Currency Hedged Equity Funds | | | 73 | |
Schedule of Investments
WisdomTree International Dividend ex-Financials Fund (DOO)
March 31, 2016
| | | | | | | | |
| Investments | | Shares | | | Value | |
| COMMON STOCKS – 99.1% | | | | | | | | |
| Australia – 8.9% | | | | | | | | |
BHP Billiton Ltd. | | | 181,853 | | | $ | 2,358,552 | |
Rio Tinto Ltd. | | | 80,862 | | | | 2,655,449 | |
Telstra Corp., Ltd. | | | 846,663 | | | | 3,471,404 | |
Wesfarmers Ltd. | | | 114,507 | | | | 3,651,101 | |
Woodside Petroleum Ltd. | | | 261,106 | | | | 5,214,214 | |
Woolworths Ltd. | | | 193,000 | | | | 3,281,081 | |
| | | | | | | | |
| Total Australia | | | | | | | 20,631,801 | |
| Belgium – 1.0% | | | | | | | | |
Anheuser-Busch InBev N.V. | | | 18,373 | | | | 2,287,363 | |
| China – 1.7% | | | | | | | | |
CNOOC Ltd. | | | 2,572,000 | | | | 3,037,371 | |
Lenovo Group Ltd. | | | 1,074,000 | | | | 836,320 | |
| | | | | | | | |
| Total China | | | | | | | 3,873,691 | |
| Denmark – 0.8% | | | | | | | | |
Coloplast A/S Class B | | | 25,131 | | | | 1,907,326 | |
| Finland – 2.4% | | | | | | | | |
Fortum Oyj(a) | | | 276,766 | | | | 4,197,826 | |
Nokia Oyj | | | 242,228 | | | | 1,442,262 | |
| | | | | | | | |
| Total Finland | | | | | | | 5,640,088 | |
| France – 8.5% | | | | | | | | |
Cap Gemini S.A. | | | 14,103 | | | | 1,327,150 | |
Electricite de France S.A.(a) | | | 193,715 | | | | 2,177,459 | |
Engie S.A. | | | 229,696 | | | | 3,570,273 | |
Orange S.A. | | | 216,019 | | | | 3,789,703 | |
Sanofi | | | 25,957 | | | | 2,095,990 | |
TOTAL S.A.(a) | | | 87,318 | | | | 3,986,101 | |
Vivendi S.A. | | | 130,785 | | | | 2,754,187 | |
| | | | | | | | |
| Total France | | | | | | | 19,700,863 | |
| Germany – 8.6% | | | | | | | | |
BASF SE | | | 29,024 | | | | 2,192,827 | |
Bayerische Motoren Werke AG | | | 20,905 | | | | 1,922,460 | |
Daimler AG Registered Shares | | | 24,978 | | | | 1,917,599 | |
Deutsche Telekom AG Registered Shares | | | 150,541 | | | | 2,706,187 | |
Evonik Industries AG | | | 62,330 | | | | 1,872,658 | |
Infineon Technologies AG | | | 98,151 | | | | 1,398,659 | |
SAP SE | | | 17,577 | | | | 1,424,124 | |
Siemens AG Registered Shares | | | 26,262 | | | | 2,787,688 | |
Telefonica Deutschland Holding AG | | | 664,428 | | | | 3,604,788 | |
| | | | | | | | |
| Total Germany | | | | | | | 19,826,990 | |
| Hong Kong – 1.5% | | | | | | | | |
CLP Holdings Ltd. | | | 374,500 | | | | 3,386,966 | |
| Israel – 0.7% | | | | | | | | |
Teva Pharmaceutical Industries Ltd. | | | 28,622 | | | | 1,543,205 | |
| Italy – 5.9% | | | | | | | | |
Atlantia SpA | | | 112,048 | | | | 3,111,668 | |
Eni SpA | | | 306,786 | | | | 4,649,655 | |
Snam SpA | | | 915,747 | | | | 5,744,687 | |
| | | | | | | | |
| Total Italy | | | | | | | 13,506,010 | |
| Japan – 7.0% | | | | | | | | |
Canon, Inc. | | | 83,200 | | | $ | 2,483,527 | |
Eisai Co., Ltd. | | | 24,700 | | | | 1,487,780 | |
Kyocera Corp. | | | 21,800 | | | | 961,454 | |
Mitsui & Co., Ltd. | | | 218,200 | | | | 2,514,071 | |
NTT DOCOMO, Inc. | | | 125,900 | | | | 2,859,199 | |
Sumitomo Corp. | | | 232,500 | | | | 2,313,726 | |
Takeda Pharmaceutical Co., Ltd. | | | 49,000 | | | | 2,239,103 | |
Yahoo Japan Corp.(a) | | | 317,900 | | | | 1,354,812 | |
| | | | | | | | |
| Total Japan | | | | | | | 16,213,672 | |
| Norway – 2.4% | | | | | | | | |
Statoil ASA | | | 219,500 | | | | 3,457,863 | |
Yara International ASA | | | 56,120 | | | | 2,112,833 | |
| | | | | | | | |
| Total Norway | | | | | | | 5,570,696 | |
| Portugal – 1.7% | | | | | | | | |
EDP-Energias de Portugal S.A. | | | 1,098,187 | | | | 3,912,000 | |
| Singapore – 1.3% | | | | | | | | |
Singapore Telecommunications Ltd. | | | 1,056,600 | | | | 2,997,335 | |
| Spain – 7.2% | | | | | | | | |
Abertis Infraestructuras S.A. | | | 203,499 | | | | 3,350,917 | |
Amadeus IT Holding S.A. Class A | | | 30,950 | | | | 1,329,292 | |
Ferrovial S.A. | | | 130,988 | | | | 2,818,916 | |
Gas Natural SDG S.A. | | | 135,656 | | | | 2,747,008 | |
Repsol S.A. | | | 245,342 | | | | 2,773,430 | |
Telefonica S.A. | | | 315,467 | | | | 3,541,701 | |
| | | | | | | | |
| Total Spain | | | | | | | 16,561,264 | |
| Sweden – 4.8% | | | | | | | | |
Hennes & Mauritz AB Class B | | | 58,702 | | | | 1,960,185 | |
Sandvik AB | | | 228,073 | | | | 2,363,247 | |
Telefonaktiebolaget LM Ericsson Class B | | | 253,484 | | | | 2,542,126 | |
TeliaSonera AB | | | 812,941 | | | | 4,228,813 | |
| | | | | | | | |
| Total Sweden | | | | | | | 11,094,371 | |
| Switzerland – 9.4% | | | | | | | | |
Givaudan S.A. Registered Shares | | | 1,314 | | | | 2,587,797 | |
Kuehne + Nagel International AG Registered Shares | | | 30,319 | | | | 4,327,893 | |
Nestle S.A. Registered Shares | | | 32,832 | | | | 2,463,300 | |
Novartis AG Registered Shares | | | 21,484 | | | | 1,563,656 | |
Roche Holding AG Bearer Shares | | | 8,369 | | | | 2,110,493 | |
SGS S.A. Registered Shares | | | 1,590 | | | | 3,373,759 | |
Swisscom AG Registered Shares | | | 5,724 | | | | 3,123,051 | |
Syngenta AG Registered Shares | | | 4,836 | | | | 2,019,945 | |
| | | | | | | | |
| Total Switzerland | | | | | | | 21,569,894 | |
| United Kingdom – 25.3% | | | | | | | | |
AstraZeneca PLC | | | 42,188 | | | | 2,366,351 | |
BAE Systems PLC | | | 364,549 | | | | 2,666,988 | |
BHP Billiton PLC | | | 194,792 | | | | 2,191,641 | |
BP PLC | | | 592,008 | | | | 2,979,402 | |
British American Tobacco PLC | | | 53,289 | | | | 3,132,624 | |
Centrica PLC | | | 809,465 | | | | 2,649,162 | |
Diageo PLC | | | 68,801 | | | | 1,860,572 | |
See Notes to Financial Statements.
| | |
| 74 | | WisdomTree Developed World ex-U.S. and Currency Hedged Equity Funds |
Schedule of Investments (concluded)
WisdomTree International Dividend ex-Financials Fund (DOO)
March 31, 2016
| | | | | | | | |
| Investments | | Shares | | | Value | |
GlaxoSmithKline PLC | | | 175,896 | | | $ | 3,569,752 | |
Imperial Brands PLC | | | 61,720 | | | | 3,426,873 | |
Marks & Spencer Group PLC | | | 248,574 | | | | 1,451,253 | |
National Grid PLC | | | 237,241 | | | | 3,366,218 | |
Next PLC | | | 15,191 | | | | 1,179,037 | |
Pearson PLC | | | 135,488 | | | | 1,703,948 | |
RELX N.V. | | | 139,335 | | | | 2,436,468 | |
RELX PLC | | | 101,304 | | | | 1,884,119 | |
Rio Tinto PLC | | | 73,741 | | | | 2,072,594 | |
Royal Dutch Shell PLC Class A | | | 137,329 | | | | 3,323,929 | |
SABMiller PLC | | | 40,154 | | | | 2,456,280 | |
Sky PLC | | | 129,606 | | | | 1,907,535 | |
Smith & Nephew PLC | | | 67,972 | | | | 1,121,552 | |
SSE PLC | | | 141,855 | | | | 3,042,012 | |
Unilever N.V. CVA | | | 58,130 | | | | 2,608,944 | |
Unilever PLC | | | 48,414 | | | | 2,193,681 | |
Vodafone Group PLC | | | 829,596 | | | | 2,637,541 | |
| | | | | | | | |
| Total United Kingdom | | | | | | | 58,228,476 | |
TOTAL COMMON STOCKS
(Cost: $265,719,332) | | | | | | | 228,452,011 | |
| EXCHANGE-TRADED FUND – 0.1% | |
| United States – 0.1% | | | | | | | | |
WisdomTree International LargeCap Dividend Fund(a)(b) | | | | | | | | |
| (Cost: $235,837) | | | 5,511 | | | | 230,746 | |
| INVESTMENT OF CASH COLLATERAL FOR SECURITIES LOANED – 2.4% | |
| United States – 2.4% | | | | | | | | |
State Street Navigator Securities Lending Prime Portfolio, 0.50%(c) | | | | | | | | |
| (Cost: $5,503,096)(d) | | | 5,503,096 | | | | 5,503,096 | |
TOTAL INVESTMENTS IN SECURITIES – 101.6% (Cost: $271,458,265) | | | | | | | 234,185,853 | |
Liabilities in Excess of Cash, Foreign Currency and Other Assets – (1.6)% | | | | | | | (3,702,817 | ) |
| | | | | | | | |
| NET ASSETS – 100.0% | | | | | | $ | 230,483,036 | |
| (a) | Security, or portion thereof, was on loan at March 31, 2016 (See Note 2). |
| (b) | Affiliated company (See Note 3). |
| (c) | Rate shown represents annualized 7-day yield as of March 31, 2016. |
| (d) | At March 31, 2016, the total market value of the Fund’s securities on loan was $10,899,170 and the total market value of the collateral held by the Fund was $11,845,410. The total market value of the collateral includes non-cash U.S. Government securities collateral having a value of $6,342,314. |
CVA – Certificaten Van Aandelen (Certificate of Stock)
| | | | | | | | | | | | | | | | | | | | |
| FINANCIAL DERIVATIVE INSTRUMENTS | |
| FORWARD CONTRACTS | |
Settlement
Date | | Contracts
To Deliver | | | In
Exchange For | | | Unrealized
Gain (Loss) | |
4/1/2016 | | | AUD | | | | 171,536 | | | | USD | | | | 131,848 | | | $ | (106 | ) |
4/1/2016 | | | GBP | | | | 90,977 | | | | USD | | | | 131,299 | | | | 537 | |
| | | | | | | | | | | | | | | | | | | $ | 431 | |
| | |
| CURRENCY LEGEND |
| AUD | | – Australian dollar |
| GBP | | – British pound |
| USD | | – U.S. dollar |
See Notes to Financial Statements.
| | | | |
| WisdomTree Developed World ex-U.S. and Currency Hedged Equity Funds | | | 75 | |
Schedule of Investments
WisdomTree International Equity Fund (DWM)
March 31, 2016
| | | | | | | | |
| Investments | | Shares | | | Value | |
| COMMON STOCKS – 99.3% | | | | | | | | |
| Australia – 8.1% | | | | | | | | |
Adelaide Brighton Ltd. | | | 72,341 | | | $ | 282,137 | |
AGL Energy Ltd. | | | 46,199 | | | | 653,910 | |
Amcor Ltd. | | | 58,099 | | | | 641,339 | |
AMP Ltd. | | | 181,967 | | | | 810,473 | |
ASX Ltd. | | | 12,438 | | | | 396,399 | |
Aurizon Holdings Ltd. | | | 152,212 | | | | 463,673 | |
Australia & New Zealand Banking Group Ltd. | | | 210,882 | | | | 3,805,703 | |
Bank of Queensland Ltd. | | | 51,621 | | | | 481,278 | |
Bendigo & Adelaide Bank Ltd. | | | 56,408 | | | | 384,886 | |
BHP Billiton Ltd. | | | 215,862 | | | | 2,799,633 | |
Boral Ltd. | | | 53,190 | | | | 252,863 | |
Brambles Ltd. | | | 65,608 | | | | 611,684 | |
Brickworks Ltd. | | | 30,530 | | | | 372,006 | |
Cabcharge Australia Ltd. | | | 83,304 | | | | 207,624 | |
Caltex Australia Ltd. | | | 14,352 | | | | 375,590 | |
Cardno Ltd.(a) | | | 42,499 | | | | 36,615 | |
Coca-Cola Amatil Ltd. | | | 61,870 | | | | 420,726 | |
Cochlear Ltd. | | | 4,561 | | | | 358,924 | |
Commonwealth Bank of Australia | | | 107,024 | | | | 6,168,027 | |
Computershare Ltd. | | | 37,770 | | | | 284,154 | |
Crown Resorts Ltd. | | | 36,017 | | | | 345,218 | |
CSL Ltd. | | | 10,320 | | | | 805,297 | |
CSR Ltd. | | | 63,362 | | | | 160,846 | |
ERM Power Ltd. | | | 74,938 | | | | 82,434 | |
Flight Centre Travel Group Ltd.(a) | | | 8,212 | | | | 273,087 | |
Fortescue Metals Group Ltd.(a) | | | 266,791 | | | | 523,334 | |
GrainCorp Ltd. Class A | | | 45,212 | | | | 262,236 | |
Incitec Pivot Ltd. | | | 89,332 | | | | 219,212 | |
Insurance Australia Group Ltd. | | | 260,415 | | | | 1,117,809 | |
IOOF Holdings Ltd.(a) | | | 50,178 | | | | 342,377 | |
JB Hi-Fi Ltd.(a) | | | 11,921 | | | | 216,234 | |
LendLease Group | | | 46,927 | | | | 500,687 | |
Macquarie Group Ltd. | | | 18,980 | | | | 964,938 | |
McMillan Shakespeare Ltd.(a) | | | 19,596 | | | | 188,277 | |
Mineral Resources Ltd.(a) | | | 42,821 | | | | 197,970 | |
Monadelphous Group Ltd.(a) | | | 26,516 | | | | 145,230 | |
National Australia Bank Ltd. | | | 203,149 | | | | 4,100,585 | |
Navitas Ltd. | | | 57,117 | | | | 223,201 | |
Origin Energy Ltd. | | | 59,880 | | | | 234,459 | |
Perpetual Ltd. | | | 8,053 | | | | 269,844 | |
Platinum Asset Management Ltd. | | | 59,765 | | | | 291,936 | |
Primary Health Care Ltd. | | | 88,324 | | | | 254,787 | |
QBE Insurance Group Ltd. | | | 47,331 | | | | 397,226 | |
Ramsay Health Care Ltd. | | | 7,499 | | | | 353,962 | |
Rio Tinto Ltd. | | | 20,929 | | | | 687,293 | |
Santos Ltd. | | | 55,515 | | | | 172,101 | |
Sonic Healthcare Ltd. | | | 29,090 | | | | 420,249 | |
Southern Cross Media Group Ltd. | | | 231,220 | | | | 197,431 | |
Star Entertainment Grp Ltd. (The) | | | 52,611 | | | | 229,875 | |
Suncorp Group Ltd. | | | 110,502 | | | | 1,012,393 | |
Super Retail Group Ltd.(a) | | | 25,277 | | | | 166,443 | |
Tabcorp Holdings Ltd. | | | 80,055 | | | | 263,572 | |
Tatts Group Ltd. | | | 148,654 | | | | 432,251 | |
Telstra Corp., Ltd. | | | 796,129 | | | | 3,264,209 | |
Wesfarmers Ltd. | | | 73,859 | | | | 2,355,024 | |
Westpac Banking Corp. | | | 239,915 | | | | 5,601,230 | |
Woodside Petroleum Ltd. | | | 97,770 | | | | 1,952,440 | |
Woolworths Ltd. | | | 94,273 | | | | 1,602,681 | |
| | | | | | | | |
| Total Australia | | | | 50,636,022 | |
| Austria – 0.4% | | | | | | | | |
Andritz AG(a) | | | 4,886 | | | | 268,676 | |
EVN AG | | | 19,757 | | | | 227,392 | |
Oesterreichische Post AG | | | 8,341 | | | | 339,613 | |
OMV AG | | | 20,221 | | | | 569,735 | |
UNIQA Insurance Group AG | | | 15,965 | | | | 112,378 | |
Verbund AG(a) | | | 23,562 | | | | 301,527 | |
Vienna Insurance Group AG Wiener Versicherung Gruppe | | | 7,257 | | | | 153,817 | |
Voestalpine AG | | | 9,216 | | | | 308,814 | |
| | | | | | | | |
| Total Austria | | | | 2,281,952 | |
| Belgium – 1.9% | | | | | | | | |
Ageas | | | 16,947 | | | | 673,408 | |
Anheuser-Busch InBev N.V. | | | 57,013 | | | | 7,097,884 | |
Bekaert S.A. | | | 8,301 | | | | 337,748 | |
D’ieteren S.A./N.V. | | | 4,402 | | | | 185,603 | |
Delhaize Group | | | 5,057 | | | | 528,729 | |
Elia System Operator S.A./N.V. | | | 8,909 | | | | 443,806 | |
Exmar N.V. | | | 15,017 | | | | 126,257 | |
Melexis N.V. | | | 867 | | | | 47,226 | |
Proximus SADP | | | 30,631 | | | | 1,048,389 | |
Solvay S.A. | | | 4,361 | | | | 438,069 | |
UCB S.A. | | | 8,172 | | | | 626,166 | |
Umicore S.A. | | | 7,478 | | | | 372,818 | |
| | | | | | | | |
| Total Belgium | | | | 11,926,103 | |
| China – 2.9% | | | | | | | | |
China Merchants Holdings International Co., Ltd. | | | 97,094 | | | | 288,533 | |
China Mobile Ltd. | | | 800,981 | | | | 8,927,269 | |
China Overseas Land & Investment Ltd. | | | 201,175 | | | | 636,732 | |
China Power International Development Ltd. | | | 508,000 | | | | 263,282 | |
China Resources Beer Holdings Co., Ltd. | | | 59,812 | | | | 111,349 | |
China Resources Power Holdings Co., Ltd. | | | 188,000 | | | | 351,445 | |
China South City Holdings Ltd.(a) | | | 458,000 | | | | 94,475 | |
China Unicom Hong Kong Ltd. | | | 623,588 | | | | 823,245 | |
CITIC Ltd. | | | 434,000 | | | | 660,242 | |
CNOOC Ltd. | | | 2,998,700 | | | | 3,541,277 | |
Dah Chong Hong Holdings Ltd. | | | 324,000 | | | | 131,997 | |
Fosun International Ltd. | | | 119,487 | | | | 170,067 | |
Guangdong Investment Ltd. | | | 158,000 | | | | 199,829 | |
Lenovo Group Ltd. | | | 359,003 | | | | 279,554 | |
Poly Property Group Co., Ltd. | | | 451,000 | | | | 123,266 | |
Shenzhen Investment Ltd. | | | 762,000 | | | | 302,578 | |
Sino-Ocean Land Holdings Ltd. | | | 647,500 | | | | 306,364 | |
Sun Art Retail Group Ltd.(a) | | | 378,500 | | | | 267,898 | |
Yuexiu Property Co., Ltd. | | | 1,660,000 | | | | 239,694 | |
| | | | | | | | |
| Total China | | | | 17,719,096 | |
See Notes to Financial Statements.
| | |
| 76 | | WisdomTree Developed World ex-U.S. and Currency Hedged Equity Funds |
Schedule of Investments (continued)
WisdomTree International Equity Fund (DWM)
March 31, 2016
| | | | | | | | |
| Investments | | Shares | | | Value | |
| Denmark – 1.2% | | | | | | | | |
AP Moeller – Maersk A/S Class B | | | 260 | | | $ | 341,606 | |
Carlsberg A/S Class B | | | 3,777 | | | | 360,487 | |
Chr Hansen Holding A/S | | | 6,780 | | | | 455,875 | |
Coloplast A/S Class B | | | 7,382 | | | | 560,259 | |
Danske Bank A/S | | | 27,110 | | | | 767,114 | |
FLSmidth & Co. A/S(a) | | | 2,105 | | | | 88,380 | |
Novo Nordisk A/S Class B | | | 51,547 | | | | 2,800,495 | |
Novozymes A/S Class B | | | 7,557 | | | | 340,287 | |
Pandora A/S | | | 4,102 | | | | 538,007 | |
TDC A/S | | | 86,988 | | | | 426,428 | |
Tryg A/S | | | 29,921 | | | | 581,675 | |
Vestas Wind Systems A/S | | | 2,090 | | | | 147,688 | |
| | | | | | | | |
| Total Denmark | | | | 7,408,301 | |
| Finland – 1.3% | | | | | | | | |
Elisa Oyj(a) | | | 15,992 | | | | 622,704 | |
Fortum Oyj(a) | | | 68,696 | | | | 1,041,941 | |
Kone Oyj Class B | | | 19,817 | | | | 956,593 | |
Konecranes Oyj(a) | | | 10,705 | | | | 255,933 | |
Lassila & Tikanoja Oyj | | | 18,228 | | | | 332,140 | |
Metso Oyj(a) | | | 9,279 | | | | 221,734 | |
Neste Oyj(a) | | | 20,985 | | | | 691,577 | |
Nokia Oyj | | | 84,105 | | | | 500,774 | |
Nokian Renkaat Oyj(a) | | | 7,492 | | | | 264,834 | |
Orion Oyj Class B | | | 13,039 | | | | 431,642 | |
Sampo Oyj Class A | | | 26,750 | | | | 1,272,359 | |
Stora Enso Oyj Class R | | | 42,324 | | | | 379,332 | |
UPM-Kymmene Oyj(a) | | | 46,258 | | | | 839,196 | |
Wartsila Oyj Abp | | | 6,779 | | | | 307,224 | |
| | | | | | | | |
| Total Finland | | | | 8,117,983 | |
| France – 10.0% | | | | | | | | |
Accor S.A. | | | 11,382 | | | | 483,016 | |
Aeroports de Paris | | | 4,088 | | | | 506,144 | |
Air Liquide S.A. | | | 10,829 | | | | 1,220,322 | |
Airbus Group SE | | | 18,034 | | | | 1,199,131 | |
Arkema S.A. | | | 3,693 | | | | 277,668 | |
AXA S.A. | | | 134,068 | | | | 3,160,962 | |
BNP Paribas S.A. | | | 46,320 | | | | 2,334,635 | |
Bourbon S.A.(a) | | | 5,239 | | | | 78,447 | |
Bouygues S.A. | | | 20,868 | | | | 852,518 | |
Bureau Veritas S.A. | | | 12,003 | | | | 267,747 | |
Cap Gemini S.A. | | | 6,002 | | | | 564,813 | |
Carrefour S.A. | | | 27,507 | | | | 757,937 | |
Casino Guichard Perrachon S.A.(a) | | | 5,721 | | | | 328,446 | |
Christian Dior SE | | | 4,254 | | | | 772,715 | |
Cie de Saint-Gobain | | | 24,631 | | | | 1,087,084 | |
Cie Generale des Etablissements Michelin | | | 6,781 | | | | 694,915 | |
CNP Assurances | | | 42,561 | | | | 664,698 | |
Credit Agricole S.A. | | | 81,780 | | | | 887,006 | |
Danone S.A. | | | 20,365 | | | | 1,450,666 | |
Edenred | | | 12,893 | | | | 250,796 | |
Eiffage S.A. | | | 4,031 | | | | 310,063 | |
Electricite de France S.A.(a) | | | 134,091 | | | | 1,507,253 | |
Engie S.A. | | | 195,618 | | | | 3,040,582 | |
Essilor International S.A. | | | 3,315 | | | | 410,060 | |
Eutelsat Communications S.A. | | | 11,580 | | | | 374,634 | |
Imerys S.A. | | | 4,012 | | | | 280,210 | |
Ipsen S.A. | | | 3,282 | | | | 188,758 | |
IPSOS | | | 5,181 | | | | 121,209 | |
Kering | | | 3,595 | | | | 643,589 | |
Klepierre(a) | | | 13,605 | | | | 652,701 | |
L’Oreal S.A. | | | 13,083 | | | | 2,347,381 | |
Legrand S.A. | | | 5,725 | | | | 321,271 | |
LVMH Moet Hennessy Louis Vuitton SE(a) | | | 14,957 | | | | 2,565,161 | |
Metropole Television S.A. | | | 17,133 | | | | 312,871 | |
Natixis S.A. | | | 152,745 | | | | 753,160 | |
Neopost S.A. | | | 3,966 | | | | 83,474 | |
Nexity S.A. | | | 6,133 | | | | 320,055 | |
Orange S.A. | | | 145,455 | | | | 2,551,772 | |
Pernod Ricard S.A. | | | 6,160 | | | | 687,924 | |
Publicis Groupe S.A. | | | 6,256 | | | | 439,932 | |
Rallye S.A.(a) | | | 8,169 | | | | 142,055 | |
Remy Cointreau S.A. | | | 2,524 | | | | 191,902 | |
Renault S.A. | | | 9,586 | | | | 953,860 | |
Rexel S.A. | | | 19,095 | | | | 273,193 | |
Safran S.A. | | | 10,341 | | | | 724,486 | |
Sanofi | | | 57,245 | | | | 4,622,451 | |
Schneider Electric SE | | | 23,576 | | | | 1,492,140 | |
SCOR SE | | | 16,758 | | | | 595,814 | |
Societe Generale S.A. | | | 25,450 | | | | 941,971 | |
Societe Television Francaise 1 | | | 18,953 | | | | 245,784 | |
Sodexo S.A. | | | 5,385 | | | | 581,370 | |
Suez Environnement Co. | | | 28,121 | | | | 516,570 | |
Technip S.A. | | | 5,405 | | | | 300,018 | |
Thales S.A. | | | 8,978 | | | | 787,778 | |
TOTAL S.A.(a) | | | 170,733 | | | | 7,794,029 | |
Unibail-Rodamco SE | | | 4,518 | | | | 1,244,905 | |
Valeo S.A. | | | 2,822 | | | | 439,923 | |
Veolia Environnement S.A. | | | 23,097 | | | | 557,199 | |
Vinci S.A. | | | 30,238 | | | | 2,255,948 | |
Vivendi S.A. | | | 85,923 | | | | 1,809,443 | |
| | | | | | | | |
| Total France | | | | 62,222,565 | |
| Germany – 7.4% | | | | | | | | |
adidas AG | | | 5,647 | | | | 662,809 | |
Allianz SE Registered Shares | | | 24,390 | | | | 3,973,100 | |
BASF SE | | | 36,893 | | | | 2,787,347 | |
Bayer AG Registered Shares | | | 20,505 | | | | 2,413,758 | |
Bayerische Motoren Werke AG | | | 25,561 | | | | 2,350,634 | |
Beiersdorf AG | | | 5,722 | | | | 517,337 | |
Brenntag AG | | | 5,706 | | | | 326,414 | |
Continental AG | | | 5,333 | | | | 1,215,445 | |
Daimler AG Registered Shares | | | 44,060 | | | | 3,382,553 | |
Deutsche Boerse AG | | | 10,384 | | | | 887,364 | |
Deutsche Post AG Registered Shares | | | 46,613 | | | | 1,297,138 | |
Deutsche Telekom AG Registered Shares | | | 205,660 | | | | 3,697,028 | |
E.ON SE | | | 96,754 | | | | 930,341 | |
See Notes to Financial Statements.
| | | | |
| WisdomTree Developed World ex-U.S. and Currency Hedged Equity Funds | | | 77 | |
Schedule of Investments (continued)
WisdomTree International Equity Fund (DWM)
March 31, 2016
| | | | | | | | |
| Investments | | Shares | | | Value | |
Evonik Industries AG | | | 24,825 | | | $ | 745,849 | |
Fielmann AG | | | 7,148 | | | | 543,305 | |
Fraport AG Frankfurt Airport Services Worldwide | | | 4,110 | | | | 249,680 | |
Freenet AG | | | 16,466 | | | | 493,301 | |
Fresenius Medical Care AG & Co. KGaA | | | 5,672 | | | | 503,121 | |
Fresenius SE & Co. KGaA | | | 9,108 | | | | 666,437 | |
GEA Group AG | | | 7,830 | | | | 383,675 | |
Hannover Rueck SE | | | 6,769 | | | | 789,874 | |
Henkel AG & Co. KGaA | | | 6,199 | | | | 610,124 | |
Hugo Boss AG | | | 4,597 | | | | 301,948 | |
Infineon Technologies AG | | | 24,958 | | | | 355,654 | |
K+S AG Registered Shares | | | 5,418 | | | | 126,970 | |
Linde AG | | | 4,374 | | | | 638,252 | |
MAN SE | | | 5,463 | | | | 592,157 | |
Merck KGaA | | | 8,249 | | | | 689,125 | |
MTU Aero Engines AG | | | 2,721 | | | | 261,359 | |
Muenchener Rueckversicherungs – Gesellschaft AG Registered Shares | | | 9,557 | | | | 1,946,710 | |
ProSiebenSat.1 Media SE | | | 13,867 | | | | 714,020 | |
SAP SE | | | 28,913 | | | | 2,342,590 | |
Siemens AG Registered Shares | | | 37,790 | | | | 4,011,376 | |
Software AG | | | 5,070 | | | | 198,487 | |
Suedzucker AG | | | 12,349 | | | | 218,050 | |
Symrise AG | | | 7,047 | | | | 473,794 | |
Talanx AG* | | | 15,183 | | | | 519,227 | |
Telefonica Deutschland Holding AG | | | 224,257 | | | | 1,216,684 | |
United Internet AG Registered Shares | | | 5,301 | | | | 266,428 | |
Volkswagen AG | | | 10,402 | | | | 1,511,927 | |
VTG AG | | | 7,526 | | | | 230,487 | |
Wacker Chemie AG | | | 1,821 | | | | 160,490 | |
Wirecard AG(a) | | | 1,712 | | | | 64,965 | |
| | | | | | | | |
| Total Germany | | | | 46,267,334 | |
| Hong Kong – 2.7% | | | | | | | | |
AIA Group Ltd. | | | 166,765 | | | | 944,920 | |
Bank of East Asia Ltd. (The)(a) | | | 125,458 | | | | 469,059 | |
BOC Hong Kong Holdings Ltd. | | | 594,444 | | | | 1,774,162 | |
Cathay Pacific Airways Ltd. | | | 86,000 | | | | 148,793 | |
CLP Holdings Ltd. | | | 136,000 | | | | 1,229,980 | |
Dah Sing Banking Group Ltd.(a) | | | 114,400 | | | | 200,879 | |
Dah Sing Financial Holdings Ltd. | | | 34,800 | | | | 214,007 | |
Galaxy Entertainment Group Ltd. | | | 37,000 | | | | 138,812 | |
Hang Lung Properties Ltd. | | | 215,000 | | | | 410,788 | |
Hang Seng Bank Ltd. | | | 109,000 | | | | 1,926,617 | |
Henderson Land Development Co., Ltd. | | | 70,894 | | | | 435,516 | |
Hong Kong & China Gas Co., Ltd. | | | 320,284 | | | | 598,735 | |
Hong Kong Exchanges and Clearing Ltd. | | | 23,500 | | | | 565,947 | |
Hysan Development Co., Ltd. | | | 72,000 | | | | 306,786 | |
MTR Corp., Ltd. | | | 258,500 | | | | 1,279,744 | |
New World Development Co., Ltd. | | | 401,000 | | | | 382,050 | |
PCCW Ltd. | | | 569,088 | | | | 368,311 | |
Power Assets Holdings Ltd. | | | 119,000 | | | | 1,217,378 | |
Sino Land Co., Ltd. | | | 356,400 | | | | 564,245 | |
SJM Holdings Ltd. | | | 654,760 | | | | 467,653 | |
Sun Hung Kai Properties Ltd. | | | 90,000 | | | | 1,100,554 | |
Swire Pacific Ltd. Class A | | | 18,500 | | | | 199,154 | |
Swire Pacific Ltd. Class B | | | 190,000 | | | | 370,371 | |
Swire Properties Ltd. | | | 178,200 | | | | 481,308 | |
Television Broadcasts Ltd. | | | 58,200 | | | | 209,343 | |
Wharf Holdings Ltd. (The) | | | 127,000 | | | | 694,226 | |
Wheelock & Co., Ltd. | | | 67,000 | | | | 299,302 | |
| | | | | | | | |
| Total Hong Kong | | | | 16,998,640 | |
| Ireland – 0.4% | | | | | | | | |
C&C Group PLC | | | 81,348 | | | | 368,019 | |
CRH PLC | | | 17,092 | | | | 483,619 | |
DCC PLC | | | 5,754 | | | | 508,619 | |
Kerry Group PLC Class A | | | 5,307 | | | | 495,177 | |
Paddy Power Betfair PLC | | | 2,632 | | | | 367,714 | |
| | | | | | | | |
| Total Ireland | | | | 2,223,148 | |
| Israel – 0.7% | | | | | | | | |
Bezeq Israeli Telecommunication Corp., Ltd. | | | 552,115 | | | | 1,244,627 | |
Delek Automotive Systems Ltd. | | | 46,258 | | | | 447,138 | |
Gazit-Globe Ltd. | | | 51,396 | | | | 468,777 | |
Israel Chemicals Ltd. | | | 45,511 | | | | 197,927 | |
Sella Capital Real Estate Ltd. | | | 188,797 | | | | 296,792 | |
Teva Pharmaceutical Industries Ltd. | | | 30,162 | | | | 1,626,237 | |
| | | | | | | | |
| Total Israel | | | | 4,281,498 | |
| Italy – 3.2% | | | | | | | | |
Assicurazioni Generali SpA | | | 47,510 | | | | 705,445 | |
Astaldi SpA(a) | | | 11,310 | | | | 52,378 | |
ASTM SpA | | | 27,742 | | | | 320,876 | |
Atlantia SpA | | | 48,098 | | | | 1,335,722 | |
Banca Generali SpA | | | 19,998 | | | | 589,089 | |
Banca Mediolanum SpA | | | 59,327 | | | | 473,919 | |
Banca Popolare di Milano SCARL | | | 94,941 | | | | 66,483 | |
Danieli & C. Officine Meccaniche SpA RSP | | | 16,530 | | | | 259,006 | |
Davide Campari-Milano SpA | | | 16,047 | | | | 160,646 | |
Enel Green Power SpA | | | 164,586 | | | | 354,477 | |
Enel SpA | | | 419,029 | | | | 1,861,313 | |
Eni SpA | | | 332,123 | | | | 5,033,663 | |
ERG SpA | | | 21,817 | | | | 297,344 | |
Hera SpA | | | 138,319 | | | | 413,914 | |
Intesa Sanpaolo SpA | | | 480,931 | | | | 1,333,942 | |
Iren SpA | | | 138,732 | | | | 248,995 | |
Luxottica Group SpA | | | 15,310 | | | | 846,156 | |
MARR SpA | | | 13,730 | | | | 276,935 | |
Parmalat SpA | | | 81,559 | | | | 226,032 | |
Prysmian SpA | | | 6,111 | | | | 138,649 | |
Recordati SpA | | | 9,855 | | | | 247,066 | |
Snam SpA | | | 269,546 | | | | 1,690,923 | |
Societa Iniziative Autostradali e Servizi SpA | | | 30,389 | | | | 311,668 | |
Telecom Italia SpA RSP | | | 329,633 | | | | 289,238 | |
Terna Rete Elettrica Nazionale SpA | | | 156,271 | | | | 893,065 | |
Tod’s SpA(a) | | | 1,616 | | | | 115,279 | |
Trevi Finanziaria Industriale SpA(a) | | | 60,816 | | | | 103,954 | |
UniCredit SpA | | | 135,739 | | | | 490,340 | |
See Notes to Financial Statements.
| | |
| 78 | | WisdomTree Developed World ex-U.S. and Currency Hedged Equity Funds |
Schedule of Investments (continued)
WisdomTree International Equity Fund (DWM)
March 31, 2016
| | | | | | | | |
| Investments | | Shares | | | Value | |
UnipolSai SpA | | | 214,879 | | | $ | 498,056 | |
| | | | | | | | |
| Total Italy | | | | 19,634,573 | |
| Japan – 14.4% | | | | | | | | |
Aeon Co., Ltd. | | | 29,200 | | | | 422,432 | |
Aichi Steel Corp. | | | 39,000 | | | | 153,023 | |
Aisin Seiki Co., Ltd. | | | 8,000 | | | | 301,793 | |
Ajinomoto Co., Inc. | | | 14,000 | | | | 316,322 | |
Amada Holdings Co., Ltd. | | | 19,600 | | | | 191,475 | |
ANA Holdings, Inc. | | | 91,000 | | | | 256,738 | |
Aozora Bank Ltd. | | | 147,000 | | | | 514,000 | |
Asahi Group Holdings Ltd. | | | 13,900 | | | | 433,714 | |
Asahi Holdings, Inc. | | | 5,500 | | | | 74,185 | |
Asahi Kasei Corp. | | | 38,000 | | | | 257,255 | |
Astellas Pharma, Inc. | | | 57,300 | | | | 762,929 | |
Axell Corp.(a) | | | 25,200 | | | | 189,457 | |
Azbil Corp. | | | 7,500 | | | | 192,246 | |
Belluna Co., Ltd. | | | 37,100 | | | | 188,479 | |
Bridgestone Corp. | | | 20,100 | | | | 751,995 | |
Brother Industries Ltd. | | | 19,700 | | | | 226,805 | |
Canon, Inc. | | | 69,900 | | | | 2,086,521 | |
Central Japan Railway Co. | | | 2,700 | | | | 478,166 | |
Chugai Pharmaceutical Co., Ltd. | | | 12,600 | | | | 390,685 | |
Chugoku Electric Power Co., Inc. (The)(a) | | | 17,900 | | | | 242,075 | |
Dai Nippon Printing Co., Ltd. | | | 31,000 | | | | 275,813 | |
Dai-ichi Life Insurance Co., Ltd. (The) | | | 29,233 | | | | 354,375 | |
Daido Steel Co., Ltd. | | | 35,000 | | | | 121,447 | |
Daihatsu Motor Co., Ltd.(a) | | | 23,800 | | | | 335,841 | |
Daiichi Sankyo Co., Ltd. | | | 32,900 | | | | 732,526 | |
Daikin Industries Ltd. | | | 4,900 | | | | 366,732 | |
Daikyo, Inc. | | | 81,000 | | | | 129,000 | |
Daito Trust Construction Co., Ltd. | | | 3,800 | | | | 540,273 | |
Daiwa House Industry Co., Ltd. | | | 20,200 | | | | 569,004 | |
Daiwa Securities Group, Inc. | | | 80,000 | | | | 492,762 | |
DeNa Co., Ltd.(a) | | | 5,800 | | | | 100,060 | |
Denka Co., Ltd. | | | 53,000 | | | | 218,328 | |
Denso Corp. | | | 23,500 | | | | 945,896 | |
Dynam Japan Holdings Co., Ltd. | | | 137,200 | | | | 197,755 | |
Earth Chemical Co., Ltd. | | | 8,200 | | | | 331,954 | |
East Japan Railway Co. | | | 6,000 | | | | 518,511 | |
Eisai Co., Ltd. | | | 7,800 | | | | 469,825 | |
Electric Power Development Co., Ltd. | | | 5,700 | | | | 178,260 | |
FANUC Corp. | | | 7,300 | | | | 1,135,642 | |
Fast Retailing Co., Ltd. | | | 1,000 | | | | 320,477 | |
France Bed Holdings Co., Ltd. | | | 34,300 | | | | 316,465 | |
Fuji Heavy Industries Ltd. | | | 17,300 | | | | 611,838 | |
FUJIFILM Holdings Corp. | | | 14,000 | | | | 554,420 | |
Future Architect, Inc. | | | 23,200 | | | | 181,026 | |
Gurunavi, Inc. | | | 3,700 | | | | 87,994 | |
Hitachi Construction Machinery Co., Ltd.(a) | | | 18,100 | | | | 287,938 | |
Hitachi Ltd. | | | 110,000 | | | | 515,379 | |
Honda Motor Co., Ltd. | | | 55,600 | | | | 1,526,595 | |
Hoya Corp. | | | 9,900 | | | | 377,080 | |
Iida Group Holdings Co., Ltd. | | | 10,400 | | | | 203,105 | |
Information Services International-Dentsu Ltd. | | | 11,900 | | | | 239,069 | |
Internet Initiative Japan, Inc. | | | 3,300 | | | | 67,911 | |
Isuzu Motors Ltd. | | | 24,900 | | | | 257,430 | |
ITOCHU Corp. | | | 72,400 | | | | 892,801 | |
Japan Airlines Co., Ltd. | | | 13,800 | | | | 506,104 | |
Japan Exchange Group, Inc. | | | 13,200 | | | | 202,472 | |
Japan Tobacco, Inc. | | | 68,644 | | | | 2,864,365 | |
JFE Holdings, Inc. | | | 21,400 | | | | 288,646 | |
JGC Corp.(a) | | | 6,000 | | | | 89,951 | |
JX Holdings, Inc.(a) | | | 107,200 | | | | 413,749 | |
Kajima Corp. | | | 49,000 | | | | 307,789 | |
Kao Corp. | | | 10,600 | | | | 566,144 | |
Kawasaki Heavy Industries Ltd.(a) | | | 50,000 | | | | 144,579 | |
KDDI Corp. | | | 72,300 | | | | 1,933,661 | |
Keiyo Co., Ltd.(a) | | | 51,300 | | | | 232,321 | |
Kikkoman Corp.(a) | | | 7,000 | | | | 230,437 | |
Kirin Holdings Co., Ltd. | | | 32,400 | | | | 454,889 | |
Kokuyo Co., Ltd. | | | 29,900 | | | | 350,356 | |
Komatsu Ltd. | | | 33,700 | | | | 574,485 | |
Kubota Corp. | | | 38,400 | | | | 524,949 | |
Kyocera Corp. | | | 11,700 | | | | 516,010 | |
Kyoei Steel Ltd. | | | 9,000 | | | | 135,486 | |
KYORIN Holdings, Inc. | | | 6,100 | | | | 116,361 | |
Kyowa Hakko Kirin Co., Ltd. | | | 17,300 | | | | 276,443 | |
Lawson, Inc. | | | 5,100 | | | | 427,439 | |
LIXIL Group Corp. | | | 9,100 | | | | 185,813 | |
Makita Corp. | | | 6,000 | | | | 372,614 | |
Marubeni Corp.(a) | | | 100,800 | | | | 511,197 | |
Marui Group Co., Ltd.(a) | | | 14,500 | | | | 208,092 | |
Matsui Securities Co., Ltd.(a) | | | 30,400 | | | | 259,385 | |
Medipal Holdings Corp. | | | 23,400 | | | | 371,002 | |
Misawa Homes Co., Ltd.(a) | | | 20,700 | | | | 137,208 | |
Mitsubishi Chemical Holdings Corp. | | | 60,300 | | | | 315,194 | |
Mitsubishi Corp. | | | 72,400 | | | | 1,227,763 | |
Mitsubishi Electric Corp. | | | 40,000 | | | | 419,770 | |
Mitsubishi Estate Co., Ltd. | | | 14,000 | | | | 260,394 | |
Mitsubishi Gas Chemical Co., Inc. | | | 31,000 | | | | 167,143 | |
Mitsubishi Heavy Industries Ltd. | | | 62,000 | | | | 230,635 | |
Mitsubishi Materials Corp. | | | 65,000 | | | | 183,905 | |
Mitsubishi Motors Corp. | | | 28,300 | | | | 212,259 | |
Mitsubishi Tanabe Pharma Corp. | | | 21,600 | | | | 376,095 | |
Mitsubishi UFJ Financial Group, Inc. | | | 398,200 | | | | 1,847,603 | |
Mitsui & Co., Ltd. | | | 97,800 | | | | 1,126,838 | |
Mitsui Fudosan Co., Ltd. | | | 9,000 | | | | 224,850 | |
Mitsui Mining & Smelting Co., Ltd. | | | 82,000 | | | | 131,323 | |
Mitsui OSK Lines Ltd. | | | 86,000 | | | | 175,221 | |
Mixi, Inc. | | | 3,500 | | | | 130,166 | |
Mizuho Financial Group, Inc. | | | 922,200 | | | | 1,379,259 | |
Monex Group, Inc. | | | 54,600 | | | | 141,364 | |
MS&AD Insurance Group Holdings, Inc. | | | 19,430 | | | | 542,128 | |
Murata Manufacturing Co., Ltd. | | | 3,300 | | | | 398,425 | |
Nexon Co., Ltd. | | | 10,500 | | | | 179,274 | |
Nidec Corp. | | | 4,000 | | | | 274,069 | |
Nikon Corp.(a) | | | 18,400 | | | | 281,906 | |
See Notes to Financial Statements.
| | | | |
| WisdomTree Developed World ex-U.S. and Currency Hedged Equity Funds | | | 79 | |
Schedule of Investments (continued)
WisdomTree International Equity Fund (DWM)
March 31, 2016
| | | | | | | | |
| Investments | | Shares | | | Value | |
Nippon Beet Sugar Manufacturing Co., Ltd. | | | 149,000 | | | $ | 253,205 | |
Nippon Electric Glass Co., Ltd. | | | 36,000 | | | | 184,492 | |
Nippon Express Co., Ltd. | | | 39,000 | | | | 177,659 | |
Nippon Steel & Sumitomo Metal Corp. | | | 26,100 | | | | 502,053 | |
Nippon Telegraph & Telephone Corp. | | | 62,800 | | | | 2,708,790 | |
Nishi-Nippon City Bank Ltd. (The) | | | 102,000 | | | | 180,595 | |
Nissan Chemical Industries Ltd. | | | 9,900 | | | | 255,438 | |
Nissan Motor Co., Ltd. | | | 156,300 | | | | 1,448,342 | |
Nissin Foods Holdings Co., Ltd. | | | 4,900 | | | | 230,624 | |
Nitto Denko Corp.(a) | | | 3,600 | | | | 200,411 | |
Nomura Holdings, Inc. | | | 133,100 | | | | 595,542 | |
Nomura Real Estate Holdings, Inc. | | | 8,900 | | | | 164,705 | |
NSK Ltd. | | | 16,100 | | | | 147,542 | |
NTT Data Corp. | | | 4,600 | | | | 231,238 | |
NTT DOCOMO, Inc. | | | 165,855 | | | | 3,766,581 | |
NTT Urban Development Corp. | | | 19,600 | | | | 191,998 | |
Oji Holdings Corp. | | | 44,000 | | | | 176,947 | |
Okuwa Co., Ltd. | | | 23,000 | | | | 205,659 | |
Ono Pharmaceutical Co., Ltd. | | | 11,000 | | | | 466,346 | |
Oracle Corp. | | | 7,100 | | | | 399,235 | |
Oriental Land Co., Ltd.(a) | | | 3,000 | | | | 212,732 | |
Osaka Gas Co., Ltd. | | | 63,000 | | | | 242,370 | |
Panasonic Corp. | | | 32,700 | | | | 300,685 | |
Park24 Co., Ltd. | | | 9,700 | | | | 271,854 | |
Rengo Co., Ltd. | | | 36,000 | | | | 181,930 | |
Resona Holdings, Inc. | | | 113,600 | | | | 405,906 | |
Ricoh Co., Ltd.(a) | | | 30,000 | | | | 305,885 | |
Saibu Gas Co., Ltd. | | | 73,000 | | | | 168,869 | |
Sanrio Co., Ltd.(a) | | | 5,300 | | | | 103,788 | |
Sanyo Special Steel Co., Ltd. | | | 38,000 | | | | 173,780 | |
Secom Co., Ltd. | | | 5,200 | | | | 387,056 | |
Sega Sammy Holdings, Inc. | | | 15,800 | | | | 172,486 | |
Seiko Epson Corp. | | | 22,200 | | | | 359,087 | |
Sekisui Chemical Co., Ltd. | | | 15,100 | | | | 186,206 | |
Sekisui House Ltd. | | | 30,000 | | | | 507,007 | |
Seven & I Holdings Co., Ltd. | | | 19,300 | | | | 822,862 | |
Shin-Etsu Chemical Co., Ltd. | | | 6,600 | | | | 341,994 | |
Shionogi & Co., Ltd. | | | 7,000 | | | | 329,899 | |
Ship Healthcare Holdings, Inc. | | | 2,400 | | | | 60,536 | |
Showa Denko K.K. | | | 182,000 | | | | 187,838 | |
Showa Shell Sekiyu K.K. | | | 33,300 | | | | 299,239 | |
SMC Corp. | | | 1,000 | | | | 232,573 | |
SoftBank Group Corp. | | | 7,800 | | | | 372,390 | |
Sojitz Corp. | | | 127,500 | | | | 262,045 | |
Sompo Japan Nipponkoa Holdings, Inc. | | | 12,700 | | | | 360,226 | |
St. Marc Holdings Co., Ltd. | | | 5,600 | | | | 154,704 | |
Sumitomo Chemical Co., Ltd. | | | 38,000 | | | | 172,089 | |
Sumitomo Corp. | | | 64,000 | | | | 636,897 | |
Sumitomo Dainippon Pharma Co., Ltd.(a) | | | 10,200 | | | | 117,614 | |
Sumitomo Electric Industries Ltd. | | | 29,800 | | | | 362,972 | |
Sumitomo Forestry Co., Ltd. | | | 17,500 | | | | 201,321 | |
Sumitomo Heavy Industries Ltd. | | | 22,000 | | | | 91,018 | |
Sumitomo Metal Mining Co., Ltd. | | | 24,000 | | | | 238,623 | |
Sumitomo Mitsui Financial Group, Inc.(a) | | | 52,300 | | | | 1,587,683 | |
Sumitomo Mitsui Trust Holdings, Inc. | | | 105,070 | | | | 308,119 | |
Sumitomo Realty & Development Co., Ltd. | | | 5,000 | | | | 146,537 | |
Sumitomo Rubber Industries Ltd. | | | 18,500 | | | | 286,236 | |
Suntory Beverage & Food Ltd. | | | 9,200 | | | | 415,001 | |
Suruga Bank Ltd. | | | 9,300 | | | | 163,667 | |
Suzuken Co., Ltd. | | | 4,000 | | | | 136,127 | |
Suzuki Motor Corp. | | | 4,700 | | | | 125,910 | |
Systena Corp. | | | 23,800 | | | | 405,296 | |
T&D Holdings, Inc. | | | 24,200 | | | | 225,970 | |
Taiheiyo Cement Corp. | | | 20,000 | | | | 46,087 | |
Taisei Corp. | | | 54,000 | | | | 357,454 | |
Taiyo Holdings Co., Ltd. | | | 4,800 | | | | 162,712 | |
Taiyo Nippon Sanso Corp.(a) | | | 10,000 | | | | 95,022 | |
Takashimaya Co., Ltd. | | | 7,000 | | | | 58,606 | |
Takeda Pharmaceutical Co., Ltd. | | | 32,700 | | | | 1,494,259 | |
Takuma Co., Ltd. | | | 16,000 | | | | 143,352 | |
Teijin Ltd. | | | 39,000 | | | | 136,020 | |
Terumo Corp. | | | 9,000 | | | | 323,102 | |
Toagosei Co., Ltd. | | | 23,300 | | | | 194,244 | |
Tobu Railway Co., Ltd. | | | 34,000 | | | | 169,705 | |
Toda Corp. | | | 29,000 | | | | 140,362 | |
Toho Co., Ltd. | | | 4,000 | | | | 105,378 | |
Toho Zinc Co., Ltd.(a) | | | 47,000 | | | | 119,178 | |
Tokai Rika Co., Ltd. | | | 9,100 | | | | 171,483 | |
Tokio Marine Holdings, Inc. | | | 19,600 | | | | 662,663 | |
Tokyo Electron Ltd. | | | 5,000 | | | | 326,349 | |
Tokyo Gas Co., Ltd. | | | 49,000 | | | | 228,749 | |
Tokyo Tatemono Co., Ltd. | | | 8,800 | | | | 109,770 | |
Tokyu Corp. | | | 20,000 | | | | 167,801 | |
TonenGeneral Sekiyu K.K. | | | 26,000 | | | | 235,491 | |
TOTO Ltd.(a) | | | 4,000 | | | | 124,917 | |
Toyo Seikan Group Holdings Ltd.(a) | | | 13,200 | | | | 247,570 | |
Toyo Suisan Kaisha Ltd. | | | 5,900 | | | | 212,073 | |
Toyobo Co., Ltd. | | | 73,000 | | | | 109,765 | |
Toyoda Gosei Co., Ltd. | | | 6,000 | | | | 115,948 | |
Toyota Motor Corp. | | | 111,300 | | | | 5,894,013 | |
Toyota Tsusho Corp. | | | 20,000 | | | | 452,511 | |
Trend Micro, Inc. | | | 9,100 | | | | 333,574 | |
TS Tech Co., Ltd. | | | 5,000 | | | | 117,176 | |
UACJ Corp.(a) | | | 47,000 | | | | 95,342 | |
Ube Industries Ltd. | | | 145,000 | | | | 256,728 | |
Unicharm Corp. | | | 7,600 | | | | 165,598 | |
Union Tool Co. | | | 5,500 | | | | 144,748 | |
United Arrows Ltd. | | | 1,500 | | | | 62,125 | |
Ushio, Inc. | | | 8,100 | | | | 107,813 | |
USS Co., Ltd. | | | 15,560 | | | | 248,916 | |
Wacoal Holdings Corp. | | | 16,000 | | | | 191,183 | |
West Japan Railway Co. | | | 8,820 | | | | 545,311 | |
Xebio Holdings Co., Ltd. | | | 6,600 | | | | 105,464 | |
Yahoo Japan Corp.(a) | | | 130,110 | | | | 554,497 | |
Yakult Honsha Co., Ltd.(a) | | | 4,000 | | | | 177,410 | |
Yamada Denki Co., Ltd.(a) | | | 24,400 | | | | 115,493 | |
Yamagata Bank Ltd. (The)(a) | | | 58,000 | | | | 220,348 | |
Yamaha Corp. | | | 6,900 | | | | 208,114 | |
See Notes to Financial Statements.
| | |
| 80 | | WisdomTree Developed World ex-U.S. and Currency Hedged Equity Funds |
Schedule of Investments (continued)
WisdomTree International Equity Fund (DWM)
March 31, 2016
| | | | | | | | |
| Investments | | Shares | | | Value | |
Yamanashi Chuo Bank Ltd. (The) | | | 44,000 | | | $ | 161,680 | |
Yamato Kogyo Co., Ltd. | | | 8,000 | | | | 173,887 | |
Yamazen Corp. | | | 31,700 | | | | 241,145 | |
Yokogawa Electric Corp. | | | 8,200 | | | | 84,849 | |
Yokohama Reito Co., Ltd. | | | 28,000 | | | | 265,563 | |
Yokohama Rubber Co., Ltd. (The) | | | 10,000 | | | | 164,687 | |
Yuasa Trading Co., Ltd. | | | 10,200 | | | | 240,037 | |
Yusen Logistics Co., Ltd. | | | 17,400 | | | | 202,648 | |
Zeon Corp. | | | 12,000 | | | | 77,726 | |
| | | | | | | | |
| Total Japan | | | | 89,690,433 | |
| Netherlands – 1.2% | | | | | | | | |
Aegon N.V. | | | 90,065 | | | | 496,131 | |
Akzo Nobel N.V. | | | 8,288 | | | | 565,731 | |
ASML Holding N.V. | | | 4,847 | | | | 493,129 | |
Boskalis Westminster | | | 7,453 | | | | 293,393 | |
Heineken N.V. | | | 13,195 | | | | 1,197,647 | |
ING Groep N.V. CVA | | | 38,495 | | | | 466,306 | |
Koninklijke Ahold N.V. | | | 40,377 | | | | 909,650 | |
Koninklijke DSM N.V. | | | 6,721 | | | | 370,194 | |
Koninklijke KPN N.V. | | | 93,561 | | | | 392,672 | |
Koninklijke Philips N.V. | | | 42,365 | | | | 1,208,616 | |
Randstad Holding N.V. | | | 8,010 | | | | 444,615 | |
Wessanen | | | 12,726 | | | | 138,000 | |
Wolters Kluwer N.V. | | | 19,759 | | | | 789,875 | |
| | | | | | | | |
| Total Netherlands | | | | 7,765,959 | |
| New Zealand – 0.6% | | | | | | | | |
Auckland International Airport Ltd. | | | 130,265 | | | | 581,548 | |
Contact Energy Ltd. | | | 71,560 | | | | 248,420 | |
Fisher & Paykel Healthcare Corp., Ltd. | | | 61,871 | | | | 420,979 | |
Fletcher Building Ltd. | | | 64,419 | | | | 352,889 | |
Mighty River Power Ltd. | | | 217,572 | | | | 441,096 | |
SKY Network Television Ltd. | | | 73,109 | | | | 252,783 | |
Spark New Zealand Ltd. | | | 228,202 | | | | 578,308 | |
Trade Me Group Ltd. | | | 74,104 | | | | 226,896 | |
TrustPower Ltd.(a) | | | 31,344 | | | | 166,698 | |
Vector Ltd. | | | 185,555 | | | | 422,565 | |
| | | | | | | | |
| Total New Zealand | | | | 3,692,182 | |
| Norway – 1.4% | | | | | | | | |
Aker ASA Class A | | | 11,858 | | | | 221,498 | |
Atea ASA* | | | 28,192 | | | | 269,266 | |
DNB ASA | | | 45,527 | | | | 538,591 | |
Gjensidige Forsikring ASA | | | 48,924 | | | | 834,599 | |
Marine Harvest ASA* | | | 48,935 | | | | 754,325 | |
Norsk Hydro ASA | | | 91,763 | | | | 377,980 | |
Orkla ASA | | | 62,457 | | | | 565,955 | |
SpareBank 1 SMN | | | 26,903 | | | | 171,574 | |
Statoil ASA | | | 212,380 | | | | 3,345,699 | |
Telenor ASA | | | 54,103 | | | | 875,852 | |
Tomra Systems ASA | | | 19,564 | | | | 204,007 | |
Yara International ASA | | | 16,129 | | | | 607,232 | |
| | | | | | | | |
| Total Norway | | | | 8,766,578 | |
| Portugal – 0.4% | | | | | | | | |
EDP-Energias de Portugal S.A. | | | 300,169 | | | | 1,069,273 | |
Galp Energia, SGPS, S.A. | | | 36,627 | | | | 461,208 | |
Jeronimo Martins, SGPS, S.A. | | | 24,924 | | | | 408,423 | |
Portucel S.A. | | | 60,675 | | | | 221,255 | |
Sonae, SGPS, S.A.(a) | | | 260,443 | | | | 314,298 | |
| | | | | | | | |
| Total Portugal | | | | 2,474,457 | |
| Singapore – 2.2% | | | | | | | | |
Asian Pay Television Trust | | | 779,500 | | | | 324,165 | |
CapitaLand Ltd. | | | 157,000 | | | | 357,931 | |
ComfortDelGro Corp., Ltd. | | | 269,300 | | | | 583,957 | |
DBS Group Holdings Ltd. | | | 86,500 | | | | 987,947 | |
Dyna-Mac Holdings Ltd. | | | 298,000 | | | | 31,867 | |
Hutchison Port Holdings Trust | | | 994,836 | | | | 497,418 | |
Jardine Cycle & Carriage Ltd. | | | 18,355 | | | | 545,634 | |
Keppel Corp., Ltd.(a) | | | 139,400 | | | | 603,521 | |
Keppel Infrastructure Trust | | | 818,960 | | | | 301,044 | |
Lian Beng Group Ltd. | | | 485,900 | | | | 173,201 | |
Oversea-Chinese Banking Corp., Ltd. | | | 187,595 | | | | 1,231,501 | |
Pacific Radiance Ltd. | | | 315,800 | | | | 79,736 | |
SATS Ltd. | | | 85,500 | | | | 250,798 | |
Sembcorp Industries Ltd. | | | 97,000 | | | | 217,540 | |
Sembcorp Marine Ltd.(a) | | | 174,300 | | | | 213,571 | |
Singapore Airlines Ltd. | | | 57,200 | | | | 485,091 | |
Singapore Post Ltd.(a) | | | 509,500 | | | | 618,619 | |
Singapore Press Holdings Ltd.(a) | | | 151,000 | | | | 448,537 | |
Singapore Technologies Engineering Ltd. | | | 159,000 | | | | 381,383 | |
Singapore Telecommunications Ltd. | | | 912,700 | | | | 2,589,124 | |
SMRT Corp., Ltd.(a) | | | 152,000 | | | | 170,444 | |
StarHub Ltd. | | | 121,200 | | | | 301,515 | |
Super Group Ltd. | | | 165,000 | | | | 121,306 | |
United Overseas Bank Ltd. | | | 55,000 | | | | 770,719 | |
Wee Hur Holdings Ltd. | | | 141,600 | | | | 28,391 | |
Wilmar International Ltd. | | | 233,500 | | | | 582,623 | |
Wing Tai Holdings Ltd. | | | 214,000 | | | | 279,697 | |
Yanlord Land Group Ltd. | | | 302,500 | | | | 274,061 | |
| | | | | | | | |
| Total Singapore | | | | 13,451,341 | |
| Spain – 4.2% | | | | | | | | |
Abengoa S.A. Class B(a) | | | 39,826 | | | | 11,845 | |
Abertis Infraestructuras S.A.(a) | | | 49,035 | | | | 807,435 | |
ACS Actividades de Construccion y Servicios S.A. | | | 24,860 | | | | 741,942 | |
Amadeus IT Holding S.A. Class A | | | 15,246 | | | | 654,810 | |
Banco Bilbao Vizcaya Argentaria S.A. | | | 275,982 | | | | 1,837,282 | |
Banco Santander S.A. | | | 1,398,024 | | | | 6,171,743 | |
Bolsas y Mercados Espanoles SHMSF S.A.(a) | | | 11,547 | | | | 373,040 | |
CaixaBank S.A. | | | 314,468 | | | | 930,641 | |
Cie Automotive S.A. | | | 5,648 | | | | 102,013 | |
Duro Felguera S.A.(a) | | | 34,560 | | | | 60,256 | |
Enagas S.A. | | | 16,720 | | | | 503,293 | |
Endesa S.A. | | | 42,505 | | | | 817,125 | |
Ferrovial S.A. | | | 49,938 | | | | 1,074,686 | |
Gas Natural SDG S.A. | | | 60,560 | | | | 1,226,329 | |
Iberdrola S.A. | | | 285,517 | | | | 1,906,941 | |
See Notes to Financial Statements.
| | | | |
| WisdomTree Developed World ex-U.S. and Currency Hedged Equity Funds | | | 81 | |
Schedule of Investments (continued)
WisdomTree International Equity Fund (DWM)
March 31, 2016
| | | | | | | | |
| Investments | | Shares | | | Value | |
Industria de Diseno Textil S.A. | | | 73,834 | | | $ | 2,487,527 | |
Mapfre S.A. | | | 176,627 | | | | 382,222 | |
Obrascon Huarte Lain S.A.(a) | | | 13,337 | | | | 85,247 | |
Red Electrica Corp. S.A. | | | 6,431 | | | | 559,161 | |
Repsol S.A. | | | 99,193 | | | | 1,121,311 | |
Tecnicas Reunidas S.A.(a) | | | 4,337 | | | | 122,197 | |
Telefonica S.A. | | | 378,303 | | | | 4,247,152 | |
| | | | | | | | |
| Total Spain | | | | 26,224,198 | |
| Sweden – 3.7% | | | | | | | | |
Alfa Laval AB | | | 19,097 | | | | 313,073 | |
Assa Abloy AB Class B | | | 16,462 | | | | 325,313 | |
Atlas Copco AB Class A | | | 20,970 | | | | 528,473 | |
Atlas Copco AB Class B | | | 22,695 | | | | 535,831 | |
Axfood AB | | | 22,758 | | | | 421,096 | |
BillerudKorsnas AB | | | 18,628 | | | | 304,925 | |
Boliden AB | | | 13,629 | | | | 218,388 | |
Electrolux AB Series B(a) | | | 15,843 | | | | 417,440 | |
Elekta AB Class B(a) | | | 15,743 | | | | 117,781 | |
Fabege AB | | | 28,867 | | | | 488,197 | |
Gunnebo AB | | | 34,241 | | | | 182,890 | |
Hennes & Mauritz AB Class B | | | 69,654 | | | | 2,325,896 | |
Hexagon AB Class B | | | 13,554 | | | | 528,336 | |
Husqvarna AB Class B | | | 37,259 | | | | 272,777 | |
ICA Gruppen AB | | | 7,916 | | | | 262,281 | |
Indutrade AB | | | 2,373 | | | | 145,834 | |
Investment AB Latour Class B | | | 11,196 | | | | 464,733 | |
Mekonomen AB | | | 8,747 | | | | 216,876 | |
NCC AB Class B | | | 12,514 | | | | 456,461 | |
Nordea Bank AB | | | 231,184 | | | | 2,224,376 | |
Peab AB | | | 83,736 | | | | 741,123 | |
Sandvik AB(a) | | | 38,809 | | | | 402,131 | |
Securitas AB Class B | | | 25,990 | | | | 431,206 | |
Skandinaviska Enskilda Banken AB Class A | | | 107,427 | | | | 1,027,664 | |
Skanska AB Class B(a) | | | 34,126 | | | | 780,040 | |
SKF AB Class B(a) | | | 20,980 | | | | 379,398 | |
Svenska Cellulosa AB SCA Class B | | | 18,638 | | | | 583,278 | |
Svenska Handelsbanken AB Class A | | | 70,394 | | | | 896,999 | |
Swedbank AB Class A | | | 79,694 | | | | 1,719,378 | |
Swedish Match AB | | | 10,535 | | | | 358,154 | |
Telefonaktiebolaget LM Ericsson Class B | | | 152,720 | | | | 1,531,589 | |
TeliaSonera AB | | | 337,704 | | | | 1,756,692 | |
Trelleborg AB Class B | | | 25,916 | | | | 513,416 | |
Volvo AB Class A | | | 57,342 | | | | 632,363 | |
Volvo AB Class B | | | 36,431 | | | | 400,410 | |
| | | | | | | | |
| Total Sweden | | | | 22,904,818 | |
| Switzerland – 8.4% | | | | | | | | |
ABB Ltd. Registered Shares* | | | 109,040 | | | | 2,133,775 | |
Actelion Ltd. Registered Shares* | | | 2,403 | | | | 360,582 | |
Adecco S.A. Registered Shares* | | | 9,018 | | | | 589,963 | |
Baloise Holding AG Registered Shares | | | 4,521 | | | | 576,898 | |
BKW AG(a) | | | 7,758 | | | | 327,284 | |
Cie Financiere Richemont S.A. Registered Shares | | | 11,706 | | | | 776,814 | |
Clariant AG Registered Shares* | | | 23,370 | | | | 424,621 | |
Coca-Cola HBC AG* | | | 12,426 | | | | 264,326 | |
Credit Suisse Group AG Registered Shares* | | | 43,997 | | | | 625,280 | |
EFG International AG* | | | 19,950 | | | | 114,577 | |
EMS-Chemie Holding AG Registered Shares | | | 830 | | | | 432,052 | |
Geberit AG Registered Shares | | | 2,075 | | | | 778,518 | |
Givaudan S.A. Registered Shares | | | 440 | | | | 866,538 | |
Implenia AG Registered Shares | | | 2,769 | | | | 174,355 | |
Julius Baer Group Ltd.* | | | 10,481 | | | | 452,008 | |
Kuehne + Nagel International AG Registered Shares | | | 8,520 | | | | 1,216,190 | |
LafargeHolcim Ltd. Registered Shares* | | | 12,571 | | | | 593,731 | |
Logitech International S.A. Registered Shares | | | 19,570 | | | | 312,662 | |
Nestle S.A. Registered Shares | | | 127,576 | | | | 9,571,697 | |
Novartis AG Registered Shares | | | 102,525 | | | | 7,462,008 | |
Panalpina Welttransport Holding AG Registered Shares | | | 748 | | | | 83,888 | |
Partners Group Holding AG | | | 1,303 | | | | 525,880 | |
Roche Holding AG Bearer Shares | | | 7,185 | | | | 1,811,912 | |
Roche Holding AG Genusschein | | | 25,408 | | | | 6,280,033 | |
Schindler Holding AG Participation Certificate | | | 3,543 | | | | 655,953 | |
SGS S.A. Registered Shares | | | 306 | | | | 649,289 | |
STMicroelectronics N.V. | | | 57,633 | | | | 319,972 | |
Straumann Holding AG Registered Shares | | | 855 | | | | 295,967 | |
Sulzer AG Registered Shares(a) | | | 2,535 | | | | 252,798 | |
Swatch Group AG (The) Registered Shares | | | 5,878 | | | | 397,432 | |
Swiss Life Holding AG Registered Shares* | | | 3,009 | | | | 803,426 | |
Swiss Re AG | | | 42,178 | | | | 3,915,443 | |
Swisscom AG Registered Shares | | | 2,981 | | | | 1,626,453 | |
Syngenta AG Registered Shares | | | 3,825 | | | | 1,597,661 | |
Tecan Group AG Registered Shares | | | 1,009 | | | | 153,934 | |
Temenos Group AG Registered Shares* | | | 2,914 | | | | 160,055 | |
UBS Group AG Registered Shares | | | 93,609 | | | | 1,514,127 | |
Vontobel Holding AG Registered Shares | | | 11,885 | | | | 516,901 | |
Zurich Insurance Group AG* | | | 11,933 | | | | 2,782,477 | |
| | | | | | | | |
| Total Switzerland | | | | 52,397,480 | |
| United Kingdom – 22.6% | | | | | | | | |
Aberdeen Asset Management PLC | | | 76,946 | | | | 306,789 | |
Admiral Group PLC | | | 8,690 | | | | 247,679 | |
Aggreko PLC | | | 9,377 | | | | 145,153 | |
Amec Foster Wheeler PLC | | | 31,964 | | | | 206,738 | |
ARM Holdings PLC | | | 22,119 | | | | 322,367 | |
Ashmore Group PLC(a) | | | 71,323 | | | | 294,826 | |
Associated British Foods PLC | | | 16,336 | | | | 786,336 | |
AstraZeneca PLC | | | 74,651 | | | | 4,187,222 | |
Aviva PLC | | | 148,853 | | | | 975,810 | |
Awilco Drilling PLC | | | 48,555 | | | | 176,110 | |
Babcock International Group PLC | | | 27,406 | | | | 374,014 | |
BAE Systems PLC | | | 229,181 | | | | 1,676,655 | |
Barclays PLC | | | 595,958 | | | | 1,284,856 | |
Barratt Developments PLC | | | 40,315 | | | | 324,780 | |
Berendsen PLC | | | 36,807 | | | | 636,419 | |
Berkeley Group Holdings PLC | | | 14,210 | | | | 657,245 | |
BGEO Group PLC | | | 3,479 | | | | 101,407 | |
BHP Billiton PLC | | | 184,018 | | | | 2,070,420 | |
See Notes to Financial Statements.
| | |
| 82 | | WisdomTree Developed World ex-U.S. and Currency Hedged Equity Funds |
Schedule of Investments (continued)
WisdomTree International Equity Fund (DWM)
March 31, 2016
| | | | | | | | |
| Investments | | Shares | | | Value | |
Bodycote PLC | | | 14,279 | | | $ | 123,858 | |
BP PLC | | | 1,804,728 | | | | 9,082,665 | |
British American Tobacco PLC | | | 123,827 | | | | 7,279,241 | |
British Land Co. PLC (The) | | | 35,981 | | | | 362,267 | |
Britvic PLC | | | 20,734 | | | | 211,736 | |
BT Group PLC | | | 319,545 | | | | 2,023,137 | |
Burberry Group PLC | | | 18,624 | | | | 365,387 | |
Cable & Wireless Communications PLC | | | 279,638 | | | | 309,682 | |
Capita PLC | | | 29,404 | | | | 440,374 | |
Carillion PLC(a) | | | 48,870 | | | | 206,578 | |
Carnival PLC | | | 9,084 | | | | 489,877 | |
Centrica PLC | | | 379,957 | | | | 1,243,497 | |
Close Brothers Group PLC | | | 28,291 | | | | 513,163 | |
CNH Industrial N.V. | | | 44,665 | | | | 304,116 | |
Cobham PLC | | | 94,655 | | | | 295,359 | |
Communisis PLC | | | 124,248 | | | | 84,826 | |
Compass Group PLC | | | 51,404 | | | | 907,283 | |
Croda International PLC | | | 7,575 | | | | 330,873 | |
Daily Mail & General Trust PLC Class A Non-Voting Shares | | | 32,959 | | | | 329,709 | |
Darty PLC | | | 140,885 | | | | 265,267 | |
De La Rue PLC | | | 14,126 | | | | 90,756 | |
Debenhams PLC | | | 201,919 | | | | 218,244 | |
Devro PLC | | | 39,768 | | | | 168,189 | |
Diageo PLC | | | 105,381 | | | | 2,849,797 | |
Direct Line Insurance Group PLC | | | 125,580 | | | | 668,197 | |
Drax Group PLC(a) | | | 29,774 | | | | 116,443 | |
easyJet PLC | | | 15,169 | | | | 331,179 | |
Electrocomponents PLC | | | 72,921 | | | | 253,010 | |
Fenner PLC | | | 53,227 | | | | 103,662 | |
Fidessa Group PLC | | | 5,320 | | | | 186,726 | |
G4S PLC | | | 92,764 | | | | 254,126 | |
GKN PLC | | | 80,207 | | | | 332,933 | |
GlaxoSmithKline PLC | | | 459,567 | | | | 9,326,763 | |
Halfords Group PLC | | | 37,058 | | | | 210,977 | |
Hammerson PLC | | | 46,499 | | | | 386,629 | |
Hargreaves Lansdown PLC | | | 10,405 | | | | 200,997 | |
Hargreaves Services PLC | | | 26,761 | | | | 68,658 | |
Hays PLC | | | 183,820 | | | | 319,687 | |
HSBC Holdings PLC | | | 1,382,711 | | | | 8,623,200 | |
Hunting PLC | | | 14,911 | | | | 68,635 | |
ICAP PLC | | | 66,588 | | | | 454,416 | |
IG Group Holdings PLC | | | 37,455 | | | | 430,673 | |
IMI PLC | | | 12,371 | | | | 169,362 | |
Imperial Brands PLC | | | 66,890 | | | | 3,713,927 | |
Inchcape PLC | | | 42,089 | | | | 437,678 | |
Inmarsat PLC | | | 23,511 | | | | 332,686 | |
InterContinental Hotels Group PLC | | | 6,389 | | | | 263,641 | |
Interserve PLC | | | 12,628 | | | | 78,736 | |
Intertek Group PLC | | | 5,992 | | | | 272,752 | |
Intu Properties PLC(a) | | | 73,297 | | | | 329,745 | |
Investec PLC | | | 45,347 | | | | 334,033 | |
ITV PLC | | | 200,514 | | | | 695,135 | |
J D Wetherspoon PLC | | | 5,613 | | | | 56,755 | |
J Sainsbury PLC(a) | | | 159,780 | | | | 634,528 | |
John Wood Group PLC | | | 33,135 | | | | 292,893 | |
Johnson Matthey PLC | | | 8,283 | | | | 326,677 | |
Kingfisher PLC | | | 99,816 | | | | 540,435 | |
Ladbrokes PLC | | | 113,473 | | | | 190,332 | |
Legal & General Group PLC | | | 332,490 | | | | 1,123,992 | |
Lloyds Banking Group PLC | | | 646,213 | | | | 631,771 | |
London Stock Exchange Group PLC | | | 17,571 | | | | 712,185 | |
Man Group PLC | | | 125,060 | | | | 274,117 | |
Marks & Spencer Group PLC | | | 90,691 | | | | 529,482 | |
Marston’s PLC | | | 122,846 | | | | 268,381 | |
Meggitt PLC | | | 45,402 | | | | 265,332 | |
Melrose Industries PLC | | | 11,270 | | | | 57,747 | |
Mondi PLC | | | 25,085 | | | | 481,690 | |
Moneysupermarket.com Group PLC | | | 39,042 | | | | 178,278 | |
N Brown Group PLC | | | 41,821 | | | | 196,437 | |
National Grid PLC | | | 263,352 | | | | 3,736,708 | |
Next PLC | | | 4,918 | | | | 381,707 | |
Nostrum Oil & Gas PLC | | | 27,800 | | | | 95,098 | |
Numis Corp. PLC | | | 50,029 | | | | 143,813 | |
Old Mutual PLC | | | 309,722 | | | | 859,611 | |
Pan African Resources PLC | | | 401,079 | | | | 77,824 | |
PayPoint PLC | | | 10,715 | | | | 115,197 | |
Pearson PLC | | | 55,470 | | | | 697,611 | |
Persimmon PLC | | | 24,185 | | | | 724,769 | |
Polar Capital Holdings PLC | | | 22,786 | | | | 118,229 | |
Premier Farnell PLC | | | 45,043 | | | | 72,995 | |
Prudential PLC | | | 85,226 | | | | 1,593,664 | |
QinetiQ Group PLC | | | 45,518 | | | | 149,164 | |
Reckitt Benckiser Group PLC | | | 31,005 | | | | 2,999,123 | |
RELX N.V. | | | 67,561 | | | | 1,181,399 | |
RELX PLC | | | 41,279 | | | | 767,734 | |
Restaurant Group PLC (The) | | | 10,542 | | | | 59,487 | |
Rexam PLC | | | 45,645 | | | | 415,939 | |
Rio Tinto PLC | | | 97,106 | | | | 2,729,300 | |
Rolls-Royce Holdings PLC* | | | 62,016 | | | | 607,905 | |
Rotork PLC | | | 32,179 | | | | 84,547 | |
Royal Dutch Shell PLC Class A | | | 347,625 | | | | 8,413,961 | |
Royal Dutch Shell PLC Class B | | | 257,841 | | | | 6,300,113 | |
Royal Mail PLC | | | 43,380 | | | | 299,717 | |
RPS Group PLC | | | 30,142 | | | | 89,895 | |
SABMiller PLC | | | 76,402 | | | | 4,673,624 | |
Sage Group PLC (The) | | | 74,572 | | | | 674,177 | |
Savills PLC | | | 10,251 | | | | 111,977 | |
Schroders PLC Non-Voting Shares | | | 13,610 | | | | 395,537 | |
Segro PLC | | | 74,656 | | | | 440,264 | |
Severn Trent PLC | | | 17,848 | | | | 557,438 | |
Sky PLC | | | 86,014 | | | | 1,265,950 | |
Smith & Nephew PLC | | | 24,102 | | | | 397,688 | |
Smiths Group PLC | | | 21,584 | | | | 333,804 | |
Soco International PLC | | | 57,334 | | | | 130,614 | |
SSE PLC | | | 69,507 | | | | 1,490,544 | |
St. Ives PLC | | | 56,207 | | | | 182,981 | |
Standard Life PLC | | | 109,779 | | | | 561,874 | |
See Notes to Financial Statements.
| | | | |
| WisdomTree Developed World ex-U.S. and Currency Hedged Equity Funds | | | 83 | |
Schedule of Investments (concluded)
WisdomTree International Equity Fund (DWM)
March 31, 2016
| | | | | | | | |
| Investments | | Shares | | | Value | |
TalkTalk Telecom Group PLC(a) | | | 73,919 | | | $ | 251,904 | |
Tate & Lyle PLC | | | 33,790 | | | | 280,714 | |
Taylor Wimpey PLC | | | 248,652 | | | | 680,108 | |
Telecom Plus PLC(a) | | | 9,577 | | | | 126,707 | |
Ultra Electronics Holdings PLC | | | 8,153 | | | | 211,515 | |
Unilever N.V. CVA | | | 67,015 | | | | 3,007,713 | |
Unilever PLC | | | 60,604 | | | | 2,746,021 | |
United Utilities Group PLC | | | 53,233 | | | | 706,204 | |
Vesuvius PLC | | | 49,377 | | | | 235,406 | |
Victrex PLC | | | 6,791 | | | | 160,856 | |
Vodafone Group PLC | | | 2,127,585 | | | | 6,764,247 | |
Weir Group PLC (The) | | | 11,043 | | | | 175,863 | |
WH Smith PLC | | | 21,297 | | | | 556,493 | |
Whitbread PLC | | | 9,622 | | | | 547,656 | |
William Hill PLC | | | 57,425 | | | | 269,896 | |
WM Morrison Supermarkets PLC(a) | | | 273,371 | | | | 780,724 | |
WS Atkins PLC | | | 5,768 | | | | 113,578 | |
| | | | | | | | |
| Total United Kingdom | | | | 140,543,932 | |
TOTAL COMMON STOCKS (Cost: $625,890,426) | | | | | | | 617,628,593 | |
| EXCHANGE-TRADED FUND – 0.1% | | | | | | | | |
| United States – 0.1% | | | | | | | | |
WisdomTree International Dividend Ex-Financials Fund(a)(b) (Cost: $312,739) | | | 8,468 | | | | 323,901 | |
| INVESTMENT OF CASH COLLATERAL FOR SECURITIES LOANED – 4.0% | |
| United States – 4.0% | | | | | | | | |
State Street Navigator Securities Lending Prime Portfolio, 0.50%(c) (Cost: $24,987,222)(d) | | | 24,987,222 | | | | 24,987,222 | |
TOTAL INVESTMENTS IN SECURITIES –103.4% (Cost: $651,190,387) | | | | | | | 642,939,716 | |
Liabilities in Excess of Cash, Foreign Currency and Other Assets – (3.4)% | | | | | | | (21,008,084 | ) |
| | | | | | | | |
| NET ASSETS – 100.0% | | | | | | $ | 621,931,632 | |
| * | Non-income producing security. |
| (a) | Security, or portion thereof, was on loan at March 31, 2016 (See Note 2). |
| (b) | Affiliated company (See Note 3). |
| (c) | Rate shown represents annualized 7-day yield as of March 31, 2016. |
| (d) | At March 31, 2016, the total market value of the Fund’s securities on loan was $26,990,017 and the total market value of the collateral held by the Fund was $28,840,963. The total market value of the collateral includes non-cash U.S. Government securities collateral having a value of $3,853,741. |
CVA – Certificaten Van Aandelen (Certificate of Stock)
RSP – Risparmio Italian Savings Shares
| | | | | | | | | | | | | | | | | | | | |
| FINANCIAL DERIVATIVE INSTRUMENTS | |
| FORWARD CONTRACTS | |
Settlement
Date | | Contracts
To Deliver | | | In
Exchange For | | | Unrealized
Gain (Loss) | |
4/1/2016 | | | AUD | | | | 137,843 | | | | SGD | | | | 142,213 | | | $ | (427 | ) |
| | |
| CURRENCY LEGEND |
AUD | | – Australian dollar |
SGD | | – Singapore dollar |
See Notes to Financial Statements.
| | |
| 84 | | WisdomTree Developed World ex-U.S. and Currency Hedged Equity Funds |
Schedule of Investments
WisdomTree International Hedged Equity Fund (HDWM)
March 31, 2016
| | | | | | | | |
| Investments | | Shares | | | Value | |
| COMMON STOCKS – 100.2% | | | | | | | | |
| Australia – 8.2% | | | | | | | | |
AGL Energy Ltd. | | | 381 | | | $ | 5,393 | |
Amcor Ltd. | | | 501 | | | | 5,530 | |
AMP Ltd. | | | 1,111 | | | | 4,948 | |
Ansell Ltd. | | | 103 | | | | 1,370 | |
Aristocrat Leisure Ltd. | | | 208 | | | | 1,648 | |
Asaleo Care Ltd. | | | 875 | | | | 1,225 | |
Asciano Ltd. | | | 382 | | | | 2,633 | |
ASX Ltd. | | | 92 | | | | 2,932 | |
Aurizon Holdings Ltd. | | | 762 | | | | 2,321 | |
Australia & New Zealand Banking Group Ltd. | | | 1,501 | | | | 27,088 | |
Bank of Queensland Ltd. | | | 140 | | | | 1,305 | |
Bendigo & Adelaide Bank Ltd. | | | 203 | | | | 1,385 | |
BHP Billiton Ltd. | | | 1,650 | | | | 21,400 | |
Boral Ltd. | | | 303 | | | | 1,440 | |
Brickworks Ltd. | | | 192 | | | | 2,339 | |
BT Investment Management Ltd. | | | 192 | | | | 1,433 | |
Caltex Australia Ltd. | | | 68 | | | | 1,780 | |
carsales.com Ltd.(a) | | | 199 | | | | 1,800 | |
CIMIC Group Ltd. | | | 152 | | | | 4,064 | |
Cleanaway Waste Management Ltd. | | | 2,152 | | | | 1,275 | |
Coca-Cola Amatil Ltd. | | | 291 | | | | 1,979 | |
Cochlear Ltd. | | | 28 | | | | 2,203 | |
Commonwealth Bank of Australia | | | 819 | | | | 47,201 | |
Computershare Ltd. | | | 139 | | | | 1,046 | |
Cover-More Group Ltd.(a) | | | 691 | | | | 824 | |
Crown Resorts Ltd. | | | 264 | | | | 2,530 | |
CSL Ltd. | | | 84 | | | | 6,555 | |
CSR Ltd. | | | 481 | | | | 1,221 | |
Downer EDI Ltd. | | | 470 | | | | 1,388 | |
Event Hospitality and Entertainment Ltd. | | | 243 | | | | 2,841 | |
Fairfax Media Ltd. | | | 2,072 | | | | 1,371 | |
Genworth Mortgage Insurance Australia Ltd. | | | 517 | | | | 990 | |
GrainCorp Ltd. Class A | | | 192 | | | | 1,114 | |
Harvey Norman Holdings Ltd. | | | 516 | | | | 1,866 | |
Healthscope Ltd. | | | 616 | | | | 1,260 | |
Incitec Pivot Ltd. | | | 433 | | | | 1,063 | |
Insurance Australia Group Ltd. | | | 1,613 | | | | 6,924 | |
IOOF Holdings Ltd. | | | 183 | | | | 1,249 | |
IRESS Ltd. | | | 188 | | | | 1,678 | |
JB Hi-Fi Ltd.(a) | | | 84 | | | | 1,524 | |
LendLease Group | | | 263 | | | | 2,806 | |
Magellan Financial Group Ltd. | | | 95 | | | | 1,657 | |
National Australia Bank Ltd. | | | 1,538 | | | | 31,045 | |
Navitas Ltd. | | | 391 | | | | 1,528 | |
New Hope Corp., Ltd. | | | 864 | | | | 871 | |
NIB Holdings Ltd. | | | 350 | | | | 1,053 | |
Orica Ltd. | | | 67 | | | | 792 | |
Origin Energy Ltd. | | | 457 | | | | 1,789 | |
Perpetual Ltd. | | | 32 | | | | 1,072 | |
Platinum Asset Management Ltd. | | | 271 | | | | 1,324 | |
Premier Investments Ltd. | | | 128 | | | | 1,666 | |
Primary Health Care Ltd. | | | 752 | | | | 2,169 | |
QBE Insurance Group Ltd. | | | 323 | | | | 2,711 | |
Qube Holdings Ltd.(a) | | | 691 | | | | 1,254 | |
REA Group Ltd.(a) | | | 43 | | | | 1,787 | |
Rio Tinto Ltd. | | | 223 | | | | 7,323 | |
Seek Ltd.(a) | | | 116 | | | | 1,444 | |
Select Harvests Ltd.(a) | | | 148 | | | | 470 | |
Sonic Healthcare Ltd. | | | 205 | | | | 2,962 | |
Star Entertainment Grp Ltd. (The) | | | 351 | | | | 1,534 | |
Steadfast Group Ltd.(a) | | | 995 | | | | 1,370 | |
Suncorp Group Ltd. | | | 681 | | | | 6,239 | |
Super Retail Group Ltd. | | | 180 | | | | 1,185 | |
Tabcorp Holdings Ltd. | | | 349 | | | | 1,149 | |
Tatts Group Ltd. | | | 699 | | | | 2,033 | |
Technology One Ltd. | | | 505 | | | | 1,853 | |
Telstra Corp., Ltd. | | | 5,399 | | | | 22,136 | |
TPG Telecom Ltd. | | | 184 | | | | 1,605 | |
Treasury Wine Estates Ltd. | | | 213 | | | | 1,580 | |
Wesfarmers Ltd. | | | 645 | | | | 20,566 | |
Westpac Banking Corp. | | | 1,846 | | | | 43,098 | |
Woodside Petroleum Ltd. | | | 798 | | | | 15,936 | |
Woolworths Ltd. | | | 580 | | | | 9,860 | |
| | | | | | | | |
| Total Australia | | | | | | | 376,003 | |
| Austria – 0.3% | | | | | | | | |
EVN AG | | | 290 | | | | 3,338 | |
Lenzing AG | | | 19 | | | | 1,506 | |
Oesterreichische Post AG | | | 56 | | | | 2,280 | |
OMV AG | | | 191 | | | | 5,382 | |
| | | | | | | | |
| Total Austria | | | | | | | 12,506 | |
| Belgium – 1.9% | | | | | | | | |
Ackermans & van Haaren N.V. | | | 23 | | | | 3,267 | |
Ageas | | | 120 | | | | 4,768 | |
Anheuser-Busch InBev N.V. | | | 458 | | | | 57,019 | |
bpost S.A. | | | 124 | | | | 3,450 | |
Colruyt S.A. | | | 60 | | | | 3,501 | |
Delhaize Group | | | 37 | | | | 3,868 | |
Euronav N.V. | | | 80 | | | | 820 | |
Proximus SADP | | | 195 | | | | 6,674 | |
UCB S.A. | | | 69 | | | | 5,287 | |
| | | | | | | | |
| Total Belgium | | | | | | | 88,654 | |
| China – 3.0% | | | | | | | | |
Beijing Enterprises Holdings Ltd. | | | 1,000 | | | | 5,473 | |
China Jinmao Holdings Group Ltd. | | | 2,000 | | | | 557 | |
China Mobile Ltd. | | | 6,000 | | | | 66,873 | |
China Overseas Land & Investment Ltd. | | | 2,000 | | | | 6,330 | |
China Power International Development Ltd. | | | 1,000 | | | | 518 | |
China South City Holdings Ltd.(a) | | | 6,000 | | | | 1,238 | |
China Unicom Hong Kong Ltd. | | | 6,000 | | | | 7,921 | |
CITIC Ltd. | | | 4,000 | | | | 6,085 | |
CNOOC Ltd. | | | 20,000 | | | | 23,619 | |
Fosun International Ltd. | | | 2,112 | | | | 3,006 | |
Guotai Junan International Holdings Ltd. | | | 4,000 | | | | 1,403 | |
Lenovo Group Ltd. | | | 2,000 | | | | 1,557 | |
See Notes to Financial Statements.
| | | | |
| WisdomTree Developed World ex-U.S. and Currency Hedged Equity Funds | | | 85 | |
Schedule of Investments (continued)
WisdomTree International Hedged Equity Fund (HDWM)
March 31, 2016
| | | | | | | | |
| Investments | | Shares | | | Value | |
Shenzhen Investment Ltd. | | | 6,000 | | | $ | 2,382 | |
Sino-Ocean Land Holdings Ltd. | | | 2,000 | | | | 946 | |
Sun Art Retail Group Ltd.(a) | | | 6,000 | | | | 4,247 | |
Yangzijiang Shipbuilding Holdings Ltd. | | | 4,300 | | | | 3,129 | |
Yuexiu Property Co., Ltd. | | | 18,000 | | | | 2,599 | |
| | | | | | | | |
| Total China | | | | | | | 137,883 | |
| Denmark – 1.1% | | | | | | | | |
Carlsberg A/S Class B | | | 20 | | | | 1,909 | |
Coloplast A/S Class B | | | 68 | | | | 5,161 | |
Danske Bank A/S | | | 175 | | | | 4,952 | |
DSV A/S | | | 56 | | | | 2,335 | |
GN Store Nord A/S | | | 60 | | | | 1,256 | |
Novo Nordisk A/S Class B | | | 377 | | | | 20,482 | |
Novozymes A/S Class B | | | 20 | | | | 901 | |
Pandora A/S | | | 19 | | | | 2,492 | |
Rockwool International A/S Class B | | | 8 | | | | 1,272 | |
Royal Unibrew A/S | | | 55 | | | | 2,658 | |
SimCorp A/S | | | 26 | | | | 1,202 | |
Sydbank A/S | | | 17 | | | | 488 | |
TDC A/S | | | 510 | | | | 2,500 | |
Tryg A/S | | | 180 | | | | 3,499 | |
Vestas Wind Systems A/S | | | 27 | | | | 1,908 | |
| | | | | | | | |
| Total Denmark | | | | | | | 53,015 | |
| Finland – 1.4% | | | | | | | | |
Atria Oyj | | | 233 | | | | 2,321 | |
Elisa Oyj(a) | | | 128 | | | | 4,984 | |
F-Secure Oyj | | | 365 | | | | 1,094 | |
Fortum Oyj | | | 640 | | | | 9,707 | |
Kesko Oyj Class B | | | 74 | | | | 3,273 | |
Kone Oyj Class B | | | 177 | | | | 8,544 | |
Metso Oyj(a) | | | 107 | | | | 2,557 | |
Neste Oyj(a) | | | 124 | | | | 4,086 | |
Nokia Oyj | | | 796 | | | | 4,739 | |
Nokian Renkaat Oyj | | | 40 | | | | 1,414 | |
Orion Oyj Class B | | | 68 | | | | 2,251 | |
Raisio Oyj Class V | | | 321 | | | | 1,584 | |
Sampo Oyj Class A | | | 285 | | | | 13,556 | |
Tieto Oyj | | | 55 | | | | 1,437 | |
UPM-Kymmene Oyj | | | 259 | | | | 4,699 | |
| | | | | | | | |
| Total Finland | | | | | | | 66,246 | |
| France – 9.9% | | | | | | | | |
Accor S.A. | | | 59 | | | | 2,504 | |
Aeroports de Paris | | | 35 | | | | 4,333 | |
Air Liquide S.A. | | | 64 | | | | 7,212 | |
Airbus Group SE | | | 147 | | | | 9,774 | |
Alten S.A. | | | 28 | | | | 1,721 | |
Arkema S.A. | | | 19 | | | | 1,429 | |
AXA S.A. | | | 872 | | | | 20,559 | |
BioMerieux | | | 16 | | | | 1,835 | |
BNP Paribas S.A. | | | 321 | | | | 16,179 | |
Bollore S.A. | | | 431 | | | | 1,677 | |
Bouygues S.A. | | | 160 | | | | 6,536 | |
Bureau Veritas S.A. | | | 151 | | | | 3,368 | |
Cap Gemini S.A. | | | 27 | | | | 2,541 | |
Carrefour S.A. | | | 171 | | | | 4,712 | |
Casino Guichard Perrachon S.A. | | | 85 | | | | 4,880 | |
Christian Dior SE | | | 32 | | | | 5,813 | |
Cie de Saint-Gobain | | | 174 | | | | 7,679 | |
CNP Assurances | | | 349 | | | | 5,451 | |
Credit Agricole S.A. | | | 643 | | | | 6,974 | |
Danone S.A. | | | 167 | | | | 11,896 | |
Dassault Systemes | | | 35 | | | | 2,781 | |
Edenred | | | 179 | | | | 3,482 | |
Electricite de France S.A. | | | 928 | | | | 10,431 | |
Elior(b) | | | 68 | | | | 1,493 | |
Engie S.A. | | | 1,330 | | | | 20,673 | |
Essilor International S.A. | | | 27 | | | | 3,340 | |
Gaztransport Et Technigaz S.A. | | | 9 | | | | 295 | |
Havas S.A. | | | 151 | | | | 1,213 | |
Hermes International | | | 10 | | | | 3,526 | |
Iliad S.A. | | | 7 | | | | 1,804 | |
Imerys S.A. | | | 23 | | | | 1,606 | |
Ingenico Group S.A. | | | 12 | | | | 1,380 | |
Ipsen S.A. | | | 27 | | | | 1,553 | |
JCDecaux S.A. | | | 55 | | | | 2,411 | |
Kering | | | 27 | | | | 4,834 | |
Klepierre | | | 91 | | | | 4,366 | |
L’Oreal S.A. | | | 82 | | | | 14,713 | |
Lagardere SCA | | | 71 | | | | 1,889 | |
Legrand S.A. | | | 48 | | | | 2,694 | |
LVMH Moet Hennessy Louis Vuitton SE | | | 96 | | | | 16,464 | |
Metropole Television S.A. | | | 84 | | | | 1,534 | |
Natixis S.A. | | | 1,106 | | | | 5,453 | |
Neopost S.A. | | | 11 | | | | 232 | |
Nexity S.A. | | | 48 | | | | 2,505 | |
Orange S.A. | | | 1,158 | | | | 20,315 | |
Pernod Ricard S.A. | | | 47 | | | | 5,249 | |
Publicis Groupe S.A. | | | 35 | | | | 2,461 | |
Remy Cointreau S.A. | | | 19 | | | | 1,445 | |
Renault S.A. | | | 41 | | | | 4,080 | |
Rexel S.A. | | | 279 | | | | 3,992 | |
Rubis SCA | | | 32 | | | | 2,573 | |
Safran S.A. | | | 81 | | | | 5,675 | |
Sanofi | | | 396 | | | | 31,976 | |
Schneider Electric SE | | | 179 | | | | 11,329 | |
SCOR SE | | | 72 | | | | 2,560 | |
Societe BIC S.A. | | | 28 | | | | 4,218 | |
Societe Generale S.A. | | | 208 | | | | 7,699 | |
Societe Television Francaise 1 | | | 72 | | | | 934 | |
Sodexo S.A. | | | 36 | | | | 3,887 | |
Suez Environnement Co. | | | 224 | | | | 4,115 | |
Technip S.A. | | | 35 | | | | 1,943 | |
Teleperformance | | | 19 | | | | 1,673 | |
Thales S.A. | | | 43 | | | | 3,773 | |
TOTAL S.A. | | | 1,281 | | | | 58,478 | |
Unibail-Rodamco SE | | | 19 | | | | 5,235 | |
See Notes to Financial Statements.
| | |
| 86 | | WisdomTree Developed World ex-U.S. and Currency Hedged Equity Funds |
Schedule of Investments (continued)
WisdomTree International Hedged Equity Fund (HDWM)
March 31, 2016
| | | | | | | | |
| Investments | | Shares | | | Value | |
Veolia Environnement S.A. | | | 324 | | | $ | 7,816 | |
Vicat S.A. | | | 42 | | | | 2,728 | |
Vinci S.A. | | | 211 | | | | 15,742 | |
Vivendi S.A. | | | 509 | | | | 10,719 | |
| | | | | | | | |
| Total France | | | | | | | 458,360 | |
| Germany – 7.7% | | | | | | | | |
adidas AG | | | 39 | | | | 4,578 | |
Allianz SE Registered Shares | | | 192 | | | | 31,277 | |
AURELIUS SE & Co. KGaA | | | 35 | | | | 2,134 | |
Axel Springer SE | | | 56 | | | | 3,023 | |
BASF SE | | | 293 | | | | 22,137 | |
Bayer AG Registered Shares | | | 162 | | | | 19,070 | |
Bayerische Motoren Werke AG | | | 123 | | | | 11,311 | |
Bechtle AG | | | 19 | | | | 1,965 | |
Beiersdorf AG | | | 36 | | | | 3,255 | |
Bertrandt AG | | | 12 | | | | 1,379 | |
Brenntag AG | | | 36 | | | | 2,059 | |
Carl Zeiss Meditec AG Bearer Shares | | | 60 | | | | 1,856 | |
Comdirect Bank AG | | | 340 | | | | 3,813 | |
Continental AG | | | 23 | | | | 5,242 | |
CTS Eventim AG & Co. KGaA | | | 55 | | | | 1,957 | |
Daimler AG Registered Shares | | | 263 | | | | 20,191 | |
Deutsche Boerse AG | | | 64 | | | | 5,469 | |
Deutsche Post AG Registered Shares | | | 452 | | | | 12,578 | |
Deutsche Telekom AG Registered Shares | | | 1,512 | | | | 27,180 | |
Deutsche Wohnen AG Bearer Shares | | | 99 | | | | 3,083 | |
DMG MORI AG | | | 35 | | | | 1,632 | |
Drillisch AG(a) | | | 31 | | | | 1,273 | |
Duerr AG | | | 33 | | | | 2,597 | |
E.ON SE | | | 789 | | | | 7,587 | |
Evonik Industries AG | | | 113 | | | | 3,395 | |
Fielmann AG | | | 75 | | | | 5,701 | |
Fraport AG Frankfurt Airport Services Worldwide | | | 39 | | | | 2,369 | |
Freenet AG | | | 80 | | | | 2,397 | |
GEA Group AG | | | 51 | | | | 2,499 | |
Gerresheimer AG | | | 20 | | | | 1,571 | |
Hamburger Hafen und Logistik AG | | | 214 | | | | 3,156 | |
Hannover Rueck SE | | | 52 | | | | 6,068 | |
Henkel AG & Co. KGaA | | | 58 | | | | 5,708 | |
Hugo Boss AG | | | 27 | | | | 1,773 | |
Infineon Technologies AG | | | 273 | | | | 3,890 | |
K+S AG Registered Shares | | | 16 | | | | 375 | |
Krones AG | | | 19 | | | | 2,292 | |
KUKA AG(a) | | | 15 | | | | 1,573 | |
LEG Immobilien AG* | | | 31 | | | | 2,927 | |
MAN SE | | | 50 | | | | 5,420 | |
Merck KGaA | | | 49 | | | | 4,093 | |
METRO AG | | | 125 | | | | 3,879 | |
Muenchener Rueckversicherungs – Gesellschaft AG Registered Shares | | | 67 | | | | 13,648 | |
OSRAM Licht AG | | | 27 | | | | 1,394 | |
ProSiebenSat.1 Media SE | | | 99 | | | | 5,098 | |
RHOEN-KLINIKUM AG | | | 104 | | | | 3,241 | |
SAP SE | | | 241 | | | | 19,526 | |
Siemens AG Registered Shares | | | 317 | | | | 33,649 | |
Software AG | | | 47 | | | | 1,840 | |
Suedzucker AG | | | 76 | | | | 1,342 | |
Talanx AG* | | | 131 | | | | 4,480 | |
Telefonica Deutschland Holding AG | | | 1,308 | | | | 7,096 | |
Volkswagen AG | | | 44 | | | | 6,395 | |
Wacker Chemie AG | | | 4 | | | | 353 | |
Wirecard AG(a) | | | 6 | | | | 228 | |
| | | | | | | | |
| Total Germany | | | | | | | 354,022 | |
| Hong Kong – 2.7% | | | | | | | | |
AIA Group Ltd. | | | 2,200 | | | | 12,466 | |
Bank of East Asia Ltd. (The)(a) | | | 800 | | | | 2,991 | |
BOC Hong Kong Holdings Ltd. | | | 2,500 | | | | 7,461 | |
CLP Holdings Ltd. | | | 1,500 | | | | 13,566 | |
Dah Sing Banking Group Ltd. | | | 2,800 | | | | 4,917 | |
Hang Seng Bank Ltd. | | | 800 | | | | 14,140 | |
Hong Kong & China Gas Co., Ltd. | | | 3,000 | | | | 5,608 | |
Hong Kong Exchanges and Clearing Ltd. | | | 300 | | | | 7,225 | |
MTR Corp., Ltd. | | | 2,000 | | | | 9,901 | |
New World Development Co., Ltd. | | | 1,000 | | | | 953 | |
Power Assets Holdings Ltd. | | | 1,500 | | | | 15,345 | |
Sino Land Co., Ltd. | | | 6,000 | | | | 9,499 | |
SJM Holdings Ltd. | | | 4,000 | | | | 2,857 | |
Techtronic Industries Co., Ltd. | | | 1,500 | | | | 5,927 | |
Wharf Holdings Ltd. (The) | | | 2,000 | | | | 10,933 | |
| | | | | | | | |
| Total Hong Kong | | | | | | | 123,789 | |
| Ireland – 0.3% | | | | | | | | |
Grafton Group PLC | | | 103 | | | | 1,069 | |
Green REIT PLC | | | 1,230 | | | | 1,978 | |
Greencore Group PLC | | | 261 | | | | 1,407 | |
IFG Group PLC | | | 1,503 | | | | 3,631 | |
Paddy Power Betfair PLC | | | 32 | | | | 4,470 | |
| | | | | | | | |
| Total Ireland | | | | | | | 12,555 | |
| Israel – 0.7% | | | | | | | | |
Bezeq Israeli Telecommunication Corp., Ltd. | | | 3,651 | | | | 8,230 | |
Delek Automotive Systems Ltd. | | | 172 | | | | 1,663 | |
First International Bank of Israel Ltd. | | | 95 | | | | 1,177 | |
Frutarom Industries Ltd. | | | 31 | | | | 1,624 | |
Harel Insurance Investments & Financial Services Ltd. | | | 287 | | | | 1,096 | |
Migdal Insurance & Financial Holding Ltd. | | | 2,825 | | | | 1,961 | |
Mizrahi Tefahot Bank Ltd. | | | 111 | | | | 1,301 | |
NICE-Systems Ltd. | | | 23 | | | | 1,508 | |
Osem Investments Ltd.* | | | 48 | | | | 1,049 | |
Teva Pharmaceutical Industries Ltd. | | | 223 | | | | 12,023 | |
| | | | | | | | |
| Total Israel | | | | | | | 31,632 | |
| Italy – 3.1% | | | | | | | | |
A2A SpA | | | 1,342 | | | | 1,748 | |
ACEA SpA | | | 163 | | | | 2,498 | |
Anima Holding SpA(b) | | | 143 | | | | 1,048 | |
Ansaldo STS SpA | | | 60 | | | | 717 | |
Ascopiave SpA | | | 979 | | | | 2,557 | |
Assicurazioni Generali SpA | | | 452 | | | | 6,711 | |
Atlantia SpA | | | 357 | | | | 9,914 | |
See Notes to Financial Statements.
| | | | |
| WisdomTree Developed World ex-U.S. and Currency Hedged Equity Funds | | | 87 | |
Schedule of Investments (continued)
WisdomTree International Hedged Equity Fund (HDWM)
March 31, 2016
| | | | | | | | |
| Investments | | Shares | | | Value | |
Azimut Holding SpA | | | 43 | | | $ | 992 | |
Banca Generali SpA | | | 56 | | | | 1,650 | |
Banca Mediolanum SpA | | | 208 | | | | 1,662 | |
Banca Popolare di Milano SCARL | | | 1,192 | | | | 835 | |
Davide Campari-Milano SpA | | | 164 | | | | 1,642 | |
De’ Longhi SpA | | | 55 | | | | 1,253 | |
DiaSorin SpA | | | 32 | | | | 1,851 | |
Enel Green Power SpA | | | 982 | | | | 2,115 | |
Enel SpA | | | 2,710 | | | | 12,038 | |
Eni SpA | | | 2,378 | | | | 36,041 | |
ERG SpA | | | 136 | | | | 1,854 | |
FinecoBank Banca Fineco SpA | | | 363 | | | | 3,061 | |
Hera SpA | | | 790 | | | | 2,364 | |
Intesa Sanpaolo SpA | | | 3,625 | | | | 10,055 | |
Iren SpA | | | 939 | | | | 1,685 | |
Luxottica Group SpA | | | 90 | | | | 4,974 | |
MARR SpA | | | 84 | | | | 1,694 | |
Parmalat SpA | | | 438 | | | | 1,214 | |
Recordati SpA | | | 108 | | | | 2,708 | |
Snam SpA | | | 2,099 | | | | 13,167 | |
Terna Rete Elettrica Nazionale SpA | | | 1,131 | | | | 6,463 | |
UniCredit SpA | | | 1,206 | | | | 4,357 | |
UnipolSai SpA | | | 1,643 | | | | 3,808 | |
| | | | | | | | |
| Total Italy | | | | | | | 142,676 | |
| Japan – 14.6% | | | | | | | | |
Amada Holdings Co., Ltd. | | | 200 | | | | 1,954 | |
Astellas Pharma, Inc. | | | 600 | | | | 7,989 | |
Bridgestone Corp. | | | 400 | | | | 14,965 | |
Brother Industries Ltd. | | | 500 | | | | 5,756 | |
Canon, Inc. | | | 700 | | | | 20,895 | |
Dai-ichi Life Insurance Co., Ltd. (The) | | | 200 | | | | 2,424 | |
Daicel Corp. | | | 300 | | | | 4,105 | |
Daihatsu Motor Co., Ltd. | | | 300 | | | | 4,233 | |
FANUC Corp. | | | 100 | | | | 15,557 | |
Fuji Heavy Industries Ltd. | | | 200 | | | | 7,073 | |
Fujitsu Ltd. | | | 1,000 | | | | 3,707 | |
Hino Motors Ltd. | | | 900 | | | | 9,745 | |
Hitachi Chemical Co., Ltd. | | | 300 | | | | 5,405 | |
Hitachi Construction Machinery Co., Ltd.(a) | | | 600 | | | | 9,545 | |
Honda Motor Co., Ltd. | | | 700 | | | | 19,220 | |
Hulic Co., Ltd. | | | 800 | | | | 7,659 | |
Idemitsu Kosan Co., Ltd. | | | 100 | | | | 1,787 | |
Iida Group Holdings Co., Ltd. | | | 300 | | | | 5,859 | |
Isuzu Motors Ltd. | | | 300 | | | | 3,102 | |
ITOCHU Corp. | | | 1,200 | | | | 14,798 | |
Japan Tobacco, Inc. | | | 600 | | | | 25,037 | |
JSR Corp. | | | 300 | | | | 4,319 | |
JTEKT Corp. | | | 300 | | | | 3,897 | |
JX Holdings, Inc. | | | 2,800 | | | | 10,807 | |
Kawasaki Kisen Kaisha Ltd.(a) | | | 2,000 | | | | 3,879 | |
KDDI Corp. | | | 700 | | | | 18,721 | |
Keiyo Co., Ltd.(a) | | | 800 | | | | 3,623 | |
Komatsu Ltd. | | | 300 | | | | 5,114 | |
Konica Minolta, Inc. | | | 300 | | | | 2,552 | |
Kuraray Co., Ltd. | | | 700 | | | | 8,570 | |
LIXIL Group Corp. | | | 400 | | | | 8,168 | |
Marubeni Corp. | | | 1,600 | | | | 8,114 | |
Mitsubishi Chemical Holdings Corp. | | | 1,200 | | | | 6,272 | |
Mitsubishi Corp. | | | 500 | | | | 8,479 | |
Mitsubishi Materials Corp. | | | 3,000 | | | | 8,488 | |
Mitsubishi Motors Corp. | | | 900 | | | | 6,750 | |
Mitsubishi UFJ Financial Group, Inc. | | | 3,100 | | | | 14,384 | |
Mitsui & Co., Ltd. | | | 1,500 | | | | 17,283 | |
Mitsui Mining & Smelting Co., Ltd. | | | 1,000 | | | | 1,601 | |
Mitsui OSK Lines Ltd. | | | 1,000 | | | | 2,037 | |
Mizuho Financial Group, Inc. | | | 7,600 | | | | 11,367 | |
Modec, Inc. | | | 100 | | | | 1,467 | |
Nikon Corp.(a) | | | 700 | | | | 10,725 | |
Nippon Steel & Sumitomo Metal Corp. | | | 300 | | | | 5,771 | |
Nippon Telegraph & Telephone Corp. | | | 500 | | | | 21,567 | |
Nippon Yusen K.K. | | | 3,000 | | | | 5,792 | |
Nissan Motor Co., Ltd. | | | 1,900 | | | | 17,606 | |
Nomura Holdings, Inc. | | | 1,000 | | | | 4,474 | |
Nomura Real Estate Holdings, Inc. | | | 400 | | | | 7,402 | |
NSK Ltd. | | | 300 | | | | 2,749 | |
NTT DOCOMO, Inc. | | | 1,300 | | | | 29,523 | |
Oji Holdings Corp. | | | 2,000 | | | | 8,043 | |
Panasonic Corp. | | | 300 | | | | 2,759 | |
Resona Holdings, Inc. | | | 1,900 | | | | 6,789 | |
Ricoh Co., Ltd. | | | 1,100 | | | | 11,216 | |
SBI Holdings, Inc. | | | 100 | | | | 1,017 | |
Sega Sammy Holdings, Inc. | | | 300 | | | | 3,275 | |
Seiko Epson Corp. | | | 300 | | | | 4,853 | |
Sekisui House Ltd. | | | 300 | | | | 5,070 | |
Shin-Etsu Chemical Co., Ltd. | | | 300 | | | | 15,545 | |
Sojitz Corp. | | | 2,400 | | | | 4,933 | |
Sumitomo Chemical Co., Ltd. | | | 2,000 | | | | 9,057 | |
Sumitomo Corp. | | | 1,600 | | | | 15,922 | |
Sumitomo Mitsui Financial Group, Inc. | | | 400 | | | | 12,143 | |
Sumitomo Mitsui Trust Holdings, Inc. | | | 1,000 | | | | 2,932 | |
Sumitomo Rubber Industries Ltd. | | | 400 | | | | 6,189 | |
Suzuki Motor Corp. | | | 200 | | | | 5,358 | |
T&D Holdings, Inc. | | | 500 | | | | 4,669 | |
Takeda Pharmaceutical Co., Ltd. | | | 300 | | | | 13,709 | |
Toyota Motor Corp. | | | 1,100 | | | | 58,252 | |
Toyota Tsusho Corp. | | | 200 | | | | 4,525 | |
Yahoo Japan Corp.(a) | | | 1,200 | | | | 5,114 | |
Yamaha Corp. | | | 300 | | | | 9,048 | |
Yamaha Motor Co., Ltd. | | | 300 | | | | 4,997 | |
Yokohama Rubber Co., Ltd. (The) | | | 300 | | | | 4,941 | |
| | | | | | | | |
| Total Japan | | | | | | | 672,672 | |
| Netherlands – 1.5% | | | | | | | | |
Aalberts Industries N.V. | | | 40 | | | | 1,390 | |
Aegon N.V. | | | 865 | | | | 4,765 | |
Akzo Nobel N.V. | | | 51 | | | | 3,481 | |
Arcadis N.V. | | | 47 | | | | 878 | |
See Notes to Financial Statements.
| | |
| 88 | | WisdomTree Developed World ex-U.S. and Currency Hedged Equity Funds |
Schedule of Investments (continued)
WisdomTree International Hedged Equity Fund (HDWM)
March 31, 2016
| | | | | | | | |
| Investments | | Shares | | | Value | |
ASM International N.V. | | | 35 | | | $ | 1,570 | |
BE Semiconductor Industries N.V. | | | 48 | | | | 1,318 | |
BinckBank N.V. | | | 128 | | | | 955 | |
Boskalis Westminster | | | 39 | | | | 1,535 | |
Brunel International N.V. | | | 64 | | | | 1,350 | |
Corbion N.V. | | | 64 | | | | 1,522 | |
Euronext N.V.(b) | | | 61 | | | | 2,536 | |
Gemalto N.V. | | | 15 | | | | 1,111 | |
Heineken N.V. | | | 112 | | | | 10,166 | |
IMCD Group N.V. | | | 35 | | | | 1,311 | |
Koninklijke Ahold N.V. | | | 275 | | | | 6,195 | |
Koninklijke KPN N.V. | | | 1,184 | | | | 4,969 | |
Koninklijke Philips N.V. | | | 283 | | | | 8,074 | |
Koninklijke Vopak N.V. | | | 35 | | | | 1,746 | |
NN Group N.V. | | | 139 | | | | 4,555 | |
Randstad Holding N.V. | | | 52 | | | | 2,886 | |
TNT Express N.V. | | | 148 | | | | 1,330 | |
Wessanen | | | 156 | | | | 1,692 | |
Wolters Kluwer N.V. | | | 100 | | | | 3,997 | |
| | | | | | | | |
| Total Netherlands | | | | | | | 69,332 | |
| New Zealand – 0.7% | | | | | | | | |
Contact Energy Ltd. | | | 703 | | | | 2,441 | |
EBOS Group Ltd. | | | 184 | | | | 2,197 | |
Freightways Ltd. | | | 549 | | | | 2,421 | |
Genesis Energy Ltd. | | | 1,282 | | | | 1,825 | |
Kiwi Property Group Ltd. | | | 1,618 | | | | 1,623 | |
Mainfreight Ltd. | | | 147 | | | | 1,619 | |
Meridian Energy Ltd. | | | 1,479 | | | | 2,690 | |
Metlifecare Ltd. | | | 760 | | | | 2,770 | |
Mighty River Power Ltd. | | | 1,000 | | | | 2,027 | |
Port of Tauranga Ltd. | | | 154 | | | | 1,962 | |
Spark New Zealand Ltd. | | | 2,072 | | | | 5,251 | |
TrustPower Ltd. | | | 585 | | | | 3,111 | |
Z Energy Ltd. | | | 339 | | | | 1,589 | |
| | | | | | | | |
| Total New Zealand | | | | | | | 31,526 | |
| Norway – 1.5% | | | | | | | | |
Atea ASA* | | | 164 | | | | 1,566 | |
Austevoll Seafood ASA | | | 317 | | | | 2,606 | |
DNB ASA | | | 533 | | | | 6,305 | |
Entra ASA(b) | | | 247 | | | | 2,329 | |
Gjensidige Forsikring ASA | | | 261 | | | | 4,452 | |
Kongsberg Gruppen ASA | | | 79 | | | | 1,299 | |
Leroy Seafood Group ASA | | | 39 | | | | 1,844 | |
Marine Harvest ASA* | | | 199 | | | | 3,068 | |
Norsk Hydro ASA | | | 415 | | | | 1,709 | |
Orkla ASA | | | 485 | | | | 4,395 | |
Salmar ASA | | | 123 | | | | 3,019 | |
SpareBank 1 SR-Bank ASA | | | 504 | | | | 2,474 | |
Statoil ASA | | | 1,567 | | | | 24,686 | |
Telenor ASA | | | 227 | | | | 3,675 | |
TGS Nopec Geophysical Co. ASA | | | 59 | | | | 901 | |
Yara International ASA | | | 72 | | | | 2,711 | |
| | | | | | | | |
| Total Norway | | | | | | | 67,039 | |
| Portugal – 0.4% | | | | | | | | |
CTT-Correios de Portugal S.A. | | | 120 | | | | 1,131 | |
EDP-Energias de Portugal S.A. | | | 2,028 | | | | 7,224 | |
Galp Energia, SGPS, S.A. | | | 342 | | | | 4,307 | |
Jeronimo Martins, SGPS, S.A. | | | 143 | | | | 2,343 | |
REN – Redes Energeticas Nacionais, SGPS, S.A. | | | 441 | | | | 1,448 | |
Sonae, SGPS, S.A. | | | 2,405 | | | | 2,902 | |
| | | | | | | | |
| Total Portugal | | | | | | | 19,355 | |
| Singapore – 2.1% | | | | | | | | |
Asian Pay Television Trust | | | 2,300 | | | | 956 | |
CapitaLand Ltd. | | | 1,200 | | | | 2,736 | |
Chip Eng Seng Corp., Ltd. | | | 2,300 | | | | 1,213 | |
City Developments Ltd. | | | 100 | | | | 607 | |
ComfortDelGro Corp., Ltd. | | | 1,100 | | | | 2,385 | |
CWT Ltd. | | | 800 | | | | 1,164 | |
DBS Group Holdings Ltd. | | | 500 | | | | 5,711 | |
Great Eastern Holdings Ltd. | | | 200 | | | | 3,340 | |
Hutchison Port Holdings Trust | | | 4,600 | | | | 2,300 | |
Jardine Cycle & Carriage Ltd. | | | 300 | | | | 8,918 | |
k1 Ventures Ltd. | | | 1,600 | | | | 945 | |
Keppel Corp., Ltd. | | | 1,100 | | | | 4,762 | |
M1 Ltd.(a) | | | 700 | | | | 1,352 | |
Olam International Ltd. | | | 1,500 | | | | 1,916 | |
OSIM International Ltd.(a) | | | 1,200 | | | | 1,221 | |
OUE Ltd. | | | 1,500 | | | | 1,877 | |
Oversea-Chinese Banking Corp., Ltd. | | | 1,200 | | | | 7,878 | |
Pacc Offshore Services Holdings Ltd. | | | 7,600 | | | | 2,032 | |
Pacific Radiance Ltd. | | | 9,300 | | | | 2,348 | |
Rotary Engineering Ltd. | | | 5,400 | | | | 1,444 | |
Sembcorp Industries Ltd. | | | 2,300 | | | | 5,158 | |
Sembcorp Marine Ltd.(a) | | | 1,600 | | | | 1,961 | |
SIA Engineering Co., Ltd. | | | 400 | | | | 1,069 | |
Singapore Airlines Ltd. | | | 500 | | | | 4,240 | |
Singapore Exchange Ltd. | | | 800 | | | | 4,723 | |
Singapore Technologies Engineering Ltd. | | | 1,200 | | | | 2,878 | |
Singapore Telecommunications Ltd. | | | 4,300 | | | | 12,198 | |
StarHub Ltd. | | | 400 | | | | 995 | |
United Engineers Ltd. | | | 300 | | | | 521 | |
United Overseas Bank Ltd. | | | 700 | | | | 9,809 | |
| | | | | | | | |
| Total Singapore | | | | | | | 98,657 | |
| Spain – 4.2% | | | | | | | | |
Amadeus IT Holding S.A. Class A | | | 95 | | | | 4,080 | |
Atresmedia Corp. de Medios de Comunicaion S.A. | | | 80 | | | | 878 | |
Banco Bilbao Vizcaya Argentaria S.A. | | | 2,202 | | | | 14,659 | |
Banco Popular Espanol S.A. | | | 629 | | | | 1,639 | |
Banco Santander S.A. | | | 11,362 | | | | 50,159 | |
Bankinter S.A. | | | 204 | | | | 1,444 | |
Bolsas y Mercados Espanoles SHMSF S.A.(a) | | | 55 | | | | 1,777 | |
CaixaBank S.A. | | | 2,534 | | | | 7,499 | |
Cia de Distribucion Integral Logista Holdings S.A. | | | 115 | | | | 2,603 | |
Distribuidora Internacional de Alimentacion S.A.* | | | 164 | | | | 853 | |
Ebro Foods S.A. | | | 127 | | | | 2,776 | |
Enagas S.A. | | | 160 | | | | 4,816 | |
See Notes to Financial Statements.
| | | | |
| WisdomTree Developed World ex-U.S. and Currency Hedged Equity Funds | | | 89 | |
Schedule of Investments (continued)
WisdomTree International Hedged Equity Fund (HDWM)
March 31, 2016
| | | | | | | | |
| Investments | | Shares | | | Value | |
Endesa S.A. | | | 179 | | | $ | 3,441 | |
Ferrovial S.A. | | | 242 | | | | 5,208 | |
Gas Natural SDG S.A. | | | 459 | | | | 9,295 | |
Grifols S.A. | | | 64 | | | | 1,427 | |
Grupo Catalana Occidente S.A. | | | 55 | | | | 1,564 | |
Iberdrola S.A. | | | 1,705 | | | | 11,388 | |
Industria de Diseno Textil S.A. | | | 535 | | | | 18,025 | |
Mapfre S.A. | | | 694 | | | | 1,502 | |
Mediaset Espana Comunicacion S.A. | | | 95 | | | | 1,094 | |
Red Electrica Corp. S.A. | | | 50 | | | | 4,347 | |
Repsol S.A. | | | 819 | | | | 9,258 | |
Tecnicas Reunidas S.A.(a) | | | 11 | | | | 310 | |
Telefonica S.A. | | | 2,685 | | | | 30,144 | |
Viscofan S.A. | | | 31 | | | | 1,860 | |
Zardoya Otis S.A. | | | 271 | | | | 3,159 | |
| | | | | | | | |
| Total Spain | | | | | | | 195,205 | |
| Sweden – 3.6% | | | | | | | | |
AAK AB | | | 20 | | | | 1,591 | |
AF AB Class B | | | 99 | | | | 1,820 | |
Atlas Copco AB Class A | | | 235 | | | | 5,922 | |
Atrium Ljungberg AB Class B | | | 128 | | | | 2,218 | |
Avanza Bank Holding AB | | | 35 | | | | 1,563 | |
Axfood AB | | | 143 | | | | 2,646 | |
Betsson AB* | | | 84 | | | | 1,306 | |
Clas Ohlson AB Class B | | | 115 | | | | 2,199 | |
Com Hem Holding AB | | | 140 | | | | 1,293 | |
Electrolux AB Series B | | | 63 | | | | 1,660 | |
Fabege AB | | | 120 | | | | 2,029 | |
Hennes & Mauritz AB Class B | | | 389 | | | | 12,989 | |
Hexpol AB | | | 120 | | | | 1,336 | |
ICA Gruppen AB | | | 91 | | | | 3,015 | |
Indutrade AB | | | 27 | | | | 1,659 | |
Investment AB Kinnevik Class B | | | 44 | | | | 1,250 | |
Investment AB Latour Class B | | | 64 | | | | 2,657 | |
Lifco AB Class B | | | 92 | | | | 2,474 | |
Loomis AB Class B | | | 47 | | | | 1,331 | |
Meda AB Class A | | | 189 | | | | 3,523 | |
NetEnt AB* | | | 23 | | | | 1,301 | |
Nordea Bank AB | | | 2,132 | | | | 20,513 | |
Sandvik AB | | | 539 | | | | 5,585 | |
Securitas AB Class B | | | 176 | | | | 2,920 | |
Skandinaviska Enskilda Banken AB Class A | | | 907 | | | | 8,676 | |
Skanska AB Class B | | | 136 | | | | 3,109 | |
Svenska Cellulosa AB SCA Class B | | | 171 | | | | 5,351 | |
Svenska Handelsbanken AB Class A | | | 668 | | | | 8,512 | |
Swedbank AB Class A | | | 585 | | | | 12,621 | |
Swedish Match AB | | | 91 | | | | 3,094 | |
Tele2 AB Class B | | | 267 | | | | 2,480 | |
Telefonaktiebolaget LM Ericsson Class B | | | 1,183 | | | | 11,864 | |
TeliaSonera AB | | | 2,876 | | | | 14,961 | |
Thule Group AB (The)(b) | | | 107 | | | | 1,478 | |
Trelleborg AB Class B | | | 68 | | | | 1,347 | |
Volvo AB Class B | | | 644 | | | | 7,078 | |
Wallenstam AB Class B | | | 220 | | | | 1,905 | |
| | | | | | | | |
| Total Sweden | | | | | | | 167,276 | |
| Switzerland – 8.4% | | | | | | | | |
ABB Ltd. Registered Shares* | | | 594 | | | | 11,624 | |
Actelion Ltd. Registered Shares* | | | 14 | | | | 2,101 | |
Adecco S.A. Registered Shares* | | | 67 | | | | 4,383 | |
Baloise Holding AG Registered Shares | | | 7 | | | | 893 | |
Cie Financiere Richemont S.A. Registered Shares | | | 77 | | | | 5,110 | |
Clariant AG Registered Shares* | | | 63 | | | | 1,145 | |
Coca-Cola HBC AG* | | | 63 | | | | 1,340 | |
Credit Suisse Group AG Registered Shares* | | | 312 | | | | 4,434 | |
DKSH Holding AG | | | 39 | | | | 2,678 | |
EMS-Chemie Holding AG Registered Shares | | | 8 | | | | 4,164 | |
Galenica AG Registered Shares | | | 2 | | | | 3,020 | |
GAM Holding AG* | | | 100 | | | | 1,451 | |
Geberit AG Registered Shares | | | 11 | | | | 4,127 | |
Givaudan S.A. Registered Shares | | | 3 | | | | 5,908 | |
Helvetia Holding AG Registered Shares | | | 8 | | | | 4,595 | |
Julius Baer Group Ltd.* | | | 44 | | | | 1,898 | |
Kuehne + Nagel International AG Registered Shares | | | 93 | | | | 13,275 | |
LafargeHolcim Ltd. Registered Shares* | | | 132 | | | | 6,234 | |
Leonteq AG* | | | 8 | | | | 761 | |
Logitech International S.A. Registered Shares | | | 84 | | | | 1,342 | |
Lonza Group AG Registered Shares* | | | 22 | | | | 3,738 | |
Nestle S.A. Registered Shares | | | 1,026 | | | | 76,978 | |
Novartis AG Registered Shares | | | 702 | | | | 51,093 | |
OC Oerlikon Corp. AG Registered Shares* | | | 200 | | | | 2,072 | |
Partners Group Holding AG | | | 11 | | | | 4,439 | |
Roche Holding AG Genusschein | | | 257 | | | | 63,522 | |
SGS S.A. Registered Shares | | | 4 | | | | 8,487 | |
Sonova Holding AG Registered Shares | | | 15 | | | | 1,923 | |
STMicroelectronics N.V. | | | 429 | | | | 2,382 | |
Straumann Holding AG Registered Shares | | | 7 | | | | 2,423 | |
Sulzer AG Registered Shares | | | 23 | | | | 2,294 | |
Swiss Life Holding AG Registered Shares* | | | 7 | | | | 1,869 | |
Swiss Re AG | | | 283 | | | | 26,271 | |
Swisscom AG Registered Shares | | | 24 | | | | 13,095 | |
Syngenta AG Registered Shares | | | 27 | | | | 11,278 | |
UBS Group AG Registered Shares | | | 941 | | | | 15,221 | |
Vontobel Holding AG Registered Shares | | | 80 | | | | 3,479 | |
Zurich Insurance Group AG* | | | 73 | | | | 17,022 | |
| | | | | | | | |
| Total Switzerland | | | | | | | 388,069 | |
| United Kingdom – 22.9% | | | | | | | | |
A.G.Barr PLC | | | 138 | | | | 1,051 | |
Abcam PLC | | | 169 | | | | 1,433 | |
Aberdeen Asset Management PLC | | | 448 | | | | 1,786 | |
Admiral Group PLC | | | 127 | | | | 3,620 | |
Aggreko PLC | | | 97 | | | | 1,502 | |
Amec Foster Wheeler PLC | | | 150 | | | | 970 | |
Ashmore Group PLC | | | 301 | | | | 1,244 | |
Associated British Foods PLC | | | 88 | | | | 4,236 | |
AstraZeneca PLC | | | 585 | | | | 32,813 | |
Aviva PLC | | | 955 | | | | 6,261 | |
See Notes to Financial Statements.
| | |
| 90 | | WisdomTree Developed World ex-U.S. and Currency Hedged Equity Funds |
Schedule of Investments (continued)
WisdomTree International Hedged Equity Fund (HDWM)
March 31, 2016
| | | | | | | | |
| Investments | | Shares | | | Value | |
Babcock International Group PLC | | | 181 | | | $ | 2,470 | |
BAE Systems PLC | | | 1,617 | | | | 11,830 | |
Barclays PLC | | | 3,207 | | | | 6,914 | |
BBA Aviation PLC | | | 605 | | | | 1,743 | |
Bellway PLC | | | 35 | | | | 1,320 | |
Berkeley Group Holdings PLC | | | 91 | | | | 4,209 | |
BHP Billiton PLC | | | 1,402 | | | | 15,774 | |
Big Yellow Group PLC | | | 234 | | | | 2,605 | |
Bodycote PLC | | | 192 | | | | 1,665 | |
Booker Group PLC | | | 628 | | | | 1,555 | |
BP PLC | | | 13,485 | | | | 67,866 | |
Brewin Dolphin Holdings PLC | | | 273 | | | | 1,018 | |
British American Tobacco PLC | | | 951 | | | | 55,905 | |
British Land Co. PLC (The) | | | 365 | | | | 3,675 | |
Britvic PLC | | | 132 | | | | 1,348 | |
BT Group PLC | | | 2,082 | | | | 13,182 | |
Burberry Group PLC | | | 79 | | | | 1,550 | |
Cable & Wireless Communications PLC | | | 2,288 | | | | 2,534 | |
Capital & Counties Properties PLC | | | 114 | | | | 540 | |
Carnival PLC | | | 66 | | | | 3,559 | |
Centrica PLC | | | 2,789 | | | | 9,128 | |
Close Brothers Group PLC | | | 68 | | | | 1,233 | |
CNH Industrial N.V. | | | 481 | | | | 3,275 | |
Compass Group PLC | | | 619 | | | | 10,925 | |
Countrywide PLC | | | 143 | | | | 793 | |
Cranswick PLC | | | 79 | | | | 2,422 | |
Croda International PLC | | | 35 | | | | 1,529 | |
Dechra Pharmaceuticals PLC | | | 175 | | | | 3,033 | |
Derwent London PLC | | | 44 | | | | 1,993 | |
Diageo PLC | | | 860 | | | | 23,257 | |
Direct Line Insurance Group PLC | | | 711 | | | | 3,783 | |
Domino’s Pizza Group PLC | | | 127 | | | | 1,840 | |
Drax Group PLC(a) | | | 219 | | | | 857 | |
DS Smith PLC | | | 396 | | | | 2,322 | |
Dunelm Group PLC | | | 171 | | | | 2,245 | |
easyJet PLC | | | 228 | | | | 4,978 | |
Electrocomponents PLC | | | 532 | | | | 1,846 | |
Essentra PLC | | | 80 | | | | 952 | |
esure Group PLC | | | 321 | | | | 1,262 | |
Foxtons Group PLC | | | 349 | | | | 816 | |
Genus PLC | | | 63 | | | | 1,385 | |
GlaxoSmithKline PLC | | | 3,546 | | | | 71,965 | |
Greggs PLC | | | 107 | | | | 1,672 | |
Halfords Group PLC | | | 151 | | | | 860 | |
Halma PLC | | | 267 | | | | 3,498 | |
Hammerson PLC | | | 277 | | | | 2,303 | |
Hargreaves Lansdown PLC | | | 136 | | | | 2,627 | |
Hays PLC | | | 254 | | | | 442 | |
Hikma Pharmaceuticals PLC | | | 40 | | | | 1,138 | |
HomeServe PLC | | | 371 | | | | 2,296 | |
Howden Joinery Group PLC | | | 255 | | | | 1,752 | |
HSBC Holdings PLC | | | 10,786 | | | | 67,266 | |
Hunting PLC | | | 182 | | | | 838 | |
ICAP PLC | | | 289 | | | | 1,972 | |
IG Group Holdings PLC | | | 247 | | | | 2,840 | |
IMI PLC | | | 75 | | | | 1,027 | |
Imperial Brands PLC | | | 572 | | | | 31,759 | |
Inchcape PLC | | | 160 | | | | 1,664 | |
Informa PLC | | | 251 | | | | 2,504 | |
Inmarsat PLC | | | 216 | | | | 3,056 | |
Intertek Group PLC | | | 52 | | | | 2,367 | |
Intu Properties PLC | | | 835 | | | | 3,756 | |
Investec PLC | | | 139 | | | | 1,024 | |
ITV PLC | | | 941 | | | | 3,262 | |
J Sainsbury PLC | | | 872 | | | | 3,463 | |
Jardine Lloyd Thompson Group PLC | | | 183 | | | | 2,221 | |
John Wood Group PLC | | | 135 | | | | 1,193 | |
Johnson Matthey PLC | | | 29 | | | | 1,144 | |
Jupiter Fund Management PLC | | | 180 | | | | 1,059 | |
Kingfisher PLC | | | 843 | | | | 4,564 | |
Ladbrokes PLC | | | 1,123 | | | | 1,884 | |
Land Securities Group PLC | | | 233 | | | | 3,687 | |
Legal & General Group PLC | | | 2,706 | | | | 9,148 | |
London Stock Exchange Group PLC | | | 40 | | | | 1,621 | |
Man Group PLC | | | 528 | | | | 1,157 | |
Marks & Spencer Group PLC | | | 413 | | | | 2,411 | |
Mediclinic International PLC | | | 15 | | | | 193 | |
Meggitt PLC | | | 172 | | | | 1,005 | |
Melrose Industries PLC | | | 406 | | | | 2,080 | |
Michael Page International PLC | | | 109 | | | | 669 | |
Micro Focus International PLC | | | 72 | | | | 1,625 | |
Mondi PLC | | | 106 | | | | 2,035 | |
Moneysupermarket.com Group PLC | | | 488 | | | | 2,228 | |
National Grid PLC | | | 2,144 | | | | 30,421 | |
Old Mutual PLC | | | 2,071 | | | | 5,748 | |
Pearson PLC | | | 350 | | | | 4,402 | |
Pennon Group PLC | | | 289 | | | | 3,369 | |
Persimmon PLC | | | 124 | | | | 3,716 | |
Prudential PLC | | | 677 | | | | 12,659 | |
PZ Cussons PLC | | | 67 | | | | 291 | |
QinetiQ Group PLC | | | 355 | | | | 1,163 | |
Reckitt Benckiser Group PLC | | | 201 | | | | 19,443 | |
Redde PLC | | | 593 | | | | 1,423 | |
RELX N.V. | | | 389 | | | | 6,802 | |
RELX PLC | | | 455 | | | | 8,462 | |
Renishaw PLC | | | 40 | | | | 1,055 | |
Restaurant Group PLC (The) | | | 202 | | | | 1,140 | |
Rexam PLC | | | 275 | | | | 2,506 | |
Rightmove PLC | | | 27 | | | | 1,634 | |
Rio Tinto PLC | | | 723 | | | | 20,321 | |
Rolls-Royce Holdings PLC* | | | 477 | | | | 4,676 | |
Rotork PLC | | | 116 | | | | 305 | |
Royal Dutch Shell PLC Class A | | | 2,539 | | | | 61,454 | |
Royal Dutch Shell PLC Class B | | | 2,049 | | | | 50,066 | |
Royal Mail PLC | | | 437 | | | | 3,019 | |
SABMiller PLC | | | 577 | | | | 35,296 | |
Saga PLC | | | 796 | | | | 2,268 | |
Sage Group PLC (The) | | | 359 | | | | 3,246 | |
See Notes to Financial Statements.
| | | | |
| WisdomTree Developed World ex-U.S. and Currency Hedged Equity Funds | | | 91 | |
Schedule of Investments (continued)
WisdomTree International Hedged Equity Fund (HDWM)
March 31, 2016
| | | | | | | | |
| Investments | | Shares | | | Value | |
Savills PLC | | | 126 | | | $ | 1,376 | |
Schroders PLC | | | 71 | | | | 2,738 | |
Segro PLC | | | 359 | | | | 2,117 | |
Severn Trent PLC | | | 141 | | | | 4,404 | |
Sky PLC | | | 661 | | | | 9,729 | |
Smith & Nephew PLC | | | 195 | | | | 3,218 | |
Smiths Group PLC | | | 208 | | | | 3,217 | |
Spectris PLC | | | 44 | | | | 1,166 | |
Spirax-Sarco Engineering PLC | | | 35 | | | | 1,831 | |
SSE PLC | | | 569 | | | | 12,202 | |
St. James’s Place PLC | | | 152 | | | | 2,007 | |
Stagecoach Group PLC | | | 373 | | | | 1,352 | |
Standard Life PLC | | | 819 | | | | 4,192 | |
TalkTalk Telecom Group PLC(a) | | | 709 | | | | 2,416 | |
Tate & Lyle PLC | | | 253 | | | | 2,102 | |
Taylor Wimpey PLC | | | 2,038 | | | | 5,574 | |
Ted Baker PLC | | | 27 | | | | 1,057 | |
Telecom Plus PLC | | | 79 | | | | 1,045 | |
Tullett Prebon PLC | | | 219 | | | | 1,107 | |
Unilever N.V. CVA | | | 505 | | | | 22,665 | |
Unilever PLC | | | 476 | | | | 21,568 | |
United Utilities Group PLC | | | 361 | | | | 4,789 | |
Victrex PLC | | | 56 | | | | 1,326 | |
Vodafone Group PLC | | | 15,828 | | | | 50,322 | |
Weir Group PLC (The) | | | 102 | | | | 1,624 | |
WH Smith PLC | | | 136 | | | | 3,554 | |
Whitbread PLC | | | 20 | | | | 1,138 | |
William Hill PLC | | | 251 | | | | 1,180 | |
WM Morrison Supermarkets PLC(a) | | | 2,321 | | | | 6,629 | |
WS Atkins PLC | | | 95 | | | | 1,871 | |
| | | | | | | | |
| Total United Kingdom | | | | | | | 1,055,728 | |
TOTAL COMMON STOCKS
(Cost: $4,808,751) | | | | | | | 4,622,200 | |
| RIGHTS – 0.0% | | | | | | | | |
| Australia – 0.0% | | | | | | | | |
Qube Holdings Ltd., expiring 4/1/16*
(Cost $0) | | | 157 | | | | 38 | |
| INVESTMENT OF CASH COLLATERAL FOR SECURITIES LOANED – 1.2% | |
| United States – 1.2% | | | | | | | | |
State Street Navigator Securities Lending Prime Portfolio, 0.50%(c) | | | | | | | | |
| (Cost: $53,752)(d) | | | 53,752 | | | | 53,752 | |
TOTAL INVESTMENTS IN SECURITIES – 101.4% (Cost: $4,862,503) | | | | | | | 4,675,990 | |
Liabilities in Excess of Cash, Foreign Currency and Other Assets – (1.4)% | | | | | | | (64,446 | ) |
| | | | | | | | |
| NET ASSETS – 100.0% | | | | | | $ | 4,611,544 | |
| * | Non-income producing security. |
| (a) | Security, or portion thereof, was on loan at March 31, 2016 (See Note 2). |
| (b) | This security is exempt from registration under rule 144A of the Securities Act of 1933. This security may be sold in transactions that are exempt from registration, normally to qualified institutional buyers. |
| (c) | Rate shown represents annualized 7-day yield as of March 31, 2016. |
| (d) | At March 31, 2016, the total market value of the Fund’s securities on loan was $73,293 and the total market value of the collateral held by the Fund was $80,364. The total market value of the collateral includes non-cash U.S. Government securities collateral having a value of $26,612. |
CVA – Certificaten Van Aandelen (Certificate of Stock)
| | | | | | | | | | | | | | | | | | | | |
| FINANCIAL DERIVATIVE INSTRUMENTS | |
| FORWARD CONTRACTS | |
Settlement
Date | | Contracts
To Deliver | | | In
Exchange For | | | Unrealized
Gain (Loss) | |
4/1/2016 | | | HKD | | | | 61,753 | | | | AUD | | | | 10,391 | | | $ | 32 | |
4/4/2016 | | | AUD | | | | 77,209 | | | | USD | | | | 55,065 | | | | (4,328 | ) |
4/4/2016 | | | AUD | | | | 101,338 | | | | USD | | | | 72,269 | | | | (5,685 | ) |
4/4/2016 | | | AUD | | | | 101,329 | | | | USD | | | | 72,269 | | | | (5,679 | ) |
4/4/2016 | | | AUD | | | | 101,329 | | | | USD | | | | 72,269 | | | | (5,679 | ) |
4/4/2016 | | | AUD | | | | 101,334 | | | | USD | | | | 72,269 | | | | (5,682 | ) |
4/4/2016 | | | CHF | | | | 60,416 | | | | USD | | | | 60,754 | | | | (2,333 | ) |
4/4/2016 | | | CHF | | | | 79,286 | | | | USD | | | | 79,735 | | | | (3,057 | ) |
4/4/2016 | | | CHF | | | | 79,292 | | | | USD | | | | 79,735 | | | | (3,063 | ) |
4/4/2016 | | | CHF | | | | 79,289 | | | | USD | | | | 79,735 | | | | (3,061 | ) |
4/4/2016 | | | CHF | | | | 79,288 | | | | USD | | | | 79,735 | | | | (3,060 | ) |
4/4/2016 | | | DKK | | | | 1,921 | | | | NZD | | | | 424 | | | | 1 | |
4/4/2016 | | | DKK | | | | 56,984 | | | | USD | | | | 8,310 | | | | (406 | ) |
4/4/2016 | | | DKK | | | | 74,769 | | | | USD | | | | 10,904 | | | | (532 | ) |
4/4/2016 | | | DKK | | | | 74,774 | | | | USD | | | | 10,904 | | | | (533 | ) |
4/4/2016 | | | DKK | | | | 74,781 | | | | USD | | | | 10,904 | | | | (534 | ) |
4/4/2016 | | | DKK | | | | 74,775 | | | | USD | | | | 10,904 | | | | (533 | ) |
4/4/2016 | | | EUR | | | | 204,679 | | | | USD | | | | 222,612 | | | | (10,630 | ) |
4/4/2016 | | | EUR | | | | 268,642 | | | | USD | | | | 292,178 | | | | (13,953 | ) |
4/4/2016 | | | EUR | | | | 268,646 | | | | USD | | | | 292,178 | | | | (13,958 | ) |
4/4/2016 | | | EUR | | | | 268,638 | | | | USD | | | | 292,178 | | | | (13,949 | ) |
4/4/2016 | | | EUR | | | | 268,648 | | | | USD | | | | 292,178 | | | | (13,960 | ) |
4/4/2016 | | | GBP | | | | 5,232 | | | | EUR | | | | 6,605 | | | | 7 | |
4/4/2016 | | | GBP | | | | 151,521 | | | | USD | | | | 211,188 | | | | (6,593 | ) |
4/4/2016 | | | GBP | | | | 115,452 | | | | USD | | | | 160,907 | | | | (5,033 | ) |
4/4/2016 | | | GBP | | | | 151,516 | | | | USD | | | | 211,188 | | | | (6,586 | ) |
4/4/2016 | | | GBP | | | | 151,524 | | | | USD | | | | 211,188 | | | | (6,597 | ) |
4/4/2016 | | | GBP | | | | 151,525 | | | | USD | | | | 211,188 | | | | (6,599 | ) |
4/4/2016 | | | ILS | | | | 19,636 | | | | USD | | | | 5,035 | | | | (188 | ) |
4/4/2016 | | | ILS | | | | 25,761 | | | | USD | | | | 6,607 | | | | (245 | ) |
4/4/2016 | | | ILS | | | | 25,764 | | | | USD | | | | 6,607 | | | | (246 | ) |
4/4/2016 | | | ILS | | | | 25,760 | | | | USD | | | | 6,607 | | | | (245 | ) |
4/4/2016 | | | ILS | | | | 25,764 | | | | USD | | | | 6,607 | | | | (246 | ) |
4/4/2016 | | | JPY | | | | 146,543 | | | | AUD | | | | 1,700 | | | | 4 | |
4/4/2016 | | | JPY | | | | 329,548 | | | | CHF | | | | 2,815 | | | | 7 | |
4/4/2016 | | | NOK | | | | 89,582 | | | | USD | | | | 10,274 | | | | (556 | ) |
4/4/2016 | | | NOK | | | | 117,537 | | | | USD | | | | 13,479 | | | | (731 | ) |
4/4/2016 | | | NOK | | | | 117,533 | | | | USD | | | | 13,479 | | | | (731 | ) |
4/4/2016 | | | NOK | | | | 117,521 | | | | USD | | | | 13,479 | | | | (729 | ) |
4/4/2016 | | | NOK | | | | 117,535 | | | | USD | | | | 13,479 | | | | (731 | ) |
4/4/2016 | | | NZD | | | | 7,141 | | | | USD | | | | 4,699 | | | | (259 | ) |
4/4/2016 | | | NZD | | | | 9,368 | | | | USD | | | | 6,164 | | | | (340 | ) |
4/4/2016 | | | NZD | | | | 9,367 | | | | USD | | | | 6,164 | | | | (339 | ) |
4/4/2016 | | | NZD | | | | 9,368 | | | | USD | | | | 6,164 | | | | (340 | ) |
4/4/2016 | | | NZD | | | | 9,367 | | | | USD | | | | 6,164 | | | | (340 | ) |
4/4/2016 | | | SEK | | | | 223,526 | | | | USD | | | | 26,056 | | | | (1,517 | ) |
4/4/2016 | | | SEK | | | | 293,319 | | | | USD | | | | 34,194 | | | | (1,988 | ) |
4/4/2016 | | | SEK | | | | 293,328 | | | | USD | | | | 34,194 | | | | (1,989 | ) |
4/4/2016 | | | SEK | | | | 293,351 | | | | USD | | | | 34,194 | | | | (1,992 | ) |
4/4/2016 | | | SEK | | | | 293,327 | | | | USD | | | | 34,194 | | | | (1,989 | ) |
See Notes to Financial Statements.
| | |
| 92 | | WisdomTree Developed World ex-U.S. and Currency Hedged Equity Funds |
Schedule of Investments (continued)
WisdomTree International Hedged Equity Fund (HDWM)
March 31, 2016
| | | | | | | | | | | | | | | | | | | | |
Settlement
Date | | Contracts
To Deliver | | | In
Exchange For | | | Unrealized
Gain (Loss) | |
4/4/2016 | | | SGD | | | | 1,487 | | | | ILS | | | | 4,134 | | | $ | (4 | ) |
4/4/2016 | | | SGD | | | | 524 | | | | NOK | | | | 3,214 | | | | (1 | ) |
4/4/2016 | | | SGD | | | | 2,811 | | | | SEK | | | | 16,923 | | | | — | |
4/4/2016 | | | USD | | | | 55,065 | | | | AUD | | | | 71,585 | | | | 1 | |
4/4/2016 | | | USD | | | | 72,269 | | | | AUD | | | | 93,953 | | | | 5 | |
4/4/2016 | | | USD | | | | 72,269 | | | | AUD | | | | 93,950 | | | | 2 | |
4/4/2016 | | | USD | | | | 72,269 | | | | AUD | | | | 93,952 | | | | 4 | |
4/4/2016 | | | USD | | | | 72,269 | | | | AUD | | | | 93,950 | | | | 2 | |
4/4/2016 | | | USD | | | | 60,754 | | | | CHF | | | | 58,180 | | | | (1 | ) |
4/4/2016 | | | USD | | | | 79,735 | | | | CHF | | | | 76,356 | | | | (2 | ) |
4/4/2016 | | | USD | | | | 79,735 | | | | CHF | | | | 76,362 | | | | 4 | |
4/4/2016 | | | USD | | | | 79,735 | | | | CHF | | | | 76,361 | | | | 3 | |
4/4/2016 | | | USD | | | | 79,735 | | | | CHF | | | | 76,356 | | | | (2 | ) |
4/4/2016 | | | USD | | | | 8,310 | | | | DKK | | | | 54,332 | | | | — | |
4/4/2016 | | | USD | | | | 10,904 | | | | DKK | | | | 71,286 | | | | (1 | ) |
4/4/2016 | | | USD | | | | 10,904 | | | | DKK | | | | 71,293 | | | | 1 | |
4/4/2016 | | | USD | | | | 10,904 | | | | DKK | | | | 71,294 | | | | 1 | |
4/4/2016 | | | USD | | | | 10,904 | | | | DKK | | | | 71,293 | | | | 1 | |
4/4/2016 | | | USD | | | | 222,612 | | | | EUR | | | | 195,356 | | | | 6 | |
4/4/2016 | | | USD | | | | 12,749 | | | | EUR | | | | 11,200 | | | | 14 | |
4/4/2016 | | | USD | | | | 292,178 | | | | EUR | | | | 256,404 | | | | 8 | |
4/4/2016 | | | USD | | | | 292,178 | | | | EUR | | | | 256,411 | | | | 16 | |
4/4/2016 | | | USD | | | | 292,178 | | | | EUR | | | | 256,411 | | | | 16 | |
4/4/2016 | | | USD | | | | 292,178 | | | | EUR | | | | 256,402 | | | | 4 | |
4/4/2016 | | | USD | | | | 160,907 | | | | GBP | | | | 111,954 | | | | 4 | |
4/4/2016 | | | USD | | | | 211,188 | | | | GBP | | | | 146,938 | | | | 6 | |
4/4/2016 | | | USD | | | | 211,188 | | | | GBP | | | | 146,942 | | | | 12 | |
4/4/2016 | | | USD | | | | 211,188 | | | | GBP | | | | 146,941 | | | | 10 | |
4/4/2016 | | | USD | | | | 211,188 | | | | GBP | | | | 146,938 | | | | 6 | |
4/4/2016 | | | USD | | | | 5,035 | | | | ILS | | | | 18,930 | | | | — | |
4/4/2016 | | | USD | | | | 6,607 | | | | ILS | | | | 24,836 | | | | (1 | ) |
4/4/2016 | | | USD | | | | 6,607 | | | | ILS | | | | 24,840 | | | | — | |
4/4/2016 | | | USD | | | | 6,607 | | | | ILS | | | | 24,840 | | | | — | |
4/4/2016 | | | USD | | | | 6,607 | | | | ILS | | | | 24,841 | | | | — | |
4/4/2016 | | | USD | | | | 10,274 | | | | NOK | | | | 84,981 | | | | — | |
4/4/2016 | | | USD | | | | 13,479 | | | | NOK | | | | 111,492 | | | | — | |
4/4/2016 | | | USD | | | | 13,479 | | | | NOK | | | | 111,493 | | | | 1 | |
4/4/2016 | | | USD | | | | 13,479 | | | | NOK | | | | 111,494 | | | | 1 | |
4/4/2016 | | | USD | | | | 13,479 | | | | NOK | | | | 111,494 | | | | 1 | |
4/4/2016 | | | USD | | | | 4,699 | | | | NZD | | | | 6,768 | | | | — | |
4/4/2016 | | | USD | | | | 6,164 | | | | NZD | | | | 8,878 | | | | — | |
4/4/2016 | | | USD | | | | 6,164 | | | | NZD | | | | 8,878 | | | | — | |
4/4/2016 | | | USD | | | | 6,164 | | | | NZD | | | | 8,879 | | | | — | |
4/4/2016 | | | USD | | | | 6,164 | | | | NZD | | | | 8,878 | | | | — | |
4/4/2016 | | | USD | | | | 26,056 | | | | SEK | | | | 211,233 | | | | 1 | |
4/4/2016 | | | USD | | | | 34,194 | | | | SEK | | | | 277,209 | | | | 1 | |
4/4/2016 | | | USD | | | | 34,194 | | | | SEK | | | | 277,215 | | | | 2 | |
4/4/2016 | | | USD | | | | 34,194 | | | | SEK | | | | 277,214 | | | | 2 | |
4/4/2016 | | | USD | | | | 34,194 | | | | SEK | | | | 277,203 | | | | — | |
4/5/2016 | | | EUR | | | | 3,184 | | | | SGD | | | | 4,883 | | | | (2 | ) |
4/5/2016 | | | HKD | | | | 309,600 | | | | USD | | | | 39,818 | | | | (97 | ) |
4/5/2016 | | | HKD | | | | 406,302 | | | | USD | | | | 52,256 | | | | (126 | ) |
4/5/2016 | | | HKD | | | | 406,324 | | | | USD | | | | 52,256 | | | | (129 | ) |
4/5/2016 | | | HKD | | | | 406,275 | | | | USD | | | | 52,256 | | | | (122 | ) |
4/5/2016 | | | HKD | | | | 406,273 | | | | USD | | | | 52,256 | | | | (122 | ) |
4/5/2016 | | | JPY | | | | 11,978,649 | | | | USD | | | | 106,244 | | | | (337 | ) |
4/5/2016 | | | JPY | | | | 15,721,441 | | | | USD | | | | 139,440 | | | | (442 | ) |
4/5/2016 | | | JPY | | | | 15,721,469 | | | | USD | | | | 139,440 | | | | (443 | ) |
4/5/2016 | | | JPY | | | | 15,721,776 | | | | USD | | | | 139,440 | | | | (445 | ) |
4/5/2016 | | | JPY | | | | 15,721,497 | | | | USD | | | | 139,440 | | | | (443 | ) |
4/5/2016 | | | JPY | | | | 1,000,000 | | | | USD | | | | 8,885 | | | | (12 | ) |
4/5/2016 | | | SGD | | | | 20,347 | | | | USD | | | | 14,455 | | | | (655 | ) |
4/5/2016 | | | SGD | | | | 26,700 | | | | USD | | | | 18,970 | | | | (858 | ) |
4/5/2016 | | | SGD | | | | 26,700 | | | | USD | | | | 18,970 | | | | (858 | ) |
4/5/2016 | | | SGD | | | | 26,704 | | | | USD | | | | 18,970 | | | | (861 | ) |
4/5/2016 | | | SGD | | | | 26,702 | | | | USD | | | | 18,970 | | | | (859 | ) |
4/5/2016 | | | USD | | | | 39,818 | | | | HKD | | | | 308,858 | | | | 1 | |
4/5/2016 | | | USD | | | | 52,256 | | | | HKD | | | | 405,347 | | | | 3 | |
4/5/2016 | | | USD | | | | 52,256 | | | | HKD | | | | 405,347 | | | | 3 | |
4/5/2016 | | | USD | | | | 52,256 | | | | HKD | | | | 405,345 | | | | 2 | |
4/5/2016 | | | USD | | | | 52,256 | | | | HKD | | | | 405,338 | | | | 2 | |
4/5/2016 | | | USD | | | | 106,244 | | | | JPY | | | | 11,940,518 | | | | (3 | ) |
4/5/2016 | | | USD | | | | 139,440 | | | | JPY | | | | 15,670,964 | | | | (7 | ) |
4/5/2016 | | | USD | | | | 139,440 | | | | JPY | | | | 15,670,127 | | | | (14 | ) |
4/5/2016 | | | USD | | | | 139,440 | | | | JPY | | | | 15,672,010 | | | | 2 | |
4/5/2016 | | | USD | | | | 139,440 | | | | JPY | | | | 15,672,818 | | | | 10 | |
4/5/2016 | | | USD | | | | 14,455 | | | | SGD | | | | 19,465 | | | | — | |
4/5/2016 | | | USD | | | | 18,970 | | | | SGD | | | | 25,546 | | | | 1 | |
4/5/2016 | | | USD | | | | 18,970 | | | | SGD | | | | 25,546 | | | | 1 | |
4/5/2016 | | | USD | | | | 18,970 | | | | SGD | | | | 25,545 | | | | — | |
4/5/2016 | | | USD | | | | 18,970 | | | | SGD | | | | 25,546 | | | | — | |
5/3/2016 | | | AUD | | | | 77,301 | | | | USD | | | | 59,383 | | | | (2 | ) |
5/3/2016 | | | AUD | | | | 101,465 | | | | USD | | | | 77,940 | | | | (8 | ) |
5/3/2016 | | | AUD | | | | 101,459 | | | | USD | | | | 77,940 | | | | (4 | ) |
5/3/2016 | | | AUD | | | | 101,461 | | | | USD | | | | 77,940 | | | | (5 | ) |
5/3/2016 | | | AUD | | | | 101,459 | | | | USD | | | | 77,940 | | | | (3 | ) |
5/3/2016 | | | CHF | | | | 58,638 | | | | USD | | | | 61,306 | | | | (2 | ) |
5/3/2016 | | | CHF | | | | 76,954 | | | | USD | | | | 80,459 | | | | 1 | |
5/3/2016 | | | CHF | | | | 76,960 | | | | USD | | | | 80,459 | | | | (6 | ) |
5/3/2016 | | | CHF | | | | 77,055 | | | | USD | | | | 80,459 | | | | (105 | ) |
5/3/2016 | | | CHF | | | | 76,954 | | | | USD | | | | 80,459 | | | | — | |
5/3/2016 | | | DKK | | | | 55,535 | | | | USD | | | | 8,500 | | | | (1 | ) |
5/3/2016 | | | DKK | | | | 72,858 | | | | USD | | | | 11,153 | | | | — | |
5/3/2016 | | | DKK | | | | 72,865 | | | | USD | | | | 11,153 | | | | (1 | ) |
5/3/2016 | | | DKK | | | | 72,866 | | | | USD | | | | 11,153 | | | | (1 | ) |
5/3/2016 | | | DKK | | | | 72,865 | | | | USD | | | | 11,153 | | | | (1 | ) |
5/3/2016 | | | EUR | | | | 205,052 | | | | USD | | | | 233,857 | | | | (11 | ) |
5/3/2016 | | | EUR | | | | 269,130 | | | | USD | | | | 306,935 | | | | (15 | ) |
5/3/2016 | | | EUR | | | | 269,135 | | | | USD | | | | 306,935 | | | | (21 | ) |
5/3/2016 | | | EUR | | | | 269,138 | | | | USD | | | | 306,935 | | | | (24 | ) |
5/3/2016 | | | EUR | | | | 269,126 | | | | USD | | | | 306,935 | | | | (11 | ) |
5/3/2016 | | | ILS | | | | 18,899 | | | | USD | | | | 5,029 | | | | — | |
5/3/2016 | | | ILS | | | | 24,800 | | | | USD | | | | 6,599 | | | | (1 | ) |
5/3/2016 | | | ILS | | | | 24,797 | | | | USD | | | | 6,599 | | | | — | |
5/3/2016 | | | ILS | | | | 24,801 | | | | USD | | | | 6,599 | | | | (1 | ) |
5/3/2016 | | | ILS | | | | 24,800 | | | | USD | | | | 6,599 | | | | (1 | ) |
5/3/2016 | | | NOK | | | | 89,490 | | | | USD | | | | 10,817 | | | | (1 | ) |
5/3/2016 | | | NOK | | | | 117,406 | | | | USD | | | | 14,192 | | | | (1 | ) |
5/3/2016 | | | NOK | | | | 117,409 | | | | USD | | | | 14,192 | | | | (1 | ) |
5/3/2016 | | | NOK | | | | 117,408 | | | | USD | | | | 14,192 | | | | (1 | ) |
5/3/2016 | | | NOK | | | | 117,408 | | | | USD | | | | 14,192 | | | | (1 | ) |
5/3/2016 | | | NZD | | | | 7,278 | | | | USD | | | | 5,045 | | | | — | |
5/3/2016 | | | NZD | | | | 9,546 | | | | USD | | | | 6,617 | | | | — | |
5/3/2016 | | | NZD | | | | 9,546 | | | | USD | | | | 6,617 | | | | — | |
5/3/2016 | | | NZD | | | | 9,546 | | | | USD | | | | 6,617 | | | | — | |
5/3/2016 | | | NZD | | | | 9,546 | | | | USD | | | | 6,617 | | | | — | |
5/3/2016 | | | SEK | | | | 285,122 | | | | USD | | | | 35,206 | | | | (1 | ) |
5/3/2016 | | | SEK | | | | 217,242 | | | | USD | | | | 26,824 | | | | (1 | ) |
See Notes to Financial Statements.
| | | | |
| WisdomTree Developed World ex-U.S. and Currency Hedged Equity Funds | | | 93 | |
Schedule of Investments (concluded)
WisdomTree International Hedged Equity Fund (HDWM)
March 31, 2016
| | | | | | | | | | | | | | | | | | | | |
Settlement
Date | | Contracts
To Deliver | | | In
Exchange For | | | Unrealized
Gain (Loss) | |
5/3/2016 | | | SEK | | | | 285,131 | | | | USD | | | | 35,206 | | | $ | (2 | ) |
5/3/2016 | | | SEK | | | | 285,133 | | | | USD | | | | 35,206 | | | | (2 | ) |
5/3/2016 | | | SEK | | | | 285,134 | | | | USD | | | | 35,206 | | | | (3 | ) |
5/4/2016 | | | GBP | | | | 115,197 | | | | USD | | | | 165,579 | | | | (8 | ) |
5/4/2016 | | | GBP | | | | 151,192 | | | | USD | | | | 217,317 | | | | (11 | ) |
5/4/2016 | | | GBP | | | | 151,194 | | | | USD | | | | 217,317 | | | | (14 | ) |
5/4/2016 | | | GBP | | | | 151,194 | | | | USD | | | | 217,317 | | | | (14 | ) |
5/4/2016 | | | GBP | | | | 151,192 | | | | USD | | | | 217,317 | | | | (11 | ) |
5/4/2016 | | | HKD | | | | 318,473 | | | | USD | | | | 41,066 | | | | (2 | ) |
5/4/2016 | | | HKD | | | | 417,978 | | | | USD | | | | 53,895 | | | | (5 | ) |
5/4/2016 | | | HKD | | | | 417,980 | | | | USD | | | | 53,895 | | | | (5 | ) |
5/4/2016 | | | HKD | | | | 417,972 | | | | USD | | | | 53,895 | | | | (4 | ) |
5/4/2016 | | | HKD | | | | 418,009 | | | | USD | | | | 53,895 | | | | (9 | ) |
5/5/2016 | | | SGD | | | | 21,304 | | | | USD | | | | 15,817 | | | | (2 | ) |
5/5/2016 | | | SGD | | | | 27,956 | | | | USD | | | | 20,754 | | | | (5 | ) |
5/5/2016 | | | SGD | | | | 27,956 | | | | USD | | | | 20,754 | | | | (5 | ) |
5/5/2016 | | | SGD | | | | 27,956 | | | | USD | | | | 20,754 | | | | (5 | ) |
5/5/2016 | | | SGD | | | | 27,954 | | | | USD | | | | 20,754 | | | | (4 | ) |
5/9/2016 | | | JPY | | | | 12,132,785 | | | | USD | | | | 108,048 | | | | (10 | ) |
5/9/2016 | | | JPY | | | | 15,924,341 | | | | USD | | | | 141,810 | | | | (17 | ) |
5/9/2016 | | | JPY | | | | 15,924,128 | | | | USD | | | | 141,810 | | | | (15 | ) |
5/9/2016 | | | JPY | | | | 15,924,128 | | | | USD | | | | 141,810 | | | | (15 | ) |
5/9/2016 | | | JPY | | | | 15,924,809 | | | | USD | | | | 141,810 | | | | (21 | ) |
| | | | | | | | | | | | | | | | | | | $ | (164,819 | ) |
AUD – Australian dollar
CHF – Swiss franc
DKK – Danish krone
EUR – Euro
GBP – British pound
HKD – Hong Kong dollar
ILS – Israeli New shekel
JPY – Japanese yen
NOK – Norwegian krone
NZD – New Zealand dollar
SEK – Swedish krona
SGD – Singapore dollar
USD – U.S. dollar
See Notes to Financial Statements.
| | |
| 94 | | WisdomTree Developed World ex-U.S. and Currency Hedged Equity Funds |
Schedule of Investments
WisdomTree International Hedged Quality Dividend Growth Fund (IHDG)
March 31, 2016
| | | | | | | | |
| Investments | | Shares | | | Value | |
| COMMON STOCKS – 100.2% | | | | | | | | |
| Australia – 6.9% | | | | | | | | |
Brambles Ltd. | | | 467,488 | | | $ | 4,358,534 | |
carsales.com Ltd.(a) | | | 112,283 | | | | 1,015,754 | |
CSL Ltd. | | | 88,168 | | | | 6,879,986 | |
Domino’s Pizza Enterprises Ltd. | | | 13,432 | | | | 593,916 | |
Incitec Pivot Ltd. | | | 716,547 | | | | 1,758,339 | |
JB Hi-Fi Ltd.(a) | | | 50,751 | | | | 920,568 | |
Platinum Asset Management Ltd. | | | 314,984 | | | | 1,538,613 | |
Ramsay Health Care Ltd. | | | 35,164 | | | | 1,659,782 | |
REA Group Ltd.(a) | | | 27,689 | | | | 1,150,826 | |
Seek Ltd.(a) | | | 82,171 | | | | 1,022,738 | |
Telstra Corp., Ltd. | | | 6,937,365 | | | | 28,443,897 | |
TPG Telecom Ltd. | | | 119,759 | | | | 1,044,693 | |
| | | | | | | | |
| Total Australia | | | | | | | 50,387,646 | |
| Belgium – 0.1% | | | | | | | | |
Melexis N.V. | | | 11,887 | | | | 647,491 | |
| China – 2.0% | | | | | | | | |
China Everbright International Ltd. | | | 370,000 | | | | 413,096 | |
China Overseas Land & Investment Ltd. | | | 2,110,000 | | | | 6,678,291 | |
China South City Holdings Ltd.(a) | | | 3,973,500 | | | | 819,643 | |
CITIC Telecom International Holdings Ltd. | | | 1,248,000 | | | | 469,817 | |
CSPC Pharmaceutical Group Ltd. | | | 1,298,000 | | | | 1,174,744 | |
Fosun International Ltd. | | | 435,679 | | | | 620,108 | |
Guangdong Investment Ltd. | | | 2,048,000 | | | | 2,590,182 | |
Guotai Junan International Holdings Ltd. | | | 899,000 | | | | 315,254 | |
Lenovo Group Ltd. | | | 1,812,500 | | | | 1,411,388 | |
| | | | | | | | |
| Total China | | | | | | | 14,492,523 | |
| Denmark – 4.3% | | | | | | | | |
Chr Hansen Holding A/S | | | 21,875 | | | | 1,470,836 | |
Coloplast A/S Class B | | | 64,031 | | | | 4,859,655 | |
Novo Nordisk A/S Class B | | | 392,370 | | | | 21,317,053 | |
Novozymes A/S Class B | | | 39,111 | | | | 1,761,145 | |
Pandora A/S | | | 18,200 | | | | 2,387,063 | |
| | | | | | | | |
| Total Denmark | | | | | | | 31,795,752 | |
| Finland – 1.9% | | | | | | | | |
Caverion Corp. | | | 56,058 | | | | 543,626 | |
Kone Oyj Class B | | | 193,098 | | | | 9,321,103 | |
Konecranes Oyj(a) | | | 27,361 | | | | 654,140 | |
Uponor Oyj | | | 38,049 | | | | 553,258 | |
Wartsila Oyj Abp | | | 69,722 | | | | 3,159,796 | |
| | | | | | | | |
| Total Finland | | | | | | | 14,231,923 | |
| France – 6.7% | | | | | | | | |
Bureau Veritas S.A. | | | 125,124 | | | | 2,791,104 | |
Cie Generale des Etablissements Michelin | | | 47,618 | | | | 4,879,882 | |
Dassault Systemes | | | 22,349 | | | | 1,775,871 | |
Essilor International S.A. | | | 24,394 | | | | 3,017,494 | |
Gaztransport Et Technigaz S.A. | | | 7,457 | | | | 244,392 | |
Hermes International | | | 7,792 | | | | 2,747,723 | |
Ingenico Group S.A. | | | 7,576 | | | | 871,525 | |
L’Oreal S.A. | | | 94,102 | | | | 16,883,990 | |
SEB S.A. | | | 10,097 | | | | 1,048,891 | |
Societe BIC S.A. | | | 11,517 | | | | 1,735,020 | |
Societe Television Francaise 1 | | | 15,010 | | | | 194,651 | |
Sodexo S.A. | | | 31,166 | | | | 3,364,713 | |
Tarkett S.A. | | | 21,011 | | | | 659,632 | |
Teleperformance | | | 12,603 | | | $ | 1,109,589 | |
Thales S.A. | | | 52,454 | | | | 4,602,597 | |
Valeo S.A. | | | 14,247 | | | | 2,220,972 | |
Zodiac Aerospace | | | 42,018 | | | | 843,195 | |
| | | | | | | | |
| Total France | | | | | | | 48,991,241 | |
| Germany – 7.2% | | | | | | | | |
Axel Springer SE | | | 39,978 | | | | 2,158,033 | |
Brenntag AG | | | 39,137 | | | | 2,238,849 | |
Continental AG | | | 30,358 | | | | 6,918,895 | |
Duerr AG | | | 10,637 | | | | 837,225 | |
Evonik Industries AG | | | 136,338 | | | | 4,096,173 | |
Fielmann AG | | | 26,205 | | | | 1,991,790 | |
Hugo Boss AG | | | 27,853 | | | | 1,829,488 | |
Infineon Technologies AG | | | 231,652 | | | | 3,301,059 | |
MTU Aero Engines AG | | | 14,310 | | | | 1,374,514 | |
ProSiebenSat.1 Media SE | | | 87,050 | | | | 4,482,256 | |
RHOEN-KLINIKUM AG | | | 38,657 | | | | 1,204,811 | |
SAP SE | | | 236,537 | | | | 19,164,710 | |
Symrise AG | | | 21,528 | | | | 1,447,402 | |
United Internet AG Registered Shares | | | 36,778 | | | | 1,848,458 | |
| | | | | | | | |
| Total Germany | | | | | | | 52,893,663 | |
| Hong Kong – 3.0% | | | | | | | | |
Chong Hing Bank Ltd. | | | 129,000 | | | | 262,772 | |
Hong Kong Exchanges and Clearing Ltd. | | | 186,700 | | | | 4,496,272 | |
Power Assets Holdings Ltd. | | | 927,500 | | | | 9,488,384 | |
Techtronic Industries Co., Ltd. | | | 238,000 | | | | 940,457 | |
Wharf Holdings Ltd. (The) | | | 1,217,000 | | | | 6,652,545 | |
| | | | | | | | |
| Total Hong Kong | | | | | | | 21,840,430 | |
| Indonesia – 0.1% | | | | | | | | |
Bumitama Agri Ltd. | | | 549,100 | | | | 379,224 | |
| Ireland – 0.3% | | | | | | | | |
Greencore Group PLC | | | 129,559 | | | | 698,307 | |
Paddy Power Betfair PLC | | | 12,467 | | | | 1,741,750 | |
| | | | | | | | |
| Total Ireland | | | | | | | 2,440,057 | |
| Israel – 1.4% | | | | | | | | |
Bezeq Israeli Telecommunication Corp., Ltd. | | | 3,729,129 | | | | 8,406,535 | |
Israel Chemicals Ltd. | | | 499,491 | | | | 2,172,278 | |
| | | | | | | | |
| Total Israel | | | | | | | 10,578,813 | |
| Italy – 1.5% | | | | | | | | |
De’ Longhi SpA | | | 33,132 | | | | 755,112 | |
Industria Macchine Automatiche SpA | | | 16,080 | | | | 944,601 | |
Luxottica Group SpA | | | 119,426 | | | | 6,600,460 | |
Recordati SpA | | | 77,501 | | | | 1,942,958 | |
Salvatore Ferragamo SpA(a) | | | 31,227 | | | | 799,233 | |
| | | | | | | | |
| Total Italy | | | | | | | 11,042,364 | |
| Japan – 13.7% | | | | | | | | |
ABC-Mart, Inc. | | | 11,900 | | | | 763,370 | |
Astellas Pharma, Inc. | | | 457,500 | | | | 6,091,452 | |
Bandai Namco Holdings, Inc. | | | 56,700 | | | | 1,237,972 | |
Casio Computer Co., Ltd.(a) | | | 46,400 | | | | 937,536 | |
Chugai Pharmaceutical Co., Ltd. | | | 81,100 | | | | 2,514,645 | |
CyberAgent, Inc.(a) | | | 8,200 | | | | 381,565 | |
Daikin Industries Ltd. | | | 37,700 | | | | 2,821,588 | |
Daito Trust Construction Co., Ltd. | | | 32,000 | | | | 4,549,669 | |
See Notes to Financial Statements.
| | | | |
| WisdomTree Developed World ex-U.S. and Currency Hedged Equity Funds | | | 95 | |
Schedule of Investments (continued)
WisdomTree International Hedged Quality Dividend Growth Fund (IHDG)
March 31, 2016
| | | | | | | | |
| Investments | | Shares | | | Value | |
Fast Retailing Co., Ltd. | | | 5,500 | | | $ | 1,762,623 | |
Fuji Heavy Industries Ltd. | | | 121,500 | | | | 4,297,011 | |
Hino Motors Ltd. | | | 181,000 | | | | 1,959,847 | |
Hoya Corp. | | | 80,600 | | | | 3,069,964 | |
Isuzu Motors Ltd. | | | 186,500 | | | | 1,928,137 | |
ITOCHU Corp. | | | 520,300 | | | | 6,416,084 | |
Japan Tobacco, Inc. | | | 511,200 | | | | 21,331,269 | |
KDDI Corp. | | | 622,000 | | | | 16,635,366 | |
Keyence Corp. | | | 2,400 | | | | 1,310,877 | |
Koito Manufacturing Co., Ltd. | | | 12,700 | | | | 576,271 | |
Kuraray Co., Ltd. | | | 104,600 | | | | 1,280,569 | |
Minebea Co., Ltd.(a) | | | 58,000 | | | | 453,081 | |
Murata Manufacturing Co., Ltd. | | | 22,340 | | | | 2,697,218 | |
Nexon Co., Ltd. | | | 43,400 | | | | 740,999 | |
Nippon Paint Holdings Co., Ltd.(a) | | | 26,100 | | | | 579,845 | |
Nitori Holdings Co., Ltd. | | | 7,400 | | | | 678,802 | |
Nitto Denko Corp.(a) | | | 18,500 | | | | 1,029,890 | |
NOK Corp. | | | 8,400 | | | | 143,643 | |
Omron Corp. | | | 45,300 | | | | 1,350,194 | |
Sanrio Co., Ltd.(a) | | | 32,500 | | | | 636,439 | |
SCSK Corp. | | | 25,500 | | | | 998,265 | |
Shionogi & Co., Ltd. | | | 50,900 | | | | 2,398,837 | |
Sundrug Co., Ltd. | | | 7,600 | | | | 569,349 | |
Sysmex Corp. | | | 12,500 | | | | 782,953 | |
Trend Micro, Inc. | | | 46,100 | | | | 1,689,862 | |
Unicharm Corp. | | | 20,000 | | | | 435,785 | |
Yahoo Japan Corp.(a) | | | 1,178,200 | | | | 5,021,200 | |
| | | | | | | | |
| Total Japan | | | | | | | 100,072,177 | |
| Netherlands – 2.8% | | | | | | | | |
Aalberts Industries N.V. | | | 26,546 | | | | 922,338 | |
ASML Holding N.V. | | | 38,275 | | | | 3,894,063 | |
Euronext N.V.(b) | | | 22,630 | | | | 941,005 | |
Heineken N.V. | | | 97,994 | | | | 8,894,444 | |
Koninklijke Ahold N.V. | | | 251,241 | | | | 5,660,187 | |
| | | | | | | | |
| Total Netherlands | | | | | | | 20,312,037 | |
| New Zealand – 1.0% | | | | | | | | |
Fisher & Paykel Healthcare Corp., Ltd. | | | 195,098 | | | | 1,327,474 | |
Mainfreight Ltd. | | | 29,413 | | | | 323,884 | |
Ryman Healthcare Ltd. | | | 79,788 | | | | 462,563 | |
Spark New Zealand Ltd. | | | 2,035,663 | | | | 5,158,765 | |
| | | | | | | | |
| Total New Zealand | | | | | | | 7,272,686 | |
| Norway – 1.7% | | | | | | | | |
Kongsberg Gruppen ASA | | | 51,134 | | | | 840,771 | |
Telenor ASA | | | 341,653 | | | | 5,530,886 | |
Veidekke ASA | | | 83,173 | | | | 1,131,263 | |
Yara International ASA | | | 120,955 | | | | 4,553,772 | |
| | | | | | | | |
| Total Norway | | | | | | | 12,056,692 | |
| Portugal – 0.3% | | | | | | | | |
Jeronimo Martins, SGPS, S.A. | | | 142,197 | | | | 2,330,145 | |
| Singapore – 0.8% | | | | | | | | |
First Resources Ltd.(a) | | | 535,300 | | | | 802,990 | |
M1 Ltd.(a) | | | 764,300 | | | | 1,475,702 | |
Raffles Medical Group Ltd.(a) | | | 132,200 | | | | 442,761 | |
Singapore Exchange Ltd. | | | 526,200 | | | | 3,106,557 | |
| | | | | | | | |
| Total Singapore | | | | | | | 5,828,010 | |
| Spain – 4.3% | | | | | | | | |
Abertis Infraestructuras S.A.(a) | | | 467,928 | | | $ | 7,705,138 | |
Amadeus IT Holding S.A. Class A | | | 96,152 | | | | 4,129,695 | |
Atresmedia Corp. de Medios de Comunicaion S.A.(a) | | | 28,171 | | | | 309,145 | |
Distribuidora Internacional de Alimentacion S.A.* | | | 178,484 | | | | 928,686 | |
Industria de Diseno Textil S.A. | | | 510,418 | | | | 17,196,396 | |
Prosegur Cia de Seguridad S.A. | | | 177,508 | | | | 1,001,283 | |
| | | | | | | | |
| Total Spain | | | | | | | 31,270,343 | |
| Sweden – 6.6% | | | | | | | | |
Alfa Laval AB | | | 139,970 | | | | 2,294,647 | |
Assa Abloy AB Class B | | | 184,412 | | | | 3,644,245 | |
Atlas Copco AB Class A | | | 197,313 | | | | 4,972,559 | |
Axfood AB | | | 85,358 | | | | 1,579,397 | |
Boliden AB | | | 60,688 | | | | 972,452 | |
Getinge AB Class B(a) | | | 38,933 | | | | 898,561 | |
Hennes & Mauritz AB Class B | | | 483,582 | | | | 16,147,834 | |
Hexagon AB Class B | | | 50,041 | | | | 1,950,604 | |
Loomis AB Class B | | | 24,575 | | | | 695,716 | |
Modern Times Group MTG AB Class B | | | 33,607 | | | | 1,008,206 | |
NCC AB Class B | | | 52,242 | | | | 1,905,579 | |
Sandvik AB(a) | | | 510,595 | | | | 5,290,683 | |
SKF AB Class B(a) | | | 143,064 | | | | 2,587,142 | |
Tele2 AB Class B | | | 179,241 | | | | 1,664,900 | |
Trelleborg AB Class B | | | 92,111 | | | | 1,824,790 | |
Wihlborgs Fastigheter AB | | | 39,339 | | | | 836,597 | |
| | | | | | | | |
| Total Sweden | | | | | | | 48,273,912 | |
| Switzerland – 9.9% | | | | | | | | |
ABB Ltd. Registered Shares* | | | 670,257 | | | | 13,116,082 | |
Actelion Ltd. Registered Shares* | | | 13,185 | | | | 1,978,473 | |
Adecco S.A. Registered Shares* | | | 60,367 | | | | 3,949,243 | |
Cie Financiere Richemont S.A. Registered Shares | | | 104,265 | | | | 6,919,063 | |
Geberit AG Registered Shares | | | 11,449 | | | | 4,295,542 | |
Georg Fischer AG Registered Shares | | | 1,599 | | | | 1,297,367 | |
Partners Group Holding AG | | | 9,780 | | | | 3,947,131 | |
Roche Holding AG Genusschein | | | 139,103 | | | | 34,381,747 | |
Sonova Holding AG Registered Shares | | | 13,269 | | | | 1,701,491 | |
Straumann Holding AG Registered Shares | | | 3,539 | | | | 1,225,060 | |
| | | | | | | | |
| Total Switzerland | | | | | | | 72,811,199 | |
| United Kingdom – 23.7% | | | | | | | | |
Aggreko PLC | | | 69,614 | | | | 1,077,605 | |
ARM Holdings PLC | | | 107,915 | | | | 1,572,777 | |
Ashmore Group PLC(a) | | | 502,632 | | | | 2,077,717 | |
Ashtead Group PLC | | | 76,025 | | | | 944,099 | |
AVEVA Group PLC | | | 16,301 | | | | 369,013 | |
Babcock International Group PLC | | | 130,940 | | | | 1,786,960 | |
BBA Aviation PLC | | | 353,459 | | | | 1,018,085 | |
Bellway PLC | | | 35,809 | | | | 1,350,013 | |
Berkeley Group Holdings PLC | | | 81,167 | | | | 3,754,161 | |
Bodycote PLC | | | 82,906 | | | | 719,135 | |
Booker Group PLC | | | 377,895 | | | | 935,845 | |
Bovis Homes Group PLC | | | 22,090 | | | | 295,751 | |
British American Tobacco PLC | | | 652,790 | | | | 38,374,631 | |
Britvic PLC | | | 111,145 | | | | 1,135,015 | |
Burberry Group PLC | | | 93,978 | | | | 1,843,768 | |
See Notes to Financial Statements.
| | |
| 96 | | WisdomTree Developed World ex-U.S. and Currency Hedged Equity Funds |
Schedule of Investments (continued)
WisdomTree International Hedged Quality Dividend Growth Fund (IHDG)
March 31, 2016
| | | | | | | | |
| Investments | | Shares | | | Value | |
Compass Group PLC | | | 435,043 | | | $ | 7,678,528 | |
Crest Nicholson Holdings PLC | | | 86,518 | | | | 700,104 | |
Croda International PLC | | | 42,226 | | | | 1,844,413 | |
Daily Mail & General Trust PLC Class A Non-Voting Shares | | | 48,310 | | | | 483,274 | |
Derwent London PLC | | | 17,024 | | | | 771,250 | |
Drax Group PLC(a) | | | 94,016 | | | | 367,687 | |
Dunelm Group PLC | | | 68,343 | | | | 897,326 | |
easyJet PLC | | | 115,474 | | | | 2,521,096 | |
Essentra PLC | | | 70,491 | | | | 838,396 | |
Fresnillo PLC | | | 27,357 | | | | 374,525 | |
Galliford Try PLC | | | 48,454 | | | | 999,376 | |
Go-Ahead Group PLC | | | 23,652 | | | | 900,868 | |
Hargreaves Lansdown PLC | | | 158,573 | | | | 3,063,204 | |
Hays PLC | | | 408,679 | | | | 710,747 | |
Howden Joinery Group PLC | | | 157,625 | | | | 1,083,157 | |
IMI PLC | | | 133,780 | | | | 1,831,486 | |
Inmarsat PLC | | | 186,710 | | | | 2,641,987 | |
Interserve PLC | | | 28,150 | | | | 175,515 | |
ITV PLC | | | 793,233 | | | | 2,749,954 | |
Melrose Industries PLC | | | 121,600 | | | | 623,075 | |
Moneysupermarket.com Group PLC | | | 231,152 | | | | 1,055,510 | |
N Brown Group PLC | | | 134,774 | | | | 633,046 | |
Next PLC | | | 24,396 | | | | 1,893,476 | |
Reckitt Benckiser Group PLC | | | 199,566 | | | | 19,304,076 | |
RELX N.V. | | | 313,677 | | | | 5,485,082 | |
Renishaw PLC | | | 10,033 | | | | 264,615 | |
Rightmove PLC | | | 17,819 | | | | 1,078,490 | |
Smith & Nephew PLC | | | 199,264 | | | | 3,287,897 | |
Taylor Wimpey PLC | | | 1,693,338 | | | | 4,631,587 | |
Unilever N.V. CVA | | | 557,134 | | | | 25,004,840 | |
Unilever PLC | | | 446,130 | | | | 20,214,543 | |
Whitbread PLC | | | 40,848 | | | | 2,324,949 | |
| | | | | | | | |
| Total United Kingdom | | | | | | | 173,688,654 | |
TOTAL COMMON STOCKS (Cost: $730,994,498) | | | | | | | 733,636,982 | |
| INVESTMENT OF CASH COLLATERAL FOR SECURITIES LOANED – 2.7% | |
| United States – 2.7% | | | | | | | | |
State Street Navigator Securities Lending Prime Portfolio, 0.50%(c) | | | | | | | | |
| (Cost: $19,354,354)(d) | | | 19,354,354 | | | | 19,354,354 | |
TOTAL INVESTMENTS IN SECURITIES – 102.9% (Cost: $750,348,852) | | | | 752,991,336 | |
Liabilities in Excess of Cash, Foreign Currency and Other Assets – (2.9)% | | | | | | | (20,941,405 | ) |
| | | | | | | | |
| NET ASSETS – 100.0% | | | | | | $ | 732,049,931 | |
| * | Non-income producing security. |
| (a) | Security, or portion thereof, was on loan at March 31, 2016 (See Note 2). |
| (b) | This security is exempt from registration under rule 144A of the Securities Act of 1933. This security may be sold in transactions that are exempt from registration, normally to qualified institutional buyers. |
| (c) | Rate shown represents annualized 7-day yield as of March 31, 2016. |
| (d) | At March 31, 2016, the total market value of the Fund’s securities on loan was $20,016,975 and the total market value of the collateral held by the Fund was $21,592,381. The total market value of the collateral includes non-cash U.S. Government securities collateral having a value of $2,238,027. |
CVA – Certificaten Van Aandelen (Certificate of Stock)
| | | | | | | | | | | | | | | | | | | | |
| FINANCIAL DERIVATIVE INSTRUMENTS | |
| FORWARD CONTRACTS | |
Settlement
Date | | Contracts
To Deliver | | | In
Exchange For | | | Unrealized
Gain (Loss) | |
4/4/2016 | | | AUD | | | | 13,894,092 | | | | USD | | | | 9,909,155 | | | $ | (778,871 | ) |
4/4/2016 | | | AUD | | | | 10,586,336 | | | | USD | | | | 7,549,836 | | | | (593,700 | ) |
4/4/2016 | | | AUD | | | | 13,894,325 | | | | USD | | | | 9,909,155 | | | | (779,051 | ) |
4/4/2016 | | | AUD | | | | 13,893,546 | | | | USD | | | | 9,909,155 | | | | (778,451 | ) |
4/4/2016 | | | AUD | | | | 13,894,910 | | | | USD | | | | 9,909,155 | | | | (779,500 | ) |
4/4/2016 | | | AUD | | | | 566,364 | | | | USD | | | | 419,063 | | | | (16,612 | ) |
4/4/2016 | | | AUD | | | | 109,980 | | | | USD | | | | 83,813 | | | | (789 | ) |
4/4/2016 | | | CHF | | | | 15,317,980 | | | | USD | | | | 15,403,795 | | | | (591,590 | ) |
4/4/2016 | | | CHF | | | | 15,317,072 | | | | USD | | | | 15,403,795 | | | | (590,641 | ) |
4/4/2016 | | | CHF | | | | 15,318,150 | | | | USD | | | | 15,403,795 | | | | (591,767 | ) |
4/4/2016 | | | CHF | | | | 11,670,749 | | | | USD | | | | 11,736,225 | | | | (450,637 | ) |
4/4/2016 | | | CHF | | | | 15,318,304 | | | | USD | | | | 15,403,795 | | | | (591,928 | ) |
4/4/2016 | | | CHF | | | | 646,400 | | | | USD | | | | 651,433 | | | | (23,553 | ) |
4/4/2016 | | | CHF | | | | 126,401 | | | | USD | | | | 130,287 | | | | (1,704 | ) |
4/4/2016 | | | DKK | | | | 45,009,755 | | | | USD | | | | 6,563,842 | | | | (320,541 | ) |
4/4/2016 | | | DKK | | | | 34,296,536 | | | | USD | | | | 5,001,026 | | | | (244,737 | ) |
4/4/2016 | | | DKK | | | | 45,013,516 | | | | USD | | | | 6,563,842 | | | | (321,117 | ) |
4/4/2016 | | | DKK | | | | 45,009,866 | | | | USD | | | | 6,563,842 | | | | (320,559 | ) |
4/4/2016 | | | DKK | | | | 45,008,665 | | | | USD | | | | 6,563,842 | | | | (320,375 | ) |
4/4/2016 | | | DKK | | | | 1,880,112 | | | | USD | | | | 277,588 | | | | (9,981 | ) |
4/4/2016 | | | DKK | | | | 368,599 | | | | USD | | | | 55,518 | | | | (860 | ) |
4/4/2016 | | | EUR | | | | 39,379,638 | | | | USD | | | | 42,829,885 | | | | (2,045,201 | ) |
4/4/2016 | | | EUR | | | | 39,378,914 | | | | USD | | | | 42,829,885 | | | | (2,044,376 | ) |
4/4/2016 | | | EUR | | | | 30,004,200 | | | | USD | | | | 32,632,298 | | | | (1,559,003 | ) |
4/4/2016 | | | EUR | | | | 39,380,543 | | | | USD | | | | 42,829,885 | | | | (2,046,232 | ) |
4/4/2016 | | | EUR | | | | 39,379,819 | | | | USD | | | | 42,829,885 | | | | (2,045,407 | ) |
4/4/2016 | | | EUR | | | | 1,644,270 | | | | USD | | | | 1,811,295 | | | | (62,434 | ) |
4/4/2016 | | | EUR | | | | 322,560 | | | | USD | | | | 362,259 | | | | (5,315 | ) |
4/4/2016 | | | GBP | | | | 15,933,149 | | | | USD | | | | 22,206,747 | | | | (693,967 | ) |
4/4/2016 | | | GBP | | | | 20,912,858 | | | | USD | | | | 29,146,355 | | | | (911,695 | ) |
4/4/2016 | | | GBP | | | | 20,913,158 | | | | USD | | | | 29,146,355 | | | | (912,126 | ) |
4/4/2016 | | | GBP | | | | 20,912,798 | | | | USD | | | | 29,146,355 | | | | (911,609 | ) |
4/4/2016 | | | GBP | | | | 20,911,583 | | | | USD | | | | 29,146,355 | | | | (909,862 | ) |
4/4/2016 | | | GBP | | | | 867,060 | | | | USD | | | | 1,232,613 | | | | (13,613 | ) |
4/4/2016 | | | GBP | | | | 173,390 | | | | USD | | | | 246,523 | | | | (2,691 | ) |
4/4/2016 | | | ILS | | | | 8,686,740 | | | | USD | | | | 2,227,456 | | | | (83,154 | ) |
4/4/2016 | | | ILS | | | | 8,685,007 | | | | USD | | | | 2,227,456 | | | | (82,693 | ) |
4/4/2016 | | | ILS | | | | 8,686,254 | | | | USD | | | | 2,227,456 | | | | (83,025 | ) |
4/4/2016 | | | ILS | | | | 6,617,668 | | | | USD | | | | 1,697,110 | | | | (63,142 | ) |
4/4/2016 | | | ILS | | | | 8,686,633 | | | | USD | | | | 2,227,456 | | | | (83,126 | ) |
4/4/2016 | | | ILS | | | | 368,112 | | | | USD | | | | 94,200 | | | | (3,715 | ) |
4/4/2016 | | | ILS | | | | 72,390 | | | | USD | | | | 18,840 | | | | (415 | ) |
4/4/2016 | | | JPY | | | | 51,570,000 | | | | DKK | | | | 3,000,000 | | | | 31 | |
4/4/2016 | | | JPY | | | | 256,234,000 | | | | EUR | | | | 2,000,000 | | | | (662 | ) |
4/4/2016 | | | JPY | | | | 23,027,829 | | | | NOK | | | | 1,690,302 | | | | (524 | ) |
4/4/2016 | | | NOK | | | | 16,457,185 | | | | USD | | | | 1,887,346 | | | | (102,339 | ) |
4/4/2016 | | | NOK | | | | 21,600,378 | | | | USD | | | | 2,477,136 | | | | (134,365 | ) |
4/4/2016 | | | NOK | | | | 21,599,102 | | | | USD | | | | 2,477,136 | | | | (134,211 | ) |
4/4/2016 | | | NOK | | | | 21,598,788 | | | | USD | | | | 2,477,136 | | | | (134,173 | ) |
4/4/2016 | | | NOK | | | | 21,600,666 | | | | USD | | | | 2,477,136 | | | | (134,400 | ) |
4/4/2016 | | | NOK | | | | 893,839 | | | | USD | | | | 104,759 | | | | (3,307 | ) |
4/4/2016 | | | NOK | | | | 176,097 | | | | USD | | | | 20,952 | | | | (338 | ) |
4/4/2016 | | | NZD | | | | 2,105,388 | | | | USD | | | | 1,385,400 | | | | (76,370 | ) |
4/4/2016 | | | NZD | | | | 1,604,088 | | | | USD | | | | 1,055,543 | | | | (58,175 | ) |
4/4/2016 | | | NZD | | | | 2,105,583 | | | | USD | | | | 1,385,400 | | | | (76,506 | ) |
4/4/2016 | | | NZD | | | | 2,105,375 | | | | USD | | | | 1,385,400 | | | | (76,362 | ) |
See Notes to Financial Statements.
| | | | |
| WisdomTree Developed World ex-U.S. and Currency Hedged Equity Funds | | | 97 | |
Schedule of Investments (continued)
WisdomTree International Hedged Quality Dividend Growth Fund (IHDG)
March 31, 2016
| | | | | | | | | | | | | | | | | | | | |
Settlement
Date | | Contracts
To Deliver | | | In
Exchange For | | | Unrealized
Gain (Loss) | |
4/4/2016 | | | NZD | | | | 2,105,417 | | | | USD | | | | 1,385,400 | | | $ | (76,390 | ) |
4/4/2016 | | | NZD | | | | 86,436 | | | | USD | | | | 58,589 | | | | (1,423 | ) |
4/4/2016 | | | NZD | | | | 17,348 | | | | USD | | | | 11,718 | | | | (327 | ) |
4/4/2016 | | | SEK | | | | 82,633,379 | | | | USD | | | | 9,632,413 | | | | (560,807 | ) |
4/4/2016 | | | SEK | | | | 82,634,612 | | | | USD | | | | 9,632,413 | | | | (560,959 | ) |
4/4/2016 | | | SEK | | | | 62,873,059 | | | | USD | | | | 7,338,982 | | | | (416,709 | ) |
4/4/2016 | | | SEK | | | | 82,638,398 | | | | USD | | | | 9,632,413 | | | | (561,426 | ) |
4/4/2016 | | | SEK | | | | 82,627,513 | | | | USD | | | | 9,632,413 | | | | (560,084 | ) |
4/4/2016 | | | SEK | | | | 3,451,191 | | | | USD | | | | 407,359 | | | | (18,362 | ) |
4/4/2016 | | | SEK | | | | 669,645 | | | | USD | | | | 81,472 | | | | (1,132 | ) |
4/4/2016 | | | USD | | | | 72,227 | | | | AUD | | | | 95,154 | | | | 970 | |
4/4/2016 | | | USD | | | | 9,999,592 | | | | AUD | | | | 12,999,483 | | | | 256 | |
4/4/2016 | | | USD | | | | 995,722 | | | | AUD | | | | 1,300,000 | | | | 4,303 | |
4/4/2016 | | | USD | | | | 9,999,592 | | | | AUD | | | | 12,999,483 | | | | 256 | |
4/4/2016 | | | USD | | | | 9,999,592 | | | | AUD | | | | 12,999,145 | | | | (4 | ) |
4/4/2016 | | | USD | | | | 7,618,737 | | | | AUD | | | | 9,904,613 | | | | 383 | |
4/4/2016 | | | USD | | | | 9,999,592 | | | | AUD | | | | 12,999,516 | | | | 282 | |
4/4/2016 | | | USD | | | | 112,277 | | | | CHF | | | | 108,603 | | | | 1,128 | |
4/4/2016 | | | USD | | | | 15,544,378 | | | | CHF | | | | 14,885,763 | | | | (325 | ) |
4/4/2016 | | | USD | | | | 15,544,378 | | | | CHF | | | | 14,885,607 | | | | (487 | ) |
4/4/2016 | | | USD | | | | 15,544,378 | | | | CHF | | | | 14,886,074 | | | | — | |
4/4/2016 | | | USD | | | | 11,843,336 | | | | CHF | | | | 11,342,339 | | | | 594 | |
4/4/2016 | | | USD | | | | 15,544,378 | | | | CHF | | | | 14,885,638 | | | | (455 | ) |
4/4/2016 | | | USD | | | | 47,843 | | | | DKK | | | | 316,628 | | | | 586 | |
4/4/2016 | | | USD | | | | 6,623,747 | | | | DKK | | | | 43,306,787 | | | | 162 | |
4/4/2016 | | | USD | | | | 5,046,669 | | | | DKK | | | | 32,998,170 | | | | 505 | |
4/4/2016 | | | USD | | | | 6,623,747 | | | | DKK | | | | 43,303,541 | | | | (334 | ) |
4/4/2016 | | | USD | | | | 6,623,747 | | | | DKK | | | | 43,305,727 | | | | — | |
4/4/2016 | | | USD | | | | 6,623,747 | | | | DKK | | | | 43,307,886 | | | | 330 | |
4/4/2016 | | | USD | | | | 312,183 | | | | EUR | | | | 277,146 | | | | 3,639 | |
4/4/2016 | | | USD | | | | 43,220,773 | | | | EUR | | | | 37,928,929 | | | | 1,157 | |
4/4/2016 | | | USD | | | | 43,220,773 | | | | EUR | | | | 37,929,828 | | | | 2,181 | |
4/4/2016 | | | USD | | | | 43,220,773 | | | | EUR | | | | 37,928,929 | | | | 1,157 | |
4/4/2016 | | | USD | | | | 32,930,117 | | | | EUR | | | | 28,898,920 | | | | 1,661 | |
4/4/2016 | | | USD | | | | 43,220,773 | | | | EUR | | | | 37,928,496 | | | | 663 | |
4/4/2016 | | | USD | | | | 212,445 | | | | GBP | | | | 147,506 | | | | (435 | ) |
4/4/2016 | | | USD | | | | 29,412,360 | | | | GBP | | | | 20,464,189 | | | | 817 | |
4/4/2016 | | | USD | | | | 29,412,360 | | | | GBP | | | | 20,463,619 | | | | (1 | ) |
4/4/2016 | | | USD | | | | 29,412,360 | | | | GBP | | | | 20,464,189 | | | | 817 | |
4/4/2016 | | | USD | | | | 22,409,418 | | | | GBP | | | | 15,592,089 | | | | 1,091 | |
4/4/2016 | | | USD | | | | 29,412,360 | | | | GBP | | | | 20,464,232 | | | | 879 | |
4/4/2016 | | | USD | | | | 16,236 | | | | ILS | | | | 62,508 | | | | 391 | |
4/4/2016 | | | USD | | | | 2,247,784 | | | | ILS | | | | 8,450,746 | | | | 54 | |
4/4/2016 | | | USD | | | | 1,712,602 | | | | ILS | | | | 6,439,169 | | | | 171 | |
4/4/2016 | | | USD | | | | 2,247,784 | | | | ILS | | | | 8,450,544 | | | | — | |
4/4/2016 | | | USD | | | | 2,247,784 | | | | ILS | | | | 8,450,971 | | | | 114 | |
4/4/2016 | | | USD | | | | 2,247,784 | | | | ILS | | | | 8,451,135 | | | | 157 | |
4/4/2016 | | | USD | | | | 18,056 | | | | NOK | | | | 151,623 | | | | 275 | |
4/4/2016 | | | USD | | | | 2,499,744 | | | | NOK | | | | 20,676,533 | | | | 63 | |
4/4/2016 | | | USD | | | | 1,904,569 | | | | NOK | | | | 15,754,741 | | | | 190 | |
4/4/2016 | | | USD | | | | 2,499,744 | | | | NOK | | | | 20,676,633 | | | | 76 | |
4/4/2016 | | | USD | | | | 2,499,744 | | | | NOK | | | | 20,676,008 | | | | — | |
4/4/2016 | | | USD | | | | 2,499,744 | | | | NOK | | | | 20,677,040 | | | | 125 | |
4/4/2016 | | | USD | | | | 10,098 | | | | NZD | | | | 14,942 | | | | 276 | |
4/4/2016 | | | USD | | | | 1,398,043 | | | | NZD | | | | 2,013,659 | | | | 40 | |
4/4/2016 | | | USD | | | | 1,065,180 | | | | NZD | | | | 1,534,026 | | | | (106 | ) |
4/4/2016 | | | USD | | | | 1,398,043 | | | | NZD | | | | 2,013,659 | | | | 40 | |
4/4/2016 | | | USD | | | | 1,398,043 | | | | NZD | | | | 2,013,601 | | | | — | |
4/4/2016 | | | USD | | | | 1,398,043 | | | | NZD | | | | 2,013,659 | | | | 40 | |
4/4/2016 | | | USD | | | | 70,210 | | | | SEK | | | | 576,836 | | | | 945 | |
4/4/2016 | | | USD | | | | 9,720,323 | | | | SEK | | | | 78,801,687 | | | | 240 | |
4/4/2016 | | | USD | | | | 7,405,963 | | | | SEK | | | | 60,043,919 | | | | 740 | |
4/4/2016 | | | USD | | | | 9,720,323 | | | | SEK | | | | 78,802,075 | | | | 288 | |
4/4/2016 | | | USD | | | | 9,720,323 | | | | SEK | | | | 78,799,742 | | | | — | |
4/4/2016 | | | USD | | | | 9,720,323 | | | | SEK | | | | 78,800,384 | | | | 79 | |
4/5/2016 | | | HKD | | | | 57,349,507 | | | | USD | | | | 7,375,779 | | | | (17,908 | ) |
4/5/2016 | | | HKD | | | | 43,691,335 | | | | USD | | | | 5,619,645 | | | | (13,186 | ) |
4/5/2016 | | | HKD | | | | 57,345,575 | | | | USD | | | | 7,375,779 | | | | (17,402 | ) |
4/5/2016 | | | HKD | | | | 57,347,493 | | | | USD | | | | 7,375,779 | | | | (17,649 | ) |
4/5/2016 | | | HKD | | | | 57,348,268 | | | | USD | | | | 7,375,779 | | | | (17,749 | ) |
4/5/2016 | | | HKD | | | | 2,420,778 | | | | USD | | | | 311,925 | | | | (170 | ) |
4/5/2016 | | | HKD | | | | 483,655 | | | | USD | | | | 62,385 | | | | 31 | |
4/5/2016 | | | JPY | | | | 2,282,910,068 | | | | USD | | | | 20,248,150 | | | | (64,149 | ) |
4/5/2016 | | | JPY | | | | 1,739,379,026 | | | | USD | | | | 15,427,166 | | | | (49,040 | ) |
4/5/2016 | | | JPY | | | | 2,282,841,225 | | | | USD | | | | 20,248,150 | | | | (63,537 | ) |
4/5/2016 | | | JPY | | | | 2,282,887,795 | | | | USD | | | | 20,248,150 | | | | (63,951 | ) |
4/5/2016 | | | JPY | | | | 2,282,918,168 | | | | USD | | | | 20,248,150 | | | | (64,222 | ) |
4/5/2016 | | | JPY | | | | 97,358,482 | | | | USD | | | | 856,303 | | | | (9,949 | ) |
4/5/2016 | | | JPY | | | | 19,137,577 | | | | USD | | | | 171,261 | | | | 984 | |
4/5/2016 | | | SGD | | | | 1,595,970 | | | | USD | | | | 1,133,825 | | | | (51,364 | ) |
4/5/2016 | | | SGD | | | | 1,595,983 | | | | USD | | | | 1,133,825 | | | | (51,374 | ) |
4/5/2016 | | | SGD | | | | 1,596,066 | | | | USD | | | | 1,133,825 | | | | (51,435 | ) |
4/5/2016 | | | SGD | | | | 1,595,846 | | | | USD | | | | 1,133,825 | | | | (51,272 | ) |
4/5/2016 | | | SGD | | | | 1,215,932 | | | | USD | | | | 863,867 | | | | (39,100 | ) |
4/5/2016 | | | SGD | | | | 66,018 | | | | USD | | | | 47,950 | | | | (1,076 | ) |
4/5/2016 | | | SGD | | | | 13,060 | | | | USD | | | | 9,590 | | | | (108 | ) |
4/5/2016 | | | USD | | | | 53,761 | | | | HKD | | | | 416,725 | | | | (35 | ) |
4/5/2016 | | | USD | | | | 7,443,095 | | | | HKD | | | | 57,734,153 | | | | 182 | |
4/5/2016 | | | USD | | | | 7,443,095 | | | | HKD | | | | 57,735,641 | | | | 374 | |
4/5/2016 | | | USD | | | | 5,670,930 | | | | HKD | | | | 43,991,247 | | | | 567 | |
4/5/2016 | | | USD | | | | 7,443,095 | | | | HKD | | | | 57,732,739 | | | | — | |
4/5/2016 | | | USD | | | | 7,443,095 | | | | HKD | | | | 57,734,465 | | | | 223 | |
4/5/2016 | | | USD | | | | 147,587 | | | | JPY | | | | 16,460,732 | | | | (1,127 | ) |
4/5/2016 | | | USD | | | | 20,432,946 | | | | JPY | | | | 2,296,411,805 | | | | (514 | ) |
4/5/2016 | | | USD | | | | 20,432,946 | | | | JPY | | | | 2,296,356,636 | | | | (1,005 | ) |
4/5/2016 | | | USD | | | | 15,567,959 | | | | JPY | | | | 1,749,723,388 | | | | 287 | |
4/5/2016 | | | USD | | | | 20,432,946 | | | | JPY | | | | 2,296,505,796 | | | | 322 | |
4/5/2016 | | | USD | | | | 20,432,946 | | | | JPY | | | | 2,296,628,394 | | | | 1,413 | |
4/5/2016 | | | USD | | | | 8,264 | | | | SGD | | | | 11,227 | | | | 73 | |
4/5/2016 | | | USD | | | | 1,144,173 | | | | SGD | | | | 1,540,725 | | | | (10 | ) |
4/5/2016 | | | USD | | | | 871,751 | | | | SGD | | | | 1,174,017 | | | | 90 | |
4/5/2016 | | | USD | | | | 1,144,173 | | | | SGD | | | | 1,540,733 | | | | (4 | ) |
4/5/2016 | | | USD | | | | 1,144,173 | | | | SGD | | | | 1,540,791 | | | | 39 | |
4/5/2016 | | | USD | | | | 1,144,173 | | | | SGD | | | | 1,540,799 | | | | 45 | |
5/3/2016 | | | AUD | | | | 13,529,572 | | | | USD | | | | 10,393,471 | | | | (283 | ) |
5/3/2016 | | | AUD | | | | 10,308,559 | | | | USD | | | | 7,918,839 | | | | (452 | ) |
5/3/2016 | | | AUD | | | | 13,529,818 | | | | USD | | | | 10,393,471 | | | | (472 | ) |
5/3/2016 | | | AUD | | | | 13,529,290 | | | | USD | | | | 10,393,471 | | | | (66 | ) |
5/3/2016 | | | AUD | | | | 13,529,765 | | | | USD | | | | 10,393,471 | | | | (431 | ) |
5/3/2016 | | | CHF | | | | 14,625,663 | | | | USD | | | | 15,291,245 | | | | (493 | ) |
5/3/2016 | | | CHF | | | | 11,143,774 | | | | USD | | | | 11,650,477 | | | | (802 | ) |
5/3/2016 | | | CHF | | | | 14,625,067 | | | | USD | | | | 15,291,245 | | | | 131 | |
5/3/2016 | | | CHF | | | | 14,626,321 | | | | USD | | | | 15,291,245 | | | | (1,180 | ) |
5/3/2016 | | | CHF | | | | 14,625,204 | | | | USD | | | | 15,291,245 | | | | (13 | ) |
5/3/2016 | | | DKK | | | | 43,588,248 | | | | USD | | | | 6,671,477 | | | | (867 | ) |
5/3/2016 | | | DKK | | | | 43,583,825 | | | | USD | | | | 6,671,477 | | | | (190 | ) |
See Notes to Financial Statements.
| | |
| 98 | | WisdomTree Developed World ex-U.S. and Currency Hedged Equity Funds |
Schedule of Investments (concluded)
WisdomTree International Hedged Quality Dividend Growth Fund (IHDG)
March 31, 2016
| | | | | | | | | | | | | | | | | | | | |
Settlement
Date | | Contracts
To Deliver | | | In
Exchange For | | | Unrealized
Gain (Loss) | |
5/3/2016 | | | DKK | | | | 33,210,067 | | | | USD | | | | 5,083,033 | | | $ | (653 | ) |
5/3/2016 | | | DKK | | | | 43,582,224 | | | | USD | | | | 6,671,477 | | | | 55 | |
5/3/2016 | | | DKK | | | | 43,585,933 | | | | USD | | | | 6,671,477 | | | | (512 | ) |
5/3/2016 | | | EUR | | | | 39,748,770 | | | | USD | | | | 45,332,478 | | | | (2,084 | ) |
5/3/2016 | | | EUR | | | | 30,285,229 | | | | USD | | | | 34,539,032 | | | | (2,103 | ) |
5/3/2016 | | �� | EUR | | | | 39,748,909 | | | | USD | | | | 45,332,478 | | | | (2,243 | ) |
5/3/2016 | | | EUR | | | | 39,750,582 | | | | USD | | | | 45,332,478 | | | | (4,151 | ) |
5/3/2016 | | | EUR | | | | 39,748,317 | | | | USD | | | | 45,332,478 | | | | (1,567 | ) |
5/3/2016 | | | ILS | | | | 8,567,269 | | | | USD | | | | 2,279,764 | | | | (120 | ) |
5/3/2016 | | | ILS | | | | 6,528,309 | | | | USD | | | | 1,736,966 | | | | (319 | ) |
5/3/2016 | | | ILS | | | | 8,567,852 | | | | USD | | | | 2,279,764 | | | | (275 | ) |
5/3/2016 | | | ILS | | | | 8,568,363 | | | | USD | | | | 2,279,764 | | | | (411 | ) |
5/3/2016 | | | ILS | | | | 8,567,809 | | | | USD | | | | 2,279,764 | | | | (264 | ) |
5/3/2016 | | | NOK | | | | 21,657,243 | | | | USD | | | | 2,617,801 | | | | (240 | ) |
5/3/2016 | | | NOK | | | | 21,656,240 | | | | USD | | | | 2,617,801 | | | | (119 | ) |
5/3/2016 | | | NOK | | | | 16,501,248 | | | | USD | | | | 1,994,519 | | | | (238 | ) |
5/3/2016 | | | NOK | | | | 21,655,463 | | | | USD | | | | 2,617,801 | | | | (25 | ) |
5/3/2016 | | | NOK | | | | 21,656,583 | | | | USD | | | | 2,617,801 | | | | (160 | ) |
5/3/2016 | | | NZD | | | | 2,134,462 | | | | USD | | | | 1,479,592 | | | | (54 | ) |
5/3/2016 | | | NZD | | | | 1,626,057 | | | | USD | | | | 1,127,311 | | | | 101 | |
5/3/2016 | | | NZD | | | | 2,134,437 | | | | USD | | | | 1,479,592 | | | | (37 | ) |
5/3/2016 | | | NZD | | | | 2,134,373 | | | | USD | | | | 1,479,592 | | | | 8 | |
5/3/2016 | | | NZD | | | | 2,134,453 | | | | USD | | | | 1,479,592 | | | | (47 | ) |
5/3/2016 | | | SEK | | | | 82,232,329 | | | | USD | | | | 10,153,670 | | | | (456 | ) |
5/3/2016 | | | SEK | | | | 82,231,182 | | | | USD | | | | 10,153,670 | | | | (314 | ) |
5/3/2016 | | | SEK | | | | 62,657,633 | | | | USD | | | | 7,736,131 | | | | (893 | ) |
5/3/2016 | | | SEK | | | | 82,228,887 | | | | USD | | | | 10,153,670 | | | | (31 | ) |
5/3/2016 | | | SEK | | | | 82,233,964 | | | | USD | | | | 10,153,670 | | | | (658 | ) |
5/4/2016 | | | GBP | | | | 21,192,503 | | | | USD | | | | 30,461,278 | | | | (1,461 | ) |
5/4/2016 | | | GBP | | | | 16,146,795 | | | | USD | | | | 23,208,596 | | | | (1,291 | ) |
5/4/2016 | | | GBP | | | | 21,192,518 | | | | USD | | | | 30,461,278 | | | | (1,482 | ) |
5/4/2016 | | | GBP | | | | 21,191,678 | | | | USD | | | | 30,461,278 | | | | (274 | ) |
5/4/2016 | | | GBP | | | | 21,192,533 | | | | USD | | | | 30,461,278 | | | | (1,504 | ) |
5/4/2016 | | | HKD | | | | 59,334,171 | | | | USD | | | | 7,650,934 | | | | (434 | ) |
5/4/2016 | | | HKD | | | | 59,336,115 | | | | USD | | | | 7,650,934 | | | | (685 | ) |
5/4/2016 | | | HKD | | | | 59,331,547 | | | | USD | | | | 7,650,934 | | | | (96 | ) |
5/4/2016 | | | HKD | | | | 45,209,807 | | | | USD | | | | 5,829,285 | | | | (692 | ) |
5/4/2016 | | | HKD | | | | 59,340,506 | | | | USD | | | | 7,650,934 | | | | (1,251 | ) |
5/5/2016 | | | SGD | | | | 1,709,712 | | | | USD | | | | 1,269,385 | | | | (181 | ) |
5/5/2016 | | | SGD | | | | 1,709,860 | | | | USD | | | | 1,269,385 | | | | (291 | ) |
5/5/2016 | | | SGD | | | | 1,709,806 | | | | USD | | | | 1,269,385 | | | | (251 | ) |
5/5/2016 | | | SGD | | | | 1,302,723 | | | | USD | | | | 967,155 | | | | (197 | ) |
5/5/2016 | | | SGD | | | | 1,709,887 | | | | USD | | | | 1,269,385 | | | | (311 | ) |
5/9/2016 | | | JPY | | | | 2,384,181,856 | | | | USD | | | | 21,232,229 | | | | (1,991 | ) |
5/9/2016 | | | JPY | | | | 2,384,209,458 | | | | USD | | | | 21,232,229 | | | | (2,237 | ) |
5/9/2016 | | | JPY | | | | 2,384,239,183 | | | | USD | | | | 21,232,229 | | | | (2,502 | ) |
5/9/2016 | | | JPY | | | | 1,816,445,390 | | | | USD | | | | 16,176,939 | | | | (854 | ) |
5/9/2016 | | | JPY | | | | 2,384,311,373 | | | | USD | | | | 21,232,229 | | | | (3,145 | ) |
| | | | | | | | | | | | | | | | | | | $ | (27,019,875 | ) |
AUD – Australian dollar
CHF – Swiss franc
DKK – Danish krone
EUR – Euro
GBP – British pound
HKD – Hong Kong dollar
ILS – Israeli New shekel
JPY – Japanese yen
NOK – Norwegian krone
NZD – New Zealand dollar
SEK – Swedish krona
SGD – Singapore dollar
USD – U.S. dollar
See Notes to Financial Statements.
| | | | |
| WisdomTree Developed World ex-U.S. and Currency Hedged Equity Funds | | | 99 | |
Schedule of Investments
WisdomTree International Hedged SmallCap Dividend Fund (HDLS)
March 31, 2016
| | | | | | | | |
| Investments | | Shares | | | Value | |
| | | | | | | | |
| EXCHANGE-TRADED FUND – 99.9% | | | | | | | | |
| United States – 99.9% | | | | | | | | |
WisdomTree International SmallCap Dividend Fund(a) | | | | | | | | |
| (Cost: $1,215,760) | | | 19,180 | | | $ | 1,129,702 | |
TOTAL INVESTMENTS IN SECURITIES – 99.9% (Cost: $1,215,760) | | | | | | | 1,129,702 | |
Cash, Foreign Currency and Other Assets in Excess of Liabilities – 0.1% | | | | | | | 1,076 | |
| | | | | | | | |
| NET ASSETS – 100.0% | | | | | | $ | 1,130,778 | |
| (a) | Affiliated company (See Note 3). |
| | | | | | | | | | | | | | | | | | | | |
| FINANCIAL DERIVATIVE INSTRUMENTS | |
| FORWARD CONTRACTS | |
Settlement
Date | | Contracts
To Deliver | | | In
Exchange For | | | Unrealized
Gain (Loss) | |
4/4/2016 | | | AUD | | | | 34,712 | | | | USD | | | | 24,756 | | | $ | (1,946 | ) |
4/4/2016 | | | AUD | | | | 26,448 | | | | USD | | | | 18,862 | | | | (1,483 | ) |
4/4/2016 | | | AUD | | | | 34,710 | | | | USD | | | | 24,756 | | | | (1,945 | ) |
4/4/2016 | | | AUD | | | | 34,712 | | | | USD | | | | 24,756 | | | | (1,946 | ) |
4/4/2016 | | | AUD | | | | 34,714 | | | | USD | | | | 24,756 | | | | (1,947 | ) |
4/4/2016 | | | CHF | | | | 3,840 | | | | USD | | | | 3,861 | | | | (148 | ) |
4/4/2016 | | | CHF | | | | 3,840 | | | | USD | | | | 3,861 | | | | (148 | ) |
4/4/2016 | | | CHF | | | | 2,929 | | | | USD | | | | 2,945 | | | | (113 | ) |
4/4/2016 | | | CHF | | | | 3,839 | | | | USD | | | | 3,861 | | | | (148 | ) |
4/4/2016 | | | CHF | | | | 3,839 | | | | USD | | | | 3,861 | | | | (148 | ) |
4/4/2016 | | | DKK | | | | 17,865 | | | | USD | | | | 2,605 | | | | (127 | ) |
4/4/2016 | | | DKK | | | | 13,627 | | | | USD | | | | 1,987 | | | | (97 | ) |
4/4/2016 | | | DKK | | | | 17,863 | | | | USD | | | | 2,605 | | | | (127 | ) |
4/4/2016 | | | DKK | | | | 17,863 | | | | USD | | | | 2,605 | | | | (127 | ) |
4/4/2016 | | | DKK | | | | 17,863 | | | | USD | | | | 2,605 | | | | (127 | ) |
4/4/2016 | | | EUR | | | | 31,863 | | | | USD | | | | 34,654 | | | | (1,656 | ) |
4/4/2016 | | | EUR | | | | 41,815 | | | | USD | | | | 45,479 | | | | (2,171 | ) |
4/4/2016 | | | EUR | | | | 41,816 | | | | USD | | | | 45,479 | | | | (2,173 | ) |
4/4/2016 | | | EUR | | | | 41,815 | | | | USD | | | | 45,479 | | | | (2,172 | ) |
4/4/2016 | | | EUR | | | | 41,816 | | | | USD | | | | 45,479 | | | | (2,172 | ) |
4/4/2016 | | | GBP | | | | 26,198 | | | | USD | | | | 36,512 | | | | (1,143 | ) |
4/4/2016 | | | GBP | | | | 26,198 | | | | USD | | | | 36,512 | | | | (1,142 | ) |
4/4/2016 | | | GBP | | | | 19,960 | | | | USD | | | | 27,819 | | | | (869 | ) |
4/4/2016 | | | GBP | | | | 26,196 | | | | USD | | | | 36,512 | | | | (1,140 | ) |
4/4/2016 | | | GBP | | | | 26,198 | | | | USD | | | | 36,512 | | | | (1,142 | ) |
4/4/2016 | | | ILS | | | | 18,380 | | | | USD | | | | 4,713 | | | | (176 | ) |
4/4/2016 | | | ILS | | | | 14,018 | | | | USD | | | | 3,595 | | | | (134 | ) |
4/4/2016 | | | ILS | | | | 18,379 | | | | USD | | | | 4,713 | | | | (176 | ) |
4/4/2016 | | | ILS | | | | 18,376 | | | | USD | | | | 4,713 | | | | (175 | ) |
4/4/2016 | | | ILS | | | | 18,380 | | | | USD | | | | 4,713 | �� | | | (176 | ) |
4/4/2016 | | | NOK | | | | 74,825 | | | | USD | | | | 8,581 | | | | (465 | ) |
4/4/2016 | | | NOK | | | | 74,821 | | | | USD | | | | 8,581 | | | | (465 | ) |
4/4/2016 | | | NOK | | | | 57,045 | | | | USD | | | | 6,542 | | | | (355 | ) |
4/4/2016 | | | NOK | | | | 74,820 | | | | USD | | | | 8,581 | | | | (465 | ) |
4/4/2016 | | | NOK | | | | 74,826 | | | | USD | | | | 8,581 | | | | (466 | ) |
4/4/2016 | | | NZD | | | | 16,902 | | | | USD | | | | 11,121 | | | | (614 | ) |
4/4/2016 | | | NZD | | | | 12,879 | | | | USD | | | | 8,475 | | | | (467 | ) |
4/4/2016 | | | NZD | | | | 16,900 | | | | USD | | | | 11,121 | | | | (613 | ) |
4/4/2016 | | | NZD | | | | 16,901 | | | | USD | | | | 11,121 | | | | (613 | ) |
4/4/2016 | | | NZD | | | | 16,901 | | | | USD | | | | 11,121 | | | | (613 | ) |
4/4/2016 | | | SEK | | | | 124,510 | | | | USD | | | | 14,513 | | | | (846 | ) |
4/4/2016 | | | SEK | | | | 124,504 | | | | USD | | | | 14,513 | | | | (845 | ) |
4/4/2016 | | | SEK | | | | 94,760 | | | | USD | | | | 11,061 | | | | (628 | ) |
4/4/2016 | | | SEK | | | | 124,502 | | | | USD | | | | 14,513 | | | $ | (845 | ) |
4/4/2016 | | | SEK | | | | 124,494 | | | | USD | | | | 14,513 | | | | (844 | ) |
4/4/2016 | | | USD | | | | 24,756 | | | | AUD | | | | 32,183 | | | | 1 | |
4/4/2016 | | | USD | | | | 1,813 | | | | AUD | | | | 2,365 | | | | 6 | |
4/4/2016 | | | USD | | | | 7,437 | | | | AUD | | | | 9,682 | | | | 11 | |
4/4/2016 | | | USD | | | | 18,862 | | | | AUD | | | | 24,519 | | | | (1 | ) |
4/4/2016 | | | USD | | | | 24,756 | | | | AUD | | | | 32,182 | | | | — | |
4/4/2016 | | | USD | | | | 24,756 | | | | AUD | | | | 32,183 | | | | 1 | |
4/4/2016 | | | USD | | | | 24,756 | | | | AUD | | | | 32,183 | | | | 1 | |
4/4/2016 | | | USD | | | | 3,861 | | | | CHF | | | | 3,697 | | | | — | |
4/4/2016 | | | USD | | | | 702 | | | | CHF | | | | 675 | | | | 3 | |
4/4/2016 | | | USD | | | | 3,861 | | | | CHF | | | | 3,697 | | | | — | |
4/4/2016 | | | USD | | | | 2,945 | | | | CHF | | | | 2,820 | | | | — | |
4/4/2016 | | | USD | | | | 3,861 | | | | CHF | | | | 3,697 | | | | — | |
4/4/2016 | | | USD | | | | 3,861 | | | | CHF | | | | 3,697 | | | | — | |
4/4/2016 | | | USD | | | | 2,605 | | | | DKK | | | | 17,032 | | | | — | |
4/4/2016 | | | USD | | | | 606 | | | | DKK | | | | 3,965 | | | | 1 | |
4/4/2016 | | | USD | | | | 1,987 | | | | DKK | | | | 12,992 | | | | — | |
4/4/2016 | | | USD | | | | 2,605 | | | | DKK | | | | 17,031 | | | | — | |
4/4/2016 | | | USD | | | | 2,605 | | | | DKK | | | | 17,032 | | | | — | |
4/4/2016 | | | USD | | | | 2,605 | | | | DKK | | | | 17,031 | | | | — | |
4/4/2016 | | | USD | | | | 45,479 | | | | EUR | | | | 39,911 | | | | 1 | |
4/4/2016 | | | USD | | | | 2,682 | | | | EUR | | | | 2,356 | | | | 3 | |
4/4/2016 | | | USD | | | | 7,648 | | | | EUR | | | | 6,715 | | | | 4 | |
4/4/2016 | | | USD | | | | 34,654 | | | | EUR | | | | 30,412 | | | | 2 | |
4/4/2016 | | | USD | | | | 45,479 | | | | EUR | | | | 39,911 | | | | 1 | |
4/4/2016 | | | USD | | | | 45,479 | | | | EUR | | | | 39,912 | | | | 2 | |
4/4/2016 | | | USD | | | | 45,479 | | | | EUR | | | | 39,910 | | | | 1 | |
4/4/2016 | | | USD | | | | 36,512 | | | | GBP | | | | 25,404 | | | | 1 | |
4/4/2016 | | | USD | | | | 365 | | | | GBP | | | | 254 | | | | — | |
4/4/2016 | | | USD | | | | 5,061 | | | | GBP | | | | 3,520 | | | | (2 | ) |
4/4/2016 | | | USD | | | | 27,819 | | | | GBP | | | | 19,356 | | | | 1 | |
4/4/2016 | | | USD | | | | 36,512 | | | | GBP | | | | 25,404 | | | | 1 | |
4/4/2016 | | | USD | | | | 36,512 | | | | GBP | | | | 25,404 | | | | 1 | |
4/4/2016 | | | USD | | | | 36,512 | | | | GBP | | | | 25,403 | | | | — | |
4/4/2016 | | | USD | | | | 4,713 | | | | ILS | | | | 17,719 | | | | — | |
4/4/2016 | | | USD | | | | 837 | | | | ILS | | | | 3,141 | | | | (1 | ) |
4/4/2016 | | | USD | | | | 4,713 | | | | ILS | | | | 17,719 | | | | — | |
4/4/2016 | | | USD | | | | 4,713 | | | | ILS | | | | 17,719 | | | | — | |
4/4/2016 | | | USD | | | | 4,713 | | | | ILS | | | | 17,720 | | | | — | |
4/4/2016 | | | USD | | | | 3,595 | | | | ILS | | | | 13,517 | | | | — | |
4/4/2016 | | | USD | | | | 8,581 | | | | NOK | | | | 70,977 | | | | — | |
4/4/2016 | | | USD | | | | 2,217 | | | | NOK | | | | 18,320 | | | | (2 | ) |
4/4/2016 | | | USD | | | | 8,581 | | | | NOK | | | | 70,976 | | | | — | |
4/4/2016 | | | USD | | | | 6,542 | | | | NOK | | | | 54,116 | | | | 1 | |
4/4/2016 | | | USD | | | | 8,581 | | | | NOK | | | | 70,978 | | | | — | |
4/4/2016 | | | USD | | | | 8,581 | | | | NOK | | | | 70,979 | | | | 1 | |
4/4/2016 | | | USD | | | | 11,121 | | | | NZD | | | | 16,018 | | | | — | |
4/4/2016 | | | USD | | | | 2,914 | | | | NZD | | | | 4,215 | | | | 12 | |
4/4/2016 | | | USD | | | | 11,121 | | | | NZD | | | | 16,018 | | | | — | |
4/4/2016 | | | USD | | | | 11,121 | | | | NZD | | | | 16,018 | | | | — | |
4/4/2016 | | | USD | | | | 11,121 | | | | NZD | | | | 16,018 | | | | — | |
4/4/2016 | | | USD | | | | 8,475 | | | | NZD | | | | 12,207 | | | | — | |
4/4/2016 | | | USD | | | | 14,513 | | | | SEK | | | | 117,655 | | | | — | |
4/4/2016 | | | USD | | | | 4,003 | | | | SEK | | | | 32,485 | | | | 4 | |
4/4/2016 | | | USD | | | | 14,513 | | | | SEK | | | | 117,656 | | | | 1 | |
4/4/2016 | | | USD | | | | 11,061 | | | | SEK | | | | 89,677 | | | | 1 | |
4/4/2016 | | | USD | | | | 14,513 | | | | SEK | | | | 117,653 | | | | — | |
4/4/2016 | | | USD | | | | 14,513 | | | | SEK | | | | 117,654 | | | | — | |
See Notes to Financial Statements.
| | |
| 100 | | WisdomTree Developed World ex-U.S. and Currency Hedged Equity Funds |
Schedule of Investments (concluded)
WisdomTree International Hedged SmallCap Dividend Fund (HDLS)
March 31, 2016
| | | | | | | | | | | | | | | | | | | | |
Settlement
Date | | Contracts
To Deliver | | | In
Exchange For | | | Unrealized
Gain (Loss) | |
4/5/2016 | | | HKD | | | | 28,533 | | | | USD | | | | 3,670 | | | $ | (9 | ) |
4/5/2016 | | | HKD | | | | 37,420 | | | | USD | | | | 4,813 | | | | (11 | ) |
4/5/2016 | | | HKD | | | | 37,422 | | | | USD | | | | 4,813 | | | | (11 | ) |
4/5/2016 | | | HKD | | | | 37,423 | | | | USD | | | | 4,813 | | | | (12 | ) |
4/5/2016 | | | HKD | | | | 37,422 | | | | USD | | | | 4,813 | | | | (12 | ) |
4/5/2016 | | | JPY | | | | 6,926,407 | | | | USD | | | | 61,434 | | | | (194 | ) |
4/5/2016 | | | JPY | | | | 5,277,837 | | | | USD | | | | 46,811 | | | | (149 | ) |
4/5/2016 | | | JPY | | | | 6,926,265 | | | | USD | | | | 61,434 | | | | (193 | ) |
4/5/2016 | | | JPY | | | | 6,926,474 | | | | USD | | | | 61,434 | | | | (195 | ) |
4/5/2016 | | | JPY | | | | 6,926,499 | | | | USD | | | | 61,434 | | | | (195 | ) |
4/5/2016 | | | SGD | | | | 10,880 | | | | USD | | | | 7,729 | | | | (351 | ) |
4/5/2016 | | | SGD | | | | 10,879 | | | | USD | | | | 7,729 | | | | (350 | ) |
4/5/2016 | | | SGD | | | | 10,879 | | | | USD | | | | 7,729 | | | | (350 | ) |
4/5/2016 | | | SGD | | | | 10,878 | | | | USD | | | | 7,729 | | | | (349 | ) |
4/5/2016 | | | SGD | | | | 8,295 | | | | USD | | | | 5,893 | | | | (267 | ) |
4/5/2016 | | | USD | | | | 4,813 | | | | HKD | | | | 37,333 | | | | — | |
4/5/2016 | | | USD | | | | 54 | | | | HKD | | | | 420 | | | | — | |
4/5/2016 | | | USD | | | | 4,813 | | | | HKD | | | | 37,334 | | | | — | |
4/5/2016 | | | USD | | | | 3,670 | | | | HKD | | | | 28,469 | | | | — | |
4/5/2016 | | | USD | | | | 4,813 | | | | HKD | | | | 37,333 | | | | — | |
4/5/2016 | | | USD | | | | 4,813 | | | | HKD | | | | 37,332 | | | | — | |
4/5/2016 | | | USD | | | | 61,434 | | | | JPY | | | | 6,904,425 | | | | (1 | ) |
4/5/2016 | | | USD | | | | 924 | | | | JPY | | | | 104,000 | | | | 1 | |
4/5/2016 | | | USD | | | | 61,434 | | | | JPY | | | | 6,904,260 | | | | (3 | ) |
4/5/2016 | | | USD | | | | 61,434 | | | | JPY | | | | 6,904,708 | | | | 1 | |
4/5/2016 | | | USD | | | | 46,811 | | | | JPY | | | | 5,261,256 | | | | 1 | |
4/5/2016 | | | USD | | | | 61,434 | | | | JPY | | | | 6,905,077 | | | | 4 | |
4/5/2016 | | | USD | | | | 7,729 | | | | SGD | | | | 10,408 | | | | — | |
4/5/2016 | | | USD | | | | 7,729 | | | | SGD | | | | 10,408 | | | | — | |
4/5/2016 | | | USD | | | | 1,668 | | | | SGD | | | | 2,247 | | | | 1 | |
4/5/2016 | | | USD | | | | 7,729 | | | | SGD | | | | 10,408 | | | | — | |
4/5/2016 | | | USD | | | | 5,893 | | | | SGD | | | | 7,936 | | | | 1 | |
4/5/2016 | | | USD | | | | 7,729 | | | | SGD | | | | 10,408 | | | | — | |
5/3/2016 | | | AUD | | | | 35,543 | | | | USD | | | | 27,304 | | | | (1 | ) |
5/3/2016 | | | AUD | | | | 35,543 | | | | USD | | | | 27,304 | | | | (1 | ) |
5/3/2016 | | | AUD | | | | 35,542 | | | | USD | | | | 27,304 | | | | — | |
5/3/2016 | | | AUD | | | | 35,543 | | | | USD | | | | 27,304 | | | | (1 | ) |
5/3/2016 | | | AUD | | | | 27,081 | | | | USD | | | | 20,805 | | | | 1 | |
5/3/2016 | | | CHF | | | | 3,944 | | | | USD | | | | 4,124 | | | | — | |
5/3/2016 | | | CHF | | | | 3,944 | | | | USD | | | | 4,124 | | | | — | |
5/3/2016 | | | CHF | | | | 3,945 | | | | USD | | | | 4,124 | | | | — | |
5/3/2016 | | | CHF | | | | 3,944 | | | | USD | | | | 4,124 | | | | — | |
5/3/2016 | | | CHF | | | | 3,007 | | | | USD | | | | 3,144 | | | | — | |
5/3/2016 | | | DKK | | | | 18,457 | | | | USD | | | | 2,825 | | | | — | |
5/3/2016 | | | DKK | | | | 14,080 | | | | USD | | | | 2,155 | | | | — | |
5/3/2016 | | | DKK | | | | 18,455 | | | | USD | | | | 2,825 | | | | — | |
5/3/2016 | | | DKK | | | | 18,456 | | | | USD | | | | 2,825 | | | | — | |
5/3/2016 | | | DKK | | | | 18,455 | | | | USD | | | | 2,825 | | | | — | |
5/3/2016 | | | EUR | | | | 41,798 | | | | USD | | | | 47,670 | | | | (2 | ) |
5/3/2016 | | | EUR | | | | 31,849 | | | | USD | | | | 36,323 | | | | (2 | ) |
5/3/2016 | | | EUR | | | | 41,800 | | | | USD | | | | 47,670 | | | | (4 | ) |
5/3/2016 | | | EUR | | | | 41,799 | | | | USD | | | | 47,670 | | | | (2 | ) |
5/3/2016 | | | EUR | | | | 41,798 | | | | USD | | | | 47,670 | | | | (2 | ) |
5/3/2016 | | | ILS | | | | 19,346 | | | | USD | | | | 5,148 | | | | — | |
5/3/2016 | | | ILS | | | | 14,748 | | | | USD | | | | 3,924 | | | | (1 | ) |
5/3/2016 | | | ILS | | | | 19,347 | | | | USD | | | | 5,148 | | | | (1 | ) |
5/3/2016 | | | ILS | | | | 19,348 | | | | USD | | | | 5,148 | | | | (1 | ) |
5/3/2016 | | | ILS | | | | 19,347 | | | | USD | | | | 5,148 | | | | (1 | ) |
5/3/2016 | | | NOK | | | | 73,390 | | | | USD | | | | 8,871 | | | $ | (1 | ) |
5/3/2016 | | | NOK | | | | 73,387 | | | | USD | | | | 8,871 | | | | — | |
5/3/2016 | | | NOK | | | | 73,384 | | | | USD | | | | 8,871 | | | | — | |
5/3/2016 | | | NOK | | | | 55,952 | | | | USD | | | | 6,763 | | | | (1 | ) |
5/3/2016 | | | NOK | | | | 73,388 | | | | USD | | | | 8,871 | | | | — | |
5/3/2016 | | | NZD | | | | 17,518 | | | | USD | | | | 12,143 | | | | — | |
5/3/2016 | | | NZD | | | | 13,347 | | | | USD | | | | 9,252 | | | | — | |
5/3/2016 | | | NZD | | | | 17,517 | | | | USD | | | | 12,143 | | | | — | |
5/3/2016 | | | NZD | | | | 17,517 | | | | USD | | | | 12,143 | | | | — | |
5/3/2016 | | | NZD | | | | 17,517 | | | | USD | | | | 12,143 | | | | — | |
5/3/2016 | | | SEK | | | | 123,830 | | | | USD | | | | 15,290 | | | | (1 | ) |
5/3/2016 | | | SEK | | | | 123,833 | | | | USD | | | | 15,290 | | | | (1 | ) |
5/3/2016 | | | SEK | | | | 94,373 | | | | USD | | | | 11,652 | | | | (1 | ) |
5/3/2016 | | | SEK | | | | 123,829 | | | | USD | | | | 15,290 | �� | | | — | |
5/3/2016 | | | SEK | | | | 123,825 | | | | USD | | | | 15,290 | | | | — | |
5/4/2016 | | | GBP | | | | 26,570 | | | | USD | | | | 38,191 | | | | (2 | ) |
5/4/2016 | | | GBP | | | | 26,569 | | | | USD | | | | 38,191 | | | | — | |
5/4/2016 | | | GBP | | | | 26,570 | | | | USD | | | | 38,191 | | | | (2 | ) |
5/4/2016 | | | GBP | | | | 20,245 | | | | USD | | | | 29,099 | | | | (2 | ) |
5/4/2016 | | | GBP | | | | 26,570 | | | | USD | | | | 38,191 | | | | (2 | ) |
5/4/2016 | | | HKD | | | | 37,993 | | | | USD | | | | 4,899 | | | | — | |
5/4/2016 | | | HKD | | | | 37,994 | | | | USD | | | | 4,899 | | | | — | |
5/4/2016 | | | HKD | | | | 28,976 | | | | USD | | | | 3,736 | | | | (1 | ) |
5/4/2016 | | | HKD | | | | 37,991 | | | | USD | | | | 4,899 | | | | — | |
5/4/2016 | | | HKD | | | | 37,997 | | | | USD | | | | 4,899 | | | | (1 | ) |
5/5/2016 | | | SGD | | | | 11,361 | | | | USD | | | | 8,434 | | | | (2 | ) |
5/5/2016 | | | SGD | | | | 11,360 | | | | USD | | | | 8,434 | | | | (1 | ) |
5/5/2016 | | | SGD | | | | 11,360 | | | | USD | | | | 8,434 | | | | (2 | ) |
5/5/2016 | | | SGD | | | | 8,656 | | | | USD | | | | 6,426 | | | | (2 | ) |
5/5/2016 | | | SGD | | | | 11,361 | | | | USD | | | | 8,434 | | | | (2 | ) |
5/9/2016 | | | JPY | | | | 7,217,260 | | | | USD | | | | 64,273 | | | | (6 | ) |
5/9/2016 | | | JPY | | | | 5,498,885 | | | | USD | | | | 48,971 | | | | (4 | ) |
5/9/2016 | | | JPY | | | | 7,217,433 | | | | USD | | | | 64,273 | | | | (8 | ) |
5/9/2016 | | | JPY | | | | 7,217,343 | | | | USD | | | | 64,273 | | | | (7 | ) |
5/9/2016 | | | JPY | | | | 7,217,652 | | | | USD | | | | 64,273 | | | | (9 | ) |
| | | | | | | | | | | | | | | | | | | $ | (39,001 | ) |
| | |
| CURRENCY LEGEND |
AUD | | – Australian dollar |
CHF | | – Swiss franc |
DKK | | – Danish krone |
EUR | | – Euro |
GBP | | – British pound |
HKD | | – Hong Kong dollar |
ILS | | – Israeli New shekel |
JPY | | – Japanese yen |
NOK | | – Norwegian krone |
NZD | | – New Zealand dollar |
SEK | | – Swedish krona |
SGD | | – Singapore dollar |
USD | | – U.S. dollar |
See Notes to Financial Statements.
| | | | |
| WisdomTree Developed World ex-U.S. and Currency Hedged Equity Funds | | | 101 | |
Schedule of Investments
WisdomTree International High Dividend Fund (DTH)
March 31, 2016
| | | | | | | | |
| Investments | | Shares | | | Value | |
| COMMON STOCKS – 99.3% | | | | | | | | |
| Australia – 11.4% | | | | | | | | |
Adelaide Brighton Ltd. | | | 50,787 | | | $ | 198,074 | |
AGL Energy Ltd. | | | 21,271 | | | | 301,074 | |
ALS Ltd. | | | 15,467 | | | | 47,473 | |
Amcor Ltd. | | | 45,036 | | | | 497,140 | |
AMP Ltd. | | | 100,117 | | | | 445,917 | |
ASX Ltd. | | | 10,184 | | | | 324,564 | |
Aurizon Holdings Ltd. | | | 67,164 | | | | 204,597 | |
Australia & New Zealand Banking Group Ltd. | | | 122,252 | | | | 2,206,233 | |
Bank of Queensland Ltd. | | | 22,871 | | | | 213,233 | |
Bendigo & Adelaide Bank Ltd. | | | 31,079 | | | | 212,060 | |
BHP Billiton Ltd. | | | 160,364 | | | | 2,079,849 | |
Brickworks Ltd. | | | 15,368 | | | | 187,258 | |
Cabcharge Australia Ltd.(a) | | | 32,518 | | | | 81,047 | |
Cardno Ltd. | | | 14,205 | | | | 12,238 | |
CIMIC Group Ltd. | | | 18,378 | | | | 491,411 | |
Coca-Cola Amatil Ltd. | | | 43,368 | | | | 294,910 | |
Commonwealth Bank of Australia | | | 62,954 | | | | 3,628,177 | |
DuluxGroup Ltd. | | | 28,783 | | | | 139,047 | |
Fairfax Media Ltd. | | | 159,722 | | | | 105,665 | |
Flight Centre Travel Group Ltd.(a) | | | 4,565 | | | | 151,808 | |
Fortescue Metals Group Ltd.(a) | | | 170,571 | | | | 334,590 | |
Harvey Norman Holdings Ltd. | | | 28,160 | | | | 101,812 | |
Incitec Pivot Ltd. | | | 75,019 | | | | 184,090 | |
Insurance Australia Group Ltd. | | | 133,792 | | | | 574,291 | |
IOOF Holdings Ltd.(a) | | | 15,835 | | | | 108,046 | |
JB Hi-Fi Ltd. | | | 7,446 | | | | 135,062 | |
LendLease Group | | | 20,121 | | | | 214,681 | |
Macquarie Group Ltd. | | | 10,564 | | | | 537,071 | |
McMillan Shakespeare Ltd.(a) | | | 7,501 | | | | 72,069 | |
Mineral Resources Ltd.(a) | | | 17,609 | | | | 81,410 | |
National Australia Bank Ltd. | | | 118,191 | | | | 2,385,699 | |
New Hope Corp., Ltd. | | | 12,367 | | | | 12,462 | |
Orica Ltd. | | | 19,468 | | | | 230,177 | |
Origin Energy Ltd. | | | 55,106 | | | | 215,766 | |
Platinum Asset Management Ltd. | | | 20,262 | | | | 98,974 | |
Primary Health Care Ltd. | | | 39,962 | | | | 115,278 | |
Programmed Maintenance Services Ltd. | | | 45,153 | | | | 51,406 | |
Rio Tinto Ltd. | | | 21,573 | | | | 708,442 | |
SAI Global Ltd. | | | 40,263 | | | | 116,766 | |
Santos Ltd. | | | 57,606 | | | | 178,583 | |
Seven Group Holdings Ltd.(a) | | | 25,988 | | | | 109,152 | |
Seven West Media Ltd. | | | 149,020 | | | | 118,073 | |
Sonic Healthcare Ltd. | | | 16,570 | | | | 239,379 | |
Suncorp Group Ltd. | | | 54,600 | | | | 500,232 | |
Super Retail Group Ltd.(a) | | | 12,721 | | | | 83,765 | |
Tabcorp Holdings Ltd. | | | 44,911 | | | | 147,864 | |
Tatts Group Ltd. | | | 85,515 | | | | 248,657 | |
Telstra Corp., Ltd. | | | 562,488 | | | | 2,306,258 | |
Wesfarmers Ltd. | | | 52,669 | | | | 1,679,372 | |
Westpac Banking Corp. | | | 139,777 | | | | 3,263,336 | |
Woodside Petroleum Ltd. | | | 71,230 | | | | 1,422,443 | |
Woolworths Ltd. | | | 60,835 | | | | 1,034,220 | |
| | | | | | | | |
| Total Australia | | | | | | | 29,431,201 | |
| Austria – 0.4% | | | | | | | | |
EVN AG | | | 13,595 | | | | 156,471 | |
Oesterreichische Post AG | | | 3,455 | | | | 140,674 | |
OMV AG | | | 17,187 | | | | 484,250 | |
UNIQA Insurance Group AG | | | 16,174 | | | | 113,849 | |
Vienna Insurance Group AG Wiener Versicherung Gruppe | | | 4,230 | | | | 89,658 | |
| | | | | | | | |
| Total Austria | | | | | | | 984,902 | |
| Belgium – 0.7% | | | | | | | | |
Ageas | | | 5,891 | | | | 234,086 | |
Bekaert S.A. | | | 4,171 | | | | 169,708 | |
bpost S.A. | | | 8,126 | | | | 226,083 | |
Cofinimmo S.A. | | | 1,193 | | | | 146,620 | |
Elia System Operator S.A./N.V. | | | 2,658 | | | | 132,410 | |
EVS Broadcast Equipment S.A. | | | 3,076 | | | | 113,868 | |
Exmar N.V.(a) | | | 5,467 | | | | 45,964 | |
Proximus SADP | | | 18,791 | | | | 643,148 | |
| | | | | | | | |
| Total Belgium | | | | | | | 1,711,887 | |
| China – 3.9% | | | | | | | | |
China Jinmao Holdings Group Ltd. | | | 280,000 | | | | 77,973 | |
China Mobile Ltd. | | | 572,000 | | | | 6,375,180 | |
China Power International Development Ltd. | | | 259,000 | | | | 134,232 | |
China Resources Power Holdings Co., Ltd. | | | 160,000 | | | | 299,102 | |
China South City Holdings Ltd.(a) | | | 300,000 | | | | 61,883 | |
CNOOC Ltd. | | | 2,160,000 | | | | 2,550,825 | |
Dah Chong Hong Holdings Ltd. | | | 201,000 | | | | 81,887 | |
Shanghai Industrial Holdings Ltd. | | | 45,000 | | | | 106,052 | |
Shenzhen Investment Ltd. | | | 312,000 | | | | 123,890 | |
Sino-Ocean Land Holdings Ltd. | | | 256,000 | | | | 121,126 | |
Yuexiu Property Co., Ltd. | | | 782,000 | | | | 112,916 | |
| | | | | | | | |
| Total China | | | | | | | 10,045,066 | |
| Denmark – 0.2% | | | | | | | | |
TDC A/S | | | 50,400 | | | | 247,068 | |
Tryg A/S | | | 14,247 | | | | 276,967 | |
| | | | | | | | |
| Total Denmark | | | | | | | 524,035 | |
| Finland – 1.9% | | | | | | | | |
Elisa Oyj(a) | | | 11,571 | | | | 450,557 | |
Fortum Oyj(a) | | | 55,067 | | | | 835,224 | |
Kemira Oyj | | | 8,391 | | | | 93,803 | |
Kesko Oyj Class B | | | 4,167 | | | | 184,290 | |
Kone Oyj Class B | | | 13,832 | | | | 667,689 | |
Metso Oyj(a) | | | 6,465 | | | | 154,490 | |
Neste Oyj(a) | | | 7,675 | | | | 252,936 | |
Nokian Renkaat Oyj(a) | | | 5,908 | | | | 208,841 | |
Orion Oyj Class B | | | 6,909 | | | | 228,715 | |
Ramirent Oyj | | | 3,895 | | | | 25,522 | |
Sampo Oyj Class A | | | 18,181 | | | | 864,776 | |
Stora Enso Oyj Class R | | | 23,632 | | | | 211,803 | |
Tikkurila Oyj | | | 3,499 | | | | 63,637 | |
UPM-Kymmene Oyj | | | 33,371 | | | | 605,405 | |
| | | | | | | | |
| Total Finland | | | | | | | 4,847,688 | |
See Notes to Financial Statements.
| | |
| 102 | | WisdomTree Developed World ex-U.S. and Currency Hedged Equity Funds |
Schedule of Investments (continued)
WisdomTree International High Dividend Fund (DTH)
March 31, 2016
| | | | | | | | |
| Investments | | Shares | | | Value | |
| France – 9.9% | | | | | | | | |
AXA S.A. | | | 75,712 | | | $ | 1,785,085 | |
BNP Paribas S.A. | | | 25,993 | | | | 1,310,107 | |
Bourbon S.A.(a) | | | 7,035 | | | | 105,340 | |
Bouygues S.A. | | | 14,744 | | | | 602,335 | |
Casino Guichard Perrachon S.A.(a) | | | 3,985 | | | | 228,781 | |
Cie de Saint-Gobain | | | 18,795 | | | | 829,513 | |
CNP Assurances | | | 30,193 | | | | 471,540 | |
Edenred | | | 6,682 | | | | 129,979 | |
Electricite de France S.A. | | | 104,935 | | | | 1,179,525 | |
Engie S.A. | | | 138,081 | | | | 2,146,258 | |
Eutelsat Communications S.A. | | | 6,651 | | | | 215,172 | |
Klepierre | | | 8,842 | | | | 424,196 | |
Lagardere SCA | | | 3,473 | | | | 92,411 | |
Metropole Television S.A. | | | 8,175 | | | | 149,286 | |
Natixis S.A. | | | 67,607 | | | | 333,359 | |
Neopost S.A. | | | 3,106 | | | | 65,374 | |
Nexity S.A. | | | 3,590 | | | | 187,347 | |
Orange S.A. | | | 111,996 | | | | 1,964,788 | |
Rallye S.A.(a) | | | 5,457 | | | | 94,895 | |
Rexel S.A. | | | 13,594 | | | | 194,490 | |
Sanofi | | | 40,797 | | | | 3,294,298 | |
SCOR SE | | | 3,306 | | | | 117,541 | |
Suez Environnement Co. | | | 25,408 | | | | 466,734 | |
Technip S.A. | | | 3,846 | | | | 213,482 | |
TOTAL S.A. | | | 125,247 | | | | 5,717,575 | |
Veolia Environnement S.A. | | | 16,696 | | | | 402,779 | |
Vinci S.A. | | | 21,995 | | | | 1,640,967 | |
Vivendi S.A. | | | 57,275 | | | | 1,206,148 | |
| | | | | | | | |
| Total France | | | | | | | 25,569,305 | |
| Germany – 8.5% | | | | | | | | |
Allianz SE Registered Shares | | | 15,118 | | | | 2,462,703 | |
Axel Springer SE | | | 3,984 | | | | 215,058 | |
BASF SE | | | 28,960 | | | | 2,187,992 | |
Bayerische Motoren Werke AG | | | 16,007 | | | | 1,472,031 | |
Comdirect Bank AG | | | 9,974 | | | | 111,863 | |
Daimler AG Registered Shares | | | 32,395 | | | | 2,487,013 | |
Deutsche Boerse AG | | | 5,960 | | | | 509,311 | |
Deutsche Post AG Registered Shares | | | 38,117 | | | | 1,060,713 | |
Deutsche Telekom AG Registered Shares | | | 144,982 | | | | 2,606,256 | |
Drillisch AG(a) | | | 3,478 | | | | 142,859 | |
E.ON SE | | | 71,389 | | | | 686,443 | |
Evonik Industries AG | | | 14,203 | | | | 426,719 | |
Freenet AG | | | 9,616 | | | | 288,084 | |
Hannover Rueck SE | | | 5,231 | | | | 610,405 | |
Hugo Boss AG | | | 2,625 | | | | 172,420 | |
K+S AG Registered Shares | | | 5,166 | | | | 121,064 | |
MAN SE | | | 3,898 | | | | 422,520 | |
Muenchener Rueckversicherungs – Gesellschaft AG Registered Shares | | | 6,036 | | | | 1,229,501 | |
ProSiebenSat.1 Media SE | | | 7,062 | | | | 363,627 | |
Siemens AG Registered Shares | | | 28,182 | | | | 2,991,495 | |
Suedzucker AG | | | 10,902 | | | | 192,500 | |
Talanx AG* | | | 9,761 | | | | 333,806 | |
Telefonica Deutschland Holding AG | | | 138,921 | | | | 753,702 | |
| | | | | | | | |
| Total Germany | | | | | | | 21,848,085 | |
| Hong Kong – 2.4% | | | | | | | | |
Bank of East Asia Ltd. (The)(a) | | | 37,800 | | | | 141,326 | |
BOC Hong Kong Holdings Ltd. | | | 307,547 | | | | 917,897 | |
CLP Holdings Ltd. | | | 109,500 | | | | 990,315 | |
Hang Lung Properties Ltd. | | | 96,000 | | | | 183,422 | |
Hang Seng Bank Ltd. | | | 60,618 | | | | 1,071,446 | |
Hopewell Holdings Ltd. | | | 46,000 | | | | 148,558 | |
Hysan Development Co., Ltd. | | | 34,000 | | | | 144,871 | |
Kowloon Development Co., Ltd. | | | 24,000 | | | | 22,433 | |
New World Development Co., Ltd. | | | 224,666 | | | | 214,049 | |
PCCW Ltd. | | | 320,380 | | | | 207,348 | |
Power Assets Holdings Ltd. | | | 83,518 | | | | 854,394 | |
Sino Land Co., Ltd. | | | 172,000 | | | | 272,307 | |
SJM Holdings Ltd. | | | 466,000 | | | | 332,833 | |
Swire Pacific Ltd. Class B | | | 80,000 | | | | 155,946 | |
Television Broadcasts Ltd. | | | 29,300 | | | | 105,391 | |
Wharf Holdings Ltd. (The) | | | 69,000 | | | | 377,178 | |
| | | | | | | | |
| Total Hong Kong | | | | | | | 6,139,714 | |
| Israel – 0.6% | | | | | | | | |
Bezeq Israeli Telecommunication Corp., Ltd. | | | 329,759 | | | | 743,372 | |
Delek Automotive Systems Ltd. | | | 17,567 | | | | 169,806 | |
Gazit-Globe Ltd. | | | 10,444 | | | | 95,259 | |
Harel Insurance Investments & Financial Services Ltd. | | | 21,907 | | | | 83,619 | |
Israel Chemicals Ltd. | | | 41,584 | | | | 180,848 | |
Matrix IT Ltd. | | | 10,764 | | | | 68,859 | |
Migdal Insurance & Financial Holding Ltd. | | | 119,643 | | | | 83,061 | |
Phoenix Holdings Ltd. (The)* | | | 7,014 | | | | 17,873 | |
Sella Capital Real Estate Ltd. | | | 23,605 | | | | 37,107 | |
Shikun & Binui Ltd. | | | 25,429 | | | | 45,115 | |
| | | | | | | | |
| Total Israel | | | | | | | 1,524,919 | |
| Italy – 3.9% | | | | | | | | |
ACEA SpA | | | 14,557 | | | | 223,114 | |
Assicurazioni Generali SpA | | | 37,717 | | | | 560,035 | |
Atlantia SpA | | | 32,668 | | | | 907,218 | |
Azimut Holding SpA | | | 3,791 | | | | 87,481 | |
Banca Generali SpA | | | 4,981 | | | | 146,727 | |
Banca Mediolanum SpA | | | 21,781 | | | | 173,992 | |
Enel SpA | | | 308,431 | | | | 1,370,041 | |
Eni SpA | | | 240,658 | | | | 3,647,418 | |
ERG SpA | | | 12,528 | | | | 170,744 | |
Hera SpA | | | 75,901 | | | | 227,131 | |
MARR SpA | | | 3,585 | | | | 72,310 | |
Snam SpA | | | 203,285 | | | | 1,275,253 | |
Societa Iniziative Autostradali e Servizi SpA | | | 21,954 | | | | 225,159 | |
Telecom Italia SpA RSP | | | 229,611 | | | | 201,473 | |
Terna Rete Elettrica Nazionale SpA | | | 101,605 | | | | 580,657 | |
Unipol Gruppo Finanziario SpA | | | 20,684 | | | | 83,816 | |
| | | | | | | | |
| Total Italy | | | | | | | 9,952,569 | |
See Notes to Financial Statements.
| | | | |
| WisdomTree Developed World ex-U.S. and Currency Hedged Equity Funds | | | 103 | |
Schedule of Investments (continued)
WisdomTree International High Dividend Fund (DTH)
March 31, 2016
| | | | | | | | |
| Investments | | Shares | | | Value | |
| Japan – 4.3% | | | | | | | | |
Aozora Bank Ltd. | | | 62,000 | | | $ | 216,789 | |
Asahi Holdings, Inc.(a) | | | 3,100 | | | | 41,813 | |
Benesse Holdings, Inc.(a) | | | 2,600 | | | | 74,950 | |
Canon, Inc. | | | 46,400 | | | | 1,385,044 | |
Daihatsu Motor Co., Ltd.(a) | | | 12,500 | | | | 176,387 | |
Daito Trust Construction Co., Ltd. | | | 2,200 | | | | 312,790 | |
Daiwa Securities Group, Inc. | | | 61,000 | | | | 375,731 | |
Dynam Japan Holdings Co., Ltd. | | | 60,000 | | | | 86,482 | |
Fuji Corp., Ltd.(a) | | | 9,600 | | | | 58,423 | |
Idec Corp. | | | 6,900 | | | | 65,688 | |
ITOCHU Corp. | | | 55,200 | | | | 680,699 | |
Japan Pulp & Paper Co., Ltd.(a) | | | 25,000 | | | | 71,622 | |
JX Holdings, Inc.(a) | | | 74,100 | | | | 285,997 | |
Marubeni Corp.(a) | | | 59,400 | | | | 301,241 | |
Matsui Securities Co., Ltd. | | | 7,000 | | | | 59,727 | |
Max Co., Ltd. | | | 7,000 | | | | 71,996 | |
Mitsui & Co., Ltd. | | | 62,000 | | | | 714,356 | |
Mizuho Financial Group, Inc. | | | 521,400 | | | | 779,815 | |
Nippon Road Co., Ltd. (The)(a) | | | 14,000 | | | | 65,145 | |
Nippon Valqua Industries Ltd. | | | 25,000 | | | | 65,617 | |
NTT DOCOMO, Inc. | | | 120,300 | | | | 2,732,023 | |
Ryoden Trading Co., Ltd.(a) | | | 9,000 | | | | 52,849 | |
Sankyo Co., Ltd. | | | 4,700 | | | | 175,212 | |
Sanoh Industrial Co., Ltd. | | | 7,200 | | | | 39,397 | |
Shinko Plantech Co., Ltd. | | | 6,800 | | | | 51,849 | |
Showa Shell Sekiyu K.K. | | | 14,200 | | | | 127,604 | |
Space Co., Ltd. | | | 6,700 | | | | 81,071 | |
Sumitomo Corp. | | | 41,400 | | | | 411,993 | |
Systena Corp. | | | 6,800 | | | | 115,799 | |
Takaoka Toko Co., Ltd.(a) | | | 5,300 | | | | 73,703 | |
Takeda Pharmaceutical Co., Ltd. | | | 22,300 | | | | 1,019,020 | |
TonenGeneral Sekiyu K.K. | | | 19,000 | | | | 172,090 | |
| | | | | | | | |
| Total Japan | | | | | | | 10,942,922 | |
| Netherlands – 0.8% | | | | | | | | |
Aegon N.V. | | | 53,611 | | | | 295,321 | |
Boskalis Westminster | | | 5,246 | | | | 206,513 | |
Koninklijke Ahold N.V. | | | 28,559 | | | | 643,403 | |
Koninklijke DSM N.V. | | | 4,110 | | | | 226,380 | |
Koninklijke Philips N.V. | | | 27,737 | | | | 791,299 | |
| | | | | | | | |
| Total Netherlands | | | | | | | 2,162,916 | |
| New Zealand – 1.0% | | | | | | | | |
Air New Zealand Ltd. | | | 90,348 | | | | 179,404 | |
Auckland International Airport Ltd. | | | 78,894 | | | | 352,210 | |
Contact Energy Ltd. | | | 38,641 | | | | 134,142 | |
Fisher & Paykel Healthcare Corp., Ltd. | | | 42,527 | | | | 289,359 | |
Fletcher Building Ltd. | | | 26,077 | | | | 142,850 | |
Genesis Energy Ltd.(a) | | | 129,657 | | | | 184,543 | |
Mighty River Power Ltd. | | | 118,356 | | | | 239,950 | |
Nuplex Industries Ltd. | | | 20,024 | | | | 72,294 | |
SKY Network Television Ltd. | | | 33,340 | | | | 115,277 | |
SKYCITY Entertainment Group Ltd. | | | 39,651 | | | | 137,924 | |
Spark New Zealand Ltd. | | | 202,647 | | | | 513,547 | |
Trade Me Group Ltd. | | | 30,934 | | | | 94,715 | |
Vector Ltd. | | | 103,832 | | | | 236,457 | |
| | | | | | | | |
| Total New Zealand | | | | | | | 2,692,672 | |
| Norway – 1.9% | | | | | | | | |
Aker ASA Class A | | | 6,045 | | | | 112,916 | |
Austevoll Seafood ASA | | | 22,971 | | | | 188,850 | |
Gjensidige Forsikring ASA | | | 27,052 | | | | 461,483 | |
Marine Harvest ASA* | | | 22,776 | | | | 351,088 | |
Ocean Yield ASA(a) | | | 11,706 | | | | 78,547 | |
Orkla ASA | | | 46,739 | | | | 423,526 | |
Salmar ASA | | | 11,658 | | | | 286,120 | |
Statoil ASA | | | 154,755 | | | | 2,437,912 | |
TGS Nopec Geophysical Co. ASA | | | 5,671 | | | | 86,595 | |
Yara International ASA | | | 11,586 | | | | 436,195 | |
| | | | | | | | |
| Total Norway | | | | | | | 4,863,232 | |
| Portugal – 0.5% | | | | | | | | |
EDP-Energias de Portugal S.A. | | | 210,322 | | | | 749,216 | |
Galp Energia, SGPS, S.A. | | | 28,367 | | | | 357,198 | |
Portucel S.A. | | | 60,916 | | | | 222,134 | |
| | | | | | | | |
| Total Portugal | | | | | | | 1,328,548 | |
| Singapore – 3.0% | | | | | | | | |
Asian Pay Television Trust | | | 349,100 | | | | 145,177 | |
DBS Group Holdings Ltd. | | | 42,900 | | | | 489,976 | |
Frasers Centrepoint Ltd. | | | 98,500 | | | | 119,230 | |
Hutchison Port Holdings Trust | | | 640,223 | | | | 320,112 | |
Jardine Cycle & Carriage Ltd. | | | 9,844 | | | | 292,630 | |
Keppel Corp., Ltd.(a) | | | 89,900 | | | | 389,215 | |
M1 Ltd.(a) | | | 61,800 | | | | 119,323 | |
Olam International Ltd. | | | 76,900 | | | | 98,224 | |
Oversea-Chinese Banking Corp., Ltd. | | | 85,847 | | | | 563,558 | |
Pacc Offshore Services Holdings Ltd. | | | 97,300 | | | | 26,012 | |
Religare Health Trust | | | 75,800 | | | | 55,164 | |
SATS Ltd. | | | 80,800 | | | | 237,012 | |
Sembcorp Industries Ltd. | | | 87,500 | | | | 196,235 | |
Sembcorp Marine Ltd.(a) | | | 116,100 | | | | 142,258 | |
SIA Engineering Co., Ltd. | | | 59,200 | | | | 158,265 | |
Singapore Airlines Ltd. | | | 47,600 | | | | 403,677 | |
Singapore Exchange Ltd. | | | 35,400 | | | | 208,993 | |
Singapore Post Ltd. | | | 215,800 | | | | 262,018 | |
Singapore Press Holdings Ltd.(a) | | | 91,600 | | | | 272,093 | |
Singapore Technologies Engineering Ltd. | | | 139,000 | | | | 333,410 | |
Singapore Telecommunications Ltd. | | | 628,400 | | | | 1,782,629 | |
StarHub Ltd. | | | 89,600 | | | | 222,902 | |
United Engineers Ltd. | | | 21,600 | | | | 37,535 | |
United Overseas Bank Ltd. | | | 33,600 | | | | 470,839 | |
Venture Corp., Ltd. | | | 39,400 | | | | 244,604 | |
Wing Tai Holdings Ltd. | | | 47,700 | | | | 62,344 | |
| | | | | | | | |
| Total Singapore | | | | | | | 7,653,435 | |
| Spain – 5.3% | | | | | | | | |
Abertis Infraestructuras S.A. | | | 42,781 | | | | 704,453 | |
Acerinox S.A.(a) | | | 8,101 | | | | 93,977 | |
ACS Actividades de Construccion y Servicios S.A. | | | 16,931 | | | | 505,303 | |
See Notes to Financial Statements.
| | |
| 104 | | WisdomTree Developed World ex-U.S. and Currency Hedged Equity Funds |
Schedule of Investments (continued)
WisdomTree International High Dividend Fund (DTH)
March 31, 2016
| | | | | | | | |
| Investments | | Shares | | | Value | |
Banco Bilbao Vizcaya Argentaria S.A. | | | 205,080 | | | $ | 1,365,270 | |
Banco Santander S.A. | | | 858,240 | | | | 3,788,802 | |
Bolsas y Mercados Espanoles SHMSF S.A.(a) | | | 6,913 | | | | 223,333 | |
CaixaBank S.A. | | | 214,820 | | | | 635,741 | |
Enagas S.A. | | | 11,707 | | | | 352,395 | |
Ferrovial S.A. | | | 19,290 | | | | 415,129 | |
Gas Natural SDG S.A. | | | 48,496 | | | | 982,035 | |
Mapfre S.A. | | | 85,997 | | | | 186,098 | |
Red Electrica Corp. S.A. | | | 5,959 | | | | 518,121 | |
Repsol S.A. | | | 79,304 | | | | 896,479 | |
Tecnicas Reunidas S.A.(a) | | | 2,331 | | | | 65,677 | |
Telefonica S.A. | | | 254,638 | | | | 2,858,783 | |
| | | | | | | | |
| Total Spain | | | | | | | 13,591,596 | |
| Sweden – 4.0% | | | | | | | | |
Atlas Copco AB Class B | | | 10,743 | | | | 253,643 | |
Axfood AB | | | 11,660 | | | | 215,747 | |
Bilia AB Class A | | | 8,189 | | | | 183,848 | |
Castellum AB | | | 14,464 | | | | 230,341 | |
Elekta AB Class B(a) | | | 13,207 | | | | 98,808 | |
Fabege AB | | | 20,333 | | | | 343,870 | |
Hennes & Mauritz AB Class B | | | 49,251 | | | | 1,644,596 | |
ICA Gruppen AB | | | 6,662 | | | | 220,733 | |
Mekonomen AB | | | 4,304 | | | | 106,715 | |
Modern Times Group MTG AB Class B | | | 2,386 | | | | 71,580 | |
Nordea Bank AB | | | 155,111 | | | | 1,492,427 | |
Peab AB | | | 38,569 | | | | 341,363 | |
Sandvik AB | | | 40,737 | | | | 422,109 | |
Skanska AB Class B | | | 18,583 | | | | 424,763 | |
SKF AB Class B(a) | | | 10,900 | | | | 197,113 | |
Svenska Handelsbanken AB Class A | | | 45,839 | | | | 584,105 | |
Swedbank AB Class A | | | 44,783 | | | | 966,182 | |
Swedish Match AB | | | 4,154 | | | | 141,222 | |
Tele2 AB Class B | | | 12,802 | | | | 118,913 | |
Telefonaktiebolaget LM Ericsson Class B | | | 103,912 | | | | 1,042,106 | |
TeliaSonera AB | | | 234,318 | | | | 1,218,892 | |
| | | | | | | | |
| Total Sweden | | | | | | | 10,319,076 | |
| Switzerland – 9.1% | | | | | | | | |
ABB Ltd. Registered Shares* | | | 69,029 | | | | 1,350,810 | |
Baloise Holding AG Registered Shares | | | 2,374 | | | | 302,932 | |
BKW AG(a) | | | 3,404 | | | | 143,603 | |
Givaudan S.A. Registered Shares | | | 242 | | | | 476,596 | |
Kuehne + Nagel International AG Registered Shares | | | 5,508 | | | | 786,241 | |
Nestle S.A. Registered Shares | | | 97,812 | | | | 7,338,581 | |
Novartis AG Registered Shares | | | 73,842 | | | | 5,374,393 | |
Partners Group Holding AG | | | 639 | | | | 257,896 | |
Roche Holding AG Bearer Shares | | | 4,567 | | | | 1,151,705 | |
SGS S.A. Registered Shares | | | 286 | | | | 606,852 | |
STMicroelectronics N.V. | | | 40,015 | | | | 222,159 | |
Sulzer AG Registered Shares(a) | | | 1,554 | | | | 154,970 | |
Swiss Re AG | | | 26,547 | | | | 2,464,396 | |
Swisscom AG Registered Shares | | | 2,319 | | | | 1,265,261 | |
Zurich Insurance Group AG* | | | 7,089 | | | | 1,652,977 | |
| | | | | | | | |
| Total Switzerland | | | | | | | 23,549,372 | |
| United Kingdom – 25.6% | | | | | | | | |
Aberdeen Asset Management PLC | | | 37,385 | | | | 149,057 | |
Admiral Group PLC | | | 8,956 | | | | 255,261 | |
Amec Foster Wheeler PLC | | | 17,698 | | | | 114,468 | |
Ashmore Group PLC(a) | | | 25,943 | | | | 107,240 | |
AstraZeneca PLC | | | 48,126 | | | | 2,699,418 | |
Aviva PLC | | | 81,526 | | | | 534,446 | |
BAE Systems PLC | | | 158,429 | | | | 1,159,044 | |
BBA Aviation PLC | | | 57,402 | | | | 165,338 | |
Berendsen PLC | | | 11,707 | | | | 202,422 | |
Berkeley Group Holdings PLC | | | 6,787 | | | | 313,914 | |
BHP Billiton PLC | | | 111,848 | | | | 1,258,422 | |
BP PLC | | | 1,090,034 | | | | 5,485,820 | |
British American Tobacco PLC | | | 79,690 | | | | 4,684,622 | |
British Land Co. PLC (The) | | | 22,982 | | | | 231,389 | |
Cable & Wireless Communications PLC | | | 190,186 | | | | 210,619 | |
Carillion PLC | | | 33,483 | | | | 141,536 | |
Centrica PLC | | | 238,622 | | | | 780,946 | |
Cobham PLC | | | 38,296 | | | | 119,498 | |
Dairy Crest Group PLC | | | 11,203 | | | | 99,591 | |
De La Rue PLC | | | 9,424 | | | | 60,547 | |
Debenhams PLC | | | 97,763 | | | | 105,667 | |
Devro PLC | | | 1,902 | | | | 8,044 | |
Diageo PLC | | | 64,006 | | | | 1,730,901 | |
Direct Line Insurance Group PLC | | | 47,504 | | | | 252,763 | |
DS Smith PLC | | | 14,134 | | | | 82,884 | |
easyJet PLC | | | 7,718 | | | | 168,504 | |
Electrocomponents PLC | | | 30,344 | | | | 105,283 | |
Evraz PLC* | | | 54,711 | | | | 70,773 | |
G4S PLC | | | 56,231 | | | | 154,044 | |
GlaxoSmithKline PLC | | | 273,877 | | | | 5,558,245 | |
Greene King PLC | | | 12,641 | | | | 158,342 | |
Halfords Group PLC | | | 20,498 | | | | 116,698 | |
HSBC Holdings PLC | | | 714,327 | | | | 4,454,861 | |
ICAP PLC | | | 38,671 | | | | 263,902 | |
IG Group Holdings PLC | | | 14,795 | | | | 170,119 | |
Imperial Brands PLC | | | 44,873 | | | | 2,491,479 | |
Inmarsat PLC | | | 13,764 | | | | 194,764 | |
Interserve PLC | | | 17,114 | | | | 106,706 | |
Intu Properties PLC(a) | | | 20,611 | | | | 92,724 | |
Investec PLC | | | 33,615 | | | | 247,614 | |
J Sainsbury PLC(a) | | | 97,358 | | | | 386,634 | |
Kier Group PLC | | | 10,018 | | | | 185,025 | |
Kingfisher PLC | | | 49,900 | | | | 270,174 | |
Ladbrokes PLC | | | 62,517 | | | | 104,862 | |
Laird PLC | | | 28,605 | | | | 156,644 | |
Legal & General Group PLC | | | 215,571 | | | | 728,744 | |
Man Group PLC | | | 68,654 | | | | 150,481 | |
Marks & Spencer Group PLC | | | 60,562 | | | | 353,580 | |
Marston’s PLC | | | 35,666 | | | | 77,919 | |
Meggitt PLC | | | 19,551 | | | | 114,257 | |
Melrose Industries PLC | | | 4,009 | | | | 20,542 | |
Moneysupermarket.com Group PLC | | | 17,790 | | | | 81,235 | |
N Brown Group PLC | | | 11,154 | | | | 52,391 | |
See Notes to Financial Statements.
| | | | |
| WisdomTree Developed World ex-U.S. and Currency Hedged Equity Funds | | | 105 | |
Schedule of Investments (concluded)
WisdomTree International High Dividend Fund (DTH)
March 31, 2016
| | | | | | | | |
| Investments | | Shares | | | Value | |
National Grid PLC | | | 183,064 | | | $ | 2,597,500 | |
Next PLC | | | 2,990 | | | | 232,066 | |
Old Mutual PLC | | | 168,114 | | | | 466,588 | |
Pearson PLC | | | 34,987 | | | | 440,010 | |
Pennon Group PLC | | | 18,071 | | | | 210,645 | |
Persimmon PLC | | | 14,834 | | | | 444,541 | |
Premier Farnell PLC | | | 38,599 | | | | 62,552 | |
RELX N.V. | | | 39,711 | | | | 694,403 | |
Rexam PLC | | | 25,304 | | | | 230,582 | |
Rio Tinto PLC | | | 58,822 | | | | 1,653,275 | |
Royal Dutch Shell PLC Class A | | | 209,232 | | | | 5,064,279 | |
Royal Mail PLC | | | 31,316 | | | | 216,365 | |
SABMiller PLC | | | 47,405 | | | | 2,899,834 | |
Segro PLC | | | 39,876 | | | | 235,158 | |
Severn Trent PLC | | | 10,810 | | | | 337,624 | |
Sky PLC | | | 51,487 | | | | 757,783 | |
Smiths Group PLC | | | 11,315 | | | | 174,990 | |
Soco International PLC | | | 27,795 | | | | 63,320 | |
SSE PLC | | | 51,935 | | | | 1,113,721 | |
Standard Life PLC | | | 60,935 | | | | 311,879 | |
TalkTalk Telecom Group PLC(a) | | | 33,942 | | | | 115,669 | |
Tate & Lyle PLC | | | 23,719 | | | | 197,048 | |
Taylor Wimpey PLC | | | 133,000 | | | | 363,779 | |
Unilever N.V. CVA | | | 51,869 | | | | 2,327,943 | |
Unilever PLC | | | 39,741 | | | | 1,800,700 | |
United Utilities Group PLC | | | 33,713 | | | | 447,246 | |
Vodafone Group PLC | | | 1,229,005 | | | | 3,907,385 | |
William Hill PLC | | | 28,564 | | | | 134,250 | |
WM Morrison Supermarkets PLC(a) | | | 160,081 | | | | 457,178 | |
| | | | | | | | |
| Total United Kingdom | | | | | | | 65,948,716 | |
TOTAL COMMON STOCKS (Cost: $284,273,674) | | | | | | | 255,631,856 | |
| EXCHANGE-TRADED FUND – 0.0% | | | | | | | | |
| United States – 0.0% | | | | | | | | |
WisdomTree International LargeCap Dividend Fund(b) | | | | | | | | |
(Cost: $6,242) | | | 150 | | | | 6,281 | |
| INVESTMENT OF CASH COLLATERAL FOR SECURITIES LOANED – 2.0% | |
| United States – 2.0% | | | | | | | | |
State Street Navigator Securities Lending Prime Portfolio, 0.50%(c) | | | | | | | | |
(Cost: $5,100,091)(d) | | | 5,100,091 | | | | 5,100,091 | |
TOTAL INVESTMENTS IN SECURITIES – 101.3% (Cost: $289,380,007) | | | | | | | 260,738,228 | |
Liabilities in Excess of Cash, Foreign Currency and Other Assets – (1.3)% | | | | | | | (3,271,532 | ) |
| | | | | | | | |
| NET ASSETS – 100.0% | | | | | | $ | 257,466,696 | |
| * | Non-income producing security. |
| (a) | Security, or portion thereof, was on loan at March 31, 2016 (See Note 2). |
| (b) | Affiliated company (See Note 3). |
| (c) | Rate shown represents annualized 7-day yield as of March 31, 2016. |
| (d) | At March 31, 2016, the total market value of the Fund’s securities on loan was $6,611,170 and the total market value of the collateral held by the Fund was $7,064,308. The total market value of the collateral includes non-cash U.S. Government securities collateral having a value of $1,964,217. |
CVA – Certificaten Van Aandelen (Certificate of Stock)
RSP – Risparmio Italian Savings Shares
| | | | | | | | | | | | | | | | | | |
| FINANCIAL DERIVATIVE INSTRUMENTS | |
| FORWARD CONTRACTS | |
Settlement Date | | | | Contracts
To Deliver | | | | | | In
Exchange For | | | Unrealized
Gain (Loss) | |
| 4/4/2016 | | GBP | | | 25,520 | | | | USD | | | | 36,705 | | | $ | 25 | |
| 4/4/2016 | | NZD | | | 34,128 | | | | USD | | | | 23,619 | | | | (76 | ) |
| 4/5/2016 | | HKD | | | 216,232 | | | | USD | | | | 27,880 | | | | 2 | |
| | | | | | | | | | | | | | | | | $ | (49 | ) |
| | |
| CURRENCY LEGEND |
GBP | | – British pound |
HKD | | – Hong Kong dollar |
NZD | | – New Zealand dollar |
USD | | – U.S. dollar |
See Notes to Financial Statements.
| | |
| 106 | | WisdomTree Developed World ex-U.S. and Currency Hedged Equity Funds |
Schedule of Investments
WisdomTree International LargeCap Dividend Fund (DOL)
March 31, 2016
| | | | | | | | |
| Investments | | Shares | | | Value | |
| COMMON STOCKS – 99.1% | | | | | | | | |
| Australia – 7.6% | | | | | | | | |
AMP Ltd. | | | 130,336 | | | $ | 580,511 | |
Australia & New Zealand Banking Group Ltd. | | | 150,037 | | | | 2,707,658 | |
BHP Billiton Ltd. | | | 180,217 | | | | 2,337,333 | |
Brambles Ltd. | | | 54,278 | | | | 506,050 | |
Commonwealth Bank of Australia | | | 80,355 | | | | 4,631,035 | |
CSL Ltd. | | | 10,347 | | | | 807,404 | |
Macquarie Group Ltd. | | | 15,245 | | | | 775,051 | |
National Australia Bank Ltd. | | | 146,565 | | | | 2,958,431 | |
QBE Insurance Group Ltd. | | | 36,793 | | | | 308,786 | |
Rio Tinto Ltd. | | | 22,366 | | | | 734,483 | |
Telstra Corp., Ltd. | | | 692,282 | | | | 2,838,426 | |
Wesfarmers Ltd. | | | 57,205 | | | | 1,824,004 | |
Westpac Banking Corp. | | | 174,296 | | | | 4,069,241 | |
Woodside Petroleum Ltd. | | | 78,853 | | | | 1,574,673 | |
Woolworths Ltd. | | | 67,949 | | | | 1,155,162 | |
| | | | | | | | |
| Total Australia | | | | | | | 27,808,248 | |
| Belgium – 1.8% | | | | | | | | |
Anheuser-Busch InBev N.V. | | | 52,110 | | | | 6,487,481 | |
| China – 3.3% | | | | | | | | |
China Mobile Ltd. | | | 668,986 | | | | 7,456,129 | |
China Overseas Land & Investment Ltd. | | | 204,000 | | | | 645,674 | |
China Unicom Hong Kong Ltd. | | | 603,522 | | | | 796,754 | |
CITIC Ltd. | | | 94,273 | | | | 143,417 | |
CNOOC Ltd. | | | 2,509,529 | | | | 2,963,597 | |
| | | | | | | | |
| Total China | | | | | | | 12,005,571 | |
| Denmark – 1.1% | | | | | | | | |
AP Moeller – Maersk A/S Class B | | | 302 | | | | 396,788 | |
Coloplast A/S Class B | | | 7,671 | | | | 582,193 | |
Danske Bank A/S | | | 30,971 | | | | 876,366 | |
Novo Nordisk A/S Class B | | | 40,274 | | | | 2,188,044 | |
| | | | | | | | |
| Total Denmark | | | | | | | 4,043,391 | |
| Finland – 1.0% | | | | | | | | |
Fortum Oyj(a) | | | 66,494 | | | | 1,008,542 | |
Kone Oyj Class B | | | 21,565 | | | | 1,040,972 | |
Nokia Oyj | | | 77,285 | | | | 460,167 | |
Sampo Oyj Class A | | | 26,557 | | | | 1,263,179 | |
| | | | | | | | |
| Total Finland | | | | | | | 3,772,860 | |
| France – 11.3% | | | | | | | | |
Air Liquide S.A. | | | 9,230 | | | | 1,040,130 | |
Airbus Group SE | | | 17,554 | | | | 1,167,214 | |
AXA S.A. | | | 95,008 | | | | 2,240,032 | |
BNP Paribas S.A. | | | 31,415 | | | | 1,583,389 | |
Carrefour S.A. | | | 19,133 | | | | 527,197 | |
Christian Dior SE | | | 3,361 | | | | 610,507 | |
Cie de Saint-Gobain | | | 19,271 | | | | 850,521 | |
Cie Generale des Etablissements Michelin | | | 5,450 | | | | 558,515 | |
Credit Agricole S.A. | | | 66,603 | | | | 722,392 | |
Danone S.A. | | | 17,534 | | | | 1,249,005 | |
Electricite de France S.A.(a) | | | 120,200 | | | | 1,351,111 | |
Engie S.A. | | | 149,097 | | | | 2,317,485 | |
Essilor International S.A. | | | 3,419 | | | $ | 422,924 | |
Kering | | | 3,471 | | | | 621,390 | |
Klepierre | | | 4,921 | | | | 236,085 | |
L’Oreal S.A. | | | 10,119 | | | | 1,815,573 | |
Legrand S.A. | | | 7,861 | | | | 441,137 | |
LVMH Moet Hennessy Louis Vuitton SE | | | 11,148 | | | | 1,911,908 | |
Natixis S.A. | | | 109,870 | | | | 541,751 | |
Orange S.A. | | | 127,633 | | | | 2,239,114 | |
Pernod Ricard S.A. | | | 4,841 | | | | 540,623 | |
Publicis Groupe S.A. | | | 5,579 | | | | 392,325 | |
Renault S.A. | | | 6,846 | | | | 681,215 | |
Safran S.A. | | | 10,554 | | | | 739,409 | |
Sanofi | | | 45,744 | | | | 3,693,762 | |
Schneider Electric SE | | | 19,341 | | | | 1,224,104 | |
Societe Generale S.A. | | | 21,427 | | | | 793,069 | |
Sodexo S.A. | | | 4,649 | | | | 501,911 | |
TOTAL S.A.(a) | | | 144,125 | | | | 6,579,363 | |
Unibail-Rodamco SE(a) | | | 2,330 | | | | 642,016 | |
Vinci S.A. | | | 22,700 | | | | 1,693,565 | |
Vivendi S.A. | | | 67,125 | | | | 1,413,578 | |
| | | | | | | | |
| Total France | | | | | | | 41,342,320 | |
| Germany – 8.6% | | | | | | | | |
adidas AG | | | 5,871 | | | | 689,101 | |
Allianz SE Registered Shares | | | 20,661 | | | | 3,365,651 | |
BASF SE | | | 35,031 | | | | 2,646,669 | |
Bayer AG Registered Shares | | | 16,520 | | | | 1,944,661 | |
Bayerische Motoren Werke AG | | | 19,352 | | | | 1,779,643 | |
Continental AG | | | 3,872 | | | | 882,468 | |
Daimler AG Registered Shares | | | 35,084 | | | | 2,693,452 | |
Deutsche Boerse AG | | | 8,039 | | | | 686,972 | |
Deutsche Post AG Registered Shares | | | 45,933 | | | | 1,278,215 | |
Deutsche Telekom AG Registered Shares | | | 169,498 | | | | 3,046,965 | |
E.ON SE | | | 88,897 | | | | 854,792 | |
Evonik Industries AG | | | 18,225 | | | | 547,556 | |
Fresenius Medical Care AG & Co. KGaA | | | 5,979 | | | | 530,353 | |
Linde AG | | | 4,646 | | | | 677,942 | |
MAN SE | | | 6,113 | | | | 662,613 | |
Merck KGaA | | | 6,590 | | | | 550,532 | |
Muenchener Rueckversicherungs—Gesellschaft AG Registered Shares | | | 7,679 | | | | 1,564,171 | |
SAP SE | | | 25,109 | | | | 2,034,382 | |
Siemens AG Registered Shares | | | 34,042 | | | | 3,613,529 | |
Telefonica Deutschland Holding AG | | | 52,323 | | | | 283,873 | |
Volkswagen AG | | | 7,166 | | | | 1,041,576 | |
| | | | | | | | |
| Total Germany | | | | | | | 31,375,116 | |
| Hong Kong – 2.7% | | | | | | | | |
AIA Group Ltd. | | | 127,400 | | | | 721,871 | |
BOC Hong Kong Holdings Ltd. | | | 373,215 | | | | 1,113,888 | |
CLP Holdings Ltd. | | | 113,500 | | | | 1,026,491 | |
Hang Lung Properties Ltd. | | | 163,000 | | | | 311,435 | |
Hang Seng Bank Ltd. | | | 71,295 | | | | 1,260,167 | |
Henderson Land Development Co., Ltd. | | | 75,709 | | | | 465,095 | |
Hong Kong & China Gas Co., Ltd. | | | 277,100 | | | | 518,007 | |
See Notes to Financial Statements.
| | | | |
| WisdomTree Developed World ex-U.S. and Currency Hedged Equity Funds | | | 107 | |
Schedule of Investments (continued)
WisdomTree International LargeCap Dividend Fund (DOL)
March 31, 2016
| | | | | | | | |
| Investments | | Shares | | | Value | |
Hong Kong Exchanges and Clearing Ltd. | | | 18,100 | | | $ | 435,900 | |
MTR Corp., Ltd. | | | 196,000 | | | | 970,328 | |
Power Assets Holdings Ltd. | | | 90,500 | | | | 925,821 | |
Sun Hung Kai Properties Ltd. | | | 75,442 | | | | 922,533 | |
Swire Properties Ltd. | | | 172,200 | | | | 465,102 | |
Wharf Holdings Ltd. (The) | | | 113,000 | | | | 617,697 | |
| | | | | | | | |
| Total Hong Kong | | | | | | | 9,754,335 | |
| Ireland – 0.1% | | | | | | | | |
CRH PLC | | | 15,289 | | | | 432,603 | |
| Israel – 0.3% | | | | | | | | |
Teva Pharmaceutical Industries Ltd. | | | 23,798 | | | | 1,283,111 | |
| Italy – 2.9% | | | | | | | | |
Assicurazioni Generali SpA | | | 47,679 | | | | 707,954 | |
Atlantia SpA | | | 35,314 | | | | 980,700 | |
Enel SpA | | | 334,670 | | | | 1,486,593 | |
Eni SpA | | | 271,581 | | | | 4,116,087 | |
Intesa Sanpaolo SpA | | | 343,353 | | | | 952,347 | |
Luxottica Group SpA | | | 13,624 | | | | 752,974 | |
Snam SpA | | | 217,227 | | | | 1,362,714 | |
UniCredit SpA | | | 106,804 | | | | 385,816 | |
| | | | | | | | |
| Total Italy | | | | | | | 10,745,185 | |
| Japan – 11.3% | | | | | | | | |
Astellas Pharma, Inc. | | | 52,600 | | | | 700,350 | |
Bridgestone Corp. | | | 24,800 | | | | 927,835 | |
Canon, Inc. | | | 61,300 | | | | 1,829,810 | |
Dai-ichi Life Insurance Co., Ltd. (The) | | | 19,600 | | | | 237,599 | |
Daiwa Securities Group, Inc. | | | 65,000 | | | | 400,369 | |
Denso Corp. | | | 19,100 | | | | 768,792 | |
East Japan Railway Co. | | | 6,300 | | | | 544,436 | |
Eisai Co., Ltd. | | | 6,200 | | | | 373,451 | |
FANUC Corp. | | | 6,700 | | | | 1,042,302 | |
Fast Retailing Co., Ltd. | | | 1,000 | | | | 320,477 | |
Fuji Heavy Industries Ltd. | | | 15,500 | | | | 548,178 | |
Hitachi Ltd. | | | 97,000 | | | | 454,470 | |
Honda Motor Co., Ltd. | | | 43,000 | | | | 1,180,640 | |
Hoya Corp. | | | 12,400 | | | | 472,302 | |
ITOCHU Corp. | | | 56,100 | | | | 691,798 | |
Japan Tobacco, Inc. | | | 54,309 | | | | 2,266,197 | |
Kao Corp. | | | 11,200 | | | | 598,190 | |
KDDI Corp. | | | 63,900 | | | | 1,709,003 | |
Komatsu Ltd. | | | 28,100 | | | | 479,021 | |
Kubota Corp. | | | 25,000 | | | | 341,763 | |
Kyocera Corp. | | | 10,700 | | | | 471,906 | |
Mitsubishi Corp. | | | 50,700 | | | | 859,773 | |
Mitsubishi Electric Corp. | | | 46,000 | | | | 482,735 | |
Mitsubishi Heavy Industries Ltd. | | | 65,000 | | | | 241,795 | |
Mitsubishi UFJ Financial Group, Inc. | | | 301,100 | | | | 1,397,070 | |
Mitsui & Co., Ltd. | | | 77,600 | | | | 894,097 | |
Mizuho Financial Group, Inc. | | | 721,498 | | | | 1,079,085 | |
MS&AD Insurance Group Holdings, Inc. | | | 16,600 | | | | 463,166 | |
Murata Manufacturing Co., Ltd. | | | 3,400 | | | | 410,499 | |
Nippon Steel & Sumitomo Metal Corp. | | | 22,200 | | | | 427,033 | |
Nippon Telegraph & Telephone Corp. | | | 55,600 | | | | 2,398,228 | |
Nissan Motor Co., Ltd. | | | 136,400 | | | | 1,263,941 | |
Nomura Holdings, Inc. | | | 102,000 | | | | 456,389 | |
NTT DOCOMO, Inc. | | | 142,400 | | | | 3,233,916 | |
Panasonic Corp. | | | 37,900 | | | | 348,500 | |
Seven & I Holdings Co., Ltd. | | | 16,400 | | | | 699,220 | |
Shin-Etsu Chemical Co., Ltd. | | | 9,600 | | | | 497,446 | |
SoftBank Group Corp. | | | 7,600 | | | | 362,842 | |
Sumitomo Corp. | | | 54,000 | | | | 537,382 | |
Sumitomo Mitsui Financial Group, Inc.(a) | | | 37,000 | | | | 1,123,217 | |
Sumitomo Mitsui Trust Holdings, Inc. | | | 114,000 | | | | 334,307 | |
Takeda Pharmaceutical Co., Ltd. | | | 29,400 | | | | 1,343,462 | |
Tokio Marine Holdings, Inc. | | | 19,000 | | | | 642,377 | |
Toyota Motor Corp. | | | 92,900 | | | | 4,919,621 | |
Yahoo Japan Corp.(a) | | | 134,000 | | | | 571,075 | |
| | | | | | | | |
| Total Japan | | | | | | | 41,346,065 | |
| Netherlands – 1.3% | | | | | | | | |
Aegon N.V. | | | 75,665 | | | | 416,807 | |
Akzo Nobel N.V. | | | 7,809 | | | | 533,035 | |
ASML Holding N.V. | | | 5,212 | | | | 530,264 | |
Heineken Holding N.V. | | | 3,032 | | | | 236,952 | |
Heineken N.V. | | | 11,181 | | | | 1,014,846 | |
ING Groep N.V. CVA | | | 16,927 | | | | 205,044 | |
Koninklijke Ahold N.V. | | | 30,163 | | | | 679,540 | |
Koninklijke Philips N.V. | | | 37,997 | | | | 1,084,003 | |
| | | | | | | | |
| Total Netherlands | | | | | | | 4,700,491 | |
| Norway – 1.2% | | | | | | | | |
DNB ASA | | | 52,472 | | | | 620,751 | |
Statoil ASA | | | 180,080 | | | | 2,836,865 | |
Telenor ASA | | | 41,678 | | | | 674,709 | |
Yara International ASA | | | 5,626 | | | | 211,810 | |
| | | | | | | | |
| Total Norway | | | | | | | 4,344,135 | |
| Portugal – 0.2% | | | | | | | | |
EDP-Energias de Portugal S.A. | | | 226,199 | | | | 805,774 | |
| Singapore – 1.3% | | | | | | | | |
DBS Group Holdings Ltd. | | | 68,200 | | | | 778,936 | |
Oversea-Chinese Banking Corp., Ltd. | | | 127,955 | | | | 839,984 | |
Singapore Telecommunications Ltd. | | | 737,100 | | | | 2,090,986 | |
United Overseas Bank Ltd. | | | 51,100 | | | | 716,068 | |
Wilmar International Ltd. | | | 137,600 | | | | 343,336 | |
| | | | | | | | |
| Total Singapore | | | | | | | 4,769,310 | |
| Spain – 4.9% | | | | | | | | |
Abertis Infraestructuras S.A. | | | 43,759 | | | | 720,558 | |
Amadeus IT Holding S.A. Class A | | | 13,639 | | | | 585,790 | |
Banco Bilbao Vizcaya Argentaria S.A. | | | 232,184 | | | | 1,545,708 | |
Banco Santander S.A. | | | 1,082,878 | | | | 4,780,493 | |
CaixaBank S.A. | | | 226,493 | | | | 670,286 | |
Endesa S.A. | | | 27,574 | | | | 530,089 | |
Ferrovial S.A. | | | 35,839 | | | | 771,270 | |
Gas Natural SDG S.A. | | | 43,508 | | | | 881,029 | |
Iberdrola S.A. | | | 179,018 | | | | 1,195,644 | |
Industria de Diseno Textil S.A. | | | 59,389 | | | | 2,000,864 | |
See Notes to Financial Statements.
| | |
| 108 | | WisdomTree Developed World ex-U.S. and Currency Hedged Equity Funds |
Schedule of Investments (continued)
WisdomTree International LargeCap Dividend Fund (DOL)
March 31, 2016
| | | | | | | | |
| Investments | | Shares | | | Value | |
Repsol S.A. | | | 85,900 | | | $ | 971,043 | |
Telefonica S.A. | | | 302,961 | | | | 3,401,298 | |
| | | | | | | | |
| Total Spain | | | | | | | 18,054,072 | |
| Sweden – 3.3% | | | | | | | | |
Assa Abloy AB Class B | | | 21,944 | | | | 433,645 | |
Atlas Copco AB Class A | | | 25,174 | | | | 634,419 | |
Hennes & Mauritz AB Class B | | | 53,344 | | | | 1,781,270 | |
Nordea Bank AB | | | 202,991 | | | | 1,953,112 | |
Sandvik AB | | | 51,141 | | | | 529,913 | |
Skandinaviska Enskilda Banken AB Class A | | | 93,209 | | | | 891,652 | |
Svenska Cellulosa AB SCA Class B | | | 16,488 | | | | 515,994 | |
Svenska Handelsbanken AB Class A | | | 60,144 | | | | 766,388 | |
Swedbank AB Class A | | | 60,242 | | | | 1,299,706 | |
Telefonaktiebolaget LM Ericsson Class B | | | 133,347 | | | | 1,337,303 | |
TeliaSonera AB | | | 276,453 | | | | 1,438,072 | |
Volvo AB Class B(a) | | | 48,514 | | | | 533,213 | |
| | | | | | | | |
| Total Sweden | | | | | | | 12,114,687 | |
| Switzerland – 10.0% | | | | | | | | |
ABB Ltd. Registered Shares* | | | 68,698 | | | | 1,344,333 | |
Adecco S.A. Registered Shares* | | | 6,932 | | | | 453,495 | |
Cie Financiere Richemont S.A. Registered Shares | | | 11,932 | | | | 791,812 | |
Credit Suisse Group AG Registered Shares* | | | 46,918 | | | | 666,793 | |
Givaudan S.A. Registered Shares | | | 412 | | | | 811,395 | |
Kuehne + Nagel International AG Registered Shares | | | 8,127 | | | | 1,160,091 | |
LafargeHolcim Ltd. Registered Shares* | | | 17,306 | | | | 817,366 | |
Nestle S.A. Registered Shares | | | 111,175 | | | | 8,341,172 | |
Novartis AG Registered Shares | | | 82,628 | | | | 6,013,858 | |
Roche Holding AG Bearer Shares | | | 4,371 | | | | 1,102,278 | |
Roche Holding AG Genusschein | | | 23,535 | | | | 5,817,088 | |
SGS S.A. Registered Shares | | | 340 | | | | 721,433 | |
Swiss Re AG | | | 29,385 | | | | 2,727,851 | |
Swisscom AG Registered Shares | | | 2,457 | | | | 1,340,555 | |
Syngenta AG Registered Shares | | | 2,973 | | | | 1,241,790 | |
UBS Group AG Registered Shares | | | 92,650 | | | | 1,498,615 | |
Zurich Insurance Group AG* | | | 8,197 | | | | 1,911,335 | |
| | | | | | | | |
| Total Switzerland | | | | | | | 36,761,260 | |
| United Kingdom – 24.9% | | | | | | | | |
Associated British Foods PLC | | | 12,390 | | | | 596,395 | |
AstraZeneca PLC | | | 64,386 | | | | 3,611,451 | |
Aviva PLC | | | 116,366 | | | | 762,840 | |
BAE Systems PLC | | | 200,308 | | | | 1,465,425 | |
Barclays PLC | | | 430,209 | | | | 927,509 | |
BHP Billiton PLC | | | 157,998 | | | | 1,777,665 | |
BP PLC | | | 1,491,192 | | | | 7,504,731 | |
British American Tobacco PLC | | | 106,881 | | | | 6,283,060 | |
BT Group PLC | | | 269,293 | | | | 1,704,976 | |
Centrica PLC | | | 319,620 | | | | 1,046,031 | |
Compass Group PLC | | | 62,265 | | | | 1,098,980 | |
Diageo PLC | | | 95,099 | | | | 2,571,743 | |
GlaxoSmithKline PLC | | | 379,217 | | | | 7,696,086 | |
HSBC Holdings PLC | | | 1,079,142 | | | | 6,730,009 | |
Imperial Brands PLC | | | 61,434 | | | | 3,410,994 | |
Legal & General Group PLC | | | 304,768 | | | | 1,030,277 | |
Lloyds Banking Group PLC | | | 298,628 | | | | 291,954 | |
Marks & Spencer Group PLC | | | 15,259 | | | | 89,087 | |
National Grid PLC | | | 242,600 | | | | 3,442,257 | |
Next PLC | | | 6,377 | | | | 494,946 | |
Old Mutual PLC | | | 247,637 | | | | 687,298 | |
Pearson PLC | | | 45,561 | | | | 572,992 | |
Prudential PLC | | | 68,159 | | | | 1,274,524 | |
Reckitt Benckiser Group PLC | | | 23,121 | | | | 2,236,501 | |
RELX N.V. | | | 38,533 | | | | 673,804 | |
RELX PLC | | | 48,120 | | | | 894,968 | |
Rio Tinto PLC | | | 83,964 | | | | 2,359,926 | |
Rolls-Royce Holdings PLC* | | | 53,179 | | | | 521,281 | |
Royal Dutch Shell PLC Class A | | | 290,526 | | | | 7,031,929 | |
Royal Dutch Shell PLC Class B | | | 210,824 | | | | 5,151,294 | |
SABMiller PLC | | | 64,414 | | | | 3,940,300 | |
Sky PLC | | | 75,071 | | | | 1,104,891 | |
SSE PLC | | | 67,425 | | | | 1,445,896 | |
Standard Life PLC | | | 100,404 | | | | 513,890 | |
Unilever N.V. CVA | | | 59,386 | | | | 2,665,315 | |
Unilever PLC | | | 50,649 | | | | 2,294,951 | |
Vodafone Group PLC | | | 1,690,303 | | | | 5,373,993 | |
| | | | | | | | |
| Total United Kingdom | | | | | | | 91,280,169 | |
TOTAL COMMON STOCKS
(Cost: $386,409,820) | | | | | | | 363,226,184 | |
| EXCHANGE-TRADED FUND – 0.3% | | | | | | | | |
| United States – 0.3% | | | | | | | | |
WisdomTree International MidCap Dividend Fund(a)(b) | | | | | | | | |
| (Cost: $927,563) | | | 17,156 | | | | 955,246 | |
| INVESTMENT OF CASH COLLATERAL FOR SECURITIES LOANED – 2.7% | |
| United States – 2.7% | | | | | | | | |
State Street Navigator Securities Lending Prime Portfolio, 0.50%(c) | | | | | | | | |
| (Cost: $10,089,231)(d) | | | 10,089,231 | | | | 10,089,231 | |
TOTAL INVESTMENTS IN SECURITIES – 102.1%
(Cost: $397,426,614) | | | | 374,270,661 | |
Liabilities in Excess of Cash and Other
Assets – (2.1)% | | | | | | | (7,657,375 | ) |
| | | | | | | | |
| NET ASSETS – 100.0% | | | | | | $ | 366,613,286 | |
| * | Non-income producing security. |
| (a) | Security, or portion thereof, was on loan at March 31, 2016 (See Note 2). |
| (b) | Affiliated company (See Note 3). |
| (c) | Rate shown represents annualized 7-day yield as of March 31, 2016. |
| (d) | At March 31, 2016, the total market value of the Fund’s securities on loan was $10,575,341 and the total market value of the collateral held by the Fund was $11,175,088. The total market value of the collateral includes non-cash U.S. Government securities collateral having a value of $1,085,857. |
CVA – Certificaten Van Aandelen (Certificate of Stock)
See Notes to Financial Statements.
| | | | |
| WisdomTree Developed World ex-U.S. and Currency Hedged Equity Funds | | | 109 | |
Schedule of Investments (concluded)
WisdomTree International LargeCap Dividend Fund (DOL)
March 31, 2016
| | | | | | | | | | | | | | | | | | |
| FINANCIAL DERIVATIVE INSTRUMENTS | |
| FORWARD CONTRACTS | |
Settlement
Date | | Contracts
To Deliver | | | In
Exchange For | | | Unrealized
Gain (Loss) | |
4/1/2016 | | AUD | | | 107,000 | | | | USD | | | | 82,035 | | | $ | (275 | ) |
4/1/2016 | | DKK | | | 19,000 | | | | USD | | | | 2,886 | | | | (20 | ) |
| | | | | | | | | | | | | | | | | $ | (295 | ) |
| | |
| CURRENCY LEGEND |
AUD | | – Australian dollar |
DKK | | – Danish krone |
USD | | – U.S. dollar |
See Notes to Financial Statements.
| | |
| 110 | | WisdomTree Developed World ex-U.S. and Currency Hedged Equity Funds |
Schedule of Investments
WisdomTree International MidCap Dividend Fund (DIM)
March 31, 2016
| | | | | | | | |
| Investments | | Shares | | | Value | |
| COMMON STOCKS – 99.6% | | | | | | | | |
| Australia – 8.5% | | | | | | | | |
AGL Energy Ltd. | | | 41,637 | | | $ | 589,338 | |
Amcor Ltd. | | | 63,932 | | | | 705,728 | |
Ansell Ltd. | | | 8,550 | | | | 113,718 | |
Aristocrat Leisure Ltd. | | | 15,556 | | | | 123,254 | |
Asciano Ltd. | | | 33,671 | | | | 232,077 | |
ASX Ltd. | | | 16,843 | | | | 536,787 | |
Aurizon Holdings Ltd. | | | 126,788 | | | | 386,225 | |
Bank of Queensland Ltd. | | | 40,804 | | | | 380,428 | |
Bendigo & Adelaide Bank Ltd. | | | 46,761 | | | | 319,062 | |
Boral Ltd. | | | 18,295 | | | | 86,974 | |
Caltex Australia Ltd. | | | 11,085 | | | | 290,093 | |
Challenger Ltd. | | | 27,948 | | | | 180,377 | |
CIMIC Group Ltd. | | | 30,472 | | | | 814,794 | |
Coca-Cola Amatil Ltd. | | | 62,142 | | | | 422,576 | |
Cochlear Ltd. | | | 2,920 | | | | 229,787 | |
Computershare Ltd. | | | 26,239 | | | | 197,403 | |
Crown Resorts Ltd. | | | 41,664 | | | | 399,343 | |
Flight Centre Travel Group Ltd.(a) | | | 7,389 | | | | 245,719 | |
Fortescue Metals Group Ltd.(a) | | | 295,442 | | | | 579,535 | |
Harvey Norman Holdings Ltd. | | | 69,584 | | | | 251,579 | |
Iluka Resources Ltd. | | | 11,123 | | | | 56,130 | |
Incitec Pivot Ltd. | | | 92,635 | | | | 227,318 | |
Insurance Australia Group Ltd. | | | 285,655 | | | | 1,226,149 | |
LendLease Group | | | 39,811 | | | | 424,763 | |
Orica Ltd. | | | 28,589 | | | | 338,018 | |
Origin Energy Ltd. | | | 79,213 | | | | 310,157 | |
Platinum Asset Management Ltd. | | | 55,386 | | | | 270,546 | |
Ramsay Health Care Ltd. | | | 5,963 | | | | 281,461 | |
REA Group Ltd. | | | 4,721 | | | | 196,217 | |
Santos Ltd. | | | 78,227 | | | | 242,510 | |
Seek Ltd.(a) | | | 17,471 | | | | 217,452 | |
Sonic Healthcare Ltd. | | | 25,624 | | | | 370,177 | |
Star Entertainment Grp Ltd. (The) | | | 12,395 | | | | 54,158 | |
Suncorp Group Ltd. | | | 114,340 | | | | 1,047,556 | |
Tabcorp Holdings Ltd. | | | 26,604 | | | | 87,591 | |
Tatts Group Ltd. | | | 109,992 | | | | 319,831 | |
TPG Telecom Ltd. | | | 10,331 | | | | 90,120 | |
Treasury Wine Estates Ltd. | | | 26,899 | | | | 199,471 | |
| | | | | | | | |
| Total Australia | | | | | | | 13,044,422 | |
| Austria – 1.3% | | | | | | | | |
Andritz AG(a) | | | 4,121 | | | | 226,610 | |
Oesterreichische Post AG | | | 4,181 | | | | 170,234 | |
OMV AG | | | 25,493 | | | | 718,275 | |
UNIQA Insurance Group AG | | | 22,153 | | | | 155,935 | |
Verbund AG(a) | | | 17,249 | | | | 220,738 | |
Vienna Insurance Group AG Wiener Versicherung Gruppe | | | 8,279 | | | | 175,479 | |
Voestalpine AG | | | 8,153 | | | | 273,195 | |
| | | | | | | | |
| Total Austria | | | | | | | 1,940,466 | |
| Belgium – 2.5% | | | | | | | | |
Ackermans & van Haaren N.V. | | | 457 | | | | 64,915 | |
Ageas | | | 17,873 | | | | 710,204 | |
bpost S.A. | | | 18,769 | | | | 522,193 | |
Cie d’Entreprises CFE | | | 365 | | | | 34,618 | |
Colruyt S.A. | | | 6,439 | | | | 375,683 | |
Delhaize Group | | | 4,144 | | | | 433,271 | |
Elia System Operator S.A./N.V. | | | 4,102 | | | | 204,343 | |
Proximus SADP | | | 25,106 | | | | 859,288 | |
Solvay S.A. | | | 4,169 | | | | 418,782 | |
Umicore S.A. | | | 5,747 | | | | 286,519 | |
| | | | | | | | |
| Total Belgium | | | | | | | 3,909,816 | |
| China – 2.2% | | | | | | | | |
Beijing Enterprises Holdings Ltd. | | | 25,200 | | | | 137,914 | |
China Everbright International Ltd. | | | 52,000 | | | | 58,057 | |
China Jinmao Holdings Group Ltd. | | | 745,242 | | | | 207,531 | |
China Merchants Holdings International Co., Ltd. | | | 114,138 | | | | 339,182 | |
China Power International Development Ltd. | | | 383,000 | | | | 198,498 | |
China Resources Beer Holdings Co., Ltd. | | | 34,000 | | | | 63,296 | |
China Resources Power Holdings Co., Ltd. | | | 278,000 | | | | 519,690 | |
China South City Holdings Ltd.(a) | | | 652,000 | | | | 134,493 | |
CSPC Pharmaceutical Group Ltd. | | | 102,000 | | | | 92,314 | |
Guangdong Investment Ltd. | | | 300,208 | | | | 379,684 | |
Guotai Junan International Holdings Ltd.(a) | | | 134,000 | | | | 46,990 | |
Shanghai Industrial Holdings Ltd. | | | 48,500 | | | | 114,301 | |
Shenzhen Investment Ltd. | | | 366,000 | | | | 145,333 | |
Sino-Ocean Land Holdings Ltd. | | | 633,464 | | | | 299,722 | |
Sun Art Retail Group Ltd.(a) | | | 485,000 | | | | 343,277 | |
Yangzijiang Shipbuilding Holdings Ltd. | | | 219,100 | | | | 159,452 | |
Yuexiu Property Co., Ltd. | | | 626,000 | | | | 90,391 | |
| | | | | | | | |
| Total China | | | | | | | 3,330,125 | |
| Denmark – 1.5% | | | | | | | | |
Carlsberg A/S Class B | | | 2,509 | | | | 239,466 | |
Chr Hansen Holding A/S | | | 3,381 | | | | 227,332 | |
ISS A/S | | | 4,731 | | | | 190,240 | |
Pandora A/S | | | 3,430 | | | | 449,870 | |
Sydbank A/S | | | 2,258 | | | | 64,826 | |
TDC A/S | | | 72,306 | | | | 354,455 | |
Tryg A/S | | | 22,184 | | | | 431,264 | |
Vestas Wind Systems A/S | | | 4,300 | | | | 303,857 | |
| | | | | | | | |
| Total Denmark | | | | | | | 2,261,310 | |
| Finland – 2.3% | | | | | | | | |
Amer Sports Oyj | | | 2,862 | | | | 83,329 | |
Elisa Oyj(a) | | | 13,296 | | | | 517,725 | |
Huhtamaki Oyj | | | 1,872 | | | | 69,608 | |
Metso Oyj | | | 9,114 | | | | 217,791 | |
Neste Oyj(a) | | | 14,279 | | | | 470,576 | |
Nokian Renkaat Oyj(a) | | | 10,025 | | | | 354,372 | |
Orion Oyj Class B(a) | | | 7,260 | | | | 240,335 | |
Stora Enso Oyj Class R | | | 40,362 | | | | 361,747 | |
UPM-Kymmene Oyj | | | 43,036 | | | | 780,744 | |
Wartsila Oyj Abp | | | 8,519 | | | | 386,080 | |
| | | | | | | | |
| Total Finland | | | | | | | 3,482,307 | |
See Notes to Financial Statements.
| | | | |
| WisdomTree Developed World ex-U.S. and Currency Hedged Equity Funds | | | 111 | |
Schedule of Investments (continued)
WisdomTree International MidCap Dividend Fund (DIM)
March 31, 2016
| | | | | | | | |
| Investments | | Shares | | | Value | |
| France – 7.6% | | | | | | | | |
Accor S.A. | | | 7,999 | | | $ | 339,452 | |
Aeroports de Paris | | | 3,265 | | | | 404,247 | |
Arkema S.A. | | | 3,317 | | | | 249,397 | |
Atos SE | | | 1,955 | | | | 159,467 | |
Bouygues S.A. | | | 23,623 | | | | 965,068 | |
Bureau Veritas S.A. | | | 13,189 | | | | 294,203 | |
Casino Guichard Perrachon S.A.(a) | | | 7,603 | | | | 436,492 | |
CNP Assurances | | | 54,606 | | | | 852,811 | |
Edenred | | | 13,755 | | | | 267,564 | |
Eiffage S.A. | | | 5,022 | | | | 386,291 | |
Eurazeo S.A. | | | 1,813 | | | | 122,762 | |
Eutelsat Communications S.A. | | | 13,141 | | | | 425,135 | |
Groupe Eurotunnel SE Registered Shares | | | 9,084 | | | | 101,964 | |
Havas S.A. | | | 14,991 | | | | 120,384 | |
Imerys S.A. | | | 2,727 | | | | 190,462 | |
Ingenico Group S.A. | | | 1,070 | | | | 123,090 | |
Ipsen S.A. | | | 3,684 | | | | 211,878 | |
JCDecaux S.A. | | | 6,509 | | | | 285,345 | |
Korian S.A. | | | 1,322 | | | | 39,003 | |
Lagardere SCA | | | 11,357 | | | | 302,193 | |
Plastic Omnium S.A. | | | 4,276 | | | | 147,278 | |
Remy Cointreau S.A. | | | 1,805 | | | | 137,236 | |
Rexel S.A. | | | 24,764 | | | | 354,300 | |
Rubis SCA | | | 1,468 | | | | 118,054 | |
SCOR SE | | | 15,480 | | | | 550,376 | |
SEB S.A. | | | 1,739 | | | | 180,650 | |
Societe BIC S.A. | | | 1,293 | | | | 194,789 | |
Societe Television Francaise 1 | | | 10,601 | | | | 137,475 | |
Suez Environnement Co. | | | 36,123 | | | | 663,563 | |
Technip S.A. | | | 7,222 | | | | 400,875 | |
Teleperformance | | | 660 | | | | 58,107 | |
Thales S.A. | | | 8,046 | | | | 705,999 | |
Valeo S.A. | | | 2,373 | | | | 369,928 | |
Veolia Environnement S.A. | | | 38,019 | | | | 917,181 | |
Vicat S.A. | | | 1,602 | | | | 104,057 | |
Wendel S.A. | | | 1,652 | | | | 180,084 | |
Zodiac Aerospace | | | 7,123 | | | | 142,941 | |
| | | | | | | | |
| Total France | | | | | | | 11,640,101 | |
| Germany – 5.0% | | | | | | | | |
Axel Springer SE | | | 7,089 | | | | 382,668 | |
Brenntag AG | | | 3,572 | | | | 204,338 | |
Deutsche Wohnen AG Bearer Shares | | | 11,176 | | | | 348,064 | |
DMG MORI AG | | | 690 | | | | 32,175 | |
Duerr AG | | | 1,293 | | | | 101,770 | |
Fielmann AG | | | 4,432 | | | | 336,868 | |
Fraport AG Frankfurt Airport Services Worldwide | | | 3,650 | | | | 221,735 | |
Freenet AG | | | 12,235 | | | | 366,546 | |
Fuchs Petrolub SE | | | 426 | | | | 16,534 | |
GEA Group AG | | | 7,027 | | | | 344,328 | |
Hannover Rueck SE | | | 7,457 | | | | 870,157 | |
Hochtief AG | | | 2,754 | | | | 337,526 | |
Hugo Boss AG | | | 3,874 | | | | 254,459 | |
K+S AG Registered Shares | | | 9,208 | | | | 215,788 | |
KION Group AG* | | | 1,635 | | | | 95,469 | |
LANXESS AG | | | 1,333 | | | | 64,163 | |
LEG Immobilien AG* | | | 2,003 | | | | 189,107 | |
METRO AG | | | 14,173 | | | | 439,788 | |
MTU Aero Engines AG | | | 1,430 | | | | 137,355 | |
OSRAM Licht AG | | | 3,082 | | | | 159,115 | |
ProSiebenSat.1 Media SE | | | 14,597 | | | | 751,608 | |
Suedzucker AG | | | 13,517 | | | | 238,674 | |
Symrise AG | | | 4,037 | | | | 271,422 | |
Talanx AG* | | | 18,126 | | | | 619,871 | |
TUI AG | | | 15,247 | | | | 236,458 | |
United Internet AG Registered Shares | | | 6,673 | | | | 335,384 | |
Wacker Chemie AG | | | 1,473 | | | | 129,820 | |
| | | | | | | | |
| Total Germany | | | | | | | 7,701,190 | |
| Hong Kong – 3.3% | | | | | | | | |
Bank of East Asia Ltd. (The)(a) | | | 134,122 | | | | 501,452 | |
Cathay Pacific Airways Ltd. | | | 119,774 | | | | 207,227 | |
Dah Sing Banking Group Ltd. | | | 32,800 | | | | 57,594 | |
Hang Lung Group Ltd. | | | 51,000 | | | | 146,296 | |
Hopewell Holdings Ltd. | | | 45,162 | | | | 145,852 | |
Hysan Development Co., Ltd. | | | 70,000 | | | | 298,264 | |
New World Development Co., Ltd. | | | 545,642 | | | | 519,857 | |
PCCW Ltd. | | | 583,543 | | | | 377,666 | |
Sino Land Co., Ltd. | | | 399,046 | | | | 631,761 | |
SJM Holdings Ltd. | | | 832,000 | | | | 594,243 | |
Swire Pacific Ltd. Class A | | | 55,500 | | | | 597,463 | |
Swire Pacific Ltd. Class B | | | 140,000 | | | | 272,905 | |
Techtronic Industries Co., Ltd. | | | 28,500 | | | | 112,618 | |
Television Broadcasts Ltd. | | | 44,424 | | | | 159,791 | |
Wheelock & Co., Ltd. | | | 103,000 | | | | 460,121 | |
| | | | | | | | |
| Total Hong Kong | | | | | | | 5,083,110 | |
| Ireland – 0.6% | | | | | | | | |
DCC PLC | | | 3,367 | | | | 297,622 | |
Kerry Group PLC Class A | | | 1,200 | | | | 111,968 | |
Paddy Power Betfair PLC | | | 2,168 | | | | 302,889 | |
Smurfit Kappa Group PLC | | | 8,322 | | | | 214,798 | |
| | | | | | | | |
| Total Ireland | | | | | | | 927,277 | |
| Israel – 1.3% | | | | | | | | |
Azrieli Group Ltd. | | | 3,647 | | | | 143,086 | |
Bank Hapoalim BM | | | 29,696 | | | | 154,029 | |
Bezeq Israeli Telecommunication Corp., Ltd. | | | 512,292 | | | | 1,154,854 | |
Elbit Systems Ltd. | | | 1,656 | | | | 155,799 | |
Israel Chemicals Ltd. | | | 82,550 | | | | 359,009 | |
| | | | | | | | |
| Total Israel | | | | | | | 1,966,777 | |
| Italy – 3.4% | | | | | | | | |
A2A SpA | | | 169,919 | | | | 221,321 | |
ACEA SpA | | | 11,857 | | | | 181,732 | |
Azimut Holding SpA | | | 8,015 | | | | 184,953 | |
Banca Generali SpA | | | 6,817 | | | | 200,811 | |
Banca Mediolanum SpA | | | 47,477 | | | | 379,258 | |
Banca Popolare di Milano SCARL | | | 164,752 | | | | 115,368 | |
See Notes to Financial Statements.
| | |
| 112 | | WisdomTree Developed World ex-U.S. and Currency Hedged Equity Funds |
Schedule of Investments (continued)
WisdomTree International MidCap Dividend Fund (DIM)
March 31, 2016
| | | | | | | | |
| Investments | | Shares | | | Value | |
Brembo SpA | | | 2,280 | | | $ | 118,087 | |
Credito Emiliano SpA | | | 7,408 | | | | 50,777 | |
Davide Campari-Milano SpA | | | 13,141 | | | | 131,554 | |
De’ Longhi SpA | | | 6,984 | | | | 159,172 | |
FinecoBank Banca Fineco SpA | | | 21,820 | | | | 184,001 | |
Hera SpA | | | 108,564 | | | | 324,873 | |
Intesa Sanpaolo SpA RSP | | | 27,936 | | | | 72,774 | |
Mediobanca SpA | | | 22,292 | | | | 160,800 | |
Parmalat SpA | | | 39,416 | | | | 109,237 | |
Prysmian SpA | | | 8,222 | | | | 186,545 | |
Recordati SpA | | | 10,334 | | | | 259,075 | |
Salvatore Ferragamo SpA(a) | | | 4,779 | | | | 122,315 | |
Telecom Italia SpA RSP | | | 339,643 | | | | 298,021 | |
Terna Rete Elettrica Nazionale SpA | | | 171,990 | | | | 982,896 | |
Tod’s SpA(a) | | | 1,414 | | | | 100,869 | |
Unione di Banche Italiane SpA | | | 16,405 | | | | 60,794 | |
UnipolSai SpA | | | 257,943 | | | | 597,872 | |
| | | | | | | | |
| Total Italy | | | | | | | 5,203,105 | |
| Japan – 20.7% | | | | | | | | |
ABC-Mart, Inc. | | | 1,678 | | | | 107,642 | |
Aeon Co., Ltd. | | | 28,099 | | | | 406,504 | |
Air Water, Inc.(a) | | | 7,000 | | | | 103,759 | |
Ajinomoto Co., Inc. | | | 10,319 | | | | 233,152 | |
Alfresa Holdings Corp. | | | 6,000 | | | | 115,254 | |
Amada Holdings Co., Ltd. | | | 14,800 | | | | 144,583 | |
ANA Holdings, Inc. | | | 68,000 | | | | 191,848 | |
Aozora Bank Ltd. | | | 106,000 | | | | 370,639 | |
Asahi Glass Co., Ltd. | | | 42,141 | | | | 230,961 | |
Asahi Kasei Corp. | | | 49,000 | | | | 331,724 | |
Asics Corp. | | | 3,630 | | | | 64,755 | |
Bandai Namco Holdings, Inc. | | | 12,300 | | | | 268,555 | |
Bank of Yokohama Ltd. (The) | | | 45,000 | | | | 204,791 | |
Benesse Holdings, Inc.(a) | | | 3,500 | | | | 100,894 | |
Brother Industries Ltd. | | | 9,900 | | | | 113,978 | |
Canon Marketing Japan, Inc. | | | 6,100 | | | | 106,700 | |
Casio Computer Co., Ltd.(a) | | | 6,000 | | | | 121,233 | |
Chiba Bank Ltd. (The) | | | 30,000 | | | | 149,740 | |
Chubu Electric Power Co., Inc. | | | 1,300 | | | | 18,177 | |
Chugoku Bank Ltd. (The)(a) | | | 6,900 | | | | 71,950 | |
Chugoku Electric Power Co., Inc. (The)(a) | | | 20,000 | | | | 270,475 | |
Dai Nippon Printing Co., Ltd.(a) | | | 31,958 | | | | 284,336 | |
Daicel Corp. | | | 9,600 | | | | 131,365 | |
Daihatsu Motor Co., Ltd.(a) | | | 21,900 | | | | 309,030 | |
Daiichi Sankyo Co., Ltd. | | | 31,400 | | | | 699,128 | |
Daito Trust Construction Co., Ltd. | | | 4,820 | | | | 685,294 | |
DIC Corp. | | | 37,000 | | | | 88,554 | |
Dowa Holdings Co., Ltd.(a) | | | 10,000 | | | | 55,785 | |
Electric Power Development Co., Ltd. | | | 5,400 | | | | 168,878 | |
FamilyMart Co., Ltd. | | | 4,200 | | | | 218,604 | |
Fuji Electric Co., Ltd. | | | 22,876 | | | | 79,174 | |
Fujitsu Ltd. | | | 29,000 | | | | 107,491 | |
Fukuoka Financial Group, Inc. | | | 41,000 | | | | 133,876 | |
Hachijuni Bank Ltd. (The) | | | 14,000 | | | | 60,412 | |
Hamamatsu Photonics K.K. | | | 4,900 | | | | 135,366 | |
Hankyu Hanshin Holdings, Inc. | | | 31,000 | | | | 198,034 | |
Hikari Tsushin, Inc. | | | 1,600 | | | | 121,998 | |
Hino Motors Ltd. | | | 26,200 | | | | 283,691 | |
Hirose Electric Co., Ltd. | | | 1,000 | | | | 110,414 | |
Hiroshima Bank Ltd. (The) | | | 26,075 | | | | 95,350 | |
Hisamitsu Pharmaceutical Co., Inc. | | | 3,900 | | | | 174,536 | |
Hitachi Chemical Co., Ltd. | | | 6,200 | | | | 111,704 | |
Hitachi Construction Machinery Co., Ltd.(a) | | | 9,800 | | | | 155,900 | |
Hitachi High-Technologies Corp. | | | 4,000 | | | | 112,816 | |
Hitachi Metals Ltd. | | | 6,100 | | | | 63,011 | |
Hokuhoku Financial Group, Inc.(a) | | | 60,000 | | | | 79,007 | |
Hokuriku Electric Power Co. | | | 10,600 | | | | 150,236 | |
Hulic Co., Ltd. | | | 7,800 | | | | 74,672 | |
Idemitsu Kosan Co., Ltd.(a) | | | 4,700 | | | | 84,010 | |
IHI Corp. | | | 42,553 | | | | 90,107 | |
Iida Group Holdings Co., Ltd. | | | 8,900 | | | | 173,811 | |
Isetan Mitsukoshi Holdings Ltd. | | | 6,634 | | | | 77,617 | |
Isuzu Motors Ltd. | | | 26,000 | | | | 268,802 | |
Itochu Techno-Solutions Corp. | | | 2,200 | | | | 41,575 | |
Iyo Bank Ltd. (The) | | | 11,000 | | | | 72,130 | |
J. Front Retailing Co., Ltd. | | | 6,400 | | | | 85,014 | |
Japan Airlines Co., Ltd. | | | 17,300 | | | | 634,464 | |
Japan Exchange Group, Inc. | | | 15,200 | | | | 233,149 | |
JGC Corp.(a) | | | 7,000 | | | | 104,942 | |
Joyo Bank Ltd. (The) | | | 34,000 | | | | 116,767 | |
JSR Corp. | | | 8,700 | | | | 125,242 | |
JTEKT Corp. | | | 5,200 | | | | 67,547 | |
JX Holdings, Inc.(a) | | | 116,400 | | | | 449,258 | |
Kajima Corp. | | | 25,953 | | | | 163,022 | |
Kansai Paint Co., Ltd. | | | 7,000 | | | | 112,603 | |
Kawasaki Heavy Industries Ltd.(a) | | | 45,565 | | | | 131,755 | |
Keikyu Corp. | | | 13,000 | | | | 114,507 | |
Keio Corp. | | | 16,000 | | | | 140,647 | |
Kintetsu Group Holdings Co., Ltd.(a) | | | 50,000 | | | | 202,856 | |
Kirin Holdings Co., Ltd. | | | 27,200 | | | | 381,882 | |
Koito Manufacturing Co., Ltd. | | | 3,500 | | | | 158,815 | |
Konami Holdings Corp.(a) | | | 5,400 | | | | 159,989 | |
Konica Minolta, Inc. | | | 15,900 | | | | 135,241 | |
Kuraray Co., Ltd. | | | 16,200 | | | | 198,329 | |
Kyowa Hakko Kirin Co., Ltd. | | | 15,000 | | | | 239,690 | |
Lawson, Inc. | | | 4,900 | | | | 410,677 | |
LIXIL Group Corp. | | | 9,900 | | | | 202,149 | |
Makita Corp. | | | 3,729 | | | | 231,580 | |
Marubeni Corp.(a) | | | 100,800 | | | | 511,197 | |
Marui Group Co., Ltd.(a) | | | 8,581 | | | | 123,147 | |
Medipal Holdings Corp. | | | 7,000 | | | | 110,984 | |
MEIJI Holdings Co., Ltd. | | | 1,800 | | | | 144,935 | |
Mitsubishi Chemical Holdings Corp. | | | 56,700 | | | | 296,377 | |
Mitsubishi Gas Chemical Co., Inc. | | | 19,000 | | | | 102,442 | |
Mitsubishi Materials Corp. | | | 46,000 | | | | 130,148 | |
Mitsubishi Motors Corp. | | | 32,000 | | | | 240,011 | |
Mitsubishi Tanabe Pharma Corp.(a) | | | 21,100 | | | | 367,389 | |
Mitsui Chemicals, Inc. | | | 32,000 | | | | 106,766 | |
See Notes to Financial Statements.
| | | | |
| WisdomTree Developed World ex-U.S. and Currency Hedged Equity Funds | | | 113 | |
Schedule of Investments (continued)
WisdomTree International MidCap Dividend Fund (DIM)
March 31, 2016
| | | | | | | | |
| Investments | | Shares | | | Value | |
Mitsui OSK Lines Ltd. | | | 32,000 | | | $ | 65,199 | |
Mixi, Inc. | | | 2,100 | | | | 78,100 | |
Nabtesco Corp. | | | 3,900 | | | | 87,650 | |
NEC Corp. | | | 47,608 | | | | 119,872 | |
Nexon Co., Ltd. | | | 5,800 | | | | 99,028 | |
NGK Insulators Ltd. | | | 7,000 | | | | 129,481 | |
NGK Spark Plug Co., Ltd. | | | 5,400 | | | | 103,489 | |
NH Foods Ltd.(a) | | | 6,000 | | | | 132,390 | |
Nikon Corp.(a) | | | 13,034 | | | | 199,693 | |
Nippon Electric Glass Co., Ltd. | | | 22,000 | | | | 112,745 | |
Nippon Express Co., Ltd. | | | 38,000 | | | | 173,104 | |
Nippon Paint Holdings Co., Ltd.(a) | | | 3,200 | | | | 71,092 | |
Nippon Yusen K.K. | | | 46,000 | | | | 88,812 | |
Nissan Chemical Industries Ltd.(a) | | | 5,100 | | | | 131,589 | |
Nisshin Seifun Group, Inc. | | | 8,700 | | | | 138,479 | |
Nissin Foods Holdings Co., Ltd. | | | 3,700 | | | | 174,145 | |
Nitori Holdings Co., Ltd. | | | 1,500 | | | | 137,595 | |
NOK Corp. | | | 2,000 | | | | 34,201 | |
Nomura Real Estate Holdings, Inc. | | | 6,468 | | | | 119,698 | |
Nomura Research Institute Ltd. | | | 8,000 | | | | 269,763 | |
NSK Ltd. | | | 9,400 | | | | 86,143 | |
NTT Data Corp. | | | 6,900 | | | | 346,857 | |
NTT Urban Development Corp. | | | 8,900 | | | | 87,183 | |
Obayashi Corp. | | | 22,000 | | | | 217,269 | |
Obic Co., Ltd. | | | 1,400 | | | | 74,114 | |
Odakyu Electric Railway Co., Ltd. | | | 13,000 | | | | 141,688 | |
Oji Holdings Corp. | | | 46,862 | | | | 188,457 | |
Omron Corp. | | | 4,600 | | | | 137,106 | |
Ono Pharmaceutical Co., Ltd. | | | 12,500 | | | | 529,939 | |
Oracle Corp. | | | 3,868 | | | | 217,499 | |
Osaka Gas Co., Ltd. | | | 67,000 | | | | 257,759 | |
Otsuka Corp. | | | 3,200 | | | | 169,118 | |
Pola Orbis Holdings, Inc. | | | 1,100 | | | | 91,312 | |
Resona Holdings, Inc. | | | 96,600 | | | | 345,163 | |
Ricoh Co., Ltd.(a) | | | 32,060 | | | | 326,890 | |
Ryohin Keikaku Co., Ltd. | | | 600 | | | | 127,052 | |
Sankyo Co., Ltd. | | | 6,300 | | | | 234,859 | |
Santen Pharmaceutical Co., Ltd. | | | 10,600 | | | | 159,667 | |
SBI Holdings, Inc. | | | 6,700 | | | | 68,136 | |
Sega Sammy Holdings, Inc.(a) | | | 9,273 | | | | 101,232 | |
Seiko Epson Corp. | | | 14,600 | | | | 236,156 | |
Sekisui Chemical Co., Ltd. | | | 16,000 | | | | 197,304 | |
Sekisui House Ltd. | | | 33,552 | | | | 567,036 | |
Seven Bank Ltd.(a) | | | 37,100 | | | | 158,441 | |
Shimadzu Corp. | | | 9,000 | | | | 141,332 | |
Shimamura Co., Ltd. | | | 1,100 | | | | 137,506 | |
Shimano, Inc. | | | 1,100 | | | | 172,641 | |
Shimizu Corp. | | | 20,000 | | | | 169,758 | |
Shionogi & Co., Ltd. | | | 7,100 | | | | 334,612 | |
Shiseido Co., Ltd. | | | 7,000 | | | | 156,448 | |
Shizuoka Bank Ltd. (The) | | | 14,000 | | | | 101,143 | |
Showa Shell Sekiyu K.K. | | | 20,109 | | | | 180,703 | |
Sojitz Corp. | | | 20,200 | | | | 41,516 | |
Sony Financial Holdings, Inc. | | | 11,209 | | | | 143,410 | |
Sumitomo Chemical Co., Ltd.(a) | | | 42,000 | | | | 190,204 | |
Sumitomo Dainippon Pharma Co., Ltd.(a) | | | 12,190 | | | | 140,560 | |
Sumitomo Electric Industries Ltd. | | | 19,812 | | | | 241,315 | |
Sumitomo Heavy Industries Ltd. | | | 17,500 | | | | 72,401 | |
Sumitomo Metal Mining Co., Ltd. | | | 19,000 | | | | 188,910 | |
Sumitomo Rubber Industries Ltd. | | | 12,800 | | | | 198,044 | |
Suntory Beverage & Food Ltd. | | | 6,300 | | | | 284,185 | |
Sysmex Corp. | | | 1,800 | | | | 112,745 | |
T&D Holdings, Inc. | | | 20,051 | | | | 187,228 | |
Taisei Corp. | | | 34,876 | | | | 230,862 | |
Taiyo Nippon Sanso Corp.(a) | | | 7,200 | | | | 68,416 | |
TDK Corp. | | | 2,900 | | | | 161,262 | |
Terumo Corp. | | | 8,900 | | | | 319,512 | |
THK Co., Ltd. | | | 2,300 | | | | 42,482 | |
Tobu Railway Co., Ltd.(a) | | | 32,000 | | | | 159,722 | |
Toho Co., Ltd. | | | 5,200 | | | | 136,992 | |
Tohoku Electric Power Co., Inc. | | | 3,500 | | | | 45,216 | |
Tokyo Electron Ltd. | | | 5,294 | | | | 345,538 | |
Tokyu Corp. | | | 30,000 | | | | 251,702 | |
Tokyu Fudosan Holdings Corp. | | | 6,600 | | | | 44,863 | |
TonenGeneral Sekiyu K.K. | | | 32,104 | | | | 290,777 | |
Toppan Printing Co., Ltd. | | | 23,000 | | | | 193,176 | |
TOTO Ltd.(a) | | | 5,000 | | | | 156,146 | |
Toyo Seikan Group Holdings Ltd.(a) | | | 6,100 | | | | 114,407 | |
Toyo Suisan Kaisha Ltd. | | | 3,700 | | | | 132,995 | |
Toyo Tire & Rubber Co., Ltd. | | | 3,300 | | | | 49,326 | |
Toyoda Gosei Co., Ltd. | | | 6,600 | | | | 127,543 | |
Toyota Tsusho Corp. | | | 10,800 | | | | 244,356 | |
Trend Micro, Inc. | | | 5,630 | | | | 206,376 | |
USS Co., Ltd. | | | 12,300 | | | | 196,765 | |
West Japan Railway Co. | | | 6,376 | | | | 394,206 | |
Yamada Denki Co., Ltd.(a) | | | 27,900 | | | | 132,059 | |
Yamaguchi Financial Group, Inc.(a) | | | 7,000 | | | | 63,713 | |
Yamaha Corp. | | | 4,900 | | | | 147,791 | |
Yamaha Motor Co., Ltd. | | | 9,460 | | | | 157,561 | |
Yamato Holdings Co., Ltd.(a) | | | 9,200 | | | | 183,926 | |
Yokohama Rubber Co., Ltd. (The)(a) | | | 7,100 | | | | 116,928 | |
| | | | | | | | |
| Total Japan | | | | | | | 31,799,333 | |
| Netherlands – 1.7% | | | | | | | | |
Aalberts Industries N.V. | | | 3,839 | | | | 133,385 | |
Boskalis Westminster | | | 8,128 | | | | 319,965 | |
Euronext N.V.(b) | | | 1,734 | | | | 72,103 | |
Koninklijke DSM N.V. | | | 8,297 | | | | 457,000 | |
Koninklijke Vopak N.V. | | | 4,281 | | | | 213,504 | |
NN Group N.V. | | | 13,428 | | | | 440,006 | |
Randstad Holding N.V. | | | 8,155 | | | | 452,664 | |
Wolters Kluwer N.V. | | | 15,067 | | | | 602,310 | |
| | | | | | | | |
| Total Netherlands | | | | | | | 2,690,937 | |
| New Zealand – 1.4% | | | | | | | | |
Auckland International Airport Ltd. | | | 100,082 | | | | 446,801 | |
Contact Energy Ltd. | | | 68,948 | | | | 239,353 | |
Fletcher Building Ltd. | | | 67,363 | | | | 369,016 | |
Mighty River Power Ltd. | | | 144,308 | | | | 292,564 | |
See Notes to Financial Statements.
| | |
| 114 | | WisdomTree Developed World ex-U.S. and Currency Hedged Equity Funds |
Schedule of Investments (continued)
WisdomTree International MidCap Dividend Fund (DIM)
March 31, 2016
| | | | | | | | |
| Investments | | Shares | | | Value | |
Spark New Zealand Ltd. | | | 301,546 | | | $ | 764,176 | |
| | | | | | | | |
| Total New Zealand | | | | | | | 2,111,910 | |
| Norway – 1.7% | | | | | | | | |
Gjensidige Forsikring ASA | | | 45,421 | | | | 774,841 | |
Marine Harvest ASA* | | | 40,527 | | | | 624,717 | |
Norsk Hydro ASA | | | 87,670 | | | | 361,120 | |
Orkla ASA | | | 76,193 | | | | 690,424 | |
TGS Nopec Geophysical Co. ASA(a) | | | 6,961 | | | | 106,293 | |
| | | | | | | | |
| Total Norway | | | | | | | 2,557,395 | |
| Portugal – 1.0% | | | | | | | | |
Galp Energia, SGPS, S.A. | | | 41,600 | | | | 523,829 | |
Jeronimo Martins, SGPS, S.A. | | | 25,356 | | | | 415,502 | |
NOS, SGPS S.A. | | | 17,973 | | | | 120,019 | |
Portucel S.A. | | | 75,674 | | | | 275,950 | |
Sonae, SGPS, S.A. | | | 126,586 | | | | 152,762 | |
| | | | | | | | |
| Total Portugal | | | | | | | 1,488,062 | |
| Singapore – 4.7% | | | | | | | | |
CapitaLand Ltd. | | | 183,500 | | | | 418,346 | |
City Developments Ltd. | | | 26,500 | | | | 160,779 | |
ComfortDelGro Corp., Ltd. | | | 124,400 | | | | 269,752 | |
Fraser and Neave Ltd.(a) | | | 75,200 | | | | 110,851 | |
Frasers Centrepoint Ltd. | | | 229,200 | | | | 277,436 | |
Global Logistic Properties Ltd. | | | 122,600 | | | | 175,260 | |
Great Eastern Holdings Ltd. | | | 12,000 | | | | 200,416 | |
Hutchison Port Holdings Trust | | | 1,125,985 | | | | 562,992 | |
Jardine Cycle & Carriage Ltd. | | | 19,511 | | | | 579,998 | |
Keppel Corp., Ltd. | | | 185,000 | | | | 800,943 | |
Olam International Ltd. | | | 136,200 | | | | 173,967 | |
SATS Ltd. | | | 89,000 | | | | 261,065 | |
Sembcorp Industries Ltd. | | | 143,300 | | | | 321,377 | |
Sembcorp Marine Ltd.(a) | | | 156,051 | | | | 191,211 | |
SIA Engineering Co., Ltd. | | | 99,536 | | | | 266,100 | |
Singapore Airlines Ltd. | | | 67,761 | | | | 574,655 | |
Singapore Exchange Ltd. | | | 55,300 | | | | 326,478 | |
Singapore Post Ltd. | | | 115,500 | | | | 140,237 | |
Singapore Press Holdings Ltd.(a) | | | 158,648 | | | | 471,255 | |
Singapore Technologies Engineering Ltd. | | | 212,300 | | | | 509,230 | |
StarHub Ltd. | | | 152,594 | | | | 379,615 | |
UOL Group Ltd. | | | 18,200 | | | | 81,093 | |
| | | | | | | | |
| Total Singapore | | | | | | | 7,253,056 | |
| Spain – 3.0% | | | | | | | | |
Abengoa S.A. Class B(a) | | | 48,382 | | | | 14,390 | |
Acerinox S.A.(a) | | | 13,113 | | | | 152,119 | |
ACS Actividades de Construccion y Servicios S.A. | | | 20,410 | | | | 609,133 | |
Banco Popular Espanol S.A. | | | 68,141 | | | | 177,586 | |
Bankinter S.A. | | | 18,163 | | | | 128,532 | |
Bolsas y Mercados Espanoles SHMSF S.A.(a) | | | 8,118 | | | | 262,262 | |
Cia de Distribucion Integral Logista Holdings S.A. | | | 4,093 | | | | 92,631 | |
Distribuidora Internacional de Alimentacion S.A.* | | | 22,054 | | | | 114,751 | |
Ebro Foods S.A.(a) | | | 11,695 | | | | 255,679 | |
Enagas S.A. | | | 22,372 | | | | 673,425 | |
Grifols S.A. | | | 10,094 | | | | 225,106 | |
Grupo Catalana Occidente S.A. | | | 3,018 | | | | 85,807 | |
Mapfre S.A. | | | 208,879 | | | | 452,016 | |
Prosegur Cia de Seguridad S.A. | | | 20,084 | | | | 113,289 | |
Red Electrica Corp. S.A. | | | 8,816 | | | | 766,531 | |
Tecnicas Reunidas S.A.(a) | | | 4,051 | | | | 114,139 | |
Viscofan S.A. | | | 2,727 | | | | 163,613 | |
Zardoya Otis S.A.(a) | | | 19,254 | | | | 224,455 | |
| | | | | | | | |
| Total Spain | | | | | | | 4,625,464 | |
| Sweden – 4.1% | | | | | | | | |
AAK AB | | | 1,413 | | | | 112,424 | |
Alfa Laval AB | | | 14,161 | | | | 232,153 | |
Atlas Copco AB Class B | | | 20,337 | | | | 480,159 | |
Axfood AB | | | 10,946 | | | | 202,536 | |
BillerudKorsnas AB | | | 5,044 | | | | 82,566 | |
Boliden AB | | | 9,424 | | | | 151,008 | |
Electrolux AB Series B(a) | | | 11,260 | | | | 296,685 | |
Getinge AB Class B(a) | | | 6,697 | | | | 154,565 | |
Hexagon AB Class B | | | 6,724 | | | | 262,102 | |
Husqvarna AB Class B | | | 15,231 | | | | 111,508 | |
ICA Gruppen AB(a) | | | 10,203 | | | | 338,057 | |
Investment AB Kinnevik Class B | | | 7,632 | | | | 216,814 | |
Investment AB Latour Class B | | | 8,289 | | | | 344,067 | |
Lundbergforetagen AB Class B | | | 4,358 | | | | 238,685 | |
Meda AB Class A | | | 11,465 | | | | 213,695 | |
Saab AB Class B | | | 6,210 | | | | 213,264 | |
Securitas AB Class B | | | 20,081 | | | | 333,168 | |
Skanska AB Class B | | | 28,928 | | | | 661,226 | |
SKF AB Class B(a) | | | 20,515 | | | | 370,989 | |
Swedish Match AB | | | 10,593 | | | | 360,126 | |
Tele2 AB Class B | | | 29,257 | | | | 271,757 | |
Trelleborg AB Class B | | | 9,394 | | | | 186,102 | |
Volvo AB Class A | | | 26,520 | | | | 292,460 | |
Wallenstam AB Class B | | | 13,995 | | | | 121,190 | |
| | | | | | | | |
| Total Sweden | | | | | | | 6,247,306 | |
| Switzerland – 4.5% | | | | | | | | |
Aryzta AG* | | | 2,253 | | | | 93,705 | |
Baloise Holding AG Registered Shares | | | 4,164 | | | | 531,343 | |
Bucher Industries AG Registered Shares | | | 381 | | | | 92,977 | |
Clariant AG Registered Shares* | | | 14,876 | | | | 270,289 | |
Coca-Cola HBC AG* | | | 8,950 | | | | 190,385 | |
DKSH Holding AG(a) | | | 1,254 | | | | 86,097 | |
EMS-Chemie Holding AG Registered Shares | | | 957 | | | | 498,162 | |
Galenica AG Registered Shares | | | 187 | | | | 282,360 | |
GAM Holding AG* | | | 11,041 | | | | 160,257 | |
Georg Fischer AG Registered Shares | | | 124 | | | | 100,609 | |
Helvetia Holding AG Registered Shares | | | 403 | | | | 231,452 | |
Julius Baer Group Ltd.* | | | 6,361 | | | | 274,327 | |
Lonza Group AG Registered Shares* | | | 2,301 | | | | 390,928 | |
OC Oerlikon Corp. AG Registered Shares* | | | 12,176 | | | | 126,127 | |
Panalpina Welttransport Holding AG Registered Shares | | | 1,262 | | | | 141,533 | |
Partners Group Holding AG | | | 1,503 | | | | 606,599 | |
Schindler Holding AG Participation Certificate | | | 1,432 | | | | 265,121 | |
See Notes to Financial Statements.
| | | | |
| WisdomTree Developed World ex-U.S. and Currency Hedged Equity Funds | | | 115 | |
Schedule of Investments (continued)
WisdomTree International MidCap Dividend Fund (DIM)
March 31, 2016
| | | | | | | | |
| Investments | | Shares | | | Value | |
Schindler Holding AG Registered Shares | | | 1,900 | | | $ | 349,387 | |
SFS Group AG* | | | 1,037 | | | | 77,424 | |
Sonova Holding AG Registered Shares | | | 1,379 | | | | 176,830 | |
STMicroelectronics N.V. | | | 77,858 | | | | 432,259 | |
Straumann Holding AG Registered Shares | | | 662 | | | | 229,158 | |
Sulzer AG Registered Shares | | | 1,858 | | | | 185,286 | |
Swatch Group AG (The) Bearer Shares(a) | | | 1,021 | | | | 355,135 | |
Swatch Group AG (The) Registered Shares | | | 3,727 | | | | 251,995 | |
Swiss Life Holding AG Registered Shares* | | | 1,534 | | | | 409,590 | |
Vontobel Holding AG Registered Shares | | | 3,370 | | | | 146,568 | |
| | | | | | | | |
| Total Switzerland | | | | | | | 6,955,903 | |
| United Kingdom – 17.3% | | | | | | | | |
Aberdeen Asset Management PLC | | | 111,463 | | | | 444,411 | |
Admiral Group PLC | | | 16,686 | | | | 475,579 | |
Aggreko PLC | | | 9,108 | | | | 140,989 | |
Amec Foster Wheeler PLC | | | 34,307 | | | | 221,893 | |
Ashmore Group PLC(a) | | | 65,322 | | | | 270,020 | |
Ashtead Group PLC | | | 9,243 | | | | 114,782 | |
Babcock International Group PLC | | | 15,420 | | | | 210,439 | |
Barratt Developments PLC | | | 32,061 | | | | 258,286 | |
Bellway PLC | | | 5,059 | | | | 190,726 | |
Berendsen PLC | | | 5,673 | | | | 98,090 | |
Berkeley Group Holdings PLC | | | 15,011 | | | | 694,293 | |
Booker Group PLC | | | 63,618 | | | | 157,548 | |
British Land Co. PLC (The) | | | 57,291 | | | | 576,822 | |
Britvic PLC | | | 8,019 | | | | 81,890 | |
Bunzl PLC | | | 11,485 | | | | 333,945 | |
Burberry Group PLC | | | 15,396 | | | | 302,056 | |
Cable & Wireless Communications PLC | | | 253,751 | | | | 281,014 | |
Capita PLC | | | 29,998 | | | | 449,270 | |
Carnival PLC | | | 9,433 | | | | 508,698 | |
Close Brothers Group PLC | | | 7,725 | | | | 140,122 | |
CNH Industrial N.V. | | | 54,344 | | | | 370,018 | |
Cobham PLC | | | 82,988 | | | | 258,954 | |
Croda International PLC | | | 5,272 | | | | 230,279 | |
Daily Mail & General Trust PLC Class A Non-Voting Shares | | | 20,014 | | | | 200,212 | |
Derwent London PLC | | | 2,267 | | | | 102,703 | |
Direct Line Insurance Group PLC | | | 100,243 | | | | 533,381 | |
Dixons Carphone PLC | | | 16,859 | | | | 103,299 | |
DS Smith PLC | | | 45,081 | | | | 264,363 | |
Dunelm Group PLC | | | 4,485 | | | | 58,887 | |
easyJet PLC | | | 21,817 | | | | 476,322 | |
Essentra PLC | | | 7,220 | | | | 85,872 | |
Evraz PLC*(a) | | | 92,384 | | | | 119,505 | |
Fresnillo PLC | | | 6,517 | | | | 89,220 | |
G4S PLC | | | 88,922 | | | | 243,601 | |
GKN PLC | | | 69,325 | | | | 287,763 | |
Greene King PLC | | | 10,857 | | | | 135,996 | |
Halma PLC | | | 13,946 | | | | 182,706 | |
Hammerson PLC | | | 35,296 | | | | 293,479 | |
Hargreaves Lansdown PLC | | | 23,450 | | | | 452,991 | |
Hays PLC | | | 44,311 | | | | 77,063 | |
Hikma Pharmaceuticals PLC | | | 3,070 | | | | 87,368 | |
Howden Joinery Group PLC | | | 16,616 | | | | 114,181 | |
ICAP PLC | | | 56,032 | | | | 382,379 | |
IG Group Holdings PLC | | | 33,182 | | | | 381,540 | |
IMI PLC | | | 18,958 | | | | 259,540 | |
Inchcape PLC | | | 24,444 | | | | 254,190 | |
Informa PLC | | | 30,860 | | | | 307,824 | |
Inmarsat PLC | | | 31,755 | | | | 449,340 | |
InterContinental Hotels Group PLC | | | 8,043 | | | | 331,893 | |
Intertek Group PLC | | | 4,439 | | | | 202,060 | |
Intu Properties PLC | | | 74,920 | | | | 337,046 | |
Investec PLC | | | 45,433 | | | | 334,667 | |
J Sainsbury PLC(a) | | | 188,000 | | | | 746,597 | |
Jardine Lloyd Thompson Group PLC | | | 12,982 | | | | 157,576 | |
John Wood Group PLC | | | 15,217 | | | | 134,509 | |
Johnson Matthey PLC | | | 6,869 | | | | 270,910 | |
Jupiter Fund Management PLC | | | 20,406 | | | | 120,046 | |
Kingfisher PLC | | | 111,092 | | | | 601,486 | |
London Stock Exchange Group PLC | | | 8,075 | | | | 327,295 | |
Man Group PLC | | | 152,415 | | | | 334,076 | |
Meggitt PLC | | | 40,063 | | | | 234,131 | |
Melrose Industries PLC | | | 7,147 | | | | 36,621 | |
Merlin Entertainments PLC(b) | | | 18,298 | | | | 121,899 | |
Michael Page International PLC | | | 17,672 | | | | 108,407 | |
Micro Focus International PLC | | | 5,470 | | | | 123,434 | |
Millennium & Copthorne Hotels PLC | | | 18,491 | | | | 110,667 | |
Mondi PLC | | | 17,956 | | | | 344,797 | |
Pennon Group PLC | | | 22,146 | | | | 258,145 | |
Persimmon PLC | | | 25,846 | | | | 774,545 | |
Renishaw PLC | | | 2,637 | | | | 69,549 | |
Rentokil Initial PLC | | | 57,556 | | | | 146,258 | |
Rexam PLC | | | 45,717 | | | | 416,595 | |
Rightmove PLC | | | 3,455 | | | | 209,113 | |
Rotork PLC | | | 28,208 | | | | 74,113 | |
Royal Mail PLC | | | 70,699 | | | | 488,467 | |
Saga PLC | | | 23,326 | | | | 66,449 | |
Sage Group PLC (The) | | | 54,680 | | | | 494,341 | |
Schroders PLC | | | 8,336 | | | | 321,459 | |
Segro PLC | | | 56,679 | | | | 334,250 | |
Severn Trent PLC | | | 17,209 | | | | 537,481 | |
Smiths Group PLC | | | 21,985 | | | | 340,006 | |
Spectris PLC | | | 5,820 | | | | 154,252 | |
Spirax-Sarco Engineering PLC | | | 1,468 | | | | 76,802 | |
St. James’s Place PLC | | | 26,592 | | | | 351,057 | |
Stagecoach Group PLC | | | 34,843 | | | | 126,301 | |
TalkTalk Telecom Group PLC(a) | | | 54,656 | | | | 186,259 | |
Tate & Lyle PLC | | | 38,234 | | | | 317,633 | |
Taylor Wimpey PLC | | | 271,181 | | | | 741,729 | |
Travis Perkins PLC | | | 7,006 | | | | 183,974 | |
United Utilities Group PLC | | | 53,343 | | | | 707,663 | |
Victrex PLC | | | 5,962 | | | | 141,220 | |
Weir Group PLC (The) | | | 9,258 | | | | 147,436 | |
WH Smith PLC | | | 3,480 | | | | 90,933 | |
William Hill PLC | | | 53,884 | | | | 253,253 | |
See Notes to Financial Statements.
| | |
| 116 | | WisdomTree Developed World ex-U.S. and Currency Hedged Equity Funds |
Schedule of Investments (concluded)
WisdomTree International MidCap Dividend Fund (DIM)
March 31, 2016
| | | | | | | | |
| Investments | | Shares | | | Value | |
WM Morrison Supermarkets PLC(a) | | | 314,367 | | | $ | 897,805 | |
| | | | | | | | |
| Total United Kingdom | | | | | | | 26,639,054 | |
TOTAL COMMON STOCKS
(Cost: $141,404,849) | | | | | | | 152,858,426 | |
| INVESTMENT OF CASH COLLATERAL FOR SECURITIES LOANED – 7.9% | |
| United States – 7.9% | | | | | | | | |
State Street Navigator Securities Lending Prime Portfolio, 0.50%(c) | | | | | | | | |
| (Cost: $12,170,282)(d) | | | 12,170,282 | | | | 12,170,282 | |
TOTAL INVESTMENTS IN SECURITIES – 107.5% (Cost: $153,575,131) | | | | 165,028,708 | |
Liabilities in Excess of Cash, Foreign Currency and Other Assets – (7.5)% | | | | | | | (11,516,395 | ) |
| | | | | | | | |
| NET ASSETS – 100.0% | | | | | | $ | 153,512,313 | |
| * | Non-income producing security. |
| (a) | Security, or portion thereof, was on loan at March 31, 2016 (See Note 2). |
| (b) | This security is exempt from registration under rule 144A of the Securities Act of 1933. This security may be sold in transactions that are exempt from registration, normally to qualified institutional buyers. |
| (c) | Rate shown represents annualized 7-day yield as of March 31, 2016. |
| (d) | At March 31, 2016, the total market value of the Fund’s securities on loan was $12,557,085 and the total market value of the collateral held by the Fund was $13,370,550. The total market value of the collateral includes non-cash U.S. Government and U.S. Government Agencies securities collateral having a value of $1,200,268. |
RSP – Risparmio Italian Savings Shares
See Notes to Financial Statements.
| | | | |
| WisdomTree Developed World ex-U.S. and Currency Hedged Equity Funds | | | 117 | |
Schedule of Investments
WisdomTree International SmallCap Dividend Fund (DLS)
March 31, 2016
| | | | | | | | |
| Investments | | Shares | | | Value | |
| COMMON STOCKS – 99.1% | | | | | | | | |
| Australia – 11.2% | | | | | | | | |
Adelaide Brighton Ltd. | | | 913,167 | | | $ | 3,561,439 | |
ALS Ltd.(a) | | | 618,286 | | | | 1,897,709 | |
Altium Ltd. | | | 218,444 | | | | 991,424 | |
AP Eagers Ltd.(a) | | | 249,352 | | | | 1,870,186 | |
ARB Corp., Ltd.(a) | | | 62,101 | | | | 718,478 | |
Asaleo Care Ltd. | | | 749,151 | | | | 1,048,837 | |
Australian Pharmaceutical Industries Ltd. | | | 822,277 | | | | 1,236,609 | |
Bega Cheese Ltd.(a) | | | 173,785 | | | | 788,736 | |
BlueScope Steel Ltd. | | | 317,387 | | | | 1,511,288 | |
Breville Group Ltd.(a) | | | 187,668 | | | | 1,128,923 | |
Brickworks Ltd. | | | 100,784 | | | | 1,228,045 | |
BT Investment Management Ltd. | | | 431,787 | | | | 3,221,875 | |
Cardno Ltd.(a) | | | 647,475 | | | | 557,838 | |
carsales.com Ltd.(a) | | | 255,632 | | | | 2,312,543 | |
Cash Converters International Ltd.(a) | | | 1,240,478 | | | | 510,517 | |
Cleanaway Waste Management Ltd. | | | 2,003,918 | | | | 1,186,965 | |
Collins Foods Ltd. | | | 307,020 | | | | 994,297 | |
Corporate Travel Management Ltd.(a) | | | 97,477 | | | | 1,005,537 | |
Cover-More Group Ltd.(a) | | | 488,623 | | | | 582,603 | |
CSG Ltd.(a) | | | 902,802 | | | | 861,155 | |
CSR Ltd. | | | 920,564 | | | | 2,336,874 | |
Decmil Group Ltd. | | | 881,967 | | | | 522,409 | |
Dick Smith Holdings Ltd.† | | | 769,150 | | | | 1 | |
Domino’s Pizza Enterprises Ltd. | | | 57,894 | | | | 2,559,868 | |
Downer EDI Ltd. | | | 695,411 | | | | 2,054,188 | |
DuluxGroup Ltd. | | | 442,659 | | | | 2,138,436 | |
ERM Power Ltd. | | | 470,397 | | | | 517,449 | |
Event Hospitality and Entertainment Ltd. | | | 220,180 | | | | 2,574,476 | |
Fairfax Media Ltd. | | | 3,495,884 | | | | 2,312,719 | |
Folkestone Education Trust | | | 642,001 | | | | 1,155,630 | |
G8 Education Ltd.(a) | | | 738,326 | | | | 2,141,198 | |
Generation Healthcare REIT | | | 407,531 | | | | 639,526 | |
Genworth Mortgage Insurance Australia Ltd.(a) | | | 1,108,708 | | | | 2,123,655 | |
GrainCorp Ltd. Class A | | | 136,622 | | | | 792,427 | |
GUD Holdings Ltd.(a) | | | 132,203 | | | | 707,812 | |
GWA Group Ltd. | | | 364,591 | | | | 633,843 | |
IMF Bentham Ltd.(a) | | | 800,924 | | | | 825,588 | |
Infomedia Ltd.(a) | | | 793,346 | | | | 353,963 | |
Invocare Ltd.(a) | | | 130,646 | | | | 1,263,277 | |
IOOF Holdings Ltd.(a) | | | 455,162 | | | | 3,105,682 | |
IRESS Ltd. | | | 245,206 | | | | 2,188,046 | |
Japara Healthcare Ltd.(a) | | | 289,049 | | | | 680,394 | |
JB Hi-Fi Ltd.(a) | | | 137,895 | | | | 2,501,265 | |
MACA Ltd. | | | 1,896,531 | | | | 1,320,310 | |
Magellan Financial Group Ltd. | | | 185,939 | | | | 3,244,000 | |
McMillan Shakespeare Ltd.(a) | | | 145,105 | | | | 1,394,159 | |
Mineral Resources Ltd.(a) | | | 357,175 | | | | 1,651,288 | |
MMA Offshore Ltd.(a) | | | 2,559,381 | | | | 767,833 | |
Monadelphous Group Ltd.(a) | | | 339,085 | | | | 1,857,188 | |
Myer Holdings Ltd.(a) | | | 2,247,353 | | | | 2,031,311 | |
MyState Ltd. | | | 152,811 | | | | 514,868 | |
Navitas Ltd.(a) | | | 614,459 | | | | 2,401,176 | |
New Hope Corp., Ltd. | | | 1,003,742 | | | | 1,011,488 | |
NIB Holdings Ltd. | | | 805,738 | | | | 2,423,472 | |
Nine Entertainment Co. Holdings Ltd.(a) | | | 1,734,515 | | | | 2,081,469 | |
Northern Star Resources Ltd. | | | 623,934 | | | | 1,646,266 | |
Nufarm Ltd.(a) | | | 203,682 | | | | 1,175,117 | |
Orora Ltd. | | | 1,246,882 | | | | 2,397,909 | |
OZ Minerals Ltd. | | | 280,463 | | | | 1,085,203 | |
OzForex Group Ltd.(a) | | | 391,751 | | | | 608,736 | |
Pact Group Holdings Ltd. | | | 469,042 | | | | 1,800,444 | |
Peet Ltd. | | | 1,216,724 | | | | 921,925 | |
Perpetual Ltd.(a) | | | 63,259 | | | | 2,119,715 | |
Premier Investments Ltd. | | | 191,522 | | | | 2,492,794 | |
Primary Health Care Ltd.(a) | | | 677,721 | | | | 1,955,013 | |
Programmed Maintenance Services Ltd. | | | 847,441 | | | | 964,803 | |
Qube Holdings Ltd.(a) | | | 622,283 | | | | 1,129,711 | |
Recall Holdings Ltd. | | | 236,409 | | | | 1,363,932 | |
Retail Food Group Ltd.(a) | | | 261,038 | | | | 1,036,146 | |
SAI Global Ltd. | | | 276,345 | | | | 801,420 | |
Sandfire Resources NL | | | 192,224 | | | | 844,328 | |
Servcorp Ltd. | | | 161,286 | | | | 849,874 | |
Seven Group Holdings Ltd.(a) | | | 627,132 | | | | 2,634,019 | |
Seven West Media Ltd. | | | 4,151,166 | | | | 3,289,082 | |
SG Fleet Group Ltd. | | | 358,926 | | | | 966,363 | |
Sigma Pharmaceuticals Ltd. | | | 1,393,626 | | | | 1,136,369 | |
Sims Metal Management Ltd.(a) | | | 199,220 | | | | 1,324,079 | |
Slater & Gordon Ltd.(a) | | | 681,187 | | | | 136,241 | |
SMS Management & Technology Ltd. | | | 278,014 | | | | 395,645 | |
Southern Cross Media Group Ltd. | | | 1,620,679 | | | | 1,383,845 | |
Spotless Group Holdings Ltd. | | | 755,143 | | | | 731,926 | |
Steadfast Group Ltd.(a) | | | 719,869 | | | | 991,229 | |
Super Retail Group Ltd.(a) | | | 280,360 | | | | 1,846,108 | |
Thorn Group Ltd. | | | 372,512 | | | | 522,962 | |
Villa World Ltd. | | | 460,953 | | | | 751,726 | |
Village Roadshow Ltd. | | | 297,734 | | | | 1,186,385 | |
Western Areas Ltd. | | | 297,883 | | | | 494,956 | |
| | | | | | | | |
| Total Australia | | | | 123,026,563 | |
| Austria – 0.5% | | | | | | | | |
Austria Technologie & Systemtechnik AG | | | 46,027 | | | | 676,606 | |
Lenzing AG | | | 16,359 | | | | 1,296,917 | |
RHI AG | | | 50,377 | | | | 985,681 | |
S IMMO AG* | | | 99,164 | | | | 920,856 | |
Schoeller-Bleckmann Oilfield Equipment AG | | | 17,178 | | | | 1,047,469 | |
Semperit AG Holding | | | 17,884 | | | | 692,911 | |
| | | | | | | | |
| Total Austria | | | | 5,620,440 | |
| Belgium – 2.0% | | | | | | | | |
Barco N.V. | | | 16,749 | | | | 1,208,546 | |
Bekaert S.A. | | | 64,082 | | | | 2,607,346 | |
Cofinimmo S.A. | | | 49,225 | | | | 6,049,778 | |
D’ieteren S.A./N.V. | | | 42,255 | | | | 1,781,613 | |
Econocom Group S.A./N.V. | | | 86,161 | | | | 893,482 | |
Euronav N.V. | | | 82,913 | | | | 849,502 | |
EVS Broadcast Equipment S.A. | | | 45,010 | | | | 1,666,194 | |
Exmar N.V.(a) | | | 110,756 | | | | 931,193 | |
See Notes to Financial Statements.
| | |
| 118 | | WisdomTree Developed World ex-U.S. and Currency Hedged Equity Funds |
Schedule of Investments (continued)
WisdomTree International SmallCap Dividend Fund (DLS)
March 31, 2016
| | | | | | | | |
| Investments | | Shares | | | Value | |
Kinepolis Group N.V. | | | 22,065 | | | $ | 958,622 | |
Melexis N.V. | | | 37,005 | | | | 2,015,681 | |
Warehouses De Pauw | | | 32,560 | | | | 3,100,019 | |
| | | | | | | | |
| Total Belgium | | | | | | | 22,061,976 | |
| China – 0.5% | | | | | | | | |
Beijing Tong Ren Tang Chinese Medicine Co., Ltd. | | | 648,392 | | | | 675,430 | |
CITIC Telecom International Holdings Ltd. | | | 3,673,822 | | | | 1,383,032 | |
CPMC Holdings Ltd. | | | 974,000 | | | | 480,938 | |
Dah Chong Hong Holdings Ltd. | | | 2,722,000 | | | | 1,108,936 | |
Goldpac Group Ltd. | | | 1,382,922 | | | | 586,577 | |
Poly Property Group Co., Ltd. | | | 3,798,129 | | | | 1,038,095 | |
Shougang Fushan Resources Group Ltd.(a) | | | 5,532,000 | | | | 698,940 | |
| | | | | | | | |
| Total China | | | | | | | 5,971,948 | |
| Denmark – 1.2% | | | | | | | | |
Dfds A/S | | | 70,141 | | | | 2,553,332 | |
FLSmidth & Co. A/S(a) | | | 48,443 | | | | 2,033,910 | |
Matas A/S | | | 56,838 | | | | 1,151,896 | |
NKT Holding A/S | | | 21,175 | | | | 1,223,612 | |
Royal Unibrew A/S | | | 47,807 | | | | 2,310,665 | |
Schouw & Co. | | | 22,746 | | | | 1,422,941 | |
SimCorp A/S | | | 29,244 | | | | 1,351,729 | |
Spar Nord Bank A/S | | | 75,603 | | | | 722,732 | |
| | | | | | | | |
| Total Denmark | | | | | | | 12,770,817 | |
| Finland – 3.3% | | | | | | | | |
Aktia Bank Oyj | | | 67,234 | | | | 752,374 | |
Aspo Oyj | | | 63,304 | | | | 535,986 | |
Cargotec Oyj Class B | | | 37,026 | | | | 1,197,859 | |
Caverion Corp. | | | 97,304 | | | | 943,613 | |
Citycon Oyj | | | 1,342,906 | | | | 3,394,226 | |
Cramo Oyj | | | 45,967 | | | | 948,633 | |
F-Secure Oyj(a) | | | 183,984 | | | | 551,403 | |
Fiskars Oyj Abp | | | 98,239 | | | | 1,932,228 | |
Kemira Oyj | | | 242,344 | | | | 2,709,161 | |
Kesko Oyj Class B(a) | | | 104,802 | | | | 4,634,969 | |
Konecranes Oyj(a) | | | 84,848 | | | | 2,028,526 | |
Lassila & Tikanoja Oyj | | | 43,123 | | | | 785,762 | |
Metsa Board Oyj | | | 270,395 | | | | 1,811,797 | |
PKC Group Oyj(a) | | | 30,660 | | | | 543,645 | |
Raisio Oyj Class V | | | 207,007 | | | | 1,021,425 | |
Ramirent Oyj | | | 262,899 | | | | 1,722,623 | |
Sanoma Oyj(a) | | | 317,052 | | | | 1,553,576 | |
Technopolis Oyj(a) | | | 268,943 | | | | 1,149,278 | |
Tieto Oyj | | | 110,777 | | | | 2,893,329 | |
Tikkurila Oyj | | | 74,507 | | | | 1,355,076 | |
Uponor Oyj(a) | | | 82,702 | | | | 1,202,542 | |
Valmet Oyj | | | 132,384 | | | | 1,460,308 | |
YIT Oyj(a) | | | 128,666 | | | | 729,295 | |
| | | | | | | | |
| Total Finland | | | | | | | 35,857,634 | |
| France – 2.7% | | | | | | | | |
Albioma S.A. | | | 60,100 | | | | 931,423 | |
Alten S.A. | | | 31,887 | | | | 1,960,009 | |
Altran Technologies S.A. | | | 96,487 | | | | 1,339,213 | |
Assystem | | | 54,431 | | | | 1,476,240 | |
Bourbon S.A.(a) | | | 173,350 | | | | 2,595,690 | |
Gaztransport Et Technigaz S.A. | | | 60,935 | | | | 1,997,051 | |
IPSOS | | | 56,433 | | | | 1,320,248 | |
Jacquet Metal Service | | | 39,611 | | | | 571,005 | |
Lectra | | | 46,985 | | | | 684,264 | |
Metropole Television S.A. | | | 216,605 | | | | 3,955,488 | |
Neopost S.A. | | | 119,999 | | | | 2,525,679 | |
Nexity S.A. | | | 97,558 | | | | 5,091,134 | |
Saft Groupe S.A. | | | 38,296 | | | | 1,160,394 | |
Sopra Steria Group | | | 10,975 | | | | 1,298,807 | |
Tarkett S.A. | | | 70,820 | | | | 2,223,367 | |
Technicolor S.A. Registered Shares | | | 129,808 | | | | 812,096 | |
| | | | | | | | |
| Total France | | | | | | | 29,942,108 | |
| Germany – 4.0% | | | | | | | | |
Aareal Bank AG | | | 68,462 | | | | 2,221,893 | |
alstria office REIT-AG* | | | 171,884 | | | | 2,483,638 | |
AURELIUS SE & Co. KGaA | | | 43,609 | | | | 2,658,664 | |
BayWa AG(a) | | | 38,696 | | | | 1,310,755 | |
Bechtle AG | | | 16,212 | | | | 1,677,105 | |
Bertrandt AG | | | 7,360 | | | | 845,838 | |
Borussia Dortmund GmbH & Co. KGaA | | | 165,171 | | | | 756,647 | |
Carl Zeiss Meditec AG Bearer Shares | | | 51,752 | | | | 1,600,555 | |
Comdirect Bank AG | | | 87,246 | | | | 978,504 | |
CompuGroup Medical SE | | | 38,895 | | | | 1,646,593 | |
Drillisch AG(a) | | | 94,078 | | | | 3,864,263 | |
ElringKlinger AG | | | 56,780 | | | | 1,558,388 | |
Gerresheimer AG | | | 13,144 | | | | 1,032,451 | |
Gerry Weber International AG(a) | | | 67,074 | | | | 942,434 | |
Grammer AG | | | 18,550 | | | | 740,699 | |
Hamburger Hafen und Logistik AG | | | 55,554 | | | | 819,187 | |
Indus Holding AG | | | 25,944 | | | | 1,281,325 | |
Jenoptik AG | | | 51,381 | | | | 822,645 | |
Leoni AG(a) | | | 30,351 | | | | 1,048,835 | |
NORMA Group SE | | | 18,593 | | | | 1,043,069 | |
Pfeiffer Vacuum Technology AG | | | 11,773 | | | | 1,322,408 | |
RHOEN-KLINIKUM AG | | | 79,899 | | | | 2,490,189 | |
Salzgitter AG | | | 16,127 | | | | 457,325 | |
Sixt SE | | | 39,198 | | | | 2,113,248 | |
Software AG | | | 56,044 | | | | 2,194,081 | |
STADA Arzneimittel AG | | | 51,537 | | | | 2,048,762 | |
Stroeer SE & Co KGaA(a) | | | 17,562 | | | | 1,105,706 | |
Takkt AG | | | 48,858 | | | | 939,813 | |
TLG Immobilien AG | | | 15,976 | | | | 348,634 | |
VTG AG | | | 25,109 | | | | 768,974 | |
Wacker Neuson SE | | | 56,166 | | | | 894,776 | |
| | | | | | | | |
| Total Germany | | | | | | | 44,017,404 | |
| Hong Kong – 1.3% | | | | | | | | |
Chong Hing Bank Ltd. | | | 444,000 | | | | 904,423 | |
Dah Sing Financial Holdings Ltd. | | | 345,029 | | | | 2,121,805 | |
Goldlion Holdings Ltd. | | | 3,359,000 | | | | 1,281,838 | |
Hong Kong Aircraft Engineering Co., Ltd.(a) | | | 151,200 | | | | 1,014,621 | |
See Notes to Financial Statements.
| | | | |
| WisdomTree Developed World ex-U.S. and Currency Hedged Equity Funds | | | 119 | |
Schedule of Investments (continued)
WisdomTree International SmallCap Dividend Fund (DLS)
March 31, 2016
| | | | | | | | |
| Investments | | Shares | | | Value | |
Hong Kong Ferry Holdings Co., Ltd. | | | 753,000 | | | $ | 856,239 | |
Hongkong & Shanghai Hotels Ltd. (The) | | | 1,168,000 | | | | 1,239,293 | |
Kowloon Development Co., Ltd. | | | 1,620,000 | | | | 1,514,204 | |
Lippo China Resources Ltd. | | | 15,060,000 | | | | 450,448 | |
Liu Chong Hing Investment Ltd. | | | 594,000 | | | | 676,971 | |
Melco International Development Ltd.(a) | | | 1,077,000 | | | | 1,499,584 | |
Miramar Hotel & Investment | | | 482,000 | | | | 832,690 | |
Vitasoy International Holdings Ltd.(a) | | | 604,364 | | | | 1,128,232 | |
Welling Holding Ltd. | | | 5,271,518 | | | | 849,527 | |
| | | | | | | | |
| Total Hong Kong | | | | | | | 14,369,875 | |
| Indonesia – 0.1% | | | | | | | | |
Bumitama Agri Ltd. | | | 1,118,000 | | | | 772,122 | |
| Ireland – 0.8% | | | | | | | | |
C&C Group PLC | | | 500,426 | | | | 2,263,935 | |
Greencore Group PLC | | | 350,184 | | | | 1,887,448 | |
Irish Continental Group PLC | | | 313,693 | | | | 1,948,206 | |
Origin Enterprises PLC | | | 126,834 | | | | 971,267 | |
UDG Healthcare PLC | | | 197,075 | | | | 1,654,214 | |
| | | | | | | | |
| Total Ireland | | | | | | | 8,725,070 | |
| Israel – 2.1% | | | | | | | | |
B Communications Ltd. | | | 40,120 | | | | 1,152,536 | |
Delek Automotive Systems Ltd. | | | 379,614 | | | | 3,669,417 | |
Delta-Galil Industries Ltd. | | | 22,380 | | | | 606,602 | |
Gazit-Globe Ltd. | | | 227,945 | | | | 2,079,062 | |
Harel Insurance Investments & Financial Services Ltd. | | | 381,832 | | | | 1,457,452 | |
Industrial Buildings Corp., Ltd. | | | 624,722 | | | | 574,787 | |
Inrom Construction Industries Ltd. | | | 370,852 | | | | 930,114 | |
Ituran Location and Control Ltd. | | | 53,557 | | | | 1,054,188 | |
Jerusalem Economy Ltd.* | | | 328,681 | | | | 609,714 | |
Magic Software Enterprises Ltd. | | | 104,256 | | | | 710,754 | |
Matrix IT Ltd. | | | 171,949 | | | | 1,099,980 | |
Melisron Ltd. | | | 49,912 | | | | 1,796,274 | |
Menorah Mivtachim Holdings Ltd.* | | | 158,447 | | | | 1,327,592 | |
Migdal Insurance & Financial Holding Ltd. | | | 2,523,889 | | | | 1,752,188 | |
Osem Investments Ltd.* | | | 64,941 | | | | 1,418,700 | |
Sella Capital Real Estate Ltd. | | | 792,872 | | | | 1,246,409 | |
Shapir Engineering and Industry Ltd. | | | 348,725 | | | | 558,220 | |
Shikun & Binui Ltd. | | | 881,203 | | | | 1,563,406 | |
| | | | | | | | |
| Total Israel | | | | | | | 23,607,395 | |
| Italy – 4.2% | | | | | | | | |
Anima Holding SpA(b) | | | 238,960 | | | | 1,750,934 | |
Ansaldo STS SpA | | | 98,546 | | | | 1,178,007 | |
Ascopiave SpA | | | 638,934 | | | | 1,668,800 | |
Astaldi SpA(a) | | | 107,115 | | | | 496,064 | |
ASTM SpA | | | 176,830 | | | | 2,045,293 | |
Banca IFIS SpA | | | 85,482 | | | | 2,835,636 | |
Banca Popolare di Sondrio SCARL | | | 210,485 | | | | 739,243 | |
Cairo Communication SpA(a) | | | 181,931 | | | | 974,817 | |
Cementir Holding SpA | | | 91,089 | | | | 456,099 | |
Danieli & C. Officine Meccaniche SpA RSP | | | 54,639 | | | | 856,129 | |
Datalogic SpA | | | 62,664 | | | | 1,224,661 | |
DiaSorin SpA | | | 31,727 | | | | 1,834,842 | |
Ei Towers SpA | | | 16,392 | | | | 914,922 | |
ERG SpA | | | 212,555 | | | | 2,896,917 | |
Falck Renewables SpA | | | 768,237 | | | | 844,367 | |
Immobiliare Grande Distribuzione SIIQ SpA | | | 1,251,802 | | | | 1,141,193 | |
Industria Macchine Automatiche SpA | | | 56,066 | | | | 3,293,531 | |
Interpump Group SpA | | | 88,806 | | | | 1,300,406 | |
Iren SpA | | | 1,587,793 | | | | 2,849,758 | |
MARR SpA | | | 116,458 | | | | 2,348,963 | |
Piaggio & C. SpA(a) | | | 325,616 | | | | 692,019 | |
RAI Way SpA(b) | | | 252,711 | | | | 1,359,251 | |
Salini Impregilo SpA | | | 168,951 | | | | 715,050 | |
Societa Cattolica di Assicurazioni SCRL | | | 311,243 | | | | 2,128,063 | |
Societa Iniziative Autostradali e Servizi SpA | | | 247,231 | | | | 2,535,590 | |
Trevi Finanziaria Industriale SpA(a) | | | 447,512 | | | | 764,944 | |
Unipol Gruppo Finanziario SpA | | | 542,900 | | | | 2,199,962 | |
UnipolSai SpA | | | 950,897 | | | | 2,204,032 | |
Vittoria Assicurazioni SpA | | | 56,260 | | | | 547,509 | |
Zignago Vetro SpA | | | 160,620 | | | | 1,057,940 | |
| | | | | | | | |
| Total Italy | | | | | | | 45,854,942 | |
| Japan – 26.7% | | | | | | | | |
77 Bank Ltd. (The) | | | 271,000 | | | | 959,633 | |
Accordia Golf Co., Ltd. | | | 54,900 | | | | 516,298 | |
Adastria Co., Ltd. | | | 29,400 | | | | 893,287 | |
ADEKA Corp. | | | 86,600 | | | | 1,265,926 | |
Aeon Delight Co., Ltd. | | | 42,100 | | | | 1,354,077 | |
Ai Holdings Corp. | | | 34,300 | | | | 996,392 | |
Aica Kogyo Co., Ltd. | | | 36,300 | | | | 763,497 | |
Aichi Steel Corp. | | | 204,940 | | | | 804,115 | |
Aida Engineering Ltd. | | | 65,600 | | | | 570,815 | |
Aisan Industry Co., Ltd. | | | 65,600 | | | | 517,119 | |
Akita Bank Ltd. (The) | | | 302,000 | | | | 824,894 | |
Alpen Co., Ltd.(a) | | | 40,800 | | | | 673,738 | |
Amano Corp. | | | 70,600 | | | | 1,116,208 | |
Anritsu Corp.(a) | | | 157,365 | | | | 866,666 | |
AOKI Holdings, Inc. | | | 60,600 | | | | 733,271 | |
Aoyama Trading Co., Ltd. | | | 39,200 | | | | 1,508,430 | |
Arcs Co., Ltd. | | | 37,300 | | | | 836,632 | |
Ariake Japan Co., Ltd. | | | 31,000 | | | | 1,820,366 | |
Asahi Diamond Industrial Co., Ltd. | | | 53,300 | | | | 478,488 | |
Ashikaga Holdings Co., Ltd. | | | 178,800 | | | | 512,243 | |
ASKUL Corp.(a) | | | 26,188 | | | | 1,067,139 | |
Autobacs Seven Co., Ltd. | | | 86,000 | | | | 1,453,801 | |
Avex Group Holdings, Inc. | | | 42,300 | | | | 552,107 | |
Axell Corp. | | | 100,100 | | | | 752,565 | |
Azbil Corp. | | | 67,800 | | | | 1,737,905 | |
Bando Chemical Industries Ltd. | | | 142,000 | | | | 643,071 | |
Bank of Nagoya Ltd. (The)(a) | | | 173,000 | | | | 569,509 | |
Bank of Saga Ltd. (The) | | | 366,764 | | | | 691,792 | |
Bank of the Ryukyus Ltd. | | | 53,800 | | | | 605,038 | |
Belluna Co., Ltd. | | | 149,200 | | | | 757,980 | |
Calsonic Kansei Corp. | | | 132,000 | | | | 982,998 | |
Canon Electronics, Inc. | | | 48,200 | | | | 710,167 | |
See Notes to Financial Statements.
| | |
| 120 | | WisdomTree Developed World ex-U.S. and Currency Hedged Equity Funds |
Schedule of Investments (continued)
WisdomTree International SmallCap Dividend Fund (DLS)
March 31, 2016
| | | | | | | | |
| Investments | | Shares | | | Value | |
Capcom Co., Ltd. | | | 41,400 | | | $ | 1,011,104 | |
Central Glass Co., Ltd. | | | 234,000 | | | | 1,272,067 | |
Chiyoda Co., Ltd. | | | 36,000 | | | | 1,037,769 | |
Citizen Holdings Co., Ltd. | | | 175,000 | | | | 993,372 | |
Cleanup Corp. | | | 81,600 | | | | 559,754 | |
Coca-Cola East Japan Co., Ltd. | | | 49,800 | | | | 827,674 | |
Coca-Cola West Co., Ltd. | | | 59,600 | | | | 1,477,340 | |
COMSYS Holdings Corp.(a) | | | 79,600 | | | | 1,230,880 | |
CONEXIO Corp. | | | 64,100 | | | | 649,013 | |
Daido Steel Co., Ltd. | | | 246,000 | | | | 853,597 | |
Daifuku Co., Ltd. | | | 61,100 | | | | 1,031,244 | |
Daiichikosho Co., Ltd. | | | 42,700 | | | | 1,861,560 | |
Daikyo, Inc. | | | 680,000 | | | | 1,082,966 | |
Daio Paper Corp.(a) | | | 48,600 | | | | 410,351 | |
Daishi Bank Ltd. (The) | | | 332,000 | | | | 1,143,147 | |
Daiwabo Holdings Co., Ltd. | | | 463,000 | | | | 865,074 | |
DCM Holdings Co., Ltd. | | | 154,000 | | | | 1,113,946 | |
Denka Co., Ltd. | | | 440,000 | | | | 1,812,536 | |
Doshisha Co., Ltd. | | | 37,100 | | | | 683,938 | |
Doutor Nichires Holdings Co., Ltd. | | | 38,700 | | | | 625,976 | |
Dynam Japan Holdings Co., Ltd. | | | 1,369,451 | | | | 1,973,875 | |
Earth Chemical Co., Ltd. | | | 27,300 | | | | 1,105,165 | |
Ebara Corp. | | | 312,000 | | | | 1,304,684 | |
EDION Corp.(a) | | | 111,500 | | | | 847,200 | |
Eighteenth Bank Ltd. (The) | | | 316,000 | | | | 702,878 | |
Exedy Corp. | | | 42,600 | | | | 943,003 | |
Fancl Corp. | | | 50,800 | | | | 693,785 | |
Fields Corp. | | | 37,800 | | | | 631,934 | |
Foster Electric Co., Ltd. | | | 34,585 | | | | 730,502 | |
France Bed Holdings Co., Ltd. | | | 119,000 | | | | 1,097,940 | |
Fuji Corp., Ltd.(a) | | | 132,400 | | | | 805,744 | |
Fuji Oil Holdings, Inc. | | | 42,800 | | | | 772,643 | |
Fujikura Ltd. | | | 141,000 | | | | 664,887 | |
Fujimi, Inc. | | | 50,841 | | | | 678,513 | |
Fujitec Co., Ltd. | | | 56,500 | | | | 576,084 | |
Fujitsu General Ltd. | | | 41,000 | | | | 633,631 | |
Fukuyama Transporting Co., Ltd.(a) | | | 135,000 | | | | 659,415 | |
Funai Soken Holdings, Inc. | | | 102,300 | | | | 1,647,431 | |
Furukawa Co., Ltd. | | | 367,000 | | | | 542,035 | |
Fuso Pharmaceutical Industries Ltd. | | | 285,000 | | | | 659,282 | |
Geo Holdings Corp.(a) | | | 115,400 | | | | 1,921,023 | |
Glory Ltd. | | | 31,600 | | | | 1,075,404 | |
GMO Internet, Inc. | | | 74,824 | | | | 1,000,583 | |
Goldcrest Co., Ltd. | | | 31,800 | | | | 475,890 | |
GS Yuasa Corp. | | | 274,000 | | | | 1,172,597 | |
Gulliver International Co., Ltd.(a) | | | 66,140 | | | | 824,433 | |
Gunze Ltd. | | | 282,000 | | | | 797,865 | |
H-One Co., Ltd. | | | 99,400 | | | | 486,410 | |
H2O Retailing Corp. | | | 40,300 | | | | 696,676 | |
Hakuto Co., Ltd. | | | 73,894 | | | | 651,532 | |
Hanwa Co., Ltd. | | | 239,000 | | | | 1,010,054 | |
Heiwa Corp. | | | 121,700 | | | | 2,526,145 | |
Heiwado Co., Ltd. | | | 70,100 | | | | 1,456,947 | |
Higashi-Nippon Bank Ltd. (The) | | | 359,000 | | | | 883,874 | |
Hiramatsu, Inc.(a) | | | 85,600 | | | | 565,107 | |
Hitachi Koki Co., Ltd. | | | 83,500 | | | | 552,729 | |
Hitachi Kokusai Electric, Inc. | | | 65,600 | | | | 789,686 | |
Hitachi Maxell Ltd. | | | 54,800 | | | | 835,201 | |
Hitachi Transport System Ltd. | | | 41,800 | | | | 699,921 | |
Hitachi Zosen Corp. | | | 100,900 | | | | 479,386 | |
Hokkoku Bank Ltd. (The) | | | 163,000 | | | | 429,272 | |
Hokuetsu Bank Ltd. (The) | | | 300,000 | | | | 485,787 | |
Hokuetsu Kishu Paper Co., Ltd.(a) | | | 193,500 | | | | 1,155,198 | |
Hokuto Corp. | | | 33,800 | | | | 669,414 | |
Horiba Ltd. | | | 25,000 | | | | 934,205 | |
Hosokawa Micron Corp. | | | 126,000 | | | | 637,875 | |
Hyakujushi Bank Ltd. (The) | | | 163,000 | | | | 458,277 | |
Idec Corp. | | | 68,800 | | | | 654,976 | |
Inaba Denki Sangyo Co., Ltd. | | | 33,400 | | | | 1,053,454 | |
Inabata & Co., Ltd. | | | 79,900 | | | | 793,349 | |
IT Holdings Corp. | | | 47,500 | | | | 1,125,851 | |
Ito En Ltd.(a) | | | 42,100 | | | | 1,331,603 | |
Itochu Enex Co., Ltd. | | | 162,400 | | | | 1,304,748 | |
Itoham Foods, Inc.(a) | | | 110,000 | | | | 721,295 | |
IwaiCosmo Holdings, Inc. | | | 80,900 | | | | 787,443 | |
Iwatani Corp.(a) | | | 114,000 | | | | 663,339 | |
J-Oil Mills, Inc. | | | 276,000 | | | | 844,735 | |
Japan Aviation Electronics Industry Ltd. | | | 44,000 | | | | 515,966 | |
Japan Steel Works Ltd. (The) | | | 124,000 | | | | 391,654 | |
Jimoto Holdings, Inc. | | | 327,200 | | | | 430,852 | |
Juroku Bank Ltd. (The) | | | 266,000 | | | | 795,196 | |
K’s Holdings Corp.(a) | | | 36,300 | | | | 1,204,671 | |
kabu.com Securities Co., Ltd. | | | 485,000 | | | | 1,553,450 | |
Kaga Electronics Co., Ltd. | | | 52,600 | | | | 668,293 | |
Kamigumi Co., Ltd. | | | 95,000 | | | | 895,102 | |
Kandenko Co., Ltd.(a) | | | 143,000 | | | | 1,021,656 | |
Kaneka Corp. | | | 188,000 | | | | 1,612,456 | |
Kanematsu Corp. | | | 354,000 | | | | 516,535 | |
Kansai Urban Banking Corp. | | | 67,900 | | | | 669,968 | |
Kato Sangyo Co., Ltd. | | | 37,800 | | | | 935,962 | |
Kawasaki Kisen Kaisha Ltd.(a) | | | 801,000 | | | | 1,553,610 | |
Keiyo Bank Ltd. (The) | | | 133,000 | | | | 481,614 | |
Kiyo Bank Ltd. (The) | | | 75,491 | | | | 857,036 | |
Koatsu Gas Kogyo Co., Ltd. | | | 123,000 | | | | 700,387 | |
Kohnan Shoji Co., Ltd. | | | 58,600 | | | | 873,304 | |
Kokuyo Co., Ltd. | | | 104,300 | | | | 1,222,146 | |
Konaka Co., Ltd. | | | 86,900 | | | | 426,015 | |
Kurabo Industries Ltd. | | | 387,000 | | | | 671,427 | |
KYB Corp. | | | 291,000 | | | | 862,165 | |
Kyokuto Kaihatsu Kogyo Co., Ltd. | | | 61,600 | | | | 623,700 | |
Kyokuto Securities Co., Ltd.(a) | | | 77,000 | | | | 926,919 | |
KYORIN Holdings, Inc. | | | 60,800 | | | | 1,159,795 | |
Kyosan Electric Manufacturing Co., Ltd. | | | 235,000 | | | | 735,976 | |
Kyoto Kimono Yuzen Co., Ltd.(a) | | | 100,100 | | | | 766,814 | |
Kyowa Exeo Corp. | | | 87,900 | | | | 977,579 | |
Kyushu Financial Group, Inc. | | | 164,300 | | | | 948,714 | |
Lintec Corp. | | | 52,830 | | | | 946,658 | |
Lion Corp. | | | 210,000 | | | | 2,371,013 | |
See Notes to Financial Statements.
| | | | |
| WisdomTree Developed World ex-U.S. and Currency Hedged Equity Funds | | | 121 | |
Schedule of Investments (continued)
WisdomTree International SmallCap Dividend Fund (DLS)
March 31, 2016
| | | | | | | | |
| Investments | | Shares | | | Value | |
Maeda Road Construction Co., Ltd. | | | 51,000 | | | $ | 842,173 | |
Makino Milling Machine Co., Ltd. | | | 61,000 | | | | 373,940 | |
Mandom Corp. | | | 22,430 | | | | 999,816 | |
Maruha Nichiro Corp. | | | 38,800 | | | | 724,598 | |
Marusan Securities Co., Ltd.(a) | | | 160,300 | | | | 1,511,793 | |
Matsui Securities Co., Ltd.(a) | | | 315,700 | | | | 2,693,681 | |
Matsumotokiyoshi Holdings Co., Ltd. | | | 36,200 | | | | 1,897,042 | |
Max Co., Ltd. | | | 58,547 | | | | 602,165 | |
MegaChips Corp.(a) | | | 75,900 | | | | 854,251 | |
Megmilk Snow Brand Co., Ltd. | | | 57,600 | | | | 1,449,801 | |
Meidensha Corp. | | | 199,000 | | | | 908,288 | |
Meitec Corp. | | | 40,900 | | | | 1,431,928 | |
Mie Bank Ltd. (The) | | | 326,056 | | | | 580,197 | |
Minato Bank Ltd. (The) | | | 435,787 | | | | 585,469 | |
Ministop Co., Ltd. | | | 37,800 | | | | 689,107 | |
Mirait Holdings Corp. | | | 60,600 | | | | 483,096 | |
Misawa Homes Co., Ltd.(a) | | | 71,600 | | | | 474,594 | |
Mitsubishi Shokuhin Co., Ltd. | | | 31,800 | | | | 809,748 | |
Mitsui Engineering & Shipbuilding Co., Ltd. | | | 326,000 | | | | 487,282 | |
Mitsui Home Co., Ltd. | | | 152,775 | | | | 714,975 | |
Mitsui Mining & Smelting Co., Ltd. | | | 605,000 | | | | 968,904 | |
Mitsui-Soko Holdings Co., Ltd. | | | 241,000 | | | | 643,267 | |
Miura Co., Ltd. | | | 76,000 | | | | 1,420,668 | |
Miyazaki Bank Ltd. (The) | | | 221,000 | | | | 538,761 | |
Mochida Pharmaceutical Co., Ltd. | | | 14,100 | | | | 1,048,766 | |
Monex Group, Inc. | | | 309,438 | | | | 801,161 | |
Morinaga Milk Industry Co., Ltd. | | | 224,000 | | | | 1,201,762 | |
Musashino Bank Ltd. (The) | | | 28,800 | | | | 726,438 | |
NAC Co., Ltd.(a) | | | 85,750 | | | | 665,279 | |
Nachi-Fujikoshi Corp. | | | 154,000 | | | | 537,106 | |
Nagaileben Co., Ltd. | | | 31,800 | | | | 654,702 | |
Nagase & Co., Ltd. | | | 84,700 | | | | 932,194 | |
Nankai Electric Railway Co., Ltd. | | | 217,000 | | | | 1,179,652 | |
NDS Co., Ltd. | | | 303,970 | | | | 838,389 | |
NEC Networks & System Integration Corp. | | | 37,700 | | | | 586,992 | |
NET One Systems Co., Ltd. | | | 123,000 | | | | 665,368 | |
Nichias Corp. | | | 131,000 | | | | 784,403 | |
Nichiha Corp. | | | 58,000 | | | | 878,811 | |
Nichirei Corp. | | | 250,000 | | | | 2,037,457 | |
Nifco, Inc. | | | 38,900 | | | | 1,872,405 | |
Nihon House Holdings Co., Ltd.(a) | | | 149,000 | | | | 538,227 | |
Nihon Kohden Corp. | | | 44,400 | | | | 1,105,309 | |
Nihon Parkerizing Co., Ltd. | | | 68,200 | | | | 617,711 | |
Nihon Unisys Ltd.(a) | | | 66,400 | | | | 880,843 | |
Nikkon Holdings Co., Ltd. | | | 52,200 | | | | 947,444 | |
Nippo Corp. | | | 42,000 | | | | 707,380 | |
Nippon Coke & Engineering Co., Ltd. | | | 682,700 | | | | 492,003 | |
Nippon Denko Co., Ltd. | | | 309,100 | | | | 495,022 | |
Nippon Flour Mills Co., Ltd. | | | 226,194 | | | | 1,861,555 | |
Nippon Kayaku Co., Ltd. | | | 98,000 | | | | 992,251 | |
Nippon Light Metal Holdings Co., Ltd.(a) | | | 442,600 | | | | 728,511 | |
Nippon Paper Industries Co., Ltd.(a) | | | 81,000 | | | | 1,443,507 | |
Nippon Road Co., Ltd. (The) | | | 164,000 | | | | 763,130 | |
Nippon Shinyaku Co., Ltd. | | | 20,300 | | | | 794,697 | |
Nippon Soda Co., Ltd. | | | 95,000 | | | | 479,247 | |
Nippon Steel & Sumikin Bussan Corp. | | | 275,736 | | | | 919,979 | |
Nippon Valqua Industries Ltd. | | | 290,000 | | | | 761,155 | |
Nipro Corp. | | | 180,691 | | | | 1,718,570 | |
Nishi-Nippon City Bank Ltd. (The) | | | 599,000 | | | | 1,060,554 | |
Nishi-Nippon Railroad Co., Ltd. | | | 242,000 | | | | 1,580,391 | |
Nishimatsu Construction Co., Ltd. | | | 197,000 | | | | 846,577 | |
Nisshin Steel Co., Ltd. | | | 96,000 | | | | 1,121,473 | |
Nisshinbo Holdings, Inc. | | | 67,200 | | | | 714,480 | |
Nissin Kogyo Co., Ltd. | | | 51,900 | | | | 700,035 | |
Nitta Corp. | | | 21,800 | | | | 549,873 | |
Nitto Kogyo Corp. | | | 37,800 | | | | 603,347 | |
Noevir Holdings Co., Ltd. | | | 28,800 | | | | 828,934 | |
NOF Corp. | | | 93,000 | | | | 660,296 | |
Noritake Co., Ltd. | | | 259,000 | | | | 585,311 | |
North Pacific Bank Ltd. | | | 151,800 | | | | 384,919 | |
NS Solutions Corp. | | | 75,600 | | | | 1,485,835 | |
NSD Co., Ltd. | | | 75,600 | | | | 1,119,253 | |
Ohsho Food Service Corp. | | | 21,800 | | | | 670,128 | |
Oiles Corp. | | | 32,800 | | | | 491,146 | |
Oita Bank Ltd. (The) | | | 138,000 | | | | 430,962 | |
Okabe Co., Ltd. | | | 74,600 | | | | 533,639 | |
Okamura Corp. | | | 52,300 | | | | 500,222 | |
Oki Electric Industry Co., Ltd.(a) | | | 540,000 | | | | 763,913 | |
OKUMA Corp.(a) | | | 63,000 | | | | 441,132 | |
Okumura Corp. | | | 163,000 | | | | 862,894 | |
Okuwa Co., Ltd. | | | 69,000 | | | | 616,976 | |
Onoken Co., Ltd. | | | 62,600 | | | | 549,167 | |
Onward Holdings Co., Ltd. | | | 169,000 | | | | 1,156,288 | |
OSG Corp.(a) | | | 54,800 | | | | 1,024,377 | |
Pal Co., Ltd. | | | 22,000 | | | | 551,786 | |
Paltac Corp. | | | 75,876 | | | | 1,345,441 | |
PanaHome Corp. | | | 117,000 | | | | 879,621 | |
Paramount Bed Holdings Co., Ltd.(a) | | | 20,100 | | | | 735,900 | |
Park24 Co., Ltd. | | | 110,500 | | | | 3,096,890 | |
Plenus Co., Ltd. | | | 47,000 | | | | 848,881 | |
Relo Holdings, Inc. | | | 10,199 | | | | 1,369,304 | |
Rengo Co., Ltd. | | | 227,000 | | | | 1,147,169 | |
Ricoh Leasing Co., Ltd. | | | 20,800 | | | | 619,031 | |
Riso Kagaku Corp. | | | 45,500 | | | | 702,772 | |
Rohto Pharmaceutical Co., Ltd. | | | 43,800 | | | | 798,879 | |
Round One Corp. | | | 98,900 | | | | 558,757 | |
Ryobi Ltd. | | | 207,000 | | | | 817,723 | |
Ryoden Trading Co., Ltd. | | | 85,000 | | | | 499,133 | |
Ryosan Co., Ltd. | | | 30,386 | | | | 760,225 | |
Saibu Gas Co., Ltd. | | | 376,000 | | | | 869,790 | |
Saizeriya Co., Ltd. | | | 42,500 | | | | 876,129 | |
San-Ai Oil Co., Ltd. | | | 80,000 | | | | 581,521 | |
San-In Godo Bank Ltd. (The) | | | 119,800 | | | | 741,855 | |
Sanden Holdings Corp.(a) | | | 276,000 | | | | 790,711 | |
Sangetsu Co., Ltd. | | | 51,800 | | | | 940,645 | |
Sankyu, Inc. | | | 261,000 | | | | 1,193,594 | |
Sanoh Industrial Co., Ltd. | | | 104,400 | | | | 571,253 | |
Sanrio Co., Ltd.(a) | | | 62,400 | | | | 1,221,962 | |
See Notes to Financial Statements.
| | |
| 122 | | WisdomTree Developed World ex-U.S. and Currency Hedged Equity Funds |
Schedule of Investments (continued)
WisdomTree International SmallCap Dividend Fund (DLS)
March 31, 2016
| | | | | | | | |
| Investments | | Shares | | | Value | |
Sanwa Holdings Corp. | | | 199,000 | | | $ | 1,481,943 | |
Sanyo Chemical Industries Ltd. | | | 90,000 | | | | 634,993 | |
Sapporo Holdings Ltd. | | | 248,000 | | | | 1,235,642 | |
Sato Holdings Corp. | | | 33,000 | | | | 703,483 | |
Sawai Pharmaceutical Co., Ltd. | | | 17,000 | | | | 1,066,329 | |
Seika Corp. | | | 230,000 | | | | 464,522 | |
Seiko Holdings Corp. | | | 111,000 | | | | 440,464 | |
Seino Holdings Co., Ltd. | | | 81,200 | | | | 876,334 | |
Sekisui Jushi Corp. | | | 47,800 | | | | 641,331 | |
Senko Co., Ltd.(a) | | | 167,000 | | | | 1,019,280 | |
Senshu Ikeda Holdings, Inc. | | | 230,800 | | | | 831,656 | |
Senshukai Co., Ltd.(a) | | | 105,400 | | | | 675,190 | |
Shikoku Bank Ltd. (The) | | | 288,000 | | | | 556,039 | |
Shimachu Co., Ltd. | | | 33,800 | | | | 808,048 | |
Shinko Electric Industries Co., Ltd. | | | 126,500 | | | | 712,438 | |
Shinsho Corp. | | | 227,680 | | | | 413,245 | |
Ship Healthcare Holdings, Inc. | | | 43,800 | | | | 1,104,791 | |
Showa Corp. | | | 88,600 | | | | 774,102 | |
Showa Denko K.K.(a) | | | 816,000 | | | | 842,173 | |
SKY Perfect JSAT Holdings, Inc. | | | 200,500 | | | | 1,168,446 | |
Sotetsu Holdings, Inc. | | | 390,000 | | | | 2,394,235 | |
Space Co., Ltd. | | | 60,600 | | | | 733,271 | |
St. Marc Holdings Co., Ltd. | | | 20,100 | | | | 555,278 | |
Star Micronics Co., Ltd. | | | 63,100 | | | | 708,503 | |
Starts Corp., Inc. | | | 39,800 | | | | 886,687 | |
Starzen Co., Ltd. | | | 22,500 | | | | 629,588 | |
Sumitomo Bakelite Co., Ltd. | | | 273,000 | | | | 1,071,160 | |
Sumitomo Forestry Co., Ltd. | | | 80,700 | | | | 928,379 | |
Sumitomo Osaka Cement Co., Ltd. | | | 316,000 | | | | 1,242,689 | |
Sumitomo Real Estate Sales Co., Ltd. | | | 41,700 | | | | 803,985 | |
Sumitomo Riko Co., Ltd. | | | 78,600 | | | | 686,032 | |
Sumitomo Warehouse Co., Ltd. (The) | | | 174,295 | | | | 888,572 | |
T-Gaia Corp.(a) | | | 66,500 | | | | 770,937 | |
Tadano Ltd. | | | 67,000 | | | | 622,937 | |
Taiyo Holdings Co., Ltd. | | | 38,659 | | | | 1,310,475 | |
Takara Standard Co., Ltd. | | | 83,000 | | | | 755,452 | |
Takasago Thermal Engineering Co., Ltd.(a) | | | 103,400 | | | | 1,300,837 | |
Takiron Co., Ltd. | | | 122,000 | | | | 605,685 | |
Toagosei Co., Ltd. | | | 105,700 | | | | 881,186 | |
Tochigi Bank Ltd. (The) | | | 122,000 | | | | 464,576 | |
Toda Corp. | | | 163,000 | | | | 788,932 | |
Toei Co., Ltd. | | | 67,000 | | | | 597,304 | |
Toho Bank Ltd. (The) | | | 300,000 | | | | 963,566 | |
Toho Holdings Co., Ltd.(a) | | | 42,500 | | | | 910,539 | |
TOKAI Holdings Corp.(a) | | | 165,200 | | | | 861,312 | |
Tokai Rika Co., Ltd. | | | 81,287 | | | | 1,531,793 | |
Tokyo Seimitsu Co., Ltd. | | | 31,000 | | | | 608,719 | |
Tokyo TY Financial Group, Inc. | | | 20,100 | | | | 467,650 | |
Tokyotokeiba Co., Ltd.(a) | | | 254,000 | | | | 510,735 | |
TOMONY Holdings, Inc. | | | 155,790 | | | | 461,569 | |
Toppan Forms Co., Ltd. | | | 109,200 | | | | 1,217,382 | |
Toshiba Machine Co., Ltd. | | | 129,000 | | | | 397,117 | |
Toyo Ink SC Holdings Co., Ltd. | | | 281,000 | | | | 1,127,550 | |
Toyo Securities Co., Ltd. | | | 316,000 | | | | 790,035 | |
Toyobo Co., Ltd. | | | 834,694 | | | | 1,255,067 | |
Transcosmos, Inc.(a) | | | 31,500 | | | | 819,485 | |
TS Tech Co., Ltd. | | | 36,000 | | | | 843,667 | |
Tsubakimoto Chain Co. | | | 90,000 | | | | 558,121 | |
Tsugami Corp.(a) | | | 110,247 | | | | 401,184 | |
Tsumura & Co.(a) | | | 60,600 | | | | 1,456,837 | |
UACJ Corp.(a) | | | 367,540 | | | | 745,577 | |
Ube Industries Ltd. | | | 865,000 | | | | 1,531,518 | |
Union Tool Co.(a) | | | 14,000 | | | | 368,451 | |
Unipres Corp. | | | 25,700 | | | | 448,398 | |
United Arrows Ltd. | | | 28,400 | | | | 1,176,227 | |
Universal Entertainment Corp. | | | 46,600 | | | | 774,905 | |
Unizo Holdings Co., Ltd.(a) | | | 24,900 | | | | 1,073,362 | |
UNY Group Holdings Co., Ltd. | | | 226,300 | | | | 1,596,654 | |
Ushio, Inc. | | | 68,600 | | | | 913,080 | |
Valor Holdings Co., Ltd. | | | 50,100 | | | | 1,265,483 | |
Vital KSK Holdings, Inc. | | | 91,600 | | | | 723,705 | |
Wacoal Holdings Corp. | | | 80,000 | | | | 955,914 | |
Wacom Co., Ltd.(a) | | | 231,100 | | | | 980,779 | |
Wakita & Co., Ltd. | | | 62,600 | | | | 523,546 | |
Yamazen Corp. | | | 89,200 | | | | 678,553 | |
Yuasa Trading Co., Ltd. | | | 37,200 | | | | 875,430 | |
Yumeshin Holdings Co., Ltd.(a) | | | 122,600 | | | | 677,384 | |
Zenrin Co., Ltd. | | | 44,100 | | | | 887,140 | |
Zeon Corp. | | | 115,000 | | | | 744,873 | |
| | | | | | | | |
| Total Japan | | | | | | | 293,363,543 | |
| Netherlands – 1.2% | | | | | | | | |
Accell Group | | | 45,081 | | | | 960,915 | |
Amsterdam Commodities N.V. | | | 46,993 | | | | 1,268,085 | |
Arcadis N.V. | | | 75,663 | | | | 1,413,176 | |
BE Semiconductor Industries N.V. | | | 88,896 | | | | 2,440,353 | |
Beter Bed Holding N.V. | | | 24,906 | | | | 624,396 | |
BinckBank N.V. | | | 115,409 | | | | 861,419 | |
Brunel International N.V. | | | 80,497 | | | | 1,697,471 | |
Kendrion N.V. | | | 24,273 | | | | 598,846 | |
NSI N.V. | | | 437,928 | | | | 2,082,997 | |
TKH Group N.V. CVA | | | 40,290 | | | | 1,727,687 | |
| | | | | | | | |
| Total Netherlands | | | | | | | 13,675,345 | |
| New Zealand – 5.1% | | | | | | | | |
Air New Zealand Ltd. | | | 2,389,767 | | | | 4,745,354 | |
EBOS Group Ltd. | | | 255,043 | | | | 3,045,712 | |
Fisher & Paykel Healthcare Corp., Ltd.(a) | | | 725,992 | | | | 4,939,750 | |
Fonterra Co-operative Group Ltd.(a) | | | 216,555 | | | | 891,600 | |
Freightways Ltd. | | | 235,733 | | | | 1,039,301 | |
Genesis Energy Ltd.(a) | | | 3,853,587 | | | | 5,484,867 | |
Heartland Bank Ltd.(a) | | | 1,251,639 | | | | 1,051,505 | |
Infratil Ltd.(a) | | | 1,063,675 | | | | 2,422,311 | |
Kathmandu Holdings Ltd.(a) | | | 1,128,578 | | | | 1,292,893 | |
Kiwi Property Group Ltd. | | | 2,322,910 | | | | 2,330,490 | |
Mainfreight Ltd.(a) | | | 74,327 | | | | 818,459 | |
Meridian Energy Ltd. | | | 3,122,308 | | | | 5,679,683 | |
Nuplex Industries Ltd. | | | 365,638 | | | | 1,320,084 | |
Restaurant Brands New Zealand Ltd. | | | 283,137 | | | | 955,388 | |
See Notes to Financial Statements.
| | | | |
| WisdomTree Developed World ex-U.S. and Currency Hedged Equity Funds | | | 123 | |
Schedule of Investments (continued)
WisdomTree International SmallCap Dividend Fund (DLS)
March 31, 2016
| | | | | | | | |
| Investments | | Shares | | | Value | |
Skellerup Holdings Ltd. | | | 1,057,291 | | | $ | 939,618 | |
SKY Network Television Ltd. | | | 923,236 | | | | 3,192,193 | |
SKYCITY Entertainment Group Ltd. | | | 1,087,556 | | | | 3,783,000 | |
Tower Ltd. | | | 595,355 | | | | 735,772 | |
Trade Me Group Ltd. | | | 933,368 | | | | 2,857,844 | |
TrustPower Ltd. | | | 707,655 | | | | 3,763,547 | |
Z Energy Ltd. | | | 900,263 | | | | 4,219,104 | |
| | | | | | | | |
| Total New Zealand | | | | | | | 55,508,475 | |
| Norway – 3.7% | | | | | | | | |
ABG Sundal Collier Holding ASA | | | 1,621,102 | | | | 1,230,832 | |
Aker ASA Class A | | | 167,479 | | | | 3,128,367 | |
American Shipping Co. ASA* | | | 70,144 | | | | 234,909 | |
Atea ASA* | | | 276,526 | | | | 2,641,143 | |
Austevoll Seafood ASA | | | 365,600 | | | | 3,005,688 | |
Borregaard ASA | | | 125,973 | | | | 845,277 | |
Entra ASA(b) | | | 243,765 | | | | 2,298,766 | |
Kongsberg Gruppen ASA(a) | | | 119,462 | | | | 1,964,254 | |
Leroy Seafood Group ASA | | | 89,816 | | | | 4,245,798 | |
Norway Royal Salmon ASA | | | 12,683 | | | | 167,906 | |
Ocean Yield ASA(a) | | | 373,638 | | | | 2,507,107 | |
Protector Forsikring ASA | | | 128,571 | | | | 1,169,710 | |
Salmar ASA | | | 350,084 | | | | 8,592,057 | |
Selvaag Bolig ASA | | | 229,080 | | | | 700,707 | |
SpareBank 1 Nord Norge | | | 224,611 | | | | 1,018,336 | |
SpareBank 1 SMN | | | 155,258 | | | | 990,160 | |
SpareBank 1 SR-Bank ASA | | | 168,138 | | | | 825,317 | |
Tomra Systems ASA | | | 143,667 | | | | 1,498,114 | |
Veidekke ASA | | | 195,250 | | | | 2,655,660 | |
XXL ASA(b) | | | 107,435 | | | | 1,311,886 | |
| | | | | | | | |
| Total Norway | | | | | | | 41,031,994 | |
| Portugal – 0.6% | | | | | | | | |
Altri, SGPS, S.A. | | | 155,720 | | | | 680,524 | |
CTT-Correios de Portugal S.A. | | | 228,796 | | | | 2,156,192 | |
REN – Redes Energeticas Nacionais, SGPS, S.A. | | | 764,878 | | | | 2,512,001 | |
Semapa-Sociedade de Investimento e Gestao | | | 129,333 | | | | 1,709,625 | |
| | | | | | | | |
| Total Portugal | | | | | | | 7,058,342 | |
| Singapore – 3.4% | | | | | | | | |
Accordia Golf Trust | | | 3,765,100 | | | | 1,677,603 | |
Asian Pay Television Trust | | | 5,819,300 | | | | 2,420,027 | |
Chip Eng Seng Corp., Ltd. | | | 2,302,978 | | | | 1,214,254 | |
CWT Ltd.(a) | | | 660,276 | | | | 961,043 | |
Dyna-Mac Holdings Ltd.(a) | | | 5,136,700 | | | | 549,298 | |
First Resources Ltd.(a) | | | 1,030,400 | | | | 1,545,677 | |
GuocoLand Ltd.(a) | | | 606,800 | | | | 811,109 | |
Ho Bee Land Ltd. | | | 501,300 | | | | 815,273 | |
Hyflux Ltd.(a) | | | 1,449,600 | | | | 645,893 | |
Keppel Infrastructure Trust | | | 3,819,800 | | | | 1,404,130 | |
Lian Beng Group Ltd. | | | 2,446,500 | | | | 872,063 | |
Low Keng Huat Singapore Ltd. | | | 1,857,000 | | | | 854,998 | |
M1 Ltd.(a) | | | 1,828,900 | | | | 3,531,219 | |
OSIM International Ltd.(a) | | | 1,124,200 | | | | 1,143,735 | |
Pacc Offshore Services Holdings Ltd. | | | 3,634,800 | | | | 971,727 | |
Pacific Radiance Ltd.(a) | | | 2,733,742 | | | | 690,236 | |
Petra Foods Ltd. | | | 530,003 | | | | 1,102,041 | |
QAF Ltd. | | | 755,000 | | | | 577,491 | |
Raffles Education Corp., Ltd.(a) | | | 2,466,400 | | | | 402,947 | |
Raffles Medical Group Ltd.(a) | | | 366,500 | | | | 1,227,473 | |
Religare Health Trust | | | 1,991,632 | | | | 1,449,428 | |
Rotary Engineering Ltd. | | | 1,872,600 | | | | 500,621 | |
Sheng Siong Group Ltd. | | | 1,632,200 | | | | 1,018,155 | |
SMRT Corp., Ltd.(a) | | | 970,100 | | | | 1,087,815 | |
Super Group Ltd. | | | 1,198,500 | | | | 881,119 | |
Swissco Holdings Ltd. | | | 3,319,800 | | | | 465,946 | |
UMS Holdings Ltd. | | | 2,251,467 | | | | 944,660 | |
United Engineers Ltd. | | | 843,589 | | | | 1,465,913 | |
UOB-Kay Hian Holdings Ltd. | | | 560,900 | | | | 583,143 | |
Venture Corp., Ltd. | | | 527,744 | | | | 3,276,355 | |
Wee Hur Holdings Ltd. | | | 2,727,799 | | | | 546,937 | |
Wing Tai Holdings Ltd.(a) | | | 715,400 | | | | 935,025 | |
Yanlord Land Group Ltd. | | | 1,109,000 | | | | 1,004,738 | |
| | | | | | | | |
| Total Singapore | | | | | | | 37,578,092 | |
| Spain – 0.8% | | | | | | | | |
Cie Automotive S.A. | | | 94,419 | | | | 1,705,384 | |
Duro Felguera S.A.(a) | | | 511,807 | | | | 892,342 | |
Ence Energia y Celulosa S.A. | | | 302,051 | | | | 1,020,560 | |
Faes Farma S.A. | | | 288,616 | | | | 911,032 | |
Indra Sistemas S.A.*(a) | | | 217,522 | | | | 2,534,546 | |
Obrascon Huarte Lain S.A.(a) | | | 154,570 | | | | 987,971 | |
Papeles y Cartones de Europa S.A. | | | 122,379 | | | | 780,262 | |
Pescanova S.A.†* | | | 7,082 | | | | 0 | |
| | | | | | | | |
| Total Spain | | | | | | | 8,832,097 | |
| Sweden – 6.4% | | | | | | | | |
Acando AB | | | 538,802 | | | | 1,315,983 | |
AF AB Class B | | | 94,958 | | | | 1,745,315 | |
Atrium Ljungberg AB Class B | | | 118,649 | | | | 2,056,347 | |
Avanza Bank Holding AB | | | 24,640 | | | | 1,100,285 | |
Betsson AB* | | | 86,915 | | | | 1,350,894 | |
Bilia AB Class A | | | 102,302 | | | | 2,296,738 | |
Byggmax Group AB | | | 83,542 | | | | 767,745 | |
Castellum AB | | | 242,607 | | | | 3,863,540 | |
Clas Ohlson AB Class B | | | 94,812 | | | | 1,812,804 | |
Com Hem Holding AB | | | 74,276 | | | | 685,798 | |
Duni AB | | | 91,424 | | | | 1,519,655 | |
Elekta AB Class B(a) | | | 482,490 | | | | 3,609,732 | |
Fabege AB | | | 238,428 | | | | 4,032,279 | |
Haldex AB(a) | | | 59,707 | | | | 526,608 | |
HIQ International AB* | | | 139,658 | | | | 861,374 | |
Holmen AB Class B | | | 77,493 | | | | 2,540,817 | |
Indutrade AB | | | 34,750 | | | | 2,135,573 | |
Intrum Justitia AB | | | 73,028 | | | | 2,579,992 | |
Inwido AB | | | 27,550 | | | | 339,842 | |
JM AB | | | 93,612 | | | | 2,431,900 | |
KappAhl AB | | | 156,765 | | | | 624,608 | |
KNOW IT AB | | | 112,539 | | | | 916,227 | |
Kungsleden AB | | | 170,002 | | | | 1,205,807 | |
See Notes to Financial Statements.
| | |
| 124 | | WisdomTree Developed World ex-U.S. and Currency Hedged Equity Funds |
Schedule of Investments (continued)
WisdomTree International SmallCap Dividend Fund (DLS)
March 31, 2016
| | | | | | | | |
| Investments | | Shares | | | Value | |
Lifco AB Class B | | | 39,752 | | | $ | 1,068,984 | |
Lindab International AB | | | 73,233 | | | | 585,831 | |
Loomis AB Class B | | | 76,147 | | | | 2,155,715 | |
Mekonomen AB | | | 55,765 | | | | 1,382,654 | |
Modern Times Group MTG AB Class B | | | 103,607 | | | | 3,108,197 | |
NCC AB Class B | | | 130,713 | | | | 4,767,888 | |
NetEnt AB* | | | 24,085 | | | | 1,361,906 | |
Nobia AB | | | 108,371 | | | | 1,134,950 | |
Nolato AB Class B | | | 44,222 | | | | 1,241,011 | |
Nordnet AB Class B | | | 190,492 | | | | 815,384 | |
Peab AB | | | 348,895 | | | | 3,087,966 | |
Platzer Fastigheter Holding AB Class B | | | 124,019 | | | | 680,776 | |
Ratos AB Class B | | | 437,243 | | | | 2,807,369 | |
Scandi Standard AB | | | 92,876 | | | | 675,945 | |
SkiStar AB | | | 59,998 | | | | 862,221 | |
Svenska Handelsbanken AB Class B | | | 2,411 | | | | 33,637 | |
Sweco AB Class B | | | 107,173 | | | | 1,763,588 | |
Wihlborgs Fastigheter AB | | | 105,815 | | | | 2,250,300 | |
| | | | | | | | |
| Total Sweden | | | | | | | 70,104,185 | |
| Switzerland – 1.8% | | | | | | | | |
Allreal Holding AG Registered Shares* | | | 23,236 | | | | 3,377,488 | |
Ascom Holding AG Registered Shares | | | 44,912 | | | | 846,511 | |
BKW AG(a) | | | 60,297 | | | | 2,543,726 | |
Cembra Money Bank AG* | | | 53,457 | | | | 3,751,173 | |
Daetwyler Holding AG Bearer Shares | | | 8,882 | | | | 1,329,077 | |
EFG International AG* | | | 106,103 | | | | 609,373 | |
Gategroup Holding AG* | | | 21,152 | | | | 949,758 | |
Implenia AG Registered Shares | | | 21,527 | | | | 1,355,483 | |
Kudelski S.A. Bearer Shares | | | 51,649 | | | | 884,502 | |
Mobilezone Holding AG Registered Shares | | | 52,799 | | | | 799,442 | |
Swissquote Group Holding S.A. Registered Shares | | | 16,399 | | | | 409,269 | |
Tecan Group AG Registered Shares | | | 6,383 | | | | 973,797 | |
Temenos Group AG Registered Shares* | | | 28,094 | | | | 1,543,094 | |
| | | | | | | | |
| Total Switzerland | | | | | | | 19,372,693 | |
| United Kingdom – 15.5% | | | | | | | | |
A.G.Barr PLC | | | 88,248 | | | | 672,246 | |
Abcam PLC | | | 124,220 | | | | 1,053,394 | |
Acacia Mining PLC | | | 230,306 | | | | 931,156 | |
Assura PLC | | | 814,928 | | | | 621,958 | |
AVEVA Group PLC | | | 32,208 | | | | 729,108 | |
BBA Aviation PLC | | | 1,069,804 | | | | 3,081,409 | |
BGEO Group PLC | | | 49,600 | | | | 1,445,763 | |
Big Yellow Group PLC | | | 162,545 | | | | 1,809,433 | |
Bodycote PLC | | | 314,735 | | | | 2,730,044 | |
Bovis Homes Group PLC | | | 147,050 | | | | 1,968,771 | |
Brammer PLC | | | 200,280 | | | | 501,600 | |
Brewin Dolphin Holdings PLC | | | 338,705 | | | | 1,262,813 | |
Card Factory PLC | | | 241,660 | | | | 1,135,795 | |
Carillion PLC(a) | | | 904,009 | | | | 3,821,336 | |
Central Asia Metals PLC | | | 321,309 | | | | 761,999 | |
Chesnara PLC | | | 252,035 | | | | 1,195,425 | |
Cineworld Group PLC | | | 274,300 | | | | 2,119,101 | |
Computacenter PLC | | | 121,166 | | | | 1,462,876 | |
Concentric AB | | | 43,519 | | | | 493,881 | |
Connect Group PLC | | | 465,763 | | | | 1,064,411 | |
Costain Group PLC | | | 189,634 | | | | 968,954 | |
Countrywide PLC | | | 228,166 | | | | 1,264,548 | |
Cranswick PLC | | | 52,954 | | | | 1,623,443 | |
Crest Nicholson Holdings PLC | | | 250,876 | | | | 2,030,088 | |
Dairy Crest Group PLC | | | 241,996 | | | | 2,151,272 | |
Darty PLC | | | 817,891 | | | | 1,539,977 | |
De La Rue PLC | | | 264,192 | | | | 1,697,362 | |
Debenhams PLC | | | 1,901,123 | | | | 2,054,828 | |
Dechra Pharmaceuticals PLC | | | 81,889 | | | | 1,419,451 | |
Devro PLC | | | 212,956 | | | | 900,645 | |
Dignity PLC | | | 7,485 | | | | 266,695 | |
Diploma PLC | | | 102,475 | | | | 1,094,345 | |
Domino’s Pizza Group PLC | | | 182,239 | | | | 2,640,276 | |
Drax Group PLC(a) | | | 500,134 | | | | 1,955,971 | |
E2V Technologies PLC | | | 331,344 | | | | 1,023,917 | |
Electrocomponents PLC | | | 820,938 | | | | 2,848,361 | |
Elementis PLC | | | 281,095 | | | | 967,219 | |
EMIS Group PLC | | | 65,041 | | | | 947,922 | |
esure Group PLC | | | 597,545 | | | | 2,348,959 | |
Fenner PLC | | | 495,534 | | | | 965,073 | |
Fidessa Group PLC | | | 49,950 | | | | 1,753,188 | |
Foxtons Group PLC | | | 239,043 | | | | 559,171 | |
Galliford Try PLC | | | 100,685 | | | | 2,076,654 | |
GAME Digital PLC(a) | | | 201,020 | | | | 361,158 | |
Genus PLC | | | 44,608 | | | | 980,319 | |
Go-Ahead Group PLC | | | 63,942 | | | | 2,435,452 | |
Greggs PLC | | | 105,850 | | | | 1,653,742 | |
Halfords Group PLC | | | 276,779 | | | | 1,575,743 | |
Hargreaves Services PLC | | | 137,639 | | | | 353,124 | |
Helical Bar PLC | | | 173,870 | | | | 964,627 | |
Hill & Smith Holdings PLC | | | 132,958 | | | | 1,725,638 | |
Hilton Food Group PLC | | | 98,443 | | | | 709,583 | |
Home Retail Group PLC | | | 714,697 | | | | 1,703,154 | |
HomeServe PLC | | | 401,087 | | | | 2,482,333 | |
Hunting PLC | | | 204,723 | | | | 942,330 | |
Interserve PLC | | | 188,330 | | | | 1,174,239 | |
ITE Group PLC | | | 435,602 | | | | 920,353 | |
J D Wetherspoon PLC(a) | | | 77,925 | | | | 787,931 | |
James Fisher & Sons PLC | | | 32,297 | | | | 612,286 | |
James Halstead PLC | | | 208,692 | | | | 1,215,559 | |
John Menzies PLC | | | 105,282 | | | | 718,400 | |
Johnson Service Group PLC | | | 452,209 | | | | 591,464 | |
Just Retirement Group PLC | | | 343,022 | | | | 778,487 | |
Kcom Group PLC | | | 1,074,277 | | | | 1,659,863 | |
Keller Group PLC | | | 58,231 | | | | 719,362 | |
Kier Group PLC | | | 127,115 | | | | 2,347,726 | |
Ladbrokes PLC | | | 2,731,510 | | | | 4,581,641 | |
Laird PLC | | | 459,843 | | | | 2,518,152 | |
Lookers PLC | | | 384,725 | | | | 875,897 | |
LSL Property Services PLC | | | 149,191 | | | | 616,493 | |
Marshalls PLC | | | 241,745 | | | | 1,236,958 | |
See Notes to Financial Statements.
| | | | |
| WisdomTree Developed World ex-U.S. and Currency Hedged Equity Funds | | | 125 | |
Schedule of Investments (continued)
WisdomTree International SmallCap Dividend Fund (DLS)
March 31, 2016
| | | | | | | | |
| Investments | | Shares | | | Value | |
Marston’s PLC | | | 1,093,009 | | | $ | 2,387,892 | |
McColl’s Retail Group PLC | | | 261,422 | | | | 617,156 | |
Mears Group PLC | | | 99,600 | | | | 599,104 | |
Mediclinic International PLC | | | 56,414 | | | | 726,511 | |
Mitie Group PLC | | | 429,916 | | | | 1,588,050 | |
Moneysupermarket.com Group PLC | | | 801,708 | | | | 3,660,841 | |
Morgan Advanced Materials PLC | | | 295,441 | | | | 964,776 | |
Morgan Sindall Group PLC | | | 69,249 | | | | 803,718 | |
N Brown Group PLC | | | 450,621 | | | | 2,116,610 | |
National Express Group PLC | | | 720,163 | | | | 3,554,500 | |
NCC Group PLC | | | 235,782 | | | | 848,918 | |
NMC Health PLC | | | 92,526 | | | | 1,405,679 | |
Northgate PLC | | | 71,466 | | | | 414,159 | |
Nostrum Oil & Gas PLC | | | 215,203 | | | | 736,161 | |
Novae Group PLC | | | 127,343 | | | | 1,606,089 | |
Numis Corp. PLC | | | 226,523 | | | | 651,163 | |
OneSavings Bank PLC | | | 145,659 | | | | 696,736 | |
Pan African Resources PLC | | | 7,674,216 | | | | 1,489,070 | |
PayPoint PLC | | | 96,147 | | | | 1,033,677 | |
Pendragon PLC | | | 1,241,544 | | | | 651,332 | |
Pets at Home Group PLC | | | 13,182 | | | | 50,985 | |
Photo-Me International PLC | | | 381,465 | | | | 974,567 | |
Polar Capital Holdings PLC | | | 230,361 | | | | 1,195,263 | |
Polypipe Group PLC | | | 109,955 | | | | 504,458 | |
Premier Farnell PLC | | | 778,854 | | | | 1,262,176 | |
PZ Cussons PLC(a) | | | 318,892 | | | | 1,384,656 | |
QinetiQ Group PLC | | | 452,970 | | | | 1,484,403 | |
Rank Group PLC | | | 397,872 | | | | 1,452,528 | |
Redde PLC | | | 637,022 | | | | 1,529,038 | |
Redrow PLC | | | 99,824 | | | | 577,208 | |
Restaurant Group PLC (The) | | | 173,767 | | | | 980,539 | |
Ricardo PLC | | | 61,181 | | | | 736,020 | |
RPC Group PLC(a) | | | 269,204 | | | | 2,938,710 | |
RPS Group PLC | | | 331,757 | | | | 989,431 | |
RWS Holdings PLC | | | 351,561 | | | | 1,049,758 | |
Safestore Holdings PLC | | | 173,260 | | | | 835,982 | |
Savills PLC | | | 117,762 | | | | 1,286,371 | |
Schroders PLC Non-Voting Shares | | | 63,661 | | | | 1,850,129 | |
Senior PLC | | | 237,967 | | | | 780,170 | |
Shanks Group PLC | | | 413,020 | | | | 492,716 | |
SIG PLC | | | 450,007 | | | | 944,321 | |
Soco International PLC | | | 748,638 | | | | 1,705,487 | |
Spirent Communications PLC | | | 669,726 | | | | 847,085 | |
SSP Group PLC | | | 18,457 | | | | 76,879 | |
St. Ives PLC | | | 125,034 | | | | 407,046 | |
St. Modwen Properties PLC | | | 104,182 | | | | 452,966 | |
SThree PLC | | | 162,044 | | | | 730,742 | |
Synthomer PLC | | | 289,346 | | | | 1,515,040 | |
Ted Baker PLC | | | 23,259 | | | | 910,303 | |
Telecom Plus PLC(a) | | | 157,361 | | | | 2,081,940 | |
TT electronics PLC | | | 290,887 | | | | 622,957 | |
Tullett Prebon PLC | | | 370,448 | | | | 1,872,076 | |
Tyman PLC | | | 160,863 | | | | 684,955 | |
U & I Group PLC | | | 163,385 | | | | 437,964 | |
Ultra Electronics Holdings PLC | | | 44,864 | | | | 1,163,919 | |
Unite Group PLC (The) | | | 99,761 | | | | 912,655 | |
Vesuvius PLC | | | 382,078 | | | | 1,821,566 | |
WS Atkins PLC | | | 95,052 | | | | 1,871,670 | |
Xchanging PLC | | | 334,965 | | | | 919,560 | |
Zoopla Property Group PLC(b) | | | 143,450 | | | | 515,452 | |
| | | | | | | | |
| Total United Kingdom | | | | | | | 170,604,685 | |
TOTAL COMMON STOCKS
(Cost: $1,034,603,290) | | | | | | | 1,089,727,745 | |
| RIGHTS – 0.0% | | | | | | | | |
| Australia – 0.0% | | | | | | | | |
Qube Holdings Ltd., expiring 4/1/16* | | | 141,427 | | | | 33,726 | |
| Israel – 0.0% | | | | | | | | |
Industrial Buildings Corp., Ltd., expiring 4/13/16* | | | 208,239 | | | | 78,044 | |
TOTAL RIGHTS
(Cost: $0) | | | | | | | 111,770 | |
| EXCHANGE-TRADED FUNDS – 0.2% | |
| United States – 0.2% | | | | | | | | |
WisdomTree Europe SmallCap Dividend Fund(a)(c) | | | 23,266 | | | | 1,326,860 | |
WisdomTree Japan SmallCap Dividend Fund(c) | | | 19,224 | | | | 1,058,281 | |
TOTAL EXCHANGE-TRADED FUNDS (Cost: $2,283,255) | | | | | | | 2,385,141 | |
| INVESTMENT OF CASH COLLATERAL FOR SECURITIES LOANED – 10.2% | |
| United States – 10.2% | | | | | | | | |
State Street Navigator Securities Lending Prime Portfolio, 0.50%(d) | | | | | | | | |
| (Cost: $112,271,066)(e) | | | 112,271,066 | | | | 112,271,066 | |
TOTAL INVESTMENTS IN SECURITIES – 109.5% (Cost: $1,149,157,611) | | | | 1,204,495,722 | |
Liabilities in Excess of Cash, Foreign Currency and Other Assets – (9.5)% | | | | | | | (104,518,790 | ) |
| | | | | | | | |
| NET ASSETS – 100.0% | | | | | | $ | 1,099,976,932 | |
| * | Non-income producing security. |
| † | Security is being fair valued by a valuation committee under the direction of the Board of Trustees. The aggregate value of fair valued securities is $1, which represents less than 0.01% of net assets. |
| (a) | Security, or portion thereof, was on loan at March 31, 2016 (See Note 2). |
| (b) | This security is exempt from registration under rule 144A of the Securities Act of 1933. This security may be sold in transactions that are exempt from registration, normally to qualified institutional buyers. |
| (c) | Affiliated company (See Note 3). |
| (d) | Rate shown represents annualized 7-day yield as of March 31, 2016. |
| (e) | At March 31, 2016, the total market value of the Fund’s securities on loan was $113,130,909 and the total market value of the collateral held by the Fund was $119,532,775. The total market value of the collateral includes non-cash U.S. Government securities collateral having a value of $7,261,709. |
CVA – Certificaten Van Aandelen (Certificate of Stock)
RSP – Risparmio Italian Savings Shares
See Notes to Financial Statements.
| | |
| 126 | | WisdomTree Developed World ex-U.S. and Currency Hedged Equity Funds |
Schedule of Investments (concluded)
WisdomTree International SmallCap Dividend Fund (DLS)
March 31, 2016
| | | | | | | | | | | | | | | | | | | | |
| FINANCIAL DERIVATIVE INSTRUMENTS | |
| FORWARD CONTRACTS | |
Settlement Date | | Contracts
To Deliver | | | In
Exchange For | | | Unrealized
Gain (Loss) | |
4/4/2016 | | | AUD | | | | 35,622 | | | | CHF | | | | 26,230 | | | $ | (13 | ) |
4/4/2016 | | | AUD | | | | 1,031,463 | | | | EUR | | | | 694,015 | | | | (2,587 | ) |
4/4/2016 | | | AUD | | | | 275,363 | | | | GBP | | | | 146,754 | | | | (893 | ) |
4/4/2016 | | | AUD | | | | 249,849 | | | | ILS | | | | 717,100 | | | | (1,453 | ) |
4/4/2016 | | | AUD | | | | 1,840,509 | | | | JPY | | | | 158,655,575 | | | | (4,222 | ) |
4/4/2016 | | | AUD | | | | 234,218 | | | | SEK | | | | 1,454,960 | | | | (696 | ) |
4/4/2016 | | | AUD | | | | 200,166 | | | | SGD | | | | 206,566 | | | | (579 | ) |
| | | | | | | | | | | | | | | | | | | $ | (10,443 | ) |
| | |
| CURRENCY LEGEND |
AUD | | – Australian dollar |
CHF | | – Swiss franc |
EUR | | – Euro |
GBP | | – British pound |
ILS | | – Israeli New shekel |
JPY | | – Japanese yen |
SEK | | – Swedish krona |
SGD | | – Singapore dollar |
See Notes to Financial Statements.
| | | | |
| WisdomTree Developed World ex-U.S. and Currency Hedged Equity Funds | | | 127 | |
Schedule of Investments
WisdomTree Japan Hedged Capital Goods Fund (DXJC)
March 31, 2016
| | | | | | | | |
| Investments | | Shares | | | Value | |
| COMMON STOCKS – 99.3% | | | | | | | | |
| Japan – 99.3% | | | | | | | | |
| Auto Components – 16.9% | | | | | | | | |
Aisin Seiki Co., Ltd. | | | 950 | | | $ | 35,838 | |
Bridgestone Corp. | | | 3,152 | | | | 117,925 | |
Calsonic Kansei Corp. | | | 711 | | | | 5,295 | |
Denso Corp. | | | 2,518 | | | | 101,352 | |
Eagle Industry Co., Ltd. | | | 200 | | | | 2,639 | |
Exedy Corp.(a) | | | 262 | | | | 5,800 | |
FCC Co., Ltd. | | | 268 | | | | 4,535 | |
HI-LEX Corp. | | | 200 | | | | 5,498 | |
Keihin Corp. | | | 277 | | | | 4,143 | |
Koito Manufacturing Co., Ltd. | | | 636 | | | | 28,859 | |
KYB Corp. | | | 2,106 | | | | 6,240 | |
Mitsuba Corp. | | | 277 | | | | 4,286 | |
NGK Spark Plug Co., Ltd. | | | 937 | | | | 17,957 | |
NHK Spring Co., Ltd. | | | 1,413 | | | | 13,540 | |
Nifco, Inc.(a) | | | 309 | | | | 14,873 | |
Nissin Kogyo Co., Ltd. | | | 268 | | | | 3,615 | |
NOK Corp. | | | 665 | | | | 11,372 | |
Pacific Industrial Co., Ltd.(a) | | | 300 | | | | 3,024 | |
Sanden Holdings Corp. | | | 720 | | | | 2,063 | |
Stanley Electric Co., Ltd.(a) | | | 868 | | | | 19,654 | |
Sumitomo Electric Industries Ltd. | | | 3,719 | | | | 45,298 | |
Sumitomo Rubber Industries Ltd. | | | 867 | | | | 13,414 | |
Tokai Rika Co., Ltd. | | | 324 | | | | 6,105 | |
Topre Corp. | | | 279 | | | | 5,205 | |
Toyo Tire & Rubber Co., Ltd. | | | 629 | | | | 9,402 | |
Toyoda Gosei Co., Ltd. | | | 326 | | | | 6,300 | |
Toyota Boshoku Corp. | | | 556 | | | | 9,072 | |
TPR Co., Ltd. | | | 215 | | | | 5,651 | |
TS Tech Co., Ltd. | | | 290 | | | | 6,796 | |
Unipres Corp. | | | 263 | | | | 4,589 | |
Yokohama Rubber Co., Ltd. (The) | | | 849 | | | | 13,982 | |
| | | | | | | | |
| Total Auto Components | | | | | | | 534,322 | |
| Automobiles – 30.8% | | | | | | | | |
Daihatsu Motor Co., Ltd.(a) | | | 1,182 | | | | 16,679 | |
Fuji Heavy Industries Ltd. | | | 3,157 | | | | 111,652 | |
Honda Motor Co., Ltd. | | | 8,830 | | | | 242,443 | |
Isuzu Motors Ltd. | | | 3,436 | | | | 35,523 | |
Mazda Motor Corp. | | | 3,136 | | | | 48,730 | |
Mitsubishi Motors Corp. | | | 3,653 | | | | 27,399 | |
Nissan Motor Co., Ltd. | | | 12,053 | | | | 111,688 | |
Nissan Shatai Co., Ltd. | | | 562 | | | | 5,665 | |
Suzuki Motor Corp. | | | 2,309 | | | | 61,857 | |
Toyota Motor Corp. | | | 5,379 | | | | 284,851 | |
Yamaha Motor Co., Ltd. | | | 1,530 | | | | 25,483 | |
| | | | | | | | |
| Total Automobiles | | | | | | | 971,970 | |
| Building Products – 5.8% | | | | | | | | |
Aica Kogyo Co., Ltd. | | | 350 | | | | 7,362 | |
Asahi Glass Co., Ltd. | | | 5,538 | | | | 30,352 | |
Bunka Shutter Co., Ltd. | | | 536 | | | | 4,411 | |
Central Glass Co., Ltd. | | | 780 | | | | 4,240 | |
Daikin Industries Ltd. | | | 1,418 | | | | 106,128 | |
Nippon Sheet Glass Co., Ltd.* | | | 5,653 | | | | 4,024 | |
Nitto Boseki Co., Ltd. | | | 966 | | | | 3,120 | |
Noritz Corp. | | | 276 | | | | 4,504 | |
Sanwa Holdings Corp. | | | 1,435 | | | | 10,686 | |
Takasago Thermal Engineering Co., Ltd.(a) | | | 512 | | | | 6,441 | |
| | | | | | | | |
| Total Building Products | | | | | | | 181,268 | |
| Chemicals – 1.8% | | | | | | | | |
Kansai Paint Co., Ltd. | | | 1,532 | | | | 24,644 | |
Nippon Paint Holdings Co., Ltd.(a) | | | 1,220 | | | | 27,104 | |
Toyo Ink SC Holdings Co., Ltd. | | | 831 | | | | 3,334 | |
| | | | | | | | |
| Total Chemicals | | | | | | | 55,082 | |
| Construction & Engineering – 1.8% | | | | | | | | |
COMSYS Holdings Corp.(a) | | | 576 | | | | 8,907 | |
JGC Corp.(a) | | | 1,064 | | | | 15,951 | |
Kandenko Co., Ltd. | | | 563 | | | | 4,022 | |
Kyowa Exeo Corp. | | | 579 | | | | 6,439 | |
Kyudenko Corp. | | | 226 | | | | 5,387 | |
Mirait Holdings Corp. | | | 519 | | | | 4,138 | |
Nippon Densetsu Kogyo Co., Ltd. | | | 301 | | | | 6,058 | |
Taikisha Ltd. | | | 259 | | | | 6,254 | |
| | | | | | | | |
| Total Construction & Engineering | | | | | | | 57,156 | |
| Electrical Equipment – 8.3% | | | | | | | | |
Daihen Corp. | | | 470 | | | | 2,141 | |
Fuji Electric Co., Ltd. | | | 3,547 | | | | 12,276 | |
Fujikura Ltd. | | | 1,602 | | | | 7,554 | |
Furukawa Electric Co., Ltd. | | | 4,095 | | | | 8,853 | |
GS Yuasa Corp. | | | 2,167 | | | | 9,274 | |
Mitsubishi Electric Corp. | | | 10,810 | | | | 113,443 | |
Nidec Corp. | | | 1,352 | | | | 92,635 | |
Nitto Kogyo Corp. | | | 300 | | | | 4,789 | |
Ushio, Inc. | | | 835 | | | | 11,114 | |
| | | | | | | | |
| Total Electrical Equipment | | | | | | | 262,079 | |
| Machinery – 28.0% | | | | | | | | |
Aida Engineering Ltd. | | | 362 | | | | 3,150 | |
Amada Holdings Co., Ltd. | | | 1,895 | | | | 18,512 | |
Asahi Diamond Industrial Co., Ltd. | | | 349 | | | | 3,133 | |
CKD Corp. | | | 510 | | | | 4,215 | |
Daifuku Co., Ltd. | | | 638 | | | | 10,768 | |
DMG Mori Co., Ltd.(a) | | | 816 | | | | 7,514 | |
Ebara Corp. | | | 2,792 | | | | 11,675 | |
FANUC Corp. | | | 872 | | | | 135,655 | |
Fuji Machine Manufacturing Co., Ltd.(a) | | | 600 | | | | 6,134 | |
Fujitec Co., Ltd. | | | 540 | | | | 5,506 | |
Furukawa Co., Ltd. | | | 2,714 | | | | 4,008 | |
Glory Ltd. | | | 331 | | | | 11,265 | |
Hino Motors Ltd. | | | 1,700 | | | | 18,407 | |
Hitachi Construction Machinery Co., Ltd.(a) | | | 558 | | | | 8,877 | |
Hitachi Zosen Corp. | | | 653 | | | | 3,102 | |
Hoshizaki Electric Co., Ltd. | | | 288 | | | | 24,061 | |
IHI Corp. | | | 8,925 | | | | 18,899 | |
Japan Steel Works Ltd. (The) | | | 2,703 | | | | 8,537 | |
See Notes to Financial Statements.
| | |
| 128 | | WisdomTree Developed World ex-U.S. and Currency Hedged Equity Funds |
Schedule of Investments (concluded)
WisdomTree Japan Hedged Capital Goods Fund (DXJC)
March 31, 2016
| | | | | | | | |
| Investments | | Shares | | | Value | |
JTEKT Corp. | | | 1,175 | | | $ | 15,263 | |
Kawasaki Heavy Industries Ltd.(a) | | | 8,974 | | | | 25,949 | |
Komatsu Ltd. | | | 4,623 | | | | 78,808 | |
Kubota Corp. | | | 5,817 | | | | 79,522 | |
Kurita Water Industries Ltd. | | | 600 | | | | 13,703 | |
Makino Milling Machine Co., Ltd. | | | 399 | | | | 2,446 | |
Makita Corp. | | | 649 | | | | 40,304 | |
Meidensha Corp. | | | 1,039 | | | | 4,742 | |
Minebea Co., Ltd.(a) | | | 1,652 | | | | 12,905 | |
Mitsubishi Heavy Industries Ltd. | | | 16,325 | | | | 60,728 | |
Mitsui Engineering & Shipbuilding Co., Ltd.(a) | | | 3,547 | | | | 5,302 | |
Miura Co., Ltd.(a) | | | 600 | | | | 11,216 | |
Nabtesco Corp. | | | 828 | | | | 18,609 | |
Nachi-Fujikoshi Corp. | | | 818 | | | | 2,853 | |
NGK Insulators Ltd. | | | 1,103 | | | | 20,403 | |
Nitta Corp. | | | 200 | | | | 5,045 | |
NSK Ltd. | | | 2,753 | | | | 25,229 | |
NTN Corp. | | | 3,059 | | | | 9,771 | |
Obara Group, Inc. | | | 45 | | | | 1,616 | |
OKUMA Corp. | | | 556 | | | | 3,893 | |
OSG Corp.(a) | | | 564 | | | | 10,543 | |
Ryobi Ltd. | | | 600 | | | | 2,370 | |
Shinmaywa Industries Ltd. | | | 351 | | | | 2,492 | |
SMC Corp. | | | 362 | | | | 84,191 | |
Star Micronics Co., Ltd. | | | 249 | | | | 2,796 | |
Sumitomo Heavy Industries Ltd. | | | 3,327 | | | | 13,764 | |
Tadano Ltd. | | | 412 | | | | 3,831 | |
Takeuchi Manufacturing Co., Ltd. | | | 200 | | | | 2,890 | |
Takuma Co., Ltd. | | | 300 | | | | 2,688 | |
THK Co., Ltd. | | | 682 | | | | 12,597 | |
Tsubakimoto Chain Co. | | | 574 | | | | 3,560 | |
| | | | | | | | |
| Total Machinery | | | | | | | 883,447 | |
| Metals & Mining – 5.9% | | | | | | | | |
Daido Steel Co., Ltd.(a) | | | 2,711 | | | | 9,407 | |
Hitachi Metals Ltd. | | | 1,198 | | | | 12,375 | |
JFE Holdings, Inc. | | | 3,022 | | | | 40,761 | |
Kobe Steel Ltd.(a) | | | 18,606 | | | | 16,389 | |
Nippon Steel & Sumitomo Metal Corp. | | | 4,600 | | | | 88,484 | |
Nisshin Steel Co., Ltd. | | | 600 | | | | 7,009 | |
Sanyo Special Steel Co., Ltd. | | | 720 | | | | 3,293 | |
Tokyo Steel Manufacturing Co., Ltd.(a) | | | 569 | | | | 3,392 | |
Yamato Kogyo Co., Ltd. | | | 291 | | | | 6,325 | |
| | | | | | | | |
| Total Metals & Mining | | | | | | | 187,435 | |
TOTAL COMMON STOCKS (Cost: $3,421,866) | | | | | | | 3,132,759 | |
| INVESTMENT OF CASH COLLATERAL FOR SECURITIES LOANED – 6.1% | |
| United States – 6.1% | | | | | | | | |
State Street Navigator Securities Lending Prime Portfolio, 0.50%(b) | | | | | | | | |
| (Cost: $192,975)(c) | | | 192,975 | | | | 192,975 | |
TOTAL INVESTMENTS IN SECURITIES – 105.4% (Cost: $3,614,841) | | | | 3,325,734 | |
Liabilities in Excess of Cash, Foreign Currency and Other Assets – (5.4)% | | | | | | | (169,911 | ) |
| | | | | | | | |
| NET ASSETS – 100.0% | | | | | | $ | 3,155,823 | |
| * | Non-income producing security. |
| (a) | Security, or portion thereof, was on loan at March 31, 2016 (See Note 2). |
| (b) | Rate shown represents annualized 7-day yield as of March 31, 2016. |
| (c) | At March 31, 2016, the total market value of the Fund’s securities on loan was $183,040 and the total market value of the collateral held by the Fund was $192,975. |
| | | | | | | | | | | | | | | | | | | | |
| FINANCIAL DERIVATIVE INSTRUMENTS | |
| FORWARD CONTRACTS | |
Settlement
Date | | Contracts
To Deliver | | | In
Exchange For | | | Unrealized
Gain (Loss) | |
4/5/2016 | | | JPY | | | | 70,896,527 | | | | USD | | | | 628,813 | | | $ | (1,992 | ) |
4/5/2016 | | | JPY | | | | 70,895,836 | | | | USD | | | | 628,813 | | | | (1,986 | ) |
4/5/2016 | | | JPY | | | | 54,017,470 | | | | USD | | | | 479,100 | | | | (1,523 | ) |
4/5/2016 | | | JPY | | | | 70,894,389 | | | | USD | | | | 628,813 | | | | (1,973 | ) |
4/5/2016 | | | JPY | | | | 70,896,779 | | | | USD | | | | 628,813 | | | | (1,994 | ) |
4/5/2016 | | | USD | | | | 479,100 | | | | JPY | | | | 53,847,294 | | | | 9 | |
4/5/2016 | | | USD | | | | 628,813 | | | | JPY | | | | 70,670,846 | | | | (16 | ) |
4/5/2016 | | | USD | | | | 628,813 | | | | JPY | | | | 70,673,739 | | | | 10 | |
4/5/2016 | | | USD | | | | 628,813 | | | | JPY | | | | 70,669,149 | | | | (31 | ) |
4/5/2016 | | | USD | | | | 628,813 | | | | JPY | | | | 70,677,512 | | | | 43 | |
5/9/2016 | | | JPY | | | | 74,389,332 | | | | USD | | | | 662,471 | | | | (62 | ) |
5/9/2016 | | | JPY | | | | 56,675,510 | | | | USD | | | | 504,742 | | | | (27 | ) |
5/9/2016 | | | JPY | | | | 74,390,193 | | | | USD | | | | 662,471 | | | | (70 | ) |
5/9/2016 | | | JPY | | | | 74,391,120 | | | | USD | | | | 662,471 | | | | (78 | ) |
5/9/2016 | | | JPY | | | | 74,393,373 | | | | USD | | | | 662,471 | | | | (98 | ) |
| | | | | | | | | | | | | | | | | | | $ | (9,788 | ) |
| | |
| CURRENCY LEGEND |
JPY | | – Japanese yen |
USD | | – U.S. dollar |
See Notes to Financial Statements.
| | | | |
| WisdomTree Developed World ex-U.S. and Currency Hedged Equity Funds | | | 129 | |
Schedule of Investments
WisdomTree Japan Hedged Equity Fund (DXJ)
March 31, 2016
| | | | | | | | |
| Investments | | Shares | | | Value | |
| COMMON STOCKS – 99.2% | | | | | | | | |
| Japan – 99.2% | | | | | | | | |
| Air Freight & Logistics – 0.0% | | | | | | | | |
Kintetsu World Express, Inc. | | | 217,500 | | | $ | 2,894,968 | |
Yusen Logistics Co., Ltd.(a) | | | 138,300 | | | | 1,610,701 | |
| | | | | | | | |
| Total Air Freight & Logistics | | | | | | | 4,505,669 | |
| Airlines – 0.9% | | | | | | | | |
Japan Airlines Co., Ltd. | | | 2,448,200 | | | | 89,785,848 | |
| Auto Components – 7.2% | | | | | | | | |
Aisan Industry Co., Ltd.(a) | | | 210,300 | | | | 1,657,777 | |
Aisin Seiki Co., Ltd. | | | 1,337,808 | | | | 50,467,600 | |
Bridgestone Corp. | | | 5,445,085 | | | | 203,715,311 | |
Calsonic Kansei Corp. | | | 1,306,000 | | | | 9,725,717 | |
Daido Metal Co., Ltd. | | | 300,100 | | | | 2,322,941 | |
Denso Corp.(a) | | | 4,114,379 | | | | 165,607,461 | |
Eagle Industry Co., Ltd. | | | 222,300 | | | | 2,933,146 | |
Exedy Corp.(a) | | | 222,115 | | | | 4,916,786 | |
FCC Co., Ltd. | | | 267,100 | | | | 4,519,989 | |
Keihin Corp. | | | 385,734 | | | | 5,769,108 | |
Koito Manufacturing Co., Ltd.(a) | | | 350,001 | | | | 15,881,535 | |
KYB Corp.(a) | | | 558,000 | | | | 1,653,223 | |
NGK Spark Plug Co., Ltd.(a) | | | 585,964 | | | | 11,229,738 | |
NHK Spring Co., Ltd.(a) | | | 1,147,900 | | | | 10,999,495 | |
Nifco, Inc.(a) | | | 267,845 | | | | 12,892,401 | |
NOK Corp.(a) | | | 617,400 | | | | 10,557,790 | |
Pacific Industrial Co., Ltd.(a) | | | 642,700 | | | | 6,478,750 | |
Press Kogyo Co., Ltd. | | | 1,233,600 | | | | 4,159,744 | |
Sanden Holdings Corp.(a) | | | 1,884,000 | | | | 5,397,464 | |
Showa Corp. | | | 642,200 | | | | 5,610,929 | |
Stanley Electric Co., Ltd.(a) | | | 619,907 | | | | 14,036,775 | |
Sumitomo Electric Industries Ltd. | | | 3,122,483 | | | | 38,032,646 | |
Sumitomo Rubber Industries Ltd. | | | 1,989,691 | | | | 30,784,934 | |
Tokai Rika Co., Ltd. | | | 750,214 | | | | 14,137,224 | |
Topre Corp. | | | 302,400 | | | | 5,642,002 | |
Toyo Tire & Rubber Co., Ltd. | | | 713,600 | | | | 10,666,382 | |
Toyoda Gosei Co., Ltd.(a) | | | 538,700 | | | | 10,410,218 | |
Toyota Boshoku Corp. | | | 480,936 | | | | 7,847,650 | |
TPR Co., Ltd.(a) | | | 222,194 | | | | 5,839,771 | |
TS Tech Co., Ltd. | | | 280,432 | | | | 6,571,982 | |
Unipres Corp.(a) | | | 222,400 | | | | 3,880,301 | |
Yokohama Rubber Co., Ltd. (The) | | | 1,022,000 | | | | 16,831,016 | |
| | | | | | | | |
| Total Auto Components | | | | | | | 701,177,806 | |
| Automobiles – 12.9% | | | | | | | | |
Daihatsu Motor Co., Ltd.(a) | | | 2,098,869 | | | | 29,617,031 | |
Fuji Heavy Industries Ltd.(a) | | | 2,956,567 | | | | 104,562,959 | |
Honda Motor Co., Ltd. | | | 9,988,547 | | | | 274,252,912 | |
Isuzu Motors Ltd. | | | 4,217,700 | | | | 43,604,853 | |
Mazda Motor Corp. | | | 492,515 | | | | 7,653,165 | |
Mitsubishi Motors Corp.(a) | | | 3,334,901 | | | | 25,012,870 | |
Nissan Motor Co., Ltd.(a) | | | 30,860,004 | | | | 285,961,957 | |
Suzuki Motor Corp.(a) | | | 976,036 | | | | 26,147,466 | |
Toyota Motor Corp. | | | 8,209,575 | | | | 434,747,012 | |
Yamaha Motor Co., Ltd.(a) | | | 1,286,600 | | | | 21,429,024 | |
| | | | | | | | |
| Total Automobiles | | | | | | | 1,252,989,249 | |
| Banks – 6.4% | | | | | | | | |
Mitsubishi UFJ Financial Group, Inc.(a) | | | 75,233,122 | | | | 349,073,118 | |
Mizuho Financial Group, Inc.(a) | | | 183,039,144 | | | | 273,756,663 | |
| | | | | | | | |
| Total Banks | | | | | | | 622,829,781 | |
| Beverages – 1.2% | | | | | | | | |
Kirin Holdings Co., Ltd. | | | 5,124,745 | | | | 71,950,244 | |
Suntory Beverage & Food Ltd. | | | 1,055,900 | | | | 47,630,348 | |
| | | | | | | | |
| Total Beverages | | | | | | | 119,580,592 | |
| Building Products – 1.3% | | | | | | | | |
Aica Kogyo Co., Ltd. | | | 370,400 | | | | 7,790,610 | |
Asahi Glass Co., Ltd. | | | 6,849,735 | | | | 37,541,143 | |
Central Glass Co., Ltd. | | | 1,496,000 | | | | 8,132,533 | |
Daikin Industries Ltd.(a) | | | 804,349 | | | | 60,200,043 | |
Noritz Corp. | | | 399,900 | | | | 6,525,349 | |
Sanwa Holdings Corp. | | | 1,404,631 | | | | 10,460,217 | |
| | | | | | | | |
| Total Building Products | | | | | | | 130,649,895 | |
| Capital Markets – 1.1% | | | | | | | | |
Monex Group, Inc.(a) | | | 1,470,696 | | | | 3,807,754 | |
Nomura Holdings, Inc.(a) | | | 22,017,745 | | | | 98,516,162 | |
| | | | | | | | |
| Total Capital Markets | | | | | | | 102,323,916 | |
| Chemicals – 5.9% | | | | | | | | |
ADEKA Corp. | | | 642,800 | | | | 9,396,507 | |
Asahi Kasei Corp.(a) | | | 6,510,522 | | | | 44,075,414 | |
Daicel Corp. | | | 1,387,142 | | | | 18,981,488 | |
Denka Co., Ltd. | | | 3,229,076 | | | | 13,301,857 | |
DIC Corp. | | | 5,811,538 | | | | 13,909,015 | |
Fujimi, Inc.(a) | | | 371,300 | | | | 4,955,292 | |
Hitachi Chemical Co., Ltd. | | | 846,415 | | | | 15,249,703 | |
JSR Corp. | | | 1,239,300 | | | | 17,840,539 | |
Kaneka Corp.(a) | | | 2,009,000 | | | | 17,230,980 | |
Kansai Paint Co., Ltd.(a) | | | 569,900 | | | | 9,167,482 | |
Kuraray Co., Ltd. | | | 1,635,837 | | | | 20,026,796 | |
Kureha Corp.(a) | | | 1,116,000 | | | | 3,554,678 | |
Lintec Corp. | | | 565,247 | | | | 10,128,631 | |
Mitsubishi Chemical Holdings Corp. | | | 6,460,063 | | | | 33,767,401 | |
Mitsubishi Gas Chemical Co., Inc. | | | 2,224,564 | | | | 11,994,179 | |
Mitsui Chemicals, Inc.(a) | | | 2,208,079 | | | | 7,367,139 | |
Nippon Kayaku Co., Ltd.(a) | | | 1,635,000 | | | | 16,554,384 | |
Nippon Paint Holdings Co., Ltd.(a) | | | 498,400 | | | | 11,072,599 | |
Nippon Shokubai Co., Ltd.(a) | | | 207,900 | | | | 10,598,932 | |
Nippon Soda Co., Ltd. | | | 959,000 | | | | 4,837,875 | |
Nippon Synthetic Chemical Industry Co., Ltd. (The) | | | 1,012,000 | | | | 6,419,823 | |
Nissan Chemical Industries Ltd.(a) | | | 641,353 | | | | 16,548,100 | |
Nitto Denko Corp.(a) | | | 605,774 | | | | 33,723,279 | |
NOF Corp.(a) | | | 866,000 | | | | 6,148,565 | |
Sanyo Chemical Industries Ltd. | | | 1,097,000 | | | | 7,739,855 | |
Shin-Etsu Chemical Co., Ltd. | | | 1,470,379 | | | | 76,190,999 | |
Showa Denko K.K.(a) | | | 5,674,312 | | | | 5,856,312 | |
Sumitomo Bakelite Co., Ltd. | | | 2,220,000 | | | | 8,710,530 | |
Sumitomo Chemical Co., Ltd.(a) | | | 5,025,485 | | | | 22,758,769 | |
Taiyo Holdings Co., Ltd.(a) | | | 222,326 | | | | 7,536,475 | |
See Notes to Financial Statements.
| | |
| 130 | | WisdomTree Developed World ex-U.S. and Currency Hedged Equity Funds |
Schedule of Investments (continued)
WisdomTree Japan Hedged Equity Fund (DXJ)
March 31, 2016
| | | | | | | | |
| Investments | | Shares | | | Value | |
Taiyo Nippon Sanso Corp.(a) | | | 1,056,453 | | | $ | 10,038,630 | |
Teijin Ltd. | | | 2,155,000 | | | | 7,515,993 | |
Toray Industries, Inc.(a) | | | 4,720,318 | | | | 40,284,079 | |
Tosoh Corp. | | | 2,015,614 | | | | 8,482,454 | |
Toyobo Co., Ltd. | | | 6,652,513 | | | | 10,002,889 | |
Ube Industries Ltd. | | | 5,285,000 | | | | 9,357,311 | |
Zeon Corp.(a) | | | 675,000 | | | | 4,372,081 | |
| | | | | | | | |
| Total Chemicals | | | | | | | 575,697,035 | |
| Commercial Services & Supplies – 0.1% | | | | | |
Pilot Corp. | | | 77,100 | | | | 2,942,827 | |
Sato Holdings Corp.(a) | | | 221,867 | | | | 4,729,688 | |
| | | | | | | | |
| Total Commercial Services & Supplies | | | | | | | 7,672,515 | |
| Communications Equipment – 0.1% | | | | | | | | |
Hitachi Kokusai Electric, Inc.(a) | | | 881,000 | | | | 10,605,392 | |
| Construction & Engineering – 0.1% | | | | | | | | |
JGC Corp.(a) | | | 442,416 | | | | 6,632,599 | |
Penta-Ocean Construction Co., Ltd. | | | 703,200 | | | | 2,946,814 | |
| | | | | | | | |
| Total Construction & Engineering | | | | | | | 9,579,413 | |
| Construction Materials – 0.1% | | | | | | | | |
Taiheiyo Cement Corp. | | | 2,993,000 | | | | 6,896,988 | |
| Containers & Packaging – 0.1% | | | | | | | | |
Fuji Seal International, Inc.(a) | | | 222,791 | | | | 7,909,036 | |
| Electrical Equipment – 1.9% | | | | | | | | |
Denyo Co., Ltd. | | | 75,100 | | | | 774,420 | |
Fuji Electric Co., Ltd. | | | 2,804,869 | | | | 9,707,674 | |
Fujikura Ltd.(a) | | | 1,474,577 | | | | 6,953,386 | |
Furukawa Electric Co., Ltd. | | | 2,256,818 | | | | 4,879,281 | |
GS Yuasa Corp.(a) | | | 2,232,920 | | | | 9,555,892 | |
Mitsubishi Electric Corp.(a) | | | 9,133,114 | | | | 95,845,082 | |
Nidec Corp.(a) | | | 620,558 | | | | 42,518,948 | |
Sanyo Denki Co., Ltd. | | | 681,000 | | | | 3,180,969 | |
Tatsuta Electric Wire and Cable Co., Ltd. | | | 1,209,700 | | | | 3,831,604 | |
Ushio, Inc. | | | 533,109 | | | | 7,095,788 | |
| | | | | | | | |
| Total Electrical Equipment | | | | | | | 184,343,044 | |
| Electronic Equipment, Instruments & Components – 4.8% | |
Alps Electric Co., Ltd.(a) | | | 21,900 | | | | 382,293 | |
Amano Corp. | | | 563,733 | | | | 8,912,794 | |
Anritsu Corp.(a) | | | 1,655,200 | | | | 9,115,786 | |
Canon Electronics, Inc. | | | 438,100 | | | | 6,454,856 | |
Citizen Holdings Co., Ltd.(a) | | | 1,142,985 | | | | 6,488,050 | |
Enplas Corp.(a) | | | 167,248 | | | | 6,205,117 | |
Hakuto Co., Ltd. | | | 199,319 | | | | 1,757,419 | |
Hamamatsu Photonics K.K.(a) | | | 616,300 | | | | 17,025,771 | |
Hirose Electric Co., Ltd.(a) | | | 223,500 | | | | 24,677,566 | |
Hitachi High-Technologies Corp. | | | 643,719 | | | | 18,155,516 | |
Hitachi Ltd.(a) | | | 16,501,028 | | | | 77,311,636 | |
Horiba Ltd. | | | 222,400 | | | | 8,310,690 | |
Ibiden Co., Ltd.(a) | | | 668,101 | | | | 8,179,251 | |
Japan Aviation Electronics Industry Ltd. | | | 290,000 | | | | 3,400,685 | |
Keyence Corp.(a) | | | 67,910 | | | | 37,092,352 | |
Koa Corp.(a) | | | 222,546 | | | | 1,649,369 | |
Kyocera Corp.(a) | | | 1,475,718 | | | | 65,084,160 | |
Murata Manufacturing Co., Ltd.(a) | | | 565,556 | | | | 68,282,352 | |
Nichicon Corp. | | | 574,600 | | | | 4,008,064 | |
Nippon Electric Glass Co., Ltd. | | | 2,220,301 | | | | 11,378,561 | |
Oki Electric Industry Co., Ltd.(a) | | | 3,356,309 | | | | 4,748,015 | |
Omron Corp. | | | 665,900 | | | | 19,847,547 | |
Ryosan Co., Ltd.(a) | | | 233,045 | | | | 5,830,531 | |
Sanshin Electronics Co., Ltd.(a) | | | 385,054 | | | | 3,045,625 | |
Shimadzu Corp. | | | 852,000 | | | | 13,379,421 | |
Siix Corp.(a) | | | 223,100 | | | | 6,838,200 | |
TDK Corp. | | | 266,468 | | | | 14,817,608 | |
Topcon Corp.(a) | | | 124,600 | | | | 1,645,148 | |
UKC Holdings Corp. | | | 140,399 | | | | 2,789,368 | |
Yaskawa Electric Corp.(a) | | | 750,100 | | | | 8,669,246 | |
Yokogawa Electric Corp.(a) | | | 466,038 | | | | 4,822,298 | |
| | | | | | | | |
| Total Electronic Equipment, Instruments & Components | | | | 470,305,295 | |
| Energy Equipment & Services – 0.1% | | | | | | | | |
Modec, Inc.(a) | | | 391,600 | | | | 5,745,348 | |
| Food & Staples Retailing – 1.5% | | | | | | | | |
Ministop Co., Ltd.(a) | | | 164,900 | | | | 3,006,184 | |
Seven & I Holdings Co., Ltd.(a) | | | 3,242,524 | | | | 138,246,141 | |
| | | | | | | | |
| Total Food & Staples Retailing | | | | | | | 141,252,325 | |
| Food Products – 1.1% | | | | | | | | |
Ajinomoto Co., Inc. | | | 1,791,513 | | | | 40,478,200 | |
Fuji Oil Holdings, Inc. | | | 547,600 | | | | 9,885,497 | |
Kikkoman Corp.(a) | | | 514,000 | | | | 16,920,681 | |
Nisshin Oillio Group Ltd. (The) | | | 2,200,909 | | | | 8,988,098 | |
Sakata Seed Corp. | | | 207,339 | | | | 5,274,098 | |
Toyo Suisan Kaisha Ltd.(a) | | | 425,900 | | | | 15,308,830 | |
Yakult Honsha Co., Ltd.(a) | | | 223,187 | | | | 9,898,903 | |
| | | | | | | | |
| Total Food Products | | | | | | | 106,754,307 | |
| Health Care Equipment & Supplies – 1.6% | | | | | |
Asahi Intecc Co., Ltd. | | | 46,600 | | | | 2,184,990 | |
Hoya Corp. | | | 1,763,357 | | | | 67,164,298 | |
Nihon Kohden Corp.(a) | | | 355,900 | | | | 8,859,898 | |
Nikkiso Co., Ltd. | | | 514,500 | | | | 3,785,680 | |
Nipro Corp.(a) | | | 1,528,200 | | | | 14,534,862 | |
Sysmex Corp.(a) | | | 278,560 | | | | 17,447,951 | |
Terumo Corp.(a) | | | 1,057,056 | | | | 37,948,494 | |
| | | | | | | | |
| Total Health Care Equipment & Supplies | | | | 151,926,173 | |
| Health Care Providers & Services – 0.1% | | | | | |
Miraca Holdings, Inc. | | | 232,300 | | | | 9,559,033 | |
| Health Care Technology – 0.0% | | | | | | | | |
M3, Inc.(a) | | | 118,000 | | | | 2,973,228 | |
| Household Durables – 1.8% | | | | | | | | |
Casio Computer Co., Ltd.(a) | | | 965,657 | | | | 19,511,607 | |
Foster Electric Co., Ltd. | | | 264,796 | | | | 5,593,004 | |
Fujitsu General Ltd. | | | 617,000 | | | | 9,535,380 | |
Nikon Corp.(a) | | | 2,079,300 | | | | 31,856,885 | |
Panasonic Corp. | | | 6,163,870 | | | | 56,678,319 | |
Rinnai Corp.(a) | | | 218,600 | | | | 19,332,568 | |
See Notes to Financial Statements.
| | | | |
| WisdomTree Developed World ex-U.S. and Currency Hedged Equity Funds | | | 131 | |
Schedule of Investments (continued)
WisdomTree Japan Hedged Equity Fund (DXJ)
March 31, 2016
| | | | | | | | |
| Investments | | Shares | | | Value | |
Sekisui Chemical Co., Ltd. | | | 2,442,500 | | | $ | 30,119,712 | |
Tamron Co., Ltd. | | | 223,100 | | | | 3,662,258 | |
| | | | | | | | |
| Total Household Durables | | | | | | | 176,289,733 | |
| Household Products – 0.4% | | | | | | | | |
Lion Corp. | | | 1,235,000 | | | | 13,943,814 | |
Pigeon Corp.(a) | | | 316,000 | | | | 8,257,414 | |
Unicharm Corp. | | | 674,900 | | | | 14,705,548 | |
| | | | | | | | |
| Total Household Products | | | | | | | 36,906,776 | |
| Industrial Conglomerates – 0.1% | | | | | | | | |
Nisshinbo Holdings, Inc. | | | 642,700 | | | | 6,833,280 | |
| Insurance – 1.4% | | | | | | | | |
Tokio Marine Holdings, Inc. | | | 3,951,000 | | | | 133,580,675 | |
| IT Services – 0.6% | | | | | | | | |
Fujitsu Ltd. | | | 4,345,328 | | | | 16,106,265 | |
NTT Data Corp. | | | 864,100 | | | | 43,437,564 | |
| | | | | | | | |
| Total IT Services | | | | | | | 59,543,829 | |
| Leisure Products – 0.4% | | | | | | | | |
Dunlop Sports Co., Ltd.(a) | | | 128,380 | | | | 1,144,506 | |
Shimano, Inc. | | | 101,100 | | | | 15,867,289 | |
Yamaha Corp.(a) | | | 765,807 | | | | 23,097,876 | |
| | | | | | | | |
| Total Leisure Products | | | | | | | 40,109,671 | |
| Machinery – 8.8% | | | | | | | | |
Aida Engineering Ltd. | | | 445,600 | | | | 3,877,368 | |
Amada Holdings Co., Ltd. | | | 2,107,193 | | | | 20,585,417 | |
Asahi Diamond Industrial Co., Ltd. | | | 545,200 | | | | 4,894,406 | |
CKD Corp.(a) | | | 489,100 | | | | 4,042,652 | |
Daifuku Co., Ltd. | | | 447,300 | | | | 7,549,518 | |
DMG Mori Co., Ltd.(a) | | | 317,100 | | | | 2,920,045 | |
Ebara Corp.(a) | | | 1,889,158 | | | | 7,899,855 | |
FANUC Corp. | | | 1,510,989 | | | | 235,060,658 | |
Fujitec Co., Ltd.(a) | | | 555,500 | | | | 5,663,980 | |
Furukawa Co., Ltd.(a) | | | 3,792,000 | | | | 5,600,534 | |
Glory Ltd. | | | 282,300 | | | | 9,607,167 | |
Hino Motors Ltd.(a) | | | 3,666,310 | | | | 39,698,379 | |
Hitachi Construction Machinery Co., Ltd.(a) | | | 1,482,800 | | | | 23,588,651 | |
Hitachi Koki Co., Ltd.(a) | | | 804,211 | | | | 5,323,484 | |
Hoshizaki Electric Co., Ltd. | | | 184,969 | | | | 15,453,169 | |
IHI Corp. | | | 2,185,882 | | | | 4,628,675 | |
JTEKT Corp. | | | 1,292,278 | | | | 16,786,564 | |
Kawasaki Heavy Industries Ltd.(a) | | | 6,653,510 | | | | 19,239,208 | |
Kitz Corp. | | | 1,178,100 | | | | 5,104,628 | |
Komatsu Ltd.(a) | | | 5,489,306 | | | | 93,576,318 | |
Kubota Corp. | | | 4,541,002 | | | | 62,077,936 | |
Kurita Water Industries Ltd. | | | 600,200 | | | | 13,708,024 | |
Makino Milling Machine Co., Ltd. | | | 548,000 | | | | 3,359,331 | |
Makita Corp. | | | 638,169 | | | | 39,631,831 | |
Meidensha Corp.(a) | | | 2,024,000 | | | | 9,238,062 | |
Minebea Co., Ltd.(a) | | | 749,701 | | | | 5,856,466 | |
Mitsubishi Heavy Industries Ltd. | | | 10,617,198 | | | | 39,495,089 | |
Mitsubishi Nichiyu Forklift Co., Ltd. | | | 293,300 | | | | 1,200,391 | |
Mitsui Engineering & Shipbuilding Co., Ltd.(a) | | | 2,224,315 | | | | 3,324,747 | |
Nabtesco Corp. | | | 397,400 | | | | 8,931,291 | |
Nachi-Fujikoshi Corp.(a) | | | 1,520,000 | | | | 5,301,303 | |
NGK Insulators Ltd.(a) | | | 966,875 | | | | 17,884,542 | |
Nippon Thompson Co., Ltd.(a) | | | 502,000 | | | | 1,795,489 | |
Nitta Corp.(a) | | | 158,400 | | | | 3,995,409 | |
NSK Ltd. | | | 1,943,966 | | | | 17,814,716 | |
NTN Corp. | | | 167,000 | | | | 533,413 | |
Obara Group, Inc.(a) | | | 77,600 | | | | 2,785,853 | |
Oiles Corp. | | | 173,400 | | | | 2,596,487 | |
OKUMA Corp.(a) | | | 498,000 | | | | 3,487,041 | |
OSG Corp.(a) | | | 380,024 | | | | 7,103,790 | |
Ryobi Ltd. | | | 1,459,000 | | | | 5,763,566 | |
SMC Corp. | | | 126,451 | | | | 29,409,041 | |
Sodick Co., Ltd.(a) | | | 181,400 | | | | 1,358,947 | |
Star Micronics Co., Ltd. | | | 641,400 | | | | 7,201,804 | |
Sumitomo Heavy Industries Ltd.(a) | | | 2,215,186 | | | | 9,164,656 | |
Tadano Ltd. | | | 808,000 | | | | 7,512,434 | |
THK Co., Ltd.(a) | | | 591,779 | | | | 10,930,497 | |
Tsubakimoto Chain Co. | | | 1,193,000 | | | | 7,398,203 | |
| | | | | | | | |
| Total Machinery | | | | | | | 859,961,035 | |
| Marine – 0.4% | | | | | | | | |
Kawasaki Kisen Kaisha Ltd.(a) | | | 8,327,725 | | | | 16,152,356 | |
Nippon Yusen K.K.(a) | | | 9,167,035 | | | | 17,698,711 | |
NS United Kaiun Kaisha Ltd. | | | 1,439,000 | | | | 1,946,065 | |
| | | | | | | | |
| Total Marine | | | | | | | 35,797,132 | |
| Media – 0.3% | | | | | | | | |
Dentsu, Inc.(a) | | | 665,100 | | | | 33,434,005 | |
| Metals & Mining – 2.2% | | | | | | | | |
Aichi Steel Corp.(a) | | | 2,226,000 | | | | 8,734,072 | |
Hitachi Metals Ltd. | | | 1,389,018 | | | | 14,348,057 | |
JFE Holdings, Inc.(a) | | | 3,178,462 | | | | 42,871,555 | |
Kyoei Steel Ltd.(a) | | | 221,500 | | | | 3,334,472 | |
Mitsubishi Materials Corp.(a) | | | 5,458,000 | | | | 15,442,360 | |
Mitsubishi Steel Manufacturing Co., Ltd. | | | 1,042,000 | | | | 1,687,299 | |
Mitsui Mining & Smelting Co., Ltd.(a) | | | 2,225,000 | | | | 3,563,326 | |
Nippon Steel & Sumitomo Metal Corp. | | | 3,666,200 | | | | 70,522,037 | |
Sanyo Special Steel Co., Ltd. | | | 1,194,000 | | | | 5,460,350 | |
Sumitomo Metal Mining Co., Ltd.(a) | | | 3,432,000 | | | | 34,123,048 | |
Toyo Kohan Co., Ltd. | | | 223,200 | | | | 671,218 | |
UACJ Corp.(a) | | | 2,219,000 | | | | 4,501,375 | |
Yamato Kogyo Co., Ltd.(a) | | | 407,200 | | | | 8,850,835 | |
| | | | | | | | |
| Total Metals & Mining | | | | | | | 214,110,004 | |
| Multiline Retail – 0.2% | | | | | | | | |
Ryohin Keikaku Co., Ltd.(a) | | | 90,400 | | | | 19,142,489 | |
| Oil, Gas & Consumable Fuels – 0.4% | | | | | | | | |
TonenGeneral Sekiyu K.K. | | | 4,638,000 | | | | 42,007,954 | |
| Paper & Forest Products – 0.2% | | | | | | | | |
Oji Holdings Corp.(a) | | | 5,119,000 | | | | 20,586,218 | |
| Personal Products – 1.1% | | | | | | | | |
Kao Corp.(a) | | | 1,593,480 | | | | 85,107,527 | |
Mandom Corp.(a) | | | 191,200 | | | | 8,522,728 | |
Shiseido Co., Ltd. | | | 713,922 | | | | 15,955,977 | |
| | | | | | | | |
| Total Personal Products | | | | | | | 109,586,232 | |
See Notes to Financial Statements.
| | |
| 132 | | WisdomTree Developed World ex-U.S. and Currency Hedged Equity Funds |
Schedule of Investments (continued)
WisdomTree Japan Hedged Equity Fund (DXJ)
March 31, 2016
| | | | | | | | |
| Investments | | Shares | | | Value | |
| Pharmaceuticals – 7.4% | | | | | | | | |
Astellas Pharma, Inc. | | | 9,543,604 | | | $ | 127,069,740 | |
Daiichi Sankyo Co., Ltd.(a) | | | 4,792,621 | | | | 106,708,786 | |
Eisai Co., Ltd.(a) | | | 1,472,877 | | | | 88,717,267 | |
Hisamitsu Pharmaceutical Co., Inc. | | | 258,900 | | | | 11,586,521 | |
Kyowa Hakko Kirin Co., Ltd.(a) | | | 2,300,370 | | | | 36,758,437 | |
Rohto Pharmaceutical Co., Ltd. | | | 410,800 | | | | 7,492,682 | |
Shionogi & Co., Ltd.(a) | | | 1,089,977 | | | | 51,368,906 | |
Sumitomo Dainippon Pharma Co., Ltd.(a) | | | 1,056,200 | | | | 12,178,791 | |
Takeda Pharmaceutical Co., Ltd.(a) | | | 6,091,063 | | | | 278,337,111 | |
| | | | | | | | |
| Total Pharmaceuticals | | | | | | | 720,218,241 | |
| Professional Services – 0.6% | | | | | | | | |
Recruit Holdings Co., Ltd.(a) | | | 1,844,400 | | | | 56,368,290 | |
| Road & Rail – 0.3% | | | | | | | | |
Hitachi Transport System Ltd. | | | 616,000 | | | | 10,314,623 | |
Nippon Express Co., Ltd. | | | 4,249,000 | | | | 19,355,736 | |
| | | | | | | | |
| Total Road & Rail | | | | | | | 29,670,359 | |
| Semiconductors & Semiconductor Equipment – 1.0% | |
Advantest Corp.(a) | | | 664,400 | | | | 6,153,658 | |
Disco Corp. | | | 83,700 | | | | 7,104,391 | |
MegaChips Corp.(a) | | | 431,300 | | | | 4,854,260 | |
Mitsui High-Tec, Inc.(a) | | | 215,600 | | | | 1,327,418 | |
SCREEN Holdings Co., Ltd. | | | 515,300 | | | | 4,080,404 | |
Shindengen Electric Manufacturing Co., Ltd. | | | 1,190,000 | | | | 4,033,898 | |
Shinko Electric Industries Co., Ltd. | | | 1,055,710 | | | | 5,945,678 | |
Tokyo Electron Ltd.(a) | | | 835,153 | | | | 54,510,275 | |
Tokyo Seimitsu Co., Ltd. | | | 264,300 | | | | 5,189,823 | |
| | | | | | | | |
| Total Semiconductors & Semiconductor Equipment | | | | 93,199,805 | |
| Software – 0.8% | | | | | | | | |
Capcom Co., Ltd.(a) | | | 292,100 | | | | 7,133,898 | |
Konami Holdings Corp.(a) | | | 323,100 | | | | 9,572,694 | |
Nexon Co., Ltd.(a) | | | 872,500 | | | | 14,896,815 | |
Square Enix Holdings Co., Ltd. | | | 341,200 | | | | 9,228,596 | |
Trend Micro, Inc.(a) | | | 991,608 | | | | 36,348,814 | |
| | | | | | | | |
| Total Software | | | | | | | 77,180,817 | |
| Specialty Retail – 1.0% | | | | | | | | |
ABC-Mart, Inc. | | | 279,600 | | | | 17,935,994 | |
Fast Retailing Co., Ltd. | | | 221,000 | | | | 70,825,392 | |
Sanrio Co., Ltd.(a) | | | 607,848 | | | | 11,903,318 | |
| | | | | | | | |
| Total Specialty Retail | | | | | | | 100,664,704 | |
| Technology Hardware, Storage & Peripherals – 6.1% | |
Brother Industries Ltd.(a) | | | 1,252,543 | | | | 14,420,487 | |
Canon, Inc.(a) | | | 12,450,597 | | | | 371,651,345 | |
FUJIFILM Holdings Corp. | | | 1,726,795 | | | | 68,383,510 | |
Hitachi Maxell Ltd.(a) | | | 666,700 | | | | 10,161,102 | |
Konica Minolta, Inc.(a) | | | 1,759,738 | | | | 14,967,833 | |
Ricoh Co., Ltd.(a) | | | 5,360,278 | | | | 54,654,376 | |
Riso Kagaku Corp. | | | 388,100 | | | | 5,994,409 | |
Roland DG Corp. | | | 218,700 | | | | 4,276,904 | |
Seiko Epson Corp.(a) | | | 2,637,800 | | | | 42,666,670 | |
Wacom Co., Ltd.(a) | | | 2,003,300 | | | | 8,501,927 | |
| | | | | | | | |
| Total Technology Hardware, Storage & Peripherals | | | | 595,678,563 | |
| Textiles, Apparel & Luxury Goods – 0.4% | | | | | |
Asics Corp. | | | 376,092 | | | | 6,709,057 | |
Descente Ltd.(a) | | | 235,681 | | | | 3,476,659 | |
Kurabo Industries Ltd. | | | 1,400,472 | | | | 2,429,753 | |
Seiko Holdings Corp. | | | 690,000 | | | | 2,738,022 | |
Seiren Co., Ltd.(a) | | | 468,610 | | | | 5,274,182 | |
Wacoal Holdings Corp.(a) | | | 1,645,000 | | | | 19,655,990 | |
| | | | | | | | |
| Total Textiles, Apparel & Luxury Goods | | | | | | | 40,283,663 | |
| Tobacco – 5.4% | | | | | | | | |
Japan Tobacco, Inc. | | | 12,546,831 | | | | 523,552,092 | |
| Trading Companies & Distributors – 8.5% | | | | | |
Hanwa Co., Ltd. | | | 2,220,000 | | | | 9,382,090 | |
Inabata & Co., Ltd. | | | 222,186 | | | | 2,206,144 | |
ITOCHU Corp.(a) | | | 12,206,094 | | | | 150,519,563 | |
Kuroda Electric Co., Ltd.(a) | | | 222,587 | | | | 3,336,973 | |
Marubeni Corp.(a) | | | 17,038,178 | | | | 86,407,415 | |
MISUMI Group, Inc.(a) | | | 433,600 | | | | 6,214,953 | |
Mitsubishi Corp. | | | 10,947,000 | | | | 185,639,770 | |
Mitsui & Co., Ltd.(a) | | | 18,187,289 | | | | 209,551,486 | |
Nagase & Co., Ltd. | | | 707,056 | | | | 7,781,737 | |
Nippon Steel & Sumikin Bussan Corp.(a) | | | 2,228,000 | | | | 7,433,605 | |
Sojitz Corp. | | | 7,143,521 | | | | 14,681,733 | |
Sumitomo Corp.(a) | | | 11,081,877 | | | | 110,281,413 | |
Toyota Tsusho Corp. | | | 1,583,710 | | | | 35,832,328 | |
| | | | | | | | |
| Total Trading Companies & Distributors | | | | 829,269,210 | |
| Transportation Infrastructure – 0.1% | | | | | | | | |
Sumitomo Warehouse Co., Ltd. (The) | | | 1,850,000 | | | | 9,431,469 | |
| Wireless Telecommunication Services – 0.8% | |
SoftBank Group Corp. | | | 1,710,100 | | | | 81,644,171 | |
TOTAL COMMON STOCKS (Cost: $10,539,832,328) | | | | | | | 9,660,112,305 | |
| INVESTMENT OF CASH COLLATERAL FOR SECURITIES LOANED – 11.0% | |
| United States – 11.0% | | | | | | | | |
State Street Navigator Securities Lending Prime Portfolio, 0.50%(b) | | | | | | | | |
| (Cost: $1,073,061,319)(c) | | | 1,073,061,319 | | | | 1,073,061,319 | |
TOTAL INVESTMENTS IN SECURITIES – 110.2% (Cost: $11,612,893,647) | | | | 10,733,173,624 | |
Liabilities in Excess of Cash, Foreign Currency and Other Assets – (10.2)% | | | | | | | (996,041,518 | ) |
| | | | | | | | |
| NET ASSETS – 100.0% | | | | | | $ | 9,737,132,106 | |
| (a) | Security, or portion thereof, was on loan at March 31, 2016 (See Note 2). |
| (b) | Rate shown represents annualized 7-day yield as of March 31, 2016. |
| (c) | At March 31, 2016, the total market value of the Fund’s securities on loan was $1,054,641,846 and the total market value of the collateral held by the Fund was $1,109,865,268. The total market value of the collateral includes non-cash U.S. Government securities collateral having a value of $36,803,949. |
See Notes to Financial Statements.
| | | | |
| WisdomTree Developed World ex-U.S. and Currency Hedged Equity Funds | | | 133 | |
Schedule of Investments (concluded)
WisdomTree Japan Hedged Equity Fund (DXJ)
March 31, 2016
| | | | | | | | | | | | | | | | | | |
| FINANCIAL DERIVATIVE INSTRUMENTS | |
| FORWARD CONTRACTS | |
Settlement Date | | Contracts
To Deliver | | | In
Exchange For | | | Unrealized
Gain (Loss) | |
4/4/2016 | | JPY | | | 127,459,332 | | | | USD | | | | 1,134,000 | | | $ | (30 | ) |
4/4/2016 | | JPY | | | 97,114,118 | | | | USD | | | | 864,000 | | | | (43 | ) |
4/4/2016 | | JPY | | | 127,459,332 | | | | USD | | | | 1,134,000 | | | | (30 | ) |
4/4/2016 | | JPY | | | 127,462,280 | | | | USD | | | | 1,134,000 | | | | (57 | ) |
4/4/2016 | | JPY | | | 127,459,672 | | | | USD | | | | 1,134,000 | | | | (33 | ) |
4/5/2016 | | JPY | | | 69,669,596,269 | | | | USD | | | | 617,329,053 | | | | (2,559,448 | ) |
4/5/2016 | | JPY | | | 69,639,038,481 | | | | USD | | | | 617,329,053 | | | | (2,287,559 | ) |
4/5/2016 | | JPY | | | 69,589,652,157 | | | | USD | | | | 617,329,053 | | | | (1,848,141 | ) |
4/5/2016 | | JPY | | | 69,545,821,794 | | | | USD | | | | 617,329,053 | | | | (1,458,159 | ) |
4/5/2016 | | JPY | | | 23,202,106,680 | | | | USD | | | | 205,776,351 | | | | (665,482 | ) |
4/5/2016 | | JPY | | | 69,558,477,040 | | | | USD | | | | 617,329,053 | | | | (1,570,759 | ) |
4/5/2016 | | JPY | | | 69,596,566,242 | | | | USD | | | | 617,329,053 | | | | (1,909,660 | ) |
4/5/2016 | | JPY | | | 69,631,630,533 | | | | USD | | | | 617,329,053 | | | | (2,221,646 | ) |
4/5/2016 | | JPY | | | 69,602,616,067 | | | | USD | | | | 617,329,053 | | | | (1,963,488 | ) |
4/5/2016 | | JPY | | | 69,600,640,614 | | | | USD | | | | 617,329,053 | | | | (1,945,912 | ) |
4/5/2016 | | JPY | | | 69,613,913,189 | | | | USD | | | | 617,329,053 | | | | (2,064,005 | ) |
4/5/2016 | | JPY | | | 69,619,283,952 | | | | USD | | | | 617,329,053 | | | | (2,111,792 | ) |
4/5/2016 | | JPY | | | 69,605,640,980 | | | | USD | | | | 617,329,053 | | | | (1,990,403 | ) |
4/5/2016 | | JPY | | | 69,559,404,048 | | | | USD | | | | 617,329,062 | | | | (1,578,998 | ) |
4/5/2016 | | JPY | | | 69,603,788,992 | | | | USD | | | | 617,329,053 | | | | (1,973,925 | ) |
4/5/2016 | | JPY | | | 69,603,233,396 | | | | USD | | | | 617,329,053 | | | | (1,968,981 | ) |
4/5/2016 | | JPY | | | 69,603,233,396 | | | | USD | | | | 617,329,053 | | | | (1,968,981 | ) |
4/5/2016 | | JPY | | | 23,214,556,149 | | | | USD | | | | 205,776,351 | | | | (776,251 | ) |
4/5/2016 | | USD | | | 23,253,954 | | | | JPY | | | | 2,621,646,123 | | | | 72,265 | |
4/5/2016 | | USD | | | 10,569,979 | | | | JPY | | | | 1,199,276,159 | | | | 100,637 | |
4/5/2016 | | USD | | | 52,849,895 | | | | JPY | | | | 5,993,114,673 | | | | 474,124 | |
4/5/2016 | | USD | | | 73,989,853 | | | | JPY | | | | 8,345,478,297 | | | | 264,432 | |
4/5/2016 | | USD | | | 95,129,811 | | | | JPY | | | | 10,779,168,397 | | | | 778,345 | |
4/5/2016 | | USD | | | 65,533,870 | | | | JPY | | | | 7,438,100,798 | | | | 646,981 | |
4/5/2016 | | USD | | | 10,569,979 | | | | JPY | | | | 1,192,025,153 | | | | 36,121 | |
4/5/2016 | | USD | | | 38,051,924 | | | | JPY | | | | 4,321,663,554 | | | | 400,280 | |
4/5/2016 | | USD | | | 69,761,861 | | | | JPY | | | | 7,760,462,893 | | | | (712,778 | ) |
4/5/2016 | | USD | | | 101,471,798 | | | | JPY | | | | 11,295,262,164 | | | | (971,673 | ) |
4/5/2016 | | USD | | | 33,823,933 | | | | JPY | | | | 3,779,577,598 | | | | (194,964 | ) |
4/5/2016 | | USD | | | 147,979,706 | | | | JPY | | | | 16,661,686,209 | | | | 268,429 | |
4/5/2016 | | USD | | | 63,419,874 | | | | JPY | | | | 7,140,392,877 | | | | 112,107 | |
4/5/2016 | | USD | | | 38,051,924 | | | | JPY | | | | 4,307,432,134 | | | | 273,655 | |
4/5/2016 | | USD | | | 4,227,992 | | | | JPY | | | | 479,209,069 | | | | 35,793 | |
4/5/2016 | | USD | | | 16,911,966 | | | | JPY | | | | 1,901,488,441 | | | | 6,617 | |
4/5/2016 | | USD | | | 566,593,154 | | | | JPY | | | | 63,543,422,221 | | | | (1,212,574 | ) |
4/5/2016 | | USD | | | 566,593,154 | | | | JPY | | | | 63,571,751,878 | | | | (960,510 | ) |
4/5/2016 | | USD | | | 566,593,154 | | | | JPY | | | | 63,707,734,235 | | | | 249,400 | |
4/5/2016 | | USD | | | 566,593,154 | | | | JPY | | | | 63,611,413,399 | | | | (607,619 | ) |
4/5/2016 | | USD | | | 566,593,154 | | | | JPY | | | | 63,672,038,867 | | | | (68,202 | ) |
4/5/2016 | | USD | | | 566,593,154 | | | | JPY | | | | 63,702,068,304 | | | | 198,987 | |
4/5/2016 | | USD | | | 566,593,154 | | | | JPY | | | | 63,682,237,543 | | | | 22,542 | |
4/5/2016 | | USD | | | 472,160,962 | | | | JPY | | | | 53,065,840,006 | | | | (5,161 | ) |
4/5/2016 | | USD | | | 472,160,962 | | | | JPY | | | | 53,092,139,372 | | | | 228,838 | |
4/5/2016 | | USD | | | 377,728,769 | | | | JPY | | | | 42,454,824,991 | | | | 15,028 | |
4/5/2016 | | USD | | | 566,593,154 | | | | JPY | | | | 63,600,081,536 | | | | (708,445 | ) |
4/5/2016 | | USD | | | 566,593,154 | | | | JPY | | | | 63,682,237,543 | | | | 22,542 | |
4/5/2016 | | USD | | | 566,593,154 | | | | JPY | | | | 63,678,214,732 | | | | (13,251 | ) |
4/5/2016 | | USD | | | 566,593,154 | | | | JPY | | | | 63,682,237,543 | | | | 22,542 | |
4/5/2016 | | USD | | | 566,593,161 | | | | JPY | | | | 63,713,400,954 | | | | 299,813 | |
4/5/2016 | | USD | | | 566,593,154 | | | | JPY | | | | 63,690,736,441 | | | | 98,161 | |
4/5/2016 | | USD | | | 566,593,154 | | | | JPY | | | | 63,696,402,372 | | | | 148,574 | |
4/5/2016 | | USD | | | 188,864,384 | | | | JPY | | | | 21,227,412,439 | | | $ | 7,514 | |
5/9/2016 | | JPY | | | 9,091,859,747 | | | | USD | | | | 80,967,166 | | | | (7,593 | ) |
5/9/2016 | | JPY | | | 63,514,809,266 | | | | USD | | | | 566,593,154 | | | | 911,710 | |
5/9/2016 | | JPY | | | 63,645,125,692 | | | | USD | | | | 566,593,154 | | | | (248,926 | ) |
5/9/2016 | | JPY | | | 63,650,225,030 | | | | USD | | | | 566,593,154 | | | | (294,343 | ) |
5/9/2016 | | JPY | | | 63,612,829,882 | | | | USD | | | | 566,593,154 | | | | 38,710 | |
5/9/2016 | | JPY | | | 63,553,054,304 | | | | USD | | | | 566,593,154 | | | | 571,088 | |
5/9/2016 | | JPY | | | 63,622,745,262 | | | | USD | | | | 566,593,154 | | | | (49,600 | ) |
5/9/2016 | | JPY | | | 53,017,207,427 | | | | USD | | | | 472,160,962 | | | | (25,774 | ) |
5/9/2016 | | JPY | | | 63,653,058,782 | | | | USD | | | | 566,593,161 | | | | (319,574 | ) |
5/9/2016 | | JPY | | | 63,618,779,110 | | | | USD | | | | 566,593,154 | | | | (14,276 | ) |
5/9/2016 | | JPY | | | 42,416,107,792 | | | | USD | | | | 377,728,769 | | | | (41,477 | ) |
5/9/2016 | | JPY | | | 63,544,838,703 | | | | USD | | | | 566,593,154 | | | | 644,259 | |
5/9/2016 | | JPY | | | 63,487,329,498 | | | | USD | | | | 566,593,154 | | | | 1,156,453 | |
5/9/2016 | | JPY | | | 63,633,793,829 | | | | USD | | | | 566,593,154 | | | | (148,002 | ) |
5/9/2016 | | JPY | | | 63,638,893,167 | | | | USD | | | | 566,593,154 | | | | (193,418 | ) |
5/9/2016 | | JPY | | | 63,624,161,745 | | | | USD | | | | 566,593,154 | | | | (62,215 | ) |
5/9/2016 | | JPY | | | 53,044,451,114 | | | | USD | | | | 472,160,962 | | | | (268,414 | ) |
5/9/2016 | | JPY | | | 63,621,612,076 | | | | USD | | | | 566,593,154 | | | | (39,507 | ) |
5/9/2016 | | JPY | | | 21,207,392,814 | | | | USD | | | | 188,864,384 | | | | (14,851 | ) |
5/9/2016 | | JPY | | | 9,091,965,004 | | | | USD | | | | 80,967,166 | | | | (8,530 | ) |
5/9/2016 | | JPY | | | 9,092,078,358 | | | | USD | | | | 80,967,166 | | | | (9,540 | ) |
5/9/2016 | | JPY | | | 6,926,847,764 | | | | USD | | | | 61,689,272 | | | | (3,258 | ) |
5/9/2016 | | JPY | | | 9,092,353,646 | | | | USD | | | | 80,967,166 | | | | (11,992 | ) |
5/9/2016 | | USD | | | 57,208,016 | | | | JPY | | | | 6,424,002,532 | | | | 6,027 | |
| | | | | | | | | | | | | | | | | $ | (31,968,276 | ) |
| | |
| CURRENCY LEGEND |
JPY | | – Japanese yen |
USD | | – U.S. dollar |
See Notes to Financial Statements.
| | |
| 134 | | WisdomTree Developed World ex-U.S. and Currency Hedged Equity Funds |
Schedule of Investments
WisdomTree Japan Hedged Financials Fund (DXJF)
March 31, 2016
| | | | | | | | |
| Investments | | Shares | | | Value | |
| COMMON STOCKS – 98.8% | | | | | | | | |
| Japan – 98.8% | | | | | | | | |
| Banks – 56.5% | | | | | | | | |
77 Bank Ltd. (The) | | | 14,419 | | | $ | 51,059 | |
Akita Bank Ltd. (The)(a) | | | 12,800 | | | | 34,962 | |
Aomori Bank Ltd. (The)(a) | | | 7,000 | | | | 20,428 | |
Aozora Bank Ltd.(a) | | | 44,830 | | | | 156,752 | |
Ashikaga Holdings Co., Ltd. | | | 8,400 | | | | 24,065 | |
Awa Bank Ltd. (The)(a) | | | 11,000 | | | | 53,339 | |
Bank of Iwate Ltd. (The) | | | 1,100 | | | | 39,931 | |
Bank of Kyoto Ltd. (The) | | | 14,517 | | | | 94,804 | |
Bank of Nagoya Ltd. (The)(a) | | | 11,500 | | | | 37,858 | |
Bank of Okinawa Ltd. (The)(a) | | | 1,100 | | | | 36,163 | |
Bank of the Ryukyus Ltd.(a) | | | 2,700 | | | | 30,364 | |
Bank of Yokohama Ltd. (The)(a) | | | 45,850 | | | | 208,659 | |
Chiba Bank Ltd. (The) | | | 31,781 | | | | 158,629 | |
Chugoku Bank Ltd. (The)(a) | | | 8,650 | | | | 90,198 | |
Daishi Bank Ltd. (The)(a) | | | 12,650 | | | | 43,557 | |
Eighteenth Bank Ltd. (The) | | | 8,000 | | | | 17,794 | |
Fukuoka Financial Group, Inc. | | | 34,133 | | | | 111,453 | |
Gunma Bank Ltd. (The) | | | 18,250 | | | | 75,504 | |
Hachijuni Bank Ltd. (The) | | | 20,709 | | | | 89,362 | |
Higashi-Nippon Bank Ltd. (The) | | | 12,000 | | | | 29,545 | |
Hiroshima Bank Ltd. (The) | | | 23,200 | | | | 84,837 | |
Hokkoku Bank Ltd. (The) | | | 13,700 | | | | 36,080 | |
Hokuhoku Financial Group, Inc.(a) | | | 57,800 | | | | 76,110 | |
Hyakugo Bank Ltd. (The)(a) | | | 11,990 | | | | 45,018 | |
Hyakujushi Bank Ltd. (The)(a) | | | 11,390 | | | | 32,023 | |
Iyo Bank Ltd. (The)(a) | | | 13,650 | | | | 89,506 | |
Japan Post Bank Co., Ltd. | | | 14,086 | | | | 173,576 | |
Joyo Bank Ltd. (The) | | | 27,746 | | | | 95,289 | |
Juroku Bank Ltd. (The)(a) | | | 13,750 | | | | 41,105 | |
Keiyo Bank Ltd. (The)(a) | | | 13,350 | | | | 48,342 | |
Kiyo Bank Ltd. (The)(a) | | | 4,120 | | | | 46,774 | |
Kyushu Financial Group, Inc. | | | 17,000 | | | | 98,163 | |
Minato Bank Ltd. (The)(a) | | | 22,500 | | | | 30,228 | |
Mitsubishi UFJ Financial Group, Inc. | | | 261,220 | | | | 1,212,031 | |
Miyazaki Bank Ltd. (The) | | | 11,000 | | | | 26,816 | |
Mizuho Financial Group, Inc. | | | 318,880 | | | | 476,923 | |
Musashino Bank Ltd. (The) | | | 1,550 | | | | 39,096 | |
Nanto Bank Ltd. (The)(a) | | | 10,420 | | | | 28,369 | |
Nishi-Nippon City Bank Ltd. (The) | | | 35,670 | | | | 63,155 | |
North Pacific Bank Ltd. | | | 16,200 | | | | 41,078 | |
Ogaki Kyoritsu Bank Ltd. (The)(a) | | | 13,050 | | | | 39,477 | |
Oita Bank Ltd. (The) | | | 9,800 | | | | 30,605 | |
Resona Holdings, Inc. | | | 81,850 | | | | 292,459 | |
San-In Godo Bank Ltd. (The)(a) | | | 8,070 | | | | 49,973 | |
Senshu Ikeda Holdings, Inc.(a) | | | 13,530 | | | | 48,753 | |
Seven Bank Ltd.(a) | | | 27,770 | | | | 118,596 | |
Shiga Bank Ltd. (The)(a) | | | 12,340 | | | | 52,041 | |
Shinsei Bank Ltd.(a) | | | 71,350 | | | | 93,318 | |
Shizuoka Bank Ltd. (The) | | | 22,740 | | | | 164,286 | |
Sumitomo Mitsui Financial Group, Inc. | | | 42,540 | | | | 1,291,396 | |
Sumitomo Mitsui Trust Holdings, Inc. | | | 148,610 | | | | 435,801 | |
| | | | | | | | |
| Investments | | Shares | | | Value | |
Suruga Bank Ltd. | | | 8,900 | | | $ | 156,628 | |
Tochigi Bank Ltd. (The)(a) | | | 8,000 | | | | 30,464 | |
Toho Bank Ltd. (The)(a) | | | 10,000 | | | | 32,119 | |
Tokyo TY Financial Group, Inc. | | | 1,600 | | | | 37,226 | |
TOMONY Holdings, Inc.(a) | | | 9,400 | | | | 27,850 | |
Yamagata Bank Ltd. (The)(a) | | | 9,300 | | | | 35,332 | |
Yamaguchi Financial Group, Inc.(a) | | | 11,511 | | | | 104,771 | |
Yamanashi Chuo Bank Ltd. (The)(a) | | | 8,700 | | | | 31,968 | |
| | | | | | | | |
| Total Banks | | | | 7,262,008 | |
| Capital Markets – 8.6% | | | | | | | | |
Daiwa Securities Group, Inc. | | | 58,330 | | | | 359,285 | |
kabu.com Securities Co., Ltd.(a) | | | 11,000 | | | | 35,233 | |
Marusan Securities Co., Ltd.(a) | | | 2,200 | | | | 20,748 | |
Matsui Securities Co., Ltd.(a) | | | 4,300 | | | | 36,690 | |
Monex Group, Inc.(a) | | | 7,300 | | | | 18,900 | |
Nomura Holdings, Inc. | | | 99,690 | | | | 446,053 | |
Okasan Securities Group, Inc.(a) | | | 9,700 | | | | 50,746 | |
SBI Holdings, Inc. | | | 8,250 | | | | 83,898 | |
Tokai Tokyo Financial Holdings, Inc.(a) | | | 8,850 | | | | 48,583 | |
| | | | | | | | |
| Total Capital Markets | | | | 1,100,136 | |
| Consumer Finance – 4.0% | | | | | | | | |
Acom Co., Ltd.*(a) | | | 15,150 | | | | 76,427 | |
AEON Financial Service Co., Ltd.(a) | | | 4,750 | | | | 112,247 | |
Aiful Corp.*(a) | | | 11,800 | | | | 41,785 | |
Credit Saison Co., Ltd. | | | 6,850 | | | | 119,393 | |
Hitachi Capital Corp. | | | 2,250 | | | | 49,046 | |
J Trust Co., Ltd.(a) | | | 4,300 | | | | 34,776 | |
Jaccs Co., Ltd.(a) | | | 9,400 | | | | 39,057 | |
Orient Corp.* | | | 23,800 | | | | 47,433 | |
| | | | | | | | |
| Total Consumer Finance | | | | 520,164 | |
| Diversified Financial Services – 4.7% | | | | | | | | |
Century Tokyo Leasing Corp. | | | 2,220 | | | | 82,464 | |
Fuyo General Lease Co., Ltd. | | | 1,167 | | | | 49,890 | |
IBJ Leasing Co., Ltd. | | | 1,832 | | | | 32,567 | |
Japan Exchange Group, Inc. | | | 20,880 | | | | 320,273 | |
Japan Securities Finance Co., Ltd. | | | 6,260 | | | | 25,175 | |
Mitsubishi UFJ Lease & Finance Co., Ltd. | | | 21,100 | | | | 92,739 | |
| | | | | | | | |
| Total Diversified Financial Services | | | | 603,108 | |
| Insurance – 25.0% | | | | | | | | |
Dai-ichi Life Insurance Co., Ltd. (The) | | | 45,740 | | | | 554,480 | |
Japan Post Holdings Co., Ltd. | | | 17,059 | | | | 227,969 | |
Japan Post Insurance Co., Ltd. | | | 2,767 | | | | 64,033 | |
MS&AD Insurance Group Holdings, Inc. | | | 21,260 | | | | 593,188 | |
Sompo Japan Nipponkoa Holdings, Inc. | | | 16,300 | | | | 462,337 | |
Sony Financial Holdings, Inc.(a) | | | 6,600 | | | | 84,441 | |
T&D Holdings, Inc. | | | 26,260 | | | | 245,206 | |
Tokio Marine Holdings, Inc. | | | 28,940 | | | | 978,442 | |
| | | | | | | | |
| Total Insurance | | | | | | | 3,210,096 | |
TOTAL COMMON STOCKS
(Cost: $16,994,057) | | | | | | | 12,695,512 | |
See Notes to Financial Statements.
| | | | |
| WisdomTree Developed World ex-U.S. and Currency Hedged Equity Funds | | | 135 | |
Schedule of Investments (concluded)
WisdomTree Japan Hedged Financials Fund (DXJF)
March 31, 2016
| | | | | | | | |
| Investments | | Shares | | | Value | |
| INVESTMENT OF CASH COLLATERAL FOR SECURITIES LOANED – 14.4% | |
| United States – 14.4% | | | | | | | | |
State Street Navigator Securities Lending Prime Portfolio, 0.50%(b) | | | | | | | | |
| (Cost: $1,843,858)(c) | | | 1,843,858 | | | $ | 1,843,858 | |
TOTAL INVESTMENTS IN SECURITIES – 113.2% (Cost: $18,837,915) | | | | 14,539,370 | |
Liabilities in Excess of Cash, Foreign Currency and Other Assets – (13.2)% | | | | | | | (1,693,127 | ) |
| | | | | | | | |
| NET ASSETS – 100.0% | | | $ | 12,846,243 | |
| * | Non-income producing security. |
| (a) | Security, or portion thereof, was on loan at March 31, 2016 (See Note 2). |
| (b) | Rate shown represents annualized 7-day yield as of March 31, 2016. |
| (c) | At March 31, 2016, the total market value of the Fund’s securities on loan was $1,772,431 and the total market value of the collateral held by the Fund was $1,875,576. The total market value of the collateral includes non-cash U.S. Government securities collateral having a value of $31,718. |
| | | | | | | | | | | | | | | | | | |
| FINANCIAL DERIVATIVE INSTRUMENTS | |
| FORWARD CONTRACTS | |
Settlement Date | | Contracts
To Deliver | | | In
Exchange For | | | Unrealized
Gain (Loss) | |
4/4/2016 | | JPY | | | 595,709 | | | | USD | | | | 5,300 | | | $ | — | |
4/5/2016 | | JPY | | | 272,169,440 | | | | USD | | | | 2,414,016 | | | | (7,624 | ) |
4/5/2016 | | JPY | | | 207,371,616 | | | | USD | | | | 1,839,252 | | | | (5,847 | ) |
4/5/2016 | | JPY | | | 272,163,888 | | | | USD | | | | 2,414,016 | | | | (7,575 | ) |
4/5/2016 | | JPY | | | 272,172,096 | | | | USD | | | | 2,414,016 | | | | (7,648 | ) |
4/5/2016 | | JPY | | | 272,173,061 | | | | USD | | | | 2,414,016 | | | | (7,657 | ) |
4/5/2016 | | JPY | | | 107,998,302 | | | | USD | | | | 957,943 | | | | (2,977 | ) |
4/5/2016 | | USD | | | 2,615,184 | | | | JPY | | | | 293,914,514 | | | | (66 | ) |
4/5/2016 | | USD | | | 1,992,523 | | | | JPY | | | | 223,944,840 | | | | 37 | |
4/5/2016 | | USD | | | 2,615,184 | | | | JPY | | | | 293,907,453 | | | | (129 | ) |
4/5/2016 | | USD | | | 2,615,184 | | | | JPY | | | | 293,926,544 | | | | 41 | |
4/5/2016 | | USD | | | 2,615,184 | | | | JPY | | | | 293,942,235 | | | | 181 | |
5/9/2016 | | JPY | | | 229,611,375 | | | | USD | | | | 2,044,878 | | | | (108 | ) |
5/9/2016 | | JPY | | | 301,377,122 | | | | USD | | | | 2,683,901 | | | | (252 | ) |
5/9/2016 | | JPY | | | 301,384,368 | | | | USD | | | | 2,683,901 | | | | (316 | ) |
5/9/2016 | | JPY | | | 301,380,611 | | | | USD | | | | 2,683,901 | | | | (283 | ) |
5/9/2016 | | JPY | | | 301,393,493 | | | | USD | | | | 2,683,901 | | | | (397 | ) |
| | | | | | | | | | | | | | | | | $ | (40,620 | ) |
| | |
| CURRENCY LEGEND |
JPY | | – Japanese yen |
USD | | – U.S. dollar |
See Notes to Financial Statements.
| | |
| 136 | | WisdomTree Developed World ex-U.S. and Currency Hedged Equity Funds |
Schedule of Investments
WisdomTree Japan Hedged Health Care Fund (DXJH)
March 31, 2016
| | | | | | | | |
| Investments | | Shares | | | Value | |
| COMMON STOCKS – 99.5% | | | | | | | | |
| Japan – 99.5% | | | | | | | | |
| Biotechnology – 0.5% | | | | | | | | |
PeptiDream, Inc.*(a) | | | 1,600 | | | $ | 97,513 | |
| Food & Staples Retailing – 6.1% | | | | | | | | |
Ain Holdings, Inc. | | | 1,575 | | | | 80,856 | |
Cocokara fine, Inc. | | | 1,550 | | | | 67,436 | |
Cosmos Pharmaceutical Corp.(a) | | | 660 | | | | 109,868 | |
Kusuri No Aoki Co., Ltd.(a) | | | 1,000 | | | | 54,718 | |
Matsumotokiyoshi Holdings Co., Ltd. | | | 2,970 | | | | 155,641 | |
Sugi Holdings Co., Ltd. | | | 2,550 | | | | 134,766 | |
Sundrug Co., Ltd. | | | 2,260 | | | | 169,306 | |
Tsuruha Holdings, Inc. | | | 2,235 | | | | 220,129 | |
Welcia Holdings Co., Ltd. | | | 1,600 | | | | 92,246 | |
| | | | | | | | |
| Total Food & Staples Retailing | | | | | | | 1,084,966 | |
| Health Care Equipment & Supplies – 22.4% | | | | | | | | |
Asahi Intecc Co., Ltd. | | | 3,600 | | | | 168,797 | |
CYBERDYNE, Inc.*(a) | | | 3,300 | | | | 63,126 | |
Hogy Medical Co., Ltd.(a) | | | 980 | | | | 52,664 | |
Hoya Corp. | | | 28,400 | | | | 1,081,724 | |
Jeol Ltd. | | | 4,000 | | | | 20,286 | |
Mani, Inc.(a) | | | 700 | | | | 10,768 | |
Nagaileben Co., Ltd. | | | 2,300 | | | | 47,353 | |
Nakanishi, Inc. | | | 1,060 | | | | 33,716 | |
Nihon Kohden Corp. | | | 5,900 | | | | 146,877 | |
Nikkiso Co., Ltd. | | | 6,050 | | | | 44,516 | |
Nipro Corp.(a) | | | 7,925 | | | | 75,375 | |
Olympus Corp. | | | 19,040 | | | | 741,136 | |
Paramount Bed Holdings Co., Ltd. | | | 1,350 | | | | 49,426 | |
Sysmex Corp. | | | 11,010 | | | | 689,625 | |
Terumo Corp. | | | 21,930 | | | | 787,291 | |
| | | | | | | | |
| Total Health Care Equipment & Supplies | | | | | | | 4,012,680 | |
| Health Care Providers & Services – 5.3% | | | | | | | | |
Alfresa Holdings Corp. | | | 13,540 | | | | 260,090 | |
Medipal Holdings Corp. | | | 12,350 | | | | 195,807 | |
Miraca Holdings, Inc. | | | 3,720 | | | | 153,076 | |
Ship Healthcare Holdings, Inc. | | | 2,580 | | | | 65,077 | |
Suzuken Co., Ltd. | | | 5,650 | | | | 192,280 | |
Toho Holdings Co., Ltd.(a) | | | 4,150 | | | | 88,911 | |
| | | | | | | | |
| Total Health Care Providers & Services | | | | | | | 955,241 | |
| Health Care Technology – 1.8% | | | | | | | | |
M3, Inc. | | | 12,750 | | | | 321,260 | |
| Pharmaceuticals – 63.4% | | | | | | | | |
Astellas Pharma, Inc. | | | 116,560 | | | | 1,551,956 | |
Chugai Pharmaceutical Co., Ltd. | | | 12,800 | | | | 396,886 | |
Daiichi Sankyo Co., Ltd.(a) | | | 42,052 | | | | 936,297 | |
Eisai Co., Ltd. | | | 16,310 | | | | 982,416 | |
Hisamitsu Pharmaceutical Co., Inc. | | | 5,010 | | | | 224,212 | |
Kaken Pharmaceutical Co., Ltd. | | | 2,400 | | | | 145,416 | |
KYORIN Holdings, Inc. | | | 4,750 | | | | 90,609 | |
Kyowa Hakko Kirin Co., Ltd. | | | 16,620 | | | | 265,577 | |
Mitsubishi Tanabe Pharma Corp.(a) | | | 15,150 | | | | 263,789 | |
Mochida Pharmaceutical Co., Ltd. | | | 1,070 | | | $ | 79,587 | |
Nichi-iko Pharmaceutical Co., Ltd. | | | 3,640 | | | | 84,073 | |
Nippon Shinyaku Co., Ltd.(a) | | | 3,728 | | | | 145,942 | |
Ono Pharmaceutical Co., Ltd. | | | 31,300 | | | | 1,326,967 | |
Otsuka Holdings Co., Ltd. | | | 33,645 | | | | 1,223,727 | |
Rohto Pharmaceutical Co., Ltd. | | | 8,521 | | | | 155,417 | |
Santen Pharmaceutical Co., Ltd.(a) | | | 26,600 | | | | 400,674 | |
Sawai Pharmaceutical Co., Ltd. | | | 2,330 | | | | 146,150 | |
Seikagaku Corp. | | | 2,850 | | | | 42,980 | |
Shionogi & Co., Ltd. | | | 18,450 | | | | 869,520 | |
Sosei Group Corp.*(a) | | | 1,180 | | | | 170,394 | |
Sumitomo Dainippon Pharma Co., Ltd.(a) | | | 10,900 | | | | 125,685 | |
Takeda Pharmaceutical Co., Ltd. | | | 34,147 | | | | 1,560,381 | |
Towa Pharmaceutical Co., Ltd. | | | 400 | | | | 16,424 | |
Tsumura & Co.(a) | | | 4,645 | | | | 111,667 | |
ZERIA Pharmaceutical Co., Ltd.(a) | | | 4,350 | | | | 56,545 | |
| | | | | | | | |
| Total Pharmaceuticals | | | | | | | 11,373,291 | |
TOTAL COMMON STOCKS (Cost: $17,777,226) | | | | | | | 17,844,951 | |
| INVESTMENT OF CASH COLLATERAL FOR SECURITIES LOANED – 13.7% | |
| United States – 13.7% | | | | | | | | |
State Street Navigator Securities Lending Prime Portfolio, 0.50%(b) | | | | | | | | |
| (Cost: $2,462,432)(c) | | | 2,462,432 | | | | 2,462,432 | |
TOTAL INVESTMENTS IN SECURITIES – 113.2% (Cost: $20,239,658) | | | | 20,307,383 | |
Liabilities in Excess of Cash, Foreign Currency and Other Assets – (13.2)% | | | | | | | (2,373,148 | ) |
| | | | | | | | |
| NET ASSETS – 100.0% | | | $ | 17,934,235 | |
| * | Non-income producing security. |
| (a) | Security, or portion thereof, was on loan at March 31, 2016 (See Note 2). |
| (b) | Rate shown represents annualized 7-day yield as of March 31, 2016. |
| (c) | At March 31, 2016, the total market value of the Fund’s securities on loan was $2,354,002 and the total market value of the collateral held by the Fund was $2,472,189. The total market value of the collateral includes non-cash U.S. Government securities collateral having a value of $9,757. |
See Notes to Financial Statements.
| | | | |
| WisdomTree Developed World ex-U.S. and Currency Hedged Equity Funds | | | 137 | |
Schedule of Investments (concluded)
WisdomTree Japan Hedged Health Care Fund (DXJH)
March 31, 2016
| | | | | | | | | | | | | | | | | | |
| FINANCIAL DERIVATIVE INSTRUMENTS | |
| FORWARD CONTRACTS | |
Settlement Date | | Contracts
To Deliver | | | In
Exchange For | | | Unrealized
Gain (Loss) | |
4/4/2016 | | JPY | | | 506,484 | | | | USD | | | | 4,500 | | | $ | (6 | ) |
4/5/2016 | | JPY | | | 449,158,341 | | | | USD | | | | 3,983,825 | | | | (12,582 | ) |
4/5/2016 | | JPY | | | 342,223,059 | | | | USD | | | | 3,035,297 | | | | (9,649 | ) |
4/5/2016 | | JPY | | | 449,149,178 | | | | USD | | | | 3,983,825 | | | | (12,501 | ) |
4/5/2016 | | JPY | | | 449,162,723 | | | | USD | | | | 3,983,825 | | | | (12,621 | ) |
4/5/2016 | | JPY | | | 449,164,317 | | | | USD | | | | 3,983,825 | | | | (12,636 | ) |
4/5/2016 | | JPY | | | 358,540,470 | | | | USD | | | | 3,161,766 | | | | (28,365 | ) |
4/5/2016 | | USD | | | 3,161,766 | | | | JPY | | | | 358,735,867 | | | | 30,103 | |
4/5/2016 | | USD | | | 1,580,883 | | | | JPY | | | | 177,998,572 | | | | 2,868 | |
4/5/2016 | | USD | | | 2,782,358 | | | | JPY | | | | 312,716,449 | | | | 51 | |
4/5/2016 | | USD | | | 3,651,839 | | | | JPY | | | | 410,421,785 | | | | (92 | ) |
4/5/2016 | | USD | | | 3,651,839 | | | | JPY | | | | 410,411,926 | | | | (180 | ) |
4/5/2016 | | USD | | | 3,651,839 | | | | JPY | | | | 410,438,584 | | | | 58 | |
4/5/2016 | | USD | | | 3,651,839 | | | | JPY | | | | 410,460,495 | | | | 253 | |
5/9/2016 | | JPY | | | 327,837,122 | | | | USD | | | | 2,919,659 | | | | (154 | ) |
5/9/2016 | | JPY | | | 430,303,464 | | | | USD | | | | 3,832,049 | | | | (359 | ) |
5/9/2016 | | JPY | | | 430,313,811 | | | | USD | | | | 3,832,049 | | | | (452 | ) |
5/9/2016 | | JPY | | | 430,308,446 | | | | USD | | | | 3,832,049 | | | | (404 | ) |
5/9/2016 | | JPY | | | 430,326,840 | | | | USD | | | | 3,832,049 | | | | (568 | ) |
| | | | | | | | | | | | | | | | | $ | (57,236 | ) |
| | |
| CURRENCY LEGEND |
JPY | | – Japanese yen |
USD | | – U.S. dollar |
See Notes to Financial Statements.
| | |
| 138 | | WisdomTree Developed World ex-U.S. and Currency Hedged Equity Funds |
Schedule of Investments
WisdomTree Japan Hedged Quality Dividend Growth Fund (JHDG)
March 31, 2016
| | | | | | | | |
| Investments | | Shares | | | Value | |
| COMMON STOCKS – 99.1% | | | | | | | | |
| Japan – 99.1% | | | | | | | | |
| Air Freight & Logistics – 0.3% | | | | | | | | |
Yamato Holdings Co., Ltd. | | | 2,135 | | | $ | 42,683 | |
| Auto Components – 6.3% | | | | | | | | |
Aisin Seiki Co., Ltd. | | | 1,981 | | | | 74,731 | |
Bridgestone Corp. | | | 8,392 | | | | 313,967 | |
Denso Corp. | | | 6,364 | | | | 256,157 | |
Exedy Corp. | | | 600 | | | | 13,282 | |
Koito Manufacturing Co., Ltd. | | | 600 | | | | 27,225 | |
NGK Spark Plug Co., Ltd. | | | 977 | | | | 18,724 | |
NHK Spring Co., Ltd. | | | 1,568 | | | | 15,025 | |
Nifco, Inc.(a) | | | 400 | | | | 19,254 | |
Nissin Kogyo Co., Ltd. | | | 600 | | | | 8,093 | |
NOK Corp. | | | 916 | | | | 15,664 | |
Stanley Electric Co., Ltd. | | | 976 | | | | 22,100 | |
Sumitomo Electric Industries Ltd. | | | 4,691 | | | | 57,138 | |
Sumitomo Rubber Industries Ltd. | | | 3,022 | | | | 46,757 | |
Toyo Tire & Rubber Co., Ltd. | | | 1,373 | | | | 20,523 | |
Toyoda Gosei Co., Ltd. | | | 1,100 | | | | 21,257 | |
Toyota Boshoku Corp. | | | 830 | | | | 13,543 | |
TS Tech Co., Ltd. | | | 600 | | | | 14,061 | |
Yokohama Rubber Co., Ltd. (The) | | | 1,500 | | | | 24,703 | |
| | | | | | | | |
| Total Auto Components | | | | 982,204 | |
| Automobiles – 11.6% | | | | | | | | |
Fuji Heavy Industries Ltd. | | | 4,696 | | | | 166,080 | |
Honda Motor Co., Ltd. | | | 15,710 | | | | 431,345 | |
Isuzu Motors Ltd. | | | 6,488 | | | | 67,076 | |
Mazda Motor Corp. | | | 1,183 | | | | 18,383 | |
Nissan Motor Co., Ltd. | | | 46,984 | | | | 435,374 | |
Suzuki Motor Corp. | | | 1,558 | | | | 41,738 | |
Toyota Motor Corp. | | | 11,611 | | | | 614,873 | |
Yamaha Motor Co., Ltd. | | | 2,115 | | | | 35,227 | |
| | | | | | | | |
| Total Automobiles | | | | 1,810,096 | |
| Banks – 0.1% | | | | | | | | |
Suruga Bank Ltd. | | | 941 | | | | 16,560 | |
| Beverages – 1.2% | | | | | | | | |
Asahi Group Holdings Ltd. | | | 2,374 | | | | 74,075 | |
Coca-Cola East Japan Co., Ltd. | | | 894 | | | | 14,858 | |
Ito En Ltd.(a) | | | 653 | | | | 20,654 | |
Suntory Beverage & Food Ltd. | | | 1,605 | | | | 72,399 | |
| | | | | | | | |
| Total Beverages | | | | 181,986 | |
| Building Products – 0.8% | | | | | | | | |
Aica Kogyo Co., Ltd. | | | 548 | | | | 11,526 | |
Daikin Industries Ltd. | | | 1,386 | | | | 103,733 | |
Sanwa Holdings Corp. | | | 2,074 | | | | 15,445 | |
| | | | | | | | |
| Total Building Products | | | | 130,704 | |
| Chemicals – 4.7% | | | | | | | | |
Air Water, Inc. | | | 1,244 | | | | 18,439 | |
Asahi Kasei Corp. | | | 10,383 | | | | 70,292 | |
Daicel Corp. | | | 2,300 | | | | 31,473 | |
DIC Corp. | | | 9,940 | | | $ | 23,790 | |
Hitachi Chemical Co., Ltd. | | | 1,400 | | | | 25,224 | |
JSR Corp. | | | 2,037 | | | | 29,324 | |
Kansai Paint Co., Ltd. | | | 1,097 | | | | 17,646 | |
Kuraray Co., Ltd. | | | 3,200 | | | | 39,176 | |
Mitsubishi Chemical Holdings Corp. | | | 11,368 | | | | 59,422 | |
Mitsubishi Gas Chemical Co., Inc. | | | 3,000 | | | | 16,175 | |
Nihon Parkerizing Co., Ltd. | | | 931 | | | | 8,432 | |
Nippon Paint Holdings Co., Ltd. | | | 859 | | | | 19,084 | |
Nippon Shokubai Co., Ltd. | | | 300 | | | | 15,294 | |
Nissan Chemical Industries Ltd. | | | 1,100 | | | | 28,382 | |
Nitto Denko Corp.(a) | | | 1,000 | | | | 55,670 | |
NOF Corp. | | | 1,699 | | | | 12,063 | |
Shin-Etsu Chemical Co., Ltd. | | | 2,570 | | | | 133,170 | |
Sumitomo Chemical Co., Ltd. | | | 8,000 | | | | 36,229 | |
Taiyo Holdings Co., Ltd. | | | 298 | | | | 10,102 | |
Toray Industries, Inc. | | | 8,000 | | | | 68,274 | |
Tosoh Corp. | | | 4,000 | | | | 16,833 | |
Zeon Corp. | | | 1,554 | | | | 10,066 | |
| | | | | | | | |
| Total Chemicals | | | | 744,560 | |
| Commercial Services & Supplies – 1.1% | | | | | | | | |
Aeon Delight Co., Ltd.(a) | | | 400 | | | | 12,865 | |
Park24 Co., Ltd. | | | 1,505 | | | | 42,180 | |
Secom Co., Ltd. | | | 1,510 | | | | 112,395 | |
| | | | | | | | |
| Total Commercial Services & Supplies | | | | 167,440 | |
| Construction & Engineering – 0.6% | | | | | | | | |
COMSYS Holdings Corp.(a) | | | 1,286 | | | | 19,886 | |
JGC Corp. | | | 1,001 | | | | 15,007 | |
Kajima Corp. | | | 4,332 | | | | 27,211 | |
Kyowa Exeo Corp. | | | 958 | | | | 10,654 | |
Maeda Road Construction Co., Ltd. | | | 790 | | | | 13,046 | |
Nippo Corp. | | | 691 | | | | 11,638 | |
| | | | | | | | |
| Total Construction & Engineering | | | | 97,442 | |
| Construction Materials – 0.2% | | | | | | | | |
Sumitomo Osaka Cement Co., Ltd. | | | 3,664 | | | | 14,409 | |
Taiheiyo Cement Corp. | | | 8,793 | | | | 20,262 | |
| | | | | | | | |
| Total Construction Materials | | | | 34,671 | |
| Electrical Equipment – 1.7% | | | | | | | | |
Fuji Electric Co., Ltd. | | | 6,214 | | | | 21,507 | |
GS Yuasa Corp. | | | 2,733 | | | | 11,696 | |
Mitsubishi Electric Corp. | | | 15,110 | | | | 158,568 | |
Nidec Corp. | | | 938 | | | | 64,269 | |
Nitto Kogyo Corp. | | | 500 | | | | 7,981 | |
| | | | | | | | |
| Total Electrical Equipment | | | | | | | 264,021 | |
| Electronic Equipment, Instruments & Components – 3.3% | | | | | |
Alps Electric Co., Ltd.(a) | | | 436 | | | | 7,611 | |
Azbil Corp. | | | 622 | | | | 15,944 | |
Hamamatsu Photonics K.K. | | | 500 | | | | 13,813 | |
Hirose Electric Co., Ltd. | | | 230 | | | | 25,395 | |
Hitachi High-Technologies Corp. | | | 900 | | | | 25,384 | |
Hitachi Ltd. | | | 29,873 | | | | 139,963 | |
Horiba Ltd. | | | 200 | | | | 7,474 | |
See Notes to Financial Statements.
| | | | |
| WisdomTree Developed World ex-U.S. and Currency Hedged Equity Funds | | | 139 | |
Schedule of Investments (continued)
WisdomTree Japan Hedged Quality Dividend Growth Fund (JHDG)
March 31, 2016
| | | | | | | | |
| Investments | | Shares | | | Value | |
Keyence Corp. | | | 93 | | | $ | 50,796 | |
Murata Manufacturing Co., Ltd. | | | 881 | | | | 106,367 | |
Oki Electric Industry Co., Ltd.(a) | | | 9,000 | | | | 12,732 | |
Omron Corp. | | | 1,100 | | | | 32,786 | |
Shimadzu Corp. | | | 1,080 | | | | 16,960 | |
TDK Corp. | | | 500 | | | | 27,804 | |
Yaskawa Electric Corp. | | | 1,540 | | | | 17,798 | |
Yokogawa Electric Corp. | | | 1,145 | | | | 11,848 | |
| | | | | | | | |
| Total Electronic Equipment, Instruments & Components | | | | 512,675 | |
| Food & Staples Retailing – 2.8% | | | | | | | | |
FamilyMart Co., Ltd. | | | 777 | | | | 40,442 | |
Lawson, Inc. | | | 1,267 | | | | 106,189 | |
Matsumotokiyoshi Holdings Co., Ltd. | | | 200 | | | | 10,481 | |
Seven & I Holdings Co., Ltd. | | | 5,385 | | | | 229,591 | |
Sundrug Co., Ltd. | | | 325 | | | | 24,347 | |
Tsuruha Holdings, Inc. | | | 200 | | | | 19,699 | |
Welcia Holdings Co., Ltd. | | | 200 | | | | 11,531 | |
| | | | | | | | |
| Total Food & Staples Retailing | | | | | | | 442,280 | |
| Food Products – 1.2% | | | | | | | | |
Ajinomoto Co., Inc. | | | 2,469 | | | | 55,786 | |
Calbee, Inc. | | | 400 | | | | 15,908 | |
Ezaki Glico Co., Ltd. | | | 223 | | | | 11,448 | |
Kikkoman Corp. | | | 672 | | | | 22,122 | |
MEIJI Holdings Co., Ltd. | | | 400 | | | | 32,208 | |
NH Foods Ltd. | | | 1,616 | | | | 35,657 | |
Yakult Honsha Co., Ltd.(a) | | | 364 | | | | 16,144 | |
| | | | | | | | |
| Total Food Products | | | | | | | 189,273 | |
| Health Care Equipment & Supplies – 1.5% | | | | | | | | |
Hoya Corp. | | | 2,795 | | | | 106,458 | |
Nihon Kohden Corp. | | | 533 | | | | 13,269 | |
Nipro Corp. | | | 2,194 | | | | 20,867 | |
Sysmex Corp. | | | 528 | | | | 33,072 | |
Terumo Corp. | | | 1,762 | | | | 63,256 | |
| | | | | | | | |
| Total Health Care Equipment & Supplies | | | | | | | 236,922 | |
| Health Care Providers & Services – 0.1% | | | | | | | | |
Miraca Holdings, Inc. | | | 300 | | | | 12,345 | |
| Hotels, Restaurants & Leisure – 0.4% | | | | | | | | |
Oriental Land Co., Ltd.(a) | | | 649 | | | | 46,021 | |
Resorttrust, Inc. | | | 626 | | | | 14,086 | |
| | | | | | | | |
| Total Hotels, Restaurants & Leisure | | | | | | | 60,107 | |
| Household Durables – 1.5% | | | | | | | | |
Casio Computer Co., Ltd.(a) | | | 1,821 | | | | 36,794 | |
Haseko Corp. | | | 922 | | | | 8,597 | |
Rinnai Corp. | | | 196 | | | | 17,334 | |
Sekisui Chemical Co., Ltd. | | | 3,975 | | | | 49,018 | |
Sekisui House Ltd. | | | 7,055 | | | | 119,231 | |
| | | | | | | | |
| Total Household Durables | | | | | | | 230,974 | |
| Household Products – 0.4% | | | | | | | | |
Lion Corp. | | | 1,000 | | | | 11,290 | |
Pigeon Corp. | | | 618 | | | | 16,149 | |
Unicharm Corp. | | | 1,400 | | | | 30,505 | |
| | | | | | | | |
| Total Household Products | | | | | | | 57,944 | |
| Insurance – 2.2% | | | | | | | | |
Sompo Japan Nipponkoa Holdings, Inc. | | | 2,837 | | | | 80,469 | |
Sony Financial Holdings, Inc.(a) | | | 3,462 | | | | 44,293 | |
Tokio Marine Holdings, Inc. | | | 6,459 | | | | 218,375 | |
| | | | | | | | |
| Total Insurance | | | | | | | 343,137 | |
| Internet & Catalog Retail – 0.2% | | | | | | | | |
Rakuten, Inc. | | | 1,510 | | | | 14,584 | |
Start Today Co., Ltd. | | | 400 | | | | 16,157 | |
| | | | | | | | |
| Total Internet & Catalog Retail | | | | | | | 30,741 | |
| Internet Software & Services – 1.4% | | | | | | | | |
Kakaku.com, Inc. | | | 1,005 | | | | 18,688 | |
Mixi, Inc. | | | 623 | | | | 23,170 | |
Yahoo Japan Corp.(a) | | | 42,314 | | | | 180,332 | |
| | | | | | | | |
| Total Internet Software & Services | | | | | | | 222,190 | |
| IT Services – 1.3% | | | | | | | | |
Itochu Techno-Solutions Corp. | | | 1,200 | | | | 22,677 | |
NEC Networks & System Integration Corp. | | | 549 | | | | 8,548 | |
Nihon Unisys Ltd.(a) | | | 900 | | | | 11,939 | |
Nomura Research Institute Ltd. | | | 1,500 | | | | 50,580 | |
NS Solutions Corp. | | | 400 | | | | 7,862 | |
Obic Co., Ltd. | | | 600 | | | | 31,763 | |
Otsuka Corp. | | | 675 | | | | 35,673 | |
SCSK Corp. | | | 749 | | | | 29,322 | |
Transcosmos, Inc. | | | 490 | | | | 12,748 | |
| | | | | | | | |
| Total IT Services | | | | | | | 211,112 | |
| Leisure Products – 0.8% | | | | | | | | |
Bandai Namco Holdings, Inc. | | | 2,465 | | | | 53,820 | |
Heiwa Corp. | | | 1,202 | | | | 24,950 | |
Shimano, Inc. | | | 243 | | | | 38,138 | |
Universal Entertainment Corp.(a) | | | 792 | | | | 13,170 | |
| | | | | | | | |
| Total Leisure Products | | | | | | | 130,078 | |
| Machinery – 7.4% | | | | | | | | |
Ebara Corp. | | | 2,935 | | | | 12,273 | |
FANUC Corp. | | | 2,461 | | | | 382,851 | |
Fujitec Co., Ltd. | | | 851 | | | | 8,677 | |
Hino Motors Ltd. | | | 6,088 | | | | 65,920 | |
Hitachi Construction Machinery Co., Ltd.(a) | | | 2,349 | | | | 37,368 | |
Hoshizaki Electric Co., Ltd. | | | 252 | | | | 21,053 | |
IHI Corp. | | | 7,677 | | | | 16,256 | |
JTEKT Corp. | | | 2,415 | | | | 31,371 | |
Kawasaki Heavy Industries Ltd. | | | 11,319 | | | | 32,730 | |
Komatsu Ltd. | | | 9,622 | | | | 164,026 | |
Kubota Corp. | | | 7,519 | | | | 102,789 | |
Kurita Water Industries Ltd. | | | 902 | | | | 20,601 | |
Makita Corp. | | | 999 | | | | 62,040 | |
Minebea Co., Ltd. | | | 948 | | | | 7,406 | |
Miura Co., Ltd.(a) | | | 994 | | | | 18,581 | |
Nabtesco Corp. | | | 925 | | | | 20,789 | |
NGK Insulators Ltd. | | | 1,223 | | | | 22,622 | |
NSK Ltd. | | | 3,162 | | | | 28,977 | |
OKUMA Corp. | | | 1,000 | | | | 7,002 | |
OSG Corp.(a) | | | 651 | | | | 12,169 | |
See Notes to Financial Statements.
| | |
| 140 | | WisdomTree Developed World ex-U.S. and Currency Hedged Equity Funds |
Schedule of Investments (continued)
WisdomTree Japan Hedged Quality Dividend Growth Fund (JHDG)
March 31, 2016
| | | | | | | | |
| Investments | | Shares | | | Value | |
SMC Corp. | | | 143 | | | $ | 33,258 | |
Sumitomo Heavy Industries Ltd. | | | 3,204 | | | | 13,256 | |
Tadano Ltd. | | | 802 | | | | 7,457 | |
THK Co., Ltd. | | | 1,248 | | | | 23,051 | |
Tsubakimoto Chain Co. | | | 1,372 | | | | 8,508 | |
| | | | | | | | |
| Total Machinery | | | | 1,161,031 | |
| Marine – 0.4% | | | | | | | | |
Kawasaki Kisen Kaisha Ltd.(a) | | | 13,257 | | | | 25,713 | |
Nippon Yusen K.K. | | | 16,507 | | | | 31,870 | |
| | | | | | | | |
| Total Marine | | | | 57,583 | |
| Media – 0.5% | | | | | | | | |
CyberAgent, Inc.(a) | | | 298 | | | | 13,866 | |
Daiichikosho Co., Ltd. | | | 590 | | | | 25,722 | |
Hakuhodo DY Holdings, Inc. | | | 1,713 | | | | 19,432 | |
Toho Co., Ltd. | | | 748 | | | | 19,706 | |
| | | | | | | | |
| Total Media | | | | 78,726 | |
| Metals & Mining – 1.7% | | | | | | | | |
Dowa Holdings Co., Ltd.(a) | | | 1,350 | | | | 7,531 | |
Hitachi Metals Ltd. | | | 2,463 | | | | 25,442 | |
Mitsubishi Materials Corp. | | | 8,000 | | | | 22,634 | |
Mitsui Mining & Smelting Co., Ltd. | | | 6,000 | | | | 9,609 | |
Nippon Steel & Sumitomo Metal Corp. | | | 6,700 | | | | 128,879 | |
Sumitomo Metal Mining Co., Ltd. | | | 6,000 | | | | 59,656 | |
UACJ Corp.(a) | | | 4,080 | | | | 8,277 | |
Yamato Kogyo Co., Ltd. | | | 400 | | | | 8,694 | |
| | | | | | | | |
| Total Metals & Mining | | | | 270,722 | |
| Multiline Retail – 0.4% | | | | | | | | |
Don Quijote Holdings Co., Ltd. | | | 200 | | | | 6,958 | |
Isetan Mitsukoshi Holdings Ltd. | | | 900 | | | | 10,530 | |
Izumi Co., Ltd. | | | 400 | | | | 17,278 | |
Ryohin Keikaku Co., Ltd. | | | 112 | | | | 23,716 | |
| | | | | | | | |
| Total Multiline Retail | | | | 58,482 | |
| Personal Products – 1.1% | | | | | | | | |
Kao Corp. | | | 2,687 | | | | 143,512 | |
Kobayashi Pharmaceutical Co., Ltd. | | | 194 | | | | 17,054 | |
Kose Corp. | | | 200 | | | | 19,485 | |
| | | | | | | | |
| Total Personal Products | | | | 180,051 | |
| Pharmaceuticals – 4.7% | | | | | | | | |
Astellas Pharma, Inc. | | | 16,424 | | | | 218,680 | |
Chugai Pharmaceutical Co., Ltd. | | | 3,235 | | | | 100,307 | |
Eisai Co., Ltd. | | | 2,430 | | | | 146,369 | |
Hisamitsu Pharmaceutical Co., Inc. | | | 733 | | | | 32,804 | |
Kaken Pharmaceutical Co., Ltd. | | | 300 | | | | 18,177 | |
KYORIN Holdings, Inc. | | | 753 | | | | 14,364 | |
Mochida Pharmaceutical Co., Ltd. | | | 159 | | | | 11,826 | |
Rohto Pharmaceutical Co., Ltd. | | | 660 | | | | 12,038 | |
Santen Pharmaceutical Co., Ltd. | | | 2,448 | | | | 36,874 | |
Sawai Pharmaceutical Co., Ltd. | | | 297 | | | | 18,629 | |
Shionogi & Co., Ltd. | | | 1,795 | | | | 84,595 | |
Sumitomo Dainippon Pharma Co., Ltd. | | | 2,191 | | | | 25,264 | |
Tsumura & Co. | | | 878 | | | | 21,107 | |
| | | | | | | | |
| Total Pharmaceuticals | | | | 741,034 | |
| Professional Services – 0.2% | | | | | | | | |
Meitec Corp. | | | 411 | | | | 14,389 | |
Temp Holdings Co., Ltd. | | | 867 | | | | 12,589 | |
| | | | | | | | |
| Total Professional Services | | | | 26,978 | |
| Real Estate Management & Development – 2.5% | | | | | | | | |
Daito Trust Construction Co., Ltd. | | | 1,061 | | | | 150,850 | |
Daiwa House Industry Co., Ltd. | | | 5,800 | | | | 163,378 | |
Hulic Co., Ltd. | | | 3,192 | | | | 30,558 | |
Sumitomo Real Estate Sales Co., Ltd. | | | 600 | | | | 11,568 | |
Sumitomo Realty & Development Co., Ltd. | | | 924 | | | | 27,080 | |
Tokyo Tatemono Co., Ltd. | | | 800 | | | | 9,979 | |
| | | | | | | | |
| Total Real Estate Management & Development | | | | 393,413 | |
| Road & Rail – 2.4% | | | | | | | | |
Central Japan Railway Co. | | | 478 | | | | 84,653 | |
East Japan Railway Co. | | | 1,797 | | | | 155,294 | |
Hitachi Transport System Ltd. | | | 686 | | | | 11,487 | |
Nippon Express Co., Ltd. | | | 6,204 | | | | 28,261 | |
Sankyu, Inc. | | | 2,602 | | | | 11,899 | |
West Japan Railway Co. | | | 1,329 | | | | 82,168 | |
| | | | | | | | |
| Total Road & Rail | | | | 373,762 | |
| Semiconductors & Semiconductor Equipment – 0.2% | | | | | |
Disco Corp. | | | 244 | | | | 20,711 | |
Shinko Electric Industries Co., Ltd. | | | 1,901 | | | | 10,706 | |
| | | | | | | | |
| Total Semiconductors & Semiconductor Equipment | | | | 31,417 | |
| Software – 1.2% | | | | | | | | |
GungHo Online Entertainment, Inc.(a) | | | 3,591 | | | | 10,128 | |
Konami Holdings Corp.(a) | | | 719 | | | | 21,302 | |
Nexon Co., Ltd. | | | 1,238 | | | | 21,137 | |
Oracle Corp. | | | 1,000 | | | | 56,230 | |
Square Enix Holdings Co., Ltd. | | | 685 | | | | 18,528 | |
Trend Micro, Inc. | | | 1,611 | | | | 59,054 | |
| | | | | | | | |
| Total Software | | | | | | | 186,379 | |
| Specialty Retail – 1.9% | | | | | | | | |
ABC-Mart, Inc. | | | 456 | | | | 29,252 | |
AOKI Holdings, Inc. | | | 930 | | | | 11,253 | |
Fast Retailing Co., Ltd. | | | 253 | | | | 81,081 | |
Hikari Tsushin, Inc. | | | 377 | | | | 28,746 | |
K’s Holdings Corp.(a) | | | 411 | | | | 13,640 | |
Nitori Holdings Co., Ltd. | | | 300 | | | | 27,519 | |
Sanrio Co., Ltd. | | | 991 | | | | 19,406 | |
Shimamura Co., Ltd. | | | 170 | | | | 21,251 | |
T-Gaia Corp. | | | 782 | | | | 9,066 | |
United Arrows Ltd. | | | 300 | | | | 12,425 | |
USS Co., Ltd. | | | 2,325 | | | | 37,193 | |
| | | | | | | | |
| Total Specialty Retail | | | | | | | 290,832 | |
| Technology Hardware, Storage & Peripherals – 5.2% | | | | | |
Brother Industries Ltd. | | | 2,213 | | | | 25,478 | |
Canon, Inc. | | | 20,593 | | | | 614,703 | |
FUJIFILM Holdings Corp. | | | 2,776 | | | | 109,933 | |
Konica Minolta, Inc. | | | 3,300 | | | | 28,069 | |
NEC Corp. | | | 13,176 | | | | 33,176 | |
| | | | | | | | |
| Total Technology Hardware, Storage & Peripherals | | | | | | | 811,359 | |
See Notes to Financial Statements.
| | | | |
| WisdomTree Developed World ex-U.S. and Currency Hedged Equity Funds | | | 141 | |
Schedule of Investments (concluded)
WisdomTree Japan Hedged Quality Dividend Growth Fund (JHDG)
March 31, 2016
| | | | | | | | |
| Investments | | Shares | | | Value | |
| Textiles, Apparel & Luxury Goods – 0.1% | | | | | | | | |
Asics Corp. | | | 795 | | | $ | 14,182 | |
| Tobacco – 5.5% | | | | | | | | |
Japan Tobacco, Inc. | | | 20,573 | | | | 858,467 | |
| Trading Companies & Distributors – 6.7% | | | | | | | | |
ITOCHU Corp. | | | 19,799 | | | | 244,152 | |
Marubeni Corp. | | | 27,355 | | | | 138,728 | |
MISUMI Group, Inc. | | | 900 | | | | 12,900 | |
Mitsubishi Corp. | | | 17,659 | | | | 299,462 | |
Mitsui & Co., Ltd. | | | 29,671 | | | | 341,865 | |
Nippon Steel & Sumikin Bussan Corp. | | | 3,000 | | | | 10,009 | |
| | | | | | | | |
| Total Trading Companies & Distributors | | | | | | | 1,047,116 | |
| Transportation Infrastructure – 0.0% | | | | | | | | |
Kamigumi Co., Ltd. | | | 698 | | | | 6,577 | |
| Wireless Telecommunication Services – 11.3% | | | | | | | | |
KDDI Corp. | | | 22,887 | | | | 612,112 | |
NTT DOCOMO, Inc. | | | 45,246 | | | | 1,027,540 | |
SoftBank Group Corp. | | | 2,895 | | | | 138,214 | |
| | | | | | | | |
| Total Wireless Telecommunication Services | | | | | | | 1,777,866 | |
TOTAL COMMON STOCKS (Cost: $16,690,151) | | | | | | | 15,518,122 | |
| INVESTMENT OF CASH COLLATERAL FOR SECURITIES LOANED – 3.8% | |
| United States – 3.8% | | | | | | | | |
State Street Navigator Securities Lending Prime Portfolio, 0.50%(b) | | | | | | | | |
| (Cost: $595,235)(c) | | | 595,235 | | | | 595,235 | |
TOTAL INVESTMENTS IN SECURITIES – 102.9% (Cost: $17,285,386) | | | | 16,113,357 | |
Liabilities in Excess of Cash, Foreign Currency and Other Assets – (2.9)% | | | | | | | (456,556 | ) |
| | | | | | | | |
| NET ASSETS – 100.0% | | | $ | 15,656,801 | |
| (a) | Security, or portion thereof, was on loan at March 31, 2016 (See Note 2). |
| (b) | Rate shown represents annualized 7-day yield as of March 31, 2016. |
| (c) | At March 31, 2016, the total market value of the Fund’s securities on loan was $600,464 and the total market value of the collateral held by the Fund was $632,176. The total market value of the collateral includes non-cash U.S. Government securities collateral having a value of $36,941. |
| | | | | | | | | | | | | | | | | | |
| FINANCIAL DERIVATIVE INSTRUMENTS | |
| FORWARD CONTRACTS | |
Settlement Date | | Contracts
To Deliver | | | In
Exchange For | | | Unrealized
Gain (Loss) | |
4/5/2016 | | JPY | | | 358,619,533 | | | | USD | | | | 3,180,788 | | | $ | (10,046 | ) |
4/5/2016 | | JPY | | | 273,239,557 | | | | USD | | | | 2,423,458 | | | | (7,704 | ) |
4/5/2016 | | JPY | | | 358,612,217 | | | | USD | | | | 3,180,788 | | | | (9,981 | ) |
4/5/2016 | | JPY | | | 358,623,032 | | | | USD | | | | 3,180,788 | | | | (10,077 | ) |
4/5/2016 | | JPY | | | 358,624,304 | | | | USD | | | | 3,180,788 | | | | (10,089 | ) |
4/5/2016 | | USD | | | 2,423,458 | | | | JPY | | | | 272,378,745 | | | | 45 | |
4/5/2016 | | USD | | | 3,180,788 | | | | JPY | | | | 357,481,447 | | | | (80 | ) |
4/5/2016 | | USD | | | 3,180,788 | | | | JPY | | | | 357,472,859 | | | | (156 | ) |
4/5/2016 | | USD | | | 3,180,788 | | | | JPY | | | | 357,496,079 | | | | 50 | |
4/5/2016 | | USD | | | 3,180,788 | | | | JPY | | | | 357,515,163 | | | | 220 | |
5/9/2016 | | JPY | | | 283,879,921 | | | | USD | | | | 2,528,184 | | | | (134 | ) |
5/9/2016 | | JPY | | | 372,607,043 | | | | USD | | | | 3,318,236 | | | | (311 | ) |
5/9/2016 | | JPY | | | 372,616,002 | | | | USD | | | | 3,318,236 | | | | (391 | ) |
5/9/2016 | | JPY | | | 372,611,356 | | | | USD | | | | 3,318,236 | | | | (350 | ) |
5/9/2016 | | JPY | | | 372,627,284 | | | | USD | | | | 3,318,236 | | | | (491 | ) |
| | | | | | | | | | | | | | | | | $ | (49,495 | ) |
| | |
| CURRENCY LEGEND |
JPY | | – Japanese yen |
USD | | – U.S. dollar |
See Notes to Financial Statements.
| | |
| 142 | | WisdomTree Developed World ex-U.S. and Currency Hedged Equity Funds |
Schedule of Investments
WisdomTree Japan Hedged Real Estate Fund (DXJR)
March 31, 2016
| | | | | | | | |
| Investments | | Shares | | | Value | |
| COMMON STOCKS – 99.6% | | | | | | | | |
| Japan – 99.6% | | | | | | | | |
| Building Products – 3.9% | | | | | | | | |
LIXIL Group Corp.(a) | | | 134,379 | | | $ | 2,743,892 | |
Nichias Corp. | | | 71,623 | | | | 428,865 | |
Takara Standard Co., Ltd. | | | 19,087 | | | | 173,727 | |
TOTO Ltd.(a) | | | 80,641 | | | | 2,518,350 | |
| | | | | | | | |
| Total Building Products | | | | 5,864,834 | |
| Construction & Engineering – 13.4% | | | | | | | | |
Hazama Ando Corp. | | | 105,206 | | | | 512,949 | |
Kajima Corp. | | | 498,547 | | | | 3,131,582 | |
Kumagai Gumi Co., Ltd. | | | 202,919 | | | | 516,347 | |
Maeda Corp.(a) | | | 89,196 | | | | 665,825 | |
Maeda Road Construction Co., Ltd. | | | 21,833 | | | | 360,533 | |
Nippo Corp. | | | 14,597 | | | | 245,848 | |
Nishimatsu Construction Co., Ltd.(a) | | | 120,858 | | | | 519,368 | |
Obayashi Corp. | | | 361,783 | | | | 3,572,927 | |
Okumura Corp.(a) | | | 100,387 | | | | 531,432 | |
Penta-Ocean Construction Co., Ltd. | | | 143,691 | | | | 602,148 | |
Raito Kogyo Co., Ltd. | | | 23,922 | | | | 221,352 | |
Shimizu Corp. | | | 376,428 | | | | 3,195,092 | |
SHO-BOND Holdings Co., Ltd.(a) | | | 12,033 | | | | 458,216 | |
Sumitomo Mitsui Construction Co., Ltd.(a) | | | 482,846 | | | | 433,893 | |
Taisei Corp. | | | 593,209 | | | | 3,926,754 | |
Toda Corp.(a) | | | 120,213 | | | | 581,840 | |
Tokyu Construction Co., Ltd.(a) | | | 48,909 | | | | 400,341 | |
Totetsu Kogyo Co., Ltd.(a) | | | 12,360 | | | | 380,494 | |
| | | | | | | | |
| Total Construction & Engineering | | | | 20,256,941 | |
| Construction Materials – 1.5% | | | | | | | | |
Sumitomo Osaka Cement Co., Ltd. | | | 207,842 | | | | 817,351 | |
Taiheiyo Cement Corp. | | | 647,909 | | | | 1,493,024 | |
| | | | | | | | |
| Total Construction Materials | | | | 2,310,375 | |
| Household Durables – 8.3% | | | | | | | | |
Haseko Corp. | | | 143,376 | | | | 1,336,875 | |
Iida Group Holdings Co., Ltd. | | | 99,014 | | | | 1,933,678 | |
PanaHome Corp.(a) | | | 18,045 | | | | 135,665 | |
Sekisui Chemical Co., Ltd. | | | 230,168 | | | | 2,838,319 | |
Sekisui House Ltd. | | | 309,210 | | | | 5,225,716 | |
Sumitomo Forestry Co., Ltd. | | | 82,368 | | | | 947,567 | |
Token Corp. | | | 1,637 | | | | 133,995 | |
| | | | | | | | |
| Total Household Durables | | | | 12,551,815 | |
| Real Estate Investment Trusts (REITs) – 32.0% | | | | | | | | |
Activia Properties, Inc. | | | 299 | | | | 1,553,592 | |
Advance Residence Investment Corp. | | | 668 | | | | 1,693,253 | |
AEON REIT Investment Corp.(a) | | | 462 | | | | 592,735 | |
Daiwa House REIT Investment Corp.(a) | | | 191 | | | | 838,636 | |
Daiwa House Residential Investment Corp. | | | 391 | | | | 816,823 | |
Daiwa Office Investment Corp. | | | 169 | | | | 1,052,538 | |
Frontier Real Estate Investment Corp. | | | 237 | | | | 1,140,771 | |
Fukuoka REIT Corp. | | | 356 | | | | 644,566 | |
Global One Real Estate Investment Corp.(a) | | | 115 | | | | 459,407 | |
GLP J-REIT | | | 1,186 | | | | 1,353,831 | |
Hankyu REIT, Inc. | | | 299 | | | $ | 365,520 | |
Hoshino Resorts REIT, Inc. | | | 26 | | | | 317,843 | |
Hulic Reit, Inc.(a) | | | 357 | | | | 581,263 | |
Ichigo Office REIT Investment | | | 718 | | | | 555,133 | |
Industrial & Infrastructure Fund Investment Corp. | | | 148 | | | | 688,678 | |
Invincible Investment Corp. | | | 1,398 | | | | 1,049,791 | |
Japan Excellent, Inc. | | | 640 | | | | 865,519 | |
Japan Hotel REIT Investment Corp. | | | 1,633 | | | | 1,439,835 | |
Japan Logistics Fund, Inc. | | | 471 | | | | 985,205 | |
Japan Prime Realty Investment Corp. | | | 472 | | | | 1,925,459 | |
Japan Real Estate Investment Corp. | | | 635 | | | | 3,672,316 | |
Japan Rental Housing Investments, Inc. | | | 586 | | | | 433,263 | |
Japan Retail Fund Investment Corp. | | | 1,305 | | | | 3,137,248 | |
Kenedix Office Investment Corp. | | | 206 | | | | 1,184,003 | |
Kenedix Residential Investment Corp. | | | 199 | | | | 524,434 | |
Kenedix Retail REIT Corp. | | | 199 | | | | 483,181 | |
MCUBS MidCity Investment Corp. | | | 121 | | | | 363,877 | |
Mori Hills REIT Investment Corp. | | | 697 | | | | 1,032,524 | |
Mori Trust Sogo REIT, Inc. | | | 523 | | | | 905,519 | |
Nippon Accommodations Fund, Inc. | | | 239 | | | | 921,807 | |
Nippon Building Fund, Inc. | | | 680 | | | | 4,035,411 | |
Nippon Prologis REIT, Inc. | | | 938 | | | | 2,102,248 | |
NIPPON REIT Investment Corp.(a) | | | 204 | | | | 535,615 | |
Nomura Real Estate Master Fund, Inc. | | | 1,841 | | | | 2,751,795 | |
Orix JREIT, Inc. | | | 1,192 | | | | 1,850,652 | |
Premier Investment Corp. | | | 661 | | | | 818,053 | |
Sekisui House REIT, Inc.(a) | | | 446 | | | | 514,669 | |
Sekisui House SI Residential Investment Corp. | | | 538 | | | | 553,820 | |
Tokyu REIT, Inc. | | | 492 | | | | 676,311 | |
Top REIT, Inc. | | | 96 | | | | 379,661 | |
United Urban Investment Corp. | | | 1,545 | | | | 2,500,427 | |
| | | | | | | | |
| Total Real Estate Investment Trusts (REITs) | | | | 48,297,232 | |
| Real Estate Management & Development – 37.9% | |
Aeon Mall Co., Ltd. | | | 62,248 | | | | 923,239 | |
Daito Trust Construction Co., Ltd. | | | 42,324 | | | | 6,017,505 | |
Daiwa House Industry Co., Ltd. | | | 315,273 | | | | 8,880,772 | |
Hulic Co., Ltd. | | | 231,090 | | | | 2,212,312 | |
Kenedix, Inc. | | | 138,003 | | | | 604,097 | |
Leopalace21 Corp. | | | 138,967 | | | | 840,763 | |
Mitsubishi Estate Co., Ltd. | | | 661,199 | | | | 12,298,025 | |
Mitsui Fudosan Co., Ltd. | | | 489,478 | | | | 12,228,784 | |
Nomura Real Estate Holdings, Inc. | | | 63,979 | | | | 1,184,006 | |
NTT Urban Development Corp. | | | 53,039 | | | | 519,560 | |
Open House Co., Ltd. | | | 12,300 | | | | 244,917 | |
Relo Holdings, Inc. | | | 4,010 | | | | 538,377 | |
Sumitomo Realty & Development Co., Ltd. | | | 239,563 | | �� | | 7,020,958 | |
TOC Co., Ltd.(a) | | | 34,700 | | | | 293,913 | |
Tokyo Tatemono Co., Ltd. | | | 110,449 | | | | 1,377,726 | |
Tokyu Fudosan Holdings Corp. | | | 251,294 | | | | 1,708,160 | |
Unizo Holdings Co., Ltd.(a) | | | 8,300 | | | | 357,787 | |
| | | | | | | | |
| Total Real Estate Management & Development | | | | 57,250,901 | |
See Notes to Financial Statements.
| | | | |
| WisdomTree Developed World ex-U.S. and Currency Hedged Equity Funds | | | 143 | |
Schedule of Investments (concluded)
WisdomTree Japan Hedged Real Estate Fund (DXJR)
March 31, 2016
| | | | | | | | |
| Investments | | Shares | | | Value | |
| Transportation Infrastructure – 2.6% | | | | | | | | |
Japan Airport Terminal Co., Ltd.(a) | | | 35,488 | | | $ | 1,262,975 | |
Kamigumi Co., Ltd. | | | 119,410 | | | | 1,125,096 | |
Mitsubishi Logistics Corp.(a) | | | 78,968 | | | | 1,038,433 | |
Sumitomo Warehouse Co., Ltd. (The) | | | 81,803 | | | | 417,039 | |
| | | | | | | | |
| Total Transportation Infrastructure | | | | | | | 3,843,543 | |
TOTAL COMMON STOCKS (Cost: $137,209,673) | | | | | | | 150,375,641 | |
| INVESTMENT OF CASH COLLATERAL FOR SECURITIES LOANED – 7.6% | |
| United States – 7.6% | | | | | | | | |
State Street Navigator Securities Lending Prime Portfolio, 0.50%(b) | | | | | | | | |
| (Cost: $11,557,970)(c) | | | 11,557,970 | | | | 11,557,970 | |
TOTAL INVESTMENTS IN SECURITIES – 107.2%
(Cost: $148,767,643) | | | | 161,933,611 | |
Liabilities in Excess of Cash, Foreign Currency and Other Assets – (7.2)% | | | | | | | (10,940,382 | ) |
| | | | | | | | |
| NET ASSETS – 100.0% | | | $ | 150,993,229 | |
| (a) | Security, or portion thereof, was on loan at March 31, 2016 (See Note 2). |
| (b) | Rate shown represents annualized 7-day yield as of March 31, 2016. |
| (c) | At March 31, 2016, the total market value of the Fund’s securities on loan was $11,555,642 and the total market value of the collateral held by the Fund was $12,153,265. The total market value of the collateral includes non-cash U.S. Government securities collateral having a value of $595,295. |
| | | | | | | | | | | | | | | | | | |
| FINANCIAL DERIVATIVE INSTRUMENTS | |
| FORWARD CONTRACTS | |
Settlement Date | | Contracts
To Deliver | | | In
Exchange For | | | Unrealized
Gain (Loss) | |
4/4/2016 | | JPY | | | 6,600,000 | | | | USD | | | | 58,672 | | | $ | (50 | ) |
4/5/2016 | | JPY | | | 3,502,862,668 | | | | USD | | | | 31,068,455 | | | | (98,430 | ) |
4/5/2016 | | JPY | | | 3,502,828,493 | | | | USD | | | | 31,068,455 | | | | (98,126 | ) |
4/5/2016 | | JPY | | | 2,668,876,287 | | | | USD | | | | 23,671,205 | | | | (75,247 | ) |
4/5/2016 | | JPY | | | 3,502,757,035 | | | | USD | | | | 31,068,455 | | | | (97,490 | ) |
4/5/2016 | | JPY | | | 3,502,875,095 | | | | USD | | | | 31,068,455 | | | | (98,540 | ) |
4/5/2016 | | JPY | | | 141,167,593 | | | | USD | | | | 1,253,771 | | | | (2,274 | ) |
4/5/2016 | | USD | | | 2,507,543 | | | | JPY | | | | 284,507,333 | | | | 23,874 | |
4/5/2016 | | USD | | | 23,470,601 | | | | JPY | | | | 2,637,921,869 | | | | 433 | |
4/5/2016 | | USD | | | 30,805,163 | | | | JPY | | | | 3,462,121,417 | | | | (775 | ) |
4/5/2016 | | USD | | | 30,805,163 | | | | JPY | | | | 3,462,038,243 | | | | (1,515 | ) |
4/5/2016 | | USD | | | 30,805,163 | | | | JPY | | | | 3,462,263,121 | | | | 485 | |
4/5/2016 | | USD | | | 30,805,163 | | | | JPY | | | | 3,462,447,952 | | | | 2,130 | |
5/9/2016 | | JPY | | | 2,727,985,297 | | | | USD | | | | 24,294,951 | | | | (1,283 | ) |
5/9/2016 | | JPY | | | 3,580,627,025 | | | | USD | | | | 31,887,120 | | | | (2,990 | ) |
5/9/2016 | | JPY | | | 3,580,668,479 | | | | USD | | | | 31,887,120 | | | | (3,359 | ) |
5/9/2016 | | JPY | | | 3,580,713,121 | | | | USD | | | | 31,887,120 | | | | (3,757 | ) |
5/9/2016 | | JPY | | | 3,580,821,537 | | | | USD | | | | 31,887,120 | | | | (4,723 | ) |
| | | | | | | | | | | | | | | | | $ | (461,637 | ) |
| | |
| CURRENCY LEGEND: |
JPY | | – Japanese yen |
USD | | – U.S. dollar |
See Notes to Financial Statements.
| | |
| 144 | | WisdomTree Developed World ex-U.S. and Currency Hedged Equity Funds |
Schedule of Investments
WisdomTree Japan Hedged SmallCap Equity Fund (DXJS)
March 31, 2016
| | | | | | | | |
| Investments | | Shares | | | Value | |
| COMMON STOCKS – 99.0% | | | | | | | | |
| Japan – 99.0% | | | | | | | | |
| Aerospace & Defense – 0.1% | | | | | | | | |
Jamco Corp.(a) | | | 1,800 | | | $ | 45,098 | |
| Air Freight & Logistics – 0.3% | | | | | | | | |
AIT Corp.(a) | | | 6,600 | | | | 54,963 | |
Kintetsu World Express, Inc. | | | 2,700 | | | | 35,938 | |
Konoike Transport Co., Ltd. | | | 7,100 | | | | 83,195 | |
Mitsui-Soko Holdings Co., Ltd. | | | 30,000 | | | | 80,075 | |
| | | | | | | | |
| Total Air Freight & Logistics | | | | 254,171 | |
| Auto Components – 4.3% | | | | | | | | |
Aisan Industry Co., Ltd. | | | 16,000 | | | | 126,127 | |
Calsonic Kansei Corp. | | | 16,000 | | | | 119,151 | |
Daido Metal Co., Ltd. | | | 5,300 | | | | 41,025 | |
Daikyonishikawa Corp. | | | 10,800 | | | | 155,185 | |
Eagle Industry Co., Ltd. | | | 3,400 | | | | 44,861 | |
Exedy Corp. | | | 8,600 | | | | 190,371 | |
FCC Co., Ltd. | | | 9,000 | | | | 152,302 | |
G-Tekt Corp. | | | 7,298 | | | | 83,502 | |
Kasai Kogyo Co., Ltd. | | | 4,400 | | | | 45,568 | |
Keihin Corp. | | | 12,700 | | | | 189,944 | |
Kinugawa Rubber Industrial Co., Ltd. | | | 14,000 | | | | 95,538 | |
KYB Corp. | | | 58,000 | | | | 171,840 | |
Musashi Seimitsu Industry Co., Ltd.(a) | | | 5,300 | | | | 105,345 | |
Nifco, Inc. | | | 8,200 | | | | 394,697 | |
Nissin Kogyo Co., Ltd. | | | 11,700 | | | | 157,811 | |
Pacific Industrial Co., Ltd.(a) | | | 12,200 | | | | 122,982 | |
Piolax, Inc. | | | 1,500 | | | | 74,603 | |
Press Kogyo Co., Ltd. | | | 21,300 | | | | 71,824 | |
Riken Corp. | | | 19,000 | | | | 62,209 | |
Sanden Holdings Corp.(a) | | | 24,000 | | | | 68,758 | |
Sanoh Industrial Co., Ltd. | | | 7,100 | | | | 38,850 | |
Shoei Co., Ltd. | | | 4,400 | | | | 72,971 | |
Showa Corp. | | | 18,000 | | | | 157,267 | |
Sumitomo Riko Co., Ltd. | | | 16,500 | | | | 144,014 | |
Taiho Kogyo Co., Ltd. | | | 6,000 | | | | 62,085 | |
Tokai Rika Co., Ltd. | | | 14,925 | | | | 281,251 | |
Topre Corp. | | | 7,200 | | | | 134,333 | |
TPR Co., Ltd. | | | 4,306 | | | | 113,172 | |
TS Tech Co., Ltd. | | | 10,900 | | | | 255,444 | |
Unipres Corp. | | | 4,300 | | | | 75,024 | |
Yorozu Corp. | | | 4,700 | | | | 98,688 | |
| | | | | | | | |
| Total Auto Components | | | | 3,906,742 | |
| Automobiles – 0.1% | | | | | | | | |
Nissan Shatai Co., Ltd. | | | 7,100 | | | | 71,572 | |
| Banks – 5.6% | | | | | | | | |
77 Bank Ltd. (The) | | | 39,000 | | | | 138,102 | |
Akita Bank Ltd. (The) | | | 34,000 | | | | 92,869 | |
Aomori Bank Ltd. (The) | | | 38,000 | | | | 110,895 | |
Ashikaga Holdings Co., Ltd. | | | 50,800 | | | | 145,537 | |
Awa Bank Ltd. (The) | | | 23,000 | | | | 111,526 | |
Bank of Nagoya Ltd. (The)(a) | | | 29,000 | | | | 95,467 | |
Bank of Okinawa Ltd. (The) | | | 2,300 | | | | 75,613 | |
Bank of Saga Ltd. (The) | | | 44,000 | | | | 82,993 | |
Bank of the Ryukyus Ltd. | | | 7,300 | | | | 82,096 | |
Chukyo Bank Ltd. (The) | | | 37,000 | | | | 63,864 | |
Daishi Bank Ltd. (The) | | | 54,000 | | | | 185,933 | |
Ehime Bank Ltd. (The)(a) | | | 44,000 | | | | 91,214 | |
Eighteenth Bank Ltd. (The) | | | 44,000 | | | | 97,869 | |
FIDEA Holdings Co., Ltd. | | | 30,400 | | | | 47,874 | |
Fukui Bank Ltd. (The)(a) | | | 37,000 | | | | 67,485 | |
Higashi-Nippon Bank Ltd. (The) | | | 39,000 | | | | 96,020 | |
Hokkoku Bank Ltd. (The) | | | 42,000 | | | | 110,610 | |
Hokuetsu Bank Ltd. (The) | | | 54,000 | | | | 87,442 | |
Hyakugo Bank Ltd. (The) | | | 41,000 | | | | 153,939 | |
Hyakujushi Bank Ltd. (The) | | | 50,000 | | | | 140,576 | |
Juroku Bank Ltd. (The) | | | 63,000 | | | | 188,336 | |
Kansai Urban Banking Corp. | | | 15,600 | | | | 153,925 | |
Keiyo Bank Ltd. (The) | | | 43,000 | | | | 155,710 | |
Kiyo Bank Ltd. (The) | | | 13,398 | | | | 152,105 | |
Kyushu Financial Group, Inc. | | | 58,100 | | | | 335,486 | |
Mie Bank Ltd. (The) | | | 40,000 | | | | 71,177 | |
Minato Bank Ltd. (The) | | | 43,587 | | | | 58,558 | |
Miyazaki Bank Ltd. (The) | | | 24,000 | | | | 58,508 | |
Musashino Bank Ltd. (The) | | | 5,500 | | | | 138,729 | |
Nanto Bank Ltd. (The) | | | 44,000 | | | | 119,792 | |
Nishi-Nippon City Bank Ltd. (The) | | | 129,000 | | | | 228,400 | |
North Pacific Bank Ltd. | | | 42,200 | | | | 107,006 | |
Ogaki Kyoritsu Bank Ltd. (The) | | | 61,000 | | | | 184,528 | |
Oita Bank Ltd. (The) | | | 21,000 | | | | 65,581 | |
San-In Godo Bank Ltd. (The) | | | 16,500 | | | | 102,175 | |
Senshu Ikeda Holdings, Inc. | | | 56,100 | | | | 202,149 | |
Shiga Bank Ltd. (The)(a) | | | 20,000 | | | | 84,345 | |
Shikoku Bank Ltd. (The) | | | 44,000 | | | | 84,950 | |
Tochigi Bank Ltd. (The) | | | 15,000 | | | | 57,120 | |
Toho Bank Ltd. (The) | | | 34,000 | | | | 109,204 | |
Tokyo TY Financial Group, Inc. | | | 3,500 | | | | 81,432 | |
TOMONY Holdings, Inc. | | | 15,800 | | | | 46,812 | |
Towa Bank Ltd. (The) | | | 100,000 | | | | 77,406 | |
Yamagata Bank Ltd. (The)(a) | | | 16,000 | | | | 60,786 | |
Yamanashi Chuo Bank Ltd. (The) | | | 21,000 | | | | 77,165 | |
| | | | | | | | |
| Total Banks | | | | 5,079,309 | |
| Beverages – 1.8% | | | | | | | | |
Coca-Cola East Japan Co., Ltd. | | | 16,000 | | | | 265,919 | |
Coca-Cola West Co., Ltd. | | | 19,817 | | | | 491,215 | |
Ito En Ltd.(a) | | | 12,600 | | | | 398,532 | |
Sapporo Holdings Ltd. | | | 58,000 | | | | 288,981 | |
Takara Holdings, Inc. | | | 18,900 | | | | 155,882 | |
| | | | | | | | |
| Total Beverages | | | | 1,600,529 | |
| Building Products – 1.6% | | | | | | | | |
Aica Kogyo Co., Ltd. | | | 9,100 | | | | 191,400 | |
Bunka Shutter Co., Ltd. | | | 12,100 | | | | 99,582 | |
Central Glass Co., Ltd. | | | 29,000 | | | | 157,649 | |
Nichias Corp. | | | 27,000 | | | | 161,671 | |
Nichiha Corp. | | | 6,500 | | | | 98,487 | |
See Notes to Financial Statements.
| | | | |
| WisdomTree Developed World ex-U.S. and Currency Hedged Equity Funds | | | 145 | |
Schedule of Investments (continued)
WisdomTree Japan Hedged SmallCap Equity Fund (DXJS)
March 31, 2016
| | | | | | | | |
| Investments | | Shares | | | Value | |
Nitto Boseki Co., Ltd. | | | 18,000 | | | $ | 58,134 | |
Noritz Corp.(a) | | | 6,000 | | | | 97,905 | |
Sanwa Holdings Corp. | | | 33,400 | | | | 248,728 | |
Sinko Industries Ltd. | | | 6,300 | | | | 91,646 | |
Takara Standard Co., Ltd. | | | 14,435 | | | | 131,385 | |
Takasago Thermal Engineering Co., Ltd.(a) | | | 11,600 | | | | 145,935 | |
| | | | | | | | |
| Total Building Products | | | | 1,482,522 | |
| Capital Markets – 2.5% | | | | | | | | |
GCA Savvian Corp. | | | 6,400 | | | | 67,419 | |
Ichiyoshi Securities Co., Ltd. | | | 13,200 | | | | 112,628 | |
IwaiCosmo Holdings, Inc.(a) | | | 10,000 | | | | 97,335 | |
kabu.com Securities Co., Ltd. | | | 87,200 | | | | 279,301 | |
Kyokuto Securities Co., Ltd.(a) | | | 16,000 | | | | 192,606 | |
Marusan Securities Co., Ltd.(a) | | | 44,100 | | | | 415,908 | |
Matsui Securities Co., Ltd.(a) | | | 89,600 | | | | 764,504 | |
Monex Group, Inc. | | | 68,065 | | | | 176,226 | |
Nihon M&A Center, Inc.(a) | | | 2,100 | | | | 122,381 | |
Toyo Securities Co., Ltd. | | | 31,000 | | | | 77,504 | |
| | | | | | | | |
| Total Capital Markets | | | | 2,305,812 | |
| Chemicals – 7.6% | | | | | | | | |
Achilles Corp. | | | 44,000 | | | | 56,373 | |
ADEKA Corp. | | | 16,400 | | | | 239,737 | |
Chugoku Marine Paints Ltd. | | | 13,000 | | | | 85,822 | |
Dainichiseika Color & Chemicals Manufacturing Co., Ltd. | | | 14,000 | | | | 56,052 | |
Denka Co., Ltd. | | | 96,000 | | | | 395,462 | |
DIC Corp. | | | 196,000 | | | | 469,096 | |
Fujimori Kogyo Co., Ltd. | | | 2,200 | | | | 51,792 | |
Ihara Chemical Industry Co., Ltd. | | | 5,900 | | | | 76,326 | |
JCU Corp.(a) | | | 1,400 | | | | 46,087 | |
JSP Corp. | | | 4,417 | | | | 88,108 | |
Kaneka Corp. | | | 60,240 | | | | 516,672 | |
Kureha Corp.(a) | | | 43,000 | | | | 136,963 | |
Lintec Corp. | | | 10,900 | | | | 195,317 | |
Mitsubishi Gas Chemical Co., Inc. | | | 84,000 | | | | 452,903 | |
Nihon Parkerizing Co., Ltd. | | | 12,700 | | | | 115,028 | |
Nippon Kayaku Co., Ltd. | | | 29,000 | | | | 293,625 | |
Nippon Shokubai Co., Ltd. | | | 5,100 | | | | 260,003 | |
Nippon Soda Co., Ltd. | | | 19,000 | | | | 95,850 | |
Nippon Synthetic Chemical Industry Co., Ltd. (The) | | | 14,000 | | | | 88,812 | |
Nippon Valqua Industries Ltd. | | | 43,000 | | | | 112,861 | |
NOF Corp. | | | 29,000 | | | | 205,899 | |
Okamoto Industries, Inc.(a) | | | 15,000 | | | | 126,785 | |
Osaka Soda Co., Ltd.(a) | | | 24,885 | | | | 90,998 | |
Sakai Chemical Industry Co., Ltd. | | | 22,000 | | | | 60,483 | |
Sakata INX Corp. | | | 10,100 | | | | 110,170 | |
Sanyo Chemical Industries Ltd. | | | 15,000 | | | | 105,832 | |
Sekisui Plastics Co., Ltd. | | | 14,000 | | | | 42,475 | |
Shikoku Chemicals Corp. | | | 9,000 | | | | 78,153 | |
Showa Denko K.K. | | | 247,759 | | | | 255,706 | |
Sumitomo Bakelite Co., Ltd. | | | 43,000 | | | | 168,718 | |
Sumitomo Seika Chemicals Co., Ltd. | | | 15,000 | | | | 74,203 | |
Taiyo Holdings Co., Ltd. | | | 4,600 | | | | 155,932 | |
Takasago International Corp. | | | 3,500 | | | | 78,286 | |
Takiron Co., Ltd. | | | 23,000 | | | | 114,187 | |
Toagosei Co., Ltd. | | | 24,600 | | | | 205,082 | |
Tokai Carbon Co., Ltd. | | | 40,000 | | | | 95,022 | |
Toyo Ink SC Holdings Co., Ltd. | | | 71,000 | | | | 284,897 | |
Toyobo Co., Ltd. | | | 160,000 | | | | 240,580 | |
Ube Industries Ltd. | | | 216,800 | | | | 383,853 | |
Zeon Corp. | | | 28,000 | | | | 181,360 | |
| | | | | | | | |
| Total Chemicals | | | | 6,891,510 | |
| Commercial Services & Supplies – 2.3% | | | | | | | | |
Aeon Delight Co., Ltd. | | | 6,500 | | | | 209,062 | |
Daiseki Co., Ltd. | | | 3,000 | | | | 49,166 | |
Kokuyo Co., Ltd. | | | 13,100 | | | | 153,501 | |
Mitsubishi Pencil Co., Ltd. | | | 1,400 | | | | 60,163 | |
NAC Co., Ltd.(a) | | | 8,300 | | | | 64,394 | |
Nippon Parking Development Co., Ltd.(a) | | | 53,700 | | | | 59,722 | |
Nissha Printing Co., Ltd.(a) | | | 4,300 | | | | 63,049 | |
Okamura Corp. | | | 16,800 | | | | 160,683 | |
Park24 Co., Ltd. | | | 30,400 | | | | 851,995 | |
Pilot Corp. | | | 1,400 | | | | 53,437 | |
Relia, Inc. | | | 10,100 | | | | 93,546 | |
Sato Holdings Corp. | | | 4,400 | | | | 93,798 | |
Toppan Forms Co., Ltd. | | | 15,200 | | | | 169,452 | |
| | | | | | | | |
| Total Commercial Services & Supplies | | | | 2,081,968 | |
| Communications Equipment – 0.3% | | | | | | | | |
Hitachi Kokusai Electric, Inc. | | | 17,200 | | | | 207,052 | |
Japan Radio Co., Ltd. | | | 13,000 | | | | 34,583 | |
| | | | | | | | |
| Total Communications Equipment | | | | 241,635 | |
| Construction & Engineering – 4.4% | | | | | | | | |
Asunaro Aoki Construction Co., Ltd. | | | 10,200 | | | | 65,976 | |
COMSYS Holdings Corp.(a) | | | 20,500 | | | | 316,998 | |
Dai-Dan Co., Ltd. | | | 13,000 | | | | 86,054 | |
Fudo Tetra Corp.(a) | | | 40,000 | | | | 44,842 | |
Hazama Ando Corp. | | | 20,500 | | | | 99,951 | |
Kandenko Co., Ltd.(a) | | | 35,000 | | | | 250,056 | |
Kyowa Exeo Corp. | | | 21,700 | | | | 241,336 | |
Kyudenko Corp.(a) | | | 9,000 | | | | 214,520 | |
Maeda Corp. | | | 14,000 | | | | 104,506 | |
Maeda Road Construction Co., Ltd. | | | 14,000 | | | | 231,185 | |
Mirait Holdings Corp. | | | 12,644 | | | | 100,796 | |
NDS Co., Ltd. | | | 11,000 | | | | 30,339 | |
Nippo Corp. | | | 12,000 | | | | 202,109 | |
Nippon Densetsu Kogyo Co., Ltd. | | | 6,200 | | | | 124,778 | |
Nippon Koei Co., Ltd. | | | 15,000 | | | | 47,378 | |
Nippon Road Co., Ltd. (The) | | | 39,000 | | | | 181,476 | |
Nishimatsu Construction Co., Ltd. | | | 51,000 | | | | 219,164 | |
Okumura Corp. | | | 42,000 | | | | 222,341 | |
Penta-Ocean Construction Co., Ltd. | | | 21,800 | | | | 91,355 | |
Sumitomo Mitsui Construction Co., Ltd. | | | 16,600 | | | | 14,917 | |
Taikisha Ltd. | | | 4,500 | | | | 108,661 | |
TOA ROAD Corp. | | | 15,000 | | | | 50,047 | |
Toda Corp. | | | 43,000 | | | | 208,123 | |
See Notes to Financial Statements.
| | |
| 146 | | WisdomTree Developed World ex-U.S. and Currency Hedged Equity Funds |
Schedule of Investments (continued)
WisdomTree Japan Hedged SmallCap Equity Fund (DXJS)
March 31, 2016
| | | | | | | | |
| Investments | | Shares | | | Value | |
Toenec Corp. | | | 14,000 | | | $ | 86,445 | |
Tokyu Construction Co., Ltd. | | | 14,200 | | | | 116,233 | |
Totetsu Kogyo Co., Ltd. | | | 2,900 | | | | 89,274 | |
Toyo Construction Co., Ltd.(a) | | | 18,700 | | | | 81,691 | |
Toyo Engineering Corp.(a) | | | 20,000 | | | | 52,138 | |
Yahagi Construction Co., Ltd.(a) | | | 10,100 | | | | 70,991 | |
Yokogawa Bridge Holdings Corp.(a) | | | 7,300 | | | | 78,589 | |
Yurtec Corp. | | | 13,000 | | | | 108,724 | |
| | | | | | | | |
| Total Construction & Engineering | | | | 3,940,993 | |
| Construction Materials – 0.2% | | | | | | | | |
Sumitomo Osaka Cement Co., Ltd. | | | 57,000 | | | | 224,156 | |
| Containers & Packaging – 0.7% | | | | | | | | |
FP Corp. | | | 4,300 | | | | 184,212 | |
Fuji Seal International, Inc. | | | 3,900 | | | | 138,449 | |
Rengo Co., Ltd. | | | 62,381 | | | | 315,249 | |
| | | | | | | | |
| Total Containers & Packaging | | | | 637,910 | |
| Distributors – 1.1% | | | | | | | | |
Canon Marketing Japan, Inc. | | | 30,000 | | | | 524,757 | |
Chori Co., Ltd. | | | 4,700 | | | | 60,927 | |
Doshisha Co., Ltd. | | | 6,700 | | | | 123,514 | |
Happinet Corp.(a) | | | 6,000 | | | | 54,558 | |
Paltac Corp. | | | 13,803 | | | | 244,756 | |
| | | | | | | | |
| Total Distributors | | | | 1,008,512 | �� |
| Diversified Consumer Services – 1.0% | | | | | | | | |
Benesse Holdings, Inc.(a) | | | 27,200 | | | | 784,092 | |
Meiko Network Japan Co., Ltd. | | | 7,000 | | | | 76,418 | |
Studio Alice Co., Ltd. | | | 3,500 | | | | 76,605 | |
| | | | | | | | |
| Total Diversified Consumer Services | | | | 937,115 | |
| Diversified Financial Services – 0.2% | | | | | | | | |
Financial Products Group Co., Ltd.(a) | | | 7,300 | | | | 88,136 | |
Ricoh Leasing Co., Ltd. | | | 4,300 | | | | 127,973 | |
| | | | | | | | |
| Total Diversified Financial Services | | | | 216,109 | |
| Electric Utilities – 0.1% | | | | | | | | |
Okinawa Electric Power Co., Inc. (The) | | | 4,000 | | | | 107,834 | |
| Electrical Equipment – 1.7% | | | | | | | | |
Daihen Corp. | | | 14,000 | | | | 63,775 | |
Denyo Co., Ltd. | | | 2,700 | | | | 27,842 | |
Endo Lighting Corp. | | | 7,209 | | | | 65,679 | |
Fujikura Ltd. | | | 37,000 | | | | 174,474 | |
Furukawa Electric Co., Ltd. | | | 78,261 | | | | 169,202 | |
GS Yuasa Corp. | | | 71,000 | | | | 303,848 | |
Idec Corp. | | | 13,100 | | | | 124,712 | |
Nissin Electric Co., Ltd. | | | 15,900 | | | | 173,719 | |
Nitto Kogyo Corp. | | | 7,400 | | | | 118,116 | |
Sanyo Denki Co., Ltd. | | | 10,000 | | | | 46,710 | |
Tatsuta Electric Wire and Cable Co., Ltd. | | | 14,500 | | | | 45,927 | |
Ushio, Inc. | | | 17,600 | | | | 234,260 | |
| | | | | | | | |
| Total Electrical Equipment | | | | 1,548,264 | |
| Electronic Equipment, Instruments & Components – 4.7% | | | | | |
Ai Holdings Corp. | | | 7,600 | | | | 220,775 | |
Amano Corp. | | | 17,500 | | | | 276,680 | |
Anritsu Corp.(a) | | | 36,200 | | | | 199,367 | |
Azbil Corp. | | | 13,400 | | | | 343,480 | |
Canon Electronics, Inc. | | | 10,100 | | | | 148,811 | |
Citizen Holdings Co., Ltd. | | | 57,000 | | | | 323,555 | |
CONEXIO Corp.(a) | | | 17,900 | | | | 181,238 | |
Daiwabo Holdings Co., Ltd. | | | 57,000 | | | | 106,499 | |
Enplas Corp. | | | 3,029 | | | | 112,380 | |
Hakuto Co., Ltd. | | | 7,300 | | | | 64,365 | |
Horiba Ltd. | | | 5,800 | | | | 216,736 | |
Iriso Electronics Co., Ltd.(a) | | | 800 | | | | 39,717 | |
Japan Aviation Electronics Industry Ltd. | | | 7,000 | | | | 82,085 | |
Kaga Electronics Co., Ltd. | | | 9,300 | | | | 118,158 | |
Koa Corp. | | | 7,200 | | | | 53,362 | |
Mitsumi Electric Co., Ltd.*(a) | | | 15,100 | | | | 70,264 | |
Nippon Electric Glass Co., Ltd. | | | 90,000 | | | | 461,230 | |
Nippon Signal Co., Ltd. | | | 9,200 | | | | 76,206 | |
Nohmi Bosai Ltd. | | | 7,366 | | | | 111,675 | |
Oki Electric Industry Co., Ltd.(a) | | | 141,000 | | | | 199,466 | |
Panasonic Industrial Devices SUNX Co., Ltd. | | | 8,700 | | | | 46,366 | |
Ryoden Trading Co., Ltd. | | | 15,000 | | | | 88,082 | |
Ryosan Co., Ltd. | | | 7,100 | | | | 177,634 | |
Sanshin Electronics Co., Ltd. | | | 9,900 | | | | 78,305 | |
Siix Corp. | | | 3,600 | | | | 110,343 | |
SMK Corp. | | | 22,000 | | | | 113,137 | |
Taiyo Yuden Co., Ltd. | | | 7,200 | | | | 70,338 | |
Tokyo Electron Device Ltd.(a) | | | 5,700 | | | | 76,629 | |
Topcon Corp.(a) | | | 5,300 | | | | 69,978 | |
UKC Holdings Corp. | | | 3,100 | | | | 61,589 | |
| | | | | | | | |
| Total Electronic Equipment, Instruments & Components | | | | 4,298,450 | |
| Energy Equipment & Services – 0.3% | | | | | | | | |
Modec, Inc.(a) | | | 10,200 | | | | 149,649 | |
Shinko Plantech Co., Ltd. | | | 13,100 | | | | 99,886 | |
| | | | | | | | |
| Total Energy Equipment & Services | | | | 249,535 | |
| Food & Staples Retailing – 3.2% | | | | | | | | |
Ain Holdings, Inc. | | | 1,400 | | | | 71,872 | |
Arcs Co., Ltd. | | | 9,100 | | | | 204,111 | |
Axial Retailing, Inc. | | | 3,100 | | | | 102,189 | |
Belc Co., Ltd. | | | 2,600 | | | | 98,314 | |
Cocokara fine, Inc. | | | 4,300 | | | | 187,081 | |
Heiwado Co., Ltd. | | | 5,400 | | | | 112,233 | |
Inageya Co., Ltd.(a) | | | 6,300 | | | | 79,314 | |
Kato Sangyo Co., Ltd. | | | 7,100 | | | | 175,802 | |
Kobe Bussan Co., Ltd. | | | 2,400 | | | | 55,647 | |
Life Corp. | | | 4,400 | | | | 110,318 | |
Matsumotokiyoshi Holdings Co., Ltd. | | | 6,600 | | | | 345,869 | |
Ministop Co., Ltd. | | | 7,200 | | | | 131,258 | |
Mitsubishi Shokuhin Co., Ltd. | | | 9,500 | | | | 241,906 | |
Qol Co., Ltd. | | | 4,400 | | | | 66,199 | |
San-A Co., Ltd. | | | 1,700 | | | | 80,466 | |
UNY Group Holdings Co., Ltd. | | | 63,536 | | | | 448,277 | |
Valor Holdings Co., Ltd. | | | 6,400 | | | | 161,658 | |
Welcia Holdings Co., Ltd. | | | 2,500 | | | | 144,135 | |
Yaoko Co., Ltd. | | | 2,200 | | | | 97,380 | |
| | | | | | | | |
| Total Food & Staples Retailing | | | | 2,914,029 | |
See Notes to Financial Statements.
| | | | |
| WisdomTree Developed World ex-U.S. and Currency Hedged Equity Funds | | | 147 | |
Schedule of Investments (continued)
WisdomTree Japan Hedged SmallCap Equity Fund (DXJS)
March 31, 2016
| | | | | | | | |
| Investments | | Shares | | | Value | |
| Food Products – 4.0% | | | | | | | | |
Ariake Japan Co., Ltd. | | | 4,100 | | | $ | 240,758 | |
Fuji Oil Holdings, Inc. | | | 13,251 | | | | 239,212 | |
Fujicco Co., Ltd.(a) | | | 4,400 | | | | 92,075 | |
Hokuto Corp.(a) | | | 6,500 | | | | 128,733 | |
Itoham Foods, Inc.(a) | | | 28,000 | | | | 183,602 | |
J-Oil Mills, Inc. | | | 32,000 | | | | 97,940 | |
Kagome Co., Ltd.(a) | | | 6,700 | | | | 131,145 | |
Marudai Food Co., Ltd. | | | 23,000 | | | | 89,426 | |
Maruha Nichiro Corp. | | | 7,200 | | | | 134,462 | |
Megmilk Snow Brand Co., Ltd. | | | 13,300 | | | | 334,763 | |
Mitsui Sugar Co., Ltd. | | | 36,000 | | | | 160,790 | |
Morinaga & Co., Ltd. | | | 38,000 | | | | 193,728 | |
Morinaga Milk Industry Co., Ltd. | | | 41,000 | | | | 219,965 | |
Nichirei Corp. | | | 41,000 | | | | 334,143 | |
Nippon Flour Mills Co., Ltd. | | | 32,000 | | | | 263,357 | |
Nippon Suisan Kaisha Ltd. | | | 24,700 | | | | 120,209 | |
Nisshin Oillio Group Ltd. (The) | | | 38,000 | | | | 155,185 | |
Riken Vitamin Co., Ltd. | | | 3,700 | | | | 132,172 | |
S Foods, Inc.(a) | | | 3,800 | | | | 82,292 | |
Sakata Seed Corp. | | | 4,400 | | | | 111,923 | |
Showa Sangyo Co., Ltd. | | | 30,000 | | | | 124,383 | |
Starzen Co., Ltd. | | | 1,600 | | | | 44,771 | |
| | | | | | | | |
| Total Food Products | | | | 3,615,034 | |
| Gas Utilities – 0.2% | | | | | | | | |
K&O Energy Group, Inc. | | | 4,300 | | | | 53,178 | |
Saibu Gas Co., Ltd.(a) | | | 43,000 | | | | 99,471 | |
Shizuoka Gas Co., Ltd. | | | 9,200 | | | | 61,800 | |
| | | | | | | | |
| Total Gas Utilities | | | | 214,449 | |
| Health Care Equipment & Supplies – 1.6% | | | | | | | | |
Asahi Intecc Co., Ltd. | | | 2,400 | | | | 112,532 | |
Eiken Chemical Co., Ltd. | | | 3,700 | | | | 77,559 | |
Hogy Medical Co., Ltd. | | | 2,300 | | | | 123,600 | |
Mani, Inc.(a) | | | 2,100 | | | | 32,305 | |
Nagaileben Co., Ltd. | | | 4,400 | | | | 90,588 | |
Nakanishi, Inc. | | | 2,100 | | | | 66,796 | |
Nihon Kohden Corp. | | | 10,200 | | | | 253,922 | |
Nikkiso Co., Ltd. | | | 10,600 | | | | 77,994 | |
Nipro Corp. | | | 47,823 | | | | 454,849 | |
Paramount Bed Holdings Co., Ltd.(a) | | | 4,503 | | | | 164,863 | |
| | | | | | | | |
| Total Health Care Equipment & Supplies | | | | 1,455,008 | |
| Health Care Providers & Services – 0.8% | | | | | | | | |
BML, Inc. | | | 4,300 | | | | 166,805 | |
Nichii Gakkan Co.(a) | | | 9,700 | | | | 67,230 | |
Ship Healthcare Holdings, Inc.(a) | | | 11,159 | | | | 281,469 | |
Toho Holdings Co., Ltd.(a) | | | 7,000 | | | | 149,971 | |
Vital KSK Holdings, Inc. | | | 9,900 | | | | 78,217 | |
| | | | | | | | |
| Total Health Care Providers & Services | | | | 743,692 | |
| Hotels, Restaurants & Leisure – 3.1% | | | | | | | | |
Accordia Golf Co., Ltd.(a) | | | 31,400 | | | | 295,296 | |
Atom Corp.(a) | | | 7,000 | | | | 41,105 | |
Create Restaurants Holdings, Inc. | | | 7,800 | | | | 73,215 | |
Doutor Nichires Holdings Co., Ltd. | | | 7,200 | | | | 116,461 | |
Hiramatsu, Inc.(a) | | | 10,100 | | | | 66,677 | |
HIS Co., Ltd. | | | 3,400 | | | | 95,138 | |
Kyoritsu Maintenance Co., Ltd.(a) | | | 1,300 | | | | 112,309 | |
McDonald’s Holdings Co., Japan Ltd.(a) | | | 12,900 | | | | 305,987 | |
MOS Food Services, Inc.(a) | | | 2,900 | | | | 75,883 | |
Ohsho Food Service Corp. | | | 5,000 | | | | 153,699 | |
Plenus Co., Ltd.(a) | | | 9,900 | | | | 178,807 | |
Resorttrust, Inc.(a) | | | 13,300 | | | | 299,263 | |
Round One Corp.(a) | | | 33,200 | | | | 187,571 | |
Saizeriya Co., Ltd. | | | 3,800 | | | | 78,336 | |
Skylark Co., Ltd. | | | 29,300 | | | | 387,382 | |
St. Marc Holdings Co., Ltd. | | | 2,800 | | | | 77,352 | |
Tokyo Dome Corp. | | | 14,000 | | | | 63,526 | |
Tokyotokeiba Co., Ltd. | | | 35,000 | | | | 70,377 | |
Yoshinoya Holdings Co., Ltd.(a) | | | 8,100 | | | | 99,237 | |
| | | | | | | | |
| Total Hotels, Restaurants & Leisure | | | | 2,777,621 | |
| Household Durables – 2.7% | | | | | | | | |
Alpine Electronics, Inc. | | | 5,700 | | | | 63,950 | |
Cleanup Corp. | | | 10,100 | | | | 69,283 | |
First Juken Co., Ltd. | | | 5,400 | | | | 64,428 | |
Foster Electric Co., Ltd. | | | 3,606 | | | | 76,166 | |
France Bed Holdings Co., Ltd. | | | 10,000 | | | | 92,264 | |
Fuji Corp., Ltd.(a) | | | 13,400 | | | | 81,548 | |
Fujitsu General Ltd. | | | 13,000 | | | | 200,907 | |
Mitsui Home Co., Ltd. | | | 14,000 | | | | 65,519 | |
Nihon House Holdings Co., Ltd.(a) | | | 18,300 | | | | 66,104 | |
Nissei Build Kogyo Co., Ltd.(a) | | | 28,000 | | | | 95,912 | |
PanaHome Corp. | | | 37,000 | | | | 278,171 | |
Pressance Corp.(a) | | | 2,300 | | | | 88,198 | |
Sangetsu Co., Ltd. | | | 15,900 | | | | 288,731 | |
Starts Corp., Inc. | | | 12,800 | | | | 285,166 | |
Sumitomo Forestry Co., Ltd. | | | 24,700 | | | | 284,150 | |
Tamron Co., Ltd. | | | 4,300 | | | | 70,586 | |
TOA Corp.(a) | | | 9,300 | | | | 88,619 | |
Token Corp. | | | 1,480 | | | | 121,144 | |
Zojirushi Corp.(a) | | | 4,400 | | | | 70,153 | |
| | | | | | | | |
| Total Household Durables | | | | 2,450,999 | |
| Household Products – 0.6% | | | | | | | | |
Earth Chemical Co., Ltd. | | | 4,400 | | | | 178,122 | |
Lion Corp. | | | 35,000 | | | | 395,169 | |
| | | | | | | | |
| Total Household Products | | | | 573,291 | |
| Independent Power & Renewable Electricity Producers – 0.1% | |
West Holdings Corp.(a) | | | 16,200 | | | | 100,174 | |
| Industrial Conglomerates – 0.4% | | | | | | | | |
Nisshinbo Holdings, Inc. | | | 16,900 | | | | 179,683 | |
TOKAI Holdings Corp.(a) | | | 31,400 | | | | 163,712 | |
| | | | | | | | |
| Total Industrial Conglomerates | | | | 343,395 | |
| Internet & Catalog Retail – 0.3% | | | | | | | | |
ASKUL Corp.(a) | | | 4,300 | | | | 175,221 | |
Belluna Co., Ltd. | | | 13,000 | | | | 66,044 | |
| | | | | | | | |
| Total Internet & Catalog Retail | | | | 241,265 | |
See Notes to Financial Statements.
| | |
| 148 | | WisdomTree Developed World ex-U.S. and Currency Hedged Equity Funds |
Schedule of Investments (continued)
WisdomTree Japan Hedged SmallCap Equity Fund (DXJS)
March 31, 2016
| | | | | | | | |
| Investments | | Shares | | | Value | |
| Internet Software & Services – 0.9% | | | | | | | | |
Dip Corp.(a) | | | 4,400 | | | $ | 103,741 | |
F@N Communications, Inc.(a) | | | 11,000 | | | | 82,699 | |
GMO Internet, Inc. | | | 14,700 | | | | 196,576 | |
Gree, Inc.(a) | | | 30,100 | | | | 165,504 | |
Gurunavi, Inc. | | | 7,200 | | | | 171,232 | |
Infomart Corp.(a) | | | 3,800 | | | | 34,215 | |
NIFTY Corp. | | | 4,400 | | | | 39,343 | |
| | | | | | | | |
| Total Internet Software & Services | | | | 793,310 | |
| IT Services – 1.9% | | | | | | | | |
DTS Corp. | | | 4,900 | | | | 93,863 | |
Future Architect, Inc. | | | 14,200 | | | | 110,800 | |
Ines Corp. | | | 9,000 | | | | 92,647 | |
Information Services International-Dentsu Ltd. | | | 7,200 | | | | 144,647 | |
IT Holdings Corp. | | | 10,200 | | | | 241,762 | |
NEC Networks & System Integration Corp. | | | 10,700 | | | | 166,600 | |
NET One Systems Co., Ltd. | | | 25,800 | | | | 139,565 | |
Nihon Unisys Ltd.(a) | | | 18,900 | | | | 250,722 | |
NS Solutions Corp. | | | 11,400 | | | | 224,054 | |
Transcosmos, Inc.(a) | | | 8,800 | | | | 228,935 | |
| | | | | | | | |
| Total IT Services | | | | 1,693,595 | |
| Leisure Products – 1.5% | | | | | | | | |
Daikoku Denki Co., Ltd.(a) | | | 5,900 | | | | 69,081 | |
Dunlop Sports Co., Ltd.(a) | | | 10,100 | | | | 90,042 | |
Fields Corp. | | | 9,500 | | | | 158,819 | |
Heiwa Corp. | | | 36,200 | | | | 751,409 | |
Tomy Co., Ltd.(a) | | | 13,100 | | | | 95,807 | |
Universal Entertainment Corp. | | | 12,200 | | | | 202,872 | |
| | | | | | | | |
| Total Leisure Products | | | | 1,368,030 | |
| Machinery – 5.9% | | | | | | | | |
Aichi Corp. | | | 12,900 | | | | 89,868 | |
Aida Engineering Ltd. | | | 12,200 | | | | 106,158 | |
Alinco, Inc.(a) | | | 7,300 | | | | 65,339 | |
Asahi Diamond Industrial Co., Ltd. | | | 9,700 | | | | 87,080 | |
Bando Chemical Industries Ltd. | | | 24,000 | | | | 108,688 | |
CKD Corp. | | | 11,500 | | | | 95,053 | |
Daifuku Co., Ltd. | | | 11,400 | | | | 192,409 | |
DMG Mori Co., Ltd.(a) | | | 10,500 | | | | 96,690 | |
Ebara Corp. | | | 71,000 | | | | 296,899 | |
Fujitec Co., Ltd. | | | 13,100 | | | | 133,570 | |
Furukawa Co., Ltd. | | | 86,000 | | | | 127,016 | |
Giken Ltd.(a) | | | 3,200 | | | | 58,195 | |
Glory Ltd. | | | 9,100 | | | | 309,689 | |
Harmonic Drive Systems, Inc.(a) | | | 4,600 | | | | 117,829 | |
Hitachi Koki Co., Ltd. | | | 22,800 | | | | 150,925 | |
Hitachi Zosen Corp. | | | 21,135 | | | | 100,415 | |
Hokuetsu Industries Co., Ltd.(a) | | | 8,700 | | | | 53,487 | |
Japan Steel Works Ltd. (The) | | | 24,018 | | | | 75,861 | |
Kitz Corp. | | | 27,400 | | | | 118,722 | |
Kobelco Eco-Solutions Co., Ltd.(a) | | | 14,433 | | | | 57,658 | |
Kokusai Co., Ltd.(a) | | | 3,700 | | | | 41,973 | |
Makino Milling Machine Co., Ltd. | | | 12,000 | | | | 73,562 | |
Max Co., Ltd. | | | 15,000 | | | | 154,277 | |
Meidensha Corp. | | | 29,000 | | | | 132,364 | |
Mitsuboshi Belting Ltd. | | | 15,000 | | | | 120,913 | |
Mitsui Engineering & Shipbuilding Co., Ltd. | | | 73,000 | | | | 109,115 | |
Miura Co., Ltd. | | | 15,900 | | | | 297,219 | |
Morita Holdings Corp. | | | 9,300 | | | | 108,891 | |
Nachi-Fujikoshi Corp. | | | 17,000 | | | | 59,291 | |
Nippon Thompson Co., Ltd. | | | 11,000 | | | | 39,343 | |
Nitta Corp. | | | 4,300 | | | | 108,461 | |
Nitto Kohki Co., Ltd. | | | 3,000 | | | | 59,496 | |
Noritake Co., Ltd. | | | 39,000 | | | | 88,136 | |
Obara Group, Inc. | | | 1,500 | | | | 53,850 | |
Oiles Corp. | | | 7,200 | | | | 107,813 | |
OKUMA Corp.(a) | | | 15,000 | | | | 105,031 | |
OSG Corp.(a) | | | 10,900 | | | | 203,754 | |
Ryobi Ltd. | | | 31,000 | | | | 122,461 | |
Shima Seiki Manufacturing Ltd.(a) | | | 5,500 | | | | 91,801 | |
Sodick Co., Ltd. | | | 8,600 | | | | 64,426 | |
Star Micronics Co., Ltd. | | | 8,500 | | | | 95,440 | |
Tadano Ltd. | | | 12,000 | | | | 111,571 | |
Takuma Co., Ltd. | | | 14,000 | | | | 125,433 | |
Tocalo Co., Ltd. | | | 4,300 | | | | 77,434 | |
Toshiba Machine Co., Ltd. | | | 15,000 | | | | 46,176 | |
Tsubakimoto Chain Co. | | | 15,000 | | | | 93,020 | |
Tsugami Corp.(a) | | | 13,000 | | | | 47,306 | |
Tsurumi Manufacturing Co., Ltd. | | | 4,500 | | | | 64,460 | |
Union Tool Co.(a) | | | 1,400 | | | | 36,845 | |
YAMABIKO Corp. | | | 7,300 | | | | 50,855 | |
| | | | | | | | |
| Total Machinery | | | | 5,332,268 | |
| Marine – 0.6% | | | | | | | | |
Japan Transcity Corp. | | | 13,000 | | | | 43,605 | |
Kawasaki Kisen Kaisha Ltd.(a) | | | 230,000 | | | | 446,105 | |
NS United Kaiun Kaisha Ltd. | | | 65,740 | | | | 88,905 | |
| | | | | | | | |
| Total Marine | | | | 578,615 | |
| Media – 1.6% | | | | | | | | |
Avex Group Holdings, Inc. | | | 7,800 | | | | 101,807 | |
Daiichikosho Co., Ltd. | | | 13,000 | | | | 566,751 | |
SKY Perfect JSAT Holdings, Inc. | | | 59,400 | | | | 346,163 | |
Toei Co., Ltd. | | | 14,000 | | | | 124,810 | |
Tv Tokyo Holdings Corp. | | | 6,300 | | | | 115,075 | |
Wowow, Inc. | | | 3,700 | | | | 78,579 | |
Zenrin Co., Ltd. | | | 7,100 | | | | 142,828 | |
| | | | | | | | |
| Total Media | | | | 1,476,013 | |
| Metals & Mining – 2.6% | | | | | | | | |
Aichi Steel Corp. | | | 31,000 | | | | 121,634 | |
Asahi Holdings, Inc. | | | 8,600 | | | | 115,998 | |
Daido Steel Co., Ltd. | | | 46,000 | | | | 159,616 | |
Dowa Holdings Co., Ltd. | | | 43,000 | | | | 239,877 | |
Godo Steel Ltd. | | | 36,000 | | | | 60,536 | |
Kyoei Steel Ltd. | | | 6,800 | | | | 102,368 | |
Mitsubishi Steel Manufacturing Co., Ltd. | | | 35,987 | | | | 58,273 | |
Mitsui Mining & Smelting Co., Ltd. | | | 92,000 | | | | 147,337 | |
Neturen Co., Ltd. | | | 6,800 | | | | 46,223 | |
Nippon Light Metal Holdings Co., Ltd.(a) | | | 116,500 | | | | 191,757 | |
See Notes to Financial Statements.
| | | | |
| WisdomTree Developed World ex-U.S. and Currency Hedged Equity Funds | | | 149 | |
Schedule of Investments (continued)
WisdomTree Japan Hedged SmallCap Equity Fund (DXJS)
March 31, 2016
| | | | | | | | |
| Investments | | Shares | | | Value | |
Nisshin Steel Co., Ltd. | | | 25,632 | | | $ | 299,433 | |
Osaka Steel Co., Ltd. | | | 4,600 | | | | 75,388 | |
OSAKA Titanium Technologies Co., Ltd.(a) | | | 1,900 | | | | 25,847 | |
Sanyo Special Steel Co., Ltd. | | | 27,000 | | | | 123,475 | |
Toho Zinc Co., Ltd.(a) | | | 24,000 | | | | 60,857 | |
Tokyo Steel Manufacturing Co., Ltd. | | | 10,100 | | | | 60,207 | |
Topy Industries Ltd. | | | 39,000 | | | | 77,032 | |
Toyo Kohan Co., Ltd. | | | 14,000 | | | | 42,102 | |
UACJ Corp.(a) | | | 73,532 | | | | 149,164 | |
Yamato Kogyo Co., Ltd. | | | 7,600 | | | | 165,192 | |
| | | | | | | | |
| Total Metals & Mining | | | | 2,322,316 | |
| Multiline Retail – 0.5% | | | | | | | | |
H2O Retailing Corp.(a) | | | 13,000 | | | | 224,734 | |
Parco Co., Ltd. | | | 11,200 | | | | 94,965 | |
Seria Co., Ltd. | | | 1,646 | | | | 99,438 | |
| | | | | | | | |
| Total Multiline Retail | | | | 419,137 | |
| Oil, Gas & Consumable Fuels – 0.7% | | | | | | | | |
BP Castrol K.K.(a) | | | 10,200 | | | | 115,799 | |
Itochu Enex Co., Ltd. | | | 20,700 | | | | 166,307 | |
Nippon Coke & Engineering Co., Ltd. | | | 105,900 | | | | 76,319 | |
Nippon Gas Co., Ltd. | | | 3,700 | | | | 83,649 | |
San-Ai Oil Co., Ltd. | | | 15,000 | | | | 109,035 | |
Sinanen Holdings Co., Ltd. | | | 14,000 | | | | 54,807 | |
| | | | | | | | |
| Total Oil, Gas & Consumable Fuels | | | | 605,916 | |
| Paper & Forest Products – 1.1% | | | | | | | | |
Daiken Corp. | | | 29,000 | | | | 81,018 | |
Daio Paper Corp.(a) | | | 8,000 | | | | 67,547 | |
Hokuetsu Kishu Paper Co., Ltd.(a) | | | 36,400 | | | | 217,309 | |
Nippon Paper Industries Co., Ltd.(a) | | | 27,400 | | | | 488,297 | |
Tokushu Tokai Paper Co., Ltd.(a) | | | 34,000 | | | | 110,112 | |
| | | | | | | | |
| Total Paper & Forest Products | | | | 964,283 | |
| Personal Products – 1.5% | | | | | | | | |
Artnature, Inc. | | | 9,300 | | | | 83,902 | |
Ci:z Holdings Co., Ltd. | | | 8,700 | | | | 178,420 | |
Fancl Corp. | | | 12,900 | | | | 176,178 | |
Kobayashi Pharmaceutical Co., Ltd. | | | 4,100 | | | | 360,407 | |
Mandom Corp. | | | 3,800 | | | | 169,385 | |
Milbon Co., Ltd. | | | 3,500 | | | | 141,688 | |
Noevir Holdings Co., Ltd. | | | 9,200 | | | | 264,798 | |
| | | | | | | | |
| Total Personal Products | | | | 1,374,778 | |
| Pharmaceuticals – 2.4% | | | | | | | | |
Fuji Pharma Co., Ltd.(a) | | | 4,200 | | | | 70,850 | |
KYORIN Holdings, Inc. | | | 13,700 | | | | 261,336 | |
Mochida Pharmaceutical Co., Ltd. | | | 4,100 | | | | 304,960 | |
Nichi-iko Pharmaceutical Co., Ltd. | | | 5,800 | | | | 133,963 | |
Nippon Shinyaku Co., Ltd. | | | 4,200 | | | | 164,420 | |
Rohto Pharmaceutical Co., Ltd. | | | 13,000 | | | | 237,110 | |
Sawai Pharmaceutical Co., Ltd. | | | 5,400 | | | | 338,716 | |
Torii Pharmaceutical Co., Ltd. | | | 2,900 | | | | 66,775 | |
Towa Pharmaceutical Co., Ltd.(a) | | | 1,800 | | | | 73,909 | |
Tsumura & Co.(a) | | | 16,000 | | | | 384,644 | |
ZERIA Pharmaceutical Co., Ltd.(a) | | | 8,500 | | | | 110,490 | |
| | | | | | | | |
| Total Pharmaceuticals | | | | 2,147,173 | |
| Professional Services – 1.4% | | | | | | | | |
Altech Corp. | | | 3,700 | | | | 77,855 | |
FULLCAST Holdings Co., Ltd. | | | 10,200 | | | | 71,784 | |
Funai Soken Holdings, Inc. | | | 9,360 | | | | 150,733 | |
Meitec Corp.(a) | | | 6,700 | | | | 234,570 | |
Nomura Co., Ltd. | | | 10,100 | | | | 146,744 | |
Space Co., Ltd. | | | 10,200 | | | | 123,422 | |
Temp Holdings Co., Ltd. | | | 12,800 | | | | 185,859 | |
Weathernews, Inc. | | | 3,700 | | | | 124,436 | |
Yumeshin Holdings Co., Ltd.(a) | | | 25,300 | | | | 139,786 | |
| | | | | | | | |
| Total Professional Services | | | | 1,255,189 | |
| Real Estate Management & Development – 1.5% | | | | | | | | |
Airport Facilities Co., Ltd. | | | 8,100 | | | | 36,682 | |
Daibiru Corp. | | | 13,000 | | | | 109,880 | |
Daikyo, Inc. | | | 129,000 | | | | 205,445 | |
Goldcrest Co., Ltd. | | | 5,100 | | | | 76,322 | |
Heiwa Real Estate Co., Ltd. | | | 6,000 | | | | 74,736 | |
Kenedix, Inc. | | | 16,400 | | | | 71,790 | |
Open House Co., Ltd. | | | 6,800 | | | | 135,401 | |
Relo Holdings, Inc.(a) | | | 1,548 | | | | 207,832 | |
Sumitomo Real Estate Sales Co., Ltd. | | | 7,200 | | | | 138,818 | |
Takara Leben Co., Ltd. | | | 13,100 | | | | 77,625 | |
TOC Co., Ltd. | | | 12,900 | | | | 109,265 | |
Unizo Holdings Co., Ltd.(a) | | | 2,600 | | | | 112,078 | |
| | | | | | | | |
| Total Real Estate Management & Development | | | | 1,355,874 | |
| Road & Rail – 2.4% | | | | | | | | |
Fukuyama Transporting Co., Ltd.(a) | | | 34,000 | | | | 166,075 | |
Hitachi Transport System Ltd. | | | 13,200 | | | | 221,028 | |
Ichinen Holdings Co., Ltd. | | | 7,100 | | | | 63,170 | |
Maruzen Showa Unyu Co., Ltd. | | | 15,000 | | | | 52,716 | |
Nankai Electric Railway Co., Ltd. | | | 53,838 | | | | 292,673 | |
Nikkon Holdings Co., Ltd. | | | 13,100 | | | | 237,768 | |
Nishi-Nippon Railroad Co., Ltd. | | | 43,000 | | | | 280,813 | |
Sankyu, Inc. | | | 42,000 | | | | 192,073 | |
Seino Holdings Co., Ltd. | | | 25,800 | | | | 278,441 | |
Senko Co., Ltd. | | | 27,000 | | | | 164,794 | |
Sotetsu Holdings, Inc. | | | 42,000 | | | | 257,841 | |
| | | | | | | | |
| Total Road & Rail | | | | 2,207,392 | |
| Semiconductors & Semiconductor Equipment – 1.1% | | | | | |
Advantest Corp.(a) | | | 18,700 | | | | 173,199 | |
Lasertec Corp. | | | 4,400 | | | | 62,088 | |
MegaChips Corp.(a) | | | 7,292 | | | | 82,071 | |
Mimasu Semiconductor Industry Co., Ltd. | | | 6,000 | | | | 55,252 | |
Mitsui High-Tec, Inc. | | | 7,300 | | | | 44,945 | |
Nuflare Technology, Inc.(a) | | | 2,100 | | | | 93,140 | |
SCREEN Holdings Co., Ltd. | | | 15,700 | | | | 124,320 | |
Shindengen Electric Manufacturing Co., Ltd. | | | 15,000 | | | | 50,847 | |
Shinko Electric Industries Co., Ltd. | | | 31,500 | | | | 177,406 | |
Tokyo Seimitsu Co., Ltd. | | | 7,800 | | | | 153,162 | |
| | | | | | | | |
| Total Semiconductors & Semiconductor Equipment | | | | 1,016,430 | |
| Software – 1.9% | | | | | | | | |
Capcom Co., Ltd. | | | 11,300 | | | | 275,977 | |
Fuji Soft, Inc. | | | 3,300 | | | | 72,081 | |
See Notes to Financial Statements.
| | |
| 150 | | WisdomTree Developed World ex-U.S. and Currency Hedged Equity Funds |
Schedule of Investments (continued)
WisdomTree Japan Hedged SmallCap Equity Fund (DXJS)
March 31, 2016
| | | | | | | | |
| Investments | | Shares | | | Value | |
Imagica Robot Holdings, Inc.(a) | | | 10,100 | | | $ | 36,394 | |
Konami Holdings Corp.(a) | | | 13,300 | | | | 394,048 | |
Marvelous, Inc.(a) | | | 6,300 | | | | 56,613 | |
MTI Ltd.(a) | | | 7,200 | | | | 50,095 | |
NSD Co., Ltd. | | | 23,300 | | | | 344,955 | |
Square Enix Holdings Co., Ltd. | | | 11,850 | | | | 320,512 | |
Systena Corp. | | | 10,200 | | | | 173,698 | |
| | | | | | | | |
| Total Software | | | | 1,724,373 | |
| Specialty Retail – 5.7% | | | | | | | | |
Adastria Co., Ltd. | | | 8,422 | | | | 255,893 | |
Alpen Co., Ltd.(a) | | | 8,000 | | | | 132,105 | |
AOKI Holdings, Inc. | | | 15,800 | | | | 191,183 | |
Aoyama Trading Co., Ltd. | | | 9,400 | | | | 361,715 | |
Arcland Sakamoto Co., Ltd. | | | 6,796 | | | | 72,075 | |
Autobacs Seven Co., Ltd. | | | 24,600 | | | | 415,855 | |
Bic Camera, Inc. | | | 11,100 | | | | 100,932 | |
Chiyoda Co., Ltd. | | | 8,300 | | | | 239,263 | |
DCM Holdings Co., Ltd. | | | 24,600 | | | | 177,942 | |
EDION Corp.(a) | | | 24,700 | | | | 187,676 | |
Geo Holdings Corp.(a) | | | 12,900 | | | | 214,742 | |
Gulliver International Co., Ltd.(a) | | | 14,900 | | | | 185,728 | |
Joyful Honda Co., Ltd.(a) | | | 5,500 | | | | 123,413 | |
K’s Holdings Corp.(a) | | | 9,617 | | | | 319,155 | |
Keiyo Co., Ltd.(a) | | | 16,000 | | | | 72,459 | |
Kohnan Shoji Co., Ltd.(a) | | | 10,100 | | | | 150,518 | |
Komeri Co., Ltd. | | | 6,700 | | | | 137,106 | |
Kyoto Kimono Yuzen Co., Ltd.(a) | | | 8,300 | | | | 63,582 | |
Nishimatsuya Chain Co., Ltd. | | | 13,000 | | | | 130,468 | |
Nojima Corp.(a) | | | 6,000 | | | | 65,554 | |
Pal Co., Ltd. | | | 3,900 | | | | 97,817 | |
Sac’s Bar Holdings, Inc.(a) | | | 3,200 | | | | 44,386 | |
Sanrio Co., Ltd.(a) | | | 17,157 | | | | 335,981 | |
Shimachu Co., Ltd. | | | 8,600 | | | | 205,598 | |
T-Gaia Corp.(a) | | | 16,700 | | | | 193,604 | |
United Arrows Ltd. | | | 7,400 | | | | 306,482 | |
VT Holdings Co., Ltd.(a) | | | 24,254 | | | | 145,876 | |
Xebio Holdings Co., Ltd. | | | 6,700 | | | | 107,062 | |
Yellow Hat Ltd. | | | 5,400 | | | | 108,725 | |
| | | | | | | | |
| Total Specialty Retail | | | | 5,142,895 | |
| Technology Hardware, Storage & Peripherals – 1.0% | | | | | |
Eizo Corp. | | | 5,000 | | | | 125,984 | |
Elecom Co., Ltd. | | | 8,500 | | | | 150,043 | |
Hitachi Maxell Ltd. | | | 17,100 | | | | 260,619 | |
Riso Kagaku Corp. | | | 9,700 | | | | 149,822 | |
Wacom Co., Ltd.(a) | | | 53,800 | | | | 228,325 | |
| | | | | | | | |
| Total Technology Hardware, Storage & Peripherals | | | | 914,793 | |
| Textiles, Apparel & Luxury Goods – 1.6% | | | | | | | | |
Descente Ltd. | | | 5,300 | | | | 78,183 | |
Fujibo Holdings, Inc. | | | 28,000 | | | | 55,803 | |
Gunze Ltd. | | | 49,000 | | | | 138,636 | |
Japan Wool Textile Co., Ltd. (The) | | | 15,500 | | | | 104,809 | |
Kurabo Industries Ltd. | | | 56,000 | | | | 97,157 | |
Onward Holdings Co., Ltd. | | | 42,639 | | | | 291,734 | |
Sanyo Shokai Ltd. | | | 33,000 | | | | 75,163 | |
Seiko Holdings Corp. | | | 26,000 | | | | 103,172 | |
Seiren Co., Ltd. | | | 10,300 | | | | 115,926 | |
Wacoal Holdings Corp. | | | 25,000 | | | | 298,723 | |
Yondoshi Holdings, Inc. | | | 3,700 | | | | 91,517 | |
| | | | | | | | |
| Total Textiles, Apparel & Luxury Goods | | | | 1,450,823 | |
| Trading Companies & Distributors – 2.7% | | | | | |
Daiichi Jitsugyo Co., Ltd. | | | 14,000 | | | | 61,408 | |
Hanwa Co., Ltd. | | | 49,000 | | | | 207,082 | |
Inaba Denki Sangyo Co., Ltd. | | | 6,400 | | | | 201,860 | |
Inabata & Co., Ltd. | | | 15,900 | | | | 157,875 | |
Iwatani Corp.(a) | | | 15,000 | | | | 87,282 | |
Japan Pulp & Paper Co., Ltd.(a) | | | 43,000 | | | | 123,191 | |
Kanematsu Corp. | | | 73,000 | | | | 106,517 | |
Kuroda Electric Co., Ltd. | | | 5,100 | | | | 76,458 | |
MonotaRO Co., Ltd.(a) | | | 4,300 | | | | 127,973 | |
Nagase & Co., Ltd. | | | 16,800 | | | | 184,898 | |
Nippon Steel & Sumikin Bussan Corp. | | | 72,960 | | | | 243,427 | |
Nishio Rent All Co., Ltd. | | | 4,300 | | | | 101,996 | |
Onoken Co., Ltd.(a) | | | 8,500 | | | | 74,567 | |
Sanyo Trading Co., Ltd. | | | 2,200 | | | | 29,008 | |
Seika Corp. | | | 13,000 | | | | 26,256 | |
Shinsho Corp. | | | 36,000 | | | | 65,341 | |
Trusco Nakayama Corp. | | | 4,000 | | | | 159,082 | |
Wakita & Co., Ltd. | | | 10,045 | | | | 84,010 | |
Yamazen Corp. | | | 16,400 | | | | 124,756 | |
Yuasa Trading Co., Ltd. | | | 7,200 | | | | 169,438 | |
| | | | | | | | |
| Total Trading Companies & Distributors | | | | 2,412,425 | |
| Transportation Infrastructure – 0.6% | | | | | | | | |
Kamigumi Co., Ltd. | | | 22,000 | | | | 207,287 | |
Mitsubishi Logistics Corp.(a) | | | 11,000 | | | | 144,650 | |
Nissin Corp. | | | 24,000 | | | | 65,768 | |
Sumitomo Warehouse Co., Ltd. (The) | | | 30,000 | | | | 152,943 | |
| | | | | | | | |
| Total Transportation Infrastructure | | | | | | | 570,648 | |
TOTAL COMMON STOCKS
(Cost: $90,624,692) | | | | | | | 89,684,979 | |
| INVESTMENT OF CASH COLLATERAL FOR SECURITIES LOANED – 20.0% | |
| United States – 20.0% | | | | | | | | |
State Street Navigator Securities Lending Prime Portfolio, 0.50%(b) | | | | | | | | |
| (Cost: $18,107,628)(c) | | | 18,107,628 | | | | 18,107,628 | |
TOTAL INVESTMENTS IN SECURITIES – 119.0%
(Cost: $108,732,320) | | | | 107,792,607 | |
Liabilities in Excess of Cash, Foreign Currency and Other Assets – (19.0)% | | | | | | | (17,208,799 | ) |
| | | | | | | | |
| NET ASSETS – 100.0% | | | $ | 90,583,808 | |
| * | Non-income producing security. |
| (a) | Security, or portion thereof, was on loan at March 31, 2016 (See Note 2). |
| (b) | Rate shown represents annualized 7-day yield as of March 31, 2016. |
| (c) | At March 31, 2016, the total market value of the Fund’s securities on loan was $17,587,909 and the total market value of the collateral held by the Fund was $18,505,307. The total market value of the collateral includes non-cash U.S. Government securities collateral having a value of $397,679. |
See Notes to Financial Statements.
| | | | |
| WisdomTree Developed World ex-U.S. and Currency Hedged Equity Funds | | | 151 | |
Schedule of Investments (concluded)
WisdomTree Japan Hedged SmallCap Equity Fund (DXJS)
March 31, 2016
| | | | | | | | | | | | | | | | | | |
| FINANCIAL DERIVATIVE INSTRUMENTS | |
| FORWARD CONTRACTS | |
Settlement Date | | Contracts
To Deliver | | | In
Exchange For | | | Unrealized
Gain (Loss) | |
4/4/2016 | | JPY | | | 4,000,000 | | | | USD | | | | 35,556 | | | $ | (33 | ) |
4/5/2016 | | JPY | | | 2,258,349,343 | | | | USD | | | | 20,030,914 | | | | (62,855 | ) |
4/5/2016 | | JPY | | | 2,258,395,414 | | | | USD | | | | 20,030,914 | | | | (63,265 | ) |
4/5/2016 | | JPY | | | 2,258,425,460 | | | | USD | | | | 20,030,914 | | | | (63,533 | ) |
4/5/2016 | | JPY | | | 2,258,417,448 | | | | USD | | | | 20,030,914 | | | | (63,461 | ) |
4/5/2016 | | JPY | | | 1,720,717,800 | | | | USD | | | | 15,261,653 | | | | (48,514 | ) |
4/5/2016 | | USD | | | 8,942,373 | | | | JPY | | | | 1,014,607,006 | | | | 85,140 | |
4/5/2016 | | USD | | | 18,153,016 | | | | JPY | | | | 2,040,175,716 | | | | (457 | ) |
4/5/2016 | | USD | | | 13,830,872 | | | | JPY | | | | 1,554,486,281 | | | | 243 | |
4/5/2016 | | USD | | | 18,153,016 | | | | JPY | | | | 2,040,368,138 | | | | 1,255 | |
4/5/2016 | | USD | | | 18,153,016 | | | | JPY | | | | 2,040,126,703 | | | | (893 | ) |
4/5/2016 | | USD | | | 18,153,016 | | | | JPY | | | | 2,040,259,220 | | | | 286 | |
5/9/2016 | | JPY | | | 2,160,879,784 | | | | USD | | | | 19,243,622 | | | | (1,805 | ) |
5/9/2016 | | JPY | | | 2,160,904,801 | | | | USD | | | | 19,243,622 | | | | (2,027 | ) |
5/9/2016 | | JPY | | | 2,160,931,742 | | | | USD | | | | 19,243,622 | | | | (2,267 | ) |
5/9/2016 | | JPY | | | 2,160,997,171 | | | | USD | | | | 19,243,622 | | | | (2,850 | ) |
5/9/2016 | | JPY | | | 1,646,425,848 | | | | USD | | | | 14,661,809 | | | | (1,741 | ) |
| | | | | | | | | | | | | | | | | $ | (226,777 | ) |
| | |
| CURRENCY LEGEND |
JPY | | – Japanese yen |
USD | | – U.S. dollar |
See Notes to Financial Statements.
| | |
| 152 | | WisdomTree Developed World ex-U.S. and Currency Hedged Equity Funds |
Schedule of Investments
WisdomTree Japan Hedged Tech, Media and Telecom Fund (DXJT)
March 31, 2016
| | | | | | | | |
| Investments | | Shares | | | Value | |
| COMMON STOCKS – 99.4% | | | | | | | | |
| Japan – 99.4% | | | | | | | | |
| Commercial Services & Supplies – 0.1% | | | | | | | | |
Nissha Printing Co., Ltd.(a) | | | 130 | | | $ | 1,906 | |
| Communications Equipment – 0.1% | | | | | | | | |
Hitachi Kokusai Electric, Inc. | | | 200 | | | | 2,408 | |
| Electronic Equipment, Instruments & Components – 25.5% | | | | | |
Ai Holdings Corp. | | | 140 | | | | 4,067 | |
Alps Electric Co., Ltd.(a) | | | 840 | | | | 14,663 | |
Amano Corp. | | | 260 | | | | 4,111 | |
Anritsu Corp.(a) | | | 520 | | | | 2,864 | |
Azbil Corp. | | | 250 | | | | 6,408 | |
Citizen Holdings Co., Ltd. | | | 1,290 | | | | 7,323 | |
Hamamatsu Photonics K.K. | | | 620 | | | | 17,128 | |
Hirose Electric Co., Ltd. | | | 121 | | | | 13,360 | |
Hitachi High-Technologies Corp. | | | 300 | | | | 8,461 | |
Hitachi Ltd. | | | 20,600 | | | | 96,516 | |
Horiba Ltd. | | | 170 | | | | 6,353 | |
Ibiden Co., Ltd.(a) | | | 630 | | | | 7,713 | |
Japan Aviation Electronics Industry Ltd. | | | 400 | | | | 4,691 | |
Japan Display, Inc. | | | 1,850 | | | | 3,621 | |
Keyence Corp. | | | 187 | | | | 102,139 | |
Kyocera Corp. | | | 1,420 | | | | 62,627 | |
Murata Manufacturing Co., Ltd. | | | 875 | | | | 105,643 | |
Nichicon Corp. | | | 330 | | | | 2,302 | |
Nippon Electric Glass Co., Ltd. | | | 1,500 | | | | 7,687 | |
Nippon Signal Co., Ltd.(a) | | | 230 | | | | 1,905 | |
Oki Electric Industry Co., Ltd.(a) | | | 4,400 | | | | 6,224 | |
Omron Corp. | | | 990 | | | | 29,507 | |
Ryosan Co., Ltd. | | | 80 | | | | 2,001 | |
Shimadzu Corp. | | | 1,030 | | | | 16,175 | |
Siix Corp. | | | 80 | | | | 2,452 | |
Taiyo Yuden Co., Ltd.(a) | | | 500 | | | | 4,885 | |
TDK Corp. | | | 540 | | | | 30,028 | |
Topcon Corp.(a) | | | 500 | | | | 6,602 | |
Yaskawa Electric Corp. | | | 1,180 | | | | 13,638 | |
Yokogawa Electric Corp. | | | 960 | | | | 9,933 | |
| | | | | | | | |
| Total Electronic Equipment, Instruments & Components | | | | 601,027 | |
| Household Durables – 11.7% | | | | | | | | |
Alpine Electronics, Inc. | | | 240 | | | | 2,693 | |
Casio Computer Co., Ltd.(a) | | | 1,100 | | | | 22,226 | |
Foster Electric Co., Ltd. | | | 110 | | | | 2,323 | |
Fujitsu General Ltd. | | | 200 | | | | 3,091 | |
Nikon Corp.(a) | | | 1,520 | | | | 23,288 | |
Panasonic Corp. | | | 9,420 | | | | 86,619 | |
Pioneer Corp.*(a) | | | 1,030 | | | | 2,731 | |
Sharp Corp.*(a) | | | 7,400 | | | | 8,493 | |
Sony Corp. | | | 4,850 | | | | 124,837 | |
| | | | | | | | |
| Total Household Durables | | | | 276,301 | |
| Internet & Catalog Retail – 2.1% | | | | | | | | |
ASKUL Corp. | | | 80 | | | | 3,260 | |
Rakuten, Inc. | | | 3,930 | | | | 37,956 | |
Start Today Co., Ltd. | | | 230 | | | | 9,290 | |
| | | | | | | | |
| Total Internet & Catalog Retail | | | | 50,506 | |
| Internet Software & Services – 2.5% | | | | | | | | |
COOKPAD, Inc.(a) | | | 180 | | | $ | 2,888 | |
DeNa Co., Ltd.(a) | | | 390 | | | | 6,728 | |
GMO Internet, Inc. | | | 360 | | | | 4,814 | |
Internet Initiative Japan, Inc.(a) | | | 140 | | | | 2,881 | |
Kakaku.com, Inc.(a) | | | 640 | | | | 11,901 | |
Mixi, Inc.(a) | | | 190 | | | | 7,066 | |
Yahoo Japan Corp.(a) | | | 5,220 | | | | 22,246 | |
| | | | | | | | |
| Total Internet Software & Services | | | | 58,524 | |
| IT Services – 7.0% | | | | | | | | |
Digital Garage, Inc.(a) | | | 290 | | | | 5,292 | |
DTS Corp. | | | 110 | | | | 2,107 | |
Fujitsu Ltd. | | | 7,900 | | | | 29,282 | |
GMO Payment Gateway, Inc. | | | 70 | | | | 4,746 | |
IT Holdings Corp. | | | 400 | | | | 9,481 | |
Itochu Techno-Solutions Corp.(a) | | | 280 | | | | 5,291 | |
NEC Networks & System Integration Corp. | | | 230 | | | | 3,581 | |
Nihon Unisys Ltd.(a) | | | 340 | | | | 4,510 | |
Nomura Research Institute Ltd. | | | 660 | | | | 22,256 | |
NS Solutions Corp. | | | 200 | | | | 3,931 | |
NTT Data Corp. | | | 560 | | | | 28,151 | |
Obic Co., Ltd. | | | 320 | | | | 16,940 | |
Otsuka Corp. | | | 250 | | | | 13,212 | |
SCSK Corp. | | | 270 | | | | 10,570 | |
Transcosmos, Inc.(a) | | | 180 | | | | 4,683 | |
| | | | | | | | |
| Total IT Services | | | | 164,033 | |
| Leisure Products – 2.6% | | | | | | | | |
Bandai Namco Holdings, Inc. | | | 810 | | | | 17,685 | |
Heiwa Corp. | | | 170 | | | | 3,529 | |
Sankyo Co., Ltd.(a) | | | 190 | | | | 7,083 | |
Sega Sammy Holdings, Inc.(a) | | | 880 | | | | 9,607 | |
Yamaha Corp. | | | 750 | | | | 22,621 | |
| | | | | | | | |
| Total Leisure Products | | | | 60,525 | |
| Media – 4.9% | | | | | | | | |
Avex Group Holdings, Inc.(a) | | | 220 | | | | 2,872 | |
CyberAgent, Inc.(a) | | | 200 | | | | 9,306 | |
Daiichikosho Co., Ltd.(a) | | | 170 | | | | 7,411 | |
Dentsu, Inc. | | | 990 | | | | 49,766 | |
Hakuhodo DY Holdings, Inc. | | | 1,260 | | | | 14,293 | |
Kadokawa Dwango* | | | 240 | | | | 3,705 | |
Shochiku Co., Ltd. | | | 200 | | | | 1,888 | |
SKY Perfect JSAT Holdings, Inc. | | | 820 | | | | 4,779 | |
Toei Co., Ltd. | | | 400 | | | | 3,566 | |
Toho Co., Ltd. | | | 550 | | | | 14,490 | |
Tokyo Broadcasting System Holdings, Inc. | | | 190 | | | | 2,948 | |
| | | | | | | | |
| Total Media | | | | | | | 115,024 | |
| Semiconductors & Semiconductor Equipment – 4.1% | | | | | |
Advantest Corp.(a) | | | 850 | | | | 7,873 | |
Disco Corp. | | | 140 | | | | 11,883 | |
Renesas Electronics Corp.*(a) | | | 1,390 | | | | 8,954 | |
SCREEN Holdings Co., Ltd. | | | 900 | | | | 7,127 | |
Sumco Corp. | | | 880 | | | | 5,543 | |
See Notes to Financial Statements.
| | | | |
| WisdomTree Developed World ex-U.S. and Currency Hedged Equity Funds | | | 153 | |
Schedule of Investments (concluded)
WisdomTree Japan Hedged Tech, Media and Telecom Fund (DXJT)
March 31, 2016
| | | | | | | | |
| Investments | | Shares | | | Value | |
Tokyo Electron Ltd. | | | 670 | | | $ | 43,731 | |
Tokyo Seimitsu Co., Ltd. | | | 200 | | | | 3,927 | |
Ulvac, Inc. | | | 200 | | | | 6,557 | |
| | | | | | | | |
| Total Semiconductors & Semiconductor Equipment | | | | 95,595 | |
| Software – 3.4% | | | | | | | | |
Capcom Co., Ltd. | | | 260 | | | | 6,350 | |
COLOPL, Inc. | | | 250 | | | | 5,345 | |
GungHo Online Entertainment, Inc.(a) | | | 2,000 | | | | 5,641 | |
Konami Holdings Corp.(a) | | | 450 | | | | 13,332 | |
Nexon Co., Ltd. | | | 740 | | | | 12,635 | |
NSD Co., Ltd. | | | 230 | | | | 3,405 | |
Oracle Corp. | | | 150 | | | | 8,434 | |
Square Enix Holdings Co., Ltd. | | | 300 | | | | 8,114 | |
Trend Micro, Inc. | | | 490 | | | | 17,962 | |
| | | | | | | | |
| Total Software | | | | | | | 81,218 | |
| Technology Hardware, Storage & Peripherals – 13.7% | | | | | |
Brother Industries Ltd. | | | 1,190 | | | | 13,701 | |
Canon, Inc. | | | 4,480 | | | | 133,728 | |
FUJIFILM Holdings Corp. | | | 1,980 | | | | 78,411 | |
Hitachi Maxell Ltd. | | | 140 | | | | 2,134 | |
Konica Minolta, Inc. | | | 2,100 | | | | 17,862 | |
NEC Corp. | | | 10,000 | | | | 25,179 | |
Ricoh Co., Ltd.(a) | | | 2,710 | | | | 27,632 | |
Riso Kagaku Corp. | | | 160 | | | | 2,471 | |
Seiko Epson Corp. | | | 1,280 | | | | 20,704 | |
Wacom Co., Ltd.(a) | | | 550 | | | | 2,334 | |
| | | | | | | | |
| Total Technology Hardware, Storage & Peripherals | | | | | | | 324,156 | |
| Trading Companies & Distributors – 0.1% | | | | | | | | |
Inaba Denki Sangyo Co., Ltd. | | | 100 | | | | 3,154 | |
| Wireless Telecommunication Services – 21.6% | | | | | | | | |
KDDI Corp. | | | 7,100 | | | | 189,889 | |
NTT DOCOMO, Inc. | | | 5,540 | | | | 125,814 | |
SoftBank Group Corp. | | | 4,060 | | | | 193,834 | |
| | | | | | | | |
| Total Wireless Telecommunication Services | | | | | | | 509,537 | |
TOTAL COMMON STOCKS
(Cost: $2,372,567) | | | | | | | 2,343,914 | |
| INVESTMENT OF CASH COLLATERAL FOR SECURITIES LOANED – 10.1% | |
| United States – 10.1% | | | | | | | | |
State Street Navigator Securities Lending Prime Portfolio, 0.50%(b) | | | | | | | | |
| (Cost: $239,672)(c) | | | 239,672 | | | | 239,672 | |
TOTAL INVESTMENTS IN SECURITIES – 109.5%
(Cost: $2,612,239) | | | | | | | 2,583,586 | |
Liabilities in Excess of Cash, Foreign Currency and Other Assets – (9.5)% | | | | | | | (224,631 | ) |
| | | | | | | | |
| NET ASSETS – 100.0% | | | | | | $ | 2,358,955 | |
| * | Non-income producing security. |
| (a) | Security, or portion thereof, was on loan at March 31, 2016 (See Note 2). |
| (b) | Rate shown represents annualized 7-day yield as of March 31, 2016. |
| (c) | At March 31, 2016, the total market value of the Fund’s securities on loan was $230,624 and the total market value of the collateral held by the Fund was $242,790. The total market value of the collateral includes non-cash U.S. Government securities collateral having a value of $3,118. |
| | | | | | | | | | | | | | | | | | |
| FINANCIAL DERIVATIVE INSTRUMENTS | |
| FORWARD CONTRACTS | |
Settlement Date | | Contracts
To Deliver | | | In
Exchange For | | | Unrealized
Gain (Loss) | |
4/4/2016 | | JPY | | | 79,867 | | | | USD | | | | 710 | | | $ | (1 | ) |
4/5/2016 | | JPY | | | 53,277,998 | | | | USD | | | | 472,551 | | | | (1,492 | ) |
4/5/2016 | | JPY | | | 40,594,056 | | | | USD | | | | 360,043 | | | | (1,144 | ) |
4/5/2016 | | JPY | | | 53,276,911 | | | | USD | | | | 472,551 | | | | (1,483 | ) |
4/5/2016 | | JPY | | | 53,278,518 | | | | USD | | | | 472,551 | | | | (1,497 | ) |
4/5/2016 | | JPY | | | 53,278,707 | | | | USD | | | | 472,551 | | | | (1,499 | ) |
4/5/2016 | | USD | | | 360,043 | | | | JPY | | | | 40,466,168 | | | | 7 | |
4/5/2016 | | USD | | | 472,551 | | | | JPY | | | | 53,108,920 | | | | (12 | ) |
4/5/2016 | | USD | | | 472,551 | | | | JPY | | | | 53,111,093 | | | | 7 | |
4/5/2016 | | USD | | | 472,551 | | | | JPY | | | | 53,107,644 | | | | (23 | ) |
4/5/2016 | | USD | | | 472,551 | | | | JPY | | | | 53,113,929 | | | | 33 | |
5/9/2016 | | JPY | | | 55,897,299 | | | | USD | | | | 497,791 | | | | (47 | ) |
5/9/2016 | | JPY | | | 42,587,086 | | | | USD | | | | 379,273 | | | | (20 | ) |
5/9/2016 | | JPY | | | 55,897,946 | | | | USD | | | | 497,791 | | | | (52 | ) |
5/9/2016 | | JPY | | | 55,898,643 | | | | USD | | | | 497,791 | | | | (59 | ) |
5/9/2016 | | JPY | | | 55,900,336 | | | | USD | | | | 497,791 | | | | (74 | ) |
| | | | | | | | | | | | | | | | | $ | (7,356 | ) |
| | |
| CURRENCY LEGEND |
JPY | | – Japanese yen |
USD | | – U.S. dollar |
See Notes to Financial Statements.
| | |
| 154 | | WisdomTree Developed World ex-U.S. and Currency Hedged Equity Funds |
Schedule of Investments
WisdomTree Japan Quality Dividend Growth Fund (JDG)
March 31, 2016
| | | | | | | | |
| Investments | | Shares | | | Value | |
| | | | | | | | |
| COMMON STOCKS – 99.0% | | | | | | | | |
| Japan – 99.0% | | | | | | | | |
| Air Freight & Logistics – 0.2% | | | | | | | | |
Yamato Holdings Co., Ltd. | | | 263 | | | $ | 5,258 | |
| Auto Components – 5.9% | | | | | | | | |
Aisin Seiki Co., Ltd. | | | 300 | | | | 11,317 | |
Bridgestone Corp. | | | 1,210 | | | | 45,269 | |
Denso Corp. | | | 934 | | | | 37,594 | |
Exedy Corp. | | | 72 | | | | 1,594 | |
Koito Manufacturing Co., Ltd. | | | 81 | | | | 3,675 | |
NGK Spark Plug Co., Ltd. | | | 135 | | | | 2,587 | |
NHK Spring Co., Ltd. | | | 200 | | | | 1,917 | |
Nifco, Inc. | | | 51 | | | | 2,455 | |
Stanley Electric Co., Ltd. | | | 132 | | | | 2,989 | |
Sumitomo Electric Industries Ltd. | | | 644 | | | | 7,844 | |
Sumitomo Rubber Industries Ltd. | | | 429 | | | | 6,638 | |
Toyo Tire & Rubber Co., Ltd. | | | 185 | | | | 2,765 | |
Toyoda Gosei Co., Ltd. | | | 116 | | | | 2,242 | |
Toyota Boshoku Corp. | | | 125 | | | | 2,040 | |
TS Tech Co., Ltd. | | | 53 | | | | 1,242 | |
Yokohama Rubber Co., Ltd. (The) | | | 200 | | | | 3,294 | |
| | | | | | | | |
| Total Auto Components | | | | 135,462 | |
| Automobiles – 11.3% | | | | | | | | |
Fuji Heavy Industries Ltd. | | | 690 | | | | 24,403 | |
Honda Motor Co., Ltd. | | | 2,235 | | | | 61,366 | |
Isuzu Motors Ltd. | | | 975 | | | | 10,080 | |
Mazda Motor Corp. | | | 137 | | | | 2,129 | |
Nissan Motor Co., Ltd. | | | 6,985 | | | | 64,726 | |
Suzuki Motor Corp. | | | 221 | | | | 5,920 | |
Toyota Motor Corp. | | | 1,731 | | | | 91,667 | |
| | | | | | | | |
| Total Automobiles | | | | 260,291 | |
| Banks – 0.1% | | | | | | | | |
Suruga Bank Ltd. | | | 152 | | | | 2,675 | |
| Beverages – 1.3% | | | | | | | | |
Asahi Group Holdings Ltd. | | | 378 | | | | 11,795 | |
Coca-Cola East Japan Co., Ltd. | | | 127 | | | | 2,111 | |
Ito En Ltd. | | | 100 | | | | 3,163 | |
Suntory Beverage & Food Ltd. | | | 261 | | | | 11,773 | |
| | | | | | | | |
| Total Beverages | | | | 28,842 | |
| Building Products – 0.9% | | | | | | | | |
Aica Kogyo Co., Ltd. | | | 100 | | | | 2,103 | |
Daikin Industries Ltd. | | | 205 | | | | 15,343 | |
Sanwa Holdings Corp. | | | 288 | | | | 2,145 | |
| | | | | | | | |
| Total Building Products | | | | 19,591 | |
| Chemicals – 4.4% | | | | | | | | |
Air Water, Inc. | | | 190 | | | | 2,816 | |
Asahi Kasei Corp. | | | 1,659 | | | | 11,231 | |
Daicel Corp. | | | 268 | | | | 3,667 | |
DIC Corp. | | | 1,377 | | | | 3,296 | |
Hitachi Chemical Co., Ltd. | | | 224 | | | | 4,036 | |
JSR Corp. | | | 248 | | | | 3,570 | |
| | | | | | | | |
Kansai Paint Co., Ltd. | | | 156 | | | $ | 2,509 | |
Kuraray Co., Ltd. | | | 416 | | | | 5,093 | |
Mitsubishi Chemical Holdings Corp. | | | 1,671 | | | | 8,734 | |
Mitsubishi Gas Chemical Co., Inc. | | | 853 | | | | 4,599 | |
Nihon Parkerizing Co., Ltd. | | | 69 | | | | 625 | |
Nippon Paint Holdings Co., Ltd. | | | 70 | | | | 1,555 | |
Nissan Chemical Industries Ltd. | | | 100 | | | | 2,580 | |
Nitto Denko Corp.(a) | | | 141 | | | | 7,849 | |
NOF Corp. | | | 249 | | | | 1,768 | |
Shin-Etsu Chemical Co., Ltd. | | | 340 | | | | 17,618 | |
Sumitomo Chemical Co., Ltd. | | | 1,681 | | | | 7,613 | |
Taiyo Holdings Co., Ltd. | | | 42 | | | | 1,424 | |
Toray Industries, Inc. | | | 921 | | | | 7,860 | |
Tosoh Corp. | | | 532 | | | | 2,239 | |
Zeon Corp. | | | 219 | | | | 1,419 | |
| | | | | | | | |
| Total Chemicals | | | | 102,101 | |
| Commercial Services & Supplies – 1.2% | | | | | | | | |
Aeon Delight Co., Ltd. | | | 100 | | | | 3,216 | |
Park24 Co., Ltd. | | | 255 | | | | 7,147 | |
Secom Co., Ltd. | | | 237 | | | | 17,641 | |
| | | | | | | | |
| Total Commercial Services & Supplies | | | | 28,004 | |
| Construction & Engineering – 0.8% | | | | | | | | |
COMSYS Holdings Corp.(a) | | | 158 | | | | 2,443 | |
Hazama Ando Corp. | | | 100 | | | | 487 | |
JGC Corp. | | | 148 | | | | 2,219 | |
Kajima Corp. | | | 759 | | | | 4,768 | |
Kyowa Exeo Corp. | | | 188 | | | | 2,091 | |
Maeda Road Construction Co., Ltd. | | | 120 | | | | 1,982 | |
Nippo Corp. | | | 105 | | | | 1,768 | |
SHO-BOND Holdings Co., Ltd. | | | 40 | | | | 1,523 | |
| | | | | | | | |
| Total Construction & Engineering | | | | 17,281 | |
| Construction Materials – 0.2% | | | | | | | | |
Sumitomo Osaka Cement Co., Ltd. | | | 520 | | | | 2,045 | |
Taiheiyo Cement Corp. | | | 1,143 | | | | 2,634 | |
| | | | | | | | |
| Total Construction Materials | | | | 4,679 | |
| Containers & Packaging – 0.1% | | | | | | | | |
Rengo Co., Ltd. | | | 352 | | | | 1,779 | |
| Electrical Equipment – 1.6% | | | | | | | | |
Fuji Electric Co., Ltd. | | | 454 | | | | 1,571 | |
GS Yuasa Corp. | | | 543 | | | | 2,324 | |
Mitsubishi Electric Corp. | | | 2,192 | | | | 23,004 | |
Nidec Corp. | | | 151 | | | | 10,346 | |
| | | | | | | | |
| Total Electrical Equipment | | | | 37,245 | |
| Electronic Equipment, Instruments & Components – 3.2% | |
Alps Electric Co., Ltd. | | | 68 | | | | 1,187 | |
Azbil Corp. | | | 116 | | | | 2,973 | |
Hamamatsu Photonics K.K. | | | 100 | | | | 2,763 | |
Hirose Electric Co., Ltd. | | | 37 | | | | 4,085 | |
Hitachi High-Technologies Corp. | | | 129 | | | | 3,638 | |
Hitachi Ltd. | | | 4,396 | | | | 20,596 | |
Horiba Ltd. | | | 46 | | | | 1,719 | |
See Notes to Financial Statements.
| | | | |
| WisdomTree Developed World ex-U.S. and Currency Hedged Equity Funds | | | 155 | |
Schedule of Investments (continued)
WisdomTree Japan Quality Dividend Growth Fund (JDG)
March 31, 2016
| | | | | | | | |
| Investments | | Shares | | | Value | |
| | | | | | | | |
Keyence Corp. | | | 15 | | | $ | 8,193 | |
Murata Manufacturing Co., Ltd. | | | 127 | | | | 15,333 | |
Oki Electric Industry Co., Ltd. | | | 1,000 | | | | 1,415 | |
Shimadzu Corp. | | | 188 | | | | 2,952 | |
TDK Corp. | | | 87 | | | | 4,838 | |
Yaskawa Electric Corp. | | | 200 | | | | 2,312 | |
Yokogawa Electric Corp. | | | 154 | | | | 1,594 | |
| | | | | | | | |
| Total Electronic Equipment, Instruments & Components | | | | 73,598 | |
| Food & Staples Retailing – 3.0% | | | | | | | | |
FamilyMart Co., Ltd. | | | 156 | | | | 8,119 | |
Lawson, Inc. | | | 168 | | | | 14,080 | |
Matsumotokiyoshi Holdings Co., Ltd. | | | 66 | | | | 3,459 | |
Seven & I Holdings Co., Ltd. | | | 779 | | | | 33,213 | |
Sugi Holdings Co., Ltd. | | | 42 | | | | 2,220 | |
Sundrug Co., Ltd. | | | 60 | | | | 4,495 | |
Tsuruha Holdings, Inc. | | | 33 | | | | 3,250 | |
| | | | | | | | |
| Total Food & Staples Retailing | | | | 68,836 | |
| Food Products – 1.4% | | | | | | | | |
Ajinomoto Co., Inc. | | | 386 | | | | 8,721 | |
Calbee, Inc. | | | 73 | | | | 2,903 | |
Ezaki Glico Co., Ltd. | | | 37 | | | | 1,900 | |
Kikkoman Corp. | | | 108 | | | | 3,555 | |
MEIJI Holdings Co., Ltd. | | | 100 | | | | 8,052 | |
NH Foods Ltd. | | | 239 | | | | 5,274 | |
Yakult Honsha Co., Ltd. | | | 32 | | | | 1,419 | |
| | | | | | | | |
| Total Food Products | | | | 31,824 | |
| Health Care Equipment & Supplies – 1.6% | | | | | | | | |
Hoya Corp. | | | 437 | | | | 16,645 | |
Nakanishi, Inc. | | | 41 | | | | 1,304 | |
Nihon Kohden Corp. | | | 100 | | | | 2,490 | |
Nipro Corp. | | | 274 | | | | 2,606 | |
Sysmex Corp. | | | 87 | | | | 5,449 | |
Terumo Corp. | | | 211 | | | | 7,575 | |
| | | | | | | | |
| Total Health Care Equipment & Supplies | | | | 36,069 | |
| Health Care Providers & Services – 0.3% | | | | | | | | |
Miraca Holdings, Inc. | | | 100 | | | | 4,115 | |
Ship Healthcare Holdings, Inc. | | | 100 | | | | 2,522 | |
| | | | | | | | |
| Total Health Care Providers & Services | | | | 6,637 | |
| Health Care Technology – 0.1% | | | | | | | | |
M3, Inc. | | | 100 | | | | 2,520 | |
| Hotels, Restaurants & Leisure – 0.4% | | | | | | | | |
Atom Corp. | | | 100 | | | | 587 | |
Oriental Land Co., Ltd. | | | 100 | | | | 7,091 | |
Resorttrust, Inc. | | | 100 | | | | 2,250 | |
| | | | | | | | |
| Total Hotels, Restaurants & Leisure | | | | 9,928 | |
| Household Durables – 1.5% | | | | | | | | |
Casio Computer Co., Ltd.(a) | | | 263 | | | | 5,314 | |
Haseko Corp. | | | 162 | | | | 1,510 | |
Rinnai Corp. | | | 31 | | | | 2,741 | |
Sekisui Chemical Co., Ltd. | | | 545 | | | | 6,721 | |
| | | | | | | | |
Sekisui House Ltd. | | | 1,056 | | | $ | 17,847 | |
| | | | | | | | |
| Total Household Durables | | | | 34,133 | |
| Household Products – 0.4% | | | | | | | | |
Lion Corp. | | | 275 | | | | 3,105 | |
Pigeon Corp. | | | 31 | | | | 810 | |
Unicharm Corp. | | | 200 | | | | 4,358 | |
| | | | | | | | |
| Total Household Products | | | | 8,273 | |
| Insurance – 2.2% | | | | | | | | |
Sompo Japan Nipponkoa Holdings, Inc. | | | 435 | | | | 12,339 | |
Sony Financial Holdings, Inc.(a) | | | 558 | | | | 7,139 | |
Tokio Marine Holdings, Inc. | | | 947 | | | | 32,017 | |
| | | | | | | | |
| Total Insurance | | | | 51,495 | |
| Internet & Catalog Retail – 0.3% | | | | | | | | |
Rakuten, Inc. | | | 200 | | | | 1,932 | |
Start Today Co., Ltd. | | | 100 | | | | 4,039 | |
| | | | | | | | |
| Total Internet & Catalog Retail | | | | 5,971 | |
| Internet Software & Services – 1.5% | | | | | | | | |
DeNa Co., Ltd. | | | 78 | | | | 1,346 | |
GMO Internet, Inc. | | | 161 | | | | 2,153 | |
Kakaku.com, Inc. | | | 148 | | | | 2,752 | |
Mixi, Inc. | | | 79 | | | | 2,938 | |
Yahoo Japan Corp.(a) | | | 6,208 | | | | 26,457 | |
| | | | | | | | |
| Total Internet Software & Services | | | | 35,646 | |
| IT Services – 1.4% | | | | | | | | |
Itochu Techno-Solutions Corp. | | | 148 | | | | 2,797 | |
NEC Networks & System Integration Corp. | | | 100 | | | | 1,557 | |
Nihon Unisys Ltd. | | | 100 | | | | 1,327 | |
Nomura Research Institute Ltd. | | | 200 | | | | 6,744 | |
NS Solutions Corp. | | | 100 | | | | 1,965 | |
Obic Co., Ltd. | | | 82 | | | | 4,341 | |
Otsuka Corp. | | | 100 | | | | 5,285 | |
SCSK Corp. | | | 126 | | | | 4,933 | |
Transcosmos, Inc. | | | 81 | | | | 2,107 | |
| | | | | | | | |
| Total IT Services | | | | 31,056 | |
| Leisure Products – 0.9% | | | | | | | | |
Bandai Namco Holdings, Inc. | | | 349 | | | | 7,620 | |
Heiwa Corp. | | | 210 | | | | 4,359 | |
Shimano, Inc. | | | 39 | | | | 6,121 | |
Universal Entertainment Corp.(a) | | | 100 | | | | 1,663 | |
| | | | | | | | |
| Total Leisure Products | | | | 19,763 | |
| Machinery – 7.0% | | | | | | | | |
Ebara Corp. | | | 586 | | | | 2,450 | |
FANUC Corp. | | | 361 | | | | 56,160 | |
Hino Motors Ltd. | | | 918 | | | | 9,940 | |
Hitachi Construction Machinery Co., Ltd.(a) | | | 368 | | | | 5,854 | |
Hoshizaki Electric Co., Ltd. | | | 40 | | | | 3,342 | |
JTEKT Corp. | | | 331 | | | | 4,300 | |
Komatsu Ltd. | | | 1,390 | | | | 23,695 | |
Kubota Corp. | | | 1,118 | | | | 15,284 | |
Kurita Water Industries Ltd. | | | 139 | | | | 3,175 | |
Makita Corp. | | | 154 | | | | 9,564 | |
See Notes to Financial Statements.
| | |
| 156 | | WisdomTree Developed World ex-U.S. and Currency Hedged Equity Funds |
Schedule of Investments (continued)
WisdomTree Japan Quality Dividend Growth Fund (JDG)
March 31, 2016
| | | | | | | | |
| Investments | | Shares | | | Value | |
| | | | | | | | |
Minebea Co., Ltd. | | | 160 | | | $ | 1,250 | |
Miura Co., Ltd.(a) | | | 157 | | | | 2,935 | |
Nabtesco Corp. | | | 127 | | | | 2,854 | |
NGK Insulators Ltd. | | | 196 | | | | 3,625 | |
OSG Corp. | | | 100 | | | | 1,869 | |
SMC Corp. | | | 23 | | | | 5,349 | |
Sumitomo Heavy Industries Ltd. | | | 660 | | | | 2,731 | |
Tadano Ltd. | | | 118 | | | | 1,097 | |
THK Co., Ltd. | | | 158 | | | | 2,918 | |
Tsubakimoto Chain Co. | | | 208 | | | | 1,290 | |
| | | | | | | | |
| Total Machinery | | | | 159,682 | |
| Marine – 0.3% | | | | | | | | |
Kawasaki Kisen Kaisha Ltd.(a) | | | 1,758 | | | | 3,410 | |
Nippon Yusen K.K. | | | 2,243 | | | | 4,330 | |
| | | | | | | | |
| Total Marine | | | | 7,740 | |
| Media – 0.6% | | | | | | | | |
CyberAgent, Inc.(a) | | | 48 | | | | 2,233 | |
Daiichikosho Co., Ltd. | | | 100 | | | | 4,360 | |
Hakuhodo DY Holdings, Inc. | | | 322 | | | | 3,653 | |
Toho Co., Ltd. | | | 130 | | | | 3,425 | |
| | | | | | | | |
| Total Media | | | | 13,671 | |
| Metals & Mining – 1.8% | | | | | | | | |
Dowa Holdings Co., Ltd. | | | 291 | | | | 1,623 | |
Hitachi Metals Ltd. | | | 311 | | | | 3,213 | |
Mitsubishi Materials Corp. | | | 1,715 | | | | 4,852 | |
Mitsui Mining & Smelting Co., Ltd. | | | 1,000 | | | | 1,601 | |
Nippon Steel & Sumitomo Metal Corp. | | | 1,000 | | | | 19,236 | |
Sumitomo Metal Mining Co., Ltd. | | | 939 | | | | 9,336 | |
Yamato Kogyo Co., Ltd. | | | 100 | | | | 2,174 | |
| | | | | | | | |
| Total Metals & Mining | | | | 42,035 | |
| Multiline Retail – 0.3% | | | | | | | | |
Isetan Mitsukoshi Holdings Ltd. | | | 160 | | | | 1,872 | |
Izumi Co., Ltd. | | | 48 | | | | 2,073 | |
Ryohin Keikaku Co., Ltd. | | | 18 | | | | 3,812 | |
| | | | | | | | |
| Total Multiline Retail | | | | 7,757 | |
| Personal Products – 1.3% | | | | | | | | |
Kao Corp. | | | 404 | | | | 21,577 | |
Kobayashi Pharmaceutical Co., Ltd. | | | 41 | | | | 3,604 | |
Kose Corp. | | | 42 | | | | 4,092 | |
| | | | | | | | |
| Total Personal Products | | | | 29,273 | |
| Pharmaceuticals – 4.7% | | | | | | | | |
Astellas Pharma, Inc. | | | 2,362 | | | | 31,449 | |
Chugai Pharmaceutical Co., Ltd. | | | 488 | | | | 15,131 | |
Eisai Co., Ltd. | | | 366 | | | | 22,046 | |
Hisamitsu Pharmaceutical Co., Inc. | | | 119 | | | | 5,326 | |
KYORIN Holdings, Inc. | | | 125 | | | | 2,384 | |
Mochida Pharmaceutical Co., Ltd. | | | 38 | | | | 2,826 | |
Rohto Pharmaceutical Co., Ltd. | | | 100 | | | | 1,824 | |
Santen Pharmaceutical Co., Ltd. | | | 325 | | | | 4,896 | |
Sawai Pharmaceutical Co., Ltd. | | | 43 | | | | 2,697 | |
Shionogi & Co., Ltd. | | | 230 | | | | 10,840 | |
| | | | | | | | |
Sumitomo Dainippon Pharma Co., Ltd. | | | 364 | | | $ | 4,197 | |
Tsumura & Co. | | | 134 | | | | 3,221 | |
| | | | | | | | |
| Total Pharmaceuticals | | | | 106,837 | |
| Professional Services – 0.1% | | | | | | | | |
Meitec Corp. | | | 44 | | | | 1,540 | |
Temp Holdings Co., Ltd. | | | 100 | | | | 1,452 | |
| | | | | | | | |
| Total Professional Services | | | | 2,992 | |
| Real Estate Management & Development – 2.3% | | | | | | | | |
Daikyo, Inc. | | | 1,000 | | | | 1,593 | |
Daito Trust Construction Co., Ltd. | | | 93 | | | | 13,223 | |
Daiwa House Industry Co., Ltd. | | | 863 | | | | 24,309 | |
Hulic Co., Ltd. | | | 454 | | | | 4,346 | |
Relo Holdings, Inc. | | | 20 | | | | 2,685 | |
Sumitomo Realty & Development Co., Ltd. | | | 155 | | | | 4,543 | |
Tokyo Tatemono Co., Ltd. | | | 100 | | | | 1,247 | |
| | | | | | | | |
| Total Real Estate Management & Development | | | | 51,946 | |
| Road & Rail – 2.5% | | | | | | | | |
Central Japan Railway Co. | | | 60 | | | | 10,626 | |
East Japan Railway Co. | | | 277 | | | | 23,938 | |
Hitachi Transport System Ltd. | | | 45 | | | | 754 | |
Keisei Electric Railway Co., Ltd. | | | 137 | | | | 1,930 | |
Nippon Express Co., Ltd. | | | 1,137 | | | | 5,179 | |
Sankyu, Inc. | | | 377 | | | | 1,724 | |
West Japan Railway Co. | | | 217 | | | | 13,416 | |
| | | | | | | | |
| Total Road & Rail | | | | 57,567 | |
| Semiconductors & Semiconductor Equipment – 0.2% | | | | | | | | |
Disco Corp. | | | 38 | | | | 3,226 | |
Shinko Electric Industries Co., Ltd. | | | 290 | | | | 1,633 | |
| | | | | | | | |
| Total Semiconductors & Semiconductor Equipment | | | | 4,859 | |
| Software – 1.1% | | | | | | | | |
Capcom Co., Ltd. | | | 100 | | | | 2,442 | |
GungHo Online Entertainment, Inc.(a) | | | 474 | | | | 1,337 | |
Konami Holdings Corp.(a) | | | 107 | | | | 3,170 | |
Nexon Co., Ltd. | | | 128 | | | | 2,186 | |
Oracle Corp. | | | 82 | | | | 4,611 | |
Square Enix Holdings Co., Ltd. | | | 93 | | | | 2,515 | |
Trend Micro, Inc. | | | 256 | | | | 9,384 | |
| | | | | | | | |
| Total Software | | | | 25,645 | |
| Specialty Retail – 1.8% | | | | | | | | |
ABC-Mart, Inc. | | | 73 | | | | 4,683 | |
AOKI Holdings, Inc. | | | 152 | | | | 1,839 | |
Fast Retailing Co., Ltd. | | | 41 | | | | 13,140 | |
Hikari Tsushin, Inc. | | | 60 | | | | 4,575 | |
K’s Holdings Corp. | | | 51 | | | | 1,692 | |
Sanrio Co., Ltd. | | | 137 | | | | 2,683 | |
Shimamura Co., Ltd. | | | 38 | | | | 4,750 | |
T-Gaia Corp. | | | 57 | | | | 661 | |
United Arrows Ltd. | | | 57 | | | | 2,361 | |
USS Co., Ltd. | | | 320 | | | | 5,119 | |
| | | | | | | | |
| Total Specialty Retail | | | | 41,503 | |
See Notes to Financial Statements.
| | | | |
| WisdomTree Developed World ex-U.S. and Currency Hedged Equity Funds | | | 157 | |
Schedule of Investments (concluded)
WisdomTree Japan Quality Dividend Growth Fund (JDG)
March 31, 2016
| | | | | | | | |
| Investments | | Shares | | | Value | |
| | | | | | | | |
| Technology Hardware, Storage & Peripherals – 5.1% | | | | | | | | |
Brother Industries Ltd. | | | 214 | | | $ | 2,464 | |
Canon, Inc. | | | 3,000 | | | | 89,550 | |
FUJIFILM Holdings Corp. | | | 436 | | | | 17,266 | |
Konica Minolta, Inc. | | | 386 | | | | 3,283 | |
NEC Corp. | | | 1,758 | | | | 4,427 | |
| | | | | | | | |
| Total Technology Hardware, Storage & Peripherals | | | | 116,990 | |
| Textiles, Apparel & Luxury Goods – 0.1% | | | | | | | | |
Asics Corp. | | | 100 | | | | 1,784 | |
| Tobacco – 5.4% | | | | | | | | |
Japan Tobacco, Inc. | | | 3,000 | | | | 125,183 | |
| Trading Companies & Distributors – 6.7% | | | | | | | | |
ITOCHU Corp. | | | 2,831 | | | | 34,911 | |
Marubeni Corp. | | | 3,979 | | | | 20,179 | |
MISUMI Group, Inc. | | | 200 | | | | 2,867 | |
Mitsubishi Corp. | | | 2,577 | | | | 43,701 | |
Mitsui & Co., Ltd. | | | 4,264 | | | | 49,129 | |
Nippon Steel & Sumikin Bussan Corp. | | | 1,000 | | | | 3,336 | |
| | | | | | | | |
| Total Trading Companies & Distributors | | | | 154,123 | |
| Transportation Infrastructure – 0.1% | | | | | | | | |
Kamigumi Co., Ltd. | | | 258 | | | | 2,431 | |
| Wireless Telecommunication Services – 11.4% | | | | | | | | |
KDDI Corp. | | | 3,355 | | | | 89,729 | |
NTT DOCOMO, Inc. | | | 6,732 | | | | 152,884 | |
SoftBank Group Corp. | | | 417 | | | | 19,909 | |
| | | | | | | | |
| Total Wireless Telecommunication Services | | | | | | | 262,522 | |
TOTAL COMMON STOCKS
(Cost: $2,446,372) | | | | | | | 2,273,497 | |
| INVESTMENT OF CASH COLLATERAL FOR SECURITIES LOANED – 2.5% | |
| United States – 2.5% | | | | | | | | |
State Street Navigator Securities Lending Prime Portfolio, 0.50%(b) (Cost: $56,861)(c) | | | 56,861 | | | | 56,861 | |
TOTAL INVESTMENTS IN SECURITIES – 101.5%
(Cost: $2,503,233) | | | | | | | 2,330,358 | |
Liabilities in Excess of Cash, Foreign Currency and Other Assets – (1.5)% | | | | | | | (34,033 | ) |
| | | | | | | | |
| NET ASSETS – 100.0% | | | | | | $ | 2,296,325 | |
| (a) | Security, or portion thereof, was on loan at March 31, 2016 (See Note 2). |
| (b) | Rate shown represents annualized 7-day yield as of March 31, 2016. |
| (c) | At March 31, 2016, the total market value of the Fund’s securities on loan was $58,757 and the total market value of the collateral held by the Fund was $61,898. The total market value of the collateral includes non-cash U.S. Government securities collateral having a value of $5,037. |
| | | | | | | | | | | | | | | | | | |
| FINANCIAL DERIVATIVE INSTRUMENTS | |
| FORWARD CONTRACTS | |
Settlement Date | | Contracts
To Deliver | | | In
Exchange For | | | Unrealized
Gain (Loss) | |
4/1/2016 | | JPY | | | 180,000 | | | | USD | | | | 1,599 | | | $ | (2 | ) |
| | |
| CURRENCY LEGEND |
JPY | | – Japanese yen |
USD | | – U.S. dollar |
See Notes to Financial Statements.
| | |
| 158 | | WisdomTree Developed World ex-U.S. and Currency Hedged Equity Funds |
Schedule of Investments
WisdomTree Japan SmallCap Dividend Fund (DFJ)
March 31, 2016
| | | | | | | | |
| Investments | | Shares | | | Value | |
| | | | | | | | |
| COMMON STOCKS – 98.9% | | | | | | | | |
| Japan – 98.9% | | | | | | | | |
| Air Freight & Logistics – 0.3% | | | | | | | | |
AIT Corp.(a) | | | 27,300 | | | $ | 227,348 | |
Kintetsu World Express, Inc. | | | 29,900 | | | | 397,975 | |
Konoike Transport Co., Ltd. | | | 21,500 | | | | 251,928 | |
Yusen Logistics Co., Ltd. | | | 34,800 | | | | 405,296 | |
| | | | | | | | |
| Total Air Freight & Logistics | | | | 1,282,547 | |
| Auto Components – 4.3% | | | | | | | | |
Aisan Industry Co., Ltd. | | | 46,300 | | | | 364,979 | |
Calsonic Kansei Corp. | | | 132,000 | | | | 982,997 | |
Daido Metal Co., Ltd. | | | 47,600 | | | | 368,451 | |
Daikyonishikawa Corp. | | | 42,400 | | | | 609,244 | |
Eagle Industry Co., Ltd. | | | 25,300 | | | | 333,822 | |
Exedy Corp. | | | 44,525 | | | | 985,615 | |
FCC Co., Ltd. | | | 46,200 | | | | 781,818 | |
G-Tekt Corp. | | | 44,500 | | | | 509,160 | |
H-One Co., Ltd. | | | 44,800 | | | | 219,227 | |
Keihin Corp. | | | 44,221 | | | | 661,377 | |
Kinugawa Rubber Industrial Co., Ltd. | | | 42,372 | | | | 289,153 | |
KYB Corp. | | | 245,400 | | | | 727,063 | |
Nifco, Inc. | | | 44,386 | | | | 2,136,467 | |
Nissin Kogyo Co., Ltd. | | | 56,300 | | | | 759,382 | |
Pacific Industrial Co., Ltd.(a) | | | 48,100 | | | | 484,873 | |
Press Kogyo Co., Ltd. | | | 93,800 | | | | 316,297 | |
Riken Corp. | | | 127,687 | | | | 418,069 | |
Sanden Holdings Corp.(a) | | | 115,963 | | | | 332,222 | |
Shoei Co., Ltd. | | | 16,200 | | | | 268,667 | |
Showa Corp. | | | 92,800 | | | | 810,798 | |
Sumitomo Riko Co., Ltd. | | | 75,300 | | | | 657,229 | |
Taiho Kogyo Co., Ltd. | | | 45,100 | | | | 466,669 | |
Tokai Rika Co., Ltd. | | | 86,358 | | | | 1,627,352 | |
Topre Corp. | | | 42,000 | | | | 783,611 | |
TPR Co., Ltd. | | | 27,700 | | | | 728,020 | |
TS Tech Co., Ltd. | | | 47,100 | | | | 1,103,798 | |
Unipres Corp. | | | 17,003 | | | | 296,658 | |
Yorozu Corp. | | | 16,400 | | | | 344,357 | |
| | | | | | | | |
| Total Auto Components | | | | 18,367,375 | |
| Automobiles – 0.1% | | | | | | | | |
Nissan Shatai Co., Ltd. | | | 31,300 | | | | 315,520 | |
| Banks – 5.6% | | | | | | | | |
77 Bank Ltd. (The) | | | 256,000 | | | | 906,517 | |
Akita Bank Ltd. (The) | | | 119,000 | | | | 325,041 | |
Aomori Bank Ltd. (The) | | | 187,622 | | | | 547,533 | |
Ashikaga Holdings Co., Ltd. | | | 242,900 | | | | 695,883 | |
Awa Bank Ltd. (The) | | | 108,378 | | | | 525,522 | |
Bank of Nagoya Ltd. (The)(a) | | | 137,691 | | | | 453,274 | |
Bank of Okinawa Ltd. (The) | | | 12,500 | | | | 410,939 | |
Bank of Saga Ltd. (The) | | | 200,448 | | | | 378,086 | |
Bank of the Ryukyus Ltd. | | | 30,708 | | | | 345,344 | |
Chukyo Bank Ltd. (The) | | | 149,000 | | | | 257,182 | |
Daishi Bank Ltd. (The) | | | 277,552 | | | | 955,671 | |
Eighteenth Bank Ltd. (The) | | | 194,046 | | | | 431,616 | |
| | | | | | | | |
FIDEA Holdings Co., Ltd. | | | 201,627 | | | | 317,523 | |
Fukui Bank Ltd. (The)(a) | | | 205,671 | | | | 375,128 | |
Higashi-Nippon Bank Ltd. (The) | | | 206,000 | | | | 507,181 | |
Hokkoku Bank Ltd. (The) | | | 166,621 | | | | 438,808 | |
Hokuetsu Bank Ltd. (The) | | | 278,000 | | | | 450,162 | |
Hyakugo Bank Ltd. (The) | | | 111,000 | | | | 416,762 | |
Hyakujushi Bank Ltd. (The) | | | 174,000 | | | | 489,203 | |
Juroku Bank Ltd. (The) | | | 299,000 | | | | 893,848 | |
Kansai Urban Banking Corp. | | | 63,800 | | | | 629,514 | |
Keiyo Bank Ltd. (The) | | | 179,684 | | | | 650,664 | |
Kiyo Bank Ltd. (The) | | | 57,690 | | | | 654,944 | |
Kyushu Financial Group, Inc. | | | 218,900 | | | | 1,263,990 | |
Mie Bank Ltd. (The) | | | 178,389 | | | | 317,432 | |
Minato Bank Ltd. (The) | | | 280,000 | | | | 376,173 | |
Miyazaki Bank Ltd. (The) | | | 188,000 | | | | 458,312 | |
Musashino Bank Ltd. (The) | | | 27,205 | | | | 686,207 | |
Nanto Bank Ltd. (The) | | | 145,000 | | | | 394,768 | |
Nishi-Nippon City Bank Ltd. (The) | | | 706,000 | | | | 1,250,002 | |
North Pacific Bank Ltd. | | | 217,315 | | | | 551,046 | |
Ogaki Kyoritsu Bank Ltd. (The) | | | 311,423 | | | | 942,069 | |
Oita Bank Ltd. (The) | | | 134,000 | | | | 418,471 | |
San-In Godo Bank Ltd. (The) | | | 90,000 | | | | 557,320 | |
Senshu Ikeda Holdings, Inc. | | | 239,240 | | | | 862,069 | |
Shiga Bank Ltd. (The)(a) | | | 128,923 | | | | 543,703 | |
Shikoku Bank Ltd. (The) | | | 202,000 | | | | 390,000 | |
Tochigi Bank Ltd. (The) | | | 37,843 | | | | 144,106 | |
Toho Bank Ltd. (The) | | | 288,000 | | | | 925,023 | |
Tokyo TY Financial Group, Inc. | | | 18,200 | | | | 423,444 | |
TOMONY Holdings, Inc. | | | 72,377 | | | | 214,436 | |
Towa Bank Ltd. (The) | | | 442,000 | | | | 342,133 | |
Yamagata Bank Ltd. (The)(a) | | | 101,000 | | | | 383,709 | |
Yamanashi Chuo Bank Ltd. (The) | | | 99,066 | | | | 364,022 | |
| | | | | | | | |
| Total Banks | | | | 23,864,780 | |
| Beverages – 1.7% | | | | | | | | |
Coca-Cola East Japan Co., Ltd. | | | 73,400 | | | | 1,219,905 | |
Coca-Cola West Co., Ltd. | | | 90,079 | | | | 2,232,840 | |
Ito En Ltd.(a) | | | 54,800 | | | | 1,733,298 | |
Sapporo Holdings Ltd. | | | 273,992 | | | | 1,365,145 | |
Takara Holdings, Inc. | | | 80,311 | | | | 662,381 | |
| | | | | | | | |
| Total Beverages | | | | 7,213,569 | |
| Building Products – 1.8% | | | | | | | | |
Aica Kogyo Co., Ltd. | | | 48,615 | | | | 1,022,518 | |
Bunka Shutter Co., Ltd. | | | 48,100 | | | | 395,858 | |
Central Glass Co., Ltd. | | | 169,933 | | | | 923,787 | |
Nichias Corp. | | | 100,827 | | | | 603,733 | |
Nichiha Corp. | | | 16,400 | | | | 248,491 | |
Nitto Boseki Co., Ltd. | | | 138,996 | | | | 448,913 | |
Noritz Corp.(a) | | | 29,500 | | | | 481,365 | |
Okabe Co., Ltd. | | | 58,800 | | | | 420,617 | |
Sanwa Holdings Corp. | | | 172,766 | | | | 1,286,580 | |
Sekisui Jushi Corp. | | | 33,000 | | | | 442,760 | |
Takara Standard Co., Ltd. | | | 58,063 | | | | 528,479 | |
See Notes to Financial Statements.
| | | | |
| WisdomTree Developed World ex-U.S. and Currency Hedged Equity Funds | | | 159 | |
Schedule of Investments (continued)
WisdomTree Japan SmallCap Dividend Fund (DFJ)
March 31, 2016
| | | | | | | | |
| Investments | | Shares | | | Value | |
| | | | | | | | |
Takasago Thermal Engineering Co., Ltd.(a) | | | 77,072 | | | $ | 969,614 | |
| | | | | | | | |
| Total Building Products | | | | 7,772,715 | |
| Capital Markets – 2.6% | | | | | | | | |
GCA Savvian Corp. | | | 28,400 | | | | 299,174 | |
Ichigo, Inc.(a) | | | 105,500 | | | | 436,474 | |
Ichiyoshi Securities Co., Ltd. | | | 59,988 | | | | 511,842 | |
IwaiCosmo Holdings, Inc.(a) | | | 44,400 | | | | 432,169 | |
kabu.com Securities Co., Ltd. | | | 438,400 | | | | 1,404,191 | |
Kyokuto Securities Co., Ltd.(a) | | | 62,600 | | | | 753,573 | |
Marusan Securities Co., Ltd.(a) | | | 194,600 | | | | 1,835,277 | |
Matsui Securities Co., Ltd.(a) | | | 425,500 | | | | 3,630,540 | |
Monex Group, Inc. | | | 257,494 | | | | 666,673 | |
Nihon M&A Center, Inc.(a) | | | 13,016 | | | | 758,528 | |
Toyo Securities Co., Ltd. | | | 111,198 | | | | 278,007 | |
| | | | | | | | |
| Total Capital Markets | | | | 11,006,448 | |
| Chemicals – 7.7% | | | | | | | | |
ADEKA Corp. | | | 97,025 | | | | 1,418,320 | |
Chugoku Marine Paints Ltd. | | | 52,000 | | | | 343,289 | |
Dainichiseika Color & Chemicals Manufacturing Co., Ltd. | | | 50,714 | | | | 203,046 | |
Denka Co., Ltd. | | | 521,000 | | | | 2,146,208 | |
DIC Corp. | | | 777,000 | | | | 1,859,629 | |
Fujimi, Inc. | | | 32,900 | | | | 439,076 | |
Fujimori Kogyo Co., Ltd. | | | 10,800 | | | | 254,253 | |
JSP Corp. | | | 27,223 | | | | 543,031 | |
Kaneka Corp. | | | 293,000 | | | | 2,513,030 | |
Kureha Corp.(a) | | | 179,648 | | | | 572,214 | |
Lintec Corp. | | | 57,565 | | | | 1,031,504 | |
Mitsubishi Gas Chemical Co., Inc. | | | 405,000 | | | | 2,183,638 | |
Nihon Nohyaku Co., Ltd.(a) | | | 42,388 | | | | 215,344 | |
Nihon Parkerizing Co., Ltd. | | | 60,400 | | | | 547,063 | |
Nippon Kayaku Co., Ltd. | | | 140,000 | | | | 1,417,501 | |
Nippon Shokubai Co., Ltd. | | | 20,500 | | | | 1,045,109 | |
Nippon Soda Co., Ltd. | | | 110,091 | | | | 555,377 | |
Nippon Synthetic Chemical Industry Co., Ltd. (The) | | | 77,860 | | | | 493,920 | |
Nippon Valqua Industries Ltd. | | | 154,688 | | | | 406,005 | |
NOF Corp. | | | 147,000 | | | | 1,043,694 | |
Okamoto Industries, Inc.(a) | | | 69,436 | | | | 586,896 | |
Osaka Soda Co., Ltd.(a) | | | 99,000 | | | | 362,018 | |
Sakai Chemical Industry Co., Ltd. | | | 155,000 | | | | 426,131 | |
Sakata INX Corp. | | | 64,000 | | | | 698,109 | |
Sanyo Chemical Industries Ltd. | | | 56,176 | | | | 396,348 | |
Sekisui Plastics Co., Ltd. | | | 108,000 | | | | 327,666 | |
Shikoku Chemicals Corp. | | | 26,000 | | | | 225,775 | |
Showa Denko K.K.(a) | | | 1,107,692 | | | | 1,143,221 | |
Sumitomo Bakelite Co., Ltd. | | | 155,092 | | | | 608,529 | |
Sumitomo Seika Chemicals Co., Ltd. | | | 105,000 | | | | 519,418 | |
Taiyo Holdings Co., Ltd. | | | 28,091 | | | | 952,237 | |
Takasago International Corp. | | | 14,500 | | | | 324,329 | |
Takiron Co., Ltd. | | | 103,000 | | | | 511,357 | |
Toagosei Co., Ltd. | | | 121,300 | | | | 1,011,238 | |
Tokai Carbon Co., Ltd. | | | 139,000 | | | | 330,202 | |
| | | | | | | | |
Toyo Ink SC Holdings Co., Ltd. | | | 327,512 | | | | 1,314,186 | |
Toyobo Co., Ltd. | | | 509,531 | | | | 766,144 | |
Ube Industries Ltd. | | | 1,061,930 | | | | 1,880,191 | |
Zeon Corp. | | | 132,000 | | | | 854,985 | |
| | | | | | | | |
| Total Chemicals | | | | 32,470,231 | |
| Commercial Services & Supplies – 2.6% | | | | | | | | |
Aeon Delight Co., Ltd.(a) | | | 44,500 | | | | 1,431,269 | |
Daiseki Co., Ltd. | | | 18,807 | | | | 308,221 | |
Itoki Corp. | | | 45,800 | | | | 324,363 | |
Kokuyo Co., Ltd. | | | 86,403 | | | | 1,012,436 | |
Kyodo Printing Co., Ltd. | | | 100,049 | | | | 300,872 | |
NAC Co., Ltd.(a) | | | 58,900 | | | | 456,967 | |
Nippon Parking Development Co., Ltd.(a) | | | 286,800 | | | | 318,964 | |
Okamura Corp. | | | 104,276 | | | | 997,346 | |
Park24 Co., Ltd. | | | 133,900 | | | | 3,752,703 | |
Relia, Inc. | | | 55,000 | | | | 509,409 | |
Sato Holdings Corp. | | | 24,938 | | | | 531,620 | |
Toppan Forms Co., Ltd. | | | 92,100 | | | | 1,026,748 | |
| | | | | | | | |
| Total Commercial Services & Supplies | | | | 10,970,918 | |
| Communications Equipment – 0.4% | | | | | | | | |
Hitachi Kokusai Electric, Inc. | | | 107,648 | | | | 1,295,856 | |
Japan Radio Co., Ltd. | | | 100,000 | | | | 266,026 | |
| | | | | | | | |
| Total Communications Equipment | | | | 1,561,882 | |
| Construction & Engineering – 4.3% | | | | | | | | |
COMSYS Holdings Corp.(a) | | | 90,200 | | | | 1,394,791 | |
Fudo Tetra Corp.(a) | | | 241,700 | | | | 270,957 | |
Hazama Ando Corp. | | | 85,300 | | | | 415,894 | |
Kandenko Co., Ltd.(a) | | | 136,138 | | | | 972,631 | |
Kitano Construction Corp. | | | 145,651 | | | | 353,777 | |
Kyowa Exeo Corp. | | | 91,066 | | | | 1,012,790 | |
Kyudenko Corp.(a) | | | 32,890 | | | | 783,952 | |
Maeda Corp. | | | 108,087 | | | | 806,842 | |
Maeda Road Construction Co., Ltd. | | | 52,694 | | | | 870,146 | |
Mirait Holdings Corp. | | | 65,800 | | | | 524,550 | |
NDS Co., Ltd. | | | 139,000 | | | | 383,380 | |
Nippo Corp. | | | 46,358 | | | | 780,779 | |
Nippon Densetsu Kogyo Co., Ltd. | | | 34,000 | | | | 684,265 | |
Nippon Koei Co., Ltd. | | | 41,000 | | | | 129,499 | |
Nippon Road Co., Ltd. (The) | | | 149,291 | | | | 694,686 | |
Nishimatsu Construction Co., Ltd. | | | 201,037 | | | | 863,925 | |
Obayashi Road Corp. | | | 36,200 | | | | 239,626 | |
Okumura Corp. | | | 172,853 | | | | 915,054 | |
Penta-Ocean Construction Co., Ltd. | | | 72,093 | | | | 302,111 | |
Raito Kogyo Co., Ltd. | | | 28,900 | | | | 267,414 | |
SHO-BOND Holdings Co., Ltd.(a) | | | 12,100 | | | | 460,768 | |
Sumitomo Densetsu Co., Ltd. | | | 25,200 | | | | 326,673 | |
Taikisha Ltd. | | | 18,365 | | | | 443,459 | |
TOA ROAD Corp. | | | 100,000 | | | | 333,645 | |
Toda Corp. | | | 158,549 | | | | 767,389 | |
Toenec Corp. | | | 94,000 | | | | 580,417 | |
Tokyu Construction Co., Ltd. | | | 72,600 | | | | 594,261 | |
Totetsu Kogyo Co., Ltd. | | | 17,579 | | | | 541,157 | |
See Notes to Financial Statements.
| | |
| 160 | | WisdomTree Developed World ex-U.S. and Currency Hedged Equity Funds |
Schedule of Investments (continued)
WisdomTree Japan SmallCap Dividend Fund (DFJ)
March 31, 2016
| | | | | | | | |
| Investments | | Shares | | | Value | |
| | | | | | | | |
Toyo Construction Co., Ltd.(a) | | | 71,600 | | | $ | 312,786 | |
Toyo Engineering Corp.(a) | | | 117,554 | | | | 306,449 | |
Yahagi Construction Co., Ltd.(a) | | | 43,600 | | | | 306,455 | |
Yokogawa Bridge Holdings Corp.(a) | | | 20,300 | | | | 218,542 | |
Yurtec Corp. | | | 63,000 | | | | 526,892 | |
| | | | | | | | |
| Total Construction & Engineering | | | | 18,385,962 | |
| Construction Materials – 0.2% | | | | | | | | |
Sumitomo Osaka Cement Co., Ltd. | | | 261,404 | | | | 1,027,987 | |
| Containers & Packaging – 0.8% | | | | | | | | |
FP Corp. | | | 27,600 | | | | 1,182,384 | |
Fuji Seal International, Inc. | | | 21,305 | | | | 756,323 | |
Rengo Co., Ltd. | | | 259,000 | | | | 1,308,884 | |
| | | | | | | | |
| Total Containers & Packaging | | | | 3,247,591 | |
| Distributors – 1.1% | | | | | | | | |
Canon Marketing Japan, Inc. | | | 131,100 | | | | 2,293,186 | |
Doshisha Co., Ltd. | | | 42,200 | | | | 777,956 | |
Happinet Corp. | | | 20,400 | | | | 185,496 | |
Paltac Corp. | | | 74,257 | | | | 1,316,733 | |
| | | | | | | | |
| Total Distributors | | | | 4,573,371 | |
| Diversified Consumer Services – 1.0% | | | | | | | | |
Benesse Holdings, Inc.(a) | | | 125,200 | | | | 3,609,128 | |
Meiko Network Japan Co., Ltd. | | | 26,586 | | | | 290,236 | |
Studio Alice Co., Ltd. | | | 14,760 | | | | 323,054 | |
| | | | | | | | |
| Total Diversified Consumer Services | | | | 4,222,418 | |
| Diversified Financial Services – 0.2% | | | | | | | | |
Financial Products Group Co., Ltd.(a) | | | 34,200 | | | | 412,913 | |
Ricoh Leasing Co., Ltd. | | | 20,400 | | | | 607,127 | |
| | | | | | | | |
| Total Diversified Financial Services | | | | 1,020,040 | |
| Electric Utilities – 0.1% | | | | | | | | |
Okinawa Electric Power Co., Inc. (The) | | | 11,600 | | | | 312,719 | |
| Electrical Equipment – 1.4% | | | | | | | | |
Daihen Corp. | | | 103,000 | | | | 469,202 | |
Fujikura Ltd. | | | 176,715 | | | | 833,302 | |
GS Yuasa Corp. | | | 301,000 | | | | 1,288,144 | |
Idec Corp. | | | 34,636 | | | | 329,735 | |
Nissin Electric Co., Ltd. | | | 62,965 | | | | 687,940 | |
Nitto Kogyo Corp. | | | 35,900 | | | | 573,020 | |
Sanyo Denki Co., Ltd. | | | 32,000 | | | | 149,473 | |
Takaoka Toko Co., Ltd.(a) | | | 25,900 | | | | 360,173 | |
Ushio, Inc. | | | 86,475 | | | | 1,151,000 | |
| | | | | | | | |
| Total Electrical Equipment | | | | 5,841,989 | |
| Electronic Equipment, Instruments & Components – 4.7% | |
Ai Holdings Corp. | | | 43,300 | | | | 1,257,836 | |
Amano Corp. | | | 81,435 | | | | 1,287,513 | |
Anritsu Corp.(a) | | | 156,300 | | | | 860,801 | |
Azbil Corp. | | | 81,354 | | | | 2,085,332 | |
Canon Electronics, Inc. | | | 35,000 | | | | 515,681 | |
Citizen Holdings Co., Ltd. | | | 245,600 | | | | 1,394,126 | |
CONEXIO Corp.(a) | | | 64,500 | | | | 653,063 | |
Daiwabo Holdings Co., Ltd. | | | 282,396 | | | | 527,632 | |
Enplas Corp. | | | 13,389 | | | | 496,749 | |
| | | | | | | | |
Hakuto Co., Ltd. | | | 30,434 | | | | 268,340 | |
Horiba Ltd. | | | 24,600 | | | | 919,258 | |
Japan Aviation Electronics Industry Ltd. | | | 27,000 | | | | 316,616 | |
Kaga Electronics Co., Ltd. | | | 46,400 | | | | 589,521 | |
Koa Corp. | | | 31,147 | | | | 230,842 | |
Mitsumi Electric Co., Ltd.*(a) | | | 59,800 | | | | 278,263 | |
Nippon Electric Glass Co., Ltd. | | | 395,000 | | | | 2,024,289 | |
Nippon Signal Co., Ltd. | | | 44,800 | | | | 371,091 | |
Nohmi Bosai Ltd. | | | 65,291 | | | | 989,865 | |
Oki Electric Industry Co., Ltd.(a) | | | 597,000 | | | | 844,548 | |
Ryoden Trading Co., Ltd. | | | 98,723 | | | | 579,716 | |
Ryosan Co., Ltd. | | | 26,500 | | | | 663,001 | |
Sanshin Electronics Co., Ltd. | | | 49,300 | | | | 389,943 | |
Shinko Shoji Co., Ltd. | | | 31,000 | | | | 299,257 | |
Siix Corp. | | | 18,300 | | | | 560,910 | |
SMK Corp. | | | 100,000 | | | | 514,258 | |
Taiyo Yuden Co., Ltd. | | | 40,200 | | | | 392,719 | |
Tokyo Electron Device Ltd.(a) | | | 20,300 | | | | 272,906 | |
Topcon Corp.(a) | | | 21,700 | | | | 286,515 | |
UKC Holdings Corp. | | | 13,200 | | | | 262,250 | |
| | | | | | | | |
| Total Electronic Equipment, Instruments & Components | | | | 20,132,841 | |
| Energy Equipment & Services – 0.2% | | | | | | | | |
Modec, Inc.(a) | | | 33,804 | | | | 495,954 | |
Shinko Plantech Co., Ltd. | | | 48,000 | | | | 365,995 | |
| | | | | | | | |
| Total Energy Equipment & Services | | | | 861,949 | |
| Food & Staples Retailing – 3.3% | | | | | | | | |
Ain Holdings, Inc. | | | 12,900 | | | | 662,245 | |
Arcs Co., Ltd. | | | 49,994 | | | | 1,121,357 | |
Belc Co., Ltd. | | | 20,300 | | | | 767,605 | |
Cawachi Ltd. | | | 30,500 | | | | 551,955 | |
Cocokara fine, Inc. | | | 17,400 | | | | 757,027 | |
Cosmos Pharmaceutical Corp.(a) | | | 1,800 | | | | 299,640 | |
Heiwado Co., Ltd. | | | 36,063 | | | | 749,528 | |
Kato Sangyo Co., Ltd. | | | 32,516 | | | | 805,125 | |
Life Corp. | | | 17,900 | | | | 448,794 | |
Matsumotokiyoshi Holdings Co., Ltd. | | | 31,800 | | | | 1,666,462 | |
Qol Co., Ltd. | | | 34,600 | | | | 520,562 | |
San-A Co., Ltd. | | | 15,500 | | | | 733,663 | |
UNY Group Holdings Co., Ltd. | | | 268,200 | | | | 1,892,278 | |
Valor Holdings Co., Ltd. | | | 34,791 | | | | 878,790 | |
Welcia Holdings Co., Ltd. | | | 17,100 | | | | 985,880 | |
Yaoko Co., Ltd. | | | 11,100 | | | | 491,325 | |
Yokohama Reito Co., Ltd. | | | 71,228 | | | | 675,555 | |
| | | | | | | | |
| Total Food & Staples Retailing | | | | 14,007,791 | |
| Food Products – 4.0% | | | | | | | | |
Ariake Japan Co., Ltd. | | | 21,428 | | | | 1,258,284 | |
Fuji Oil Holdings, Inc. | | | 56,300 | | | | 1,016,350 | |
Fujicco Co., Ltd.(a) | | | 41,500 | | | | 868,437 | |
Hokuto Corp. | | | 31,591 | | | | 625,665 | |
J-Oil Mills, Inc. | | | 193,981 | | | | 593,705 | |
Kameda Seika Co., Ltd. | | | 4,300 | | | | 171,396 | |
Marudai Food Co., Ltd. | | | 163,000 | | | | 633,756 | |
Maruha Nichiro Corp. | | | 35,032 | | | | 654,230 | |
See Notes to Financial Statements.
| | | | |
| WisdomTree Developed World ex-U.S. and Currency Hedged Equity Funds | | | 161 | |
Schedule of Investments (continued)
WisdomTree Japan SmallCap Dividend Fund (DFJ)
March 31, 2016
| | | | | | | | |
| Investments | | Shares | | | Value | |
| | | | | | | | |
Megmilk Snow Brand Co., Ltd. | | | 59,200 | | | $ | 1,490,073 | |
Mitsui Sugar Co., Ltd. | | | 128,492 | | | | 573,895 | |
Morinaga & Co., Ltd. | | | 178,439 | | | | 909,698 | |
Morinaga Milk Industry Co., Ltd. | | | 164,411 | | | | 882,066 | |
Nichirei Corp. | | | 186,096 | | | | 1,516,651 | |
Nippon Beet Sugar Manufacturing Co., Ltd. | | | 215,000 | | | | 365,363 | |
Nippon Flour Mills Co., Ltd. | | | 184,766 | | | | 1,520,606 | |
Nippon Suisan Kaisha Ltd. | | | 95,600 | | | | 465,263 | |
Nisshin Oillio Group Ltd. (The) | | | 187,000 | | | | 763,673 | |
Riken Vitamin Co., Ltd. | | | 14,000 | | | | 500,111 | |
S Foods, Inc.(a) | | | 34,100 | | | | 738,462 | |
Sakata Seed Corp. | | | 14,000 | | | | 356,119 | |
Showa Sangyo Co., Ltd. | | | 205,000 | | | | 849,949 | |
Starzen Co., Ltd. | | | 13,700 | | | | 383,349 | |
| | | | | | | | |
| Total Food Products | | | | 17,137,101 | |
| Gas Utilities – 0.1% | | | | | | | | |
K&O Energy Group, Inc. | | | 26,100 | | | | 322,781 | |
Shizuoka Gas Co., Ltd. | | | 42,692 | | | | 286,779 | |
| | | | | | | | |
| Total Gas Utilities | | | | 609,560 | |
| Health Care Equipment & Supplies – 1.8% | | | | | | | | |
Asahi Intecc Co., Ltd. | | | 12,000 | | | | 562,659 | |
Eiken Chemical Co., Ltd. | | | 15,435 | | | | 323,545 | |
Hogy Medical Co., Ltd. | | | 12,700 | | | | 682,486 | |
Nagaileben Co., Ltd. | | | 32,126 | | | | 661,413 | |
Nakanishi, Inc. | | | 15,100 | | | | 480,293 | |
Nihon Kohden Corp. | | | 50,500 | | | | 1,257,164 | |
Nikkiso Co., Ltd. | | | 58,300 | | | | 428,970 | |
Nipro Corp. | | | 214,200 | | | | 2,037,278 | |
Paramount Bed Holdings Co., Ltd.(a) | | | 29,721 | | | | 1,088,144 | |
| | | | | | | | |
| Total Health Care Equipment & Supplies | | | | 7,521,952 | |
| Health Care Providers & Services – 0.6% | | | | | | | | |
BML, Inc. | | | 17,600 | | | | 682,735 | |
Ship Healthcare Holdings, Inc. | | | 51,407 | | | | 1,296,667 | |
Toho Holdings Co., Ltd.(a) | | | 28,900 | | | | 619,166 | |
| | | | | | | | |
| Total Health Care Providers & Services | | | | 2,598,568 | |
| Hotels, Restaurants & Leisure – 3.4% | | | | | | | | |
Accordia Golf Co., Ltd.(a) | | | 125,000 | | | | 1,175,542 | |
Doutor Nichires Holdings Co., Ltd. | | | 46,753 | | | | 756,234 | |
Fuji Kyuko Co., Ltd.(a) | | | 27,402 | | | | 377,160 | |
Hiramatsu, Inc.(a) | | | 58,300 | | | | 384,880 | |
HIS Co., Ltd. | | | 12,000 | | | | 335,780 | |
Ichibanya Co., Ltd. | | | 9,918 | | | | 635,345 | |
Kyoritsu Maintenance Co., Ltd.(a) | | | 8,700 | | | | 751,608 | |
McDonald’s Holdings Co., Japan Ltd.(a) | | | 66,500 | | | | 1,577,375 | |
MOS Food Services, Inc.(a) | | | 17,500 | | | | 457,916 | |
Ohsho Food Service Corp. | | | 25,200 | | | | 774,643 | |
Plenus Co., Ltd.(a) | | | 42,868 | | | | 774,252 | |
Resorttrust, Inc.(a) | | | 72,208 | | | | 1,624,752 | |
Round One Corp.(a) | | | 148,437 | | | | 838,627 | |
Royal Holdings Co., Ltd. | | | 10,600 | | | | 214,367 | |
Saizeriya Co., Ltd. | | | 25,700 | | | | 529,800 | |
Skylark Co., Ltd. | | | 124,500 | | | | 1,646,043 | |
| | | | | | | | |
St. Marc Holdings Co., Ltd. | | | 20,300 | | | | 560,804 | |
Tokyotokeiba Co., Ltd.(a) | | | 180,424 | | | | 362,790 | |
Yoshinoya Holdings Co., Ltd.(a) | | | 35,600 | | | | 436,151 | |
| | | | | | | | |
| Total Hotels, Restaurants & Leisure | | | | 14,214,069 | |
| Household Durables – 2.5% | | | | | | | | |
Alpine Electronics, Inc. | | | 28,800 | | | | 323,118 | |
Cleanup Corp. | | | 34,400 | | | | 235,975 | |
First Juken Co., Ltd. | | | 27,500 | | | | 328,106 | |
Foster Electric Co., Ltd. | | | 24,000 | | | | 506,927 | |
France Bed Holdings Co., Ltd. | | | 77,300 | | | | 713,200 | |
Fujitsu General Ltd. | | | 41,000 | | | | 633,631 | |
Mitsui Home Co., Ltd. | | | 100,000 | | | | 467,992 | |
Nihon House Holdings Co., Ltd.(a) | | | 106,800 | | | | 385,789 | |
Nissei Build Kogyo Co., Ltd.(a) | | | 103,000 | | | | 352,818 | |
PanaHome Corp. | | | 143,177 | | | | 1,076,423 | |
Pressance Corp.(a) | | | 13,200 | | | | 506,179 | |
Sangetsu Co., Ltd. | | | 66,300 | | | | 1,203,953 | |
Starts Corp., Inc. | | | 46,000 | | | | 1,024,814 | |
Sumitomo Forestry Co., Ltd. | | | 92,300 | | | | 1,061,826 | |
Tamron Co., Ltd. | | | 26,366 | | | | 432,806 | |
TOA Corp.(a) | | | 32,952 | | | | 313,996 | |
Token Corp. | | | 10,770 | | | | 881,570 | |
| | | | | | | | |
| Total Household Durables | | | | 10,449,123 | |
| Household Products – 0.8% | | | | | | | | |
Earth Chemical Co., Ltd. | | | 27,700 | | | | 1,121,358 | |
Lion Corp. | | | 186,013 | | | | 2,100,187 | |
| | | | | | | | |
| Total Household Products | | | | 3,221,545 | |
| Independent Power & Renewable Electricity Producers – 0.1% | |
West Holdings Corp.(a) | | | 77,900 | | | | 481,698 | |
| Industrial Conglomerates – 0.4% | | | | | | | | |
Nisshinbo Holdings, Inc. | | | 90,500 | | | | 962,209 | |
TOKAI Holdings Corp.(a) | | | 134,600 | | | | 701,772 | |
| | | | | | | | |
| Total Industrial Conglomerates | | | | 1,663,981 | |
| Internet & Catalog Retail – 0.4% | | | | | | | | |
ASKUL Corp.(a) | | | 21,465 | | | | 874,681 | |
Belluna Co., Ltd. | | | 71,084 | | | | 361,128 | |
Senshukai Co., Ltd.(a) | | | 71,076 | | | | 455,311 | |
| | | | | | | | |
| Total Internet & Catalog Retail | | | | 1,691,120 | |
| Internet Software & Services – 0.9% | | | | | | | | |
Dip Corp.(a) | | | 16,500 | | | | 389,030 | |
F@N Communications, Inc.(a) | | | 56,200 | | | | 422,519 | |
GMO Internet, Inc. | | | 73,272 | | | | 979,828 | |
Gree, Inc.(a) | | | 118,500 | | | | 651,568 | |
Gurunavi, Inc. | | | 28,200 | | | | 670,658 | |
Internet Initiative Japan, Inc. | | | 27,700 | | | | 570,044 | |
NIFTY Corp. | | | 18,600 | | | | 166,315 | |
| | | | | | | | |
| Total Internet Software & Services | | | | 3,849,962 | |
| IT Services – 1.9% | | | | | | | | |
DTS Corp. | | | 28,691 | | | | 549,595 | |
Future Architect, Inc. | | | 45,900 | | | | 358,150 | |
Ines Corp. | | | 41,510 | | | | 427,306 | |
See Notes to Financial Statements.
| | |
| 162 | | WisdomTree Developed World ex-U.S. and Currency Hedged Equity Funds |
Schedule of Investments (continued)
WisdomTree Japan SmallCap Dividend Fund (DFJ)
March 31, 2016
| | | | | | | | |
| Investments | | Shares | | | Value | |
| | | | | | | | |
Information Services International-Dentsu Ltd. | | | 34,000 | | | $ | 683,055 | |
IT Holdings Corp. | | | 58,800 | | | | 1,393,685 | |
NEC Networks & System Integration Corp. | | | 47,079 | | | | 733,024 | |
NET One Systems Co., Ltd. | | | 139,758 | | | | 756,020 | |
Nihon Unisys Ltd.(a) | | | 73,100 | | | | 969,724 | |
NS Solutions Corp. | | | 61,380 | | | | 1,206,357 | |
Transcosmos, Inc.(a) | | | 31,000 | | | | 806,477 | |
| | | | | | | | |
| Total IT Services | | | | 7,883,393 | |
| Leisure Products – 1.5% | | | | | | | | |
Dunlop Sports Co., Ltd.(a) | | | 42,886 | | | | 382,328 | |
Fields Corp. | | | 49,200 | | | | 822,517 | |
Heiwa Corp. | | | 157,900 | | | | 3,277,554 | |
Mizuno Corp.(a) | | | 107,616 | | | | 496,932 | |
Tomy Co., Ltd.(a) | | | 48,000 | | | | 351,048 | |
Universal Entertainment Corp. | | | 55,900 | | | | 929,553 | |
| | | | | | | | |
| Total Leisure Products | | | | 6,259,932 | |
| Life Sciences Tools & Services – 0.1% | | | | | | | | |
CMIC Holdings Co., Ltd.(a) | | | 20,600 | | | | 260,261 | |
EPS Holdings, Inc. | | | 15,500 | | | | 189,759 | |
| | | | | | | | |
| Total Life Sciences Tools & Services | | | | 450,020 | |
| Machinery – 5.5% | | | | | | | | |
Aida Engineering Ltd. | | | 81,700 | | | | 710,909 | |
Alinco, Inc.(a) | | | 30,100 | | | | 269,412 | |
Anest Iwata Corp. | | | 49,000 | | | | 469,968 | |
Asahi Diamond Industrial Co., Ltd. | | | 43,000 | | | | 386,022 | |
Bando Chemical Industries Ltd. | | | 114,787 | | | | 519,833 | |
CKD Corp. | | | 42,641 | | | | 352,449 | |
Daifuku Co., Ltd. | | | 41,304 | | | | 697,128 | |
DMG Mori Co., Ltd.(a) | | | 51,200 | | | | 471,480 | |
Ebara Corp. | | | 342,000 | | | | 1,430,135 | |
Fujitec Co., Ltd. | | | 65,861 | | | | 671,531 | |
Furukawa Co., Ltd. | | | 343,000 | | | | 506,588 | |
Glory Ltd. | | | 34,900 | | | | 1,187,709 | |
Hitachi Koki Co., Ltd. | | | 92,827 | | | | 614,469 | |
Hitachi Zosen Corp. | | | 92,200 | | | | 438,051 | |
Iseki & Co., Ltd.(a) | | | 131,000 | | | | 257,583 | |
Japan Steel Works Ltd. (The) | | | 100,524 | | | | 317,505 | |
Kato Works Co., Ltd.(a) | | | 64,000 | | | | 248,837 | |
Kito Corp. | | | 19,200 | | | | 143,665 | |
Kitz Corp. | | | 91,789 | | | | 397,716 | |
Kobelco Eco-Solutions Co., Ltd.(a) | | | 106,000 | | | | 423,453 | |
Kyokuto Kaihatsu Kogyo Co., Ltd. | | | 28,980 | | | | 293,423 | |
Makino Milling Machine Co., Ltd. | | | 45,578 | | | | 279,401 | |
Max Co., Ltd. | | | 36,000 | | | | 370,266 | |
Meidensha Corp. | | | 144,000 | | | | 657,253 | |
Mitsubishi Nichiyu Forklift Co., Ltd. | | | 62,600 | | | | 256,204 | |
Mitsuboshi Belting Ltd. | | | 37,092 | | | | 298,993 | |
Mitsui Engineering & Shipbuilding Co., Ltd. | | | 316,404 | | | | 472,938 | |
Miura Co., Ltd. | | | 93,600 | | | | 1,749,665 | |
Morita Holdings Corp. | | | 41,005 | | | | 480,115 | |
Nachi-Fujikoshi Corp. | | | 127,000 | | | | 442,938 | |
Nippon Thompson Co., Ltd. | | | 99,051 | | | | 354,273 | |
Nitta Corp. | | | 17,900 | | | | 451,501 | |
| | | | | | | | |
Obara Group, Inc. | | | 12,979 | | | | 465,948 | |
Oiles Corp. | | | 33,200 | | | | 497,136 | |
OKUMA Corp.(a) | | | 45,852 | | | | 321,060 | |
OSG Corp.(a) | | | 60,000 | | | | 1,121,580 | |
Ryobi Ltd. | | | 115,000 | | | | 454,291 | |
Shinmaywa Industries Ltd. | | | 63,685 | | | | 452,161 | |
Sodick Co., Ltd. | | | 35,500 | | | | 265,946 | |
Star Micronics Co., Ltd. | | | 48,034 | | | | 539,338 | |
Tadano Ltd. | | | 49,000 | | | | 455,581 | |
Tocalo Co., Ltd. | | | 19,500 | | | | 351,154 | |
Toshiba Machine Co., Ltd. | | | 52,806 | | | | 162,559 | |
Tsubakimoto Chain Co. | | | 118,228 | | | | 733,172 | |
Tsugami Corp.(a) | | | 41,000 | | | | 149,197 | |
Union Tool Co.(a) | | | 15,900 | | | | 418,455 | |
YAMABIKO Corp. | | | 29,800 | | | | 207,602 | |
| | | | | | | | |
| Total Machinery | | | | 23,216,593 | |
| Marine – 0.6% | | | | | | | | |
Kawasaki Kisen Kaisha Ltd.(a) | | | 1,018,000 | | | | 1,974,501 | |
NS United Kaiun Kaisha Ltd. | | | 291,000 | | | | 393,540 | |
| | | | | | | | |
| Total Marine | | | | 2,368,041 | |
| Media – 1.6% | | | | | | | | |
Avex Group Holdings, Inc. | | | 43,799 | | | | 571,672 | |
Daiichikosho Co., Ltd. | | | 56,300 | | | | 2,454,469 | |
Kadokawa Dwango* | | | 33,500 | | | | 517,127 | |
SKY Perfect JSAT Holdings, Inc. | | | 231,500 | | | | 1,349,104 | |
Toei Co., Ltd. | | | 64,313 | | | | 573,349 | |
Tv Tokyo Holdings Corp. | | | 19,900 | | | | 363,492 | |
Wowow, Inc. | | | 15,500 | | | | 329,183 | |
Zenrin Co., Ltd. | | | 30,087 | | | | 605,247 | |
| | | | | | | | |
| Total Media | | | | 6,763,643 | |
| Metals & Mining – 2.5% | | | | | | | | |
Aichi Steel Corp. | | | 127,000 | | | | 498,305 | |
Asahi Holdings, Inc. | | | 42,300 | | | | 570,549 | |
Daido Steel Co., Ltd. | | | 194,000 | | | | 673,162 | |
Dowa Holdings Co., Ltd. | | | 200,000 | | | | 1,115,708 | |
Godo Steel Ltd. | | | 126,000 | | | | 211,878 | |
Kyoei Steel Ltd. | | | 29,314 | | | | 441,294 | |
Mitsubishi Steel Manufacturing Co., Ltd. | | | 143,000 | | | | 231,558 | |
Mitsui Mining & Smelting Co., Ltd. | | | 347,000 | | | | 555,719 | |
Neturen Co., Ltd. | | | 35,800 | | | | 243,349 | |
Nippon Denko Co., Ltd. | | | 97,941 | | | | 156,852 | |
Nippon Light Metal Holdings Co., Ltd.(a) | | | 490,900 | | | | 808,012 | |
Nisshin Steel Co., Ltd.(a) | | | 108,428 | | | | 1,266,657 | |
Osaka Steel Co., Ltd. | | | 17,500 | | | | 286,801 | |
OSAKA Titanium Technologies Co., Ltd.(a) | | | 11,200 | | | | 152,363 | |
Sanyo Special Steel Co., Ltd. | | | 114,000 | | | | 521,340 | |
Toho Zinc Co., Ltd.(a) | | | 141,967 | | | | 359,986 | |
Tokyo Steel Manufacturing Co., Ltd. | | | 40,500 | | | | 241,425 | |
Topy Industries Ltd. | | | 100,000 | | | | 197,518 | |
Toyo Kohan Co., Ltd. | | | 109,405 | | | | 329,008 | |
UACJ Corp.(a) | | | 405,632 | | | | 822,849 | |
Yamato Kogyo Co., Ltd. | | | 44,400 | | | | 965,071 | |
| | | | | | | | |
| Total Metals & Mining | | | | 10,649,404 | |
See Notes to Financial Statements.
| | | | |
| WisdomTree Developed World ex-U.S. and Currency Hedged Equity Funds | | | 163 | |
Schedule of Investments (continued)
WisdomTree Japan SmallCap Dividend Fund (DFJ)
March 31, 2016
| | | | | | | | |
| Investments | | Shares | | | Value | |
| | | | | | | | |
| Multiline Retail – 0.5% | | | | | | | | |
H2O Retailing Corp.(a) | | | 54,700 | | | $ | 945,613 | |
Parco Co., Ltd. | | | 59,500 | | | | 504,502 | |
Seria Co., Ltd. | | | 11,500 | | | | 694,737 | |
| | | | | | | | |
| Total Multiline Retail | | | | 2,144,852 | |
| Oil, Gas & Consumable Fuels – 0.7% | | | | | | | | |
BP Castrol K.K.(a) | | | 42,400 | | | | 481,359 | |
Itochu Enex Co., Ltd. | | | 134,181 | | | | 1,078,032 | |
Nippon Coke & Engineering Co., Ltd. | | | 401,873 | | | | 289,619 | |
Nippon Gas Co., Ltd.(a) | | | 19,400 | | | | 438,591 | |
San-Ai Oil Co., Ltd. | | | 52,916 | | | | 384,647 | |
Sinanen Holdings Co., Ltd. | | | 74,771 | | | | 292,711 | |
| | | | | | | | |
| Total Oil, Gas & Consumable Fuels | | | | 2,964,959 | |
| Paper & Forest Products – 0.9% | | | | | | | | |
Daio Paper Corp.(a) | | | 39,478 | | | | 333,330 | |
Hokuetsu Kishu Paper Co., Ltd.(a) | | | 146,232 | | | | 873,007 | |
Nippon Paper Industries Co., Ltd.(a) | | | 118,300 | | | | 2,108,234 | |
Tokushu Tokai Paper Co., Ltd. | | | 147,000 | | | | 476,071 | |
| | | | | | | | |
| Total Paper & Forest Products | | | | 3,790,642 | |
| Personal Products – 1.2% | | | | | | | | |
Artnature, Inc. | | | 50,900 | | | | 459,207 | |
Fancl Corp. | | | 65,400 | | | | 893,180 | |
Kobayashi Pharmaceutical Co., Ltd. | | | 18,100 | | | | 1,591,067 | |
Mandom Corp. | | | 16,053 | | | | 715,562 | |
Milbon Co., Ltd. | | | 12,200 | | | | 493,883 | |
Noevir Holdings Co., Ltd. | | | 33,000 | | | | 949,820 | |
| | | | | | | | |
| Total Personal Products | | | | 5,102,719 | |
| Pharmaceuticals – 2.5% | | | | | | | | |
Fuji Pharma Co., Ltd.(a) | | | 18,400 | | | | 310,391 | |
KYORIN Holdings, Inc. | | | 57,985 | | | | 1,106,097 | |
Mochida Pharmaceutical Co., Ltd. | | | 16,611 | | | | 1,235,535 | |
Nichi-iko Pharmaceutical Co., Ltd. | | | 35,100 | | | | 810,709 | |
Nippon Shinyaku Co., Ltd. | | | 29,200 | | | | 1,143,111 | |
Rohto Pharmaceutical Co., Ltd. | | | 57,100 | | | | 1,041,461 | |
Sawai Pharmaceutical Co., Ltd. | | | 26,224 | | | | 1,644,906 | |
Torii Pharmaceutical Co., Ltd. | | | 17,300 | | | | 398,349 | |
Towa Pharmaceutical Co., Ltd.(a) | | | 10,800 | | | | 443,454 | |
Tsumura & Co.(a) | | | 70,800 | | | | 1,702,047 | |
ZERIA Pharmaceutical Co., Ltd. | | | 45,200 | | | | 587,546 | |
| | | | | | | | |
| Total Pharmaceuticals | | | | 10,423,606 | |
| Professional Services – 1.2% | | | | | | | | |
FULLCAST Holdings Co., Ltd. | | | 41,900 | | | | 294,879 | |
Funai Soken Holdings, Inc. | | | 32,240 | | | | 519,190 | |
Meitec Corp.(a) | | | 42,000 | | | | 1,470,439 | |
Nomura Co., Ltd. | | | 34,500 | | | | 501,255 | |
Space Co., Ltd. | | | 33,100 | | | | 400,516 | |
Temp Holdings Co., Ltd. | | | 63,600 | | | | 923,486 | |
Weathernews, Inc. | | | 11,000 | | | | 369,945 | |
Yumeshin Holdings Co., Ltd.(a) | | | 91,600 | | | | 506,104 | |
| | | | | | | | |
| Total Professional Services | | | | 4,985,814 | |
| | | | | | | | |
| Real Estate Management & Development – 1.6% | | | | | | | | |
Airport Facilities Co., Ltd. | | | 60,919 | | | | 275,882 | |
Daibiru Corp. | | | 72,300 | | | | 611,104 | |
Daikyo, Inc. | | | 634,000 | | | | 1,009,707 | |
Goldcrest Co., Ltd. | | | 28,100 | | | | 420,519 | |
Heiwa Real Estate Co., Ltd. | | | 40,568 | | | | 505,318 | |
Kenedix, Inc. | | | 87,200 | | | | 381,711 | |
Open House Co., Ltd. | | | 26,600 | | | | 529,657 | |
Relo Holdings, Inc.(a) | | | 10,446 | | | | 1,402,466 | |
Takara Leben Co., Ltd. | | | 78,200 | | | | 463,376 | |
TOC Co., Ltd. | | | 50,700 | | | | 429,435 | |
Unizo Holdings Co., Ltd.(a) | | | 16,700 | | | | 719,885 | |
| | | | | | | | |
| Total Real Estate Management & Development | | | | 6,749,060 | |
| Road & Rail – 2.6% | | | | | | | | |
Fukuyama Transporting Co., Ltd.(a) | | | 164,059 | | | | 801,356 | |
Hitachi Transport System Ltd. | | | 55,100 | | | | 922,623 | |
Ichinen Holdings Co., Ltd. | | | 33,200 | | | | 295,387 | |
Maruzen Showa Unyu Co., Ltd. | | | 117,000 | | | | 411,184 | |
Nankai Electric Railway Co., Ltd. | | | 206,000 | | | | 1,119,854 | |
Nikkon Holdings Co., Ltd. | | | 71,060 | | | | 1,289,758 | |
Nishi-Nippon Railroad Co., Ltd. | | | 180,000 | | | | 1,175,497 | |
Sankyu, Inc. | | | 248,532 | | | | 1,136,576 | |
Seino Holdings Co., Ltd. | | | 109,260 | | | | 1,179,166 | |
Senko Co., Ltd. | | | 138,156 | | | | 843,232 | |
Sotetsu Holdings, Inc. | | | 284,000 | | | | 1,743,494 | |
| | | | | | | | |
| Total Road & Rail | | | | 10,918,127 | |
| Semiconductors & Semiconductor Equipment – 1.2% | | | | | |
Advantest Corp.(a) | | | 89,700 | | | | 830,799 | |
Axell Corp. | | | 28,600 | | | | 215,019 | |
Lasertec Corp. | | | 19,100 | | | | 269,519 | |
MegaChips Corp.(a) | | | 28,500 | | | | 320,766 | |
Mimasu Semiconductor Industry Co., Ltd. | | | 18,427 | | | | 169,687 | |
Mitsui High-Tec, Inc. | | | 32,500 | | | | 200,098 | |
Nuflare Technology, Inc.(a) | | | 13,200 | | | | 585,453 | |
Sanken Electric Co., Ltd.(a) | | | 36,000 | | | | 108,261 | |
SCREEN Holdings Co., Ltd. | | | 100,000 | | | | 791,850 | |
Shindengen Electric Manufacturing Co., Ltd. | | | 44,000 | | | | 149,153 | |
Shinko Electric Industries Co., Ltd. | | | 136,553 | | | | 769,056 | |
Tokyo Seimitsu Co., Ltd. | | | 30,500 | | | | 598,901 | |
| | | | | | | | |
| Total Semiconductors & Semiconductor Equipment | | | | 5,008,562 | |
| Software – 1.8% | | | | | | | | |
Capcom Co., Ltd. | | | 45,813 | | | | 1,118,881 | |
Fuji Soft, Inc. | | | 17,800 | | | | 388,798 | |
Imagica Robot Holdings, Inc.(a) | | | 49,600 | | | | 178,727 | |
Konami Holdings Corp.(a) | | | 59,100 | | | | 1,750,994 | |
Marvelous, Inc.(a) | | | 31,000 | | | | 278,571 | |
MTI Ltd.(a) | | | 34,400 | | | | 239,342 | |
NSD Co., Ltd. | | | 89,000 | | | | 1,317,639 | |
Square Enix Holdings Co., Ltd. | | | 62,900 | | | | 1,701,286 | |
Systena Corp. | | | 34,000 | | | | 578,994 | |
| | | | | | | | |
| Total Software | | | | 7,553,232 | |
See Notes to Financial Statements.
| | |
| 164 | | WisdomTree Developed World ex-U.S. and Currency Hedged Equity Funds |
Schedule of Investments (concluded)
WisdomTree Japan SmallCap Dividend Fund (DFJ)
March 31, 2016
| | | | | | | | |
| Investments | | Shares | | | Value | |
| | | | | | | | |
| Specialty Retail – 5.5% | | | | | | | | |
Adastria Co., Ltd. | | | 39,900 | | | $ | 1,212,318 | |
AOKI Holdings, Inc. | | | 73,454 | | | | 888,807 | |
Aoyama Trading Co., Ltd. | | | 47,700 | | | | 1,835,513 | |
Arcland Sakamoto Co., Ltd. | | | 31,416 | | | | 333,181 | |
Autobacs Seven Co., Ltd. | | | 108,900 | | | | 1,840,918 | |
Bic Camera, Inc. | | | 56,500 | | | | 513,751 | |
Chiyoda Co., Ltd. | | | 43,291 | | | | 1,247,945 | |
DCM Holdings Co., Ltd. | | | 132,145 | | | | 955,860 | |
EDION Corp.(a) | | | 132,339 | | | | 1,005,539 | |
Geo Holdings Corp.(a) | | | 71,800 | | | | 1,195,229 | |
Gulliver International Co., Ltd.(a) | | | 71,060 | | | | 885,761 | |
Joshin Denki Co., Ltd. | | | 41,000 | | | | 315,539 | |
Joyful Honda Co., Ltd.(a) | | | 20,500 | | | | 459,994 | |
K’s Holdings Corp.(a) | | | 44,974 | | | | 1,492,531 | |
Kohnan Shoji Co., Ltd. | | | 65,600 | | | | 977,624 | |
Komeri Co., Ltd. | | | 29,937 | | | | 612,617 | |
Konaka Co., Ltd. | | | 59,700 | | | | 292,670 | |
Kyoto Kimono Yuzen Co., Ltd.(a) | | | 58,700 | | | | 449,670 | |
Nishimatsuya Chain Co., Ltd. | | | 59,900 | | | | 601,158 | |
Nojima Corp.(a) | | | 18,700 | | | | 204,312 | |
Pal Co., Ltd. | | | 18,700 | | | | 469,018 | |
Sanrio Co., Ltd.(a) | | | 88,342 | | | | 1,729,977 | |
Shimachu Co., Ltd. | | | 40,864 | | | | 976,926 | |
T-Gaia Corp.(a) | | | 81,600 | | | | 945,992 | |
United Arrows Ltd. | | | 33,629 | | | | 1,392,793 | |
VT Holdings Co., Ltd.(a) | | | 91,500 | | | | 550,327 | |
| | | | | | | | |
| Total Specialty Retail | | | | 23,385,970 | |
| Technology Hardware, Storage & Peripherals – 1.0% | |
Eizo Corp. | | | 16,000 | | | | 403,150 | |
Elecom Co., Ltd. | | | 33,200 | | | | 586,047 | |
Hitachi Maxell Ltd. | | | 65,500 | | | | 998,278 | |
Riso Kagaku Corp. | | | 48,600 | | | | 750,653 | |
Roland DG Corp. | | | 15,800 | | | | 308,985 | |
Wacom Co., Ltd.(a) | | | 270,111 | | | | 1,146,341 | |
| | | | | | | | |
| Total Technology Hardware, Storage & Peripherals | | | | 4,193,454 | |
| Textiles, Apparel & Luxury Goods – 1.7% | | | | | | | | |
Descente Ltd. | | | 42,653 | | | | 629,198 | |
Fujibo Holdings, Inc. | | | 129,000 | | | | 257,093 | |
Gunze Ltd. | | | 199,834 | | | | 565,392 | |
Japan Wool Textile Co., Ltd. (The) | | | 57,425 | | | | 388,300 | |
Kurabo Industries Ltd. | | | 197,766 | | | | 343,115 | |
Onward Holdings Co., Ltd. | | | 196,433 | | | | 1,343,983 | |
Sanyo Shokai Ltd. | | | 162,000 | | | | 368,984 | |
Seiko Holdings Corp. | | | 133,000 | | | | 527,764 | |
Seiren Co., Ltd. | | | 63,111 | | | | 710,311 | |
Wacoal Holdings Corp. | | | 140,000 | | | | 1,672,850 | |
Yondoshi Holdings, Inc. | | | 18,200 | | | | 450,162 | |
| | | | | | | | |
| Total Textiles, Apparel & Luxury Goods | | | | 7,257,152 | |
| Trading Companies & Distributors – 2.8% | | | | | | | | |
Daiichi Jitsugyo Co., Ltd. | | | 46,000 | | | | 201,771 | |
Hanwa Co., Ltd. | | | 190,114 | | | | 803,453 | |
Inaba Denki Sangyo Co., Ltd. | | | 42,694 | | | | 1,346,592 | |
| | | | | | | | |
Inabata & Co., Ltd. | | | 90,941 | | | | 902,978 | |
Iwatani Corp.(a) | | | 61,166 | | | | 355,911 | |
Japan Pulp & Paper Co., Ltd.(a) | | | 148,578 | | | | 425,661 | |
Kanamoto Co., Ltd. | | | 15,528 | | | | 365,974 | |
Kanematsu Corp. | | | 281,000 | | | | 410,018 | |
Kuroda Electric Co., Ltd. | | | 33,765 | | | | 506,197 | |
MonotaRO Co., Ltd.(a) | | | 14,700 | | | | 437,488 | |
Nagase & Co., Ltd. | | | 92,804 | | | | 1,021,385 | |
Nippon Steel & Sumikin Bussan Corp. | | | 305,000 | | | | 1,017,616 | |
Nishio Rent All Co., Ltd. | | | 17,900 | | | | 424,587 | |
Onoken Co., Ltd.(a) | | | 34,900 | | | | 306,165 | |
Seika Corp. | | | 123,000 | | | | 248,419 | |
Shinsho Corp. | | | 151,000 | | | | 274,069 | |
Trusco Nakayama Corp. | | | 24,700 | | | | 982,330 | |
Wakita & Co., Ltd. | | | 45,900 | | | | 383,878 | |
Yamazen Corp. | | | 97,006 | | | | 737,934 | |
Yuasa Trading Co., Ltd. | | | 27,000 | | | | 635,393 | |
| | | | | | | | |
| Total Trading Companies & Distributors | | | | | | | 11,787,819 | |
| Transportation Infrastructure – 0.6% | | | | | | | | |
Kamigumi Co., Ltd. | | | 103,000 | | | | 970,479 | |
Mitsubishi Logistics Corp.(a) | | | 43,000 | | | | 565,452 | |
Nissin Corp. | | | 116,000 | | | | 317,879 | |
Sumitomo Warehouse Co., Ltd. (The) | | | 125,538 | | | | 640,004 | |
| | | | | | | | |
| Total Transportation Infrastructure | | | | | | | 2,493,814 | |
TOTAL COMMON STOCKS
(Cost: $393,539,268) | | | | | | | 418,250,130 | |
| INVESTMENT OF CASH COLLATERAL FOR SECURITIES LOANED – 16.1% | |
| United States – 16.1% | | | | | | | | |
State Street Navigator Securities Lending Prime Portfolio, 0.50%(b) (Cost: $68,392,118)(c) | | | 68,392,118 | | | | 68,392,118 | |
TOTAL INVESTMENTS IN SECURITIES – 115.0%
(Cost: $461,931,386) | | | | 486,642,248 | |
Liabilities in Excess of Cash, Foreign Currency and Other Assets – (15.0)% | | | | | | | (63,611,484 | ) |
| | | | | | | | |
| NET ASSETS – 100.0% | | | $ | 423,030,764 | |
| * | Non-income producing security. |
| (a) | Security, or portion thereof, was on loan at March 31, 2016 (See Note 2). |
| (b) | Rate shown represents annualized 7-day yield as of March 31, 2016. |
| (c) | At March 31, 2016, the total market value of the Fund’s securities on loan was $68,662,149 and the total market value of the collateral held by the Fund was $72,233,036. The total market value of the collateral includes non-cash U.S. Government securities collateral having a value of $3,840,918. |
See Notes to Financial Statements.
| | | | |
| WisdomTree Developed World ex-U.S. and Currency Hedged Equity Funds | | | 165 | |
Schedule of Investments
WisdomTree Korea Hedged Equity Fund (DXKW)
March 31, 2016
| | | | | | | | |
| Investments | | Shares | | | Value | |
| | | | | | | | |
| COMMON STOCKS – 99.1% | | | | | | | | |
| South Korea – 99.1% | | | | | | | | |
| Aerospace & Defense – 1.3% | | | | | | | | |
Korea Aerospace Industries Ltd. | | | 4,319 | | | $ | 246,239 | |
| Air Freight & Logistics – 2.7% | | | | | | | | |
Hyundai Glovis Co., Ltd. | | | 3,166 | | | | 521,853 | |
| Auto Components – 5.7% | | | | | | | | |
Hankook Tire Co., Ltd. | | | 11,242 | | | | 534,772 | |
Hanon Systems | | | 34,133 | | | | 274,592 | |
Mando Corp. | | | 1,465 | | | | 200,483 | |
Nexen Tire Corp. | | | 8,422 | | | | 107,153 | |
| | | | | | | | |
| Total Auto Components | | | | 1,117,000 | |
| Automobiles – 9.9% | | | | | | | | |
Hyundai Motor Co. | | | 7,239 | | | | 965,327 | |
Kia Motors Corp. | | | 22,519 | | | | 951,091 | |
| | | | | | | | |
| Total Automobiles | | | | 1,916,418 | |
| Biotechnology – 0.3% | | | | | | | | |
Medy-Tox, Inc. | | | 140 | | | | 54,049 | |
| Chemicals – 20.3% | | | | | | | | |
Hanwha Chemical Corp. | | | 13,678 | | | | 298,414 | |
Hyosung Corp. | | | 6,135 | | | | 772,508 | |
Korea Petrochemical Ind Co., Ltd. | | | 1,480 | | | | 331,305 | |
Kumho Petrochemical Co., Ltd. | | | 3,708 | | | | 188,707 | |
LG Chem Ltd. | | | 3,638 | | | | 1,041,837 | |
Lotte Chemical Corp. | | | 3,419 | | | | 1,020,976 | |
OCI Co., Ltd.(a) | | | 2,416 | | | | 223,939 | |
SK Materials Co., Ltd. | | | 730 | | | | 71,174 | |
| | | | | | | | |
| Total Chemicals | | | | 3,948,860 | |
| Construction & Engineering – 5.6% | | | | | | | | |
Daelim Industrial Co., Ltd. | | | 4,057 | | | | 322,474 | |
Daewoo Engineering & Construction Co., Ltd.* | | | 22,927 | | | | 125,902 | |
GS Engineering & Construction Corp.* | | | 1,692 | | | | 40,391 | |
Hyundai Engineering & Construction Co., Ltd. | | | 16,068 | | | | 592,223 | |
| | | | | | | | |
| Total Construction & Engineering | | | | 1,080,990 | |
| Electronic Equipment, Instruments & Components – 4.4% | |
LG Display Co., Ltd. | | | 36,380 | | | | 846,195 | |
Samsung Electro-Mechanics Co., Ltd. | | | 327 | | | | 16,813 | |
| | | | | | | | |
| Total Electronic Equipment, Instruments & Components | | | | 863,008 | |
| Food Products – 1.4% | | | | | | | | |
CJ CheilJedang Corp. | | | 876 | | | | 266,186 | |
| Household Durables – 1.0% | | | | | | | | |
LG Electronics, Inc. | | | 3,467 | | | | 186,750 | |
| Industrial Conglomerates – 0.0% | | | | | | | | |
Hanwha Techwin Co., Ltd. | | | 240 | | | | 8,468 | |
| Internet Software & Services – 3.4% | | | | | | | | |
NAVER Corp. | | | 1,203 | | | | 670,086 | |
| IT Services – 2.7% | | | | | | | | |
Samsung SDS Co., Ltd. | | | 3,372 | | | | 516,002 | |
| | | | | | | | |
| Media – 0.6% | | | | | | | | |
Cheil Worldwide, Inc. | | | 7,821 | | | $ | 116,262 | |
| Metals & Mining – 5.9% | | | | | | | | |
Hyundai Steel Co. | | | 17,797 | | | | 863,705 | |
POSCO | | | 1,445 | | | | 277,350 | |
| | | | | | | | |
| Total Metals & Mining | | | | | | | 1,141,055 | |
| Oil, Gas & Consumable Fuels – 11.0% | | | | | | | | |
S-Oil Corp. | | | 12,721 | | | | 1,089,005 | |
SK Innovation Co., Ltd. | | | 6,982 | | | | 1,050,108 | |
| | | | | | | | |
| Total Oil, Gas & Consumable Fuels | | | | | | | 2,139,113 | |
| Personal Products – 4.9% | | | | | | | | |
Amorepacific Corp. | | | 2,826 | | | | 955,097 | |
| Pharmaceuticals – 0.1% | | | | | | | | |
Hanmi Pharm Co., Ltd. | | | 35 | | | | 21,393 | |
| Semiconductors & Semiconductor Equipment – 3.9% | |
Eo Technics Co., Ltd. | | | 356 | | | | 37,231 | |
SK Hynix, Inc. | | | 29,625 | | | | 729,227 | |
| | | | | | | | |
| Total Semiconductors & Semiconductor Equipment | | | | 766,458 | |
| Software – 1.8% | | | | | | | | |
Com2uS Corp.* | | | 1,380 | | | | 149,512 | |
NCSoft Corp. | | | 927 | | | | 205,487 | |
| | | | | | | | |
| Total Software | | | | | | | 354,999 | |
| Technology Hardware, Storage & Peripherals – 9.5% | |
Samsung Electronics Co., Ltd. | | | 1,619 | | | | 1,857,405 | |
| Textiles, Apparel & Luxury Goods – 1.6% | | | | | | | | |
Hansae Co., Ltd. | | | 2,490 | | | | 123,455 | |
Youngone Corp. | | | 4,611 | | | | 193,939 | |
| | | | | | | | |
| Total Textiles, Apparel & Luxury Goods | | | | | | | 317,394 | |
| Trading Companies & Distributors – 1.1% | | | | | | | | |
Posco Daewoo Corp. | | | 10,834 | | | | 204,629 | |
TOTAL COMMON STOCKS
(Cost: $18,822,204) | | | | | | | 19,269,714 | |
| INVESTMENT OF CASH COLLATERAL FOR SECURITIES LOANED – 0.9% | |
| United States – 0.9% | | | | | | | | |
State Street Navigator Securities Lending Prime Portfolio, 0.50%(b) (Cost: $175,140)(c) | | | 175,140 | | | | 175,140 | |
TOTAL INVESTMENTS IN SECURITIES – 100.0%
(Cost: $18,997,344) | | | | | | | 19,444,854 | |
Cash, Foreign Currency and Other Assets in Excess of Liabilities – 0.0% | | | | | | | 5,079 | |
| | | | | | | | |
| NET ASSETS – 100.0% | | | $ | 19,449,933 | |
| * | Non-income producing security. |
| (a) | Security, or portion thereof, was on loan at March 31, 2016 (See Note 2). |
| (b) | Rate shown represents annualized 7-day yield as of March 31, 2016. |
| (c) | At March 31, 2016, the total market value of the Fund’s securities on loan was $166,842 and the total market value of the collateral held by the Fund was $175,140. |
See Notes to Financial Statements.
| | |
| 166 | | WisdomTree Developed World ex-U.S. and Currency Hedged Equity Funds |
Schedule of Investments (concluded)
WisdomTree Korea Hedged Equity Fund (DXKW)
March 31, 2016
| | | | | | | | | | | | | | | | | | |
| FORWARD CONTRACTS | |
Settlement Date | | Contracts
To Deliver | | | In
Exchange For | | | Unrealized
Gain (Loss) | |
4/5/2016 | | KRW | | | 7,778,030,400 | | | | USD | | | | 6,283,754 | | | $ | (517,644 | ) |
4/5/2016 | | KRW | | | 8,006,796,000 | | | | USD | | | | 6,468,518 | | | | (532,922 | ) |
4/5/2016 | | KRW | | | 7,091,733,600 | | | | USD | | | | 5,728,842 | | | | (472,433 | ) |
4/5/2016 | | KRW | �� | | 1,660,915,055 | | | | USD | | | | 1,448,809 | | | | (3,547 | ) |
4/5/2016 | | USD | | | 156,929 | | | | KRW | | | | 194,808,000 | | | | 13,419 | |
4/5/2016 | | USD | | | 4,958,844 | | | | KRW | | | | 5,670,438,000 | | | | (403 | ) |
4/5/2016 | | USD | | | 4,957,543 | | | | KRW | | | | 5,670,438,000 | | | | 898 | |
4/5/2016 | | USD | | | 4,957,977 | | | | KRW | | | | 5,670,438,000 | | | | 465 | |
4/5/2016 | | USD | | | 4,958,844 | | | | KRW | | | | 5,670,438,000 | | | | (403 | ) |
5/4/2016 | | KRW | | | 5,611,687,750 | | | | USD | | | | 4,903,521 | | | | (728 | ) |
5/4/2016 | | KRW | | | 5,611,687,750 | | | | USD | | | | 4,903,178 | | | | (1,071 | ) |
5/4/2016 | | KRW | | | 5,611,687,750 | | | | USD | | | | 4,902,108 | | | | (2,142 | ) |
5/4/2016 | | KRW | | | 5,611,687,750 | | | | USD | | | | 4,902,536 | | | | (1,714 | ) |
5/4/2016 | | USD | | | 8,266 | | | | KRW | | | | 9,418,000 | | | | (36 | ) |
| | | | | | | | | | | | | | | | | $ | (1,518,261 | ) |
| | |
| CURRENCY LEGEND |
KRW | | – South Korean won |
USD | | – U.S. dollar |
See Notes to Financial Statements.
| | | | |
| WisdomTree Developed World ex-U.S. and Currency Hedged Equity Funds | | | 167 | |
Schedule of Investments
WisdomTree United Kingdom Hedged Equity Fund (DXPS)
March 31, 2016
| | | | | | | | |
| Investments | | Shares | | | Value | |
| | | | | | | | |
| COMMON STOCKS – 99.3% | | | | | | | | |
| United Kingdom – 99.3% | | | | | | | | |
| Aerospace & Defense – 2.9% | | | | | | | | |
BAE Systems PLC | | | 64,249 | | | $ | 470,036 | |
Cobham PLC | | | 19,115 | | | | 59,646 | |
Meggitt PLC | | | 9,753 | | | | 56,997 | |
QinetiQ Group PLC | | | 6,179 | | | | 20,249 | |
Rolls-Royce Holdings PLC* | | | 17,179 | | | | 168,395 | |
Senior PLC | | | 3,220 | | | | 10,557 | |
Ultra Electronics Holdings PLC | | | 760 | | | | 19,717 | |
| | | | | | | | |
| Total Aerospace & Defense | | | | 805,597 | |
| Airlines – 0.4% | | | | | | | | |
easyJet PLC | | | 4,917 | | | | 107,351 | |
| Auto Components – 0.3% | | | | | | | | |
GKN PLC | | | 16,979 | | | | 70,478 | |
| Banks – 5.4% | | | | | | | | |
Barclays PLC | | | 170,718 | | | | 368,060 | |
BGEO Group PLC | | | 520 | | | | 15,157 | |
HSBC Holdings PLC | | | 178,905 | | | | 1,115,731 | |
| | | | | | | | |
| Total Banks | | | | 1,498,948 | |
| Beverages – 8.4% | | | | | | | | |
Britvic PLC | | | 3,159 | | | | 32,260 | |
Diageo PLC | | | 33,650 | | | | 909,990 | |
SABMiller PLC | | | 22,998 | | | | 1,406,822 | |
| | | | | | | | |
| Total Beverages | �� | | | 2,349,072 | |
| Biotechnology – 0.1% | | | | | | | | |
Abcam PLC | | | 1,388 | | | | 11,770 | |
Genus PLC | | | 189 | | | | 4,154 | |
| | | | | | | | |
| Total Biotechnology | | | | 15,924 | |
| Building Products – 0.0% | | | | | | | | |
James Halstead PLC | | | 1,665 | | | | 9,698 | |
| Capital Markets – 1.6% | | | | | | | | |
Aberdeen Asset Management PLC | | | 24,950 | | | | 99,477 | |
ICAP PLC | | | 11,399 | | | | 77,790 | |
Investec PLC | | | 9,019 | | | | 66,436 | |
Man Group PLC | | | 29,884 | | | | 65,502 | |
Schroders PLC | | | 2,468 | | | | 95,173 | |
Schroders PLC Non-Voting Shares | | | 647 | | | | 18,803 | |
Tullett Prebon PLC | | | 4,316 | | | | 21,811 | |
| | | | | | | | |
| Total Capital Markets | | | | 444,992 | |
| Chemicals – 0.8% | | | | | | | | |
Croda International PLC | | | 1,403 | | | | 61,282 | |
Elementis PLC | | | 3,185 | | | | 10,959 | |
Essentra PLC | | | 2,086 | | | | 24,810 | |
Johnson Matthey PLC | | | 1,719 | | | | 67,797 | |
Synthomer PLC | | | 3,200 | | | | 16,756 | |
Victrex PLC | | | 1,765 | | | | 41,807 | |
| | | | | | | | |
| Total Chemicals | | | | 223,411 | |
| Commercial Services & Supplies – 0.6% | | | | | | | | |
Aggreko PLC | | | 1,912 | | | | 29,597 | |
Berendsen PLC | | | 2,067 | | | | 35,740 | |
| | | | | | | | |
G4S PLC | | | 21,191 | | | | 58,053 | |
HomeServe PLC | | | 3,528 | | | | 21,835 | |
Rentokil Initial PLC | | | 13,352 | | | | 33,929 | |
| | | | | | | | |
| Total Commercial Services & Supplies | | | | 179,154 | |
| Construction & Engineering – 0.2% | | | | | | | | |
Carillion PLC | | | 10,011 | | | | 42,317 | |
Keller Group PLC | | | 839 | | | | 10,365 | |
| | | | | | | | |
| Total Construction & Engineering | | | | 52,682 | |
| Containers & Packaging – 0.6% | | | | | | | | |
DS Smith PLC | | | 11,399 | | | | 66,846 | |
Rexam PLC | | | 9,705 | | | | 88,437 | |
RPC Group PLC | | | 2,197 | | | | 23,983 | |
| | | | | | | | |
| Total Containers & Packaging | | | | 179,266 | |
| Distributors – 0.2% | | | | | | | | |
Inchcape PLC | | | 4,804 | | | | 49,956 | |
| Diversified Financial Services – 0.5% | | | | | | | | |
IG Group Holdings PLC | | | 6,502 | | | | 74,762 | |
London Stock Exchange Group PLC | | | 1,316 | | | | 53,340 | |
| | | | | | | | |
| Total Diversified Financial Services | | | | 128,102 | |
| Diversified Telecommunication Services – 2.6% | | | | | | | | |
BT Group PLC | | | 87,554 | | | | 554,331 | |
Cable & Wireless Communications PLC | | | 64,640 | | | | 71,585 | |
Inmarsat PLC | | | 6,703 | | | | 94,849 | |
| | | | | | | | |
| Total Diversified Telecommunication Services | | | | 720,765 | |
| Electronic Equipment, Instruments & Components – 0.5% | | | | | |
Electrocomponents PLC | | | 9,898 | | | | 34,343 | |
Halma PLC | | | 2,334 | | | | 30,578 | |
Laird PLC | | | 3,313 | | | | 18,142 | |
Premier Farnell PLC | | | 6,564 | | | | 10,637 | |
Renishaw PLC | | | 562 | | | | 14,822 | |
Spectris PLC | | | 1,072 | | | | 28,412 | |
| | | | | | | | |
| Total Electronic Equipment, Instruments & Components | | | | 136,934 | |
| Energy Equipment & Services – 0.4% | | | | | | | | |
Amec Foster Wheeler PLC | | | 8,124 | | | | 52,545 | |
Hunting PLC | | | 1,934 | | | | 8,902 | |
John Wood Group PLC | | | 4,460 | | | | 39,424 | |
| | | | | | | | |
| Total Energy Equipment & Services | | | | 100,871 | |
| Food Products – 1.0% | | | | | | | | |
Associated British Foods PLC | | | 3,890 | | | | 187,246 | |
Tate & Lyle PLC | | | 9,601 | | | | 79,761 | |
| | | | | | | | |
| Total Food Products | | | | 267,007 | |
| Health Care Equipment & Supplies – 0.4% | | | | | | | | |
Smith & Nephew PLC | | | 7,171 | | | | 118,323 | |
| Health Care Providers & Services – 0.0% | | | | | | | | |
Mediclinic International PLC | | | 727 | | | | 9,362 | |
NMC Health PLC | | | 191 | | | | 2,902 | |
| | | | | | | | |
| Total Health Care Providers & Services | | | | 12,264 | |
| Hotels, Restaurants & Leisure – 2.0% | | | | | | | | |
Carnival PLC | | | 1,975 | | | | 106,507 | |
Compass Group PLC | | | 17,983 | | | | 317,401 | |
See Notes to Financial Statements.
| | |
| 168 | | WisdomTree Developed World ex-U.S. and Currency Hedged Equity Funds |
Schedule of Investments (continued)
WisdomTree United Kingdom Hedged Equity Fund (DXPS)
March 31, 2016
| | | | | | | | |
| Investments | | Shares | | | Value | |
| | | | | | | | |
InterContinental Hotels Group PLC | | | 1,921 | | | $ | 79,270 | |
Merlin Entertainments PLC(a) | | | 6,118 | | | | 40,757 | |
Millennium & Copthorne Hotels PLC | | | 3,309 | | | | 19,804 | |
SSP Group PLC | | | 1,260 | | | | 5,248 | |
| | | | | | | | |
| Total Hotels, Restaurants & Leisure | | | | 568,987 | |
| Household Products – 2.8% | | | | | | | | |
PZ Cussons PLC(b) | | | 3,895 | | | | 16,913 | |
Reckitt Benckiser Group PLC | | | 7,848 | | | | 759,139 | |
| | | | | | | | |
| Total Household Products | | | | 776,052 | |
| Industrial Conglomerates – 0.3% | | | | | | | | |
Smiths Group PLC | | | 6,251 | | | | 96,674 | |
| Insurance – 4.4% | | | | | | | | |
Aviva PLC | | | 44,732 | | | | 293,242 | |
Jardine Lloyd Thompson Group PLC | | | 2,580 | | | | 31,316 | |
Old Mutual PLC | | | 89,469 | | | | 248,315 | |
Prudential PLC | | | 25,683 | | | | 480,253 | |
RSA Insurance Group PLC | | | 2,184 | | | | 14,933 | |
Standard Life PLC | | | 31,975 | | | | 163,655 | |
| | | | | | | | |
| Total Insurance | | | | 1,231,714 | |
| IT Services – 0.1% | | | | | | | | |
Computacenter PLC | | | 1,533 | | | | 18,508 | |
| Machinery – 0.7% | | | | | | | | |
Bodycote PLC | | | 3,834 | | | | 33,256 | |
IMI PLC | | | 3,658 | | | | 50,079 | |
Melrose Industries PLC | | | 741 | | | | 3,797 | |
Morgan Advanced Materials PLC | | | 4,402 | | | | 14,375 | |
Rotork PLC | | | 7,376 | | | | 19,380 | |
Spirax-Sarco Engineering PLC | | | 600 | | | | 31,391 | |
Vesuvius PLC | | | 4,997 | | | | 23,823 | |
Weir Group PLC (The) | | | 2,115 | | | | 33,682 | |
| | | | | | | | |
| Total Machinery | | | | 209,783 | |
| Media – 2.0% | | | | | | | | |
Cineworld Group PLC | | | 3,268 | | | | 25,247 | |
Daily Mail & General Trust PLC Class A Non-Voting Shares | | | 3,274 | | | | 32,752 | |
Informa PLC | | | 8,809 | | | | 87,868 | |
Pearson PLC | | | 14,124 | | | | 177,629 | |
RELX PLC | | | 13,023 | | | | 242,210 | |
| | | | | | | | |
| Total Media | | | | 565,706 | |
| Metals & Mining – 5.3% | | | | | | | | |
Acacia Mining PLC | | | 2,021 | | | | 8,171 | |
BHP Billiton PLC | | | 55,151 | | | | 620,514 | |
Evraz PLC*(b) | | | 16,394 | | | | 21,207 | |
Fresnillo PLC | | | 581 | | | | 7,954 | |
Rio Tinto PLC | | | 29,632 | | | | 832,849 | |
| | | | | | | | |
| Total Metals & Mining | | | | 1,490,695 | |
| Multi-Utilities – 5.6% | | | | | | | | |
Centrica PLC | | | 111,580 | | | | 365,172 | |
National Grid PLC | | | 84,186 | | | | 1,194,517 | |
| | | | | | | | |
| Total Multi-Utilities | | | | 1,559,689 | |
| | | | | | | | |
| Oil, Gas & Consumable Fuels – 15.8% | | | | | | | | |
BP PLC | | | 250,616 | | | | 1,261,276 | |
James Fisher & Sons PLC | | | 264 | | | | 5,005 | |
Nostrum Oil & Gas PLC | | | 2,096 | | | | 7,170 | |
Royal Dutch Shell PLC Class A | | | 58,633 | | | | 1,419,161 | |
Royal Dutch Shell PLC Class B | | | 69,868 | | | | 1,707,162 | |
| | | | | | | | |
| Total Oil, Gas & Consumable Fuels | | | | 4,399,774 | |
| Paper & Forest Products – 0.2% | | | | | | | | |
Mondi PLC | | | 3,528 | | | | 67,746 | |
| Personal Products – 2.9% | | | | | | | | |
Unilever PLC | | | 17,758 | | | | 804,631 | |
| Pharmaceuticals – 10.5% | | | | | | | | |
AstraZeneca PLC | | | 22,987 | | | | 1,289,355 | |
Dechra Pharmaceuticals PLC | | | 392 | | | | 6,795 | |
GlaxoSmithKline PLC | | | 79,711 | | | | 1,617,709 | |
Hikma Pharmaceuticals PLC | | | 644 | | | | 18,327 | |
| | | | | | | | |
| Total Pharmaceuticals | | | | 2,932,186 | |
| Professional Services – 0.4% | | | | | | | | |
Hays PLC | | | 10,521 | | | | 18,297 | |
Intertek Group PLC | | | 1,398 | | | | 63,636 | |
Michael Page International PLC | | | 2,966 | | | | 18,195 | |
WS Atkins PLC | | | 1,040 | | | | 20,479 | |
| | | | | | | | |
| Total Professional Services | | | | 120,607 | |
| Real Estate Investment Trusts (REITs) – 0.5% | | | | | | | | |
Hammerson PLC | | | 9,415 | | | | 78,284 | |
Segro PLC | | | 10,962 | | | | 64,645 | |
| | | | | | | | |
| Total Real Estate Investment Trusts (REITs) | | | | 142,929 | |
| Real Estate Management & Development – 0.1% | | | | | | | | |
Savills PLC | | | 1,439 | | | | 15,719 | |
| Road & Rail – 0.1% | | | | | | | | |
National Express Group PLC | | | 7,274 | | | | 35,902 | |
Northgate PLC | | | 924 | | | | 5,355 | |
| | | | | | | | |
| Total Road & Rail | | | | 41,257 | |
| Semiconductors & Semiconductor Equipment – 0.2% | |
ARM Holdings PLC | | | 3,921 | | | | 57,145 | |
| Software – 0.6% | | | | | | | | |
AVEVA Group PLC | | | 247 | | | | 5,591 | |
Fidessa Group PLC | | | 654 | | | | 22,955 | |
Micro Focus International PLC | | | 1,548 | | | | 34,932 | |
Sage Group PLC (The) | | | 11,164 | | | | 100,929 | |
| | | | | | | | |
| Total Software | | | | 164,407 | |
| Specialty Retail – 0.7% | | | | | | | | |
Dixons Carphone PLC | | | 4,978 | | | | 30,501 | |
JD Sports Fashion PLC | | | 761 | | | | 12,316 | |
Kingfisher PLC | | | 27,338 | | | | 148,017 | |
| | | | | | | | |
| Total Specialty Retail | | | | 190,834 | |
| Textiles, Apparel & Luxury Goods – 0.3% | | | | | | | | |
Burberry Group PLC | | | 3,741 | | | | 73,395 | |
Ted Baker PLC | | | 293 | | | | 11,468 | |
| | | | | | | | |
| Total Textiles, Apparel & Luxury Goods | | | | 84,863 | |
See Notes to Financial Statements.
| | | | |
| WisdomTree Developed World ex-U.S. and Currency Hedged Equity Funds | | | 169 | |
Schedule of Investments (concluded)
WisdomTree United Kingdom Hedged Equity Fund (DXPS)
March 31, 2016
| | | | | | | | |
| Investments | | Shares | | | Value | |
| | | | | | | | |
| Tobacco – 11.0% | | | | | | | | |
British American Tobacco PLC | | | 32,008 | | | $ | 1,881,609 | |
Imperial Brands PLC | | | 21,175 | | | | 1,175,697 | |
| | | | | | | | |
| Total Tobacco | | | | 3,057,306 | |
| Trading Companies & Distributors – 0.5% | | | | | | | | |
Ashtead Group PLC | | | 2,336 | | | | 29,009 | |
Bunzl PLC | | | 2,777 | | | | 80,746 | |
Diploma PLC | | | 1,156 | | | | 12,345 | |
SIG PLC | | | 6,084 | | | | 12,767 | |
| | | | | | | | |
| Total Trading Companies & Distributors | | | | 134,867 | |
| Transportation Infrastructure – 0.1% | | | | | | | | |
BBA Aviation PLC | | | 9,672 | | | | 27,859 | |
| Wireless Telecommunication Services – 5.3% | | | | | | | | |
Vodafone Group PLC | | | 464,093 | | | | 1,475,494 | |
TOTAL COMMON STOCKS
(Cost: $32,584,240) | | | | | | | 27,706,227 | |
| INVESTMENT OF CASH COLLATERAL FOR SECURITIES LOANED – 0.1% | |
| United States – 0.1% | | | | | | | | |
State Street Navigator Securities Lending Prime Portfolio, 0.50%(c) (Cost: $38,819)(d) | | | 38,819 | | | | 38,819 | |
TOTAL INVESTMENTS IN SECURITIES – 99.4%
(Cost: $32,623,059) | | | | | | | 27,745,046 | |
Cash, Foreign Currency and Other Assets in Excess of Liabilities – 0.6% | | | | | | | 157,053 | |
| | | | | | | | |
| NET ASSETS – 100.0% | | | $ | 27,902,099 | |
| * | Non-income producing security. |
| (a) | This security is exempt from registration under rule 144A of the Securities Act of 1933. This security may be sold in transactions that are exempt from registration, normally to qualified institutional buyers. |
| (b) | Security, or portion thereof, was on loan at March 31, 2016 (See Note 2). |
| (c) | Rate shown represents annualized 7-day yield as of March 31, 2016. |
| (d) | At March 31, 2016, the total market value of the Fund’s securities on loan was $36,208 and the total market value of the collateral held by the Fund was $38,819. |
| | | | | | | | | | | | | | | | | | |
| FINANCIAL DERIVATIVE INSTRUMENTS | |
| FORWARD CONTRACTS | |
Settlement Date | | Contracts
To Deliver | | | In
Exchange For | | | Unrealized
Gain (Loss) | |
4/4/2016 | | GBP | | | 4,535,235 | | | | USD | | | | 6,320,798 | | | $ | (197,695 | ) |
4/4/2016 | | GBP | | | 4,535,313 | | | | USD | | | | 6,320,798 | | | | (197,807 | ) |
4/4/2016 | | GBP | | | 4,535,248 | | | | USD | | | | 6,320,798 | | | | (197,714 | ) |
4/4/2016 | | GBP | | | 4,534,972 | | | | USD | | | | 6,320,798 | | | | (197,316 | ) |
4/4/2016 | | GBP | | | 3,455,318 | | | | USD | | | | 4,815,850 | | | | (150,479 | ) |
4/4/2016 | | USD | | | 1,157,655 | | | | GBP | | | | 817,625 | | | | 17,518 | |
4/4/2016 | | USD | | | 446,000 | | | | GBP | | | | 309,669 | | | | (913 | ) |
4/4/2016 | | USD | | | 1,157,655 | | | | GBP | | | | 818,364 | | | | 18,580 | |
4/4/2016 | | USD | | | 5,740,923 | | | | GBP | | | | 3,994,352 | | | | 160 | |
4/4/2016 | | USD | | | 4,374,040 | | | | GBP | | | | 3,043,382 | | | | 213 | |
4/4/2016 | | USD | | | 5,740,923 | | | | GBP | | | | 3,994,352 | | | | 160 | |
4/4/2016 | | USD | | | 5,740,923 | | | | GBP | | | | 3,994,464 | | | | 319 | |
4/4/2016 | | USD | | | 5,740,923 | | | | GBP | | | | 3,994,361 | | | | 171 | |
5/4/2016 | | GBP | | | 4,099,729 | | | | USD | | | | 5,892,790 | | | | (283 | ) |
5/4/2016 | | GBP | | | 4,099,731 | | | | USD | | | | 5,892,790 | | | | (287 | ) |
5/4/2016 | | GBP | | | 3,123,651 | | | | USD | | | | 4,489,748 | | �� | | (281 | ) |
5/4/2016 | | GBP | | | 4,099,794 | | | | USD | | | | 5,892,790 | | | | (377 | ) |
5/4/2016 | | GBP | | | 4,099,734 | | | | USD | | | | 5,892,790 | | | | (291 | ) |
| | | | | | | | | | | | | | | | | $ | (906,322 | ) |
| | |
| CURRENCY LEGEND |
GBP | | – British pound |
USD | | – U.S. dollar |
See Notes to Financial Statements.
| | |
| 170 | | WisdomTree Developed World ex-U.S. and Currency Hedged Equity Funds |
Statements of Assets and Liabilities
WisdomTree Developed World ex-U.S. and Currency Hedged Equity Funds
March 31, 2016
| | | | | | | | | | | | | | | | | | | | |
| | | WisdomTree
Australia
Dividend Fund | | | WisdomTree
Europe Hedged
Equity Fund | | | WisdomTree
Europe Hedged
SmallCap
Equity Fund | | | WisdomTree
Europe Quality
Dividend
Growth Fund | | | WisdomTree
Europe
SmallCap
Dividend Fund | |
ASSETS: | | | | | | | | | | | | | | | | | | | | |
| | | | | |
Investments, at cost | | $ | 38,533,370 | | | $ | 15,448,688,361 | | | $ | 282,027,540 | | | $ | 18,784,581 | | | $ | 1,187,099,951 | |
| | | | | |
Investment in affiliates, at cost (Note 3) | | | — | | | | — | | | | — | | | | — | | | | 2,673,076 | |
| | | | | |
Foreign currency, at cost | | | 20,594 | | | | 1,321,147 | | | | 409,505 | | | | 3,706 | | | | 545,570 | |
Investments in securities, at value1 (Note 2) | | | 35,216,619 | | | | 14,076,411,621 | | | | 287,155,134 | | | | 18,027,137 | | | | 1,171,627,377 | |
| | | | | |
Investment in affiliates, at value (Note 3) | | | — | | | | — | | | | — | | | | — | | | | 2,908,723 | |
| | | | | |
Cash | | | 16,603 | | | | 24,555,406 | | | | 36,274 | | | | 7,340 | | | | 38,872 | |
| | | | | |
Foreign currency, at value | | | 20,587 | | | | 1,336,742 | | | | 416,756 | | | | 3,780 | | | | 548,262 | |
| | | | | |
Unrealized appreciation on forward foreign currency contracts | | | — | | | | 26,469,670 | | | | 8,437 | | | | — | | | | 1,240 | |
| | | | | |
Receivables: | | | | | | | | | | | | | | | | | | | | |
| | | | | |
Investment securities sold | | | 946,133 | | | | 617,643,805 | | | | 10,505,175 | | | | — | | | | 118,269 | |
| | | | | |
Dividends and interest | | | 323,463 | | | | 9,862,003 | | | | 770,878 | | | | 33,231 | | | | 3,867,997 | |
| | | | | |
Foreign tax reclaims | | | — | | | | 5,745,746 | | | | 196,507 | | | | 29,164 | | | | 834,830 | |
Total Assets | | | 36,523,405 | | | | 14,762,024,993 | | | | 299,089,161 | | | | 18,100,652 | | | | 1,179,945,570 | |
LIABILITIES: | | | | | | | | | | | | | | | | | | | | |
| | | | | |
Unrealized depreciation on forward foreign currency contracts | | | — | | | | 672,918,232 | | | | 12,176,615 | | | | — | | | | 384 | |
| | | | | |
Payables: | | | | | | | | | | | | | | | | | | | | |
| | | | | |
Investment of cash collateral for securities loaned (Note 2) | | | 1,647,113 | | | | 291,263,715 | | | | 19,074,318 | | | | 238,241 | | | | 52,561,886 | |
| | | | | |
Investment securities purchased | | | 1,043,127 | | | | — | | | | — | | | | — | | | | 956,359 | |
| | | | | |
Capital shares redeemed | | | — | | | | 73,710,169 | | | | — | | | | — | | | | — | |
| | | | | |
Advisory fees (Note 3) | | | 16,170 | | | | 7,125,812 | | | | 129,430 | | | | 8,545 | | | | 482,276 | |
| | | | | |
Service fees (Note 2) | | | 123 | | | | 54,058 | | | | 982 | | | | 65 | | | | 3,669 | |
| | | | | |
Professional fees (Note 2) | | | — | | | | — | | | | — | | | | 90 | | | | 6,215 | |
Total Liabilities | | | 2,706,533 | | | | 1,045,071,986 | | | | 31,381,345 | | | | 246,941 | | | | 54,010,789 | |
NET ASSETS | | $ | 33,816,872 | | | $ | 13,716,953,007 | | | $ | 267,707,816 | | | $ | 17,853,711 | | | $ | 1,125,934,781 | |
NET ASSETS: | | | | | | | | | | | | | | | | | | | | |
| | | | | |
Paid-in capital | | $ | 61,669,086 | | | $ | 16,968,291,190 | | | $ | 289,363,885 | | | $ | 19,923,835 | | | $ | 1,247,433,398 | |
| | | | | |
Undistributed (Distributions in excess of) net investment income | | | 126,595 | | | | 24,118,619 | | | | (2,214,679 | ) | | | 39,608 | | | | 4,068,208 | |
| | | | | |
Accumulated net realized loss on investments, forward foreign currency contracts and foreign currency related transactions | | | (24,676,251 | ) | | | (1,257,020,586 | ) | | | (12,425,680 | ) | | | (1,353,385 | ) | | | (110,341,303 | ) |
| | | | | |
Net unrealized depreciation on investments, forward foreign currency contracts and translation of assets and liabilities denominated in foreign currencies | | | (3,302,558 | ) | | | (2,018,436,216 | ) | | | (7,015,710 | ) | | | (756,347 | ) | | | (15,225,522 | ) |
NET ASSETS | | $ | 33,816,872 | | | $ | 13,716,953,007 | | | $ | 267,707,816 | | | $ | 17,853,711 | | | $ | 1,125,934,781 | |
Outstanding beneficial interest shares of $0.001 par value (unlimited number of shares authorized) | | | 700,000 | | | | 263,600,000 | | | | 11,200,000 | | | | 800,000 | | | | 19,750,000 | |
Net asset value per share | | $ | 48.31 | | | $ | 52.04 | | | $ | 23.90 | | | $ | 22.32 | | | $ | 57.01 | |
1 Includes market value of securities out on loan of: | | $ | 1,786,687 | | | $ | 276,592,888 | | | $ | 24,062,711 | | | $ | 226,763 | | | $ | 49,720,141 | |
See Notes to Financial Statements.
| | | | |
| WisdomTree Developed World ex-U.S. and Currency Hedged Equity Funds | | | 171 | |
Statements of Assets and Liabilities (continued)
WisdomTree Developed World ex-U.S. and Currency Hedged Equity Funds
March 31, 2016
| | | | | | | | | | | | | | | | | | | | |
| | | WisdomTree
Germany Hedged
Equity Fund | | | WisdomTree
Global ex-
U.S. Hedged
Dividend Fund | | | WisdomTree
Global ex-U.S.
Hedged Real
Estate Fund | | | WisdomTree
International
Dividend ex-
Financials Fund | | | WisdomTree
International
Equity Fund | |
ASSETS: | | | | | | | | | | | | | | | | | | | | |
| | | | | |
Investments, at cost | | $ | 220,506,042 | | | $ | 4,727,222 | | | $ | 2,477,344 | | | $ | 271,222,428 | | | $ | 650,877,648 | |
| | | | | |
Investment in affiliates, at cost (Note 3) | | | — | | | | — | | | | — | | | | 235,837 | | | | 312,739 | |
| | | | | |
Foreign currency, at cost | | | 60,731 | | | | 12,917 | | | | 4,571 | | | | 184,811 | | | | 43,074 | |
Investments in securities, at value1 (Note 2) | | | 200,582,730 | | | | 4,362,561 | | | | 2,458,848 | | | | 233,955,107 | | | | 642,615,815 | |
| | | | | |
Investment in affiliates, at value (Note 3) | | | — | | | | — | | | | — | | | | 230,746 | | | | 323,901 | |
| | | | | |
Cash | | | 5,708 | | | | 698 | | | | 558 | | | | 29,599 | | | | 47,722 | |
| | | | | |
Foreign currency, at value | | | 61,387 | | | | 13,035 | | | | 4,664 | | | | 184,956 | | | | 46,745 | |
| | | | | |
Unrealized appreciation on forward foreign currency contracts | | | 346,062 | | | | 206 | | | | 122 | | | | 537 | | | | — | |
| | | | | |
Receivables: | | | | | | | | | | | | | | | | | | | | |
| | | | | |
Investment securities sold | | | 28,683,625 | | | | 87,076 | | | | 54,638 | | | | — | | | | 161,420 | |
| | | | | |
Dividends and interest | | | 1,742 | | | | 24,533 | | | | 5,839 | | | | 1,071,634 | | | | 2,988,568 | |
| | | | | |
Foreign tax reclaims | | | 376,363 | | | | 1,827 | | | | 82 | | | | 627,283 | | | | 1,236,414 | |
Total Assets | | | 230,057,617 | | | | 4,489,936 | | | | 2,524,751 | | | | 236,099,862 | | | | 647,420,585 | |
LIABILITIES: | | | | | | | | | | | | | | | | | | | | |
| | | | | |
Unrealized depreciation on forward foreign currency contracts | | | 9,497,256 | | | | 148,531 | | | | 77,075 | | | | 106 | | | | 427 | |
| | | | | |
Payables: | | | | | | | | | | | | | | | | | | | | |
| | | | | |
Investment of cash collateral for securities loaned (Note 2) | | | 897,196 | | | | 41,257 | | | | 9,894 | | | | 5,503,096 | | | | 24,987,222 | |
| | | | | |
Investment securities purchased | | | 19,080,648 | | | | — | | | | — | | | | — | | | | 248,227 | |
| | | | | |
Advisory fees (Note 3) | | | 80,557 | | | | 1,596 | | | | 871 | | | | 111,041 | | | | 247,388 | |
| | | | | |
Service fees (Note 2) | | | 738 | | | | 16 | | | | 9 | | | | 844 | | | | 2,274 | |
| | | | | |
Professional fees (Note 2) | | | — | | | | 8 | | | | — | | | | 1,739 | | | | 3,415 | |
Total Liabilities | | | 29,556,395 | | | | 191,408 | | | | 87,849 | | | | 5,616,826 | | | | 25,488,953 | |
NET ASSETS | | $ | 200,501,222 | | | $ | 4,298,528 | | | $ | 2,436,902 | | | $ | 230,483,036 | | | $ | 621,931,632 | |
NET ASSETS: | | | | | | | | | | | | | | | | | | | | |
| | | | | |
Paid-in capital | | $ | 249,365,919 | | | $ | 4,977,502 | | | $ | 2,488,157 | | | $ | 423,686,359 | | | $ | 878,977,219 | |
| | | | | |
Undistributed (Distributions in excess of) net investment income | | | 2,098,282 | | | | (12,363 | ) | | | 6,634 | | | | 661,692 | | | | 2,250,019 | |
| | | | | |
Accumulated net realized gain (loss) on investments, forward foreign currency contracts and foreign currency related transactions | | | (21,897,509 | ) | | | (154,223 | ) | | | 37,402 | | | | (156,596,542 | ) | | | (251,080,519 | ) |
| | | | | |
Net unrealized depreciation on investments, forward foreign currency contracts and translation of assets and liabilities denominated in foreign currencies | | | (29,065,470 | ) | | | (512,388 | ) | | | (95,291 | ) | | | (37,268,473 | ) | | | (8,215,087 | ) |
NET ASSETS | | $ | 200,501,222 | | | $ | 4,298,528 | | | $ | 2,436,902 | | | $ | 230,483,036 | | | $ | 621,931,632 | |
Outstanding beneficial interest shares of $0.001 par value (unlimited number of shares authorized) | | | 7,850,000 | | | | 200,000 | | | | 100,004 | | | | 6,000,000 | | | | 13,550,000 | |
Net asset value per share | | $ | 25.54 | | | $ | 21.49 | | | $ | 24.37 | | | $ | 38.41 | | | $ | 45.90 | |
1 Includes market value of securities out on loan of: | | $ | 870,057 | | | $ | 56,482 | | | $ | 89,965 | | | $ | 10,899,170 | | | $ | 26,990,017 | |
See Notes to Financial Statements.
| | |
| 172 | | WisdomTree Developed World ex-U.S. and Currency Hedged Equity Funds |
Statements of Assets and Liabilities (continued)
WisdomTree Developed World ex-U.S. and Currency Hedged Equity Funds
March 31, 2016
| | | | | | | | | | | | | | | | | | | | |
| | | WisdomTree
International
Hedged
Equity Fund | | | WisdomTree
International
Hedged Quality
Dividend
Growth Fund | | | WisdomTree
International
Hedged
SmallCap
Dividend Fund | | | WisdomTree
International
High
Dividend Fund | | | WisdomTree
International
LargeCap
Dividend Fund | |
ASSETS: | | | | | | | | | | | | | | | | | | | | |
| | | | | |
Investments, at cost | | $ | 4,862,503 | | | $ | 750,348,852 | | | $ | — | | | $ | 289,373,765 | | | $ | 396,499,051 | |
| | | | | |
Investment in affiliates, at cost (Note 3) | | | — | | | | — | | | | 1,215,760 | | | | 6,242 | | | | 927,563 | |
| | | | | |
Foreign currency, at cost | | | 9,863 | | | | 488,869 | | | | 32 | | | | 46,203 | | | | — | |
Investments in securities, at value1 (Note 2) | | | 4,675,990 | | | | 752,991,336 | | | | — | | | | 260,731,947 | | | | 373,315,415 | |
| | | | | |
Investment in affiliates, at value (Note 3) | | | — | | | | — | | | | 1,129,702 | | | | 6,281 | | | | 955,246 | |
| | | | | |
Cash | | | 263 | | | | 200,136 | | | | 2,061 | | | | 12,531 | | | | 109,109 | |
| | | | | |
Foreign currency, at value | | | 9,947 | | | | 494,233 | | | | 33 | | | | 47,590 | | | | — | |
| | | | | |
Unrealized appreciation on forward foreign currency contracts | | | 212 | | | | 33,077 | | | | 72 | | | | 27 | | | | — | |
| | | | | |
Receivables: | | | | | | | | | | | | | | | | | | | | |
| | | | | |
Investment securities sold | | | 120,401 | | | | 25,744,365 | | | | 37,633 | | | | 157,138 | | | | — | |
| | | | | |
Dividends and interest | | | 23,320 | | | | 3,203,900 | | | | 354 | | | | 1,326,168 | | | | 1,809,039 | |
| | | | | |
Foreign tax reclaims | | | 1,589 | | | | 498,002 | | | | — | | | | 462,166 | | | | 762,173 | |
Total Assets | | | 4,831,722 | | | | 783,165,049 | | | | 1,169,855 | | | | 262,743,848 | | | | 376,950,982 | |
LIABILITIES: | | | | | | | | | | | | | | | | | | | | |
| | | | | |
Foreign currency due to custodian, at value2 | | | — | | | | — | | | | — | | | | — | | | | 97,522 | |
| | | | | |
Unrealized depreciation on forward foreign currency contracts | | | 165,031 | | | | 27,052,952 | | | | 39,073 | | | | 76 | | | | 295 | |
| | | | | |
Payables: | | | | | | | | | | | | | | | | | | | | |
| | | | | |
Investment of cash collateral for securities loaned (Note 2) | | | 53,752 | | | | 19,354,354 | | | | — | | | | 5,100,091 | | | | 10,089,231 | |
| | | | | |
Investment securities purchased | | | — | | | | 4,347,210 | | | | — | | | | 49,649 | | | | — | |
| | | | | |
Advisory fees (Note 3) | | | 1,365 | | | | 356,199 | | | | — | | | | 124,557 | | | | 147,169 | |
| | | | | |
Service fees (Note 2) | | | 18 | | | | 2,703 | | | | 4 | | | | 946 | | | | 1,353 | |
| | | | | |
Professional fees (Note 2) | | | 12 | | | | 1,700 | | | | — | | | | 1,833 | | | | 2,126 | |
Total Liabilities | | | 220,178 | | | | 51,115,118 | | | | 39,077 | | | | 5,277,152 | | | | 10,337,696 | |
NET ASSETS | | $ | 4,611,544 | | | $ | 732,049,931 | | | $ | 1,130,778 | | | $ | 257,466,696 | | | $ | 366,613,286 | |
NET ASSETS: | | | | | | | | | | | | | | | | | | | | |
| | | | | |
Paid-in capital | | $ | 4,918,660 | | | $ | 759,516,085 | | | $ | 1,243,756 | | | $ | 382,587,236 | | | $ | 456,229,135 | |
| | | | | |
Undistributed (Distributions in excess of) net investment income | | | 11,811 | | | | 2,804,720 | | | | (10,534 | ) | | | 798,833 | | | | 1,253,392 | |
| | | | | |
Accumulated net realized gain (loss) on investments, forward foreign currency contracts and foreign currency related transactions | | | 31,876 | | | | (6,010,655 | ) | | | 22,614 | | | | (97,298,258 | ) | | | (67,736,153 | ) |
| | | | | |
Net unrealized depreciation on investments, forward foreign currency contracts and translation of assets and liabilities denominated in foreign currencies | | | (350,803 | ) | | | (24,260,219 | ) | | | (125,058 | ) | | | (28,621,115 | ) | | | (23,133,088 | ) |
NET ASSETS | | $ | 4,611,544 | | | $ | 732,049,931 | | | $ | 1,130,778 | | | $ | 257,466,696 | | | $ | 366,613,286 | |
Outstanding beneficial interest shares of $0.001 par value (unlimited number of shares authorized) | | | 200,000 | | | | 28,450,000 | | | | 50,000 | | | | 6,850,000 | | | | 8,700,000 | |
Net asset value per share | | $ | 23.06 | | | $ | 25.73 | | | $ | 22.62 | | | $ | 37.59 | | | $ | 42.14 | |
1 Includes market value of securities out on loan of: | | $ | 73,293 | | | $ | 20,016,975 | | | | — | | | $ | 6,611,170 | | | $ | 10,575,341 | |
2 Foreign currency due to custodian, proceeds | | | — | | | | — | | | | — | | | | — | | | $ | 97,669 | |
See Notes to Financial Statements.
| | | | |
| WisdomTree Developed World ex-U.S. and Currency Hedged Equity Funds | | | 173 | |
Statements of Assets and Liabilities (continued)
WisdomTree Developed World ex-U.S. and Currency Hedged Equity Funds
March 31, 2016
| | | | | | | | | | | | | | | | | | | | |
| | | WisdomTree
International
MidCap
Dividend Fund | | | WisdomTree
International
SmallCap
Dividend Fund | | | WisdomTree
Japan Hedged
Capital Goods
Fund | | | WisdomTree
Japan Hedged
Equity Fund | | | WisdomTree
Japan Hedged
Financials Fund | |
ASSETS: | | | | | | | | | | | | | | | | | | | | |
| | | | | |
Investments, at cost | | $ | 153,575,131 | | | $ | 1,146,874,356 | | | $ | 3,614,841 | | | $ | 11,612,893,647 | | | $ | 18,837,915 | |
| | | | | |
Investment in affiliates, at cost (Note 3) | | | — | | | | 2,283,255 | | | | — | | | | — | | | | — | |
| | | | | |
Foreign currency, at cost | | | 235,597 | | | | 1,428,750 | | | | 2,961 | | | | 13,585,615 | | | | 9,350 | |
Investments in securities, at value1 (Note 2) | | | 165,028,708 | | | | 1,202,110,581 | | | | 3,325,734 | | | | 10,733,173,624 | | | | 14,539,370 | |
| | | | | |
Investment in affiliates, at value (Note 3) | | | — | | | | 2,385,141 | | | | — | | | | — | | | | — | |
| | | | | |
Cash | | | 4,067 | | | | 17,860 | | | | 1,661 | | | | 1,056,602 | | | | 1,853 | |
| | | | | |
Foreign currency, at value | | | 237,444 | | | | 1,442,521 | | | | 2,972 | | | | 13,592,867 | | | | 9,449 | |
| | | | | |
Unrealized appreciation on forward foreign currency contracts | | | — | | | | — | | | | 62 | | | | 8,111,974 | | | | 259 | |
| | | | | |
Receivables: | | | | | | | | | | | | | | | | | | | | |
| | | | | |
Investment securities sold | | | 599,936 | | | | 4,009,653 | | | | — | | | | 79,888,077 | | | | — | |
| | | | | |
Capital shares sold | | | — | | | | — | | | | — | | | | 6,714,270 | | | | — | |
| | | | | |
Dividends and interest | | | 640,354 | | | | 6,959,308 | | | | 29,506 | | | | 97,209,141 | | | | 185,379 | |
| | | | | |
Foreign tax reclaims | | | 136,431 | | | | 531,239 | | | | — | | | | 6,786,336 | | | | — | |
Total Assets | | | 166,646,940 | | | | 1,217,456,303 | | | | 3,359,935 | | | | 10,946,532,891 | | | | 14,736,310 | |
LIABILITIES: | | | | | | | | | | | | | | | | | | | | |
| | | | | |
Unrealized depreciation on forward foreign currency contracts | | | — | | | | 10,443 | | | | 9,850 | | | | 40,080,250 | | | | 40,879 | |
| | | | | |
Payables: | | | | | | | | | | | | | | | | | | | | |
| | | | | |
Investment of cash collateral for securities loaned (Note 2) | | | 12,170,282 | | | | 112,271,066 | | | | 192,975 | | | | 1,073,061,319 | | | | 1,843,858 | |
| | | | | |
Investment securities purchased | | | 889,907 | | | | 4,669,355 | | | | — | | | | 6,221,197 | | | | — | |
| | | | | |
Capital shares redeemed | | | — | | | | — | | | | — | | | | 85,801,565 | | | | — | |
| | | | | |
Advisory fees (Note 3) | | | 73,238 | | | | 520,509 | | | | 1,275 | | | | 4,197,974 | | | | 5,282 | |
| | | | | |
Service fees (Note 2) | | | 557 | | | | 3,956 | | | | 12 | | | | 38,480 | | | | 48 | |
| | | | | |
Professional fees (Note 2) | | | 643 | | | | 4,042 | | | | — | | | | — | | | | — | |
Total Liabilities | | | 13,134,627 | | | | 117,479,371 | | | | 204,112 | | | | 1,209,400,785 | | | | 1,890,067 | |
NET ASSETS | | $ | 153,512,313 | | | $ | 1,099,976,932 | | | $ | 3,155,823 | | | $ | 9,737,132,106 | | | $ | 12,846,243 | |
NET ASSETS: | | | | | | | | | | | | | | | | | | | | |
| | | | | |
Paid-in capital | | $ | 219,707,466 | | | $ | 1,289,720,923 | | | $ | 3,696,531 | | | $ | 11,934,163,248 | | | $ | 19,572,149 | |
| | | | | |
Undistributed net investment income | | | 559,159 | | | | 7,079,390 | | | | 25,729 | | | | 84,187,911 | | | | 167,716 | |
| | | | | |
Accumulated net realized loss on investments, forward foreign currency contracts and foreign currency related transactions | | | (78,214,477 | ) | | | (252,213,886 | ) | | | (267,777 | ) | | | (1,369,715,060 | ) | | | (2,555,958 | ) |
| | | | | |
Net unrealized appreciation (depreciation) on investments, forward foreign currency contracts and translation of assets and liabilities denominated in foreign currencies | | | 11,460,165 | | | | 55,390,505 | | | | (298,660 | ) | | | (911,503,993 | ) | | | (4,337,664 | ) |
NET ASSETS | | $ | 153,512,313 | | | $ | 1,099,976,932 | | | $ | 3,155,823 | | | $ | 9,737,132,106 | | | $ | 12,846,243 | |
Outstanding beneficial interest shares of $0.001 par value (unlimited number of shares authorized) | | | 2,750,000 | | | | 18,650,000 | | | | 150,000 | | | | 222,050,000 | | | | 650,000 | |
Net asset value per share | | $ | 55.82 | | | $ | 58.98 | | | $ | 21.04 | | | $ | 43.85 | | | $ | 19.76 | |
1 Includes market value of securities out on loan of: | | $ | 12,557,085 | | | $ | 113,130,909 | | | $ | 183,040 | | | $ | 1,054,641,846 | | | $ | 1,772,431 | |
See Notes to Financial Statements.
| | |
| 174 | | WisdomTree Developed World ex-U.S. and Currency Hedged Equity Funds |
Statements of Assets and Liabilities (continued)
WisdomTree Developed World ex-U.S. and Currency Hedged Equity Funds
March 31, 2016
| | | | | | | | | | | | | | | | | | | | |
| | | WisdomTree
Japan Hedged
Health Care
Fund | | | WisdomTree
Japan Hedged
Quality Dividend
Growth Fund | | | WisdomTree
Japan Hedged
Real Estate
Fund | | | WisdomTree
Japan Hedged
SmallCap
Equity Fund | | | WisdomTree
Japan Hedged
Tech, Media
and Telecom
Fund | |
ASSETS: | | | | | | | | | | | | | | | | | | | | |
| | | | | |
Investments, at cost | | $ | 20,239,658 | | | $ | 17,285,386 | | | $ | 148,767,643 | | | $ | 108,732,320 | | | $ | 2,612,239 | |
| | | | | |
Foreign currency, at cost | | | 28,646 | | | | 43,862 | | | | 59,713 | | | | 164,603 | | | | 5,943 | |
Investments in securities, at value1 (Note 2) | | | 20,307,383 | | | | 16,113,357 | | | | 161,933,611 | | | | 107,792,607 | | | | 2,583,586 | |
| | | | | |
Cash | | | 5,226 | | | | 211 | | | | 17,484 | | | | 20,611 | | | | 540 | |
| | | | | |
Foreign currency, at value | | | 28,731 | | | | 44,053 | | | | 59,847 | | | | 165,259 | | | | 5,968 | |
| | | | | |
Unrealized appreciation on forward foreign currency contracts | | | 33,333 | | | | 315 | | | | 26,922 | | | | 86,924 | | | | 47 | |
| | | | | |
Receivables: | | | | | | | | | | | | | | | | | | | | |
| | | | | |
Dividends and interest | | | 120,237 | | | | 138,767 | | | | 1,062,644 | | | | 975,419 | | | | 16,851 | |
| | | | | |
Foreign tax reclaims | | | — | | | | 10,891 | | | | 454 | | | | 9,237 | | | | — | |
Total Assets | | | 20,494,910 | | | | 16,307,594 | | | | 163,100,962 | | | | 109,050,057 | | | | 2,606,992 | |
LIABILITIES: | | | | | | | | | | | | | | | | | | | | |
| | | | | |
Unrealized depreciation on forward foreign currency contracts | | | 90,569 | | | | 49,810 | | | | 488,559 | | | | 313,701 | | | | 7,403 | |
| | | | | |
Payables: | | | | | | | | | | | | | | | | | | | | |
| | | | | |
Investment of cash collateral for securities loaned (Note 2) | | | 2,462,432 | | | | 595,235 | | | | 11,557,970 | | | | 18,107,628 | | | | 239,672 | |
| | | | | |
Advisory fees (Note 3) | | | 7,605 | | | | 5,690 | | | | 60,648 | | | | 44,582 | | | | 953 | |
| | | | | |
Service fees (Note 2) | | | 69 | | | | 58 | | | | 556 | | | | 338 | | | | 9 | |
Total Liabilities | | | 2,560,675 | | | | 650,793 | | | | 12,107,733 | | | | 18,466,249 | | | | 248,037 | |
NET ASSETS | | $ | 17,934,235 | | | $ | 15,656,801 | | | $ | 150,993,229 | | | $ | 90,583,808 | | | $ | 2,358,955 | |
NET ASSETS: | | | | | | | | | | | | | | | | | | | | |
| | | | | |
Paid-in capital | | $ | 20,170,711 | | | $ | 18,532,973 | | | $ | 144,727,410 | | | $ | 107,206,523 | | | $ | 2,649,186 | |
| | | | | |
Undistributed net investment income | | | 94,245 | | | | 101,479 | | | | 1,139,515 | | | | 969,444 | | | | 12,959 | |
| | | | | |
Accumulated net realized loss on investments, forward foreign currency contracts and foreign currency related transactions | | | (2,342,137 | ) | | | (1,758,306 | ) | | | (7,586,786 | ) | | | (16,433,673 | ) | | | (267,329 | ) |
| | | | | |
Net unrealized appreciation (depreciation) on investments, forward foreign currency contracts and translation of assets and liabilities denominated in foreign currencies | | | 11,416 | | | | (1,219,345 | ) | | | 12,713,090 | | | | (1,158,486 | ) | | | (35,861 | ) |
NET ASSETS | | $ | 17,934,235 | | | $ | 15,656,801 | | | $ | 150,993,229 | | | $ | 90,583,808 | | | $ | 2,358,955 | |
Outstanding beneficial interest shares of $0.001 par value (unlimited number of shares authorized) | | | 550,000 | | | | 700,000 | | | | 5,850,000 | | | | 2,900,000 | | | | 100,000 | |
Net asset value per share | | $ | 32.61 | | | $ | 22.37 | | | $ | 25.81 | | | $ | 31.24 | | | $ | 23.59 | |
1 Includes market value of securities out on loan of: | | $ | 2,354,002 | | | $ | 600,464 | | | $ | 11,555,642 | | | $ | 17,587,909 | | | $ | 230,624 | |
See Notes to Financial Statements.
| | | | |
| WisdomTree Developed World ex-U.S. and Currency Hedged Equity Funds | | | 175 | |
Statements of Assets and Liabilities (concluded)
WisdomTree Developed World ex-U.S. and Currency Hedged Equity Funds
March 31, 2016
| | | | | | | | | | | | | | | | |
| | | WisdomTree
Japan Quality
Dividend
Growth Fund | | | WisdomTree
Japan
SmallCap
Dividend Fund | | | WisdomTree
Korea Hedged
Equity Fund | | | WisdomTree
United
Kingdom
Hedged Equity
Fund | |
ASSETS: | | | | | | | | | | | | | | | | |
| | | | |
Investments, at cost | | $ | 2,503,233 | | | $ | 461,931,386 | | | $ | 18,997,344 | | | $ | 32,623,059 | |
| | | | |
Foreign currency, at cost | | | 5,281 | | | | 137,056 | | | | 4,834 | | | | 84,523 | |
Investments in securities, at value1 (Note 2) | | | 2,330,358 | | | | 486,642,248 | | | | 19,444,854 | | | | 27,745,046 | |
| | | | |
Cash | | | 294 | | | | 270,892 | | | | 7,091 | | | | 9,235 | |
| | | | |
Foreign currency, at value | | | 5,300 | | | | 137,252 | | | | 4,922 | | | | 84,849 | |
| | | | |
Unrealized appreciation on forward foreign currency contracts | | | — | | | | — | | | | 14,782 | | | | 37,121 | |
| | | | |
Receivables: | | | | | | | | | | | | | | | | |
| | | | |
Investment securities sold | | | 25,040 | | | | — | | | | 1,452,357 | | | | 780,746 | |
| | | | |
Dividends and interest | | | 20,209 | | | | 4,437,750 | | | | 243,503 | | | | 239,876 | |
| | | | |
Foreign tax reclaims | | | 384 | | | | 144,475 | | | | — | | | | 177 | |
Total Assets | | | 2,381,585 | | | | 491,632,617 | | | | 21,167,509 | | | | 28,897,050 | |
LIABILITIES: | | | | | | | | | | | | | | | | |
| | | | |
Unrealized depreciation on forward foreign currency contracts | | | 2 | | | | — | | | | 1,533,043 | | | | 943,443 | |
| | | | |
Payables: | | | | | | | | | | | | | | | | |
| | | | |
Investment of cash collateral for securities loaned (Note 2) | | | 56,861 | | | | 68,392,118 | | | | 175,140 | | | | 38,819 | |
| | | | |
Investment securities purchased | | | 27,556 | | | | — | | | | — | | | | — | |
| | | | |
Advisory fees (Note 3) | | | 832 | | | | 208,155 | | | | 9,322 | | | | 11,887 | |
| | | | |
Service fees (Note 2) | | | 9 | | | | 1,580 | | | | 71 | | | | 109 | |
| | | | |
Professional fees (Note 2) | | | — | | | | — | | | | — | | | | 693 | |
Total Liabilities | | | 85,260 | | | | 68,601,853 | | | | 1,717,576 | | | | 994,951 | |
NET ASSETS | | $ | 2,296,325 | | | $ | 423,030,764 | | | $ | 19,449,933 | | | $ | 27,902,099 | |
NET ASSETS: | | | | | | | | | | | | | | | | |
| | | | |
Paid-in capital | | $ | 2,481,551 | | | $ | 429,086,258 | | | $ | 21,119,264 | | | $ | 33,680,057 | |
| | | | |
Undistributed (Distributions in excess of) net investment income | | | 17,020 | | | | 3,493,019 | | | | (17,796 | ) | | | 105,641 | |
| | | | |
Accumulated net realized loss on investments, forward foreign currency contracts and foreign currency related transactions | | | (29,594 | ) | | | (34,282,843 | ) | | | (586,283 | ) | | | (100,963 | ) |
| | | | |
Net unrealized appreciation (depreciation) on investments, forward foreign currency contracts and translation of assets and liabilities denominated in foreign currencies | | | (172,652 | ) | | | 24,734,330 | | | | (1,065,252 | ) | | | (5,782,636 | ) |
NET ASSETS | | $ | 2,296,325 | | | $ | 423,030,764 | | | $ | 19,449,933 | | | $ | 27,902,099 | |
Outstanding beneficial interest shares of $0.001 par value (unlimited number of shares authorized) | | | 100,000 | | | | 7,650,000 | | | | 900,000 | | | | 1,200,000 | |
Net asset value per share | | $ | 22.96 | | | $ | 55.30 | | | $ | 21.61 | | | $ | 23.25 | |
1 Includes market value of securities out on loan of: | | $ | 58,757 | | | $ | 68,662,149 | | | $ | 166,842 | | | $ | 36,208 | |
See Notes to Financial Statements.
| | |
| 176 | | WisdomTree Developed World ex-U.S. and Currency Hedged Equity Funds |
Statements of Operations
WisdomTree Developed World ex-U.S. and Currency Hedged Equity Funds
For the Year Ended March 31, 2016
| | | | | | | | | | | | | | | | | | | | |
| | | WisdomTree
Australia
Dividend Fund | | | WisdomTree
Europe Hedged
Equity Fund | | | WisdomTree
Europe Hedged
SmallCap
Equity Fund | | | WisdomTree
Europe Quality
Dividend
Growth Fund | | | WisdomTree
Europe
SmallCap
Dividend Fund | |
INVESTMENT INCOME: | | | | | | | | | | | | | | | | | | | | |
| | | | | |
Dividends1 | | $ | 1,442,210 | | | $ | 503,623,248 | | | $ | 6,449,161 | | | $ | 456,823 | | | $ | 29,519,431 | |
| | | | | |
Dividends from affiliates (Note 3) | | | — | | | | — | | | | — | | | | — | | | | 93,645 | |
| | | | | |
Securities lending income (Note 2) | | | 39,692 | | | | 16,216,552 | | | | 443,408 | | | | 9,673 | | | | 1,333,474 | |
Total investment income | | | 1,481,902 | | | | 519,839,800 | | | | 6,892,569 | | | | 466,496 | | | | 30,946,550 | |
EXPENSES: | | | | | | | | | | | | | | | | | | | | |
| | | | | |
Advisory fees (Note 3) | | | 206,536 | | | | 108,535,454 | | | | 1,309,783 | | | | 99,611 | | | | 5,660,782 | |
| | | | | |
Service fees (Note 2) | | | 1,567 | | | | 823,372 | | | | 9,936 | | | | 755 | | | | 42,944 | |
| | | | | |
Professional fees (Note 2) | | | — | | | | — | | | | — | | | | 90 | | | | 6,215 | |
Total expenses | | | 208,103 | | | | 109,358,826 | | | | 1,319,719 | | | | 100,456 | | | | 5,709,941 | |
Expense waivers (Note 3) | | | — | | | | — | | | | — | | | | — | | | | (7,672 | ) |
Net expenses | | | 208,103 | | | | 109,358,826 | | | | 1,319,719 | | | | 100,456 | | | | 5,702,269 | |
Net investment income | | | 1,273,799 | | | | 410,480,974 | | | | 5,572,850 | | | | 366,040 | | | | 25,244,281 | |
NET REALIZED AND UNREALIZED GAIN (LOSS) ON INVESTMENTS: | | | | | | | | | | | | | | | | | | | | |
| | | | | |
Net realized gain (loss) from: | | | | | | | | | | | | | | | | | | | | |
| | | | | |
Investment transactions | | | (4,011,011 | ) | | | (939,785,902 | ) | | | (9,157,971 | ) | | | (1,301,322 | ) | | | (39,507,165 | ) |
| | | | | |
Investment transactions in affiliates (Note 3) | | | — | | | | — | | | | — | | | | — | | | | (118,636 | ) |
| | | | | |
In-kind redemptions | | | 1,450,567 | | | | (34,602,476 | ) | | | 1,869,260 | | | | — | | | | 4,244,382 | |
| | | | | |
In-kind redemptions in affiliates (Note 3) | | | — | | | | — | | | | — | | | | — | | | | 195 | |
| | | | | |
Forward foreign currency contracts and foreign currency related transactions | | | (6,747 | ) | | | 218,946,572 | | | | (1,529,468 | ) | | | (1,359 | ) | | | (73,720 | ) |
Net realized loss | | | (2,567,191 | ) | | | (755,441,806 | ) | | | (8,818,179 | ) | | | (1,302,681 | ) | | | (35,454,944 | ) |
Net change in unrealized appreciation (depreciation) from: | | | | | | | | | | | | | | | | | | | | |
| | | | | |
Investment transactions | | | (1,935,489 | ) | | | (1,655,094,587 | ) | | | 4,348,686 | | | | 315,177 | | | | 53,235,722 | |
| | | | | |
Forward foreign currency contracts and translation of assets and liabilities denominated in foreign currencies | | | 21,364 | | | | (1,203,107,082 | ) | | | (12,690,960 | ) | | | 1,982 | | | | 105,854 | |
Net change in unrealized appreciation (depreciation) | | | (1,914,125 | ) | | | (2,858,201,669 | ) | | | (8,342,274 | ) | | | 317,159 | | | | 53,341,576 | |
Net realized and unrealized gain (loss) on investments | | | (4,481,316 | ) | | | (3,613,643,475 | ) | | | (17,160,453 | ) | | | (985,522 | ) | | | 17,886,632 | |
NET INCREASE (DECREASE) IN NET ASSETS RESULTING FROM OPERATIONS | | $ | (3,207,517 | ) | | $ | (3,203,162,501 | ) | | $ | (11,587,603 | ) | | $ | (619,482 | ) | | $ | 43,130,913 | |
1 Net of foreign withholding tax of: | | $ | 13,707 | | | $ | 69,256,381 | | | $ | 912,685 | | | $ | 50,331 | | | $ | 2,807,678 | |
See Notes to Financial Statements.
| | | | |
| WisdomTree Developed World ex-U.S. and Currency Hedged Equity Funds | | | 177 | |
Statements of Operations (continued)
WisdomTree Developed World ex-U.S. and Currency Hedged Equity Funds
For the Year or Period Ended March 31, 2016
| | | | | | | | | | | | | | | | | | | | |
| | | WisdomTree
Germany
Hedged Equity
Fund | | | WisdomTree
Global ex-U.S.
Hedged
Dividend Fund1 | | | WisdomTree
Global ex-
U.S. Hedged Real
Estate Fund2 | | | WisdomTree
International
Dividend
ex-Financials Fund | | | WisdomTree
International
Equity Fund | |
INVESTMENT INCOME: | | | | | | | | | | | | | | | | | | | | |
| | | | | |
Dividends3 | | $ | 7,780,296 | | | $ | 131,874 | | | $ | 31,065 | | | $ | 12,843,381 | | | $ | 25,268,053 | |
| | | | | |
Dividends from affiliates (Note 3) | | | — | | | | — | | | | — | | | | 106,875 | | | | 173,384 | |
| | | | | |
Interest | | | — | | | | 1 | | | | — | | | | — | | | | — | |
| | | | | |
Securities lending income (Note 2) | | | 281,351 | | | | 1,088 | | | | 1,004 | | | | 419,542 | | | | 633,235 | |
Total investment income | | | 8,061,647 | | | | 132,963 | | | | 32,069 | | | | 13,369,798 | | | | 26,074,672 | |
EXPENSES: | | | | | | | | | | | | | | | | | | | | |
| | | | | |
Advisory fees (Note 3) | | | 1,452,851 | | | | 21,408 | | | | 5,778 | | | | 1,695,519 | | | | 3,168,653 | |
| | | | | |
Service fees (Note 2) | | | 13,318 | | | | 214 | | | | 44 | | | | 12,862 | | | | 29,046 | |
| | | | | |
Professional fees (Note 2) | | | — | | | | 8 | | | | — | | | | 1,739 | | | | 3,415 | |
Total expenses | | | 1,466,169 | | | | 21,630 | | | | 5,822 | | | | 1,710,120 | | | | 3,201,114 | |
Expense waivers (Note 3) | | | — | | | | — | | | | (1,494 | ) | | | (3,535 | ) | | | (2,846 | ) |
Net expenses | | | 1,466,169 | | | | 21,630 | | | | 4,328 | | | | 1,706,585 | | | | 3,198,268 | |
Net investment income | | | 6,595,478 | | | | 111,333 | | | | 27,741 | | | | 11,663,213 | | | | 22,876,404 | |
NET REALIZED AND UNREALIZED GAIN (LOSS) ON INVESTMENTS: | | | | | | | | | | | | | | | | | | | | |
| | | | | |
Net realized gain (loss) from: | | | | | | | | | | | | | | | | | | | | |
| | | | | |
Investment transactions | | | (15,031,600 | ) | | | (365,598 | ) | | | (3,824 | ) | | | (9,706,835 | ) | | | (3,168,116 | ) |
| | | | | |
Investment transactions in affiliates (Note 3) | | | — | | | | — | | | | — | | | | (233,452 | ) | | | (152,482 | ) |
| | | | | |
In-kind redemptions | | | (8,639,951 | ) | | | (300,110 | ) | | | — | | | | (1,467,325 | ) | | | 6,526,706 | |
| | | | | |
In-kind redemptions in affiliates (Note 3) | | | — | | | | — | | | | — | | | | 6,183 | | | | (272 | ) |
| | | | | |
Forward foreign currency contracts and foreign currency related transactions | | | (1,306,394 | ) | | | 159,550 | | | | 35,543 | | | | (45,571 | ) | | | (81,857 | ) |
Net realized gain (loss) | | | (24,977,945 | ) | | | (506,158 | ) | | | 31,719 | | | | (11,447,000 | ) | | | 3,123,979 | |
Net change in unrealized appreciation (depreciation) from: | | | | | | | | | | | | | | | | | | | | |
| | | | | |
Investment transactions | | | (24,680,368 | ) | | | (364,661 | ) | | | (18,496 | ) | | | (30,054,342 | ) | | | (84,474,207 | ) |
| | | | | |
Forward foreign currency contracts and translation of assets and liabilities denominated in foreign currencies | | | (12,698,930 | ) | | | (147,727 | ) | | | (76,795 | ) | | | 58,652 | | | | 91,494 | |
Net change in unrealized appreciation (depreciation) | | | (37,379,298 | ) | | | (512,388 | ) | | | (95,291 | ) | | | (29,995,690 | ) | | | (84,382,713 | ) |
Net realized and unrealized loss on investments | | | (62,357,243 | ) | | | (1,018,546 | ) | | | (63,572 | ) | | | (41,442,690 | ) | | | (81,258,734 | ) |
NET DECREASE IN NET ASSETS RESULTING FROM OPERATIONS | | $ | (55,761,765 | ) | | $ | (907,213 | ) | | $ | (35,831 | ) | | $ | (29,779,477 | ) | | $ | (58,382,330 | ) |
1 For the period June 4, 2015 (commencement of operations) through March 31, 2016. | | | | | | | | | | | | | | | | | |
2 For the period October 29, 2015 (commencement of operations) through March 31, 2016. | | | | | | | | | | | | | | | | | |
3 Net of foreign withholding tax of: | | $ | 1,187,140 | | | $ | 13,933 | | | $ | 3,248 | | | $ | 1,172,510 | | | $ | 1,902,176 | |
See Notes to Financial Statements.
| | |
| 178 | | WisdomTree Developed World ex-U.S. and Currency Hedged Equity Funds |
Statements of Operations (continued)
WisdomTree Developed World ex-U.S. and Currency Hedged Equity Funds
For the Year or Period Ended March 31, 2016
| | | | | | | | | | | | | | | | | | | | |
| | | WisdomTree
International
Hedged
Equity Fund1 | | | WisdomTree
International
Hedged Quality
Dividend
Growth Fund | | | WisdomTree
International
Hedged
SmallCap
Dividend Fund2 | | | WisdomTree
International
High Dividend
Fund | | | WisdomTree
International
LargeCap
Dividend Fund | |
INVESTMENT INCOME: | | | | | | | | | | | | | | | | | | | | |
| | | | | |
Dividends3 | | $ | 82,928 | | | $ | 16,480,599 | | | $ | — | | | $ | 13,860,973 | | | $ | 14,917,497 | |
| | | | | |
Dividends from affiliates (Note 3) | | | — | | | | — | | | | 59,989 | | | | 114,211 | | | | 58,725 | |
| | | | | |
Securities lending income (Note 2) | | | 838 | | | | 251,247 | | | | 1,679 | | | | 411,307 | | | | 310,188 | |
Total investment income | | | 83,766 | | | | 16,731,846 | | | | 61,668 | | | | 14,386,491 | | | | 15,286,410 | |
EXPENSES: | | | | | | | | | | | | | | | | | | | | |
| | | | | |
Advisory fees (Note 3) | | | 9,437 | | | | 2,913,182 | | | | 9,832 | | | | 1,783,677 | | | | 1,835,591 | |
| | | | | |
Service fees (Note 2) | | | 120 | | | | 22,100 | | | | 75 | | | | 13,531 | | | | 16,825 | |
| | | | | |
Professional fees (Note 2) | | | 12 | | | | 1,700 | | | | — | | | | 1,833 | | | | 2,126 | |
Total expenses | | | 9,569 | | | | 2,936,982 | | | | 9,907 | | | | 1,799,041 | | | | 1,854,542 | |
Expense waivers (Note 3) | | | — | | | | — | | | | (9,832 | ) | | | (1,413 | ) | | | (2,015 | ) |
Net expenses | | | 9,569 | | | | 2,936,982 | | | | 75 | | | | 1,797,628 | | | | 1,852,527 | |
Net investment income | | | 74,197 | | | | 13,794,864 | | | | 61,593 | | | | 12,588,863 | | | | 13,433,883 | |
NET REALIZED AND UNREALIZED GAIN (LOSS) ON INVESTMENTS: | | | | | | | | | | | | | | | | | | | | |
| | | | | |
Net realized gain (loss) from: | | | | | | | | | | | | | | | | | | | | |
| | | | | |
Investment transactions | | | (101,674 | ) | | | (16,484,235 | ) | | | — | | | | (5,072,454 | ) | | | (2,984,179 | ) |
| | | | | |
Investment transactions in affiliates (Note 3) | | | — | | | | — | | | | (10,694 | ) | | | (94,563 | ) | | | (200,659 | ) |
| | | | | |
In-kind redemptions | | | — | | | | 2,767,437 | | | | — | | | | 3,240,818 | | | | 769,390 | |
| | | | | |
In-kind redemptions in affiliates (Note 3) | | | — | | | | — | | | | (82,473 | ) | | | (845 | ) | | | 158 | |
| | | | | |
Forward foreign currency contracts and foreign currency related transactions | | | 105,667 | | | | 12,016,996 | | | | 27,661 | | | | (48,412 | ) | | | (65,574 | ) |
Net realized gain (loss) | | | 3,993 | | | | (1,699,802 | ) | | | (65,506 | ) | | | (1,975,456 | ) | | | (2,480,864 | ) |
Net change in unrealized appreciation (depreciation) from: | | | | | | | | | | | | | | | | | | | | |
| | | | | |
Investment transactions | | | (186,513 | ) | | | 2,369,108 | | | | (86,058 | ) | | | (45,584,285 | ) | | | (56,224,230 | ) |
| | | | | |
Forward foreign currency contracts and translation of assets and liabilities denominated in foreign currencies | | | (164,290 | ) | | | (30,943,195 | ) | | | (39,000 | ) | | | 49,311 | | | | 60,376 | |
Net change in unrealized appreciation (depreciation) | | | (350,803 | ) | | | (28,574,087 | ) | | | (125,058 | ) | | | (45,534,974 | ) | | | (56,163,854 | ) |
Net realized and unrealized loss on investments | | | (346,810 | ) | | | (30,273,889 | ) | | | (190,564 | ) | | | (47,510,430 | ) | | | (58,644,718 | ) |
NET DECREASE IN NET ASSETS RESULTING FROM OPERATIONS | | $ | (272,613 | ) | | $ | (16,479,025 | ) | | $ | (128,971 | ) | | $ | (34,921,567 | ) | | $ | (45,210,835 | ) |
1 For the period July 9, 2015 (commencement of operations) through March 31, 2016. | | | | | | | | | | | | | | | | | |
2 For the period June 4, 2015 (commencement of operations) through March 31, 2016. | | | | | | | | | | | | | | | | | |
3 Net of foreign withholding tax of: | | $ | 6,345 | | | $ | 1,235,408 | | | | — | | | $ | 1,006,261 | | | $ | 1,124,933 | |
See Notes to Financial Statements.
| | | | |
| WisdomTree Developed World ex-U.S. and Currency Hedged Equity Funds | | | 179 | |
Statements of Operations (continued)
WisdomTree Developed World ex-U.S. and Currency Hedged Equity Funds
For the Year Ended March 31, 2016
| | | | | | | | | | | | | | | | | | | | |
| | | WisdomTree
International
MidCap
Dividend Fund | | | WisdomTree
International
SmallCap
Dividend Fund | | | WisdomTree
Japan Hedged
Capital Goods
Fund | | | WisdomTree
Japan Hedged
Equity Fund | | | WisdomTree
Japan Hedged
Financials
Fund | |
INVESTMENT INCOME: | | | | | | | | | | | | | | | | | | | | |
| | | | | |
Dividends1 | | $ | 5,177,492 | | | $ | 33,883,597 | | | $ | 59,620 | | | $ | 311,254,732 | | | $ | 430,609 | |
| | | | | |
Dividends from affiliates (Note 3) | | | 11,577 | | | | 39,092 | | | | — | | | | — | | | | — | |
| | | | | |
Interest | | | — | | | | — | | | | — | | | | 146 | | | | — | |
| | | | | |
Securities lending income (Note 2) | | | 210,646 | | | | 1,558,370 | | | | 690 | | | | 2,586,983 | | | | 6,628 | |
Total investment income | | | 5,399,715 | | | | 35,481,059 | | | | 60,310 | | | | 313,841,861 | | | | 437,237 | |
EXPENSES: | | | | | | | | | | | | | | | | | | | | |
| | | | | |
Advisory fees (Note 3) | | | 897,286 | | | | 6,039,734 | | | | 12,855 | | | | 75,240,202 | | | | 108,539 | |
| | | | | |
Service fees (Note 2) | | | 6,807 | | | | 45,818 | | | | 118 | | | | 689,702 | | | | 995 | |
| | | | | |
Professional fees (Note 2) | | | 643 | | | | 4,042 | | | | — | | | | — | | | | — | |
Total expenses | | | 904,736 | | | | 6,089,594 | | | | 12,973 | | | | 75,929,904 | | | | 109,534 | |
Expense waivers (Note 3) | | | (446 | ) | | | (10,707 | ) | | | (480 | ) | | | — | | | | (3,476 | ) |
Net expenses | | | 904,290 | | | | 6,078,887 | | | | 12,493 | | | | 75,929,904 | | | | 106,058 | |
Net investment income | | | 4,495,425 | | | | 29,402,172 | | | | 47,817 | | | | 237,911,957 | | | | 331,179 | |
NET REALIZED AND UNREALIZED GAIN (LOSS) ON INVESTMENTS: | | | | | | | | | | | | | | | | | | | | |
| | | | | |
Net realized gain (loss) from: | | | | | | | | | | | | | | | | | | | | |
| | | | | |
Investment transactions | | | 3,333,082 | | | | (18,150,855 | ) | | | (129,565 | ) | | | (552,984,406 | ) | | | (1,010,039 | ) |
| | | | | |
Investment transactions in affiliates (Note 3) | | | (35,555 | ) | | | 212,179 | | | | — | | | | — | | | | — | |
| | | | | |
In-kind redemptions | | | — | | | | 4,804,267 | | | | — | | | | 424,517,254 | | | | (2,014,956 | ) |
| | | | | |
In-kind redemptions in affiliates (Note 3) | | | — | | | | 3,140 | | | | — | | | | — | | | | — | |
| | | | | |
Capital gain distributions from affiliates (Note 3) | | | 7,726 | | | | — | | | | — | | | | — | | | | — | |
| | | | | |
Forward foreign currency contracts and foreign currency related transactions | | | (26,418 | ) | | | (227,215 | ) | | | (127,778 | ) | | | (740,740,958 | ) | | | (1,644,238 | ) |
Net realized gain (loss) | | | 3,278,835 | | | | (13,358,484 | ) | | | (257,343 | ) | | | (869,208,110 | ) | | | (4,669,233 | ) |
Net change in unrealized appreciation (depreciation) from: | | | | | | | | | | | | | | | | | | | | |
| | | | | |
Investment transactions | | | (11,304,986 | ) | | | (1,202,433 | ) | | | (278,717 | ) | | | (1,970,056,076 | ) | | | (4,424,517 | ) |
| | | | | |
Forward foreign currency contracts and translation of assets and liabilities denominated in foreign currencies | | | 20,041 | | | | 141,820 | | | | (16,114 | ) | | | (68,525,366 | ) | | | (42,953 | ) |
Net change in unrealized appreciation (depreciation) | | | (11,284,945 | ) | | | (1,060,613 | ) | | | (294,831 | ) | | | (2,038,581,442 | ) | | | (4,467,470 | ) |
Net realized and unrealized loss on investments | | | (8,006,110 | ) | | | (14,419,097 | ) | | | (552,174 | ) | | | (2,907,789,552 | ) | | | (9,136,703 | ) |
NET INCREASE (DECREASE) IN NET ASSETS RESULTING FROM OPERATIONS | | $ | (3,510,685 | ) | | $ | 14,983,075 | | | $ | (504,357 | ) | | $ | (2,669,877,595 | ) | | $ | (8,805,524 | ) |
1 Net of foreign withholding tax of: | | $ | 424,651 | | | $ | 3,056,397 | | | $ | 6,615 | | | $ | 34,593,446 | | | $ | 47,846 | |
See Notes to Financial Statements.
| | |
| 180 | | WisdomTree Developed World ex-U.S. and Currency Hedged Equity Funds |
Statements of Operations (continued)
WisdomTree Developed World ex-U.S. and Currency Hedged Equity Funds
For the Year or Period Ended March 31, 2016
| | | | | | | | | | | | | | | | | | | | |
| | | WisdomTree
Japan Hedged
Health Care
Fund | | | WisdomTree
Japan Hedged
Quality
Dividend
Growth Fund1 | | | WisdomTree
Japan Hedged
Real Estate
Fund | | | WisdomTree
Japan Hedged
SmallCap
Equity Fund | | | WisdomTree
Japan Hedged
Tech, Media
and Telecom
Fund | |
INVESTMENT INCOME: | | | | | | | | | | | | | | | | | | | | |
| | | | | |
Dividends2 | | $ | 218,025 | | | $ | 394,214 | | | $ | 1,402,972 | | | $ | 2,916,958 | | | $ | 51,982 | |
| | | | | |
Securities lending income (Note 2) | | | 6,646 | | | | 2,381 | | | | 22,685 | | | | 209,243 | | | | 3,179 | |
Total investment income | | | 224,671 | | | | 396,595 | | | | 1,425,657 | | | | 3,126,201 | | | | 55,161 | |
EXPENSES: | | | | | | | | | | | | | | | | | | | | |
| | | | | |
Advisory fees (Note 3) | | | 60,053 | | | | 82,170 | | | | 235,971 | | | | 1,016,609 | | | | 18,260 | |
| | | | | |
Service fees (Note 2) | | | 551 | | | | 753 | | | | 2,164 | | | | 7,712 | | | | 167 | |
Total expenses | | | 60,604 | | | | 82,923 | | | | 238,135 | | | | 1,024,321 | | | | 18,427 | |
Expense waivers (Note 3) | | | (782 | ) | | | (8,559 | ) | | | (5,442 | ) | | | — | | | | (763 | ) |
Net expenses | | | 59,822 | | | | 74,364 | | | | 232,693 | | | | 1,024,321 | | | | 17,664 | |
Net investment income | | | 164,849 | | | | 322,231 | | | | 1,192,964 | | | | 2,101,880 | | | | 37,497 | |
NET REALIZED AND UNREALIZED GAIN (LOSS) ON INVESTMENTS: | | | | | | | | | | | | | | | | | | | | |
| | | | | |
Net realized gain (loss) from: | | | | | | | | | | | | | | | | | | | | |
| | | | | |
Investment transactions | | | (510,896 | ) | | | (612,616 | ) | | | (1,487,352 | ) | | | (7,470,341 | ) | | | (135,799 | ) |
| | | | | |
In-kind redemptions | | | 1,231,493 | | | | 523,120 | | | | 1,475,694 | | | | 9,164,794 | | | | 185,215 | |
| | | | | |
Forward foreign currency contracts and foreign currency related transactions | | | (1,871,785 | ) | | | (1,218,578 | ) | | | (5,975,188 | ) | | | (9,982,388 | ) | | | (107,240 | ) |
| | | | | |
Payments by sub-advisor (Note 3) | | | — | | | | — | | | | — | | | | 888,000 | | | | — | |
Net realized loss | | | (1,151,188 | ) | | | (1,308,074 | ) | | | (5,986,846 | ) | | | (7,399,935 | ) | | | (57,824 | ) |
Net change in unrealized appreciation (depreciation) from: | | | | | | | | | | | | | | | | | | | | |
| | | | | |
Investment transactions | | | (214,559 | ) | | | (1,172,029 | ) | | | 13,150,094 | | | | (5,036,047 | ) | | | (360,913 | ) |
| | | | | |
Forward foreign currency contracts and translation of assets and liabilities denominated in foreign currencies | | | (57,315 | ) | | | (47,316 | ) | | | (577,513 | ) | | | (686,773 | ) | | | (21,907 | ) |
Net change in unrealized appreciation (depreciation) | | | (271,874 | ) | | | (1,219,345 | ) | | | 12,572,581 | | | | (5,722,820 | ) | | | (382,820 | ) |
Net realized and unrealized gain (loss) on investments | | | (1,423,062 | ) | | | (2,527,419 | ) | | | 6,585,735 | | | | (13,122,755 | ) | | | (440,644 | ) |
NET INCREASE (DECREASE) IN NET ASSETS RESULTING FROM OPERATIONS | | $ | (1,258,213 | ) | | $ | (2,205,188 | ) | | $ | 7,778,699 | | | $ | (11,020,875 | ) | | $ | (403,147 | ) |
1 For the period April 9, 2015 (commencement of operations) through March 31, 2016. | | | | | | | | | | | | | | | | | |
2 Net of foreign withholding tax of: | | $ | 24,225 | | | $ | 48,202 | | | $ | 153,109 | | | $ | 322,978 | | | $ | 5,776 | |
See Notes to Financial Statements.
| | | | |
| WisdomTree Developed World ex-U.S. and Currency Hedged Equity Funds | | | 181 | |
Statements of Operations (concluded)
WisdomTree Developed World ex-U.S. and Currency Hedged Equity Funds
For the Year or Period Ended March 31, 2016
| | | | | | | | | | | | | | | | |
| | | WisdomTree
Japan Quality
Dividend
Growth Fund1 | | | WisdomTree
Japan
SmallCap
Dividend Fund | | | WisdomTree
Korea Hedged
Equity Fund | | | WisdomTree
United Kingdom
Hedged Equity
Fund | |
INVESTMENT INCOME: | | | | | | | | | | | | | | | | |
| | | | |
Dividends2 | | $ | 46,719 | | | $ | 7,265,083 | | | $ | 263,564 | | | $ | 1,637,741 | |
| | | | |
Dividends from affiliates (Note 3) | | | — | | | | 24,504 | | | | — | | | | — | |
| | | | |
Securities lending income (Note 2) | | | 76 | | | | 324,959 | | | | 4,397 | | | | 6,446 | |
Total investment income | | | 46,795 | | | | 7,614,546 | | | | 267,961 | | | | 1,644,187 | |
EXPENSES: | | | | | | | | | | | | | | | | |
| | | | |
Advisory fees (Note 3) | | | 9,458 | | | | 1,975,700 | | | | 127,925 | | | | 159,731 | |
| | | | |
Service fees (Note 2) | | | 87 | | | | 14,988 | | | | 971 | | | | 1,464 | |
| | | | |
Professional fees (Note 2) | | | — | | | | — | | | | — | | | | 693 | |
Total expenses | | | 9,545 | | | | 1,990,688 | | | | 128,896 | | | | 161,888 | |
Expense waivers (Note 3) | | | (985 | ) | | | (1,731 | ) | | | — | | | | — | |
Net expenses | | | 8,560 | | | | 1,988,957 | | | | 128,896 | | | | 161,888 | |
Net investment income | | | 38,235 | | | | 5,625,589 | | | | 139,065 | | | | 1,482,299 | |
NET REALIZED AND UNREALIZED GAIN (LOSS) ON INVESTMENTS: | | | | | | | | | | | | | | | | |
| | | | |
Net realized gain (loss) from: | | | | | | | | | | | | | | | | |
| | | | |
Investment transactions | | | (29,471 | ) | | | 3,903,975 | | | | (2,542,347 | ) | | | (2,338,133 | ) |
| | | | |
Investment transactions in affiliates (Note 3) | | | — | | | | (328,884 | ) | | | — | | | | — | |
| | | | |
In-kind redemptions | | | — | | | | 10,935,697 | | | | — | | | | 338,540 | |
| | | | |
Capital gain distributions from affiliates (Note 3) | | | — | | | | 101,506 | | | | — | | | | — | |
| | | | |
Forward foreign currency contracts and foreign currency related transactions | | | 144 | | | | (102,438 | ) | | | 2,272,953 | | | | 2,987,638 | |
Net realized gain (loss) | | | (29,327 | ) | | | 14,509,856 | | | | (269,394 | ) | | | 988,045 | |
Net change in unrealized appreciation (depreciation) from: | | | | | | | | | | | | | | | | |
| | | | |
Investment transactions | | | (172,875 | ) | | | (9,251,501 | ) | | | 702,677 | | | | (2,845,958 | ) |
| | | | |
Forward foreign currency contracts and translation of assets and liabilities denominated in foreign currencies | | | 223 | | | | 64,890 | | | | (1,629,373 | ) | | | (1,919,673 | ) |
Net change in unrealized appreciation (depreciation) | | | (172,652 | ) | | | (9,186,611 | ) | | | (926,696 | ) | | | (4,765,631 | ) |
Net realized and unrealized gain (loss) on investments | | | (201,979 | ) | | | 5,323,245 | | | | (1,196,090 | ) | | | (3,777,586 | ) |
NET INCREASE (DECREASE) IN NET ASSETS RESULTING FROM OPERATIONS | | $ | (163,744 | ) | | $ | 10,948,834 | | | $ | (1,057,025 | ) | | $ | (2,295,287 | ) |
1 For the period May 28, 2015 (commencement of operations) through March 31, 2016. | | | | | | | | | | | | | |
2 Net of foreign withholding tax of: | | $ | 6,697 | | | $ | 804,889 | | | $ | 46,541 | | | $ | 18,391 | |
See Notes to Financial Statements.
| | |
| 182 | | WisdomTree Developed World ex-U.S. and Currency Hedged Equity Funds |
Statements of Changes in Net Assets
WisdomTree Developed World ex-U.S. and Currency Hedged Equity Funds
| | | | | | | | | | | | | | | | | | | | | | | | |
| | | WisdomTree
Australia Dividend Fund | | | WisdomTree
Europe Hedged Equity Fund | | | WisdomTree
Europe Hedged SmallCap Equity Fund | |
| | | For the
Year Ended
March 31, 2016 | | | For the
Year Ended
March 31, 2015 | | | For the
Year Ended
March 31, 2016 | | | For the
Year Ended
March 31, 2015 | | | For the
Year Ended
March 31, 2016 | | | For the Period
March 4, 2015*
through
March 31, 2015 | |
INCREASE (DECREASE) IN NET ASSETS RESULTING FROM OPERATIONS: | | | | | | | | | | | | | | | | | | | | | |
| | | | | | |
Net investment income | | $ | 1,273,799 | | | $ | 2,116,489 | | | $ | 410,480,974 | | | $ | 87,040,055 | | | $ | 5,572,850 | | | $ | 361,661 | |
| | | | | | |
Net realized gain (loss) on investments, forward foreign currency contracts and foreign currency related transactions | | | (2,567,191 | ) | | | 2,073,246 | | | | (755,441,806 | ) | | | 862,968,028 | | | | (8,818,179 | ) | | | 19,017 | |
| | | | | | |
Net change in unrealized appreciation (depreciation) on investments, forward foreign currency contracts and translation of assets and liabilities denominated in foreign currencies | | | (1,914,125 | ) | | | (8,829,312 | ) | | | (2,858,201,669 | ) | | | 746,785,856 | | | | (8,342,274 | ) | | | 1,326,564 | |
Net increase (decrease) in net assets resulting from operations | | | (3,207,517 | ) | | | (4,639,577 | ) | | | (3,203,162,501 | ) | | | 1,696,793,939 | | | | (11,587,603 | ) | | | 1,707,242 | |
DIVIDENDS AND DISTRIBUTIONS: | | | | | | | | | | | | | | | | | | | | | | | | |
| | | | | | |
Net investment income | | | (1,267,826 | ) | | | (1,972,575 | ) | | | (425,372,088 | ) | | | (73,966,189 | ) | | | (9,484,190 | ) | | | — | |
| | | | | | |
Capital gains | | | — | | | | — | | | | (1,222,489,223 | ) | | | (184,744,238 | ) | | | (576,534 | ) | | | — | |
Total dividends and distributions | | | (1,267,826 | ) | | | (1,972,575 | ) | | | (1,647,861,311 | ) | | | (258,710,427 | ) | | | (10,060,724 | ) | | | — | |
CAPITAL SHARE TRANSACTIONS: | | | | | | | | | | | | | | | | | | | | | | | | |
| | | | | | |
Net proceeds from sale of shares | | | — | | | | 5,447,076 | | | | 6,799,716,305 | | | | 15,173,767,490 | | | | 200,035,603 | | | | 124,121,761 | |
| | | | | | |
Cost of shares redeemed | | | (10,345,831 | ) | | | (5,334,442 | ) | | | (5,776,224,174 | ) | | | (127,685,798 | ) | | | (36,508,563 | ) | | | — | |
Net increase (decrease) in net assets resulting from capital share transactions | | | (10,345,831 | ) | | | 112,634 | | | | 1,023,492,131 | | | | 15,046,081,692 | | | | 163,527,040 | | | | 124,121,761 | |
Net Increase (Decrease) in Net Assets | | | (14,821,174 | ) | | | (6,499,518 | ) | | | (3,827,531,681 | ) | | | 16,484,165,204 | | | | 141,878,713 | | | | 125,829,003 | |
NET ASSETS: | | | | | | | | | | | | | | | | | | | | | | | | |
| | | | | | |
Beginning of period | | $ | 48,638,046 | | | $ | 55,137,564 | | | $ | 17,544,484,688 | | | $ | 1,060,319,484 | | | $ | 125,829,103 | | | $ | 100 | |
| | | | | | |
End of period | | $ | 33,816,872 | | | $ | 48,638,046 | | | $ | 13,716,953,007 | | | $ | 17,544,484,688 | | | $ | 267,707,816 | | | $ | 125,829,103 | |
Undistributed (Distributions in excess of) net investment income included in net assets at end of period | | $ | 126,595 | | | $ | 127,605 | | | $ | 24,118,619 | | | $ | 24,551,126 | | | $ | (2,214,679 | ) | | $ | 361,991 | |
SHARES CREATED AND REDEEMED: | | | | | | | | | | | | | | | | | | | | | | | | |
| | | | | | |
Shares outstanding, beginning of period | | | 900,000 | | | | 900,000 | | | | 265,200,000 | | | | 18,800,000 | | | | 4,850,004 | | | | 4 | |
| | | | | | |
Shares created | | | — | | | | 100,000 | | | | 104,900,000 | | | | 248,650,000 | | | | 7,900,000 | | | | 4,850,000 | |
| | | | | | |
Shares redeemed | | | (200,000 | ) | | | (100,000 | ) | | | (106,500,000 | ) | | | (2,250,000 | ) | | | (1,550,004 | ) | | | — | |
Shares outstanding, end of period | | | 700,000 | | | | 900,000 | | | | 263,600,000 | | | | 265,200,000 | | | | 11,200,000 | | | | 4,850,004 | |
| * | Commencement of operations. |
See Notes to Financial Statements.
| | | | |
| WisdomTree Developed World ex-U.S. and Currency Hedged Equity Funds | | | 183 | |
Statements of Changes in Net Assets (continued)
WisdomTree Developed World ex-U.S. and Currency Hedged Equity Funds
| | | | | | | | | | | | | | | | | | | | | | | | |
| | | WisdomTree
Europe Quality Dividend Growth Fund | | | WisdomTree
Europe SmallCap Dividend Fund | | | WisdomTree
Germany Hedged Equity Fund | |
| | | For the
Year Ended
March 31, 2016 | | | For the Period
May 7, 2014*
through
March 31, 2015 | | | For the
Year Ended
March 31, 2016 | | | For the
Year Ended
March 31, 2015 | | | For the
Year Ended
March 31, 2016 | | | For the
Year Ended
March 31, 2015 | |
INCREASE (DECREASE) IN NET ASSETS RESULTING FROM OPERATIONS: | | | | | | | | | | | | | | | | | |
| | | | | | |
Net investment income | | $ | 366,040 | | | $ | 200,687 | | | $ | 25,244,281 | | | $ | 38,486,170 | | | $ | 6,595,478 | | | $ | 177,748 | |
| | | | | | |
Net realized gain (loss) on investments, forward foreign currency contracts and foreign currency related transactions | | | (1,302,681 | ) | | | (223,873 | ) | | | (35,454,944 | ) | | | 2,038,267 | | | | (24,977,945 | ) | | | 3,974,938 | |
| | | | | | |
Net change in unrealized appreciation (depreciation) on investments, forward foreign currency contracts and translation of assets and liabilities denominated in foreign currencies | | | 317,159 | | | | (1,073,506 | ) | | | 53,341,576 | | | | (212,714,789 | ) | | | (37,379,298 | ) | | | 7,691,136 | |
Net increase (decrease) in net assets resulting from operations | | | (619,482 | ) | | | (1,096,692 | ) | | | 43,130,913 | | | | (172,190,352 | ) | | | (55,761,765 | ) | | | 11,843,822 | |
DIVIDENDS AND DISTRIBUTIONS: | | | | | | | | | | | | | | | | | | | | | |
| | | | | | |
Net investment income | | | (346,859 | ) | | | (174,792 | ) | | | (26,876,423 | ) | | | (37,998,494 | ) | | | (8,172,182 | ) | | | (178,439 | ) |
| | | | | | |
Capital gains | | | — | | | | — | | | | — | | | | — | | | | (6,396,889 | ) | | | (1,063,257 | ) |
Total dividends and distributions | | | (346,859 | ) | | | (174,792 | ) | | | (26,876,423 | ) | | | (37,998,494 | ) | | | (14,569,071 | ) | | | (1,241,696 | ) |
CAPITAL SHARE TRANSACTIONS: | | | | | | | | | | | | | | | | | | | | | | | | |
| | | | | | |
Net proceeds from sale of shares | | | 7,229,470 | | | | 20,859,822 | | | | 329,434,397 | | | | 885,658,937 | | | | 131,626,801 | | | | 271,770,808 | |
| | | | | | |
Cost of shares redeemed | | | — | | | | (7,997,856 | ) | | | (73,628,506 | ) | | | (1,268,466,721 | ) | | | (152,610,531 | ) | | | — | |
Net increase (decrease) in net assets resulting from capital share transactions | | | 7,229,470 | | | | 12,861,966 | | | | 255,805,891 | | | | (382,807,784 | ) | | | (20,983,730 | ) | | | 271,770,808 | |
Net Increase (Decrease) in Net Assets | | | 6,263,129 | | | | 11,590,482 | | | | 272,060,381 | | | | (592,996,630 | ) | | | (91,314,566 | ) | | | 282,372,934 | |
NET ASSETS: | | | | | | | | | | | | | | | | | | | | | | | | |
| | | | | | |
Beginning of period | | $ | 11,590,582 | | | $ | 100 | | | $ | 853,874,400 | | | $ | 1,446,871,030 | | | $ | 291,815,788 | | | $ | 9,442,854 | |
| | | | | | |
End of period | | $ | 17,853,711 | | | $ | 11,590,582 | | | $ | 1,125,934,781 | | | $ | 853,874,400 | | | $ | 200,501,222 | | | $ | 291,815,788 | |
Undistributed net investment income included in net assets at end of period | | $ | 39,608 | | | $ | 21,498 | | | $ | 4,068,208 | | | $ | 4,634,978 | | | $ | 2,098,282 | | | $ | 45,782 | |
SHARES CREATED AND REDEEMED: | | | | | | | | | | | | | | | | | | | | | | | | |
| | | | | | |
Shares outstanding, beginning of period | | | 500,000 | | | | 4 | | | | 15,350,000 | | | | 23,250,000 | | | | 9,300,000 | | | | 350,000 | |
| | | | | | |
Shares created | | | 300,000 | | | | 850,000 | | | | 5,800,000 | | | | 14,550,000 | | | | 4,350,000 | | | | 8,950,000 | |
| | | | | | |
Shares redeemed | | | — | | | | (350,004 | ) | | | (1,400,000 | ) | | | (22,450,000 | ) | | | (5,800,000 | ) | | | — | |
Shares outstanding, end of period | | | 800,000 | | | | 500,000 | | | | 19,750,000 | | | | 15,350,000 | | | | 7,850,000 | | | | 9,300,000 | |
| * | Commencement of operations. |
See Notes to Financial Statements.
| | |
| 184 | | WisdomTree Developed World ex-U.S. and Currency Hedged Equity Funds |
Statements of Changes in Net Assets (continued)
WisdomTree Developed World ex-U.S. and Currency Hedged Equity Funds
| | | | | | | | | | | | | | | | |
| | | WisdomTree
Global ex-U.S.
Hedged Dividend Fund | | | WisdomTree
Global ex-U.S. Hedged
Real Estate Fund | | | WisdomTree
International Dividend
ex-Financials Fund | |
| | | For the Period
June 4, 2015*
through
March 31, 2016 | | | For the Period
October 29, 2015*
through
March 31, 2016 | | | For the
Year Ended
March 31, 2016 | | | For the
Year Ended
March 31, 2015 | |
INCREASE (DECREASE) IN NET ASSETS RESULTING FROM OPERATIONS: | | | | | | | | | | | | | |
| | | | |
Net investment income | | $ | 111,333 | | | $ | 27,741 | | | $ | 11,663,213 | | | $ | 15,653,193 | |
| | | | |
Net realized gain (loss) on investments, forward foreign currency contracts and foreign currency related transactions | | | (506,158 | ) | | | 31,719 | | | | (11,447,000 | ) | | | 24,818,165 | |
| | | | |
Net change in unrealized depreciation on investments, forward foreign currency contracts and translation of assets and liabilities denominated in foreign currencies | | | (512,388 | ) | | | (95,291 | ) | | | (29,995,690 | ) | | | (73,124,349 | ) |
Net increase (decrease) in net assets resulting from operations | | | (907,213 | ) | | | (35,831 | ) | | | (29,779,477 | ) | | | (32,652,991 | ) |
DIVIDENDS: | | | | | | | | | | | | | | | | |
Net investment income | | | (88,558 | ) | | | (15,424 | ) | | | (11,777,974 | ) | | | (15,437,232 | ) |
CAPITAL SHARE TRANSACTIONS: | | | | | | | | | | | | | | | | |
| | | | |
Net proceeds from sale of shares | | | 9,701,882 | | | | 2,488,057 | | | | 22,357,782 | | | | 70,209,452 | |
| | | | |
Cost of shares redeemed | | | (4,407,683 | ) | | | — | | | | (74,399,815 | ) | | | (47,582,200 | ) |
Net increase (decrease) in net assets resulting from capital share transactions | | | 5,294,199 | | | | 2,488,057 | | | | (52,042,033 | ) | | | 22,627,252 | |
Net Increase (Decrease) in Net Assets | | | 4,298,428 | | | | 2,436,802 | | | | (93,599,484 | ) | | | (25,462,971 | ) |
NET ASSETS: | | | | | | | | | | | | | | | | |
| | | | |
Beginning of period | | $ | 100 | | | $ | 100 | | | $ | 324,082,520 | | | $ | 349,545,491 | |
| | | | |
End of period | | $ | 4,298,528 | | | $ | 2,436,902 | | | $ | 230,483,036 | | | $ | 324,082,520 | |
Undistributed (Distributions in excess of) net investment income included in net assets at end of period | | $ | (12,363 | ) | | $ | 6,634 | | | $ | 661,692 | | | $ | 799,832 | |
SHARES CREATED AND REDEEMED: | | | | | | | | | | | | | | | | |
| | | | |
Shares outstanding, beginning of period | | | 4 | | | | 4 | | | | 7,400,000 | | | | 7,100,000 | |
| | | | |
Shares created | | | 400,000 | | | | 100,000 | | | | 500,000 | | | | 1,400,000 | |
| | | | |
Shares redeemed | | | (200,004 | ) | | | — | | | | (1,900,000 | ) | | | (1,100,000 | ) |
Shares outstanding, end of period | | | 200,000 | | | | 100,004 | | | | 6,000,000 | | | | 7,400,000 | |
| * | Commencement of operations. |
See Notes to Financial Statements.
| | | | |
| WisdomTree Developed World ex-U.S. and Currency Hedged Equity Funds | | | 185 | |
Statements of Changes in Net Assets (continued)
WisdomTree Developed World ex-U.S. and Currency Hedged Equity Funds
| | | | | | | | | | | | | | | | | | | | |
| | | WisdomTree
International Equity Fund | | | WisdomTree
International Hedged
Equity Fund | | | WisdomTree
International Hedged Quality
Dividend Growth Fund | |
| | | For the
Year Ended
March 31, 2016 | | | For the
Year Ended
March 31, 2015 | | | For the Period
July 9, 2015*
through
March 31, 2016 | | | For the
Year Ended
March 31, 2016 | | | For the Period
May 7, 2014*
through
March 31, 2015 | |
INCREASE (DECREASE) IN NET ASSETS RESULTING FROM OPERATIONS: | | | | | | | | | | | | | |
| | | | | |
Net investment income | | $ | 22,876,404 | | | $ | 21,501,935 | | | $ | 74,197 | | | $ | 13,794,864 | | | $ | 1,015,552 | |
| | | | | |
Net realized gain (loss) on investments and forward foreign currency contracts and foreign currency related transactions | | | 3,123,979 | | | | (3,579,736 | ) | | | 3,993 | | | | (1,699,802 | ) | | | 1,861,841 | |
| | | | | |
Net change in unrealized appreciation (depreciation) on investments, forward foreign currency contracts, translation of assets and liabilities denominated in foreign currencies | | | (84,382,713 | ) | | | (27,203,920 | ) | | | (350,803 | ) | | | (28,574,087 | ) | | | 4,313,868 | |
Net increase (decrease) in net assets resulting from operations | | | (58,382,330 | ) | | | (9,281,721 | ) | | | (272,613 | ) | | | (16,479,025 | ) | | | 7,191,261 | |
DIVIDENDS AND DISTRIBUTIONS: | | | | | | | | | | | | | | | | | |
| | | | | |
Net investment income | | | (22,674,788 | ) | | | (20,650,247 | ) | | | (34,502 | ) | | | (9,084,135 | ) | | | (341,603 | ) |
| | | | | |
Capital gains | | | — | | | | — | | | | — | | | | (5,684,499 | ) | | | (453,216 | ) |
Total dividends and distributions | | | (22,674,788 | ) | | | (20,650,247 | ) | | | (34,502 | ) | | | (14,768,634 | ) | | | (794,819 | ) |
CAPITAL SHARE TRANSACTIONS: | | | | | | | | | | | | | | | | | | | | |
| | | | | |
Net proceeds from sale of shares | | | 88,509,931 | | | | 106,576,595 | | | | 4,918,658 | | | | 645,025,011 | | | | 200,056,027 | |
| | | | | |
Cost of shares redeemed | | | (31,353,466 | ) | | | — | | | | (99 | ) | | | (88,179,888 | ) | | | (102 | ) |
Net increase in net assets resulting from capital share transactions | | | 57,156,465 | | | | 106,576,595 | | | | 4,918,559 | | | | 556,845,123 | | | | 200,055,925 | |
Net Increase (Decrease) in Net Assets | | | (23,900,653 | ) | | | 76,644,627 | | | | 4,611,444 | | | | 525,597,464 | | | | 206,452,367 | |
NET ASSETS: | | | | | | | | | | | | | | | | | | | | |
| | | | | |
Beginning of period | | $ | 645,832,285 | | | $ | 569,187,658 | | | $ | 100 | | | $ | 206,452,467 | | | $ | 100 | |
| | | | | |
End of period | | $ | 621,931,632 | | | $ | 645,832,285 | | | $ | 4,611,544 | | | $ | 732,049,931 | | | $ | 206,452,467 | |
Undistributed net investment income included in net assets at end of period | | $ | 2,250,019 | | | $ | 2,127,485 | | | $ | 11,811 | | | $ | 2,804,720 | | | $ | 447,698 | |
SHARES CREATED AND REDEEMED: | | | | | | | | | | | | | | | | | | | | |
| | | | | |
Shares outstanding, beginning of period | | | 12,500,000 | | | | 10,450,000 | | | | 4 | | | | 7,650,000 | | | | 4 | |
| | | | | |
Shares created | | | 1,700,000 | | | | 2,050,000 | | | | 200,000 | | | | 24,300,000 | | | | 7,650,000 | |
| | | | | |
Shares redeemed | | | (650,000 | ) | | | — | | | | (4 | ) | | | (3,500,000 | ) | | | (4 | ) |
Shares outstanding, end of period | | | 13,550,000 | | | | 12,500,000 | | | | 200,000 | | | | 28,450,000 | | | | 7,650,000 | |
| * | Commencement of operations. |
See Notes to Financial Statements.
| | |
| 186 | | WisdomTree Developed World ex-U.S. and Currency Hedged Equity Funds |
Statements of Changes in Net Assets (continued)
WisdomTree Developed World ex-U.S. and Currency Hedged Equity Funds
| | | | | | | | | | | | | | | | | | | | |
| | | WisdomTree
International Hedged
SmallCap Dividend Fund | | | WisdomTree
International High Dividend Fund | | | WisdomTree
International LargeCap Dividend Fund | |
| | | For the Period
June 4, 2015*
through
March 31, 2016 | | | For the
Year Ended
March 31, 2016 | | | For the
Year Ended
March 31, 2015 | | | For the
Year Ended
March 31, 2016 | | | For the
Year Ended
March 31, 2015 | |
INCREASE (DECREASE) IN NET ASSETS RESULTING FROM OPERATIONS: | | | | | | | | | | | | | |
| | | | | |
Net investment income | | $ | 61,593 | | | $ | 12,588,863 | | | $ | 13,809,485 | | | $ | 13,433,883 | | | $ | 12,677,361 | |
| | | | | |
Net realized gain (loss) on investments, forward foreign currency contracts and foreign currency related transactions | | | (65,506 | ) | | | (1,975,456 | ) | | | 419,457 | | | | (2,480,864 | ) | | | (2,025,000 | ) |
| | | | | |
Net change in unrealized depreciation on investments, forward foreign currency contracts and translation of assets and liabilities denominated in foreign currencies | | | (125,058 | ) | | | (45,534,974 | ) | | | (33,653,687 | ) | | | (56,163,854 | ) | | | (20,391,028 | ) |
Net increase (decrease) in net assets resulting from operations | | | (128,971 | ) | | | (34,921,567 | ) | | | (19,424,745 | ) | | | (45,210,835 | ) | | | (9,738,667 | ) |
DIVIDENDS AND DISTRIBUTIONS: | | | | | | | | | | | | | | | | | | | | |
| | | | | |
Net investment income | | | (46,268 | ) | | | (12,735,562 | ) | | | (13,241,538 | ) | | | (13,065,991 | ) | | | (12,260,118 | ) |
| | | | | |
Capital gains | | | (9,658 | ) | | | — | | | | — | | | | — | | | | — | |
Total dividends and distributions | | | (55,926 | ) | | | (12,735,562 | ) | | | (13,241,538 | ) | | | (13,065,991 | ) | | | (12,260,118 | ) |
CAPITAL SHARE TRANSACTIONS: | | | | | | | | | | | | | | | | | | | | |
| | | | | |
Net proceeds from sale of shares | | | 3,608,925 | | | | 15,673,504 | | | | 65,533,642 | | | | 72,019,236 | | | | 61,995,325 | |
| | | | | |
Cost of shares redeemed | | | (2,293,350 | ) | | | (48,169,750 | ) | | | — | | | | (2,402,150 | ) | | | — | |
Net increase (decrease) in net assets resulting from capital share transactions | | | 1,315,575 | | | | (32,496,246 | ) | | | 65,533,642 | | | | 69,617,086 | | | | 61,995,325 | |
Net Increase (Decrease) in Net Assets | | | 1,130,678 | | | | (80,153,375 | ) | | | 32,867,359 | | | | 11,340,260 | | | | 39,996,540 | |
NET ASSETS: | | | | | | | | | | | | | | | | | | | | |
| | | | | |
Beginning of period | | $ | 100 | | | $ | 337,620,071 | | | $ | 304,752,712 | | | $ | 355,273,026 | | | $ | 315,276,486 | |
| | | | | |
End of period | | $ | 1,130,778 | | | $ | 257,466,696 | | | $ | 337,620,071 | | | $ | 366,613,286 | | | $ | 355,273,026 | |
Undistributed (Distributions in excess of) net investment income included in net assets at end of period | | $ | (10,534 | ) | | $ | 798,833 | | | $ | 1,043,346 | | | $ | 1,253,392 | | | $ | 945,301 | |
SHARES CREATED AND REDEEMED: | | | | | | | | | | | | | | | | | | | | |
| | | | | |
Shares outstanding, beginning of period | | | 4 | | | | 7,800,000 | | | | 6,400,000 | | | | 7,300,000 | | | | 6,100,000 | |
| | | | | |
Shares created | | | 150,000 | | | | 350,000 | | | | 1,400,000 | | | | 1,450,000 | | | | 1,200,000 | |
| | | | | |
Shares redeemed | | | (100,004 | ) | | | (1,300,000 | ) | | | — | | | | (50,000 | ) | | | — | |
Shares outstanding, end of period | | | 50,000 | | | | 6,850,000 | | | | 7,800,000 | | | | 8,700,000 | | | | 7,300,000 | |
| * | Commencement of operations. |
See Notes to Financial Statements.
| | | | |
| WisdomTree Developed World ex-U.S. and Currency Hedged Equity Funds | | | 187 | |
Statements of Changes in Net Assets (continued)
WisdomTree Developed World ex-U.S. and Currency Hedged Equity Funds
| | | | | | | | | | | | | | | | | | | | | | | | |
| | | WisdomTree
International MidCap Dividend Fund | | | WisdomTree
International SmallCap Dividend Fund | | | WisdomTree
Japan Hedged Capital Goods Fund | |
| | | For the
Year Ended
March 31, 2016 | | | For the
Year Ended
March 31, 2015 | | | For the
Year Ended
March 31, 2016 | | | For the
Year Ended
March 31, 2015 | | | For the
Year Ended
March 31, 2016 | | | For the Period
April 8, 2014*
through
March 31, 2015 | |
INCREASE (DECREASE) IN NET ASSETS RESULTING FROM OPERATIONS: | | | | | | | | | | | | | | | | | |
| | | | | | |
Net investment income | | $ | 4,495,425 | | | $ | 4,474,571 | | | $ | 29,402,172 | | | $ | 29,220,559 | | | $ | 47,817 | | | $ | 31,938 | |
| | | | | | |
Net realized gain (loss) on investments, forward foreign currency contracts and foreign currency related transactions | | | 3,278,835 | | | | 5,935,280 | | | | (13,358,484 | ) | | | 39,724,242 | | | | (257,343 | ) | | | 435,751 | |
| | | | | | |
Net change in unrealized depreciation on investments, forward foreign currency contracts and translation of assets and liabilities denominated in foreign currencies | | | (11,284,945 | ) | | | (10,092,610 | ) | | | (1,060,613 | ) | | | (130,956,257 | ) | | | (294,831 | ) | | | (3,829 | ) |
Net increase (decrease) in net assets resulting from operations | | | (3,510,685 | ) | | | 317,241 | | | | 14,983,075 | | | | (62,011,456 | ) | | | (504,357 | ) | | | 463,860 | |
DIVIDENDS AND DISTRIBUTIONS: | | | | | | | | | | | | | | | | | | | | | | | | |
| | | | | | |
Net investment income | | | (4,425,194 | ) | | | (4,298,234 | ) | | | (28,273,035 | ) | | | (28,286,347 | ) | | | (36,226 | ) | | | (17,112 | ) |
| | | | | | |
Capital gains | | | — | | | | — | | | | — | | | | — | | | | (80,794 | ) | | | (144,392 | ) |
Total dividends and distributions | | | (4,425,194 | ) | | | (4,298,234 | ) | | | (28,273,035 | ) | | | (28,286,347 | ) | | | (117,020 | ) | | | (161,504 | ) |
CAPITAL SHARE TRANSACTIONS: | | | | | | | | | | | | | | | | | | | | | | | | |
| | | | | | |
Net proceeds from sale of shares | | | 6,034,375 | | | | 29,317,147 | | | | 221,656,200 | | | | 309,891,793 | | | | 1,000,497 | | | | 5,180,742 | |
| | | | | | |
Cost of shares redeemed | | | — | | | | (11,004,207 | ) | | | (26,166,852 | ) | | | (225,813,659 | ) | | | — | | | | (2,706,495 | ) |
Net increase in net assets resulting from capital share transactions | | | 6,034,375 | | | | 18,312,940 | | | | 195,489,348 | | | | 84,078,134 | | | | 1,000,497 | | | | 2,474,247 | |
Net Increase (Decrease) in Net Assets | | | (1,901,504 | ) | | | 14,331,947 | | | | 182,199,388 | | | | (6,219,669 | ) | | | 379,120 | | | | 2,776,603 | |
NET ASSETS: | | | | | | | | | | | | | | | | | | | | | | | | |
| | | | | | |
Beginning of period | | $ | 155,413,817 | | | $ | 141,081,870 | | | $ | 917,777,544 | | | $ | 923,997,213 | | | $ | 2,776,703 | | | $ | 100 | |
| | | | | | |
End of period | | $ | 153,512,313 | | | $ | 155,413,817 | | | $ | 1,099,976,932 | | | $ | 917,777,544 | | | $ | 3,155,823 | | | $ | 2,776,703 | |
Undistributed net investment income included in net assets at end of period | | $ | 559,159 | | | $ | 539,941 | | | $ | 7,709,390 | | | $ | 6,109,280 | | | $ | 25,729 | | | $ | 19,455 | |
SHARES CREATED AND REDEEMED: | | | | | | | | | | | | | | | | | | | | | | | | |
| | | | | | |
Shares outstanding, beginning of period | | | 2,650,000 | | | | 2,350,000 | | | | 15,500,000 | | | | 14,250,000 | | | | 100,000 | | | | 4 | |
| | | | | | |
Shares created | | | 100,000 | | | | 500,000 | | | | 3,600,000 | | | | 4,800,000 | | | | 50,000 | | | | 200,000 | |
| | | | | | |
Shares redeemed | | | — | | | | (200,000 | ) | | | (450,000 | ) | | | (3,550,000 | ) | | | — | | | | (100,004 | ) |
Shares outstanding, end of period | | | 2,750,000 | | | | 2,650,000 | | | | 18,650,000 | | | | 15,500,000 | | | | 150,000 | | | | 100,000 | |
| * | Commencement of operations. |
See Notes to Financial Statements.
| | |
| 188 | | WisdomTree Developed World ex-U.S. and Currency Hedged Equity Funds |
Statements of Changes in Net Assets (continued)
WisdomTree Developed World ex-U.S. and Currency Hedged Equity Funds
| | | | | | | | | | | | | | | | | | | | | | | | |
| | | WisdomTree
Japan Hedged Equity Fund | | | WisdomTree
Japan Hedged Financials Fund | | | WisdomTree
Japan Hedged Health Care Fund | |
| | | For the
Year Ended
March 31, 2016 | | | For the
Year Ended
March 31, 2015 | | | For the
Year Ended
March 31, 2016 | | | For the Period
April 8, 2014*
through
March 31, 2015 | | | For the
Year Ended
March 31, 2016 | | | For the Period
April 8, 2014*
through
March 31, 2015 | |
INCREASE (DECREASE) IN NET ASSETS RESULTING FROM OPERATIONS: | | | | | | | | | | | | | | | | | |
| | | | | | |
Net investment income | | $ | 237,911,957 | | | $ | 207,629,618 | | | $ | 331,179 | | | $ | 103,633 | | | $ | 164,849 | | | $ | 24,339 | |
| | | | | | |
Net realized gain (loss) on investments, forward foreign currency contracts and foreign currency related transactions | | | (869,208,110 | ) | | | 1,728,402,048 | | | | (4,669,233 | ) | | | 995,871 | | | | (1,151,188 | ) | | | 385,027 | |
| | | | | | |
Net change in unrealized appreciation (depreciation) on investments, forward foreign currency contracts and translation of assets and liabilities denominated in foreign currencies | | | (2,038,581,442 | ) | | | 1,094,343,830 | | | | (4,467,470 | ) | | | 129,806 | | | | (271,874 | ) | | | 283,290 | |
Net increase (decrease) in net assets resulting from operations | | | (2,669,877,595 | ) | | | 3,030,375,496 | | | | (8,805,524 | ) | | | 1,229,310 | | | | (1,258,213 | ) | | | 692,656 | |
DIVIDENDS AND DISTRIBUTIONS: | | | | | | | | | | | | | | | | | | | | | | | | |
| | | | | | |
Net investment income | | | (230,973,038 | ) | | | (207,539,167 | ) | | | (142,770 | ) | | | (43,420 | ) | | | (72,516 | ) | | | (6,684 | ) |
| | | | | | |
Capital gains | | | (664,378,176 | ) | | | (1,104,073,317 | ) | | | (43,093 | ) | | | (641,620 | ) | | | (85,560 | ) | | | (194,150 | ) |
Total dividends and distributions | | | (895,351,214 | ) | | | (1,311,612,484 | ) | | | (185,863 | ) | | | (685,040 | ) | | | (158,076 | ) | | | (200,834 | ) |
CAPITAL SHARE TRANSACTIONS: | | | | | | | | | | | | | | | | | | | | | | | | |
| | | | | | |
Net proceeds from sale of shares | | | 3,667,346,807 | | | | 5,763,303,856 | | | | 28,772,026 | | | | 10,088,110 | | | | 29,116,174 | | | | 4,026,460 | |
| | | | | | |
Cost of shares redeemed | | | (6,171,836,073 | ) | | | (3,117,040,421 | ) | | | (14,820,936 | ) | | | (2,745,940 | ) | | | (12,866,365 | ) | | | (1,417,667 | ) |
Net increase (decrease) in net assets resulting from capital share transactions | | | (2,504,489,266 | ) | | | 2,646,263,435 | | | | 13,951,090 | | | | 7,342,170 | | | | 16,249,809 | | | | 2,608,793 | |
Net Increase (Decrease) in Net Assets | | | (6,069,718,075 | ) | | | 4,365,026,447 | | | | 4,959,703 | | | | 7,886,440 | | | | 14,833,520 | | | | 3,100,615 | |
NET ASSETS: | | | | | | | | | | | | | | | | | | | | | | | | |
| | | | | | |
Beginning of period | | $ | 15,806,850,181 | | | $ | 11,441,823,734 | | | $ | 7,886,540 | | | $ | 100 | | | $ | 3,100,715 | | | $ | 100 | |
| | | | | | |
End of period | | $ | 9,737,132,106 | | | $ | 15,806,850,181 | | | $ | 12,846,243 | | | $ | 7,886,540 | | | $ | 17,934,235 | | | $ | 3,100,715 | |
Undistributed net investment income included in net assets at end of period | | $ | 84,187,911 | | | $ | 111,129,937 | | | $ | 167,716 | | | $ | 60,576 | | | $ | 94,245 | | | $ | 15,669 | |
SHARES CREATED AND REDEEMED: | | | | | | | | | | | | | | | | | | | | | | | | |
| | | | | | |
Shares outstanding, beginning of period | | | 287,250,000 | | | | 240,900,000 | | | | 300,000 | | | | 4 | | | | 100,000 | | | | 4 | |
| | | | | | |
Shares created | | | 64,500,000 | | | | 110,000,000 | | | | 1,000,000 | | | | 400,000 | | | | 850,000 | | | | 150,000 | |
| | | | | | |
Shares redeemed | | | (129,700,000 | ) | | | (63,650,000 | ) | | | (650,000 | ) | | | (100,004 | ) | | | (400,000 | ) | | | (50,004 | ) |
Shares outstanding, end of period | | | 222,050,000 | | | | 287,250,000 | | | | 650,000 | | | | 300,000 | | | | 550,000 | | | | 100,000 | |
| * | Commencement of operations. |
See Notes to Financial Statements.
| | | | |
| WisdomTree Developed World ex-U.S. and Currency Hedged Equity Funds | | | 189 | |
Statements of Changes in Net Assets (continued)
WisdomTree Developed World ex-U.S. and Currency Hedged Equity Funds
| | | | | | | | | | | | | | | | | | | | |
| | | WisdomTree
Japan Hedged Quality
Dividend Growth Fund | | | WisdomTree
Japan Hedged Real Estate Fund | | | WisdomTree
Japan Hedged SmallCap Equity Fund | |
| | | For the Period
April 9, 2015*
through
March 31, 2016 | | | For the
Year Ended
March 31, 2016 | | | For the Period
April 8, 2014*
through
March 31, 2015 | | | For the
Year Ended
March 31, 2016 | | | For the
Year Ended
March 31, 2015 | |
INCREASE (DECREASE) IN NET ASSETS RESULTING FROM OPERATIONS: | | | | | | | | | | | | | |
| | | | | |
Net investment income | | $ | 322,231 | | | $ | 1,192,964 | | | $ | 331,326 | | | $ | 2,101,880 | | | $ | 1,337,825 | |
| | | | | |
Net realized gain (loss) on investments, forward foreign currency contracts, foreign currency related transactions and payments by sub-advisor | | | (1,308,074 | ) | | | (5,986,846 | ) | | | 3,171,447 | | | | (7,399,935 | ) | | | 14,309,386 | |
| | | | | |
Net change in unrealized appreciation (depreciation) on investments, forward foreign currency contracts and translation of assets and liabilities denominated in foreign currencies | | | (1,219,345 | ) | | | 12,572,581 | | | | 140,509 | | | | (5,722,820 | ) | | | 4,954,193 | |
Net increase (decrease) in net assets resulting from operations | | | (2,205,188 | ) | | | 7,778,699 | | | | 3,643,282 | | | | (11,020,875 | ) | | | 20,601,404 | |
DIVIDENDS AND DISTRIBUTIONS: | | | | | | | | | | | | | | | | | | | | |
| | | | | |
Net investment income | | | (167,600 | ) | | | (531,873 | ) | | | (236,203 | ) | | | (1,876,401 | ) | | | (1,189,252 | ) |
| | | | | |
Capital gains | | | — | | | | (1,039,401 | ) | | | (1,864,720 | ) | | | (4,667,763 | ) | | | (6,902,460 | ) |
Total dividends and distributions | | | (167,600 | ) | | | (1,571,274 | ) | | | (2,100,923 | ) | | | (6,544,164 | ) | | | (8,091,712 | ) |
CAPITAL SHARE TRANSACTIONS: | | | | | | | | | | | | | | | | | | | | |
| | | | | |
Net proceeds from sale of shares | | | 30,625,387 | | | | 136,185,687 | | | | 35,926,393 | | | | 117,861,175 | | | | 51,771,606 | |
| | | | | |
Cost of shares redeemed | | | (12,595,898 | ) | | | (23,379,300 | ) | | | (5,489,435 | ) | | | (127,474,420 | ) | | | (22,132,969 | ) |
Net increase (decrease) in net assets resulting from capital share transactions | | | 18,029,489 | | | | 112,806,387 | | | | 30,436,958 | | | | (9,613,245 | ) | | | 29,638,637 | |
Net Increase (Decrease) in Net Assets | | | 15,656,701 | | | | 119,013,812 | | | | 31,979,317 | | | | (27,178,284 | ) | | | 42,148,329 | |
NET ASSETS: | | | | | | | | | | | | | | | | | | | | |
| | | | | |
Beginning of period | | $ | 100 | | | $ | 31,979,417 | | | $ | 100 | | | $ | 117,762,092 | | | $ | 75,613,763 | |
| | | | | |
End of period | | $ | 15,656,801 | | | $ | 150,993,229 | | | $ | 31,979,417 | | | $ | 90,583,808 | | | $ | 117,762,092 | |
Undistributed net investment income included in net assets at end of period | | $ | 101,479 | | | $ | 1,139,515 | | | $ | 191,039 | | | $ | 969,444 | | | $ | 843,781 | |
SHARES CREATED AND REDEEMED: | | | | | | | | | | | | | | | | | | | | |
| | | | | |
Shares outstanding, beginning of period | | | 4 | | | | 1,150,000 | | | | 4 | | | | 3,500,000 | | | | 2,600,000 | |
| | | | | |
Shares created | | | 1,200,000 | | | | 5,600,000 | | | | 1,350,000 | | | | 3,400,000 | | | | 1,600,000 | |
| | | | | |
Shares redeemed | | | (500,004 | ) | | | (900,000 | ) | | | (200,004 | ) | | | (4,000,000 | ) | | | (700,000 | ) |
Shares outstanding, end of period | | | 700,000 | | | | 5,850,000 | | | | 1,150,000 | | | | 2,900,000 | | | | 3,500,000 | |
| * | Commencement of operations. |
See Notes to Financial Statements.
| | |
| 190 | | WisdomTree Developed World ex-U.S. and Currency Hedged Equity Funds |
Statements of Changes in Net Assets (continued)
WisdomTree Developed World ex-U.S. and Currency Hedged Equity Funds
| | | | | | | | | | | | | | | | | | | | |
| | | WisdomTree
Japan Hedged Tech,
Media and Telecom Fund | | | WisdomTree
Japan Quality
Dividend Growth Fund | | | WisdomTree
Japan SmallCap Dividend Fund | |
| | | For the
Year Ended
March 31, 2016 | | | For the Period
April 8, 2014*
through
March 31, 2015 | | | For the Period
May 28, 2015*
through
March 31, 2016 | | | For the
Year Ended
March 31, 2016 | | | For the
Year Ended
March 31, 2015 | |
INCREASE (DECREASE) IN NET ASSETS RESULTING FROM OPERATIONS: | | | | | | | | | | | | | |
| | | | | |
Net investment income | | $ | 37,497 | | | $ | 38,008 | | | $ | 38,235 | | | $ | 5,625,589 | | | $ | 4,037,659 | |
| | | | | |
Net realized gain (loss) on investments, forward foreign currency contracts and foreign currency related transactions | | | (57,824 | ) | | | 585,963 | | | | (29,327 | ) | | | 14,509,856 | | | | 5,093,710 | |
| | | | | |
Net change in unrealized appreciation (depreciation) on investments, forward foreign currency contracts and translation of assets and liabilities denominated in foreign currencies | | | (382,820 | ) | | | 346,959 | | | | (172,652 | ) | | | (9,186,611 | ) | | | 14,593,693 | |
Net increase (decrease) in net assets resulting from operations | | | (403,147 | ) | | | 970,930 | | | | (163,744 | ) | | | 10,948,834 | | | | 23,725,062 | |
DIVIDENDS AND DISTRIBUTIONS: | | | | | | | | | | | | | | | | | |
| | | | | |
Net investment income | | | (93,992 | ) | | | (7,800 | ) | | | (21,482 | ) | | | (4,387,792 | ) | | | (4,434,720 | ) |
| | | | | |
Capital gains | | | (168,013 | ) | | | (314,270 | ) | | | — | | | | — | | | | — | |
Total dividends and distributions | | | (262,005 | ) | | | (322,070 | ) | | | (21,482 | ) | | | (4,387,792 | ) | | | (4,434,720 | ) |
CAPITAL SHARE TRANSACTIONS: | | | | | | | | | | | | | | | | | | | | |
| | | | | |
Net proceeds from sale of shares | | | — | | | | 5,131,256 | | | | 2,481,545 | | | | 190,910,353 | | | | 23,851,555 | |
| | | | | |
Cost of shares redeemed | | | (1,407,639 | ) | | | (1,348,470 | ) | | | (94 | ) | | | (61,091,211 | ) | | | (40,597,337 | ) |
Net increase (decrease) in net assets resulting from capital share transactions | | | (1,407,639 | ) | | | 3,782,786 | | | | 2,481,451 | | | | 129,819,142 | | | | (16,745,782 | ) |
Net Increase (Decrease) in Net Assets | | | (2,072,791 | ) | | | 4,431,646 | | | | 2,296,225 | | | | 136,380,184 | | | | 2,544,560 | |
NET ASSETS: | | | | | | | | | | | | | | | | | | | | |
| | | | | |
Beginning of period | | $ | 4,431,746 | | | $ | 100 | | | $ | 100 | | | $ | 286,650,580 | | | $ | 284,106,020 | |
| | | | | |
End of period | | $ | 2,358,955 | | | $ | 4,431,746 | | | $ | 2,296,325 | | | $ | 423,030,764 | | | $ | 286,650,580 | |
Undistributed net investment income included in net assets at end of period | | $ | 12,959 | | | $ | 75,567 | | | $ | 17,020 | | | $ | 3,493,019 | | | $ | 2,130,343 | |
SHARES CREATED AND REDEEMED: | | | | | | | | | | | | | | | | | | | | |
| | | | | |
Shares outstanding, beginning of period | | | 150,000 | | | | 4 | | | | 4 | | | | 5,300,000 | | | | 5,650,000 | |
| | | | | |
Shares created | | | — | | | | 200,000 | | | | 100,000 | | | | 3,500,000 | | | | 450,000 | |
| | | | | |
Shares redeemed | | | (50,000 | ) | | | (50,004 | ) | | | (4 | ) | | | (1,150,000 | ) | | | (800,000 | ) |
Shares outstanding, end of period | | | 100,000 | | | | 150,000 | | | | 100,000 | | | | 7,650,000 | | | | 5,300,000 | |
| * | Commencement of operations. |
See Notes to Financial Statements.
| | | | |
| WisdomTree Developed World ex-U.S. and Currency Hedged Equity Funds | | | 191 | |
Statements of Changes in Net Assets (concluded)
WisdomTree Developed World ex-U.S. and Currency Hedged Equity Funds
| | | | | | | | | | | | | | | | |
| | | WisdomTree
Korea Hedged Equity Fund | | | WisdomTree
United Kingdom Hedged Equity Fund | |
| | | For the
Year Ended
March 31, 2016 | | | For the
Year Ended
March 31, 2015 | | | For the
Year Ended
March 31, 2016 | | | For the
Year Ended
March 31, 2015 | |
INCREASE (DECREASE) IN NET ASSETS RESULTING FROM OPERATIONS: | | | | | | | | | |
| | | | |
Net investment income | | $ | 139,065 | | | $ | 71,374 | | | $ | 1,482,299 | | | $ | 825,310 | |
| | | | |
Net realized gain (loss) on investments, forward foreign currency contracts and foreign currency related transactions | | | (269,394 | ) | | | (277,371 | ) | | | 988,045 | | | | 2,035,518 | |
| | | | |
Net change in unrealized depreciation on investments, forward foreign currency contracts and translation of assets and liabilities denominated in foreign currencies | | | (926,696 | ) | | | (164,333 | ) | | | (4,765,631 | ) | | | (1,860,531 | ) |
Net increase (decrease) in net assets resulting from operations | | | (1,057,025 | ) | | | (370,330 | ) | | | (2,295,287 | ) | | | 1,000,297 | |
DIVIDENDS AND DISTRIBUTIONS: | | | | | | | | | | | | | | | | |
| | | | |
Net investment income | | | (52,830 | ) | | | (84,857 | ) | | | (1,234,508 | ) | | | (756,787 | ) |
| | | | |
Capital gains | | | — | | | | — | | | | (435,498 | ) | | | — | |
Total dividends and distributions | | | (52,830 | ) | | | (84,857 | ) | | | (1,670,006 | ) | | | (756,787 | ) |
CAPITAL SHARE TRANSACTIONS: | | | | | | | | | | | | | | | | |
| | | | |
Net proceeds from sale of shares | | | 13,197,915 | | | | 11,774,183 | | | | 11,464,154 | | | | 17,699,217 | |
| | | | |
Cost of shares redeemed | | | (12,108,242 | ) | | | — | | | | (8,003,902 | ) | | | (6,125,906 | ) |
Net increase in net assets resulting from capital share transactions | | | 1,089,673 | | | | 11,774,183 | | | | 3,460,252 | | | | 11,573,311 | |
Net Increase (Decrease) in Net Assets | | | (20,182 | ) | | | 11,318,996 | | | | (505,041 | ) | | | 11,816,821 | |
NET ASSETS: | | | | | | | | | | | | | | | | |
| | | | |
Beginning of year | | $ | 19,470,115 | | | $ | 8,151,119 | | | $ | 28,407,140 | | | $ | 16,590,319 | |
| | | | |
End of year | | $ | 19,449,933 | | | $ | 19,470,115 | | | $ | 27,902,099 | | | $ | 28,407,140 | |
Undistributed (Distributions in excess of) net investment income included in net assets at end of period | | $ | (17,796 | ) | | $ | 3,082 | | | $ | 105,641 | | | $ | 119,088 | |
SHARES CREATED AND REDEEMED: | | | | | | | | | | | | | | | | |
| | | | |
Shares outstanding, beginning of year | | | 900,000 | | | | 350,000 | | | | 1,100,000 | | | | 650,000 | |
| | | | |
Shares created | | | 600,000 | | | | 550,000 | | | | 450,000 | | | | 700,000 | |
| | | | |
Shares redeemed | | | (600,000 | ) | | | — | | | | (350,000 | ) | | | (250,000 | ) |
Shares outstanding, end of year | | | 900,000 | | | | 900,000 | | | | 1,200,000 | | | | 1,100,000 | |
See Notes to Financial Statements.
| | |
| 192 | | WisdomTree Developed World ex-U.S. and Currency Hedged Equity Funds |
Financial Highlights
WisdomTree Developed World ex-U.S. and Currency Hedged Equity Funds
Selected data for a share of beneficial interest outstanding throughout the period is presented below:
| | | | | | | | | | | | | | | | | | | | |
WisdomTree Australia Dividend
Fund | | For the
Year Ended
March 31, 2016 | | | For the
Year Ended
March 31, 2015 | | | For the
Period Ended
March 31, 2014 | | | For the
Period Ended
March 28, 2013 | | | For the
Year Ended
March 31, 20121 | |
Net asset value, beginning of period | | $ | 54.04 | | | $ | 61.26 | | | $ | 64.33 | | | $ | 55.87 | | | $ | 61.64 | |
Investment operations: | | | | | | | | | | | | | | | | | | | | |
Net investment income2 | | | 1.71 | | | | 2.37 | | | | 2.32 | | | | 2.60 | | | | 2.87 | |
Net realized and unrealized gain (loss) | | | (5.70 | ) | | | (7.40 | ) | | | (2.81 | ) | | | 8.44 | | | | (5.48 | ) |
Total from investment operations | | | (3.99 | ) | | | (5.03 | ) | | | (0.49 | ) | | | 11.04 | | | | (2.61 | ) |
Dividends to shareholders: | | | | | | | | | | | | | | | | | | | | |
Net investment income | | | (1.74 | ) | | | (2.19 | ) | | | (2.58 | ) | | | (2.58 | ) | | | (3.16 | ) |
Net asset value, end of period | | $ | 48.31 | | | $ | 54.04 | | | $ | 61.26 | | | $ | 64.33 | | | $ | 55.87 | |
| | | | | |
TOTAL RETURN3 | | | (7.17 | )% | | | (8.30 | )% | | | (0.59 | )% | | | 20.49 | % | | | (3.86 | )% |
RATIOS/SUPPLEMENTAL DATA: | | | | | | | | | | | | | | | | | | | | |
Net assets, end of period (000’s omitted) | | $ | 33,817 | | | $ | 48,638 | | | $ | 55,138 | | | $ | 77,193 | | | $ | 61,456 | |
Ratios to average net assets of: | | | | | | | | | | | | | | | | | | | | |
Expenses | | | 0.58 | % | | | 0.59 | %4 | | | 0.58 | %5 | | | 0.58 | %5 | | | 0.58 | %6,7 |
Net investment income | | | 3.58 | % | | | 4.09 | % | | | 3.86 | %5 | | | 4.71 | %5 | | | 5.18 | %6 |
Portfolio turnover rate8 | | | 41 | % | | | 26 | % | | | 27 | % | | | 31 | % | | | 68 | % |
| | | | | | | | | | | | | | | | | | | | |
| | | | | | |
WisdomTree Europe Hedged
Equity Fund | | For the
Year Ended
March 31, 2016 | | | For the
Year Ended
March 31, 2015 | | | For the
Period Ended
March 31, 2014 | | | For the
Period Ended
March 28, 20139 | | | For the
Year Ended
March 31, 2012 | |
Net asset value, beginning of period | | $ | 66.16 | | | $ | 56.40 | | | $ | 49.86 | | | $ | 43.93 | | | $ | 47.61 | |
Investment operations: | | | | | | | | | | | | | | | | | | | | |
Net investment income2 | | | 1.29 | | | | 1.14 | | | | 1.31 | | | | 0.89 | | | | 1.73 | |
Net realized and unrealized gain (loss) | | | (10.26 | ) | | | 11.83 | | | | 6.35 | | | | 5.96 | | | | (3.84 | ) |
Total from investment operations | | | (8.97 | ) | | | 12.97 | | | | 7.66 | | | | 6.85 | | | | (2.11 | ) |
Dividends and distributions to shareholders: | | | | | | | | | | | | | | | | | | | | |
Net investment income | | | (1.35 | ) | | | (1.19 | ) | | | (1.12 | ) | | | (0.92 | ) | | | (1.57 | ) |
Capital gains | | | (3.80 | ) | | | (2.02 | ) | | | — | | | | — | | | | — | |
Total dividends and distributions to shareholders | | | (5.15 | ) | | | (3.21 | ) | | | (1.12 | ) | | | (0.92 | ) | | | (1.57 | ) |
Net asset value, end of period | | $ | 52.04 | | | $ | 66.16 | | | $ | 56.40 | | | $ | 49.86 | | | $ | 43.93 | |
| | | | | |
TOTAL RETURN3 | | | (13.85 | )% | | | 24.02 | % | | | 15.73 | % | | | 16.06 | % | | | (4.41 | )% |
RATIOS/SUPPLEMENTAL DATA: | | | | | | | | | | | | | | | | | | | | |
Net assets, end of period (000’s omitted) | | $ | 13,716,953 | | | $ | 17,544,485 | | | $ | 1,060,319 | | | $ | 164,527 | | | $ | 21,963 | |
Ratios to average net assets of: | | | | | | | | | | | | | | | | | | | | |
Expenses, net of expense waivers | | | 0.58 | % | | | 0.59 | %4 | | | 0.58 | %5 | | | 0.58 | %5,6 | | | 0.58 | %6 |
Expenses, prior to expense waivers | | | 0.58 | % | | | 0.59 | %4 | | | 0.58 | %5 | | | 0.73 | %5,6 | | | 1.25 | %6 |
Net investment income | | | 2.19 | % | | | 1.91 | % | | | 2.43 | %5 | | | 2.01 | %5,6 | | | 3.99 | %6 |
Portfolio turnover rate8 | | | 29 | % | | | 12 | % | | | 28 | % | | | 43 | % | | | 42 | % |
| 1 | The information reflects the investment objective and strategy of the WisdomTree Pacific ex-Japan Equity Income Fund through June 19, 2011 and the investment objective and strategy of the WisdomTree Australia Dividend Fund thereafter. |
| 2 | Based on average shares outstanding. |
| 3 | Total return is calculated assuming an initial investment made at the net asset value at the beginning of the period, reinvestment of all dividends and distributions at net asset value during the period and redemption on the last day of the period. Total return calculated for a period of less than one year is not annualized. For the periods in which the investment advisor waived advisory fees, the total return would have been lower if certain expenses had not been waived (Notes 2 and 3). |
| 4 | Included in the expense ratio are proxy expenses. Without these proxy expenses, the expense ratio would have been 0.58%. |
| 6 | The ratios to average net assets do not include net investment income (loss) or expenses of other funds in which the Fund invests. |
| 7 | The expense ratio includes investment advisory fee waivers. Without these investment advisory fee waivers, the expense ratio would have been unchanged. |
| 8 | Portfolio turnover rate is not annualized and excludes the value of the portfolio securities received or delivered as a result of in-kind creations or redemptions of the Fund’s capital shares. Short-term securities with maturities less than or equal to 365 days are excluded from the portfolio turnover calculation as well. |
| 9 | The information reflects the investment objective and strategy of the WisdomTree International Hedged Equity Fund through August 29, 2012 and the investment objective and strategy of the WisdomTree Europe Hedged Equity Fund thereafter. |
See Notes to Financial Statements.
| | | | |
| WisdomTree Developed World ex-U.S. and Currency Hedged Equity Funds | | | 193 | |
Financial Highlights (continued)
WisdomTree Developed World ex-U.S. and Currency Hedged Equity Funds
Selected data for a share of beneficial interest outstanding throughout the period is presented below:
| | | | | | | | |
| WisdomTree Europe Hedged SmallCap Equity Fund | | For the
Year Ended
March 31, 2016 | | | For the Period
March 4, 2015*
through
March 31, 2015 | |
Net asset value, beginning of period | | $ | 25.94 | | | $ | 24.87 | |
Investment operations: | | | | | | | | |
Net investment income1 | | | 0.61 | | | | 0.13 | |
Net realized and unrealized gain (loss) | | | (1.57 | ) | | | 0.94 | |
Total from investment operations | | | (0.96 | ) | | | 1.07 | |
Dividends and distributions to shareholders: | | | | | | | | |
Net investment income | | | (1.02 | ) | | | — | |
Capital gains | | | (0.06 | ) | | | — | |
Total dividends and distributions to shareholders | | | (1.08 | ) | | | — | |
Net asset value, end of period | | $ | 23.90 | | | $ | 25.94 | |
| | |
TOTAL RETURN2 | | | (3.79 | )% | | | 4.30 | % |
RATIOS/SUPPLEMENTAL DATA: | | | | | | | | |
Net assets, end of period (000’s omitted) | | $ | 267,708 | | | $ | 125,829 | |
Ratios to average net assets of: | | | | | | | | |
Expenses | | | 0.58 | % | | | 0.58 | %3 |
Net investment income | | | 2.47 | % | | | 6.87 | %3 |
Portfolio turnover rate4 | | | 39 | % | | | 1 | % |
| | | | | | | | |
| | | |
| WisdomTree Europe Quality Dividend Growth Fund | | For the
Year Ended
March 31, 2016 | | | For the Period
May 7, 2014*
through
March 31, 2015 | |
Net asset value, beginning of period | | $ | 23.18 | | | $ | 25.10 | |
Investment operations: | | | | | | | | |
Net investment income1 | | | 0.48 | | | | 0.37 | |
Net realized and unrealized loss | | | (0.89 | ) | | | (1.96 | ) |
Total from investment operations | | | (0.41 | ) | | | (1.59 | ) |
Dividends to shareholders: | | | | | | | | |
Net investment income | | | (0.45 | ) | | | (0.33 | ) |
Net asset value, end of period | | $ | 22.32 | | | $ | 23.18 | |
| | |
TOTAL RETURN2 | | | (1.83 | )% | | | (6.35 | )% |
RATIOS/SUPPLEMENTAL DATA: | | | | | | | | |
Net assets, end of period (000’s omitted) | | $ | 17,854 | | | $ | 11,591 | |
Ratios to average net assets of: | | | | | | | | |
Expenses | | | 0.58 | %5 | | | 0.58 | %3 |
Net investment income | | | 2.13 | % | | | 1.75 | %3 |
Portfolio turnover rate4 | | | 54 | % | | | 21 | % |
| * | Commencement of operations. |
| 1 | Based on average shares outstanding. |
| 2 | Total return is calculated assuming an initial investment made at the net asset value at the beginning of the period, reinvestment of all dividends and distributions at net asset value during the period and redemption on the last day of the period. Total return calculated for a period of less than one year is not annualized. |
| 4 | Portfolio turnover rate is not annualized and excludes the value of the portfolio securities received or delivered as a result of in-kind creations or redemptions of the Fund’s capital shares. Short-term securities with maturities less than or equal to 365 days are excluded from the portfolio turnover calculation as well. |
| 5 | Included in the expense ratio are non-recurring professional expenses. Without these expenses, the expense ratio would have been unchanged. |
See Notes to Financial Statements.
| | |
| 194 | | WisdomTree Developed World ex-U.S. and Currency Hedged Equity Funds |
Financial Highlights (continued)
WisdomTree Developed World ex-U.S. and Currency Hedged Equity Funds
Selected data for a share of beneficial interest outstanding throughout the period is presented below:
| | | | | | | | | | | | | | | | | | | | |
| WisdomTree Europe SmallCap Dividend Fund | | For the
Year Ended
March 31, 2016 | | | For the
Year Ended
March 31, 2015 | | | For the
Period Ended
March 31, 2014 | | | For the
Period Ended
March 28, 2013 | | | For the
Year Ended
March 31, 2012 | |
Net asset value, beginning of period | | $ | 55.63 | | | $ | 62.23 | | | $ | 41.98 | | | $ | 38.22 | | | $ | 44.44 | |
Investment operations: | | | | | | | | | | | | | | | | | | | | |
Net investment income1 | | | 1.45 | | | | 1.94 | | | | 0.73 | | | | 1.32 | | | | 1.44 | |
Net realized and unrealized gain (loss) | | | 1.49 | | | | (7.03 | ) | | | 20.90 | | | | 3.82 | | | | (5.74 | ) |
Total from investment operations | | | 2.94 | | | | (5.09 | ) | | | 21.63 | | | | 5.14 | | | | (4.30 | ) |
Dividends to shareholders: | | | | | | | | | | | | | | | | | | | | |
Net investment income | | | (1.56 | ) | | | (1.51 | ) | | | (1.38 | ) | | | (1.38 | ) | | | (1.92 | ) |
Net asset value, end of period | | $ | 57.01 | | | $ | 55.63 | | | $ | 62.23 | | | $ | 41.98 | | | $ | 38.22 | |
| | | | | |
TOTAL RETURN2 | | | 5.25 | % | | | (8.26 | )% | | | 53.06 | % | | | 14.33 | % | | | (9.80 | )% |
RATIOS/SUPPLEMENTAL DATA: | | | | | | | | | | | | | | | | | | | | |
Net assets, end of period (000’s omitted) | | $ | 1,125,935 | | | $ | 853,874 | | | $ | 1,446,871 | | | $ | 60,874 | | | $ | 28,668 | |
Ratios to average net assets3 of: | | | | | | | | | | | | | | | | | | | | |
Expenses, net of expense waivers | | | 0.58 | %4 | | | 0.59 | %5 | | | 0.58 | %6 | | | 0.58 | %6 | | | 0.58 | % |
Expenses, prior to expense waivers | | | 0.59 | %4 | | | 0.59 | %5 | | | 0.58 | %6 | | | 0.58 | %6 | | | 0.58 | % |
Net investment income | | | 2.59 | % | | | 3.40 | % | | | 1.29 | %6 | | | 3.52 | %6 | | | 3.79 | % |
Portfolio turnover rate7 | | | 50 | % | | | 42 | % | | | 24 | % | | | 48 | % | | | 58 | % |
| | | | | | | | | | | | |
| | | | |
| WisdomTree Germany Hedged Equity Fund | | For the
Year Ended
March 31, 2016 | | | For the
Year Ended
March 31, 2015 | | | For the Period
October 17, 2013*
through
March 31, 2014 | |
Net asset value, beginning of period | | $ | 31.38 | | | $ | 26.98 | | | $ | 25.01 | |
Investment operations: | | | | | | | | | | | | |
Net investment income (loss)1 | | | 0.60 | | | | 0.16 | | | | (0.00 | )8 |
Net realized and unrealized gain (loss) | | | (5.05 | ) | | | 5.90 | | | | 1.97 | |
Total from investment operations | | | (4.45 | ) | | | 6.06 | | | | 1.97 | |
Dividends and distributions to shareholders: | | | | | | | | | | | | |
Net investment income | | | (0.73 | ) | | | (0.41 | ) | | | — | |
Capital gains | | | (0.66 | ) | | | (1.25 | ) | | | — | |
Total dividends and distributions to shareholders | | | (1.39 | ) | | | (1.66 | ) | | | — | |
Net asset value, end of period | | $ | 25.54 | | | $ | 31.38 | | | $ | 26.98 | |
| | | |
TOTAL RETURN2 | | | (14.44 | )% | | | 23.70 | % | | | 7.88 | % |
RATIOS/SUPPLEMENTAL DATA: | | | | | | | | | | | | |
Net assets, end of period (000’s omitted) | | $ | 200,501 | | | $ | 291,816 | | | $ | 9,443 | |
Ratios to average net assets of: | | | | | | | | | | | | |
Expenses | | | 0.48 | % | | | 0.49 | %9 | | | 0.48 | %6 |
Net investment income (loss) | | | 2.18 | % | | | 0.55 | % | | | (0.00 | )%6,10 |
Portfolio turnover rate7 | | | 38 | % | | | 11 | % | | | 4 | % |
| * | Commencement of operations. |
| 1 | Based on average shares outstanding. |
| 2 | Total return is calculated assuming an initial investment made at the net asset value at the beginning of the period, reinvestment of all dividends and distributions at net asset value during the period and redemption on the last day of the period. Total return calculated for a period of less than one year is not annualized. For the periods in which the investment advisor waived advisory fees for the WisdomTree Europe SmallCap Dividend Fund, the total return would have been lower if certain expenses had not been waived (Notes 2 and 3). |
| 3 | The ratios to average net assets do not include net investment income (loss) or expenses of other funds in which the Fund invests. |
| 4 | Included in the expense ratio are non-recurring professional expenses. Without these expenses, the expense ratio (net of expense waivers) would have been 0.58% and the expense ratio (prior to expense waivers) would have been 0.58%. |
| 5 | Included in the expense ratio are proxy expenses. Without these proxy expenses, the expense ratio (net of expense waivers) would have been 0.58% and the expense ratio (prior to expense waivers) would have been 0.58%. |
| 7 | Portfolio turnover rate is not annualized and excludes the value of the portfolio securities received or delivered as a result of in-kind creations or redemptions of the Fund’s capital shares. Short-term securities with maturities less than or equal to 365 days are excluded from the portfolio turnover calculation as well. |
| 8 | Amount represents less than $0.005. |
| 9 | Included in the expense ratio are proxy expenses. Without these proxy expenses, the expense ratio would have been 0.48%. |
| 10 | Amount represents less than 0.005%. |
See Notes to Financial Statements.
| | | | |
| WisdomTree Developed World ex-U.S. and Currency Hedged Equity Funds | | | 195 | |
Financial Highlights (continued)
WisdomTree Developed World ex-U.S. and Currency Hedged Equity Funds
Selected data for a share of beneficial interest outstanding throughout the period is presented below:
| | | | |
| WisdomTree Global ex-U.S. Hedged Dividend Fund | | For the Period
June 4, 2015*
through
March 31, 2016 | |
Net asset value, beginning of period | | $ | 24.76 | |
Investment operations: | | | | |
Net investment income1 | | | 0.42 | |
Net realized and unrealized loss | | | (3.39 | ) |
Total from investment operations | | | (2.97 | ) |
Dividends to shareholders: | | | | |
Net investment income | | | (0.30 | ) |
Net asset value, end of period | | $ | 21.49 | |
| |
TOTAL RETURN2 | | | (12.02 | )% |
RATIOS/SUPPLEMENTAL DATA: | | | | |
Net assets, end of period (000’s omitted) | | $ | 4,299 | |
Ratios to average net assets of: | | | | |
Expenses | | | 0.44 | %3,4 |
Net investment income | | | 2.29 | %3 |
Portfolio turnover rate5 | | | 61 | % |
| | | | |
| WisdomTree Global ex-U.S. Hedged Real Estate Fund | | For the Period
October 29, 2015*
through
March 31, 2016 | |
Net asset value, beginning of period | | $ | 24.79 | |
Investment operations: | | | | |
Net investment income1 | | | 0.28 | |
Net realized and unrealized loss | | | (0.55 | ) |
Total from investment operations | | | (0.27 | ) |
Dividends to shareholders: | | | | |
Net investment income | | | (0.15 | ) |
Net asset value, end of period | | $ | 24.37 | |
| |
TOTAL RETURN2 | | | (1.06 | )% |
RATIOS/SUPPLEMENTAL DATA: | | | | |
Net assets, end of period (000’s omitted) | | $ | 2,437 | |
Ratios to average net assets of: | | | | |
Expenses, net of expense waivers | | | 0.43 | %3 |
Expenses, prior to expense waivers | | | 0.58 | %3 |
Net investment income | | | 2.78 | %3 |
Portfolio turnover rate5 | | | 4 | % |
| * | Commencement of operations. |
| 1 | Based on average shares outstanding. |
| 2 | Total return is calculated assuming an initial investment made at the net asset value at the beginning of the period, reinvestment of all dividends and distributions at net asset value during the period and redemption on the last day of the period. Total return calculated for a period of less than one year is not annualized. For the periods in which the investment advisor waived advisory fees for the WisdomTree Global ex-U.S. Hedged Real Estate Fund, the total return would have been lower if certain expenses had not been waived (Notes 2 and 3). |
| 4 | Included in the expense ratio are non-recurring professional expenses. Without these expenses, the expense ratio would have been unchanged. |
| 5 | Portfolio turnover rate is not annualized and excludes the value of the portfolio securities received or delivered as a result of in-kind creations or redemptions of the Fund’s capital shares. Short-term securities with maturities less than or equal to 365 days are excluded from the portfolio turnover calculation as well. |
See Notes to Financial Statements.
| | |
| 196 | | WisdomTree Developed World ex-U.S. and Currency Hedged Equity Funds |
Financial Highlights (continued)
WisdomTree Developed World ex-U.S. and Currency Hedged Equity Funds
Selected data for a share of beneficial interest outstanding throughout the period is presented below:
| | | | | | | | | | | | | | | | | | | | |
WisdomTree International Dividend
ex-Financials Fund | | For the
Year Ended
March 31, 2016 | | | For the
Year Ended
March 31, 2015 | | | For the
Period Ended
March 31, 2014 | | | For the
Period Ended
March 28, 2013 | | | For the
Year Ended
March 31, 2012 | |
Net asset value, beginning of period | | $ | 43.79 | | | $ | 49.23 | | | $ | 42.13 | | | $ | 41.64 | | | $ | 46.85 | |
Investment operations: | | | | | | | | | | | | | | | | | | | | |
Net investment income1 | | | 1.64 | | | | 2.00 | | | | 2.06 | | | | 1.82 | | | | 1.74 | |
Net realized and unrealized gain (loss) | | | (5.41 | ) | | | (5.53 | ) | | | 7.11 | | | | 0.45 | | | | (5.11 | ) |
Total from investment operations | | | (3.77 | ) | | | (3.53 | ) | | | 9.17 | | | | 2.27 | | | | (3.37 | ) |
Dividends to shareholders: | | | | | | | | | | | | | | | | | | | | |
Net investment income | | | (1.61 | ) | | | (1.91 | ) | | | (2.07 | ) | | | (1.78 | ) | | | (1.84 | ) |
Net asset value, end of period | | $ | 38.41 | | | $ | 43.79 | | | $ | 49.23 | | | $ | 42.13 | | | $ | 41.64 | |
| | | | | |
TOTAL RETURN2 | | | (8.83 | )% | | | (7.41 | )% | | | 22.58 | % | | | 5.98 | % | | | (7.24 | )% |
RATIOS/SUPPLEMENTAL DATA: | | | | | | | | | | | | | | | | | | | | |
Net assets, end of period (000’s omitted) | | $ | 230,483 | | | $ | 324,083 | | | $ | 349,545 | | | $ | 349,681 | | | $ | 355,992 | |
Ratios to average net assets3 of: | | | | | | | | | | | | | | | | | | | | |
Expenses8 | | | 0.58 | %4 | | | 0.59 | %5 | | | 0.58 | %6 | | | 0.58 | %6 | | | 0.58 | % |
Net investment income | | | 3.99 | % | | | 4.23 | % | | | 4.54 | %6 | | | 4.58 | %6 | | | 4.20 | % |
Portfolio turnover rate7 | | | 40 | % | | | 44 | % | | | 36 | % | | | 50 | % | | | 28 | % |
| | | | | | | | | | | | | | | | | | | | |
| | | | | | |
| WisdomTree International Equity Fund | | For the
Year Ended
March 31, 2016 | | | For the
Year Ended
March 31, 2015 | | | For the
Period Ended
March 31, 2014 | | | For the
Period Ended
March 28, 2013 | | | For the
Year Ended
March 31, 2012 | |
Net asset value, beginning of period | | $ | 51.67 | | | $ | 54.47 | | | $ | 47.77 | | | $ | 44.53 | | | $ | 49.51 | |
Investment operations: | | | | | | | | | | | | | | | | | | | | |
Net investment income1 | | | 1.68 | | | | 1.92 | | | | 2.27 | | | | 1.63 | | | | 1.90 | |
Net realized and unrealized gain (loss) | | | (5.79 | ) | | | (2.86 | ) | | | 6.72 | | | | 3.22 | | | | (4.99 | ) |
Total from investment operations | | | (4.11 | ) | | | (0.94 | ) | | | 8.99 | | | | 4.85 | | | | (3.09 | ) |
Dividends to shareholders: | | | | | | | | | | | | | | | | | | | | |
Net investment income | | | (1.66 | ) | | | (1.86 | ) | | | (2.29 | ) | | | (1.61 | ) | | | (1.89 | ) |
Net asset value, end of period | | $ | 45.90 | | | $ | 51.67 | | | $ | 54.47 | | | $ | 47.77 | | | $ | 44.53 | |
| | | | | |
TOTAL RETURN2 | | | (8.15 | )% | | | (1.83 | )% | | | 19.43 | % | | | 11.42 | % | | | (6.18 | )% |
RATIOS/SUPPLEMENTAL DATA: | | | | | | | | | | | | | | | | | | | | |
Net assets, end of period (000’s omitted) | | $ | 621,932 | | | $ | 645,832 | | | $ | 569,188 | | | $ | 458,607 | | | $ | 385,202 | |
Ratios to average net assets3 of: | | | | | | | | | | | | | | | | | | | | |
Expenses8 | | | 0.48 | %4 | | | 0.49 | %9 | | | 0.48 | %6 | | | 0.48 | %6 | | | 0.48 | % |
Net investment income | | | 3.47 | % | | | 3.63 | % | | | 4.41 | %6 | | | 3.75 | %6 | | | 4.22 | % |
Portfolio turnover rate7 | | | 13 | % | | | 19 | % | | | 21 | % | | | 20 | % | | | 27 | % |
| 1 | Based on average shares outstanding. |
| 2 | Total return is calculated assuming an initial investment made at the net asset value at the beginning of the period, reinvestment of all dividends and distributions at net asset value during the period and redemption on the last day of the period. Total return calculated for a period of less than one year is not annualized. For the periods in which the investment advisor waived advisory fees, the total return would have been lower if certain expenses had not been waived (Notes 2 and 3). |
| 3 | The ratios to average net assets do not include net investment income (loss) or expenses of other funds in which the Fund invests. |
| 4 | Included in the expense ratio are non-recurring professional expenses. Without these expenses, the expense ratio would have been unchanged. |
| 5 | Included in the expense ratio are proxy expenses. Without these proxy expenses, the expense ratio would have been 0.58%. |
| 7 | Portfolio turnover rate is not annualized and excludes the value of the portfolio securities received or delivered as a result of in-kind creations or redemptions of the Fund’s capital shares. Short-term securities with maturities less than or equal to 365 days are excluded from the portfolio turnover calculation as well. |
| 8 | The expense ratio includes investment advisory fee waivers. Without these investment advisory fee waivers, the expense ratio would have been unchanged. |
| 9 | Included in the expense ratio are proxy expenses. Without these proxy expenses, the expense ratio would have been 0.48%. |
See Notes to Financial Statements.
| | | | |
| WisdomTree Developed World ex-U.S. and Currency Hedged Equity Funds | | | 197 | |
Financial Highlights (continued)
WisdomTree Developed World ex-U.S. and Currency Hedged Equity Funds
Selected data for a share of beneficial interest outstanding throughout the period is presented below:
| | | | |
| WisdomTree International Hedged Equity Fund | | For the Period
July 9, 2015*
through
March 31, 2016 | |
Net asset value, beginning of period | | $ | 25.02 | |
Investment operations: | | | | |
Net investment income1 | | | 0.47 | |
Net realized and unrealized loss | | | (2.26 | ) |
Total from investment operations | | | (1.79 | ) |
Dividends to shareholders: | | | | |
Net investment income | | | (0.17 | ) |
Net asset value, end of period | | $ | 23.06 | |
| |
TOTAL RETURN2 | | | (7.16 | )% |
RATIOS/SUPPLEMENTAL DATA: | | | | |
Net assets, end of period (000’s omitted) | | $ | 4,612 | |
Ratios to average net assets of: | | | | |
Expenses | | | 0.35 | %3,4 |
Net investment income | | | 2.75 | %3 |
Portfolio turnover rate5 | | | 12 | % |
| | | | | | | | |
| | | |
| WisdomTree International Hedged Quality Dividend Growth Fund | | For the
Year Ended
March 31, 2016 | | | For the Period
May 7, 2014*
through
March 31, 2015 | |
Net asset value, beginning of period | | $ | 26.99 | | | $ | 24.90 | |
Investment operations: | | | | | | | | |
Net investment income1 | | | 0.71 | | | | 0.90 | |
Net realized and unrealized gain (loss) | | | (1.17 | ) | | | 2.18 | |
Total from investment operations | | | (0.46 | ) | | | 3.08 | |
Dividends and distributions to shareholders: | | | | | | | | |
Net investment income | | | (0.55 | ) | | | (0.23 | ) |
Capital gains | | | (0.25 | ) | | | (0.76 | ) |
Total dividends and distributions to shareholders | | | (0.80 | ) | | | (0.99 | ) |
Net asset value, end of period | | $ | 25.73 | | | $ | 26.99 | |
| | |
TOTAL RETURN2 | | | (1.73 | )% | | | 12.78 | % |
RATIOS/SUPPLEMENTAL DATA: | | | | | | | | |
Net assets, end of period (000’s omitted) | | $ | 732,050 | | | $ | 206,452 | |
Ratios to average net assets of: | | | | | | | | |
Expenses | | | 0.58 | %4 | | | 0.58 | %3 |
Net investment income | | | 2.75 | % | | | 3.89 | %3 |
Portfolio turnover rate5 | | | 48 | % | | | 14 | % |
| * | Commencement of operations. |
| 1 | Based on average shares outstanding. |
| 2 | Total return is calculated assuming an initial investment made at the net asset value at the beginning of the period, reinvestment of all dividends and distributions at net asset value during the period and redemption on the last day of the period. Total return calculated for a period of less than one year is not annualized. |
| 4 | Included in the expense ratio are non-recurring professional expenses. Without these expenses, the expense ratio would have been unchanged. |
| 5 | Portfolio turnover rate is not annualized and excludes the value of the portfolio securities received or delivered as a result of in-kind creations or redemptions of the Fund’s capital shares. Short-term securities with maturities less than or equal to 365 days are excluded from the portfolio turnover calculation as well. |
See Notes to Financial Statements.
| | |
| 198 | | WisdomTree Developed World ex-U.S. and Currency Hedged Equity Funds |
Financial Highlights (continued)
WisdomTree Developed World ex-U.S. and Currency Hedged Equity Funds
Selected data for a share of beneficial interest outstanding throughout the period is presented below:
| | | | |
| |
| WisdomTree International Hedged SmallCap Dividend Fund | | For the Period
June 4, 2015*
through
March 31, 2016 | |
Net asset value, beginning of period | | $ | 24.72 | |
Investment operations: | | | | |
Net investment income1 | | | 0.69 | |
Net realized and unrealized loss | | | (2.09 | ) |
Total from investment operations | | | (1.40 | ) |
Dividends and distributions to shareholders: | | | | |
Net investment income | | | (0.51 | ) |
Capital gains | | | (0.19 | ) |
Total dividends and distributions to shareholders | | | (0.70 | ) |
Net asset value, end of period | | $ | 22.62 | |
| |
TOTAL RETURN2 | | | (5.66 | )% |
RATIOS/SUPPLEMENTAL DATA: | | | | |
Net assets, end of period (000’s omitted) | | $ | 1,131 | |
Ratios to average net assets3 of: | | | | |
Expenses, net of expense waivers | | | 0.00 | %4,5 |
Expenses, prior to expense waivers | | | 0.58 | %5 |
Net investment income | | | 3.63 | %5 |
Portfolio turnover rate6 | | | 7 | % |
| | | | | | | | | | | | | | | | | | | | |
| | | | | | |
WisdomTree International High
Dividend Fund | | For the
Year Ended
March 31, 2016 | | | For the
Year Ended
March 31, 2015 | | | For the
Period Ended
March 31, 2014 | | | For the
Period Ended
March 28, 2013 | | | For the
Year Ended
March 31, 2012 | |
Net asset value, beginning of period | | $ | 43.28 | | | $ | 47.62 | | | $ | 41.39 | | | $ | 38.64 | | | $ | 43.82 | |
Investment operations: | | | | | | | | | | | | | | | | | | | | |
Net investment income1 | | | 1.65 | | | | 1.94 | | | | 2.57 | | | | 1.74 | | | | 1.90 | |
Net realized and unrealized gain (loss) | | | (5.70 | ) | | | (4.41 | ) | | | 6.14 | | | | 2.70 | | | | (5.17 | ) |
Total from investment operations | | | (4.05 | ) | | | (2.47 | ) | | | 8.71 | | | | 4.44 | | | | (3.27 | ) |
Dividends to shareholders: | | | | | | | | | | | | | | | | | | | | |
Net investment income | | | (1.64 | ) | | | (1.87 | ) | | | (2.48 | ) | | | (1.69 | ) | | | (1.91 | ) |
Net asset value, end of period | | $ | 37.59 | | | $ | 43.28 | | | $ | 47.62 | | | $ | 41.39 | | | $ | 38.64 | |
| | | | | |
TOTAL RETURN2 | | | (9.60 | )% | | | (5.41 | )% | | | 21.82 | % | | | 12.08 | % | | | (7.45 | )% |
RATIOS/SUPPLEMENTAL DATA: | | | | | | | | | | | | | | | | | | | | |
Net assets, end of period (000’s omitted) | | $ | 257,467 | | | $ | 337,620 | | | $ | 304,753 | | | $ | 209,010 | | | $ | 175,809 | |
Ratios to average net assets3 of: | | | | | | | | | | | | | | | | | | | | |
Expenses9 | | | 0.58 | %7 | | | 0.59 | %8 | | | 0.58 | %5 | | | 0.58 | %5 | | | 0.58 | % |
Net investment income | | | 4.09 | % | | | 4.24 | % | | | 5.71 | %5 | | | 4.58 | %5 | | | 4.84 | % |
Portfolio turnover rate6 | | | 21 | % | | | 20 | % | | | 26 | % | | | 31 | % | | | 32 | % |
| * | Commencement of operations. |
| 1 | Based on average shares outstanding. |
| 2 | Total return is calculated assuming an initial investment made at the net asset value at the beginning of the period, reinvestment of all dividends and distributions at net asset value during the period and redemption on the last day of the period. Total return calculated for a period of less than one year is not annualized. For the periods in which the investment advisor waived advisory fees, the total return would have been lower if certain expenses had not been waived (Notes 2 and 3). |
| 3 | The ratios to average net assets do not include net investment income (loss) or expenses of other funds in which the Fund invests. |
| 4 | Amount represents less than 0.005%. |
| 6 | Portfolio turnover rate is not annualized and excludes the value of the portfolio securities received or delivered as a result of in-kind creations or redemptions of the Fund’s capital shares. Short-term securities with maturities less than or equal to 365 days are excluded from the portfolio turnover calculation as well. |
| 7 | Included in the expense ratio are non-recurring professional expenses. Without these expenses, the expense ratio would have been unchanged. |
| 8 | Included in the expense ratio are proxy expenses. Without these proxy expenses, the expense ratio would have been 0.58%. |
| 9 | The expense ratio includes investment advisory fee waivers. Without these investment advisory fee waivers, the expense ratio would have been unchanged. |
See Notes to Financial Statements.
| | | | |
| WisdomTree Developed World ex-U.S. and Currency Hedged Equity Funds | | | 199 | |
Financial Highlights (continued)
WisdomTree Developed World ex-U.S. and Currency Hedged Equity Funds
Selected data for a share of beneficial interest outstanding throughout the period is presented below:
| | | | | | | | | | | | | | | | | | | | |
WisdomTree International
LargeCap Dividend Fund | | For the
Year Ended
March 31, 2016 | | | For the
Year Ended
March 31, 2015 | | | For the
Period Ended
March 31, 2014 | | | For the
Period Ended
March 28, 2013 | | | For the
Year Ended
March 31, 2012 | |
Net asset value, beginning of period | | $ | 48.67 | | | $ | 51.68 | | | $ | 45.77 | | | $ | 42.89 | | | $ | 47.68 | |
Investment operations: | | | | | | | | | | | | | | | | | | | | |
Net investment income1 | | | 1.59 | | | | 1.88 | | | | 2.35 | | | | 1.59 | | | | 1.86 | |
Net realized and unrealized gain (loss) | | | (6.58 | ) | | | (3.09 | ) | | | 5.79 | | | | 2.84 | | | | (4.75 | ) |
Total from investment operations | | | (4.99 | ) | | | (1.21 | ) | | | 8.14 | | | | 4.43 | | | | (2.89 | ) |
Dividends to shareholders: | | | | | | | | | | | | | | | | | | | | |
Net investment income | | | (1.54 | ) | | | (1.80 | ) | | | (2.23 | ) | | | (1.55 | ) | | | (1.90 | ) |
Net asset value, end of period | | $ | 42.14 | | | $ | 48.67 | | | $ | 51.68 | | | $ | 45.77 | | | $ | 42.89 | |
| | | | | |
TOTAL RETURN2 | | | (10.49 | )% | | | (2.47 | )% | | | 18.35 | % | | | 10.80 | % | | | (6.02 | )% |
RATIOS/SUPPLEMENTAL DATA: | | | | | | | | | | | | | | | | | | | | |
Net assets, end of period (000’s omitted) | | $ | 366,613 | | | $ | 355,273 | | | $ | 315,276 | | | $ | 210,541 | | | $ | 167,253 | |
Ratios to average net assets3 of: | | | | | | | | | | | | | | | | | | | | |
Expenses8 | | | 0.48 | %4 | | | 0.49 | %5 | | | 0.48 | %6 | | | 0.48 | %6 | | | 0.48 | % |
Net investment income | | | 3.51 | % | | | 3.72 | % | | | 4.77 | %6 | | | 3.77 | %6 | | | 4.34 | % |
Portfolio turnover rate7 | | | 19 | % | | | 12 | % | | | 15 | % | | | 19 | % | | | 23 | % |
| | | | | | | | | | | | | | | | | | | | |
| | | | | | |
WisdomTree International MidCap
Dividend Fund | | For the
Year Ended
March 31, 2016 | | | For the
Year Ended
March 31, 2015 | | | For the
Period Ended
March 31, 2014 | | | For the
Period Ended
March 28, 2013 | | | For the
Year Ended
March 31, 2012 | |
Net asset value, beginning of period | | $ | 58.65 | | | $ | 60.03 | | | $ | 51.77 | | | $ | 48.10 | | | $ | 53.80 | |
Investment operations: | | | | | | | | | | | | | | | | | | | | |
Net investment income1 | | | 1.64 | | | | 1.81 | | | | 1.83 | | | | 1.51 | | | | 1.79 | |
Net realized and unrealized gain (loss) | | | (2.85 | ) | | | (1.45 | ) | | | 8.31 | | | | 3.68 | | | | (5.69 | ) |
Total from investment operations | | | (1.21 | ) | | | 0.36 | | | | 10.14 | | | | 5.19 | | | | (3.90 | ) |
Dividends to shareholders: | | | | | | | | | | | | | | | | | | | | |
Net investment income | | | (1.62 | ) | | | (1.74 | ) | | | (1.88 | ) | | | (1.52 | ) | | | (1.80 | ) |
Net asset value, end of period | | $ | 55.82 | | | $ | 58.65 | | | $ | 60.03 | | | $ | 51.77 | | | $ | 48.10 | |
| | | | | |
TOTAL RETURN2 | | | (2.12 | )% | | | 0.57 | % | | | 20.22 | % | | | 11.32 | % | | | (7.21 | )% |
RATIOS/SUPPLEMENTAL DATA: | | | | | | | | | | | | | | | | | | | | |
Net assets, end of period (000’s omitted) | | $ | 153,512 | | | $ | 155,414 | | | $ | 141,082 | | | $ | 119,069 | | | $ | 105,823 | |
Ratios to average net assets3 of: | | | | | | | | | | | | | | | | | | | | |
Expenses8 | | | 0.58 | %4 | | | 0.59 | %9 | | | 0.58 | %6 | | | 0.58 | %6 | | | 0.58 | % |
Net investment income | | | 2.91 | % | | | 3.09 | % | | | 3.27 | %6 | | | 3.23 | %6 | | | 3.69 | % |
Portfolio turnover rate7 | | | 24 | % | | | 29 | % | | | 22 | % | | | 38 | % | | | 47 | % |
| 1 | Based on average shares outstanding. |
| 2 | Total return is calculated assuming an initial investment made at the net asset value at the beginning of the period, reinvestment of all dividends and distributions at net asset value during the period and redemption on the last day of the period. Total return calculated for a period of less than one year is not annualized. For the periods in which the investment advisor waived advisory fees, the total return would have been lower if certain expenses had not been waived (Notes 2 and 3). |
| 3 | The ratios to average net assets do not include net investment income (loss) or expenses of other funds in which the Fund invests. |
| 4 | Included in the expense ratio are non-recurring professional expenses. Without these expenses, the expense ratio would have been unchanged. |
| 5 | Included in the expense ratio are proxy expenses. Without these proxy expenses, the expense ratio would have been 0.48%. |
| 7 | Portfolio turnover rate is not annualized and excludes the value of the portfolio securities received or delivered as a result of in-kind creations or redemptions of the Fund’s capital shares. Short-term securities with maturities less than or equal to 365 days are excluded from the portfolio turnover calculation as well. |
| 8 | The expense ratio includes investment advisory fee waivers. Without these investment advisory fee waivers, the expense ratio would have been unchanged. |
| 9 | Included in the expense ratio are proxy expenses. Without these proxy expenses, the expense ratio would have been 0.58%. |
See Notes to Financial Statements.
| | |
| 200 | | WisdomTree Developed World ex-U.S. and Currency Hedged Equity Funds |
Financial Highlights (continued)
WisdomTree Developed World ex-U.S. and Currency Hedged Equity Funds
Selected data for a share of beneficial interest outstanding throughout the period is presented below:
| | | | | | | | | | | | | | | | | | | | |
WisdomTree International SmallCap
Dividend Fund | | For the
Year Ended
March 31, 2016 | | | For the
Year Ended
March 31, 2015 | | | For the
Period Ended
March 31, 2014 | | | For the
Period Ended
March 28, 2013 | | | For the
Year Ended
March 31, 2012 | |
Net asset value, beginning of period | | $ | 59.21 | | | $ | 64.84 | | | $ | 55.38 | | | $ | 49.33 | | | $ | 53.15 | |
Investment operations: | | | | | | | | | | | | | | | | | | | | |
Net investment income1 | | | 1.64 | | | | 1.91 | | | | 1.91 | | | | 1.82 | | | | 1.77 | |
Net realized and unrealized gain (loss) | | | (0.31 | ) | | | (5.67 | ) | | | 9.97 | | | | 6.09 | | | | (3.66 | ) |
Total from investment operations | | | 1.33 | | | | (3.76 | ) | | | 11.88 | | | | 7.91 | | | | (1.89 | ) |
Dividends to shareholders: | | | | | | | | | | | | | | | | | | | | |
Net investment income | | | (1.56 | ) | | | (1.87 | ) | | | (2.42 | ) | | | (1.86 | ) | | | (1.93 | ) |
Net asset value, end of period | | $ | 58.98 | | | $ | 59.21 | | | $ | 64.84 | | | $ | 55.38 | | | $ | 49.33 | |
| | | | | |
TOTAL RETURN2 | | | 2.26 | % | | | (5.87 | )% | | | 22.26 | % | | | 16.78 | % | | | (3.41 | )% |
RATIOS/SUPPLEMENTAL DATA: | | | | | | | | | | | | | | | | | | | | |
Net assets, end of period (000’s omitted) | | $ | 1,099,977 | | | $ | 917,778 | | | $ | 923,997 | | | $ | 562,133 | | | $ | 424,264 | |
Ratios to average net assets3 of: | | | | | | | | | | | | | | | | | | | | |
Expenses4 | | | 0.58 | %5 | | | 0.59 | %6 | | | 0.58 | %7 | | | 0.58 | %7 | | | 0.58 | % |
Net investment income | | | 2.82 | % | | | 3.16 | % | | | 3.20 | %7 | | | 3.76 | %7 | | | 3.65 | % |
Portfolio turnover rate8 | | | 48 | % | | | 25 | % | | | 42 | % | | | 56 | % | | | 52 | % |
| | | | | | | | |
| | | |
| WisdomTree Japan Hedged Capital Goods Fund | | For the
Year Ended
March 31, 2016 | | | For the Period
April 8, 2014*
through
March 31, 2015 | |
Net asset value, beginning of period | | $ | 27.77 | | | $ | 24.11 | |
Investment operations: | | | | | | | | |
Net investment income1 | | | 0.45 | | | | 0.38 | |
Net realized and unrealized gain (loss) | | | (6.01 | ) | | | 6.51 | |
Total from investment operations | | | (5.56 | ) | | | 6.89 | |
Dividends and distributions to shareholders: | | | | | | | | |
Net investment income | | | (0.36 | ) | | | (0.34 | ) |
Capital gains | | | (0.81 | ) | | | (2.89 | ) |
Total dividends and distributions to shareholders | | | (1.17 | ) | | | (3.23 | ) |
Net asset value, end of period | | $ | 21.04 | | | $ | 27.77 | |
| | |
TOTAL RETURN2 | | | (20.72 | )% | | | 29.47 | % |
RATIOS/SUPPLEMENTAL DATA: | | | | | | | | |
Net assets, end of period (000’s omitted) | | $ | 3,156 | | | $ | 2,777 | |
Ratios to average net assets of: | | | | | | | | |
Expenses, net of expense waivers | | | 0.47 | %9 | | | 0.43 | %7 |
Expenses, prior to expense waivers | | | 0.48 | % | | | 0.48 | %7 |
Net investment income | | | 1.79 | % | | | 1.47 | %7 |
Portfolio turnover rate8 | | | 13 | % | | | 35 | % |
| * | Commencement of operations. |
| 1 | Based on average shares outstanding. |
| 2 | Total return is calculated assuming an initial investment made at the net asset value at the beginning of the period, reinvestment of all dividends and distributions at net asset value during the period and redemption on the last day of the period. Total return calculated for a period of less than one year is not annualized. For the periods in which the investment advisor waived advisory fees, the total return would have been lower if certain expenses had not been waived (Notes 2 and 3). |
| 3 | The ratios to average net assets do not include net investment income (loss) or expenses of other funds in which the Fund invests. |
| 4 | The expense ratio includes investment advisory fee waivers. Without these investment advisory fee waivers, the expense ratio would have been unchanged. |
| 5 | Included in the expense ratio are non-recurring professional expenses. Without these expenses, the expense ratio would have been unchanged. |
| 6 | Included in the expense ratio are proxy expenses. Without these proxy expenses, the expense ratio would have been 0.58%. |
| 8 | Portfolio turnover rate is not annualized and excludes the value of the portfolio securities received or delivered as a result of in-kind creations or redemptions of the Fund’s capital shares. Short-term securities with maturities less than or equal to 365 days are excluded from the portfolio turnover calculation as well. |
| 9 | During the period, the investment advisor had contractually agreed to limit the advisory fee to 0.43% through July 31, 2015. On July 31, 2015, the contractual waiver expired and was not renewed. |
See Notes to Financial Statements.
| | | | |
| WisdomTree Developed World ex-U.S. and Currency Hedged Equity Funds | | | 201 | |
Financial Highlights (continued)
WisdomTree Developed World ex-U.S. and Currency Hedged Equity Funds
Selected data for a share of beneficial interest outstanding throughout the period is presented below:
| | | | | | | | | | | | | | | | | | | | |
WisdomTree Japan Hedged Equity
Fund | | For the
Year Ended
March 31, 2016 | | | For the
Year Ended
March 31, 2015 | | | For the
Period Ended
March 31, 2014 | | | For the
Period Ended
March 28, 2013 | | | For the
Year Ended
March 31, 2012 | |
Net asset value, beginning of period | | $ | 55.03 | | | $ | 47.50 | | | $ | 42.95 | | | $ | 36.66 | | | $ | 36.94 | |
Investment operations: | | | | | | | | | | | | | | | | | | | | |
Net investment income1 | | | 0.80 | | | | 0.91 | | | | 0.88 | | | | 1.54 | | | | 0.81 | |
Net realized and unrealized gain (loss) | | | (9.00 | ) | | | 12.34 | | | | 4.91 | | | | 5.30 | | | | (0.34 | ) |
Total from investment operations | | | (8.20 | ) | | | 13.25 | | | | 5.79 | | | | 6.84 | | | | 0.47 | |
Dividends and distributions to shareholders: | | | | | | | | | | | | | | | | | | | | |
Net investment income | | | (0.76 | ) | | | (0.94 | ) | | | (0.62 | ) | | | (0.55 | ) | | | (0.75 | ) |
Capital gains | | | (2.22 | ) | | | (4.78 | ) | | | (0.62 | ) | | | — | | | | — | |
Total dividends and distributions to shareholders | | | (2.98 | ) | | | (5.72 | ) | | | (1.24 | ) | | | (0.55 | ) | | | (0.75 | ) |
Net asset value, end of period | | $ | 43.85 | | | $ | 55.03 | | | $ | 47.50 | | | $ | 42.95 | | | $ | 36.66 | |
| | | | | |
TOTAL RETURN2 | | | (15.64 | )% | | | 29.30 | % | | | 13.48 | % | | | 19.12 | % | | | 1.46 | % |
RATIOS/SUPPLEMENTAL DATA: | | | | | | | | | | | | | | | | | | | | |
Net assets, end of period (000’s omitted) | | $ | 9,737,132 | | | $ | 15,806,850 | | | $ | 11,441,824 | | | $ | 5,632,633 | | | $ | 606,707 | |
Ratios to average net assets of: | | | | | | | | | | | | | | | | | | | | |
Expenses | | | 0.48 | % | | | 0.49 | %3 | | | 0.48 | %4 | | | 0.48 | %4 | | | 0.48 | % |
Net investment income | | | 1.52 | % | | | 1.81 | % | | | 1.84 | %4 | | | 4.22 | %4 | | | 2.41 | % |
Portfolio turnover rate5 | | | 27 | % | | | 31 | % | | | 24 | % | | | 36 | % | | | 41 | % |
| | | | | | | | |
| | | |
| WisdomTree Japan Hedged Financials Fund | | For the
Year Ended
March 31, 2016 | | | For the Period
April 8, 2014*
through
March 31, 2015 | |
Net asset value, beginning of period | | $ | 26.29 | | | $ | 23.83 | |
Investment operations: | | | | | | | | |
Net investment income1 | | | 0.39 | | | | 0.45 | |
Net realized and unrealized gain (loss) | | | (6.72 | ) | | | 5.44 | |
Total from investment operations | | | (6.33 | ) | | | 5.89 | |
Dividends and distributions to shareholders: | | | | | | | | |
Net investment income | | | (0.15 | ) | | | (0.22 | ) |
Capital gains | | | (0.05 | ) | | | (3.21 | ) |
Total dividends and distributions to shareholders | | | (0.20 | ) | | | (3.43 | ) |
Net asset value, end of period | | $ | 19.76 | | | $ | 26.29 | |
| | |
TOTAL RETURN2 | | | (24.30 | )% | | | 25.94 | % |
RATIOS/SUPPLEMENTAL DATA: | | | | | | | | |
Net assets, end of period (000’s omitted) | | $ | 12,846 | | | $ | 7,887 | |
Ratios to average net assets of: | | | | | | | | |
Expenses, net of expense waivers | | | 0.47 | %6 | | | 0.43 | %4 |
Expenses, prior to expense waivers | | | 0.48 | % | | | 0.48 | %4 |
Net investment income | | | 1.46 | % | | | 1.80 | %4 |
Portfolio turnover rate5 | | | 21 | % | | | 29 | % |
| * | Commencement of operations. |
| 1 | Based on average shares outstanding. |
| 2 | Total return is calculated assuming an initial investment made at the net asset value at the beginning of the period, reinvestment of all dividends and distributions at net asset value during the period and redemption on the last day of the period. Total return calculated for a period of less than one year is not annualized. For the periods in which the investment advisor waived advisory fees for the WisdomTree Japan Hedged Financials Fund, the total return would have been lower if certain expenses had not been waived (Notes 2 and 3). |
| 3 | Included in the expense ratio are proxy expenses. Without these proxy expenses, the expense ratio would have been 0.48%. |
| 5 | Portfolio turnover rate is not annualized and excludes the value of the portfolio securities received or delivered as a result of in-kind creations or redemptions of the Fund’s capital shares. Short-term securities with maturities less than or equal to 365 days are excluded from the portfolio turnover calculation as well. |
| 6 | During the period, the investment advisor had contractually agreed to limit the advisory fee to 0.43% through July 31, 2015. On July 31, 2015, the contractual waiver expired and was not renewed. |
See Notes to Financial Statements.
| | |
| 202 | | WisdomTree Developed World ex-U.S. and Currency Hedged Equity Funds |
Financial Highlights (continued)
WisdomTree Developed World ex-U.S. and Currency Hedged Equity Funds
Selected data for a share of beneficial interest outstanding throughout the period is presented below:
| | | | | | | | |
| WisdomTree Japan Hedged Health Care Fund | | For the
Year Ended
March 31, 2016 | | | For the Period
April 8, 2014*
through
March 31, 2015 | |
Net asset value, beginning of period | | $ | 31.01 | | | $ | 24.20 | |
Investment operations: | | | | | | | | |
Net investment income1 | | | 0.43 | | | | 0.32 | |
Net realized and unrealized gain | | | 1.49 | | | | 10.50 | |
Total from investment operations | | | 1.92 | | | | 10.82 | |
Dividends and distributions to shareholders: | | | | | | | | |
Net investment income | | | (0.18 | ) | | | (0.13 | ) |
Capital gains | | | (0.14 | ) | | | (3.88 | ) |
Total dividends and distributions to shareholders | | | (0.32 | ) | | | (4.01 | ) |
Net asset value, end of period | | $ | 32.61 | | | $ | 31.01 | |
| | |
TOTAL RETURN2 | | | 6.16 | % | | | 48.27 | % |
RATIOS/SUPPLEMENTAL DATA: | | | | | | | | |
Net assets, end of period (000’s omitted) | | $ | 17,934 | | | $ | 3,101 | |
Ratios to average net assets of: | | | | | | | | |
Expenses, net of expense waivers | | | 0.48 | %5 | | | 0.43 | %3 |
Expenses, prior to expense waivers | | | 0.48 | % | | | 0.48 | %3 |
Net investment income | | | 1.32 | % | | | 1.24 | %3 |
Portfolio turnover rate4 | | | 25 | % | | | 29 | % |
| | | | |
| | |
| WisdomTree Japan Hedged Quality Dividend Growth Fund | | For the Period
April 9, 2015*
through
March 31, 2016 | |
Net asset value, beginning of period | | $ | 25.59 | |
Investment operations: | | | | |
Net investment income1 | | | 0.45 | |
Net realized and unrealized loss | | | (3.43 | ) |
Total from investment operations | | | (2.98 | ) |
Dividends to shareholders: | | | | |
Net investment income | | | (0.24 | ) |
Net asset value, end of period | | $ | 22.37 | |
| |
TOTAL RETURN2 | | | (11.73 | )% |
RATIOS/SUPPLEMENTAL DATA: | | | | |
Net assets, end of period (000’s omitted) | | $ | 15,657 | |
Ratios to average net assets of: | | | | |
Expenses, net of expense waivers | | | 0.43 | %3 |
Expenses, prior to expense waivers | | | 0.48 | %3 |
Net investment income | | | 1.88 | %3 |
Portfolio turnover rate4 | | | 40 | % |
| * | Commencement of operations. |
| 1 | Based on average shares outstanding. |
| 2 | Total return is calculated assuming an initial investment made at the net asset value at the beginning of the period, reinvestment of all dividends and distributions at net asset value during the period and redemption on the last day of the period. Total return calculated for a period of less than one year is not annualized. For the periods in which the investment advisor waived advisory fees, the total return would have been lower if certain expenses had not been waived (Notes 2 and 3). |
| 4 | Portfolio turnover rate is not annualized and excludes the value of the portfolio securities received or delivered as a result of in-kind creations or redemptions of the Fund’s capital shares. Short-term securities with maturities less than or equal to 365 days are excluded from the portfolio turnover calculation as well. |
| 5 | During the period, the investment advisor had contractually agreed to limit the advisory fee to 0.43% through July 31, 2015. On July 31, 2015, the contractual waiver expired and was not renewed. |
See Notes to Financial Statements.
| | | | |
| WisdomTree Developed World ex-U.S. and Currency Hedged Equity Funds | | | 203 | |
Financial Highlights (continued)
WisdomTree Developed World ex-U.S. and Currency Hedged Equity Funds
Selected data for a share of beneficial interest outstanding throughout the period is presented below:
| | | | | | | | |
| WisdomTree Japan Hedged Real Estate Fund | | For the
Year Ended
March 31, 2016 | | | For the Period
April 8, 2014*
through
March 31, 2015 | |
Net asset value, beginning of period | | $ | 27.81 | | | $ | 24.32 | |
Investment operations: | | | | | | | | |
Net investment income1 | | | 0.63 | | | | 0.42 | |
Net realized and unrealized gain (loss) | | | (1.21 | ) | | | 4.98 | |
Total from investment operations | | | (0.58 | ) | | | 5.40 | |
Dividends and distributions to shareholders: | | | | | | | | |
Net investment income | | | (0.48 | ) | | | (0.21 | ) |
Capital gains | | | (0.94 | ) | | | (1.70 | ) |
Total dividends and distributions to shareholders | | | (1.42 | ) | | | (1.91 | ) |
Net asset value, end of period | | $ | 25.81 | | | $ | 27.81 | |
| | |
TOTAL RETURN2 | | | (2.21 | )% | | | 22.59 | % |
RATIOS/SUPPLEMENTAL DATA: | | | | | | | | |
Net assets, end of period (000’s omitted) | | $ | 150,993 | | | $ | 31,979 | |
Ratios to average net assets of: | | | | | | | | |
Expenses, net of expense waivers | | | 0.47 | %7 | | | 0.43 | %3 |
Expenses, prior to expense waivers | | | 0.48 | % | | | 0.48 | %3 |
Net investment income | | | 2.43 | % | | | 1.59 | %3 |
Portfolio turnover rate4 | | | 14 | % | | | 20 | % |
| | | | | | | | | | | | |
| | | | |
| WisdomTree Japan Hedged SmallCap Equity Fund | | For the
Year Ended
March 31, 2016 | | | For the
Year Ended
March 31, 2015 | | | For the Period
June 28, 2013*
through
March 31, 2014 | |
Net asset value, beginning of period | | $ | 33.65 | | | $ | 29.08 | | | $ | 26.17 | |
Investment operations: | | | | | | | | | | | | |
Net investment income1 | | | 0.41 | | | | 0.47 | | | | 0.59 | |
Net realized and unrealized gain (loss) | | | (1.59 | ) | | | 6.74 | | | | 2.38 | |
Total from investment operations | | | (1.18 | ) | | | 7.21 | | | | 2.97 | |
Dividends and distributions to shareholders: | | | | | | | | | | | | |
Net investment income | | | (0.35 | ) | | | (0.41 | ) | | | (0.06 | ) |
Capital gains | | | (0.88 | ) | | | (2.23 | ) | | | — | |
Total dividends and distributions to shareholders | | | (1.23 | ) | | | (2.64 | ) | | | (0.06 | ) |
Net asset value, end of period | | $ | 31.24 | | | $ | 33.65 | | | $ | 29.08 | |
| | | |
TOTAL RETURN2 | | | (3.83 | )%5 | | | 25.86 | % | | | 11.37 | % |
RATIOS/SUPPLEMENTAL DATA: | | | | | | | | | | | | |
Net assets, end of period (000’s omitted) | | $ | 90,584 | | | $ | 117,762 | | | $ | 75,614 | |
Ratios to average net assets of: | | | | | | | | | | | | |
Expenses | | | 0.58 | % | | | 0.59 | %6 | | | 0.58 | %3 |
Net investment income | | | 1.20 | % | | | 1.52 | % | | | 2.75 | %3 |
Portfolio turnover rate4 | | | 45 | % | | | 41 | % | | | 19 | % |
| * | Commencement of operations. |
| 1 | Based on average shares outstanding. |
| 2 | Total return is calculated assuming an initial investment made at the net asset value at the beginning of the period, reinvestment of all dividends and distributions at net asset value during the period and redemption on the last day of the period. Total return calculated for a period of less than one year is not annualized. For the periods in which the investment advisor waived advisory fees for the WisdomTree Japan Hedged Real Estate Fund, the total return would have been lower if certain expenses had not been waived (Notes 2 and 3). |
| 4 | Portfolio turnover rate is not annualized and excludes the value of the portfolio securities received or delivered as a result of in-kind creations or redemptions of the Fund’s capital shares. Short-term securities with maturities less than or equal to 365 days are excluded from the portfolio turnover calculation as well. |
| 5 | Includes a voluntary reimbursement from the sub-adviser for investment losses on certain foreign exchange transactions during the period. Excluding this voluntary reimbursement, total return would have been 0.95% lower. |
| 6 | Included in the expense ratio are proxy expenses. Without these proxy expenses, the expense ratio would have been 0.58%. |
| 7 | During the period, the investment advisor had contractually agreed to limit the advisory fee to 0.43% through July 31, 2015. On July 31, 2015, the contractual waiver expired and was not renewed. |
See Notes to Financial Statements.
| | |
| 204 | | WisdomTree Developed World ex-U.S. and Currency Hedged Equity Funds |
Financial Highlights (continued)
WisdomTree Developed World ex-U.S. and Currency Hedged Equity Funds
Selected data for a share of beneficial interest outstanding throughout the period is presented below:
| | | | | | | | |
| WisdomTree Japan Hedged Tech, Media and Telecom Fund | | For the
Year Ended
March 31, 2016 | | | For the Period
April 8, 2014*
through
March 31, 2015 | |
Net asset value, beginning of period | | $ | 29.54 | | | $ | 24.02 | |
Investment operations: | | | | | | | | |
Net investment income1 | | | 0.28 | | | | 0.31 | |
Net realized and unrealized gain (loss) | | | (3.85 | ) | | | 7.36 | |
Total from investment operations | | | (3.57 | ) | | | 7.67 | |
Dividends and distributions to shareholders: | | | | | | | | |
Net investment income | | | (0.70 | ) | | | (0.05 | ) |
Capital gains | | | (1.68 | ) | | | (2.10 | ) |
Total dividends and distributions to shareholders | | | (2.38 | ) | | | (2.15 | ) |
Net asset value, end of period | | $ | 23.59 | | | $ | 29.54 | |
| | |
TOTAL RETURN2 | | | (12.99 | )% | | | 32.83 | % |
RATIOS/SUPPLEMENTAL DATA: | | | | | | | | |
Net assets, end of period (000’s omitted) | | $ | 2,359 | | | $ | 4,432 | |
Ratios to average net assets of: | | | | | | | | |
Expenses, net of expense waivers | | | 0.46 | %5 | | | 0.43 | %3 |
Expenses, prior to expense waivers | | | 0.48 | % | | | 0.48 | %3 |
Net investment income | | | 0.99 | % | | | 1.18 | %3 |
Portfolio turnover rate4 | | | 20 | % | | | 28 | % |
| | | | |
| | |
| WisdomTree Japan Quality Dividend Growth Fund | | For the Period
May 28, 2015*
through
March 31, 2016 | |
Net asset value, beginning of period | | $ | 24.67 | |
Investment operations: | | | | |
Net investment income1 | | | 0.38 | |
Net realized and unrealized loss | | | (1.88 | ) |
Total from investment operations | | | (1.50 | ) |
Dividends to shareholders: | | | | |
Net investment income | | | (0.21 | ) |
Net asset value, end of period | | $ | 22.96 | |
| |
TOTAL RETURN2 | | | (6.07 | )% |
RATIOS/SUPPLEMENTAL DATA: | | | | |
Net assets, end of period (000’s omitted) | | $ | 2,296 | |
Ratios to average net assets of: | | | | |
Expenses, net of expense waivers | | | 0.43 | %3 |
Expenses, prior to expense waivers | | | 0.48 | %3 |
Net investment income | | | 1.94 | %3 |
Portfolio turnover rate4 | | | 34 | % |
| * | Commencement of operations. |
| 1 | Based on average shares outstanding. |
| 2 | Total return is calculated assuming an initial investment made at the net asset value at the beginning of the period, reinvestment of all dividends and distributions at net asset value during the period and redemption on the last day of the period. Total return calculated for a period of less than one year is not annualized. For the periods in which the investment advisor waived advisory fees, the total return would have been lower if certain expenses had not been waived (Notes 2 and 3). |
| 4 | Portfolio turnover rate is not annualized and excludes the value of the portfolio securities received or delivered as a result of in-kind creations or redemptions of the Fund’s capital shares. Short-term securities with maturities less than or equal to 365 days are excluded from the portfolio turnover calculation as well. |
| 5 | During the period, the investment advisor had contractually agreed to limit the advisory fee to 0.43% through July 31, 2015. On July 31, 2015, the contractual waiver expired and was not renewed. |
See Notes to Financial Statements.
| | | | |
| WisdomTree Developed World ex-U.S. and Currency Hedged Equity Funds | | | 205 | |
Financial Highlights (continued)
WisdomTree Developed World ex-U.S. and Currency Hedged Equity Funds
Selected data for a share of beneficial interest outstanding throughout the period is presented below:
| | | | | | | | | | | | | | | | | | | | |
| WisdomTree Japan SmallCap Dividend Fund | | For the
Year Ended
March 31, 2016 | | | For the
Year Ended
March 31, 2015 | | | For the
Period Ended
March 31, 2014 | | | For the
Period Ended
March 28, 2013 | | | For the
Year Ended
March 31, 2012 | |
Net asset value, beginning of period | | $ | 54.09 | | | $ | 50.28 | | | $ | 48.84 | | | $ | 45.45 | | | $ | 43.25 | |
Investment operations: | | | | | | | | | | | | | | | | | | | | |
Net investment income1 | | | 0.91 | | | | 0.71 | | | | 0.72 | | | | 0.78 | | | | 0.68 | |
Net realized and unrealized gain | | | 1.00 | | | | 3.89 | | | | 1.84 | | | | 3.58 | | | | 2.42 | |
Total from investment operations | | | 1.91 | | | | 4.60 | | | | 2.56 | | | | 4.36 | | | | 3.10 | |
Dividends to shareholders: | | | | | | | | | | | | | | | | | | | | |
Net investment income | | | (0.70 | ) | | | (0.79 | ) | | | (1.12 | ) | | | (0.97 | ) | | | (0.90 | ) |
Net asset value, end of period | | $ | 55.30 | | | $ | 54.09 | | | $ | 50.28 | | | $ | 48.84 | | | $ | 45.45 | |
| | | | | |
TOTAL RETURN2 | | | 3.51 | % | | | 9.26 | % | | | 5.41 | % | | | 9.97 | % | | | 7.36 | % |
RATIOS/SUPPLEMENTAL DATA: | | | | | | | | | | | | | | | | | | | | |
Net assets, end of period (000’s omitted) | | $ | 423,031 | | | $ | 286,651 | | | $ | 284,106 | | | $ | 192,914 | | | $ | 193,172 | |
Ratios to average net assets3 of: | | | | | | | | | | | | | | | | | | | | |
Expenses4 | | | 0.58 | % | | | 0.59 | %5 | | | 0.58 | %6 | | | 0.58 | %6 | | | 0.58 | % |
Net investment income | | | 1.65 | % | | | 1.40 | % | | | 1.44 | %6 | | | 1.84 | %6 | | | 1.58 | % |
Portfolio turnover rate7 | | | 29 | % | | | 36 | % | | | 21 | % | | | 41 | % | | | 36 | % |
| | | | | | | | | | | | |
| | | | |
| WisdomTree Korea Hedged Equity Fund | | For the
Year Ended
March 31, 2016 | | | For the
Year Ended
March 31, 2015 | | | For the Period
November 7, 2013*
through
March 31, 2014 | |
Net asset value, beginning of period | | $ | 21.63 | | | $ | 23.29 | | | $ | 25.01 | |
Investment operations: | | | | | | | | | | | | |
Net investment income1 | | | 0.13 | | | | 0.15 | | | | 0.06 | |
Net realized and unrealized loss | | | (0.10 | ) | | | (1.64 | ) | | | (1.55 | ) |
Total from investment operations | | | 0.03 | | | | (1.49 | ) | | | (1.49 | ) |
Dividends to shareholders: | | | | | | | | | | | | |
Net investment income | | | (0.05 | ) | | | (0.17 | ) | | | (0.23 | ) |
Net asset value, end of period | | $ | 21.61 | | | $ | 21.63 | | | $ | 23.29 | |
| | | |
TOTAL RETURN2 | | | 0.17 | % | | | (6.41 | )% | | | (5.97 | )% |
RATIOS/SUPPLEMENTAL DATA: | | | | | | | | | | | | |
Net assets, end of period (000’s omitted) | | $ | 19,450 | | | $ | 19,470 | | | $ | 8,151 | |
Ratios to average net assets of: | | | | | | | | | | | | |
Expenses | | | 0.58 | % | | | 0.59 | %5 | | | 0.58 | %6 |
Net investment income | | | 0.63 | % | | | 0.70 | % | | | 0.64 | %6 |
Portfolio turnover rate7 | | | 106 | % | | | 84 | % | | | 37 | % |
| * | Commencement of operations. |
| 1 | Based on average shares outstanding. |
| 2 | Total return is calculated assuming an initial investment made at the net asset value at the beginning of the period, reinvestment of all dividends and distributions at net asset value during the period and redemption on the last day of the period. Total return calculated for a period of less than one year is not annualized. For the periods in which the investment advisor waived advisory fees for the WisdomTree Japan SmallCap Dividend Fund, the total return would have been lower if certain expenses had not been waived (Notes 2 and 3). |
| 3 | The ratios to average net assets do not include net investment income (loss) or expenses of other funds in which the Fund invests. |
| 4 | The expense ratio includes investment advisory fee waivers. Without these investment advisory fee waivers, the expense ratio would have been unchanged. |
| 5 | Included in the expense ratio are proxy expenses. Without these proxy expenses, the expense ratio would have been 0.58%. |
| 7 | Portfolio turnover rate is not annualized and excludes the value of the portfolio securities received or delivered as a result of in-kind creations or redemptions of the Fund’s capital shares. Short-term securities with maturities less than or equal to 365 days are excluded from the portfolio turnover calculation as well. |
See Notes to Financial Statements.
| | |
| 206 | | WisdomTree Developed World ex-U.S. and Currency Hedged Equity Funds |
Financial Highlights (concluded)
WisdomTree Developed World ex-U.S. and Currency Hedged Equity Funds
Selected data for a share of beneficial interest outstanding throughout the period is presented below:
| | | | | | | | | | | | |
| | | |
| WisdomTree United Kingdom Hedged Equity Fund | | For the
Year Ended
March 31, 2016 | | | For the
Year Ended
March 31, 2015 | | | For the Period
June 28, 2013*
through
March 31, 2014 | |
Net asset value, beginning of period | | $ | 25.82 | | | $ | 25.52 | | | $ | 24.99 | |
Investment operations: | | | | | | | | | | | | |
Net investment income1 | | | 1.08 | | | | 0.97 | | | | 1.40 | |
Net realized and unrealized gain (loss) | | | (2.42 | ) | | | 0.23 | | | | 0.91 | |
Total from investment operations | | | (1.34 | ) | | | 1.20 | | | | 2.31 | |
Dividends and distributions to shareholders: | | | | | | | | | | | | |
Net investment income | | | (0.92 | ) | | | (0.90 | ) | | | (1.78 | ) |
Capital gains | | | (0.31 | ) | | | — | | | | — | |
Total dividends and distributions to shareholders | | | (1.23 | ) | | | (0.90 | ) | | | 0.00 | |
Net asset value, end of period | | $ | 23.25 | | | $ | 25.82 | | | $ | 25.52 | |
| | | |
TOTAL RETURN2 | | | (5.15 | )% | | | 4.71 | % | | | 9.36 | % |
RATIOS/SUPPLEMENTAL DATA: | | | | | | | | | | | | |
Net assets, end of period (000’s omitted) | | $ | 27,902 | | | $ | 28,407 | | | $ | 16,590 | |
Ratios to average net assets of: | | | | | | | | | | | | |
Expenses | | | 0.49 | %3 | | | 0.49 | %4 | | | 0.48 | %5 |
Net investment income | | | 4.45 | % | | | 3.75 | % | | | 6.98 | %5 |
Portfolio turnover rate6 | | | 30 | % | | | 20 | % | | | 12 | % |
| * | Commencement of operations. |
| 1 | Based on average shares outstanding. |
| 2 | Total return is calculated assuming an initial investment made at the net asset value at the beginning of the period, reinvestment of all dividends and distributions at net asset value during the period and redemption on the last day of the period. Total return calculated for a period of less than one year is not annualized. |
| 3 | Included in the expense ratio are non-recurring professional expenses. Without these expenses, the expense ratio would have been 0.48%. |
| 4 | Included in the expense ratio are proxy expenses. Without these proxy expenses, the expense ratio would have been 0.48%. |
| 6 | Portfolio turnover rate is not annualized and excludes the value of the portfolio securities received or delivered as a result of in-kind creations or redemptions of the Fund’s capital shares. Short-term securities with maturities less than or equal to 365 days are excluded from the portfolio turnover calculation as well. |
See Notes to Financial Statements.
| | | | |
| WisdomTree Developed World ex-U.S. and Currency Hedged Equity Funds | | | 207 | |
Notes to Financial Statements
1. ORGANIZATION
WisdomTree Trust (the “Trust”) is registered under the Investment Company Act of 1940, as amended (the “1940 Act”), as an open-end management investment company. The Trust was established as a Delaware statutory trust on December 15, 2005. As of March 31, 2016, the Trust offered 91 investment funds (each a “Fund”, collectively, the “Funds”). In accordance with Accounting Standard Update (“ASU”) 2013-08, Financial Services-Investment Companies, each Fund listed below qualifies as an investment company and is applying the accounting and reporting guidance for investment companies. These notes relate only to the Funds listed in the table below:
| | | | |
| Fund | | Commencement
of Operations | |
WisdomTree Australia Dividend Fund (“Australia Dividend Fund”) | | | June 16, 2006 | |
WisdomTree Europe Hedged Equity Fund (“Europe Hedged Equity Fund” and also referred to herein as “Currency Hedged Equity Fund”) | | | December 31, 2009 | |
WisdomTree Europe Hedged SmallCap Equity Fund (“Europe Hedged SmallCap Equity Fund” and also referred to herein as “Currency Hedged Equity Fund”) | | | March 4, 2015 | |
WisdomTree Europe Quality Dividend Growth Fund (“Europe Quality Dividend Growth Fund”)
(formerly, WisdomTree Europe Dividend Growth Fund) | | | May 7, 2014 | |
WisdomTree Europe SmallCap Dividend Fund (“Europe SmallCap Dividend Fund”) | | | June 16, 2006 | |
WisdomTree Germany Hedged Equity Fund (“Germany Hedged Equity Fund” and also referred to herein as “Currency Hedged Equity Fund”) | | | October 17, 2013 | |
WisdomTree Global ex-U.S. Hedged Dividend Fund (“Global ex-U.S. Hedged Dividend Fund” and also referred to herein as “Currency Hedged Equity Fund”) | | | June 4, 2015 | |
WisdomTree Global ex-U.S. Hedged Real Estate Fund (“Global ex-U.S. Hedged Real Estate Fund” and also referred to herein as “Currency Hedged Equity Fund”) | | | October 29, 2015 | |
WisdomTree International Dividend ex-Financials Fund (“International Dividend ex-Financials Fund”) | | | June 16, 2006 | |
WisdomTree International Equity Fund (“International Equity Fund”) (formerly, WisdomTree DEFA Fund) | | | June 16, 2006 | |
WisdomTree International Hedged Equity Fund (“International Hedged Equity Fund” and also referred to herein as “Currency Hedged Equity Fund”) | | | July 9, 2015 | |
WisdomTree International Hedged Quality Dividend Growth Fund (“International Hedged Quality Dividend Growth Fund” and also referred to herein as “Currency Hedged Equity Fund”) (formerly, WisdomTree International Hedged Dividend Growth Fund) | | | May 7, 2014 | |
WisdomTree International Hedged SmallCap Dividend Fund (“International Hedged SmallCap Dividend Fund” and also referred to herein as “Currency Hedged Equity Fund”) | | | June 4, 2015 | |
WisdomTree International High Dividend Fund (“International High Dividend Fund”) (formerly, WisdomTree DEFA Equity Income Fund) | | | June 16, 2006 | |
WisdomTree International LargeCap Dividend Fund (“International LargeCap Dividend Fund”) | | | June 16, 2006 | |
WisdomTree International MidCap Dividend Fund (“International MidCap Dividend Fund”) | | | June 16, 2006 | |
WisdomTree International SmallCap Dividend Fund (“International SmallCap Dividend Fund”) | | | June 16, 2006 | |
WisdomTree Japan Hedged Capital Goods Fund (“Japan Hedged Capital Goods Fund” and also referred to herein as “Currency Hedged Equity Fund”) | | | April 8, 2014 | |
WisdomTree Japan Hedged Equity Fund (“Japan Hedged Equity Fund” and also referred to herein as “Currency Hedged Equity Fund”) | | | June 16, 2006 | |
WisdomTree Japan Hedged Financials Fund (“Japan Hedged Financials Fund” and also referred to herein as “Currency Hedged Equity Fund”) | | | April 8, 2014 | |
WisdomTree Japan Hedged Health Care Fund (“Japan Hedged Health Care Fund” and also referred to herein as “Currency Hedged Equity Fund”) | | | April 8, 2014 | |
WisdomTree Japan Hedged Quality Dividend Growth Fund (“Japan Hedged Quality Dividend Growth Fund” and also referred to herein as “Currency Hedged Equity Fund”) (formerly, WisdomTree Japan Hedged Dividend Growth Fund) | | | April 9, 2015 | |
WisdomTree Japan Hedged Real Estate Fund (“Japan Hedged Real Estate Fund” and also referred to herein as “Currency Hedged Equity Fund”) | | | April 8, 2014 | |
WisdomTree Japan Hedged SmallCap Equity Fund (“Japan Hedged SmallCap Equity Fund” and also referred to herein as “Currency Hedged Equity Fund”) | | | June 28, 2013 | |
WisdomTree Japan Hedged Tech, Media and Telecom Fund (“Japan Hedged Tech, Media and Telecom Fund” and also referred to herein as “Currency Hedged Equity Fund”) | | | April 8, 2014 | |
WisdomTree Japan Quality Dividend Growth Fund (“Japan Quality Dividend Growth Fund”)
(formerly, WisdomTree Japan Dividend Growth Fund) | | | May 28, 2015 | |
WisdomTree Japan SmallCap Dividend Fund (“Japan SmallCap Dividend Fund”) | | | June 16, 2006 | |
WisdomTree Korea Hedged Equity Fund (“Korea Hedged Equity Fund” and also referred to herein as “Currency Hedged Equity Fund”) | | | November 7, 2013 | |
WisdomTree United Kingdom Hedged Equity Fund (“United Kingdom Hedged Equity Fund” and also referred to herein as “Currency Hedged Equity Fund”) | | | June 28, 2013 | |
Each Fund seeks to track the price and yield performance, before fees and expenses, of a particular index (“Index”) developed by WisdomTree Investments, Inc. (“WisdomTree Investments”). WisdomTree Investments is the parent company of WisdomTree Asset Management, Inc. (‘‘WTAM’’), the investment adviser to each Fund and the Trust. “WisdomTree” is a registered mark of WisdomTree Investments and has been licensed for use by the Trust. Each Fund described herein is considered to be non-diversified.
| | |
| 208 | | WisdomTree Developed World ex-U.S. and Currency Hedged Equity Funds |
Notes to Financial Statements (continued)
In the normal course of business, the Funds may enter into contracts that contain a variety of representations or that provide indemnification for certain liabilities. The Funds’ maximum exposure under these arrangements is unknown, as this would involve future claims that may be made against the Funds that have not yet occurred. However, the Funds have not had prior claims or losses pursuant to these contracts.
2. SIGNIFICANT ACCOUNTING POLICIES
The Financial Accounting Standards Board (“FASB”) Accounting Standards Codification (the “Codification”) is the exclusive reference of authoritative U.S. generally accepted accounting principles (“GAAP”) recognized by the FASB to be applied by nongovernmental entities. Rules and interpretive releases of the Securities and Exchange Commission (“SEC”) under authority of federal laws are also sources of authoritative GAAP for SEC registrants.
The following is a summary of significant accounting policies followed by the Funds:
Use of Estimates — The preparation of financial statements in conformity with GAAP, requires management to make certain estimates and assumptions that affect the reported amounts of assets and liabilities and disclosure of contingent assets and liabilities at the date of the financial statements and the reported amounts of increases and decreases in the net assets from operations during the reporting period. Actual results could differ from those estimates.
Investment Valuation — The net asset value (“NAV”) of each Fund’s shares is calculated each day a Fund is open for business as of the regularly scheduled close of regular trading on the New York Stock Exchange, normally 4:00 p.m. Eastern time (the “NAV Calculation Time”). NAV per share is calculated by dividing a Fund’s net assets by the number of Fund shares outstanding. Each Fund issues and redeems shares at NAV only in large blocks of shares known as creation units, which only certain institutions or large investors may purchase or redeem. Shares of each Fund are listed on a national securities exchange and trade at market prices. Most investors will buy and sell shares in the secondary market through brokers. Because Fund shares trade at market prices rather than NAV, shares may trade at a price greater than NAV or less than NAV. In calculating each Fund’s NAV, investments are valued under policies approved by the Board of Trustees. Equity securities (including preferred stock) traded on any recognized U.S. or non-U.S. exchange are valued at the last sale price or official closing price on the exchange or system on which they are principally traded. Unlisted equity securities (including preferred stock) are valued at the last quoted sale price or, if no sale price is available, at the mean between the highest bid and lowest ask price. Each Fund may invest in money market funds which are valued at their NAV per share and affiliated exchange-traded funds (“ETFs” or “ETF”) which are valued at their last sale or official closing price on the exchange on which they are principally traded or at their NAV per share in instances where the affiliated ETF has not traded on its principal exchange. Fixed income securities (including short-term debt securities with remaining maturities of 60 days or less) generally are valued at current market quotations or mean prices obtained from broker-dealers or independent pricing service providers. Broker-dealers or independent pricing service providers, in determining the value of securities may consider such factors as recent transactions, indications from broker-dealers yields and quoted prices on similar securities, and market sentiment for the type of security. Forward foreign currency contracts are valued daily using WM/Reuters closing spot and forward rates as of 4:00 p.m. London time, except for the Global ex-U.S. Hedged Dividend Growth Fund, Global ex-U.S. Hedged Real Estate Fund and Korea Hedged Equity Fund, which values forward foreign currency contracts daily using WM/Reuters closing spot and forward rates as of 2:00 p.m. Singapore time.
In certain instances, such as when reliable market valuations are not readily available or are not deemed to reflect current market values, a Fund’s investments, which include derivatives, will be fair valued in accordance with the Fund’s pricing policy. The Board of Trustees of the Trust has established a pricing committee (the “Pricing Committee”) which is comprised of senior representatives of WTAM and which reports to the Board of Trustees on a quarterly basis. In the event that a financial instrument cannot be valued based upon a price from a national securities exchange, independent pricing service provider or broker-dealer quotation, or such prices are deemed to not reflect current market value, the Pricing Committee may value the financial instrument in good faith under the policies and procedures approved by the Board of Trustees based on current facts and circumstances. Securities that may be valued using “fair value” pricing may include, but are not limited to, securities for which there are no current market quotations, securities whose issuer is in default or bankruptcy, securities subject to corporate actions (such as mergers or reorganizations), securities subject to non-U.S. investment limits or currency controls, and securities affected by “significant events.” An example of a significant event is an event occurring after the close of the market in which a security trades but before a Fund’s next NAV Calculation Time that may materially affect the value of a Fund’s investment (e.g., government action, natural disaster, or significant market fluctuation). When fair value pricing is employed, the prices of securities used by a Fund to calculate its NAV may differ from quoted or published prices for the same securities.
Fair Value Measurement — In accordance with Codification Topic 820 (“ASC 820”), Fair Value Measurements and Disclosures, fair value is defined as the price that each Fund would receive upon selling an investment in an orderly transaction to an independent buyer in the principal or most advantageous market of the investment. ASC 820 established a three-tier hierarchy of inputs to be used when determining fair value measurements for disclosure purposes. Inputs refer broadly to the assumptions that market participants would use in pricing the asset or liability, including assumptions about risk — for example, the risk inherent in a particular valuation
| | | | |
| WisdomTree Developed World ex-U.S. and Currency Hedged Equity Funds | | | 209 | |
Notes to Financial Statements (continued)
technique used to measure fair value (such as a pricing model) and/or the risk inherent in the inputs to the valuation technique. Inputs may be observable or unobservable. Observable inputs reflect the assumptions market participants would use in pricing the asset or liability. Observable inputs are based on market data obtained from sources independent of the reporting entity. Unobservable inputs reflect the reporting entity’s own assumptions about the assumptions market participants would use in pricing the asset or liability. Unobservable inputs are based on the best information available in the circumstances. The three-tier hierarchy of inputs is summarized in the three broad levels listed below:
Level 1 – quoted prices in active markets for identical securities
Level 2 – other significant observable inputs (including quoted prices for similar securities, interest rates, prepayment speeds, credit risk, etc.)
Level 3 – significant unobservable inputs (including each Fund’s assumptions in determining the fair value of investments)
The inputs or methodology used for valuation are not necessarily an indication of the risk associated with investing in those investments.
Investments that use Level 2 or Level 3 inputs may include, but are not limited to: (i) an unlisted security related to corporate actions; (ii) a restricted security (e.g., one that may not be publicly sold without registration under the Securities Act of 1933, as amended); (iii) a security whose trading has been suspended or which has been de-listed from its primary trading exchange; (iv) a security that is thinly traded; (v) a security in default or bankruptcy proceedings for which there is no current market quotation or market activity; (vi) a security affected by currency controls or restrictions; and (vii) a security affected by a significant event (e.g., an event that occurs after the close of the markets on which the security is traded but before the time as of which a Fund’s NAV is computed and that may materially affect the value of the Fund’s investments).
The valuation techniques and significant inputs used in determining the fair market value measurements for Level 2 and Level 3 positions are as follows:
Financial instruments are generally valued by independent pricing service providers that use broker-dealer quotations, reported trades or valuation estimates from their internal pricing models. Depending on the type of financial instrument, the independent pricing service providers’ internal pricing models may use inputs that are observable such as issuer details, interest rates, yield curves, prepayment speeds, credit risks/spreads, default rates and quoted prices for similar assets. Financial instruments that use similar valuation techniques and observable inputs as described above and have an appropriate level of market activity are categorized as Level 2 of the fair value hierarchy, otherwise a Level 3 fair value classification is appropriate. Over-the-counter financial derivative instruments derive their value from underlying asset prices, indices, reference rates, and other inputs or a combination of these factors. These instruments are normally valued on the basis of broker-dealer quotations or independent pricing service providers. Depending on the product and the terms of the transaction, the value of the financial derivative instruments can be estimated by an independent pricing service provider using a series of techniques including simulation pricing models. The pricing models use inputs that are observed from actively quoted markets such as issuer details, indices, credit risks/spreads, interest rates, yield curves, default and exchange rates. Derivative contracts that use valuation techniques and observable inputs as described above and have an appropriate level of market activity are categorized as Level 2 of the fair value hierarchy, otherwise a Level 3 fair value classification is appropriate.
Determination of a fair value by the Pricing Committee may include significant unobservable inputs and therefore would be reflected as a Level 3 of the fair value hierarchy. The Pricing Committee may employ a market-based valuation approach which may use, among other potential considerations, related or comparable securities, recent transactions, market multiples, and other relevant information to determine fair value. The Pricing Committee may also use an income-based valuation approach in which anticipated future cash flows of the financial instrument are discounted to calculate fair value. The Pricing Committee meets at least on a monthly basis to review and discuss the appropriateness of such fair values using more current information such as, recent security news, recent market transactions, updated corporate action information and/or other macro or security specific events. Also, when observable inputs become available, the Pricing Committee conducts back testing of the methodologies used to value Level 3 financial instruments to substantiate the unobservable inputs used to value those investments. Such back testing includes comparing Level 3 investment values to observable inputs such as exchange-traded prices, transaction prices, and/or vendor prices.
The following is a summary of the fair valuations according to the inputs used as of March 31, 2016 in valuing each Fund’s assets:
| | | | | | | | | | | | |
| Australia Dividend Fund | | Level 1 | | | Level 2 | | | Level 3 | |
Common Stocks* | | $ | 33,560,660 | | | $ | — | | | $ | — | |
Rights | | | — | | | | 8,846 | | | | — | |
Investment of Cash Collateral for Securities Loaned | | | — | | | | 1,647,113 | | | | — | |
Total | | $ | 33,560,660 | | | $ | 1,655,959 | | | $ | — | |
| | |
| 210 | | WisdomTree Developed World ex-U.S. and Currency Hedged Equity Funds |
Notes to Financial Statements (continued)
| | | | | | | | | | | | |
| Europe Hedged Equity Fund | | Level 1 | | | Level 2 | | | Level 3 | |
Common Stocks* | | $ | 13,785,147,906 | | | $ | — | | | $ | — | |
Investment of Cash Collateral for Securities Loaned | | | — | | | | 291,263,715 | | | | — | |
Total | | $ | 13,785,147,906 | | | $ | 291,263,715 | | | $ | — | |
Unrealized Appreciation on Forward Foreign Currency Contracts | | | — | | | | 26,469,670 | | | | — | |
Unrealized Depreciation on Forward Foreign Currency Contracts | | | — | | | | (672,918,232 | ) | | | — | |
Total - Net | | $ | 13,785,147,906 | | | $ | (355,184,847 | ) | | $ | — | |
| | | | | | | | | | | | |
| Europe Hedged SmallCap Equity Fund | | Level 1 | | | Level 2 | | | Level 3 | |
Common Stocks* | | $ | 268,080,816 | | | $ | — | | | $ | — | |
Investment of Cash Collateral for Securities Loaned | | | — | | | | 19,074,318 | | | | — | |
Total | | $ | 268,080,816 | | | $ | 19,074,318 | | | $ | — | |
Unrealized Appreciation on Forward Foreign Currency Contracts | | | — | | | | 8,437 | | | | — | |
Unrealized Depreciation on Forward Foreign Currency Contracts | | | — | | | | (12,176,615 | ) | | | — | |
Total - Net | | $ | 268,080,816 | | | $ | 6,906,140 | | | $ | — | |
| | | | | | | | | | | | |
| Europe Quality Dividend Growth Fund | | Level 1 | | | Level 2 | | | Level 3 | |
Common Stocks* | | $ | 17,788,896 | | | $ | — | | | $ | — | |
Investment of Cash Collateral for Securities Loaned | | | — | | | | 238,241 | | | | — | |
Total | | $ | 17,788,896 | | | $ | 238,241 | | | $ | — | |
| | | | | | | | | | | | |
| Europe SmallCap Dividend Fund | | Level 1 | | | Level 2 | | | Level 3 | |
Common Stocks | | | | | | | | | | | | |
Spain | | $ | 31,589,389 | | | $ | — | | | $ | 0 | ** |
Other* | | | 1,087,476,102 | | | | — | | | | — | |
Exchange-Traded Fund | | | 2,908,723 | | | | — | | | | — | |
Investment of Cash Collateral for Securities Loaned | | | — | | | | 52,561,886 | | | | — | |
Total | | $ | 1,121,974,214 | | | $ | 52,561,886 | | | $ | 0 | |
Unrealized Appreciation on Forward Foreign Currency Contracts | | | — | | | | 1,240 | | | | — | |
Unrealized Depreciation on Forward Foreign Currency Contracts | | | — | | | | (384 | ) | | | — | |
Total - Net | | $ | 1,121,974,214 | | | $ | 52,562,742 | | | $ | 0 | |
| | | | | | | | | | | | |
| Germany Hedged Equity Fund | | Level 1 | | | Level 2 | | | Level 3 | |
Common Stocks* | | $ | 199,685,534 | | | $ | — | | | $ | — | |
Investment of Cash Collateral for Securities Loaned | | | — | | | | 897,196 | | | | — | |
Total | | $ | 199,685,534 | | | $ | 897,196 | | | $ | — | |
Unrealized Appreciation on Forward Foreign Currency Contracts | | | — | | | | 346,062 | | | | — | |
Unrealized Depreciation on Forward Foreign Currency Contracts | | | — | | | | (9,497,256 | ) | | | — | |
Total - Net | | $ | 199,685,534 | | | $ | (8,253,998 | ) | | $ | — | |
| | | | | | | | | | | | |
| Global ex-U.S. Hedged Dividend Fund | | Level 1 | | | Level 2 | | | Level 3 | |
Common Stocks* | | $ | 4,254,558 | | | $ | — | | | $ | — | |
Exchange-Traded Note | | | 66,746 | | | | — | | | | ��� | |
Investment of Cash Collateral for Securities Loaned | | | — | | | | 41,257 | | | | — | |
Total | | $ | 4,321,304 | | | $ | 41,257 | | | $ | — | |
Unrealized Appreciation on Forward Foreign Currency Contracts | | | — | | | | 206 | | | | — | |
Unrealized Depreciation on Forward Foreign Currency Contracts | | | — | | | | (148,531 | ) | | | — | |
Total - Net | | $ | 4,321,304 | | | $ | (107,068 | ) | | $ | — | |
| | | | |
| WisdomTree Developed World ex-U.S. and Currency Hedged Equity Funds | | | 211 | |
Notes to Financial Statements (continued)
| | | | | | | | | | | | |
| Global ex-U.S. Hedged Real Estate Fund | | Level 1 | | | Level 2 | | | Level 3 | |
Common Stocks* | | $ | 2,448,452 | | | $ | — | | | $ | — | |
Exchange-Traded Note | | | 502 | | | | — | | | | — | |
Investment of Cash Collateral for Securities Loaned | | | — | | | | 9,894 | | | | — | |
Total | | $ | 2,448,954 | | | $ | 9,894 | | | $ | — | |
Unrealized Appreciation on Forward Foreign Currency Contracts | | | — | | | | 122 | | | | — | |
Unrealized Depreciation on Forward Foreign Currency Contracts | | | — | | | | (77,075 | ) | | | — | |
Total - Net | | $ | 2,448,954 | | | $ | (67,059 | ) | | $ | — | |
| | | | | | | | | | | | |
| International Dividend ex-Financials Fund | | Level 1 | | | Level 2 | | | Level 3 | |
Common Stocks* | | $ | 228,452,011 | | | $ | — | | | $ | — | |
Exchange-Traded Fund | | | 230,746 | | | | — | | | | — | |
Investment of Cash Collateral for Securities Loaned | | | — | | | | 5,503,096 | | | | — | |
Total | | $ | 228,682,757 | | | $ | 5,503,096 | | | $ | — | |
Unrealized Appreciation on Forward Foreign Currency Contracts | | | — | | | | 537 | | | | — | |
Unrealized Depreciation on Forward Foreign Currency Contracts | | | — | | | | (106 | ) | | | — | |
Total - Net | | $ | 228,682,757 | | | $ | 5,503,527 | | | $ | — | |
| | | | | | | | | | | | |
| International Equity Fund | | Level 1 | | | Level 2 | | | Level 3 | |
Common Stocks* | | $ | 617,628,593 | | | $ | — | | | $ | — | |
Exchange-Traded Fund | | | 323,901 | | | | — | | | | — | |
Investment of Cash Collateral for Securities Loaned | | | — | | | | 24,987,222 | | | | — | |
Total | | $ | 617,952,494 | | | $ | 24,987,222 | | | $ | — | |
Unrealized Depreciation on Forward Foreign Currency Contracts | | | — | | | | (427 | ) | | | — | |
Total - Net | | $ | 617,952,494 | | | $ | 24,986,795 | | | $ | — | |
| | | | | | | | | | | | |
| International Hedged Equity Fund | | Level 1 | | | Level 2 | | | Level 3 | |
Common Stocks* | | $ | 4,622,200 | | | $ | — | | | $ | — | |
Rights | | | — | | | | 38 | | | | — | |
Investment of Cash Collateral for Securities Loaned | | | — | | | | 53,752 | | | | — | |
Total | | $ | 4,622,200 | | | $ | 53,790 | | | $ | — | |
Unrealized Appreciation on Forward Foreign Currency Contracts | | | — | | | | 212 | | | | — | |
Unrealized Depreciation on Forward Foreign Currency Contracts | | | — | | | | (165,031 | ) | | | — | |
Total - Net | | $ | 4,622,200 | | | $ | (111,029 | ) | | $ | — | |
| | | | | | | | | | | | |
| International Hedged Quality Dividend Growth Fund | | Level 1 | | | Level 2 | | | Level 3 | |
Common Stocks* | | $ | 733,636,982 | | | $ | — | | | $ | — | |
Investment of Cash Collateral for Securities Loaned | | | — | | | | 19,354,354 | | | | — | |
Total | | $ | 733,636,982 | | | $ | 19,354,354 | | | $ | — | |
Unrealized Appreciation on Forward Foreign Currency Contracts | | | — | | | | 33,077 | | | | — | |
Unrealized Depreciation on Forward Foreign Currency Contracts | | | — | | | | (27,052,952 | ) | | | — | |
Total - Net | | $ | 733,636,982 | | | $ | (7,665,521 | ) | | $ | — | |
| | |
| 212 | | WisdomTree Developed World ex-U.S. and Currency Hedged Equity Funds |
Notes to Financial Statements (continued)
| | | | | | | | | | | | |
| International Hedged SmallCap Dividend Fund | | Level 1 | | | Level 2 | | | Level 3 | |
Exchange-Traded Fund | | $ | 1,129,702 | | | $ | — | | | $ | — | |
Total | | $ | 1,129,702 | | | $ | — | | | $ | — | |
Unrealized Appreciation on Forward Foreign Currency Contracts | | | — | | | | 72 | | | | — | |
Unrealized Depreciation on Forward Foreign Currency Contracts | | | — | | | | (39,073 | ) | | | — | |
Total - Net | | $ | 1,129,702 | | | $ | (39,001 | ) | | $ | — | |
| | | | | | | | | | | | |
| International High Dividend Fund | | Level 1 | | | Level 2 | | | Level 3 | |
Common Stocks* | | $ | 255,631,856 | | | $ | — | | | $ | — | |
Exchange-Traded Fund | | | 6,281 | | | | — | | | | — | |
Investment of Cash Collateral for Securities Loaned | | | — | | | | 5,100,091 | | | | — | |
Total | | $ | 255,638,137 | | | $ | 5,100,091 | | | $ | — | |
Unrealized Appreciation on Forward Foreign Currency Contracts | | | — | | | | 27 | | | | — | |
Unrealized Depreciation on Forward Foreign Currency Contracts | | | — | | | | (76 | ) | | | — | |
Total - Net | | $ | 255,638,137 | | | $ | 5,100,042 | | | $ | — | |
| | | | | | | | | | | | |
| International LargeCap Dividend Fund | | Level 1 | | | Level 2 | | | Level 3 | |
Common Stocks* | | $ | 363,226,184 | | | $ | — | | | $ | — | |
Exchange-Traded Fund | | | 955,246 | | | | — | | | | — | |
Investment of Cash Collateral for Securities Loaned | | | — | | | | 10,089,231 | | | | — | |
Total | | $ | 364,181,430 | | | $ | 10,089,231 | | | $ | — | |
Unrealized Depreciation on Forward Foreign Currency Contracts | | | — | | | | (295 | ) | | | — | |
Total - Net | | $ | 364,181,430 | | | $ | 10,088,936 | | | $ | — | |
| | | | | | | | | | | | |
| International MidCap Dividend Fund | | Level 1 | | | Level 2 | | | Level 3 | |
Common Stocks | | | | | | | | | | | | |
Japan | | $ | 31,594,542 | | | $ | 204,791 | | | $ | — | |
Other* | | | 121,059,093 | | | | — | | | | — | |
Investment of Cash Collateral for Securities Loaned | | | — | | | | 12,170,282 | | | | — | |
Total | | $ | 152,653,635 | | | $ | 12,375,073 | | | $ | — | |
| | | | | | | | | | | | |
| International SmallCap Dividend Fund | | Level 1 | | | Level 2 | | | Level 3 | |
Common Stocks | | | | | | | | | | | | |
Australia | | $ | 123,026,562 | | | $ | — | | | $ | 1 | ** |
Japan | | | 291,758,374 | | | | 1,605,169 | | | | — | |
Spain | | | 8,832,097 | | | | — | | | | 0 | ** |
Other* | | | 664,505,542 | | | | — | | | | — | |
Rights* | | | — | | | | 111,770 | | | | — | |
Exchange-Traded Funds | | | 2,385,141 | | | | — | | | | — | |
Investment of Cash Collateral for Securities Loaned | | | — | | | | 112,271,066 | | | | — | |
Total | | $ | 1,090,507,716 | | | $ | 113,988,005 | | | $ | 1 | |
Unrealized Depreciation on Forward Foreign Currency Contracts | | | — | | | | (10,443 | ) | | | — | |
Total - Net | | $ | 1,090,507,716 | | | $ | 113,977,562 | | | $ | 1 | |
| | | | |
| WisdomTree Developed World ex-U.S. and Currency Hedged Equity Funds | | | 213 | |
Notes to Financial Statements (continued)
| | | | | | | | | | | | |
| Japan Hedged Capital Goods Fund | | Level 1 | | | Level 2 | | | Level 3 | |
Common Stocks* | | $ | 3,132,759 | | | $ | — | | | $ | — | |
Investment of Cash Collateral for Securities Loaned | | | — | | | | 192,975 | | | | — | |
Total | | $ | 3,132,759 | | | $ | 192,975 | | | $ | — | |
Unrealized Appreciation on Forward Foreign Currency Contracts | | | — | | | | 62 | | | | — | |
Unrealized Depreciation on Forward Foreign Currency Contracts | | | — | | | | (9,850 | ) | | | — | |
Total - Net | | $ | 3,132,759 | | | $ | 183,187 | | | $ | — | |
| | | | | | | | | | | | |
| Japan Hedged Equity Fund | | Level 1 | | | Level 2 | | | Level 3 | |
Common Stocks* | | $ | 9,660,112,305 | | | $ | — | | | $ | — | |
Investment of Cash Collateral for Securities Loaned | | | — | | | | 1,073,061,319 | | | | — | |
Total | | $ | 9,660,112,305 | | | $ | 1,073,061,319 | | | $ | — | |
Unrealized Appreciation on Forward Foreign Currency Contracts | | | — | | | | 8,111,974 | | | | — | |
Unrealized Depreciation on Forward Foreign Currency Contracts | | | — | | | | (40,080,250 | ) | | | — | |
Total - Net | | $ | 9,660,112,305 | | | $ | 1,041,093,043 | | | $ | — | |
| | | | | | | | | | | | |
| Japan Hedged Financials Fund | | Level 1 | | | Level 2 | | | Level 3 | |
Common Stocks | | | | | | | | | | | | |
Banks | | $ | 7,023,804 | | | $ | 238,204 | | | $ | — | |
Other* | | | 5,433,504 | | | | — | | | | — | |
Investment of Cash Collateral for Securities Loaned | | | — | | | | 1,843,858 | | | | — | |
Total | | $ | 12,457,308 | | | $ | 2,082,062 | | | $ | — | |
Unrealized Appreciation on Forward Foreign Currency Contracts | | | — | | | | 259 | | | | — | |
Unrealized Depreciation on Forward Foreign Currency Contracts | | | — | | | | (40,879 | ) | | | — | |
Total - Net | | $ | 12,457,308 | | | $ | 2,041,442 | | | $ | — | |
| | | | | | | | | | | | |
| Japan Hedged Health Care Fund | | Level 1 | | | Level 2 | | | Level 3 | |
Common Stocks* | | $ | 17,844,951 | | | $ | — | | | $ | — | |
Investment of Cash Collateral for Securities Loaned | | | — | | | | 2,462,432 | | | | — | |
Total | | $ | 17,844,951 | | | $ | 2,462,432 | | | $ | — | |
Unrealized Appreciation on Forward Foreign Currency Contracts | | | — | | | | 33,333 | | | | — | |
Unrealized Depreciation on Forward Foreign Currency Contracts | | | — | | | | (90,569 | ) | | | — | |
Total - Net | | $ | 17,844,951 | | | $ | 2,405,196 | | | $ | — | |
| | | | | | | | | | | | |
| Japan Hedged Quality Dividend Growth Fund | | Level 1 | | | Level 2 | | | Level 3 | |
Common Stocks* | | $ | 15,518,122 | | | $ | — | | | $ | — | |
Investment of Cash Collateral for Securities Loaned | | | — | | | | 595,235 | | | | — | |
Total | | $ | 15,518,122 | | | $ | 595,235 | | | $ | — | |
Unrealized Appreciation on Forward Foreign Currency Contracts | | | — | | | | 315 | | | | — | |
Unrealized Depreciation on Forward Foreign Currency Contracts | | | — | | | | (49,810 | ) | | | — | |
Total - Net | | $ | 15,518,122 | | | $ | 545,740 | | | $ | — | |
| | |
| 214 | | WisdomTree Developed World ex-U.S. and Currency Hedged Equity Funds |
Notes to Financial Statements (continued)
| | | | | | | | | | | | |
| Japan Hedged Real Estate Fund | | Level 1 | | | Level 2 | | | Level 3 | |
Common Stocks* | | $ | 150,375,641 | | | $ | — | | | $ | — | |
Investment of Cash Collateral for Securities Loaned | | | — | | | | 11,557,970 | | | | — | |
Total | | $ | 150,375,641 | | | $ | 11,557,970 | | | $ | — | |
Unrealized Appreciation on Forward Foreign Currency Contracts | | | — | | | | 26,922 | | | | — | |
Unrealized Depreciation on Forward Foreign Currency Contracts | | | — | | | | (488,559 | ) | | | — | |
Total - Net | | $ | 150,375,641 | | | $ | 11,096,333 | | | $ | — | |
| | | | | | | | | | | | |
| Japan Hedged SmallCap Equity Fund | | Level 1 | | | Level 2 | | | Level 3 | |
Common Stocks | | | | | | | | | | | | |
Banks | | $ | 4,983,289 | | | $ | 96,020 | | | $ | — | |
Food Products | | | 3,431,432 | | | | 183,602 | | | | — | |
Other* | | | 80,990,636 | | | | — | | | | — | |
Investment of Cash Collateral for Securities Loaned | | | — | | | | 18,107,628 | | | | — | |
Total | | $ | 89,405,357 | | | $ | 18,387,250 | | | $ | — | |
Unrealized Appreciation on Forward Foreign Currency Contracts | | | — | | | | 86,924 | | | | — | |
Unrealized Depreciation on Forward Foreign Currency Contracts | | | — | | | | (313,701 | ) | | | — | |
Total - Net | | $ | 89,405,357 | | | $ | 18,160,473 | | | $ | — | |
| | | | | | | | | | | | |
| Japan Hedged Tech, Media and Telecom Fund | | Level 1 | | | Level 2 | | | Level 3 | |
Common Stocks* | | $ | 2,343,914 | | | $ | — | | | $ | — | |
Investment of Cash Collateral for Securities Loaned | | | — | | | | 239,672 | | | | — | |
Total | | $ | 2,343,914 | | | $ | 239,672 | | | $ | — | |
Unrealized Appreciation on Forward Foreign Currency Contracts | | | — | | | | 47 | | | | — | |
Unrealized Depreciation on Forward Foreign Currency Contracts | | | — | | | | (7,403 | ) | | | — | |
Total - Net | | $ | 2,343,914 | | | $ | 232,316 | | | $ | — | |
| | | | | | | | | | | | |
| Japan Quality Dividend Growth Fund | | Level 1 | | | Level 2 | | | Level 3 | |
Common Stocks* | | $ | 2,273,497 | | | $ | — | | | $ | — | |
Investment of Cash Collateral for Securities Loaned | | | — | | | | 56,861 | | | | — | |
Total | | $ | 2,273,497 | | | $ | 56,861 | | | $ | — | |
Unrealized Depreciation on Forward Foreign Currency Contracts | | | — | | | | (2 | ) | | | — | |
Total - Net | | $ | 2,273,497 | | | $ | 56,859 | | | $ | — | |
| | | | | | | | | | | | |
| Japan SmallCap Dividend Fund | | Level 1 | | | Level 2 | | | Level 3 | |
Common Stocks | | | | | | | | | | | | |
Banks | | $ | 23,357,599 | | | $ | 507,181 | | | $ | — | |
Other* | | | 394,385,350 | | | | — | | | | — | |
Investment of Cash Collateral for Securities Loaned | | | — | | | | 68,392,118 | | | | — | |
Total | | $ | 417,742,949 | | | $ | 68,899,299 | | | $ | — | |
| | | | | | | | | | | | |
| Korea Hedged Equity Fund | | Level 1 | | | Level 2 | | | Level 3 | |
Common Stocks* | | $ | 19,269,714 | | | $ | — | | | $ | — | |
Investment of Cash Collateral for Securities Loaned | | | — | | | | 175,140 | | | | — | |
Total | | $ | 19,269,714 | | | $ | 175,140 | | | $ | — | |
Unrealized Appreciation on Forward Foreign Currency Contracts | | | — | | | | 14,782 | | | | — | |
Unrealized Depreciation on Forward Foreign Currency Contracts | | | — | | | | (1,533,043 | ) | | | — | |
Total - Net | | $ | 19,269,714 | | | $ | (1,343,121 | ) | | $ | — | |
| | | | |
| WisdomTree Developed World ex-U.S. and Currency Hedged Equity Funds | | | 215 | |
Notes to Financial Statements (continued)
| | | | | | | | | | | | |
| United Kingdom Hedged Equity Fund | | Level 1 | | | Level 2 | | | Level 3 | |
Common Stocks* | | $ | 27,706,227 | | | $ | — | | | $ | — | |
Investment of Cash Collateral for Securities Loaned | | | — | | | | 38,819 | | | | — | |
Total | | $ | 27,706,227 | | | $ | 38,819 | | | $ | — | |
Unrealized Appreciation on Forward Foreign Currency Contracts | | | — | | | | 37,121 | | | | — | |
Unrealized Depreciation on Forward Foreign Currency Contracts | | | — | | | | (943,443 | ) | | | — | |
Total - Net | | $ | 27,706,227 | | | $ | (867,503 | ) | | $ | — | |
| | * | Please refer to the Schedule of Investments for a breakdown of the valuation by industry type and country. |
| | ** | Security is being fair valued by the Pricing Committee. |
The following is a summary of transfers between fair value measurement levels that occurred during fiscal year ended March 31, 2016. The Funds have elected to use the beginning of period method for transfers between fair value measurement levels.
| | | | | | | | |
| | | Transfers from
Level 1 to Level 21 | | | Transfers from
Level 2 to Level 12 | |
International MidCap Dividend Fund | | $ | 252,424 | | | $ | — | |
International SmallCap Dividend Fund | | | 1,635,672 | | | | 972,986 | |
Japan Hedged Financials Fund | | | 145,878 | | | | — | |
Japan Hedged SmallCap Equity Fund | | | 433,971 | | | | — | |
Japan SmallCap Dividend Fund | | | 548,443 | | | | — | |
| | 1 | Transfers from Level 1 to Level 2 are as a result of the unavailability of a quoted price in an active market for identical investments as of March 31, 2016. |
| | 2 | Transfers from Level 2 to Level 1 are as a result of the availability of a quoted price in an active market for identical investments as of March 31, 2016. |
Derivatives and Hedging Disclosure — Codification Topic 815 (“ASC 815”), Derivatives and Hedging, requires qualitative disclosures about objectives and strategies for using derivatives, quantitative disclosures about fair value amounts of gains and losses on derivative instruments, and disclosures about credit-risk-related contingent features in derivative agreements. The Funds have invested in derivatives, specifically forward foreign currency contracts during the year or period ended March 31, 2016 which are detailed in each Fund’s schedule of investments. All of the derivative instruments disclosed and described herein are subject to risk. Risks may arise upon entering into forward foreign currency contracts from potential inability of a counterparty to meet the terms of their contracts and from unanticipated movements in the value of the foreign currencies relative to the U.S. dollar or each other. The Funds’ derivative agreements contain credit-risk related contingent features which include, but are not limited to, a percentage decline in the Funds’ NAV over a specified time period. If an event occurred at March 31, 2016 that triggered a contingent feature, the counterparty to the agreement may require the Funds to post additional collateral or terminate the derivative positions and demand payment. Any collateral posted with respect to the derivative positions would be used to offset or reduce the payment. The maximum exposure to derivatives agreements with credit-risk related contingent features would be the total value of derivatives in net liability positions for each Fund, as disclosed on pages 223 through 225. At March 31, 2016, the Funds did not receive or post collateral with any counterparty for derivatives and no event occurred that triggered a credit-risk-related contingent feature.
As of March 31, 2016, the effects of such derivative instruments on each Fund’s financial position as reflected in the Statements of Assets and Liabilities are presented in the summary below:
| | | | | | | | | | | | |
| | | Asset Derivatives | | | Liability Derivatives | |
| Fund | | Balance Sheet Location | | Value | | | Balance Sheet Location | | Value | |
Europe Hedged Equity Fund | | | | | | | | | | | | |
Foreign exchange contracts | | Unrealized appreciation on forward foreign currency contracts | | $ | 26,469,670 | | | Unrealized depreciation on forward foreign currency contracts | | $ | 672,918,232 | |
Europe Hedged SmallCap Equity Fund | | | | | | | | | | | | |
Foreign exchange contracts | | Unrealized appreciation on forward foreign currency contracts | | | 8,437 | | | Unrealized depreciation on forward foreign currency contracts | | | 12,176,615 | |
Europe SmallCap Dividend Fund | | | | | | | | | | | | |
Foreign exchange contracts | | Unrealized appreciation on forward foreign currency contracts | | | 1,240 | | | Unrealized depreciation on forward foreign currency contracts | | | 384 | |
Germany Hedged Equity Fund | | | | | | | | | | | | |
Foreign exchange contracts | | Unrealized appreciation on forward foreign currency contracts | | | 346,062 | | | Unrealized depreciation on forward foreign currency contracts | | | 9,497,256 | |
Global ex-U.S. Hedged Dividend Fund | | | | | | | | | | | | |
Foreign exchange contracts | | Unrealized appreciation on forward foreign currency contracts | | | 206 | | | Unrealized depreciation on forward foreign currency contracts | | | 148,531 | |
| | |
| 216 | | WisdomTree Developed World ex-U.S. and Currency Hedged Equity Funds |
Notes to Financial Statements (continued)
| | | | | | | | | | | | |
| | | Asset Derivatives | | | Liability Derivatives | |
| Fund | | Balance Sheet Location | | Value | | | Balance Sheet Location | | Value | |
Global ex-U.S. Hedged Real Estate Fund | | | | | | | | | | | | |
Foreign exchange contracts | | Unrealized appreciation on forward foreign currency contracts | | $ | 122 | | | Unrealized depreciation on forward foreign currency contracts | | $ | 77,075 | |
International Dividend ex-Financials Fund | | | | | | | | | | | | |
Foreign exchange contracts | | Unrealized appreciation on forward foreign currency contracts | | | 537 | | | Unrealized depreciation on forward foreign currency contracts | | | 106 | |
International Equity Fund | | | | | | | | | | | | |
Foreign exchange contracts | | Unrealized appreciation on forward foreign currency contracts | | | — | | | Unrealized depreciation on forward foreign currency contracts | | | 427 | |
International Hedged Equity Fund | | | | | | | | | | | | |
Foreign exchange contracts | | Unrealized appreciation on forward foreign currency contracts | | | 212 | | | Unrealized depreciation on forward foreign currency contracts | | | 165,031 | |
International Hedged Quality Dividend Growth Fund | | | | | | | | | | | | |
Foreign exchange contracts | | Unrealized appreciation on forward foreign currency contracts | | | 33,077 | | | Unrealized depreciation on forward foreign currency contracts | | | 27,052,952 | |
International Hedged SmallCap Dividend Fund | | | | | | | | | | | | |
Foreign exchange contracts | | Unrealized appreciation on forward foreign currency contracts | | | 72 | | | Unrealized depreciation on forward foreign currency contracts | | | 39,073 | |
International High Dividend Fund | | | | | | | | | | | | |
Foreign exchange contracts | | Unrealized appreciation on forward foreign currency contracts | | | 27 | | | Unrealized depreciation on forward foreign currency contracts | | | 76 | |
International LargeCap Dividend Fund | | | | | | | | | | | | |
Foreign exchange contracts | | Unrealized appreciation on forward foreign currency contracts | | | — | | | Unrealized depreciation on forward foreign currency contracts | | | 295 | |
International SmallCap Dividend Fund | | | | | | | | | | | | |
Foreign exchange contracts | | Unrealized appreciation on forward foreign currency contracts | | | — | | | Unrealized depreciation on forward foreign currency contracts | | | 10,443 | |
Japan Hedged Capital Goods Fund | | | | | | | | | | | | |
Foreign exchange contracts | | Unrealized appreciation on forward foreign currency contracts | | | 62 | | | Unrealized depreciation on forward foreign currency contracts | | | 9,850 | |
Japan Hedged Equity Fund | | | | | | | | | | | | |
Foreign exchange contracts | | Unrealized appreciation on forward foreign currency contracts | | | 8,111,974 | | | Unrealized depreciation on forward foreign currency contracts | | | 40,080,250 | |
Japan Hedged Financials Fund | | | | | | | | | | | | |
Foreign exchange contracts | | Unrealized appreciation on forward foreign currency contracts | | | 259 | | | Unrealized depreciation on forward foreign currency contracts | | | 40,879 | |
Japan Hedged Health Care Fund | | | | | | | | | | | | |
Foreign exchange contracts | | Unrealized appreciation on forward foreign currency contracts | | | 33,333 | | | Unrealized depreciation on forward foreign currency contracts | | | 90,569 | |
Japan Hedged Quality Dividend Growth Fund | | | | | | | | | | | | |
Foreign exchange contracts | | Unrealized appreciation on forward foreign currency contracts | | | 315 | | | Unrealized depreciation on forward foreign currency contracts | | | 49,810 | |
Japan Hedged Real Estate Fund | | | | | | | | | | | | |
Foreign exchange contracts | | Unrealized appreciation on forward foreign currency contracts | | | 26,922 | | | Unrealized depreciation on forward foreign currency contracts | | | 488,559 | |
Japan Hedged SmallCap Equity Fund | | | | | | | | | | | | |
Foreign exchange contracts | | Unrealized appreciation on forward foreign currency contracts | | | 86,924 | | | Unrealized depreciation on forward foreign currency contracts | | | 313,701 | |
Japan Hedged Tech, Media and Telecom Fund | | | | | | | | | | | | |
Foreign exchange contracts | | Unrealized appreciation on forward foreign currency contracts | | | 47 | | | Unrealized depreciation on forward foreign currency contracts | | | 7,403 | |
Japan Quality Dividend Growth Fund | | | | | | | | | | | | |
Foreign exchange contracts | | Unrealized appreciation on forward foreign currency contracts | | | — | | | Unrealized depreciation on forward foreign currency contracts | | | 2 | |
| | | | |
| WisdomTree Developed World ex-U.S. and Currency Hedged Equity Funds | | | 217 | |
Notes to Financial Statements (continued)
| | | | | | | | | | | | |
| | | Asset Derivatives | | | Liability Derivatives | |
| Fund | | Balance Sheet Location | | Value | | | Balance Sheet Location | | Value | |
Korea Hedged Equity Fund | | | | | | | | | | | | |
Foreign exchange contracts | | Unrealized appreciation on forward foreign currency contracts | | $ | 14,782 | | | Unrealized depreciation on forward foreign currency contracts | | $ | 1,533,043 | |
United Kingdom Hedged Equity Fund | | | | | | | | | | | | |
Foreign exchange contracts | | Unrealized appreciation on forward foreign currency contracts | | | 37,121 | | | Unrealized depreciation on forward foreign currency contracts | | | 943,443 | |
For the fiscal year or period ended March 31, 2016, the effect of derivative instruments on each Fund’s financial performance as reflected in the Statements of Operations are presented in the summary below:
| | | | | | | | |
| Fund | | Amount of Realized
Gain or (Loss) on Derivatives
Recognized1 | | | Change in Unrealized
Appreciation or (Depreciation) on
Derivatives Recognized2 | |
Australia Dividend Fund | | | | | | | | |
Foreign exchange contracts | | $ | 5,544 | | | $ | — | |
Europe Hedged Equity Fund | | | | | | | | |
Foreign exchange contracts | | | 257,042,609 | | | | (1,203,691,996 | ) |
Europe Hedged SmallCap Equity Fund | | | | | | | | |
Foreign exchange contracts | | | (1,207,875 | ) | | | (12,720,268 | ) |
Europe Quality Dividend Growth Fund | | | | | | | | |
Foreign exchange contracts | | | (4,286 | ) | | | (2 | ) |
Europe SmallCap Dividend Fund | | | | | | | | |
Foreign exchange contracts | | | 802,639 | | | | 950 | |
Germany Hedged Equity Fund | | | | | | | | |
Foreign exchange contracts | | | (737,188 | ) | | | (12,710,368 | ) |
Global ex-U.S. Hedged Dividend Fund3 | | | | | | | | |
Foreign exchange contracts | | | 164,152 | | | | (148,325 | ) |
Global ex-U.S. Hedged Real Estate Fund4 | | | | | | | | |
Foreign exchange contracts | | | 35,312 | | | | (76,953 | ) |
International Dividend ex-Financials Fund | | | | | | | | |
Foreign exchange contracts | | | (77,807 | ) | | | 556 | |
International Equity Fund | | | | | | | | |
Foreign exchange contracts | | | (28,718 | ) | | | (9,246 | ) |
International Hedged Equity Fund5 | | | | | | | | |
Foreign exchange contracts | | | 106,336 | | | | (164,819 | ) |
International Hedged Quality Dividend Growth Fund | | | | | | | | |
Foreign exchange contracts | | | 12,191,240 | | | | (31,062,982 | ) |
International Hedged SmallCap Dividend Fund3 | | | | | | | | |
Foreign exchange contracts | | | 27,660 | | | | (39,001 | ) |
International High Dividend Fund | | | | | | | | |
Foreign exchange contracts | | | 121,852 | | | | (4,825 | ) |
International LargeCap Dividend Fund | | | | | | | | |
Foreign exchange contracts | | | (85,266 | ) | | | 534 | |
International MidCap Dividend Fund | | | | | | | | |
Foreign exchange contracts | | | 27,687 | | | | 33 | |
International SmallCap Dividend Fund | | | | | | | | |
Foreign exchange contracts | | | 19,833 | | | | (18,502 | ) |
Japan Hedged Capital Goods Fund | | | | | | | | |
Foreign exchange contracts | | | (127,873 | ) | | | (16,499 | ) |
Japan Hedged Equity Fund | | | | | | | | |
Foreign exchange contracts | | | (743,237,005 | ) | | | (70,531,594 | ) |
Japan Hedged Financials Fund | | | | | | | | |
Foreign exchange contracts | | | (1,643,858 | ) | | | (44,952 | ) |
Japan Hedged Health Care Fund | | | | | | | | |
Foreign exchange contracts | | | (1,869,049 | ) | | | (58,379 | ) |
| | |
| 218 | | WisdomTree Developed World ex-U.S. and Currency Hedged Equity Funds |
Notes to Financial Statements (continued)
| | | | | | | | |
| Fund | | Amount of Realized
Gain or (Loss) on Derivatives
Recognized1 | | | Change in Unrealized
Appreciation or (Depreciation) on
Derivatives Recognized2 | |
Japan Hedged Quality Dividend Growth Fund6 | | | | | | | | |
Foreign exchange contracts | | $ | (1,211,036 | ) | | $ | (49,495 | ) |
Japan Hedged Real Estate Fund | | | | | | | | |
Foreign exchange contracts | | | (5,904,427 | ) | | | (588,455 | ) |
Japan Hedged SmallCap Equity Fund | | | | | | | | |
Foreign exchange contracts | | | (9,979,737 | ) | | | (703,264 | ) |
Japan Hedged Tech, Media and Telecom Fund | | | | | | | | |
Foreign exchange contracts | | | (107,090 | ) | | | (22,169 | ) |
Japan Quality Dividend Growth Fund7 | | | | | | | | |
Foreign exchange contracts | | | (61 | ) | | | (2 | ) |
Japan SmallCap Dividend Fund | | | | | | | | |
Foreign exchange contracts | | | 19,294 | | | | 312 | |
Korea Hedged Equity Fund | | | | | | | | |
Foreign exchange contracts | | | 2,285,218 | | | | (1,636,219 | ) |
United Kingdom Hedged Equity Fund | | | | | | | | |
Foreign exchange contracts | | | 3,038,614 | | | | (1,922,325 | ) |
| | 1 | Realized gains (losses) on derivatives are located on the Statements of Operations as follows: |
| | |
Foreign exchange contracts | | Net realized gain (loss) from forward foreign currency contracts and foreign
currency related transactions |
| | 2 | Change in unrealized appreciation (depreciation) is located on the Statements of Operations as follows: |
| | |
Foreign exchange contracts | | Net change in unrealized appreciation (depreciation) from forward foreign
currency contracts and translation of assets and liabilities denominated in
foreign currencies |
| | 3 | For the period June 4, 2015 (commencement of operations) through March 31, 2016. |
| | 4 | For the period October 29, 2015 (commencement of operations) through March 31, 2016. |
| | 5 | For the period July 9, 2015 (commencement of operations) through March 31, 2016. |
| | 6 | For the period April 9, 2015 (commencement of operations) through March 31, 2016. |
| | 7 | For the period May 28, 2015 (commencement of operations) through March 31, 2016. |
During the fiscal year or period ended March 31, 2016, the volume of derivative activity (based on the average of month-end balances) for the Funds was as follows:
| | | | | | | | |
| | | Average Notional | |
| Fund | | Forward foreign
currency contracts
(to deliver) | | | Forward foreign
currency contracts
(to receive) | |
Australia Dividend Fund | |
Foreign exchange contracts | | $ | — | | | $ | 5,804 | |
Europe Hedged Equity Fund | |
Foreign exchange contracts | | | 19,265,221,194 | | | | 37,613,172,911 | |
Europe Hedged SmallCap Equity Fund | |
Foreign exchange contracts | | | 232,096,347 | | | | 452,621,112 | |
Europe Quality Dividend Growth Fund | |
Foreign exchange contracts | | | 443 | | | | 3,435 | |
Europe SmallCap Dividend Fund | |
Foreign exchange contracts | | | 318,321 | | | | 393,639 | |
Germany Hedged Equity Fund | |
Foreign exchange contracts | | | 315,344,380 | | | | 611,735,992 | |
Global ex-U.S. Hedged Dividend Fund1 | |
Foreign exchange contracts | | | 4,990,754 | | | | 9,557,414 | |
Global ex-U.S. Hedged Real Estate Fund2 | |
Foreign exchange contracts | | | 1,100,034 | | | | 2,184,999 | |
International Dividend ex-Financials Fund | |
Foreign exchange contracts | | | 3,952 | | | | 115,993 | |
| | | | |
| WisdomTree Developed World ex-U.S. and Currency Hedged Equity Funds | | | 219 | |
Notes to Financial Statements (continued)
| | | | | | | | |
| | | Average Notional | |
| Fund | | Forward foreign
currency contracts
(to deliver) | | | Forward foreign
currency contracts
(to receive) | |
International Equity Fund | |
Foreign exchange contracts | | $ | 78,069 | | | $ | 443,961 | |
International Hedged Equity Fund3 | |
Foreign exchange contracts | | | 3,854,667 | | | | 7,633,957 | |
International Hedged Quality Dividend Growth Fund | |
Foreign exchange contracts | | | 507,050,498 | | | | 1,006,016,821 | |
International Hedged SmallCap Dividend Fund1 | |
Foreign exchange contracts | | | 1,979,011 | | | | 3,722,259 | |
International High Dividend Fund | |
Foreign exchange contracts | | | 170,679 | | | | 254,784 | |
International LargeCap Dividend Fund | |
Foreign exchange contracts | | | 67,440 | | | | 149,777 | |
International MidCap Dividend Fund | |
Foreign exchange contracts | | | 42,902 | | | | 74,019 | |
International SmallCap Dividend Fund | |
Foreign exchange contracts | | | 346,013 | | | | 589,495 | |
Japan Hedged Capital Goods Fund | |
Foreign exchange contracts | | | 2,756,446 | | | | 5,461,719 | |
Japan Hedged Equity Fund | |
Foreign exchange contracts | | | 16,220,211,162 | | | | 31,568,433,393 | |
Japan Hedged Financials Fund | |
Foreign exchange contracts | | | 23,863,378 | | | | 45,916,007 | |
Japan Hedged Health Care Fund | |
Foreign exchange contracts | | | 13,380,761 | | | | 25,711,661 | |
Japan Hedged Quality Dividend Growth Fund4 | |
Foreign exchange contracts | | | 19,042,907 | | | | 36,805,912 | |
Japan Hedged Real Estate Fund | |
Foreign exchange contracts | | | 56,908,443 | | | | 111,474,843 | |
Japan Hedged SmallCap Equity Fund | |
Foreign exchange contracts | | | 166,406,351 | | | | 349,906,380 | |
Japan Hedged Tech, Media and Telecom Fund | |
Foreign exchange contracts | | | 3,913,495 | | | | 7,677,515 | |
Japan Quality Dividend Growth Fund5 | |
Foreign exchange contracts | | | — | | | | 411 | |
Japan SmallCap Dividend Fund | |
Foreign exchange contracts | | | — | | | | 83,548 | |
Korea Hedged Equity Fund | |
Foreign exchange contracts | | | 21,865,685 | | | | 45,833,061 | |
United Kingdom Hedged Equity Fund | |
Foreign exchange contracts | | | 33,885,147 | | | | 67,000,296 | |
| | 1 | For the period June 4, 2015 (commencement of operations) through March 31, 2016. |
| | 2 | For the period October 29, 2015 (commencement of operations) through March 31, 2016. |
| | 3 | For the period July 9, 2015 (commencement of operations) through March 31, 2016. |
| | 4 | For the period April 9, 2015 (commencement of operations) through March 31, 2016. |
| | 5 | For the period May 28, 2015 (commencement of operations) through March 31, 2016. |
Investment Transactions and Investment Income — Investment transactions are recorded as of the date that the securities are purchased or sold (trade date). Realized gains and losses on sales of portfolio securities are calculated using the identified-cost method. Dividend income is recognized on the ex-dividend date, net of any foreign taxes withheld. Interest income including amortization of premiums and discounts, is accrued daily.
Foreign Currency Translation — The accounting records of the Funds are maintained in U.S. dollars. Foreign currencies, as well as investment securities and other assets and liabilities denominated in foreign currencies, are translated into U.S. dollars using exchange rates prevailing on the respective dates of such transactions that are deemed appropriate by WTAM. Realized and unrealized foreign exchange gains and losses on investments are included as a component of net realized gain (loss) from
| | |
| 220 | | WisdomTree Developed World ex-U.S. and Currency Hedged Equity Funds |
Notes to Financial Statements (continued)
investment transactions and net change in unrealized appreciation (depreciation) from investment transactions, respectively, on the Statements of Operations. Net realized and unrealized foreign exchange gains or losses arising from sales of foreign currencies, including gains and losses of forward foreign currency contracts, currency gains or losses recognized between the trade and settlement dates on investment transactions, and the difference between the amounts of dividends and foreign withholding taxes recorded on the Funds’ books and the U.S. dollar equivalent of the amounts actually received or paid are included in net realized gain (loss) from forward foreign currency contracts and foreign currency related transactions and/or net change in unrealized appreciation (depreciation) from forward foreign currency contracts and translation of assets and liabilities denominated in foreign currencies in the Statements of Operations. Certain foreign exchange gains and losses included in realized and unrealized gains or losses are included in, or are a reduction of, ordinary income in accordance with U.S. Federal income tax regulations.
Expenses/Reimbursements — Under the investment advisory agreement for each Fund, except for Funds that commenced operations on or after March 26, 2013, WTAM has agreed to pay all expenses of the Trust, except for: (i) brokerage expenses and other expenses (such as stamp taxes) connected with the execution of portfolio transactions or in connection with creation and redemption transactions; (ii) legal fees or expenses in connection with any arbitration, litigation or pending or threatened arbitration or litigation, including any settlements in connection therewith; (iii) compensation and expenses of trustees who are not interested persons of the Funds (“Independent Trustees”); (iv) compensation and expenses of counsel to the Independent Trustees; (v) compensation and expenses of the Trust’s Chief Compliance Officer (“CCO”); (vi) extraordinary expenses; (vii) distribution fees and expenses paid by the Trust under any distribution plan adopted pursuant to Rule 12b-1 under the 1940 Act; and (viii) the advisory fee payable to WTAM.
Under the investment advisory agreement for Funds that commenced operations on or after March 26, 2013, WTAM has agreed to pay all expenses of the Trust, except for: (i) brokerage expenses and other fees, charges, taxes, levies or expenses (such as stamp taxes) incurred in connection with the execution of portfolio transactions or in connection with creation and redemption transactions (including without limitation any fees, charges, taxes, levies or expenses related to the purchase or sale of an amount of any currency, or the partition or repatriation of any security or other asset, related to the execution of portfolio transactions or any creation or redemption transactions); (ii) legal fees or expenses in connection with any arbitration, litigation or pending or threatened arbitration or litigation, including any settlements in connection therewith; (iii) compensation and expenses of each Independent Trustee; (iv) compensation and expenses of counsel to the Independent Trustees; (v) compensation and expenses of the Trust’s CCO; (vi) extraordinary expenses (in each case as determined by a majority of the Independent Trustees); (vii) distribution fees and expenses paid by the Trust under any distribution plan adopted pursuant to Rule 12b-1 under the 1940 Act; (viii) interest and taxes of any kind or nature (including, but not limited to, income, excise, transfer and withholding taxes); (ix) fees and expenses related to the provision of securities lending services; and (x) the advisory fee payable to WTAM.
The internal expenses of pooled investment vehicles in which the Funds may invest (acquired fund fees and expenses) are not expenses of the Funds and are not paid by WTAM.
Pursuant to a separate contractual arrangement, WTAM arranges for the provision of CCO services with respect to each Fund, and is liable and responsible for, and administers, payments to the CCO, the Independent Trustees and counsel to the Independent Trustees. WTAM receives a fee, as shown on the Statements of Operations under “Service fees”, of up to 0.0044% of each Fund’s average daily net assets for providing such services and paying such expenses. WTAM provides CCO services to the Trust.
During the fiscal year ended March 31, 2016, certain Funds, as shown on the Statements of Operations under “Professional fees”, incurred non-recurring fees with respect to obtaining tax relief on United Kingdom stamp duty reserve taxes.
Currency Transactions — The Funds may enter into foreign currency forward and foreign currency futures contracts to facilitate local securities settlements or to protect against currency exposure. The Funds, other than the Currency Hedged Equity Funds, do not expect to engage in currency transactions for the purpose of hedging against declines in the value of a Fund’s assets that are denominated in one or more foreign currencies. The Funds may not enter into such contracts for speculative purposes.
Forward Foreign Currency Contracts — A forward foreign currency contract (“Forward Contract”) involves an obligation to purchase or sell a specific currency at a future date, which may be any fixed number of days from the date of the contract agreed upon by the parties, at a price set at the time of the contract. These contracts are principally traded in the inter-bank market conducted directly between currency traders (usually large, commercial banks) and their customers. A Forward Contract generally does not require an initial margin deposit and no commissions are charged at any stage for trades. However, if a Fund is in an unrealized loss position on a Forward Contract, it may be required to pledge collateral (or additional collateral) to the counterparty. If a Fund is in an unrealized gain position on a Forward Contract, it may receive collateral from the counterparty.
Risks may arise upon entering into Forward Contracts from the potential inability of counterparties to meet the terms of their contracts and from unanticipated movements in the value of foreign currencies relative to the U.S. dollar or each other.
| | | | |
| WisdomTree Developed World ex-U.S. and Currency Hedged Equity Funds | | | 221 | |
Notes to Financial Statements (continued)
Fluctuations in the value of open Forward Contracts are recorded for book purposes as unrealized gains or losses on Forward Contracts by the Funds. Realized gains and losses on Forward Contracts include net gains or losses recognized by the Funds on contracts which have matured or were sold.
Securities Lending — Each Fund may lend portfolio securities to certain creditworthy borrowers, including the Funds’ securities lending agent. It is the Funds’ policy that, at origination, all loans are secured by collateral of at least 102% of the value of U.S. securities loaned and 105% of the value of foreign securities loaned. Collateral in the form of cash and/or high-grade debt obligations, equivalent to at least 100% of the market value of securities, is maintained at all times. The cash collateral can be invested in certain money market mutual funds which also have exposure to the fluctuations of the market. The values of the investments of cash collateral for securities on loan along with the obligations to return such collateral are included on the Statements of Assets and Liabilities. The total value of securities received as collateral for securities on loan is included in a footnote following each Schedule of Investments, but is not included within the Statements of Assets and Liabilities because the receiving Fund does not have the right to sell or repledge the securities received as collateral. Each Fund receives compensation for lending its securities from interest or dividends earned on the cash or U.S. government securities held as collateral, net of fee rebates paid to the borrower plus reasonable administrative and custody fees, all of which are included in the securities lending income earned by the Funds and disclosed on the Statements of Operations. The dividend and interest income earned on the securities loaned is accounted for in the same manner as other dividend and interest income. The borrower pays to the Funds an amount equal to any dividends or interest received on loaned securities. Dividends received while a security is out on loan are not considered Qualified Dividend Income (“QDI”) under the specific criteria issued by the Internal Revenue Service and are subject to taxation at the shareholder’s ordinary income tax rate instead of the lower long-term capital gains tax rate. Lending portfolio securities could result in a loss or delay in recovering each Fund’s securities if the borrower defaults.
Master Netting Arrangements — ASU No. 2011-11 “Disclosures about Offsetting Assets and Liabilities” (“ASU 2011-11”) is generally intended to (i) help investors and other financial statement users to better assess the effect or potential effect of offsetting arrangements on a company’s financial position, (ii) improve transparency in the reporting of how companies mitigate credit risk, and (iii) facilitate comparisons between those entities that prepare their financial statements on the basis of GAAP and those entities that prepare their financial statements on the basis of international financial reporting standards. ASU 2011-11 requires entities to disclose (i) gross and net information about both instruments and transactions eligible for offset in the financial statements, and (ii) instruments and transactions subject to an agreement similar to a master netting agreement. ASU 2011-11 is limited in scope to the following financial instruments, to the extent they are offset in the financial statements or subject to an enforceable master netting arrangement or similar agreement: (i) recognized derivative instruments accounted for under ASC 815 (Derivatives and Hedging); (ii) repurchase agreements and reverse repurchase agreements; and (iii) securities borrowing and securities lending transactions.
In order to better define its contractual rights and to secure rights that will help a Fund mitigate its counterparty risk, a Fund may enter into an International Swaps and Derivatives Association, Inc. Master Agreement (“ISDA Master Agreement”) or similar agreement with its counterparties. An ISDA Master Agreement is a bilateral agreement between a Fund and a counterparty that governs over-the-counter derivatives (“OTC”), including Forward Contracts, and typically contains, among other things, collateral posting terms, netting and rights of set-off provisions in the event of a default and/or termination event. Under an ISDA Master Agreement, a Fund may, under certain circumstances, offset with the counterparty certain derivative financial instruments’ payables and receivables to create a single net payment. The provisions of the ISDA Master Agreement typically permit a single net payment in the event of a default (close-out netting) or similar event, including the bankruptcy or insolvency of the counterparty.
Collateral requirements generally differ by type of derivative. Collateral terms are contract-specific for OTC derivatives (e.g. foreign exchange contracts, options and certain swaps). Generally, for transactions traded under an ISDA Master Agreement, the collateral requirements are calculated by netting the marked to market amount for each transaction under such agreement and comparing that amount to the value of any collateral currently pledged by a Fund and the counterparty. Generally, the amount of collateral due from or to a counterparty must exceed a minimum transfer amount threshold before a transfer is required to be made. To the extent amounts due to a Fund from its derivatives counterparties are not fully collateralized, contractually or otherwise, the Fund bears the risk of loss from a counterparty’s non-performance.
A Fund’s security lending activities are governed by a Securities Lending Authorization Agreement (“Lending Agreement”) between the Fund and the lending agent. The Lending Agreement authorizes the lending agent to lend qualifying U.S. and foreign securities held by a Fund to approved borrowers (each a “Borrower”). To mitigate borrower risk, a Fund typically receives from a Borrower, collateral in the form of U.S. dollar cash and/or securities issued or guaranteed by the U.S. government or its agencies in excess of the market value of the securities loaned. Under the provisions of the Lending Agreement, a Fund shall have, as to the collateral, all of the rights and remedies of a secured party under applicable law. A Fund is exposed to risk of loss if a Borrower defaults on its obligation to return borrowed securities and the value of the collateral a Fund received is insufficient to cover the market value of the securities loaned. Also, the lending agent is permitted to invest the cash collateral it receives from a Borrower into a money market
| | |
| 222 | | WisdomTree Developed World ex-U.S. and Currency Hedged Equity Funds |
Notes to Financial Statements (continued)
fund which is subject to market fluctuation. Therefore, a Fund is exposed to risk of loss if the value of invested cash collateral is insufficient to satisfy the Fund’s obligation to return the full amount owed to such Borrower.
For financial reporting purposes, the Funds elect to not offset assets and liabilities subject to an ISDA Master Agreement or Lending Agreement, if any, in the Statements of Assets and Liabilities. Therefore, all qualifying transactions are presented on a gross basis in the Statements of Assets and Liabilities. As of March 31, 2016, the impact of netting of assets and liabilities and the offsetting of collateral pledged or received based on contractual netting/set-off provisions in the ISDA Master Agreement and the Lending Agreement are detailed in the following table:
| | | | | | | | | | | | | | | | | | | | | | | | | | | | | | | | | | |
| | | Assets | | | | | Liabilities | |
| | | Gross Amounts in
the Statements of
Assets and Liabilities | | | Gross Amounts Not Offset
in the Statements of
Assets and Liabilities | | | Net
Amount | | | | | Gross Amounts in
the Statements of
Assets and Liabilities | | | Gross Amounts Not Offset
in the Statements of
Assets and Liabilities | | | | |
| Fund | | | Financial
Instruments | | | Collateral
Received | | | | | | Financial
Instruments | | | Collateral
Pledged | | | Net
Amount | |
Australia Dividend Fund | | | | | | | | | | | | | | | |
Securities Lending | | $ | 1,786,687 | | | $ | — | | | $ | (1,786,687 | )1 | | $ | — | | | | | $ | — | | | $ | — | | | $ | — | | | $ | — | |
Europe Hedged Equity Fund | | | | | | | | | | | | | | | |
Securities Lending | | | 276,592,888 | | | | — | | | | (276,592,888 | )1 | | | — | | | | | | — | | | | — | | | | — | | | | — | |
Forward Foreign Currency Contracts | | | 26,469,670 | | | | (24,487,629 | ) | | | — | | | | 1,982,041 | | | | | | 672,918,232 | | | | (24,487,629 | ) | | | — | | | | 648,430,603 | |
Europe Hedged SmallCap Equity Fund | | | | | | | | | | | | | | | |
Securities Lending | | | 24,062,711 | | | | — | | | | (24,062,711 | )1 | | | — | | | | | | — | | | | — | | | | — | | | | — | |
Forward Foreign Currency Contracts | | | 8,437 | | | | — | | | | — | | | | 8,437 | | | | | | 12,176,615 | | | | — | | | | — | | | | 12,176,615 | |
Europe Quality Dividend Growth Fund | | | | | | | | | | | | | | | |
Securities Lending | | | 226,763 | | | | — | | | | (226,763 | )1 | | | — | | | | | | — | | | | — | | | | — | | | | — | |
Europe SmallCap Dividend Fund | | | | | | | | | | | | | | | |
Securities Lending | | | 49,720,141 | | | | — | | | | (49,720,141 | )1 | | | — | | | | | | — | | | | — | | | | — | | | | — | |
Forward Foreign Currency Contracts | | | 1,240 | | | | — | | | | — | | | | 1,240 | | | | | | 384 | | | | — | | | | — | | | | 384 | |
Germany Hedged Equity Fund | | | | | | | | | | | | | | | |
Securities Lending | | | 870,057 | | | | — | | | | (870,057 | )1 | | | — | | | | | | — | | | | — | | | | — | | | | — | |
Forward Foreign Currency Contracts | | | 346,062 | | | | (342,391 | ) | | | — | | | | 3,671 | | | | | | 9,497,256 | | | | (342,391 | ) | | | — | | | | 9,154,865 | |
Global ex-U.S. Hedged Dividend Fund | | | | | | | | | | | | | | | |
Securities Lending | | | 56,482 | | | | — | | | | (56,482 | )1 | | | — | | | | | | — | | | | — | | | | — | | | | — | |
Forward Foreign Currency Contracts | | | 206 | | | | (45 | ) | | | — | | | | 161 | | | | | | 148,531 | | | | (45 | ) | | | — | | | | 148,486 | |
Global ex-U.S. Hedged Real Estate Fund | | | | | | | | | | | | | | | |
Securities Lending | | | 89,965 | | | | — | | | | (89,965 | )1 | | | — | | | | | | — | | | | — | | | | — | | | | — | |
Forward Foreign Currency Contracts | | | 122 | | | | (26 | ) | | | — | | | | 96 | | | | | | 77,075 | | | | (26 | ) | | | — | | | | 77,049 | |
International Dividend ex-Financials Fund | | | | | | | | | | | | | | | |
Securities Lending | | | 10,899,170 | | | | — | | | | (10,899,170 | )1 | | | — | | | | | | — | | | | — | | | | — | | | | — | |
Forward Foreign Currency Contracts | | | 537 | | | | — | | | | — | | | | 537 | | | | | | 106 | | | | — | | | | — | | | | 106 | |
International Equity Fund | | | | | | | | | | | | | | | |
Securities Lending | | | 26,990,017 | | | | — | | | | (26,990,017 | )1 | | | — | | | | | | — | | | | — | | | | — | | | | — | |
Forward Foreign Currency Contracts | | | — | | | | — | | | | — | | | | — | | | | | | 427 | | | | — | | | | — | | | | 427 | |
International Hedged Equity Fund | | | | | | | | | | | | | | | |
Securities Lending | | | 73,293 | | | | — | | | | (73,293 | )1 | | | — | | | | | | — | | | | — | | | | — | | | | — | |
Forward Foreign Currency Contracts | | | 212 | | | | — | | | | — | | | | 212 | | | | | | 165,031 | | | | — | | | | — | | | | 165,031 | |
International Hedged Quality Dividend Growth Fund | | | | | | | | | | | | | | | |
Securities Lending | | | 20,016,975 | | | | — | | | | (20,016,975 | )1 | | | — | | | | | | — | | | | — | | | | — | | | | — | |
Forward Foreign Currency Contracts | | | 33,077 | | | | — | | | | — | | | | 33,077 | | | | | | 27,052,952 | | | | — | | | | — | | | | 27,052,952 | |
| | | | |
| WisdomTree Developed World ex-U.S. and Currency Hedged Equity Funds | | | 223 | |
Notes to Financial Statements (continued)
| | | | | | | | | | | | | | | | | | | | | | | | | | | | | | | | | | |
| | | Assets | | | | | Liabilities | |
| | | Gross Amounts in
the Statements of
Assets and Liabilities | | | Gross Amounts Not Offset
in the Statements of
Assets and Liabilities | | | Net
Amount | | | | | Gross Amounts in
the Statements of
Assets and Liabilities | | | Gross Amounts Not Offset
in the Statements of
Assets and Liabilities | | | | |
| Fund | | | Financial
Instruments | | | Collateral
Received | | | | | | Financial
Instruments | | | Collateral
Pledged | | | Net
Amount | |
International Hedged SmallCap Dividend Fund | | | | | | | | | | | | | | | |
Forward Foreign Currency Contracts | | $ | 72 | | | $ | (8 | ) | | $ | — | | | $ | 64 | | | | | $ | 39,073 | | | $ | (8 | ) | | $ | — | | | $ | 39,065 | |
International High Dividend Fund | | | | | | | | | | | | | | | |
Securities Lending | | | 6,611,170 | | | | — | | | | (6,611,170 | )1 | | | — | | | | | | — | | | | — | | | | — | | | | — | |
Forward Foreign Currency Contracts | | | 27 | | | | — | | | | — | | | | 27 | | | | | | 76 | | | | — | | | | — | | | | 76 | |
International LargeCap Dividend Fund | | | | | | | | | | | | | | | |
Securities Lending | | | 10,575,341 | | | | — | | | | (10,575,341 | )1 | | | — | | | | | | — | | | | — | | | | — | | | | — | |
Forward Foreign Currency Contracts | | | — | | | | — | | | | — | | | | — | | | | | | 295 | | | | — | | | | — | | | | 295 | |
International MidCap Dividend Fund | | | | | | | | | | | | | | | |
Securities Lending | | | 12,557,085 | | | | — | | | | (12,557,085 | )1 | | | — | | | | | | — | | | | — | | | | — | | | | — | |
International SmallCap Dividend Fund | | | | | | | | | | | | | | | |
Securities Lending | | | 113,130,909 | | | | — | | | | (113,130,909 | )1 | | | — | | | | | | — | | | | — | | | | — | | | | — | |
Forward Foreign Currency Contracts | | | — | | | | — | | | | — | | | | — | | | | | | 10,443 | | | | — | | | | — | | | | 10,443 | |
Japan Hedged Capital Goods Fund | | | | | | | | | | | | | | | |
Securities Lending | | | 183,040 | | | | — | | | | (183,040 | )1 | | | — | | | | | | — | | | | — | | | | — | | | | — | |
Forward Foreign Currency Contracts | | | 62 | | | | — | | | | — | | | | 62 | | | | | | 9,850 | | | | — | | | | — | | | | 9,850 | |
Japan Hedged Equity Fund | | | | | | | | | | | | | | | |
Securities Lending | | | 1,054,641,846 | | | | — | | | | (1,054,641,846 | )1 | | | — | | | | | | — | | | | — | | | | — | | | | — | |
Forward Foreign Currency Contracts | | | 8,111,974 | | | | (4,185,887 | ) | | | — | | | | 3,926,087 | | | | | | 40,080,250 | | | | (4,185,887 | ) | | | — | | | | 35,894,363 | |
Japan Hedged Financials Fund | | | | | | | | | | | | | | | |
Securities Lending | | | 1,772,431 | | | | — | | | | (1,772,431 | )1 | | | — | | | | | | — | | | | — | | | | — | | | | — | |
Forward Foreign Currency Contracts | | | 259 | | | | — | | | | — | | | | 259 | | | | | | 40,879 | | | | — | | | | — | | | | 40,879 | |
Japan Hedged Health Care Fund | | | | | | | | | | | | | | | |
Securities Lending | | | 2,354,002 | | | | — | | | | (2,354,002 | )1 | | | — | | | | | | — | | | | — | | | | — | | | | — | |
Forward Foreign Currency Contracts | | | 33,333 | | | | — | | | | — | | | | 33,333 | | | | | | 90,569 | | | | — | | | | — | | | | 90,569 | |
Japan Hedged Quality Dividend Growth Fund | | | | | | | | | | | | | | | |
Securities Lending | | | 600,464 | | | | — | | | | (600,464 | )1 | | | — | | | | | | — | | | | — | | | | — | | | | — | |
Forward Foreign Currency Contracts | | | 315 | | | | — | | | | — | | | | 315 | | | | | | 49,810 | | | | — | | | | — | | | | 49,810 | |
Japan Hedged Real Estate Fund | | | | | | | | | | | | | | | |
Securities Lending | | | 11,555,642 | | | | — | | | | (11,555,642 | )1 | | | — | | | | | | — | | | | — | | | | — | | | | — | |
Forward Foreign Currency Contracts | | | 26,922 | | | | — | | | | — | | | | 26,922 | | | | | | 488,559 | | | | — | | | | — | | | | 488,559 | |
Japan Hedged SmallCap Equity Fund | | | | | | | | | | | | | | | |
Securities Lending | | | 17,587,909 | | | | — | | | | (17,587,909 | )1 | | | — | | | | | | — | | | | — | | | | — | | | | — | |
Forward Foreign Currency Contracts | | | 86,924 | | | | (66,597 | ) | | | — | | | | 20,327 | | | | | | 313,701 | | | | (66,597 | ) | | | — | | | | 247,104 | |
Japan Hedged Tech, Media and Telecom Fund | | | | | | | | | | | | | | | |
Securities Lending | | | 230,624 | | | | — | | | | (230,624 | )1 | | | — | | | | | | — | | | | — | | | | — | | | | — | |
Forward Foreign Currency Contracts | | | 47 | | | | — | | | | — | | | | 47 | | | | | | 7,403 | | | | — | | | | — | | | | 7,403 | |
| | |
| 224 | | WisdomTree Developed World ex-U.S. and Currency Hedged Equity Funds |
Notes to Financial Statements (continued)
| | | | | | | | | | | | | | | | | | | | | | | | | | | | | | | | | | |
| | | Assets | | | | | Liabilities | |
| | | Gross Amounts in
the Statements of
Assets and Liabilities | | | Gross Amounts Not Offset
in the Statements of
Assets and Liabilities | | | Net
Amount | | | | | Gross Amounts in
the Statements of
Assets and Liabilities | | | Gross Amounts Not Offset
in the Statements of
Assets and Liabilities | | | | |
| Fund | | | Financial
Instruments | | | Collateral
Received | | | | | | Financial
Instruments | | | Collateral
Pledged | | | Net
Amount | |
Japan Quality Dividend Growth Fund | | | | | | | | | | | | | | | |
Securities Lending | | $ | 58,757 | | | $ | — | | | $ | (58,757 | )1 | | $ | — | | | | | $ | — | | | $ | — | | | $ | — | | | $ | — | |
Forward Foreign Currency Contracts | | | — | | | | — | | | | — | | | | — | | | | | | 2 | | | | — | | | | — | | | | 2 | |
Japan SmallCap Dividend Fund | | | | | | | | | | | | | | | |
Securities Lending | | | 68,662,149 | | | | — | | | | (68,662,149 | )1 | | | — | | | | | | — | | | | — | | | | — | | | | — | |
Korea Hedged Equity Fund | | | | | | | | | | | | | | | |
Securities Lending | | | 166,842 | | | | — | | | | (166,842 | )1 | | | — | | | | | | — | | | | — | | | | — | | | | — | |
Forward Foreign Currency Contracts | | | 14,782 | | | | (465 | ) | | | — | | | | 14,317 | | | | | | 1,533,043 | | | | (465 | ) | | | — | | | | 1,532,578 | |
United Kingdom Hedged Equity Fund | | | | | | | | | | | | | | | |
Securities Lending | | | 36,208 | | | | — | | | | (36,208 | )1 | | | — | | | | | | — | | | | — | | | | — | | | | — | |
Forward Foreign Currency Contracts | | | 37,121 | | | | (17,689 | ) | | | — | | | | 19,432 | | | | | | 943,443 | | | | (17,689 | ) | | | — | | | | 925,754 | |
| | 1 | The amount of collateral presented has been limited such that the net amount by counterparty cannot be less than zero. |
Short-Term Investments — Each Fund may invest a portion of its assets in high-quality money market instruments on an ongoing basis to provide liquidity or for other reasons. The instruments include short-term obligations issued by the U.S. government, its agencies, non-U.S. government agencies, negotiable certificates of deposit (“CDs”), fixed time deposits and bankers’ acceptances of U.S. and foreign banks and similar institutions, commercial papers, repurchase agreements and money market funds. CDs are short-term negotiable obligations of commercial banks. Time deposits are non-negotiable deposits maintained in banking institutions for specified periods of time at stated interest rates. Banker’s acceptances are time drafts drawn on commercial banks by borrowers, usually in connection with international transactions.
Tax Information and Dividends and Distributions to Shareholders — It is each Fund’s policy to comply with all requirements of the Internal Revenue Code of 1986, as amended (the “Code”). Each Fund intends to qualify for and to elect treatment as a separate Regulated Investment Company (“RIC”) under Subchapter M of the Code. In order to qualify for the special tax treatment accorded RICs and their shareholders, each Fund must, among other things, distribute with respect to each taxable year an amount equal to or greater than the sum of 90% of its investment company taxable income and 90% of its net tax-exempt interest income. There can be no guarantee that a Fund will pay dividends. Taxable net realized gains from investment transactions, reduced by capital loss carryforwards, if any, are declared and distributed to shareholders at least annually. The capital loss carryforward amount, if any, is available to offset future net capital gains. The Funds may occasionally be required to make supplemental distributions at some other time during the year. The Trust reserves the right to declare special distributions if, in its reasonable discretion, such action is necessary or advisable to preserve the status of each Fund as a RIC or to avoid imposition of income or excise taxes on undistributed income. Dividends and distributions to shareholders are recorded on the ex-dividend date. The amount of dividends and distributions from net investment income and net realized capital gains are determined in accordance with the requirements of the Code and the U.S. Treasury regulations. These book/tax differences are either considered temporary or permanent in nature. To the extent these differences are permanent in nature, such amounts are reclassified within the components of net assets based on their Federal tax basis treatment; temporary differences do not require reclassification. Dividends and distributions that exceed earnings and profit for tax purposes are reported for tax purposes as a return of capital.
3. ADVISORY FEES AND OTHER TRANSACTIONS WITH AFFILIATES
WTAM has overall responsibility for the general management and administration of the Trust. WTAM provides an investment program for each Fund. WTAM has arranged for Mellon Capital Management Corporation (‘‘MCM’’) to provide sub-advisory services to the Funds. MCM is compensated by WTAM at no additional cost to the Funds. WTAM also arranges for transfer agency, custody, fund accounting, fund administration, securities lending and all other non-distribution related services necessary for the Funds to operate, which are generally under separate agreements entered into between the Trust on behalf of the Funds and the applicable service provider. Under the investment advisory agreement for each Fund, WTAM agrees to pay all expenses of the Funds, except for certain expenses described in Note 2.
| | | | |
| WisdomTree Developed World ex-U.S. and Currency Hedged Equity Funds | | | 225 | |
Notes to Financial Statements (continued)
Pursuant to a separate contractual arrangement, as also described in Note 2, WTAM arranges for the provision of CCO services with respect to each Fund, and is liable and responsible for, and administers, payments to the CCO, the Independent Trustees and counsel to the Independent Trustees in exchange for a fee of up to 0.0044% of each Fund’s average daily net assets. WTAM expects to receive advisory fees from each Fund, based on a percentage of the Fund’s average daily net assets, as shown in the following table:
| | | | |
| Fund | | Advisory Fee Rate | |
Australia Dividend Fund | | | 0.58 | % |
Europe Hedged Equity Fund | | | 0.58 | % |
Europe Hedged SmallCap Equity Fund | | | 0.58 | % |
Europe Quality Dividend Growth Fund | | | 0.58 | % |
Europe SmallCap Dividend Fund | | | 0.58 | % |
Germany Hedged Equity Fund | | | 0.48 | % |
Global ex-U.S. Hedged Dividend Fund | | | 0.44 | % |
Global ex-U.S. Hedged Real Estate Fund | | | 0.58 | %* |
International Dividend ex-Financials Fund | | | 0.58 | % |
International Equity Fund | | | 0.48 | % |
International Hedged Equity Fund | | | 0.35 | % |
International Hedged Quality Dividend Growth Fund | | | 0.58 | % |
International Hedged SmallCap Dividend Fund | | | 0.58 | %** |
International High Dividend Fund | | | 0.58 | % |
International LargeCap Dividend Fund | | | 0.48 | % |
International MidCap Dividend Fund | | | 0.58 | % |
International SmallCap Dividend Fund | | | 0.58 | % |
Japan Hedged Capital Goods Fund | | | 0.48 | %† |
Japan Hedged Equity Fund | | | 0.48 | % |
Japan Hedged Financials Fund | | | 0.48 | %† |
Japan Hedged Health Care Fund | | | 0.48 | %† |
Japan Hedged Quality Dividend Growth Fund | | | 0.48 | %*** |
Japan Hedged Real Estate Fund | | | 0.48 | %† |
Japan Hedged SmallCap Equity Fund | | | 0.58 | % |
Japan Hedged Tech, Media and Telecom Fund | | | 0.48 | %† |
Japan Quality Dividend Growth Fund | | | 0.48 | %*** |
Japan SmallCap Dividend Fund | | | 0.58 | % |
Korea Hedged Equity Fund | | | 0.58 | % |
United Kingdom Hedged Equity Fund | | | 0.48 | % |
| | † | During the period, WTAM had contractually agreed to limit the advisory fee to 0.43% through July 31, 2015. On July 31, 2015, the contractual waivers expired and were not renewed. |
| | * | WTAM has contractually agreed to limit the advisory fee to 0.43% through July 31, 2017, unless earlier terminated by the Board of Trustees of the Trust for any reason. |
| | ** | WTAM has contractually agreed to waive a portion of its advisory fee in an amount equal to the AFFEs attributable to the Fund’s investments in the Underlying Fund through July 31, 2018, unless earlier terminated by the Board of Trustees the Trust for any reason. |
| | *** | WTAM has contractually agreed to limit the advisory fee to 0.43% through July 31, 2016, unless earlier terminated by the Board of Trustees of the Trust for any reason. |
Each Fund may purchase shares of affiliated ETFs in secondary market transactions to reduce cash balances. For these transactions, WTAM waives its advisory fees related to each Fund’s investment in affiliated funds. The waivers may be reduced to offset the incremental costs related to these investments (fund accounting, safekeeping, transaction fees, etc.) that are paid by WTAM out of its advisory fee. The dollar amount of advisory fees waived during the period for the Funds, if any, are shown in the Statements of Operations.
| | |
| 226 | | WisdomTree Developed World ex-U.S. and Currency Hedged Equity Funds |
Notes to Financial Statements (continued)
Affiliated holdings are funds which are managed by, or an affiliate of, WTAM. Transactions with affiliated funds during the fiscal year or period ended March 31, 2016 are as follows:
| | | | | | | | | | | | | | | | | | | | | | | | |
| Fund | | Value at
3/31/2015 | | | Purchases/
Additions | | | Sales/
Reductions | | | Value at
3/31/2016 | | | Dividend
Income | | | Capital Gain
Distributions | |
Europe SmallCap Dividend Fund | |
WisdomTree International MidCap Dividend Fund | | $ | 940,186 | | | $ | 14,492,440 | | | $ | 12,618,354 | | | $ | 2,908,723 | | | $ | 93,645 | | | $ | — | |
International Dividend ex-Financials Fund | | | | | | | | | | | | | | | | | | | | | | | | |
WisdomTree International LargeCap Dividend Fund | | $ | 217,173 | | | $ | 7,934,299 | | | $ | 7,700,350 | | | $ | 230,746 | | | $ | 106,875 | | | $ | — | |
International Equity Fund | | | | | | | | | | | | | | | | | | | | | | | | |
WisdomTree International Dividend ex-Financials Fund | | $ | 1,935,496 | | | $ | 17,223,106 | | | $ | 18,692,588 | | | $ | 323,901 | | | $ | 173,384 | | | $ | — | |
International Hedged SmallCap Dividend Fund1 | | | | | | | | | | | | | | | | | | | | | | | | |
WisdomTree International SmallCap Dividend Fund | | $ | — | | | $ | 3,758,335 | | | $ | 2,449,408 | | | $ | 1,129,702 | | | $ | 59,989 | | | $ | — | |
International High Dividend Fund | | | | | | | | | | | | | | | | | | | | | | | | |
WisdomTree International LargeCap Dividend Fund | | $ | 409,180 | | | $ | 10,179,011 | | | $ | 10,490,434 | | | $ | 6,281 | | | $ | 114,211 | | | $ | — | |
International LargeCap Dividend Fund | | | | | | | | | | | | | | | | | | | | | | | | |
WisdomTree International MidCap Dividend Fund | | $ | 531,164 | | | $ | 7,080,310 | | | $ | 6,480,885 | | | $ | 955,246 | | | $ | 58,725 | | | $ | — | |
International MidCap Dividend Fund | | | | | | | | | | | | | | | | | | | | | | | | |
WisdomTree Australia Dividend Fund | | $ | 285,049 | | | $ | 931,485 | | | $ | 1,217,256 | | | $ | — | | | $ | 7,937 | | | $ | — | |
WisdomTree Japan Hedged Equity Fund | | | 287,065 | | | | 930,302 | | | | 1,190,642 | | | | — | | | | 3,640 | | | | 7,726 | |
Total | | $ | 572,114 | | | $ | 1,861,787 | | | $ | 2,407,898 | | | $ | — | | | $ | 11,577 | | | $ | 7,726 | |
International SmallCap Dividend Fund | | | | | | | | | | | | | | | | | | | | | | | | |
WisdomTree Europe SmallCap Dividend Fund | | $ | 3,658,097 | | | $ | 13,631,323 | | | $ | 16,118,806 | | | $ | 1,326,860 | | | $ | 26,145 | | | $ | — | |
WisdomTree Japan SmallCap Dividend Fund | | | 3,007,859 | | | | 11,249,270 | | | | 13,284,367 | | | | 1,058,281 | | | | 12,947 | | | | — | |
Total | | $ | 6,665,956 | | | $ | 24,880,593 | | | $ | 29,403,173 | | | $ | 2,385,141 | | | $ | 39,092 | | | $ | — | |
Japan SmallCap Dividend Fund | | | | | | | | | | | | | | | | | | | | | | | | |
WisdomTree Japan Hedged Equity Fund | | $ | 258,844 | | | $ | 4,709,894 | | | $ | 4,646,474 | | | $ | — | | | $ | 24,504 | | | $ | 101,506 | |
| | 1 | For the period June 4, 2015 (commencement of operations) through March 31, 2016. |
During the fiscal year ended March 31, 2016, the Japan Hedged SmallCap Equity Fund received a voluntary reimbursement of $888,000 from MCM for investment losses on certain foreign exchange transactions.
During the period ended March 31, 2016, the Global ex-U.S. Hedged Dividend Fund engaged in purchase and sale transactions with funds that have a common investment adviser, WTAM. These interfund purchase and sale transactions were at fair value and complied with Rule 17a-7 under the 1940 Act. For the period ended March 31, 2016, the cost of purchases, proceeds from sales and the net realized loss recognized upon the disposal of securities resulting from interfund transactions amounted to $949,793, $490,791 and $28,819, respectively.
4. CAPITAL SHARE TRANSACTIONS
As of March 31, 2016, there were an unlimited number of $0.001 par value shares of beneficial interest authorized by the Trust. Shares are issued and redeemed by each Fund only in creation units or multiples thereof. Except when aggregated in creation units, shares of each Fund are not redeemable. Transactions in shares for each Fund are disclosed in detail in the Statements of Changes in Net Assets. The consideration for the purchase of creation units of a Fund generally consists of the in-kind contribution of a designated portfolio of equity securities constituting a portfolio sampling representation of the securities included in the relevant Fund’s underlying Index and an amount of cash. Investors purchasing and redeeming creation units may be charged a purchase transaction fee and a redemption transaction fee to offset transfer and other transaction costs associated with the issuance and redemption of creation units.
5. INVESTMENT PORTFOLIO TRANSACTIONS
Purchases and sales of investments (excluding purchases and sales resulting from in-kind capital share transactions and short-term investments) and the cost of purchases and the proceeds from sales resulting from in-kind capital share transactions (excluding
| | | | |
| WisdomTree Developed World ex-U.S. and Currency Hedged Equity Funds | | | 227 | |
Notes to Financial Statements (continued)
short-term investments) for the fiscal year or period ended March 31, 2016 are shown in the following table. Realized gains and losses on sales resulting from in-kind capital share redemptions, as shown on the Statements of Operations, are not recognized by the Funds for tax purposes.
| | | | | | | | | | | | | | | | |
| | | | | | In-kind Capital Share Transactions | |
| Fund | | Purchases | | | Sales | | | Purchases | | | Sales | |
Australia Dividend Fund | | $ | 14,887,337 | | | $ | 14,794,764 | | | $ | — | | | $ | 10,334,887 | |
Europe Hedged Equity Fund | | | 5,342,827,472 | | | | 6,840,332,932 | | | | 6,438,732,385 | | | | 5,910,499,806 | |
Europe Hedged SmallCap Equity Fund | | | 86,685,053 | | | | 102,738,824 | | | | 198,972,765 | | | | 36,540,066 | |
Europe Quality Dividend Growth Fund | | | 9,247,243 | | | | 9,226,935 | | | | 7,196,818 | | | | — | |
Europe SmallCap Dividend Fund | | | 496,206,256 | | | | 483,916,333 | | | | 328,025,101 | | | | 73,643,340 | |
Germany Hedged Equity Fund | | | 113,458,914 | | | | 136,345,594 | | | | 133,177,213 | | | | 152,840,505 | |
Global ex-U.S. Hedged Dividend Fund1 | | | 4,002,353 | | | | 3,706,146 | | | | 9,182,971 | | | | 4,122,472 | |
Global ex-U.S. Hedged Real Estate Fund2 | | | 122,329 | | | | 91,028 | | | | 2,439,974 | | | | — | |
International Dividend ex-Financials Fund | | | 114,297,214 | | | | 115,608,015 | | | | 22,237,265 | | | | 74,006,495 | |
International Equity Fund | | | 89,627,871 | | | | 86,789,976 | | | | 84,335,526 | | | | 29,691,224 | |
International Hedged Equity Fund3 | | | 464,134 | | | | 498,769 | | | | 4,947,076 | | | | — | |
International Hedged Quality Dividend Growth Fund | | | 244,805,546 | | | | 250,738,550 | | | | 632,015,898 | | | | 86,388,768 | |
International Hedged SmallCap Dividend Fund1 | | | 130,395 | | | | 134,009 | | | | 3,627,940 | | | | 2,315,399 | |
International High Dividend Fund | | | 62,971,684 | | | | 63,931,107 | | | | 15,363,255 | | | | 47,677,394 | |
International LargeCap Dividend Fund | | | 73,629,594 | | | | 73,630,113 | | | | 71,265,433 | | | | 2,283,915 | |
International MidCap Dividend Fund | | | 37,689,422 | | | | 37,088,490 | | | | 5,921,244 | | | | — | |
International SmallCap Dividend Fund | | | 509,685,517 | | | | 496,654,259 | | | | 215,596,710 | | | | 25,696,841 | |
Japan Hedged Capital Goods Fund | | | 361,458 | | | | 635,313 | | | | 1,065,703 | | | | — | |
Japan Hedged Equity Fund | | | 4,131,960,726 | | | | 5,159,337,151 | | | | 3,116,128,848 | | | | 5,965,967,614 | |
Japan Hedged Financials Fund | | | 4,678,414 | | | | 5,420,800 | | | | 28,061,307 | | | | 14,999,570 | |
Japan Hedged Health Care Fund | | | 3,093,415 | | | | 4,655,828 | | | | 29,003,970 | | | | 13,180,088 | |
Japan Hedged Quality Dividend Growth Fund4 | | | 7,183,757 | | | | 7,686,203 | | | | 29,503,015 | | | | 12,220,922 | |
Japan Hedged Real Estate Fund | | | 7,474,304 | | | | 14,989,260 | | | | 135,801,427 | | | | 22,786,514 | |
Japan Hedged SmallCap Equity Fund | | | 76,695,781 | | | | 90,266,592 | | | | 118,248,822 | | | | 128,189,704 | |
Japan Hedged Tech, Media and Telecom Fund | | | 760,224 | | | | 1,077,857 | | | | — | | | | 1,422,854 | |
Japan Quality Dividend Growth Fund5 | | | 787,509 | | | | 813,807 | | | | 2,502,141 | | | | — | |
Japan SmallCap Dividend Fund | | | 99,347,317 | | | | 98,485,509 | | | | 189,166,578 | | | | 60,623,324 | |
Korea Hedged Equity Fund | | | 25,338,052 | | | | 23,507,426 | | | | — | | | | — | |
United Kingdom Hedged Equity Fund | | | 11,031,167 | | | | 9,938,451 | | | | 11,416,661 | | | | 7,917,455 | |
| | 1 | For the period June 4, 2015 (commencement of operations) through March 31, 2016. |
| | 2 | For the period October 29, 2015 (commencement of operations) through March 31, 2016. |
| | 3 | For the period July 9, 2015 (commencement of operations) through March 31, 2016. |
| | 4 | For the period April 9, 2015 (commencement of operations) through March 31, 2016. |
| | 5 | For the period May 28, 2015 (commencement of operations) through March 31, 2016. |
6. FEDERAL INCOME TAXES
At March 31, 2016, the cost of investments (including securities on loan) for Federal income tax purposes was as follows:
| | | | | | | | | | | | | | | | |
| Fund | | Tax Cost | | | Gross Unrealized
Appreciation | | | Gross Unrealized
Depreciation | | | Net Unrealized
Appreciation/
(Depreciation) | |
Australia Dividend Fund | | $ | 38,994,524 | | | $ | 3,827,748 | | | $ | (7,605,653 | ) | | $ | (3,777,905 | ) |
Europe Hedged Equity Fund | | | 15,635,477,864 | | | | 443,032,028 | | | | (2,002,098,271 | ) | | | (1,559,066,243 | ) |
Europe Hedged SmallCap Equity Fund | | | 282,750,311 | | | | 22,920,448 | | | | (18,515,625 | ) | | | 4,404,823 | |
Europe Quality Dividend Growth Fund | | | 18,788,638 | | | | 727,950 | | | | (1,489,451 | ) | | | (761,501 | ) |
Europe SmallCap Dividend Fund | | | 1,193,263,769 | | | | 93,900,462 | | | | (112,628,131 | ) | | | (18,727,669 | ) |
Germany Hedged Equity Fund | | | 221,413,678 | | | | 7,158,246 | | | | (27,989,194 | ) | | | (20,830,948 | ) |
Global ex-U.S. Hedged Dividend Fund | | | 4,741,671 | | | | 111,679 | | | | (490,789 | ) | | | (379,110 | ) |
| | |
| 228 | | WisdomTree Developed World ex-U.S. and Currency Hedged Equity Funds |
Notes to Financial Statements (continued)
| | | | | | | | | | | | | | | | |
| Fund | | Tax Cost | | | Gross Unrealized
Appreciation | | | Gross Unrealized
Depreciation | | | Net Unrealized
Appreciation/
(Depreciation) | |
Global ex-U.S. Hedged Real Estate Fund | | $ | 2,539,555 | | | $ | 100,785 | | | $ | (181,492 | ) | | $ | (80,707 | ) |
International Dividend ex-Financials Fund | | | 271,670,328 | | | | 13,331,356 | | | | (50,815,831 | ) | | | (37,484,475 | ) |
International Equity Fund | | | 651,761,464 | | | | 71,645,487 | | | | (80,467,235 | ) | | | (8,821,748 | ) |
International Hedged Equity Fund | | | 4,865,228 | | | | 175,069 | | | | (364,307 | ) | | | (189,238 | ) |
International Hedged Quality Dividend Growth Fund | | | 752,434,361 | | | | 31,738,869 | | | | (31,181,894 | ) | | | 556,975 | |
International Hedged SmallCap Dividend Fund | | | 1,217,353 | | | | — | | | | (87,651 | ) | | | (87,651 | ) |
International High Dividend Fund | | | 290,617,774 | | | | 20,704,316 | | | | (50,583,862 | ) | | | (29,879,546 | ) |
International LargeCap Dividend Fund | | | 398,013,918 | | | | 31,344,369 | | | | (55,087,626 | ) | | | (23,743,257 | ) |
International MidCap Dividend Fund | | | 153,746,921 | | | | 25,318,657 | | | | (14,036,870 | ) | | | 11,281,787 | |
International SmallCap Dividend Fund | | | 1,152,092,721 | | | | 159,192,718 | | | | (106,789,717 | ) | | | 52,403,001 | |
Japan Hedged Capital Goods Fund | | | 3,627,162 | | | | 73,271 | | | | (374,699 | ) | | | (301,428 | ) |
Japan Hedged Equity Fund | | | 11,720,815,046 | | | | 536,374,337 | | | | (1,524,015,759 | ) | | | (987,641,422 | ) |
Japan Hedged Financials Fund | | | 18,847,384 | | | | 39,693 | | | | (4,347,707 | ) | | | (4,308,014 | ) |
Japan Hedged Health Care Fund | | | 20,248,747 | | | | 840,229 | | | | (781,593 | ) | | | 58,636 | |
Japan Hedged Quality Dividend Growth Fund | | | 17,324,115 | | | | 623,420 | | | | (1,834,178 | ) | | | (1,210,758 | ) |
Japan Hedged Real Estate Fund | | | 155,213,898 | | | | 7,539,179 | | | | (819,466 | ) | | | 6,719,713 | |
Japan Hedged SmallCap Equity Fund | | | 109,038,417 | | | | 7,318,432 | | | | (8,564,242 | ) | | | (1,245,810 | ) |
Japan Hedged Tech, Media and Telecom Fund | | | 2,624,336 | | | | 276,294 | | | | (317,044 | ) | | | (40,750 | ) |
Japan Quality Dividend Growth Fund | | | 2,503,449 | | | | 112,906 | | | | (285,997 | ) | | | (173,091 | ) |
Japan SmallCap Dividend Fund | | | 463,243,316 | | | | 46,504,077 | | | | (23,105,145 | ) | | | 23,398,932 | |
Korea Hedged Equity Fund | | | 19,516,816 | | | | 1,069,469 | | | | (1,141,431 | ) | | | (71,962 | ) |
United Kingdom Hedged Equity Fund | | | 32,983,110 | | | | 886,976 | | | | (6,125,040 | ) | | | (5,238,064 | ) |
At March 31, 2016, the components of accumulated earnings/(loss) on a tax-basis were as follows:
| | | | | | | | | | | | | | | | | | | | |
| Fund | | Undistributed
Ordinary Income | | | Undistributed
Capital and Other
Losses | | | Net Unrealized
Appreciation/ (Depreciation) | | | Currency and
Other Unrealized
Appreciation/
(Depreciation) | | | Total Accumulated
Earnings/(Losses) | |
Australia Dividend Fund | | $ | 129,981 | | | $ | (24,218,483 | ) | | $ | (3,777,905 | ) | | $ | 14,193 | | | $ | (27,852,214 | ) |
Europe Hedged Equity Fund | | | 24,118,619 | | | | (1,713,557,531 | ) | | | (1,559,066,243 | ) | | | (2,833,028 | ) | | | (3,251,338,183 | ) |
Europe Hedged SmallCap Equity Fund | | | — | | | | (26,094,203 | ) | | | 4,404,823 | | | | 33,311 | | | | (21,656,069 | ) |
Europe Quality Dividend Growth Fund | | | 39,608 | | | | (1,349,328 | ) | | | (761,501 | ) | | | 1,097 | | | | (2,070,124 | ) |
Europe SmallCap Dividend Fund | | | 6,118,460 | | | | (108,900,813 | ) | | | (18,727,669 | ) | | | 11,405 | | | | (121,498,617 | ) |
Germany Hedged Equity Fund | | | 2,098,282 | | | | (30,147,366 | ) | | | (20,830,948 | ) | | | 15,335 | | | | (48,864,697 | ) |
Global ex-U.S. Hedged Dividend Fund | | | — | | | | (289,489 | ) | | | (379,110 | ) | | | (10,375 | ) | | | (678,974 | ) |
Global ex-U.S. Hedged Real Estate Fund | | | 67,532 | | | | (24,098 | ) | | | (80,707 | ) | | | (13,982 | ) | | | (51,255 | ) |
International Dividend ex-Financials Fund | | | 661,692 | | | | (156,384,479 | ) | | | (37,484,475 | ) | | | 3,939 | | | | (193,203,323 | ) |
International Equity Fund | | | 2,388,098 | | | | (250,647,521 | ) | | | (8,821,748 | ) | | | 35,584 | | | | (257,045,587 | ) |
International Hedged Equity Fund | | | 12,048 | | | | (123,365 | ) | | | (189,238 | ) | | | (6,561 | ) | | | (307,116 | ) |
International Hedged Quality Dividend Growth Fund | | | 2,804,720 | | | | (29,089,708 | ) | | | 556,975 | | | | (1,738,141 | ) | | | (27,466,154 | ) |
International Hedged SmallCap Dividend Fund | | | — | | | | (23,049 | ) | | | (87,651 | ) | | | (2,278 | ) | | | (112,978 | ) |
International High Dividend Fund | | | 828,267 | | | | (96,089,925 | ) | | | (29,879,546 | ) | | | 20,664 | | | | (125,120,540 | ) |
International LargeCap Dividend Fund | | | 1,253,392 | | | | (67,148,849 | ) | | | (23,743,257 | ) | | | 22,865 | | | | (89,615,849 | ) |
International MidCap Dividend Fund | | | 625,844 | | | | (78,109,372 | ) | | | 11,281,787 | | | | 6,588 | | | | (66,195,153 | ) |
International SmallCap Dividend Fund | | | 8,264,398 | | | | (250,463,784 | ) | | | 52,403,001 | | | | 52,394 | | | | (189,743,991 | ) |
Japan Hedged Capital Goods Fund | | | 26,498 | | | | (266,013 | ) | | | (301,428 | ) | | | 235 | | | | (540,708 | ) |
Japan Hedged Equity Fund | | | 84,734,836 | | | | (1,294,308,669 | ) | | | (987,641,422 | ) | | | 184,113 | | | | (2,197,031,142 | ) |
Japan Hedged Financials Fund | | | 169,638 | | | | (2,589,031 | ) | | | (4,308,014 | ) | | | 1,501 | | | | (6,725,906 | ) |
Japan Hedged Health Care Fund | | | 94,245 | | | | (2,390,278 | ) | | | 58,636 | | | | 921 | | | | (2,236,476 | ) |
Japan Hedged Quality Dividend Growth Fund | | | 101,479 | | | | (1,769,072 | ) | | | (1,210,758 | ) | | | 2,179 | | | | (2,876,172 | ) |
| | | | |
| WisdomTree Developed World ex-U.S. and Currency Hedged Equity Funds | | | 229 | |
Notes to Financial Statements (continued)
| | | | | | | | | | | | | | | | | | | | |
| Fund | | Undistributed
Ordinary Income | | | Undistributed
Capital and Other
Losses | | | Net Unrealized
Appreciation/ (Depreciation) | | | Currency and
Other Unrealized
Appreciation/
(Depreciation) | | | Total Accumulated
Earnings/(Losses) | |
Japan Hedged Real Estate Fund | | $ | 7,328,590 | | | $ | (7,791,194 | ) | | $ | 6,719,713 | | | $ | 8,710 | | | $ | 6,265,819 | |
Japan Hedged SmallCap Equity Fund | | | 1,030,569 | | | | (16,415,444 | ) | | | (1,245,810 | ) | | | 7,970 | | | | (16,622,715 | ) |
Japan Hedged Tech, Media and Telecom Fund | | | 13,359 | | | | (262,987 | ) | | | (40,750 | ) | | | 147 | | | | (290,231 | ) |
Japan Quality Dividend Growth Fund | | | 17,020 | | | | (29,378 | ) | | | (173,091 | ) | | | 223 | | | | (185,226 | ) |
Japan SmallCap Dividend Fund | | | 4,003,560 | | | | (33,481,454 | ) | | | 23,398,932 | | | | 23,468 | | | | (6,055,494 | ) |
Korea Hedged Equity Fund | | | — | | | | (1,602,868 | ) | | | (71,962 | ) | | | 5,499 | | | | (1,669,331 | ) |
United Kingdom Hedged Equity Fund | | | 105,641 | | | | (648,257 | ) | | | (5,238,064 | ) | | | 2,722 | | | | (5,777,958 | ) |
The tax character of distributions paid during the fiscal years or periods ended March 31, 2016 and March 31, 2015, was as follows:
| | | | | | | | | | | | | | | | |
| | | Year/Period Ended March 31, 2016 | | | Year/Period Ended March 31, 2015 | |
| Fund | | Distributions Paid
from Ordinary
Income* | | | Distributions Paid
from Long-Term
Capital Gains | | | Distributions Paid
from Ordinary
Income* | | | Distributions Paid
from Long-Term
Gains | |
Australia Dividend Fund | | $ | 1,267,826 | | | $ | — | | | $ | 1,972,575 | | | $ | — | |
Europe Hedged Equity Fund | | | 910,776,247 | | | | 737,085,064 | | | | 144,026,657 | | | | 114,683,770 | |
Europe Hedged SmallCap Equity Fund | | | 9,725,888 | | | | 334,836 | | | | — | 1 | | | — | 1 |
Europe Quality Dividend Growth Fund | | | 346,859 | | | | — | | | | 174,792 | 2 | | | — | 2 |
Europe SmallCap Dividend Fund | | | 26,876,423 | | | | — | | | | 37,998,494 | | | | — | |
Germany Hedged Equity Fund | | | 10,642,012 | | | | 3,927,059 | | | | 633,487 | | | | 608,209 | |
Global ex-U.S. Hedged Dividend Fund3 | | | 88,558 | | | | — | | | | — | | | | — | |
Global ex-U.S. Hedged Real Estate Fund4 | | | 15,424 | | | | — | | | | — | | | | — | |
International Dividend ex-Financials Fund | | | 11,777,974 | | | | — | | | | 15,437,232 | | | | — | |
International Equity Fund | | | 22,674,788 | | | | — | | | | 20,650,247 | | | | — | |
International Hedged Equity Fund5 | | | 34,502 | | | | — | | | | — | | | | — | |
International Hedged Quality Dividend Growth Fund | | | 11,453,265 | | | | 3,315,369 | | | | 437,423 | 2 | | | 357,396 | 2 |
International Hedged SmallCap Dividend Fund3 | | | 51,534 | | | | 4,392 | | | | — | | | | — | |
International High Dividend Fund | | | 12,735,562 | | | | — | | | | 13,241,538 | | | | — | |
International LargeCap Dividend Fund | | | 13,065,991 | | | | — | | | | 12,260,118 | | | | — | |
International MidCap Dividend Fund | | | 4,425,194 | | | | — | | | | 4,298,234 | | | | — | |
International SmallCap Dividend Fund | | | 28,273,035 | | | | — | | | | 28,286,347 | | | | — | |
Japan Hedged Capital Goods Fund | | | 66,028 | | | | 50,992 | | | | 74,676 | 6 | | | 86,828 | 6 |
Japan Hedged Equity Fund | | | 458,522,581 | | | | 436,828,633 | | | | 627,071,174 | | | | 684,541,310 | |
Japan Hedged Financials Fund | | | 152,954 | | | | 32,909 | | | | 296,278 | 6 | | | 388,762 | 6 |
Japan Hedged Health Care Fund | | | 102,133 | | | | 55,943 | | | | 91,689 | 6 | | | 109,145 | 6 |
Japan Hedged Quality Dividend Growth Fund7 | | | 167,600 | | | | — | | | | — | | | | — | |
Japan Hedged Real Estate Fund | | | 869,975 | | | | 701,299 | | | | 985,776 | 6 | | | 1,115,147 | 6 |
Japan Hedged SmallCap Equity Fund | | | 3,379,441 | | | | 3,164,723 | | | | 3,081,275 | | | | 5,010,437 | |
Japan Hedged Tech, Media and Telecom Fund | | | 155,414 | | | | 106,591 | | | | 131,588 | 6 | | | 190,482 | 6 |
Japan Quality Dividend Growth Fund8 | | | 21,482 | | | | — | | | | — | | | | — | |
Japan SmallCap Dividend Fund | | | 4,387,792 | | | | — | | | | 4,434,720 | | | | — | |
Korea Hedged Equity Fund | | | 52,830 | | | | — | | | | 84,857 | | | | — | |
United Kingdom Hedged Equity Fund | | | 1,569,517 | | | | 100,489 | | | | 756,787 | | | | — | |
| | * | Includes short-term capital gains if any. |
| | 1 | For the period March 4, 2015 (commencement of operations) through March 31, 2015. |
| | 2 | For the period May 7, 2014 (commencement of operations) through March 31, 2015. |
| | 3 | For the period June 4, 2015 (commencement of operations) through March 31, 2016. |
| | 4 | For the period October 29, 2015 (commencement of operations) through March 31, 2016. |
| | 5 | For the period July 9, 2015 (commencement of operations) through March 31, 2016. |
| | 6 | For the period April 8, 2014 (commencement of operations) through March 31, 2015. |
| | 7 | For the period April 9, 2015 (commencement of operations) through March 31, 2016. |
| | 8 | For the period May 28, 2015 (commencement of operations) through March 31, 2016. |
| | |
| 230 | | WisdomTree Developed World ex-U.S. and Currency Hedged Equity Funds |
Notes to Financial Statements (continued)
At March 31, 2016, for Federal tax purposes, the Funds have capital loss carryforwards available to offset future capital gains through the years indicated. To the extent that these loss carryforwards are utilized, capital gains so offset will not be distributed to shareholders.
| | | | | | | | | | | | | | | | | | | | | | | | |
| Fund | | Capital Loss
Available
Through 2017 | | | Capital Loss
Available
Through 2018 | | | Capital Loss
Available
Through 2019 | | | Short-Term
Post-Effective
No Expiration | | | Long-Term
Post-Effective
No Expiration | | | Capital Loss
Available Total | |
Australia Dividend Fund | | $ | 2,237,436 | | | $ | 10,402,798 | | | $ | 2,670,223 | | | $ | 4,896,921 | | | $ | 2,441,429 | | | $ | 22,648,807 | |
Europe Hedged Equity Fund | | | — | | | | — | | | | — | | | | 670,437,210 | | | | 643,791,769 | | | | 1,314,228,979 | |
Europe Hedged SmallCap Equity Fund | | | — | | | | — | | | | — | | | | 6,763,118 | | | | 6,462,891 | | | | 13,226,009 | |
Europe Quality Dividend Growth Fund | | | — | | | | — | | | | — | | | | 596,597 | | | | 568,582 | | | | 1,165,179 | |
Europe SmallCap Dividend Fund | | | — | | | | 15,981,777 | | | | 2,102,724 | | | | 64,472,960 | | | | 19,959,582 | | | | 102,517,043 | |
Germany Hedged Equity Fund | | | — | | | | — | | | | — | | | | 10,262,984 | | | | 11,260,581 | | | | 21,523,565 | |
Global ex-U.S. Hedged Dividend Fund | | | — | | | | — | | | | — | | | | 178,408 | | | | — | | | | 178,408 | |
Global ex-U.S. Hedged Real Estate Fund | | | — | | | | — | | | | — | | | | — | | | | — | | | | — | |
International Dividend ex-Financials Fund | | | 37,831,029 | | | | 106,422,557 | | | | — | | | | 12,130,893 | | | | — | | | | 156,384,479 | |
International Equity Fund | | | 24,645,745 | �� | | | 187,173,747 | | | | 8,855,174 | | | | 5,050,956 | | | | 18,842,790 | | | | 244,568,412 | |
International Hedged Equity Fund | | | — | | | | — | | | | — | | | | 107,153 | | | | 16,212 | | | | 123,365 | |
International Hedged Quality Dividend Growth Fund | | | — | | | | — | | | | — | | | | 7,231,187 | | | | 3,753,826 | | | | 10,985,013 | |
International Hedged SmallCap Dividend Fund | | | — | | | | — | | | | — | | | | — | | | | — | | | | — | |
International High Dividend Fund | | | 24,469,991 | | | | 41,582,445 | | | | 7,637,372 | | | | 5,894,151 | | | | 11,894,511 | | | | 91,478,470 | |
International LargeCap Dividend Fund | | | 10,714,056 | | | | 21,950,675 | | | | 8,092,071 | | | | 6,720,929 | | | | 15,948,318 | | | | 63,426,049 | |
International MidCap Dividend Fund | | | 10,045,031 | | | | 49,400,362 | | | | 11,183,904 | | | | 2,975,604 | | | | 2,968,684 | | | | 76,573,585 | |
International SmallCap Dividend Fund | | | 21,554,037 | | | | 176,126,796 | | | | 6,365,431 | | | | 41,445,601 | | | | — | | | | 245,491,865 | |
Japan Hedged Capital Goods Fund | | | — | | | | — | | | | — | | | | 16,669 | | | | — | | | | 16,669 | |
Japan Hedged Equity Fund | | | — | | | | — | | | | — | | | | 838,645,217 | | | | 455,663,452 | | | | 1,294,308,669 | |
Japan Hedged Financials Fund | | | — | | | | — | | | | — | | | | 347,837 | | | | 220,326 | | | | 568,163 | |
Japan Hedged Health Care Fund | | | — | | | | — | | | | — | | | | 337,738 | | | | 125,601 | | | | 463,339 | |
Japan Hedged Quality Dividend Growth Fund | | | — | | | | — | | | | — | | | | 321,610 | | | | 99,516 | | | | 421,126 | |
Japan Hedged Real Estate Fund | | | — | | | | — | | | | — | | | | — | | | | — | | | | — | |
Japan Hedged SmallCap Equity Fund | | | — | | | | — | | | | — | | | | 2,444,369 | | | | 530,275 | | | | 2,974,644 | |
Japan Hedged Tech, Media and Telecom Fund | | | — | | | | — | | | | — | | | | 37,625 | | | | 14,166 | | | | 51,791 | |
Japan Quality Dividend Growth Fund | | | — | | | | — | | | | — | | | | 8,918 | | | | — | | | | 8,918 | |
Japan SmallCap Dividend Fund | | | 2,793,131 | | | | 13,069,045 | | | | 3,661,232 | | | | 6,565,534 | | | | 5,195,038 | | | | 31,283,980 | |
Korea Hedged Equity Fund | | | — | | | | — | | | | — | | | | 520,536 | | | | — | | | | 520,536 | |
United Kingdom Hedged Equity Fund | | | — | | | | — | | | | — | | | | 365,278 | | | | 282,979 | | | | 648,257 | |
Capital losses incurred after October 31 (“post-October capital losses”) and late year ordinary losses incurred after December 31 within the taxable year are deemed to arise on the first business day of each Fund’s next taxable year.
During the fiscal year or period ended March 31, 2016, the following Funds incurred and will elect to defer post-October capital losses and late year ordinary losses as follows:
| | | | | | | | | | | | |
| Fund | | Late Year
Ordinary Loss | | | Short-Term
Post-October
Capital Losses | | | Long-Term
Post-October
Capital Losses | |
Australia Dividend Fund | | $ | — | | | $ | 524,671 | | | $ | 1,045,005 | |
Europe Hedged Equity Fund | | | — | | | | 397,117,460 | | | | 2,211,092 | |
Europe Hedged SmallCap Equity Fund | | | 1,806,453 | | | | 7,578,343 | | | | 3,483,398 | |
Europe Quality Dividend Growth Fund | | | — | | | | 145,691 | | | | 38,458 | |
Europe SmallCap Dividend Fund | | | — | | | | 4,929,923 | | | | 1,453,847 | |
Germany Hedged Equity Fund | | | — | | | | 8,052,216 | | | | 571,585 | |
Global ex-U.S. Hedged Dividend Fund1 | | | 12,145 | | | | 127,884 | | | | (28,948 | ) |
| | | | |
| WisdomTree Developed World ex-U.S. and Currency Hedged Equity Funds | | | 231 | |
Notes to Financial Statements (continued)
| | | | | | | | | | | | |
| Fund | | Late Year
Ordinary Loss | | | Short-Term
Post-October
Capital Losses | | | Long-Term
Post-October
Capital Losses | |
Global ex-U.S. Hedged Real Estate Fund2 | | $ | — | | | $ | 8,687 | | | $ | 15,411 | |
International Dividend ex-Financials Fund | | | — | | | | — | | | | — | |
International Equity Fund | | | — | | | | 2,470,783 | | | | 3,608,326 | |
International Hedged Equity Fund3 | | | — | | | | — | | | | — | |
International Hedged Quality Dividend Growth Fund | | | — | | | | 12,470,124 | | | | 5,634,571 | |
International Hedged SmallCap Dividend Fund1 | | | 10,534 | | | | 10,185 | | | | 2,330 | |
International High Dividend Fund | | | — | | | | 1,047,565 | | | | 3,563,890 | |
International LargeCap Dividend Fund | | | — | | | | 1,392,088 | | | | 2,330,712 | |
International MidCap Dividend Fund | | | — | | | | 1,153,111 | | | | 382,676 | |
International SmallCap Dividend Fund | | | — | | | | 5,382,276 | | | | (410,357 | ) |
Japan Hedged Capital Goods Fund | | | — | | | | 142,559 | | | | 106,785 | |
Japan Hedged Equity Fund | | | — | | | | — | | | | — | |
Japan Hedged Financials Fund | | | — | | | | 1,264,277 | | | | 756,591 | |
Japan Hedged Health Care Fund | | | — | | | | 887,146 | | | | 1,039,793 | |
Japan Hedged Quality Dividend Growth Fund4 | | | — | | | | 718,509 | | | | 629,437 | |
Japan Hedged Real Estate Fund | | | — | | | | 2,927,221 | | | | 4,863,973 | |
Japan Hedged SmallCap Equity Fund | | | — | | | | 7,080,356 | | | | 6,360,444 | |
Japan Hedged Tech, Media and Telecom Fund | | | — | | | | 72,811 | | | | 138,385 | |
Japan Quality Dividend Growth Fund5 | | | — | | | | 20,380 | | | | 80 | |
Japan SmallCap Dividend Fund | | | — | | | | 1,876,075 | | | | 321,399 | |
Korea Hedged Equity Fund | | | 17,796 | | | | 941,282 | | | | 123,254 | |
United Kingdom Hedged Equity Fund | | | — | | | | — | | | | — | |
| | 1 | For the period June 4, 2015 (commencement of operations) through March 31, 2016. |
| | 2 | For the period October 29, 2015 (commencement of operations) through March 31, 2016. |
| | 3 | For the period July 9, 2015 (commencement of operations) through March 31, 2016. |
| | 4 | For the period April 9, 2015 (commencement of operations) through March 31, 2016. |
| | 5 | For the period May 28, 2015 (commencement of operations) through March 31, 2016. |
During the fiscal year or period ended March 31, 2016, the amount of capital loss carryforwards used to offset realized gains and the amount of capital loss carryforwards that expired unused are shown in the following table:
| | | | | | | | |
| Fund | | Expired Capital Loss Carryforward | | | Utilized Capital Loss
Carryforward | |
Australia Dividend Fund | | $ | 23,230 | | | $ | — | |
Europe Hedged Equity Fund | | | — | | | | — | |
Europe Hedged SmallCap Equity Fund | | | — | | | | — | |
Europe Quality Dividend Growth Fund | | | — | | | | — | |
Europe SmallCap Dividend Fund | | | — | | | | — | |
Germany Hedged Equity Fund | | | — | | | | — | |
Global ex-U.S. Hedged Dividend Fund1 | | | — | | | | — | |
Global ex-U.S. Hedged Real Estate Fund2 | | | — | | | | — | |
International Dividend ex-Financials Fund | | | — | | | | — | |
International Equity Fund | | | — | | | | 929,862 | |
International Hedged Equity Fund3 | | | — | | | | — | |
International Hedged Quality Dividend Growth Fund | | | — | | | | — | |
International Hedged SmallCap Dividend Fund1 | | | — | | | | — | |
International High Dividend Fund | | | 972,353 | | | | — | |
International LargeCap Dividend Fund | | | 911,666 | | | | — | |
International MidCap Dividend Fund | | | 2,200,353 | | | | 4,616,686 | |
International SmallCap Dividend Fund | | | — | | | | — | |
Japan Hedged Capital Goods Fund | | | — | | | | — | |
| | |
| 232 | | WisdomTree Developed World ex-U.S. and Currency Hedged Equity Funds |
Notes to Financial Statements (continued)
| | | | | | | | |
| Fund | | Expired Capital Loss Carryforward | | | Utilized Capital Loss
Carryforward | |
Japan Hedged Equity Fund | | $ | — | | | $ | — | |
Japan Hedged Financials Fund | | | — | | | | — | |
Japan Hedged Health Care Fund | | | — | | | | — | |
Japan Hedged Quality Dividend Growth Fund4 | | | — | | | | — | |
Japan Hedged Real Estate Fund | | | — | | | | — | |
Japan Hedged SmallCap Equity Fund | | | — | | | | — | |
Japan Hedged Tech, Media and Telecom Fund | | | — | | | | — | |
Japan Quality Dividend Growth Fund5 | | | — | | | | — | |
Japan SmallCap Dividend Fund | | | 450,744 | | | | 4,953,416 | |
Korea Hedged Equity Fund | | | — | | | | — | |
United Kingdom Hedged Equity Fund | | | — | | | | — | |
| | 1 | For the period June 4, 2015 (commencement of operations) through March 31, 2016. |
| | 2 | For the period October 29, 2015 (commencement of operations) through March 31, 2016. |
| | 3 | For the period July 9, 2015 (commencement of operations) through March 31, 2016. |
| | 4 | For the period April 9, 2015 (commencement of operations) through March 31, 2016. |
| | 5 | For the period May 28, 2015 (commencement of operations) through March 31, 2016. |
At March 31, 2016, the effect of permanent “book/tax” reclassifications resulted in increases (decreases) to the components of net assets as follows:
| | | | | | | | | | | | |
| Fund | | Undistributed Net
Investment Income/(Loss) | | | Accumulated
Net Realized
Gain/(Loss) | | | Paid-in Capital | |
Australia Dividend Fund | | $ | (6,983 | ) | | $ | (1,366,710 | ) | | $ | 1,373,693 | |
Europe Hedged Equity Fund | | | 14,458,607 | | | | 111,391,949 | | | | (125,850,556 | ) |
Europe Hedged SmallCap Equity Fund | | | 1,334,670 | | | | (3,049,654 | ) | | | 1,714,984 | |
Europe Quality Dividend Growth Fund | | | (1,071 | ) | | | 1,071 | | | | — | |
Europe SmallCap Dividend Fund | | | 1,065,372 | | | | (5,049,199 | ) | | | 3,983,827 | |
Germany Hedged Equity Fund | | | 3,629,204 | | | | 6,781,848 | | | | (10,411,052 | ) |
Global ex-U.S. Hedged Dividend Fund | | | (35,138 | ) | | | 351,935 | | | | (316,797 | ) |
Global ex-U.S. Hedged Real Estate Fund | | | (5,683 | ) | | | 5,683 | | | | — | |
International Dividend ex-Financials Fund | | | (23,379 | ) | | | 1,601,715 | | | | (1,578,336 | ) |
International Equity Fund | | | (79,082 | ) | | | (6,420,908 | ) | | | 6,499,990 | |
International Hedged Equity Fund | | | (27,884 | ) | | | 27,883 | | | | 1 | |
International Hedged Quality Dividend Growth Fund | | | (2,353,707 | ) | | | (261,230 | ) | | | 2,614,937 | |
International Hedged SmallCap Dividend Fund | | | (25,859 | ) | | | 97,778 | | | | (71,919 | ) |
International High Dividend Fund | | | (97,814 | ) | | | (1,963,781 | ) | | | 2,061,595 | |
International LargeCap Dividend Fund | | | (59,801 | ) | | | 219,007 | | | | (159,206 | ) |
International MidCap Dividend Fund | | | (51,013 | ) | | | 2,251,366 | | | | (2,200,353 | ) |
International SmallCap Dividend Fund | | | (159,027 | ) | | | (4,583,781 | ) | | | 4,742,808 | |
Japan Hedged Capital Goods Fund | | | (5,317 | ) | | | 5,316 | | | | 1 | |
Japan Hedged Equity Fund | | | (33,880,945 | ) | | | (296,132,101 | ) | | | 330,013,046 | |
Japan Hedged Financials Fund | | | (81,269 | ) | | | 2,151,950 | | | | (2,070,681 | ) |
Japan Hedged Health Care Fund | | | (13,757 | ) | | | (1,178,691 | ) | | | 1,192,448 | |
Japan Hedged Quality Dividend Growth Fund | | | (53,152 | ) | | | (450,232 | ) | | | 503,384 | |
Japan Hedged Real Estate Fund | | | 287,385 | | | | (1,269,421 | ) | | | 982,036 | |
Japan Hedged SmallCap Equity Fund | | | (99,816 | ) | | | (8,332,287 | ) | | | 8,432,103 | |
Japan Hedged Tech, Media and Telecom Fund | | | (6,113 | ) | | | (170,317 | ) | | | 176,430 | |
Japan Quality Dividend Growth Fund | | | 267 | | | | (267 | ) | | | — | |
Japan SmallCap Dividend Fund | | | 124,879 | | | | (10,212,926 | ) | | | 10,088,047 | |
Korea Hedged Equity Fund | | | (107,113 | ) | | | 130,754 | | | | (23,641 | ) |
United Kingdom Hedged Equity Fund | | | (261,238 | ) | | | 151,279 | | | | 109,959 | |
| | | | |
| WisdomTree Developed World ex-U.S. and Currency Hedged Equity Funds | | | 233 | |
Notes to Financial Statements (concluded)
The differences are primarily due to redemptions-in-kind, foreign currency transactions, investments in passive foreign investment companies, investments in partnerships, expiration of capital loss carryforwards, re-designation of dividends, and utilization of earnings and profits distributed to shareholders on redemption of shares.
GAAP provides guidance on tax provisions that prescribe a minimum threshold for financial statement recognition of the benefit of a tax position taken or expected to be taken in a tax return. Foreign taxes are provided for based on each Fund’s understanding of the tax rules and rates that exist in the foreign markets in which it invests. Taxes are accrued and applied to net investment income, net realized capital gains and net unrealized appreciation, as applicable, as the income is earned or capital gains are recorded. As of and during the fiscal year or period ended March 31, 2016, the Funds did not have any liabilities for unrecognized tax benefits relating to uncertain income tax positions they have taken or expect to take in the future. If applicable, the Funds will recognize interest accrued related to unrecognized tax benefits in interest expense and penalties in “Other” expenses on the Statements of Operations. The Funds file tax returns with the Internal Revenue Service, the State of New York, and various other states. Generally, each of the tax years in the four-year period ended March 31, 2016, remains subject to examination by taxing authorities.
7. RECENT ACCOUNTING PRONOUNCEMENTS
In June 2014, the FASB issued ASU 2014-11 Transfers & Servicing (Topic 860): Repurchase-to-Maturity Transactions, Repurchase Financings, and Disclosures to improve the financial reporting of repurchase agreements and other similar transactions. The guidance includes expanded disclosure requirements for entities that enter into repurchase agreements or securities lending transactions. The guidance is effective for financial statements with fiscal years beginning on or after January 1, 2015, and interim periods within those fiscal years. WTAM has evaluated ASU 2014-11 and determined that there is no impact on the Trust’s financial statements.
In May 2015, the FASB issued ASU 2015-07 Fair Value Measurement (Topic 820): Disclosures for Investments in Certain Entities that Calculate Net Asset Value per Share (or its Equivalent). This is an update to ASC 820. The amendments in this ASU remove the requirement to categorize within the fair value hierarchy all investments for which fair value is measured using the net asset value per share practical expedient. ASU 2015-07 also limits certain disclosures to investments for which the entity has elected to measure the fair value using the practical expedient. ASU 2015-07 will be effective for financial statements issued for fiscal years beginning after December 15, 2015, and interim periods within those fiscal years (earlier application is also permitted). WTAM has evaluated ASU 2015-07 and determined that there is no impact on the Trust’s financial statements.
| | |
| 234 | | WisdomTree Developed World ex-U.S. and Currency Hedged Equity Funds |
Report of Independent Registered Public Accounting Firm
The Board of Trustees and Shareholders of WisdomTree Trust:
We have audited the accompanying statements of assets and liabilities, including the schedules of investments, of WisdomTree Australia Dividend Fund, WisdomTree Europe Hedged Equity Fund, WisdomTree Europe Hedged SmallCap Equity Fund, WisdomTree Europe Quality Dividend Growth Fund (formerly WisdomTree Europe Dividend Growth Fund), WisdomTree Europe SmallCap Dividend Fund, WisdomTree Germany Hedged Equity Fund, WisdomTree Global ex-U.S. Hedged Dividend Fund, WisdomTree Global ex-U.S. Hedged Real Estate Fund, WisdomTree International Dividend ex-Financials Fund, WisdomTree International Equity Fund (formerly WisdomTree DEFA Fund), WisdomTree International Hedged Equity Fund, WisdomTree International Hedged Quality Dividend Growth Fund (formerly WisdomTree International Hedged Dividend Growth Fund), WisdomTree International Hedged SmallCap Dividend Fund, WisdomTree International High Dividend Fund (formerly WisdomTree DEFA Equity Income Fund), WisdomTree International LargeCap Dividend Fund, WisdomTree International MidCap Dividend Fund, WisdomTree International SmallCap Dividend Fund, WisdomTree Japan Hedged Capital Goods Fund, WisdomTree Japan Hedged Equity Fund, WisdomTree Japan Hedged Financials Fund, WisdomTree Japan Hedged Health Care Fund, WisdomTree Japan Hedged Quality Dividend Growth Fund (formerly WisdomTree Japan Hedged Dividend Growth Fund), WisdomTree Japan Hedged Real Estate Fund, WisdomTree Japan Hedged SmallCap Equity Fund, WisdomTree Japan Hedged Tech, Media and Telecom Fund, WisdomTree Japan Quality Dividend Growth Fund (formerly WisdomTree Japan Dividend Growth Fund), WisdomTree Japan SmallCap Dividend Fund, WisdomTree Korea Hedged Equity Fund, and WisdomTree United Kingdom Hedged Equity Fund, twenty-nine of the investment funds constituting the WisdomTree Trust (the “Trust”), as of March 31, 2016, and the related statements of operations, the statements of changes in net assets and the financial highlights for each of the periods presented therein. These financial statements and financial highlights are the responsibility of the Trust’s management. Our responsibility is to express an opinion on these financial statements and financial highlights based on our audits.
We conducted our audits in accordance with the standards of the Public Company Accounting Oversight Board (United States). Those standards require that we plan and perform the audits to obtain reasonable assurance about whether the financial statements and financial highlights are free of material misstatement. We were not engaged to perform an audit of the Trust’s internal control over financial reporting. Our audits included consideration of internal control over financial reporting as a basis for designing audit procedures that are appropriate in the circumstances, but not for the purpose of expressing an opinion on the effectiveness of the Trust’s internal control over financial reporting. Accordingly, we express no such opinion. An audit also includes examining, on a test basis, evidence supporting the amounts and disclosures in the financial statements and financial highlights, assessing the accounting principles used and significant estimates made by management, and evaluating the overall financial statement presentation. Our procedures included confirmation of securities owned as of March 31, 2016, by correspondence with the custodian and others, or by other appropriate auditing procedures where replies from others were not received. We believe that our audits provide a reasonable basis for our opinion.
In our opinion, the financial statements and financial highlights referred to above present fairly, in all material respects, the financial position of WisdomTree Australia Dividend Fund, WisdomTree Europe Hedged Equity Fund, WisdomTree Europe Hedged SmallCap Equity Fund, WisdomTree Europe Quality Dividend Growth Fund, WisdomTree Europe SmallCap Dividend Fund, WisdomTree Germany Hedged Equity Fund, WisdomTree Global ex-U.S. Hedged Dividend Fund, WisdomTree Global ex-U.S. Hedged Real Estate Fund, WisdomTree International Dividend ex-Financials Fund, WisdomTree International Equity Fund, WisdomTree International Hedged Equity Fund, WisdomTree International Hedged Quality Dividend Growth Fund, WisdomTree International Hedged SmallCap Dividend Fund, WisdomTree International High Dividend Fund, WisdomTree International LargeCap Dividend Fund, WisdomTree International MidCap Dividend Fund, WisdomTree International SmallCap Dividend Fund, WisdomTree Japan Hedged Capital Goods Fund, WisdomTree Japan Hedged Equity Fund, WisdomTree Japan Hedged Financials Fund, WisdomTree Japan Hedged Health Care Fund, WisdomTree Japan Hedged Quality Dividend Growth Fund, WisdomTree Japan Hedged Real Estate Fund, WisdomTree Japan Hedged SmallCap Equity Fund, WisdomTree Japan Hedged Tech, Media and Telecom Fund, WisdomTree Japan Quality Dividend Growth Fund, WisdomTree Japan SmallCap Dividend Fund, WisdomTree Korea Hedged Equity Fund, and WisdomTree United Kingdom Hedged Equity Fund, twenty-nine of the investment funds constituting the WisdomTree Trust, at March 31, 2016, the results of their operations, the changes in their net assets and the financial highlights for each of the periods presented therein, in conformity with U.S. generally accepted accounting principles.

New York, New York
May 26, 2016
| | | | |
| WisdomTree Developed World ex-U.S. and Currency Hedged Equity Funds | | | 235 | |
Approval of Investment Advisory and Sub-Advisory Agreements (unaudited)
Approval of Investment Advisory and Sub-Advisory Agreements with respect to the WisdomTree Global ex-U.S. Hedged Dividend Fund, WisdomTree International Hedged Equity Fund, WisdomTree International Hedged SmallCap Dividend Fund, and the WisdomTree Japan Hedged Quality Dividend Growth Fund (the “Funds”)
At a meeting of the Board of Trustees (the “Board”) of the WisdomTree Trust (the “Trust”) held on March 23-24, 2015, the Trustees (the “Trustees”), including those Trustees who are not “interested persons” (as defined in the Investment Company Act of 1940, as amended) of the Trust (the “Independent Trustees”), considered the approval of the Investment Advisory Agreement (the “Advisory Agreement”), pursuant to which WisdomTree Asset Management, Inc. (“WTAM”) will provide the Funds with investment advisory services, and the Sub-Investment Advisory Agreement (together with the Advisory Agreement, the “Agreements”), pursuant to which Mellon Capital Management Corporation (the “Sub-Adviser”) will coordinate the investment and reinvestment of the assets of the Funds.
In considering whether to approve the Agreements, the Trustees considered and discussed information and analysis provided by WTAM. The Trustees, a majority of whom are Independent Trustees, were assisted in their review by independent legal counsel and met with counsel in executive session separate from representatives of WTAM and the Sub-Adviser. In considering the approval of the Agreements, the Board considered all factors that it believed to be relevant, including those discussed below. The Board did not identify any one factor as dispositive, and each Trustee may have attributed different weights to the factors considered.
Analysis of Nature, Extent, and Quality of Services to be Provided to the Funds. The Board considered information provided to them at the meeting and in previous presentations throughout the year from WTAM representatives regarding the nature, extent, and quality of the services provided to the WisdomTree funds, recognizing WTAM’s and the Sub-Adviser’s operational capabilities and resources. The Board also discussed WTAM’s proposed role as index provider to the Funds. The Board also noted the extensive responsibilities that WTAM will have as investment adviser to the Funds, including the selection of, and supervisory responsibilities and activities over, the Sub-Adviser, including oversight of the Sub-Adviser’s compliance with fund policies and objectives, oversight of general Fund compliance with federal and state laws and the implementation of Board directives as they relate to the Funds. The Board also considered research support available to, and management capabilities of, the Funds’ management personnel and that WTAM will provide oversight of day-to-day Fund operations, including fund accounting, administration and legal assistance in meeting disclosure and regulatory requirements.
Based on review of this information and the other factors considered at the meeting, the Board concluded that the nature, extent and quality of services to be provided by WTAM and the Sub-Adviser under the Advisory Agreement and Sub-Advisory Agreement, respectively, are adequate and appropriate.
Comparative Analysis of the Funds’ Performance, Advisory Fees and Fund Expenses. As the Funds had not yet commenced operations, the Board was not able to review the Funds’ performance. The Board discussed with representatives of WTAM and the Sub-Adviser the portfolio management team and the investment strategies to be employed in the management of each Funds’ assets. The Board noted the reputation and experience of WTAM and the Sub-Adviser.
The Board considered the fees to be paid to WTAM by the Funds. The Board examined the fee to be paid by the Funds in light of fees paid to other investment advisers by comparable funds and the method of computing the Funds’ fee. The Board also considered the fee to be paid to the Sub-Adviser in relation to the fee to be paid to WTAM by each Fund and the respective services to be provided by the Sub-Adviser and WTAM. The Board also noted the Sub-Adviser’s fees will be paid by WTAM (out of its fees from the Funds) and not the Funds. Based on this review, the Board concluded that the fees to be paid to WTAM and the Sub-Adviser were reasonable in light of the considerations described above.
Analysis of Profitability and Economies of Scale. As the Funds had not yet commenced operations, WTAM representatives were not able to review the dollar amount of expenses allocated and profit received by WTAM, or any economies of scale. The Board considered potential benefits to WTAM and the Sub-Adviser from acting as investment adviser and sub- adviser, respectively. The Board also considered the uncertainty of the estimated asset levels and the renewal requirements for advisory agreements and their ability to review the advisory fees annually after the initial term of the Agreements. The Board determined that because the Funds had not yet commenced operations, economies of scale were not a factor, but, to the extent in the future it were determined that material economies of scale had not been shared with a Fund, the Board would seek to have those economies of scale shared with the Fund in connection with future renewals.
* * * * * *
In evaluating the Agreements, the Board considered the conclusions and determinations discussed above and also relied on its knowledge, gained through meetings and other interactions with WTAM and the Sub-Adviser, of other funds advised by WTAM and the Sub-Adviser. In light of the foregoing, the Board, including a majority of the Independent Trustees, determined to approve the Agreements.
| | |
| 236 | | WisdomTree Developed World ex-U.S. and Currency Hedged Equity Funds |
Approval of Investment Advisory and Sub-Advisory Agreements (unaudited) (continued)
Approval of the amended Sub-Advisory Agreement with respect to the WisdomTree International Hedged Equity Fund, WisdomTree Global ex-U.S. Hedged Dividend Fund and the WisdomTree International Hedged SmallCap Dividend Fund (the “Funds”)
At a meeting of the Board of Trustees (the “Board”) of the WisdomTree Trust (the “Trust”) held on May 20, 2015, the Trustees (the “Trustees”), including those Trustees who are not “interested persons” (as defined in the Investment Company Act of 1940, as amended) of the Trust (the “Independent Trustees”), considered the approval of the amendment of the Sub-Advisory Agreement (the “Sub-Advisory Agreement”) between WisdomTree Asset Management, Inc. (“WTAM”) and Mellon Capital Management Corporation (the “Sub-Adviser”), pursuant to which the Sub-Adviser will coordinate the investment and reinvestment of the assets of WisdomTree International Hedged Equity Fund, WisdomTree Global ex-U.S. Hedged Dividend Fund and WisdomTree International Hedged SmallCap Dividend Fund (the “Funds”). The Board initially approved the Sub-Advisory Agreement at a meeting held on March 23-24, 2015 (the “March Meeting”). Representatives of WTAM explained that, subsequent to that approval, WTAM and the Sub-Adviser negotiated new sub-advisory fees for all new multi-currency hedged and emerging markets funds, including the Funds. Noting the Funds’ unitary fee structure, representatives of WTAM stated that the amended sub-advisory fee would have no effect on the fees to be paid by the Funds. In considering whether to approve the amendment of the Sub-Advisory Agreement, the Trustees considered and discussed information and analysis provided by WTAM. The Independent Trustees were assisted in their review by independent legal counsel and met with counsel in executive session separate from representatives of WTAM. In considering the approval of the amendment of the Sub-Advisory Agreement, the Board considered all factors that it believed to be relevant, including those discussed below. The Board did not identify any one factor as dispositive, and each Trustee may have attributed different weights to the factors considered. Since the Board had approved the Sub-Advisory Agreement at the March Meeting, and, other than as discussed below, there had been no material changes in the information presented, the Trustees addressed many of the relevant considerations by reference to their considerations and determinations at the March Meeting.
Analysis of Nature, Extent, and Quality of Services to be Provided to the Funds. The nature, extent and quality of services to be provided by the Sub-Adviser under the Sub-Advisory Agreement had been considered at the March Meeting, and there had been no material changes in this information. Representatives of WTAM stated, and the Trustees considered, that WTAM does not believe that the proposed amendment of the Sub-Advisory Agreement would have any impact on the scope or quality of the services provided to the Funds by WTAM or the Sub-Adviser; and the proposed amendment also would not result in any change to the investment management of the Funds.
Comparative Analysis of the Funds’ Performance, Advisory Fees and Fund Expenses. As the Funds had not yet commenced operations, the Board was not able to review the Funds’ performance. The Board had considered the portfolio management team and the investment strategies to be employed in the management of each Fund’s assets at the March Meeting. The Board also had considered comparative management fee and expense ratio information at the March Meeting. The Board noted that, because the Sub-Adviser’s fees will be paid by WTAM (out of its fees paid by the Funds) and not the Funds, the amendment would not affect the management fees paid by the Funds. As a result, the Board did not reconsider comparative fee and expense information. The Board considered that the amendment would, at current aggregate international fund asset levels, increase the fee to be paid to the Sub-Adviser in relation to the fee to be paid to WTAM by each Fund. The Board also considered the fee to be paid to the Sub-Adviser in relation to the fee to be paid to WTAM by each Fund and the respective services to be provided by the Sub-Adviser and WTAM. Based on this review, the Board concluded that the fees to be paid to WTAM and the Sub-Adviser were justified in light of the considerations described above.
Analysis of Profitability and Economies of Scale. As the Funds had not yet commenced operations, WTAM representatives were not able to review the dollar amount of expenses allocated and profit received by WTAM, or any economies of scale. The Board had considered at the March Meeting the potential benefits to the Sub-Adviser from acting as sub-adviser, which would not change materially under the amendment from those considered at the March Meeting. The Board considered the uncertainty of the estimated asset levels and the renewal requirements for sub-advisory agreements and their ability to review the sub-advisory fees annually after the initial term of the Sub-Advisory Agreement. The Board determined that because the Funds had not yet commenced operations, economies of scale were not a factor, but, to the extent in the future it were determined that material economies of scale had not been shared with a Fund, the Board would seek to have those economies of scale shared with the Fund in connection with future renewals.
* * * * * *
In evaluating the amendment of the Sub-Advisory Agreement, the Board considered the conclusions and determinations discussed above and also relied on its knowledge, gained through meetings and other interactions with WTAM and the Sub-Adviser, of other funds advised by WTAM and the Sub-Adviser. In light of the foregoing, the Board, including a majority of the Independent Trustees, determined to approve the amendment of the Sub-Advisory Agreement.
Approval of Investment Advisory and Sub-Advisory Agreement with respect to the WisdomTree Japan Quality Dividend Growth Fund (the “Fund”)
At a meeting of the Board of Trustees (the “Board”) of the WisdomTree Trust (the “Trust”) held on May 20, 2015, the Trustees (the “Trustees”), including those Trustees who are not “interested persons” (as defined in the Investment Company Act of 1940, as
| | | | |
| WisdomTree Developed World ex-U.S. and Currency Hedged Equity Funds | | | 237 | |
Approval of Investment Advisory and Sub-Advisory Agreements (unaudited) (continued)
amended) of the Trust (the “Independent Trustees”), considered the approval of the Investment Advisory Agreement (the “Advisory Agreement”), pursuant to which WisdomTree Asset Management, Inc. (“WTAM”) will provide the Fund with investment advisory services, and the Sub-Advisory Agreement (together with the Advisory Agreement, the “Agreements”), pursuant to which Mellon Capital Management Corporation (the “Sub-Adviser”) will coordinate the investment and reinvestment of the assets of the Fund.
In considering whether to approve the Agreements, the Trustees considered and discussed information and analysis provided by WTAM and Lipper, Inc., an independent provider of investment company data. The Independent Trustees were assisted in their review by independent legal counsel and met with counsel in executive session separate from WTAM representatives and the Sub-Adviser. In considering the approval of the Agreements, the Board considered all factors that it believed to be relevant, including those discussed below. The Board did not identify any one factor as dispositive, and each Trustee may have attributed different weights to the factors considered.
Analysis of Nature, Extent, and Quality of Services to be Provided to the Fund. The Board considered information provided to them at the meeting and in previous presentations throughout the year from WTAM representatives regarding the nature, extent, and quality of the services provided to the WisdomTree funds, recognizing WTAM’s and the Sub-Adviser’s operational capabilities and resources. The Board also discussed the proposed role of WisdomTree Investments, Inc. (“WTI”), the parent of WTAM, as index provider to the Fund. The Board noted that the strategies represented by the Fund is unique, based on WTI’s intellectual property and are only available for use by the Fund through WTAM. The Board noted WTAM’s belief that shareholders will invest in the Fund on the strength of WTI’s intellectual property and WTAM’s industry standing and reputation and with the expectation that WTAM will have a continuing role in providing advisory services to the Fund based on the WTI indexes. The Board also noted the extensive responsibilities that WTAM will have as investment adviser to the Fund, including: the selection of, and supervisory responsibilities and activities over, the Sub-Adviser, including oversight of the Sub-Adviser’s adherence to the Fund’s investment strategy and restrictions, monitoring of the Sub-Adviser’s buying and selling of securities and derivatives transactions, review of Sub-Adviser performance, review of proxies voted by the Sub-Adviser and oversight of, and the provision of consultation to, the Sub-Adviser with respect to the creation of custom creation or redemption baskets for authorized participants; oversight of the daily valuation of the Fund’s portfolio holdings; oversight of general Fund compliance with federal and state laws; and implementation of Board directives as they relate to the Fund. The Board also considered research support available to, and management capabilities of, the Fund’s management personnel and that WTAM will provide oversight of day-to-day Fund operations, including fund accounting, tax matters, administration, compliance and legal assistance in meeting disclosure and regulatory requirements.
Based on review of this information and the other factors considered at the meeting, the Board concluded that the nature, extent and quality of services to be provided by WTAM and the Sub-Adviser under the Advisory Agreement and Sub-Advisory Agreement, respectively, are adequate and appropriate and supported the Board’s approval of the Agreements.
Comparative Analysis of the Fund’s Performance, Advisory Fees and Fund Expenses. As the Fund had not yet commenced operations, the Board was not able to review the Fund’s performance. The Board discussed with WTAM representatives the portfolio management team and the investment strategies to be employed in the management of the Fund’s assets. The Board noted the reputation and experience of WTAM and the Sub-Adviser.
The Board considered the fees to be paid to WTAM by the Fund. The Board examined the fee to be paid by the Fund in light of fees paid to other investment advisers by comparable funds and the method of computing the Fund’s fee. The Board also considered the fee to be paid to the Sub-Adviser in relation to the fee to be paid to WTAM by the Fund and the respective services to be provided by the Sub-Adviser and WTAM. The Board also noted the Sub-Adviser’s fees will be paid by WTAM (out of its fees paid by the Fund) and not the Fund. The Board considered the meaningful differences in the services that WTAM will provide to the Fund as compared to the Sub-Adviser, including that the role of the Sub-Adviser in making investment recommendations with respect to the Fund is a rules-based function, with oversight by WTAM in seeking to ensure compliance with such rules. The Board also considered the entrepreneurial and expense risk to be borne by WTAM that is associated with the Fund’s unitary fee structure, which includes minimum fees (such as those to the Sub-Adviser), regardless of whether the asset size of the Fund grows to a sufficient size. Based on this review, the Board concluded that the fees to be paid to WTAM and the Sub-Adviser supported the Board’s approval of the Agreements.
Analysis of Profitability and Economies of Scale. As the Fund had not yet commenced operations, WTAM representatives were not able to review the dollar amount of expenses allocated and profit received by WTAM, or any economies of scale. The Board considered potential benefits to WTAM and the Sub-Adviser from acting as investment adviser and sub-adviser, respectively. The Board also considered the uncertainty of the estimated asset levels and the renewal requirements for advisory agreements and their ability to review the advisory fees annually after the initial term of the Agreements. The Board determined that because the Fund had not yet commenced operations, economies of scale were not a factor, but, to the extent in the future it were determined that material economies of scale had not been shared with the Fund, the Board would seek to have those economies of scale shared with the Fund in connection with future renewals.
* * * * * *
| | |
| 238 | | WisdomTree Developed World ex-U.S. and Currency Hedged Equity Funds |
Approval of Investment Advisory and Sub-Advisory Agreements (unaudited) (continued)
In evaluating the Agreements, the Board considered the conclusions and determinations discussed above and also relied on its knowledge, gained through meetings and other interactions with WTAM and the Sub-Adviser, of other funds advised by WTAM and the Sub-Adviser. In light of the foregoing, the Board, including a majority of the Independent Trustees, determined to approve the Agreements.
Approval of Investment Advisory and Sub-Advisory Agreement with respect to the WisdomTree Global ex-U.S. Hedged Real Estate Fund (the “Fund”)
At a meeting of the Board of Trustees (the “Board”) of the WisdomTree Trust (the “Trust”) held on September 21-22, 2015, the Trustees (the “Trustees”), including those Trustees who are not “interested persons” (as defined in the Investment Company Act of 1940, as amended) of the Trust (the “Independent Trustees”), considered the approval of the Investment Advisory Agreement (the “Advisory Agreement”), pursuant to which WisdomTree Asset Management, Inc. (“WTAM”) will provide the Fund with investment advisory services, and the Sub-Advisory Agreement (together with the Advisory Agreement, the “Agreements”), pursuant to which Mellon Capital Management Corporation (the “Sub-Adviser”) will coordinate the investment and reinvestment of the assets of the Fund.
In considering whether to approve the Agreements, the Trustees considered and discussed information and analysis provided by WTAM and Lipper, Inc., an independent provider of investment company data. The Independent Trustees were assisted in their review by independent legal counsel and met with counsel in executive session separate from WTAM representatives and the Sub-Adviser. In considering the approval of the Agreements, the Board considered all factors that it believed to be relevant, including those discussed below. The Board did not identify any one factor as dispositive, and each Trustee may have attributed different weights to the factors considered.
Analysis of Nature, Extent, and Quality of Services to be Provided to the Fund. The Board considered information provided to them at the meeting and in previous presentations throughout the year from WTAM representatives regarding the nature, extent, and quality of the services provided to the WisdomTree funds, recognizing WTAM’s and the Sub-Adviser’s operational capabilities and resources. The Board also discussed the proposed role of WisdomTree Investments, Inc. (“WTI”), the parent of WTAM, as index provider to the Fund. The Board noted that the strategies represented by the Fund is unique, based on WTI’s intellectual property and are only available for use by the Fund through WTAM. The Board noted WTAM’s belief that shareholders will invest in the Fund on the strength of WTI’s intellectual property and WTAM’s industry standing and reputation and with the expectation that WTAM will have a continuing role in providing advisory services to the Fund based on the WTI indexes. The Board also noted the extensive responsibilities that WTAM will have as investment adviser to the Fund, including: the selection of, and supervisory responsibilities and activities over, the Sub-Adviser, including oversight of the Sub-Adviser’s adherence to the Fund’s investment strategy and restrictions, monitoring of the Sub-Adviser’s buying and selling of securities and derivatives transactions, review of Sub-Adviser performance, review of proxies voted by the Sub-Adviser and oversight of, and the provision of consultation to, the Sub-Adviser with respect to the creation of custom creation or redemption baskets for authorized participants; oversight of the daily valuation of the Fund’s portfolio holdings; oversight of general Fund compliance with federal and state laws; and implementation of Board directives as they relate to the Fund. The Board also considered research support available to, and management capabilities of, the Fund’s management personnel and that WTAM will provide oversight of day-to-day Fund operations, including fund accounting, tax matters, administration, compliance and legal assistance in meeting disclosure and regulatory requirements.
Based on review of this information and the other factors considered at the meeting, the Board concluded that the nature, extent and quality of services to be provided by WTAM and the Sub-Adviser under the Advisory Agreement and Sub-Advisory Agreement, respectively, are adequate and appropriate and supported the Board’s approval of the Agreements.
Comparative Analysis of the Fund’s Performance, Advisory Fees and Fund Expenses. As the Fund had not yet commenced operations, the Board was not able to review the Fund’s performance. The Board discussed with WTAM representatives the portfolio management team and the investment strategies to be employed in the management of the Fund’s assets. The Board noted the reputation and experience of WTAM and the Sub-Adviser.
The Board considered the fees to be paid to WTAM by the Fund. The Board examined the fee to be paid by the Fund in light of fees paid to other investment advisers by comparable funds and the method of computing the Fund’s fee. The Board also considered the fee to be paid to the Sub-Adviser in relation to the fee to be paid to WTAM by the Fund and the respective services to be provided by the Sub-Adviser and WTAM. The Board also noted the Sub-Adviser’s fees will be paid by WTAM (out of its fees paid by the Fund) and not the Fund. The Board considered the meaningful differences in the services that WTAM will provide to the Fund as compared to the Sub-Adviser, including that the role of the Sub-Adviser in making investment recommendations with respect to the Fund is a rules-based function, with oversight by WTAM in seeking to ensure compliance with such rules. The Board also considered the entrepreneurial and expense risk to be borne by WTAM that is associated with the Fund’s unitary fee structure, which includes minimum fees (such as those to the Sub-Adviser), regardless of whether the asset size of the Fund grows to a sufficient size. Based on this review, the Board concluded that the fees to be paid to WTAM and the Sub-Adviser supported the Board’s approval of the Agreements.
| | | | |
| WisdomTree Developed World ex-U.S. and Currency Hedged Equity Funds | | | 239 | |
Approval of Investment Advisory and Sub-Advisory Agreements (unaudited) (concluded)
Analysis of Profitability and Economies of Scale. As the Fund had not yet commenced operations, WTAM representatives were not able to review the dollar amount of expenses allocated and profit received by WTAM, or any economies of scale. The Board considered potential benefits to WTAM and the Sub-Adviser from acting as investment adviser and sub-adviser, respectively. The Board also considered the uncertainty of the estimated asset levels and the renewal requirements for advisory agreements and their ability to review the advisory fees annually after the initial term of the Agreements. The Board determined that because the Fund had not yet commenced operations, economies of scale were not a factor, but, to the extent in the future it were determined that material economies of scale had not been shared with the Fund, the Board would seek to have those economies of scale shared with the Fund in connection with future renewals.
* * * * * *
In evaluating the Agreements, the Board considered the conclusions and determinations discussed above and also relied on its knowledge, gained through meetings and other interactions with WTAM and the Sub-Adviser, of other funds advised by WTAM and the Sub-Adviser. In light of the foregoing, the Board, including a majority of the Independent Trustees, determined to approve the Agreements.
| | |
| 240 | | WisdomTree Developed World ex-U.S. and Currency Hedged Equity Funds |
Trustees and Officers Information (unaudited)
The Board of Trustees has responsibility for the overall management and operations of the Funds, including general supervision of the duties performed by WTAM and other service providers. The Board of Trustees elects the officers of the Trust who are responsible for administering the Trust’s day-to-day operations. Each Trustee serves until his or her successor is duly elected or appointed and qualified.
The address of each Trustee and Officer is c/o WisdomTree Asset Management, Inc., 245 Park Avenue, 35th Floor, New York, NY 10167.
Independent Trustees
| | | | | | | | |
Name
and Year of Birth
of Trustee/Officer | | Position(s) Held with
the Trust, Term of
Office and Length
of Time Served | | Principal Occupation(s)
During the Past 5 Years | | Number of Portfolios
in Fund Complex
Overseen by Trustee/
Officer+ | | Other
Directorships
Held by Trustee
During the Past
5 Years |
David G. Chrencik*
(1948) | | Trustee, 2014- present | | Chief Financial Officer of Sarus Indochina Select LP (hedge fund) since 2012; Chief Financial Officer of GeoGreen BioFuels, Inc. (biodiesel fuel producer) from 2010 to 2014; Audit Partner at PricewaterhouseCoopers LLP (public accounting firm) from 1972 to 2009 (includes positions prior to becoming Audit Partner and predecessor firms). | | 91 | | Trustee,
Vericimetry
Funds
(2011-2014) |
| | | | |
Joel Goldberg**
(1945) | | Trustee, 2012- present | | Attorney, Of Counsel/Partner at Stroock & Stroock & Lavan LLP, 2010 to present; Attorney, Partner at Willkie Farr & Gallagher LLP, 2006 to 2010. | | 91 | | Director,
Better
Business
Bureau
(Metropolitan
New York,
Long Island
and the Mid-
Hudson
Region) |
| | | | |
Toni Massaro***
(1955) | | Trustee, 2006- present | | Dean Emerita at the University of Arizona James E. Rogers College of Law (“Rogers College of Law”) since 2009 (distinguished Emerita in July 2009); Dean at the Rogers College of Law from 1999 to 2009; Regents’ Professor at the Rogers College of Law since 1990. | | 91 | | None |
| | | | |
Melinda A. Raso Kirstein‡
(1955) | | Trustee, 2014- present | | Retired, Merrill Lynch Investment Management, Vice President; Senior Portfolio Manager, Fixed Income Management; Director, Tax Exempt Fund Management. | | 91 | | Associate
Alumnae of
Douglass
College,
Member of
Investment
Committee |
| | | | |
Victor Ugolyn
(1947) | | Trustee, 2006- present; Chairman of the Board of Trustees, 2006- present | | Private Investor, 2005 to present; President and Chief Executive Officer of William D. Witter, Inc. from 2005 to 2006; Consultant to AXA Enterprise in 2004; Chairman, President and Chief Executive Officer of Enterprise Capital Management (subsidiary of The MONY Group, Inc.) and Enterprise Group of Funds, Chairman of MONY Securities Corporation, and Chairman of the Fund Board of Enterprise Group of Funds from 1991 to 2004. | | 91 | | Member of the
Board of
Governors of
Naismith
Memorial
Basketball Hall
of Fame,
Member of the
Board of
Directors of
the New York
Society of
Security
Analysts
(NYSSA) |
| * | Chair of the Audit Committee. |
| ** | Chair of the Contracts Review Committee. |
| *** | Chair of the Governance and Nominating Committee. |
| ‡ | Chair of the Investment Committee. |
| | | | |
| WisdomTree Developed World ex-U.S. and Currency Hedged Equity Funds | | | 241 | |
Trustees and Officers Information (unaudited) (concluded)
Interested Trustee and Officers
| | | | | | | | |
Name
and Year of Birth
of Trustee/Officer | | Position(s) Held with
the Trust, Term of
Office and Length
of Time Served | | Principal Occupation(s)
During the Past 5 Years | | Number of Portfolios
in Fund Complex
Overseen by Trustee/
Officer+ | | Other
Directorships
Held by Trustee During the Past
5 Years |
Jonathan Steinberg****
(1964) | | Trustee, 2005- present President, 2005- present | | President, WisdomTree Trust since 2005; President, WisdomTree Investments, Inc. and WisdomTree Asset Management, Inc.; Chief Executive Officer, WisdomTree Investments, Inc. and WisdomTree Asset Management, Inc. | | 91 | | Director, WisdomTree Investments, Inc. and WisdomTree Asset Management, Inc. |
| | | | |
David Castano****
(1971) | | Treasurer, 2013- present | | Director of Fund Accounting & Administration, WisdomTree Asset Management, Inc., since 2011; Vice President of Legg Mason & Co. and served as Treasurer from 2010 to 2011 and Controller from 2006 to 2010 of certain mutual funds associated with Legg Mason & Co.; Assistant Treasurer of Lord Abbett mutual funds from 2004 to 2006. | | 91 | | None |
| | | | |
Terry Jane Feld****
(1960) | | Chief Compliance Officer, 2012- present | | Chief Compliance Officer, WisdomTree Asset Management, Inc. since 2012; Senior Compliance Officer, WisdomTree Asset Management since 2011; Senior Compliance Officer, TIAA-CREF, 2007 to 2010; Vice President/NASD-SEC Compliance, Mutual of America Life Insurance Co., 2004 to 2007. | | 91 | | None |
| | | | |
Ryan Louvar****
(1972) | | Secretary and Chief Legal Officer, 2013- present | | General Counsel, WisdomTree Asset Management, Inc. since 2013; Vice President and Senior Managing Counsel, State Street, 2005 to 2013. | | 91 | | None |
| | | | |
Sarah English****
(1977) | | Assistant Secretary, 2013- present | | Investment Management Counsel, WisdomTree Asset Management, Inc. since 2010 (includes prior positions at WisdomTree Asset Management, Inc.); Attorney, NYFIX, Inc. from 2006 to 2009. | | 91 | | None |
| | | | |
Clint Martin**** (1977) | | Assistant Treasurer, 2015-present | | Fund Manager, Fund Accounting & Administration, WisdomTree Asset Management, Inc., since 2012; Vice President of Legg Mason & Co. and served as Assistant Treasurer from 2010 to 2012 and Assistant Controller from 2006 to 2010 of certain mutual funds associated with Legg Mason & Co. | | 91 | | None |
| **** | Elected by and serves at the pleasure of the Board. |
| | |
| 242 | | WisdomTree Developed World ex-U.S. and Currency Hedged Equity Funds |
Supplemental Information (unaudited)
Federal Income Tax Information
The following Federal tax information related to the Funds’ fiscal year or period ended March 31, 2016, is provided for information purposes only and should not be used for reporting to federal or state revenue agencies. Federal tax information for the calendar year will be reported to you on Form 1099-DIV in January 2017.
Certain dividends paid by the Funds may be subject to a maximum tax rate of 15%, as provided by the Jobs and Growth Tax Relief Reconciliation Act of 2003. Of the distributions paid during the fiscal year or period ended March 31, 2016, the following represents the maximum amount of ordinary income distributions that may be considered qualified dividend income:
| | | | |
| Fund | | Qualified Dividend
Income | |
Australia Dividend Fund | | $ | 1,168,480 | |
Europe Hedged Equity Fund | | | 236,329,888 | |
Europe Hedged SmallCap Equity Fund | | | 5,746,507 | |
Europe Quality Dividend Growth Fund | | | 342,539 | |
Europe SmallCap Dividend Fund | | | 24,998,058 | |
Germany Hedged Equity Fund | | | 4,080,499 | |
Global ex-U.S. Hedged Dividend Fund1 | | | 88,558 | |
Global ex-U.S. Hedged Real Estate Fund2 | | | 7,362 | |
International Dividend ex-Financials Fund | | | 7,258,760 | |
International Equity Fund | | | 16,761,628 | |
International Hedged Equity Fund3 | | | 34,502 | |
International Hedged Quality Dividend Growth Fund | | | 11,453,235 | |
International Hedged SmallCap Dividend Fund1 | | | 43,767 | |
International High Dividend Fund | | | 8,950,123 | |
International LargeCap Dividend Fund | | | 10,025,703 | |
International MidCap Dividend Fund | | | 3,427,314 | |
International SmallCap Dividend Fund | | | 26,723,012 | |
Japan Hedged Capital Goods Fund | | | 65,860 | |
Japan Hedged Equity Fund | | | 322,406,344 | |
Japan Hedged Financials Fund | | | 152,945 | |
Japan Hedged Health Care Fund | | | 102,132 | |
Japan Hedged Quality Dividend Growth Fund4 | | | 167,600 | |
Japan Hedged Real Estate Fund | | | 869,969 | |
Japan Hedged SmallCap Equity Fund | | | 2,525,540 | |
Japan Hedged Tech, Media and Telecom Fund | | | 48,068 | |
Japan Quality Dividend Growth Fund5 | | | 21,482 | |
Japan SmallCap Dividend Fund | | | 4,387,792 | |
Korea Hedged Equity Fund | | | 52,830 | |
United Kingdom Hedged Equity Fund | | | 1,377,052 | |
| | 1 | For the period June 4, 2015 (commencement of operations) through March 31, 2016. |
| | 2 | For the period October 29, 2015 (commencement of operations) through March 31, 2016. |
| | 3 | For the period July 9, 2015 (commencement of operations) through March 31, 2016. |
| | 4 | For the period April 9, 2015 (commencement of operations) through March 31, 2016. |
| | 5 | For the period May 28, 2015 (commencement of operations) through March 31, 2016. |
The Funds intend to elect to pass through to shareholders the credit for taxes paid during the fiscal year or period ended March 31, 2016, to foreign countries. The gross foreign source income and foreign taxes paid are as follows:
| | | | | | | | |
| Fund | | Gross Foreign
Income | | | Foreign
Taxes Paid | |
Australia Dividend Fund | | $ | 1,196,708 | | | $ | 12,833 | |
Europe Hedged Equity Fund | | | 241,752,201 | | | | 20,649,034 | |
Europe Hedged SmallCap Equity Fund | | | 6,151,540 | | | | 743,066 | |
Europe Quality Dividend Growth Fund | | | 368,422 | | | | 28,702 | |
| | | | |
| WisdomTree Developed World ex-U.S. and Currency Hedged Equity Funds | | | 243 | |
Supplemental Information (unaudited) (concluded)
| | | | | | | | |
| Fund | | Gross Foreign
Income | | | Foreign
Taxes Paid | |
Europe SmallCap Dividend Fund | | $ | 25,744,701 | | | $ | 2,006,630 | |
Germany Hedged Equity Fund | | | 4,254,451 | | | | 545,906 | |
Global ex-U.S. Hedged Dividend Fund1 | | | 133,140 | | | | 12,688 | |
Global ex-U.S. Hedged Real Estate Fund2 | | | 34,595 | | | | 2,644 | |
International Dividend ex-Financials Fund | | | 7,641,766 | | | | 343,779 | |
International Equity Fund | | | 18,293,731 | | | | 884,172 | |
International Hedged Equity Fund3 | | | 83,066 | | | | 5,875 | |
International Hedged Quality Dividend Growth Fund | | | 14,944,882 | | | | 823,633 | |
International Hedged SmallCap Dividend Fund1 | | | 59,923 | | | | 4,125 | |
International High Dividend Fund | | | 9,794,260 | | | | 409,457 | |
International LargeCap Dividend Fund | | | 10,629,616 | | | | 511,643 | |
International MidCap Dividend Fund | | | 4,031,414 | | | | 224,432 | |
International SmallCap Dividend Fund | | | 30,489,401 | | | | 2,431,345 | |
Japan Hedged Capital Goods Fund | | | 66,235 | | | | 6,615 | |
Japan Hedged Equity Fund | | | 320,261,985 | | | | 32,029,542 | |
Japan Hedged Financials Fund | | | 472,695 | | | | 47,259 | |
Japan Hedged Health Care Fund | | | 230,509 | | | | 23,051 | |
Japan Hedged Quality Dividend Growth Fund4 | | | 384,588 | | | | 41,873 | |
Japan Hedged Real Estate Fund | | | 1,440,326 | | | | 140,417 | |
Japan Hedged SmallCap Equity Fund | | | 2,620,320 | | | | 261,551 | |
Japan Hedged Tech, Media and Telecom Fund | | | 48,345 | | | | 4,830 | |
Japan Quality Dividend Growth Fund5 | | | 53,403 | | | | 6,690 | |
Japan SmallCap Dividend Fund | | | 7,418,798 | | | | 742,686 | |
Korea Hedged Equity Fund | | | 310,005 | | | | 46,541 | |
United Kingdom Hedged Equity Fund | | | 1,397,377 | | | | 14,180 | |
| | 1 | For the period June 4, 2015 (commencement of operations) through March 31, 2016. |
| | 2 | For the period October 29, 2015 (commencement of operations) through March 31, 2016. |
| | 3 | For the period July 9, 2015 (commencement of operations) through March 31, 2016. |
| | 4 | For the period April 9, 2015 (commencement of operations) through March 31, 2016. |
| | 5 | For the period May 28, 2015 (commencement of operations) through March 31, 2016. |
| | |
| 244 | | WisdomTree Developed World ex-U.S. and Currency Hedged Equity Funds |
General Information (unaudited)
Proxy Voting Policies, Procedures and Record
A complete copy of the Proxy Voting Policy may be obtained by calling 1-866-909-WISE (9473) or writing to: WisdomTree Trust, c/o Foreside Fund Services, LLC, Three Canal Plaza Suite 100, Portland, ME, 04101.
The Trust is required to disclose annually the Funds’ complete proxy voting record on Form N-PX covering the most recent 12-month period ended June 30 and to file Form N-PX with the SEC no later than August 31 of each year. The current Form N-PX for the Funds is available at no charge upon request by calling 1-866-909-WISE (9473) or through the Trust’s website at www.wisdomtree.com. The Funds’ Form N-PX is also available on the SEC’s website at www.sec.gov.
Shareholder Reports and Quarterly Portfolio Disclosure
The Funds are required to file their complete schedule of portfolio holdings with the SEC for their first and third fiscal quarters on Form N-Q. Copies of the filings are available, without charge, on the SEC’s website at www.sec.gov and are also available by calling the Trust at 1-866-909-WISE (9473). You can also obtain copies of Form N-Q by (i) visiting the SEC’s Public Reference Room in Washington, DC (information on the operation of the Public Reference Room may be obtained by calling 1-800-SEC-0330); (ii) sending your request and a duplicating fee to the SEC’s Public Reference Room, Washington, DC 20549-0102; or (iii) sending your request electronically to publicinfo@sec.gov.
Information about each Fund’s portfolio holdings is available daily, without charge, at www.wisdomtree.com.
The Statement of Additional Information (“SAI”) has additional information about the Funds’ Trustees and Officers and is available without charge upon request. Contact your financial representative for a free prospectus or SAI.
Frequency Distribution of Discounts & Premiums
Information about differences between the per share net asset value of each Fund and the market trading price of shares of each Fund are available, without charge, at www.wisdomtree.com
| | | | |
| WisdomTree Developed World ex-U.S. and Currency Hedged Equity Funds | | | 245 | |
The WisdomTree Family of Funds
The following is a list of WisdomTree Funds being offered, along with their respective ticker symbols, as of March 31, 2016:
| | |
WisdomTree Domestic Earnings and Dividend Funds WisdomTree Dividend ex-Financials Fund (DTN) WisdomTree Earnings 500 Fund (EPS) WisdomTree High Dividend Fund (DHS) WisdomTree LargeCap Dividend Fund (DLN) WisdomTree LargeCap Value Fund (EZY) WisdomTree MidCap Dividend Fund (DON) WisdomTree MidCap Earnings Fund (EZM) WisdomTree SmallCap Dividend Fund (DES) WisdomTree SmallCap Earnings Fund (EES) WisdomTree Total Dividend Fund (DTD) WisdomTree Total Earnings Fund (EXT) WisdomTree U.S. Quality Dividend Growth Fund (DGRW) WisdomTree U.S. SmallCap Quality Dividend Growth Fund (DGRS) WisdomTree Developed World ex-U.S. and Currency Hedged Equity Funds WisdomTree Australia Dividend Fund (AUSE) WisdomTree Dynamic Currency Hedged Europe Equity Fund (DDEZ) WisdomTree Dynamic Currency Hedged International Equity Fund (DDWM) WisdomTree Dynamic Currency Hedged International SmallCap Equity Fund (DDLS) WisdomTree Dynamic Currency Hedged Japan Equity Fund (DDJP) WisdomTree Europe Hedged Equity Fund (HEDJ) WisdomTree Europe Hedged SmallCap Equity Fund (EUSC) WisdomTree Europe Local Recovery Fund (EZR) WisdomTree Europe Quality Dividend Growth Fund (EUDG) WisdomTree Europe SmallCap Dividend Fund (DFE) WisdomTree Germany Hedged Equity Fund (DXGE) WisdomTree Global ex-U.S. Hedged Dividend Fund (DXUS) WisdomTree Global ex-U.S. Hedged Real Estate Fund (HDRW) WisdomTree Global Hedged SmallCap Dividend Fund (HGSD) WisdomTree International Dividend ex-Financials Fund (DOO) WisdomTree International Equity Fund (DWM) WisdomTree International Hedged Equity Fund (HDWM) WisdomTree International Hedged Quality Dividend Growth Fund (IHDG) WisdomTree International Hedged SmallCap Dividend Fund (HDLS) WisdomTree International High Dividend Fund (DTH) WisdomTree International LargeCap Dividend Fund (DOL) WisdomTree International MidCap Dividend Fund (DIM) WisdomTree International SmallCap Dividend Fund (DLS) WisdomTree Japan Hedged Capital Goods Fund (DXJC) WisdomTree Japan Hedged Equity Fund (DXJ) WisdomTree Japan Hedged Financials Fund (DXJF) WisdomTree Japan Hedged Health Care Fund (DXJH) WisdomTree Japan Hedged Quality Dividend Growth Fund (JHDG) WisdomTree Japan Hedged Real Estate Fund (DXJR) WisdomTree Japan Hedged SmallCap Equity Fund (DXJS) WisdomTree Japan Hedged Tech, Media and Telecom Fund (DXJT) WisdomTree Japan Quality Dividend Growth Fund (JDG) WisdomTree Japan SmallCap Dividend Fund (DFJ) WisdomTree Korea Hedged Equity Fund (DXKW) WisdomTree United Kingdom Hedged Equity Fund (DXPS) | | WisdomTree Global/Global ex-U.S. and Emerging/Frontier Markets WisdomTree Asia Pacific ex-Japan Fund (AXJL) WisdomTree China ex-State-Owned Enterprises Fund (CXSE) WisdomTree Commodity Country Equity Fund (CCXE) WisdomTree Emerging Markets Consumer Growth Fund (EMCG) WisdomTree Emerging Markets ex-State-Owned Enterprises Fund (XSOE) WisdomTree Emerging Markets High Dividend Fund (DEM) WisdomTree Emerging Markets Quality Dividend Growth Fund (DGRE) WisdomTree Emerging Markets SmallCap Dividend Fund (DGS) WisdomTree Global ex-U.S. Quality Dividend Growth Fund (DNL) WisdomTree Global ex-U.S. Real Estate Fund (DRW) WisdomTree Global ex-U.S. Utilities Fund (DBU) WisdomTree Global High Dividend Fund (DEW) WisdomTree Global Natural Resources Fund (GNAT) WisdomTree Global SmallCap Dividend Fund (GSD) WisdomTree India Earnings Fund (EPI) WisdomTree Middle East Dividend Fund (GULF) WisdomTree Dollar Sensitive Equity Funds WisdomTree Strong Dollar Emerging Markets Equity Fund (EMSD) WisdomTree Strong Dollar U.S. Equity Fund (USSD) WisdomTree Weak Dollar U.S. Equity Fund (USWD) WisdomTree Currency Strategy Funds WisdomTree Bloomberg U.S. Dollar Bullish Fund (USDU) WisdomTree Brazilian Real Strategy Fund (BZF) WisdomTree Chinese Yuan Strategy Fund (CYB) WisdomTree Commodity Currency Strategy Fund (CCX) WisdomTree Emerging Currency Strategy Fund (CEW) WisdomTree Indian Rupee Strategy Fund (ICN) WisdomTree Fixed Income Funds WisdomTree Asia Local Debt Fund (ALD) WisdomTree Australia & New Zealand Debt Fund (AUNZ) WisdomTree Barclays U.S. Aggregate Bond Enhanced Yield Fund (AGGY) WisdomTree Barclays U.S. Aggregate Bond Negative Duration Fund (AGND) WisdomTree Barclays U.S. Aggregate Bond Zero Duration Fund (AGZD) WisdomTree Bloomberg Floating Rate Treasury Fund (USFR) WisdomTree BofA Merrill Lynch High Yield Bond Negative Duration Fund (HYND) WisdomTree BofA Merrill Lynch High Yield Bond Zero Duration Fund (HYZD) WisdomTree Emerging Markets Corporate Bond Fund (EMCB) WisdomTree Emerging Markets Local Debt Fund (ELD) WisdomTree Japan Interest Rate Strategy Fund (JGBB) WisdomTree Strategic Corporate Bond Fund (CRDT) WisdomTree Western Asset Unconstrained Bond Fund (UBND) WisdomTree Alternative Funds WisdomTree CBOE S&P 500 PutWrite Strategy Fund (PUTW) WisdomTree Coal Fund (TONS) WisdomTree Continuous Commodity Index Fund (GCC) WisdomTree Dynamic Bearish U.S. Equity Fund (DYB) WisdomTree Dynamic Long/Short U.S. Equity Fund (DYLS) WisdomTree Global Real Return Fund (RRF) WisdomTree Managed Futures Strategy Fund (WDTI) |
The WisdomTree Funds are exchange traded funds (“ETFs”) registered with the United States Securities and Exchange Commission as separate series (“Funds”) of WisdomTree Trust (“Trust”). WisdomTree Asset Management, Inc., a wholly owned subsidiary of WisdomTree Investments, Inc., serves as the investment adviser to the Trust. None of the WisdomTree entities are affiliated with Foreside Fund Services, LLC, the Funds’ distributor. WisdomTree Investments, its affiliates and their independent providers are not liable for any informational errors, incompleteness, delays, or for any actions taken in reliance on information contained herein.
Investors should consider the investment objectives, risks, charges and expenses of the Funds carefully before investing. A prospectus, containing this and other information, is available at www.wisdomtree.com, or by calling 1-866-909-WISE (9473). Investors should read the prospectus carefully before investing. There are risks associated with investing, including possible loss of principal. Past performance does not guarantee future results. Indexes are unmanaged and you cannot invest directly in an index.
There are risks associated with investing including possible loss of principal. Foreign investing involves special risks, such as risk of loss from currency fluctuation or political or economic uncertainty. Investments in real estate involve additional special risks, such as credit risk, interest rate fluctuations and the effect of varied economic conditions. Funds that focus their investments in one country or region may be significantly impacted by events and developments associated with the region which can adversely affect performance. Funds focusing on a single sector and/or smaller companies generally experience greater price volatility. Investments in emerging, offshore or frontier markets are generally less liquid and less efficient than investments in developed markets and are subject to additional risks, such as risks of adverse governmental regulation and intervention or political developments. Inflation protected securities do not eliminate risks associated with inflation or deflation. Investments in currency involve additional special risks, such as credit risk and interest rate fluctuations. Derivative investments can be volatile and these investments may be less liquid than other securities, and more sensitive to the effect of varied economic conditions. As these Funds can have a high concentration in some issuers the Funds can be adversely impacted by changes affecting such issuers. Due to the investment strategy of certain Funds they may make higher capital gain distributions than other ETFs. Please read the Fund’s prospectus for specific details regarding the Fund’s risk profile.
Transactions in Fund shares will result in brokerage commissions and will generate tax consequences. Shares may be sold through brokerage accounts, but may be redeemed from the Funds only in large amounts of 50,000 shares or more.
WisdomTree Trust
245 Park Avenue, 35th Floor
New York, NY 10167
WisdomTree Developed World ex-U.S. and Currency Hedged Equity Funds
WisdomTree Australia Dividend Fund (AUSE)
WisdomTree Europe Hedged Equity Fund (HEDJ)
WisdomTree Europe Hedged SmallCap Equity Fund (EUSC)
WisdomTree Europe Quality Dividend Growth Fund (EUDG)
(formerly, WisdomTree Europe Dividend Growth Fund)
WisdomTree Europe SmallCap Dividend Fund (DFE)
WisdomTree Germany Hedged Equity Fund (DXGE)
WisdomTree Global ex-U.S. Hedged Dividend Fund (DXUS)
WisdomTree Global ex-U.S. Hedged Real Estate Fund (HDRW)
WisdomTree International Dividend ex-Financials Fund (DOO)
WisdomTree International Equity Fund (DWM)
(formerly, WisdomTree DEFA Fund)
WisdomTree International Hedged Equity Fund (HDWM)
WisdomTree International Hedged Quality Dividend Growth Fund (IHDG)
(formerly, WisdomTree International Hedged Dividend Growth Fund)
WisdomTree International Hedged SmallCap Dividend Fund (HDLS)
WisdomTree International High Dividend Fund (DTH)
(formerly, WisdomTree DEFA Equity Income Fund)
WisdomTree International LargeCap Dividend Fund (DOL)
WisdomTree International MidCap Dividend Fund (DIM)
WisdomTree International SmallCap Dividend Fund (DLS)
WisdomTree Japan Hedged Capital Goods Fund (DXJC)
WisdomTree Japan Hedged Equity Fund (DXJ)
WisdomTree Japan Hedged Financials Fund (DXJF)
WisdomTree Japan Hedged Health Care Fund (DXJH)
WisdomTree Japan Hedged Quality Dividend Growth Fund (JHDG)
(formerly, WisdomTree Japan Hedged Dividend Growth Fund)
WisdomTree Japan Hedged Real Estate Fund (DXJR)
WisdomTree Japan Hedged SmallCap Equity Fund (DXJS)
WisdomTree Japan Hedged Tech, Media and Telecom Fund (DXJT)
WisdomTree Japan Quality Dividend Growth Fund (JDG)
(formerly, WisdomTree Japan Dividend Growth Fund)
WisdomTree Japan SmallCap Dividend Fund (DFJ)
WisdomTree Korea Hedged Equity Fund (DXKW)
WisdomTree United Kingdom Hedged Equity Fund (DXPS)
WisdomTree Fund shares are distributed by Foreside Fund Services, LLC, in the U.S. only.
WTGM-1422


WisdomTree Trust
Global/Global ex-U.S. and Emerging/Frontier Markets Funds
Annual Report
March 31, 2016
WisdomTree Asia Pacific ex-Japan Fund (AXJL)
WisdomTree China ex-State-Owned Enterprises Fund (CXSE)
(formerly, WisdomTree China Dividend ex-Financials Fund (CHXF))
WisdomTree Commodity Country Equity Fund (CCXE)
WisdomTree Emerging Markets Consumer Growth Fund (EMCG)
WisdomTree Emerging Markets ex-State-Owned Enterprises Fund (XSOE)
WisdomTree Emerging Markets High Dividend Fund (DEM)
(formerly, WisdomTree Emerging Markets Equity Income Fund)
WisdomTree Emerging Markets Quality Dividend Growth Fund (DGRE)
(formerly, WisdomTree Emerging Markets Dividend Growth Fund)
WisdomTree Emerging Markets SmallCap Dividend Fund (DGS)
WisdomTree Global ex-U.S. Quality Dividend Growth Fund (DNL)
(formerly, WisdomTree Global ex-U.S. Dividend Growth Fund)
WisdomTree Global ex-U.S. Real Estate Fund (DRW)
WisdomTree Global ex-U.S. Utilities Fund (DBU)
WisdomTree Global High Dividend Fund (DEW)
(formerly, WisdomTree Global Equity Income Fund)
WisdomTree Global Natural Resources Fund (GNAT)
WisdomTree India Earnings Fund (EPI)
WisdomTree Middle East Dividend Fund (GULF)
Table of Contents
“WisdomTree” is a registered mark of WisdomTree Investments, Inc. and is licensed for use by the WisdomTree Trust.
Management’s Discussion of Funds’ Performance (unaudited)
Market Environment Overview
The emerging markets, measured by the MSCI Emerging Markets Index, a broad measure of equity performance for emerging markets, returned -12.03% in the 12-month period that ended March 31, 2016 (the “period”). The global ex-U.S. equity markets, measured by the MSCI ACWI ex-USA Index, a broad measure of equity performance for both developed and emerging markets excluding the U.S., returned -9.19% over the period. Both the MSCI Emerging Markets Index and MSCI ACWI ex-USA Index lagged the S&P 500 Index by 13.81% and 10.97%, respectively. In local terms, the MSCI Emerging Markets Index and MSCI ACWI ex-USA Index returned -7.70% and -10.29%, respectively. It is important to note the variations in the returns of these international exposures in both U.S. dollar and local terms. Particularly within the emerging markets, the prolonged decline in commodities prices led to significant losses in the relative value of many emerging market currencies relative to the U.S. dollar over the period. This headwind was a significant detractor on the returns experienced by U.S. investors holding emerging market securities.
Within the MSCI Emerging Markets Index, in local currency terms, nine out of ten sectors were negative. The Consumer Staples and Energy sectors led performance while the Industrials and Financials sectors lagged most heavily. Within the MSCI ACWI ex-USA Index, in local currency terms, nine out of ten sectors were negative, with the Consumer Staples and Utilities sectors leading and Materials and the Financials sectors lagging. It is particularly important to note the effects of a strong U.S. dollar which adversely impacted commodity prices over the period.
WisdomTree Fund’s Performance Overview
The following table reflects the WisdomTree Funds’ performance versus capitalization-weighted benchmark indexes:
| | | | | | | | | | | | |
| Ticker | | WisdomTree Fund | | 1-Year
NAV Return | | Performance Benchmark | | 1-Year
Return | | | Difference |
AXJL | | WisdomTree Asia Pacific ex-Japan Fund | | -12.06% | | MSCI Pacific ex-Japan/MSCI AC Asia Pacific ex-Japan Spliced Index | | | -11.58% | | | -0.48% |
CXSE | | WisdomTree China ex-State-Owned Enterprises Fund | | -13.40% | | FTSE China 50 Index | | | -20.80% | | | 7.40% |
CCXE | | WisdomTree Commodity Country Equity Fund | | -8.30% | | S&P Global 1200 Materials Sector/S&P Developed Ex-U.S. BMI Materials Sector; MSCI ACWI ex-USA Spliced Index | | | -9.19% | | | 0.89% |
EMCG | | WisdomTree Emerging Markets Consumer Growth Fund | | -15.21% | | MSCI Emerging Markets Index | | | -12.03% | | | -3.18% |
XSOE | | WisdomTree Emerging Markets ex-State-Owned Enterprises Fund | | -11.69% | | MSCI Emerging Markets Index | | | -12.03% | | | 0.34% |
DEM | | WisdomTree Emerging Markets High Dividend Fund | | -14.07% | | MSCI Emerging Markets Index | | | -12.03% | | | -2.04% |
DGRE | | WisdomTree Emerging Markets Quality Dividend Growth Fund | | -9.89% | | MSCI Emerging Markets Index | | | -12.03% | | | 2.14% |
DGS | | WisdomTree Emerging Markets SmallCap Dividend Fund | | -12.20% | | MSCI Emerging Markets Small Cap Index | | | -9.20% | | | -3.00% |
DNL | | WisdomTree Global ex-U.S. Quality Dividend Growth Fund | | -5.42% | | MSCI Japan Value/MSCI AC World ex-USA Growth Spliced Index | | | -6.08% | | | 0.66% |
DRW | | WisdomTree Global ex-U.S. Real Estate Fund | | -3.89% | | Dow Jones Global ex-U.S. Select Real Estate Securities Index | | | -1.16% | | | -2.73% |
DBU | | WisdomTree Global ex-U.S. Utilities Fund | | -5.18% | | S&P Global 1200 Utilities Sector/S&P Developed ex-U.S. BMI Utilities Sector Spliced Index | | | 0.40% | | | -5.58% |
| | | | |
| WisdomTree Global/Global ex-U.S. and Emerging/Frontier Markets Funds | | | 1 | |
Management’s Discussion of Funds’ Performance
(unaudited) (concluded)
| | | | | | | | | | | | |
| Ticker | | WisdomTree Fund | | 1-Year
NAV Return | | Performance Benchmark | | 1-Year
Return | | | Difference |
DEW | | WisdomTree Global High Dividend Fund | | -3.77% | | MSCI Europe Value/MSCI AC World Spliced Index | | | -4.34% | | | 0.57% |
GNAT | | WisdomTree Global Natural Resources Fund | | -21.91% | | S&P Global 1200 Energy Sector/S&P Developed Ex-U.S. BMI Energy Sector/S&P Global Natural Resources Spliced Index | | | -15.30% | | | -6.61% |
EPI | | WisdomTree India Earnings Fund | | -13.31% | | MSCI India Index | | | -13.15% | | | -0.16% |
GULF | | WisdomTree Middle East Dividend Fund | | -11.57% | | MSCI Arabian Markets ex-Saudi Arabia Index | | | -11.79% | | | 0.22% |
WisdomTree’s emerging market and global ex-U.S. fundamentally-weighted funds are designed to track indexes based on the dividend or earnings stream generated by the companies included in the index. The dividend stream is defined as the sum of all dividends paid over the prior 12 months for each company. The earnings stream is defined as the total dollar level of earnings for all companies within each Index. There are two primary factors that drive performance differentials versus market cap-weighted benchmarks. The first is aggregate exposure to one or more sectors or countries. The second is stock selection within each sector or country. Both of these are determined as part of WisdomTree’s rules-based index methodology. These exposures are not subjectively determined. Rather, they are objectively determined at the Index rebalancing dates based on the dividend stream or earnings stream.
While the overall emerging markets lagged both the broad U.S. and developed international markets, there was a noticeable difference in performance between the different sectors and countries. The WisdomTree Emerging Markets Quality Dividend Growth Fund (DGRE) was the best performing fund over the full period, outperforming broader emerging markets by 2.14%. The fundamental screens for return on equity and return on assets led DGRE to have significant underweights in more traditionally leveraged sectors such as Financials and Energy. The WisdomTree China ex-State-Owned Enterprises Fund (CXSE) outperformed its performance benchmark, the FTSE China 50 Index by 7.40%. China was an area of particular focus over the period as concerns mounted over the country’s economic growth rate and state level intervention in financial markets. CXSE’s strategy aims to screen out companies which the state owns 20% or more of which led to overweights in Information Technology and Consumer Discretionary and underweights in Financials and Energy.
Among the WisdomTree global and global-ex U.S. funds, the WisdomTree Global High Dividend Fund (DEW) and WisdomTree Global ex-U.S. Real Estate Fund (DRW) were the best performing funds over the period, returning -3.77% and -3.89% respectively. Around the world, interest rates remained low causing investors to seek out income alternatives to fixed income. The worst performing fund over the period was the WisdomTree Global Natural Resources Fund (GNAT), which returned -21.91% over the period. The fund invests heavily in the Energy and Materials sectors, which were the two worst performing sectors over the period, driven by lower oil prices, a stronger dollar and slower than expected global growth.
Fund returns are shown at NAV. Please see Performance Summaries on the subsequent pages for more complete performance information. Please see pages 18-20 for the list of index descriptions.
Fund performance assumes reinvestment of dividends and capital gain distributions. An index is a statistical measure of a specified financial market or sector. An index does not actually hold a portfolio of securities, incur expenses or pay any transaction costs. Therefore, index returns do not reflect deductions for fees or expenses and an index is not available for direct investment. In comparison, the Funds’ performance is negatively impacted by these deductions. Fund returns do not reflect brokerage commissions or taxes on transactions in Fund shares or taxes that a shareholder would pay on Fund distributions. Past performance is no guarantee of future results. For the most recent month-end performance information visit www.wisdomtree.com.
| | |
| 2 | | WisdomTree Global/Global ex-U.S. and Emerging/Frontier Markets Funds |
Performance Summary (unaudited)
WisdomTree Asia Pacific ex-Japan Fund (AXJL)
Sector Breakdown† as of 3/31/16
| | | | |
| |
| Sector | | % of Net Assets | |
Financials | | | 23.5% | |
Telecommunication Services | | | 18.6% | |
Information Technology | | | 13.6% | |
Materials | | | 8.5% | |
Energy | | | 8.0% | |
Industrials | | | 6.8% | |
Consumer Staples | | | 6.6% | |
Utilities | | | 5.0% | |
Consumer Discretionary | | | 4.6% | |
Investment Company | | | 3.1% | |
Healthcare | | | 1.1% | |
Other Assets less Liabilities‡ | | | 0.6% | |
Total | | | 100.0% | |
| † | The Fund’s sector breakdown is expressed as a percentage of net assets and may change over time. In addition, a sector may be comprised of several industries. It does not include derivatives (if any). |
| ‡ | Other assets includes investment of cash collateral for securities on loan (if any). |
Top Ten Holdings* as of 3/31/16
| | | | |
| |
| Description | | % of Net Assets | |
China Mobile Ltd. | | | 5.7% | |
Taiwan Semiconductor Manufacturing Co., Ltd. | | | 4.3% | |
China Construction Bank Corp., Class H | | | 3.0% | |
iPath MSCI India Index ETN | | | 2.9% | |
BHP Billiton Ltd. | | | 2.7% | |
Samsung Electronics Co., Ltd. | | | 2.7% | |
Telstra Corp., Ltd. | | | 2.6% | |
CNOOC Ltd. | | | 2.4% | |
Singapore Telecommunications Ltd. | | | 2.1% | |
Commonwealth Bank of Australia | | | 2.0% | |
| * | The ten largest holdings are subject to change, and there are no guarantees the Fund will remain invested in any particular company. Excludes investment of cash collateral for securities on loan (if any). |
The WisdomTree Asia Pacific ex-Japan Fund (the ‘‘Fund’’) seeks to track the price and yield performance, before fees and expenses, of the WisdomTree Asia Pacific ex-Japan Index.
The Fund returned -12.06% at net asset value (“NAV”) for the fiscal year ending March 31, 2016 (for more complete performance information please see the table below). The Fund benefited the most from its position in South Korea. The Fund’s position in Australia created the greatest drag on performance.
The following performance table is provided for comparative purposes and represents the period noted. The Fund’s per share NAV is the value of one share of the Fund and is calculated by dividing the value of total assets less total liabilities by the number of shares outstanding. The NAV return is based on the NAV of the Fund and the market price return is based on the market price per share of the Fund. The price used to calculate market price returns is the mid-point of the highest bid and lowest offer for Fund shares as of the close of trading on the exchange where Fund shares are listed. NAV and market price returns assume that dividends and capital gain distributions have been reinvested in the Fund at NAV and market price, respectively. As with other ETFs, NAV returns and market price returns may differ because of factors such as the supply and demand for Fund shares and investors’ assessments of the underlying value of the Fund’s portfolio securities.
An index is a statistical measure of a specified financial market or sector. An index does not actually hold a portfolio of securities, incur expenses or pay any transaction costs. Therefore, index returns do not reflect deductions for fees or expenses and the index is not available for direct investment. In comparison, the Fund’s performance is negatively impacted by these deductions. Fund returns do not reflect brokerage commissions or taxes a shareholder would pay on the sale of Fund shares or on Fund distributions. As of the Fund’s current prospectus dated August 1, 2015, as revised November 12, 2015, the Fund’s annual expense ratio was 0.48%.
Performance as of 3/31/16
| | | | | | | | | | | | | | | | |
| | | Average Annual Total Return | |
| | | 1 Year | | | 3 Year | | | 5 Year | | | Since
Inception1 | |
Fund NAV Returns | | | -12.06 | % | | | -2.72 | % | | | 0.01 | % | | | 5.62 | % |
Fund Market Price Returns | | | -12.46 | % | | | -3.02 | % | | | -0.12 | % | | | 5.58 | % |
WisdomTree Pacific ex-Japan Dividend/Asia Pacific ex-Japan Spliced Index2 | | | -11.84 | % | | | -2.53 | % | | | 0.45 | % | | | 6.48 | % |
MSCI Pacific ex-Japan/MSCI AC Asia Pacific ex-Japan Spliced Index3 | | | -11.58 | % | | | -1.25 | % | | | -0.15 | % | | | 5.35 | % |
| 1 | Total returns are calculated based on the commencement of Fund trading on the NYSE Arca, Inc. on June 16, 2006. |
| 2 | WisdomTree Pacific ex-Japan Dividend Index through June 17, 2011; WisdomTree Asia Pacific ex-Japan Index thereafter. |
| 3 | MSCI Pacific ex-Japan Index through June 17, 2011; MSCI AC Asia Pacific ex-Japan Index thereafter. |
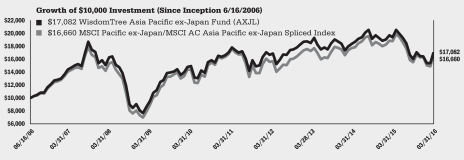
Performance is historical and does not guarantee future results. Current performance may be lower or higher than quoted. Investment returns and the principal value of an investment will fluctuate so that an investor’s shares, when redeemed, may be worth more or less than their original cost. Performance data for the most recent month-end is available at www.wisdomtree.com. WisdomTree shares are bought and sold at market price (not NAV) and are not individually redeemed from the Fund. Fund NAV returns are calculated using the Fund’s daily 4:00 p.m. NAV. Market price returns reflect the midpoint of the bid/ask spread as of the close of trading on the exchange where Fund shares are listed. Market price returns do not represent the returns you would receive if you traded shares at other times. The returns do not reflect the deduction of taxes that a shareholder would pay on Fund distributions or on the redemption of Fund shares. Total returns for a period of less than one year are cumulative.
| | | | |
| WisdomTree Global/Global ex-U.S. and Emerging/Frontier Markets Funds | | | 3 | |
Performance Summary (unaudited)
WisdomTree China ex-State-Owned Enterprises Fund (CXSE)
(formerly, WisdomTree China Dividend ex-Financials Fund)
Sector Breakdown† as of 3/31/16
| | | | |
| |
| Sector | | % of Net Assets | |
Information Technology | | | 34.8% | |
Consumer Discretionary | | | 29.2% | |
Financials | | | 19.7% | |
Consumer Staples | | | 8.8% | |
Healthcare | | | 4.6% | |
Industrials | | | 2.9% | |
Other Assets less Liabilities‡ | | | 0.0% | |
Total | | | 100.0% | |
| † | The Fund’s sector breakdown is expressed as a percentage of net assets and may change over time. In addition, a sector may be comprised of several industries. It does not include derivatives (if any). |
| ‡ | Other assets includes investment of cash collateral for securities on loan (if any). |
Top Ten Holdings* as of 3/31/16
| | | | |
| |
| Description | | % of Net Assets | |
Baidu, Inc., ADR | | | 9.0% | |
Ping An Insurance Group Co. of China Ltd., Class H | | | 8.9% | |
JD.com, Inc., ADR | | | 8.7% | |
Alibaba Group Holding Ltd., ADR | | | 8.0% | |
Tencent Holdings Ltd. | | | 7.8% | |
Ctrip.com International Ltd., ADR | | | 5.8% | |
Hengan International
Group Co., Ltd. | | | 2.6% | |
China Minsheng Banking Corp., Ltd., Class H | | | 2.3% | |
NetEase, Inc., ADR | | | 2.3% | |
WH Group Ltd. | | | 1.9% | |
| * | The ten largest holdings are subject to change, and there are no guarantees the Fund will remain invested in any particular company. Excludes investment of cash collateral for securities on loan (if any). |
The WisdomTree China ex-State-Owned Enterprises Fund (the ‘‘Fund’’), seeks to track the price and yield performance, before fees and expenses, of the WisdomTree China ex-State-Owned Enterprises Index.
The Fund returned -13.40% at net asset value (“NAV”) for the fiscal year ending March 31, 2016 (for more complete performance information please see the table below). The Fund benefited the most from its position in the Utilities sector. The Fund’s position in the Financials sector created the greatest drag on performance.
The following performance table is provided for comparative purposes and represents the period noted. The Fund’s per share NAV is the value of one share of the Fund and is calculated by dividing the value of total assets less total liabilities by the number of shares outstanding. The NAV return is based on the NAV of the Fund and the market price return is based on the market price per share of the Fund. The price used to calculate market price returns is the mid-point of the highest bid and lowest offer for Fund shares as of the close of trading on the exchange where Fund shares are listed. NAV and market price returns assume that dividends and capital gain distributions have been reinvested in the Fund at NAV and market price, respectively. As with other ETFs, NAV returns and market price returns may differ because of factors such as the supply and demand for Fund shares and investors’ assessments of the underlying value of the Fund’s portfolio securities.
An index is a statistical measure of a specified financial market or sector. An index does not actually hold a portfolio of securities, incur expenses or pay any transaction costs. Therefore, index returns do not reflect deductions for fees or expenses and the index is not available for direct investment. In comparison, the Fund’s performance is negatively impacted by these deductions. Fund returns do not reflect brokerage commissions or taxes a shareholder would pay on the sale of Fund shares or on Fund distributions. As of the Fund’s current prospectus dated August 1, 2015, as revised November 12, 2015, the Fund’s net and gross annual expense ratios were 0.53% and 0.63%, respectively. WisdomTree Asset Management, Inc. has contractually agreed to limit the management fee to 0.53% effective July 1, 2015 through July 31, 2016, unless earlier terminated by the Board of Trustees of the Trust for any reason at any time.
Performance as of 3/31/16
| | | | | | | | | | | | |
| | | Average Annual Total Return | |
| | | 1 Year | | | 3 Year | | | Since
Inception1 | |
Fund NAV Returns | | | -13.40 | % | | | -0.91 | % | | | 0.27 | % |
Fund Market Price Returns | | | -14.50 | % | | | -1.18 | % | | | -0.20 | % |
WisdomTree China Dividend ex-Financials/China ex-State-Owned Enterprises Spliced Index2 | | | -11.03 | % | | | 0.19 | % | | | 1.28 | % |
MSCI China Index | | | -18.84 | % | | | 0.94 | % | | | 3.01 | % |
FTSE China 50 Index | | | -20.80 | % | | | 0.68 | % | | | 2.26 | % |
| 1 | Total returns are calculated based on the commencement of Fund trading on the NASDAQ on September 19, 2012. |
| 2 | WisdomTree China Dividend ex-Financials Index through June 30, 2015; WisdomTree China ex-State-Owned Enterprises Index thereafter. |
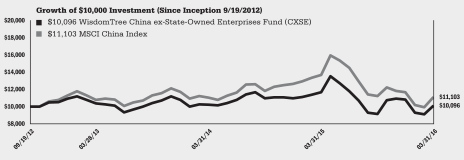
Performance is historical and does not guarantee future results. Current performance may be lower or higher than quoted. Investment returns and the principal value of an investment will fluctuate so that an investor’s shares, when redeemed, may be worth more or less than their original cost. Performance data for the most recent month-end is available at www.wisdomtree.com. WisdomTree shares are bought and sold at market price (not NAV) and are not individually redeemed from the Fund. Fund NAV returns are calculated using the Fund’s daily 4:00 p.m. NAV. Market price returns reflect the midpoint of the bid/ask spread as of the close of trading on the exchange where Fund shares are listed. Market price returns do not represent the returns you would receive if you traded shares at other times. The returns do not reflect the deduction of taxes that a shareholder would pay on Fund distributions or on the redemption of Fund shares. Total returns for a period of less than one year are cumulative.
| | |
| 4 | | WisdomTree Global/Global ex-U.S. and Emerging/Frontier Markets Funds |
Performance Summary (unaudited)
WisdomTree Commodity Country Equity Fund (CCXE)
Sector Breakdown† as of 3/31/16
| | | | |
| |
| Sector | | % of Net Assets | |
Financials | | | 24.3% | |
Energy | | | 20.6% | |
Telecommunication Services | | | 12.1% | |
Materials | | | 11.4% | |
Consumer Staples | | | 9.7% | |
Utilities | | | 8.0% | |
Industrials | | | 4.9% | |
Consumer Discretionary | | | 4.8% | |
Healthcare | | | 1.8% | |
Investment Company | | | 1.1% | |
Information Technology | | | 0.6% | |
Other Assets less Liabilities‡ | | | 0.7% | |
Total | | | 100.0% | |
| † | The Fund’s sector breakdown is expressed as a percentage of net assets and may change over time. In addition, a sector may be comprised of several industries. It does not include derivatives (if any). |
| ‡ | Other assets includes investment of cash collateral for securities on loan (if any). |
Top Ten Holdings* as of 3/31/16
| | | | |
| |
| Description | | % of Net Assets | |
Statoil ASA | | | 5.6% | |
Ambev S.A. | | | 3.9% | |
Spark New Zealand Ltd. | | | 3.2% | |
Gazprom PAO, ADR | | | 2.8% | |
MMC Norilsk Nickel PJSC, ADR | | | 2.3% | |
Lukoil PJSC, ADR | | | 2.3% | |
MTN Group Ltd. | | | 2.0% | |
Meridian Energy Ltd. | | | 1.9% | |
Fletcher Building Ltd. | | | 1.8% | |
Rosneft OAO, GDR Reg S | | | 1.6% | |
| * | The ten largest holdings are subject to change, and there are no guarantees the Fund will remain invested in any particular company. Excludes investment of cash collateral for securities on loan (if any). |
The WisdomTree Commodity Country Equity Fund (the ‘‘Fund’’) seeks to track the price and yield performance, before fees and expenses, of the WisdomTree Commodity Country Equity Index.
The Fund returned -8.30% at net asset value (“NAV”) for the fiscal year ending March 31, 2016 (for more complete performance information please the table below). The Fund benefited the most from its position in New Zealand. The Fund’s position in South Africa created the greatest drag on performance.
The following performance table is provided for comparative purposes and represents the period noted. The Fund’s per share NAV is the value of one share of the Fund and is calculated by dividing the value of total assets less total liabilities by the number of shares outstanding. The NAV return is based on the NAV of the Fund and the market price return is based on the market price per share of the Fund. The price used to calculate market price returns is the mid-point of the highest bid and lowest offer for Fund shares as of the close of trading on the exchange where Fund shares are listed. NAV and market price returns assume that dividends and capital gain distributions have been reinvested in the Fund at NAV and market price, respectively. As with other ETFs, NAV returns and market price returns may differ because of factors such as the supply and demand for Fund shares and investors’ assessments of the underlying value of the Fund’s portfolio securities.
An index is a statistical measure of a specified financial market or sector. An index does not actually hold a portfolio of securities, incur expenses or pay any transaction costs. Therefore, index returns do not reflect deductions for fees or expenses and the index is not available for direct investment. In comparison, the Fund’s performance is negatively impacted by these deductions. Fund returns do not reflect brokerage commissions or taxes a shareholder would pay on the sale of Fund shares or on Fund distributions. As of the Fund’s current prospectus dated August 1, 2015, as revised November 12, 2015, the Fund’s annual expense ratio was 0.58%.
Performance as of 3/31/16
| | | | | | | | | | | | | | | | |
| | | Average Annual Total Return | |
| | | 1 Year | | | 3 Year | | | 5 Year | | | Since
Inception1 | |
Fund NAV Returns | | | -8.30 | % | | | -7.79 | % | | | -4.03 | % | | | 1.89 | % |
Fund Market Price Returns | | | -8.26 | % | | | -7.97 | % | | | -4.27 | % | | | 1.71 | % |
WisdomTree International Basic Materials Sector/Commodity Country Equity Spliced Index2 | | | -7.92 | % | | | -7.44 | % | | | -3.65 | % | | | 2.47 | % |
S&P Global 1200 Materials Sector/S&P Developed ex-U.S. BMI Materials Sector/MSCI ACWI ex-USA Spliced Index3 | | | -9.19 | % | | | 0.32 | % | | | -0.27 | % | | | 5.42 | % |
| 1 | Total returns are calculated based on the commencement of Fund trading on the NYSE Arca, Inc. on October 13, 2006. |
| 2 | WisdomTree International Basic Materials Sector Index through June 17, 2011; WisdomTree Commodity Country Equity Index thereafter. |
| 3 | S&P Global 1200 Materials Sector Index through March 31, 2008; S&P Developed ex-U.S. BMI Materials Sector Index through June 17, 2011; MSCI ACWI ex-USA Index thereafter. |
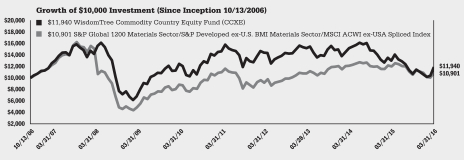
Performance is historical and does not guarantee future results. Current performance may be lower or higher than quoted. Investment returns and the principal value of an investment will fluctuate so that an investor’s shares, when redeemed, may be worth more or less than their original cost. Performance data for the most recent month-end is available at www.wisdomtree.com. WisdomTree shares are bought and sold at market price (not NAV) and are not individually redeemed from the Fund. Fund NAV returns are calculated using the Fund’s daily 4:00 p.m. NAV. Market price returns reflect the midpoint of the bid/ask spread as of the close of trading on the exchange where Fund shares are listed. Market price returns do not represent the returns you would receive if you traded shares at other times. The returns do not reflect the deduction of taxes that a shareholder would pay on Fund distributions or on the redemption of Fund shares. Total returns for a period of less than one year are cumulative.
| | | | |
| WisdomTree Global/Global ex-U.S. and Emerging/Frontier Markets Funds | | | 5 | |
Performance Summary (unaudited)
WisdomTree Emerging Markets Consumer Growth Fund (EMCG)
Sector Breakdown† as of 3/31/16
| | | | |
| |
| Sector | | % of Net Assets | |
Consumer Discretionary | | | 32.3% | |
Consumer Staples | | | 28.5% | |
Financials | | | 14.3% | |
Information Technology | | | 12.0% | |
Telecommunication Services | | | 4.5% | |
Utilities | | | 4.2% | |
Industrials | | | 3.1% | |
Healthcare | | | 0.7% | |
Other Assets less Liabilities‡ | | | 0.4% | |
Total | | | 100.0% | |
| † | The Fund’s sector breakdown is expressed as a percentage of net assets and may change over time. In addition, a sector may be comprised of several industries. It does not include derivatives (if any). |
| ‡ | Other assets includes investment of cash collateral for securities on loan (if any). |
Top Ten Holdings* as of 3/31/16
| | | | |
| |
| Description | | % of Net Assets | |
Ambev S.A. | | | 8.1% | |
Hyundai Mobis Co., Ltd. | | | 6.1% | |
Alibaba Group Holding Ltd., ADR | | | 2.8% | |
Astra International Tbk PT | | | 2.4% | |
Ping An Insurance Group Co. of China Ltd., Class H | | | 2.2% | |
LG Display Co., Ltd. | | | 2.0% | |
MTN Group Ltd. | | | 1.9% | |
KT&G Corp. | | | 1.8% | |
BB Seguridade Participacoes S.A. | | | 1.8% | |
Magnit PJSC, GDR Reg S | | | 1.8% | |
| * | The ten largest holdings are subject to change, and there are no guarantees the Fund will remain invested in any particular company. Excludes investment of cash collateral for securities on loan (if any). |
The WisdomTree Emerging Markets Consumer Growth Fund (the ‘‘Fund’’) seeks to track the price and yield performance, before fees and expenses, of the WisdomTree Emerging Markets Consumer Growth Index.
The Fund returned -15.21% at net asset value (“NAV”) for the fiscal year ending March 31, 2016 (for more complete performance information please see the table below). The Fund benefited the most from its position in Mexico. The Fund’s position in China created the greatest drag on performance.
The following performance table is provided for comparative purposes and represents
the period noted. The Fund’s per share NAV is the value of one share of the Fund and is calculated by dividing the value of total assets less total liabilities by the number of shares outstanding. The NAV return is based on the NAV of the Fund and the market price return is based on the market price per share of the Fund. The price used to calculate market price returns is the mid-point of the highest bid and lowest offer for Fund shares as of the close of trading on the exchange where Fund shares are listed. NAV and market price returns assume that dividends and capital gain distributions have been reinvested in the Fund at NAV and market price, respectively. As with other ETFs, NAV returns and market price returns may differ because of factors such as the supply and demand for Fund shares and investors’ assessments of the underlying value of the Fund’s portfolio securities.
An index is a statistical measure of a specified financial market or sector. An index does not actually hold a portfolio of securities, incur expenses or pay any transaction costs. Therefore, index returns do not reflect deductions for fees or expenses and the index is not available for direct investment. In comparison, the Fund’s performance is negatively impacted by these deductions. Fund returns do not reflect brokerage commissions or taxes a shareholder would pay on the sale of Fund shares or on Fund distributions. As of the Fund’s current prospectus dated August 1, 2015, as revised November 12, 2015, the Fund’s annual expense ratio was 0.63%.
Performance as of 3/31/16
| | | | | | | | |
| | | Average Annual Total Return | |
| | | 1 Year | | | Since
Inception1 | |
Fund NAV Returns | | | -15.21 | % | | | -5.40 | % |
Fund Market Price Returns | | | -15.86 | % | | | -5.91 | % |
WisdomTree Emerging Markets Consumer Growth Index | | | -14.93 | % | | | -4.72 | % |
MSCI Emerging Markets Index | | | -12.03 | % | | | -4.76 | % |
| 1 | Total returns are calculated based on the commencement of Fund trading on the NASDAQ on September 27, 2013. |
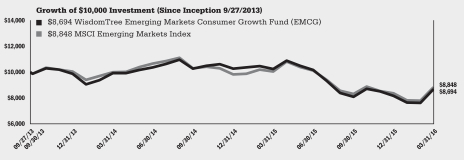
Performance is historical and does not guarantee future results. Current performance may be lower or higher than quoted. Investment returns and the principal value of an investment will fluctuate so that an investor’s shares, when redeemed, may be worth more or less than their original cost. Performance data for the most recent month-end is available at www.wisdomtree.com. WisdomTree shares are bought and sold at market price (not NAV) and are not individually redeemed from the Fund. Fund NAV returns are calculated using the Fund’s daily 4:00 p.m. NAV. Market price returns reflect the midpoint of the bid/ask spread as of the close of trading on the exchange where Fund shares are listed. Market price returns do not represent the returns you would receive if you traded shares at other times. The returns do not reflect the deduction of taxes that a shareholder would pay on Fund distributions or on the redemption of Fund shares. Total returns for a period of less than one year are cumulative.
| | |
| 6 | | WisdomTree Global/Global ex-U.S. and Emerging/Frontier Markets Funds |
Performance Summary (unaudited)
WisdomTree Emerging Markets ex-State-Owned Enterprises Fund (XSOE)
Sector Breakdown† as of 3/31/16
| | | | |
| |
| Sector | | % of Net Assets | |
Information Technology | | | 27.0% | |
Financials | | | 20.9% | |
Consumer Discretionary | | | 14.6% | |
Consumer Staples | | | 11.1% | |
Materials | | | 6.3% | |
Industrials | | | 6.0% | |
Telecommunication Services | | | 4.5% | |
Healthcare | | | 4.1% | |
Energy | | | 3.8% | |
Utilities | | | 1.3% | |
Other Assets less Liabilities‡ | | | 0.4% | |
Total | | | 100.0% | |
| † | The Fund’s sector breakdown is expressed as a percentage of net assets and may change over time. In addition, a sector may be comprised of several industries. It does not include derivatives (if any). |
| ‡ | Other assets includes investment of cash collateral for securities on loan (if any). |
Top Ten Holdings* as of 3/31/16
| | | | |
| |
| Description | | % of Net Assets | |
Tencent Holdings Ltd. | | | 5.3% | |
Alibaba Group Holding Ltd., ADR | | | 4.0% | |
Samsung Electronics Co., Ltd. | | | 3.2% | |
Baidu, Inc., ADR | | | 2.7% | |
Taiwan Semiconductor Manufacturing Co., Ltd. | | | 2.3% | |
Ping An Insurance Group Co. of China Ltd., Class H | | | 1.9% | |
Naspers Ltd., Class N | | | 1.6% | |
JD.com, Inc., ADR | | | 1.5% | |
Reliance Industries Ltd., GDR | | | 1.1% | |
Lukoil PJSC, ADR | | | 1.0% | |
| * | The ten largest holdings are subject to change, and there are no guarantees the Fund will remain invested in any particular company. Excludes investment of cash collateral for securities on loan (if any). |
The WisdomTree Emerging Markets ex-State-Owned Enterprises Fund (the ‘‘Fund’’) seeks to track the price and yield performance, before fees and expenses, of the WisdomTree Emerging Markets ex-State-Owned Enterprises Index.
The Fund returned -11.69% at net asset value (“NAV”) for the fiscal year ending March 31, 2016 (for more complete performance information please see the table below). The Fund’s position in Hungary contributed the most positively to performance. The Fund’s position in India created the greatest drag on performance.
The following performance table is provided for comparative purposes and represents the period noted. The Fund’s per share NAV is the value of one share of the Fund and is calculated by dividing the value of total assets less total liabilities by the number of shares outstanding. The NAV return is based on the NAV of the Fund and the market price return is based on the market price per share of the Fund. The price used to calculate market price returns is the mid-point of the highest bid and lowest offer for Fund shares as of the close of trading on the exchange where Fund shares are listed. NAV and market price returns assume that dividends and capital gain distributions have been reinvested in the Fund at NAV and market price, respectively. As with other ETFs, NAV returns and market price returns may differ because of factors such as the supply and demand for Fund shares and investors’ assessments of the underlying value of the Fund’s portfolio securities.
An index is a statistical measure of a specified financial market or sector. An index does not actually hold a portfolio of securities, incur expenses or pay any transaction costs. Therefore, index returns do not reflect deductions for fees or expenses and the index is not available for direct investment. In comparison, the Fund’s performance is negatively impacted by these deductions. Fund returns do not reflect brokerage commissions or taxes a shareholder would pay on the sale of Fund shares or on Fund distributions. As of the Fund’s current prospectus dated August 1, 2015, as revised November 12, 2015, the Fund’s annual expense ratio was 0.58%.
Performance as of 3/31/16
| | | | | | | | |
| | | Average Annual Total Return | |
| | | 1 Year | | | Since
Inception1 | |
Fund NAV Returns | | | -11.69 | % | | | -7.28 | % |
Fund Market Price Returns | | | -12.00 | % | | | -7.09 | % |
WisdomTree Emerging Markets ex-State-Owned Enterprises Index | | | -9.21 | % | | | -5.13 | % |
MSCI Emerging Markets Index | | | -12.03 | % | | | -7.83 | % |
| 1 | Total returns are calculated based on the commencement of Fund trading on the NYSE Arca, Inc. on December 10, 2014. |
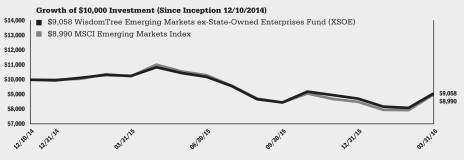
Performance is historical and does not guarantee future results. Current performance may be lower or higher than quoted. Investment returns and the principal value of an investment will fluctuate so that an investor’s shares, when redeemed, may be worth more or less than their original cost. Performance data for the most recent month-end is available at www.wisdomtree.com. WisdomTree shares are bought and sold at market price (not NAV) and are not individually redeemed from the Fund. Fund NAV returns are calculated using the Fund’s daily 4:00 p.m. NAV. Market price returns reflect the midpoint of the bid/ask spread as of the close of trading on the exchange where Fund shares are listed. Market price returns do not represent the returns you would receive if you traded shares at other times. The returns do not reflect the deduction of taxes that a shareholder would pay on Fund distributions or on the redemption of Fund shares. Total returns for a period of less than one year are cumulative.
| | | | |
| WisdomTree Global/Global ex-U.S. and Emerging/Frontier Markets Funds | | | 7 | |
Performance Summary (unaudited)
WisdomTree Emerging Markets High Dividend Fund (DEM)
(formerly, WisdomTree Emerging Markets Equity Income Fund)
Sector Breakdown† as of 3/31/16
| | | | |
| |
| Sector | | % of Net Assets | |
Financials | | | 24.5% | |
Energy | | | 16.1% | |
Telecommunication Services | | | 14.4% | |
Materials | | | 14.3% | |
Information Technology | | | 12.4% | |
Utilities | | | 6.4% | |
Consumer Discretionary | | | 5.4% | |
Industrials | | | 4.8% | |
Consumer Staples | | | 1.2% | |
Healthcare | | | 0.3% | |
Other Assets less Liabilities‡ | | | 0.2% | |
Total | | | 100.0% | |
| † | The Fund’s sector breakdown is expressed as a percentage of net assets and may change over time. In addition, a sector may be comprised of several industries. It does not include derivatives (if any). |
| ‡ | Other assets includes investment of cash collateral for securities on loan (if any). |
Top Ten Holdings* as of 3/31/16
| | | | |
| |
| Description | | % of Net Assets | |
CNOOC Ltd. | | | 4.1% | |
Gazprom PAO, ADR | | | 3.8% | |
MMC Norilsk Nickel PJSC, ADR | | | 3.1% | |
Lukoil PJSC, ADR | | | 3.1% | |
China Construction Bank Corp., Class H | | | 2.5% | |
Chunghwa Telecom Co., Ltd. | | | 2.0% | |
Industrial & Commercial Bank of China Ltd., Class H | | | 2.0% | |
MTN Group Ltd. | | | 1.7% | |
MediaTek, Inc. | | | 1.6% | |
Vale S.A. | | | 1.6% | |
| * | The ten largest holdings are subject to change, and there are no guarantees the Fund will remain invested in any particular company. Excludes investment of cash collateral for securities on loan (if any). |
The WisdomTree Emerging Markets High Dividend Fund (the ‘‘Fund’’) seeks to track the price and yield performance, before fees and expenses, of the WisdomTree Emerging Markets High Dividend Index. Prior to August 31, 2015, the WisdomTree Emerging Markets High Dividend Index was named the WisdomTree Emerging Markets Equity Income Index.
The Fund returned -14.07% for the fiscal year ending March 31, 2016 (for more complete performance information please see the table below). The Fund benefited the most from its position in South Korea. The Fund’s position in China created the greatest drag on performance.
The following performance table is provided for comparative purposes and represents the period noted. The Fund’s per share NAV is the value of one share of the Fund and is calculated by dividing the value of total assets less total liabilities by the number of shares outstanding. The NAV return is based on the NAV of the Fund and the market price return is based on the market price per share of the Fund. The price used to calculate market price returns is the mid-point of the highest bid and lowest offer for Fund shares as of the close of trading on the exchange where Fund shares are listed. NAV and market price returns assume that dividends and capital gain distributions have been reinvested in the Fund at NAV and market price, respectively. As with other ETFs, NAV returns and market price returns may differ because of factors such as the supply and demand for Fund shares and investors’ assessments of the underlying value of the Fund’s portfolio securities.
An index is a statistical measure of a specified financial market or sector. An index does not actually hold a portfolio of securities, incur expenses or pay any transaction costs. Therefore, index returns do not reflect deductions for fees or expenses and the index is not available for direct investment. In comparison, the Fund’s performance is negatively impacted by these deductions. Fund returns do not reflect brokerage commissions or taxes a shareholder would pay on the sale of Fund shares or on Fund distributions. As of the Fund’s current prospectus dated August 1, 2015, as revised November 12, 2015, the Fund’s annual expense ratio was 0.63%.
Performance as of 3/31/16
| | | | | | | | | | | | | | | | |
| | | Average Annual Total Return | |
| | | 1 Year | | | 3 Year | | | 5 Year | | | Since
Inception1 | |
Fund NAV Returns | | | -14.07 | % | | | -9.95 | % | | | -6.49 | % | | | -0.17 | % |
Fund Market Price Returns | | | -14.13 | % | | | -10.25 | % | | | -6.77 | % | | | -0.56 | % |
WisdomTree Emerging Markets High Dividend Index | | | -13.26 | % | | | -8.92 | % | | | -5.46 | % | | | 0.86 | % |
MSCI Emerging Markets Index | | | -12.03 | % | | | -4.50 | % | | | -4.13 | % | | | -1.25 | % |
| 1 | Total returns are calculated based on the commencement of Fund trading on the NYSE Arca, Inc. on July 13, 2007. |
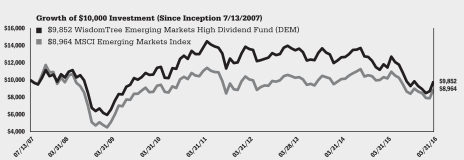
Performance is historical and does not guarantee future results. Current performance may be lower or higher than quoted. Investment returns and the principal value of an investment will fluctuate so that an investor’s shares, when redeemed, may be worth more or less than their original cost. Performance data for the most recent month-end is available at www.wisdomtree.com. WisdomTree shares are bought and sold at market price (not NAV) and are not individually redeemed from the Fund. Fund NAV returns are calculated using the Fund’s daily 4:00 p.m. NAV. Market price returns reflect the midpoint of the bid/ask spread as of the close of trading on the exchange where Fund shares are listed. Market price returns do not represent the returns you would receive if you traded shares at other times. The returns do not reflect the deduction of taxes that a shareholder would pay on Fund distributions or on the redemption of Fund shares. Total returns for a period of less than one year are cumulative.
| | |
| 8 | | WisdomTree Global/Global ex-U.S. and Emerging/Frontier Markets Funds |
Performance Summary (unaudited)
WisdomTree Emerging Markets Quality Dividend Growth Fund (DGRE)
(formerly, WisdomTree Emerging Markets Dividend Growth Fund)
Sector Breakdown† as of 3/31/16
| | | | |
| |
| Sector | | % of Net Assets | |
Information Technology | | | 18.0% | |
Financials | | | 17.2% | |
Consumer Staples | | | 16.1% | |
Consumer Discretionary | | | 14.1% | |
Telecommunication Services | | | 12.5% | |
Industrials | | | 9.2% | |
Investment Company | | | 3.7% | |
Healthcare | | | 2.4% | |
Materials | | | 2.3% | |
Energy | | | 2.2% | |
Utilities | | | 1.9% | |
Other Assets less Liabilities‡ | | | 0.4% | |
Total | | | 100.0% | |
| † | The Fund’s sector breakdown is expressed as a percentage of net assets and may change over time. In addition, a sector may be comprised of several industries. It does not include derivatives (if any). |
| ‡ | Other assets includes investment of cash collateral for securities on loan (if any). |
Top Ten Holdings* as of 3/31/16
| | | | |
| |
| Description | | % of Net Assets | |
Taiwan Semiconductor Manufacturing Co., Ltd. | | | 6.3% | |
Ambev S.A. | | | 5.3% | |
Evergrande Real Estate Group Ltd. | | | 4.7% | |
iPath MSCI India Index ETN | | | 3.7% | |
BB Seguridade Participacoes S.A. | | | 3.5% | |
Vodacom Group Ltd. | | | 3.2% | |
Advanced Info Service PCL, NVDR | | | 3.1% | |
Telekomunikasi Indonesia Persero Tbk PT | | | 3.0% | |
China Overseas Land & Investment Ltd. | | | 2.6% | |
Tencent Holdings Ltd. | | | 1.9% | |
| * | The ten largest holdings are subject to change, and there are no guarantees the Fund will remain invested in any particular company. Excludes investment of cash collateral for securities on loan (if any). |
The WisdomTree Emerging Markets Quality Dividend Growth Fund (the ‘‘Fund’’) seeks to track the price and yield performance, before fees and expenses, of the WisdomTree Emerging Markets Quality Dividend Growth Index. Prior to August 31, 2015, the WisdomTree Emerging Markets Quality Dividend Growth Index was named the WisdomTree Emerging Markets Dividend Growth Index.
The Fund returned -9.89% at net asset value (“NAV”) for the fiscal year ending March 31, 2016 (for more complete performance information please see the table below). The Fund benefited the most from its position in South Korea. The Fund’s position in South Africa created the greatest drag on performance.
The following performance table is provided for comparative purposes and represents the period noted. The Fund’s per share NAV is the value of one share of the Fund and is calculated by dividing the value of total assets less total liabilities by the number of shares outstanding. The NAV return is based on the NAV of the Fund and the market price return is based on the market price per share of the Fund. The price used to calculate market price returns is the mid-point of the highest bid and lowest offer for Fund shares as of the close of trading on the exchange where Fund shares are listed. NAV and market price returns assume that dividends and capital gain distributions have been reinvested in the Fund at NAV and market price, respectively. As with other ETFs, NAV returns and market price returns may differ because of factors such as the supply and demand for Fund shares and investors’ assessments of the underlying value of the Fund’s portfolio securities.
An index is a statistical measure of a specified financial market or sector. An index does not actually hold a portfolio of securities, incur expenses or pay any transaction costs. Therefore, index returns do not reflect deductions for fees or expenses and the index is not available for direct investment. In comparison, the Fund’s performance is negatively impacted by these deductions. Fund returns do not reflect brokerage commissions or taxes a shareholder would pay on the sale of Fund shares or on Fund distributions. As of the Fund’s current prospectus dated August 1, 2015, as revised November 12, 2015, the Fund’s annual expense ratio was 0.63%.
Performance as of 3/31/16
| | | | | | | | |
| | | Average Annual Total Return | |
| | | 1 Year | | | Since
Inception1 | |
Fund NAV Returns | | | -9.89 | % | | | -4.38 | % |
Fund Market Price Returns | | | -10.21 | % | | | -5.15 | % |
WisdomTree Emerging Markets Quality Dividend Growth Index | | | -9.20 | % | | | -3.47 | % |
MSCI Emerging Markets Index | | | -12.03 | % | | | -2.64 | % |
| 1 | Total returns are calculated based on the commencement of Fund trading on the NASDAQ on August 1, 2013. |
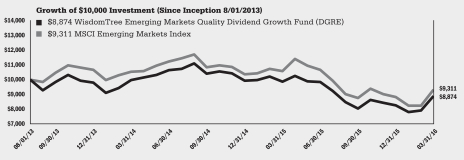
Performance is historical and does not guarantee future results. Current performance may be lower or higher than quoted. Investment returns and the principal value of an investment will fluctuate so that an investor’s shares, when redeemed, may be worth more or less than their original cost. Performance data for the most recent month-end is available at www.wisdomtree.com. WisdomTree shares are bought and sold at market price (not NAV) and are not individually redeemed from the Fund. Fund NAV returns are calculated using the Fund’s daily 4:00 p.m. NAV. Market price returns reflect the midpoint of the bid/ask spread as of the close of trading on the exchange where Fund shares are listed. Market price returns do not represent the returns you would receive if you traded shares at other times. The returns do not reflect the deduction of taxes that a shareholder would pay on Fund distributions or on the redemption of Fund shares. Total returns for a period of less than one year are cumulative.
| | | | |
| WisdomTree Global/Global ex-U.S. and Emerging/Frontier Markets Funds | | | 9 | |
Performance Summary (unaudited)
WisdomTree Emerging Markets SmallCap Dividend Fund (DGS)
Sector Breakdown† as of 3/31/16
| | | | |
| |
| Sector | | % of Net Assets | |
Financials | | | 21.5% | |
Information Technology | | | 18.1% | |
Consumer Discretionary | | | 16.0% | |
Industrials | | | 14.2% | |
Materials | | | 11.0% | |
Consumer Staples | | | 6.3% | |
Utilities | | | 5.6% | |
Energy | | | 2.9% | |
Healthcare | | | 2.7% | |
Telecommunication Services | | | 0.6% | |
Investment Company | | | 0.6% | |
Other Assets less Liabilities‡ | | | 0.5% | |
Total | | | 100.0% | |
| † | The Fund’s sector breakdown is expressed as a percentage of net assets and may change over time. In addition, a sector may be comprised of several industries. It does not include derivatives (if any). |
| ‡ | Other assets includes investment of cash collateral for securities on loan (if any). |
Top Ten Holdings* as of 3/31/16
| | | | |
| |
| Description | | % of Net Assets | |
Inventec Corp. | | | 1.0% | |
Cia Siderurgica Nacional S.A. | | | 0.9% | |
Novatek Microelectronics Corp. | | | 0.9% | |
Transmissora Alianca de Energia Eletrica S.A. | | | 0.8% | |
CIFI Holdings Group Co., Ltd. | | | 0.7% | |
Synnex Technology International Corp. | | | 0.7% | |
Ruentex Industries Ltd. | | | 0.7% | |
KWG Property Holding Ltd. | | | 0.6% | |
Coronation Fund Managers Ltd. | | | 0.6% | |
WPG Holdings Ltd. | | | 0.6% | |
| * | The ten largest holdings are subject to change, and there are no guarantees the Fund will remain invested in any particular company. Excludes investment of cash collateral for securities on loan (if any). |
The WisdomTree Emerging Markets SmallCap Dividend Fund (the ‘‘Fund’’) seeks to track the price and yield performance, before fees and expenses, of the WisdomTree Emerging Markets SmallCap Dividend Index.
The Fund returned -12.20% for the fiscal ending March 31, 2016 (for more complete performance information please see the table below). The Fund benefited the most from its position in Brazil. The Fund’s position in China created the greatest drag on performance.
The following performance table is provided for comparative purposes and represents the period noted. The Fund’s per share NAV is the value of one share of the Fund and is calculated by dividing the value of total assets less total liabilities by the number of shares outstanding. The NAV return is based on the NAV of the Fund and the market price return is based on the market price per share of the Fund. The price used to calculate market price returns is the mid-point of the highest bid and lowest offer for Fund shares as of the close of trading on the exchange where Fund shares are listed. NAV and market price returns assume that dividends and capital gain distributions have been reinvested in the Fund at NAV and market price, respectively. As with other ETFs, NAV returns and market price returns may differ because of factors such as the supply and demand for Fund shares and investors’ assessments of the underlying value of the Fund’s portfolio securities.
An index is a statistical measure of a specified financial market or sector. An index does not actually hold a portfolio of securities, incur expenses or pay any transaction costs. Therefore, index returns do not reflect deductions for fees or expenses and the index is not available for direct investment. In comparison, the Fund’s performance is negatively impacted by these deductions. Fund returns do not reflect brokerage commissions or taxes a shareholder would pay on the sale of Fund shares or on Fund distributions. As of the Fund’s current prospectus dated August 1, 2015, as revised November 12, 2015, the Fund’s annual expense ratio was 0.63%.
Performance as of 3/31/16
| | | | | | | | | | | | | | | | |
| | | Average Annual Total Return | |
| | | 1 Year | | | 3 Year | | | 5 Year | | | Since
Inception1 | |
Fund NAV Returns | | | -12.20 | % | | | -6.70 | % | | | -3.51 | % | | | -0.34 | % |
Fund Market Price Returns | | | -12.02 | % | | | -7.06 | % | | | -3.65 | % | | | -0.37 | % |
WisdomTree Emerging Markets SmallCap Dividend Index | | | -11.21 | % | | | -5.74 | % | | | -2.37 | % | | | 0.81 | % |
MSCI Emerging Markets Small Cap Index | | | -9.20 | % | | | -2.69 | % | | | -2.56 | % | | | -1.24 | % |
| 1 | Total returns are calculated based on the commencement of Fund trading on the NYSE Arca, Inc. on October 30, 2007. |
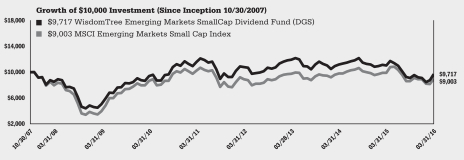
Performance is historical and does not guarantee future results. Current performance may be lower or higher than quoted. Investment returns and the principal value of an investment will fluctuate so that an investor’s shares, when redeemed, may be worth more or less than their original cost. Performance data for the most recent month-end is available at www.wisdomtree.com. WisdomTree shares are bought and sold at market price (not NAV) and are not individually redeemed from the Fund. Fund NAV returns are calculated using the Fund’s daily 4:00 p.m. NAV. Market price returns reflect the midpoint of the bid/ask spread as of the close of trading on the exchange where Fund shares are listed. Market price returns do not represent the returns you would receive if you traded shares at other times. The returns do not reflect the deduction of taxes that a shareholder would pay on Fund distributions or on the redemption of Fund shares. Total returns for a period of less than one year are cumulative.
| | |
| 10 | | WisdomTree Global/Global ex-U.S. and Emerging/Frontier Markets Funds |
Performance Summary (unaudited)
WisdomTree Global ex-U.S. Quality Dividend Growth Fund (DNL)
(formerly, WisdomTree Global ex-U.S. Dividend Growth Fund)
Sector Breakdown† as of 3/31/16
| | | | |
| |
| Sector | | % of Net Assets | |
Consumer Discretionary | | | 18.1% | |
Consumer Staples | | | 15.7% | |
Information Technology | | | 15.2% | |
Financials | | | 12.6% | |
Healthcare | | | 10.0% | |
Industrials | | | 9.8% | |
Energy | | | 5.9% | |
Materials | | | 4.0% | |
Telecommunication Services | | | 2.9% | |
Utilities | | | 2.8% | |
Investment Company | | | 2.5% | |
Other Assets less Liabilities‡ | | | 0.5% | |
Total | | | 100.0% | |
| † | The Fund’s sector breakdown is expressed as a percentage of net assets and may change over time. In addition, a sector may be comprised of several industries. It does not include derivatives (if any). |
| ‡ | Other assets includes investment of cash collateral for securities on loan (if any). |
Top Ten Holdings* as of 3/31/16
| | | | |
| |
| Description | | % of Net Assets | |
Taiwan Semiconductor Manufacturing Co., Ltd. | | | 6.1% | |
Ambev S.A. | | | 5.1% | |
Gazprom PAO, ADR | | | 4.6% | |
Imperial Brands PLC | | | 4.2% | |
Novo Nordisk A/S, Class B | | | 2.9% | |
Industria de Diseno Textil S.A. | | | 2.9% | |
Hennes & Mauritz AB, Class B | | | 2.5% | |
iPath MSCI India Index ETN | | | 2.4% | |
Evergrande Real Estate Group Ltd. | | | 2.3% | |
Roche Holding AG, Bearer Shares | | | 2.2% | |
| * | The ten largest holdings are subject to change, and there are no guarantees the Fund will remain invested in any particular company. Excludes investment of cash collateral for securities on loan (if any). |
The WisdomTree Global ex-U.S. Quality Dividend Growth Fund (the ‘‘Fund’’) seeks to track the price and yield performance, before fees and expenses, of the WisdomTree Global ex-U.S. Quality Dividend Growth Index. Prior to August 31, 2015, the WisdomTree Global ex-U.S. Quality Dividend Growth Index was named the WisdomTree Global ex-U.S. Dividend Growth Index.
The Fund returned -5.42% at net asset value (“NAV”) for the fiscal year ending March 31, 2016 (for more complete performance information please see the table below). The Fund benefited the most from its position in the United Kingdom. The Fund’s position in South Africa created the greatest drag on performance.
The following performance table is provided for comparative purposes and represents the period noted. The Fund’s per share NAV is the value of one share of the Fund and is calculated by dividing the value of total assets less total liabilities by the number of shares outstanding. The NAV return is based on the NAV of the Fund and the market price return is based on the market price per share of the Fund. The price used to calculate market price returns is the mid-point of the highest bid and lowest offer for Fund shares as of the close of trading on the exchange where Fund shares are listed. NAV and market price returns assume that dividends and capital gain distributions have been reinvested in the Fund at NAV and market price, respectively. As with other ETFs, NAV returns and market price returns may differ because of factors such as the supply and demand for Fund shares and investors’ assessments of the underlying value of the Fund’s portfolio securities.
An index is a statistical measure of a specified financial market or sector. An index does not actually hold a portfolio of securities, incur expenses or pay any transaction costs. Therefore, index returns do not reflect deductions for fees or expenses and the index is not available for direct investment. In comparison, the Fund’s performance is negatively impacted by these deductions. Fund returns do not reflect brokerage commissions or taxes a shareholder would pay on the sale of Fund shares or on Fund distributions. As of the Fund’s current prospectus dated August 1, 2015, as revised November 12, 2015, the Fund’s annual expense ratio was 0.58%.
Performance as of 3/31/16
| | | | | | | | | | | | | | | | |
| | | Average Annual Total Return | |
| | | 1 Year | | | 3 Year | | | 5 Year | | | Since
Inception1 | |
Fund NAV Returns | | | -5.42 | % | | | -0.94 | % | | | -0.65 | % | | | 1.81 | % |
Fund Market Price Returns | | | -6.28 | % | | | -1.28 | % | | | -0.95 | % | | | 1.78 | % |
WisdomTree Japan Equity Income/Global ex-U.S. Quality Dividend Growth Spliced Index2 | | | -4.93 | % | | | -0.40 | % | | | 0.03 | % | | | 2.38 | % |
MSCI Japan Value/MSCI AC World ex-USA Growth Spliced Index3 | | | -6.08 | % | | | 1.92 | % | | | 1.60 | % | | | 3.46 | % |
| 1 | Total returns are calculated based on the commencement of Fund trading on the NYSE Arca, Inc. on June 16, 2006. |
| 2 | WisdomTree Japan Equity Income Index through June 19, 2009; WisdomTree Global ex-U.S. Quality Dividend Growth Index thereafter. |
| 3 | MSCI Japan Value Index through June 19, 2009; MSCI AC World ex-USA Growth Index thereafter. |
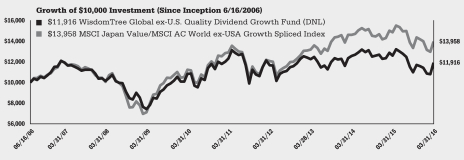
Performance is historical and does not guarantee future results. Current performance may be lower or higher than quoted. Investment returns and the principal value of an investment will fluctuate so that an investor’s shares, when redeemed, may be worth more or less than their original cost. Performance data for the most recent month-end is available at www.wisdomtree.com. WisdomTree shares are bought and sold at market price (not NAV) and are not individually redeemed from the Fund. Fund NAV returns are calculated using the Fund’s daily 4:00 p.m. NAV. Market price returns reflect the midpoint of the bid/ask spread as of the close of trading on the exchange where Fund shares are listed. Market price returns do not represent the returns you would receive if you traded shares at other times. The returns do not reflect the deduction of taxes that a shareholder would pay on Fund distributions or on the redemption of Fund shares. Total returns for a period of less than one year are cumulative.
| | | | |
| WisdomTree Global/Global ex-U.S. and Emerging/Frontier Markets Funds | | | 11 | |
Performance Summary (unaudited)
WisdomTree Global ex-U.S. Real Estate Fund (DRW)
Industry Breakdown† as of 3/31/16
| | | | |
| |
| Industry | | % of Net Assets | |
Real Estate Management & Development | | | 52.2% | |
Real Estate Investment Trusts (REITs) | | | 47.4% | |
Investment Company | | | 0.1% | |
Other Assets less Liabilities‡ | | | 0.3% | |
Total | | | 100.0% | |
| † | The Fund’s industry breakdown is expressed as a percentage of net assets and may change over time. It does not include derivatives (if any). |
| ‡ | Other assets includes investment of cash collateral for securities on loan (if any). |
Top Ten Holdings* as of 3/31/16
| | | | |
| |
| Description | | % of Net Assets | |
Evergrande Real Estate Group Ltd. | | | 3.8% | |
Sun Hung Kai Properties Ltd. | | | 3.4% | |
Unibail-Rodamco SE | | | 3.3% | |
Scentre Group | | | 2.8% | |
Country Garden Holdings Co., Ltd. | | | 2.1% | |
China Overseas Land & Investment Ltd. | | | 2.1% | |
Wharf Holdings Ltd. (The) | | | 2.0% | |
Link REIT | | | 1.7% | |
Westfield Corp. | | | 1.7% | |
Stockland | | | 1.4% | |
| * | The ten largest holdings are subject to change, and there are no guarantees the Fund will remain invested in any particular company. Excludes investment of cash collateral for securities on loan (if any). |
The WisdomTree Global ex-U.S. Real Estate Fund (the ‘‘Fund’’) seeks to track the price and yield performance, before fees and expenses, of the WisdomTree Global ex-U.S. Real Estate Index.
The Fund returned -3.89% at net asset value (“NAV”) for the fiscal year ending March 31, 2016 (for more complete performance information please see the table below). The Fund benefited the most from its position in Australia. The Fund’s position in Hong Kong created the greatest drag on performance.
The following performance table is provided for comparative purposes and represents the period noted. The Fund’s per share NAV is the value of one share of the Fund and is calculated by dividing the value of total assets less total liabilities by the number of shares outstanding. The NAV return is based on the NAV of the Fund and the market price return is based on the market price per share of the Fund. The price used to calculate market price returns is the mid-point of the highest bid and lowest offer for Fund shares as of the close of trading on the exchange where Fund shares are listed. NAV and market price returns assume that dividends and capital gain distributions have been reinvested in the Fund at NAV and market price, respectively. As with other ETFs, NAV returns and market price returns may differ because of factors such as the supply and demand for Fund shares and investors’ assessments of the underlying value of the Fund’s portfolio securities.
An index is a statistical measure of a specified financial market or sector. An index does not actually hold a portfolio of securities, incur expenses or pay any transaction costs. Therefore, index returns do not reflect deductions for fees or expenses and the index is not available for direct investment. In comparison, the Fund’s performance is negatively impacted by these deductions. Fund returns do not reflect brokerage commissions or taxes a shareholder would pay on the sale of Fund shares or on Fund distributions. As of the Fund’s current prospectus dated August 1, 2015, as revised November 12, 2015, the Fund’s annual expense ratio was 0.58%.
Performance as of 3/31/16
| | | | | | | | | | | | | | | | |
| | | Average Annual Total Return | |
| | | 1 Year | | | 3 Year | | | 5 Year | | | Since
Inception1 | |
Fund NAV Returns | | | -3.89 | % | | | 1.58 | % | | | 4.29 | % | | | -1.12 | % |
Fund Market Price Returns | | | -3.78 | % | | | 1.32 | % | | | 4.16 | % | | | -1.26 | % |
WisdomTree International Real Estate/Global ex-U.S. Real Estate Spliced Index2 | | | -3.74 | % | | | 1.76 | % | | | 4.45 | % | | | -0.97 | % |
Dow Jones Global ex-U.S. Select Real Estate Securities Index | | | -1.16 | | | | 2.71 | | | | 6.18 | | | | -0.75 | |
| 1 | Total returns are calculated based on the commencement of Fund trading on the NYSE Arca, Inc. on June 5, 2007. |
| 2 | WisdomTree International Real Estate Index through June 17, 2011; WisdomTree Global ex-U.S. Real Estate Index thereafter. |
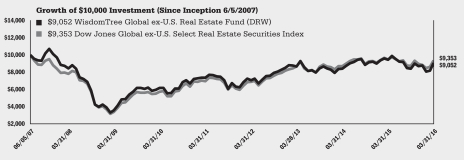
Performance is historical and does not guarantee future results. Current performance may be lower or higher than quoted. Investment returns and the principal value of an investment will fluctuate so that an investor’s shares, when redeemed, may be worth more or less than their original cost. Performance data for the most recent month-end is available at www.wisdomtree.com. WisdomTree shares are bought and sold at market price (not NAV) and are not individually redeemed from the Fund. Fund NAV returns are calculated using the Fund’s daily 4:00 p.m. NAV. Market price returns reflect the midpoint of the bid/ask spread as of the close of trading on the exchange where Fund shares are listed. Market price returns do not represent the returns you would receive if you traded shares at other times. The returns do not reflect the deduction of taxes that a shareholder would pay on Fund distributions or on the redemption of Fund shares. Total returns for a period of less than one year are cumulative.
| | |
| 12 | | WisdomTree Global/Global ex-U.S. and Emerging/Frontier Markets Funds |
Performance Summary (unaudited)
WisdomTree Global ex-U.S. Utilities Fund (DBU)
Industry Breakdown† as of 3/31/16
| | | | |
| |
| Industry | | % of Net Assets | |
Electric Utilities | | | 37.2% | |
Independent Power & Renewable Electricity Producers | | | 23.2% | |
Multi-Utilities | | | 17.5% | |
Gas Utilities | | | 14.1% | |
Water Utilities | | | 6.7% | |
Investment Company | | | 1.0% | |
Other Assets less Liabilities‡ | | | 0.3% | |
Total | | | 100.0% | |
| † | The Fund’s industry breakdown is expressed as a percentage of net assets and may change over time. It does not include derivatives (if any). |
| ‡ | Other assets includes investment of cash collateral for securities on loan (if any). |
Top Ten Holdings* as of 3/31/16
| | | | |
| |
| Description | | % of Net Assets | |
Fortum Oyj | | | 2.5% | |
Snam SpA | | | 2.2% | |
Meridian Energy Ltd. | | | 2.1% | |
Contact Energy Ltd. | | | 2.1% | |
Engie S.A. | | | 2.1% | |
CEZ AS | | | 2.0% | |
E.ON SE | | | 2.0% | |
SSE PLC | | | 1.9% | |
TransAlta Corp. | | | 1.9% | |
Tractebel Energia S.A. | | | 1.9% | |
| * | The ten largest holdings are subject to change, and there are no guarantees the Fund will remain invested in any particular company. Excludes investment of cash collateral for securities on loan (if any). |
The WisdomTree Global ex-U.S. Utilities Fund (the ‘‘Fund’’) seeks to track the price and yield performance, before fees and expenses, of the WisdomTree Global ex-U.S. Utilities Index.
The Fund returned -5.18% at net asset value (“NAV”) for the fiscal year ending March 31, 2016 (for more complete performance information please see the table below). The Fund benefited the most from its position in Italy. The Fund’s position in China created the greatest drag on performance.
The following performance table is provided for comparative purposes and represents the period noted. The Fund’s per share NAV is the value of one share of the Fund and is calculated by dividing the value of total assets less total liabilities by the number of shares outstanding. The NAV return is based on the NAV of the Fund and the market price return is based on the market price per share of the Fund. The price used to calculate market price returns is the mid-point of the highest bid and lowest offer for Fund shares as of the close of trading on the exchange where Fund shares are listed. NAV and market price returns assume that dividends and capital gain distributions have been reinvested in the Fund at NAV and market price, respectively. As with other ETFs, NAV returns and market price returns may differ because of factors such as the supply and demand for Fund shares and investors’ assessments of the underlying value of the Fund’s portfolio securities.
An index is a statistical measure of a specified financial market or sector. An index does not actually hold a portfolio of securities, incur expenses or pay any transaction costs. Therefore, index returns do not reflect deductions for fees or expenses and the index is not available for direct investment. In comparison, the Fund’s performance is negatively impacted by these deductions. Fund returns do not reflect brokerage commissions or taxes a shareholder would pay on the sale of Fund shares or on Fund distributions. As of the Fund’s current prospectus dated August 1, 2015, as revised November 12, 2015, the Fund’s annual expense ratio was 0.58%.
Performance as of 3/31/16
| | | | | | | | | | | | | | | | |
| | | Average Annual Total Return | |
| | | 1 Year | | | 3 Year | | | 5 Year | | | Since
Inception1 | |
Fund NAV Returns | | | -5.18 | % | | | 0.47 | % | | | -1.55 | % | | | -0.70 | % |
Fund Market Price Returns | | | -5.74 | % | | | 0.15 | % | | | -1.72 | % | | | -0.86 | % |
WisdomTree International Utilities Sector/Global ex-U.S. Utilities Spliced Index2 | | | -4.87 | % | | | 0.74 | % | | | -1.49 | % | | | -0.52 | % |
S&P Global 1200 Utilities/S&P Developed ex-U.S. BMI Utilities Spliced Index3 | | | 0.40 | % | | | 4.75 | % | | | -0.06 | % | | | -0.21 | % |
| 1 | Total returns are calculated based on the commencement of Fund trading on the NYSE Arca, Inc. on October 13, 2006. |
| 2 | WisdomTree International Utilities Sector Index through June 17, 2011; WisdomTree Global ex-U.S. Utilities Index thereafter. |
| 3 | S&P Global 1200 Utilities Sector Index through March 31, 2008; S&P Developed ex-U.S. BMI Utilities Sector Index thereafter. |
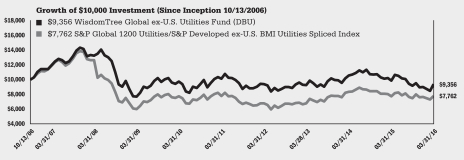
Performance is historical and does not guarantee future results. Current performance may be lower or higher than quoted. Investment returns and the principal value of an investment will fluctuate so that an investor’s shares, when redeemed, may be worth more or less than their original cost. Performance data for the most recent month-end is available at www.wisdomtree.com. WisdomTree shares are bought and sold at market price (not NAV) and are not individually redeemed from the Fund. Fund NAV returns are calculated using the Fund’s daily 4:00 p.m. NAV. Market price returns reflect the midpoint of the bid/ask spread as of the close of trading on the exchange where Fund shares are listed. Market price returns do not represent the returns you would receive if you traded shares at other times. The returns do not reflect the deduction of taxes that a shareholder would pay on Fund distributions or on the redemption of Fund shares. Total returns for a period of less than one year are cumulative.
| | | | |
| WisdomTree Global/Global ex-U.S. and Emerging/Frontier Markets Funds | | | 13 | |
Performance Summary (unaudited)
WisdomTree Global High Dividend Fund (DEW)
(formerly, WisdomTree Global Equity Income Fund)
Sector Breakdown† as of 3/31/16
| | | | |
| |
| Sector | | % of Net Assets | |
Financials | | | 23.3% | |
Energy | | | 13.8% | |
Telecommunication Services | | | 11.0% | |
Consumer Staples | | | 10.1% | |
Utilities | | | 8.9% | |
Industrials | | | 7.6% | |
Healthcare | | | 7.4% | |
Consumer Discretionary | | | 6.9% | |
Information Technology | | | 5.9% | |
Materials | | | 4.6% | |
Other Assets less Liabilities‡ | | | 0.5% | |
Total | | | 100.0% | |
| † | The Fund’s sector breakdown is expressed as a percentage of net assets and may change over time. In addition, a sector may be comprised of several industries. It does not include derivatives (if any). |
| ‡ | Other assets includes investment of cash collateral for securities on loan (if any). |
Top Ten Holdings* as of 3/31/16
| | | | |
| |
| Description | | % of Net Assets | |
Exxon Mobil Corp. | | | 3.1% | |
AT&T, Inc. | | | 3.0% | |
Verizon Communications, Inc. | | | 2.7% | |
General Electric Co. | | | 2.6% | |
Johnson & Johnson | | | 2.2% | |
Chevron Corp. | | | 2.2% | |
Procter & Gamble Co. (The) | | | 1.9% | |
Philip Morris International, Inc. | | | 1.8% | |
Pfizer, Inc. | | | 1.5% | |
Coca-Cola Co. (The) | | | 1.5% | |
| * | The ten largest holdings are subject to change, and there are no guarantees the Fund will remain invested in any particular company. Excludes investment of cash collateral for securities on loan (if any). |
The WisdomTree Global High Dividend Fund (the ‘‘Fund’’) seeks to track the price and yield performance, before fees and expenses, of the WisdomTree Global High Dividend Index. Prior to August 31, 2015, the WisdomTree Global High Dividend Index was named the WisdomTree Global Equity Income Index.
The Fund returned -3.77% at net asset value (“NAV”) for the fiscal year ending March 31, 2016 (for more complete performance information please see the table below). The Fund benefited the most from its position in the United States of America. The Fund’s position in Australia created the greatest drag on performance.
The following performance table is provided for comparative purposes and represents
the period noted. The Fund’s per share NAV is the value of one share of the Fund and is calculated by dividing the value of total assets less total liabilities by the number of shares outstanding. The NAV return is based on the NAV of the Fund and the market price return is based on the market price per share of the Fund. The price used to calculate market price returns is the mid-point of the highest bid and lowest offer for Fund shares as of the close of trading on the exchange where Fund shares are listed. NAV and market price returns assume that dividends and capital gain distributions have been reinvested in the Fund at NAV and market price, respectively. As with other ETFs, NAV returns and market price returns may differ because of factors such as the supply and demand for Fund shares and investors’ assessments of the underlying value of the Fund’s portfolio securities.
An index is a statistical measure of a specified financial market or sector. An index does not actually hold a portfolio of securities, incur expenses or pay any transaction costs. Therefore, index returns do not reflect deductions for fees or expenses and the index is not available for direct investment. In comparison, the Fund’s performance is negatively impacted by these deductions. Fund returns do not reflect brokerage commissions or taxes a shareholder would pay on the sale of Fund shares or on Fund distributions. As of the Fund’s current prospectus dated August 1, 2015, as revised November 12, 2015, the Fund’s annual expense ratio was 0.58%.
Performance as of 3/31/16
| | | | | | | | | | | | | | | | |
| | | Average Annual Total Return | |
| | | 1 Year | | | 3 Year | | | 5 Year | | | Since
Inception1 | |
Fund NAV Returns | | | -3.77 | % | | | 1.75 | % | | | 2.52 | % | | | 2.38 | % |
Fund Market Price Returns | | | -4.05 | % | | | 1.33 | % | | | 2.28 | % | | | 2.25 | % |
WisdomTree Europe Equity Income/Global High Dividend Spliced Index2 | | | -4.10 | % | | | 1.79 | % | | | 2.57 | % | | | 2.63 | % |
MSCI Europe Value/MSCI AC World Spliced Index3 | | | -4.34 | % | | | 5.54 | % | | | 5.22 | % | | | 3.55 | % |
| 1 | Total returns are calculated based on the commencement of Fund trading on the NYSE Arca, Inc. on June 16, 2006. |
| 2 | WisdomTree Europe Equity Income Index through June 19, 2009; WisdomTree Global High Dividend Index thereafter. |
| 3 | MSCI Europe Value Index through June 19, 2009; MSCI AC World Index thereafter. |
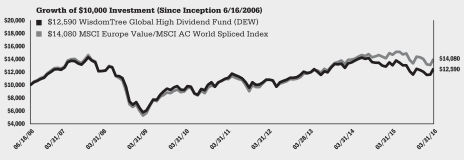
Performance is historical and does not guarantee future results. Current performance may be lower or higher than quoted. Investment returns and the principal value of an investment will fluctuate so that an investor’s shares, when redeemed, may be worth more or less than their original cost. Performance data for the most recent month-end is available at www.wisdomtree.com. WisdomTree shares are bought and sold at market price (not NAV) and are not individually redeemed from the Fund. Fund NAV returns are calculated using the Fund’s daily 4:00 p.m. NAV. Market price returns reflect the midpoint of the bid/ask spread as of the close of trading on the exchange where Fund shares are listed. Market price returns do not represent the returns you would receive if you traded shares at other times. The returns do not reflect the deduction of taxes that a shareholder would pay on Fund distributions or on the redemption of Fund shares. Total returns for a period of less than one year are cumulative.
| | |
| 14 | | WisdomTree Global/Global ex-U.S. and Emerging/Frontier Markets Funds |
Performance Summary (unaudited)
WisdomTree Global Natural Resources Fund (GNAT)
Industry Breakdown† as of 3/31/16
| | | | |
| |
| Industry | | % of Net Assets | |
Oil, Gas & Consumable Fuels | | | 48.8% | |
Metals & Mining | | | 23.9% | |
Chemicals | | | 12.1% | |
Energy Equipment & Services | | | 9.1% | |
Food Products | | | 4.6% | |
Investment Company | | | 1.1% | |
Other Assets less Liabilities‡ | | | 0.4% | |
Total | | | 100.0% | |
| † | The Fund’s industry breakdown is expressed as a percentage of net assets and may change over time. It does not include derivatives (if any). |
| ‡ | Other assets includes investment of cash collateral for securities on loan (if any). |
Top Ten Holdings* as of 3/31/16
| | | | |
| |
| Description | | % of Net Assets | |
Teck Resources Ltd., Class B | | | 3.1% | |
MMC Norilsk Nickel PJSC, ADR | | | 2.7% | |
Woodside Petroleum Ltd. | | | 2.7% | |
Royal Dutch Shell PLC, Class B | | | 2.6% | |
Vale S.A. | | | 2.3% | |
BP PLC | | | 2.3% | |
Royal Dutch Shell PLC, Class A | | | 2.2% | |
CNOOC Ltd. | | | 2.2% | |
Repsol S.A. | | | 2.2% | |
Lukoil PJSC, ADR | | | 2.1% | |
| * | The ten largest holdings are subject to change, and there are no guarantees the Fund will remain invested in any particular company. Excludes investment of cash collateral for securities on loan (if any). |
The WisdomTree Global Natural Resources Fund (the ‘‘Fund’’) seeks to track the price and yield performance, before fees and expenses, of the WisdomTree Global Natural Resources Index.
The Fund returned -21.91% at net asset value (“NAV”) for the fiscal year ending March 31, 2016 (for more complete performance information please see the table below). The Fund benefited the most from its position in France. The Fund’s position in the United States of America created the greatest drag on performance.
The following performance table is provided for comparative purposes and represents
the period noted. The Fund’s per share NAV is the value of one share of the Fund and is calculated by dividing the value of total assets less total liabilities by the number of shares outstanding. The NAV return is based on the NAV of the Fund and the market price return is based on the market price per share of the Fund. The price used to calculate market price returns is the mid-point of the highest bid and lowest offer for Fund shares as of the close of trading on the exchange where Fund shares are listed. NAV and market price returns assume that dividends and capital gain distributions have been reinvested in the Fund at NAV and market price, respectively. As with other ETFs, NAV returns and market price returns may differ because of factors such as the supply and demand for Fund shares and investors’ assessments of the underlying value of the Fund’s portfolio securities.
An index is a statistical measure of a specified financial market or sector. An index does not actually hold a portfolio of securities, incur expenses or pay any transaction costs. Therefore, index returns do not reflect deductions for fees or expenses and the index is not available for direct investment. In comparison, the Fund’s performance is negatively impacted by these deductions. Fund returns do not reflect brokerage commissions or taxes a shareholder would pay on the sale of Fund shares or on Fund distributions. As of the Fund’s current prospectus dated August 1, 2015, as revised November 12, 2015, the Fund’s annual expense ratio was 0.58%.
Performance as of 3/31/16
| | | | | | | | | | | | | | | | |
| | | Average Annual Total Return | |
| | | 1 Year | | | 3 Year | | | 5 Year | | | Since
Inception1 | |
Fund NAV Returns | | | -21.91 | % | | | -16.67 | % | | | -13.94 | % | | | -4.43 | % |
Fund Market Price Returns | | | -22.28 | % | | | -16.77 | % | | | -14.03 | % | | | -4.55 | % |
WisdomTree International Energy Sector/Global Natural Resources Spliced Index2 | | | -21.66 | % | | | -16.42 | % | | | -13.61 | % | | | -4.09 | % |
S&P Global 1200 Energy Sector/S&P Developed ex-U.S. BMI Energy Sector/S&P Global Natural Resources Spliced Index3 | | | -15.30 | % | | | -8.78 | % | | | -8.52 | % | | | -0.55 | % |
| 1 | Total returns are calculated based on the commencement of Fund trading on the NYSE Arca, Inc. on October 13, 2006. |
| 2 | WisdomTree International Energy Sector Index through June 17, 2011; WisdomTree Global Natural Resources Index thereafter. |
| 3 | S&P Global 1200 Energy Sector Index through March 31, 2008; S&P Developed ex-U.S. BMI Energy Sector Index through June 17, 2011; S&P Global Natural Resources Index thereafter. |
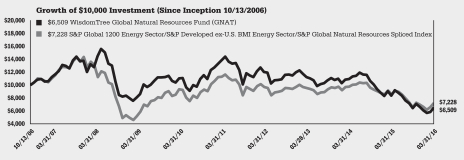
Performance is historical and does not guarantee future results. Current performance may be lower or higher than quoted. Investment returns and the principal value of an investment will fluctuate so that an investor’s shares, when redeemed, may be worth more or less than their original cost. Performance data for the most recent month-end is available at www.wisdomtree.com. WisdomTree shares are bought and sold at market price (not NAV) and are not individually redeemed from the Fund. Fund NAV returns are calculated using the Fund’s daily 4:00 p.m. NAV. Market price returns reflect the midpoint of the bid/ask spread as of the close of trading on the exchange where Fund shares are listed. Market price returns do not represent the returns you would receive if you traded shares at other times. The returns do not reflect the deduction of taxes that a shareholder would pay on Fund distributions or on the redemption of Fund shares. Total returns for a period of less than one year are cumulative.
| | | | |
| WisdomTree Global/Global ex-U.S. and Emerging/Frontier Markets Funds | | | 15 | |
Performance Summary (unaudited)
WisdomTree India Earnings Fund (EPI)
Sector Breakdown† as of 3/31/16
| | | | |
| |
| Sector | | % of Net Assets | |
Financials | | | 23.1% | |
Information Technology | | | 19.5% | |
Energy | | | 18.7% | |
Consumer Discretionary | | | 9.9% | |
Materials | | | 6.2% | |
Utilities | | | 5.4% | |
Healthcare | | | 5.3% | |
Consumer Staples | | | 4.7% | |
Industrials | | | 4.5% | |
Telecommunication Services | | | 2.6% | |
Other Assets less Liabilities‡ | | | 0.1% | |
Total | | | 100.0% | |
| † | The Fund’s sector breakdown is expressed as a percentage of net assets and may change over time. In addition, a sector may be comprised of several industries. It does not include derivatives (if any). |
| ‡ | Other assets includes investment of cash collateral for securities on loan (if any). |
Top Ten Holdings* as of 3/31/16
| | | | |
| |
| Description | | % of Net Assets | |
Reliance Industries Ltd. | | | 10.8 | % |
Infosys Ltd. | | | 9.2 | % |
Housing Development Finance Corp., Ltd. | | | 5.3 | % |
Tata Motors Ltd. | | | 4.3 | % |
Tata Consultancy Services Ltd. | | | 3.7 | % |
ICICI Bank Ltd. | | | 3.3 | % |
Oil & Natural Gas Corp., Ltd. | | | 2.9 | % |
Axis Bank Ltd. | | | 2.4 | % |
HCL Technologies Ltd. | | | 1.9 | % |
NTPC Ltd. | | | 1.9 | % |
| * | The ten largest holdings are subject to change, and there are no guarantees the Fund will remain invested in any particular company. Excludes investment of cash collateral for securities on loan (if any). |
The WisdomTree India Earnings Fund (the ‘‘Fund’’) seeks to track the price and yield performance, before fees and expenses, of the WisdomTree India Earnings Index.
The Fund returned -13.31% at net asset value (“NAV”) for the fiscal year ending March 31, 2016 (for more complete performance information please see the table below). The Fund benefited the most from its position in the Energy sector. The Fund’s position in the Financials sector created the greatest drag on performance.
The following performance table is provided for comparative purposes and represents the period noted. The Fund’s per share NAV is the value of one share of the Fund and is calculated by dividing the value of total assets less total liabilities by the number of shares outstanding. The NAV return is based on the NAV of the Fund and the market price return is based on the market price per share of the Fund. The price used to calculate market price returns is the mid-point of the highest bid and lowest offer for Fund shares as of the close of trading on the exchange where Fund shares are listed. NAV and market price returns assume that dividends and capital gain distributions have been reinvested in the Fund at NAV and market price, respectively. As with other ETFs, NAV returns and market price returns may differ because of factors such as the supply and demand for Fund shares and investors’ assessments of the underlying value of the Fund’s portfolio securities.
An index is a statistical measure of a specified financial market or sector. An index does not actually hold a portfolio of securities, incur expenses or pay any transaction costs. Therefore, index returns do not reflect deductions for fees or expenses and the index is not available for direct investment. In comparison, the Fund’s performance is negatively impacted by these deductions. Fund returns do not reflect brokerage commissions or taxes a shareholder would pay on the sale of Fund shares or on Fund distributions. As of the Fund’s current prospectus dated August 1, 2015, as revised November 12, 2015, the Fund’s annual expense ratio was 0.83%.
Performance as of 3/31/16
| | | | | | | | | | | | | | | | |
| | | Average Annual Total Return | |
| | | 1 Year | | | 3 Year | | | 5 Year | | | Since
Inception1 | |
Fund NAV Returns | | | -13.31 | % | | | 3.70 | % | | | -3.90 | % | | | -2.25 | % |
Fund Market Price Returns | | | -13.42 | % | | | 3.88 | % | | | -3.75 | % | | | -2.29 | % |
WisdomTree India Earnings Index | | | -12.16 | % | | | 4.83 | % | | | -2.65 | % | | | -0.93 | % |
MSCI India Index | | | -13.15 | % | | | 3.82 | % | | | -1.88 | % | | | -1.14 | % |
| 1 | Total returns are calculated based on the commencement of Fund trading on the NYSE Arca, Inc. on February 22, 2008. |
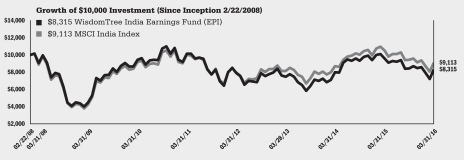
Performance is historical and does not guarantee future results. Current performance may be lower or higher than quoted. Investment returns and the principal value of an investment will fluctuate so that an investor’s shares, when redeemed, may be worth more or less than their original cost. Performance data for the most recent month-end is available at www.wisdomtree.com. WisdomTree shares are bought and sold at market price (not NAV) and are not individually redeemed from the Fund. Fund NAV returns are calculated using the Fund’s daily 4:00 p.m. NAV. Market price returns reflect the midpoint of the bid/ask spread as of the close of trading on the exchange where Fund shares are listed. Market price returns do not represent the returns you would receive if you traded shares at other times. The returns do not reflect the deduction of taxes that a shareholder would pay on Fund distributions or on the redemption of Fund shares. Total returns for a period of less than one year are cumulative.
| | |
| 16 | | WisdomTree Global/Global ex-U.S. and Emerging/Frontier Markets Funds |
Performance Summary (unaudited)
WisdomTree Middle East Dividend Fund (GULF)
Sector Breakdown† as of 3/31/16
| | | | |
| |
| Sector | | % of Net Assets | |
Financials | | | 59.0% | |
Telecommunication Services | | | 23.7% | |
Industrials | | | 9.2% | |
Consumer Discretionary | | | 1.9% | |
Energy | | | 1.8% | |
Materials | | | 1.3% | |
Utilities | | | 1.0% | |
Consumer Staples | | | 0.2% | |
Other Assets less Liabilities‡ | | | 1.9% | |
Total | | | 100.0% | |
| † | The Fund’s sector breakdown is expressed as a percentage of net assets and may change over time. In addition, a sector may be comprised of several industries. It does not include derivatives (if any). |
| ‡ | Other assets includes investment of cash collateral for securities on loan (if any). |
Top Ten Holdings* as of 3/31/16
| | | | |
| |
| Description | | % of Net Assets | |
Maroc Telecom | | | 9.3% | |
Mobile Telecommunications Co. KSC | | | 6.9% | |
Qatar National Bank SAQ | | | 5.7% | |
National Bank of Kuwait SAKP | | | 5.6% | |
First Gulf Bank PJSC | | | 5.2% | |
Industries Qatar QSC | | | 4.5% | |
Oman Telecommunications Co. SAOG | | | 3.5% | |
Ahli United Bank BSC | | | 3.4% | |
Abu Dhabi Commercial Bank PJSC | | | 3.1% | |
National Bank of Abu Dhabi PJSC | | | 2.8% | |
| * | The ten largest holdings are subject to change, and there are no guarantees the Fund will remain invested in any particular company. Excludes investment of cash collateral for securities on loan (if any). |
The WisdomTree Middle East Dividend Fund (the ‘‘Fund’’) seeks to track the price and yield performance, before fees and expenses, of the WisdomTree Middle East Dividend Index.
The Fund returned -11.57% at net asset value (“NAV”) for the fiscal year ending March 31, 2016 (for more complete performance information please see the table below). The Fund benefited the most from its position in Morocco. The Fund’s position in Qatar created the greatest drag on performance.
The following performance table is provided for comparative purposes and represents the period noted. The Fund’s per share NAV is the value of one share of the Fund and is calculated by dividing the value of total assets less total liabilities by the number of shares outstanding. The NAV return is based on the NAV of the Fund and the market price return is based on the market price per share of the Fund. The price used to calculate market price returns is the mid-point of the highest bid and lowest offer for Fund shares as of the close of trading on the exchange where Fund shares are listed. NAV and market price returns assume that dividends and capital gain distributions have been reinvested in the Fund at NAV and market price, respectively. As with other ETFs, NAV returns and market price returns may differ because of factors such as the supply and demand for Fund shares and investors’ assessments of the underlying value of the Fund’s portfolio securities.
An index is a statistical measure of a specified financial market or sector. An index does not actually hold a portfolio of securities, incur expenses or pay any transaction costs. Therefore, index returns do not reflect deductions for fees or expenses and the index is not available for direct investment. In comparison, the Fund’s performance is negatively impacted by these deductions. Fund returns do not reflect brokerage commissions or taxes a shareholder would pay on the sale of Fund shares or on Fund distributions. As of the Fund’s current prospectus dated August 1, 2015, as revised November 12, 2015, the Fund’s annual expense ratio was 0.88%.
Performance as of 3/31/16
| | | | | | | | | | | | | | | | |
| | | Average Annual Total Return | |
| | | 1 Year | | | 3 Year | | | 5 Year | | | Since
Inception1 | |
Fund NAV Returns | | | -11.57 | % | | | 6.10 | % | | | 5.60 | % | | | -0.72 | % |
Fund Market Price Returns | | | -12.46 | % | | | 5.05 | % | | | 4.75 | % | | | -1.16 | % |
WisdomTree Middle East Dividend Index | | | -10.35 | % | | | 7.21 | % | | | 6.03 | % | | | 0.53 | % |
MSCI Arabian Markets ex-Saudi Arabia Index | | | -11.79 | % | | | 2.77 | % | | | 1.41 | % | | | -5.37 | % |
| 1 | Total returns are calculated based on the commencement of Fund trading on the NASDAQ on July 16, 2008. |
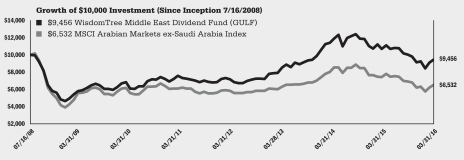
Performance is historical and does not guarantee future results. Current performance may be lower or higher than quoted. Investment returns and the principal value of an investment will fluctuate so that an investor’s shares, when redeemed, may be worth more or less than their original cost. Performance data for the most recent month-end is available at www.wisdomtree.com. WisdomTree shares are bought and sold at market price (not NAV) and are not individually redeemed from the Fund. Fund NAV returns are calculated using the Fund’s daily 4:00 p.m. NAV. Market price returns reflect the midpoint of the bid/ask spread as of the close of trading on the exchange where Fund shares are listed. Market price returns do not represent the returns you would receive if you traded shares at other times. The returns do not reflect the deduction of taxes that a shareholder would pay on Fund distributions or on the redemption of Fund shares. Total returns for a period of less than one year are cumulative.
| | | | |
| WisdomTree Global/Global ex-U.S. and Emerging/Frontier Markets Funds | | | 17 | |
Description of Indexes (unaudited)
Below are descriptions of each Index referenced in this report:
The Dow Jones Global ex-U.S. Select Real Estate Securities Index is a float-adjusted market capitalization weighted index that defines and measures the investable universe of publicly traded real estate securities in countries outside the U.S.
The FTSE China 50 Index is a capitalization weighted index that is comprised of the 50 largest and most liquid Chinese securities.
The MSCI AC Asia Pacific ex-Japan Index is comprised of large- and mid-capitalization segments of emerging market and developed market countries in the Asia Pacific region, excluding Japan.
The MSCI AC World ex-USA Growth Index is comprised of growth stocks in the developed and emerging markets covered by MSCI, excluding the U.S.
The MSCI AC World Index is comprised of the world stock market indexes covered by MSCI.
The MSCI ACWI ex-USA Index is comprised of large- and mid-capitalization segments of the developed and emerging markets covered by MSCI, excluding the U.S.
The MSCI Arabian Markets ex-Saudi Arabia Index is a free float-adjusted market capitalization index that aims to represent the universe of companies in the Gulf Cooperation Council (GCC) countries, excluding Saudi Arabia, plus Jordan, Egypt, Morocco, Tunisia and Lebanon.
The MSCI China Index is a free float-adjusted market capitalization weighted index designed to measure the performance of the Chinese equity market.
The MSCI Emerging Markets Index is a free float-adjusted market capitalization index that is designed to measure emerging markets equity performance.
The MSCI Emerging Markets Small Cap Index is a free float-adjusted market capitalization index that is designed to measure the performance of small capitalization equities in the emerging markets.
The MSCI Europe Value Index is comprised of value stocks in the MSCI Europe Index.
The MSCI India Index is a free float-adjusted market capitalization index that is designed to measure the performance of the Indian equity market.
The MSCI Japan Value Index is comprised of value stocks in the MSCI Japan Index.
The MSCI Pacific ex-Japan Index is a subset of the MSCI EAFE Index that is comprised of stocks in Australia, Hong Kong, Singapore and New Zealand.
The S&P 500® Index is a capitalization-weighted index of 500 stocks selected by Standard & Poor’s Index Committee, designed to represent the performance of the leading industries in the United States economy.
The S&P Developed ex-U.S. BMI Sector Indexes are indexes that track specific sectors of developed global markets outside the U.S. The S&P Developed ex-U.S. BMI Utilities Index includes companies that are classified as members of the GICS Utilities sector and sub-industries; the S&P Developed Ex-U.S. BMI Materials Index includes companies of the GICS material sector and sub-industries; the S&P Developed Ex-U.S. BMI Energy Index includes companies of the GICS Energy sector and sub-industries.
The S&P Global 1200 Sector Indexes are sub-indices of the S&P Global 1200 Index. The S&P Global 1200 Index represents the global equity market and captures approximately 70% of global market capitalization. The S&P Global 1200 Energy Sector Index consists of all members of the S&P Global 1200 that are classified within the GICS energy sector. The S&P Global 1200 Materials Sector Index consists of all members of the S&P Global 1200 that are classified within the GICS materials sector. The S&P Global 1200 Utilities Sector Index consists of all members of the S&P Global 1200 that are classified within the GICS utilities sector.
| | |
| 18 | | WisdomTree Global/Global ex-U.S. and Emerging/Frontier Markets Funds |
Description of Indexes (unaudited) (continued)
The S&P Global Natural Resources Index is comprised of the largest publicly traded companies in natural resources and commodities businesses that meet specific eligibility requirements.
The WisdomTree Asia Pacific ex-Japan Index is comprised of dividend-paying companies incorporated in emerging market and developed countries in the Pacific region, excluding Japan.
The WisdomTree China Dividend ex-Financials Index is comprised of Chinese dividend paying stocks outside the Financials sector.
The WisdomTree China ex-State-Owned Enterprises Index measures the performance of Chinese stocks that are not state-owned enterprises. WisdomTree Investments, Inc., as index provider, defines state-owned enterprises as companies with over 20% government ownership.
The WisdomTree Commodity Country Equity Index is comprised of dividend-paying companies in developed and emerging market countries outside the U.S. and Canada in the Commodities sector.
The WisdomTree Emerging Markets Consumer Growth Index consists of stocks that best exemplify growth trends in emerging market consumers and their local economies.
The WisdomTree Emerging Markets ex-State-Owned Enterprises Index is a modified market capitalization weighted index that consists of common stocks in emerging markets, excluding common stocks of “state-owned enterprises.” WisdomTree Investments, Inc., as index provider, defines state-owned enterprises as companies with over 20% government ownership.
The WisdomTree Emerging Markets High Dividend Index is comprised of the highest dividend-yielding stocks selected from the WisdomTree Emerging Markets Dividend Index.
The WisdomTree Emerging Markets Quality Dividend Growth Index consists of dividend paying stocks with growth characteristics selected from the WisdomTree Emerging Markets Dividend Index.
The WisdomTree Emerging Markets SmallCap Dividend Index is comprised of primarily small-capitalization stocks selected from the WisdomTree Emerging Markets Dividend Index.
The WisdomTree Europe Equity Income Index is comprised of companies with high dividend yields selected from the WisdomTree Europe Dividend Index.
The WisdomTree Global ex-U.S. Quality Dividend Growth Index is comprised of growth companies selected from developed and emerging markets outside the U.S.
The WisdomTree Global ex-U.S. Real Estate Index is comprised of companies in developed and emerging markets outside of Canada and the U.S., which WisdomTree classifies as being Global Real Estate securities.
The WisdomTree Global ex-U.S. Utilities Index is comprised of dividend-paying companies in developed and emerging market countries outside the U.S. and Canada in the Utilities sector.
The WisdomTree Global High Dividend Index is comprised of high dividend-paying companies selected from the WisdomTree Global Dividend Index.
The WisdomTree Global Natural Resources Index is comprised of dividend-paying companies in developed and emerging market countries outside the U.S. and Canada in the Natural Resources sector.
The WisdomTree India Earnings Index is a fundamentally weighted index that is comprised of companies incorporated and traded in India that are profitable and that are eligible to be purchased by foreign investors as of the index measurement date.
The WisdomTree International Real Estate Index is comprised of companies in developed markets outside of the U.S. and Canada that pay regular cash dividends and that WisdomTree Investments classifies as being part of the International Real Estate sector.
| | | | |
| WisdomTree Global/Global ex-U.S. and Emerging/Frontier Markets Funds | | | 19 | |
Description of Indexes (unaudited) (concluded)
The WisdomTree International Sector Indexes, which encompass Basic Materials, Energy and Utilities, are derived from the WisdomTree International Equity Index, and measure the performance of dividend-paying companies in developed markets outside the U.S. and Canada, within their specific international sectors.
The WisdomTree Japan Equity Income Index is comprised of companies with high dividend yields selected from the WisdomTree Japan Dividend Index.
The WisdomTree Middle East Dividend Index is comprised of companies in the Middle East region that pay regular cash dividends on shares of common stock and that meet specified requirements as of the index measurement date.
The WisdomTree Pacific ex-Japan Dividend Index is comprised of dividend-paying
companies incorporated in the Pacific region, excluding Japan.
The Dow Jones Global ex-U.S. Select Real Estate Securities Index is calculated, distributed and marketed by Dow Jones Indexes, a licensed trademark of CME Group Index Services LLC, and has been licensed for use.
The Global Industry Classification Standard (“GICS”) was developed by and is the exclusive property and a service mark of MSCI Inc. (“MSCI”) and Standard & Poor’s (“S&P”), a division of The McGraw-Hill Companies, Inc. and is licensed for use by WisdomTree Investments, Inc. Neither MSCI, S&P nor any other party involved in making or compiling the GICS or any GICS classifications makes any express or implied warranties or representations with respect to such standard or classification (or the results to be obtained by the use thereof), and all such parties hereby expressly disclaim all warranties of originality, accuracy, completeness, merchantability and fitness for a particular purpose with respect to any such standard or classification. Without limiting any of the foregoing, in no event shall MSCI, S&P, any of their affiliates or any third party involved in making or compiling the GICS or any GICS classifications have any liability for any direct, indirect, special, punitive, consequential or any other damages (including lost profits) even if notified of the possibility of such damages.
Neither MSCI nor any other party involved in or related to compiling, computing or creating the MSCI data makes any express or implied warranties or representations with respect to such data (or the results to be obtained by the use thereof), and all such parties hereby expressly disclaim all warranties of originality, accuracy, completeness, merchantability or fitness for a particular purpose with respect to any such data. Without limiting any of the foregoing, in no event shall MSCI, any of its affiliates or any third party involved in or related to compiling, computing or creating the data have any liability for any direct, indirect, special, punitive, consequential or any other damages (including lost profits) even if notified of the possibility of such damages. No further distribution or dissemination of the MSCI data is permitted without MSCI’s express written consent.
WisdomTree Investments and WisdomTree Asset Management (together, “WisdomTree”) and the Funds make no representation or warranty, express or implied, to the owners of shares of the Funds or any member of the public regarding the advisability of investing in securities generally or in the Funds particularly or the ability of the underlying Indexes to track the performance of their underlying securities. WisdomTree Investments is the licensor of certain trademarks, service marks and trade names of the Funds. WisdomTree Investments has no obligation to take the needs of the Funds or the owners of shares of the Funds into consideration in determining, composing, or calculating the underlying WisdomTree Indexes of the applicable Funds. WisdomTree Investments is not responsible for, and has not participated in, the determination of the timing of, prices of, or quantities of shares of the Funds to be issued or in the determination or calculation of the equation by which the shares of the Funds are redeemable. WisdomTree and the Funds do not guarantee the accuracy, completeness, or performance of the underlying Indexes or the data included therein and shall have no liability in connection with the underlying Indexes or their calculation.
Index performance information assumes the reinvestment of net dividends and excludes management fees, transaction costs and expenses. You cannot directly invest in an index.
| | |
| 20 | | WisdomTree Global/Global ex-U.S. and Emerging/Frontier Markets Funds |
Shareholder Expense Examples (unaudited)
As a shareholder of a WisdomTree Fund, you incur two types of cost: (1) transaction costs, including brokerage commissions on purchases and sales of your Fund shares and (2) ongoing costs, including management fees and other Fund expenses. The following example is intended to help you understand your ongoing costs (in dollars and cents) of investing in a Fund and to compare these costs with the ongoing costs of investing in other funds.
The example is based on an investment of $1,000 invested at the beginning of the period and held for the entire period from October 1, 2015 to March 31, 2016.
Actual expenses
The first line under each Fund in the table on the next page provides information about actual account values and actual expenses. You may use the information in this line, together with the amount you invested, to estimate the expenses that you paid over the period. Simply divide your account value by $1,000 (for example, an $8,600 account value divided by $1,000 = 8.6), then multiply the result by the number in the first line for your Fund under the heading entitled “Expenses Paid During the Period 10/1/15 to 3/31/16” to estimate the expenses you paid on your account during the period.
Hypothetical example for comparison purposes
The second line under each Fund in the table on the next page provides information
about hypothetical account values and hypothetical expenses based on each Fund’s actual expense ratio and an assumed rate of return of 5% per year before expenses, which is not the Fund’s actual return. The hypothetical account values and expenses may not be used to estimate the actual ending account balance or expenses you paid for the period. You may use this information to compare the ongoing costs of investing in your Fund and other funds. To do so, compare this 5% hypothetical example with the 5% hypothetical examples that appear in the shareholder reports of the other funds.
Please note that the expenses shown in the table are meant to highlight your ongoing costs only and do not reflect any transactional costs, such as brokerage commissions paid on purchases and sales of Fund shares. Therefore, the second line under each Fund in the table is useful in comparing ongoing Fund costs only and will not help you determine the relative total costs of owning different funds. In addition, if these transactional costs were included, your costs would have been higher.
| | | | |
| WisdomTree Global/Global ex-U.S. and Emerging/Frontier Markets Funds | | | 21 | |
Shareholder Expense Examples (unaudited) (concluded)
| | | | | | | | | | | | | | | | |
| | | Beginning
Account Value
10/1/15 | | | Ending
Account Value
3/31/16 | | | Annualized
Expense Ratio
Based on the
Period
10/1/15 to
3/31/16 | | | Expenses Paid
During the
Period†
10/1/15 to
3/31/16 | |
WisdomTree Asia Pacific ex-Japan Fund | | | | | | | | | | | | |
Actual | | $ | 1,000.00 | | | $ | 1,064.10 | | | | 0.48 | % | | $ | 2.48 | |
Hypothetical (5% return before expenses) | | $ | 1,000.00 | | | $ | 1,022.60 | | | | 0.48 | % | | $ | 2.43 | |
WisdomTree China ex-State-Owned Enterprises Fund | | | | | | | | | | | | |
Actual | | $ | 1,000.00 | | | $ | 1,103.30 | | | | 0.53 | %* | | $ | 2.79 | |
Hypothetical (5% return before expenses) | | $ | 1,000.00 | | | $ | 1,022.35 | | | | 0.53 | %* | | $ | 2.68 | |
WisdomTree Commodity Country Equity Fund | | | | | | | | | | | | |
Actual | | $ | 1,000.00 | | | $ | 1,108.90 | | | | 0.58 | % | | $ | 3.06 | |
Hypothetical (5% return before expenses) | | $ | 1,000.00 | | | $ | 1,022.10 | | | | 0.58 | % | | $ | 2.93 | |
WisdomTree Emerging Markets Consumer Growth Fund | | | | | | | | | | | | |
Actual | | $ | 1,000.00 | | | $ | 1,073.30 | | | | 0.63 | % | | $ | 3.27 | |
Hypothetical (5% return before expenses) | | $ | 1,000.00 | | | $ | 1,021.85 | | | | 0.63 | % | | $ | 3.18 | |
WisdomTree Emerging Markets ex-State-Owned Enterprises Fund | | | | | | | | | | | | |
Actual | | $ | 1,000.00 | | | $ | 1,073.00 | | | | 0.58 | % | | $ | 3.01 | |
Hypothetical (5% return before expenses) | | $ | 1,000.00 | | | $ | 1,022.10 | | | | 0.58 | % | | $ | 2.93 | |
WisdomTree Emerging Markets High Dividend Fund | | | | | | | | | | | | |
Actual | | $ | 1,000.00 | | | $ | 1,058.10 | | | | 0.63 | % | | $ | 3.24 | |
Hypothetical (5% return before expenses) | | $ | 1,000.00 | | | $ | 1,021.85 | | | | 0.63 | % | | $ | 3.18 | |
WisdomTree Emerging Markets Quality Dividend Growth Fund | | | | | | | | | | | | |
Actual | | $ | 1,000.00 | | | $ | 1,102.70 | | | | 0.63 | % | | $ | 3.31 | |
Hypothetical (5% return before expenses) | | $ | 1,000.00 | | | $ | 1,021.85 | | | | 0.63 | % | | $ | 3.18 | |
WisdomTree Emerging Markets SmallCap Dividend Fund | | | | | | | | | | | | |
Actual | | $ | 1,000.00 | | | $ | 1,065.90 | | | | 0.63 | % | | $ | 3.25 | |
Hypothetical (5% return before expenses) | | $ | 1,000.00 | | | $ | 1,021.85 | | | | 0.63 | % | | $ | 3.18 | |
WisdomTree Global ex-U.S. Quality Dividend Growth Fund | | | | | | | | | | | | |
Actual | | $ | 1,000.00 | | | $ | 1,086.00 | | | | 0.58 | % | | $ | 3.02 | |
Hypothetical (5% return before expenses) | | $ | 1,000.00 | | | $ | 1,022.10 | | | | 0.58 | % | | $ | 2.93 | |
WisdomTree Global ex-U.S. Real Estate Fund | | | | | | | | | | | | |
Actual | | $ | 1,000.00 | | | $ | 1,076.50 | | | | 0.58 | % | | $ | 3.01 | |
Hypothetical (5% return before expenses) | | $ | 1,000.00 | | | $ | 1,022.10 | | | | 0.58 | % | | $ | 2.93 | |
WisdomTree Global ex-U.S. Utilities Fund | | | | | | | | | | | | |
Actual | | $ | 1,000.00 | | | $ | 1,020.70 | | | | 0.58 | % | | $ | 2.93 | |
Hypothetical (5% return before expenses) | | $ | 1,000.00 | | | $ | 1,022.10 | | | | 0.58 | % | | $ | 2.93 | |
WisdomTree Global High Dividend Fund | | | | | | | | | | | | |
Actual | | $ | 1,000.00 | | | $ | 1,081.10 | | | | 0.58 | % | | $ | 3.02 | |
Hypothetical (5% return before expenses) | | $ | 1,000.00 | | | $ | 1,022.10 | | | | 0.58 | % | | $ | 2.93 | |
WisdomTree Global Natural Resources Fund | | | | | | | | | | | | |
Actual | | $ | 1,000.00 | | | $ | 1,010.80 | | | | 0.58 | % | | $ | 2.92 | |
Hypothetical (5% return before expenses) | | $ | 1,000.00 | | | $ | 1,022.10 | | | | 0.58 | % | | $ | 2.93 | |
WisdomTree India Earnings Fund (consolidated) | | | | | | | | | | | | |
Actual | | $ | 1,000.00 | | | $ | 985.50 | | | | 0.83 | % | | $ | 4.12 | |
Hypothetical (5% return before expenses) | | $ | 1,000.00 | | | $ | 1,020.85 | | | | 0.83 | % | | $ | 4.19 | |
WisdomTree Middle East Dividend Fund | | | | | | | | | | | | |
Actual | | $ | 1,000.00 | | | $ | 942.40 | | | | 0.88 | % | | $ | 4.27 | |
Hypothetical (5% return before expenses) | | $ | 1,000.00 | | | $ | 1,020.60 | | | | 0.88 | % | | $ | 4.45 | |
| † | Expenses are calculated using each Fund’s annualized expense ratio, multiplied by the average account value for the period, multiplied by 183/366 (to reflect the one-half year period). |
| * | WisdomTree Asset Management, Inc. has contractually agreed to limit the management fee to 0.53% effective July 1, 2015 through July 31, 2016, unless earlier terminated by the Board of Trustees of the WisdomTree Trust for any reason. |
| | |
| 22 | | WisdomTree Global/Global ex-U.S. and Emerging/Frontier Markets Funds |
Schedule of Investments
WisdomTree Asia Pacific ex-Japan Fund (AXJL)
March 31, 2016
| | | | | | | | |
| Investments | | Shares | | | Value | |
| | | | | | | | |
| COMMON STOCKS – 96.3% | | | | | | | | |
| Australia – 22.0% | | | | | | | | |
AGL Energy Ltd. | | | 12,305 | | | $ | 174,167 | |
Amcor Ltd. | | | 21,261 | | | | 234,695 | |
AMP Ltd. | | | 27,555 | | | | 122,729 | |
Aurizon Holdings Ltd. | | | 46,549 | | | | 141,799 | |
Australia & New Zealand Banking Group Ltd. | | | 30,002 | | | | 541,434 | |
BHP Billiton Ltd. | | | 96,417 | | | | 1,250,485 | |
Brambles Ltd. | | | 19,586 | | | | 182,606 | |
Caltex Australia Ltd. | | | 4,200 | | | | 109,914 | |
CIMIC Group Ltd. | | | 6,182 | | | | 165,301 | |
Coca-Cola Amatil Ltd. | | | 16,424 | | | | 111,686 | |
Commonwealth Bank of Australia | | | 16,000 | | | | 922,115 | |
Crown Resorts Ltd. | | | 10,784 | | | | 103,363 | |
CSL Ltd. | | | 3,908 | | | | 304,952 | |
Incitec Pivot Ltd. | | | 23,400 | | | | 57,421 | |
Insurance Australia Group Ltd. | | | 25,151 | | | | 107,959 | |
Macquarie Group Ltd. | | | 2,686 | | | | 136,556 | |
National Australia Bank Ltd. | | | 26,940 | | | | 543,787 | |
Origin Energy Ltd. | | | 41,567 | | | | 162,755 | |
QBE Insurance Group Ltd. | | | 8,145 | | | | 68,357 | |
Ramsay Health Care Ltd. | | | 1,600 | | | | 75,522 | |
Rio Tinto Ltd. | | | 10,352 | | | | 339,952 | |
Sonic Healthcare Ltd. | | | 7,575 | | | | 109,432 | |
Suncorp Group Ltd. | | | 13,850 | | | | 126,890 | |
Telstra Corp., Ltd. | | | 291,503 | | | | 1,195,192 | |
Wesfarmers Ltd. | | | 25,053 | | | | 798,825 | |
Westpac Banking Corp. | | | 32,658 | | | | 762,457 | |
Woodside Petroleum Ltd. | | | 34,269 | | | | 684,342 | |
Woolworths Ltd. | | | 29,455 | | | | 500,747 | |
| | | | | | | | |
| Total Australia | | | | 10,035,440 | |
| China – 21.2% | | | | | | | | |
AAC Technologies Holdings, Inc.(a) | | | 11,500 | | | | 87,919 | |
Agricultural Bank of China Ltd. Class H | | | 299,000 | | | | 107,549 | |
ANTA Sports Products Ltd. | | | 31,000 | | | | 68,262 | |
Bank of China Ltd. Class H | | | 744,255 | | | | 308,965 | |
Bank of Communications Co., Ltd. Class H | | | 282,955 | | | | 186,045 | |
Beijing Enterprises Holdings Ltd. | | | 7,000 | | | | 38,310 | |
Belle International Holdings Ltd. | | | 293,000 | | | | 169,608 | |
China Construction Bank Corp. Class H | | | 2,136,100 | | | | 1,363,196 | |
China Life Insurance Co., Ltd. Class H | | | 24,396 | | | | 60,199 | |
China Merchants Bank Co., Ltd. Class H | | | 27,904 | | | | 58,639 | |
China Merchants Holdings International Co., Ltd. | | | 33,223 | | | | 98,728 | |
China Mobile Ltd. | | | 233,234 | | | | 2,599,491 | |
China Overseas Land & Investment Ltd. | | | 33,065 | | | | 104,653 | |
China Petroleum & Chemical Corp. Class H | | | 392,261 | | | | 257,409 | |
China Power International Development Ltd. | | | 100,000 | | | | 51,827 | |
China Resources Land Ltd. | | | 28,000 | | | | 71,836 | |
China Resources Power Holdings Co., Ltd. | | | 72,218 | | | | 135,003 | |
China Shenhua Energy Co., Ltd. Class H | | | 124,736 | | | | 196,193 | |
China Telecom Corp., Ltd. Class H | | | 129,038 | | | | 68,208 | |
China Unicom Hong Kong Ltd. | | | 210,345 | | | | 277,692 | |
CITIC Ltd. | | | 173,000 | | | | 263,184 | |
CNOOC Ltd. | | | 945,561 | | | | 1,116,648 | |
| | | | | | | | |
Country Garden Holdings Co., Ltd. | | | 291,000 | | | $ | 115,551 | |
Evergrande Real Estate Group Ltd.(a) | | | 236,000 | | | | 182,251 | |
Fosun International Ltd. | | | 46,500 | | | | 66,184 | |
Guangdong Investment Ltd. | | | 66,000 | | | | 83,473 | |
Hengan International Group Co., Ltd. | | | 12,500 | | | | 108,457 | |
Industrial & Commercial Bank of China Ltd. Class H | | | 760,270 | | | | 425,392 | |
Kunlun Energy Co., Ltd. | | | 114,000 | | | | 99,059 | |
Lenovo Group Ltd. | | | 171,000 | | | | 133,157 | |
PetroChina Co., Ltd. Class H | | | 230,919 | | | | 153,618 | |
Ping An Insurance Group Co. of China Ltd. Class H | | | 21,646 | | | | 103,534 | |
Shenzhou International Group Holdings Ltd. | | | 14,000 | | | | 76,168 | |
Shimao Property Holdings Ltd. | | | 36,000 | | | | 53,281 | |
Sun Art Retail Group Ltd.(a) | | | 93,225 | | | | 65,984 | |
Tencent Holdings Ltd. | | | 9,900 | | | | 202,172 | |
Tingyi Cayman Islands Holding Corp. | | | 40,000 | | | | 44,711 | |
Want Want China Holdings Ltd.(a) | | | 109,000 | | | | 80,803 | |
| | | | | | | | |
| Total China | | | | 9,683,359 | |
| Hong Kong – 7.6% | | | | | | | | |
AIA Group Ltd. | | | 26,925 | | | | 152,562 | |
Bank of East Asia Ltd. (The)(a) | | | 20,000 | | | | 74,776 | |
BOC Hong Kong Holdings Ltd. | | | 87,889 | | | | 262,311 | |
Cathay Pacific Airways Ltd. | | | 62,000 | | | | 107,269 | |
CLP Holdings Ltd. | | | 44,104 | | | | 398,875 | |
Galaxy Entertainment Group Ltd. | | | 35,000 | | | | 131,308 | |
Hang Lung Properties Ltd. | | | 40,000 | | | | 76,426 | |
Hang Seng Bank Ltd. | | | 13,003 | | | | 229,833 | |
Henderson Land Development Co., Ltd. | | | 15,196 | | | | 93,352 | |
Hong Kong & China Gas Co., Ltd. | | | 122,062 | | | | 228,181 | |
Hong Kong Exchanges and Clearing Ltd. | | | 6,135 | | | | 147,748 | |
MTR Corp., Ltd. | | | 82,765 | | | | 409,741 | |
New World Development Co., Ltd. | | | 95,409 | | | | 90,900 | |
Power Assets Holdings Ltd. | | | 36,079 | | | | 369,090 | |
Sino Land Co., Ltd. | | | 46,924 | | | | 74,289 | |
Sun Hung Kai Properties Ltd. | | | 17,534 | | | | 214,412 | |
Swire Pacific Ltd. Class A | | | 6,000 | | | | 64,591 | |
Swire Pacific Ltd. Class B | | | 40,000 | | | | 77,973 | |
Swire Properties Ltd. | | | 33,800 | | | | 91,292 | |
Wharf Holdings Ltd. (The) | | | 22,350 | | | | 122,173 | |
Wheelock & Co., Ltd. | | | 13,000 | | | | 58,074 | |
| | | | | | | | |
| Total Hong Kong | | | | 3,475,176 | |
| India – 0.3% | | | | | | | | |
Infosys Ltd. | | | 100 | | | | 1,840 | |
Infosys Ltd. ADR | | | 6,967 | | | | 132,512 | |
| | | | | | | | |
| Total India | | | | 134,352 | |
| Indonesia – 2.8% | | | | | | | | |
Astra International Tbk PT | | | 634,661 | | | | 347,005 | |
Bank Central Asia Tbk PT | | | 74,275 | | | | 74,499 | |
Bank Mandiri Persero Tbk PT | | | 141,324 | | | | 109,777 | |
Bank Rakyat Indonesia Persero Tbk PT | | | 145,900 | | | | 125,709 | |
Telekomunikasi Indonesia Persero Tbk PT | | | 1,503,500 | | | | 377,009 | |
Unilever Indonesia Tbk PT | | | 70,735 | | | | 228,982 | |
| | | | | | | | |
| Total Indonesia | | | | 1,262,981 | |
See Notes to Financial Statements.
| | | | |
| WisdomTree Global/Global ex-U.S. and Emerging/Frontier Markets Funds | | | 23 | |
Schedule of Investments (continued)
WisdomTree Asia Pacific ex-Japan Fund (AXJL)
March 31, 2016
| | | | | | | | |
| Investments | | Shares | | | Value | |
| | | | | | | | |
| Malaysia – 4.8% | | | | | | | | |
Axiata Group Bhd | | | 141,300 | | | $ | 213,317 | |
DiGi.Com Bhd | | | 158,500 | | | | 200,690 | |
Genting Malaysia Bhd | | | 440 | | | | 512 | |
IOI Corp. Bhd | | | 83,600 | | | | 97,924 | |
Kuala Lumpur Kepong Bhd | | | 16,300 | | | | 100,269 | |
Malayan Banking Bhd | | | 112,094 | | | | 259,154 | |
Maxis Bhd | | | 168,100 | | | | 273,596 | |
MISC Bhd | | | 37,000 | | | | 84,403 | |
Petronas Chemicals Group Bhd | | | 96,408 | | | | 165,808 | |
Petronas Gas Bhd | | | 30,300 | | | | 170,857 | |
Public Bank Bhd | | | 23,490 | | | | 113,070 | |
Sime Darby Bhd | | | 107,600 | | | | 219,254 | |
Telekom Malaysia Bhd | | | 59,700 | | | | 100,992 | |
Tenaga Nasional Bhd | | | 60,500 | | | | 216,166 | |
| | | | | | | | |
| Total Malaysia | | | | 2,216,012 | |
| Philippines – 2.1% | | | | | | | | |
Aboitiz Equity Ventures, Inc. | | | 65,350 | | | | 92,252 | |
Aboitiz Power Corp. | | | 151,000 | | | | 144,130 | |
Globe Telecom, Inc. | | | 1,840 | | | | 88,713 | |
Manila Electric Co. | | | 20,750 | | | | 145,559 | |
Philippine Long Distance Telephone Co. | | | 6,370 | | | | 273,919 | |
SM Investments Corp. | | | 5,586 | | | | 115,190 | |
Universal Robina Corp. | | | 19,620 | | | | 92,379 | |
| | | | | | | | |
| Total Philippines | | | | 952,142 | |
| Singapore – 6.0% | | | | | | | | |
CapitaLand Ltd. | | | 36,000 | | | | 82,073 | |
DBS Group Holdings Ltd. | | | 15,817 | | | | 180,652 | |
Hutchison Port Holdings Trust | | | 360,007 | | | | 180,004 | |
Jardine Cycle & Carriage Ltd. | | | 6,878 | | | | 204,460 | |
Keppel Corp., Ltd. | | | 55,484 | | | | 240,214 | |
Oversea-Chinese Banking Corp., Ltd. | | | 28,001 | | | | 183,818 | |
Singapore Airlines Ltd. | | | 11,457 | | | | 97,162 | |
Singapore Technologies Engineering Ltd. | | | 76,225 | | | | 182,836 | |
Singapore Telecommunications Ltd. | | | 340,177 | | | | 965,005 | |
United Overseas Bank Ltd. | | | 13,774 | | | | 193,016 | |
Wilmar International Ltd. | | | 85,800 | | | | 214,086 | |
| | | | | | | | |
| Total Singapore | | | | 2,723,326 | |
| South Korea – 9.1% | | | | | | | | |
Coway Co., Ltd. | | | 1,131 | | | | 95,437 | |
Hyundai Mobis Co., Ltd. | | | 707 | | | | 153,937 | |
Hyundai Motor Co. | | | 2,517 | | | | 335,644 | |
Kangwon Land, Inc. | | | 3,049 | | | | 109,045 | |
KB Financial Group, Inc. | | | 1,868 | | | | 52,025 | |
Kia Motors Corp. | | | 3,889 | | | | 164,252 | |
Korea Electric Power Corp. | | | 3,500 | | | | 184,243 | |
Korea Zinc Co., Ltd. | | | 166 | | | | 69,892 | |
KT&G Corp. | | | 2,217 | | | | 213,248 | |
LG Chem Ltd. | | | 528 | | | | 151,207 | |
LG Corp. | | | 1,678 | | | | 100,510 | |
LG Display Co., Ltd. | | | 2,000 | | | | 46,520 | |
LG Household & Health Care Ltd. | | | 9 | | | | 7,437 | |
| | | | | | | | |
POSCO | | | 2,006 | | | $ | 385,027 | |
S-Oil Corp. | | | 1,200 | | | | 102,728 | |
Samsung Electronics Co., Ltd. | | | 1,088 | | | | 1,248,213 | |
Samsung Life Insurance Co., Ltd. | | | 994 | | | | 102,129 | |
Shinhan Financial Group Co., Ltd. | | | 2,700 | | | | 95,619 | |
SK Holdings Co., Ltd. | | | 453 | | | | 88,334 | |
SK Hynix, Inc. | | | 3,000 | | | | 73,846 | |
SK Telecom Co., Ltd. | | | 473 | | | | 86,237 | |
SK Telecom Co., Ltd. ADR(a) | | | 8,459 | | | | 170,618 | |
Woori Bank | | | 12,100 | | | | 100,093 | |
| | | | | | | | |
| Total South Korea | | | | 4,136,241 | |
| Taiwan – 16.0% | | | | | | | | |
Advanced Semiconductor Engineering, Inc. | | | 205,175 | | | | 238,746 | |
Asustek Computer, Inc. | | | 19,740 | | | | 177,258 | |
Catcher Technology Co., Ltd. | | | 7,000 | | | | 57,420 | |
Cathay Financial Holding Co., Ltd. | | | 105,614 | | | | 126,504 | |
Cheng Shin Rubber Industry Co., Ltd. | | | 71,948 | | | | 144,638 | |
China Steel Corp. | | | 376,078 | | | | 261,749 | |
Chunghwa Telecom Co., Ltd. | | | 174,436 | | | | 593,486 | |
CTBC Financial Holding Co., Ltd. | | | 159,805 | | | | 84,411 | |
Delta Electronics, Inc. | | | 48,415 | | | | 213,613 | |
Far Eastern New Century Corp. | | | 101,683 | | | | 83,093 | |
Far EasTone Telecommunications Co., Ltd. | | | 68,000 | | | | 152,337 | |
First Financial Holding Co., Ltd. | | | 112 | | | | 55 | |
Formosa Chemicals & Fibre Corp. | | | 46,685 | | | | 116,335 | |
Formosa Petrochemical Corp. | | | 62,511 | | | | 179,663 | |
Formosa Plastics Corp. | | | 67,444 | | | | 167,227 | |
Fubon Financial Holding Co., Ltd. | | | 107,803 | | | | 137,333 | |
Hon Hai Precision Industry Co., Ltd. | | | 286,120 | | | | 753,883 | |
Hua Nan Financial Holdings Co., Ltd. | | | 86,536 | | | | 43,021 | |
Largan Precision Co., Ltd. | | | 1,000 | | | | 77,523 | |
MediaTek, Inc. | | | 61,000 | | | | 468,152 | |
Mega Financial Holding Co., Ltd. | | | 170,827 | | | | 121,549 | |
Nan Ya Plastics Corp. | | | 140,537 | | | | 295,187 | |
Pegatron Corp. | | | 58,000 | | | | 135,341 | |
President Chain Store Corp. | | | 17,000 | | | | 123,866 | |
Quanta Computer, Inc. | | | 124,000 | | | | 216,530 | |
Taiwan Mobile Co., Ltd. | | | 87,100 | | | | 282,810 | |
Taiwan Semiconductor Manufacturing Co., Ltd. | | | 390,241 | | | | 1,964,300 | |
Uni-President Enterprises Corp. | | | 62,346 | | | | 109,450 | |
| | | | | | | | |
| Total Taiwan | | | | | | | 7,325,480 | |
| Thailand – 4.4% | | | | | | | | |
Advanced Info Service PCL | | | 60,300 | | | | 311,956 | |
Advanced Info Service PCL NVDR | | | 14,800 | | | | 76,566 | |
Airports of Thailand PCL NVDR | | | 12,584 | | | | 143,797 | |
Bangkok Bank PCL NVDR | | | 12,700 | | | | 64,980 | |
CP ALL PCL | | | 76,200 | | | | 99,095 | |
Intouch Holdings PCL NVDR | | | 98,285 | | | | 178,103 | |
Krung Thai Bank PCL NVDR | | | 142,100 | | | | 75,533 | |
PTT Exploration & Production PCL | | | 72,513 | | | | 144,799 | |
PTT Global Chemical PCL | | | 88,694 | | | | 152,529 | |
PTT PCL | | | 46,600 | | | | 370,892 | |
PTT PCL NVDR | | | 8,300 | | | | 66,060 | |
See Notes to Financial Statements.
| | |
| 24 | | WisdomTree Global/Global ex-U.S. and Emerging/Frontier Markets Funds |
Schedule of Investments (concluded)
WisdomTree Asia Pacific ex-Japan Fund (AXJL)
March 31, 2016
| | | | | | | | |
| Investments | | Shares | | | Value | |
| | | | | | | | |
Siam Cement PCL (The) NVDR | | | 17,771 | | | $ | 235,398 | |
Siam Commercial Bank PCL (The) | | | 21,700 | | | | 86,973 | |
| | | | | | | | |
| Total Thailand | | | | | | | 2,006,681 | |
TOTAL COMMON STOCKS (Cost: $46,712,798) | | | | | | | 43,951,190 | |
| EXCHANGE-TRADED FUNDS AND NOTES – 3.1% | | | | | | | | |
| United States – 3.1% | | | | | | | | |
iPath MSCI India Index ETN* | | | 21,215 | | | | 1,332,090 | |
WisdomTree Global ex-U.S. Real Estate Fund(a)(b) | | | 3,650 | | | | 99,499 | |
TOTAL EXCHANGE-TRADED FUNDS AND NOTES (Cost: $1,307,165) | | | | | | | 1,431,589 | |
| INVESTMENT OF CASH COLLATERAL FOR SECURITIES LOANED – 1.1% | |
| United States – 1.1% | | | | | | | | |
State Street Navigator Securities Lending Prime Portfolio, 0.50%(c)
| | | | | | | | |
| (Cost: $489,837)(d) | | | 489,837 | | | | 489,837 | |
TOTAL INVESTMENTS IN SECURITIES – 100.5% (Cost: $48,509,800) | | | | | | | 45,872,616 | |
Liabilities in Excess of Cash, Foreign Currency and Other Assets – (0.5)% | | | | | | | (207,731 | ) |
| | | | | | | | |
| NET ASSETS – 100.0% | | | | | | $ | 45,664,885 | |
| * | Non-income producing security. |
| (a) | Security, or portion thereof, was on loan at March 31, 2016 (See Note 2). |
| (b) | Affiliated company (See Note 3). |
| (c) | Rate shown represents annualized 7-day yield as of March 31, 2016. |
| (d) | At March 31, 2016, the total market value of the Fund’s securities on loan was $609,423 and the total market value of the collateral held by the Fund was $645,429. The total market value of the collateral includes non-cash U.S. Government securities collateral having a value of $155,592. |
ADR – American Depositary Receipt
ETN – Exchange-Traded Note
NVDR – Non-Voting Depositary Receipt
| | | | | | | | | | | | | | | | | | | | |
| FINANCIAL DERIVATIVE INSTRUMENTS | |
| FORWARD CONTRACTS | | | | | | | |
Settlement
Date | | Contracts
To Deliver | | | In
Exchange For | | | Unrealized
Gain (Loss) | |
4/4/2016 | | | AUD | | | | 28,000 | | | | USD | | | | 21,484 | | | $ | (55 | ) |
AUD – Australian dollar
USD – U.S. dollar
See Notes to Financial Statements.
| | | | |
| WisdomTree Global/Global ex-U.S. and Emerging/Frontier Markets Funds | | | 25 | |
Schedule of Investments
WisdomTree China ex-State-Owned Enterprises Fund (CXSE)
March 31, 2016
| | | | | | | | |
| Investments | | Shares | | | Value | |
| | | | | | | | |
| COMMON STOCKS – 100.0% | | | | | | | | |
| China – 97.0% | | | | | | | | |
| Auto Components – 1.2% | | | | | | | | |
Minth Group Ltd. | | | 24,000 | | | $ | 55,880 | |
Xinyi Glass Holdings Ltd. | | | 84,000 | | | | 55,989 | |
| | | | | | | | |
| Total Auto Components | | | | 111,869 | |
| Automobiles – 3.3% | | | | | | | | |
Byd Co., Ltd. Class H*(a) | | | 24,000 | | | | 137,690 | |
Geely Automobile Holdings Ltd. | | | 180,000 | | | | 89,112 | |
Great Wall Motor Co., Ltd. Class H | | | 100,500 | | | | 81,628 | |
| | | | | | | | |
| Total Automobiles | | | | 308,430 | |
| Banks – 2.3% | | | | | | | | |
China Minsheng Banking Corp., Ltd. Class H | | | 229,000 | | | | 213,750 | |
| Capital Markets – 1.6% | | | | | | | | |
GF Securities Co., Ltd. Class H*(a) | | | 60,000 | | | | 146,354 | |
| Communications Equipment – 0.3% | | | | | | | | |
ZTE Corp. Class H† | | | 17,000 | | | | 31,034 | |
| Diversified Consumer Services – 2.6% | | | | | | | | |
New Oriental Education & Technology Group, Inc. ADR | | | 4,648 | | | | 160,775 | |
TAL Education Group ADR*(a) | | | 1,546 | | | | 76,805 | |
| | | | | | | | |
| Total Diversified Consumer Services | | | | 237,580 | |
| Electronic Equipment, Instruments & Components – 1.7% | | | | | |
AAC Technologies Holdings, Inc.(a) | | | 16,000 | | | | 122,322 | |
Sunny Optical Technology Group Co., Ltd.(a) | | | 13,000 | | | | 36,537 | |
| | | | | | | | |
| Total Electronic Equipment, Instruments & Components | | | | 158,859 | |
| Food & Staples Retailing – 0.6% | | | | | | | | |
Sun Art Retail Group Ltd.(a) | | | 75,500 | | | | 53,438 | |
| Food Products – 5.6% | | | | | | | | |
China Huishan Dairy Holdings Co., Ltd.(a) | | | 185,000 | | | | 69,644 | |
Tingyi Cayman Islands Holding Corp. | | | 56,000 | | | | 62,595 | |
Uni-President China Holdings Ltd. | | | 50,000 | | | | 39,902 | |
Want Want China Holdings Ltd.(a) | | | 237,000 | | | | 175,690 | |
WH Group Ltd.*(b) | | | 247,000 | | | | 178,964 | |
| | | | | | | | |
| Total Food Products | | | | 526,795 | |
| Health Care Equipment & Supplies – 0.4% | | | | | | | | |
Shandong Weigao Group Medical Polymer Co., Ltd. Class H | | | 60,000 | | | | 38,213 | |
| Insurance – 8.9% | | | | | | | | |
Ping An Insurance Group Co. of China Ltd. Class H | | | 174,000 | | | | 832,251 | |
| Internet & Catalog Retail – 16.0% | | | | | | | | |
Ctrip.com International Ltd. ADR* | | | 12,266 | | | | 542,893 | |
JD.com, Inc. ADR* | | | 30,703 | | | | 813,629 | |
Vipshop Holdings Ltd. ADR* | | | 11,101 | | | | 142,981 | |
| | | | | | | | |
| Total Internet & Catalog Retail | | | | 1,499,503 | |
| Internet Software & Services – 31.7% | | | | | | | | |
21Vianet Group, Inc. ADR* | | | 1,354 | | | | 27,039 | |
Alibaba Group Holding Ltd. ADR* | | | 9,502 | | | | 750,943 | |
Autohome, Inc. ADR*(a) | | | 900 | | | | 25,146 | |
| | | | | | | | |
Baidu, Inc. ADR* | | | 4,388 | | | $ | 837,581 | |
Bitauto Holdings Ltd. ADR* | | | 694 | | | | 17,204 | |
NetEase, Inc. ADR | | | 1,472 | | | | 211,350 | |
Qihoo 360 Technology Co., Ltd. ADR* | | | 1,959 | | | | 148,003 | |
SINA Corp.* | | | 1,099 | | | | 52,060 | |
Sohu.com, Inc.* | | | 614 | | | | 30,418 | |
SouFun Holdings Ltd. ADR | | | 5,166 | | | | 30,944 | |
Tencent Holdings Ltd. | | | 35,700 | | | | 729,046 | |
Youku Tudou, Inc. ADR* | | | 2,148 | | | | 59,049 | |
YY, Inc. ADR* | | | 699 | | | | 43,051 | |
| | | | | | | | |
| Total Internet Software & Services | | | | 2,961,834 | |
| Machinery – 1.8% | | | | | | | | |
China Conch Venture Holdings Ltd. | | | 64,363 | | | | 126,958 | |
Haitian International Holdings Ltd. | | | 24,000 | | | | 41,152 | |
| | | | | | | | |
| Total Machinery | | | | 168,110 | |
| Multiline Retail – 0.5% | | | | | | | | |
Intime Retail Group Co., Ltd.(a) | | | 59,000 | | | | 47,997 | |
| Personal Products – 2.6% | | | | | | | | |
Hengan International Group Co., Ltd. | | | 27,500 | | | | 238,605 | |
| Pharmaceuticals – 3.5% | | | | | | | | |
China Medical System Holdings Ltd. | | | 44,000 | | | | 61,037 | |
CSPC Pharmaceutical Group Ltd. | | | 86,000 | | | | 77,834 | |
Luye Pharma Group Ltd.* | | | 48,607 | | | | 37,599 | |
Shanghai Fosun Pharmaceutical Group Co., Ltd. Class H | | | 13,500 | | | | 37,246 | |
Sino Biopharmaceutical Ltd. | | | 155,000 | | | | 116,302 | |
| | | | | | | | |
| Total Pharmaceuticals | | | | 330,018 | |
| Real Estate Management & Development – 6.9% | | | | | | | | |
China Vanke Co., Ltd. Class H | | | 47,976 | | | | 117,643 | |
Country Garden Holdings Co., Ltd. | | | 282,000 | | | | 111,978 | |
Dalian Wanda Commercial Properties Co., Ltd.
Class H(b) | | | 21,700 | | | | 128,551 | |
Evergrande Real Estate Group Ltd.(a) | | | 170,000 | | | | 131,282 | |
Longfor Properties Co., Ltd. | | | 44,500 | | | | 63,452 | |
Renhe Commercial Holdings Co., Ltd.*(a) | | | 770,000 | | | | 30,774 | |
Shimao Property Holdings Ltd. | | | 43,500 | | | | 64,382 | |
| | | | | | | | |
| Total Real Estate Management & Development | | | | | | | 648,062 | |
| Road & Rail – 0.5% | | | | | | | | |
CAR, Inc.*(a) | | | 36,635 | | | | 42,980 | |
| Semiconductors & Semiconductor Equipment – 0.7% | | | | | |
GCL-Poly Energy Holdings Ltd.(a) | | | 208,000 | | | | 34,324 | |
Hanergy Thin Film Power Group Ltd.*† | | | 502,000 | | | | 6,472 | |
Xinyi Solar Holdings Ltd. | | | 78,000 | | | | 27,755 | |
| | | | | | | | |
| Total Semiconductors & Semiconductor Equipment | | | | 68,551 | |
| Software – 0.4% | | | | | | | | |
Kingsoft Corp., Ltd.(a) | | | 14,000 | | | | 32,813 | |
| Specialty Retail – 0.6% | | | | | | | | |
GOME Electrical Appliances Holding Ltd.(a) | | | 410,000 | | | | 59,202 | |
See Notes to Financial Statements.
| | |
| 26 | | WisdomTree Global/Global ex-U.S. and Emerging/Frontier Markets Funds |
Schedule of Investments (concluded)
WisdomTree China ex-State-Owned Enterprises Fund (CXSE)
March 31, 2016
| | | | | | | | |
| Investments | | Shares | | | Value | |
| | | | | | | | |
| Textiles, Apparel & Luxury Goods – 3.3% | | | | | | | | |
ANTA Sports Products Ltd. | | | 35,000 | | | $ | 77,071 | |
Belle International Holdings Ltd. | | | 184,000 | | | | 106,511 | |
Shenzhou International Group Holdings Ltd. | | | 23,000 | | | | 125,133 | |
| | | | | | | | |
| Total Textiles, Apparel & Luxury Goods | | | | | | | 308,715 | |
| Total China | | | | | | | 9,064,963 | |
| Hong Kong – 2.3% | | | | | | | | |
| Electrical Equipment – 0.6% | | | | | | | | |
Tech Pro Technology Development Ltd.*(a) | | | 190,000 | | | | 57,564 | |
| Household Durables – 0.4% | | | | | | | | |
Skyworth Digital Holdings Ltd. | | | 60,000 | | | | 37,130 | |
| Media – 1.0% | | | | | | | | |
Alibaba Pictures Group Ltd.*(a) | | | 420,000 | | | | 95,842 | |
| Specialty Retail – 0.3% | | | | | | | | |
BEP International Holdings Ltd. | | | 280,000 | | | | 22,381 | |
| | | | | | | | |
| Total Hong Kong | | | | | | | 212,917 | |
| United States – 0.7% | | | | | | | | |
| Biotechnology – 0.7% | | | | | | | | |
China Biologic Products, Inc.*(a) | | | 592 | | | | 67,772 | |
TOTAL COMMON STOCKS (Cost: $10,380,740) | | | | | | | 9,345,652 | |
| INVESTMENT OF CASH COLLATERAL FOR SECURITIES LOANED – 9.6% | |
| United States – 9.6% | | | | | | | | |
State Street Navigator Securities Lending Prime Portfolio, 0.50%(c) | | | | | | | | |
| (Cost: $900,596)(d) | | | 900,596 | | | | 900,596 | |
TOTAL INVESTMENTS IN SECURITIES – 109.6% (Cost: $11,281,336) | | | | | | | 10,246,248 | |
Liabilities in Excess of Cash, Foreign Currency and Other Assets – (9.6)% | | | | | | | (895,746 | ) |
| | | | | | | | |
| NET ASSETS – 100.0% | | | | | | $ | 9,350,502 | |
| * | Non-income producing security. |
| † | Security is being fair valued by a valuation committee under the direction of the Board of Trustees. The aggregate value of fair valued securities is $37,506, which represents 0.4% of net assets. |
| (a) | Security, or portion thereof, was on loan at March 31, 2016 (See Note 2). |
| (b) | This security is exempt from registration under rule 144A of the Securities Act of 1933. This security may be sold in transactions that are exempt from registration, normally to qualified institutional buyers. |
| (c) | Rate shown represents annualized 7-day yield as of March 31, 2016. |
| (d) | At March 31, 2016, the total market value of the Fund’s securities on loan was $1,016,683 and the total market value of the collateral held by the Fund was $1,102,395. The total market value of the collateral includes non-cash U.S. Government securities collateral having a value of $201,799. |
ADR – American Depositary Receipt
See Notes to Financial Statements.
| | | | |
| WisdomTree Global/Global ex-U.S. and Emerging/Frontier Markets Funds | | | 27 | |
Schedule of Investments
WisdomTree Commodity Country Equity Fund (CCXE)
March 31, 2016
| | | | | | | | |
| Investments | | Shares | | | Value | |
| | | | | | | | |
| COMMON STOCKS – 98.2% | | | | | | | | |
| Australia – 11.2% | | | | | | | | |
Amcor Ltd. | | | 1,439 | | | $ | 15,885 | |
AMP Ltd. | | | 2,689 | | | | 11,977 | |
Aurizon Holdings Ltd. | | | 2,898 | | | | 8,828 | |
Australia & New Zealand Banking Group Ltd. | | | 3,385 | | | | 61,088 | |
BHP Billiton Ltd. | | | 6,559 | | | | 85,067 | |
Brambles Ltd. | | | 1,249 | | | | 11,645 | |
Commonwealth Bank of Australia | | | 1,775 | | | | 102,297 | |
CSL Ltd. | | | 254 | | | | 19,820 | |
Insurance Australia Group Ltd. | | | 2,563 | | | | 11,001 | |
Macquarie Group Ltd. | | | 268 | | | | 13,625 | |
National Australia Bank Ltd. | | | 3,001 | | | | 60,576 | |
Origin Energy Ltd. | | | 2,482 | | | | 9,718 | |
QBE Insurance Group Ltd. | | | 825 | | | | 6,924 | |
Rio Tinto Ltd. | | | 684 | | | | 22,462 | |
Suncorp Group Ltd. | | | 1,486 | | | | 13,614 | |
Telstra Corp., Ltd. | | | 19,595 | | | | 80,341 | |
Wesfarmers Ltd. | | | 1,655 | | | | 52,770 | |
Westpac Banking Corp. | | | 3,585 | | | | 83,698 | |
Woodside Petroleum Ltd. | | | 2,225 | | | | 44,433 | |
Woolworths Ltd. | | | 1,937 | | | | 32,930 | |
| | | | | | | | |
| Total Australia | | | | 748,699 | |
| Brazil – 11.7% | | | | | | | | |
Ambev S.A. | | | 48,453 | | | | 257,304 | |
Banco Bradesco S.A.* | | | 4,785 | | | | 40,613 | |
Banco do Brasil S.A. | | | 14,156 | | | | 78,968 | |
Banco Santander Brasil S.A. | | | 12,750 | | | | 60,980 | |
BB Seguridade Participacoes S.A. | | | 5,743 | | | | 48,128 | |
BM&FBovespa S.A. - Bolsa de Valores Mercadorias e Futuros | | | 3,889 | | | | 16,877 | |
BRF S.A. | | | 1,063 | | | | 15,390 | |
CCR S.A. | | | 8,546 | | | | 33,832 | |
Cia Siderurgica Nacional S.A. | | | 8,172 | | | | 16,487 | |
Cielo S.A. | | | 2,612 | | | | 25,774 | |
EcoRodovias Infraestrutura e Logistica S.A. | | | 4,493 | | | | 7,607 | |
Itau Unibanco Holding S.A. | | | 1,160 | | | | 8,743 | |
Natura Cosmeticos S.A. | | | 2,216 | | | | 16,595 | |
Tractebel Energia S.A. | | | 2,631 | | | | 27,231 | |
Transmissora Alianca de Energia Eletrica S.A. | | | 2,791 | | | | 15,892 | |
Ultrapar Participacoes S.A. | | | 945 | | | | 18,609 | |
Vale S.A. | | | 19,235 | | | | 82,226 | |
WEG S.A. | | | 2,845 | | | | 11,247 | |
| | | | | | | | |
| Total Brazil | | | | 782,503 | |
| Canada – 11.7% | | | | | | | | |
Bank of Montreal | | | 653 | | | | 39,818 | |
Bank of Nova Scotia (The) | | | 1,349 | | | | 66,196 | |
BCE, Inc. | | | 1,486 | | | | 68,001 | |
Canadian Imperial Bank of Commerce | | | 387 | | | | 29,028 | |
Canadian National Railway Co. | | | 449 | | | | 28,173 | |
Canadian Natural Resources Ltd. | | | 1,176 | | | | 31,940 | |
Crescent Point Energy Corp.(a) | | | 1,719 | | | | 23,896 | |
Enbridge, Inc. | | | 1,041 | | | | 40,692 | |
| | | | | | | | |
Great-West Lifeco, Inc. | | | 919 | | | $ | 25,393 | |
Manulife Financial Corp. | | | 1,449 | | | | 20,590 | |
Potash Corp. of Saskatchewan, Inc. | | | 2,249 | | | | 38,444 | |
Power Financial Corp.(a) | | | 818 | | | | 20,535 | |
Royal Bank of Canada | | | 1,499 | | | | 86,722 | |
Sun Life Financial, Inc. | | | 531 | | | | 17,201 | |
Suncor Energy, Inc. | | | 1,717 | | | | 48,014 | |
TELUS Corp. | | | 889 | | | | 29,060 | |
Thomson Reuters Corp. | | | 998 | | | | 40,601 | |
Toronto-Dominion Bank (The) | | | 1,717 | | | | 74,417 | |
TransCanada Corp.(a) | | | 1,240 | | | | 48,950 | |
| | | | | | | | |
| Total Canada | | | | 777,671 | |
| Chile – 10.2% | | | | | | | | |
AES Gener S.A. | | | 51,039 | | | | 25,834 | |
Aguas Andinas S.A. Class A | | | 58,609 | | | | 33,541 | |
Banco de Chile | | | 583,241 | | | | 62,818 | |
Banco de Credito e Inversiones | | | 548 | | | | 22,191 | |
Banco Santander Chile | | | 1,092,544 | | | | 53,201 | |
CAP S.A. | | | 3,126 | | | | 9,252 | |
Cencosud S.A. | | | 11,658 | | | | 29,449 | |
Cia Cervecerias Unidas S.A. | | | 2,139 | | | | 24,141 | |
Colbun S.A. | | | 59,045 | | | | 16,476 | |
Corpbanca S.A. | | | 3,439,784 | | | | 31,505 | |
Empresa Nacional de Electricidad S.A. | | | 56,752 | | | | 79,065 | |
Empresa Nacional de Telecomunicaciones S.A. | | | 1,174 | | | | 10,381 | |
Empresas CMPC S.A. | | | 4,673 | | | | 10,921 | |
Empresas COPEC S.A. | | | 6,172 | | | | 59,178 | |
Enersis Americas S.A. | | | 343,665 | | | | 95,327 | |
Inversiones Aguas Metropolitanas S.A. | | | 7,290 | | | | 11,596 | |
Inversiones La Construccion S.A. | | | 773 | | | | 8,798 | |
Ripley Corp. S.A. | | | 21,691 | | | | 9,867 | |
S.A.C.I. Falabella | | | 11,175 | | | | 78,166 | |
Sociedad Matriz del Banco de Chile S.A. Class B | | | 36,853 | | | | 10,466 | |
| | | | | | | | |
| Total Chile | | | | 682,173 | |
| New Zealand – 16.4% | | | | | | | | |
Air New Zealand Ltd. | | | 24,005 | | | | 47,667 | |
Auckland International Airport Ltd. | | | 21,725 | | | | 96,988 | |
Contact Energy Ltd. | | | 23,014 | | | | 79,893 | |
EBOS Group Ltd. | | | 1,950 | | | | 23,287 | |
Fisher & Paykel Healthcare Corp., Ltd. | | | 7,596 | | | | 51,684 | |
Fletcher Building Ltd. | | | 21,372 | | | | 117,076 | |
Freightways Ltd. | | | 4,630 | | | | 20,413 | |
Heartland Bank Ltd.(a) | | | 13,492 | | | | 11,335 | |
Infratil Ltd. | | | 8,912 | | | | 20,295 | |
Kathmandu Holdings Ltd. | | | 7,992 | | | | 9,156 | |
Kiwi Property Group Ltd. | | | 19,439 | | | | 19,503 | |
Mainfreight Ltd. | | | 1,588 | | | | 17,486 | |
Meridian Energy Ltd. | | | 68,829 | | | | 125,205 | |
Nuplex Industries Ltd. | | | 6,223 | | | | 22,467 | |
Ryman Healthcare Ltd. | | | 4,718 | | | | 27,352 | |
SKY Network Television Ltd. | | | 16,507 | | | | 57,075 | |
SKYCITY Entertainment Group Ltd. | | | 15,547 | | | | 54,079 | |
Spark New Zealand Ltd. | | | 83,707 | | | | 212,130 | |
See Notes to Financial Statements.
| | |
| 28 | | WisdomTree Global/Global ex-U.S. and Emerging/Frontier Markets Funds |
Schedule of Investments (continued)
WisdomTree Commodity Country Equity Fund (CCXE)
March 31, 2016
| | | | | | | | |
| Investments | | Shares | | | Value | |
| | | | | | | | |
Trade Me Group Ltd. | | | 12,339 | | | $ | 37,780 | |
Z Energy Ltd. | | | 9,866 | | | | 46,237 | |
| | | | | | | | |
| Total New Zealand | | | | 1,097,108 | |
| Norway – 13.1% | | | | | | | | |
Aker ASA Class A | | | 426 | | | | 7,957 | |
Atea ASA* | | | 1,156 | | | | 11,041 | |
Austevoll Seafood ASA | | | 1,098 | | | | 9,027 | |
DNB ASA | | | 4,930 | | | | 58,323 | |
Entra ASA(b) | | | 706 | | | | 6,658 | |
Gjensidige Forsikring ASA | | | 2,411 | | | | 41,129 | |
Kongsberg Gruppen ASA(a) | | | 578 | | | | 9,504 | |
Leroy Seafood Group ASA | | | 306 | | | | 14,465 | |
Marine Harvest ASA* | | | 2,908 | | | | 44,826 | |
Norsk Hydro ASA | | | 9,309 | | | | 38,345 | |
Ocean Yield ASA(a) | | | 1,472 | | | | 9,877 | |
Orkla ASA | | | 5,840 | | | | 52,919 | |
Salmar ASA | | | 1,236 | | | | 30,335 | |
SpareBank 1 SR-Bank ASA | | | 1,097 | | | | 5,385 | |
Statoil ASA | | | 23,770 | | | | 374,457 | |
Telenor ASA | | | 5,153 | | | | 83,420 | |
TGS Nopec Geophysical Co. ASA | | | 767 | | | | 11,712 | |
Veidekke ASA | | | 702 | | | | 9,548 | |
Yara International ASA | | | 1,500 | | | | 56,473 | |
| | | | | | | | |
| Total Norway | | | | 875,401 | |
| Russia – 13.7% | | | | | | | | |
Gazprom Neft PAO ADR | | | 483 | | | | 5,385 | |
Gazprom PAO ADR | | | 42,966 | | | | 185,312 | |
LSR Group PJSC GDR Reg S | | | 2,882 | | | | 6,557 | |
Lukoil PJSC ADR | | | 3,945 | | | | 151,547 | |
Magnit PJSC GDR Reg S | | | 786 | | | | 31,401 | |
Magnitogorsk Iron & Steel Works OJSC GDR Reg S | | | 1,698 | | | | 7,369 | |
MegaFon PJSC GDR Reg S | | | 925 | | | | 10,175 | |
MMC Norilsk Nickel PJSC ADR | | | 11,777 | | | | 152,041 | |
Mobile TeleSystems PJSC ADR | | | 8,235 | | | | 66,621 | |
NovaTek OAO GDR Reg S | | | 422 | | | | 37,917 | |
Novolipetsk Steel GDR Reg S | | | 2,485 | | | | 31,062 | |
PhosAgro OAO GDR Reg S | | | 990 | | | | 13,959 | |
Rosneft OAO GDR Reg S | | | 23,700 | | | | 107,645 | |
Rostelecom PJSC ADR | | | 1,179 | | | | 10,470 | |
RusHydro PJSC ADR | | | 6,789 | | | | 6,823 | |
Sberbank of Russia PJSC ADR | | | 1,278 | | | | 8,895 | |
Severstal PAO GDR Reg S | | | 3,752 | | | | 39,696 | |
Sistema JSFC GDR Reg S | | | 731 | | | | 4,722 | |
Tatneft PAO ADR | | | 846 | | | | 26,937 | |
VTB Bank PJSC GDR Reg S | | | 4,901 | | | | 10,861 | |
| | | | | | | | |
| Total Russia | | | | 915,395 | |
| South Africa – 10.2% | | | | | | | | |
Barclays Africa Group Ltd.(a) | | | 3,501 | | | | 35,607 | |
Bidvest Group Ltd. (The) | | | 1,018 | | | | 25,817 | |
Coronation Fund Managers Ltd. | | | 2,269 | | | | 11,323 | |
FirstRand Ltd.(a) | | | 17,783 | | | | 58,483 | |
Liberty Holdings Ltd.(a) | | | 1,057 | | | | 10,390 | |
MMI Holdings Ltd.(a) | | | 7,196 | | | | 12,183 | |
| | | | | | | | |
MTN Group Ltd.(a) | | | 14,393 | | | $ | 132,304 | |
Naspers Ltd. Class N | | | 118 | | | | 16,535 | |
Nedbank Group Ltd.(a) | | | 1,814 | | | | 23,958 | |
Rand Merchant Investment Holdings Ltd.(a) | | | 2,949 | | | | 8,345 | |
Remgro Ltd. | | | 548 | | | | 9,321 | |
RMB Holdings Ltd.(a) | | | 4,352 | | | | 18,126 | |
Sanlam Ltd. | | | 5,568 | | | | 25,928 | |
Sasol Ltd. | | | 3,011 | | | | 90,391 | |
Shoprite Holdings Ltd.(a) | | | 1,592 | | | | 18,793 | |
Standard Bank Group Ltd. | | | 5,258 | | | | 47,361 | |
Tiger Brands Ltd. | | | 623 | | | | 13,776 | |
Vodacom Group Ltd. | | | 9,266 | | | | 101,134 | |
Woolworths Holdings Ltd. | | | 2,927 | | | | 17,845 | |
| | | | | | | | |
| Total South Africa | | | | | | | 677,620 | |
TOTAL COMMON STOCKS (Cost: $8,550,444) | | | | | | | 6,556,570 | |
| RIGHTS – 0.0% | | | | | | | | |
| Chile – 0.0% | | | | | | | | |
| Banco de Credito e Inversiones, expiring 4/19/16* (Cost $0) | | | 62 | | | | 133 | |
| EXCHANGE-TRADED FUND – 1.1% | | | | | | | | |
| United States – 1.1% | | | | | | | | |
WisdomTree Global Natural Resources Fund(c) (Cost: $65,718) | | | 6,310 | | | | 73,941 | |
| INVESTMENT OF CASH COLLATERAL FOR SECURITIES LOANED – 5.0% | |
| United States – 5.0% | | | | | | | | |
State Street Navigator Securities Lending Prime Portfolio, 0.50%(d) | | | | | | | | |
| (Cost: $336,033)(e) | | | 336,033 | | | | 336,033 | |
TOTAL INVESTMENTS IN SECURITIES – 104.3% (Cost: $8,952,195) | | | | | | | 6,966,677 | |
Liabilities in Excess of Cash, Foreign Currency and Other Assets – (4.3)% | | | | | | | (287,922 | ) |
| | | | | | | | |
| NET ASSETS – 100.0% | | | | | | $ | 6,678,755 | |
| * | Non-income producing security. |
| (a) | Security, or portion thereof, was on loan at March 31, 2016 (See Note 2). |
| (b) | This security is exempt from registration under rule 144A of the Securities Act of 1933. This security may be sold in transactions that are exempt from registration, normally to qualified institutional buyers. |
| (c) | Affiliated company (See Note 3). |
| (d) | Rate shown represents annualized 7-day yield as of March 31, 2016. |
| (e) | At March 31, 2016, the total market value of the Fund’s securities on loan was $386,013 and the total market value of the collateral held by the Fund was $411,350. The total market value of the collateral includes non-cash U.S. Government securities collateral having a value of $75,317. |
ADR – American Depositary Receipt
GDR – Global Depositary Receipt
Reg S – Regulation S provides an exclusion from the registration requirements of the Securities Act of 1933. These securities may be resold in transactions exempt from registration, normally to qualified institutional buyers.
See Notes to Financial Statements.
| | | | |
| WisdomTree Global/Global ex-U.S. and Emerging/Frontier Markets Funds | | | 29 | |
Schedule of Investments (concluded)
WisdomTree Commodity Country Equity Fund (CCXE)
March 31, 2016
| | | | | | | | | | | | | | | | | | | | |
| FINANCIAL DERIVATIVE INSTRUMENTS | |
| FORWARD CONTRACTS | | | | | | | | | | |
Settlement
Date | | Contracts
To Deliver | | | In
Exchange For | | | Unrealized
Gain (Loss) | |
4/1/2016 | | | AUD | | | | 10,000 | | | | USD | | | | 7,698 | | | $ | 5 | |
4/1/2016 | | | BRL | | | | 474,581 | | | | USD | | | | 129,243 | | | | (4,668 | ) |
4/1/2016 | | | NZD | | | | 12,000 | | | | USD | | | | 8,328 | | | | (3 | ) |
4/4/2016 | | | CAD | | | | 1,500 | | | | USD | | | | 1,155 | | | | (4 | ) |
4/4/2016 | | | NZD | | | | 2,000 | | | | USD | | | | 1,383 | | | | (6 | ) |
| | | | | | | | | | | | | | | | | | | $ | (4,676 | ) |
| | | |
| CURRENCY LEGEND | | | | | | | | | | |
| | | | | | | | | | |
AUD – Australian dollar |
BRL – Brazilian real |
CAD – Canadian dollar |
NZD – New Zealand dollar |
USD – U.S. dollar |
See Notes to Financial Statements.
| | |
| 30 | | WisdomTree Global/Global ex-U.S. and Emerging/Frontier Markets Funds |
Schedule of Investments
WisdomTree Emerging Markets Consumer Growth Fund (EMCG)
March 31, 2016
| | | | | | | | |
| Investments | | Shares | | | Value | |
| | | | | | | | |
| COMMON STOCKS – 99.6% | | | | | | | | |
| Brazil – 22.3% | | | | | | | | |
Alupar Investimento S.A. | | | 4,700 | | | $ | 19,694 | |
Ambev S.A. | | | 189,112 | | | | 1,004,257 | |
Arezzo Industria e Comercio S.A. | | | 2,100 | | | | 13,836 | |
BB Seguridade Participacoes S.A. | | | 26,122 | | | | 218,912 | |
BRF S.A. | | | 11,100 | | | | 160,706 | |
CCR S.A. | | | 16,898 | | | | 66,896 | |
CETIP S.A. - Mercados Organizados | | | 3,200 | | | | 36,253 | |
Cia Hering | | | 5,960 | | | | 24,738 | |
Cielo S.A. | | | 15,900 | | | | 156,891 | |
CVC Brasil Operadora e Agencia de Viagens S.A. | | | 4,004 | | | | 18,913 | |
Cyrela Brazil Realty S.A. Empreendimentos e Participacoes | | | 16,308 | | | | 47,994 | |
Equatorial Energia S.A. | | | 8,100 | | | | 93,616 | |
Estacio Participacoes S.A. | | | 7,678 | | | | 25,608 | |
Ez Tec Empreendimentos e Participacoes S.A. | | | 11,837 | | | | 53,908 | |
GAEC Educacao S.A.* | | | 3,500 | | | | 9,826 | |
Grendene S.A. | | | 8,790 | | | | 42,412 | |
Guararapes Confeccoes S.A. | | | 728 | | | | 11,688 | |
Kroton Educacional S.A. | | | 38,300 | | | | 124,064 | |
Light S.A. | | | 9,500 | | | | 26,591 | |
Localiza Rent a Car S.A. | | | 3,180 | | | | 26,667 | |
Lojas Americanas S.A. | | | 13,406 | | | | 43,464 | |
Lojas Renner S.A. | | | 9,990 | | | | 58,604 | |
M. Dias Branco S.A. | | | 2,778 | | | | 52,809 | |
MRV Engenharia e Participacoes S.A. | | | 22,282 | | | | 74,441 | |
Multiplus S.A. | | | 3,600 | | | | 33,278 | |
Natura Cosmeticos S.A. | | | 7,912 | | | | 59,251 | |
Porto Seguro S.A. | | | 6,014 | | | | 46,225 | |
Sao Martinho S.A. | | | 2,100 | | | | 28,614 | |
Ser Educacional S.A.(a) | | | 9,000 | | | | 26,817 | |
Smiles S.A. | | | 3,200 | | | | 34,321 | |
TOTVS S.A. | | | 2,200 | | | | 16,885 | |
Tractebel Energia S.A. | | | 9,188 | | | | 95,095 | |
| | | | | | | | |
| Total Brazil | | | | 2,753,274 | |
| Chile – 0.1% | | | | | | | | |
Forus S.A. | | | 5,436 | | | | 15,442 | |
| China – 20.0% | | | | | | | | |
Alibaba Group Holding Ltd. ADR* | | | 4,380 | | | | 346,151 | |
Autohome, Inc. ADR*(b) | | | 300 | | | | 8,382 | |
BAIC Motor Corp. Ltd. Class H(a) | | | 95,000 | | | | 72,751 | |
Baidu, Inc. ADR* | | | 1,022 | | | | 195,079 | |
CGN Power Co., Ltd. Class H(a) | | | 173,000 | | | | 58,659 | |
China Life Insurance Co., Ltd. Class H | | | 82,000 | | | | 202,343 | |
China Machinery Engineering Corp. Class H | | | 26,000 | | | | 18,168 | |
China Pacific Insurance Group Co., Ltd. Class H | | | 42,600 | | | | 159,272 | |
China Southern Airlines Co., Ltd. Class H | | | 96,000 | | | | 60,522 | |
Fuyao Glass Industry Group Co., Ltd. Class H*(a)(b) | | | 22,000 | | | | 53,209 | |
Great Wall Motor Co., Ltd. Class H | | | 123,000 | | | | 99,903 | |
Guangzhou Automobile Group Co., Ltd. Class H | | | 70,000 | | | | 72,829 | |
Guangzhou Baiyunshan Pharmaceutical Holdings Co., Ltd. Class H | | | 6,000 | | | | 13,552 | |
| | | | | | | | |
Hisense Kelon Electrical Holdings Co., Ltd. Class H* | | | 13,000 | | | $ | 5,464 | |
Huadian Fuxin Energy Corp., Ltd. Class H | | | 42,000 | | | | 9,801 | |
Huaneng Power International, Inc. Class H | | | 118,000 | | | | 105,578 | |
Huaneng Renewables Corp., Ltd. Class H | | | 52,000 | | | | 16,157 | |
Jiangsu Expressway Co., Ltd. Class H | | | 28,000 | | | | 37,687 | |
NetEase, Inc. ADR | | | 447 | | | | 64,180 | |
New China Life Insurance Co., Ltd. Class H | | | 23,400 | | | | 82,510 | |
New Oriental Education & Technology Group, Inc. ADR | | | 1,068 | | | | 36,942 | |
PICC Property & Casualty Co., Ltd. Class H | | | 108,000 | | | | 197,995 | |
Ping An Insurance Group Co. of China Ltd. Class H | | | 56,000 | | | | 267,851 | |
Qihoo 360 Technology Co., Ltd. ADR* | | | 366 | | | | 27,651 | |
Shandong Weigao Group Medical Polymer Co., Ltd. Class H | | | 24,000 | | | | 15,285 | |
Shanghai Fosun Pharmaceutical Group Co., Ltd. Class H | | | 8,978 | | | | 24,770 | |
Shanghai Jin Jiang International Hotels Group Co., Ltd. Class H(b) | | | 54,000 | | | | 21,999 | |
Shanghai Pharmaceuticals Holding Co., Ltd. Class H | | | 15,400 | | | | 30,417 | |
Sinopec Engineering Group Co., Ltd. Class H | | | 44,500 | | | | 36,029 | |
Travelsky Technology Ltd. Class H | | | 15,000 | | | | 24,560 | |
Tsingtao Brewery Co., Ltd. Class H | | | 8,000 | | | | 30,374 | |
Vipshop Holdings Ltd. ADR* | | | 1,457 | | | | 18,766 | |
Xinhua Winshare Publishing and Media Co., Ltd. Class H | | | 18,000 | | | | 15,571 | |
YY, Inc. ADR* | | | 240 | | | | 14,782 | |
Zhuzhou CRRC Times Electric Co., Ltd. Class H | | | 4,500 | | | | 26,281 | |
| | | | | | | | |
| Total China | | | | 2,471,470 | |
| India – 2.2% | | | | | | | | |
Apollo Tyres Ltd. | | | 11,341 | | | | 29,953 | |
Bajaj Auto Ltd. | | | 982 | | | | 35,677 | |
Britannia Industries Ltd. | | | 608 | | | | 24,665 | |
Ceat Ltd. | | | 861 | | | | 14,128 | |
Dabur India Ltd. | | | 3,221 | | | | 12,155 | |
Exide Industries Ltd. | | | 5,904 | | | | 12,424 | |
Hero MotoCorp Ltd. | | | 939 | | | | 41,768 | |
JK Tyre & Industries Ltd. | | | 10,391 | | | | 13,212 | |
JSW Energy Ltd. | | | 14,063 | | | | 14,770 | |
Sintex Industries Ltd. | | | 10,308 | | | | 11,985 | |
SRF Ltd. | | | 730 | | | | 14,424 | |
Sun TV Network Ltd. | | | 5,706 | | | �� | 32,523 | |
Zee Entertainment Enterprises Ltd. | | | 2,837 | | | | 16,577 | |
| | | | | | | | |
| Total India | | | | 274,261 | |
| Indonesia – 7.5% | | | | | | | | |
Alam Sutera Realty Tbk PT | | | 472,900 | | | | 13,267 | |
Astra Agro Lestari Tbk PT | | | 21,400 | | | | 29,372 | |
Astra International Tbk PT | | | 546,500 | | | | 298,803 | |
Bumi Serpong Damai Tbk PT | | | 251,700 | | | | 34,832 | |
Charoen Pokphand Indonesia Tbk PT | | | 153,600 | | | | 41,585 | |
Gudang Garam Tbk PT | | | 19,000 | | | | 93,567 | |
Indofood CBP Sukses Makmur Tbk PT | | | 49,100 | | | | 56,283 | |
Lippo Cikarang Tbk PT* | | | 21,800 | | | | 11,632 | |
Matahari Putra Prima Tbk PT | | | 64,000 | | | | 7,819 | |
Media Nusantara Citra Tbk PT | | | 202,300 | | | | 33,259 | |
See Notes to Financial Statements.
| | | | |
| WisdomTree Global/Global ex-U.S. and Emerging/Frontier Markets Funds | | | 31 | |
Schedule of Investments (continued)
WisdomTree Emerging Markets Consumer Growth Fund (EMCG)
March 31, 2016
| | | | | | | | |
| Investments | | Shares | | | Value | |
| | | | | | | | |
Pakuwon Jati Tbk PT | | | 967,700 | | | $ | 35,322 | |
Perusahaan Gas Negara Persero Tbk | | | 394,600 | | | | 77,819 | |
Sawit Sumbermas Sarana Tbk PT | | | 102,900 | | | | 14,938 | |
Sri Rejeki Isman Tbk PT | | | 587,500 | | | | 14,311 | |
Summarecon Agung Tbk PT | | | 160,900 | | | | 19,233 | |
Surya Citra Media Tbk PT | | | 125,700 | | | | 29,766 | |
Unilever Indonesia Tbk PT | | | 36,500 | | | | 118,157 | |
| | | | | | | | |
| Total Indonesia | | | | 929,965 | |
| Malaysia – 1.4% | | | | | | | | |
Berjaya Auto Bhd | | | 31,100 | | | | 17,298 | |
Berjaya Sports Toto Bhd | | | 32,400 | | | | 26,242 | |
British American Tobacco Malaysia Bhd | | | 4,000 | | | | 55,404 | |
Carlsberg Brewery Malaysia Bhd | | | 4,900 | | | | 17,558 | |
Mah Sing Group Bhd | | | 52,962 | | | | 19,276 | |
Sunway Bhd | | | 46,000 | | | | 37,022 | |
| | | | | | | | |
| Total Malaysia | | | | 172,800 | |
| Mexico – 4.6% | | | | | | | | |
Coca-Cola Femsa S.A.B. de C.V. Series L | | | 21,840 | | | | 182,950 | |
El Puerto de Liverpool S.A.B. de C.V. Class C1 | | | 9,000 | | | | 107,268 | |
Grupo Lala S.A.B. de C.V. | | | 20,800 | | | | 57,141 | |
Industrias Bachoco S.A.B. de C.V. Series B | | | 13,100 | | | | 56,580 | |
Kimberly-Clark de Mexico S.A.B. de C.V. Class A | | | 24,120 | | | | 58,506 | |
La Comer S.A.B. de C.V.* | | | 15,532 | | | | 16,903 | |
Megacable Holdings S.A.B. de C.V. Series CPO | | | 11,954 | | | | 49,978 | |
Promotora y Operadora de Infraestructura S.A.B. de C.V. | | | 3,200 | | | | 35,474 | |
| | | | | | | | |
| Total Mexico | | | | 564,800 | |
| Philippines – 1.1% | | | | | | | | |
Puregold Price Club, Inc. | | | 39,200 | | | | 30,989 | |
Robinsons Retail Holdings, Inc. | | | 14,760 | | | | 23,721 | |
Universal Robina Corp. | | | 16,970 | | | | 79,902 | |
| | | | | | | | |
| Total Philippines | | | | 134,612 | |
| Poland – 0.2% | | | | | | | | |
CCC S.A. | | | 697 | | | | 29,916 | |
| Russia – 3.5% | | | | | | | | |
Magnit PJSC GDR Reg S | | | 5,427 | | | | 216,809 | |
MegaFon PJSC GDR Reg S | | | 6,992 | | | | 76,912 | |
Mobile TeleSystems PJSC ADR | | | 16,790 | | | | 135,831 | |
| | | | | | | | |
| Total Russia | | | | 429,552 | |
| South Africa – 7.8% | | | | | | | | |
Astral Foods Ltd. | | | 1,231 | | | | 9,290 | |
AVI Ltd. | | | 3,877 | | | | 22,901 | |
Clicks Group Ltd. | | | 2,808 | | | | 18,553 | |
Famous Brands Ltd.(b) | | | 1,227 | | | | 9,752 | |
Foschini Group Ltd. (The) | | | 3,670 | | | | 35,293 | |
Hosken Consolidated Investments Ltd. | | | 2,418 | | | | 18,416 | |
Hyprop Investments Ltd. | | | 5,334 | | | | 42,674 | |
Illovo Sugar Ltd. | | | 12,557 | | | | 17,630 | |
Imperial Holdings Ltd. | | | 3,572 | | | | 36,526 | |
Lewis Group Ltd.(b) | | | 4,704 | | | | 15,032 | |
Massmart Holdings Ltd. | | | 2,339 | | | | 20,170 | |
| | | | | | | | |
Metair Investments Ltd. | | | 7,134 | | | $ | 9,604 | |
Mr. Price Group Ltd. | | | 3,221 | | | | 38,857 | |
MTN Group Ltd.(b) | | | 25,502 | | | | 234,421 | |
Oceana Group Ltd. | | | 1,407 | | | | 11,958 | |
Pick n Pay Stores Ltd. | | | 3,734 | | | | 17,832 | |
Resilient REIT Ltd. | | | 7,648 | | | | 70,479 | |
Shoprite Holdings Ltd.(b) | | | 6,973 | | | | 82,313 | |
SPAR Group Ltd. (The) | | | 2,071 | | | | 28,021 | |
Sun International Ltd.(b) | | | 3,377 | | | | 15,774 | |
Super Group Ltd.* | | | 7,987 | | | | 23,698 | |
Tiger Brands Ltd. | | | 2,241 | | | | 49,554 | |
Truworths International Ltd. | | | 7,991 | | | | 53,364 | |
Tsogo Sun Holdings Ltd. | | | 18,156 | | | | 29,182 | |
Woolworths Holdings Ltd. | | | 8,144 | | | | 49,651 | |
| | | | | | | | |
| Total South Africa | | | | 960,945 | |
| South Korea – 15.8% | | | | | | | | |
Amorepacific Corp. | | | 347 | | | | 117,275 | |
CJ E&M Corp. | | | 1,077 | | | | 60,085 | |
CJ O Shopping Co., Ltd. | | | 120 | | | | 20,777 | |
Com2uSCorp* | | | 178 | | | | 19,285 | |
Cuckoo Electronics Co., Ltd. | | | 93 | | | | 16,305 | |
DRB Holding Co., Ltd. | | | 925 | | | | 10,434 | |
Grand Korea Leisure Co., Ltd. | | | 973 | | | | 19,441 | |
Hanssem Co., Ltd. | | | 109 | | | | 21,302 | |
Hyundai Home Shopping Network Corp. | | | 310 | | | | 35,375 | |
Hyundai Hy Communications & Network Co., Ltd. | | | 3,667 | | | | 10,902 | |
Hyundai Mobis Co., Ltd. | | | 3,443 | | | | 749,656 | |
Hyundai Wia Corp. | | | 892 | | | | 81,899 | |
Kangwon Land, Inc. | | | 2,358 | | | | 84,332 | |
KT&G Corp. | | | 2,373 | | | | 228,253 | |
LEADCORP, Inc. (The) | | | 904 | | | | 7,257 | |
LG Display Co., Ltd. | | | 10,370 | | | | 241,205 | |
LG Household & Health Care Ltd. | | | 123 | | | | 101,640 | |
Loen Entertainment, Inc. | | | 180 | | | | 12,293 | |
Pyeong Hwa Automotive Co., Ltd. | | | 1,005 | | | | 11,732 | |
Shinsegae Co., Ltd. | | | 439 | | | | 77,927 | |
WeMade Entertainment Co., Ltd.* | | | 811 | | | | 22,161 | |
| | | | | | | | |
| Total South Korea | | | | 1,949,536 | |
| Taiwan – 6.1% | | | | | | | | |
Catcher Technology Co., Ltd. | | | 10,000 | | | | 82,028 | |
Cheng Shin Rubber Industry Co., Ltd. | | | 66,000 | | | | 132,681 | |
Chimei Materials Technology Corp. | | | 21,000 | | | | 12,789 | |
De Licacy Industrial Co., Ltd. | | | 9,000 | | | | 10,123 | |
Depo Auto Parts Ind Co., Ltd. | | | 4,000 | | | | 13,112 | |
Formosa International Hotels Corp. | | | 2,000 | | | | 12,056 | |
Foxconn Technology Co., Ltd. | | | 23,000 | | | | 51,597 | |
Highwealth Construction Corp. | | | 35,000 | | | | 51,112 | |
Holiday Entertainment Co., Ltd. | | | 7,000 | | | | 12,202 | |
Huaku Development Co., Ltd. | | | 11,000 | | | | 20,336 | |
Merida Industry Co., Ltd. | | | 5,000 | | | | 22,138 | |
Nanya Technology Corp. | | | 121,595 | | | | 150,936 | |
Novatek Microelectronics Corp. | | | 10,000 | | | | 40,238 | |
Ruentex Development Co., Ltd. | | | 34,000 | | | | 43,049 | |
See Notes to Financial Statements.
| | |
| 32 | | WisdomTree Global/Global ex-U.S. and Emerging/Frontier Markets Funds |
Schedule of Investments (concluded)
WisdomTree Emerging Markets Consumer Growth Fund (EMCG)
March 31, 2016
| | | | | | | | |
| Investments | | Shares | | | Value | |
| | | | | | | | |
Ruentex Industries Ltd. | | | 35,000 | | | $ | 57,637 | |
Test Research, Inc. | | | 7,000 | | | | 10,723 | |
Yulon Nissan Motor Co., Ltd. | | | 6,000 | | | | 38,498 | |
| | | | | | | | |
| Total Taiwan | | | | 761,255 | |
| Thailand – 4.3% | | | | | | | | |
Amata Corp. PCL NVDR | | | 35,200 | | | | 12,307 | |
AP Thailand PCL NVDR | | | 95,370 | | | | 16,537 | |
BEC World PCL NVDR | | | 21,500 | | | | 17,265 | |
CH Karnchang PCL NVDR | | | 24,200 | | | | 17,541 | |
Charoen Pokphand Foods PCL NVDR | | | 134,300 | | | | 93,147 | |
CP ALL PCL NVDR | | | 60,900 | | | | 79,198 | |
GFPT PCL NVDR | | | 40,700 | | | | 13,999 | |
Home Product Center PCL NVDR | | | 129,059 | | | | 30,265 | |
Intouch Holdings PCL NVDR | | | 35,600 | | | | 64,511 | |
Jasmine International PCL NVDR | | | 415,700 | | | | 41,121 | |
LPN Development PCL NVDR | | | 26,200 | | | | 10,426 | |
Minor International PCL NVDR | | | 45,120 | | | | 47,454 | |
MK Restaurants Group PCL NVDR | | | 9,200 | | | | 13,926 | |
Pruksa Real Estate PCL NVDR | | | 40,200 | | | | 30,853 | |
Robinson Department Store PCL NVDR | | | 14,000 | | | | 19,997 | |
Supalai PCL NVDR | | | 49,700 | | | | 26,418 | |
| | | | | | | | |
| Total Thailand | | | | | | | 534,965 | |
| Turkey – 2.7% | | | | | | | | |
Aksa Akrilik Kimya Sanayii AS | | | 5,135 | | | | 19,040 | |
BIM Birlesik Magazalar AS | | | 2,183 | | | | 47,332 | |
Brisa Bridgestone Sabanci Sanayi ve Ticaret AS | | | 5,237 | | | | 14,526 | |
Dogus Otomotiv Servis ve Ticaret AS | | | 9,383 | | | | 41,921 | |
Emlak Konut Gayrimenkul Yatirim Ortakligi AS | | | 41,088 | | | | 41,880 | |
Saf Gayrimenkul Yatirim Ortakligi AS | | | 49,080 | | | | 13,770 | |
Tat Gida Sanayi A/S* | | | 8,802 | | | | 18,537 | |
TAV Havalimanlari Holding AS | | | 4,936 | | | | 29,468 | |
Tofas Turk Otomobil Fabrikasi AS | | | 10,428 | | | | 84,663 | |
Ulker Biskuvi Sanayi AS | | | 2,706 | | | | 20,086 | |
| | | | | | | | |
| Total Turkey | | | | | | | 331,223 | |
TOTAL COMMON STOCKS (Cost: $13,357,768) | | | | | | | 12,314,016 | |
| WARRANTS – 0.0% | | | | | | | | |
| South Africa – 0.0% | | | | | | | | |
Adcock Ingram Holdings Ltd., 07/26/19*
(Cost: $0) | | | 182 | | | | 49 | |
| INVESTMENT OF CASH COLLATERAL FOR SECURITIES LOANED – 2.2% | |
| United States – 2.2% | | | | | | | | |
State Street Navigator Securities Lending Prime Portfolio, 0.50%(c) | | | | | | | | |
| (Cost: $269,888)(d) | | | 269,888 | | | | 269,888 | |
TOTAL INVESTMENTS IN SECURITIES – 101.8% (Cost: $13,627,656) | | | | | | | 12,583,953 | |
Liabilities in Excess of Cash, Foreign Currency and Other Assets – (1.8)% | | | | | | | (226,834 | ) |
| | | | | | | | |
| NET ASSETS – 100.0% | | | | | | $ | 12,357,119 | |
| * | Non-income producing security. |
| (a) | This security is exempt from registration under rule 144A of the Securities Act of 1933. This security may be sold in transactions that are exempt from registration, normally to qualified institutional buyers. |
| (b) | Security, or portion thereof, was on loan at March 31, 2016 (See Note 2). |
| (c) | Rate shown represents annualized 7-day yield as of March 31, 2016. |
| (d) | At March 31, 2016, the total market value of the Fund’s securities on loan was $350,230 and the total market value of the collateral held by the Fund was $368,414. The total market value of the collateral includes non-cash U.S. Government securities collateral having a value of $98,526. |
ADR – American Depositary Receipt
GDR – Global Depositary Receipt
NVDR – Non-Voting Depositary Receipt
Reg S – Regulation S provides an exclusion from the registration requirements of the Securities Act of 1933. These securities may be resold in transactions exempt from registration, normally to qualified institutional buyers.
| | | | | | | | | | | | | | | | | | | | |
| FINANCIAL DERIVATIVE INSTRUMENTS | |
| FORWARD CONTRACTS | | | | | | | | | | |
Settlement
Date | | Contracts
To Deliver | | | In
Exchange For | | | Unrealized
Gain (Loss) | |
4/4/2016 | | | TRY | | | | 6,600 | | | | USD | | | | 2,337 | | | $ | (7 | ) |
4/4/2016 | | | ZAR | | | | 10,000 | | | | USD | | | | 677 | | | | (3 | ) |
4/5/2016 | | | ZAR | | | | 171,432 | | | | HKD | | | | 90,000 | | | | (53 | ) |
| | | | | | | | | | | | | | | | | | | $ | (63 | ) |
| | | | |
| CURRENCY LEGEND | | | | | | | | | | | | | |
| | | | | | | | | | |
HKD – Hong Kong dollar |
TRY – Turkish New lira |
USD – U.S. dollar |
ZAR – South African rand |
See Notes to Financial Statements.
| | | | |
| WisdomTree Global/Global ex-U.S. and Emerging/Frontier Markets Funds | | | 33 | |
Schedule of Investments
WisdomTree Emerging Markets ex-State-Owned Enterprises Fund (XSOE)
March 31, 2016
| | | | | | | | |
| Investments | | Shares | | | Value | |
| | | | | | | | |
| COMMON STOCKS – 99.6% | | | | | | | | |
| Brazil – 4.1% | | | | | | | | |
Ambev S.A. | | | 3,382 | | | $ | 17,960 | |
Banco Bradesco S.A.* | | | 361 | | | | 3,064 | |
Banco Santander Brasil S.A. | | | 345 | | | | 1,650 | |
BM&FBovespa S.A. - Bolsa de Valores Mercadorias e Futuros | | | 1,661 | | | | 7,208 | |
BRF S.A. | | | 467 | | | | 6,761 | |
CCR S.A. | | | 815 | | | | 3,226 | |
CETIP S.A. - Mercados Organizados | | | 135 | | | | 1,529 | |
Cielo S.A. | | | 474 | | | | 4,677 | |
CPFL Energia S.A.* | | | 816 | | | | 4,513 | |
Embraer S.A. | | | 511 | | | | 3,439 | |
Equatorial Energia S.A. | | | 163 | | | | 1,884 | |
Hypermarcas S.A.* | | | 200 | | | | 1,587 | |
Itau Unibanco Holding S.A. | | | 300 | | | | 2,261 | |
JBS S.A. | | | 739 | | | | 2,283 | |
Klabin S.A. | | | 633 | | | | 3,460 | |
Kroton Educacional S.A. | | | 991 | | | | 3,210 | |
Lojas Renner S.A. | | | 555 | | | | 3,256 | |
Raia Drogasil S.A. | | | 263 | | | | 3,874 | |
Tim Participacoes S.A. | | | 933 | | | | 2,106 | |
TOTVS S.A. | | | 100 | | | | 768 | |
Tractebel Energia S.A. | | | 88 | | | | 911 | |
Ultrapar Participacoes S.A. | | | 370 | | | | 7,286 | |
WEG S.A. | | | 511 | | | | 2,020 | |
| | | | | | | | |
| Total Brazil | | | | 88,933 | |
| Chile – 1.5% | | | | | | | | |
Banco de Chile | | | 24,590 | | | | 2,648 | |
Banco de Credito e Inversiones | | | 33 | | | | 1,336 | |
Banco Santander Chile | | | 41,659 | | | | 2,029 | |
Cencosud S.A. | | | 530 | | | | 1,339 | |
Cia Cervecerias Unidas S.A. | | | 162 | | | | 1,828 | |
Colbun S.A. | | | 8,356 | | | | 2,332 | |
Empresa Nacional de Electricidad S.A. | | | 2,139 | | | | 2,980 | |
Empresa Nacional de Telecomunicaciones S.A. | | | 92 | | | | 814 | |
Empresas CMPC S.A. | | | 1,256 | | | | 2,935 | |
Empresas COPEC S.A. | | | 488 | | | | 4,679 | |
Enersis Americas S.A. | | | 14,044 | | | | 3,896 | |
S.A.C.I. Falabella | | | 722 | | | | 5,050 | |
| | | | | | | | |
| Total Chile | | | | 31,866 | |
| China – 26.1% | | | | | | | | |
21Vianet Group, Inc. ADR* | | | 79 | | | | 1,578 | |
AAC Technologies Holdings, Inc. | | | 1,000 | | | | 7,645 | |
Alibaba Group Holding Ltd. ADR* | | | 1,100 | | | | 86,933 | |
ANTA Sports Products Ltd. | | | 1,000 | | | | 2,202 | |
Baidu, Inc. ADR* | | | 302 | | | | 57,646 | |
Belle International Holdings Ltd. | | | 8,000 | | | | 4,631 | |
Bitauto Holdings Ltd. ADR* | | | 38 | | | | 942 | |
Byd Co., Ltd. Class H* | | | 1,000 | | | | 5,737 | |
CAR, Inc.* | | | 2,000 | | | | 2,346 | |
China Conch Venture Holdings Ltd. | | | 2,900 | | | | 5,720 | |
China Huishan Dairy Holdings Co., Ltd. | | | 8,000 | | | | 3,012 | |
| | | | | | | | |
China Medical System Holdings Ltd. | | | 2,000 | | | $ | 2,774 | |
China Minsheng Banking Corp., Ltd. Class H | | | 13,000 | | | | 12,134 | |
China Vanke Co., Ltd. Class H | | | 2,500 | | | | 6,130 | |
Country Garden Holdings Co., Ltd. | | | 14,000 | | | | 5,559 | |
CSPC Pharmaceutical Group Ltd. | | | 4,000 | | | | 3,620 | |
Ctrip.com International Ltd. ADR* | | | 477 | | | | 21,112 | |
Dalian Wanda Commercial Properties Co., Ltd. Class H(a) | | | 1,100 | | | | 6,516 | |
Evergrande Real Estate Group Ltd. | | | 9,000 | | | | 6,950 | |
GCL-Poly Energy Holdings Ltd. | | | 11,000 | | | | 1,815 | |
Geely Automobile Holdings Ltd. | | | 5,000 | | | | 2,475 | |
GF Securities Co., Ltd. Class H* | | | 3,000 | | | | 7,318 | |
GOME Electrical Appliances Holding Ltd. | | | 16,000 | | | | 2,310 | |
Great Wall Motor Co., Ltd. Class H | | | 4,000 | | | | 3,249 | |
Haitian International Holdings Ltd. | | | 1,000 | | | | 1,715 | |
Hanergy Thin Film Power Group Ltd.*† | | | 102,000 | | | | 1,315 | |
Hengan International Group Co., Ltd. | | | 1,000 | | | | 8,677 | |
Intime Retail Group Co., Ltd. | | | 2,500 | | | | 2,034 | |
JD.com, Inc. ADR* | | | 1,200 | | | | 31,800 | |
Kingsoft Corp., Ltd. | | | 1,000 | | | | 2,344 | |
Longfor Properties Co., Ltd. | | | 2,000 | | | | 2,852 | |
Luye Pharma Group Ltd.* | | | 2,500 | | | | 1,934 | |
NetEase, Inc. ADR | | | 78 | | | | 11,199 | |
New Oriental Education & Technology Group, Inc. ADR | | | 181 | | | | 6,261 | |
Ping An Insurance Group Co. of China Ltd. Class H | | | 8,500 | | | | 40,656 | |
Qihoo 360 Technology Co., Ltd. ADR* | | | 103 | | | | 7,782 | |
Renhe Commercial Holdings Co., Ltd.* | | | 42,000 | | | | 1,679 | |
Shandong Weigao Group Medical Polymer Co., Ltd. Class H | | | 4,000 | | | | 2,548 | |
Shanghai Fosun Pharmaceutical Group Co., Ltd. Class H | | | 749 | | | | 2,066 | |
Shenzhou International Group Holdings Ltd. | | | 1,000 | | | | 5,441 | |
Shimao Property Holdings Ltd. | | | 1,500 | | | | 2,220 | |
SINA Corp.* | | | 59 | | | | 2,795 | |
Sino Biopharmaceutical Ltd. | | | 6,000 | | | | 4,502 | |
Sohu.com, Inc.* | | | 34 | | | | 1,684 | |
SouFun Holdings Ltd. ADR | | | 251 | | | | 1,503 | |
Sun Art Retail Group Ltd. | | | 3,000 | | | | 2,123 | |
Sunny Optical Technology Group Co., Ltd. | | | 1,000 | | | | 2,811 | |
TAL Education Group ADR* | | | 61 | | | | 3,030 | |
Tencent Holdings Ltd. | | | 5,600 | | | | 114,360 | |
Tingyi Cayman Islands Holding Corp. | | | 2,000 | | | | 2,236 | |
Uni-President China Holdings Ltd. | | | 2,000 | | | | 1,596 | |
Vipshop Holdings Ltd. ADR* | | | 422 | | | | 5,435 | |
Want Want China Holdings Ltd. | | | 9,000 | | | | 6,672 | |
WH Group Ltd.*(a) | | | 10,000 | | | | 7,246 | |
Xinyi Glass Holdings Ltd. | | | 4,000 | | | | 2,666 | |
Xinyi Solar Holdings Ltd. | | | 4,000 | | | | 1,423 | |
Youku Tudou, Inc. ADR* | | | 123 | | | | 3,381 | |
YY, Inc. ADR* | | | 42 | | | | 2,587 | |
ZTE Corp. Class H† | | | 960 | | | | 1,753 | |
| | | | | | | | |
| Total China | | | | 560,680 | |
See Notes to Financial Statements.
| | |
| 34 | | WisdomTree Global/Global ex-U.S. and Emerging/Frontier Markets Funds |
Schedule of Investments (continued)
WisdomTree Emerging Markets ex-State-Owned Enterprises Fund (XSOE)
March 31, 2016
| | | | | | | | |
| Investments | | Shares | | | Value | |
| | | | | | | | |
| Czech Republic – 0.3% | | | | | | | | |
Komercni Banka AS | | | 24 | | | $ | 5,308 | |
| Hong Kong – 0.5% | | | | | | | | |
Alibaba Pictures Group Ltd.* | | | 20,000 | | | | 4,564 | |
BEP International Holdings Ltd. | | | 10,000 | | | | 799 | |
Skyworth Digital Holdings Ltd. | | | 2,000 | | | | 1,238 | |
Tech Pro Technology Development Ltd.* | | | 10,000 | | | | 3,030 | |
| | | | | | | | |
| Total Hong Kong | | | | 9,631 | |
| Hungary – 0.4% | | | | | | | | |
OTP Bank PLC | | | 326 | | | | 8,189 | |
| India – 9.1% | | | | | | | | |
Adani Ports & Special Economic Zone Ltd. | | | 821 | | | | 3,071 | |
Ambuja Cements Ltd. | | | 610 | | | | 2,142 | |
Asian Paints Ltd. | | | 281 | | | | 3,685 | |
Aurobindo Pharma Ltd. | | | 289 | | | | 3,251 | |
Bajaj Auto Ltd. | | | 58 | | | | 2,107 | |
Bharat Forge Ltd. | | | 110 | | | | 1,450 | |
Bharti Airtel Ltd. | | | 1,352 | | | | 7,162 | |
Bharti Infratel Ltd. | | | 487 | | | | 2,809 | |
Britannia Industries Ltd. | | | 26 | | | | 1,055 | |
Cadila Healthcare Ltd. | | | 238 | | | | 1,139 | |
Cairn India Ltd. | | | 497 | | | | 1,155 | |
Cipla Ltd. | | | 314 | | | | 2,427 | |
Crompton Greaves Consumer Electricals Ltd.*† | | | 423 | | | | 649 | |
Crompton Greaves Ltd. | | | 423 | | | | 312 | |
Dabur India Ltd. | | | 585 | | | | 2,208 | |
Dr. Reddy’s Laboratories Ltd. | | | 86 | | | | 3,942 | |
Glenmark Pharmaceuticals Ltd. | | | 160 | | | | 1,921 | |
HCL Technologies Ltd. | | | 474 | | | | 5,827 | |
Hero MotoCorp Ltd. | | | 82 | | | | 3,648 | |
Hindustan Unilever Ltd. | | | 652 | | | | 8,561 | |
ICICI Bank Ltd. ADR | | | 1,218 | | | | 8,721 | |
Idea Cellular Ltd. | | | 1,288 | | | | 2,143 | |
IndusInd Bank Ltd. | | | 348 | | | | 5,085 | |
Infosys Ltd. ADR | | | 830 | | | | 15,787 | |
ITC Ltd. | | | 1,665 | | | | 8,253 | |
JSW Steel Ltd. | | | 115 | | | | 2,228 | |
Larsen & Toubro Ltd. GDR Reg S | | | 210 | | | | 3,790 | |
Lupin Ltd. | | | 228 | | | | 5,093 | |
Mahindra & Mahindra Ltd. | | | 296 | | | | 5,412 | |
Marico Ltd. | | | 428 | | | | 1,579 | |
Maruti Suzuki India Ltd. | | | 79 | | | | 4,433 | |
Motherson Sumi Systems Ltd. | | | 331 | | | | 1,332 | |
Reliance Communications Ltd.* | | | 1,168 | | | | 882 | |
Reliance Industries Ltd. GDR(a) | | | 773 | | | | 23,692 | |
Siemens Ltd. | | | 95 | | | | 1,578 | |
Sun Pharmaceutical Industries Ltd. | | | 1,019 | | | | 12,618 | |
Tata Consultancy Services Ltd. | | | 297 | | | | 11,303 | |
Tata Motors Ltd. ADR* | | | 158 | | | | 4,590 | |
Tech Mahindra Ltd. | | | 333 | | | | 2,388 | |
UltraTech Cement Ltd. | | | 72 | | | | 3,510 | |
United Spirits Ltd.* | | | 45 | | | | 1,698 | |
UPL Ltd. | | | 311 | | | | 2,243 | |
| | | | | | | | |
Vedanta Ltd. | | | 1,257 | | | $ | 1,705 | |
Wipro Ltd. | | | 474 | | | | 4,039 | |
Yes Bank Ltd. | | | 248 | | | | 3,240 | |
| | | | | | | | |
| Total India | | | | 195,863 | |
| Indonesia – 2.4% | | | | | | | | |
Astra International Tbk PT | | | 19,700 | | | | 10,771 | |
Bank Central Asia Tbk PT | | | 19,100 | | | | 19,157 | |
Gudang Garam Tbk PT | | | 700 | | | | 3,447 | |
Indocement Tunggal Prakarsa Tbk PT | | | 900 | | | | 1,339 | |
Indofood Sukses Makmur Tbk PT | | | 3,900 | | | | 2,125 | |
Kalbe Farma Tbk PT | | | 17,600 | | | | 1,918 | |
Lippo Karawaci Tbk PT | | | 24,400 | | | | 1,923 | |
Matahari Department Store Tbk PT | | | 2,500 | | | | 3,460 | |
Surya Citra Media Tbk PT | | | 5,200 | | | | 1,231 | |
Unilever Indonesia Tbk PT | | | 1,500 | | | | 4,856 | |
United Tractors Tbk PT | | | 1,800 | | | | 2,077 | |
| | | | | | | | |
| Total Indonesia | | | | 52,304 | |
| Malaysia – 3.1% | | | | | | | | |
Astro Malaysia Holdings Bhd | | | 6,200 | | | | 4,751 | |
British American Tobacco Malaysia Bhd | | | 200 | | | | 2,770 | |
Dialog Group Bhd | | | 9,100 | | | | 3,732 | |
Genting Bhd | | | 4,500 | | | | 11,303 | |
Genting Malaysia Bhd | | | 6,500 | | | | 7,564 | |
Hong Leong Bank Bhd | | | 1,508 | | | | 5,218 | |
IOI Corp. Bhd | | | 5,300 | | | | 6,208 | |
Maxis Bhd | | | 3,700 | | | | 6,022 | |
PPB Group Bhd | | | 1,300 | | | | 5,565 | |
SapuraKencana Petroleum Bhd | | | 6,100 | | | | 2,908 | |
Westports Holdings Bhd | | | 3,400 | | | | 3,599 | |
YTL Corp. Bhd | | | 10,500 | | | | 4,414 | |
YTL Power International Bhd | | | 9,300 | | | | 3,528 | |
| | | | | | | | |
| Total Malaysia | | | | 67,582 | |
| Mexico – 5.0% | | | | | | | | |
Alfa S.A.B. de C.V. Class A | | | 2,444 | | | | 4,947 | |
Alsea S.A.B. de C.V. | | | 263 | | | | 995 | |
America Movil S.A.B. de C.V. Series L | | | 21,310 | | | | 16,700 | |
Cemex S.A.B. de C.V. Series CPO* | | | 7,393 | | | | 5,414 | |
Coca-Cola Femsa S.A.B. de C.V. Series L | | | 263 | | | | 2,203 | |
El Puerto de Liverpool S.A.B. de C.V. Class C1 | | | 160 | | | | 1,907 | |
Fomento Economico Mexicano S.A.B. de C.V. | | | 1,424 | | | | 13,860 | |
Gruma S.A.B. de C.V. Class B | | | 118 | | | | 1,885 | |
Grupo Aeroportuario del Pacifico S.A.B. de C.V. Class B | | | 307 | | | | 2,761 | |
Grupo Aeroportuario del Sureste S.A.B. de C.V. Class B | | | 208 | | | | 3,158 | |
Grupo Bimbo S.A.B. de C.V. Series A* | | | 939 | | | | 2,798 | |
Grupo Financiero Banorte S.A.B. de C.V. Class O | | | 2,400 | | | | 13,644 | |
Grupo Financiero Inbursa S.A.B. de C.V. Class O | | | 2,215 | | | | 4,458 | |
Grupo Financiero Santander Mexico S.A.B. de C.V. Class B | | | 1,179 | | | | 2,157 | |
Grupo Lala S.A.B. de C.V. | | | 479 | | | | 1,316 | |
Grupo Mexico S.A.B. de C.V. Series B | | | 2,773 | | | | 6,739 | |
Grupo Televisa S.A.B. Series CPO | | | 1,537 | | | | 8,533 | |
See Notes to Financial Statements.
| | | | |
| WisdomTree Global/Global ex-U.S. and Emerging/Frontier Markets Funds | | | 35 | |
Schedule of Investments (continued)
WisdomTree Emerging Markets ex-State-Owned Enterprises Fund (XSOE)
March 31, 2016
| | | | | | | | |
| Investments | | Shares | | | Value | |
| | | | | | | | |
Kimberly-Clark de Mexico S.A.B. de C.V. Class A | | | 833 | | | $ | 2,021 | |
Mexichem S.A.B. de C.V. | | | 788 | | | | 1,946 | |
Promotora y Operadora de Infraestructura S.A.B. de C.V. | | | 138 | | | | 1,850 | |
Telesites S.A.B. de C.V.* | | | 1,836 | | | | 1,075 | |
Wal-Mart de Mexico S.A.B. de C.V. Series V | | | 3,061 | | | | 7,323 | |
| | | | | | | | |
| Total Mexico | | | | 107,690 | |
| Philippines – 2.2% | | | | | | | | |
Aboitiz Equity Ventures, Inc. | | | 1,700 | | | | 2,400 | |
Aboitiz Power Corp. | | | 1,300 | | | | 1,241 | |
Ayala Corp. | | | 250 | | | | 4,072 | |
Ayala Land, Inc. | | | 4,900 | | | | 3,751 | |
Bank of the Philippine Islands | | | 1,760 | | | | 3,325 | |
BDO Unibank, Inc. | | | 1,190 | | | | 2,644 | |
Globe Telecom, Inc. | | | 25 | | | | 1,205 | |
GT Capital Holdings, Inc. | | | 60 | | | | 1,811 | |
JG Summit Holdings, Inc. | | | 2,440 | | | | 4,205 | |
Manila Electric Co. | | | 170 | | | | 1,193 | |
Megaworld Corp. | | | 14,000 | | | | 1,262 | |
Metro Pacific Investments Corp. | | | 9,800 | | | | 1,249 | |
Metropolitan Bank & Trust Co. | | | 1,480 | | | | 2,650 | |
Philippine Long Distance Telephone Co. | | | 45 | | | | 1,935 | |
SM Investments Corp. | | | 310 | | | | 6,393 | |
SM Prime Holdings, Inc. | | | 10,000 | | | | 4,767 | |
Universal Robina Corp. | | | 530 | | | | 2,496 | |
| | | | | | | | |
| Total Philippines | | | | 46,599 | |
| Poland – 1.6% | | | | | | | | |
Alior Bank S.A.* | | | 141 | | | | 2,461 | |
Asseco Poland S.A. | | | 191 | | | | 3,109 | |
Bank Pekao S.A. | | | 298 | | | | 13,187 | |
Bank Zachodni WBK S.A.* | | | 60 | | | | 4,948 | |
Cyfrowy Polsat S.A.* | | | 461 | | | | 3,006 | |
ING Bank Slaski S.A. | | | 67 | | | | 2,178 | |
LPP S.A. | | | 1 | | | | 1,478 | |
mBank S.A.* | | | 21 | | | | 1,918 | |
Orange Polska S.A. | | | 1,215 | | | | 2,200 | |
| | | | | | | | |
| Total Poland | | | | 34,485 | |
| Russia – 3.1% | | | | | | | | |
Lukoil PJSC ADR | | | 580 | | | | 22,281 | |
Magnit PJSC GDR Reg S | | | 319 | | | | 12,744 | |
Mail.ru Group Ltd. GDR Reg S* | | | 97 | | | | 2,105 | |
MegaFon PJSC GDR Reg S | | | 146 | | | | 1,606 | |
MMC Norilsk Nickel PJSC ADR | | | 840 | | | | 10,844 | |
Mobile TeleSystems PJSC ADR | | | 584 | | | | 4,725 | |
PhosAgro OAO GDR Reg S | | | 118 | | | | 1,664 | |
Polymetal International PLC | | | 249 | | | | 2,430 | |
Severstal PAO GDR Reg S | | | 222 | | | | 2,349 | |
Sistema JSFC GDR Reg S | | | 244 | | | | 1,576 | |
X5 Retail Group N.V. GDR Reg S* | | | 131 | | | | 2,777 | |
Yandex N.V. Class A* | | | 159 | | | | 2,436 | |
| | | | | | | | |
| Total Russia | | | | 67,537 | |
| | | | | | | | |
| South Africa – 6.8% | | | | | | | | |
AngloGold Ashanti Ltd.* | | | 302 | | | $ | 4,199 | |
Aspen Pharmacare Holdings Ltd.* | | | 160 | | | | 3,483 | |
AVI Ltd. | | | 232 | | | | 1,370 | |
Barclays Africa Group Ltd.(b) | | | 281 | | | | 2,858 | |
Bidvest Group Ltd. (The) | | | 207 | | | | 5,250 | |
Capitec Bank Holdings Ltd. | | | 53 | | | | 2,065 | |
Clicks Group Ltd. | | | 138 | | | | 912 | |
Discovery Ltd. | | | 355 | | | | 2,933 | |
FirstRand Ltd. | | | 2,908 | | | | 9,564 | |
Foschini Group Ltd. (The) | | | 115 | | | | 1,106 | |
Gold Fields Ltd. | | | 625 | | | | 2,484 | |
Impala Platinum Holdings Ltd.* | | | 590 | | | | 1,885 | |
Imperial Holdings Ltd.(b) | | | 206 | | | | 2,107 | |
Investec Ltd. | | | 246 | | | | 1,838 | |
Life Healthcare Group Holdings Ltd. | | | 511 | | | | 1,240 | |
Mediclinic International PLC | | | 177 | | | | 2,284 | |
MMI Holdings Ltd. | | | 749 | | | | 1,268 | |
Mondi Ltd. | | | 100 | | | | 1,930 | |
Mr. Price Group Ltd. | | | 133 | | | | 1,604 | |
MTN Group Ltd. | | | 953 | | | | 8,760 | |
Naspers Ltd. Class N | | | 251 | | | | 35,172 | |
Nedbank Group Ltd.(b) | | | 212 | | | | 2,800 | |
Netcare Ltd. | | | 1,063 | | | | 2,609 | |
Pioneer Foods Group Ltd. | | | 99 | | | | 936 | |
PSG Group Ltd. | | | 79 | | | | 1,077 | |
Rand Merchant Investment Holdings Ltd. | | | 503 | | | | 1,423 | |
Remgro Ltd. | | | 347 | | | | 5,902 | |
Resilient REIT Ltd. | | | 376 | | | | 3,465 | |
RMB Holdings Ltd. | | | 499 | | | | 2,078 | |
Sanlam Ltd. | | | 1,185 | | | | 5,518 | |
Sappi Ltd.* | | | 392 | | | | 1,742 | |
Shoprite Holdings Ltd. | | | 249 | | | | 2,939 | |
Standard Bank Group Ltd. | | | 1,031 | | | | 9,287 | |
Tiger Brands Ltd. | | | 111 | | | | 2,455 | |
Truworths International Ltd. | | | 306 | | | | 2,043 | |
Vodacom Group Ltd. | | | 365 | | | | 3,984 | |
Woolworths Holdings Ltd. | | | 541 | | | | 3,298 | |
| | | | | | | | |
| Total South Africa | | | | 145,868 | |
| South Korea – 17.1% | | | | | | | | |
Amorepacific Corp. | | | 22 | | | | 7,435 | |
AMOREPACIFIC Group | | | 21 | | | | 2,690 | |
BGF retail Co., Ltd. | | | 11 | | | | 1,578 | |
BNK Financial Group, Inc. | | | 193 | | | | 1,637 | |
Celltrion, Inc.* | | | 75 | | | | 7,201 | |
Cheil Worldwide, Inc. | | | 57 | | | | 847 | |
CJ CGV Co., Ltd. | | | 9 | | | | 777 | |
CJ CheilJedang Corp. | | | 6 | | | | 1,823 | |
CJ Corp. | | | 12 | | | | 2,051 | |
CJ E&M Corp. | | | 18 | | | | 1,004 | |
CJ Korea Express Corp.* | | | 6 | | | | 997 | |
Cosmax, Inc. | | | 6 | | | | 659 | |
Coway Co., Ltd. | | | 36 | | | | 3,038 | |
See Notes to Financial Statements.
| | |
| 36 | | WisdomTree Global/Global ex-U.S. and Emerging/Frontier Markets Funds |
Schedule of Investments (continued)
WisdomTree Emerging Markets ex-State-Owned Enterprises Fund (XSOE)
March 31, 2016
| | | | | | | | |
| Investments | | Shares | | | Value | |
| | | | | | | | |
Daelim Industrial Co., Ltd. | | | 19 | | | $ | 1,510 | |
DGB Financial Group, Inc. | | | 159 | | | | 1,237 | |
Dongbu Insurance Co., Ltd. | | | 35 | | | | 2,323 | |
Doosan Corp. | | | 11 | | | | 850 | |
Doosan Heavy Industries & Construction Co., Ltd. | | | 60 | | | | 1,133 | |
E-Mart, Inc. | | | 15 | | | | 2,302 | |
Green Cross Holdings Corp. | | | 32 | | | | 1,019 | |
GS Engineering & Construction Corp.* | | | 45 | | | | 1,074 | |
GS Holdings Corp. | | | 28 | | | | 1,445 | |
GS Retail Co., Ltd. | | | 26 | | | | 1,072 | |
Hana Financial Group, Inc. | | | 265 | | | | 5,747 | |
Hankook Tire Co., Ltd. | | | 65 | | | | 3,092 | |
Hanmi Pharm Co., Ltd. | | | 4 | | | | 2,445 | |
Hanmi Science Co., Ltd. | | | 25 | | | | 3,257 | |
Hanssem Co., Ltd. | | | 11 | | | | 2,150 | |
Hanwha Chemical Corp. | | | 78 | | | | 1,702 | |
Hanwha Corp. | | | 52 | | | | 1,614 | |
Hanwha Life Insurance Co., Ltd. | | | 295 | | | | 1,728 | |
Hanwha Techwin Co., Ltd. | | | 37 | | | | 1,306 | |
Hotel Shilla Co., Ltd. | | | 26 | | | | 1,512 | |
Hyosung Corp. | | | 19 | | | | 2,393 | |
Hyundai Department Store Co., Ltd. | | | 15 | | | | 1,804 | |
Hyundai Development Co-Engineering & Construction | | | 48 | | | | 1,929 | |
Hyundai Engineering & Construction Co., Ltd. | | | 45 | | | | 1,659 | |
Hyundai Glovis Co., Ltd. | | | 17 | | | | 2,802 | |
Hyundai Heavy Industries Co., Ltd.* | | | 39 | | | | 3,632 | |
Hyundai Marine & Fire Insurance Co., Ltd. | | | 65 | | | | 1,887 | |
Hyundai Mobis Co., Ltd. | | | 46 | | | | 10,016 | |
Hyundai Motor Co. | | | 105 | | | | 14,002 | |
Hyundai Steel Co. | | | 58 | | | | 2,815 | |
Hyundai Wia Corp. | | | 12 | | | | 1,102 | |
Kakao Corp. | | | 19 | | | | 1,648 | |
KB Financial Group, Inc. | | | 342 | | | | 9,525 | |
KB Insurance Co., Ltd. | | | 59 | | | | 1,757 | |
Kia Motors Corp. | | | 199 | | | | 8,405 | |
Korea Investment Holdings Co., Ltd. | | | 44 | | | | 1,691 | |
Korea Zinc Co., Ltd. | | | 9 | | | | 3,789 | |
KT Corp. | | | 105 | | | | 2,736 | |
KT&G Corp. | | | 98 | | | | 9,426 | |
LG Chem Ltd. | | | 35 | | | | 10,023 | |
LG Corp. | | | 96 | | | | 5,750 | |
LG Display Co., Ltd. | | | 144 | | | | 3,349 | |
LG Electronics, Inc. | | | 71 | | | | 3,824 | |
LG Household & Health Care Ltd. | | | 7 | | | | 5,784 | |
LG Uplus Corp. | | | 205 | | | | 1,981 | |
Lotte Chemical Corp. | | | 13 | | | | 3,882 | |
Lotte Shopping Co., Ltd. | | | 12 | | | | 2,634 | |
Medy-Tox, Inc. | | | 4 | | | | 1,544 | |
Meritz Securities Co., Ltd. | | | 370 | | | | 1,153 | |
Mirae Asset Securities Co., Ltd. | | | 79 | | | | 1,613 | |
NAVER Corp. | | | 14 | | | | 7,798 | |
NCSoft Corp. | | | 7 | | | | 1,552 | |
NH Investment & Securities Co., Ltd. | | | 122 | | | | 1,059 | |
OCI Co., Ltd. | | | 15 | | | | 1,390 | |
| | | | | | | | |
Orion Corp/Republic of Korea | | | 2 | | | $ | 1,599 | |
Ottogi Corp. | | | 2 | | | | 1,586 | |
POSCO | | | 55 | | | | 10,557 | |
S-1 Corp. | | | 14 | | | | 1,082 | |
Samsung C&T Corp. | | | 67 | | | | 8,378 | |
Samsung Electro-Mechanics Co., Ltd. | | | 37 | | | | 1,902 | |
Samsung Electronics Co., Ltd. | | | 59 | | | | 67,688 | |
Samsung Fire & Marine Insurance Co., Ltd. | | | 35 | | | | 9,029 | |
Samsung Heavy Industries Co., Ltd. | | | 142 | | | | 1,372 | |
Samsung Life Insurance Co., Ltd. | | | 93 | | | | 9,555 | |
Samsung SDS Co., Ltd. | | | 21 | | | | 3,214 | |
Samsung Securities Co., Ltd. | | | 47 | | | | 1,642 | |
Shinhan Financial Group Co., Ltd. | | | 416 | | | | 14,732 | |
Shinsegae Co., Ltd. | | | 6 | | | | 1,065 | |
SK Holdings Co., Ltd. | | | 26 | | | | 5,070 | |
SK Hynix, Inc. | | | 272 | | | | 6,695 | |
SK Innovation Co., Ltd. | | | 45 | | | | 6,768 | |
SK Telecom Co., Ltd. | | | 32 | | | | 5,834 | |
ViroMed Co., Ltd.* | | | 11 | | | | 1,480 | |
Yuhan Corp. | | | 6 | | | | 1,472 | |
| | | | | | | | |
| Total South Korea | | | | 367,329 | |
| Taiwan – 11.5% | | | | | | | | |
Acer, Inc.* | | | 3,000 | | | | 1,151 | |
Advanced Semiconductor Engineering, Inc. | | | 4,000 | | | | 4,654 | |
Asia Cement Corp. | | | 1,000 | | | | 913 | |
AU Optronics Corp. | | | 8,000 | | | | 2,404 | |
Cathay Financial Holding Co., Ltd. | | | 8,000 | | | | 9,582 | |
Chang Hwa Commercial Bank Ltd. | | | 6,000 | | | | 3,076 | |
Cheng Shin Rubber Industry Co., Ltd. | | | 1,000 | | | | 2,010 | |
China Development Financial Holding Corp. | | | 17,000 | | | | 4,543 | |
China Life Insurance Co., Ltd. | | | 4,400 | | | | 3,384 | |
Compal Electronics, Inc. | | | 3,000 | | | | 1,883 | |
CTBC Financial Holding Co., Ltd. | | | 18,215 | | | | 9,621 | |
Delta Electronics, Inc. | | | 1,052 | | | | 4,642 | |
E.Sun Financial Holding Co., Ltd. | | | 8,782 | | | | 4,912 | |
Eva Airways Corp.* | | | 3,000 | | | | 1,678 | |
Far Eastern New Century Corp. | | | 3,080 | | | | 2,517 | |
Far EasTone Telecommunications Co., Ltd. | | | 1,000 | | | | 2,240 | |
Formosa Chemicals & Fibre Corp. | | | 3,000 | | | | 7,476 | |
Formosa Petrochemical Corp. | | | 2,000 | | | | 5,748 | |
Formosa Plastics Corp. | | | 4,000 | | | | 9,918 | |
Foxconn Technology Co., Ltd. | | | 1,010 | | | | 2,266 | |
Fubon Financial Holding Co., Ltd. | | | 7,000 | | | | 8,917 | |
Giant Manufacturing Co., Ltd. | | | 1,000 | | | | 5,779 | |
Highwealth Construction Corp. | | | 1,000 | | | | 1,460 | |
Hon Hai Precision Industry Co., Ltd. | | | 7,350 | | | | 19,366 | |
HTC Corp. | | | 1,000 | | | | 2,865 | |
Innolux Corp. | | | 8,000 | | | | 2,796 | |
Inotera Memories, Inc.* | | | 1,000 | | | | 906 | |
Inventec Corp. | | | 2,000 | | | | 1,268 | |
Lite-On Technology Corp. | | | 2,005 | | | | 2,448 | |
MediaTek, Inc. | | | 1,000 | | | | 7,675 | |
Nan Ya Plastics Corp. | | | 4,000 | | | | 8,402 | |
See Notes to Financial Statements.
| | | | |
| WisdomTree Global/Global ex-U.S. and Emerging/Frontier Markets Funds | | | 37 | |
Schedule of Investments (concluded)
WisdomTree Emerging Markets ex-State-Owned Enterprises Fund (XSOE)
March 31, 2016
| | | | | | | | |
| Investments | | Shares | | | Value | |
| | | | | | | | |
Pegatron Corp. | | | 1,000 | | | $ | 2,333 | |
Pou Chen Corp. | | | 3,000 | | | | 3,822 | |
Quanta Computer, Inc. | | | 2,000 | | | | 3,492 | |
Ruentex Industries Ltd. | | | 1,000 | | | | 1,647 | |
Shin Kong Financial Holding Co., Ltd. | | | 9,449 | | | | 1,897 | |
Siliconware Precision Industries Co., Ltd. | | | 2,000 | | | | 3,231 | |
SinoPac Financial Holdings Co., Ltd. | | | 11,662 | | | | 3,605 | |
Synnex Technology International Corp. | | | 1,000 | | | | 1,030 | |
Taishin Financial Holding Co., Ltd. | | | 7,000 | | | | 2,469 | |
Taiwan Cement Corp. | | | 4,000 | | | | 3,915 | |
Taiwan Mobile Co., Ltd. | | | 1,000 | | | | 3,247 | |
Taiwan Semiconductor Manufacturing Co., Ltd. | | | 10,000 | | | | 50,336 | |
Teco Electric and Machinery Co., Ltd. | | | 2,000 | | | | 1,631 | |
Uni-President Enterprises Corp. | | | 4,160 | | | | 7,303 | |
United Microelectronics Corp. | | | 11,000 | | | | 4,546 | |
WPG Holdings Ltd. | | | 1,000 | | | | 1,066 | |
Yuanta Financial Holding Co., Ltd. | | | 11,236 | | | | 4,015 | |
| | | | | | | | |
| Total Taiwan | | | | 246,085 | |
| Thailand – 2.8% | | | | | | | | |
Advanced Info Service PCL NVDR | | | 1,600 | | | | 8,277 | |
Bangkok Dusit Medical Services PCL NVDR | | | 6,400 | | | | 4,257 | |
Bank of Ayudhya PCL NVDR | | | 3,000 | | | | 2,942 | |
Big C Supercenter PCL NVDR | | | 500 | | | | 3,567 | |
BTS Group Holdings PCL NVDR | | | 9,000 | | | | 2,290 | |
Bumrungrad Hospital PCL NVDR | | | 500 | | | | 3,013 | |
Central Pattana PCL NVDR | | | 2,200 | | | | 3,221 | |
Charoen Pokphand Foods PCL NVDR | | | 3,600 | | | | 2,497 | |
CP ALL PCL NVDR | | | 5,300 | | | | 6,892 | |
Delta Electronics Thailand PCL NVDR | | | 500 | | | | 1,236 | |
Energy Absolute PCL NVDR | | | 2,300 | | | | 1,458 | |
Glow Energy PCL NVDR | | | 500 | | | | 1,308 | |
Indorama Ventures PCL NVDR | | | 2,300 | | | | 1,491 | |
Kasikornbank PCL NVDR | | | 2,000 | | | | 9,835 | |
Minor International PCL NVDR | | | 2,110 | | | | 2,219 | |
Thai Union Group PCL NVDR | | | 3,400 | | | | 2,020 | |
Total Access Communication PCL NVDR | | | 1,400 | | | | 1,642 | |
True Corp. PCL NVDR* | | | 13,300 | | | | 2,873 | |
| | | | | | | | |
| Total Thailand | | | | 61,038 | |
| Turkey – 1.9% | | | | | | | | |
Akbank TAS | | | 1,717 | | | | 4,891 | |
Anadolu Efes Biracilik ve Malt Sanayii AS | | | 181 | | | | 1,378 | |
Arcelik AS | | | 355 | | | | 2,416 | |
BIM Birlesik Magazalar AS | | | 191 | | | | 4,141 | |
Enka Insaat ve Sanayi AS | | | 1,120 | | | | 1,941 | |
Haci Omer Sabanci Holding AS | | | 1,414 | | | | 4,891 | |
KOC Holding AS | | | 896 | | | | 4,554 | |
TAV Havalimanlari Holding AS | | | 216 | | | | 1,290 | |
Tupras Turkiye Petrol Rafinerileri AS* | | | 146 | | | | 4,114 | |
Turkcell Iletisim Hizmetleri AS | | | 855 | | | | 3,598 | |
Turkiye Garanti Bankasi AS | | | 2,231 | | | | 6,529 | |
Ulker Biskuvi Sanayi AS | | | 165 | | | | 1,225 | |
| | | | | | | | |
| Total Turkey | | | | 40,968 | |
| | | | | | | | |
| United States – 0.1% | | | | | | | | |
| China Biologic Products, Inc.* | | | 20 | | | $ | 2,290 | |
TOTAL COMMON STOCKS (Cost: $2,259,552) | | | | 2,140,245 | |
| RIGHTS – 0.0% | | | | | | | | |
| Chile – 0.0% | | | | | | | | |
| Banco de Credito e Inversiones, expiring 4/19/16* (Cost $0) | | | 3 | | | | 7 | |
| INVESTMENT OF CASH COLLATERAL FOR SECURITIES LOANED – 0.3% | |
United States – 0.3% | | | | | | | | |
State Street Navigator Securities Lending Prime Portfolio, 0.50%(c) | | | | | | | | |
| (Cost: $5,855)(d) | | | 5,855 | | | | 5,855 | |
TOTAL INVESTMENTS IN SECURITIES – 99.9% (Cost: $2,265,407) | | | | | | | 2,146,107 | |
Cash, Foreign Currency and Other Assets in Excess of Liabilities – 0.1% | | | | | | | 1,652 | |
| | | | | | | | |
| NET ASSETS - 100.0% | | | | | | $ | 2,147,759 | |
| * | Non-income producing security. |
| † | Security is being fair valued by a valuation committee under the direction of the Board of Trustees. The aggregate value of fair valued securities is $3,717, which represents 0.2% of net assets. |
| (a) | This security is exempt from registration under rule 144A of the Securities Act of 1933. This security may be sold in transactions that are exempt from registration, normally to qualified institutional buyers. |
| (b) | Security, or portion thereof, was on loan at March 31, 2016 (See Note 2). |
| (c) | Rate shown represents annualized 7-day yield as of March 31, 2016. |
| (d) | At March 31, 2016, the total market value of the Fund’s securities on loan was $5,574 and the total market value of the collateral held by the Fund was $5,855. |
ADR – American Depositary Receipt
GDR – Global Depositary Receipt
NVDR – Non-Voting Depositary Receipt
Reg S – Regulation S provides an exclusion from the registration requirements of the Securities Act of 1933. These securities may be resold in transactions exempt from registration, normally to qualified institutional buyers.
| | | | | | | | | | | | | | | | | | | | |
| FINANCIAL DERIVATIVE INSTRUMENTS | |
| FORWARD CONTRACTS | | | | | | | | | | |
Settlement
Date | | Contracts
To Deliver | | | In
Exchange For | | | Unrealized
Gain (Loss) | |
4/4/2016 | | | ZAR | | | | 11,188 | | | | USD | | | | 763 | | | $ | 2 | |
| | | | |
| CURRENCY LEGEND | | | | | | | | | | | | | |
| | | | | | | | | | |
USD – U.S. dollar |
ZAR – South African rand |
See Notes to Financial Statements.
| | |
| 38 | | WisdomTree Global/Global ex-U.S. and Emerging/Frontier Markets Funds |
Schedule of Investments
WisdomTree Emerging Markets High Dividend Fund (DEM)
March 31, 2016
| | | | | | | | |
| Investments | | Shares | | | Value | |
| | | | | | | | |
| COMMON STOCKS – 99.8% | | | | | | | | |
| Brazil – 8.8% | | | | | | | | |
AES Tiete Energia S.A. | | | 227,757 | | | $ | 993,545 | |
Alupar Investimento S.A. | | | 385,256 | | | | 1,614,292 | |
Banco do Brasil S.A. | | | 2,735,923 | | | | 15,262,189 | |
Banco Santander Brasil S.A. | | | 2,428,214 | | | | 11,613,495 | |
BB Seguridade Participacoes S.A. | | | 1,151,168 | | | | 9,647,204 | |
BM&FBovespa S.A. – Bolsa de Valores Mercadorias e Futuros | | | 728,657 | | | | 3,162,174 | |
BR Malls Participacoes S.A. | | | 269,188 | | | | 1,120,351 | |
CCR S.A. | | | 2,139,946 | | | | 8,471,626 | |
CETIP S.A. – Mercados Organizados | | | 135,386 | | | | 1,533,789 | |
Cia Hering | | | 198,454 | | | | 823,718 | |
Cia Paranaense de Energia | | | 220,474 | | | | 1,147,162 | |
Cia Siderurgica Nacional S.A. | | | 1,951,279 | | | | 3,936,694 | |
CVC Brasil Operadora e Agencia de Viagens S.A. | | | 178,512 | | | | 843,197 | |
Cyrela Brazil Realty S.A. Empreendimentos e Participacoes | | | 412,846 | | | | 1,215,007 | |
EcoRodovias Infraestrutura e Logistica S.A. | | | 1,175,152 | | | | 1,989,535 | |
Even Construtora e Incorporadora S.A. | | | 580,862 | | | | 681,824 | |
Ez Tec Empreendimentos e Participacoes S.A. | | | 277,646 | | | | 1,264,449 | |
Fleury S.A. | | | 208,974 | | | | 1,270,708 | |
Grendene S.A. | | | 260,504 | | | | 1,256,947 | |
Light S.A. | | | 242,462 | | | | 678,675 | |
Mahle-Metal Leve S.A. | | | 186,881 | | | | 1,242,358 | |
MRV Engenharia e Participacoes S.A. | | | 563,743 | | | | 1,883,385 | |
Multiplus S.A. | | | 231,124 | | | | 2,136,462 | |
Natura Cosmeticos S.A. | | | 535,553 | | | | 4,010,603 | |
Odontoprev S.A. | | | 532,618 | | | | 1,713,275 | |
Porto Seguro S.A. | | | 152,974 | | | | 1,175,793 | |
Smiles S.A. | | | 211,385 | | | | 2,267,140 | |
Tractebel Energia S.A. | | | 657,902 | | | | 6,809,211 | |
Transmissora Alianca de Energia Eletrica S.A. | | | 697,970 | | | | 3,974,333 | |
Tupy S.A. | | | 140,055 | | | | 652,062 | |
Vale S.A. | | | 4,808,070 | | | | 20,553,685 | |
Via Varejo S.A. | | | 766,107 | | | | 1,204,068 | |
| | | | | | | | |
| Total Brazil | | | | 116,148,956 | |
| Chile – 1.8% | | | | | | | | |
AES Gener S.A. | | | 6,573,182 | | | | 3,327,080 | |
Aguas Andinas S.A. Class A | | | 6,467,180 | | | | 3,701,084 | |
Banco de Chile | | | 49,510,321 | | | | 5,332,541 | |
Banco Santander Chile | | | 95,671,164 | | | | 4,658,688 | |
CAP S.A. | | | 243,395 | | | | 720,403 | |
Corpbanca S.A. | | | 210,516,936 | | | | 1,928,097 | |
Inversiones Aguas Metropolitanas S.A. | | | 1,139,023 | | | | 1,811,749 | |
Ripley Corp. S.A. | | | 3,888,677 | | | | 1,768,934 | |
| | | | | | | | |
| Total Chile | | | | 23,248,576 | |
| China – 19.9% | | | | | | | | |
Agricultural Bank of China Ltd. Class H | | | 19,377,000 | | | | 6,969,829 | |
Anhui Expressway Co., Ltd. Class H | | | 635,057 | | | | 494,517 | |
BAIC Motor Corp. Ltd. Class H(a) | | | 1,487,000 | | | | 1,138,751 | |
| | | | | | | | |
Bank of China Ltd. Class H | | | 45,688,084 | | | $ | 18,966,632 | |
Bank of Communications Co., Ltd. Class H | | | 17,162,287 | | | | 11,284,355 | |
Belle International Holdings Ltd. | | | 14,081,000 | | | | 8,151,007 | |
China Aoyuan Property Group Ltd. | | | 2,997,000 | | | | 610,485 | |
China Construction Bank Corp. Class H | | | 52,129,054 | | | | 33,267,215 | |
China Everbright Bank Co., Ltd. Class H | | | 4,161,000 | | | | 2,022,416 | |
China Hongqiao Group Ltd.(b) | | | 6,831,000 | | | | 4,746,838 | |
China Jinmao Holdings Group Ltd. | | | 5,256,000 | | | | 1,463,661 | |
China Lilang Ltd. | | | 1,440,000 | | | | 879,979 | |
China Merchants Bank Co., Ltd. Class H | | | 1,692,932 | | | | 3,557,611 | |
China National Building Material Co., Ltd. Class H(b) | | | 2,636,000 | | | | 1,223,431 | |
China Oilfield Services Ltd. Class H(b) | | | 1,880,000 | | | | 1,468,797 | |
China Petroleum & Chemical Corp. Class H | | | 19,305,799 | | | | 12,668,843 | |
China Resources Cement Holdings Ltd.(b) | | | 4,896,000 | | | | 1,495,964 | |
China Resources Power Holdings Co., Ltd. | | | 3,318,000 | | | | 6,202,629 | |
China Shenhua Energy Co., Ltd. Class H | | | 3,630,000 | | | | 5,709,497 | |
China Shineway Pharmaceutical Group Ltd. | | | 665,000 | | | | 801,613 | |
China South City Holdings Ltd.(b) | | | 4,896,000 | | | | 1,009,934 | |
China Zhongwang Holdings Ltd.(b) | | | 5,530,000 | | | | 2,730,583 | |
Chongqing Rural Commercial Bank Co., Ltd. Class H | | | 2,011,991 | | | | 1,063,509 | |
CIFI Holdings Group Co., Ltd. | | | 5,902,000 | | | | 1,415,284 | |
CIMC Enric Holdings Ltd. | | | 1,496,000 | | | | 794,621 | |
CNOOC Ltd. | | | 46,045,000 | | | | 54,376,263 | |
Country Garden Holdings Co., Ltd. | | | 16,995,000 | | | | 6,748,438 | |
Datang International Power Generation Co., Ltd. Class H | | | 2,638,350 | | | | 812,946 | |
Dongyue Group Ltd. | | | 3,374,000 | | | | 595,932 | |
Evergrande Real Estate Group Ltd.(b) | | | 13,424,000 | | | | 10,366,691 | |
Great Wall Motor Co., Ltd. Class H | | | 2,286,500 | | | | 1,857,134 | |
Greatview Aseptic Packaging Co., Ltd. | | | 1,257,000 | | | | 597,989 | |
Huadian Power International Corp., Ltd. Class H | | | 1,134,000 | | | | 722,223 | |
Huaneng Power International, Inc. Class H | | | 3,298,000 | | | | 2,950,812 | |
Industrial & Commercial Bank of China Ltd. Class H | | | 46,870,823 | | | | 26,225,496 | |
Jiangsu Expressway Co., Ltd. Class H | | | 1,136,527 | | | | 1,529,719 | |
KWG Property Holding Ltd. | | | 1,783,000 | | | | 1,172,338 | |
Lonking Holdings Ltd. | | | 5,857,000 | | | | 1,042,043 | |
Shanghai Industrial Holdings Ltd. | | | 668,000 | | | | 1,574,288 | |
Shenzhen Expressway Co., Ltd. Class H | | | 772,000 | | | | 673,810 | |
Shenzhen Investment Ltd. | | | 3,934,000 | | | | 1,562,127 | |
Shimao Property Holdings Ltd. | | | 2,077,000 | | | | 3,074,042 | |
Sino-Ocean Land Holdings Ltd. | | | 3,190,000 | | | | 1,509,344 | |
Sinopec Engineering Group Co., Ltd. Class H | | | 1,333,000 | | | | 1,079,248 | |
SITC International Holdings Co., Ltd. | | | 2,638,000 | | | | 1,302,582 | |
Sunac China Holdings Ltd. | | | 1,682,000 | | | | 1,131,952 | |
TCL Communication Technology Holdings Ltd.(b) | | | 1,513,000 | | | | 994,811 | |
Xingda International Holdings Ltd. | | | 2,828,000 | | | | 601,582 | |
Xinhua Winshare Publishing and Media Co., Ltd. Class H | | | 812,000 | | | | 702,441 | |
Xinyi Glass Holdings Ltd. | | | 3,042,000 | | | | 2,027,595 | |
XTEP International Holdings Ltd. | | | 1,975,000 | | | | 1,064,326 | |
See Notes to Financial Statements.
| | | | |
| WisdomTree Global/Global ex-U.S. and Emerging/Frontier Markets Funds | | | 39 | |
Schedule of Investments (continued)
WisdomTree Emerging Markets High Dividend Fund (DEM)
March 31, 2016
| | | | | | | | |
| Investments | | Shares | | | Value | |
| | | | | | | | |
Yingde Gases Group Co., Ltd. | | | 2,709,000 | | | $ | 1,037,282 | |
Yuexiu Property Co., Ltd. | | | 8,262,000 | | | | 1,192,984 | |
Yuexiu Transport Infrastructure Ltd. | | | 1,664,000 | | | | 1,119,838 | |
Zhejiang Expressway Co., Ltd. Class H | | | 1,296,398 | | | | 1,390,571 | |
Zijin Mining Group Co., Ltd. Class H(b) | | | 4,774,000 | | | | 1,477,152 | |
| | | | | | | | |
| Total China | | | | 262,652,000 | |
| Czech Republic – 1.9% | | | | | | | | |
CEZ AS | | | 881,993 | | | | 15,580,440 | |
Komercni Banka AS | | | 24,411 | | | | 5,399,265 | |
O2 Czech Republic AS | | | 353,014 | | | | 3,725,541 | |
| | | | | | | | |
| Total Czech Republic | | | | 24,705,246 | |
| Hong Kong – 0.3% | | | | | | | | |
Ajisen China Holdings Ltd. | | | 1,319,000 | | | | 489,743 | |
CP Pokphand Co., Ltd.(b) | | | 17,152,000 | | | | 1,791,147 | |
Kingboard Chemical Holdings Ltd. | | | 881,500 | | | | 1,520,582 | |
| | | | | | | | |
| Total Hong Kong | | | | 3,801,472 | |
| Hungary – 0.3% | | | | | | | | |
| MOL Hungarian Oil & Gas PLC | | | 76,643 | | | | 4,611,834 | |
| Indonesia – 1.7% | | | | | | | | |
Adaro Energy Tbk PT | | | 30,600,800 | | | | 1,488,500 | |
Indo Tambangraya Megah Tbk PT | | | 2,504,600 | | | | 1,251,355 | |
Indocement Tunggal Prakarsa Tbk PT | | | 4,566,200 | | | | 6,792,481 | |
Media Nusantara Citra Tbk PT | | | 13,684,300 | | | | 2,249,757 | |
Perusahaan Gas Negara Persero Tbk | | | 23,417,408 | | | | 4,618,139 | |
Tambang Batubara Bukit Asam Persero Tbk PT | | | 2,044,126 | | | | 967,337 | |
United Tractors Tbk PT | | | 3,015,400 | | | | 3,479,308 | |
Vale Indonesia Tbk PT* | | | 11,340,900 | | | | 1,496,725 | |
| | | | | | | | |
| Total Indonesia | | | | 22,343,602 | |
| Malaysia – 5.7% | | | | | | | | |
AMMB Holdings Bhd | | | 1,932,500 | | | | 2,278,483 | |
Berjaya Auto Bhd | | | 1,670,600 | | | | 929,182 | |
Berjaya Sports Toto Bhd | | | 1,334,672 | | | | 1,081,011 | |
British American Tobacco Malaysia Bhd | | | 283,197 | | | | 3,922,585 | |
Carlsberg Brewery Malaysia Bhd | | | 254,236 | | | | 910,988 | |
DiGi.Com Bhd | | | 7,101,547 | | | | 8,991,834 | |
Felda Global Ventures Holdings Bhd | | | 4,933,800 | | | | 1,909,532 | |
HAP Seng Consolidated Bhd | | | 1,949,865 | | | | 3,763,292 | |
JCY International Bhd | | | 3,264,900 | | | | 610,887 | |
Mah Sing Group Bhd | | | 2,478,900 | | | | 902,227 | |
Malayan Banking Bhd | | | 6,505,165 | | | | 15,039,495 | |
Maxis Bhd | | | 7,443,884 | | | | 12,115,510 | |
Press Metal Bhd | | | 1,323,400 | | | | 898,888 | |
Sime Darby Bhd | | | 5,137,600 | | | | 10,468,773 | |
UMW Holdings Bhd | | | 1,261,700 | | | | 2,221,679 | |
YTL Corp. Bhd | | | 12,880,700 | | | | 5,414,417 | |
YTL Power International Bhd | | | 8,864,900 | | | | 3,362,822 | |
| | | | | | | | |
| Total Malaysia | | | | 74,821,605 | |
| Mexico – 0.2% | | | | | | | | |
Concentradora Fibra Danhos S.A. de C.V. | | | 707,473 | | | | 1,484,485 | |
Macquarie Mexico Real Estate Management S.A. de C.V.* | | | 677,157 | | | | 920,248 | |
| | | | | | | | |
| Total Mexico | | | | 2,404,733 | |
| Philippines – 1.2% | | | | | | | | |
Energy Development Corp. | | | 19,224,900 | | | $ | 2,455,042 | |
Nickel Asia Corp. | | | 8,566,800 | | | | 978,638 | |
Philippine Long Distance Telephone Co. | | | 297,069 | | | | 12,774,386 | |
| | | | | | | | |
| Total Philippines | | | | 16,208,066 | |
| Poland – 2.9% | | | | | | | | |
Asseco Poland S.A. | | | 100,886 | | | | 1,642,356 | |
Bank Handlowy w Warszawie S.A. | | | 119,128 | | | | 2,896,661 | |
Bank Pekao S.A. | | | 181,246 | | | | 8,020,424 | |
Energa S.A. | | | 713,141 | | | | 2,511,964 | |
KGHM Polska Miedz S.A. | | | 177,250 | | | | 3,624,150 | |
Lubelski Wegiel Bogdanka S.A. | | | 41,574 | | | | 428,932 | |
Orange Polska S.A. | | | 1,849,414 | | | | 3,349,109 | |
PGE Polska Grupa Energetyczna S.A. | | | 2,135,652 | | | | 8,021,821 | |
Powszechny Zaklad Ubezpieczen S.A. | | | 708,002 | | | | 6,772,044 | |
Tauron Polska Energia S.A. | | | 1,883,306 | | | | 1,523,080 | |
| | | | | | | | |
| Total Poland | | | | 38,790,541 | |
| Russia – 12.9% | | | | | | | | |
Gazprom PAO ADR | | | 11,537,358 | | | | 49,760,625 | |
LSR Group PJSC GDR Reg S | | | 605,087 | | | | 1,376,573 | |
Lukoil PJSC ADR | | | 1,061,728 | | | | 40,786,281 | |
MMC Norilsk Nickel PJSC ADR | | | 3,166,492 | | | | 40,879,412 | |
Mobile TeleSystems PJSC ADR | | | 2,229,393 | | | | 18,035,789 | |
Novolipetsk Steel GDR Reg S | | | 674,475 | | | | 8,430,938 | |
Severstal PAO GDR Reg S | | | 1,009,568 | | | | 10,681,230 | |
TMK PAO GDR Reg S | | | 294,776 | | | | 893,171 | |
| | | | | | | | |
| Total Russia | | | | 170,844,019 | |
| South Africa – 8.0% | | | | | | | | |
African Rainbow Minerals Ltd. | | | 212,693 | | | | 1,374,233 | |
Assore Ltd. | | | 173,017 | | | | 1,893,917 | |
Astral Foods Ltd. | | | 66,386 | | | | 501,009 | |
Barclays Africa Group Ltd.(b) | | | 487,646 | | | | 4,959,679 | |
Barloworld Ltd. | | | 196,853 | | | | 1,011,836 | |
Coronation Fund Managers Ltd. | | | 322,442 | | | | 1,609,141 | |
Exxaro Resources Ltd.(b) | | | 287,349 | | | | 1,406,658 | |
FirstRand Ltd.(b) | | | 2,509,133 | | | | 8,251,752 | |
Foschini Group Ltd. (The) | | | 189,238 | | | | 1,819,814 | |
Hudaco Industries Ltd. | | | 21,967 | | | | 161,302 | |
Hyprop Investments Ltd. | | | 131,798 | | | | 1,054,438 | |
Imperial Holdings Ltd.(b) | | | 185,708 | | | | 1,898,999 | |
Lewis Group Ltd.(b) | | | 209,254 | | | | 668,680 | |
Liberty Holdings Ltd.(b) | | | 150,186 | | | | 1,476,230 | |
MMI Holdings Ltd.(b) | | | 949,354 | | | | 1,607,215 | |
MTN Group Ltd.(b) | | | 2,501,301 | | | | 22,992,650 | |
Nampak Ltd. | | | 837,273 | | | | 1,212,532 | |
Nedbank Group Ltd.(b) | | | 241,594 | | | | 3,190,756 | |
PPC Ltd. | | | 644,429 | | | | 534,541 | |
Reunert Ltd. | | | 218,607 | | | | 1,029,718 | |
RMB Holdings Ltd.(b) | | | 574,434 | | | | 2,392,564 | |
Sasol Ltd. | | | 523,267 | | | | 15,708,683 | |
Sibanye Gold Ltd. | | | 646,104 | | | | 2,488,124 | |
Standard Bank Group Ltd. | | | 751,443 | | | | 6,768,505 | |
See Notes to Financial Statements.
| | |
| 40 | | WisdomTree Global/Global ex-U.S. and Emerging/Frontier Markets Funds |
Schedule of Investments (continued)
WisdomTree Emerging Markets High Dividend Fund (DEM)
March 31, 2016
| | | | | | | | |
| Investments | | Shares | | | Value | |
| | | | | | | | |
Truworths International Ltd.(b) | | | 392,603 | | | $ | 2,621,802 | |
Vodacom Group Ltd. | | | 1,594,773 | | | | 17,406,099 | |
| | | | | | | | |
| Total South Africa | | | | 106,040,877 | |
| South Korea – 1.7% | | | | | | | | |
Hite Jinro Co., Ltd. | | | 68,699 | | | | 1,736,097 | |
POSCO | | | 79,940 | | | | 15,343,503 | |
Woori Bank | | | 569,587 | | | | 4,711,694 | |
| | | | | | | | |
| Total South Korea | | | | 21,791,294 | |
| Taiwan – 23.2% | | | | | | | | |
AcBel Polytech, Inc. | | | 943,000 | | | | 780,852 | |
Accton Technology Corp. | | | 1,324,000 | | | | 1,448,074 | |
Advanced Semiconductor Engineering, Inc. | | | 9,533,000 | | | | 11,092,805 | |
Alpha Networks, Inc.(b) | | | 1,695,000 | | | | 890,054 | |
Asia Cement Corp. | | | 4,624,158 | | | | 4,224,156 | |
Asustek Computer, Inc. | | | 925,000 | | | | 8,306,146 | |
AU Optronics Corp.(b) | | | 10,393,000 | | | | 3,122,679 | |
Capital Securities Corp. | | | 3,575,121 | | | | 975,316 | |
Cathay Financial Holding Co., Ltd. | | | 5,907,000 | | | | 7,075,405 | |
Cathay Real Estate Development Co., Ltd. | | | 759,000 | | | | 338,418 | |
Cheng Shin Rubber Industry Co., Ltd. | | | 3,200,000 | | | | 6,433,010 | |
Cheng Uei Precision Industry Co., Ltd.(b) | | | 568,000 | | | | 751,827 | |
Chicony Electronics Co., Ltd.(b) | | | 735,276 | | | | 1,891,650 | |
Chimei Materials Technology Corp. | | | 1,700,000 | | | | 1,035,297 | |
Chin-Poon Industrial Co., Ltd.(b) | | | 600,000 | | | | 1,083,147 | |
China Development Financial Holding Corp. | | | 11,791,000 | | | | 3,150,715 | |
China Metal Products | | | 532,000 | | | | 490,113 | |
China Steel Chemical Corp.(b) | | | 336,000 | | | | 1,184,937 | |
China Steel Corp.(b) | | | 16,415,000 | | | | 11,424,807 | |
China Synthetic Rubber Corp. | | | 1,442,176 | | | | 1,091,132 | |
ChipMOS TECHNOLOGIES, Inc.(b) | | | 1,262,000 | | | | 1,319,485 | |
Chong Hong Construction Co., Ltd.(b) | | | 631,050 | | | | 941,163 | |
Chroma ATE, Inc.(b) | | | 440,000 | | | | 946,060 | |
Chung-Hsin Electric & Machinery Manufacturing Corp. | | | 1,696,750 | | | | 951,601 | |
Chunghwa Telecom Co., Ltd. | | | 7,877,000 | | | | 26,800,009 | |
Clevo Co.(b) | | | 944,000 | | | | 852,076 | |
Compal Electronics, Inc. | | | 4,251,000 | | | | 2,668,102 | |
Coxon Precise Industrial Co., Ltd. | | | 461,000 | | | | 704,735 | |
CTCI Corp.(b) | | | 822,000 | | | | 1,080,369 | |
Cyberlink Corp.(b) | | | 417,571 | | | | 952,328 | |
Darwin Precisions Corp. | | | 2,050,000 | | | | 748,431 | |
Delta Electronics, Inc. | | | 2,070,457 | | | | 9,135,126 | |
Elan Microelectronics Corp.(b) | | | 567,000 | | | | 678,272 | |
Elitegroup Computer Systems Co., Ltd. | | | 1,109,000 | | | | 692,608 | |
Eternal Materials Co., Ltd. | | | 1,253,820 | | | | 1,279,766 | |
Everlight Electronics Co., Ltd.(b) | | | 801,000 | | | | 1,334,004 | |
Far Eastern Department Stores Ltd. | | | 1,823,000 | | | | 957,268 | |
Far Eastern New Century Corp. | | | 4,376,402 | | | | 3,576,292 | |
Far EasTone Telecommunications Co., Ltd. | | | 3,199,000 | | | | 7,166,539 | |
Farglory Land Development Co., Ltd.(b) | | | 1,065,000 | | | | 1,226,021 | |
Feng Hsin Steel Co., Ltd. | | | 944,000 | | | | 1,233,383 | |
Flytech Technology Co., Ltd. | | | 186,098 | | | | 638,946 | |
Formosan Rubber Group, Inc. | | | 1,756,000 | | | | 963,006 | |
| | | | | | | | |
Fubon Financial Holding Co., Ltd. | | | 6,242,000 | | | $ | 7,951,839 | |
Getac Technology Corp. | | | 1,290,000 | | | | 905,854 | |
Gigabyte Technology Co., Ltd. | | | 1,168,000 | | | | 1,288,342 | |
Greatek Electronics, Inc. | | | 1,262,000 | | | | 1,443,003 | |
Highwealth Construction Corp.(b) | | | 944,000 | | | | 1,378,573 | |
Holtek Semiconductor, Inc. | | | 534,000 | | | | 871,085 | |
Huaku Development Co., Ltd. | | | 383,726 | | | | 709,411 | |
IEI Integration Corp.(b) | | | 493,000 | | | | 569,070 | |
Innolux Corp. | | | 14,051,000 | | | | 4,911,563 | |
Inventec Corp. | | | 7,226,000 | | | | 4,580,239 | |
Kenda Rubber Industrial Co., Ltd. | | | 745,000 | | | | 1,185,185 | |
King Yuan Electronics Co., Ltd. | | | 1,628,000 | | | | 1,446,706 | |
King’s Town Bank Co., Ltd. | | | 1,017,000 | | | | 699,930 | |
Kinik Co. | | | 581,000 | | | | 956,780 | |
Kinsus Interconnect Technology Corp.(b) | | | 663,000 | | | | 1,472,921 | |
Lien Hwa Industrial Corp. | | | 872,000 | | | | 548,658 | |
Lite-On Technology Corp. | | | 2,868,225 | | | | 3,502,400 | |
MediaTek, Inc. | | | 2,732,000 | | | | 20,967,064 | |
Mega Financial Holding Co., Ltd. | | | 8,483,302 | | | | 6,036,155 | |
Merry Electronics Co., Ltd.(b) | | | 424,000 | | | | 724,584 | |
Micro-Star International Co., Ltd. | | | 1,765,000 | | | | 2,717,367 | |
Nanya Technology Corp.(b) | | | 2,902,314 | | | | 3,602,642 | |
Novatek Microelectronics Corp. | | | 1,196,000 | | | | 4,812,391 | |
Pegatron Corp. | | | 2,630,000 | | | | 6,136,994 | |
Powertech Technology, Inc. | | | 830,000 | | | | 1,882,612 | |
Qisda Corp.(b) | | | 2,492,000 | | | | 805,270 | |
Quanta Computer, Inc.(b) | | | 5,515,990 | | | | 9,632,073 | |
Radiant Opto-Electronics Corp.(b) | | | 524,170 | | | | 1,016,288 | |
Realtek Semiconductor Corp. | | | 943,000 | | | | 2,593,074 | |
Rechi Precision Co., Ltd. | | | 166,000 | | | | 136,683 | |
Richtek Technology Corp. | | | 188,000 | | | | 1,133,234 | |
Ruentex Development Co., Ltd. | | | 1,178,266 | | | | 1,491,870 | |
Ruentex Industries Ltd.(b) | | | 1,912,000 | | | | 3,148,645 | |
Sampo Corp. | | | 258,000 | | | | 107,821 | |
Siliconware Precision Industries Co., Ltd. | | | 4,723,724 | | | | 7,632,167 | |
Sinbon Electronics Co., Ltd. | | | 454,000 | | | | 926,790 | |
SinoPac Financial Holdings Co., Ltd. | | | 5,160,000 | | | | 1,595,265 | |
Syncmold Enterprise Corp. | | | 647,324 | | | | 1,084,103 | |
Synnex Technology International Corp.(b) | | | 3,050,786 | | | | 3,142,355 | |
Taiflex Scientific Co., Ltd.(b) | | | 489,254 | | | | 553,345 | |
Taiwan Cement Corp. | | | 5,034,485 | | | | 4,927,488 | |
Taiwan Cogeneration Corp. | | | 1,319,000 | | | | 989,742 | |
Taiwan Fertilizer Co., Ltd.(b) | | | 1,401,000 | | | | 2,117,781 | |
Taiwan Mobile Co., Ltd. | | | 3,992,253 | | | | 12,962,666 | |
Taiwan PCB Techvest Co., Ltd. | | | 780,000 | | | | 833,706 | |
Taiwan Secom Co., Ltd.(b) | | | 421,538 | | | | 1,218,091 | |
Taiwan Surface Mounting Technology Corp.(b) | | | 769,900 | | | | 684,164 | |
Test Research, Inc. | | | 368,000 | | | | 563,709 | |
Test Rite International Co., Ltd. | | | 1,301,000 | | | | 800,391 | |
Tong Hsing Electronic Industries Ltd.(b) | | | 292,000 | | | | 842,866 | |
Topco Scientific Co., Ltd. | | | 339,718 | | | | 632,274 | |
Transcend Information, Inc. | | | 748,000 | | | | 2,312,516 | |
Tripod Technology Corp.(b) | | | 724,000 | | | | 1,313,746 | |
TSRC Corp.(b) | | | 1,150,584 | | | | 974,193 | |
See Notes to Financial Statements.
| | | | |
| WisdomTree Global/Global ex-U.S. and Emerging/Frontier Markets Funds | | | 41 | |
Schedule of Investments (concluded)
WisdomTree Emerging Markets High Dividend Fund (DEM)
March 31, 2016
| | | | | | | | |
| Investments | | Shares | | | Value | |
| | | | | | | | |
Tung Ho Steel Enterprise Corp. | | | 1,826,000 | | | $ | 1,109,194 | |
U-Ming Marine Transport Corp.(b) | | | 944,048 | | | | 747,987 | |
United Integrated Services Co., Ltd. | | | 651,853 | | | | 1,032,951 | |
United Microelectronics Corp. | | | 12,777,000 | | | | 5,280,080 | |
Wan Hai Lines Ltd. | | | 4,010,000 | | | | 2,311,257 | |
Wistron Corp.(b) | | | 3,319,179 | | | | 2,052,314 | |
WPG Holdings Ltd. | | | 2,405,000 | | | | 2,563,121 | |
WT Microelectronics Co., Ltd.(b) | | | 944,470 | | | | 1,129,819 | |
WUS Printed Circuit Co., Ltd. | | | 824,000 | | | | 760,403 | |
Yuanta Financial Holding Co., Ltd. | | | 6,719,913 | | | | 2,401,162 | |
Yulon Nissan Motor Co., Ltd.(b) | | | 712,000 | | | | 4,568,357 | |
Yungtay Engineering Co., Ltd. | | | 567,000 | | | | 809,522 | |
Zeng Hsing Industrial Co., Ltd. | | | 191,000 | | | | 881,292 | |
| | | | | | | | |
| Total Taiwan | | | | 306,757,273 | |
| Thailand – 6.9% | | | | | | | | |
Advanced Info Service PCL | | | 3,260,261 | | | | 16,866,615 | |
Bangchak Petroleum PCL (The) NVDR | | | 1,097,700 | | | | 912,670 | |
Bangkok Expressway & Metro PCL* | | | 11,686,035 | | | | 1,843,590 | |
Bangkok Land PCL NVDR | | | 17,131,700 | | | | 720,720 | |
Banpu PCL NVDR(b) | | | 3,167,280 | | | | 1,503,513 | |
BEC World PCL NVDR | | | 2,200,500 | | | | 1,767,030 | |
BTS Group Holdings PCL NVDR | | | 16,646,843 | | | | 4,235,055 | |
Electricity Generating PCL | | | 439,600 | | | | 2,230,489 | |
Hana Microelectronics PCL NVDR | | | 1,146,200 | | | | 1,164,771 | |
Ichitan Group PCL NVDR | | | 1,725,000 | | | | 637,436 | |
Intouch Holdings PCL NVDR(b) | | | 4,182,559 | | | | 7,579,253 | |
Kiatnakin Bank PCL NVDR | | | 1,008,000 | | | | 1,203,411 | |
Krung Thai Bank PCL NVDR | | | 8,056,800 | | | | 4,282,608 | |
Land & Houses PCL NVDR | | | 10,406,753 | | | | 2,647,539 | |
Pruksa Real Estate PCL NVDR | | | 1,378,500 | | | | 1,057,973 | |
PTT Global Chemical PCL NVDR | | | 4,037,134 | | | | 6,942,769 | |
PTT PCL NVDR | | | 2,366,294 | | | | 18,833,494 | |
Ratchaburi Electricity Generating Holding PCL | | | 1,150,496 | | | | 1,659,684 | |
Siam City Cement PCL NVDR | | | 208,300 | | | | 1,823,661 | |
Siam Commercial Bank PCL (The) NVDR | | | 1,567,500 | | | | 6,282,476 | |
Total Access Communication PCL NVDR(b) | | | 4,646,024 | | | | 5,447,655 | |
TTW PCL NVDR | | | 5,608,877 | | | | 1,594,337 | |
| | | | | | | | |
| Total Thailand | | | | 91,236,749 | |
| Turkey – 2.4% | | | | | | | | |
Brisa Bridgestone Sabanci Sanayi ve Ticaret AS | | | 430,672 | | | | 1,194,569 | |
Cimsa Cimento Sanayi ve Ticaret AS | | | 299,134 | | | | 1,672,184 | |
Dogus Otomotiv Servis ve Ticaret AS(b) | | | 349,900 | | | | 1,563,285 | |
Eregli Demir ve Celik Fabrikalari TAS | | | 7,058,572 | | | | 10,629,096 | |
Koza Altin Isletmeleri AS | | | 176,282 | | | | 1,131,305 | |
Turk Telekomunikasyon AS | | | 5,725,042 | | | | 13,582,158 | |
Turk Traktor ve Ziraat Makineleri AS(b) | | | 58,971 | | | | 1,758,218 | |
Vestel Beyaz Esya Sanayi ve Ticaret AS | | | 201,488 | | | | 826,504 | |
| | | | | | | | |
| Total Turkey | | | | 32,357,319 | |
TOTAL COMMON STOCKS (Cost: $1,671,150,608) | | | | 1,318,764,162 | |
| | | | | | | | |
| INVESTMENT OF CASH COLLATERAL FOR SECURITIES LOANED – 4.5% | |
| United States – 4.5% | | | | | | | | |
State Street Navigator Securities Lending Prime Portfolio, 0.50%(c) | | | | | | | | |
| (Cost: $59,328,633)(d) | | | 59,328,633 | | | $ | 59,328,633 | |
TOTAL INVESTMENTS IN SECURITIES – 104.3% (Cost: $1,730,479,241) | | | | 1,378,092,795 | |
Liabilities in Excess of Cash, Foreign Currency and Other Assets – (4.3)% | | | | (56,871,492 | ) |
| | | | | | | | |
| NET ASSETS – 100.0% | | | $ | 1,321,221,303 | |
| * | Non-income producing security. |
| (a) | This security is exempt from registration under rule 144A of the Securities Act of 1933. This security may be sold in transactions that are exempt from registration, normally to qualified institutional buyers. |
| (b) | Security, or portion thereof, was on loan at March 31, 2016 (See Note 2). |
| (c) | Rate shown represents annualized 7-day yield as of March 31, 2016. |
| (d) | At March 31, 2016, the total market value of the Fund’s securities on loan was $81,437,076 and the total market value of the collateral held by the Fund was $91,020,865. The total market value of the collateral includes non-cash U.S. Government securities collateral having a value of $31,692,232. |
| ADR | – American Depositary Receipt |
| GDR | – Global Depositary Receipt |
| NVDR | – Non-Voting Depositary Receipt |
Reg S – Regulation S provides an exclusion from the registration requirements of the Securities Act of 1933. These securities may be resold in transactions exempt from registration, normally to qualified institutional buyers.
| | | | | | | | | | | | | | | | | | | | |
| FINANCIAL DERIVATIVE INSTRUMENTS | |
| FORWARD CONTRACTS | |
| Settlement Date | | Contracts
To Deliver | | | In
Exchange For | | | Unrealized
Gain (Loss) | |
4/1/2016 | | | USD | | | | 19,708 | | | | HKD | | | | 152,841 | | | $ | (3 | ) |
4/1/2016 | | | USD | | | | 260,634 | | | | TWD | | | | 8,388,502 | | | | 8 | |
4/4/2016 | | | USD | | | | 274,345 | | | | BRL | | | | 983,306 | | | | 3,112 | |
4/4/2016 | | | USD | | | | 266,456 | | | | THB | | | | 9,379,253 | | | | 151 | |
4/4/2016 | | | ZAR | | | | 18,200,000 | | | | USD | | | | 1,218,812 | | | | (18,610 | ) |
4/5/2016 | | | BRL | | | | 8,720,237 | | | | USD | | | | 2,457,789 | | | | (2,774 | ) |
4/5/2016 | | | KRW | | | | 526,618,430 | | | | USD | | | | 459,648 | | | | (844 | ) |
4/5/2016 | | | MYR | | | | 6,152,512 | | | | USD | | | | 1,574,741 | | | | (2,220 | ) |
4/5/2016 | | | USD | | | | 710,498 | | | | HKD | | | | 5,509,060 | | | | (252 | ) |
| | | | | | | | | | | | | | | | | | | $ | (21,432 | ) |
| | |
CURRENCY LEGEND |
BRL – Brazilian real |
HKD – Hong Kong dollar |
KRW – South Korean won |
MYR – Malaysian ringgit |
THB – Thai baht |
TWD – New Taiwan dollar |
USD – U.S. dollar |
ZAR – South African rand |
See Notes to Financial Statements.
| | |
| 42 | | WisdomTree Global/Global ex-U.S. and Emerging/Frontier Markets Funds |
Schedule of Investments
WisdomTree Emerging Markets Quality Dividend Growth Fund (DGRE)
March 31, 2016
| | | | | | | | |
| Investments | | Shares | | | Value | |
| | | | | | | | |
| COMMON STOCKS – 95.9% | | | | | | | | |
| Brazil – 17.0% | | | | | | | | |
AES Tiete Energia S.A. | | | 13,203 | | | $ | 57,596 | |
Ambev S.A. | | | 317,695 | | | | 1,687,082 | |
BB Seguridade Participacoes S.A. | | | 132,702 | | | | 1,112,091 | |
CCR S.A. | | | 123,945 | | | | 490,674 | |
CETIP S.A. – Mercados Organizados | | | 11,869 | | | | 134,464 | |
Cielo S.A. | | | 37,808 | | | | 373,066 | |
Equatorial Energia S.A. | | | 4,601 | | | | 53,176 | |
Estacio Participacoes S.A. | | | 6,903 | | | | 23,023 | |
GAEC Educacao S.A.* | | | 3,500 | | | | 9,826 | |
Grendene S.A. | | | 17,506 | | | | 84,467 | |
Lojas Renner S.A. | | | 9,824 | | | | 57,630 | |
M. Dias Branco S.A. | | | 485 | | | | 9,220 | |
Multiplus S.A. | | | 14,006 | | | | 129,469 | |
Natura Cosmeticos S.A. | | | 34,980 | | | | 261,955 | |
Odontoprev S.A. | | | 29,741 | | | | 95,668 | |
Ser Educacional S.A.(a) | | | 3,701 | | | | 11,028 | |
Smiles S.A. | | | 9,503 | | | | 101,921 | |
TOTVS S.A. | | | 7,502 | | | | 57,577 | |
Tractebel Energia S.A. | | | 39,400 | | | | 407,786 | |
Via Varejo S.A. | | | 45,213 | | | | 71,060 | |
WEG S.A. | | | 42,357 | | | | 167,444 | |
| | | | | | | | |
| Total Brazil | | | | 5,396,223 | |
| Chile – 0.1% | | | | | | | | |
Forus S.A. | | | 12,106 | | | | 34,389 | |
| China – 19.7% | | | | | | | | |
AAC Technologies Holdings, Inc.(b) | | | 29,000 | | | | 221,709 | |
ANTA Sports Products Ltd. | | | 101,000 | | | | 222,403 | |
Boer Power Holdings Ltd.(b) | | | 28,000 | | | | 22,092 | |
Brilliance China Automotive Holdings Ltd. | | | 64,000 | | | | 66,256 | |
Cabbeen Fashion Ltd. | | | 40,000 | | | | 18,617 | |
China Conch Venture Holdings Ltd. | | | 49,000 | | | | 96,654 | |
China Everbright International Ltd. | | | 53,000 | | | | 59,173 | |
China Hongqiao Group Ltd.(b) | | | 502,000 | | | | 348,838 | |
China Lesso Group Holdings Ltd. | | | 70,000 | | | | 37,542 | |
China Lilang Ltd. | | | 79,000 | | | | 48,277 | |
China Medical System Holdings Ltd. | | | 51,000 | | | | 70,748 | |
China Overseas Land & Investment Ltd. | | | 258,000 | | | | 816,587 | |
China Pioneer Pharma Holdings Ltd. | | | 82,000 | | | | 21,461 | |
China Saite Group Co., Ltd. | | | 72,000 | | | | 6,034 | |
China Silver Group Ltd.(b) | | | 62,000 | | | | 14,308 | |
China State Construction International Holdings Ltd. | | | 124,000 | | | | 184,804 | |
Colour Life Services Group Co., Ltd. | | | 18,000 | | | | 13,785 | |
Cosmo Lady China Holdings Co., Ltd.(a)(b) | | | 30,000 | | | | 24,250 | |
CSPC Pharmaceutical Group Ltd. | | | 98,000 | | | | 88,694 | |
CT Environmental Group Ltd.(b) | | | 18,000 | | | | 5,291 | |
Evergrande Real Estate Group Ltd.(b) | | | 1,909,000 | | | | 1,474,226 | |
Fu Shou Yuan International Group Ltd. | | | 28,000 | | | | 20,035 | |
Golden Eagle Retail Group Ltd.(b) | | | 79,000 | | | | 92,581 | |
Goldpac Group Ltd. | | | 33,000 | | | | 13,997 | |
Great Wall Motor Co., Ltd. Class H | | | 154,000 | | | | 125,081 | |
| | | | | | | | |
Guorui Properties Ltd.(b) | | | 76,000 | | | $ | 26,553 | |
Haier Electronics Group Co., Ltd. | | | 26,000 | | | | 45,319 | |
Hengan International Group Co., Ltd. | | | 40,500 | | | | 351,400 | |
Honworld Group Ltd.(a) | | | 23,000 | | | | 15,953 | |
HOSA International Ltd. | | | 86,000 | | | | 24,614 | |
Jiangnan Group Ltd. | | | 174,000 | | | | 30,733 | |
Kingsoft Corp., Ltd.(b) | | | 13,000 | | | | 30,470 | |
Koradior Holdings Ltd. | | | 52,000 | | | | 82,057 | |
Logan Property Holdings Co., Ltd. | | | 168,000 | | | | 62,595 | |
Ourgame International Holdings Ltd.(b) | | | 21,000 | | | | 11,777 | |
Pacific Online Ltd. | | | 106,000 | | | | 30,202 | |
Shandong Luoxin Pharmaceutical Group Stock Co., Ltd. Class H | | | 2,000 | | | | 3,182 | |
Shenzhou International Group Holdings Ltd. | | | 44,000 | | | | 239,385 | |
Sino Biopharmaceutical Ltd. | | | 54,000 | | | | 40,518 | |
Sinopec Engineering Group Co., Ltd. Class H | | | 86,000 | | | | 69,629 | |
SSY Group Ltd.(b) | | | 44,000 | | | | 13,955 | |
Sunny Optical Technology Group Co., Ltd.(b) | | | 14,000 | | | | 39,347 | |
Tencent Holdings Ltd. | | | 29,900 | | | | 610,601 | |
Tenwow International Holdings Ltd. | | | 96,000 | | | | 25,620 | |
Travelsky Technology Ltd. Class H | | | 18,000 | | | | 29,472 | |
Trigiant Group Ltd. | | | 168,000 | | | | 29,023 | |
Wisdom Sports Group | | | 57,000 | | | | 18,959 | |
Xinyi Glass Holdings Ltd. | | | 186,000 | | | | 123,975 | |
Xinyi Solar Holdings Ltd.(b) | | | 162,000 | | | | 57,644 | |
Yangtze Optical Fibre and Cable Joint Stock Ltd. Co. Class H(a) | | | 50,500 | | | | 60,288 | |
Yestar International Holdings Co., Ltd. | | | 20,000 | | | | 8,432 | |
Zhuzhou CRRC Times Electric Co., Ltd. Class H | | | 9,364 | | | | 54,688 | |
| | | | | | | | |
| Total China | | | | 6,249,834 | |
| Hong Kong – 0.2% | | | | | | | | |
Dawnrays Pharmaceutical Holdings Ltd. | | | 16,000 | | | | 12,769 | |
Hang Fat Ginseng Holdings Co., Ltd. | | | 300,000 | | | | 1,895 | |
Tibet Water Resources Ltd. | | | 86,000 | | | | 26,610 | |
Wasion Group Holdings Ltd. | | | 28,000 | | | | 14,800 | |
| | | | | | | | |
| Total Hong Kong | | | | 56,074 | |
| India – 0.9% | | | | | | | | |
Infosys Ltd. ADR | | | 9,730 | | | | 185,065 | |
Wipro Ltd. ADR(b) | | | 6,730 | | | | 84,663 | |
| | | | | | | | |
| Total India | | | | 269,728 | |
| Indonesia – 5.5% | | | | | | | | |
Ace Hardware Indonesia Tbk PT | | | 652,200 | | | | 44,021 | |
AKR Corporindo Tbk PT | | | 103,900 | | | | 54,457 | |
Alam Sutera Realty Tbk PT | | | 228,500 | | | | 6,411 | |
Kalbe Farma Tbk PT | | | 618,431 | | | | 67,393 | |
Media Nusantara Citra Tbk PT | | | 330,000 | | | | 54,253 | |
Mitra Keluarga Karyasehat Tbk PT | | | 142,100 | | | | 25,987 | |
Pakuwon Jati Tbk PT | | | 451,800 | | | | 16,491 | |
Pembangunan Perumahan Persero Tbk PT | | | 21,064 | | | | 6,132 | |
Sawit Sumbermas Sarana Tbk PT | | | 199,300 | | | | 28,933 | |
Summarecon Agung Tbk PT | | | 192,600 | | | | 23,022 | |
Surya Citra Media Tbk PT | | | 281,500 | | | | 66,660 | |
Telekomunikasi Indonesia Persero Tbk PT | | | 3,847,300 | | | | 964,727 | |
See Notes to Financial Statements.
| | | | |
| WisdomTree Global/Global ex-U.S. and Emerging/Frontier Markets Funds | | | 43 | |
Schedule of Investments (continued)
WisdomTree Emerging Markets Quality Dividend Growth Fund (DGRE)
March 31, 2016
| | | | | | | | |
| Investments | | Shares | | | Value | |
| | | | | | | | |
Unilever Indonesia Tbk PT | | | 118,200 | | | $ | 382,635 | |
Waskita Karya Persero Tbk PT | | | 28,929 | | | | 4,374 | |
Wijaya Karya Beton Tbk PT | | | 88,800 | | | | 6,697 | |
| | | | | | | | |
| Total Indonesia | | | | 1,752,193 | |
| Malaysia – 3.7% | | | | | | | | |
Berjaya Auto Bhd | | | 80,800 | | | | 44,941 | |
Bursa Malaysia Bhd | | | 23,600 | | | | 53,836 | |
Carlsberg Brewery Malaysia Bhd | | | 15,200 | | | | 54,465 | |
Datasonic Group Bhd | | | 41,600 | | | | 13,861 | |
DiGi.Com Bhd | | | 408,200 | | | | 516,855 | |
Globetronics Technology Bhd | | | 16,100 | | | | 22,325 | |
HAP Seng Consolidated Bhd | | | 67,200 | | | | 129,698 | |
Hartalega Holdings Bhd | | | 29,800 | | | | 37,045 | |
Inari Amertron Bhd | | | 26,275 | | | | 21,685 | |
Kossan Rubber Industries | | | 7,700 | | | | 11,940 | |
KSL Holdings Bhd | | | 56,100 | | | | 18,980 | |
Mah Sing Group Bhd | | | 24,300 | | | | 8,844 | |
Padini Holdings Bhd | | | 71,100 | | | | 37,723 | |
Sunway Bhd | | | 87,900 | | | | 70,744 | |
VS Industry Bhd | | | 28,000 | | | | 8,612 | |
Westports Holdings Bhd | | | 127,400 | | | | 134,862 | |
| | | | | | | | |
| Total Malaysia | | | | 1,186,416 | |
| Mexico – 1.7% | | | | | | | | |
Grupo Aeroportuario del Sureste S.A.B. de C.V. Class B | | | 7,073 | | | | 107,405 | |
Grupo Carso S.A.B. de C.V. Series A1 | | | 26,710 | | | | 125,572 | |
Grupo Lala S.A.B. de C.V. | | | 27,210 | | | | 74,750 | |
Industrias Bachoco S.A.B. de C.V. Series B | | | 14,006 | | | | 60,493 | |
Kimberly-Clark de Mexico S.A.B. de C.V. Class A | | | 67,881 | | | | 164,655 | |
| | | | | | | | |
| Total Mexico | | | | 532,875 | |
| Philippines – 1.7% | | | | | | | | |
D&L Industries, Inc. | | | 74,800 | | | | 15,611 | |
DMCI Holdings, Inc. | | | 592,740 | | | | 172,499 | |
Jollibee Foods Corp. | | | 7,980 | | | | 39,341 | |
Semirara Mining & Power Corp. | | | 34,360 | | | | 97,980 | |
Universal Robina Corp. | | | 45,060 | | | | 212,162 | |
| | | | | | | | |
| Total Philippines | | | | 537,593 | |
| Poland – 0.1% | | | | | | | | |
| CCC S.A. | | | 1,040 | | | | 44,638 | |
| Russia – 2.3% | | | | | | | | |
MegaFon PJSC GDR Reg S | | | 11,880 | | | | 130,680 | |
NovaTek OAO GDR Reg S | | | 6,491 | | | | 583,216 | |
| | | | | | | | |
| Total Russia | | | | 713,896 | |
| South Africa – 12.0% | | | | | | | | |
Assore Ltd. | | | 6,920 | | | | 75,749 | |
Astral Foods Ltd. | | | 2,633 | | | | 19,871 | |
AVI Ltd. | | | 17,283 | | | | 102,091 | |
Capitec Bank Holdings Ltd. | | | 2,503 | | | | 97,518 | |
Cashbuild Ltd. | | | 739 | | | | 16,279 | |
Clicks Group Ltd. | | | 8,255 | | | | 54,543 | |
Discovery Ltd. | | | 9,222 | | | | 76,181 | |
EOH Holdings Ltd. | | | 2,053 | | | | 20,586 | |
| | | | | | | | |
Famous Brands Ltd.(b) | | | 3,393 | | | $ | 26,968 | |
Foschini Group Ltd. (The) | | | 9,563 | | | | 91,963 | |
Hosken Consolidated Investments Ltd. | | | 1,438 | | | | 10,952 | |
Hyprop Investments Ltd. | | | 13,048 | | | | 104,389 | |
Life Healthcare Group Holdings Ltd. | | | 24,277 | | | | 58,893 | |
Massmart Holdings Ltd. | | | 8,514 | | | | 73,418 | |
Mr. Price Group Ltd. | | | 8,989 | | | | 108,439 | |
Naspers Ltd. Class N | | | 1,316 | | | | 184,408 | |
Netcare Ltd. | | | 38,535 | | | | 94,582 | |
Oceana Group Ltd. | | | 3,061 | | | | 26,015 | |
Pick n Pay Stores Ltd. | | | 15,290 | | | | 73,019 | |
PPC Ltd. | | | 25,713 | | | | 21,329 | |
Rand Merchant Investment Holdings Ltd. | | | 45,144 | | | | 127,746 | |
Resilient REIT Ltd. | | | 15,335 | | | | 141,318 | |
RMB Holdings Ltd. | | | 57,547 | | | | 239,688 | |
Santam Ltd. | | | 5,255 | | | | 83,877 | |
Shoprite Holdings Ltd. | | | 16,704 | | | | 197,182 | |
SPAR Group Ltd. (The) | | | 7,769 | | | | 105,115 | |
Tiger Brands Ltd. | | | 6,785 | | | | 150,033 | |
Truworths International Ltd.(b) | | | 21,677 | | | | 144,759 | |
Tsogo Sun Holdings Ltd. | | | 44,491 | | | | 71,510 | |
Vodacom Group Ltd. | | | 92,297 | | | | 1,007,373 | |
Woolworths Holdings Ltd. | | | 30,708 | | | | 187,217 | |
| | | | | | | | |
| Total South Africa | | | | 3,793,011 | |
| South Korea – 2.1% | | | | | | | | |
Amorepacific Corp. | | | 167 | | | | 56,441 | |
Bluecom Co., Ltd. | | | 793 | | | | 8,529 | |
Coway Co., Ltd. | | | 2,053 | | | | 173,238 | |
Cuckoo Electronics Co., Ltd. | | | 69 | | | | 12,097 | |
e-LITECOM Co., Ltd. | | | 445 | | | | 5,623 | |
Grand Korea Leisure Co., Ltd. | | | 2,109 | | | | 42,139 | |
Hana Tour Service, Inc. | | | 137 | | | | 10,135 | |
Hancom, Inc. | | | 819 | | | | 13,786 | |
Hansae Co., Ltd. | | | 126 | | | | 6,247 | |
Hanssem Co., Ltd. | | | 122 | | | | 23,843 | |
KH Vatec Co., Ltd. | | | 742 | | | | 10,608 | |
LEENO Industrial, Inc. | | | 359 | | | | 12,196 | |
LG Household & Health Care Ltd. | | | 114 | | | | 94,203 | |
Loen Entertainment, Inc. | | | 221 | | | | 15,093 | |
Medy-Tox, Inc. | | | 32 | | | | 12,354 | |
Modetour Network, Inc. | | | 193 | | | | 5,080 | |
NAVER Corp. | | | 43 | | | | 23,952 | |
Partron Co., Ltd. | | | 1,872 | | | | 19,889 | |
Samlip General Foods Co., Ltd. | | | 31 | | | | 5,801 | |
Seowonintech Co., Ltd. | | | 1,361 | | | | 14,400 | |
Silicon Works Co., Ltd. | | | 298 | | | | 8,677 | |
SK Holdings Co., Ltd. | | | 436 | | | | 85,019 | |
Soulbrain Co., Ltd. | | | 232 | | | | 8,419 | |
Youngone Corp. | | | 234 | | | | 9,842 | |
| | | | | | | | |
| Total South Korea | | | | 677,611 | |
| Taiwan – 16.7% | | | | | | | | |
Advantech Co., Ltd. | | | 21,000 | | | | 154,316 | |
Aerospace Industrial Development Corp. | | | 9,000 | | | | 11,801 | |
See Notes to Financial Statements.
| | |
| 44 | | WisdomTree Global/Global ex-U.S. and Emerging/Frontier Markets Funds |
Schedule of Investments (continued)
WisdomTree Emerging Markets Quality Dividend Growth Fund (DGRE)
March 31, 2016
| | | | | | | | |
| Investments | | Shares | | | Value | |
| | | | | | | | |
Aten International Co., Ltd. | | | 11,000 | | | $ | 25,531 | |
BenQ Materials Corp. | | | 29,000 | | | | 17,751 | |
Catcher Technology Co., Ltd. | | | 16,000 | | | | 131,245 | |
Chimei Materials Technology Corp. | | | 69,000 | | | | 42,021 | |
Chong Hong Construction Co., Ltd. | | | 34,500 | | | | 51,454 | |
Cub Elecparts, Inc. | | | 2,000 | | | | 24,391 | |
Eclat Textile Co., Ltd. | | | 7,160 | | | | 94,216 | |
Elite Advanced Laser Corp. | | | 8,000 | | | | 44,743 | |
Ennoconn Corp. | | | 1,000 | | | | 12,025 | |
Feng TAY Enterprise Co., Ltd. | | | 14,000 | | | | 74,385 | |
FLEXium Interconnect, Inc. | | | 5,000 | | | | 12,895 | |
Flytech Technology Co., Ltd. | | | 9,000 | | | | 30,900 | |
Formosan Rubber Group, Inc. | | | 77,000 | | | | 42,228 | |
Grape King Bio Ltd. | | | 4,000 | | | | 22,931 | |
Highwealth Construction Corp. | | | 91,000 | | | | 132,892 | |
Hiwin Technologies Corp. | | | 5,000 | | | | 22,138 | |
Holiday Entertainment Co., Ltd. | | | 12,000 | | | | 20,917 | |
Holtek Semiconductor, Inc. | | | 18,000 | | | | 29,362 | |
Hota Industrial Manufacturing Co., Ltd. | | | 6,000 | | | | 26,100 | |
Hotai Motor Co., Ltd. | | | 18,000 | | | | 197,987 | |
Huaku Development Co., Ltd. | | | 28,000 | | | | 51,765 | |
Iron Force Industrial Co., Ltd. | | | 2,000 | | | | 12,149 | |
KEE TAI Properties Co., Ltd. | | | 57,000 | | | | 29,134 | |
Kenda Rubber Industrial Co., Ltd. | | | 43,000 | | | | 68,407 | |
King Slide Works Co., Ltd. | | | 3,000 | | | | 34,629 | |
Kung Long Batteries Industrial Co., Ltd. | | | 3,000 | | | | 13,236 | |
Largan Precision Co., Ltd. | | | 3,000 | | | | 232,569 | |
Makalot Industrial Co., Ltd. | | | 9,454 | | | | 56,840 | |
Nan Liu Enterprise Co., Ltd. | | | 2,000 | | | | 8,793 | |
Nanya Technology Corp.(b) | | | 169,289 | | | | 210,138 | |
Posiflex Technology, Inc. | | | 4,000 | | | | 20,196 | |
President Chain Store Corp. | | | 44,000 | | | | 320,594 | |
Ruentex Development Co., Ltd. | | | 88,364 | | | | 111,883 | |
Ruentex Industries Ltd. | | | 110,000 | | | | 181,146 | |
San Shing Fastech Corp. | | | 10,000 | | | | 19,886 | |
Siliconware Precision Industries Co., Ltd. | | | 281,000 | | | | 454,014 | |
Standard Foods Corp. | | | 20,000 | | | | 49,590 | |
Swancor Ind Co., Ltd. | | | 3,000 | | | | 13,749 | |
Taiwan Secom Co., Ltd. | | | 21,000 | | | | 60,682 | |
Taiwan Semiconductor Manufacturing Co., Ltd. | | | 393,291 | | | | 1,979,653 | |
Test Research, Inc. | | | 19,000 | | | | 29,105 | |
Tong Hsing Electronic Industries Ltd. | | | 13,000 | | | | 37,525 | |
Voltronic Power Technology Corp. | | | 3,000 | | | | 47,260 | |
WUS Printed Circuit Co., Ltd. | | | 16,000 | | | | 14,765 | |
Zeng Hsing Industrial Co., Ltd. | | | 3,000 | | | | 13,842 | |
| | | | | | | | |
| Total Taiwan | | | | 5,293,779 | |
| Thailand – 9.0% | | | | | | | | |
Advanced Info Service PCL NVDR | | | 190,216 | | | | 984,062 | |
Airports of Thailand PCL NVDR | | | 28,300 | | | | 323,383 | |
Amata Corp. PCL NVDR | | | 53,400 | | | | 18,670 | |
Asia Plus Group Holdings PCL NVDR | | | 290,000 | | | | 28,027 | |
Bangkok Airways Co., Ltd. NVDR | | | 61,400 | | | | 43,633 | |
Beauty Community PCL NVDR | | | 157,100 | | | | 24,114 | |
BEC World PCL NVDR | | | 77,411 | | | | 62,162 | |
Bumrungrad Hospital PCL NVDR | | | 12,062 | | | | 72,688 | |
| | | | | | | | |
Central Pattana PCL NVDR | | | 84,516 | | | $ | 123,723 | |
Central Plaza Hotel PCL NVDR | | | 20,000 | | | | 24,304 | |
CH Karnchang PCL NVDR | | | 40,500 | | | | 29,356 | |
Chularat Hospital PCL NVDR | | | 223,000 | | | | 16,988 | |
CP ALL PCL NVDR | | | 176,917 | | | | 230,073 | |
Delta Electronics Thailand PCL NVDR | | | 52,400 | | | | 129,585 | |
Dynasty Ceramic PCL NVDR | | | 304,820 | | | | 38,298 | |
Energy Earth PCL NVDR | | | 172,100 | | | | 22,992 | |
Intouch Holdings PCL NVDR | | | 201,542 | | | | 365,216 | |
Jasmine International PCL NVDR | | | 56,700 | | | | 5,609 | |
KCE Electronics PCL NVDR | | | 14,000 | | | | 31,438 | |
MK Restaurants Group PCL NVDR | | | 50,500 | | | | 76,439 | |
Robinson Department Store PCL NVDR | | | 37,800 | | | | 53,992 | |
STP & I PCL NVDR | | | 20,710 | | | | 5,946 | |
Tipco Asphalt PCL NVDR | | | 24,100 | | | | 17,126 | |
TTW PCL NVDR | | | 240,900 | | | | 68,476 | |
VGI Global Media PCL NVDR | | | 297,380 | | | | 40,406 | |
| | | | | | | | |
| Total Thailand | | | | 2,836,706 | |
| Turkey – 3.2% | | | | | | | | |
Aselsan Elektronik Sanayi ve Ticaret AS | | | 5,034 | | | | 32,717 | |
Aslan Cimento AS | | | 874 | | | | 13,918 | |
BIM Birlesik Magazalar AS | | | 5,420 | | | | 117,516 | |
Celebi Hava Servisi AS | | | 1,350 | | | | 16,340 | |
Cimsa Cimento Sanayi ve Ticaret AS | | | 13,166 | | | | 73,599 | |
Dogus Otomotiv Servis ve Ticaret AS | | | 16,369 | | | | 73,134 | |
EGE Endustri VE Ticaret AS | | | 158 | | | | 17,867 | |
Emlak Konut Gayrimenkul Yatirim Ortakligi AS | | | 156,925 | | | | 159,951 | |
Ford Otomotiv Sanayi AS | | | 14,482 | | | | 191,022 | |
Koza Altin Isletmeleri AS | | | 7,447 | | | | 47,792 | |
Saf Gayrimenkul Yatirim Ortakligi AS | | | 115,946 | | | | 32,531 | |
Soda Sanayii AS | | | 15,976 | | | | 28,880 | |
TAV Havalimanlari Holding AS | | | 15,523 | | | | 92,674 | |
Turk Traktor ve Ziraat Makineleri AS | | | 2,358 | | | | 70,304 | |
Ulker Biskuvi Sanayi AS | | | 4,444 | | | | 32,986 | |
| | | | | | | | |
| Total Turkey | | | | | | | 1,001,231 | |
TOTAL COMMON STOCKS (Cost: $31,051,402) | | | | | | | 30,376,197 | |
| WARRANTS – 0.0% | | | | | | | | |
| Malaysia – 0.0% | | | | | | | | |
VS Industry Bhd, expiring 1/6/19*
(Cost: $0) | | | 8,425 | | | | 691 | |
| EXCHANGE-TRADED NOTE – 3.7% | | | | | | | | |
| United States – 3.7% | | | | | | | | |
iPath MSCI India Index ETN* (Cost: $1,262,838) | | | 18,738 | | | | 1,176,559 | |
| INVESTMENT OF CASH COLLATERAL FOR SECURITIES LOANED – 3.2% | |
| United States – 3.2% | | | | | | | | |
State Street Navigator Securities Lending Prime Portfolio, 0.50%(c) | | | | | | | | |
| (Cost: $994,811)(d) | | | 994,811 | | | | 994,811 | |
TOTAL INVESTMENTS IN SECURITIES – 102.8% (Cost: $33,309,051) | | | | | | | 32,548,258 | |
Liabilities in Excess of Cash, Foreign Currency and Other Assets – (2.8)% | | | | | | | (880,786 | ) |
| | | | | | | | |
| NET ASSETS – 100.0% | | | | | | $ | 31,667,472 | |
See Notes to Financial Statements.
| | | | |
| WisdomTree Global/Global ex-U.S. and Emerging/Frontier Markets Funds | | | 45 | |
Schedule of Investments (concluded)
WisdomTree Emerging Markets Quality Dividend Growth Fund (DGRE)
March 31, 2016
| * | Non-income producing security. |
| (a) | This security is exempt from registration under rule 144A of the Securities Act of 1933. This security may be sold in transactions that are exempt from registration, normally to qualified institutional buyers. |
| (b) | Security, or portion thereof, was on loan at March 31, 2016 (See Note 2). |
| (c) | Rate shown represents annualized 7-day yield as of March 31, 2016. |
| (d) | At March 31, 2016, the total market value of the Fund’s securities on loan was $2,143,687 and the total market value of the collateral held by the Fund was $2,315,524. The total market value of the collateral includes non-cash U.S. Government securities collateral having a value of $1,320,713. |
| ADR | - American Depositary Receipt |
| ETN | - Exchange-Traded Note |
| GDR | - Global Depositary Receipt |
| NVDR | - Non-Voting Depositary Receipt |
Reg S - Regulation S provides an exclusion from the registration requirements of the Securities Act of 1933. These securities may be resold in transactions exempt from registration, normally to qualified institutional buyers.
See Notes to Financial Statements.
| | |
| 46 | | WisdomTree Global/Global ex-U.S. and Emerging/Frontier Markets Funds |
Schedule of Investments
WisdomTree Emerging Markets SmallCap Dividend Fund (DGS)
March 31, 2016
| | | | | | | | |
| Investments | | Shares | | | Value | |
| COMMON STOCKS – 98.9% | | | | | | | | |
| Brazil – 9.2% | | | | | | | | |
AES Tiete Energia S.A. | | | 377,439 | | | $ | 1,646,503 | |
Aliansce Shopping Centers S.A. | | | 429,351 | | | | 1,551,915 | |
Arezzo Industria e Comercio S.A. | | | 126,945 | | | | 836,390 | |
Arteris S.A. | | | 434,839 | | | | 1,181,574 | |
BR Malls Participacoes S.A. | | | 736,619 | | | | 3,065,782 | |
Cia Hering | | | 384,323 | | | | 1,595,201 | |
Cia Siderurgica Nacional S.A. | | | 4,143,413 | | | | 8,359,312 | |
CVC Brasil Operadora e Agencia de Viagens S.A. | | | 280,406 | | | | 1,324,491 | |
Cyrela Brazil Realty S.A. Empreendimentos e Participacoes | | | 777,387 | | | | 2,287,852 | |
Duratex S.A. | | | 786,090 | | | | 1,679,092 | |
EcoRodovias Infraestrutura e Logistica S.A. | | | 2,297,969 | | | | 3,890,467 | |
EDP - Energias do Brasil S.A. | | | 695,883 | | | | 2,474,076 | |
Equatorial Energia S.A. | | | 192,899 | | | | 2,229,442 | |
Estacio Participacoes S.A. | | | 250,051 | | | | 833,974 | |
Even Construtora e Incorporadora S.A. | | | 663,101 | | | | 778,358 | |
Ez Tec Empreendimentos e Participacoes S.A. | | | 454,331 | | | | 2,069,103 | |
Fleury S.A. | | | 296,855 | | | | 1,805,086 | |
GAEC Educacao S.A.* | | | 139,811 | | | | 392,528 | |
Grendene S.A. | | | 534,623 | | | | 2,579,586 | |
Guararapes Confeccoes S.A. | | | 54,657 | | | | 877,535 | |
Iguatemi Empresa de Shopping Centers S.A. | | | 125,660 | | | | 875,791 | |
Light S.A. | | | 506,413 | | | | 1,417,499 | |
Localiza Rent a Car S.A. | | | 198,964 | | | | 1,668,513 | |
M. Dias Branco S.A. | | | 32,486 | | | | 617,546 | |
Mahle-Metal Leve S.A. | | | 325,506 | | | | 2,163,917 | |
MRV Engenharia e Participacoes S.A. | | | 934,638 | | | | 3,122,493 | |
Multiplan Empreendimentos Imobiliarios S.A. | | | 159,274 | | | | 2,413,379 | |
Multiplus S.A. | | | 439,139 | | | | 4,059,310 | |
Odontoprev S.A. | | | 894,133 | | | | 2,876,161 | |
Qualicorp S.A. | | | 286,828 | | | | 1,203,480 | |
Santos Brasil Participacoes S.A. | | | 209,055 | | | | 773,338 | |
Sao Martinho S.A. | | | 68,254 | | | | 930,018 | |
Smiles S.A. | | | 365,723 | | | | 3,922,441 | |
Sul America S.A. | | | 348,213 | | | | 1,576,980 | |
TOTVS S.A. | | | 230,935 | | | | 1,772,413 | |
Transmissora Alianca de Energia Eletrica S.A. | | | 1,280,248 | | | | 7,289,900 | |
Tupy S.A. | | | 259,823 | | | | 1,209,672 | |
Valid Solucoes e Servicos de Seguranca em Meios de Pagamento e Identificacao S.A. | | | 64,916 | | | | 550,247 | |
Via Varejo S.A. | | | 1,732,627 | | | | 2,723,119 | |
| | | | | | | | |
| Total Brazil | | | | 82,624,484 | |
| Chile – 1.3% | | | | | | | | |
CAP S.A. | | | 441,722 | | | | 1,307,414 | |
E.CL S.A. | | | 640,221 | | | | 1,050,125 | |
Forus S.A. | | | 359,811 | | | | 1,022,099 | |
Inversiones Aguas Metropolitanas S.A. | | | 835,507 | | | | 1,328,971 | |
Inversiones La Construccion S.A. | | | 80,765 | | | | 919,271 | |
Parque Arauco S.A. | | | 845,360 | | | | 1,553,816 | |
Ripley Corp. S.A. | | | 3,054,713 | | | | 1,389,569 | |
SONDA S.A. | | | 874,285 | | | | 1,686,586 | |
Vina Concha y Toro S.A. | | | 663,463 | | | | 1,155,600 | |
| | | | | | | | |
| Total Chile | | | | 11,413,451 | |
| China – 19.1% | | | | | | | | |
361 Degrees International Ltd. | | | 3,376,000 | | | | 1,044,588 | |
Anhui Expressway Co., Ltd. Class H | | | 979,666 | | | | 762,863 | |
BAIC Motor Corp. Ltd. Class H(a)(b) | | | 4,239,000 | | | | 3,246,245 | |
Bank of Chongqing Co., Ltd. Class H | | | 2,924,000 | | | | 2,371,152 | |
Baoxin Auto Group Ltd.(a) | | | 1,830,500 | | | | 1,156,371 | |
BBMG Corp. Class H | | | 684,169 | | | | 528,350 | |
Beijing Capital International Airport Co., Ltd. Class H | | | 1,814,000 | | | | 1,936,418 | |
Beijing Capital Land Ltd. Class H(a) | | | 3,972,000 | | | | 1,654,029 | |
Beijing Jingneng Clean Energy Co., Ltd. Class H | | | 2,368,000 | | | | 757,120 | |
Boer Power Holdings Ltd.(a) | | | 1,044,000 | | | | 823,727 | |
Cabbeen Fashion Ltd. | | | 1,288,000 | | | | 599,452 | |
CECEP COSTIN New Materials Group Ltd. | | | 3,207,000 | | | | 256,343 | |
Central China Securities Co., Ltd. Class H | | | 4,326,000 | | | | 2,258,775 | |
China Aoyuan Property Group Ltd. | | | 8,270,000 | | | | 1,684,589 | |
China Coal Energy Co., Ltd. Class H(a) | | | 1,288,000 | | | | 534,691 | |
China Communications Services Corp., Ltd. Class H | | | 4,112,000 | | | | 1,876,669 | |
China Creative Home Group Ltd. | | | 4,186,000 | | | | 356,184 | |
China Harmony New Energy Auto Holding Ltd. | | | 1,345,000 | | | | 712,682 | |
China Lilang Ltd. | | | 2,491,000 | | | | 1,522,241 | |
China Machinery Engineering Corp. Class H | | | 1,489,000 | | | | 1,040,460 | |
China National Building Material Co., Ltd. Class H(a) | | | 4,856,000 | | | | 2,253,786 | |
China Oilfield Services Ltd. Class H(a) | | | 4,612,000 | | | | 3,603,241 | |
China Power New Energy Development Co., Ltd. | | | 11,260,000 | | | | 841,972 | |
China Shineway Pharmaceutical Group Ltd. | | | 1,521,000 | | | | 1,833,463 | |
China Silver Group Ltd.(a) | | | 1,936,000 | | | | 446,776 | |
China Singyes Solar Technologies Holdings Ltd.(a) | | | 685,000 | | | | 288,782 | |
China South City Holdings Ltd.(a) | | | 22,692,000 | | | | 4,680,844 | |
China Southern Airlines Co., Ltd. Class H | | | 1,122,000 | | | | 707,348 | |
China XLX Fertiliser Ltd. | | | 1,268,000 | | | | 425,034 | |
China Yongda Automobiles Services Holdings Ltd.(a) | | | 2,278,000 | | | | 1,342,151 | |
China ZhengTong Auto Services Holdings Ltd. | | | 2,752,000 | | | | 1,050,199 | |
Chongqing Rural Commercial Bank Co., Ltd. Class H | | | 5,666,000 | | | | 2,994,966 | |
CIFI Holdings Group Co., Ltd. | | | 25,182,000 | | | | 6,038,576 | |
CIMC Enric Holdings Ltd. | | | 3,256,000 | | | | 1,729,470 | |
CITIC Telecom International Holdings Ltd. | | | 5,911,000 | | | | 2,225,232 | |
Colour Life Services Group Co., Ltd. | | | 692,000 | | | | 529,937 | |
CPMC Holdings Ltd.(a) | | | 1,019,000 | | | | 503,158 | |
Dah Chong Hong Holdings Ltd. | | | 3,188,000 | | | | 1,298,784 | |
Datang International Power Generation Co., Ltd. Class H | | | 6,789,049 | | | | 2,091,887 | |
Dongyue Group Ltd. | | | 4,491,000 | | | | 793,223 | |
Fantasia Holdings Group Co., Ltd. | | | 14,704,500 | | | | 1,857,838 | |
Fu Shou Yuan International Group Ltd. | | | 982,000 | | | | 702,645 | |
Fufeng Group Ltd.(a) | | | 2,500,000 | | | | 796,101 | |
Future Land Development Holdings Ltd. | | | 14,920,565 | | | | 2,039,025 | |
See Notes to Financial Statements.
| | | | |
| WisdomTree Global/Global ex-U.S. and Emerging/Frontier Markets Funds | | | 47 | |
Schedule of Investments (continued)
WisdomTree Emerging Markets SmallCap Dividend Fund (DGS)
March 31, 2016
| | | | | | | | |
| Investments | | Shares | | | Value | |
Goldpac Group Ltd.(a) | | | 1,085,000 | | | $ | 460,211 | |
Greatview Aseptic Packaging Co., Ltd. | | | 3,062,000 | | | | 1,456,676 | |
Guangshen Railway Co., Ltd. Class H | | | 1,342,665 | | | | 576,426 | |
Guangzhou Automobile Group Co., Ltd. Class H | | | 2,574,000 | | | | 2,678,018 | |
Guangzhou R&F Properties Co., Ltd. Class H | | | 2,021,600 | | | | 2,898,220 | |
Guotai Junan International Holdings Ltd.(a) | | | 9,474,000 | | | | 3,322,261 | |
Hilong Holding Ltd.(a) | | | 2,377,000 | | | | 291,128 | |
Honworld Group Ltd.(b) | | | 734,000 | | | | 509,108 | |
HOSA International Ltd.(a) | | | 2,910,000 | | | | 832,870 | |
Huadian Fuxin Energy Corp., Ltd. Class H | | | 2,128,000 | | | | 496,571 | |
Huadian Power International Corp., Ltd. Class H | | | 3,588,000 | | | | 2,285,129 | |
Huaneng Renewables Corp., Ltd. Class H | | | 1,638,000 | | | | 508,935 | |
Huishang Bank Corp., Ltd. Class H(a) | | | 6,877,000 | | | | 3,324,771 | |
Jiangnan Group Ltd.(a) | | | 6,752,000 | | | | 1,192,571 | |
Jiangsu Expressway Co., Ltd. Class H | | | 2,317,933 | | | | 3,119,843 | |
Jiangxi Copper Co., Ltd. Class H | | | 1,225,000 | | | | 1,470,338 | |
KWG Property Holding Ltd. | | | 8,614,000 | | | | 5,663,781 | |
Lonking Holdings Ltd. | | | 9,715,000 | | | | 1,728,436 | |
Minth Group Ltd. | | | 1,606,000 | | | | 3,739,338 | |
Pacific Online Ltd.(a) | | | 4,144,000 | | | | 1,180,711 | |
Parkson Retail Group Ltd.(a) | | | 6,706,000 | | | | 717,585 | |
Poly Property Group Co., Ltd.(a) | | | 5,735,000 | | | | 1,567,475 | |
Powerlong Real Estate Holdings Ltd. | | | 8,430,000 | | | | 1,760,654 | |
Redco Properties Group Ltd.(b) | | | 734,000 | | | | 529,926 | |
Shandong Weigao Group Medical Polymer Co., Ltd. Class H | | | 1,244,000 | | | | 792,280 | |
Shanghai Electric Group Co., Ltd. Class H(a) | | | 2,238,000 | | | | 1,021,397 | |
Shanghai Fosun Pharmaceutical Group Co., Ltd. Class H | | | 280,000 | | | | 772,508 | |
Shanghai Jin Jiang International Hotels Group Co., Ltd. Class H(a) | | | 1,775,587 | | | | 723,370 | |
Shanghai Pharmaceuticals Holding Co., Ltd. Class H | | | 680,600 | | | | 1,344,256 | |
Shenzhen Expressway Co., Ltd. Class H | | | 1,433,697 | | | | 1,251,346 | |
Shougang Fushan Resources Group Ltd. | | | 9,028,000 | | | | 1,140,641 | |
Shui On Land Ltd. | | | 11,127,000 | | | | 2,998,167 | |
Sichuan Expressway Co., Ltd. Class H(a) | | | 1,638,768 | | | | 542,978 | |
Sinofert Holdings Ltd. | | | 3,442,000 | | | | 479,254 | |
Sinopec Engineering Group Co., Ltd. Class H | | | 3,288,500 | | | | 2,662,496 | |
Sinopec Kantons Holdings Ltd. | | | 1,468,000 | | | | 704,045 | |
Sinotrans Ltd. Class H | | | 2,680,000 | | | | 1,171,294 | |
SITC International Holdings Co., Ltd. | | | 3,739,000 | | | | 1,846,229 | |
SSY Group Ltd.(a) | | | 2,108,000 | | | | 668,555 | |
Sunac China Holdings Ltd. | | | 6,871,000 | | | | 4,624,043 | |
TCL Communication Technology Holdings Ltd.(a) | | | 3,558,000 | | | | 2,339,416 | |
TCL Multimedia Technology Holdings Ltd.(a) | | | 1,174,000 | | | | 715,914 | |
Tenwow International Holdings Ltd. | | | 2,766,000 | | | | 738,166 | |
Times Property Holdings Ltd. | | | 4,514,000 | | | | 1,844,812 | |
Tong Ren Tang Technologies Co., Ltd. Class H | | | 499,888 | | | | 803,012 | |
Travelsky Technology Ltd. Class H | | | 740,000 | | | | 1,211,621 | |
Trigiant Group Ltd.(a) | | | 5,852,000 | | | | 1,010,975 | |
Universal Health International Group Holding Ltd.(a) | | | 1,666,000 | | | | 182,568 | |
Weichai Power Co., Ltd. Class H | | | 1,429,538 | | | | 1,601,574 | |
Wisdom Sports Group(a) | | | 2,165,000 | | | | 720,127 | |
Xiamen International Port Co., Ltd. Class H | | | 1,688,000 | | | | 346,020 | |
Xingda International Holdings Ltd. | | | 5,841,000 | | | | 1,242,518 | |
Xinhua Winshare Publishing and Media Co., Ltd. Class H | | | 1,198,000 | | | | 1,036,360 | |
Xinjiang Goldwind Science & Technology Co., Ltd. Class H(a) | | | 726,400 | | | | 1,039,514 | |
Xinyi Glass Holdings Ltd. | | | 6,758,000 | | | | 4,504,433 | |
XTEP International Holdings Ltd. | | | 4,295,500 | | | | 2,314,842 | |
Yanzhou Coal Mining Co., Ltd. Class H(a) | | | 628,000 | | | | 327,904 | |
Yashili International Holdings Ltd.(a) | | | 2,206,000 | | | | 497,708 | |
Yingde Gases Group Co., Ltd. | | | 7,206,000 | | | | 2,759,193 | |
Yuexiu Transport Infrastructure Ltd.(a) | | | 3,980,000 | | | | 2,678,459 | |
Yuzhou Properties Co., Ltd. | | | 12,303,000 | | | | 3,235,732 | |
Zhejiang Expressway Co., Ltd. Class H | | | 2,670,000 | | | | 2,863,954 | |
Zhongsheng Group Holdings Ltd. | | | 2,673,000 | | | | 1,295,741 | |
Zijin Mining Group Co., Ltd. Class H(a) | | | 10,702,000 | | | | 3,311,369 | |
ZTE Corp. Class H† | | | 466,400 | | | | 851,438 | |
| | | | | | | | |
| Total China | | | | | | | 170,724,598 | |
| Hong Kong – 2.1% | | | | | | | | |
Ajisen China Holdings Ltd. | | | 2,457,000 | | | | 912,282 | |
AMVIG Holdings Ltd. | | | 1,642,000 | | | | 685,882 | |
C C Land Holdings Ltd. | | | 3,305,000 | | | | 984,271 | |
China All Access Holdings Ltd. | | | 2,576,000 | | | | 890,045 | |
China Water Affairs Group Ltd. | | | 1,246,000 | | | | 512,437 | |
Concord New Energy Group Ltd. | | | 8,030,000 | | | | 434,807 | |
Dawnrays Pharmaceutical Holdings Ltd. | | | 728,000 | | | | 580,970 | |
Digital China Holdings Ltd. | | | 1,325,000 | | | | 1,769,730 | |
EVA Precision Industrial Holdings Ltd. | | | 2,862,000 | | | | 424,325 | |
Hang Fat Ginseng Holdings Co., Ltd.(a) | | | 13,320,000 | | | | 84,146 | |
Hua Han Health Industry Holdings Ltd.(a) | | | 7,332,000 | | | | 794,023 | |
Ju Teng International Holdings Ltd. | | | 1,970,000 | | | | 1,015,916 | |
Kingboard Chemical Holdings Ltd. | | | 2,068,000 | | | | 3,567,287 | |
NewOcean Energy Holdings Ltd.(a) | | | 1,560,000 | | | | 561,126 | |
Skyworth Digital Holdings Ltd. | | | 3,976,000 | | | | 2,460,475 | |
Tibet Water Resources Ltd.(a) | | | 2,481,000 | | | | 767,661 | |
Victory City International Holdings Ltd.(a) | | | 6,272,000 | | | | 452,820 | |
Vinda International Holdings Ltd.(a) | | | 535,000 | | | | 893,902 | |
Wasion Group Holdings Ltd.(a) | | | 1,250,000 | | | | 660,732 | |
| | | | | | | | |
| Total Hong Kong | | | | | | | 18,452,837 | |
| Indonesia – 3.2% | | | | | | | | |
Ace Hardware Indonesia Tbk PT | | | 13,686,500 | | | | 923,787 | |
Adaro Energy Tbk PT | | | 62,740,800 | | | | 3,051,872 | |
AKR Corporindo Tbk PT | | | 3,697,645 | | | | 1,938,057 | |
Astra Agro Lestari Tbk PT | | | 2,320,500 | | | | 3,185,000 | |
Bank Tabungan Negara Persero Tbk PT | | | 10,606,816 | | | | 1,395,844 | |
Bumi Serpong Damai Tbk PT | | | 8,513,300 | | | | 1,178,123 | |
Ciputra Development Tbk PT | | | 6,299,312 | | | | 619,955 | |
Global Mediacom Tbk PT | | | 13,738,100 | | | | 1,248,447 | |
Lippo Karawaci Tbk PT | | | 24,719,600 | | | | 1,948,113 | |
Media Nusantara Citra Tbk PT | | | 14,576,940 | | | | 2,396,511 | |
Pakuwon Jati Tbk PT | | | 24,575,500 | | | | 897,024 | |
Perusahaan Perkebunan London Sumatra Indonesia Tbk PT | | | 11,746,452 | | | | 1,612,258 | |
See Notes to Financial Statements.
| | |
| 48 | | WisdomTree Global/Global ex-U.S. and Emerging/Frontier Markets Funds |
Schedule of Investments (continued)
WisdomTree Emerging Markets SmallCap Dividend Fund (DGS)
March 31, 2016
| | | | | | | | |
| Investments | | Shares | | | Value | |
Sawit Sumbermas Sarana Tbk PT | | | 5,839,400 | | | $ | 847,726 | |
Summarecon Agung Tbk PT | | | 9,445,572 | | | | 1,129,052 | |
Tambang Batubara Bukit Asam Persero Tbk PT | | | 4,644,500 | | | | 2,197,906 | |
Timah Persero Tbk PT | | | 13,277,322 | | | | 740,967 | |
Vale Indonesia Tbk PT* | | | 24,724,100 | | | | 3,262,985 | |
Wijaya Karya Persero Tbk PT | | | 2,528,852 | | | | 497,760 | |
| | | | | | | | |
| Total Indonesia | | | | | | | 29,071,387 | |
| Malaysia – 5.1% | | | | | | | | |
Aeon Co. M Bhd | | | 1,268,652 | | | | 887,715 | |
AirAsia Bhd | | | 2,791,800 | | | | 1,309,495 | |
Alliance Financial Group Bhd | | | 2,750,647 | | | | 2,925,845 | |
Berjaya Auto Bhd | | | 2,416,980 | | | | 1,344,315 | |
Berjaya Sports Toto Bhd | | | 2,048,900 | | | | 1,659,496 | |
Bumi Armada Bhd* | | | 4,195,900 | | | | 849,612 | |
Bursa Malaysia Bhd | | | 921,200 | | | | 2,101,417 | |
Cahya Mata Sarawak Bhd | | | 1,074,100 | | | | 1,307,696 | |
Dialog Group Bhd | | | 2,982,676 | | | | 1,223,191 | |
Eastern & Oriental Bhd* | | | 850,900 | | | | 359,858 | |
Felda Global Ventures Holdings Bhd | | | 9,387,000 | | | | 3,633,057 | |
Globetronics Technology Bhd | | | 742,200 | | | | 1,029,169 | |
Hartalega Holdings Bhd | | | 1,110,544 | | | | 1,380,530 | |
Inari Amertron Bhd | | | 1,130,075 | | | | 932,678 | |
IOI Properties Group Bhd | | | 2,992,800 | | | | 1,771,977 | |
JCY International Bhd | | | 6,251,491 | | | | 1,169,701 | |
KPJ Healthcare Bhd | | | 1,022,941 | | | | 1,119,559 | |
KSL Holdings Bhd | | | 1,634,600 | | | | 553,037 | |
Kulim Malaysia Bhd* | | | 1,796,300 | | | | 1,786,401 | |
Lafarge Malaysia Bhd | | | 973,300 | | | | 2,245,213 | |
Mah Sing Group Bhd | | | 4,469,477 | | | | 1,626,722 | |
Malaysian Resources Corp. Bhd | | | 2,303,043 | | | | 737,871 | |
Media Prima Bhd | | | 2,846,536 | | | | 1,065,217 | |
MMC Corp. Bhd | | | 2,249,100 | | | | 1,262,471 | |
Pharmaniaga Bhd | | | 264,800 | | | | 390,939 | |
Press Metal Bhd | | | 2,348,000 | | | | 1,594,822 | |
SP Setia Bhd Group | | | 1,711,900 | | | | 1,373,381 | |
Sunway Bhd | | | 2,521,500 | | | | 2,029,350 | |
Supermax Corp. Bhd | | | 1,098,667 | | | | 726,531 | |
Syarikat Takaful Malaysia Bhd | | | 649,600 | | | | 675,990 | |
Top Glove Corp. Bhd | | | 1,266,580 | | | | 1,629,689 | |
UEM Sunrise Bhd | | | 5,104,400 | | | | 1,491,482 | |
Unisem M Bhd | | | 1,397,700 | | | | 795,308 | |
VS Industry Bhd | | | 1,719,000 | | | | 528,720 | |
| | | | | | | | |
| Total Malaysia | | | | | | | 45,518,455 | |
| Mexico – 1.3% | | | | | | | | |
Banregio Grupo Financiero S.A.B. de C.V. | | | 161,282 | | | | 947,962 | |
Bolsa Mexicana de Valores S.A.B. de C.V.* | | | 1,024,466 | | | | 1,768,243 | |
Corp. Inmobiliaria Vesta S.A.B. de C.V. | | | 528,628 | | | | 797,673 | |
Grupo Aeroportuario del Centro Norte S.A.B. de C.V.* | | | 487,838 | | | | 2,807,856 | |
Grupo Financiero Interacciones S.A. de C.V. | | | 156,530 | | | | 894,914 | |
Grupo Herdez S.A.B. de C.V. | | | 450,782 | | | | 1,002,424 | |
Macquarie Mexico Real Estate Management S.A. de C.V.* | | | 2,010,280 | | | | 2,731,947 | |
Megacable Holdings S.A.B. de C.V. Series CPO | | | 215,202 | | | | 899,723 | |
| | | | | | | | |
| Total Mexico | | | | | | | 11,850,742 | |
| Philippines – 1.7% | | | | | | | | |
Cebu Air, Inc. | | | 483,700 | | | | 940,192 | |
D&L Industries, Inc. | | | 2,934,800 | | | | 612,519 | |
Filinvest Land, Inc. | | | 32,380,000 | | | | 1,244,708 | |
First Gen Corp. | | | 4,402,500 | | | | 2,117,828 | |
First Philippine Holdings Corp. | | | 656,186 | | | | 940,564 | |
Lopez Holdings Corp. | | | 4,001,512 | | | | 608,331 | |
Manila Water Co., Inc. | | | 2,727,445 | | | | 1,599,327 | |
Nickel Asia Corp. | | | 11,341,148 | | | | 1,295,568 | |
Petron Corp. | | | 3,157,800 | | | | 706,382 | |
Premium Leisure Corp. | | | 27,917,000 | | | | 545,668 | |
Puregold Price Club, Inc. | | | 1,119,700 | | | | 885,158 | |
Robinsons Land Corp. | | | 1,976,960 | | | | 1,197,897 | |
Robinsons Retail Holdings, Inc. | | | 429,370 | | | | 690,051 | |
Security Bank Corp. | | | 373,284 | | | | 1,418,714 | |
Vista Land & Lifescapes, Inc. | | | 9,535,100 | | | | 965,003 | |
| | | | | | | | |
| Total Philippines | | | | | | | 15,767,910 | |
| Poland – 2.0% | | | | | | | | |
Asseco Poland S.A. | | | 196,672 | | | | 3,201,686 | |
CCC S.A. | | | 29,841 | | | | 1,280,824 | |
Enea S.A. | | | 658,413 | | | | 2,108,677 | |
Energa S.A. | | | 1,412,574 | | | | 4,975,643 | |
Eurocash S.A. | | | 97,492 | | | | 1,397,458 | |
Lubelski Wegiel Bogdanka S.A. | | | 85,649 | | | | 883,667 | |
PKP Cargo S.A. | | | 69,786 | | | | 804,379 | |
Tauron Polska Energia S.A. | | | 3,166,179 | | | | 2,560,574 | |
Warsaw Stock Exchange(a) | | | 101,238 | | | | 1,066,264 | |
| | | | | | | | |
| Total Poland | | | | | | | 18,279,172 | |
| Russia – 0.1% | | | | | | | | |
TMK PAO GDR Reg S | | | 350,634 | | | | 1,062,421 | |
| South Africa – 8.0% | | | | | | | | |
Adcock Ingram Holdings Ltd.(a) | | | 147,077 | | | | 439,891 | |
Adcorp Holdings Ltd. | | | 281,796 | | | | 287,391 | |
Aeci Ltd. | | | 207,948 | | | | 1,286,597 | |
African Rainbow Minerals Ltd.(a) | | | 438,730 | | | | 2,834,683 | |
Alexander Forbes Group Holdings Ltd. | | | 948,431 | | | | 432,043 | |
Assore Ltd.(a) | | | 212,583 | | | | 2,327,024 | |
Astral Foods Ltd. | | | 88,501 | | | | 667,909 | |
AVI Ltd. | | | 533,966 | | | | 3,154,132 | |
Barloworld Ltd. | | | 335,792 | | | | 1,725,991 | |
Blue Label Telecoms Ltd. | | | 843,186 | | | | 874,258 | |
Cashbuild Ltd. | | | 31,373 | | | | 691,110 | |
Clicks Group Ltd. | | | 233,455 | | | | 1,542,505 | |
Coronation Fund Managers Ltd.(a) | | | 1,126,343 | | | | 5,620,994 | |
DataTec Ltd. | | | 273,925 | | | | 856,155 | |
Exxaro Resources Ltd.(a) | | | 597,597 | | | | 2,925,414 | |
Famous Brands Ltd.(a) | | | 120,380 | | | | 956,787 | |
Foschini Group Ltd. (The) | | | 346,791 | | | | 3,334,928 | |
Grindrod Ltd.(a) | | | 723,723 | | | | 566,362 | |
Hosken Consolidated Investments Ltd. | | | 52,075 | | | | 396,617 | |
See Notes to Financial Statements.
| | | | |
| WisdomTree Global/Global ex-U.S. and Emerging/Frontier Markets Funds | | | 49 | |
Schedule of Investments (continued)
WisdomTree Emerging Markets SmallCap Dividend Fund (DGS)
March 31, 2016
| | | | | | | | |
| Investments | | Shares | | | Value | |
Hudaco Industries Ltd. | | | 83,682 | | | $ | 614,472 | |
Investec Ltd. | | | 358,656 | | | | 2,680,166 | |
Invicta Holdings Ltd. | | | 146,619 | | | | 521,261 | |
JSE Ltd.(a) | | | 145,112 | | | | 1,470,063 | |
KAP Industrial Holdings Ltd. | | | 2,507,934 | | | | 1,099,821 | |
Lewis Group Ltd.(a) | | | 327,769 | | | | 1,047,399 | |
Massmart Holdings Ltd. | | | 290,778 | | | | 2,507,436 | |
Mondi Ltd. | | | 92,445 | | | | 1,784,475 | |
Mpact Ltd. | | | 189,430 | | | | 667,152 | |
Murray & Roberts Holdings Ltd.(a) | | | 830,657 | | | | 711,604 | |
Nampak Ltd. | | | 1,898,355 | | | | 2,749,182 | |
Omnia Holdings Ltd. | | | 90,380 | | | | 838,786 | |
Peregrine Holdings Ltd. | | | 519,504 | | | | 962,502 | |
Pick n Pay Holdings Ltd. | | | 543,380 | | | | 1,051,441 | |
Pick n Pay Stores Ltd. | | | 401,240 | | | | 1,916,175 | |
PPC Ltd.(a) | | | 1,386,802 | | | | 1,150,325 | |
Raubex Group Ltd. | | | 404,512 | | | | 504,402 | |
Reunert Ltd. | | | 440,003 | | | | 2,072,573 | |
Santam Ltd. | | | 158,785 | | | | 2,534,428 | |
Sibanye Gold Ltd. | | | 1,244,915 | | | | 4,794,125 | |
SPAR Group Ltd. (The) | | | 208,489 | | | | 2,820,867 | |
Sun International Ltd.(a) | | | 133,677 | | | | 624,396 | |
Tongaat Hulett Ltd. | | | 160,730 | | | | 1,141,327 | |
Trencor Ltd. | | | 354,285 | | | | 1,108,044 | |
Tsogo Sun Holdings Ltd. | | | 1,411,608 | | | | 2,268,861 | |
Wilson Bayly Holmes-Ovcon Ltd. | | | 84,286 | | | | 681,944 | |
| | | | | | | | |
| Total South Africa | | | | | | | 71,244,018 | |
| South Korea – 6.8% | | | | | | | | |
Binggrae Co., Ltd. | | | 13,275 | | | | 805,601 | |
CJ O Shopping Co., Ltd. | | | 4,565 | | | | 790,372 | |
CS Wind Corp.(a) | | | 28,849 | | | | 513,359 | |
Daeduck Electronics Co. | | | 129,572 | | | | 940,405 | |
Daewoo Shipbuilding & Marine Engineering Co., Ltd.(a) | | | 207,771 | | | | 921,125 | |
Daishin Securities Co., Ltd. | | | 80,781 | | | | 847,650 | |
DGB Financial Group, Inc. | | | 263,951 | | | | 2,054,183 | |
Doosan Heavy Industries & Construction Co., Ltd.(a) | | | 156,098 | | | | 2,948,336 | |
Grand Korea Leisure Co., Ltd.(a) | | | 78,945 | | | | 1,577,381 | |
Green Cross Corp. | | | 5,187 | | | | 811,886 | |
Green Cross Holdings Corp. | | | 21,591 | | | | 687,227 | |
Hana Tour Service, Inc.(a) | | | 6,997 | | | | 517,616 | |
Hankook Tire Worldwide Co., Ltd.(a) | | | 82,337 | | | | 1,652,356 | |
Hanwha Corp. | | | 43,866 | | | | 1,361,703 | |
Hite Jinro Co., Ltd. | | | 137,389 | | | | 3,471,968 | |
Hitejinro Holdings Co., Ltd.(a) | | | 50,403 | | | | 674,332 | |
Huchems Fine Chemical Corp. | | | 71,046 | | | | 1,192,797 | |
Huvis Corp.(a) | | | 88,539 | | | | 688,275 | |
Hyundai Securities Co., Ltd.(a) | | | 104,830 | | | | 629,750 | |
iMarketKorea, Inc. | | | 36,068 | | | | 597,664 | |
KB Insurance Co., Ltd. | | | 61,827 | | | | 1,840,862 | |
KEPCO Engineering & Construction Co., Inc.(a) | | | 38,282 | | | | 1,046,093 | |
Kolon Industries, Inc. | | | 15,220 | | | | 963,561 | |
Korean Reinsurance Co. | | | 104,121 | | | | 1,270,101 | |
KT Skylife Co., Ltd. | | | 48,309 | | | | 701,232 | |
Kumho Petrochemical Co., Ltd.(a) | | | 34,762 | | | | 1,769,105 | |
LF Corp. | | | 30,800 | | | | 697,552 | |
LG Hausys Ltd. | | | 4,919 | | | | 595,734 | |
LG International Corp. | | | 21,699 | | | | 679,280 | |
Loen Entertainment, Inc.(a) | | | 13,002 | | | | 887,947 | |
LS Corp. | | | 51,372 | | | | 2,012,474 | |
LS Industrial Systems Co., Ltd. | | | 42,673 | | | | 1,778,042 | |
Mando Corp. | | | 7,383 | | | | 1,010,353 | |
Medy-Tox, Inc. | | | 1,861 | | | | 718,461 | |
Meritz Fire & Marine Insurance Co., Ltd. | | | 131,341 | | | | 1,837,580 | |
Meritz Securities Co., Ltd. | | | 459,220 | | | | 1,431,549 | |
Moorim P&P Co., Ltd.(a) | | | 148,063 | | | | 629,876 | |
NH Investment & Securities Co., Ltd. | | | 213,434 | | | | 1,853,270 | |
NongShim Co., Ltd.(a) | | | 4,065 | | | | 1,421,826 | |
Partron Co., Ltd. | | | 74,259 | | | | 788,953 | |
Poongsan Corp. | | | 35,759 | | | | 927,120 | |
S&T Motiv Co., Ltd. | | | 14,540 | | | | 878,554 | |
Samyang Holdings Corp. | | | 4,274 | | | | 588,628 | |
Seah Besteel Corp. | | | 52,702 | | | | 1,267,318 | |
Seowonintech Co., Ltd. | | | 47,303 | | | | 500,495 | |
Shinsegae Co., Ltd. | | | 2,866 | | | | 508,743 | |
Silicon Works Co., Ltd. | | | 20,201 | | | | 588,224 | |
SK Gas Ltd.(a) | | | 12,188 | | | | 850,474 | |
SK Networks Co., Ltd. | | | 171,748 | | | | 961,164 | |
SKC Co., Ltd. | | | 32,163 | | | | 894,354 | |
Sungwoo Hitech Co., Ltd. | | | 83,750 | | | | 725,013 | |
Tongyang Life Insurance Co., Ltd. | | | 187,596 | | | | 1,935,670 | |
Youlchon Chemical Co., Ltd.(a) | | | 76,562 | | | | 860,285 | |
Yuhan Corp. | | | 5,781 | | | | 1,417,953 | |
| | | | | | | | |
| Total South Korea | | | | | | | 60,521,832 | |
| Taiwan – 27.4% | | | | | | | | |
AcBel Polytech, Inc.(a) | | | 1,611,303 | | | | 1,334,241 | |
Accton Technology Corp.(a) | | | 1,685,633 | | | | 1,843,596 | |
Aerospace Industrial Development Corp. | | | 1,000 | | | | 1,311 | |
Alpha Networks, Inc.(a) | | | 1,873,309 | | | | 983,685 | |
Asia Vital Components Co., Ltd. | | | 747,000 | | | | 652,209 | |
Aten International Co., Ltd. | | | 436,000 | | | | 1,011,969 | |
BenQ Materials Corp.(a) | | | 987,000 | | | | 604,148 | |
Capital Securities Corp. | | | 5,789,723 | | | | 1,579,473 | |
Cathay Real Estate Development Co., Ltd. | | | 1,581,000 | | | | 704,926 | |
CHC Healthcare Group(a) | | | 333,185 | | | | 566,282 | |
Cheng Uei Precision Industry Co., Ltd.(a) | | | 846,820 | | | | 1,120,884 | |
Chicony Electronics Co., Ltd.(a) | | | 1,488,347 | | | | 3,829,081 | |
Chicony Power Technology Co., Ltd. | | | 643,000 | | | | 762,194 | |
Chimei Materials Technology Corp.(a) | | | 2,369,000 | | | | 1,442,717 | |
Chin-Poon Industrial Co., Ltd.(a) | | | 838,650 | | | | 1,513,969 | |
China Bills Finance Corp. | | | 2,651,000 | | | | 1,013,153 | |
China Metal Products | | | 984,000 | | | | 906,525 | |
China Steel Chemical Corp.(a) | | | 756,726 | | | | 2,668,668 | |
China Synthetic Rubber Corp. | | | 2,119,580 | | | | 1,603,647 | |
ChipMOS TECHNOLOGIES, Inc.(a) | | | 2,294,000 | | | | 2,398,493 | |
Chong Hong Construction Co., Ltd. | | | 970,000 | | | | 1,446,682 | |
Chroma ATE, Inc.(a) | | | 721,132 | | | | 1,550,532 | |
See Notes to Financial Statements.
| | |
| 50 | | WisdomTree Global/Global ex-U.S. and Emerging/Frontier Markets Funds |
Schedule of Investments (continued)
WisdomTree Emerging Markets SmallCap Dividend Fund (DGS)
March 31, 2016
| | | | | | | | |
| Investments | | Shares | | | Value | |
Chung-Hsin Electric & Machinery Manufacturing Corp.(a) | | | 1,502,396 | | | $ | 842,600 | |
Cleanaway Co., Ltd. | | | 256,161 | | | | 1,420,729 | |
Clevo Co.(a) | | | 1,859,000 | | | | 1,677,975 | |
Compeq Manufacturing Co., Ltd. | | | 1,510,000 | | | | 966,505 | |
Coxon Precise Industrial Co., Ltd. | | | 423,000 | | | | 646,644 | |
CTCI Corp.(a) | | | 1,566,190 | | | | 2,058,471 | |
Cub Elecparts, Inc.(a) | | | 77,742 | | | | 948,103 | |
Cyberlink Corp. | | | 530,011 | | | | 1,208,762 | |
Darwin Precisions Corp. | | | 2,198,000 | | | | 802,464 | |
Depo Auto Parts Ind Co., Ltd. | | | 280,646 | | | | 919,965 | |
Elan Microelectronics Corp.(a) | | | 1,649,156 | | | | 1,972,797 | |
Elite Advanced Laser Corp.(a) | | | 118,000 | | | | 659,955 | |
Elite Material Co., Ltd. | | | 520,163 | | | | 990,741 | |
Elite Semiconductor Memory Technology, Inc.(a) | | | 1,007,000 | | | | 882,345 | |
Elitegroup Computer Systems Co., Ltd. | | | 2,239,000 | | | | 1,398,332 | |
Eternal Materials Co., Ltd. | | | 1,223,767 | | | | 1,249,091 | |
Everlight Electronics Co., Ltd.(a) | | | 1,463,165 | | | | 2,436,790 | |
Far Eastern Department Stores Ltd. | | | 3,227,841 | | | | 1,694,958 | |
Far Eastern International Bank | | | 4,144,894 | | | | 1,227,344 | |
Faraday Technology Corp. | | | 586,200 | | | | 764,078 | |
Farglory Land Development Co., Ltd.(a) | | | 3,392,640 | | | | 3,905,584 | |
Feng Hsin Steel Co., Ltd. | | | 504,950 | | | | 659,742 | |
FLEXium Interconnect, Inc.(a) | | | 280,543 | | | | 723,498 | |
Flytech Technology Co., Ltd. | | | 349,655 | | | | 1,200,500 | |
Formosa International Hotels Corp. | | | 194,976 | | | | 1,175,284 | |
Formosan Rubber Group, Inc. | | | 2,894,122 | | | | 1,587,163 | |
Getac Technology Corp. | | | 1,542,292 | | | | 1,083,016 | |
Gigabyte Technology Co., Ltd. | | | 2,064,000 | | | | 2,276,659 | |
Goldsun Building Materials Co., Ltd.(a) | | | 2,914,000 | | | | 854,715 | |
Grape King Bio Ltd.(a) | | | 162,988 | | | | 934,355 | |
Great Wall Enterprise Co., Ltd.(a) | | | 1,726,446 | | | | 1,115,774 | |
Greatek Electronics, Inc. | | | 2,165,000 | | | | 2,475,516 | |
Highwealth Construction Corp. | | | 2,967,613 | | | | 4,333,762 | |
Hiwin Technologies Corp.(a) | | | 180,864 | | | | 800,805 | |
Holiday Entertainment Co., Ltd. | | | 563,000 | | | | 981,367 | |
Holtek Semiconductor, Inc.(a) | | | 707,773 | | | | 1,154,551 | |
Hota Industrial Manufacturing Co., Ltd.(a) | | | 220,000 | | | | 956,997 | |
HTC Corp.(a) | | | 236,000 | | | | 676,088 | |
Huaku Development Co., Ltd. | | | 835,296 | | | | 1,544,249 | |
IEI Integration Corp.(a) | | | 833,620 | | | | 962,248 | |
Inventec Corp.(a) | | | 13,561,992 | | | | 8,596,341 | |
Johnson Health Tech Co., Ltd.(a) | | | 385,725 | | | | 634,006 | |
KEE TAI Properties Co., Ltd. | | | 1,341,999 | | | | 685,927 | |
Kenda Rubber Industrial Co., Ltd.(a) | | | 1,287,601 | | | | 2,048,383 | |
Kerry TJ Logistics Co., Ltd. | | | 154,000 | | | | 198,577 | |
King Slide Works Co., Ltd.(a) | | | 99,004 | | | | 1,142,803 | |
King Yuan Electronics Co., Ltd. | | | 3,105,960 | | | | 2,760,081 | |
King’s Town Bank Co., Ltd.(a) | | | 3,036,000 | | | | 2,089,467 | |
Kingdom Construction Corp.(a) | | | 2,436,187 | | | | 1,230,053 | |
Kinik Co. | | | 557,495 | | | | 918,072 | |
Kinsus Interconnect Technology Corp.(a) | | | 1,053,368 | | | | 2,340,163 | |
Kung Long Batteries Industrial Co., Ltd. | | | 182,000 | | | | 803,008 | |
Lealea Enterprise Co., Ltd. | | | 2,676,000 | | | | 788,233 | |
Lextar Electronics Corp.(a) | | | 1,714,000 | | | | 873,403 | |
Long Chen Paper Co., Ltd. | | | 2,136,000 | | | | 852,834 | |
Lotes Co., Ltd.(a) | | | 235,233 | | | | 782,064 | |
Makalot Industrial Co., Ltd.(a) | | | 241,233 | | | | 1,450,366 | |
Masterlink Securities Corp. | | | 3,394,060 | | | | 973,377 | |
Mercuries & Associates Holding Ltd. | | | 881,362 | | | | 568,241 | |
Merida Industry Co., Ltd.(a) | | | 417,043 | | | | 1,846,527 | |
Merry Electronics Co., Ltd.(a) | | | 742,146 | | | | 1,268,271 | |
Micro-Star International Co., Ltd.(a) | | | 3,375,877 | | | | 5,197,449 | |
MIN AIK Technology Co., Ltd. | | | 296,000 | | | | 495,725 | |
Namchow Chemical Industrial Co., Ltd. | | | 392,086 | | | | 760,197 | |
Nan Ya Printed Circuit Board Corp.(a) | | | 1,053,000 | | | | 1,110,780 | |
Neo Solar Power Corp. | | | 75,323 | | | | 48,914 | |
Novatek Microelectronics Corp. | | | 2,037,000 | | | | 8,196,355 | |
Oriental Union Chemical Corp.(a) | | | 1,579,767 | | | | 998,889 | |
Posiflex Technology, Inc.(a) | | | 129,320 | | | | 652,949 | |
Powertech Technology, Inc. | | | 1,485,000 | | | | 3,368,289 | |
President Securities Corp.(a) | | | 2,246,000 | | | | 956,071 | |
Primax Electronics Ltd.(a) | | | 768,000 | | | | 900,820 | |
Prince Housing & Development Corp.(a) | | | 3,289,460 | | | | 1,221,385 | |
Qisda Corp. | | | 4,499,000 | | | | 1,453,816 | |
Radiant Opto-Electronics Corp.(a) | | | 958,252 | | | | 1,857,908 | |
Realtek Semiconductor Corp. | | | 1,781,770 | | | | 4,899,535 | |
Richtek Technology Corp. | | | 244,910 | | | | 1,476,278 | |
Ruentex Development Co., Ltd.(a) | | | 4,021,520 | | | | 5,091,876 | |
Ruentex Industries Ltd. | | | 3,549,162 | | | | 5,844,693 | |
Sampo Corp. | | | 1,755,000 | | | | 733,431 | |
San Fang Chemical Industry Co., Ltd. | | | 672,000 | | | | 820,582 | |
San Shing Fastech Corp.(a) | | | 439,000 | | | | 872,980 | |
Senao International Co., Ltd. | | | 407,599 | | | | 547,113 | |
Sercomm Corp.(a) | | | 362,488 | | | | 922,439 | |
Shin Zu Shing Co., Ltd. | | | 210,580 | | | | 752,445 | |
Shinkong Synthetic Fibers Corp.(a) | | | 3,498,761 | | | | 988,185 | |
Sinbon Electronics Co., Ltd.(a) | | | 527,307 | | | | 1,076,438 | |
Sitronix Technology Corp. | | | 271,000 | | | | 784,775 | |
Standard Foods Corp. | | | 642,073 | | | | 1,592,015 | |
Sunspring Metal Corp.(a) | | | 492,000 | | | | 616,070 | |
Swancor Ind Co., Ltd.(a) | | | 145,000 | | | | 664,538 | |
Syncmold Enterprise Corp. | | | 635,220 | | | | 1,063,832 | |
Synnex Technology International Corp. | | | 5,731,000 | | | | 5,903,016 | |
TA Chen Stainless Pipe(a) | | | 1,975,000 | | | | 926,625 | |
Taichung Commercial Bank Co., Ltd. | | | 2,736,000 | | | | 802,506 | |
Taiflex Scientific Co., Ltd. | | | 735,974 | | | | 832,384 | |
Taiwan Cogeneration Corp.(a) | | | 1,987,970 | | | | 1,491,719 | |
Taiwan Fertilizer Co., Ltd. | | | 2,063,000 | | | | 3,118,474 | |
Taiwan FU Hsing Industrial Co., Ltd. | | | 400,000 | | | | 558,041 | |
Taiwan Hon Chuan Enterprise Co., Ltd.(a) | | | 561,692 | | | | 815,905 | |
Taiwan Paiho Ltd.(a) | | | 350,000 | | | | 1,048,347 | |
Taiwan PCB Techvest Co., Ltd. | | | 1,086,302 | | | | 1,161,098 | |
Taiwan Secom Co., Ltd. | | | 710,674 | | | | 2,053,588 | |
Taiwan Shin Kong Security Co., Ltd. | | | 844,000 | | | | 1,050,280 | |
Taiwan Surface Mounting Technology Corp. | | | 745,781 | | | | 662,731 | |
Taiwan TEA Corp.(a) | | | 1,719,000 | | | | 793,163 | |
Teco Electric and Machinery Co., Ltd. | | | 3,167,683 | | | | 2,583,634 | |
See Notes to Financial Statements.
| | | | |
| WisdomTree Global/Global ex-U.S. and Emerging/Frontier Markets Funds | | | 51 | |
Schedule of Investments (continued)
WisdomTree Emerging Markets SmallCap Dividend Fund (DGS)
March 31, 2016
| | | | | | | | |
| Investments | | Shares | | | Value | |
Test Research, Inc. | | | 731,115 | | | $ | 1,119,934 | |
Test Rite International Co., Ltd. | | | 1,213,888 | | | | 746,799 | |
Ton Yi Industrial Corp. | | | 1,754,538 | | | | 817,738 | |
Tong Hsing Electronic Industries Ltd.(a) | | | 462,918 | | | | 1,336,226 | |
Tong Yang Industry Co., Ltd. | | | 566,685 | | | | 851,330 | |
Topco Scientific Co., Ltd. | | | 585,439 | | | | 1,089,603 | |
Transcend Information, Inc. | | | 1,521,479 | | | | 4,703,802 | |
Tripod Technology Corp.(a) | | | 1,136,928 | | | | 2,063,031 | |
TSRC Corp.(a) | | | 2,316,011 | | | | 1,960,953 | |
Tung Ho Steel Enterprise Corp. | | | 1,251,153 | | | | 760,006 | |
TXC Corp.(a) | | | 825,549 | | | | 1,123,510 | |
U-Ming Marine Transport Corp.(a) | | | 2,193,420 | | | | 1,737,889 | |
United Integrated Services Co., Ltd. | | | 784,461 | | | | 1,243,087 | |
Universal Cement Corp. | | | 929,300 | | | | 645,347 | |
Visual Photonics Epitaxy Co., Ltd.(a) | | | 657,000 | | | | 1,132,970 | |
Voltronic Power Technology Corp.(a) | | | 100,300 | | | | 1,580,043 | |
Wan Hai Lines Ltd. | | | 7,371,000 | | | | 4,248,448 | |
Wistron Corp.(a) | | | 6,504,148 | | | | 4,021,643 | |
Wistron NeWeb Corp.(a) | | | 506,508 | | | | 1,356,605 | |
Wowprime Corp.(a) | | | 125,833 | | | | 545,417 | |
WPG Holdings Ltd.(a) | | | 5,111,759 | | | | 5,447,842 | |
WT Microelectronics Co., Ltd.(a) | | | 1,351,112 | | | | 1,616,263 | |
WUS Printed Circuit Co., Ltd.(a) | | | 878,000 | | | | 810,235 | |
Yageo Corp. | | | 686,000 | | | | 1,131,823 | |
YFY, Inc. | | | 2,435,000 | | | | 783,068 | |
Yieh Phui Enterprise Co., Ltd. | | | 2,213,000 | | | | 534,960 | |
Yulon Motor Co., Ltd.(a) | | | 1,178,000 | | | | 1,143,814 | |
YungShin Global Holding Corp. | | | 543,250 | | | | 847,351 | |
Yungtay Engineering Co., Ltd.(a) | | | 933,790 | | | | 1,333,198 | |
Zeng Hsing Industrial Co., Ltd. | | | 193,000 | | | | 890,520 | |
Zinwell Corp.(a) | | | 647,186 | | | | 1,256,809 | |
| | | | | | | | |
| Total Taiwan | | | | | | | 245,207,651 | |
| Thailand – 8.2% | | | | | | | | |
Amata Corp. PCL NVDR(a) | | | 2,666,600 | | | | 932,325 | |
AP Thailand PCL | | | 6,796,966 | | | | 1,178,553 | |
Asia Plus Group Holdings PCL NVDR | | | 7,780,500 | | | | 751,953 | |
Bangchak Petroleum PCL (The) | | | 2,237,639 | | | | 1,860,459 | |
Bangkok Airways Co., Ltd. NVDR | | | 2,125,000 | | | | 1,510,091 | |
Bangkok Expressway & Metro PCL* | | | 19,404,536 | | | | 3,061,261 | |
Bangkok Land PCL NVDR | | | 49,071,014 | | | | 2,064,386 | |
Banpu PCL NVDR(a) | | | 5,923,900 | | | | 2,812,084 | |
BEC World PCL NVDR | | | 2,954,700 | | | | 2,372,663 | |
Berli Jucker PCL NVDR(a) | | | 997,000 | | | | 1,027,324 | |
Carabao Group PCL NVDR | | | 1,093,500 | | | | 1,251,091 | |
Central Plaza Hotel PCL NVDR(a) | | | 653,200 | | | | 793,755 | |
CH Karnchang PCL NVDR(a) | | | 1,613,325 | | | | 1,169,408 | |
Dynasty Ceramic PCL NVDR | | | 7,348,400 | | | | 923,250 | |
Electricity Generating PCL | | | 704,291 | | | | 3,573,506 | |
GFPT PCL NVDR | | | 2,674,400 | | | | 919,848 | |
Hana Microelectronics PCL | | | 2,151,647 | | | | 2,186,509 | |
Ichitan Group PCL NVDR(a) | | | 2,791,600 | | | | 1,031,575 | |
IRPC PCL NVDR | | | 16,901,300 | | | | 2,426,139 | |
Jasmine International PCL(a) | | | 8,238,496 | | | | 814,951 | |
KCE Electronics PCL NVDR | | | 526,600 | | | | 1,182,530 | |
Kiatnakin Bank PCL | | | 522,023 | | | | 623,222 | |
Kiatnakin Bank PCL NVDR | | | 1,098,106 | | | | 1,310,985 | |
LPN Development PCL NVDR(a) | | | 3,009,418 | | | | 1,197,608 | |
Major Cineplex Group PCL | | | 1,302,969 | | | | 1,120,375 | |
MC Group PCL NVDR | | | 2,109,000 | | | | 779,335 | |
MK Restaurants Group PCL NVDR(a) | | | 1,094,600 | | | | 1,656,835 | |
Pruksa Real Estate PCL | | | 3,739,341 | | | | 2,869,875 | |
Pruksa Real Estate PCL NVDR | | | 1,146,200 | | | | 879,687 | |
Quality Houses PCL NVDR | | | 12,803,944 | | | | 858,934 | |
Ratchaburi Electricity Generating Holding PCL | | | 1,000,890 | | | | 1,443,865 | |
Ratchaburi Electricity Generating Holding PCL NVDR | | | 527,300 | | | | 760,673 | |
Robinson Department Store PCL NVDR | | | 1,112,400 | | | | 1,588,917 | |
Rojana Industrial Park PCL NVDR | | | 3,820,600 | | | | 591,878 | |
Samart Corp. PCL(a) | | | 1,455,200 | | | | 694,922 | |
Sansiri PCL | | | 38,177,924 | | | | 1,660,382 | |
Siamgas & Petrochemicals PCL NVDR(a) | | | 1,584,600 | | | | 504,477 | |
Sino-Thai Engineering & Construction PCL NVDR(a) | | | 1,128,100 | | | | 727,910 | |
SPCG PCL NVDR | | | 971,100 | | | | 576,918 | |
STP & I PCL NVDR | | | 2,353,300 | | | | 675,620 | |
Supalai PCL | | | 4,283,027 | | | | 2,276,652 | |
Thai Union Group PCL NVDR | | | 6,121,420 | | | | 3,636,659 | |
Thaicom PCL NVDR | | | 1,114,400 | | | | 910,716 | |
Thanachart Capital PCL | | | 2,533,066 | | | | 2,718,114 | |
Thoresen Thai Agencies PCL NVDR(a) | | | 3,159,400 | | | | 709,473 | |
TICON Industrial Connection PCL NVDR | | | 2,421,015 | | | | 825,815 | |
Tipco Asphalt PCL NVDR | | | 923,700 | | | | 656,410 | |
Tisco Financial Group PCL NVDR | | | 1,895,857 | | | | 2,452,004 | |
TPI Polene PCL NVDR(a) | | | 7,028,610 | | | | 539,433 | |
TTW PCL(a) | | | 7,149,624 | | | | 2,032,298 | |
Vanachai Group PCL NVDR | | | 2,014,500 | | | | 692,878 | |
VGI Global Media PCL NVDR | | | 9,319,600 | | | | 1,266,279 | |
| | | | | | | | |
| Total Thailand | | | | 73,082,810 | |
| Turkey – 3.4% | | | | | | | | |
Albaraka Turk Katilim Bankasi AS | | | 1,386,733 | | | | 812,626 | |
Anadolu Cam Sanayii AS* | | | 1 | | | | 1 | |
Aselsan Elektronik Sanayi ve Ticaret AS | | | 194,729 | | | | 1,265,596 | |
AvivaSA Emeklilik ve Hayat AS Class A | | | 115,178 | | | | 793,160 | |
Brisa Bridgestone Sabanci Sanayi ve Ticaret AS(a) | | | 699,408 | | | | 1,939,971 | |
Celebi Hava Servisi AS | | | 68,402 | | | | 827,908 | |
Cimsa Cimento Sanayi ve Ticaret AS | | | 364,651 | | | | 2,038,430 | |
Dogus Otomotiv Servis ve Ticaret AS(a) | | | 598,415 | | | | 2,673,602 | |
EGE Endustri VE Ticaret AS | | | 5,919 | | | | 669,322 | |
Gubre Fabrikalari TAS | | | 369,462 | | | | 796,475 | |
Is Gayrimenkul Yatirim Ortakligi AS(a) | | | 1,643,842 | | | | 1,062,540 | |
Kardemir Karabuk Demir Celik Sanayi ve Ticaret AS Class D | | | 1,251,687 | | | | 640,135 | |
Konya Cimento Sanayii AS | | | 6,260 | | | | 738,118 | |
Koza Altin Isletmeleri AS | | | 309,936 | | | | 1,989,041 | |
Otokar Otomotiv ve Savunma Sanayi AS(a) | | | 43,271 | | | | 1,659,718 | |
Saf Gayrimenkul Yatirim Ortakligi AS | | | 3,732,054 | | | | 1,047,101 | |
Soda Sanayii AS | | | 623,967 | | | | 1,127,959 | |
See Notes to Financial Statements.
| | |
| 52 | | WisdomTree Global/Global ex-U.S. and Emerging/Frontier Markets Funds |
Schedule of Investments (concluded)
WisdomTree Emerging Markets SmallCap Dividend Fund (DGS)
March 31, 2016
| | | | | | | | |
| Investments | | Shares | | | Value | |
Tekfen Holding AS(a) | | | 456,082 | | | $ | 881,161 | |
Torunlar Gayrimenkul Yatirim Ortakligi AS | | | 672,843 | | | | 1,056,208 | |
Turk Traktor ve Ziraat Makineleri AS | | | 110,110 | | | | 3,282,926 | |
Turkiye Sise ve Cam Fabrikalari AS | | | 1,248,858 | | | | 1,623,334 | |
Ulker Biskuvi Sanayi AS | | | 205,095 | | | | 1,522,352 | |
Vestel Beyaz Esya Sanayi ve Ticaret AS | | | 413,334 | | | | 1,695,496 | |
| | | | | | | | |
| Total Turkey | | | | | | | 30,143,180 | |
TOTAL COMMON STOCKS (Cost: $928,658,674) | | | | | | | 884,964,948 | |
| WARRANTS – 0.0% | | | | | | | | |
| Malaysia – 0.0% | | | | | | | | |
VS Industry Bhd, expiring 1/6/19*
(Cost: $0) | | | 449,975 | | | | 36,907 | |
| EXCHANGE-TRADED NOTE – 0.6% | | | | | | | | |
| United States – 0.6% | | | | | | | | |
| iPath MSCI India Index ETN*(a) (Cost: $5,374,395) | | | 82,503 | | | | 5,180,363 | |
| INVESTMENT OF CASH COLLATERAL FOR SECURITIES LOANED – 5.3% | |
| United States – 5.3% | | | | | | | | |
State Street Navigator Securities Lending Prime Portfolio, 0.50%(c) | | | | | | | | |
| (Cost: $47,246,610)(d) | | | 47,246,610 | | | | 47,246,610 | |
TOTAL INVESTMENTS IN SECURITIES – 104.8% (Cost: $981,279,679) | | | | 937,428,828 | |
Liabilities in Excess of Cash, Foreign Currency and Other Assets – (4.8)% | | | | | | | (42,960,846 | ) |
| | | | | | | | |
| NET ASSETS – 100.0% | | | | | | $ | 894,467,982 | |
| * | Non-income producing security. |
| † | Security is being fair valued by a valuation committee under the direction of the Board of Trustees. The aggregate value of fair valued securities is $851,438, which represents 0.1% of net assets. |
| (a) | Security, or portion thereof, was on loan at March 31, 2016 (See Note 2). |
| (b) | This security is exempt from registration under rule 144A of the Securities Act of 1933. This security may be sold in transactions that are exempt from registration, normally to qualified institutional buyers. |
| (c) | Rate shown represents annualized 7-day yield as of March 31, 2016. |
| (d) | At March 31, 2016, the total market value of the Fund’s securities on loan was $88,264,527 and the total market value of the collateral held by the Fund was $100,343,418. The total market value of the collateral includes non-cash U.S. Government securities collateral having a value of $53,096,808. |
ETN - Exchange-Traded Note
GDR - Global Depositary Receipt
NVDR - Non-Voting Depositary Receipt
Reg S - Regulation S provides an exclusion from the registration requirements of the Securities Act of 1933. These securities may be resold in transactions exempt from registration, normally to qualified institutional buyers.
| | | | | | | | | | | | | | | | | | | | |
| FINANCIAL DERIVATIVE INSTRUMENTS | |
| FORWARD CONTRACTS | |
Settlement
Date | | Contracts
To Deliver | | | In
Exchange For | | | Unrealized
Gain (Loss) | |
4/1/2016 | | | USD | | | | 38,676 | | | | HKD | | | | 300,000 | | | $ | – | |
4/1/2016 | | | USD | | | | 2,194 | | | | KRW | | | | 2,508,390 | | | | – | |
4/1/2016 | | | USD | | | | 6,664 | | | | MYR | | | | 26,223 | | | | 57 | |
4/1/2016 | | | USD | | | | 33,051 | | | | TWD | | | | 1,063,897 | | | | 6 | |
4/1/2016 | | | USD | | | | 244,863 | | | | ZAR | | | | 3,755,687 | | | | 10,487 | |
4/4/2016 | | | USD | | | | 11,033 | | | | MYR | | | | 43,029 | | | | (4 | ) |
| | | | | | | | | | | | | | | | | | | $ | 10,546 | |
| | |
| CURRENCY LEGEND |
| HKD – Hong Kong dollar |
| KRW – South Korean won |
| MYR – Malaysian ringgit |
| TWD – New Taiwan dollar |
| USD – U.S. dollar |
| ZAR – South African rand |
See Notes to Financial Statements.
| | | | |
| WisdomTree Global/Global ex-U.S. and Emerging/Frontier Markets Funds | | | 53 | |
Schedule of Investments
WisdomTree Global ex-U.S. Quality Dividend Growth Fund (DNL)
March 31, 2016
| | | | | | | | |
| Investments | | Shares | | | Value | |
| COMMON STOCKS – 97.0% | | | | | | | | |
| Australia – 3.4% | | | | | | | | |
Brambles Ltd. | | | 38,911 | | | $ | 362,779 | |
Cochlear Ltd. | | | 2,262 | | | | 178,006 | |
CSL Ltd. | | | 10,814 | | | | 843,846 | |
Domino’s Pizza Enterprises Ltd. | | | 1,408 | | | | 62,257 | |
Fortescue Metals Group Ltd.(a) | | | 79,833 | | | | 156,599 | |
Magellan Financial Group Ltd. | | | 6,756 | | | | 117,869 | |
Platinum Asset Management Ltd. | | | 38,821 | | | | 189,630 | |
REA Group Ltd. | | | 1,450 | | | | 60,266 | |
Seek Ltd. | | | 10,785 | | | | 134,235 | |
TPG Telecom Ltd. | | | 12,827 | | | | 111,894 | |
| | | | | | | | |
| Total Australia | | | | | | | 2,217,381 | |
| Austria – 0.0% | | | | | | | | |
ams AG | | | 348 | | | | 11,974 | |
| Brazil – 9.4% | | | | | | | | |
Ambev S.A. | | | 630,568 | | | | 3,348,558 | |
BB Seguridade Participacoes S.A. | | | 136,908 | | | | 1,147,338 | |
CCR S.A. | | | 136,331 | | | | 539,708 | |
CETIP S.A. – Mercados Organizados | | | 17,971 | | | | 203,594 | |
Cielo S.A. | | | 43,566 | | | | 429,882 | |
Lojas Renner S.A. | | | 15,159 | | | | 88,927 | |
Tractebel Energia S.A. | | | 28,499 | | | | 294,961 | |
WEG S.A. | | | 32,887 | | | | 130,008 | |
| | | | | | | | |
| Total Brazil | | | | | | | 6,182,976 | |
| Canada – 1.3% | | | | | | | | |
CCL Industries, Inc. Class B | | | 493 | | | | 93,954 | |
CI Financial Corp.(a) | | | 6,686 | | | | 148,354 | |
Constellation Software, Inc. | | | 273 | | | | 112,241 | |
Dollarama, Inc. | | | 1,040 | | | | 73,482 | |
Gildan Activewear, Inc. | | | 3,790 | | | | 116,034 | |
Linamar Corp. | | | 438 | | | | 21,161 | |
Silver Wheaton Corp.(a) | | | 6,349 | | | | 105,780 | |
SNC-Lavalin Group, Inc. | | | 5,206 | | | | 190,981 | |
| | | | | | | | |
| Total Canada | | | | | | | 861,987 | |
| Chile – 0.2% | | | | | | | | |
Cia Cervecerias Unidas S.A. | | | 12,133 | | | | 136,936 | |
| China – 9.1% | | | | | | | | |
AAC Technologies Holdings, Inc. | | | 31,000 | | | | 237,000 | |
ANTA Sports Products Ltd. | | | 88,000 | | | | 193,777 | |
Brilliance China Automotive Holdings Ltd. | | | 60,000 | | | | 62,115 | |
China Conch Venture Holdings Ltd. | | | 51,500 | | | | 101,585 | |
China Everbright International Ltd. | | | 62,000 | | | | 69,222 | |
China Hongqiao Group Ltd.(a) | | | 504,500 | | | | 350,575 | |
China Medical System Holdings Ltd. | | | 53,000 | | | | 73,522 | |
China Overseas Land & Investment Ltd. | | | 265,300 | | | | 839,692 | |
China Resources Cement Holdings Ltd. | | | 382,000 | | | | 116,719 | |
China Resources Land Ltd. | | | 210,000 | | | | 538,771 | |
China State Construction International Holdings Ltd. | | | 128,000 | | | | 190,765 | |
Cosmo Lady China Holdings Co., Ltd.(a)(b) | | | 29,700 | | | | 24,008 | |
CSPC Pharmaceutical Group Ltd. | | | 98,400 | | | | 89,056 | |
Evergrande Real Estate Group Ltd.(a) | | | 1,989,900 | | | | 1,536,701 | |
Geely Automobile Holdings Ltd. | | | 50,000 | | | | 24,753 | |
Golden Eagle Retail Group Ltd.(a) | | | 77,000 | | | | 90,237 | |
Great Wall Motor Co., Ltd. Class H | | | 148,400 | | | | 120,533 | |
Guorui Properties Ltd.(a) | | | 90,000 | | | | 31,444 | |
Kingsoft Corp., Ltd.(a) | | | 14,000 | | | | 32,814 | |
Logan Property Holdings Co., Ltd. | | | 192,000 | | | | 71,537 | |
Shenzhen International Holdings Ltd. | | | 88,000 | | | | 142,723 | |
Shenzhou International Group Holdings Ltd. | | | 42,200 | | | | 229,592 | |
Sino Biopharmaceutical Ltd. | | | 54,500 | | | | 40,893 | |
Sunny Optical Technology Group Co., Ltd.(a) | | | 18,000 | | | | 50,590 | |
Tencent Holdings Ltd. | | | 30,100 | | | | 614,686 | |
Xinyi Solar Holdings Ltd.(a) | | | 164,000 | | | | 58,356 | |
Zhuzhou CRRC Times Electric Co., Ltd. Class H | | | 11,200 | | | | 65,411 | |
| | | | | | | | |
| Total China | | | | | | | 5,997,077 | |
| Denmark – 4.3% | | | | | | | | |
Coloplast A/S Class B | | | 5,990 | | | | 454,613 | |
Novo Nordisk A/S Class B | | | 35,416 | | | | 1,924,114 | |
Novozymes A/S Class B | | | 3,583 | | | | 161,341 | |
Pandora A/S | | | 1,730 | | | | 226,902 | |
Royal Unibrew A/S | | | 1,450 | | | | 70,083 | |
SimCorp A/S | | | 427 | | | | 19,737 | |
| | | | | | | | |
| Total Denmark | | | | | | | 2,856,790 | |
| Finland – 4.1% | | | | | | | | |
Elisa Oyj(a) | | | 7,304 | | | | 284,406 | |
Fortum Oyj(a) | | | 89,413 | | | | 1,356,164 | |
Kone Oyj Class B | | | 17,032 | | | | 822,158 | |
Nokian Renkaat Oyj | | | 6,116 | | | | 216,194 | |
| | | | | | | | |
| Total Finland | | | | | | | 2,678,922 | |
| France – 1.2% | | | | | | | | |
Eurazeo S.A. | | | 1,347 | | | | 91,208 | |
Hermes International | | | 973 | | | | 343,113 | |
Iliad S.A. | | | 288 | | | | 74,220 | |
Ingenico Group S.A. | | | 728 | | | | 83,747 | |
Plastic Omnium S.A. | | | 2,379 | | | | 81,940 | |
Zodiac Aerospace | | | 4,942 | | | | 99,174 | |
| | | | | | | | |
| Total France | | | | | | | 773,402 | |
| Germany – 1.6% | | | | | | | | |
CTS Eventim AG & Co. KGaA | | | 1,366 | | | | 48,606 | |
Fielmann AG | | | 3,089 | | | | 234,789 | |
Fuchs Petrolub SE | | | 2,363 | | | | 91,715 | |
Henkel AG & Co. KGaA | | | 4,480 | | | | 440,935 | |
KUKA AG(a) | | | 357 | | | | 37,440 | |
United Internet AG Registered Shares | | | 3,869 | | | | 194,455 | |
Wirecard AG(a) | | | 1,072 | | | | 40,679 | |
| | | | | | | | |
| Total Germany | | | | | | | 1,088,619 | |
| Hong Kong – 0.8% | | | | | | | | |
Joy City Property Ltd. | | | 210,000 | | | | 31,947 | |
PCCW Ltd. | | | 575,000 | | | | 372,137 | |
Techtronic Industries Co., Ltd. | | | 32,000 | | | | 126,448 | |
| | | | | | | | |
| Total Hong Kong | | | | | | | 530,532 | |
See Notes to Financial Statements.
| | |
| 54 | | WisdomTree Global/Global ex-U.S. and Emerging/Frontier Markets Funds |
Schedule of Investments (continued)
WisdomTree Global ex-U.S. Quality Dividend Growth Fund (DNL)
March 31, 2016
| | | | | | | | |
| Investments | | Shares | | | Value | |
| India – 1.2% | | | | | | | | |
Infosys Ltd. ADR | | | 31,292 | | | $ | 595,174 | |
Mahindra & Mahindra Ltd. GDR | | | 11,046 | | | | 198,275 | |
| | | | | | | | |
| Total India | | | | | | | 793,449 | |
| Indonesia – 1.2% | | | | | | | | |
Jasa Marga Persero Tbk PT | | | 145,001 | | | | 59,050 | |
Kalbe Farma Tbk PT | | | 841,700 | | | | 91,724 | |
Mitra Keluarga Karyasehat Tbk PT | | | 162,200 | | | | 29,663 | |
Surya Citra Media Tbk PT | | | 147,900 | | | | 35,023 | |
Unilever Indonesia Tbk PT | | | 178,500 | | | | 577,837 | |
| | | | | | | | |
| Total Indonesia | | | | | | | 793,297 | |
| Ireland – 0.3% | | | | | | | | |
Paddy Power Betfair PLC | | | 1,401 | | | | 195,732 | |
| Israel – 0.8% | | | | | | | | |
Frutarom Industries Ltd. | | | 580 | | | | 30,392 | |
Israel Chemicals Ltd. | | | 89,607 | | | | 389,699 | |
Osem Investments Ltd.* | | | 3,826 | | | | 83,583 | |
| | | | | | | | |
| Total Israel | | | | | | | 503,674 | |
| Italy – 1.6% | | | | | | | | |
Azimut Holding SpA | | | 7,018 | | | | 161,947 | |
Luxottica Group SpA | | | 12,561 | | | | 694,224 | |
Moncler SpA | | | 2,781 | | | | 47,061 | |
Salvatore Ferragamo SpA(a) | | | 2,503 | | | | 64,062 | |
Tod’s SpA(a) | | | 1,193 | | | | 85,104 | |
| | | | | | | | |
| Total Italy | | | | | | | 1,052,398 | |
| Japan – 7.0% | | | | | | | | |
Asahi Intecc Co., Ltd. | | | 300 | | | | 14,066 | |
Bandai Namco Holdings, Inc. | | | 5,400 | | | | 117,902 | |
Calbee, Inc.(a) | | | 1,400 | | | | 55,679 | |
CyberAgent, Inc.(a) | | | 700 | | | | 32,573 | |
Daiichikosho Co., Ltd. | | | 700 | | | | 30,517 | |
Daito Trust Construction Co., Ltd. | | | 3,500 | | | | 497,620 | |
DeNa Co., Ltd.(a) | | | 600 | | | | 10,351 | |
Fast Retailing Co., Ltd. | | | 700 | | | | 224,334 | |
Fuji Heavy Industries Ltd. | | | 13,300 | | | | 470,372 | |
GungHo Online Entertainment, Inc.(a) | | | 16,100 | | | | 45,409 | |
Haseko Corp. | | | 2,100 | | | | 19,581 | |
Hikari Tsushin, Inc. | | | 900 | | | | 68,624 | |
Iida Group Holdings Co., Ltd. | | | 6,100 | | | | 119,129 | |
Kakaku.com, Inc.(a) | | | 4,000 | | | | 74,381 | |
Kaken Pharmaceutical Co., Ltd. | | | 700 | | | | 42,413 | |
M3, Inc. | | | 1,100 | | | | 27,717 | |
MISUMI Group, Inc.(a) | | | 3,400 | | | | 48,734 | |
Mixi, Inc. | | | 3,000 | | | | 111,571 | |
MonotaRO Co., Ltd.(a) | | | 500 | | | | 14,881 | |
Murata Manufacturing Co., Ltd. | | | 3,500 | | | | 422,572 | |
Nexon Co., Ltd. | | | 3,300 | | | | 56,343 | |
Nippon Paint Holdings Co., Ltd.(a) | | | 4,500 | | | | 99,973 | |
Nissan Chemical Industries Ltd.(a) | | | 2,900 | | | | 74,825 | |
Nitori Holdings Co., Ltd. | | | 700 | | | | 64,211 | |
Obic Co., Ltd. | | | 1,700 | | | | 89,995 | |
Oracle Corp. | | | 3,400 | | | | 191,183 | |
Park24 Co., Ltd. | | | 4,900 | | | | 137,328 | |
Pigeon Corp. | | | 2,000 | | | | 52,262 | |
Ryohin Keikaku Co., Ltd. | | | 300 | | | | 63,526 | |
Sanrio Co., Ltd.(a) | | | 2,500 | | | | 48,957 | |
Seiko Epson Corp. | | | 18,900 | | | | 305,709 | |
Shimano, Inc. | | | 700 | | | | 109,863 | |
Shionogi & Co., Ltd. | | | 5,500 | | | | 259,206 | |
Start Today Co., Ltd. | | | 1,000 | | | | 40,393 | |
Sumitomo Rubber Industries Ltd. | | | 8,300 | | | | 128,419 | |
Sysmex Corp. | | | 1,800 | | | | 112,745 | |
Temp Holdings Co., Ltd. | | | 1,200 | | | | 17,424 | |
Tosoh Corp. | | | 12,000 | | | | 50,501 | |
TOTO Ltd.(a) | | | 2,800 | | | | 87,442 | |
USS Co., Ltd. | | | 6,400 | | | | 102,382 | |
Yokohama Rubber Co., Ltd. (The)(a) | | | 3,500 | | | | 57,640 | |
| | | | | | | | |
| Total Japan | | | | | | | 4,598,753 | |
| Malaysia – 0.3% | | | | | | | | |
HAP Seng Consolidated Bhd | | | 121,200 | | | | 233,919 | |
| Mexico – 1.2% | | | | | | | | |
Grupo Aeroportuario del Pacifico S.A.B. de C.V. Class B | | | 19,520 | | | | 175,566 | |
Grupo Aeroportuario del Sureste S.A.B. de C.V. Class B | | | 8,356 | | | | 126,888 | |
Grupo Carso S.A.B. de C.V. Series A1 | | | 31,956 | | | | 150,235 | |
Grupo Lala S.A.B. de C.V. | | | 38,464 | | | | 105,666 | |
Industrias Bachoco S.A.B. de C.V. Series B | | | 14,743 | | | | 63,677 | |
Kimberly-Clark de Mexico S.A.B. de C.V. Class A | | | 61,161 | | | | 148,355 | |
| | | | | | | | |
| Total Mexico | | | | | | | 770,387 | |
| Netherlands – 0.8% | | | | | | | | |
ASML Holding N.V. | | | 5,009 | | | | 509,611 | |
Euronext N.V.(b) | | | 988 | | | | 41,083 | |
| | | | | | | | |
| Total Netherlands | | | | | | | 550,694 | |
| New Zealand – 0.3% | | | | | | | | |
Fisher & Paykel Healthcare Corp., Ltd. | | | 28,953 | | | | 197,000 | |
| Norway – 1.1% | | | | | | | | |
Telenor ASA | | | 44,255 | | | | 716,427 | |
| Philippines – 0.8% | | | | | | | | |
Emperador, Inc. | | | 391,200 | | | | 64,400 | |
Jollibee Foods Corp. | | | 2,590 | | | | 12,769 | |
Semirara Mining & Power Corp. | | | 61,720 | | | | 175,998 | |
Universal Robina Corp. | | | 60,350 | | | | 284,154 | |
| | | | | | | | |
| Total Philippines | | | | | | | 537,321 | |
| Russia – 5.5% | | | | | | | | |
Gazprom PAO ADR | | | 709,861 | | | | 3,061,631 | |
NovaTek OAO GDR Reg S | | | 6,418 | | | | 576,657 | |
| | | | | | | | |
| Total Russia | | | | | | | 3,638,288 | |
| Singapore – 0.3% | | | | | | | | |
SIA Engineering Co., Ltd. | | | 74,200 | | | | 198,366 | |
| South Africa – 3.3% | | | | | | | | |
Capitec Bank Holdings Ltd. | | | 1,957 | | | | 76,246 | |
Discovery Ltd.(a) | | | 9,895 | | | | 81,741 | |
See Notes to Financial Statements.
| | | | |
| WisdomTree Global/Global ex-U.S. and Emerging/Frontier Markets Funds | | | 55 | |
Schedule of Investments (continued)
WisdomTree Global ex-U.S. Quality Dividend Growth Fund (DNL)
March 31, 2016
| | | | | | | | |
| Investments | | Shares | | | Value | |
Foschini Group Ltd. (The) | | | 4,956 | | | $ | 47,660 | |
Hyprop Investments Ltd. | | | 17,781 | | | | 142,255 | |
Life Healthcare Group Holdings Ltd. | | | 12,015 | | | | 29,147 | |
Mr. Price Group Ltd. | | | 9,520 | | | | 114,845 | |
Naspers Ltd. Class N | | | 1,223 | | | | 171,376 | |
Netcare Ltd. | | | 54,088 | | | | 132,756 | |
Pick n Pay Stores Ltd. | | | 13,680 | | | | 65,331 | |
Pioneer Foods Group Ltd. | | | 4,211 | | | | 39,808 | |
PSG Group Ltd. | | | 1,459 | | | | 19,889 | |
Rand Merchant Investment Holdings Ltd.(a) | | | 53,533 | | | | 151,485 | |
Resilient REIT Ltd. | | | 17,059 | | | | 157,205 | |
RMB Holdings Ltd.(a) | | | 68,569 | | | | 285,596 | |
Shoprite Holdings Ltd.(a) | | | 11,403 | | | | 134,606 | |
SPAR Group Ltd. (The) | | | 7,349 | | | | 99,432 | |
Tiger Brands Ltd. | | | 4,723 | | | | 104,437 | |
Truworths International Ltd.(a) | | | 25,121 | | | | 167,758 | |
Woolworths Holdings Ltd. | | | 30,845 | | | | 188,052 | |
| | | | | | | | |
| Total South Africa | | | | | | | 2,209,625 | |
| South Korea – 1.9% | | | | | | | | |
Amorepacific Corp. | | | 189 | | | | 63,876 | |
Coway Co., Ltd. | | | 2,183 | | | | 184,207 | |
Cuckoo Electronics Co., Ltd. | | | 91 | | | | 15,954 | |
Hanssem Co., Ltd. | | | 92 | | | | 17,980 | |
Hotel Shilla Co., Ltd. | | | 217 | | | | 12,619 | |
Hyundai Wia Corp. | | | 299 | | | | 27,453 | |
Korea Aerospace Industries Ltd. | | | 382 | | | | 21,779 | |
Korea Zinc Co., Ltd. | | | 295 | | | | 124,207 | |
KT&G Corp. | | | 5,289 | | | | 508,736 | |
LG Household & Health Care Ltd. | | | 68 | | | | 56,191 | |
Medy-Tox, Inc. | | | 37 | | | | 14,284 | |
S-1 Corp. | | | 834 | | | | 64,468 | |
Samlip General Foods Co., Ltd. | | | 33 | | | | 6,175 | |
SK Holdings Co., Ltd. | | | 497 | | | | 96,914 | |
Youngone Corp. | | | 421 | | | | 17,707 | |
| | | | | | | | |
| Total South Korea | | | | | | | 1,232,550 | |
| Spain – 3.0% | | | | | | | | |
Industria de Diseno Textil S.A. | | | 55,936 | | | | 1,884,529 | |
Tecnicas Reunidas S.A.(a) | | | 2,836 | | | | 79,906 | |
| | | | | | | | |
| Total Spain | | | | | | | 1,964,435 | |
| Sweden – 3.8% | | | | | | | | |
Atlas Copco AB Class B | | | 13,999 | | | | 330,518 | |
Axfood AB | | | 8,265 | | | | 152,929 | |
Hennes & Mauritz AB Class B | | | 49,730 | | | | 1,660,591 | |
Hexpol AB | | | 6,621 | | | | 73,710 | |
Investment AB Kinnevik Class B | | | 7,741 | | | | 219,911 | |
Investment AB Latour Class B | | | 1,975 | | | | 81,980 | |
| | | | | | | | |
| Total Sweden | | | | | | | 2,519,639 | |
| Switzerland – 5.0% | | | | | | | | |
Actelion Ltd. Registered Shares* | | | 1,529 | | | | 229,434 | |
Bucher Industries AG Registered Shares | | | 380 | | | | 92,733 | |
EMS-Chemie Holding AG Registered Shares | | | 870 | | | | 452,874 | |
Georg Fischer AG Registered Shares | | | 150 | | | | 121,704 | |
Partners Group Holding AG | | | 819 | | | | 330,542 | |
Roche Holding AG Bearer Shares | | | 5,848 | | | | 1,474,748 | |
Schindler Holding AG Participation Certificate | | | 1,925 | | | | 356,396 | |
Schindler Holding AG Registered Shares | | | 63 | | | | 11,585 | |
Swatch Group AG (The) Registered Shares | | | 2,749 | | | | 185,869 | |
Temenos Group AG Registered Shares* | | | 1,035 | | | | 56,849 | |
| | | | | | | | |
| Total Switzerland | | | | | | | 3,312,734 | |
| Taiwan – 9.1% | | | | | | | | |
Advantech Co., Ltd. | | | 23,000 | | | | 169,012 | |
Catcher Technology Co., Ltd. | | | 20,000 | | | | 164,057 | |
Eclat Textile Co., Ltd. | | | 7,160 | | | | 94,216 | |
Feng TAY Enterprise Co., Ltd. | | | 13,000 | | | | 69,072 | |
Hotai Motor Co., Ltd. | | | 12,000 | | | | 131,991 | |
Largan Precision Co., Ltd. | | | 4,000 | | | | 310,092 | |
Nanya Technology Corp. | | | 174,028 | | | | 216,021 | |
President Chain Store Corp. | | | 48,000 | | | | 349,739 | |
Siliconware Precision Industries Co., Ltd. | | | 312,000 | | | | 504,101 | |
Taiwan Semiconductor Manufacturing Co., Ltd. | | | 795,000 | | | | 4,001,678 | |
| | | | | | | | |
| Total Taiwan | | | | | | | 6,009,979 | |
| Thailand – 2.5% | | | | | | | | |
Airports of Thailand PCL NVDR | | | 26,900 | | | | 307,385 | |
Bangkok Dusit Medical Services PCL NVDR | | | 295,200 | | | | 196,353 | |
Big C Supercenter PCL NVDR | | | 21,800 | | | | 155,537 | |
Bumrungrad Hospital PCL NVDR | | | 9,100 | | | | 54,838 | |
Central Pattana PCL NVDR | | | 87,550 | | | | 128,164 | |
CP ALL PCL | | | 195,656 | | | | 254,442 | |
Glow Energy PCL NVDR | | | 80,100 | | | | 209,471 | |
Intouch Holdings PCL NVDR(a) | | | 185,553 | | | | 336,242 | |
| | | | | | | | |
| Total Thailand | | | | | | | 1,642,432 | |
| Turkey – 0.9% | | | | | | | | |
Aselsan Elektronik Sanayi ve Ticaret AS | | | 6,283 | | | | 40,835 | |
BIM Birlesik Magazalar AS | | | 6,020 | | | | 130,526 | |
Emlak Konut Gayrimenkul Yatirim Ortakligi AS | | | 128,568 | | | | 131,047 | |
Ford Otomotiv Sanayi AS | | | 12,472 | | | | 164,510 | |
TAV Havalimanlari Holding AS | | | 16,604 | | | | 99,127 | |
Ulker Biskuvi Sanayi AS | | | 6,948 | | | | 51,573 | |
| | | | | | | | |
| Total Turkey | | | | | | | 617,618 | |
| United Kingdom – 9.7% | | | | | | | | |
ARM Holdings PLC | | | 16,526 | | | | 240,854 | |
Ashmore Group PLC(a) | | | 54,656 | | | | 225,930 | |
Ashtead Group PLC | | | 10,274 | | | | 127,585 | |
Berendsen PLC | | | 6,765 | | | | 116,972 | |
Bovis Homes Group PLC | | | 5,018 | | | | 67,183 | |
Crest Nicholson Holdings PLC | | | 6,718 | | | | 54,362 | |
Croda International PLC | | | 5,774 | | | | 252,206 | |
Daily Mail & General Trust PLC Class A Non-Voting Shares | | | 11,448 | | | | 114,521 | |
Domino’s Pizza Group PLC | | | 3,926 | | | | 56,880 | |
Dunelm Group PLC | | | 4,269 | | | | 56,051 | |
Hammerson PLC | | | 37,964 | | | | 315,662 | |
Hays PLC | | | 40,397 | | | | 70,256 | |
Hikma Pharmaceuticals PLC | | | 2,154 | | | | 61,300 | |
See Notes to Financial Statements.
| | |
| 56 | | WisdomTree Global/Global ex-U.S. and Emerging/Frontier Markets Funds |
Schedule of Investments (concluded)
WisdomTree Global ex-U.S. Quality Dividend Growth Fund (DNL)
March 31, 2016
| | | | | | | | |
| Investments | | Shares | | | Value | |
Howden Joinery Group PLC | | | 11,832 | | | $ | 81,306 | |
IG Group Holdings PLC | | | 17,069 | | | | 196,266 | |
Imperial Brands PLC | | | 49,830 | | | | 2,766,706 | |
ITV PLC | | | 86,254 | | | | 299,023 | |
Jardine Lloyd Thompson Group PLC | | | 6,772 | | | | 82,198 | |
JD Sports Fashion PLC | | | 637 | | | | 10,309 | |
Restaurant Group PLC (The) | | | 7,612 | | | | 42,953 | |
Rightmove PLC | | | 1,427 | | | | 86,369 | |
Rotork PLC | | | 31,659 | | | | 83,180 | |
Smiths Group PLC | | | 20,996 | | | | 324,710 | |
Spirax-Sarco Engineering PLC | | | 1,859 | | | | 97,259 | |
Taylor Wimpey PLC | | | 184,983 | | | | 505,962 | |
Ted Baker PLC | | | 441 | | | | 17,260 | |
Unite Group PLC (The) | | | 7,971 | | | | 72,922 | |
| | | | | | | | |
| Total United Kingdom | | | | | | | 6,426,185 | |
TOTAL COMMON STOCKS (Cost: $62,124,848) | | | | | | | 64,051,498 | |
| EXCHANGE-TRADED FUNDS AND NOTES – 2.5% | | | | | |
| United States – 2.5% | | | | | | | | |
iPath MSCI India Index ETN*(a) | | | 25,588 | | | | 1,606,670 | |
WisdomTree Emerging Markets High Dividend Fund(c) | | | 511 | | | | 17,798 | |
WisdomTree International Equity Fund(c) | | | 577 | | | | 26,421 | |
TOTAL EXCHANGE-TRADED FUNDS AND NOTES (Cost: $1,740,596) | | | | | | | 1,650,889 | |
| INVESTMENT OF CASH COLLATERAL FOR SECURITIES LOANED – 5.2% | |
| United States – 5.2% | | | | | | | | |
State Street Navigator
Securities Lending Prime
Portfolio, 0.50%(d) (Cost: $3,457,503)(e) | | | 3,457,503 | | | | 3,457,503 | |
TOTAL INVESTMENTS IN SECURITIES – 104.7% (Cost: $67,322,947) | | | | | | | 69,159,890 | |
Liabilities in Excess of Cash, Foreign Currency and Other Assets – (4.7)% | | | | | | | (3,134,156 | ) |
| | | | | | | | |
| NET ASSETS – 100.0% | | | | | | $ | 66,025,734 | |
| * | Non-income producing security. |
| (a) | Security, or portion thereof, was on loan at March 31, 2016 (See Note 2). |
| (b) | This security is exempt from registration under rule 144A of the Securities Act of 1933. This security may be sold in transactions that are exempt from registration, normally to qualified institutional buyers. |
| (c) | Affiliated company (See Note 3). |
| (d) | Rate shown represents annualized 7-day yield as of March 31, 2016. |
| (e) | At March 31, 2016, the total market value of the Fund’s securities on loan was $5,692,262 and the total market value of the collateral held by the Fund was $6,162,643. The total market value of the collateral includes non-cash U.S. Government securities collateral having a value of $2,705,140. |
| | | | |
| ADR | | – | | American Depositary Receipt |
| | | | |
| ETN | | – | | Exchange-Traded Note |
| | | | |
| GDR | | – | | Global Depositary Receipt |
| | | | |
| NVDR | | – | | Non-Voting Depositary Receipt |
| | | | |
| Reg S – Regulation S provides an exclusion from the registration requirements of the Securities Act of 1933. These securities may be resold in transactions exempt from registration, normally to qualified institutional buyers. |
See Notes to Financial Statements.
| | | | |
| WisdomTree Global/Global ex-U.S. and Emerging/Frontier Markets Funds | | | 57 | |
Schedule of Investments
WisdomTree Global ex-U.S. Real Estate Fund (DRW)
March 31, 2016
| | | | | | | | |
| Investments | | Shares | | | Value | |
| COMMON STOCKS – 99.6% | | | | | | | | |
| Australia – 13.3% | | | | | | | | |
Abacus Property Group | | | 67,850 | | | $ | 155,537 | |
BWP Trust | | | 74,479 | | | | 195,942 | |
Charter Hall Group | | | 61,748 | | | | 220,398 | |
Charter Hall Retail REIT | | | 60,826 | | | | 214,768 | |
Cromwell Property Group | | | 352,279 | | | | 281,830 | |
Dexus Property Group | | | 147,330 | | | | 899,868 | |
Goodman Group | | | 184,649 | | | | 947,415 | |
GPT Group (The) | | | 230,448 | | | | 886,360 | |
Growthpoint Properties Australia Ltd.(a) | | | 95,604 | | | | 230,926 | |
Investa Office Fund | | | 78,140 | | | | 251,857 | |
LendLease Group | | | 68,698 | | | | 732,973 | |
Mirvac Group | | | 557,832 | | | | 830,332 | |
Scentre Group | | | 761,807 | | | | 2,601,928 | |
Stockland | | | 405,776 | | | | 1,332,851 | |
Vicinity Centres | | | 457,127 | | | | 1,121,747 | |
Westfield Corp. | | | 203,538 | | | | 1,564,150 | |
| | | | | | | | |
| Total Australia | | | | | | | 12,468,882 | |
| Austria – 0.2% | | | | | | | | |
CA Immobilien Anlagen AG* | | | 7,836 | | | | 154,257 | |
| Belgium – 1.0% | | | | | | | | |
Befimmo S.A. | | | 3,716 | | | | 239,084 | |
Cofinimmo S.A. | | | 4,045 | | | | 497,133 | |
Warehouses De Pauw | | | 2,304 | | | | 219,362 | |
| | | | | | | | |
| Total Belgium | | | | | | | 955,579 | |
| Brazil – 0.4% | | | | | | | | |
BR Malls Participacoes S.A. | | | 45,492 | | | | 189,336 | |
Multiplan Empreendimentos Imobiliarios S.A. | | | 11,701 | | | | 177,298 | |
| | | | | | | | |
| Total Brazil | | | | | | | 366,634 | |
| Canada – 7.1% | | | | | | | | |
Allied Properties Real Estate Investment Trust | | | 9,440 | | | | 255,222 | |
Artis Real Estate Investment Trust | | | 30,784 | | | | 305,353 | |
Boardwalk Real Estate Investment Trust | | | 5,406 | | | | 216,457 | |
Brookfield Asset Management, Inc. Class A | | | 36,650 | | | | 1,279,895 | |
Canadian Apartment Properties REIT | | | 13,305 | | | | 297,073 | |
Canadian Real Estate Investment Trust | | | 9,157 | | | | 319,074 | |
Cominar Real Estate Investment Trust | | | 37,337 | | | | 496,499 | |
Dream Office Real Estate Investment Trust | | | 30,255 | | | | 485,362 | |
First Capital Realty, Inc. | | | 30,619 | | | | 488,124 | |
Granite Real Estate Investment Trust | | | 7,920 | | | | 229,067 | |
H&R Real Estate Investment Trust | | | 49,940 | | | | 810,422 | |
RioCan Real Estate Investment Trust | | | 48,109 | | | | 989,369 | |
Smart Real Estate Investment Trust | | | 18,379 | | | | 482,121 | |
| | | | | | | | |
| Total Canada | | | | | | | 6,654,038 | |
| Chile – 0.1% | | | | | | | | |
Parque Arauco S.A. | | | 74,563 | | | | 137,051 | |
| China – 15.7% | | | | | | | | |
China Jinmao Holdings Group Ltd. | | | 1,687,000 | | | | 469,786 | |
China Overseas Land & Investment Ltd. | | | 628,049 | | | | 1,987,817 | |
China Resources Land Ltd. | | | 474,000 | | | | 1,216,082 | |
China South City Holdings Ltd.(a) | | | 1,572,800 | | | | 324,433 | |
China Vanke Co., Ltd. Class H | | | 156,400 | | | | 383,512 | |
CIFI Holdings Group Co., Ltd. | | | 1,735,900 | | | | 416,264 | |
Country Garden Holdings Co., Ltd. | | | 5,062,000 | | | | 2,010,038 | |
Dalian Wanda Commercial Properties Co., Ltd. Class H(b) | | | 42,700 | | | | 252,956 | |
Evergrande Real Estate Group Ltd.(a) | | | 4,601,000 | | | | 3,553,125 | |
Guorui Properties Ltd.(a) | | | 224,000 | | | | 78,261 | |
KWG Property Holding Ltd. | | | 580,500 | | | | 381,683 | |
Logan Property Holdings Co., Ltd. | | | 460,000 | | | | 171,391 | |
Longfor Properties Co., Ltd. | | | 575,000 | | | | 819,888 | |
Poly Property Group Co., Ltd. | | | 323,000 | | | | 88,281 | |
Shenzhen Investment Ltd. | | | 1,012,000 | | | | 401,849 | |
Shimao Property Holdings Ltd. | | | 676,000 | | | | 1,000,507 | |
Shui On Land Ltd. | | | 754,000 | | | | 203,165 | |
Sino-Ocean Land Holdings Ltd. | | | 1,065,200 | | | | 503,998 | |
Sunac China Holdings Ltd. | | | 480,900 | | | | 323,636 | |
Yuexiu Property Co., Ltd. | | | 1,548,000 | | | | 223,522 | |
| | | | | | | | |
| Total China | | | | | | | 14,810,194 | |
| Finland – 0.5% | | | | | | | | |
Citycon Oyj | | | 109,032 | | | | 275,581 | |
Sponda Oyj | | | 39,702 | | | | 167,397 | |
| | | | | | | | |
| Total Finland | | | | | | | 442,978 | |
| France – 8.7% | | | | | | | | |
Fonciere Des Regions | | | 10,016 | | | | 947,911 | |
Gecina S.A. | | | 7,449 | | | | 1,027,110 | |
ICADE | | | 12,261 | | | | 940,597 | |
Klepierre | | | 26,950 | | | | 1,292,928 | |
Mercialys S.A. | | | 16,397 | | | | 381,085 | |
Nexity S.A. | | | 8,810 | | | | 459,756 | |
Unibail-Rodamco SE | | | 11,291 | | | | 3,111,160 | |
| | | | | | | | |
| Total France | | | | | | | 8,160,547 | |
| Germany – 2.8% | | | | | | | | |
alstria office REIT-AG* | | | 8,617 | | | | 124,511 | |
Deutsche Euroshop AG | | | 4,427 | | | | 208,249 | |
Deutsche Wohnen AG Bearer Shares | | | 18,973 | | | | 590,893 | |
LEG Immobilien AG* | | | 4,635 | | | | 437,599 | |
TAG Immobilien AG(a) | | | 16,007 | | | | 216,883 | |
Vonovia SE | | | 28,578 | | | | 1,029,902 | |
| | | | | | | | |
| Total Germany | | | | | | | 2,608,037 | |
| Hong Kong – 18.3% | | | | | | | | |
Champion REIT | | | 850,000 | | | | 432,860 | |
Fortune Real Estate Investment Trust | | | 311,000 | | | | 333,191 | |
Hang Lung Group Ltd. | | | 120,649 | | | | 346,087 | |
Hang Lung Properties Ltd. | | | 544,283 | | | | 1,039,931 | |
Henderson Land Development Co., Ltd. | | | 212,440 | | | | 1,305,060 | |
Hui Xian REIT | | | 703,634 | | | | 337,767 | |
Hysan Development Co., Ltd. | | | 116,115 | | | | 494,756 | |
Link REIT | | | 276,615 | | | | 1,640,457 | |
New World Development Co., Ltd. | | | 1,350,497 | | | | 1,286,677 | |
Sino Land Co., Ltd. | | | 711,735 | | | | 1,126,803 | |
Sun Hung Kai Properties Ltd. | | | 259,810 | | | | 3,177,054 | |
See Notes to Financial Statements.
| | |
| 58 | | WisdomTree Global/Global ex-U.S. and Emerging/Frontier Markets Funds |
Schedule of Investments (continued)
WisdomTree Global ex-U.S. Real Estate Fund (DRW)
March 31, 2016
| | | | | | | | |
| Investments | | Shares | | | Value | |
Swire Pacific Ltd. Class A | | | 116,278 | | | $ | 1,251,744 | |
Swire Properties Ltd. | | | 493,141 | | | | 1,331,946 | |
Wharf Holdings Ltd. (The) | | | 345,872 | | | | 1,890,657 | |
Wheelock & Co., Ltd. | | | 188,231 | | | | 840,864 | |
Yuexiu Real Estate Investment Trust | | | 631,000 | | | | 350,621 | |
| | | | | | | | |
| Total Hong Kong | | | | | | | 17,186,475 | |
| Indonesia – 0.3% | | | | | | | | |
Bumi Serpong Damai Tbk PT | | | 541,224 | | | | 74,898 | |
Lippo Karawaci Tbk PT | | | 1,720,400 | | | | 135,582 | |
Summarecon Agung Tbk PT | | | 665,600 | | | | 79,561 | |
| | | | | | | | |
| Total Indonesia | | | | | | | 290,041 | |
| Ireland – 0.1% | | | | | | | | |
Green REIT PLC | | | 36,741 | | | | 59,076 | |
| Israel – 0.7% | | | | | | | | |
Azrieli Group Ltd. | | | 6,947 | | | | 272,558 | |
Gazit-Globe Ltd. | | | 24,475 | | | | 223,234 | |
Melisron Ltd. | | | 4,492 | | | | 161,662 | |
| | | | | | | | |
| Total Israel | | | | | | | 657,454 | |
| Italy – 0.2% | | | | | | | | |
Beni Stabili SpA SIIQ | | | 225,254 | | | | 169,286 | |
| Japan – 4.6% | | | | | | | | |
Aeon Mall Co., Ltd. | | | 4,930 | | | | 73,120 | |
Daito Trust Construction Co., Ltd. | | | 7,300 | | | | 1,037,893 | |
Daiwa House Industry Co., Ltd. | | | 41,200 | | | | 1,160,543 | |
Hulic Co., Ltd. | | | 20,400 | | | | 195,297 | |
Mitsubishi Estate Co., Ltd. | | | 23,589 | | | | 438,746 | |
Mitsui Fudosan Co., Ltd. | | | 27,308 | | | | 682,244 | |
Nomura Real Estate Holdings, Inc. | | | 11,365 | | | | 210,322 | |
NTT Urban Development Corp. | | | 13,600 | | | | 133,223 | |
Sumitomo Realty & Development Co., Ltd. | | | 9,279 | | | | 271,943 | |
Tokyu Fudosan Holdings Corp. | | | 22,968 | | | | 156,124 | |
| | | | | | | | |
| Total Japan | | | | | | | 4,359,455 | |
| Malaysia – 1.2% | | | | | | | | |
IGB Real Estate Investment Trust | | | 263,900 | | | | 103,490 | |
IOI Properties Group Bhd | | | 251,900 | | | | 149,145 | |
KLCCP Stapled Group | | | 172,800 | | | | 317,121 | |
SP Setia Bhd Group | | | 175,555 | | | | 140,840 | |
Sunway Bhd | | | 185,500 | | | | 149,294 | |
Sunway Real Estate Investment Trust | | | 446,796 | | | | 183,231 | |
UEM Sunrise Bhd | | | 349,000 | | | | 101,976 | |
| | | | | | | | |
| Total Malaysia | | | | | | | 1,145,097 | |
| Mexico – 1.6% | | | | | | | | |
Concentradora Fibra Danhos S.A. de C.V. | | | 76,721 | | | | 160,983 | |
Fibra Uno Administracion S.A. de C.V. | | | 430,033 | | | | 1,007,724 | |
Macquarie Mexico Real Estate Management S.A. de C.V.* | | | 125,838 | | | | 171,012 | |
PLA Administradora Industrial S de RL de C.V.* | | | 106,302 | | | | 198,676 | |
| | | | | | | | |
| Total Mexico | | | | | | | 1,538,395 | |
| Netherlands – 0.6% | | | | | | | | |
Eurocommercial Properties N.V. CVA | | | 5,680 | | | | 266,220 | |
Wereldhave N.V. | | | 5,228 | | | | 292,815 | |
| | | | | | | | |
| Total Netherlands | | | | | | | 559,035 | |
| New Zealand – 0.2% | | | | | | | | |
Kiwi Property Group Ltd. | | | 178,216 | | | | 178,798 | |
| Norway – 0.2% | | | | | | | | |
Entra ASA(b) | | | 20,885 | | | | 196,951 | |
| Philippines – 0.9% | | | | | | | | |
Ayala Land, Inc. | | | 458,700 | | | | 351,160 | |
Robinsons Land Corp. | | | 137,400 | | | | 83,255 | |
SM Prime Holdings, Inc. | | | 777,375 | | | | 370,580 | |
| | | | | | | | |
| Total Philippines | | | | | | | 804,995 | |
| Singapore – 7.8% | | | | | | | | |
Ascendas Real Estate Investment Trust | | | 443,084 | | | | 786,403 | |
Ascott Residence Trust(a) | | | 291,373 | | | | 231,523 | |
CapitaLand Commercial Trust Ltd. | | | 548,635 | | | | 598,911 | |
CapitaLand Ltd. | | | 347,289 | | | | 791,755 | |
CapitaLand Mall Trust | | | 558,086 | | | | 866,181 | |
City Developments Ltd. | | | 46,203 | | | | 280,320 | |
Frasers Centrepoint Trust(a) | | | 145,500 | | | | 216,100 | |
Global Logistic Properties Ltd. | | | 334,500 | | | | 478,177 | |
Keppel REIT | | | 455,600 | | | | 336,642 | |
Mapletree Commercial Trust | | | 398,690 | | | | 417,461 | |
Mapletree Greater China Commercial Trust | | | 525,500 | | | | 372,681 | |
Mapletree Industrial Trust | | | 366,218 | | | | 433,772 | |
Mapletree Logistics Trust | | | 535,487 | | | | 401,635 | |
SPH REIT | | | 269,600 | | | | 193,201 | |
Starhill Global REIT | | | 394,584 | | | | 228,558 | |
Suntec Real Estate Investment Trust | | | 440,628 | | | | 548,085 | |
UOL Group Ltd. | | | 43,800 | | | | 195,158 | |
| | | | | | | | |
| Total Singapore | | | | | | | 7,376,563 | |
| South Africa – 2.3% | | | | | | | | |
Fortress Income Fund Ltd.(a) | | | 120,777 | | | | 293,977 | |
Fortress Income Fund Ltd. Class A | | | 155,759 | | | | 166,370 | |
Growthpoint Properties Ltd. | | | 353,346 | | | | 590,272 | |
Hyprop Investments Ltd. | | | 33,570 | | | | 268,574 | |
Redefine Properties Ltd. | | | 678,121 | | | | 552,345 | |
Resilient REIT Ltd. | | | 32,732 | | | | 301,638 | |
| | | | | | | | |
| Total South Africa | | | | | | | 2,173,176 | |
| Sweden – 1.5% | | | | | | | | |
Atrium Ljungberg AB Class B | | | 8,387 | | | | 145,358 | |
Castellum AB | | | 15,894 | | | | 253,113 | |
Fabege AB | | | 12,581 | | | | 212,769 | |
Hemfosa Fastigheter AB | | | 10,710 | | | | 117,911 | |
Hufvudstaden AB Class A | | | 19,304 | | | | 306,466 | |
Kungsleden AB | | | 11,175 | | | | 79,263 | |
Wallenstam AB Class B | | | 19,161 | | | | 165,925 | |
Wihlborgs Fastigheter AB | | | 5,884 | | | | 125,131 | |
| | | | | | | | |
| Total Sweden | | | | | | | 1,405,936 | |
| Switzerland – 1.3% | | | | | | | | |
PSP Swiss Property AG Registered Shares | | | 5,023 | | | | 485,174 | |
See Notes to Financial Statements.
| | | | |
| WisdomTree Global/Global ex-U.S. and Emerging/Frontier Markets Funds | | | 59 | |
Schedule of Investments (concluded)
WisdomTree Global ex-U.S. Real Estate Fund (DRW)
March 31, 2016
| | | | | | | | |
| Investments | | Shares | | | Value | |
Swiss Prime Site AG Registered Shares* | | | 8,507 | | | $ | 753,296 | |
| | | | | | | | |
| Total Switzerland | | | | | | | 1,238,470 | |
| Taiwan – 0.8% | | | | | | | | |
Highwealth Construction Corp. | | | 229,110 | | | | 334,581 | |
Ruentex Development Co., Ltd. | | | 318,954 | | | | 403,846 | |
| | | | | | | | |
| Total Taiwan | | | | | | | 738,427 | |
| Thailand – 1.2% | | | | | | | | |
Central Pattana PCL NVDR | | | 193,574 | | | | 283,373 | |
Land & Houses PCL NVDR | | | 2,554,511 | | | | 649,883 | |
Pruksa Real Estate PCL NVDR | | | 318,893 | | | | 244,744 | |
| | | | | | | | |
| Total Thailand | | | | | | | 1,178,000 | |
| Turkey – 0.4% | | | | | | | | |
Emlak Konut Gayrimenkul Yatirim Ortakligi AS | | | 370,886 | | | | 378,038 | |
| United Kingdom – 5.6% | | | | | | | | |
Big Yellow Group PLC | | | 12,877 | | | | 143,345 | |
British Land Co. PLC (The) | | | 98,579 | | | | 992,522 | |
Capital & Counties Properties PLC | | | 17,019 | | | | 80,674 | |
Countrywide PLC | | | 20,715 | | | | 114,807 | |
Derwent London PLC | | | 3,584 | | | | 162,368 | |
Foxtons Group PLC | | | 27,728 | | | | 64,862 | |
Great Portland Estates PLC | | | 15,464 | | | | 161,808 | |
Hammerson PLC | | | 81,178 | | | | 674,977 | |
Hansteen Holdings PLC(a) | | | 88,221 | | | | 134,915 | |
Intu Properties PLC | | | 154,867 | | | | 696,708 | |
Land Securities Group PLC | | | 57,837 | | | | 915,252 | |
Londonmetric Property PLC | | | 62,899 | | | | 143,382 | |
Savills PLC | | | 11,181 | | | | 122,135 | |
Segro PLC | | | 71,477 | | | | 421,517 | |
Shaftesbury PLC | | | 17,918 | | | | 234,615 | |
Unite Group PLC (The) | | | 18,109 | | | | 165,669 | |
Workspace Group PLC | | | 7,035 | | | | 79,172 | |
| | | | | | | | |
| Total United Kingdom | | | | | | | 5,308,728 | |
TOTAL COMMON STOCKS (Cost: $93,785,774) | | | | | | | 93,700,593 | |
| EXCHANGE-TRADED FUNDS AND NOTES – 0.1% | |
| United States – 0.1% | | | | | | | | |
iPath MSCI India Index ETN* | | | 340 | | | | 21,348 | |
WisdomTree Global Natural Resources Fund(c) | | | 4,718 | | | | 55,286 | |
TOTAL EXCHANGE-TRADED FUNDS AND NOTES (Cost: $75,874) | | | | | | | 76,634 | |
| INVESTMENT OF CASH COLLATERAL FOR SECURITIES LOANED – 3.9% | |
| United States – 3.9% | | | | | | | | |
State Street Navigator Securities Lending Prime Portfolio, 0.50%(d) (Cost: $3,611,625)(e) | | | 3,611,625 | | | | 3,611,625 | |
TOTAL INVESTMENTS IN SECURITIES – 103.6% (Cost: $97,473,273) | | | | 97,388,852 | |
Liabilities in Excess of Cash, Foreign Currency and Other Assets – (3.6)% | | | | | | | (3,344,796 | ) |
| | | | | | | | |
| NET ASSETS – 100.0% | | | | | | $ | 94,044,056 | |
| * | Non-income producing security. |
| (a) | Security, or portion thereof, was on loan at March 31, 2016 (See Note 2). |
| (b) | This security is exempt from registration under rule 144A of the Securities Act of 1933. This security may be sold in transactions that are exempt from registration, normally to qualified institutional buyers. |
| (c) | Affiliated company (See Note 3). |
| (d) | Rate shown represents annualized 7-day yield as of March 31, 2016. |
| (e) | At March 31, 2016, the total market value of the Fund’s securities on loan was $4,021,658 and the total market value of the collateral held by the Fund was $4,414,345. The total market value of the collateral includes non-cash U.S. Government securities collateral having a value of $802,720. |
| | | | |
| CVA – Certificaten Van Aandelen (Certificate of Stock) |
| | | | |
| ETN – Exchange-Traded Note |
| | | | |
| NVDR – Non-Voting Depositary Receipt |
| | | | | | | | | | | | | | | | | | | | |
| FINANCIAL DERIVATIVE INSTRUMENTS | |
| FORWARD CONTRACTS | |
Settlement
Date | | Contracts
To Deliver | | | In
Exchange For | | | Unrealized
Gain (Loss) | |
4/4/2016 | | | EUR | | | | 6,454 | | | | USD | | | | 7,347 | | | $ | (8 | ) |
4/4/2016 | | | ZAR | | | | 358,389 | | | | USD | | | | 24,376 | | | | 9 | |
| | | | | | | | | | | | | | | | | | | $ | 1 | |
| | |
| CURRENCY LEGEND | | | | | | | |
EUR – Euro
USD – U.S. dollar
ZAR – South African rand
See Notes to Financial Statements.
| | |
| 60 | | WisdomTree Global/Global ex-U.S. and Emerging/Frontier Markets Funds |
Schedule of Investments
WisdomTree Global ex-U.S. Utilities Fund (DBU)
March 31, 2016
| | | | | | | | |
| Investments | | Shares | | | Value | |
| COMMON STOCKS – 98.7% | | | | | | | | |
| Australia – 1.5% | | | | | | | | |
AGL Energy Ltd. | | | 16,347 | | | $ | 231,379 | |
| Austria – 0.7% | | | | | | | | |
Verbund AG(a) | | | 8,586 | | | | 109,876 | |
| Belgium – 0.6% | | | | | | | | |
Elia System Operator S.A./N.V. | | | 1,947 | | | | 96,991 | |
| Brazil – 5.2% | | | | | | | | |
Cia de Saneamento Basico do Estado de Sao Paulo | | | 24,530 | | | | 165,979 | |
EDP – Energias do Brasil S.A. | | | 56,616 | | | | 201,287 | |
Equatorial Energia S.A. | | | 12,334 | | | | 142,551 | |
Tractebel Energia S.A. | | | 27,849 | | | | 288,234 | |
| | | | | | | | |
| Total Brazil | | | | | | | 798,051 | |
| Canada – 10.4% | | | | | | | | |
Algonquin Power & Utilities Corp.(a) | | | 18,717 | | | | 157,295 | |
Atco Ltd. Class I | | | 3,874 | | | | 117,647 | |
Canadian Utilities Ltd. Class A | | | 5,464 | | | | 153,556 | |
Capital Power Corp.(a) | | | 13,028 | | | | 181,301 | |
Emera, Inc. | | | 5,365 | | | | 197,187 | |
Fortis, Inc. | | | 5,445 | | | | 171,376 | |
Northland Power, Inc.(a) | | | 13,400 | | | | 221,909 | |
Superior Plus Corp. | | | 13,342 | | | | 95,311 | |
TransAlta Corp. | | | 62,047 | | | | 289,740 | |
| | | | | | | | |
| Total Canada | | | | | | | 1,585,322 | |
| Chile – 3.5% | | | | | | | | |
Aguas Andinas S.A. Class A | | | 151,213 | | | | 86,537 | |
Colbun S.A. | | | 219,558 | | | | 61,266 | |
E.CL S.A. | | | 38,438 | | | | 63,048 | |
Empresa Nacional de Electricidad S.A. | | | 98,276 | | | | 136,915 | |
Enersis Americas S.A. | | | 653,157 | | | | 181,174 | |
| | | | | | | | |
| Total Chile | | | | | | | 528,940 | |
| China – 9.7% | | | | | | | | |
Beijing Enterprises Water Group Ltd.(a) | | | 56,000 | | | | 35,088 | |
Beijing Jingneng Clean Energy Co., Ltd. Class H | | | 326,000 | | | | 104,232 | |
China Gas Holdings Ltd. | | | 48,000 | | | | 70,794 | |
China Longyuan Power Group Corp., Ltd. Class H | | | 38,100 | | | | 28,195 | |
China Power International Development Ltd. | | | 279,000 | | | | 144,598 | |
China Resources Gas Group Ltd. | | | 24,000 | | | | 68,536 | |
China Resources Power Holdings Co., Ltd. | | | 92,100 | | | | 172,170 | |
CT Environmental Group Ltd.(a) | | | 70,000 | | | | 20,576 | |
Datang International Power Generation Co., Ltd. Class H | | | 658,000 | | | | 202,747 | |
Guangdong Investment Ltd. | | | 96,600 | | | | 122,174 | |
Huadian Fuxin Energy Corp., Ltd. Class H | | | 264,000 | | | | 61,605 | |
Huadian Power International Corp., Ltd. Class H | | | 324,000 | | | | 206,349 | |
Huaneng Power International, Inc. Class H | | | 234,640 | | | | 209,939 | |
Huaneng Renewables Corp., Ltd. Class H | | | 106,000 | | | | 32,935 | |
| | | | | | | | |
| Total China | | | | | | | 1,479,938 | |
| Czech Republic – 2.0% | | | | | | | | |
CEZ AS | | | 16,984 | | | | 300,023 | |
| Finland – 2.5% | | | | | | | | |
Fortum Oyj(a) | | | 25,056 | | | | 380,035 | |
| France – 7.0% | | | | | | | | |
Electricite de France S.A. | | | 19,899 | | | | 223,675 | |
Engie S.A. | | | 20,222 | | | | 314,320 | |
Rubis SCA | | | 1,863 | | | | 149,819 | |
Suez Environnement Co. | | | 10,499 | | | | 192,862 | |
Veolia Environnement S.A. | | | 7,413 | | | | 178,833 | |
| | | | | | | | |
| Total France | | | | | | | 1,059,509 | |
| Germany – 2.0% | | | | | | | | |
E.ON SE | | | 31,134 | | | | 299,370 | |
| Hong Kong – 3.3% | | | | | | | | |
CLP Holdings Ltd. | | | 22,822 | | | | 206,402 | |
Hong Kong & China Gas Co., Ltd. | | | 56,645 | | | | 105,891 | |
Power Assets Holdings Ltd. | | | 18,886 | | | | 193,205 | |
| | | | | | | | |
| Total Hong Kong | | | | | | | 505,498 | |
| Indonesia – 1.6% | | | | | | | | |
Perusahaan Gas Negara Persero Tbk | | | 1,247,000 | | | | 245,920 | |
| Italy – 8.8% | | | | | | | | |
A2A SpA | | | 119,004 | | | | 155,004 | |
Enel Green Power SpA | | | 46,705 | | | | 100,591 | |
Enel SpA | | | 37,301 | | | | 165,690 | |
Hera SpA | | | 56,444 | | | | 168,906 | |
Iren SpA | | | 92,017 | | | | 165,151 | |
Snam SpA | | | 52,321 | | | | 328,221 | |
Terna Rete Elettrica Nazionale SpA | | | 45,749 | | | | 261,449 | |
| | | | | | | | |
| Total Italy | | | | | | | 1,345,012 | |
| Japan – 4.8% | | | | | | | | |
Chubu Electric Power Co., Inc. | | | 3,700 | | | | 51,733 | |
Chugoku Electric Power Co., Inc. (The)(a) | | | 10,300 | | | | 139,295 | |
Electric Power Development Co., Ltd. | | | 2,842 | | | | 88,880 | |
Hokuriku Electric Power Co. | | | 10,600 | | | | 150,236 | |
Osaka Gas Co., Ltd.(a) | | | 28,000 | | | | 107,720 | |
Toho Gas Co., Ltd.(a) | | | 11,000 | | | | 78,197 | |
Tohoku Electric Power Co., Inc. | | | 3,000 | | | | 38,756 | |
Tokyo Gas Co., Ltd. | | | 17,000 | | | | 79,362 | |
| | | | | | | | |
| Total Japan | | | | | | | 734,179 | |
| Malaysia – 1.9% | | | | | | | | |
Petronas Gas Bhd | | | 25,600 | | | | 144,355 | |
Tenaga Nasional Bhd | | | 38,900 | | | | 138,989 | |
| | | | | | | | |
| Total Malaysia | | | | | | | 283,344 | |
| Mexico – 1.0% | | | | | | | | |
Infraestructura Energetica Nova S.A.B. de C.V.(a) | | | 36,917 | | | | 152,146 | |
| New Zealand – 4.2% | | | | | | | | |
Contact Energy Ltd. | | | 91,843 | | | | 318,833 | |
Meridian Energy Ltd. | | | 178,667 | | | | 325,007 | |
| | | | | | | | |
| Total New Zealand | | | | | | | 643,840 | |
| Philippines – 2.2% | | | | | | | | |
Aboitiz Power Corp. | | | 96,900 | | | | 92,491 | |
Energy Development Corp. | | | 631,000 | | | | 80,580 | |
See Notes to Financial Statements.
| | | | |
| WisdomTree Global/Global ex-U.S. and Emerging/Frontier Markets Funds | | | 61 | |
Schedule of Investments (concluded)
WisdomTree Global ex-U.S. Utilities Fund (DBU)
March 31, 2016
| | | | | | | | |
| Investments | | Shares | | | Value | |
Manila Electric Co. | | | 23,610 | | | $ | 165,621 | |
| | | | | | | | |
| Total Philippines | | | | | | | 338,692 | |
| Poland – 3.4% | | | | | | | | |
Energa S.A. | | | 32,269 | | | | 113,664 | |
PGE Polska Grupa Energetyczna S.A. | | | 74,287 | | | | 279,033 | |
Tauron Polska Energia S.A. | | | 163,600 | | | | 132,308 | |
| | | | | | | | |
| Total Poland | | | | | | | 525,005 | |
| Portugal – 1.4% | | | | | | | | |
EDP-Energias de Portugal S.A. | | | 59,684 | | | | 212,608 | |
| Russia – 0.2% | | | | | | | | |
RusHydro PJSC ADR | | | 26,850 | | | | 26,984 | |
| Singapore – 0.4% | | | | | | | | |
Keppel Infrastructure Trust | | | 174,900 | | | | 64,292 | |
| South Korea – 0.6% | | | | | | | | |
Korea Electric Power Corp. | | | 1,235 | | | | 65,011 | |
Korea Gas Corp. | | | 929 | | | | 31,154 | |
| | | | | | | | |
| Total South Korea | | | | | | | 96,165 | |
| Spain – 7.3% | | | | | | | | |
EDP Renovaveis S.A. | | | 4,756 | | | | 36,366 | |
Enagas S.A. | | | 8,362 | | | | 251,707 | |
Endesa S.A. | | | 9,000 | | | | 173,018 | |
Gas Natural SDG S.A. | | | 11,677 | | | | 236,457 | |
Iberdrola S.A. | | | 31,788 | | | | 212,309 | |
Red Electrica Corp. S.A. | | | 2,248 | | | | 195,458 | |
| | | | | | | | |
| Total Spain | | | | | | | 1,105,315 | |
| Thailand – 1.0% | | | | | | | | |
Electricity Generating PCL NVDR | | | 14,546 | | | | 73,805 | |
Glow Energy PCL | | | 28,500 | | | | 74,531 | |
| | | | | | | | |
| Total Thailand | | | | | | | 148,336 | |
| United Kingdom – 11.5% | | | | | | | | |
Centrica PLC | | | 76,935 | | | | 251,788 | |
Drax Group PLC(a) | | | 63,403 | | | | 247,962 | |
National Grid PLC | | | 17,641 | | | | 250,309 | |
Pennon Group PLC | | | 17,378 | | | | 202,567 | |
Severn Trent PLC | | | 6,173 | | | | 192,798 | |
SSE PLC | | | 13,540 | | | | 290,359 | |
Telecom Plus PLC | | | 9,166 | | | | 121,269 | |
United Utilities Group PLC | | | 14,984 | | | | 198,782 | |
| | | | | | | | |
| Total United Kingdom | | | | | | | 1,755,834 | |
TOTAL COMMON STOCKS (Cost: $18,033,621) | | | | | | | 15,052,604 | |
| EXCHANGE-TRADED FUNDS AND NOTES – 1.0% | | | | | | | | |
| United States – 1.0% | | | | | | | | |
iPath MSCI India Index ETN*(a) | | | 2,361 | | | | 148,247 | |
WisdomTree Global ex-U.S. Real Estate Fund(a)(b) | | | 161 | | | | 4,389 | |
TOTAL EXCHANGE-TRADED FUNDS AND NOTES (Cost: $144,301) | | | | | | | 152,636 | |
| INVESTMENT OF CASH COLLATERAL FOR SECURITIES LOANED – 9.4% | |
| United States – 9.4% | | | | | | | | |
State Street Navigator Securities Lending Prime Portfolio, 0.50%(c) | | | | | | | | |
| (Cost: $1,443,263)(d) | | | 1,443,263 | | | | 1,443,263 | |
TOTAL INVESTMENTS IN SECURITIES – 109.1% (Cost: $19,621,185) | | | | | | | 16,648,503 | |
Liabilities in Excess of Cash, Foreign Currency and
Other Assets – (9.1)% | | | | | | | (1,393,889 | ) |
| | | | | | | | |
| NET ASSETS – 100.0% | | | | | | $ | 15,254,614 | |
| * | Non-income producing security. |
| (a) | Security, or portion thereof, was on loan at March 31, 2016 (See Note 2). |
| (b) | Affiliated company (See Note 3). |
| (c) | Rate shown represents annualized 7-day yield as of March 31, 2016. |
| (d) | At March 31, 2016, the total market value of the Fund’s securities on loan was $1,784,892 and the total market value of the collateral held by the Fund was $1,902,446. The total market value of the collateral includes non-cash U.S. Government securities collateral having a value of $459,183. |
| | | | |
| ADR – American Depositary Receipt |
| ETN – Exchange-Traded Note |
| NVDR – Non-Voting Depositary Receipt |
See Notes to Financial Statements.
| | |
| 62 | | WisdomTree Global/Global ex-U.S. and Emerging/Frontier Markets Funds |
Schedule of Investments
WisdomTree Global High Dividend Fund (DEW)
March 31, 2016
| | | | | | | | |
| Investments | | Shares | | | Value | |
| | | | | | | | |
| COMMON STOCKS – 99.5% | | | | | | | | |
| Australia – 4.2% | | | | | | | | |
AGL Energy Ltd. | | | 3,163 | | | $ | 44,770 | |
Alumina Ltd.(a) | | | 33,919 | | | | 33,920 | |
Amcor Ltd. | | | 6,078 | | | | 67,093 | |
AMP Ltd. | | | 7,602 | | | | 33,859 | |
ASX Ltd. | | | 1,240 | | | | 39,519 | |
Aurizon Holdings Ltd. | | | 10,505 | | | | 32,001 | |
Australia & New Zealand Banking Group Ltd. | | | 15,026 | | | | 271,168 | |
Bank of Queensland Ltd. | | | 3,563 | | | | 33,219 | |
Bendigo & Adelaide Bank Ltd. | | | 5,745 | | | | 39,200 | |
BHP Billiton Ltd. | | | 12,343 | | | | 160,083 | |
Challenger Ltd. | | | 6,595 | | | | 42,564 | |
CIMIC Group Ltd. | | | 1,686 | | | | 45,082 | |
Commonwealth Bank of Australia | | | 8,390 | | | | 483,534 | |
Crown Resorts Ltd. | | | 2,843 | | | | 27,250 | |
Insurance Australia Group Ltd. | | | 3,090 | | | | 13,264 | |
Macquarie Group Ltd. | | | 2,057 | | | | 104,577 | |
National Australia Bank Ltd. | | | 13,244 | | | | 267,332 | |
Origin Energy Ltd. | | | 12,783 | | | | 50,052 | |
Rio Tinto Ltd. | | | 1,862 | | | | 61,147 | |
Santos Ltd. | | | 7,323 | | | | 22,702 | |
Sonic Healthcare Ltd. | | | 2,410 | | | | 34,816 | |
Suncorp Group Ltd. | | | 6,704 | | | | 61,420 | |
Tabcorp Holdings Ltd. | | | 7,136 | | | | 23,494 | |
Tatts Group Ltd. | | | 16,630 | | | | 48,356 | |
Telstra Corp., Ltd. | | | 72,202 | | | | 296,035 | |
Wesfarmers Ltd. | | | 4,420 | | | | 140,933 | |
Westpac Banking Corp. | | | 16,762 | | | | 391,338 | |
Woodside Petroleum Ltd. | | | 6,143 | | | | 122,674 | |
Woolworths Ltd. | | | 4,204 | | | | 71,470 | |
| | | | | | | | |
| Total Australia | | | | 3,062,872 | |
| Austria – 0.1% | | | | | | | | |
Oesterreichische Post AG | | | 659 | | | | 26,832 | |
OMV AG | | | 1,600 | | | | 45,081 | |
Vienna Insurance Group AG Wiener Versicherung Gruppe | | | 236 | | | | 5,002 | |
| | | | | | | | |
| Total Austria | | | | 76,915 | |
| Belgium – 0.3% | | | | | | | | |
Ageas | | | 1,145 | | | | 45,498 | |
Cofinimmo S.A. | | | 272 | | | | 33,429 | |
Elia System Operator S.A./N.V. | | | 879 | | | | 43,788 | |
Euronav N.V. | | | 2,232 | | | | 22,868 | |
Proximus SADP | | | 1,568 | | | | 53,667 | |
Solvay S.A. | | | 344 | | | | 34,555 | |
| | | | | | | | |
| Total Belgium | | | | 233,805 | |
| Brazil – 1.3% | | | | | | | | |
Ambev S.A. | | | 45,267 | | | | 240,385 | |
Banco Bradesco S.A.* | | | 12,359 | | | | 104,898 | |
Banco do Brasil S.A. | | | 12,149 | | | | 67,773 | |
Banco Santander Brasil S.A. | | | 27,146 | | | | 129,832 | |
BB Seguridade Participacoes S.A. | | | 2,653 | | | | 22,233 | |
| | | | | | | | |
BM&FBovespa S.A. – Bolsa de Valores Mercadorias e Futuros | | | 13,905 | | | $ | 60,344 | |
CETIP S.A. – Mercados Organizados | | | 6,244 | | | | 70,738 | |
Itau Unibanco Holding S.A. | | | 5,353 | | | | 40,344 | |
Natura Cosmeticos S.A. | | | 5,815 | | | | 43,547 | |
Porto Seguro S.A. | | | 1,485 | | | | 11,414 | |
Tractebel Energia S.A. | | | 6,788 | | | | 70,255 | |
Vale S.A. | | | 14,259 | | | | 60,955 | |
| | | | | | | | |
| Total Brazil | | | | 922,718 | |
| Canada – 3.4% | | | | | | | | |
Agrium, Inc.(a) | | | 594 | | | | 52,661 | |
AltaGas Ltd.(a) | | | 1,426 | | | | 36,823 | |
Bank of Montreal | | | 2,770 | | | | 168,905 | |
Bank of Nova Scotia (The) | | | 4,205 | | | | 206,341 | |
BCE, Inc. | | | 3,882 | | | | 177,645 | |
Canadian Imperial Bank of Commerce | | | 1,886 | | | | 141,466 | |
Canadian Natural Resources Ltd. | | | 3,462 | | | | 94,028 | |
Cenovus Energy, Inc. | | | 1,535 | | | | 20,056 | |
CI Financial Corp.(a) | | | 1,788 | | | | 39,673 | |
Crescent Point Energy Corp.(a) | | | 2,139 | | | | 29,734 | |
Emera, Inc. | | | 940 | | | | 34,549 | |
Enbridge, Inc. | | | 2,851 | | | | 111,443 | |
Encana Corp. | | | 4,073 | | | | 24,940 | |
Finning International, Inc. | | | 1,222 | | | | 18,017 | |
Goldcorp, Inc. | | | 3,666 | | | | 59,718 | |
Great-West Lifeco, Inc. | | | 3,315 | | | | 91,598 | |
Keyera Corp. | | | 1,090 | | | | 33,219 | |
National Bank of Canada | | | 1,057 | | | | 34,723 | |
Pembina Pipeline Corp.(a) | | | 1,565 | | | | 42,481 | |
Peyto Exploration & Development Corp.(a) | | | 1,090 | | | | 24,346 | |
Potash Corp. of Saskatchewan, Inc. | | | 4,590 | | | | 78,461 | |
Power Corp. of Canada | | | 1,804 | | | | 41,786 | |
Power Financial Corp.(a) | | | 2,430 | | | | 61,001 | |
RioCan Real Estate Investment Trust | | | 2,378 | | | | 48,904 | |
Rogers Communications, Inc. Class B | | | 1,771 | | | | 71,199 | |
Royal Bank of Canada | | | 5,220 | | | | 301,993 | |
Shaw Communications, Inc. Class B(a) | | | 1,688 | | | | 32,743 | |
Teck Resources Ltd. Class B(a) | | | 5,457 | | | | 41,557 | |
TELUS Corp. | | | 2,073 | | | | 67,762 | |
Toronto-Dominion Bank (The) | | | 5,896 | | | | 255,541 | |
TransCanada Corp.(a) | | | 2,293 | | | | 90,518 | |
| | | | | | | | |
| Total Canada | | | | 2,533,831 | |
| Chile – 0.2% | | | | | | | | |
AES Gener S.A. | | | 17,745 | | | | 8,982 | |
Banco de Chile | | | 750,895 | | | | 80,876 | |
Banco Santander Chile | | | 1,379,789 | | | | 67,188 | |
| | | | | | | | |
| Total Chile | | | | 157,046 | |
| China – 3.3% | | | | | | | | |
Agricultural Bank of China Ltd. Class H | | | 161,074 | | | | 57,938 | |
Bank of China Ltd. Class H | | | 424,366 | | | | 176,168 | |
Bank of Communications Co., Ltd. Class H | | | 156,125 | | | | 102,654 | |
Belle International Holdings Ltd. | | | 73,000 | | | | 42,257 | |
See Notes to Financial Statements.
| | | | |
| WisdomTree Global/Global ex-U.S. and Emerging/Frontier Markets Funds | | | 63 | |
Schedule of Investments (continued)
WisdomTree Global High Dividend Fund (DEW)
March 31, 2016
| | | | | | | | |
| Investments | | Shares | | | Value | |
| | | | | | | | |
China Construction Bank Corp. Class H | | | 1,277,536 | | | $ | 815,286 | |
China Everbright Bank Co., Ltd. Class H | | | 67,000 | | | | 32,565 | |
China Hongqiao Group Ltd.(a) | | | 48,500 | | | | 33,702 | |
China Jinmao Holdings Group Ltd. | | | 105,447 | | | | 29,364 | |
China Merchants Bank Co., Ltd. Class H | | | 25,027 | | | | 52,593 | |
China Petroleum & Chemical Corp. Class H | | | 110,000 | | | | 72,184 | |
China Power International Development Ltd. | | | 31,224 | | | | 16,183 | |
China Resources Power Holdings Co., Ltd. | | | 21,575 | | | | 40,332 | |
China Shenhua Energy Co., Ltd. Class H | | | 9,500 | | | | 14,942 | |
China Vanke Co., Ltd. Class H | | | 6,800 | | | | 16,674 | |
China Zhongwang Holdings Ltd.(a) | | | 50,000 | | | | 24,689 | |
CNOOC Ltd. | | | 187,415 | | | | 221,325 | |
Country Garden Holdings Co., Ltd. | | | 181,000 | | | | 71,872 | |
Evergrande Real Estate Group Ltd.(a) | | | 135,000 | | | | 104,254 | |
Great Wall Motor Co., Ltd. Class H | | | 8,597 | | | | 6,983 | |
Huaneng Power International, Inc. Class H | | | 30,137 | | | | 26,964 | |
Industrial & Commercial Bank of China Ltd. Class H | | | 447,000 | | | | 250,109 | |
Kunlun Energy Co., Ltd. | | | 20,000 | | | | 17,379 | |
Lenovo Group Ltd. | | | 38,000 | | | | 29,590 | |
PetroChina Co., Ltd. Class H | | | 36,000 | | | | 23,949 | |
Shenzhen Investment Ltd. | | | 48,000 | | | | 19,060 | |
Shimao Property Holdings Ltd. | | | 27,000 | | | | 39,961 | |
Sino-Ocean Land Holdings Ltd. | | | 44,775 | | | | 21,185 | |
Yangzijiang Shipbuilding Holdings Ltd. | | | 52,200 | | | | 37,989 | |
| | | | | | | | |
| Total China | | | | 2,398,151 | |
| Czech Republic – 0.1% | | | | | | | | |
CEZ AS | | | 1,771 | | | | 31,285 | |
Komercni Banka AS | | | 253 | | | | 55,959 | |
O2 Czech Republic AS | | | 1,520 | | | | 16,041 | |
| | | | | | | | |
| Total Czech Republic | | | | 103,285 | |
| Denmark – 0.1% | | | | | | | | |
TDC A/S | | | 2,693 | | | | 13,201 | |
Tryg A/S | | | 1,442 | | | | 28,033 | |
| | | | | | | | |
| Total Denmark | | | | 41,234 | |
| Finland – 0.6% | | | | | | | | |
Elisa Oyj(a) | | | 1,850 | | | | 72,036 | |
Fortum Oyj(a) | | | 2,090 | | | | 31,700 | |
Kesko Oyj Class B | | | 710 | | | | 31,400 | |
Kone Oyj Class B | | | 968 | | | | 46,727 | |
Metso Oyj(a) | | | 812 | | | | 19,404 | |
Nokian Renkaat Oyj(a) | | | 684 | | | | 24,179 | |
Sampo Oyj Class A | | | 2,776 | | | | 132,040 | |
Stora Enso Oyj Class R | | | 4,132 | | | | 37,033 | |
UPM-Kymmene Oyj | | | 2,866 | | | | 51,994 | |
| | | | | | | | |
| Total Finland | | | | 446,513 | |
| France – 3.0% | | | | | | | | |
AXA S.A. | | | 10,253 | | | | 241,738 | |
Bouygues S.A. | | | 1,516 | | | | 61,933 | |
CNP Assurances | | | 2,414 | | | | 37,701 | |
Electricite de France S.A. | | | 9,733 | | | | 109,404 | |
Engie S.A. | | | 10,923 | | | | 169,781 | |
| | | | | | | | |
Eutelsat Communications S.A. | | | 915 | | | $ | 29,602 | |
ICADE | | | 476 | | | | 36,516 | |
Lagardere SCA | | | 984 | | | | 26,183 | |
Metropole Television S.A. | | | 1,386 | | | | 25,310 | |
Natixis S.A. | | | 10,292 | | | | 50,748 | |
Orange S.A. | | | 12,796 | | | | 224,485 | |
Rexel S.A. | | | 2,013 | | | | 28,800 | |
Schneider Electric SE | | | 1,902 | | | | 120,379 | |
SCOR SE | | | 1,566 | | | | 55,678 | |
Suez Environnement Co. | | | 1,389 | | | | 25,515 | |
Technip S.A. | | | 660 | | | | 36,635 | |
TOTAL S.A. | | | 12,384 | | | | 565,335 | |
Unibail-Rodamco SE | | | 451 | | | | 124,270 | |
Vivendi S.A. | | | 9,696 | | | | 204,187 | |
| | | | | | | | |
| Total France | | | | 2,174,200 | |
| Germany – 2.6% | | | | | | | | |
Aareal Bank AG | | | 799 | | | | 25,931 | |
Allianz SE Registered Shares | | | 1,708 | | | | 278,231 | |
BASF SE | | | 3,083 | | | | 232,927 | |
Bayerische Motoren Werke AG | | | 2,161 | | | | 198,729 | |
Daimler AG Registered Shares | | | 4,011 | | | | 307,931 | |
E.ON SE | | | 7,683 | | | | 73,876 | |
Freenet AG | | | 1,126 | | | | 33,734 | |
METRO AG | | | 1,098 | | | | 34,071 | |
Muenchener Rueckversicherungs – Gesellschaft AG Registered Shares | | | 797 | | | | 162,345 | |
ProSiebenSat.1 Media SE | | | 522 | | | | 26,878 | |
Siemens AG Registered Shares | | | 3,383 | | | | 359,102 | |
Telefonica Deutschland Holding AG | | | 8,178 | | | | 44,369 | |
Volkswagen AG | | | 1,093 | | | | 158,867 | |
| | | | | | | | |
| Total Germany | | | | 1,936,991 | |
| Hong Kong – 1.1% | | | | | | | | |
Bank of East Asia Ltd. (The)(a) | | | 9,600 | | | | 35,892 | |
BOC Hong Kong Holdings Ltd. | | | 45,500 | | | | 135,798 | |
Cathay Pacific Airways Ltd. | | | 16,000 | | | | 27,682 | |
CLP Holdings Ltd. | | | 8,500 | | | | 76,874 | |
CP Pokphand Co., Ltd. | | | 106,000 | | | | 11,069 | |
Hang Lung Properties Ltd. | | | 13,472 | | | | 25,740 | |
Hang Seng Bank Ltd. | | | 6,700 | | | | 118,425 | |
Hopewell Holdings Ltd. | | | 8,500 | | | | 27,451 | |
Hysan Development Co., Ltd. | | | 6,000 | | | | 25,566 | |
New World Development Co., Ltd. | | | 53,423 | | | | 50,898 | |
PCCW Ltd. | | | 14,000 | | | | 9,061 | |
Power Assets Holdings Ltd. | | | 7,000 | | | | 71,611 | |
Sino Land Co., Ltd. | | | 36,000 | | | | 56,995 | |
SJM Holdings Ltd. | | | 59,000 | | | | 42,140 | |
Swire Pacific Ltd. Class A | | | 6,500 | | | | 69,973 | |
Wharf Holdings Ltd. (The) | | | 6,519 | | | | 35,635 | |
| | | | | | | | |
| Total Hong Kong | | | | 820,810 | |
| Hungary – 0.1% | | | | | | | | |
MOL Hungarian Oil & Gas PLC | | | 1,120 | | | | 67,394 | |
See Notes to Financial Statements.
| | |
| 64 | | WisdomTree Global/Global ex-U.S. and Emerging/Frontier Markets Funds |
Schedule of Investments (continued)
WisdomTree Global High Dividend Fund (DEW)
March 31, 2016
| | | | | | | | |
| Investments | | Shares | | | Value | |
| | | | | | | | |
| Indonesia – 0.2% | | | | | | | | |
Astra International Tbk PT | | | 115,700 | | | $ | 63,260 | |
Indofood Sukses Makmur Tbk PT | | | 34,200 | | | | 18,635 | |
Perusahaan Gas Negara Persero Tbk | | | 115,000 | | | | 22,679 | |
Semen Indonesia Persero Tbk PT | | | 19,800 | | | | 15,193 | |
United Tractors Tbk PT | | | 16,100 | | | | 18,577 | |
| | | | | | | | |
| Total Indonesia | | | | 138,344 | |
| Israel – 0.1% | | | | | | | | |
Bezeq Israeli Telecommunication Corp., Ltd. | | | 23,275 | | | | 52,468 | |
Israel Chemicals Ltd. | | | 5,375 | | | | 23,376 | |
| | | | | | | | |
| Total Israel | | | | 75,844 | |
| Italy – 1.0% | | | | | | | | |
Assicurazioni Generali SpA | | | 3,590 | | | | 53,306 | |
Banca Mediolanum SpA | | | 3,390 | | | | 27,080 | |
Enel SpA | | | 34,751 | | | | 154,363 | |
Eni SpA | | | 17,623 | | | | 267,095 | |
Hera SpA | | | 12,406 | | | | 37,124 | |
Snam SpA | | | 18,967 | | | | 118,984 | |
Terna Rete Elettrica Nazionale SpA | | | 9,660 | | | | 55,205 | |
UnipolSai SpA | | | 15,299 | | | | 35,461 | |
| | | | | | | | |
| Total Italy | | | | 748,618 | |
| Japan – 2.4% | | | | | | | | |
Aozora Bank Ltd.(a) | | | 14,331 | | | | 50,110 | |
Canon, Inc. | | | 2,300 | | | | 68,655 | |
Daiwa Securities Group, Inc. | | | 12,601 | | | | 77,616 | |
FANUC Corp. | | | 1,400 | | | | 217,794 | |
Hino Motors Ltd. | | | 1,700 | | | | 18,407 | |
ITOCHU Corp. | | | 8,342 | | | | 102,870 | |
JFE Holdings, Inc. | | | 2,600 | | | | 35,069 | |
JX Holdings, Inc.(a) | | | 15,100 | | | | 58,280 | |
Marubeni Corp.(a) | | | 5,469 | | | | 27,736 | |
Mitsui & Co., Ltd. | | | 5,458 | | | | 62,886 | |
Nomura Holdings, Inc. | | | 15,900 | | | | 71,143 | |
NTT DOCOMO, Inc. | | | 12,500 | | | | 283,876 | |
Resona Holdings, Inc. | | | 14,100 | | | | 50,381 | |
Seiko Epson Corp. | | | 1,700 | | | | 27,498 | |
Sumitomo Corp. | | | 5,286 | | | | 52,604 | |
Tokyo Electron Ltd. | | | 700 | | | | 45,689 | |
Toyota Motor Corp. | | | 10,200 | | | | 540,152 | |
| | | | | | | | |
| Total Japan | | | | 1,790,766 | |
| Malaysia – 0.4% | | | | | | | | |
AMMB Holdings Bhd | | | 39,300 | | | | 46,336 | |
Axiata Group Bhd | | | 6,201 | | | | 9,361 | |
British American Tobacco Malaysia Bhd | | | 1,700 | | | | 23,547 | |
DiGi.Com Bhd | | | 60,900 | | | | 77,110 | |
HAP Seng Consolidated Bhd | | | 27,300 | | | | 52,690 | |
Malayan Banking Bhd | | | 19,000 | | | | 43,927 | |
Maxis Bhd | | | 27,200 | | | | 44,270 | |
YTL Power International Bhd | | | 30,651 | | | | 11,627 | |
| | | | | | | | |
| Total Malaysia | | | | 308,868 | |
| | | | | | | | |
| Mexico – 0.3% | | | | | | | | |
Grupo Financiero Santander Mexico S.A.B. de C.V. Class B | | | 17,109 | | | $ | 31,297 | |
Kimberly-Clark de Mexico S.A.B. de C.V. Class A | | | 5,001 | | | | 12,131 | |
Wal-Mart de Mexico S.A.B. de C.V. Series V | | | 58,800 | | | | 140,672 | |
| | | | | | | | |
| Total Mexico | | | | 184,100 | |
| Netherlands – 0.2% | | | | | | | | |
Aegon N.V. | | | 5,074 | | | | 27,951 | |
Koninklijke Philips N.V. | | | 2,212 | | | | 63,105 | |
NN Group N.V. | | | 1,235 | | | | 40,468 | |
| | | | | | | | |
| Total Netherlands | | | | 131,524 | |
| New Zealand – 0.2% | | | | | | | | |
Fletcher Building Ltd. | | | 3,156 | | | | 17,289 | |
Meridian Energy Ltd. | | | 13,014 | | | | 23,673 | |
Mighty River Power Ltd. | | | 10,841 | | | | 21,978 | |
Spark New Zealand Ltd. | | | 20,350 | | | | 51,571 | |
| | | | | | | | |
| Total New Zealand | | | | 114,511 | |
| Norway – 0.5% | | | | | | | | |
Gjensidige Forsikring ASA | | | 1,893 | | | | 32,293 | |
Marine Harvest ASA* | | | 3,784 | | | | 58,330 | |
Norsk Hydro ASA | | | 8,001 | | | | 32,957 | |
Orkla ASA | | | 5,796 | | | | 52,520 | |
Statoil ASA | | | 11,654 | | | | 183,590 | |
Yara International ASA | | | 1,052 | | | | 39,606 | |
| | | | | | | | |
| Total Norway | | | | 399,296 | |
| Philippines – 0.1% | | | | | | | | |
Aboitiz Power Corp. | | | 31,500 | | | | 30,067 | |
DMCI Holdings, Inc. | | | 53,500 | | | | 15,570 | |
Energy Development Corp. | | | 116,900 | | | | 14,928 | |
Philippine Long Distance Telephone Co. | | | 770 | | | | 33,111 | |
| | | | | | | | |
| Total Philippines | | | | 93,676 | |
| Poland – 0.2% | | | | | | | | |
Bank Handlowy w Warszawie S.A. | | | 1,560 | | | | 37,932 | |
Bank Pekao S.A. | | | 895 | | | | 39,605 | |
PGE Polska Grupa Energetyczna S.A. | | | 4,636 | | | | 17,414 | |
Powszechny Zaklad Ubezpieczen S.A. | | | 4,502 | | | | 43,062 | |
| | | | | | | | |
| Total Poland | | | | 138,013 | |
| Portugal – 0.1% | | | | | | | | |
EDP-Energias de Portugal S.A. | | | 15,694 | | | | 55,906 | |
Galp Energia, SGPS, S.A. | | | 2,663 | | | | 33,532 | |
Portucel S.A. | | | 4,746 | | | | 17,307 | |
| | | | | | | | |
| Total Portugal | | | | 106,745 | |
| Russia – 0.9% | | | | | | | | |
Gazprom Neft PAO ADR | | | 4,304 | | | | 47,990 | |
Gazprom PAO ADR | | | 18,449 | | | | 79,570 | |
Lukoil PJSC ADR | | | 4,073 | | | | 156,464 | |
MMC Norilsk Nickel PJSC ADR | | | 12,733 | | | | 164,383 | |
Mobile TeleSystems PJSC ADR | | | 10,031 | | | | 81,151 | |
Novolipetsk Steel GDR Reg S | | | 4,362 | | | | 54,525 | |
Rostelecom PJSC ADR | | | 3,667 | | | | 32,563 | |
Severstal PAO GDR Reg S | | | 5,690 | | | | 60,200 | |
| | | | | | | | |
| Total Russia | | | | 676,846 | |
See Notes to Financial Statements.
| | | | |
| WisdomTree Global/Global ex-U.S. and Emerging/Frontier Markets Funds | | | 65 | |
Schedule of Investments (continued)
WisdomTree Global High Dividend Fund (DEW)
March 31, 2016
| | | | | | | | |
| Investments | | Shares | | | Value | |
| | | | | | | | |
| Singapore – 0.9% | | | | | | | | |
DBS Group Holdings Ltd. | | | 7,600 | | | $ | 86,802 | |
Frasers Centrepoint Ltd. | | | 27,100 | | | | 32,803 | |
Hutchison Port Holdings Trust | | | 68,300 | | | | 34,150 | |
Jardine Cycle & Carriage Ltd. | | | 1,700 | | | | 50,536 | |
Keppel Corp., Ltd.(a) | | | 4,100 | | | | 17,751 | |
Olam International Ltd. | | | 13,600 | | | | 17,371 | |
Oversea-Chinese Banking Corp., Ltd. | | | 18,603 | | | | 122,123 | |
SATS Ltd. | | | 6,820 | | | | 20,005 | |
Singapore Telecommunications Ltd. | | | 74,300 | | | | 210,772 | |
StarHub Ltd. | | | 9,900 | | | | 24,629 | |
United Overseas Bank Ltd. | | | 2,129 | | | | 29,834 | |
| | | | | | | | |
| Total Singapore | | | | 646,776 | |
| South Africa – 0.7% | | | | | | | | |
Barclays Africa Group Ltd.(a) | | | 2,947 | | | | 29,973 | |
FirstRand Ltd.(a) | | | 18,649 | | | | 61,331 | |
Foschini Group Ltd. (The) | | | 2,258 | | | | 21,714 | |
Hyprop Investments Ltd. | | | 3,753 | | | | 30,026 | |
Imperial Holdings Ltd. | | | 1,728 | | | | 17,670 | |
MMI Holdings Ltd.(a) | | | 12,081 | | | | 20,453 | |
MTN Group Ltd.(a) | | | 7,032 | | | | 64,640 | |
Nedbank Group Ltd.(a) | | | 2,637 | | | | 34,827 | |
RMB Holdings Ltd.(a) | | | 6,275 | | | | 26,136 | |
Sanlam Ltd. | | | 10,152 | | | | 47,274 | |
Sasol Ltd. | | | 2,173 | | | | 65,234 | |
Standard Bank Group Ltd. | | | 1,526 | | | | 13,745 | |
Telkom S.A. SOC Ltd. | | | 3,342 | | | | 13,081 | |
Truworths International Ltd.(a) | | | 3,543 | | | | 23,660 | |
Vodacom Group Ltd. | | | 6,629 | | | | 72,352 | |
| | | | | | | | |
| Total South Africa | | | | 542,116 | |
| South Korea – 0.2% | | | | | | | | |
POSCO | | | 306 | | | | 58,733 | |
SK Telecom Co., Ltd. | | | 377 | | | | 68,734 | |
Woori Bank | | | 4,721 | | | | 39,053 | |
| | | | | | | | |
| Total South Korea | | | | 166,520 | |
| Spain – 2.3% | | | | | | | | |
Abertis Infraestructuras S.A. | | | 5,303 | | | | 87,322 | |
Acerinox S.A. | | | 2,809 | | | | 32,586 | |
ACS Actividades de Construccion y Servicios S.A. | | | 1,483 | | | | 44,260 | |
Banco Bilbao Vizcaya Argentaria S.A. | | | 13,756 | | | | 91,577 | |
Banco Santander S.A. | | | 101,860 | | | | 449,673 | |
CaixaBank S.A. | | | 16,743 | | | | 49,550 | |
Enagas S.A. | | | 1,534 | | | | 46,175 | |
Endesa S.A. | | | 4,696 | | | | 90,277 | |
Gas Natural SDG S.A. | | | 4,584 | | | | 92,825 | |
Iberdrola S.A. | | | 29,317 | | | | 195,805 | |
Mapfre S.A. | | | 11,802 | | | | 25,540 | |
Red Electrica Corp. S.A. | | | 736 | | | | 63,994 | |
Repsol S.A. | | | 6,628 | | | | 74,925 | |
Tecnicas Reunidas S.A.(a) | | | 362 | | | | 10,199 | |
Telefonica S.A. | | | 27,420 | | | | 307,840 | |
| | | | | | | | |
| Total Spain | | | | 1,662,548 | |
| | | | | | | | |
| Sweden – 1.3% | | | | | | | | |
Castellum AB | | | 1,579 | | | $ | 25,146 | |
Nordea Bank AB | | | 23,199 | | | | 223,213 | |
Skandinaviska Enskilda Banken AB Class A | | | 10,874 | | | | 104,023 | |
Skanska AB Class B | | | 3,025 | | | | 69,144 | |
SKF AB Class B(a) | | | 1,505 | | | | 27,216 | |
Svenska Handelsbanken AB Class A | | | 6,600 | | | | 84,101 | |
Swedbank AB Class A | | | 6,144 | | | | 132,555 | |
Telefonaktiebolaget LM Ericsson Class B | | | 11,002 | | | | 110,336 | |
TeliaSonera AB | | | 20,746 | | | | 107,918 | |
Volvo AB Class B | | | 5,374 | | | | 59,065 | |
| | | | | | | | |
| Total Sweden | | | | 942,717 | |
| Switzerland – 1.6% | | | | | | | | |
ABB Ltd. Registered Shares* | | | 7,213 | | | | 141,149 | |
Baloise Holding AG Registered Shares | | | 632 | | | | 80,646 | |
Helvetia Holding AG Registered Shares | | | 72 | | | | 41,351 | |
Kuehne + Nagel International AG Registered Shares | | | 521 | | | | 74,370 | |
Logitech International S.A. Registered Shares | | | 1,982 | | | | 31,666 | |
SGS S.A. Registered Shares | | | 17 | | | | 36,072 | |
STMicroelectronics N.V. | | | 4,336 | | | | 24,073 | |
Sulzer AG Registered Shares | | | 329 | | | | 32,809 | |
Swiss Re AG | | | 3,130 | | | | 290,562 | |
Swisscom AG Registered Shares | | | 270 | | | | 147,314 | |
Syngenta AG Registered Shares | | | 306 | | | | 127,813 | |
Zurich Insurance Group AG* | | | 732 | | | | 170,684 | |
| | | | | | | | |
| Total Switzerland | | | | 1,198,509 | |
| Taiwan – 1.7% | | | | | | | | |
Advanced Semiconductor Engineering, Inc. | | | 33,108 | | | | 38,525 | |
Asia Cement Corp. | | | 15,514 | | | | 14,172 | |
Asustek Computer, Inc. | | | 5,486 | | | | 49,262 | |
AU Optronics Corp. | | | 86,000 | | | | 25,839 | |
Cathay Financial Holding Co., Ltd. | | | 47,000 | | | | 56,297 | |
Cheng Shin Rubber Industry Co., Ltd. | | | 8,197 | | | | 16,479 | |
China Development Financial Holding Corp. | | | 125,000 | | | | 33,402 | |
China Steel Corp. | | | 71,000 | | | | 49,416 | |
Chunghwa Telecom Co., Ltd. | | | 26,000 | | | | 88,460 | |
Compal Electronics, Inc. | | | 19,000 | | | | 11,925 | |
CTBC Financial Holding Co., Ltd. | | | 81,000 | | | | 42,785 | |
Delta Electronics, Inc. | | | 10,525 | | | | 46,438 | |
Far Eastern New Century Corp. | | | 15,994 | | | | 13,070 | |
First Financial Holding Co., Ltd. | | | 63,000 | | | | 31,124 | |
Fubon Financial Holding Co., Ltd. | | | 63,195 | | | | 80,506 | |
Hon Hai Precision Industry Co., Ltd. | | | 55,000 | | | | 144,917 | |
Innolux Corp. | | | 99,000 | | | | 34,606 | |
MediaTek, Inc. | | | 14,389 | | | | 110,430 | |
Mega Financial Holding Co., Ltd. | | | 84,941 | | | | 60,438 | |
Nan Ya Plastics Corp. | | | 19,000 | | | | 39,908 | |
Nanya Technology Corp. | | | 17,686 | | | | 21,954 | |
Pegatron Corp. | | | 16,680 | | | | 38,922 | |
Quanta Computer, Inc. | | | 19,210 | | | | 33,545 | |
Siliconware Precision Industries Co., Ltd. | | | 18,000 | | | | 29,083 | |
SinoPac Financial Holdings Co., Ltd. | | | 72,000 | | | | 22,259 | |
See Notes to Financial Statements.
| | |
| 66 | | WisdomTree Global/Global ex-U.S. and Emerging/Frontier Markets Funds |
Schedule of Investments (continued)
WisdomTree Global High Dividend Fund (DEW)
March 31, 2016
| | | | | | | | |
| Investments | | Shares | | | Value | |
| | | | | | | | |
Taiwan Mobile Co., Ltd. | | | 16,800 | | | $ | 54,549 | |
United Microelectronics Corp. | | | 74,000 | | | | 30,580 | |
Yuanta Financial Holding Co., Ltd. | | | 89,000 | | | | 31,801 | |
| | | | | | | | |
| Total Taiwan | | | | 1,250,692 | |
| Thailand – 0.5% | | | | | | | | |
Advanced Info Service PCL | | | 12,641 | | | | 65,397 | |
Charoen Pokphand Foods PCL NVDR | | | 33,000 | | | | 22,888 | |
Glow Energy PCL NVDR | | | 6,300 | | | | 16,475 | |
Intouch Holdings PCL NVDR | | | 13,071 | | | | 23,686 | |
Krung Thai Bank PCL NVDR | | | 28,600 | | | | 15,202 | |
Land & Houses PCL NVDR | | | 119,400 | | | | 30,376 | |
PTT Exploration & Production PCL NVDR | | | 17,900 | | | | 35,744 | |
PTT Global Chemical PCL NVDR | | | 11,936 | | | | 20,527 | |
PTT PCL NVDR | | | 5,300 | | | | 42,183 | |
Siam Commercial Bank PCL (The) NVDR | | | 19,100 | | | | 76,552 | |
Total Access Communication PCL NVDR | | | 20,000 | | | | 23,451 | |
| | | | | | | | |
| Total Thailand | | | | 372,481 | |
| Turkey – 0.2% | | | | | | | | |
Emlak Konut Gayrimenkul Yatirim Ortakligi AS | | | 32,200 | | | | 32,821 | |
Eregli Demir ve Celik Fabrikalari TAS | | | 4,849 | | | | 7,302 | |
Turk Telekomunikasyon AS | | | 31,476 | | | | 74,674 | |
| | | | | | | | |
| Total Turkey | | | | 114,797 | |
| United Kingdom – 9.1% | | | | | | | | |
Admiral Group PLC | | | 780 | | | | 22,231 | |
AstraZeneca PLC | | | 5,466 | | | | 306,591 | |
Aviva PLC | | | 13,073 | | | | 85,700 | |
BAE Systems PLC | | | 18,348 | | | | 134,231 | |
Berkeley Group Holdings PLC | | | 1,206 | | | | 55,780 | |
BHP Billiton PLC | | | 10,092 | | | | 113,547 | |
BP PLC | | | 135,533 | | | | 682,098 | |
British American Tobacco PLC | | | 7,765 | | | | 456,470 | |
Cable & Wireless Communications PLC | | | 29,493 | | | | 32,662 | |
Centrica PLC | | | 14,724 | | | | 48,188 | |
Cobham PLC | | | 3,809 | | | | 11,886 | |
Diageo PLC | | | 8,326 | | | | 225,158 | |
Direct Line Insurance Group PLC | | | 3,969 | | | | 21,119 | |
GlaxoSmithKline PLC | | | 31,215 | | | | 633,498 | |
HSBC Holdings PLC | | | 123,332 | | | | 769,153 | |
ICAP PLC | | | 5,988 | | | | 40,864 | |
IG Group Holdings PLC | | | 3,159 | | | | 36,323 | |
Imperial Brands PLC | | | 4,315 | | | | 239,581 | |
Inmarsat PLC | | | 3,597 | | | | 50,898 | |
Intu Properties PLC(a) | | | 4,711 | | | | 21,194 | |
J Sainsbury PLC(a) | | | 13,380 | | | | 53,136 | |
Legal & General Group PLC | | | 30,844 | | | | 104,269 | |
Man Group PLC | | | 14,452 | | | | 31,677 | |
Marks & Spencer Group PLC | | | 7,547 | | | | 44,062 | |
National Grid PLC | | | 19,634 | | | | 278,587 | |
Next PLC | | | 615 | | | | 47,733 | |
Old Mutual PLC | | | 20,835 | | | | 57,826 | |
Pearson PLC | | | 3,241 | | | | 40,760 | |
Pennon Group PLC | | | 2,159 | | | | 25,166 | |
| | | | | | | | |
Rexam PLC | | | 3,236 | | | $ | 29,488 | |
Rio Tinto PLC | | | 9,234 | | | | 259,535 | |
Royal Dutch Shell PLC Class A | | | 23,685 | | | | 573,275 | |
Royal Mail PLC | | | 5,983 | | | | 41,337 | |
Segro PLC | | | 8,760 | | | | 51,660 | |
Severn Trent PLC | | | 1,472 | | | | 45,974 | |
SSE PLC | | | 5,877 | | | | 126,029 | |
Standard Life PLC | | | 10,222 | | | | 52,319 | |
TalkTalk Telecom Group PLC | | | 4,039 | | | | 13,764 | |
Tate & Lyle PLC | | | 1,800 | | | | 14,954 | |
Taylor Wimpey PLC | | | 21,161 | | | | 57,879 | |
Unilever PLC | | | 4,525 | | | | 205,032 | |
United Utilities Group PLC | | | 4,599 | | | | 61,012 | |
Vodafone Group PLC | | | 124,124 | | | | 394,628 | |
Weir Group PLC (The) | | | 1,134 | | | | 18,059 | |
WM Morrison Supermarkets PLC(a) | | | 14,057 | | | | 40,146 | |
| | | | | | | | |
| Total United Kingdom | | | | 6,655,479 | |
| United States – 54.0% | | | | | | | | |
AbbVie, Inc. | | | 9,924 | | | | 566,859 | |
AES Corp. | | | 5,283 | | | | 62,339 | |
AGL Resources, Inc. | | | 1,042 | | | | 67,876 | |
Alliant Energy Corp. | | | 693 | | | | 51,476 | |
Altria Group, Inc. | | | 13,081 | | | | 819,655 | |
Ameren Corp. | | | 1,968 | | | | 98,597 | |
American Campus Communities, Inc. | | | 284 | | | | 13,374 | |
American Eagle Outfitters, Inc. | | | 1,659 | | | | 27,656 | |
American Electric Power Co., Inc. | | | 3,413 | | | | 226,623 | |
AT&T, Inc. | | | 55,372 | | | | 2,168,921 | |
Baxter International, Inc. | | | 4,992 | | | | 205,071 | |
Brandywine Realty Trust | | | 2,651 | | | | 37,194 | |
CA, Inc. | | | 2,465 | | | | 75,897 | |
Camden Property Trust | | | 712 | | | | 59,873 | |
Caterpillar, Inc. | | | 4,418 | | | | 338,154 | |
CBL & Associates Properties, Inc. | | | 3,440 | | | | 40,936 | |
CenterPoint Energy, Inc. | | | 4,183 | | | | 87,508 | |
CenturyLink, Inc. | | | 9,072 | | | | 289,941 | |
Chevron Corp. | | | 16,654 | | | | 1,588,792 | |
Cincinnati Financial Corp. | | | 884 | | | | 57,778 | |
Cisco Systems, Inc. | | | 26,352 | | | | 750,241 | |
CME Group, Inc. | | | 2,811 | | | | 269,997 | |
CMS Energy Corp. | | | 1,379 | | | | 58,525 | |
Coach, Inc. | | | 2,374 | | | | 95,174 | |
Coca-Cola Co. (The) | | | 23,754 | | | | 1,101,948 | |
Columbia Property Trust, Inc. | | | 1,205 | | | | 26,498 | |
Compass Minerals International, Inc. | | | 377 | | | | 26,714 | |
ConocoPhillips | | | 11,924 | | | | 480,179 | |
Consolidated Edison, Inc. | | | 2,148 | | | | 164,580 | |
Corrections Corp. of America | | | 1,799 | | | | 57,658 | |
Crown Castle International Corp. | | | 2,633 | | | | 227,754 | |
Cullen/Frost Bankers, Inc.(a) | | | 574 | | | | 31,633 | |
Cummins, Inc. | | | 982 | | | | 107,961 | |
CVR Energy, Inc. | | | 905 | | | | 23,621 | |
Darden Restaurants, Inc. | | | 855 | | | | 56,687 | |
See Notes to Financial Statements.
| | | | |
| WisdomTree Global/Global ex-U.S. and Emerging/Frontier Markets Funds | | | 67 | |
Schedule of Investments (continued)
WisdomTree Global High Dividend Fund (DEW)
March 31, 2016
| | | | | | | | |
| Investments | | Shares | | | Value | |
| | | | | | | | |
DCT Industrial Trust, Inc. | | | 570 | | | $ | 22,498 | |
DDR Corp. | | | 2,714 | | | | 48,282 | |
Deere & Co. | | | 1,786 | | | | 137,504 | |
DiamondRock Hospitality Co. | | | 2,478 | | | | 25,077 | |
Digital Realty Trust, Inc. | | | 1,062 | | | | 93,976 | |
Dominion Resources, Inc. | | | 3,552 | | | | 266,826 | |
Dow Chemical Co. (The) | | | 7,418 | | | | 377,279 | |
DTE Energy Co. | | | 1,069 | | | | 96,916 | |
Duke Energy Corp. | | | 5,610 | | | | 452,615 | |
Duke Realty Corp. | | | 1,557 | | | | 35,095 | |
E.I. du Pont de Nemours & Co. | | | 5,097 | | | | 322,742 | |
Emerson Electric Co. | | | 4,837 | | | | 263,036 | |
Entergy Corp. | | | 1,861 | | | | 147,540 | |
EPR Properties | | | 959 | | | | 63,889 | |
Eversource Energy | | | 1,672 | | | | 97,544 | |
Exelon Corp. | | | 6,607 | | | | 236,927 | |
Exxon Mobil Corp. | | | 27,640 | | | | 2,310,428 | |
First Niagara Financial Group, Inc. | | | 3,024 | | | | 29,272 | |
FirstEnergy Corp. | | | 3,646 | | | | 131,147 | |
FirstMerit Corp. | | | 2,220 | | | | 46,731 | |
Ford Motor Co. | | | 27,223 | | | | 367,510 | |
Frontier Communications Corp. | | | 15,739 | | | | 87,981 | |
GameStop Corp. Class A(a) | | | 820 | | | | 26,019 | |
Gaming and Leisure Properties, Inc. | | | 1,517 | | | | 46,906 | |
Gap, Inc. (The) | | | 2,559 | | | | 75,235 | |
General Electric Co. | | | 59,682 | | | | 1,897,291 | |
General Mills, Inc. | | | 3,124 | | | | 197,905 | |
General Motors Co. | | | 12,042 | | | | 378,480 | |
Geo Group, Inc. (The) | | | 1,558 | | | | 54,016 | |
Great Plains Energy, Inc. | | | 1,782 | | | | 57,470 | |
Hancock Holding Co. | | | 1,058 | | | | 24,292 | |
Hawaiian Electric Industries, Inc. | | | 1,188 | | | | 38,491 | |
HCP, Inc. | | | 4,596 | | | | 149,738 | |
Helmerich & Payne, Inc.(a) | | | 1,075 | | | | 63,124 | |
Highwoods Properties, Inc. | | | 904 | | | | 43,220 | |
HollyFrontier Corp. | | | 1,867 | | | | 65,942 | |
Hospitality Properties Trust | | | 1,890 | | | | 50,198 | |
Host Hotels & Resorts, Inc. | | | 6,406 | | | | 106,980 | |
Huntsman Corp. | | | 3,325 | | | | 44,223 | |
Intel Corp. | | | 25,238 | | | | 816,449 | |
International Business Machines Corp. | | | 5,659 | | | | 857,056 | |
International Paper Co. | | | 2,675 | | | | 109,782 | |
Iron Mountain, Inc. | | | 2,414 | | | | 81,859 | |
Johnson & Johnson | | | 15,255 | | | | 1,650,591 | |
Kimberly-Clark Corp. | | | 1,837 | | | | 247,095 | |
Kimco Realty Corp. | | | 3,031 | | | | 87,232 | |
Kinder Morgan, Inc. | | | 21,125 | | | | 377,292 | |
KLA-Tencor Corp. | | | 854 | | | | 62,180 | |
Kohl’s Corp. | | | 1,495 | | | | 69,682 | |
Lamar Advertising Co. Class A | | | 918 | | | | 56,457 | |
Las Vegas Sands Corp. | | | 7,907 | | | | 408,634 | |
LaSalle Hotel Properties | | | 1,021 | | | | 25,842 | |
Leidos Holdings, Inc. | | | 400 | | | | 20,128 | |
Liberty Property Trust | | | 1,698 | | | | 56,815 | |
| | | | | | | | |
Macerich Co. (The) | | | 916 | | | $ | 72,584 | |
Marathon Oil Corp. | | | 5,407 | | | | 60,234 | |
Mattel, Inc. | | | 4,458 | | | | 149,878 | |
Maxim Integrated Products, Inc. | | | 1,531 | | | | 56,310 | |
McDonald’s Corp. | | | 5,821 | | | | 731,583 | |
MDU Resources Group, Inc. | | | 1,495 | | | | 29,093 | |
Medical Properties Trust, Inc. | | | 3,878 | | | | 50,336 | |
Merck & Co., Inc. | | | 18,133 | | | | 959,417 | |
MetLife, Inc. | | | 6,303 | | | | 276,954 | |
Microchip Technology, Inc. | | | 997 | | | | 48,055 | |
Mid-America Apartment Communities, Inc. | | | 449 | | | | 45,892 | |
Mosaic Co. (The) | | | 2,057 | | | | 55,539 | |
Murphy Oil Corp. | | | 2,871 | | | | 72,320 | |
National Oilwell Varco, Inc. | | | 3,986 | | | | 123,965 | |
National Retail Properties, Inc. | | | 1,053 | | | | 48,649 | |
Navient Corp. | | | 6,066 | | | | 72,610 | |
New York Community Bancorp, Inc. | | | 4,861 | | | | 77,290 | |
NiSource, Inc. | | | 3,776 | | | | 88,963 | |
Norfolk Southern Corp. | | | 1,550 | | | | 129,037 | |
NRG Energy, Inc. | | | 2,272 | | | | 29,559 | |
Nu Skin Enterprises, Inc. Class A(a) | | | 523 | | | | 20,005 | |
Nucor Corp. | | | 2,095 | | | | 99,093 | |
Occidental Petroleum Corp. | | | 5,965 | | | | 408,185 | |
OGE Energy Corp. | | | 1,271 | | | | 36,389 | |
Old Republic International Corp. | | | 2,849 | | | | 52,080 | |
Omega Healthcare Investors, Inc. | | | 1,485 | | | | 52,421 | |
Omnicom Group, Inc. | | | 1,065 | | | | 88,640 | |
ONEOK, Inc. | | | 2,568 | | | | 76,680 | |
Outfront Media, Inc. | | | 1,745 | | | | 36,820 | |
PACCAR, Inc. | | | 2,101 | | | | 114,904 | |
Packaging Corp. of America | | | 495 | | | | 29,898 | |
PacWest Bancorp | | | 1,028 | | | | 38,190 | |
Paychex, Inc. | | | 2,190 | | | | 118,282 | |
PBF Energy, Inc. Class A | | | 1,192 | | | | 39,574 | |
People’s United Financial, Inc. | | | 3,883 | | | | 61,856 | |
Pfizer, Inc. | | | 37,285 | | | | 1,105,127 | |
PG&E Corp. | | | 3,015 | | | | 180,056 | |
Philip Morris International, Inc. | | | 13,200 | | | | 1,295,052 | |
Piedmont Natural Gas Co., Inc. | | | 794 | | | | 47,505 | |
Piedmont Office Realty Trust, Inc. Class A | | | 2,060 | | | | 41,839 | |
Pinnacle West Capital Corp. | | | 938 | | | | 70,416 | |
Pitney Bowes, Inc. | | | 1,744 | | | | 37,566 | |
PPL Corp. | | | 5,457 | | | | 207,748 | |
Principal Financial Group, Inc. | | | 1,235 | | | | 48,721 | |
Procter & Gamble Co. (The) | | | 17,122 | | | | 1,409,312 | |
Prologis, Inc. | | | 3,500 | | | | 154,630 | |
Prudential Financial, Inc. | | | 2,511 | | | | 181,344 | |
Public Service Enterprise Group, Inc. | | | 3,479 | | | | 164,000 | |
QUALCOMM, Inc. | | | 9,063 | | | | 463,482 | |
Questar Corp. | | | 1,617 | | | | 40,102 | |
R.R. Donnelley & Sons Co. | | | 3,226 | | | | 52,906 | |
Rayonier, Inc. | | | 1,294 | | | | 31,936 | |
Realty Income Corp. | | | 1,697 | | | | 106,079 | |
RLJ Lodging Trust | | | 2,106 | | | | 48,185 | |
See Notes to Financial Statements.
| | |
| 68 | | WisdomTree Global/Global ex-U.S. and Emerging/Frontier Markets Funds |
Schedule of Investments (concluded)
WisdomTree Global High Dividend Fund (DEW)
March 31, 2016
| | | | | | | | |
| Investments | | Shares | | | Value | |
| | | | | | | | |
SCANA Corp. | | | 1,185 | | | $ | 83,128 | |
Senior Housing Properties Trust | | | 4,026 | | | | 72,025 | |
Simon Property Group, Inc. | | | 1,477 | | | | 306,758 | |
Six Flags Entertainment Corp. | | | 523 | | | | 29,021 | |
Southern Co. (The) | | | 7,665 | | | | 396,510 | |
Spectra Energy Corp. | | | 6,646 | | | | 203,368 | |
Spirit Realty Capital, Inc. | | | 5,473 | | | | 61,571 | |
Staples, Inc. | | | 5,396 | | | | 59,518 | |
Steel Dynamics, Inc. | | | 1,757 | | | | 39,550 | |
Sunstone Hotel Investors, Inc. | | | 1,247 | | | | 17,458 | |
Symantec Corp. | | | 3,087 | | | | 56,739 | |
Sysco Corp. | | | 3,341 | | | | 156,125 | |
Targa Resources Corp. | | | 1,523 | | | | 45,477 | |
Taubman Centers, Inc. | | | 306 | | | | 21,796 | |
TECO Energy, Inc. | | | 2,702 | | | | 74,386 | |
TEGNA, Inc. | | | 1,534 | | | | 35,988 | |
Time, Inc. | | | 1,635 | | | | 25,244 | |
Timken Co. (The) | | | 988 | | | | 33,088 | |
Tupperware Brands Corp. | | | 595 | | | | 34,498 | |
UDR, Inc. | | | 1,088 | | | | 41,921 | |
Umpqua Holdings Corp. | | | 2,600 | | | | 41,236 | |
Vector Group Ltd. | | | 1,521 | | | | 34,740 | |
Ventas, Inc. | | | 2,815 | | | | 177,232 | |
Verizon Communications, Inc. | | | 36,631 | | | | 1,981,004 | |
Viacom, Inc. Class B | | | 1,993 | | | | 82,271 | |
W.P. Carey, Inc. | | | 935 | | | | 58,194 | |
Waddell & Reed Financial, Inc. Class A | | | 1,397 | | | | 32,885 | |
Waste Management, Inc. | | | 2,161 | | | | 127,499 | |
Weingarten Realty Investors | | | 645 | | | | 24,200 | |
Welltower, Inc. | | | 2,917 | | | | 202,265 | |
Westar Energy, Inc. | | | 1,059 | | | | 52,537 | |
Western Union Co. (The) | | | 2,367 | | | | 45,659 | |
Weyerhaeuser Co. | | | 5,563 | | | | 172,342 | |
WGL Holdings, Inc. | | | 414 | | | | 29,961 | |
Williams Cos., Inc. (The) | | | 8,239 | | | | 132,401 | |
WP GLIMCHER, Inc. | | | 4,271 | | | | 40,532 | |
Wynn Resorts Ltd.(a) | | | 1,288 | | | | 120,338 | |
Xcel Energy, Inc. | | | 3,076 | | | | 128,638 | |
| | | | | | | | |
| Total United States | | | | | | | 39,686,523 | |
TOTAL COMMON STOCKS
(Cost: $74,242,278) | | | | | | | 73,122,074 | |
| INVESTMENT OF CASH COLLATERAL FOR SECURITIES LOANED – 1.6% | |
| United States – 1.6% | | | | | | | | |
State Street Navigator Securities Lending Prime Portfolio, 0.50%(b) | | | | | | | | |
| (Cost: $1,172,860)(c) | | | 1,172,860 | | | | 1,172,860 | |
TOTAL INVESTMENTS IN SECURITIES – 101.1% (Cost: $75,415,138) | | | | | | | 74,294,934 | |
Liabilities in Excess of Cash, Foreign Currency and Other Assets – (1.1)% | | | | | | | (783,606 | ) |
| | | | | | | | |
| NET ASSETS – 100.0% | | | | | | $ | 73,511,328 | |
| * | Non-income producing security. |
| (a) | Security, or portion thereof, was on loan at March 31, 2016 (See Note 2). |
| (b) | Rate shown represents annualized 7-day yield as of March 31, 2016. |
| (c) | At March 31, 2016, the total market value of the Fund’s securities on loan was $1,444,274 and the total market value of the collateral held by the Fund was $1,532,022. The total market value of the collateral includes non-cash U.S. Government securities collateral having a value of $359,162. |
ADR – American Depositary Receipt
GDR – Global Depositary Receipt
NVDR – Non-Voting Depositary Receipt
Reg S – Regulation S provides an exclusion from the registration requirements of the Securities Act of 1933. These securities may be resold in transactions exempt from registration, normally to qualified institutional buyers.
| | | | | | | | | | | | | | | | | | | | |
| FINANCIAL DERIVATIVE INSTRUMENTS | |
| FORWARD CONTRACTS | |
Settlement
Date | | Contracts
To Deliver | | | In
Exchange For | | | Unrealized
Gain (Loss) | |
4/1/2016 | | | GBP | | | | 24,105 | | | | CAD | | | | 45,297 | | | $ | 375 | |
| | |
| CURRENCY LEGEND | | | | | | | |
CAD – Canadian dollar
GBP – British pound
See Notes to Financial Statements.
| | | | |
| WisdomTree Global/Global ex-U.S. and Emerging/Frontier Markets Funds | | | 69 | |
Schedule of Investments
WisdomTree Global Natural Resources Fund (GNAT)
March 31, 2016
| | | | | | | | |
| Investments | | Shares | | | Value | |
| | | | | | | | |
| COMMON STOCKS – 98.5% | | | | | | | | |
| Australia – 7.1% | | | | | | | | |
BHP Billiton Ltd. | | | 20,765 | | | $ | 269,313 | |
Fortescue Metals Group Ltd.(a) | | | 79,011 | | | | 154,987 | |
Rio Tinto Ltd. | | | 7,362 | | | | 241,762 | |
Woodside Petroleum Ltd. | | | 20,584 | | | | 411,057 | |
| | | | | | | | |
| Total Australia | | | | 1,077,119 | |
| Brazil – 2.3% | | | | | | | | |
Vale S.A. | | | 82,608 | | | | 353,135 | |
| Canada – 9.6% | | | | | | | | |
Agrium, Inc.(a) | | | 1,840 | | | | 163,124 | |
Cameco Corp.(a) | | | 8,162 | | | | 105,192 | |
Canadian Natural Resources Ltd. | | | 6,870 | | | | 186,589 | |
First Quantum Minerals Ltd. | | | 11,478 | | | | 60,698 | |
Imperial Oil Ltd. | | | 1,889 | | | | 63,368 | |
Potash Corp. of Saskatchewan, Inc. | | | 15,956 | | | | 272,749 | |
Suncor Energy, Inc. | | | 5,294 | | | | 148,041 | |
Teck Resources Ltd. Class B(a) | | | 61,556 | | | | 468,767 | |
| | | | | | | | |
| Total Canada | | | | 1,468,528 | |
| China – 7.0% | | | | | | | | |
China Petroleum & Chemical Corp. Class H | | | 350,600 | | | | 230,071 | |
China Shenhua Energy Co., Ltd. Class H | | | 202,700 | | | | 318,820 | |
CNOOC Ltd. | | | 289,018 | | | | 341,312 | |
Kunlun Energy Co., Ltd. | | | 208,000 | | | | 180,740 | |
| | | | | | | | |
| Total China | | | | 1,070,943 | |
| France – 3.1% | | | | | | | | |
Technip S.A. | | | 3,887 | | | | 215,758 | |
TOTAL S.A. | | | 5,552 | | | | 253,451 | |
| | | | | | | | |
| Total France | | | | 469,209 | |
| Germany – 1.2% | | | | | | | | |
Aurubis AG | | | 1,273 | | | | 63,437 | |
K+S AG Registered Shares | | | 4,963 | | | | 116,307 | |
| | | | | | | | |
| Total Germany | | | | 179,744 | |
| Hong Kong – 0.6% | | | | | | | | |
CP Pokphand Co., Ltd. | | | 931,000 | | | | 97,222 | |
| Israel – 1.4% | | | | | | | | |
Israel Chemicals Ltd. | | | 50,173 | | | | 218,202 | |
| Italy – 1.8% | | | | | | | | |
Eni SpA | | | 18,217 | | | | 276,097 | |
| Japan – 1.9% | | | | | | | | |
Dowa Holdings Co., Ltd.(a) | | | 11,000 | | | | 61,364 | |
Mitsubishi Materials Corp. | | | 38,000 | | | | 107,514 | |
Sumitomo Metal Mining Co., Ltd. | | | 12,000 | | | | 119,311 | |
| | | | | | | | |
| Total Japan | | | | 288,189 | |
| Malaysia – 2.1% | | | | | | | | |
IOI Corp. Bhd | | | 92,700 | | | | 108,584 | |
Kuala Lumpur Kepong Bhd | | | 20,900 | | | | 128,566 | |
SapuraKencana Petroleum Bhd | | | 169,500 | | | | 80,807 | |
| | | | | | | | |
| Total Malaysia | | | | 317,957 | |
| | | | | | | | |
| Mexico – 0.9% | | | | | | | | |
Grupo Mexico S.A.B. de C.V. Series B | | | 45,857 | | | $ | 111,447 | |
Industrias Penoles S.A.B. de C.V. | | | 2,282 | | | | 28,925 | |
| | | | | | | | |
| Total Mexico | | | | 140,372 | |
| Norway – 2.7% | | | | | | | | |
Statoil ASA | | | 15,763 | | | | 248,320 | |
Yara International ASA | | | 4,138 | | | | 155,790 | |
| | | | | | | | |
| Total Norway | | | | 404,110 | |
| Philippines – 0.8% | | | | | | | | |
Semirara Mining & Power Corp. | | | 45,090 | | | | 128,577 | |
| Poland – 1.2% | | | | | | | | |
KGHM Polska Miedz S.A. | | | 9,250 | | | | 189,131 | |
| Russia – 11.4% | | | | | | | | |
Gazprom PAO ADR | | | 55,411 | | | | 238,988 | |
Lukoil PJSC ADR | | | 8,421 | | | | 323,493 | |
MMC Norilsk Nickel PJSC ADR | | | 32,106 | | | | 414,488 | |
NovaTek OAO GDR Reg S | | | 915 | | | | 82,213 | |
Novolipetsk Steel GDR Reg S | | | 14,873 | | | | 185,912 | |
PhosAgro OAO GDR Reg S | | | 11,229 | | | | 158,329 | |
Rosneft OAO GDR Reg S | | | 36,709 | | | | 166,732 | |
Tatneft PAO ADR | | | 5,137 | | | | 163,562 | |
| | | | | | | | |
| Total Russia | | | | 1,733,717 | |
| Singapore – 1.1% | | | | | | | | |
Wilmar International Ltd. | | | 69,100 | | | | 172,416 | |
| South Africa – 1.3% | | | | | | | | |
Sasol Ltd. | | | 6,600 | | | | 198,135 | |
| South Korea – 0.4% | | | | | | | | |
Korea Zinc Co., Ltd. | | | 158 | | | | 66,524 | |
| Spain – 2.9% | | | | | | | | |
Repsol S.A. | | | 30,062 | | | | 339,831 | |
Tecnicas Reunidas S.A.(a) | | | 3,581 | | | | 100,896 | |
| | | | | | | | |
| Total Spain | | | | 440,727 | |
| Sweden – 0.5% | | | | | | | | |
Boliden AB | | | 4,426 | | | | 70,921 | |
| Switzerland – 1.4% | | | | | | | | |
Syngenta AG Registered Shares | | | 501 | | | | 209,262 | |
| Thailand – 2.5% | | | | | | | | |
PTT Exploration & Production PCL | | | 59,041 | | | | 117,897 | |
PTT Exploration & Production PCL NVDR | | | 21,300 | | | | 42,533 | |
PTT PCL NVDR | | | 28,500 | | | | 226,834 | |
| | | | | | | | |
| Total Thailand | | | | | | | 387,264 | |
| United Kingdom – 12.7% | | | | | | | | |
Amec Foster Wheeler PLC | | | 25,633 | | | | 165,790 | |
BHP Billiton PLC | | | 23,147 | | | | 260,431 | |
BP PLC | | | 70,100 | | | | 352,793 | |
Fresnillo PLC | | | 2,591 | | | | 35,471 | |
John Wood Group PLC | | | 14,830 | | | | 131,088 | |
Rio Tinto PLC | | | 8,964 | | | | 251,946 | |
Royal Dutch Shell PLC Class A | | | 14,132 | | | | 342,053 | |
Royal Dutch Shell PLC Class B | | | 16,196 | | | | 395,735 | |
| | | | | | | | |
| Total United Kingdom | | | | | | | 1,935,307 | |
See Notes to Financial Statements.
| | |
| 70 | | WisdomTree Global/Global ex-U.S. and Emerging/Frontier Markets Funds |
Schedule of Investments (concluded)
WisdomTree Global Natural Resources Fund (GNAT)
March 31, 2016
| | | | | | | | |
| Investments | | Shares | | | Value | |
| | | | | | | | |
| United States – 20.6% | | | | | | | | |
Anadarko Petroleum Corp. | | | 1,283 | | | $ | 59,749 | |
Apache Corp. | | | 2,676 | | | | 130,616 | |
Archer-Daniels-Midland Co. | | | 2,731 | | | | 99,163 | |
Baker Hughes, Inc. | | | 1,078 | | | | 47,249 | |
Cabot Oil & Gas Corp. | | | 766 | | | | 17,396 | |
CF Industries Holdings, Inc. | | | 2,583 | | | | 80,951 | |
Chevron Corp. | | | 2,889 | | | | 275,611 | |
Cimarex Energy Co. | | | 266 | | | | 25,874 | |
Compass Minerals International, Inc. | | | 1,856 | | | | 131,516 | |
ConocoPhillips | | | 5,313 | | | | 213,954 | |
Devon Energy Corp. | | | 2,946 | | | | 80,838 | |
EOG Resources, Inc. | | | 518 | | | | 37,596 | |
EQT Corp. | | | 124 | | | | 8,340 | |
Exxon Mobil Corp. | | | 2,280 | | | | 190,585 | |
FMC Corp. | | | 2,258 | | | | 91,155 | |
Halliburton Co. | | | 2,438 | | | | 87,085 | |
Helmerich & Payne, Inc.(a) | | | 4,643 | | | | 272,637 | |
Hess Corp. | | | 1,648 | | | | 86,767 | |
Ingredion, Inc. | | | 920 | | | | 98,247 | |
Marathon Oil Corp. | | | 13,544 | | | | 150,880 | |
Monsanto Co. | | | 1,197 | | | | 105,025 | |
Mosaic Co. (The) | | | 4,861 | | | | 131,247 | |
National Oilwell Varco, Inc. | | | 6,156 | | | | 191,452 | |
Noble Energy, Inc. | | | 2,855 | | | | 89,676 | |
Occidental Petroleum Corp. | | | 2,878 | | | | 196,942 | |
Oceaneering International, Inc. | | | 2,947 | | | | 97,958 | |
Pioneer Natural Resources Co. | | | 35 | | | | 4,926 | |
Scotts Miracle-Gro Co. (The) Class A | | | 2,032 | | | | 147,869 | |
| | | | | | | | |
| Total United States | | | | | | | 3,151,304 | |
TOTAL COMMON STOCKS (Cost: $21,944,814) | | | | | | | 15,044,112 | |
| EXCHANGE-TRADED FUNDS AND NOTES – 1.1% | | | | | | | | |
| United States – 1.1% | | | | | | | | |
iPath MSCI India Index ETN* | | | 2,662 | | | | 167,147 | |
WisdomTree Global High Dividend Fund(b) | | | 230 | | | | 9,382 | |
TOTAL EXCHANGE-TRADED FUNDS AND NOTES (Cost: $182,404) | | | | | | | 176,529 | |
| INVESTMENT OF CASH COLLATERAL FOR SECURITIES LOANED – 7.4% | |
| United States – 7.4% | | | | | | | | |
State Street Navigator Securities Lending Prime Portfolio, 0.50%(c) | | | | | | | | |
| (Cost: $1,133,085)(d) | | | 1,133,085 | | | | 1,133,085 | |
TOTAL INVESTMENTS IN SECURITIES – 107.0% (Cost: $23,260,303) | | | | | | | 16,353,726 | |
Liabilities in Excess of Cash, Foreign Currency and Other Assets – (7.0)% | | | | | | | (1,073,851 | ) |
| | | | | | | | |
| NET ASSETS – 100.0% | | | | | | $ | 15,279,875 | |
| * | Non-income producing security. |
| (a) | Security, or portion thereof, was on loan at March 31, 2016 (See Note 2). |
| (b) | Affiliated company (See Note 3). |
| (c) | Rate shown represents annualized 7-day yield as of March 31, 2016. |
| (d) | At March 31, 2016, the total market value of the Fund’s securities on loan was $1,083,365 and the total market value of the collateral held by the Fund was $1,133,085. |
ADR – American Depositary Receipt
ETN – Exchange-Traded Note
GDR – Global Depositary Receipt
NVDR – Non-Voting Depositary Receipt
Reg S – Regulation S provides an exclusion from the registration requirements of the Securities Act of 1933. These securities may be resold in transactions exempt from registration, normally to qualified institutional buyers.
| | | | | | | | | | | | | | | | | | | | |
| FINANCIAL DERIVATIVE INSTRUMENTS | |
| FORWARD CONTRACTS | | | | |
Settlement
Date | | Contracts
To Deliver | | | In
Exchange For | | | Unrealized
Gain (Loss) | |
4/1/2016 | | | CAD | | | | 2,874 | | | | USD | | | | 2,217 | | | $ | (5 | ) |
4/1/2016 | | | GBP | | | | 2,093 | | | | SGD | | | | 4,070 | | | | 15 | |
4/1/2016 | | | GBP | | | | 8,030 | | | | USD | | | | 11,554 | | | | 13 | |
4/1/2016 | | | USD | | | | 650 | | | | MYR | | | | 2,536 | | | | (1 | ) |
| | | | | | | | | | | | | | | | | | | $ | 22 | |
| |
| CURRENCY LEGEND | | | | |
| | |
CAD – Canadian dollar |
GBP – British pound |
MYR – Malaysian ringgit |
SGD – Singapore dollar |
USD – U.S. dollar |
See Notes to Financial Statements.
| | | | |
| WisdomTree Global/Global ex-U.S. and Emerging/Frontier Markets Funds | | | 71 | |
Schedule of Investments
WisdomTree India Earnings Fund (EPI) (consolidated)
March 31, 2016
| | | | | | | | |
| Investments | | Shares | | | Value | |
| COMMON STOCKS – 99.9% | | | | | | | | |
| India – 99.9% | | | | | | | | |
| Aerospace & Defense – 0.3% | | | | | | | | |
Bharat Electronics Ltd. | | | 221,309 | | | $ | 4,091,489 | |
| Air Freight & Logistics – 0.0% | | | | | | | | |
Allcargo Logistics Ltd. | | | 140,564 | | | | 324,758 | |
| Auto Components – 1.3% | | | | | | | | |
Apollo Tyres Ltd. | | | 1,500,684 | | | | 3,963,451 | |
Balkrishna Industries Ltd. | | | 214,276 | | | | 2,043,020 | |
Bharat Forge Ltd. | | | 303,900 | | | | 4,006,721 | |
Bosch Ltd. | | | 7,753 | | | | 2,433,346 | |
Ceat Ltd. | | | 44,073 | | | | 723,197 | |
Exide Industries Ltd. | | | 739,107 | | | | 1,555,280 | |
JK Tyre & Industries Ltd. | | | 593,355 | | | | 754,434 | |
Motherson Sumi Systems Ltd. | | | 470,796 | | | | 1,894,274 | |
Tube Investments of India Ltd. | | | 222,170 | | | | 1,298,515 | |
| | | | | | | | |
| Total Auto Components | | | | 18,672,238 | |
| Automobiles – 7.0% | | | | | | | | |
Bajaj Auto Ltd. | | | 245,396 | | | | 8,915,558 | |
Hero MotoCorp Ltd. | | | 290,671 | | | | 12,929,587 | |
Mahindra & Mahindra Ltd. | | | 976,310 | | | | 17,849,198 | |
Tata Motors Ltd.* | | | 10,817,790 | | | | 63,153,122 | |
TVS Motor Co., Ltd. | | | 220,457 | | | | 1,074,612 | |
| | | | | | | | |
| Total Automobiles | | | | 103,922,077 | |
| Banks – 11.6% | | | | | | | | |
Allahabad Bank | | | 878,714 | | | | 727,811 | |
Andhra Bank | | | 1,878,818 | | | | 1,482,400 | |
Axis Bank Ltd. | | | 5,276,391 | | | | 35,388,411 | |
Bank of Baroda | | | 2,686,226 | | | | 5,962,856 | |
Bank of India | | | 1,544,457 | | | | 2,263,423 | |
Canara Bank | | | 1,504,831 | | | | 4,318,670 | |
Central Bank of India | | | 594,776 | | | | 666,875 | |
City Union Bank Ltd. | | | 768,033 | | | | 1,099,468 | |
DCB Bank Ltd.* | | | 618,944 | | | | 740,705 | |
Federal Bank Ltd. | | | 5,371,920 | | | | 3,767,990 | |
ICICI Bank Ltd. | | | 13,635,814 | | | | 48,728,384 | |
IDBI Bank Ltd. | | | 2,640,312 | | | | 2,767,000 | |
Indian Bank | | | 959,925 | | | | 1,506,077 | |
IndusInd Bank Ltd. | | | 683,376 | | | | 9,985,045 | |
Jammu & Kashmir Bank Ltd. (The) | | | 758,365 | | | | 692,832 | |
Karnataka Bank Ltd. (The) | | | 1,347,469 | | | | 2,088,681 | |
Karur Vysya Bank Ltd. (The) | | | 309,418 | | | | 2,040,904 | |
Lakshmi Vilas Bank Ltd. (The) | | | 321,261 | | | | 393,678 | |
Oriental Bank of Commerce | | | 275,671 | | | | 381,521 | |
South Indian Bank Ltd. (The) | | | 7,337,667 | | | | 1,955,677 | |
State Bank of India | | | 8,860,326 | | | | 25,989,933 | |
Syndicate Bank | | | 2,391,407 | | | | 2,442,956 | |
UCO Bank | | | 4,677,040 | | | | 2,740,294 | |
Union Bank of India | | | 1,116,418 | | | | 2,205,104 | |
Yes Bank Ltd. | | | 859,251 | | | | 11,224,207 | |
| | | | | | | | |
| Total Banks | | | | 171,560,902 | |
| Biotechnology – 0.1% | | | | | | | | |
Biocon Ltd. | | | 105,976 | | | $ | 773,506 | |
| Building Products – 0.3% | | | | | | | | |
Kajaria Ceramics Ltd. | | | 60,632 | | | | 876,988 | |
Sintex Industries Ltd. | | | 2,419,409 | | | | 2,813,160 | |
| | | | | | | | |
| Total Building Products | | | | 3,690,148 | |
| Capital Markets – 0.1% | | | | | | | | |
Edelweiss Financial Services Ltd. | | | 1,166,083 | | | | 992,243 | |
JM Financial Ltd. | | | 972,617 | | | | 558,844 | |
PTC India Financial Services Ltd. | | | 799,025 | | | | 409,029 | |
| | | | | | | | |
| Total Capital Markets | | | | 1,960,116 | |
| Chemicals – 1.8% | | | | | | | | |
Aarti Industries | | | 56,313 | | | | 438,318 | |
Akzo Nobel India Ltd. | | | 22,526 | | | | 463,956 | |
Asian Paints Ltd. | | | 524,015 | | | | 6,871,601 | |
Atul Ltd. | | | 30,040 | | | | 695,993 | |
Bayer CropScience Ltd. | | | 16,695 | | | | 956,371 | |
Berger Paints India Ltd. | | | 205,188 | | | | 758,504 | |
Castrol India Ltd. | | | 200,218 | | | | 1,131,210 | |
Chambal Fertilizers and Chemicals Ltd. | | | 1,175,487 | | | | 974,506 | |
Godrej Industries Ltd. | | | 206,505 | | | | 1,107,015 | |
Gujarat Fluorochemicals Ltd. | | | 138,563 | | | | 1,080,822 | |
Gujarat Narmada Valley Fertilizers & Chemicals Ltd.* | | | 29 | | | | 36 | |
Jindal Poly Films Ltd. | | | 94,516 | | | | 603,940 | |
Kansai Nerolac Paints Ltd. | | | 165,294 | | | | 700,389 | |
Max Ventures & Industries Ltd.*† | | | 23,506 | | | | 18,511 | |
Monsanto India Ltd. | | | 14,174 | | | | 355,075 | |
PI Industries Ltd. | | | 86,173 | | | | 739,704 | |
Pidilite Industries Ltd. | | | 146,072 | | | | 1,299,864 | |
Rallis India Ltd. | | | 169,472 | | | | 435,436 | |
Rashtriya Chemicals & Fertilizers Ltd. | | | 1,399,436 | | | | 816,765 | |
Tata Chemicals Ltd. | | | 330,883 | | | | 1,867,205 | |
UPL Ltd. | | | 799,113 | | | | 5,764,450 | |
| | | | | | | | |
| Total Chemicals | | | | 27,079,671 | |
| Construction & Engineering – 1.2% | | | | | | | | |
Ahluwalia Contracts India Ltd.* | | | 56,904 | | | | 260,535 | |
Ashoka Buildcon Ltd. | | | 62,195 | | | | 160,506 | |
Engineers India Ltd. | | | 100,141 | | | | 257,224 | |
IRB Infrastructure Developers Ltd. | | | 935,113 | | | | 3,285,904 | |
KEC International Ltd. | | | 154,580 | | | | 285,479 | |
Larsen & Toubro Ltd. | | | 566,655 | | | | 10,411,101 | |
NCC Ltd. | | | 552,597 | | | | 632,517 | |
Voltas Ltd. | | | 549,772 | | | | 2,308,756 | |
| | | | | | | | |
| Total Construction & Engineering | | | | 17,602,022 | |
| Construction Materials – 1.2% | | | | | | | | |
ACC Ltd. | | | 108,165 | | | | 2,257,136 | |
Ambuja Cements Ltd. | | | 1,888,853 | | | | 6,632,984 | |
Ramco Cements Ltd. (The) | | | 190,242 | | | | 1,148,677 | |
UltraTech Cement Ltd. | | | 169,171 | | | | 8,248,116 | |
| | | | | | | | |
| Total Construction Materials | | | | 18,286,913 | |
See Notes to Financial Statements.
| | |
| 72 | | WisdomTree Global/Global ex-U.S. and Emerging/Frontier Markets Funds |
Schedule of Investments (continued)
WisdomTree India Earnings Fund (EPI) (consolidated)
March 31, 2016
| | | | | | | | |
| Investments | | Shares | | | Value | |
| Consumer Finance – 1.7% | | | | | | | | |
Bajaj Finance Ltd. | | | 57,126 | | | $ | 5,973,030 | |
Cholamandalam Investment and Finance Co., Ltd. | | | 68,426 | | | | 745,249 | |
Mahindra & Mahindra Financial Services Ltd. | | | 1,057,861 | | | | 3,898,539 | |
Manappuram Finance Ltd. | | | 4,590,614 | | | | 2,426,237 | |
Muthoot Finance Ltd. | | | 471,717 | | | | 1,273,274 | |
Shriram City Union Finance Ltd. | | | 47,544 | | | | 1,078,530 | |
Shriram Transport Finance Co., Ltd. | | | 555,830 | | | | 8,000,141 | |
SKS Microfinance Ltd.* | | | 144,422 | | | | 1,190,423 | |
Sundaram Finance Ltd. | | | 52,246 | | | | 1,026,104 | |
| | | | | | | | |
| Total Consumer Finance | | | | 25,611,527 | |
| Containers & Packaging – 0.0% | | | | | | | | |
HSIL Ltd. | | | 88,259 | | | | 370,908 | |
| Diversified Financial Services – 2.1% | | | | | | | | |
Bajaj Holdings & Investment Ltd. | | | 98,888 | | | | 2,192,865 | |
Credit Analysis & Research Ltd. | | | 63,207 | | | | 893,951 | |
CRISIL Ltd. | | | 11,746 | | | | 319,074 | |
IFCI Ltd. | | | 9,115,570 | | | | 3,399,971 | |
L&T Finance Holdings Ltd. | | | 2,117,908 | | | | 2,042,032 | |
Power Finance Corp., Ltd. | | | 3,874,749 | | | | 10,025,871 | |
Rural Electrification Corp., Ltd. | | | 4,688,553 | | | | 11,766,960 | |
Srei Infrastructure Finance Ltd. | | | 1,163,013 | | | | 970,312 | |
| | | | | | | | |
| Total Diversified Financial Services | | | | 31,611,036 | |
| Diversified Telecommunication Services – 0.5% | | | | | |
Bharti Infratel Ltd. | | | 948,713 | | | | 5,471,870 | |
Himachal Futuristic Communications Ltd.* | | | 7,782,185 | | | | 1,903,755 | |
| | | | | | | | |
| Total Diversified Telecommunication Services | | | | 7,375,625 | |
| Electric Utilities – 1.4% | | | | | | | | |
CESC Ltd. | | | 240,975 | | | | 1,720,093 | |
Reliance Infrastructure Ltd. | | | 2,027,018 | | | | 16,333,071 | |
Tata Power Co., Ltd. | | | 1,141,866 | | | | 1,114,752 | |
Torrent Power Ltd. | | | 481,216 | | | | 1,685,137 | |
| | | | | | | | |
| Total Electric Utilities | | | | 20,853,053 | |
| Electrical Equipment – 0.5% | | | | | | | | |
ABB India Ltd. | | | 28,590 | | | | 553,538 | |
Amara Raja Batteries Ltd. | | | 88,500 | | | | 1,172,828 | |
Bharat Heavy Electricals Ltd. | | | 1,228,362 | | | | 2,111,805 | |
Crompton Greaves Ltd. | | | 270,339 | | | | 199,419 | |
Havells India Ltd. | | | 671,201 | | | | 3,257,057 | |
| | | | | | | | |
| Total Electrical Equipment | | | | 7,294,647 | |
Electronic Equipment, Instruments &
Components – 0.2% | | | | | |
Redington India Ltd. | | | 1,437,559 | | | | 2,488,824 | |
| Energy Equipment & Services – 0.1% | | | | | | | | |
Aban Offshore Ltd. | | | 695,816 | | | | 1,854,003 | |
Global Offshore Services Ltd.* | | | 75,642 | | | | 209,944 | |
| | | | | | | | |
| Total Energy Equipment & Services | | | | 2,063,947 | |
| Food Products – 0.6% | | | | | | | | |
Britannia Industries Ltd. | | | 40,255 | | | | 1,633,056 | |
KRBL Ltd. | | | 639,183 | | | | 2,157,233 | |
Nestle India Ltd. | | | 34,262 | | | | 2,978,721 | |
Tata Global Beverages Ltd. | | | 698,524 | | | $ | 1,278,962 | |
| | | | | | | | |
| Total Food Products | | | | 8,047,972 | |
| Gas Utilities – 0.9% | | | | | | | | |
GAIL India Ltd. | | | 1,653,648 | | | | 8,899,696 | |
Gujarat State Petronet Ltd. | | | 1,181,375 | | | | 2,527,854 | |
Indraprastha Gas Ltd. | | | 252,576 | | | | 2,172,484 | |
| | | | | | | | |
| Total Gas Utilities | | | | 13,600,034 | |
| Health Care Providers & Services – 0.2% | | | | | | | | |
Apollo Hospitals Enterprise Ltd. | | | 128,889 | | | | 2,587,219 | |
Max India Ltd.† | | | 117,530 | | | | 163,670 | |
| | | | | | | | |
| Total Health Care Providers & Services | | | | 2,750,889 | |
| Hotels, Restaurants & Leisure – 0.0% | | | | | | | | |
Jubilant Foodworks Ltd. | | | 19,253 | | | | 371,221 | |
| Household Durables – 0.1% | | | | | | | | |
Crompton Greaves Consumer Electricals Ltd.*† | | | 263,931 | | | | 404,929 | |
Symphony Ltd. | | | 8,128 | | | | 291,938 | |
Whirlpool of India Ltd.* | | | 70,069 | | | | 743,463 | |
| | | | | | | | |
| Total Household Durables | | | | 1,440,330 | |
| Household Products – 1.3% | | | | | | | | |
Hindustan Unilever Ltd. | | | 1,455,574 | | | | 19,111,655 | |
Jyothy Laboratories Ltd. | | | 60,753 | | | | 267,333 | |
| | | | | | | | |
| Total Household Products | | | | 19,378,988 | |
Independent Power & Renewable Electricity
Producers – 3.0% | |
Jaiprakash Power Ventures Ltd.* | | | 9,286,123 | | | | 652,051 | |
JSW Energy Ltd. | | | 3,144,591 | | | | 3,302,598 | |
NHPC Ltd. | | | 15,034,795 | | | | 5,482,884 | |
NTPC Ltd. | | | 14,514,694 | | | | 28,241,434 | |
PTC India Ltd. | | | 2,413,389 | | | | 2,332,393 | |
Reliance Power Ltd. | | | 6,035,811 | | | | 4,502,534 | |
| | | | | | | | |
Total Independent Power & Renewable
Electricity Producers | | | | 44,513,894 | |
| Industrial Conglomerates – 0.3% | | | | | | | | |
Aditya Birla Nuvo Ltd. | | | 158,479 | | | | 1,968,588 | |
Siemens Ltd. | | | 152,380 | | | | 2,530,444 | |
| | | | | | | | |
| Total Industrial Conglomerates | | | | 4,499,032 | |
| Insurance – 0.4% | | | | | | | | |
Bajaj Finserv Ltd. | | | 187,253 | | | | 4,838,365 | |
Max Financial Services Ltd. | | | 118,427 | | | | 615,271 | |
| | | | | | | | |
| Total Insurance | | | | 5,453,636 | |
| Internet Software & Services – 0.1% | | | | | | | | |
Just Dial Ltd. | | | 64,713 | | | | 748,930 | |
| IT Services – 18.6% | | | | | | | | |
eClerx Services Ltd. | | | 79,626 | | | | 1,562,099 | |
HCL Technologies Ltd. | | | 2,315,646 | | | | 28,467,174 | |
Hexaware Technologies Ltd. | | | 512,204 | | | | 2,081,765 | |
Infosys Ltd. | | | 7,354,481 | | | | 135,300,905 | |
Mindtree Ltd. | | | 493,025 | | | | 4,863,431 | |
Mphasis Ltd. | | | 464,859 | | | | 3,452,266 | |
Persistent Systems Ltd. | | | 75,645 | | | | 870,593 | |
See Notes to Financial Statements.
| | | | |
| WisdomTree Global/Global ex-U.S. and Emerging/Frontier Markets Funds | | | 73 | |
Schedule of Investments (continued)
WisdomTree India Earnings Fund (EPI) (consolidated)
March 31, 2016
| | | | | | | | |
| Investments | | Shares | | | Value | |
Polaris Consulting & Services Ltd. | | | 410,385 | | | $ | 1,171,555 | |
Rolta India Ltd. | | | 1,062,830 | | | | 1,217,345 | |
Sonata Software Ltd. | | | 181,127 | | | | 398,645 | |
Tata Consultancy Services Ltd. | | | 1,441,568 | | | | 54,863,284 | |
Tech Mahindra Ltd. | | | 1,790,431 | | | | 12,841,032 | |
Vakrangee Ltd. | | | 1,061,175 | | | | 3,175,232 | |
Wipro Ltd. | | | 2,813,023 | | | | 23,968,413 | |
| | | | | | | | |
| Total IT Services | | | | | | | 274,233,739 | |
| Life Sciences Tools & Services – 0.3% | | | | | | | | |
Dishman Pharmaceuticals & Chemicals Ltd. | | | 60,694 | | | | 306,896 | |
Divi’s Laboratories Ltd. | | | 231,077 | | | | 3,444,913 | |
| | | | | | | | |
| Total Life Sciences Tools & Services | | | | | | | 3,751,809 | |
| Machinery – 0.6% | | | | | | | | |
AIA Engineering Ltd. | | | 116,233 | | | | 1,649,526 | |
Cummins India Ltd. | | | 201,421 | | | | 2,560,402 | |
Eicher Motors Ltd. | | | 9,424 | | | | 2,729,555 | |
Escorts Ltd. | | | 352,179 | | | | 740,548 | |
Jain Irrigation Systems Ltd. | | | 731,550 | | | | 666,125 | |
Thermax Ltd. | | | 31,795 | | | | 364,174 | |
| | | | | | | | |
| Total Machinery | | | | | | | 8,710,330 | |
| Marine – 0.1% | | | | | | | | |
Shipping Corp. of India Ltd.* | | | 689,212 | | | | 675,968 | |
| Media – 0.7% | | | | | | | | |
Eros International Media Ltd.* | | | 82,109 | | | | 209,108 | |
Jagran Prakashan Ltd. | | | 404,058 | | | | 978,074 | |
Sun TV Network Ltd. | | | 324,723 | | | | 1,850,832 | |
Zee Entertainment Enterprises Ltd. | | | 1,247,917 | | | | 7,291,804 | |
| | | | | | | | |
| Total Media | | | | | | | 10,329,818 | |
| Metals & Mining – 3.1% | | | | | | | | |
Hindalco Industries Ltd. | | | 2,422,335 | | | | 3,217,099 | |
Hindustan Copper Ltd. | | | 287,431 | | | | 218,538 | |
Hindustan Zinc Ltd. | | | 3,190,116 | | | | 8,844,506 | |
JSW Steel Ltd. | | | 665,763 | | | | 12,901,059 | |
National Aluminium Co., Ltd. | | | 6,045,787 | | | | 3,606,155 | |
NMDC Ltd. | | | 8,198,016 | | | | 12,131,913 | |
Steel Authority of India Ltd. | | | 6,944,116 | | | | 4,519,482 | |
Welspun Corp., Ltd. | | | 430,502 | | | | 641,633 | |
| | | | | | | | |
| Total Metals & Mining | | | | | | | 46,080,385 | |
| Multiline Retail – 0.0% | | | | | | | | |
Future Retail Ltd. | | | 326,906 | | | | 634,338 | |
| Oil, Gas & Consumable Fuels – 18.5% | | | | | | | | |
Aegis Logistics Ltd. | | | 229,642 | | | | 336,197 | |
Bharat Petroleum Corp., Ltd. | | | 1,115,777 | | | | 15,236,470 | |
Cairn India Ltd. | | | 5,638,522 | | | | 13,099,575 | |
Coal India Ltd. | | | 6,231,108 | | | | 27,470,602 | |
Great Eastern Shipping Co., Ltd. (The) | | | 580,746 | | | | 2,734,367 | |
Hindustan Petroleum Corp., Ltd. | | | 456,139 | | | | 5,426,003 | |
Indian Oil Corp., Ltd. | | | 1,046,356 | | | | 6,219,121 | |
Oil & Natural Gas Corp., Ltd. | | | 13,324,161 | | | | 43,077,547 | |
Reliance Industries Ltd. | | | 10,140,529 | | | | 160,049,544 | |
| | | | | | | | |
| Total Oil, Gas & Consumable Fuels | | | | | | | 273,649,426 | |
| Paper & Forest Products – 0.0% | | | | | | | | |
Century Plyboards India Ltd. | | | 169,752 | | | $ | 437,950 | |
| Personal Products – 1.0% | | | | | | | | |
Bajaj Corp., Ltd. | | | 142,967 | | | | 833,115 | |
Colgate-Palmolive India Ltd. | | | 119,050 | | | | 1,493,642 | |
Dabur India Ltd. | | | 974,055 | | | | 3,675,735 | |
Emami Ltd. | | | 57,911 | | | | 815,288 | |
Godrej Consumer Products Ltd. | | | 232,788 | | | | 4,853,844 | |
Marico Ltd. | | | 706,156 | | | | 2,605,065 | |
| | | | | | | | |
| Total Personal Products | | | | | | | 14,276,689 | |
| Pharmaceuticals – 4.8% | | | | | | | | |
Ajanta Pharma Ltd. | | | 15,545 | | | | 330,782 | |
Aurobindo Pharma Ltd. | | | 923,652 | | | | 10,389,647 | |
Cadila Healthcare Ltd. | | | 714,750 | | | | 3,420,352 | |
Cipla Ltd. | | | 669,071 | | | | 5,172,425 | |
Dr. Reddy’s Laboratories Ltd. | | | 210,586 | | | | 9,651,865 | |
Glenmark Pharmaceuticals Ltd. | | | 164,490 | | | | 1,974,824 | |
Ipca Laboratories Ltd. | | | 50,963 | | | | 448,007 | |
Lupin Ltd. | | | 359,554 | | | | 8,031,564 | |
Marksans Pharma Ltd. | | | 399,940 | | | | 279,621 | |
Pfizer Ltd. | | | 18,023 | | | | 488,075 | |
Strides Shasun Ltd. | | | 291,647 | | | | 4,774,207 | |
Sun Pharmaceutical Industries Ltd. | | | 1,785,489 | | | | 22,108,815 | |
Suven Life Sciences Ltd. | | | 114,423 | | | | 332,872 | |
Torrent Pharmaceuticals Ltd. | | | 114,972 | | | | 2,326,871 | |
Wockhardt Ltd.* | | | 85,386 | | | | 1,255,792 | |
| | | | | | | | |
| Total Pharmaceuticals | | | | | | | 70,985,719 | |
| Real Estate Management & Development – 0.3% | | | | | |
DLF Ltd. | | | 787,869 | | | | 1,365,215 | |
Godrej Properties Ltd. | | | 68,391 | | | | 305,538 | |
Housing Development & Infrastructure Ltd.* | | | 1,696,407 | | | | 1,873,867 | |
Oberoi Realty Ltd. | | | 134,259 | | | | 489,615 | |
Prestige Estates Projects Ltd. | | | 77,651 | | | | 202,563 | |
Sobha Ltd. | | | 3,507 | | | | 14,508 | |
| | | | | | | | |
| Total Real Estate Management & Development | | | | 4,251,306 | |
| Road & Rail – 0.2% | | | | | | | | |
Container Corp. of India Ltd. | | | 174,426 | | | | 3,274,908 | |
| Software – 0.7% | | | | | | | | |
Cyient Ltd. | | | 272,056 | | | | 1,752,974 | |
KPIT Technologies Ltd. | | | 1,002,844 | | | | 2,238,974 | |
NIIT Technologies Ltd. | | | 117,698 | | | | 882,791 | |
Oracle Financial Services Software Ltd. | | | 61,556 | | | | 3,280,694 | |
TAKE Solutions Ltd. | | | 121,072 | | | | 259,704 | |
Tata Elxsi Ltd. | | | 7,800 | | | | 221,889 | |
Zensar Technologies Ltd. | | | 74,806 | | | | 1,054,327 | |
| | | | | | | | |
| Total Software | | | | | | | 9,691,353 | |
| Specialty Retail – 0.1% | | | | | | | | |
PC Jeweller Ltd. | | | 338,710 | | | | 1,859,459 | |
| Textiles, Apparel & Luxury Goods – 0.6% | | | | | | | | |
Aditya Birla Fashion and Retail Ltd.* | | | 837,732 | | | | 1,848,836 | |
Arvind Ltd. | | | 826,374 | | | | 3,411,066 | |
See Notes to Financial Statements.
| | |
| 74 | | WisdomTree Global/Global ex-U.S. and Emerging/Frontier Markets Funds |
Schedule of Investments (concluded)
WisdomTree India Earnings Fund (EPI) (consolidated)
March 31, 2016
| | | | | | | | |
| Investments | | Shares | | | Value | |
Bata India Ltd. | | | 82,020 | | | $ | 629,928 | |
Indo Count Industries Ltd. | | | 10,848 | | | | 159,143 | |
Raymond Ltd. | | | 61,252 | | | | 375,203 | |
SRF Ltd. | | | 29,000 | | | | 572,993 | |
Vardhman Textiles Ltd. | | | 57,407 | | | | 670,532 | |
Welspun India Ltd. | | | 999,320 | | | | 1,493,189 | |
| | | | | | | | |
| Total Textiles, Apparel & Luxury Goods | | | | | | | 9,160,890 | |
| Thrifts & Mortgage Finance – 6.8% | | | | | | | | |
Dewan Housing Finance Corp., Ltd. | | | 953,979 | | | | 2,828,552 | |
Housing Development Finance Corp., Ltd. | | | 4,662,415 | | | | 77,840,100 | |
Indiabulls Housing Finance Ltd. | | | 1,036,219 | | | | 10,169,334 | |
LIC Housing Finance Ltd. | | | 1,200,811 | | | | 8,942,277 | |
| | | | | | | | |
| Total Thrifts & Mortgage Finance | | | | | | | 99,780,263 | |
| Tobacco – 1.9% | | | | | | | | |
ITC Ltd. | | | 5,560,757 | | | | 27,563,419 | |
| Trading Companies & Distributors – 0.4% | | | | | | | | |
Adani Enterprises Ltd. | | | 5,279,348 | | | | 5,883,437 | |
| Transportation Infrastructure – 0.8% | | | | | | | | |
Adani Ports & Special Economic Zone Ltd. | | | 2,283,614 | | | | 8,541,677 | |
Gateway Distriparks Ltd. | | | 240,364 | | | | 1,016,663 | |
Gujarat Pipavav Port Ltd.* | | | 559,783 | | | | 1,491,965 | |
| | | | | | | | |
| Total Transportation Infrastructure | | | | | | | 11,050,305 | |
| Water Utilities – 0.0% | | | | | | | | |
VA Tech Wabag Ltd. | | | 46,858 | | | | 366,776 | |
| Wireless Telecommunication Services – 2.1% | | | | | | | | |
Bharti Airtel Ltd. | | | 3,887,512 | | | | 20,593,291 | |
Idea Cellular Ltd. | | | 4,634,841 | | | | 7,712,778 | |
Reliance Communications Ltd.* | | | 3,881,417 | | | | 2,930,588 | |
| | | | | | | | |
| Total Wireless Telecommunication Services | | | | | | | 31,236,657 | |
TOTAL INVESTMENTS IN SECURITIES – 99.9%
(Cost: $1,336,924,186) | | | | | | | 1,474,323,277 | |
Cash, Foreign Currency and Other Assets in Excess of Liabilities – 0.1% | | | | | | | 1,292,506 | |
| | | | | | | | |
| NET ASSETS – 100.0% | | | | | | $ | 1,475,615,783 | |
| * | Non-income producing security. |
| † | Security is being fair valued by a valuation committee under the direction of the Board of Trustees. The aggregate value of fair valued securities is $587,110, which represents less than 0.01% of net assets. |
See Notes to Financial Statements.
| | | | |
| WisdomTree Global/Global ex-U.S. and Emerging/Frontier Markets Funds | | | 75 | |
Schedule of Investments
WisdomTree Middle East Dividend Fund (GULF)
March 31, 2016
| | | | | | | | |
| Investments | | Shares | | | Value | |
| COMMON STOCKS – 97.9% | | | | | | | | |
| Bahrain – 3.7% | | | | | | | | |
Ahli United Bank BSC | | | 1,173,737 | | | $ | 706,883 | |
Al-Salam Bank-Bahrain BSC | | | 266,444 | | | | 66,013 | |
| | | | | | | | |
| Total Bahrain | | | | | | | 772,896 | |
| Egypt – 6.3% | | | | | | | | |
Amer Group Holding | | | 359,180 | | | | 17,393 | |
Commercial International Bank Egypt SAE | | | 68,171 | | | | 294,642 | |
Credit Agricole Egypt SAE | | | 51,115 | | | | 135,847 | |
Egypt Kuwait Holding Co. SAE | | | 124,972 | | | | 58,737 | |
Heliopolis Housing | | | 7,647 | | | | 44,504 | |
Juhayna Food Industries | | | 32,288 | | | | 26,870 | |
Oriental Weavers | | | 47,962 | | | | 39,158 | |
Sidi Kerir Petrochemicals Co. | | | 168,057 | | | | 239,407 | |
Talaat Moustafa Group | | | 106,709 | | | | 76,427 | |
Telecom Egypt Co. | | | 400,820 | | | | 371,483 | |
| | | | | | | | |
| Total Egypt | | | | | | | 1,304,468 | |
| Jordan – 1.5% | | | | | | | | |
Arab Bank PLC | | | 28,926 | | | | 249,457 | |
Jordan Petroleum Refinery Co. | | | 8,071 | | | | 52,544 | |
| | | | | | | | |
| Total Jordan | | | | | | | 302,001 | |
| Kuwait – 22.0% | | | | | | | | |
Agility Public Warehousing Co. KSC | | | 208,922 | | | | 331,842 | |
Boubyan Bank KSCP | | | 68,022 | | | | 95,663 | |
Burgan Bank SAK | | | 204,266 | | | | 229,816 | |
Kuwait Finance House KSCP | | | 343,747 | | | | 545,991 | |
Kuwait Food Co. Americana SAK | | | 42,811 | | | | 348,495 | |
Kuwait Projects Co. Holding KSCP | | | 173,062 | | | | 314,970 | |
Mabanee Co. SAK | | | 35,844 | | | | 102,005 | |
Mobile Telecommunications Co. KSC | | | 1,221,647 | | | | 1,435,092 | |
National Bank of Kuwait SAKP | | | 518,954 | | | | 1,150,560 | |
| | | | | | | | |
| Total Kuwait | | | | | | | 4,554,434 | |
| Morocco – 12.1% | | | | | | | | |
Attijariwafa Bank | | | 16,443 | | | | 577,353 | |
Maroc Telecom | | | 155,125 | | | | 1,936,143 | |
| | | | | | | | |
| Total Morocco | | | | | | | 2,513,496 | |
| Oman – 5.2% | | | | | | | | |
Bank Muscat SAOG | | | 358,357 | | | | 355,472 | |
Oman Telecommunications Co. SAOG | | | 180,994 | | | | 716,738 | |
| | | | | | | | |
| Total Oman | | | | | | | 1,072,210 | |
| Qatar – 23.6% | | | | | | | | |
Aamal Co. | | | 38,938 | | | | 136,765 | |
Barwa Real Estate Co. | | | 17,426 | | | | 173,236 | |
Commercial Bank QSC (The) | | | 16,642 | | | | 190,350 | |
Doha Bank QSC | | | 18,712 | | | | 190,902 | |
Ezdan Holding Group QSC | | | 48,840 | | | | 244,106 | |
Gulf International Services OSC | | | 13,658 | | | | 136,152 | |
Industries Qatar QSC | | | 31,135 | | | | 925,996 | |
Masraf Al Rayan QSC | | | 27,021 | | | | 264,912 | |
Mazaya Qatar Real Estate Development QSC | | | 1,685 | | | | 6,506 | |
National Leasing | | | 2,863 | | | | 13,051 | |
Ooredoo QSC | | | 15,342 | | | $ | 391,829 | |
Qatar Electricity & Water Co. QSC | | | 3,653 | | | | 210,669 | |
Qatar Gas Transport Co., Ltd. | | | 26,571 | | | | 173,667 | |
Qatar Insurance Co. SAQ | | | 4,107 | | | | 93,500 | |
Qatar International Islamic Bank QSC | | | 7,538 | | | | 139,109 | |
Qatar Islamic Bank SAQ | | | 8,025 | | | | 228,316 | |
Qatar National Bank SAQ | | | 30,671 | | | | 1,185,939 | |
Qatari Investors Group QSC | | | 1,717 | | | | 28,008 | |
Salam International Investment Ltd. QSC | | | 6,381 | | | | 23,289 | |
United Development Co. QSC | | | 16,166 | | | | 87,414 | |
Vodafone Qatar QSC | | | 15,874 | | | | 53,707 | |
| | | | | | | | |
| Total Qatar | | | | | | | 4,897,423 | |
| United Arab Emirates – 23.5% | | | | | | | | |
Abu Dhabi Commercial Bank PJSC | | | 346,763 | | | | 632,538 | |
Agthia Group PJSC | | | 11,010 | | | | 22,991 | |
Air Arabia PJSC | | | 376,797 | | | | 126,180 | |
Al Waha Capital PJSC | | | 282,424 | | | | 163,011 | |
Aldar Properties PJSC | | | 349,466 | | | | 261,647 | |
Aramex PJSC | | | 73,267 | | | | 67,622 | |
DAMAC Properties Dubai Co. PJSC | | | 211,181 | | | | 156,963 | |
DP World Ltd. | | | 11,158 | | | | 209,659 | |
Dubai Financial Market PJSC | | | 385,552 | | | | 142,758 | |
Dubai Investments PJSC | | | 219,004 | | | | 128,791 | |
Dubai Islamic Bank PJSC | | | 281,999 | | | | 455,283 | |
Emaar Properties PJSC | | | 187,007 | | | | 306,502 | |
First Gulf Bank PJSC | | | 339,786 | | | | 1,086,982 | |
National Bank of Abu Dhabi PJSC | | | 244,207 | | | | 581,097 | |
National Bank of Ras Al-Khaimah PSC (The) | | | 146,770 | | | | 239,755 | |
National Central Cooling Co. PJSC | | | 35,067 | | | | 11,457 | |
RAK Properties PJSC | | | 205,151 | | | | 31,837 | |
Ras Al Khaimah Ceramics | | | 103,732 | | | | 90,373 | |
Union National Bank PJSC | | | 138,427 | | | | 139,068 | |
Union Properties PJSC | | | 123,595 | | | | 28,737 | |
| | | | | | | | |
| Total United Arab Emirates | | | | | | | 4,883,251 | |
TOTAL COMMON STOCKS (Cost: $21,653,194) | | | | | | | 20,300,179 | |
| RIGHTS – 0.1% | | | | | | | | |
| Qatar – 0.1% | | | | | | | | |
Qatar Insurance Co. SAQ, expiring 5/1/16* (Cost $0) | | | 821 | | | | 6,989 | |
| CONVERTIBLE BONDS – 0.1% | | | | | | | | |
| Oman – 0.1% | | | | | | | | |
Bank Muscat SAOG | | | | | | | | |
4.50%, 3/20/17 | | | 48,842 | | | | 13,063 | |
3.50%, 3/19/18 | | | 38,597 | | | | 9,221 | |
TOTAL CONVERTIBLE BONDS (Cost: $33,023) | | | | | | | 22,284 | |
TOTAL INVESTMENTS IN SECURITIES — 98.1% (Cost: $21,686,217) | | | | | | | 20,329,452 | |
Cash, Foreign Currency and Other Assets in Excess of Liabilities — 1.9% | | | | | | | 401,163 | |
| | | | | | | | |
| NET ASSETS — 100.0% | | | | | | $ | 20,730,615 | |
| * | Non-income producing security. |
See Notes to Financial Statements.
| | |
| 76 | | WisdomTree Global/Global ex-U.S. and Emerging/Frontier Markets Funds |
Schedule of Investments (concluded)
WisdomTree Middle East Dividend Fund (GULF)
March 31, 2016
| | | | | | | | | | | | | | | | | | | | |
| FINANCIAL DERIVATIVE INSTRUMENTS | |
| FORWARD CONTRACTS | |
Settlement
Date | | | | | Contracts
To
Deliver | | | | | | In
Exchange For | | | Unrealized
Gain (Loss) | |
4/4/2016 | | | AED | | | | 123,473 | | | | USD | | | | 33,609 | | | $ | (7 | ) |
4/4/2016 | | | KWD | | | | 3,000 | | | | USD | | | | 9,899 | | | | (29 | ) |
4/4/2016 | | | QAR | | | | 24,504 | | | | USD | | | | 6,723 | | | | (6 | ) |
4/4/2016 | | | USD | | | | 6,346 | | | | JOD | | | | 4,500 | | | | (5 | ) |
4/5/2016 | | | USD | | | | 10,158 | | | | OMR | | | | 3,900 | | | | (30 | ) |
| | | | | | | | | | | | | | | | | | | $ | (77 | ) |
| | |
| CURRENCY LEGEND | | | | | | | |
AED – United Arab Emirates dirham
JOD – Jordanian dinar
KWD – Kuwaiti dinar
OMR – Omani rial
QAR – Qatari riyal
USD – U.S. dollar
See Notes to Financial Statements.
| | | | |
| WisdomTree Global/Global ex-U.S. and Emerging/Frontier Markets Funds | | | 77 | |
Statements of Assets and Liabilities
WisdomTree Global/Global ex-U.S. and Emerging/Frontier Markets Funds
March 31, 2016
| | | | | | | | | | | | | | | | | | | | |
| | | WisdomTree
Asia Pacific ex-
Japan Fund | | | WisdomTree
China ex-
State-Owned
Enterprises
Fund | | | WisdomTree
Commodity
Country Equity
Fund | | | WisdomTree
Emerging
Markets
Consumer
Growth Fund | | | WisdomTree
Emerging
Markets ex-
State-Owned
Enterprises
Fund | |
ASSETS: | | | | | | | | | | | | | | | | | | | | |
| | | | | |
Investments, at cost | | $ | 48,414,661 | | | $ | 11,281,336 | | | $ | 8,886,477 | | | $ | 13,627,656 | | | $ | 2,265,407 | |
| | | | | |
Investment in affiliates, at cost (Note 3) | | | 95,139 | | | | — | | | | 65,718 | | | | — | | | | — | |
| | | | | |
Foreign currency, at cost | | | 24,891 | | | | 9 | | | | 119,545 | | | | 12,160 | | | | 1,507 | |
Investments in securities, at value1 (Note 2) | | | 45,773,117 | | | | 10,246,248 | | | | 6,892,736 | | | | 12,583,953 | | | | 2,146,107 | |
| | | | | |
Investment in affiliates, at value (Note 3) | | | 99,499 | | | | — | | | | 73,941 | | | | — | | | | — | |
| | | | | |
Cash | | | 5,362 | | | | 5,754 | | | | 258 | | | | 10,595 | | | | 747 | |
| | | | | |
Foreign currency, at value | | | 25,051 | | | | 9 | | | | 120,300 | | | | 12,396 | | | | 1,548 | |
| | | | | |
Unrealized appreciation on forward foreign currency contracts | | | — | | | | — | | | | 5 | | | | — | | | | 2 | |
| | | | | |
Receivables: | | | | | | | | | | | | | | | | | | | | |
| | | | | |
Investment securities sold | | | — | | | | — | | | | 963,451 | | | | — | | | | — | |
| | | | | |
Dividends and interest | | | 269,972 | | | | 3,151 | | | | 44,387 | | | | 52,465 | | | | 6,230 | |
| | | | | |
Foreign tax reclaims | | | — | | | | — | | | | 15,924 | | | | — | | | | — | |
Total Assets | | | 46,173,001 | | | | 10,255,162 | | | | 8,111,002 | | | | 12,659,409 | | | | 2,154,634 | |
LIABILITIES: | | | | | | | | | | | | | | | | | | | | |
| | | | | |
Unrealized depreciation on forward foreign currency contracts | | | 55 | | | | — | | | | 4,681 | | | | 63 | | | | — | |
| | | | | |
Payables: | | | | | | | | | | | | | | | | | | | | |
| | | | | |
Investment of cash collateral for securities loaned (Note 2) | | | 489,837 | | | | 900,596 | | | | 336,033 | | | | 269,888 | | | | 5,855 | |
| | | | | |
Investment securities purchased | | | — | | | | — | | | | 11,135 | | | | 25,980 | | | | — | |
| | | | | |
Capital shares redeemed | | | — | | | | — | | | | 1,076,751 | | | | — | | | | — | |
| | | | | |
Advisory fees (Note 3) | | | 18,020 | | | | 4,030 | | | | 3,619 | | | | 6,315 | | | | 1,012 | |
| | | | | |
Service fees (Note 2) | | | 165 | | | | 34 | | | | 28 | | | | 44 | | | | 8 | |
| | | | | |
Foreign capital gains tax | | | 39 | | | | — | | | | — | | | | — | | | | — | |
Total Liabilities | | | 508,116 | | | | 904,660 | | | | 1,432,247 | | | | 302,290 | | | | 6,875 | |
NET ASSETS | | $ | 45,664,885 | | | $ | 9,350,502 | | | $ | 6,678,755 | | | $ | 12,357,119 | | | $ | 2,147,759 | |
NET ASSETS: | | | | | | | | | | | | | | | | | | | | |
| | | | | |
Paid-in capital | | $ | 73,105,977 | | | $ | 13,926,872 | | | $ | 27,681,523 | | | $ | 15,966,550 | | | $ | 2,555,312 | |
| | | | | |
Undistributed (Distributions in excess of) net investment income | | | 61,335 | | | | (19 | ) | | | 45,399 | | | | 25,593 | | | | 924 | |
| | | | | |
Accumulated net realized loss on investments, forward foreign currency contracts and foreign currency related transactions | | | (24,875,645 | ) | | | (3,541,263 | ) | | | (19,064,782 | ) | | | (2,593,045 | ) | | | (289,366 | ) |
| | | | | |
Net unrealized depreciation on investments, forward foreign currency contracts and translation of assets and liabilities denominated in foreign currencies | | | (2,626,782 | ) | | | (1,035,088 | ) | | | (1,983,385 | ) | | | (1,041,979 | ) | | | (119,111 | ) |
NET ASSETS | | $ | 45,664,885 | | | $ | 9,350,502 | | | $ | 6,678,755 | | | $ | 12,357,119 | | | $ | 2,147,759 | |
Outstanding beneficial interest shares of $0.001 par value (unlimited number of shares authorized) | | | 800,000 | | | | 200,000 | | | | 300,000 | | | | 600,000 | | | | 100,000 | |
Net asset value per share | | $ | 57.08 | | | $ | 46.75 | | | $ | 22.26 | | | $ | 20.60 | | | $ | 21.48 | |
1 Includes market value of securities out on loan of: | | $ | 609,423 | | | $ | 1,016,683 | | | $ | 386,013 | | | $ | 350,230 | | | $ | 5,574 | |
See Notes to Financial Statements.
| | |
| 78 | | WisdomTree Global/Global ex-U.S. and Emerging/Frontier Markets Funds |
Statements of Assets and Liabilities (continued)
WisdomTree Global/Global ex-U.S. and Emerging/Frontier Markets Funds
March 31, 2016
| | | | | | | | | | | | | | | | | | | | |
| | | WisdomTree
Emerging
Markets High
Dividend Fund | | | WisdomTree
Emerging
Markets Quality
Dividend
Growth Fund | | | WisdomTree
Emerging
Markets
SmallCap
Dividend Fund | | | WisdomTree
Global ex-U.S.
Quality
Dividend
Growth Fund | | | WisdomTree
Global ex-U.S.
Real Estate
Fund | |
ASSETS: | | | | | | | | | | | | | | | | | | | | |
| | | | | |
Investments, at cost | | $ | 1,730,479,241 | | | $ | 33,309,051 | | | $ | 981,279,679 | | | $ | 67,281,069 | | | $ | 97,419,016 | |
| | | | | |
Investment in affiliates, at cost (Note 3) | | | — | | | | — | | | | — | | | | 41,878 | | | | 54,257 | |
| | | | | |
Foreign currency, at cost | | | 683,333 | | | | 14,926 | | | | 1,417,882 | | | | 29,635 | | | | 34,443 | |
Investments in securities, at value1 (Note 2) | | | 1,378,092,795 | | | | 32,548,258 | | | | 937,428,828 | | | | 69,115,671 | | | | 97,333,566 | |
| | | | | |
Investment in affiliates, at value (Note 3) | | | — | | | | — | | | | — | | | | 44,219 | | | | 55,286 | |
| | | | | |
Cash | | | 1,233,497 | | | | 19,746 | | | | 848,595 | | | | 65,307 | | | | 74,355 | |
| | | | | |
Foreign currency, at value | | | 694,816 | | | | 15,212 | | | | 1,430,089 | | | | 30,122 | | | | 35,555 | |
| | | | | |
Unrealized appreciation on forward foreign currency contracts | | | 3,271 | | | | — | | | | 10,550 | | | | — | | | | 9 | |
| | | | | |
Receivables: | | | | | | | | | | | | | | | | | | | | |
| | | | | |
Investment securities sold | | | 27,748,609 | | | | — | | | | 36,299 | | | | — | | | | — | |
| | | | | |
Dividends and interest | | | 4,148,556 | | | | 95,564 | | | | 2,920,288 | | | | 139,686 | | | | 229,872 | |
| | | | | |
Foreign tax reclaims | | | 3,530 | | | | — | | | | — | | | | 119,994 | | | | 26,529 | |
Total Assets | | | 1,411,925,074 | | | | 32,678,780 | | | | 942,674,649 | | | | 69,514,999 | | | | 97,755,172 | |
LIABILITIES: | | | | | | | | | | | | | | | | | | | | |
| | | | | |
Unrealized depreciation on forward foreign currency contracts | | | 24,703 | | | | — | | | | 4 | | | | — | | | | 8 | |
| | | | | |
Payables: | | | | | | | | | | | | | | | | | | | | |
| | | | | |
Investment of cash collateral for securities loaned (Note 2) | | | 59,328,633 | | | | 994,811 | | | | 47,246,610 | | | | 3,457,503 | | | | 3,611,625 | |
| | | | | |
Investment securities purchased | | | 2,613,174 | | | | — | | | | 493,573 | | | | — | | | | 54,257 | |
| | | | | |
Capital shares redeemed | | | 28,037,412 | | | | — | | | | — | | | | — | | | | — | |
| | | | | |
Advisory fees (Note 3) | | | 694,995 | | | | 16,383 | | | | 463,246 | | | | 31,363 | | | | 44,672 | |
| | | | | |
Service fees (Note 2) | | | 4,854 | | | | 114 | | | | 3,234 | | | | 238 | | | | 339 | |
| | | | | |
Professional fees (Note 2) | | | — | | | | — | | | | — | | | | 161 | | | | 215 | |
Total Liabilities | | | 90,703,771 | | | | 1,011,308 | | | | 48,206,667 | | | | 3,489,265 | | | | 3,711,116 | |
NET ASSETS | | $ | 1,321,221,303 | | | $ | 31,667,472 | | | $ | 894,467,982 | | | $ | 66,025,734 | | | $ | 94,044,056 | |
NET ASSETS: | | | | | | | | | | | | | | | | | | | | |
| | | | | |
Paid-in capital | | $ | 2,896,201,609 | | | $ | 40,271,294 | | | $ | 1,395,413,780 | | | $ | 93,982,182 | | | $ | 155,817,038 | |
| | | | | |
Undistributed (Distributions in excess of) net investment income | | | 936,703 | | | | 85,033 | | | | 740,433 | | | | 162,461 | | | | (1,429,445 | ) |
| | | | | |
Accumulated net realized loss on investments, forward foreign currency contracts and foreign currency related transactions | | | (1,223,636,837 | ) | | | (7,930,230 | ) | | | (457,890,188 | ) | | | (29,954,532 | ) | | | (60,260,788 | ) |
| | | | | |
Net unrealized appreciation (depreciation) on investments, forward foreign currency contracts and translation of assets and liabilities denominated in foreign currencies | | | (352,280,172 | ) | | | (758,625 | ) | | | (43,796,043 | ) | | | 1,835,623 | | | | (82,749 | ) |
NET ASSETS | | $ | 1,321,221,303 | | | $ | 31,667,472 | | | $ | 894,467,982 | | | $ | 66,025,734 | | | $ | 94,044,056 | |
Outstanding beneficial interest shares of $0.001 par value (unlimited number of shares authorized) | | | 37,700,000 | | | | 1,500,000 | | | | 23,600,000 | | | | 1,400,000 | | | | 3,450,000 | |
Net asset value per share | | $ | 35.05 | | | $ | 21.11 | | | $ | 37.90 | | | $ | 47.16 | | | $ | 27.26 | |
1 Includes market value of securities out on loan of: | | $ | 81,437,076 | | | $ | 2,143,687 | | | $ | 88,264,527 | | | $ | 5,692,262 | | | $ | 4,021,658 | |
See Notes to Financial Statements.
| | | | |
| WisdomTree Global/Global ex-U.S. and Emerging/Frontier Markets Funds | | | 79 | |
Statements of Assets and Liabilities (concluded)
WisdomTree Global/Global ex-U.S. and Emerging/Frontier Markets Funds
March 31, 2016
| | | | | | | | | | | | | | | | | | | | |
| | | WisdomTree
Global ex-U.S.
Utilities Fund | | | WisdomTree
Global High
Dividend Fund | | | WisdomTree
Global Natural
Resources Fund | | | WisdomTree India
Earnings
Fund
(consolidated) | | | WisdomTree
Middle East
Dividend Fund | |
ASSETS: | | | | | | | | | | | | | | | | | | | | |
| | | | | |
Investments, at cost | | $ | 19,617,371 | | | $ | 75,415,138 | | | $ | 23,251,104 | | | $ | 1,336,924,186 | | | $ | 21,686,217 | |
| | | | | |
Investment in affiliates, at cost (Note 3) | | | 3,814 | | | | — | | | | 9,199 | | | | — | | | | — | |
| | | | | |
Foreign currency, at cost | | | 3,218 | | | | 38,198 | | | | 22,341 | | | | 3,428,895 | | | | 216,339 | |
Investments in securities, at value1 (Note 2) | | | 16,644,114 | | | | 74,294,934 | | | | 16,344,344 | | | | 1,474,323,277 | | | | 20,329,452 | |
| | | | | |
Investment in affiliates, at value (Note 3) | | | 4,389 | | | | — | | | | 9,382 | | | | — | | | | — | |
| | | | | |
Cash | | | 1,454 | | | | 138,935 | | | | 2,587 | | | | 1,049,424 | | | | 368 | |
| | | | | |
Foreign currency, at value | | | 3,297 | | | | 38,961 | | | | 22,642 | | | | 3,456,260 | | | | 214,876 | |
| | | | | |
Unrealized appreciation on forward foreign currency contracts | | | — | | | | 375 | | | | 28 | | | | — | | | | — | |
| | | | | |
Receivables: | | | | | | | | | | | | | | | | | | | | |
| | | | | |
Investment securities sold | | | — | | | | 604 | | | | 269 | | | | — | | | | — | |
| | | | | |
Dividends and interest | | | 41,891 | | | | 281,150 | | | | 55,650 | | | | 438,794 | | | | 367,393 | |
| | | | | |
Foreign tax reclaims | | | 10,111 | | | | 129,466 | | | | 13,517 | | | | — | | | | — | |
Total Assets | | | 16,705,256 | | | | 74,884,425 | | | | 16,448,419 | | | | 1,479,267,755 | | | | 20,912,089 | |
LIABILITIES: | | | | | | | | | | | | | | | | | | | | |
| | | | | |
Unrealized depreciation on forward foreign currency contracts | | | — | | | | — | | | | 6 | | | | — | | | | 77 | |
| | | | | |
Payables: | | | | | | | | | | | | | | | | | | | | |
| | | | | |
Investment of cash collateral for securities loaned (Note 2) | | | 1,443,263 | | | | 1,172,860 | | | | 1,133,085 | | | | — | | | | — | |
| | | | | |
Investment securities purchased | | | — | | | | 162,741 | | | | 27,879 | | | | 2,672,629 | | | | 166,067 | |
| | | | | |
Capital shares redeemed | | | — | | | | — | | | | — | | | | 7,428 | | | | — | |
| | | | | |
Advisory fees (Note 3) | | | 7,263 | | | | 36,832 | | | | 7,453 | | | | 966,790 | | | | 15,254 | |
| | | | | |
Service fees (Note 2) | | | 55 | | | | 280 | | | | 57 | | | | 5,125 | | | | 76 | |
| | | | | |
Professional fees (Note 2) | | | 61 | | | | 384 | | | | 64 | | | | — | | | | — | |
Total Liabilities | | | 1,450,642 | | | | 1,373,097 | | | | 1,168,544 | | | | 3,651,972 | | | | 181,474 | |
NET ASSETS | | $ | 15,254,614 | | | $ | 73,511,328 | | | $ | 15,279,875 | | | $ | 1,475,615,783 | | | $ | 20,730,615 | |
NET ASSETS: | | | | | | | | | | | | | | | | | | | | |
| | | | | |
Paid-in capital | | $ | 46,989,532 | | | $ | 107,162,375 | | | $ | 46,860,172 | | | $ | 1,777,177,906 | | | $ | 30,897,794 | |
| | | | | |
Undistributed net investment income | | | 41,377 | | | | 201,294 | | | | 36,247 | | | | 7,530,595 | | | | 581,332 | |
| | | | | |
Accumulated net realized loss on investments, forward foreign currency contracts and foreign currency related transactions | | | (28,802,817 | ) | | | (32,732,130 | ) | | | (24,710,290 | ) | | | (446,515,318 | ) | | | (9,390,161 | ) |
| | | | | |
Net unrealized appreciation (depreciation) on investments, forward foreign currency contracts and translation of assets and liabilities denominated in foreign currencies | | | (2,973,478 | ) | | | (1,120,211 | ) | | | (6,906,254 | ) | | | 137,422,600 | | | | (1,358,350 | ) |
NET ASSETS | | $ | 15,254,614 | | | $ | 73,511,328 | | | $ | 15,279,875 | | | $ | 1,475,615,783 | | | $ | 20,730,615 | |
Outstanding beneficial interest shares of $0.001 par value (unlimited number of shares authorized) | | | 950,000 | | | | 1,800,000 | | | | 1,300,000 | | | | 76,000,000 | | | | 1,200,000 | |
Net asset value per share | | $ | 16.06 | | | $ | 40.84 | | | $ | 11.75 | | | $ | 19.42 | | | $ | 17.28 | |
1 Includes market value of securities out on loan of: | | $ | 1,784,892 | | | $ | 1,444,274 | | | $ | 1,083,365 | | | | — | | | | — | |
See Notes to Financial Statements.
| | |
| 80 | | WisdomTree Global/Global ex-U.S. and Emerging/Frontier Markets Funds |
Statements of Operations
WisdomTree Global/Global ex-U.S. and Emerging/Frontier Markets Funds
For the Year Ended March 31, 2016
| | | | | | | | | | | | | | | | | | | | |
| | | WisdomTree
Asia Pacific
ex-Japan Fund | | | WisdomTree
China ex-
State-Owned
Enterprises
Fund | | | WisdomTree
Commodity
Country Equity
Fund | | | WisdomTree
Emerging
Markets
Consumer
Growth Fund | | | WisdomTree
Emerging
Markets ex-
State-Owned
Enterprises
Fund | |
INVESTMENT INCOME: | | | | | | | | | | | | | | | | | | | | |
| | | | | |
Dividends1 | | $ | 1,889,753 | | | $ | 329,514 | | | $ | 388,415 | | | $ | 452,815 | | | $ | 73,324 | |
| | | | | |
Dividends from affiliates (Note 3) | | | 9,112 | | | | — | | | | 2,331 | | | | — | | | | — | |
| | | | | |
Interest | | | 6 | | | | — | | | | — | | | | 8 | | | | 4 | |
| | | | | |
Securities lending income (Note 2) | | | 15,774 | | | | 35,146 | | | | 12,842 | | | | 3,143 | | | | 115 | |
Total investment income | | | 1,914,645 | | | | 364,660 | | | | 403,588 | | | | 455,966 | | | | 73,443 | |
EXPENSES: | | | | | | | | | | | | | | | | | | | | |
| | | | | |
Advisory fees (Note 3) | | | 225,640 | | | | 76,674 | | | | 53,100 | | | | 94,991 | | | | 20,652 | |
| | | | | |
Service fees (Note 2) | | | 2,068 | | | | 535 | | | | 403 | | | | 663 | | | | 156 | |
Total expenses | | | 227,708 | | | | 77,209 | | | | 53,503 | | | | 95,654 | | | | 20,808 | |
Expense waivers (Note 3) | | | (407 | ) | | | (7,648 | ) | | | (38 | ) | | | — | | | | — | |
Net expenses | | | 227,301 | | | | 69,561 | | | | 53,465 | | | | 95,654 | | | | 20,808 | |
Net investment income | | | 1,687,344 | | | | 295,099 | | | | 350,123 | | | | 360,312 | | | | 52,635 | |
NET REALIZED AND UNREALIZED GAIN (LOSS) ON INVESTMENTS: | | | | | | | | | | | | | | | | | | | | |
| | | | | |
Net realized gain (loss) from: | | | | | | | | | | | | | | | | | | | | |
| | | | | |
Investment transactions2 | | | (1,127,655 | ) | | | (1,428,675 | ) | | | (1,424,352 | ) | | | (1,686,707 | ) | | | (231,660 | ) |
| | | | | |
Investment transactions in affiliates (Note 3) | | | (19,791 | ) | | | — | | | | (18,810 | ) | | | — | | | | — | |
| | | | | |
In-kind redemptions | | | — | | | | 715,962 | | | | (305,529 | ) | | | (194,809 | ) | | | 238,007 | |
| | | | | |
In-kind redemptions in affiliates (Note 3) | | | — | | | | — | | | | 1,343 | | | | — | | | | — | |
| | | | | |
Forward foreign currency contracts and foreign currency related transactions | | | (15,265 | ) | | | (192 | ) | | | (7,846 | ) | | | (23,544 | ) | | | (4,264 | ) |
| | | | | |
Payments by sub-advisor (Note 3) | | | 63 | | | | — | | | | — | | | | — | | | | — | |
Net realized gain (loss) | | | (1,162,648 | ) | | | (712,905 | ) | | | (1,755,194 | ) | | | (1,905,060 | ) | | | 2,083 | |
Net change in unrealized appreciation (depreciation) from: | | | | | | | | | | | | | | | | | | | | |
| | | | | |
Investment transactions | | | (7,357,123 | ) | | | (1,635,394 | ) | | | 324,014 | | | | (1,699,329 | ) | | | (214,834 | ) |
| | | | | |
Forward foreign currency contracts and translation of assets and liabilities denominated in foreign currencies | | | 11,230 | | | | (2 | ) | | | 3,637 | | | | 2,800 | | | | 508 | |
Net change in unrealized appreciation (depreciation) | | | (7,345,893 | ) | | | (1,635,396 | ) | | | 327,651 | | | | (1,696,529 | ) | | | (214,326 | ) |
Net realized and unrealized loss on investments | | | (8,508,541 | ) | | | (2,348,301 | ) | | | (1,427,543 | ) | | | (3,601,589 | ) | | | (212,243 | ) |
NET DECREASE IN NET ASSETS RESULTING FROM OPERATIONS | | $ | (6,821,197 | ) | | $ | (2,053,202 | ) | | $ | (1,077,420 | ) | | $ | (3,241,277 | ) | | $ | (159,608 | ) |
1 Net of foreign withholding tax of: | | $ | 144,789 | | | $ | 24,759 | | | $ | 58,527 | | | $ | 55,781 | | | $ | 8,993 | |
2 Net of foreign capital gains tax withheld of: | | | — | | | | — | | | | — | | | $ | 140 | | | $ | 764 | |
See Notes to Financial Statements.
| | | | |
| WisdomTree Global/Global ex-U.S. and Emerging/Frontier Markets Funds | | | 81 | |
Statements of Operations (continued)
WisdomTree Global/Global ex-U.S. and Emerging/Frontier Markets Funds
For the Year Ended March 31, 2016
| | | | | | | | | | | | | | | | | | | | |
| | | WisdomTree
Emerging
Markets High
Dividend Fund | | | WisdomTree
Emerging
Markets
Quality
Dividend
Growth Fund | | | WisdomTree
Emerging
Markets
SmallCap
Dividend Fund | | | WisdomTree
Global ex-U.S.
Quality
Dividend
Growth Fund | | | WisdomTree
Global ex-U.S.
Real Estate
Fund | |
INVESTMENT INCOME: | | | | | | | | | | | | | | | | | | | | |
| | | | | |
Dividends1 | | $ | 90,039,394 | | | $ | 1,104,866 | | | $ | 39,480,722 | | | $ | 2,039,242 | | | $ | 4,062,320 | |
| | | | | |
Dividends from affiliates (Note 3) | | | 65,770 | | | | — | | | | 285,356 | | | | 13,233 | | | | 10,724 | |
| | | | | |
Interest | | | 1,694 | | | | — | | | | 228 | | | | — | | | | — | |
| | | | | |
Securities lending income (Note 2) | | | 1,292,133 | | | | 42,005 | | | | 1,862,368 | | | | 90,405 | | | | 112,205 | |
Total investment income | | | 91,398,991 | | | | 1,146,871 | | | | 41,628,674 | | | | 2,142,880 | | | | 4,185,249 | |
EXPENSES: | | | | | | | | | | | | | | | | | | | | |
| | | | | |
Advisory fees (Note 3) | | | 10,911,297 | | | | 224,118 | | | | 6,962,000 | | | | 455,278 | | | | 638,097 | |
| | | | | |
Service fees (Note 2) | | | 76,206 | | | | 1,565 | | | | 48,623 | | | | 3,454 | | | | 4,840 | |
| | | | | |
Professional fees (Note 2) | | | — | | | | — | | | | — | | | | 161 | | | | 215 | |
Total expenses | | | 10,987,503 | | | | 225,683 | | | | 7,010,623 | | | | 458,893 | | | | 643,152 | |
Expense waivers (Note 3) | | | (5,162 | ) | | | — | | | | (6,830 | ) | | | (146 | ) | | | — | |
Net expenses | | | 10,982,341 | | | | 225,683 | | | | 7,003,793 | | | | 458,747 | | | | 643,152 | |
Net investment income | | | 80,416,650 | | | | 921,188 | | | | 34,624,881 | | | | 1,684,133 | | | | 3,542,097 | |
NET REALIZED AND UNREALIZED GAIN (LOSS) ON INVESTMENTS: | | | | | | | | | | | | | | | | | | | | |
| | | | | |
Net realized gain (loss) from: | | | | | | | | | | | | | | | | | | | | |
| | | | | |
Investment transactions | | | (266,278,224 | ) | | | (5,758,607 | ) | | | (79,662,664 | ) | | | (4,755,663 | ) | | | (612,203 | ) |
| | | | | |
Investment transactions in affiliates (Note 3) | | | (83,820 | ) | | | — | | | | (1,181,953 | ) | | | (74,141 | ) | | | (56,954 | ) |
| | | | | |
In-kind redemptions | | | (56,204,283 | ) | | | (139,109 | ) | | | 3,043,986 | | | | 1,032,704 | | | | 1,523,533 | |
| | | | | |
In-kind redemptions in affiliates (Note 3) | | | (7,630 | ) | | | — | | | | (6,366 | ) | | | — | | | | (275 | ) |
| | | | | |
Forward foreign currency contracts and foreign currency related transactions | | | (1,564,805 | ) | | | (31,501 | ) | | | (1,778,438 | ) | | | (22,687 | ) | | | (42,037 | ) |
| | | | | |
Payments by sub-advisor (Note 3) | | | — | | | | 260 | | | | — | | | | — | | | | — | |
Net realized gain (loss) | | | (324,138,762 | ) | | | (5,928,957 | ) | | | (79,585,435 | ) | | | (3,819,787 | ) | | | 812,064 | |
| | | | | |
Net change in unrealized appreciation (depreciation) from: | | | | | | | | | | | | | | | | | | | | |
| | | | | |
Investment transactions | | | (75,830,834 | ) | | | (323,120 | ) | | | (136,651,369 | ) | | | (4,174,085 | ) | | | (11,600,696 | ) |
| | | | | |
Forward foreign currency contracts and translation of assets and liabilities denominated in foreign currencies | | | 210,645 | | | | 3,075 | | | | 153,618 | | | | 8,140 | | | | 7,811 | |
Net change in unrealized appreciation (depreciation) | | | (75,620,189 | ) | | | (320,045 | ) | | | (136,497,751 | ) | | | (4,165,945 | ) | | | (11,592,885 | ) |
Net realized and unrealized loss on investments | | | (399,758,951 | ) | | | (6,249,002 | ) | | | (216,083,186 | ) | | | (7,985,732 | ) | | | (10,780,821 | ) |
NET DECREASE IN NET ASSETS RESULTING FROM OPERATIONS | | $ | (319,342,301 | ) | | $ | (5,327,814 | ) | | $ | (181,458,305 | ) | | $ | (6,301,599 | ) | | $ | (7,238,724 | ) |
1 Net of foreign withholding tax of: | | $ | 12,123,890 | | | $ | 163,885 | | | $ | 6,495,675 | | | $ | 262,513 | | | $ | 381,006 | |
See Notes to Financial Statements.
| | |
| 82 | | WisdomTree Global/Global ex-U.S. and Emerging/Frontier Markets Funds |
Statements of Operations (concluded)
WisdomTree Global/Global ex-U.S. and Emerging/Frontier Markets Funds
For the Year Ended March 31, 2016
| | | | | | | | | | | | | | | | | | | | |
| | | WisdomTree
Global ex-U.S.
Utilities Fund | | | WisdomTree
Global High
Dividend Fund | | | WisdomTree
Global Natural
Resources
Fund | | | WisdomTree
India Earnings
Fund
(consolidated) | | | WisdomTree
Middle East
Dividend Fund | |
INVESTMENT INCOME: | | | | | | | | | | | | | | | | | | | | |
| | | | | |
Dividends1 | | $ | 754,674 | | | $ | 4,776,650 | | | $ | 729,702 | | | $ | 40,326,601 | | | $ | 1,072,753 | |
| | | | | |
Dividends from affiliates (Note 3) | | | 1,872 | | | | 25,494 | | | | 2,850 | | | | — | | | | — | |
| | | | | |
Interest | | | 642 | | | | — | | | | — | | | | 3,541 | | | | 10,945 | |
| | | | | |
Securities lending income (Note 2) | | | 28,045 | | | | 100,190 | | | | 43,527 | | | | — | | | | — | |
Total investment income | | | 785,233 | | | | 4,902,334 | | | | 776,079 | | | | 40,330,142 | | | | 1,083,698 | |
EXPENSES: | | | | | | | | | | | | | | | | | | | | |
| | | | | |
Advisory fees (Note 3) | | | 110,455 | | | | 595,448 | | | | 99,304 | | | | 15,795,713 | | | | 237,697 | |
| | | | | |
Service fees (Note 2) | | | 838 | | | | 4,517 | | | | 753 | | | | 83,736 | | | | 1,188 | |
| | | | | |
Interest expense (Note 8) | | | — | | | | — | | | | — | | | | 97,124 | | | | — | |
| | | | | |
Professional fees (Note 2) | | | 61 | | | | 384 | | | | 64 | | | | — | | | | — | |
Total expenses | | | 111,354 | | | | 600,349 | | | | 100,121 | | | | 15,976,573 | | | | 238,885 | |
Expense waivers (Note 3) | | | — | | | | (573 | ) | | | (23 | ) | | | — | | | | — | |
Net expenses | | | 111,354 | | | | 599,776 | | | | 100,098 | | | | 15,976,573 | | | | 238,885 | |
Net investment income | | | 673,879 | | | | 4,302,558 | | | | 675,981 | | | | 24,353,569 | | | | 844,813 | |
NET REALIZED AND UNREALIZED GAIN (LOSS) ON INVESTMENTS: | | | | | | | | | | | | | | | | | | | | |
| | | | | |
Net realized gain (loss) from: | | | | | | | | | | | | | | | | | | | | |
| | | | | |
Investment transactions2 | | | (925,225 | ) | | | (4,617,632 | ) | | | (5,288,911 | ) | | | (93,866,955 | ) | | | (1,565,101 | ) |
| | | | | |
Investment transactions in affiliates (Note 3) | | | (3,366 | ) | | | (27,317 | ) | | | (1,700 | ) | | | — | | | | — | |
| | | | | |
In-kind redemptions | | | 271,842 | | | | 6,469,805 | | | | — | | | | — | | | | — | |
| | | | | |
In-kind redemptions in affiliates (Note 3) | | | 96 | | | | 3,995 | | | | — | | | | — | | | | — | |
| | | | | |
Forward foreign currency contracts and foreign currency related transactions | | | (7,670 | ) | | | (37,758 | ) | | | (3,394 | ) | | | (2,730,855 | ) | | | (19,999 | ) |
Net realized gain (loss) | | | (664,323 | ) | | | 1,791,093 | | | | (5,294,005 | ) | | | (96,597,810 | ) | | | (1,585,100 | ) |
| | | | | |
Net change in unrealized appreciation (depreciation) from: | | | | | | | | | | | | | | | | | | | | |
| | | | | |
Investment transactions | | | (1,370,230 | ) | | | (11,970,325 | ) | | | 15,621 | | | | (224,296,795 | ) | | | (2,927,051 | ) |
| | | | | |
Forward foreign currency contracts and translation of assets and liabilities denominated in foreign currencies | | | 1,800 | | | | 10,532 | | | | 2,706 | | | | 25,013 | | | | (1,484 | ) |
Net change in unrealized appreciation (depreciation) | | | (1,368,430 | ) | | | (11,959,793 | ) | | | 18,327 | | | | (224,271,782 | ) | | | (2,928,535 | ) |
Net realized and unrealized loss on investments | | | (2,032,753 | ) | | | (10,168,700 | ) | | | (5,275,678 | ) | | | (320,869,592 | ) | | | (4,513,635 | ) |
NET DECREASE IN NET ASSETS RESULTING FROM OPERATIONS | | $ | (1,358,874 | ) | | $ | (5,866,142 | ) | | $ | (4,599,697 | ) | | $ | (296,516,023 | ) | | $ | (3,668,822 | ) |
1 Net of foreign withholding tax of: | | $ | 91,962 | | | $ | 306,374 | | | $ | 54,586 | | | | — | | | $ | 58,398 | |
2 Net of foreign capital gains tax withheld of: | | | — | | | | — | | | | — | | | $ | 30 | | | | — | |
See Notes to Financial Statements.
| | | | |
| WisdomTree Global/Global ex-U.S. and Emerging/Frontier Markets Funds | | | 83 | |
Statements of Changes in Net Assets
WisdomTree Global/Global ex-U.S. and Emerging/Frontier Markets Funds
| | | | | | | | | | | | | | | | | | | | | | | | |
| | | WisdomTree
Asia Pacific ex-Japan Fund | | | WisdomTree China ex-State-Owned Enterprises Fund | | | WisdomTree Commodity Country Equity Fund | |
| | | For the
Year Ended
March 31, 2016 | | | For the
Year Ended
March 31, 2015 | | | For the
Year Ended
March 31, 2016 | | | For the
Year Ended
March 31, 2015 | | | For the
Year Ended
March 31, 2016 | | | For the
Year Ended
March 31, 2015 | |
INCREASE (DECREASE) IN NET ASSETS RESULTING FROM OPERATIONS: | | | | | | | | | | | | | | | | | | | | | |
| | | | | | |
Net investment income | | $ | 1,687,344 | | | $ | 1,636,393 | | | $ | 295,099 | | | $ | 456,837 | | | $ | 350,123 | | | $ | 729,118 | |
| | | | | | |
Net realized gain (loss) on investments, forward foreign currency contracts, foreign currency related transactions and payments by sub-advisor | | | (1,162,648 | ) | | | 874,420 | | | | (712,905 | ) | | | 22,758 | | | | (1,755,194 | ) | | | (150,948 | ) |
| | | | | | |
Net change in unrealized appreciation (depreciation) on investments, forward foreign currency contracts and translation of assets and liabilities denominated in foreign currencies | | | (7,345,893 | ) | | | 338,696 | | | | (1,635,396 | ) | | | 1,786,692 | | | | 327,651 | | | | (2,813,859 | ) |
Net increase (decrease) in net assets resulting from operations | | | (6,821,197 | ) | | | 2,849,509 | | | | (2,053,202 | ) | | | 2,266,287 | | | | (1,077,420 | ) | | | (2,235,689 | ) |
DIVIDENDS: | | | | | | | | | | | | | | | | | | | | | | | | |
| | | | | | |
Net investment income | | | (1,643,992 | ) | | | (1,585,507 | ) | | | (300,252 | ) | | | (427,018 | ) | | | (350,206 | ) | | | (754,412 | ) |
CAPITAL SHARE TRANSACTIONS: | | | | | | | | | | | | | | | | | | | | | | | | |
| | | | | | |
Net proceeds from sale of shares | | | 7,093,290 | | | | — | | | | 5,438,556 | | | | 2,565,916 | | | | — | | | | — | |
| | | | | | |
Cost of shares redeemed | | | — | | | | (6,805,857 | ) | | | (10,319,479 | ) | | | (5,215,961 | ) | | | (3,239,283 | ) | | | (7,186,372 | ) |
Net increase (decrease) in net assets resulting from capital share transactions | | | 7,093,290 | | | | (6,805,857 | ) | | | (4,880,923 | ) | | | (2,650,045 | ) | | | (3,239,283 | ) | | | (7,186,372 | ) |
Net Decrease in Net Assets | | | (1,371,899 | ) | | | (5,541,855 | ) | | | (7,234,377 | ) | | | (810,776 | ) | | | (4,666,909 | ) | | | (10,176,473 | ) |
NET ASSETS: | | | | | | | | | | | | | | | | | | | | | | | | |
| | | | | | |
Beginning of year | | $ | 47,036,784 | | | $ | 52,578,639 | | | $ | 16,584,879 | | | $ | 17,395,655 | | | $ | 11,345,664 | | | $ | 21,522,137 | |
| | | | | | |
End of year | | $ | 45,664,885 | | | $ | 47,036,784 | | | $ | 9,350,502 | | | $ | 16,584,879 | | | $ | 6,678,755 | | | $ | 11,345,664 | |
Undistributed (Distributions in excess of) net investment income included in net assets at end of year | | $ | 61,335 | | | $ | 59,872 | | | $ | (19 | ) | | $ | 4,102 | | | $ | 45,399 | | | $ | 48,368 | |
SHARES CREATED AND REDEEMED: | | | | | | | | | | | | | | | | | | | | | | | | |
| | | | | | |
Shares outstanding, beginning of year | | | 700,000 | | | | 800,000 | | | | 300,000 | | | | 350,000 | | | | 450,000 | | | | 700,000 | |
| | | | | | |
Shares created | | | 100,000 | | | | — | | | | 100,000 | | | | 50,000 | | | | — | | | | — | |
| | | | | | |
Shares redeemed | | | — | | | | (100,000 | ) | | | (200,000 | ) | | | (100,000 | ) | | | (150,000 | ) | | | (250,000 | ) |
Shares outstanding, end of year | | | 800,000 | | | | 700,000 | | | | 200,000 | | | | 300,000 | | | | 300,000 | | | | 450,000 | |
See Notes to Financial Statements.
| | |
| 84 | | WisdomTree Global/Global ex-U.S. and Emerging/Frontier Markets Funds |
Statements of Changes in Net Assets (continued)
WisdomTree Global/Global ex-U.S. and Emerging/Frontier Markets Funds
| | | | | | | | | | | | | | | | | | | | | | | | |
| | | WisdomTree Emerging Markets Consumer
Growth Fund | | | WisdomTree Emerging Markets ex-State-Owned
Enterprises Fund | | | WisdomTree Emerging Markets High
Dividend Fund | |
| | | For the
Year Ended
March 31, 2016 | | | For the
Year Ended
March 31, 2015 | | | For the
Year Ended
March 31, 2016 | | | For the Period
December 10, 2014*
through
March 31, 2015 | | | For the
Year Ended
March 31, 2016 | | | For the Year Ended
March 31, 2015 | |
INCREASE (DECREASE) IN NET ASSETS RESULTING FROM OPERATIONS: | | | | | | | | | | | | | | | | | | | | | |
| | | | | | |
Net investment income | | $ | 360,312 | | | $ | 380,135 | | | $ | 52,635 | | | $ | 26,893 | | | $ | 80,416,650 | | | $ | 145,437,478 | |
| | | | | | |
Net realized gain (loss) on investments, forward foreign currency contracts and foreign currency related transactions | | | (1,905,060 | ) | | | (182,881 | ) | | | 2,083 | | | | (32,530 | ) | | | (324,138,762 | ) | | | (222,985,348 | ) |
| | | | | | |
Net change in unrealized appreciation (depreciation) on investments, forward foreign currency contracts and translation of assets and liabilities denominated in foreign currencies | | | (1,696,529 | ) | | | 465,786 | | | | (214,326 | ) | | | 95,215 | | | | (75,620,189 | ) | | | (206,212,534 | ) |
Net increase (decrease) in net assets resulting from operations | | | (3,241,277 | ) | | | 663,040 | | | | (159,608 | ) | | | 89,578 | | | | (319,342,301 | ) | | | (283,760,404 | ) |
DIVIDENDS: | | | | | | | | | | | | | | | | | | | | | | | | |
| | | | | | |
Net investment income | | | (365,298 | ) | | | (374,552 | ) | | | (80,372 | ) | | | (20,436 | ) | | | (76,758,776 | ) | | | (150,590,028 | ) |
CAPITAL SHARE TRANSACTIONS: | | | | | | | | | | | | | | | | | | | | | | | | |
| | | | | | |
Net proceeds from sale of shares | | | — | | | | 2,439,400 | | | | — | | | | 10,000,000 | | | | 37,455,882 | | | | 102,476,902 | |
| | | | | | |
Cost of shares redeemed | | | (3,948,523 | ) | | | (2,463,158 | ) | | | (7,681,503 | ) | | | — | | | | (479,690,654 | ) | | | (1,397,423,523 | ) |
Net increase (decrease) in net assets resulting from capital share transactions | | | (3,948,523 | ) | | | (23,758 | ) | | | (7,681,503 | ) | | | 10,000,000 | | | | (442,234,772 | ) | | | (1,294,946,621 | ) |
Net Increase (Decrease) in Net Assets | | | (7,555,098 | ) | | | 264,730 | | | | (7,921,483 | ) | | | 10,069,142 | | | | (838,335,849 | ) | | | (1,729,297,053 | ) |
NET ASSETS: | | | | | | | | | | | | | | | | | | | | | | | | |
| | | | | | |
Beginning of period | | $ | 19,912,217 | | | $ | 19,647,487 | | | $ | 10,069,242 | | | $ | 100 | | | $ | 2,159,557,152 | | | $ | 3,888,854,205 | |
| | | | | | |
End of period | | $ | 12,357,119 | | | $ | 19,912,217 | | | $ | 2,147,759 | | | $ | 10,069,242 | | | $ | 1,321,221,303 | | | $ | 2,159,557,152 | |
Undistributed net investment income included in net assets at end of period | | $ | 25,593 | | | $ | 60,717 | | | $ | 924 | | | $ | 30,495 | | | $ | 936,703 | | | $ | 482,542 | |
SHARES CREATED AND REDEEMED: | | | | | | | | | | | | | | | | | | | | | | | | |
| | | | | | |
Shares outstanding, beginning of period | | | 800,000 | | | | 800,000 | | | | 400,004 | | | | 4 | | | | 50,600,000 | | | | 79,000,000 | |
| | | | | | |
Shares created | | | — | | | | 100,000 | | | | — | | | | 400,000 | | | | 800,000 | | | | 2,200,000 | |
| | | | | | |
Shares redeemed | | | (200,000 | ) | | | (100,000 | ) | | | (300,004 | ) | | | — | | | | (13,700,000 | ) | | | (30,600,000 | ) |
Shares outstanding, end of period | | | 600,000 | | | | 800,000 | | | | 100,000 | | | | 400,004 | | | | 37,700,000 | | | | 50,600,000 | |
| * | Commencement of operations. |
See Notes to Financial Statements.
| | | | |
| WisdomTree Global/Global ex-U.S. and Emerging/Frontier Markets Funds | | | 85 | |
Statements of Changes in Net Assets (continued)
WisdomTree Global/Global ex-U.S. and Emerging/Frontier Markets Funds
| | | | | | | | | | | | | | | | | | | | | | | | |
| | | WisdomTree Emerging Markets Quality Dividend Growth Fund | | | WisdomTree Emerging Markets SmallCap
Dividend Fund | | | WisdomTree Global ex-U.S. Quality Dividend Growth Fund | |
| | | For the
Year Ended
March 31, 2016 | | | For the
Year Ended
March 31, 2015 | | | For the
Year Ended
March 31, 2016 | | | For the
Year Ended
March 31, 2015 | | | For the
Year Ended
March 31, 2016 | | | For the
Year Ended
March 31, 2015 | |
INCREASE (DECREASE) IN NET ASSETS RESULTING FROM OPERATIONS: | | | | | | | | | | | | | | | | | | | | | |
| | | | | | |
Net investment income | | $ | 921,188 | | | $ | 756,365 | | | $ | 34,624,881 | | | $ | 50,505,978 | | | $ | 1,684,133 | | | $ | 1,483,803 | |
| | | | | | |
Net realized loss on investments, forward foreign currency contracts, foreign currency related transactions and payments by sub-advisor | | | (5,928,957 | ) | | | (1,387,669 | ) | | | (79,585,435 | ) | | | (48,764,584 | ) | | | (3,819,787 | ) | | | (442,751 | ) |
| | | | | | |
Net change in unrealized depreciation on investments, forward foreign currency contracts and translation of assets and liabilities denominated in foreign currencies | | | (320,045 | ) | | | (648,158 | ) | | | (136,497,751 | ) | | | (41,436,635 | ) | | | (4,165,945 | ) | | | (13,449 | ) |
Net increase (decrease) in net assets resulting from operations | | | (5,327,814 | ) | | | (1,279,462 | ) | | | (181,458,305 | ) | | | (39,695,241 | ) | | | (6,301,599 | ) | | | 1,027,603 | |
DIVIDENDS: | | | | | | | | | | | | | | | | | | | | | | | | |
| | | | | | |
Net investment income | | | (905,013 | ) | | | (632,102 | ) | | | (33,004,695 | ) | | | (51,526,431 | ) | | | (1,522,376 | ) | | | (1,355,492 | ) |
CAPITAL SHARE TRANSACTIONS: | | | | | | | | | | | | | | | | | | | | | | | | |
| | | | | | |
Net proceeds from sale of shares | | | 12,300,542 | | | | 27,936,634 | | | | — | | | | 197,770,356 | | | | 5,295,418 | | | | 24,669,241 | |
| | | | | | |
Cost of shares redeemed | | | (15,344,613 | ) | | | (5,020,174 | ) | | | (304,738,228 | ) | | | (507,206,009 | ) | | | (17,798,647 | ) | | | — | |
Net increase (decrease) in net assets resulting from capital share transactions | | | (3,044,071 | ) | | | 22,916,460 | | | | (304,738,228 | ) | | | (309,435,653 | ) | | | (12,503,229 | ) | | | 24,669,241 | |
Net Increase (Decrease) in Net Assets | | | (9,276,898 | ) | | | 21,004,896 | | | | (519,201,228 | ) | | | (400,657,325 | ) | | | (20,327,204 | ) | | | 24,341,352 | |
NET ASSETS: | | | | | | | | | | | | | | | | | | | | | | | | |
| | | | | | |
Beginning of year | | $ | 40,944,370 | | | $ | 19,939,474 | | | $ | 1,413,669,210 | | | $ | 1,814,326,535 | | | $ | 86,352,938 | | | $ | 62,011,586 | |
| | | | | | |
End of year | | $ | 31,667,472 | | | $ | 40,944,370 | | | $ | 894,467,982 | | | $ | 1,413,669,210 | | | $ | 66,025,734 | | | $ | 86,352,938 | |
Undistributed net investment income included in net assets at end of year | | $ | 85,033 | | | $ | 184,912 | | | $ | 740,433 | | | $ | 2,021,960 | | | $ | 162,461 | | | $ | 243,441 | |
SHARES CREATED AND REDEEMED: | | | | | | | | | | | | | | | | | | | | | | | | |
| | | | | | |
Shares outstanding, beginning of year | | | 1,700,000 | | | | 800,000 | | | | 31,800,000 | | | | 39,100,000 | | | | 1,700,000 | | | | 1,200,000 | |
| | | | | | |
Shares created | | | 600,000 | | | | 1,100,000 | | | | — | | | | 4,200,000 | | | | 100,000 | | | | 500,000 | |
| | | | | | |
Shares redeemed | | | (800,000 | ) | | | (200,000 | ) | | | (8,200,000 | ) | | | (11,500,000 | ) | | | (400,000 | ) | | | — | |
Shares outstanding, end of year | | | 1,500,000 | | | | 1,700,000 | | | | 23,600,000 | | | | 31,800,000 | | | | 1,400,000 | | | | 1,700,000 | |
See Notes to Financial Statements.
| | |
| 86 | | WisdomTree Global/Global ex-U.S. and Emerging/Frontier Markets Funds |
Statements of Changes in Net Assets (continued)
WisdomTree Global/Global ex-U.S. and Emerging/Frontier Markets Funds
| | | | | | | | | | | | | | | | | | | | | | | | |
| | | WisdomTree Global ex-U.S. Real Estate
Fund | | | WisdomTree Global ex-U.S. Utilities Fund | | | WisdomTree Global High Dividend Fund | |
| | | For the
Year Ended
March 31, 2016 | | | For the
Year Ended
March 31, 2015 | | | For the
Year Ended
March 31, 2016 | | | For the
Year Ended
March 31, 2015 | | | For the
Year Ended
March 31, 2016 | | | For the
Year Ended
March 31, 2015 | |
INCREASE (DECREASE) IN NET ASSETS RESULTING FROM OPERATIONS: | | | | | | | | | | | | | | | | | | | | | |
| | | | | | |
Net investment income | | $ | 3,542,097 | | | $ | 6,530,201 | | | $ | 673,879 | | | $ | 1,046,546 | | | $ | 4,302,558 | | | $ | 4,590,392 | |
| | | | | | |
Net realized gain (loss) on investments, forward foreign currency contracts and foreign currency related transactions | | | 812,064 | | | | 5,637,464 | | | | (664,323 | ) | | | 445,386 | | | | 1,791,093 | | | | 4,124,180 | |
| | | | | | |
Net change in unrealized appreciation (depreciation) on investments, forward foreign currency contracts and translation of assets and liabilities denominated in foreign currencies | | | (11,592,885 | ) | | | 2,108,731 | | | | (1,368,430 | ) | | | (2,988,584 | ) | | | (11,959,793 | ) | | | (12,010,690 | ) |
Net increase (decrease) in net assets resulting from operations | | | (7,238,724 | ) | | | 14,276,396 | | | | (1,358,874 | ) | | | (1,496,652 | ) | | | (5,866,142 | ) | | | (3,296,118 | ) |
DIVIDENDS: | | | | | | | | | | | | | | | | | | | | | | | | |
| | | | | | |
Net investment income | | | (4,821,127 | ) | | | (5,988,422 | ) | | | (663,621 | ) | | | (1,013,012 | ) | | | (4,186,444 | ) | | | (4,555,009 | ) |
CAPITAL SHARE TRANSACTIONS: | | | | | | | | | | | | | | | | | | | | | | | | |
| | | | | | |
Net proceeds from sale of shares | | | 7,375,451 | | | | 13,323,866 | | | | 1,885,313 | | | | 1,019,963 | | | | 42,469,284 | | | | 2,283,977 | |
| | | | | | |
Cost of shares redeemed | | | (22,831,545 | ) | | | (27,775,762 | ) | | | (4,732,986 | ) | | | (8,632,891 | ) | | | (60,623,361 | ) | | | (16,241,360 | ) |
Net decrease in net assets resulting from capital share transactions | | | (15,456,094 | ) | | | (14,451,896 | ) | | | (2,847,673 | ) | | | (7,612,928 | ) | | | (18,154,077 | ) | | | (13,957,383 | ) |
Net Decrease in Net Assets | | | (27,515,945 | ) | | | (6,163,922 | ) | | | (4,870,168 | ) | | | (10,122,592 | ) | | | (28,206,663 | ) | | | (21,808,510 | ) |
NET ASSETS: | | | | | | | | | | | | | | | | | | | | | | | | |
| | | | | | |
Beginning of year | | $ | 121,560,001 | | | $ | 127,723,923 | | | $ | 20,124,782 | | | $ | 30,247,374 | | | $ | 101,717,991 | | | $ | 123,526,501 | |
| | | | | | |
End of year | | $ | 94,044,056 | | | $ | 121,560,001 | | | $ | 15,254,614 | | | $ | 20,124,782 | | | $ | 73,511,328 | | | $ | 101,717,991 | |
Undistributed (Distributions in excess of) net investment income included in net assets at end of year | | $ | (1,429,445 | ) | | $ | (1,992,495 | ) | | $ | 41,377 | | | $ | 25,574 | | | $ | 201,294 | | | $ | 241,431 | |
SHARES CREATED AND REDEEMED: | | | | | | | | | | | | | | | | | | | | | | | | |
| | | | | | |
Shares outstanding, beginning of year | | | 4,100,000 | | | | 4,600,000 | | | | 1,150,000 | | | | 1,550,000 | | | | 2,300,000 | | | | 2,600,000 | |
| | | | | | |
Shares created | | | 250,000 | | | | 450,000 | | | | 100,000 | | | | 50,000 | | | | 1,000,000 | | | | 50,000 | |
| | | | | | |
Shares redeemed | | | (900,000 | ) | | | (950,000 | ) | | | (300,000 | ) | | | (450,000 | ) | | | (1,500,000 | ) | | | (350,000 | ) |
Shares outstanding, end of year | | | 3,450,000 | | | | 4,100,000 | | | | 950,000 | | | | 1,150,000 | | | | 1,800,000 | | | | 2,300,000 | |
See Notes to Financial Statements.
| | | | |
| WisdomTree Global/Global ex-U.S. and Emerging/Frontier Markets Funds | | | 87 | |
Statements of Changes in Net Assets (concluded)
WisdomTree Global/Global ex-U.S. and Emerging/Frontier Markets Funds
| | | | | | | | | | | | | | | | | | | | | | | | |
| | | WisdomTree Global Natural Resources Fund | | | WisdomTree India Earnings Fund (consolidated) | | | WisdomTree Middle East Dividend Fund | |
| | | For the
Year Ended
March 31, 2016 | | | For the
Year Ended
March 31, 2015 | | | For the
Year Ended
March 31, 2016 | | | For the
Year Ended
March 31, 2015 | | | For the
Year Ended
March 31, 2016 | | | For the
Year Ended
March 31, 2015 | |
INCREASE (DECREASE) IN NET ASSETS RESULTING FROM OPERATIONS: | | | | | | | | | | | | | | | | | | | | | |
| | | | | | |
Net investment income | | $ | 675,981 | | | $ | 785,038 | | | $ | 24,353,569 | | | $ | 18,603,043 | | | $ | 844,813 | | | $ | 1,635,873 | |
| | | | | | |
Net realized gain (loss) on investments, forward foreign currency contracts and foreign currency related transactions | | | (5,294,005 | ) | | | (1,804,423 | ) | | | (96,597,810 | ) | | | 45,657,435 | | | | (1,585,100 | ) | | | 1,384,169 | |
| | | | | | |
Net change in unrealized appreciation (depreciation) on investments, forward foreign currency contracts and translation of assets and liabilities denominated in foreign currencies | | | 18,327 | | | | (4,353,442 | ) | | | (224,271,782 | ) | | | 132,238,460 | | | | (2,928,535 | ) | | | (7,394,322 | ) |
Net increase (decrease) in net assets resulting from operations | | | (4,599,697 | ) | | | (5,372,827 | ) | | | (296,516,023 | ) | | | 196,498,938 | | | | (3,668,822 | ) | | | (4,374,280 | ) |
DIVIDENDS: | | | | | | | | | | | | | | | | | | | | | | | | |
| | | | | | |
Net investment income | | | (638,131 | ) | | | (818,563 | ) | | | (20,581,518 | ) | | | (13,679,148 | ) | | | (1,098,138 | ) | | | (1,679,464 | ) |
CAPITAL SHARE TRANSACTIONS: | | | | | | | | | | | | | | | | | | | | | | | | |
| | | | | | |
Net proceeds from sale of shares | | | 2,550,729 | | | | 4,589,603 | | | | 372,464,901 | | | | 1,402,033,920 | | | | — | | | | 35,127,164 | |
| | | | | | |
Cost of shares redeemed | | | — | | | | (2,814,089 | ) | | | (952,172,686 | ) | | | (151,511,226 | ) | | | (8,922,913 | ) | | | (48,370,043 | ) |
| | | | | | |
Payments by affiliates (Note 3) | | | — | | | | — | | | | 14,984 | | | | — | | | | — | | | | — | |
Net increase (decrease) in net assets resulting from capital share transactions | | | 2,550,729 | | | | 1,775,514 | | | | (579,692,801 | ) | | | 1,250,522,694 | | | | (8,922,913 | ) | | | (13,242,879 | ) |
Net Increase (Decrease) in Net Assets | | | (2,687,099 | ) | | | (4,415,876 | ) | | | (896,790,342 | ) | | | 1,433,342,484 | | | | (13,689,873 | ) | | | (19,296,623 | ) |
NET ASSETS: | | | | | | | | | | | | | | | | | | | | | | | | |
| | | | | | |
Beginning of year | | $ | 17,966,974 | | | $ | 22,382,850 | | | $ | 2,372,406,125 | | | $ | 939,063,641 | | | $ | 34,420,488 | | | $ | 53,717,111 | |
| | | | | | |
End of year | | $ | 15,279,875 | | | $ | 17,966,974 | | | $ | 1,475,615,783 | | | $ | 2,372,406,125 | | | $ | 20,730,615 | | | $ | 34,420,488 | |
Undistributed net investment income included in net assets at end of year | | $ | 36,247 | | | $ | 1,817 | | | $ | 7,530,595 | | | $ | 4,961,413 | | | $ | 581,332 | | | $ | 852,852 | |
SHARES CREATED AND REDEEMED: | | | | | | | | | | | | | | | | | | | | | | | | |
| | | | | | |
Shares outstanding, beginning of year | | | 1,150,000 | | | | 1,050,000 | | | | 104,800,000 | | | | 49,600,000 | | | | 1,700,000 | | | | 2,400,000 | |
| | | | | | |
Shares created | | | 150,000 | | | | 250,000 | | | | 17,800,000 | | | | 62,000,000 | | | | — | | | | 1,500,000 | |
| | | | | | |
Shares redeemed | | | — | | | | (150,000 | ) | | | (46,600,000 | ) | | | (6,800,000 | ) | | | (500,000 | ) | | | (2,200,000 | ) |
Shares outstanding, end of year | | | 1,300,000 | | | | 1,150,000 | | | | 76,000,000 | | | | 104,800,000 | | | | 1,200,000 | | | | 1,700,000 | |
See Notes to Financial Statements.
| | |
| 88 | | WisdomTree Global/Global ex-U.S. and Emerging/Frontier Markets Funds |
Financial Highlights
WisdomTree Global/Global ex-U.S. and Emerging/Frontier Markets Funds
Selected data for a share of beneficial interest outstanding throughout the period is presented below:
| | | | | | | | | | | | | | | | | | | | |
WisdomTree Asia Pacific
ex-Japan Fund | | For the
Year Ended
March 31, 2016 | | | For the
Year Ended
March 31, 2015 | | | For the
Period Ended
March 31, 2014 | | | For the
Period Ended
March 28, 2013 | | | For the
Year Ended
March 31, 20121 | |
Net asset value, beginning of period | | $ | 67.20 | | | $ | 65.72 | | | $ | 68.70 | | | $ | 64.05 | | | $ | 67.99 | |
Investment operations: | | | | | | | | | | | | | | | | | | | | |
Net investment income2 | | | 2.14 | | | | 2.29 | | | | 2.25 | | | | 2.27 | | | | 2.14 | |
Net realized and unrealized gain (loss) | | | (10.20 | ) | | | 1.46 | | | | (3.01 | ) | | | 4.65 | | | | (3.85 | ) |
Total from investment operations | | | (8.06 | ) | | | 3.75 | | | | (0.76 | ) | | | 6.92 | | | | (1.71 | ) |
Dividends to shareholders: | | | | | | | | | | | | | | | | | | | | |
Net investment income | | | (2.06 | ) | | | (2.27 | ) | | | (2.22 | ) | | | (2.27 | ) | | | (2.23 | ) |
Net asset value, end of period | | $ | 57.08 | | | $ | 67.20 | | | $ | 65.72 | | | $ | 68.70 | | | $ | 64.05 | |
| | | | | |
TOTAL RETURN3 | | | (12.06 | )%4 | | | 5.71 | % | | | (0.98 | )% | | | 11.18 | % | | | (2.22 | )% |
RATIOS/SUPPLEMENTAL DATA: | | | | | | | | | | | | | | | | | | | | |
Net assets, end of period (000’s omitted) | | $ | 45,665 | | | $ | 47,037 | | | $ | 52,579 | | | $ | 96,187 | | | $ | 89,672 | |
Ratios to average net assets5 of: | | | | | | | | | | | | | | | | | | | | |
Expenses6 | | | 0.48 | % | | | 0.49 | %7 | | | 0.48 | %8 | | | 0.48 | %8 | | | 0.48 | % |
Net investment income | | | 3.59 | % | | | 3.36 | % | | | 3.35 | %8 | | | 3.53 | %8 | | | 3.42 | % |
Portfolio turnover rate9 | | | 24 | % | | | 17 | % | | | 21 | % | | | 26 | % | | | 60 | % |
| | | | | | | | | | | | | | | | |
| | | | | |
WisdomTree China ex-State-Owned
Enterprises Fund | | For the
Year Ended
March 31, 201610 | | | For the
Year Ended
March 31, 2015 | | | For the
Period Ended
March 31, 2014 | | | For the Period
September 19, 2012*
through
March 28, 2013 | |
Net asset value, beginning of period | | $ | 55.28 | | | $ | 49.70 | | | $ | 51.90 | | | $ | 50.02 | |
Investment operations: | | | | | | | | | | | | | | | | |
Net investment income2 | | | 1.25 | | | | 1.33 | | | | 1.39 | | | | (0.14 | ) |
Net realized and unrealized gain (loss) | | | (8.59 | ) | | | 5.48 | | | | (2.15 | ) | | | 2.02 | |
Total from investment operations | | | (7.34 | ) | | | 6.81 | | | | (0.76 | ) | | | 1.88 | |
Dividends to shareholders: | | | | | | | | | | | | | | | | |
Net investment income | | | (1.19 | ) | | | (1.23 | ) | | | (1.44 | ) | | | — | |
Net asset value, end of period | | $ | 46.75 | | | $ | 55.28 | | | $ | 49.70 | | | $ | 51.90 | |
| | | | |
TOTAL RETURN3 | | | (13.40 | )% | | | 13.86 | % | | | (1.32 | )% | | | 3.76 | % |
RATIOS/SUPPLEMENTAL DATA: | | | | | | | | | | | | | | | | |
Net assets, end of period (000’s omitted) | | $ | 9,351 | | | $ | 16,585 | | | $ | 17,396 | | | $ | 36,331 | |
Ratios to average net assets of: | | | | | | | | | | | | | | | | |
Expenses, net of expense waivers | | | 0.57 | %12 | | | 0.64 | %11 | | | 0.63 | %8 | | | 0.63 | %8 |
Expenses, prior to expense waivers | | | 0.63 | % | | | 0.64 | %11 | | | 0.63 | %8 | | | 0.63 | %8 |
Net investment income (loss) | | | 2.42 | % | | | 2.53 | % | | | 2.75 | %8 | | | (0.51 | )%8 |
Portfolio turnover rate9 | | | 143 | % | | | 30 | % | | | 21 | % | | | 0 | % |
| * | Commencement of operations. |
| 1 | The information reflects the investment objective and strategy of the WisdomTree Pacific ex-Japan Total Dividend Fund through June 19, 2011 and the investment objective and strategy of the WisdomTree Asia Pacific ex-Japan Fund thereafter. |
| 2 | Based on average shares outstanding. |
| 3 | Total return is calculated assuming an initial investment made at the net asset value at the beginning of the period, reinvestment of all dividends and distributions at net asset value during the period and redemption on the last day of the period. Total return calculated for a period of less than one year is not annualized. For the periods in which the investment advisor waived advisory fees, the total return would have been lower if certain expenses had not been waived (Notes 2 and 3). |
| 4 | Includes a voluntary reimbursement from the sub-adviser for investment losses on certain foreign exchange transactions during the period. Excluding this voluntary reimbursement, total return would have been unchanged. |
| 5 | The ratios to average net assets do not include net investment income (loss) or expenses of other funds in which the Fund invests. |
| 6 | The expense ratio includes investment advisory fee waivers. Without these investment advisory fee waivers, the expense ratio would have been unchanged. |
| 7 | Included in the expense ratio are proxy expenses. Without these proxy expenses, the expense ratio would have been 0.48%. |
| 9 | Portfolio turnover rate is not annualized and excludes the value of the portfolio securities received or delivered as a result of in-kind creations or redemptions of the Fund’s capital shares. Short-term securities with maturities less than or equal to 365 days are excluded from the portfolio turnover calculation as well. |
| 10 | The information reflects the investment objective and strategy of the WisdomTree China Dividend ex-Financials Fund through June 30, 2015 and the investment objective and strategy of the WisdomTree China ex-State-Owned Enterprises Fund thereafter. |
| 11 | Included in the expense ratio are proxy expenses. Without these proxy expenses, the expense ratio would have been 0.63%. |
| 12 | Effective July 1, 2015, the investment advisor contractually agreed to limit the advisory fee to 0.53% through July 31, 2016, unless earlier terminated by the Board of Trustees of the Trust. |
See Notes to Financial Statements.
| | | | |
| WisdomTree Global/Global ex-U.S. and Emerging/Frontier Markets Funds | | | 89 | |
Financial Highlights (continued)
WisdomTree Global/Global ex-U.S. and Emerging/Frontier Markets Funds
Selected data for a share of beneficial interest outstanding throughout the period is presented below:
| | | | | | | | | | | | | | | | | | | | |
WisdomTree Commodity
Country Equity Fund | | For the
Year Ended
March 31, 2016 | | | For the
Year Ended
March 31, 2015 | | | For the
Period Ended
March 31, 2014 | | | For the
Period Ended
March 28, 2013 | | | For the
Year Ended
March 31, 20121 | |
Net asset value, beginning of period | | $ | 25.21 | | | $ | 30.75 | | | $ | 32.00 | | | $ | 31.44 | | | $ | 33.21 | |
Investment operations: | | | | | | | | | | | | | | | | | | | | |
Net investment income2 | | | 0.87 | | | | 1.25 | | | | 1.14 | | | | 1.13 | | | | 1.09 | |
Net realized and unrealized gain (loss) | | | (2.98 | ) | | | (5.49 | ) | | | (1.29 | ) | | | 0.56 | | | | (1.76 | ) |
Total from investment operations | | | (2.11 | ) | | | (4.24 | ) | | | (0.15 | ) | | | 1.69 | | | | (0.67 | ) |
Dividends to shareholders: | | | | | | | | | | | | | | | | | | | | |
Net investment income | | | (0.84 | ) | | | (1.30 | ) | | | (1.10 | ) | | | (1.13 | ) | | | (1.10 | ) |
Net asset value, end of period | | $ | 22.26 | | | $ | 25.21 | | | $ | 30.75 | | | $ | 32.00 | | | $ | 31.44 | |
| | | | | |
TOTAL RETURN3 | | | (8.30 | )% | | | (14.32 | )% | | | (0.22 | )% | | | 5.72 | % | | | (1.77 | )% |
RATIOS/SUPPLEMENTAL DATA: | | | | | | | | | | | | | | | | | | | | |
Net assets, end of period (000’s omitted) | | $ | 6,679 | | | $ | 11,346 | | | $ | 21,522 | | | $ | 23,999 | | | $ | 31,439 | |
Ratios to average net assets4 of: | | | | | | | | | | | | | | | | | | | | |
Expenses5 | | | 0.58 | % | | | 0.59 | %6 | | | 0.58 | %7 | | | 0.58 | %7 | | | 0.58 | % |
Net investment income | | | 3.82 | % | | | 4.25 | % | | | 3.75 | %7 | | | 3.71 | %7 | | | 3.52 | % |
Portfolio turnover rate8 | | | 24 | % | | | 20 | % | | | 23 | % | | | 22 | % | | | 116 | % |
| | | | | | | | | | | | |
| | | | |
| WisdomTree Emerging Markets Consumer Growth Fund | | For the
Year Ended
March 31, 2016 | | | For the
Year Ended
March 31, 2015 | | | For the Period
September 27, 2013*
through
March 31, 2014 | |
Net asset value, beginning of period | | $ | 24.89 | | | $ | 24.56 | | | $ | 24.79 | |
Investment operations: | | | | | | | | | | | | |
Net investment income2 | | | 0.52 | | | | 0.48 | | | | 0.17 | |
Net realized and unrealized gain (loss) | | | (4.28 | ) | | | 0.32 | | | | (0.33 | ) |
Total from investment operations | | | (3.76 | ) | | | 0.80 | | | | (0.16 | ) |
Dividends to shareholders: | | | | | | | | | | | | |
Net investment income | | | (0.53 | ) | | | (0.47 | ) | | | (0.07 | ) |
Net asset value, end of period | | $ | 20.60 | | | $ | 24.89 | | | $ | 24.56 | |
| | | |
TOTAL RETURN3 | | | (15.21 | )% | | | 3.24 | % | | | (0.63 | )% |
RATIOS/SUPPLEMENTAL DATA: | | | | | | | | | | | | |
Net assets, end of period (000’s omitted) | | $ | 12,357 | | | $ | 19,912 | | | $ | 19,647 | |
Ratios to average net assets of: | | | | | | | | | | | | |
Expenses | | | 0.63 | % | | | 0.64 | %9 | | | 0.63 | %7 |
Net investment income | | | 2.39 | % | | | 1.88 | % | | | 1.46 | %7 |
Portfolio turnover rate8 | | | 49 | % | | | 41 | % | | | 7 | % |
| * | Commencement of operations. |
| 1 | The information reflects the investment objective and strategy of the WisdomTree International Basic Materials Sector Fund through June 19, 2011 and the investment objective and strategy of the WisdomTree Commodity Country Equity Fund thereafter. |
| 2 | Based on average shares outstanding. |
| 3 | Total return is calculated assuming an initial investment made at the net asset value at the beginning of the period, reinvestment of all dividends and distributions at net asset value during the period and redemption on the last day of the period. Total return calculated for a period of less than one year is not annualized. For the periods in which the investment advisor waived advisory fees for the WisdomTree Commodity Country Equity Fund, the total return would have been lower if certain expenses had not been waived (Notes 2 and 3). |
| 4 | The ratios to average net assets do not include net investment income (loss) or expenses of other funds in which the Fund invests. |
| 5 | The expense ratio includes investment advisory fee waivers. Without these investment advisory fee waivers, the expense ratio would have been unchanged. |
| 6 | Included in the expense ratio are proxy expenses. Without these proxy expenses, the expense ratio would have been 0.58%. |
| 8 | Portfolio turnover rate is not annualized and excludes the value of the portfolio securities received or delivered as a result of in-kind creations or redemptions of the Fund’s capital shares. Short-term securities with maturities less than or equal to 365 days are excluded from the portfolio turnover calculation as well. |
| 9 | Included in the expense ratio are proxy expenses. Without these proxy expenses, the expense ratio would have been 0.63%. |
See Notes to Financial Statements.
| | |
| 90 | | WisdomTree Global/Global ex-U.S. and Emerging/Frontier Markets Funds |
Financial Highlights (continued)
WisdomTree Global/Global ex-U.S. and Emerging/Frontier Markets Funds
Selected data for a share of beneficial interest outstanding throughout the period is presented below:
| | | | | | | | |
| WisdomTree Emerging Markets ex-State-Owned Enterprises Fund | | For the
Year Ended
March 31, 2016 | | | For the Period
December 10, 2014*
through
March 31, 2015 | |
Net asset value, beginning of period | | $ | 25.17 | | | $ | 24.59 | |
Investment operations: | | | | | | | | |
Net investment income1 | | | 0.35 | | | | 0.07 | |
Net realized and unrealized gain (loss) | | | (3.24 | ) | | | 0.56 | |
Total from investment operations | | | (2.89 | ) | | | 0.63 | |
Dividends to shareholders: | | | | | | | | |
Net investment income | | | (0.80 | ) | | | (0.05 | ) |
Net asset value, end of period | | $ | 21.48 | | | $ | 25.17 | |
| | |
TOTAL RETURN2 | | | (11.69 | )% | | | 2.57 | % |
RATIOS/SUPPLEMENTAL DATA: | | | | | | | | |
Net assets, end of period (000’s omitted) | | $ | 2,148 | | | $ | 10,069 | |
Ratios to average net assets of: | | | | | | | | |
Expenses | | | 0.58 | % | | | 0.58 | %3 |
Net investment income | | | 1.48 | % | | | 0.88 | %3 |
Portfolio turnover rate4 | | | 46 | % | | | 2 | % |
| | | | | | | | | | | | | | | | | | | | |
| | | | | | |
WisdomTree Emerging
Markets High
Dividend Fund | | For the
Year Ended
March 31, 2016 | | | For the
Year Ended
March 31, 2015 | | | For the
Period Ended
March 31, 2014 | | | For the
Period Ended
March 28, 2013 | | | For the
Year Ended
March 31, 2012 | |
Net asset value, beginning of period | | $ | 42.68 | | | $ | 49.23 | | | $ | 54.81 | | | $ | 57.34 | | | $ | 60.51 | |
Investment operations: | | | | | | | | | | | | | | | | | | | | |
Net investment income1 | | | 1.76 | | | | 2.16 | | | | 2.16 | | | | 1.78 | | | | 2.25 | |
Net realized and unrealized loss | | | (7.74 | ) | | | (6.57 | ) | | | (5.60 | ) | | | (2.50 | ) | | | (3.11 | ) |
Total from investment operations | | | (5.98 | ) | | | (4.41 | ) | | | (3.44 | ) | | | (0.72 | ) | | | (0.86 | ) |
Dividends to shareholders: | | | | | | | | | | | | | | | | | | | | |
Net investment income | | | (1.65 | ) | | | (2.14 | ) | | | (2.14 | ) | | | (1.81 | ) | | | (2.31 | ) |
Net asset value, end of period | | $ | 35.05 | | | $ | 42.68 | | | $ | 49.23 | | | $ | 54.81 | | | $ | 57.34 | |
| | | | | |
TOTAL RETURN2 | | | (14.07 | )% | | | (9.40 | )% | | | (6.22 | )% | | | (1.05 | )% | | | (1.03 | )% |
RATIOS/SUPPLEMENTAL DATA: | | | | | | | | | | | | | | | | | | | | |
Net assets, end of period (000’s omitted) | | $ | 1,321,221 | | | $ | 2,159,557 | | | $ | 3,888,854 | | | $ | 5,475,068 | | | $ | 3,640,891 | |
Ratios to average net assets5 of: | | | | | | | | | | | | | | | | | | | | |
Expenses6 | | | 0.63 | % | | | 0.64 | %7 | | | 0.63 | %3 | | | 0.63 | %3 | | | 0.63 | % |
Net investment income | | | 4.64 | % | | | 4.45 | % | | | 4.20 | %3 | | | 3.32 | %3 | | | 4.12 | % |
Portfolio turnover rate4 | | | 43 | % | | | 39 | % | | | 39 | % | | | 47 | % | | | 37 | % |
| * | Commencement of operations. |
| 1 | Based on average shares outstanding. |
| 2 | Total return is calculated assuming an initial investment made at the net asset value at the beginning of the period, reinvestment of all dividends and distributions at net asset value during the period and redemption on the last day of the period. Total return calculated for a period of less than one year is not annualized. For the periods in which the investment advisor waived advisory fees for the WisdomTree Emerging Markets High Dividend Fund, the total return would have been lower if certain expenses had not been waived (Notes 2 and 3). |
| 4 | Portfolio turnover rate is not annualized and excludes the value of the portfolio securities received or delivered as a result of in-kind creations or redemptions of the Fund’s capital shares. Short-term securities with maturities less than or equal to 365 days are excluded from the portfolio turnover calculation as well. |
| 5 | The ratios to average net assets do not include net investment income (loss) or expenses of other funds in which the Fund invests. |
| 6 | The expense ratio includes investment advisory fee waivers. Without these investment advisory fee waivers, the expense ratio would have been unchanged. |
| 7 | Included in the expense ratio are proxy expenses. Without these proxy expenses, the expense ratio would have been 0.63%. |
See Notes to Financial Statements.
| | | | |
| WisdomTree Global/Global ex-U.S. and Emerging/Frontier Markets Funds | | | 91 | |
Financial Highlights (continued)
WisdomTree Global/Global ex-U.S. and Emerging/Frontier Markets Funds
Selected data for a share of beneficial interest outstanding throughout the period is presented below:
| | | | | | | | | | | | |
| WisdomTree Emerging Markets Quality Dividend Growth Fund | | For the
Year Ended
March 31, 2016 | | | For the
Year Ended
March 31, 2015 | | | For the Period
August 1, 2013*
through
March 31, 2014 | |
Net asset value, beginning of period | | $ | 24.08 | | | $ | 24.92 | | | $ | 25.22 | |
Investment operations: | | | | | | | | | | | | |
Net investment income1 | | | 0.55 | | | | 0.61 | | | | 0.33 | |
Net realized and unrealized loss | | | (2.94 | ) | | | (0.87 | ) | | | (0.42 | ) |
Total from investment operations | | | (2.39 | ) | | | (0.26 | ) | | | (0.09 | ) |
Dividends to shareholders: | | | | | | | | | | | | |
Net investment income | | | (0.58 | ) | | | (0.58 | ) | | | (0.21 | ) |
Net asset value, end of period | | $ | 21.11 | | | $ | 24.08 | | | $ | 24.92 | |
| | | |
TOTAL RETURN2 | | | (9.89 | )%3 | | | (1.19 | )% | | | (0.33 | )% |
RATIOS/SUPPLEMENTAL DATA: | | | | | | | | | | | | |
Net assets, end of period (000’s omitted) | | $ | 31,667 | | | $ | 40,944 | | | $ | 19,939 | |
Ratios to average net assets of: | | | | | | | | | | | | |
Expenses | | | 0.63 | % | | | 0.64 | %4 | | | 0.63 | %5 |
Net investment income | | | 2.59 | % | | | 2.42 | % | | | 2.03 | %5 |
Portfolio turnover rate6 | | | 62 | % | | | 47 | % | | | 3 | % |
| | | | | | | | | | | | | | | | | | | | |
| | | | | | |
WisdomTree Emerging Markets
SmallCap Dividend Fund | | For the
Year Ended
March 31, 2016 | | | For the
Year Ended
March 31, 2015 | | | For the
Period Ended
March 31, 2014 | | | For the
Period Ended
March 28, 2013 | | | For the
Year Ended
March 31, 2012 | |
Net asset value, beginning of period | | $ | 44.46 | | | $ | 46.40 | | | $ | 51.18 | | | $ | 47.80 | | | $ | 53.30 | |
Investment operations: | | | | | | | | | | | | | | | | | | | | |
Net investment income1 | | | 1.24 | | | | 1.32 | | | | 1.40 | | | | 1.15 | | | | 1.47 | |
Net realized and unrealized gain (loss) | | | (6.65 | ) | | | (1.97 | ) | | | (4.57 | ) | | | 3.69 | | | | (5.31 | ) |
Total from investment operations | | | (5.41 | ) | | | (0.65 | ) | | | (3.17 | ) | | | 4.84 | | | | (3.84 | ) |
Dividends to shareholders: | | | | | | | | | | | | | | | | | | | | |
Net investment income | | | (1.15 | ) | | | (1.29 | ) | | | (1.61 | ) | | | (1.46 | ) | | | (1.66 | ) |
Net asset value, end of period | | $ | 37.90 | | | $ | 44.46 | | | $ | 46.40 | | | $ | 51.18 | | | $ | 47.80 | |
| | | | | |
TOTAL RETURN2 | | | (12.20 | )% | | | (1.51 | )% | | | (6.08 | )% | | | 10.58 | % | | | (6.88 | )% |
RATIOS/SUPPLEMENTAL DATA: | | | | | | | | | | | | | | | | | | | | |
Net assets, end of period (000’s omitted) | | $ | 894,468 | | | $ | 1,413,669 | | | $ | 1,814,327 | | | $ | 1,474,099 | | | $ | 1,022,868 | |
Ratios to average net assets7 of: | | | | | | | | | | | | | | | | | | | | |
Expenses8 | | | 0.63 | % | | | 0.64 | %4 | | | 0.63 | %5 | | | 0.63 | %5 | | | 0.63 | %9 |
Net investment income | | | 3.13 | % | | | 2.84 | % | | | 2.96 | %5 | | | 2.49 | %5 | | | 3.13 | % |
Portfolio turnover rate6 | | | 52 | % | | | 42 | % | | | 26 | % | | | 44 | % | | | 53 | % |
| * | Commencement of operations. |
| 1 | Based on average shares outstanding. |
| 2 | Total return is calculated assuming an initial investment made at the net asset value at the beginning of the period, reinvestment of all dividends and distributions at net asset value during the period and redemption on the last day of the period. Total return calculated for a period of less than one year is not annualized. For the periods in which the investment advisor waived advisory fees for the WisdomTree Emerging Markets SmallCap Dividend Fund, the total return would have been lower if certain expenses had not been waived (Notes 2 and 3). |
| 3 | Includes a voluntary reimbursement from the sub-adviser for investment losses on certain foreign exchange transactions during the period. Excluding this voluntary reimbursement, total return would have been unchanged. |
| 4 | Included in the expense ratio are proxy expenses. Without these proxy expenses, the expense ratio would have been 0.63%. |
| 6 | Portfolio turnover rate is not annualized and excludes the value of the portfolio securities received or delivered as a result of in-kind creations or redemptions of the Fund’s capital shares. Short-term securities with maturities less than or equal to 365 days are excluded from the portfolio turnover calculation as well. |
| 7 | The ratios to average net assets do not include net investment income (loss) or expenses of other funds in which the Fund invests. |
| 8 | The expense ratio includes investment advisory fee waivers. Without these investment advisory fee waivers, the expense ratio would have been unchanged. |
| 9 | Reflects the Fund’s advisory fees, after waiver, and the fees and expenses of the WisdomTree India Earnings Fund that were paid indirectly by the Fund. The Fund invests a portion of its assets in the WisdomTree India Earnings Fund in order to achieve exposure to securities in India. |
See Notes to Financial Statements.
| | |
| 92 | | WisdomTree Global/Global ex-U.S. and Emerging/Frontier Markets Funds |
Financial Highlights (continued)
WisdomTree Global/Global ex-U.S. and Emerging/Frontier Markets Funds
Selected data for a share of beneficial interest outstanding throughout the period is presented below:
| | | | | | | | | | | | | | | | | | | | |
WisdomTree Global
ex-U.S.
Quality Dividend Growth Fund | | For the
Year Ended
March 31, 2016 | | | For the
Year Ended
March 31, 2015 | | | For the
Period Ended
March 31, 2014 | | | For the
Period Ended
March 28, 2013 | | | For the
Year Ended
March 31, 2012 | |
Net asset value, beginning of period | | $ | 50.80 | | | $ | 51.68 | | | $ | 51.75 | | | $ | 50.70 | | | $ | 54.94 | |
Investment operations: | | | | | | | | | | | | | | | | | | | | |
Net investment income1 | | | 1.02 | | | | 1.05 | | | | 1.38 | | | | 1.34 | | | | 1.39 | |
Net realized and unrealized gain (loss) | | | (3.75 | ) | | | (0.91 | ) | | | (0.19 | ) | | | 1.08 | | | | (4.32 | ) |
Total from investment operations | | | (2.73 | ) | | | 0.14 | | | | 1.19 | | | | 2.42 | | | | (2.93 | ) |
Dividends to shareholders: | | | | | | | | | | | | | | | | | | | | |
Net investment income | | | (0.91 | ) | | | (1.02 | ) | | | (1.26 | ) | | | (1.37 | ) | | | (1.31 | ) |
Net asset value, end of period | | $ | 47.16 | | | $ | 50.80 | | | $ | 51.68 | | | $ | 51.75 | | | $ | 50.70 | |
| | | | | |
TOTAL RETURN2 | | | (5.42 | )% | | | 0.24 | % | | | 2.53 | % | | | 5.03 | % | | | (5.20 | )% |
RATIOS/SUPPLEMENTAL DATA: | | | | | | | | | | | | | | | | | | | | |
Net assets, end of period (000’s omitted) | | $ | 66,026 | | | $ | 86,353 | | | $ | 62,012 | | | $ | 87,977 | | | $ | 55,774 | |
Ratios to average net assets3 of: | | | | | | | | | | | | | | | | | | | | |
Expenses | | | 0.58 | %4,5 | | | 0.59 | %5,6 | | | 0.58 | %7 | | | 0.58 | %5,7 | | | 0.58 | %5,8 |
Net investment income | | | 2.15 | % | | | 2.05 | % | | | 2.73 | %7 | | | 2.72 | %7 | | | 2.73 | % |
Portfolio turnover rate9 | | | 61 | % | | | 64 | % | | | 93 | % | | | 59 | % | | | 28 | % |
| | | | | | | | | | | | | | | | | | | | |
| | | | | | |
WisdomTree Global
ex-U.S.
Real Estate Fund | | For the
Year Ended
March 31, 2016 | | | For the
Year Ended
March 31, 2015 | | | For the
Period Ended
March 31, 2014 | | | For the
Period Ended
March 28, 2013 | | | For the
Year Ended
March 31, 201210 | |
Net asset value, beginning of period | | $ | 29.65 | | | $ | 27.77 | | | $ | 29.90 | | | $ | 26.40 | | | $ | 28.86 | |
Investment operations: | | | | | | | | | | | | | | | | | | | | |
Net investment income1 | | | 0.89 | | | | 1.54 | | | | 0.96 | | | | 0.97 | | | | 1.15 | |
Net realized and unrealized gain (loss) | | | (2.08 | ) | | | 1.75 | | | | (1.84 | ) | | | 4.87 | | | | (2.32 | ) |
Total from investment operations | | | (1.19 | ) | | | 3.29 | | | | (0.88 | ) | | | 5.84 | | | | (1.17 | ) |
Dividends and distributions to shareholders: | | | | | | | | | | | | | | | | | | | | |
Net investment income | | | (1.20 | ) | | | (1.41 | ) | | | (1.17 | ) | | | (2.34 | ) | | | (1.21 | ) |
Return of capital | | | — | | | | — | | | | (0.08 | ) | | | — | | | | (0.08 | ) |
Total dividends and distributions to shareholders | | | (1.20 | ) | | | (1.41 | ) | | | (1.25 | ) | | | (2.34 | ) | | | (1.29 | ) |
Net asset value, end of period | | $ | 27.26 | | | $ | 29.65 | | | $ | 27.77 | | | $ | 29.90 | | | $ | 26.40 | |
| | | | | |
TOTAL RETURN2 | | | (3.89 | )% | | | 12.08 | % | | | (2.70 | )% | | | 22.62 | % | | | (3.99 | )% |
RATIOS/SUPPLEMENTAL DATA: | | | | | | | | | | | | | | | | | | | | |
Net assets, end of period (000’s omitted) | | $ | 94,044 | | | $ | 121,560 | | | $ | 127,724 | | | $ | 113,631 | | | $ | 108,221 | |
Ratios to average net assets3 of: | | | | | | | | | | | | | | | | | | | | |
Expenses | | | 0.58 | %4 | | | 0.59 | %5,6 | | | 0.58 | %5,7 | | | 0.58 | %5,7 | | | 0.58 | %5 |
Net investment income | | | 3.22 | % | | | 5.21 | % | | | 3.37 | %7 | | | 3.42 | %7 | | | 4.36 | % |
Portfolio turnover rate9 | | | 32 | % | | | 26 | % | | | 18 | % | | | 23 | % | | | 43 | % |
| 1 | Based on average shares outstanding. |
| 2 | Total return is calculated assuming an initial investment made at the net asset value at the beginning of the period, reinvestment of all dividends and distributions at net asset value during the period and redemption on the last day of the period. Total return calculated for a period of less than one year is not annualized. For the periods in which the investment advisor waived advisory fees, the total return would have been lower if certain expenses had not been waived (Notes 2 and 3). |
| 3 | The ratios to average net assets do not include net investment income (loss) or expenses of other funds in which the Fund invests. |
| 4 | Included in the expense ratio are non-recurring professional expenses. Without these expenses, the expense ratio would have been unchanged. |
| 5 | The expense ratio includes investment advisory fee waivers. Without these investment advisory fee waivers, the expense ratio would have been unchanged. |
| 6 | Included in the expense ratio are proxy expenses. Without these proxy expenses, the expense ratio would have been 0.58%. |
| 8 | Reflects the Fund’s advisory fees, after waiver, and the fees and expenses of the WisdomTree India Earnings Fund that were paid indirectly by the Fund. The Fund invests a portion of its assets in the WisdomTree India Earnings Fund in order to achieve exposure to securities in India. |
| 9 | Portfolio turnover rate is not annualized and excludes the value of the portfolio securities received or delivered as a result of in-kind creations or redemptions of the Fund’s capital shares. Short-term securities with maturities less than or equal to 365 days are excluded from the portfolio turnover calculation as well. |
| 10 | The information reflects the investment objective and strategy of the WisdomTree International Real Estate Fund through June 19, 2011 and the investment objective and strategy of the WisdomTree Global ex-U.S. Real Estate Fund thereafter. |
See Notes to Financial Statements.
| | | | |
| WisdomTree Global/Global ex-U.S. and Emerging/Frontier Markets Funds | | | 93 | |
Financial Highlights (continued)
WisdomTree Global/Global ex-U.S. and Emerging/Frontier Markets Funds
Selected data for a share of beneficial interest outstanding throughout the period is presented below:
| | | | | | | | | | | | | | | | | | | | |
WisdomTree Global
ex-U.S.
Utilities Fund | | For the
Year Ended
March 31, 2016 | | | For the
Year Ended
March 31, 2015 | | | For the
Period Ended
March 31, 2014 | | | For the
Period Ended
March 28, 2013 | | | For the
Year Ended
March 31, 20121 | |
Net asset value, beginning of period | | $ | 17.50 | | | $ | 19.51 | | | $ | 17.83 | | | $ | 18.90 | | | $ | 21.33 | |
Investment operations: | | | | | | | | | | | | | | | | | | | | |
Net investment income2 | | | 0.59 | | | | 0.85 | | | | 0.76 | | | | 0.74 | | | | 0.87 | |
Net realized and unrealized gain (loss) | | | (1.48 | ) | | | (2.03 | ) | | | 1.69 | | | | (1.07 | ) | | | (2.45 | ) |
Total from investment operations | | | (0.89 | ) | | | (1.18 | ) | | | 2.45 | | | | (0.33 | ) | | | (1.58 | ) |
Dividends to shareholders: | | | | | | | | | | | | | | | | | | | | |
Net investment income | | | (0.55 | ) | | | (0.83 | ) | | | (0.77 | ) | | | (0.74 | ) | | | (0.85 | ) |
Net asset value, end of period | | $ | 16.06 | | | $ | 17.50 | | | $ | 19.51 | | | $ | 17.83 | | | $ | 18.90 | |
| | | | | |
TOTAL RETURN3 | | | (5.18 | )% | | | (6.44 | )% | | | 14.34 | % | | | (1.54 | )% | | | (7.41 | )% |
RATIOS/SUPPLEMENTAL DATA: | | | | | | | | | | | | | | | | | | | | |
Net assets, end of period (000’s omitted) | | $ | 15,255 | | | $ | 20,125 | | | $ | 30,247 | | | $ | 37,434 | | | $ | 30,241 | |
Ratios to average net assets4 of: | | | | | | | | | | | | | | | | | | | | |
Expenses | | | 0.58 | %5 | | | 0.59 | %6,7 | | | 0.58 | %8 | | | 0.58 | %7,8 | | | 0.58 | %7 |
Net investment income | | | 3.54 | % | | | 4.41 | % | | | 4.18 | %8 | | | 4.21 | %8 | | | 4.48 | % |
Portfolio turnover rate9 | | | 32 | % | | | 36 | % | | | 37 | % | | | 33 | % | | | 66 | % |
| | | | | | | | | | | | | | | | | | | | |
| | | | | | |
WisdomTree Global High
Dividend Fund | | For the
Year Ended
March 31, 2016 | | | For the
Year Ended
March 31, 2015 | | | For the
Period Ended
March 31, 2014 | | | For the
Period Ended
March 28, 2013 | | | For the
Year Ended
March 31, 2012 | |
Net asset value, beginning of period | | $ | 44.23 | | | $ | 47.51 | | | $ | 44.03 | | | $ | 41.50 | | | $ | 44.66 | |
Investment operations: | | | | | | | | | | | | | | | | | | | | |
Net investment income2 | | | 1.76 | | | | 1.83 | | | | 2.11 | | | | 1.68 | | | | 1.86 | |
Net realized and unrealized gain (loss) | | | (3.43 | ) | | | (3.28 | ) | | | 3.46 | | | | 2.51 | | | | (3.14 | ) |
Total from investment operations | | | (1.67 | ) | | | (1.45 | ) | | | 5.57 | | | | 4.19 | | | | (1.28 | ) |
Dividends to shareholders: | | | | | | | | | | | | | | | | | | | | |
Net investment income | | | (1.72 | ) | | | (1.83 | ) | | | (2.09 | ) | | | (1.66 | ) | | | (1.88 | ) |
Net asset value, end of period | | $ | 40.84 | | | $ | 44.23 | | | $ | 47.51 | | | $ | 44.03 | | | $ | 41.50 | |
| | | | | |
TOTAL RETURN3 | | | (3.77 | )% | | | (3.23 | )% | | | 13.13 | % | | | 10.51 | % | | | (2.70 | )% |
RATIOS/SUPPLEMENTAL DATA: | | | | | | | | | | | | | | | | | | | | |
Net assets, end of period (000’s omitted) | | $ | 73,511 | | | $ | 101,718 | | | $ | 123,527 | | | $ | 103,473 | | | $ | 91,304 | |
Ratios to average net assets4 of: | | | | | | | | | | | | | | | | | | | | |
Expenses7 | | | 0.58 | %5 | | | 0.59 | %6 | | | 0.58 | %8 | | | 0.58 | %8 | | | 0.58 | % |
Net investment income | | | 4.19 | % | | | 3.91 | % | | | 4.60 | %8 | | | 4.10 | %8 | | | 4.53 | % |
Portfolio turnover rate9 | | | 56 | % | | | 30 | % | | | 25 | % | | | 32 | % | | | 25 | % |
| 1 | The information reflects the investment objective and strategy of the WisdomTree International Utilities Sector Fund through June 19, 2011 and the investment objective and strategy of the WisdomTree Global ex-U.S. Utilities Fund thereafter. |
| 2 | Based on average shares outstanding. |
| 3 | Total return is calculated assuming an initial investment made at the net asset value at the beginning of the period, reinvestment of all dividends and distributions at net asset value during the period and redemption on the last day of the period. Total return calculated for a period of less than one year is not annualized. For the periods in which the investment advisor waived advisory fees, the total return would have been lower if certain expenses had not been waived (Notes 2 and 3). |
| 4 | The ratios to average net assets do not include net investment income (loss) or expenses of other funds in which the Fund invests. |
| 5 | Included in the expense ratio are non-recurring professional expenses. Without these expenses, the expense ratio would have been unchanged. |
| 6 | Included in the expense ratio are proxy expenses. Without these proxy expenses, the expense ratio would have been 0.58%. |
| 7 | The expense ratio includes investment advisory fee waivers. Without these investment advisory fee waivers, the expense ratio would have been unchanged. |
| 9 | Portfolio turnover rate is not annualized and excludes the value of the portfolio securities received or delivered as a result of in-kind creations or redemptions of the Fund’s capital shares. Short-term securities with maturities less than or equal to 365 days are excluded from the portfolio turnover calculation as well. |
See Notes to Financial Statements.
| | |
| 94 | | WisdomTree Global/Global ex-U.S. and Emerging/Frontier Markets Funds |
Financial Highlights (continued)
WisdomTree Global/Global ex-U.S. and Emerging/Frontier Markets Funds
Selected data for a share of beneficial interest outstanding throughout the period is presented below:
| | | | | | | | | | | | | | | | | | | | |
| WisdomTree Global Natural Resources Fund | | For the
Year Ended
March 31, 2016 | | | For the
Year Ended
March 31, 2015 | | | For the
Period Ended
March 31, 2014 | | | For the
Period Ended
March 28, 2013 | | | For the
Year Ended
March 31, 20121 | |
Net asset value, beginning of period | | $ | 15.62 | | | $ | 21.32 | | | $ | 22.69 | | | $ | 25.16 | | | $ | 29.86 | |
Investment operations: | | | | | | | | | | | | | | | | | | | | |
Net investment income2 | | | 0.52 | | | | 0.72 | | | | 0.74 | | | | 0.80 | | | | 0.93 | |
Net realized and unrealized loss | | | (3.90 | ) | | | (5.67 | ) | | | (1.39 | ) | | | (2.45 | ) | | | (4.74 | ) |
Total from investment operations | | | (3.38 | ) | | | (4.95 | ) | | | (0.65 | ) | | | (1.65 | ) | | | (3.81 | ) |
Dividends and distributions to shareholders: | | | | | | | | | | | | | | | | | | | | |
Net investment income | | | (0.49 | ) | | | (0.75 | ) | | | (0.72 | ) | | | (0.82 | ) | | | (0.89 | ) |
Return of capital | | | — | | | | — | | | | — | | | | (0.00 | )3 | | | — | |
Total dividends and distributions to shareholders | | | (0.49 | ) | | | (0.75 | ) | | | (0.72 | ) | | | (0.82 | ) | | | (0.89 | ) |
Net asset value, end of period | | $ | 11.75 | | | $ | 15.62 | | | $ | 21.32 | | | $ | 22.69 | | | $ | 25.16 | |
| | | | | |
TOTAL RETURN4 | | | (21.91 | )% | | | (23.84 | )% | | | (2.72 | )% | | | (6.55 | )% | | | (12.70 | )% |
RATIOS/SUPPLEMENTAL DATA: | | | | | | | | | | | | | | | | | | | | |
Net assets, end of period (000’s omitted) | | $ | 15,280 | | | $ | 17,967 | | | $ | 22,383 | | | $ | 24,964 | | | $ | 31,452 | |
Ratios to average net assets5 of: | | | | | | | | | | | | | | | | | | | | |
Expenses6 | | | 0.58 | %7 | | | 0.59 | %8 | | | 0.58 | %9 | | | 0.58 | %9 | | | 0.58 | % |
Net investment income | | | 3.95 | % | | | 3.64 | % | | | 3.45 | %9 | | | 3.45 | %9 | | | 3.54 | % |
Portfolio turnover rate10 | | | 40 | % | | | 34 | % | | | 30 | % | | | 38 | % | | | 99 | % |
| | | | | | | | | | | | | | | | | | | | |
| | | | | | |
| WisdomTree India Earnings Fund (consolidated) | | For the
Year Ended
March 31, 2016 | | | For the
Year Ended
March 31, 2015 | | | For the
Year Ended
March 31, 2014 | | | For the
Year Ended
March 31, 2013 | | | For the
Year Ended
March 31, 2012 | |
Net asset value, beginning of year | | $ | 22.64 | | | $ | 18.93 | | | $ | 17.97 | | | $ | 19.24 | | | $ | 24.87 | |
Investment operations: | | | | | | | | | | | | | | | | | | | | |
Net investment income2 | | | 0.26 | | | | 0.22 | | | | 0.25 | | | | 0.17 | | | | 0.19 | |
Net realized and unrealized gain (loss) | | | (3.26 | ) | | | 3.65 | | | | 0.94 | | | | (1.29 | ) | | | (5.65 | ) |
Total from investment operations | | | (3.00 | ) | | | 3.87 | | | | 1.19 | | | | (1.12 | ) | | | (5.46 | ) |
Dividends to shareholders: | | | | | | | | | | | | | | | | | | | | |
Net investment income | | | (0.22 | ) | | | (0.16 | ) | | | (0.23 | ) | | | (0.15 | ) | | | (0.17 | ) |
Net asset value, end of year | | $ | 19.42 | | | $ | 22.64 | | | $ | 18.93 | | | $ | 17.97 | | | $ | 19.24 | |
| | | | | |
TOTAL RETURN4 | | | (13.31 | )%11 | | | 20.44 | % | | | 6.81 | % | | | (5.80 | )% | | | (21.96 | )% |
RATIOS/SUPPLEMENTAL DATA: | | | | | | | | | | | | | | | | | | | | |
Net assets, end of year (000’s omitted) | | $ | 1,475,616 | | | $ | 2,372,406 | | | $ | 939,064 | | | $ | 1,071,074 | | | $ | 916,024 | |
Ratios to average net assets of: | | | | | | | | | | | | | | | | | | | | |
Expenses, net of expense reimbursements | | | 0.84 | %12 | | | 0.84 | %12,13 | | | 0.84 | %12 | | | 0.84 | %14 | | | 0.76 | %14,15 |
Expenses, prior to expense reimbursements | | | 0.84 | %12 | | | 0.84 | %12,13 | | | 0.84 | %12 | | | 0.86 | %14 | | | 0.82 | %14 |
Net investment income | | | 1.28 | % | | | 0.99 | % | | | 1.49 | % | | | 0.91 | % | | | 0.91 | % |
Portfolio turnover rate10 | | | 38 | % | | | 26 | % | | | 43 | % | | | 27 | % | | | 32 | % |
| 1 | The information reflects the investment objective and strategy of the WisdomTree International Energy Sector Fund through June 19, 2011 and the investment objective and strategy of the WisdomTree Global Natural Resources Fund thereafter. |
| 2 | Based on average shares outstanding. |
| 3 | Amount represents less than $0.005. |
| 4 | Total return is calculated assuming an initial investment made at the net asset value at the beginning of the period, reinvestment of all dividends and distributions at net asset value during the period and redemption on the last day of the period. Total return calculated for a period of less than one year is not annualized. For the periods in which the investment advisor waived advisory fees, the total return would have been lower if certain expenses had not been waived (Notes 2 and 3). |
| 5 | The ratios to average net assets do not include net investment income (loss) or expenses of other funds in which the Fund invests. |
| 6 | The expense ratio includes investment advisory fee waivers. Without these investment advisory fee waivers, the expense ratio would have been unchanged. |
| 7 | Included in the expense ratio are non-recurring professional expenses. Without these expenses, the expense ratio would have been unchanged. |
| 8 | Included in the expense ratio are proxy expenses. Without these proxy expenses, the expense ratio would have been 0.58%. |
| 10 | Portfolio turnover rate is not annualized and excludes the value of the portfolio securities received or delivered as a result of in-kind creations or redemptions of the Fund’s capital shares. Short-term securities with maturities less than or equal to 365 days are excluded from the portfolio turnover calculation as well. |
| 11 | Includes a reimbursement from the sub-adviser for operating losses on a creation that took place during the period when the NAV was understated. Excluding this reimbursement, total return would have been unchanged. |
| 12 | Includes interest expense of 0.01%, 0.01% and 0.01% for the fiscal years ended 2016, 2015 and 2014, respectively. |
| 13 | Included in the expense ratio are proxy expenses. Without these proxy expenses, the expense ratio would have been unchanged. |
| 14 | Excludes Mauritius income tax expense (see Note 7). If Mauritius income tax expense had been included, the Fund’s expense ratios (before and after expense reimbursements) would have been higher by: 0.02% and 0.06% for the fiscal years ended 2013 and 2012, respectively. |
| 15 | During the period, the Fund was reimbursed for certain expenses that occurred during the previous fiscal year. |
See Notes to Financial Statements.
| | | | |
| WisdomTree Global/Global ex-U.S. and Emerging/Frontier Markets Funds | | | 95 | |
Financial Highlights (concluded)
WisdomTree Global/Global ex-U.S. and Emerging/Frontier Markets Funds
Selected data for a share of beneficial interest outstanding throughout the period is presented below:
| | | | | | | | | | | | | | | | | | | | |
WisdomTree Middle East
Dividend Fund | | For the
Year Ended
March 31, 2016 | | | For the
Year Ended
March 31, 2015 | | | For the
Period Ended
March 31, 2014 | | | For the
Period Ended
March 28, 2013 | | | For the
Year Ended
March 31, 2012 | |
Net asset value, beginning of period | | $ | 20.25 | | | $ | 22.38 | | | $ | 16.11 | | | $ | 15.60 | | | $ | 16.31 | |
Investment operations: | | | | | | | | | | | | | | | | | | | | |
Net investment income1 | | | 0.58 | | | | 0.67 | | | | 1.28 | | | | 0.63 | | | | 0.83 | |
Net realized and unrealized gain (loss) | | | (2.85 | ) | | | (2.06 | ) | | | 5.71 | | | | 0.59 | | | | (0.61 | ) |
Total from investment operations | | | (2.27 | ) | | | (1.39 | ) | | | 6.99 | | | | 1.22 | | | | 0.22 | |
Dividends to shareholders: | | | | | | | | | | | | | | | | | | | | |
Net investment income | | | (0.70 | ) | | | (0.74 | ) | | | (0.72 | ) | | | (0.71 | ) | | | (0.93 | ) |
Net asset value, end of period | | $ | 17.28 | | | $ | 20.25 | | | $ | 22.38 | | | $ | 16.11 | | | $ | 15.60 | |
| | | | | |
TOTAL RETURN2 | | | (11.57 | )% | | | (6.28 | )% | | | 44.12 | % | | | 8.46 | % | | | 1.35 | % |
RATIOS/SUPPLEMENTAL DATA: | | | | | | | | | | | | | | | | | | | | |
Net assets, end of period (000’s omitted) | | $ | 20,731 | | | $ | 34,420 | | | $ | 53,717 | | | $ | 14,498 | | | $ | 14,038 | |
Ratios to average net assets of: | | | | | | | | | | | | | | | | | | | | |
Expenses, net of expense waivers | | | 0.88 | % | | | 0.89 | %3 | | | 0.88 | %4 | | | 0.88 | %4 | | | 0.88 | % |
Expenses, prior to expense waivers | | | 0.88 | % | | | 0.89 | %3 | | | 0.88 | %4 | | | 1.35 | %4 | | | 1.83 | % |
Net investment income | | | 3.13 | % | | | 2.93 | % | | | 6.61 | %4 | | | 4.26 | %4 | | | 5.31 | % |
Portfolio turnover rate5 | | | 25 | % | | | 89 | % | | | 26 | % | | | 52 | % | | | 37 | % |
| 1 | Based on average shares outstanding. |
| 2 | Total return is calculated assuming an initial investment made at the net asset value at the beginning of the period, reinvestment of all dividends and distributions at net asset value during the period and redemption on the last day of the period. Total return calculated for a period of less than one year is not annualized. For the periods in which the investment advisor waived advisory fees, the total return would have been lower if certain expenses had not been waived (Notes 2 and 3). |
| 3 | Included in the expense ratio are proxy expenses. Without these proxy expenses, the expense ratio would have been 0.88%. |
| 5 | Portfolio turnover rate is not annualized and excludes the value of the portfolio securities received or delivered as a result of in-kind creations or redemptions of the Fund’s capital shares. Short-term securities with maturities less than or equal to 365 days are excluded from the portfolio turnover calculation as well. |
See Notes to Financial Statements.
| | |
| 96 | | WisdomTree Global/Global ex-U.S. and Emerging/Frontier Markets Funds |
Notes to Financial Statements
1. ORGANIZATION
WisdomTree Trust (the “Trust”) is registered under the Investment Company Act of 1940, as amended (the “1940 Act”), as an open-end management investment company. The Trust was established as a Delaware statutory trust on December 15, 2005. As of March 31, 2016, the Trust offered 91 investment funds (each a “Fund”, collectively, the “Funds”). In accordance with Accounting Standard Update (“ASU”) 2013-08, Financial Services-Investment Companies, each Fund listed below qualifies as an investment company and is applying the accounting and reporting guidance for investment companies. These notes relate only to the Funds listed in the table below:
| | | | |
| Fund | | Commencement
of Operations | |
WisdomTree Asia Pacific ex-Japan Fund (“Asia Pacific ex-Japan Fund”) | | | June 16, 2006 | |
WisdomTree China ex-State-Owned Enterprises Fund (“China ex-State-Owned Enterprises Fund”)
(formerly, WisdomTree China Dividend ex-Financials Fund) | | | September 19, 2012 | |
WisdomTree Commodity Country Equity Fund (“Commodity Country Equity Fund”) | | | October 13, 2006 | |
WisdomTree Emerging Markets Consumer Growth Fund (“Emerging Markets Consumer Growth Fund”) | | | September 27, 2013 | |
WisdomTree Emerging Markets ex-State-Owned Enterprises Fund (“Emerging Markets ex-State-Owned Enterprises Fund”) | | | December 10, 2014 | |
WisdomTree Emerging Markets High Dividend Fund (“Emerging Markets High Dividend Fund”)
(formerly, WisdomTree Emerging Markets Equity Income Fund) | | | July 13, 2007 | |
WisdomTree Emerging Markets Quality Dividend Growth Fund (“Emerging Markets Quality Dividend Growth Fund”)
(formerly, WisdomTree Emerging Markets Dividend Growth Fund) | | | August 1, 2013 | |
WisdomTree Emerging Markets SmallCap Dividend Fund (“Emerging Markets SmallCap Dividend Fund”) | | | October 30, 2007 | |
WisdomTree Global ex-U.S. Quality Dividend Growth Fund (“Global ex-U.S. Quality Dividend Growth Fund”)
(formerly, WisdomTree Global ex-U.S. Dividend Growth Fund) | | | June 16, 2006 | |
WisdomTree Global ex-U.S. Real Estate Fund (“Global ex-U.S. Real Estate Fund”) | | | June 5, 2007 | |
WisdomTree Global ex-U.S. Utilities Fund (“Global ex-U.S. Utilities Fund”) | | | October 13, 2006 | |
WisdomTree Global High Dividend Fund (“Global High Dividend Fund”)
(formerly, WisdomTree Global Equity Income Fund) | | | June 16, 2006 | |
WisdomTree Global Natural Resources Fund (“Global Natural Resources Fund”) | | | October 13, 2006 | |
WisdomTree India Earnings Fund (“India Earnings Fund”) (consolidated) | | | February 22, 2008 | |
WisdomTree Middle East Dividend Fund (“Middle East Dividend Fund”) | | | July 16, 2008 | |
The India Earnings Fund makes its investments through the WisdomTree India Investment Portfolio, Inc. (the “Portfolio”), a wholly owned subsidiary organized in the Republic of Mauritius (“Mauritius”). The Portfolio was incorporated under the provisions of the Mauritius Companies Act, 2001 and holds a Global Business License Category 1 issued by the Financial Services Commission. The Portfolio is advised by WisdomTree Asset Management, Inc. (“WTAM”) and is sub-advised by Mellon Capital Management Corporation (“MCM”).
Each Fund seeks to track the price and yield performance, before fees and expenses, of a particular index (“Index”) developed by WisdomTree Investments, Inc. (“WisdomTree Investments”). WisdomTree Investments is the parent company of WTAM, the investment adviser to each Fund and the Trust. “WisdomTree” is a registered mark of WisdomTree Investments and has been licensed for use by the Trust. Each Fund described herein is considered to be non-diversified. The securities in each Index are weighted based on earnings or earnings yield.
In the normal course of business, the Funds may enter into contracts that contain a variety of representations or that provide indemnification for certain liabilities. The Funds’ maximum exposure under these arrangements is unknown, as this would involve future claims that may be made against the Funds that have not yet occurred. However, the Funds have not had prior claims or losses pursuant to these contracts.
2. SIGNIFICANT ACCOUNTING POLICIES
The Financial Accounting Standards Board (“FASB”) Accounting Standards Codification (the “Codification”) is the exclusive reference of authoritative U.S. generally accepted accounting principles (“GAAP”) recognized by the FASB to be applied by nongovernmental entities. Rules and interpretive releases of the Securities and Exchange Commission (“SEC”) under authority of federal laws are also sources of authoritative GAAP for SEC registrants.
The following is a summary of significant accounting policies followed by the Funds:
Use of Estimates — The preparation of financial statements in conformity with GAAP, requires management to make certain estimates and assumptions that affect the reported amounts of assets and liabilities and disclosure of contingent assets and liabilities
| | | | |
| WisdomTree Global/Global ex-U.S. and Emerging/Frontier Markets Funds | | | 97 | |
Notes to Financial Statements (continued)
at the date of the financial statements and the reported amounts of increases and decreases in the net assets from operations during the reporting period. Actual results could differ from those estimates.
Basis of Consolidation — The financial statements for the India Earnings Fund include the accounts of a wholly-owned and controlled Mauritius subsidiary (the “Subsidiary”). The Fund’s accompanying financial statements reflect the financial position and the results of operations on a consolidated basis with its Subsidiary. All intercompany accounts and transactions have been eliminated in the consolidation.
Investment Valuation — The net asset value (“NAV”) of each Fund’s shares is calculated each day a Fund is open for business as of the regularly scheduled close of regular trading on the New York Stock Exchange, normally 4:00 p.m. Eastern time (the “NAV Calculation Time”). NAV per share is calculated by dividing a Fund’s net assets by the number of Fund shares outstanding. Each Fund issues and redeems shares at NAV only in large blocks of shares known as creation units, which only certain institutions or large investors may purchase or redeem. Shares of each Fund are listed on a national securities exchange and trade at market prices. Most investors will buy and sell shares in the secondary market through brokers. Because Fund shares trade at market prices rather than NAV, shares may trade at a price greater than NAV or less than NAV. In calculating each Fund’s NAV, investments are valued under policies approved by the Board of Trustees. Equity securities (including preferred stock) traded on any recognized U.S. or non-U.S. exchange are valued at the last sale price or official closing price on the exchange or system on which they are principally traded. Unlisted equity securities (including preferred stock) are valued at the last quoted sale price or, if no sale price is available, at the mean between the highest bid and lowest ask price. Each Fund may invest in money market funds which are valued at their NAV per share and affiliated exchange-traded funds (“ETFs” or “ETF”) which are valued at their last sale or official closing price on the exchange on which they are principally traded or at their NAV per share in instances where the affiliated ETF has not traded on its principal exchange. Fixed income securities (including short-term debt securities with remaining maturities of 60 days or less) generally are valued at current market quotations or mean prices obtained from broker-dealers or independent pricing service providers. Broker-dealers or independent pricing service providers, in determining the value of securities may consider such factors as recent transactions, indications from broker-dealers yields and quoted prices on similar securities, and market sentiment for the type of security. Forward foreign currency contracts are valued daily using WM/Reuters closing spot and forward rates as of 4:00 p.m. London time.
In certain instances, such as when reliable market valuations are not readily available or are not deemed to reflect current market values, a Fund’s investments, which include derivatives, will be fair valued in accordance with the Fund’s pricing policy. The Board of Trustees of the Trust has established a pricing committee (the “Pricing Committee”) which is comprised of senior representatives of WTAM and which reports to the Board of Trustees on a quarterly basis. In the event that a financial instrument cannot be valued based upon a price from a national securities exchange, independent pricing service provider or broker-dealer quotation, or such prices are deemed to not reflect current market value, the Pricing Committee may value the financial instrument in good faith under the policies and procedures approved by the Board of Trustees based on current facts and circumstances. Securities that may be valued using “fair value” pricing may include, but are not limited to, securities for which there are no current market quotations, securities whose issuer is in default or bankruptcy, securities subject to corporate actions (such as mergers or reorganizations), securities subject to non-U.S. investment limits or currency controls, and securities affected by “significant events.” An example of a significant event is an event occurring after the close of the market in which a security trades but before a Fund’s next NAV Calculation Time that may materially affect the value of a Fund’s investment (e.g., government action, natural disaster, or significant market fluctuation). When fair value pricing is employed, the prices of securities used by a Fund to calculate its NAV may differ from quoted or published prices for the same securities.
Fair Value Measurement — In accordance with Codification Topic 820 (“ASC 820”), Fair Value Measurements and Disclosures, fair value is defined as the price that each Fund would receive upon selling an investment in an orderly transaction to an independent buyer in the principal or most advantageous market of the investment. ASC 820 established a three-tier hierarchy of inputs to be used when determining fair value measurements for disclosure purposes. Inputs refer broadly to the assumptions that market participants would use in pricing the asset or liability, including assumptions about risk — for example, the risk inherent in a particular valuation technique used to measure fair value (such as a pricing model) and/or the risk inherent in the inputs to the valuation technique. Inputs may be observable or unobservable. Observable inputs reflect the assumptions market participants would use in pricing the asset or liability. Observable inputs are based on market data obtained from sources independent of the reporting entity. Unobservable inputs reflect the reporting entity’s own assumptions about the assumptions market participants would use in pricing the asset or liability. Unobservable inputs are based on the best information available in the circumstances. The three-tier hierarchy of inputs is summarized in the three broad levels listed below:
Level 1 – quoted prices in active markets for identical securities
Level 2 – other significant observable inputs (including quoted prices for similar securities, interest rates, prepayment speeds, credit risk, etc.)
Level 3 – significant unobservable inputs (including each Fund’s assumptions in determining the fair value of investments)
| | |
| 98 | | WisdomTree Global/Global ex-U.S. and Emerging/Frontier Markets Funds |
Notes to Financial Statements (continued)
The inputs or methodology used for valuation are not necessarily an indication of the risk associated with investing in those investments.
Investments that use Level 2 or Level 3 inputs may include, but are not limited to: (i) an unlisted security related to corporate actions; (ii) a restricted security (e.g., one that may not be publicly sold without registration under the Securities Act of 1933, as amended); (iii) a security whose trading has been suspended or which has been de-listed from its primary trading exchange; (iv) a security that is thinly traded; (v) a security in default or bankruptcy proceedings for which there is no current market quotation or market activity; (vi) a security affected by currency controls or restrictions; and (vii) a security affected by a significant event (e.g., an event that occurs after the close of the markets on which the security is traded but before the time as of which a Fund’s NAV is computed and that may materially affect the value of the Fund’s investments).
The valuation techniques and significant inputs used in determining the fair market value measurements for Level 2 and Level 3 positions are as follows:
Financial instruments are generally valued by independent pricing service providers that use broker-dealer quotations, reported trades or valuation estimates from their internal pricing models. Depending on the type of financial instrument, the independent pricing service providers’ internal pricing models may use inputs that are observable such as issuer details, interest rates, yield curves, prepayment speeds, credit risks/spreads, default rates and quoted prices for similar assets. Financial instruments that use similar valuation techniques and observable inputs as described above and have an appropriate level of market activity are categorized as Level 2 of the fair value hierarchy, otherwise a Level 3 fair value classification is appropriate. Over-the-counter financial derivative instruments derive their value from underlying asset prices, indices, reference rates, and other inputs or a combination of these factors. These instruments are normally valued on the basis of broker-dealer quotations or independent pricing service providers. Depending on the product and the terms of the transaction, the value of the financial derivative instruments can be estimated by an independent pricing service provider using a series of techniques including simulation pricing models. The pricing models use inputs that are observed from actively quoted markets such as issuer details, indices, credit risks/spreads, interest rates, yield curves, default and exchange rates. Derivative contracts that use valuation techniques and observable inputs as described above and have an appropriate level of market activity are categorized as Level 2 of the fair value hierarchy, otherwise a Level 3 fair value classification is appropriate.
Determination of a fair value by the Pricing Committee may include significant unobservable inputs and therefore would be reflected as a Level 3 of the fair value hierarchy. The Pricing Committee may employ a market-based valuation approach which may use, among other potential considerations, related or comparable securities, recent transactions, market multiples, and other relevant information to determine fair value. The Pricing Committee may also use an income-based valuation approach in which anticipated future cash flows of the financial instrument are discounted to calculate fair value. The Pricing Committee meets at least on a monthly basis to review and discuss the appropriateness of such fair values using more current information such as, recent security news, recent market transactions, updated corporate action information and/or other macro or security specific events. Also, when observable inputs become available, the Pricing Committee conducts back testing of the methodologies used to value Level 3 financial instruments to substantiate the unobservable inputs used to value those investments. Such back testing includes comparing Level 3 investment values to observable inputs such as exchange-traded prices, transaction prices, and/or vendor prices.
The following is a summary of the fair valuations according to the inputs used as of March 31, 2016 in valuing each Fund’s assets:
| | | | | | | | | | | | |
| Asia Pacific ex-Japan Fund | | Level 1 | | | Level 2 | | | Level 3 | |
Common Stocks* | | $ | 43,951,190 | | | $ | — | | | $ | — | |
Exchange-Traded Funds and Notes | | | 1,431,589 | | | | — | | | | — | |
Investment of Cash Collateral for Securities Loaned | | | — | | | | 489,837 | | | | — | |
Total | | $ | 45,382,779 | | | $ | 489,837 | | | $ | — | |
Unrealized Depreciation on Forward Foreign Currency Contracts | | | — | | | | (55 | ) | | | — | |
Total - Net | | $ | 45,382,779 | | | $ | 489,782 | | | $ | — | |
| | | | | | | | | | | | |
| China ex-State-Owned Enterprises Fund | | Level 1 | | | Level 2 | | | Level 3 | |
Common Stocks | | | | | | | | | | | | |
Communications Equipment | | $ | — | | | $ | — | | | $ | 31,034 | ** |
Semiconductors & Semiconductor Equipment | | | 62,079 | | | | — | | | | 6,472 | ** |
Other* | | | 9,246,067 | | | | — | | | | — | |
Investment of Cash Collateral for Securities Loaned | | | — | | | | 900,596 | | | | — | |
Total | | $ | 9,308,146 | | | $ | 900,596 | | | $ | 37,506 | |
| | | | |
| WisdomTree Global/Global ex-U.S. and Emerging/Frontier Markets Funds | | | 99 | |
Notes to Financial Statements (continued)
| | | | | | | | | | | | |
| Commodity Country Equity Fund | | Level 1 | | | Level 2 | | | Level 3 | |
Common Stocks* | | $ | 6,556,570 | | | $ | — | | | $ | — | |
Rights* | | | 133 | | | | — | | | | — | |
Exchange-Traded Fund | | | 73,941 | | | | — | | | | — | |
Investment of Cash Collateral for Securities Loaned | | | — | | | | 336,033 | | | | — | |
Total | | $ | 6,630,644 | | | $ | 336,033 | | | $ | — | |
Unrealized Appreciation on Forward Foreign Currency Contracts | | | — | | | | 5 | | | | — | |
Unrealized Depreciation on Forward Foreign Currency Contracts | | | — | | | | (4,681 | ) | | | — | |
Total - Net | | $ | 6,630,644 | | | $ | 331,357 | | | $ | — | |
| | | | | | | | | | | | |
| Emerging Markets Consumer Growth Fund | | Level 1 | | | Level 2 | | | Level 3 | |
Common Stocks* | | $ | 12,314,016 | | | $ | — | | | $ | — | |
Warrants* | | | 49 | | | | — | | | | — | |
Investment of Cash Collateral for Securities Loaned | | | — | | | | 269,888 | | | | — | |
Total | | $ | 12,314,065 | | | $ | 269,888 | | | $ | — | |
Unrealized Depreciation on Forward Foreign Currency Contracts | | | — | | | | (63 | ) | | | — | |
Total - Net | | $ | 12,314,065 | | | $ | 269,825 | | | $ | — | |
| | | | | | | | | | | | |
| Emerging Markets ex-State-Owned Enterprises Fund | | Level 1 | | | Level 2 | | | Level 3 | |
Common Stocks | | | | | | | | | | | | |
China | | $ | 557,612 | | | $ | — | | | $ | 3,068 | ** |
India | | | 195,214 | | | | — | | | | 649 | ** |
Other* | | | 1,383,702 | | | | — | | | | — | |
Rights* | | | 7 | | | | — | | | | — | |
Investment of Cash Collateral for Securities Loaned | | | — | | | | 5,855 | | | | — | |
Total | | $ | 2,136,535 | | | $ | 5,855 | | | $ | 3,717 | |
Unrealized Appreciation on Forward Foreign Currency Contracts | | | — | | | | 2 | | | | — | |
Total - Net | | $ | 2,136,535 | | | $ | 5,857 | | | $ | 3,717 | |
| | | | | | | | | | | | |
| Emerging Markets High Dividend Fund | | Level 1 | | | Level 2 | | | Level 3 | |
Common Stocks* | | $ | 1,318,764,162 | | | $ | — | | | $ | — | |
Investment of Cash Collateral for Securities Loaned | | | — | | | | 59,328,633 | | | | — | |
Total | | $ | 1,318,764,162 | | | $ | 59,328,633 | | | $ | — | |
Unrealized Appreciation on Forward Foreign Currency Contracts | | | — | | | | 3,271 | | | | — | |
Unrealized Depreciation on Forward Foreign Currency Contracts | | | — | | | | (24,703 | ) | | | — | |
Total - Net | | $ | 1,318,764,162 | | | $ | 59,307,201 | | | $ | — | |
| | | | | | | | | | |
| Emerging Markets Quality Dividend Growth Fund | | Level 1 | | | Level 2 | | | Level 3 | |
Common Stocks* | | $ | 30,376,197 | | | $ | — | | | $ | — | |
Warrants* | | | 691 | | | | — | | | | — | |
Exchange-Traded Note | | | 1,176,559 | | | | — | | | | — | |
Investment of Cash Collateral for Securities Loaned | | | — | | | | 994,811 | | | | — | |
Total | | $ | 31,553,447 | | | $ | 994,811 | | | $ | — | |
| | |
| 100 | | WisdomTree Global/Global ex-U.S. and Emerging/Frontier Markets Funds |
Notes to Financial Statements (continued)
| | | | | | | | | | | | |
| Emerging Markets SmallCap Dividend Fund | | Level 1 | | | Level 2 | | | Level 3 | |
Common Stocks | | | | | | | | | | | | |
China | | $ | 169,873,160 | | | $ | — | | | $ | 851,438 | ** |
Other* | | | 714,240,350 | | | | — | | | | — | |
Warrants* | | | 36,907 | | | | — | | | | — | |
Exchange-Traded Note | | | 5,180,363 | | | | — | | | | — | |
Investment of Cash Collateral for Securities Loaned | | | — | | | | 47,246,610 | | | | — | |
Total | | $ | 889,330,780 | | | $ | 47,246,610 | | | $ | 851,438 | |
Unrealized Appreciation on Forward Foreign Currency Contracts | | | — | | | | 10,550 | | | | — | |
Unrealized Depreciation on Forward Foreign Currency Contracts | | | — | | | | (4 | ) | | | — | |
Total - Net | | $ | 889,330,780 | | | $ | 47,257,156 | | | $ | 851,438 | |
| | | | | | | | | | |
| Global ex-U.S. Quality Dividend Growth Fund | | Level 1 | | | Level 2 | | | Level 3 | |
Common Stocks* | | $ | 64,051,498 | | | $ | — | | | $ | — | |
Exchange-Traded Funds and Notes | | | 1,650,889 | | | | — | | | | — | |
Investment of Cash Collateral for Securities Loaned | | | — | | | | 3,457,503 | | | | — | |
Total | | $ | 65,702,387 | | | $ | 3,457,503 | | | $ | — | |
| | | | | | | | | | |
| Global ex-U.S. Real Estate Fund | | Level 1 | | | Level 2 | | | Level 3 | |
Common Stocks* | | $ | 93,700,593 | | | $ | — | | | $ | — | |
Exchange-Traded Funds and Notes | | | 76,634 | | | | — | | | | — | |
Investment of Cash Collateral for Securities Loaned | | | — | | | | 3,611,625 | | | | — | |
Total | | $ | 93,777,227 | | | $ | 3,611,625 | | | $ | — | |
Unrealized Appreciation on Forward Foreign Currency Contracts | | | — | | | | 9 | | | | — | |
Unrealized Depreciation on Forward Foreign Currency Contracts | | | — | | | | (8 | ) | | | — | |
Total - Net | | $ | 93,777,227 | | | $ | 3,611,626 | | | $ | — | |
| | | | | | | | | | |
| Global ex-U.S. Utilities Fund | | Level 1 | | | Level 2 | | | Level 3 | |
Common Stocks* | | $ | 15,052,604 | | | $ | — | | | $ | — | |
Exchange-Traded Funds and Notes | | | 152,636 | | | | — | | | | — | |
Investment of Cash Collateral for Securities Loaned | | | — | | | | 1,443,263 | | | | — | |
Total | | $ | 15,205,240 | | | $ | 1,443,263 | | | $ | — | |
| | | | | | | | | | |
| Global High Dividend Fund | | Level 1 | | | Level 2 | | | Level 3 | |
Common Stocks* | | $ | 73,122,074 | | | $ | — | | | $ | — | |
Investment of Cash Collateral for Securities Loaned | | | — | | | | 1,172,860 | | | | — | |
Total | | $ | 73,122,074 | | | $ | 1,172,860 | | | $ | — | |
Unrealized Appreciation on Forward Foreign Currency Contracts | | | — | | | | 375 | | | | — | |
Total - Net | | $ | 73,122,074 | | | $ | 1,173,235 | | | $ | — | |
| | | | | | | | | | | | |
| Global Natural Resources Fund | | Level 1 | | | Level 2 | | | Level 3 | |
Common Stocks* | | $ | 15,044,112 | | | $ | — | | | $ | — | |
Exchange-Traded Funds and Notes | | | 176,529 | | | | — | | | | — | |
Investment of Cash Collateral for Securities Loaned | | | — | | | | 1,133,085 | | | | — | |
Total | | $ | 15,220,641 | | | $ | 1,133,085 | | | $ | — | |
Unrealized Appreciation on Forward Foreign Currency Contracts | | | — | | | | 28 | | | | — | |
Unrealized Depreciation on Forward Foreign Currency Contracts | | | — | | | | (6 | ) | | | — | |
Total - Net | | $ | 15,220,641 | | | $ | 1,133,107 | | | $ | — | |
| | | | |
| WisdomTree Global/Global ex-U.S. and Emerging/Frontier Markets Funds | | | 101 | |
Notes to Financial Statements (continued)
| | | | | | | | | | | | |
| India Earnings Fund (consolidated) | | Level 1 | | | Level 2 | | | Level 3 | |
Common Stocks* | | | | | | | | | | | | |
Chemicals | | $ | 27,061,160 | | | $ | — | | | $ | 18,511 | ** |
Health Care Providers & Services | | | 2,587,219 | | | | — | | | | 163,670 | ** |
Household Durables | | | 1,035,401 | | | | — | | | | 404,929 | ** |
Other* | | | 1,443,052,387 | | | | — | | | | — | |
Total | | $ | 1,473,736,167 | | | $ | — | | | $ | 587,110 | |
| | | | | | | | | | |
| Middle East Dividend Fund | | Level 1 | | | Level 2 | | | Level 3 | |
Common Stocks* | | $ | 20,300,179 | | | $ | — | | | $ | — | |
Rights* | | | 6,989 | | | | — | | | | — | |
Convertible Bonds | | | — | | | | 22,284 | | | | — | |
Total | | $ | 20,307,168 | | | $ | 22,284 | | | $ | — | |
Unrealized Depreciation on Forward Foreign Currency Contracts | | | — | | | | (77 | ) | | | — | |
Total - Net | | $ | 20,307,168 | | | $ | 22,207 | | | $ | — | |
| | * | Please refer to the Schedule of Investments for a breakdown of the valuation by industry type and country. |
| | ** | Security is being fair valued by the Pricing Committee. |
The following is a summary of transfers between fair value measurement levels that occurred during fiscal year ended March 31, 2016. The Funds have elected to use the beginning of period method for transfers between fair value measurement levels.
| | | | | | | | |
| | | Transfers from
Level 1 to Level 31 | | | Transfers from
Level 2 to Level 12 | |
China ex-State-Owned Enterprises Fund | | $ | 451,946 | | | $ | 75,019 | |
Emerging Markets Consumer Growth Fund | | | — | | | | 59,942 | |
Emerging Markets ex-State-Owned Enterprises Fund | | | 100,544 | | | | 11,670 | |
Emerging Markets SmallCap Dividend Fund | | | — | | | | 1,173,629 | |
| | 1 | Transfers from Level 1 to Level 3 are as a result of the unavailability of a quoted price in an active market for identical investments as of March 31, 2016. |
| | 2 | Transfers from Level 2 to Level 1 are as a result of the availability of a quoted price in an active market for identical investments as of March 31, 2016. |
Derivatives and Hedging Disclosure — Codification Topic 815 (“ASC 815”), Derivatives and Hedging, requires qualitative disclosures about objectives and strategies for using derivatives, quantitative disclosures about fair value amounts of gains and losses on derivative instruments, and disclosures about credit-risk-related contingent features in derivative agreements. The Funds have invested in derivatives, specifically forward foreign currency contracts during the year ended March 31, 2016 which are detailed in each Fund’s schedule of investments. All of the derivative instruments disclosed and described herein are subject to risk. Risks may arise upon entering into forward foreign currency contracts from potential inability of a counterparty to meet the terms of their contracts and from unanticipated movements in the value of the foreign currencies relative to the U.S. dollar or each other. The Funds’ derivative agreements contain credit-risk related contingent features which include, but are not limited to, a percentage decline in the Funds’ NAV over a specified time period. If an event occurred at March 31, 2016 that triggered a contingent feature, the counterparty to the agreement may require the Funds to post additional collateral or terminate the derivative positions and demand payment. Any collateral posted with respect to the derivative positions would be used to offset or reduce the payment. The maximum exposure to derivatives agreements with credit-risk related contingent features would be the total value of derivatives in net liability positions for each Fund, as disclosed on pages 107 and 108. At March 31, 2016, the Funds did not receive or post collateral with any counterparty for derivatives and no event occurred that triggered a credit-risk-related contingent feature.
| | |
| 102 | | WisdomTree Global/Global ex-U.S. and Emerging/Frontier Markets Funds |
Notes to Financial Statements (continued)
As of March 31, 2016, the effects of such derivative instruments on each Fund’s financial position as reflected in the Statements of Assets and Liabilities are presented in the summary below:
| | | | | | | | | | | | |
| | | Asset Derivatives | | | Liability Derivatives | |
| Fund | | Balance Sheet Location | | Value | | | Balance Sheet Location | | Value | |
Asia Pacific ex-Japan Fund | | | | | | | | | | | | |
Foreign exchange contracts | | Unrealized appreciation on forward foreign currency contracts | | $ | — | | | Unrealized depreciation on forward foreign currency contracts | | $ | 55 | |
Commodity Country Equity Fund | | | | | | | | | | | | |
Foreign exchange contracts | | Unrealized appreciation on forward foreign currency contracts | | | 5 | | | Unrealized depreciation on forward foreign currency contracts | | | 4,681 | |
Emerging Markets Consumer Growth Fund | | | | | | | | | | | | |
Foreign exchange contracts | | Unrealized appreciation on forward foreign currency contracts | | | — | | | Unrealized depreciation on forward foreign currency contracts | | | 63 | |
Emerging Markets ex-State-Owned Enterprises Fund | | | | | | | | | | | | |
Foreign exchange contracts | | Unrealized appreciation on forward foreign currency contracts | | | 2 | | | Unrealized depreciation on forward foreign currency contracts | | | — | |
Emerging Markets High Dividend Fund | | | | | | | | | | | | |
Foreign exchange contracts | | Unrealized appreciation on forward foreign currency contracts | | | 3,271 | | | Unrealized depreciation on forward foreign currency contracts | | | 24,703 | |
Emerging Markets SmallCap Dividend Fund | | | | | | | | | | | | |
Foreign exchange contracts | | Unrealized appreciation on forward foreign currency contracts | | | 10,550 | | | Unrealized depreciation on forward foreign currency contracts | | | 4 | |
Global ex-U.S. Real Estate Fund | | | | | | | | | | | | |
Foreign exchange contracts | | Unrealized appreciation on forward foreign currency contracts | | | 9 | | | Unrealized depreciation on forward foreign currency contracts | | | 8 | |
Global High Dividend Fund | | | | | | | | | | | | |
Foreign exchange contracts | | Unrealized appreciation on forward foreign currency contracts | | | 375 | | | Unrealized depreciation on forward foreign currency contracts | | | — | |
Global Natural Resources Fund | | | | | | | | | | | | |
Foreign exchange contracts | | Unrealized appreciation on forward foreign currency contracts | | | 28 | | | Unrealized depreciation on forward foreign currency contracts | | | 6 | |
Middle East Dividend Fund | | | | | | | | | | | | |
Foreign exchange contracts | | Unrealized appreciation on forward foreign currency contracts | | | — | | | Unrealized depreciation on forward foreign currency contracts | | | 77 | |
For the fiscal year ended March 31, 2016, the effect of derivative instruments on each Fund’s financial performance as reflected in the Statements of Operations are presented in the summary below:
| | | | | | | | |
| Fund | | Amount of Realized Gain
or (Loss) on Derivatives
Recognized1 | | | Change in Unrealized
Appreciation or (Depreciation) on
Derivatives Recognized2 | |
Asia Pacific ex-Japan Fund | | | | | | | | |
Foreign exchange contracts | | $ | 24,066 | | | $ | 113 | |
China ex-State-Owned Enterprises Fund | | | | | | | | |
Foreign exchange contracts | | | 166 | | | | 3 | |
Commodity Country Equity Fund | | | | | | | | |
Foreign exchange contracts | | | (8,656 | ) | | | (4,641 | ) |
Emerging Markets Consumer Growth Fund | | | | | | | | |
Foreign exchange contracts | | | 1,663 | | | | (843 | ) |
Emerging Markets ex-State-Owned Enterprises Fund | | | | | | | | |
Foreign exchange contracts | | | 2,586 | | | | 2 | |
Emerging Markets High Dividend Fund | | | | | | | | |
Foreign exchange contracts | | | 930,574 | | | | (15,857 | ) |
Emerging Markets Quality Dividend Growth Fund | | | | | | | | |
Foreign exchange contracts | | | 26,995 | | | | (262 | ) |
Emerging Markets SmallCap Dividend Fund | | | | | | | | |
Foreign exchange contracts | | | 821,724 | | | | 7,138 | |
Global ex-U.S. Quality Dividend Growth Fund | | | | | | | | |
| | | | |
| WisdomTree Global/Global ex-U.S. and Emerging/Frontier Markets Funds | | | 103 | |
Notes to Financial Statements (continued)
| | | | | | | | |
| Fund | | Amount of Realized Gain
or (Loss) on Derivatives
Recognized1 | | | Change in Unrealized
Appreciation or (Depreciation) on
Derivatives Recognized2 | |
Foreign exchange contracts | | $ | 221,174 | | | $ | — | |
Global ex-U.S. Real Estate Fund | | | | | | | | |
Foreign exchange contracts | | | 64,296 | | | | 1,828 | |
Global ex-U.S. Utilities Fund | | | | | | | | |
Foreign exchange contracts | | | (18,461 | ) | | | 9 | |
Global High Dividend Fund | | | | | | | | |
Foreign exchange contracts | | | 167,749 | | | | 408 | |
Global Natural Resources Fund | | | | | | | | |
Foreign exchange contracts | | | 16,763 | | | | 12 | |
India Earnings Fund (consolidated) | | | | | | | | |
Foreign exchange contracts | | | (2,420,303 | ) | | | — | |
Middle East Dividend Fund | | | | | | | | |
Foreign exchange contracts | | | (15,827 | ) | | | (45 | ) |
| | 1 | Realized gains (losses) on derivatives are located on the Statements of Operations as follows: |
| | |
Foreign exchange contracts | | Net realized gain (loss) from forward foreign currency contracts and foreign currency related transactions |
| | 2 | Change in unrealized appreciation (depreciation) is located on the Statements of Operations as follows: |
| | |
Foreign exchange contracts | | Net change in unrealized appreciation (depreciation) from forward foreign currency contracts and translation of assets and liabilities denominated in foreign currencies |
During the fiscal year ended March 31, 2016, the volume of derivative activity (based on the average of month-end balances) for the Funds was as follows:
| | | | | | | | |
| | | Average Notional | |
| Fund | | Forward foreign
currency
contracts
(to deliver) | | | Forward foreign
currency
contracts
(to receive) | |
Asia Pacific ex-Japan Fund | | | | | | | | |
Foreign exchange contracts | | $ | 13,318 | | | $ | 10,668 | |
China ex-State-Owned Enterprises Fund | | | | | | | | |
Foreign exchange contracts | | | 167 | | | | 2,476 | |
Commodity Country Equity Fund | | | | | | | | |
Foreign exchange contracts | | | 4,417 | | | | 24,541 | |
Emerging Markets Consumer Growth Fund | | | | | | | | |
Foreign exchange contracts | | | 7,363 | | | | 10,879 | |
Emerging Markets ex-State-Owned Enterprises Fund | | | | | | | | |
Foreign exchange contracts | | | 803 | | | | 230,303 | |
Emerging Markets High Dividend Fund | | | | | | | | |
Foreign exchange contracts | | | 1,266,895 | | | | 3,422,535 | |
Emerging Markets Quality Dividend Growth Fund | | | | | | | | |
Foreign exchange contracts | | | 21,196 | | | | 18,681 | |
Emerging Markets SmallCap Dividend Fund | | | | | | | | |
Foreign exchange contracts | | | 1,051,464 | | | | 2,022,503 | |
Global ex-U.S. Quality Dividend Growth Fund | | | | | | | | |
Foreign exchange contracts | | | — | | | | 106,749 | |
Global ex-U.S. Real Estate Fund | | | | | | | | |
Foreign exchange contracts | | | 127,467 | | | | 91,261 | |
Global ex-U.S. Utilities Fund | | | | | | | | |
Foreign exchange contracts | | | 2,686 | | | | 9,898 | |
Global High Dividend Fund | | | | | | | | |
Foreign exchange contracts | | | 67,962 | | | | 61,560 | |
Global Natural Resources Fund | | | | | | | | |
| | |
| 104 | | WisdomTree Global/Global ex-U.S. and Emerging/Frontier Markets Funds |
Notes to Financial Statements (continued)
| | | | | | | | |
| | | Average Notional | |
| Fund | | Forward foreign
currency
contracts
(to deliver) | | | Forward foreign
currency
contracts
(to receive) | |
Foreign exchange contracts | | $ | 14,166 | | | $ | 17,915 | |
India Earnings Fund (consolidated) | | | | | | | | |
Foreign exchange contracts | | | — | | | | 1,138,997 | |
Middle East Dividend Fund | | | | | | | | |
Foreign exchange contracts | | | 8,514 | | | | 38,798 | |
Investment Transactions and Investment Income — Investment transactions are recorded as of the date that the securities are purchased or sold (trade date). Realized gains and losses on sales of portfolio securities are calculated using the identified-cost method. Dividend income is recognized on the ex-dividend date, net of any foreign taxes withheld. Interest income including amortization of premiums and discounts, is accrued daily.
Foreign Currency Translation — The accounting records of the Funds are maintained in U.S. dollars. Foreign currencies, as well as investment securities and other assets and liabilities denominated in foreign currencies, are translated into U.S. dollars using exchange rates prevailing on the respective dates of such transactions that are deemed appropriate by WTAM. Realized and unrealized foreign exchange gains and losses on investments are included as a component of net realized gain (loss) from investment transactions and net change in unrealized appreciation (depreciation) from investment transactions, respectively, on the Statements of Operations. Net realized and unrealized foreign exchange gains or losses arising from sales of foreign currencies, including gains and losses of forward foreign currency contracts, currency gains or losses recognized between the trade and settlement dates on investment transactions, and the difference between the amounts of dividends and foreign withholding taxes recorded on the Funds’ books and the U.S. dollar equivalent of the amounts actually received or paid are included in net realized gain (loss) from forward foreign currency contracts and foreign currency related transactions and/or net change in unrealized appreciation (depreciation) from forward foreign currency contracts and translation of assets and liabilities denominated in foreign currencies in the Statements of Operations. Certain foreign exchange gains and losses included in realized and unrealized gains or losses are included in, or are a reduction of, ordinary income in accordance with U.S. Federal income tax regulations.
Expenses/Reimbursements — Under the investment advisory agreement for each Fund, except for Funds that commenced operations on or after March 26, 2013, WTAM has agreed to pay all expenses of the Trust, except for: (i) brokerage expenses and other expenses (such as stamp taxes) connected with the execution of portfolio transactions or in connection with creation and redemption transactions; (ii) legal fees or expenses in connection with any arbitration, litigation or pending or threatened arbitration or litigation, including any settlements in connection therewith; (iii) compensation and expenses of trustees who are not interested persons of the Funds (“Independent Trustees”); (iv) compensation and expenses of counsel to the Independent Trustees; (v) compensation and expenses of the Trust’s Chief Compliance Officer (“CCO”); (vi) extraordinary expenses; (vii) distribution fees and expenses paid by the Trust under any distribution plan adopted pursuant to Rule 12b-1 under the 1940 Act; and (viii) the advisory fee payable to WTAM.
Under the investment advisory agreement for Funds that commenced operations on or after March 26, 2013, WTAM has agreed to pay all expenses of the Trust, except for: (i) brokerage expenses and other fees, charges, taxes, levies or expenses (such as stamp taxes) incurred in connection with the execution of portfolio transactions or in connection with creation and redemption transactions (including without limitation any fees, charges, taxes, levies or expenses related to the purchase or sale of an amount of any currency, or the partition or repatriation of any security or other asset, related to the execution of portfolio transactions or any creation or redemption transactions); (ii) legal fees or expenses in connection with any arbitration, litigation or pending or threatened arbitration or litigation, including any settlements in connection therewith; (iii) compensation and expenses of each Independent Trustee; (iv) compensation and expenses of counsel to the Independent Trustees; (v) compensation and expenses of the Trust’s CCO; (vi) extraordinary expenses (in each case as determined by a majority of the Independent Trustees); (vii) distribution fees and expenses paid by the Trust under any distribution plan adopted pursuant to Rule 12b-1 under the 1940 Act; (viii) interest and taxes of any kind or nature (including, but not limited to, income, excise, transfer and withholding taxes); (ix) fees and expenses related to the provision of securities lending services; and (x) the advisory fee payable to WTAM.
The internal expenses of pooled investment vehicles in which the Funds may invest (acquired fund fees and expenses) are not expenses of the Funds and are not paid by WTAM.
Pursuant to a separate contractual arrangement, WTAM arranges for the provision of CCO services with respect to each Fund, and is liable and responsible for, and administers, payments to the CCO, the Independent Trustees and counsel to the Independent Trustees. WTAM receives a fee, as shown on the Statements of Operations under “Service fees”, of up to 0.0044% of each Fund’s average daily net assets for providing such services and paying such expenses. WTAM provides CCO services to the Trust.
| | | | |
| WisdomTree Global/Global ex-U.S. and Emerging/Frontier Markets Funds | | | 105 | |
Notes to Financial Statements (continued)
During the fiscal year ended March 31, 2016, certain Funds, as shown on the Statements of Operations under “Professional fees”, incurred non-recurring fees with respect to obtaining tax relief on United Kingdom stamp duty reserve taxes.
Currency Transactions — The Funds may enter into forward foreign currency contracts to facilitate local securities settlements or to protect against currency exposure. The Funds do not expect to engage in currency transactions for the purpose of hedging against declines in the value of the Fund’s assets that are denominated in one or more foreign currencies. The Funds may not enter into such contracts for speculative purposes.
Forward Foreign Currency Contracts — A forward foreign currency contract (“Forward Contract”) involves an obligation to purchase or sell a specific currency at a future date, which may be any fixed number of days from the date of the contract agreed upon by the parties, at a price set at the time of the contract. These contracts are principally traded in the inter-bank market conducted directly between currency traders (usually large, commercial banks) and their customers. A Forward Contract generally does not require an initial margin deposit and no commissions are charged at any stage for trades. However, if a Fund is in an unrealized loss position on a Forward Contract, it may be required to pledge collateral (or additional collateral) to the counterparty. If a Fund is in an unrealized gain position on a Forward Contract, it may receive collateral from the counterparty.
Risks may arise upon entering into Forward Contracts from the potential inability of counterparties to meet the terms of their contracts and from unanticipated movements in the value of foreign currencies relative to the U.S. dollar or each other.
Fluctuations in the value of open Forward Contracts are recorded for book purposes as unrealized gains or losses on Forward Contracts by the Funds. Realized gains and losses on Forward Contracts include net gains or losses recognized by the Funds on contracts which have matured or were sold.
Securities Lending — Each Fund may lend portfolio securities to certain creditworthy borrowers, including the Funds’ securities lending agent. It is the Funds’ policy that, at origination, all loans are secured by collateral of at least 102% of the value of U.S. securities loaned and 105% of the value of foreign securities loaned. Collateral in the form of cash and/or high-grade debt obligations, equivalent to at least 100% of the market value of securities, is maintained at all times. The cash collateral can be invested in certain money market mutual funds which also have exposure to the fluctuations of the market. The values of the investments of cash collateral for securities on loan along with the obligations to return such collateral are included on the Statements of Assets and Liabilities. The total value of securities received as collateral for securities on loan is included in a footnote following each Schedule of Investments, but is not included within the Statements of Assets and Liabilities because the receiving Fund does not have the right to sell or repledge the securities received as collateral. Each Fund receives compensation for lending its securities from interest or dividends earned on the cash or U.S. government securities held as collateral, net of fee rebates paid to the borrower plus reasonable administrative and custody fees, all of which are included in the securities lending income earned by the Funds and disclosed on the Statements of Operations. The dividend and interest income earned on the securities loaned is accounted for in the same manner as other dividend and interest income. The borrower pays to the Funds an amount equal to any dividends or interest received on loaned securities. Dividends received while a security is out on loan are not considered Qualified Dividend Income (“QDI”) under the specific criteria issued by the Internal Revenue Service and are subject to taxation at the shareholder’s ordinary income tax rate instead of the lower long-term capital gains tax rate. Lending portfolio securities could result in a loss or delay in recovering each Fund’s securities if the borrower defaults.
Master Netting Arrangements — ASU No. 2011-11 “Disclosures about Offsetting Assets and Liabilities” (“ASU 2011-11”) is generally intended to (i) help investors and other financial statement users to better assess the effect or potential effect of offsetting arrangements on a company’s financial position, (ii) improve transparency in the reporting of how companies mitigate credit risk, and (iii) facilitate comparisons between those entities that prepare their financial statements on the basis of GAAP and those entities that prepare their financial statements on the basis of international financial reporting standards. ASU 2011-11 requires entities to disclose (i) gross and net information about both instruments and transactions eligible for offset in the financial statements, and (ii) instruments and transactions subject to an agreement similar to a master netting agreement. ASU 2011-11 is limited in scope to the following financial instruments, to the extent they are offset in the financial statements or subject to an enforceable master netting arrangement or similar agreement: (i) recognized derivative instruments accounted for under ASC 815 (Derivatives and Hedging); (ii) repurchase agreements and reverse repurchase agreements; and (iii) securities borrowing and securities lending transactions.
In order to better define its contractual rights and to secure rights that will help a Fund mitigate its counterparty risk, a Fund may enter into an International Swaps and Derivatives Association, Inc. Master Agreement (“ISDA Master Agreement”) or similar agreement with its counterparties. An ISDA Master Agreement is a bilateral agreement between a Fund and a counterparty that governs over-the-counter derivatives (“OTC”), including Forward Contracts, and typically contains, among other things, collateral posting terms, netting and rights of set-off provisions in the event of a default and/or termination event. Under an ISDA Master Agreement, a Fund may, under certain circumstances, offset with the counterparty certain derivative financial instruments’ payables and receivables to create a single net payment. The provisions of the ISDA Master Agreement typically permit a single net payment in the event of a default (close-out netting) or similar event, including the bankruptcy or insolvency of the counterparty.
| | |
| 106 | | WisdomTree Global/Global ex-U.S. and Emerging/Frontier Markets Funds |
Notes to Financial Statements (continued)
Collateral requirements generally differ by type of derivative. Collateral terms are contract-specific for OTC derivatives (e.g. foreign exchange contracts, options and certain swaps). Generally, for transactions traded under an ISDA Master Agreement, the collateral requirements are calculated by netting the marked to market amount for each transaction under such agreement and comparing that amount to the value of any collateral currently pledged by a Fund and the counterparty. Generally, the amount of collateral due from or to a counterparty must exceed a minimum transfer amount threshold before a transfer is required to be made. To the extent amounts due to a Fund from its derivatives counterparties are not fully collateralized, contractually or otherwise, the Fund bears the risk of loss from a counterparty’s non-performance.
A Fund’s security lending activities are governed by a Securities Lending Authorization Agreement (“Lending Agreement”) between the Fund and the lending agent. The Lending Agreement authorizes the lending agent to lend qualifying U.S. and foreign securities held by a Fund to approved borrowers (each a “Borrower”). To mitigate borrower risk, a Fund typically receives from a Borrower, collateral in the form of U.S. dollar cash and/or securities issued or guaranteed by the U.S. government or its agencies in excess of the market value of the securities loaned. Under the provisions of the Lending Agreement, a Fund shall have, as to the collateral, all of the rights and remedies of a secured party under applicable law. A Fund is exposed to risk of loss if a Borrower defaults on its obligation to return borrowed securities and the value of the collateral a Fund received is insufficient to cover the market value of the securities loaned. Also, the lending agent is permitted to invest the cash collateral it receives from a Borrower into a money market fund which is subject to market fluctuation. Therefore, a Fund is exposed to risk of loss if the value of invested cash collateral is insufficient to satisfy the Fund’s obligation to return the full amount owed to such Borrower. For financial reporting purposes, the Funds elect to not offset assets and liabilities subject to an ISDA Master Agreement or Lending Agreement, if any, in the Statements of Assets and Liabilities. Therefore, all qualifying transactions are presented on a gross basis in the Statements of Assets and Liabilities. As of March 31, 2016, the impact of netting of assets and liabilities and the offsetting of collateral pledged or received based on contractual netting/set-off provisions in the ISDA Master Agreement and the Lending Agreement are detailed in the following table:
| | | | | | | | | | | | | | | | | | | | | | | | | | | | | | | | |
| | | | | | Assets | | | | | | | | | Liabilities | | | | |
| | | Gross Amounts in
the Statements of
Assets and Liabilities | | | Gross Amounts Not Offset in the Statements of Assets and Liabilities | | | Net
Amount | | | Gross Amounts in
the Statements of
Assets and Liabilities | | | Gross Amounts Not Offset in the Statements of Assets and Liabilities | | | Net
Amount | |
| Fund | | | Financial
Instruments | | | Collateral
Received | | | | | Financial
Instruments | | | Collateral
Pledged | | |
Asia Pacific ex-Japan Fund | | | | | | | | | | | | | | | | | |
Securities Lending | | $ | 609,423 | | | $ | — | | | $ | (609,423 | )1 | | $ | — | | | $ | — | | | $ | — | | | $ | — | | | $ | — | |
Forward Foreign Currency Contracts | | | — | | | | — | | | | — | | | | — | | | | 55 | | | | — | | | | — | | | | 55 | |
China ex-State-Owned Enterprises Fund | | | | | | | | | | | | | | | | | |
Securities Lending | | | 1,016,683 | | | | — | | | | (1,016,683 | )1 | | | — | | | | — | | | | — | | | | — | | | | — | |
Commodity Country Equity Fund | | | | | | | | | | | | | | | | | |
Securities Lending | | | 386,013 | | | | — | | | | (386,013 | )1 | | | — | | | | — | | | | — | | | | — | | | | — | |
Forward Foreign Currency Contracts | | | 5 | | | | — | | | | — | | | | 5 | | | | 4,681 | | | | — | | | | — | | | | 4,681 | |
Emerging Markets Consumer Growth Fund | | | | | | | | | | | | | | | | | |
Securities Lending | | | 350,230 | | | | — | | | | (350,230 | )1 | | | — | | | | — | | | | — | | | | — | | | | — | |
Forward Foreign Currency Contracts | | | — | | | | — | | | | — | | | | — | | | | 63 | | | | — | | | | — | | | | 63 | |
Emerging Markets ex-State-Owned Enterprises Fund | | | | | | | | | | | | | | | | | |
Securities Lending | | | 5,574 | | | | — | | | | (5,574 | )1 | | | — | | | | — | | | | — | | | | — | | | | — | |
Forward Foreign Currency Contracts | | | 2 | | | | — | | | | — | | | | 2 | | | | — | | | | — | | | | — | | | | — | |
Emerging Markets High Dividend Fund | |
Securities Lending | | | 81,437,076 | | | | — | | | | (81,437,076 | )1 | | | — | | | | — | | | | — | | | | — | | | | — | |
Forward Foreign Currency Contracts | | | 3,271 | | | | — | | | | — | | | | 3,271 | | | | 24,703 | | | | — | | | | — | | | | 24,703 | |
Emerging Markets Quality Dividend Growth Fund | |
Securities Lending | | | 2,143,687 | | | | — | | | | (2,143,687 | )1 | | | — | | | | — | | | | — | | | | — | | | | — | |
Emerging Markets SmallCap Dividend Fund | |
Securities Lending | | | 88,264,527 | | | | — | | | | (88,264,527 | )1 | | | — | | | | — | | | | — | | | | — | | | | — | |
Forward Foreign Currency Contracts | | | 10,550 | | | | — | | | | — | | | | 10,550 | | | | 4 | | | | — | | | | — | | | | 4 | |
| | | | |
| WisdomTree Global/Global ex-U.S. and Emerging/Frontier Markets Funds | | | 107 | |
Notes to Financial Statements (continued)
| | | | | | | | | | | | | | | | | | | | | | | | | | | | | | | | |
| | | | | | Assets | | | | | | | | | Liabilities | | | | |
| | | Gross Amounts in
the Statements of
Assets and Liabilities | | | Gross Amounts Not Offset in the Statements of Assets and Liabilities | | | Net
Amount | | | Gross Amounts in
the Statements of
Assets and Liabilities | | | Gross Amounts Not Offset in the Statements of Assets and Liabilities | | | Net
Amount | |
| Fund | | | Financial
Instruments | | | Collateral
Received | | | | | Financial
Instruments | | | Collateral
Pledged | | |
Global ex-U.S. Quality Dividend Growth Fund | |
Securities Lending | | $ | 5,692,262 | | | $ | — | | | $ | (5,692,262 | )1 | | $ | — | | | $ | — | | | $ | — | | | $ | — | | | $ | — | |
Global ex-U.S. Real Estate Fund | |
Securities Lending | | | 4,021,658 | | | | — | | | | (4,021,658 | )1 | | | — | | | | — | | | | — | | | | — | | | | — | |
Forward Foreign Currency Contracts | | | 9 | | | | — | | | | — | | | | 9 | | | | 8 | | | | — | | | | — | | | | 8 | |
Global ex-U.S. Utilities Fund | |
Securities Lending | | | 1,784,892 | | | | — | | | | (1,784,892 | )1 | | | — | | | | — | | | | — | | | | — | | | | — | |
Global High Dividend Fund | |
Securities Lending | | | 1,444,274 | | | | — | | | | (1,444,274 | )1 | | | — | | | | — | | | | — | | | | — | | | | — | |
Forward Foreign Currency Contracts | | | 375 | | | | — | | | | — | | | | 375 | | | | — | | | | — | | | | — | | | | — | |
Global Natural Resources Fund | |
Securities Lending | | | 1,083,365 | | | | — | | | | (1,083,365 | )1 | | | — | | | | — | | | | — | | | | — | | | | — | |
Forward Foreign Currency Contracts | | | 28 | | | | — | | | | — | | | | 28 | | | | 6 | | | | — | | | | — | | | | 6 | |
Middle East Dividend Fund | |
Forward Foreign Currency Contracts | | | — | | | | — | | | | — | | | | — | | | | 77 | | | | — | | | | — | | | | 77 | |
| | 1 | The amount of collateral presented has been limited such that the net amount by counterparty cannot be less than zero |
Short-Term Investments — Each Fund may invest a portion of its assets in high-quality money market instruments on an ongoing basis to provide liquidity or for other reasons. The instruments include short-term obligations issued by the U.S. government, its agencies, non-U.S. government agencies, negotiable certificates of deposit (“CDs”), fixed time deposits and bankers’ acceptances of U.S. and foreign banks and similar institutions, commercial papers, repurchase agreements and money market funds. CDs are short-term negotiable obligations of commercial banks. Time deposits are non-negotiable deposits maintained in banking institutions for specified periods of time at stated interest rates. Banker’s acceptances are time drafts drawn on commercial banks by borrowers, usually in connection with international transactions.
Tax Information and Dividends and Distributions to Shareholders — It is each Fund’s policy to comply with all requirements of the Internal Revenue Code of 1986, as amended (the “Code”). Each Fund intends to qualify for and to elect treatment as a separate Regulated Investment Company (“RIC”) under Subchapter M of the Code. In order to qualify for the special tax treatment accorded RICs and their shareholders, each Fund must, among other things, distribute with respect to each taxable year an amount equal to or greater than the sum of 90% of its investment company taxable income and 90% of its net tax-exempt interest income. There can be no guarantee that a Fund will pay dividends. Taxable net realized gains from investment transactions, reduced by capital loss carryforwards, if any, are declared and distributed to shareholders at least annually. The capital loss carryforward amount, if any, is available to offset future net capital gains. The Funds may occasionally be required to make supplemental distributions at some other time during the year. The Trust reserves the right to declare special distributions if, in its reasonable discretion, such action is necessary or advisable to preserve the status of each Fund as a RIC or to avoid imposition of income or excise taxes on undistributed income. Dividends and distributions to shareholders are recorded on the ex-dividend date. The amount of dividends and distributions from net investment income and net realized capital gains are determined in accordance with the requirements of the Code and the U.S. Treasury regulations. These book/tax differences are either considered temporary or permanent in nature. To the extent these differences are permanent in nature, such amounts are reclassified within the components of net assets based on their Federal tax basis treatment; temporary differences do not require reclassification. Dividends and distributions that exceed earnings and profit for tax purposes are reported for tax purposes as a return of capital. The India Earnings Fund has filed an election to treat the Portfolio as a ‘‘pass-through’’ entity for tax purposes.
3. ADVISORY FEES AND OTHER TRANSACTIONS WITH AFFILIATES
WTAM has overall responsibility for the general management and administration of the Trust. WTAM provides an investment program for each Fund. WTAM has arranged for MCM to provide sub-advisory services to the Funds. MCM is compensated by WTAM at no additional cost to the Funds. WTAM also arranges for transfer agency, custody, fund accounting, fund administration, securities lending and all other non-distribution related services necessary for the Funds to operate, which are generally under separate agreements entered into between the Trust on behalf of the Funds and the applicable service provider. Under the investment advisory agreement for each Fund, WTAM agrees to pay all expenses of the Funds, except for certain expenses described in Note 2.
| | |
| 108 | | WisdomTree Global/Global ex-U.S. and Emerging/Frontier Markets Funds |
Notes to Financial Statements (continued)
Pursuant to a separate contractual arrangement, as also described in Note 2, WTAM arranges for the provision of CCO services with respect to each Fund, and is liable and responsible for, and administers, payments to the CCO, the Independent Trustees and counsel to the Independent Trustees in exchange for a fee of up to 0.0044% of each Fund’s average daily net assets. WTAM expects to receive advisory fees from each Fund, based on a percentage of the Fund’s average daily net assets, as shown in the following table:
| | | | |
| Fund | | Advisory Fee Rate | |
Asia Pacific ex-Japan Fund | | | 0.48 | % |
China ex-State-Owned Enterprises Fund | | | 0.63 | %* |
Commodity Country Equity Fund | | | 0.58 | % |
Emerging Markets Consumer Growth Fund | | | 0.63 | % |
Emerging Markets ex-State-Owned Enterprises Fund | | | 0.58 | % |
Emerging Markets High Dividend Fund | | | 0.63 | % |
Emerging Markets Quality Dividend Growth Fund | | | 0.63 | % |
Emerging Markets SmallCap Dividend Fund | | | 0.63 | % |
Global ex-U.S. Quality Dividend Growth Fund | | | 0.58 | % |
Global ex-U.S. Real Estate Fund | | | 0.58 | % |
Global ex-U.S. Utilities Fund | | | 0.58 | % |
Global High Dividend Fund | | | 0.58 | % |
Global Natural Resources Fund | | | 0.58 | % |
India Earnings Fund | | | 0.83 | % |
Middle East Dividend Fund | | | 0.88 | % |
| | * | WTAM has contractually agreed to limit the advisory fee to 0.53% effective July 1, 2015 through July 31, 2016, unless earlier terminated by the Board of Trustees of the Trust for any reason. |
Each Fund may purchase shares of affiliated ETFs in secondary market transactions to reduce cash balances. For these transactions, WTAM waives its advisory fees related to each Fund’s investment in affiliated funds. The waivers may be reduced to offset the incremental costs related to these investments (fund accounting, safekeeping, transaction fees, etc.) that are paid by WTAM out of its advisory fee. The dollar amount of advisory fees waived during the period for the Funds, if any, are shown in the Statements of Operations.
Affiliated holdings are funds which are managed by, or an affiliate of, WTAM. Transactions with affiliated funds during the fiscal year ended March 31, 2016 are as follows:
| | | | | | | | | | | | | | | | | | | | |
| Fund | | Value at
3/31/2015 | | | Purchases/
Additions | | | Sales/
Reductions | | | Value at
3/31/2016 | | | Dividend
Income | |
Asia Pacific ex-Japan Fund | |
WisdomTree Global ex-U.S. Real Estate Fund | | $ | — | | | $ | 577,138 | | | $ | 462,208 | | | $ | 99,499 | | | $ | 9,112 | |
|
Commodity Country Equity Fund | |
WisdomTree Global Natural Resources Fund | | $ | 19,013 | | | $ | 261,370 | | | $ | 198,964 | | | $ | 73,941 | | | $ | 2,331 | |
|
Emerging Markets High Dividend Fund | |
WisdomTree Global High Dividend Fund | | $ | 2,103,933 | | | $ | 8,695,640 | | | $ | 10,679,653 | | | $ | — | | | $ | 65,770 | |
|
Emerging Markets SmallCap Dividend Fund | |
WisdomTree Emerging Markets High Dividend Fund | | $ | 115,388 | | | $ | 25,260,520 | | | $ | 24,186,719 | | | $ | — | | | $ | 285,356 | |
|
Global ex-U.S. Quality Dividend Growth Fund | |
WisdomTree Emerging Markets High Dividend Fund | | $ | 47,982 | | | $ | 496,468 | | | $ | 489,709 | | | $ | 17,798 | | | $ | 5,771 | |
WisdomTree International Equity Fund | | | 70,241 | | | | 727,971 | | | | 739,504 | | | | 26,421 | | | | 7,462 | |
Total | | $ | 118,223 | | | $ | 1,224,439 | | | $ | 1,229,213 | | | $ | 44,219 | | | $ | 13,233 | |
|
Global ex-U.S. Real Estate Fund | |
WisdomTree Global Natural Resources Fund | | $ | — | | | $ | 2,055,827 | | | $ | 1,944,341 | | | $ | 55,286 | | | $ | 10,724 | |
|
Global ex-U.S. Utilities Fund | |
WisdomTree Global ex-U.S. Real Estate Fund | | $ | 21,659 | | | $ | 227,057 | | | $ | 240,950 | | | $ | 4,389 | | | $ | 1,872 | |
| | | | |
| WisdomTree Global/Global ex-U.S. and Emerging/Frontier Markets Funds | | | 109 | |
Notes to Financial Statements (continued)
| | | | | | | | | | | | | | | | | | | | |
| Fund | | Value at
3/31/2015 | | | Purchases/
Additions | | | Sales/
Reductions | | | Value at
3/31/2016 | | | Dividend
Income | |
|
Global High Dividend Fund | |
WisdomTree High Dividend Fund | | $ | 36,948 | | | $ | 1,056,829 | | | $ | 1,098,972 | | | $ | — | | | $ | 3,011 | |
WisdomTree International High Dividend Fund | | | 108,896 | | | | 3,180,731 | | | | 3,262,871 | | | | — | | | | 22,483 | |
Total | | $ | 145,844 | | | $ | 4,237,560 | | | $ | 4,361,843 | | | $ | — | | | $ | 25,494 | |
|
Global Natural Resources Fund | |
WisdomTree Global High Dividend Fund | | $ | 8,735 | | | $ | 358,278 | | | $ | 355,889 | | | $ | 9,382 | | | $ | 2,850 | |
During the fiscal year ended March 31, 2016, the Asia Pacific ex-Japan Fund and Emerging Markets Quality Dividend Growth Fund received a voluntary reimbursement of $63 and $260, respectively, from MCM for investment losses on certain foreign exchange transactions. The India Earnings Fund also received a reimbursement of $14,984 from WTAM for a creation that took place during the period when the NAV was understated.
During the fiscal year ended March 31, 2016, certain Funds engaged in purchase and sale transactions with funds that have a common investment adviser, WTAM. These interfund purchase and sale transactions were at fair value and complied with Rule 17a-7 under the 1940 Act. For the fiscal year ended March 31, 2016, the cost of purchases, proceeds from sales and the net realized gain or loss recognized upon the disposal of securities resulting from interfund transactions are shown in the following table:
| | | | | | | | | | | | |
| Fund | | Purchases | | | Sales | | | Net Realized
Gain/(Loss) | |
Asia Pacific ex-Japan Fund | | $ | 1,490,526 | | | $ | 1,301,932 | | | $ | (386,018 | ) |
China ex-State-Owned Enterprises Fund | | | 23,818 | | | | 668,500 | | | | (133,614 | ) |
Commodity Country Equity Fund | | | 457,334 | | | | 217,964 | | | | 4,500 | |
Emerging Markets Consumer Growth Fund | | | 2,036,342 | | | | 1,208,461 | | | | (295,560 | ) |
Emerging Markets ex-State-Owned Enterprises Fund | | | 217,340 | | | | 210,370 | | | | (24,903 | ) |
Emerging Markets High Dividend Fund | | | 22,089,795 | | | | 33,658,924 | | | | (9,190,101 | ) |
Emerging Markets Quality Dividend Growth Fund | | | 3,141,238 | | | | 5,365,246 | | | | (1,426,551 | ) |
Emerging Markets SmallCap Dividend Fund | | | 30,589,509 | | | | 13,608,888 | | | | (4,713,696 | ) |
Global ex-U.S. Quality Dividend Growth Fund | | | 8,025,375 | | | | 7,679,182 | | | | (2,774,728 | ) |
Global ex-U.S. Real Estate Fund | | | 468,249 | | | | 1,293,257 | | | | (416,819 | ) |
Global ex-U.S. Utilities Fund | | | 727,492 | | | | 389,545 | | | | (48,322 | ) |
Global High Dividend Fund | | | 1,728,382 | | | | 5,678,599 | | | | (1,207,576 | ) |
Global Natural Resources Fund | | | 1,068,260 | | | | 747,276 | | | | (715,012 | ) |
4. CAPITAL SHARE TRANSACTIONS
As of March 31, 2016, there were an unlimited number of $0.001 par value shares of beneficial interest authorized by the Trust. Shares are issued and redeemed by each Fund only in creation units or multiples thereof. Except when aggregated in creation units, shares of each Fund are not redeemable. Transactions in shares for each Fund are disclosed in detail in the Statements of Changes in Net Assets. The consideration for the purchase of creation units of a Fund generally consists of the in-kind contribution of a designated portfolio of equity securities constituting a portfolio sampling representation of the securities included in the relevant Fund’s underlying Index and an amount of cash. The India Earnings Fund and Middle East Dividend Fund issue and redeem shares on a cash basis only. Investors purchasing and redeeming creation units may be charged a purchase transaction fee and a redemption transaction fee to offset transfer and other transaction costs associated with the issuance and redemption of creation units.
5. INVESTMENT PORTFOLIO TRANSACTIONS
Purchases and sales of investments (excluding purchases and sales resulting from in-kind capital share transactions and short-term investments) and the cost of purchases and the proceeds from sales resulting from in-kind capital share transactions (excluding short-term investments) for the fiscal year ended March 31, 2016 are shown in the following table. Realized gains and losses on sales
| | |
| 110 | | WisdomTree Global/Global ex-U.S. and Emerging/Frontier Markets Funds |
Notes to Financial Statements (continued)
resulting from in-kind capital share redemptions, as shown on the Statements of Operations, are not recognized by the Funds for tax purposes.
| | | | | | | | | | | | | | | | | | | | |
| | | | | | | | | | | In-kind Capital Share Transactions | | | |
| Fund | | | Purchases | | | | Sales | | | | | | Purchases | | | | Sales | | | |
Asia Pacific ex-Japan Fund | | $ | 12,880,160 | | | $ | 11,359,037 | | | | | $ | 5,451,001 | | | $ | — | | | |
China ex-State-Owned Enterprises Fund | | | 17,428,502 | | | | 17,490,502 | | | | | | 5,408,818 | | | | 10,232,875 | | | |
Commodity Country Equity Fund | | | 2,176,306 | | | | 2,897,643 | | | | | | — | | | | 2,523,968 | | | |
Emerging Markets Consumer Growth Fund | | | 7,355,672 | | | | 8,622,232 | | | | | | — | | | | 2,677,880 | | | |
Emerging Markets ex-State-Owned Enterprises Fund | | | 1,573,230 | | | | 5,097,778 | | | | | | — | | | | 4,172,572 | | | |
Emerging Markets High Dividend Fund | | | 731,127,261 | | | | 881,426,519 | | | | | | 26,591,449 | | | | 310,724,315 | | | |
Emerging Markets Quality Dividend Growth Fund | | | 21,880,878 | | | | 23,001,922 | | | | | | 7,551,206 | | | | 9,398,488 | | | |
Emerging Markets SmallCap Dividend Fund | | | 568,205,553 | | | | 720,068,021 | | | | | | — | | | | 149,964,779 | | | |
Global ex-U.S. Quality Dividend Growth Fund | | | 47,455,101 | | | | 49,615,331 | | | | | | 4,211,306 | | | | 14,333,082 | | | |
Global ex-U.S. Real Estate Fund | | | 34,708,933 | | | | 36,269,363 | | | | | | 7,391,953 | | | | 22,462,499 | | | |
Global ex-U.S. Utilities Fund | | | 6,048,479 | | | | 6,311,801 | | | | | | 1,686,395 | | | | 4,275,172 | | | |
Global High Dividend Fund | | | 56,357,479 | | | | 56,256,123 | | | | | | 39,818,538 | | | | 57,359,221 | | | |
Global Natural Resources Fund | | | 7,019,600 | | | | 6,871,181 | | | | | | 2,439,683 | | | | — | | | |
India Earnings Fund (consolidated) | | | 717,323,742 | | | | 1,291,424,036 | | | | | | — | | | | — | | | |
Middle East Dividend Fund | | | 6,632,519 | | | | 15,716,873 | | | | | | — | | | | — | | | |
6. FEDERAL INCOME TAXES
At March 31, 2016, the cost of investments (including securities on loan) for Federal income tax purposes was as follows:
| | | | | | | | | | | | | | | | |
| Fund | | Tax Cost | | | Gross Unrealized
Appreciation | | | Gross Unrealized
Depreciation | | | Net Unrealized
Appreciation/
(Depreciation) | |
Asia Pacific ex-Japan Fund | | $ | 49,177,584 | | | $ | 4,229,014 | | | $ | (7,533,982 | ) | | $ | (3,304,968 | ) |
China ex-State-Owned Enterprises Fund | | | 11,445,471 | | | | 517,975 | | | | (1,717,198 | ) | | | (1,199,223 | ) |
Commodity Country Equity Fund | | | 8,997,039 | | | | 443,586 | | | | (2,473,948 | ) | | | (2,030,362 | ) |
Emerging Markets Consumer Growth Fund | | | 13,790,919 | | | | 718,946 | | | | (1,925,912 | ) | | | (1,206,966 | ) |
Emerging Markets ex-State-Owned Enterprises Fund | | | 2,279,222 | | | | 151,504 | | | | (284,619 | ) | | | (133,115 | ) |
Emerging Markets High Dividend Fund | | | 1,743,423,105 | | | | 52,219,587 | | | | (417,549,897 | ) | | | (365,330,310 | ) |
Emerging Markets Quality Dividend Growth Fund | | | 33,919,982 | | | | 2,116,807 | | | | (3,488,531 | ) | | | (1,371,724 | ) |
Emerging Markets SmallCap Dividend Fund | | | 986,720,086 | | | | 86,473,044 | | | | (135,764,302 | ) | | | (49,291,258 | ) |
Global ex-U.S. Quality Dividend Growth Fund | | | 67,392,164 | | | | 5,623,837 | | | | (3,856,111 | ) | | | 1,767,726 | |
Global ex-U.S. Real Estate Fund | | | 102,074,081 | | | | 8,208,472 | | | | (12,893,701 | ) | | | (4,685,229 | ) |
Global ex-U.S. Utilities Fund | | | 19,677,689 | | | | 1,201,194 | | | | (4,230,380 | ) | | | (3,029,186 | ) |
Global High Dividend Fund | | | 75,589,655 | | | | 5,228,467 | | | | (6,523,188 | ) | | | (1,294,721 | ) |
Global Natural Resources Fund | | | 23,441,784 | | | | 179,792 | | | | (7,267,850 | ) | | | (7,088,058 | ) |
India Earnings Fund (consolidated) | | | 1,395,052,496 | | | | 180,197,706 | | | | (100,926,925 | ) | | | 79,270,781 | |
Middle East Dividend Fund | | | 22,257,407 | | | | 1,436,239 | | | | (3,364,194 | ) | | | (1,927,955 | ) |
At March 31, 2016, the components of accumulated earnings/(loss) on a tax-basis were as follows:
| | | | | | | | | | | | | | | | | | | | |
| Fund | | Undistributed
Ordinary Income | | | Undistributed
Capital and Other
Losses | | | Net Unrealized
Appreciation/
(Depreciation) | | | Currency and
Other Unrealized
Appreciation/
(Depreciation) | | | Total Accumulated
Losses | |
Asia Pacific ex-Japan Fund | | $ | 63,408 | | | $ | (24,209,934 | ) | | $ | (3,304,968 | ) | | $ | 10,402 | | | $ | (27,441,092 | ) |
China ex-State-Owned Enterprises Fund | | | — | | | | (3,377,147 | ) | | | (1,199,223 | ) | | | — | | | | (4,576,370 | ) |
Commodity Country Equity Fund | | | 47,036 | | | | (19,026,243 | ) | | | (2,030,362 | ) | | | 6,801 | | | | (21,002,768 | ) |
Emerging Markets Consumer Growth Fund | | | 61,300 | | | | (2,465,489 | ) | | | (1,206,966 | ) | | | 1,724 | | | | (3,609,431 | ) |
Emerging Markets ex-State-Owned Enterprises Fund | | | 2,028 | | | | (276,655 | ) | | | (133,115 | ) | | | 189 | | | | (407,553 | ) |
Emerging Markets High Dividend Fund | | | 1,343,142 | | | | (1,211,121,640 | ) | | | (365,330,310 | ) | | | 128,502 | | | | (1,574,980,306 | ) |
| | | | |
| WisdomTree Global/Global ex-U.S. and Emerging/Frontier Markets Funds | | | 111 | |
Notes to Financial Statements (continued)
| | | | | | | | | | | | | | | | | | | | |
| Fund | | Undistributed
Ordinary Income | | | Undistributed
Capital and Other
Losses | | | Net Unrealized
Appreciation/
(Depreciation) | | | Currency and
Other Unrealized
Appreciation/
(Depreciation) | | | Total Accumulated
Losses | |
Emerging Markets Quality Dividend Growth Fund | | $ | 91,634 | | | $ | (7,325,900 | ) | | $ | (1,371,724 | ) | | $ | 2,168 | | | $ | (8,603,822 | ) |
Emerging Markets SmallCap Dividend Fund | | | 1,714,141 | | | | (453,413,002 | ) | | | (49,291,258 | ) | | | 44,321 | | | | (500,945,798 | ) |
Global ex-U.S. Quality Dividend Growth Fund | | | 162,461 | | | | (29,885,315 | ) | | | 1,767,726 | | | | (1,320 | ) | | | (27,956,448 | ) |
Global ex-U.S. Real Estate Fund | | | 2,078,658 | | | | (59,168,083 | ) | | | (4,685,229 | ) | | | 1,672 | | | | (61,772,982 | ) |
Global ex-U.S. Utilities Fund | | | 41,377 | | | | (28,746,313 | ) | | | (3,029,186 | ) | | | (796 | ) | | | (31,734,918 | ) |
Global High Dividend Fund | | | 202,275 | | | | (32,558,219 | ) | | | (1,294,721 | ) | | | (382 | ) | | | (33,651,047 | ) |
Global Natural Resources Fund | | | 36,247 | | | | (24,528,809 | ) | | | (7,088,058 | ) | | | 323 | | | | (31,580,297 | ) |
India Earnings Fund (consolidated) | | | 7,530,595 | | | | (388,387,008 | ) | | | 79,270,781 | | | | 23,509 | | | | (301,562,123 | ) |
Middle East Dividend Fund | | | 581,332 | | | | (8,818,971 | ) | | | (1,927,955 | ) | | | (1,585 | ) | | | (10,167,179 | ) |
The tax character of distributions paid during the fiscal years ended March 31, 2016 and March 31, 2015, was as follows:
| | | | | | | | |
| | | Year Ended March 31, 2016 | | | Year/Period Ended
March 31, 2015 | |
| Fund | | Distributions Paid
from Ordinary
Income* | | | Distributions Paid
from Ordinary
Income* | |
Asia Pacific ex-Japan Fund | | $ | 1,643,992 | | | $ | 1,585,507 | |
China ex-State-Owned Enterprises Fund | | | 300,252 | | | | 427,018 | |
Commodity Country Equity Fund | | | 350,206 | | | | 754,412 | |
Emerging Markets Consumer Growth Fund | | | 365,298 | | | | 374,552 | |
Emerging Markets ex-State-Owned Enterprises Fund | | | 80,372 | | | | 20,436 | 1 |
Emerging Markets High Dividend Fund | | | 76,758,776 | | | | 150,590,028 | |
Emerging Markets Quality Dividend Growth Fund | | | 905,013 | | | | 632,102 | |
Emerging Markets SmallCap Dividend Fund | | | 33,004,695 | | | | 51,526,431 | |
Global ex-U.S. Quality Dividend Growth Fund | | | 1,522,376 | | | | 1,355,492 | |
Global ex-U.S. Real Estate Fund | | | 4,821,127 | | | | 5,988,422 | |
Global ex-U.S. Utilities Fund | | | 663,621 | | | | 1,013,012 | |
Global High Dividend Fund | | | 4,186,444 | | | | 4,555,009 | |
Global Natural Resources Fund | | | 638,131 | | | | 818,563 | |
India Earnings Fund (consolidated) | | | 20,581,518 | | | | 13,679,148 | |
Middle East Dividend Fund | | | 1,098,138 | | | | 1,679,464 | |
| | * | Includes short-term capital gains if any. |
| | 1 | For the period December 10, 2014 (commencement of operations) through March 31, 2015. |
At March 31, 2016, for Federal tax purposes, the Funds have capital loss carryforwards available to offset future capital gains through the years indicated. To the extent that these loss carryforwards are utilized, capital gains so offset will not be distributed to shareholders.
| | | | | | | | | | | | | | | | | | | | | | | | |
| Fund | | Capital Loss
Available
Through 2017 | | | Capital Loss
Available
Through 2018 | | | Capital Loss
Available
Through 2019 | | | Short-Term
Post-Effective
No Expiration | | | Long-Term
Post-Effective
No Expiration | | | Capital Loss
Available
Total | |
Asia Pacific ex-Japan Fund | | $ | 1,942,155 | | | $ | 11,545,171 | | | $ | 2,148,087 | | | $ | 3,033,926 | | | $ | 5,531,116 | | | $ | 24,200,455 | |
China ex-State-Owned Enterprises Fund | | | — | | | | — | | | | — | | | | 1,658,598 | | | | 1,642,218 | | | | 3,300,816 | |
Commodity Country Equity Fund | | | — | | | | 11,126,004 | | | | 3,769,123 | | | | 1,024,645 | | | | 2,793,678 | | | | 18,713,450 | |
Emerging Markets Consumer Growth Fund | | | — | | | | — | | | | — | | | | 1,821,595 | | | | 557,678 | | | | 2,379,273 | |
Emerging Markets ex-State-Owned Enterprises Fund | | | — | | | | — | | | | — | | | | 217,379 | | | | 22,765 | | | | 240,144 | |
Emerging Markets High Dividend Fund | | | 3,240,763 | | | | 32,150,807 | | | | 561,494 | | | | 488,518,693 | | | | 652,367,581 | | | | 1,176,839,338 | |
Emerging Markets Quality Dividend Growth Fund | | | — | | | | – | | | | — | | | | 4,977,212 | | | | 1,801,435 | | | | 6,778,647 | |
Emerging Markets SmallCap Dividend Fund | | | 4,224,150 | | | | 9,367,814 | | | | 4,882,951 | | | | 222,558,801 | | | | 186,924,374 | | | | 427,958,090 | |
Global ex-U.S. Quality Dividend Growth Fund | | | 3,657,374 | | | | 8,823,117 | | | | — | | | | 12,899,181 | | | | 3,563,732 | | | | 28,943,404 | |
Global ex-U.S. Real Estate Fund | | | 12,351,482 | | | | 23,011,711 | | | | 10,538,886 | | | | 2,909,532 | | | | 9,679,499 | | | | 58,491,110 | |
Global ex-U.S. Utilities Fund | | | 1,722,994 | | | | 5,793,876 | | | | 1,986,702 | | | | 1,150,746 | | | | 17,447,262 | | | | 28,101,580 | |
| | |
| 112 | | WisdomTree Global/Global ex-U.S. and Emerging/Frontier Markets Funds |
Notes to Financial Statements (continued)
| | | | | | | | | | | | | | | | | | | | | | | | |
| Fund | | Capital Loss
Available
Through 2017 | | | Capital Loss
Available
Through 2018 | | | Capital Loss
Available
Through 2019 | | | Short-Term
Post-Effective
No Expiration | | | Long-Term
Post-Effective
No Expiration | | | Capital Loss
Available
Total | |
Global High Dividend Fund | | $ | 5,329,783 | | | $ | 15,414,669 | | | $ | 807,956 | | | $ | 5,340,596 | | | $ | 4,995,585 | | | $ | 31,888,589 | |
Global Natural Resources Fund | | | 1,245,793 | | | | 4,858,681 | | | | 6,793,018 | | | | 3,008,872 | | | | 6,734,706 | | | | 22,641,070 | |
India Earnings Fund (consolidated) | | | 20,567,350 | | | | 7,978,486 | | | | 6,294,051 | | | | 159,800,834 | | | | 167,392,059 | | | | 362,032,780 | |
Middle East Dividend Fund | | | — | | | | 5,098,493 | | | | 763,315 | | | | 2,014,587 | | | | 942,576 | | | | 8,818,971 | |
Capital losses incurred after October 31 (“post-October capital losses”) and late year ordinary losses incurred after December 31 within the taxable year are deemed to arise on the first business day of each Fund’s next taxable year.
During the fiscal year ended March 31, 2016, the following Funds incurred and will elect to defer post-October capital losses and late year ordinary losses as follows:
| | | | | | | | | | | | |
| Fund | | Late Year
Ordinary Loss | | | Short-Term
Post-October
Capital Losses | | | Long-Term
Post-October
Capital Losses | |
Asia Pacific ex-Japan Fund | | $ | — | | | $ | 9,479 | | | $ | — | |
China ex-State-Owned Enterprises Fund | | | 19 | | | | 51,824 | | | | 24,488 | |
Commodity Country Equity Fund | | | — | | | | 45,888 | | | | 266,905 | |
Emerging Markets Consumer Growth Fund | | | — | | | | 11,384 | | | | 74,832 | |
Emerging Markets ex-State-Owned Enterprises Fund | | | — | | | | 4,000 | | | | 32,511 | |
Emerging Markets High Dividend Fund | | | — | | | | 4,769,453 | | | | 29,512,849 | |
Emerging Markets Quality Dividend Growth Fund | | | — | | | | 286,857 | | | | 260,396 | |
Emerging Markets SmallCap Dividend Fund | | | — | | | | 6,034,820 | | | | 19,420,092 | |
Global ex-U.S. Quality Dividend Growth Fund | | | — | | | | 247,185 | | | | 694,726 | |
Global ex-U.S. Real Estate Fund | | | — | | | | 270,254 | | | | 406,719 | |
Global ex-U.S. Utilities Fund | | | — | | | | 112,341 | | | | 532,392 | |
Global High Dividend Fund | | | — | | | | 364,549 | | | | 305,081 | |
Global Natural Resources Fund | | | — | | | | 493,049 | | | | 1,394,690 | |
India Earnings Fund (consolidated) | | | — | | | | 14,015,985 | | | | 12,338,243 | |
Middle East Dividend Fund | | | — | | | | — | | | | — | |
During the fiscal year ended March 31, 2016, the amount of capital loss carryforwards that expired unused are shown in the following table:
| | | | |
| Fund | | Expired Capital
Loss Carryforward | |
Asia Pacific ex-Japan Fund | | $ | 434,717 | |
China ex-State-Owned Enterprises Fund | | | — | |
Commodity Country Equity Fund | | | — | |
Emerging Markets Consumer Growth Fund | | | — | |
Emerging Markets ex-State-Owned Enterprises Fund | | | — | |
Emerging Markets High Dividend Fund | | | 166,963 | |
Emerging Markets Quality Dividend Growth Fund | | | — | |
Emerging Markets SmallCap Dividend Fund | | | — | |
Global ex-U.S. Quality Dividend Growth Fund | | | 638,234 | |
Global ex-U.S. Real Estate Fund | | | 261,244 | |
Global ex-U.S. Utilities Fund | | | 13,301 | |
Global High Dividend Fund | | | — | |
Global Natural Resources Fund | | | 45,822 | |
India Earnings Fund (consolidated) | | | 1,179 | |
Middle East Dividend Fund | | | — | |
| | | | |
| WisdomTree Global/Global ex-U.S. and Emerging/Frontier Markets Funds | | | 113 | |
Notes to Financial Statements (continued)
At March 31, 2016, the effect of permanent “book/tax” reclassifications resulted in increases (decreases) to the components of net assets as follows:
| | | | | | | | | | | | |
| Fund | | Undistributed Net
Investment
Income/(Loss) | | | Accumulated Net
Realized Gain/(Loss) | | | Paid-in Capital | |
Asia Pacific ex-Japan Fund | | $ | (41,889 | ) | | $ | 476,606 | | | $ | (434,717 | ) |
China ex-State-Owned Enterprises Fund | | | 1,032 | | | | (694,899 | ) | | | 693,867 | |
Commodity Country Equity Fund | | | (2,886 | ) | | | 314,643 | | | | (311,757 | ) |
Emerging Markets Consumer Growth Fund | | | (30,138 | ) | | | 238,907 | | | | (208,769 | ) |
Emerging Markets ex-State-Owned Enterprises Fund | | | (1,834 | ) | | | (234,881 | ) | | | 236,715 | |
Emerging Markets High Dividend Fund | | | (3,203,713 | ) | | | 61,887,944 | | | | (58,684,231 | ) |
Emerging Markets Quality Dividend Growth Fund | | | (116,054 | ) | | | 267,499 | | | | (151,445 | ) |
Emerging Markets SmallCap Dividend Fund | | | (2,901,713 | ) | | | 286,284 | | | | 2,615,429 | |
Global ex-U.S. Quality Dividend Growth Fund | | | (242,737 | ) | | | (151,666 | ) | | | 394,403 | |
Global ex-U.S. Real Estate Fund | | | 1,842,080 | | | | (1,149,367 | ) | | | (692,713 | ) |
Global ex-U.S. Utilities Fund | | | 5,545 | | | | (209,072 | ) | | | 203,527 | |
Global High Dividend Fund | | | (156,251 | ) | | | (6,153,619 | ) | | | 6,309,870 | |
Global Natural Resources Fund | | | (3,420 | ) | | | 50,500 | | | | (47,080 | ) |
India Earnings Fund (consolidated) | | | (1,202,869 | ) | | | 1,219,031 | | | | (16,162 | ) |
Middle East Dividend Fund | | | (18,195 | ) | | | 18,196 | | | | (1 | ) |
These differences are primarily due to redemptions-in-kind, foreign currency transactions, investments in passive foreign investment
companies, expiration of capital loss carryforwards, investments in partnerships, and investments in real estate investment trusts.
GAAP provides guidance on tax provisions that prescribe a minimum threshold for financial statement recognition of the benefit of a tax position taken or expected to be taken in a tax return. Foreign taxes are provided for based on each Fund’s understanding of the tax rules and rates that exist in the foreign markets in which it invests. Taxes are accrued and applied to net investment income, net realized capital gains and net unrealized appreciation, as applicable, as the income is earned or capital gains are recorded. As of and during the fiscal year ended March 31, 2016, the Funds did not have any liabilities for unrecognized tax benefits relating to uncertain income tax positions they have taken or expect to take in the future. If applicable, the Funds will recognize interest accrued related to unrecognized tax benefits in interest expense and penalties in “Other” expenses on the Statements of Operations. The Funds file tax returns with the Internal Revenue Service, the State of New York, and various other states. Generally, each of the tax years in the four-year period ended March 31, 2016, remains subject to examination by taxing authorities.
7. MAURITIUS INCOME TAX
The Portfolio holds a tax residency certificate issued by the Mauritian Revenue authorities which entitles it to claim the benefits of the double taxation avoidance agreement entered between the Government of India and Mauritius (“tax treaty”). Since the India Earnings Fund makes its investments through the Portfolio, a wholly owned subsidiary organized in the Republic of Mauritius, this structure should permit the India Earnings Fund to benefit from the tax treaty. The Supreme Court of India upheld the validity of this tax treaty in response to a lower court challenge contesting the treaty’s applicability to entities such as the Portfolio. In March 2012, the Indian Finance Minister introduced a new chapter to the Indian Income Tax Act, 1961 (“IT Act”), which included certain General Anti-Avoidance Rules (“GAAR”). The Finance Act, 2015 (“FA 2015”) amended the IT Act to defer the applicability of GAAR to financial years beginning on or after April 1, 2017. The Government of India has also committed to grandfather all investments made into India up-to April 1, 2017 from the applicability of GAAR, irrespective of the date of exit of the investments. See Note 10 for information on recent tax treaty changes.
The taxable profits derived from the worldwide income of the wholly owned subsidiary of the India Earnings Fund, i.e. the Portfolio, is subject to income tax at the rate of 15% in the Republic of Mauritius. As with all Mauritian tax residents, the Portfolio is entitled to a foreign tax credit (“FTC”) on its foreign sourced income. The FTC is based on the lower of the Mauritian tax or the foreign taxes incurred. Where documentary evidence is not available to substantiate the foreign taxes suffered, the FTC can be presumed to be 80% of the Mauritius tax on its foreign source income. The presumed FTC effectively reduces the Mauritian income tax rate on the foreign sourced income of the Portfolio to a maximum of 3%. Interest income on call and deposit accounts with Mauritian banks is exempt from tax, and there is no tax on capital gains in Mauritius. Effective August 8, 2012, in connection with the new advisory agreement, the Mauritius income tax is paid by WTAM.
| | |
| 114 | | WisdomTree Global/Global ex-U.S. and Emerging/Frontier Markets Funds |
Notes to Financial Statements (concluded)
8. DEMAND NOTE
During the fiscal year ended March 31, 2016, the India Earnings Fund had a demand note agreement with Morgan Stanley Bank, N.A. which allowed the Fund to borrow up to $325,000,000 until the stated maturity date of October 16, 2015. During the fiscal year ended March 31, 2016, the Fund utilized the demand note and borrowed for a period of 17 days with an average outstanding loan balance of $91,930,018 and a weighted average interest rate of 2.27% per annum. Interest expense related to the loan for the fiscal year ended March 31, 2016 was $97,124. At March 31, 2016, the Fund did not have any outstanding demand note agreements or amounts.
9. RECENT ACCOUNTING PRONOUNCEMENTS
In June 2014, the FASB issued ASU 2014-11 Transfers & Servicing (Topic 860): Repurchase-to-Maturity Transactions, Repurchase Financings, and Disclosures to improve the financial reporting of repurchase agreements and other similar transactions. The guidance includes expanded disclosure requirements for entities that enter into repurchase agreements or securities lending transactions. The guidance is effective for financial statements with fiscal years beginning on or after January 1, 2015, and interim periods within those fiscal years. WTAM has evaluated ASU 2014-11 and determined that there is no impact on the Trust’s financial statements.
In May 2015, the FASB issued ASU 2015-07 Fair Value Measurement (Topic 820): Disclosures for Investments in Certain Entities that Calculate Net Asset Value per Share (or its Equivalent). This is an update to ASC 820. The amendments in this ASU remove the requirement to categorize within the fair value hierarchy all investments for which fair value is measured using the net asset value per share practical expedient. ASU 2015-07 also limits certain disclosures to investments for which the entity has elected to measure the fair value using the practical expedient. ASU 2015-07 will be effective for financial statements issued for fiscal years beginning after December 15, 2015, and interim periods within those fiscal years (earlier application is also permitted). WTAM has evaluated ASU 2015-07 and determined that there is no impact on the Trust’s financial statements.
10. SUBSEQUENT EVENT
In a press release issued on May 10, 2016, India announced a protocol (“2016 Protocol”) for amendment of the tax treaty between India and Mauritius. With this protocol, purchases of Indian shares by Mauritius entities, made on or after April 1, 2017, will be subject to capital gains tax in India. Amendments to the Capital Gains Article will be effective in India from tax year 2017-18 once the requisite procedures for ratification of the 2016 Protocol are completed in both the countries. The 2016 Protocol grandfathers shares acquired up to March 31, 2017, which would exempt them from taxation. In addition, during a transition period covering April 1, 2017 through March 31, 2019, the capital gains tax could potentially be limited to 50% of the domestic tax rates as applicable in India, if certain Limitation of Benefits articles are not satisfied. If WisdomTree India Earnings Fund satisfied the Limitation of Benefits articles, any shares acquired by the Portfolio after April 1, 2017 and transferred on or after April 1, 2019 shall be subject to the full rate of capital gains tax in India. It is important to note that the 2016 Protocol only amends the capital gains article in relation to the taxation of shares. In other words, all other “securities” besides shares shall be subject to similar taxation principles, as they apply currently to the Portfolio. This amendment could reduce the return to the India Earnings Fund on its investments made on or after April 1, 2017 and the return received by India Earnings Fund shareholders.
| | | | |
| WisdomTree Global/Global ex-U.S. and Emerging/Frontier Markets Funds | | | 115 | |
Report of Independent Registered Public Accounting Firm
The Board of Trustees and Shareholders of WisdomTree Trust:
We have audited the accompanying statements of assets and liabilities, including the schedules of investments, of WisdomTree Asia Pacific ex-Japan Fund, WisdomTree China ex-State-Owned Enterprises Fund (formerly WisdomTree China Dividend ex-Financials Fund), WisdomTree Commodity Country Equity Fund, WisdomTree Emerging Markets Consumer Growth Fund, WisdomTree Emerging Markets ex-State-Owned Enterprises Fund, WisdomTree Emerging Markets High Dividend Fund (formerly WisdomTree Emerging Markets Equity Income Fund), WisdomTree Emerging Markets Quality Dividend Growth Fund (formerly WisdomTree Emerging Markets Dividend Growth Fund), WisdomTree Emerging Markets SmallCap Dividend Fund, WisdomTree Global ex-U.S. Quality Dividend Growth Fund (formerly WisdomTree Global ex-U.S. Dividend Growth Fund), WisdomTree Global ex-U.S. Real Estate Fund, WisdomTree Global ex-U.S. Utilities Fund, WisdomTree Global High Dividend Fund (formerly WisdomTree Global Equity Income Fund), WisdomTree Global Natural Resources Fund, WisdomTree India Earnings Fund (consolidated), and WisdomTree Middle East Dividend Fund, fifteen of the investment funds constituting the WisdomTree Trust (the “Trust”), as of March 31, 2016, and the related statements of operations, the statements of changes in net assets and the financial highlights for each of the periods presented therein. These financial statements and financial highlights are the responsibility of the Trust’s management. Our responsibility is to express an opinion on these financial statements and financial highlights based on our audits.
We conducted our audits in accordance with the standards of the Public Company Accounting Oversight Board (United States). Those standards require that we plan and perform the audits to obtain reasonable assurance about whether the financial statements and financial highlights are free of material misstatement. We were not engaged to perform an audit of the Trust’s internal control over financial reporting. Our audits included consideration of internal control over financial reporting as a basis for designing audit procedures that are appropriate in the circumstances, but not for the purpose of expressing an opinion on the effectiveness of the Trust’s internal control over financial reporting. Accordingly, we express no such opinion. An audit also includes examining, on a test basis, evidence supporting the amounts and disclosures in the financial statements and financial highlights, assessing the accounting principles used and significant estimates made by management, and evaluating the overall financial statement presentation. Our procedures included confirmation of securities owned as of March 31, 2016, by correspondence with the custodian and others, or by other appropriate auditing procedures where replies from others were not received. We believe that our audits provide a reasonable basis for our opinion.
In our opinion, the financial statements and financial highlights referred to above present fairly, in all material respects, the financial position of WisdomTree Asia Pacific ex-Japan Fund, WisdomTree China ex-State-Owned Enterprises Fund, WisdomTree Commodity Country Equity Fund, WisdomTree Emerging Markets Consumer Growth Fund, WisdomTree Emerging Markets ex-State-Owned Enterprises Fund, WisdomTree Emerging Markets High Dividend Fund, WisdomTree Emerging Markets Quality Dividend Growth Fund, WisdomTree Emerging Markets SmallCap Dividend Fund, WisdomTree Global ex-U.S. Quality Dividend Growth Fund, WisdomTree Global ex-U.S. Real Estate Fund, WisdomTree Global ex-U.S. Utilities Fund, WisdomTree Global High Dividend Fund, WisdomTree Global Natural Resources Fund, WisdomTree India Earnings Fund (consolidated), and WisdomTree Middle East Dividend Fund, fifteen of the investment funds constituting the WisdomTree Trust, at March 31, 2016, the results of their operations, the changes in their net assets and the financial highlights for each of the periods presented therein, in conformity with U.S. generally accepted accounting principles.

New York, New York
May 26, 2016
| | |
| 116 | | WisdomTree Global/Global ex-U.S. and Emerging/Frontier Markets Funds |
Trustees and Officers Information (unaudited)
The Board of Trustees has responsibility for the overall management and operations of the Funds, including general supervision of the duties performed by WTAM and other service providers. The Board of Trustees elects the officers of the Trust who are responsible for administering the Trust’s day-to-day operations. Each Trustee serves until his or her successor is duly elected or appointed and qualified.
The address of each Trustee and Officer is c/o WisdomTree Asset Management, Inc., 245 Park Avenue, 35th Floor, New York, NY 10167.
Independent Trustees
| | | | | | | | |
Name
and Year of Birth
of Trustee/Officer | | Position(s) Held with
the Trust, Term of
Office and Length
of Time Served | | Principal Occupation(s)
During the Past 5 Years | | Number of Portfolios
in Fund Complex
Overseen by Trustee/
Officer+ | | Other
Directorships
Held by Trustee
During the Past
5 Years |
David G. Chrencik*
(1948) | | Trustee, 2014- present | | Chief Financial Officer of Sarus Indochina Select LP (hedge fund) since 2012; Chief Financial Officer of GeoGreen BioFuels, Inc. (biodiesel fuel producer) from 2010 to 2014; Audit Partner at PricewaterhouseCoopers LLP (public accounting firm) from 1972 to 2009 (includes positions prior to becoming Audit Partner and predecessor firms). | | 91 | | Trustee,
Vericimetry
Funds
(2011-2014) |
| | | | |
Joel Goldberg**
(1945) | | Trustee, 2012- present | | Attorney, Of Counsel/Partner at Stroock & Stroock & Lavan LLP, 2010 to present; Attorney, Partner at Willkie Farr & Gallagher LLP, 2006 to 2010. | | 91 | | Director,
Better
Business
Bureau
(Metropolitan
New York,
Long Island
and the Mid-
Hudson
Region) |
| | | | |
Toni Massaro***
(1955) | | Trustee, 2006- present | | Dean Emerita at the University of Arizona James E. Rogers College of Law (“Rogers College of Law”) since 2009 (distinguished Emerita in July 2009); Dean at the Rogers College of Law from 1999 to 2009; Regents’ Professor at the Rogers College of Law since 1990. | | 91 | | None |
| | | | |
Melinda A. Raso Kirstein‡
(1955) | | Trustee, 2014- present | | Retired, Merrill Lynch Investment Management, Vice President; Senior Portfolio Manager, Fixed Income Management; Director, Tax Exempt Fund Management. | | 91 | | Associate
Alumnae of
Douglass
College,
Member of
Investment
Committee |
| | | | |
Victor Ugolyn
(1947) | | Trustee, 2006- present; Chairman of the Board of Trustees, 2006- present | | Private Investor, 2005 to present; President and Chief Executive Officer of William D. Witter, Inc. from 2005 to 2006; Consultant to AXA Enterprise in 2004; Chairman, President and Chief Executive Officer of Enterprise Capital Management (subsidiary of The MONY Group, Inc.) and Enterprise Group of Funds, Chairman of MONY Securities Corporation, and Chairman of the Fund Board of Enterprise Group of Funds from 1991 to 2004. | | 91 | | Member of the
Board of
Governors of
Naismith
Memorial
Basketball Hall
of Fame,
Member of the
Board of
Directors of
the New York
Society of
Security
Analysts
(NYSSA) |
| * | Chair of the Audit Committee. |
| ** | Chair of the Contracts Review Committee. |
| *** | Chair of the Governance and Nominating Committee. |
| ‡ | Chair of the Investment Committee. |
| | | | |
| WisdomTree Global/Global ex-U.S. and Emerging/Frontier Markets Funds | | | 117 | |
Trustees and Officers Information (unaudited) (concluded)
Interested Trustee and Officers
| | | | | | | | |
Name
and Year of Birth
of Trustee/Officer | | Position(s) Held with
the Trust, Term of
Office and Length
of Time Served | | Principal Occupation(s)
During the Past 5 Years | | Number of Portfolios
in Fund Complex
Overseen by Trustee/
Officer+ | | Other
Directorships
Held by Trustee During the Past
5 Years |
Jonathan Steinberg****
(1964) | | Trustee, 2005- present President, 2005- present | | President, WisdomTree Trust since 2005; President, WisdomTree Investments, Inc. and WisdomTree Asset Management, Inc.; Chief Executive Officer, WisdomTree Investments, Inc. and WisdomTree Asset Management, Inc. | | 91 | | Director, WisdomTree Investments, Inc. and WisdomTree Asset Management, Inc. |
| | | | |
David Castano****
(1971) | | Treasurer, 2013- present | | Director of Fund Accounting & Administration, WisdomTree Asset Management, Inc., since 2011; Vice President of Legg Mason & Co. and served as Treasurer from 2010 to 2011 and Controller from 2006 to 2010 of certain mutual funds associated with Legg Mason & Co.; Assistant Treasurer of Lord Abbett mutual funds from 2004 to 2006. | | 91 | | None |
| | | | |
Terry Jane Feld****
(1960) | | Chief Compliance Officer, 2012- present | | Chief Compliance Officer, WisdomTree Asset Management, Inc. since 2012; Senior Compliance Officer, WisdomTree Asset Management since 2011; Senior Compliance Officer, TIAA-CREF, 2007 to 2010; Vice President/NASD-SEC Compliance, Mutual of America Life Insurance Co., 2004 to 2007. | | 91 | | None |
| | | | |
Ryan Louvar****
(1972) | | Secretary and Chief Legal Officer, 2013- present | | General Counsel, WisdomTree Asset Management, Inc. since 2013; Vice President and Senior Managing Counsel, State Street, 2005 to 2013. | | 91 | | None |
| | | | |
Sarah English****
(1977) | | Assistant Secretary, 2013- present | | Investment Management Counsel, WisdomTree Asset Management, Inc. since 2010 (includes prior positions at WisdomTree Asset Management, Inc.); Attorney, NYFIX, Inc. from 2006 to 2009. | | 91 | | None |
| | | | |
Clint Martin**** (1977) | | Assistant Treasurer, 2015-present | | Fund Manager, Fund Accounting & Administration, WisdomTree Asset Management, Inc., since 2012; Vice President of Legg Mason & Co. and served as Assistant Treasurer from 2010 to 2012 and Assistant Controller from 2006 to 2010 of certain mutual funds associated with Legg Mason & Co. | | 91 | | None |
| **** | Elected by and serves at the pleasure of the Board. |
| | |
| 118 | | WisdomTree Global/Global ex-U.S. and Emerging/Frontier Markets Funds |
Supplemental Information (unaudited)
Federal Income Tax Information
The following Federal tax information related to the Funds’ fiscal year ended March 31, 2016, is provided for information purposes only and should not be used for reporting to federal or state revenue agencies. Federal tax information for the calendar year will be reported to you on Form 1099-DIV in January 2017.
Certain dividends paid by the Funds may be subject to a maximum tax rate of 15%, as provided by the Jobs and Growth Tax Relief Reconciliation Act of 2003. Of the distributions paid during the fiscal year ended March 31, 2016, the following represents the maximum amount of ordinary income distributions that may be considered qualified dividend income:
| | | | |
| Fund | | Qualified Dividend
Income | |
Asia Pacific ex-Japan Fund | | $ | 1,300,306 | |
China ex-State-Owned Enterprises Fund | | | 200,961 | |
Commodity Country Equity Fund | | | 247,583 | |
Emerging Markets Consumer Growth Fund | | | 323,723 | |
Emerging Markets ex-State-Owned Enterprises Fund | | | 45,009 | |
Emerging Markets High Dividend Fund | | | 60,794,820 | |
Emerging Markets Quality Dividend Growth Fund | | | 608,053 | |
Emerging Markets SmallCap Dividend Fund | | | 17,433,924 | |
Global ex-U.S. Quality Dividend Growth Fund | | | 1,188,648 | |
Global ex-U.S. Real Estate Fund | | | 832,510 | |
Global ex-U.S. Utilities Fund | | | 322,861 | |
Global High Dividend Fund | | | 3,033,260 | |
Global Natural Resources Fund | | | 560,339 | |
India Earnings Fund (consolidated) | | | 20,581,518 | |
Middle East Dividend Fund | | | 179,129 | |
The Funds intend to elect to pass through to shareholders the credit for taxes paid during the fiscal year ended March 31, 2016, to foreign countries. The gross foreign source income and foreign taxes paid are as follows:
| | | | | | | | |
| Fund | | Gross Foreign
Income | | | Foreign
Taxes Paid | |
Asia Pacific ex-Japan Fund | | $ | 1,877,823 | | | $ | 142,863 | |
China ex-State-Owned Enterprises Fund | | | 291,928 | | | | 20,361 | |
Commodity Country Equity Fund | | | 333,580 | | | | 38,408 | |
Emerging Markets Consumer Growth Fund | | | 475,718 | | | | 51,523 | |
Emerging Markets ex-State-Owned Enterprises Fund | | | 79,914 | | | | 9,697 | |
Emerging Markets High Dividend Fund | | | 89,233,043 | | | | 9,904,484 | |
Emerging Markets Quality Dividend Growth Fund | | | 1,139,203 | | | | 145,249 | |
Emerging Markets SmallCap Dividend Fund | | | 41,566,437 | | | | 5,653,241 | |
Global ex-U.S. Quality Dividend Growth Fund | | | 1,784,291 | | | | 193,871 | |
Global ex-U.S. Real Estate Fund | | | 3,638,523 | | | | 223,786 | |
Global ex-U.S. Utilities Fund | | | 415,339 | | | | 40,401 | |
Global High Dividend Fund | | | — | | | | — | |
Global Natural Resources Fund | | | 528,068 | | | | 36,186 | |
India Earnings Fund (consolidated) | | | — | | | | — | |
Middle East Dividend Fund | | | 1,131,151 | | | | 58,398 | |
| | | | |
| WisdomTree Global/Global ex-U.S. and Emerging/Frontier Markets Funds | | | 119 | |
Supplemental Information (unaudited) (concluded)
The following represents the percentage of dividends paid during the fiscal year ended March 31, 2016, that qualify for the 70% dividends received deduction for corporate shareholders:
| | | | |
| Fund | | Dividends-Received
Deduction | |
Asia Pacific ex-Japan Fund | | | — | |
China ex-State-Owned Enterprises Fund | | | — | |
Commodity Country Equity Fund | | | 0.01 | % |
Emerging Markets Consumer Growth Fund | | | — | |
Emerging Markets ex-State-Owned Enterprises Fund | | | — | |
Emerging Markets High Dividend Fund | | | 0.01 | % |
Emerging Markets Quality Dividend Growth Fund | | | — | |
Emerging Markets SmallCap Dividend Fund | | | — | |
Global ex-U.S. Quality Dividend Growth Fund | | | 0.01 | % |
Global ex-U.S. Real Estate Fund | | | — | |
Global ex-U.S. Utilities Fund | | | — | |
Global High Dividend Fund | | | 22.91 | % |
Global Natural Resources Fund | | | 8.35 | % |
India Earnings Fund (consolidated) | | | — | |
Middle East Dividend Fund | | | — | |
| | |
| 120 | | WisdomTree Global/Global ex-U.S. and Emerging/Frontier Markets Funds |
General Information (unaudited)
Proxy Voting Policies, Procedures and Record
A complete copy of the Proxy Voting Policy may be obtained by calling 1-866-909-WISE (9473) or writing to: WisdomTree Trust, c/o Foreside Fund Services, LLC, Three Canal Plaza Suite 100, Portland, ME, 04101.
The Trust is required to disclose annually the Funds’ complete proxy voting record on Form N-PX covering the most recent 12-month period ended June 30 and to file Form N-PX with the SEC no later than August 31 of each year. The current Form N-PX for the Funds is available at no charge upon request by calling 1-866-909-WISE (9473) or through the Trust’s website at www.wisdomtree.com. The Funds’ Form N-PX is also available on the SEC’s website at www.sec.gov.
Shareholder Reports and Quarterly Portfolio Disclosure
The Funds are required to file their complete schedule of portfolio holdings with the SEC for their first and third fiscal quarters on Form N-Q. Copies of the filings are available, without charge, on the SEC’s website at www.sec.gov and are also available by calling the Trust at 1-866-909-WISE (9473). You can also obtain copies of Form N-Q by (i) visiting the SEC’s Public Reference Room in Washington, DC (information on the operation of the Public Reference Room may be obtained by calling 1-800-SEC-0330); (ii) sending your request and a duplicating fee to the SEC’s Public Reference Room, Washington, DC 20549-0102; or (iii) sending your request electronically to publicinfo@sec.gov.
Information about each Fund’s portfolio holdings is available daily, without charge, at www.wisdomtree.com.
The Statement of Additional Information (“SAI”) has additional information about the Funds’ Trustees and Officers and is available without charge upon request. Contact your financial representative for a free prospectus or SAI.
Frequency Distribution of Discounts & Premiums
Information about differences between the per share net asset value of each Fund and the market trading price of shares of each Fund are available, without charge, at www.wisdomtree.com
| | | | |
| WisdomTree Global/Global ex-U.S. and Emerging/Frontier Markets Funds | | | 121 | |
The WisdomTree Family of Funds
The following is a list of WisdomTree Funds being offered, along with their respective ticker symbols, as of March 31, 2016:
| | |
WisdomTree Domestic Earnings and Dividend Funds WisdomTree Dividend ex-Financials Fund (DTN) WisdomTree Earnings 500 Fund (EPS) WisdomTree High Dividend Fund (DHS) WisdomTree LargeCap Dividend Fund (DLN) WisdomTree LargeCap Value Fund (EZY) WisdomTree MidCap Dividend Fund (DON) WisdomTree MidCap Earnings Fund (EZM) WisdomTree SmallCap Dividend Fund (DES) WisdomTree SmallCap Earnings Fund (EES) WisdomTree Total Dividend Fund (DTD) WisdomTree Total Earnings Fund (EXT) WisdomTree U.S. Quality Dividend Growth Fund (DGRW) WisdomTree U.S. SmallCap Quality Dividend Growth Fund (DGRS) WisdomTree Developed World ex-U.S. and Currency Hedged Equity Funds WisdomTree Australia Dividend Fund (AUSE) WisdomTree Dynamic Currency Hedged Europe Equity Fund (DDEZ) WisdomTree Dynamic Currency Hedged International Equity Fund (DDWM) WisdomTree Dynamic Currency Hedged International SmallCap Equity Fund (DDLS) WisdomTree Dynamic Currency Hedged Japan Equity Fund (DDJP) WisdomTree Europe Hedged Equity Fund (HEDJ) WisdomTree Europe Hedged SmallCap Equity Fund (EUSC) WisdomTree Europe Local Recovery Fund (EZR) WisdomTree Europe Quality Dividend Growth Fund (EUDG) WisdomTree Europe SmallCap Dividend Fund (DFE) WisdomTree Germany Hedged Equity Fund (DXGE) WisdomTree Global ex-U.S. Hedged Dividend Fund (DXUS) WisdomTree Global ex-U.S. Hedged Real Estate Fund (HDRW) WisdomTree Global Hedged SmallCap Dividend Fund (HGSD) WisdomTree International Dividend ex-Financials Fund (DOO) WisdomTree International Equity Fund (DWM) WisdomTree International Hedged Equity Fund (HDWM) WisdomTree International Hedged Quality Dividend Growth Fund (IHDG) WisdomTree International Hedged SmallCap Dividend Fund (HDLS) WisdomTree International High Dividend Fund (DTH) WisdomTree International LargeCap Dividend Fund (DOL) WisdomTree International MidCap Dividend Fund (DIM) WisdomTree International SmallCap Dividend Fund (DLS) WisdomTree Japan Hedged Capital Goods Fund (DXJC) WisdomTree Japan Hedged Equity Fund (DXJ) WisdomTree Japan Hedged Financials Fund (DXJF) WisdomTree Japan Hedged Health Care Fund (DXJH) WisdomTree Japan Hedged Quality Dividend Growth Fund (JHDG) WisdomTree Japan Hedged Real Estate Fund (DXJR) WisdomTree Japan Hedged SmallCap Equity Fund (DXJS) WisdomTree Japan Hedged Tech, Media and Telecom Fund (DXJT) WisdomTree Japan Quality Dividend Growth Fund (JDG) WisdomTree Japan SmallCap Dividend Fund (DFJ) WisdomTree Korea Hedged Equity Fund (DXKW) WisdomTree United Kingdom Hedged Equity Fund (DXPS) | | WisdomTree Global/Global ex-U.S. and Emerging/Frontier Markets WisdomTree Asia Pacific ex-Japan Fund (AXJL) WisdomTree China ex-State-Owned Enterprises Fund (CXSE) WisdomTree Commodity Country Equity Fund (CCXE) WisdomTree Emerging Markets Consumer Growth Fund (EMCG) WisdomTree Emerging Markets ex-State-Owned Enterprises Fund (XSOE) WisdomTree Emerging Markets High Dividend Fund (DEM) WisdomTree Emerging Markets Quality Dividend Growth Fund (DGRE) WisdomTree Emerging Markets SmallCap Dividend Fund (DGS) WisdomTree Global ex-U.S. Quality Dividend Growth Fund (DNL) WisdomTree Global ex-U.S. Real Estate Fund (DRW) WisdomTree Global ex-U.S. Utilities Fund (DBU) WisdomTree Global High Dividend Fund (DEW) WisdomTree Global Natural Resources Fund (GNAT) WisdomTree Global SmallCap Dividend Fund (GSD) WisdomTree India Earnings Fund (EPI) WisdomTree Middle East Dividend Fund (GULF) WisdomTree Dollar Sensitive Equity Funds WisdomTree Strong Dollar Emerging Markets Equity Fund (EMSD) WisdomTree Strong Dollar U.S. Equity Fund (USSD) WisdomTree Weak Dollar U.S. Equity Fund (USWD) WisdomTree Currency Strategy Funds WisdomTree Bloomberg U.S. Dollar Bullish Fund (USDU) WisdomTree Brazilian Real Strategy Fund (BZF) WisdomTree Chinese Yuan Strategy Fund (CYB) WisdomTree Commodity Currency Strategy Fund (CCX) WisdomTree Emerging Currency Strategy Fund (CEW) WisdomTree Indian Rupee Strategy Fund (ICN) WisdomTree Fixed Income Funds WisdomTree Asia Local Debt Fund (ALD) WisdomTree Australia & New Zealand Debt Fund (AUNZ) WisdomTree Barclays U.S. Aggregate Bond Enhanced Yield Fund (AGGY) WisdomTree Barclays U.S. Aggregate Bond Negative Duration Fund (AGND) WisdomTree Barclays U.S. Aggregate Bond Zero Duration Fund (AGZD) WisdomTree Bloomberg Floating Rate Treasury Fund (USFR) WisdomTree BofA Merrill Lynch High Yield Bond Negative Duration Fund (HYND) WisdomTree BofA Merrill Lynch High Yield Bond Zero Duration Fund (HYZD) WisdomTree Emerging Markets Corporate Bond Fund (EMCB) WisdomTree Emerging Markets Local Debt Fund (ELD) WisdomTree Japan Interest Rate Strategy Fund (JGBB) WisdomTree Strategic Corporate Bond Fund (CRDT) WisdomTree Western Asset Unconstrained Bond Fund (UBND) WisdomTree Alternative Funds WisdomTree CBOE S&P 500 PutWrite Strategy Fund (PUTW) WisdomTree Coal Fund (TONS) WisdomTree Continuous Commodity Index Fund (GCC) WisdomTree Dynamic Bearish U.S. Equity Fund (DYB) WisdomTree Dynamic Long/Short U.S. Equity Fund (DYLS) WisdomTree Global Real Return Fund (RRF) WisdomTree Managed Futures Strategy Fund (WDTI) |
The WisdomTree Funds are exchange traded funds (“ETFs”) registered with the United States Securities and Exchange Commission as separate series (“Funds”) of WisdomTree Trust (“Trust”). WisdomTree Asset Management, Inc., a wholly owned subsidiary of WisdomTree Investments, Inc., serves as the investment adviser to the Trust. None of the WisdomTree entities are affiliated with Foreside Fund Services, LLC, the Funds’ distributor. WisdomTree Investments, its affiliates and their independent providers are not liable for any informational errors, incompleteness, delays, or for any actions taken in reliance on information contained herein.
Investors should consider the investment objectives, risks, charges and expenses of the Funds carefully before investing. A prospectus, containing this and other information, is available at www.wisdomtree.com, or by calling 1-866-909-WISE (9473). Investors should read the prospectus carefully before investing. There are risks associated with investing, including possible loss of principal. Past performance does not guarantee future results. Indexes are unmanaged and you cannot invest directly in an index.
There are risks associated with investing including possible loss of principal. Foreign investing involves special risks, such as risk of loss from currency fluctuation or political or economic uncertainty. Investments in real estate involve additional special risks, such as credit risk, interest rate fluctuations and the effect of varied economic conditions. Funds that focus their investments in one country or region may be significantly impacted by events and developments associated with the region which can adversely affect performance. Funds focusing on a single sector and/or smaller companies generally experience greater price volatility. Investments in emerging, offshore or frontier markets are generally less liquid and less efficient than investments in developed markets and are subject to additional risks, such as risks of adverse governmental regulation and intervention or political developments. Inflation protected securities do not eliminate risks associated with inflation or deflation. Investments in currency involve additional special risks, such as credit risk and interest rate fluctuations. Derivative investments can be volatile and these investments may be less liquid than other securities, and more sensitive to the effect of varied economic conditions. As these Funds can have a high concentration in some issuers the Funds can be adversely impacted by changes affecting such issuers. Due to the investment strategy of certain Funds they may make higher capital gain distributions than other ETFs. Please read the Fund’s prospectus for specific details regarding the Fund’s risk profile.
The Dow Jones Global ex-U.S. Select Real Estate Securities Index is calculated, distributed and marketed by Dow Jones Indexes, a licensed trademark of CME Group Index Services LLC, and has been licensed for use.
Transactions in Fund shares will result in brokerage commissions and will generate tax consequences. Shares may be sold through brokerage accounts, but may be redeemed from the Funds only in large amounts of 50,000 shares or more.
WisdomTree Trust
245 Park Avenue, 35th Floor
New York, NY 10167

WisdomTree Global/Global ex-U.S. and Emerging/Frontier Markets
WisdomTree Asia Pacific ex-Japan Fund (AXJL)
WisdomTree China ex-State-Owned Enterprises Fund (CXSE)
(formerly, WisdomTree China Dividend ex-Financials Fund (CHXF))
WisdomTree Commodity Country Equity Fund (CCXE)
WisdomTree Emerging Markets Consumer Growth Fund (EMCG)
WisdomTree Emerging Markets ex-State-Owned Enterprises Fund (XSOE)
WisdomTree Emerging Markets High Dividend Fund (DEM)
(formerly, WisdomTree Emerging Markets Equity Income Fund)
WisdomTree Emerging Markets Quality Dividend Growth Fund (DGRE)
(formerly, WisdomTree Emerging Markets Dividend Growth Fund)
WisdomTree Emerging Markets SmallCap Dividend Fund (DGS)
WisdomTree Global ex-U.S. Quality Dividend Growth Fund (DNL)
(formerly, WisdomTree Global ex-U.S. Dividend Growth Fund)
WisdomTree Global ex-U.S. Real Estate Fund (DRW)
WisdomTree Global ex-U.S. Utilities Fund (DBU)
WisdomTree Global High Dividend Fund (DEW)
(formerly, WisdomTree Global Equity Income Fund)
WisdomTree Global Natural Resources Fund (GNAT)
WisdomTree India Earnings Fund (EPI)
WisdomTree Middle East Dividend Fund (GULF)
WisdomTree Fund shares are distributed by Foreside Fund Services, LLC, in the U.S. only.
WTGM-1423


WisdomTree Trust
Domestic Earnings and Dividend Funds
Annual Report
March 31, 2016
WisdomTree Dividend ex-Financials Fund (DTN)
WisdomTree Earnings 500 Fund (EPS)
WisdomTree High Dividend Fund (DHS)
(formerly, WisdomTree Equity Income Fund)
WisdomTree LargeCap Dividend Fund (DLN)
WisdomTree LargeCap Value Fund (EZY)
WisdomTree MidCap Dividend Fund (DON)
WisdomTree MidCap Earnings Fund (EZM)
WisdomTree SmallCap Dividend Fund (DES)
WisdomTree SmallCap Earnings Fund (EES)
WisdomTree Total Dividend Fund (DTD)
WisdomTree Total Earnings Fund (EXT)
WisdomTree U.S. Quality Dividend Growth Fund (DGRW)
(formerly, WisdomTree U.S. Dividend Growth Fund)
WisdomTree U.S. SmallCap Quality Dividend Growth Fund (DGRS)
(formerly, WisdomTree U.S. SmallCap Dividend Growth Fund)
Table of Contents
“WisdomTree” is a registered mark of WisdomTree Investments, Inc. and is licensed for use by the WisdomTree Trust.
Management’s Discussion of Funds’ Performance (unaudited)
Market Environment Overview
The U.S. equity market, as measured by the S&P 500® Index, returned 1.78% for the 12-month period ended March 31, 2016 (the “period”). After bottoming in March of 2009, the S&P 500® Index recorded its seventh straight year of gains. Measured from March 31, 2009 through March 31, 2016, the seven year cumulative total return on the S&P 500® Index was 199.55%. This represents a substantial recovery in the equity markets as earnings and dividend levels reached and surpassed previous levels. In fact, this was also enough for the S&P 500® Index to reach new highs.
While the overall return for the period was positive, it was marked by several bouts of volatility. One of the most significant events over the period was the prolonged decline in energy prices and, most notably, crude oil which briefly dipped below $30 a barrel for the first time in 12 years. This dragged on the performance of not only the Energy sector, but the Financials sector as well, as investors contemplated the contagion effects of low energy prices on the credit markets. Another important topic over the period was the volatility in the foreign exchange markets tied to different central bank agendas around the world. In December, the U.S. Federal Reserve (Fed) raised interest rates for the first time since the 2008 financial crisis. Contrast this with the European Central Bank (ECB) and the Bank of Japan (BOJ) which both took further measures throughout the period to stimulate growth in their respective domiciles, with the ECB and BOJ implementing negative interest rate policies amid renewed concerns over global growth. Over the period, it is also notable that U.S. 10-year government note yields actually fell. The U.S. 10-year government yields started the period by rising on expectations of the Fed’s eventual rate hike, but reversed as fears of a U.S. recession peaked in February.
WisdomTree Funds’ Performance Overview
The following table reflects the WisdomTree Funds’ performance versus their capitalization-weighted benchmark indexes:
| | | | | | | | | | | | |
| Ticker | | WisdomTree Fund | | 1-Year
NAV Return | | Performance Benchmark | | 1-Year
Return | | | Difference |
DTN | | WisdomTree Dividend ex-Financials Fund | | 2.96% | | Dow Jones U.S. Select Dividend IndexSM | | | 8.87% | | | -5.91% |
EPS | | WisdomTree Earnings 500 Fund | | -0.45% | | S&P 500® Index | | | 1.78% | | | -2.23% |
DHS | | WisdomTree High Dividend Fund | | 7.88% | | Russell 1000® Value Index | | | -1.54% | | | 9.42% |
DLN | | WisdomTree LargeCap Dividend Fund | | 3.04% | | S&P 500® Index | | | 1.78% | | | 1.26% |
EZY | | WisdomTree LargeCap Value Fund | | -4.00% | | Russell 1000® Value Index | | | -1.54% | | | -2.46% |
DON | | WisdomTree MidCap Dividend Fund | | 2.98% | | S&P MidCap 400® Index | | | -3.60% | | | 6.58% |
EZM | | WisdomTree MidCap Earnings Fund | | -5.29% | | S&P MidCap 400® Index | | | -3.60% | | | -1.69% |
DES | | WisdomTree SmallCap Dividend Fund | | -1.69% | | Russell 2000® Index | | | -9.76% | | | 8.07% |
EES | | WisdomTree SmallCap Earnings Fund | | -7.60% | | Russell 2000® Index | | | -9.76% | | | 2.16% |
DTD | | WisdomTree Total Dividend Fund | | 2.84% | | Russell 3000® Index | | | -0.34% | | | 3.18% |
EXT | | WisdomTree Total Earnings Fund | | -1.18% | | Russell 3000® Index | | | -0.34% | | | -0.84% |
DGRW | | WisdomTree U.S. Quality Dividend Growth Fund | | 2.25% | | NASDAQ U.S. Dividend AchieversTM Select Index | | | 3.09% | | | -0.84% |
DGRS | | WisdomTree U.S. SmallCap Quality Dividend Growth Fund | | -4.42% | | Russell 2000® Index | | | -9.76% | | | 5.34% |
The top-performing performance benchmark within the above table was the Dow Jones U.S. Select Dividend IndexSM, which is a measure of dividend paying value stocks. Of the performance benchmarks shown, the Russell 2000® Index was the lowest performer, indicating that small-cap stocks lagged large- and mid-cap stocks over the period. Within the Russell 2000® Index, energy exposure was a leading detractor from performance over the period.
| | | | |
| WisdomTree Domestic Earnings and Dividend Funds | | | 1 | |
Management’s Discussion of Funds’ Performance (unaudited) (continued)
WisdomTree’s fundamentally-weighted funds are designed to track indexes based on the dividend stream or earnings stream, respectively, generated by the companies included in the underlying WisdomTree Index. The dividend stream is defined as the sum of the dollar value of dividends indicated to be paid by each company. The earnings stream is defined as the total dollar level of earnings for all companies within each Index. There are two primary factors that drive performance differentials of the WisdomTree Funds and Indexes versus their performance benchmarks. The first is aggregate exposure to one or more sectors. The second is stock selection within each sector. Both of these are determined as part of WisdomTree’s rules-based index methodology. These exposures are not subjectively determined. Rather, they are objectively determined at the Index rebalancing dates based on the dividend or earnings stream.
Six of the ten sectors represented within the S&P 500® Index experienced positive performance over the period. The best-performing sector over the period was the Telecommunication Services sector, with Utilities and Consumer Staples sectors close behind. Each of these sectors delivered a return greater than 10% over the period. While defensive sectors generally outperformed, the Healthcare sector lagged as many investors rotated away from momentum plays, particularly within the biotechnology. Consumer Discretionary and Information Technology sectors tend to be higher growth and more economically sensitive, which allowed them to benefit from a continual improvement in the economy and consumers with greater disposable income due to the decline in gas prices. The worst performing sectors over the period were the Financials, Healthcare, Materials, and Energy sectors. The Energy, Materials, and Financials sectors were under pressure as concerns about global growth and a slow-down in China grew. Energy and Financials sectors were also affected by the prolonged decline in energy prices as investors contemplated the potential for increased default rates in the Energy sector.
The performance of most WisdomTree dividend-weighted Funds compared to their performance benchmark was favorable over the period. This ultimately makes sense, in that WisdomTree’s dividend-focused approaches have tended to historically tilt greater weight toward dividend-paying firms, and dividend paying equities tend to do well when interest rates are under pressure. The performance of most of the WisdomTree earnings-weighted Funds compared to its performance benchmark was unfavorable over the period. The WisdomTree earnings-weighted Funds track an underlying WisdomTree Index that focuses solely on generating exposure to the performance of companies that have generated positive profits on a cumulative basis leading up to the Index screening date. Although we feel investing in only profitable companies is a long term prudent strategy, during certain years, market performance can be driven by momentum and future growth expectations of more speculative and less profitable companies.
The strongest relative performance advantage measured versus the requisite performance benchmarks came with respect to the WisdomTree High Dividend Fund (DHS), outperforming its performance benchmark by 9.42%, driven primarily by stock selection within the Financials and Consumer Staples sectors in addition to a large overweight in the Telecommunication Services sector. The WisdomTree SmallCap Dividend Fund (DES) also saw strong relative outperformance with selection again being a major driver of performance. DES’s fundamentally-weighted methodology helps highlight how value outperformed market capitalization-weighted benchmarks over the period. The WisdomTree MidCap Dividend Fund (DON) also displayed strong performance over the period and outperformed its performance benchmark, primarily due to stock selection among Consumer Discretionary, Energy, and Information Technology sectors.
Fund returns are shown at NAV. Please see Performance Summaries on the subsequent pages for more complete performance information. Please see pages 17 and 18 for a list of index descriptions.
| | |
| 2 | | WisdomTree Domestic Earnings and Dividend Funds |
Management’s Discussion of Funds’ Performance (unaudited) (concluded)
Fund performance assumes reinvestment of dividends and capital gain distributions. An index is a statistical measure of a specified financial market or sector. An index does not actually hold a portfolio of securities, incur expenses or pay any transaction costs. Therefore, index returns do not reflect deductions for fees or expenses and an index is not available for direct investment. In comparison, the Funds’ performance is negatively impacted by these deductions. Fund returns do not reflect brokerage commissions or taxes on transactions in Fund shares or taxes that a shareholder would pay on Fund distributions. Past performance is no guarantee of future results. For the most recent month-end performance information visit www.wisdomtree.com.
| | | | |
| WisdomTree Domestic Earnings and Dividend Funds | | | 3 | |
Performance Summary (unaudited)
WisdomTree Dividend ex-Financials Fund (DTN)
Sector Breakdown† as of 3/31/16
| | | | |
| |
| Sector | | % of Net Assets | |
Utilities | | | 16.7% | |
Consumer Discretionary | | | 14.6% | |
Energy | | | 12.4% | |
Consumer Staples | | | 11.1% | |
Industrials | | | 10.7% | |
Information Technology | | | 10.3% | |
Materials | | | 8.6% | |
Healthcare | | | 7.8% | |
Telecommunication Services | | | 6.7% | |
Investment Company | | | 0.8% | |
Other Assets less Liabilities‡ | | | 0.3% | |
Total | | | 100.0% | |
| † | The Fund’s sector breakdown is expressed as a percentage of net assets and may change over time. In addition, a sector may be comprised of several industries. |
| ‡ | Other assets includes investment of cash collateral for securities on loan (if any). |
Top Ten Holdings* as of 3/31/16
| | | | |
| |
| Description | | % of Net Assets | |
CenturyLink, Inc. | | | 3.0% | |
Mattel, Inc. | | | 2.3% | |
Spectra Energy Corp. | | | 2.2% | |
Las Vegas Sands Corp. | | | 2.2% | |
CenterPoint Energy, Inc. | | | 2.1% | |
AT&T, Inc. | | | 1.9% | |
Exelon Corp. | | | 1.8% | |
Entergy Corp. | | | 1.8% | |
Verizon Communications, Inc. | | | 1.8% | |
Duke Energy Corp. | | | 1.7% | |
| * | The ten largest holdings are subject to change, and there are no guarantees the Fund will remain invested in any particular company. Excludes investment of cash collateral for securities on loan (if any). |
The WisdomTree Dividend ex-Financials Fund (the ‘‘Fund’’) seeks to track the price and yield performance, before fees and expenses, of the WisdomTree Dividend ex-Financials Index.
The Fund returned 2.96% at net asset value (“NAV”) for the fiscal year ending March 31, 2016 (for more complete performance information see the table below). The Fund benefited from its position in the Consumer Staples sector. The Fund’s position in the Energy sector created the greatest drag on performance.
The following performance table is provided for comparative purposes and represents the period noted. The Fund’s per share NAV is the value of one share of the Fund and is calculated by dividing the value of total assets less total liabilities by the number of shares outstanding. The NAV return is based on the NAV of the Fund and the market price return is based on the market price per share of the Fund. The price used to calculate market price returns is the mid-point of the highest bid and lowest offer for Fund shares as of the close of trading on the exchange where Fund shares are listed. NAV and market price returns assume that dividends and capital gain distributions have been reinvested in the Fund at NAV and market price, respectively. As with other ETFs, NAV returns and market price returns may differ because of factors such as the supply and demand for Fund shares and investors’ assessments of the underlying value of the Fund’s portfolio securities.
An index is a statistical measure of a specified financial market or sector. An index does not actually hold a portfolio of securities, incur expenses or pay any transaction costs. Therefore, index returns do not reflect deductions for fees or expenses and the index is not available for direct investment. In comparison, the Fund’s performance is negatively impacted by these deductions. Fund returns do not reflect brokerage commissions or taxes a shareholder would pay on the sale of Fund shares or on Fund distributions. As of the Fund’s current prospectus dated August 1, 2015, the Fund’s annual expense ratio was 0.38%.
Performance as of 3/31/16
| | | | | | | | | | | | | | | | |
| | | Average Annual Total Return | |
| | | 1 Year | | | 3 Year | | | 5 Year | | | Since
Inception1 | |
Fund NAV Returns | | | 2.96 | % | | | 10.18 | % | | | 12.30 | % | | | 8.07 | % |
Fund Market Price Returns | | | 2.90 | % | | | 10.17 | % | | | 12.28 | % | | | 8.05 | % |
WisdomTree Dividend Top 100/Dividend ex-Financials Spliced Index2 | | | 3.40 | % | | | 10.61 | % | | | 12.72 | % | | | 8.47 | % |
Dow Jones U.S. Select Dividend IndexSM | | | 8.87 | % | | | 12.83 | % | | | 13.61 | % | | | 7.23 | % |
| 1 | Total returns are calculated based on the commencement of Fund trading on the NYSE Arca, Inc. on June 16, 2006. |
| 2 | WisdomTree Dividend Top 100 Index through May 7, 2009; WisdomTree Dividend ex-Financials Index thereafter. |
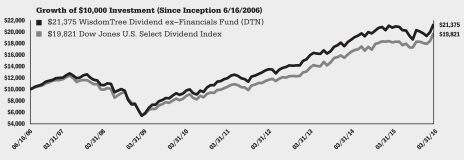
Performance is historical and does not guarantee future results. Current performance may be lower or higher than quoted. Investment returns and the principal value of an investment will fluctuate so that an investor’s shares, when redeemed, may be worth more or less than their original cost. Performance data for the most recent month-end is available at www.wisdomtree.com. WisdomTree shares are bought and sold at market price (not NAV) and are not individually redeemed from the Fund. Fund NAV returns are calculated using the Fund’s daily 4:00 p.m. NAV. Market price returns reflect the midpoint of the bid/ask spread as of the close of trading on the exchange where Fund shares are listed. Market price returns do not represent the returns you would receive if you traded shares at other times. The returns do not reflect the deduction of taxes that a shareholder would pay on Fund distributions or on the redemption of Fund shares. Total returns for a period of less than one year are cumulative.
| | |
| 4 | | WisdomTree Domestic Earnings and Dividend Funds |
Performance Summary (unaudited)
WisdomTree Earnings 500 Fund (EPS)
Sector Breakdown† as of 3/31/16
| | | | |
| |
| Sector | | % of Net Assets | |
Financials | | | 21.2% | |
Information Technology | | | 19.8% | |
Consumer Discretionary | | | 12.1% | |
Industrials | | | 11.1% | |
Healthcare | | | 10.8% | |
Consumer Staples | | | 10.4% | |
Energy | | | 5.2% | |
Utilities | | | 3.6% | |
Materials | | | 2.7% | |
Telecommunication Services | | | 2.7% | |
Investment Company | | | 0.2% | |
Other Assets less Liabilities‡ | | | 0.2% | |
Total | | | 100.0% | |
| † | The Fund’s sector breakdown is expressed as a percentage of net assets and may change over time. In addition, a sector may be comprised of several industries. |
| ‡ | Other assets includes investment of cash collateral for securities on loan (if any). |
Top Ten Holdings* as of 3/31/16
| | | | |
| |
| Description | | % of Net Assets | |
Apple, Inc. | | | 5.3% | |
Berkshire Hathaway, Inc., Class B | | | 2.5% | |
Exxon Mobil Corp. | | | 2.4% | |
JPMorgan Chase & Co. | | | 2.3% | |
Wells Fargo & Co. | | | 2.0% | |
Wal-Mart Stores, Inc. | | | 1.8% | |
Verizon Communications, Inc. | | | 1.7% | |
Johnson & Johnson | | | 1.6% | |
Microsoft Corp. | | | 1.6% | |
Gilead Sciences, Inc. | | | 1.6% | |
| * | The ten largest holdings are subject to change, and there are no guarantees the Fund will remain invested in any particular company. Excludes investment of cash collateral for securities on loan (if any). |
The WisdomTree Earnings 500 Fund (the ‘‘Fund’’) seeks to track the price and yield performance, before fees and expenses, of the WisdomTree Earnings 500 Index.
The Fund returned -0.45% at net asset value (“NAV”) for the fiscal year ending March 31, 2016 (for more complete performance information see table below). The Fund benefited the most from its position in the Consumer Staples sector. The Fund’s position in the Financials sector created the greatest drag on performance.
The following performance table is provided for comparative purposes and represents the period noted. The Fund’s per share NAV is the value of one share of the Fund and is calculated by dividing the value of total assets less total liabilities by the number of shares outstanding. The NAV return is based on the NAV of the Fund and the market price return is based on the market price per share of the Fund. The price used to calculate market price returns is the mid-point of the highest bid and lowest offer for Fund shares as of the close of trading on the exchange where Fund shares are listed. NAV and market price returns assume that dividends and capital gain distributions have been reinvested in the Fund at NAV and market price, respectively. As with other ETFs, NAV returns and market price returns may differ because of factors such as the supply and demand for Fund shares and investors’ assessments of the underlying value of the Fund’s portfolio securities.
An index is a statistical measure of a specified financial market or sector. An index does not actually hold a portfolio of securities, incur expenses or pay any transaction costs. Therefore, index returns do not reflect deductions for fees or expenses and the index is not available for direct investment. In comparison, the Fund’s performance is negatively impacted by these deductions. Fund returns do not reflect brokerage commissions or taxes a shareholder would pay on the sale of Fund shares or on Fund distributions. As of the Fund’s current prospectus dated August 1, 2015, the Fund’s annual expense ratio was 0.28%.
Performance as of 3/31/16
| | | | | | | | | | | | | | | | |
| | | Average Annual Total Return | |
| | | 1 Year | | | 3 Year | | | 5 Year | | | Since
Inception1 | |
Fund NAV Returns | | | -0.45 | % | | | 10.63 | % | | | 11.03 | % | | | 5.83 | % |
Fund Market Price Returns | | | -0.56 | % | | | 10.61 | % | | | 11.02 | % | | | 5.82 | % |
WisdomTree Earnings 500 Index | | | -0.24 | % | | | 10.93 | % | | | 11.32 | % | | | 6.13 | % |
S&P 500® Index | | | 1.78 | % | | | 11.82 | % | | | 11.58 | % | | | 6.18 | % |
| 1 | Total returns are calculated based on the commencement of Fund trading on the NYSE Arca, Inc. on February 23, 2007. |
Performance is historical and does not guarantee future results. Current performance may be lower or higher than quoted. Investment returns and the principal value of an investment will fluctuate so that an investor’s shares, when redeemed, may be worth more or less than their original cost. Performance data for the most recent month-end is available at www.wisdomtree.com. WisdomTree shares are bought and sold at market price (not NAV) and are not individually redeemed from the Fund. Fund NAV returns are calculated using the Fund’s daily 4:00 p.m. NAV. Market price returns reflect the midpoint of the bid/ask spread as of the close of trading on the exchange where Fund shares are listed. Market price returns do not represent the returns you would receive if you traded shares at other times. The returns do not reflect the deduction of taxes that a shareholder would pay on Fund distributions or on the redemption of Fund shares. Total returns for a period of less than one year are cumulative.
| | | | |
| WisdomTree Domestic Earnings and Dividend Funds | | | 5 | |
Performance Summary (unaudited)
WisdomTree High Dividend Fund (DHS)
(formerly, WisdomTree Equity Income Fund)
Sector Breakdown† as of 3/31/16
| | | | |
| |
| Sector | | % of Net Assets | |
Consumer Staples | | | 17.8% | |
Energy | | | 15.0% | |
Financials | | | 14.6% | |
Telecommunication Services | | | 10.8% | |
Utilities | | | 10.8% | |
Consumer Discretionary | | | 7.4% | |
Industrials | | | 7.3% | |
Information Technology | | | 7.2% | |
Healthcare | | | 6.4% | |
Materials | | | 2.1% | |
Investment Company | | | 0.3% | |
Other Assets less Liabilities‡ | | | 0.3% | |
Total | | | 100.0% | |
| † | The Fund’s sector breakdown is expressed as a percentage of net assets and may change over time. In addition, a sector may be comprised of several industries. |
| ‡ | Other assets includes investment of cash collateral for securities on loan (if any). |
Top Ten Holdings* as of 3/31/16
| | | | |
| |
| Description | | % of Net Assets | |
AT&T, Inc. | | | 5.4% | |
Exxon Mobil Corp. | | | 5.1% | |
Verizon Communications, Inc. | | | 4.5% | |
General Electric Co. | | | 3.7% | |
Chevron Corp. | | | 3.6% | |
Procter & Gamble Co. (The) | | | 3.1% | |
Wal-Mart Stores, Inc. | | | 2.9% | |
Philip Morris International, Inc. | | | 2.9% | |
Pfizer, Inc. | | | 2.6% | |
Coca-Cola Co. (The) | | | 2.5% | |
| * | The ten largest holdings are subject to change, and there are no guarantees the Fund will remain invested in any particular company. Excludes investment of cash collateral for securities on loan (if any). |
The WisdomTree High Dividend Fund (the ‘‘Fund’’) seeks to track the price and yield performance, before fees and expenses, of the WisdomTree High Dividend Index. Prior to August 31, 2015, the WisdomTree High Dividend Index was named the WisdomTree Equity Income Index.
The Fund returned 7.88% at net asset value (“NAV”) for the fiscal year ending March 31, 2016 (for more complete performance information please see the table below). The Fund benefited the most from its position in the Consumer Staples sector. The Fund’s position in the Energy sector created the greatest drag on performance.
The following performance table is provided for comparative purposes and represents the period noted. The Fund’s per share NAV is the value of one share of the Fund and is calculated by dividing the value of total assets less total liabilities by the number of shares outstanding. The NAV return is based on the NAV of the Fund and the market price return is based on the market price per share of the Fund. The price used to calculate market price returns is the mid-point of the highest bid and lowest offer for Fund shares as of the close of trading on the exchange where Fund shares are listed. NAV and market price returns assume that dividends and capital gain distributions have been reinvested in the Fund at NAV and market price, respectively. As with other ETFs, NAV returns and market price returns may differ because of factors such as the supply and demand for Fund shares and investors’ assessments of the underlying value of the Fund’s portfolio securities.
An index is a statistical measure of a specified financial market or sector. An index does not actually hold a portfolio of securities, incur expenses or pay any transaction costs. Therefore, index returns do not reflect deductions for fees or expenses and the index is not available for direct investment. In comparison, the Fund’s performance is negatively impacted by these deductions. Fund returns do not reflect brokerage commissions or taxes a shareholder would pay on the sale of Fund shares or on Fund distributions. As of the Fund’s current prospectus dated August 1, 2015, the Fund’s annual expense ratio was 0.38%.
Performance as of 3/31/16
| | | | | | | | | | | | | | | | |
| | | Average Annual Total Return | |
| | | 1 Year | | | 3 Year | | | 5 Year | | | Since
Inception1 | |
Fund NAV Returns | | | 7.88 | % | | | 10.89 | % | | | 13.18 | % | | | 6.36 | % |
Fund Market Price Returns | | | 7.83 | % | | | 10.86 | % | | | 13.17 | % | | | 6.36 | % |
WisdomTree High Dividend Index | | | 8.38 | % | | | 11.27 | % | | | 13.61 | % | | | 6.70 | % |
Russell 1000® Value Index | | | -1.54 | % | | | 9.38 | % | | | 10.25 | % | | | 6.02 | % |
| 1 | Total returns are calculated based on the commencement of Fund trading on the NYSE Arca, Inc. on June 16, 2006. |
Performance is historical and does not guarantee future results. Current performance may be lower or higher than quoted. Investment returns and the principal value of an investment will fluctuate so that an investor’s shares, when redeemed, may be worth more or less than their original cost. Performance data for the most recent month-end is available at www.wisdomtree.com. WisdomTree shares are bought and sold at market price (not NAV) and are not individually redeemed from the Fund. Fund NAV returns are calculated using the Fund’s daily 4:00 p.m. NAV. Market price returns reflect the midpoint of the bid/ask spread as of the close of trading on the exchange where Fund shares are listed. Market price returns do not represent the returns you would receive if you traded shares at other times. The returns do not reflect the deduction of taxes that a shareholder would pay on Fund distributions or on the redemption of Fund shares. Total returns for a period of less than one year are cumulative.
| | |
| 6 | | WisdomTree Domestic Earnings and Dividend Funds |
Performance Summary (unaudited)
WisdomTree LargeCap Dividend Fund (DLN)
Sector Breakdown† as of 3/31/16
| | | | |
| |
| Sector | | % of Net Assets | |
Consumer Staples | | | 15.3% | |
Information Technology | | | 14.5% | |
Financials | | | 14.5% | |
Energy | | | 10.8% | |
Healthcare | | | 10.7% | |
Industrials | | | 10.3% | |
Consumer Discretionary | | | 8.8% | |
Telecommunication Services | | | 6.7% | |
Utilities | | | 5.5% | |
Materials | | | 2.4% | |
Investment Company | | | 0.3% | |
Other Assets less Liabilities‡ | | | 0.2% | |
Total | | | 100.0% | |
| † | The Fund’s sector breakdown is expressed as a percentage of net assets and may change over time. In addition, a sector may be comprised of several industries. |
| ‡ | Other assets includes investment of cash collateral for securities on loan (if any). |
Top Ten Holdings* as of 3/31/16
| | | | |
| |
| Description | | % of Net Assets | |
Exxon Mobil Corp. | | | 3.5% | |
AT&T, Inc. | | | 3.5% | |
Microsoft Corp. | | | 3.0% | |
Apple, Inc. | | | 2.9% | |
Verizon Communications, Inc. | | | 2.8% | |
General Electric Co. | | | 2.3% | |
Chevron Corp. | | | 2.3% | |
Johnson & Johnson | | | 2.3% | |
Procter & Gamble Co. (The) | | | 1.9% | |
Wal-Mart Stores, Inc. | | | 1.9% | |
| * | The ten largest holdings are subject to change, and there are no guarantees the Fund will remain invested in any particular company. Excludes investment of cash collateral for securities on loan (if any). |
The WisdomTree LargeCap Dividend Fund (the ‘‘Fund’’) seeks to track the price and yield performance, before fees and expenses, of the WisdomTree LargeCap Dividend Index.
The Fund returned 3.04% at net asset value (“NAV”) for the fiscal year ending March 31, 2016 (for more complete performance information please see the table below). The Fund benefited the most from its position in the Consumer Staples sector. The Fund’s position in the Energy sector created the greatest drag on performance.
The following performance table is provided for comparative purposes and represents the period noted. The Fund’s per share NAV is the value of one share of the Fund and is calculated by dividing the value of total assets less total liabilities by the number of shares outstanding. The NAV return is based on the NAV of the Fund and the market price return is based on the market price per share of the Fund. The price used to calculate market price returns is the mid-point of the highest bid and lowest offer for Fund shares as of the close of trading on the exchange where Fund shares are listed. NAV and market price returns assume that dividends and capital gain distributions have been reinvested in the Fund at NAV and market price, respectively. As with other ETFs, NAV returns and market price returns may differ because of factors such as the supply and demand for Fund shares and investors’ assessments of the underlying value of the Fund’s portfolio securities.
An index is a statistical measure of a specified financial market or sector. An index does not actually hold a portfolio of securities, incur expenses or pay any transaction costs. Therefore, index returns do not reflect deductions for fees or expenses and the index is not available for direct investment. In comparison, the Fund’s performance is negatively impacted by these deductions. Fund returns do not reflect brokerage commissions or taxes a shareholder would pay on the sale of Fund shares or on Fund distributions. As of the Fund’s current prospectus dated August 1, 2015, the Fund’s annual expense ratio was 0.28%.
Performance as of 3/31/16
| | | | | | | | | | | | | | | | |
| | | Average Annual Total Return | |
| | | 1 Year | | | 3 Year | | | 5 Year | | | Since
Inception1 | |
Fund NAV Returns | | | 3.04 | % | | | 10.44 | % | | | 11.76 | % | | | 6.86 | % |
Fund Market Price Returns | | | 2.93 | % | | | 10.43 | % | | | 11.75 | % | | | 6.83 | % |
WisdomTree LargeCap Dividend Index | | | 3.36 | % | | | 10.74 | % | | | 12.06 | % | | | 7.21 | % |
S&P 500® Index | | | 1.78 | % | | | 11.82 | % | | | 11.58 | % | | | 7.49 | % |
| 1 | Total returns are calculated based on the commencement of Fund trading on the NYSE Arca, Inc. on June 16, 2006. |
Performance is historical and does not guarantee future results. Current performance may be lower or higher than quoted. Investment returns and the principal value of an investment will fluctuate so that an investor’s shares, when redeemed, may be worth more or less than their original cost. Performance data for the most recent month-end is available at www.wisdomtree.com. WisdomTree shares are bought and sold at market price (not NAV) and are not individually redeemed from the Fund. Fund NAV returns are calculated using the Fund’s daily 4:00 p.m. NAV. Market price returns reflect the midpoint of the bid/ask spread as of the close of trading on the exchange where Fund shares are listed. Market price returns do not represent the returns you would receive if you traded shares at other times. The returns do not reflect the deduction of taxes that a shareholder would pay on Fund distributions or on the redemption of Fund shares. Total returns for a period of less than one year are cumulative.
| | | | |
| WisdomTree Domestic Earnings and Dividend Funds | | | 7 | |
Performance Summary (unaudited)
WisdomTree LargeCap Value Fund (EZY)
Sector Breakdown† as of 3/31/16
| | | | |
| |
| Sector | | % of Net Assets | |
Consumer Discretionary | | | 22.1% | |
Consumer Staples | | | 16.9% | |
Industrials | | | 14.3% | |
Financials | | | 13.9% | |
Healthcare | | | 12.0% | |
Energy | | | 7.5% | |
Information Technology | | | 6.1% | |
Materials | | | 3.8% | |
Utilities | | | 2.7% | |
Investment Company | | | 0.3% | |
Telecommunication Services | | | 0.3% | |
Other Assets less Liabilities‡ | | | 0.1% | |
Total | | | 100.0% | |
| † | The Fund’s sector breakdown is expressed as a percentage of net assets and may change over time. In addition, a sector may be comprised of several industries. |
| ‡ | Other assets includes investment of cash collateral for securities on loan (if any). |
Top Ten Holdings* as of 3/31/16
| | | | |
| |
| Description | | % of Net Assets | |
Mondelez International, Inc., Class A | | | 4.0% | |
Home Depot, Inc. (The) | | | 3.4% | |
UnitedHealth Group, Inc. | | | 3.3% | |
CVS Health Corp. | | | 2.8% | |
Boeing Co. (The) | | | 2.6% | |
Phillips 66 | | | 2.4% | |
Valero Energy Corp. | | | 2.3% | |
Lockheed Martin Corp. | | | 2.0% | |
Dow Chemical Co. (The) | | | 1.9% | |
Travelers Cos., Inc. (The) | | | 1.9% | |
| * | The ten largest holdings are subject to change, and there are no guarantees the Fund will remain invested in any particular company. Excludes investment of cash collateral for securities on loan (if any). |
The WisdomTree LargeCap Value Fund (the ‘‘Fund’’) seeks to track the price and yield performance, before fees and expenses, of the WisdomTree LargeCap Value Index.
The Fund returned -4.00% at net asset value (“NAV”) for the fiscal year ending March 31, 2016 (for more complete performance information please see the table below). The Fund benefited the most from its position in the Utilities sector. The Fund’s position in the Information Technology sector created the greatest drag on performance.
The following performance table is provided for comparative purposes and represents the period noted. The Fund’s per share NAV is the value of one share of the Fund and is calculated by dividing the value of total assets less total liabilities by the number of shares outstanding. The NAV return is based on the NAV of the Fund and the market price return is based on the market price per share of the Fund. The price used to calculate market price returns is the mid-point of the highest bid and lowest offer for Fund shares as of the close of trading on the exchange where Fund shares are listed. NAV and market price returns assume that dividends and capital gain distributions have been reinvested in the Fund at NAV and market price, respectively. As with other ETFs, NAV returns and market price returns may differ because of factors such as the supply and demand for Fund shares and investors’ assessments of the underlying value of the Fund’s portfolio securities.
An index is a statistical measure of a specified financial market or sector. An index does not actually hold a portfolio of securities, incur expenses or pay any transaction costs. Therefore, index returns do not reflect deductions for fees or expenses and the index is not available for direct investment. In comparison, the Fund’s performance is negatively impacted by these deductions. Fund returns do not reflect brokerage commissions or taxes a shareholder would pay on the sale of Fund shares or on Fund distributions. As of the Fund’s current prospectus dated August 1, 2015, the Fund’s annual expense ratio was 0.38%.
Performance as of 3/31/16
| | | | | | | | | | | | | | | | |
| | | Average Annual Total Return | |
| | | 1 Year | | | 3 Year | | | 5 Year | | | Since
Inception1 | |
Fund NAV Returns | | | -4.00 | % | | | 10.11 | % | | | 9.56 | % | | | 4.35 | % |
Fund Market Price Returns | | | -4.08 | % | | | 10.12 | % | | | 9.57 | % | | | 4.37 | % |
WisdomTree Low P/E/LargeCap Value Spliced Index2 | | | -3.65 | % | | | 10.51 | % | | | 9.95 | % | | | 4.72 | % |
Russell 1000® Value Index | | | -1.54 | % | | | 9.38 | % | | | 10.25 | % | | | 4.35 | % |
| 1 | Total returns are calculated based on the commencement of Fund trading on the NYSE Arca, Inc. on February 23, 2007. |
| 2 | WisdomTree Low P/E Index through June 19, 2009; WisdomTree LargeCap Value Index thereafter. |
Performance is historical and does not guarantee future results. Current performance may be lower or higher than quoted. Investment returns and the principal value of an investment will fluctuate so that an investor’s shares, when redeemed, may be worth more or less than their original cost. Performance data for the most recent month-end is available at www.wisdomtree.com. WisdomTree shares are bought and sold at market price (not NAV) and are not individually redeemed from the Fund. Fund NAV returns are calculated using the Fund’s daily 4:00 p.m. NAV. Market price returns reflect the midpoint of the bid/ask spread as of the close of trading on the exchange where Fund shares are listed. Market price returns do not represent the returns you would receive if you traded shares at other times. The returns do not reflect the deduction of taxes that a shareholder would pay on Fund distributions or on the redemption of Fund shares. Total returns for a period of less than one year are cumulative.
| | |
| 8 | | WisdomTree Domestic Earnings and Dividend Funds |
Performance Summary (unaudited)
WisdomTree MidCap Dividend Fund (DON)
Sector Breakdown† as of 3/31/16
| | | | |
| |
| Sector | | % of Net Assets | |
Financials | | | 23.9% | |
Consumer Discretionary | | | 18.9% | |
Utilities | | | 15.2% | |
Industrials | | | 14.2% | |
Materials | | | 8.0% | |
Information Technology | | | 7.3% | |
Energy | | | 5.3% | |
Consumer Staples | | | 3.3% | |
Healthcare | | | 2.0% | |
Telecommunication Services | | | 1.5% | |
Investment Company | | | 0.1% | |
Other Assets less Liabilities‡ | | | 0.3% | |
Total | | | 100.0% | |
| † | The Fund’s sector breakdown is expressed as a percentage of net assets and may change over time. In addition, a sector may be comprised of several industries. |
| ‡ | Other assets includes investment of cash collateral for securities on loan (if any). |
Top Ten Holdings* as of 3/31/16
| | | | |
| |
| Description | | % of Net Assets | |
ONEOK, Inc. | | | 1.7% | |
Mattel, Inc. | | | 1.5% | |
Frontier Communications Corp. | | | 1.4% | |
CenterPoint Energy, Inc. | | | 1.2% | |
Coach, Inc. | | | 1.1% | |
CMS Energy Corp. | | | 0.9% | |
SCANA Corp. | | | 0.9% | |
Macquarie Infrastructure Corp. | | | 0.8% | |
Staples, Inc. | | | 0.8% | |
AES Corp. | | | 0.8% | |
| * | The ten largest holdings are subject to change, and there are no guarantees the Fund will remain invested in any particular company. Excludes investment of cash collateral for securities on loan (if any). |
The WisdomTree MidCap Dividend Fund (the ‘‘Fund’’) seeks to track the price and yield performance, before fees and expenses, of the WisdomTree MidCap Dividend Index.
The Fund returned 2.98% at net asset value (“NAV”) for the fiscal year ending March 31, 2016 (for more complete performance information please the table below). The Fund benefited most from its position in the Utilities sector. The Fund’s position in the Energy sector created the greatest drag on performance.
The following performance table is provided for comparative purposes and represents the period noted. The Fund’s per share NAV is the value of one share of the Fund and is calculated by dividing the value of total assets less total liabilities by the number of shares outstanding. The NAV return is based on the NAV of the Fund and the market price return is based on the market price per share of the Fund. The price used to calculate market price returns is the mid-point of the highest bid and lowest offer for Fund shares as of the close of trading on the exchange where Fund shares are listed. NAV and market price returns assume that dividends and capital gain distributions have been reinvested in the Fund at NAV and market price, respectively. As with other ETFs, NAV returns and market price returns may differ because of factors such as the supply and demand for Fund shares and investors’ assessments of the underlying value of the Fund’s portfolio securities.
An index is a statistical measure of a specified financial market or sector. An index does not actually hold a portfolio of securities, incur expenses or pay any transaction costs. Therefore, index returns do not reflect deductions for fees or expenses and the index is not available for direct investment. In comparison, the Fund’s performance is negatively impacted by these deductions. Fund returns do not reflect brokerage commissions or taxes a shareholder would pay on the sale of Fund shares or on Fund distributions. As of the Fund’s current prospectus dated August 1, 2015, the Fund’s annual expense ratio was 0.38%.
Performance as of 3/31/16
| | | | | | | | | | | | | | | | |
| | | Average Annual Total Return | |
| | | 1 Year | | | 3 Year | | | 5 Year | | | Since
Inception1 | |
Fund NAV Returns | | | 2.98 | % | | | 12.64 | % | | | 12.90 | % | | | 8.91 | % |
Fund Market Price Returns | | | 2.89 | % | | | 12.60 | % | | | 12.89 | % | | | 8.95 | % |
WisdomTree MidCap Dividend Index | | | 3.38 | % | | | 12.97 | % | | | 13.22 | % | | | 8.94 | % |
S&P MidCap 400® Index | | | -3.60 | % | | | 9.46 | % | | | 9.52 | % | | | 8.67 | % |
| 1 | Total returns are calculated based on the commencement of Fund trading on the NYSE Arca, Inc. on June 16, 2006. |
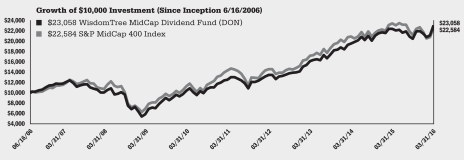
Performance is historical and does not guarantee future results. Current performance may be lower or higher than quoted. Investment returns and the principal value of an investment will fluctuate so that an investor’s shares, when redeemed, may be worth more or less than their original cost. Performance data for the most recent month-end is available at www.wisdomtree.com. WisdomTree shares are bought and sold at market price (not NAV) and are not individually redeemed from the Fund. Fund NAV returns are calculated using the Fund’s daily 4:00 p.m. NAV. Market price returns reflect the midpoint of the bid/ask spread as of the close of trading on the exchange where Fund shares are listed. Market price returns do not represent the returns you would receive if you traded shares at other times. The returns do not reflect the deduction of taxes that a shareholder would pay on Fund distributions or on the redemption of Fund shares. Total returns for a period of less than one year are cumulative.
| | | | |
| WisdomTree Domestic Earnings and Dividend Funds | | | 9 | |
Performance Summary (unaudited)
WisdomTree MidCap Earnings Fund (EZM)
Sector Breakdown† as of 3/31/16
| | | | |
| |
| Sector | | % of Net Assets | |
Financials | | | 23.2% | |
Industrials | | | 19.0% | |
Consumer Discretionary | | | 18.8% | |
Information Technology | | | 12.2% | |
Utilities | | | 6.9% | |
Energy | | | 5.3% | |
Healthcare | | | 5.1% | |
Materials | | | 4.8% | |
Consumer Staples | | | 4.1% | |
Telecommunication Services | | | 0.3% | |
Investment Company | | | 0.2% | |
Other Assets less Liabilities‡ | | | 0.1% | |
Total | | | 100.0% | |
| † | The Fund’s sector breakdown is expressed as a percentage of net assets and may change over time. In addition, a sector may be comprised of several industries. |
| ‡ | Other assets includes investment of cash collateral for securities on loan (if any). |
Top Ten Holdings* as of 3/31/16
| | | | |
| |
| Description | | % of Net Assets | |
Antero Resources Corp. | | | 1.8% | |
Pilgrim’s Pride Corp. | | | 0.9% | |
TEGNA, Inc. | | | 0.8% | |
Radian Group, Inc. | | | 0.8% | |
Navient Corp. | | | 0.8% | |
MGIC Investment Corp. | | | 0.8% | |
Discovery Communications, Inc., Class A | | | 0.8% | |
First Solar, Inc. | | | 0.7% | |
Scripps Networks Interactive, Inc., Class A | | | 0.7% | |
Popular, Inc. | | | 0.7% | |
| * | The ten largest holdings are subject to change, and there are no guarantees the Fund will remain invested in any particular company. Excludes investment of cash collateral for securities on loan (if any). |
The WisdomTree MidCap Earnings Fund (the ‘‘Fund’’) seeks to track the price and yield performance, before fees and expenses, of the WisdomTree MidCap Earnings Index.
The Fund returned -5.29% at net asset value (“NAV”) for the fiscal year ending March 31, 2016 (for more complete performance information please see the table below). The Fund benefited the most from its position in the Utilities sector. The Fund’s position in the Energy sector created the greatest drag on performance.
The following performance table is provided for comparative purposes and represents the period noted. The Fund’s per share NAV is the value of one share of the Fund and is calculated by dividing the value of total assets less total liabilities by the number of shares outstanding. The NAV return is based on the NAV of the Fund and the market price return is based on the market price per share of the Fund. The price used to calculate market price returns is the mid-point of the highest bid and lowest offer for Fund shares as of the close of trading on the exchange where Fund shares are listed. NAV and market price returns assume that dividends and capital gain distributions have been reinvested in the Fund at NAV and market price, respectively. As with other ETFs, NAV returns and market price returns may differ because of factors such as the supply and demand for Fund shares and investors’ assessments of the underlying value of the Fund’s portfolio securities.
An index is a statistical measure of a specified financial market or sector. An index does not actually hold a portfolio of securities, incur expenses or pay any transaction costs. Therefore, index returns do not reflect deductions for fees or expenses and the index is not available for direct investment. In comparison, the Fund’s performance is negatively impacted by these deductions. Fund returns do not reflect brokerage commissions or taxes a shareholder would pay on the sale of Fund shares or on Fund distributions. As of the Fund’s current prospectus dated August 1, 2015, the Fund’s annual expense ratio was 0.38%.
Performance as of 3/31/16
| | | | | | | | | | | | | | | | |
| | | Average Annual Total Return | |
| | | 1 Year | | | 3 Year | | | 5 Year | | | Since
Inception1 | |
Fund NAV Returns | | | -5.29 | % | | | 9.85 | % | | | 10.37 | % | | | 8.12 | % |
Fund Market Price Returns | | | -5.50 | % | | | 9.81 | % | | | 10.36 | % | | | 8.12 | % |
WisdomTree MidCap Earnings Index | | | -5.05 | % | | | 10.10 | % | | | 10.64 | % | | | 8.34 | % |
S&P MidCap 400® Index | | | -3.60 | % | | | 9.46 | % | | | 9.52 | % | | | 7.37 | % |
| 1 | Total returns are calculated based on the commencement of Fund trading on the NYSE Arca, Inc. on February 23, 2007. |
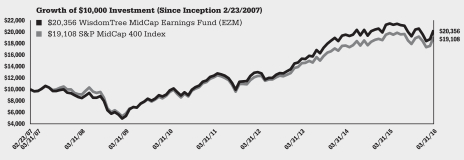
Performance is historical and does not guarantee future results. Current performance may be lower or higher than quoted. Investment returns and the principal value of an investment will fluctuate so that an investor’s shares, when redeemed, may be worth more or less than their original cost. Performance data for the most recent month-end is available at www.wisdomtree.com. WisdomTree shares are bought and sold at market price (not NAV) and are not individually redeemed from the Fund. Fund NAV returns are calculated using the Fund’s daily 4:00 p.m. NAV. Market price returns reflect the midpoint of the bid/ask spread as of the close of trading on the exchange where Fund shares are listed. Market price returns do not represent the returns you would receive if you traded shares at other times. The returns do not reflect the deduction of taxes that a shareholder would pay on Fund distributions or on the redemption of Fund shares. Total returns for a period of less than one year are cumulative.
| | |
| 10 | | WisdomTree Domestic Earnings and Dividend Funds |
Performance Summary (unaudited)
WisdomTree SmallCap Dividend Fund (DES)
Sector Breakdown† as of 3/31/16
| | | | |
| |
| Sector | | % of Net Assets | |
Financials | | | 24.6% | |
Consumer Discretionary | | | 17.8% | |
Industrials | | | 16.6% | |
Utilities | | | 9.9% | |
Materials | | | 7.4% | |
Information Technology | | | 7.3% | |
Consumer Staples | | | 5.5% | |
Energy | | | 4.0% | |
Healthcare | | | 3.7% | |
Telecommunication Services | | | 2.3% | |
Investment Company | | | 0.7% | |
Other Assets less Liabilities‡ | | | 0.2% | |
Total | | | 100.0% | |
| † | The Fund’s sector breakdown is expressed as a percentage of net assets and may change over time. In addition, a sector may be comprised of several industries. |
| ‡ | Other assets includes investment of cash collateral for securities on loan (if any). |
Top Ten Holdings* as of 3/31/16
| | | | |
| |
| Description | | % of Net Assets | |
Targa Resources Corp. | | | 1.5% | |
Cal-Maine Foods, Inc. | | | 1.3% | |
Covanta Holding Corp. | | | 1.1% | |
Innoviva, Inc. | | | 1.1% | |
Regal Entertainment Group, Class A | | | 0.9% | |
Black Hills Corp. | | | 0.8% | |
ALLETE, Inc. | | | 0.8% | |
Pattern Energy Group, Inc. | | | 0.8% | |
Joy Global, Inc. | | | 0.7% | |
Laclede Group, Inc. (The) | | | 0.7% | |
| * | The ten largest holdings are subject to change, and there are no guarantees the Fund will remain invested in any particular company. Excludes investment of cash collateral for securities on loan (if any). |
The WisdomTree SmallCap Dividend Fund (the ‘‘Fund’’) seeks to track the price and yield performance, before fees and expenses, of the WisdomTree SmallCap Dividend Index.
The Fund returned -1.69% at net asset value (“NAV”) for the fiscal year ending March 31, 2016 (for more complete performance information please see the table below). The Fund benefited the most from its position in the Utilities sector. The Fund’s position in the Energy sector created the greatest drag on performance.
The following performance table is provided for comparative purposes and represents the period noted. The Fund’s per share NAV is the value of one share of the Fund and is calculated by dividing the value of total assets less total liabilities by the number of shares outstanding. The NAV return is based on the NAV of the Fund and the market price return is based on the market price per share of the Fund. The price used to calculate market price returns is the mid-point of the highest bid and lowest offer for Fund shares as of the close of trading on the exchange where Fund shares are listed. NAV and market price returns assume that dividends and capital gain distributions have been reinvested in the Fund at NAV and market price, respectively. As with other ETFs, NAV returns and market price returns may differ because of factors such as the supply and demand for Fund shares and investors’ assessments of the underlying value of the Fund’s portfolio securities.
An index is a statistical measure of a specified financial market or sector. An index does not actually hold a portfolio of securities, incur expenses or pay any transaction costs. Therefore, index returns do not reflect deductions for fees or expenses and the index is not available for direct investment. In comparison, the Fund’s performance is negatively impacted by these deductions. Fund returns do not reflect brokerage commissions or taxes a shareholder would pay on the sale of Fund shares or on Fund distributions. As of the Fund’s current prospectus dated August 1, 2015, the Fund’s annual expense ratio was 0.38%.
Performance as of 3/31/16
| | | | | | | | | | | | | | | | |
| | | Average Annual Total Return | |
| | | 1 Year | | | 3 Year | | | 5 Year | | | Since
Inception1 | |
Fund NAV Returns | | | -1.69 | % | | | 9.41 | % | | | 10.62 | % | | | 7.02 | % |
Fund Market Price Returns | | | -1.83 | % | | | 9.35 | % | | | 10.63 | % | | | 7.00 | % |
WisdomTree SmallCap Dividend Index | | | -1.59 | % | | | 9.35 | % | | | 10.70 | % | | | 7.07 | % |
Russell 2000® Index | | | -9.76 | % | | | 6.84 | % | | | 7.20 | % | | | 6.42 | % |
| 1 | Total returns are calculated based on the commencement of Fund trading on the NYSE Arca, Inc. on June 16, 2006. |
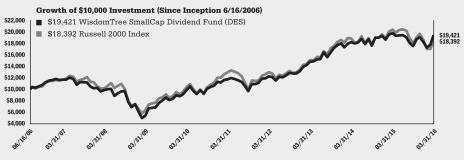
Performance is historical and does not guarantee future results. Current performance may be lower or higher than quoted. Investment returns and the principal value of an investment will fluctuate so that an investor’s shares, when redeemed, may be worth more or less than their original cost. Performance data for the most recent month-end is available at www.wisdomtree.com. WisdomTree shares are bought and sold at market price (not NAV) and are not individually redeemed from the Fund. Fund NAV returns are calculated using the Fund’s daily 4:00 p.m. NAV. Market price returns reflect the midpoint of the bid/ask spread as of the close of trading on the exchange where Fund shares are listed. Market price returns do not represent the returns you would receive if you traded shares at other times. The returns do not reflect the deduction of taxes that a shareholder would pay on Fund distributions or on the redemption of Fund shares. Total returns for a period of less than one year are cumulative.
| | | | |
| WisdomTree Domestic Earnings and Dividend Funds | | | 11 | |
Performance Summary (unaudited)
WisdomTree SmallCap Earnings Fund (EES)
Sector Breakdown† as of 3/31/16
| | | | |
| |
| Sector | | % of Net Assets | |
Financials | | | 24.2% | |
Industrials | | | 21.1% | |
Consumer Discretionary | | | 17.9% | |
Information Technology | | | 11.3% | |
Healthcare | | | 7.8% | |
Energy | | | 5.5% | |
Materials | | | 4.1% | |
Consumer Staples | | | 4.0% | |
Utilities | | | 2.5% | |
Telecommunication Services | | | 1.0% | |
Investment Company | | | 0.3% | |
Other Assets less Liabilities‡ | | | 0.3% | |
Total | | | 100.0% | |
| † | The Fund’s sector breakdown is expressed as a percentage of net assets and may change over time. In addition, a sector may be comprised of several industries. |
| ‡ | Other assets includes investment of cash collateral for securities on loan (if any). |
Top Ten Holdings* as of 3/31/16
| | | | |
| |
| Description | | % of Net Assets | |
EP Energy Corp., Class A | | | 2.0% | |
Sanderson Farms, Inc. | | | 0.9% | |
Joy Global, Inc. | | | 0.9% | |
Atwood Oceanics, Inc. | | | 0.8% | |
Hyatt Hotels Corp., Class A | | | 0.8% | |
PDL BioPharma, Inc. | | | 0.7% | |
Nelnet, Inc., Class A | | | 0.7% | |
Swift Transportation Co. | | | 0.7% | |
First BanCorp | | | 0.7% | |
Rambus, Inc. | | | 0.7% | |
| * | The ten largest holdings are subject to change, and there are no guarantees the Fund will remain invested in any particular company. Excludes investment of cash collateral for securities on loan (if any). |
The WisdomTree SmallCap Earnings Fund (the ‘‘Fund’’) seeks to track the price and yield performance, before fees and expenses, of the WisdomTree SmallCap Earnings Index.
The Fund returned -7.60% at net asset value (“NAV”) for the fiscal year ending March 31, 2016 (for more complete performance information please see the table below). The Fund benefited the most from its position in the Consumer Staples sector. The Fund’s position in the Energy sector created the greatest drag on performance.
The following performance table is provided for comparative purposes and represents the period noted. The Fund’s per share NAV is the value of one share of the Fund and is calculated by dividing the value of total assets less total liabilities by the number of shares outstanding. The NAV return is based on the NAV of the Fund and the market price return is based on the market price per share of the Fund. The price used to calculate market price returns is the mid-point of the highest bid and lowest offer for Fund shares as of the close of trading on the exchange where Fund shares are listed. NAV and market price returns assume that dividends and capital gain distributions have been reinvested in the Fund at NAV and market price, respectively. As with other ETFs, NAV returns and market price returns may differ because of factors such as the supply and demand for Fund shares and investors’ assessments of the underlying value of the Fund’s portfolio securities.
An index is a statistical measure of a specified financial market or sector. An index does not actually hold a portfolio of securities, incur expenses or pay any transaction costs. Therefore, index returns do not reflect deductions for fees or expenses and the index is not available for direct investment. In comparison, the Fund’s performance is negatively impacted by these deductions. Fund returns do not reflect brokerage commissions or taxes a shareholder would pay on the sale of Fund shares or on Fund distributions. As of the Fund’s current prospectus dated August 1, 2015, the Fund’s annual expense ratio was 0.38%.
Performance as of 3/31/16
| | | | | | | | | | | | | | | | |
| | | Average Annual Total Return | |
| | | 1 Year | | | 3 Year | | | 5 Year | | | Since
Inception1 | |
Fund NAV Returns | | | -7.60 | % | | | 7.88 | % | | | 8.40 | % | | | 6.17 | % |
Fund Market Price Returns | | | -7.81 | % | | | 7.85 | % | | | 8.35 | % | | | 6.14 | % |
WisdomTree SmallCap Earnings Index | | | -7.54 | % | | | 7.97 | % | | | 8.58 | % | | | 6.26 | % |
Russell 2000® Index | | | -9.76 | % | | | 6.84 | % | | | 7.20 | % | | | 4.77 | % |
| 1 | Total returns are calculated based on the commencement of Fund trading on the NYSE Arca, Inc. on February 23, 2007. |
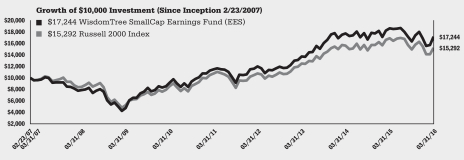
Performance is historical and does not guarantee future results. Current performance may be lower or higher than quoted. Investment returns and the principal value of an investment will fluctuate so that an investor’s shares, when redeemed, may be worth more or less than their original cost. Performance data for the most recent month-end is available at www.wisdomtree.com. WisdomTree shares are bought and sold at market price (not NAV) and are not individually redeemed from the Fund. Fund NAV returns are calculated using the Fund’s daily 4:00 p.m. NAV. Market price returns reflect the midpoint of the bid/ask spread as of the close of trading on the exchange where Fund shares are listed. Market price returns do not represent the returns you would receive if you traded shares at other times. The returns do not reflect the deduction of taxes that a shareholder would pay on Fund distributions or on the redemption of Fund shares. Total returns for a period of less than one year are cumulative.
| | |
| 12 | | WisdomTree Domestic Earnings and Dividend Funds |
Performance Summary (unaudited)
WisdomTree Total Dividend Fund (DTD)
Sector Breakdown† as of 3/31/16
| | | | |
| |
| Sector | | % of Net Assets | |
Financials | | | 18.8% | |
Consumer Staples | | | 13.2% | |
Information Technology | | | 13.0% | |
Industrials | | | 10.4% | |
Consumer Discretionary | | | 9.8% | |
Energy | | | 9.7% | |
Healthcare | | | 9.2% | |
Utilities | | | 6.4% | |
Telecommunication Services | | | 5.9% | |
Materials | | | 3.1% | |
Investment Company | | | 0.2% | |
Other Assets less Liabilities‡ | | | 0.3% | |
Total | | | 100.0% | |
| † | The Fund’s sector breakdown is expressed as a percentage of net assets and may change over time. In addition, a sector may be comprised of several industries. |
| ‡ | Other assets includes investment of cash collateral for securities on loan (if any). |
Top Ten Holdings* as of 3/31/16
| | | | |
| |
| Description | | % of Net Assets | |
Exxon Mobil Corp. | | | 2.9% | |
AT&T, Inc. | | | 2.9% | |
Microsoft Corp. | | | 2.5% | |
Apple, Inc. | | | 2.4% | |
Verizon Communications, Inc. | | | 2.4% | |
General Electric Co. | | | 1.9% | |
Chevron Corp. | | | 1.9% | |
Johnson & Johnson | | | 1.9% | |
Procter & Gamble Co. (The) | | | 1.6% | |
Wal-Mart Stores, Inc. | | | 1.6% | |
| * | The ten largest holdings are subject to change, and there are no guarantees the Fund will remain invested in any particular company. Excludes investment of cash collateral for securities on loan (if any). |
The WisdomTree Total Dividend Fund (the ‘‘Fund’’) seeks to track the price and yield performance, before fees and expenses, of the WisdomTree Dividend Index.
The Fund returned 2.84% at net asset value (“NAV”) for the fiscal year ending March 31, 2016 (for more complete performance information please see the table below). The Fund benefited the most from its position in the Consumer Staples sector. The Fund’s position in the Energy sector created the greatest drag on performance.
The following performance table is provided for comparative purposes and represents the period noted. The Fund’s per share NAV is the value of one share of the Fund and is calculated by dividing the value of total assets less total liabilities by the number of shares outstanding. The NAV return is based on the NAV of the Fund and the market price return is based on the market price per share of the Fund. The price used to calculate market price returns is the mid-point of the highest bid and lowest offer for Fund shares as of the close of trading on the exchange where Fund shares are listed. NAV and market price returns assume that dividends and capital gain distributions have been reinvested in the Fund at NAV and market price, respectively. As with other ETFs, NAV returns and market price returns may differ because of factors such as the supply and demand for Fund shares and investors’ assessments of the underlying value of the Fund’s portfolio securities.
An index is a statistical measure of a specified financial market or sector. An index does not actually hold a portfolio of securities, incur expenses or pay any transaction costs. Therefore, index returns do not reflect deductions for fees or expenses and the index is not available for direct investment. In comparison, the Fund’s performance is negatively impacted by these deductions. Fund returns do not reflect brokerage commissions or taxes a shareholder would pay on the sale of Fund shares or on Fund distributions. As of the Fund’s current prospectus dated August 1, 2015, the Fund’s annual expense ratio was 0.28%.
Performance as of 3/31/16
| | | | | | | | | | | | | | | | |
| | | Average Annual Total Return | |
| | | 1 Year | | | 3 Year | | | 5 Year | | | Since
Inception1 | |
Fund NAV Returns | | | 2.84 | % | | | 10.62 | % | | | 11.80 | % | | | 7.09 | % |
Fund Market Price Returns | | | 2.65 | % | | | 10.63 | % | | | 11.78 | % | | | 7.08 | % |
WisdomTree Dividend Index | | | 3.15 | % | | | 10.91 | % | | | 12.15 | % | | | 7.52 | % |
Russell 3000® Index | | | -0.34 | % | | | 11.15 | % | | | 11.01 | % | | | 7.47 | % |
| 1 | Total returns are calculated based on the commencement of Fund trading on the NYSE Arca, Inc. on June 16, 2006. |
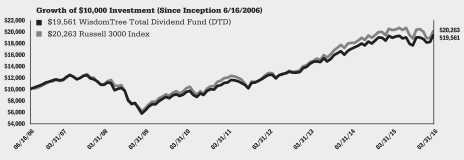
Performance is historical and does not guarantee future results. Current performance may be lower or higher than quoted. Investment returns and the principal value of an investment will fluctuate so that an investor’s shares, when redeemed, may be worth more or less than their original cost. Performance data for the most recent month-end is available at www.wisdomtree.com. WisdomTree shares are bought and sold at market price (not NAV) and are not individually redeemed from the Fund. Fund NAV returns are calculated using the Fund’s daily 4:00 p.m. NAV. Market price returns reflect the midpoint of the bid/ask spread as of the close of trading on the exchange where Fund shares are listed. Market price returns do not represent the returns you would receive if you traded shares at other times. The returns do not reflect the deduction of taxes that a shareholder would pay on Fund distributions or on the redemption of Fund shares. Total returns for a period of less than one year are cumulative.
| | | | |
| WisdomTree Domestic Earnings and Dividend Funds | | | 13 | |
Performance Summary (unaudited)
WisdomTree Total Earnings Fund (EXT)
Sector Breakdown† as of 3/31/16
| | | | |
| |
| Sector | | % of Net Assets | |
Financials | | | 21.7% | |
Information Technology | | | 18.9% | |
Consumer Discretionary | | | 12.9% | |
Industrials | | | 12.3% | |
Healthcare | | | 10.0% | |
Consumer Staples | | | 9.7% | |
Energy | | | 5.3% | |
Utilities | | | 3.8% | |
Materials | | | 2.8% | |
Telecommunication Services | | | 2.4% | |
Other Assets less Liabilities‡ | | | 0.2% | |
Total | | | 100.0% | |
| † | The Fund’s sector breakdown is expressed as a percentage of net assets and may change over time. In addition, a sector may be comprised of several industries. |
| ‡ | Other assets includes investment of cash collateral for securities on loan (if any). |
Top Ten Holdings* as of 3/31/16
| | | | |
| |
| Description | | % of Net Assets | |
Apple, Inc. | | | 4.6% | |
Exxon Mobil Corp. | | | 2.2% | |
Berkshire Hathaway, Inc., Class B | | | 2.2% | |
JPMorgan Chase & Co. | | | 2.0% | |
Wells Fargo & Co. | | | 1.8% | |
Wal-Mart Stores, Inc. | | | 1.5% | |
Verizon Communications, Inc. | | | 1.5% | |
Microsoft Corp. | | | 1.5% | |
Johnson & Johnson | | | 1.4% | |
Alphabet, Inc., Class A | | | 1.4% | |
| * | The ten largest holdings are subject to change, and there are no guarantees the Fund will remain invested in any particular company. Excludes investment of cash collateral for securities on loan (if any). |
The WisdomTree Total Earnings Fund (the ‘‘Fund’’) seeks to track the price and yield performance, before fees and expenses, of the WisdomTree Earnings Index.
The Fund returned -1.18% at net asset value (“NAV”) for the fiscal year ending March 31, 2016 (for more complete performance information please see the table below). The Fund benefited the most from its position in the Consumer Staples sector. The Fund’s position in the Financials sector created the greatest drag on performance.
The following performance table is provided for comparative purposes and represents the period noted. The Fund’s per share NAV is the value of one share of the Fund and is calculated by dividing the value of total assets less total liabilities by the number of shares outstanding. The NAV return is based on the NAV of the Fund and the market price return is based on the market price per share of the Fund. The price used to calculate market price returns is the mid-point of the highest bid and lowest offer for Fund shares as of the close of trading on the exchange where Fund shares are listed. NAV and market price returns assume that dividends and capital gain distributions have been reinvested in the Fund at NAV and market price, respectively. As with other ETFs, NAV returns and market price returns may differ because of factors such as the supply and demand for Fund shares and investors’ assessments of the underlying value of the Fund’s portfolio securities.
An index is a statistical measure of a specified financial market or sector. An index does not actually hold a portfolio of securities, incur expenses or pay any transaction costs. Therefore, index returns do not reflect deductions for fees or expenses and the index is not available for direct investment. In comparison, the Fund’s performance is negatively impacted by these deductions. Fund returns do not reflect brokerage commissions or taxes a shareholder would pay on the sale of Fund shares or on Fund distributions. As of the Fund’s current prospectus dated August 1, 2015, the Fund’s annual expense ratio was 0.28%.
Performance as of 3/31/16
| | | | | | | | | | | | | | | | |
| | | Average Annual Total Return | |
| | | 1 Year | | | 3 Year | | | 5 Year | | | Since
Inception1 | |
Fund NAV Returns | | | -1.18 | % | | | 10.44 | % | | | 10.85 | % | | | 6.08 | % |
Fund Market Price Returns | | | -1.38 | % | | | 10.37 | % | | | 10.81 | % | | | 6.06 | % |
WisdomTree Earnings Index | | | -0.95 | % | | | 10.80 | % | | | 11.19 | % | | | 6.34 | % |
Russell 3000® Index | | | -0.34 | % | | | 11.15 | % | | | 11.01 | % | | | 6.10 | % |
| 1 | Total returns are calculated based on the commencement of Fund trading on the NYSE Arca, Inc. on February 23, 2007. |
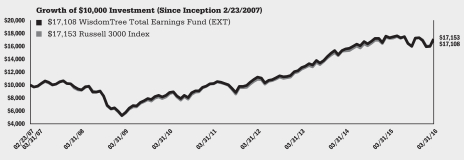
Performance is historical and does not guarantee future results. Current performance may be lower or higher than quoted. Investment returns and the principal value of an investment will fluctuate so that an investor’s shares, when redeemed, may be worth more or less than their original cost. Performance data for the most recent month-end is available at www.wisdomtree.com. WisdomTree shares are bought and sold at market price (not NAV) and are not individually redeemed from the Fund. Fund NAV returns are calculated using the Fund’s daily 4:00 p.m. NAV. Market price returns reflect the midpoint of the bid/ask spread as of the close of trading on the exchange where Fund shares are listed. Market price returns do not represent the returns you would receive if you traded shares at other times. The returns do not reflect the deduction of taxes that a shareholder would pay on Fund distributions or on the redemption of Fund shares. Total returns for a period of less than one year are cumulative.
| | |
| 14 | | WisdomTree Domestic Earnings and Dividend Funds |
Performance Summary (unaudited)
WisdomTree U.S. Quality Dividend Growth Fund (DGRW)
(formerly, WisdomTree U.S. Dividend Growth Fund)
Sector Breakdown† as of 3/31/16
| | | | |
| |
| Sector | | % of Net Assets | |
Industrials | | | 20.2% | |
Consumer Discretionary | | | 20.2% | |
Information Technology | | | 19.6% | |
Consumer Staples | | | 18.5% | |
Healthcare | | | 14.0% | |
Financials | | | 3.4% | |
Materials | | | 3.0% | |
Energy | | | 0.9% | |
Other Assets less Liabilities‡ | | | 0.2% | |
Total | | | 100.0% | |
| † | The Fund’s sector breakdown is expressed as a percentage of net assets and may change over time. In addition, a sector may be comprised of several industries. |
| ‡ | Other assets includes investment of cash collateral for securities on loan (if any). |
Top Ten Holdings* as of 3/31/16
| | | | |
| |
| Description | | % of Net Assets | |
Coca-Cola Co. (The) | | | 4.3% | |
Microsoft Corp. | | | 3.5% | |
Altria Group, Inc. | | | 3.3% | |
Apple, Inc. | | | 3.3% | |
AbbVie, Inc. | | | 2.7% | |
International Business Machines Corp. | | | 2.4% | |
McDonald’s Corp. | | | 2.1% | |
Cisco Systems, Inc. | | | 1.9% | |
3M Co. | | | 1.8% | |
Home Depot, Inc. (The) | | | 1.8% | |
| * | The ten largest holdings are subject to change, and there are no guarantees the Fund will remain invested in any particular company. Excludes investment of cash collateral for securities on loan (if any). |
The WisdomTree U.S. Quality Dividend Growth Fund (the ‘‘Fund’’) seeks to track the price and yield performance, before fees and expenses, of the WisdomTree U.S. Quality Dividend Growth Index. Prior to August 31, 2015, the WisdomTree U.S. Quality Dividend Growth Index was named the WisdomTree U.S. Dividend Growth Index.
The Fund returned 2.25% at net asset value (“NAV”) for the fiscal year ending March 31, 2016 (for more complete performance information please see the table below). The Fund benefited the most from its position in the Consumer Staples sector. The Fund’s position in the Materials sector created the greatest drag on performance.
The following performance table is provided for comparative purposes and represents the period noted. The Fund’s per share NAV is the value of one share of the Fund and is calculated by dividing the value of total assets less total liabilities by the number of shares outstanding. The NAV return is based on the NAV of the Fund and the market price return is based on the market price per share of the Fund. The price used to calculate market price returns is the mid-point of the highest bid and lowest offer for Fund shares as of the close of trading on the exchange where Fund shares are listed. NAV and market price returns assume that dividends and capital gain distributions have been reinvested in the Fund at NAV and market price, respectively. As with other ETFs, NAV returns and market price returns may differ because of factors such as the supply and demand for Fund shares and investors’ assessments of the underlying value of the Fund’s portfolio securities.
An index is a statistical measure of a specified financial market or sector. An index does not actually hold a portfolio of securities, incur expenses or pay any transaction costs. Therefore, index returns do not reflect deductions for fees or expenses and the index is not available for direct investment. In comparison, the Fund’s performance is negatively impacted by these deductions. Fund returns do not reflect brokerage commissions or taxes a shareholder would pay on the sale of Fund shares or on Fund distributions. As of the Fund’s current prospectus dated August 1, 2015, the Fund’s annual expense ratio was 0.28%.
Performance as of 3/31/16
| | | | | | | | |
| | | Average Annual Total Return | |
| | | 1 Year | | | Since
Inception1 | |
Fund NAV Returns | | | 2.25 | % | | | 10.49 | % |
Fund Market Price Returns | | | 2.11 | % | | | 10.47 | % |
WisdomTree U.S. Quality Dividend Growth Index | | | 2.52 | % | | | 10.78 | % |
NASDAQ U.S. Dividend AchieversTM Select Index | | | 3.09 | % | | | 8.46 | % |
| 1 | Total returns are calculated based on the commencement of Fund trading on the NASDAQ on May 22, 2013. |
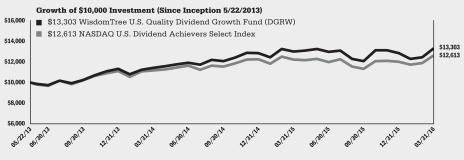
Performance is historical and does not guarantee future results. Current performance may be lower or higher than quoted. Investment returns and the principal value of an investment will fluctuate so that an investor’s shares, when redeemed, may be worth more or less than their original cost. Performance data for the most recent month-end is available at www.wisdomtree.com. WisdomTree shares are bought and sold at market price (not NAV) and are not individually redeemed from the Fund. Fund NAV returns are calculated using the Fund’s daily 4:00 p.m. NAV. Market price returns reflect the midpoint of the bid/ask spread as of the close of trading on the exchange where Fund shares are listed. Market price returns do not represent the returns you would receive if you traded shares at other times. The returns do not reflect the deduction of taxes that a shareholder would pay on Fund distributions or on the redemption of Fund shares. Total returns for a period of less than one year are cumulative.
| | | | |
| WisdomTree Domestic Earnings and Dividend Funds | | | 15 | |
Performance Summary (unaudited)
WisdomTree U.S. SmallCap Quality Dividend Growth Fund (DGRS)
(formerly, WisdomTree U.S. SmallCap Dividend Growth Fund)
Sector Breakdown† as of 3/31/16
| | | | |
| |
| Sector | | % of Net Assets | |
Industrials | | | 25.4% | |
Consumer Discretionary | | | 25.0% | |
Materials | | | 11.9% | |
Information Technology | | | 9.9% | |
Financials | | | 9.8% | |
Consumer Staples | | | 8.3% | |
Utilities | | | 4.5% | |
Healthcare | | | 2.6% | |
Telecommunication Services | | | 1.4% | |
Energy | | | 0.8% | |
Other Assets less Liabilities‡ | | | 0.4% | |
Total | | | 100.0% | |
| † | The Fund’s sector breakdown is expressed as a percentage of net assets and may change over time. In addition, a sector may be comprised of several industries. |
| ‡ | Other assets includes investment of cash collateral for securities on loan (if any). |
Top Ten Holdings* as of 3/31/16
| | | | |
| |
| Description | | % of Net Assets | |
Cal-Maine Foods, Inc. | | | 2.5% | |
South Jersey Industries, Inc. | | | 2.1% | |
Nu Skin Enterprises, Inc., Class A | | | 1.8% | |
Joy Global, Inc. | | | 1.7% | |
Science Applications International Corp. | | | 1.4% | |
Worthington Industries, Inc. | | | 1.3% | |
Axiall Corp. | | | 1.3% | |
Cohen & Steers, Inc. | | | 1.3% | |
GATX Corp. | | | 1.2% | |
DineEquity, Inc. | | | 1.2% | |
| * | The ten largest holdings are subject to change, and there are no guarantees the Fund will remain invested in any particular company. Excludes investment of cash collateral for securities on loan (if any). |
The WisdomTree U.S. SmallCap Quality Dividend Growth Fund (the ‘‘Fund’’) seeks to track the price and yield performance, before fees and expenses, of the WisdomTree U.S. SmallCap Quality Dividend Growth Index. Prior to August 31, 2015, the WisdomTree U.S. SmallCap Quality Dividend Growth Index was named the WisdomTree U.S. SmallCap Dividend Growth Index.
The Fund returned -4.42% at net asset value (“NAV”) for the fiscal year ending March 31, 2016 (for more complete performance information please see the table below). The Fund benefited the most from its position in the Utilities sector. The Fund’s position in the Industrials sector created the greatest drag on performance.
The following performance table is provided for comparative purposes and represents the period noted. The Fund’s per share NAV is the value of one share of the Fund and is calculated by dividing the value of total assets less total liabilities by the number of shares outstanding. The NAV return is based on the NAV of the Fund and the market price return is based on the market price per share of the Fund. The price used to calculate market price returns is the mid-point of the highest bid and lowest offer for Fund shares as of the close of trading on the exchange where Fund shares are listed. NAV and market price returns assume that dividends and capital gain distributions have been reinvested in the Fund at NAV and market price, respectively. As with other ETFs, NAV returns and market price returns may differ because of factors such as the supply and demand for Fund shares and investors’ assessments of the underlying value of the Fund’s portfolio securities.
An index is a statistical measure of a specified financial market or sector. An index does not actually hold a portfolio of securities, incur expenses or pay any transaction costs. Therefore, index returns do not reflect deductions for fees or expenses and the index is not available for direct investment. In comparison, the Fund’s performance is negatively impacted by these deductions. Fund returns do not reflect brokerage commissions or taxes a shareholder would pay on the sale of Fund shares or on Fund distributions. As of the Fund’s current prospectus dated August 1, 2015, the Fund’s annual expense ratio was 0.38%.
Performance as of 3/31/16
| | | | | | | | |
| | | Average Annual Total Return | |
| | | 1 Year | | | Since
Inception1 | |
Fund NAV Returns | | | -4.42 | % | | | 6.62 | % |
Fund Market Price Returns | | | -4.56 | % | | | 6.55 | % |
WisdomTree U.S. SmallCap Quality Dividend Growth Index | | | -4.33 | % | | | 6.83 | % |
Russell 2000® Index | | | -9.76 | % | | | 3.49 | % |
| 1 | Total returns are calculated based on the commencement of Fund trading on the NASDAQ on July 25, 2013. |
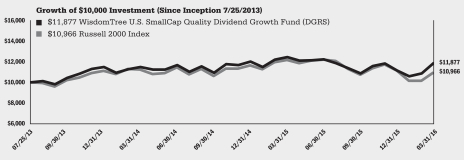
Performance is historical and does not guarantee future results. Current performance may be lower or higher than quoted. Investment returns and the principal value of an investment will fluctuate so that an investor’s shares, when redeemed, may be worth more or less than their original cost. Performance data for the most recent month-end is available at www.wisdomtree.com. WisdomTree shares are bought and sold at market price (not NAV) and are not individually redeemed from the Fund. Fund NAV returns are calculated using the Fund’s daily 4:00 p.m. NAV. Market price returns reflect the midpoint of the bid/ask spread as of the close of trading on the exchange where Fund shares are listed. Market price returns do not represent the returns you would receive if you traded shares at other times. The returns do not reflect the deduction of taxes that a shareholder would pay on Fund distributions or on the redemption of Fund shares. Total returns for a period of less than one year are cumulative.
| | |
| 16 | | WisdomTree Domestic Earnings and Dividend Funds |
Description of Indexes (unaudited)
Below are descriptions of each Index referenced in this report:
The Dow Jones U.S. Select Dividend IndexSM is comprised of 100 U.S. dividend-paying companies.
The NASDAQ U.S. Dividend AchieversTM Select Index is a capitalization-weighted index that measures the performance of U.S. common stocks that have a history of increasing dividends for at least ten consecutive years.
The Russell 1000® Value Index is a capitalization-weighted index that is comprised of the large-capitalization value segment of the U.S. equity universe, selecting from the Russell 1000 Index.
The Russell 2000® Index is a capitalization-weighted index that is comprised of the smallest 2,000 securities in the Russell 3000 Index, based on total market capitalization.
The Russell 3000® Index is a capitalization-weighted index that is comprised of the 3,000 largest U.S. companies, based on total market capitalization.
The S&P 500® Index is a capitalization-weighted index of 500 stocks selected by Standard & Poor’s Index Committee, designed to represent the performance of the leading industries in the United States economy.
The S&P MidCap 400® Index is a capitalization-weighted index that is comprised of the mid-capitalization range of the U.S. stock market, with stocks selected by the Standard & Poor’s Index Committee.
The WisdomTree Dividend ex-Financials Index is comprised of high dividend-yielding stocks outside the Financials sector.
The WisdomTree Dividend Index defines the dividend-paying portion of the U.S. stock market.
The WisdomTree Dividend Top 100 Index is comprised of the 100 highest dividend-yielding companies in the WisdomTree LargeCap Dividend Index.
The WisdomTree Earnings 500 Index is comprised of earnings-generating companies within the large-capitalization segment of the U.S. stock market.
The WisdomTree Earnings Index is comprised of earnings-generating companies within the broad U.S. stock market.
The WisdomTree High Dividend Index is comprised of companies with high dividend yields, selected from the WisdomTree Dividend Index.
The WisdomTree LargeCap Dividend Index is comprised of the large-capitalization segment of the U.S. dividend-paying market, selected from the WisdomTree Dividend Index.
The WisdomTree LargeCap Value Index is comprised of the large-capitalization value segment within the earnings-generating companies of the U.S. stock market.
The WisdomTree Low P/E Index is comprised of companies with the lowest price-to- earnings ratios (P/E ratios) in the WisdomTree Earnings Index.
The WisdomTree MidCap Dividend Index is comprised of the mid-capitalization segment of the U.S. dividend-paying market, selected from the WisdomTree Dividend Index.
The WisdomTree MidCap Earnings Index is comprised of earnings-generating companies within the mid-capitalization segment of the U.S. stock market.
The WisdomTree SmallCap Dividend Index is comprised of the small-capitalization segment of the U.S. dividend-paying market, selected from the WisdomTree Dividend Index.
The WisdomTree SmallCap Earnings Index is comprised of earnings-generating companies within the small-capitalization segment of the U.S. stock market.
| | | | |
| WisdomTree Domestic Earnings and Dividend Funds | | | 17 | |
Description of Indexes (unaudited) (concluded)
The WisdomTree U.S. Quality Dividend Growth Index is comprised of dividend-paying stocks with growth characteristics.
The WisdomTree U.S. SmallCap Quality Dividend Growth Index is comprised of the small-capitalization segment of dividend-paying stocks with growth characteristics.
Index performance information assumes the reinvestment of net dividends and excludes management fees, transaction costs and expenses. You cannot directly invest in an index.
The Dow Jones U.S. Select Dividend Index is calculated, distributed and marketed by Dow Jones Indexes, a licensed trademark of CME Group Index Services LLC, and has been licensed for use.
The Global Industry Classification Standard (“GICS”) was developed by and is the exclusive property and a service mark of MSCI Inc. (“MSCI”) and Standard & Poor’s (“S&P”), a division of The McGraw-Hill Companies, Inc., and is licensed for use by WisdomTree Investments, Inc. Neither MSCI, S&P nor any other party involved in making or compiling the GICS or any GICS classifications makes any express or implied warranties or representations with respect to such standard or classification (or the results to be obtained by the use thereof), and all such parties hereby expressly disclaim all warranties of originality, accuracy, completeness, merchantability and fitness for a particular purpose with respect to any such standard or classification. Without limiting any of the foregoing, in no event shall MSCI, S&P, any of their affiliates or any third party involved in making or compiling the GICS or any GICS classifications have any liability for any direct, indirect, special, punitive, consequential or any other damages (including lost profits) even if notified of the possibility of such damages.
Neither MSCI nor any other party involved in or related to compiling, computing or creating the MSCI data makes any express or implied warranties or representations with respect to such data (or the results to be obtained by the use thereof), and all such parties hereby expressly disclaim all warranties of originality, accuracy, completeness, merchantability or fitness for a particular purpose with respect to any such data. Without limiting any of the foregoing, in no event shall MSCI, any of its affiliates or any third party involved in or related to compiling, computing or creating the data have any liability for any direct, indirect, special, punitive, consequential or any other damages (including lost profits) even if notified of the possibility of such damages. No further distribution or dissemination of the MSCI data is permitted without MSCI’s express written consent.
WisdomTree Investments and WisdomTree Asset Management (together, “WisdomTree”) and the Funds make no representation or warranty, express or implied, to the owners of shares of the Funds or any member of the public regarding the advisability of investing in securities generally or in the Funds particularly or the ability of the underlying Indexes to track the performance of their underlying securities. WisdomTree Investments is the licensor of certain trademarks, service marks and trade names of the Funds. WisdomTree Investments has no obligation to take the needs of the Funds or the owners of shares of the Funds into consideration in determining, composing, or calculating the underlying WisdomTree Indexes of the applicable Funds. WisdomTree Investments is not responsible for, and has not participated in, the determination of the timing of, prices of, or quantities of shares of the Funds to be issued or in the determination or calculation of the equation by which the shares of the Funds are redeemable. WisdomTree and the Funds do not guarantee the accuracy, completeness, or performance of the underlying Indexes or the data included therein and shall have no liability in connection with the underlying Indexes or their calculation.
| | |
| 18 | | WisdomTree Domestic Earnings and Dividend Funds |
Shareholder Expense Examples (unaudited)
As a shareholder of a WisdomTree Fund, you incur two types of cost: (1) transaction costs, including brokerage commissions on purchases and sales of your Fund shares and (2) ongoing costs, including management fees and other Fund expenses. The following example is intended to help you understand your ongoing costs (in dollars and cents) of investing in a Fund and to compare these costs with the ongoing costs of investing in other funds.
The example is based on an investment of $1,000 invested at the beginning of the period and held for the entire period from October 1, 2015 to March 31, 2016.
Actual expenses
The first line under each Fund in the table on the next page provides information about actual account values and actual expenses. You may use the information in this line, together with the amount you invested, to estimate the expenses that you paid over the period. Simply divide your account value by $1,000 (for example, an $8,600 account value divided by $1,000 = 8.6), then multiply the result by the number in the first line for your Fund under the heading entitled “Expenses Paid During the Period 10/1/15 to 3/31/16” to estimate the expenses you paid on your account during the period.
Hypothetical example for comparison purposes
The second line under each Fund in the table on the next page provides information about hypothetical account values and hypothetical expenses based on each Fund’s actual expense ratio and an assumed rate of return of 5% per year before expenses, which is not the Fund’s actual return. The hypothetical account values and expenses may not be used to estimate the actual ending account balance or expenses you paid for the period. You may use this information to compare the ongoing costs of investing in your Fund and other funds. To do so, compare this 5% hypothetical example with the 5% hypothetical examples that appear in the shareholder reports of the other funds.
Please note that the expenses shown in the table are meant to highlight your ongoing costs only and do not reflect any transactional costs, such as brokerage commissions paid on purchases and sales of Fund shares. Therefore, the second line under each Fund in the table is useful in comparing ongoing Fund costs only and will not help you determine the relative total costs of owning different funds. In addition, if these transactional costs were included, your costs would have been higher.
| | | | |
| WisdomTree Domestic Earnings and Dividend Funds | | | 19 | |
Shareholder Expense Examples (unaudited) (concluded)
| | | | | | | | | | | | | | | | |
| | | Beginning
Account Value
10/1/15 | | | Ending
Account Value
3/31/16 | | | Annualized
Expense Ratio
Based on the
Period
10/1/15 to
3/31/16 | | | Expenses Paid
During the
Period†
10/1/15 to
3/31/16 | |
WisdomTree Dividend ex-Financials Fund | | | | | | | | | | | | | | | | |
Actual | | $ | 1,000.00 | | | $ | 1,141.80 | | | | 0.38 | % | | $ | 2.03 | |
Hypothetical (5% return before expenses) | | $ | 1,000.00 | | | $ | 1,023.10 | | | | 0.38 | % | | $ | 1.92 | |
WisdomTree Earnings 500 Fund | | | | | | | | | | | | | | | | |
Actual | | $ | 1,000.00 | | | $ | 1,070.90 | | | | 0.28 | % | | $ | 1.45 | |
Hypothetical (5% return before expenses) | | $ | 1,000.00 | | | $ | 1,023.60 | | | | 0.28 | % | | $ | 1.42 | |
WisdomTree High Dividend Fund | | | | | | | | | | | | | | | | |
Actual | | $ | 1,000.00 | | | $ | 1,158.60 | | | | 0.38 | % | | $ | 2.05 | |
Hypothetical (5% return before expenses) | | $ | 1,000.00 | | | $ | 1,023.10 | | | | 0.38 | % | | $ | 1.92 | |
WisdomTree LargeCap Dividend Fund | | | | | | | | | | | | | | | | |
Actual | | $ | 1,000.00 | | | $ | 1,107.40 | | | | 0.28 | % | | $ | 1.48 | |
Hypothetical (5% return before expenses) | | $ | 1,000.00 | | | $ | 1,023.60 | | | | 0.28 | % | | $ | 1.42 | |
WisdomTree LargeCap Value Fund | | | | | | | | | | | | | | | | |
Actual | | $ | 1,000.00 | | | $ | 1,024.20 | | | | 0.38 | % | | $ | 1.92 | |
Hypothetical (5% return before expenses) | | $ | 1,000.00 | | | $ | 1,023.10 | | | | 0.38 | % | | $ | 1.92 | |
WisdomTree MidCap Dividend Fund | | | | | | | | | | | | | | | | |
Actual | | $ | 1,000.00 | | | $ | 1,126.40 | | | | 0.38 | % | | $ | 2.02 | |
Hypothetical (5% return before expenses) | | $ | 1,000.00 | | | $ | 1,023.10 | | | | 0.38 | % | | $ | 1.92 | |
WisdomTree MidCap Earnings Fund | | | | | | | | | | | | | | | | |
Actual | | $ | 1,000.00 | | | $ | 1,056.10 | | | | 0.38 | % | | $ | 1.95 | |
Hypothetical (5% return before expenses) | | $ | 1,000.00 | | | $ | 1,023.10 | | | | 0.38 | % | | $ | 1.92 | |
WisdomTree SmallCap Dividend Fund | | | | | | | | | | | | | | | | |
Actual | | $ | 1,000.00 | | | $ | 1,105.90 | | | | 0.38 | % | | $ | 2.00 | |
Hypothetical (5% return before expenses) | | $ | 1,000.00 | | | $ | 1,023.10 | | | | 0.38 | % | | $ | 1.92 | |
WisdomTree SmallCap Earnings Fund | | | | | | | | | | | | | | | | |
Actual | | $ | 1,000.00 | | | $ | 1,053.90 | | | | 0.38 | % | | $ | 1.95 | |
Hypothetical (5% return before expenses) | | $ | 1,000.00 | | | $ | 1,023.10 | | | | 0.38 | % | | $ | 1.92 | |
WisdomTree Total Dividend Fund | | | | | | | | | | | | | | | | |
Actual | | $ | 1,000.00 | | | $ | 1,108.80 | | | | 0.28 | % | | $ | 1.48 | |
Hypothetical (5% return before expenses) | | $ | 1,000.00 | | | $ | 1,023.60 | | | | 0.28 | % | | $ | 1.42 | |
WisdomTree Total Earnings Fund | | | | | | | | | | | | | | | | |
Actual | | $ | 1,000.00 | | | $ | 1,068.40 | | | | 0.28 | % | | $ | 1.45 | |
Hypothetical (5% return before expenses) | | $ | 1,000.00 | | | $ | 1,023.60 | | | | 0.28 | % | | $ | 1.42 | |
WisdomTree U.S. Quality Dividend Growth Fund | | | | | | | | | | | | | |
Actual | | $ | 1,000.00 | | | $ | 1,103.10 | | | | 0.28 | % | | $ | 1.47 | |
Hypothetical (5% return before expenses) | | $ | 1,000.00 | | | $ | 1,023.60 | | | | 0.28 | % | | $ | 1.42 | |
WisdomTree U.S. SmallCap Quality Dividend Growth Fund | | | | | | | | | | | | | |
Actual | | $ | 1,000.00 | | | $ | 1,093.20 | | | | 0.38 | % | | $ | 1.99 | |
Hypothetical (5% return before expenses) | | $ | 1,000.00 | | | $ | 1,023.10 | | | | 0.38 | % | | $ | 1.92 | |
| † | Expenses are calculated using each Fund’s annualized expense ratio, multiplied by the average account value for the period, multiplied by 183/366 (to reflect the one-half year period). |
| | |
| 20 | | WisdomTree Domestic Earnings and Dividend Funds |
Schedule of Investments
WisdomTree Dividend ex-Financials Fund (DTN)
March 31, 2016
| | | | | | | | |
| Investments | | Shares | | | Value | |
| | | | | | | | |
| COMMON STOCKS – 98.9% | | | | | | | | |
| United States – 98.9% | | | | | | | | |
| Aerospace & Defense – 0.9% | | | | | | | | |
Lockheed Martin Corp. | | | 37,216 | | | $ | 8,243,344 | |
| Air Freight & Logistics – 0.9% | | | | | | | | |
United Parcel Service, Inc. Class B | | | 78,170 | | | | 8,244,590 | |
| Automobiles – 2.3% | | | | | | | | |
Ford Motor Co. | | | 824,175 | | | | 11,126,362 | |
General Motors Co. | | | 309,142 | | | | 9,716,333 | |
| | | | | | | | |
| Total Automobiles | | | | | | | 20,842,695 | |
| Beverages – 1.0% | | | | | | | | |
Coca-Cola Co. (The) | | | 196,863 | | | | 9,132,475 | |
| Biotechnology – 1.8% | | | | | | | | |
AbbVie, Inc. | | | 194,942 | | | | 11,135,087 | |
Amgen, Inc. | | | 33,917 | | | | 5,085,176 | |
| | | | | | | | |
| Total Biotechnology | | | | | | | 16,220,263 | |
| Chemicals – 5.3% | | | | | | | | |
Air Products & Chemicals, Inc. | | | 48,715 | | | | 7,017,396 | |
CF Industries Holdings, Inc. | | | 170,072 | | | | 5,330,056 | |
Dow Chemical Co. (The) | | | 177,484 | | | | 9,026,836 | |
E.I. du Pont de Nemours & Co. | | | 85,958 | | | | 5,442,861 | |
Monsanto Co. | | | 65,178 | | | | 5,718,718 | |
Mosaic Co. (The) | | | 318,044 | | | | 8,587,188 | |
Praxair, Inc. | | | 64,742 | | | | 7,409,722 | |
| | | | | | | | |
| Total Chemicals | | | | | | | 48,532,777 | |
| Commercial Services & Supplies – 1.8% | | | | | | | | |
Republic Services, Inc. | | | 169,718 | | | | 8,087,063 | |
Waste Management, Inc. | | | 149,797 | | | | 8,838,023 | |
| | | | | | | | |
| Total Commercial Services & Supplies | | | | | | | 16,925,086 | |
| Communications Equipment – 1.0% | | | | | | | | |
Cisco Systems, Inc. | | | 316,301 | | | | 9,005,089 | |
| Containers & Packaging – 2.1% | | | | | | | | |
International Paper Co. | | | 296,590 | | | | 12,172,054 | |
WestRock Co. | | | 174,040 | | | | 6,792,781 | |
| | | | | | | | |
| Total Containers & Packaging | | | | | | | 18,964,835 | |
| Diversified Telecommunication Services – 6.7% | | | | | | | | |
AT&T, Inc. | | | 452,262 | | | | 17,715,103 | |
CenturyLink, Inc. | | | 865,121 | | | | 27,649,267 | |
Verizon Communications, Inc. | | | 297,843 | | | | 16,107,349 | |
| | | | | | | | |
| Total Diversified Telecommunication Services | | | | | | | 61,471,719 | |
| Electric Utilities – 11.5% | | | | | | | | |
American Electric Power Co., Inc. | | | 197,012 | | | | 13,081,597 | |
Duke Energy Corp. | | | 192,879 | | | | 15,561,478 | |
Entergy Corp. | | | 208,959 | | | | 16,566,269 | |
Exelon Corp. | | | 470,422 | | | | 16,869,333 | |
FirstEnergy Corp. | | | 391,911 | | | | 14,097,039 | |
PPL Corp. | | | 364,493 | | | | 13,876,248 | |
Southern Co. (The) | | | 294,915 | | | | 15,255,953 | |
| | | | | | | | |
| Total Electric Utilities | | | | | | | 105,307,917 | |
| | | | | | | | |
| Electrical Equipment – 1.3% | | | | | | | | |
Emerson Electric Co. | | | 224,330 | | | | 12,199,065 | |
| Energy Equipment & Services – 1.3% | | | | | | | | |
National Oilwell Varco, Inc. | | | 397,847 | | | | 12,373,042 | |
| Food & Staples Retailing – 2.1% | | | | | | | | |
Sysco Corp. | | | 198,027 | | | | 9,253,802 | |
Wal-Mart Stores, Inc. | | | 150,788 | | | | 10,327,470 | |
| | | | | | | | |
| Total Food & Staples Retailing | | | | | | | 19,581,272 | |
| Food Products – 3.0% | | | | | | | | |
Archer-Daniels-Midland Co. | | | 240,990 | | | | 8,750,347 | |
General Mills, Inc. | | | 140,829 | | | | 8,921,517 | |
Kraft Heinz Co. (The) | | | 120,209 | | | | 9,443,619 | |
| | | | | | | | |
| Total Food Products | | | | | | | 27,115,483 | |
| Health Care Equipment & Supplies – 1.2% | | | | | | | | |
Abbott Laboratories | | | 129,558 | | | | 5,419,411 | |
ResMed, Inc. | | | 97,708 | | | | 5,649,477 | |
| | | | | | | | |
| Total Health Care Equipment & Supplies | | | | | | | 11,068,888 | |
| Health Care Providers & Services – 0.7% | | | | | | | | |
Quest Diagnostics, Inc. | | | 88,551 | | | | 6,326,969 | |
| Hotels, Restaurants & Leisure – 3.5% | | | | | | | | |
Darden Restaurants, Inc. | | | 182,226 | | | | 12,081,584 | |
Las Vegas Sands Corp. | | | 384,354 | | | | 19,863,414 | |
| | | | | | | | |
| Total Hotels, Restaurants & Leisure | | | | | | | 31,944,998 | |
| Household Products – 1.1% | | | | | | | | |
Procter & Gamble Co. (The) | | | 122,306 | | | | 10,067,007 | |
| Industrial Conglomerates – 0.9% | | | | | | | | |
General Electric Co. | | | 272,592 | | | | 8,665,700 | |
| IT Services – 3.2% | | | | | | | | |
International Business Machines Corp. | | | 74,489 | | | | 11,281,359 | |
Paychex, Inc. | | | 159,151 | | | | 8,595,745 | |
Western Union Co. (The) | | | 482,623 | | | | 9,309,798 | |
| | | | | | | | |
| Total IT Services | | | | | | | 29,186,902 | |
| Leisure Products – 2.3% | | | | | | | | |
Mattel, Inc. | | | 625,961 | | | | 21,044,809 | |
| Machinery – 3.8% | | | | | | | | |
Caterpillar, Inc. | | | 174,150 | | | | 13,329,441 | |
Cummins, Inc. | | | 119,218 | | | | 13,106,827 | |
Deere & Co. | | | 105,084 | | | | 8,090,417 | |
| | | | | | | | |
| Total Machinery | | | | | | | 34,526,685 | |
| Metals & Mining – 1.2% | | | | | | | | |
Nucor Corp. | | | 241,674 | | | | 11,431,180 | |
| Multi-Utilities – 5.2% | | | | | | | | |
CenterPoint Energy, Inc. | | | 940,476 | | | | 19,674,758 | |
Consolidated Edison, Inc. | | | 184,899 | | | | 14,166,961 | |
Public Service Enterprise Group, Inc. | | | 289,489 | | | | 13,646,512 | |
| | | | | | | | |
| Total Multi-Utilities | | | | | | | 47,488,231 | |
| Multiline Retail – 2.4% | | | | | | | | |
Kohl’s Corp. | | | 222,058 | | | | 10,350,124 | |
Macy’s, Inc. | | | 269,426 | | | | 11,878,992 | |
| | | | | | | | |
| Total Multiline Retail | | | | | | | 22,229,116 | |
See Notes to Financial Statements.
| | | | |
| WisdomTree Domestic Earnings and Dividend Funds | | | 21 | |
Schedule of Investments (concluded)
WisdomTree Dividend ex-Financials Fund (DTN)
March 31, 2016
| | | | | | | | |
| Investments | | Shares | | | Value | |
| | | | | | | | |
| Oil, Gas & Consumable Fuels – 11.1% | | | | | | | | |
Chevron Corp. | | | 145,471 | | | $ | 13,877,934 | |
ConocoPhillips | | | 305,822 | | | | 12,315,452 | |
Exxon Mobil Corp. | | | 129,031 | | | | 10,785,701 | |
HollyFrontier Corp. | | | 169,357 | | | | 5,981,689 | |
Kinder Morgan, Inc. | | | 485,124 | | | | 8,664,315 | |
Occidental Petroleum Corp. | | | 161,380 | | | | 11,043,233 | |
Spectra Energy Corp. | | | 668,465 | | | | 20,455,029 | |
Valero Energy Corp. | | | 110,833 | | | | 7,108,829 | |
Williams Cos., Inc. (The) | | | 712,353 | | | | 11,447,513 | |
| | | | | | | | |
| Total Oil, Gas & Consumable Fuels | | | | | | | 101,679,695 | |
| Pharmaceuticals – 4.1% | | | | | | | | |
Bristol-Myers Squibb Co. | | | 87,716 | | | | 5,603,298 | |
Eli Lilly & Co. | | | 78,414 | | | | 5,646,592 | |
Johnson & Johnson | | | 78,080 | | | | 8,448,256 | |
Merck & Co., Inc. | | | 178,629 | | | | 9,451,261 | |
Pfizer, Inc. | | | 286,261 | | | | 8,484,776 | |
| | | | | | | | |
| Total Pharmaceuticals | | | | | | | 37,634,183 | |
| Semiconductors & Semiconductor Equipment – 3.1% | | | | | |
KLA-Tencor Corp. | | | 123,199 | | | | 8,970,119 | |
Maxim Integrated Products, Inc. | | | 219,948 | | | | 8,089,687 | |
QUALCOMM, Inc. | | | 222,619 | | | | 11,384,736 | |
| | | | | | | | |
| Total Semiconductors & Semiconductor Equipment | | | | 28,444,542 | |
| Software – 1.2% | | | | | | | | |
CA, Inc. | | | 351,813 | | | | 10,832,322 | |
| Specialty Retail – 2.5% | | | | | | | | |
Gap, Inc. (The) | | | 354,854 | | | | 10,432,707 | |
Staples, Inc. | | | 1,124,721 | | | | 12,405,673 | |
| | | | | | | | |
| Total Specialty Retail | | | | | | | 22,838,380 | |
| Technology Hardware, Storage & Peripherals – 1.9% | | | | | |
HP, Inc. | | | 870,367 | | | | 10,722,921 | |
Western Digital Corp. | | | 138,795 | | | | 6,556,676 | |
| | | | | | | | |
| Total Technology Hardware, Storage & Peripherals | | | | 17,279,597 | |
| Textiles, Apparel & Luxury Goods – 1.6% | | | | | | | | |
Coach, Inc. | | | 375,923 | | | | 15,070,753 | |
| Tobacco – 3.9% | | | | | | | | |
Altria Group, Inc. | | | 186,787 | | | | 11,704,074 | |
Philip Morris International, Inc. | | | 145,369 | | | | 14,262,153 | |
Reynolds American, Inc. | | | 187,613 | | | | 9,438,810 | |
| | | | | | | | |
| Total Tobacco | | | | | | | 35,405,037 | |
| Trading Companies & Distributors – 1.0% | | | | | | | | |
Fastenal Co.(a) | | | 187,971 | | | | 9,210,579 | |
TOTAL COMMON STOCKS
(Cost: $839,691,132) | | | | | | | 906,535,225 | |
| | | | | | | | |
| EXCHANGE-TRADED FUNDS – 0.8% | | | | | | | | |
| United States – 0.8% | | | | | | | | |
WisdomTree LargeCap Dividend Fund(b) | | | 51,428 | | | | 3,774,815 | |
WisdomTree MidCap Dividend Fund(b) | | | 44,357 | | | | 3,819,581 | |
TOTAL EXCHANGE-TRADED FUNDS
(Cost: $7,117,820) | | | | | | | 7,594,396 | |
| INVESTMENT OF CASH COLLATERAL FOR SECURITIES LOANED – 0.9% | |
| United States – 0.9% | | | | | | | | |
State Street Navigator Securities Lending Prime Portfolio, 0.50%(c) (Cost: $7,851,900)(d) | | | 7,851,900 | | | | 7,851,900 | |
TOTAL INVESTMENTS IN SECURITIES – 100.6%
(Cost: $854,660,852) | | | | | | | 921,981,521 | |
Liabilities in Excess of Cash and Other Assets – (0.6)% | | | | (5,788,815 | ) |
| | | | | | | | |
| NET ASSETS – 100.0% | | | �� | | | $ | 916,192,706 | |
| (a) | Security, or portion thereof, was on loan at March 31, 2016 (See Note 2). |
| (b) | Affiliated company (See Note 3). |
| (c) | Rate shown represents annualized 7-day yield as of March 31, 2016. |
| (d) | At March 31, 2016, the total market value of the Fund’s securities on loan was $7,694,862 and the total market value of the collateral held by the Fund was $7,851,900. |
See Notes to Financial Statements.
| | |
| 22 | | WisdomTree Domestic Earnings and Dividend Funds |
Schedule of Investments
WisdomTree Earnings 500 Fund (EPS)
March 31, 2016
| | | | | | | | |
| Investments | | Shares | | | Value | |
| | | | | | | | |
| COMMON STOCKS – 99.6% | | | | | | | | |
| United States – 99.6% | | | | | | | | |
| Aerospace & Defense – 3.1% | | | | | | | | |
Boeing Co. (The) | | | 5,084 | | | $ | 645,363 | |
General Dynamics Corp. | | | 2,706 | | | | 355,487 | |
Honeywell International, Inc. | | | 5,248 | | | | 588,038 | |
L-3 Communications Holdings, Inc. | | | 616 | | | | 72,996 | |
Lockheed Martin Corp. | | | 2,205 | | | | 488,408 | |
Northrop Grumman Corp. | | | 1,176 | | | | 232,730 | |
Raytheon Co. | | | 2,196 | | | | 269,296 | |
Rockwell Collins, Inc. | | | 971 | | | | 89,536 | |
Spirit AeroSystems Holdings, Inc. Class A* | | | 1,824 | | | | 82,737 | |
Textron, Inc. | | | 1,992 | | | | 72,628 | |
TransDigm Group, Inc.* | | | 233 | | | | 51,339 | |
United Technologies Corp. | | | 7,347 | | | | 735,435 | |
| | | | | | | | |
| Total Aerospace & Defense | | | | | | | 3,683,993 | |
| Air Freight & Logistics – 0.8% | | | | | | | | |
C.H. Robinson Worldwide, Inc. | | | 946 | | | | 70,221 | |
Expeditors International of Washington, Inc. | | | 1,118 | | | | 54,570 | |
FedEx Corp. | | | 1,184 | | | | 192,660 | |
United Parcel Service, Inc. Class B | | | 6,104 | | | | 643,789 | |
| | | | | | | | |
| Total Air Freight & Logistics | | | | | | | 961,240 | |
| Airlines – 1.8% | | | | | | | | |
Alaska Air Group, Inc. | | | 1,182 | | | | 96,948 | |
American Airlines Group, Inc. | | | 13,816 | | | | 566,594 | |
Delta Air Lines, Inc. | | | 6,917 | | | | 336,720 | |
JetBlue Airways Corp.* | | | 2,839 | | | | 59,960 | |
Southwest Airlines Co. | | | 5,024 | | | | 225,075 | |
United Continental Holdings, Inc.* | | | 13,918 | | | | 833,131 | |
| | | | | | | | |
| Total Airlines | | | | | | | 2,118,428 | |
| Auto Components – 0.6% | | | | | | | | |
BorgWarner, Inc. | | | 1,850 | | | | 71,040 | |
Goodyear Tire & Rubber Co. (The) | | | 10,916 | | | | 360,010 | |
Johnson Controls, Inc. | | | 4,650 | | | | 181,210 | |
Lear Corp. | | | 752 | | | | 83,600 | |
| | | | | | | | |
| Total Auto Components | | | | | | | 695,860 | |
| Automobiles – 1.0% | | | | | | | | |
Ford Motor Co. | | | 48,826 | | | | 659,151 | |
General Motors Co. | | | 14,251 | | | | 447,909 | |
Harley-Davidson, Inc. | | | 2,039 | | | | 104,662 | |
| | | | | | | | |
| Total Automobiles | | | | | | | 1,211,722 | |
| Banks – 8.7% | | | | | | | | |
Bank of America Corp. | | | 111,838 | | | | 1,512,050 | |
BB&T Corp. | | | 6,375 | | | | 212,096 | |
CIT Group, Inc. | | | 3,433 | | | | 106,526 | |
Citigroup, Inc. | | | 31,795 | | | | 1,327,441 | |
Citizens Financial Group, Inc. | | | 3,770 | | | | 78,982 | |
Comerica, Inc. | | | 1,634 | | | | 61,880 | |
Fifth Third Bancorp | | | 8,278 | | | | 138,160 | |
First Republic Bank | | | 792 | | | | 52,779 | |
Huntington Bancshares, Inc. | | | 7,732 | | | | 73,763 | |
JPMorgan Chase & Co. | | | 46,342 | | | | 2,744,373 | |
| | | | | | | | |
KeyCorp | | | 8,685 | | | | 95,882 | |
M&T Bank Corp. | | | 989 | | | | 109,779 | |
PNC Financial Services Group, Inc. (The) | | | 4,994 | | | | 422,343 | |
Regions Financial Corp. | | | 11,584 | | | | 90,934 | |
Signature Bank* | | | 271 | | | | 36,889 | |
SunTrust Banks, Inc. | | | 5,104 | | | | 184,152 | |
SVB Financial Group* | | | 308 | | | | 31,431 | |
U.S. Bancorp | | | 16,649 | | | | 675,783 | |
Wells Fargo & Co. | | | 49,469 | | | | 2,392,321 | |
| | | | | | | | |
| Total Banks | | | | | | | 10,347,564 | |
| Beverages – 1.7% | | | | | | | | |
Brown-Forman Corp. Class B | | | 875 | | | | 86,161 | |
Coca-Cola Co. (The) | | | 17,177 | | | | 796,841 | |
Coca-Cola Enterprises, Inc. | | | 1,433 | | | | 72,710 | |
Constellation Brands, Inc. Class A | | | 874 | | | | 132,053 | |
Dr. Pepper Snapple Group, Inc. | | | 1,006 | | | | 89,957 | |
Molson Coors Brewing Co. Class B | | | 808 | | | | 77,713 | |
Monster Beverage Corp.* | | | 363 | | | | 48,417 | |
PepsiCo, Inc. | | | 6,416 | | | | 657,512 | |
| | | | | | | | |
| Total Beverages | | | | | | | 1,961,364 | |
| Biotechnology – 3.3% | | | | | | | | |
AbbVie, Inc. | | | 6,322 | | | | 361,113 | |
Alexion Pharmaceuticals, Inc.* | | | 178 | | | | 24,781 | |
Amgen, Inc. | | | 5,086 | | | | 762,544 | |
Baxalta, Inc. | | | 3,757 | | | | 151,783 | |
Biogen, Inc.* | | | 1,562 | | | | 406,620 | |
Celgene Corp.* | | | 1,844 | | | | 184,566 | |
Gilead Sciences, Inc. | | | 20,603 | | | | 1,892,591 | |
Medivation, Inc.* | | | 763 | | | | 35,083 | |
Regeneron Pharmaceuticals, Inc.* | | | 130 | | | | 46,857 | |
United Therapeutics Corp.* | | | 517 | | | | 57,609 | |
| | | | | | | | |
| Total Biotechnology | | | | | | | 3,923,547 | |
| Building Products – 0.1% | | | | | | | | |
Fortune Brands Home & Security, Inc. | | | 612 | | | | 34,297 | |
Masco Corp. | | | 1,676 | | | | 52,710 | |
| | | | | | | | |
| Total Building Products | | | | | | | 87,007 | |
| Capital Markets – 2.8% | | | | | | | | |
Affiliated Managers Group, Inc.* | | | 417 | | | | 67,721 | |
Ameriprise Financial, Inc. | | | 1,864 | | | | 175,235 | |
Bank of New York Mellon Corp. (The) | | | 7,772 | | | | 286,243 | |
BlackRock, Inc. | | | 1,242 | | | | 422,988 | |
Charles Schwab Corp. (The) | | | 4,960 | | | | 138,979 | |
E*TRADE Financial Corp.* | | | 875 | | | | 21,429 | |
Franklin Resources, Inc. | | | 6,767 | | | | 264,251 | |
Goldman Sachs Group, Inc. (The) | | | 4,816 | | | | 756,016 | |
Morgan Stanley | | | 22,248 | | | | 556,422 | |
Northern Trust Corp. | | | 1,580 | | | | 102,968 | |
Raymond James Financial, Inc. | | | 1,047 | | | | 49,848 | |
SEI Investments Co. | | | 742 | | | | 31,943 | |
State Street Corp. | | | 3,888 | | | | 227,526 | |
T. Rowe Price Group, Inc. | | | 2,009 | | | | 147,581 | |
TD Ameritrade Holding Corp. | | | 2,828 | | | | 89,167 | |
| | | | | | | | |
| Total Capital Markets | | | | | | | 3,338,317 | |
See Notes to Financial Statements.
| | | | |
| WisdomTree Domestic Earnings and Dividend Funds | | | 23 | |
Schedule of Investments (continued)
WisdomTree Earnings 500 Fund (EPS)
March 31, 2016
| | | | | | | | |
| Investments | | Shares | | | Value | |
| | | | | | | | |
| Chemicals – 2.1% | | | | | | | | |
Air Products & Chemicals, Inc. | | | 1,190 | | | $ | 171,419 | |
Airgas, Inc. | | | 347 | | | | 49,149 | |
Ashland, Inc. | | | 548 | | | | 60,258 | |
Celanese Corp. Series A | | | 919 | | | | 60,195 | |
CF Industries Holdings, Inc. | | | 2,765 | | | | 86,655 | |
Dow Chemical Co. (The) | | | 9,180 | | | | 466,895 | |
E.I. du Pont de Nemours & Co. | | | 4,071 | | | | 257,776 | |
Eastman Chemical Co. | | | 1,488 | | | | 107,478 | |
Ecolab, Inc. | | | 1,235 | | | | 137,727 | |
GCP Applied Technologies, Inc.* | | | 228 | | | | 4,546 | |
International Flavors & Fragrances, Inc. | | | 488 | | | | 55,520 | |
Monsanto Co. | | | 3,030 | | | | 265,852 | |
Mosaic Co. (The) | | | 4,986 | | | | 134,622 | |
PPG Industries, Inc. | | | 1,436 | | | | 160,100 | |
Praxair, Inc. | | | 1,663 | | | | 190,330 | |
Sherwin-Williams Co. (The) | | | 436 | | | | 124,116 | |
Valspar Corp. (The) | | | 525 | | | | 56,186 | |
W.R. Grace & Co.* | | | 228 | | | | 16,229 | |
Westlake Chemical Corp. | | | 1,583 | | | | 73,293 | |
| | | | | | | | |
| Total Chemicals | | | | | | | 2,478,346 | |
| Commercial Services & Supplies – 0.3% | | | | | | | | |
Cintas Corp. | | | 567 | | | | 50,922 | |
Republic Services, Inc. | | | 1,812 | | | | 86,342 | |
Stericycle, Inc.* | | | 334 | | | | 42,148 | |
Waste Connections, Inc. | | | 377 | | | | 24,350 | |
Waste Management, Inc. | | | 1,764 | | | | 104,076 | |
| | | | | | | | |
| Total Commercial Services & Supplies | | | | | | | 307,838 | |
| Communications Equipment – 1.2% | | | | | | | | |
Cisco Systems, Inc. | | | 43,893 | | | | 1,249,634 | |
F5 Networks, Inc.* | | | 438 | | | | 46,362 | |
Harris Corp. | | | 558 | | | | 43,446 | |
Juniper Networks, Inc. | | | 2,065 | | | | 52,678 | |
Motorola Solutions, Inc. | | | 664 | | | | 50,265 | |
| | | | | | | | |
| Total Communications Equipment | | | | | | | 1,442,385 | |
| Construction & Engineering – 0.1% | | | | | | | | |
Fluor Corp. | | | 1,919 | | | | 103,050 | |
| Construction Materials – 0.0% | | | | | | | | |
Martin Marietta Materials, Inc. | | | 222 | | | | 35,411 | |
Vulcan Materials Co. | | | 197 | | | | 20,797 | |
| | | | | | | | |
| Total Construction Materials | | | | | | | 56,208 | |
| Consumer Finance – 1.3% | | | | | | | | |
American Express Co. | | | 9,117 | | | | 559,784 | |
Capital One Financial Corp. | | | 6,539 | | | | 453,218 | |
Discover Financial Services | | | 4,909 | | | | 249,966 | |
Synchrony Financial* | | | 8,830 | | | | 253,068 | |
| | | | | | | | |
| Total Consumer Finance | | | | | | | 1,516,036 | |
| Containers & Packaging – 0.3% | | | | | | | | |
Ball Corp. | | | 518 | | | | 36,928 | |
Crown Holdings, Inc.* | | | 911 | | | | 45,177 | |
International Paper Co. | | | 3,769 | | | | 154,680 | |
| | | | | | | | |
Packaging Corp. of America | | | 872 | | | | 52,669 | |
Sealed Air Corp. | | | 698 | | | | 33,511 | |
WestRock Co. | | | 1,444 | | | | 56,359 | |
| | | | | | | | |
| Total Containers & Packaging | | | | | | | 379,324 | |
| Distributors – 0.1% | | | | | | | | |
Genuine Parts Co. | | | 986 | | | | 97,969 | |
LKQ Corp.* | | | 1,715 | | | | 54,760 | |
| | | | | | | | |
| Total Distributors | | | | | | | 152,729 | |
| Diversified Consumer Services – 0.0% | | | | | | | | |
H&R Block, Inc. | | | 1,978 | | | | 52,259 | |
| Diversified Financial Services – 3.3% | | | | | | | | |
Berkshire Hathaway, Inc. Class B* | | | 20,884 | | | | 2,963,022 | |
CME Group, Inc. | | | 1,642 | | | | 157,714 | |
FactSet Research Systems, Inc. | | | 164 | | | | 24,851 | |
Intercontinental Exchange, Inc. | | | 586 | | | | 137,792 | |
Leucadia National Corp. | | | 1,806 | | | | 29,203 | |
McGraw Hill Financial, Inc. | | | 1,216 | | | | 120,360 | |
Moody’s Corp. | | | 1,252 | | | | 120,893 | |
MSCI, Inc. | | | 357 | | | | 26,447 | |
Nasdaq, Inc. | | | 878 | | | | 58,282 | |
Voya Financial, Inc. | | | 7,889 | | | | 234,855 | |
| | | | | | | | |
| Total Diversified Financial Services | | | | | | | 3,873,419 | |
| Diversified Telecommunication Services – 2.6% | | | | | | | | |
AT&T, Inc. | | | 24,332 | | | | 953,084 | |
CenturyLink, Inc. | | | 2,879 | | | | 92,013 | |
Level 3 Communications, Inc.* | | | 465 | | | | 24,575 | |
Verizon Communications, Inc. | | | 37,374 | | | | 2,021,186 | |
| | | | | | | | |
| Total Diversified Telecommunication Services | | | | | | | 3,090,858 | |
| Electric Utilities – 2.3% | | | | | | | | |
American Electric Power Co., Inc. | | | 3,822 | | | | 253,781 | |
Duke Energy Corp. | | | 4,519 | | | | 364,593 | |
Edison International | | | 2,913 | | | | 209,415 | |
Eversource Energy | | | 2,312 | | | | 134,882 | |
Exelon Corp. | | | 7,945 | | | | 284,908 | |
FirstEnergy Corp. | | | 3,109 | | | | 111,831 | |
NextEra Energy, Inc. | | | 3,801 | | | | 449,810 | |
PG&E Corp. | | | 3,187 | | | | 190,328 | |
Pinnacle West Capital Corp. | | | 727 | | | | 54,576 | |
PPL Corp. | | | 6,320 | | | | 240,602 | |
Southern Co. (The) | | | 6,484 | | | | 335,417 | |
Xcel Energy, Inc. | | | 3,552 | | | | 148,545 | |
| | | | | | | | |
| Total Electric Utilities | | | | | | | 2,778,688 | |
| Electrical Equipment – 0.4% | | | | | | | | |
Acuity Brands, Inc. | | | 109 | | | | 23,777 | |
AMETEK, Inc. | | | 1,392 | | | | 69,572 | |
Emerson Electric Co. | | | 5,942 | | | | 323,126 | |
Rockwell Automation, Inc. | | | 1,012 | | | | 115,115 | |
| | | | | | | | |
| Total Electrical Equipment | | | | | | | 531,590 | |
See Notes to Financial Statements.
| | |
| 24 | | WisdomTree Domestic Earnings and Dividend Funds |
Schedule of Investments (continued)
WisdomTree Earnings 500 Fund (EPS)
March 31, 2016
| | | | | | | | |
| Investments | | Shares | | | Value | |
| | | | | | | | |
| Electronic Equipment, Instruments & Components – 0.3% | | | | | |
Amphenol Corp. Class A | | | 1,740 | | | $ | 100,607 | |
CDW Corp. | | | 1,001 | | | | 41,541 | |
Corning, Inc. | | | 11,965 | | | | 249,949 | |
| | | | | | | | |
| Total Electronic Equipment, Instruments & Components | | | | 392,097 | |
| Energy Equipment & Services – 0.3% | | | | | | | | |
Cameron International Corp.* | | | 1,069 | | | | 71,677 | |
FMC Technologies, Inc.* | | | 2,067 | | | | 56,553 | |
Halliburton Co. | | | 936 | | | | 33,434 | |
National Oilwell Varco, Inc. | | | 5,001 | | | | 155,531 | |
| | | | | | | | |
| Total Energy Equipment & Services | | | | | | | 317,195 | |
| Food & Staples Retailing – 3.5% | | | | | | | | |
Costco Wholesale Corp. | | | 1,820 | | | | 286,795 | |
CVS Health Corp. | | | 6,579 | | | | 682,440 | |
Kroger Co. (The) | | | 5,665 | | | | 216,686 | |
Rite Aid Corp.* | | | 31,359 | | | | 255,576 | |
Sysco Corp. | | | 1,931 | | | | 90,236 | |
Wal-Mart Stores, Inc. | | | 31,255 | | | | 2,140,655 | |
Walgreens Boots Alliance, Inc. | | | 5,120 | | | | 431,309 | |
Whole Foods Market, Inc. | | | 1,864 | | | | 57,989 | |
| | | | | | | | |
| Total Food & Staples Retailing | | | | | | | 4,161,686 | |
| Food Products – 2.0% | | | | | | | | |
Archer-Daniels-Midland Co. | | | 6,033 | | | | 219,058 | |
Campbell Soup Co. | | | 1,684 | | | | 107,422 | |
ConAgra Foods, Inc. | | | 2,548 | | | | 113,692 | |
General Mills, Inc. | | | 3,088 | | | | 195,625 | |
Hershey Co. (The) | | | 1,062 | | | | 97,800 | |
Hormel Foods Corp. | | | 2,129 | | | | 92,058 | |
Ingredion, Inc. | | | 471 | | | | 50,298 | |
J.M. Smucker Co. (The) | | | 391 | | | | 50,768 | |
Kellogg Co. | | | 902 | | | | 69,048 | |
Kraft Heinz Co. (The) | | | 477 | | | | 37,473 | |
McCormick & Co., Inc. Non-Voting Shares | | | 621 | | | | 61,777 | |
Mead Johnson Nutrition Co. | | | 1,068 | | | | 90,748 | |
Mondelez International, Inc. Class A | | | 24,385 | | | | 978,326 | |
Tyson Foods, Inc. Class A | | | 2,539 | | | | 169,250 | |
WhiteWave Foods Co. (The)* | | | 458 | | | | 18,613 | |
| | | | | | | | |
| Total Food Products | | | | | | | 2,351,956 | |
| Gas Utilities – 0.0% | | | | | | | | |
AGL Resources, Inc. | | | 763 | | | | 49,702 | |
| Health Care Equipment & Supplies – 1.1% | | | | | | | | |
Abbott Laboratories | | | 6,295 | | | | 263,320 | |
Baxter International, Inc. | | | 2,834 | | | | 116,421 | |
Becton, Dickinson and Co. | | | 591 | | | | 89,726 | |
Boston Scientific Corp.* | | | 3,401 | | | | 63,973 | |
C.R. Bard, Inc. | | | 464 | | | | 94,039 | |
Cooper Cos., Inc. (The) | | | 197 | | | | 30,332 | |
DENTSPLY SIRONA, Inc. | | | 614 | | | | 37,841 | |
Edwards Lifesciences Corp.* | | | 693 | | | | 61,129 | |
Hologic, Inc.* | | | 381 | | | | 13,144 | |
IDEXX Laboratories, Inc.* | | | 346 | | | | 27,099 | |
Intuitive Surgical, Inc.* | | | 135 | | | | 81,142 | |
| | | | | | | | |
ResMed, Inc. | | | 790 | | | | 45,678 | |
St. Jude Medical, Inc. | | | 1,967 | | | | 108,185 | |
Stryker Corp. | | | 1,490 | | | | 159,862 | |
Varian Medical Systems, Inc.* | | | 677 | | | | 54,173 | |
Zimmer Biomet Holdings, Inc. | | | 234 | | | | 24,951 | |
| | | | | | | | |
| Total Health Care Equipment & Supplies | | | | | | | 1,271,015 | |
| Health Care Providers & Services – 2.7% | | | | | | | | |
Aetna, Inc. | | | 2,592 | | | | 291,211 | |
Anthem, Inc. | | | 2,501 | | | | 347,614 | |
Cardinal Health, Inc. | | | 1,844 | | | | 151,116 | |
Centene Corp.* | | | 747 | | | | 45,993 | |
Cigna Corp. | | | 1,791 | | | | 245,797 | |
DaVita HealthCare Partners, Inc.* | | | 1,335 | | | | 97,962 | |
Express Scripts Holding Co.* | | | 3,284 | | | | 225,578 | |
HCA Holdings, Inc.* | | | 3,823 | | | | 298,385 | |
Henry Schein, Inc.* | | | 398 | | | | 68,707 | |
Humana, Inc. | | | 798 | | | | 145,994 | |
Laboratory Corp. of America Holdings* | | | 461 | | | | 53,997 | |
McKesson Corp. | | | 1,382 | | | | 217,320 | |
MEDNAX, Inc.* | | | 544 | | | | 35,153 | |
Quest Diagnostics, Inc. | | | 1,233 | | | | 88,098 | |
UnitedHealth Group, Inc. | | | 6,328 | | | | 815,679 | |
Universal Health Services, Inc. Class B | | | 674 | | | | 84,061 | |
| | | | | | | | |
| Total Health Care Providers & Services | | | | | | | 3,212,665 | |
| Health Care Technology – 0.1% | | | | | | | | |
Cerner Corp.* | | | 1,029 | | | | 54,496 | |
IMS Health Holdings, Inc.* | | | 1,761 | | | | 46,754 | |
| | | | | | | | |
| Total Health Care Technology | | | | | | | 101,250 | |
| Hotels, Restaurants & Leisure – 1.5% | | | | | | | | |
Aramark | | | 842 | | | | 27,887 | |
Chipotle Mexican Grill, Inc.* | | | 112 | | | | 52,749 | |
Darden Restaurants, Inc. | | | 594 | | | | 39,382 | |
Hilton Worldwide Holdings, Inc. | | | 3,599 | | | | 81,049 | |
Las Vegas Sands Corp. | | | 6,645 | | | | 343,413 | |
Marriott International, Inc. Class A(a) | | | 1,548 | | | | 110,187 | |
McDonald’s Corp. | | | 4,548 | | | | 571,593 | |
Starbucks Corp. | | | 4,844 | | | | 289,187 | |
Starwood Hotels & Resorts Worldwide, Inc. | | | 963 | | | | 80,343 | |
Wyndham Worldwide Corp. | | | 936 | | | | 71,538 | |
Yum! Brands, Inc. | | | 1,608 | | | | 131,615 | |
| | | | | | | | |
| Total Hotels, Restaurants & Leisure | | | | | | | 1,798,943 | |
| Household Durables – 0.5% | | | | | | | | |
D.R. Horton, Inc. | | | 2,824 | | | | 85,369 | |
Harman International Industries, Inc. | | | 451 | | | | 40,157 | |
Jarden Corp.* | | | 577 | | | | 34,014 | |
Lennar Corp. Class A | | | 1,823 | | | | 88,160 | |
Mohawk Industries, Inc.* | | | 413 | | | | 78,842 | |
Newell Rubbermaid, Inc. | | | 1,208 | | | | 53,502 | |
NVR, Inc.* | | | 27 | | | | 46,775 | |
PulteGroup, Inc. | | | 3,267 | | | | 61,126 | |
Toll Brothers, Inc.* | | | 1,182 | | | | 34,881 | |
Whirlpool Corp. | | | 564 | | | | 101,712 | |
| | | | | | | | |
| Total Household Durables | | | | | | | 624,538 | |
See Notes to Financial Statements.
| | | | |
| WisdomTree Domestic Earnings and Dividend Funds | | | 25 | |
Schedule of Investments (continued)
WisdomTree Earnings 500 Fund (EPS)
March 31, 2016
| | | | | | | | |
| Investments | | Shares | | | Value | |
| | | | | | | | |
| Household Products – 1.5% | | | | | | | | |
Church & Dwight Co., Inc. | | | 642 | | | $ | 59,180 | |
Clorox Co. (The) | | | 636 | | | | 80,174 | |
Colgate-Palmolive Co. | | | 4,786 | | | | 338,131 | |
Kimberly-Clark Corp. | | | 677 | | | | 91,063 | |
Procter & Gamble Co. (The) | | | 14,116 | | | | 1,161,888 | |
| | | | | | | | |
| Total Household Products | | | | | | | 1,730,436 | |
| Independent Power & Renewable Electricity Producers – 0.1% | | | | | |
AES Corp. | | | 8,925 | | | | 105,315 | |
| Industrial Conglomerates – 1.5% | | | | | | | | |
3M Co. | | | 3,905 | | | | 650,690 | |
Danaher Corp. | | | 3,241 | | | | 307,442 | |
General Electric Co. | | | 22,542 | | | | 716,610 | |
Roper Technologies, Inc. | | | 460 | | | | 84,074 | |
| | | | | | | | |
| Total Industrial Conglomerates | | | | | | | 1,758,816 | |
| Insurance – 3.2% | | | | | | | | |
Aflac, Inc. | | | 4,788 | | | | 302,314 | |
Alleghany Corp.* | | | 126 | | | | 62,521 | |
Allstate Corp. (The) | | | 4,396 | | | | 296,159 | |
American Financial Group, Inc. | | | 725 | | | | 51,018 | |
American International Group, Inc. | | | 7,968 | | | | 430,670 | |
Arthur J. Gallagher & Co. | | | 903 | | | | 40,165 | |
Cincinnati Financial Corp. | | | 1,122 | | | | 73,334 | |
CNA Financial Corp. | | | 2,567 | | | | 82,606 | |
Hartford Financial Services Group, Inc. (The) | | | 4,399 | | | | 202,706 | |
Lincoln National Corp. | | | 3,101 | | | | 121,559 | |
Loews Corp. | | | 2,186 | | | | 83,636 | |
Markel Corp.* | | | 65 | | | | 57,952 | |
Marsh & McLennan Cos., Inc. | | | 3,093 | | | | 188,024 | |
MetLife, Inc. | | | 14,486 | | | | 636,515 | |
Principal Financial Group, Inc. | | | 3,373 | | | | 133,065 | |
Progressive Corp. (The) | | | 4,976 | | | | 174,857 | |
Prudential Financial, Inc. | | | 2,302 | | | | 166,251 | |
Torchmark Corp. | | | 1,169 | | | | 63,313 | |
Travelers Cos., Inc. (The) | | | 3,949 | | | | 460,888 | |
Unum Group | | | 1,498 | | | | 46,318 | |
W.R. Berkley Corp. | | | 1,006 | | | | 56,537 | |
| | | | | | | | |
| Total Insurance | | | | | | | 3,730,408 | |
| Internet & Catalog Retail – 0.4% | | | | | | | | |
Amazon.com, Inc.* | | | 59 | | | | 35,025 | |
Expedia, Inc. | | | 411 | | | | 44,314 | |
Netflix, Inc.* | | | 187 | | | | 19,117 | |
Priceline Group, Inc. (The)* | | | 235 | | | | 302,906 | |
TripAdvisor, Inc.* | | | 393 | | | | 26,134 | |
| | | | | | | | |
| Total Internet & Catalog Retail | | | | | | | 427,496 | |
| Internet Software & Services – 2.1% | | | | | | | | |
Akamai Technologies, Inc.* | | | 744 | | | | 41,344 | |
Alphabet, Inc. Class A* | | | 2,382 | | | | 1,817,228 | |
eBay, Inc.* | | | 6,670 | | | | 159,146 | |
Facebook, Inc. Class A* | | | 3,357 | | | | 383,034 | |
VeriSign, Inc.* | | | 493 | | | | 43,650 | |
| | | | | | | | |
Yahoo!, Inc.* | | | 1,061 | | | | 39,055 | |
| | | | | | | | |
| Total Internet Software & Services | | | | | | | 2,483,457 | |
| IT Services – 3.6% | | | | | | | | |
Alliance Data Systems Corp.* | | | 275 | | | | 60,500 | |
Automatic Data Processing, Inc. | | | 2,049 | | | | 183,816 | |
Broadridge Financial Solutions, Inc. | | | 634 | | | | 37,602 | |
Cognizant Technology Solutions Corp. Class A* | | | 3,287 | | | | 206,095 | |
Fidelity National Information Services, Inc. | | | 1,289 | | | | 81,607 | |
Fiserv, Inc.* | | | 959 | | | | 98,374 | |
FleetCor Technologies, Inc.* | | | 336 | | | | 49,980 | |
Gartner, Inc.* | | | 239 | | | | 21,355 | |
Global Payments, Inc. | | | 480 | | | | 31,344 | |
International Business Machines Corp. | | | 12,055 | | | | 1,825,730 | |
Jack Henry & Associates, Inc. | | | 321 | | | | 27,147 | |
MasterCard, Inc. Class A | | | 4,832 | | | | 456,624 | |
Paychex, Inc. | | | 1,708 | | | | 92,249 | |
Sabre Corp. | | | 1,010 | | | | 29,209 | |
Total System Services, Inc. | | | 785 | | | | 37,350 | |
Vantiv, Inc. Class A* | | | 368 | | | | 19,828 | |
Visa, Inc. Class A | | | 10,073 | | | | 770,383 | |
Western Union Co. (The) | | | 5,912 | | | | 114,042 | |
Xerox Corp. | | | 6,841 | | | | 76,346 | |
| | | | | | | | |
| Total IT Services | | | | | | | 4,219,581 | |
| Leisure Products – 0.1% | | | | | | | | |
Hasbro, Inc. | | | 815 | | | | 65,282 | |
Mattel, Inc. | | | 1,528 | | | | 51,371 | |
Polaris Industries, Inc. | | | 608 | | | | 59,876 | |
| | | | | | | | |
| Total Leisure Products | | | | | | | 176,529 | |
| Life Sciences Tools & Services – 0.4% | | | | | | | | |
Agilent Technologies, Inc. | | | 1,314 | | | | 52,363 | |
Illumina, Inc.* | | | 317 | | | | 51,388 | |
Mettler-Toledo International, Inc.* | | | 138 | | | | 47,577 | |
Quintiles Transnational Holdings, Inc.* | | | 709 | | | | 46,156 | |
Thermo Fisher Scientific, Inc. | | | 1,771 | | | | 250,756 | |
Waters Corp.* | | | 475 | | | | 62,662 | |
| | | | | | | | |
| Total Life Sciences Tools & Services | | | | | | | 510,902 | |
| Machinery – 1.6% | | | | | | | | |
Caterpillar, Inc. | | | 5,678 | | | | 434,594 | |
Cummins, Inc. | | | 2,325 | | | | 255,611 | |
Deere & Co. | | | 3,507 | | | | 270,004 | |
Dover Corp. | | | 1,277 | | | | 82,149 | |
Illinois Tool Works, Inc. | | | 2,498 | | | | 255,895 | |
PACCAR, Inc. | | | 4,182 | | | | 228,714 | |
Parker-Hannifin Corp. | | | 1,244 | | | | 138,184 | |
Snap-on, Inc. | | | 357 | | | | 56,045 | |
Stanley Black & Decker, Inc. | | | 949 | | | | 99,844 | |
Wabtec Corp. | | | 652 | | | | 51,697 | |
Xylem, Inc. | | | 1,006 | | | | 41,145 | |
| | | | | | | | |
| Total Machinery | | | | | | | 1,913,882 | |
| Media – 3.9% | | | | | | | | |
Cablevision Systems Corp. Class A | | | 490 | | | | 16,170 | |
CBS Corp. Class B Non-Voting Shares | | | 3,989 | | | | 219,754 | |
See Notes to Financial Statements.
| | |
| 26 | | WisdomTree Domestic Earnings and Dividend Funds |
Schedule of Investments (continued)
WisdomTree Earnings 500 Fund (EPS)
March 31, 2016
| | | | | | | | |
| Investments | | Shares | | | Value | |
| | | | | | | | |
Comcast Corp. Class A | | | 17,104 | | | $ | 1,044,712 | |
DISH Network Corp. Class A* | | | 2,488 | | | | 115,095 | |
Interpublic Group of Cos., Inc. (The) | | | 2,685 | | | | 61,621 | |
Omnicom Group, Inc. | | | 1,753 | | | | 145,902 | |
Sirius XM Holdings, Inc.* | | | 16,965 | | | | 67,012 | |
Time Warner Cable, Inc. | | | 1,282 | | | | 262,323 | |
Time Warner, Inc. | | | 6,793 | | | | 492,832 | |
Twenty-First Century Fox, Inc. Class A | | | 35,562 | | | | 991,469 | |
Viacom, Inc. Class B | | | 5,559 | | | | 229,475 | |
Walt Disney Co. (The) | | | 9,420 | | | | 935,500 | |
| | | | | | | | |
| Total Media | | | | | | | 4,581,865 | |
| Metals & Mining – 0.2% | | | | | | | | |
Alcoa, Inc. | | | 9,636 | | | | 92,313 | |
Newmont Mining Corp. | | | 3,008 | | | | 79,952 | |
Nucor Corp. | | | 1,863 | | | | 88,120 | |
| | | | | | | | |
| Total Metals & Mining | | | | | | | 260,385 | |
| Multi-Utilities – 1.1% | | | | | | | | |
Alliant Energy Corp. | | | 879 | | | | 65,292 | |
Ameren Corp. | | | 1,653 | | | | 82,815 | |
CenterPoint Energy, Inc. | | | 2,470 | | | | 51,672 | |
CMS Energy Corp. | | | 1,792 | | | | 76,052 | |
Consolidated Edison, Inc. | | | 2,564 | | | | 196,454 | |
Dominion Resources, Inc. | | | 2,521 | | | | 189,378 | |
DTE Energy Co. | | | 1,457 | | | | 132,092 | |
Public Service Enterprise Group, Inc. | | | 2,599 | | | | 122,517 | |
SCANA Corp. | | | 1,162 | | | | 81,514 | |
Sempra Energy | | | 1,633 | | | | 169,914 | |
WEC Energy Group, Inc. | | | 1,474 | | | | 88,543 | |
| | | | | | | | |
| Total Multi-Utilities | | | | | | | 1,256,243 | |
| Multiline Retail – 0.8% | | | | | | | | |
Dollar General Corp. | | | 1,921 | | | | 164,438 | |
Dollar Tree, Inc.* | | | 527 | | | | 43,456 | |
Kohl’s Corp. | | | 1,923 | | | | 89,631 | |
Macy’s, Inc. | | | 4,310 | | | | 190,028 | |
Nordstrom, Inc.(a) | | | 1,453 | | | | 83,126 | |
Target Corp. | | | 4,848 | | | | 398,893 | |
| | | | | | | | |
| Total Multiline Retail | | | | | | | 969,572 | |
| Oil, Gas & Consumable Fuels – 4.9% | | | | | | | | |
Chevron Corp. | | | 9,375 | | | | 894,375 | |
Concho Resources, Inc.* | | | 262 | | | | 26,473 | |
EQT Corp. | | | 607 | | | | 40,827 | |
Exxon Mobil Corp. | | | 33,304 | | | | 2,783,881 | |
HollyFrontier Corp. | | | 1,628 | | | | 57,501 | |
Kinder Morgan, Inc. | | | 7,912 | | | | 141,308 | |
Marathon Petroleum Corp. | | | 8,407 | | | | 312,572 | |
Phillips 66 | | | 6,766 | | | | 585,868 | |
Pioneer Natural Resources Co. | | | 659 | | | | 92,748 | |
Spectra Energy Corp. | | | 4,078 | | | | 124,787 | |
Tesoro Corp. | | | 1,939 | | | | 166,773 | |
Valero Energy Corp. | | | 8,670 | | | | 556,094 | |
Williams Cos., Inc. (The) | | | 1,689 | | | | 27,142 | |
| | | | | | | | |
| Total Oil, Gas & Consumable Fuels | | | | | | | 5,810,349 | |
| Personal Products – 0.1% | | | | | | | | |
Estee Lauder Cos., Inc. (The) Class A | | | 1,715 | | | | 161,742 | |
| Pharmaceuticals – 3.2% | | | | | | | | |
Bristol-Myers Squibb Co. | | | 3,751 | | | | 239,614 | |
Eli Lilly & Co. | | | 3,272 | | | | 235,617 | |
Johnson & Johnson | | | 17,719 | | | | 1,917,196 | |
Merck & Co., Inc. | | | 8,022 | | | | 424,444 | |
Pfizer, Inc. | | | 32,086 | | | | 951,029 | |
Zoetis, Inc. | | | 1,228 | | | | 54,437 | |
| | | | | | | | |
| Total Pharmaceuticals | | | | | | | 3,822,337 | |
| Professional Services – 0.2% | | | | | | | | |
Equifax, Inc. | | | 503 | | | | 57,488 | |
IHS, Inc. Class A* | | | 216 | | | | 26,818 | |
ManpowerGroup, Inc. | | | 604 | | | | 49,178 | |
Robert Half International, Inc. | | | 874 | | | | 40,711 | |
Verisk Analytics, Inc.* | | | 777 | | | | 62,098 | |
| | | | | | | | |
| Total Professional Services | | | | | | | 236,293 | |
| Real Estate Investment Trusts (REITs) – 1.8% | | | | | | | | |
Alexandria Real Estate Equities, Inc. | | | 72 | | | | 6,544 | |
American Tower Corp. | | | 761 | | | | 77,904 | |
AvalonBay Communities, Inc. | | | 494 | | | | 93,959 | |
Boston Properties, Inc. | | | 588 | | | | 74,723 | |
Brixmor Property Group, Inc. | | | 736 | | | | 18,856 | |
Camden Property Trust | | | 568 | | | | 47,763 | |
Crown Castle International Corp. | | | 673 | | | | 58,215 | |
Digital Realty Trust, Inc. | | | 368 | | | | 32,564 | |
Duke Realty Corp. | | | 875 | | | | 19,723 | |
Equity Residential | | | 1,350 | | | | 101,290 | |
Essex Property Trust, Inc. | | | 75 | | | | 17,540 | |
Extra Space Storage, Inc. | | | 306 | | | | 28,599 | |
Federal Realty Investment Trust | | | 141 | | | | 22,003 | |
General Growth Properties, Inc. | | | 4,922 | | | | 146,331 | |
HCP, Inc. | | | 951 | | | | 30,984 | |
Host Hotels & Resorts, Inc. | | | 4,849 | | | | 80,978 | |
Kimco Realty Corp. | | | 2,475 | | | | 71,230 | |
Macerich Co. (The) | | | 2,337 | | | | 185,184 | |
Mid-America Apartment Communities, Inc. | | | 426 | | | | 43,541 | |
Prologis, Inc. | | | 3,337 | | | | 147,429 | |
Public Storage | | | 528 | | | | 145,638 | |
Realty Income Corp. | | | 597 | | | | 37,318 | |
Simon Property Group, Inc. | | | 1,081 | | | | 224,513 | |
SL Green Realty Corp. | | | 225 | | | | 21,798 | |
UDR, Inc. | | | 756 | | | | 29,129 | |
Ventas, Inc. | | | 863 | | | | 54,334 | |
Vornado Realty Trust | | | 595 | | | | 56,186 | |
W.P. Carey, Inc. | | | 289 | | | | 17,987 | |
Welltower, Inc. | | | 1,652 | | | | 114,550 | |
Weyerhaeuser Co. | | | 2,783 | | | | 86,217 | |
| | | | | | | | |
| Total Real Estate Investment Trusts (REITs) | | | | | | | 2,093,030 | |
| Real Estate Management & Development – 0.1% | | | | | | | | |
CBRE Group, Inc. Class A* | | | 1,967 | | | | 56,689 | |
Jones Lang LaSalle, Inc. | | | 324 | | | | 38,012 | |
| | | | | | | | |
| Total Real Estate Management & Development | | | | | | | 94,701 | |
See Notes to Financial Statements.
| | | | |
| WisdomTree Domestic Earnings and Dividend Funds | | | 27 | |
Schedule of Investments (continued)
WisdomTree Earnings 500 Fund (EPS)
March 31, 2016
| | | | | | | | |
| Investments | | Shares | | | Value | |
| | | | | | | | |
| Road & Rail – 1.0% | | | | | | | | |
AMERCO | | | 129 | | | $ | 46,093 | |
CSX Corp. | | | 9,436 | | | | 242,977 | |
JB Hunt Transport Services, Inc. | | | 676 | | | | 56,946 | |
Kansas City Southern | | | 768 | | | | 65,626 | |
Norfolk Southern Corp. | | | 2,311 | | | | 192,391 | |
Union Pacific Corp. | | | 7,855 | | | | 624,865 | |
| | | | | | | | |
| Total Road & Rail | | | | | | | 1,228,898 | |
| Semiconductors & Semiconductor Equipment – 3.0% | | | | | |
Analog Devices, Inc. | | | 1,489 | | | | 88,134 | |
Applied Materials, Inc. | | | 9,053 | | | | 191,743 | |
Intel Corp. | | | 40,704 | | | | 1,316,774 | |
KLA-Tencor Corp. | | | 821 | | | | 59,777 | |
Lam Research Corp. | | | 1,293 | | | | 106,802 | |
Linear Technology Corp. | | | 1,377 | | | | 61,359 | |
Maxim Integrated Products, Inc. | | | 384 | | | | 14,124 | |
Microchip Technology, Inc. | | | 1,028 | | | | 49,550 | |
Micron Technology, Inc.* | | | 24,808 | | | | 259,740 | |
NVIDIA Corp. | | | 2,307 | | | | 82,198 | |
Qorvo, Inc.* | | | 186 | | | | 9,376 | |
QUALCOMM, Inc. | | | 15,980 | | | | 817,217 | |
Skyworks Solutions, Inc. | | | 1,169 | | | | 91,065 | |
Texas Instruments, Inc. | | | 6,412 | | | | 368,177 | |
Xilinx, Inc. | | | 1,515 | | | | 71,856 | |
| | | | | | | | |
| Total Semiconductors & Semiconductor Equipment | | | | 3,587,892 | |
| Software – 3.4% | | | | | | | | |
Activision Blizzard, Inc. | | | 3,573 | | | | 120,910 | |
Adobe Systems, Inc.* | | | 636 | | | | 59,657 | |
ANSYS, Inc.* | | | 358 | | | | 32,027 | |
CA, Inc. | | | 3,368 | | | | 103,701 | |
Cadence Design Systems, Inc.* | | | 1,290 | | | | 30,418 | |
CDK Global, Inc. | | | 492 | | | | 22,903 | |
Citrix Systems, Inc.* | | | 498 | | | | 39,133 | |
Electronic Arts, Inc.* | | | 1,504 | | | | 99,429 | |
Intuit, Inc. | | | 648 | | | | 67,398 | |
Microsoft Corp. | | | 34,450 | | | | 1,902,674 | |
Oracle Corp. | | | 31,377 | | | | 1,283,633 | |
Red Hat, Inc.* | | | 330 | | | | 24,588 | |
SS&C Technologies Holdings, Inc. | | | 101 | | | | 6,405 | |
Symantec Corp. | | | 4,269 | | | | 78,464 | |
Synopsys, Inc.* | | | 611 | | | | 29,597 | |
VMware, Inc. Class A*(a) | | | 1,922 | | | | 100,540 | |
| | | | | | | | |
| Total Software | | | | | | | 4,001,477 | |
| Specialty Retail – 2.4% | | | | | | | | |
Advance Auto Parts, Inc. | | | 398 | | | | 63,815 | |
AutoNation, Inc.* | | | 890 | | | | 41,545 | |
AutoZone, Inc.* | | | 189 | | | | 150,574 | |
Bed Bath & Beyond, Inc.* | | | 2,042 | | | | 101,365 | |
Best Buy Co., Inc. | | | 3,329 | | | | 107,993 | |
CarMax, Inc.* | | | 1,299 | | | | 66,379 | |
Foot Locker, Inc. | | | 1,075 | | | | 69,338 | |
Gap, Inc. (The) | | | 3,695 | | | | 108,633 | |
| | | | | | | | |
Home Depot, Inc. (The) | | | 6,294 | | | | 839,809 | |
L Brands, Inc. | | | 1,412 | | | | 123,988 | |
Lowe’s Cos., Inc. | | | 4,855 | | | | 367,766 | |
O’Reilly Automotive, Inc.* | | | 452 | | | | 123,694 | |
Ross Stores, Inc. | | | 2,268 | | | | 131,317 | |
Staples, Inc. | | | 3,951 | | | | 43,580 | |
Tiffany & Co. | | | 716 | | | | 52,540 | |
TJX Cos., Inc. (The) | | | 3,935 | | | | 308,307 | |
Tractor Supply Co. | | | 595 | | | | 53,824 | |
Ulta Salon Cosmetics & Fragrance, Inc.* | | | 210 | | | | 40,685 | |
| | | | | | | | |
| Total Specialty Retail | | | | | | | 2,795,152 | |
| Technology Hardware, Storage & Peripherals – 6.2% | | | | | |
Apple, Inc. | | | 57,509 | | | | 6,267,906 | |
EMC Corp. | | | 11,312 | | | | 301,465 | |
HP, Inc. | | | 44,623 | | | | 549,755 | |
NetApp, Inc. | | | 1,797 | | | | 49,040 | |
SanDisk Corp. | | | 768 | | | | 58,430 | |
Western Digital Corp. | | | 2,514 | | | | 118,761 | |
| | | | | | | | |
| Total Technology Hardware, Storage & Peripherals | | | | | | | 7,345,357 | |
| Textiles, Apparel & Luxury Goods – 0.7% | | | | | | | | |
Coach, Inc. | | | 1,595 | | | | 63,944 | |
Hanesbrands, Inc. | | | 1,723 | | | | 48,830 | |
NIKE, Inc. Class B | | | 6,732 | | | | 413,816 | |
PVH Corp. | | | 867 | | | | 85,885 | |
Ralph Lauren Corp. | | | 592 | | | | 56,986 | |
Under Armour, Inc. Class A* | | | 359 | | | | 30,454 | |
VF Corp. | | | 2,323 | | | | 150,437 | |
| | | | | | | | |
| Total Textiles, Apparel & Luxury Goods | | | | | | | 850,352 | |
| Thrifts & Mortgage Finance – 0.1% | | | | | | | | |
New York Community Bancorp, Inc. | | | 3,742 | | | | 59,498 | |
| Tobacco – 1.7% | | | | | | | | |
Altria Group, Inc. | | | 11,324 | | | | 709,562 | |
Philip Morris International, Inc. | | | 10,201 | | | | 1,000,820 | |
Reynolds American, Inc. | | | 4,888 | | | | 245,915 | |
| | | | | | | | |
| Total Tobacco | | | | | | | 1,956,297 | |
| Trading Companies & Distributors – 0.2% | | | | | | | | |
Fastenal Co.(a) | | | 1,567 | | | | 76,783 | |
United Rentals, Inc.* | | | 1,072 | | | | 66,667 | |
W.W. Grainger, Inc. | | | 481 | | | | 112,280 | |
| | | | | | | | |
| Total Trading Companies & Distributors | | | | | | | 255,730 | |
| Water Utilities – 0.1% | | | | | | | | |
American Water Works Co., Inc. | | | 1,044 | | | | 71,963 | |
| Wireless Telecommunication Services – 0.1% | | | | | | | | |
T-Mobile U.S., Inc.* | | | 1,630 | | | | 62,429 | |
TOTAL COMMON STOCKS
(Cost: $107,897,616) | | | | | | | 117,931,203 | |
| EXCHANGE-TRADED FUND – 0.2% | | | | | | | | |
| United States – 0.2% | | | | | | | | |
| WisdomTree High Dividend Fund(a)(b) (Cost: $265,268) | | | 4,670 | | | | 295,518 | |
See Notes to Financial Statements.
| | |
| 28 | | WisdomTree Domestic Earnings and Dividend Funds |
Schedule of Investments (concluded)
WisdomTree Earnings 500 Fund (EPS)
March 31, 2016
| | | | | | | | |
| Investments | | Shares | | | Value | |
| | | | | | | | |
| INVESTMENT OF CASH COLLATERAL FOR SECURITIES LOANED – 0.3% | |
| United States – 0.3% | | | | | | | | |
State Street Navigator Securities Lending Prime Portfolio, 0.50%(c) (Cost: $360,227)(d) | | | 360,227 | | | $ | 360,227 | |
TOTAL INVESTMENTS IN SECURITIES – 100.1%
(Cost: $108,523,111) | | | | | | | 118,586,948 | |
Liabilities in Excess of Cash and Other Assets – (0.1)% | | | | (175,286 | ) |
| | | | | | | | |
| NET ASSETS – 100.0% | | | | | | $ | 118,411,662 | |
| * | Non-income producing security. |
| (a) | Security, or portion thereof, was on loan at March 31, 2016 (See Note 2). |
| (b) | Affiliated company (See Note 3). |
| (c) | Rate shown represents annualized 7-day yield as of March 31, 2016. |
| (d) | At March 31, 2016, the total market value of the Fund’s securities on loan was $352,445 and the total market value of the collateral held by the Fund was $360,227. |
See Notes to Financial Statements.
| | | | |
| WisdomTree Domestic Earnings and Dividend Funds | | | 29 | |
Schedule of Investments
WisdomTree High Dividend Fund (DHS)
March 31, 2016
| | | | | | | | |
| Investments | | Shares | | | Value | |
| | | | | | | | |
| COMMON STOCKS – 99.4% | | | | | | | | |
| United States – 99.4% | | | | | | | | |
| Aerospace & Defense – 0.8% | | | | | | | | |
American Science & Engineering, Inc. | | | 1,546 | | | $ | 42,809 | |
Lockheed Martin Corp. | | | 38,568 | | | | 8,542,812 | |
| | | | | | | | |
| Total Aerospace & Defense | | | | | | | 8,585,621 | |
| Auto Components – 0.0% | | | | | | | | |
Superior Industries International, Inc. | | | 4,569 | | | | 100,884 | |
| Automobiles – 1.8% | | | | | | | | |
Ford Motor Co. | | | 708,132 | | | | 9,559,782 | |
General Motors Co. | | | 268,198 | | | | 8,429,463 | |
| | | | | | | | |
| Total Automobiles | | | | | | | 17,989,245 | |
| Banks – 0.8% | | | | | | | | |
American National Bankshares, Inc. | | | 1,369 | | | | 34,677 | |
Arrow Financial Corp. | | | 2,697 | | | | 71,659 | |
Banc of California, Inc. | | | 6,952 | | | | 121,660 | |
Bridge Bancorp, Inc. | | | 1,650 | | | | 50,275 | |
Brookline Bancorp, Inc. | | | 9,336 | | | | 102,789 | |
Chemical Financial Corp. | | | 5,201 | | | | 185,624 | |
City Holding Co. | | | 2,332 | | | | 111,423 | |
CNB Financial Corp. | | | 1,967 | | | | 34,600 | |
Community Bank System, Inc. | | | 5,382 | | | | 205,646 | |
Community Trust Bancorp, Inc. | | | 2,619 | | | | 92,503 | |
Cullen/Frost Bankers, Inc.(a) | | | 8,476 | | | | 467,112 | |
Financial Institutions, Inc. | | | 2,204 | | | | 64,070 | |
First Bancorp, Inc. | | | 1,897 | | | | 37,010 | |
First Busey Corp. | | | 4,348 | | | | 89,047 | |
First Commonwealth Financial Corp. | | | 13,682 | | | | 121,223 | |
First Financial Bancorp | | | 8,887 | | | | 161,566 | |
First Niagara Financial Group, Inc. | | | 44,951 | | | | 435,126 | |
FirstMerit Corp. | | | 25,353 | | | | 533,681 | |
Flushing Financial Corp. | | | 3,607 | | | | 77,983 | |
FNB Corp. | | | 26,602 | | | | 346,092 | |
Hancock Holding Co. | | | 12,441 | | | | 285,645 | |
Merchants Bancshares, Inc. | | | 931 | | | | 27,688 | |
National Penn Bancshares, Inc. | | | 21,447 | | | | 228,196 | |
NBT Bancorp, Inc. | | | 5,745 | | | | 154,828 | |
Old National Bancorp | | | 18,129 | | | | 220,993 | |
PacWest Bancorp | | | 22,437 | | | | 833,535 | |
Park National Corp.(a) | | | 2,591 | | | | 233,190 | |
Penns Woods Bancorp, Inc.(a) | | | 695 | | | | 26,785 | |
People’s United Financial, Inc. | | | 53,637 | | | | 854,437 | |
Peoples Financial Services Corp.(a) | | | 1,000 | | | | 37,200 | |
Republic Bancorp, Inc. Class A | | | 2,690 | | | | 69,483 | |
Sandy Spring Bancorp, Inc. | | | 3,885 | | | | 108,120 | |
Southside Bancshares, Inc. | | | 3,795 | | | | 98,936 | |
Tompkins Financial Corp. | | | 1,827 | | | | 116,928 | |
Trustmark Corp. | | | 11,041 | | | | 254,274 | |
Umpqua Holdings Corp. | | | 35,751 | | | | 567,011 | |
United Bankshares, Inc. | | | 10,190 | | | | 373,973 | |
Univest Corp. of Pennsylvania | | | 2,844 | | | | 55,486 | |
Valley National Bancorp | | | 43,081 | | | | 410,993 | |
Washington Trust Bancorp, Inc. | | | 2,893 | | | | 107,967 | |
| | | | | | | | |
West Bancorp, Inc. | | | 2,736 | | | | 49,877 | |
Westamerica Bancorp(a) | | | 3,934 | | | | 191,625 | |
| | | | | | | | |
| Total Banks | | | | | | | 8,650,936 | |
| Beverages – 2.5% | | | | | | | | |
Coca-Cola Co. (The) | | | 561,346 | | | | 26,040,841 | |
| Biotechnology – 1.6% | | | | | | | | |
AbbVie, Inc. | | | 285,116 | | | | 16,285,826 | |
PDL BioPharma, Inc. | | | 84,101 | | | | 280,056 | |
| | | | | | | | |
| Total Biotechnology | | | | | | | 16,565,882 | |
| Capital Markets – 0.3% | | | | | | | | |
Arlington Asset Investment Corp. Class A(a) | | | 13,675 | | | | 171,348 | |
Artisan Partners Asset Management, Inc. Class A | | | 11,224 | | | | 346,148 | |
BGC Partners, Inc. Class A | | | 54,389 | | | | 492,220 | |
Cohen & Steers, Inc. | | | 6,095 | | | | 237,217 | |
Federated Investors, Inc. Class B | | | 15,663 | | | | 451,878 | |
Greenhill & Co., Inc. | | | 8,371 | | | | 185,836 | |
Moelis & Co. Class A | | | 3,469 | | | | 97,930 | |
Virtu Financial, Inc. Class A | | | 6,190 | | | | 136,861 | |
Waddell & Reed Financial, Inc. Class A | | | 19,765 | | | | 465,268 | |
Westwood Holdings Group, Inc. | | | 1,555 | | | | 91,201 | |
| | | | | | | | |
| Total Capital Markets | | | | | | | 2,675,907 | |
| Chemicals – 1.1% | | | | | | | | |
Axiall Corp. | | | 11,431 | | | | 249,653 | |
Dow Chemical Co. (The) | | | 164,984 | | | | 8,391,086 | |
Huntsman Corp. | | | 49,138 | | | | 653,536 | |
Innophos Holdings, Inc. | | | 5,014 | | | | 154,983 | |
Kronos Worldwide, Inc.(a) | | | 51,331 | | | | 293,613 | |
Mosaic Co. (The) | | | 51,894 | | | | 1,401,138 | |
Olin Corp. | | | 27,990 | | | | 486,186 | |
| | | | | | | | |
| Total Chemicals | | | | | | | 11,630,195 | |
| Commercial Services & Supplies – 0.7% | | | | | | | | |
Brady Corp. Class A | | | 6,933 | | | | 186,082 | |
CECO Environmental Corp. | | | 5,102 | | | | 31,684 | |
Covanta Holding Corp. | | | 37,986 | | | | 640,444 | |
Ennis, Inc. | | | 3,931 | | | | 76,851 | |
KAR Auction Services, Inc. | | | 16,223 | | | | 618,745 | |
McGrath RentCorp | | | 3,813 | | | | 95,630 | |
Pitney Bowes, Inc. | | | 31,317 | | | | 674,568 | |
Quad/Graphics, Inc. | | | 18,661 | | | | 241,473 | |
R.R. Donnelley & Sons Co. | | | 59,880 | | | | 982,032 | |
Waste Management, Inc. | | | 55,228 | | | | 3,258,452 | |
West Corp. | | | 13,334 | | | | 304,282 | |
| | | | | | | | |
| Total Commercial Services & Supplies | | | | | | | 7,110,243 | |
| Communications Equipment – 1.9% | | | | | | | | |
Cisco Systems, Inc. | | | 673,755 | | | | 19,181,805 | |
Comtech Telecommunications Corp. | | | 4,019 | | | | 93,924 | |
| | | | | | | | |
| Total Communications Equipment | | | | | | | 19,275,729 | |
| Consumer Finance – 0.1% | | | | | | | | |
Navient Corp. | | | 77,922 | | | | 932,726 | |
See Notes to Financial Statements.
| | |
| 30 | | WisdomTree Domestic Earnings and Dividend Funds |
Schedule of Investments (continued)
WisdomTree High Dividend Fund (DHS)
March 31, 2016
| | | | | | | | |
| Investments | | Shares | | | Value | |
| | | | | | | | |
| Containers & Packaging – 0.5% | | | | | | | | |
Greif, Inc. Class B | | | 4,635 | | | $ | 216,918 | |
International Paper Co. | | | 78,955 | | | | 3,240,313 | |
Myers Industries, Inc. | | | 4,638 | | | | 59,645 | |
Packaging Corp. of America | | | 13,681 | | | | 826,332 | |
Sonoco Products Co. | | | 13,895 | | | | 674,880 | |
| | | | | | | | |
| Total Containers & Packaging | | | | | | | 5,018,088 | |
| Distributors – 0.0% | | | | | | | | |
Weyco Group, Inc. | | | 1,389 | | | | 36,975 | |
| Diversified Consumer Services – 0.0% | | | | | | | | |
Capella Education Co. | | | 1,429 | | | | 75,223 | |
| Diversified Financial Services – 0.0% | | | | | | | | |
Marlin Business Services Corp. | | | 1,719 | | | | 24,599 | |
| Diversified Telecommunication Services – 10.8% | | | | | |
AT&T, Inc. | | | 1,405,633 | | | | 55,058,645 | |
CenturyLink, Inc. | | | 196,891 | | | | 6,292,636 | |
Cogent Communications Holdings, Inc. | | | 8,430 | | | | 329,023 | |
Consolidated Communications Holdings, Inc. | | | 15,733 | | | | 405,282 | |
Frontier Communications Corp. | | | 443,244 | | | | 2,477,734 | |
IDT Corp. Class B | | | 6,224 | | | | 97,032 | |
Inteliquent, Inc. | | | 5,138 | | | | 82,465 | |
Verizon Communications, Inc. | | | 847,960 | | | | 45,857,677 | |
Windstream Holdings, Inc.(a) | | | 41,355 | | | | 317,606 | |
| | | | | | | | |
| Total Diversified Telecommunication Services | | | | 110,918,100 | |
| Electric Utilities – 6.7% | | | | | | | | |
ALLETE, Inc. | | | 8,467 | | | | 474,745 | |
American Electric Power Co., Inc. | | | 83,351 | | | | 5,534,506 | |
Cleco Corp. | | | 7,681 | | | | 424,068 | |
Duke Energy Corp. | | | 138,277 | | | | 11,156,188 | |
El Paso Electric Co. | | | 5,655 | | | | 259,451 | |
Empire District Electric Co. (The) | | | 7,677 | | | | 253,725 | |
Entergy Corp. | | | 38,126 | | | | 3,022,629 | |
Eversource Energy | | | 44,793 | | | | 2,613,224 | |
Exelon Corp. | | | 181,800 | | | | 6,519,348 | |
FirstEnergy Corp. | | | 79,982 | | | | 2,876,953 | |
Great Plains Energy, Inc. | | | 25,595 | | | | 825,439 | |
Hawaiian Electric Industries, Inc. | | | 19,436 | | | | 629,726 | |
IDACORP, Inc. | | | 6,378 | | | | 475,735 | |
NextEra Energy, Inc. | | | 60,220 | | | | 7,126,435 | |
OGE Energy Corp. | | | 36,542 | | | | 1,046,197 | |
Otter Tail Corp. | | | 7,870 | | | | 233,109 | |
PG&E Corp. | | | 71,341 | | | | 4,260,485 | |
Pinnacle West Capital Corp. | | | 18,456 | | | | 1,385,492 | |
Portland General Electric Co. | | | 12,052 | | | | 475,933 | |
PPL Corp. | | | 128,081 | | | | 4,876,044 | |
Southern Co. (The) | | | 183,472 | | | | 9,491,007 | |
Westar Energy, Inc. | | | 20,520 | | | | 1,017,997 | |
Xcel Energy, Inc. | | | 76,866 | | | | 3,214,536 | |
| | | | | | | | |
| Total Electric Utilities | | | | | | | 68,192,972 | |
| Electrical Equipment – 0.6% | | | | | | | | |
Emerson Electric Co. | | | 113,098 | | | | 6,150,269 | |
General Cable Corp. | | | 12,174 | | | | 148,645 | |
| | | | | | | | |
| Total Electrical Equipment | | | | | | | 6,298,914 | |
| | | | | | | | |
| Electronic Equipment, Instruments & Components – 0.0% | | | | | |
AVX Corp. | | | 23,428 | | | | 294,490 | |
Daktronics, Inc. | | | 6,698 | | | | 52,914 | |
Electro Rent Corp. | | | 5,521 | | | | 51,125 | |
| | | | | | | | |
| Total Electronic Equipment, Instruments & Components | | | | 398,529 | |
| Energy Equipment & Services – 0.4% | | | | | | | | |
Archrock, Inc. | | | 22,023 | | | | 176,184 | |
Bristow Group, Inc. | | | 7,437 | | | | 140,708 | |
Helmerich & Payne, Inc.(a) | | | 23,696 | | | | 1,391,429 | |
National Oilwell Varco, Inc. | | | 85,684 | | | | 2,664,773 | |
| | | | | | | | |
| Total Energy Equipment & Services | | | | | | | 4,373,094 | |
| Food & Staples Retailing – 3.3% | | | | | | | | |
Sysco Corp. | | | 70,554 | | | | 3,296,988 | |
Village Super Market, Inc. Class A | | | 2,483 | | | | 59,989 | |
Wal-Mart Stores, Inc. | | | 437,530 | | | | 29,966,430 | |
| | | | | | | | |
| Total Food & Staples Retailing | | | | | | | 33,323,407 | |
| Food Products – 2.4% | | | | | | | | |
Archer-Daniels-Midland Co. | | | 80,590 | | | | 2,926,223 | |
B&G Foods, Inc. | | | 9,707 | | | | 337,901 | |
Cal-Maine Foods, Inc.(a) | | | 15,306 | | | | 794,535 | |
General Mills, Inc. | | | 74,654 | | | | 4,729,331 | |
Kellogg Co. | | | 41,679 | | | | 3,190,527 | |
Kraft Heinz Co. (The) | | | 165,379 | | | | 12,992,174 | |
| | | | | | | | |
| Total Food Products | | | | | | | 24,970,691 | |
| Gas Utilities – 0.4% | | | | | | | | |
AGL Resources, Inc. | | | 16,198 | | | | 1,055,138 | |
Laclede Group, Inc. (The) | | | 6,278 | | | | 425,334 | |
National Fuel Gas Co. | | | 14,664 | | | | 733,933 | |
New Jersey Resources Corp. | | | 12,382 | | | | 451,076 | |
Northwest Natural Gas Co. | | | 4,412 | | | | 237,586 | |
Questar Corp. | | | 32,309 | | | | 801,263 | |
South Jersey Industries, Inc. | | | 13,913 | | | | 395,825 | |
WGL Holdings, Inc. | | | 6,442 | | | | 466,208 | |
| | | | | | | | |
| Total Gas Utilities | | | | | | | 4,566,363 | |
| Health Care Equipment & Supplies – 0.0% | | | | | | | | |
Meridian Bioscience, Inc. | | | 7,035 | | | | 144,991 | |
| Health Care Providers & Services – 0.0% | | | | | | | | |
Kindred Healthcare, Inc. | | | 12,813 | | | | 158,241 | |
| Health Care Technology – 0.0% | | | | | | | | |
Computer Programs & Systems, Inc.(a) | | | 2,711 | | | | 141,297 | |
| Hotels, Restaurants & Leisure – 3.0% | | | | | | | | |
Bob Evans Farms, Inc. | | | 3,019 | | | | 140,957 | |
Cracker Barrel Old Country Store, Inc.(a) | | | 3,510 | | | | 535,872 | |
Darden Restaurants, Inc. | | | 20,112 | | | | 1,333,426 | |
DineEquity, Inc. | | | 3,387 | | | | 316,447 | |
Interval Leisure Group, Inc.(a) | | | 7,018 | | | | 101,340 | |
Las Vegas Sands Corp. | | | 207,125 | | | | 10,704,220 | |
McDonald’s Corp. | | | 116,284 | | | | 14,614,573 | |
SeaWorld Entertainment, Inc.(a) | | | 17,543 | | | | 369,456 | |
Six Flags Entertainment Corp. | | | 17,488 | | | | 970,409 | |
Speedway Motorsports, Inc. | | | 5,085 | | | | 100,836 | |
See Notes to Financial Statements.
| | | | |
| WisdomTree Domestic Earnings and Dividend Funds | | | 31 | |
Schedule of Investments (continued)
WisdomTree High Dividend Fund (DHS)
March 31, 2016
| | | | | | | | |
| Investments | | Shares | | | Value | |
| | | | | | | | |
Wynn Resorts Ltd.(a) | | | 13,380 | | | $ | 1,250,093 | |
| | | | | | | | |
| Total Hotels, Restaurants & Leisure | | | | | | | 30,437,629 | |
| Household Durables – 0.1% | | | | | | | | |
MDC Holdings, Inc. | | | 8,060 | | | | 201,983 | |
Tupperware Brands Corp. | | | 10,408 | | | | 603,456 | |
| | | | | | | | |
| Total Household Durables | | | | | | | 805,439 | |
| Household Products – 3.7% | | | | | | | | |
Kimberly-Clark Corp. | | | 44,336 | | | | 5,963,635 | |
Orchids Paper Products Co. | | | 2,470 | | | | 67,950 | |
Procter & Gamble Co. (The) | | | 383,343 | | | | 31,552,962 | |
| | | | | | | | |
| Total Household Products | | | | | | | 37,584,547 | |
| Independent Power & Renewable Electricity Producers – 0.3% | | | | | |
AES Corp. | | | 124,111 | | | | 1,464,510 | |
NRG Energy, Inc. | | | 74,477 | | | | 968,946 | |
NRG Yield, Inc. Class A | | | 10,230 | | | | 138,821 | |
Pattern Energy Group, Inc. | | | 23,703 | | | | 452,016 | |
TerraForm Global, Inc. Class A*(a) | | | 50,235 | | | | 119,559 | |
| | | | | | | | |
| Total Independent Power & Renewable Electricity Producers | | | | 3,143,852 | |
| Industrial Conglomerates – 3.7% | | | | | | | | |
General Electric Co. | | | 1,185,795 | | | | 37,696,423 | |
Raven Industries, Inc. | | | 4,786 | | | | 76,672 | |
| | | | | | | | |
| Total Industrial Conglomerates | | | | | | | 37,773,095 | |
| Insurance – 1.0% | | | | | | | | |
American National Insurance Co. | | | 3,699 | | | | 427,235 | |
Arthur J. Gallagher & Co. | | | 25,010 | | | | 1,112,445 | |
Baldwin & Lyons, Inc. Class B | | | 2,599 | | | | 63,961 | |
Cincinnati Financial Corp. | | | 21,060 | | | | 1,376,482 | |
Donegal Group, Inc. Class A | | | 3,263 | | | | 46,922 | |
EMC Insurance Group, Inc. | | | 3,362 | | | | 86,235 | |
Erie Indemnity Co. Class A | | | 5,374 | | | | 499,728 | |
HCI Group, Inc. | | | 1,538 | | | | 51,215 | |
Horace Mann Educators Corp. | | | 5,650 | | | | 179,049 | |
Mercury General Corp. | | | 11,636 | | | | 645,798 | |
Old Republic International Corp. | | | 44,020 | | | | 804,686 | |
Prudential Financial, Inc. | | | 64,234 | | | | 4,638,979 | |
Safety Insurance Group, Inc. | | | 3,616 | | | | 206,329 | |
| | | | | | | | |
| Total Insurance | | | | | | | 10,139,064 | |
| Internet & Catalog Retail – 0.0% | | | | | | | | |
Nutrisystem, Inc. | | | 3,990 | | | | 83,271 | |
PetMed Express, Inc.(a) | | | 4,865 | | | | 87,132 | |
| | | | | | | | |
| Total Internet & Catalog Retail | | | | | | | 170,403 | |
| IT Services – 2.7% | | | | | | | | |
International Business Machines Corp. | | | 154,949 | | | | 23,467,026 | |
Paychex, Inc. | | | 47,759 | | | | 2,579,464 | |
Western Union Co. (The) | | | 70,227 | | | | 1,354,679 | |
| | | | | | | | |
| Total IT Services | | | | | | | 27,401,169 | |
| Leisure Products – 0.3% | | | | | | | | |
Mattel, Inc. | | | 81,037 | | | | 2,724,464 | |
| | | | | | | | |
| Machinery – 1.3% | | | | | | | | |
American Railcar Industries, Inc.(a) | | | 2,684 | | | | 109,319 | |
Caterpillar, Inc. | | | 113,330 | | | | 8,674,278 | |
Cummins, Inc. | | | 32,630 | | | | 3,587,342 | |
Douglas Dynamics, Inc. | | | 3,740 | | | | 85,684 | |
Joy Global, Inc.(a) | | | 27,604 | | | | 443,596 | |
Miller Industries, Inc. | | | 1,590 | | | | 32,245 | |
Timken Co. (The) | | | 12,542 | | | | 420,032 | |
| | | | | | | | |
| Total Machinery | | | | | | | 13,352,496 | |
| Media – 0.5% | | | | | | | | |
AMC Entertainment Holdings, Inc. Class A | | | 3,170 | | | | 88,728 | |
Cinemark Holdings, Inc. | | | 14,332 | | | | 513,516 | |
Gannett Co., Inc. | | | 17,288 | | | | 261,740 | |
Harte-Hanks, Inc. | | | 25,468 | | | | 64,434 | |
Meredith Corp. | | | 6,495 | | | | 308,513 | |
National CineMedia, Inc. | | | 14,764 | | | | 224,560 | |
New Media Investment Group, Inc. | | | 12,737 | | | | 211,944 | |
Regal Entertainment Group Class A(a) | | | 26,930 | | | | 569,300 | |
Time, Inc. | | | 21,409 | | | | 330,555 | |
Viacom, Inc. Class B | | | 55,130 | | | | 2,275,766 | |
World Wrestling Entertainment, Inc. Class A(a) | | | 4,307 | | | | 76,062 | |
| | | | | | | | |
| Total Media | | | | | | | 4,925,118 | |
| Metals & Mining – 0.4% | | | | | | | | |
Allegheny Technologies, Inc.(a) | | | 25,414 | | | | 414,248 | |
Commercial Metals Co. | | | 16,075 | | | | 272,793 | |
Compass Minerals International, Inc. | | | 4,740 | | | | 335,876 | |
Nucor Corp. | | | 49,216 | | | | 2,327,917 | |
Schnitzer Steel Industries, Inc. Class A | | | 5,781 | | | | 106,602 | |
Steel Dynamics, Inc. | | | 32,141 | | | | 723,494 | |
| | | | | | | | |
| Total Metals & Mining | | | | | | | 4,180,930 | |
| Multi-Utilities – 3.4% | | | | | | | | |
Alliant Energy Corp. | | | 17,616 | | | | 1,308,516 | |
Ameren Corp. | | | 40,960 | | | | 2,052,096 | |
Avista Corp. | | | 10,111 | | | | 412,327 | |
Black Hills Corp.(a) | | | 8,140 | | | | 489,458 | |
CenterPoint Energy, Inc. | | | 105,474 | | | | 2,206,516 | |
CMS Energy Corp. | | | 37,987 | | | | 1,612,168 | |
Consolidated Edison, Inc. | | | 51,758 | | | | 3,965,698 | |
Dominion Resources, Inc. | | | 98,265 | | | | 7,381,667 | |
DTE Energy Co. | | | 27,673 | | | | 2,508,834 | |
MDU Resources Group, Inc. | | | 35,521 | | | | 691,239 | |
NiSource, Inc. | | | 43,855 | | | | 1,033,224 | |
NorthWestern Corp. | | | 7,162 | | | | 442,254 | |
Public Service Enterprise Group, Inc. | | | 87,944 | | | | 4,145,680 | |
SCANA Corp. | | | 22,295 | | | | 1,563,994 | |
TECO Energy, Inc. | | | 33,112 | | | | 911,573 | |
Unitil Corp. | | | 2,829 | | | | 120,204 | |
Vectren Corp. | | | 13,614 | | | | 688,324 | |
WEC Energy Group, Inc. | | | 49,141 | | | | 2,951,900 | |
| | | | | | | | |
| Total Multi-Utilities | | | | | | | 34,485,672 | |
See Notes to Financial Statements.
| | |
| 32 | | WisdomTree Domestic Earnings and Dividend Funds |
Schedule of Investments (continued)
WisdomTree High Dividend Fund (DHS)
March 31, 2016
| | | | | | | | |
| Investments | | Shares | | | Value | |
| | | | | | | | |
| Multiline Retail – 1.0% | | | | | | | | |
Kohl’s Corp. | | | 31,299 | | | $ | 1,458,846 | |
Macy’s, Inc. | | | 50,866 | | | | 2,242,682 | |
Target Corp. | | | 79,263 | | | | 6,521,760 | |
| | | | | | | | |
| Total Multiline Retail | | | | | | | 10,223,288 | |
| Oil, Gas & Consumable Fuels – 14.5% | | | | | | | | |
Alon USA Energy, Inc. | | | 10,872 | | | | 112,199 | |
Chevron Corp. | | | 385,153 | | | | 36,743,597 | |
ConocoPhillips | | | 313,557 | | | | 12,626,940 | |
CVR Energy, Inc. | | | 17,582 | | | | 458,890 | |
Evolution Petroleum Corp. | | | 8,699 | | | | 42,277 | |
Exxon Mobil Corp. | | | 627,126 | | | | 52,421,462 | |
Kinder Morgan, Inc. | | | 1,129,487 | | | | 20,172,638 | |
Murphy Oil Corp. | | | 44,219 | | | | 1,113,877 | |
Occidental Petroleum Corp. | | | 143,308 | | | | 9,806,566 | |
ONEOK, Inc. | | | 104,659 | | | | 3,125,118 | |
PBF Energy, Inc. Class A | | | 13,400 | | | | 444,880 | |
SemGroup Corp. Class A | | | 11,808 | | | | 264,499 | |
Spectra Energy Corp. | | | 180,452 | | | | 5,521,831 | |
Targa Resources Corp. | | | 29,739 | | | | 888,007 | |
Western Refining, Inc. | | | 15,197 | | | | 442,081 | |
Williams Cos., Inc. (The) | | | 299,473 | | | | 4,812,531 | |
| | | | | | | | |
| Total Oil, Gas & Consumable Fuels | | | | | | | 148,997,393 | |
| Paper & Forest Products – 0.0% | | | | | | | | |
Schweitzer-Mauduit International, Inc. | | | 5,176 | | | | 162,941 | |
| Personal Products – 0.0% | | | | | | | | |
Nu Skin Enterprises, Inc. Class A(a) | | | 9,834 | | | | 376,151 | |
| Pharmaceuticals – 4.7% | | | | | | | | |
Innoviva, Inc.(a) | | | 50,579 | | | | 636,790 | |
Merck & Co., Inc. | | | 407,416 | | | | 21,556,381 | |
Pfizer, Inc. | | | 891,354 | | | | 26,419,732 | |
| | | | | | | | |
| Total Pharmaceuticals | | | | | | | 48,612,903 | |
| Real Estate Investment Trusts (REITs) – 12.1% | | | | | |
Acadia Realty Trust | | | 9,107 | | | | 319,929 | |
Agree Realty Corp. | | | 4,195 | | | | 161,382 | |
Alexander’s, Inc. | | | 796 | | | | 302,918 | |
Alexandria Real Estate Equities, Inc. | | | 10,329 | | | | 938,803 | |
American Campus Communities, Inc. | | | 19,464 | | | | 916,560 | |
Apartment Investment & Management Co. Class A | | | 20,702 | | | | 865,758 | |
Apple Hospitality REIT, Inc.(a) | | | 45,134 | | | | 894,105 | |
Armada Hoffler Properties, Inc. | | | 7,672 | | | | 86,310 | |
Ashford Hospitality Trust, Inc. | | | 30,435 | | | | 194,175 | |
Bluerock Residential Growth REIT, Inc. | | | 8,240 | | | | 89,651 | |
Brandywine Realty Trust | | | 34,405 | | | | 482,702 | |
Brixmor Property Group, Inc. | | | 48,977 | | | | 1,254,791 | |
Camden Property Trust | | | 13,345 | | | | 1,122,181 | |
CareTrust REIT, Inc. | | | 11,440 | | | | 145,288 | |
CatchMark Timber Trust, Inc. Class A | | | 6,951 | | | | 75,279 | |
CBL & Associates Properties, Inc. | | | 59,334 | | | | 706,075 | |
Chatham Lodging Trust | | | 8,887 | | | | 190,448 | |
| | | | | | | | |
Chesapeake Lodging Trust | | | 14,957 | | | | 395,762 | |
Colony Starwood Homes | | | 5,293 | | | | 131,002 | |
Columbia Property Trust, Inc. | | | 26,035 | | | | 572,510 | |
Communications Sales & Leasing, Inc. | | | 79,693 | | | | 1,773,169 | |
CorEnergy Infrastructure Trust, Inc.(a) | | | 8,677 | | | | 174,494 | |
CoreSite Realty Corp. | | | 3,884 | | | | 271,919 | |
Corporate Office Properties Trust | | | 19,578 | | | | 513,727 | |
Corrections Corp. of America | | | 41,772 | | | | 1,338,793 | |
Cousins Properties, Inc. | | | 30,504 | | | | 316,631 | |
Crown Castle International Corp. | | | 57,626 | | | | 4,984,649 | |
CyrusOne, Inc. | | | 9,515 | | | | 434,360 | |
DCT Industrial Trust, Inc. | | | 11,601 | | | | 457,891 | |
DDR Corp. | | | 63,796 | | | | 1,134,931 | |
DiamondRock Hospitality Co. | | | 39,167 | | | | 396,370 | |
Digital Realty Trust, Inc. | | | 29,449 | | | | 2,605,942 | |
Duke Realty Corp. | | | 49,839 | | | | 1,123,371 | |
DuPont Fabros Technology, Inc. | | | 14,307 | | | | 579,863 | |
Easterly Government Properties, Inc. | | | 4,643 | | | | 85,988 | |
EastGroup Properties, Inc. | | | 5,815 | | | | 351,052 | |
Education Realty Trust, Inc. | | | 9,700 | | | | 403,520 | |
EPR Properties | | | 16,010 | | | | 1,066,586 | |
Equity One, Inc. | | | 18,135 | | | | 519,749 | |
Extra Space Storage, Inc. | | | 14,123 | | | | 1,319,936 | |
First Potomac Realty Trust | | | 14,052 | | | | 127,311 | |
Franklin Street Properties Corp. | | | 32,119 | | | | 340,783 | |
Gaming and Leisure Properties, Inc. | | | 38,023 | | | | 1,175,671 | |
Geo Group, Inc. (The) | | | 28,643 | | | | 993,053 | |
Getty Realty Corp. | | | 7,770 | | | | 154,079 | |
Gladstone Commercial Corp. | | | 9,583 | | | | 156,970 | |
Global Net Lease, Inc. | | | 57,708 | | | | 493,980 | |
Government Properties Income Trust | | | 31,546 | | | | 563,096 | |
Gramercy Property Trust | | | 37,088 | | | | 313,394 | |
HCP, Inc. | | | 121,771 | | | | 3,967,299 | |
Healthcare Realty Trust, Inc. | | | 18,381 | | | | 567,789 | |
Healthcare Trust of America, Inc. Class A | | | 23,531 | | | | 692,282 | |
Hersha Hospitality Trust | | | 9,615 | | | | 205,184 | |
Highwoods Properties, Inc. | | | 15,975 | | | | 763,765 | |
Hospitality Properties Trust | | | 47,946 | | | | 1,273,446 | |
Host Hotels & Resorts, Inc. | | | 156,959 | | | | 2,621,215 | |
Independence Realty Trust, Inc. | | | 18,973 | | | | 135,088 | |
InfraREIT, Inc. | | | 7,975 | | | | 135,974 | |
Investors Real Estate Trust | | | 37,991 | | | | 275,815 | |
Iron Mountain, Inc. | | | 63,250 | | | | 2,144,807 | |
Kimco Realty Corp. | | | 69,504 | | | | 2,000,325 | |
Kite Realty Group Trust | | | 15,231 | | | | 422,051 | |
Lamar Advertising Co. Class A | | | 16,336 | | | | 1,004,664 | |
LaSalle Hotel Properties | | | 32,396 | | | | 819,943 | |
Lexington Realty Trust(a) | | | 80,654 | | | | 693,624 | |
Liberty Property Trust | | | 35,924 | | | | 1,202,017 | |
LTC Properties, Inc. | | | 7,529 | | | | 340,612 | |
Macerich Co. (The) | | | 23,089 | | | | 1,829,572 | |
Medical Properties Trust, Inc. | | | 76,726 | | | | 995,903 | |
Mid-America Apartment Communities, Inc. | | | 10,874 | | | | 1,111,432 | |
See Notes to Financial Statements.
| | | | |
| WisdomTree Domestic Earnings and Dividend Funds | | | 33 | |
Schedule of Investments (continued)
WisdomTree High Dividend Fund (DHS)
March 31, 2016
| | | | | | | | |
| Investments | | Shares | | | Value | |
| | | | | | | | |
Monmouth Real Estate Investment Corp. Class A(a) | | | 16,711 | | | $ | 198,694 | |
National Health Investors, Inc. | | | 8,711 | | | | 579,456 | |
National Retail Properties, Inc. | | | 25,823 | | | | 1,193,023 | |
National Storage Affiliates Trust | | | 4,574 | | | | 96,969 | |
New Senior Investment Group, Inc. | | | 40,973 | | | | 422,022 | |
New York REIT, Inc. | | | 26,978 | | | | 272,478 | |
NexPoint Residential Trust, Inc. | | | 5,726 | | | | 74,953 | |
NorthStar Realty Finance Corp. | | | 102,894 | | | | 1,349,969 | |
Omega Healthcare Investors, Inc. | | | 51,945 | | | | 1,833,658 | |
One Liberty Properties, Inc. | | | 4,515 | | | | 101,181 | |
Outfront Media, Inc. | | | 35,954 | | | | 758,629 | |
Parkway Properties, Inc. | | | 22,936 | | | | 359,178 | |
Pebblebrook Hotel Trust | | | 12,250 | | | | 356,107 | |
Pennsylvania Real Estate Investment Trust | | | 12,228 | | | | 267,182 | |
Physicians Realty Trust | | | 20,177 | | | | 374,889 | |
Piedmont Office Realty Trust, Inc. Class A | | | 26,876 | | | | 545,852 | |
Post Properties, Inc. | | | 6,781 | | | | 405,097 | |
Potlatch Corp. | | | 8,092 | | | | 254,898 | |
Preferred Apartment Communities, Inc. Class A | | | 5,883 | | | | 74,596 | |
Prologis, Inc. | | | 83,522 | | | | 3,690,002 | |
Public Storage | | | 20,101 | | | | 5,544,459 | |
QTS Realty Trust, Inc. Class A | | | 5,299 | | | | 251,067 | |
Ramco-Gershenson Properties Trust | | | 17,216 | | | | 310,404 | |
Rayonier, Inc. | | | 22,580 | | | | 557,274 | |
Realty Income Corp. | | | 48,435 | | | | 3,027,672 | |
Regency Centers Corp. | | | 11,533 | | | | 863,245 | |
Retail Opportunity Investments Corp. | | | 17,040 | | | | 342,845 | |
Retail Properties of America, Inc. Class A | | | 44,412 | | | | 703,930 | |
Rexford Industrial Realty, Inc. | | | 7,726 | | | | 140,304 | |
RLJ Lodging Trust | | | 30,216 | | | | 691,342 | |
Rouse Properties, Inc. | | | 11,866 | | | | 218,097 | |
Ryman Hospitality Properties, Inc. | | | 11,670 | | | | 600,772 | |
Sabra Health Care REIT, Inc. | | | 21,744 | | | | 436,837 | |
Saul Centers, Inc. | | | 2,878 | | | | 152,592 | |
Select Income REIT | | | 38,556 | | | | 888,716 | |
Senior Housing Properties Trust | | | 109,606 | | | | 1,960,851 | |
Silver Bay Realty Trust Corp. | | | 4,479 | | | | 66,513 | |
Simon Property Group, Inc. | | | 44,305 | | | | 9,201,705 | |
Sovran Self Storage, Inc. | | | 5,223 | | | | 616,053 | |
Spirit Realty Capital, Inc. | | | 122,965 | | | | 1,383,356 | |
STAG Industrial, Inc. | | | 20,920 | | | | 425,931 | |
STORE Capital Corp. | | | 25,167 | | | | 651,322 | |
Summit Hotel Properties, Inc. | | | 13,837 | | | | 165,629 | |
Sun Communities, Inc. | | | 9,247 | | | | 662,178 | |
Tanger Factory Outlet Centers, Inc. | | | 14,177 | | | | 515,901 | |
Taubman Centers, Inc. | | | 7,715 | | | | 549,539 | |
Terreno Realty Corp. | | | 6,071 | | | | 142,365 | |
Tier REIT, Inc. | | | 9,201 | | | | 123,661 | |
UDR, Inc. | | | 33,401 | | | | 1,286,941 | |
UMH Properties, Inc. | | | 8,571 | | | | 85,024 | |
Universal Health Realty Income Trust | | | 3,191 | | | | 179,494 | |
Urban Edge Properties | | | 14,759 | | | | 381,373 | |
Urstadt Biddle Properties, Inc. Class A | | | 6,516 | | | | 136,510 | |
| | | | | | | | |
Ventas, Inc. | | | 79,787 | | | | 5,023,389 | |
VEREIT, Inc. | | | 254,005 | | | | 2,253,024 | |
W.P. Carey, Inc. | | | 27,933 | | | | 1,738,550 | |
Washington Real Estate Investment Trust | | | 12,439 | | | | 363,343 | |
Weingarten Realty Investors | | | 20,946 | | | | 785,894 | |
Welltower, Inc. | | | 76,422 | | | | 5,299,101 | |
Weyerhaeuser Co. | | | 128,064 | | | | 3,967,423 | |
Whitestone REIT | | | 11,061 | | | | 139,037 | |
WP GLIMCHER, Inc. | | | 73,751 | | | | 699,897 | |
Xenia Hotels & Resorts, Inc. | | | 27,495 | | | | 429,472 | |
| | | | | | | | |
| Total Real Estate Investment Trusts (REITs) | | | | | | | 124,391,579 | |
| Semiconductors & Semiconductor Equipment – 1.7% | | | | | |
Brooks Automation, Inc. | | | 9,936 | | | | 103,334 | |
Intersil Corp. Class A | | | 19,853 | | | | 265,435 | |
KLA-Tencor Corp. | | | 19,669 | | | | 1,432,100 | |
Maxim Integrated Products, Inc. | | | 37,349 | | | | 1,373,696 | |
Microchip Technology, Inc. | | | 26,851 | | | | 1,294,218 | |
QUALCOMM, Inc. | | | 251,105 | | | | 12,841,510 | |
| | | | | | | | |
| Total Semiconductors & Semiconductor Equipment | | | | 17,310,293 | |
| Software – 0.4% | | | | | | | | |
American Software, Inc. Class A | | | 4,267 | | | | 38,403 | |
CA, Inc. | | | 66,946 | | | | 2,061,267 | |
Symantec Corp. | | | 85,194 | | | | 1,565,866 | |
| | | | | | | | |
| Total Software | | | | | | | 3,665,536 | |
| Specialty Retail – 0.6% | | | | | | | | |
Abercrombie & Fitch Co. Class A | | | 8,208 | | | | 258,880 | |
American Eagle Outfitters, Inc.(a) | | | 25,927 | | | | 432,203 | |
Barnes & Noble, Inc. | | | 20,134 | | | | 248,856 | |
Big 5 Sporting Goods Corp. | | | 3,121 | | | | 34,674 | |
Cato Corp. (The) Class A | | | 3,528 | | | | 136,004 | |
DSW, Inc. Class A | | | 10,832 | | | | 299,397 | |
GameStop Corp. Class A(a) | | | 20,761 | | | | 658,747 | |
Gap, Inc. (The) | | | 59,332 | | | | 1,744,361 | |
Guess?, Inc. | | | 16,133 | | | | 302,816 | |
Pier 1 Imports, Inc. | | | 16,277 | | | | 114,102 | |
Rent-A-Center, Inc. | | | 13,199 | | | | 209,204 | |
Stage Stores, Inc. | | | 9,625 | | | | 77,578 | |
Staples, Inc. | | | 134,589 | | | | 1,484,517 | |
Stein Mart, Inc. | | | 7,780 | | | | 57,027 | |
Tailored Brands, Inc. | | | 9,396 | | | | 168,188 | |
| | | | | | | | |
| Total Specialty Retail | | | | | | | 6,226,554 | |
| Technology Hardware, Storage & Peripherals – 0.6% | | | | | |
Diebold, Inc. | | | 9,683 | | | | 279,935 | |
HP, Inc. | | | 302,433 | | | | 3,725,974 | |
Lexmark International, Inc. Class A | | | 11,099 | | | | 371,040 | |
Western Digital Corp. | | | 30,828 | | | | 1,456,315 | |
| | | | | | | | |
| Total Technology Hardware, Storage & Peripherals | | | | 5,833,264 | |
| Textiles, Apparel & Luxury Goods – 0.2% | | | | | | | | |
Coach, Inc. | | | 51,170 | | | | 2,051,405 | |
See Notes to Financial Statements.
| | |
| 34 | | WisdomTree Domestic Earnings and Dividend Funds |
Schedule of Investments (concluded)
WisdomTree High Dividend Fund (DHS)
March 31, 2016
| | | | | | | | |
| Investments | | Shares | | | Value | |
| | | | | | | | |
| Thrifts & Mortgage Finance – 0.3% | | | | | | | | |
Dime Community Bancshares, Inc. | | | 4,993 | | | $ | 87,977 | |
Fox Chase Bancorp, Inc. | | | 1,308 | | | | 25,270 | |
New York Community Bancorp, Inc. | | | 124,102 | | | | 1,973,222 | |
Northwest Bancshares, Inc. | | | 18,680 | | | | 252,367 | |
Oritani Financial Corp. | | | 8,112 | | | | 137,660 | |
Provident Financial Services, Inc. | | | 9,330 | | | | 188,373 | |
TrustCo Bank Corp. | | | 19,014 | | | | 115,225 | |
United Financial Bancorp, Inc. | | | 7,598 | | | | 95,659 | |
| | | | | | | | |
| Total Thrifts & Mortgage Finance | | | | | | | 2,875,753 | |
| Tobacco – 5.9% | | | | | | | | |
Altria Group, Inc. | | | 324,414 | | | | 20,327,781 | |
Philip Morris International, Inc. | | | 302,674 | | | | 29,695,346 | |
Reynolds American, Inc. | | | 190,737 | | | | 9,595,978 | |
Universal Corp. | | | 3,750 | | | | 213,038 | |
Vector Group Ltd.(a) | | | 33,394 | | | | 762,719 | |
| | | | | | | | |
| Total Tobacco | | | | | | | 60,594,862 | |
| Trading Companies & Distributors – 0.1% | | | | | | | | |
GATX Corp. | | | 6,268 | | | | 297,730 | |
H&E Equipment Services, Inc. | | | 9,735 | | | | 170,654 | |
TAL International Group, Inc.* | | | 15,024 | | | | 231,971 | |
| | | | | | | | |
| Total Trading Companies & Distributors | | | | | | | 700,355 | |
| Transportation Infrastructure – 0.2% | | | | | | | | |
Macquarie Infrastructure Corp. | | | 22,427 | | | | 1,512,477 | |
| Water Utilities – 0.0% | | | | | | | | |
Artesian Resources Corp. Class A | | | 1,169 | | | | 32,685 | |
Connecticut Water Service, Inc. | | | 1,260 | | | | 56,826 | |
Middlesex Water Co. | | | 2,192 | | | | 67,623 | |
| | | | | | | | |
| Total Water Utilities | | | | | | | 157,134 | |
TOTAL COMMON STOCKS
(Cost: $943,590,587) | | | | | | | 1,019,015,459 | |
| EXCHANGE-TRADED FUND – 0.3% | | | | | | | | |
| United States – 0.3% | | | | | | | | |
| WisdomTree Total Dividend Fund(a)(b) (Cost: $3,445,080) | | | 49,657 | | | | 3,686,039 | |
| INVESTMENT OF CASH COLLATERAL FOR SECURITIES LOANED – 1.1% | |
| United States – 1.1% | | | | | | | | |
State Street Navigator Securities Lending Prime Portfolio, 0.50%(c) (Cost: $10,967,234)(d) | | | 10,967,234 | | | | 10,967,234 | |
TOTAL INVESTMENTS IN SECURITIES – 100.8%
(Cost: $958,002,901) | | | | 1,033,668,732 | |
Liabilities in Excess of Cash and Other Assets – (0.8)% | | | | (8,306,337 | ) |
| | | | | | | | |
| NET ASSETS – 100.0% | | | | | | $ | 1,025,362,395 | |
| * | Non-income producing security. |
| (a) | Security, or portion thereof, was on loan at March 31, 2016 (See Note 2). |
| (b) | Affiliated company (See Note 3). |
| (c) | Rate shown represents annualized 7-day yield as of March 31, 2016. |
| (d) | At March 31, 2016, the total market value of the Fund’s securities on loan was $11,767,064 and the total market value of the collateral held by the Fund was $12,070,235. The total market value of the collateral includes non-cash U.S. Government securities collateral having a value of $1,103,001. |
See Notes to Financial Statements.
| | | | |
| WisdomTree Domestic Earnings and Dividend Funds | | | 35 | |
Schedule of Investments
WisdomTree LargeCap Dividend Fund (DLN)
March 31, 2016
| | | | | | | | |
| Investments | | Shares | | | Value | |
| | | | | | | | |
| COMMON STOCKS – 99.5% | | | | | | | | |
| United States – 99.5% | | | | | | | | |
| Aerospace & Defense – 2.9% | | | | | | | | |
Boeing Co. (The) | | | 74,573 | | | $ | 9,466,297 | |
General Dynamics Corp. | | | 28,121 | | | | 3,694,256 | |
Honeywell International, Inc. | | | 82,361 | | | | 9,228,550 | |
Lockheed Martin Corp. | | | 41,345 | | | | 9,157,917 | |
Northrop Grumman Corp. | | | 14,181 | | | | 2,806,420 | |
Raytheon Co. | | | 28,673 | | | | 3,516,170 | |
Rockwell Collins, Inc. | | | 9,163 | | | | 844,920 | |
Textron, Inc. | | | 1,919 | | | | 69,967 | |
United Technologies Corp. | | | 107,542 | | | | 10,764,954 | |
| | | | | | | | |
| Total Aerospace & Defense | | | | | | | 49,549,451 | |
| Air Freight & Logistics – 0.6% | | | | | | | | |
FedEx Corp. | | | 8,324 | | | | 1,354,481 | |
United Parcel Service, Inc. Class B | | | 92,168 | | | | 9,720,959 | |
| | | | | | | | |
| Total Air Freight & Logistics | | | | | | | 11,075,440 | |
| Airlines – 0.2% | | | | | | | | |
American Airlines Group, Inc. | | | 26,527 | | | | 1,087,872 | |
Delta Air Lines, Inc. | | | 37,054 | | | | 1,803,789 | |
Southwest Airlines Co. | | | 20,130 | | | | 901,824 | |
| | | | | | | | |
| Total Airlines | | | | | | | 3,793,485 | |
| Auto Components – 0.2% | | | | | | | | |
Johnson Controls, Inc. | | | 81,266 | | | | 3,166,936 | |
| Automobiles – 1.1% | | | | | | | | |
Ford Motor Co. | | | 757,690 | | | | 10,228,815 | |
General Motors Co. | | | 286,985 | | | | 9,019,939 | |
| | | | | | | | |
| Total Automobiles | | | | | | | 19,248,754 | |
| Banks – 5.2% | | | | | | | | |
Bank of America Corp. | | | 551,083 | | | | 7,450,642 | |
BB&T Corp. | | | 99,517 | | | | 3,310,931 | |
Citigroup, Inc. | | | 49,687 | | | | 2,074,432 | |
Citizens Financial Group, Inc. | | | 33,783 | | | | 707,754 | |
Fifth Third Bancorp | | | 95,100 | | | | 1,587,219 | |
JPMorgan Chase & Co. | | | 445,257 | | | | 26,368,120 | |
KeyCorp | | | 86,789 | | | | 958,151 | |
M&T Bank Corp. | | | 17,769 | | | | 1,972,359 | |
PNC Financial Services Group, Inc. (The) | | | 50,044 | | | | 4,232,221 | |
Regions Financial Corp. | | | 147,634 | | | | 1,158,927 | |
SunTrust Banks, Inc. | | | 51,618 | | | | 1,862,377 | |
U.S. Bancorp | | | 187,810 | | | | 7,623,208 | |
Wells Fargo & Co. | | | 634,037 | | | | 30,662,029 | |
| | | | | | | | |
| Total Banks | | | | | | | 89,968,370 | |
| Beverages – 3.0% | | | | | | | | |
Brown-Forman Corp. Class B | | | 7,802 | | | | 768,263 | |
Coca-Cola Co. (The) | | | 598,201 | | | | 27,750,544 | |
Coca-Cola Enterprises, Inc. | | | 21,580 | | | | 1,094,969 | |
Constellation Brands, Inc. Class A | | | 6,267 | | | | 946,881 | |
Dr. Pepper Snapple Group, Inc. | | | 18,426 | | | | 1,647,653 | |
Molson Coors Brewing Co. Class B | | | 13,374 | | | | 1,286,311 | |
PepsiCo, Inc. | | | 184,630 | | | | 18,920,883 | |
| | | | | | | | |
| Total Beverages | | | | | | | 52,415,504 | |
| | | | | | | | |
| Biotechnology – 2.2% | | | | | | | | |
AbbVie, Inc. | | | 304,037 | | | $ | 17,366,594 | |
Amgen, Inc. | | | 67,629 | | | | 10,139,616 | |
Baxalta, Inc. | | | 20,451 | | | | 826,220 | |
Gilead Sciences, Inc. | | | 109,472 | | | | 10,056,098 | |
| | | | | | | | |
| Total Biotechnology | | | | | | | 38,388,528 | |
| Capital Markets – 1.7% | | | | | | | | |
Ameriprise Financial, Inc. | | | 19,124 | | | | 1,797,847 | |
Bank of New York Mellon Corp. (The) | | | 81,878 | | | | 3,015,567 | |
BlackRock, Inc. | | | 19,359 | | | | 6,593,095 | |
Charles Schwab Corp. (The) | | | 45,553 | | | | 1,276,395 | |
Franklin Resources, Inc. | | | 44,908 | | | | 1,753,657 | |
Goldman Sachs Group, Inc. (The) | | | 27,462 | | | | 4,310,985 | |
Morgan Stanley | | | 156,642 | | | | 3,917,616 | |
Northern Trust Corp. | | | 21,354 | | | | 1,391,640 | |
State Street Corp. | | | 36,076 | | | | 2,111,168 | |
T. Rowe Price Group, Inc. | | | 31,826 | | | | 2,337,938 | |
TD Ameritrade Holding Corp. | | | 47,550 | | | | 1,499,251 | |
| | | | | | | | |
| Total Capital Markets | | | | | | | 30,005,159 | |
| Chemicals – 2.0% | | | | | | | | |
Air Products & Chemicals, Inc. | | | 23,714 | | | | 3,416,002 | |
CF Industries Holdings, Inc. | | | 30,106 | | | | 943,522 | |
Dow Chemical Co. (The) | | | 176,814 | | | | 8,992,760 | |
E.I. du Pont de Nemours & Co. | | | 84,104 | | | | 5,325,465 | |
Eastman Chemical Co. | | | 15,456 | | | | 1,116,387 | |
Ecolab, Inc. | | | 15,415 | | | | 1,719,081 | |
Monsanto Co. | | | 43,995 | | | | 3,860,121 | |
Mosaic Co. (The) | | | 53,216 | | | | 1,436,832 | |
PPG Industries, Inc. | | | 17,178 | | | | 1,915,175 | |
Praxair, Inc. | | | 33,729 | | | | 3,860,284 | |
Sherwin-Williams Co. (The) | | | 4,216 | | | | 1,200,169 | |
| | | | | | | | |
| Total Chemicals | | | | | | | 33,785,798 | |
| Commercial Services & Supplies – 0.3% | | | | | | | | |
Republic Services, Inc. | | | 43,897 | | | | 2,091,692 | |
Waste Management, Inc. | | | 60,267 | | | | 3,555,753 | |
| | | | | | | | |
| Total Commercial Services & Supplies | | | | | | | 5,647,445 | |
| Communications Equipment – 1.3% | | | | | | | | |
Cisco Systems, Inc. | | | 716,889 | | | | 20,409,830 | |
Juniper Networks, Inc. | | | 21,510 | | | | 548,720 | |
Motorola Solutions, Inc. | | | 19,822 | | | | 1,500,525 | |
| | | | | | | | |
| Total Communications Equipment | | | | | | | 22,459,075 | |
| Construction Materials – 0.0% | | | | | | | | |
Vulcan Materials Co. | | | 2,312 | | | | 244,078 | |
| Consumer Finance – 0.6% | | | | | | | | |
American Express Co. | | | 71,704 | | | | 4,402,626 | |
Capital One Financial Corp. | | | 51,482 | | | | 3,568,217 | |
Discover Financial Services | | | 39,310 | | | | 2,001,665 | |
| | | | | | | | |
| Total Consumer Finance | | | | | | | 9,972,508 | |
| Containers & Packaging – 0.3% | | | | | | | | |
International Paper Co. | | | 86,114 | | | | 3,534,119 | |
WestRock Co. | | | 35,678 | | | | 1,392,512 | |
| | | | | | | | |
| Total Containers & Packaging | | | | | | | 4,926,631 | |
See Notes to Financial Statements.
| | |
| 36 | | WisdomTree Domestic Earnings and Dividend Funds |
Schedule of Investments (continued)
WisdomTree LargeCap Dividend Fund (DLN)
March 31, 2016
| | | | | | | | |
| Investments | | Shares | | | Value | |
| | | | | | | | |
| Distributors – 0.1% | | | | | | | | |
Genuine Parts Co. | | | 19,030 | | | $ | 1,890,821 | |
| Diversified Financial Services – 0.4% | | | | | | | | |
CME Group, Inc. | | | 32,865 | | | | 3,156,683 | |
Intercontinental Exchange, Inc. | | | 6,088 | | | | 1,431,532 | |
McGraw Hill Financial, Inc. | | | 17,177 | | | | 1,700,180 | |
Moody’s Corp. | | | 12,641 | | | | 1,220,615 | |
| | | | | | | | |
| Total Diversified Financial Services | | | | | | | 7,509,010 | |
| Diversified Telecommunication Services – 6.7% | | | | | |
AT&T, Inc. | | | 1,539,900 | | | | 60,317,883 | |
CenturyLink, Inc. | | | 211,195 | | | | 6,749,792 | |
Verizon Communications, Inc. | | | 906,225 | | | | 49,008,648 | |
| | | | | | | | |
| Total Diversified Telecommunication Services | | | | 116,076,323 | |
| Electric Utilities – 3.9% | | | | | | | | |
American Electric Power Co., Inc. | | | 88,386 | | | | 5,868,830 | |
Duke Energy Corp. | | | 147,756 | | | | 11,920,954 | |
Edison International | | | 39,792 | | | | 2,860,647 | |
Entergy Corp. | | | 39,998 | | | | 3,171,041 | |
Eversource Energy | | | 47,726 | | | | 2,784,335 | |
Exelon Corp. | | | 194,504 | | | | 6,974,913 | |
FirstEnergy Corp. | | | 84,900 | | | | 3,053,853 | |
NextEra Energy, Inc. | | | 63,712 | | | | 7,539,678 | |
PG&E Corp. | | | 76,930 | | | | 4,594,260 | |
PPL Corp. | | | 137,256 | | | | 5,225,336 | |
Southern Co. (The) | | | 195,520 | | | | 10,114,250 | |
Xcel Energy, Inc. | | | 82,588 | | | | 3,453,830 | |
| | | | | | | | |
| Total Electric Utilities | | | | | | | 67,561,927 | |
| Electrical Equipment – 0.5% | | | | | | | | |
AMETEK, Inc. | | | 8,225 | | | | 411,086 | |
Emerson Electric Co. | | | 118,974 | | | | 6,469,806 | |
Rockwell Automation, Inc. | | | 17,126 | | | | 1,948,082 | |
| | | | | | | | |
| Total Electrical Equipment | | | | | | | 8,828,974 | |
| Electronic Equipment, Instruments & Components – 0.2% | | | | | |
Amphenol Corp. Class A | | | 14,586 | | | | 843,363 | |
Corning, Inc. | | | 132,252 | | | | 2,762,744 | |
| | | | | | | | |
| Total Electronic Equipment, Instruments & Components | | | | 3,606,107 | |
| Energy Equipment & Services – 0.4% | | | | | | | | |
Baker Hughes, Inc. | | | 27,332 | | | | 1,197,961 | |
Halliburton Co. | | | 74,550 | | | | 2,662,926 | |
National Oilwell Varco, Inc. | | | 93,396 | | | | 2,904,616 | |
| | | | | | | | |
| Total Energy Equipment & Services | | | | | | | 6,765,503 | |
| Food & Staples Retailing – 3.2% | | | | | | | | |
Costco Wholesale Corp. | | | 19,670 | | | | 3,099,599 | |
CVS Health Corp. | | | 72,637 | | | | 7,534,636 | |
Kroger Co. (The) | | | 45,494 | | | | 1,740,145 | |
Sysco Corp. | | | 76,941 | | | | 3,595,453 | |
Wal-Mart Stores, Inc. | | | 466,262 | | | | 31,934,284 | |
Walgreens Boots Alliance, Inc. | | | 84,545 | | | | 7,122,071 | |
| | | | | | | | |
| Total Food & Staples Retailing | | | | | | | 55,026,188 | |
| | | | | | | | |
| Food Products – 2.4% | | | | | | | | |
Archer-Daniels-Midland Co. | | | 87,106 | | | $ | 3,162,819 | |
Campbell Soup Co. | | | 33,437 | | | | 2,132,946 | |
ConAgra Foods, Inc. | | | 49,977 | | | | 2,229,974 | |
General Mills, Inc. | | | 80,777 | | | | 5,117,223 | |
Hershey Co. (The) | | | 18,370 | | | | 1,691,693 | |
Hormel Foods Corp. | | | 35,690 | | | | 1,543,236 | |
J.M. Smucker Co. (The) | | | 12,005 | | | | 1,558,729 | |
Kellogg Co. | | | 45,437 | | | | 3,478,202 | |
Kraft Heinz Co. (The) | | | 176,624 | | | | 13,875,582 | |
Mead Johnson Nutrition Co. | | | 18,067 | | | | 1,535,153 | |
Mondelez International, Inc. Class A | | | 112,793 | | | | 4,525,255 | |
Tyson Foods, Inc. Class A | | | 14,709 | | | | 980,502 | |
| | | | | | | | |
| Total Food Products | | | | | | | 41,831,314 | |
| Health Care Equipment & Supplies – 0.9% | | | | | | | | |
Abbott Laboratories | | | 143,437 | | | | 5,999,970 | |
Baxter International, Inc. | | | 32,001 | | | | 1,314,601 | |
Becton, Dickinson and Co. | | | 15,997 | | | | 2,428,664 | |
C.R. Bard, Inc. | | | 1,843 | | | | 373,521 | |
St. Jude Medical, Inc. | | | 23,366 | | | | 1,285,130 | |
Stryker Corp. | | | 25,103 | | | | 2,693,301 | |
Zimmer Biomet Holdings, Inc. | | | 7,810 | | | | 832,780 | |
| | | | | | | | |
| Total Health Care Equipment & Supplies | | | | | | | 14,927,967 | |
| Health Care Providers & Services – 1.1% | | | | | | | | |
Aetna, Inc. | | | 15,297 | | | | 1,718,618 | |
AmerisourceBergen Corp. | | | 12,440 | | | | 1,076,682 | |
Anthem, Inc. | | | 20,868 | | | | 2,900,443 | |
Cardinal Health, Inc. | | | 26,459 | | | | 2,168,315 | |
Cigna Corp. | | | 389 | | | | 53,387 | |
Humana, Inc. | | | 4,660 | | | | 852,547 | |
McKesson Corp. | | | 5,881 | | | | 924,787 | |
UnitedHealth Group, Inc. | | | 72,297 | | | | 9,319,083 | |
Universal Health Services, Inc. Class B | | | 1,283 | | | | 160,016 | |
| | | | | | | | |
| Total Health Care Providers & Services | | | | | | | 19,173,878 | |
| Hotels, Restaurants & Leisure – 2.3% | | | | | | | | |
Hilton Worldwide Holdings, Inc. | | | 52,181 | | | | 1,175,116 | |
Las Vegas Sands Corp. | | | 221,412 | | | | 11,442,572 | |
Marriott International, Inc. Class A(a) | | | 16,640 | | | | 1,184,435 | |
McDonald’s Corp. | | | 124,303 | | | | 15,622,401 | |
Starbucks Corp. | | | 88,446 | | | | 5,280,226 | |
Starwood Hotels & Resorts Worldwide, Inc. | | | 16,015 | | | | 1,336,132 | |
Yum! Brands, Inc. | | | 49,375 | | | | 4,041,344 | |
| | | | | | | | |
| Total Hotels, Restaurants & Leisure | | | | | | | 40,082,226 | |
| Household Durables – 0.2% | | | | | | | | |
D.R. Horton, Inc. | | | 14,556 | | | | 440,028 | |
Newell Rubbermaid, Inc. | | | 18,318 | | | | 811,304 | |
Whirlpool Corp. | | | 8,327 | | | | 1,501,691 | |
| | | | | | | | |
| Total Household Durables | | | | | | | 2,753,023 | |
| Household Products – 2.9% | | | | | | | | |
Church & Dwight Co., Inc. | | | 9,989 | | | | 920,786 | |
Clorox Co. (The) | | | 14,446 | | | | 1,821,063 | |
Colgate-Palmolive Co. | | | 92,308 | | | | 6,521,560 | |
See Notes to Financial Statements.
| | | | |
| WisdomTree Domestic Earnings and Dividend Funds | | | 37 | |
Schedule of Investments (continued)
WisdomTree LargeCap Dividend Fund (DLN)
March 31, 2016
| | | | | | | | |
| Investments | | Shares | | | Value | |
| | | | | | | | |
Kimberly-Clark Corp. | | | 47,689 | | | $ | 6,414,647 | |
Procter & Gamble Co. (The) | | | 408,484 | | | | 33,622,318 | |
| | | | | | | | |
| Total Household Products | | | | | | | 49,300,374 | |
| Industrial Conglomerates – 3.2% | | | | | | | | |
3M Co. | | | 72,177 | | | | 12,026,853 | |
Danaher Corp. | | | 17,100 | | | | 1,622,106 | |
General Electric Co. | | | 1,267,611 | | | | 40,297,354 | |
Roper Technologies, Inc. | | | 2,462 | | | | 449,980 | |
| | | | | | | | |
| Total Industrial Conglomerates | | | | | | | 54,396,293 | |
| Insurance – 2.1% | | | | | | | | |
Aflac, Inc. | | | 52,705 | | | | 3,327,794 | |
Allstate Corp. (The) | | | 33,481 | | | | 2,255,615 | |
American International Group, Inc. | | | 103,492 | | | | 5,593,743 | |
Hartford Financial Services Group, Inc. (The) | | | 35,259 | | | | 1,624,735 | |
Lincoln National Corp. | | | 21,306 | | | | 835,195 | |
Loews Corp. | | | 10,820 | | | | 413,973 | |
Marsh & McLennan Cos., Inc. | | | 52,014 | | | | 3,161,931 | |
MetLife, Inc. | | | 154,729 | | | | 6,798,792 | |
Principal Financial Group, Inc. | | | 43,084 | | | | 1,699,664 | |
Progressive Corp. (The) | | | 57,831 | | | | 2,032,181 | |
Prudential Financial, Inc. | | | 69,243 | | | | 5,000,730 | |
Travelers Cos., Inc. (The) | | | 30,375 | | | | 3,545,066 | |
| | | | | | | | |
| Total Insurance | | | | | | | 36,289,419 | |
| Internet & Catalog Retail – 0.0% | | | | | | | | |
Expedia, Inc. | | | 3,491 | | | | 376,400 | |
| IT Services – 2.5% | | | | | | | | |
Automatic Data Processing, Inc. | | | 52,414 | | | | 4,702,060 | |
Fidelity National Information Services, Inc. | | | 21,356 | | | | 1,352,048 | |
International Business Machines Corp. | | | 165,198 | | | | 25,019,237 | |
MasterCard, Inc. Class A | | | 32,198 | | | | 3,042,711 | |
Paychex, Inc. | | | 52,263 | | | | 2,822,725 | |
Visa, Inc. Class A | | | 63,865 | | | | 4,884,395 | |
Xerox Corp. | | | 123,209 | | | | 1,375,013 | |
| | | | | | | | |
| Total IT Services | | | | | | | 43,198,189 | |
| Life Sciences Tools & Services – 0.1% | | | | | | | | |
Agilent Technologies, Inc. | | | 16,893 | | | | 673,186 | |
Thermo Fisher Scientific, Inc. | | | 8,148 | | | | 1,153,675 | |
| | | | | | | | |
| Total Life Sciences Tools & Services | | | | | | | 1,826,861 | |
| Machinery – 1.5% | | | | | | | | |
Caterpillar, Inc. | | | 121,177 | | | | 9,274,888 | |
Cummins, Inc. | | | 35,137 | | | | 3,862,962 | |
Deere & Co. | | | 45,700 | | | | 3,518,443 | |
Illinois Tool Works, Inc. | | | 38,742 | | | | 3,968,730 | |
PACCAR, Inc. | | | 30,450 | | | | 1,665,310 | |
Parker-Hannifin Corp. | | | 15,761 | | | | 1,750,732 | |
Stanley Black & Decker, Inc. | | | 14,198 | | | | 1,493,772 | |
| | | | | | | | |
| Total Machinery | | | | | | | 25,534,837 | |
| Media – 2.3% | | | | | | | | |
CBS Corp. Class B Non-Voting Shares | | | 24,654 | | | | 1,358,189 | |
Comcast Corp. Class A | | | 186,254 | | | | 11,376,394 | |
Omnicom Group, Inc. | | | 29,390 | | | | 2,446,130 | |
| | | | | | | | |
Time Warner Cable, Inc. | | | 21,073 | | | $ | 4,311,957 | |
Time Warner, Inc. | | | 75,951 | | | | 5,510,245 | |
Twenty-First Century Fox, Inc. Class A | | | 54,879 | | | | 1,530,027 | |
Twenty-First Century Fox, Inc. Class B | | | 36,225 | | | | 1,021,545 | |
Viacom, Inc. Class B | | | 56,816 | | | | 2,345,364 | |
Walt Disney Co. (The) | | | 89,494 | | | | 8,887,649 | |
| | | | | | | | |
| Total Media | | | | | | | 38,787,500 | |
| Metals & Mining – 0.2% | | | | | | | | |
Alcoa, Inc. | | | 75,193 | | | | 720,349 | |
Nucor Corp. | | | 51,722 | | | | 2,446,451 | |
| | | | | | | | |
| Total Metals & Mining | | | | | | | 3,166,800 | |
| Multi-Utilities – 1.6% | | | | | | | | |
Ameren Corp. | | | 44,929 | | | | 2,250,943 | |
Consolidated Edison, Inc. | | | 55,408 | | | | 4,245,361 | |
Dominion Resources, Inc. | | | 105,361 | | | | 7,914,718 | |
DTE Energy Co. | | | 29,808 | | | | 2,702,393 | |
Public Service Enterprise Group, Inc. | | | 93,332 | | | | 4,399,670 | |
Sempra Energy | | | 32,973 | | | | 3,430,841 | |
WEC Energy Group, Inc. | | | 52,955 | | | | 3,181,007 | |
| | | | | | | | |
| Total Multi-Utilities | | | | | | | 28,124,933 | |
| Multiline Retail – 0.6% | | | | | | | | |
Dollar General Corp. | | | 15,096 | | | | 1,292,218 | |
Macy’s, Inc. | | | 55,772 | | | | 2,458,987 | |
Target Corp. | | | 85,389 | | | | 7,025,807 | |
| | | | | | | | |
| Total Multiline Retail | | | | | | | 10,777,012 | |
| Oil, Gas & Consumable Fuels – 10.4% | | | | | | | | |
Anadarko Petroleum Corp. | | | 47,215 | | | | 2,198,802 | |
Apache Corp. | | | 37,837 | | | | 1,846,824 | |
Chevron Corp. | | | 410,394 | | | | 39,151,589 | |
Cimarex Energy Co. | | | 2,418 | | | | 235,199 | |
ConocoPhillips | | | 335,969 | | | | 13,529,472 | |
Devon Energy Corp. | | | 50,252 | | | | 1,378,915 | |
EOG Resources, Inc. | | | 21,655 | | | | 1,571,720 | |
Exxon Mobil Corp. | | | 722,137 | | | | 60,363,432 | |
Hess Corp. | | | 24,490 | | | | 1,289,398 | |
Kinder Morgan, Inc. | | | 1,204,344 | | | | 21,509,584 | |
Marathon Oil Corp. | | | 47,666 | | | | 530,999 | |
Marathon Petroleum Corp. | | | 61,634 | | | | 2,291,552 | |
Noble Energy, Inc. | | | 40,217 | | | | 1,263,216 | |
Occidental Petroleum Corp. | | | 152,013 | | | | 10,402,249 | |
Phillips 66 | | | 64,276 | | | | 5,565,659 | |
Pioneer Natural Resources Co. | | | 430 | | | | 60,518 | |
Spectra Energy Corp. | | | 193,680 | | | | 5,926,608 | |
Tesoro Corp. | | | 9,901 | | | | 851,585 | |
Valero Energy Corp. | | | 62,230 | | | | 3,991,432 | |
Williams Cos., Inc. (The) | | | 316,153 | | | | 5,080,579 | |
| | | | | | | | |
| Total Oil, Gas & Consumable Fuels | | | | | | | 179,039,332 | |
| Personal Products – 0.1% | | | | | | | | |
Estee Lauder Cos., Inc. (The) Class A | | | 14,151 | | | | 1,334,581 | |
See Notes to Financial Statements.
| | |
| 38 | | WisdomTree Domestic Earnings and Dividend Funds |
Schedule of Investments (continued)
WisdomTree LargeCap Dividend Fund (DLN)
March 31, 2016
| | | | | | | | |
| Investments | | Shares | | | Value | |
| | | | | | | | |
| Pharmaceuticals – 6.4% | | | | | | | | |
Bristol-Myers Squibb Co. | | | 161,449 | | | $ | 10,313,362 | |
Eli Lilly & Co. | | | 117,736 | | | | 8,478,169 | |
Johnson & Johnson | | | 360,645 | | | | 39,021,789 | |
Merck & Co., Inc. | | | 435,692 | | | | 23,052,464 | |
Pfizer, Inc. | | | 949,406 | | | | 28,140,394 | |
Zoetis, Inc. | | | 16,174 | | | | 716,993 | |
| | | | | | | | |
| Total Pharmaceuticals | | | | | | | 109,723,171 | |
| Professional Services – 0.0% | | | | | | | | |
Equifax, Inc. | | | 5,023 | | | | 574,079 | |
| Real Estate Investment Trusts (REITs) – 4.4% | | | | | |
American Tower Corp. | | | 37,074 | | | | 3,795,265 | |
AvalonBay Communities, Inc. | | | 17,441 | | | | 3,317,278 | |
Boston Properties, Inc. | | | 14,396 | | | | 1,829,444 | |
Crown Castle International Corp. | | | 62,051 | | | | 5,367,411 | |
Equinix, Inc. | | | 6,446 | | | | 2,131,757 | |
Equity Residential | | | 46,439 | | | | 3,484,318 | |
Essex Property Trust, Inc. | | | 7,421 | | | | 1,735,475 | |
General Growth Properties, Inc. | | | 113,156 | | | | 3,364,128 | |
HCP, Inc. | | | 131,417 | | | | 4,281,566 | |
Host Hotels & Resorts, Inc. | | | 163,252 | | | | 2,726,308 | |
Kimco Realty Corp. | | | 76,183 | | | | 2,192,547 | |
Macerich Co. (The) | | | 24,517 | | | | 1,942,727 | |
Prologis, Inc. | | | 87,619 | | | | 3,871,007 | |
Public Storage | | | 21,676 | | | | 5,978,891 | |
Realty Income Corp.(a) | | | 50,249 | | | | 3,141,065 | |
Simon Property Group, Inc. | | | 47,517 | | | | 9,868,806 | |
SL Green Realty Corp. | | | 9,298 | | | | 900,790 | |
Ventas, Inc. | | | 86,003 | | | | 5,414,749 | |
Vornado Realty Trust | | | 22,034 | | | | 2,080,671 | |
Welltower, Inc. | | | 82,058 | | | | 5,689,902 | |
Weyerhaeuser Co. | | | 90,515 | | | | 2,804,155 | |
| | | | | | | | |
| Total Real Estate Investment Trusts (REITs) | | | | | | | 75,918,260 | |
| Road & Rail – 0.9% | | | | | | | | |
CSX Corp. | | | 121,805 | | | | 3,136,479 | |
Norfolk Southern Corp. | | | 34,530 | | | | 2,874,622 | |
Union Pacific Corp. | | | 107,472 | | | | 8,549,398 | |
| | | | | | | | |
| Total Road & Rail | | | | | | | 14,560,499 | |
| Semiconductors & Semiconductor Equipment – 3.0% | | | | | |
Analog Devices, Inc. | | | 39,117 | | | | 2,315,335 | |
Applied Materials, Inc. | | | 113,500 | | | | 2,403,930 | |
Intel Corp. | | | 582,715 | | | | 18,850,830 | |
Lam Research Corp. | | | 10,266 | | | | 847,972 | |
Linear Technology Corp. | | | 29,173 | | | | 1,299,949 | |
Maxim Integrated Products, Inc. | | | 38,009 | | | | 1,397,971 | |
NVIDIA Corp. | | | 35,717 | | | | 1,272,597 | |
QUALCOMM, Inc. | | | 268,451 | | | | 13,728,584 | |
Skyworks Solutions, Inc. | | | 10,173 | | | | 792,477 | |
Texas Instruments, Inc. | | | 121,781 | | | | 6,992,665 | |
Xilinx, Inc. | | | 30,728 | | | | 1,457,429 | |
| | | | | | | | |
| Total Semiconductors & Semiconductor Equipment | | | | 51,359,739 | |
| | | | | | | | |
| Software – 4.1% | | | | | | | | |
Activision Blizzard, Inc. | | | 21,832 | | | $ | 738,795 | |
CA, Inc. | | | 72,253 | | | | 2,224,670 | |
Intuit, Inc. | | | 14,704 | | | | 1,529,363 | |
Microsoft Corp. | | | 939,799 | | | | 51,905,098 | |
Oracle Corp. | | | 303,458 | | | | 12,414,467 | |
Symantec Corp. | | | 90,203 | | | | 1,657,931 | |
| | | | | | | | |
| Total Software | | | | | | | 70,470,324 | |
| Specialty Retail – 1.6% | | | | | | | | |
Advance Auto Parts, Inc. | | | 553 | | | | 88,668 | |
Best Buy Co., Inc. | | | 45,625 | | | | 1,480,075 | |
Gap, Inc. (The) | | | 61,617 | | | | 1,811,540 | |
Home Depot, Inc. (The) | | | 101,312 | | | | 13,518,060 | |
L Brands, Inc. | | | 26,079 | | | | 2,289,997 | |
Lowe’s Cos., Inc. | | | 61,662 | | | | 4,670,897 | |
Ross Stores, Inc. | | | 16,281 | | | | 942,670 | |
TJX Cos., Inc. (The) | | | 35,437 | | | | 2,776,489 | |
Tractor Supply Co. | | | 4,831 | | | | 437,012 | |
| | | | | | | | |
| Total Specialty Retail | | | | | | | 28,015,408 | |
| Technology Hardware, Storage & Peripherals – 3.4% | | | | | |
Apple, Inc. | | | 452,579 | | | | 49,326,585 | |
EMC Corp. | | | 153,367 | | | | 4,087,231 | |
HP, Inc. | | | 315,743 | | | | 3,889,954 | |
Western Digital Corp. | | | 31,547 | | | | 1,490,280 | |
| | | | | | | | |
| Total Technology Hardware, Storage & Peripherals | | | | 58,794,050 | |
| Textiles, Apparel & Luxury Goods – 0.4% | | | | | | | | |
Hanesbrands, Inc. | | | 23,396 | | | | 663,043 | |
NIKE, Inc. Class B | | | 61,242 | | | | 3,764,546 | |
VF Corp. | | | 43,923 | | | | 2,844,453 | |
| | | | | | | | |
| Total Textiles, Apparel & Luxury Goods | | | | | | | 7,272,042 | |
| Tobacco – 3.7% | | | | | | | | |
Altria Group, Inc. | | | 345,985 | | | | 21,679,420 | |
Philip Morris International, Inc. | | | 322,463 | | | | 31,636,845 | |
Reynolds American, Inc. | | | 204,481 | | | | 10,287,439 | |
| | | | | | | | |
| Total Tobacco | | | | | | | 63,603,704 | |
| Trading Companies & Distributors – 0.2% | | | | | |
Fastenal Co.(a) | | | 36,075 | | | | 1,767,675 | |
W.W. Grainger, Inc.(a) | | | 6,722 | | | | 1,569,116 | |
| | | | | | | | |
| Total Trading Companies & Distributors | | | | | | | 3,336,791 | |
TOTAL COMMON STOCKS
(Cost: $1,592,645,741) | | | | 1,716,461,021 | |
| EXCHANGE-TRADED FUND – 0.3% | | | | | | | | |
| United States – 0.3% | | | | | | | | |
WisdomTree Total Dividend Fund(a)(b)
(Cost: $5,058,055) | | | 73,272 | | | | 5,438,981 | |
See Notes to Financial Statements.
| | | | |
| WisdomTree Domestic Earnings and Dividend Funds | | | 39 | |
Schedule of Investments (concluded)
WisdomTree LargeCap Dividend Fund (DLN)
March 31, 2016
| | | | | | | | |
| Investments | | Shares | | | Value | |
| | | | | | | | |
| INVESTMENT OF CASH COLLATERAL FOR SECURITIES LOANED – 0.4% | |
| United States – 0.4% | | | | | | | | |
State Street Navigator Securities Lending Prime Portfolio, 0.50%(c) (Cost: $7,428,445)(d) | | | 7,428,445 | | | $ | 7,428,445 | |
TOTAL INVESTMENTS IN SECURITIES – 100.2%
(Cost: $1,605,132,241) | | | | 1,729,328,447 | |
Liabilities in Excess of Cash and Other Assets – (0.2)% | | | | (4,069,362 | ) |
| | | | | | | | |
| NET ASSETS – 100.0% | | | $ | 1,725,259,085 | |
| (a) | Security, or portion thereof, was on loan at March 31, 2016 (See Note 2). |
| (b) | Affiliated company (See Note 3). |
| (c) | Rate shown represents annualized 7-day yield as of March 31, 2016. |
| (d) | At March 31, 2016, the total market value of the Fund’s securities on loan was $7,272,171 and the total market value of the collateral held by the Fund was $7,428,445. |
See Notes to Financial Statements.
| | |
| 40 | | WisdomTree Domestic Earnings and Dividend Funds |
Schedule of Investments
WisdomTree LargeCap Value Fund (EZY)
March 31, 2016
| | | | | | | | |
| Investments | | Shares | | | Value | |
| | | | | | | | |
| COMMON STOCKS – 99.6% | | | | | | | | |
| United States – 99.6% | | | | | | | | |
| Aerospace & Defense – 7.4% | | | | | | | | |
Boeing Co. (The) | | | 28,685 | | | $ | 3,641,274 | |
BWX Technologies, Inc. | | | 1,188 | | | | 39,869 | |
Huntington Ingalls Industries, Inc. | | | 2,556 | | | | 350,019 | |
Lockheed Martin Corp. | | | 12,411 | | | | 2,749,037 | |
Northrop Grumman Corp. | | | 6,597 | | | | 1,305,546 | |
Orbital ATK, Inc. | | | 1,631 | | | | 141,799 | |
Raytheon Co. | | | 12,321 | | | | 1,510,924 | |
Spirit AeroSystems Holdings, Inc. Class A* | | | 10,474 | | | | 475,101 | |
| | | | | | | | |
| Total Aerospace & Defense | | | | | | | 10,213,569 | |
| Airlines – 3.1% | | | | | | | | |
Alaska Air Group, Inc. | | | 6,377 | | | | 523,042 | |
Allegiant Travel Co. | | | 698 | | | | 124,286 | |
Delta Air Lines, Inc. | | | 38,888 | | | | 1,893,068 | |
Hawaiian Holdings, Inc.* | | | 2,854 | | | | 134,680 | |
JetBlue Airways Corp.* | | | 16,449 | | | | 347,403 | |
Southwest Airlines Co. | | | 28,603 | | | | 1,281,414 | |
| | | | | | | | |
| Total Airlines | | | | | | | 4,303,893 | |
| Auto Components – 2.0% | | | | | | | | |
Cooper Tire & Rubber Co. | | | 3,520 | | | | 130,310 | |
Goodyear Tire & Rubber Co. (The) | | | 60,861 | | | | 2,007,196 | |
Lear Corp. | | | 4,312 | | | | 479,365 | |
Tenneco, Inc.* | | | 3,211 | | | | 165,399 | |
Visteon Corp. | | | 224 | | | | 17,828 | |
| | | | | | | | |
| Total Auto Components | | | | | | | 2,800,098 | |
| Automobiles – 1.9% | | | | | | | | |
General Motors Co. | | | 79,992 | | | | 2,514,149 | |
Thor Industries, Inc. | | | 2,425 | | | | 154,642 | |
| | | | | | | | |
| Total Automobiles | | | | | | | 2,668,791 | |
| Banks – 0.8% | | | | | | | | |
BancorpSouth, Inc. | | | 3,999 | | | | 85,219 | |
First Horizon National Corp. | | | 9,286 | | | | 121,647 | |
First Niagara Financial Group, Inc. | | | 14,167 | | | | 137,137 | |
Fulton Financial Corp. | | | 7,831 | | | | 104,779 | |
Hilltop Holdings, Inc.* | | | 7,657 | | | | 144,564 | |
PrivateBancorp, Inc. | | | 2,812 | | | | 108,543 | |
Synovus Financial Corp. | | | 4,702 | | | | 135,935 | |
Webster Financial Corp. | | | 3,566 | | | | 128,019 | |
Wintrust Financial Corp. | | | 2,157 | | | | 95,641 | |
| | | | | | | | |
| Total Banks | | | | | | | 1,061,484 | |
| Beverages – 1.2% | | | | | | | | |
Coca-Cola Enterprises, Inc. | | | 7,792 | | | | 395,366 | |
Constellation Brands, Inc. Class A | | | 4,838 | | | | 730,973 | |
Dr. Pepper Snapple Group, Inc. | | | 5,538 | | | | 495,208 | |
National Beverage Corp.* | | | 746 | | | | 31,571 | |
| | | | | | | | |
| Total Beverages | | | | | | | 1,653,118 | |
| Biotechnology – 0.0% | | | | | | | | |
Insys Therapeutics, Inc.*(a) | | | 1,185 | | | | 18,948 | |
| | | | | | | | |
| Building Products – 0.5% | | | | | | | | |
A.O. Smith Corp. | | | 2,420 | | | $ | 184,670 | |
Fortune Brands Home & Security, Inc. | | | 3,170 | | | | 177,647 | |
Lennox International, Inc. | | | 1,183 | | | | 159,930 | |
Owens Corning | | | 3,612 | | | | 170,775 | |
| | | | | | | | |
| Total Building Products | | | | | | | 693,022 | |
| Capital Markets – 0.2% | | | | | | | | |
E*TRADE Financial Corp.* | | | 5,237 | | | | 128,254 | |
Evercore Partners, Inc. Class A | | | 617 | | | | 31,930 | |
Interactive Brokers Group, Inc. Class A | | | 619 | | | | 24,339 | |
LPL Financial Holdings, Inc.(a) | | | 3,083 | | | | 76,458 | |
| | | | | | | | |
| Total Capital Markets | | | | | | | 260,981 | |
| Chemicals – 2.7% | | | | | | | | |
Airgas, Inc. | | | 1,843 | | | | 261,042 | |
Celanese Corp. Series A | | | 4,972 | | | | 325,666 | |
Chemtura Corp.* | | | 11,005 | | | | 290,532 | |
Dow Chemical Co. (The) | | | 51,666 | | | | 2,627,733 | |
Scotts Miracle-Gro Co. (The) Class A | | | 1,669 | | | | 121,453 | |
Sensient Technologies Corp. | | | 1,278 | | | | 81,102 | |
| | | | | | | | |
| Total Chemicals | | | | | | | 3,707,528 | |
| Commercial Services & Supplies – 1.1% | | | | | | | | |
Cintas Corp. | | | 3,073 | | | | 275,986 | |
Healthcare Services Group, Inc. | | | 1,188 | | | | 43,730 | |
R.R. Donnelley & Sons Co. | | | 6,781 | | | | 111,209 | |
Republic Services, Inc. | | | 9,897 | | | | 471,592 | |
Waste Management, Inc. | | | 10,121 | | | | 597,139 | |
| | | | | | | | |
| Total Commercial Services & Supplies | | | | | | | 1,499,656 | |
| Communications Equipment – 0.4% | | | | | | | | |
CommScope Holding Co., Inc.* | | | 1,187 | | | | 33,141 | |
Harris Corp. | | | 2,947 | | | | 229,453 | |
Infinera Corp.*(a) | | | 1,586 | | | | 25,471 | |
Juniper Networks, Inc. | | | 11,968 | | | | 305,304 | |
| | | | | | | | |
| Total Communications Equipment | | | | | | | 593,369 | |
| Construction & Engineering – 0.3% | | | | | | | | |
Dycom Industries, Inc.* | | | 699 | | | | 45,204 | |
EMCOR Group, Inc. | | | 2,377 | | | | 115,522 | |
Jacobs Engineering Group, Inc.* | | | 5,845 | | | | 254,550 | |
| | | | | | | | |
| Total Construction & Engineering | | | | | | | 415,276 | |
| Construction Materials – 0.2% | | | | | | | | |
Martin Marietta Materials, Inc. | | | 1,318 | | | | 210,234 | |
Vulcan Materials Co. | | | 1,226 | | | | 129,429 | |
| | | | | | | | |
| Total Construction Materials | | | | | | | 339,663 | |
| Consumer Finance – 1.0% | | | | | | | | |
Synchrony Financial* | | | 50,213 | | | | 1,439,105 | |
| Containers & Packaging – 0.9% | | | | | | | | |
AptarGroup, Inc. | | | 1,888 | | | | 148,038 | |
Avery Dennison Corp. | | | 3,210 | | | | 231,473 | |
Bemis Co., Inc. | | | 3,691 | | | | 191,120 | |
Graphic Packaging Holding Co. | | | 11,620 | | | | 149,317 | |
Sealed Air Corp. | | | 4,137 | | | | 198,617 | |
See Notes to Financial Statements.
| | | | |
| WisdomTree Domestic Earnings and Dividend Funds | | | 41 | |
Schedule of Investments (continued)
WisdomTree LargeCap Value Fund (EZY)
March 31, 2016
| | | | | | | | |
| Investments | | Shares | | | Value | |
| | | | | | | | |
Silgan Holdings, Inc. | | | 1,941 | | | $ | 103,203 | |
Sonoco Products Co. | | | 3,519 | | | | 170,918 | |
| | | | | | | | |
| Total Containers & Packaging | | | | | | | 1,192,686 | |
| Distributors – 0.1% | | | | | | | | |
Core-Mark Holding Co., Inc. | | | 390 | | | | 31,808 | |
Pool Corp. | | | 1,059 | | | | 92,917 | |
| | | | | | | | |
| Total Distributors | | | | | | | 124,725 | |
| Diversified Consumer Services – 0.2% | | | | | | | | |
Bright Horizons Family Solutions, Inc.* | | | 923 | | | | 59,792 | |
Graham Holdings Co. Class B | | | 170 | | | | 81,600 | |
Service Corp. International | | | 3,294 | | | | 81,296 | |
ServiceMaster Global Holdings, Inc.* | | | 3,036 | | | | 114,396 | |
| | | | | | | | |
| Total Diversified Consumer Services | | | | | | | 337,084 | |
| Diversified Financial Services – 1.2% | | | | | | | | |
Nasdaq, Inc. | | | 4,707 | | | | 312,450 | |
Voya Financial, Inc. | | | 43,697 | | | | 1,300,860 | |
| | | | | | | | |
| Total Diversified Financial Services | | | | | | | 1,613,310 | |
| Electric Utilities – 1.4% | | | | | | | | |
Hawaiian Electric Industries, Inc. | | | 3,609 | | | | 116,931 | |
PG&E Corp. | | | 17,776 | | | | 1,061,583 | |
Xcel Energy, Inc. | | | 19,307 | | | | 807,419 | |
| | | | | | | | |
| Total Electric Utilities | | | | | | | 1,985,933 | |
| Electrical Equipment – 0.1% | | | | | | | | |
Acuity Brands, Inc. | | | 657 | | | | 143,318 | |
| Electronic Equipment, Instruments & Components – 1.2% | |
Arrow Electronics, Inc.* | | | 5,589 | | | | 359,988 | |
Avnet, Inc. | | | 8,838 | | | | 391,523 | |
CDW Corp. | | | 5,859 | | | | 243,149 | |
Ingram Micro, Inc. Class A | | | 4,180 | | | | 150,104 | |
Jabil Circuit, Inc. | | | 8,453 | | | | 162,889 | |
SYNNEX Corp. | | | 1,536 | | | | 142,218 | |
Tech Data Corp.* | | | 2,116 | | | | 162,445 | |
| | | | | | | | |
| Total Electronic Equipment, Instruments & Components | | | | | | | 1,612,316 | |
| Energy Equipment & Services – 0.3% | | | | | | | | |
Cameron International Corp.* | | | 5,805 | | | | 389,225 | |
| Food & Staples Retailing – 8.0% | | | | | | | | |
Casey’s General Stores, Inc. | | | 1,052 | | | | 119,213 | |
Costco Wholesale Corp. | | | 10,168 | | | | 1,602,273 | |
CVS Health Corp. | | | 36,958 | | | | 3,833,653 | |
Kroger Co. (The) | | | 31,722 | | | | 1,213,367 | |
Rite Aid Corp.* | | | 173,981 | | | | 1,417,945 | |
Sysco Corp. | | | 10,555 | | | | 493,235 | |
Walgreens Boots Alliance, Inc. | | | 28,683 | | | | 2,416,256 | |
| | | | | | | | |
| Total Food & Staples Retailing | | | | | | | 11,095,942 | |
| Food Products – 6.8% | | | | | | | | |
B&G Foods, Inc. | | | 1,358 | | | | 47,272 | |
Cal-Maine Foods, Inc.(a) | | | 4,049 | | | | 210,184 | |
Campbell Soup Co. | | | 9,234 | | | | 589,037 | |
ConAgra Foods, Inc. | | | 14,250 | | | | 635,835 | |
| | | | | | | | |
Flowers Foods, Inc. | | | 5,768 | | | $ | 106,477 | |
Hormel Foods Corp. | | | 11,658 | | | | 504,092 | |
Ingredion, Inc. | | | 2,733 | | | | 291,857 | |
J.M. Smucker Co. (The) | | | 2,103 | | | | 273,054 | |
Lancaster Colony Corp. | | | 657 | | | | 72,644 | |
Mondelez International, Inc. Class A | | | 137,194 | | | | 5,504,223 | |
Pinnacle Foods, Inc. | | | 2,776 | | | | 124,032 | |
Snyder’s-Lance, Inc. | | | 1,228 | | | | 38,657 | |
TreeHouse Foods, Inc.* | | | 927 | | | | 80,417 | |
Tyson Foods, Inc. Class A | | | 14,080 | | | | 938,573 | |
| | | | | | | | |
| Total Food Products | | | | | | | 9,416,354 | |
| Gas Utilities – 0.7% | | | | | | | | |
AGL Resources, Inc. | | | 4,444 | | | | 289,482 | |
Atmos Energy Corp. | | | 3,611 | | | | 268,153 | |
New Jersey Resources Corp. | | | 3,823 | | | | 139,272 | |
ONE Gas, Inc. | | | 1,717 | | | | 104,909 | |
Piedmont Natural Gas Co., Inc. | | | 1,675 | | | | 100,215 | |
WGL Holdings, Inc. | | | 1,674 | | | | 121,147 | |
| | | | | | | | |
| Total Gas Utilities | | | | | | | 1,023,178 | |
| Health Care Equipment & Supplies – 0.5% | | | | | | | | |
ABIOMED, Inc.* | | | 1,059 | | | | 100,404 | |
Boston Scientific Corp.* | | | 18,430 | | | | 346,668 | |
Cantel Medical Corp. | | | 526 | | | | 37,535 | |
Hill-Rom Holdings, Inc. | | | 742 | | | | 37,323 | |
Hologic, Inc.* | | | 2,378 | | | | 82,041 | |
Integra LifeSciences Holdings Corp.* | | | 90 | | | | 6,062 | |
Masimo Corp.* | | | 1,321 | | | | 55,271 | |
| | | | | | | | |
| Total Health Care Equipment & Supplies | | | | | | | 665,304 | |
| Health Care Providers & Services – 11.0% | | | | | | | | |
Aetna, Inc. | | | 14,529 | | | | 1,632,333 | |
Amsurg Corp.* | | | 1,011 | | | | 75,421 | |
Anthem, Inc. | | | 13,988 | | | | 1,944,192 | |
Cardinal Health, Inc. | | | 10,525 | | | | 862,524 | |
Centene Corp.* | | | 5,397 | | | | 332,293 | |
Chemed Corp. | | | 522 | | | | 70,705 | |
Cigna Corp. | | | 10,036 | | | | 1,377,341 | |
Diplomat Pharmacy, Inc.*(a) | | | 397 | | | | 10,878 | |
Express Scripts Holding Co.* | | | 18,694 | | | | 1,284,091 | |
Henry Schein, Inc.* | | | 2,157 | | | | 372,363 | |
Humana, Inc. | | | 4,437 | | | | 811,749 | |
Laboratory Corp. of America Holdings* | | | 2,504 | | | | 293,293 | |
LifePoint Health, Inc.* | | | 1,456 | | | | 100,828 | |
Molina Healthcare, Inc.* | | | 1,758 | | | | 113,373 | |
Owens & Minor, Inc. | | | 1,664 | | | | 67,259 | |
Quest Diagnostics, Inc. | | | 7,083 | | | | 506,080 | |
UnitedHealth Group, Inc. | | | 35,694 | | | | 4,600,957 | |
Universal Health Services, Inc. Class B | | | 3,875 | | | | 483,290 | |
VCA, Inc.* | | | 2,156 | | | | 124,380 | |
WellCare Health Plans, Inc.* | | | 1,099 | | | | 101,932 | |
| | | | | | | | |
| Total Health Care Providers & Services | | | | | | | 15,165,282 | |
See Notes to Financial Statements.
| | |
| 42 | | WisdomTree Domestic Earnings and Dividend Funds |
Schedule of Investments (continued)
WisdomTree LargeCap Value Fund (EZY)
March 31, 2016
| | | | | | | | |
| Investments | | Shares | | | Value | |
| | | | | | | | |
| Hotels, Restaurants & Leisure – 1.7% | | | | | | | | |
Aramark | | | 4,974 | | | $ | 164,739 | |
Boyd Gaming Corp.* | | | 1,714 | | | | 35,411 | |
Churchill Downs, Inc. | | | 180 | | | | 26,618 | |
Darden Restaurants, Inc. | | | 3,473 | | | | 230,260 | |
Diamond Resorts International, Inc.*(a) | | | 2,999 | | | | 72,876 | |
Pinnacle Entertainment, Inc.* | | | 1,545 | | | | 54,230 | |
Starbucks Corp. | | | 27,143 | | | | 1,620,437 | |
Texas Roadhouse, Inc. | | | 1,852 | | | | 80,710 | |
Vail Resorts, Inc. | | | 566 | | | | 75,674 | |
Wendy’s Co. (The) | | | 3,125 | | | | 34,031 | |
| | | | | | | | |
| Total Hotels, Restaurants & Leisure | | | | | | | 2,394,986 | |
| Household Durables – 2.0% | | | | | | | | |
CalAtlantic Group, Inc. | | | 2,767 | | | | 92,473 | |
D.R. Horton, Inc. | | | 16,229 | | | | 490,603 | |
Jarden Corp.* | | | 2,986 | | | | 176,025 | |
Leggett & Platt, Inc. | | | 4,805 | | | | 232,562 | |
Lennar Corp. Class A | | | 10,472 | | | | 506,426 | |
Mohawk Industries, Inc.* | | | 2,374 | | | | 453,196 | |
Newell Rubbermaid, Inc. | | | 6,464 | | | | 286,290 | |
NVR, Inc.* | | | 137 | | | | 237,339 | |
Tempur Sealy International, Inc.* | | | 1,325 | | | | 80,547 | |
Toll Brothers, Inc.* | | | 6,869 | | | | 202,704 | |
| | | | | | | | |
| Total Household Durables | | | | | | | 2,758,165 | |
| Insurance – 10.3% | | | | | | | | |
Aflac, Inc. | | | 26,841 | | | | 1,694,741 | |
Alleghany Corp.* | | | 700 | | | | 347,340 | |
American Financial Group, Inc. | | | 4,220 | | | | 296,961 | |
American International Group, Inc. | | | 44,876 | | | | 2,425,548 | |
AmTrust Financial Services, Inc. | | | 12,014 | | | | 310,922 | |
Assurant, Inc. | | | 877 | | | | 67,661 | |
Cincinnati Financial Corp. | | | 6,470 | | | | 422,879 | |
CNO Financial Group, Inc. | | | 8,012 | | | | 143,575 | |
Erie Indemnity Co. Class A | | | 616 | | | | 57,282 | |
First American Financial Corp. | | | 5,415 | | | | 206,366 | |
Hanover Insurance Group, Inc. (The) | | | 2,636 | | | | 237,820 | |
Hartford Financial Services Group, Inc. (The) | | | 25,089 | | | | 1,156,101 | |
Kemper Corp. | | | 1,892 | | | | 55,946 | |
Markel Corp.* | | | 391 | | | | 348,604 | |
National General Holdings Corp. | | | 4,619 | | | | 99,724 | |
Old Republic International Corp. | | | 13,597 | | | | 248,553 | |
Progressive Corp. (The) | | | 27,636 | | | | 971,129 | |
Prudential Financial, Inc. | | | 13,152 | | | | 949,838 | |
Reinsurance Group of America, Inc. | | | 4,446 | | | | 427,928 | |
RLI Corp. | | | 1,456 | | | | 97,348 | |
Selective Insurance Group, Inc. | | | 3,164 | | | | 115,834 | |
Torchmark Corp. | | | 6,338 | | | | 343,266 | |
Travelers Cos., Inc. (The) | | | 22,223 | | | | 2,593,646 | |
Unum Group | | | 8,049 | | | | 248,875 | |
W.R. Berkley Corp. | | | 5,856 | | | | 329,107 | |
| | | | | | | | |
| Total Insurance | | | | | | | 14,196,994 | |
| | | | | | | | |
| Internet & Catalog Retail – 0.2% | | | | | | | | |
Expedia, Inc. | | | 2,197 | | | $ | 236,881 | |
Netflix, Inc.* | | | 962 | | | | 98,345 | |
| | | | | | | | |
| Total Internet & Catalog Retail | | | | 335,226 | |
| Internet Software & Services – 0.7% | | | | | | | | |
eBay, Inc.* | | | 38,067 | | | | 908,279 | |
| IT Services – 1.9% | | | | | | | | |
Blackhawk Network Holdings, Inc.* | | | 613 | | | | 21,026 | |
Booz Allen Hamilton Holding Corp. | | | 5,060 | | | | 153,217 | |
Broadridge Financial Solutions, Inc. | | | 3,735 | | | | 221,523 | |
CACI International, Inc. Class A* | | | 963 | | | | 102,752 | |
Computer Sciences Corp. | | | 6,072 | | | | 208,816 | |
Convergys Corp. | | | 5,145 | | | | 142,877 | |
DST Systems, Inc. | | | 1,627 | | | | 183,477 | |
EPAM Systems, Inc.* | | | 661 | | | | 49,357 | |
Euronet Worldwide, Inc.* | | | 924 | | | | 68,478 | |
Fiserv, Inc.* | | | 5,240 | | | | 537,519 | |
Global Payments, Inc. | | | 2,857 | | | | 186,562 | |
Heartland Payment Systems, Inc. | | | 349 | | | | 33,703 | |
Leidos Holdings, Inc. | | | 1,669 | | | | 83,984 | |
Sabre Corp. | | | 5,980 | | | | 172,942 | |
Science Applications International Corp. | | | 1,883 | | | | 100,439 | |
Total System Services, Inc. | | | 4,570 | | | | 217,440 | |
Vantiv, Inc. Class A* | | | 2,247 | | | | 121,068 | |
| | | | | | | | |
| Total IT Services | | | | | | | 2,605,180 | |
| Leisure Products – 0.4% | | | | | | | | |
Brunswick Corp. | | | 3,782 | | | | 181,460 | |
Hasbro, Inc. | | | 4,226 | | | | 338,503 | |
| | | | | | | | |
| Total Leisure Products | | | | | | | 519,963 | |
| Life Sciences Tools & Services – 0.4% | | | | | | | | |
Bio-Rad Laboratories, Inc. Class A* | | | 571 | | | | 78,067 | |
Bruker Corp. | | | 2,117 | | | | 59,276 | |
Charles River Laboratories International, Inc.* | | | 1,237 | | | | 93,938 | |
INC Research Holdings, Inc. Class A* | | | 533 | | | | 21,965 | |
PAREXEL International Corp.* | | | 1,411 | | | | 88,512 | |
PerkinElmer, Inc. | | | 2,813 | | | | 139,131 | |
PRA Health Sciences, Inc.* | | | 444 | | | | 18,986 | |
VWR Corp.* | | | 3,921 | | | | 106,102 | |
| | | | | | | | |
| Total Life Sciences Tools & Services | | | | | | | 605,977 | |
| Machinery – 1.0% | | | | | | | | |
AGCO Corp. | | | 4,003 | | | | 198,949 | |
Oshkosh Corp. | | | 4,133 | | | | 168,916 | |
Snap-on, Inc. | | | 1,931 | | | | 303,147 | |
Stanley Black & Decker, Inc. | | | 5,452 | | | | 573,605 | |
Toro Co. (The) | | | 1,716 | | | | 147,782 | |
| | | | | | | | |
| Total Machinery | | | | | | | 1,392,399 | |
| Marine – 0.1% | | | | | | | | |
Matson, Inc. | | | 1,717 | | | | 68,972 | |
| Media – 1.9% | | | | | | | | |
Crown Media Holdings, Inc. Class A* | | | 13,338 | | | | 67,757 | |
Interpublic Group of Cos., Inc. (The) | | | 15,576 | | | | 357,469 | |
See Notes to Financial Statements.
| | | | |
| WisdomTree Domestic Earnings and Dividend Funds | | | 43 | |
Schedule of Investments (continued)
WisdomTree LargeCap Value Fund (EZY)
March 31, 2016
| | | | | | | | |
| Investments | | Shares | | | Value | |
| | | | | | | | |
New York Times Co. (The) Class A | | | 3,166 | | | $ | 39,448 | |
Sinclair Broadcast Group, Inc. Class A | | | 3,914 | | | | 120,356 | |
TEGNA, Inc. | | | 23,894 | | | | 560,553 | |
Time Warner Cable, Inc. | | | 7,174 | | | | 1,467,944 | |
| | | | | | | | |
| Total Media | | | | | | | 2,613,527 | |
| Multi-Utilities – 0.6% | | | | | | | | |
CMS Energy Corp. | | | 9,725 | | | | 412,729 | |
NiSource, Inc. | | | 8,754 | | | | 206,244 | |
TECO Energy, Inc. | | | 5,676 | | | | 156,261 | |
| | | | | | | | |
| Total Multi-Utilities | | | | | | | 775,234 | |
| Multiline Retail – 1.8% | | | | | | | | |
Dollar Tree, Inc.* | | | 2,775 | | | | 228,827 | |
Target Corp. | | | 27,141 | | | | 2,233,161 | |
| | | | | | | | |
| Total Multiline Retail | | | | | | | 2,461,988 | |
| Oil, Gas & Consumable Fuels – 7.2% | | | | | | | | |
CVR Energy, Inc. | | | 2,380 | | | | 62,118 | |
HollyFrontier Corp. | | | 8,842 | | | | 312,300 | |
Marathon Petroleum Corp. | | | 47,779 | | | | 1,776,423 | |
PDC Energy, Inc.* | | | 137 | | | | 8,145 | |
Phillips 66 | | | 38,058 | | | | 3,295,442 | |
Tesoro Corp. | | | 11,052 | | | | 950,583 | |
Valero Energy Corp. | | | 48,881 | | | | 3,135,227 | |
Western Refining, Inc. | | | 9,197 | | | | 267,541 | |
World Fuel Services Corp. | | | 3,304 | | | | 160,508 | |
| | | | | | | | |
| Total Oil, Gas & Consumable Fuels | | | | | | | 9,968,287 | |
| Personal Products – 0.8% | | | | | | | | |
Coty, Inc. Class A(a) | | | 8,713 | | | | 242,483 | |
Estee Lauder Cos., Inc. (The) Class A | | | 9,543 | | | | 900,000 | |
| | | | | | | | |
| Total Personal Products | | | | | | | 1,142,483 | |
| Pharmaceuticals – 0.1% | | | | | | | | |
Prestige Brands Holdings, Inc.* | | | 1,360 | | | | 72,610 | |
| Professional Services – 0.5% | | | | | | | | |
Equifax, Inc. | | | 2,727 | | | | 311,669 | |
ManpowerGroup, Inc. | | | 3,519 | | | | 286,517 | |
On Assignment, Inc.* | | | 1,103 | | | | 40,723 | |
| | | | | | | | |
| Total Professional Services | | | | | | | 638,909 | |
| Real Estate Management & Development – 0.4% | | | | | |
CBRE Group, Inc. Class A* | | | 11,392 | | | | 328,317 | |
Jones Lang LaSalle, Inc. | | | 1,883 | | | | 220,914 | |
| | | | | | | | |
| Total Real Estate Management & Development | | | | 549,231 | |
| Road & Rail – 0.2% | | | | | | | | |
AMERCO | | | 753 | | | | 269,054 | |
| Semiconductors & Semiconductor Equipment – 1.0% | | | | | |
Cirrus Logic, Inc.* | | | 2,200 | | | | 80,102 | |
First Solar, Inc.* | | | 7,123 | | | | 487,712 | |
Integrated Device Technology, Inc.* | | | 3,875 | | | | 79,205 | |
Microsemi Corp.* | | | 1,632 | | | | 62,522 | |
NVIDIA Corp. | | | 12,583 | | | | 448,332 | |
ON Semiconductor Corp.* | | | 10,685 | | | | 102,469 | |
Synaptics, Inc.* | | | 836 | | | | 66,663 | |
| | | | | | | | |
| Total Semiconductors & Semiconductor Equipment | | | | 1,327,005 | |
| | | | | | | | |
| Software – 1.0% | | | | | | | | |
ACI Worldwide, Inc.* | | | 2,202 | | | $ | 45,779 | |
Activision Blizzard, Inc. | | | 19,795 | | | | 669,863 | |
Electronic Arts, Inc.* | | | 8,619 | | | | 569,802 | |
Fair Isaac Corp. | | | 656 | | | | 69,595 | |
Pegasystems, Inc. | | | 794 | | | | 20,152 | |
| | | | | | | | |
| Total Software | | | | | | | 1,375,191 | |
| Specialty Retail – 7.8% | | | | | | | | |
Advance Auto Parts, Inc. | | | 2,326 | | | | 372,951 | |
American Eagle Outfitters, Inc.(a) | | | 6,288 | | | | 104,821 | |
Asbury Automotive Group, Inc.* | | | 1,370 | | | | 81,981 | |
AutoNation, Inc.* | | | 5,188 | | | | 242,176 | |
CarMax, Inc.* | | | 7,485 | | | | 382,484 | |
Foot Locker, Inc. | | | 5,846 | | | | 377,067 | |
Home Depot, Inc. (The) | | | 35,516 | | | | 4,738,900 | |
Lithia Motors, Inc. Class A | | | 1,056 | | | | 92,220 | |
Lowe’s Cos., Inc. | | | 27,146 | | | | 2,056,310 | |
Monro Muffler Brake, Inc. | | | 619 | | | | 44,240 | |
Murphy USA, Inc.* | | | 2,198 | | | | 135,067 | |
O’Reilly Automotive, Inc.* | | | 2,503 | | | | 684,971 | |
Penske Automotive Group, Inc. | | | 5,098 | | | | 193,214 | |
Ross Stores, Inc. | | | 12,581 | | | | 728,440 | |
Tractor Supply Co. | | | 3,207 | | | | 290,105 | |
Ulta Salon Cosmetics & Fragrance, Inc.* | | | 1,091 | | | | 211,370 | |
| | | | | | | | |
| Total Specialty Retail | | | | | | | 10,736,317 | |
| Textiles, Apparel & Luxury Goods – 2.0% | | | | | | | | |
Columbia Sportswear Co. | | | 2,552 | | | | 153,350 | |
G-III Apparel Group Ltd.* | | | 1,716 | | | | 83,895 | |
NIKE, Inc. Class B | | | 37,886 | | | | 2,328,852 | |
Skechers U.S.A., Inc. Class A* | | | 5,237 | | | | 159,467 | |
| | | | | | | | |
| Total Textiles, Apparel & Luxury Goods | | | | | | | 2,725,564 | |
| Trading Companies & Distributors – 0.1% | | | | | | | | |
Beacon Roofing Supply, Inc.* | | | 885 | | | | 36,294 | |
Watsco, Inc. | | | 885 | | | | 119,245 | |
| | | | | | | | |
| Total Trading Companies & Distributors | | | | | | | 155,539 | |
| Wireless Telecommunication Services – 0.3% | | | | | |
T-Mobile U.S., Inc.* | | | 9,419 | | | | 360,748 | |
Telephone & Data Systems, Inc. | | | 830 | | | | 24,975 | |
United States Cellular Corp.* | | | 918 | | | | 41,943 | |
| | | | | | | | |
| Total Wireless Telecommunication Services | | | | | | | 427,666 | |
TOTAL COMMON STOCKS
(Cost: $133,486,102) | | | | | | | 137,457,904 | |
| EXCHANGE-TRADED FUNDS – 0.3% | | | | | | | | |
| United States – 0.3% | | | | | | | | |
WisdomTree Earnings 500 Fund(b) | | | 4,488 | | | | 312,455 | |
WisdomTree MidCap Earnings Fund(b) | | | 1,537 | | | | 138,591 | |
| | | | | | | | |
TOTAL EXCHANGE-TRADED FUNDS
(Cost: $442,117) | | | | | | | 451,046 | |
See Notes to Financial Statements.
| | |
| 44 | | WisdomTree Domestic Earnings and Dividend Funds |
Schedule of Investments (concluded)
WisdomTree LargeCap Value Fund (EZY)
March 31, 2016
| | | | | | | | |
| Investments | | Shares | | | Value | |
| | | | | | | | |
| INVESTMENT OF CASH COLLATERAL FOR SECURITIES LOANED – 0.4% | |
| United States – 0.4% | | | | | | | | |
State Street Navigator Securities Lending Prime Portfolio, 0.50%(c) (Cost: $603,608)(d) | | | 603,608 | | | $ | 603,608 | |
TOTAL INVESTMENTS IN SECURITIES – 100.3%
(Cost: $134,531,827) | | | | 138,512,558 | |
Liabilities in Excess of Cash and Other Assets – (0.3)% | | | | (450,975 | ) |
| | | | | | | | |
| NET ASSETS – 100.0% | | | $ | 138,061,583 | |
| * | Non-income producing security. |
| (a) | Security, or portion thereof, was on loan at March 31, 2016 (See Note 2). |
| (b) | Affiliated company (See Note 3). |
| (c) | Rate shown represents annualized 7-day yield as of March 31, 2016. |
| (d) | At March 31, 2016, the total market value of the Fund’s securities on loan was $588,660 and the total market value of the collateral held by the Fund was $603,608. |
See Notes to Financial Statements.
| | | | |
| WisdomTree Domestic Earnings and Dividend Funds | | | 45 | |
Schedule of Investments
WisdomTree MidCap Dividend Fund (DON)
March 31, 2016
| | | | | | | | |
| Investments | | Shares | | | Value | |
| | | | | | | | |
| COMMON STOCKS – 99.6% | | | | | | | | |
| United States – 99.6% | | | | | | | | |
| Aerospace & Defense – 1.2% | | | | | | | | |
B/E Aerospace, Inc. | | | 69,789 | | | $ | 3,218,669 | |
BWX Technologies, Inc. | | | 30,047 | | | | 1,008,377 | |
Curtiss-Wright Corp. | | | 12,690 | | | | 960,252 | |
Hexcel Corp. | | | 30,915 | | | | 1,351,295 | |
Huntington Ingalls Industries, Inc. | | | 27,349 | | | | 3,745,172 | |
L-3 Communications Holdings, Inc. | | | 62,789 | | | | 7,440,497 | |
Orbital ATK, Inc. | | | 26,381 | | | | 2,293,564 | |
| | | | | | | | |
| Total Aerospace & Defense | | | | | | | 20,017,826 | |
| Air Freight & Logistics – 0.9% | | | | | | | | |
C.H. Robinson Worldwide, Inc. | | | 129,293 | | | | 9,597,419 | |
Expeditors International of Washington, Inc. | | | 105,129 | | | | 5,131,347 | |
| | | | | | | | |
| Total Air Freight & Logistics | | | | | | | 14,728,766 | |
| Airlines – 0.3% | | | | | | | | |
Alaska Air Group, Inc. | | | 44,929 | | | | 3,685,077 | |
Allegiant Travel Co. | | | 4,169 | | | | 742,332 | |
| | | | | | | | |
| Total Airlines | | | | | | | 4,427,409 | |
| Auto Components – 0.8% | | | | | | | | |
BorgWarner, Inc. | | | 107,823 | | | | 4,140,403 | |
Gentex Corp. | | | 232,548 | | | | 3,648,678 | |
Goodyear Tire & Rubber Co. (The) | | | 85,764 | | | | 2,828,497 | |
Lear Corp. | | | 22,753 | | | | 2,529,451 | |
| | | | | | | | |
| Total Auto Components | | | | | | | 13,147,029 | |
| Automobiles – 0.8% | | | | | | | | |
Harley-Davidson, Inc.(a) | | | 190,703 | | | | 9,788,785 | |
Thor Industries, Inc. | | | 40,684 | | | | 2,594,419 | |
| | | | | | | | |
| Total Automobiles | | | | | | | 12,383,204 | |
| Banks – 3.2% | | | | | | | | |
Associated Banc-Corp. | | | 62,238 | | | | 1,116,550 | |
Bank of Hawaii Corp. | | | 23,022 | | | | 1,571,942 | |
Bank of the Ozarks, Inc. | | | 18,252 | | | | 766,036 | |
BankUnited, Inc. | | | 42,732 | | | | 1,471,690 | |
BOK Financial Corp.(a) | | | 34,100 | | | | 1,862,542 | |
Cathay General Bancorp | | | 34,916 | | | | 989,170 | |
CIT Group, Inc. | | | 53,033 | | | | 1,645,614 | |
Comerica, Inc. | | | 64,374 | | | | 2,437,843 | |
Commerce Bancshares, Inc. | | | 36,111 | | | | 1,623,189 | |
Cullen/Frost Bankers, Inc.(a) | | | 37,527 | | | | 2,068,113 | |
East West Bancorp, Inc. | | | 50,792 | | | | 1,649,724 | |
First Citizens BancShares, Inc. Class A | | | 1,072 | | | | 269,147 | |
First Horizon National Corp. | | | 69,760 | | | | 913,856 | |
First Niagara Financial Group, Inc. | | | 191,998 | | | | 1,858,541 | |
First Republic Bank | | | 23,543 | | | | 1,568,906 | |
FirstMerit Corp. | | | 111,776 | | | | 2,352,885 | |
Home BancShares, Inc. | | | 18,393 | | | | 753,193 | |
Huntington Bancshares, Inc. | | | 370,292 | | | | 3,532,586 | |
Iberiabank Corp.(a) | | | 18,697 | | | | 958,595 | |
Investors Bancorp, Inc. | | | 98,195 | | | | 1,142,990 | |
MB Financial, Inc. | | | 28,858 | | | | 936,442 | |
PacWest Bancorp | | | 99,866 | | | | 3,710,022 | |
| | | | | | | | |
People’s United Financial, Inc. | | | 234,568 | | | $ | 3,736,668 | |
PrivateBancorp, Inc. | | | 1,351 | | | | 52,149 | |
Prosperity Bancshares, Inc. | | | 31,447 | | | | 1,458,826 | |
Synovus Financial Corp. | | | 35,318 | | | | 1,021,043 | |
TCF Financial Corp. | | | 62,857 | | | | 770,627 | |
UMB Financial Corp. | | | 17,974 | | | | 927,998 | |
Umpqua Holdings Corp.(a) | | | 157,901 | | | | 2,504,310 | |
United Bankshares, Inc. | | | 44,883 | | | | 1,647,206 | |
Valley National Bancorp | | | 188,601 | | | | 1,799,254 | |
Webster Financial Corp. | | | 39,484 | | | | 1,417,476 | |
Zions Bancorp | | | 31,381 | | | | 759,734 | |
| | | | | | | | |
| Total Banks | | | | | | | 51,294,867 | |
| Beverages – 0.2% | | | | | | | | |
Brown-Forman Corp. Class A(a) | | | 38,261 | | | | 4,082,066 | |
| Building Products – 1.0% | | | | | | | | |
A.O. Smith Corp. | | | 27,353 | | | | 2,087,307 | |
Fortune Brands Home & Security, Inc. | | | 58,891 | | | | 3,300,252 | |
Lennox International, Inc.(a) | | | 18,285 | | | | 2,471,949 | |
Masco Corp. | | | 162,448 | | | | 5,108,990 | |
Owens Corning | | | 62,080 | | | | 2,935,142 | |
| | | | | | | | |
| Total Building Products | | | | | | | 15,903,640 | |
| Capital Markets – 0.9% | | | | | | | | |
Eaton Vance Corp. | | | 68,800 | | | | 2,306,176 | |
Federated Investors, Inc. Class B | | | 65,867 | | | | 1,900,263 | |
Interactive Brokers Group, Inc. Class A | | | 10,659 | | | | 419,112 | |
Janus Capital Group, Inc. | | | 88,871 | | | | 1,300,183 | |
Legg Mason, Inc. | | | 39,926 | | | | 1,384,634 | |
LPL Financial Holdings, Inc.(a) | | | 39,436 | | | | 978,013 | |
NorthStar Asset Management Group, Inc. | | | 121,071 | | | | 1,374,156 | |
Raymond James Financial, Inc. | | | 37,038 | | | | 1,763,379 | |
SEI Investments Co. | | | 27,493 | | | | 1,183,573 | |
Waddell & Reed Financial, Inc. Class A | | | 87,994 | | | | 2,071,379 | |
| | | | | | | | |
| Total Capital Markets | | | | | | | 14,680,868 | |
| Chemicals – 4.4% | | | | | | | | |
Airgas, Inc. | | | 46,225 | | | | 6,547,309 | |
Albemarle Corp. | | | 99,002 | | | | 6,329,198 | |
Ashland, Inc. | | | 36,715 | | | | 4,037,181 | |
Cabot Corp. | | | 48,977 | | | | 2,367,058 | |
Celanese Corp. Series A | | | 98,103 | | | | 6,425,747 | |
FMC Corp.(a) | | | 85,525 | | | | 3,452,644 | |
Huntsman Corp. | | | 430,508 | | | | 5,725,756 | |
International Flavors & Fragrances, Inc. | | | 56,455 | | | | 6,422,885 | |
NewMarket Corp. | | | 7,344 | | | | 2,910,134 | |
Olin Corp. | | | 255,215 | | | | 4,433,085 | |
PolyOne Corp. | | | 47,935 | | | | 1,450,034 | |
RPM International, Inc. | | | 118,904 | | | | 5,627,726 | |
Scotts Miracle-Gro Co. (The) Class A | | | 63,533 | | | | 4,623,296 | |
Sensient Technologies Corp. | | | 29,502 | | | | 1,872,197 | |
Valspar Corp. (The) | | | 46,723 | | | | 5,000,296 | |
Westlake Chemical Corp. | | | 63,711 | | | | 2,949,819 | |
| | | | | | | | |
| Total Chemicals | | | | | | | 70,174,365 | |
See Notes to Financial Statements.
| | |
| 46 | | WisdomTree Domestic Earnings and Dividend Funds |
Schedule of Investments (continued)
WisdomTree MidCap Dividend Fund (DON)
March 31, 2016
| | | | | | | | |
| Investments | | Shares | | | Value | |
| | | | | | | | |
| Commercial Services & Supplies – 2.5% | | | | | |
ADT Corp. (The) | | | 154,083 | | | $ | 6,357,465 | |
Cintas Corp. | | | 45,811 | | | | 4,114,286 | |
Deluxe Corp. | | | 39,173 | | | | 2,447,921 | |
Healthcare Services Group, Inc. | | | 52,357 | | | | 1,927,261 | |
KAR Auction Services, Inc. | | | 144,204 | | | | 5,499,940 | |
Pitney Bowes, Inc. | | | 275,275 | | | | 5,929,423 | |
R.R. Donnelley & Sons Co.(a) | | | 534,017 | | | | 8,757,879 | |
Rollins, Inc. | | | 97,083 | | | | 2,632,891 | |
Waste Connections, Inc.(a) | | | 48,401 | | | | 3,126,221 | |
| | | | | | | | |
| Total Commercial Services & Supplies | | | | | | | 40,793,287 | |
| Communications Equipment – 0.7% | | | | | | | | |
Brocade Communications Systems, Inc. | | | 312,103 | | | | 3,302,050 | |
Harris Corp. | | | 110,919 | | | | 8,636,153 | |
| | | | | | | | |
| Total Communications Equipment | | | | | | | 11,938,203 | |
| Construction & Engineering – 0.5% | | | | | | | | |
EMCOR Group, Inc. | | | 14,979 | | | | 727,979 | |
Fluor Corp. | | | 96,482 | | | | 5,181,083 | |
KBR, Inc. | | | 99,426 | | | | 1,539,115 | |
Valmont Industries, Inc. | | | 11,922 | | | | 1,476,421 | |
| | | | | | | | |
| Total Construction & Engineering | | | | | | | 8,924,598 | |
| Construction Materials – 0.3% | | | | | | | | |
Eagle Materials, Inc. | | | 12,526 | | | | 878,198 | |
Martin Marietta Materials, Inc. | | | 27,214 | | | | 4,340,905 | |
| | | | | | | | |
| Total Construction Materials | | | | | | | 5,219,103 | |
| Consumer Finance – 0.2% | | | | | | | | |
Navient Corp. | | | 341,348 | | | | 4,085,936 | |
| Containers & Packaging – 2.3% | | | | | | | | |
AptarGroup, Inc. | | | 37,666 | | | | 2,953,391 | |
Avery Dennison Corp. | | | 78,784 | | | | 5,681,114 | |
Ball Corp. | | | 36,424 | | | | 2,596,667 | |
Bemis Co., Inc. | | | 87,576 | | | | 4,534,685 | |
Graphic Packaging Holding Co. | | | 183,913 | | | | 2,363,282 | |
Packaging Corp. of America | | | 120,444 | | | | 7,274,818 | |
Sealed Air Corp.(a) | | | 87,112 | | | | 4,182,247 | |
Silgan Holdings, Inc. | | | 26,547 | | | | 1,411,504 | |
Sonoco Products Co. | | | 123,652 | | | | 6,005,778 | |
| | | | | | | | |
| Total Containers & Packaging | | | | | | | 37,003,486 | |
| Distributors – 0.1% | | | | | | | | |
Pool Corp. | | | 20,218 | | | | 1,773,927 | |
| Diversified Consumer Services – 0.7% | | | | | | | | |
Graham Holdings Co. Class B | | | 1,656 | | | | 794,880 | |
H&R Block, Inc. | | | 251,958 | | | | 6,656,730 | |
Service Corp. International | | | 131,908 | | | | 3,255,490 | |
| | | | | | | | |
| Total Diversified Consumer Services | | | | | | | 10,707,100 | |
| Diversified Financial Services – 0.7% | | | | | | | | |
CBOE Holdings, Inc. | | | 20,452 | | | | 1,336,129 | |
FactSet Research Systems, Inc. | | | 7,912 | | | | 1,198,906 | |
Leucadia National Corp. | | | 99,111 | | | | 1,602,625 | |
MarketAxess Holdings, Inc. | | | 4,852 | | | | 605,675 | |
| | | | | | | | |
Morningstar, Inc. | | | 7,619 | | | $ | 672,529 | |
MSCI, Inc. | | | 23,379 | | | | 1,731,916 | |
Nasdaq, Inc. | | | 54,468 | | | | 3,615,586 | |
Voya Financial, Inc. | | | 4,855 | | | | 144,533 | |
| | | | | | | | |
| Total Diversified Financial Services | | | | | | | 10,907,899 | |
| Diversified Telecommunication Services – 1.4% | | | | | |
Frontier Communications Corp.(a) | | | 3,937,415 | | | | 22,010,150 | |
| Electric Utilities – 3.8% | | | | | | | | |
Cleco Corp. | | | 68,858 | | | | 3,801,650 | |
Great Plains Energy, Inc. | | | 227,515 | | | | 7,337,359 | |
Hawaiian Electric Industries, Inc. | | | 174,551 | | | | 5,655,452 | |
IDACORP, Inc. | | | 57,167 | | | | 4,264,087 | |
ITC Holdings Corp. | | | 111,044 | | | | 4,838,187 | |
OGE Energy Corp. | | | 324,111 | | | | 9,279,298 | |
Pinnacle West Capital Corp. | | | 165,297 | | | | 12,408,846 | |
Portland General Electric Co. | | | 107,839 | | | | 4,258,562 | |
Westar Energy, Inc. | | | 183,027 | | | | 9,079,969 | |
| | | | | | | | |
| Total Electric Utilities | | | | | | | 60,923,410 | |
| Electrical Equipment – 0.5% | | | | | | | | |
Acuity Brands, Inc. | | | 3,521 | | | | 768,071 | |
EnerSys | | | 19,761 | | | | 1,101,083 | |
Hubbell, Inc. | | | 49,138 | | | | 5,205,188 | |
Regal Beloit Corp. | | | 26,082 | | | | 1,645,514 | |
| | | | | | | | |
| Total Electrical Equipment | | | | | | | 8,719,856 | |
| Electronic Equipment, Instruments & Components – 1.3% | |
Avnet, Inc. | | | 73,727 | | | | 3,266,106 | |
Belden, Inc. | | | 6,054 | | | | 371,595 | |
CDW Corp. | | | 61,878 | | | | 2,567,937 | |
Cognex Corp. | | | 25,209 | | | | 981,891 | |
FEI Co. | | | 22,727 | | | | 2,022,930 | |
FLIR Systems, Inc. | | | 76,987 | | | | 2,536,722 | |
Ingram Micro, Inc. Class A | | | 69,787 | | | | 2,506,051 | |
Jabil Circuit, Inc.(a) | | | 94,210 | | | | 1,815,427 | |
National Instruments Corp. | | | 122,067 | | | | 3,675,437 | |
SYNNEX Corp. | | | 12,963 | | | | 1,200,244 | |
| | | | | | | | |
| Total Electronic Equipment, Instruments & Components | | | | 20,944,340 | |
| Energy Equipment & Services – 1.0% | | | | | | | | |
Helmerich & Payne, Inc.(a) | | | 211,769 | | | | 12,435,076 | |
Oceaneering International, Inc. | | | 102,426 | | | | 3,404,640 | |
| | | | | | | | |
| Total Energy Equipment & Services | | | | | | | 15,839,716 | |
| Food & Staples Retailing – 0.5% | | | | | | | | |
Casey’s General Stores, Inc. | | | 9,812 | | | | 1,111,896 | |
PriceSmart, Inc. | | | 8,787 | | | | 743,204 | |
Whole Foods Market, Inc. | | | 197,487 | | | | 6,143,821 | |
| | | | | | | | |
| Total Food & Staples Retailing | | | | | | | 7,998,921 | |
| Food Products – 1.6% | | | | | | | | |
Flowers Foods, Inc. | | | 209,792 | | | | 3,872,760 | |
Ingredion, Inc.(a) | | | 49,755 | | | | 5,313,337 | |
Lancaster Colony Corp.(a) | | | 18,167 | | | | 2,008,725 | |
McCormick & Co., Inc. Non-Voting Shares | | | 87,296 | | | | 8,684,206 | |
See Notes to Financial Statements.
| | | | |
| WisdomTree Domestic Earnings and Dividend Funds | | | 47 | |
Schedule of Investments (continued)
WisdomTree MidCap Dividend Fund (DON)
March 31, 2016
| | | | | | | | |
| Investments | | Shares | | | Value | |
| | | | | | | | |
Pinnacle Foods, Inc. | | | 104,568 | | | $ | 4,672,098 | |
Snyder’s-Lance, Inc. | | | 48,516 | | | | 1,527,284 | |
| | | | | | | | |
| Total Food Products | | | | | | | 26,078,410 | |
| Gas Utilities – 3.3% | | | | | | | | |
AGL Resources, Inc. | | | 143,590 | | | | 9,353,452 | |
Atmos Energy Corp. | | | 103,041 | | | | 7,651,825 | |
National Fuel Gas Co.(a) | | | 128,668 | | | | 6,439,833 | |
New Jersey Resources Corp. | | | 107,839 | | | | 3,928,575 | |
Piedmont Natural Gas Co., Inc. | | | 67,005 | | | | 4,008,909 | |
Questar Corp. | | | 291,417 | | | | 7,227,142 | |
Southwest Gas Corp. | | | 55,368 | | | | 3,645,983 | |
UGI Corp. | | | 180,319 | | | | 7,265,052 | |
WGL Holdings, Inc. | | | 57,524 | | | | 4,163,012 | |
| | | | | | | | |
| Total Gas Utilities | | | | | | | 53,683,783 | |
| Health Care Equipment & Supplies – 0.9% | | | | | |
Cantel Medical Corp. | | | 2,701 | | | | 192,743 | |
Cooper Cos., Inc. (The) | | | 697 | | | | 107,317 | |
DENTSPLY SIRONA, Inc. | | | 25,209 | | | | 1,553,631 | |
Hill-Rom Holdings, Inc. | | | 32,416 | | | | 1,630,525 | |
ResMed, Inc. | | | 110,469 | | | | 6,387,318 | |
Teleflex, Inc. | | | 16,127 | | | | 2,532,100 | |
West Pharmaceutical Services, Inc. | | | 20,916 | | | | 1,449,897 | |
| | | | | | | | |
| Total Health Care Equipment & Supplies | | | | | | | 13,853,531 | |
| Health Care Providers & Services – 1.0% | | | | | |
Chemed Corp. | | | 3,762 | | | | 509,563 | |
HealthSouth Corp. | | | 88,578 | | | | 3,333,190 | |
Patterson Cos., Inc. | | | 76,539 | | | | 3,561,360 | |
Quest Diagnostics, Inc. | | | 118,162 | | | | 8,442,675 | |
| | | | | | | | |
| Total Health Care Providers & Services | | | | | | | 15,846,788 | |
| Hotels, Restaurants & Leisure – 4.1% | | | | | | | | |
Aramark | | | 101,424 | | | | 3,359,163 | |
Brinker International, Inc. | | | 62,504 | | | | 2,872,059 | |
Choice Hotels International, Inc. | | | 32,820 | | | | 1,773,921 | |
Churchill Downs, Inc. | | | 5,201 | | | | 769,124 | |
Cracker Barrel Old Country Store, Inc.(a) | | | 30,246 | | | | 4,617,657 | |
Darden Restaurants, Inc. | | | 179,098 | | | | 11,874,197 | |
Domino’s Pizza, Inc. | | | 22,749 | | | | 2,999,683 | |
Dunkin’ Brands Group, Inc.(a) | | | 85,044 | | | | 4,011,525 | |
Jack in the Box, Inc. | | | 20,075 | | | | 1,282,190 | |
Six Flags Entertainment Corp. | | | 155,348 | | | | 8,620,261 | |
Vail Resorts, Inc. | | | 25,844 | | | | 3,455,343 | |
Wendy’s Co. (The) | | | 228,939 | | | | 2,493,146 | |
Wyndham Worldwide Corp. | | | 98,045 | | | | 7,493,579 | |
Wynn Resorts Ltd.(a) | | | 118,121 | | | | 11,036,045 | |
| | | | | | | | |
| Total Hotels, Restaurants & Leisure | | | | | | | 66,657,893 | |
| Household Durables – 1.4% | | | | | | | | |
CalAtlantic Group, Inc. | | | 17,969 | | | | 600,524 | |
Harman International Industries, Inc. | | | 39,576 | | | | 3,523,847 | |
Leggett & Platt, Inc. | | | 146,682 | | | | 7,099,409 | |
Lennar Corp. Class A(a) | | | 20,880 | | | | 1,009,757 | |
PulteGroup, Inc. | | | 233,235 | | | | 4,363,827 | |
Tupperware Brands Corp. | | | 90,715 | | | | 5,259,655 | |
| | | | | | | | |
| Total Household Durables | | | | | | | 21,857,019 | |
| | | | | | | | |
| Household Products – 0.2% | | | | | | | | |
Spectrum Brands Holdings, Inc. | | | 29,846 | | | $ | 3,261,571 | |
Independent Power & Renewable Electricity
Producers – 1.3% | | | | | |
AES Corp. | | | 1,101,165 | | | | 12,993,747 | |
NRG Energy, Inc. | | | 660,037 | | | | 8,587,081 | |
| | | | | | | | |
| Total Independent Power & Renewable Electricity Producers | | | | | | | 21,580,828 | |
| Industrial Conglomerates – 0.2% | | | | | | | | |
Carlisle Cos., Inc. | | | 32,087 | | | | 3,192,657 | |
| Insurance – 3.0% | | | | | | | | |
American Financial Group, Inc. | | | 25,148 | | | | 1,769,665 | |
American National Insurance Co. | | | 15,444 | | | | 1,783,782 | |
AmTrust Financial Services, Inc.(a) | | | 63,181 | | | | 1,635,124 | |
Arthur J. Gallagher & Co. | | | 109,427 | | | | 4,867,313 | |
Assurant, Inc. | | | 28,996 | | | | 2,237,041 | |
Brown & Brown, Inc. | | | 39,626 | | | | 1,418,611 | |
Cincinnati Financial Corp. | | | 92,520 | | | | 6,047,107 | |
CNA Financial Corp. | | | 141,240 | | | | 4,545,103 | |
CNO Financial Group, Inc. | | | 49,414 | | | | 885,499 | |
Erie Indemnity Co. Class A | | | 23,640 | | | | 2,198,284 | |
First American Financial Corp. | | | 44,762 | | | | 1,705,880 | |
FNF Group | | | 54,408 | | | | 1,844,431 | |
Hanover Insurance Group, Inc. (The) | | | 15,473 | | | | 1,395,974 | |
Mercury General Corp. | | | 51,075 | | | | 2,834,662 | |
Old Republic International Corp. | | | 192,763 | | | | 3,523,708 | |
ProAssurance Corp. | | | 23,923 | | | | 1,210,504 | |
Reinsurance Group of America, Inc. | | | 20,658 | | | | 1,988,333 | |
RLI Corp. | | | 9,805 | | | | 655,562 | |
Torchmark Corp. | | | 20,133 | | | | 1,090,403 | |
Unum Group | | | 95,889 | | | | 2,964,888 | |
W.R. Berkley Corp. | | | 19,321 | | | | 1,085,840 | |
| | | | | | | | |
| Total Insurance | | | | | | | 47,687,714 | |
| Internet & Catalog Retail – 0.2% | | | | | | | | |
HSN, Inc. | | | 53,121 | | | | 2,778,760 | |
| Internet Software & Services – 0.1% | | | | | | | | |
j2 Global, Inc. | | | 28,963 | | | | 1,783,542 | |
| IT Services – 2.4% | | | | | | | | |
Booz Allen Hamilton Holding Corp. | | | 96,606 | | | | 2,925,230 | |
Broadridge Financial Solutions, Inc. | | | 99,122 | | | | 5,878,926 | |
Computer Sciences Corp.(a) | | | 94,555 | | | | 3,251,746 | |
DST Systems, Inc. | | | 13,181 | | | | 1,486,421 | |
Global Payments, Inc. | | | 2,706 | | | | 176,702 | |
Heartland Payment Systems, Inc. | | | 6,219 | | | | 600,569 | |
Jack Henry & Associates, Inc. | | | 37,789 | | | | 3,195,816 | |
Leidos Holdings, Inc. | | | 61,274 | | | | 3,083,308 | |
MAXIMUS, Inc. | | | 7,635 | | | | 401,906 | |
Sabre Corp. | | | 130,760 | | | | 3,781,579 | |
Total System Services, Inc. | | | 49,602 | | | | 2,360,063 | |
Western Union Co. (The) | | | 628,996 | | | | 12,133,333 | |
| | | | | | | | |
| Total IT Services | | | | | | | 39,275,599 | |
See Notes to Financial Statements.
| | |
| 48 | | WisdomTree Domestic Earnings and Dividend Funds |
Schedule of Investments (continued)
WisdomTree MidCap Dividend Fund (DON)
March 31, 2016
| | | | | | | | |
| Investments | | Shares | | | Value | |
| | | | | | | | |
| Leisure Products – 2.6% | | | | | | | | |
Brunswick Corp.(a) | | | 39,768 | | | $ | 1,908,069 | |
Hasbro, Inc. | | | 123,151 | | | | 9,864,395 | |
Mattel, Inc. | | | 720,554 | | | | 24,225,025 | |
Polaris Industries, Inc. | | | 54,302 | | | | 5,347,661 | |
| | | | | | | | |
| Total Leisure Products | | | | | | | 41,345,150 | |
| Life Sciences Tools & Services – 0.2% | | | | | | | | |
Bio-Techne Corp. | | | 19,855 | | | | 1,876,694 | |
PerkinElmer, Inc. | | | 22,291 | | | | 1,102,513 | |
| | | | | | | | |
| Total Life Sciences Tools & Services | | | | | | | 2,979,207 | |
| Machinery – 4.0% | | | | | | | | |
AGCO Corp. | | | 31,097 | | | | 1,545,521 | |
Allison Transmission Holdings, Inc. | | | 150,531 | | | | 4,061,326 | |
CLARCOR, Inc. | | | 34,274 | | | | 1,980,695 | |
Crane Co. | | | 59,054 | | | | 3,180,649 | |
Donaldson Co., Inc. | | | 122,060 | | | | 3,894,935 | |
Dover Corp. | | | 154,818 | | | | 9,959,442 | |
Flowserve Corp. | | | 84,191 | | | | 3,738,922 | |
Graco, Inc.(a) | | | 35,000 | | | | 2,938,600 | |
IDEX Corp. | | | 47,647 | | | | 3,948,983 | |
ITT Corp.(a) | | | 42,045 | | | | 1,551,040 | |
Lincoln Electric Holdings, Inc.(a) | | | 63,861 | | | | 3,740,339 | |
Nordson Corp. | | | 33,279 | | | | 2,530,535 | |
Oshkosh Corp.(a) | | | 53,451 | | | | 2,184,542 | |
Snap-on, Inc. | | | 31,201 | | | | 4,898,245 | |
Timken Co. (The) | | | 110,499 | | | | 3,700,612 | |
Toro Co. (The) | | | 26,612 | | | | 2,291,825 | |
Trinity Industries, Inc. | | | 103,310 | | | | 1,891,606 | |
Wabtec Corp. | | | 16,621 | | | | 1,317,879 | |
Woodward, Inc.(a) | | | 19,454 | | | | 1,011,997 | |
Xylem, Inc. | | | 102,727 | | | | 4,201,534 | |
| | | | | | | | |
| Total Machinery | | | | | | | 64,569,227 | |
| Media – 2.3% | | | | | | | | |
Cable One, Inc. | | | 2,953 | | | | 1,290,845 | |
Cablevision Systems Corp. Class A | | | 161,654 | | | | 5,334,582 | |
Cinemark Holdings, Inc. | | | 127,515 | | | | 4,568,862 | |
Interpublic Group of Cos., Inc. (The) | | | 320,139 | | | | 7,347,190 | |
News Corp. Class A | | | 207,225 | | | | 2,646,263 | |
News Corp. Class B | | | 107,905 | | | | 1,429,741 | |
Scripps Networks Interactive, Inc. Class A | | | 58,724 | | | | 3,846,422 | |
TEGNA, Inc. | | | 179,625 | | | | 4,214,002 | |
Tribune Media Co. Class A | | | 103,430 | | | | 3,966,541 | |
Viacom, Inc. Class A(a) | | | 65,815 | | | | 2,981,420 | |
| | | | | | | | |
| Total Media | | | | | | | 37,625,868 | |
| Metals & Mining – 1.1% | | | | | | | | |
Compass Minerals International, Inc. | | | 41,786 | | | | 2,960,956 | |
Newmont Mining Corp. | | | 100,876 | | | | 2,681,284 | |
Reliance Steel & Aluminum Co. | | | 74,088 | | | | 5,126,149 | |
Steel Dynamics, Inc. | | | 282,140 | | | | 6,350,971 | |
| | | | | | | | |
| Total Metals & Mining | | | | | | | 17,119,360 | |
| Multi-Utilities – 5.8% | | | | | | | | |
Alliant Energy Corp. | | | 156,240 | | | | 11,605,507 | |
CenterPoint Energy, Inc. | | | 936,031 | | | | 19,581,769 | |
| | | | | | | | |
CMS Energy Corp. | | | 339,278 | | | $ | 14,398,958 | |
MDU Resources Group, Inc. | | | 317,552 | | | | 6,179,562 | |
NiSource, Inc. | | | 388,850 | | | | 9,161,306 | |
NorthWestern Corp. | | | 64,674 | | | | 3,993,620 | |
SCANA Corp. | | | 198,996 | | | | 13,959,569 | |
TECO Energy, Inc. | | | 290,638 | | | | 8,001,264 | |
Vectren Corp. | | | 119,432 | | | | 6,038,482 | |
| | | | | | | | |
| Total Multi-Utilities | | | | | | | 92,920,037 | |
| Multiline Retail – 1.5% | | | | | | | | |
Dillard’s, Inc. Class A | | | 4,855 | | | | 412,238 | |
Kohl’s Corp. | | | 277,842 | | | | 12,950,216 | |
Nordstrom, Inc.(a) | | | 184,516 | | | | 10,556,160 | |
| | | | | | | | |
| Total Multiline Retail | | | | | | | 23,918,614 | |
| Oil, Gas & Consumable Fuels – 4.3% | | | | | | | | |
Cabot Oil & Gas Corp. | | | 75,305 | | | | 1,710,177 | |
Columbia Pipeline Group, Inc. | | | 308,879 | | | | 7,752,863 | |
CVR Energy, Inc.(a) | | | 153,961 | | | | 4,018,382 | |
EQT Corp. | | | 13,700 | | | | 921,462 | |
HollyFrontier Corp. | | | 203,761 | | | | 7,196,839 | |
Murphy Oil Corp. | | | 389,838 | | | | 9,820,019 | |
ONEOK, Inc. | | | 929,397 | | | | 27,751,794 | |
PBF Energy, Inc. Class A | | | 119,299 | | | | 3,960,727 | |
Range Resources Corp.(a) | | | 44,056 | | | | 1,426,533 | |
Western Refining, Inc.(a) | | | 133,132 | | | | 3,872,810 | |
World Fuel Services Corp. | | | 15,025 | | | | 729,914 | |
| | | | | | | | |
| Total Oil, Gas & Consumable Fuels | | | | | | | 69,161,520 | |
| Personal Products – 0.3% | | | | | | | | |
Edgewell Personal Care Co. | | | 58,846 | | | | 4,738,868 | |
| Professional Services – 0.7% | | | | | | | | |
Dun & Bradstreet Corp. (The) | | | 23,696 | | | | 2,442,584 | |
ManpowerGroup, Inc. | | | 51,733 | | | | 4,212,101 | |
Robert Half International, Inc. | | | 84,037 | | | | 3,914,443 | |
| | | | | | | | |
| Total Professional Services | | | | | | | 10,569,128 | |
| Real Estate Investment Trusts (REITs) – 15.2% | | | | | | | | |
Alexandria Real Estate Equities, Inc. | | | 45,165 | | | | 4,105,047 | |
American Campus Communities, Inc. | | | 84,672 | | | | 3,987,204 | |
American Homes 4 Rent Class A | | | 45,928 | | | | 730,255 | |
Apartment Investment & Management Co. Class A | | | 90,060 | | | | 3,766,309 | |
Apple Hospitality REIT, Inc.(a) | | | 198,164 | | | | 3,925,629 | |
Brixmor Property Group, Inc. | | | 216,793 | | | | 5,554,237 | |
Camden Property Trust | | | 58,983 | | | | 4,959,880 | |
Columbia Property Trust, Inc. | | | 114,853 | | | | 2,525,617 | |
Communications Sales & Leasing, Inc. | | | 349,774 | | | | 7,782,471 | |
Corrections Corp. of America | | | 181,585 | | | | 5,819,799 | |
CubeSmart | | | 69,082 | | | | 2,300,431 | |
DCT Industrial Trust, Inc. | | | 51,485 | | | | 2,032,113 | |
DDR Corp. | | | 278,675 | | | | 4,957,628 | |
Digital Realty Trust, Inc.(a) | | | 128,859 | | | | 11,402,733 | |
Douglas Emmett, Inc. | | | 74,985 | | | | 2,257,798 | |
Duke Realty Corp. | | | 220,064 | | | | 4,960,243 | |
EPR Properties | | | 70,985 | | | | 4,729,021 | |
Equity LifeStyle Properties, Inc. | | | 36,759 | | | | 2,673,482 | |
See Notes to Financial Statements.
| | | | |
| WisdomTree Domestic Earnings and Dividend Funds | | | 49 | |
Schedule of Investments (continued)
WisdomTree MidCap Dividend Fund (DON)
March 31, 2016
| | | | | | | | |
| Investments | | Shares | | | Value | |
| | | | | | | | |
Equity One, Inc.(a) | | | 79,845 | | | $ | 2,288,358 | |
Extra Space Storage, Inc. | | | 62,030 | | | | 5,797,324 | |
Federal Realty Investment Trust | | | 33,321 | | | | 5,199,742 | |
Gaming and Leisure Properties, Inc. | | | 168,650 | | | | 5,214,658 | |
Healthcare Realty Trust, Inc.(a) | | | 79,882 | | | | 2,467,555 | |
Healthcare Trust of America, Inc. Class A | | | 103,460 | | | | 3,043,793 | |
Highwoods Properties, Inc. | | | 70,010 | | | | 3,347,178 | |
Hospitality Properties Trust | | | 208,098 | | | | 5,527,083 | |
Hudson Pacific Properties, Inc. | | | 28,431 | | | | 822,225 | |
Iron Mountain, Inc. | | | 276,547 | | | | 9,377,709 | |
Kilroy Realty Corp. | | | 36,687 | | | | 2,269,825 | |
Lamar Advertising Co. Class A | | | 71,443 | | | | 4,393,745 | |
LaSalle Hotel Properties | | | 141,991 | | | | 3,593,792 | |
Liberty Property Trust | | | 159,180 | | | | 5,326,163 | |
Medical Properties Trust, Inc. | | | 335,862 | | | | 4,359,489 | |
Mid-America Apartment Communities, Inc. | | | 47,323 | | | | 4,836,884 | |
National Retail Properties, Inc. | | | 114,327 | | | | 5,281,907 | |
NorthStar Realty Finance Corp. | | | 448,462 | | | | 5,883,821 | |
Omega Healthcare Investors, Inc. | | | 227,296 | | | | 8,023,549 | |
Outfront Media, Inc. | | | 157,783 | | | | 3,329,221 | |
Paramount Group, Inc.(a) | | | 83,899 | | | | 1,338,189 | |
Piedmont Office Realty Trust, Inc. Class A | | | 119,404 | | | | 2,425,095 | |
Post Properties, Inc. | | | 30,014 | | | | 1,793,036 | |
Rayonier, Inc. | | | 98,731 | | | | 2,436,681 | |
Regency Centers Corp. | | | 50,252 | | | | 3,761,362 | |
Retail Properties of America, Inc. Class A | | | 194,957 | | | | 3,090,068 | |
RLJ Lodging Trust | | | 133,284 | | | | 3,049,538 | |
Ryman Hospitality Properties, Inc.(a) | | | 51,120 | | | | 2,631,658 | |
Senior Housing Properties Trust | | | 478,644 | | | | 8,562,941 | |
Sovran Self Storage, Inc. | | | 22,254 | | | | 2,624,859 | |
Spirit Realty Capital, Inc. | | | 534,334 | | | | 6,011,258 | |
STORE Capital Corp. | | | 110,129 | | | | 2,850,139 | |
Sun Communities, Inc. | | | 40,711 | | | | 2,915,315 | |
Sunstone Hotel Investors, Inc. | | | 56,216 | | | | 787,024 | |
Tanger Factory Outlet Centers, Inc. | | | 61,547 | | | | 2,239,695 | |
Taubman Centers, Inc. | | | 33,957 | | | | 2,418,757 | |
UDR, Inc.(a) | | | 147,039 | | | | 5,665,413 | |
VEREIT, Inc. | | | 1,115,069 | | | | 9,890,662 | |
W.P. Carey, Inc. | | | 122,366 | | | | 7,616,060 | |
Weingarten Realty Investors | | | 91,689 | | | | 3,440,171 | |
| | | | | | | | |
| Total Real Estate Investment Trusts (REITs) | | | | | | | 244,401,839 | |
| Real Estate Management & Development – 0.1% | |
Jones Lang LaSalle, Inc. | | | 2,913 | | | | 341,753 | |
Kennedy-Wilson Holdings, Inc. | | | 39,874 | | | | 873,241 | |
| | | | | | | | |
| Total Real Estate Management & Development | | | | 1,214,994 | |
| Road & Rail – 0.9% | | | | | | | | |
JB Hunt Transport Services, Inc. | | | 48,452 | | | | 4,081,597 | |
Kansas City Southern | | | 70,391 | | | | 6,014,911 | |
Landstar System, Inc.(a) | | | 8,564 | | | | 553,320 | |
Ryder System, Inc. | | | 57,430 | | | | 3,720,315 | |
| | | | | | | | |
| Total Road & Rail | | | | | | | 14,370,143 | |
| | | | | | | | |
| Semiconductors & Semiconductor Equipment – 1.8% | |
Atmel Corp. | | | 287,998 | | | $ | 2,338,544 | |
KLA-Tencor Corp. | | | 175,395 | | | | 12,770,510 | |
Microchip Technology, Inc.(a) | | | 239,499 | | | | 11,543,852 | |
Monolithic Power Systems, Inc. | | | 18,485 | | | | 1,176,385 | |
Teradyne, Inc. | | | 91,088 | | | | 1,966,590 | |
| | | | | | | | |
| Total Semiconductors & Semiconductor Equipment | | | | 29,795,881 | |
| Software – 0.4% | | | | | | | | |
Blackbaud, Inc. | | | 12,532 | | | | 788,137 | |
CDK Global, Inc. | | | 68,832 | | | | 3,204,130 | |
Fair Isaac Corp. | | | 974 | | | | 103,332 | |
SS&C Technologies Holdings, Inc. | | | 26,999 | | | | 1,712,276 | |
| | | | | | | | |
| Total Software | | | | | | | 5,807,875 | |
| Specialty Retail – 2.8% | | | | | | | | |
American Eagle Outfitters, Inc.(a) | | | 228,714 | | | | 3,812,662 | |
CST Brands, Inc.(a) | | | 17,483 | | | | 669,424 | |
Dick’s Sporting Goods, Inc. | | | 48,960 | | | | 2,288,880 | |
Foot Locker, Inc. | | | 77,242 | | | | 4,982,109 | |
GameStop Corp. Class A(a) | | | 184,677 | | | | 5,859,801 | |
Lithia Motors, Inc. Class A | | | 5,709 | | | | 498,567 | |
Penske Automotive Group, Inc. | | | 74,292 | | | | 2,815,667 | |
Staples, Inc. | | | 1,193,540 | | | | 13,164,746 | |
Tiffany & Co. | | | 100,213 | | | | 7,353,630 | |
Williams-Sonoma, Inc.(a) | | | 76,113 | | | | 4,166,426 | |
| | | | | | | | |
| Total Specialty Retail | | | | | | | 45,611,912 | |
| Technology Hardware, Storage & Peripherals – 0.5% | |
NetApp, Inc. | | | 268,505 | | | | 7,327,501 | |
| Textiles, Apparel & Luxury Goods – 1.7% | | | | | | | | |
Carter’s, Inc. | | | 18,875 | | | | 1,989,048 | |
Coach, Inc. | | | 452,349 | | | | 18,134,671 | |
Columbia Sportswear Co. | | | 39,372 | | | | 2,365,863 | |
PVH Corp. | | | 5,731 | | | | 567,713 | |
Ralph Lauren Corp. | | | 38,368 | | | | 3,693,304 | |
| | | | | | | | |
| Total Textiles, Apparel & Luxury Goods | | | | | | | 26,750,599 | |
| Thrifts & Mortgage Finance – 0.7% | | | | | |
New York Community Bancorp, Inc. | | | 543,029 | | | | 8,634,161 | |
Radian Group, Inc. | | | 3,235 | | | | 40,114 | |
TFS Financial Corp. | | | 113,468 | | | | 1,970,939 | |
| | | | | | | | |
| Total Thrifts & Mortgage Finance | | | | | | | 10,645,214 | |
| Tobacco – 0.4% | | | | | | | | |
Vector Group Ltd.(a) | | | 295,060 | | | | 6,739,170 | |
| Trading Companies & Distributors – 0.5% | | | | | |
Air Lease Corp. | | | 22,667 | | | | 728,064 | |
MSC Industrial Direct Co., Inc. Class A | | | 52,245 | | | | 3,986,816 | |
Watsco, Inc. | | | 25,483 | | | | 3,433,579 | |
| | | | | | | | |
| Total Trading Companies & Distributors | | | | | | | 8,148,459 | |
| Transportation Infrastructure – 0.8% | | | | | |
Macquarie Infrastructure Corp.(a) | | | 199,186 | | | | 13,433,104 | |
See Notes to Financial Statements.
| | |
| 50 | | WisdomTree Domestic Earnings and Dividend Funds |
Schedule of Investments (concluded)
WisdomTree MidCap Dividend Fund (DON)
March 31, 2016
| | | | | | | | |
| Investments | | Shares | | | Value | |
| | | | | | | | |
| Water Utilities – 1.0% | | | | | | | | |
American Water Works Co., Inc. | | | 157,971 | | | $ | 10,888,941 | |
Aqua America, Inc. | | | 159,322 | | | | 5,069,626 | |
| | | | | | | | |
| Total Water Utilities | | | | | | | 15,958,567 | |
| Wireless Telecommunication Services – 0.1% | | | | | |
Telephone & Data Systems, Inc. | | | 79,095 | | | | 2,379,969 | |
TOTAL COMMON STOCKS
(Cost: $1,464,445,208) | | | | | | | 1,603,700,273 | |
| EXCHANGE-TRADED FUND – 0.1% | | | | | | | | |
| United States – 0.1% | | | | | | | | |
WisdomTree LargeCap Dividend Fund(b)
(Cost: $1,620,820) | | | 23,858 | | | | 1,751,177 | |
| INVESTMENT OF CASH COLLATERAL FOR SECURITIES LOANED – 4.1% | |
| United States – 4.1% | | | | | | | | |
State Street Navigator Securities Lending Prime Portfolio, 0.50%(c) (Cost: $65,947,592)(d) | | | 65,947,592 | | | | 65,947,592 | |
TOTAL INVESTMENTS IN SECURITIES – 103.8%
(Cost: $1,532,013,620) | | | | 1,671,399,042 | |
Liabilities in Excess of Cash and Other Assets – (3.8)% | | | | (61,914,865 | ) |
| | | | | | | | |
| NET ASSETS – 100.0% | | | | | | $ | 1,609,484,177 | |
| (a) | Security, or portion thereof, was on loan at March 31, 2016 (See Note 2). |
| (b) | Affiliated company (See Note 3). |
| (c) | Rate shown represents annualized 7-day yield as of March 31, 2016. |
| (d) | At March 31, 2016, the total market value of the Fund’s securities on loan was $66,948,860 and the total market value of the collateral held by the Fund was $68,507,212. The total market value of the collateral includes non-cash U.S. Government securities collateral having a value of $2,559,620. |
See Notes to Financial Statements.
| | | | |
| WisdomTree Domestic Earnings and Dividend Funds | | | 51 | |
Schedule of Investments
WisdomTree MidCap Earnings Fund (EZM)
March 31, 2016
| | | | | | | | |
| Investments | | Shares | | | Value | |
| | | | | | | | |
| COMMON STOCKS – 99.7% | | | | | | | | |
| United States – 99.7% | | | | | | | | |
| Aerospace & Defense – 1.9% | | | | | | | | |
B/E Aerospace, Inc. | | | 27,457 | | | $ | 1,266,317 | |
BWX Technologies, Inc. | | | 12,348 | | | | 414,399 | |
Curtiss-Wright Corp. | | | 16,960 | | | | 1,283,363 | |
Esterline Technologies Corp.* | | | 10,136 | | | | 649,414 | |
Hexcel Corp. | | | 36,335 | | | | 1,588,203 | |
Huntington Ingalls Industries, Inc. | | | 25,604 | | | | 3,506,212 | |
Moog, Inc. Class A* | | | 14,796 | | | | 675,881 | |
Orbital ATK, Inc. | | | 16,487 | | | | 1,433,380 | |
Teledyne Technologies, Inc.* | | | 15,194 | | | | 1,339,199 | |
Triumph Group, Inc. | | | 23,799 | | | | 749,192 | |
| | | | | | | | |
| Total Aerospace & Defense | | | | | | | 12,905,560 | |
| Airlines – 0.7% | | | | | | | | |
Allegiant Travel Co. | | | 6,851 | | | | 1,219,889 | |
Hawaiian Holdings, Inc.* | | | 28,547 | | | | 1,347,133 | |
Spirit Airlines, Inc.* | | | 49,129 | | | | 2,357,209 | |
| | | | | | | | |
| Total Airlines | | | | | | | 4,924,231 | |
| Auto Components – 1.5% | | | | | | | | |
American Axle & Manufacturing Holdings, Inc.* | | | 72,446 | | | | 1,114,944 | |
Cooper Tire & Rubber Co. | | | 35,212 | | | | 1,303,548 | |
Dana Holding Corp. | | | 219,784 | | | | 3,096,756 | |
Gentex Corp. | | | 131,204 | | | | 2,058,591 | |
Gentherm, Inc.* | | | 13,223 | | | | 549,945 | |
Tenneco, Inc.* | | | 32,064 | | | | 1,651,617 | |
Visteon Corp. | | | 2,417 | | | | 192,369 | |
| | | | | | | | |
| Total Auto Components | | | | | | | 9,967,770 | |
| Automobiles – 0.2% | | | | | | | | |
Thor Industries, Inc. | | | 24,548 | | | | 1,565,426 | |
| Banks – 7.3% | | | | | | | | |
Associated Banc-Corp. | | | 52,602 | | | | 943,680 | |
BancorpSouth, Inc. | | | 32,011 | | | | 682,154 | |
Bank of Hawaii Corp. | | | 14,418 | | | | 984,461 | |
Bank of the Ozarks, Inc. | | | 17,689 | | | | 742,407 | |
BankUnited, Inc. | | | 36,482 | | | | 1,256,440 | |
Banner Corp. | | | 5,928 | | | | 249,213 | |
BOK Financial Corp.(a) | | | 26,051 | | | | 1,422,906 | |
Cathay General Bancorp | | | 27,974 | | | | 792,503 | |
Columbia Banking System, Inc. | | | 16,031 | | | | 479,648 | |
Commerce Bancshares, Inc. | | | 33,327 | | | | 1,498,049 | |
Community Bank System, Inc. | | | 13,165 | | | | 503,035 | |
Cullen/Frost Bankers, Inc.(a) | | | 25,238 | | | | 1,390,866 | |
CVB Financial Corp. | | | 32,617 | | | | 569,167 | |
East West Bancorp, Inc. | | | 52,094 | | | | 1,692,013 | |
First Citizens BancShares, Inc. Class A | | | 4,973 | | | | 1,248,571 | |
First Financial Bankshares, Inc.(a) | | | 17,665 | | | | 522,531 | |
First Horizon National Corp. | | | 75,205 | | | | 985,186 | |
First Niagara Financial Group, Inc. | | | 116,940 | | | | 1,131,979 | |
FirstMerit Corp. | | | 70,470 | | | | 1,483,393 | |
FNB Corp. | | | 64,220 | | | | 835,502 | |
Fulton Financial Corp. | | | 63,287 | | | | 846,780 | |
| | | | | | | | |
Glacier Bancorp, Inc. | | | 24,702 | | | $ | 627,925 | |
Hancock Holding Co. | | | 32,219 | | | | 739,748 | |
Hilltop Holdings, Inc.* | | | 63,538 | | | | 1,199,597 | |
Home BancShares, Inc. | | | 18,322 | | | | 750,286 | |
Iberiabank Corp. | | | 13,452 | | | | 689,684 | |
International Bancshares Corp. | | | 30,986 | | | | 764,115 | |
Investors Bancorp, Inc. | | | 80,970 | | | | 942,491 | |
MB Financial, Inc. | | | 24,897 | | | | 807,908 | |
National Penn Bancshares, Inc. | | | 49,772 | | | | 529,574 | |
PacWest Bancorp | | | 38,262 | | | | 1,421,433 | |
People’s United Financial, Inc. | | | 88,467 | | | | 1,409,279 | |
Pinnacle Financial Partners, Inc. | | | 9,675 | | | | 474,656 | |
Popular, Inc. | | | 159,539 | | | | 4,564,411 | |
PrivateBancorp, Inc. | | | 22,611 | | | | 872,785 | |
Prosperity Bancshares, Inc. | | | 34,083 | | | | 1,581,110 | |
Simmons First National Corp. Class A | | | 6,271 | | | | 282,634 | |
South State Corp. | | | 7,583 | | | | 487,056 | |
Sterling Bancorp | | | 16,622 | | | | 264,788 | |
Synovus Financial Corp. | | | 38,690 | | | | 1,118,528 | |
TCF Financial Corp. | | | 59,469 | | | | 729,090 | |
Texas Capital Bancshares, Inc.* | | | 15,901 | | | | 610,280 | |
UMB Financial Corp. | | | 14,962 | | | | 772,488 | |
Umpqua Holdings Corp. | | | 75,846 | | | | 1,202,918 | |
United Bankshares, Inc. | | | 20,594 | | | | 755,800 | |
Valley National Bancorp | | | 60,965 | | | | 581,606 | |
Webster Financial Corp. | | | 29,627 | | | | 1,063,609 | |
Western Alliance Bancorp* | | | 26,955 | | | | 899,758 | |
Wintrust Financial Corp. | | | 17,425 | | | | 772,625 | |
Zions Bancorp | | | 46,440 | | | | 1,124,312 | |
| | | | | | | | |
| Total Banks | | | | | | | 48,300,978 | |
| Beverages – 0.1% | | | | | | | | |
Boston Beer Co., Inc. (The) Class A* | | | 3,254 | | | | 602,218 | |
National Beverage Corp.* | | | 7,323 | | | | 309,909 | |
| | | | | | | | |
| Total Beverages | | | | | | | 912,127 | |
| Biotechnology – 0.4% | | | | | | | | |
Insys Therapeutics, Inc.*(a) | | | 11,656 | | | | 186,380 | |
Ligand Pharmaceuticals, Inc.*(a) | | | 17,566 | | | | 1,881,143 | |
Myriad Genetics, Inc.* | | | 14,710 | | | | 550,595 | |
| | | | | | | | |
| Total Biotechnology | | | | | | | 2,618,118 | |
| Building Products – 1.1% | | | | | | | | |
A.O. Smith Corp. | | | 24,079 | | | | 1,837,469 | |
Armstrong World Industries, Inc.* | | | 10,535 | | | | 509,578 | |
Lennox International, Inc. | | | 11,747 | | | | 1,588,077 | |
Owens Corning | | | 36,343 | | | | 1,718,297 | |
Simpson Manufacturing Co., Inc. | | | 13,404 | | | | 511,631 | |
USG Corp.* | | | 35,645 | | | | 884,352 | |
| | | | | | | | |
| Total Building Products | | | | | | | 7,049,404 | |
| Capital Markets – 1.3% | | | | | | | | |
BGC Partners, Inc. Class A | | | 38,654 | | | | 349,819 | |
Eaton Vance Corp. | | | 42,340 | | | | 1,419,237 | |
Evercore Partners, Inc. Class A | | | 5,028 | | | | 260,199 | |
Federated Investors, Inc. Class B | | | 30,343 | | | | 875,396 | |
See Notes to Financial Statements.
| | |
| 52 | | WisdomTree Domestic Earnings and Dividend Funds |
Schedule of Investments (continued)
WisdomTree MidCap Earnings Fund (EZM)
March 31, 2016
| | | | | | | | |
| Investments | | Shares | | | Value | |
| | | | | | | | |
Financial Engines, Inc. | | | 5,482 | | | $ | 172,299 | |
Interactive Brokers Group, Inc. Class A | | | 5,046 | | | | 198,409 | |
Janus Capital Group, Inc. | | | 61,714 | | | | 902,876 | |
Legg Mason, Inc. | | | 44,763 | | | | 1,552,381 | |
LPL Financial Holdings, Inc.(a) | | | 24,853 | | | | 616,354 | |
NorthStar Asset Management Group, Inc. | | | 62,944 | | | | 714,414 | |
Stifel Financial Corp.* | | | 16,822 | | | | 497,931 | |
Waddell & Reed Financial, Inc. Class A | | | 46,285 | | | | 1,089,549 | |
| | | | | | | | |
| Total Capital Markets | | | | | | | 8,648,864 | |
| Chemicals – 2.0% | | | | | | | | |
Albemarle Corp. | | | 25,811 | | | | 1,650,097 | |
Balchem Corp. | | | 6,781 | | | | 420,558 | |
Chemtura Corp.* | | | 110,486 | | | | 2,916,830 | |
FMC Corp. | | | 12,642 | | | | 510,358 | |
H.B. Fuller Co. | | | 13,074 | | | | 554,991 | |
Huntsman Corp. | | | 36,558 | | | | 486,221 | |
Minerals Technologies, Inc. | | | 14,408 | | | | 819,095 | |
NewMarket Corp. | | | 4,269 | | | | 1,691,634 | |
PolyOne Corp. | | | 30,263 | | | | 915,456 | |
RPM International, Inc. | | | 33,491 | | | | 1,585,129 | |
Scotts Miracle-Gro Co. (The) Class A | | | 16,673 | | | | 1,213,294 | |
Sensient Technologies Corp. | | | 12,823 | | | | 813,748 | |
| | | | | | | | |
| Total Chemicals | | | | | | | 13,577,411 | |
| Commercial Services & Supplies – 2.7% | | | | | | | | |
ADT Corp. (The) | | | 61,365 | | | | 2,531,920 | |
Clean Harbors, Inc.* | | | 17,349 | | | | 856,000 | |
Copart, Inc.* | | | 39,481 | | | | 1,609,640 | |
Deluxe Corp. | | | 26,752 | | | | 1,671,733 | |
Healthcare Services Group, Inc. | | | 12,447 | | | | 458,174 | |
Herman Miller, Inc. | | | 42,743 | | | | 1,320,331 | |
HNI Corp. | | | 16,465 | | | | 644,934 | |
KAR Auction Services, Inc. | | | 39,464 | | | | 1,505,157 | |
Matthews International Corp. Class A | | | 6,105 | | | | 314,224 | |
MSA Safety, Inc. | | | 12,737 | | | | 615,834 | |
Pitney Bowes, Inc. | | | 113,396 | | | | 2,442,550 | |
R.R. Donnelley & Sons Co. | | | 66,814 | | | | 1,095,750 | |
Rollins, Inc. | | | 39,350 | | | | 1,067,172 | |
Steelcase, Inc. Class A | | | 28,174 | | | | 420,356 | |
West Corp. | | | 55,527 | | | | 1,267,126 | |
| | | | | | | | |
| Total Commercial Services & Supplies | | | | | | | 17,820,901 | |
| Communications Equipment – 1.3% | | | | | | | | |
Arista Networks, Inc.*(a) | | | 10,813 | | | | 682,300 | |
Brocade Communications Systems, Inc. | | | 266,681 | | | | 2,821,485 | |
CommScope Holding Co., Inc.* | | | 11,652 | | | | 325,324 | |
EchoStar Corp. Class A* | | | 28,357 | | | | 1,255,932 | |
Infinera Corp.*(a) | | | 15,734 | | | | 252,688 | |
InterDigital, Inc. | | | 13,968 | | | | 777,319 | |
NetScout Systems, Inc.* | | | 8,084 | | | | 185,689 | |
Plantronics, Inc. | | | 12,976 | | | | 508,529 | |
Polycom, Inc.* | | | 41,005 | | | | 457,206 | |
Ubiquiti Networks, Inc.*(a) | | | 30,137 | | | | 1,002,658 | |
ViaSat, Inc.* | | | 2,258 | | | | 165,918 | |
| | | | | | | | |
| Total Communications Equipment | | | | | | | 8,435,048 | |
| | | | | | | | |
| Construction & Engineering – 1.0% | | | | | | | | |
Dycom Industries, Inc.* | | | 7,234 | | | $ | 467,823 | |
EMCOR Group, Inc. | | | 23,933 | | | | 1,163,144 | |
Jacobs Engineering Group, Inc.* | | | 58,084 | | | | 2,529,558 | |
Quanta Services, Inc.* | | | 65,954 | | | | 1,487,922 | |
Valmont Industries, Inc. | | | 7,622 | | | | 943,908 | |
| | | | | | | | |
| Total Construction & Engineering | | | | | | | 6,592,355 | |
| Construction Materials – 0.2% | | | | | | | | |
Eagle Materials, Inc. | | | 18,862 | | | | 1,322,415 | |
| Consumer Finance – 1.9% | | | | | | | | |
Credit Acceptance Corp.*(a) | | | 7,871 | | | | 1,428,980 | |
Navient Corp. | | | 443,210 | | | | 5,305,224 | |
PRA Group, Inc.* | | | 26,376 | | | | 775,191 | |
Santander Consumer USA Holdings, Inc.* | | | 362,309 | | | | 3,800,621 | |
SLM Corp.* | | | 158,560 | | | | 1,008,441 | |
| | | | | | | | |
| Total Consumer Finance | | | | | | | 12,318,457 | |
| Containers & Packaging – 1.7% | | | | | | | | |
AptarGroup, Inc. | | | 18,807 | | | | 1,474,657 | |
Avery Dennison Corp. | | | 32,217 | | | | 2,323,168 | |
Bemis Co., Inc. | | | 36,651 | | | | 1,897,789 | |
Berry Plastics Group, Inc.* | | | 16,534 | | | | 597,704 | |
Graphic Packaging Holding Co. | | | 117,633 | | | | 1,511,584 | |
Owens-Illinois, Inc.* | | | 28,469 | | | | 454,365 | |
Silgan Holdings, Inc. | | | 19,127 | | | | 1,016,982 | |
Sonoco Products Co. | | | 35,079 | | | | 1,703,787 | |
| | | | | | | | |
| Total Containers & Packaging | | | | | | | 10,980,036 | |
| Distributors – 0.2% | | | | | | | | |
Core-Mark Holding Co., Inc. | | | 3,717 | | | | 303,159 | |
Pool Corp. | | | 10,475 | | | | 919,076 | |
| | | | | | | | |
| Total Distributors | | | | | | | 1,222,235 | |
| Diversified Consumer Services – 0.8% | | | | | | | | |
Bright Horizons Family Solutions, Inc.* | | | 9,407 | | | | 609,385 | |
Graham Holdings Co. Class B | | | 1,521 | | | | 730,080 | |
Grand Canyon Education, Inc.* | | | 22,544 | | | | 963,531 | |
Service Corp. International | | | 32,642 | | | | 805,605 | |
ServiceMaster Global Holdings, Inc.* | | | 29,945 | | | | 1,128,328 | |
Sotheby’s | | | 32,676 | | | | 873,429 | |
| | | | | | | | |
| Total Diversified Consumer Services | | | | | | | 5,110,358 | |
| Diversified Financial Services – 0.4% | | | | | | | | |
CBOE Holdings, Inc. | | | 17,782 | | | | 1,161,698 | |
MarketAxess Holdings, Inc. | | | 4,905 | | | | 612,291 | |
Morningstar, Inc. | | | 8,796 | | | | 776,423 | |
| | | | | | | | |
| Total Diversified Financial Services | | | | | | | 2,550,412 | |
| Diversified Telecommunication Services – 0.2% | | | | | | | | |
Globalstar, Inc.*(a) | | | 744,975 | | | | 1,095,113 | |
| Electric Utilities – 2.5% | | | | | | | | |
ALLETE, Inc. | | | 22,779 | | | | 1,277,219 | |
Cleco Corp. | | | 17,703 | | | | 977,383 | |
Great Plains Energy, Inc. | | | 63,936 | | | | 2,061,936 | |
Hawaiian Electric Industries, Inc. | | | 35,718 | | | | 1,157,263 | |
IDACORP, Inc. | | | 19,902 | | | | 1,484,490 | |
See Notes to Financial Statements.
| | | | |
| WisdomTree Domestic Earnings and Dividend Funds | | | 53 | |
Schedule of Investments (continued)
WisdomTree MidCap Earnings Fund (EZM)
March 31, 2016
| | | | | | | | |
| Investments | | Shares | | | Value | |
| | | | | | | | |
ITC Holdings Corp. | | | 45,717 | | | $ | 1,991,890 | |
OGE Energy Corp. | | | 81,261 | | | | 2,326,502 | |
PNM Resources, Inc. | | | 30,246 | | | | 1,019,895 | |
Portland General Electric Co. | | | 32,694 | | | | 1,291,086 | |
Westar Energy, Inc. | | | 55,938 | | | | 2,775,084 | |
| | | | | | | | |
| Total Electric Utilities | | | | | | | 16,362,748 | |
| Electrical Equipment – 0.8% | | | | | | | | |
EnerSys | | | 22,675 | | | | 1,263,451 | |
Generac Holdings, Inc.*(a) | | | 26,371 | | | | 982,056 | |
Hubbell, Inc. | | | 21,335 | | | | 2,260,016 | |
Regal Beloit Corp. | | | 18,040 | | | | 1,138,144 | |
| | | | | | | | |
| Total Electrical Equipment | | | | | | | 5,643,667 | |
| Electronic Equipment, Instruments & Components – 4.8% | |
Anixter International, Inc.* | | | 14,600 | | | | 760,806 | |
Arrow Electronics, Inc.* | | | 56,225 | | | | 3,621,452 | |
Avnet, Inc. | | | 88,268 | | | | 3,910,272 | |
AVX Corp. | | | 117,039 | | | | 1,471,180 | |
Belden, Inc. | | | 4,907 | | | | 301,192 | |
Cognex Corp. | | | 22,070 | | | | 859,626 | |
Dolby Laboratories, Inc. Class A | | | 37,643 | | | | 1,635,965 | |
FEI Co. | | | 10,558 | | | | 939,768 | |
FLIR Systems, Inc. | | | 57,729 | | | | 1,902,171 | |
Ingram Micro, Inc. Class A | | | 41,780 | | | | 1,500,320 | |
IPG Photonics Corp.* | | | 18,522 | | | | 1,779,594 | |
Jabil Circuit, Inc. | | | 85,176 | | | | 1,641,341 | |
Keysight Technologies, Inc.* | | | 78,363 | | | | 2,173,790 | |
Littelfuse, Inc. | | | 5,074 | | | | 624,660 | |
National Instruments Corp. | | | 24,944 | | | | 751,064 | |
OSI Systems, Inc.* | | | 4,834 | | | | 316,579 | |
Sanmina Corp.* | | | 125,782 | | | | 2,940,783 | |
SYNNEX Corp. | | | 15,139 | | | | 1,401,720 | |
Tech Data Corp.* | | | 21,155 | | | | 1,624,069 | |
Trimble Navigation Ltd.* | | | 37,701 | | | | 934,985 | |
Universal Display Corp.* | | | 1,159 | | | | 62,702 | |
VeriFone Systems, Inc.* | | | 18,942 | | | | 534,922 | |
| | | | | | | | |
| Total Electronic Equipment, Instruments & Components | | | | 31,688,961 | |
| Energy Equipment & Services – 1.1% | | | | | | | | |
Diamond Offshore Drilling, Inc.(a) | | | 24,132 | | | | 524,388 | |
Dril-Quip, Inc.* | | | 24,093 | | | | 1,459,072 | |
Helmerich & Payne, Inc.(a) | | | 55,050 | | | | 3,232,536 | |
Oceaneering International, Inc. | | | 55,291 | | | | 1,837,873 | |
RPC, Inc.(a) | | | 9,995 | | | | 141,729 | |
| | | | | | | | |
| Total Energy Equipment & Services | | | | | | | 7,195,598 | |
| Food & Staples Retailing – 0.7% | | | | | | | | |
Casey’s General Stores, Inc. | | | 10,434 | | | | 1,182,381 | |
PriceSmart, Inc. | | | 7,204 | | | | 609,314 | |
Sprouts Farmers Market, Inc.* | | | 31,728 | | | | 921,381 | |
SUPERVALU, Inc.* | | | 182,064 | | | | 1,048,689 | |
United Natural Foods, Inc.* | | | 22,885 | | | | 922,265 | |
| | | | | | | | |
| Total Food & Staples Retailing | | | | | | | 4,684,030 | |
| | | | | | | | |
| Food Products – 2.5% | | | | | | | | |
B&G Foods, Inc. | | | 13,853 | | | $ | 482,223 | |
Cal-Maine Foods, Inc.(a) | | | 40,593 | | | | 2,107,183 | |
Darling Ingredients, Inc.* | | | 45,522 | | | | 599,525 | |
Flowers Foods, Inc. | | | 58,316 | | | | 1,076,513 | |
Hain Celestial Group, Inc. (The)* | | | 32,621 | | | | 1,334,525 | |
J&J Snack Foods Corp. | | | 4,212 | | | | 456,075 | |
Lancaster Colony Corp. | | | 6,609 | | | | 730,757 | |
Pilgrim’s Pride Corp.*(a) | | | 238,928 | | | | 6,068,771 | |
Pinnacle Foods, Inc. | | | 27,971 | | | | 1,249,744 | |
Seaboard Corp.* | | | 418 | | | | 1,255,258 | |
Snyder’s-Lance, Inc. | | | 12,520 | | | | 394,130 | |
TreeHouse Foods, Inc.* | | | 9,394 | | | | 814,930 | |
| | | | | | | | |
| Total Food Products | | | | | | | 16,569,634 | |
| Gas Utilities – 2.0% | | | | | | | | |
Atmos Energy Corp. | | | 36,320 | | | | 2,697,123 | |
New Jersey Resources Corp. | | | 38,359 | | | | 1,397,418 | |
ONE Gas, Inc. | | | 16,968 | | | | 1,036,745 | |
Piedmont Natural Gas Co., Inc. | | | 16,579 | | | | 991,922 | |
Questar Corp. | | | 83,521 | | | | 2,071,321 | |
Southwest Gas Corp. | | | 18,425 | | | | 1,213,286 | |
UGI Corp. | | | 60,741 | | | | 2,447,255 | |
WGL Holdings, Inc. | | | 16,586 | | | | 1,200,329 | |
| | | | | | | | |
| Total Gas Utilities | | | | | | | 13,055,399 | |
| Health Care Equipment & Supplies – 1.1% | | | | | | | | |
ABIOMED, Inc.* | | | 10,507 | | | | 996,169 | |
Align Technology, Inc.* | | | 14,039 | | | | 1,020,495 | |
Cantel Medical Corp. | | | 5,559 | | | | 396,690 | |
Globus Medical, Inc. Class A* | | | 27,393 | | | | 650,584 | |
Greatbatch, Inc.* | | | 3,435 | | | | 122,423 | |
Hill-Rom Holdings, Inc. | | | 7,190 | | | | 361,657 | |
ICU Medical, Inc.* | | | 2,904 | | | | 302,306 | |
Integra LifeSciences Holdings Corp.* | | | 921 | | | | 62,039 | |
Masimo Corp.* | | | 13,788 | | | | 576,890 | |
Neogen Corp.*(a) | | | 3,920 | | | | 197,372 | |
NuVasive, Inc.* | | | 5,168 | | | | 251,423 | |
Nuvectra Corp.* | | | 1,145 | | | | 6,195 | |
Teleflex, Inc. | | | 10,401 | | | | 1,633,061 | |
West Pharmaceutical Services, Inc. | | | 13,835 | | | | 959,042 | |
| | | | | | | | |
| Total Health Care Equipment & Supplies | | | | | | | 7,536,346 | |
| Health Care Providers & Services – 2.1% | | | | | | | | |
Acadia Healthcare Co., Inc.* | | | 10,994 | | | | 605,879 | |
Amsurg Corp.* | | | 10,286 | | | | 767,336 | |
Centene Corp.* | | | 101 | | | | 6,209 | |
Chemed Corp. | | | 5,058 | | | | 685,106 | |
Community Health Systems, Inc.* | | | 103,842 | | | | 1,922,115 | |
Diplomat Pharmacy, Inc.*(a) | | | 3,883 | | | | 106,394 | |
Envision Healthcare Holdings, Inc.* | | | 41,187 | | | | 840,215 | |
HealthEquity, Inc.* | | | 2,955 | | | | 72,900 | |
HealthSouth Corp. | | | 35,647 | | | | 1,341,397 | |
LifePoint Health, Inc.* | | | 14,729 | | | | 1,019,983 | |
Molina Healthcare, Inc.* | | | 17,244 | | | | 1,112,066 | |
Owens & Minor, Inc. | | | 16,509 | | | | 667,294 | |
See Notes to Financial Statements.
| | |
| 54 | | WisdomTree Domestic Earnings and Dividend Funds |
Schedule of Investments (continued)
WisdomTree MidCap Earnings Fund (EZM)
March 31, 2016
| | | | | | | | |
| Investments | | Shares | | | Value | |
| | | | | | | | |
Patterson Cos., Inc. | | | 30,243 | | | $ | 1,407,207 | |
Team Health Holdings, Inc.* | | | 15,229 | | | | 636,724 | |
Tenet Healthcare Corp.* | | | 16,280 | | | | 470,980 | |
VCA, Inc.* | | | 21,697 | | | | 1,251,700 | |
WellCare Health Plans, Inc.* | | | 10,782 | | | | 1,000,031 | |
| | | | | | | | |
| Total Health Care Providers & Services | | | | | | | 13,913,536 | |
| Health Care Technology – 0.1% | | | | | | | | |
Medidata Solutions, Inc.* | | | 1,735 | | | | 67,162 | |
Veeva Systems, Inc. Class A* | | | 13,442 | | | | 336,587 | |
| | | | | | | | |
| Total Health Care Technology | | | | | | | 403,749 | |
| Hotels, Restaurants & Leisure – 2.8% | | | | | | | | |
Bloomin’ Brands, Inc. | | | 54,565 | | | | 920,512 | |
Boyd Gaming Corp.* | | | 18,245 | | | | 376,942 | |
Brinker International, Inc. | | | 30,344 | | | | 1,394,307 | |
Buffalo Wild Wings, Inc.*(a) | | | 3,944 | | | | 584,185 | |
Cheesecake Factory, Inc. (The) | | | 16,899 | | | | 897,168 | |
Choice Hotels International, Inc. | | | 17,264 | | | | 933,119 | |
Churchill Downs, Inc. | | | 2,056 | | | | 304,041 | |
Cracker Barrel Old Country Store, Inc.(a) | | | 9,035 | | | | 1,379,373 | |
Diamond Resorts International, Inc.*(a) | | | 30,691 | | | | 745,791 | |
Domino’s Pizza, Inc. | | | 11,144 | | | | 1,469,448 | |
Dunkin’ Brands Group, Inc. | | | 27,159 | | | | 1,281,090 | |
Jack in the Box, Inc. | | | 10,266 | | | | 655,689 | |
La Quinta Holdings, Inc.* | | | 4,331 | | | | 54,138 | |
Marriott Vacations Worldwide Corp. | | | 13,300 | | | | 897,750 | |
Panera Bread Co. Class A* | | | 5,794 | | | | 1,186,785 | |
Papa John’s International, Inc. | | | 9,755 | | | | 528,623 | |
Pinnacle Entertainment, Inc.* | | | 16,088 | | | | 564,689 | |
Six Flags Entertainment Corp. | | | 15,485 | | | | 859,263 | |
Texas Roadhouse, Inc. | | | 18,620 | | | | 811,460 | |
Vail Resorts, Inc. | | | 5,540 | | | | 740,698 | |
Wendy’s Co. (The) | | | 32,573 | | | | 354,720 | |
Wynn Resorts Ltd.(a) | | | 21,217 | | | | 1,982,304 | |
| | | | | | | | |
| Total Hotels, Restaurants & Leisure | | | | | | | 18,922,095 | |
| Household Durables – 1.1% | | | | | | | | |
CalAtlantic Group, Inc. | | | 27,265 | | | | 911,196 | |
GoPro, Inc. Class A*(a) | | | 68,184 | | | | 815,480 | |
Leggett & Platt, Inc. | | | 47,947 | | | | 2,320,635 | |
Tempur Sealy International, Inc.* | | | 13,087 | | | | 795,559 | |
TRI Pointe Group, Inc.* | | | 87,390 | | | | 1,029,454 | |
Tupperware Brands Corp. | | | 25,962 | | | | 1,505,277 | |
| | | | | | | | |
| Total Household Durables | | | | | | | 7,377,601 | |
| Household Products – 0.2% | | | | | | | | |
Spectrum Brands Holdings, Inc. | | | 12,518 | | | | 1,367,967 | |
| Independent Power & Renewable Electricity Producers – 0.8% | |
Calpine Corp.* | | | 270,192 | | | | 4,098,813 | |
Dynegy, Inc.* | | | 31,703 | | | | 455,572 | |
Ormat Technologies, Inc. | | | 20,702 | | | | 853,750 | |
| | | | | | | | |
| Total Independent Power & Renewable Electricity Producers | | | | 5,408,135 | |
| Industrial Conglomerates – 0.3% | | | | | | | | |
Carlisle Cos., Inc. | | | 22,488 | | | | 2,237,556 | |
| | | | | | | | |
| Insurance – 3.5% | | | | | | | | |
American Equity Investment Life Holding Co. | | | 48,900 | | | $ | 821,520 | |
American National Insurance Co. | | | 11,696 | | | | 1,350,888 | |
AmTrust Financial Services, Inc. | | | 99,018 | | | | 2,562,586 | |
Assurant, Inc. | | | 7,306 | | | | 563,658 | |
Brown & Brown, Inc. | | | 42,028 | | | | 1,504,603 | |
CNO Financial Group, Inc. | | | 66,183 | | | | 1,185,999 | |
Erie Indemnity Co. Class A | | | 5,250 | | | | 488,198 | |
First American Financial Corp. | | | 44,549 | | | | 1,697,762 | |
Hanover Insurance Group, Inc. (The) | | | 21,574 | | | | 1,946,406 | |
Kemper Corp. | | | 16,018 | | | | 473,652 | |
Mercury General Corp. | | | 12,070 | | | | 669,885 | |
National General Holdings Corp. | | | 37,476 | | | | 809,107 | |
Old Republic International Corp. | | | 111,982 | | | | 2,047,031 | |
Primerica, Inc. | | | 21,349 | | | | 950,671 | |
ProAssurance Corp. | | | 15,631 | | | | 790,929 | |
Reinsurance Group of America, Inc. | | | 36,637 | | | | 3,526,311 | |
RLI Corp. | | | 11,864 | | | | 793,227 | |
Selective Insurance Group, Inc. | | | 25,574 | | | | 936,264 | |
| | | | | | | | |
| Total Insurance | | | | | | | 23,118,697 | |
| Internet & Catalog Retail – 0.2% | | | | | | | | |
HSN, Inc. | | | 24,430 | | | | 1,277,933 | |
| Internet Software & Services – 0.4% | | | | | | | | |
GrubHub, Inc.*(a) | | | 10,237 | | | | 257,256 | |
IAC/InterActiveCorp | | | 23,165 | | | | 1,090,608 | |
j2 Global, Inc. | | | 11,189 | | | | 689,019 | |
LogMeIn, Inc.* | | | 1,098 | | | | 55,405 | |
Rackspace Hosting, Inc.* | | | 35,184 | | | | 759,622 | |
Yelp, Inc.* | | | 4,791 | | | | 95,245 | |
| | | | | | | | |
| Total Internet Software & Services | | | | | | | 2,947,155 | |
| IT Services – 2.7% | | | | | | | | |
Blackhawk Network Holdings, Inc.* | | | 5,996 | | | | 205,663 | |
Booz Allen Hamilton Holding Corp. | | | 50,522 | | | | 1,529,806 | |
CACI International, Inc. Class A* | | | 9,261 | | | | 988,149 | |
Computer Sciences Corp. | | | 61,095 | | | | 2,101,057 | |
Convergys Corp. | | | 51,705 | | | | 1,435,848 | |
CoreLogic, Inc.* | | | 20,380 | | | | 707,186 | |
DST Systems, Inc. | | | 16,263 | | | | 1,833,978 | |
EPAM Systems, Inc.* | | | 6,562 | | | | 489,985 | |
Euronet Worldwide, Inc.* | | | 8,849 | | | | 655,799 | |
Heartland Payment Systems, Inc. | | | 3,552 | | | | 343,017 | |
Leidos Holdings, Inc. | | | 16,466 | | | | 828,569 | |
MAXIMUS, Inc. | | | 19,597 | | | | 1,031,586 | |
Science Applications International Corp. | | | 18,575 | | | | 990,790 | |
Syntel, Inc.* | | | 36,158 | | | | 1,805,369 | |
Teradata Corp.* | | | 71,940 | | | | 1,887,706 | |
WEX, Inc.* | | | 10,166 | | | | 847,438 | |
| | | | | | | | |
| Total IT Services | | | | | | | 17,681,946 | |
| Leisure Products – 0.4% | | | | | | | | |
Brunswick Corp. | | | 37,599 | | | | 1,804,000 | |
Vista Outdoor, Inc.* | | | 11,566 | | | | 600,391 | |
| | | | | | | | |
| Total Leisure Products | | | | | | | 2,404,391 | |
See Notes to Financial Statements.
| | | | |
| WisdomTree Domestic Earnings and Dividend Funds | | | 55 | |
Schedule of Investments (continued)
WisdomTree MidCap Earnings Fund (EZM)
March 31, 2016
| | | | | | | | |
| Investments | | Shares | | | Value | |
| | | | | | | | |
| Life Sciences Tools & Services – 1.0% | | | | | | | | |
Bio-Rad Laboratories, Inc. Class A* | | | 5,656 | | | $ | 773,288 | |
Bio-Techne Corp. | | | 7,757 | | | | 733,192 | |
Bruker Corp. | | | 20,808 | | | | 582,624 | |
Charles River Laboratories International, Inc.* | | | 12,399 | | | | 941,580 | |
INC Research Holdings, Inc. Class A* | | | 5,404 | | | | 222,699 | |
PAREXEL International Corp.* | | | 13,889 | | | | 871,257 | |
PerkinElmer, Inc. | | | 28,102 | | | | 1,389,925 | |
PRA Health Sciences, Inc.* | | | 4,458 | | | | 190,624 | |
VWR Corp.* | | | 38,738 | | | | 1,048,250 | |
| | | | | | | | |
| Total Life Sciences Tools & Services | | | | | | | 6,753,439 | |
| Machinery – 6.2% | | | | | | | | |
AGCO Corp. | | | 40,064 | | | | 1,991,181 | |
Allison Transmission Holdings, Inc. | | | 59,649 | | | | 1,609,330 | |
Barnes Group, Inc. | | | 25,154 | | | | 881,145 | |
CLARCOR, Inc. | | | 21,381 | | | | 1,235,608 | |
Colfax Corp.* | | | 58,848 | | | | 1,682,464 | |
Crane Co. | | | 30,392 | | | | 1,636,913 | |
Donaldson Co., Inc. | | | 51,995 | | | | 1,659,160 | |
Flowserve Corp. | | | 61,088 | | | | 2,712,918 | |
Graco, Inc. | | | 24,190 | | | | 2,030,992 | |
Hillenbrand, Inc. | | | 26,654 | | | | 798,287 | |
IDEX Corp. | | | 25,291 | | | | 2,096,118 | |
ITT Corp. | | | 57,791 | | | | 2,131,910 | |
Kennametal, Inc. | | | 13,603 | | | | 305,931 | |
Lincoln Electric Holdings, Inc. | | | 19,315 | | | | 1,131,280 | |
Manitowoc Co., Inc. (The)(a) | | | 26,726 | | | | 115,724 | |
Manitowoc Foodservice, Inc.* | | | 26,726 | | | | 393,941 | |
Middleby Corp. (The)* | | | 12,645 | | | | 1,350,107 | |
Mueller Industries, Inc. | | | 19,176 | | | | 564,158 | |
Nordson Corp. | | | 25,868 | | | | 1,967,003 | |
Oshkosh Corp. | | | 41,076 | | | | 1,678,776 | |
Proto Labs, Inc.*(a) | | | 4,901 | | | | 377,818 | |
Rexnord Corp.* | | | 32,012 | | | | 647,283 | |
Terex Corp. | | | 78,626 | | | | 1,956,215 | |
Timken Co. (The) | | | 57,737 | | | | 1,933,612 | |
Toro Co. (The) | | | 17,190 | | | | 1,480,403 | |
Trinity Industries, Inc. | | | 193,933 | | | | 3,550,913 | |
WABCO Holdings, Inc.* | | | 17,103 | | | | 1,828,653 | |
Woodward, Inc. | | | 25,201 | | | | 1,310,956 | |
| | | | | | | | |
| Total Machinery | | | | | | | 41,058,799 | |
| Marine – 0.4% | | | | | | | | |
Kirby Corp.* | | | 30,007 | | | | 1,809,122 | |
Matson, Inc. | | | 17,158 | | | | 689,237 | |
| | | | | | | | |
| Total Marine | | | | | | | 2,498,359 | |
| Media – 4.7% | | | | | | | | |
AMC Networks, Inc. Class A* | | | 31,418 | | | | 2,040,285 | |
Cable One, Inc. | | | 1,417 | | | | 619,413 | |
Cinemark Holdings, Inc. | | | 42,647 | | | | 1,528,042 | |
Crown Media Holdings, Inc. Class A* | | | 132,194 | | | | 671,546 | |
Discovery Communications, Inc. Class A*(a) | | | 176,787 | | | | 5,061,412 | |
Gannett Co., Inc. | | | 75,422 | | | | 1,141,889 | |
John Wiley & Sons, Inc. Class A | | | 27,408 | | | | 1,339,977 | |
| | | | | | | | |
Liberty Media Corp. Class A* | | | 16,482 | | | $ | 636,700 | |
Meredith Corp. | | | 17,447 | | | | 828,732 | |
New York Times Co. (The) Class A | | | 33,077 | | | | 412,139 | |
Nexstar Broadcasting Group, Inc. Class A(a) | | | 10,217 | | | | 452,307 | |
Regal Entertainment Group Class A(a) | | | 53,441 | | | | 1,129,743 | |
Scripps Networks Interactive, Inc. Class A | | | 71,931 | | | | 4,711,480 | |
Sinclair Broadcast Group, Inc. Class A | | | 39,351 | | | | 1,210,043 | |
Starz Class A* | | | 59,309 | | | | 1,561,606 | |
TEGNA, Inc. | | | 239,767 | | | | 5,624,934 | |
Time, Inc. | | | 83,840 | | | | 1,294,490 | |
Tribune Media Co. Class A | | | 17,001 | | | | 651,988 | |
| | | | | | | | |
| Total Media | | | | | | | 30,916,726 | |
| Metals & Mining – 0.9% | | | | | | | | |
Carpenter Technology Corp. | | | 12,581 | | | | 430,648 | |
Compass Minerals International, Inc. | | | 15,538 | | | | 1,101,023 | |
Reliance Steel & Aluminum Co. | | | 39,329 | | | | 2,721,173 | |
Steel Dynamics, Inc. | | | 30,990 | | | | 697,585 | |
Worthington Industries, Inc. | | | 22,380 | | | | 797,623 | |
| | | | | | | | |
| Total Metals & Mining | | | | | | | 5,748,052 | |
| Multi-Utilities – 1.4% | | | | | | | | |
Avista Corp. | | | 23,836 | | | | 972,032 | |
Black Hills Corp.(a) | | | 4,383 | | | | 263,550 | |
MDU Resources Group, Inc. | | | 75,425 | | | | 1,467,771 | |
NiSource, Inc. | | | 87,550 | | | | 2,062,678 | |
NorthWestern Corp. | | | 18,363 | | | | 1,133,915 | |
TECO Energy, Inc. | | | 57,111 | | | | 1,572,266 | |
Vectren Corp. | | | 30,588 | | | | 1,546,529 | |
| | | | | | | | |
| Total Multi-Utilities | | | | | | | 9,018,741 | |
| Multiline Retail – 0.6% | | | | | | | | |
Big Lots, Inc. | | | 25,145 | | | | 1,138,817 | |
Dillard’s, Inc. Class A | | | 30,673 | | | | 2,604,444 | |
| | | | | | | | |
| Total Multiline Retail | | | | | | | 3,743,261 | |
| Oil, Gas & Consumable Fuels – 4.2% | | | | | | | | |
Antero Resources Corp.* | | | 481,406 | | | | 11,972,567 | |
Columbia Pipeline Group, Inc. | | | 94,905 | | | | 2,382,116 | |
CVR Energy, Inc.(a) | | | 23,323 | | | | 608,730 | |
Delek U.S. Holdings, Inc. | | | 23,362 | | | | 356,037 | |
Memorial Resource Development Corp.* | | | 118,410 | | | | 1,205,414 | |
ONEOK, Inc. | | | 109,921 | | | | 3,282,241 | |
Parsley Energy, Inc. Class A* | | | 2,767 | | | | 62,534 | |
PDC Energy, Inc.* | | | 1,403 | | | | 83,408 | |
Rice Energy, Inc.* | | | 69,980 | | | | 976,921 | |
RSP Permian, Inc.* | | | 24,548 | | | | 712,874 | |
SM Energy Co.(a) | | | 40,831 | | | | 765,173 | |
Targa Resources Corp. | | | 14,040 | | | | 419,234 | |
Western Refining, Inc. | | | 92,185 | | | | 2,681,662 | |
World Fuel Services Corp. | | | 33,287 | | | | 1,617,082 | |
WPX Energy, Inc.* | | | 122,948 | | | | 859,407 | |
| | | | | | | | |
| Total Oil, Gas & Consumable Fuels | | | | | | | 27,985,400 | |
| Paper & Forest Products – 0.1% | | | | | | | | |
KapStone Paper and Packaging Corp. | | | 37,082 | | | | 513,586 | |
See Notes to Financial Statements.
| | |
| 56 | | WisdomTree Domestic Earnings and Dividend Funds |
Schedule of Investments (continued)
WisdomTree MidCap Earnings Fund (EZM)
March 31, 2016
| | | | | | | | |
| Investments | | Shares | | | Value | |
| | | | | | | | |
| Personal Products – 0.5% | | | | | | | | |
Coty, Inc. Class A(a) | | | 87,154 | | | $ | 2,425,496 | |
Nu Skin Enterprises, Inc. Class A(a) | | | 27,603 | | | | 1,055,815 | |
| | | | | | | | |
| Total Personal Products | | | | | | | 3,481,311 | |
| Pharmaceuticals – 0.4% | | | | | | | | |
Akorn, Inc.* | | | 5,508 | | | | 129,603 | |
Catalent, Inc.* | | | 63,819 | | | | 1,702,053 | |
Impax Laboratories, Inc.* | | | 4,747 | | | | 151,999 | |
Pacira Pharmaceuticals, Inc.*(a) | | | 1,030 | | | | 54,569 | |
Prestige Brands Holdings, Inc.* | | | 13,989 | | | | 746,873 | |
| | | | | | | | |
| Total Pharmaceuticals | | | | | | | 2,785,097 | |
| Professional Services – 0.5% | | | | | | | | |
CEB, Inc. | | | 11,306 | | | | 731,838 | |
Dun & Bradstreet Corp. (The) | | | 15,199 | | | | 1,566,713 | |
Korn/Ferry International | | | 18,722 | | | | 529,645 | |
On Assignment, Inc.* | | | 11,813 | | | | 436,136 | |
| | | | | | | | |
| Total Professional Services | | | | | | | 3,264,332 | |
| Real Estate Investment Trusts (REITs) – 6.6% | | | | | | | | |
Acadia Realty Trust | | | 11,399 | | | | 400,447 | |
Alexander’s, Inc. | | | 1,015 | | | | 386,258 | |
American Assets Trust, Inc. | | | 5,203 | | | | 207,704 | |
American Campus Communities, Inc. | | | 16,589 | | | | 781,176 | |
Apartment Investment & Management Co. Class A | | | 30,982 | | | | 1,295,667 | |
Apple Hospitality REIT, Inc.(a) | | | 45,652 | | | | 904,366 | |
Brandywine Realty Trust | | | 9,151 | | | | 128,389 | |
CBL & Associates Properties, Inc. | | | 68,982 | | | | 820,886 | |
Columbia Property Trust, Inc. | | | 21,869 | | | | 480,899 | |
Communications Sales & Leasing, Inc. | | | 7,614 | | | | 169,412 | |
CoreSite Realty Corp. | | | 2,031 | | | | 142,190 | |
Corporate Office Properties Trust | | | 28,564 | | | | 749,519 | |
Corrections Corp. of America | | | 46,036 | | | | 1,475,454 | |
Cousins Properties, Inc. | | | 57,895 | | | | 600,950 | |
CubeSmart | | | 7,445 | | | | 247,919 | |
DCT Industrial Trust, Inc. | | | 13,188 | | | | 520,530 | |
DiamondRock Hospitality Co. | | | 66,775 | | | | 675,763 | |
Douglas Emmett, Inc. | | | 10,068 | | | | 303,147 | |
DuPont Fabros Technology, Inc. | | | 13,076 | | | | 529,970 | |
EastGroup Properties, Inc. | | | 4,910 | | | | 296,417 | |
Education Realty Trust, Inc. | | | 4,055 | | | | 168,688 | |
Empire State Realty Trust, Inc. Class A | | | 8,916 | | | | 156,297 | |
EPR Properties | | | 17,409 | | | | 1,159,788 | |
Equity LifeStyle Properties, Inc. | | | 11,218 | | | | 815,885 | |
Equity One, Inc. | | | 12,369 | | | | 354,496 | |
First Industrial Realty Trust, Inc. | | | 9,266 | | | | 210,709 | |
Gaming and Leisure Properties, Inc. | | | 29,220 | | | | 903,482 | |
Geo Group, Inc. (The) | | | 26,540 | | | | 920,142 | |
Gramercy Property Trust | | | 9,891 | | | | 83,579 | |
Healthcare Realty Trust, Inc. | | | 9,770 | | | | 301,795 | |
Healthcare Trust of America, Inc. Class A | | | 9,040 | | | | 265,957 | |
Highwoods Properties, Inc. | | | 12,966 | | | | 619,904 | |
Hospitality Properties Trust | | | 47,129 | | | | 1,251,746 | |
Iron Mountain, Inc. | | | 27,471 | | | | 931,542 | |
Kilroy Realty Corp. | | | 18,264 | | | | 1,129,994 | |
| | | | | | | | |
Kite Realty Group Trust | | | 3,064 | | | $ | 84,903 | |
Lamar Advertising Co. Class A | | | 38,121 | | | | 2,344,442 | |
LaSalle Hotel Properties | | | 26,210 | | | | 663,375 | |
Lexington Realty Trust(a) | | | 51,301 | | | | 441,189 | |
Liberty Property Trust | | | 42,409 | | | | 1,419,005 | |
Medical Properties Trust, Inc. | | | 47,326 | | | | 614,291 | |
National Health Investors, Inc. | | | 11,373 | | | | 756,532 | |
National Retail Properties, Inc. | | | 25,637 | | | | 1,184,429 | |
Omega Healthcare Investors, Inc. | | | 37,663 | | | | 1,329,504 | |
Outfront Media, Inc. | | | 19,005 | | | | 401,006 | |
Paramount Group, Inc. | | | 13,164 | | | | 209,966 | |
Parkway Properties, Inc. | | | 36,804 | | | | 576,351 | |
Pebblebrook Hotel Trust | | | 12,315 | | | | 357,997 | |
Piedmont Office Realty Trust, Inc. Class A | | | 17,217 | | | | 349,677 | |
Post Properties, Inc. | | | 7,376 | | | | 440,642 | |
PS Business Parks, Inc. | | | 8,845 | | | | 889,011 | |
QTS Realty Trust, Inc. Class A | | | 2,560 | | | | 121,293 | |
Rayonier, Inc. | | | 12,721 | | | | 313,954 | |
Regency Centers Corp. | | | 15,738 | | | | 1,177,989 | |
Retail Opportunity Investments Corp. | | | 6,328 | | | | 127,319 | |
Retail Properties of America, Inc. Class A | | | 53,251 | | | | 844,028 | |
RLJ Lodging Trust | | | 44,161 | | | | 1,010,404 | |
Ryman Hospitality Properties, Inc. | | | 14,841 | | | | 764,015 | |
Select Income REIT | | | 26,507 | | | | 610,986 | |
Senior Housing Properties Trust | | | 65,854 | | | | 1,178,128 | |
Sovran Self Storage, Inc. | | | 6,089 | | | | 718,198 | |
Spirit Realty Capital, Inc. | | | 77,097 | | | | 867,341 | |
STORE Capital Corp. | | | 19,015 | | | | 492,108 | |
Sun Communities, Inc. | | | 2,718 | | | | 194,636 | |
Sunstone Hotel Investors, Inc. | | | 41,392 | | | | 579,488 | |
Tanger Factory Outlet Centers, Inc. | | | 18,610 | | | | 677,218 | |
Urban Edge Properties | | | 9,438 | | | | 243,878 | |
Washington Real Estate Investment Trust | | | 5,823 | | | | 170,090 | |
Weingarten Realty Investors | | | 33,569 | | | | 1,259,509 | |
WP GLIMCHER, Inc. | | | 16,478 | | | | 156,376 | |
Xenia Hotels & Resorts, Inc. | | | 7,172 | | | | 112,027 | |
| | | | | | | | |
| Total Real Estate Investment Trusts (REITs) | | | | | | | 44,072,372 | |
| Real Estate Management & Development – 0.3% | | | | | | | | |
Alexander & Baldwin, Inc. | | | 7,618 | | | | 279,428 | |
Howard Hughes Corp. (The)* | | | 6,589 | | | | 697,709 | |
Kennedy-Wilson Holdings, Inc. | | | 2,494 | | | | 54,619 | |
Realogy Holdings Corp.* | | | 28,281 | | | | 1,021,227 | |
| | | | | | | | |
| Total Real Estate Management & Development | | | | | | | 2,052,983 | |
| Road & Rail – 1.6% | | | | | | | | |
Avis Budget Group, Inc.* | | | 61,546 | | | | 1,683,899 | |
Genesee & Wyoming, Inc. Class A* | | | 30,298 | | | | 1,899,685 | |
Knight Transportation, Inc. | | | 33,257 | | | | 869,670 | |
Landstar System, Inc. | | | 17,660 | | | | 1,141,013 | |
Old Dominion Freight Line, Inc.* | | | 34,978 | | | | 2,435,168 | |
Ryder System, Inc. | | | 28,640 | | | | 1,855,299 | |
Werner Enterprises, Inc. | | | 30,525 | | | | 829,059 | |
| | | | | | | | |
| Total Road & Rail | | | | | | | 10,713,793 | |
See Notes to Financial Statements.
| | | | |
| WisdomTree Domestic Earnings and Dividend Funds | | | 57 | |
Schedule of Investments (continued)
WisdomTree MidCap Earnings Fund (EZM)
March 31, 2016
| | | | | | | | |
| Investments | | Shares | | | Value | |
| | | | | | | | |
| Semiconductors & Semiconductor Equipment – 2.0% | |
Atmel Corp. | | | 10,348 | | | $ | 84,026 | |
Cirrus Logic, Inc.* | | | 21,613 | | | | 786,929 | |
Entegris, Inc.* | | | 38,831 | | | | 528,878 | |
First Solar, Inc.* | | | 71,321 | | | | 4,883,349 | |
Integrated Device Technology, Inc.* | | | 38,219 | | | | 781,196 | |
Intersil Corp. Class A | | | 29,076 | | | | 388,746 | |
Microsemi Corp.* | | | 17,103 | | | | 655,216 | |
MKS Instruments, Inc. | | | 24,787 | | | | 933,231 | |
Monolithic Power Systems, Inc. | | | 3,497 | | | | 222,549 | |
ON Semiconductor Corp.* | | | 105,616 | | | | 1,012,857 | |
Silicon Laboratories, Inc.* | | | 4,653 | | | | 209,199 | |
SunPower Corp.*(a) | | | 23,965 | | | | 535,378 | |
Synaptics, Inc.* | | | 8,612 | | | | 686,721 | |
Teradyne, Inc. | | | 74,057 | | | | 1,598,891 | |
| | | | | | | | |
| Total Semiconductors & Semiconductor Equipment | | | | 13,307,166 | |
| Software – 0.9% | | | | | | | | |
ACI Worldwide, Inc.* | | | 22,574 | | | | 469,313 | |
Aspen Technology, Inc.* | | | 22,642 | | | | 818,055 | |
Blackbaud, Inc. | | | 2,738 | | | | 172,193 | |
Ellie Mae, Inc.* | | | 2,486 | | | | 225,331 | |
Fair Isaac Corp. | | | 6,598 | | | | 699,982 | |
Fortinet, Inc.* | | | 4,175 | | | | 127,880 | |
Guidewire Software, Inc.* | | | 1,298 | | | | 70,715 | |
Manhattan Associates, Inc.* | | | 9,448 | | | | 537,308 | |
Mentor Graphics Corp. | | | 61,130 | | | | 1,242,773 | |
Paycom Software, Inc.* | | | 3,099 | | | | 110,324 | |
Pegasystems, Inc. | | | 7,844 | | | | 199,081 | |
PTC, Inc.* | | | 15,238 | | | | 505,292 | |
Synchronoss Technologies, Inc.* | | | 8,662 | | | | 280,129 | |
Tyler Technologies, Inc.* | | | 2,805 | | | | 360,751 | |
Ultimate Software Group, Inc. (The)* | | | 953 | | | | 184,406 | |
Verint Systems, Inc.* | | | 949 | | | | 31,678 | |
| | | | | | | | |
| Total Software | | | | | | | 6,035,211 | |
| Specialty Retail – 4.7% | | | | | | | | |
Aaron’s, Inc. | | | 41,047 | | | | 1,030,280 | |
Abercrombie & Fitch Co. Class A | | | 1,376 | | | | 43,399 | |
American Eagle Outfitters, Inc.(a) | | | 61,682 | | | | 1,028,239 | |
Asbury Automotive Group, Inc.* | | | 13,943 | | | | 834,349 | |
Ascena Retail Group, Inc.* | | | 39,472 | | | | 436,560 | |
Burlington Stores, Inc.* | | | 15,363 | | | | 864,015 | |
Cabela’s, Inc.* | | | 27,170 | | | | 1,322,907 | |
CST Brands, Inc. | | | 37,819 | | | | 1,448,090 | |
Dick’s Sporting Goods, Inc. | | | 67,259 | | | | 3,144,358 | |
DSW, Inc. Class A | | | 47,954 | | | | 1,325,449 | |
GameStop Corp. Class A | | | 93,774 | | | | 2,975,449 | |
GNC Holdings, Inc. Class A | | | 50,805 | | | | 1,613,059 | |
Group 1 Automotive, Inc. | | | 14,037 | | | | 823,832 | |
Lithia Motors, Inc. Class A | | | 10,445 | | | | 912,162 | |
Mattress Firm Holding Corp.*(a) | | | 6,892 | | | | 292,152 | |
Michaels Cos., Inc. (The)* | | | 98,789 | | | | 2,763,128 | |
Monro Muffler Brake, Inc. | | | 6,554 | | | | 468,414 | |
Murphy USA, Inc.* | | | 22,026 | | | | 1,353,498 | |
| | | | | | | | |
Penske Automotive Group, Inc. | | | 50,918 | | | $ | 1,929,792 | |
Restoration Hardware Holdings, Inc.*(a) | | | 8,135 | | | | 340,856 | |
Sally Beauty Holdings, Inc.* | | | 59,704 | | | | 1,933,216 | |
Urban Outfitters, Inc.* | | | 70,180 | | | | 2,322,256 | |
Williams-Sonoma, Inc. | | | 34,430 | | | | 1,884,698 | |
| | | | | | | | |
| Total Specialty Retail | | | | | | | 31,090,158 | |
| Technology Hardware, Storage & Peripherals – 0.1% | |
Diebold, Inc. | | | 18,060 | | | | 522,115 | |
Electronics For Imaging, Inc.* | | | 5,036 | | | | 213,476 | |
| | | | | | | | |
| Total Technology Hardware, Storage & Peripherals | | | | 735,591 | |
| Textiles, Apparel & Luxury Goods – 1.7% | | | | | | | | |
Carter’s, Inc. | | | 18,001 | | | | 1,896,946 | |
Columbia Sportswear Co. | | | 25,599 | | | | 1,538,244 | |
Fossil Group, Inc.*(a) | | | 55,558 | | | | 2,467,886 | |
G-III Apparel Group Ltd.* | | | 17,080 | | | | 835,041 | |
Kate Spade & Co.* | | | 32,944 | | | | 840,731 | |
Skechers U.S.A., Inc. Class A* | | | 52,381 | | | | 1,595,002 | |
Steven Madden Ltd.* | | | 24,957 | | | | 924,407 | |
Wolverine World Wide, Inc. | | | 49,315 | | | | 908,382 | |
| | | | | | | | |
| Total Textiles, Apparel & Luxury Goods | | | | | | | 11,006,639 | |
| Thrifts & Mortgage Finance – 1.9% | | | | | | | | |
Capitol Federal Financial, Inc. | | | 35,274 | | | | 467,733 | |
EverBank Financial Corp. | | | 38,538 | | | | 581,539 | |
MGIC Investment Corp.* | | | 682,930 | | | | 5,238,073 | |
Radian Group, Inc. | | | 428,609 | | | | 5,314,752 | |
TFS Financial Corp. | | | 22,120 | | | | 384,224 | |
Washington Federal, Inc. | | | 36,809 | | | | 833,724 | |
| | | | | | | | |
| Total Thrifts & Mortgage Finance | | | | | | | 12,820,045 | |
| Tobacco – 0.0% | | | | | | | | |
Vector Group Ltd.(a) | | | 14,416 | | | | 329,261 | |
| Trading Companies & Distributors – 1.7% | | | | | | | | |
Air Lease Corp. | | | 62,407 | | | | 2,004,513 | |
Beacon Roofing Supply, Inc.* | | | 9,560 | | | | 392,056 | |
GATX Corp. | | | 24,537 | | | | 1,165,508 | |
HD Supply Holdings, Inc.* | | | 66,164 | | | | 2,188,043 | |
MSC Industrial Direct Co., Inc. Class A | | | 26,871 | | | | 2,050,526 | |
Watsco, Inc. | | | 8,864 | | | | 1,194,335 | |
WESCO International, Inc.* | | | 38,412 | | | | 2,099,984 | |
| | | | | | | | |
| Total Trading Companies & Distributors | | | | | | | 11,094,965 | |
| Water Utilities – 0.2% | | | | | | | | |
Aqua America, Inc. | | | 52,337 | | | | 1,665,363 | |
| Wireless Telecommunication Services – 0.1% | | | | | | | | |
Telephone & Data Systems, Inc. | | | 7,976 | | | | 239,998 | |
United States Cellular Corp.* | | | 9,491 | | | | 433,643 | |
| | | | | | | | |
| Total Wireless Telecommunication Services | | | | | | | 673,641 | |
TOTAL COMMON STOCKS
(Cost: $634,910,978) | | | | | | | 661,078,654 | |
See Notes to Financial Statements.
| | |
| 58 | | WisdomTree Domestic Earnings and Dividend Funds |
Schedule of Investments (concluded)
WisdomTree MidCap Earnings Fund (EZM)
March 31, 2016
| | | | | | | | |
| Investments | | Shares | | | Value | |
| EXCHANGE-TRADED FUND – 0.2% | | | | | | | | |
| United States – 0.2% | | | | | | | | |
WisdomTree MidCap Dividend Fund(b)
(Cost: $1,132,390) | | | 13,824 | | | $ | 1,190,385 | |
| INVESTMENT OF CASH COLLATERAL FOR SECURITIES LOANED – 4.8% | |
| United States – 4.8% | | | | | | | | |
State Street Navigator Securities Lending Prime Portfolio, 0.50%(c) (Cost: $32,026,035)(d) | | | 32,026,035 | | | | 32,026,035 | |
TOTAL INVESTMENTS IN SECURITIES – 104.7%
(Cost: $668,069,403) | | | | 694,295,074 | |
Liabilities in Excess of Cash and Other Assets – (4.7)% | | | | (31,350,743 | ) |
| | | | | | | | |
| NET ASSETS – 100.0% | | | | | | $ | 662,944,331 | |
| * | Non-income producing security. |
| (a) | Security, or portion thereof, was on loan at March 31, 2016 (See Note 2). |
| (b) | Affiliated company (See Note 3). |
| (c) | Rate shown represents annualized 7-day yield as of March 31, 2016. |
| (d) | At March 31, 2016, the total market value of the Fund’s securities on loan was $33,834,243 and the total market value of the collateral held by the Fund was $34,608,774. The total market value of the collateral includes non-cash U.S. Government securities collateral having a value of $2,582,739. |
See Notes to Financial Statements.
| | | | |
| WisdomTree Domestic Earnings and Dividend Funds | | | 59 | |
Schedule of Investments
WisdomTree SmallCap Dividend Fund (DES)
March 31, 2016
| | | | | | | | |
| Investments | | Shares | | | Value | |
| COMMON STOCKS – 99.1% | | | | | | | | |
| United States – 99.1% | | | | | | | | |
| Aerospace & Defense – 0.4% | | | | | | | | |
AAR Corp. | | | 40,707 | | | $ | 947,252 | |
American Science & Engineering, Inc. | | | 29,034 | | | | 803,952 | |
Cubic Corp. | | | 13,463 | | | | 537,982 | |
HEICO Corp. | | | 6,655 | | | | 400,165 | |
HEICO Corp. Class A | | | 11,119 | | | | 529,264 | |
National Presto Industries, Inc.(a) | | | 7,311 | | | | 612,223 | |
Triumph Group, Inc. | | | 18,659 | | | | 587,385 | |
| | | | | | | | |
| Total Aerospace & Defense | | | | | | | 4,418,223 | |
| Air Freight & Logistics – 0.2% | | | | | | | | |
Forward Air Corp. | | | 29,165 | | | | 1,321,758 | |
Park-Ohio Holdings Corp. | | | 15,009 | | | | 642,685 | |
| | | | | | | | |
| Total Air Freight & Logistics | | | | | | | 1,964,443 | |
| Airlines – 0.1% | | | | | | | | |
SkyWest, Inc. | | | 36,169 | | | | 723,018 | |
| Auto Components – 0.9% | | | | | | | | |
Cooper Tire & Rubber Co. | | | 51,927 | | | | 1,922,338 | |
Dana Holding Corp. | | | 219,643 | | | | 3,094,770 | |
Metaldyne Performance Group, Inc. | | | 107,430 | | | | 1,805,898 | |
Spartan Motors, Inc. | | | 78,661 | | | | 310,711 | |
Standard Motor Products, Inc. | | | 29,278 | | | | 1,014,483 | |
Strattec Security Corp. | | | 2,601 | | | | 149,271 | |
Superior Industries International, Inc. | | | 88,492 | | | | 1,953,903 | |
Tower International, Inc. | | | 25,212 | | | | 685,766 | |
Unique Fabricating, Inc. | | | 34,279 | | | | 423,346 | |
| | | | | | | | |
| Total Auto Components | | | | | | | 11,360,486 | |
| Automobiles – 0.1% | | | | | | | | |
Winnebago Industries, Inc.(a) | | | 43,216 | | | | 970,199 | |
| Banks – 6.0% | | | | | | | | |
1st Source Corp. | | | 19,280 | | | | 613,875 | |
Access National Corp. | | | 9,443 | | | | 187,255 | |
American National Bankshares, Inc. | | | 11,004 | | | | 278,731 | |
Ameris Bancorp | | | 5,917 | | | | 175,025 | |
Arrow Financial Corp.(a) | | | 14,778 | | | | 392,651 | |
Banc of California, Inc. | | | 40,510 | | | | 708,925 | |
BancFirst Corp. | | | 12,208 | | | | 696,222 | |
BancorpSouth, Inc. | | | 48,723 | | | | 1,038,287 | |
Banner Corp. | | | 16,472 | | | | 692,483 | |
Bar Harbor Bankshares(a) | | | 6,378 | | | | 211,877 | |
BBCN Bancorp, Inc. | | | 64,737 | | | | 983,355 | |
BCB Bancorp, Inc. | | | 17,571 | | | | 175,886 | |
Berkshire Hills Bancorp, Inc. | | | 25,589 | | | | 688,088 | |
Blue Hills Bancorp, Inc. | | | 4,319 | | | | 59,041 | |
Boston Private Financial Holdings, Inc. | | | 85,784 | | | | 982,227 | |
Bridge Bancorp, Inc. | | | 16,994 | | | | 517,807 | |
Brookline Bancorp, Inc. | | | 69,911 | | | | 769,720 | |
Bryn Mawr Bank Corp. | | | 14,900 | | | | 383,377 | |
C&F Financial Corp. | | | 3,457 | | | | 132,057 | |
Camden National Corp. | | | 8,538 | | | | 358,596 | |
Capital Bank Financial Corp. Class A | | | 10,491 | | | | 323,647 | |
Capital City Bank Group, Inc.(a) | | | 5,470 | | | | 79,807 | |
Cardinal Financial Corp. | | | 19,947 | | | | 405,921 | |
Centerstate Banks, Inc. | | | 8,520 | | | | 126,863 | |
Central Pacific Financial Corp. | | | 27,637 | | | | 601,658 | |
Century Bancorp, Inc. Class A(a) | | | 1,210 | | | | 47,081 | |
Chemical Financial Corp. | | | 36,415 | | | | 1,299,651 | |
City Holding Co. | | | 17,573 | | | | 839,638 | |
CNB Financial Corp. | | | 18,587 | | | | 326,945 | |
CoBiz Financial, Inc. | | | 17,328 | | | | 204,817 | |
Columbia Banking System, Inc. | | | 41,406 | | | | 1,238,868 | |
Community Bank System, Inc. | | | 40,607 | | | | 1,551,593 | |
Community Trust Bancorp, Inc. | | | 20,310 | | | | 717,349 | |
ConnectOne Bancorp, Inc. | | | 15,161 | | | | 247,882 | |
CVB Financial Corp. | | | 96,791 | | | | 1,689,003 | |
Enterprise Bancorp, Inc. | | | 7,477 | | | | 196,197 | |
Enterprise Financial Services Corp. | | | 7,006 | | | | 189,442 | |
Fidelity Southern Corp. | | | 12,826 | | | | 205,729 | |
Financial Institutions, Inc. | | | 13,422 | | | | 390,178 | |
First Bancorp | | | 10,374 | | | | 195,550 | |
First Bancorp, Inc. | | | 14,296 | | | | 278,915 | |
First Busey Corp. | | | 29,240 | | | | 598,835 | |
First Business Financial Services, Inc. | | | 5,467 | | | | 125,358 | |
First Commonwealth Financial Corp. | | | 87,349 | | | | 773,912 | |
First Community Bancshares, Inc. | | | 16,533 | | | | 328,015 | |
First Connecticut Bancorp, Inc. | | | 7,841 | | | | 125,142 | |
First Financial Bancorp | | | 67,743 | | | | 1,231,568 | |
First Financial Bankshares, Inc.(a) | | | 42,771 | | | | 1,265,166 | |
First Financial Corp. | | | 11,782 | | | | 403,062 | |
First Guaranty Bancshares, Inc. | | | 6,834 | | | | 105,927 | |
First Interstate BancSystem, Inc. Class A | | | 19,063 | | | | 536,242 | |
First Merchants Corp. | | | 20,242 | | | | 477,104 | |
First Midwest Bancorp, Inc. | | | 48,220 | | | | 868,924 | |
Flushing Financial Corp. | | | 27,355 | | | | 591,415 | |
FNB Corp. | | | 211,548 | | | | 2,752,240 | |
Fulton Financial Corp. | | | 150,908 | | | | 2,019,149 | |
German American Bancorp, Inc. | | | 8,369 | | | | 269,482 | |
Glacier Bancorp, Inc. | | | 70,238 | | | | 1,785,450 | |
Great Southern Bancorp, Inc. | | | 7,961 | | | | 295,592 | |
Great Western Bancorp, Inc. | | | 32,675 | | | | 891,047 | |
Guaranty Bancorp | | | 15,736 | | | | 243,279 | |
Hancock Holding Co. | | | 92,321 | | | | 2,119,690 | |
Hanmi Financial Corp. | | | 18,582 | | | | 409,176 | |
Heartland Financial USA, Inc. | | | 7,724 | | | | 237,822 | |
Heritage Commerce Corp. | | | 29,940 | | | | 299,699 | |
Heritage Financial Corp. | | | 22,891 | | | | 402,195 | |
Horizon Bancorp | | | 8,372 | | | | 206,956 | |
Independent Bank Corp. | | | 32,972 | | | | 1,065,163 | |
Independent Bank Group, Inc. | | | 4,979 | | | | 136,425 | |
International Bancshares Corp. | | | 47,747 | | | | 1,177,441 | |
Lakeland Bancorp, Inc. | | | 34,281 | | | | 347,952 | |
Lakeland Financial Corp. | | | 10,839 | | | | 496,209 | |
LegacyTexas Financial Group, Inc. | | | 33,352 | | | | 655,367 | |
Macatawa Bank Corp.(a) | | | 17,886 | | | | 111,788 | |
MainSource Financial Group, Inc. | | | 18,053 | | | | 380,738 | |
See Notes to Financial Statements.
| | |
| 60 | | WisdomTree Domestic Earnings and Dividend Funds |
Schedule of Investments (continued)
WisdomTree SmallCap Dividend Fund (DES)
March 31, 2016
| | | | | | | | |
| Investments | | Shares | | | Value | |
Mercantile Bank Corp. | | | 12,152 | | | $ | 272,448 | |
Merchants Bancshares, Inc.(a) | | | 6,999 | | | | 208,150 | |
MidSouth Bancorp, Inc. | | | 9,949 | | | | 75,911 | |
MidWestOne Financial Group, Inc.(a) | | | 7,752 | | | | 212,792 | |
MutualFirst Financial, Inc. | | | 4,712 | | | | 118,742 | |
National Bank Holdings Corp. Class A | | | 8,912 | | | | 181,716 | |
National Penn Bancshares, Inc.(a) | | | 161,223 | | | | 1,715,413 | |
NBT Bancorp, Inc. | | | 43,665 | | | | 1,176,772 | |
Northrim BanCorp, Inc. | | | 6,367 | | | | 152,235 | |
Old National Bancorp | | | 126,960 | | | | 1,547,642 | |
Opus Bank | | | 11,926 | | | | 405,484 | |
Pacific Continental Corp. | | | 17,705 | | | | 285,582 | |
Park National Corp.(a) | | | 19,551 | | | | 1,759,590 | |
Park Sterling Corp. | | | 24,458 | | | | 163,135 | |
Peapack Gladstone Financial Corp.(a) | | | 4,502 | | | | 76,084 | |
Penns Woods Bancorp, Inc.(a) | | | 6,224 | | | | 239,873 | |
Peoples Bancorp, Inc. | | | 18,177 | | | | 355,179 | |
Peoples Financial Services Corp. | | | 7,437 | | | | 276,656 | |
Pinnacle Financial Partners, Inc. | | | 12,036 | | | | 590,486 | |
Preferred Bank | | | 5,861 | | | | 177,295 | |
QCR Holdings, Inc. | | | 1,533 | | | | 36,562 | |
Renasant Corp. | | | 24,777 | | | | 815,411 | |
Republic Bancorp, Inc. Class A | | | 18,533 | | | | 478,707 | |
S&T Bancorp, Inc. | | | 27,138 | | | | 699,075 | |
Sandy Spring Bancorp, Inc. | | | 27,412 | | | | 762,876 | |
ServisFirst Bancshares, Inc. | | | 4,108 | | | | 182,395 | |
Shore Bancshares, Inc. | | | 2,850 | | | | 34,143 | |
Sierra Bancorp | | | 9,744 | | | | 176,854 | |
Simmons First National Corp. Class A | | | 16,678 | | | | 751,677 | |
South State Corp. | | | 11,083 | | | | 711,861 | |
Southern National Bancorp of Virginia, Inc. | | | 9,144 | | | | 108,997 | |
Southside Bancshares, Inc. | | | 29,840 | | | | 777,929 | |
Southwest Bancorp, Inc. | | | 8,560 | | | | 128,828 | |
Sterling Bancorp | | | 70,711 | | | | 1,126,426 | |
Stock Yards Bancorp, Inc. | | | 13,013 | | | | 501,391 | |
Stonegate Bank | | | 3,106 | | | | 93,056 | |
Suffolk Bancorp | | | 5,241 | | | | 132,283 | |
Tompkins Financial Corp. | | | 13,643 | | | | 873,152 | |
Towne Bank(a) | | | 36,580 | | | | 701,970 | |
Trico Bancshares | | | 14,102 | | | | 357,063 | |
Trustmark Corp. | | | 84,070 | | | | 1,936,132 | |
Union Bankshares Corp. | | | 42,624 | | | | 1,049,829 | |
United Community Banks, Inc. | | | 25,674 | | | | 474,199 | |
Univest Corp. of Pennsylvania | | | 24,217 | | | | 472,474 | |
Washington Trust Bancorp, Inc. | | | 18,949 | | | | 707,177 | |
WesBanco, Inc. | | | 37,011 | | | | 1,099,597 | |
West Bancorp, Inc. | | | 15,866 | | | | 289,237 | |
Westamerica Bancorp(a) | | | 27,822 | | | | 1,355,210 | |
Wilshire Bancorp, Inc. | | | 52,743 | | | | 543,253 | |
Wintrust Financial Corp. | | | 13,792 | | | | 611,537 | |
Yadkin Financial Corp. | | | 19,311 | | | | 457,091 | |
| | | | | | | | |
| Total Banks | | | | | | | 73,373,326 | |
| Beverages – 0.0% | | | | | | | | |
Coca-Cola Bottling Co. Consolidated | | | 3,232 | | | | 516,344 | |
MGP Ingredients, Inc. | | | 3,713 | | | | 90,003 | |
| | | | | | | | |
| Total Beverages | | | | | | | 606,347 | |
| Biotechnology – 0.5% | | | | | | | | |
PDL BioPharma, Inc. | | | 1,750,417 | | | | 5,828,889 | |
| Building Products – 0.8% | | | | | | | | |
AAON, Inc. | | | 44,192 | | | | 1,237,376 | |
Advanced Drainage Systems, Inc.(a) | | | 40,610 | | | | 864,993 | |
Apogee Enterprises, Inc. | | | 23,565 | | | | 1,034,268 | |
Griffon Corp. | | | 45,994 | | | | 710,607 | |
Insteel Industries, Inc.(a) | | | 9,715 | | | | 296,988 | |
Quanex Building Products Corp. | | | 26,288 | | | | 456,360 | |
Simpson Manufacturing Co., Inc. | | | 76,586 | | | | 2,923,288 | |
Universal Forest Products, Inc. | | | 20,014 | | | | 1,717,601 | |
| | | | | | | | |
| Total Building Products | | | | | | | 9,241,481 | |
| Capital Markets – 1.4% | | | | | | | | |
Arlington Asset Investment Corp. Class A(a) | | | 92,257 | | | | 1,155,980 | |
Artisan Partners Asset Management, Inc. Class A | | | 86,458 | | | | 2,666,365 | |
BGC Partners, Inc. Class A | | | 408,036 | | | | 3,692,726 | |
Calamos Asset Management, Inc. Class A | | | 41,912 | | | | 355,833 | |
Cohen & Steers, Inc.(a) | | | 47,826 | | | | 1,861,388 | |
Evercore Partners, Inc. Class A | | | 28,701 | | | | 1,485,277 | |
FBR & Co. | | | 8,538 | | | | 154,452 | |
Financial Engines, Inc. | | | 12,885 | | | | 404,976 | |
GAMCO Investors, Inc. Class A | | | 2,406 | | | | 89,166 | |
Greenhill & Co., Inc. | | | 64,645 | | | | 1,435,119 | |
Houlihan Lokey, Inc. | | | 9,650 | | | | 240,285 | |
Investment Technology Group, Inc. | | | 16,326 | | | | 360,805 | |
Manning & Napier, Inc. | | | 35,520 | | | | 286,646 | |
Moelis & Co. Class A | | | 27,687 | | | | 781,604 | |
Oppenheimer Holdings, Inc. Class A(a) | | | 11,375 | | | | 179,497 | |
Pzena Investment Management, Inc. Class A | | | 6,666 | | | | 50,328 | |
Silvercrest Asset Management Group, Inc. Class A | | | 9,086 | | | | 115,756 | |
Virtu Financial, Inc. Class A | | | 48,314 | | | | 1,068,222 | |
Virtus Investment Partners, Inc. | | | 3,798 | | | | 296,662 | |
Westwood Holdings Group, Inc. | | | 12,147 | | | | 712,422 | |
| | | | | | | | |
| Total Capital Markets | | | | | | | 17,393,509 | |
| Chemicals – 2.7% | | | | | | | | |
A. Schulman, Inc. | | | 68,987 | | | | 1,877,826 | |
Axiall Corp. | | | 242,805 | | | | 5,302,861 | |
Balchem Corp. | | | 12,686 | | | | 786,786 | |
Calgon Carbon Corp. | | | 52,147 | | | | 731,101 | |
Chase Corp. | | | 12,404 | | | | 652,326 | |
Chemours Co. (The) | | | 325,214 | | | | 2,276,498 | |
FutureFuel Corp. | | | 66,446 | | | | 783,398 | |
H.B. Fuller Co. | | | 61,802 | | | | 2,623,495 | |
Hawkins, Inc. | | | 18,748 | | | | 676,615 | |
Innophos Holdings, Inc. | | | 104,403 | | | | 3,227,097 | |
Innospec, Inc. | | | 22,882 | | | | 992,164 | |
KMG Chemicals, Inc. | | | 4,760 | | | | 109,813 | |
See Notes to Financial Statements.
| | | | |
| WisdomTree Domestic Earnings and Dividend Funds | | | 61 | |
Schedule of Investments (continued)
WisdomTree SmallCap Dividend Fund (DES)
March 31, 2016
| | | | | | | | |
| Investments | | Shares | | | Value | |
Kronos Worldwide, Inc.(a) | | | 1,072,892 | | | $ | 6,136,942 | |
Minerals Technologies, Inc. | | | 10,781 | | | | 612,900 | |
Quaker Chemical Corp. | | | 18,591 | | | | 1,577,632 | |
Rayonier Advanced Materials, Inc.(a) | | | 112,307 | | | | 1,066,917 | |
Stepan Co. | | | 28,776 | | | | 1,591,025 | |
Tredegar Corp. | | | 86,357 | | | | 1,357,532 | |
| | | | | | | | |
| Total Chemicals | | | | | | | 32,382,928 | |
| Commercial Services & Supplies – 5.8% | | | | | | | | |
ABM Industries, Inc. | | | 107,399 | | | | 3,470,062 | |
Brady Corp. Class A | | | 132,555 | | | | 3,557,776 | |
Brink’s Co. (The) | | | 55,589 | | | | 1,867,235 | |
CECO Environmental Corp. | | | 108,784 | | | | 675,549 | |
Covanta Holding Corp. | | | 792,567 | | | | 13,362,680 | |
Ennis, Inc. | | | 79,092 | | | | 1,546,249 | |
Essendant, Inc. | | | 54,709 | | | | 1,746,858 | |
G&K Services, Inc. Class A | | | 40,513 | | | | 2,967,577 | |
Herman Miller, Inc. | | | 101,468 | | | | 3,134,347 | |
HNI Corp. | | | 105,722 | | | | 4,141,131 | |
Interface, Inc. | | | 59,234 | | | | 1,098,198 | |
Kimball International, Inc. Class B | | | 67,490 | | | | 766,011 | |
Knoll, Inc. | | | 99,411 | | | | 2,152,248 | |
Matthews International Corp. Class A | | | 30,194 | | | | 1,554,085 | |
McGrath RentCorp | | | 79,454 | | | | 1,992,706 | |
Mobile Mini, Inc. | | | 91,276 | | | | 3,013,934 | |
MSA Safety, Inc. | | | 94,647 | | | | 4,576,182 | |
Multi-Color Corp. | | | 4,387 | | | | 234,046 | |
Quad/Graphics, Inc.(a) | | | 391,737 | | | | 5,069,077 | |
Steelcase, Inc. Class A | | | 186,993 | | | | 2,789,936 | |
Tetra Tech, Inc. | | | 60,440 | | | | 1,802,321 | |
U.S. Ecology, Inc. | | | 35,644 | | | | 1,574,039 | |
UniFirst Corp. | | | 1,982 | | | | 216,276 | |
Viad Corp. | | | 22,183 | | | | 646,856 | |
VSE Corp. | | | 3,271 | | | | 222,068 | |
West Corp. | | | 277,506 | | | | 6,332,687 | |
| | | | | | | | |
| Total Commercial Services & Supplies | | | | | | | 70,510,134 | |
| Communications Equipment – 0.8% | | | | | | | | |
ADTRAN, Inc. | | | 92,426 | | | | 1,868,854 | |
Alliance Fiber Optic Products, Inc.* | | | 14,740 | | | | 218,004 | |
Bel Fuse, Inc. Class B | | | 13,033 | | | | 190,282 | |
Black Box Corp. | | | 59,383 | | | | 799,889 | |
Comtech Telecommunications Corp. | | | 83,456 | | | | 1,950,367 | |
InterDigital, Inc. | | | 48,798 | | | | 2,715,609 | |
Plantronics, Inc. | | | 35,478 | | | | 1,390,383 | |
TESSCO Technologies, Inc. | | | 27,430 | | | | 456,709 | |
| | | | | | | | |
| Total Communications Equipment | | | | | | | 9,590,097 | |
| Construction & Engineering – 0.4% | | | | | | | | |
Argan, Inc. | | | 27,459 | | | | 965,458 | |
Comfort Systems USA, Inc. | | | 26,147 | | | | 830,690 | |
Granite Construction, Inc. | | | 42,691 | | | | 2,040,630 | |
Primoris Services Corp.(a) | | | 44,363 | | | | 1,078,021 | |
| | | | | | | | |
| Total Construction & Engineering | | | | | | | 4,914,799 | |
| Construction Materials – 0.0% | | | | | | | | |
United States Lime & Minerals, Inc.(a) | | | 4,194 | | | | 251,682 | |
| Consumer Finance – 0.1% | | | | | | | | |
Cash America International, Inc.(a) | | | 5,060 | | | | 195,519 | |
Nelnet, Inc. Class A | | | 15,898 | | | | 625,904 | |
| | | | | | | | |
| Total Consumer Finance | | | | | | | 821,423 | |
| Containers & Packaging – 0.4% | | | | | | | | |
Greif, Inc. Class A | | | 106,554 | | | | 3,489,643 | |
Myers Industries, Inc. | | | 97,179 | | | | 1,249,722 | |
| | | | | | | | |
| Total Containers & Packaging | | | | | | | 4,739,365 | |
| Distributors – 0.2% | | | | | | | | |
Core-Mark Holding Co., Inc. | | | 14,495 | | | | 1,182,212 | |
Weyco Group, Inc.(a) | | | 27,478 | | | | 731,465 | |
| | | | | | | | |
| Total Distributors | | | | | | | 1,913,677 | |
| Diversified Consumer Services – 0.4% | | | | | | | | |
Capella Education Co.(a) | | | 30,601 | | | | 1,610,837 | |
Carriage Services, Inc. | | | 6,696 | | | | 144,700 | |
Collectors Universe, Inc. | | | 68,840 | | | | 1,142,744 | |
DeVry Education Group, Inc.(a) | | | 82,018 | | | | 1,416,451 | |
Liberty Tax, Inc.(a) | | | 30,201 | | | | 591,638 | |
Universal Technical Institute, Inc. | | | 39,400 | | | | 169,814 | |
| | | | | | | | |
| Total Diversified Consumer Services | | | | | | | 5,076,184 | |
| Diversified Financial Services – 0.1% | | | | | | | | |
A-Mark Precious Metals, Inc. | | | 2,501 | | | | 49,770 | |
Gain Capital Holdings, Inc. | | | 42,968 | | | | 281,870 | |
Marlin Business Services Corp. | | | 14,527 | | | | 207,881 | |
Resource America, Inc. Class A(a) | | | 35,539 | | | | 205,060 | |
| | | | | | | | |
| Total Diversified Financial Services | | | | | | | 744,581 | |
| Diversified Telecommunication Services –2.1% | | | | | | | | |
Atlantic Tele-Network, Inc. | | | 22,594 | | | | 1,713,303 | |
Cogent Communications Holdings, Inc. | | | 163,964 | | | | 6,399,515 | |
Consolidated Communications Holdings, Inc. | | | 319,428 | | | | 8,228,465 | |
IDT Corp. Class B | | | 119,310 | | | | 1,860,043 | |
Inteliquent, Inc. | | | 94,578 | | | | 1,517,977 | |
Windstream Holdings, Inc.(a) | | | 847,700 | | | | 6,510,336 | |
| | | | | | | | |
| Total Diversified Telecommunication Services | | | | | | | 26,229,639 | |
| Electric Utilities – 2.9% | | | | | | | | |
ALLETE, Inc. | | | 172,218 | | | | 9,656,263 | |
El Paso Electric Co. | | | 112,330 | | | | 5,153,700 | |
Empire District Electric Co. (The)(a) | | | 156,984 | | | | 5,188,321 | |
MGE Energy, Inc. | | | 80,800 | | | | 4,221,800 | |
Otter Tail Corp.(a) | | | 154,743 | | | | 4,583,488 | |
PNM Resources, Inc. | | | 189,972 | | | | 6,405,856 | |
| | | | | | | | |
| Total Electric Utilities | | | | | | | 35,209,428 | |
| Electrical Equipment – 0.8% | | | | | | | | |
Allied Motion Technologies, Inc. | | | 3,827 | | | | 68,886 | |
AZZ, Inc. | | | 23,822 | | | | 1,348,325 | |
Encore Wire Corp. | | | 3,497 | | | | 136,138 | |
Franklin Electric Co., Inc. | | | 52,471 | | | | 1,687,992 | |
General Cable Corp. | | | 247,262 | | | | 3,019,069 | |
See Notes to Financial Statements.
| | |
| 62 | | WisdomTree Domestic Earnings and Dividend Funds |
Schedule of Investments (continued)
WisdomTree SmallCap Dividend Fund (DES)
March 31, 2016
| | | | | | | | |
| Investments | | Shares | | | Value | |
Hubbell, Inc. | | | 12,632 | | | $ | 1,338,108 | |
LSI Industries, Inc. | | | 31,367 | | | | 368,562 | |
Powell Industries, Inc. | | | 39,109 | | | | 1,165,840 | |
Preformed Line Products Co.(a) | | | 8,148 | | | | 297,565 | |
| | | | | | | | |
| Total Electrical Equipment | | | | | | | 9,430,485 | |
| Electronic Equipment, Instruments & Components – 1.9% | | | | | |
AVX Corp. | | | 483,005 | | | | 6,071,373 | |
Badger Meter, Inc. | | | 16,997 | | | | 1,130,471 | |
CTS Corp. | | | 25,842 | | | | 406,753 | |
Daktronics, Inc. | | | 167,005 | | | | 1,319,340 | |
Dolby Laboratories, Inc. Class A | | | 63,961 | | | | 2,779,745 | |
Electro Rent Corp. | | | 105,040 | | | | 972,670 | |
Electro Scientific Industries, Inc.* | | | 162,258 | | | | 1,160,145 | |
Littelfuse, Inc. | | | 20,439 | | | | 2,516,245 | |
Mesa Laboratories, Inc.(a) | | | 1,776 | | | | 171,118 | |
Methode Electronics, Inc. | | | 37,099 | | | | 1,084,775 | |
MTS Systems Corp. | | | 25,137 | | | | 1,529,586 | |
Park Electrochemical Corp. | | | 43,444 | | | | 695,538 | |
Vishay Intertechnology, Inc.(a) | | | 237,667 | | | | 2,901,914 | |
| | | | | | | | |
| Total Electronic Equipment, Instruments & Components | | | | 22,739,673 | |
| Energy Equipment & Services – 1.5% | | | | | | | | |
Archrock, Inc. | | | 465,517 | | | | 3,724,136 | |
Bristow Group, Inc. | | | 157,581 | | | | 2,981,432 | |
Gulf Island Fabrication, Inc. | | | 54,633 | | | | 428,869 | |
Patterson-UTI Energy, Inc. | | | 336,429 | | | | 5,927,879 | |
Superior Energy Services, Inc. | | | 302,871 | | | | 4,055,443 | |
U.S. Silica Holdings, Inc.(a) | | | 57,871 | | | | 1,314,829 | |
| | | | | | | | |
| Total Energy Equipment & Services | | | | | | | 18,432,588 | |
| Food & Staples Retailing – 0.7% | | | | | | | | |
Andersons, Inc. (The) | | | 46,282 | | | | 1,453,718 | |
Ingles Markets, Inc. Class A | | | 16,339 | | | | 612,713 | |
SpartanNash Co. | | | 78,069 | | | | 2,366,271 | |
Village Super Market, Inc. Class A | | | 32,665 | | | | 789,186 | |
Weis Markets, Inc. | | | 66,445 | | | | 2,994,012 | |
| | | | | | | | |
| Total Food & Staples Retailing | | | | | | | 8,215,900 | |
| Food Products – 2.7% | | | | | | | | |
Alico, Inc. | | | 3,972 | | | | 109,667 | |
B&G Foods, Inc. | | | 199,722 | | | | 6,952,323 | |
Cal-Maine Foods, Inc.(a) | | | 313,123 | | | | 16,254,215 | |
Calavo Growers, Inc. | | | 22,749 | | | | 1,298,058 | |
Dean Foods Co. | | | 126,315 | | | | 2,187,776 | |
J&J Snack Foods Corp. | | | 20,037 | | | | 2,169,606 | |
Limoneira Co.(a) | | | 13,345 | | | | 202,844 | |
Sanderson Farms, Inc.(a) | | | 22,415 | | | | 2,021,384 | |
Tootsie Roll Industries, Inc.(a) | | | 38,505 | | | | 1,345,375 | |
| | | | | | | | |
| Total Food Products | | | | | | | 32,541,248 | |
| Gas Utilities – 2.5% | | | | | | | | |
Chesapeake Utilities Corp. | | | 28,835 | | | | 1,815,740 | |
Laclede Group, Inc. (The) | | | 129,258 | | | | 8,757,230 | |
Northwest Natural Gas Co. | | | 90,664 | | | | 4,882,256 | |
ONE Gas, Inc. | | | 113,370 | | | | 6,926,907 | |
South Jersey Industries, Inc. | | | 290,261 | | | | 8,257,925 | |
| | | | | | | | |
| Total Gas Utilities | | | | | | | 30,640,058 | |
| Health Care Equipment & Supplies – 0.6% | | | | | | | | |
Abaxis, Inc. | | | 16,606 | | | | 753,746 | |
Analogic Corp. | | | 4,949 | | | | 391,021 | |
Atrion Corp. | | | 1,436 | | | | 567,737 | |
CONMED Corp. | | | 45,846 | | | | 1,922,781 | |
CryoLife, Inc. | | | 27,384 | | | | 294,378 | |
Invacare Corp.(a) | | | 7,095 | | | | 93,441 | |
LeMaitre Vascular, Inc.(a) | | | 15,035 | | | | 233,343 | |
Meridian Bioscience, Inc. | | | 143,898 | | | | 2,965,738 | |
Utah Medical Products, Inc. | | | 6,161 | | | | 385,309 | |
| | | | | | | | |
| Total Health Care Equipment & Supplies | | | | | | | 7,607,494 | |
| Health Care Providers & Services – 1.2% | | | | | | | | |
Aceto Corp. | | | 23,632 | | | | 556,770 | |
Digirad Corp. | | | 56,754 | | | | 281,500 | |
Ensign Group, Inc. (The) | | | 26,858 | | | | 608,065 | |
Kindred Healthcare, Inc. | | | 271,030 | | | | 3,347,221 | |
Landauer, Inc. | | | 23,908 | | | | 790,638 | |
National Healthcare Corp.(a) | | | 31,553 | | | | 1,965,752 | |
National Research Corp. Class A(a) | | | 24,888 | | | | 387,008 | |
Owens & Minor, Inc. | | | 151,612 | | | | 6,128,157 | |
U.S. Physical Therapy, Inc. | | | 12,702 | | | | 631,670 | |
| | | | | | | | |
| Total Health Care Providers & Services | | | | | | | 14,696,781 | |
| Health Care Technology – 0.2% | | | | | | | | |
Computer Programs & Systems, Inc.(a) | | | 53,733 | | | | 2,800,564 | |
| Hotels, Restaurants & Leisure – 3.7% | | | | | | | | |
Bloomin’ Brands, Inc. | | | 147,903 | | | | 2,495,124 | |
Bob Evans Farms, Inc. | | | 63,950 | | | | 2,985,826 | |
Cheesecake Factory, Inc. (The) | | | 72,374 | | | | 3,842,336 | |
ClubCorp Holdings, Inc. | | | 164,501 | | | | 2,309,594 | |
DineEquity, Inc. | | | 68,843 | | | | 6,432,001 | |
International Speedway Corp. Class A | | | 16,788 | | | | 619,645 | |
Interval Leisure Group, Inc.(a) | | | 148,991 | | | | 2,151,430 | |
Marcus Corp. (The) | | | 35,824 | | | | 678,865 | |
Marriott Vacations Worldwide Corp. | | | 43,916 | | | | 2,964,330 | |
Papa John’s International, Inc. | | | 40,771 | | | | 2,209,380 | |
Peak Resorts, Inc.(a) | | | 67,604 | | | | 229,854 | |
Ruth’s Hospitality Group, Inc. | | | 43,733 | | | | 805,125 | |
SeaWorld Entertainment, Inc.(a) | | | 359,522 | | | | 7,571,533 | |
Sonic Corp. | | | 61,609 | | | | 2,166,172 | |
Speedway Motorsports, Inc. | | | 104,874 | | | | 2,079,651 | |
Texas Roadhouse, Inc. | | | 117,594 | | | | 5,124,747 | |
| | | | | | | | |
| Total Hotels, Restaurants & Leisure | | | | | | | 44,665,613 | |
| Household Durables – 1.0% | | | | | | | | |
Bassett Furniture Industries, Inc. | | | 13,009 | | | | 414,467 | |
CSS Industries, Inc. | | | 20,275 | | | | 566,281 | |
Ethan Allen Interiors, Inc. | | | 50,947 | | | | 1,621,133 | |
Flexsteel Industries, Inc. | | | 10,673 | | | | 466,197 | |
Hooker Furniture Corp.(a) | | | 15,230 | | | | 500,305 | |
KB Home(a) | | | 61,449 | | | | 877,492 | |
La-Z-Boy, Inc. | | | 68,680 | | | | 1,836,503 | |
See Notes to Financial Statements.
| | | | |
| WisdomTree Domestic Earnings and Dividend Funds | | | 63 | |
Schedule of Investments (continued)
WisdomTree SmallCap Dividend Fund (DES)
March 31, 2016
| | | | | | | | |
| Investments | | Shares | | | Value | |
Lennar Corp. Class B | | | 11,247 | | | $ | 435,371 | |
Libbey, Inc. | | | 35,171 | | | | 654,180 | |
Lifetime Brands, Inc. | | | 15,087 | | | | 227,361 | |
MDC Holdings, Inc. | | | 166,577 | | | | 4,174,420 | |
NACCO Industries, Inc. Class A | | | 11,365 | | | | 652,465 | |
| | | | | | | | |
| Total Household Durables | | | | | | | 12,426,175 | |
| Household Products – 0.8% | | | | | | | | |
Energizer Holdings, Inc. | | | 155,317 | | | | 6,291,892 | |
Oil-Dri Corp. of America | | | 10,676 | | | | 360,635 | |
Orchids Paper Products Co.(a) | | | 43,571 | | | | 1,198,638 | |
WD-40 Co. | | | 19,006 | | | | 2,052,838 | |
| | | | | | | | |
| Total Household Products | | | | | | | 9,904,003 | |
Independent Power & Renewable Electricity
Producers – 1.8% | | | | | |
NRG Yield, Inc. Class A(a) | | | 213,783 | | | | 2,901,035 | |
NRG Yield, Inc. Class C(a) | | | 371,673 | | | | 5,292,624 | |
Ormat Technologies, Inc. | | | 29,500 | | | | 1,216,580 | |
Pattern Energy Group, Inc.(a) | | | 496,084 | | | | 9,460,322 | |
TerraForm Global, Inc. Class A*(a) | | | 1,061,803 | | | | 2,527,091 | |
| | | | | | | | |
| Total Independent Power & Renewable Electricity Producers | | | | | | | 21,397,652 | |
| Industrial Conglomerates – 0.1% | | | | | | | | |
Raven Industries, Inc. | | | 101,161 | | | | 1,620,599 | |
| Insurance – 1.2% | | | | | | | | |
American Equity Investment Life Holding Co. | | | 22,815 | | | | 383,292 | |
AMERISAFE, Inc. | | | 7,533 | | | | 395,784 | |
Baldwin & Lyons, Inc. Class B | | | 15,878 | | | | 390,758 | |
Crawford & Co. Class A | | | 50,045 | | | | 301,271 | |
Crawford & Co. Class B(a) | | | 22,135 | | | | 143,435 | |
Donegal Group, Inc. Class A | | | 27,378 | | | | 393,696 | |
EMC Insurance Group, Inc. | | | 20,003 | | | | 513,077 | |
Employers Holdings, Inc. | | | 8,876 | | | | 249,771 | |
FBL Financial Group, Inc. Class A | | | 19,840 | | | | 1,220,557 | |
Federated National Holding Co. | | | 3,548 | | | | 69,754 | |
Fidelity & Guaranty Life | | | 19,207 | | | | 503,992 | |
HCI Group, Inc. | | | 11,631 | | | | 387,312 | |
Horace Mann Educators Corp. | | | 38,605 | | | | 1,223,392 | |
Independence Holding Co.(a) | | | 4,385 | | | | 69,809 | |
Infinity Property & Casualty Corp. | | | 7,497 | | | | 603,508 | |
Investors Title Co. | | | 431 | | | | 39,251 | |
Kemper Corp. | | | 39,198 | | | | 1,159,085 | |
National General Holdings Corp. | | | 18,151 | | | | 391,880 | |
National Interstate Corp. | | | 12,094 | | | | 361,852 | |
National Western Life Group, Inc. Class A(a) | | | 147 | | | | 33,903 | |
Primerica, Inc.(a) | | | 19,846 | | | | 883,742 | |
Safety Insurance Group, Inc. | | | 25,147 | | | | 1,434,888 | |
Selective Insurance Group, Inc. | | | 32,602 | | | | 1,193,559 | |
State Auto Financial Corp. | | | 24,314 | | | | 536,367 | |
State National Cos., Inc.(a) | | | 35,358 | | | | 445,511 | |
Stewart Information Services Corp. | | | 2,363 | | | | 85,730 | |
United Fire Group, Inc. | | | 18,387 | | | | 805,718 | |
Universal Insurance Holdings, Inc.(a) | | | 23,523 | | | | 418,709 | |
| | | | | | | | |
| Total Insurance | | | | | | | 14,639,603 | |
| Internet & Catalog Retail – 0.2% | | | | | | | | |
Nutrisystem, Inc. | | | 81,060 | | | | 1,691,722 | |
PetMed Express, Inc.(a) | | | 74,443 | | | | 1,333,274 | |
| | | | | | | | |
| Total Internet & Catalog Retail | | | | | | | 3,024,996 | |
| Internet Software & Services – 0.2% | | | | | | | | |
EarthLink Holdings Corp. | | | 243,397 | | | | 1,380,061 | |
Marchex, Inc. Class B | | | 58,505 | | | | 260,347 | |
Reis, Inc. | | | 22,321 | | | | 525,660 | |
| | | | | | | | |
| Total Internet Software & Services | | | | | | | 2,166,068 | |
| IT Services – 1.4% | | | | | | | | |
Cass Information Systems, Inc. | | | 17,073 | | | | 893,771 | |
Computer Task Group, Inc. | | | 61,326 | | | | 313,376 | |
Convergys Corp. | | | 108,262 | | | | 3,006,436 | |
CSG Systems International, Inc. | | | 56,744 | | | | 2,562,559 | |
Forrester Research, Inc. | | | 34,566 | | | | 1,161,763 | |
Hackett Group, Inc. (The) | | | 28,831 | | | | 435,925 | |
ManTech International Corp. Class A | | | 55,386 | | | | 1,771,798 | |
Science Applications International Corp. | | | 103,165 | | | | 5,502,821 | |
TeleTech Holdings, Inc. | | | 53,193 | | | | 1,476,638 | |
| | | | | | | | |
| Total IT Services | | | | | | | 17,125,087 | |
| Leisure Products – 0.2% | | | | | | | | |
Callaway Golf Co. | | | 30,111 | | | | 274,612 | |
Escalade, Inc.(a) | | | 39,864 | | | | 469,199 | |
Johnson Outdoors, Inc. Class A | | | 10,769 | | | | 239,287 | |
Sturm Ruger & Co., Inc.(a) | | | 26,799 | | | | 1,832,516 | |
| | | | | | | | |
| Total Leisure Products | | | | | | | 2,815,614 | |
| Machinery – 4.6% | | | | | | | | |
Actuant Corp. Class A | | | 9,625 | | | | 237,834 | |
Alamo Group, Inc. | | | 5,770 | | | | 321,447 | |
Albany International Corp. Class A | | | 45,050 | | | | 1,693,430 | |
Altra Industrial Motion Corp. | | | 50,744 | | | | 1,409,668 | |
American Railcar Industries, Inc.(a) | | | 55,616 | | | | 2,265,240 | |
Astec Industries, Inc. | | | 19,869 | | | | 927,286 | |
Barnes Group, Inc. | | | 63,054 | | | | 2,208,782 | |
Briggs & Stratton Corp. | | | 112,271 | | | | 2,685,522 | |
CIRCOR International, Inc. | | | 4,507 | | | | 209,080 | |
Columbus McKinnon Corp. | | | 13,816 | | | | 217,740 | |
Douglas Dynamics, Inc. | | | 76,050 | | | | 1,742,306 | |
Dynamic Materials Corp.(a) | | | 27,367 | | | | 177,338 | |
Eastern Co. (The) | | | 13,240 | | | | 217,401 | |
EnPro Industries, Inc. | | | 32,802 | | | | 1,892,019 | |
ESCO Technologies, Inc. | | | 18,630 | | | | 726,197 | |
Federal Signal Corp. | | | 94,691 | | | | 1,255,603 | |
FreightCar America, Inc. | | | 17,249 | | | | 268,739 | |
Global Brass & Copper Holdings, Inc. | | | 12,394 | | | | 309,230 | |
Gorman-Rupp Co. (The)(a) | | | 33,658 | | | | 872,752 | |
Graham Corp. | | | 15,492 | | | | 308,446 | |
Greenbrier Cos., Inc. (The)(a) | | | 66,622 | | | | 1,841,432 | |
Hardinge, Inc. | | | 11,328 | | | | 141,260 | |
Hillenbrand, Inc. | | | 147,608 | | | | 4,420,860 | |
Hurco Cos., Inc. | | | 6,692 | | | | 220,769 | |
Hyster-Yale Materials Handling, Inc. | | | 22,974 | | | | 1,530,068 | |
See Notes to Financial Statements.
| | |
| 64 | | WisdomTree Domestic Earnings and Dividend Funds |
Schedule of Investments (continued)
WisdomTree SmallCap Dividend Fund (DES)
March 31, 2016
| | | | | | | | |
| Investments | | Shares | | | Value | |
John Bean Technologies Corp. | | | 18,908 | | | $ | 1,066,600 | |
Joy Global, Inc.(a) | | | 560,187 | | | | 9,002,205 | |
Kadant, Inc. | | | 15,457 | | | | 698,038 | |
Kennametal, Inc.(a) | | | 211,268 | | | | 4,751,417 | |
L.B. Foster Co. Class A | | | 12,093 | | | | 219,609 | |
Lindsay Corp.(a) | | | 16,001 | | | | 1,145,832 | |
Manitowoc Co., Inc. (The)(a) | | | 62,200 | | | | 269,326 | |
Miller Industries, Inc. | | | 29,435 | | | | 596,942 | |
Mueller Industries, Inc. | | | 52,626 | | | | 1,548,257 | |
Mueller Water Products, Inc. Class A | | | 126,400 | | | | 1,248,832 | |
NN, Inc.(a) | | | 40,417 | | | | 552,905 | |
Standex International Corp. | | | 7,472 | | | | 581,396 | |
Sun Hydraulics Corp. | | | 25,958 | | | | 861,546 | |
Supreme Industries, Inc. Class A | | | 19,413 | | | | 171,611 | |
Tennant Co. | | | 20,927 | | | | 1,077,322 | |
Terex Corp. | | | 116,321 | | | | 2,894,066 | |
Titan International, Inc.(a) | | | 21,829 | | | | 117,440 | |
Watts Water Technologies, Inc. Class A | | | 30,364 | | | | 1,673,967 | |
| | | | | | | | |
| Total Machinery | | | | | | | 56,577,760 | |
| Marine – 0.2% | | | | | | | | |
Matson, Inc. | | | 60,251 | | | | 2,420,283 | |
| Media – 4.9% | | | | | | | | |
A.H. Belo Corp. Class A | | | 96,436 | | | | 463,857 | |
AMC Entertainment Holdings, Inc. Class A | | | 63,231 | | | | 1,769,836 | |
Entravision Communications Corp. Class A | | | 68,237 | | | | 507,683 | |
Gannett Co., Inc.(a) | | | 365,933 | | | | 5,540,226 | |
Harte-Hanks, Inc. | | | 532,779 | | | | 1,347,931 | |
John Wiley & Sons, Inc. Class A | | | 110,289 | | | | 5,392,029 | |
Journal Media Group, Inc. | | | 41,592 | | | | 497,440 | |
Meredith Corp. | | | 130,741 | | | | 6,210,197 | |
National CineMedia, Inc. | | | 303,346 | | | | 4,613,893 | |
New Media Investment Group, Inc. | | | 266,905 | | | | 4,441,299 | |
New York Times Co. (The) Class A | | | 165,711 | | | | 2,064,759 | |
Nexstar Broadcasting Group, Inc. Class A(a) | | | 35,069 | | | | 1,552,505 | |
Regal Entertainment Group Class A(a) | | | 539,122 | | | | 11,397,039 | |
Saga Communications, Inc. Class A(a) | | | 9,178 | | | | 367,671 | |
Salem Media Group, Inc. Class A | | | 60,576 | | | | 348,918 | |
Scholastic Corp. | | | 39,982 | | | | 1,494,127 | |
Sinclair Broadcast Group, Inc. Class A | | | 120,030 | | | | 3,690,923 | |
Time, Inc. | | | 446,139 | | | | 6,888,386 | |
World Wrestling Entertainment, Inc. Class A(a) | | | 88,077 | | | | 1,555,440 | |
| | | | | | | | |
| Total Media | | | | | | | 60,144,159 | |
| Metals & Mining – 3.5% | | | | | | | | |
Allegheny Technologies, Inc.(a) | | | 515,557 | | | | 8,403,579 | |
Ampco-Pittsburgh Corp. | | | 54,527 | | | | 758,471 | |
Carpenter Technology Corp. | | | 94,689 | | | | 3,241,204 | |
Commercial Metals Co. | | | 331,174 | | | | 5,620,023 | |
Gold Resource Corp.(a) | | | 258,661 | | | | 602,680 | |
Haynes International, Inc. | | | 27,457 | | | | 1,002,180 | |
Hecla Mining Co.(a) | | | 165,577 | | | | 460,304 | |
Kaiser Aluminum Corp. | | | 29,218 | | | | 2,470,090 | |
Materion Corp. | | | 22,566 | | | | 597,548 | |
Olympic Steel, Inc. | | | 8,546 | | | | 147,931 | |
Royal Gold, Inc. | | | 134,871 | | | | 6,917,534 | |
Schnitzer Steel Industries, Inc. Class A | | | 111,831 | | | | 2,062,164 | |
United States Steel Corp.(a) | | | 300,215 | | | | 4,818,451 | |
Worthington Industries, Inc. | | | 149,818 | | | | 5,339,513 | |
| | | | | | | | |
| Total Metals & Mining | | | | | | | 42,441,672 | |
| Multi-Utilities – 1.7% | | | | | | | | |
Avista Corp. | | | 208,610 | | | | 8,507,116 | |
Black Hills Corp.(a) | | | 169,806 | | | | 10,210,434 | |
Unitil Corp. | | | 48,920 | | | | 2,078,611 | |
| | | | | | | | |
| Total Multi-Utilities | | | | | | | 20,796,161 | |
| Multiline Retail – 0.4% | | | | | | | | |
Big Lots, Inc. | | | 82,993 | | | | 3,758,753 | |
Fred’s, Inc. Class A(a) | | | 48,826 | | | | 727,996 | |
| | | | | | | | |
| Total Multiline Retail | | | | | | | 4,486,749 | |
| Oil, Gas & Consumable Fuels – 2.5% | | | | | | | | |
Adams Resources & Energy, Inc.(a) | | | 8,022 | | | | 320,719 | |
Alon USA Energy, Inc. | | | 230,053 | | | | 2,374,147 | |
Delek U.S. Holdings, Inc. | | | 126,533 | | | | 1,928,363 | |
Evolution Petroleum Corp.(a) | | | 102,967 | | | | 500,420 | |
Green Plains, Inc. | | | 73,331 | | | | 1,170,363 | |
Panhandle Oil and Gas, Inc. Class A | | | 14,724 | | | | 254,872 | |
SemGroup Corp. Class A | | | 250,751 | | | | 5,616,822 | |
SM Energy Co.(a) | | | 26,163 | | | | 490,295 | |
Targa Resources Corp. | | | 608,394 | | | | 18,166,645 | |
| | | | | | | | |
| Total Oil, Gas & Consumable Fuels | | | | | | | 30,822,646 | |
| Paper & Forest Products – 0.8% | | | | | | | | |
Deltic Timber Corp.(a) | | | 7,132 | | | | 428,990 | |
KapStone Paper and Packaging Corp. | | | 138,899 | | | | 1,923,751 | |
Neenah Paper, Inc. | | | 30,322 | | | | 1,930,298 | |
PH Glatfelter Co. | | | 105,168 | | | | 2,180,133 | |
Schweitzer-Mauduit International, Inc. | | | 102,052 | | | | 3,212,597 | |
| | | | | | | | |
| Total Paper & Forest Products | | | | | | | 9,675,769 | |
| Personal Products – 0.9% | | | | | | | | |
Coty, Inc. Class A(a) | | | 67,419 | | | | 1,876,271 | |
Inter Parfums, Inc. | | | 55,427 | | | | 1,712,694 | |
Nu Skin Enterprises, Inc. Class A(a) | | | 192,613 | | | | 7,367,447 | |
| | | | | | | | |
| Total Personal Products | | | | | | | 10,956,412 | |
| Pharmaceuticals – 1.1% | | | | | | | | |
Innoviva, Inc.(a) | | | 1,052,788 | | | | 13,254,601 | |
Phibro Animal Health Corp. Class A | | | 19,377 | | | | 523,954 | |
| | | | | | | | |
| Total Pharmaceuticals | | | | | | | 13,778,555 | |
| Professional Services – 1.1% | | | | | | | | |
Barrett Business Services, Inc. | | | 12,687 | | | | 364,751 | |
CEB, Inc. | | | 65,933 | | | | 4,267,843 | |
Exponent, Inc. | | | 25,835 | | | | 1,317,843 | |
Heidrick & Struggles International, Inc. | | | 29,006 | | | | 687,442 | |
Insperity, Inc. | | | 39,134 | | | | 2,024,402 | |
Kelly Services, Inc. Class A | | | 38,381 | | | | 733,845 | |
Kforce, Inc. | | | 48,986 | | | | 959,146 | |
See Notes to Financial Statements.
| | | | |
| WisdomTree Domestic Earnings and Dividend Funds | | | 65 | |
Schedule of Investments (continued)
WisdomTree SmallCap Dividend Fund (DES)
March 31, 2016
| | | | | | | | |
| Investments | | Shares | | | Value | |
Korn/Ferry International | | | 49,049 | | | $ | 1,387,596 | |
Resources Connection, Inc. | | | 74,760 | | | | 1,163,266 | |
| | | | | | | | |
| Total Professional Services | | | | | | | 12,906,134 | |
| Real Estate Investment Trusts (REITs) – 14.5% | | | | | |
Acadia Realty Trust | | | 66,433 | | | | 2,333,791 | |
Agree Realty Corp. | | | 33,623 | | | | 1,293,477 | |
Alexander’s, Inc. | | | 5,888 | | | | 2,240,678 | |
American Assets Trust, Inc. | | | 37,428 | | | | 1,494,126 | |
Armada Hoffler Properties, Inc. | | | 54,150 | | | | 609,187 | |
Ashford Hospitality Prime, Inc.(a) | | | 25,644 | | | | 299,265 | |
Ashford Hospitality Trust, Inc. | | | 236,286 | | | | 1,507,505 | |
Bluerock Residential Growth REIT, Inc.(a) | | | 64,591 | | | | 702,750 | |
Brandywine Realty Trust | | | 257,002 | | | | 3,605,738 | |
CareTrust REIT, Inc. | | | 88,701 | | | | 1,126,503 | |
CatchMark Timber Trust, Inc. Class A | | | 56,793 | | | | 615,068 | |
CBL & Associates Properties, Inc. | | | 455,490 | | | | 5,420,331 | |
Cedar Realty Trust, Inc. | | | 77,257 | | | | 558,568 | |
Chatham Lodging Trust | | | 69,099 | | | | 1,480,791 | |
Chesapeake Lodging Trust | | | 115,364 | | | | 3,052,531 | |
Colony Starwood Homes | | | 41,344 | | | | 1,023,264 | |
Community Healthcare Trust, Inc. | | | 18,873 | | | | 348,962 | |
CorEnergy Infrastructure Trust, Inc.(a) | | | 66,581 | | | | 1,338,944 | |
CoreSite Realty Corp. | | | 28,711 | | | | 2,010,057 | |
Corporate Office Properties Trust | | | 149,722 | | | | 3,928,705 | |
Cousins Properties, Inc. | | | 239,984 | | | | 2,491,034 | |
CyrusOne, Inc. | | | 73,443 | | | | 3,352,673 | |
DiamondRock Hospitality Co. | | | 301,926 | | | | 3,055,491 | |
DuPont Fabros Technology, Inc. | | | 110,002 | | | | 4,458,381 | |
Easterly Government Properties, Inc. | | | 36,395 | | | | 674,035 | |
EastGroup Properties, Inc. | | | 44,586 | | | | 2,691,657 | |
Education Realty Trust, Inc. | | | 72,823 | | | | 3,029,437 | |
Empire State Realty Trust, Inc. Class A | | | 71,566 | | | | 1,254,552 | |
FelCor Lodging Trust, Inc. | | | 102,189 | | | | 829,775 | |
First Industrial Realty Trust, Inc. | | | 81,367 | | | | 1,850,286 | |
First Potomac Realty Trust | | | 97,960 | | | | 887,518 | |
Franklin Street Properties Corp. | | | 246,223 | | | | 2,612,426 | |
Geo Group, Inc. (The) | | | 216,022 | | | | 7,489,483 | |
Getty Realty Corp. | | | 61,226 | | | | 1,214,112 | |
Gladstone Commercial Corp. | | | 74,225 | | | | 1,215,805 | |
Global Net Lease, Inc.(a) | | | 431,075 | | | | 3,690,002 | |
Government Properties Income Trust(a) | | | 242,962 | | | | 4,336,872 | |
Gramercy Property Trust(a) | | | 273,411 | | | | 2,310,323 | |
Hersha Hospitality Trust | | | 72,637 | | | | 1,550,074 | |
Independence Realty Trust, Inc. | | | 147,256 | | | | 1,048,463 | |
InfraREIT, Inc. | | | 62,247 | | | | 1,061,311 | |
Investors Real Estate Trust(a) | | | 284,138 | | | | 2,062,842 | |
Kite Realty Group Trust | | | 110,915 | | | | 3,073,455 | |
Lexington Realty Trust(a) | | | 619,371 | | | | 5,326,591 | |
LTC Properties, Inc. | | | 57,212 | | | | 2,588,271 | |
Mack-Cali Realty Corp. | | | 76,725 | | | | 1,803,037 | |
Monmouth Real Estate Investment Corp. Class A(a) | | | 124,313 | | | | 1,478,082 | |
Monogram Residential Trust, Inc.(a) | | | 163,222 | | | | 1,609,369 | |
National Health Investors, Inc. | | | 66,969 | | | | 4,454,778 | |
National Storage Affiliates Trust | | | 35,885 | | | | 760,762 | |
New Senior Investment Group, Inc.(a) | | | 306,345 | | | | 3,155,353 | |
New York REIT, Inc.(a) | | | 203,541 | | | | 2,055,764 | |
NexPoint Residential Trust, Inc. | | | 45,525 | | | | 595,922 | |
One Liberty Properties, Inc.(a) | | | 37,546 | | | | 841,406 | |
Parkway Properties, Inc.(a) | | | 166,128 | | | | 2,601,564 | |
Pebblebrook Hotel Trust | | | 96,272 | | | | 2,798,627 | |
Pennsylvania Real Estate Investment Trust(a) | | | 88,114 | | | | 1,925,291 | |
Physicians Realty Trust | | | 155,746 | | | | 2,893,761 | |
Potlatch Corp. | | | 62,515 | | | | 1,969,222 | |
Preferred Apartment Communities, Inc. Class A(a) | | | 46,179 | | | | 585,550 | |
PS Business Parks, Inc. | | | 23,766 | | | | 2,388,721 | |
QTS Realty Trust, Inc. Class A | | | 39,786 | | | | 1,885,061 | |
Ramco-Gershenson Properties Trust | | | 128,055 | | | | 2,308,832 | |
Retail Opportunity Investments Corp. | | | 119,694 | | | | 2,408,243 | |
Rexford Industrial Realty, Inc.(a) | | | 59,128 | | | | 1,073,764 | |
Rouse Properties, Inc.(a) | | | 91,143 | | | | 1,675,208 | |
Sabra Health Care REIT, Inc. | | | 167,263 | | | | 3,360,314 | |
Saul Centers, Inc. | | | 21,531 | | | | 1,141,574 | |
Select Income REIT | | | 290,642 | | | | 6,699,298 | |
Silver Bay Realty Trust Corp. | | | 35,975 | | | | 534,229 | |
STAG Industrial, Inc. | | | 160,661 | | | | 3,271,058 | |
Summit Hotel Properties, Inc. | | | 106,048 | | | | 1,269,394 | |
Terreno Realty Corp. | | | 44,326 | | | | 1,039,445 | |
Tier REIT, Inc.(a) | | | 71,837 | | | | 965,489 | |
UMH Properties, Inc. | | | 64,952 | | | | 644,324 | |
Universal Health Realty Income Trust | | | 20,891 | | | | 1,175,119 | |
Urban Edge Properties | | | 110,261 | | | | 2,849,144 | |
Urstadt Biddle Properties, Inc. Class A | | | 41,988 | | | | 879,649 | |
Washington Real Estate Investment Trust | | | 94,306 | | | | 2,754,678 | |
Whitestone REIT(a) | | | 84,881 | | | | 1,066,954 | |
WP GLIMCHER, Inc. | | | 554,784 | | | | 5,264,900 | |
Xenia Hotels & Resorts, Inc.(a) | | | 205,531 | | | | 3,210,394 | |
| | | | | | | | |
| Total Real Estate Investment Trusts (REITs) | | | | 176,539,390 | |
| Real Estate Management & Development – 0.1% | | | | | |
Alexander & Baldwin, Inc. | | | 10,720 | | | | 393,210 | |
Consolidated-Tomoka Land Co. | | | 411 | | | | 18,963 | |
Farmland Partners, Inc. | | | 17,223 | | | | 184,803 | |
Griffin Industrial Realty, Inc. | | | 2,210 | | | | 54,278 | |
RE/MAX Holdings, Inc. Class A | | | 6,624 | | | | 227,203 | |
| | | | | | | | |
| Total Real Estate Management & Development | | | | | | | 878,457 | |
| Road & Rail – 0.5% | | | | | | | | |
ArcBest Corp. | | | 33,369 | | | | 720,437 | |
Celadon Group, Inc. | | | 17,389 | | | | 182,237 | |
Heartland Express, Inc.(a) | | | 34,081 | | | | 632,203 | |
Knight Transportation, Inc. | | | 68,244 | | | | 1,784,581 | |
Marten Transport Ltd. | | | 17,670 | | | | 330,782 | |
Universal Truckload Services, Inc.(a) | | | 50,754 | | | | 835,918 | |
Werner Enterprises, Inc. | | | 59,220 | | | | 1,608,415 | |
| | | | | | | | |
| Total Road & Rail | | | | | | | 6,094,573 | |
| Semiconductors & Semiconductor Equipment – 1.3% | | | | | |
Brooks Automation, Inc. | | | 204,282 | | | | 2,124,533 | |
Cohu, Inc. | | | 42,130 | | | | 500,504 | |
See Notes to Financial Statements.
| | |
| 66 | | WisdomTree Domestic Earnings and Dividend Funds |
Schedule of Investments (continued)
WisdomTree SmallCap Dividend Fund (DES)
March 31, 2016
| | | | | | | | |
| Investments | | Shares | | | Value | |
Intersil Corp. Class A | | | 407,635 | | | $ | 5,450,080 | |
IXYS Corp. | | | 35,133 | | | | 394,192 | |
MKS Instruments, Inc. | | | 85,191 | | | | 3,207,441 | |
Power Integrations, Inc. | | | 23,860 | | | | 1,184,888 | |
Tessera Technologies, Inc. | | | 107,868 | | | | 3,343,908 | |
| | | | | | | | |
| Total Semiconductors & Semiconductor Equipment | | | | 16,205,546 | |
| Software – 0.6% | | | | | | | | |
American Software, Inc. Class A | | | 85,286 | | | | 767,574 | |
Ebix, Inc.(a) | | | 26,649 | | | | 1,087,013 | |
Epiq Systems, Inc. | | | 78,841 | | | | 1,184,192 | |
Mentor Graphics Corp. | | | 125,994 | | | | 2,561,458 | |
Monotype Imaging Holdings, Inc. | | | 53,729 | | | | 1,285,198 | |
Pegasystems, Inc. | | | 28,119 | | | | 713,660 | |
QAD, Inc. Class A | | | 17,420 | | | | 370,175 | |
| | | | | | | | |
| Total Software | | | | | | | 7,969,270 | |
| Specialty Retail – 5.4% | | | | | | | | |
Aaron’s, Inc. | | | 27,485 | | | | 689,873 | |
Abercrombie & Fitch Co. Class A | | | 173,841 | | | | 5,482,945 | |
Barnes & Noble, Inc. | | | 427,868 | | | | 5,288,448 | |
Big 5 Sporting Goods Corp. | | | 81,945 | | | | 910,409 | |
Buckle, Inc. (The)(a) | | | 119,112 | | | | 4,034,323 | |
Caleres, Inc. | | | 36,398 | | | | 1,029,699 | |
Cato Corp. (The) Class A | | | 70,274 | | | | 2,709,063 | |
Chico’s FAS, Inc. | | | 318,383 | | | | 4,224,942 | |
Children’s Place, Inc. (The)(a) | | | 18,940 | | | | 1,580,922 | |
Citi Trends, Inc. | | | 14,666 | | | | 261,495 | |
DSW, Inc. Class A | | | 229,338 | | | | 6,338,902 | |
Finish Line, Inc. (The) Class A | | | 83,777 | | | | 1,767,695 | |
GNC Holdings, Inc. Class A | | | 163,000 | | | | 5,175,250 | |
Group 1 Automotive, Inc. | | | 22,597 | | | | 1,326,218 | |
Guess?, Inc. | | | 333,058 | | | | 6,251,499 | |
Haverty Furniture Cos., Inc. | | | 30,923 | | | | 654,331 | |
Monro Muffler Brake, Inc. | | | 23,497 | | | | 1,679,331 | |
Outerwall, Inc.(a) | | | 42,115 | | | | 1,557,834 | |
Pier 1 Imports, Inc. | | | 344,196 | | | | 2,412,814 | |
Rent-A-Center, Inc. | | | 280,416 | | | | 4,444,594 | |
Shoe Carnival, Inc. | | | 19,957 | | | | 538,041 | |
Sonic Automotive, Inc. Class A | | | 21,336 | | | | 394,289 | |
Stage Stores, Inc.(a) | | | 203,410 | | | | 1,639,485 | |
Stein Mart, Inc. | | | 166,941 | | | | 1,223,677 | |
Tailored Brands, Inc. | | | 198,861 | | | | 3,559,612 | |
Winmark Corp. | | | 1,037 | | | | 101,605 | |
| | | | | | | | |
| Total Specialty Retail | | | | | | | 65,277,296 | |
| Technology Hardware, Storage & Peripherals – 1.1% | | | | | |
Diebold, Inc.(a) | | | 199,360 | | | | 5,763,498 | |
Lexmark International, Inc. Class A | | | 233,924 | | | | 7,820,079 | |
| | | | | | | | |
| Total Technology Hardware, Storage & Peripherals | | | | 13,583,577 | |
| Textiles, Apparel & Luxury Goods – 0.4% | | | | | | | | |
Culp, Inc. | | | 9,338 | | | | 244,842 | |
Movado Group, Inc. | | | 23,971 | | | | 659,922 | |
Oxford Industries, Inc. | | | 23,020 | | | | 1,547,635 | |
Superior Uniform Group, Inc.(a) | | | 23,187 | | | | 413,192 | |
Wolverine World Wide, Inc. | | | 119,969 | | | | 2,209,829 | |
| | | | | | | | |
| Total Textiles, Apparel & Luxury Goods | | | | | | | 5,075,420 | |
| Thrifts & Mortgage Finance – 1.2% | | | | | | | | |
Astoria Financial Corp. | | | 32,291 | | | | 511,489 | |
Bank Mutual Corp. | | | 35,205 | | | | 266,502 | |
BankFinancial Corp. | | | 9,225 | | | | 109,040 | |
Cape Bancorp, Inc. | | | 13,816 | | | | 185,687 | |
Capitol Federal Financial, Inc. | | | 115,943 | | | | 1,537,404 | |
Clifton Bancorp, Inc. | | | 13,730 | | | | 207,598 | |
Dime Community Bancshares, Inc. | | | 37,779 | | | | 665,666 | |
EverBank Financial Corp. | | | 57,451 | | | | 866,936 | |
Federal Agricultural Mortgage Corp. Class C | | | 5,203 | | | | 196,309 | |
First Defiance Financial Corp. | | | 5,690 | | | | 218,553 | |
First Financial Northwest, Inc. | | | 7,539 | | | | 99,289 | |
Fox Chase Bancorp, Inc. | | | 9,900 | | | | 191,268 | |
Hingham Institution for Savings(a) | | | 615 | | | | 73,253 | |
Home Bancorp, Inc. | | | 2,704 | | | | 72,494 | |
Meridian Bancorp, Inc. | | | 14,319 | | | | 199,320 | |
Meta Financial Group, Inc. | | | 2,911 | | �� | | 132,742 | |
Northfield Bancorp, Inc. | | | 26,363 | | | | 433,408 | |
Northwest Bancshares, Inc. | | | 133,528 | | | | 1,803,963 | |
OceanFirst Financial Corp. | | | 14,200 | | | | 251,056 | |
Oritani Financial Corp. | | | 61,854 | | | | 1,049,662 | |
Provident Financial Holdings, Inc. | | | 6,740 | | | | 114,917 | |
Provident Financial Services, Inc. | | | 71,171 | | | | 1,436,942 | |
Prudential Bancorp, Inc. | | | 2,027 | | | | 29,027 | |
Pulaski Financial Corp. | | | 9,314 | | | | 150,421 | |
Riverview Bancorp, Inc. | | | 9,370 | | | | 39,354 | |
SI Financial Group, Inc. | | | 4,533 | | | | 63,145 | |
Territorial Bancorp, Inc. | | | 7,340 | | | | 191,280 | |
TrustCo Bank Corp. | | | 135,075 | | | | 818,554 | |
United Community Financial Corp. | | | 25,236 | | | | 148,135 | |
United Financial Bancorp, Inc. | | | 57,619 | | | | 725,423 | |
Washington Federal, Inc. | | | 64,678 | | | | 1,464,957 | |
Waterstone Financial, Inc. | | | 13,148 | | | | 179,865 | |
Westfield Financial, Inc. | | | 8,632 | | | | 72,768 | |
WSFS Financial Corp. | | | 6,760 | | | | 219,835 | |
| | | | | | | | |
| Total Thrifts & Mortgage Finance | | | | | | | 14,726,262 | |
| Tobacco – 0.4% | | | | | | | | |
Universal Corp. | | | 76,473 | | | | 4,344,431 | |
| Trading Companies & Distributors – 1.7% | | | | | |
Applied Industrial Technologies, Inc. | | | 90,843 | | | | 3,942,586 | |
GATX Corp.(a) | | | 133,291 | | | | 6,331,322 | |
H&E Equipment Services, Inc. | | | 203,081 | | | | 3,560,010 | |
Houston Wire & Cable Co. | | | 61,116 | | | | 427,201 | |
Kaman Corp. | | | 40,827 | | | | 1,742,905 | |
TAL International Group, Inc.* | | | 313,846 | | | | 4,845,782 | |
| | | | | | | | |
| Total Trading Companies & Distributors | | | | | | | 20,849,806 | |
| Water Utilities – 1.0% | | | | | | | | |
American States Water Co. | | | 69,554 | | | | 2,737,646 | |
Artesian Resources Corp. Class A | | | 24,917 | | | | 696,679 | |
See Notes to Financial Statements.
| | | | |
| WisdomTree Domestic Earnings and Dividend Funds | | | 67 | |
Schedule of Investments (concluded)
WisdomTree SmallCap Dividend Fund (DES)
March 31, 2016
| | | | | | | | |
| Investments | | Shares | | | Value | |
California Water Service Group | | | 121,512 | | | $ | 3,246,801 | |
Connecticut Water Service, Inc. | | | 28,991 | | | | 1,307,494 | |
Middlesex Water Co. | | | 44,938 | | | | 1,386,337 | |
SJW Corp. | | | 48,904 | | | | 1,777,660 | |
York Water Co. (The) | | | 29,271 | | | | 893,351 | |
| | | | | | | | |
| Total Water Utilities | | | | | | | 12,045,968 | |
| Wireless Telecommunication Services – 0.2% | | | | | |
Shenandoah Telecommunications Co. | | | 44,429 | | | | 1,188,476 | |
Spok Holdings, Inc. | | | 52,266 | | | | 915,177 | |
| | | | | | | | |
| Total Wireless Telecommunication Services | | | | 2,103,653 | |
TOTAL COMMON STOCKS
(Cost: $1,147,136,911) | | | | | | | 1,205,854,008 | |
| EXCHANGE-TRADED FUND – 0.7% | | | | | | | | |
| United States – 0.7% | | | | | | | | |
| WisdomTree MidCap Dividend Fund(a)(b) (Cost: $7,331,835) | | | 92,626 | | | | 7,976,025 | |
| INVESTMENT OF CASH COLLATERAL FOR SECURITIES LOANED – 12.5% | |
| United States – 12.5% | | | | | | | | |
State Street Navigator Securities Lending Prime Portfolio, 0.50%(c) (Cost: $152,545,820)(d) | | | 152,545,820 | | | | 152,545,820 | |
TOTAL INVESTMENTS IN SECURITIES – 112.3% (Cost: $1,307,014,566) | | | | 1,366,375,853 | |
Liabilities in Excess of Cash and Other Assets –(12.3)% | | | | (149,718,290 | ) |
| | | | | | | | |
| NET ASSETS – 100.0% | | | | | | $ | 1,216,657,563 | |
| * | Non-income producing security. |
| (a) | Security, or portion thereof, was on loan at March 31, 2016 (See Note 2). |
| (b) | Affiliated company (See Note 3). |
| (c) | Rate shown represents annualized 7-day yield as of March 31, 2016. |
| (d) | At March 31, 2016, the total market value of the Fund’s securities on loan was $149,799,674 and the total market value of the collateral held by the Fund was $154,047,827. The total market value of the collateral includes non-cash U.S. Government securities collateral having a value of $1,502,007. |
See Notes to Financial Statements.
| | |
| 68 | | WisdomTree Domestic Earnings and Dividend Funds |
Schedule of Investments
WisdomTree SmallCap Earnings Fund (EES)
March 31, 2016
| | | | | | | | |
| Investments | | Shares | | | Value | |
| COMMON STOCKS – 99.4% | | | | | | | | |
| Puerto Rico – 0.8% | | | | | | | | |
| Banks – 0.7% | | | | | | | | |
First BanCorp* | | | 855,547 | | | $ | 2,498,197 | |
| IT Services – 0.1% | | | | | | | | |
EVERTEC, Inc. | | | 39,959 | | | | 558,627 | |
| | | | | | | | |
| Total Puerto Rico | | | | | | | 3,056,824 | |
| United States – 98.6% | | | | | | | | |
| Aerospace & Defense – 1.2% | | | | | | | | |
Aerojet Rocketdyne Holdings, Inc.* | | | 20,138 | | | | 329,860 | |
American Science & Engineering, Inc. | | | 708 | | | | 19,605 | |
Astronics Corp.* | | | 19,764 | | | | 753,997 | |
Cubic Corp. | | | 7,416 | | | | 296,343 | |
DigitalGlobe, Inc.* | | | 13,264 | | | | 229,467 | |
Engility Holdings, Inc.* | | | 2,036 | | | | 38,195 | |
HEICO Corp. | | | 25,816 | | | | 1,552,316 | |
KLX, Inc.* | | | 7,576 | | | | 243,493 | |
National Presto Industries, Inc.(a) | | | 4,648 | | | | 389,224 | |
Sparton Corp.* | | | 7,719 | | | | 138,865 | |
Taser International, Inc.* | | | 11,764 | | | | 230,927 | |
Vectrus, Inc.* | | | 13,728 | | | | 312,312 | |
| | | | | | | | |
| Total Aerospace & Defense | | | | 4,534,604 | |
| Air Freight & Logistics – 0.9% | | | | | | | | |
Air Transport Services Group, Inc.* | | | 34,070 | | | | 523,997 | |
Atlas Air Worldwide Holdings, Inc.* | | | 23,084 | | | | 975,761 | |
Echo Global Logistics, Inc.* | | | 5,773 | | | | 156,795 | |
Forward Air Corp. | | | 11,357 | | | | 514,699 | |
Hub Group, Inc. Class A* | | | 19,037 | | | | 776,519 | |
Park-Ohio Holdings Corp. | | | 12,259 | | | | 524,930 | |
Radiant Logistics, Inc.* | | | 7,526 | | | | 26,868 | |
| | | | | | | | |
| Total Air Freight & Logistics | �� | | | 3,499,569 | |
| Airlines – 0.6% | | | | | | | | |
SkyWest, Inc. | | | 25,788 | | | | 515,502 | |
Virgin America, Inc.*(a) | | | 44,094 | | | | 1,700,265 | |
| | | | | | | | |
| Total Airlines | | | | 2,215,767 | |
| Auto Components – 1.5% | | | | | | | | |
Cooper-Standard Holding, Inc.* | | | 8,543 | | | | 613,729 | |
Dorman Products, Inc.* | | | 19,678 | | | | 1,070,877 | |
Drew Industries, Inc. | | | 12,238 | | | | 788,861 | |
Fox Factory Holding Corp.* | | | 12,879 | | | | 203,617 | |
Metaldyne Performance Group, Inc. | | | 67,392 | | | | 1,132,860 | |
Motorcar Parts of America, Inc.* | | | 3,353 | | | | 127,347 | |
Shiloh Industries, Inc.*(a) | | | 21,298 | | | | 109,259 | |
Standard Motor Products, Inc. | | | 13,756 | | | | 476,645 | |
Stoneridge, Inc.* | | | 10,113 | | | | 147,245 | |
Strattec Security Corp. | | | 2,525 | | | | 144,910 | |
Superior Industries International, Inc. | | | 10,346 | | | | 228,440 | |
Tower International, Inc. | | | 14,320 | | | | 389,504 | |
| | | | | | | | |
| Total Auto Components | | | | 5,433,294 | |
| Automobiles – 0.1% | | | | | | | | |
Winnebago Industries, Inc. | | | 20,285 | | | | 455,398 | |
| Banks – 9.6% | | | | | | | | |
1st Source Corp. | | | 15,885 | | | | 505,778 | |
Access National Corp. | | | 6,178 | | | | 122,510 | |
American National Bankshares, Inc. | | | 4,735 | | | | 119,938 | |
Ameris Bancorp | | | 9,569 | | | | 283,051 | |
Arrow Financial Corp. | | | 7,299 | | | | 193,934 | |
Banc of California, Inc. | | | 23,382 | | | | 409,185 | |
BancFirst Corp. | | | 9,826 | | | | 560,377 | |
Bar Harbor Bankshares | | | 3,786 | | | | 125,771 | |
BBCN Bancorp, Inc. | | | 46,616 | | | | 708,097 | |
Berkshire Hills Bancorp, Inc. | | | 13,151 | | | | 353,630 | |
Blue Hills Bancorp, Inc. | | | 4,084 | | | | 55,828 | |
Boston Private Financial Holdings, Inc. | | | 40,374 | | | | 462,282 | |
Bridge Bancorp, Inc. | | | 4,729 | | | | 144,093 | |
Brookline Bancorp, Inc. | | | 35,924 | | | | 395,523 | |
Bryn Mawr Bank Corp. | | | 8,908 | | | | 229,203 | |
C1 Financial, Inc.*(a) | | | 4,953 | | | | 119,863 | |
Camden National Corp. | | | 4,881 | | | | 205,002 | |
Capital Bank Financial Corp. Class A | | | 14,460 | | | | 446,091 | |
Capital City Bank Group, Inc. | | | 4,824 | | | | 70,382 | |
Cardinal Financial Corp. | | | 17,696 | | | | 360,114 | |
Centerstate Banks, Inc. | | | 20,855 | | | | 310,531 | |
Central Pacific Financial Corp. | | | 20,743 | | | | 451,575 | |
Chemical Financial Corp. | | | 18,982 | | | | 677,468 | |
City Holding Co. | | | 8,853 | | | | 422,996 | |
CNB Financial Corp. | | | 11,542 | | | | 203,024 | |
CoBiz Financial, Inc. | | | 18,576 | | | | 219,568 | |
Community Trust Bancorp, Inc. | | | 11,078 | | | | 391,275 | |
ConnectOne Bancorp, Inc. | | | 18,663 | | | | 305,140 | |
Customers Bancorp, Inc.* | | | 16,717 | | | | 395,023 | |
Enterprise Financial Services Corp. | | | 10,332 | | | | 279,377 | |
Farmers Capital Bank Corp. | | | 4,774 | | | | 126,129 | |
FCB Financial Holdings, Inc. Class A* | | | 8,623 | | | | 286,801 | |
Fidelity Southern Corp. | | | 15,525 | | | | 249,021 | |
Financial Institutions, Inc. | | | 8,511 | | | | 247,415 | |
First Bancorp | | | 12,163 | | | | 229,273 | |
First Bancorp, Inc. | | | 6,632 | | | | 129,390 | |
First Busey Corp. | | | 14,674 | | | | 300,524 | |
First Business Financial Services, Inc. | | | 5,892 | | | | 135,104 | |
First Commonwealth Financial Corp. | | | 43,700 | | | | 387,182 | |
First Community Bancshares, Inc. | | | 10,530 | | | | 208,915 | |
First Connecticut Bancorp, Inc. | | | 6,634 | | | | 105,879 | |
First Financial Bancorp | | | 33,461 | | | | 608,321 | |
First Financial Corp. | | | 8,443 | | | | 288,835 | |
First Interstate BancSystem, Inc. Class A | | | 25,432 | | | | 715,402 | |
First Merchants Corp. | | | 20,316 | | | | 478,848 | |
First Midwest Bancorp, Inc. | | | 36,821 | | | | 663,514 | |
First NBC Bank Holding Co.*(a) | | | 15,184 | | | | 312,639 | |
Flushing Financial Corp. | | | 16,898 | | | | 365,335 | |
Franklin Financial Network, Inc.*(a) | | | 4,011 | | | | 108,297 | |
German American Bancorp, Inc. | | | 7,796 | | | | 251,031 | |
Great Southern Bancorp, Inc. | | | 8,390 | | | | 311,521 | |
Great Western Bancorp, Inc. | | | 31,450 | | | | 857,641 | |
Green Bancorp, Inc.* | | | 11,035 | | | | 83,535 | |
See Notes to Financial Statements.
| | | | |
| WisdomTree Domestic Earnings and Dividend Funds | | | 69 | |
Schedule of Investments (continued)
WisdomTree SmallCap Earnings Fund (EES)
March 31, 2016
| | | | | | | | |
| Investments | | Shares | | | Value | |
Guaranty Bancorp | | | 9,405 | | | $ | 145,401 | |
Hanmi Financial Corp. | | | 17,746 | | | | 390,767 | |
Heartland Financial USA, Inc. | | | 15,028 | | | | 462,712 | |
Heritage Commerce Corp. | | | 10,442 | | | | 104,524 | |
Heritage Financial Corp. | | | 16,494 | | | | 289,800 | |
HomeTrust Bancshares, Inc.* | | | 3,690 | | | | 67,638 | |
Horizon Bancorp | | | 6,423 | | | | 158,777 | |
Independent Bank Corp. | | | 21,719 | | | | 670,693 | |
Independent Bank Group, Inc. | | | 9,577 | | | | 262,410 | |
Lakeland Bancorp, Inc. | | | 23,400 | | | | 237,510 | |
Lakeland Financial Corp. | | | 8,085 | | | | 370,131 | |
LegacyTexas Financial Group, Inc. | | | 20,102 | | | | 395,004 | |
MainSource Financial Group, Inc. | | | 12,940 | | | | 272,905 | |
Mercantile Bank Corp. | | | 9,316 | | | | 208,865 | |
MidSouth Bancorp, Inc. | | | 10,446 | | | | 79,703 | |
MidWestOne Financial Group, Inc. | | | 5,942 | | | | 163,108 | |
National Bank Holdings Corp. Class A | | | 1,619 | | | | 33,011 | |
National Commerce Corp.*(a) | | | 2,220 | | | | 52,414 | |
NBT Bancorp, Inc. | | | 22,698 | | | | 611,711 | |
Northrim BanCorp, Inc. | | | 6,071 | | | | 145,158 | |
OFG Bancorp(a) | | | 7,262 | | | | 50,761 | |
Old National Bancorp | | | 71,825 | | | | 875,547 | |
Old Second Bancorp, Inc.* | | | 12,653 | | | | 90,722 | |
Opus Bank | | | 11,415 | | | | 388,110 | |
Pacific Continental Corp. | | | 9,639 | | | | 155,477 | |
Pacific Premier Bancorp, Inc.* | | | 8,807 | | | | 188,206 | |
Park National Corp. | | | 7,549 | | | | 679,410 | |
Park Sterling Corp. | | | 18,764 | | | | 125,156 | |
Peapack Gladstone Financial Corp. | | | 7,871 | | | | 133,020 | |
Penns Woods Bancorp, Inc.(a) | | | 2,494 | | | | 96,119 | |
Peoples Bancorp, Inc. | | | 6,836 | | | | 133,575 | |
Peoples Financial Services Corp.(a) | | | 4,154 | | | | 154,529 | |
Preferred Bank | | | 7,351 | | | | 222,368 | |
QCR Holdings, Inc. | | | 4,791 | | | | 114,265 | |
Renasant Corp. | | | 15,363 | | | | 505,596 | |
Republic Bancorp, Inc. Class A | | | 11,127 | | | | 287,410 | |
S&T Bancorp, Inc. | | | 17,944 | | | | 462,237 | |
Sandy Spring Bancorp, Inc. | | | 13,479 | | | | 375,121 | |
Seacoast Banking Corp. of Florida* | | | 7,876 | | | | 124,362 | |
ServisFirst Bancshares, Inc. | | | 10,841 | | | | 481,340 | |
Sierra Bancorp | | | 7,673 | | | | 139,265 | |
Southside Bancshares, Inc. | | | 9,723 | | | | 253,479 | |
Southwest Bancorp, Inc. | | | 9,115 | | | | 137,181 | |
Stock Yards Bancorp, Inc. | | | 8,316 | | | | 320,415 | |
Stonegate Bank | | | 6,021 | | | | 180,389 | |
Suffolk Bancorp | | | 5,527 | | | | 139,501 | |
Tompkins Financial Corp. | | | 8,010 | | | | 512,640 | |
Towne Bank(a) | | | 23,425 | | | | 449,526 | |
Trico Bancshares | | | 11,744 | | | | 297,358 | |
Tristate Capital Holdings, Inc.* | | | 14,841 | | | | 186,997 | |
Triumph Bancorp, Inc.* | | | 13,553 | | | | 214,544 | |
Trustmark Corp. | | | 43,198 | | | | 994,850 | |
Union Bankshares Corp. | | | 21,590 | | | | 531,762 | |
United Community Banks, Inc. | | | 32,406 | | | | 598,539 | |
Univest Corp. of Pennsylvania | | | 10,473 | | | | 204,328 | |
Veritex Holdings, Inc.* | | | 3,958 | | | | 57,510 | |
Washington Trust Bancorp, Inc. | | | 9,783 | | | | 365,102 | |
WesBanco, Inc. | | | 21,030 | | | | 624,801 | |
West Bancorp, Inc. | | | 9,074 | | | | 165,419 | |
Westamerica Bancorp(a) | | | 11,206 | | | | 545,844 | |
Wilshire Bancorp, Inc. | | | 47,715 | | | | 491,464 | |
Yadkin Financial Corp. | | | 23,335 | | | | 552,339 | |
| | | | | | | | |
| Total Banks | | | | 35,706,007 | |
| Beverages – 0.2% | | | | | | | | |
Coca-Cola Bottling Co. Consolidated | | | 3,308 | | | | 528,486 | |
Craft Brew Alliance, Inc.* | | | 2,395 | | | | 19,711 | |
MGP Ingredients, Inc. | | | 8,545 | | | | 207,131 | |
| | | | | | | | |
| Total Beverages | | | | 755,328 | |
| Biotechnology – 1.9% | | | | | | | | |
Acorda Therapeutics, Inc.* | | | 728 | | | | 19,256 | |
AMAG Pharmaceuticals, Inc.*(a) | | | 64,964 | | | | 1,520,158 | |
Array BioPharma, Inc.* | | | 5,435 | | | | 16,033 | |
BioSpecifics Technologies Corp.* | | | 2,080 | | | | 72,426 | |
Concert Pharmaceuticals, Inc.* | | | 7,234 | | | | 98,816 | |
Emergent Biosolutions, Inc.* | | | 16,870 | | | | 613,224 | |
Enanta Pharmaceuticals, Inc.*(a) | | | 23,109 | | | | 678,711 | |
NewLink Genetics Corp.*(a) | | | 33,398 | | | | 607,844 | |
Osiris Therapeutics, Inc.*(a) | | | 2,809 | | | | 16,039 | |
PDL BioPharma, Inc. | | | 814,322 | | | | 2,711,692 | |
Repligen Corp.* | | | 4,068 | | | | 109,104 | |
Retrophin, Inc.* | | | 45,701 | | | | 624,276 | |
| | | | | | | | |
| Total Biotechnology | | | | 7,087,579 | |
| Building Products – 1.4% | | | | | | | | |
AAON, Inc. | | | 19,184 | | | | 537,152 | |
Advanced Drainage Systems, Inc.(a) | | | 6,496 | | | | 138,365 | |
American Woodmark Corp.* | | | 5,030 | | | | 375,188 | |
Apogee Enterprises, Inc. | | | 12,177 | | | | 534,448 | |
Continental Building Products, Inc.* | | | 9,636 | | | | 178,844 | |
Gibraltar Industries, Inc.* | | | 7,813 | | | | 223,452 | |
Griffon Corp. | | | 19,868 | | | | 306,961 | |
Insteel Industries, Inc. | | | 10,034 | | | | 306,739 | |
NCI Building Systems, Inc.* | | | 12,809 | | | | 181,888 | |
Patrick Industries, Inc.* | | | 9,492 | | | | 430,842 | |
PGT, Inc.* | | | 20,345 | | | | 200,195 | |
Ply Gem Holdings, Inc.* | | | 9,408 | | | | 132,182 | |
Quanex Building Products Corp. | | | 4,874 | | | | 84,613 | |
Trex Co., Inc.* | | | 11,735 | | | | 562,458 | |
Universal Forest Products, Inc. | | | 9,818 | | | | 842,581 | |
| | | | | | | | |
| Total Building Products | | | | 5,035,908 | |
| Capital Markets – 2.7% | | | | | | | | |
Artisan Partners Asset Management, Inc. Class A | | | 16,349 | | | | 504,203 | |
Calamos Asset Management, Inc. Class A | | | 7,128 | | | | 60,517 | |
Cohen & Steers, Inc. | | | 21,163 | | | | 823,664 | |
Cowen Group, Inc. Class A*(a) | | | 317,511 | | | | 1,209,717 | |
Diamond Hill Investment Group, Inc. | | | 1,585 | | | | 281,116 | |
GAMCO Investors, Inc. Class A | | | 24,099 | | | | 893,109 | |
See Notes to Financial Statements.
| | |
| 70 | | WisdomTree Domestic Earnings and Dividend Funds |
Schedule of Investments (continued)
WisdomTree SmallCap Earnings Fund (EES)
March 31, 2016
| | | | | | | | |
| Investments | | Shares | | | Value | |
Greenhill & Co., Inc. | | | 10,791 | | | $ | 239,560 | |
HFF, Inc. Class A | | | 20,021 | | | | 551,178 | |
INTL FCStone, Inc.* | | | 9,792 | | | | 261,740 | |
Investment Technology Group, Inc. | | | 11,065 | | | | 244,536 | |
KCG Holdings, Inc. Class A* | | | 196,221 | | | | 2,344,841 | |
Manning & Napier, Inc. | | | 18,595 | | | | 150,062 | |
Moelis & Co. Class A | | | 9,599 | | | | 270,980 | |
Oppenheimer Holdings, Inc. Class A | | | 4,232 | | | | 66,781 | |
Piper Jaffray Cos.* | | | 11,780 | | | | 583,817 | |
Pzena Investment Management, Inc. Class A | | | 8,481 | | | | 64,031 | |
Virtu Financial, Inc. Class A | | | 32,549 | | | | 719,658 | |
Virtus Investment Partners, Inc. | | | 3,998 | | | | 312,284 | |
Westwood Holdings Group, Inc. | | | 4,588 | | | | 269,086 | |
| | | | | | | | |
| Total Capital Markets | | | | 9,850,880 | |
| Chemicals – 1.8% | | | | | | | | |
A. Schulman, Inc. | | | 9,611 | | | | 261,612 | |
American Vanguard Corp.* | | | 4,256 | | | | 67,160 | |
Calgon Carbon Corp. | | | 29,700 | | | | 416,394 | |
Chase Corp. | | | 6,500 | | | | 341,835 | |
Chemours Co. (The) | | | 133,872 | | | | 937,104 | |
Core Molding Technologies, Inc.* | | | 10,691 | | | | 133,424 | |
Ferro Corp.* | | | 35,105 | | | | 416,696 | |
Flotek Industries, Inc.*(a) | | | 4,401 | | | | 32,259 | |
FutureFuel Corp. | | | 35,471 | | | | 418,203 | |
Hawkins, Inc. | | | 5,482 | | | | 197,845 | |
Innophos Holdings, Inc. | | | 14,415 | | | | 445,568 | |
Innospec, Inc. | | | 18,575 | | | | 805,412 | |
KMG Chemicals, Inc. | | | 3,539 | | | | 81,645 | |
OMNOVA Solutions, Inc.* | | | 7,931 | | | | 44,096 | |
Quaker Chemical Corp. | | | 7,044 | | | | 597,754 | |
Rayonier Advanced Materials, Inc. | | | 18,883 | | | | 179,389 | |
Stepan Co. | | | 13,111 | | | | 724,907 | |
Trecora Resources* | | | 15,220 | | | | 146,416 | |
Tredegar Corp. | | | 23,503 | | | | 369,467 | |
| | | | | | | | |
| Total Chemicals | | | | 6,617,186 | |
| Commercial Services & Supplies – 3.3% | | | | | | | | |
ABM Industries, Inc. | | | 24,309 | | | | 785,424 | |
ACCO Brands Corp.* | | | 131,890 | | | | 1,184,372 | |
ARC Document Solutions, Inc.* | | | 189,503 | | | | 852,763 | |
Brady Corp. Class A | | | 19,837 | | | | 532,425 | |
Brink’s Co. (The) | | | 5,446 | | | | 182,931 | |
CECO Environmental Corp. | | | 3,368 | | | | 20,915 | |
Ennis, Inc. | | | 9,945 | | | | 194,425 | |
Essendant, Inc. | | | 28,007 | | | | 894,264 | |
G&K Services, Inc. Class A | | | 9,826 | | | | 719,754 | |
InnerWorkings, Inc.* | | | 12,548 | | | | 99,757 | |
Interface, Inc. | | | 34,275 | | | | 635,459 | |
Kimball International, Inc. Class B | | | 15,083 | | | | 171,192 | |
Knoll, Inc. | | | 32,588 | | | | 705,530 | |
McGrath RentCorp | | | 17,088 | | | | 428,567 | |
Mobile Mini, Inc. | | | 3,322 | | | | 109,692 | |
Multi-Color Corp. | | | 8,169 | | | | 435,816 | |
SP Plus Corp.* | | | 10,231 | | | | 246,158 | |
Team, Inc.* | | | 13,883 | | | | 421,766 | |
Tetra Tech, Inc. | | | 37,171 | | | | 1,108,439 | |
TRC Cos., Inc.*(a) | | | 20,401 | | | | 147,907 | |
U.S. Ecology, Inc. | | | 9,093 | | | | 401,547 | |
UniFirst Corp. | | | 12,419 | | | | 1,355,161 | |
Viad Corp. | | | 6,805 | | | | 198,434 | |
VSE Corp. | | | 3,803 | | | | 258,186 | |
| | | | | | | | |
| Total Commercial Services & Supplies | | | | 12,090,884 | |
| Communications Equipment – 0.5% | | | | | | | | |
ADTRAN, Inc. | | | 10,355 | | | | 209,378 | |
Alliance Fiber Optic Products, Inc.* | | | 9,674 | | | | 143,079 | |
Applied Optoelectronics, Inc.*(a) | | | 5,299 | | | | 79,008 | |
Bel Fuse, Inc. Class B | | | 10,857 | | | | 158,512 | |
Black Box Corp. | | | 12,939 | | | | 174,288 | |
CalAmp Corp.*(a) | | | 8,926 | | | | 160,043 | |
Clearfield, Inc.*(a) | | | 4,707 | | | | 75,642 | |
Comtech Telecommunications Corp. | | | 11,828 | | | | 276,421 | |
Digi International, Inc.* | | | 4,745 | | | | 44,745 | |
EMCORE Corp.* | | | 17,479 | | | | 87,395 | |
Finisar Corp.* | | | 6,180 | | | | 112,723 | |
Ixia* | | | 524 | | | | 6,529 | |
NETGEAR, Inc.* | | | 9,382 | | | | 378,751 | |
Ruckus Wireless, Inc.* | | | 4,758 | | | | 46,676 | |
TESSCO Technologies, Inc. | | | 3,088 | | | | 51,415 | |
| | | | | | | | |
| Total Communications Equipment | | | | 2,004,605 | |
| Construction & Engineering – 1.0% | | | | | | | | |
Aegion Corp.* | | | 11,665 | | | | 246,015 | |
Ameresco, Inc. Class A*(a) | | | 18,379 | | | | 87,668 | |
Argan, Inc. | | | 11,775 | | | | 414,009 | |
Comfort Systems USA, Inc. | | | 15,153 | | | | 481,411 | |
Granite Construction, Inc. | | | 10,304 | | | | 492,531 | |
Great Lakes Dredge & Dock Corp.* | | | 29,271 | | | | 130,549 | |
MasTec, Inc.* | | | 18,115 | | | | 366,647 | |
MYR Group, Inc.* | | | 18,260 | | | | 458,508 | |
Primoris Services Corp. | | | 15,546 | | | | 377,768 | |
Tutor Perini Corp.* | | | 52,859 | | | | 821,429 | |
| | | | | | | | |
| Total Construction & Engineering | | | | 3,876,535 | |
| Construction Materials – 0.4% | | | | | | | | |
Headwaters, Inc.* | | | 78,202 | | | | 1,551,528 | |
Summit Materials, Inc. Class A* | | | 2,772 | | | | 53,915 | |
| | | | | | | | |
| Total Construction Materials | | | | 1,605,443 | |
| Consumer Finance – 1.9% | | | | | | | | |
Cash America International, Inc. | | | 6,138 | | | | 237,172 | |
Consumer Portfolio Services, Inc.* | | | 56,422 | | | | 238,665 | |
Encore Capital Group, Inc.*(a) | | | 34,602 | | | | 890,656 | |
Enova International, Inc.* | | | 83,607 | | | | 527,560 | |
EZCORP, Inc. Class A* | | | 10,326 | | | | 30,668 | |
First Cash Financial Services, Inc. | | | 16,295 | | | | 750,548 | |
Green Dot Corp. Class A* | | | 22,048 | | | | 506,443 | |
Nelnet, Inc. Class A | | | 68,441 | | | | 2,694,522 | |
Regional Management Corp.* | | | 11,360 | | | | 194,370 | |
World Acceptance Corp.*(a) | | | 23,071 | | | | 874,852 | |
| | | | | | | | |
| Total Consumer Finance | | | | 6,945,456 | |
See Notes to Financial Statements.
| | | | |
| WisdomTree Domestic Earnings and Dividend Funds | | | 71 | |
Schedule of Investments (continued)
WisdomTree SmallCap Earnings Fund (EES)
March 31, 2016
| | | | | | | | |
| Investments | | Shares | | | Value | |
| Containers & Packaging – 0.3% | | | | | | | | |
AEP Industries, Inc. | | | 2,155 | | | $ | 142,230 | |
Greif, Inc. Class A | | | 28,425 | | | | 930,919 | |
Myers Industries, Inc. | | | 9,768 | | | | 125,616 | |
| | | | | | | | |
| Total Containers & Packaging | | | | 1,198,765 | |
| Distributors – 0.1% | | | | | | | | |
Weyco Group, Inc. | | | 7,569 | | | | 201,487 | |
| Diversified Consumer Services – 1.0% | | | | | | | | |
American Public Education, Inc.* | | | 16,920 | | | | 349,060 | |
Apollo Education Group, Inc.* | | | 74,623 | | | | 613,028 | |
Capella Education Co. | | | 8,487 | | | | 446,756 | |
Carriage Services, Inc. | | | 8,597 | | | | 185,781 | |
Collectors Universe, Inc. | | | 5,019 | | | | 83,315 | |
DeVry Education Group, Inc.(a) | | | 51,627 | | | | 891,598 | |
K12, Inc.* | | | 5,873 | | | | 58,084 | |
Liberty Tax, Inc. | | | 5,355 | | | | 104,904 | |
LifeLock, Inc.* | | | 24,662 | | | | 297,670 | |
Strayer Education, Inc.* | | | 7,100 | | | | 346,125 | |
Universal Technical Institute, Inc. | | | 5,458 | | | | 23,524 | |
Weight Watchers International, Inc.*(a) | | | 20,301 | | | | 294,974 | |
| | | | | | | | |
| Total Diversified Consumer Services | | | | 3,694,819 | |
| Diversified Financial Services – 0.1% | | | | | | | | |
Gain Capital Holdings, Inc. | | | 24,152 | | | | 158,437 | |
Marlin Business Services Corp. | | | 9,053 | | | | 129,549 | |
NewStar Financial, Inc.* | | | 14,584 | | | | 127,610 | |
| | | | | | | | |
| Total Diversified Financial Services | | | | 415,596 | |
| Diversified Telecommunication Services – 0.8% | | | | | | | | |
Atlantic Tele-Network, Inc. | | | 4,649 | | | | 352,534 | |
Cincinnati Bell, Inc.* | | | 104,110 | | | | 402,906 | |
Hawaiian Telcom Holdco, Inc.* | | | 1,553 | | | | 36,573 | |
IDT Corp. Class B | | | 32,784 | | | | 511,102 | |
Inteliquent, Inc. | | | 22,092 | | | | 354,576 | |
Iridium Communications, Inc.*(a) | | | 112,290 | | | | 883,722 | |
Lumos Networks Corp.* | | | 9,571 | | | | 122,892 | |
Vonage Holdings Corp.* | | | 49,140 | | | | 224,570 | |
| | | | | | | | |
| Total Diversified Telecommunication Services | | | | 2,888,875 | |
| Electric Utilities – 0.9% | | | | | | | | |
El Paso Electric Co. | | | 23,394 | | | | 1,073,317 | |
Empire District Electric Co. (The) | | | 25,508 | | | | 843,039 | |
MGE Energy, Inc. | | | 16,678 | | | | 871,426 | |
Otter Tail Corp. | | | 23,573 | | | | 698,232 | |
| | | | | | | | |
| Total Electric Utilities | | | | 3,486,014 | |
| Electrical Equipment – 0.8% | | | | | | | | |
Allied Motion Technologies, Inc. | | | 7,678 | | | | 138,204 | |
AZZ, Inc. | | | 13,062 | | | | 739,309 | |
Babcock & Wilcox Enterprises, Inc.* | | | 14,636 | | | | 313,210 | |
Encore Wire Corp. | | | 10,906 | | | | 424,571 | |
Franklin Electric Co., Inc. | | | 20,771 | | | | 668,203 | |
LSI Industries, Inc. | | | 6,596 | | | | 77,503 | |
Powell Industries, Inc. | | | 2,291 | | | | 68,295 | |
PowerSecure International, Inc.* | | | 2,507 | | | | 46,856 | |
Thermon Group Holdings, Inc.* | | | 23,082 | | | | 405,320 | |
Vicor Corp.* | | | 6,772 | | | | 70,970 | |
| | | | | | | | |
| Total Electrical Equipment | | | | 2,952,441 | |
| Electronic Equipment, Instruments & Components – 3.8% | | | | | |
Badger Meter, Inc. | | | 4,683 | | | | 311,466 | |
Benchmark Electronics, Inc.* | | | 38,706 | | | | 892,173 | |
Checkpoint Systems, Inc.* | | | 10,244 | | | | 103,669 | |
Coherent, Inc.* | | | 12,142 | | | | 1,115,850 | |
Control4 Corp.*(a) | | | 4,522 | | | | 35,995 | |
CTS Corp. | | | 14,892 | | | | 234,400 | |
Daktronics, Inc. | | | 18,485 | | | | 146,031 | |
DTS, Inc.* | | | 1,327 | | | | 28,902 | |
Electro Rent Corp. | | | 12,857 | | | | 119,056 | |
ePlus, Inc.* | | | 4,764 | | | | 383,550 | |
FARO Technologies, Inc.* | | | 5,681 | | | | 182,985 | |
Fitbit, Inc. Class A*(a) | | | 52,937 | | | | 801,996 | |
II-VI, Inc.* | | | 36,646 | | | | 795,585 | |
Insight Enterprises, Inc.* | | | 30,391 | | | | 870,398 | |
InvenSense, Inc.* | | | 9,275 | | | | 77,910 | |
Kimball Electronics, Inc.* | | | 24,050 | | | | 268,638 | |
Mercury Systems, Inc.* | | | 7,880 | | | | 159,964 | |
Mesa Laboratories, Inc. | | | 845 | | | | 81,416 | |
Methode Electronics, Inc. | | | 34,183 | | | | 999,511 | |
MTS Systems Corp. | | | 8,020 | | | | 488,017 | |
Multi-Fineline Electronix, Inc.* | | | 18,576 | | | | 431,149 | |
Newport Corp.* | | | 20,844 | | | | 479,412 | |
Park Electrochemical Corp. | | | 10,255 | | | | 164,183 | |
PC Connection, Inc. | | | 20,474 | | | | 528,434 | |
Plexus Corp.* | | | 27,438 | | | | 1,084,350 | |
QLogic Corp.* | | | 31,788 | | | | 427,231 | |
Rofin-Sinar Technologies, Inc.*(a) | | | 16,305 | | | | 525,347 | |
Rogers Corp.* | | | 9,389 | | | | 562,119 | |
ScanSource, Inc.* | | | 18,152 | | | | 732,978 | |
Vishay Intertechnology, Inc. | | | 99,829 | | | | 1,218,912 | |
| | | | | | | | |
| Total Electronic Equipment, Instruments & Components | | | | 14,251,627 | |
| Energy Equipment & Services – 2.3% | | | | | | | | |
Atwood Oceanics, Inc.(a) | | | 342,222 | | | | 3,138,176 | |
Bristow Group, Inc. | | | 4,971 | | | | 94,051 | |
Era Group, Inc.* | | | 15,206 | | | | 142,632 | |
Fairmount Santrol Holdings, Inc.*(a) | | | 160,561 | | | | 403,008 | |
Forum Energy Technologies, Inc.* | | | 75,064 | | | | 990,845 | |
Helix Energy Solutions Group, Inc.* | | | 70,876 | | | | 396,906 | |
Hornbeck Offshore Services, Inc.*(a) | | | 71,806 | | | | 713,034 | |
Matrix Service Co.* | | | 10,409 | | | | 184,239 | |
Natural Gas Services Group, Inc.* | | | 5,459 | | | | 118,078 | |
Newpark Resources, Inc.* | | | 33,811 | | | | 146,063 | |
Oil States International, Inc.* | | | 30,338 | | | | 956,254 | |
PHI, Inc. Non-Voting Shares* | | | 16,433 | | | | 310,419 | |
SEACOR Holdings, Inc.*(a) | | | 1,484 | | | | 80,804 | |
U.S. Silica Holdings, Inc.(a) | | | 31,222 | | | | 709,364 | |
| | | | | | | | |
| Total Energy Equipment & Services | | | | 8,383,873 | |
See Notes to Financial Statements.
| | |
| 72 | | WisdomTree Domestic Earnings and Dividend Funds |
Schedule of Investments (continued)
WisdomTree SmallCap Earnings Fund (EES)
March 31, 2016
| | | | | | | | |
| Investments | | Shares | | | Value | |
| Food & Staples Retailing – 1.1% | | | | | | | | |
Andersons, Inc. (The) | | | 19,083 | | | $ | 599,397 | |
Chefs’ Warehouse, Inc. (The)* | | | 8,606 | | | | 174,616 | |
Fresh Market, Inc. (The)* | | | 28,697 | | | | 818,725 | |
Ingles Markets, Inc. Class A | | | 13,091 | | | | 490,913 | |
Natural Grocers by Vitamin Cottage, Inc.* | | | 8,256 | | | | 175,605 | |
Smart & Final Stores, Inc.* | | | 21,680 | | | | 351,216 | |
SpartanNash Co. | | | 25,741 | | | | 780,210 | |
Village Super Market, Inc. Class A | | | 12,046 | | | | 291,031 | |
Weis Markets, Inc. | | | 10,614 | | | | 478,267 | |
| | | | | | | | |
| Total Food & Staples Retailing | | | | 4,159,980 | |
| Food Products – 1.5% | | | | | | | | |
Alico, Inc. | | | 4,678 | | | | 129,160 | |
Calavo Growers, Inc. | | | 5,551 | | | | 316,740 | |
John B. Sanfilippo & Son, Inc. | | | 5,892 | | | | 407,078 | |
Landec Corp.* | | | 11,009 | | | | 115,595 | |
Lifeway Foods, Inc.*(a) | | | 568 | | | | 6,151 | |
Limoneira Co.(a) | | | 1,976 | | | | 30,035 | |
Omega Protein Corp.* | | | 14,078 | | | | 238,481 | |
Sanderson Farms, Inc.(a) | | | 37,506 | | | | 3,382,291 | |
Seneca Foods Corp. Class A* | | | 7,086 | | | | 246,168 | |
Tootsie Roll Industries, Inc.(a) | | | 21,291 | | | | 743,912 | |
| | | | | | | | |
| Total Food Products | | | | 5,615,611 | |
| Gas Utilities – 0.7% | | | | | | | | |
Chesapeake Utilities Corp. | | | 7,190 | | | | 452,754 | |
Northwest Natural Gas Co. | | | 12,157 | | | | 654,655 | |
South Jersey Industries, Inc. | | | 46,471 | | | | 1,322,100 | |
| | | | | | | | |
| Total Gas Utilities | | | | 2,429,509 | |
| Health Care Equipment & Supplies – 1.1% | | | | | | | | |
Abaxis, Inc. | | | 4,827 | | | | 219,097 | |
Analogic Corp. | | | 4,266 | | | | 337,057 | |
Anika Therapeutics, Inc.* | | | 7,599 | | | | 339,827 | |
Atrion Corp. | | | 752 | | | | 297,311 | |
CONMED Corp. | | | 8,210 | | | | 344,327 | |
CryoLife, Inc. | | | 1,364 | | | | 14,663 | |
Cynosure, Inc. Class A* | | | 8,198 | | | | 361,696 | |
Exactech, Inc.* | | | 9,314 | | | | 188,702 | |
Haemonetics Corp.* | | | 7,689 | | | | 268,961 | |
Halyard Health, Inc.* | | | 10,383 | | | | 298,304 | |
Inogen, Inc.* | | | 2,434 | | | | 109,481 | |
LeMaitre Vascular, Inc. | | | 4,556 | | | | 70,709 | |
Meridian Bioscience, Inc. | | | 18,321 | | | | 377,596 | |
Merit Medical Systems, Inc.* | | | 14,359 | | | | 265,498 | |
Natus Medical, Inc.* | | | 8,264 | | | | 317,585 | |
OraSure Technologies, Inc.* | | | 2,393 | | | | 17,301 | |
Quidel Corp.* | | | 542 | | | | 9,355 | |
RTI Surgical, Inc.* | | | 21,762 | | | | 87,048 | |
SurModics, Inc.* | | | 7,378 | | | | 135,829 | |
Vascular Solutions, Inc.* | | | 3,958 | | | | 128,754 | |
Zeltiq Aesthetics, Inc.*(a) | | | 869 | | | | 23,602 | |
| | | | | | | | |
| Total Health Care Equipment & Supplies | | | | 4,212,703 | |
| Health Care Providers & Services – 2.5% | | | | | | | | |
AAC Holdings, Inc.*(a) | | | 5,719 | | | | 113,179 | |
Aceto Corp. | | | 15,253 | | | | 359,361 | |
Addus HomeCare Corp.* | | | 4,917 | | | | 84,523 | |
Adeptus Health, Inc. Class A*(a) | | | 2,202 | | | | 122,299 | |
Air Methods Corp.* | | | 26,428 | | | | 957,222 | |
Almost Family, Inc.* | | | 5,675 | | | | 211,337 | |
AMN Healthcare Services, Inc.* | | | 24,378 | | | | 819,345 | |
BioTelemetry, Inc.* | | | 2,415 | | | | 28,207 | |
Corvel Corp.* | | | 7,427 | | | | 292,772 | |
Ensign Group, Inc. (The) | | | 22,712 | | | | 514,200 | |
ExamWorks Group, Inc.* | | | 1,907 | | | | 56,371 | |
Landauer, Inc. | | | 4,881 | | | | 161,415 | |
LHC Group, Inc.* | | | 6,745 | | | | 239,852 | |
Magellan Health, Inc.* | | | 7,678 | | | | 521,566 | |
National Healthcare Corp. | | | 6,913 | | | | 430,680 | |
PharMerica Corp.* | | | 9,287 | | | | 205,336 | |
Providence Service Corp. (The)* | | | 2,052 | | | | 104,796 | |
RadNet, Inc.* | | | 18,727 | | | | 90,451 | |
Select Medical Holdings Corp.* | | | 101,554 | | | | 1,199,353 | |
Surgical Care Affiliates, Inc.* | | | 37,833 | | | | 1,750,911 | |
Triple-S Management Corp. Class B* | | | 27,704 | | | | 688,721 | |
U.S. Physical Therapy, Inc. | | | 4,323 | | | | 214,983 | |
| | | | | | | | |
| Total Health Care Providers & Services | | | | 9,166,880 | |
| Health Care Technology – 1.1% | | | | | | | | |
Computer Programs & Systems, Inc.(a) | | | 4,771 | | | | 248,664 | |
Evolent Health, Inc. Class A* | | | 219,924 | | | | 2,322,397 | |
HealthStream, Inc.* | | | 4,245 | | | | 93,772 | |
HMS Holdings Corp.* | | | 11,094 | | | | 159,199 | |
Inovalon Holdings, Inc. Class A*(a) | | | 32,757 | | | | 606,660 | |
Omnicell, Inc.* | | | 10,111 | | | | 281,794 | |
Quality Systems, Inc. | | | 22,104 | | | | 336,865 | |
| | | | | | | | |
| Total Health Care Technology | | | | 4,049,351 | |
| Hotels, Restaurants & Leisure – 3.2% | | | | | | | | |
Biglari Holdings, Inc.* | | | 799 | | | | 296,996 | |
BJ’s Restaurants, Inc.* | | | 9,936 | | | | 413,040 | |
Bob Evans Farms, Inc. | | | 8,995 | | | | 419,977 | |
Bojangles’, Inc.*(a) | | | 17,456 | | | | 296,927 | |
Bravo Brio Restaurant Group, Inc.* | | | 12,105 | | | | 93,814 | |
Chuy’s Holdings, Inc.* | | | 4,822 | | | | 149,820 | |
ClubCorp Holdings, Inc. | | | 16,579 | | | | 232,769 | |
Dave & Buster’s Entertainment, Inc.* | | | 10,963 | | | | 425,145 | |
Del Frisco’s Restaurant Group, Inc.* | | | 10,015 | | | | 166,049 | |
DineEquity, Inc. | | | 6,779 | | | | 633,362 | |
El Pollo Loco Holdings, Inc.* | | | 19,133 | | | | 255,234 | |
Fiesta Restaurant Group, Inc.* | | | 11,065 | | | | 362,711 | |
Fogo De Chao, Inc.*(a) | | | 15,459 | | | | 241,315 | |
Habit Restaurants, Inc. (The) Class A*(a) | | | 961 | | | | 17,903 | |
Hyatt Hotels Corp. Class A*(a) | | | 56,905 | | | | 2,816,228 | |
International Speedway Corp. Class A | | | 13,956 | | | | 515,116 | |
Interval Leisure Group, Inc.(a) | | | 49,506 | | | | 714,867 | |
Isle of Capri Casinos, Inc.* | | | 11,269 | | | | 157,766 | |
Jamba, Inc.*(a) | | | 7,560 | | | | 93,442 | |
See Notes to Financial Statements.
| | | | |
| WisdomTree Domestic Earnings and Dividend Funds | | | 73 | |
Schedule of Investments (continued)
WisdomTree SmallCap Earnings Fund (EES)
March 31, 2016
| | | | | | | | |
| Investments | | Shares | | | Value | |
Krispy Kreme Doughnuts, Inc.* | | | 22,077 | | | $ | 344,180 | |
Marcus Corp. (The) | | | 14,491 | | | | 274,604 | |
Monarch Casino & Resort, Inc.* | | | 8,944 | | | | 174,050 | |
Nathan’s Famous, Inc.* | | | 2,117 | | | | 92,301 | |
Papa Murphy’s Holdings, Inc.*(a) | | | 4,507 | | | | 53,859 | |
Popeyes Louisiana Kitchen, Inc.* | | | 7,454 | | | | 388,055 | |
Potbelly Corp.* | | | 4,365 | | | | 59,408 | |
RCI Hospitality Holdings, Inc. | | | 14,869 | | | | 131,739 | |
Red Robin Gourmet Burgers, Inc.* | | | 6,650 | | | | 428,725 | |
Ruth’s Hospitality Group, Inc. | | | 18,996 | | | | 349,716 | |
SeaWorld Entertainment, Inc.(a) | | | 19,982 | | | | 420,821 | |
Sonic Corp. | | | 21,663 | | | | 761,671 | |
Wingstop, Inc.*(a) | | | 2,939 | | | | 66,657 | |
| | | | | | | | |
| Total Hotels, Restaurants & Leisure | | | | 11,848,267 | |
| Household Durables – 2.4% | | | | | | | | |
Bassett Furniture Industries, Inc. | | | 5,375 | | | | 171,247 | |
Cavco Industries, Inc.* | | | 3,249 | | | | 303,652 | |
Century Communities, Inc.*(a) | | | 19,793 | | | | 337,866 | |
CSS Industries, Inc. | | | 6,507 | | | | 181,741 | |
Ethan Allen Interiors, Inc. | | | 14,620 | | | | 465,208 | |
Flexsteel Industries, Inc. | | | 5,190 | | | | 226,699 | |
Hooker Furniture Corp. | | | 6,112 | | | | 200,779 | |
Installed Building Products, Inc.* | | | 9,690 | | | | 257,851 | |
iRobot Corp.*(a) | | | 10,113 | | | | 356,989 | |
La-Z-Boy, Inc. | | | 30,075 | | | | 804,205 | |
LGI Homes, Inc.*(a) | | | 18,191 | | | | 440,404 | |
Libbey, Inc. | | | 25,228 | | | | 469,241 | |
Lifetime Brands, Inc. | | | 8,049 | | | | 121,298 | |
M/I Homes, Inc.* | | | 21,484 | | | | 400,677 | |
MDC Holdings, Inc. | | | 23,500 | | | | 588,910 | |
Meritage Homes Corp.* | | | 37,898 | | | | 1,381,761 | |
New Home Co., Inc. (The)*(a) | | | 12,338 | | | | 151,264 | |
Skullcandy, Inc.* | | | 17,160 | | | | 61,090 | |
Taylor Morrison Home Corp. Class A* | | | 34,540 | | | | 487,705 | |
TopBuild Corp.* | | | 8,832 | | | | 262,664 | |
Universal Electronics, Inc.* | | | 6,484 | | | | 401,943 | |
WCI Communities, Inc.* | | | 17,538 | | | | 325,856 | |
William Lyon Homes Class A*(a) | | | 32,680 | | | | 473,533 | |
ZAGG, Inc.* | | | 21,286 | | | | 191,787 | |
| | | | | | | | |
| Total Household Durables | | | | 9,064,370 | |
| Household Products – 0.3% | | | | | | | | |
Central Garden and Pet Co. Class A* | | | 19,776 | | | | 322,151 | |
Orchids Paper Products Co. | | | 4,378 | | | | 120,439 | |
WD-40 Co. | | | 4,649 | | | | 502,138 | |
| | | | | | | | |
| Total Household Products | | | | 944,728 | |
Independent Power & Renewable Electricity
Producers – 0.1% | | | | | |
NRG Yield, Inc. Class C | | | 18,305 | | | | 260,663 | |
Vivint Solar, Inc.*(a) | | | 21,674 | | | | 57,436 | |
| | | | | | | | |
| Total Independent Power & Renewable Electricity Producers | | | | | | | 318,099 | |
| Industrial Conglomerates – 0.1% | | | | | | | | |
Raven Industries, Inc. | | | 13,783 | | | | 220,804 | |
| Insurance – 3.5% | | | | | | | | |
AMERISAFE, Inc. | | | 11,554 | | | | 607,047 | |
Baldwin & Lyons, Inc. Class B | | | 9,963 | | | | 245,189 | |
EMC Insurance Group, Inc. | | | 17,640 | | | | 452,466 | |
Employers Holdings, Inc. | | | 30,516 | | | | 858,720 | |
FBL Financial Group, Inc. Class A | | | 14,273 | | | | 878,075 | |
Federated National Holding Co. | | | 11,425 | | | | 224,616 | |
Fidelity & Guaranty Life | | | 38,696 | | | | 1,015,383 | |
Hallmark Financial Services, Inc.* | | | 13,492 | | | | 155,158 | |
HCI Group, Inc. | | | 16,254 | | | | 541,258 | |
Heritage Insurance Holdings, Inc.(a) | | | 36,773 | | | | 587,265 | |
Horace Mann Educators Corp. | | | 25,224 | | | | 799,349 | |
Infinity Property & Casualty Corp. | | | 6,366 | | | | 512,463 | |
MBIA, Inc.* | | | 179,809 | | | | 1,591,310 | |
National Interstate Corp. | | | 7,599 | | | | 227,362 | |
National Western Life Group, Inc. Class A | | | 2,995 | | | | 690,737 | |
Navigators Group, Inc. (The)* | | | 7,579 | | | | 635,651 | |
State Auto Financial Corp. | | | 35,599 | | | | 785,314 | |
State National Cos., Inc. | | | 33,290 | | | | 419,454 | |
Stewart Information Services Corp. | | | 6,741 | | | | 244,563 | |
United Fire Group, Inc. | | | 20,979 | | | | 919,300 | |
Universal Insurance Holdings, Inc.(a) | | | 37,613 | | | | 669,511 | |
| | | | | | | | |
| Total Insurance | | | | 13,060,191 | |
| Internet & Catalog Retail – 0.2% | | | | | | | | |
1-800-Flowers.com, Inc. Class A* | | | 10,209 | | | | 80,447 | |
Blue Nile, Inc. | | | 3,084 | | | | 79,290 | |
FTD Cos., Inc.* | | | 2,702 | | | | 70,927 | |
Nutrisystem, Inc. | | | 12,934 | | | | 269,932 | |
Overstock.com, Inc.*(a) | | | 7,328 | | | | 105,377 | |
PetMed Express, Inc.(a) | | | 12,221 | | | | 218,878 | |
| | | | | | | | |
| Total Internet & Catalog Retail | | | | 824,851 | |
| Internet Software & Services – 0.9% | | | | | | | | |
Alarm.com Holdings, Inc.*(a) | | | 7,932 | | | | 187,988 | |
Angie’s List, Inc.* | | | 12,092 | | | | 97,583 | |
Bankrate, Inc.* | | | 20,878 | | | | 191,451 | |
DHI Group, Inc.* | | | 26,816 | | | | 216,405 | |
Envestnet, Inc.* | | | 3,709 | | | | 100,885 | |
Everyday Health, Inc.* | | | 3,486 | | | | 19,522 | |
NIC, Inc. | | | 21,221 | | | | 382,615 | |
Reis, Inc. | | | 3,306 | | | | 77,856 | |
RetailMeNot, Inc.* | | | 17,256 | | | | 138,221 | |
SciQuest, Inc.* | | | 1,039 | | | | 14,421 | |
Shutterstock, Inc.*(a) | | | 6,578 | | | | 241,610 | |
SPS Commerce, Inc.* | | | 451 | | | | 19,366 | |
Stamps.com, Inc.* | | | 3,543 | | | | 376,550 | |
TechTarget, Inc.* | | | 8,726 | | | | 64,747 | |
Travelzoo, Inc.* | | | 12,875 | | | | 104,545 | |
United Online, Inc.* | | | 8,436 | | | | 97,351 | |
Web.com Group, Inc.* | | | 1,886 | | | | 37,381 | |
WebMD Health Corp.* | | | 11,934 | | | | 747,426 | |
XO Group, Inc.* | | | 2,645 | | | | 42,452 | |
| | | | | | | | |
| Total Internet Software & Services | | | | 3,158,375 | |
See Notes to Financial Statements.
| | |
| 74 | | WisdomTree Domestic Earnings and Dividend Funds |
Schedule of Investments (continued)
WisdomTree SmallCap Earnings Fund (EES)
March 31, 2016
| | | | | | | | |
| Investments | | Shares | | | Value | |
| IT Services – 1.9% | | | | | | | | |
Cardtronics, Inc.* | | | 16,716 | | | $ | 601,609 | |
Cass Information Systems, Inc. | | | 4,639 | | | | 242,852 | |
Ciber, Inc.* | | | 24,226 | | | | 51,117 | |
Computer Task Group, Inc. | | | 8,223 | | | | 42,020 | |
CSG Systems International, Inc. | | | 15,356 | | | | 693,477 | |
Datalink Corp.*(a) | | | 8,260 | | | | 75,496 | |
ExlService Holdings, Inc.* | | | 10,018 | | | | 518,932 | |
Forrester Research, Inc. | | | 4,699 | | | | 157,933 | |
Hackett Group, Inc. (The) | | | 7,216 | | | | 109,106 | |
Lionbridge Technologies, Inc.* | | | 24,897 | | | | 125,979 | |
ManTech International Corp. Class A | | | 16,929 | | | | 541,559 | |
NeuStar, Inc. Class A*(a) | | | 77,892 | | | | 1,916,143 | |
Perficient, Inc.* | | | 13,373 | | | | 290,462 | |
Sykes Enterprises, Inc.* | | | 22,542 | | | | 680,318 | |
TeleTech Holdings, Inc. | | | 24,769 | | | | 687,587 | |
Virtusa Corp.* | | | 10,253 | | | | 384,077 | |
| | | | | | | | |
| Total IT Services | | | | 7,118,667 | |
| Leisure Products – 0.6% | | | | | | | | |
Callaway Golf Co. | | | 3,880 | | | | 35,386 | |
Escalade, Inc. | | | 10,566 | | | | 124,362 | |
JAKKS Pacific, Inc.*(a) | | | 47,464 | | | | 353,132 | |
Johnson Outdoors, Inc. Class A | | | 3,893 | | | | 86,503 | |
Malibu Boats, Inc. Class A* | | | 11,006 | | | | 180,498 | |
Nautilus, Inc.* | | | 15,885 | | | | 306,898 | |
Smith & Wesson Holding Corp.*(a) | | | 20,821 | | | | 554,255 | |
Sturm Ruger & Co., Inc. | | | 8,230 | | | | 562,767 | |
| | | | | | | | |
| Total Leisure Products | | | | 2,203,801 | |
| Life Sciences Tools & Services – 0.4% | | | | | | | | |
Affymetrix, Inc.* | | | 19,425 | | | | 272,144 | |
Cambrex Corp.* | | | 13,934 | | | | 613,096 | |
Luminex Corp.* | | | 20,902 | | | | 405,499 | |
Sequenom, Inc.*(a) | | | 99,607 | | | | 140,446 | |
| | | | | | | | |
| Total Life Sciences Tools & Services | | | | 1,431,185 | |
| Machinery – 5.9% | | | | | | | | |
Accuride Corp.*(a) | | | 12,790 | | | | 19,825 | |
Actuant Corp. Class A | | | 48,479 | | | | 1,197,916 | |
Alamo Group, Inc. | | | 8,159 | | | | 454,538 | |
Albany International Corp. Class A | | | 8,291 | | | | 311,659 | |
Altra Industrial Motion Corp. | | | 15,196 | | | | 422,145 | |
American Railcar Industries, Inc.(a) | | | 25,057 | | | | 1,020,572 | |
Astec Industries, Inc. | | | 9,562 | | | | 446,259 | |
Blount International, Inc.* | | | 15,533 | | | | 155,019 | |
Briggs & Stratton Corp. | | | 24,621 | | | | 588,934 | |
Chart Industries, Inc.* | | | 27,424 | | | | 595,649 | |
CIRCOR International, Inc. | | | 4,066 | | | | 188,622 | |
Columbus McKinnon Corp. | | | 9,054 | | | | 142,691 | |
Commercial Vehicle Group, Inc.* | | | 46,645 | | | | 123,609 | |
Douglas Dynamics, Inc. | | | 19,176 | | | | 439,322 | |
EnPro Industries, Inc. | | | 5,286 | | | | 304,896 | |
ESCO Technologies, Inc. | | | 11,341 | | | | 442,072 | |
Federal Signal Corp. | | | 48,256 | | | | 639,875 | |
FreightCar America, Inc. | | | 12,085 | | | | 188,284 | |
Global Brass & Copper Holdings, Inc. | | | 14,391 | | | | 359,055 | |
Gorman-Rupp Co. (The) | | | 10,153 | | | | 263,267 | |
Graham Corp. | | | 7,181 | | | | 142,974 | |
Greenbrier Cos., Inc. (The)(a) | | | 67,095 | | | | 1,854,506 | |
Hurco Cos., Inc. | | | 6,366 | | | | 210,014 | |
Hyster-Yale Materials Handling, Inc. | | | 16,347 | | | | 1,088,710 | |
John Bean Technologies Corp. | | | 10,951 | | | | 617,746 | |
Joy Global, Inc.(a) | | | 203,811 | | | | 3,275,243 | |
Kadant, Inc. | | | 8,067 | | | | 364,306 | |
L.B. Foster Co. Class A | | | 20,440 | | | | 371,190 | |
Lindsay Corp.(a) | | | 4,028 | | | | 288,445 | |
Lydall, Inc.* | | | 10,950 | | | | 356,094 | |
Meritor, Inc.* | | | 100,286 | | | | 808,305 | |
Miller Industries, Inc. | | | 8,664 | | | | 175,706 | |
Mueller Water Products, Inc. Class A | | | 36,496 | | | | 360,580 | |
NN, Inc. | | | 11,804 | | | | 161,479 | |
RBC Bearings, Inc.* | | | 8,796 | | | | 644,395 | |
Standex International Corp. | | | 7,265 | | | | 565,290 | |
Sun Hydraulics Corp. | | | 12,623 | | | | 418,957 | |
Tennant Co. | | | 6,321 | | | | 325,405 | |
TriMas Corp.* | | | 19,481 | | | | 341,307 | |
Twin Disc, Inc. | | | 3,627 | | | | 36,742 | |
Wabash National Corp.* | | | 80,789 | | | | 1,066,415 | |
Xerium Technologies, Inc.* | | | 12,167 | | | | 63,512 | |
| | | | | | | | |
| Total Machinery | | | | 21,841,530 | |
| Media – 1.3% | | | | | | | | |
AMC Entertainment Holdings, Inc. Class A | | | 39,902 | | | | 1,116,857 | |
Entercom Communications Corp. Class A* | | | 23,262 | | | | 246,112 | |
Entravision Communications Corp. Class A | | | 34,230 | | | | 254,671 | |
Gray Television, Inc.* | | | 38,300 | | | | 448,876 | |
Hemisphere Media Group, Inc.*(a) | | | 9,455 | | | | 124,144 | |
MSG Networks, Inc. Class A* | | | 94,262 | | | | 1,629,790 | |
National CineMedia, Inc. | | | 11,498 | | | | 174,884 | |
New Media Investment Group, Inc. | | | 12,064 | | | | 200,745 | |
Scholastic Corp. | | | 4,553 | | | | 170,146 | |
Townsquare Media, Inc. Class A* | | | 11,985 | | | | 134,352 | |
Tribune Publishing Co. | | | 20,025 | | | | 154,593 | |
World Wrestling Entertainment, Inc. Class A(a) | | | 15,241 | | | | 269,156 | |
| | | | | | | | |
| Total Media | | | | 4,924,326 | |
| Metals & Mining – 0.8% | | | | | | | | |
Ampco-Pittsburgh Corp. | | | 1,153 | | | | 16,038 | |
Century Aluminum Co.* | | | 43,867 | | | | 309,262 | |
Commercial Metals Co. | | | 97,208 | | | | 1,649,620 | |
Gold Resource Corp.(a) | | | 35,667 | | | | 83,104 | |
Haynes International, Inc. | | | 9,799 | | | | 357,664 | |
Materion Corp. | | | 13,177 | | | | 348,927 | |
Ryerson Holding Corp.*(a) | | | 54,944 | | | | 305,489 | |
| | | | | | | | |
| Total Metals & Mining | | | | 3,070,104 | |
| Multi-Utilities – 0.1% | | | | | | | | |
Unitil Corp. | | | 7,870 | | | | 334,396 | |
| Multiline Retail – 0.0% | | | | | | | | |
Tuesday Morning Corp.* | | | 17,584 | | | | 143,837 | |
See Notes to Financial Statements.
| | | | |
| WisdomTree Domestic Earnings and Dividend Funds | | | 75 | |
Schedule of Investments (continued)
WisdomTree SmallCap Earnings Fund (EES)
March 31, 2016
| | | | | | | | |
| Investments | | Shares | | | Value | |
| Oil, Gas & Consumable Fuels – 3.3% | | | | | | | | |
Alon USA Energy, Inc. | | | 72,514 | | | $ | 748,345 | |
EP Energy Corp. Class A*(a) | | | 1,648,792 | | | | 7,452,540 | |
Evolution Petroleum Corp. | | | 9,917 | | | | 48,197 | |
Green Plains, Inc. | | | 24,088 | | | | 384,444 | |
Jones Energy, Inc. Class A*(a) | | | 74,394 | | | | 247,732 | |
Oasis Petroleum, Inc.*(a) | | | 152,082 | | | | 1,107,157 | |
Panhandle Oil and Gas, Inc. Class A | | | 12,764 | | | | 220,945 | |
Par Pacific Holdings, Inc.* | | | 32,849 | | | | 616,247 | |
Renewable Energy Group, Inc.* | | | 15,626 | | | | 147,509 | |
REX American Resources Corp.* | | | 11,323 | | | | 628,087 | |
Ring Energy, Inc.* | | | 1,666 | | | | 8,413 | |
SemGroup Corp. Class A | | | 14,402 | | | | 322,605 | |
Synergy Resources Corp.*(a) | | | 17,864 | | | | 138,803 | |
| | | | | | | | |
| Total Oil, Gas & Consumable Fuels | | | | 12,071,024 | |
| Paper & Forest Products – 0.7% | | | | | | | | |
Boise Cascade Co.* | | | 25,204 | | | | 522,227 | |
Clearwater Paper Corp.* | | | 3,819 | | | | 185,260 | |
Deltic Timber Corp. | | | 756 | | �� | | 45,473 | |
Neenah Paper, Inc. | | | 11,793 | | | | 750,742 | |
PH Glatfelter Co. | | | 28,105 | | | | 582,617 | |
Schweitzer-Mauduit International, Inc. | | | 21,814 | | | | 686,705 | |
| | | | | | | | |
| Total Paper & Forest Products | | | | 2,773,024 | |
| Personal Products – 0.6% | | | | | | | | |
Inter Parfums, Inc. | | | 13,229 | | | | 408,776 | |
Medifast, Inc. | | | 6,907 | | | | 208,522 | |
Nutraceutical International Corp.* | | | 6,371 | | | | 155,134 | |
Revlon, Inc. Class A* | | | 10,741 | | | | 391,080 | |
Synutra International, Inc.* | | | 60,926 | | | | 302,802 | |
USANA Health Sciences, Inc.* | | | 7,332 | | | | 890,252 | |
| | | | | | | | |
| Total Personal Products | | | | 2,356,566 | |
| Pharmaceuticals – 0.8% | | | | | | | | |
ANI Pharmaceuticals, Inc.*(a) | | | 8,015 | | | | 269,785 | |
Aoxing Pharmaceutical Co., Inc.* | | | 52,224 | | | | 34,468 | |
Depomed, Inc.*(a) | | | 28,183 | | | | 392,589 | |
Lannett Co., Inc.*(a) | | | 38,295 | | | | 686,629 | |
Phibro Animal Health Corp. Class A | | | 19,376 | | | | 523,927 | |
Sagent Pharmaceuticals, Inc.* | | | 17,654 | | | | 214,849 | |
Sciclone Pharmaceuticals, Inc.* | | | 23,823 | | | | 262,053 | |
Sucampo Pharmaceuticals, Inc. Class A* | | | 21,336 | | | | 233,203 | |
Supernus Pharmaceuticals, Inc.* | | | 8,716 | | | | 132,919 | |
Teligent, Inc.*(a) | | | 22,209 | | | | 108,824 | |
| | | | | | | | |
| Total Pharmaceuticals | | | | 2,859,246 | |
| Professional Services – 1.9% | | | | | | | | |
Barrett Business Services, Inc. | | | 4,933 | | | | 141,824 | |
CBIZ, Inc.* | | | 31,988 | | | | 322,759 | |
CRA International, Inc.* | | | 7,044 | | | | 138,344 | |
Exponent, Inc. | | | 8,569 | | | | 437,105 | |
Franklin Covey Co.* | | | 6,992 | | | | 122,989 | |
FTI Consulting, Inc.* | | | 16,450 | | | | 584,139 | |
GP Strategies Corp.* | | | 8,078 | | | | 221,337 | |
Heidrick & Struggles International, Inc. | | | 6,309 | | | | 149,523 | |
Hill International, Inc.* | | | 13,961 | | | | 47,049 | |
Huron Consulting Group, Inc.* | | | 10,084 | | | | 586,788 | |
ICF International, Inc.* | | | 11,140 | | | | 382,882 | |
Insperity, Inc. | | | 8,408 | | | | 434,946 | |
Kelly Services, Inc. Class A | | | 23,771 | | | | 454,501 | |
Kforce, Inc. | | | 17,101 | | | | 334,838 | |
Mistras Group, Inc.* | | | 9,889 | | | | 244,951 | |
Navigant Consulting, Inc.* | | | 30,840 | | | | 487,580 | |
Resources Connection, Inc. | | | 17,518 | | | | 272,580 | |
RPX Corp.* | | | 33,050 | | | | 372,143 | |
TriNet Group, Inc.* | | | 12,897 | | | | 185,072 | |
TrueBlue, Inc.* | | | 27,326 | | | | 714,575 | |
WageWorks, Inc.* | | | 4,738 | | | | 239,790 | |
| | | | | | | | |
| Total Professional Services | | | | 6,875,715 | |
| Real Estate Investment Trusts (REITs) – 2.5% | | | | | | | | |
Agree Realty Corp. | | | 8,941 | | | | 343,960 | |
Armada Hoffler Properties, Inc. | | | 15,401 | | | | 173,261 | |
Ashford Hospitality Trust, Inc. | | | 335,473 | | | | 2,140,318 | |
CareTrust REIT, Inc. | | | 4,226 | | | | 53,670 | |
Cedar Realty Trust, Inc. | | | 4,539 | | | | 32,817 | |
Chatham Lodging Trust | | | 9,372 | | | | 200,842 | |
Chesapeake Lodging Trust | | | 16,906 | | | | 447,333 | |
CorEnergy Infrastructure Trust, Inc.(a) | | | 3,247 | | | | 65,297 | |
Easterly Government Properties, Inc. | | | 2,507 | | | | 46,430 | |
Franklin Street Properties Corp. | | | 20,649 | | | | 219,086 | |
Getty Realty Corp. | | | 8,265 | | | | 163,895 | |
Gladstone Commercial Corp. | | | 1,277 | | | | 20,917 | |
Hersha Hospitality Trust | | | 8,896 | | | | 189,841 | |
Independence Realty Trust, Inc. | | | 27,857 | | | | 198,342 | |
Investors Real Estate Trust | | | 20,754 | | | | 150,674 | |
LTC Properties, Inc. | | | 14,671 | | | | 663,716 | |
Monmouth Real Estate Investment Corp. Class A | | | 10,258 | | | | 121,968 | |
Monogram Residential Trust, Inc. | | | 65,450 | | | | 645,337 | |
National Storage Affiliates Trust | | | 4,061 | | | | 86,093 | |
One Liberty Properties, Inc. | | | 9,667 | | | | 216,637 | |
Physicians Realty Trust | | | 3,785 | | | | 70,325 | |
Potlatch Corp. | | | 13,515 | | | | 425,723 | |
Ramco-Gershenson Properties Trust | | | 15,337 | | | | 276,526 | |
Rexford Industrial Realty, Inc. | | | 621 | | | | 11,277 | |
Rouse Properties, Inc. | | | 17,673 | | | | 324,830 | |
Sabra Health Care REIT, Inc. | | | 28,105 | | | | 564,629 | |
Saul Centers, Inc. | | | 4,376 | | | | 232,016 | |
Summit Hotel Properties, Inc. | | | 19,762 | | | | 236,551 | |
Terreno Realty Corp. | | | 4,742 | | | | 111,200 | |
Universal Health Realty Income Trust | | | 5,954 | | | | 334,913 | |
Urstadt Biddle Properties, Inc. Class A | | | 15,961 | | | | 334,383 | |
Whitestone REIT | | | 3,499 | | | | 43,982 | |
| | | | | | | | |
| Total Real Estate Investment Trusts (REITs) | | | | 9,146,789 | |
| Real Estate Management & Development – 0.2% | | | | | | | | |
Consolidated-Tomoka Land Co. | | | 588 | | | | 27,131 | |
Marcus & Millichap, Inc.* | | | 17,536 | | | | 445,239 | |
RE/MAX Holdings, Inc. Class A | | | 3,211 | | | | 110,137 | |
Tejon Ranch Co.* | | | 1,616 | | | | 33,241 | |
| | | | | | | | |
| Total Real Estate Management & Development | | | | 615,748 | |
See Notes to Financial Statements.
| | |
| 76 | | WisdomTree Domestic Earnings and Dividend Funds |
Schedule of Investments (continued)
WisdomTree SmallCap Earnings Fund (EES)
March 31, 2016
| | | | | | | | |
| Investments | | Shares | | | Value | |
| Road & Rail – 2.0% | | | | | | | | |
ArcBest Corp. | | | 26,449 | | | $ | 571,034 | |
Celadon Group, Inc. | | | 27,654 | | | | 289,814 | |
Covenant Transportation Group, Inc. Class A* | | | 23,127 | | | | 559,442 | |
Heartland Express, Inc.(a) | | | 36,318 | | | | 673,699 | |
Marten Transport Ltd. | | | 22,484 | | | | 420,900 | |
PAM Transportation Services, Inc.* | | | 4,940 | | | | 152,152 | |
Roadrunner Transportation Systems, Inc.* | | | 49,918 | | | | 621,978 | |
Saia, Inc.* | | | 27,299 | | | | 768,467 | |
Swift Transportation Co.* | | | 140,877 | | | | 2,624,539 | |
Universal Truckload Services, Inc. | | | 31,807 | | | | 523,861 | |
USA Truck, Inc.* | | | 5,784 | | | | 108,971 | |
YRC Worldwide, Inc.* | | | 24,940 | | | | 232,441 | |
| | | | | | | | |
| Total Road & Rail | | | | 7,547,298 | |
| Semiconductors & Semiconductor Equipment – 2.4% | | | | | |
Amkor Technology, Inc.* | | | 256,343 | | | | 1,509,860 | |
Axcelis Technologies, Inc.* | | | 55,949 | | | | 156,657 | |
Brooks Automation, Inc. | | | 13,178 | | | | 137,051 | |
Cabot Microelectronics Corp. | | | 13,430 | | | | 549,421 | |
Cascade Microtech, Inc.* | | | 7,816 | | | | 161,166 | |
Ceva, Inc.* | | | 951 | | | | 21,398 | |
Cohu, Inc. | | | 5,428 | | | | 64,485 | |
Diodes, Inc.* | | | 19,829 | | | | 398,563 | |
DSP Group, Inc.* | | | 4,498 | | | | 41,022 | |
IXYS Corp. | | | 18,441 | | | | 206,908 | |
Mattson Technology, Inc.* | | | 45,458 | | | | 165,922 | |
NeoPhotonics Corp.* | | | 4,964 | | | | 69,695 | |
PDF Solutions, Inc.* | | | 14,042 | | | | 187,882 | |
Photronics, Inc.* | | | 24,505 | | | | 255,097 | |
Power Integrations, Inc. | | | 8,693 | | | | 431,694 | |
Rambus, Inc.* | | | 178,152 | | | | 2,449,590 | |
Rudolph Technologies, Inc.* | | | 11,187 | | | | 152,814 | |
Semtech Corp.* | | | 909 | | | | 19,989 | |
Tessera Technologies, Inc. | | | 41,482 | | | | 1,285,942 | |
Ultra Clean Holdings, Inc.* | | | 18,837 | | | | 100,966 | |
Xcerra Corp.* | | | 52,247 | | | | 340,650 | |
| | | | | | | | |
| Total Semiconductors & Semiconductor Equipment | | | | 8,706,772 | |
| Software – 0.9% | | | | | | | | |
American Software, Inc. Class A | | | 9,345 | | | | 84,105 | |
Ebix, Inc.(a) | | | 22,786 | | | | 929,441 | |
Gigamon, Inc.* | | | 2,496 | | | | 77,426 | |
MicroStrategy, Inc. Class A* | | | 5,226 | | | | 939,217 | |
Monotype Imaging Holdings, Inc. | | | 12,077 | | | | 288,882 | |
Progress Software Corp.* | | | 7,377 | | | | 177,933 | |
QAD, Inc. Class A | | | 6,400 | | | | 136,000 | |
Qualys, Inc.* | | | 10,531 | | | | 266,539 | |
Silver Spring Networks, Inc.* | | | 12,837 | | | | 189,346 | |
TiVo, Inc.* | | | 36,605 | | | | 348,113 | |
Zix Corp.* | | | 10,961 | | | | 43,077 | |
| | | | | | | | |
| Total Software | | | | 3,480,079 | |
| Specialty Retail – 5.8% | | | | | | | | |
America’s Car-Mart, Inc.*(a) | | | 10,110 | | | | 252,750 | |
Big 5 Sporting Goods Corp. | | | 17,506 | | | | 194,492 | |
Boot Barn Holdings, Inc.* | | | 8,311 | | | | 78,123 | |
Buckle, Inc. (The)(a) | | | 50,470 | | | | 1,709,419 | |
Build-A-Bear Workshop, Inc.* | | | 15,361 | | | | 199,539 | |
Caleres, Inc. | | | 25,952 | | | | 734,182 | |
Cato Corp. (The) Class A | | | 16,137 | | | | 622,081 | |
Chico’s FAS, Inc. | | | 77,443 | | | | 1,027,669 | |
Children’s Place, Inc. (The) | | | 11,089 | | | | 925,599 | |
Citi Trends, Inc. | | | 7,255 | | | | 129,357 | |
Conn’s, Inc.*(a) | | | 17,585 | | | | 219,109 | |
Container Store Group, Inc. (The)*(a) | | | 20,690 | | | | 121,450 | |
Express, Inc.* | | | 53,545 | | | | 1,146,399 | |
Finish Line, Inc. (The) Class A | | | 50,906 | | | | 1,074,117 | |
Five Below, Inc.* | | | 16,577 | | | | 685,293 | |
Francesca’s Holdings Corp.* | | | 19,046 | | | | 364,921 | |
Genesco, Inc.* | | | 18,625 | | | | 1,345,656 | |
Guess?, Inc. | | | 49,728 | | | | 933,395 | |
Haverty Furniture Cos., Inc. | | | 8,538 | | | | 180,664 | |
Hibbett Sports, Inc.*(a) | | | 23,681 | | | | 850,148 | |
Kirkland’s, Inc. | | | 12,270 | | | | 214,848 | |
MarineMax, Inc.* | | | 27,065 | | | | 526,956 | |
Outerwall, Inc.(a) | | | 39,191 | | | | 1,449,675 | |
Party City Holdco, Inc.* | | | 2,265 | | | | 34,066 | |
Pier 1 Imports, Inc. | | | 107,331 | | | | 752,390 | |
Rent-A-Center, Inc. | | | 47,564 | | | | 753,889 | |
Select Comfort Corp.* | | | 39,600 | | | | 767,844 | |
Shoe Carnival, Inc. | | | 12,268 | | | | 330,745 | |
Sonic Automotive, Inc. Class A | | | 36,179 | | | | 668,588 | |
Sportsman’s Warehouse Holdings, Inc.*(a) | | | 16,917 | | | | 213,154 | |
Stage Stores, Inc. | | | 38,095 | | | | 307,046 | |
Stein Mart, Inc. | | | 41,088 | | | | 301,175 | |
Tailored Brands, Inc. | | | 37,452 | | | | 670,391 | |
Tile Shop Holdings, Inc.* | | | 8,451 | | | | 126,004 | |
Vitamin Shoppe, Inc.* | | | 18,441 | | | | 570,933 | |
West Marine, Inc.* | | | 6,363 | | | | 57,840 | |
Winmark Corp. | | | 2,541 | | | | 248,967 | |
Zumiez, Inc.*(a) | | | 31,048 | | | | 618,476 | |
| | | | | | | | |
| Total Specialty Retail | | | | 21,407,350 | |
| Technology Hardware, Storage & Peripherals – 0.7% | | | | | |
Avid Technology, Inc.* | | | 2,724 | | | | 18,414 | |
Cray, Inc.* | | | 26,376 | | | | 1,105,418 | |
Immersion Corp.* | | | 2,572 | | | | 21,245 | |
Super Micro Computer, Inc.* | | | 42,722 | | | | 1,455,966 | |
| | | | | | | | |
| Total Technology Hardware, Storage & Peripherals | | | | 2,601,043 | |
| Textiles, Apparel & Luxury Goods – 1.7% | | | | | | | | |
Cherokee, Inc.* | | | 5,777 | | | | 102,773 | |
Culp, Inc. | | | 6,537 | | | | 171,400 | |
Deckers Outdoor Corp.* | | | 29,729 | | | | 1,781,064 | |
Iconix Brand Group, Inc.*(a) | | | 99,832 | | | | 803,648 | |
Movado Group, Inc. | | | 18,691 | | | | 514,563 | |
Oxford Industries, Inc. | | | 9,709 | | | | 652,736 | |
Superior Uniform Group, Inc. | | | 7,782 | | | | 138,675 | |
Tumi Holdings, Inc.* | | | 36,423 | | | | 976,865 | |
Unifi, Inc.* | | | 15,173 | | | | 347,614 | |
See Notes to Financial Statements.
| | | | |
| WisdomTree Domestic Earnings and Dividend Funds | | | 77 | |
Schedule of Investments (concluded)
WisdomTree SmallCap Earnings Fund (EES)
March 31, 2016
| | | | | | | | |
| Investments | | Shares | | | Value | |
Vera Bradley, Inc.* | | | 17,692 | | | $ | 359,855 | |
Vince Holding Corp.*(a) | | | 47,304 | | | | 299,434 | |
| | | | | | | | |
| Total Textiles, Apparel & Luxury Goods | | | | 6,148,627 | |
| Thrifts & Mortgage Finance – 3.1% | | | | | | | | |
Anchor BanCorp Wisconsin, Inc.* | | | 26,557 | | | | 1,196,658 | |
Astoria Financial Corp. | | | 43,984 | | | | 696,707 | |
Bank Mutual Corp. | | | 15,619 | | | | 118,236 | |
BankFinancial Corp. | | | 28,125 | | | | 332,438 | |
Beneficial Bancorp, Inc.* | | | 14,555 | | | | 199,258 | |
BofI Holding, Inc.*(a) | | | 40,289 | | | | 859,767 | |
Cape Bancorp, Inc. | | | 7,596 | | | | 102,090 | |
Clifton Bancorp, Inc. | | | 5,329 | | | | 80,575 | |
Dime Community Bancshares, Inc. | | | 22,381 | | | | 394,353 | |
Federal Agricultural Mortgage Corp. Class C | | | 10,504 | | | | 396,316 | |
First Defiance Financial Corp. | | | 5,696 | | | | 218,783 | |
First Financial Northwest, Inc. | | | 6,231 | | | | 82,062 | |
Flagstar Bancorp, Inc.* | | | 38,248 | | | | 820,802 | |
Fox Chase Bancorp, Inc. | | | 4,044 | | | | 78,130 | |
Hingham Institution for Savings | | | 1,196 | | | | 142,456 | |
HomeStreet, Inc.* | | | 12,192 | | | | 253,716 | |
Impac Mortgage Holdings, Inc.*(a) | | | 32,269 | | | | 447,571 | |
Kearny Financial Corp. | | | 4,095 | | | | 50,573 | |
LendingTree, Inc.*(a) | | | 1,879 | | | | 183,729 | |
Meridian Bancorp, Inc. | | | 14,428 | | | | 200,838 | |
Meta Financial Group, Inc. | | | 3,468 | | | | 158,141 | |
Northfield Bancorp, Inc. | | | 10,392 | | | | 170,845 | |
Northwest Bancshares, Inc. | | | 38,388 | | | | 518,622 | |
OceanFirst Financial Corp. | | | 8,824 | | | | 156,008 | |
Oritani Financial Corp. | | | 26,359 | | | | 447,312 | |
PennyMac Financial Services, Inc. Class A* | | | 23,194 | | | | 272,761 | |
Provident Financial Services, Inc. | | | 35,773 | | | | 722,257 | |
Territorial Bancorp, Inc. | | | 4,541 | | | | 118,338 | |
TrustCo Bank Corp. | | | 60,240 | | | | 365,054 | |
United Community Financial Corp. | | | 23,070 | | | | 135,421 | |
United Financial Bancorp, Inc. | | | 26,981 | | | | 339,691 | |
Walker & Dunlop, Inc.* | | | 22,892 | | | | 555,589 | |
Waterstone Financial, Inc. | | | 9,999 | | | | 136,786 | |
WSFS Financial Corp. | | | 13,923 | | | | 452,776 | |
| | | | | | | | |
| Total Thrifts & Mortgage Finance | | | | 11,404,659 | |
| Tobacco – 0.3% | | | | | | | | |
Universal Corp. | | | 19,022 | | | | 1,080,640 | |
| Trading Companies & Distributors – 1.7% | | | | | | | | |
Applied Industrial Technologies, Inc. | | | 28,138 | | | | 1,221,189 | |
BMC Stock Holdings, Inc.* | | | 9,156 | | | | 152,173 | |
CAI International, Inc.* | | | 61,969 | | | | 598,620 | |
DXP Enterprises, Inc.* | | | 7,550 | | | | 132,578 | |
H&E Equipment Services, Inc. | | | 30,765 | | | | 539,310 | |
Houston Wire & Cable Co. | | | 16,041 | | | | 112,127 | |
Kaman Corp. | | | 16,590 | | | | 708,227 | |
Lawson Products, Inc.*(a) | | | 569 | | | | 11,141 | |
MRC Global, Inc.* | | | 68,570 | | | | 901,010 | |
Rush Enterprises, Inc. Class A* | | | 39,991 | | | | 729,436 | |
TAL International Group, Inc.* | | | 66,999 | | | | 1,034,465 | |
Veritiv Corp.* | | | 699 | | | | 26,045 | |
| | | | | | | | |
| Total Trading Companies & Distributors | | | | 6,166,321 | |
| Transportation Infrastructure – 0.3% | | | | | | | | |
Wesco Aircraft Holdings, Inc.* | | | 69,365 | | | | 998,162 | |
| Water Utilities – 0.7% | | | | | | | | |
American States Water Co. | | | 15,895 | | | | 625,627 | |
Artesian Resources Corp. Class A | | | 4,885 | | | | 136,585 | |
California Water Service Group | | | 26,045 | | | | 695,922 | |
Connecticut Water Service, Inc. | | | 6,755 | | | | 304,651 | |
Middlesex Water Co. | | | 7,651 | | | | 236,033 | |
SJW Corp. | | | 10,808 | | | | 392,871 | |
York Water Co. (The) | | | 5,856 | | | | 178,725 | |
| | | | | | | | |
| Total Water Utilities | | | | 2,570,414 | |
| Wireless Telecommunication Services – 0.2% | | | | | |
Shenandoah Telecommunications Co. | | | 17,497 | | | | 468,045 | |
Spok Holdings, Inc. | | | 11,064 | | | | 193,730 | |
| | | | | | | | |
| Total Wireless Telecommunication Services | | | | | | | 661,775 | |
| Total United States | | | | | | | 364,800,757 | |
TOTAL COMMON STOCKS
(Cost: $366,805,219) | | | | | | | 367,857,581 | |
| RIGHTS – 0.0% | | | | | | | | |
| United States – 0.0% | | | | | | | | |
| Vince Holding Corp., expiring 4/14/16*(a) (Cost $0) | | | 47,304 | | | | 12,529 | |
| EXCHANGE-TRADED FUND – 0.3% | | | | | | | | |
| United States – 0.3% | | | | | | | | |
WisdomTree MidCap Earnings Fund(b)
(Cost: $1,179,390) | | | 14,290 | | | | 1,288,529 | |
| INVESTMENT OF CASH COLLATERAL FOR SECURITIES LOANED – 12.8% | |
| United States – 12.8% | | | | | | | | |
State Street Navigator Securities Lending Prime Portfolio, 0.50%(c) (Cost: $47,210,603)(d) | | | 47,210,603 | | | | 47,210,603 | |
TOTAL INVESTMENTS IN SECURITIES – 112.5%
(Cost: $415,195,212) | | | | 416,369,242 | |
Liabilities in Excess of Cash and Other Assets – (12.5)% | | | | (46,404,561 | ) |
| | | | | | | | |
| NET ASSETS – 100.0% | | | | | | $ | 369,964,681 | |
| * | Non-income producing security. |
| (a) | Security, or portion thereof, was on loan at March 31, 2016 (See Note 2). |
| (b) | Affiliated company (See Note 3). |
| (c) | Rate shown represents annualized 7-day yield as of March 31, 2016. |
| (d) | At March 31, 2016, the total market value of the Fund’s securities on loan was $46,400,922 and the total market value of the collateral held by the Fund was $47,795,873. The total market value of the collateral includes non-cash U.S. Government securities collateral having a value of $585,270. |
See Notes to Financial Statements.
| | |
| 78 | | WisdomTree Domestic Earnings and Dividend Funds |
Schedule of Investments
WisdomTree Total Dividend Fund (DTD)
March 31, 2016
| | | | | | | | |
| Investments | | Shares | | | Value | |
| COMMON STOCKS – 99.5% | | | | | | | | |
| United States – 99.5% | | | | | | | | |
| Aerospace & Defense – 2.5% | | | | | | | | |
American Science & Engineering, Inc. | | | 378 | | | $ | 10,467 | |
B/E Aerospace, Inc. | | | 2,057 | | | | 94,869 | |
Boeing Co. (The) | | | 17,864 | | | | 2,267,656 | |
General Dynamics Corp. | | | 6,819 | | | | 895,812 | |
Honeywell International, Inc. | | | 19,729 | | | | 2,210,634 | |
Huntington Ingalls Industries, Inc. | | | 924 | | | | 126,533 | |
L-3 Communications Holdings, Inc. | | | 2,044 | | | | 242,214 | |
Lockheed Martin Corp. | | | 9,887 | | | | 2,189,970 | |
Northrop Grumman Corp. | | | 3,430 | | | | 678,797 | |
Orbital ATK, Inc. | | | 967 | | | | 84,071 | |
Raytheon Co. | | | 6,890 | | | | 844,921 | |
Rockwell Collins, Inc. | | | 2,247 | | | | 207,196 | |
United Technologies Corp. | | | 25,935 | | | | 2,596,093 | |
| | | | | | | | |
| Total Aerospace & Defense | | | | | | | 12,449,233 | |
| Air Freight & Logistics – 0.6% | | | | | | | | |
C.H. Robinson Worldwide, Inc. | | | 3,815 | | | | 283,187 | |
Expeditors International of Washington, Inc. | | | 3,851 | | | | 187,967 | |
FedEx Corp. | | | 2,091 | | | | 340,248 | |
United Parcel Service, Inc. Class B | | | 22,184 | | | | 2,339,747 | |
| | | | | | | | |
| Total Air Freight & Logistics | | | | | | | 3,151,149 | |
| Airlines – 0.2% | | | | | | | | |
Alaska Air Group, Inc. | | | 1,090 | | | | 89,402 | |
American Airlines Group, Inc. | | | 6,519 | | | | 267,344 | |
Delta Air Lines, Inc. | | | 9,137 | | | | 444,789 | |
Southwest Airlines Co. | | | 4,660 | | | | 208,768 | |
| | | | | | | | |
| Total Airlines | | | | | | | 1,010,303 | |
| Auto Components – 0.3% | | | | | | | | |
BorgWarner, Inc. | | | 2,851 | | | | 109,478 | |
Gentex Corp. | | | 7,854 | | | | 123,229 | |
Goodyear Tire & Rubber Co. (The) | | | 3,597 | | | | 118,629 | |
Johnson Controls, Inc. | | | 19,410 | | | | 756,408 | |
Lear Corp. | | | 911 | | | | 101,276 | |
Spartan Motors, Inc. | | | 6,522 | | | | 25,762 | |
Unique Fabricating, Inc. | | | 1,814 | | | | 22,403 | |
| | | | | | | | |
| Total Auto Components | | | | | | | 1,257,185 | |
| Automobiles – 1.0% | | | | | | | | |
Ford Motor Co. | | | 182,231 | | | | 2,460,118 | |
General Motors Co. | | | 68,513 | | | | 2,153,364 | |
Harley-Davidson, Inc. | | | 5,365 | | | | 275,385 | |
Thor Industries, Inc. | | | 1,867 | | | | 119,059 | |
| | | | | | | | |
| Total Automobiles | | | | | | | 5,007,926 | |
| Banks – 5.5% | | | | | | | | |
American National Bankshares, Inc. | | | 957 | | | | 24,241 | |
Arrow Financial Corp. | | | 1,648 | | | | 43,787 | |
Associated Banc-Corp. | | | 5,728 | | | | 102,760 | |
Banc of California, Inc. | | | 3,477 | | | | 60,848 | |
Bank of America Corp. | | | 132,198 | | | | 1,787,317 | |
Bank of Hawaii Corp. | | | 2,014 | | | | 137,516 | |
Bank of the Ozarks, Inc. | | | 1,790 | | | | 75,126 | |
BankUnited, Inc. | | | 3,684 | | | | 126,877 | |
Bar Harbor Bankshares | | | 714 | | | | 23,719 | |
BB&T Corp. | | | 24,639 | | | | 819,740 | |
BCB Bancorp, Inc. | | | 2,218 | | | | 22,202 | |
BOK Financial Corp.(a) | | | 2,448 | | | | 133,710 | |
Cathay General Bancorp | | | 3,171 | | | | 89,834 | |
CIT Group, Inc. | | | 2,629 | | | | 81,578 | |
Citigroup, Inc. | | | 13,026 | | | | 543,835 | |
Citizens Financial Group, Inc. | | | 9,390 | | | | 196,721 | |
CNB Financial Corp. | | | 1,365 | | | | 24,010 | |
Comerica, Inc. | | | 4,267 | | | | 161,591 | |
Commerce Bancshares, Inc. | | | 2,868 | | | | 128,917 | |
Community Bank System, Inc. | | | 1,398 | | | | 53,418 | |
Cullen/Frost Bankers, Inc.(a) | | | 2,170 | | | | 119,589 | |
CVB Financial Corp. | | | 4,848 | | | | 84,598 | |
East West Bancorp, Inc. | | | 3,522 | | | | 114,395 | |
Enterprise Bancorp, Inc. | | | 970 | | | | 25,453 | |
Fifth Third Bancorp | | | 23,676 | | | | 395,152 | |
Financial Institutions, Inc. | | | 1,071 | | | | 31,134 | |
First Business Financial Services, Inc. | | | 938 | | | | 21,508 | |
First Community Bancshares, Inc. | | | 1,248 | | | | 24,760 | |
First Connecticut Bancorp, Inc. | | | 1,400 | | | | 22,344 | |
First Financial Corp. | | | 927 | | | | 31,713 | |
First Horizon National Corp. | | | 6,307 | | | | 82,622 | |
First Niagara Financial Group, Inc. | | | 12,500 | | | | 121,000 | |
First Republic Bank | | | 2,108 | | | | 140,477 | |
FirstMerit Corp. | | | 8,452 | | | | 177,915 | |
FNB Corp. | | | 10,120 | | | | 131,661 | |
Fulton Financial Corp. | | | 7,398 | | | | 98,985 | |
Glacier Bancorp, Inc. | | | 3,367 | | | | 85,589 | |
Hancock Holding Co. | | | 4,891 | | | | 112,297 | |
Heritage Commerce Corp. | | | 2,227 | | | | 22,292 | |
Horizon Bancorp | | | 892 | | | | 22,050 | |
Huntington Bancshares, Inc. | | | 24,507 | | | | 233,797 | |
Iberiabank Corp. | | | 1,456 | | | | 74,649 | |
Independent Bank Corp. | | | 1,547 | | | | 22,509 | |
Investors Bancorp, Inc. | | | 6,964 | | | | 81,061 | |
JPMorgan Chase & Co. | | | 106,483 | | | | 6,305,923 | |
KeyCorp | | | 21,148 | | | | 233,474 | |
M&T Bank Corp. | | | 4,453 | | | | 494,283 | |
Macatawa Bank Corp. | | | 3,892 | | | | 24,325 | |
MB Financial, Inc. | | | 2,598 | | | | 84,305 | |
MidSouth Bancorp, Inc. | | | 2,327 | | | | 17,755 | |
MidWestOne Financial Group, Inc. | | | 785 | | | | 21,548 | |
National Penn Bancshares, Inc. | | | 5,861 | | | | 62,361 | |
Old National Bancorp | | | 7,524 | | | | 91,718 | |
Pacific Continental Corp. | | | 1,568 | | | | 25,292 | |
PacWest Bancorp | | | 5,684 | | | | 211,161 | |
Park National Corp. | | | 1,097 | | | | 98,730 | |
Park Sterling Corp. | | | 3,175 | | | | 21,177 | |
Peapack Gladstone Financial Corp. | | | 1,094 | | | | 18,489 | |
Penns Woods Bancorp, Inc. | | | 1,069 | | | | 41,199 | |
People’s United Financial, Inc. | | | 14,859 | | | | 236,704 | |
Peoples Bancorp, Inc. | | | 1,259 | | | | 24,601 | |
See Notes to Financial Statements.
| | | | |
| WisdomTree Domestic Earnings and Dividend Funds | | | 79 | |
Schedule of Investments (continued)
WisdomTree Total Dividend Fund (DTD)
March 31, 2016
| | | | | | | | |
| Investments | | Shares | | | Value | |
PNC Financial Services Group, Inc. (The) | | | 12,119 | | | $ | 1,024,904 | |
Prosperity Bancshares, Inc. | | | 2,249 | | | | 104,331 | |
QCR Holdings, Inc. | | | 1,019 | | | | 24,303 | |
Regions Financial Corp. | | | 34,126 | | | | 267,889 | |
Shore Bancshares, Inc. | | | 2,165 | | | | 25,937 | |
Sierra Bancorp | | | 1,284 | | | | 23,305 | |
Stonegate Bank | | | 725 | | | | 21,721 | |
Suffolk Bancorp | | | 829 | | | | 20,924 | |
SunTrust Banks, Inc. | | | 12,350 | | | | 445,588 | |
Synovus Financial Corp. | | | 2,752 | | | | 79,560 | |
TCF Financial Corp. | | | 4,662 | | | | 57,156 | |
Trustmark Corp. | | | 4,340 | | | | 99,950 | |
U.S. Bancorp | | | 45,070 | | | | 1,829,391 | |
UMB Financial Corp. | | | 1,580 | | | | 81,575 | |
Umpqua Holdings Corp. | | | 10,628 | | | | 168,560 | |
United Bankshares, Inc. | | | 3,531 | | | | 129,588 | |
Univest Corp. of Pennsylvania | | | 2,881 | | | | 56,208 | |
Valley National Bancorp | | | 15,592 | | | | 148,748 | |
Webster Financial Corp. | | | 3,072 | | | | 110,285 | |
Wells Fargo & Co. | | | 151,973 | | | | 7,349,414 | |
West Bancorp, Inc. | | | 1,187 | | | | 21,639 | |
Zions Bancorp | | | 3,154 | | | | 76,358 | |
| | | | | | | | |
| Total Banks | | | | | | | 27,095,676 | |
| Beverages – 2.6% | | | | | | | | |
Brown-Forman Corp. Class A | | | 1,392 | | | | 148,512 | |
Brown-Forman Corp. Class B | | | 1,824 | | | | 179,609 | |
Coca-Cola Co. (The) | | | 143,399 | | | | 6,652,280 | |
Coca-Cola Enterprises, Inc. | | | 5,438 | | | | 275,924 | |
Constellation Brands, Inc. Class A | | | 1,501 | | | | 226,786 | |
Dr. Pepper Snapple Group, Inc. | | | 4,248 | | | | 379,856 | |
Molson Coors Brewing Co. Class B | | | 3,025 | | | | 290,945 | |
PepsiCo, Inc. | | | 43,863 | | | | 4,495,080 | |
| | | | | | | | |
| Total Beverages | | | | | | | 12,648,992 | |
| Biotechnology – 1.9% | | | | | | | | |
AbbVie, Inc. | | | 73,005 | | | | 4,170,046 | |
Amgen, Inc. | | | 16,411 | | | | 2,460,501 | |
Baxalta, Inc. | | | 5,307 | | | | 214,403 | |
Gilead Sciences, Inc. | | | 26,181 | | | | 2,404,987 | |
PDL BioPharma, Inc. | | | 21,828 | | | | 72,687 | |
| | | | | | | | |
| Total Biotechnology | | | | | | | 9,322,624 | |
| Building Products – 0.1% | | | | | | | | |
A.O. Smith Corp. | | | 1,264 | | | | 96,456 | |
Fortune Brands Home & Security, Inc. | | | 2,373 | | | | 132,983 | |
Lennox International, Inc. | | | 663 | | | | 89,631 | |
Masco Corp. | | | 5,006 | | | | 157,439 | |
Owens Corning | | | 2,348 | | | | 111,013 | |
| | | | | | | | |
| Total Building Products | | | | | | | 587,522 | |
| Capital Markets – 1.8% | | | | | | | | |
Ameriprise Financial, Inc. | | | 4,404 | | | | 414,020 | |
Arlington Asset Investment Corp. Class A(a) | | | 3,624 | | | | 45,409 | |
Artisan Partners Asset Management, Inc. Class A | | | 2,502 | | | | 77,162 | |
Bank of New York Mellon Corp. (The) | | | 19,992 | | | | 736,305 | |
BGC Partners, Inc. Class A | | | 17,953 | | | | 162,475 | |
BlackRock, Inc. | | | 4,574 | | | | 1,557,767 | |
Calamos Asset Management, Inc. Class A | | | 2,596 | | | | 22,040 | |
Charles Schwab Corp. (The) | | | 10,696 | | | | 299,702 | |
Cohen & Steers, Inc. | | | 2,379 | | | | 92,591 | |
Eaton Vance Corp. | | | 4,332 | | | | 145,208 | |
Evercore Partners, Inc. Class A | | | 1,602 | | | | 82,903 | |
FBR & Co. | | | 1,160 | | | | 20,984 | |
Federated Investors, Inc. Class B | | | 4,715 | | | | 136,028 | |
Franklin Resources, Inc. | | | 10,194 | | | | 398,076 | |
Goldman Sachs Group, Inc. (The) | | | 6,586 | | | | 1,033,870 | |
Greenhill & Co., Inc. | | | 2,920 | | | | 64,824 | |
Houlihan Lokey, Inc. | | | 1,020 | | | | 25,398 | |
Janus Capital Group, Inc. | | | 7,516 | | | | 109,959 | |
Legg Mason, Inc. | | | 2,471 | | | | 85,694 | |
LPL Financial Holdings, Inc.(a) | | | 2,718 | | | | 67,406 | |
Manning & Napier, Inc. | | | 2,871 | | | | 23,169 | |
Morgan Stanley | | | 37,275 | | | | 932,248 | |
Northern Trust Corp. | | | 5,298 | | | | 345,271 | |
NorthStar Asset Management Group, Inc. | | | 7,285 | | | | 82,685 | |
Oppenheimer Holdings, Inc. Class A | | | 1,451 | | | | 22,897 | |
Raymond James Financial, Inc. | | | 2,329 | | | | 110,884 | |
SEI Investments Co. | | | 2,518 | | | | 108,400 | |
Silvercrest Asset Management Group, Inc. Class A | | | 1,952 | | | | 24,868 | |
State Street Corp. | | | 8,860 | | | | 518,487 | |
T. Rowe Price Group, Inc. | | | 7,389 | | | | 542,796 | |
TD Ameritrade Holding Corp. | | | 11,502 | | | | 362,658 | |
Virtu Financial, Inc. Class A | | | 1,997 | | | | 44,154 | |
Waddell & Reed Financial, Inc. Class A | | | 4,602 | | | | 108,331 | |
| | | | | | | | |
| Total Capital Markets | | | | 8,804,669 | |
| Chemicals – 2.1% | | | | | | | | |
A. Schulman, Inc. | | | 1,676 | | | | 45,621 | |
Air Products & Chemicals, Inc. | | | 5,618 | | | | 809,273 | |
Airgas, Inc. | | | 1,344 | | | | 190,364 | |
Albemarle Corp. | | | 2,821 | | | | 180,347 | |
Ashland, Inc. | | | 1,008 | | | | 110,840 | |
Axiall Corp. | | | 3,255 | | | | 71,089 | |
Cabot Corp. | | | 2,189 | | | | 105,794 | |
Celanese Corp. Series A | | | 3,116 | | | | 204,098 | |
CF Industries Holdings, Inc. | | | 7,364 | | | | 230,788 | |
Chemours Co. (The) | | | 4,067 | | | | 28,469 | |
Dow Chemical Co. (The) | | | 42,001 | | | | 2,136,171 | |
E.I. du Pont de Nemours & Co. | | | 19,989 | | | | 1,265,703 | |
Eastman Chemical Co. | | | 3,739 | | | | 270,068 | |
Ecolab, Inc. | | | 3,779 | | | | 421,434 | |
FMC Corp. | | | 2,356 | | | | 95,112 | |
FutureFuel Corp. | | | 3,580 | | | | 42,208 | |
Huntsman Corp. | | | 12,319 | | | | 163,843 | |
Innophos Holdings, Inc. | | | 2,135 | | | | 65,993 | |
International Flavors & Fragrances, Inc. | | | 1,895 | | | | 215,594 | |
KMG Chemicals, Inc. | | | 956 | | | | 22,055 | |
Kronos Worldwide, Inc.(a) | | | 12,147 | | | | 69,481 | |
Monsanto Co. | | | 10,395 | | | | 912,057 | |
See Notes to Financial Statements.
| | |
| 80 | | WisdomTree Domestic Earnings and Dividend Funds |
Schedule of Investments (continued)
WisdomTree Total Dividend Fund (DTD)
March 31, 2016
| | | | | | | | |
| Investments | | Shares | | | Value | |
Mosaic Co. (The) | | | 12,917 | | | $ | 348,759 | |
NewMarket Corp. | | | 231 | | | | 91,536 | |
Olin Corp. | | | 6,910 | | | | 120,027 | |
PPG Industries, Inc. | | | 4,006 | | | | 446,629 | |
Praxair, Inc. | | | 8,189 | | | | 937,231 | |
Rayonier Advanced Materials, Inc. | | | 2,533 | | | | 24,063 | |
RPM International, Inc. | | | 3,443 | | | | 162,957 | |
Scotts Miracle-Gro Co. (The) Class A | | | 2,221 | | | | 161,622 | |
Sensient Technologies Corp. | | | 1,286 | | | | 81,610 | |
Sherwin-Williams Co. (The) | | | 1,047 | | | | 298,049 | |
Valhi, Inc.(a) | | | 5,976 | | | | 7,052 | |
Valspar Corp. (The) | | | 1,356 | | | | 145,119 | |
Westlake Chemical Corp. | | | 1,974 | | | | 91,396 | |
| | | | | | | | |
| Total Chemicals | | | | 10,572,452 | |
| Commercial Services & Supplies – 0.7% | | | | | | | | |
ADT Corp. (The) | | | 5,257 | | | | 216,904 | |
Brady Corp. Class A | | | 2,554 | | | | 68,549 | |
CECO Environmental Corp. | | | 3,287 | | | | 20,412 | |
Cintas Corp. | | | 1,791 | | | | 160,850 | |
Covanta Holding Corp. | | | 8,382 | | | | 141,321 | |
Deluxe Corp. | | | 1,513 | | | | 94,547 | |
Ennis, Inc. | | | 1,992 | | | | 38,944 | |
Healthcare Services Group, Inc. | | | 2,657 | | | | 97,804 | |
HNI Corp. | | | 2,326 | | | | 91,109 | |
KAR Auction Services, Inc. | | | 5,150 | | | | 196,421 | |
McGrath RentCorp | | | 2,365 | | | | 59,314 | |
Mobile Mini, Inc. | | | 1,430 | | | | 47,219 | |
MSA Safety, Inc. | | | 1,711 | | | | 82,727 | |
Pitney Bowes, Inc. | | | 8,565 | | | | 184,490 | |
Quad/Graphics, Inc. | | | 5,003 | | | | 64,739 | |
R.R. Donnelley & Sons Co. | | | 17,074 | | | | 280,014 | |
Republic Services, Inc. | | | 10,659 | | | | 507,901 | |
Rollins, Inc. | | | 4,443 | | | | 120,494 | |
Waste Connections, Inc.(a) | | | 1,669 | | | | 107,801 | |
Waste Management, Inc. | | | 14,459 | | | | 853,081 | |
West Corp. | | | 4,477 | | | | 102,165 | |
| | | | | | | | |
| Total Commercial Services & Supplies | | | | 3,536,806 | |
| Communications Equipment – 1.2% | | | | | | | | |
Alliance Fiber Optic Products, Inc.* | | | 1,592 | | | | 23,546 | |
Black Box Corp. | | | 2,384 | | | | 32,112 | |
Brocade Communications Systems, Inc. | | | 9,100 | | | | 96,278 | |
Cisco Systems, Inc. | | | 172,824 | | | | 4,920,299 | |
Comtech Telecommunications Corp. | | | 1,531 | | | | 35,779 | |
Harris Corp. | | | 3,281 | | | | 255,459 | |
Juniper Networks, Inc. | | | 5,821 | | | | 148,494 | |
Motorola Solutions, Inc. | | | 4,468 | | | | 338,228 | |
TESSCO Technologies, Inc. | | | 1,177 | | | | 19,597 | |
| | | | | | | | |
| Total Communications Equipment | | | | 5,869,792 | |
| Construction & Engineering – 0.1% | | | | | | | | |
Fluor Corp. | | | 3,369 | | | | 180,916 | |
KBR, Inc. | | | 4,461 | | | | 69,056 | |
| | | | | | | | |
| Total Construction & Engineering | | | | 249,972 | |
| Construction Materials – 0.1% | | | | | | | | |
Martin Marietta Materials, Inc. | | | 888 | | | $ | 141,645 | |
United States Lime & Minerals, Inc. | | | 423 | | | | 25,384 | |
Vulcan Materials Co. | | | 789 | | | | 83,295 | |
| | | | | | | | |
| Total Construction Materials | | | | 250,324 | |
| Consumer Finance – 0.5% | | | | | | | | |
American Express Co. | | | 17,163 | | | | 1,053,808 | |
Capital One Financial Corp. | | | 11,893 | | | | 824,304 | |
Discover Financial Services | | | 9,291 | | | | 473,098 | |
Navient Corp. | | | 19,829 | | | | 237,353 | |
Nelnet, Inc. Class A | | | 1,324 | | | | 52,126 | |
| | | | | | | | |
| Total Consumer Finance | | | | 2,640,689 | |
| Containers & Packaging – 0.5% | | | | | | | | |
AptarGroup, Inc. | | | 1,550 | | | | 121,535 | |
Avery Dennison Corp. | | | 2,335 | | | | 168,377 | |
Ball Corp. | | | 1,362 | | | | 97,097 | |
Bemis Co., Inc. | | | 3,323 | | | | 172,065 | |
Graphic Packaging Holding Co. | | | 5,467 | | | | 70,251 | |
Greif, Inc. Class A | | | 1,234 | | | | 40,414 | |
Greif, Inc. Class B | | | 1,890 | | | | 88,452 | |
International Paper Co. | | | 19,972 | | | | 819,651 | |
Packaging Corp. of America | | | 3,475 | | | | 209,890 | |
Sealed Air Corp. | | | 3,305 | | | | 158,673 | |
Sonoco Products Co. | | | 4,154 | | | | 201,760 | |
WestRock Co. | | | 8,969 | | | | 350,060 | |
| | | | | | | | |
| Total Containers & Packaging | | | | 2,498,225 | |
| Distributors – 0.1% | | | | | | | | |
Genuine Parts Co. | | | 4,571 | | | | 454,175 | |
Pool Corp. | | | 602 | | | | 52,819 | |
Weyco Group, Inc. | | | 870 | | | | 23,159 | |
| | | | | | | | |
| Total Distributors | | | | 530,153 | |
| Diversified Consumer Services – 0.1% | | | | | | | | |
Collectors Universe, Inc. | | | 1,229 | | | | 20,401 | |
DeVry Education Group, Inc.(a) | | | 1,012 | | | | 17,477 | |
H&R Block, Inc. | | | 8,090 | | | | 213,738 | |
Liberty Tax, Inc. | | | 1,098 | | | | 21,510 | |
Service Corp. International | | | 4,240 | | | | 104,643 | |
| | | | | | | | |
| Total Diversified Consumer Services | | | | 377,769 | |
| Diversified Financial Services – 0.5% | | | | | | | | |
CBOE Holdings, Inc. | | | 1,583 | | | | 103,417 | |
CME Group, Inc. | | | 7,936 | | | | 762,253 | |
FactSet Research Systems, Inc. | | | 676 | | | | 102,434 | |
Intercontinental Exchange, Inc. | | | 1,533 | | | | 360,470 | |
Leucadia National Corp. | | | 5,325 | | | | 86,105 | |
Marlin Business Services Corp. | | | 1,435 | | | | 20,535 | |
McGraw Hill Financial, Inc. | | | 4,118 | | | | 407,600 | |
Moody’s Corp. | | | 3,084 | | | | 297,791 | |
MSCI, Inc. | | | 1,534 | | | | 113,639 | |
Nasdaq, Inc. | | | 2,705 | | | | 179,558 | |
| | | | | | | | |
| Total Diversified Financial Services | | | | 2,433,802 | |
See Notes to Financial Statements.
| | | | |
| WisdomTree Domestic Earnings and Dividend Funds | | | 81 | |
Schedule of Investments (continued)
WisdomTree Total Dividend Fund (DTD)
March 31, 2016
| | | | | | | | |
| Investments | | Shares | | | Value | |
| Diversified Telecommunication Services – 5.8% | | | | | | | | |
AT&T, Inc. | | | 368,810 | | | $ | 14,446,288 | |
CenturyLink, Inc. | | | 51,021 | | | | 1,630,631 | |
Cogent Communications Holdings, Inc. | | | 2,952 | | | | 115,216 | |
Consolidated Communications Holdings, Inc. | | | 5,689 | | | | 146,549 | |
Frontier Communications Corp. | | | 109,427 | | | | 611,697 | |
Verizon Communications, Inc. | | | 216,899 | | | | 11,729,898 | |
Windstream Holdings, Inc.(a) | | | 13,518 | | | | 103,818 | |
| | | | | | | | |
| Total Diversified Telecommunication Services | | | | 28,784,097 | |
| Electric Utilities – 3.7% | | | | | | | | |
ALLETE, Inc. | | | 3,025 | | | | 169,612 | |
American Electric Power Co., Inc. | | | 21,667 | | | | 1,438,689 | |
Cleco Corp. | | | 2,114 | | | | 116,714 | |
Duke Energy Corp. | | | 35,131 | | | | 2,834,369 | |
Edison International | | | 8,962 | | | | 644,278 | |
El Paso Electric Co. | | | 2,544 | | | | 116,719 | |
Empire District Electric Co. (The) | | | 3,381 | | | | 111,742 | |
Entergy Corp. | | | 8,980 | | | | 711,934 | |
Eversource Energy | | | 11,102 | | | | 647,691 | |
Exelon Corp. | | | 46,583 | | | | 1,670,466 | |
FirstEnergy Corp. | | | 19,165 | | | | 689,365 | |
Great Plains Energy, Inc. | | | 6,385 | | | | 205,916 | |
Hawaiian Electric Industries, Inc. | | | 4,918 | | | | 159,343 | |
IDACORP, Inc. | | | 2,176 | | | | 162,308 | |
ITC Holdings Corp. | | | 3,570 | | | | 155,545 | |
NextEra Energy, Inc. | | | 15,403 | | | | 1,822,791 | |
OGE Energy Corp. | | | 8,755 | | | | 250,656 | |
Otter Tail Corp. | | | 3,677 | | | | 108,913 | |
PG&E Corp. | | | 18,393 | | | | 1,098,430 | |
Pinnacle West Capital Corp. | | | 4,711 | | | | 353,655 | |
PNM Resources, Inc. | | | 3,842 | | | | 129,552 | |
Portland General Electric Co. | | | 3,260 | | | | 128,737 | |
PPL Corp. | | | 32,976 | | | | 1,255,396 | |
Southern Co. (The) | | | 46,855 | | | | 2,423,809 | |
Westar Energy, Inc. | | | 5,286 | | | | 262,239 | |
Xcel Energy, Inc. | | | 19,942 | | | | 833,974 | |
| | | | | | | | |
| Total Electric Utilities | | | | 18,502,843 | |
| Electrical Equipment – 0.5% | | | | | | | | |
AMETEK, Inc. | | | 2,216 | | | | 110,756 | |
Emerson Electric Co. | | | 28,573 | | | | 1,553,800 | |
General Cable Corp. | | | 4,219 | | | | 51,514 | |
Hubbell, Inc. | | | 1,829 | | | | 193,746 | |
Rockwell Automation, Inc. | | | 3,943 | | | | 448,516 | |
| | | | | | | | |
| Total Electrical Equipment | | | | 2,358,332 | |
| Electronic Equipment, Instruments & Components – 0.3% | | | | | |
Amphenol Corp. Class A | | | 3,550 | | | | 205,261 | |
Avnet, Inc. | | | 2,372 | | | | 105,080 | |
AVX Corp. | | | 9,477 | | | | 119,126 | |
CDW Corp. | | | 1,736 | | | | 72,044 | |
Corning, Inc. | | | 32,190 | | | | 672,449 | |
Electro Rent Corp. | | | 579 | | | | 5,361 | |
Electro Scientific Industries, Inc.* | | | 4,486 | | | | 32,075 | |
FEI Co. | | | 939 | | | | 83,580 | |
FLIR Systems, Inc. | | | 3,093 | | | | 101,914 | |
Ingram Micro, Inc. Class A | | | 1,667 | | | | 59,862 | |
Jabil Circuit, Inc. | | | 4,140 | | | | 79,778 | |
National Instruments Corp. | | | 4,372 | | | | 131,641 | |
Park Electrochemical Corp. | | | 1,465 | | | | 23,455 | |
| | | | | | | | |
| Total Electronic Equipment, Instruments & Components | | | | 1,691,626 | |
| Energy Equipment & Services – 0.5% | | | | | | | | |
Archrock, Inc. | | | 5,172 | | | | 41,376 | |
Baker Hughes, Inc. | | | 7,035 | | | | 308,344 | |
Bristow Group, Inc. | | | 2,008 | | | | 37,991 | |
Gulf Island Fabrication, Inc. | | | 2,587 | | | | 20,308 | |
Halliburton Co. | | | 17,827 | | | | 636,780 | |
Helmerich & Payne, Inc.(a) | | | 5,634 | | | | 330,829 | |
National Oilwell Varco, Inc. | | | 21,696 | | | | 674,746 | |
Oceaneering International, Inc. | | | 2,877 | | | | 95,632 | |
Patterson-UTI Energy, Inc. | | | 5,156 | | | | 90,849 | |
Superior Energy Services, Inc. | | | 3,514 | | | | 47,052 | |
U.S. Silica Holdings, Inc. | | | 1,317 | | | | 29,922 | |
| | | | | | | | |
| Total Energy Equipment & Services | | | | 2,313,829 | |
| Food & Staples Retailing – 2.7% | | | | | | | | |
Costco Wholesale Corp. | | | 4,646 | | | | 732,117 | |
CVS Health Corp. | | | 17,496 | | | | 1,814,860 | |
Kroger Co. (The) | | | 10,839 | | | | 414,592 | |
SpartanNash Co. | | | 1,244 | | | | 37,706 | |
Sysco Corp. | | | 17,976 | | | | 840,018 | |
Village Super Market, Inc. Class A | | | 913 | | | | 22,058 | |
Wal-Mart Stores, Inc. | | | 112,323 | | | | 7,693,002 | |
Walgreens Boots Alliance, Inc. | | | 20,666 | | | | 1,740,904 | |
Whole Foods Market, Inc. | | | 6,098 | | | | 189,709 | |
| | | | | | | | |
| Total Food & Staples Retailing | | | | 13,484,966 | |
| Food Products – 2.3% | | | | | | | | |
Archer-Daniels-Midland Co. | | | 20,359 | | | | 739,235 | |
B&G Foods, Inc. | | | 3,453 | | | | 120,199 | |
Cal-Maine Foods, Inc.(a) | | | 3,439 | | | | 178,519 | |
Campbell Soup Co. | | | 7,849 | | | | 500,688 | |
ConAgra Foods, Inc. | | | 11,623 | | | | 518,618 | |
Flowers Foods, Inc. | | | 6,993 | | | | 129,091 | |
General Mills, Inc. | | | 18,952 | | | | 1,200,609 | |
Hershey Co. (The) | | | 4,447 | | | | 409,524 | |
Hormel Foods Corp. | | | 8,532 | | | | 368,924 | |
Ingredion, Inc. | | | 1,791 | | | | 191,261 | |
J.M. Smucker Co. (The) | | | 2,802 | | | | 363,812 | |
Kellogg Co. | | | 10,648 | | | | 815,104 | |
Kraft Heinz Co. (The) | | | 42,399 | | | | 3,330,865 | |
Lancaster Colony Corp. | | | 795 | | | | 87,903 | |
McCormick & Co., Inc. Non-Voting Shares | | | 2,813 | | | | 279,837 | |
Mead Johnson Nutrition Co. | | | 4,288 | | | | 364,351 | |
Mondelez International, Inc. Class A | | | 26,754 | | | | 1,073,371 | |
Pinnacle Foods, Inc. | | | 3,737 | | | | 166,969 | |
Snyder’s-Lance, Inc. | | | 2,547 | | | | 80,180 | |
Tyson Foods, Inc. Class A | | | 3,561 | | | | 237,376 | |
| | | | | | | | |
| Total Food Products | | | | 11,156,436 | |
See Notes to Financial Statements.
| | |
| 82 | | WisdomTree Domestic Earnings and Dividend Funds |
Schedule of Investments (continued)
WisdomTree Total Dividend Fund (DTD)
March 31, 2016
| | | | | | | | |
| Investments | | Shares | | | Value | |
| Gas Utilities – 0.4% | | | | | | | | |
AGL Resources, Inc. | | | 4,048 | | | $ | 263,687 | |
Atmos Energy Corp. | | | 3,326 | | | | 246,989 | |
Laclede Group, Inc. (The) | | | 2,219 | | | | 150,337 | |
National Fuel Gas Co. | | | 3,626 | | | | 181,481 | |
New Jersey Resources Corp. | | | 2,848 | | | | 103,753 | |
Northwest Natural Gas Co. | | | 2,037 | | | | 109,692 | |
ONE Gas, Inc. | | | 1,697 | | | | 103,687 | |
Piedmont Natural Gas Co., Inc. | | | 2,128 | | | | 127,318 | |
Questar Corp. | | | 7,994 | | | | 198,251 | |
South Jersey Industries, Inc. | | | 3,954 | | | | 112,491 | |
Southwest Gas Corp. | | | 1,810 | | | | 119,188 | |
UGI Corp. | | | 4,868 | | | | 196,132 | |
WGL Holdings, Inc. | | | 2,191 | | | | 158,563 | |
| | | | | | | | |
| Total Gas Utilities | | | | 2,071,569 | |
| Health Care Equipment & Supplies – 0.8% | | | | | | | | |
Abbott Laboratories | | | 34,095 | | | | 1,426,194 | |
Baxter International, Inc. | | | 7,555 | | | | 310,359 | |
Becton, Dickinson and Co. | | | 3,746 | | | | 568,718 | |
C.R. Bard, Inc. | | | 416 | | | | 84,311 | |
CryoLife, Inc. | | | 2,268 | | | | 24,381 | |
Hill-Rom Holdings, Inc. | | | 899 | | | | 45,220 | |
LeMaitre Vascular, Inc. | | | 1,481 | | | | 22,985 | |
Meridian Bioscience, Inc. | | | 3,967 | | | | 81,760 | |
ResMed, Inc. | | | 3,542 | | | | 204,798 | |
St. Jude Medical, Inc. | | | 5,388 | | | | 296,340 | |
Stryker Corp. | | | 5,869 | | | | 629,685 | |
Teleflex, Inc. | | | 706 | | | | 110,849 | |
Zimmer Biomet Holdings, Inc. | | | 1,839 | | | | 196,092 | |
| | | | | | | | |
| Total Health Care Equipment & Supplies | | | | 4,001,692 | |
| Health Care Providers & Services – 1.1% | | | | | | | | |
Aetna, Inc. | | | 3,575 | | | | 401,651 | |
AmerisourceBergen Corp. | | | 2,912 | | | | 252,034 | |
Anthem, Inc. | | | 4,847 | | | | 673,685 | |
Cardinal Health, Inc. | | | 6,342 | | | | 519,727 | |
HealthSouth Corp. | | | 3,020 | | | | 113,643 | |
Humana, Inc. | | | 1,098 | | | | 200,879 | |
Kindred Healthcare, Inc. | | | 4,141 | | | | 51,141 | |
Landauer, Inc. | | | 1,195 | | | | 39,519 | |
McKesson Corp. | | | 1,574 | | | | 247,511 | |
National Healthcare Corp. | | | 1,040 | | | | 64,792 | |
Owens & Minor, Inc. | | | 2,688 | | | | 108,649 | |
Patterson Cos., Inc. | | | 2,775 | | | | 129,121 | |
Quest Diagnostics, Inc. | | | 3,607 | | | | 257,720 | |
UnitedHealth Group, Inc. | | | 17,445 | | | | 2,248,660 | |
| | | | | | | | |
| Total Health Care Providers & Services | | | | 5,308,732 | |
| Health Care Technology – 0.0% | | | | | | | | |
Computer Programs & Systems, Inc.(a) | | | 629 | | | | 32,783 | |
| Hotels, Restaurants & Leisure – 2.4% | | | | | | | | |
Aramark | | | 3,519 | | | | 116,549 | |
Bob Evans Farms, Inc. | | | 1,194 | | | | 55,748 | |
Brinker International, Inc. | | | 2,413 | | | | 110,877 | |
Cracker Barrel Old Country Store, Inc.(a) | | | 968 | | | | 147,785 | |
Darden Restaurants, Inc. | | | 5,281 | | | $ | 350,130 | |
DineEquity, Inc. | | | 1,096 | | | | 102,399 | |
Domino’s Pizza, Inc. | | | 775 | | | | 102,192 | |
Dunkin’ Brands Group, Inc. | | | 2,525 | | | | 119,104 | |
Hilton Worldwide Holdings, Inc. | | | 13,794 | | | | 310,641 | |
Interval Leisure Group, Inc.(a) | | | 1,950 | | | | 28,158 | |
Las Vegas Sands Corp. | | | 53,155 | | | | 2,747,051 | |
Marriott International, Inc. Class A(a) | | | 4,199 | | | | 298,885 | |
McDonald’s Corp. | | | 29,604 | | | | 3,720,631 | |
Peak Resorts, Inc. | | | 3,331 | | | | 11,325 | |
SeaWorld Entertainment, Inc.(a) | | | 5,565 | | | | 117,199 | |
Six Flags Entertainment Corp. | | | 4,463 | | | | 247,652 | |
Starbucks Corp. | | | 21,002 | | | | 1,253,819 | |
Starwood Hotels & Resorts Worldwide, Inc. | | | 4,507 | | | | 376,019 | |
Texas Roadhouse, Inc. | | | 2,152 | | | | 93,784 | |
Vail Resorts, Inc. | | | 957 | | | | 127,951 | |
Wendy’s Co. (The) | | | 7,375 | | | | 80,314 | |
Wyndham Worldwide Corp. | | | 2,914 | | | | 222,717 | |
Wynn Resorts Ltd.(a) | | | 3,596 | | | | 335,974 | |
Yum! Brands, Inc. | | | 11,768 | | | | 963,211 | |
| | | | | | | | |
| Total Hotels, Restaurants & Leisure | | | | 12,040,115 | |
| Household Durables – 0.3% | | | | | | | | |
D.R. Horton, Inc. | | | 4,957 | | | | 149,850 | |
Harman International Industries, Inc. | | | 1,239 | | | | 110,321 | |
Hooker Furniture Corp. | | | 931 | | | | 30,583 | |
Leggett & Platt, Inc. | | | 4,863 | | | | 235,369 | |
Lifetime Brands, Inc. | | | 1,797 | | | | 27,081 | |
MDC Holdings, Inc. | | | 3,313 | | | | 83,024 | |
Newell Rubbermaid, Inc. | | | 5,076 | | | | 224,816 | |
PulteGroup, Inc. | | | 7,564 | | | | 141,522 | |
Tupperware Brands Corp. | | | 2,850 | | | | 165,243 | |
Whirlpool Corp. | | | 2,002 | | | | 361,041 | |
| | | | | | | | |
| Total Household Durables | | | | 1,528,850 | |
| Household Products – 2.4% | | | | | | | | |
Church & Dwight Co., Inc. | | | 2,334 | | | | 215,148 | |
Clorox Co. (The) | | | 3,349 | | | | 422,175 | |
Colgate-Palmolive Co. | | | 22,083 | | | | 1,560,164 | |
Energizer Holdings, Inc. | | | 1,799 | | | | 72,878 | |
Kimberly-Clark Corp. | | | 11,318 | | | | 1,522,384 | |
Oil-Dri Corp. of America | | | 660 | | | | 22,295 | |
Procter & Gamble Co. (The) | | | 97,968 | | | | 8,063,746 | |
Spectrum Brands Holdings, Inc. | | | 968 | | | | 105,783 | |
| | | | | | | | |
| Total Household Products | | | | 11,984,573 | |
| Independent Power & Renewable Electricity Producers – 0.2% | | | | | | | | |
AES Corp. | | | 30,443 | | | | 359,227 | |
NRG Energy, Inc. | | | 18,238 | | | | 237,276 | |
NRG Yield, Inc. Class C | | | 6,649 | | | | 94,682 | |
Pattern Energy Group, Inc. | | | 5,854 | | | | 111,636 | |
TerraForm Global, Inc. Class A* | | | 12,487 | | | | 29,719 | |
| | | | | | | | |
Total Independent Power & Renewable Electricity
Producers | | | | 832,540 | |
See Notes to Financial Statements.
| | | | |
| WisdomTree Domestic Earnings and Dividend Funds | | | 83 | |
Schedule of Investments (continued)
WisdomTree Total Dividend Fund (DTD)
March 31, 2016
| | | | | | | | |
| Investments | | Shares | | | Value | |
| Industrial Conglomerates – 2.7% | | | | | | | | |
3M Co. | | | 17,168 | | | $ | 2,860,704 | |
Carlisle Cos., Inc. | | | 1,056 | | | | 105,072 | |
Danaher Corp. | | | 4,378 | | | | 415,297 | |
General Electric Co. | | | 302,431 | | | | 9,614,282 | |
Roper Technologies, Inc. | | | 568 | | | | 103,813 | |
| | | | | | | | |
| Total Industrial Conglomerates | | | | 13,099,168 | |
| Insurance – 2.4% | | | | | | | | |
Aflac, Inc. | | | 13,081 | | | | 825,934 | |
Allstate Corp. (The) | | | 8,059 | | | | 542,935 | |
American Financial Group, Inc. | | | 1,682 | | | | 118,362 | |
American International Group, Inc. | | | 23,976 | | | | 1,295,903 | |
American National Insurance Co. | | | 1,342 | | | | 155,001 | |
AmTrust Financial Services, Inc. | | | 4,045 | | | | 104,685 | |
Arthur J. Gallagher & Co. | | | 5,992 | | | | 266,524 | |
Assurant, Inc. | | | 1,712 | | | | 132,081 | |
Baldwin & Lyons, Inc. Class B | | | 1,477 | | | | 36,349 | |
Brown & Brown, Inc. | | | 2,665 | | | | 95,407 | |
Cincinnati Financial Corp. | | | 5,440 | | | | 355,558 | |
CNA Financial Corp. | | | 7,712 | | | | 248,172 | |
CNO Financial Group, Inc. | | | 4,232 | | | | 75,837 | |
Crawford & Co. Class B | | | 4,060 | | | | 26,309 | |
Donegal Group, Inc. Class A | | | 2,231 | | | | 32,082 | |
Erie Indemnity Co. Class A | | | 1,493 | | | | 138,834 | |
First American Financial Corp. | | | 3,424 | | | | 130,489 | |
FNF Group | | | 3,729 | | | | 126,413 | |
Hanover Insurance Group, Inc. (The) | | | 1,379 | | | | 124,413 | |
Hartford Financial Services Group, Inc. (The) | | | 8,608 | | | | 396,657 | |
Kemper Corp. | | | 2,483 | | | | 73,422 | |
Lincoln National Corp. | | | 5,670 | | | | 222,264 | |
Loews Corp. | | | 2,950 | | | | 112,867 | |
Marsh & McLennan Cos., Inc. | | | 12,644 | | | | 768,629 | |
Mercury General Corp. | | | 3,299 | | | | 183,095 | |
MetLife, Inc. | | | 37,728 | | | | 1,657,768 | |
Old Republic International Corp. | | | 11,508 | | | | 210,366 | |
Principal Financial Group, Inc. | | | 10,777 | | | | 425,153 | |
ProAssurance Corp. | | | 1,905 | | | | 96,393 | |
Progressive Corp. (The) | | | 13,267 | | | | 466,202 | |
Prudential Financial, Inc. | | | 16,435 | | | | 1,186,936 | |
Reinsurance Group of America, Inc. | | | 1,485 | | | | 142,931 | |
State Auto Financial Corp. | | | 2,765 | | | | 60,996 | |
Torchmark Corp. | | | 1,404 | | | | 76,041 | |
Travelers Cos., Inc. (The) | | | 7,250 | | | | 846,147 | |
Universal Insurance Holdings, Inc.(a) | | | 1,827 | | | | 32,521 | |
Unum Group | | | 6,013 | | | | 185,922 | |
W.R. Berkley Corp. | | | 1,412 | | | | 79,354 | |
| | | | | | | | |
| Total Insurance | | | | 12,054,952 | |
| Internet & Catalog Retail – 0.1% | | | | | | | | |
Expedia, Inc. | | | 1,213 | | | | 130,786 | |
HSN, Inc. | | | 1,747 | | | | 91,385 | |
Nutrisystem, Inc. | | | 1,778 | | | | 37,107 | |
PetMed Express, Inc.(a) | | | 1,396 | | | | 25,002 | |
| | | | | | | | |
| Total Internet & Catalog Retail | | | | 284,280 | |
| Internet Software & Services – 0.0% | | | | | | | | |
j2 Global, Inc. | | | 1,365 | | | $ | 84,056 | |
Marchex, Inc. Class B | | | 5,606 | | | | 24,947 | |
Reis, Inc. | | | 987 | | | | 23,244 | |
| | | | | | | | |
| Total Internet Software & Services | | | | 132,247 | |
| IT Services – 2.3% | | | | | | | | |
Automatic Data Processing, Inc. | | | 12,500 | | | | 1,121,375 | |
Booz Allen Hamilton Holding Corp. | | | 3,138 | | | | 95,019 | |
Broadridge Financial Solutions, Inc. | | | 3,041 | | | | 180,362 | |
Computer Sciences Corp. | | | 2,780 | | | | 95,604 | |
Computer Task Group, Inc. | | | 3,572 | | | | 18,253 | |
Fidelity National Information Services, Inc. | | | 5,144 | | | | 325,667 | |
International Business Machines Corp. | | | 39,697 | | | | 6,012,111 | |
Jack Henry & Associates, Inc. | | | 1,587 | | | | 134,213 | |
Leidos Holdings, Inc. | | | 1,863 | | | | 93,746 | |
MasterCard, Inc. Class A | | | 7,865 | | | | 743,242 | |
Paychex, Inc. | | | 12,408 | | | | 670,156 | |
Sabre Corp. | | | 3,937 | | | | 113,858 | |
Science Applications International Corp. | | | 1,481 | | | | 78,996 | |
Total System Services, Inc. | | | 1,626 | | | | 77,365 | |
Visa, Inc. Class A | | | 15,148 | | | | 1,158,519 | |
Western Union Co. (The) | | | 17,855 | | | | 344,423 | |
Xerox Corp. | | | 28,944 | | | | 323,015 | |
| | | | | | | | |
| Total IT Services | | | | 11,585,924 | |
| Leisure Products – 0.3% | | | | | | | | |
Brunswick Corp. | | | 1,164 | | | | 55,849 | |
Escalade, Inc. | | | 1,925 | | | | 22,657 | |
Hasbro, Inc. | | | 3,829 | | | | 306,703 | |
Johnson Outdoors, Inc. Class A | | | 1,035 | | | | 22,998 | |
Mattel, Inc. | | | 20,874 | | | | 701,784 | |
Polaris Industries, Inc. | | | 1,528 | | | | 150,477 | |
| | | | | | | | |
| Total Leisure Products | | | | 1,260,468 | |
| Life Sciences Tools & Services – 0.1% | | | | | | | | |
Agilent Technologies, Inc. | | | 4,044 | | | | 161,153 | |
Bio-Techne Corp. | | | 1,044 | | | | 98,679 | |
Thermo Fisher Scientific, Inc. | | | 1,994 | | | | 282,331 | |
| | | | | | | | |
| Total Life Sciences Tools & Services | | | | 542,163 | |
| Machinery – 1.8% | | | | | | | | |
AGCO Corp. | | | 1,526 | | | | 75,842 | |
Allison Transmission Holdings, Inc. | | | 5,231 | | | | 141,132 | |
American Railcar Industries, Inc.(a) | | | 655 | | | | 26,678 | |
Briggs & Stratton Corp. | | | 3,468 | | | | 82,955 | |
Caterpillar, Inc. | | | 28,678 | | | | 2,195,014 | |
Crane Co. | | | 2,323 | | | | 125,117 | |
Cummins, Inc. | | | 8,243 | | | | 906,236 | |
Deere & Co. | | | 11,164 | | | | 859,516 | |
Donaldson Co., Inc. | | | 3,909 | | | | 124,736 | |
Dover Corp. | | | 4,543 | | | | 292,251 | |
Flowserve Corp. | | | 2,521 | | | | 111,958 | |
Graco, Inc. | | | 1,556 | | | | 130,642 | |
Graham Corp. | | | 1,388 | | | | 27,635 | |
Greenbrier Cos., Inc. (The)(a) | | | 883 | | | | 24,406 | |
See Notes to Financial Statements.
| | |
| 84 | | WisdomTree Domestic Earnings and Dividend Funds |
Schedule of Investments (continued)
WisdomTree Total Dividend Fund (DTD)
March 31, 2016
| | | | | | | | |
| Investments | | Shares | | | Value | |
Hardinge, Inc. | | | 2,420 | | | $ | 30,177 | |
Hillenbrand, Inc. | | | 3,076 | | | | 92,126 | |
Hurco Cos., Inc. | | | 907 | | | | 29,922 | |
IDEX Corp. | | | 1,666 | | | | 138,078 | |
Illinois Tool Works, Inc. | | | 9,609 | | | | 984,346 | |
Joy Global, Inc.(a) | | | 7,374 | | | | 118,500 | |
Kennametal, Inc. | | | 3,205 | | | | 72,081 | |
Lincoln Electric Holdings, Inc. | | | 2,221 | | | | 130,084 | |
Miller Industries, Inc. | | | 1,125 | | | | 22,815 | |
Nordson Corp. | | | 1,449 | | | | 110,182 | |
Oshkosh Corp. | | | 1,880 | | | | 76,836 | |
PACCAR, Inc. | | | 7,561 | | | | 413,511 | |
Parker-Hannifin Corp. | | | 4,035 | | | | 448,208 | |
Snap-on, Inc. | | | 1,089 | | | | 170,962 | |
Stanley Black & Decker, Inc. | | | 3,515 | | | | 369,813 | |
Supreme Industries, Inc. Class A | | | 3,062 | | | | 27,068 | |
Terex Corp. | | | 1,885 | | | | 46,899 | |
Timken Co. (The) | | | 3,604 | | | | 120,698 | |
Toro Co. (The) | | | 1,114 | | | | 95,938 | |
Trinity Industries, Inc. | | | 4,278 | | | | 78,330 | |
Xylem, Inc. | | | 3,410 | | | | 139,469 | |
| | | | | | | | |
| Total Machinery | | | | 8,840,161 | |
| Media – 2.3% | | | | | | | | |
Cablevision Systems Corp. Class A | | | 4,723 | | | | 155,859 | |
CBS Corp. Class A | | | 963 | | | | 56,730 | |
CBS Corp. Class B Non-Voting Shares | | | 6,277 | | | | 345,800 | |
Cinemark Holdings, Inc. | | | 3,736 | | | | 133,861 | |
Comcast Corp. Class A | | | 44,136 | | | | 2,695,827 | |
Gannett Co., Inc. | | | 4,344 | | | | 65,768 | |
Harte-Hanks, Inc. | | | 6,971 | | | | 17,637 | |
Interpublic Group of Cos., Inc. (The) | | | 9,282 | | | | 213,022 | |
John Wiley & Sons, Inc. Class A | | | 2,144 | | | | 104,820 | |
Journal Media Group, Inc. | | | 1,929 | | | | 23,071 | |
Meredith Corp. | | | 2,132 | | | | 101,270 | |
National CineMedia, Inc. | | | 6,565 | | | | 99,854 | |
New Media Investment Group, Inc. | | | 3,751 | | | | 62,417 | |
News Corp. Class A | | | 8,353 | | | | 106,668 | |
Omnicom Group, Inc. | | | 7,041 | | | | 586,022 | |
Regal Entertainment Group Class A(a) | | | 7,721 | | | | 163,222 | |
Scripps Networks Interactive, Inc. Class A | | | 1,681 | | | | 110,105 | |
Sinclair Broadcast Group, Inc. Class A | | | 2,691 | | | | 82,748 | |
TEGNA, Inc. | | | 5,466 | | | | 128,232 | |
Time Warner Cable, Inc. | | | 4,971 | | | | 1,017,166 | |
Time Warner, Inc. | | | 17,833 | | | | 1,293,784 | |
Time, Inc. | | | 5,562 | | | | 85,877 | |
Tribune Media Co. Class A | | | 2,956 | | | | 113,363 | |
Twenty-First Century Fox, Inc. Class A | | | 12,036 | | | | 335,564 | |
Twenty-First Century Fox, Inc. Class B | | | 10,563 | | | | 297,877 | |
Viacom, Inc. Class A | | | 2,407 | | | | 109,037 | |
Viacom, Inc. Class B | | | 13,450 | | | | 555,216 | |
Walt Disney Co. (The) | | | 21,504 | | | | 2,135,562 | |
World Wrestling Entertainment, Inc. Class A | | | 1,281 | | | | 22,622 | |
| | | | | | | | |
| Total Media | | | | 11,219,001 | |
| Metals & Mining – 0.4% | | | | | | | | |
Alcoa, Inc. | | | 18,690 | | | $ | 179,050 | |
Allegheny Technologies, Inc.(a) | | | 6,454 | | | | 105,200 | |
Ampco-Pittsburgh Corp. | | | 2,032 | | | | 28,265 | |
Carpenter Technology Corp. | | | 1,342 | | | | 45,937 | |
Commercial Metals Co. | | | 7,350 | | | | 124,730 | |
Compass Minerals International, Inc. | | | 1,470 | | | | 104,164 | |
Hecla Mining Co.(a) | | | 14,623 | | | | 40,652 | |
Newmont Mining Corp. | | | 2,856 | | | | 75,912 | |
Nucor Corp. | | | 12,304 | | | | 581,979 | |
Reliance Steel & Aluminum Co. | | | 2,582 | | | | 178,649 | |
Royal Gold, Inc. | | | 1,583 | | | | 81,192 | |
Steel Dynamics, Inc. | | | 8,174 | | | | 183,997 | |
United States Steel Corp.(a) | | | 4,385 | | | | 70,379 | |
Worthington Industries, Inc. | | | 2,984 | | | | 106,350 | |
| | | | | | | | |
| Total Metals & Mining | | | | 1,906,456 | |
| Multi-Utilities – 2.0% | | | | | | | | |
Alliant Energy Corp. | | | 4,076 | | | | 302,765 | |
Ameren Corp. | | | 10,444 | | | | 523,244 | |
Avista Corp. | | | 3,380 | | | | 137,836 | |
Black Hills Corp.(a) | | | 2,473 | | | | 148,702 | |
CenterPoint Energy, Inc. | | | 26,647 | | | | 557,455 | |
CMS Energy Corp. | | | 9,531 | | | | 404,496 | |
Consolidated Edison, Inc. | | | 13,223 | | | | 1,013,146 | |
Dominion Resources, Inc. | | | 24,859 | | | | 1,867,408 | |
DTE Energy Co. | | | 6,736 | | | | 610,686 | |
MDU Resources Group, Inc. | | | 8,956 | | | | 174,284 | |
NiSource, Inc. | | | 11,848 | | | | 279,139 | |
NorthWestern Corp. | | | 2,462 | | | | 152,029 | |
Public Service Enterprise Group, Inc. | | | 22,493 | | | | 1,060,320 | |
SCANA Corp. | | | 5,779 | | | | 405,397 | |
Sempra Energy | | | 7,937 | | | | 825,845 | |
TECO Energy, Inc. | | | 8,593 | | | | 236,565 | |
Vectren Corp. | | | 3,457 | | | | 174,786 | |
WEC Energy Group, Inc. | | | 12,935 | | | | 777,005 | |
| | | | | | | | |
| Total Multi-Utilities | | | | 9,651,108 | |
| Multiline Retail – 0.7% | | | | | | | | |
Big Lots, Inc. | | | 1,605 | | | | 72,690 | |
Dollar General Corp. | | | 3,666 | | | | 313,810 | |
Kohl’s Corp. | | | 7,871 | | | | 366,867 | |
Macy’s, Inc. | | | 12,865 | | | | 567,218 | |
Nordstrom, Inc.(a) | | | 4,947 | | | | 283,018 | |
Target Corp. | | | 20,284 | | | | 1,668,968 | |
| | | | | | | | |
| Total Multiline Retail | | | | 3,272,571 | |
| Oil, Gas & Consumable Fuels – 9.2% | | | | | | | | |
Alon USA Energy, Inc. | | | 2,897 | | | | 29,897 | |
Anadarko Petroleum Corp. | | | 11,573 | | | | 538,955 | |
Apache Corp. | | | 9,172 | | | | 447,685 | |
Cabot Oil & Gas Corp. | | | 2,627 | | | | 59,659 | |
Chevron Corp. | | | 98,647 | | | | 9,410,925 | |
Cimarex Energy Co. | | | 723 | | | | 70,326 | |
Columbia Pipeline Group, Inc. | | | 8,441 | | | | 211,869 | |
See Notes to Financial Statements.
| | | | |
| WisdomTree Domestic Earnings and Dividend Funds | | | 85 | |
Schedule of Investments (continued)
WisdomTree Total Dividend Fund (DTD)
March 31, 2016
| | | | | | | | |
| Investments | | Shares | | | Value | |
ConocoPhillips | | | 80,385 | | | $ | 3,237,104 | |
CVR Energy, Inc. | | | 4,675 | | | | 122,018 | |
Delek U.S. Holdings, Inc. | | | 2,185 | | | | 33,299 | |
Devon Energy Corp. | | | 12,240 | | | | 335,866 | |
EOG Resources, Inc. | | | 5,331 | | | | 386,924 | |
Evolution Petroleum Corp. | | | 4,402 | | | | 21,394 | |
Exxon Mobil Corp. | | | 172,877 | | | | 14,450,788 | |
Hess Corp. | | | 5,929 | | | | 312,162 | |
HollyFrontier Corp. | | | 6,037 | | | | 213,227 | |
Kinder Morgan, Inc. | | | 290,571 | | | | 5,189,598 | |
Marathon Oil Corp. | | | 10,881 | | | | 121,214 | |
Marathon Petroleum Corp. | | | 14,659 | | | | 545,022 | |
Murphy Oil Corp. | | | 11,018 | | | | 277,543 | |
Noble Energy, Inc. | | | 9,920 | | | | 311,587 | |
Occidental Petroleum Corp. | | | 36,227 | | | | 2,479,014 | |
ONEOK, Inc. | | | 26,252 | | | | 783,885 | |
Panhandle Oil and Gas, Inc. Class A | | | 1,478 | | | | 25,584 | |
PBF Energy, Inc. Class A | | | 3,596 | | | | 119,387 | |
Phillips 66 | | | 15,326 | | | | 1,327,078 | |
Range Resources Corp.(a) | | | 1,976 | | | | 63,983 | |
SemGroup Corp. Class A | | | 3,118 | | | | 69,843 | |
Spectra Energy Corp. | | | 45,533 | | | | 1,393,310 | |
Targa Resources Corp. | | | 7,299 | | | | 217,948 | |
Tesoro Corp. | | | 2,489 | | | | 214,079 | |
Valero Energy Corp. | | | 14,945 | | | | 958,572 | |
Western Refining, Inc. | | | 3,804 | | | | 110,658 | |
Williams Cos., Inc. (The) | | | 77,921 | | | | 1,252,191 | |
| | | | | | | | |
| Total Oil, Gas & Consumable Fuels | | | | 45,342,594 | |
| Paper & Forest Products – 0.0% | | | | | | | | |
KapStone Paper and Packaging Corp. | | | 1,991 | | | | 27,575 | |
Schweitzer-Mauduit International, Inc. | | | 1,870 | | | | 58,868 | |
| | | | | | | | |
| Total Paper & Forest Products | | | | 86,443 | |
| Personal Products – 0.1% | | | | | | | | |
Edgewell Personal Care Co. | | | 1,692 | | | | 136,257 | |
Estee Lauder Cos., Inc. (The) Class A | | | 3,463 | | | | 326,595 | |
Nu Skin Enterprises, Inc. Class A(a) | | | 2,403 | | | | 91,915 | |
| | | | | | | | |
| Total Personal Products | | | | 554,767 | |
| Pharmaceuticals – 5.3% | | | | | | | | |
Bristol-Myers Squibb Co. | | | 38,456 | | | | 2,456,569 | |
Eli Lilly & Co. | | | 28,032 | | | | 2,018,584 | |
Innoviva, Inc.(a) | | | 12,780 | | | | 160,900 | |
Johnson & Johnson | | | 86,223 | | | | 9,329,329 | |
Merck & Co., Inc. | | | 104,288 | | | | 5,517,878 | |
Pfizer, Inc. | | | 227,851 | | | | 6,753,504 | |
Zoetis, Inc. | | | 4,152 | | | | 184,058 | |
| | | | | | | | |
| Total Pharmaceuticals | | | | 26,420,822 | |
| Professional Services – 0.1% | | | | | | | | |
CEB, Inc. | | | 1,142 | | | | 73,922 | |
Dun & Bradstreet Corp. (The) | | | 703 | | | | 72,465 | |
Equifax, Inc. | | | 1,460 | | | | 166,863 | |
Insperity, Inc. | | | 1,027 | | | | 53,127 | |
ManpowerGroup, Inc. | | | 1,809 | | | | 147,289 | |
Robert Half International, Inc. | | | 2,817 | | | | 131,216 | |
| | | | | | | | |
| Total Professional Services | | | | 644,882 | |
| Real Estate Investment Trusts (REITs) – 7.9% | | | | | | | | |
Acadia Realty Trust | | | 3,021 | | | | 106,128 | |
Alexander’s, Inc. | | | 229 | | | | 87,146 | |
Alexandria Real Estate Equities, Inc. | | | 2,636 | | | | 239,586 | |
American Assets Trust, Inc. | | | 2,088 | | | | 83,353 | |
American Campus Communities, Inc. | | | 4,224 | | | | 198,908 | |
American Tower Corp. | | | 8,552 | | | | 875,468 | |
Apartment Investment & Management Co. Class A | | | 4,879 | | | | 204,040 | |
Apple Hospitality REIT, Inc.(a) | | | 10,503 | | | | 208,064 | |
Armada Hoffler Properties, Inc. | | | 4,694 | | | | 52,808 | |
Ashford Hospitality Prime, Inc. | | | 4,873 | | | | 56,868 | |
Ashford Hospitality Trust, Inc. | | | 10,638 | | | | 67,870 | |
AvalonBay Communities, Inc. | | | 4,271 | | | | 812,344 | |
Bluerock Residential Growth REIT, Inc. | | | 2,146 | | | | 23,349 | |
Boston Properties, Inc. | | | 3,436 | | | | 436,647 | |
Brandywine Realty Trust | | | 9,038 | | | | 126,803 | |
Brixmor Property Group, Inc. | | | 12,222 | | | | 313,128 | |
Camden Property Trust | | | 3,426 | | | | 288,092 | |
CBL & Associates Properties, Inc. | | | 14,508 | | | | 172,645 | |
Chatham Lodging Trust | | | 2,852 | | | | 61,118 | |
Chesapeake Lodging Trust | | | 3,885 | | | | 102,797 | |
Columbia Property Trust, Inc. | | | 6,908 | | | | 151,907 | |
Communications Sales & Leasing, Inc. | | | 20,023 | | | | 445,512 | |
Community Healthcare Trust, Inc. | | | 1,269 | | | | 23,464 | |
CorEnergy Infrastructure Trust, Inc.(a) | | | 1,921 | | | | 38,631 | |
CoreSite Realty Corp. | | | 926 | | | | 64,829 | |
Corporate Office Properties Trust | | | 5,571 | | | | 146,183 | |
Corrections Corp. of America | | | 10,189 | | | | 326,557 | |
Cousins Properties, Inc. | | | 10,317 | | | | 107,091 | |
Crown Castle International Corp. | | | 14,780 | | | | 1,278,470 | |
CubeSmart | | | 4,862 | | | | 161,905 | |
CyrusOne, Inc. | | | 2,428 | | | | 110,838 | |
DCT Industrial Trust, Inc. | | | 3,403 | | | | 134,316 | |
DDR Corp. | | | 14,541 | | | | 258,684 | |
DiamondRock Hospitality Co. | | | 10,269 | | | | 103,922 | |
Digital Realty Trust, Inc. | | | 7,582 | | | | 670,931 | |
Douglas Emmett, Inc. | | | 5,253 | | | | 158,168 | |
Duke Realty Corp. | | | 12,308 | | | | 277,422 | |
DuPont Fabros Technology, Inc. | | | 4,535 | | | | 183,804 | |
EastGroup Properties, Inc. | | | 2,034 | | | | 122,793 | |
Education Realty Trust, Inc. | | | 3,139 | | | | 130,582 | |
EPR Properties | | | 3,584 | | | | 238,766 | |
Equinix, Inc. | | | 1,415 | | | | 467,955 | |
Equity LifeStyle Properties, Inc. | | | 2,755 | | | | 200,371 | |
Equity One, Inc. | | | 6,099 | | | | 174,797 | |
Equity Residential | | | 11,389 | | | | 854,517 | |
Essex Property Trust, Inc. | | | 1,783 | | | | 416,972 | |
Extra Space Storage, Inc. | | | 3,879 | | | | 362,531 | |
Federal Realty Investment Trust | | | 1,947 | | | | 303,829 | |
First Industrial Realty Trust, Inc. | | | 3,303 | | | | 75,110 | |
Franklin Street Properties Corp. | | | 11,021 | | | | 116,933 | |
See Notes to Financial Statements.
| | |
| 86 | | WisdomTree Domestic Earnings and Dividend Funds |
Schedule of Investments (continued)
WisdomTree Total Dividend Fund (DTD)
March 31, 2016
| | | | | | | | |
| Investments | | Shares | | | Value | |
Gaming and Leisure Properties, Inc. | | | 10,217 | | | $ | 315,910 | |
General Growth Properties, Inc. | | | 28,061 | | | | 834,254 | |
Geo Group, Inc. (The) | | | 7,316 | | | | 253,646 | |
Getty Realty Corp. | | | 3,575 | | | | 70,892 | |
Gladstone Commercial Corp. | | | 2,254 | | | | 36,921 | |
Global Net Lease, Inc. | | | 13,383 | | | | 114,559 | |
Government Properties Income Trust | | | 7,643 | | | | 136,428 | |
Gramercy Property Trust | | | 11,665 | | | | 98,569 | |
HCP, Inc. | | | 31,009 | | | | 1,010,273 | |
Healthcare Realty Trust, Inc. | | | 5,508 | | | | 170,142 | |
Healthcare Trust of America, Inc. Class A | | | 7,084 | | | | 208,411 | |
Hersha Hospitality Trust | | | 4,412 | | | | 94,152 | |
Highwoods Properties, Inc. | | | 3,779 | | | | 180,674 | |
Hospitality Properties Trust | | | 11,733 | | | | 311,629 | |
Host Hotels & Resorts, Inc. | | | 39,628 | | | | 661,788 | |
Hudson Pacific Properties, Inc. | | | 2,076 | | | | 60,038 | |
Independence Realty Trust, Inc. | | | 7,918 | | | | 56,376 | |
InfraREIT, Inc. | | | 2,388 | | | | 40,715 | |
Investors Real Estate Trust | | | 15,123 | | | | 109,793 | |
Iron Mountain, Inc. | | | 15,334 | | | | 519,976 | |
Kilroy Realty Corp. | | | 2,131 | | | | 131,845 | |
Kimco Realty Corp. | | | 17,353 | | | | 499,419 | |
Kite Realty Group Trust | | | 4,550 | | | | 126,081 | |
Lamar Advertising Co. Class A | | | 4,614 | | | | 283,761 | |
LaSalle Hotel Properties | | | 7,838 | | | | 198,380 | |
Lexington Realty Trust(a) | | | 19,714 | | | | 169,540 | |
Liberty Property Trust | | | 8,779 | | | | 293,745 | |
LTC Properties, Inc. | | | 2,899 | | | | 131,151 | |
Macerich Co. (The) | | | 6,107 | | | | 483,919 | |
Mack-Cali Realty Corp. | | | 4,158 | | | | 97,713 | |
Medical Properties Trust, Inc. | | | 18,372 | | | | 238,469 | |
Mid-America Apartment Communities, Inc. | | | 3,082 | | | | 315,011 | |
Monogram Residential Trust, Inc. | | | 4,477 | | | | 44,143 | |
National Health Investors, Inc. | | | 2,132 | | | | 141,821 | |
National Retail Properties, Inc. | | | 6,085 | | | | 281,127 | |
New Senior Investment Group, Inc. | | | 8,854 | | | | 91,196 | |
New York REIT, Inc. | | | 10,532 | | | | 106,373 | |
NexPoint Residential Trust, Inc. | | | 1,891 | | | | 24,753 | |
NorthStar Realty Finance Corp. | | | 25,050 | | | | 328,656 | |
Omega Healthcare Investors, Inc. | | | 12,492 | | | | 440,968 | |
One Liberty Properties, Inc. | | | 3,196 | | | | 71,622 | |
Outfront Media, Inc. | | | 9,535 | | | | 201,189 | |
Paramount Group, Inc. | | | 4,339 | | | | 69,207 | |
Parkway Properties, Inc. | | | 7,474 | | | | 117,043 | |
Pebblebrook Hotel Trust | | | 3,191 | | | | 92,762 | |
Pennsylvania Real Estate Investment Trust | | | 5,200 | | | | 113,620 | |
Physicians Realty Trust | | | 6,372 | | | | 118,392 | |
Piedmont Office Realty Trust, Inc. Class A | | | 7,717 | | | | 156,732 | |
Post Properties, Inc. | | | 1,968 | | | | 117,568 | |
Potlatch Corp. | | | 2,568 | | | | 80,892 | |
Preferred Apartment Communities, Inc. Class A | | | 1,978 | | | | 25,081 | |
Prologis, Inc. | | | 20,740 | | | | 916,293 | |
PS Business Parks, Inc. | | | 1,229 | | | | 123,527 | |
Public Storage | | | 5,251 | | | | 1,448,383 | |
QTS Realty Trust, Inc. Class A | | | 1,917 | | | | 90,827 | |
Ramco-Gershenson Properties Trust | | | 5,841 | | | | 105,313 | |
Rayonier, Inc. | | | 5,613 | | | | 138,529 | |
Realty Income Corp. | | | 12,106 | | | | 756,746 | |
Regency Centers Corp. | | | 3,129 | | | | 234,206 | |
Retail Opportunity Investments Corp. | | | 5,868 | | | | 118,064 | |
Retail Properties of America, Inc. Class A | | | 11,133 | | | | 176,458 | |
RLJ Lodging Trust | | | 7,654 | | | | 175,124 | |
Rouse Properties, Inc. | | | 2,683 | | | | 49,314 | |
Ryman Hospitality Properties, Inc. | | | 2,940 | | | | 151,351 | |
Sabra Health Care REIT, Inc. | | | 5,531 | | | | 111,118 | |
Select Income REIT | | | 9,074 | | | | 209,156 | |
Senior Housing Properties Trust | | | 27,105 | | | | 484,908 | |
Simon Property Group, Inc. | | | 11,108 | | | | 2,307,021 | |
SL Green Realty Corp. | | | 2,066 | | | | 200,154 | |
Sovran Self Storage, Inc. | | | 1,185 | | | | 139,771 | |
Spirit Realty Capital, Inc. | | | 29,323 | | | | 329,884 | |
STAG Industrial, Inc. | | | 6,274 | | | | 127,739 | |
STORE Capital Corp. | | | 5,772 | | | | 149,379 | |
Summit Hotel Properties, Inc. | | | 6,032 | | | | 72,203 | |
Sun Communities, Inc. | | | 2,794 | | | | 200,078 | |
Tanger Factory Outlet Centers, Inc. | | | 3,639 | | | | 132,423 | |
Taubman Centers, Inc. | | | 2,026 | | | | 144,312 | |
UDR, Inc. | | | 9,369 | | | | 360,988 | |
UMH Properties, Inc. | | | 2,454 | | | | 24,344 | |
Urban Edge Properties | | | 3,329 | | | | 86,021 | |
Ventas, Inc. | | | 20,424 | | | | 1,285,895 | |
VEREIT, Inc. | | | 66,978 | | | | 594,095 | |
Vornado Realty Trust | | | 5,461 | | | | 515,682 | |
W.P. Carey, Inc. | | | 6,592 | | | | 410,286 | |
Washington Real Estate Investment Trust | | | 4,699 | | | | 137,258 | |
Weingarten Realty Investors | | | 5,241 | | | | 196,642 | |
Welltower, Inc. | | | 18,878 | | | | 1,309,001 | |
Weyerhaeuser Co. | | | 32,837 | | | | 1,017,290 | |
WP GLIMCHER, Inc. | | | 17,392 | | | | 165,050 | |
Xenia Hotels & Resorts, Inc. | | | 6,061 | | | | 94,673 | |
| | | | | | | | |
| Total Real Estate Investment Trusts (REITs) | | | | 38,791,783 | |
| Real Estate Management & Development – 0.0% | | | | | | | | |
Farmland Partners, Inc. | | | 2,163 | | | | 23,209 | |
Kennedy-Wilson Holdings, Inc. | | | 2,405 | | | | 52,669 | |
| | | | | | | | |
| Total Real Estate Management & Development | | | | 75,878 | |
| Road & Rail – 0.8% | | | | | | | | |
Celadon Group, Inc. | | | 2,221 | | | | 23,276 | |
CSX Corp. | | | 28,257 | | | | 727,618 | |
JB Hunt Transport Services, Inc. | | | 1,616 | | | | 136,132 | |
Kansas City Southern | | | 1,923 | | | | 164,320 | |
Norfolk Southern Corp. | | | 8,552 | | | | 711,954 | |
Ryder System, Inc. | | | 1,741 | | | | 112,782 | |
Union Pacific Corp. | | | 25,919 | | | | 2,061,856 | |
| | | | | | | | |
| Total Road & Rail | | | | 3,937,938 | |
| Semiconductors & Semiconductor Equipment – 2.7% | | | | | |
Analog Devices, Inc. | | | 9,375 | | | | 554,906 | |
Applied Materials, Inc. | | | 27,211 | | | | 576,329 | |
See Notes to Financial Statements.
| | | | |
| WisdomTree Domestic Earnings and Dividend Funds | | | 87 | |
Schedule of Investments (continued)
WisdomTree Total Dividend Fund (DTD)
March 31, 2016
| | | | | | | | |
| Investments | | Shares | | | Value | |
Atmel Corp. | | | 7,618 | | | $ | 61,858 | |
Brooks Automation, Inc. | | | 3,904 | | | | 40,602 | |
Intel Corp. | | | 140,461 | | | | 4,543,913 | |
Intersil Corp. Class A | | | 7,187 | | | | 96,090 | |
KLA-Tencor Corp. | | | 5,241 | | | | 381,597 | |
Lam Research Corp. | | | 2,368 | | | | 195,597 | |
Linear Technology Corp. | | | 7,005 | | | | 312,143 | |
Maxim Integrated Products, Inc. | | | 9,537 | | | | 350,771 | |
Microchip Technology, Inc. | | | 7,879 | | | | 379,768 | |
NVIDIA Corp. | | | 8,172 | | | | 291,168 | |
QUALCOMM, Inc. | | | 64,572 | | | | 3,302,212 | |
Skyworks Solutions, Inc. | | | 2,496 | | | | 194,439 | |
Teradyne, Inc. | | | 3,427 | | | | 73,989 | |
Texas Instruments, Inc. | | | 28,908 | | | | 1,659,897 | |
Xilinx, Inc. | | | 7,228 | | | | 342,824 | |
| | | | | | | | |
| Total Semiconductors & Semiconductor Equipment | | | | 13,358,103 | |
| Software – 3.5% | | | | | | | | |
Activision Blizzard, Inc. | | | 4,901 | | | | 165,850 | |
American Software, Inc. Class A | | | 1,589 | | | | 14,301 | |
CA, Inc. | | | 17,242 | | | | 530,881 | |
CDK Global, Inc. | | | 1,674 | | | | 77,925 | |
Intuit, Inc. | | | 3,706 | | | | 385,461 | |
Microsoft Corp. | | | 225,307 | | | | 12,443,706 | |
Oracle Corp. | | | 72,876 | | | | 2,981,357 | |
QAD, Inc. Class A | | | 1,035 | | | | 21,994 | |
SS&C Technologies Holdings, Inc. | | | 1,141 | | | | 72,362 | |
Symantec Corp. | | | 21,183 | | | | 389,343 | |
| | | | | | | | |
| Total Software | | | | 17,083,180 | |
| Specialty Retail – 1.8% | | | | | | | | |
Abercrombie & Fitch Co. Class A | | | 2,480 | | | | 78,219 | |
American Eagle Outfitters, Inc.(a) | | | 6,796 | | | | 113,289 | |
Barnes & Noble, Inc. | | | 4,528 | | | | 55,966 | |
Best Buy Co., Inc. | | | 11,096 | | | | 359,954 | |
Big 5 Sporting Goods Corp. | | | 2,545 | | | | 28,275 | |
Buckle, Inc. (The)(a) | | | 1,868 | | | | 63,269 | |
Chico’s FAS, Inc. | | | 3,900 | | | | 51,753 | |
Citi Trends, Inc. | | | 1,123 | | | | 20,023 | |
Dick’s Sporting Goods, Inc. | | | 1,684 | | | | 78,727 | |
DSW, Inc. Class A | | | 3,189 | | | | 88,144 | |
Foot Locker, Inc. | | | 2,851 | | | | 183,889 | |
GameStop Corp. Class A(a) | | | 5,421 | | | | 172,008 | |
Gap, Inc. (The) | | | 14,757 | | | | 433,856 | |
GNC Holdings, Inc. Class A | | | 2,666 | | | | 84,646 | |
Guess?, Inc. | | | 5,623 | | | | 105,544 | |
Home Depot, Inc. (The) | | | 24,153 | | | | 3,222,735 | |
L Brands, Inc. | | | 6,101 | | | | 535,729 | |
Lowe’s Cos., Inc. | | | 14,606 | | | | 1,106,404 | |
Penske Automotive Group, Inc. | | | 2,650 | | | | 100,435 | |
Pier 1 Imports, Inc. | | | 4,349 | | | | 30,486 | |
Rent-A-Center, Inc. | | | 3,435 | | | | 54,445 | |
Ross Stores, Inc. | | | 3,899 | | | | 225,752 | |
Stage Stores, Inc. | | | 2,900 | | | | 23,374 | |
Staples, Inc. | | | 33,787 | | | | 372,671 | |
Stein Mart, Inc. | | | 3,287 | | | | 24,094 | |
Tailored Brands, Inc. | | | 2,757 | | | | 49,350 | |
Tiffany & Co. | | | 2,789 | | | | 204,657 | |
TJX Cos., Inc. (The) | | | 8,812 | | | | 690,420 | |
Tractor Supply Co. | | | 1,291 | | | | 116,784 | |
Williams-Sonoma, Inc. | | | 2,063 | | | | 112,929 | |
| | | | | | | | |
| Total Specialty Retail | | | | 8,787,827 | |
| Technology Hardware, Storage & Peripherals – 2.9% | | | | | |
Apple, Inc. | | | 108,471 | | | | 11,822,254 | |
Diebold, Inc. | | | 2,236 | | | | 64,643 | |
EMC Corp. | | | 36,427 | | | | 970,780 | |
HP, Inc. | | | 79,081 | | | | 974,278 | |
Lexmark International, Inc. Class A | | | 3,715 | | | | 124,192 | |
NetApp, Inc. | | | 7,553 | | | | 206,121 | |
Western Digital Corp. | | | 7,763 | | | | 366,724 | |
| | | | | | | | |
| Total Technology Hardware, Storage & Peripherals | | | | 14,528,992 | |
| Textiles, Apparel & Luxury Goods – 0.5% | | | | | | | | |
Carter’s, Inc. | | | 672 | | | | 70,815 | |
Coach, Inc. | | | 12,922 | | | | 518,043 | |
Columbia Sportswear Co. | | | 1,586 | | | | 95,303 | |
Hanesbrands, Inc. | | | 5,983 | | | | 169,558 | |
NIKE, Inc. Class B | | | 14,440 | | | | 887,627 | |
Ralph Lauren Corp. | | | 1,049 | | | | 100,977 | |
VF Corp. | | | 10,477 | | | | 678,491 | |
Wolverine World Wide, Inc. | | | 2,615 | | | | 48,168 | |
| | | | | | | | |
| Total Textiles, Apparel & Luxury Goods | | | | 2,568,982 | |
| Thrifts & Mortgage Finance – 0.2% | | | | | | | | |
BankFinancial Corp. | | | 1,858 | | | | 21,961 | |
Capitol Federal Financial, Inc. | | | 4,141 | | | | 54,910 | |
Federal Agricultural Mortgage Corp. Class C | | | 748 | | | | 28,222 | |
New York Community Bancorp, Inc. | | | 31,641 | | | | 503,092 | |
Northwest Bancshares, Inc. | | | 4,908 | | | | 66,307 | |
OceanFirst Financial Corp. | | | 2,376 | | | | 42,008 | |
Provident Financial Services, Inc. | | | 4,352 | | | | 87,867 | |
Riverview Bancorp, Inc. | | | 5,322 | | | | 22,352 | |
Territorial Bancorp, Inc. | | | 854 | | | | 22,255 | |
TFS Financial Corp. | | | 6,826 | | | | 118,568 | |
Washington Federal, Inc. | | | 3,514 | | | | 79,592 | |
Westfield Financial, Inc. | | | 2,969 | | | | 25,029 | |
| | | | | | | | |
| Total Thrifts & Mortgage Finance | | | | 1,072,163 | |
| Tobacco – 3.1% | | | | | | | | |
Altria Group, Inc. | | | 83,071 | | | | 5,205,229 | |
Philip Morris International, Inc. | | | 77,325 | | | | 7,586,356 | |
Reynolds American, Inc. | | | 48,637 | | | | 2,446,927 | |
Universal Corp. | | | 1,105 | | | | 62,775 | |
Vector Group Ltd.(a) | | | 9,915 | | | | 226,459 | |
| | | | | | | | |
| Total Tobacco | | | | 15,527,746 | |
| Trading Companies & Distributors – 0.3% | | | | | | | | |
Fastenal Co.(a) | | | 9,024 | | | | 442,176 | |
GATX Corp. | | | 2,019 | | | | 95,902 | |
H&E Equipment Services, Inc. | | | 2,696 | | | | 47,261 | |
MSC Industrial Direct Co., Inc. Class A | | | 1,635 | | | | 124,767 | |
See Notes to Financial Statements.
| | |
| 88 | | WisdomTree Domestic Earnings and Dividend Funds |
Schedule of Investments (concluded)
WisdomTree Total Dividend Fund (DTD)
March 31, 2016
| | | | | | | | |
| Investments | | Shares | | | Value | |
TAL International Group, Inc.* | | | 4,422 | | | $ | 68,276 | |
W.W. Grainger, Inc. | | | 1,564 | | | | 365,084 | |
Watsco, Inc. | | | 1,094 | | | | 147,406 | |
| | | | | | | | |
| Total Trading Companies & Distributors | | | | | | | 1,290,872 | |
| Transportation Infrastructure – 0.1% | | | | | | | | |
Macquarie Infrastructure Corp. | | | 6,331 | | | | 426,963 | |
| Water Utilities – 0.1% | | | | | | | | |
American Water Works Co., Inc. | | | 4,470 | | | | 308,117 | |
Aqua America, Inc. | | | 5,492 | | | | 174,755 | |
Artesian Resources Corp. Class A | | | 937 | | | | 26,199 | |
Connecticut Water Service, Inc. | | | 1,134 | | | | 51,143 | |
| | | | | | | | |
| Total Water Utilities | | | | | | | 560,214 | |
| Wireless Telecommunication Services – 0.0% | | | | | | | | |
Telephone & Data Systems, Inc. | | | 2,962 | | | | 89,127 | |
TOTAL COMMON STOCKS
(Cost: $430,060,658) | | | | | | | 491,386,021 | |
| EXCHANGE-TRADED FUND – 0.2% | | | | | | | | |
| United States – 0.2% | | | | | | | | |
WisdomTree Total Earnings Fund(a)(b)
(Cost: $790,703) | | | 11,325 | | | | 809,851 | |
| INVESTMENT OF CASH COLLATERAL FOR SECURITIES LOANED – 0.9% | |
| United States – 0.9% | | | | | | | | |
State Street Navigator Securities Lending Prime Portfolio, 0.50%(c) (Cost: $4,643,317)(d) | | | 4,643,317 | | | | 4,643,317 | |
TOTAL INVESTMENTS IN SECURITIES – 100.6%
(Cost: $435,494,678) | | | | | | | 496,839,189 | |
Liabilities in Excess of Cash and Other Assets – (0.6)% | | | | (3,130,851 | ) |
| | | | | | | | |
| NET ASSETS – 100.0% | | | | | | $ | 493,708,338 | |
| * | Non-income producing security. |
| (a) | Security, or portion thereof, was on loan at March 31, 2016 (See Note 2). |
| (b) | Affiliated company (See Note 3). |
| (c) | Rate shown represents annualized 7-day yield as of March 31, 2016. |
| (d) | At March 31, 2016, the total market value of the Fund’s securities on loan was $4,526,378 and the total market value of the collateral held by the Fund was $4,643,317. |
See Notes to Financial Statements.
| | | | |
| WisdomTree Domestic Earnings and Dividend Funds | | | 89 | |
Schedule of Investments
WisdomTree Total Earnings Fund (EXT)
March 31, 2016
| | | | | | | | |
| Investments | | Shares | | | Value | |
| | | | | | | | |
| COMMON STOCKS – 99.8% | | | | | | | | |
| United States – 99.8% | | | | | | | | |
| Aerospace & Defense – 2.9% | | | | | | | | |
B/E Aerospace, Inc. | | | 22 | | | $ | 1,015 | |
Boeing Co. (The) | | | 2,361 | | | | 299,705 | |
BWX Technologies, Inc. | | | 423 | | | | 14,196 | |
Cubic Corp. | | | 98 | | | | 3,916 | |
Curtiss-Wright Corp. | | | 121 | | | | 9,156 | |
Esterline Technologies Corp.* | | | 94 | | | | 6,023 | |
General Dynamics Corp. | | | 1,019 | | | | 133,866 | |
HEICO Corp. | | | 65 | | | | 3,908 | |
Hexcel Corp. | | | 201 | | | | 8,786 | |
Honeywell International, Inc. | | | 2,134 | | | | 239,115 | |
Huntington Ingalls Industries, Inc. | | | 184 | | | | 25,197 | |
KLX, Inc.* | | | 80 | | | | 2,571 | |
L-3 Communications Holdings, Inc. | | | 287 | | | | 34,010 | |
Lockheed Martin Corp. | | | 1,065 | | | | 235,897 | |
Moog, Inc. Class A* | | | 127 | | | | 5,801 | |
National Presto Industries, Inc. | | | 33 | | | | 2,763 | |
Northrop Grumman Corp. | | | 697 | | | | 137,936 | |
Orbital ATK, Inc. | | | 261 | | | | 22,691 | |
Raytheon Co. | | | 1,138 | | | | 139,553 | |
Rockwell Collins, Inc. | | | 403 | | | | 37,161 | |
Spirit AeroSystems Holdings, Inc. Class A* | | | 111 | | | | 5,035 | |
Teledyne Technologies, Inc.* | | | 94 | | | | 8,285 | |
Textron, Inc. | | | 760 | | | | 27,710 | |
TransDigm Group, Inc.* | | | 61 | | | | 13,441 | |
United Technologies Corp. | | | 2,649 | | | | 265,165 | |
| | | | | | | | |
| Total Aerospace & Defense | | | | 1,682,902 | |
| Air Freight & Logistics – 0.8% | | | | | | | | |
Atlas Air Worldwide Holdings, Inc.* | | | 117 | | | | 4,946 | |
C.H. Robinson Worldwide, Inc. | | | 425 | | | | 31,548 | |
Expeditors International of Washington, Inc. | | | 500 | | | | 24,405 | |
FedEx Corp. | | | 636 | | | | 103,490 | |
Forward Air Corp. | | | 76 | | | | 3,444 | |
Hub Group, Inc. Class A* | | | 97 | | | | 3,957 | |
Park-Ohio Holdings Corp. | | | 114 | | | | 4,881 | |
United Parcel Service, Inc. Class B | | | 2,549 | | | | 268,843 | |
| | | | | | | | |
| Total Air Freight & Logistics | | | | 445,514 | |
| Airlines – 1.7% | | | | | | | | |
Alaska Air Group, Inc. | | | 537 | | | | 44,045 | |
Allegiant Travel Co. | | | 29 | | | | 5,164 | |
American Airlines Group, Inc. | | | 5,340 | | | | 218,993 | |
Delta Air Lines, Inc. | | | 4,618 | | | | 224,804 | |
Hawaiian Holdings, Inc.* | | | 349 | | | | 16,469 | |
JetBlue Airways Corp.* | | | 810 | | | | 17,107 | |
Southwest Airlines Co. | | | 1,928 | | | | 86,374 | |
Spirit Airlines, Inc.* | | | 429 | | | | 20,584 | |
United Continental Holdings, Inc.* | | | 5,915 | | | | 354,072 | |
| | | | | | | | |
| Total Airlines | | | | 987,612 | |
| Auto Components – 0.6% | | | | | | | | |
American Axle & Manufacturing Holdings, Inc.* | | | 483 | | | | 7,433 | |
BorgWarner, Inc. | | | 732 | | | | 28,109 | |
Cooper Tire & Rubber Co. | | | 269 | | | $ | 9,958 | |
Dana Holding Corp. | | | 1,002 | | | | 14,118 | |
Dorman Products, Inc.* | | | 98 | | | | 5,333 | |
Drew Industries, Inc. | | | 88 | | | | 5,673 | |
Gentex Corp. | | | 1,142 | | | | 17,918 | |
Gentherm, Inc.* | | | 120 | | | | 4,991 | |
Goodyear Tire & Rubber Co. (The) | | | 3,686 | | | | 121,564 | |
Johnson Controls, Inc. | | | 1,952 | | | | 76,070 | |
Lear Corp. | | | 260 | | | | 28,904 | |
Standard Motor Products, Inc. | | | 128 | | | | 4,435 | |
Superior Industries International, Inc. | | | 217 | | | | 4,791 | |
Tenneco, Inc.* | | | 327 | | | | 16,844 | |
Tower International, Inc. | | | 184 | | | | 5,005 | |
Visteon Corp. | | | 130 | | | | 10,347 | |
| | | | | | | | |
| Total Auto Components | | | | 361,493 | |
| Automobiles – 1.0% | | | | | | | | |
Ford Motor Co. | | | 22,461 | | | | 303,224 | |
General Motors Co. | | | 6,008 | | | | 188,831 | |
Harley-Davidson, Inc. | | | 863 | | | | 44,298 | |
Thor Industries, Inc. | | | 147 | | | | 9,374 | |
Winnebago Industries, Inc. | | | 375 | | | | 8,419 | |
| | | | | | | | |
| Total Automobiles | | | | 554,146 | |
| Banks – 8.7% | | | | | | | | |
1st Source Corp. | | | 105 | | | | 3,343 | |
Associated Banc-Corp. | | | 480 | | | | 8,611 | |
BancFirst Corp. | | | 50 | | | | 2,852 | |
BancorpSouth, Inc. | | | 291 | | | | 6,201 | |
Bank of America Corp. | | | 49,701 | | | | 671,958 | |
Bank of Hawaii Corp. | | | 148 | | | | 10,106 | |
Bank of the Ozarks, Inc. | | | 138 | | | | 5,792 | |
BankUnited, Inc. | | | 396 | | | | 13,638 | |
Banner Corp. | | | 74 | | | | 3,111 | |
BB&T Corp. | | | 2,856 | | | | 95,019 | |
BBCN Bancorp, Inc. | | | 527 | | | | 8,005 | |
BOK Financial Corp.(a) | | | 245 | | | | 13,382 | |
Boston Private Financial Holdings, Inc. | | | 518 | | | | 5,931 | |
Camden National Corp. | | | 74 | | | | 3,108 | |
Cardinal Financial Corp. | | | 26 | | | | 529 | |
Cathay General Bancorp | | | 264 | | | | 7,479 | |
Central Pacific Financial Corp. | | | 329 | | | | 7,162 | |
Chemical Financial Corp. | | | 93 | | | | 3,319 | |
CIT Group, Inc. | | | 1,299 | | | | 40,308 | |
Citigroup, Inc. | | | 13,295 | | | | 555,066 | |
Citizens Financial Group, Inc. | | | 728 | | | | 15,252 | |
City Holding Co. | | | 73 | | | | 3,488 | |
CoBiz Financial, Inc. | | | 328 | | | | 3,877 | |
Columbia Banking System, Inc. | | | 180 | | | | 5,386 | |
Comerica, Inc. | | | 1,143 | | | | 43,285 | |
Commerce Bancshares, Inc. | | | 314 | | | | 14,114 | |
Community Bank System, Inc. | | | 110 | | | | 4,203 | |
Community Trust Bancorp, Inc. | | | 83 | | | | 2,932 | |
Cullen/Frost Bankers, Inc.(a) | | | 186 | | | | 10,251 | |
Customers Bancorp, Inc.* | | | 108 | | | | 2,552 | |
See Notes to Financial Statements.
| | |
| 90 | | WisdomTree Domestic Earnings and Dividend Funds |
Schedule of Investments (continued)
WisdomTree Total Earnings Fund (EXT)
March 31, 2016
| | | | | | | | |
| Investments | | Shares | | | Value | |
CVB Financial Corp. | | | 277 | | | $ | 4,834 | |
East West Bancorp, Inc. | | | 488 | | | | 15,850 | |
Fifth Third Bancorp | | | 3,847 | | | | 64,206 | |
First Citizens BancShares, Inc. Class A | | | 28 | | | | 7,030 | |
First Commonwealth Financial Corp. | | | 807 | | | | 7,150 | |
First Financial Bancorp | | | 248 | | | | 4,509 | |
First Financial Bankshares, Inc.(a) | | | 168 | | | | 4,969 | |
First Horizon National Corp. | | | 1,095 | | | | 14,345 | |
First Interstate BancSystem, Inc. Class A | | | 153 | | | | 4,304 | |
First Merchants Corp. | | | 175 | | | | 4,125 | |
First Midwest Bancorp, Inc. | | | 432 | | | | 7,785 | |
First Niagara Financial Group, Inc. | | | 1,085 | | | | 10,503 | |
First Republic Bank | | | 432 | | | | 28,789 | |
FirstMerit Corp. | | | 700 | | | | 14,735 | |
Flushing Financial Corp. | | | 153 | | | | 3,308 | |
FNB Corp. | | | 597 | | | | 7,767 | |
Fulton Financial Corp. | | | 738 | | | | 9,874 | |
Glacier Bancorp, Inc. | | | 170 | | | | 4,321 | |
Great Southern Bancorp, Inc. | | | 88 | | | | 3,267 | |
Hancock Holding Co. | | | 162 | | | | 3,720 | |
Hanmi Financial Corp. | | | 264 | | | | 5,813 | |
Hilltop Holdings, Inc.* | | | 280 | | | | 5,286 | |
Home BancShares, Inc. | | | 160 | | | | 6,552 | |
Huntington Bancshares, Inc. | | | 2,824 | | | | 26,941 | |
Iberiabank Corp. | | | 80 | | | | 4,102 | |
Independent Bank Corp. | | | 67 | | | | 3,079 | |
International Bancshares Corp. | | | 305 | | | | 7,521 | |
Investors Bancorp, Inc. | | | 518 | | | | 6,030 | |
JPMorgan Chase & Co. | | | 19,384 | | | | 1,147,921 | |
KeyCorp | | | 3,716 | | | | 41,025 | |
Lakeland Financial Corp. | | | 95 | | | | 4,349 | |
M&T Bank Corp. | | | 502 | | | | 55,722 | |
MB Financial, Inc. | | | 120 | | | | 3,894 | |
National Penn Bancshares, Inc. | | | 299 | | | | 3,181 | |
NBT Bancorp, Inc. | | | 105 | | | | 2,830 | |
Old National Bancorp | | | 312 | | | | 3,803 | |
Opus Bank | | | 216 | | | | 7,344 | |
PacWest Bancorp | | | 88 | | | | 3,269 | |
Park National Corp. | | | 48 | | | | 4,320 | |
People’s United Financial, Inc. | | | 689 | | �� | | 10,976 | |
Pinnacle Financial Partners, Inc. | | | 115 | | | | 5,642 | |
PNC Financial Services Group, Inc. (The) | | | 2,295 | | | | 194,088 | |
Popular, Inc. | | | 536 | | | | 15,335 | |
PrivateBancorp, Inc. | | | 222 | | | | 8,569 | |
Prosperity Bancshares, Inc. | | | 287 | | | | 13,314 | |
Regions Financial Corp. | | | 5,559 | | | | 43,638 | |
Renasant Corp. | | | 131 | | | | 4,311 | |
Republic Bancorp, Inc. Class A | | | 192 | | | | 4,959 | |
S&T Bancorp, Inc. | | | 82 | | | | 2,112 | |
Seacoast Banking Corp. of Florida* | | | 143 | | | | 2,258 | |
ServisFirst Bancshares, Inc. | | | 106 | | | | 4,706 | |
Signature Bank* | | | 115 | | | | 15,654 | |
Simmons First National Corp. Class A | | | 83 | | | | 3,741 | |
South State Corp. | | | 78 | | | | 5,010 | |
Southside Bancshares, Inc. | | | 137 | | | | 3,572 | |
Sterling Bancorp | | | 408 | | | | 6,499 | |
SunTrust Banks, Inc. | | | 2,373 | | | | 85,618 | |
SVB Financial Group* | | | 143 | | | | 14,593 | |
Synovus Financial Corp. | | | 313 | | | | 9,049 | |
TCF Financial Corp. | | | 445 | | | | 5,456 | |
Texas Capital Bancshares, Inc.* | | | 80 | | | | 3,070 | |
Tompkins Financial Corp. | | | 67 | | | | 4,288 | |
Towne Bank | | | 250 | | | | 4,798 | |
Trustmark Corp. | | | 248 | | | | 5,711 | |
U.S. Bancorp | | | 6,905 | | | | 280,274 | |
UMB Financial Corp. | | | 197 | | | | 10,171 | |
Umpqua Holdings Corp. | | | 297 | | | | 4,710 | |
Union Bankshares Corp. | | | 292 | | | | 7,192 | |
United Bankshares, Inc. | | | 111 | | | | 4,074 | |
United Community Banks, Inc. | | | 122 | | | | 2,253 | |
Valley National Bancorp | | | 265 | | | | 2,528 | |
Webster Financial Corp. | | | 341 | | | | 12,242 | |
Wells Fargo & Co. | | | 20,763 | | | | 1,004,099 | |
WesBanco, Inc. | | | 100 | | | | 2,971 | |
Westamerica Bancorp(a) | | | 63 | | | | 3,069 | |
Western Alliance Bancorp* | | | 324 | | | | 10,815 | |
Wilshire Bancorp, Inc. | | | 754 | | | | 7,766 | |
Wintrust Financial Corp. | | | 97 | | | | 4,301 | |
Zions Bancorp | | | 911 | | | | 22,055 | |
| | | | | | | | |
| Total Banks | | | | 4,994,120 | |
| Beverages – 1.6% | | | | | | | | |
Boston Beer Co., Inc. (The) Class A* | | | 17 | | | | 3,146 | |
Brown-Forman Corp. Class B | | | 392 | | | | 38,600 | |
Coca-Cola Bottling Co. Consolidated | | | 46 | | | | 7,349 | |
Coca-Cola Co. (The) | | | 7,494 | | | | 347,647 | |
Coca-Cola Enterprises, Inc. | | | 808 | | | | 40,998 | |
Constellation Brands, Inc. Class A | | | 417 | | | | 63,005 | |
Dr. Pepper Snapple Group, Inc. | | | 488 | | | | 43,637 | |
Molson Coors Brewing Co. Class B | | | 504 | | | | 48,475 | |
Monster Beverage Corp.* | | | 219 | | | | 29,210 | |
National Beverage Corp.* | | | 151 | | | | 6,390 | |
PepsiCo, Inc. | | | 2,827 | | | | 289,711 | |
| | | | | | | | |
| Total Beverages | | | | 918,168 | |
| Biotechnology – 2.9% | | | | | | | | |
AbbVie, Inc. | | | 2,550 | | | | 145,656 | |
Acorda Therapeutics, Inc.* | | | 126 | | | | 3,333 | |
Alexion Pharmaceuticals, Inc.* | | | 146 | | | | 20,326 | |
AMAG Pharmaceuticals, Inc.*(a) | | | 120 | | | | 2,808 | |
Amgen, Inc. | | | 2,144 | | | | 321,450 | |
Baxalta, Inc. | | | 1,602 | | | | 64,721 | |
Biogen, Inc.* | | | 634 | | | | 165,043 | |
Celgene Corp.* | | | 877 | | | | 87,779 | |
Emergent Biosolutions, Inc.* | | | 101 | | | | 3,671 | |
Gilead Sciences, Inc. | | | 8,609 | | | | 790,823 | |
Insys Therapeutics, Inc.*(a) | | | 152 | | | | 2,430 | |
Medivation, Inc.* | | | 235 | | | | 10,805 | |
Myriad Genetics, Inc.* | | | 307 | | | | 11,491 | |
See Notes to Financial Statements.
| | | | |
| WisdomTree Domestic Earnings and Dividend Funds | | | 91 | |
Schedule of Investments (continued)
WisdomTree Total Earnings Fund (EXT)
March 31, 2016
| | | | | | | | |
| Investments | | Shares | | | Value | |
PDL BioPharma, Inc. | | | 1,993 | | | $ | 6,637 | |
Regeneron Pharmaceuticals, Inc.* | | | 40 | | | | 14,418 | |
United Therapeutics Corp.* | | | 128 | | | | 14,263 | |
| | | | | | | | |
| Total Biotechnology | | | | 1,665,654 | |
| Building Products – 0.3% | | | | | | | | |
A.O. Smith Corp. | | | 155 | | | | 11,828 | |
American Woodmark Corp.* | | | 63 | | | | 4,699 | |
Armstrong World Industries, Inc.* | | | 108 | | | | 5,224 | |
Fortune Brands Home & Security, Inc. | | | 338 | | | | 18,942 | |
Lennox International, Inc. | | | 97 | | | | 13,113 | |
Masco Corp. | | | 1,730 | | | | 54,409 | |
Owens Corning | | | 370 | | | | 17,494 | |
Simpson Manufacturing Co., Inc. | | | 96 | | | | 3,664 | |
Universal Forest Products, Inc. | | | 72 | | | | 6,179 | |
USG Corp.* | | | 336 | | | | 8,336 | |
| | | | | | | | |
| Total Building Products | | | | 143,888 | |
| Capital Markets – 2.7% | | | | | | | | |
Affiliated Managers Group, Inc.* | | | 121 | | | | 19,650 | |
Ameriprise Financial, Inc. | | | 577 | | | | 54,244 | |
Artisan Partners Asset Management, Inc. Class A | | | 70 | | | | 2,159 | |
Bank of New York Mellon Corp. (The) | | | 3,182 | | | | 117,193 | |
BlackRock, Inc. | | | 490 | | | | 166,879 | |
Calamos Asset Management, Inc. Class A | | | 257 | | | | 2,182 | |
Charles Schwab Corp. (The) | | | 2,224 | | | | 62,316 | |
Cohen & Steers, Inc. | | | 70 | | | | 2,724 | |
E*TRADE Financial Corp.* | | | 729 | | | | 17,853 | |
Eaton Vance Corp. | | | 382 | | | | 12,805 | |
Evercore Partners, Inc. Class A | | | 101 | | | | 5,227 | |
Federated Investors, Inc. Class B | | | 466 | | | | 13,444 | |
Financial Engines, Inc. | | | 122 | | | | 3,834 | |
Franklin Resources, Inc. | | | 2,793 | | | | 109,067 | |
GAMCO Investors, Inc. Class A | | | 91 | | | | 3,372 | |
Goldman Sachs Group, Inc. (The) | | | 2,189 | | | | 343,629 | |
Greenhill & Co., Inc. | | | 168 | | | | 3,730 | |
HFF, Inc. Class A | | | 151 | | | | 4,157 | |
Interactive Brokers Group, Inc. Class A | | | 184 | | | | 7,235 | |
INTL FCStone, Inc.* | | | 224 | | | | 5,988 | |
Investment Technology Group, Inc. | | | 281 | | | | 6,210 | |
Janus Capital Group, Inc. | | | 815 | | | | 11,923 | |
KCG Holdings, Inc. Class A* | | | 264 | | | | 3,155 | |
Legg Mason, Inc. | | | 404 | | | | 14,011 | |
LPL Financial Holdings, Inc.(a) | | | 232 | | | | 5,754 | |
Morgan Stanley | | | 9,300 | | | | 232,593 | |
Northern Trust Corp. | | | 551 | | | | 35,909 | |
NorthStar Asset Management Group, Inc. | | | 568 | | | | 6,447 | |
Raymond James Financial, Inc. | | | 459 | | | | 21,853 | |
SEI Investments Co. | | | 374 | | | | 16,101 | |
State Street Corp. | | | 1,833 | | | | 107,267 | |
Stifel Financial Corp.* | | | 174 | | | | 5,150 | |
T. Rowe Price Group, Inc. | | | 865 | | | | 63,543 | |
TD Ameritrade Holding Corp. | | | 1,211 | | | | 38,183 | |
Virtus Investment Partners, Inc. | | | 45 | | | | 3,515 | |
Waddell & Reed Financial, Inc. Class A | | | 444 | | | | 10,452 | |
| | | | | | | | |
| Total Capital Markets | | | | 1,539,754 | |
| Chemicals – 2.1% | | | | | | | | |
A. Schulman, Inc. | | | 83 | | | | 2,259 | |
Air Products & Chemicals, Inc. | | | 472 | | | | 67,992 | |
Airgas, Inc. | | | 148 | | | | 20,963 | |
Albemarle Corp. | | | 328 | | | | 20,969 | |
Balchem Corp. | | | 59 | | | | 3,659 | |
Calgon Carbon Corp. | | | 296 | | | | 4,150 | |
Celanese Corp. Series A | | | 1,098 | | | | 71,919 | |
CF Industries Holdings, Inc. | | | 1,133 | | | | 35,508 | |
Chemours Co. (The) | | | 2 | | | | 14 | |
Chemtura Corp.* | | | 467 | | | | 12,329 | |
Dow Chemical Co. (The) | | | 4,360 | | | | 221,750 | |
E.I. du Pont de Nemours & Co. | | | 2,081 | | | | 131,769 | |
Eastman Chemical Co. | | | 606 | | | | 43,771 | |
Ecolab, Inc. | | | 552 | | | | 61,559 | |
Ferro Corp.* | | | 148 | | | | 1,757 | |
Flotek Industries, Inc.*(a) | | | 305 | | | | 2,236 | |
FMC Corp. | | | 56 | | | | 2,261 | |
GCP Applied Technologies, Inc.* | | | 199 | | | | 3,968 | |
H.B. Fuller Co. | | | 120 | | | | 5,094 | |
Innospec, Inc. | | | 119 | | | | 5,160 | |
International Flavors & Fragrances, Inc. | | | 210 | | | | 23,892 | |
Minerals Technologies, Inc. | | | 88 | | | | 5,003 | |
Monsanto Co. | | | 1,302 | | | | 114,237 | |
Mosaic Co. (The) | | | 733 | | | | 19,791 | |
NewMarket Corp. | | | 37 | | | | 14,662 | |
OMNOVA Solutions, Inc.* | | | 336 | | | | 1,868 | |
PolyOne Corp. | | | 201 | | | | 6,080 | |
PPG Industries, Inc. | | | 574 | | | | 63,995 | |
Praxair, Inc. | | | 631 | | | | 72,218 | |
Quaker Chemical Corp. | | | 46 | | | | 3,904 | |
Rayonier Advanced Materials, Inc. | | | 35 | | | | 332 | |
RPM International, Inc. | | | 343 | | | | 16,234 | |
Scotts Miracle-Gro Co. (The) Class A | | | 124 | | | | 9,023 | |
Sensient Technologies Corp. | | | 132 | | | | 8,377 | |
Sherwin-Williams Co. (The) | | | 168 | | | | 47,824 | |
Stepan Co. | | | 96 | | | | 5,308 | |
Valspar Corp. (The) | | | 200 | | | | 21,404 | |
W.R. Grace & Co.* | | | 199 | | | | 14,165 | |
Westlake Chemical Corp. | | | 417 | | | | 19,307 | |
| | | | | | | | |
| Total Chemicals | | | | 1,186,711 | |
| Commercial Services & Supplies – 0.5% | | | | | | | | |
ABM Industries, Inc. | | | 145 | | | | 4,685 | |
ACCO Brands Corp.* | | | 772 | | | | 6,932 | |
ADT Corp. (The) | | | 553 | | | | 22,817 | |
Brady Corp. Class A | | | 128 | | | | 3,435 | |
Brink’s Co. (The) | | | 174 | | | | 5,845 | |
Cintas Corp. | | | 243 | | | | 21,824 | |
Clean Harbors, Inc.* | | | 34 | | | | 1,678 | |
Copart, Inc.* | | | 204 | | | | 8,317 | |
Deluxe Corp. | | | 220 | | | | 13,748 | |
Ennis, Inc. | | | 196 | | | | 3,832 | |
Essendant, Inc. | | | 157 | | | | 5,013 | |
See Notes to Financial Statements.
| | |
| 92 | | WisdomTree Domestic Earnings and Dividend Funds |
Schedule of Investments (continued)
WisdomTree Total Earnings Fund (EXT)
March 31, 2016
| | | | | | | | |
| Investments | | Shares | | | Value | |
Herman Miller, Inc. | | | 149 | | | $ | 4,603 | |
HNI Corp. | | | 99 | | | | 3,878 | |
KAR Auction Services, Inc. | | | 280 | | | | 10,679 | |
Knoll, Inc. | | | 196 | | | | 4,243 | |
Matthews International Corp. Class A | | | 77 | | | | 3,963 | |
McGrath RentCorp | | | 53 | | | | 1,329 | |
Mobile Mini, Inc. | | | 93 | | | | 3,071 | |
MSA Safety, Inc. | | | 105 | | | | 5,077 | |
Pitney Bowes, Inc. | | | 913 | | | | 19,666 | |
R.R. Donnelley & Sons Co. | | | 504 | | | | 8,266 | |
Republic Services, Inc. | | | 970 | | | | 46,220 | |
Rollins, Inc. | | | 265 | | | | 7,187 | |
Steelcase, Inc. Class A | | | 232 | | | | 3,461 | |
Stericycle, Inc.* | | | 107 | | | | 13,502 | |
Tetra Tech, Inc. | | | 184 | | | | 5,487 | |
UniFirst Corp. | | | 86 | | | | 9,384 | |
Waste Connections, Inc. | | | 210 | | | | 13,564 | |
Waste Management, Inc. | | | 525 | | | | 30,975 | |
West Corp. | | | 280 | | | | 6,390 | |
| | | | | | | | |
| Total Commercial Services & Supplies | | | | 299,071 | |
| Communications Equipment – 1.2% | | | | | | | | |
ADTRAN, Inc. | | | 95 | | | | 1,921 | |
Arista Networks, Inc.*(a) | | | 40 | | | | 2,524 | |
Black Box Corp. | | | 78 | | | | 1,051 | |
Brocade Communications Systems, Inc. | | | 1,266 | | | | 13,394 | |
Cisco Systems, Inc. | | | 17,651 | | | | 502,524 | |
CommScope Holding Co., Inc.* | | | 363 | | | | 10,135 | |
Comtech Telecommunications Corp. | | | 74 | | | | 1,729 | |
EchoStar Corp. Class A* | | | 56 | | | | 2,480 | |
F5 Networks, Inc.* | | | 152 | | | | 16,089 | |
Finisar Corp.* | | | 256 | | | | 4,670 | |
Harris Corp. | | | 468 | | | | 36,439 | |
InterDigital, Inc. | | | 86 | | | | 4,786 | |
Juniper Networks, Inc. | | | 996 | | | | 25,408 | |
Motorola Solutions, Inc. | | | 536 | | | | 40,575 | |
NETGEAR, Inc.* | | | 81 | | | | 3,270 | |
Plantronics, Inc. | | | 118 | | | | 4,624 | |
Polycom, Inc.* | | | 113 | | | | 1,260 | |
Ubiquiti Networks, Inc.*(a) | | | 294 | | | | 9,781 | |
| | | | | | | | |
| Total Communications Equipment | | | | 682,660 | |
| Construction & Engineering – 0.2% | | | | | | | | |
Aegion Corp.* | | | 226 | | | | 4,766 | |
Comfort Systems USA, Inc. | | | 207 | | | | 6,577 | |
Dycom Industries, Inc.* | | | 72 | | | | 4,656 | |
EMCOR Group, Inc. | | | 165 | | | | 8,019 | |
Fluor Corp. | | | 799 | | | | 42,906 | |
Jacobs Engineering Group, Inc.* | | | 482 | | | | 20,991 | |
MasTec, Inc.* | | | 309 | | | | 6,254 | |
Primoris Services Corp. | | | 147 | | | | 3,572 | |
Quanta Services, Inc.* | | | 730 | | | | 16,469 | |
Tutor Perini Corp.* | | | 323 | | | | 5,020 | |
Valmont Industries, Inc. | | | 74 | | | | 9,164 | |
| | | | | | | | |
| Total Construction & Engineering | | | | 128,394 | |
| Construction Materials – 0.0% | | | | | | | | |
Eagle Materials, Inc. | | | 88 | | | | 6,169 | |
Martin Marietta Materials, Inc. | | | 72 | | | | 11,485 | |
| | | | | | | | |
| Total Construction Materials | | | | 17,654 | |
| Consumer Finance – 1.3% | | | | | | | | |
American Express Co. | | | 3,818 | | | | 234,425 | |
Capital One Financial Corp. | | | 2,840 | | | | 196,840 | |
Cash America International, Inc. | | | 376 | | | | 14,529 | |
Credit Acceptance Corp.*(a) | | | 95 | | | | 17,247 | |
Discover Financial Services | | | 1,920 | | | | 97,766 | |
Encore Capital Group, Inc.*(a) | | | 200 | | | | 5,148 | |
First Cash Financial Services, Inc. | | | 69 | | | | 3,178 | |
Green Dot Corp. Class A* | | | 224 | | | | 5,145 | |
Navient Corp. | | | 2,485 | | | | 29,746 | |
Nelnet, Inc. Class A | | | 360 | | | | 14,173 | |
PRA Group, Inc.* | | | 261 | | | | 7,671 | |
Regional Management Corp.* | | | 108 | | | | 1,848 | |
Santander Consumer USA Holdings, Inc.* | | | 1,692 | | | | 17,749 | |
SLM Corp.* | | | 739 | | | | 4,700 | |
Synchrony Financial* | | | 3,112 | | | | 89,190 | |
World Acceptance Corp.*(a) | | | 66 | | | | 2,503 | |
| | | | | | | | |
| Total Consumer Finance | | | | 741,858 | |
| Containers & Packaging – 0.4% | | | | | | | | |
AptarGroup, Inc. | | | 142 | | | | 11,134 | |
Avery Dennison Corp. | | | 237 | | | | 17,090 | |
Ball Corp. | | | 413 | | | | 29,443 | |
Bemis Co., Inc. | | | 264 | | | | 13,670 | |
Berry Plastics Group, Inc.* | | | 136 | | | | 4,916 | |
Crown Holdings, Inc.* | | | 494 | | | | 24,498 | |
Graphic Packaging Holding Co. | | | 712 | | | | 9,149 | |
Greif, Inc. Class A | | | 49 | | | | 1,605 | |
International Paper Co. | | | 856 | | | | 35,130 | |
Packaging Corp. of America | | | 376 | | | | 22,711 | |
Sealed Air Corp. | | | 320 | | | | 15,363 | |
Silgan Holdings, Inc. | | | 172 | | | | 9,145 | |
Sonoco Products Co. | | | 285 | | | | 13,843 | |
WestRock Co. | | | 479 | | | | 18,695 | |
| | | | | | | | |
| Total Containers & Packaging | | | | 226,392 | |
| Distributors – 0.1% | | | | | | | | |
Core-Mark Holding Co., Inc. | | | 100 | | | | 8,156 | |
Genuine Parts Co. | | | 370 | | | | 36,763 | |
LKQ Corp.* | | | 702 | | | | 22,415 | |
Pool Corp. | | | 104 | | | | 9,125 | |
| | | | | | | | |
| Total Distributors | | | | 76,459 | |
| Diversified Consumer Services – 0.1% | | | | | | | | |
Apollo Education Group, Inc.* | | | 446 | | | | 3,664 | |
Bright Horizons Family Solutions, Inc.* | | | 104 | | | | 6,737 | |
Capella Education Co. | | | 63 | | | | 3,316 | |
DeVry Education Group, Inc.(a) | | | 402 | | | | 6,942 | |
Graham Holdings Co. Class B | | | 8 | | | | 3,840 | |
Grand Canyon Education, Inc.* | | | 170 | | | | 7,266 | |
H&R Block, Inc. | | | 802 | | | | 21,189 | |
See Notes to Financial Statements.
| | | | |
| WisdomTree Domestic Earnings and Dividend Funds | | | 93 | |
Schedule of Investments (continued)
WisdomTree Total Earnings Fund (EXT)
March 31, 2016
| | | | | | | | |
| Investments | | Shares | | | Value | |
Service Corp. International | | | 160 | | | $ | 3,949 | |
Sotheby’s | | | 94 | | | | 2,513 | |
Strayer Education, Inc.* | | | 100 | | | | 4,875 | |
Weight Watchers International, Inc.*(a) | | | 198 | | | | 2,877 | |
| | | | | | | | |
| Total Diversified Consumer Services | | | | 67,168 | |
| Diversified Financial Services – 2.8% | | | | | | | | |
Berkshire Hathaway, Inc. Class B* | | | 8,676 | | | | 1,230,951 | |
CBOE Holdings, Inc. | | | 168 | | | | 10,975 | |
CME Group, Inc. | | | 614 | | | | 58,975 | |
FactSet Research Systems, Inc. | | | 76 | | | | 11,516 | |
Intercontinental Exchange, Inc. | | | 123 | | | | 28,922 | |
Leucadia National Corp. | | | 565 | | | | 9,136 | |
MarketAxess Holdings, Inc. | | | 70 | | | | 8,738 | |
McGraw Hill Financial, Inc. | | | 536 | | | | 53,053 | |
Moody’s Corp. | | | 517 | | | | 49,921 | |
Morningstar, Inc. | | | 66 | | | | 5,826 | |
MSCI, Inc. | | | 259 | | | | 19,187 | |
Nasdaq, Inc. | | | 491 | | | | 32,593 | |
Voya Financial, Inc. | | | 2,532 | | | | 75,378 | |
| | | | | | | | |
| Total Diversified Financial Services | | | | 1,595,171 | |
| Diversified Telecommunication Services – 2.4% | | | | | | | | |
AT&T, Inc. | | | 11,977 | | | | 469,139 | |
Atlantic Tele-Network, Inc. | | | 61 | | | | 4,626 | |
CenturyLink, Inc. | | | 338 | | | | 10,802 | |
Iridium Communications, Inc.*(a) | | | 626 | | | | 4,927 | |
Level 3 Communications, Inc.* | | | 290 | | | | 15,327 | |
Verizon Communications, Inc. | | | 15,880 | | | | 858,790 | |
| | | | | | | | |
| Total Diversified Telecommunication Services | | | | 1,363,611 | |
| Electric Utilities – 2.3% | | | | | | | | |
ALLETE, Inc. | | | 109 | | | | 6,112 | |
American Electric Power Co., Inc. | | | 1,422 | | | | 94,421 | |
Cleco Corp. | | | 351 | | | | 19,379 | |
Duke Energy Corp. | | | 1,730 | | | | 139,576 | |
Edison International | | | 1,136 | | | | 81,667 | |
El Paso Electric Co. | | | 129 | | | | 5,918 | |
Empire District Electric Co. (The) | | | 168 | | | | 5,552 | |
Eversource Energy | | | 968 | | | | 56,473 | |
Exelon Corp. | | | 2,729 | | | | 97,862 | |
FirstEnergy Corp. | | | 1,314 | | | | 47,264 | |
Great Plains Energy, Inc. | | | 604 | | | | 19,479 | |
Hawaiian Electric Industries, Inc. | | | 203 | | | | 6,577 | |
IDACORP, Inc. | | | 127 | | | | 9,473 | |
ITC Holdings Corp. | | | 448 | | | | 19,519 | |
MGE Energy, Inc. | | | 120 | | | | 6,270 | |
NextEra Energy, Inc. | | | 1,499 | | | | 177,392 | |
OGE Energy Corp. | | | 686 | | | | 19,640 | |
PG&E Corp. | | | 1,462 | | | | 87,311 | |
Pinnacle West Capital Corp. | | | 344 | | | | 25,824 | |
PNM Resources, Inc. | | | 330 | | | | 11,128 | |
Portland General Electric Co. | | | 376 | | | | 14,848 | |
PPL Corp. | | | 2,354 | | | | 89,617 | |
Southern Co. (The) | | | 2,911 | | | | 150,586 | |
Westar Energy, Inc. | | | 424 | | | | 21,035 | |
Xcel Energy, Inc. | | | 1,713 | | | | 71,638 | |
| | | | | | | | |
| Total Electric Utilities | | | | 1,284,561 | |
| Electrical Equipment – 0.5% | | | | | | | | |
Acuity Brands, Inc. | | | 84 | | | | 18,324 | |
AMETEK, Inc. | | | 613 | | | | 30,638 | |
AZZ, Inc. | | | 62 | | | | 3,509 | |
Babcock & Wilcox Enterprises, Inc.* | | | 211 | | | | 4,515 | |
Emerson Electric Co. | | | 2,648 | | | | 143,998 | |
EnerSys | | | 168 | | | | 9,361 | |
Franklin Electric Co., Inc. | | | 102 | | | | 3,281 | |
Generac Holdings, Inc.* | | | 102 | | | | 3,799 | |
Hubbell, Inc. | | | 154 | | | | 16,313 | |
Powell Industries, Inc. | | | 53 | | | | 1,580 | |
Regal Beloit Corp. | | | 132 | | | | 8,328 | |
Rockwell Automation, Inc. | | | 423 | | | | 48,116 | |
| | | | | | | | |
| Total Electrical Equipment | | | | 291,762 | |
| Electronic Equipment, Instruments & Components – 0.9% | | | | | |
Amphenol Corp. Class A | | | 708 | | | | 40,937 | |
Anixter International, Inc.* | | | 108 | | | | 5,628 | |
Arrow Electronics, Inc.* | | | 472 | | | | 30,402 | |
Avnet, Inc. | | | 584 | | | | 25,871 | |
AVX Corp. | | | 569 | | | | 7,152 | |
Belden, Inc. | | | 106 | | | | 6,506 | |
Benchmark Electronics, Inc.* | | | 336 | | | | 7,745 | |
CDW Corp. | | | 401 | | | | 16,641 | |
Cognex Corp. | | | 139 | | | | 5,414 | |
Coherent, Inc.* | | | 60 | | | | 5,514 | |
Corning, Inc. | | | 4,862 | | | | 101,567 | |
Dolby Laboratories, Inc. Class A | | | 280 | | | | 12,169 | |
FEI Co. | | | 85 | | | | 7,566 | |
Fitbit, Inc. Class A*(a) | | | 203 | | | | 3,075 | |
FLIR Systems, Inc. | | | 368 | | | | 12,126 | |
II-VI, Inc.* | | | 381 | | | | 8,271 | |
Ingram Micro, Inc. Class A | | | 633 | | | | 22,731 | |
Insight Enterprises, Inc.* | | | 328 | | | | 9,394 | |
InvenSense, Inc.* | | | 175 | | | | 1,470 | |
IPG Photonics Corp.* | | | 118 | | | | 11,337 | |
Jabil Circuit, Inc. | | | 561 | | | | 10,810 | |
Keysight Technologies, Inc.* | | | 196 | | | | 5,437 | |
Littelfuse, Inc. | | | 86 | | | | 10,587 | |
Methode Electronics, Inc. | | | 153 | | | | 4,474 | |
MTS Systems Corp. | | | 93 | | | | 5,659 | |
National Instruments Corp. | | | 174 | | | | 5,239 | |
OSI Systems, Inc.* | | | 37 | | | | 2,423 | |
PC Connection, Inc. | | | 257 | | | | 6,633 | |
Plexus Corp.* | | | 196 | | | | 7,746 | |
Rofin-Sinar Technologies, Inc.* | | | 128 | | | | 4,124 | |
Rogers Corp.* | | | 63 | | | | 3,772 | |
Sanmina Corp.* | | | 472 | | | | 11,035 | |
ScanSource, Inc.* | | | 141 | | | | 5,694 | |
SYNNEX Corp. | | | 159 | | | | 14,722 | |
Tech Data Corp.* | | | 176 | | | | 13,512 | |
See Notes to Financial Statements.
| | |
| 94 | | WisdomTree Domestic Earnings and Dividend Funds |
Schedule of Investments (continued)
WisdomTree Total Earnings Fund (EXT)
March 31, 2016
| | | | | | | | |
| Investments | | Shares | | | Value | |
Trimble Navigation Ltd.* | | | 306 | | | $ | 7,589 | |
Universal Display Corp.* | | | 176 | | | | 9,522 | |
VeriFone Systems, Inc.* | | | 321 | | | | 9,065 | |
Vishay Intertechnology, Inc. | | | 736 | | | | 8,987 | |
| | | | | | | | |
| Total Electronic Equipment, Instruments & Components | | | | 488,546 | |
| Energy Equipment & Services – 0.4% | | | | | | | | |
Bristow Group, Inc. | | | 11 | | | | 208 | |
Cameron International Corp.* | | | 779 | | | | 52,232 | |
Dril-Quip, Inc.* | | | 156 | | | | 9,447 | |
Era Group, Inc.* | | | 104 | | | | 976 | |
FMC Technologies, Inc.* | | | 591 | | | | 16,170 | |
Forum Energy Technologies, Inc.* | | | 135 | | | | 1,782 | |
Halliburton Co. | | | 1,393 | | | | 49,758 | |
Helmerich & Payne, Inc.(a) | | | 385 | | | | 22,607 | |
National Oilwell Varco, Inc. | | | 2,126 | | | | 66,119 | |
Newpark Resources, Inc.* | | | 595 | | | | 2,570 | |
Oceaneering International, Inc. | | | 200 | | | | 6,648 | |
Oil States International, Inc.* | | | 95 | | | | 2,994 | |
RPC, Inc.(a) | | | 968 | | | | 13,726 | |
U.S. Silica Holdings, Inc. | | | 248 | | | | 5,635 | |
| | | | | | | | |
| Total Energy Equipment & Services | | | | 250,872 | |
| Food & Staples Retailing – 3.0% | | | | | | | | |
Andersons, Inc. (The) | | | 116 | | | | 3,644 | |
Casey’s General Stores, Inc. | | | 87 | | | | 9,859 | |
Costco Wholesale Corp. | | | 744 | | | | 117,239 | |
CVS Health Corp. | | | 2,678 | | | | 277,789 | |
Fresh Market, Inc. (The)* | | | 41 | | | | 1,170 | |
Ingles Markets, Inc. Class A | | | 139 | | | | 5,212 | |
Kroger Co. (The) | | | 2,540 | | | | 97,155 | |
PriceSmart, Inc. | | | 58 | | | | 4,906 | |
Rite Aid Corp.* | | | 11,385 | | | | 92,788 | |
SpartanNash Co. | | | 59 | | | | 1,788 | |
Sprouts Farmers Market, Inc.* | | | 125 | | | | 3,630 | |
SUPERVALU, Inc.* | | | 817 | | | | 4,706 | |
Sysco Corp. | | | 1,075 | | | | 50,235 | |
United Natural Foods, Inc.* | | | 41 | | | | 1,652 | |
Wal-Mart Stores, Inc. | | | 12,793 | | | | 876,193 | |
Walgreens Boots Alliance, Inc. | | | 1,976 | | | | 166,458 | |
Weis Markets, Inc. | | | 62 | | | | 2,794 | |
Whole Foods Market, Inc. | | | 250 | | | | 7,777 | |
| | | | | | | | |
| Total Food & Staples Retailing | | | | 1,724,995 | |
| Food Products – 2.1% | | | | | | | | |
Archer-Daniels-Midland Co. | | | 1,781 | | | | 64,668 | |
B&G Foods, Inc. | | | 85 | | | | 2,959 | |
Cal-Maine Foods, Inc.(a) | | | 184 | | | | 9,551 | |
Campbell Soup Co. | | | 965 | | | | 61,557 | |
ConAgra Foods, Inc. | | | 1,048 | | | | 46,762 | |
Darling Ingredients, Inc.* | | | 150 | | | | 1,976 | |
Flowers Foods, Inc. | | | 390 | | | | 7,199 | |
General Mills, Inc. | | | 1,488 | | | | 94,265 | |
Hain Celestial Group, Inc. (The)* | | | 104 | | | | 4,255 | |
Hershey Co. (The) | | | 338 | | | | 31,126 | |
Hormel Foods Corp. | | | 1,239 | | | | 53,574 | |
Ingredion, Inc. | | | 265 | | | | 28,299 | |
J&J Snack Foods Corp. | | | 35 | | | | 3,790 | |
J.M. Smucker Co. (The) | | | 296 | | | | 38,433 | |
Kellogg Co. | | | 726 | | | | 55,575 | |
Kraft Heinz Co. (The) | | | 713 | | | | 56,013 | |
Lancaster Colony Corp. | | | 84 | | | | 9,288 | |
Landec Corp.* | | | 222 | | | | 2,331 | |
McCormick & Co., Inc. Non-Voting Shares | | | 323 | | | | 32,132 | |
Mead Johnson Nutrition Co. | | | 293 | | | | 24,896 | |
Mondelez International, Inc. Class A | | | 9,769 | | | | 391,932 | |
Pilgrim’s Pride Corp.*(a) | | | 1,000 | | | | 25,400 | |
Pinnacle Foods, Inc. | | | 364 | | | | 16,264 | |
Sanderson Farms, Inc.(a) | | | 74 | | | | 6,673 | |
Seaboard Corp.* | | | 5 | | | | 15,015 | |
Seneca Foods Corp. Class A* | | | 71 | | | | 2,467 | |
Snyder’s-Lance, Inc. | | | 24 | | | | 756 | |
Tootsie Roll Industries, Inc.(a) | | | 98 | | | | 3,419 | |
TreeHouse Foods, Inc.* | | | 69 | | | | 5,986 | |
Tyson Foods, Inc. Class A | | | 1,048 | | | | 69,860 | |
WhiteWave Foods Co. (The)* | | | 149 | | | | 6,055 | |
| | | | | | | | |
| Total Food Products | | | | 1,172,476 | |
| Gas Utilities – 0.2% | | | | | | | | |
AGL Resources, Inc. | | | 503 | | | | 32,765 | |
Atmos Energy Corp. | | | 266 | | | | 19,753 | |
New Jersey Resources Corp. | | | 168 | | | | 6,120 | |
Northwest Natural Gas Co. | | | 70 | | | | 3,770 | |
ONE Gas, Inc. | | | 118 | | | | 7,210 | |
Piedmont Natural Gas Co., Inc. | | | 155 | | | | 9,274 | |
Questar Corp. | | | 592 | | | | 14,682 | |
South Jersey Industries, Inc. | | | 184 | | | | 5,235 | |
Southwest Gas Corp. | | | 121 | | | | 7,968 | |
UGI Corp. | | | 360 | | | | 14,504 | |
WGL Holdings, Inc. | | | 133 | | | | 9,625 | |
| | | | | | | | |
| Total Gas Utilities | | | | 130,906 | |
| Health Care Equipment & Supplies – 1.1% | | | | | | | | |
Abbott Laboratories | | | 2,440 | | | | 102,065 | |
Align Technology, Inc.* | | | 104 | | | | 7,560 | |
Baxter International, Inc. | | | 1,306 | | | | 53,650 | |
Becton, Dickinson and Co. | | | 464 | | | | 70,444 | |
Boston Scientific Corp.* | | | 1,770 | | | | 33,294 | |
C.R. Bard, Inc. | | | 152 | | | | 30,806 | |
CONMED Corp. | | | 96 | | | | 4,026 | |
Cooper Cos., Inc. (The) | | | 88 | | | | 13,549 | |
DENTSPLY SIRONA, Inc. | | | 477 | | | | 29,398 | |
Edwards Lifesciences Corp.* | | | 214 | | | | 18,877 | |
Globus Medical, Inc. Class A* | | | 166 | | | | 3,943 | |
Greatbatch, Inc.* | | | 80 | | | | 2,851 | |
Haemonetics Corp.* | | | 92 | | | | 3,218 | |
Hill-Rom Holdings, Inc. | | | 145 | | | | 7,294 | |
IDEXX Laboratories, Inc.* | | | 168 | | | | 13,158 | |
Intuitive Surgical, Inc.* | | | 47 | | | | 28,249 | |
Masimo Corp.* | | | 123 | | | | 5,146 | |
See Notes to Financial Statements.
| | | | |
| WisdomTree Domestic Earnings and Dividend Funds | | | 95 | |
Schedule of Investments (continued)
WisdomTree Total Earnings Fund (EXT)
March 31, 2016
| | | | | | | | |
| Investments | | Shares | | | Value | |
Nuvectra Corp.* | | | 26 | | | $ | 141 | |
ResMed, Inc. | | | 332 | | | | 19,196 | |
St. Jude Medical, Inc. | | | 820 | | | | 45,100 | |
Stryker Corp. | | | 394 | | | | 42,272 | |
Teleflex, Inc. | | | 86 | | | | 13,503 | |
Varian Medical Systems, Inc.* | | | 233 | | | | 18,645 | |
West Pharmaceutical Services, Inc. | | | 154 | | | | 10,675 | |
Zimmer Biomet Holdings, Inc. | | | 311 | | | | 33,162 | |
| | | | | | | | |
| Total Health Care Equipment & Supplies | | | | 610,222 | |
| Health Care Providers & Services – 2.6% | | | | | | | | |
Acadia Healthcare Co., Inc.* | | | 88 | | | | 4,850 | |
Aetna, Inc. | | | 1,153 | | | | 129,540 | |
Air Methods Corp.* | | | 88 | | | | 3,187 | |
Amsurg Corp.* | | | 24 | | | | 1,790 | |
Anthem, Inc. | | | 934 | | | | 129,817 | |
Cardinal Health, Inc. | | | 681 | | | | 55,808 | |
Centene Corp.* | | | 398 | | | | 24,480 | |
Chemed Corp. | | | 78 | | | | 10,565 | |
Cigna Corp. | | | 935 | | | | 128,319 | |
Community Health Systems, Inc.* | | | 715 | | | | 13,235 | |
DaVita HealthCare Partners, Inc.* | | | 607 | | | | 44,542 | |
Ensign Group, Inc. (The) | | | 214 | | | | 4,845 | |
Express Scripts Holding Co.* | | | 1,381 | | | | 94,861 | |
HCA Holdings, Inc.* | | | 1,542 | | | | 120,353 | |
HealthSouth Corp. | | | 145 | | | | 5,456 | |
Henry Schein, Inc.* | | | 184 | | | | 31,764 | |
Humana, Inc. | | | 344 | | | | 62,935 | |
Laboratory Corp. of America Holdings* | | | 283 | | | | 33,148 | |
Landauer, Inc. | | | 18 | | | | 595 | |
LifePoint Health, Inc.* | | | 124 | | | | 8,587 | |
Magellan Health, Inc.* | | | 101 | | | | 6,861 | |
McKesson Corp. | | | 456 | | | | 71,706 | |
MEDNAX, Inc.* | | | 233 | | | | 15,056 | |
Molina Healthcare, Inc.* | | | 51 | | | | 3,289 | |
National Healthcare Corp. | | | 32 | | | | 1,994 | |
Owens & Minor, Inc. | | | 147 | | | | 5,942 | |
Patterson Cos., Inc. | | | 261 | | | | 12,144 | |
Quest Diagnostics, Inc. | | | 432 | | | | 30,866 | |
Select Medical Holdings Corp.* | | | 551 | | | | 6,507 | |
Team Health Holdings, Inc.* | | | 113 | | | | 4,725 | |
Tenet Healthcare Corp.* | | | 127 | | | | 3,674 | |
Triple-S Management Corp. Class B* | | | 140 | | | | 3,480 | |
UnitedHealth Group, Inc. | | | 2,788 | | | | 359,373 | |
Universal Health Services, Inc. Class B | | | 244 | | | | 30,432 | |
VCA, Inc.* | | | 190 | | | | 10,961 | |
WellCare Health Plans, Inc.* | | | 41 | | | | 3,803 | |
| | | | | | | | |
| Total Health Care Providers & Services | | | | 1,479,490 | |
| Health Care Technology – 0.1% | | | | | | | | |
Cerner Corp.* | | | 392 | | | | 20,760 | |
HMS Holdings Corp.* | | | 150 | | | | 2,153 | |
IMS Health Holdings, Inc.* | | | 108 | | | | 2,867 | |
Medidata Solutions, Inc.* | | | 100 | | | | 3,871 | |
Veeva Systems, Inc. Class A* | | | 154 | | | | 3,856 | |
| | | | | | | | |
| Total Health Care Technology | | | | 33,507 | |
| Hotels, Restaurants & Leisure – 1.7% | | | | | | | | |
Aramark | | | 302 | | | | 10,002 | |
Bloomin’ Brands, Inc. | | | 408 | | | | 6,883 | |
Bob Evans Farms, Inc. | | | 117 | | | | 5,463 | |
Bravo Brio Restaurant Group, Inc.* | | | 34 | | | | 264 | |
Brinker International, Inc. | | | 176 | | | | 8,087 | |
Buffalo Wild Wings, Inc.* | | | 30 | | | | 4,444 | |
Cheesecake Factory, Inc. (The) | | | 83 | | | | 4,407 | |
Chipotle Mexican Grill, Inc.* | | | 38 | | | | 17,897 | |
Choice Hotels International, Inc. | | | 129 | | | | 6,973 | |
Churchill Downs, Inc. | | | 39 | | | | 5,767 | |
Cracker Barrel Old Country Store, Inc.(a) | | | 43 | | | | 6,565 | |
Darden Restaurants, Inc. | | | 104 | | | | 6,895 | |
DineEquity, Inc. | | | 47 | | | | 4,391 | |
Domino’s Pizza, Inc. | | | 104 | | | | 13,713 | |
Dunkin’ Brands Group, Inc. | | | 24 | | | | 1,132 | |
Hilton Worldwide Holdings, Inc. | | | 1,402 | | | | 31,573 | |
Hyatt Hotels Corp. Class A*(a) | | | 270 | | | | 13,362 | |
International Speedway Corp. Class A | | | 141 | | | | 5,204 | |
Interval Leisure Group, Inc.(a) | | | 225 | | | | 3,249 | |
Jack in the Box, Inc. | | | 101 | | | | 6,451 | |
Krispy Kreme Doughnuts, Inc.* | | | 329 | | | | 5,129 | |
La Quinta Holdings, Inc.* | | | 272 | | | | 3,400 | |
Las Vegas Sands Corp. | | | 2,952 | | | | 152,559 | |
Marriott International, Inc. Class A(a) | | | 676 | | | | 48,118 | |
McDonald’s Corp. | | | 2,232 | | | | 280,518 | |
Panera Bread Co. Class A* | | | 47 | | | | 9,627 | |
Papa John’s International, Inc. | | | 44 | | | | 2,384 | |
SeaWorld Entertainment, Inc.(a) | | | 200 | | | | 4,212 | |
Six Flags Entertainment Corp. | | | 184 | | | | 10,210 | |
Sonic Corp. | | | 187 | | | | 6,575 | |
Starbucks Corp. | | | 2,394 | | | | 142,922 | |
Starwood Hotels & Resorts Worldwide, Inc. | | | 597 | | | | 49,808 | |
Texas Roadhouse, Inc. | | | 138 | | | | 6,014 | |
Vail Resorts, Inc. | | | 26 | | | | 3,476 | |
Wendy’s Co. (The) | | | 680 | | | | 7,405 | |
Wyndham Worldwide Corp. | | | 451 | | | | 34,470 | |
Wynn Resorts Ltd.(a) | | | 31 | | | | 2,896 | |
Yum! Brands, Inc. | | | 792 | | | | 64,825 | |
| | | | | | | | |
| Total Hotels, Restaurants & Leisure | | | | 997,270 | |
| Household Durables – 0.7% | | | | | | | | |
CalAtlantic Group, Inc. | | | 696 | | | | 23,260 | |
D.R. Horton, Inc. | | | 1,229 | | | | 37,153 | |
Ethan Allen Interiors, Inc. | | | 96 | | | | 3,055 | |
GoPro, Inc. Class A*(a) | | | 302 | | | | 3,612 | |
Harman International Industries, Inc. | | | 143 | | | | 12,733 | |
iRobot Corp.*(a) | | | 94 | | | | 3,318 | |
Jarden Corp.* | | | 264 | | | | 15,563 | |
La-Z-Boy, Inc. | | | 154 | | | | 4,118 | |
Leggett & Platt, Inc. | | | 275 | | | | 13,310 | |
Lennar Corp. Class A | | | 724 | | | | 35,013 | |
M/I Homes, Inc.* | | | 322 | | | | 6,005 | |
MDC Holdings, Inc. | | | 240 | | | | 6,014 | |
See Notes to Financial Statements.
| | |
| 96 | | WisdomTree Domestic Earnings and Dividend Funds |
Schedule of Investments (continued)
WisdomTree Total Earnings Fund (EXT)
March 31, 2016
| | | | | | | | |
| Investments | | Shares | | | Value | |
Meritage Homes Corp.* | | | 200 | | | $ | 7,292 | |
Mohawk Industries, Inc.* | | | 168 | | | | 32,071 | |
Newell Rubbermaid, Inc. | | | 665 | | | | 29,453 | |
NVR, Inc.* | | | 9 | | | | 15,592 | |
PulteGroup, Inc. | | | 1,461 | | | | 27,335 | |
Taylor Morrison Home Corp. Class A* | | | 213 | | | | 3,008 | |
Tempur Sealy International, Inc.* | | | 98 | | | | 5,957 | |
Toll Brothers, Inc.* | | | 566 | | | | 16,703 | |
TopBuild Corp.* | | | 168 | | | | 4,996 | |
TRI Pointe Group, Inc.* | | | 293 | | | | 3,452 | |
Tupperware Brands Corp. | | | 124 | | | | 7,189 | |
WCI Communities, Inc.* | | | 393 | | | | 7,302 | |
Whirlpool Corp. | | | 216 | | | | 38,953 | |
William Lyon Homes Class A*(a) | | | 519 | | | | 7,520 | |
| | | | | | | | |
| Total Household Durables | | | | 369,977 | |
| Household Products – 1.4% | | | | | | | | |
Church & Dwight Co., Inc. | | | 254 | | | | 23,414 | |
Clorox Co. (The) | | | 265 | | | | 33,406 | |
Colgate-Palmolive Co. | | | 1,598 | | | | 112,899 | |
Kimberly-Clark Corp. | | | 701 | | | | 94,291 | |
Procter & Gamble Co. (The) | | | 5,960 | | | | 490,568 | |
Spectrum Brands Holdings, Inc. | | | 127 | | | | 13,878 | |
WD-40 Co. | | | 41 | | | | 4,428 | |
| | | | | | | | |
| Total Household Products | | | | 772,884 | |
Independent Power & Renewable Electricity
Producers – 0.1% | | | | | |
AES Corp. | | | 3,617 | | | | 42,681 | |
Calpine Corp.* | | | 968 | | | | 14,685 | |
Dynegy, Inc.* | | | 192 | | | | 2,759 | |
Ormat Technologies, Inc. | | | 135 | | | | 5,567 | |
| | | | | | | | |
| Total Independent Power & Renewable Electricity Producers | | | | 65,692 | |
| Industrial Conglomerates – 1.3% | | | | | | | | |
3M Co. | | | 1,532 | | | | 255,277 | |
Carlisle Cos., Inc. | | | 175 | | | | 17,413 | |
Danaher Corp. | | | 1,543 | | | | 146,369 | |
General Electric Co. | | | 9,621 | | | | 305,852 | |
Raven Industries, Inc. | | | 62 | | | | 993 | |
Roper Technologies, Inc. | | | 216 | | | | 39,478 | |
| | | | | | | | |
| Total Industrial Conglomerates | | | | 765,382 | |
| Insurance – 3.4% | | | | | | | | |
Aflac, Inc. | | | 2,097 | | | | 132,405 | |
Alleghany Corp.* | | | 61 | | | | 30,268 | |
Allstate Corp. (The) | | | 1,924 | | | | 129,620 | |
American Equity Investment Life Holding Co. | | | 357 | | | | 5,998 | |
American Financial Group, Inc. | | | 312 | | | | 21,955 | |
American International Group, Inc. | | | 4,567 | | | | 246,846 | |
American National Insurance Co. | | | 99 | | | | 11,435 | |
AMERISAFE, Inc. | | | 113 | | | | 5,937 | |
AmTrust Financial Services, Inc. | | | 668 | | | | 17,288 | |
Arthur J. Gallagher & Co. | | | 403 | | | | 17,925 | |
Assurant, Inc. | | | 369 | | | | 28,468 | |
Brown & Brown, Inc. | | | 344 | | | | 12,315 | |
Cincinnati Financial Corp. | | | 382 | | | | 24,968 | |
CNA Financial Corp. | | | 1,144 | | | | 36,814 | |
CNO Financial Group, Inc. | | | 972 | | | | 17,418 | |
Employers Holdings, Inc. | | | 232 | | | | 6,528 | |
FBL Financial Group, Inc. Class A | | | 174 | | | | 10,704 | |
Fidelity & Guaranty Life | | | 332 | | | | 8,712 | |
First American Financial Corp. | | | 421 | | | | 16,044 | |
Hanover Insurance Group, Inc. (The) | | | 159 | | | | 14,345 | |
Hartford Financial Services Group, Inc. (The) | | | 1,761 | | | | 81,147 | |
Horace Mann Educators Corp. | | | 280 | | | | 8,873 | |
Infinity Property & Casualty Corp. | | | 60 | | | | 4,830 | |
Kemper Corp. | | | 133 | | | | 3,933 | |
Lincoln National Corp. | | | 1,144 | | | | 44,845 | |
Loews Corp. | | | 1,183 | | | | 45,262 | |
Markel Corp.* | | | 18 | | | | 16,048 | |
Marsh & McLennan Cos., Inc. | | | 1,292 | | | | 78,541 | |
MBIA, Inc.* | | | 699 | | | | 6,186 | |
Mercury General Corp. | | | 128 | | | | 7,104 | |
MetLife, Inc. | | | 6,135 | | | | 269,572 | |
National General Holdings Corp. | | | 318 | | | | 6,866 | |
National Western Life Group, Inc. Class A | | | 23 | | | | 5,304 | |
Navigators Group, Inc. (The)* | | | 39 | | | | 3,271 | |
Old Republic International Corp. | | | 935 | | | | 17,092 | |
Primerica, Inc. | | | 277 | | | | 12,335 | |
Principal Financial Group, Inc. | | | 1,136 | | | | 44,815 | |
ProAssurance Corp. | | | 235 | | | | 11,891 | |
Progressive Corp. (The) | | | 2,018 | | | | 70,913 | |
Prudential Financial, Inc. | | | 1,002 | | | | 72,364 | |
Reinsurance Group of America, Inc. | | | 312 | | | | 30,030 | |
RLI Corp. | | | 181 | | | | 12,102 | |
Selective Insurance Group, Inc. | | | 193 | | | | 7,066 | |
State Auto Financial Corp. | | | 203 | | | | 4,478 | |
Stewart Information Services Corp. | | | 152 | | | | 5,515 | |
Torchmark Corp. | | | 490 | | | | 26,538 | |
Travelers Cos., Inc. (The) | | | 1,768 | | | | 206,343 | |
United Fire Group, Inc. | | | 115 | | | | 5,039 | |
Universal Insurance Holdings, Inc.(a) | | | 231 | | | | 4,112 | |
Unum Group | | | 1,000 | | | | 30,920 | |
W.R. Berkley Corp. | | | 440 | | | | 24,728 | |
| | | | | | | | |
| Total Insurance | | | | 1,964,056 | |
| Internet & Catalog Retail – 0.4% | | | | | | | | |
Expedia, Inc. | | | 259 | | | | 27,925 | |
HSN, Inc. | | | 78 | | | | 4,080 | |
Netflix, Inc.* | | | 197 | | | | 20,139 | |
PetMed Express, Inc.(a) | | | 448 | | | | 8,024 | |
Priceline Group, Inc. (The)* | | | 105 | | | | 135,341 | |
TripAdvisor, Inc.* | | | 115 | | | | 7,648 | |
| | | | | | | | |
| Total Internet & Catalog Retail | | | | 203,157 | |
| Internet Software & Services – 1.9% | | | | | | | | |
Akamai Technologies, Inc.* | | | 165 | | | | 9,169 | |
Alphabet, Inc. Class A* | | | 1,044 | | | | 796,468 | |
eBay, Inc.* | | | 1,993 | | | | 47,553 | |
Facebook, Inc. Class A* | | | 1,446 | | | | 164,989 | |
See Notes to Financial Statements.
| | | | |
| WisdomTree Domestic Earnings and Dividend Funds | | | 97 | |
Schedule of Investments (continued)
WisdomTree Total Earnings Fund (EXT)
March 31, 2016
| | | | | | | | |
| Investments | | Shares | | | Value | |
IAC/InterActiveCorp | | | 168 | | | $ | 7,909 | |
j2 Global, Inc. | | | 72 | | | | 4,434 | |
Stamps.com, Inc.* | | | 79 | | | | 8,396 | |
VeriSign, Inc.* | | | 488 | | | | 43,207 | |
Yahoo!, Inc.* | | | 395 | | | | 14,540 | |
| | | | | | | | |
| Total Internet Software & Services | | | | 1,096,665 | |
| IT Services – 3.5% | | | | | | | | |
Alliance Data Systems Corp.* | | | 116 | | | | 25,520 | |
Automatic Data Processing, Inc. | | | 935 | | | | 83,879 | |
Booz Allen Hamilton Holding Corp. | | | 521 | | | | 15,776 | |
Broadridge Financial Solutions, Inc. | | | 317 | | | | 18,801 | |
CACI International, Inc. Class A* | | | 122 | | | | 13,017 | |
Cardtronics, Inc.* | | | 95 | | | | 3,419 | |
Cognizant Technology Solutions Corp. Class A* | | | 1,368 | | | | 85,774 | |
Computer Sciences Corp. | | | 584 | | | | 20,084 | |
Convergys Corp. | | | 282 | | | | 7,831 | |
CoreLogic, Inc.* | | | 207 | | | | 7,183 | |
CSG Systems International, Inc. | | | 159 | | | | 7,180 | |
DST Systems, Inc. | | | 158 | | | | 17,818 | |
EPAM Systems, Inc.* | | | 119 | | | | 8,886 | |
Euronet Worldwide, Inc.* | | | 76 | | | | 5,632 | |
Fidelity National Information Services, Inc. | | | 472 | | | | 29,882 | |
Fiserv, Inc.* | | | 509 | | | | 52,213 | |
FleetCor Technologies, Inc.* | | | 126 | | | | 18,743 | |
Gartner, Inc.* | | | 147 | | | | 13,134 | |
Global Payments, Inc. | | | 360 | | | | 23,508 | |
Heartland Payment Systems, Inc. | | | 94 | | | | 9,078 | |
International Business Machines Corp. | | | 5,079 | | | | 769,215 | |
Jack Henry & Associates, Inc. | | | 203 | | | | 17,168 | |
ManTech International Corp. Class A | | | 151 | | | | 4,830 | |
MasterCard, Inc. Class A | | | 2,083 | | | | 196,843 | |
MAXIMUS, Inc. | | | 120 | | | | 6,317 | |
NeuStar, Inc. Class A*(a) | | | 444 | | | | 10,922 | |
Paychex, Inc. | | | 712 | | | | 38,455 | |
Science Applications International Corp. | | | 146 | | | | 7,788 | |
Sykes Enterprises, Inc.* | | | 249 | | | | 7,515 | |
Syntel, Inc.* | | | 260 | | | | 12,982 | |
TeleTech Holdings, Inc. | | | 277 | | | | 7,690 | |
Teradata Corp.* | | | 227 | | | | 5,956 | |
Total System Services, Inc. | | | 422 | | | | 20,079 | |
Vantiv, Inc. Class A* | | | 88 | | | | 4,741 | |
Visa, Inc. Class A | | | 4,484 | | | | 342,936 | |
Western Union Co. (The) | | | 2,565 | | | | 49,479 | |
WEX, Inc.* | | | 74 | | | | 6,169 | |
Xerox Corp. | | | 3,363 | | | | 37,531 | |
| | | | | | | | |
| Total IT Services | | | | 2,013,974 | |
| Leisure Products – 0.3% | | | | | | | | |
Brunswick Corp. | | | 842 | | | | 40,399 | |
Hasbro, Inc. | | | 370 | | | | 29,637 | |
Mattel, Inc. | | | 914 | | | | 30,729 | |
Polaris Industries, Inc. | | | 70 | | | | 6,894 | |
Smith & Wesson Holding Corp.* | | | 527 | | | | 14,029 | |
Sturm Ruger & Co., Inc. | | | 164 | | | | 11,214 | |
Vista Outdoor, Inc.* | | | 376 | | | | 19,518 | |
| | | | | | | | |
| Total Leisure Products | | | | 152,420 | |
| Life Sciences Tools & Services – 0.4% | | | | | | | | |
Agilent Technologies, Inc. | | | 640 | | | | 25,504 | |
Bio-Rad Laboratories, Inc. Class A* | | | 69 | | | | 9,434 | |
Bio-Techne Corp. | | | 77 | | | | 7,278 | |
Bruker Corp. | | | 289 | | | | 8,092 | |
Cambrex Corp.* | | | 120 | | | | 5,280 | |
Charles River Laboratories International, Inc.* | | | 153 | | | | 11,619 | |
Illumina, Inc.* | | | 94 | | | | 15,238 | |
Luminex Corp.* | | | 138 | | | | 2,677 | |
Mettler-Toledo International, Inc.* | | | 51 | | | | 17,583 | |
PAREXEL International Corp.* | | | 124 | | | | 7,778 | |
PerkinElmer, Inc. | | | 274 | | | | 13,552 | |
Quintiles Transnational Holdings, Inc.* | | | 317 | | | | 20,637 | |
Thermo Fisher Scientific, Inc. | | | 553 | | | | 78,299 | |
Waters Corp.* | | | 216 | | | | 28,495 | |
| | | | | | | | |
| Total Life Sciences Tools & Services | | | | 251,466 | |
| Machinery – 2.2% | | | | | | | | |
Actuant Corp. Class A | | | 466 | | | | 11,515 | |
AGCO Corp. | | | 589 | | | | 29,273 | |
Allison Transmission Holdings, Inc. | | | 832 | | | | 22,447 | |
American Railcar Industries, Inc.(a) | | | 57 | | | | 2,322 | |
Astec Industries, Inc. | | | 85 | | | | 3,967 | |
Barnes Group, Inc. | | | 159 | | | | 5,570 | |
Blount International, Inc.* | | | 482 | | | | 4,810 | |
Briggs & Stratton Corp. | | | 344 | | | | 8,229 | |
Caterpillar, Inc. | | | 2,701 | | | | 206,735 | |
Chart Industries, Inc.* | | | 17 | | | | 369 | |
CLARCOR, Inc. | | | 110 | | | | 6,357 | |
Cummins, Inc. | | | 1,112 | | | | 122,253 | |
Deere & Co. | | | 1,622 | | | | 124,878 | |
Donaldson Co., Inc. | | | 89 | | | | 2,840 | |
Dover Corp. | | | 473 | | | | 30,428 | |
EnPro Industries, Inc. | | | 84 | | | | 4,845 | |
ESCO Technologies, Inc. | | | 149 | | | | 5,808 | |
Federal Signal Corp. | | | 215 | | | | 2,851 | |
Flowserve Corp. | | | 599 | | | | 26,602 | |
Global Brass & Copper Holdings, Inc. | | | 201 | | | | 5,015 | |
Graco, Inc. | | | 143 | | | | 12,006 | |
Greenbrier Cos., Inc. (The)(a) | | | 118 | | | | 3,262 | |
Hillenbrand, Inc. | | | 218 | | | | 6,529 | |
Hyster-Yale Materials Handling, Inc. | | | 86 | | | | 5,728 | |
IDEX Corp. | | | 189 | | | | 15,664 | |
Illinois Tool Works, Inc. | | | 1,032 | | | | 105,718 | |
ITT Corp. | | | 318 | | | | 11,731 | |
John Bean Technologies Corp. | | | 93 | | | | 5,246 | |
Joy Global, Inc.(a) | | | 1,248 | | | | 20,055 | |
Kennametal, Inc. | | | 431 | | | | 9,693 | |
Lincoln Electric Holdings, Inc. | | | 169 | | | | 9,898 | |
Lindsay Corp.(a) | | | 26 | | | | 1,862 | |
Manitowoc Co., Inc. (The)(a) | | | 215 | | | | 931 | |
See Notes to Financial Statements.
| | |
| 98 | | WisdomTree Domestic Earnings and Dividend Funds |
Schedule of Investments (continued)
WisdomTree Total Earnings Fund (EXT)
March 31, 2016
| | | | | | | | |
| Investments | | Shares | | | Value | |
Manitowoc Foodservice, Inc.* | | | 215 | | | $ | 3,169 | |
Meritor, Inc.* | | | 444 | | | | 3,579 | |
Middleby Corp. (The)* | | | 133 | | | | 14,200 | |
Mueller Industries, Inc. | | | 215 | | | | 6,325 | |
Nordson Corp. | | | 161 | | | | 12,242 | |
Oshkosh Corp. | | | 463 | | | | 18,923 | |
PACCAR, Inc. | | | 1,547 | | | | 84,605 | |
Parker-Hannifin Corp. | | | 505 | | | | 56,095 | |
RBC Bearings, Inc.* | | | 56 | | | | 4,103 | |
Rexnord Corp.* | | | 8 | | | | 162 | |
Snap-on, Inc. | | | 178 | | | | 27,944 | |
Standex International Corp. | | | 42 | | | | 3,268 | |
Stanley Black & Decker, Inc. | | | 354 | | | | 37,244 | |
Terex Corp. | | | 537 | | | | 13,361 | |
Timken Co. (The) | | | 646 | | | | 21,635 | |
Toro Co. (The) | | | 162 | | | | 13,951 | |
TriMas Corp.* | | | 112 | | | | 1,962 | |
Trinity Industries, Inc. | | | 824 | | | | 15,088 | |
Wabash National Corp.* | | | 451 | | | | 5,953 | |
WABCO Holdings, Inc.* | | | 329 | | | | 35,177 | |
Wabtec Corp. | | | 311 | | | | 24,659 | |
Woodward, Inc. | | | 137 | | | | 7,127 | |
Xylem, Inc. | | | 531 | | | | 21,718 | |
| | | | | | | | |
| Total Machinery | | | | 1,267,927 | |
| Marine – 0.0% | | | | | | | | |
Kirby Corp.* | | | 291 | | | | 17,544 | |
Matson, Inc. | | | 52 | | | | 2,089 | |
| | | | | | | | |
| Total Marine | | | | 19,633 | |
| Media – 3.9% | | | | | | | | |
AMC Entertainment Holdings, Inc. Class A | | | 664 | | | | 18,585 | |
AMC Networks, Inc. Class A* | | | 148 | | | | 9,611 | |
Cable One, Inc. | | | 8 | | | | 3,497 | |
Cablevision Systems Corp. Class A | | | 589 | | | | 19,437 | |
CBS Corp. Class B Non-Voting Shares | | | 1,755 | | | | 96,683 | |
Cinemark Holdings, Inc. | | | 275 | | | | 9,853 | |
Comcast Corp. Class A | | | 6,907 | | | | 421,880 | |
Crown Media Holdings, Inc. Class A* | | | 1,951 | | | | 9,911 | |
Discovery Communications, Inc. Class A* | | | 1,494 | | | | 42,773 | |
DISH Network Corp. Class A* | | | 760 | | | | 35,158 | |
Entercom Communications Corp. Class A* | | | 437 | | | | 4,623 | |
Entravision Communications Corp. Class A | | | 1,374 | | | | 10,223 | |
Gannett Co., Inc. | | | 359 | | | | 5,435 | |
Interpublic Group of Cos., Inc. (The) | | | 1,205 | | | | 27,655 | |
John Wiley & Sons, Inc. Class A | | | 216 | | | | 10,560 | |
Liberty Media Corp. Class A* | | | 934 | | | | 36,080 | |
Meredith Corp. | | | 175 | | | | 8,312 | |
MSG Networks, Inc. Class A* | | | 437 | | | | 7,556 | |
National CineMedia, Inc. | | | 248 | | | | 3,772 | |
New York Times Co. (The) Class A | | | 276 | | | | 3,439 | |
Nexstar Broadcasting Group, Inc. Class A | | | 121 | | | | 5,357 | |
Omnicom Group, Inc. | | | 699 | | | | 58,178 | |
Regal Entertainment Group Class A(a) | | | 251 | | | | 5,306 | |
Scholastic Corp. | | | 148 | | | | 5,531 | |
Scripps Networks Interactive, Inc. Class A | | | 453 | | | | 29,671 | |
Sinclair Broadcast Group, Inc. Class A | | | 250 | | | | 7,687 | |
Sirius XM Holdings, Inc.*(a) | | | 5,500 | | | | 21,725 | |
Starz Class A* | | | 488 | | | | 12,849 | |
TEGNA, Inc. | | | 1,285 | | | | 30,146 | |
Time Warner Cable, Inc. | | | 705 | | | | 144,257 | |
Time Warner, Inc. | | | 2,821 | | | | 204,664 | |
Time, Inc. | | | 366 | | | | 5,651 | |
Tribune Media Co. Class A | | | 48 | | | | 1,841 | |
Twenty-First Century Fox, Inc. Class A | | | 15,134 | | | | 421,936 | |
Viacom, Inc. Class B | | | 2,392 | | | | 98,742 | |
Walt Disney Co. (The) | | | 4,089 | | | | 406,079 | |
| | | | | | | | |
| Total Media | | | | 2,244,663 | |
| Metals & Mining – 0.3% | | | | | | | | |
Alcoa, Inc. | | | 3,981 | | | | 38,138 | |
Carpenter Technology Corp. | | | 7 | | | | 239 | |
Commercial Metals Co. | | | 645 | | | | 10,946 | |
Compass Minerals International, Inc. | | | 73 | | | | 5,173 | |
Gold Resource Corp.(a) | | | 914 | | | | 2,130 | |
Haynes International, Inc. | | | 40 | | | | 1,460 | |
Materion Corp. | | | 82 | | | | 2,171 | |
Newmont Mining Corp. | | | 743 | | | | 19,749 | |
Nucor Corp. | | | 928 | | | | 43,894 | |
Reliance Steel & Aluminum Co. | | | 316 | | | | 21,864 | |
Steel Dynamics, Inc. | | | 584 | | | | 13,146 | |
Worthington Industries, Inc. | | | 248 | | | | 8,839 | |
| | | | | | | | |
| Total Metals & Mining | | | | 167,749 | |
| Multi-Utilities – 1.1% | | | | | | | | |
Alliant Energy Corp. | | | 329 | | | | 24,438 | |
Ameren Corp. | | | 838 | | | | 41,984 | |
Avista Corp. | | | 161 | | | | 6,566 | |
Black Hills Corp. | | | 69 | | | | 4,149 | |
CenterPoint Energy, Inc. | | | 1,280 | | | | 26,778 | |
CMS Energy Corp. | | | 769 | | | | 32,636 | |
Consolidated Edison, Inc. | | | 1,122 | | | | 85,968 | |
Dominion Resources, Inc. | | | 796 | | | | 59,795 | |
DTE Energy Co. | | | 514 | | | | 46,599 | |
MDU Resources Group, Inc. | | | 512 | | | | 9,964 | |
NiSource, Inc. | | | 767 | | | | 18,071 | |
NorthWestern Corp. | | | 126 | | | | 7,780 | |
Public Service Enterprise Group, Inc. | | | 1,704 | | | | 80,327 | |
SCANA Corp. | | | 506 | | | | 35,496 | |
Sempra Energy | | | 504 | | | | 52,441 | |
TECO Energy, Inc. | | | 606 | | | | 16,683 | |
Vectren Corp. | | | 190 | | | | 9,606 | |
WEC Energy Group, Inc. | | | 904 | | | | 54,303 | |
| | | | | | | | |
| Total Multi-Utilities | | | | | | | 613,584 | |
| Multiline Retail – 0.8% | | | | | | | | |
Big Lots, Inc. | | | 234 | | | | 10,598 | |
Dillard’s, Inc. Class A | | | 87 | | | | 7,387 | |
Dollar General Corp. | | | 834 | | | | 71,390 | |
Dollar Tree, Inc.* | | | 434 | | | | 35,788 | |
Kohl’s Corp. | | | 968 | | | | 45,118 | |
See Notes to Financial Statements.
| | | | |
| WisdomTree Domestic Earnings and Dividend Funds | | | 99 | |
Schedule of Investments (continued)
WisdomTree Total Earnings Fund (EXT)
March 31, 2016
| | | | | | | | |
| Investments | | Shares | | | Value | |
Macy’s, Inc. | | | 2,053 | | | $ | 90,517 | |
Nordstrom, Inc.(a) | | | 789 | | | | 45,139 | |
Target Corp. | | | 1,888 | | | | 155,345 | |
| | | | | | | | |
| Total Multiline Retail | | | | | | | 461,282 | |
| Oil, Gas & Consumable Fuels – 4.8% | | | | | | | | |
Alon USA Energy, Inc. | | | 264 | | | | 2,724 | |
Antero Resources Corp.* | | | 3,441 | | | | 85,578 | |
Chevron Corp. | | | 4,641 | | | | 442,751 | |
Columbia Pipeline Group, Inc. | | | 668 | | | | 16,767 | |
Concho Resources, Inc.* | | | 264 | | | | 26,675 | |
CVR Energy, Inc. | | | 213 | | | | 5,559 | |
Delek U.S. Holdings, Inc. | | | 301 | | | | 4,587 | |
EP Energy Corp. Class A*(a) | | | 1,748 | | | | 7,901 | |
EQT Corp. | | | 24 | | | | 1,614 | |
Exxon Mobil Corp. | | | 14,990 | | | | 1,253,014 | |
Green Plains, Inc. | | | 216 | | | | 3,447 | |
HollyFrontier Corp. | | | 887 | | | | 31,329 | |
Kinder Morgan, Inc. | | | 3,482 | | | | 62,189 | |
Marathon Petroleum Corp. | | | 3,551 | | | | 132,026 | |
Memorial Resource Development Corp.* | | | 136 | | | | 1,384 | |
Oasis Petroleum, Inc.*(a) | | | 520 | | | | 3,786 | |
ONEOK, Inc. | | | 36 | | | | 1,075 | |
PDC Energy, Inc.* | | | 77 | | | | 4,578 | |
Phillips 66 | | | 2,872 | | | | 248,687 | |
Pioneer Natural Resources Co. | | | 164 | | | | 23,081 | |
Renewable Energy Group, Inc.* | | | 666 | | | | 6,287 | |
RSP Permian, Inc.* | | | 114 | | | | 3,311 | |
SM Energy Co.(a) | | | 157 | | | | 2,942 | |
Spectra Energy Corp. | | | 989 | | | | 30,263 | |
Tesoro Corp. | | | 712 | | | | 61,239 | |
Valero Energy Corp. | | | 3,832 | | | | 245,785 | |
Western Refining, Inc. | | | 744 | | | | 21,643 | |
Williams Cos., Inc. (The) | | | 420 | | | | 6,749 | |
World Fuel Services Corp. | | | 220 | | | | 10,688 | |
WPX Energy, Inc.* | | | 765 | | | | 5,347 | |
| | | | | | | | |
| Total Oil, Gas & Consumable Fuels | | | | | | | 2,753,006 | |
| Paper & Forest Products – 0.0% | | | | | | | | |
Boise Cascade Co.* | | | 92 | | | | 1,906 | |
Clearwater Paper Corp.* | | | 107 | | | | 5,190 | |
KapStone Paper and Packaging Corp. | | | 488 | | | | 6,759 | |
PH Glatfelter Co. | | | 215 | | | | 4,457 | |
Schweitzer-Mauduit International, Inc. | | | 68 | | | | 2,141 | |
| | | | | | | | |
| Total Paper & Forest Products | | | | | | | 20,453 | |
| Personal Products – 0.2% | | | | | | | | |
Coty, Inc. Class A(a) | | | 104 | | | | 2,894 | |
Estee Lauder Cos., Inc. (The) Class A | | | 803 | | | | 75,731 | |
Inter Parfums, Inc. | | | 234 | | | | 7,231 | |
Medifast, Inc. | | | 152 | | | | 4,589 | |
Nu Skin Enterprises, Inc. Class A(a) | | | 297 | | | | 11,360 | |
Revlon, Inc. Class A* | | | 8 | | | | 291 | |
USANA Health Sciences, Inc.* | | | 62 | | | | 7,528 | |
| | | | | | | | |
| Total Personal Products | | | | | | | 109,624 | |
| Pharmaceuticals – 3.0% | | | | | | | | |
Akorn, Inc.* | | | 72 | | | | 1,694 | |
Bristol-Myers Squibb Co. | | | 1,838 | | | | 117,411 | |
Depomed, Inc.*(a) | | | 312 | | | | 4,346 | |
Eli Lilly & Co. | | | 1,727 | | | | 124,361 | |
Impax Laboratories, Inc.* | | | 187 | | | | 5,988 | |
Johnson & Johnson | | | 7,534 | | | | 815,179 | |
Lannett Co., Inc.*(a) | | | 86 | | | | 1,542 | |
Merck & Co., Inc. | | | 3,281 | | | | 173,598 | |
Pfizer, Inc. | | | 13,920 | | | | 412,589 | |
Prestige Brands Holdings, Inc.* | | | 168 | | | | 8,970 | |
Zoetis, Inc. | | | 692 | | | | 30,676 | |
| | | | | | | | |
| Total Pharmaceuticals | | | | | | | 1,696,354 | |
| Professional Services – 0.3% | | | | | | | | |
CBIZ, Inc.* | | | 544 | | | | 5,489 | |
CEB, Inc. | | | 71 | | | | 4,596 | |
Dun & Bradstreet Corp. (The) | | | 140 | | | | 14,431 | |
Equifax, Inc. | | | 231 | | | | 26,401 | |
FTI Consulting, Inc.* | | | 111 | | | | 3,942 | |
Huron Consulting Group, Inc.* | | | 84 | | | | 4,888 | |
IHS, Inc. Class A* | | | 70 | | | | 8,691 | |
Insperity, Inc. | | | 121 | | | | 6,259 | |
Kelly Services, Inc. Class A | | | 150 | | | | 2,868 | |
Korn/Ferry International | | | 148 | | | | 4,187 | |
ManpowerGroup, Inc. | | | 330 | | | | 26,869 | |
Navigant Consulting, Inc.* | | | 292 | | | | 4,616 | |
On Assignment, Inc.* | | | 152 | | | | 5,612 | |
Robert Half International, Inc. | | | 376 | | | | 17,514 | |
RPX Corp.* | | | 380 | | | | 4,279 | |
TriNet Group, Inc.* | | | 98 | | | | 1,406 | |
TrueBlue, Inc.* | | | 171 | | | | 4,472 | |
Verisk Analytics, Inc.* | | | 271 | | | | 21,658 | |
WageWorks, Inc.* | | | 41 | | | | 2,075 | |
| | | | | | | | |
| Total Professional Services | | | | | | | 170,253 | |
| Real Estate Investment Trusts (REITs) – 2.4% | | | | | | | | |
Acadia Realty Trust | | | 249 | | | | 8,747 | |
Agree Realty Corp. | | | 73 | | | | 2,808 | |
Alexander’s, Inc. | | | 9 | | | | 3,425 | |
Alexandria Real Estate Equities, Inc. | | | 60 | | | | 5,453 | |
American Campus Communities, Inc. | | | 120 | | | | 5,651 | |
American Tower Corp. | | | 434 | | | | 44,429 | |
Apartment Investment & Management Co. Class A | | | 440 | | | | 18,401 | |
Apple Hospitality REIT, Inc.(a) | | | 307 | | | | 6,082 | |
AvalonBay Communities, Inc. | | | 187 | �� | | | 35,567 | |
Boston Properties, Inc. | | | 109 | | | | 13,852 | |
Brandywine Realty Trust | | | 165 | | | | 2,315 | |
Brixmor Property Group, Inc. | | | 101 | | | | 2,588 | |
Camden Property Trust | | | 113 | | | | 9,502 | |
CBL & Associates Properties, Inc. | | | 779 | | | | 9,270 | |
Chatham Lodging Trust | | | 366 | | | | 7,843 | |
Corporate Office Properties Trust | | | 428 | | | | 11,231 | |
Corrections Corp. of America | | | 476 | | | | 15,256 | |
Cousins Properties, Inc. | | | 193 | | | | 2,003 | |
See Notes to Financial Statements.
| | |
| 100 | | WisdomTree Domestic Earnings and Dividend Funds |
Schedule of Investments (continued)
WisdomTree Total Earnings Fund (EXT)
March 31, 2016
| | | | | | | | |
| Investments | | Shares | | | Value | |
Crown Castle International Corp. | | | 277 | | | $ | 23,960 | |
DCT Industrial Trust, Inc. | | | 123 | | | | 4,855 | |
Digital Realty Trust, Inc. | | | 227 | | | | 20,087 | |
Douglas Emmett, Inc. | | | 127 | | | | 3,824 | |
Duke Realty Corp. | | | 639 | | | | 14,403 | |
Empire State Realty Trust, Inc. Class A | | | 507 | | | | 8,888 | |
EPR Properties | | | 200 | | | | 13,324 | |
Equity LifeStyle Properties, Inc. | | | 73 | | | | 5,309 | |
Equity One, Inc. | | | 136 | | | | 3,898 | |
Equity Residential | | | 352 | | | | 26,411 | |
Essex Property Trust, Inc. | | | 19 | | | | 4,443 | |
Extra Space Storage, Inc. | | | 197 | | | | 18,412 | |
Federal Realty Investment Trust | | | 62 | | | | 9,675 | |
First Industrial Realty Trust, Inc. | | | 151 | | | | 3,434 | |
Gaming and Leisure Properties, Inc. | | | 418 | | | | 12,925 | |
General Growth Properties, Inc. | | | 1,837 | | | | 54,614 | |
Geo Group, Inc. (The) | | | 166 | | | | 5,755 | |
HCP, Inc. | | | 1,315 | | | | 42,843 | |
Healthcare Realty Trust, Inc. | | | 120 | | | | 3,707 | |
Healthcare Trust of America, Inc. Class A | | | 126 | | | | 3,707 | |
Hersha Hospitality Trust | | | 319 | | | | 6,807 | |
Highwoods Properties, Inc. | | | 220 | | | | 10,518 | |
Hospitality Properties Trust | | | 324 | | | | 8,605 | |
Host Hotels & Resorts, Inc. | | | 2,581 | | | | 43,103 | |
Iron Mountain, Inc. | | | 567 | | | | 19,227 | |
Kilroy Realty Corp. | | | 124 | | | | 7,672 | |
Kimco Realty Corp. | | | 1,104 | | | | 31,773 | |
Lamar Advertising Co. Class A | | | 118 | | | | 7,257 | |
LaSalle Hotel Properties | | | 734 | | | | 18,578 | |
Lexington Realty Trust(a) | | | 197 | | | | 1,694 | |
Liberty Property Trust | | | 301 | | | | 10,071 | |
LTC Properties, Inc. | | | 92 | | | | 4,162 | |
Macerich Co. (The) | | | 1,015 | | | | 80,429 | |
Medical Properties Trust, Inc. | | | 509 | | | | 6,607 | |
Mid-America Apartment Communities, Inc. | | | 73 | | | | 7,461 | |
Monogram Residential Trust, Inc. | | | 247 | | | | 2,435 | |
National Health Investors, Inc. | | | 136 | | | | 9,047 | |
National Retail Properties, Inc. | | | 261 | | | | 12,058 | |
Omega Healthcare Investors, Inc. | | | 338 | | | | 11,931 | |
Outfront Media, Inc. | | | 488 | | | | 10,297 | |
Parkway Properties, Inc. | | | 139 | | | | 2,177 | |
Physicians Realty Trust | | | 184 | | | | 3,419 | |
Piedmont Office Realty Trust, Inc. Class A | | | 313 | | | | 6,357 | |
Post Properties, Inc. | | | 196 | | | | 11,709 | |
Potlatch Corp. | | | 159 | | | | 5,009 | |
Prologis, Inc. | | | 953 | | | | 42,104 | |
PS Business Parks, Inc. | | | 35 | | | | 3,518 | |
Public Storage | | | 254 | | | | 70,061 | |
Ramco-Gershenson Properties Trust | | | 141 | | | | 2,542 | |
Rayonier, Inc. | | | 544 | | | | 13,426 | |
Realty Income Corp. | | | 355 | | | | 22,191 | |
Regency Centers Corp. | | | 104 | | | | 7,784 | |
Retail Opportunity Investments Corp. | | | 375 | | | | 7,545 | |
RLJ Lodging Trust | | | 459 | | | | 10,502 | |
Ryman Hospitality Properties, Inc. | | | 72 | | | | 3,707 | |
Sabra Health Care REIT, Inc. | | | 152 | | | | 3,054 | |
Select Income REIT | | | 356 | | | | 8,206 | |
Senior Housing Properties Trust | | | 1,123 | | | | 20,090 | |
Simon Property Group, Inc. | | | 396 | | | | 82,245 | |
SL Green Realty Corp. | | | 136 | | | | 13,176 | |
Sovran Self Storage, Inc. | | | 60 | | | | 7,077 | |
Spirit Realty Capital, Inc. | | | 189 | | | | 2,126 | |
STORE Capital Corp. | | | 75 | | | | 1,941 | |
Sunstone Hotel Investors, Inc. | | | 523 | | | | 7,322 | |
Tanger Factory Outlet Centers, Inc. | | | 288 | | | | 10,480 | |
UDR, Inc. | | | 325 | | | | 12,522 | |
Universal Health Realty Income Trust | | | 153 | | | | 8,606 | |
Urban Edge Properties | | | 171 | | | | 4,419 | |
Ventas, Inc. | | | 744 | | | | 46,842 | |
Vornado Realty Trust | | | 116 | | | | 10,954 | |
W.P. Carey, Inc. | | | 111 | | | | 6,909 | |
Weingarten Realty Investors | | | 424 | | | | 15,908 | |
Welltower, Inc. | | | 448 | | | | 31,064 | |
Weyerhaeuser Co. | | | 1,827 | | | | 56,600 | |
| | | | | | | | |
| Total Real Estate Investment Trusts (REITs) | | | | | | | 1,360,221 | |
| Real Estate Management & Development – 0.1% | | | | | | | | |
CBRE Group, Inc. Class A* | | | 848 | | | | 24,439 | |
Jones Lang LaSalle, Inc. | | | 120 | | | | 14,078 | |
Realogy Holdings Corp.* | | | 360 | | | | 13,000 | |
| | | | | | | | |
| Total Real Estate Management & Development | | | | | | | 51,517 | |
| Road & Rail – 1.1% | | | | | | | | |
AMERCO | | | 72 | | | | 25,726 | |
ArcBest Corp. | | | 122 | | | | 2,634 | |
Avis Budget Group, Inc.* | | | 136 | | | | 3,721 | |
CSX Corp. | | | 3,855 | | | | 99,266 | |
Genesee & Wyoming, Inc. Class A* | | | 252 | | | | 15,801 | |
Heartland Express, Inc.(a) | | | 264 | | | | 4,897 | |
JB Hunt Transport Services, Inc. | | | 239 | | | | 20,133 | |
Kansas City Southern | | | 345 | | | | 29,480 | |
Knight Transportation, Inc. | | | 261 | | | | 6,825 | |
Landstar System, Inc. | | | 202 | | | | 13,051 | |
Norfolk Southern Corp. | | | 1,080 | | | | 89,910 | |
Old Dominion Freight Line, Inc.* | | | 292 | | | | 20,329 | |
Ryder System, Inc. | | | 216 | | | | 13,993 | |
Saia, Inc.* | | | 104 | | | | 2,928 | |
Swift Transportation Co.* | | | 1,256 | | | | 23,399 | |
Union Pacific Corp. | | | 3,306 | | | | 262,992 | |
Werner Enterprises, Inc. | | | 247 | | | | 6,709 | |
YRC Worldwide, Inc.* | | | 127 | | | | 1,184 | |
| | | | | | | | |
| Total Road & Rail | | | | | | | 642,978 | |
| Semiconductors & Semiconductor Equipment – 2.8% | | | | | |
Amkor Technology, Inc.* | | | 1,290 | | | | 7,598 | |
Analog Devices, Inc. | | | 569 | | | | 33,679 | |
Applied Materials, Inc. | | | 3,398 | | | | 71,970 | |
Brooks Automation, Inc. | | | 432 | | | | 4,493 | |
Cabot Microelectronics Corp. | | | 42 | | | | 1,718 | |
Cirrus Logic, Inc.* | | | 350 | | | | 12,744 | |
See Notes to Financial Statements.
| | | | |
| WisdomTree Domestic Earnings and Dividend Funds | | | 101 | |
Schedule of Investments (continued)
WisdomTree Total Earnings Fund (EXT)
March 31, 2016
| | | | | | | | |
| Investments | | Shares | | | Value | |
Diodes, Inc.* | | | 191 | | | $ | 3,839 | |
Entegris, Inc.* | | | 441 | | | | 6,006 | |
First Solar, Inc.* | | | 520 | | | | 35,604 | |
Integrated Device Technology, Inc.* | | | 261 | | | | 5,335 | |
Intel Corp. | | | 16,497 | | | | 533,678 | |
KLA-Tencor Corp. | | | 440 | | | | 32,036 | |
Lam Research Corp. | | | 400 | | | | 33,040 | |
Linear Technology Corp. | | | 472 | | | | 21,032 | |
Maxim Integrated Products, Inc. | | | 720 | | | | 26,482 | |
Microchip Technology, Inc. | | | 488 | | | | 23,522 | |
Micron Technology, Inc.* | | | 10,384 | | | | 108,720 | |
MKS Instruments, Inc. | | | 169 | | | | 6,363 | |
NVIDIA Corp. | | | 1,530 | | | | 54,514 | |
ON Semiconductor Corp.* | | | 761 | | | | 7,298 | |
Qorvo, Inc.* | | | 73 | | | | 3,680 | |
QUALCOMM, Inc. | | | 6,616 | | | | 338,342 | |
Silicon Laboratories, Inc.* | | | 45 | | | | 2,023 | |
Skyworks Solutions, Inc. | | | 385 | | | | 29,992 | |
SunPower Corp.*(a) | | | 280 | | | | 6,255 | |
Synaptics, Inc.* | | | 109 | | | | 8,692 | |
Teradyne, Inc. | | | 662 | | | | 14,293 | |
Tessera Technologies, Inc. | | | 88 | | | | 2,728 | |
Texas Instruments, Inc. | | | 2,493 | | | | 143,148 | |
Xilinx, Inc. | | | 765 | | | | 36,284 | |
| | | | | | | | |
| Total Semiconductors & Semiconductor Equipment | | | | | | | 1,615,108 | |
| Software – 3.1% | | | | | | | | |
ACI Worldwide, Inc.* | | | 329 | | | | 6,840 | |
Activision Blizzard, Inc. | | | 1,717 | | | | 58,103 | |
Adobe Systems, Inc.* | | | 210 | | | | 19,698 | |
ANSYS, Inc.* | | | 141 | | | | 12,614 | |
Aspen Technology, Inc.* | | | 181 | | | | 6,540 | |
CA, Inc. | | | 1,336 | | | | 41,135 | |
Cadence Design Systems, Inc.* | | | 305 | | | | 7,192 | |
Citrix Systems, Inc.* | | | 232 | | | | 18,231 | |
Ebix, Inc.(a) | | | 358 | | | | 14,603 | |
Electronic Arts, Inc.* | | | 457 | | | | 30,212 | |
Fair Isaac Corp. | | | 106 | | | | 11,246 | |
Fortinet, Inc.* | | | 83 | | | | 2,542 | |
Intuit, Inc. | | | 445 | | | | 46,285 | |
Manhattan Associates, Inc.* | | | 154 | | | | 8,758 | |
Mentor Graphics Corp. | | | 280 | | | | 5,692 | |
Microsoft Corp. | | | 15,309 | | | | 845,516 | |
Oracle Corp. | | | 12,754 | | | | 521,766 | |
Progress Software Corp.* | | | 192 | | | | 4,631 | |
PTC, Inc.* | | | 238 | | | | 7,892 | |
Red Hat, Inc.* | | | 173 | | | | 12,890 | |
SS&C Technologies Holdings, Inc. | | | 106 | | | | 6,723 | |
Symantec Corp. | | | 1,480 | | | | 27,202 | |
Synopsys, Inc.* | | | 289 | | | | 13,999 | |
TiVo, Inc.* | | | 602 | | | | 5,725 | |
Tyler Technologies, Inc.* | | | 50 | | | | 6,431 | |
VMware, Inc. Class A*(a) | | | 456 | | | | 23,853 | |
| | | | | | | | |
| Total Software | | | | | | | 1,766,319 | |
| Specialty Retail – 2.6% | | | | | | | | |
Aaron’s, Inc. | | | 241 | | | | 6,049 | |
Abercrombie & Fitch Co. Class A | | | 208 | | | | 6,560 | |
Advance Auto Parts, Inc. | | | 140 | | | | 22,448 | |
American Eagle Outfitters, Inc.(a) | | | 503 | | | | 8,385 | |
Asbury Automotive Group, Inc.* | | | 105 | | | | 6,283 | |
Ascena Retail Group, Inc.* | | | 428 | | | | 4,734 | |
AutoNation, Inc.* | | | 305 | | | | 14,237 | |
AutoZone, Inc.* | | | 88 | | | | 70,109 | |
Bed Bath & Beyond, Inc.* | | | 605 | | | | 30,032 | |
Best Buy Co., Inc. | | | 1,484 | | | | 48,141 | |
Buckle, Inc. (The)(a) | | | 171 | | | | 5,792 | |
Cabela’s, Inc.* | | | 132 | | | | 6,427 | |
Caleres, Inc. | | | 102 | | | | 2,886 | |
CarMax, Inc.* | | | 635 | | | | 32,448 | |
Cato Corp. (The) Class A | | | 156 | | | | 6,014 | |
Chico’s FAS, Inc. | | | 632 | | | | 8,387 | |
Children’s Place, Inc. (The) | | | 70 | | | | 5,843 | |
Conn’s, Inc.*(a) | | | 248 | | | | 3,090 | |
CST Brands, Inc. | | | 257 | | | | 9,841 | |
Dick’s Sporting Goods, Inc. | | | 540 | | | | 25,245 | |
DSW, Inc. Class A | | | 671 | | | | 18,546 | |
Express, Inc.* | | | 434 | | | | 9,292 | |
Finish Line, Inc. (The) Class A | | | 178 | | | | 3,756 | |
Five Below, Inc.* | | | 122 | | | | 5,043 | |
Foot Locker, Inc. | | | 463 | | | | 29,864 | |
Francesca’s Holdings Corp.* | | | 202 | | | | 3,870 | |
GameStop Corp. Class A(a) | | | 692 | | | | 21,957 | |
Gap, Inc. (The) | | | 880 | | | | 25,872 | |
Genesco, Inc.* | | | 45 | | | | 3,251 | |
GNC Holdings, Inc. Class A | | | 403 | | | | 12,795 | |
Group 1 Automotive, Inc. | | | 42 | | | | 2,465 | |
Guess?, Inc. | | | 489 | | | | 9,179 | |
Hibbett Sports, Inc.*(a) | | | 8 | | | | 287 | |
Home Depot, Inc. (The) | | | 2,904 | | | | 387,481 | |
L Brands, Inc. | | | 579 | | | | 50,842 | |
Lithia Motors, Inc. Class A | | | 86 | | | | 7,510 | |
Lowe’s Cos., Inc. | | | 2,004 | | | | 151,803 | |
Mattress Firm Holding Corp.*(a) | | | 94 | | | | 3,985 | |
Michaels Cos., Inc. (The)* | | | 440 | | | | 12,307 | |
Monro Muffler Brake, Inc. | | | 47 | | | | 3,359 | |
Murphy USA, Inc.* | | | 161 | | | | 9,893 | |
O’Reilly Automotive, Inc.* | | | 200 | | | | 54,732 | |
Outerwall, Inc.(a) | | | 126 | | | | 4,661 | |
Penske Automotive Group, Inc. | | | 326 | | | | 12,355 | |
Rent-A-Center, Inc. | | | 315 | | | | 4,993 | |
Restoration Hardware Holdings, Inc.*(a) | | | 40 | | | | 1,676 | |
Ross Stores, Inc. | | | 968 | | | | 56,047 | |
Sally Beauty Holdings, Inc.* | | | 561 | | | | 18,165 | |
Select Comfort Corp.* | | | 188 | | | | 3,645 | |
Sonic Automotive, Inc. Class A | | | 272 | | | | 5,027 | |
Staples, Inc. | | | 1,184 | | | | 13,060 | |
Tailored Brands, Inc. | | | 88 | | | | 1,575 | |
Tiffany & Co. | | | 360 | | | | 26,417 | |
See Notes to Financial Statements.
| | |
| 102 | | WisdomTree Domestic Earnings and Dividend Funds |
Schedule of Investments (continued)
WisdomTree Total Earnings Fund (EXT)
March 31, 2016
| | | | | | | | |
| Investments | | Shares | | | Value | |
TJX Cos., Inc. (The) | | | 1,688 | | | $ | 132,255 | |
Tractor Supply Co. | | | 201 | | | | 18,182 | |
Ulta Salon Cosmetics & Fragrance, Inc.* | | | 97 | | | | 18,793 | |
Urban Outfitters, Inc.* | | | 207 | | | | 6,850 | |
Vitamin Shoppe, Inc.* | | | 44 | | | | 1,362 | |
Williams-Sonoma, Inc. | | | 215 | | | | 11,769 | |
Zumiez, Inc.*(a) | | | 124 | | | | 2,470 | |
| | | | | | | | |
| Total Specialty Retail | | | | | | | 1,490,342 | |
| Technology Hardware, Storage & Peripherals – 5.5% | | | | | |
Apple, Inc. | | | 24,269 | | | | 2,645,078 | |
Diebold, Inc. | | | 143 | | | | 4,134 | |
Electronics For Imaging, Inc.* | | | 115 | | | | 4,875 | |
EMC Corp. | | | 4,747 | | | | 126,508 | |
HP, Inc. | | | 18,965 | | | | 233,649 | |
NetApp, Inc. | | | 960 | | | | 26,198 | |
SanDisk Corp. | | | 408 | | | | 31,041 | |
Western Digital Corp. | | | 1,096 | | | | 51,775 | |
| | | | | | | | |
| Total Technology Hardware, Storage & Peripherals | | | | | | | 3,123,258 | |
| Textiles, Apparel & Luxury Goods – 0.7% | | | | | | | | |
Carter’s, Inc. | | | 113 | | | | 11,908 | |
Coach, Inc. | | | 1,069 | | | | 42,856 | |
Columbia Sportswear Co. | | | 109 | | | | 6,550 | |
Deckers Outdoor Corp.* | | | 40 | | | | 2,396 | |
G-III Apparel Group Ltd.* | | | 60 | | | | 2,933 | |
Hanesbrands, Inc. | | | 754 | | | | 21,368 | |
Iconix Brand Group, Inc.*(a) | | | 200 | | | | 1,610 | |
Kate Spade & Co.* | | | 389 | | | | 9,927 | |
NIKE, Inc. Class B | | | 2,988 | | | | 183,672 | |
PVH Corp. | | | 74 | | | | 7,330 | |
Ralph Lauren Corp. | | | 270 | | | | 25,990 | |
Skechers U.S.A., Inc. Class A* | | | 293 | | | | 8,922 | |
Steven Madden Ltd.* | | | 216 | | | | 8,001 | |
Tumi Holdings, Inc.* | | | 125 | | | | 3,353 | |
Under Armour, Inc. Class A* | | | 142 | | | | 12,046 | |
Vera Bradley, Inc.* | | | 178 | | | | 3,621 | |
VF Corp. | | | 997 | | | | 64,566 | |
Wolverine World Wide, Inc. | | | 150 | | | | 2,763 | |
| | | | | | | | |
| Total Textiles, Apparel & Luxury Goods | | | | | | | 419,812 | |
| Thrifts & Mortgage Finance – 0.3% | | | | | | | | |
Astoria Financial Corp. | | | 393 | | | | 6,225 | |
BofI Holding, Inc.*(a) | | | 298 | | | | 6,359 | |
Capitol Federal Financial, Inc. | | | 269 | | | | 3,567 | |
Dime Community Bancshares, Inc. | | | 77 | | | | 1,357 | |
EverBank Financial Corp. | | | 344 | | | | 5,191 | |
Flagstar Bancorp, Inc.* | | | 311 | | | | 6,674 | |
HomeStreet, Inc.* | | | 201 | | | | 4,183 | |
MGIC Investment Corp.* | | | 5,916 | | | | 45,376 | |
New York Community Bancorp, Inc. | | | 1,513 | | | | 24,056 | |
Northwest Bancshares, Inc. | | | 390 | | | | 5,269 | |
Provident Financial Services, Inc. | | | 249 | | | | 5,027 | |
Radian Group, Inc. | | | 3,272 | | | | 40,573 | |
Territorial Bancorp, Inc. | | | 168 | | | | 4,378 | |
TFS Financial Corp. | | | 208 | | | | 3,613 | |
Walker & Dunlop, Inc.* | | | 103 | | | | 2,500 | |
Washington Federal, Inc. | | | 420 | | | | 9,513 | |
WSFS Financial Corp. | | | 144 | | | | 4,683 | |
| | | | | | | | |
| Total Thrifts & Mortgage Finance | | | | | | | 178,544 | |
| Tobacco – 1.5% | | | | | | | | |
Altria Group, Inc. | | | 4,464 | | | | 279,714 | |
Philip Morris International, Inc. | | | 4,360 | | | | 427,760 | |
Reynolds American, Inc. | | | 2,780 | | | | 139,862 | |
Universal Corp. | | | 115 | | | | 6,533 | |
Vector Group Ltd. | | | 104 | | | | 2,375 | |
| | | | | | | | |
| Total Tobacco | | | | | | | 856,244 | |
| Trading Companies & Distributors – 0.3% | | | | | | | | |
Air Lease Corp. | | | 388 | | | | 12,463 | |
Applied Industrial Technologies, Inc. | | | 185 | | | | 8,029 | |
Beacon Roofing Supply, Inc.* | | | 148 | | | | 6,069 | |
CAI International, Inc.* | | | 121 | | | | 1,169 | |
DXP Enterprises, Inc.* | | | 88 | | | | 1,545 | |
Fastenal Co.(a) | | | 579 | | | | 28,371 | |
GATX Corp. | | | 211 | | | | 10,023 | |
HD Supply Holdings, Inc.* | | | 119 | | | | 3,935 | |
Kaman Corp. | | | 80 | | | | 3,415 | |
MRC Global, Inc.* | | | 409 | | | | 5,374 | |
MSC Industrial Direct Co., Inc. Class A | | | 165 | | | | 12,591 | |
Rush Enterprises, Inc. Class A* | | | 146 | | | | 2,663 | |
TAL International Group, Inc.* | | | 66 | | | | 1,019 | |
United Rentals, Inc.* | | | 397 | | | | 24,689 | |
W.W. Grainger, Inc.(a) | | | 171 | | | | 39,917 | |
Watsco, Inc. | | | 74 | | | | 9,971 | |
WESCO International, Inc.* | | | 7 | | | | 383 | |
| | | | | | | | |
| Total Trading Companies & Distributors | | | | | | | 171,626 | |
| Transportation Infrastructure – 0.0% | | | | | | | | |
Wesco Aircraft Holdings, Inc.* | | | 376 | | | | 5,411 | |
| Water Utilities – 0.1% | | | | | | | | |
American States Water Co. | | | 162 | | | | 6,376 | |
American Water Works Co., Inc. | | | 432 | | | | 29,778 | |
Aqua America, Inc. | | | 463 | | | | 14,733 | |
California Water Service Group | | | 317 | | | | 8,470 | |
| | | | | | | | |
| Total Water Utilities | | | | | | | 59,357 | |
| Wireless Telecommunication Services – 0.1% | | | | | | | | |
Spok Holdings, Inc. | | | 287 | | | | 5,025 | |
T-Mobile U.S., Inc.* | | | 676 | | | | 25,891 | |
| | | | | | | | |
| Total Wireless Telecommunication Services | | | | | | | 30,916 | |
TOTAL COMMON STOCKS (Cost: $54,727,484) | | | | | | | 57,094,861 | |
See Notes to Financial Statements.
| | | | |
| WisdomTree Domestic Earnings and Dividend Funds | | | 103 | |
Schedule of Investments (concluded)
WisdomTree Total Earnings Fund (EXT)
March 31, 2016
| | | | | | | | |
| Investments | | Shares | | | Value | |
| INVESTMENT OF CASH COLLATERAL FOR SECURITIES LOANED – 1.0% | |
| United States – 1.0% | | | | | | | | |
State Street Navigator Securities Lending Prime Portfolio, 0.50%(b) (Cost: $546,794)(c) | | | 546,794 | | | $ | 546,794 | |
TOTAL INVESTMENTS IN SECURITIES – 100.8% (Cost: $55,274,278) | | | | | | | 57,641,655 | |
Liabilities in Excess of Cash and Other Assets – (0.8)% | | | | (437,679 | ) |
| | | | | | | | |
| NET ASSETS – 100.0% | | | | | | $ | 57,203,976 | |
| * | Non-income producing security. |
| (a) | Security, or portion thereof, was on loan at March 31, 2016 (See Note 2). |
| (b) | Rate shown represents annualized 7-day yield as of March 31, 2016. |
| (c) | At March 31, 2016, the total market value of the Fund’s securities on loan was $557,263 and the total market value of the collateral held by the Fund was $585,288. The total market value of the collateral includes non-cash U.S. Government securities collateral having a value of $38,494. |
See Notes to Financial Statements.
| | |
| 104 | | WisdomTree Domestic Earnings and Dividend Funds |
Schedule of Investments
WisdomTree U.S. Quality Dividend Growth Fund (DGRW)
March 31, 2016
| | | | | | | | |
| Investments | | Shares | | | Value | |
| COMMON STOCKS – 99.8% | | | | | | | | |
| United States – 99.8% | | | | | | | | |
| Aerospace & Defense – 7.2% | | | | | | | | |
B/E Aerospace, Inc. | | | 7,611 | | | $ | 351,019 | |
Boeing Co. (The) | | | 67,942 | | | | 8,624,557 | |
BWX Technologies, Inc. | | | 3,255 | | | | 109,238 | |
Hexcel Corp. | | | 3,187 | | | | 139,304 | |
Honeywell International, Inc. | | | 75,232 | | | | 8,429,746 | |
Huntington Ingalls Industries, Inc. | | | 2,936 | | | | 402,056 | |
Lockheed Martin Corp. | | | 37,667 | | | | 8,343,241 | |
Northrop Grumman Corp. | | | 12,674 | | | | 2,508,185 | |
Orbital ATK, Inc. | | | 2,844 | | | | 247,257 | |
Raytheon Co. | | | 25,818 | | | | 3,166,061 | |
Rockwell Collins, Inc. | | | 7,973 | | | | 735,190 | |
United Technologies Corp. | | | 98,167 | | | | 9,826,517 | |
| | | | | | | | |
| Total Aerospace & Defense | | | | 42,882,371 | |
| Air Freight & Logistics – 2.0% | | | | | | | | |
C.H. Robinson Worldwide, Inc. | | | 14,266 | | | | 1,058,965 | |
Expeditors International of Washington, Inc. | | | 11,651 | | | | 568,685 | |
FedEx Corp. | | | 7,850 | | | | 1,277,352 | |
United Parcel Service, Inc. Class B | | | 84,034 | | | | 8,863,066 | |
| | | | | | | | |
| Total Air Freight & Logistics | | | | 11,768,068 | |
| Airlines – 0.2% | | | | | | | | |
Alaska Air Group, Inc. | | | 5,067 | | | | 415,595 | |
Allegiant Travel Co. | | | 454 | | | | 80,839 | |
Southwest Airlines Co. | | | 17,896 | | | | 801,741 | |
| | | | | | | | |
| Total Airlines | | | | 1,298,175 | |
| Auto Components – 0.2% | | | | | | | | |
BorgWarner, Inc. | | | 10,157 | | | | 390,029 | |
Gentex Corp. | | | 22,511 | | | | 353,197 | |
Lear Corp. | | | 2,330 | | | | 259,026 | |
| | | | | | | | |
| Total Auto Components | | | | 1,002,252 | |
| Automobiles – 2.8% | | | | | | | | |
Ford Motor Co. | | | 602,329 | | | | 8,131,442 | |
General Motors Co. | | | 228,158 | | | | 7,171,006 | |
Harley-Davidson, Inc. | | | 18,437 | | | | 946,371 | |
Thor Industries, Inc. | | | 4,020 | | | | 256,355 | |
| | | | | | | | |
| Total Automobiles | | | | 16,505,174 | |
| Banks – 0.1% | | | | | | | | |
First Republic Bank | | | 5,352 | | | | 356,657 | |
| Beverages – 5.0% | | | | | | | | |
Brown-Forman Corp. Class A | | | 4,223 | | | | 450,552 | |
Brown-Forman Corp. Class B | | | 6,827 | | | | 672,255 | |
Coca-Cola Co. (The) | | | 547,411 | | | | 25,394,396 | |
Coca-Cola Enterprises, Inc. | | | 21,199 | | | | 1,075,637 | |
Constellation Brands, Inc. Class A | | | 6,226 | | | | 940,687 | |
Dr. Pepper Snapple Group, Inc. | | | 16,253 | | | | 1,453,343 | |
| | | | | | | | |
| Total Beverages | | | | 29,986,870 | |
| Biotechnology – 5.8% | | | | | | | | |
AbbVie, Inc. | | | 277,968 | | | | 15,877,532 | |
Amgen, Inc. | | | 62,292 | | | | 9,339,440 | |
Gilead Sciences, Inc. | | | 99,955 | | | $ | 9,181,866 | |
| | | | | | | | |
| Total Biotechnology | | | | 34,398,838 | |
| Building Products – 0.2% | | | | | | | | |
A.O. Smith Corp. | | | 3,071 | | | | 234,348 | |
Lennox International, Inc. | | | 1,965 | | | | 265,649 | |
Masco Corp. | | | 17,774 | | | | 558,992 | |
Owens Corning | | | 6,818 | | | | 322,355 | |
| | | | | | | | |
| Total Building Products | | | | 1,381,344 | |
| Capital Markets – 1.4% | | | | | | | | |
Ameriprise Financial, Inc. | | | 17,797 | | | | 1,673,096 | |
Charles Schwab Corp. (The) | | | 40,386 | | | | 1,131,616 | |
Eaton Vance Corp. | | | 15,066 | | | | 505,012 | |
Federated Investors, Inc. Class B | | | 14,475 | | | | 417,604 | |
Janus Capital Group, Inc. | | | 19,200 | | | | 280,896 | |
LPL Financial Holdings, Inc.(a) | | | 9,593 | | | | 237,906 | |
Raymond James Financial, Inc. | | | 8,065 | | | | 383,975 | |
SEI Investments Co. | | | 6,584 | | | | 283,441 | |
T. Rowe Price Group, Inc. | | | 29,944 | | | | 2,199,686 | |
TD Ameritrade Holding Corp. | | | 43,043 | | | | 1,357,146 | |
| | | | | | | | |
| Total Capital Markets | | | | 8,470,378 | |
| Chemicals – 2.7% | | | | | | | | |
Airgas, Inc. | | | 5,034 | | | | 713,016 | |
CF Industries Holdings, Inc. | | | 27,735 | | | | 869,215 | |
Ecolab, Inc. | | | 14,031 | | | | 1,564,737 | |
FMC Corp. | | | 9,115 | | | | 367,973 | |
International Flavors & Fragrances, Inc. | | | 6,330 | | | | 720,164 | |
Monsanto Co. | | | 40,845 | | | | 3,583,740 | |
NewMarket Corp. | | | 825 | | | | 326,914 | |
PolyOne Corp. | | | 5,124 | | | | 155,001 | |
PPG Industries, Inc. | | | 15,883 | | | | 1,770,796 | |
Praxair, Inc. | | | 31,414 | | | | 3,595,332 | |
Scotts Miracle-Gro Co. (The) Class A | | | 7,082 | | | | 515,357 | |
Sherwin-Williams Co. (The) | | | 3,860 | | | | 1,098,826 | |
Valspar Corp. (The) | | | 5,045 | | | | 539,916 | |
| | | | | | | | |
| Total Chemicals | | | | 15,820,987 | |
| Commercial Services & Supplies – 0.2% | | | | | | | | |
Cintas Corp. | | | 5,220 | | | | 468,808 | |
Deluxe Corp. | | | 4,408 | | | | 275,456 | |
Healthcare Services Group, Inc. | | | 5,471 | | | | 201,388 | |
Rollins, Inc. | | | 10,866 | | | | 294,686 | |
| | | | | | | | |
| Total Commercial Services & Supplies | | | | 1,240,338 | |
| Communications Equipment – 2.0% | | | | | | | | |
Cisco Systems, Inc. | | | 406,272 | | | | 11,566,564 | |
Harris Corp. | | | 7,505 | | | | 584,339 | |
| | | | | | | | |
| Total Communications Equipment | | | | | | | 12,150,903 | |
| Construction & Engineering – 0.0% | | | | | | | | |
EMCOR Group, Inc. | | | 1,932 | | | | 93,895 | |
Valmont Industries, Inc. | | | 1,377 | | | | 170,528 | |
| | | | | | | | |
| Total Construction & Engineering | | | | 264,423 | |
See Notes to Financial Statements.
| | | | |
| WisdomTree Domestic Earnings and Dividend Funds | | | 105 | |
Schedule of Investments (continued)
WisdomTree U.S. Quality Dividend Growth Fund (DGRW)
March 31, 2016
| | | | | | | | |
| Investments | | Shares | | | Value | |
| Construction Materials – 0.1% | | | | | | | | |
Martin Marietta Materials, Inc. | | | 2,930 | | | $ | 467,364 | |
| Consumer Finance – 0.7% | | | | | | | | |
American Express Co. | | | 66,743 | | | | 4,098,020 | |
| Containers & Packaging – 0.2% | | | | | | | | |
AptarGroup, Inc. | | | 4,232 | | | | 331,831 | |
Graphic Packaging Holding Co. | | | 20,844 | | | | 267,845 | |
Packaging Corp. of America | | | 13,247 | | | | 800,119 | |
| | | | | | | | |
| Total Containers & Packaging | | | | 1,399,795 | |
| Distributors – 0.3% | | | | | | | | |
Genuine Parts Co. | | | 15,214 | | | | 1,511,663 | |
Pool Corp. | | | 1,830 | | | | 160,564 | |
| | | | | | | | |
| Total Distributors | | | | 1,672,227 | |
| Diversified Consumer Services – 0.1% | | | | | | | | |
H&R Block, Inc. | | | 24,521 | | | | 647,845 | |
| Diversified Financial Services – 0.7% | | | | | | | | |
CBOE Holdings, Inc. | | | 4,891 | | | | 319,529 | |
FactSet Research Systems, Inc. | | | 1,722 | | | | 260,935 | |
Intercontinental Exchange, Inc. | | | 5,443 | | | | 1,279,867 | |
MarketAxess Holdings, Inc. | | | 1,064 | | | | 132,819 | |
McGraw Hill Financial, Inc. | | | 15,522 | | | | 1,536,367 | |
Morningstar, Inc. | | | 1,615 | | | | 142,556 | |
MSCI, Inc. | | | 5,213 | | | | 386,179 | |
| | | | | | | | |
| Total Diversified Financial Services | | | | 4,058,252 | |
| Electrical Equipment – 1.5% | | | | | | | | |
Acuity Brands, Inc. | | | 342 | | | | 74,604 | |
AMETEK, Inc. | | | 6,770 | | | | 338,365 | |
Emerson Electric Co. | | | 110,140 | | | | 5,989,413 | |
EnerSys | | | 2,268 | | | | 126,373 | |
Hubbell, Inc. | | | 5,354 | | | | 567,149 | |
Rockwell Automation, Inc. | | | 15,241 | | | | 1,733,664 | |
| | | | | | | | |
| Total Electrical Equipment | | | | 8,829,568 | |
| Electronic Equipment, Instruments & Components – 0.2% | | | | | |
Amphenol Corp. Class A | | | 8,374 | | | | 484,185 | |
Belden, Inc. | | | 405 | | | | 24,859 | |
Cognex Corp. | | | 1,582 | | | | 61,619 | |
FEI Co. | | | 1,415 | | | | 125,949 | |
FLIR Systems, Inc. | | | 5,312 | | | | 175,030 | |
National Instruments Corp. | | | 8,425 | | | | 253,677 | |
| | | | | | | | |
| Total Electronic Equipment, Instruments & Components | | | | 1,125,319 | |
| Energy Equipment & Services – 0.5% | | | | | | | | |
Halliburton Co. | | | 66,933 | | | | 2,390,847 | |
Oceaneering International, Inc. | | | 11,162 | | | | 371,025 | |
| | | | | | | | |
| Total Energy Equipment & Services | | | | 2,761,872 | |
| Food & Staples Retailing – 3.7% | | | | | | | | |
Casey’s General Stores, Inc. | | | 1,195 | | | | 135,417 | |
Costco Wholesale Corp. | | | 17,618 | | | | 2,776,244 | |
CVS Health Corp. | | | 66,974 | | | | 6,947,213 | |
Kroger Co. (The) | | | 40,283 | | | | 1,540,825 | |
PriceSmart, Inc. | | | 1,063 | | | | 89,909 | |
Sysco Corp. | | | 68,927 | | | | 3,220,959 | |
Walgreens Boots Alliance, Inc. | | | 77,289 | | | | 6,510,825 | |
Whole Foods Market, Inc. | | | 21,995 | | | | 684,265 | |
| | | | | | | | |
| Total Food & Staples Retailing | | | | 21,905,657 | |
| Food Products – 2.5% | | | | | | | | |
Campbell Soup Co. | | | 29,260 | | | | 1,866,495 | |
Flowers Foods, Inc. | | | 23,278 | | | | 429,712 | |
General Mills, Inc. | | | 72,899 | | | | 4,618,152 | |
Hershey Co. (The) | | | 16,808 | | | | 1,547,849 | |
Hormel Foods Corp. | | | 32,220 | | | | 1,393,193 | |
Ingredion, Inc. | | | 5,455 | | | | 582,539 | |
Kellogg Co. | | | 40,812 | | | | 3,124,159 | |
Lancaster Colony Corp. | | | 1,906 | | | | 210,746 | |
McCormick & Co., Inc. Non-Voting Shares | | | 9,494 | | | | 944,463 | |
| | | | | | | | |
| Total Food Products | | | | 14,717,308 | |
| Health Care Equipment & Supplies – 2.5% | | | | | | | | |
Abbott Laboratories | | | 130,009 | | | | 5,438,277 | |
Baxter International, Inc. | | | 27,857 | | | | 1,144,366 | |
Becton, Dickinson and Co. | | | 14,887 | | | | 2,260,144 | |
C.R. Bard, Inc. | | | 1,505 | | | | 305,018 | |
Cantel Medical Corp. | | | 292 | | | | 20,837 | |
Cooper Cos., Inc. (The) | | | 30 | | | | 4,619 | |
DENTSPLY SIRONA, Inc. | | | 2,576 | | | | 158,759 | |
ResMed, Inc. | | | 12,246 | | | | 708,064 | |
St. Jude Medical, Inc. | | | 21,893 | | | | 1,204,115 | |
Stryker Corp. | | | 22,656 | | | | 2,430,762 | |
West Pharmaceutical Services, Inc. | | | 2,310 | | | | 160,129 | |
Zimmer Biomet Holdings, Inc. | | | 7,357 | | | | 784,477 | |
| | | | | | | | |
| Total Health Care Equipment & Supplies | | | | 14,619,567 | |
| Health Care Providers & Services – 2.6% | | | | | | | | |
Aetna, Inc. | | | 13,481 | | | | 1,514,590 | |
Cardinal Health, Inc. | | | 23,800 | | | | 1,950,410 | |
Chemed Corp. | | | 410 | | | | 55,534 | |
Cigna Corp. | | | 280 | | | | 38,427 | |
HealthSouth Corp. | | | 9,832 | | | | 369,978 | |
Humana, Inc. | | | 4,008 | | | | 733,264 | |
McKesson Corp. | | | 5,494 | | | | 863,931 | |
Patterson Cos., Inc. | | | 8,269 | | | | 384,757 | |
Quest Diagnostics, Inc. | | | 13,024 | | | | 930,565 | |
UnitedHealth Group, Inc. | | | 66,219 | | | | 8,535,629 | |
Universal Health Services, Inc. Class B | | | 1,162 | | | | 144,925 | |
| | | | | | | | |
| Total Health Care Providers & Services | | | | 15,522,010 | |
| Hotels, Restaurants & Leisure – 5.7% | | | | | | | | |
Churchill Downs, Inc. | | | 492 | | | | 72,757 | |
Cracker Barrel Old Country Store, Inc.(a) | | | 3,003 | | | | 458,468 | |
Darden Restaurants, Inc. | | | 17,029 | | | | 1,129,023 | |
Dunkin’ Brands Group, Inc. | | | 8,390 | | | | 395,756 | |
Hilton Worldwide Holdings, Inc. | | | 44,333 | | | | 998,379 | |
Jack in the Box, Inc. | | | 1,876 | | | | 119,820 | |
Las Vegas Sands Corp. | | | 176,399 | | | | 9,116,300 | |
McDonald’s Corp. | | | 99,034 | | | | 12,446,593 | |
Starbucks Corp. | | | 69,888 | | | | 4,172,314 | |
See Notes to Financial Statements.
| | |
| 106 | | WisdomTree Domestic Earnings and Dividend Funds |
Schedule of Investments (continued)
WisdomTree U.S. Quality Dividend Growth Fund (DGRW)
March 31, 2016
| | | | | | | | |
| Investments | | Shares | | | Value | |
Starwood Hotels & Resorts Worldwide, Inc. | | | 13,023 | | | $ | 1,086,509 | |
Wyndham Worldwide Corp. | | | 9,274 | | | | 708,812 | |
Yum! Brands, Inc. | | | 39,090 | | | | 3,199,516 | |
| | | | | | | | |
| Total Hotels, Restaurants & Leisure | | | | 33,904,247 | |
| Household Durables – 0.6% | | | | | | | | |
D.R. Horton, Inc. | | | 13,497 | | | | 408,014 | |
Harman International Industries, Inc. | | | 3,791 | | | | 337,551 | |
Lennar Corp. Class A | | | 2,193 | | | | 106,053 | |
Newell Rubbermaid, Inc. | | | 15,678 | | | | 694,379 | |
PulteGroup, Inc. | | | 22,729 | | | | 425,260 | |
Tupperware Brands Corp. | | | 8,631 | | | | 500,425 | |
Whirlpool Corp. | | | 6,806 | | | | 1,227,394 | |
| | | | | | | | |
| Total Household Durables | | | | 3,699,076 | |
| Household Products – 2.1% | | | | | | | | |
Church & Dwight Co., Inc. | | | 8,546 | | | | 787,771 | |
Colgate-Palmolive Co. | | | 84,205 | | | | 5,949,083 | |
Kimberly-Clark Corp. | | | 43,251 | | | | 5,817,692 | |
| | | | | | | | |
| Total Household Products | | | | 12,554,546 | |
| Industrial Conglomerates – 2.2% | | | | | | | | |
3M Co. | | | 65,759 | | | | 10,957,422 | |
Carlisle Cos., Inc. | | | 3,511 | | | | 349,345 | |
Danaher Corp. | | | 16,014 | | | | 1,519,088 | |
Roper Technologies, Inc. | | | 2,239 | | | | 409,222 | |
| | | | | | | | |
| Total Industrial Conglomerates | | | | 13,235,077 | |
| Insurance – 0.5% | | | | | | | | |
AmTrust Financial Services, Inc. | | | 13,772 | | | | 356,419 | |
Marsh & McLennan Cos., Inc. | | | 47,485 | | | | 2,886,613 | |
| | | | | | | | |
| Total Insurance | | | | 3,243,032 | |
| Internet & Catalog Retail – 0.1% | | | | | | | | |
Expedia, Inc. | | | 3,332 | | | | 359,256 | |
HSN, Inc. | | | 5,045 | | | | 263,904 | |
| | | | | | | | |
| Total Internet & Catalog Retail | | | | 623,160 | |
| Internet Software & Services – 0.0% | | | | | | | | |
j2 Global, Inc. | | | 2,201 | | | | 135,538 | |
| IT Services – 4.3% | | | | | | | | |
Automatic Data Processing, Inc. | | | 29,241 | | | | 2,623,210 | |
Booz Allen Hamilton Holding Corp. | | | 6,809 | | | | 206,177 | |
Broadridge Financial Solutions, Inc. | | | 6,723 | | | | 398,741 | |
DST Systems, Inc. | | | 1,064 | | | | 119,987 | |
Fidelity National Information Services, Inc. | | | 11,884 | | | | 752,376 | |
Global Payments, Inc. | | | 34 | | | | 2,220 | |
Heartland Payment Systems, Inc. | | | 416 | | | | 40,173 | |
International Business Machines Corp. | | | 93,364 | | | | 14,139,978 | |
Jack Henry & Associates, Inc. | | | 2,489 | | | | 210,495 | |
MasterCard, Inc. Class A | | | 18,557 | | | | 1,753,637 | |
MAXIMUS, Inc. | | | 771 | | | | 40,585 | |
Paychex, Inc. | | | 29,033 | | | | 1,568,072 | |
Total System Services, Inc. | | | 3,744 | | | | 178,140 | |
Visa, Inc. Class A | | | 35,658 | | | | 2,727,124 | |
Western Union Co. (The) | | | 43,474 | | | | 838,613 | |
| | | | | | | | |
| Total IT Services | | | | 25,599,528 | |
| Leisure Products – 0.3% | | | | | | | | |
Brunswick Corp. | | | 3,845 | | | | 184,483 | |
Hasbro, Inc. | | | 11,968 | | | | 958,637 | |
Polaris Industries, Inc. | | | 5,118 | | | | 504,021 | |
| | | | | | | | |
| Total Leisure Products | | | | 1,647,141 | |
| Life Sciences Tools & Services – 0.1% | | | | | | | | |
Agilent Technologies, Inc. | | | 15,212 | | | | 606,198 | |
Bio-Techne Corp. | | | 2,195 | | | | 207,472 | |
| | | | | | | | |
| Total Life Sciences Tools & Services | | | | 813,670 | |
| Machinery – 4.3% | | | | | | | | |
AGCO Corp. | | | 3,181 | | | | 158,096 | |
Allison Transmission Holdings, Inc. | | | 16,224 | | | | 437,723 | |
Caterpillar, Inc. | | | 110,420 | | | | 8,451,547 | |
CLARCOR, Inc. | | | 3,670 | | | | 212,089 | |
Cummins, Inc. | | | 31,926 | | | | 3,509,944 | |
Donaldson Co., Inc. | | | 13,118 | | | | 418,595 | |
Dover Corp. | | | 16,838 | | | | 1,083,189 | |
Flowserve Corp. | | | 9,002 | | | | 399,779 | |
Graco, Inc. | | | 3,833 | | | | 321,819 | |
IDEX Corp. | | | 5,160 | | | | 427,661 | |
Illinois Tool Works, Inc. | | | 35,240 | | | | 3,609,986 | |
ITT Corp. | | | 4,649 | | | | 171,502 | |
Lincoln Electric Holdings, Inc. | | | 6,870 | | | | 402,376 | |
Nordson Corp. | | | 3,629 | | | | 275,949 | |
PACCAR, Inc. | | | 28,800 | | | | 1,575,072 | |
Parker-Hannifin Corp. | | | 14,504 | | | | 1,611,104 | |
Stanley Black & Decker, Inc. | | | 12,347 | | | | 1,299,028 | |
Toro Co. (The) | | | 3,019 | | | | 259,996 | |
Trinity Industries, Inc. | | | 10,786 | | | | 197,492 | |
Wabtec Corp. | | | 1,729 | | | | 137,092 | |
Xylem, Inc. | | | 11,379 | | | | 465,401 | |
| | | | | | | | |
| Total Machinery | | | | 25,425,440 | |
| Media – 4.4% | | | | | | | | |
CBS Corp. Class B Non-Voting Shares | | | 19,805 | | | | 1,091,058 | |
Cinemark Holdings, Inc. | | | 12,469 | | | | 446,764 | |
Comcast Corp. Class A | | | 148,154 | | | | 9,049,246 | |
Scripps Networks Interactive, Inc. Class A | | | 5,505 | | | | 360,578 | |
Time Warner, Inc. | | | 60,011 | | | | 4,353,798 | |
Twenty-First Century Fox, Inc. Class A | | | 45,155 | | | | 1,258,921 | |
Twenty-First Century Fox, Inc. Class B | | | 30,087 | | | | 848,453 | |
Viacom, Inc. Class B | | | 46,706 | | | | 1,928,024 | |
Walt Disney Co. (The) | | | 71,052 | | | | 7,056,174 | |
| | | | | | | | |
| Total Media | | | | 26,393,016 | |
| Multiline Retail – 0.7% | | | | | | | | |
Dollar General Corp. | | | 12,890 | | | | 1,103,384 | |
Macy’s, Inc. | | | 43,410 | | | | 1,913,947 | |
Nordstrom, Inc.(a) | | | 17,765 | | | | 1,016,336 | |
| | | | | | | | |
| Total Multiline Retail | | | | 4,033,667 | |
| Oil, Gas & Consumable Fuels – 0.5% | | | | | | | | |
Cabot Oil & Gas Corp. | | | 8,042 | | | | 182,634 | |
CVR Energy, Inc.(a) | | | 16,762 | | | | 437,488 | |
EQT Corp. | | | 1,434 | | | | 96,451 | |
See Notes to Financial Statements.
| | | | |
| WisdomTree Domestic Earnings and Dividend Funds | | | 107 | |
Schedule of Investments (concluded)
WisdomTree U.S. Quality Dividend Growth Fund (DGRW)
March 31, 2016
| | | | | | | | |
| Investments | | Shares | | | Value | |
HollyFrontier Corp. | | | 22,667 | | | $ | 800,599 | |
Tesoro Corp. | | | 9,520 | | | | 818,815 | |
Western Refining, Inc. | | | 14,501 | | | | 421,834 | |
| | | | | | | | |
| Total Oil, Gas & Consumable Fuels | | | | 2,757,821 | |
| Personal Products – 0.3% | | | | | | | | |
Edgewell Personal Care Co. | | | 6,464 | | | | 520,546 | |
Estee Lauder Cos., Inc. (The) Class A | | | 12,665 | | | | 1,194,436 | |
| | | | | | | | |
| Total Personal Products | | | | 1,714,982 | |
| Pharmaceuticals – 3.0% | | | | | | | | |
Bristol-Myers Squibb Co. | | | 147,275 | | | | 9,407,927 | |
Eli Lilly & Co. | | | 107,332 | | | | 7,728,977 | |
Zoetis, Inc. | | | 14,450 | | | | 640,569 | |
| | | | | | | | |
| Total Pharmaceuticals | | | | 17,777,473 | |
| Professional Services – 0.2% | | | | | | | | |
Equifax, Inc. | | | 5,028 | | | | 574,650 | |
ManpowerGroup, Inc. | | | 5,657 | | | | 460,593 | |
Robert Half International, Inc. | | | 9,028 | | | | 420,524 | |
| | | | | | | | |
| Total Professional Services | | | | 1,455,767 | |
| Real Estate Management & Development – 0.0% | | | | | | | | |
Jones Lang LaSalle, Inc. | | | 615 | | | | 72,152 | |
| Road & Rail – 1.5% | | | | | | | | |
JB Hunt Transport Services, Inc. | | | 5,243 | | | | 441,670 | |
Kansas City Southern | | | 7,841 | | | | 670,014 | |
Landstar System, Inc. | | | 845 | | | | 54,595 | |
Union Pacific Corp. | | | 97,958 | | | | 7,792,559 | |
| | | | | | | | |
| Total Road & Rail | | | | 8,958,838 | |
| Semiconductors & Semiconductor Equipment – 4.8% | | | | | |
Analog Devices, Inc. | | | 22,034 | | | | 1,304,193 | |
Applied Materials, Inc. | | | 64,974 | | | | 1,376,149 | |
Intel Corp. | | | 329,512 | | | | 10,659,713 | |
KLA-Tencor Corp. | | | 11,918 | | | | 867,750 | |
Linear Technology Corp. | | | 16,686 | | | | 743,528 | |
Monolithic Power Systems, Inc. | | | 1,172 | | | | 74,586 | |
NVIDIA Corp. | | | 18,605 | | | | 662,896 | |
QUALCOMM, Inc. | | | 151,595 | | | | 7,752,568 | |
Skyworks Solutions, Inc. | | | 5,951 | | | | 463,583 | |
Teradyne, Inc. | | | 6,515 | | | | 140,659 | |
Texas Instruments, Inc. | | | 68,246 | | | | 3,918,685 | |
Xilinx, Inc. | | | 17,040 | | | | 808,207 | |
| | | | | | | | |
| Total Semiconductors & Semiconductor Equipment | | | | 28,772,517 | |
| Software – 4.9% | | | | | | | | |
Activision Blizzard, Inc. | | | 11,691 | | | | 395,624 | |
Blackbaud, Inc. | | | 838 | | | | 52,702 | |
Intuit, Inc. | | | 8,339 | | | | 867,339 | |
Microsoft Corp. | | | 377,582 | | | | 20,853,854 | |
Oracle Corp. | | | 171,199 | | | | 7,003,751 | |
SS&C Technologies Holdings, Inc. | | | 1,920 | | | | 121,766 | |
| | | | | | | | |
| Total Software | | | | 29,295,036 | |
| Specialty Retail – 3.7% | | | | | | | | |
Advance Auto Parts, Inc. | | | 456 | | | | 73,115 | |
American Eagle Outfitters, Inc.(a) | | | 21,942 | | | | 365,773 | |
CST Brands, Inc. | | | 1,604 | | | | 61,417 | |
Dick’s Sporting Goods, Inc. | | | 4,644 | | | | 217,107 | |
Foot Locker, Inc. | | | 7,221 | | | | 465,755 | |
Gap, Inc. (The) | | | 50,403 | | | | 1,481,848 | |
Home Depot, Inc. (The) | | | 80,677 | | | | 10,764,732 | |
Lithia Motors, Inc. Class A | | | 540 | | | | 47,158 | |
Lowe’s Cos., Inc. | | | 48,489 | | | | 3,673,042 | |
Penske Automotive Group, Inc. | | | 7,091 | | | | 268,749 | |
Ross Stores, Inc. | | | 12,810 | | | | 741,699 | |
Tiffany & Co. | | | 9,431 | | | | 692,047 | |
TJX Cos., Inc. (The) | | | 28,285 | | | | 2,216,130 | |
Tractor Supply Co. | | | 4,393 | | | | 397,391 | |
Williams-Sonoma, Inc. | | | 7,253 | | | | 397,029 | |
| | | | | | | | |
| Total Specialty Retail | | | | 21,862,992 | |
| Technology Hardware, Storage & Peripherals – 3.3% | | | | | |
Apple, Inc. | | | 180,348 | | | | 19,656,128 | |
| Textiles, Apparel & Luxury Goods – 1.4% | | | | | | | | |
Carter’s, Inc. | | | 1,881 | | | | 198,220 | |
Coach, Inc. | | | 43,296 | | | | 1,735,737 | |
Columbia Sportswear Co. | | | 3,807 | | | | 228,762 | |
Hanesbrands, Inc. | | | 18,848 | | | | 534,152 | |
NIKE, Inc. Class B | | | 48,012 | | | | 2,951,298 | |
Ralph Lauren Corp. | | | 3,581 | | | | 344,707 | |
VF Corp. | | | 35,746 | | | | 2,314,911 | |
| | | | | | | | |
| Total Textiles, Apparel & Luxury Goods | | | | 8,307,787 | |
| Tobacco – 4.9% | | | | | | | | |
Altria Group, Inc. | | | 316,323 | | | | 19,820,799 | |
Reynolds American, Inc. | | | 186,273 | | | | 9,371,395 | |
| | | | | | | | |
| Total Tobacco | | | | 29,192,194 | |
| Trading Companies & Distributors – 0.6% | | | | | | | | |
Fastenal Co.(a) | | | 33,191 | | | | 1,626,359 | |
MSC Industrial Direct Co., Inc. Class A | | | 5,597 | | | | 427,107 | |
W.W. Grainger, Inc.(a) | | | 6,216 | | | | 1,451,001 | |
Watsco, Inc. | | | 2,778 | | | | 374,308 | |
| | | | | | | | |
| Total Trading Companies & Distributors | | | | 3,878,775 | |
TOTAL COMMON STOCKS (Cost: $576,270,517) | | | | | | | 594,361,182 | |
| INVESTMENT OF CASH COLLATERAL FOR SECURITIES LOANED – 0.6% | |
| United States – 0.6% | | | | | | | | |
State Street Navigator Securities Lending Prime Portfolio, 0.50%(b) (Cost: $3,415,965)(c) | | | 3,415,965 | | | | 3,415,965 | |
TOTAL INVESTMENTS IN SECURITIES – 100.4% (Cost: $579,686,482) | | | | | | | 597,777,147 | |
Liabilities in Excess of Cash and Other Assets – (0.4)% | | | | (2,426,224 | ) |
| | | | | | | | |
| NET ASSETS – 100.0% | | | | | | $ | 595,350,923 | |
| (a) | Security, or portion thereof, was on loan at March 31, 2016 (See Note 2). |
| (b) | Rate shown represents annualized 7-day yield as of March 31, 2016. |
| (c) | At March 31, 2016, the total market value of the Fund’s securities on loan was $3,344,182 and the total market value of the collateral held by the Fund was $3,420,702. The total market value of the collateral includes non-cash U.S. Government securities collateral having a value of $4,737. |
See Notes to Financial Statements.
| | |
| 108 | | WisdomTree Domestic Earnings and Dividend Funds |
Schedule of Investments
WisdomTree U.S. SmallCap Quality Dividend Growth Fund (DGRS)
March 31, 2016
| | | | | | | | |
| Investments | | Shares | | | Value | |
| COMMON STOCKS – 99.6% | | | | | | | | |
| United States – 99.6% | | | | | | | | |
| Aerospace & Defense – 0.4% | | | | | | | | |
HEICO Corp. | | | 447 | | | $ | 26,878 | |
HEICO Corp. Class A | | | 738 | | | | 35,129 | |
National Presto Industries, Inc.(a) | | | 475 | | | | 39,776 | |
Triumph Group, Inc. | | | 1,250 | | | | 39,350 | |
| | | | | | | | |
| Total Aerospace & Defense | | | | 141,133 | |
| Air Freight & Logistics – 0.4% | | | | | | | | |
Forward Air Corp. | | | 1,938 | | | | 87,830 | |
Park-Ohio Holdings Corp. | | | 992 | | | | 42,478 | |
| | | | | | | | |
| Total Air Freight & Logistics | | | | 130,308 | |
| Auto Components – 1.2% | | | | | | | | |
Cooper Tire & Rubber Co. | | | 3,423 | | | | 126,719 | |
Dana Holding Corp. | | | 14,599 | | | | 205,700 | |
Standard Motor Products, Inc. | | | 1,958 | | | | 67,845 | |
Strattec Security Corp. | | | 164 | | | | 9,412 | |
| | | | | | | | |
| Total Auto Components | | | | 409,676 | |
| Automobiles – 0.2% | | | | | | | | |
Winnebago Industries, Inc. | | | 2,938 | | | | 65,958 | |
| Banks – 3.0% | | | | | | | | |
Access National Corp. | | | 1,977 | | | | 39,204 | |
BancFirst Corp. | | | 2,239 | | | | 127,690 | |
BBCN Bancorp, Inc. | | | 15,760 | | | | 239,394 | |
Central Pacific Financial Corp. | | | 6,500 | | | | 141,505 | |
Great Southern Bancorp, Inc. | | | 1,955 | | | | 72,589 | |
Hanmi Financial Corp. | | | 4,575 | | | | 100,741 | |
Independent Bank Corp. | | | 3,574 | | | | 52,002 | |
ServisFirst Bancshares, Inc. | | | 1,024 | | | | 45,466 | |
United Community Banks, Inc. | | | 5,999 | | | | 110,802 | |
Wilshire Bancorp, Inc. | | | 12,533 | | | | 129,090 | |
| | | | | | | | |
| Total Banks | | | | 1,058,483 | |
| Beverages – 0.1% | | | | | | | | |
Coca-Cola Bottling Co. Consolidated | | | 294 | | | | 46,969 | |
| Building Products – 1.4% | | | | | | | | |
AAON, Inc. | | | 2,967 | | | | 83,076 | |
Apogee Enterprises, Inc. | | | 1,622 | | | | 71,190 | |
Insteel Industries, Inc. | | | 627 | | | | 19,167 | |
Simpson Manufacturing Co., Inc. | | | 5,153 | | | | 196,690 | |
Universal Forest Products, Inc. | | | 1,362 | | | | 116,887 | |
| | | | | | | | |
| Total Building Products | | | | 487,010 | |
| Capital Markets – 3.8% | | | | | | | | |
Arlington Asset Investment Corp. Class A(a) | | | 22,156 | | | | 277,615 | |
Cohen & Steers, Inc. | | | 11,401 | | | | 443,727 | |
Evercore Partners, Inc. Class A | | | 6,848 | | | | 354,384 | |
Financial Engines, Inc.(a) | | | 3,179 | | | | 99,916 | |
GAMCO Investors, Inc. Class A | | | 413 | | | | 15,306 | |
Pzena Investment Management, Inc. Class A | | | 1,541 | | | | 11,634 | |
Westwood Holdings Group, Inc. | | | 2,424 | | | | 142,168 | |
| | | | | | | | |
| Total Capital Markets | | | | 1,344,750 | |
| Chemicals – 5.3% | | | | | | | | |
A. Schulman, Inc. | | | 6,067 | | | $ | 165,144 | |
Axiall Corp. | | | 21,481 | | | | 469,145 | |
Balchem Corp. | | | 1,133 | | | | 70,269 | |
Calgon Carbon Corp. | | | 4,719 | | | | 66,160 | |
Chase Corp. | | | 726 | | | | 38,180 | |
FutureFuel Corp. | | | 5,897 | | | | 69,526 | |
H.B. Fuller Co. | | | 5,433 | | | | 230,631 | |
Hawkins, Inc. | | | 1,669 | | | | 60,234 | |
Innophos Holdings, Inc. | | | 9,280 | | | | 286,845 | |
Innospec, Inc. | | | 2,019 | | | | 87,544 | |
Minerals Technologies, Inc. | | | 957 | | | | 54,405 | |
Quaker Chemical Corp. | | | 1,634 | | | | 138,661 | |
Stepan Co. | | | 2,555 | | | | 141,266 | |
| | | | | | | | |
| Total Chemicals | | | | 1,878,010 | |
| Commercial Services & Supplies – 6.5% | | | | | | | | |
ABM Industries, Inc. | | | 7,273 | | | | 234,990 | |
Essendant, Inc. | | | 3,705 | | | | 118,301 | |
G&K Services, Inc. Class A | | | 2,732 | | | | 200,119 | |
Herman Miller, Inc. | | | 6,842 | | | | 211,349 | |
HNI Corp. | | | 7,136 | | | | 279,517 | |
Knoll, Inc. | | | 6,686 | | | | 144,752 | |
Matthews International Corp. Class A | | | 2,043 | | | | 105,153 | |
McGrath RentCorp | | | 5,309 | | | | 133,150 | |
Mobile Mini, Inc. | | | 6,133 | | | | 202,512 | |
MSA Safety, Inc. | | | 6,362 | | | | 307,603 | |
Multi-Color Corp. | | | 312 | | | | 16,645 | |
Steelcase, Inc. Class A | | | 12,663 | | | | 188,932 | |
U.S. Ecology, Inc. | | | 2,434 | | | | 107,485 | |
UniFirst Corp. | | | 133 | | | | 14,513 | |
VSE Corp. | | | 221 | | | | 15,004 | |
| | | | | | | | |
| Total Commercial Services & Supplies | | | | 2,280,025 | |
| Communications Equipment – 1.1% | | | | | | | | |
Alliance Fiber Optic Products, Inc.* | | | 1,373 | | | | 20,307 | |
InterDigital, Inc. | | | 4,281 | | | | 238,237 | |
Plantronics, Inc. | | | 3,100 | | | | 121,489 | |
| | | | | | | | |
| Total Communications Equipment | | | | 380,033 | |
| Construction & Engineering – 0.6% | | | | | | | | |
Argan, Inc. | | | 1,888 | | | | 66,382 | |
Comfort Systems USA, Inc. | | | 1,753 | | | | 55,693 | |
Primoris Services Corp. | | | 2,996 | | | | 72,803 | |
| | | | | | | | |
| Total Construction & Engineering | | | | 194,878 | |
| Construction Materials – 0.1% | | | | | | | | |
United States Lime & Minerals, Inc. | | | 387 | | | | 23,224 | |
| Consumer Finance – 0.1% | |
Cash America International, Inc. | | | 1,261 | | | | 48,725 | |
| Containers & Packaging – 0.9% | | | | | | | | |
Greif, Inc. Class A | | | 9,468 | | | | 310,077 | |
| Distributors – 0.2% | | | | | | | | |
Core-Mark Holding Co., Inc. | | | 955 | | | | 77,890 | |
See Notes to Financial Statements.
| | | | |
| WisdomTree Domestic Earnings and Dividend Funds | | | 109 | |
Schedule of Investments (continued)
WisdomTree U.S. SmallCap Quality Dividend Growth Fund (DGRS)
March 31, 2016
| | | | | | | | |
| Investments | | Shares | | | Value | |
| Diversified Consumer Services – 0.7% | | | | | | | | |
Capella Education Co. | | | 2,021 | | | $ | 106,385 | |
Carriage Services, Inc. | | | 424 | | | | 9,163 | |
DeVry Education Group, Inc.(a) | | | 5,459 | | | | 94,277 | |
Liberty Tax, Inc. | | | 2,033 | | | | 39,826 | |
Universal Technical Institute, Inc. | | | 2,725 | | | | 11,745 | |
| | | | | | | | |
| Total Diversified Consumer Services | | | | 261,396 | |
| Diversified Financial Services – 0.2% | | | | | | | | |
A-Mark Precious Metals, Inc. | | | 642 | | | | 12,776 | |
Marlin Business Services Corp. | | | 3,238 | | | | 46,336 | |
| | | | | | | | |
| Total Diversified Financial Services | | | | 59,112 | |
| Diversified Telecommunication Services – 0.8% | | | | | | | | |
Atlantic Tele-Network, Inc. | | | 2,022 | | | | 153,328 | |
Inteliquent, Inc. | | | 8,339 | | | | 133,841 | |
| | | | | | | | |
| Total Diversified Telecommunication Services | | | | 287,169 | |
| Electric Utilities – 0.9% | | | | | | | | |
MGE Energy, Inc. | | | 6,396 | | | | 334,191 | |
| Electrical Equipment – 0.8% | | | | | | | | |
Allied Motion Technologies, Inc. | | | 232 | | | | 4,176 | |
AZZ, Inc. | | | 1,601 | | | | 90,617 | |
Encore Wire Corp. | | | 255 | | | | 9,927 | |
Franklin Electric Co., Inc. | | | 3,536 | | | | 113,753 | |
Hubbell, Inc. | | | 453 | | | | 47,986 | |
Preformed Line Products Co. | | | 582 | | | | 21,255 | |
| | | | | | | | |
| Total Electrical Equipment | | | | 287,714 | |
| Electronic Equipment, Instruments & Components – 2.4% | | | | | |
Badger Meter, Inc. | | | 1,486 | | | | 98,834 | |
CTS Corp. | | | 2,169 | | | | 34,140 | |
Dolby Laboratories, Inc. Class A | | | 5,634 | | | | 244,854 | |
Littelfuse, Inc. | | | 1,808 | | | | 222,583 | |
Mesa Laboratories, Inc. | | | 165 | | | | 15,898 | |
Methode Electronics, Inc. | | | 3,302 | | | | 96,550 | |
MTS Systems Corp. | | | 2,223 | | | | 135,269 | |
| | | | | | | | |
| Total Electronic Equipment, Instruments & Components | | | | 848,128 | |
| Energy Equipment & Services – 0.3% | | | | | | | | |
U.S. Silica Holdings, Inc.(a) | | | 5,133 | | | | 116,622 | |
| Food & Staples Retailing – 0.9% | | | | | | | | |
Andersons, Inc. (The) | | | 4,080 | | | | 128,153 | |
Weis Markets, Inc. | | | 3,803 | | | | 171,363 | |
| | | | | | | | |
| Total Food & Staples Retailing | | | | 299,516 | |
| Food Products – 3.4% | | | | | | | | |
Alico, Inc. | | | 379 | | | | 10,464 | |
Cal-Maine Foods, Inc.(a) | | | 16,946 | | | | 879,667 | |
Limoneira Co.(a) | | | 1,256 | | | | 19,091 | |
Sanderson Farms, Inc.(a) | | | 1,978 | | | | 178,376 | |
Tootsie Roll Industries, Inc.(a) | | | 3,383 | | | | 118,212 | |
| | | | | | | | |
| Total Food Products | | | | 1,205,810 | |
| Gas Utilities – 2.5% | | | | | | | | |
Chesapeake Utilities Corp. | | | 2,530 | | | | 159,314 | |
South Jersey Industries, Inc. | | | 25,658 | | | | 729,970 | |
| | | | | | | | |
| Total Gas Utilities | | | | 889,284 | |
| Health Care Equipment & Supplies – 1.8% | | | | | | | | |
Abaxis, Inc. | | | 1,465 | | | $ | 66,496 | |
Analogic Corp. | | | 449 | | | | 35,476 | |
Atrion Corp. | | | 127 | | | | 50,211 | |
CONMED Corp. | | | 4,042 | | | | 169,521 | |
LeMaitre Vascular, Inc. | | | 1,408 | | | | 21,852 | |
Meridian Bioscience, Inc. | | | 12,759 | | | | 262,963 | |
Utah Medical Products, Inc. | | | 528 | | | | 33,021 | |
| | | | | | | | |
| Total Health Care Equipment & Supplies | | | | 639,540 | |
| Health Care Providers & Services – 0.8% | | | | | | | | |
Aceto Corp. | | | 2,116 | | | | 49,853 | |
Ensign Group, Inc. (The) | | | 2,375 | | | | 53,770 | |
National Healthcare Corp. | | | 1,920 | | | | 119,616 | |
U.S. Physical Therapy, Inc. | | | 1,118 | | | | 55,598 | |
| | | | | | | | |
| Total Health Care Providers & Services | | | | 278,837 | |
| Hotels, Restaurants & Leisure – 4.7% | | | | | | | | |
Bloomin’ Brands, Inc. | | | 9,790 | | | | 165,157 | |
Cheesecake Factory, Inc. (The) | | | 4,803 | | | | 254,991 | |
DineEquity, Inc. | | | 4,570 | | | | 426,975 | |
Interval Leisure Group, Inc.(a) | | | 9,820 | | | | 141,801 | |
Papa John’s International, Inc. | | | 2,697 | | | | 146,150 | |
Ruth’s Hospitality Group, Inc. | | | 2,899 | | | | 53,371 | |
Sonic Corp. | | | 4,050 | | | | 142,398 | |
Texas Roadhouse, Inc. | | | 7,784 | | | | 339,227 | |
| | | | | | | | |
| Total Hotels, Restaurants & Leisure | | | | 1,670,070 | |
| Household Durables – 2.0% | | | | | | | | |
Bassett Furniture Industries, Inc. | | | 856 | | | | 27,272 | |
Ethan Allen Interiors, Inc. | | | 3,363 | | | | 107,011 | |
Flexsteel Industries, Inc. | | | 676 | | | | 29,528 | |
KB Home(a) | | | 3,994 | | | | 57,034 | |
La-Z-Boy, Inc. | | | 4,573 | | | | 122,282 | |
Lennar Corp. Class B | | | 714 | | | | 27,639 | |
Libbey, Inc. | | | 2,330 | | | | 43,338 | |
Lifetime Brands, Inc. | | | 1,077 | | | | 16,230 | |
MDC Holdings, Inc. | | | 11,060 | | | | 277,164 | |
| | | | | | | | |
| Total Household Durables | | | | 707,498 | |
| Household Products – 0.6% | | | | | | | | |
Oil-Dri Corp. of America | | | 600 | | | | 20,268 | |
WD-40 Co. | | | 1,675 | | | | 180,917 | |
| | | | | | | | |
| Total Household Products | | | | 201,185 | |
| Insurance – 1.4% | |
AMERISAFE, Inc. | | | 1,778 | | | | 93,416 | |
Employers Holdings, Inc. | | | 2,208 | | | | 62,133 | |
Federated National Holding Co. | | | 747 | | | | 14,686 | |
Fidelity & Guaranty Life | | | 4,427 | | | | 116,164 | |
HCI Group, Inc. | | | 2,864 | | | | 95,371 | |
Investors Title Co. | | | 45 | | | | 4,098 | |
Stewart Information Services Corp. | | | 438 | | | | 15,891 | |
Universal Insurance Holdings, Inc.(a) | | | 5,792 | | | | 103,098 | |
| | | | | | | | |
| Total Insurance | | | | 504,857 | |
See Notes to Financial Statements.
| | |
| 110 | | WisdomTree Domestic Earnings and Dividend Funds |
Schedule of Investments (continued)
WisdomTree U.S. SmallCap Quality Dividend Growth Fund (DGRS)
March 31, 2016
| | | | | | | | |
| Investments | | Shares | | | Value | |
| Internet & Catalog Retail – 0.6% | | | | | | | | |
Nutrisystem, Inc. | | | 5,427 | | | $ | 113,262 | |
PetMed Express, Inc.(a) | | | 4,975 | | | | 89,102 | |
| | | | | | | | |
| Total Internet & Catalog Retail | | | | 202,364 | |
| Internet Software & Services – 0.1% | | | | | | | | |
Reis, Inc. | | | 2,012 | | | | 47,383 | |
| IT Services – 3.6% | | | | | | | | |
Computer Task Group, Inc. | | | 3,239 | | | | 16,551 | |
Convergys Corp. | | | 9,618 | | | | 267,092 | |
CSG Systems International, Inc. | | | 5,015 | | | | 226,477 | |
Forrester Research, Inc. | | | 3,078 | | | | 103,452 | |
Hackett Group, Inc. (The) | | | 2,487 | | | | 37,603 | |
Science Applications International Corp. | | | 9,118 | | | | 486,354 | |
TeleTech Holdings, Inc. | | | 4,706 | | | | 130,639 | |
| | | | | | | | |
| Total IT Services | | | | 1,268,168 | |
| Leisure Products – 0.4% | | | | | | | | |
Escalade, Inc. | | | 1,536 | | | | 18,079 | |
Johnson Outdoors, Inc. Class A | | | 728 | | | | 16,176 | |
Sturm Ruger & Co., Inc. | | | 1,775 | | | | 121,374 | |
| | | | | | | | |
| Total Leisure Products | | | | 155,629 | |
| Machinery – 8.8% | | | | | | | | |
Actuant Corp. Class A | | | 629 | | | | 15,543 | |
Alamo Group, Inc. | | | 409 | | | | 22,785 | |
Albany International Corp. Class A | | | 3,051 | | | | 114,687 | |
Altra Industrial Motion Corp. | | | 3,410 | | | | 94,730 | |
American Railcar Industries, Inc.(a) | | | 3,724 | | | | 151,678 | |
Barnes Group, Inc. | | | 4,243 | | | | 148,632 | |
CIRCOR International, Inc. | | | 330 | | | | 15,309 | |
Columbus McKinnon Corp. | | | 936 | | | | 14,751 | |
Douglas Dynamics, Inc. | | | 5,146 | | | | 117,895 | |
Eastern Co. (The) | | | 723 | | | | 11,872 | |
EnPro Industries, Inc. | | | 2,210 | | | | 127,473 | |
Federal Signal Corp. | | | 6,335 | | | | 84,002 | |
Gorman-Rupp Co. (The) | | | 2,291 | | | | 59,406 | |
Graham Corp. | | | 1,104 | | | | 21,981 | |
Greenbrier Cos., Inc. (The)(a) | | | 4,451 | | | | 123,026 | |
Hillenbrand, Inc. | | | 9,921 | | | | 297,134 | |
Hurco Cos., Inc. | | | 492 | | | | 16,231 | |
Hyster-Yale Materials Handling, Inc. | | | 1,547 | | | | 103,030 | |
John Bean Technologies Corp. | | | 1,299 | | | | 73,277 | |
Joy Global, Inc.(a) | | | 37,800 | | | | 607,446 | |
Kadant, Inc. | | | 1,022 | | | | 46,153 | |
L.B. Foster Co. Class A | | | 879 | | | | 15,963 | |
Lindsay Corp.(a) | | | 1,078 | | | | 77,195 | |
Manitowoc Co., Inc. (The)(a) | | | 4,192 | | | | 18,151 | |
Mueller Industries, Inc. | | | 3,559 | | | | 104,706 | |
Mueller Water Products, Inc. Class A | | | 8,472 | | | | 83,703 | |
NN, Inc. | | | 2,608 | | | | 35,677 | |
Standex International Corp. | | | 511 | | | | 39,761 | |
Sun Hydraulics Corp. | | | 1,748 | | | | 58,016 | |
Supreme Industries, Inc. Class A | | | 1,389 | | | | 12,279 | |
Tennant Co. | | | 1,385 | | | | 71,300 | |
Terex Corp. | | | 7,840 | | | | 195,059 | |
Watts Water Technologies, Inc. Class A | | | 2,031 | | | | 111,969 | |
| | | | | | | | |
| Total Machinery | | | | 3,090,820 | |
| Marine – 0.5% | | | | | | | | |
Matson, Inc. | | | 4,044 | | | $ | 162,448 | |
| Media – 3.3% | | | | | | | | |
A.H. Belo Corp. Class A | | | 4,274 | | | | 20,558 | |
AMC Entertainment Holdings, Inc. Class A | | | 4,212 | | | | 117,894 | |
John Wiley & Sons, Inc. Class A | | | 7,300 | | | | 356,897 | |
Meredith Corp. | | | 8,678 | | | | 412,205 | |
New York Times Co. (The) Class A | | | 10,890 | | | | 135,689 | |
Saga Communications, Inc. Class A | | | 570 | | | | 22,834 | |
Scholastic Corp. | | | 2,661 | | | | 99,442 | |
| | | | | | | | |
| Total Media | | | | 1,165,519 | |
| Metals & Mining – 3.3% | | | | | | | | |
Carpenter Technology Corp. | | | 8,413 | | | | 287,977 | |
Gold Resource Corp.(a) | | | 22,293 | | | | 51,943 | |
Haynes International, Inc. | | | 2,381 | | | | 86,906 | |
Kaiser Aluminum Corp. | | | 2,563 | | | | 216,676 | |
Materion Corp. | | | 1,984 | | | | 52,536 | |
Worthington Industries, Inc. | | | 13,243 | | | | 471,981 | |
| | | | | | | | |
| Total Metals & Mining | | | | 1,168,019 | |
| Multiline Retail – 0.7% | | | | | | | | |
Big Lots, Inc. | | | 5,508 | | | | 249,457 | |
| Oil, Gas & Consumable Fuels – 0.5% | | | | | | | | |
Green Plains, Inc. | | | 6,490 | | | | 103,580 | |
Panhandle Oil and Gas, Inc. Class A | | | 1,289 | | | | 22,313 | |
SM Energy Co.(a) | | | 2,233 | | | | 41,846 | |
| | | | | | | | |
| Total Oil, Gas & Consumable Fuels | | | | 167,739 | |
| Paper & Forest Products – 2.3% | | | | | | | | |
KapStone Paper and Packaging Corp. | | | 12,324 | | | | 170,687 | |
Neenah Paper, Inc. | | | 2,666 | | | | 169,718 | |
PH Glatfelter Co. | | | 9,307 | | | | 192,934 | |
Schweitzer-Mauduit International, Inc. | | | 9,031 | | | | 284,296 | |
| | | | | | | | |
| Total Paper & Forest Products | | | | 817,635 | |
| Personal Products – 2.3% | | | | | | | | |
Inter Parfums, Inc. | | | 4,894 | | | | 151,224 | |
Nu Skin Enterprises, Inc. Class A(a) | | | 17,027 | | | | 651,283 | |
| | | | | | | | |
| Total Personal Products | | | | 802,507 | |
| Professional Services – 2.0% | | | | | | | | |
Barrett Business Services, Inc. | | | 836 | | | | 24,035 | |
CEB, Inc. | | | 4,450 | | | | 288,048 | |
Exponent, Inc. | | | 1,731 | | | | 88,298 | |
Insperity, Inc. | | | 2,622 | | | | 135,636 | |
Kforce, Inc. | | | 3,246 | | | | 63,557 | |
Korn/Ferry International | | | 3,319 | | | | 93,895 | |
| | | | | | | | |
| Total Professional Services | | | | 693,469 | |
| Real Estate Investment Trusts (REITs) – 1.2% | | | | | | | | |
Universal Health Realty Income Trust | | | 4,576 | | | | 257,400 | |
Urstadt Biddle Properties, Inc. Class A | | | 7,466 | | | | 156,413 | |
| | | | | | | | |
| Total Real Estate Investment Trusts (REITs) | | | | 413,813 | |
See Notes to Financial Statements.
| | | | |
| WisdomTree Domestic Earnings and Dividend Funds | | | 111 | |
Schedule of Investments (concluded)
WisdomTree U.S. SmallCap Quality Dividend Growth Fund (DGRS)
March 31, 2016
| | | | | | | | |
| Investments | | Shares | | | Value | |
| Road & Rail – 1.1% | | | | | | | | |
ArcBest Corp. | | | 2,237 | | | $ | 48,297 | |
Celadon Group, Inc. | | | 1,254 | | | | 13,142 | |
Heartland Express, Inc.(a) | | | 2,274 | | | | 42,183 | |
Knight Transportation, Inc. | | | 4,597 | | | | 120,211 | |
Universal Truckload Services, Inc. | | | 3,497 | | | | 57,596 | |
Werner Enterprises, Inc. | | | 3,990 | | | | 108,368 | |
| | | | | | | | |
| Total Road & Rail | | | | 389,797 | |
| Semiconductors & Semiconductor Equipment – 1.2% | | | | | |
IXYS Corp. | | | 3,174 | | | | 35,612 | |
MKS Instruments, Inc. | | | 7,554 | | | | 284,408 | |
Power Integrations, Inc. | | | 2,124 | | | | 105,478 | |
| | | | | | | | |
| Total Semiconductors & Semiconductor Equipment | | | | 425,498 | |
| Software – 1.5% | | | | | | | | |
Ebix, Inc.(a) | | | 2,345 | | | | 95,653 | |
Mentor Graphics Corp. | | | 11,123 | | | | 226,131 | |
Monotype Imaging Holdings, Inc. | | | 4,707 | | | | 112,591 | |
Pegasystems, Inc. | | | 2,538 | | | | 64,414 | |
QAD, Inc. Class A | | | 1,514 | | | | 32,173 | |
| | | | | | | | |
| Total Software | | | | 530,962 | |
| Specialty Retail – 9.9% | | | | | | | | |
Aaron’s, Inc. | | | 1,817 | | | | 45,607 | |
Abercrombie & Fitch Co. Class A | | | 11,538 | | | | 363,908 | |
Big 5 Sporting Goods Corp. | | | 5,360 | | | | 59,550 | |
Buckle, Inc. (The)(a) | | | 7,909 | | | | 267,878 | |
Cato Corp. (The) Class A | | | 4,682 | | | | 180,491 | |
Chico’s FAS, Inc. | | | 21,138 | | | | 280,501 | |
Children’s Place, Inc. (The) | | | 1,266 | | | | 105,673 | |
DSW, Inc. Class A | | | 15,223 | | | | 420,764 | |
Finish Line, Inc. (The) Class A | | | 5,518 | | | | 116,430 | |
GNC Holdings, Inc. Class A | | | 10,780 | | | | 342,265 | |
Group 1 Automotive, Inc. | | | 1,491 | | | | 87,507 | |
Guess?, Inc. | | | 22,105 | | | | 414,911 | |
Monro Muffler Brake, Inc. | | | 1,544 | | | | 110,350 | |
Outerwall, Inc.(a) | | | 2,834 | | | | 104,830 | |
Pier 1 Imports, Inc. | | | 22,833 | | | | 160,059 | |
Rent-A-Center, Inc. | | | 18,623 | | | | 295,174 | |
Shoe Carnival, Inc. | | | 1,296 | | | | 34,940 | |
Sonic Automotive, Inc. Class A | | | 1,361 | | | | 25,151 | |
Stein Mart, Inc. | | | 10,893 | | | | 79,846 | |
Winmark Corp. | | | 76 | | | | 7,446 | |
| | | | | | | | |
| Total Specialty Retail | | | | 3,503,281 | |
| Textiles, Apparel & Luxury Goods – 1.0% | | | | | | | | |
Culp, Inc. | | | 665 | | | | 17,436 | |
Movado Group, Inc. | | | 1,561 | | | | 42,974 | |
Oxford Industries, Inc. | | | 1,541 | | | | 103,602 | |
Superior Uniform Group, Inc. | | | 1,574 | | | | 28,049 | |
Wolverine World Wide, Inc. | | | 7,888 | | | | 145,297 | |
| | | | | | | | |
| Total Textiles, Apparel & Luxury Goods | | | | 337,358 | |
| Thrifts & Mortgage Finance – 0.1% | | | | | | | | |
Hingham Institution for Savings | | | 153 | | | | 18,224 | |
| Tobacco – 1.1% | | | | | | | | |
Universal Corp. | | | 6,732 | | | $ | 382,445 | |
| Trading Companies & Distributors – 3.1% | | | | | | | | |
Applied Industrial Technologies, Inc. | | | 6,132 | | | | 266,129 | |
GATX Corp. | | | 8,994 | | | | 427,215 | |
H&E Equipment Services, Inc. | | | 13,767 | | | | 241,335 | |
Houston Wire & Cable Co. | | | 4,235 | | | | 29,603 | |
Kaman Corp. | | | 2,751 | | | | 117,440 | |
| | | | | | | | |
| Total Trading Companies & Distributors | | | | 1,081,722 | |
| Water Utilities – 1.0% | | | | | | | | |
American States Water Co. | | | 6,167 | | | | 242,733 | |
Connecticut Water Service, Inc. | | | 2,534 | | | | 114,284 | |
| | | | | | | | |
| Total Water Utilities | | | | 357,017 | |
| Wireless Telecommunication Services – 0.5% | | | | | | | | |
Shenandoah Telecommunications Co. | | | 3,996 | | | | 106,893 | |
Spok Holdings, Inc. | | | 4,639 | | | | 81,229 | |
| | | | | | | | |
| Total Wireless Telecommunication Services | | | | 188,122 | |
TOTAL COMMON STOCKS
(Cost: $33,840,479) | | | | 35,087,474 | |
| INVESTMENT OF CASH COLLATERAL FOR SECURITIES LOANED – 11.4% | |
| United States – 11.4% | | | | | | | | |
State Street Navigator Securities Lending Prime Portfolio, 0.50%(b) (Cost: $4,010,875)(c) | | | 4,010,875 | | | | 4,010,875 | |
TOTAL INVESTMENTS IN SECURITIES – 111.0%
(Cost: $37,851,354) | | | | | | | 39,098,349 | |
Liabilities in Excess of Cash and Other Assets – (11.0)% | | | | (3,890,158 | ) |
| | | | | | | | |
| NET ASSETS – 100.0% | | | | | | $ | 35,208,191 | |
| * | Non-income producing security. |
| (a) | Security, or portion thereof, was on loan at March 31, 2016 (See Note 2). |
| (b) | Rate shown represents annualized 7-day yield as of March 31, 2016. |
| (c) | At March 31, 2016, the total market value of the Fund’s securities on loan was $3,910,024 and the total market value of the collateral held by the Fund was $4,010,875. |
See Notes to Financial Statements.
| | |
| 112 | | WisdomTree Domestic Earnings and Dividend Funds |
Statements of Assets and Liabilities
WisdomTree Domestic Earnings and Dividend Funds
March 31, 2016
| | | | | | | | | | | | | | | | | | | | |
| | | WisdomTree
Dividend ex-
Financials Fund | | | WisdomTree
Earnings 500
Fund | | | WisdomTree
High Dividend
Fund | | | WisdomTree LargeCap
Dividend Fund | | | WisdomTree
LargeCap Value Fund | |
ASSETS: | | | | | | | | | | | | | | | | | | | | |
| | | | | |
Investments, at cost | | $ | 847,543,032 | | | $ | 108,257,843 | | | $ | 954,557,821 | | | $ | 1,600,074,186 | | | $ | 134,089,710 | |
| | | | | |
Investment in affiliates, at cost (Note 3) | | | 7,117,820 | | | | 265,268 | | | | 3,445,080 | | | | 5,058,055 | | | | 442,117 | |
Investments in securities, at value1 (Note 2) | | | 914,387,125 | | | | 118,291,430 | | | | 1,029,982,693 | | | | 1,723,889,466 | | | | 138,061,512 | |
| | | | | |
Investment in affiliates, at value (Note 3) | | | 7,594,396 | | | | 295,518 | | | | 3,686,039 | | | | 5,438,981 | | | | 451,046 | |
| | | | | |
Cash | | | 534,592 | | | | 78,538 | | | | 1,247,791 | | | | 861,667 | | | | 74,146 | |
| | | | | |
Receivables: | | | | | | | | | | | | | | | | | | | | |
| | | | | |
Corporate action proceeds | | | — | | | | — | | | | 269,929 | | | | — | | | | — | |
| | | | | |
Investment securities sold | | | 15,219 | | | | — | | | | 12,819 | | | | 14,272 | | | | — | |
| | | | | |
Capital shares sold | | | 7,541,501 | | | | — | | | | — | | | | 3,677,646 | | | | 3,140,152 | |
| | | | | |
Dividends and interest | | | 1,794,424 | | | | 134,593 | | | | 2,641,160 | | | | 2,885,552 | | | | 98,856 | |
Total Assets | | | 931,867,257 | | | | 118,800,079 | | | | 1,037,840,431 | | | | 1,736,767,584 | | | | 141,825,712 | |
LIABILITIES: | | | | | | | | | | | | | | | | | | | | |
| | | | | |
Payables: | | | | | | | | | | | | | | | | | | | | |
| | | | | |
Investment of cash collateral for securities loaned (Note 2) | | | 7,851,900 | | | | 360,227 | | | | 10,967,234 | | | | 7,428,445 | | | | 603,608 | |
| | | | | |
Investment securities purchased | | | 7,530,373 | | | | — | | | | 1,192,457 | | | | 3,673,492 | | | | 3,137,760 | |
| | | | | |
Advisory fees (Note 3) | | | 288,901 | | | | 27,752 | | | | 314,689 | | | | 400,246 | | | | 22,498 | |
| | | | | |
Service fees (Note 2) | | | 3,377 | | | | 438 | | | | 3,656 | | | | 6,316 | | | | 263 | |
Total Liabilities | | | 15,674,551 | | | | 388,417 | | | | 12,478,036 | | | | 11,508,499 | | | | 3,764,129 | |
NET ASSETS | | $ | 916,192,706 | | | $ | 118,411,662 | | | $ | 1,025,362,395 | | | $ | 1,725,259,085 | | | $ | 138,061,583 | |
NET ASSETS: | | | | | | | | | | | | | | | | | | | | |
| | | | | |
Paid-in capital | | $ | 993,849,555 | | | $ | 127,767,541 | | | $ | 1,035,828,212 | | | $ | 1,692,621,592 | | | $ | 145,103,459 | |
| | | | | |
Undistributed net investment income | | | 1,793,666 | | | | 119,227 | | | | 2,271,943 | | | | 2,220,554 | | | | 100,708 | |
| | | | | |
Accumulated net realized loss on investments | | | (146,771,184 | ) | | | (19,538,943 | ) | | | (88,403,591 | ) | | | (93,779,267 | ) | | | (11,123,315 | ) |
| | | | | |
Net unrealized appreciation on investments | | | 67,320,669 | | | | 10,063,837 | | | | 75,665,831 | | | | 124,196,206 | | | | 3,980,731 | |
NET ASSETS | | $ | 916,192,706 | | | $ | 118,411,662 | | | $ | 1,025,362,395 | | | $ | 1,725,259,085 | | | $ | 138,061,583 | |
Outstanding beneficial interest shares of $0.001 par value (unlimited number of shares authorized) | | | 12,150,000 | | | | 1,700,000 | | | | 16,200,000 | | | | 23,500,000 | | | | 2,200,000 | |
Net asset value per share | | $ | 75.41 | | | $ | 69.65 | | | $ | 63.29 | | | $ | 73.42 | | | $ | 62.76 | |
1 Includes market value of securities out on loan of: | | $ | 7,694,862 | | | $ | 352,445 | | | $ | 11,767,064 | | | $ | 7,272,171 | | | $ | 588,660 | |
| | | | | | | | | | | | | | | | | | | | |
See Notes to Financial Statements.
| | | | |
| WisdomTree Domestic Earnings and Dividend Funds | | | 113 | |
Statements of Assets and Liabilities (continued)
WisdomTree Domestic Earnings and Dividend Funds
March 31, 2016
| | | | | | | | | | | | | | | | | | | | |
| | | WisdomTree
MidCap
Dividend Fund | | | WisdomTree
MidCap
Earnings Fund | | | WisdomTree
SmallCap
Dividend Fund | | | WisdomTree
SmallCap
Earnings Fund | | | WisdomTree
Total Dividend
Fund | |
ASSETS: | | | | | | | | | | | | | | | | | | | | |
| | | | | |
Investments, at cost | | $ | 1,530,392,800 | | | $ | 666,937,013 | | | $ | 1,299,682,731 | | | $ | 414,015,822 | | | $ | 434,703,975 | |
| | | | | |
Investment in affiliates, at cost (Note 3) | | | 1,620,820 | | | | 1,132,390 | | | | 7,331,835 | | | | 1,179,390 | | | | 790,703 | |
Investments in securities, at value1 (Note 2) | | | 1,669,647,865 | | | | 693,104,689 | | | | 1,358,399,828 | | | | 415,080,713 | | | | 496,029,338 | |
| | | | | |
Investment in affiliates, at value (Note 3) | | | 1,751,177 | | | | 1,190,385 | | | | 7,976,025 | | | | 1,288,529 | | | | 809,851 | |
| | | | | |
Cash | | | 1,434,185 | | | | 680,623 | | | | 743,138 | | | | 157,352 | | | | 609,501 | |
| | | | | |
Receivables: | | | | | | | | | | | | | | | | | | | | |
| | | | | |
Corporate action proceeds | | | — | | | | — | | | | 1,868,006 | | | | 128,832 | | | | 110,081 | |
| | | | | |
Investment securities sold | | | — | | | | 634,863 | | | | — | | | | — | | | | 3,497 | |
| | | | | |
Capital shares sold | | | 8,574,020 | | | | — | | | | 3,425,264 | | | | — | | | | — | |
| | | | | |
Dividends and interest | | | 3,081,297 | | | | 893,099 | | | | 3,555,746 | | | | 636,700 | | | | 906,769 | |
Total Assets | | | 1,684,488,544 | | | | 696,503,659 | | | | 1,375,968,007 | | | | 417,292,126 | | | | 498,469,037 | |
LIABILITIES: | | | | | | | | | | | | | | | | | | | | |
| | | | | |
Payables: | | | | | | | | | | | | | | | | | | | | |
| | | | | |
Investment of cash collateral for securities loaned (Note 2) | | | 65,947,592 | | | | 32,026,035 | | | | 152,545,820 | | | | 47,210,603 | | | | 4,643,317 | |
| | | | | |
Investment securities purchased | | | 8,557,910 | | | | 1,323,375 | | | | 6,386,091 | | | | — | | | | — | |
| | | | | |
Advisory fees (Note 3) | | | 493,150 | | | | 207,509 | | | | 374,168 | | | | 115,499 | | | | 115,562 | |
| | | | | |
Service fees (Note 2) | | | 5,715 | | | | 2,409 | | | | 4,365 | | | | 1,343 | | | | 1,820 | |
Total Liabilities | | | 75,004,367 | | | | 33,559,328 | | | | 159,310,444 | | | | 47,327,445 | | | | 4,760,699 | |
NET ASSETS | | $ | 1,609,484,177 | | | $ | 662,944,331 | | | $ | 1,216,657,563 | | | $ | 369,964,681 | | | $ | 493,708,338 | |
NET ASSETS: | | | | | | | | | | | | | | | | | | | | |
| | | | | |
Paid-in capital | | $ | 1,551,036,277 | | | $ | 709,037,890 | | | $ | 1,288,422,179 | | | $ | 418,827,390 | | | $ | 461,111,806 | |
| | | | | |
Undistributed net investment income | | | 3,831,392 | | | | 922,187 | | | | 3,602,359 | | | | 671,594 | | | | 813,671 | |
| | | | | |
Accumulated net realized loss on investments | | | (84,768,914 | ) | | | (73,241,417 | ) | | | (134,728,262 | ) | | | (50,708,333 | ) | | | (29,561,650 | ) |
| | | | | |
Net unrealized appreciation on investments | | | 139,385,422 | | | | 26,225,671 | | | | 59,361,287 | | | | 1,174,030 | | | | 61,344,511 | |
NET ASSETS | | $ | 1,609,484,177 | | | $ | 662,944,331 | | | $ | 1,216,657,563 | | | $ | 369,964,681 | | | $ | 493,708,338 | |
Outstanding beneficial interest shares of $0.001 par value (unlimited number of shares authorized) | | | 18,700,000 | | | | 7,350,000 | | | | 17,700,000 | | | | 4,800,000 | | | | 6,650,000 | |
Net asset value per share | | $ | 86.07 | | | $ | 90.20 | | | $ | 68.74 | | | $ | 77.08 | | | $ | 74.24 | |
1 Includes market value of securities out on loan of: | | $ | 66,948,860 | | | $ | 33,834,243 | | | $ | 149,799,674 | | | $ | 46,400,922 | | | $ | 4,526,378 | |
| | | | | | | | | | | | | | | | | | | | |
See Notes to Financial Statements.
| | |
| 114 | | WisdomTree Domestic Earnings and Dividend Funds |
Statements of Assets and Liabilities (concluded)
WisdomTree Domestic Earnings and Dividend Funds
March 31, 2016
| | | | | | | | | | | | |
| | | WisdomTree
Total Earnings
Fund | | | WisdomTree
U.S. Quality
Dividend
Growth Fund | | | WisdomTree
U.S. SmallCap
Quality
Dividend
Growth Fund | |
ASSETS: | | | | | | | | | | | | |
| | | |
Investments, at cost | | $ | 55,274,278 | | | $ | 579,686,482 | | | $ | 37,851,354 | |
Investments in securities, at value1 (Note 2) | | | 57,641,655 | | | | 597,777,147 | | | | 39,098,349 | |
| | | |
Cash | | | 54,112 | | | | 340,445 | | | | 47,394 | |
| | | |
Receivables: | | | | | | | | | | | | |
| | | |
Corporate action proceeds | | | 2,809 | | | | — | | | | — | |
| | | |
Capital shares sold | | | — | | | | 1,557,015 | | | | — | |
| | | |
Dividends and interest | | | 65,750 | | | | 787,988 | | | | 84,405 | |
Total Assets | | | 57,764,326 | | | | 600,462,595 | | | | 39,230,148 | |
LIABILITIES: | | | | | | | | | | | | |
| | | |
Payables: | | | | | | | | | | | | |
| | | |
Investment of cash collateral for securities loaned (Note 2) | | | 546,794 | | | | 3,415,965 | | | | 4,010,875 | |
| | | |
Investment securities purchased | | | — | | | | 1,555,795 | | | | — | |
| | | |
Advisory fees (Note 3) | | | 13,346 | | | | 137,747 | | | | 10,955 | |
| | | |
Service fees (Note 2) | | | 210 | | | | 2,165 | | | | 127 | |
Total Liabilities | | | 560,350 | | | | 5,111,672 | | | | 4,021,957 | |
NET ASSETS | | $ | 57,203,976 | | | $ | 595,350,923 | | | $ | 35,208,191 | |
NET ASSETS: | | | | | | | | | | | | |
| | | |
Paid-in capital | | $ | 61,397,562 | | | $ | 592,425,548 | | | $ | 37,899,186 | |
| | | |
Undistributed net investment income | | | 62,502 | | | | 762,081 | | | | 85,633 | |
| | | |
Accumulated net realized loss on investments | | | (6,623,465 | ) | | | (15,927,371 | ) | | | (4,023,623 | ) |
| | | |
Net unrealized appreciation on investments | | | 2,367,377 | | | | 18,090,665 | | | | 1,246,995 | |
NET ASSETS | | $ | 57,203,976 | | | $ | 595,350,923 | | | $ | 35,208,191 | |
Outstanding beneficial interest shares of $0.001 par value (unlimited number of shares authorized) | | | 800,000 | | | | 19,050,000 | | | | 1,250,000 | |
Net asset value per share | | $ | 71.50 | | | $ | 31.25 | | | $ | 28.17 | |
1 Includes market value of securities out on loan of: | | $ | 557,263 | | | $ | 3,344,182 | | | $ | 3,910,024 | |
| | | | | | | | | | | | |
See Notes to Financial Statements.
| | | | |
| WisdomTree Domestic Earnings and Dividend Funds | | | 115 | |
Statements of Operations
WisdomTree Domestic Earnings and Dividend Funds
For the Year Ended March 31, 2016
| | | | | | | | | | | | | | | | | | | | |
| | | WisdomTree
Dividend ex-
Financials Fund | | | WisdomTree
Earnings 500
Fund | | | WisdomTree
High Dividend
Fund | | | WisdomTree
LargeCap
Dividend Fund | | | WisdomTree
LargeCap
Value Fund | |
INVESTMENT INCOME: | | | | | | | | | | | | | | | | | | | | |
| | | | | |
Dividends | | $ | 38,222,875 | | | $ | 3,131,541 | | | $ | 37,045,597 | | | $ | 54,594,005 | | | $ | 734,371 | |
| | | | | |
Dividends from affiliates (Note 3) | | | 156,186 | | | | 15,998 | | | | 66,172 | | | | 146,234 | | | | 3,690 | |
| | | | | |
Securities lending income (Note 2) | | | 109,715 | | | | 15,610 | | | | 205,575 | | | | 70,172 | | | | 9,970 | |
Total investment income | | | 38,488,776 | | | | 3,163,149 | | | | 37,317,344 | | | | 54,810,411 | | | | 748,031 | |
EXPENSES: | | | | | | | | | | | | | | | | | | | | |
| | | | | |
Advisory fees (Note 3) | | | 3,872,643 | | | | 369,836 | | | | 3,618,575 | | | | 4,967,081 | | | | 137,447 | |
| | | | | |
Service fees (Note 2) | | | 44,841 | | | | 5,812 | | | | 41,900 | | | | 78,054 | | | | 1,591 | |
| | | | | |
Legal fees (Note 2) | | | — | | | | — | | | | 2,642 | | | | — | | | | — | |
Total expenses | | | 3,917,484 | | | | 375,648 | | | | 3,663,117 | | | | 5,045,135 | | | | 139,038 | |
Expense waivers (Note 3) | | | (11,255 | ) | | | (193 | ) | | | (3,505 | ) | | | (8,198 | ) | | | (103 | ) |
Net expenses | | | 3,906,229 | | | | 375,455 | | | | 3,659,612 | | | | 5,036,937 | | | | 138,935 | |
Net investment income | | | 34,582,547 | | | | 2,787,694 | | | | 33,657,732 | | | | 49,773,474 | | | | 609,096 | |
NET REALIZED AND UNREALIZED GAIN (LOSS) ON INVESTMENTS: | | | | | | | | | | | | | | | | | | | | |
| | | | | |
Net realized gain (loss) from: | | | | | | | | | | | | | | | | | | | | |
| | | | | |
Investment transactions | | | (64,849,494 | ) | | | (341,769 | ) | | | (23,716,495 | ) | | | (26,025,062 | ) | | | (2,628,069 | ) |
| | | | | |
Investment transactions in affiliates (Note 3) | | | 25,551 | | | | (18,970 | ) | | | (121,353 | ) | | | (199,834 | ) | | | (13,855 | ) |
| | | | | |
In-kind redemptions | | | 102,489,087 | | | | 10,007,196 | | | | 50,516,410 | | | | 134,116,351 | | | | 2,385,543 | |
| | | | | |
In-kind redemptions in affiliates (Note 3) | | | 21,912 | | | | 4,546 | | | | 19,592 | | | | 5,941 | | | | — | |
| | | | | |
Capital gain distributions from affiliates (Note 3) | | | 17,402 | | | | — | | | | — | | | | — | | | | — | |
Net realized gain (loss) | | | 37,704,458 | | | | 9,651,003 | | | | 26,698,154 | | | | 107,897,396 | | | | (256,381 | ) |
Net change in unrealized appreciation (depreciation) on investments | | | (62,963,675 | ) | | | (12,967,759 | ) | | | 8,731,396 | | | | (112,492,541 | ) | | | (1,005,141 | ) |
Net realized and unrealized gain (loss) on investments | | | (25,259,217 | ) | | | (3,316,756 | ) | | | 35,429,550 | | | | (4,595,145 | ) | | | (1,261,522 | ) |
NET INCREASE (DECREASE) IN NET ASSETS RESULTING FROM OPERATIONS | | $ | 9,323,330 | | | $ | (529,062 | ) | | $ | 69,087,282 | | | $ | 45,178,329 | | | $ | (652,426 | ) |
See Notes to Financial Statements.
| | |
| 116 | | WisdomTree Domestic Earnings and Dividend Funds |
Statements of Operations (continued)
WisdomTree Domestic Earnings and Dividend Funds
For the Year Ended March 31, 2016
| | | | | | | | | | | | | | | | | | | | |
| | | WisdomTree
MidCap
Dividend Fund | | | WisdomTree
MidCap
Earnings Fund | | | WisdomTree
SmallCap
Dividend Fund | | | WisdomTree
SmallCap
Earnings Fund | | | WisdomTree
Total Dividend
Fund | |
INVESTMENT INCOME: | | | | | | | | | | | | | | | | | | | | |
| | | | | |
Dividends1 | | $ | 44,567,405 | | | $ | 11,463,722 | | | $ | 38,673,118 | | | $ | 5,254,168 | | | $ | 15,613,538 | |
| | | | | |
Dividends from affiliates (Note 3) | | | 80,788 | | | | 74,868 | | | | 160,378 | | | | 20,771 | | | | 21,948 | |
| | | | | |
Securities lending income (Note 2) | | | 847,447 | | | | 640,439 | | | | 2,533,860 | | | | 1,328,138 | | | | 71,874 | |
Total investment income | | | 45,495,640 | | | | 12,179,029 | | | | 41,367,356 | | | | 6,603,077 | | | | 15,707,360 | |
EXPENSES: | | | | | | | | | | | | | | | | | | | | |
| | | | | |
Advisory fees (Note 3) | | | 5,798,838 | | | | 2,722,923 | | | | 4,514,411 | | | | 1,485,408 | | | | 1,412,887 | |
| | | | | |
Service fees (Note 2) | | | 67,144 | | | | 31,529 | | | | 52,272 | | | | 17,199 | | | | 22,203 | |
| | | | | |
Legal fees (Note 2) | | | 8,688 | | | | — | | | | — | | | | — | | | | 1,091 | |
Total expenses | | | 5,874,670 | | | | 2,754,452 | | | | 4,566,683 | | | | 1,502,607 | | | | 1,436,181 | |
Expense waivers (Note 3) | | | (4,393 | ) | | | (2,368 | ) | | | (12,702 | ) | | | (2,930 | ) | | | (336 | ) |
Net expenses | | | 5,870,277 | | | | 2,752,084 | | | | 4,553,981 | | | | 1,499,677 | | | | 1,435,845 | |
Net investment income | | | 39,625,363 | | | | 9,426,945 | | | | 36,813,375 | | | | 5,103,400 | | | | 14,271,515 | |
NET REALIZED AND UNREALIZED GAIN (LOSS) ON INVESTMENTS: | | | | | | | | | | | | | | | | | | | | |
| | | | | |
Net realized gain (loss) from: | | | | | | | | | | | | | | | | | | | | |
| | | | | |
Investment transactions | | | (76,989,129 | ) | | | (55,121,597 | ) | | | (65,523,980 | ) | | | (17,477,926 | ) | | | (6,865,536 | ) |
| | | | | |
Investment transactions in affiliates (Note 3) | | | (174,731 | ) | | | (33,714 | ) | | | (152,227 | ) | | | (87,443 | ) | | | 3,804 | |
| | | | | |
In-kind redemptions | | | 95,750,695 | | | | 46,090,508 | | | | 69,562,832 | | | | 6,563,625 | | | | 50,232,892 | |
| | | | | |
In-kind redemptions in affiliates (Note 3) | | | 5,477 | | | | 52 | | | | 27,171 | | | | 3,089 | | | | — | |
| | | | | |
Capital gain distributions from affiliates (Note 3) | | | — | | | | 19,516 | | | | 57,850 | | | | — | | | | — | |
Net realized gain (loss) | | | 18,592,312 | | | | (9,045,235 | ) | | | 3,971,646 | | | | (10,998,655 | ) | | | 43,371,160 | |
Net change in unrealized depreciation on investments | | | (26,432,803 | ) | | | (51,333,584 | ) | | | (71,379,353 | ) | | | (27,316,211 | ) | | | (45,084,996 | ) |
Net realized and unrealized loss on investments | | | (7,840,491 | ) | | | (60,378,819 | ) | | | (67,407,707 | ) | | | (38,314,866 | ) | | | (1,713,836 | ) |
NET INCREASE (DECREASE) IN NET ASSETS RESULTING FROM OPERATIONS | | $ | 31,784,872 | | | $ | (50,951,874 | ) | | $ | (30,594,332 | ) | | $ | (33,211,466 | ) | | $ | 12,557,679 | |
1 Net of foreign withholding tax of: | | | — | | | $ | 2,393 | | | | — | | | $ | 911 | | | | — | |
| | | | | | | | | | | | | | | | | | | | |
See Notes to Financial Statements.
| | | | |
| WisdomTree Domestic Earnings and Dividend Funds | | | 117 | |
Statements of Operations (concluded)
WisdomTree Domestic Earnings and Dividend Funds
For the Year Ended March 31, 2016
| | | | | | | | | | | | |
| | | WisdomTree
Total Earnings
Fund | | | WisdomTree
U.S. Quality
Dividend
Growth Fund | | | WisdomTree
U.S. SmallCap
Quality
Dividend
Growth Fund | |
INVESTMENT INCOME: | | | | | | | | | | | | |
| | | |
Dividends1 | | $ | 1,753,512 | | | $ | 13,586,195 | | | $ | 771,059 | |
| | | |
Securities lending income (Note 2) | | | 25,889 | | | | 28,503 | | | | 52,781 | |
Total investment income | | | 1,779,401 | | | | 13,614,698 | | | | 823,840 | |
EXPENSES: | | | | | | | | | | | | |
| | | |
Advisory fees (Note 3) | | | 218,074 | | | | 1,476,847 | | | | 111,123 | |
| | | |
Service fees (Note 2) | | | 3,427 | | | | 23,208 | | | | 1,287 | |
Total expenses | | | 221,501 | | | | 1,500,055 | | | | 112,410 | |
Net investment income | | | 1,557,900 | | | | 12,114,643 | | | | 711,430 | |
NET REALIZED AND UNREALIZED GAIN (LOSS) ON INVESTMENTS: | | | | | | | | | | | | |
| | | |
Net realized gain (loss) from: | | | | | | | | | | | | |
| | | |
Investment transactions | | | (1,437,264 | ) | | | (13,901,592 | ) | | | (2,996,689 | ) |
| | | |
In-kind redemptions | | | 12,988,767 | | | | 16,350,188 | | | | 1,114,959 | |
Net realized gain (loss) | | | 11,551,503 | | | | 2,448,596 | | | | (1,881,730 | ) |
Net change in unrealized appreciation (depreciation) on investments | | | (16,664,487 | ) | | | (4,122,300 | ) | | | 15,256 | |
Net realized and unrealized loss on investments | | | (5,112,984 | ) | | | (1,673,704 | ) | | | (1,866,474 | ) |
NET INCREASE (DECREASE) IN NET ASSETS RESULTING FROM OPERATIONS | | $ | (3,555,084 | ) | | $ | 10,440,939 | | | $ | (1,155,044 | ) |
1 Net of foreign withholding tax of: | | $ | 27 | | | | — | | | | — | |
| | | | | | | | | | | | |
See Notes to Financial Statements.
| | |
| 118 | | WisdomTree Domestic Earnings and Dividend Funds |
Statements of Changes in Net Assets
WisdomTree Domestic Earnings and Dividend Funds
| | | | | | | | | | | | | | | | | | | | | | | | |
| | | WisdomTree
Dividend ex-Financials Fund | | | WisdomTree
Earnings 500 Fund | | | WisdomTree
High Dividend Fund | |
| | | For the
Year Ended
March 31, 2016 | | | For the
Year Ended
March 31, 2015 | | | For the
Year Ended
March 31, 2016 | | | For the
Year Ended
March 31, 2015 | | | For the
Year Ended
March 31, 2016 | | | For the
Year Ended
March 31, 2015 | |
INCREASE (DECREASE) IN NET ASSETS RESULTING FROM OPERATIONS: | | | | | | | | | | | | | | | | | | | | | |
| | | | | | |
Net investment income | | $ | 34,582,547 | | | $ | 40,438,109 | | | $ | 2,787,694 | | | $ | 2,326,752 | | | $ | 33,657,732 | | | $ | 31,264,944 | |
| | | | | | |
Net realized gain on investments | | | 37,704,458 | | | | 100,929,982 | | | | 9,651,003 | | | | 10,117,566 | | | | 26,698,154 | | | | 100,160,031 | |
| | | | | | |
Net change in unrealized appreciation (depreciation) on investments | | | (62,963,675 | ) | | | (13,005,302 | ) | | | (12,967,759 | ) | | | (211,909 | ) | | | 8,731,396 | | | | (41,482,698 | ) |
Net increase (decrease) in net assets resulting from operations | | | 9,323,330 | | | | 128,362,789 | | | | (529,062 | ) | | | 12,232,409 | | | | 69,087,282 | | | | 89,942,277 | |
DIVIDENDS: | | | | | | | | | | | | | | | | | | | | | | | | |
| | | | | | |
Net investment income | | | (34,743,423 | ) | | | (39,456,992 | ) | | | (2,740,986 | ) | | | (2,297,699 | ) | | | (32,904,903 | ) | | | (30,019,168 | ) |
CAPITAL SHARE TRANSACTIONS: | | | | | | | | | | | | | | | | | | | | | | | | |
| | | | | | |
Net proceeds from sale of shares | | | 276,794,268 | | | | 378,042,831 | | | | 10,234,135 | | | | 49,289,980 | | | | 202,163,650 | | | | 562,545,150 | |
| | | | | | |
Cost of shares redeemed | | | (586,168,230 | ) | | | (343,773,894 | ) | | | (27,938,473 | ) | | | (21,189,284 | ) | | | (272,832,879 | ) | | | (360,213,965 | ) |
Net increase (decrease) in net assets resulting from capital share transactions | | | (309,373,962 | ) | | | 34,268,937 | | | | (17,704,338 | ) | | | 28,100,696 | | | | (70,669,229 | ) | | | 202,331,185 | |
Net Increase (Decrease) in Net Assets | | | (334,794,055 | ) | | | 123,174,734 | | | | (20,974,386 | ) | | | 38,035,406 | | | | (34,486,850 | ) | | | 262,254,294 | |
NET ASSETS: | | | | | | | | | | | | | | | | | | | | | | | | |
| | | | | | |
Beginning of year | | $ | 1,250,986,761 | | | $ | 1,127,812,027 | | | $ | 139,386,048 | | | $ | 101,350,642 | | | $ | 1,059,849,245 | | | $ | 797,594,951 | |
| | | | | | |
End of year | | $ | 916,192,706 | | | $ | 1,250,986,761 | | | $ | 118,411,662 | | | $ | 139,386,048 | | | $ | 1,025,362,395 | | | $ | 1,059,849,245 | |
Undistributed net investment income included in net assets at end of year | | $ | 1,793,666 | | | $ | 1,544,980 | | | $ | 119,227 | | | $ | 68,476 | | | $ | 2,271,943 | | | $ | 1,451,628 | |
SHARES CREATED AND REDEEMED: | | | | | | | | | | | | | | | | | | | | | | | | |
| | | | | | |
Shares outstanding, beginning of year | | | 16,500,000 | | | | 16,050,000 | | | | 1,950,000 | | | | 1,550,000 | | | | 17,450,000 | | | | 14,100,000 | |
Shares created | | | 3,950,000 | | | | 4,950,000 | | | | 150,000 | | | | 700,000 | | | | 3,400,000 | | | | 9,250,000 | |
Shares redeemed | | | (8,300,000 | ) | | | (4,500,000 | ) | | | (400,000 | ) | | | (300,000 | ) | | | (4,650,000 | ) | | | (5,900,000 | ) |
Shares outstanding, end of year | | | 12,150,000 | | | | 16,500,000 | | | | 1,700,000 | | | | 1,950,000 | | | | 16,200,000 | | | | 17,450,000 | |
See Notes to Financial Statements.
| | | | |
| WisdomTree Domestic Earnings and Dividend Funds | | | 119 | |
Statements of Changes in Net Assets (continued)
WisdomTree Domestic Earnings and Dividend Funds
| | | | | | | | | | | | | | | | | | | | | | | | |
| | | WisdomTree
LargeCap Dividend Fund | | | WisdomTree
LargeCap Value Fund | | | WisdomTree
MidCap Dividend Fund | |
| | | For the
Year Ended
March 31, 2016 | | | For the
Year Ended
March 31, 2015 | | | For the
Year Ended
March 31, 2016 | | | For the
Year Ended
March 31, 2015 | | | For the
Year Ended
March 31, 2016 | | | For the
Year Ended
March 31, 2015 | |
INCREASE (DECREASE) IN NET ASSETS RESULTING FROM OPERATIONS: | | | | | | | | | | | | | | | | | | | | | |
| | | | | | |
Net investment income | | $ | 49,773,474 | | | $ | 54,055,938 | | | $ | 609,096 | | | $ | 389,856 | | | $ | 39,625,363 | | | $ | 32,448,034 | |
| | | | | | |
Net realized gain (loss) on investments | | | 107,897,396 | | | | 270,980,053 | | | | (256,381 | ) | | | 4,288,300 | | | | 18,592,312 | | | | 124,743,157 | |
| | | | | | |
Net change in unrealized appreciation (depreciation) on investments | | | (112,492,541 | ) | | | (78,758,022 | ) | | | (1,005,141 | ) | | | (860,084 | ) | | | (26,432,803 | ) | | | 7,825,969 | |
Net increase (decrease) in net assets resulting from operations | | | 45,178,329 | | | | 246,277,969 | | | | (652,426 | ) | | | 3,818,072 | | | | 31,784,872 | | | | 165,017,160 | |
DIVIDENDS AND DISTRIBUTIONS: | | | | | | | | | | | | | | | | | | | | | | | | |
| | | | | | |
Net investment income | | | (49,180,302 | ) | | | (52,955,618 | ) | | | (522,957 | ) | | | (385,836 | ) | | | (38,312,134 | ) | | | (30,452,989 | ) |
| | | | | | |
Capital gains | | | — | | | | — | | | | — | | | | — | | | | (5,471,376 | ) | | | — | |
Total dividends and distributions | | | (49,180,302 | ) | | | (52,955,618 | ) | | | (522,957 | ) | | | (385,836 | ) | | | (43,783,510 | ) | | | (30,452,989 | ) |
CAPITAL SHARE TRANSACTIONS: | | | | | | | | | | | | | | | | | | | | | | | | |
| | | | | | |
Net proceeds from sale of shares | | | 174,323,599 | | | | 895,710,195 | | | | 129,363,313 | | | | 17,435,834 | | | | 452,684,354 | | | | 765,348,105 | |
| | | | | | |
Cost of shares redeemed | | | (551,680,751 | ) | | | (804,300,296 | ) | | | (16,637,196 | ) | | | (20,714,417 | ) | | | (427,097,281 | ) | | | (297,164,121 | ) |
Net increase (decrease) in net assets resulting from capital share transactions | | | (377,357,152 | ) | | | 91,409,899 | | | | 112,726,117 | | | | (3,278,583 | ) | | | 25,587,073 | | | | 468,183,984 | |
Net Increase (Decrease) in Net Assets | | | (381,359,125 | ) | | | 284,732,250 | | | | 111,550,734 | | | | 153,653 | | | | 13,588,435 | | | | 602,748,155 | |
NET ASSETS: | | | | | | | | | | | | | | | | | | | | | | | | |
| | | | | | |
Beginning of year | | $ | 2,106,618,210 | | | $ | 1,821,885,960 | | | $ | 26,510,849 | | | $ | 26,357,196 | | | $ | 1,595,895,742 | | | $ | 993,147,587 | |
| | | | | | |
End of year | | $ | 1,725,259,085 | | | $ | 2,106,618,210 | | | $ | 138,061,583 | | | $ | 26,510,849 | | | $ | 1,609,484,177 | | | $ | 1,595,895,742 | |
Undistributed net investment income included in net assets at end of year | | $ | 2,220,554 | | | $ | 1,613,503 | | | $ | 100,708 | | | $ | 12,607 | | | $ | 3,831,392 | | | $ | 1,981,151 | |
SHARES CREATED AND REDEEMED: | | | | | | | | | | | | | | | | | | | | | | | | |
| | | | | | |
Shares outstanding, beginning of year | | | 28,750,000 | | | | 26,950,000 | | | | 400,000 | | | | 450,000 | | | | 18,550,000 | | | | 12,900,000 | |
Shares created | | | 2,450,000 | | | | 12,750,000 | | | | 2,050,000 | | | | 300,000 | | | | 5,550,000 | | | | 9,250,000 | |
Shares redeemed | | | (7,700,000 | ) | | | (10,950,000 | ) | | | (250,000 | ) | | | (350,000 | ) | | | (5,400,000 | ) | | | (3,600,000 | ) |
Shares outstanding, end of year | | | 23,500,000 | | | | 28,750,000 | | | | 2,200,000 | | | | 400,000 | | | | 18,700,000 | | | | 18,550,000 | |
See Notes to Financial Statements.
| | |
| 120 | | WisdomTree Domestic Earnings and Dividend Funds |
Statements of Changes in Net Assets (continued)
WisdomTree Domestic Earnings and Dividend Funds
| | | | | | | | | | | | | | | | | | | | | | | | |
| | | WisdomTree
MidCap Earnings Fund | | | WisdomTree
SmallCap Dividend Fund | | | WisdomTree
SmallCap Earnings Fund | |
| | | For the
Year Ended
March 31, 2016 | | | For the
Year Ended
March 31, 2015 | | | For the
Year Ended
March 31, 2016 | | | For the
Year Ended
March 31, 2015 | | | For the
Year Ended
March 31, 2016 | | | For the
Year Ended
March 31, 2015 | |
INCREASE (DECREASE) IN NET ASSETS RESULTING FROM OPERATIONS: | | | | | | | | | | | | | | | | | | | | | |
| | | | | | |
Net investment income | | $ | 9,426,945 | | | $ | 8,335,542 | | | $ | 36,813,375 | | | $ | 31,096,433 | | | $ | 5,103,400 | | | $ | 5,250,296 | |
| | | | | | |
Net realized gain (loss) on investments | | | (9,045,235 | ) | | | 53,922,532 | | | | 3,971,646 | | | | 69,775,853 | | | | (10,998,655 | ) | | | 37,522,298 | |
| | | | | | |
Net change in unrealized depreciation on investments | | | (51,333,584 | ) | | | (1,974,745 | ) | | | (71,379,353 | ) | | | (11,600,102 | ) | | | (27,316,211 | ) | | | (22,953,050 | ) |
Net increase (decrease) in net assets resulting from operations | | | (50,951,874 | ) | | | 60,283,329 | | | | (30,594,332 | ) | | | 89,272,184 | | | | (33,211,466 | ) | | | 19,819,544 | |
DIVIDENDS: | | | | | | | | | | | | | | | | | | | | | | | | |
| | | | | | |
Net investment income | | | (8,681,892 | ) | | | (8,472,389 | ) | | | (34,291,884 | ) | | | (31,680,603 | ) | | | (4,657,222 | ) | | | (5,168,210 | ) |
CAPITAL SHARE TRANSACTIONS: | | | | | | | | | | | | | | | | | | | | | | | | |
| | | | | | |
Net proceeds from sale of shares | | | 236,177,386 | | | | 371,307,213 | | | | 321,756,216 | | | | 442,081,745 | | | | 31,074,547 | | | | 171,056,045 | |
| | | | | | |
Cost of shares redeemed | | | (251,130,947 | ) | | | (200,268,963 | ) | | | (289,144,744 | ) | | | (313,266,398 | ) | | | (45,362,482 | ) | | | (203,157,138 | ) |
Net increase (decrease) in net assets resulting from capital share transactions | | | (14,953,561 | ) | | | 171,038,250 | | | | 32,611,472 | | | | 128,815,347 | | | | (14,287,935 | ) | | | (32,101,093 | ) |
Net Increase (Decrease) in Net Assets | | | (74,587,327 | ) | | | 222,849,190 | | | | (32,274,744 | ) | | | 186,406,928 | | | | (52,156,623 | ) | | | (17,449,759 | ) |
NET ASSETS: | | | | | | | | | | | | | | | | | | | | | | | | |
| | | | | | |
Beginning of year | | $ | 737,531,658 | | | $ | 514,682,468 | | | $ | 1,248,932,307 | | | $ | 1,062,525,379 | | | $ | 422,121,304 | | | $ | 439,571,063 | |
| | | | | | |
End of year | | $ | 662,944,331 | | | $ | 737,531,658 | | | $ | 1,216,657,563 | | | $ | 1,248,932,307 | | | $ | 369,964,681 | | | $ | 422,121,304 | |
Undistributed net investment income included in net assets at end of year | | $ | 922,187 | | | $ | 144,332 | | | $ | 3,602,359 | | | $ | 1,035,913 | | | $ | 671,594 | | | $ | 198,054 | |
SHARES CREATED AND REDEEMED: | | | | | | | | | | | | | | | | | | | | | | | | |
| | | | | | |
Shares outstanding, beginning of year | | | 7,650,000 | | | | 5,800,000 | | | | 17,350,000 | | | | 15,550,000 | | | | 5,000,000 | | | | 5,400,000 | |
Shares created | | | 2,650,000 | | | | 4,050,000 | | | | 4,850,000 | | | | 6,300,000 | | | | 400,000 | | | | 2,100,000 | |
Shares redeemed | | | (2,950,000 | ) | | | (2,200,000 | ) | | | (4,500,000 | ) | | | (4,500,000 | ) | | | (600,000 | ) | | | (2,500,000 | ) |
Shares outstanding, end of year | | | 7,350,000 | | | | 7,650,000 | | | | 17,700,000 | | | | 17,350,000 | | | | 4,800,000 | | | | 5,000,000 | |
See Notes to Financial Statements.
| | | | |
| WisdomTree Domestic Earnings and Dividend Funds | | | 121 | |
Statements of Changes in Net Assets (continued)
WisdomTree Domestic Earnings and Dividend Funds
| | | | | | | | | | | | | | | | | | | | | | | | |
| | | WisdomTree
Total Dividend Fund | | | WisdomTree
Total Earnings Fund | | | WisdomTree
U.S. Quality Dividend Growth Fund | |
| | | For the
Year Ended
March 31, 2016 | | | For the
Year Ended
March 31, 2015 | | | For the
Year Ended
March 31, 2016 | | | For the
Year Ended
March 31, 2015 | | | For the
Year Ended
March 31, 2016 | | | For the
Year Ended
March 31, 2015 | |
INCREASE (DECREASE) IN NET ASSETS RESULTING FROM OPERATIONS: | | | | | | | | | | | | | | | | | | | | | |
| | | | | | |
Net investment income | | $ | 14,271,515 | | | $ | 13,604,539 | | | $ | 1,557,900 | | | $ | 1,709,121 | | | $ | 12,114,643 | | | $ | 4,538,731 | |
| | | | | | |
Net realized gain on investments | | | 43,371,160 | | | | 35,717,037 | | | | 11,551,503 | | | | 7,455,398 | | | | 2,448,596 | | | | 5,617,690 | |
| | | | | | |
Net change in unrealized appreciation (depreciation) on investments | | | (45,084,996 | ) | | | 4,486,777 | | | | (16,664,487 | ) | | | (348,237 | ) | | | (4,122,300 | ) | | | 15,841,017 | |
Net increase (decrease) in net assets resulting from operations | | | 12,557,679 | | | | 53,808,353 | | | | (3,555,084 | ) | | | 8,816,282 | | | | 10,440,939 | | | | 25,997,438 | |
DIVIDENDS AND DISTRIBUTIONS: | | | | | | | | | | | | | | | | | | | | | | | | |
| | | | | | |
Net investment income | | | (14,082,024 | ) | | | (13,202,159 | ) | | | (1,549,810 | ) | | | (1,687,769 | ) | | | (11,551,881 | ) | | | (4,457,140 | ) |
| | | | | | |
Capital gains | | | — | | | | — | | | | — | | | | — | | | | — | | | | (5,475 | ) |
Total dividends and distributions | | | (14,082,024 | ) | | | (13,202,159 | ) | | | (1,549,810 | ) | | | (1,687,769 | ) | | | (11,551,881 | ) | | | (4,462,615 | ) |
CAPITAL SHARE TRANSACTIONS: | | | | | | | | | | | | | | | | | | | | | | | | |
| | | | | | |
Net proceeds from sale of shares | | | 42,946,184 | | | | 189,610,089 | | | | — | | | | 43,490,775 | | | | 270,044,627 | | | | 393,421,791 | |
| | | | | | |
Cost of shares redeemed | | | (130,575,780 | ) | | | (67,308,790 | ) | | | (44,900,157 | ) | | | (14,584,629 | ) | | | (121,740,728 | ) | | | (71,600,204 | ) |
Net increase (decrease) in net assets resulting from capital share transactions | | | (87,629,596 | ) | | | 122,301,299 | | | | (44,900,157 | ) | | | 28,906,146 | | | | 148,303,899 | | | | 321,821,587 | |
Net Increase (Decrease) in Net Assets | | | (89,153,941 | ) | | | 162,907,493 | | | | (50,005,051 | ) | | | 36,034,659 | | | | 147,192,957 | | | | 343,356,410 | |
NET ASSETS: | | | | | | | | | | | | | | | | | | | | | | | | |
| | | | | | |
Beginning of year | | $ | 582,862,279 | | | $ | 419,954,786 | | | $ | 107,209,027 | | | $ | 71,174,368 | | | $ | 448,157,966 | | | $ | 104,801,556 | |
| | | | | | |
End of year | | $ | 493,708,338 | | | $ | 582,862,279 | | | $ | 57,203,976 | | | $ | 107,209,027 | | | $ | 595,350,923 | | | $ | 448,157,966 | |
Undistributed net investment income included in net assets at end of year | | $ | 813,671 | | | $ | 596,466 | | | $ | 62,502 | | | $ | 49,850 | | | $ | 762,081 | | | $ | 170,127 | |
SHARES CREATED AND REDEEMED: | | | | | | | | | | | | | | | | | | | | | | | | |
| | | | | | |
Shares outstanding, beginning of year | | | 7,850,000 | | | | 6,150,000 | | | | 1,450,000 | | | | 1,050,000 | | | | 14,350,000 | | | | 3,750,000 | |
Shares created | | | 600,000 | | | | 2,600,000 | | | | — | | | | 600,000 | | | | 8,800,000 | | | | 12,900,000 | |
Shares redeemed | | | (1,800,000 | ) | | | (900,000 | ) | | | (650,000 | ) | | | (200,000 | ) | | | (4,100,000 | ) | | | (2,300,000 | ) |
Shares outstanding, end of year | | | 6,650,000 | | | | 7,850,000 | | | | 800,000 | | | | 1,450,000 | | | | 19,050,000 | | | | 14,350,000 | |
See Notes to Financial Statements.
| | |
| 122 | | WisdomTree Domestic Earnings and Dividend Funds |
Statements of Changes in Net Assets (concluded)
WisdomTree Domestic Earnings and Dividend Funds
| | | | | | | | |
| | | WisdomTree U.S. SmallCap Quality
Dividend Growth Fund | |
| | | For the
Year Ended
March 31, 2016 | | | For the
Year Ended
March 31, 2015 | |
INCREASE (DECREASE) IN NET ASSETS RESULTING FROM OPERATIONS: | | | | | | | | |
| | |
Net investment income | | $ | 711,430 | | | $ | 562,440 | |
| | |
Net realized gain (loss) on investments | | | (1,881,730 | ) | | | 883,609 | |
| | |
Net change in unrealized appreciation on investments | | | 15,256 | | | | 466,901 | |
Net increase (decrease) in net assets resulting from operations | | | (1,155,044 | ) | | | 1,912,950 | |
DIVIDENDS AND DISTRIBUTIONS: | | | | | | | | |
| | |
Net investment income | | | (646,575 | ) | | | (581,041 | ) |
| | |
Capital gains | | | — | | | | (1,702 | ) |
Total dividends and distributions | | | (646,575 | ) | | | (582,743 | ) |
CAPITAL SHARE TRANSACTIONS: | | | | | | | | |
| | |
Net proceeds from sale of shares | | | 22,218,605 | | | | 10,037,640 | |
| | |
Cost of shares redeemed | | | (7,802,447 | ) | | | (12,937,188 | ) |
Net increase (decrease) in net assets resulting from capital share transactions | | | 14,416,158 | | | | (2,899,548 | ) |
Net Increase (Decrease) in Net Assets | | | 12,614,539 | | | | (1,569,341 | ) |
NET ASSETS: | | | | | | | | |
| | |
Beginning of year | | $ | 22,593,652 | | | $ | 24,162,993 | |
| | |
End of year | | $ | 35,208,191 | | | $ | 22,593,652 | |
Undistributed net investment income included in net assets at end of year | | $ | 85,633 | | | $ | 19,691 | |
SHARES CREATED AND REDEEMED: | | | | | | | | |
| | |
Shares outstanding, beginning of year | | | 750,000 | | | | 850,000 | |
| | |
Shares created | | | 800,000 | | | | 350,000 | |
| | |
Shares redeemed | | | (300,000 | ) | | | (450,000 | ) |
Shares outstanding, end of year | | | 1,250,000 | | | | 750,000 | |
See Notes to Financial Statements.
| | | | |
| WisdomTree Domestic Earnings and Dividend Funds | | | 123 | |
Financial Highlights
WisdomTree Domestic Earnings and Dividend Funds
Selected data for a share of beneficial interest outstanding throughout the period is presented below:
| | | | | | | | | | | | | | | | | | | | |
| WisdomTree Dividend ex-Financials Fund | | For the
Year Ended
March 31, 2016 | | | For the
Year Ended
March 31, 2015 | | | For the
Year Ended
March 31, 2014 | | | For the
Year Ended
March 31, 2013 | | | For the
Year Ended
March 31, 2012 | |
Net asset value, beginning of year | | $ | 75.82 | | | $ | 70.27 | | | $ | 62.03 | | | $ | 54.81 | | | $ | 50.13 | |
Investment operations: | | | | | | | | | | | | | | | | | | | | |
Net investment income1 | | | 2.46 | | | | 2.47 | | | | 2.00 | | | | 2.27 | | | | 2.06 | |
Net realized and unrealized gain (loss) | | | (0.38 | ) | | | 5.38 | | | | 8.22 | | | | 7.36 | | | | 4.31 | |
Total from investment operations | | | 2.08 | | | | 7.85 | | | | 10.22 | | | | 9.63 | | | | 6.37 | |
Dividends to shareholders: | | | | | | | | | | | | | | | | | | | | |
Net investment income | | | (2.49 | ) | | | (2.30 | ) | | | (1.98 | ) | | | (2.41 | ) | | | (1.69 | ) |
Net asset value, end of year | | $ | 75.41 | | | $ | 75.82 | | | $ | 70.27 | | | $ | 62.03 | | | $ | 54.81 | |
| | | | | |
TOTAL RETURN2 | | | 2.96 | % | | | 11.27 | % | | | 16.75 | % | | | 18.18 | % | | | 12.99 | % |
RATIOS/SUPPLEMENTAL DATA: | | | | | | | | | | | | | | | | | | | | |
Net assets, end of year (000’s omitted) | | $ | 916,193 | | | $ | 1,250,987 | | | $ | 1,127,812 | | | $ | 1,094,800 | | | $ | 1,268,812 | |
Ratios to average net assets3 of: | | | | | | | | | | | | | | | | | | | | |
Expenses4 | | | 0.38 | % | | | 0.39 | %5 | | | 0.38 | % | | | 0.38 | % | | | 0.38 | % |
Net investment income | | | 3.39 | % | | | 3.34 | % | | | 3.06 | % | | | 4.08 | % | | | 4.05 | % |
Portfolio turnover rate6 | | | 32 | % | | | 32 | % | | | 35 | % | | | 34 | % | | | 38 | % |
| | | | | | | | | | | | | | | | | | | | |
| | | | | | |
| WisdomTree Earnings 500 Fund | | For the
Year Ended
March 31, 2016 | | | For the
Year Ended
March 31, 2015 | | | For the
Year Ended
March 31, 2014 | | | For the
Year Ended
March 31, 2013 | | | For the
Year Ended
March 31, 2012 | |
Net asset value, beginning of year | | $ | 71.48 | | | $ | 65.39 | | | $ | 54.46 | | | $ | 49.42 | | | $ | 45.59 | |
Investment operations: | | | | | | | | | | | | | | | | | | | | |
Net investment income1 | | | 1.47 | | | | 1.34 | | | | 1.14 | | | | 1.04 | | | | 0.88 | |
Net realized and unrealized gain (loss) | | | (1.81 | ) | | | 6.01 | | | | 10.88 | | | | 5.10 | | | | 3.84 | |
Total from investment operations | | | (0.34 | ) | | | 7.35 | | | | 12.02 | | | | 6.14 | | | | 4.72 | |
Dividends to shareholders: | | | | | | | | | | | | | | | | | | | | |
Net investment income | | | (1.49 | ) | | | (1.26 | ) | | | (1.09 | ) | | | (1.10 | ) | | | (0.89 | ) |
Net asset value, end of year | | $ | 69.65 | | | $ | 71.48 | | | $ | 65.39 | | | $ | 54.46 | | | $ | 49.42 | |
| | | | | |
TOTAL RETURN2 | | | (0.45 | )% | | | 11.28 | % | | | 22.24 | % | | | 12.66 | % | | | 10.60 | % |
RATIOS/SUPPLEMENTAL DATA: | | | | | | | | | | | | | | | | | | | | |
Net assets, end of year (000’s omitted) | | $ | 118,412 | | | $ | 139,386 | | | $ | 101,351 | | | $ | 65,354 | | | $ | 69,187 | |
Ratios to average net assets3 of: | | | | | | | | | | | | | | | | | | | | |
Expenses | | | 0.28 | %4 | | | 0.29 | %4,5 | | | 0.28 | % | | | 0.28 | %4 | | | 0.28 | %4 |
Net investment income | | | 2.11 | % | | | 1.93 | % | | | 1.89 | % | | | 2.12 | % | | | 1.98 | % |
Portfolio turnover rate6 | | | 18 | % | | | 16 | % | | | 15 | % | | | 13 | % | | | 16 | % |
| 1 | Based on average shares outstanding. |
| 2 | Total return is calculated assuming an initial investment made at the net asset value at the beginning of the period, reinvestment of all dividends and distributions at net asset value during the period and redemption on the last day of the period. For the periods in which the investment advisor waived advisory fees, the total return would have been lower if certain expenses had not been waived (Notes 2 and 3). |
| 3 | The ratios to average net assets do not include net investment income (loss) or expenses of other funds in which the Fund invests. |
| 4 | The expense ratio includes investment advisory fee waivers. Without these investment advisory fee waivers, the expense ratio would have been unchanged. |
| 5 | Included in the expense ratio are proxy expenses. Without these proxy expenses, the expense ratio would have been 0.38% and 0.28%, for WisdomTree Dividend ex-Financials Fund and WisdomTree Earnings 500 Fund, respectively. |
| 6 | Portfolio turnover rate is not annualized and excludes the value of the portfolio securities received or delivered as a result of in-kind creations or redemptions of the Fund’s capital shares. Short-term securities with maturities less than or equal to 365 days are excluded from the portfolio turnover calculation as well. |
See Notes to Financial Statements.
| | |
| 124 | | WisdomTree Domestic Earnings and Dividend Funds |
Financial Highlights (continued)
WisdomTree Domestic Earnings and Dividend Funds
Selected data for a share of beneficial interest outstanding throughout the period is presented below:
| | | | | | | | | | | | | | | | | | | | |
| WisdomTree High Dividend Fund | | For the
Year Ended
March 31, 2016 | | | For the
Year Ended
March 31, 2015 | | | For the
Year Ended
March 31, 2014 | | | For the
Year Ended
March 31, 2013 | | | For the
Year Ended
March 31, 2012 | |
Net asset value, beginning of year | | $ | 60.74 | | | $ | 56.57 | | | $ | 51.17 | | | $ | 44.81 | | | $ | 40.52 | |
Investment operations: | | | | | | | | | | | | | | | | | | | | |
Net investment income1 | | | 2.10 | | | | 1.95 | | | | 1.77 | | | | 1.82 | | | | 1.66 | |
Net realized and unrealized gain | | | 2.50 | | | | 4.03 | | | | 5.37 | | | | 6.40 | | | | 4.15 | |
Total from investment operations | | | 4.60 | | | | 5.98 | | | | 7.14 | | | | 8.22 | | | | 5.81 | |
Dividends to shareholders: | | | | | | | | | | | | | | | | | | | | |
Net investment income | | | (2.05 | ) | | | (1.81 | ) | | | (1.74 | ) | | | (1.86 | ) | | | (1.52 | ) |
Net asset value, end of year | | $ | 63.29 | | | $ | 60.74 | | | $ | 56.57 | | | $ | 51.17 | | | $ | 44.81 | |
| | | | | |
TOTAL RETURN2 | | | 7.88 | % | | | 10.64 | % | | | 14.24 | % | | | 18.83 | % | | | 14.66 | % |
RATIOS/SUPPLEMENTAL DATA: | | | | | | | | | | | | | | | | | | | | |
Net assets, end of year (000’s omitted) | | $ | 1,025,362 | | | $ | 1,059,849 | | | $ | 797,595 | | | $ | 639,585 | | | $ | 427,918 | |
Ratios to average net assets3 of: | | | | | | | | | | | | | | | | | | | | |
Expenses4 | | | 0.38 | %5 | | | 0.39 | %6 | | | 0.38 | % | | | 0.38 | % | | | 0.38 | % |
Net investment income | | | 3.53 | % | | | 3.25 | % | | | 3.31 | % | | | 3.91 | % | | | 3.99 | % |
Portfolio turnover rate7 | | | 20 | % | | | 27 | % | | | 30 | % | | | 28 | % | | | 22 | % |
| | | | | | | | | | | | | | | | | | | | |
| | | | | | |
| WisdomTree LargeCap Dividend Fund | | For the
Year Ended
March 31, 2016 | | | For the
Year Ended
March 31, 2015 | | | For the
Year Ended
March 31, 2014 | | | For the
Year Ended
March 31, 2013 | | | For the
Year Ended
March 31, 2012 | |
Net asset value, beginning of year | | $ | 73.27 | | | $ | 67.60 | | | $ | 58.94 | | | $ | 52.98 | | | $ | 48.31 | |
Investment operations: | | | | | | | | | | | | | | | | | | | | |
Net investment income1 | | | 2.01 | | | | 1.86 | | | | 1.65 | | | | 1.61 | | | | 1.45 | |
Net realized and unrealized gain | | | 0.13 | | | | 5.59 | | | | 8.64 | | | | 6.00 | | | | 4.59 | |
Total from investment operations | | | 2.14 | | | | 7.45 | | | | 10.29 | | | | 7.61 | | | | 6.04 | |
Dividends to shareholders: | | | | | | | | | | | | | | | | | | | | |
Net investment income | | | (1.99 | ) | | | (1.78 | ) | | | (1.63 | ) | | | (1.65 | ) | | | (1.37 | ) |
Net asset value, end of year | | $ | 73.42 | | | $ | 73.27 | | | $ | 67.60 | | | $ | 58.94 | | | $ | 52.98 | |
| | | | | |
TOTAL RETURN2 | | | 3.04 | % | | | 11.08 | % | | | 17.70 | % | | | 14.69 | % | | | 12.82 | % |
RATIOS/SUPPLEMENTAL DATA: | | | | | | | | | | | | | | | | | | | | |
Net assets, end of year (000’s omitted) | | $ | 1,725,259 | | | $ | 2,106,618 | | | $ | 1,821,886 | | | $ | 1,500,106 | | | $ | 1,205,215 | |
Ratios to average net assets3 of: | | | | | | | | | | | | | | | | | | | | |
Expenses | | | 0.28 | %4 | | | 0.29 | %4,8 | | | 0.28 | % | | | 0.28 | %4 | | | 0.28 | %4 |
Net investment income | | | 2.81 | % | | | 2.59 | % | | | 2.62 | % | | | 2.97 | % | | | 3.02 | % |
Portfolio turnover rate7 | | | 11 | % | | | 12 | % | | | 11 | % | | | 14 | % | | | 14 | % |
| 1 | Based on average shares outstanding. |
| 2 | Total return is calculated assuming an initial investment made at the net asset value at the beginning of the period, reinvestment of all dividends and distributions at net asset value during the period and redemption on the last day of the period. For the periods in which the investment advisor waived advisory fees, the total return would have been lower if certain expenses had not been waived (Notes 2 and 3). |
| 3 | The ratios to average net assets do not include net investment income (loss) or expenses of other funds in which the Fund invests. |
| 4 | The expense ratio includes investment advisory fee waivers. Without these investment advisory fee waivers, the expense ratio would have been unchanged. |
| 5 | Included in the expense ratio are legal expenses. Without these legal expenses, the annualized expense ratio would have been unchanged. |
| 6 | Included in the expense ratio are proxy and legal expenses. Without these proxy and legal expenses, the expense ratio would have been 0.38%. |
| 7 | Portfolio turnover rate is not annualized and excludes the value of the portfolio securities received or delivered as a result of in-kind creations or redemptions of the Fund’s capital shares. Short-term securities with maturities less than or equal to 365 days are excluded from the portfolio turnover calculation as well. |
| 8 | Included in the expense ratio are proxy expenses. Without these proxy expenses, the expense ratio would have been 0.28%. |
See Notes to Financial Statements.
| | | | |
| WisdomTree Domestic Earnings and Dividend Funds | | | 125 | |
Financial Highlights (continued)
WisdomTree Domestic Earnings and Dividend Funds
Selected data for a share of beneficial interest outstanding throughout the period is presented below:
| | | | | | | | | | | | | | | | | | | | |
| WisdomTree LargeCap Value Fund | | For the
Year Ended
March 31, 2016 | | | For the
Year Ended
March 31, 2015 | | | For the
Year Ended
March 31, 2014 | | | For the
Year Ended
March 31, 2013 | | | For the
Year Ended
March 31, 2012 | |
Net asset value, beginning of year | | $ | 66.28 | | | $ | 58.57 | | | $ | 48.86 | | | $ | 44.31 | | | $ | 43.02 | |
Investment operations: | | | | | | | | | | | | | | | | | | | | |
Net investment income1 | | | 1.06 | | | | 0.88 | | | | 0.61 | | | | 1.02 | | | | 0.75 | |
Net realized and unrealized gain (loss) | | | (3.70 | ) | | | 7.71 | | | | 9.70 | | | | 4.56 | | | | 1.26 | |
Total from investment operations | | | (2.64 | ) | | | 8.59 | | | | 10.31 | | | | 5.58 | | | | 2.01 | |
Dividends to shareholders: | | | | | | | | | | | | | | | | | | | | |
Net investment income | | | (0.88 | ) | | | (0.88 | ) | | | (0.60 | ) | | | (1.03 | ) | | | (0.72 | ) |
Net asset value, end of year | | $ | 62.76 | | | $ | 66.28 | | | $ | 58.57 | | | $ | 48.86 | | | $ | 44.31 | |
| | | | | |
TOTAL RETURN2 | | | (4.00 | )% | | | 14.73 | % | | | 21.20 | % | | | 12.81 | % | | | 4.83 | % |
RATIOS/SUPPLEMENTAL DATA: | | | | | | | | | | | | | | | | | | | | |
Net assets, end of year (000’s omitted) | | $ | 138,062 | | | $ | 26,511 | | | $ | 26,357 | | | $ | 24,428 | | | $ | 31,015 | |
Ratios to average net assets3 of: | | | | | | | | | | | | | | | | | | | | |
Expenses | | | 0.38 | %4 | | | 0.39 | %4,5 | | | 0.38 | % | | | 0.38 | % | | | 0.38 | %4 |
Net investment income | | | 1.68 | % | | | 1.42 | % | | | 1.14 | % | | | 2.26 | % | | | 1.84 | % |
Portfolio turnover rate6 | | | 85 | % | | | 63 | % | | | 67 | % | | | 65 | % | | | 62 | % |
| | | | | | | | | | | | | | | | | | | | |
| | | | | | |
| WisdomTree MidCap Dividend Fund | | For the
Year Ended
March 31, 2016 | | | For the
Year Ended
March 31, 2015 | | | For the
Year Ended
March 31, 2014 | | | For the
Year Ended
March 31, 2013 | | | For the
Year Ended
March 31, 2012 | |
Net asset value, beginning of year | | $ | 86.03 | | | $ | 76.99 | | | $ | 65.15 | | | $ | 56.25 | | | $ | 54.01 | |
Investment operations: | | | | | | | | | | | | | | | | | | | | |
Net investment income1 | | | 2.12 | | | | 2.16 | | | | 1.83 | | | | 1.99 | | | | 1.47 | |
Net realized and unrealized gain | | | 0.26 | | | | 8.84 | | | | 11.82 | | | | 8.91 | | | | 2.17 | |
Total from investment operations | | | 2.38 | | | | 11.00 | | | | 13.65 | | | | 10.90 | | | | 3.64 | |
Dividends and distributions to shareholders: | | | | | | | | | | | | | | | | | | | | |
Net investment income | | | (2.05 | ) | | | (1.96 | ) | | | (1.81 | ) | | | (2.00 | ) | | | (1.40 | ) |
Capital gains | | | (0.29 | ) | | | — | | | | — | | | | — | | | | — | |
Total dividends and distributions to shareholders | | | (2.34 | ) | | | (1.96 | ) | | | (1.81 | ) | | | (2.00 | ) | | | (1.40 | ) |
Net asset value, end of year | | $ | 86.07 | | | $ | 86.03 | | | $ | 76.99 | | | $ | 65.15 | | | $ | 56.25 | |
| | | | | |
TOTAL RETURN2 | | | 2.98 | % | | | 14.46 | % | | | 21.24 | % | | | 19.96 | % | | | 6.99 | % |
RATIOS/SUPPLEMENTAL DATA: | | | | | | | | | | | | | | | | | | | | |
Net assets, end of year (000’s omitted) | | $ | 1,609,484 | | | $ | 1,595,896 | | | $ | 993,148 | | | $ | 540,728 | | | $ | 345,963 | |
Ratios to average net assets3 of: | | | | | | | | | | | | | | | | | | | | |
Expenses | | | 0.38 | %7 | | | 0.39 | %8 | | | 0.38 | % | | | 0.38 | % | | | 0.38 | % |
Net investment income | | | 2.60 | % | | | 2.65 | % | | | 2.58 | % | | | 3.46 | % | | | 2.81 | % |
Portfolio turnover rate6 | | | 32 | % | | | 30 | % | | | 32 | % | | | 33 | % | | | 29 | % |
| 1 | Based on average shares outstanding. |
| 2 | Total return is calculated assuming an initial investment made at the net asset value at the beginning of the period, reinvestment of all dividends and distributions at net asset value during the period and redemption on the last day of the period. For the periods in which the investment advisor waived advisory fees, the total return would have been lower if certain expenses had not been waived (Notes 2 and 3). |
| 3 | The ratios to average net assets do not include net investment income (loss) or expenses of other funds in which the Fund invests. |
| 4 | The expense ratio includes investment advisory fee waivers. Without these investment advisory fee waivers, the expense ratio would have been unchanged. |
| 5 | Included in the expense ratio are proxy expenses. Without these proxy expenses, the expense ratio would have been 0.38%. |
| 6 | Portfolio turnover rate is not annualized and excludes the value of the portfolio securities received or delivered as a result of in-kind creations or redemptions of the Fund’s capital shares. Short-term securities with maturities less than or equal to 365 days are excluded from the portfolio turnover calculation as well. |
| 7 | Included in the expense ratio are legal expenses. Without these legal expenses, the annualized expense ratio would have been unchanged. |
| 8 | Included in the expense ratio are proxy and legal expenses. Without these proxy and legal expenses, the expense ratio would have been 0.38%. |
See Notes to Financial Statements.
| | |
| 126 | | WisdomTree Domestic Earnings and Dividend Funds |
Financial Highlights (continued)
WisdomTree Domestic Earnings and Dividend Funds
Selected data for a share of beneficial interest outstanding throughout the period is presented below:
| | | | | | | | | | | | | | | | | | | | |
| WisdomTree MidCap Earnings Fund | | For the
Year Ended
March 31, 2016 | | | For the
Year Ended
March 31, 2015 | | | For the
Year Ended
March 31, 2014 | | | For the
Year Ended
March 31, 2013 | | | For the
Year Ended
March 31, 2012 | |
Net asset value, beginning of year | | $ | 96.41 | | | $ | 88.74 | | | $ | 70.55 | | | $ | 61.00 | | | $ | 58.75 | |
Investment operations: | | | | | | | | | | | | | | | | | | | | |
Net investment income1 | | | 1.19 | | | | 1.25 | | | | 1.00 | | | | 1.09 | | | | 0.62 | |
Net realized and unrealized gain (loss) | | | (6.30 | ) | | | 7.56 | | | | 18.11 | | | | 9.54 | | | | 2.20 | |
Total from investment operations | | | (5.11 | ) | | | 8.81 | | | | 19.11 | | | | 10.63 | | | | 2.82 | |
Dividends to shareholders: | | | | | | | | | | | | | | | | | | | | |
Net investment income | | | (1.10 | ) | | | (1.14 | ) | | | (0.92 | ) | | | (1.08 | ) | | | (0.57 | ) |
Net asset value, end of year | | $ | 90.20 | | | $ | 96.41 | | | $ | 88.74 | | | $ | 70.55 | | | $ | 61.00 | |
| | | | | |
TOTAL RETURN2 | | | (5.29 | )% | | | 9.99 | % | | | 27.26 | % | | | 17.75 | % | | | 4.92 | % |
RATIOS/SUPPLEMENTAL DATA: | | | | | | | | | | | | | | | | | | | | |
Net assets, end of year (000’s omitted) | | $ | 662,944 | | | $ | 737,532 | | | $ | 514,682 | | | $ | 211,643 | | | $ | 158,596 | |
Ratios to average net assets3 of: | | | | | | | | | | | | | | | | | | | | |
Expenses4 | | | 0.38 | % | | | 0.39 | %5 | | | 0.38 | % | | | 0.38 | % | | | 0.38 | % |
Net investment income | | | 1.32 | % | | | 1.37 | % | | | 1.24 | % | | | 1.80 | % | | | 1.11 | % |
Portfolio turnover rate6 | | | 40 | % | | | 36 | % | | | 41 | % | | | 39 | % | | | 38 | % |
| | | | | | | | | | | | | | | | | | | | |
| | | | | | |
| WisdomTree SmallCap Dividend Fund | | For the
Year Ended
March 31, 2016 | | | For the
Year Ended
March 31, 2015 | | | For the
Year Ended
March 31, 2014 | | | For the
Year Ended
March 31, 2013 | | | For the
Year Ended
March 31, 2012 | |
Net asset value, beginning of year | | $ | 71.98 | | | $ | 68.33 | | | $ | 57.07 | | | $ | 49.03 | | | $ | 48.66 | |
Investment operations: | | | | | | | | | | | | | | | | | | | | |
Net investment income1 | | | 2.07 | | | | 1.97 | | | | 1.85 | | | | 1.87 | | | | 1.68 | |
Net realized and unrealized gain (loss) | | | (3.38 | ) | | | 3.62 | | | | 11.10 | | | | 8.14 | | | | 0.34 | |
Total from investment operations | | | (1.31 | ) | | | 5.59 | | | | 12.95 | | | | 10.01 | | | | 2.02 | |
Dividends to shareholders: | | | | | | | | | | | | | | | | | | | | |
Net investment income | | | (1.93 | ) | | | (1.94 | ) | | | (1.69 | ) | | | (1.97 | ) | | | (1.65 | ) |
Net asset value, end of year | | $ | 68.74 | | | $ | 71.98 | | | $ | 68.33 | | | $ | 57.07 | | | $ | 49.03 | |
| | | | | |
TOTAL RETURN2 | | | (1.69 | )% | | | 8.33 | % | | | 22.99 | % | | | 21.06 | % | | | 4.50 | % |
RATIOS/SUPPLEMENTAL DATA: | | | | | | | | | | | | | | | | | | | | |
Net assets, end of year (000’s omitted) | | $ | 1,216,658 | | | $ | 1,248,932 | | | $ | 1,062,525 | | | $ | 553,551 | | | $ | 313,791 | |
Ratios to average net assets3 of: | | | | | | | | | | | | | | | | | | | | |
Expenses4 | | | 0.38 | % | | | 0.39 | %5 | | | 0.38 | % | | | 0.38 | % | | | 0.38 | % |
Net investment income | | | 3.10 | % | | | 2.86 | % | | | 2.93 | % | | | 3.71 | % | | | 3.69 | % |
Portfolio turnover rate6 | | | 33 | % | | | 33 | % | | | 42 | % | | | 49 | % | | | 31 | % |
| 1 | Based on average shares outstanding. |
| 2 | Total return is calculated assuming an initial investment made at the net asset value at the beginning of the period, reinvestment of all dividends and distributions at net asset value during the period and redemption on the last day of the period. For the periods in which the investment advisor waived advisory fees, the total return would have been lower if certain expenses had not been waived (Notes 2 and 3). |
| 3 | The ratios to average net assets do not include net investment income (loss) or expenses of other funds in which the Fund invests. |
| 4 | The expense ratio includes investment advisory fee waivers. Without these investment advisory fee waivers, the expense ratio would have been unchanged. |
| 5 | Included in the expense ratio are proxy expenses. Without these proxy expenses, the expense ratio would have been 0.38%. |
| 6 | Portfolio turnover rate is not annualized and excludes the value of the portfolio securities received or delivered as a result of in-kind creations or redemptions of the Fund’s capital shares. Short-term securities with maturities less than or equal to 365 days are excluded from the portfolio turnover calculation as well. |
See Notes to Financial Statements.
| | | | |
| WisdomTree Domestic Earnings and Dividend Funds | | | 127 | |
Financial Highlights (continued)
WisdomTree Domestic Earnings and Dividend Funds
Selected data for a share of beneficial interest outstanding throughout the period is presented below:
| | | | | | | | | | | | | | | | | | | | |
| WisdomTree SmallCap Earnings Fund | | For the
Year Ended
March 31, 2016 | | | For the
Year Ended
March 31, 2015 | | | For the
Year Ended
March 31, 2014 | | | For the
Year Ended
March 31, 2013 | | | For the
Year Ended
March 31, 2012 | |
Net asset value, beginning of year | | $ | 84.42 | | | $ | 81.40 | | | $ | 63.40 | | | $ | 56.59 | | | $ | 54.97 | |
Investment operations: | | | | | | | | | | | | | | | | | | | | |
Net investment income1 | | | 1.03 | | | | 0.99 | | | | 0.73 | | | | 1.03 | | | | 0.74 | |
Net realized and unrealized gain (loss) | | | (7.44 | ) | | | 2.96 | | | | 17.95 | | | | 6.86 | | | | 1.59 | |
Total from investment operations | | | (6.41 | ) | | | 3.95 | | | | 18.68 | | | | 7.89 | | | | 2.33 | |
Dividends to shareholders: | | | | | | | | | | | | | | | | | | | | |
Net investment income | | | (0.93 | ) | | | (0.93 | ) | | | (0.68 | ) | | | (1.08 | ) | | | (0.71 | ) |
Net asset value, end of year | | $ | 77.08 | | | $ | 84.42 | | | $ | 81.40 | | | $ | 63.40 | | | $ | 56.59 | |
| | | | | |
TOTAL RETURN2 | | | (7.60 | )% | | | 4.89 | % | | | 29.55 | % | | | 14.20 | % | | | 4.39 | % |
RATIOS/SUPPLEMENTAL DATA: | | | | | | | | | | | | | | | | | | | | |
Net assets, end of year (000’s omitted) | | $ | 369,965 | | | $ | 422,121 | | | $ | 439,571 | | | $ | 180,687 | | | $ | 147,127 | |
Ratios to average net assets3 of: | | | | | | | | | | | | | | | | | | | | |
Expenses | | | 0.38 | %4 | | | 0.39 | %4,5 | | | 0.38 | % | | | 0.38 | %4 | | | 0.38 | %4 |
Net investment income | | | 1.31 | % | | | 1.24 | % | | | 0.98 | % | | | 1.83 | % | | | 1.43 | % |
Portfolio turnover rate6 | | | 43 | % | | | 43 | % | | | 61 | % | | | 50 | % | | | 41 | % |
| | | | | | | | | | | | | | | | | | | | |
| | | | | | |
| WisdomTree Total Dividend Fund | | For the
Year Ended
March 31, 2016 | | | For the
Year Ended
March 31, 2015 | | | For the
Year Ended
March 31, 2014 | | | For the
Year Ended
March 31, 2013 | | | For the
Year Ended
March 31, 2012 | |
Net asset value, beginning of year | | $ | 74.25 | | | $ | 68.29 | | | $ | 59.33 | | | $ | 53.04 | | | $ | 48.84 | |
Investment operations: | | | | | | | | | | | | | | | | | | | | |
Net investment income1 | | | 2.04 | | | | 1.91 | | | | 1.68 | | | | 1.65 | | | | 1.47 | |
Net realized and unrealized gain (loss) | | | (0.03 | ) | | | 5.86 | | | | 8.91 | | | | 6.32 | | | | 4.15 | |
Total from investment operations | | | 2.01 | | | | 7.77 | | | | 10.59 | | | | 7.97 | | | | 5.62 | |
Dividends to shareholders: | | | | | | | | | | | | | | | | | | | | |
Net investment income | | | (2.02 | ) | | | (1.81 | ) | | | (1.63 | ) | | | (1.68 | ) | | | (1.42 | ) |
Net asset value, end of year | | $ | 74.24 | | | $ | 74.25 | | | $ | 68.29 | | | $ | 59.33 | | | $ | 53.04 | |
| | | | | |
TOTAL RETURN2 | | | 2.84 | % | | | 11.47 | % | | | 18.10 | % | | | 15.39 | % | | | 11.81 | % |
RATIOS/SUPPLEMENTAL DATA: | | | | | | | | | | | | | | | | | | | | |
Net assets, end of year (000’s omitted) | | $ | 493,708 | | | $ | 582,862 | | | $ | 419,955 | | | $ | 296,638 | | | $ | 243,985 | |
Ratios to average net assets3 of: | | | | | | | | | | | | | | | | | | | | |
Expenses | | | 0.28 | %4,7 | | | 0.29 | %4,8 | | | 0.28 | % | | | 0.28 | %4 | | | 0.28 | %4 |
Net investment income | | | 2.83 | % | | | 2.64 | % | | | 2.65 | % | | | 3.05 | % | | | 3.03 | % |
Portfolio turnover rate6 | | | 12 | % | | | 13 | % | | | 12 | % | | | 13 | % | | | 15 | % |
| 1 | Based on average shares outstanding. |
| 2 | Total return is calculated assuming an initial investment made at the net asset value at the beginning of the period, reinvestment of all dividends and distributions at net asset value during the period and redemption on the last day of the period. For the periods in which the investment advisor waived advisory fees, the total return would have been lower if certain expenses had not been waived (Notes 2 and 3). |
| 3 | The ratios to average net assets do not include net investment income (loss) or expenses of other funds in which the Fund invests. |
| 4 | The expense ratio includes investment advisory fee waivers. Without these investment advisory fee waivers, the expense ratio would have been unchanged. |
| 5 | Included in the expense ratio are proxy expenses. Without these proxy expenses, the expense ratio would have been 0.38%. |
| 6 | Portfolio turnover rate is not annualized and excludes the value of the portfolio securities received or delivered as a result of in-kind creations or redemptions of the Fund’s capital shares. Short-term securities with maturities less than or equal to 365 days are excluded from the portfolio turnover calculation as well. |
| 7 | Included in the expense ratio are legal expenses. Without these legal expenses, the annualized expense ratio would have been unchanged. |
| 8 | Included in the expense ratio are proxy and legal expenses. Without these proxy and legal expenses, the expense ratio would have been 0.28%. |
See Notes to Financial Statements.
| | |
| 128 | | WisdomTree Domestic Earnings and Dividend Funds |
Financial Highlights (continued)
WisdomTree Domestic Earnings and Dividend Funds
Selected data for a share of beneficial interest outstanding throughout the period is presented below:
| | | | | | | | | | | | | | | | | | | | |
| WisdomTree Total Earnings Fund | | For the
Year Ended
March 31, 2016 | | | For the
Year Ended
March 31, 2015 | | | For the
Year Ended
March 31, 2014 | | | For the
Year Ended
March 31, 2013 | | | For the
Year Ended
March 31, 2012 | |
Net asset value, beginning of year | | $ | 73.94 | | | $ | 67.79 | | | $ | 56.14 | | | $ | 50.62 | | | $ | 47.12 | |
Investment operations: | | | | | | | | | | | | | | | | | | | | |
Net investment income1 | | | 1.45 | | | | 1.34 | | | | 1.12 | | | | 1.07 | | | | 0.88 | |
Net realized and unrealized gain (loss) | | | (2.34 | ) | | | 6.05 | | | | 11.63 | | | | 5.51 | | | | 3.58 | |
Total from investment operations | | | (0.89 | ) | | | 7.39 | | | | 12.75 | | | | 6.58 | | | | 4.46 | |
Dividends to shareholders: | | | | | | | | | | | | | | | | | | | | |
Net investment income | | | (1.55 | ) | | | (1.24 | ) | | | (1.10 | ) | | | (1.06 | ) | | | (0.96 | ) |
Net asset value, end of year | | $ | 71.50 | | | $ | 73.94 | | | $ | 67.79 | | | $ | 56.14 | | | $ | 50.62 | |
| | | | | |
TOTAL RETURN2 | | | (1.18 | )% | | | 10.93 | % | | | 22.89 | % | | | 13.23 | % | | | 9.74 | % |
RATIOS/SUPPLEMENTAL DATA: | | | | | | | | | | | | | | | | | | | | |
Net assets, end of year (000’s omitted) | | $ | 57,204 | | | $ | 107,209 | | | $ | 71,174 | | | $ | 53,329 | | | $ | 43,026 | |
Ratios to average net assets of: | | | | | | | | | | | | | | | | | | | | |
Expenses | | | 0.28 | % | | | 0.29 | %3 | | | 0.28 | % | | | 0.28 | %4 | | | 0.28 | %4,5 |
Net investment income | | | 2.00 | % | | | 1.88 | % | | | 1.81 | % | | | 2.10 | %4 | | | 1.90 | %4 |
Portfolio turnover rate6 | | | 12 | % | | | 16 | % | | | 13 | % | | | 13 | % | | | 12 | % |
| | | | | | | | | | | | |
| | | | |
| WisdomTree U.S. Quality Dividend Growth Fund | | For the
Year Ended
March 31, 2016 | | | For the
Year Ended
March 31, 2015 | | | For the Period
May 22, 2013*
through
March 31, 2014 | |
Net asset value, beginning of period | | $ | 31.23 | | | $ | 27.95 | | | $ | 24.86 | |
Investment operations: | | | | | | | | | | | | |
Net investment income1 | | | 0.70 | | | | 0.66 | | | | 0.48 | |
Net realized and unrealized gain (loss) | | | (0.02 | ) | | | 3.21 | | | | 3.02 | |
Total from investment operations | | | 0.68 | | | | 3.87 | | | | 3.50 | |
Dividends and distributions to shareholders: | | | | | | | | | | | | |
Net investment income | | | (0.66 | ) | | | (0.59 | ) | | | (0.41 | ) |
Capital gains | | | — | | | | (0.00 | )7 | | | (0.00 | )7 |
Total dividends and distributions to shareholders | | | (0.66 | ) | | | (0.59 | ) | | | (0.41 | ) |
Net asset value, end of period | | $ | 31.25 | | | $ | 31.23 | | | $ | 27.95 | |
| | | |
TOTAL RETURN2 | | | 2.25 | % | | | 13.94 | % | | | 14.19 | % |
RATIOS/SUPPLEMENTAL DATA: | | | | | | | | | | | | |
Net assets, end of period (000’s omitted) | | $ | 595,351 | | | $ | 448,158 | | | $ | 104,802 | |
Ratios to average net assets of: | | | | | | | | | | | | |
Expenses | | | 0.28 | % | | | 0.29 | %3 | | | 0.28 | %8 |
Net investment income | | | 2.30 | % | | | 2.19 | % | | | 2.11 | %8 |
Portfolio turnover rate6 | | | 32 | % | | | 35 | % | | | 31 | % |
| * | Commencement of operations. |
| 1 | Based on average shares outstanding. |
| 2 | Total return is calculated assuming an initial investment made at the net asset value at the beginning of the period, reinvestment of all dividends and distributions at net asset value during the period and redemption on the last day of the period. Total return calculated for a period of less than one year is not annualized. For the periods in which the investment advisor waived advisory fees, the total return would have been lower if certain expenses had not been waived (Notes 2 and 3). |
| 3 | Included in the expense ratio are proxy expenses. Without these proxy expenses, the expense ratio would have been 0.28%. |
| 4 | The ratios to average net assets do not include net investment income (loss) or expenses of other funds in which the Fund invests. |
| 5 | The expense ratio includes investment advisory fee waivers. Without these investment advisory fee waivers, the expense ratio would have been unchanged. |
| 6 | Portfolio turnover rate is not annualized and excludes the value of the portfolio securities received or delivered as a result of in-kind creations or redemptions of the Fund’s capital shares. Short-term securities with maturities less than or equal to 365 days are excluded from the portfolio turnover calculation as well. |
| 7 | Amount represents less than $0.005. |
See Notes to Financial Statements.
| | | | |
| WisdomTree Domestic Earnings and Dividend Funds | | | 129 | |
Financial Highlights (concluded)
WisdomTree Domestic Earnings and Dividend Funds
Selected data for a share of beneficial interest outstanding throughout the period is presented below:
| | | | | | | | | | | | |
| WisdomTree U.S. SmallCap Quality Dividend Growth Fund | | For the
Year Ended
March 31, 2016 | | | For the
Year Ended
March 31, 2015 | | | For the Period
July 25, 2013*
through
March 31, 2014 | |
Net asset value, beginning of period | | $ | 30.12 | | | $ | 28.43 | | | $ | 25.02 | |
Investment operations: | | | | | | | | | | | | |
Net investment income1 | | | 0.67 | | | | 0.65 | | | | 0.34 | |
Net realized and unrealized gain (loss) | | | (2.02 | ) | | | 1.69 | | | | 3.32 | |
Total from investment operations | | | (1.35 | ) | | | 2.34 | | | | 3.66 | |
Dividends and distributions to shareholders: | | | | | | | | | | | | |
Net investment income | | | (0.60 | ) | | | (0.65 | ) | | | (0.25 | ) |
Capital gains | | | — | | | | (0.00 | )2 | | | — | |
Total dividends and distributions to shareholders | | | (0.60 | ) | | | (0.65 | ) | | | (0.25 | ) |
Net asset value, end of period | | $ | 28.17 | | | $ | 30.12 | | | $ | 28.43 | |
| | | |
TOTAL RETURN3 | | | (4.42 | )% | | | 8.37 | % | | | 14.66 | % |
RATIOS/SUPPLEMENTAL DATA: | | | | | | | | | | | | |
Net assets, end of period (000’s omitted) | | $ | 35,208 | | | $ | 22,594 | | | $ | 24,163 | |
Ratios to average net assets of: | | | | | | | | | | | | |
Expenses | | | 0.38 | % | | | 0.39 | %4 | | | 0.38 | %5 |
Net investment income | | | 2.43 | % | | | 2.30 | % | | | 1.82 | %5 |
Portfolio turnover rate6 | | | 50 | % | | | 53 | % | | | 71 | % |
| * | Commencement of operations. |
| 1 | Based on average shares outstanding. |
| 2 | Amount represents less than $0.005. |
| 3 | Total return is calculated assuming an initial investment made at the net asset value at the beginning of the period, reinvestment of all dividends and distributions at net asset value during the period and redemption on the last day of the period. Total return calculated for a period of less than one year is not annualized. |
| 4 | Included in the expense ratio are proxy expenses. Without these proxy expenses, the expense ratio would have been 0.38%. |
| 6 | Portfolio turnover rate is not annualized and excludes the value of the portfolio securities received or delivered as a result of in-kind creations or redemptions of the Fund’s capital shares. Short-term securities with maturities less than or equal to 365 days are excluded from the portfolio turnover calculation as well. |
See Notes to Financial Statements.
| | |
| 130 | | WisdomTree Domestic Earnings and Dividend Funds |
Notes to Financial Statements
1. ORGANIZATION
WisdomTree Trust (the “Trust”) is registered under the Investment Company Act of 1940, as amended (the “1940 Act”), as an open-end management investment company. The Trust was established as a Delaware statutory trust on December 15, 2005. As of March 31, 2016, the Trust offered 91 investment funds (each a “Fund”, collectively, the “Funds”). In accordance with Accounting Standard Update (“ASU”) 2013-08, Financial Services-Investment Companies, each Fund listed below qualifies as an investment company and is applying the accounting and reporting guidance for investment companies. These notes relate only to the Funds listed in the table below:
| | | | |
| Fund | | Commencement
of Operations | |
WisdomTree Dividend ex-Financials Fund (“Dividend ex-Financials Fund”) | | | June 16, 2006 | |
WisdomTree Earnings 500 Fund (“Earnings 500 Fund”) | | | February 23, 2007 | |
WisdomTree High Dividend Fund (“High Dividend Fund”) (formerly, WisdomTree Equity Income Fund) | | | June 16, 2006 | |
WisdomTree LargeCap Dividend Fund (“LargeCap Dividend Fund”) | | | June 16, 2006 | |
WisdomTree LargeCap Value Fund (“LargeCap Value Fund”) | | | February 23, 2007 | |
WisdomTree MidCap Dividend Fund (“MidCap Dividend Fund”) | | | June 16, 2006 | |
WisdomTree MidCap Earnings Fund (“MidCap Earnings Fund”) | | | February 23, 2007 | |
WisdomTree SmallCap Dividend Fund (“SmallCap Dividend Fund”) | | | June 16, 2006 | |
WisdomTree SmallCap Earnings Fund (“SmallCap Earnings Fund”) | | | February 23, 2007 | |
WisdomTree Total Dividend Fund (“Total Dividend Fund”) | | | June 16, 2006 | |
WisdomTree Total Earnings Fund (“Total Earnings Fund”) | | | February 23, 2007 | |
WisdomTree U.S. Quality Dividend Growth Fund (“U.S. Quality Dividend Growth Fund”) (formerly, WisdomTree U.S. Dividend Growth Fund) | | | May 22, 2013 | |
WisdomTree U.S. SmallCap Quality Dividend Growth Fund (“U.S. SmallCap Quality Dividend Growth Fund”)
(formerly, WisdomTree U.S. SmallCap Dividend Growth Fund) | | | July 25, 2013 | |
Each Fund seeks to track the price and yield performance, before fees and expenses, of a particular index (“Index”) developed by WisdomTree Investments, Inc. (“WisdomTree Investments”). WisdomTree Investments is the parent company of WisdomTree Asset Management, Inc. (“WTAM”), the investment adviser to each Fund and the Trust. “WisdomTree” is a registered mark of WisdomTree Investments and has been licensed for use by the Trust. Each Fund described herein is considered to be non-diversified.
In the normal course of business, the Funds may enter into contracts that contain a variety of representations or that provide indemnification for certain liabilities. The Funds’ maximum exposure under these arrangements is unknown, as this would involve future claims that may be made against the Funds that have not yet occurred. However, the Funds have not had prior claims or losses pursuant to these contracts.
2. SIGNIFICANT ACCOUNTING POLICIES
The Financial Accounting Standards Board (“FASB”) Accounting Standards Codification (the “Codification”) is the exclusive reference of authoritative U.S. generally accepted accounting principles (“GAAP”) recognized by the FASB to be applied by nongovernmental entities. Rules and interpretive releases of the Securities and Exchange Commission (“SEC”) under authority of federal laws are also sources of authoritative GAAP for SEC registrants.
The following is a summary of significant accounting policies followed by the Funds:
Use of Estimates — The preparation of financial statements in conformity with GAAP, requires management to make certain estimates and assumptions that affect the reported amounts of assets and liabilities and disclosure of contingent assets and liabilities at the date of the financial statements and the reported amounts of increases and decreases in the net assets from operations during the reporting period. Actual results could differ from those estimates.
Investment Valuation — The net asset value (“NAV”) of each Fund’s shares is calculated each day a Fund is open for business as of the regularly scheduled close of regular trading on the New York Stock Exchange, normally 4:00 p.m. Eastern time (the “NAV Calculation Time”). NAV per share is calculated by dividing a Fund’s net assets by the number of Fund shares outstanding. Each Fund issues and redeems shares at NAV only in large blocks of shares known as creation units, which only certain institutions or large investors may purchase or redeem. Shares of each Fund are listed on a national securities exchange and trade at market prices. Most investors will buy and sell shares in the secondary market through brokers. Because Fund shares trade at market prices rather than NAV, shares may trade at a price greater than NAV or less than NAV. In calculating each Fund’s NAV, investments are valued under policies approved by the Board of Trustees. Equity securities (including preferred stock) traded on any recognized U.S. or non-U.S. exchange are valued at the last sale price or official closing price on the exchange or system on which they are principally traded. Unlisted equity securities (including preferred stock) are valued at the last quoted sale price or, if no sale price is available, at the
| | | | |
| WisdomTree Domestic Earnings and Dividend Funds | | | 131 | |
Notes to Financial Statements (continued)
mean between the highest bid and lowest ask price. Fixed income securities (including short-term debt securities with remaining maturities of 60 days or less) generally are valued at current market quotations or mean prices obtained from broker-dealers or independent pricing service providers. Each Fund may invest in money market funds which are valued at their NAV per share and affiliated exchange-traded funds (“ETFs” or “ETF”) which are valued at their last sale or official closing price on the exchange on which they are principally traded or at their NAV per share in instances where the affiliated ETF has not traded on its principal exchange.
In certain instances, such as when reliable market valuations are not readily available or are not deemed to reflect current market values, a Fund’s investments, which include derivatives, will be fair valued in accordance with the Fund’s pricing policy. The Board of Trustees of the Trust has established a pricing committee (the “Pricing Committee”) which is comprised of senior representatives of WTAM and which reports to the Board of Trustees on a quarterly basis. In the event that a financial instrument cannot be valued based upon a price from a national securities exchange, independent pricing service provider or broker-dealer quotation, or such prices are deemed to not reflect current market value, the Pricing Committee may value the financial instrument in good faith under the policies and procedures approved by the Board of Trustees based on current facts and circumstances. Securities that may be valued using “fair value” pricing may include, but are not limited to, securities for which there are no current market quotations, securities whose issuer is in default or bankruptcy, securities subject to corporate actions (such as mergers or reorganizations), securities subject to non-U.S. investment limits or currency controls, and securities affected by “significant events.” An example of a significant event is an event occurring after the close of the market in which a security trades but before a Fund’s next NAV Calculation Time that may materially affect the value of a Fund’s investment (e.g., government action, natural disaster, or significant market fluctuation). When fair value pricing is employed, the prices of securities used by a Fund to calculate its NAV may differ from quoted or published prices for the same securities.
Fair Value Measurement — In accordance with Codification Topic 820 (“ASC 820”), Fair Value Measurements and Disclosures, fair value is defined as the price that each Fund would receive upon selling an investment in an orderly transaction to an independent buyer in the principal or most advantageous market of the investment. ASC 820 established a three-tier hierarchy of inputs to be used when determining fair value measurements for disclosure purposes. Inputs refer broadly to the assumptions that market participants would use in pricing the asset or liability, including assumptions about risk — for example, the risk inherent in a particular valuation technique used to measure fair value (such as a pricing model) and/or the risk inherent in the inputs to the valuation technique. Inputs may be observable or unobservable. Observable inputs reflect the assumptions market participants would use in pricing the asset or liability. Observable inputs are based on market data obtained from sources independent of the reporting entity. Unobservable inputs reflect the reporting entity’s own assumptions about the assumptions market participants would use in pricing the asset or liability. Unobservable inputs are based on the best information available in the circumstances. The three-tier hierarchy of inputs is summarized in the three broad levels listed below:
Level 1 – quoted prices in active markets for identical securities
Level 2 – other significant observable inputs (including quoted prices for similar securities, interest rates, prepayment speeds, credit risk, etc.)
Level 3 – significant unobservable inputs (including each Fund’s assumptions in determining the fair value of investments)
The inputs or methodology used for valuation are not necessarily an indication of the risk associated with investing in those investments.
Investments that use Level 2 or Level 3 inputs may include, but are not limited to: (i) an unlisted security related to corporate actions; (ii) a restricted security (e.g., one that may not be publicly sold without registration under the Securities Act of 1933, as amended); (iii) a security whose trading has been suspended or which has been de-listed from its primary trading exchange; (iv) a security that is thinly traded; (v) a security in default or bankruptcy proceedings for which there is no current market quotation or market activity; (vi) a security affected by currency controls or restrictions; and (vii) a security affected by a significant event (e.g., an event that occurs after the close of the markets on which the security is traded but before the time as of which a Fund’s NAV is computed and that may materially affect the value of the Fund’s investments).
The valuation techniques and significant inputs used in determining the fair market value measurements for Level 2 and Level 3 positions are as follows:
Financial instruments are generally valued by independent pricing service providers that use broker-dealer quotations, reported trades or valuation estimates from their internal pricing models. Depending on the type of financial instrument, the independent pricing service providers’ internal pricing models may use inputs that are observable such as issuer details, interest rates, yield curves, prepayment speeds, credit risks/spreads, default rates and quoted prices for similar assets. Financial instruments that use similar valuation techniques and observable inputs as described above and have an appropriate level of market activity are categorized as Level 2 of the fair value hierarchy, otherwise a Level 3 fair value classification is appropriate. Over-the-counter financial derivative instruments derive their value from underlying asset prices, indices, reference rates, and other inputs or a combination of these
| | |
| 132 | | WisdomTree Domestic Earnings and Dividend Funds |
Notes to Financial Statements (continued)
factors. These instruments are normally valued on the basis of broker-dealer quotations or independent pricing service providers. Depending on the product and the terms of the transaction, the value of the financial derivative instruments can be estimated by an independent pricing service provider using a series of techniques including simulation pricing models. The pricing models use inputs that are observed from actively quoted markets such as issuer details, indices, credit risks/spreads, interest rates, yield curves, default and exchange rates. Derivative contracts that use valuation techniques and observable inputs as described above and have an appropriate level of market activity are categorized as Level 2 of the fair value hierarchy, otherwise a Level 3 fair value classification is appropriate.
Determination of a fair value by the Pricing Committee may include significant unobservable inputs and therefore would be reflected as a Level 3 of the fair value hierarchy. The Pricing Committee may employ a market-based valuation approach which may use, among other potential considerations, related or comparable securities, recent transactions, market multiples, and other relevant information to determine fair value. The Pricing Committee may also use an income-based valuation approach in which anticipated future cash flows of the financial instrument are discounted to calculate fair value. The Pricing Committee meets at least on a monthly basis to review and discuss the appropriateness of such fair values using more current information such as, recent security news, recent market transactions, updated corporate action information and/or other macro or security specific events. Also, when observable inputs become available, the Pricing Committee conducts back testing of the methodologies used to value Level 3 financial instruments to substantiate the unobservable inputs used to value those investments. Such back testing includes comparing Level 3 investment values to observable inputs such as exchange-traded prices, transaction prices, and/or vendor prices.
The following is a summary of the fair valuations according to the inputs used as of March 31, 2016 in valuing each Fund’s assets:
| | | | | | | | | | | | |
| Dividend ex-Financials Fund | | Level 1 | | | Level 2 | | | Level 3 | |
Common Stocks* | | $ | 906,535,225 | | | $ | — | | | $ | — | |
Exchange-Traded Funds | | | 7,594,396 | | | | — | | | | — | |
Investment of Cash Collateral for Securities Loaned | | | — | | | | 7,851,900 | | | | — | |
Total | | $ | 914,129,621 | | | $ | 7,851,900 | | | $ | — | |
| | | | | | | | | | | | |
| Earnings 500 Fund | | Level 1 | | | Level 2 | | | Level 3 | |
Common Stocks* | | $ | 117,931,203 | | | $ | — | | | $ | — | |
Exchange-Traded Fund | | | 295,518 | | | | — | | | | — | |
Investment of Cash Collateral for Securities Loaned | | | — | | | | 360,227 | | | | — | |
Total | | $ | 118,226,721 | | | $ | 360,227 | | | $ | — | |
| | | | | | | | | | | | |
| High Dividend Fund | | Level 1 | | | Level 2 | | | Level 3 | |
Common Stocks* | | $ | 1,019,015,459 | | | $ | — | | | $ | — | |
Exchange-Traded Fund | | | 3,686,039 | | | | — | | | | — | |
Investment of Cash Collateral for Securities Loaned | | | — | | | | 10,967,234 | | | | — | |
Total | | $ | 1,022,701,498 | | | $ | 10,967,234 | | | $ | — | |
| | | | | | | | | | | | |
| LargeCap Dividend Fund | | Level 1 | | | Level 2 | | | Level 3 | |
Common Stocks* | | $ | 1,716,461,021 | | | $ | — | | | $ | — | |
Exchange-Traded Fund | | | 5,438,981 | | | | — | | | | — | |
Investment of Cash Collateral for Securities Loaned | | | — | | | | 7,428,445 | | | | — | |
Total | | $ | 1,721,900,002 | | | $ | 7,428,445 | | | $ | — | |
| | | | | | | | | | | | |
| LargeCap Value Fund | | Level 1 | | | Level 2 | | | Level 3 | |
Common Stocks* | | $ | 137,457,904 | | | $ | — | | | $ | — | |
Exchange-Traded Funds | | | 451,046 | | | | — | | | | — | |
Investment of Cash Collateral for Securities Loaned | | | — | | | | 603,608 | | | | — | |
Total | | $ | 137,908,950 | | | $ | 603,608 | | | $ | — | |
| | | | |
| WisdomTree Domestic Earnings and Dividend Funds | | | 133 | |
Notes to Financial Statements (continued)
| | | | | | | | | | | | |
| MidCap Dividend Fund | | Level 1 | | | Level 2 | | | Level 3 | |
Common Stocks* | | $ | 1,603,700,273 | | | $ | — | | | $ | — | |
Exchange-Traded Fund | | | 1,751,177 | | | | — | | | | — | |
Investment of Cash Collateral for Securities Loaned | | | — | | | | 65,947,592 | | | | — | |
Total | | $ | 1,605,451,450 | | | $ | 65,947,592 | | | $ | — | |
| | | | | | | | | | | | |
| MidCap Earnings Fund | | Level 1 | | | Level 2 | | | Level 3 | |
Common Stocks* | | $ | 661,078,654 | | | $ | — | | | $ | — | |
Exchange-Traded Fund | | | 1,190,385 | | | | — | | | | — | |
Investment of Cash Collateral for Securities Loaned | | | — | | | | 32,026,035 | | | | — | |
Total | | $ | 662,269,039 | | | $ | 32,026,035 | | | $ | — | |
| | | | | | | | | | | | |
| SmallCap Dividend Fund | | Level 1 | | | Level 2 | | | Level 3 | |
Common Stocks* | | $ | 1,205,854,008 | | | $ | — | | | $ | — | |
Exchange-Traded Fund | | | 7,976,025 | | | | — | | | | — | |
Investment of Cash Collateral for Securities Loaned | | | — | | | | 152,545,820 | | | | — | |
Total | | $ | 1,213,830,033 | | | $ | 152,545,820 | | | $ | — | |
| | | | | | | | | | | | |
| SmallCap Earnings Fund | | Level 1 | | | Level 2 | | | Level 3 | |
Common Stocks* | | $ | 367,857,581 | | | $ | — | | | $ | — | |
Rights | | | — | | | | 12,529 | | | | — | |
Exchange-Traded Fund | | | 1,288,529 | | | | — | | | | — | |
Investment of Cash Collateral for Securities Loaned | | | — | | | | 47,210,603 | | | | — | |
Total | | $ | 369,146,110 | | | $ | 47,223,132 | | | $ | — | |
| | | | | | | | | | | | |
| Total Dividend Fund | | Level 1 | | | Level 2 | | | Level 3 | |
Common Stocks* | | $ | 491,386,021 | | | $ | — | | | $ | — | |
Exchange-Traded Fund | | | 809,851 | | | | — | | | | — | |
Investment of Cash Collateral for Securities Loaned | | | — | | | | 4,643,317 | | | | — | |
Total | | $ | 492,195,872 | | | $ | 4,643,317 | | | $ | — | |
| | | | | | | | | | | | |
| Total Earnings Fund | | Level 1 | | | Level 2 | | | Level 3 | |
Common Stocks* | | $ | 57,094,861 | | | $ | — | | | $ | — | |
Investment of Cash Collateral for Securities Loaned | | | — | | | | 546,794 | | | | — | |
Total | | $ | 57,094,861 | | | $ | 546,794 | | | $ | — | |
| | | | | | | | | | | | |
| U.S. Quality Dividend Growth Fund | | Level 1 | | | Level 2 | | | Level 3 | |
Common Stocks* | | $ | 594,361,182 | | | $ | — | | | $ | — | |
Investment of Cash Collateral for Securities Loaned | | | — | | | | 3,415,965 | | | | — | |
Total | | $ | 594,361,182 | | | $ | 3,415,965 | | | $ | — | |
| | | | | | | | | | | | |
| U.S. SmallCap Quality Dividend Growth Fund | | Level 1 | | | Level 2 | | | Level 3 | |
Common Stocks* | | $ | 35,087,474 | | | $ | — | | | $ | — | |
Investment of Cash Collateral for Securities Loaned | | | — | | | | 4,010,875 | | | | — | |
Total | | $ | 35,087,474 | | | $ | 4,010,875 | | | $ | — | |
| | * | Please refer to the Schedule of Investments for a breakdown of the valuation by industry and country. |
| | |
| 134 | | WisdomTree Domestic Earnings and Dividend Funds |
Notes to Financial Statements (continued)
There were no Level 3 securities at or during the fiscal year ended March 31, 2016.
The Funds have elected to use the beginning of period method for transfers between fair value measurement levels.
During the fiscal year ended March 31, 2016, SmallCap Dividend Fund transferred securities with a fair value of $66,688 from Level 2 to Level 1 primarily due to the availability of a quoted price in an active market for identical investments.
Investment Transactions and Investment Income — Investment transactions are recorded as of the date that the securities are purchased or sold (trade date). Realized gains and losses on sales of portfolio securities are calculated using the identified-cost method. Dividend income is recognized on the ex-dividend date, net of any foreign taxes withheld, if any.
Expenses/Reimbursements — Under the investment advisory agreement for each Fund, except for Funds that commenced operations on or after March 26, 2013, WTAM has agreed to pay all expenses of the Trust, except for: (i) brokerage expenses and other expenses (such as stamp taxes) connected with the execution of portfolio transactions or in connection with creation and redemption transactions; (ii) legal fees or expenses in connection with any arbitration, litigation or pending or threatened arbitration or litigation, including any settlements in connection therewith; (iii) compensation and expenses of trustees who are not interested persons of the Funds (“Independent Trustees”); (iv) compensation and expenses of counsel to the Independent Trustees; (v) compensation and expenses of the Trust’s Chief Compliance Officer (“CCO”); (vi) extraordinary expenses; (vii) distribution fees and expenses paid by the Trust under any distribution plan adopted pursuant to Rule 12b-1 under the 1940 Act; and (viii) the advisory fee payable to WTAM.
Under the investment advisory agreement for Funds that commenced operations on or after March 26, 2013, WTAM has agreed to pay all expenses of the Trust, except for: (i) brokerage expenses and other fees, charges, taxes, levies or expenses (such as stamp taxes) incurred in connection with the execution of portfolio transactions or in connection with creation and redemption transactions (including without limitation any fees, charges, taxes, levies or expenses related to the purchase or sale of an amount of any currency, or the partition or repatriation of any security or other asset, related to the execution of portfolio transactions or any creation or redemption transactions); (ii) legal fees or expenses in connection with any arbitration, litigation or pending or threatened arbitration or litigation, including any settlements in connection therewith; (iii) compensation and expenses of each Independent Trustee; (iv) compensation and expenses of counsel to the Independent Trustees; (v) compensation and expenses of the Trust’s CCO; (vi) extraordinary expenses (in each case as determined by a majority of the Independent Trustees); (vii) distribution fees and expenses paid by the Trust under any distribution plan adopted pursuant to Rule 12b-1 under the 1940 Act; (viii) interest and taxes of any kind or nature (including, but not limited to, income, excise, transfer and withholding taxes); (ix) fees and expenses related to the provision of securities lending services; and (x) the advisory fee payable to WTAM.
The internal expenses of pooled investment vehicles in which the Funds may invest (acquired fund fees and expenses) are not expenses of the Funds and are not paid by WTAM.
During the fiscal year ended March 31, 2016, High Dividend Fund, MidCap Dividend Fund and Total Dividend Fund (the “Affected Funds”) incurred legal expenses pertaining to litigation brought against former shareholders of Lyondell Chemical Company (“Lyondell”), such as the Affected Funds. The lawsuit seeks to recover amounts paid to former shareholders of Lyondell as fraudulent transfer in connection with the leveraged buyout of Lyondell by Basell AF S.C.A in December of 2007 after Lyondell filed for bankruptcy in 2008. While the Affected Funds believe that they have valid defenses and are participating in the defense along with a number of other shareholders, at this stage of the proceedings, the Affected Funds are not able to make a reliable prediction as to the outcome of these lawsuits or the effect, if any, on an Affected Fund’s net asset value.
Pursuant to a separate contractual arrangement, WTAM arranges for the provision of CCO services with respect to each Fund, and is liable and responsible for, and administers, payments to the CCO, the Independent Trustees and counsel to the Independent Trustees. WTAM receives a fee, as shown on the Statements of Operations under “Service fees”, of up to 0.0044% of each Fund’s average daily net assets for providing such services and paying such expenses. WTAM provides CCO services to the Trust.
Securities Lending — Each Fund may lend portfolio securities to certain creditworthy borrowers, including the Funds’ securities lending agent. It is the Funds’ policy that, at origination, all loans are secured by collateral of at least 102% of the value of U.S. securities loaned and 105% of the value of foreign securities loaned. Collateral in the form of cash and/or high-grade debt obligations, equivalent to at least 100% of the market value of securities, is maintained at all times. The cash collateral can be invested in certain money market mutual funds which also have exposure to the fluctuations of the market. The values of the investments of cash collateral for securities on loan along with the obligations to return such collateral are included on the Statements of Assets and Liabilities. The total value of securities received as collateral for securities on loan is included in a footnote following each Schedule of Investments, but is not included within the Statements of Assets and Liabilities because the receiving Fund does not have the right to sell or repledge the securities received as collateral. Each Fund receives compensation for lending its securities from interest or dividends earned on the cash or U.S. government securities held as collateral, net of fee rebates paid to the borrower plus reasonable administrative and custody fees, all of which are included in the securities lending income earned by the Funds and disclosed on the Statements of Operations. The dividend and interest income earned on the securities loaned is
| | | | |
| WisdomTree Domestic Earnings and Dividend Funds | | | 135 | |
Notes to Financial Statements (continued)
accounted for in the same manner as other dividend and interest income. The borrower pays to the Funds an amount equal to any dividends or interest received on loaned securities. Dividends received while a security is out on loan are not considered Qualified Dividend Income (“QDI”) under the specific criteria issued by the Internal Revenue Service and are subject to taxation at the shareholder’s ordinary income tax rate instead of the lower long-term capital gains tax rate. Lending portfolio securities could result in a loss or delay in recovering each Fund’s securities if the borrower defaults.
Master Netting Arrangements — ASU No. 2011-11 “Disclosures about Offsetting Assets and Liabilities” (“ASU 2011-11”) is generally intended to (i) help investors and other financial statement users to better assess the effect or potential effect of offsetting arrangements on a company’s financial position, (ii) improve transparency in the reporting of how companies mitigate credit risk, and (iii) facilitate comparisons between those entities that prepare their financial statements on the basis of GAAP and those entities that prepare their financial statements on the basis of international financial reporting standards. ASU 2011-11 requires entities to disclose (i) gross and net information about both instruments and transactions eligible for offset in the financial statements, and (ii) instruments and transactions subject to an agreement similar to a master netting agreement. ASU 2011-11 is limited in scope to the following financial instruments, to the extent they are offset in the financial statements or subject to an enforceable master netting arrangement or similar agreement: (i) recognized derivative instruments accounted for under ASC 815 (Derivatives and Hedging); (ii) repurchase agreements and reverse repurchase agreements; and (iii) securities borrowing and securities lending transactions.
A Fund’s security lending activities are governed by a Securities Lending Authorization Agreement (“Lending Agreement”) between the Fund and the lending agent. The Lending Agreement authorizes the lending agent to lend qualifying U.S. and foreign securities held by a Fund to approved borrowers (each a “Borrower”). To mitigate borrower risk, a Fund typically receives from a Borrower, collateral in the form of U.S. dollar cash and/or securities issued or guaranteed by the U.S. government or its agencies in excess of the market value of the securities loaned. Under the provisions of the Lending Agreement, a Fund shall have, as to the collateral, all of the rights and remedies of a secured party under applicable law. A Fund is exposed to risk of loss if a Borrower defaults on its obligation to return borrowed securities and the value of the collateral a Fund received is insufficient to cover the market value of the securities loaned. Also, the lending agent is permitted to invest the cash collateral it receives from a Borrower into a money market fund which is subject to market fluctuation. Therefore, a Fund is exposed to risk of loss if the value of invested cash collateral is insufficient to satisfy the Fund’s obligation to return the full amount owed to such Borrower.
For financial reporting purposes, the Funds elect to not offset assets and liabilities subject to the Lending Agreement or similar arrangements in the Statements of Assets and Liabilities. Therefore, all qualifying transactions, if any at March 31, 2016, are presented on a gross basis in the Statements of Assets and Liabilities. As of March 31, 2016, the Funds had securities on loan and the value of the related collateral received by each Fund exceeded the value of the securities loaned by each Fund. The value of the securities loaned by each Fund is located in the Statements of Assets and Liabilities. In addition, a breakout of the total amount of cash and non-cash securities lending collateral received is located in the Schedules of Investments.
Short-Term Investments — Each Fund may invest a portion of its assets in high-quality money market instruments on an ongoing basis to provide liquidity or for other reasons. The instruments include short-term obligations issued by the U.S. government, its agencies, non-U.S. government agencies, negotiable certificates of deposit (“CDs”), fixed time deposits and bankers’ acceptances of U.S. and foreign banks and similar institutions, commercial papers, repurchase agreements and money market funds. CDs are short-term negotiable obligations of commercial banks. Time deposits are non-negotiable deposits maintained in banking institutions for specified periods of time at stated interest rates. Banker’s acceptances are time drafts drawn on commercial banks by borrowers, usually in connection with international transactions.
Tax Information and Dividends and Distributions to Shareholders — It is each Fund’s policy to comply with all requirements of the Internal Revenue Code of 1986, as amended (the “Code”). Each Fund intends to qualify for and to elect treatment as a separate Regulated Investment Company (“RIC”) under Subchapter M of the Code. In order to qualify for the special tax treatment accorded RICs and their shareholders, each Fund must, among other things, distribute with respect to each taxable year an amount equal to or greater than the sum of 90% of its investment company taxable income and 90% of its net tax-exempt interest income. There can be no guarantee that a Fund will pay dividends. Taxable net realized gains from investment transactions, reduced by capital loss carryforwards, if any, are declared and distributed to shareholders at least annually. The capital loss carryforward amount, if any, is available to offset future net capital gains. The Funds may occasionally be required to make supplemental distributions at some other time during the year. The Trust reserves the right to declare special distributions if, in its reasonable discretion, such action is necessary or advisable to preserve the status of each Fund as a RIC or to avoid imposition of income or excise taxes on undistributed income. Dividends and distributions to shareholders are recorded on the ex-dividend date. The amount of dividends and distributions from net investment income and net realized capital gains are determined in accordance with the requirements of the Code and the U.S. Treasury regulations. These book/tax differences are either considered temporary or permanent in nature. To the extent these differences are permanent in nature, such amounts are reclassified within the components of net assets based on their Federal tax basis treatment; temporary differences do not require reclassification. Dividends and distributions that exceed earnings and profit for tax purposes are reported for tax purposes as a return of capital.
| | |
| 136 | | WisdomTree Domestic Earnings and Dividend Funds |
Notes to Financial Statements (continued)
3. ADVISORY FEES AND OTHER TRANSACTIONS WITH AFFILIATES
WTAM has overall responsibility for the general management and administration of the Trust. WTAM provides an investment program for each Fund. WTAM has arranged for Mellon Capital Management Corporation (‘‘MCM’’) to provide sub-advisory services to the Funds. MCM is compensated by WTAM at no additional cost to the Funds. WTAM also arranges for transfer agency, custody, fund accounting, fund administration, securities lending and all other non-distribution related services necessary for the Funds to operate, which are generally under separate agreements entered into between the Trust on behalf of the Funds and the applicable service provider. Under the investment advisory agreement for each Fund, WTAM agrees to pay all expenses of the Funds, except for certain expenses described in Note 2.
Pursuant to a separate contractual arrangement, as also described in Note 2, WTAM arranges for the provision of CCO services with respect to each Fund, and is liable and responsible for, and administers, payments to the CCO, the Independent Trustees and counsel to the Independent Trustees in exchange for a fee of up to 0.0044% of each Fund’s average daily net assets. WTAM expects to receive advisory fees from each Fund, based on a percentage of the Fund’s average daily net assets, as shown in the following table:
| | | | |
| Fund | | Advisory Fee Rate | |
Dividend ex-Financials Fund | | | 0.38 | % |
Earnings 500 Fund | | | 0.28 | % |
High Dividend Fund | | | 0.38 | % |
LargeCap Dividend Fund | | | 0.28 | % |
LargeCap Value Fund | | | 0.38 | % |
MidCap Dividend Fund | | | 0.38 | % |
MidCap Earnings Fund | | | 0.38 | % |
SmallCap Dividend Fund | | | 0.38 | % |
SmallCap Earnings Fund | | | 0.38 | % |
Total Dividend Fund | | | 0.28 | % |
Total Earnings Fund | | | 0.28 | % |
U.S. Quality Dividend Growth Fund | | | 0.28 | % |
U.S. SmallCap Quality Dividend Growth Fund | | | 0.38 | % |
Each Fund may purchase shares of affiliated ETFs in secondary market transactions to reduce cash balances. For these transactions, WTAM waives its advisory fees related to each Fund’s investment in affiliated funds. The waivers may be reduced to offset the incremental costs related to these investments (fund accounting, safekeeping, transaction fees, etc.) that are paid by WTAM out of its advisory fee. The dollar amount of advisory fees waived during the period for the Funds, if any, are shown in the Statements of Operations.
| | | | |
| WisdomTree Domestic Earnings and Dividend Funds | | | 137 | |
Notes to Financial Statements (continued)
Affiliated holdings are funds which are managed by, or an affiliate of, WTAM. Transactions with affiliated funds during the fiscal year ended March 31, 2016 are as follows:
| | | | | | | | | | | | | | | | | | | | | | | | |
| Fund | | Value at
3/31/2015 | | | Purchases/
Additions | | | Sales/
Reductions | | | Value at
3/31/2016 | | | Dividend
Income | | | Capital Gain
Distributions | |
Dividend ex-Financials Fund | | | | | | | | | | | | | | | | | | | | | | | | |
WisdomTree LargeCap Dividend Fund | | $ | 2,992,839 | | | $ | 13,712,591 | | | $ | 13,129,958 | | | $ | 3,774,815 | | | $ | 82,011 | | | $ | — | |
WisdomTree MidCap Dividend Fund | | | 3,008,754 | | | | 13,686,804 | | | | 13,136,212 | | | | 3,819,581 | | | | 74,175 | | | | 17,402 | |
Total | | $ | 6,001,593 | | | $ | 27,399,395 | | | $ | 26,266,170 | | | $ | 7,594,396 | | | $ | 156,186 | | | $ | 17,402 | |
| | | | | | |
Earnings 500 Fund | | | | | | | | | | | | | | | | | | | | | | | | |
WisdomTree High Dividend Fund | | $ | 158,834 | | | $ | 2,308,596 | | | $ | 2,185,834 | | | $ | 295,518 | | | $ | 15,998 | | | $ | — | |
| | | | | | |
High Dividend Fund | | | | | | | | | | | | | | | | | | | | | | | | |
WisdomTree Total Dividend Fund | | $ | 1,968,955 | | | $ | 15,802,114 | | | $ | 14,191,526 | | | $ | 3,686,039 | | | $ | 66,172 | | | $ | — | |
| | | | | | |
LargeCap Dividend Fund | | | | | | | | | | | | | | | | | | | | | | | | |
WisdomTree Total Dividend Fund | | $ | 2,427,941 | | | $ | 28,940,885 | | | $ | 26,128,134 | | | $ | 5,438,981 | | | $ | 146,234 | | | $ | — | |
| | | | | | |
LargeCap Value Fund | | | | | | | | | | | | | | | | | | | | | | | | |
WisdomTree Earnings 500 Fund | | $ | 34,983 | | | $ | 493,525 | | | $ | 209,761 | | | $ | 312,455 | | | $ | 2,977 | | | $ | — | |
WisdomTree MidCap Earnings Fund | | | 15,154 | | | | 213,615 | | | | 87,211 | | | | 138,591 | | | | 713 | | | | — | |
Total | | $ | 50,137 | | | $ | 707,140 | | | $ | 296,972 | | | $ | 451,046 | | | $ | 3,690 | | | $ | — | |
| | | | | | |
MidCap Dividend Fund | | | | | | | | | | | | | | | | | | | | | | | | |
WisdomTree LargeCap Dividend Fund | | $ | 2,739,441 | | | $ | 29,870,944 | | | $ | 30,826,288 | | | $ | 1,751,177 | | | $ | 80,788 | | | $ | — | |
| | | | | | |
MidCap Earnings Fund | | | | | | | | | | | | | | | | | | | | | | | | |
WisdomTree MidCap Dividend Fund | | $ | 2,841,673 | | | $ | 7,092,002 | | | $ | 8,584,704 | | | $ | 1,190,385 | | | $ | 74,868 | | | $ | 19,516 | |
| | | | | | |
SmallCap Dividend Fund | | | | | | | | | | | | | | | | | | | | | | | | |
WisdomTree MidCap Dividend Fund | | $ | 1,781,942 | | | $ | 28,518,442 | | | $ | 22,734,002 | | | $ | 7,976,025 | | | $ | 160,378 | | | $ | 57,850 | |
| | | | | | |
SmallCap Earnings Fund | | | | | | | | | | | | | | | | | | | | | | | | |
WisdomTree MidCap Earnings Fund | | $ | 1,153,993 | | | $ | 3,691,409 | | | $ | 3,554,420 | | | $ | 1,288,529 | | | $ | 20,771 | | | $ | — | |
| | | | | | |
Total Dividend Fund | | | | | | | | | | | | | | | | | | | | | | | | |
WisdomTree Total Earnings Fund | | $ | 1,129,266 | | | $ | 5,429,514 | | | $ | 5,724,576 | | | $ | 809,851 | | | $ | 21,948 | | | $ | — | |
4. CAPITAL SHARE TRANSACTIONS
As of March 31, 2016, there were an unlimited number of $0.001 par value shares of beneficial interest authorized by the Trust. Shares are issued and redeemed by each Fund only in creation units or multiples thereof. Except when aggregated in creation units, shares of each Fund are not redeemable. Transactions in shares for each Fund are disclosed in detail in the Statements of Changes in Net Assets. The consideration for the purchase of creation units of a Fund generally consists of the in-kind contribution of a designated portfolio of equity securities constituting a portfolio sampling representation of the securities included in the relevant Fund’s underlying Index and an amount of cash. Investors purchasing and redeeming creation units may be charged a purchase transaction fee and a redemption transaction fee to offset transfer and other transaction costs associated with the issuance and redemption of creation units.
5. INVESTMENT PORTFOLIO TRANSACTIONS
Purchases and sales of investments (excluding purchases and sales resulting from in-kind capital share transactions and short-term investments) and the cost of purchases and the proceeds from sales resulting from in-kind capital share transactions (excluding
| | |
| 138 | | WisdomTree Domestic Earnings and Dividend Funds |
Notes to Financial Statements (continued)
short-term investments) for the fiscal year ended March 31, 2016 are shown in the following table. Realized gains and losses on sales resulting from in-kind capital share redemptions, as shown on the Statements of Operations, are not recognized by the Funds for tax purposes.
| | | | | | | | | | | | | | | | |
| | | | | | In-kind Capital Share Transactions | |
| Fund | | Purchases | | | Sales | | | Purchases | | | Sales | |
Dividend ex-Financials Fund | | $ | 345,768,820 | | | $ | 325,183,616 | | | $ | 275,784,087 | | | $ | 586,602,313 | |
Earnings 500 Fund | | | 24,390,270 | | | | 24,016,320 | | | | 10,220,504 | | | | 27,840,130 | |
High Dividend Fund | | | 198,418,713 | | | | 188,545,618 | | | | 201,439,289 | | | | 273,051,796 | |
LargeCap Dividend Fund | | | 196,356,176 | | | | 189,049,935 | | | | 173,900,483 | | | | 550,175,294 | |
LargeCap Value Fund | | | 35,275,479 | | | | 35,139,544 | | | | 129,277,625 | | | | 16,630,672 | |
MidCap Dividend Fund | | | 499,173,421 | | | | 492,183,862 | | | | 451,329,915 | | | | 427,911,085 | |
MidCap Earnings Fund | | | 287,867,528 | | | | 284,577,830 | | | | 235,439,517 | | | | 250,522,085 | |
SmallCap Dividend Fund | | | 405,181,030 | | | | 395,888,036 | | | | 320,533,111 | | | | 287,875,257 | |
SmallCap Earnings Fund | | | 168,027,845 | | | | 166,935,114 | | | | 31,028,327 | | | | 45,326,529 | |
Total Dividend Fund | | | 59,867,596 | | | | 59,057,897 | | | | 42,811,133 | | | | 129,053,417 | |
Total Earnings Fund | | | 9,683,851 | | | | 9,479,827 | | | | – | | | | 44,758,823 | |
U.S. Quality Dividend Growth Fund | | | 165,754,744 | | | | 164,238,244 | | | | 260,702,595 | | | | 112,533,107 | |
U.S. SmallCap Quality Dividend Growth Fund | | | 15,123,953 | | | | 14,793,096 | | | | 22,177,984 | | | | 8,031,013 | |
6. FEDERAL INCOME TAXES
At March 31, 2016, the cost of investments (including securities on loan) for Federal income tax purposes was as follows:
| | | | | | | | | | | | | | | | |
| Fund | | Tax Cost | | | Gross Unrealized
Appreciation | | | Gross Unrealized
Depreciation | | | Net Unrealized
Appreciation/
(Depreciation) | |
Dividend ex-Financials Fund | | $ | 870,807,746 | | | $ | 86,416,007 | | | $ | (35,242,232 | ) | | $ | 51,173,775 | |
Earnings 500 Fund | | | 108,884,478 | | | | 14,202,551 | | | | (4,500,081 | ) | | | 9,702,470 | |
High Dividend Fund | | | 973,268,120 | | | | 95,083,831 | | | | (34,683,219 | ) | | | 60,400,612 | |
LargeCap Dividend Fund | | | 1,614,939,446 | | | | 185,596,465 | | | | (71,207,464 | ) | | | 114,389,001 | |
LargeCap Value Fund | | | 134,561,162 | | | | 5,065,400 | | | | (1,114,004 | ) | | | 3,951,396 | |
MidCap Dividend Fund | | | 1,552,391,088 | | | | 163,353,411 | | | | (44,345,457 | ) | | | 119,007,954 | |
MidCap Earnings Fund | | | 679,094,691 | | | | 50,582,406 | | | | (35,382,023 | ) | | | 15,200,383 | |
SmallCap Dividend Fund | | | 1,337,872,401 | | | | 105,971,588 | | | | (77,468,136 | ) | | | 28,503,452 | |
SmallCap Earnings Fund | | | 417,076,210 | | | | 35,952,030 | | | | (36,658,998 | ) | | | (706,968 | ) |
Total Dividend Fund | | | 441,099,809 | | | | 71,370,427 | | | | (15,631,047 | ) | | | 55,739,380 | |
Total Earnings Fund | | | 55,407,179 | | | | 5,627,381 | | | | (3,392,905 | ) | | | 2,234,476 | |
U.S. Quality Dividend Growth Fund | | | 580,695,027 | | | | 37,676,773 | | | | (20,594,653 | ) | | | 17,082,120 | |
U.S. SmallCap Quality Dividend Growth Fund | | | 38,466,973 | | | | 2,352,803 | | | | (1,721,427 | ) | | | 631,376 | |
At March 31, 2016, the components of accumulated earnings/(loss) on a tax-basis were as follows:
| | | | | | | | | | | | | | | | |
| Fund | | Undistributed
Ordinary Income | | | Undistributed
Capital and Other
Losses | | | Net Unrealized
Appreciation/
(Depreciation) | | | Total Accumulated
Earnings/(Losses) | |
Dividend ex-Financials Fund | | $ | 1,793,681 | | | $ | (130,624,305 | ) | | $ | 51,173,775 | | | $ | (77,656,849 | ) |
Earnings 500 Fund | | | 122,469 | | | | (19,180,818 | ) | | | 9,702,470 | | | | (9,355,879 | ) |
High Dividend Fund | | | 2,310,527 | | | | (73,176,956 | ) | | | 60,400,612 | | | | (10,465,817 | ) |
LargeCap Dividend Fund | | | 2,220,554 | | | | (83,972,062 | ) | | | 114,389,001 | | | | 32,637,493 | |
LargeCap Value Fund | | | 100,708 | | | | (11,093,980 | ) | | | 3,951,396 | | | | (7,041,876 | ) |
MidCap Dividend Fund | | | 3,978,313 | | | | (64,538,367 | ) | | | 119,007,954 | | | | 58,447,900 | |
MidCap Earnings Fund | | | 930,210 | | | | (62,224,152 | ) | | | 15,200,383 | | | | (46,093,559 | ) |
SmallCap Dividend Fund | | | 3,646,549 | | | | (103,914,617 | ) | | | 28,503,452 | | | | (71,764,616 | ) |
SmallCap Earnings Fund | | | 696,655 | | | | (48,852,396 | ) | | | (706,968 | ) | | | (48,862,709 | ) |
Total Dividend Fund | | | 831,157 | | | | (23,974,005 | ) | | | 55,739,380 | | | | 32,596,532 | |
| | | | |
| WisdomTree Domestic Earnings and Dividend Funds | | | 139 | |
Notes to Financial Statements (continued)
| | | | | | | | | | | | | | | | |
| Fund | | Undistributed
Ordinary Income | | | Undistributed
Capital and Other
Losses | | | Net Unrealized
Appreciation/
(Depreciation) | | | Total Accumulated
Earnings/(Losses) | |
Total Earnings Fund | | $ | 64,003 | | | $ | (6,492,065 | ) | | $ | 2,234,476 | | | $ | (4,193,586 | ) |
U.S. Quality Dividend Growth Fund | | | 762,164 | | | | (14,918,909 | ) | | | 17,082,120 | | | | 2,925,375 | |
U.S. SmallCap Quality Dividend Growth Fund | | | 86,486 | | | | (3,408,857 | ) | | | 631,376 | | | | (2,690,995 | ) |
The tax character of distributions paid during the fiscal years ended March 31, 2016 and March 31, 2015, was as follows:
| | | | | | | | | | | | |
| | | Year Ended March 31, 2016 | | | Year Ended
March 31, 2015 | |
| Fund | | Distributions Paid
from Ordinary
Income* | | | Distributions Paid
from Long-Term
Capital Gains | | | Distributions Paid
from Ordinary
Income* | |
Dividend ex-Financials Fund | | $ | 34,743,423 | | | $ | — | | | $ | 39,456,992 | |
Earnings 500 Fund | | | 2,740,986 | | | | — | | | | 2,297,699 | |
High Dividend Fund | | | 32,904,903 | | | | — | | | | 30,019,168 | |
LargeCap Dividend Fund | | | 49,180,302 | | | | — | | | | 52,955,618 | |
LargeCap Value Fund | | | 522,957 | | | | — | | | | 385,836 | |
MidCap Dividend Fund | | | 38,312,256 | | | | 5,471,254 | | | | 30,452,989 | |
MidCap Earnings Fund | | | 8,681,892 | | | | — | | | | 8,472,389 | |
SmallCap Dividend Fund | | | 34,291,884 | | | | — | | | | 31,680,603 | |
SmallCap Earnings Fund | | | 4,657,222 | | | | — | | | | 5,168,210 | |
Total Dividend Fund | | | 14,082,024 | | | | — | | | | 13,202,159 | |
Total Earnings Fund | | | 1,549,810 | | | | — | | | | 1,687,769 | |
U.S. Quality Dividend Growth Fund | | | 11,551,881 | | | | — | | | | 4,462,615 | |
U.S. SmallCap Quality Dividend Growth Fund | | | 646,575 | | | | — | | | | 582,743 | |
| | * | Includes short-term capital gains if any. |
At March 31, 2016, for Federal tax purposes, the Funds have capital loss carryforwards available to offset future capital gains through the years indicated. To the extent that these loss carryforwards are utilized, capital gains so offset will not be distributed to shareholders.
| | | | | | | | | | | | | | | | | | | | | | | | |
| Fund | | Capital Loss
Available
Through
2017 | | | Capital Loss
Available
Through 2018 | | | Capital Loss
Available
Through 2019 | | | Short-Term
Post-Effective
No Expiration | | | Long-Term
Post-Effective
No Expiration | | | Capital Loss
Available Total | |
Dividend ex-Financials Fund | | $ | 5,713,004 | | | $ | 68,035,975 | | | $ | 1,318,159 | | | $ | — | | | $ | — | | | $ | 75,067,138 | |
Earnings 500 Fund | | | 1,286,040 | | | | 10,811,338 | | | | 4,536,572 | | | | 188,860 | | | | 1,332,499 | | | | 18,155,309 | |
High Dividend Fund | | | — | | | | 32,791,690 | | | | 21,181,473 | | | | — | | | | — | | | | 53,973,163 | |
LargeCap Dividend Fund | | | — | | | | 30,813,569 | | | | 32,903,699 | | | | — | | | | — | | | | 63,717,268 | |
LargeCap Value Fund | | | — | | | | 8,176,315 | | | | 295,465 | | | | 428,445 | | | | — | | | | 8,900,225 | |
MidCap Dividend Fund | | | — | | | | — | | | | — | | | | 42,715,873 | | | | 21,822,494 | | | | 64,538,367 | |
MidCap Earnings Fund | | | 1,545,771 | | | | 6,328,159 | | | | 346,722 | | | | 47,683,032 | | | | 6,320,468 | | | | 62,224,152 | |
SmallCap Dividend Fund | | | — | | | | 29,790,025 | | | | 6,604,794 | | | | 11,421,321 | | | | 4,292,860 | | | | 52,109,000 | |
SmallCap Earnings Fund | | | 1,465,208 | | | | 4,654,874 | | | | 921,406 | | | | 15,862,443 | | | | 5,383,892 | | | | 28,287,823 | |
Total Dividend Fund | | | — | | | | 8,122,736 | | | | 10,786,298 | | | | — | | | | — | | | | 18,909,034 | |
Total Earnings Fund | | | 220,855 | | | | 3,393,418 | | | | 935,380 | | | | — | | | | — | | | | 4,549,653 | |
U.S. Quality Dividend Growth Fund | | | — | | | | — | | | | — | | | | 92,153 | | | | — | | | | 92,153 | |
U.S. SmallCap Quality Dividend Growth Fund | | | — | | | | — | | | | — | | | | 775,933 | | | | 159,765 | | | | 935,698 | |
Capital losses incurred after October 31 (“post-October capital losses”) and late year ordinary losses incurred after December 31 within the taxable year are deemed to arise on the first business day of each Fund’s next taxable year.
| | |
| 140 | | WisdomTree Domestic Earnings and Dividend Funds |
Notes to Financial Statements (concluded)
During the fiscal year ended March 31, 2016, the following Funds incurred and will elect to defer post-October capital losses and late year ordinary losses as follows:
| | | | | | | | |
| Fund | | Short-Term
Post-October
Capital Losses | | | Long-Term
Post-October
Capital Losses | |
Dividend ex-Financials Fund | | $ | 36,962,934 | | | $ | 18,594,233 | |
Earnings 500 Fund | | | 1,148,448 | | | | (122,939 | ) |
High Dividend Fund | | | 12,309,104 | | | | 6,894,689 | |
LargeCap Dividend Fund | | | 9,215,586 | | | | 11,039,208 | |
LargeCap Value Fund | | | 2,558,314 | | | | (364,559 | ) |
MidCap Dividend Fund | | | — | | | | — | |
MidCap Earnings Fund | | | — | | | | — | |
SmallCap Dividend Fund | | | 27,539,495 | | | | 24,266,122 | |
SmallCap Earnings Fund | | | 20,636,123 | | | | (71,550 | ) |
Total Dividend Fund | | | 2,332,840 | | | | 2,732,131 | |
Total Earnings Fund | | | 890,801 | | | | 1,051,611 | |
U.S. Quality Dividend Growth Fund | | | 11,761,909 | | | | 3,064,847 | |
U.S. SmallCap Quality Dividend Growth Fund | | | 1,959,783 | | | | 513,376 | |
During the fiscal year ended March 31, 2016, the amount of capital loss carryforwards used to offset realized gains and the amount of capital loss carryforwards that expired unused are shown in the following table:
| | | | | | | | |
| Fund | | Expired
Capital Loss
Carryforward | | | Utilized
Capital Loss
Carryforward | |
Dividend ex-Financials Fund | | $ | — | | | $ | 6,406,424 | |
Earnings 500 Fund | | | 194,476 | | | | 108,185 | |
High Dividend Fund | | | — | | | | 2,081,059 | |
LargeCap Dividend Fund | | | — | | | | 2,821,262 | |
LargeCap Value Fund | | | — | | | | — | |
MidCap Dividend Fund | | | — | | | | — | |
MidCap Earnings Fund | | | 354,730 | | | | — | |
SmallCap Dividend Fund | | | — | | | | — | |
SmallCap Earnings Fund | | | 31,705 | | | | — | |
Total Dividend Fund | | | — | | | | 929,100 | |
Total Earnings Fund | | | — | | | | 217,156 | |
U.S. Quality Dividend Growth Fund | | | — | | | | — | |
U.S. SmallCap Quality Dividend Growth Fund | | | — | | | | — | |
At March 31, 2016, the effect of permanent “book/tax” reclassifications resulted in increases (decreases) to the components of net assets as follows:
| | | | | | | | | | | | |
| Fund | | Undistributed Net
Investment
Income | | | Accumulated Net
Realized Loss | | | Paid-in Capital | |
Dividend ex-Financials Fund | | $ | 409,562 | | | $ | (88,266,633 | ) | | $ | 87,857,071 | |
Earnings 500 Fund | | | 4,043 | | | | (9,782,772 | ) | | | 9,778,729 | |
High Dividend Fund | | | 67,486 | | | | (48,357,964 | ) | | | 48,290,478 | |
LargeCap Dividend Fund | | | 13,879 | | | | (128,003,368 | ) | | | 127,989,489 | |
LargeCap Value Fund | | | 1,962 | | | | (2,385,851 | ) | | | 2,383,889 | |
MidCap Dividend Fund | | | 537,012 | | | | (92,555,748 | ) | | | 92,018,736 | |
MidCap Earnings Fund | | | 32,802 | | | | (41,219,570 | ) | | | 41,186,768 | |
SmallCap Dividend Fund | | | 44,955 | | | | (67,087,918 | ) | | | 67,042,963 | |
SmallCap Earnings Fund | | | 27,362 | | | | (6,061,702 | ) | | | 6,034,340 | |
Total Dividend Fund | | | 27,714 | | | | (49,203,109 | ) | | | 49,175,395 | |
| | | | |
| WisdomTree Domestic Earnings and Dividend Funds | | | 141 | |
Notes to Financial Statements (continued)
| | | | | | | | | | | | |
| Fund | | Undistributed Net
Investment
Income | | | Accumulated Net
Realized Loss | | | Paid-in Capital | |
Total Earnings Fund | | $ | 4,562 | | | $ | (12,666,139 | ) | | $ | 12,661,577 | |
U.S. Quality Dividend Growth Fund | | | 29,192 | | | | (16,320,795 | ) | | | 16,291,603 | |
U.S. SmallCap Quality Dividend Growth Fund | | | 1,087 | | | | (1,069,980 | ) | | | 1,068,893 | |
These differences are primarily due to redemptions-in-kind, distribution re-designations, investments in real estate investment trusts, non-deductible expenses, expiration of capital loss carryforwards and realized basis adjustments on securities.
GAAP provides guidance on tax provisions that prescribe a minimum threshold for financial statement recognition of the benefit of a tax position taken or expected to be taken in a tax return. Foreign taxes are provided for based on each Fund’s understanding of the tax rules and rates that exist in the foreign markets in which it invests. Taxes are accrued and applied to net investment income, net realized capital gains and net unrealized appreciation, as applicable, as the income is earned or capital gains are recorded. As of and during the fiscal year ended March 31, 2016, the Funds did not have any liabilities for unrecognized tax benefits relating to uncertain income tax positions they have taken or expect to take in the future. If applicable, the Funds will recognize interest accrued related to unrecognized tax benefits in interest expense and penalties in “Other” expenses on the Statements of Operations. The Funds file tax returns with the Internal Revenue Service, the State of New York, and various other states. Generally, each of the tax years in the four-year period ended March 31, 2016, remains subject to examination by taxing authorities.
7. RECENT ACCOUNTING PRONOUNCEMENTS
In June 2014, the FASB issued ASU 2014-11 Transfers & Servicing (Topic 860): Repurchase-to-Maturity Transactions, Repurchase Financings, and Disclosures to improve the financial reporting of repurchase agreements and other similar transactions. The guidance includes expanded disclosure requirements for entities that enter into repurchase agreements or securities lending transactions. The guidance is effective for financial statements with fiscal years beginning on or after January 1, 2015, and interim periods within those fiscal years. WTAM has evaluated ASU 2014-11 and determined that there is no impact on the Trust’s financial statements.
In May 2015, the FASB issued ASU 2015-07 Fair Value Measurement (Topic 820): Disclosures for Investments in Certain Entities that Calculate Net Asset Value per Share (or its Equivalent). This is an update to ASC 820. The amendments in this ASU remove the requirement to categorize within the fair value hierarchy all investments for which fair value is measured using the net asset value per share practical expedient. ASU 2015-07 also limits certain disclosures to investments for which the entity has elected to measure the fair value using the practical expedient. ASU 2015-07 will be effective for financial statements issued for fiscal years beginning after December 15, 2015, and interim periods within those fiscal years (earlier application is also permitted). WTAM has evaluated ASU 2015-07 and determined that there is no impact on the Trust’s financial statements.
| | |
| 142 | | WisdomTree Domestic Earnings and Dividend Funds |
Report of Independent Registered Public Accounting Firm
The Board of Trustees and Shareholders of WisdomTree Trust:
We have audited the accompanying statements of assets and liabilities, including the schedules of investments, of WisdomTree Dividend ex-Financials Fund, WisdomTree Earnings 500 Fund, WisdomTree High Dividend Fund (formerly WisdomTree Equity Income Fund), WisdomTree LargeCap Dividend Fund, WisdomTree LargeCap Value Fund, WisdomTree MidCap Dividend Fund, WisdomTree MidCap Earnings Fund, WisdomTree SmallCap Dividend Fund, WisdomTree SmallCap Earnings Fund, WisdomTree Total Dividend Fund, WisdomTree Total Earnings Fund, WisdomTree U.S. Quality Dividend Growth Fund (formerly WisdomTree U.S. Dividend Growth Fund), and WisdomTree U.S. SmallCap Quality Dividend Growth Fund (formerly WisdomTree U.S. SmallCap Dividend Growth Fund), thirteen of the investment funds constituting the WisdomTree Trust (the “Trust”), as of March 31, 2016, and the related statements of operations, the statements of changes in net assets and the financial highlights for each of the periods presented therein. These financial statements and financial highlights are the responsibility of the Trust’s management. Our responsibility is to express an opinion on these financial statements and financial highlights based on our audits.
We conducted our audits in accordance with the standards of the Public Company Accounting Oversight Board (United States). Those standards require that we plan and perform the audits to obtain reasonable assurance about whether the financial statements and financial highlights are free of material misstatement. We were not engaged to perform an audit of the Trust’s internal control over financial reporting. Our audits included consideration of internal control over financial reporting as a basis for designing audit procedures that are appropriate in the circumstances, but not for the purpose of expressing an opinion on the effectiveness of the Trust’s internal control over financial reporting. Accordingly, we express no such opinion. An audit also includes examining, on a test basis, evidence supporting the amounts and disclosures in the financial statements and financial highlights, assessing the accounting principles used and significant estimates made by management, and evaluating the overall financial statement presentation. Our procedures included confirmation of securities owned as of March 31, 2016, by correspondence with the custodian and others, or by other appropriate auditing procedures where replies from others were not received. We believe that our audits provide a reasonable basis for our opinion.
In our opinion, the financial statements and financial highlights referred to above present fairly, in all material respects, the financial position of WisdomTree Dividend ex-Financials Fund, WisdomTree Earnings 500 Fund, WisdomTree High Dividend Fund, WisdomTree LargeCap Dividend Fund, WisdomTree LargeCap Value Fund, WisdomTree MidCap Dividend Fund, WisdomTree MidCap Earnings Fund, WisdomTree SmallCap Dividend Fund, WisdomTree SmallCap Earnings Fund, WisdomTree Total Dividend Fund, WisdomTree Total Earnings Fund, WisdomTree U.S. Quality Dividend Growth Fund, and WisdomTree U.S. SmallCap Quality Dividend Growth Fund, thirteen of the investment funds constituting the WisdomTree Trust, at March 31, 2016, the results of their operations, the changes in their net assets and the financial highlights for each of the periods presented therein, in conformity with U.S. generally accepted accounting principles.

New York, New York
May 26, 2016
| | | | |
| WisdomTree Domestic Earnings and Dividend Funds | | | 143 | |
Trustees and Officers Information (unaudited)
The Board of Trustees has responsibility for the overall management and operations of the Funds, including general supervision of the duties performed by WTAM and other service providers. The Board of Trustees elects the officers of the Trust who are responsible for administering the Trust’s day-to-day operations. Each Trustee serves until his or her successor is duly elected or appointed and qualified.
The address of each Trustee and Officer is c/o WisdomTree Asset Management, Inc., 245 Park Avenue, 35th Floor, New York, NY 10167.
Independent Trustees
| | | | | | | | |
Name
and Year of Birth
of Trustee/Officer | | Position(s) Held with
the Trust, Term of
Office and Length
of Time Served | | Principal Occupation(s)
During the Past 5 Years | | Number of Portfolios
in Fund Complex
Overseen by Trustee/
Officer+ | | Other
Directorships
Held by Trustee
During the Past
5 Years |
David G. Chrencik*
(1948) | | Trustee, 2014- present | | Chief Financial Officer of Sarus Indochina Select LP (hedge fund) since 2012; Chief Financial Officer of GeoGreen BioFuels, Inc. (biodiesel fuel producer) from 2010 to 2014; Audit Partner at PricewaterhouseCoopers LLP (public accounting firm) from 1972 to 2009 (includes positions prior to becoming Audit Partner and predecessor firms). | | 91 | | Trustee,
Vericimetry
Funds (2011-
2014) |
| | | | |
Joel Goldberg**
(1945) | | Trustee, 2012- present | | Attorney, Of Counsel/Partner at Stroock & Stroock & Lavan LLP, 2010 to present; Attorney, Partner at Willkie Farr & Gallagher LLP, 2006 to 2010. | | 91 | | Director,
Better
Business
Bureau
(Metropolitan
New York,
Long Island
and the Mid-
Hudson
Region) |
| | | | |
Toni Massaro***
(1955) | | Trustee, 2006- present | | Dean Emerita at the University of Arizona James E. Rogers College of Law (“Rogers College of Law”) since 2009 (distinguished Emerita in July 2009); Dean at the Rogers College of Law from 1999 to 2009; Regents’ Professor at the Rogers College of Law since 1990. | | 91 | | None |
| | | | |
Melinda A. Raso Kirstein‡
(1955) | | Trustee, 2014- present | | Retired, Merrill Lynch Investment Management, Vice President; Senior Portfolio Manager, Fixed Income Management; Director, Tax Exempt Fund Management. | | 91 | | Associate
Alumnae of
Douglass
College,
Member of
Investment
Committee |
| | | | |
Victor Ugolyn
(1947) | | Trustee, 2006- present; Chairman of the Board of Trustees, 2006- present | | Private Investor, 2005 to present; President and Chief Executive Officer of William D. Witter, Inc. from 2005 to 2006; Consultant to AXA Enterprise in 2004; Chairman, President and Chief Executive Officer of Enterprise Capital Management (subsidiary of The MONY Group, Inc.) and Enterprise Group of Funds, Chairman of MONY Securities Corporation, and Chairman of the Fund Board of Enterprise Group of Funds from 1991 to 2004. | | 91 | | Member of the
Board of
Governors of
Naismith
Memorial
Basketball Hall
of Fame,
Member of the
Board of
Directors of
the New York
Society of
Security
Analysts
(NYSSA) |
| * | Chair of the Audit Committee. |
| ** | Chair of the Contracts Review Committee. |
| *** | Chair of the Governance and Nominating Committee. |
| ‡ | Chair of the Investment Committee. |
| | |
| 144 | | WisdomTree Domestic Earnings and Dividend Funds |
Trustees and Officers Information (unaudited) (concluded)
Interested Trustee and Officers
| | | | | | | | |
Name
and Year of Birth
of Trustee/Officer | | Position(s) Held with
the Trust, Term of
Office and Length
of Time Served | | Principal Occupation(s)
During the Past 5 Years | | Number of Portfolios
in Fund Complex
Overseen by Trustee/
Officer+ | | Other
Directorships
Held by Trustee During the Past
5 Years |
Jonathan Steinberg****
(1964) | | Trustee, 2005- present President, 2005- present | | President, WisdomTree Trust since 2005; President, WisdomTree Investments, Inc. and WisdomTree Asset Management, Inc.; Chief Executive Officer, WisdomTree Investments, Inc. and WisdomTree Asset Management, Inc. | | 91 | | Director, WisdomTree Investments, Inc. and WisdomTree Asset Management, Inc. |
| | | | |
David Castano****
(1971) | | Treasurer, 2013- present | | Director of Fund Accounting & Administration, WisdomTree Asset Management, Inc., since 2011; Vice President of Legg Mason & Co. and served as Treasurer from 2010 to 2011 and Controller from 2006 to 2010 of certain mutual funds associated with Legg Mason & Co.; Assistant Treasurer of Lord Abbett mutual funds from 2004 to 2006. | | 91 | | None |
| | | | |
Terry Jane Feld****
(1960) | | Chief Compliance Officer, 2012- present | | Chief Compliance Officer, WisdomTree Asset Management, Inc. since 2012; Senior Compliance Officer, WisdomTree Asset Management since 2011; Senior Compliance Officer, TIAA-CREF, 2007 to 2010; Vice President/NASD-SEC Compliance, Mutual of America Life Insurance Co., 2004 to 2007. | | 91 | | None |
| | | | |
Ryan Louvar****
(1972) | | Secretary and Chief Legal Officer, 2013- present | | General Counsel, WisdomTree Asset Management, Inc. since 2013; Vice President and Senior Managing Counsel, State Street, 2005 to 2013. | | 91 | | None |
| | | | |
Sarah English****
(1977) | | Assistant Secretary, 2013- present | | Investment Management Counsel, WisdomTree Asset Management, Inc. since 2010 (includes prior positions at WisdomTree Asset Management, Inc.); Attorney, NYFIX, Inc. from 2006 to 2009. | | 91 | | None |
| | | | |
Clint Martin**** (1977) | | Assistant Treasurer, 2015-present | | Fund Manager, Fund Accounting & Administration, WisdomTree Asset Management, Inc., since 2012; Vice President of Legg Mason & Co. and served as Assistant Treasurer from 2010 to 2012 and Assistant Controller from 2006 to 2010 of certain mutual funds associated with Legg Mason & Co. | | 91 | | None |
| **** | Elected by and serves at the pleasure of the Board. |
| | | | |
| WisdomTree Domestic Earnings and Dividend Funds | | | 145 | |
Supplemental Information (unaudited)
Federal Income Tax Information
The following Federal tax information related to the Funds’ fiscal year ended March 31, 2016, is provided for information purposes only and should not be used for reporting to federal or state revenue agencies. Federal tax information for the calendar year will be reported to you on Form 1099-DIV in January 2017.
Certain dividends paid by the Funds may be subject to a maximum tax rate of 15%, as provided by the Jobs and Growth Tax Relief Reconciliation Act of 2003. Of the distributions paid during the fiscal year ended March 31, 2016, the following represents the maximum amount of ordinary income distributions that may be considered qualified dividend income:
| | | | |
| Fund | | Qualified Dividend
Income | |
Dividend ex-Financials Fund | | $ | 34,743,423 | |
Earnings 500 Fund | | | 2,740,986 | |
High Dividend Fund | | | 31,537,739 | |
LargeCap Dividend Fund | | | 49,180,302 | |
LargeCap Value Fund | | | 522,957 | |
MidCap Dividend Fund | | | 28,589,527 | |
MidCap Earnings Fund | | | 8,163,291 | |
SmallCap Dividend Fund | | | 26,624,794 | |
SmallCap Earnings Fund | | | 4,037,837 | |
Total Dividend Fund | | | 13,609,155 | |
Total Earnings Fund | | | 1,359,391 | |
U.S. Quality Dividend Growth Fund | | | 11,551,881 | |
U.S. SmallCap Quality Dividend Growth Fund | | | 620,030 | |
The following represents the percentage of dividends paid during the fiscal year ended March 31, 2016, that qualify for the 70% dividends received deduction for corporate shareholders:
| | | | |
| Fund | | Dividends-Received
Deduction | |
Dividend ex-Financials Fund | | | 99.21 | % |
Earnings 500 Fund | | | 97.48 | % |
High Dividend Fund | | | 93.24 | % |
LargeCap Dividend Fund | | | 98.74 | % |
LargeCap Value Fund | | | 85.46 | % |
MidCap Dividend Fund | | | 71.40 | % |
MidCap Earnings Fund | | | 86.18 | % |
SmallCap Dividend Fund | | | 72.06 | % |
SmallCap Earnings Fund | | | 78.15 | % |
Total Dividend Fund | | | 94.86 | % |
Total Earnings Fund | | | 86.67 | % |
U.S. Quality Dividend Growth Fund | | | 94.98 | % |
U.S. SmallCap Quality Dividend Growth Fund | | | 86.60 | % |
| | |
| 146 | | WisdomTree Domestic Earnings and Dividend Funds |
General Information (unaudited)
Proxy Voting Policies, Procedures and Record
A complete copy of the Proxy Voting Policy may be obtained by calling 1-866-909-WISE (9473) or writing to: WisdomTree Trust, c/o Foreside Fund Services, LLC, Three Canal Plaza Suite 100, Portland, ME, 04101.
The Trust is required to disclose annually the Funds’ complete proxy voting record on Form N-PX covering the most recent 12-month period ended June 30 and to file Form N-PX with the SEC no later than August 31 of each year. The current Form N-PX for the Funds is available at no charge upon request by calling 1-866-909-WISE (9473) or through the Trust’s website at www.wisdomtree.com. The Funds’ Form N-PX is also available on the SEC’s website at www.sec.gov.
Shareholder Reports and Quarterly Portfolio Disclosure
The Funds are required to file their complete schedule of portfolio holdings with the SEC for their first and third fiscal quarters on Form N-Q. Copies of the filings are available, without charge, on the SEC’s website at www.sec.gov and are also available by calling the Trust at 1-866-909-WISE (9473). You can also obtain copies of Form N-Q by (i) visiting the SEC’s Public Reference Room in Washington, DC (information on the operation of the Public Reference Room may be obtained by calling 1-800-SEC-0330); (ii) sending your request and a duplicating fee to the SEC’s Public Reference Room, Washington, DC 20549-0102; or (iii) sending your request electronically to publicinfo@sec.gov.
Information about each Fund’s portfolio holdings is available daily, without charge, at www.wisdomtree.com.
The Statement of Additional Information (“SAI”) has additional information about the Funds’ Trustees and Officers and is available without charge upon request. Contact your financial representative for a free prospectus or SAI.
Frequency Distribution of Discounts & Premiums
Information about differences between the per share net asset value of each Fund and the market trading price of shares of each Fund are available, without charge, at www.wisdomtree.com
| | | | |
| WisdomTree Domestic Earnings and Dividend Funds | | | 147 | |
The WisdomTree Family of Funds
The following is a list of WisdomTree Funds being offered, along with their respective ticker symbols, as of March 31, 2016:
| | |
WisdomTree Domestic Earnings and Dividend Funds WisdomTree Dividend ex-Financials Fund (DTN) WisdomTree Earnings 500 Fund (EPS) WisdomTree High Dividend Fund (DHS) WisdomTree LargeCap Dividend Fund (DLN) WisdomTree LargeCap Value Fund (EZY) WisdomTree MidCap Dividend Fund (DON) WisdomTree MidCap Earnings Fund (EZM) WisdomTree SmallCap Dividend Fund (DES) WisdomTree SmallCap Earnings Fund (EES) WisdomTree Total Dividend Fund (DTD) WisdomTree Total Earnings Fund (EXT) WisdomTree U.S. Quality Dividend Growth Fund (DGRW) WisdomTree U.S. SmallCap Quality Dividend Growth Fund (DGRS) WisdomTree Developed World ex-U.S. and Currency Hedged Equity Funds WisdomTree Australia Dividend Fund (AUSE) WisdomTree Dynamic Currency Hedged Europe Equity Fund (DDEZ) WisdomTree Dynamic Currency Hedged International Equity Fund (DDWM) WisdomTree Dynamic Currency Hedged International SmallCap Equity Fund (DDLS) WisdomTree Dynamic Currency Hedged Japan Equity Fund (DDJP) WisdomTree Europe Hedged Equity Fund (HEDJ) WisdomTree Europe Hedged SmallCap Equity Fund (EUSC) WisdomTree Europe Local Recovery Fund (EZR) WisdomTree Europe Quality Dividend Growth Fund (EUDG) WisdomTree Europe SmallCap Dividend Fund (DFE) WisdomTree Germany Hedged Equity Fund (DXGE) WisdomTree Global ex-U.S. Hedged Dividend Fund (DXUS) WisdomTree Global ex-U.S. Hedged Real Estate Fund (HDRW) WisdomTree Global Hedged SmallCap Dividend Fund (HGSD) WisdomTree International Dividend ex-Financials Fund (DOO) WisdomTree International Equity Fund (DWM) WisdomTree International Hedged Equity Fund (HDWM) WisdomTree International Hedged Quality Dividend Growth Fund (IHDG) WisdomTree International Hedged SmallCap Dividend Fund (HDLS) WisdomTree International High Dividend Fund (DTH) WisdomTree International LargeCap Dividend Fund (DOL) WisdomTree International MidCap Dividend Fund (DIM) WisdomTree International SmallCap Dividend Fund (DLS) WisdomTree Japan Hedged Capital Goods Fund (DXJC) WisdomTree Japan Hedged Equity Fund (DXJ) WisdomTree Japan Hedged Financials Fund (DXJF) WisdomTree Japan Hedged Health Care Fund (DXJH) WisdomTree Japan Hedged Quality Dividend Growth Fund (JHDG) WisdomTree Japan Hedged Real Estate Fund (DXJR) WisdomTree Japan Hedged SmallCap Equity Fund (DXJS) WisdomTree Japan Hedged Tech, Media and Telecom Fund (DXJT) WisdomTree Japan Quality Dividend Growth Fund (JDG) WisdomTree Japan SmallCap Dividend Fund (DFJ) WisdomTree Korea Hedged Equity Fund (DXKW) WisdomTree United Kingdom Hedged Equity Fund (DXPS) | | WisdomTree Global/Global ex-U.S. and Emerging/Frontier Markets WisdomTree Asia Pacific ex-Japan Fund (AXJL) WisdomTree China ex-State-Owned Enterprises Fund (CXSE) WisdomTree Commodity Country Equity Fund (CCXE) WisdomTree Emerging Markets Consumer Growth Fund (EMCG) WisdomTree Emerging Markets ex-State-Owned Enterprises Fund (XSOE) WisdomTree Emerging Markets High Dividend Fund (DEM) WisdomTree Emerging Markets Quality Dividend Growth Fund (DGRE) WisdomTree Emerging Markets SmallCap Dividend Fund (DGS) WisdomTree Global ex-U.S. Quality Dividend Growth Fund (DNL) WisdomTree Global ex-U.S. Real Estate Fund (DRW) WisdomTree Global ex-U.S. Utilities Fund (DBU) WisdomTree Global High Dividend Fund (DEW) WisdomTree Global Natural Resources Fund (GNAT) WisdomTree Global SmallCap Dividend Fund (GSD) WisdomTree India Earnings Fund (EPI) WisdomTree Middle East Dividend Fund (GULF) WisdomTree Dollar Sensitive Equity Funds WisdomTree Strong Dollar Emerging Markets Equity Fund (EMSD) WisdomTree Strong Dollar U.S. Equity Fund (USSD) WisdomTree Weak Dollar U.S. Equity Fund (USWD) WisdomTree Currency Strategy Funds WisdomTree Bloomberg U.S. Dollar Bullish Fund (USDU) WisdomTree Brazilian Real Strategy Fund (BZF) WisdomTree Chinese Yuan Strategy Fund (CYB) WisdomTree Commodity Currency Strategy Fund (CCX) WisdomTree Emerging Currency Strategy Fund (CEW) WisdomTree Indian Rupee Strategy Fund (ICN) WisdomTree Fixed Income Funds WisdomTree Asia Local Debt Fund (ALD) WisdomTree Australia & New Zealand Debt Fund (AUNZ) WisdomTree Barclays U.S. Aggregate Bond Enhanced Yield Fund (AGGY) WisdomTree Barclays U.S. Aggregate Bond Negative Duration Fund (AGND) WisdomTree Barclays U.S. Aggregate Bond Zero Duration Fund (AGZD) WisdomTree Bloomberg Floating Rate Treasury Fund (USFR) WisdomTree BofA Merrill Lynch High Yield Bond Negative Duration Fund (HYND) WisdomTree BofA Merrill Lynch High Yield Bond Zero Duration Fund (HYZD) WisdomTree Emerging Markets Corporate Bond Fund (EMCB) WisdomTree Emerging Markets Local Debt Fund (ELD) WisdomTree Japan Interest Rate Strategy Fund (JGBB) WisdomTree Strategic Corporate Bond Fund (CRDT) WisdomTree Western Asset Unconstrained Bond Fund (UBND) WisdomTree Alternative Funds WisdomTree CBOE S&P 500 PutWrite Strategy Fund (PUTW) WisdomTree Coal Fund (TONS) WisdomTree Continuous Commodity Index Fund (GCC) WisdomTree Dynamic Bearish U.S. Equity Fund (DYB) WisdomTree Dynamic Long/Short U.S. Equity Fund (DYLS) WisdomTree Global Real Return Fund (RRF) WisdomTree Managed Futures Strategy Fund (WDTI) |
The WisdomTree Funds are exchange traded funds (“ETFs”) registered with the United States Securities and Exchange Commission as separate series (“Funds”) of WisdomTree Trust (“Trust”). WisdomTree Asset Management, Inc., a wholly owned subsidiary of WisdomTree Investments, Inc., serves as the investment adviser to the Trust. None of the WisdomTree entities are affiliated with Foreside Fund Services, LLC, the Funds’ distributor. WisdomTree Investments, its affiliates and their independent providers are not liable for any informational errors, incompleteness, delays, or for any actions taken in reliance on information contained herein.
Investors should consider the investment objectives, risks, charges and expenses of the Funds carefully before investing. A prospectus, containing this and other information, is available at www.wisdomtree.com, or by calling 1-866-909-WISE (9473). Investors should read the prospectus carefully before investing. There are risks associated with investing, including possible loss of principal. Past performance does not guarantee future results. Indexes are unmanaged and you cannot invest directly in an index.
There are risks associated with investing, including possible loss of principal. Funds focusing their investments on certain sectors and/or smaller companies increase their vulnerability to any single economic or regulatory development. This may result in greater share price volatility. Due to the investment strategy of certain Funds they may make higher capital gain distributions than other ETFs. Please read the Fund’s prospectus for specific details regarding the Fund’s risk profile.
Transactions in Fund shares will result in brokerage commissions and will generate tax consequences. Shares may be sold through brokerage accounts, but may be redeemed from the Funds only in large amounts of 50,000 shares or more.
WisdomTree Trust
245 Park Avenue, 35th Floor
New York, NY 10167
WisdomTree Domestic Earnings and Dividend Funds
WisdomTree Dividend ex-Financials Fund (DTN)
WisdomTree Earnings 500 Fund (EPS)
WisdomTree High Dividend Fund (DHS)
(formerly, WisdomTree Equity Income Fund)
WisdomTree LargeCap Dividend Fund (DLN)
WisdomTree LargeCap Value Fund (EZY)
WisdomTree MidCap Dividend Fund (DON)
WisdomTree MidCap Earnings Fund (EZM)
WisdomTree SmallCap Dividend Fund (DES)
WisdomTree SmallCap Earnings Fund (EES)
WisdomTree Total Dividend Fund (DTD)
WisdomTree Total Earnings Fund (EXT)
WisdomTree U.S. Quality Dividend Growth Fund (DGRW)
(formerly, WisdomTree U.S. Dividend Growth Fund)
WisdomTree U.S. SmallCap Quality Dividend Growth Fund (DGRS)
(formerly, WisdomTree U.S. SmallCap Dividend Growth Fund)
WisdomTree Fund shares are distributed by Foreside Fund Services, LLC, in the U.S. only.
WTGM-1421
Item 2. Code of Ethics.
| | (a) | The registrant, as of the end of the period covered by this report, has adopted a code of ethics that applies to the registrant’s principal executive officer, principal financial officer, principal accounting officer or controller, or persons performing similar functions, regardless of whether these individuals are employed by the registrant or a third party. |
| | (c) | There have been no amendments, during the period covered by this report, to a provision of the code of ethics that applies to the registrant’s principal executive officer, principal financial officer, principal accounting officer or controller, or persons performing similar functions, regardless of whether these individuals are employed by the registrant or a third party, and that relates to any element of the code of ethics description. |
| | (d) | The registrant has not granted any waivers, including an implicit waiver, from a provision of the code of ethics that applies to the registrant’s principal executive officer, principal financial officer, principal accounting officer or controller, or persons performing similar functions, regardless of whether these individuals are employed by the registrant or a third party, that relates to one or more of the items set forth in paragraph (b) of this item’s instructions. |
| | (f) | The code of ethics is attached hereto as exhibit 12(a)(1). |
Item 3. Audit Committee Financial Expert.
The Registrant’s Board of Trustees has determined that the Registrant has one audit committee financial expert, as that term is defined under Item 3(b) and 3(c), serving on its audit committee. The audit committee financial expert serving on the Registrant’s audit committee is David Chrencik, who is an independent Trustee of the Trust, as that term is defined under Item 3(a) (2).
Item 4. Principal Accountant Fees and Services.
Audit Fees
| | (a) | The aggregate fees billed for each of the last two fiscal years for professional services rendered by the principal accountant for the audit of the registrant’s annual financial statements or services that are normally provided by the accountant in connection with statutory and regulatory filings or engagements for those fiscal years are $1,443,613 for 2016 and $1,265,915 for 2015. |
Audit-Related Fees
| | (b) | The aggregate fees billed in each of the last two fiscal years for assurance and related services by the principal accountant that are reasonably related to the performance of the audit of the registrant’s financial statements and are not reported under paragraph (a) of this Item are $152,847 for 2016 and $118,935.83 for 2015. |
Tax Fees
| | (c) | The aggregate fees billed in each of the last two fiscal years for professional services rendered by the principal accountant for tax compliance, tax advice, and tax planning are $475,875 for 2016 and $443,414 for 2015. |
All Other Fees
| | (d) | The aggregate fees billed in each of the last two fiscal years for products and services provided by the principal accountant, other than the services reported in paragraphs (a) through (c) of this Item are $0 for 2016 and $0 for 2015. |
| | (e)(1) | Disclose the audit committee’s pre-approval policies and procedures described in paragraph (c)(7) of Rule 2-01 of Regulation S-X. |
Per Rule 2-01(c) (7) (A), the Registrant’s audit committee charter provides that the audit committee shall select and approve in advance the retention of independent accountants to annually audit and provide their opinion on the Registrant’s financial statements. The audit committee must also approve prior to appointment the engagement of the principal accountant to provide other audit services to the Registrant or to provide non-audit services to the Registrant, its investment adviser, or any entity controlling, controlled by, or under common control with its investment adviser (“adviser/affiliate”) that provides ongoing services to the Registrant, if the engagement by the investment adviser or adviser affiliate relates directly to the operations and financial reporting of the Registrant. The audit committee must also, prior to appointment of the engagement of the principal accountant, review and approve the fees proposed to be charged to the Registrant by the auditors for each audit and non-audit service. The audit committee must also consider whether non-audit services provided by the Registrant’s principal accountant to the Registrant’s investment adviser, or adviser/affiliate that provides ongoing services to the Trust are compatible with maintaining the auditor’s independence.
| | (e)(2) | The Registrant’s Audit committee has approved 100% of services described in each of Items 4(b) through (d) pursuant to paragraph (c)(7)(i)(C) of Rule 2-01 of Regulation S-X. |
| | (f) | The percentage of hours expended on the principal accountant’s engagement to audit the registrant’s financial statements for the most recent fiscal year that were attributed to work performed by persons other than the principal accountant’s full-time, permanent employees was 0%. |
| | (g) | The aggregate non-audit fees billed by the registrant’s accountant for services rendered to the registrant, and rendered to the registrant’s investment adviser (not including any sub-adviser whose role is primarily portfolio management and is subcontracted with or overseen by another investment adviser), and any entity controlling, controlled by, or under common control with the adviser that provides ongoing services to the registrant for each of the last two fiscal years of the registrant was $513,212.29 for 2016 and $691,995 for 2015. |
Item 5. Audit Committee of Listed registrants.
The Registrant is an issuer as defined in Rule 10A-3 under the Exchange Act and has a separately-designated standing audit committee established in accordance with Section 3(a) (58)A of the Exchange Act. The Registrant’s audit committee members are David Chrencik, Melinda Raso Kirstein and Victor Ugolyn.
Item 6. Investments.
| (a) | Schedule of Investments in securities of unaffiliated issuers as of the close of the reporting period is included as part of the report to shareholders filed under Item 1 of this form. |
Item 7. Disclosure of Proxy Voting Policies and Procedures for Closed-End Management Investment Companies.
Not applicable.
Item 8. Portfolio Managers of Closed-End Management Investment Companies.
Not applicable.
Item 9. Purchases of Equity Securities by Closed-End Management Investment Company and Affiliated Purchasers.
Not applicable.
Item 10. Submission of Matters to a Vote of Security Holders.
There have been no material changes to the procedures by which the shareholders may recommend nominees to the registrant’s board of directors, where those changes were implemented after the registrant last provided disclosure in response to the requirements of Item 407(c)(2)(iv) of Regulation S-K (17 CFR 229.407) (as required by Item 22(b)(15) of Schedule 14A (17 CFR 240.14a-101)), or this Item.
Item 11. Controls and Procedures.
| | (a) | The registrant’s principal executive and principal financial officers, or persons performing similar functions, have concluded that the registrant’s disclosure controls and procedures (as defined in Rule 30a-3(c) under the Investment Company Act of 1940, as amended (the “1940 |
| | Act”) (17 CFR 270.30a-3(c))) are effective, as of a date within 90 days of the filing date of the report that includes the disclosure required by this paragraph, based on their evaluation of these controls and procedures required by Rule 30a-3(b) under the 1940 Act (17 CFR 270.30a-3(b)) and Rules 13a-15(b) or 15d-15(b) under the Securities Exchange Act of 1934, as amended (17 CFR 240.13a-15(b) or 240.15d-15(b)). |
| | (b) | There were no changes in the registrant’s internal control over financial reporting (as defined in Rule 30a-3(d) under the 1940 Act (17 CFR 270.30a-3(d)) that occurred during the registrant’s second fiscal quarter of the period covered by this report that has materially affected, or is reasonably likely to materially affect, the registrant’s internal control over financial reporting. |
Item 12. Exhibits.
| | | | |
| | (a)(1) | | Code of ethics, or any amendment thereto, that is the subject of disclosure required by Item 2 is attached hereto. |
| | |
| | (a)(2) | | Certifications pursuant to Rule 30a-2(a) under the 1940 Act and Section 302 of the Sarbanes-Oxley Act of 2002 are attached hereto. |
| | |
| | (a)(3) | | Not applicable. |
| | |
| | (b) | | Certifications pursuant to Rule 30a-2(b) under the 1940 Act and Section 906 of the Sarbanes-Oxley Act of 2002 are attached hereto. |
SIGNATURES
Pursuant to the requirements of the Securities Exchange Act of 1934 and the Investment Company Act of 1940, the registrant has duly caused this report to be signed on its behalf by the undersigned, thereunto duly authorized.
| | | | |
| (Registrant) | | WisdomTree Trust | | |
| | | | |
| By (Signature and Title) | | /s/ Jonathan L. Steinberg | | |
| | Jonathan L. Steinberg, President | | |
| | (principal executive officer) | | |
Date: June 6, 2016
Pursuant to the requirements of the Securities Exchange Act of 1934 and the Investment Company Act of 1940, this report has been signed below by the following persons on behalf of the registrant and in the capacities and on the dates indicated.
| | | | |
| By (Signature and Title) | | /s/ Jonathan L. Steinberg | | |
| | Jonathan L. Steinberg, President | | |
| | (principal executive officer) | | |
Date: June 6, 2016
| | | | |
| By (Signature and Title) | | /s/ David Castano | | |
| | David Castano, Treasurer | | |
| | (principal financial officer) | | |
Date: June 6, 2016