Table of Contents
UNITED STATES
SECURITIES AND EXCHANGE COMMISSION
Washington, D.C. 20549
FORM N-CSR
CERTIFIED SHAREHOLDER REPORT OF REGISTERED
MANAGEMENT INVESTMENT COMPANIES
Investment Company Act file number 811-21864
WisdomTree Trust
(Exact name of registrant as specified in charter)
230 Park Avenue
New York, NY 10169
(Address of principal executive offices) (Zip code)
The Corporation Trust Company
1209 Orange Street
Wilmington, DE 19801
(Name and address of agent for service)
Registrant’s telephone number, including area code: (866) 909-9473
Date of fiscal year end: August 31
Date of reporting period: August 31, 2021
Form N-CSR is to be used by management investment companies to file reports with the Commission not later than 10 days after the transmission to stockholders of any report that is required to be transmitted to stockholders under Rule 30e-1 under the Investment Company Act of 1940 (17 CFR 270.30e-1). The Commission may use the information provided on Form N-CSR in its regulatory, disclosure review, inspection, and policymaking roles.
A registrant is required to disclose the information specified by Form N-CSR, and the Commission will make this information public. A registrant is not required to respond to the collection of information contained in Form N-CSR unless the Form displays a currently valid Office of Management and Budget (“OMB”) control number. Please direct comments concerning the accuracy of the information collection burden estimate and any suggestions for reducing the burden to Secretary, Securities and Exchange Commission, 100 F Street, NE, Washington, DC 20549. The OMB has reviewed this collection of information under the clearance requirements of 44 U.S.C. § 3507.
Table of Contents
Item 1. Reports to Stockholders.
| (a) | The Reports to Shareholders are attached hereto. |
| (b) | Not Applicable. |
Table of Contents


WisdomTree Trust
Annual Report
August 31, 2021
Currency Strategy Funds:
WisdomTree Bloomberg U.S. Dollar Bullish Fund (USDU)
WisdomTree Chinese Yuan Strategy Fund (CYB)
WisdomTree Emerging Currency Strategy Fund (CEW)
Fixed Income Funds:
WisdomTree Emerging Markets Corporate Bond Fund (EMCB)
WisdomTree Emerging Markets Local Debt Fund (ELD)
WisdomTree Floating Rate Treasury Fund (USFR)
WisdomTree Interest Rate Hedged High Yield Bond Fund (HYZD)
WisdomTree Interest Rate Hedged U.S. Aggregate Bond Fund (AGZD)
WisdomTree Mortgage Plus Bond Fund (MTGP)
WisdomTree Yield Enhanced U.S. Aggregate Bond Fund (AGGY)
WisdomTree Yield Enhanced U.S. Short-Term Aggregate Bond Fund (SHAG)
Alternative Funds:
WisdomTree Alternative Income Fund (HYIN)
WisdomTree CBOE S&P 500 PutWrite Strategy Fund (PUTW)
WisdomTree Enhanced Commodity Strategy Fund (GCC)
WisdomTree Managed Futures Strategy Fund (WTMF)
Table of Contents
| 1 | ||||
Information about Performance and Shareholder Expense Examples (unaudited) | 4 | |||
| 5 | ||||
| 20 | ||||
| Schedules of Investments | ||||
| 26 | ||||
| 28 | ||||
| 30 | ||||
| 32 | ||||
| 37 | ||||
| 41 | ||||
| 42 | ||||
| 49 | ||||
| 76 | ||||
| 79 | ||||
WisdomTree Yield Enhanced U.S. Short-Term Aggregate Bond Fund | 111 | |||
| 120 | ||||
| 121 | ||||
| 122 | ||||
| 125 | ||||
| 127 | ||||
| 130 | ||||
| 134 | ||||
| 140 | ||||
| 149 | ||||
| 168 | ||||
Approval of Investment Advisory and Sub-Advisory Agreements (unaudited) | 170 | |||
| 173 | ||||
| 174 | ||||
| 176 | ||||
| 177 | ||||
“WisdomTree” is a registered mark of WisdomTree Investments, Inc. and is licensed for use by the WisdomTree Trust.
Table of Contents
(unaudited)
Global equity markets, as measured by the MSCI ACWI Index, returned 28.64% in U.S. dollar terms for the 12-month period ending August 31, 2021. Over the same period, U.S. equities, measured by the S&P 500 Index, returned 31.17%. Internationally, the MSCI EAFE Index, which represents equity markets in the developed world outside the U.S. and Canada, returned 26.65% in U.S. dollar terms. Within emerging markets, the MSCI Emerging Markets Index returned 21.12% in U.S. dollar terms over the same period.
Equity performance was mixed over the 12-month period. Markets were optimistic from the beginning of the fiscal year through the end of 2020 as global economies continued their recovery from the novel coronavirus (“COVID-19”) pandemic. Early in 2021, investors became more discerning as a number of headline risks related to COVID-19 infections, geopolitics, and central bank policy materialized in the various regions. These sentiments had material impacts for the fixed income, commodity, currency, and options markets.
The Bloomberg U.S. Aggregate Bond Index, a measurement of broad U.S. fixed income, returned 0.15% over the fiscal year, while the Bloomberg Commodity Index, representing global commodity activity, returned 31.00%. Foreign exchange performance over the 12-month period was also mixed, with the U.S. dollar strengthening and weakening against several developed and emerging market currencies. Fluctuations in currency markets were often directly tied to local monetary policy activity as well as each country’s trajectory of economic recovery. The CBOE® Volatility Index (VIX®), which measures options market positioning as a proxy for volatility, steadily declined over the fiscal year but exhibited brief spikes coinciding with major headline risks.
The remaining four months of 2020 exhibited much of the same economic recovery that began to materialize in the late-spring months, after the onset of the COVID-19 pandemic. With monetary policy around the world remaining firmly accommodative, investors continued their return to equity investing, sending global markets higher. Despite intermittent bouts of volatility, markets were generally calm as economic data improved but not such to suggest the threat of an imminent slowdown.
Late in the year, markets were also catalyzed by the results of the U.S. presidential election and the initial announcement of a vaccine to counteract COVID-19. The former event was a tailwind for U.S. markets, as the Biden administration’s plans for new infrastructure policy was additive for the cyclical economy. For investors, it also marked the perceived return to diplomatic relationships and coordinated global cooperation with the rest of the world. Unlike his predecessor, President Biden and his administration were keen on reestablishing diplomatic ties and rebuilding relationships that had deteriorated under the previous administration.
The vaccine announcement was bigger news, however, as it seemed to finally be the world’s ticket out of the pandemic. Investors piled more money into equities, sending global markets higher, in an effort to participate in the economic reopening.
The beginning of 2021 continued with much of the same optimism that concluded 2020. As equity markets continued higher on the back of vaccine approval and distributions, fixed income markets continued to suffer at the expense of the equity rally. The 10-year U.S. Treasury yield, which had already risen about 25 basis points off its lows at the start of the fiscal year, continued to rise to roughly 1.7% by the end of the first quarter of 2021. The U.S. dollar also strengthened against a basket of international currencies on the back of the rosier economic growth outlook and improved yields in fixed income. Commodity markets surged higher from the start of the calendar year, as the prospect of a global economic reopening supported prices that had been suppressed for much of 2020 after nearly a year of economic inactivity and diminished production.
Meanwhile, global economic data continued to improve and markets began to digest the possibility that more contractionary monetary and fiscal policies may be needed to quell overheating economies and rising inflation sooner than expected. Global equities continued to move higher, but investors became more discerning as they assessed the specific risks to each region.
| WisdomTree Trust | 1 |
Table of Contents
Market Environment Overview
(unaudited) (continued)
In the U.S., inflationary pressures were top of mind but combatted with the fear that the improved economic outlook was too good to be true and would surely slow after the initial economic reopening. Because of this, investors’ eyes were focused on the U.S. Federal Reserve (“Fed”), looking to interpret any action (or inaction) as a sign of either continued accommodative monetary policy, or a hawkish pivot. More people continued to get vaccinated, which was additive for the cyclical economy that had been beaten down last year, but the U.S. continued to grapple with intermittent increases in COVID-19 infections, largely in areas of the country where vaccination rates were lowest. U.S. politics also presented challenges as well, as it became clear that U.S. Congress was bitterly divided and would face a number of hurdles in an effort to pass President Biden’s ambitious economic agenda.
In the developed international region, markets performed inline with the COVID-19 landscape. Those countries that were able to approve, secure and distribute vaccines most efficiently marched further toward a complete economic reopening. Those that lagged in the vaccination effort seemed to stagnate. In the late-spring and early-summer months of 2021, vaccination rates began to quickly improve in Europe and Japan, which provided a much-needed tailwind for both regions. Economic data continued to improve, though investors were confident the recovery still had a long way to go and therefore did not have much concern about restrictive fiscal and monetary policy pivots in the near-term.
Emerging markets were less fortunate. Certain areas grappled with rising COVID-19 infections, most notably India, Brazil and southeast Asia, while the region as a whole struggled to acquire and distribute vaccines like its developed market peers. Despite this, the Indian market continued to perform well amid the impact of COVID-19 and political tensions throughout the nation. Emerging markets continued higher on the back of accommodative global monetary policy, particularly within the U.S., and investors’ renewed risk appetite.
However, the outlook for emerging markets shifted in the summer months of 2021 with issues centering on China. Investors began to digest the reality that the U.S. political system under President Biden would be neither more friendly nor as constructive with China as they had hoped. Antipathy was common in U.S. Congress and across political parties. Relations between the U.S. and the largest emerging market economy continued to be marked by tension, stagnation, and remained on less favorable terms.
Meanwhile, Chinese markets had issues of their own through the end of the fiscal period. The biggest headwind was a shift in economic attitude from the Chinese Communist Party, led by President Xi Jinping. While China had historically been a market-friendly economy, despite being nominally communist, Chinese President Jinping and his underlings in government began to express distaste for the excessive wealth and influence that many of the nation’s most successful businesses and entrepreneurs began to accumulate. In a dramatic shift, government officials began to mandate several new policies that threatened the growth potential and profitability of many of China’s biggest companies, a sentiment which weighed heavily on emerging markets and erased much of 2021’s gains. These included limitations on profit-seeking, public listing of equity, and monopolization.
Concluding the 12-month fiscal period, global financial markets were generally stable, but many of the outsized gains witnessed across asset classes were in the rearview mirror. Global equities continued to oscillate with idiosyncratic risks related to geopolitics, monetary policy, and economic disruptions in connection with COVID-19 infections. The U.S. and China have embodied these issues significantly. The latter is now seeing signs of an economic slowdown despite remaining unscathed since the start of the pandemic. After the rapid, global economic improvement earlier this year, fixed income yields were rangebound with the 10-year U.S. Treasury yield remaining between roughly 1.20%-1.50%. Spreads remained at historically tight levels in corporate credit. Neither indicator may move very much until decisive actions are taken by the Fed. Currency performance was mixed, but the U.S. dollar continued to strengthen against international currencies
| 2 | WisdomTree Trust |
Table of Contents
Market Environment Overview
(unaudited) (concluded)
during the summer of 2021 after weakening briefly in the spring of 2021. Commodities stagnated late during the fiscal period and remain tied to the overall economic growth outlook. Volatility implied by the VIX® remained low despite intermittent spikes.
Each WisdomTree Fund’s performance as set forth in “Management’s Discussion of Funds’ Performance” in the pages that follow should also be viewed in light of the foregoing market environment.
| WisdomTree Trust | 3 |
Table of Contents
Information about Performance and Shareholder Expense Examples (unaudited)
Performance
The performance tables on the following pages are provided for comparative purposes and represent the period noted. Each Fund’s per share net asset value (“NAV”) is the value of one share of the Fund and is calculated by dividing the value of total assets less total liabilities by the number of shares outstanding. The NAV return is based on the NAV of the Fund and the market price return is based on the market price per share of the Fund. The price used to calculate market price returns is the midpoint of the bid and ask price for Fund shares as of the close of trading on the exchange where Fund shares are listed. NAV and market price returns assume that dividends and capital gain distributions have been reinvested in the Fund at NAV and market price, respectively. As with other exchange traded funds (“ETFs”), NAV returns and market price returns may differ because of factors such as the supply and demand for Fund shares and investors’ assessments of the underlying value of a Fund’s portfolio securities.
Fund shares are bought and sold at market price (not NAV) and are not individually redeemed from a Fund. Fund NAV returns are calculated using a Fund’s daily 4:00 p.m. eastern time NAV. Market price returns reflect the midpoint of the bid and ask price as of the close of trading on the exchange where Fund shares are listed. Market price returns do not represent the returns you would receive if you traded shares at other times. The returns do not reflect the deduction of taxes that a shareholder would pay on Fund distributions or on the redemption of Fund shares. Total returns for a period of less than one year are cumulative.
Performance is historical and does not guarantee future results. Current performance may be lower or higher than quoted. Investment returns and the principal value of an investment will fluctuate so that an investor’s shares, when redeemed, may be worth more or less than their original cost.
An index is a statistical measure of a specified financial market or sector. An index does not actually hold a portfolio of securities, incur expenses or pay any transaction costs. Therefore, index returns do not reflect deductions for fees or expenses and an index is not available for direct investment. In comparison, the Funds’ performance is negatively impacted by these deductions. Fund returns do not reflect brokerage commissions or taxes on transactions in Fund shares or taxes that a shareholder would pay on Fund distributions. Past performance is no guarantee of future results. For the most recent month-end performance information visit www.wisdomtree.com.
Shareholder Expense Examples
Each Fund’s performance table is accompanied by a shareholder expense example. As a shareholder of a WisdomTree Fund, you incur two types of cost: (1) transaction costs, including brokerage commissions on purchases and sales of your Fund shares and (2) ongoing costs, including management fees and other Fund expenses. The examples are intended to help you understand your ongoing costs (in dollars and cents) of investing in a Fund and to compare these costs with the ongoing costs of investing in other funds.
The examples are based on an investment of $1,000 invested at the beginning of the period and held for the entire period from March 1, 2021 to August 31, 2021. Except where noted, expenses are calculated using each Fund’s annualized expense ratio (after the effect of contractual or voluntary fee waivers, if any), multiplied by the average account value for the period, multiplied by 184/365 (to reflect the one-half year period). The annualized expense ratio does not include acquired fund fees and expenses (“AFFEs”), which are fees and expenses incurred indirectly by a Fund through its investments in certain underlying investment companies.
Actual expenses
The first line in the shareholder expense example table shown on the following pages provides information about actual account values and actual expenses. You may use the information in this line, together with the amount you invested, to estimate the expenses that you paid over the period. Simply divide your account value by $1,000 (for example, an $8,600 account value divided by $1,000 = 8.6), then multiply the result by the number in the first line for your Fund under the heading entitled “Expenses Paid During the Period” to estimate the expenses you paid on your account during the period.
Hypothetical example for comparison purposes
The second line in the shareholder expense example table shown on the following pages provides information about hypothetical account values and hypothetical expenses based on the Fund’s actual expense ratio and an assumed rate of return of 5% per year before expenses, which is not the Fund’s actual return. The hypothetical account values and expenses may not be used to estimate the actual ending account balance or expenses you paid for the period. You may use this information to compare the ongoing costs of investing in your Fund and other funds. To do so, compare this 5% hypothetical example with the 5% hypothetical examples that appear in the shareholder reports of the other funds.
Please note that the expenses shown in the table are meant to highlight your ongoing costs only and do not reflect any transactional costs, such as brokerage commissions paid on purchases and sales of Fund shares. Therefore, the second line in the table is useful in comparing ongoing Fund costs only and will not help you determine the relative total costs of owning different funds. In addition, if these transactional costs were included, your costs would have been higher.
| 4 | WisdomTree Trust |
Table of Contents
Management’s Discussion of Funds’ Performance
as of August 31, 2021 (unaudited)
WisdomTree Bloomberg U.S. Dollar Bullish Fund (USDU)
Investment Breakdown†
| Investment Type | % of Net Assets | |||
U.S. Government Obligations | 94.9% | |||
Exchange-Traded Funds | 4.1% | |||
Other Assets less Liabilities‡ | 1.0% | |||
Total | 100.0% | |||
| † | The Fund’s investment breakdown may change over time. It does not include derivatives (if any). |
| ‡ | Other assets less liabilities may include investment of cash collateral for securities on loan and/or receivables/payables on derivatives (if any). |
Top Holdings*
| Description | % of Net Assets | |||
U.S. Treasury Bill, | 24.5% | |||
U.S. Treasury Bill, | 24.0% | |||
U.S. Treasury Bill, | 24.0% | |||
U.S. Treasury Bill, | 22.4% | |||
WisdomTree Floating Rate Treasury Fund (USFR)^ | 4.1% | |||
| * | The largest holdings are subject to change, and there are no guarantees the Fund will remain invested in any particular security. Excludes derivatives and investment of cash collateral for securities on loan (if any). |
| ^ | For a full list of holdings information for the underlying WisdomTree fund, please see page 41 of this report. |
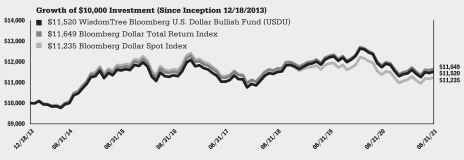
The WisdomTree Bloomberg U.S. Dollar Bullish Fund (the “Fund”) seeks to provide total returns, before fees and expenses, that exceed the performance of the Bloomberg Dollar Total Return Index (the “Index”). The Fund seeks to achieve its investment objective by investing in short-term securities and instruments designed to potentially benefit as the U.S. dollar appreciates in value relative to a basket of global currencies. Although the Fund invests in short-term, investment grade instruments, the Fund is not a “money market” fund and it is not the objective of the Fund to maintain a constant share price.
The Fund returned -1.85% at net asset value (“NAV”) for the fiscal year ended August 31, 2021 (for more complete performance information please see the table below). Currency market performance was mixed during the fiscal year, with the U.S. dollar exhibiting periods of outperformance and underperformance versus a basket of global currencies. Overall, the Fund’s use of derivatives to gain long exposure to the U.S. dollar measured against a basket of global currencies detracted from performance during the fiscal year as the U.S. dollar weakened relative to the Fund’s exposures to global currencies. Likewise, interest rates in the U.S. Treasury market began to increase after a prolonged period of low rates during 2020. This was partly due to upgraded expectations for economic growth as the outlook for the COVID-19 pandemic improved. Investors migrated out of the U.S. Treasury and fixed income markets, causing rates to rise, as they moved back into equity markets to participate in the growth potential associated with the economic recovery. As the growth outlook also improved in developed and emerging markets, investors increased their equity exposures overseas, which helped support global currencies while intermittently weighing on the U.S. dollar. It finished the fiscal year at roughly the same level but had slightly negative performance due to its U.S. Treasury positioning.
Shareholder Expense Example (for the six-month period ended August 31, 2021)
| Beginning Account Value | Ending Account Value | Annualized Net Expense Ratio | Expenses Paid During the Period | |||||||||||||
Actual | $ | 1,000.00 | $ | 1,006.30 | 0.50 | %1 | $ | 2.53 | ||||||||
Hypothetical (5% return before expenses) | $ | 1,000.00 | $ | 1,022.68 | 0.50 | %1 | $ | 2.55 | ||||||||
| 1 | WisdomTree Asset Management, Inc. voluntarily waives a portion of its advisory fee, that it would otherwise charge, in an amount equal to the acquired fund fees and expenses (“AFFEs”) attributable to the Fund’s investment in the underlying WisdomTree fund. The “Annualized Net Expense Ratio” does not include the impact of AFFEs. |
Performance
| Average Annual Total Return | ||||||||||||||||
| 1 Year | 3 Year | 5 Year | Since Inception1 | |||||||||||||
Fund NAV Returns | -1.85 | % | 0.03 | % | 0.31 | % | 1.85 | % | ||||||||
Fund Market Price Returns | -2.07 | % | 0.03 | % | 0.31 | % | 1.86 | % | ||||||||
Bloomberg Dollar Total Return Index | -1.40 | % | -0.06 | % | 0.22 | % | 2.00 | % | ||||||||
Bloomberg Dollar Spot Index | -1.24 | % | -1.02 | % | -0.70 | % | 1.52 | % | ||||||||
| 1 | Total returns are calculated based on the commencement of Fund trading on the NYSE Arca, Inc. on December 18, 2013. |
Performance is historical and does not guarantee future results. The returns do not reflect the deduction of taxes that a shareholder would pay on Fund distributions or on the redemption of Fund shares.
| WisdomTree Trust | 5 |
Table of Contents
Management’s Discussion of Funds’ Performance
as of August 31, 2021 (unaudited)
WisdomTree Chinese Yuan Strategy Fund (CYB)
Investment Breakdown†
| Investment Type | % of Net Assets | |||
U.S. Government Obligations | 65.4% | |||
Repurchase Agreement | 30.0% | |||
Exchange-Traded Funds | 4.2% | |||
Other Assets less Liabilities‡ | 0.4% | |||
Total | 100.0% | |||
| † | The Fund’s investment breakdown may change over time. It does not include derivatives (if any). |
| ‡ | Other assets less liabilities may include investment of cash collateral for securities on loan and/or receivables/payables on derivatives (if any). |
Top Holdings*
| Description | % of Net Assets | |||
U.S. Treasury Bill, | 33.8 | % | ||
U.S. Treasury Bill, | 31.6 | % | ||
Citigroup, Inc., tri-party repurchase agreement, | 30.0 | % | ||
WisdomTree Floating Rate Treasury Fund (USFR)^ | 4.2 | % | ||
| * | The largest holdings are subject to change, and there are no guarantees the Fund will remain invested in any particular security. Excludes derivatives and investment of cash collateral for securities on loan (if any). |
| †† | Fully collateralized by U.S. Government agency securities. |
| ^ | For a full list of holdings information for the underlying WisdomTree fund, please see page 41 of this report. |
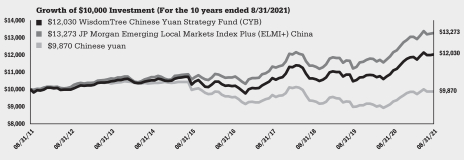
The WisdomTree Chinese Yuan Strategy Fund (the “Fund”) seeks to achieve total returns reflective of both money market rates in China available to foreign investors and changes in value of the Chinese yuan relative to the U.S. dollar. The Fund seeks to achieve its investment objective by investing in short-term securities and instruments designed to provide exposure to Chinese currency and money market rates. The Chinese yuan is a developing market currency, which can experience periods of significant volatility. Although the Fund invests in short-term, investment grade instruments, the Fund is not a “money market” fund and it is not the objective of the Fund to maintain a constant share price.
The Fund returned 8.39% at net asset value (“NAV”) for the fiscal year ended August 31, 2021 (for more complete performance information please see the table below). Global currency market performance was mixed during the fiscal year, but the Chinese yuan steadily appreciated against the U.S. dollar. As a result, the Fund’s use of derivatives to gain exposure to the Chinese yuan contributed positively to Fund performance during the fiscal year as the U.S. dollar weakened overall relative to the Fund’s exposure to the Chinese yuan. Dating back to last year, the Chinese economy was least impacted by the COVID-19 pandemic compared to the rest of the world and even managed to grow despite the global slowdown that defined 2020. That made investors increasingly bullish on China and the Chinese yuan, especially as the economic forecast for the U.S. economy was in doubt until this spring. The U.S. dollar rallied against the Chinese yuan during that brief period, but the Chinese yuan then resurged to continue its outperformance against the U.S. dollar to close the fiscal year. The outperformance of the Chinese yuan and underperformance of the U.S. dollar was also driven by changing investor attitudes impacting the U.S. Treasury market, where rates rose as investors sold their bond positions in order to participate in the economy recovery via the stock market as the economic outlook improved.
Shareholder Expense Example (for the six-month period ended August 31, 2021)
| Beginning Account Value | Ending Account Value | Annualized Net Expense Ratio | Expenses Paid During the Period | |||||||||||||
Actual | $ | 1,000.00 | $ | 1,012.40 | 0.45 | %1 | $ | 2.28 | ||||||||
Hypothetical (5% return before expenses) | $ | 1,000.00 | $ | 1,022.94 | 0.45 | %1 | $ | 2.29 | ||||||||
| 1 | WisdomTree Asset Management, Inc. voluntarily waives a portion of its advisory fee, that it would otherwise charge, in an amount equal to the acquired fund fees and expenses (“AFFEs”) attributable to the Fund’s investment in the underlying WisdomTree fund. The “Annualized Net Expense Ratio” does not include the impact of AFFEs. |
Performance
| Average Annual Total Return | ||||||||||||||||
| 1 Year | 3 Year | 5 Year | 10 Year | |||||||||||||
Fund NAV Returns | 8.39 | % | 4.23 | % | 3.40 | % | 1.87 | % | ||||||||
Fund Market Price Returns | 8.01 | % | 4.35 | % | 3.43 | % | 1.86 | % | ||||||||
JP Morgan Emerging Local Markets Index Plus (ELMI+) China | 9.27 | % | 5.26 | % | 4.43 | % | 2.87 | % | ||||||||
Chinese yuan | 6.20 | % | 1.88 | % | 0.67 | % | -0.13 | % | ||||||||
Performance is historical and does not guarantee future results. The returns do not reflect the deduction of taxes that a shareholder would pay on Fund distributions or on the redemption of Fund shares.
| 6 | WisdomTree Trust |
Table of Contents
Management’s Discussion of Funds’ Performance
as of August 31, 2021 (unaudited)
WisdomTree Emerging Currency Strategy Fund (CEW)
Investment Breakdown†
| Investment Type | % of Net Assets | |||
U.S. Government Obligations | 62.6% | |||
Repurchase Agreement | 31.4% | |||
Exchange-Traded Funds | 4.5% | |||
Other Assets less Liabilities‡ | 1.5% | |||
Total | 100.0% | |||
| † | The Fund’s investment breakdown may change over time. It does not include derivatives (if any). |
| ‡ | Other assets less liabilities may include investment of cash collateral for securities on loan and/or receivables/payables on derivatives (if any). |
Top Holdings*
| Description | % of Net Assets | |||
U.S. Treasury Bill, | 31.9% | |||
Citigroup, Inc., tri-party repurchase agreement, | 31.4% | |||
U.S. Treasury Bill, | 30.7% | |||
WisdomTree Floating Rate Treasury Fund (USFR)^ | 4.5% | |||
| * | The largest holdings are subject to change, and there are no guarantees the Fund will remain invested in any particular security. Excludes derivatives and investment of cash collateral for securities on loan (if any). |
| †† | Fully collateralized by U.S. Government agency securities. |
| ^ | For a full list of holdings information for the underlying WisdomTree fund, please see page 41 of this report. |
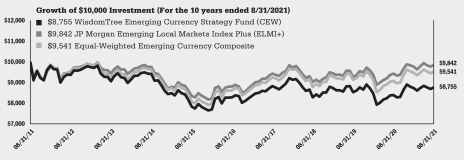
The WisdomTree Emerging Currency Strategy Fund (the “Fund”) seeks to achieve total returns reflective of both money market rates in selected emerging market countries available to foreign investors and changes to the value of these currencies relative to the U.S. dollar. The Fund seeks to achieve its investment objective by investing in short-term securities and instruments designed to provide exposure to the currencies and money market rates of selected emerging market countries. Emerging market currencies can experience periods of significant volatility. Although the Fund invests in short-term, investment grade instruments, the Fund is not a “money market” fund and it is not the objective of the Fund to maintain a constant share price.
The Fund returned 4.31% at net asset value (“NAV”) for the fiscal year ended August 31, 2021 (for more complete performance information please see the table below). Global currency market performance was mixed during the fiscal year, but emerging market currencies generally appreciated against the U.S. dollar (“USD”). As a result, the Fund’s use of derivatives to gain long exposure to a basket of emerging market currencies measured against the USD contributed positively to Fund performance during the fiscal year as the USD weakened overall relative to the Fund’s exposures to emerging market currencies. One strong outperformer was the Chinese yuan. Dating back to last year, the Chinese economy was least impacted by the COVID-19 pandemic compared to the rest of the world and even managed to grow despite the global slowdown that defined 2020. That made investors increasingly bullish on China and the Chinese yuan, and helped it edge higher versus the USD. Other outperformers included the South Korean won and Turkish lira. The underperformance of the USD was also driven by changing investor attitudes impacting the U.S. Treasury market, where rates rose as investors sold their bond positions in order to participate in the economy recovery via the stock market as the economic outlook improved.
Shareholder Expense Example (for the six-month period ended August 31, 2021)
| Beginning Account Value | Ending Account Value | Annualized Net Expense Ratio | Expenses Paid During the Period | |||||||||||||
Actual | $ | 1,000.00 | $ | 1,001.10 | 0.55 | %1 | $ | 2.77 | ||||||||
Hypothetical (5% return before expenses) | $ | 1,000.00 | $ | 1,022.43 | 0.55 | %1 | $ | 2.80 | ||||||||
| 1 | WisdomTree Asset Management, Inc. voluntarily waives a portion of its advisory fee, that it would otherwise charge, in an amount equal to the acquired fund fees and expenses (“AFFEs”) attributable to the Fund’s investment in the underlying WisdomTree fund. The “Annualized Net Expense Ratio” does not include the impact of AFFEs. |
Performance
| Average Annual Total Return | ||||||||||||||||
| 1 Year | 3 Year | 5 Year | 10 Year | |||||||||||||
Fund NAV Returns | 4.31 | % | 1.89 | % | 1.13 | % | -1.32 | % | ||||||||
Fund Market Price Returns | 4.49 | % | 1.94 | % | 1.11 | % | -1.33 | % | ||||||||
JP Morgan Emerging Local Markets Index Plus (ELMI+) | 4.50 | % | 2.93 | % | 2.26 | % | -0.16 | % | ||||||||
Equal-Weighted Emerging Currency Composite | 5.23 | % | 2.86 | % | 2.04 | % | -0.47 | % | ||||||||
Performance is historical and does not guarantee future results. The returns do not reflect the deduction of taxes that a shareholder would pay on Fund distributions or on the redemption of Fund shares.
| WisdomTree Trust | 7 |
Table of Contents
Management’s Discussion of Funds’ Performance
as of August 31, 2021 (unaudited)
WisdomTree Emerging Markets Corporate Bond Fund (EMCB)
Country Breakdown†
| Country | % of Net Assets | |||
Brazil | 9.0% | |||
Colombia | 6.8% | |||
Peru | 5.8% | |||
Russia | 5.8% | |||
India | 5.7% | |||
Mexico | 5.6% | |||
Chile | 5.5% | |||
Turkey | 4.5% | |||
Israel | 3.5% | |||
China | 3.5% | |||
South Korea | 3.3% | |||
United Arab Emirates | 3.1% | |||
Saudi Arabia | 3.0% | |||
Thailand | 2.7% | |||
Indonesia | 2.5% | |||
Kuwait | 2.4% | |||
Panama | 2.3% | |||
Kazakhstan | 2.3% | |||
Argentina | 2.1% | |||
Luxembourg | 1.9% | |||
South Africa | 1.7% | |||
Hong Kong | 1.7% | |||
Oman | 1.6% | |||
Netherlands | 1.5% | |||
Qatar | 1.4% | |||
Singapore | 1.3% | |||
Ireland | 1.2% | |||
Others | 5.7% | ^ | ||
Other Assets less Liabilities‡ | 2.6% | |||
Total | 100.0% | |||
| † | The Fund’s country breakdown may change over time. It does not include derivatives (if any). |
| ^ | Includes countries that represent less than 1% of net assets. |
| ‡ | Other assets less liabilities may include investment of cash collateral for securities on loan and/or receivables/payables on derivatives (if any). |
Top Ten Holdings*
| Description | % of Net Assets | |||
Tengizchevroil Finance Co. International Ltd., | 1.5% | |||
NBK Tier 1 Financing 2 Ltd., | 1.4% | |||
Bank of China Ltd., | 1.4% | |||
Reliance Industries Ltd., | 1.3% | |||
Saudi Arabian Oil Co., | 1.3% | |||
Lukoil Securities B.V., | 1.3% | |||
AES Panama Generation Holdings SRL, | 1.2% | |||
Bancolombia S.A., | 1.2% | |||
PTTEP Treasury Center Co., Ltd., | 1.2% | |||
Cia de Minas Buenaventura S.A.A., | 1.2% | |||
| * | The ten largest holdings are subject to change, and there are no guarantees the Fund will remain invested in any particular company. Excludes derivatives and investment of cash collateral for securities on loan (if any). |
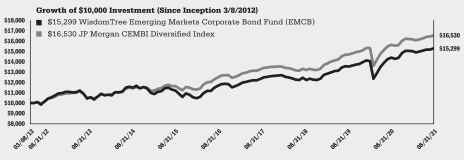
The WisdomTree Emerging Markets Corporate Bond Fund (the “Fund”) seeks a high level of total return consisting of both income and capital appreciation. The Fund attempts to achieve its objective through investments in U.S. dollar denominated debt securities issued by corporate entities that are domiciled in, or economically tied to, emerging market countries.
The Fund returned 6.26% at net asset value (“NAV”) for the fiscal year ended August 31, 2021. The largest contributors to the Fund’s performance were its overweight positions in Brazil, Mexico, and Turkey. The largest detractors to the Fund’s performance were its positions in China. The Fund’s performance was driven largely by the rate movement across the emerging markets region. Post COVID-19 economic rebound and higher interest rates led emerging markets rates to increase, which caused the performance to lag. During the fiscal year, the Fund utilized derivatives to manage interest rate risk. The Fund’s use of derivatives to shorten the portfolio’s duration contributed positively to Fund performance as the spread between long- and short-term interest rates widened during the fiscal year.
Shareholder Expense Example (for the six-month period ended August 31, 2021)
| Beginning Account Value | Ending Account Value | Annualized Expense Ratio | Expenses Paid During the Period | |||||||||||||
Actual | $ | 1,000.00 | $ | 1,017.80 | 0.60 | % | $ | 3.05 | ||||||||
Hypothetical (5% return before expenses) | $ | 1,000.00 | $ | 1,022.18 | 0.60 | % | $ | 3.06 | ||||||||
Performance
| Average Annual Total Return | ||||||||||||||||
| 1 Year | 3 Year | 5 Year | Since Inception1 | |||||||||||||
Fund NAV Returns | 6.26 | % | 7.75 | % | 5.27 | % | 4.58 | % | ||||||||
Fund Market Price Returns | 5.26 | % | 7.71 | % | 5.38 | % | 4.55 | % | ||||||||
JP Morgan CEMBI Diversified Index | 5.72 | % | 7.81 | % | 5.47 | % | 5.44 | % | ||||||||
| 1 | Total returns are calculated based on the commencement of Fund trading on the NASDAQ on March 8, 2012. |
Performance is historical and does not guarantee future results. The returns do not reflect the deduction of taxes that a shareholder would pay on Fund distributions or on the redemption of Fund shares.
| 8 | WisdomTree Trust |
Table of Contents
Management’s Discussion of Funds’ Performance
as of August 31, 2021 (unaudited)
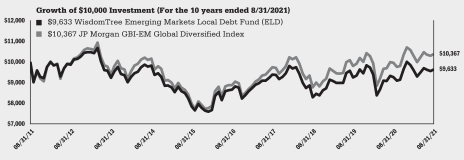
WisdomTree Emerging Markets Local Debt Fund (ELD)
Country Breakdown†
| Country | % of Net Assets | |||
Indonesia | 11.2% | |||
Russia | 11.2% | |||
Supranational Bonds | 8.8% | |||
Brazil | 8.3% | |||
Malaysia | 6.3% | |||
South Africa | 6.2% | |||
Mexico | 6.0% | |||
United States | 5.1% | |||
Poland | 4.8% | |||
China | 4.8% | |||
India | 4.4% | |||
Colombia | 3.2% | |||
Chile | 3.1% | |||
Peru | 2.9% | |||
Turkey | 2.8% | |||
Thailand | 2.3% | |||
Hungary | 2.0% | |||
Romania | 1.9% | |||
Philippines | 1.8% | |||
Other Assets less Liabilities‡ | 2.9% | |||
Total | 100.0% | |||
| † | The Fund’s country breakdown may change over time. It does not include derivatives (if any). |
| ‡ | Other assets less liabilities may include investment of cash collateral for securities on loan and/or receivables/payables on derivatives (if any). |
Top Ten Holdings*
| Description | % of Net Assets | |||
Citigroup, Inc., tri-party repurchase agreement, | 5.1% | |||
Republic of Poland Government Bond, | 1.8% | |||
Republic of Poland Government Bond, | 1.7% | |||
Brazil Letras do Tesouro Nacional, | 1.6% | |||
European Investment Bank, | 1.5% | |||
Brazil Notas do Tesouro Nacional, | 1.4% | |||
International Finance Corp., | 1.3% | |||
Brazil Letras do Tesouro Nacional, | 1.3% | |||
Philippine Government International Bond, | 1.2% | |||
International Finance Corp., | 1.2% | |||
| * | The ten largest holdings are subject to change, and there are no guarantees the Fund will remain invested in any particular security. Excludes derivatives and investment of cash collateral for securities on loan (if any). |
| †† | Fully collateralized by U.S. Government agency securities. |
The WisdomTree Emerging Markets Local Debt Fund (the “Fund”) seeks a high level of total return consisting of both income and capital appreciation. The Fund attempts to achieve its objective through investments in fixed income instruments denominated in the local currencies of emerging market countries.
The Fund returned 4.06% at net asset value (“NAV”) for the fiscal year ended August 31, 2021. The largest contributor to the Fund’s performance was its overweight positions in Russia, as well as positions in South Africa and Brazil. The largest detractor to the Fund’s performance was its positions in Colombia, Peru, and Thailand. The Fund’s performance was driven largely by the movement in bond prices as a function of creditworthiness across the emerging markets (“EM”) region. For the first half of the fiscal year, there was continued economic recovery around the world and de-escalating concerns over COVID-19 amongst the world’s largest economies, leading to a continued upward trend in risk-on assets around the world, including EM sovereign debt. However, EM assets during the second half of the fiscal year have faced increased volatility, particularly as China has begun heavier regulations on privatized businesses and there have been some prominent defaults in the Chinese high yield market. In aggregate, the global recovery has added to positive performance along with a prolonged weaker U.S. dollar during the fiscal year.
Shareholder Expense Example (for the six-month period ended August 31, 2021)
| Beginning Account Value | Ending Account Value | Annualized Expense Ratio | Expenses Paid During the Period | |||||||||||||
Actual | $ | 1,000.00 | $ | 1,004.70 | 0.55 | % | $ | 2.78 | ||||||||
Hypothetical (5% return before expenses) | $ | 1,000.00 | $ | 1,022.43 | 0.55 | % | $ | 2.80 | ||||||||
Performance
| Average Annual Total Return | ||||||||||||||||
| 1 Year | 3 Year | 5 Year | 10 Year | |||||||||||||
Fund NAV Returns | 4.06 | % | 5.16 | % | 2.18 | % | -0.37 | % | ||||||||
Fund Market Price Returns | 4.10 | % | 5.06 | % | 2.17 | % | -0.41 | % | ||||||||
JP Morgan Government Bond Index-Emerging Markets (GBI-EM) Global Diversified Index | 4.14 | % | 5.78 | % | 3.18 | % | 0.36 | % | ||||||||
Performance is historical and does not guarantee future results. The returns do not reflect the deduction of taxes that a shareholder would pay on Fund distributions or on the redemption of Fund shares.
| WisdomTree Trust | 9 |
Table of Contents
Management’s Discussion of Funds’ Performance
as of August 31, 2021 (unaudited)
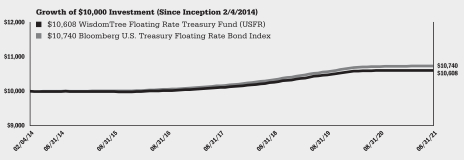
WisdomTree Floating Rate Treasury Fund (USFR)
Investment Breakdown†
| Investment Type | % of Net Assets | |||
U.S. Government Obligations | 100.0% | |||
Other Assets less Liabilities‡ | 0.0% | ^ | ||
Total | 100.0% | |||
| † | The Fund’s investment breakdown may change over time. It does not include derivatives (if any). |
| ‡ | Other assets less liabilities may include investment of cash collateral for securities on loan and/or receivables/payables on derivatives (if any). |
| ^ | Represents less than 0.05%. |
Top Holdings*
| Description | % of Net Assets | |||
U.S. Treasury Floating Rate Note, | 27.8% | |||
U.S. Treasury Floating Rate Note, | 27.8% | |||
U.S. Treasury Floating Rate Note, | 25.7% | |||
U.S. Treasury Floating Rate Note, | 18.7% | |||
| * | The holdings are subject to change, and there are no guarantees the Fund will remain invested in any particular security. Excludes derivatives and investment of cash collateral for securities on loan (if any). |
The WisdomTree Floating Rate Treasury Fund (the “Fund”) seeks to track the price and yield performance, before fees and expenses, of the Bloomberg U.S. Treasury Floating Rate Bond Index (the “Index”). In seeking to track the Index, the Fund invests in floating rate public obligations of the U.S. Treasury. The Fund generally uses a representative sampling strategy to achieve its investment objective, meaning it generally will invest in a sample of the securities in the Index whose risk, return and other characteristics resemble the risk, return and other characteristics of the Index as a whole.
The Fund returned 0.00% at net asset value (“NAV”) for the fiscal year ended August 31, 2021 (for more complete performance information please see the table below). As a result of the low short-term interest rate environment, there was no meaningful increase or decrease in the Fund’s overall performance during the fiscal year. The fiscal year began toward summer’s end 2020, when short-term rates in the U.S. Treasury market were virtually at 0% after the U.S. Federal Reserve (the “Fed”) stepped in earlier in the year to ease monetary conditions after the economic disruptions caused by the COVID-19 pandemic. Due to the severe economic impact, the Fed maintained that it would not raise short-term interest rates until the U.S. economy was steadily recovering from the pandemic. Since the short-dated yields of the U.S. Treasury market tend to mimic Fed activity, their rates remained close to 0% for the duration of the fiscal year. It is unlikely that they will change significantly until the Fed intervenes to raise interest rates once they have determined that the U.S. economy is once again growing at a sufficient pace and economic activity returns to pre-pandemic levels.
Shareholder Expense Example (for the six-month period ended August 31, 2021)
| Beginning Account Value | Ending Account Value | Annualized Expense Ratio | Expenses Paid During the Period | |||||||||||||
Actual | $ | 1,000.00 | $ | 1,000.00 | 0.15 | % | $ | 0.76 | ||||||||
Hypothetical (5% return before expenses) | $ | 1,000.00 | $ | 1,024.45 | 0.15 | % | $ | 0.77 | ||||||||
Performance
| Average Annual Total Return | ||||||||||||||||
| 1 Year | 3 Year | 5 Year | Since Inception1 | |||||||||||||
Fund NAV Returns | 0.00 | %2 | 1.10 | % | 1.14 | % | 0.78 | % | ||||||||
Fund Market Price Returns | 0.00 | %2 | 1.08 | % | 1.19 | % | 0.77 | % | ||||||||
Bloomberg U.S. Treasury Floating Rate Bond Index | 0.17 | % | 1.27 | % | 1.32 | % | 0.95 | % | ||||||||
| 1 | Total returns are calculated based on the commencement of Fund trading on the NYSE Arca, Inc. on February 4, 2014. |
| 2 | Represents less than 0.005%. |
Performance is historical and does not guarantee future results. The returns do not reflect the deduction of taxes that a shareholder would pay on Fund distributions or on the redemption of Fund shares.
| 10 | WisdomTree Trust |
Table of Contents
Management’s Discussion of Funds’ Performance
as of August 31, 2021 (unaudited)
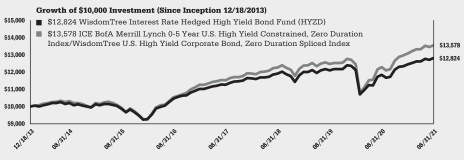
WisdomTree Interest Rate Hedged High Yield Bond Fund (HYZD)
Investment Breakdown†
| Investment Type | % of Net Assets | |||
U.S. Corporate Bonds | 96.0% | |||
Foreign Corporate Bonds | 0.7% | |||
Other Assets less Liabilities‡ | 3.3% | |||
Total | 100.0% | |||
| † | The Fund’s investment breakdown may change over time. It does not include derivatives (if any). |
| ‡ | Other assets less liabilities may include investment of cash collateral for securities on loan and/or receivables/payables on derivatives (if any). |
Top Ten Holdings*
| Description | % of Net Assets | |||
Organon & Co., | 0.9% | |||
Community Health Systems, Inc., | 0.8% | |||
DaVita, Inc., | 0.8% | |||
MGM Resorts International, | 0.8% | |||
Iron Mountain, Inc., | 0.8% | |||
TransDigm, Inc., | 0.7% | |||
DISH DBS Corp., | 0.7% | |||
Diamond Sports Group LLC, | 0.7% | |||
Scientific Games International, Inc., | 0.7% | |||
CSC Holdings LLC, | 0.6% | |||
| * | The ten largest holdings are subject to change, and there are no guarantees the Fund will remain invested in any particular company. Excludes derivatives and investment of cash collateral for securities on loan (if any). |
The WisdomTree Interest Rate Hedged High Yield Bond Fund (the “Fund”) seeks to track the price and yield performance, before fees and expenses, of the WisdomTree U.S. High Yield Corporate Bond, Zero Duration Index (the “Index”). In seeking to track the Index, the Fund invests mainly in U.S. non-investment-grade corporate fixed income securities that are deemed to have favorable fundamental and income characteristics and obtains short exposure to U.S. Treasuries such that the Fund’s total portfolio duration approximates zero years. The Fund generally uses a representative sampling strategy to achieve its investment objective, meaning it generally will invest in a sample of the securities in the Index whose risk, return and other characteristics resemble the risk, return and other characteristics of the Index as a whole.
The Fund returned 8.33% at net asset value (“NAV”) for the fiscal year ended August 31, 2021 (for more complete performance information please see the table below). Prior to the fiscal year, interest rates fell dramatically as COVID-19 concerns forced the U.S. Federal Reserve (the “Fed”) to cut the Fed funds rate to 0%, resulting in declines across the entire U.S. Treasury yield curve. During the fiscal year, however, interest rates steadily climbed from their historic lows from the beginning of the fiscal year to recent highs during the spring of 2021, where the U.S. 10-year Treasury yield peaked at 1.74% (after starting the year at 0.72%). The U.S. 10-year Treasury yield subsequentially closed out the fiscal year at 1.30%. The Fund in aggregate benefited from its zero-duration hedge as opposed to longer duration counterparts. As a result, the Fund’s use of short futures contracts on U.S. Treasuries contributed positively to Fund performance during the fiscal year. High yield spreads consistently compressed during the fiscal year, causing high yield corporates to outperform. Historic amounts of fiscal and monetary stimulus, which have helped the markets and economy recover, have been enacted in the U.S. and are continuing to make their way through the economy, with talks of more spending stimulus potentially coming soon. This has benefited lower quality, high yield corporate issuers as they are able to recover now more quickly. The Fund had fully recovered all of its former pandemic-induced lows during February of 2021 and has continually reached new highs through the remainder of the fiscal year. The Fund’s underperformance relative to its Index was primarily attributable to representative sampling of the Index, amplified by the Fund’s tilt toward higher quality selections within the high yield spectrum (i.e., underweight CCC-rated and lower bonds). Over the fiscal year, many of the lowest quality names in the Index rallied to higher relative performance when compared to the Fund’s higher quality high yield securities coming off of their pandemic-selloff lows.
Shareholder Expense Example (for the six-month period ended August 31, 2021)
| Beginning Account Value | Ending Account Value | Annualized Expense Ratio | Expenses Paid During the Period | |||||||||||||
Actual | $ | 1,000.00 | $ | 1,029.80 | 0.43 | % | $ | 2.20 | ||||||||
Hypothetical (5% return before expenses) | $ | 1,000.00 | $ | 1,023.04 | 0.43 | % | $ | 2.19 | ||||||||
Performance
| Average Annual Total Return | ||||||||||||||||
| 1 Year | 3 Year | 5 Year | Since Inception1 | |||||||||||||
Fund NAV Returns | 8.33 | % | 2.49 | % | 4.16 | % | 3.28 | % | ||||||||
Fund Market Price Returns | 9.41 | % | 2.54 | % | 4.20 | % | 3.30 | % | ||||||||
ICE BofA Merrill Lynch 0-5 Year U.S. High Yield Constrained, Zero Duration Index/WisdomTree U.S. High Yield Corporate Bond, Zero Duration Spliced Index2 | 10.55 | % | 3.41 | % | 5.19 | % | 4.05 | % | ||||||||
| 1 | Total returns are calculated based on the commencement of Fund trading on the NASDAQ on December 18, 2013. |
| 2 | ICE BofA Merrill Lynch 0-5 Year U.S. High Yield Constrained, Zero Duration Index through May 31, 2020; WisdomTree U.S. High Yield Corporate Bond, Zero Duration Index thereafter. |
Performance is historical and does not guarantee future results. The returns do not reflect the deduction of taxes that a shareholder would pay on Fund distributions or on the redemption of Fund shares.
| WisdomTree Trust | 11 |
Table of Contents
Management’s Discussion of Funds’ Performance
as of August 31, 2021 (unaudited)
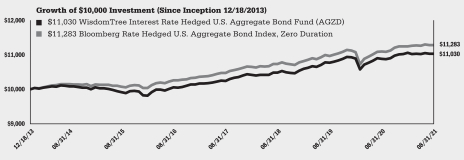
WisdomTree Interest Rate Hedged U.S. Aggregate Bond Fund (AGZD)
Investment Breakdown†
| Investment Type | % of Net Assets | |||
U.S. Government Obligations | 37.7% | |||
U.S. Government Agencies | 28.2% | |||
U.S. Corporate Bonds | 23.0% | |||
Repurchase Agreement | 7.2% | |||
Foreign Corporate Bonds | 3.4% | |||
Commercial Mortgage-Backed Securities | 2.0% | |||
Supranational Bonds | 1.5% | |||
Foreign Government Obligations | 1.0% | |||
Foreign Government Agencies | 0.7% | |||
Municipal Bonds | 0.6% | |||
Asset-Backed Securities | 0.4% | |||
Other Assets less Liabilities‡ | -5.7% | |||
Total | 100.0% | |||
| † | The Fund’s investment breakdown may change over time. It does not include derivatives (if any). |
| ‡ | Other assets less liabilities may include investment of cash collateral for securities on loan and/or receivables/payables on derivatives (if any). |
Top Ten Holdings*
| Description | % of Net Assets | |||
Citigroup, Inc., tri-party repurchase agreement, | 7.2 | % | ||
Uniform Mortgage-Backed Security, | 2.5 | % | ||
Uniform Mortgage-Backed Security, | 1.3 | % | ||
Government National Mortgage Association, | 0.9 | % | ||
Government National Mortgage Association, | 0.7 | % | ||
Uniform Mortgage-Backed Security, | 0.7 | % | ||
U.S. Treasury Note, | 0.5 | % | ||
Federal National Mortgage Association, | 0.4 | % | ||
U.S. Treasury Note, | 0.4 | % | ||
U.S. Treasury Note, | 0.4 | % | ||
| * | The ten largest holdings are subject to change, and there are no guarantees the Fund will remain invested in any particular security. Excludes derivatives and investment of cash collateral for securities on loan (if any). |
| †† | Fully collateralized by U.S. Government agency securities. |
The WisdomTree Interest Rate Hedged U.S. Aggregate Bond Fund (the “Fund”) seeks to track the price and yield performance, before fees and expenses, of the Bloomberg Rate Hedged U.S. Aggregate Bond Index, Zero Duration (the “Index”). In seeking to track the Index, the Fund invests mainly in U.S. investment grade fixed income securities and obtains short exposure to U.S. Treasuries such that the Fund’s total portfolio duration approximates zero years. The Fund generally uses a representative sampling strategy to achieve its investment objective, meaning it generally will invest in a sample of the securities in the Index whose risk, return and other characteristics resemble the risk, return and other characteristics of the Index as a whole.
The Fund returned 1.34% at net asset value (“NAV”) for the fiscal year ended August 31, 2021 (for more complete performance information please see the table below). Prior to the fiscal year, interest rates fell dramatically as COVID-19 concerns forced the U.S. Federal Reserve (the “Fed”) to cut the Fed funds rate to 0%, resulting in declines across the entire U.S. Treasury yield curve. During the fiscal year, however, interest rates steadily climbed from their historic lows from the beginning of the fiscal year to recent highs during the spring of 2021, where the U.S. 10-year Treasury yield topped out at 1.74% (after starting the year at 0.72%). From the beginning of the fiscal year to when the U.S. 10-year Treasury yield peaked at 1.74%, the Fund outperformed the broad U.S. bond market by 378 basis points. The U.S. 10-year Treasury yield subsequentially closed out the fiscal year at 1.30%. The Fund’s use of short futures contracts on U.S. Treasuries to hedge interest rate risk detracted from Fund performance during the fiscal year due to interest rate volatility and the timing of Fund flows. The U.S. Aggregate bond universe experienced modest positive performance over the fiscal year, primarily driven by corporate bonds recovering from their pandemic lows and spreads tightened, somewhat offset by the losses in longer duration U.S. Treasury bonds. Historic amounts of fiscal and monetary stimulus, which have helped the markets and economy recover, have been enacted in the U.S. and are continuing to make their way through the economy, with talks of more spending stimulus potentially coming soon.
Shareholder Expense Example (for the six-month period ended August 31, 2021)
| Beginning Account Value | Ending Account Value | Annualized Expense Ratio | Expenses Paid During the Period | |||||||||||||
Actual | $ | 1,000.00 | $ | 997.40 | 0.23 | % | $ | 1.16 | ||||||||
Hypothetical (5% return before expenses) | $ | 1,000.00 | $ | 1,024.05 | 0.23 | % | $ | 1.17 | ||||||||
Performance
| Average Annual Total Return | ||||||||||||||||
| 1 Year | 3 Year | 5 Year | Since Inception1 | |||||||||||||
Fund NAV Returns | 1.34 | % | 1.70 | % | 1.88 | % | 1.28 | % | ||||||||
Fund Market Price Returns | 1.45 | % | 1.59 | % | 1.91 | % | 1.30 | % | ||||||||
Bloomberg Rate Hedged U.S. Aggregate Bond Index, Zero Duration | 1.67 | % | 1.69 | % | 1.92 | % | 1.58 | % | ||||||||
| 1 | Total returns are calculated based on the commencement of Fund trading on the NASDAQ on December 18, 2013. |
Performance is historical and does not guarantee future results. The returns do not reflect the deduction of taxes that a shareholder would pay on Fund distributions or on the redemption of Fund shares.
��
| 12 | WisdomTree Trust |
Table of Contents
Management’s Discussion of Funds’ Performance
as of August 31, 2021 (unaudited)
WisdomTree Mortgage Plus Bond Fund (MTGP)
Investment Breakdown†
| Investment Type | % of Net Assets | |||
U.S. Government Agencies | 44.4% | |||
Collateralized Mortgage Obligations | 43.3% | |||
Collateralized Loan Obligations | 5.3% | |||
Commercial Mortgage-Backed Securities | 4.9% | |||
Asset-Backed Securities | 1.5% | |||
Other Assets less Liabilities‡ | 0.6% | |||
Total | 100.0% | |||
| † | The Fund’s investment breakdown may change over time. It does not include derivatives (if any). |
| ‡ | Other assets less liabilities may include investment of cash collateral for securities on loan and/or receivables/payables on derivatives (if any). |
Top Ten Holdings*
| Description | % of Net Assets | |||
Uniform Mortgage-Backed Security, | 8.6% | |||
Uniform Mortgage-Backed Security, | 8.2% | |||
Government National Mortgage Association, | 6.3% | |||
Government National Mortgage Association, | 5.1% | |||
Government National Mortgage Association, | 4.3% | |||
Federal National Mortgage Association, | 3.0% | |||
Federal Home Loan Mortgage Corp. REMIC, | 2.5% | |||
Government National Mortgage Association, | 1.8% | |||
Federal Home Loan Mortgage Corp. REMIC, | 1.6% | |||
Government National Mortgage Association, | 1.6% | |||
| * | The ten largest holdings are subject to change, and there are no guarantees the Fund will remain invested in any particular company. Excludes derivatives and investment of cash collateral for securities on loan (if any). |
The WisdomTree Mortgage Plus Bond Fund (the “Fund”) seeks income and capital appreciation. The Fund attempts to achieve its objective through investments in mortgage-related debt and other securitized debt.
The Fund returned 0.99% at net asset value (“NAV”) for the fiscal year ended August 31, 2021 (for more complete performance information please see the table below). Security selection within agency mortgages continued to be the main source of outperformance for the Fund. In addition, low rates, robust home sales, and limited inventory all contributed to a strong housing market. Solid growth expectations as the world re-opens, combined with strong earnings and consumer re-engagement, helped the securitized credit sectors’ returns. During the fiscal year, the Fund utilized derivatives to manage interest rate risk. The Fund’s use of derivatives to shorten the portfolio’s duration contributed positively to Fund performance as the spread between long- and short-term interest rates widened during the fiscal year.
Shareholder Expense Example (for the six-month period ended August 31, 2021)
| Beginning Account Value | Ending Account Value | Annualized Expense Ratio | Expenses Paid During the Period | |||||||||||||
Actual | $ | 1,000.00 | $ | 1,007.40 | 0.45 | % | $ | 2.28 | ||||||||
Hypothetical (5% return before expenses) | $ | 1,000.00 | $ | 1,022.94 | 0.45 | % | $ | 2.29 | ||||||||
Performance
| Average Annual Total Return | ||||||||
| 1 Year | Since Inception1 | |||||||
Fund NAV Returns | 0.99 | % | 3.01 | % | ||||
Fund Market Price Returns | 1.05 | % | 3.07 | % | ||||
Bloomberg U.S. Securitized Mortgage Backed Securities/Asset Backed Securities/Commercial Mortgage Backed Securities (MBS/ABS/CMBS) Index | -0.03 | % | 2.36 | % | ||||
| 1 | Total returns are calculated based on the commencement of Fund trading on the NYSE Arca, Inc. on November 14, 2019. |

Performance is historical and does not guarantee future results. The returns do not reflect the deduction of taxes that a shareholder would pay on Fund distributions or on the redemption of Fund shares.
| WisdomTree Trust | 13 |
Table of Contents
Management’s Discussion of Funds’ Performance
as of August 31, 2021 (unaudited)
WisdomTree Yield Enhanced U.S. Aggregate Bond Fund (AGGY)
Investment Breakdown†
| Investment Type | % of Net Assets | |||
U.S. Government Agencies | 45.3% | |||
U.S. Corporate Bonds | 27.7% | |||
U.S. Government Obligations | 17.9% | |||
Repurchase Agreement | 13.5% | |||
Foreign Corporate Bonds | 5.1% | |||
Commercial Mortgage-Backed Securities | 1.9% | |||
Foreign Government Obligations | 1.8% | |||
Municipal Bonds | 0.6% | |||
Foreign Government Agencies | 0.2% | |||
Asset-Backed Securities | 0.1% | |||
Supranational Bonds | 0.1% | |||
U.S. Government Agencies Sold Short | -1.4% | |||
Other Assets less Liabilities‡ | -12.8% | |||
Total | 100.0% | |||
| † | The Fund’s investment breakdown may change over time. It does not include derivatives (if any). |
| ‡ | Other assets less liabilities may include investment of cash collateral for securities on loan and/or receivables/payables on derivatives (if any). |
Top Ten Holdings*
| Description | % of Net Assets | |||
Citigroup, Inc., tri-party repurchase agreement, | 13.5% | |||
Uniform Mortgage-Backed Security, | 5.9% | |||
Uniform Mortgage-Backed Security, | 3.4% | |||
Federal Home Loan Mortgage Corp., | 1.8% | |||
Government National Mortgage Association, | 1.1% | |||
Tennessee Valley Authority, | 1.1% | |||
Government National Mortgage Association, | 1.0% | |||
Government National Mortgage Association, | 0.9% | |||
Federal Home Loan Bank, | 0.8% | |||
Uniform Mortgage-Backed Security, | 0.8% | |||
| * | The ten largest holdings are subject to change, and there are no guarantees the Fund will remain invested in any particular security. Excludes derivatives and investment of cash collateral for securities on loan (if any). |
| †† | Fully collateralized by U.S. Government agency securities. |
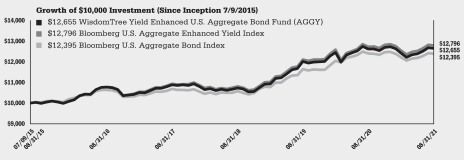
The WisdomTree Yield Enhanced U.S. Aggregate Bond Fund (the “Fund”) seeks to track the price and yield performance, before fees and expenses, of the Bloomberg U.S. Aggregate Enhanced Yield Index (the “Index”). In seeking to track the Index, the Fund invests mainly in U.S. investment grade fixed income securities. The Fund generally uses a representative sampling strategy to achieve its investment objective, meaning it generally will invest in a sample of the securities in the Index whose risk, return and other characteristics resemble the risk, return and other characteristics of the Index as a whole.
The Fund returned 0.18% at net asset value (“NAV”) for the fiscal year ended August 31, 2021 (for more complete performance information please see the table below). Rising rates over the fiscal year negatively affected performance due to the Fund’s longer duration relative to the Index. However, investment grade spreads consistently tightened from the beginning to the end of the fiscal year, benefiting the non-U.S. Treasury exposure within the Fund. The Fund benefited from a significant underweight to longer-term U.S. Treasuries and an overweight to corporates, securitized debt, and agency debt as yields rose and spreads tightened. From a sector perspective, the Fund’s overweight position to Energy sector corporate bonds contributed positively to performance as commodity prices rose over the fiscal year. Historic amounts of fiscal and monetary stimulus, which have helped the markets and economy recover, have been enacted in the U.S. and are continuing to make their way through the economy, with talks of more spending stimulus potentially coming soon. The Fund benefited from owning a diversified basket of assets, however, due to its 100% investment grade mandate, the Fund lagged high-yield/junk-status bond issuers who had larger recoveries during the fiscal year.
Shareholder Expense Example (for the six-month period ended August 31, 2021)
| Beginning Account Value | Ending Account Value | Annualized Expense Ratio | Expenses Paid During the Period | |||||||||||||
Actual | $ | 1,000.00 | $ | 1,018.70 | 0.12 | % | $ | 0.61 | ||||||||
Hypothetical (5% return before expenses) | $ | 1,000.00 | $ | 1,024.60 | 0.12 | % | $ | 0.61 | ||||||||
Performance
| Average Annual Total Return | ||||||||||||||||
| 1 Year | 3 Year | 5 Year | Since Inception1 | |||||||||||||
Fund NAV Returns | 0.18 | % | 5.64 | % | 3.26 | % | 3.90 | % | ||||||||
Fund Market Price Returns | 0.20 | % | 5.62 | % | 3.22 | % | 3.90 | % | ||||||||
Bloomberg U.S. Aggregate Enhanced Yield Index | 0.47 | % | 5.79 | % | 3.50 | % | 4.09 | % | ||||||||
Bloomberg U.S. Aggregate Bond Index | -0.08 | % | 5.43 | % | 3.11 | % | 3.55 | % | ||||||||
| 1 | Total returns are calculated based on the commencement of Fund trading on the NYSE Arca, Inc. on July 9, 2015. |
Performance is historical and does not guarantee future results. The returns do not reflect the deduction of taxes that a shareholder would pay on Fund distributions or on the redemption of Fund shares.
| 14 | WisdomTree Trust |
Table of Contents
Management’s Discussion of Funds’ Performance
as of August 31, 2021 (unaudited)
WisdomTree Yield Enhanced U.S. Short-Term Aggregate Bond Fund (SHAG)
Investment Breakdown†
| Investment Type | % of Net Assets | |||
U.S. Government Obligations | 72.5% | |||
U.S. Corporate Bonds | 26.5% | |||
U.S. Government Agencies | 22.4% | |||
Commercial Mortgage-Backed Securities | 8.0% | |||
Foreign Corporate Bonds | 5.8% | |||
Asset-Backed Securities | 1.7% | |||
Supranational Bonds | 0.5% | |||
Foreign Government Obligations | 0.5% | |||
Foreign Government Agencies | 0.4% | |||
Other Assets less Liabilities‡ | -38.3% | |||
Total | 100.0% | |||
| † | The Fund’s investment breakdown may change over time. It does not include derivatives (if any). |
| ‡ | Other assets less liabilities may include investment of cash collateral for securities on loan and/or receivables/payables on derivatives (if any). |
Top Ten Holdings*
| Description | % of Net Assets | |||
U.S. Treasury Bill, | 19.5% | |||
U.S. Treasury Bill, | 18.5% | |||
Uniform Mortgage-Backed Security, | 15.9% | |||
U.S. Treasury Note, | 11.0% | |||
U.S. Treasury Bill, | 4.9% | |||
Uniform Mortgage-Backed Security, | 3.4% | |||
U.S. Treasury Note, | 3.0% | |||
U.S. Treasury Note, | 3.0% | |||
Federal Home Loan Mortgage Corp., | 1.8% | |||
U.S. Treasury Note, | 1.5% | |||
| * | The ten largest holdings are subject to change, and there are no guarantees the Fund will remain invested in any particular company. Excludes derivatives and investment of cash collateral for securities on loan (if any). |
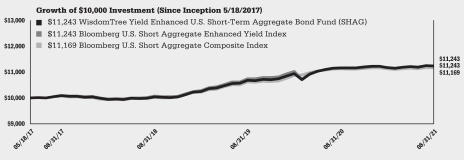
The WisdomTree Yield Enhanced U.S. Short-Term Aggregate Bond Fund (the “Fund”) seeks to track the price and yield performance, before fees and expenses, of the Bloomberg U.S. Short Aggregate Enhanced Yield Index (the “Index”). In seeking to track the Index, the Fund invests mainly in short-term U.S. investment-grade fixed income securities having effective maturities generally shorter than five years. The Fund generally uses a representative sampling strategy to achieve its investment objective, meaning it generally will invest in a sample of the securities in the Index whose risk, return and other characteristics resemble the risk, return and other characteristics of the Index as a whole.
The Fund returned 0.69% at net asset value (“NAV”) for the fiscal year ended August 31, 2021 (for more complete performance information please see the table below). Rising rates over the fiscal year negatively affected performance due to the Fund’s longer duration exposure relative to the Index. However, because the Fund is investing in a shorter-term maturing universe of bonds, it had positive relative performance when compared to longer-duration strategies. Investment grade spreads consistently tightened from the beginning to the end of the fiscal year, benefiting the non-U.S. Treasury exposure within the Fund. The Fund benefited from a significant underweight position to U.S. Treasuries and an overweight allocation to corporates, securitized debt, and agency debt as yields rose and spreads tightened. From a sector perspective, the Fund’s overweight to Energy sector corporate bonds contributed positively to performance as commodity prices rose over the fiscal year. Historic amounts of fiscal and monetary stimulus, which have helped the markets and economy recover, have been enacted in the U.S. and are continuing to make their way through the economy, with talks of more spending stimulus potentially coming soon. The Fund benefited from owning a diversified basket of assets, however, due to its 100% investment grade mandate, the Fund lagged high-yield/junk-status bond issuers who had larger recoveries during the fiscal year.
Shareholder Expense Example (for the six-month period ended August 31, 2021)
| Beginning Account Value | Ending Account Value | Annualized Expense Ratio | Expenses Paid During the Period | |||||||||||||
Actual | $ | 1,000.00 | $ | 1,005.70 | 0.12 | % | $ | 0.61 | ||||||||
Hypothetical (5% return before expenses) | $ | 1,000.00 | $ | 1,024.60 | 0.12 | % | $ | 0.61 | ||||||||
Performance
| Average Annual Total Return | ||||||||||||
| 1 Year | 3 Year | Since Inception1 | ||||||||||
Fund NAV Returns | 0.69 | % | 3.85 | % | 2.77 | % | ||||||
Fund Market Price Returns | 0.65 | % | 3.79 | % | 2.76 | % | ||||||
Bloomberg U.S. Short Aggregate Enhanced Yield Index | 0.76 | % | 3.74 | % | 2.77 | % | ||||||
Bloomberg U.S. Short Aggregate Composite Index | 0.40 | % | 3.67 | % | 2.61 | % | ||||||
| 1 | Total returns are calculated based on the commencement of Fund trading on the Cboe BZX Exchange, Inc. on May 18, 2017. |
Performance is historical and does not guarantee future results. The returns do not reflect the deduction of taxes that a shareholder would pay on Fund distributions or on the redemption of Fund shares.
| WisdomTree Trust | 15 |
Table of Contents
Management’s Discussion of Funds’ Performance
as of August 31, 2021 (unaudited)
WisdomTree Alternative Income Fund (HYIN)
Investment Breakdown†
| Investment Type | % of Net Assets | |||
Common Stocks | 70.8% | |||
Closed-End Mutual Funds | 29.1% | |||
Other Assets less Liabilities‡ | 0.1% | |||
Total | 100.0% | |||
| † | The Fund’s investment breakdown may change over time. It does not include derivatives (if any). |
| ‡ | Other assets less liabilities may include investment of cash collateral for securities on loan and/or receivables/payables on derivatives (if any). |
Top Ten Holdings*
| Description | % of Net Assets | |||
Great Ajax Corp. | 3.2% | |||
FS KKR Capital Corp. | 3.1% | |||
PIMCO Corporate & Income Opportunity Fund | 3.0% | |||
Ares Capital Corp. | 3.0% | |||
BlackRock Corporate High Yield Fund, Inc. | 3.0% | |||
New Residential Investment Corp. | 3.0% | |||
Arbor Realty Trust, Inc. | 2.9% | |||
Eaton Vance Limited Duration Income Fund | 2.9% | |||
Highland Income Fund | 2.9% | |||
Blackstone Mortgage Trust, Inc., Class A | 2.9% | |||
| * | The ten largest holdings are subject to change, and there are no guarantees the Fund will remain invested in any particular company. Excludes derivatives and investment of cash collateral for securities on loan (if any). |
The WisdomTree Alternative Income Fund (the “Fund”) seeks to track the price and yield performance, before fees and expenses, of the Gapstow Liquid Alternative Credit Index (the “Index”), which is designed to provide diversified exposure to alternative credit sectors. Alternative credit is an asset class that includes debt and debt-based investments that have a higher expected risk, return, and yield than traditional investment grade fixed income instruments. In seeking to track the Index, the Fund invests mainly in registered closed-end investment companies (“CEFs”), including CEFs that have elected to be regulated as “business development companies” under the Investment Company Act of 1940, as amended, and real estate investment trusts that are listed and publicly traded on a major U.S. stock exchange. The Fund generally uses a representative sampling strategy to achieve its investment objective, meaning it generally will invest in a sample of the securities in the Index whose risk, return and other characteristics resemble the risk, return and other characteristics of the Index as a whole.
The Fund had less than six months of operating history at the end of the reporting period and therefore no discussion of Fund performance or comparative performance information is shown in this shareholder report. Comparative performance information for the most recent month-end is available at www.wisdomtree.com.
Shareholder Expense Example (for the period1 ended August 31, 2021)
| Beginning Account Value | Ending Account Value | Annualized Expense Ratio | Expenses Paid During the Period | |||||||||||||
Actual1 | $ | 1,000.00 | $ | 1,033.30 | 0.50 | % | $ | 1.64 | ||||||||
Hypothetical (5% return before expenses) | $ | 1,000.00 | $ | 1,022.68 | 0.50 | % | $ | 2.55 | ||||||||
| 1 | Fund commenced operations on May 6, 2021. Actual expenses are calculated using the Fund’s annualized expense ratio, multiplied by the average account value for the period, multiplied by 118/365 (to reflect the period since commencement of operations). |
| 16 | WisdomTree Trust |
Table of Contents
Management’s Discussion of Funds’ Performance
as of August 31, 2021 (unaudited)
WisdomTree CBOE S&P 500 PutWrite Strategy Fund (PUTW)
Investment Breakdown†
| Investment Type | % of Net Assets | |||
U.S. Government Obligations | 91.3% | |||
Exchange-Traded Funds | 4.5% | |||
Other Assets less Liabilities‡ | 4.2% | |||
Total | 100.0% | |||
| † | The Fund’s investment breakdown may change over time. It does not include derivatives (if any). |
| ‡ | Other assets less liabilities may include investment of cash collateral for securities on loan and/or receivables/payables on derivatives (if any). |
Top Holdings*
| Description | % of Net Assets | |||
U.S. Treasury Bill, | 67.2 | % | ||
U.S. Treasury Bill, | 24.1 | % | ||
WisdomTree Floating Rate Treasury Fund (USFR)^ | 4.5 | % | ||
| * | The holdings are subject to change, and there are no guarantees the Fund will remain invested in any particular security. Excludes derivatives and investment of cash collateral for securities on loan (if any). |
| ^ | For a full list of holdings information for the underlying WisdomTree fund, please see page 41 of this report. |
The WisdomTree CBOE S&P 500 PutWrite Strategy Fund (the “Fund”) seeks to track the price and yield performance, before fees and expenses, of the CBOE S&P 500 PutWrite Index (the “Index”), utilizing a strategy of writing put options on the S&P 500 Index. The strategy is designed to receive a premium from the option buyer by selling (i.e., writing) a sequence of one-month, at-the-money, S&P 500 Index put options. The Fund generally uses a representative sampling strategy to achieve its investment objective, meaning it generally will invest in a sample of the securities in the Index whose risk, return and other characteristics resemble the risk, return and other characteristics of the Index as a whole.
The Fund returned 24.87% at net asset value (“NAV”) for the fiscal year ended August 31, 2021 (for more complete performance information please see the table below). During the fiscal year, the S&P 500 Index, the level of which the Fund writes monthly at-the-money options for, surged higher with minimal volatility to abate it. This was extremely positive for the Fund and helped its total return. Only three months of the fiscal year saw the S&P 500 exhibit a decline, all of which were slight. This weighed negatively on performance for the Fund but its impact was modest. The fiscal year saw slight, intermittent bouts of volatility in financial markets but nothing so prolonged that it became a severe headwind for the performance of the Fund. The Fund was able to write at-the-money options and collect the premium income from buyers, and the options regularly finished out-of-the-money, which meant that returns were not hampered by paying distributions to option buyers.
Shareholder Expense Example (for the six-month period ended August 31, 2021)
| Beginning Account Value | Ending Account Value | Annualized Net Expense Ratio | Expenses Paid During the Period | |||||||||||||
Actual | $ | 1,000.00 | $ | 1,131.10 | 0.44 | %1 | $ | 2.36 | ||||||||
Hypothetical (5% return before expenses) | $ | 1,000.00 | $ | 1,022.99 | 0.44 | %1 | $ | 2.24 | ||||||||
| 1 | WisdomTree Asset Management, Inc. voluntarily waives a portion of its advisory fee, that it would otherwise charge, in an amount equal to the acquired fund fees and expenses (“AFFEs”) attributable to the Fund’s investment in the underlying WisdomTree fund. The “Annualized Net Expense Ratio” does not include the impact of AFFEs. |
Performance
| Average Annual Total Return | ||||||||||||||||
| 1 Year | 3 Year | 5 Year | Since Inception1 | |||||||||||||
Fund NAV Returns | 24.87 | % | 5.42 | % | 6.99 | % | 7.76 | % | ||||||||
Fund Market Price Returns | 24.71 | % | 5.44 | % | 6.98 | % | 7.75 | % | ||||||||
CBOE S&P 500® PutWrite Index | 25.86 | % | 5.92 | % | 7.57 | % | 8.34 | % | ||||||||
S&P 500® Index | 31.17 | % | 18.07 | % | 18.02 | % | 18.94 | % | ||||||||
| 1 | Total returns are calculated based on the commencement of Fund trading on the NYSE Arca, Inc. on February 24, 2016. |
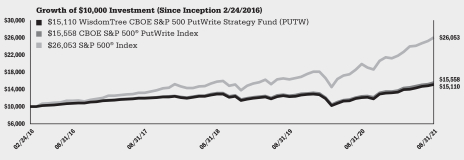
Performance is historical and does not guarantee future results. The returns do not reflect the deduction of taxes that a shareholder would pay on Fund distributions or on the redemption of Fund shares.
| WisdomTree Trust | 17 |
Table of Contents
Management’s Discussion of Funds’ Performance
as of August 31, 2021 (unaudited)
WisdomTree Enhanced Commodity Strategy Fund (GCC) (consolidated)
(predecessor, WisdomTree Continuous Commodity Index Fund)
Investment Breakdown†
| Investment Type | % of Net Assets | |||
U.S. Government Obligations | 80.4% | |||
Exchange-Traded Funds | 4.2% | |||
Other Assets less Liabilities‡ | 15.4% | |||
Total | 100.0% | |||
| † | The Fund’s investment breakdown may change over time. It does not include derivatives (if any). |
| ‡ | Other assets less liabilities may include investment of cash collateral for securities on loan and/or receivables/payables on derivatives (if any). |
Top Holdings*
| Description | % of Net Assets | |||
U.S. Treasury Bill, | 74.9% | |||
U.S. Treasury Bill, | 4.8% | |||
WisdomTree Floating Rate Treasury Fund (USFR)^ | 4.2% | |||
U.S. Treasury Bill, | 0.6% | |||
U.S. Treasury Bill, | 0.1% | |||
| * | The largest holdings are subject to change, and there are no guarantees the Fund will remain invested in any particular security. Excludes derivatives and investment of cash collateral for securities on loan (if any). |
| ^ | For a full list of holdings information for the underlying WisdomTree fund, please see page 41 of this report. |
The WisdomTree Enhanced Commodity Strategy Fund (the “Successor Fund” and also herein, the “Fund”) seeks to achieve positive total returns in rising and falling markets that are not directly correlated to broad market equity or fixed income returns. The Successor Fund is actively managed and intends to provide broad-based exposure to the following four commodity sectors: Energy, Agriculture, Industrial Metals, and Precious Metals primarily through investments in futures contracts. The Successor Fund acquired all of the assets and all of the stated liabilities of the WisdomTree Continuous Commodity Index Fund (the “Predecessor Fund”) after the close of business on December 18, 2020 (the “Reorganization”). The Predecessor Fund was not registered as an investment company under the Investment Company Act of 1940, as amended, and was not required to register under the Act. Prior to the Reorganization, the Predecessor Fund’s investment objective sought to provide investors with exposure to the daily change in the price of a portfolio of commodities (the “Index Commodities”) comprising the Thomson Reuters Continuous Commodity Index, also known as the Continuous Commodity Total Return Index or Refinitiv Equal Weight Continuous Commodity Total Return Index (the “Index”), before expenses. The Index Commodities consisted of corn, soybeans, wheat, live cattle, lean hogs, gold, silver, copper, cocoa, coffee, sugar, cotton, soybean oil, platinum, crude oil, NY Harbor ULSD (formerly known as heating oil), and natural gas.
Prior to December 19, 2020, the ticker symbol GCC was used for the Predecessor Fund.
The Fund returned 18.04% at net asset value (“NAV”) for the fiscal period from December 19, 2020 through August 31, 2021. The largest contributors to the Fund’s performance were its exposures to the Energy sector. The largest detractors to the Fund’s performance were its exposures to Precious Metals. Due to post COVID-19 economic recovery and a high demand for fuel, the Energy sector has rallied for more than 30%. Precious Metals however, underperformed due to higher interest rates and economic optimism. In general, the Fund’s use of derivatives to obtain commodities exposure saw a rally during the fiscal period due to inflation fear and the increasing price for raw materials.
Shareholder Expense Example (for the six-month period ended August 31, 2021)
| Beginning Account Value | Ending Account Value | Annualized Net Expense Ratio | Expenses Paid During the Period | |||||||||||||
Actual | $ | 1,000.00 | $ | 1,084.30 | 0.55 | %1 | $ | 2.89 | ||||||||
Hypothetical (5% return before expenses) | $ | 1,000.00 | $ | 1,022.43 | 0.55 | %1 | $ | 2.80 | ||||||||
| 1 | WisdomTree Asset Management, Inc. voluntarily waives a portion of its advisory fee, that it would otherwise charge, in an amount equal to the acquired fund fees and expenses (“AFFEs”) attributable to the Fund’s investment in the underlying WisdomTree fund. The “Annualized Net Expense Ratio” does not include the impact of AFFEs. |
Performance
| Cumulative Total Return1 | ||||
Fund NAV Returns | 18.04 | % | ||
Fund Market Price Returns | 18.04 | % | ||
S&P GSCI Index | 30.86 | % | ||
Bloomberg Commodity Index Total Return | 24.18 | % | ||
| 1 | For the period December 19, 2020 (post-reorganization) through August 31, 2021. |
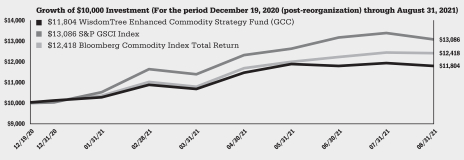
Performance is historical and does not guarantee future results. The returns do not reflect the deduction of taxes that a shareholder would pay on Fund distributions or on the redemption of Fund shares.
| 18 | WisdomTree Trust |
Table of Contents
Management’s Discussion of Funds’ Performance
as of August 31, 2021 (unaudited)
WisdomTree Managed Futures Strategy Fund (WTMF) (consolidated)
Investment Breakdown†
| Investment Type | % of Net Assets | |||
U.S. Government Obligations | 72.9% | |||
Exchange-Traded Funds | 4.1% | |||
Other Assets less Liabilities‡ | 23.0% | |||
Total | 100.0% | |||
| † | The Fund’s investment breakdown may change over time. It does not include derivatives (if any). |
| ‡ | Other assets less liabilities may include investment of cash collateral for securities on loan and/or receivables/payables on derivatives (if any). |
Top Holdings*
| Description | % of Net Assets | |||
U.S. Treasury Bill, | 68.7% | |||
U.S. Treasury Bill, | 4.2% | |||
WisdomTree Floating Rate Treasury Fund (USFR)^ | 4.1% | |||
| * | The largest holdings are subject to change, and there are no guarantees the Fund will remain invested in any particular security. Excludes derivatives and investment of cash collateral for securities on loan (if any). |
| ^ | For a full list of holdings information for the underlying WisdomTree fund, please see page 41 of this report. |
The WisdomTree Managed Futures Strategy Fund (the “Fund”) seeks to provide investors with positive total returns in rising or falling markets that are not directly correlated to broad market equity or fixed income returns. The Fund is managed using a quantitative, rules-based strategy and invests in a combination of diversified futures contracts for commodities, equities, currencies and interest rates.
The Fund returned 17.83% at net asset value (“NAV”) for the fiscal year ended August 31, 2021. The largest contributor to the Fund’s performance was its exposure to commodities, specifically its long exposures to agriculture and energy commodities. The largest detractors to the Fund’s performance were its exposures to gold and cocoa commodities. The Fund was restructured on June 7, 2021, with the new model benefiting from long exposures to equities as well as the U.S. dollar. The Fund has also benefited from a long commodity exposure to natural gas added in early August 2021. Due to post COVID-19 economic recovery, increasing demand for raw materials, and inflation fear, there was a strong rally in commodities. As a result, the Fund’s use of derivatives to obtain commodities exposure benefited Fund performance overall during the fiscal year. The Fund’s use of interest rate derivatives detracted from Fund performance due to the overall increase in interest rates on long-term U.S. Treasuries during the fiscal year.
Shareholder Expense Example (for the six-month period ended August 31, 2021)
| Beginning Account Value | Ending Account Value | Annualized Net Expense Ratio | Expenses Paid During the Period | |||||||||||||
Actual | $ | 1,000.00 | $ | 1,049.90 | 0.65 | %1 | $ | 3.36 | ||||||||
Hypothetical (5% return before expenses) | $ | 1,000.00 | $ | 1,021.93 | 0.65 | %1 | $ | 3.31 | ||||||||
| 1 | WisdomTree Asset Management, Inc. voluntarily waives a portion of its advisory fee, that it would otherwise charge, in an amount equal to the acquired fund fees and expenses (“AFFEs”) attributable to the Fund’s investment in the underlying WisdomTree fund. The “Annualized Net Expense Ratio” does not include the impact of AFFEs. |
Performance
| Average Annual Total Return | ||||||||||||||||
| 1 Year | 3 Year | 5 Year | 10 Year | |||||||||||||
Fund NAV Returns | 17.83 | % | 2.59 | % | 1.27 | % | -1.13 | % | ||||||||
Fund Market Price Returns | 18.31 | % | 2.67 | % | 1.37 | % | -1.08 | % | ||||||||
S&P Diversified Trends Indicator Index | 11.33 | % | 2.78 | % | 2.57 | % | -0.03 | % | ||||||||
S&P GSCI Index | 43.86 | % | -2.15 | % | 3.27 | % | -6.60 | % | ||||||||
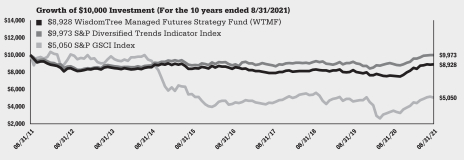
Performance is historical and does not guarantee future results. The returns do not reflect the deduction of taxes that a shareholder would pay on Fund distributions or on the redemption of Fund shares.
| WisdomTree Trust | 19 |
Table of Contents
Description of Terms and Indexes (unaudited)
Below are descriptions of certain terms and of each index referenced in this report.
Basis point:
A basis point is one hundredth of one percent, used mostly in expressing differences in interest rates.
Bloomberg Rate Hedged U.S. Aggregate Bond Index, Zero Duration:
The Bloomberg Rate Hedged U.S. Aggregate Bond Index, Zero Duration combines long positions in the Bloomberg U.S. Aggregate Bond Index with short positions in U.S. Treasury Bonds to provide a duration exposure of 0 years. Market values of long and short positions are rebalanced at month-end.
Bloomberg U.S. Aggregate Enhanced Yield Index:
The Bloomberg U.S. Aggregate Enhanced Yield Index uses a rules-based approach to reallocate across subcomponents in the Bloomberg U.S. Aggregate Bond Index seeking to enhance yield while maintaining a similar risk profile.
Bloomberg U.S. Securitized MBS/ABS/CMBS Index:
The Bloomberg U.S. Securitized MBS/ABS/CMBS Index is a market capitalization index that is designed to measure the performance of residential mortgage-backed securities issued by Government Sponsored Enterprises, commercial mortgage-backed securities, and asset backed securities.
Bloomberg U.S. Short Aggregate Composite Index:
The Bloomberg U.S. Short Aggregate Composite Index measures the performance of the short-term U.S. investment-grade bond market.
Bloomberg U.S. Short Aggregate Enhanced Yield Index:
The Bloomberg U.S. Short Aggregate Enhanced Yield Index uses a rules-based approach to reallocate across subcomponents in the Bloomberg U.S. Aggregate Bond Index that generally have effective maturities shorter than 5 years and seeks to enhance yield while maintaining a similar risk profile.
Bloomberg U.S. Aggregate Index:
The Bloomberg U.S. Aggregate Index represents the investment-grade, U.S. dollar-denominated, fixed-rate taxable bond market, including Treasuries, government-related and corporate securities, as well as mortgage and asset-backed securities.
Bloomberg Commodity Index Total Return:
Bloomberg Commodity Index Total Return is composed of futures contracts and reflects the returns on a fully collateralized investment in the Bloomberg Commodity Index (“BCOM”). This combines the returns of the BCOM with the returns on cash collateral invested in 13-week U.S. Treasury Bills.
Bloomberg Dollar Spot Index:
The Bloomberg Dollar Spot Index tracks the performance of a basket of 10 leading global currencies versus the U.S. dollar. Each currency in the basket and its weight is determined annually based on its share of international trade and foreign exchange (FX) liquidity.
| 20 | WisdomTree Trust |
Table of Contents
Description of Terms and Indexes (unaudited) (continued)
Bloomberg Dollar Total Return Index:
The Bloomberg Dollar Total Return Index is total return version of the Bloomberg Dollar Spot Index (BBDXY). It is generated by adding the daily forward implied yield of each currency, and U.S. funding rate, to BBDXY returns.
Bloomberg U.S. Treasury Floating Rate Bond Index:
The Bloomberg U.S. Treasury Floating Rate Bond Index is a rules-based, market-value weighted index engineered to measure the performance and characteristics of floating rate coupon U.S. Treasuries which have a maturity greater than 12 months.
Bond Spread:
A bond spread is the difference between the yields of two bonds with differing credit ratings. Most often, a corporate bond with a certain amount of risk is compared to a standard risk-free Treasury Bond. The bond spread will show the additional yield that could be earned from a bond which has a higher risk. Generally, bond spreads are often a good barometer of economic health — widening (bad) and narrowing (good).
CBOE® S&P 500 PutWrite Index:
The CBOE® S&P 500 PutWrite Index tracks the value of a cash-secured (i.e., collateralized) put option sales strategy, which consists of selling (or “writing”) S&P 500® Index put options and investing the sale proceeds in one- and three-month Treasury bills.
Collateralized loan obligation (CLO):
A collateralized loan obligation is a form of securitization where payments from multiple middle sized and large business loans are pooled together and passed on to different classes of owners.
Commercial mortgage-backed securities (CMBS):
A type of mortgage-backed security that is backed by commercial and multifamily mortgages rather than residential real estate.
Consumer Price Index:
The Consumer Price Index (CPI) is a measure of the average change over time in the prices paid by urban consumers for a market basket of consumer goods and services.
Duration:
Duration is a measure of a bond’s sensitivity to changes in interest rates. The weighted average accounts for the various durations of the bonds purchased as well as the proportion of the total government bond portfolio that they make up.
Equal-Weighted Emerging Currency Composite:
A composite incorporating equal-weighted exposure to the currencies within the Emerging Currency Strategy Fund was constructed as an additional gauge of Emerging Currency Strategy Fund performance. The composite tracks the returns for the currencies using the total returns of the country subindices of the JP Morgan Emerging Local Markets Index Plus (ELMI+). Each subindex uses a weighted basket of one-month, two-month and three-month currency forwards (deliverable or nondeliverable) collateralized with U.S. money market rates to proxy the total returns of an investment in local-currency money market instruments. Currency exposures are rebalanced back to equal-weighting at the end of the month in which the Emerging Currency Strategy Fund intends to rebalance, and currency changes are reflected in the composite at the end of the month they are reflected in the Fund.
| WisdomTree Trust | 21 |
Table of Contents
Description of Terms and Indexes (unaudited) (continued)
Gapstow Liquid Alternative Credit Index:
The Gapstow Liquid Alternative Credit Index (GLACI) is an equal-weighted index that tracks the performance of 35 Publicly Traded Alternative Credit Vehicles (“PACs”) using an objective, rules-based methodology. PACs are a subset of business development companies, real estate investment trusts, and closed-end funds, and selected because of their exposure to a range of U.S. alternative credit sectors (tradeable high yield, structured, and private credit) and borrower segments (households, corporations, and commercial real estate sponsors). GLACI is the first index constructed to provide diversified exposure to these alternative credit sectors and segments.
Gross Domestic Product:
Gross Domestic Product (GDP) is the total monetary or market value of all the finished goods and services produced within a country’s borders in a specific time period. As a broad measure of overall domestic production, it functions as a comprehensive scorecard of a country’s economic health.
ICE BofA Merrill Lynch 0-5 Year U.S. High Yield Constrained, Zero Duration Index:
The ICE BofA Merrill Lynch 0-5 Year U.S. High Yield Constrained, Zero Duration Index tracks the performance of the combination of a long position in short maturity U.S. high yield bonds and a short position in on-the-run U.S. Treasuries where the net interest rate exposure of the index is adjusted to a zero year duration. Market values of long and short positions are rebalanced at month-end.
ICE BofA Merrill Lynch U.S. Corporate Master Option-Adjusted Spread and the ICE BofA Merrill Lynch U.S. High Yield Option-Adjusted Spread:
The ICE BofA Merrill Lynch Option-Adjusted Spreads (“OAS”) are the calculated spreads between a computed OAS index of all bonds in a given rating category and a spot Treasury curve. An OAS index is constructed using each constituent bond weighted by market capitalization. The ICE BofA Merrill Lynch U.S. Corporate Master OAS uses an index of bonds that are considered investment grade (those rated BBB or better) and the ICE BofA Merrill Lynch U.S. High Yield Master OAS uses an index of bonds that are below investment grade (those rated BB or below).
ISM Manufacturing Index:
The ISM manufacturing index, also known as the purchasing managers’ index (PMI) is a monthly indicator of U.S. economic activity based on a survey of purchasing managers at more than 300 manufacturing firms. It is considered to be a key indicator of the state of the U.S. economy.
JP Morgan CEMBI Diversified Index:
The JP Morgan CEMBI Diversified Index is an alternatively weighted version of the JP Morgan CEMBI Index (a comprehensive U.S. dollar-denominated emerging market corporate bond index) which limits the weights of those index countries with larger corporate debt stocks by only including a specified portion of these countries’ eligible current face amounts of debt outstanding.
JP Morgan Emerging Local Markets Index Plus (ELMI+):
The JP Morgan Emerging Local Markets Index Plus (ELMI+) and its underlying country and regional subindices track the total returns for local-currency denominated money market instruments in emerging market countries.
| 22 | WisdomTree Trust |
Table of Contents
Description of Terms and Indexes (unaudited) (continued)
JP Morgan Emerging Local Markets Index Plus (ELMI+) China:
The China subindex uses a weighted basket of one-month, two-month and three-month currency forwards collateralized with U.S. money market rates to proxy the total returns of an investment in Chinese yuan money market instruments. The returns are reported in U.S. dollar terms.
JP Morgan Government Bond Index-Emerging Markets (GBI-EM) Global Diversified Index:
The JP Morgan Government Bond Index-Emerging Markets (GBI-EM) Global Diversified Index tracks the performance of local currency debt issued by emerging market governments, whose debt is accessible by most of the international investor base. The index incorporates a constrained market capitalization methodology in which individual issuer exposures are capped at 10% (with the excess distributed to smaller issuers) for greater diversification among issuing governments. The returns are reported in U.S. dollar terms.
Mortgage-backed security (MBS):
A mortgage-backed security is a type of asset-backed security which is secured by a mortgage or collection of mortgages.
Purchasing Managers’ Index:
The Purchasing Managers’ Index (PMI) is an index of the prevailing direction of economic trends in the manufacturing and service sectors. It consists of a diffusion index that summarizes whether market conditions, as viewed by purchasing managers, are expanding, staying the same, or contracting.
Risk-on and Risk-off:
Investors’ appetites for risk rise and fall over time. During periods when risk is perceived as low, the risk-on risk-off theory states that investors tend to engage in higher-risk investments (i.e., “Risk-on”). When risk is perceived to be high, investors have the tendency to gravitate toward lower-risk investments (i.e., “Risk-off”).
S&P 500® Index:
The S&P 500® Index is a capitalization-weighted index of 500 stocks selected by Standard & Poor’s Index Committee designed to represent the performance of the leading industries in the United States economy.
S&P Diversified Trends Indicator Index:
The S&P Diversified Trends Indicator Index is a diversified composite of global commodity and financial futures that are highly liquid.
S&P GSCI Index:
The S&P GSCI Index comprises the principal physical commodities that are the subject to active, liquid futures markets.
Spot Rate and NDF Rate Returns:
A “spot” rate is the foreign exchange rate on foreign currency contracts settled generally within two business days from the trade date. The NDF rate is the foreign exchange rate on non-deliverable forward currency contracts settled on a future date that is generally greater than two business days from the trade date. The Chinese yuan NDF return rate relative to the U.S. dollar calculated by WisdomTree is the rate of return percentage difference between the end of period NDF rate and the beginning of period NDF rate using WM/Reuters Singapore closing rates.
| WisdomTree Trust | 23 |
Table of Contents
Description of Terms and Indexes (unaudited) (continued)
Thomson Reuters Continuous Commodity Index:
The Thomson Reuters Continuous Commodity Index, also known as the Continuous Commodity Total Return Index or Refinitiv Equal Weight Continuous Commodity Total Return Index (the “Index”), is composed of notional amounts of each of the following commodities (“Index Commodities”): corn, soybean, wheat, live cattle, lean hogs, gold, silver, copper, cocoa, coffee, sugar, cotton, soybean oil, platinum, crude oil, NY Harbor ULSD (formerly known as heating oil), and natural gas. The notional amounts of each Index Commodity included in the Index are in equal weight proportion to the Index Commodities or 1/17 weighting per index commodity rebalanced daily.
Tranches:
Are pieces of a pooled collection of securities, usually debt instruments, that are split up by risk or other characteristics in order to be marketable to different investors.
WisdomTree U.S. High Yield Corporate Bond, Zero Duration Index:
The WisdomTree U.S. High Yield Corporate Bond, Zero Duration Index is a rules-based alternatively weighted index that is designed to provide exposure to U.S. high yield corporate bonds with a short position in U.S. Treasuries where the net interest rate exposure of the index is adjusted to a zero year duration.
Yield Curve:
Graphical Depiction of interest rates on government bonds, with the current yield on the vertical axis and the years to maturity on the horizontal axis.
* * * * * *
Bloomberg® and the Bloomberg Indices are service marks of Bloomberg Finance L.P. and its affiliates, including Bloomberg Index Services Limited (“BISL”), the administrator of the index (collectively, “Bloomberg”) and have been licensed for use for certain purposes by WisdomTree. Bloomberg is not affiliated with WisdomTree, and Bloomberg does not approve, endorse, review, or recommend each of AGGY, SHAG, or AGZD. Bloomberg does not guarantee the timeliness, accurateness, or completeness of any data or information relating to each of AGGY, SHAG, or AGZD.
Merrill Lynch, Pierce, Fenner & Smith Incorporated and its affiliates (“ICE BofA Merrill Lynch”) indices and related information, the name “ICE BofA Merrill Lynch”, and related trademarks, are intellectual property licensed from ICE BofA Merrill Lynch, and may not be copied, used, or distributed without ICE BofA Merrill Lynch’s prior written approval. The licensee’s products have not been passed on as to their legality or suitability, and are not regulated, issued, endorsed, sold, guaranteed, or promoted by ICE BofA Merrill Lynch. ICE BofA MERRILL LYNCH MAKES NO WARRANTIES AND BEARS NO LIABILITY WITH RESPECT TO THE INDICES, ANY RELATED INFORMATION, ITS TRADEMARKS, OR THE PRODUCT(S) (INCLUDING WITHOUT LIMITATION, THEIR QUALITY, ACCURACY, SUITABILITY AND/OR COMPLETENESS).
The CBOE S&P 500 PutWrite Index is a product of S&P Dow Jones Indices LLC or its affiliates (“SPDJI”) and CBOE® and has been licensed for use by WisdomTree. Standard & Poor’s® and S&P® are registered trademarks of Standard & Poor’s Financial Services LLC (“S&P”); Dow Jones® is registered trademark of Dow Jones Trademarks Holdings LLC (“Dow Jones”); and these trademarks have been licensed for use by SPDJI and sublicensed for certain purposes by WisdomTree. CBOE® is a trademark of the Chicago Board Options Exchange, Incorporated, and has been licensed for use by SPDJI and WisdomTree. The WisdomTree CBOE S&P 500 PutWrite Strategy Fund is not
| 24 | WisdomTree Trust |
Table of Contents
Description of Terms and Indexes (unaudited) (concluded)
sponsored, endorsed, sold or promoted by SPDJI, Dow Jones, S&P, their respective affiliates or the Chicago Board Options Exchange, Incorporated, and none of such parties make any representation regarding the advisability of investing in such product(s), nor do they have any liability for any errors, omissions or interruptions of the CBOE S&P 500 PutWrite Index.
The Gapstow Liquid Alternative Credit Index is a registered service mark of Gapstow Capital Partners L.P. and has been licensed for use by WisdomTree Asset Management and WisdomTree Trust as the issuer of the WisdomTree Alternative Income Fund. The WisdomTree Alternative Income Fund is not sponsored, endorsed, sold, or promoted by Gapstow Capital Partners L.P., and it makes no representation regarding the advisability of investing in the Fund. GAPSTOW CAPITAL PARTNERS L.P. AND ITS AFFILIATES MAKE NO WARRANTIES AND BEAR NO LIABILITY WITH RESPECT TO THE WISDOMTREE ALTERNATIVE INCOME FUND. Gapstow Capital Partners L.P. contracts with a calculation agent to independently calculate and publish the Gapstow Liquid Alternative Credit Index, and Gapstow Capital Partners L.P. cannot assure its accuracy. The publication of the Gapstow Liquid Alternative Credit Index does not constitute a recommendation by Gapstow Capital Partners L.P. to invest in the WisdomTree Alternative Income Fund. Gapstow Capital Partners L.P. offers no guarantee or assurance with regard to the results of using the Gapstow Liquid Alternative Credit Index.
WisdomTree Investments, Inc. and WisdomTree Asset Management, Inc. (together, “WisdomTree”) and the Funds make no representation or warranty, express or implied, to the owners of shares of the Funds or any member of the public regarding the advisability of investing in securities generally or in the Funds particularly or the ability of the underlying Indexes to track the performance of their underlying securities. WisdomTree Investments is the licensor of certain trademarks, service marks and trade names of the Funds. WisdomTree Investments has no obligation to take the needs of the Funds or the owners of shares of the Funds into consideration in determining, composing, or calculating the underlying WisdomTree Indexes of the applicable Funds. WisdomTree Investments is not responsible for, and has not participated in, the determination of the timing of, prices of, or quantities of shares of the Funds to be issued or in the determination or calculation of the equation by which the shares of the Funds are redeemable. WisdomTree and the Funds do not guarantee the accuracy, completeness, or performance of the underlying Indexes or the data included therein and shall have no liability in connection with the underlying Indexes or their calculation.
Index returns do not reflect expenses paid by the Funds. Index returns assume reinvestment of distributions. It is not possible to invest directly in an index.
* * * * * *
Abbreviations used in the schedules of investments and related tables included in this report are as follows:
| CURRENCY ABBREVIATIONS: | ||||||||||
| AUD | Australian dollar | GBP | British pound | PHP | Philippine peso | |||||
| BRL | Brazilian real | HUF | Hungary forint | PLN | Polish zloty | |||||
| CAD | Canadian dollar | IDR | Indonesian rupiah | RON | Romanian leu | |||||
| CHF | Swiss franc | INR | Indian rupee | RUB | Russian ruble | |||||
| CLP | Chilean peso | JPY | Japanese yen | THB | Thai baht | |||||
| CNH | Offshore Chinese renminbi | KRW | South Korean won | TRY | Turkish new lira | |||||
| CNY | Chinese yuan | MXN | Mexican peso | USD | U.S. dollar | |||||
| COP | Colombian peso | MYR | Malaysian ringgit | ZAR | South African rand | |||||
| EUR | Euro | PEN | Peruvian nuevo sol | |||||||
| OTHER ABBREVIATIONS: | ||||||||||
| HRW | Hard Red Winter | |||||||||
| RBOB | Reformulated Blendstock for Oxygenate Blending | |||||||||
| REMIC | Real Estate Mortgage Investment Conduit | |||||||||
| STRIPS | Separate Trading of Registered Interest and Principal of Securities | |||||||||
| ULSD | Ultra-Low-Sulfur Diesel | |||||||||
| WTI | West Texas Intermediate | |||||||||
| WisdomTree Trust | 25 |
Table of Contents
WisdomTree Bloomberg U.S. Dollar Bullish Fund (USDU)
August 31, 2021
| Investments | Principal Amount | Value | ||||||
| U.S. GOVERNMENT OBLIGATIONS – 94.9% |
| |||||||
| U.S. Treasury Bills – 94.9% |
| |||||||
0.04%, 9/9/21* | $ | 35,025,000 | $ | 35,024,752 | ||||
0.04%, 9/16/21* | 34,406,000 | 34,405,642 | ||||||
0.04%, 10/7/21* | 34,361,000 | 34,359,711 | ||||||
0.04%, 10/14/21* | 32,011,000 | 32,009,662 | ||||||
| TOTAL U.S. GOVERNMENT OBLIGATIONS (Cost: $135,799,184) |
| 135,799,767 | ||||||
| Investments | Shares | Value | ||||||
| EXCHANGE-TRADED FUND – 4.1% |
| |||||||
| United States – 4.1% |
| |||||||
WisdomTree Floating Rate Treasury Fund(a) | ||||||||
| (Cost: $5,901,568) | 235,000 | $ | 5,898,500 | |||||
TOTAL INVESTMENTS IN SECURITIES – 99.0% (Cost: $141,700,752) |
| 141,698,267 | ||||||
Other Assets less Liabilities – 1.0% |
| 1,469,812 | ||||||
|
| |||||||
| NET ASSETS – 100.0% |
| $ | 143,168,079 | |||||
| * | Interest rate shown reflects the yield to maturity at the time of purchase. |
| (a) | Affiliated holding. See “Investment in Affiliates” supplementary table included in this Schedule of Investments for additional information. |
| INVESTMENT IN AFFILIATES | ||||||||||||||
Affiliated holdings are investments in entities in which the Fund owns 5% or more of the outstanding voting securities or are investments in entities which are under common ownership or control. Investments in affiliates during the fiscal year ended August 31, 2021 were as follows:
| Affiliate | Value at 8/31/2020 | Purchases/ Additions | Sales/ Reductions | Realized Gain/(Loss) | Change in Unrealized Appreciation/ Depreciation | Value at 8/31/2021 | Dividend Income | Capital Gain Distributions | ||||||||||||||||||||||||
WisdomTree Floating Rate Treasury Fund | $ | 3,465,180 | $ | 4,697,240 | $ | 2,258,599 | $ | (3,198 | ) | $ | (2,123 | ) | $ | 5,898,500 | $ | 866 | $ | 822 | ||||||||||||||
| FINANCIAL DERIVATIVE INSTRUMENTS | ||||||||||||||||||||||||||||
| FOREIGN CURRENCY CONTRACTS (OTC – OVER THE COUNTER) | ||||||||||||||||||||||||||||
| Counterparty | Settlement Date | Amount and Description of Currency to be Purchased | Amount and Description of Currency to be Sold | Unrealized Appreciation | Unrealized Depreciation | |||||||||||||||||||||||
Bank of America N.A. | 9/3/2021 | 7,262,277 | USD | 9,895,000 | AUD | $ | 23,550 | $ | — | |||||||||||||||||||
Barclays Bank PLC | 9/3/2021 | 27,645,000 | CNH | 4,282,707 | USD | 347 | — | |||||||||||||||||||||
Barclays Bank PLC | 9/3/2021 | 2,329,895,000 | JPY | 21,179,208 | USD | — | (1,081 | ) | ||||||||||||||||||||
Barclays Bank PLC | 9/3/2021 | 5,612,960,000 | KRW | 4,842,516 | USD | — | (1,539 | ) | ||||||||||||||||||||
Barclays Bank PLC | 9/3/2021 | 4,266,075 | USD | 27,645,000 | CNH | — | (16,978 | ) | ||||||||||||||||||||
Barclays Bank PLC | 10/6/2021 | 20,960,142 | USD | 2,305,165,000 | JPY | 864 | — | |||||||||||||||||||||
Barclays Bank PLC | 10/6/2021 | 4,948,174 | USD | 5,737,655,000 | KRW | 1,596 | — | |||||||||||||||||||||
Barclays Bank PLC | 10/13/2021 | 4,305,101 | USD | 27,885,000 | CNH | — | (353 | ) | ||||||||||||||||||||
Canadian Imperial Bank of Commerce | 9/3/2021 | 378,468 | USD | 525,000 | AUD | — | (5,598 | ) | ||||||||||||||||||||
Canadian Imperial Bank of Commerce | 9/3/2021 | 686,768 | USD | 870,000 | CAD | — | (2,802 | ) | ||||||||||||||||||||
Canadian Imperial Bank of Commerce | 9/3/2021 | 4,867,882 | USD | 5,612,960,000 | KRW | 26,906 | — | |||||||||||||||||||||
Citibank N.A. | 9/3/2021 | 46,320,882 | USD | 39,040,000 | EUR | 223,547 | — | |||||||||||||||||||||
Citibank N.A. | 9/3/2021 | 4,211,006 | USD | 314,120,000 | INR | — | (91,208 | ) | ||||||||||||||||||||
Citibank N.A. | 9/3/2021 | 568,360 | USD | 11,585,000 | MXN | — | (8,390 | ) | ||||||||||||||||||||
Goldman Sachs | 9/3/2021 | 22,005,000 | CAD | 17,441,556 | USD | — | (190 | ) | ||||||||||||||||||||
Goldman Sachs | 9/3/2021 | 293,715,000 | MXN | 14,622,653 | USD | — | (302 | ) | ||||||||||||||||||||
Goldman Sachs | 9/3/2021 | 14,114,933 | USD | 282,130,000 | MXN | 69,331 | — | |||||||||||||||||||||
Goldman Sachs | 10/6/2021 | 17,072,042 | USD | 21,540,000 | CAD | 104 | — | |||||||||||||||||||||
Goldman Sachs | 10/6/2021 | 14,283,165 | USD | 288,160,000 | MXN | — | (59 | ) | ||||||||||||||||||||
HSBC Holdings PLC | 9/3/2021 | 1,144,180 | USD | 975,000 | EUR | — | (7,072 | ) | ||||||||||||||||||||
JP Morgan Chase Bank N.A. | 9/3/2021 | 603,496 | USD | 440,000 | GBP | — | (1,439 | ) | ||||||||||||||||||||
JP Morgan Chase Bank N.A. | 9/3/2021 | 20,825,720 | USD | 2,284,165,000 | JPY | 63,267 | — | |||||||||||||||||||||
Morgan Stanley & Co. International | 9/3/2021 | 10,420,000 | AUD | 7,622,897 | USD | — | (104 | ) | ||||||||||||||||||||
Morgan Stanley & Co. International | 9/3/2021 | 12,130,000 | GBP | 16,677,210 | USD | — | (243 | ) | ||||||||||||||||||||
Morgan Stanley & Co. International | 9/3/2021 | 16,939,725 | USD | 21,135,000 | CAD | 187,928 | — | |||||||||||||||||||||
Morgan Stanley & Co. International | 10/6/2021 | 7,397,396 | USD | 10,110,000 | AUD | — | (24 | ) | ||||||||||||||||||||
Morgan Stanley & Co. International | 10/6/2021 | 16,451,600 | USD | 11,965,000 | GBP | 41 | — | |||||||||||||||||||||
Standard Chartered Bank | 9/3/2021 | 314,120,000 | INR | 4,302,424 | USD | — | (210 | ) | ||||||||||||||||||||
Standard Chartered Bank | 10/6/2021 | 4,255,649 | USD | 311,705,000 | INR | — | — | |||||||||||||||||||||
See Notes to Financial Statements.
| 26 | WisdomTree Trust |
Table of Contents
Schedule of Investments (concluded)
WisdomTree Bloomberg U.S. Dollar Bullish Fund (USDU)
August 31, 2021
| FINANCIAL DERIVATIVE INSTRUMENTS | ||||||||||||||||||||||||||||
| FOREIGN CURRENCY CONTRACTS (OTC – OVER THE COUNTER) | ||||||||||||||||||||||||||||
| Counterparty | Settlement Date | Amount and Description of Currency to be Purchased | Amount and Description of Currency to be Sold | Unrealized Appreciation | Unrealized Depreciation | |||||||||||||||||||||||
UBS AG | 9/3/2021 | 6,155,000 | CHF | 6,721,369 | USD | $ | 65 | $ | — | |||||||||||||||||||
UBS AG | 9/3/2021 | 40,015,000 | EUR | 47,249,192 | USD | — | (605 | ) | ||||||||||||||||||||
UBS AG | 9/3/2021 | 6,799,933 | USD | 6,155,000 | CHF | 78,498 | — | |||||||||||||||||||||
UBS AG | 9/3/2021 | 16,250,257 | USD | 11,690,000 | GBP | 178,226 | — | |||||||||||||||||||||
UBS AG | 9/3/2021 | 416,557 | USD | 45,730,000 | JPY | 883 | — | |||||||||||||||||||||
UBS AG | 10/6/2021 | 6,852,467 | USD | 6,270,000 | CHF | — | (248 | ) | ||||||||||||||||||||
UBS AG | 10/6/2021 | 46,824,708 | USD | 39,630,000 | EUR | 69 | — | |||||||||||||||||||||
| $ | 855,222 | $ | (138,445 | ) | ||||||||||||||||||||||||
| FAIR VALUATION SUMMARY | ||||||||
The following is a summary of the fair valuations according to the inputs used as of August 31, 2021 in valuing the Fund’s investments (See Note 2 — Fair Value Measurement):
Quoted Prices in Active Markets | Other Significant Inputs | Significant Unobservable Inputs (Level 3) | Total | |||||||||||||
Assets: |
| |||||||||||||||
Investments in Securities | ||||||||||||||||
U.S. Government Obligations | $ | — | $ | 135,799,767 | $ | — | $ | 135,799,767 | ||||||||
Exchange-Traded Fund | 5,898,500 | — | — | 5,898,500 | ||||||||||||
Total Investments in Securities | $ | 5,898,500 | $ | 135,799,767 | $ | — | $ | 141,698,267 | ||||||||
Financial Derivative Instruments | ||||||||||||||||
Foreign Currency Contracts1 | $ | — | $ | 855,222 | $ | — | $ | 855,222 | ||||||||
Liabilities: | ||||||||||||||||
Financial Derivative Instruments | ||||||||||||||||
Foreign Currency Contracts1 | $ | — | $ | (138,445 | ) | $ | — | $ | (138,445 | ) | ||||||
Total – Net | $ | 5,898,500 | $ | 136,516,544 | $ | — | $ | 142,415,044 | ||||||||
| 1 | Amount shown represents the unrealized appreciation (depreciation) on the financial instrument. |
See Notes to Financial Statements.
| WisdomTree Trust | 27 |
Table of Contents
Schedule of Investments
WisdomTree Chinese Yuan Strategy Fund (CYB)
August 31, 2021
| Investments | Principal Amount | Value | ||||||
| U.S. GOVERNMENT OBLIGATIONS – 65.4% |
| |||||||
| U.S. Treasury Bills – 65.4% |
| |||||||
0.04%, 9/9/21* | $ | 14,579,000 | $ | 14,578,897 | ||||
0.04%, 10/14/21* | 13,638,000 | 13,637,430 | ||||||
TOTAL U.S. GOVERNMENT OBLIGATIONS (Cost: $28,216,200) |
| 28,216,327 | ||||||
| Shares | ||||||||
| EXCHANGE-TRADED FUND – 4.2% |
| |||||||
| United States – 4.2% |
| |||||||
WisdomTree Floating Rate Treasury Fund(a) | ||||||||
| (Cost: $1,822,572) | 72,600 | 1,822,260 | ||||||
| Investments | Principal Amount | Value | ||||||
| REPURCHASE AGREEMENT – 30.0% |
| |||||||
| United States – 30.0% |
| |||||||
Citigroup, Inc., tri-party repurchase agreement dated 8/31/21 (tri-party custodian: The Bank of New York Mellon Corp.), 0.06% due 9/1/21; Proceeds at maturity – $12,960,022 (fully collateralized by Fannie Mae Pool, 2.50% due 8/1/51, Freddie Mac Pool, 2.00% – 3.50% due 8/1/51; Market value including accrued interest – $13,608,053) | ||||||||
| (Cost: $12,960,000) | $ | 12,960,000 | $ | 12,960,000 | ||||
TOTAL INVESTMENTS IN SECURITIES – 99.6% (Cost: $42,998,772) |
| 42,998,587 | ||||||
Other Assets less Liabilities – 0.4% |
| 167,111 | ||||||
|
| |||||||
| NET ASSETS – 100.0% |
| $ | 43,165,698 | |||||
| * | Interest rate shown reflects the yield to maturity at the time of purchase. |
| (a) | Affiliated holding. See “Investment in Affiliates” supplementary table included in this Schedule of Investments for additional information. |
| INVESTMENT IN AFFILIATES | ||||||||||||||
Affiliated holdings are investments in entities in which the Fund owns 5% or more of the outstanding voting securities or are investments in entities which are under common ownership or control. Investments in affiliates during the fiscal year ended August 31, 2021 were as follows:
| Affiliate | Value at 8/31/2020 | Purchases/ Additions | Sales/ Reductions | Realized Gain/(Loss) | Change in Unrealized Appreciation/ Depreciation | Value at 8/31/2021 | Dividend Income | Capital Gain Distributions | ||||||||||||||||||||||||
WisdomTree Floating Rate Treasury Fund | $ | 1,119,906 | $ | 1,130,013 | $ | 426,613 | $ | (400 | ) | $ | (646 | ) | $ | 1,822,260 | $ | 302 | $ | 282 | ||||||||||||||
| FINANCIAL DERIVATIVE INSTRUMENTS | ||||||||||||||||||||||||||||
| FOREIGN CURRENCY CONTRACTS (OTC – OVER THE COUNTER) | ||||||||||||||||||||||||||||
| Counterparty | Settlement Date | Amount and Description of Currency to be Purchased | Amount and Description of Currency to be Sold | Unrealized Appreciation | Unrealized Depreciation | |||||||||||||||||||||||
Bank of Montreal | 10/21/2021 | 993,838 | USD | 6,500,000 | CNY | $ | — | $ | (7,363 | ) | ||||||||||||||||||
Barclays Bank PLC | 10/21/2021 | 53,500,000 | CNH | 8,217,316 | USD | 31,891 | — | |||||||||||||||||||||
Canadian Imperial Bank of Commerce | 9/13/2021 | 203,763 | USD | 1,322,000 | CNH | — | (717 | ) | ||||||||||||||||||||
Canadian Imperial Bank of Commerce | 10/21/2021 | 211,275 | USD | 1,375,000 | CNH | — | (738 | ) | ||||||||||||||||||||
Citibank N.A. | 9/13/2021 | 42,360,000 | CNH | 6,586,602 | USD | — | (34,563 | ) | ||||||||||||||||||||
Citibank N.A. | 10/21/2021 | 57,750,000 | CNY | 8,880,517 | USD | 14,773 | — | |||||||||||||||||||||
Citibank N.A. | 10/21/2021 | 451,103 | USD | 2,938,000 | CNY | — | (1,440 | ) | ||||||||||||||||||||
Citibank N.A. | 10/21/2021 | 2,261,150 | USD | 14,728,000 | CNY | — | (7,419 | ) | ||||||||||||||||||||
Citibank N.A. | 11/12/2021 | 60,500,000 | CNY | 9,281,134 | USD | 22,455 | — | |||||||||||||||||||||
Citibank N.A. | 11/12/2021 | 2,575,098 | USD | 16,802,000 | CNY | — | (8,685 | ) | ||||||||||||||||||||
Goldman Sachs | 9/13/2021 | 5,405,000 | CNH | 841,576 | USD | — | (5,556 | ) | ||||||||||||||||||||
Goldman Sachs | 10/21/2021 | 382,720 | USD | 2,500,000 | CNH | — | (2,757 | ) | ||||||||||||||||||||
Goldman Sachs | 10/21/2021 | 1,058,702 | USD | 6,891,000 | CNH | — | (3,827 | ) | ||||||||||||||||||||
HSBC Holdings PLC | 9/13/2021 | 1,291,000 | CNH | 198,067 | USD | 1,618 | — | |||||||||||||||||||||
HSBC Holdings PLC | 9/13/2021 | 6,359,158 | USD | 41,106,000 | CNH | 1,082 | — | |||||||||||||||||||||
HSBC Holdings PLC | 10/21/2021 | 57,750,000 | CNY | 8,865,520 | USD | 29,769 | — | |||||||||||||||||||||
HSBC Holdings PLC | 12/13/2021 | 41,550,000 | CNH | 6,382,870 | USD | 5,835 | — | |||||||||||||||||||||
Standard Chartered Bank | 9/13/2021 | 1,021,443 | USD | 6,628,000 | CNH | — | (3,744 | ) | ||||||||||||||||||||
UBS AG | 11/12/2021 | 60,500,000 | CNY | 9,266,492 | USD | 37,097 | — | |||||||||||||||||||||
| $ | 144,520 | $ | (76,809 | ) | ||||||||||||||||||||||||
See Notes to Financial Statements.
| 28 | WisdomTree Trust |
Table of Contents
Schedule of Investments (concluded)
WisdomTree Chinese Yuan Strategy Fund (CYB)
August 31, 2021
| FAIR VALUATION SUMMARY | ||||||||
The following is a summary of the fair valuations according to the inputs used as of August 31, 2021 in valuing the Fund’s investments (See Note 2 — Fair Value Measurement):
Quoted Prices in Markets (Level 1) | Other Significant Observable Inputs (Level 2) | Significant Unobservable Inputs (Level 3) | Total | |||||||||||||
Assets: |
| |||||||||||||||
Investments in Securities | ||||||||||||||||
U.S. Government Obligations | $ | — | $ | 28,216,327 | $ | — | $ | 28,216,327 | ||||||||
Exchange-Traded Fund | 1,822,260 | — | — | 1,822,260 | ||||||||||||
Repurchase Agreement | — | 12,960,000 | — | 12,960,000 | ||||||||||||
Total Investments in Securities | $ | 1,822,260 | $ | 41,176,327 | $ | — | $ | 42,998,587 | ||||||||
Financial Derivative Instruments | ||||||||||||||||
Foreign Currency Contracts1 | $ | — | $ | 144,520 | $ | — | $ | 144,520 | ||||||||
Liabilities: | ||||||||||||||||
Financial Derivative Instruments | ||||||||||||||||
Foreign Currency Contracts1 | $ | — | $ | (76,809 | ) | $ | — | $ | (76,809 | ) | ||||||
Total – Net | $ | 1,822,260 | $ | 41,244,038 | $ | — | $ | 43,066,298 | ||||||||
| 1 | Amount shown represents the unrealized appreciation (depreciation) on the financial instrument. |
See Notes to Financial Statements.
| WisdomTree Trust | 29 |
Table of Contents
Schedule of Investments
WisdomTree Emerging Currency Strategy Fund (CEW)
August 31, 2021
| Investments | Principal Amount | Value | ||||||
| U.S. GOVERNMENT OBLIGATIONS – 62.6% |
| |||||||
| U.S. Treasury Bills – 62.6% |
| |||||||
0.04%, 9/9/21* | $ | 3,913,000 | $ | 3,912,972 | ||||
0.04%, 10/14/21* | 4,063,000 | 4,062,830 | ||||||
TOTAL U.S. GOVERNMENT OBLIGATIONS (Cost: $7,975,766) |
| 7,975,802 | ||||||
| Shares | ||||||||
| EXCHANGE-TRADED FUND – 4.5% |
| |||||||
| United States – 4.5% |
| |||||||
WisdomTree Floating Rate Treasury Fund(a) | ||||||||
| (Cost: $567,356) | 22,600 | 567,260 | ||||||
| Investments | Principal Amount | Value | ||||||
| REPURCHASE AGREEMENT – 31.4% |
| |||||||
| United States – 31.4% |
| |||||||
Citigroup, Inc., tri-party repurchase agreement dated 8/31/21 (tri-party custodian: The Bank of New York Mellon Corp.), 0.06% due 9/1/21; Proceeds at maturity – $4,000,007 (fully collateralized by U.S. Treasury Bond, 3.75% due 11/15/43; Market value including accrued interest – $4,080,116) | ||||||||
| (Cost: $4,000,000) | $ | 4,000,000 | $ | 4,000,000 | ||||
TOTAL INVESTMENTS IN SECURITIES – 98.5% (Cost: $12,543,122) |
| 12,543,062 | ||||||
Other Assets less Liabilities – 1.5% |
| 188,970 | ||||||
|
| |||||||
| NET ASSETS – 100.0% |
| $ | 12,732,032 | |||||
| * | Interest rate shown reflects the yield to maturity at the time of purchase. |
| (a) | Affiliated holding. See “Investment in Affiliates” supplementary table included in this Schedule of Investments for additional information. |
| INVESTMENT IN AFFILIATES | ||||||||||||||
Affiliated holdings are investments in entities in which the Fund owns 5% or more of the outstanding voting securities or are investments in entities which are under common ownership or control. Investments in affiliates during the fiscal year ended August 31, 2021 were as follows:
| Affiliate | Value at 8/31/2020 | Purchases/ Additions | Sales/ Reductions | Realized Gain/(Loss) | Change in Unrealized Appreciation/ Depreciation | Value at 8/31/2021 | Dividend Income | Capital Gain Distributions | ||||||||||||||||||||||||
WisdomTree Floating Rate Treasury Fund | $ | 467,046 | $ | 251,125 | $ | 150,584 | $ | (91 | ) | $ | (236 | ) | $ | 567,260 | $ | 126 | $ | 148 | ||||||||||||||
| FINANCIAL DERIVATIVE INSTRUMENTS | ||||||||||||||||||||||||||||
| FOREIGN CURRENCY CONTRACTS (OTC – OVER THE COUNTER) | ||||||||||||||||||||||||||||
| Counterparty | Settlement Date | Amount and Description of Currency to be Purchased | Amount and Description of Currency to be Sold | Unrealized Appreciation | Unrealized Depreciation | |||||||||||||||||||||||
Bank of America N.A. | 11/4/2021 | 6,220,000 | CNH | 954,749 | USD | $ | 3,383 | $ | — | |||||||||||||||||||
Citibank N.A. | 11/4/2021 | 727,255,000 | CLP | 955,243 | USD | — | (19,349 | ) | ||||||||||||||||||||
Citibank N.A. | 11/4/2021 | 31,435,000 | THB | 954,149 | USD | 18,533 | — | |||||||||||||||||||||
Goldman Sachs | 11/3/2021 | 118,412 | USD | 8,885,625 | RUB | — | (1,599 | ) | ||||||||||||||||||||
Goldman Sachs | 11/4/2021 | 3,682,565,000 | COP | 948,687 | USD | 26,706 | — | |||||||||||||||||||||
Goldman Sachs | 11/4/2021 | 115,960 | USD | 612,500 | BRL | — | (2,592 | ) | ||||||||||||||||||||
Goldman Sachs | 11/4/2021 | 116,006 | USD | 90,906,875 | CLP | — | (981 | ) | ||||||||||||||||||||
Goldman Sachs | 11/4/2021 | 114,794 | USD | 460,320,625 | COP | — | (7,130 | ) | ||||||||||||||||||||
Goldman Sachs | 11/4/2021 | 117,977 | USD | 2,403,125 | MXN | — | (937 | ) | ||||||||||||||||||||
Goldman Sachs | 11/4/2021 | 117,806 | USD | 460,000 | PLN | — | (2,346 | ) | ||||||||||||||||||||
Goldman Sachs | 11/4/2021 | 117,758 | USD | 1,060,625 | TRY | — | (5,748 | ) | ||||||||||||||||||||
Goldman Sachs | 11/4/2021 | 117,549 | USD | 1,761,875 | ZAR | — | (3,254 | ) | ||||||||||||||||||||
HSBC Holdings PLC | 11/4/2021 | 117,139 | USD | 3,929,375 | THB | — | (4,446 | ) | ||||||||||||||||||||
JP Morgan Chase Bank N.A. | 11/3/2021 | 71,085,000 | RUB | 956,742 | USD | 3,346 | — | |||||||||||||||||||||
Morgan Stanley & Co. International | 11/3/2021 | 71,710,000 | INR | 954,606 | USD | 19,102 | — | |||||||||||||||||||||
Morgan Stanley & Co. International | 11/3/2021 | 4,065,000 | MYR | 957,259 | USD | 19,048 | — | |||||||||||||||||||||
Morgan Stanley & Co. International | 11/3/2021 | 119,437 | USD | 8,963,750 | INR | — | (2,276 | ) | ||||||||||||||||||||
Morgan Stanley & Co. International | 11/3/2021 | 118,971 | USD | 508,125 | MYR | — | (3,067 | ) | ||||||||||||||||||||
Morgan Stanley & Co. International | 11/4/2021 | 4,900,000 | BRL | 939,777 | USD | 8,639 | — | |||||||||||||||||||||
Morgan Stanley & Co. International | 11/4/2021 | 13,941,950,000 | IDR | 953,622 | USD | 16,505 | — | |||||||||||||||||||||
Morgan Stanley & Co. International | 11/4/2021 | 1,097,205,000 | KRW | 953,014 | USD | — | (7,169 | ) | ||||||||||||||||||||
Morgan Stanley & Co. International | 11/4/2021 | 48,240,000 | PHP | 954,869 | USD | 10,850 | — | |||||||||||||||||||||
Morgan Stanley & Co. International | 11/4/2021 | 119,192 | USD | 777,500 | CNH | — | (574 | ) | ||||||||||||||||||||
See Notes to Financial Statements.
| 30 | WisdomTree Trust |
Table of Contents
Schedule of Investments (concluded)
WisdomTree Emerging Currency Strategy Fund (CEW)
August 31, 2021
| FINANCIAL DERIVATIVE INSTRUMENTS | ||||||||||||||||||||||||||||
| FOREIGN CURRENCY CONTRACTS (OTC – OVER THE COUNTER) | ||||||||||||||||||||||||||||
| Counterparty | Settlement Date | Amount and Description of Currency to be Purchased | Amount and Description of Currency to be Sold | Unrealized Appreciation | Unrealized Depreciation | |||||||||||||||||||||||
Morgan Stanley & Co. International | 11/4/2021 | 119,776 | USD | 1,742,743,750 | IDR | $ | — | $ | (1,490 | ) | ||||||||||||||||||
Morgan Stanley & Co. International | 11/4/2021 | 119,220 | USD | 137,150,625 | KRW | 989 | — | |||||||||||||||||||||
Morgan Stanley & Co. International | 11/4/2021 | 118,631 | USD | 6,030,000 | PHP | — | (2,084 | ) | ||||||||||||||||||||
UBS AG | 11/4/2021 | 19,225,000 | MXN | 955,788 | USD | — | (4,479 | ) | ||||||||||||||||||||
UBS AG | 11/4/2021 | 3,680,000 | PLN | 956,164 | USD | 5,046 | — | |||||||||||||||||||||
UBS AG | 11/4/2021 | 8,485,000 | TRY | 961,700 | USD | 26,346 | — | |||||||||||||||||||||
UBS AG | 11/4/2021 | 14,095,000 | ZAR | 952,371 | USD | 14,054 | — | |||||||||||||||||||||
| $ | 172,547 | $ | (69,521 | ) | ||||||||||||||||||||||||
| FAIR VALUATION SUMMARY | ||||||||
The following is a summary of the fair valuations according to the inputs used as of August 31, 2021 in valuing the Fund’s investments (See Note 2 — Fair Value Measurement):
Quoted Prices in Active Markets (Level 1) | Other Significant (Level 2) | Significant (Level 3) | Total | |||||||||||||
Assets: |
| |||||||||||||||
Investments in Securities | ||||||||||||||||
U.S. Government Obligations | $ | — | $ | 7,975,802 | $ | — | $ | 7,975,802 | ||||||||
Exchange-Traded Fund | 567,260 | — | — | 567,260 | ||||||||||||
Repurchase Agreement | — | 4,000,000 | — | 4,000,000 | ||||||||||||
Total Investments in Securities | $ | 567,260 | $ | 11,975,802 | $ | — | $ | 12,543,062 | ||||||||
Financial Derivative Instruments | ||||||||||||||||
Foreign Currency Contracts1 | $ | — | $ | 172,547 | $ | — | $ | 172,547 | ||||||||
Liabilities: | ||||||||||||||||
Financial Derivative Instruments | ||||||||||||||||
Foreign Currency Contracts1 | $ | — | $ | (69,521 | ) | $ | — | $ | (69,521 | ) | ||||||
Total – Net | $ | 567,260 | $ | 12,078,828 | $ | — | $ | 12,646,088 | ||||||||
| 1 | Amount shown represents the unrealized appreciation (depreciation) on the financial instrument. |
See Notes to Financial Statements.
| WisdomTree Trust | 31 |
Table of Contents
Schedule of Investments
WisdomTree Emerging Markets Corporate Bond Fund (EMCB)
August 31, 2021
| Investments | Principal Amount | Value | ||||||
| FOREIGN CORPORATE BONDS – 96.2% |
| |||||||
| Argentina – 2.1% |
| |||||||
Arcor SAIC | $ | 500,000 | $ | 500,818 | ||||
MercadoLibre, Inc. | 200,000 | 200,875 | ||||||
3.13%, 1/14/31(a) | 200,000 | 197,500 | ||||||
YPF S.A. | 263,000 | 203,675 | ||||||
|
| |||||||
| Total Argentina |
| 1,102,868 | ||||||
| Austria – 0.6% |
| |||||||
Suzano Austria GmbH | 226,000 | 305,654 | ||||||
| Brazil – 9.0% |
| |||||||
Arcos Dorados Holdings, Inc. | 200,000 | 211,020 | ||||||
Braskem Finance Ltd. | 300,000 | 335,341 | ||||||
Braskem Netherlands Finance B.V. | 400,000 | 429,040 | ||||||
Centrais Eletricas Brasileiras S.A. | 200,000 | 204,125 | ||||||
CSN Resources S.A. | 325,000 | 337,187 | ||||||
Fibria Overseas Finance Ltd. | 306,000 | 354,440 | ||||||
Hidrovias International Finance Sarl | 325,000 | 327,031 | ||||||
Itau Unibanco Holding S.A. | ||||||||
4.63%, 2/27/25, (4.625% fixed rate until 2/27/25; 5-year Constant Maturity Treasury Rate + 3.222% thereafter)(b)(c)(d) | 300,000 | 291,789 | ||||||
3.88%, 4/15/31, (3.875% fixed rate until 1/15/26; 5-year Constant Maturity Treasury Rate + 3.446% thereafter)(b)(c) | 275,000 | 273,982 | ||||||
Klabin Finance S.A. | 300,000 | 334,312 | ||||||
Minerva Luxembourg S.A. | 200,000 | 211,950 | ||||||
4.38%, 3/18/31(b) | 275,000 | 270,188 | ||||||
Natura Cosmeticos S.A. | 400,000 | 412,600 | ||||||
Petrobras Global Finance B.V. | 200,000 | 224,530 | ||||||
St Marys Cement, Inc. | 200,000 | 233,420 | ||||||
5.75%, 1/28/27(e) | 300,000 | 350,130 | ||||||
|
| |||||||
| Total Brazil |
| 4,801,085 | ||||||
| Chile – 5.5% |
| |||||||
ATP Tower Holdings LLC | 300,000 | 305,779 | ||||||
Celulosa Arauco y Constitucion S.A. | 330,000 | 357,553 | ||||||
5.50%, 11/2/47 | 325,000 | 392,548 | ||||||
Colbun S.A. | 250,000 | 274,809 | ||||||
3.95%, 10/11/27(b) | 200,000 | 219,847 | ||||||
Inversiones CMPC S.A. | 250,000 | 270,003 | ||||||
3.00%, 4/6/31(b) | 325,000 | 330,281 | ||||||
VTR Comunicaciones SpA | 461,000 | 482,749 | ||||||
4.38%, 4/15/29(b) | 275,000 | 277,558 | ||||||
|
| |||||||
| Total Chile |
| 2,911,127 | ||||||
| China – 3.5% |
| |||||||
Alibaba Group Holding Ltd. | 500,000 | 544,250 | ||||||
Baidu, Inc. | 200,000 | 211,617 | ||||||
Bank of China Ltd. | 650,000 | 724,315 | ||||||
China Evergrande Group | 200,000 | 70,750 | ||||||
ENN Clean Energy International Investment Ltd. | 300,000 | 305,349 | ||||||
|
| |||||||
| Total China |
| 1,856,281 | ||||||
| Colombia – 6.8% |
| |||||||
Banco Bilbao Vizcaya Argentaria Colombia S.A. | 200,000 | 209,375 | ||||||
Bancolombia S.A. | ||||||||
4.63%, 12/18/29, (4.625% fixed rate until 12/18/24; 5-year Constant Maturity Treasury Rate + 2.944% thereafter)(c) | 635,000 | 645,957 | ||||||
Ecopetrol S.A. | 500,000 | 603,260 | ||||||
5.88%, 5/28/45 | 70,000 | 75,152 | ||||||
Geopark Ltd. | 375,000 | 375,517 | ||||||
Millicom International Cellular S.A. | 500,000 | 524,269 | ||||||
Oleoducto Central S.A. | 250,000 | 259,296 | ||||||
Promigas S.A. ESP | 200,000 | 201,078 | ||||||
SierraCol Energy Andina LLC | 300,000 | 299,863 | ||||||
Transportadora de Gas Internacional S.A. ESP | 400,000 | 456,538 | ||||||
|
| |||||||
| Total Colombia |
| 3,650,305 | ||||||
| Ghana – 0.5% |
| |||||||
Tullow Oil PLC | 265,000 | 275,434 | ||||||
| Hong Kong – 1.7% |
| |||||||
Melco Resorts Finance Ltd. | 275,000 | 287,253 | ||||||
5.75%, 7/21/28(e) | 325,000 | 339,480 | ||||||
5.38%, 12/4/29(e) | 250,000 | 259,829 | ||||||
|
| |||||||
| Total Hong Kong |
| 886,562 | ||||||
See Notes to Financial Statements.
| 32 | WisdomTree Trust |
Table of Contents
Schedule of Investments (continued)
WisdomTree Emerging Markets Corporate Bond Fund (EMCB)
August 31, 2021
| Investments | Principal Amount | Value | ||||||
| India – 5.7% |
| |||||||
Adani Ports & Special Economic Zone Ltd. | $ | 200,000 | $ | 212,737 | ||||
Bharti Airtel International Netherlands B.V. | 323,000 | 354,576 | ||||||
Bharti Airtel Ltd. | 200,000 | 217,512 | ||||||
Network i2i Ltd. | ||||||||
3.98%, 3/3/26, (3.975% fixed rate until 3/3/26; 5-year Constant Maturity Treasury Rate + 3.39% thereafter)(b)(c)(d) | 300,000 | 302,917 | ||||||
Reliance Industries Ltd. | 650,000 | 717,264 | ||||||
Summit Digitel Infrastructure Pvt Ltd. | 350,000 | 341,553 | ||||||
Vedanta Resources Finance II PLC | 275,000 | 303,267 | ||||||
8.95%, 3/11/25(b) | 450,000 | 457,594 | ||||||
Vedanta Resources Ltd. | 150,000 | 148,091 | ||||||
|
| |||||||
| Total India |
| 3,055,511 | ||||||
| Indonesia – 2.5% |
| |||||||
Medco Bell Pte Ltd. | 478,000 | 487,806 | ||||||
Pertamina Persero PT | 250,000 | 261,351 | ||||||
Perusahaan Perseroan Persero PT Perusahaan Listrik Negara | 541,000 | 594,997 | ||||||
|
| |||||||
| Total Indonesia |
| 1,344,154 | ||||||
| Ireland – 1.2% |
| |||||||
C&W Senior Financing DAC | 600,000 | 638,250 | ||||||
| Israel – 3.5% |
| |||||||
Bank Leumi Le-Israel BM | ||||||||
3.28%, 1/29/31, (3.275% fixed rate until 1/29/26; 5-year Constant Maturity Treasury Rate + 1.631% thereafter)(b)(c)(e) | 500,000 | 511,016 | ||||||
Israel Electric Corp., Ltd. | 200,000 | 224,463 | ||||||
Mizrahi Tefahot Bank Ltd. | ||||||||
3.08%, 4/7/31, (3.077% fixed rate until 4/7/26; 5-year Constant Maturity Treasury Rate + 2.25% thereafter)(b)(c)(e) | 350,000 | 354,462 | ||||||
Teva Pharmaceutical Finance Netherlands III B.V. 2.80%, 7/21/23 | 170,000 | 168,840 | ||||||
3.15%, 10/1/26 | 650,000 | 626,208 | ||||||
|
| |||||||
| Total Israel |
| 1,884,989 | ||||||
| Jamaica – 0.2% |
| |||||||
Digicel International Finance Ltd. | 81,000 | 84,265 | ||||||
| Kazakhstan – 2.3% |
| |||||||
KazMunayGas National Co. JSC | 380,000 | 399,380 | ||||||
Tengizchevroil Finance Co. International Ltd. | 798,000 | 821,142 | ||||||
|
| |||||||
| Total Kazakhstan |
| 1,220,522 | ||||||
| Kuwait – 2.4% |
| |||||||
Equate Petrochemical B.V. | 200,000 | 222,486 | ||||||
2.63%, 4/28/28(b) | 350,000 | 356,125 | ||||||
NBK Tier 1 Financing 2 Ltd. | ||||||||
4.50%, 8/27/25, (4.50% fixed rate until 8/27/25; 6-year U.S. dollar Swap Rate + 2.832% thereafter)(b)(c)(d) | 700,000 | 727,396 | ||||||
|
| |||||||
| Total Kuwait |
| 1,306,007 | ||||||
| Luxembourg – 1.9% |
| |||||||
Altice Financing S.A. | 500,000 | 513,525 | ||||||
JBS Finance Luxembourg SARL | 475,000 | 492,722 | ||||||
|
| |||||||
| Total Luxembourg |
| 1,006,247 | ||||||
| Malaysia – 0.7% |
| |||||||
Genm Capital Labuan Ltd. | 375,000 | 380,038 | ||||||
| Mexico – 5.6% |
| |||||||
Alpek S.A.B. de C.V. | 400,000 | 441,400 | ||||||
Banco Mercantil del Norte S.A. | ||||||||
7.50%, 6/27/29, (7.50% fixed rate until 6/27/29; 10-year Constant Maturity Treasury Rate + 5.47% thereafter)(b)(c)(d) | 200,000 | 227,632 | ||||||
Cemex S.A.B. de C.V. | ||||||||
5.13%, 6/8/26, (5.125% fixed rate until 6/8/26; 5-year Constant Maturity Treasury Rate + 4.534% thereafter)(b)(c)(d) | 200,000 | 209,550 | ||||||
7.38%, 6/5/27(b) | 200,000 | 225,988 | ||||||
5.20%, 9/17/30(b) | 200,000 | 219,500 | ||||||
Credito Real S.A.B. de C.V. SOFOM ER | 500,000 | 451,800 | ||||||
Grupo Bimbo S.A.B. de C.V. | ||||||||
5.95%, 4/17/23, (5.95% fixed rate until 4/17/23; 5-year Constant Maturity Treasury Rate + 3.28% thereafter)(b)(c)(d) | 400,000 | 423,600 | ||||||
Industrias Penoles S.A.B. de C.V. | 335,000 | 385,070 | ||||||
Orbia Advance Corp. S.A.B. de C.V. | 400,000 | 407,500 | ||||||
|
| |||||||
| Total Mexico |
| 2,992,040 | ||||||
| Morocco – 0.5% |
| |||||||
OCP S.A. | 200,000 | 244,647 | ||||||
| Netherlands – 1.5% |
| |||||||
Sigma Finance Netherlands B.V. | 200,000 | 230,223 | ||||||
VEON Holdings B.V. | 550,000 | 580,690 | ||||||
|
| |||||||
| Total Netherlands |
| 810,913 | ||||||
See Notes to Financial Statements.
| WisdomTree Trust | 33 |
Table of Contents
Schedule of Investments (continued)
WisdomTree Emerging Markets Corporate Bond Fund (EMCB)
August 31, 2021
| Investments | Principal Amount | Value | ||||||
| Oman – 1.6% |
| |||||||
OQ SAOC | $ | 300,000 | $ | 305,250 | ||||
Oryx Funding Ltd. | 250,000 | 265,625 | ||||||
Oztel Holdings SPC Ltd. | 250,000 | 265,021 | ||||||
|
| |||||||
| Total Oman |
| 835,896 | ||||||
| Panama – 2.3% |
| |||||||
Aeropuerto Internacional de Tocumen S.A. | 325,000 | 334,291 | ||||||
AES Panama Generation Holdings SRL | 625,000 | 650,159 | ||||||
Banco Nacional de Panama | 250,000 | 242,813 | ||||||
|
| |||||||
| Total Panama |
| 1,227,263 | ||||||
| Peru – 5.8% |
| |||||||
Banco de Credito del Peru | ||||||||
3.13%, 7/1/30, (3.125% fixed rate until 7/1/25; 5-year Constant Maturity Treasury Rate + 3.00% thereafter)(b)(c) | 300,000 | 300,000 | ||||||
3.13%, 7/1/30, (3.125% fixed rate until 7/1/25; 5-year Constant Maturity Treasury Rate + 3.00% thereafter)(c)(e) | 250,000 | 250,000 | ||||||
Cia de Minas Buenaventura S.A.A. | 650,000 | 643,175 | ||||||
Credicorp Ltd. | 225,000 | 229,652 | ||||||
Inkia Energy Ltd. | 200,000 | 205,487 | ||||||
InRetail Consumer | 375,000 | 373,500 | ||||||
Kallpa Generacion S.A. | 250,000 | 258,827 | ||||||
Southern Copper Corp. | 200,000 | 256,435 | ||||||
5.88%, 4/23/45(a) | 200,000 | 278,975 | ||||||
Volcan Cia Minera S.A.A. | 325,000 | 316,907 | ||||||
|
| |||||||
| Total Peru |
| 3,112,958 | ||||||
| Poland – 0.9% |
| |||||||
Canpack S.A. | 465,000 | 475,869 | ||||||
| Qatar – 1.4% |
| |||||||
Ooredoo International Finance Ltd. | 375,000 | 388,125 | ||||||
Qatar Petroleum | 325,000 | 335,563 | ||||||
|
| |||||||
| Total Qatar |
| 723,688 | ||||||
| Russia – 5.8% |
| |||||||
Alfa Bank AO via Alfa Bond Issuance PLC | ||||||||
5.95%, 4/15/30, (5.95% fixed rate until 4/15/25; 5-year Constant Maturity Treasury Rate + 4.546% thereafter)(b)(c) | 350,000 | 367,724 | ||||||
Evraz PLC | 500,000 | 538,296 | ||||||
Gazprom PJSC via Gaz Capital S.A. | 335,000 | 373,985 | ||||||
Gazprom PJSC via Gaz Finance PLC | ||||||||
4.60%, 10/26/25, (4.599% fixed rate until 10/26/25; 5-year Constant Maturity Treasury Rate + 4.264% thereafter)(b)(c)(d) | 225,000 | 234,706 | ||||||
Lukoil Securities B.V. | 633,000 | 673,354 | ||||||
Severstal OAO Via Steel Capital S.A. | 200,000 | 209,085 | ||||||
Sovcombank Via SovCom Capital DAC | ||||||||
7.75%, 5/6/25, (7.75% fixed rate until 5/6/25; 5-year Constant Maturity Treasury Rate + 6.38% thereafter)(b)(c)(d) | 300,000 | 309,692 | ||||||
VTB Bank OJSC via VTB Capital S.A. | 353,000 | 370,771 | ||||||
|
| |||||||
| Total Russia |
| 3,077,613 | ||||||
| Saudi Arabia – 3.0% |
| |||||||
Arabian Centres Sukuk II Ltd. | 450,000 | 469,687 | ||||||
S.A. Global Sukuk Ltd. | 200,000 | 205,219 | ||||||
Saudi Arabian Oil Co. | 700,000 | 699,786 | ||||||
Saudi Electricity Global Sukuk Co. 2 | 200,000 | 244,424 | ||||||
|
| |||||||
| Total Saudi Arabia |
| 1,619,116 | ||||||
| Singapore – 1.3% |
| |||||||
Oversea-Chinese Banking Corp., Ltd. | 250,000 | 271,461 | ||||||
1.83%, 9/10/30, (1.832% fixed rate until 9/10/25; 5-year Constant Maturity Treasury Rate + 1.58% thereafter)(b)(c) | 425,000 | 427,269 | ||||||
|
| |||||||
| Total Singapore |
| 698,730 | ||||||
| South Africa – 1.7% |
| |||||||
AngloGold Ashanti Holdings PLC | 200,000 | 207,300 | ||||||
6.50%, 4/15/40(a) | 256,000 | 320,306 | ||||||
Sasol Financing USA LLC | 375,000 | 389,062 | ||||||
|
| |||||||
| Total South Africa |
| 916,668 | ||||||
| South Korea – 3.3% |
| |||||||
Kookmin Bank | 475,000 | 479,940 | ||||||
Shinhan Financial Group Co., Ltd. | ||||||||
2.88%, 5/12/26, (2.875% fixed rate until 5/12/26; 5-year Constant Maturity Treasury Rate + 2.064% thereafter)(b)(c)(d) | 525,000 | 521,719 | ||||||
SK Hynix, Inc. | 300,000 | 297,015 | ||||||
Woori Bank | 400,000 | 437,467 | ||||||
|
| |||||||
| Total South Korea |
| 1,736,141 | ||||||
See Notes to Financial Statements.
| 34 | WisdomTree Trust |
Table of Contents
Schedule of Investments (continued)
WisdomTree Emerging Markets Corporate Bond Fund (EMCB)
August 31, 2021
| Investments | Principal Amount | Value | ||||||
| Thailand – 2.7% |
| |||||||
Bangkok Bank PCL | ||||||||
5.00%, 9/23/25, (5.00% fixed rate until 9/23/25; 5-year Constant Maturity Treasury Rate + 4.729% thereafter)(b)(c)(d) | $ | 450,000 | $ | 472,861 | ||||
4.45%, 9/19/28(b) | 300,000 | 348,722 | ||||||
PTTEP Treasury Center Co., Ltd. | 600,000 | 645,126 | ||||||
|
| |||||||
| Total Thailand |
| 1,466,709 | ||||||
| Turkey – 4.5% |
| |||||||
Akbank T.A.S. | 600,000 | 639,300 | ||||||
Turk Telekomunikasyon AS | 200,000 | 220,413 | ||||||
Turkiye Is Bankasi AS | 200,000 | 209,480 | ||||||
Turkiye Sise ve Cam Fabrikalari AS | 500,000 | 558,900 | ||||||
Turkiye Vakiflar Bankasi TAO | 450,000 | 466,313 | ||||||
Yapi ve Kredi Bankasi AS | ||||||||
7.88%, 1/22/31, (7.875% fixed rate until 1/22/26; 5-year Constant Maturity Treasury Rate + 7.415% thereafter)(b)(c) | 300,000 | 318,000 | ||||||
|
| |||||||
| Total Turkey |
| 2,412,406 | ||||||
| United Arab Emirates – 3.1% |
| |||||||
Abu Dhabi National Energy Co. PJSC | 475,000 | 481,531 | ||||||
DP World Ltd. | 100,000 | 135,702 | ||||||
Galaxy Pipeline Assets Bidco Ltd. | 300,000 | 298,875 | ||||||
2.94%, 9/30/40(b) | 225,000 | 229,219 | ||||||
MAF Global Securities Ltd. | 200,000 | 217,250 | ||||||
MHP Lux S.A. | 275,000 | 278,202 | ||||||
|
| |||||||
| Total United Arab Emirates |
| 1,640,779 | ||||||
| United Kingdom – 0.7% |
| |||||||
CK Hutchison International 21 Ltd. | 350,000 | 361,428 | ||||||
| Zambia – 0.4% |
| |||||||
First Quantum Minerals Ltd. | 200,000 | 208,305 | ||||||
TOTAL FOREIGN CORPORATE BONDS (Cost: $50,149,956) |
| 51,270,468 | ||||||
| FOREIGN GOVERNMENT OBLIGATIONS – 1.2% |
| |||||||
| Egypt – 0.4% |
| |||||||
Egypt Government International Bond | 200,000 | 219,495 | ||||||
| Ghana – 0.4% |
| |||||||
Ghana Government International Bond | 200,000 | 196,155 | ||||||
| Nigeria – 0.4% |
| |||||||
Nigeria Government International Bond | 200,000 | 211,574 | ||||||
TOTAL FOREIGN GOVERNMENT OBLIGATIONS (Cost: $600,000) |
| 627,224 | ||||||
| Shares | ||||||||
| INVESTMENT OF CASH COLLATERAL FOR SECURITIES LOANED – 4.4% |
| |||||||
| United States – 4.4% |
| |||||||
State Street Navigator Securities Lending Government Money Market Portfolio, 0.03%(f) | ||||||||
| (Cost: $2,348,675) | 2,348,675 | $ | 2,348,675 | |||||
TOTAL INVESTMENTS IN SECURITIES – 101.8% (Cost: $53,098,631) |
| 54,246,367 | ||||||
Other Assets less Liabilities – (1.8)% |
| (967,440 | ) | |||||
|
| |||||||
| NET ASSETS – 100.0% |
| $ | 53,278,927 | |||||
| (a) | Security, or portion thereof, was on loan at August 31, 2021 (See Note 2). At August 31, 2021, the total market value of the Fund’s securities on loan identified in the Schedule of Investments was $3,565,545 and the total market value of the collateral held by the Fund was $3,663,915. The total market value of the collateral includes non-cash U.S. Government securities collateral having a value of $1,315,240. |
| (b) | This security is exempt from registration under rule 144A of the Securities Act of 1933. This security may be sold in transactions that are exempt from registration, normally to qualified institutional buyers. |
| (c) | Rate shown reflects the accrual rate as of August 31, 2021 on securities with variable or step rates. |
| (d) | The security has a perpetual maturity; the date displayed is the next call date. |
| (e) | This security is exempt from registration under Regulation S of the Securities Act of 1933, which exempts from registration securities offered and sold outside the United States. This security may not be offered or sold in the United States except pursuant to an exemption from, or in a transaction not subject to, the registration requirements of the Securities Act of 1933. |
| (f) | Rate shown represents annualized 7-day yield as of August 31, 2021. |
See Notes to Financial Statements.
| WisdomTree Trust | 35 |
Table of Contents
Schedule of Investments (concluded)
WisdomTree Emerging Markets Corporate Bond Fund (EMCB)
August 31, 2021
| FINANCIAL DERIVATIVE INSTRUMENTS |
| FUTURES CONTRACTS (EXCHANGE-TRADED) |
| Short Exposure | Contracts | Expiration Date | Notional Value | Unrealized Appreciation/ (Depreciation) | ||||||||||||
10 Year U.S. Treasury Note | 39 | 12/21/21 | $ | (5,204,672 | ) | $ | (16,200 | ) | ||||||||
Ultra 10 Year U.S. Treasury Note | 26 | 12/21/21 | (3,848,406 | ) | (14,828 | ) | ||||||||||
| $ | (9,053,078 | ) | $ | (31,028 | ) | |||||||||||
| Long Exposure | ||||||||||||||||
2 Year U.S. Treasury Note | 32 | 12/31/21 | $ | 7,050,500 | $ | 4,648 | ||||||||||
5 Year U.S. Treasury Note | 12 | 12/31/21 | 1,484,625 | 3,792 | ||||||||||||
U.S. Treasury Long Bond | 3 | 12/21/21 | 488,906 | 1,735 | ||||||||||||
| $ | 9,024,031 | $ | 10,175 | |||||||||||||
Total – Net |
| $ | (29,047 | ) | $ | (20,853 | ) | |||||||||
| FAIR VALUATION SUMMARY |
The following is a summary of the fair valuations according to the inputs used as of August 31, 2021 in valuing the Fund’s investments (See Note 2 — Fair Value Measurement):
| Quoted Prices in Active Markets (Level 1) | Other Significant Observable Inputs (Level 2) | Significant Unobservable Inputs (Level 3) | Total | |||||||||||||
Assets: |
| |||||||||||||||
Investments in Securities | ||||||||||||||||
Foreign Corporate Bonds | $ | — | $ | 51,270,468 | $ | — | $ | 51,270,468 | ||||||||
Foreign Government Obligations | — | 627,224 | — | 627,224 | ||||||||||||
Investment of Cash Collateral for Securities Loaned | — | 2,348,675 | — | 2,348,675 | ||||||||||||
Total Investments in Securities | $ | — | $ | 54,246,367 | $ | — | $ | 54,246,367 | ||||||||
Financial Derivative Instruments | ||||||||||||||||
Futures Contracts1 | $ | 10,175 | $ | — | $ | — | $ | 10,175 | ||||||||
Liabilities: | ||||||||||||||||
Financial Derivative Instruments | ||||||||||||||||
Futures Contracts1 | $ | (31,028 | ) | $ | — | $ | — | $ | (31,028 | ) | ||||||
Total – Net | $ | (20,853 | ) | $ | 54,246,367 | $ | — | $ | 54,225,514 | |||||||
| 1 | Amount shown represents the unrealized appreciation (depreciation) on the financial instrument. |
See Notes to Financial Statements.
| 36 | WisdomTree Trust |
Table of Contents
Schedule of Investments
WisdomTree Emerging Markets Local Debt Fund (ELD)
August 31, 2021
| Investments | Principal Amount† | Value | ||||||||||
| FOREIGN GOVERNMENT OBLIGATIONS – 83.2% |
| |||||||||||
| Brazil – 8.3% |
| |||||||||||
Brazil Letras do Tesouro Nacional |
| |||||||||||
6.26%, 7/1/22, Series LTN(a) | 5,130,000 | BRL | $ | 940,583 | ||||||||
6.88%, 7/1/23, Series LTN(a) | 10,130,000 | BRL | 1,690,968 | |||||||||
6.09%, 1/1/24, Series LTN(a) | 13,990,000 | BRL | 2,223,039 | |||||||||
8.25%, 7/1/24, Series LTN(a) | 4,905,000 | BRL | 742,459 | |||||||||
Brazil Notas do Tesouro Nacional |
| |||||||||||
10.00%, 1/1/23, Series F | 9,835,000 | BRL | 1,954,272 | |||||||||
10.00%, 1/1/25, Series F | 6,249,000 | BRL | 1,237,136 | |||||||||
10.00%, 1/1/27, Series F | 5,480,000 | BRL | 1,071,012 | |||||||||
10.00%, 1/1/29, Series F | 6,160,000 | BRL | 1,193,759 | |||||||||
10.00%, 1/1/31, Series F | 500,000 | BRL | 95,126 | |||||||||
|
| |||||||||||
| Total Brazil |
| 11,148,354 | ||||||||||
| Chile – 3.1% |
| |||||||||||
Bonos de la Tesoreria de la |
| |||||||||||
4.00%, 3/1/23(b)(c) | 200,000,000 | CLP | 261,914 | |||||||||
2.50%, 3/1/25 | 800,000,000 | CLP | 991,548 | |||||||||
4.50%, 3/1/26 | 680,000,000 | CLP | 897,219 | |||||||||
2.30%, 10/1/28(b)(c) | 105,000,000 | CLP | 117,481 | |||||||||
4.70%, 9/1/30(b)(c) | 175,000,000 | CLP | 225,866 | |||||||||
5.00%, 3/1/35 | 940,000,000 | CLP | 1,206,189 | |||||||||
6.00%, 1/1/43, Series 30YR | 380,000,000 | CLP | 536,787 | |||||||||
|
| |||||||||||
| Total Chile |
| 4,237,004 | ||||||||||
| China – 4.8% |
| |||||||||||
China Government Bond |
| |||||||||||
3.02%, 10/22/25, Series INBK | 800,000 | CNY | 125,467 | |||||||||
3.22%, 12/6/25, Series 1828 | 1,800,000 | CNY | 284,454 | |||||||||
3.25%, 6/6/26, Series 1907 | 5,800,000 | CNY | 920,811 | |||||||||
3.12%, 12/5/26, Series 1916 | 8,000,000 | CNY | 1,260,107 | |||||||||
2.85%, 6/4/27, Series INBK | 1,700,000 | CNY | 263,270 | |||||||||
3.25%, 11/22/28, Series 1827 | 8,000,000 | CNY | 1,267,797 | |||||||||
3.29%, 5/23/29, Series 1906 | 8,000,000 | CNY | 1,273,111 | |||||||||
3.13%, 11/21/29, Series 1915 | 4,000,000 | CNY | 626,276 | |||||||||
2.68%, 5/21/30, Series INBK | 2,970,000 | CNY | 449,801 | |||||||||
|
| |||||||||||
| Total China |
| 6,471,094 | ||||||||||
| Colombia – 3.2% |
| |||||||||||
Colombian TES |
| |||||||||||
7.00%, 5/4/22, Series B | 1,341,700,000 | COP | 367,952 | |||||||||
10.00%, 7/24/24, Series B | 1,608,700,000 | COP | 485,821 | |||||||||
6.25%, 11/26/25, Series B | 1,502,400,000 | COP | 408,300 | |||||||||
7.50%, 8/26/26, Series B | 1,604,300,000 | COP | 453,126 | |||||||||
5.75%, 11/3/27, Series B | 1,579,700,000 | COP | 406,308 | |||||||||
6.00%, 4/28/28, Series B | 1,845,600,000 | COP | 474,903 | |||||||||
7.75%, 9/18/30, Series B | 1,762,200,000 | COP | 493,698 | |||||||||
7.00%, 6/30/32, Series B | 1,537,500,000 | COP | 400,240 | |||||||||
7.25%, 10/18/34, Series B | 2,210,400,000 | COP | 578,377 | |||||||||
7.25%, 10/26/50, Series B | 850,000,000 | COP | 207,051 | |||||||||
|
| |||||||||||
| Total Colombia |
| 4,275,776 | ||||||||||
| Hungary – 2.0% |
| |||||||||||
Hungary Government Bond |
| |||||||||||
1.75%, 10/26/22, Series 22/B | 66,770,000 | HUF | 228,294 | |||||||||
6.00%, 11/24/23, Series 23/A | 17,600,000 | HUF | 65,590 | |||||||||
3.00%, 6/26/24, Series 24/B | 213,440,000 | HUF | 742,819 | |||||||||
1.00%, 11/26/25, Series 25/C | 30,000,000 | HUF | 96,364 | |||||||||
3.00%, 10/27/27, Series 27/A | 266,740,000 | HUF | 931,367 | |||||||||
3.00%, 8/21/30, Series 30/A | 55,660,000 | HUF | 193,726 | |||||||||
3.25%, 10/22/31, Series 31/A | 72,870,000 | HUF | 257,013 | |||||||||
2.25%, 4/20/33, Series 33/A | 20,610,000 | HUF | 64,804 | |||||||||
3.00%, 10/27/38, Series 38/A | 27,000,000 | HUF | 87,330 | |||||||||
|
| |||||||||||
| Total Hungary |
| 2,667,307 | ||||||||||
| India – 4.4% |
| |||||||||||
India Government Bond |
| |||||||||||
7.68%, 12/15/23 | 30,000,000 | INR | 439,460 | |||||||||
8.40%, 7/28/24 | 73,000,000 | INR | 1,095,887 | |||||||||
7.59%, 3/20/29 | 100,000,000 | INR | 1,477,109 | |||||||||
7.88%, 3/19/30 | 100,000,000 | INR | 1,506,010 | |||||||||
9.20%, 9/30/30 | 90,920,000 | INR | 1,467,522 | |||||||||
|
| |||||||||||
| Total India |
| 5,985,988 | ||||||||||
| Indonesia – 11.2% |
| |||||||||||
Indonesia Treasury Bond |
| |||||||||||
8.38%, 3/15/24, Series FR70 | 8,465,000,000 | IDR | 651,200 | |||||||||
8.13%, 5/15/24, Series FR77 | 8,178,000,000 | IDR | 628,724 | |||||||||
6.50%, 6/15/25, Series FR81 | 18,200,000,000 | IDR | 1,350,086 | |||||||||
5.50%, 4/15/26, Series FR86 | 2,000,000,000 | IDR | 142,955 | |||||||||
8.38%, 9/15/26, Series FR56 | 16,931,000,000 | IDR | 1,355,668 | |||||||||
6.13%, 5/15/28, Series FR64 | 18,000,000,000 | IDR | 1,293,603 | |||||||||
9.00%, 3/15/29, Series FR71 | 14,875,000,000 | IDR | 1,232,240 | |||||||||
8.25%, 5/15/29, Series FR78 | 3,520,000,000 | IDR | 281,415 | |||||||||
7.00%, 9/15/30, Series FR82 | 17,000,000,000 | IDR | 1,263,454 | |||||||||
8.75%, 5/15/31, Series FR73 | 13,601,000,000 | IDR | 1,129,086 | |||||||||
8.25%, 6/15/32, Series FR58 | 11,549,000,000 | IDR | 916,471 | |||||||||
8.38%, 3/15/34, Series FR68 | 16,000,000,000 | IDR | 1,286,170 | |||||||||
7.50%, 6/15/35, Series FR80 | 11,063,000,000 | IDR | 835,397 | |||||||||
8.25%, 5/15/36, Series FR72 | 11,563,000,000 | IDR | 911,663 | |||||||||
7.50%, 5/15/38, Series FR75 | 3,300,000,000 | IDR | 244,680 | |||||||||
8.38%, 4/15/39, Series FR79 | 10,000,000,000 | IDR | 807,713 | |||||||||
7.50%, 4/15/40, Series FR83 | 4,000,000,000 | IDR | 298,769 | |||||||||
8.75%, 2/15/44, Series FR67 | 1,390,000,000 | IDR | 115,045 | |||||||||
Perusahaan Penerbit SBSN Indonesia | 5,000,000,000 | IDR | 372,260 | |||||||||
|
| |||||||||||
| Total Indonesia |
| 15,116,599 | ||||||||||
| Malaysia – 6.3% |
| |||||||||||
Malaysia Government Bond |
| |||||||||||
3.48%, 6/14/24, Series 0319 | 2,000,000 | MYR | 495,580 | |||||||||
4.18%, 7/15/24, Series 0114 | 1,560,000 | MYR | 394,400 | |||||||||
3.96%, 9/15/25, Series 0115 | 2,890,000 | MYR | 731,346 | |||||||||
3.91%, 7/15/26, Series 0119 | 465,000 | MYR | 118,176 | |||||||||
3.90%, 11/16/27, Series 0417 | 4,410,000 | MYR | 1,118,113 | |||||||||
3.89%, 8/15/29, Series 0219 | 3,190,000 | MYR | 805,115 | |||||||||
2.63%, 4/15/31, Series 0220 | 2,000,000 | MYR | 458,248 | |||||||||
3.83%, 7/5/34, Series 0419 | 1,485,000 | MYR | 358,585 | |||||||||
4.76%, 4/7/37, Series 0317 | 1,832,000 | MYR | 483,645 | |||||||||
3.76%, 5/22/40, Series 0519 | 1,500,000 | MYR | 348,647 | |||||||||
4.07%, 6/15/50, Series 0120 | 1,315,000 | MYR | 309,741 | |||||||||
Malaysia Government Investment Issue |
| |||||||||||
4.13%, 8/15/25, Series 0118 | 4,000,000 | MYR | 1,019,318 | |||||||||
3.73%, 3/31/26, Series 0319 | 4,000,000 | MYR | 1,006,963 | |||||||||
3.42%, 9/30/27, Series 0120 | 500,000 | MYR | 122,876 | |||||||||
3.47%, 10/15/30, Series 0220 | 1,980,000 | MYR | 482,437 | |||||||||
3.45%, 7/15/36, Series 0121 | 1,125,000 | MYR | 257,475 | |||||||||
|
| |||||||||||
| Total Malaysia |
| 8,510,665 | ||||||||||
See Notes to Financial Statements.
| WisdomTree Trust | 37 |
Table of Contents
Schedule of Investments (continued)
WisdomTree Emerging Markets Local Debt Fund (ELD)
August 31, 2021
| Investments | Principal Amount† | Value | ||||||||||
| Mexico – 6.0% |
| |||||||||||
Mexican Bonos |
| |||||||||||
8.00%, 9/5/24, Series M | 18,075,000 | MXN | $ | 948,673 | ||||||||
10.00%, 12/5/24, Series M 20 | 18,410,000 | MXN | 1,022,562 | |||||||||
5.75%, 3/5/26, Series M | 3,700,000 | MXN | 179,262 | |||||||||
8.50%, 5/31/29, Series M 20 | 21,945,000 | MXN | 1,199,665 | |||||||||
7.75%, 5/29/31, Series M | 20,133,000 | MXN | 1,059,641 | |||||||||
7.75%, 11/23/34, Series M | 9,319,000 | MXN | 487,576 | |||||||||
10.00%, 11/20/36, Series M 30 | 4,237,000 | MXN | 263,400 | |||||||||
8.50%, 11/18/38, Series M 30 | 19,854,000 | MXN | 1,085,434 | |||||||||
7.75%, 11/13/42, Series M | 15,142,000 | MXN | 770,946 | |||||||||
8.00%, 11/7/47, Series M | 20,000,000 | MXN | 1,041,014 | |||||||||
|
| |||||||||||
| Total Mexico |
| 8,058,173 | ||||||||||
| Peru – 2.9% |
| |||||||||||
Peru Government Bond |
| |||||||||||
5.70%, 8/12/24 | 1,000,000 | PEN | 259,684 | |||||||||
8.20%, 8/12/26 | 125,000 | PEN | 35,521 | |||||||||
6.35%, 8/12/28 | 3,250,000 | PEN | 830,019 | |||||||||
5.94%, 2/12/29 | 3,800,000 | PEN | 944,191 | |||||||||
6.15%, 8/12/32 | 3,451,000 | PEN | 834,804 | |||||||||
5.40%, 8/12/34 | 2,830,000 | PEN | 617,194 | |||||||||
5.35%, 8/12/40 | 2,000,000 | PEN | 407,221 | |||||||||
|
| |||||||||||
| Total Peru |
| 3,928,634 | ||||||||||
| Philippines – 1.8% |
| |||||||||||
Philippine Government International Bond |
| |||||||||||
3.90%, 11/26/22 | 39,000,000 | PHP | 792,701 | |||||||||
6.25%, 1/14/36 | 70,000,000 | PHP | 1,682,795 | |||||||||
|
| |||||||||||
| Total Philippines |
| 2,475,496 | ||||||||||
| Poland – 4.8% |
| |||||||||||
Republic of Poland Government Bond |
| |||||||||||
2.50%, 4/25/24, Series 0424 | 1,200,000 | PLN | 329,267 | |||||||||
2.50%, 7/25/26, Series 0726 | 8,095,000 | PLN | 2,250,396 | |||||||||
2.50%, 7/25/27, Series 0727 | 8,505,000 | PLN | 2,367,263 | |||||||||
2.75%, 10/25/29, Series 1029 | 3,585,000 | PLN | 1,021,156 | |||||||||
1.25%, 10/25/30, Series 1030 | 2,215,000 | PLN | 557,742 | |||||||||
|
| |||||||||||
| Total Poland |
| 6,525,824 | ||||||||||
| Romania – 1.9% |
| |||||||||||
Romania Government Bond |
| |||||||||||
3.50%, 12/19/22, Series 7Y | 1,735,000 | RON | 419,801 | |||||||||
5.85%, 4/26/23, Series 10Y | 1,470,000 | RON | 369,480 | |||||||||
4.00%, 10/25/23, Series 3Y | 565,000 | RON | 138,696 | |||||||||
3.25%, 4/29/24, Series 7Y | 950,000 | RON | 228,771 | |||||||||
4.75%, 2/24/25, Series 10Y | 1,410,000 | RON | 355,207 | |||||||||
4.15%, 1/26/28, Series 8Y | 940,000 | RON | 233,419 | |||||||||
5.00%, 2/12/29, Series 10Y | 500,000 | RON | 129,864 | |||||||||
4.85%, 4/22/26, Series 7Y | 1,000,000 | RON | 254,974 | |||||||||
5.80%, 7/26/27, Series 15Y | 1,080,000 | RON | 291,666 | |||||||||
3.65%, 9/24/31, Series 15Y | 500,000 | RON | 117,931 | |||||||||
|
| |||||||||||
| Total Romania |
| 2,539,809 | ||||||||||
| Russia – 11.2% |
| |||||||||||
Russian Federal Bond – OFZ |
| |||||||||||
7.00%, 1/25/23, Series 6211 | 18,349,000 | RUB | 251,668 | |||||||||
7.00%, 8/16/23, Series 6215 | 49,505,000 | RUB | 680,191 | |||||||||
6.50%, 2/28/24, Series 6223 | 103,910,000 | RUB | 1,411,939 | |||||||||
7.40%, 7/17/24, Series 6227 | 90,000,000 | RUB | 1,250,606 | |||||||||
7.10%, 10/16/24, Series 6222 | 67,486,000 | RUB | 930,827 | |||||||||
4.50%, 7/16/25, Series 6234 | 62,046,000 | RUB | 783,556 | |||||||||
7.15%, 11/12/25, Series 6229 | 58,668,000 | RUB | 812,081 | |||||||||
7.75%, 9/16/26, Series 6219 | 58,000,000 | RUB | 828,431 | |||||||||
7.95%, 10/7/26, Series 6226 | 49,063,000 | RUB | 705,000 | |||||||||
8.15%, 2/3/27, Series 6207 | 43,606,000 | RUB | 633,194 | |||||||||
7.05%, 1/19/28, Series 6212 | 104,885,000 | RUB | 1,455,316 | |||||||||
5.70%, 5/17/28, Series 6236 | 25,000,000 | RUB | 322,206 | |||||||||
6.90%, 5/23/29, Series 6224 | 55,000,000 | RUB | 754,006 | |||||||||
7.65%, 4/10/30, Series 6228 | 24,000,000 | RUB | 344,873 | |||||||||
8.50%, 9/17/31, Series 6218 | 52,440,000 | RUB | 800,436 | |||||||||
7.70%, 3/23/33, Series 6221 | 71,865,000 | RUB | 1,035,712 | |||||||||
7.25%, 5/10/34, Series 6225 | 65,860,000 | RUB | 913,111 | |||||||||
6.10%, 7/18/35, Series 6233 | 45,500,000 | RUB | 567,335 | |||||||||
7.70%, 3/16/39, Series 6230 | 38,765,000 | RUB | 559,731 | |||||||||
|
| |||||||||||
| Total Russia |
| 15,040,219 | ||||||||||
| South Africa – 6.2% |
| |||||||||||
Republic of South Africa Government Bond |
| |||||||||||
8.00%, 1/31/30, Series 2030 | 16,655,000 | ZAR | 1,100,623 | |||||||||
7.00%, 2/28/31, Series R213 | 16,267,000 | ZAR | 976,020 | |||||||||
8.25%, 3/31/32, Series 2032 | 13,000,000 | ZAR | 830,230 | |||||||||
8.88%, 2/28/35, Series 2035 | 11,810,000 | ZAR | 751,215 | |||||||||
6.25%, 3/31/36, Series R209 | 12,301,600 | ZAR | 611,241 | |||||||||
8.50%, 1/31/37, Series 2037 | 11,000,000 | ZAR | 660,570 | |||||||||
9.00%, 1/31/40, Series 2040 | 14,300,000 | ZAR | 881,479 | |||||||||
6.50%, 2/28/41, Series R214 | 4,005,000 | ZAR | 188,607 | |||||||||
8.75%, 1/31/44, Series 2044 | 16,665,000 | ZAR | 990,526 | |||||||||
8.75%, 2/28/48, Series 2048 | 23,120,000 | ZAR | 1,372,416 | |||||||||
|
| |||||||||||
| Total South Africa |
| 8,362,927 | ||||||||||
| Thailand – 2.3% |
| |||||||||||
Thailand Government Bond |
| |||||||||||
2.00%, 12/17/22 | 6,000,000 | THB | 189,865 | |||||||||
0.75%, 6/17/24 | 3,025,000 | THB | 94,524 | |||||||||
1.45%, 12/17/24 | 9,565,000 | THB | 305,887 | |||||||||
0.95%, 6/17/25 | 7,000,000 | THB | 220,464 | |||||||||
3.85%, 12/12/25 | 5,480,000 | THB | 193,041 | |||||||||
2.13%, 12/17/26 | 10,000,000 | THB | 332,028 | |||||||||
2.88%, 12/17/28 | 3,615,000 | THB | 125,361 | |||||||||
4.88%, 6/22/29 | 9,167,000 | THB | 359,798 | |||||||||
3.65%, 6/20/31 | 9,000,000 | THB | 331,628 | |||||||||
1.60%, 6/17/35 | 6,130,000 | THB | 183,000 | |||||||||
3.40%, 6/17/36 | 14,285,000 | THB | 519,866 | |||||||||
2.88%, 6/17/46 | 5,985,000 | THB | 203,959 | |||||||||
|
| |||||||||||
| Total Thailand |
| 3,059,421 | ||||||||||
| Turkey – 2.8% |
| |||||||||||
Turkey Government Bond |
| |||||||||||
11.00%, 3/2/22 | 5,620,000 | TRY | 655,481 | |||||||||
12.20%, 1/18/23 | 8,000,000 | TRY | 902,520 | |||||||||
16.20%, 6/14/23 | 2,030,000 | TRY | 239,269 | |||||||||
9.00%, 7/24/24 | 733,000 | TRY | 72,158 | |||||||||
8.00%, 3/12/25 | 4,657,000 | TRY | 428,761 | |||||||||
12.60%, 10/1/25 | 815,000 | TRY | 85,867 | |||||||||
10.60%, 2/11/26 | 2,290,000 | TRY | 223,092 | |||||||||
11.00%, 2/24/27 | 6,586,000 | TRY | 629,331 | |||||||||
10.50%, 8/11/27 | 3,410,000 | TRY | 316,622 | |||||||||
11.70%, 11/13/30 | 1,905,000 | TRY | 178,254 | |||||||||
|
| |||||||||||
| Total Turkey |
| 3,731,355 | ||||||||||
TOTAL FOREIGN GOVERNMENT OBLIGATIONS (Cost: $122,628,476) |
| 112,134,645 | ||||||||||
See Notes to Financial Statements.
| 38 | WisdomTree Trust |
Table of Contents
Schedule of Investments (continued)
WisdomTree Emerging Markets Local Debt Fund (ELD)
August 31, 2021
| Investments | Principal Amount† | Value | ||||||||||
| SUPRANATIONAL BONDS – 8.8% |
| |||||||||||
European Bank for Reconstruction & Development | 7,910,000,000 | IDR | $ | 570,102 | ||||||||
European Investment Bank |
| |||||||||||
7.63%, 1/12/22 | 18,000,000 | MXN | 907,747 | |||||||||
7.50%, 7/30/23 | 38,000,000 | MXN | 1,959,780 | |||||||||
8.13%, 12/21/26 | 9,740,000 | ZAR | 717,824 | |||||||||
8.00%, 5/5/27(b) | 18,500,000 | ZAR | 1,357,669 | |||||||||
International Bank for Reconstruction & Development | 12,675,000 | ZAR | 936,938 | |||||||||
International Finance Corp. |
| |||||||||||
5.75%, 3/2/23 | 32,000,000 | MXN | 1,597,817 | |||||||||
7.00%, 7/20/27 | 35,000,000 | MXN | 1,769,430 | |||||||||
7.50%, 1/18/28 | 31,000,000 | MXN | 1,600,469 | |||||||||
5.50%, 2/28/28 | 34,850,000 | RUB | 471,649 | |||||||||
TOTAL SUPRANATIONAL BONDS (Cost: $11,495,928) |
| 11,889,425 | ||||||||||
| REPURCHASE AGREEMENT – 5.1% |
| |||||||||||
| United States – 5.1% |
| |||||||||||
Citigroup, Inc., tri-party repurchase agreement dated 8/31/21 (tri-party custodian: The Bank of New York Mellon Corp.), 0.06% due 9/1/21; Proceeds at maturity – $6,860,011 (fully collateralized by Freddie Mac Pool, 1.50% – 4.00% due 8/1/51; Market value including accrued interest – $7,204,041) | ||||||||||||
| (Cost: $6,860,000) | 6,860,000 | 6,860,000 | ||||||||||
TOTAL INVESTMENTS IN SECURITIES – 97.1% (Cost: $140,984,404) |
| 130,884,070 | ||||||||||
Other Assets less Liabilities – 2.9% |
| 3,899,469 | ||||||||||
|
| |||||||||||
| NET ASSETS – 100.0% |
| $ | 134,783,539 | |||||||||
| † | Principal amount is reported in U.S. dollars unless otherwise noted. |
| (a) | Represents a zero coupon bond. Rate shown reflects the effective yield as of August 31, 2021. |
| (b) | This security is exempt from registration under Regulation S of the Securities Act of 1933, which exempts from registration securities offered and sold outside the United States. This security may not be offered or sold in the United States except pursuant to an exemption from, or in a transaction not subject to, the registration requirements of the Securities Act of 1933. |
| (c) | This security is exempt from registration under rule 144A of the Securities Act of 1933. This security may be sold in transactions that are exempt from registration, normally to qualified institutional buyers. |
| FINANCIAL DERIVATIVE INSTRUMENTS | ||||||||||||||||||||||||||||
| FOREIGN CURRENCY CONTRACTS (OTC – OVER THE COUNTER) | ||||||||||||||||||||||||||||
| Counterparty | Settlement Date | Amount and Description of | Amount and Description of Currency to be Sold | Unrealized Appreciation | Unrealized Depreciation | |||||||||||||||||||||||
Bank of Montreal | 9/15/2021 | 2,000,000 | CNY | 309,167 | USD | $ | 56 | �� | $ | — | ||||||||||||||||||
Barclays Bank PLC | 9/15/2021 | 7,600,000 | MYR | 1,839,748 | USD | — | (11,718 | ) | ||||||||||||||||||||
Barclays Bank PLC | 9/15/2021 | 606,995 | USD | 44,778,000 | INR | — | (4,367 | ) | ||||||||||||||||||||
Citibank N.A. | 9/1/2021 | 262,960 | USD | 1,700,000 | CNY | — | (67 | ) | ||||||||||||||||||||
Citibank N.A. | 9/15/2021 | 20,609,000 | CNY | 3,201,746 | USD | — | (15,357 | ) | ||||||||||||||||||||
Citibank N.A. | 9/15/2021 | 335,865 | USD | 1,300,000 | PLN | — | (3,675 | ) | ||||||||||||||||||||
Goldman Sachs | 9/15/2021 | 14,040,000 | PLN | 3,830,528 | USD | — | (163,492 | ) | ||||||||||||||||||||
Goldman Sachs | 9/15/2021 | 2,000,000 | TRY | 221,053 | USD | 17,797 | — | |||||||||||||||||||||
JPMorgan Chase & Co. | 9/1/2021 | 631,479 | USD | 9,077,512,000 | IDR | — | (4,981 | ) | ||||||||||||||||||||
JPMorgan Chase & Co. | 9/1/2021 | 223,482 | USD | 3,212,556,000 | IDR | — | (1,763 | ) | ||||||||||||||||||||
Morgan Stanley & Co. International | 9/15/2021 | 445,229 | USD | 2,900,000 | CNY | — | (3,144 | ) | ||||||||||||||||||||
Morgan Stanley & Co. International | 9/15/2021 | 356,715 | USD | 26,800,000 | INR | — | (9,190 | ) | ||||||||||||||||||||
Morgan Stanley & Co. International | 9/15/2021 | 473,261 | USD | 2,000,000 | MYR | — | (7,800 | ) | ||||||||||||||||||||
State Street Bank and Trust | 9/1/2021 | 48,059 | USD | 699,508 | ZAR | — | (299 | ) | ||||||||||||||||||||
| $ | 17,853 | $ | (225,853 | ) | ||||||||||||||||||||||||
See Notes to Financial Statements.
| WisdomTree Trust | 39 |
Table of Contents
Schedule of Investments (concluded)
WisdomTree Emerging Markets Local Debt Fund (ELD)
August 31, 2021
| FAIR VALUATION SUMMARY |
The following is a summary of the fair valuations according to the inputs used as of August 31, 2021 in valuing the Fund’s investments (See Note 2 — Fair Value Measurement):
| Quoted Prices in Active Markets (Level 1) | Other Significant Observable Inputs (Level 2) | Significant Unobservable Inputs (Level 3) | Total | |||||||||||||
Assets: | ||||||||||||||||
Investments in Securities | ||||||||||||||||
Foreign Government Obligations | $ | — | $ | 112,134,645 | $ | — | $ | 112,134,645 | ||||||||
Supranational Bonds | — | 11,889,425 | — | 11,889,425 | ||||||||||||
Repurchase Agreement | — | 6,860,000 | — | 6,860,000 | ||||||||||||
Total Investments in Securities | $ | — | $ | 130,884,070 | $ | — | $ | 130,884,070 | ||||||||
Financial Derivative Instruments | ||||||||||||||||
Foreign Currency Contracts1 | $ | — | $ | 17,853 | $ | — | $ | 17,853 | ||||||||
Liabilities: | ||||||||||||||||
Financial Derivative Instruments | ||||||||||||||||
Foreign Currency Contracts1 | $ | — | $ | (225,853 | ) | $ | — | $ | (225,853 | ) | ||||||
Total – Net | $ | — | $ | 130,676,070 | $ | — | $ | 130,676,070 | ||||||||
| 1 | Amount shown represents the unrealized appreciation (depreciation) on the financial instrument. |
See Notes to Financial Statements.
| 40 | WisdomTree Trust |
Table of Contents
Schedule of Investments
WisdomTree Floating Rate Treasury Fund (USFR)
August 31, 2021
| Investments | Principal Amount | Value | ||||||
| U.S. GOVERNMENT OBLIGATIONS – 100.0% |
| |||||||
| U.S. Treasury Notes – 100.0% |
| |||||||
U.S. Treasury Floating Rate Notes |
| |||||||
0.10%, 10/31/22, (3-month U.S. Treasury Bill Money Market Yield + 0.055%)* | $ | 279,002,000 | $ | 279,166,645 | ||||
0.09%, 1/31/23, (3-month U.S. Treasury Bill Money Market Yield + 0.049%)* | 301,743,000 | 301,883,283 | ||||||
0.08%, 4/30/23, (3-month U.S. Treasury Bill Money Market Yield + 0.034%)* | 301,663,000 | 301,748,639 | ||||||
0.07%, 7/31/23, (3-month U.S. Treasury Bill Money Market Yield + 0.029%)* | 203,624,000 | 203,655,265 | ||||||
TOTAL INVESTMENTS IN SECURITIES – 100.0% (Cost: $1,086,163,211) |
| 1,086,453,832 | ||||||
Other Assets less Liabilities – 0.0% |
| 1,281 | ||||||
|
| |||||||
| NET ASSETS – 100.0% |
| $ | 1,086,455,113 | |||||
| * | Floating rate note. Coupon shown is in effect at August 31, 2021. Date represents the ultimate maturity date. |
| FAIR VALUATION SUMMARY |
The following is a summary of the fair valuations according to the inputs used as of August 31, 2021 in valuing the Fund’s investments (See Note 2 – Fair Value Measurement):
| Quoted Prices in Active Markets (Level 1) | Other Significant | Significant Unobservable Inputs (Level 3) | Total | |||||||||||||
Assets: | ||||||||||||||||
Investments in Securities | ||||||||||||||||
U.S. Government Obligations | $ | — | $ | 1,086,453,832 | $ | — | $ | 1,086,453,832 | ||||||||
Total Investments in Securities | $ | — | $ | 1,086,453,832 | $ | — | $ | 1,086,453,832 | ||||||||
See Notes to Financial Statements.
| WisdomTree Trust | 41 |
Table of Contents
Schedule of Investments
WisdomTree Interest Rate Hedged High Yield Bond Fund (HYZD)
August 31, 2021
| Investments | Principal Amount | Value | ||||||
| U.S. CORPORATE BONDS – 96.0% |
| |||||||
| United States – 96.0% |
| |||||||
ACCO Brands Corp. | $ | 135,000 | $ | 135,836 | ||||
AdaptHealth LLC | 122,000 | 122,511 | ||||||
ADT Security Corp. (The) | 212,000 | 215,708 | ||||||
Adtalem Global Education, Inc. | 260,000 | 266,562 | ||||||
AECOM | 231,000 | 258,357 | ||||||
Allison Transmission, Inc. | 699,000 | 771,179 | ||||||
Ally Financial, Inc. | 156,000 | 178,330 | ||||||
8.00%, 11/1/31 | 393,000 | 577,164 | ||||||
AMC Networks, Inc. | 245,000 | 248,812 | ||||||
4.75%, 8/1/25(b) | 588,000 | 603,629 | ||||||
American Axle & Manufacturing, Inc. | 269,000 | 278,162 | ||||||
AmeriGas Partners L.P. | 221,000 | 242,121 | ||||||
5.50%, 5/20/25 | 533,000 | 588,070 | ||||||
5.75%, 5/20/27 | 17,000 | 19,159 | ||||||
Amkor Technology, Inc. | 304,000 | 327,596 | ||||||
Antero Midstream Partners L.P. | 587,000 | 611,008 | ||||||
Antero Resources Corp. | 100,000 | 102,219 | ||||||
7.63%, 2/1/29(a) | 495,000 | 545,416 | ||||||
Apache Corp. | 400,000 | 445,132 | ||||||
4.75%, 4/15/43(b) | 516,000 | 555,015 | ||||||
APX Group, Inc. | 400,000 | 428,932 | ||||||
Aramark Services, Inc. | 324,000 | 343,003 | ||||||
5.00%, 2/1/28(a) | 441,000 | 459,315 | ||||||
Archrock Partners L.P. | 488,000 | 497,770 | ||||||
ASGN, Inc. | 135,000 | 141,035 | ||||||
Audacy Capital Corp. | 160,000 | 161,702 | ||||||
Avantor Funding, Inc. | 346,000 | 366,182 | ||||||
Avient Corp. | 150,000 | 158,399 | ||||||
Axalta Coating Systems LLC | 190,000 | 186,593 | ||||||
B&G Foods, Inc. | 281,000 | 288,550 | ||||||
5.25%, 9/15/27(b) | 136,000 | 141,277 | ||||||
Ball Corp. | 183,000 | 194,000 | ||||||
2.88%, 8/15/30 | 220,000 | 220,557 | ||||||
Bally’s Corp. | 150,000 | 162,516 | ||||||
Bath & Body Works, Inc. | 300,000 | 336,366 | ||||||
7.50%, 6/15/29(b) | 295,000 | 342,940 | ||||||
6.63%, 10/1/30(a) | 300,000 | 348,588 | ||||||
6.75%, 7/1/36 | 693,000 | 883,755 | ||||||
Bausch Health Americas, Inc. | 778,000 | 838,824 | ||||||
Bed Bath & Beyond, Inc. | 330,000 | 314,305 | ||||||
Berry Global, Inc. | 518,000 | 547,215 | ||||||
Black Knight InfoServ LLC | 261,000 | 264,338 | ||||||
Booz Allen Hamilton, Inc. | 200,000 | 207,068 | ||||||
Brink’s Co. (The) | 44,000 | 46,255 | ||||||
Brookfield Property REIT, Inc. | 463,000 | 478,960 | ||||||
Builders FirstSource, Inc. | 256,000 | 274,130 | ||||||
Cable One, Inc. | 120,000 | 121,405 | ||||||
Catalent Pharma Solutions, Inc. | 280,000 | 276,900 | ||||||
CCO Holdings LLC | 243,000 | 244,577 | ||||||
5.75%, 2/15/26(a) | 636,000 | 654,285 | ||||||
5.13%, 5/1/27(a) | 530,000 | 554,762 | ||||||
4.75%, 3/1/30(a) | 420,000 | 444,217 | ||||||
4.50%, 8/15/30(a) | 574,000 | 600,857 | ||||||
CDK Global, Inc. | 10,000 | 11,118 | ||||||
5.25%, 5/15/29(a) | 48,000 | 52,205 | ||||||
CDW LLC | 108,000 | 120,033 | ||||||
4.13%, 5/1/25 | 144,000 | 149,901 | ||||||
4.25%, 4/1/28 | 154,000 | 161,541 | ||||||
Cedar Fair L.P. | 463,000 | 482,835 | ||||||
Centene Corp. | 339,000 | 372,439 | ||||||
3.00%, 10/15/30 | 580,000 | 600,822 | ||||||
Central Garden & Pet Co. | 200,000 | 205,348 | ||||||
CF Industries, Inc. | 292,000 | 307,245 | ||||||
5.38%, 3/15/44 | 244,000 | 317,490 | ||||||
Charles River Laboratories International, Inc. | 160,000 | 170,976 | ||||||
Charter Communications Operating LLC | 610,000 | 614,789 | ||||||
3.85%, 4/1/61 | 341,000 | 339,687 | ||||||
Chemours Co. (The) | 33,000 | 35,876 | ||||||
5.75%, 11/15/28(a) | 400,000 | 424,200 | ||||||
See Notes to Financial Statements.
| 42 | WisdomTree Trust |
Table of Contents
Schedule of Investments (continued)
WisdomTree Interest Rate Hedged High Yield Bond Fund (HYZD)
August 31, 2021
| Investments | Principal Amount | Value | ||||||
Churchill Downs, Inc. | $ | 272,000 | $ | 283,595 | ||||
Clear Channel Outdoor Holdings, Inc. | 823,000 | 859,303 | ||||||
Clearway Energy Operating LLC | 330,000 | 350,183 | ||||||
3.75%, 2/15/31(a) | 277,000 | 281,953 | ||||||
CNX Resources Corp. | 396,000 | 420,227 | ||||||
CommScope Technologies LLC | 864,000 | 879,474 | ||||||
5.00%, 3/15/27(a)(b) | 349,000 | 344,390 | ||||||
CommScope, Inc. | 305,000 | 320,159 | ||||||
8.25%, 3/1/27(a) | 300,000 | 316,341 | ||||||
Community Health Systems, Inc. | 632,000 | 665,433 | ||||||
8.00%, 3/15/26(a) | 714,000 | 764,515 | ||||||
8.00%, 12/15/27(a) | 360,000 | 398,120 | ||||||
6.88%, 4/15/29(a) | 150,000 | 155,961 | ||||||
4.75%, 2/15/31(a)(b) | 1,325,000 | 1,348,863 | ||||||
Compass Minerals International, Inc. | 317,000 | 336,664 | ||||||
Consolidated Communications, Inc. | 290,000 | 317,489 | ||||||
Continental Resources, Inc. | 200,000 | 208,876 | ||||||
4.90%, 6/1/44 | 252,000 | 284,057 | ||||||
CoreLogic, Inc. | 318,000 | 317,615 | ||||||
Cornerstone Building Brands, Inc. | 288,000 | 308,316 | ||||||
Coty, Inc. | 276,000 | 284,840 | ||||||
Crestwood Midstream Partners L.P. | 394,000 | 398,425 | ||||||
6.00%, 2/1/29(a) | 200,000 | 204,936 | ||||||
Crown Americas LLC | 197,000 | 206,275 | ||||||
CSC Holdings LLC | 756,000 | 816,253 | ||||||
5.50%, 4/15/27(a) | 260,000 | 272,519 | ||||||
7.50%, 4/1/28(a) | 570,000 | 626,117 | ||||||
6.50%, 2/1/29(a) | 400,000 | 442,424 | ||||||
5.75%, 1/15/30(a) | 1,010,000 | 1,067,701 | ||||||
3.38%, 2/15/31(a) | 210,000 | 199,973 | ||||||
CVR Partners L.P. | 73,000 | 73,339 | ||||||
DaVita, Inc. | 350,000 | 366,093 | ||||||
3.75%, 2/15/31(a) | 1,323,000 | 1,308,791 | ||||||
Del Monte Foods, Inc. | 167,000 | 187,947 | ||||||
Delta Air Lines, Inc. | 981,000 | 992,095 | ||||||
2.90%, 10/28/24 | 50,000 | 50,922 | ||||||
4.38%, 4/19/28(b) | 210,000 | 224,612 | ||||||
3.75%, 10/28/29(b) | 44,000 | 44,610 | ||||||
Devon Energy Corp. | 145,000 | 171,921 | ||||||
Diamond Sports Group LLC | 1,716,000 | 1,141,123 | ||||||
6.63%, 8/15/27(a)(b) | 815,000 | 351,827 | ||||||
DISH DBS Corp. | 921,000 | 953,051 | ||||||
5.00%, 3/15/23 | 244,000 | 255,307 | ||||||
5.88%, 11/15/24 | 1,093,000 | 1,183,227 | ||||||
7.75%, 7/1/26 | 895,000 | 1,025,912 | ||||||
Diversified Healthcare Trust | 308,000 | 313,368 | ||||||
4.38%, 3/1/31 | 611,000 | 600,925 | ||||||
Dycom Industries, Inc. | 183,000 | 188,585 | ||||||
Edgewell Personal Care Co. | 407,000 | 431,457 | ||||||
4.13%, 4/1/29(a) | 70,000 | 70,958 | ||||||
Element Solutions, Inc. | 174,000 | 178,442 | ||||||
EMC Corp. | 49,000 | 50,813 | ||||||
Encompass Health Corp. | 345,000 | 368,391 | ||||||
Energizer Holdings, Inc. | 435,000 | 436,623 | ||||||
EnLink Midstream LLC | 110,000 | 115,713 | ||||||
EnLink Midstream Partners L.P. | 161,000 | 167,638 | ||||||
4.15%, 6/1/25 | 208,000 | 214,427 | ||||||
5.45%, 6/1/47 | 220,000 | 209,539 | ||||||
EPR Properties | 118,000 | 118,472 | ||||||
EQM Midstream Partners L.P. | 500,000 | 559,075 | ||||||
5.50%, 7/15/28 | 180,000 | 196,636 | ||||||
4.75%, 1/15/31(a) | 300,000 | 306,012 | ||||||
6.50%, 7/15/48 | 500,000 | 564,985 | ||||||
Fluor Corp. | 389,000 | 408,104 | ||||||
Ford Motor Co. | 531,000 | 587,944 | ||||||
9.00%, 4/22/25 | 483,000 | 589,308 | ||||||
9.63%, 4/22/30 | 437,000 | 623,293 | ||||||
5.29%, 12/8/46 | 520,000 | 589,477 | ||||||
Ford Motor Credit Co. LLC | 70,000 | 70,619 | ||||||
3.35%, 11/1/22 | 90,000 | 92,061 | ||||||
4.14%, 2/15/23 | 660,000 | 683,529 | ||||||
3.66%, 9/8/24 | 20,000 | 20,888 | ||||||
4.39%, 1/8/26 | 10,000 | 10,786 | ||||||
4.54%, 8/1/26 | 180,000 | 196,529 | ||||||
Fortress Transportation & Infrastructure Investors LLC | 250,000 | 258,135 | ||||||
5.50%, 5/1/28(a) | 327,000 | 333,164 | ||||||
See Notes to Financial Statements.
| WisdomTree Trust | 43 |
Table of Contents
Schedule of Investments (continued)
WisdomTree Interest Rate Hedged High Yield Bond Fund (HYZD)
August 31, 2021
| Investments | Principal Amount | Value | ||||||
Freeport-McMoRan, Inc. | $ | 825,000 | $ | 857,332 | ||||
4.55%, 11/14/24 | 235,000 | 255,311 | ||||||
5.00%, 9/1/27 | 270,000 | 285,185 | ||||||
5.45%, 3/15/43 | 8,000 | 10,241 | ||||||
Gap, Inc. (The) | 12,000 | 13,416 | ||||||
8.63%, 5/15/25(a) | 437,000 | 477,947 | ||||||
8.88%, 5/15/27(a) | 111,000 | 127,855 | ||||||
Gartner, Inc. | 201,000 | 210,602 | ||||||
Genesis Energy L.P. | 928,000 | 910,878 | ||||||
GLP Capital L.P. | 341,000 | 370,374 | ||||||
Go Daddy Operating Co. LLC | 294,000 | 291,648 | ||||||
Golden Nugget, Inc. | 400,000 | 401,432 | ||||||
Goodyear Tire & Rubber Co. (The) | 450,000 | 463,559 | ||||||
4.88%, 3/15/27(b) | 300,000 | 322,566 | ||||||
5.25%, 7/15/31(a) | 809,000 | 867,110 | ||||||
Gray Television, Inc. | 338,000 | 349,208 | ||||||
7.00%, 5/15/27(a)(b) | 647,000 | 694,904 | ||||||
Greif, Inc. | 258,000 | 271,055 | ||||||
Griffon Corp. | 392,000 | 417,029 | ||||||
GrubHub Holdings, Inc. | 187,000 | 195,589 | ||||||
Hanesbrands, Inc. | 273,000 | 290,548 | ||||||
4.88%, 5/15/26(a)(b) | 267,000 | 292,173 | ||||||
HCA, Inc. | 254,000 | 274,538 | ||||||
5.38%, 2/1/25 | 937,000 | 1,055,746 | ||||||
3.50%, 9/1/30 | 415,000 | 445,851 | ||||||
Hilton Domestic Operating Co., Inc. | 426,000 | 460,067 | ||||||
3.63%, 2/15/32(a) | 464,000 | 463,341 | ||||||
HLF Financing Sarl LLC | 243,000 | 245,717 | ||||||
Holly Energy Partners L.P. | 200,000 | 204,418 | ||||||
Hologic, Inc. | 162,000 | 166,175 | ||||||
Horizon Therapeutics USA, Inc. | 110,000 | 116,900 | ||||||
Hughes Satellite Systems Corp. | 257,000 | 291,520 | ||||||
6.63%, 8/1/26(b) | 242,000 | 275,570 | ||||||
iHeartCommunications, Inc. | 600,000 | 638,040 | ||||||
4.75%, 1/15/28(a) | 510,000 | 529,905 | ||||||
Ingevity Corp. | 150,000 | 150,594 | ||||||
IQVIA, Inc. | 250,000 | 261,650 | ||||||
Iron Mountain, Inc. | 436,000 | 455,642 | ||||||
5.25%, 3/15/28(a) | 173,000 | 182,361 | ||||||
4.50%, 2/15/31(a) | 1,216,000 | 1,252,419 | ||||||
iStar, Inc. | 400,000 | 425,168 | ||||||
4.25%, 8/1/25 | 240,000 | 251,158 | ||||||
J2 Global, Inc. | 278,000 | 294,716 | ||||||
JBS USA LUX S.A. | 190,000 | 208,650 | ||||||
6.50%, 4/15/29(a) | 390,000 | 442,455 | ||||||
5.50%, 1/15/30(a) | 11,000 | 12,440 | ||||||
Kaiser Aluminum Corp. | 188,000 | 195,868 | ||||||
4.50%, 6/1/31(a) | 138,000 | 143,252 | ||||||
Kennedy-Wilson, Inc. | 350,000 | 365,190 | ||||||
Kraft Heinz Foods Co. | 156,000 | 172,603 | ||||||
5.00%, 7/15/35 | 176,000 | 218,868 | ||||||
4.63%, 10/1/39 | 300,000 | 358,602 | ||||||
5.20%, 7/15/45 | 808,000 | 1,035,032 | ||||||
4.38%, 6/1/46 | 439,000 | 508,406 | ||||||
4.88%, 10/1/49 | 88,000 | 109,785 | ||||||
5.50%, 6/1/50 | 89,000 | 119,115 | ||||||
Ladder Capital Finance Holdings LLLP | 313,000 | 317,244 | ||||||
Lamar Media Corp. | 240,000 | 239,717 | ||||||
Lamb Weston Holdings, Inc. | 305,000 | 314,135 | ||||||
Lennar Corp. | 100,000 | 108,694 | ||||||
Level 3 Financing, Inc. | 807,000 | 783,863 | ||||||
3.75%, 7/15/29(a) | 292,000 | 284,928 | ||||||
Lions Gate Capital Holdings LLC | 390,000 | 398,697 | ||||||
LPL Holdings, Inc. | 140,000 | 143,016 | ||||||
Lumen Technologies, Inc. | 838,000 | 858,481 | ||||||
7.50%, 4/1/24, Series Y | 54,000 | 60,200 | ||||||
5.63%, 4/1/25 | 501,000 | 543,119 | ||||||
5.13%, 12/15/26(a) | 373,000 | 385,880 | ||||||
4.00%, 2/15/27(a) | 341,000 | 350,681 | ||||||
Marriott Ownership Resorts, Inc. | 86,000 | 90,650 | ||||||
6.50%, 9/15/26 | 162,000 | 167,558 | ||||||
Maxim Crane Works Holdings Capital LLC | 230,000 | 237,100 | ||||||
MEDNAX, Inc. | 347,000 | 366,252 | ||||||
See Notes to Financial Statements.
| 44 | WisdomTree Trust |
Table of Contents
Schedule of Investments (continued)
WisdomTree Interest Rate Hedged High Yield Bond Fund (HYZD)
August 31, 2021
| Investments | Principal Amount | Value | ||||||
MGM Growth Properties Operating Partnership L.P. | $ | 478,000 | $ | 522,014 | ||||
5.75%, 2/1/27 | 588,000 | 677,635 | ||||||
MGM Resorts International | 1,259,000 | 1,303,909 | ||||||
6.00%, 3/15/23 | 24,000 | 25,499 | ||||||
6.75%, 5/1/25 | 9,000 | 9,569 | ||||||
Michaels Cos., Inc.(The) | 773,000 | 794,799 | ||||||
Midwest Gaming Borrower LLC | 289,000 | 293,023 | ||||||
Molina Healthcare, Inc. | 246,000 | 255,360 | ||||||
3.88%, 11/15/30(a) | 393,000 | 419,174 | ||||||
Moog, Inc. | 104,000 | 107,391 | ||||||
MPH Acquisition Holdings LLC | 591,000 | 565,156 | ||||||
MPT Operating Partnership L.P. | 632,000 | 653,336 | ||||||
MSCI, Inc. | 230,000 | 246,988 | ||||||
Nationstar Mortgage Holdings, Inc. | 882,000 | 931,754 | ||||||
5.13%, 12/15/30(a) | 200,000 | 205,190 | ||||||
Navient Corp. | 191,000 | 199,045 | ||||||
5.50%, 1/25/23 | 158,000 | 166,485 | ||||||
7.25%, 9/25/23 | 207,000 | 227,727 | ||||||
6.13%, 3/25/24 | 788,000 | 855,161 | ||||||
5.88%, 10/25/24 | 251,000 | 273,705 | ||||||
6.75%, 6/15/26(b) | 31,000 | 35,029 | ||||||
4.88%, 3/15/28 | 370,000 | 377,633 | ||||||
NCR Corp. | 330,000 | 342,662 | ||||||
6.13%, 9/1/29(a) | 768,000 | 837,489 | ||||||
Newell Brands, Inc. | 245,000 | 258,637 | ||||||
4.70%, 4/1/26 | 38,000 | 42,496 | ||||||
6.00%, 4/1/46 | 284,000 | 369,595 | ||||||
Newmark Group, Inc. | 23,000 | 25,056 | ||||||
News Corp. | 241,000 | 248,167 | ||||||
Nexstar Media, Inc. | 733,000 | 778,937 | ||||||
4.75%, 11/1/28(a) | 254,000 | 264,396 | ||||||
NextEra Energy Operating Partners L.P. | 305,000 | 322,257 | ||||||
4.25%, 9/15/24(a) | 55,000 | 58,319 | ||||||
Nielsen Finance LLC | 491,000 | 525,753 | ||||||
Nordstrom, Inc. | 578,000 | 574,833 | ||||||
NRG Energy, Inc. | 566,000 | 614,444 | ||||||
3.63%, 2/15/31(a) | 220,000 | 224,013 | ||||||
NuStar Logistics L.P. | 300,000 | 325,329 | ||||||
5.63%, 4/28/27 | 344,000 | 366,167 | ||||||
6.38%, 10/1/30 | 235,000 | 260,122 | ||||||
Occidental Petroleum Corp. | 726,000 | 746,248 | ||||||
3.50%, 6/15/25 | 252,000 | 264,663 | ||||||
3.40%, 4/15/26 | 123,000 | 127,352 | ||||||
6.63%, 9/1/30 | 400,000 | 499,016 | ||||||
7.50%, 5/1/31 | 440,000 | 576,321 | ||||||
6.45%, 9/15/36 | 288,000 | 361,630 | ||||||
4.10%, 2/15/47 | 481,000 | 477,094 | ||||||
4.40%, 8/15/49 | 868,000 | 875,135 | ||||||
Oceaneering International, Inc. | 200,000 | 203,990 | ||||||
Olin Corp. | 424,000 | 442,351 | ||||||
5.00%, 2/1/30 | 285,000 | 306,389 | ||||||
OneMain Finance Corp. | 437,000 | 452,107 | ||||||
6.13%, 3/15/24 | 301,000 | 324,902 | ||||||
8.88%, 6/1/25 | 236,000 | 258,819 | ||||||
7.13%, 3/15/26 | 522,000 | 610,996 | ||||||
5.38%, 11/15/29 | 477,000 | 521,852 | ||||||
4.00%, 9/15/30 | 520,000 | 521,950 | ||||||
Organon & Co. | 200,000 | 206,528 | ||||||
5.13%, 4/30/31(a) | 1,390,000 | 1,459,333 | ||||||
Outfront Media Capital LLC | 343,000 | 348,104 | ||||||
Owens & Minor, Inc. | 232,000 | 237,549 | ||||||
Owens-Brockway Glass Container, Inc. | 604,000 | 643,665 | ||||||
Par Pharmaceutical, Inc. | 1,033,000 | 1,048,722 | ||||||
Park Intermediate Holdings LLC | 396,000 | 422,488 | ||||||
4.88%, 5/15/29(a) | 60,000 | 61,846 | ||||||
Party City Holdings, Inc. | 370,000 | 387,272 | ||||||
Patterson-UTI Energy, Inc. | 199,000 | 196,144 | ||||||
PBF Holding Co. LLC | 566,000 | 546,779 | ||||||
7.25%, 6/15/25 | 452,000 | 317,336 | ||||||
6.00%, 2/15/28 | 470,000 | 309,204 | ||||||
PBF Logistics L.P. | 373,000 | 363,153 | ||||||
Pilgrim’s Pride Corp. | 240,000 | 256,572 | ||||||
4.25%, 4/15/31(a) | 230,000 | 247,988 | ||||||
Plains All American Pipeline L.P. | 269,000 | 293,457 | ||||||
Plantronics, Inc. | 252,000 | 241,839 | ||||||
Post Holdings, Inc. | 552,000 | 578,038 | ||||||
5.63%, 1/15/28(a)(b) | 570,000 | 600,535 | ||||||
See Notes to Financial Statements.
| WisdomTree Trust | 45 |
Table of Contents
Schedule of Investments (continued)
WisdomTree Interest Rate Hedged High Yield Bond Fund (HYZD)
August 31, 2021
| Investments | Principal Amount | Value | ||||||
4.63%, 4/15/30(a) | $ | 731,000 | $ | 747,740 | ||||
4.50%, 9/15/31(a) | 290,000 | 293,599 | ||||||
Prestige Brands, Inc. | 227,000 | 224,378 | ||||||
Prime Healthcare Services, Inc. | 449,000 | 481,871 | ||||||
Prime Security Services Borrower LLC | 625,000 | 665,812 | ||||||
5.75%, 4/15/26(a) | 396,000 | 429,094 | ||||||
6.25%, 1/15/28(a) | 637,000 | 660,830 | ||||||
PTC, Inc. | 250,000 | 259,030 | ||||||
Qorvo, Inc. | 192,000 | 213,001 | ||||||
QVC, Inc. | 124,000 | 130,243 | ||||||
4.85%, 4/1/24 | 247,000 | 268,995 | ||||||
4.45%, 2/15/25 | 272,000 | 291,366 | ||||||
4.75%, 2/15/27 | 35,000 | 37,520 | ||||||
Rackspace Technology Global, Inc. | 351,000 | 338,129 | ||||||
Radian Group, Inc. | 143,000 | 161,426 | ||||||
Realogy Group LLC | 631,000 | 698,530 | ||||||
5.75%, 1/15/29(a) | 159,000 | 166,618 | ||||||
Renewable Energy Group, Inc. | 70,000 | 72,550 | ||||||
RHP Hotel Properties L.P. | 331,000 | 336,753 | ||||||
Sabre GLBL, Inc. | 508,000 | 586,202 | ||||||
Sally Holdings LLC | 166,000 | 171,441 | ||||||
SBA Communications Corp. | 175,000 | 172,144 | ||||||
Scientific Games International, Inc. | 1,069,000 | 1,138,239 | ||||||
7.00%, 5/15/28(a) | 252,000 | 271,417 | ||||||
7.25%, 11/15/29(a) | 272,000 | 303,685 | ||||||
Scotts Miracle-Gro Co. (The) | 136,000 | 136,602 | ||||||
Scripps Escrow II, Inc. | 280,000 | 277,595 | ||||||
Scripps Escrow, Inc. | 374,000 | 384,210 | ||||||
Select Medical Corp. | 487,000 | 515,967 | ||||||
Sensata Technologies, Inc. | 250,000 | 253,350 | ||||||
Service Corp. International | 442,000 | 467,830 | ||||||
3.38%, 8/15/30 | 140,000 | 141,037 | ||||||
Service Properties Trust | 599,000 | 676,588 | ||||||
Silgan Holdings, Inc. | 154,000 | 159,473 | ||||||
Sinclair Television Group, Inc. | 250,000 | 245,158 | ||||||
4.13%, 12/1/30(a) | 287,000 | 280,715 | ||||||
Sirius XM Radio, Inc. | 622,000 | 681,762 | ||||||
4.13%, 7/1/30(a) | 350,000 | 358,866 | ||||||
Six Flags Entertainment Corp. | 250,000 | 253,085 | ||||||
Six Flags Theme Parks, Inc. | 496,000 | 531,280 | ||||||
Spectrum Brands, Inc. | 152,000 | 155,846 | ||||||
3.88%, 3/15/31(a) | 110,000 | 108,785 | ||||||
Spirit AeroSystems, Inc. | 424,000 | 450,207 | ||||||
4.60%, 6/15/28(b) | 392,000 | 383,623 | ||||||
Sprint Communications, Inc. | 520,000 | 550,165 | ||||||
Sprint Corp. | 551,000 | 624,481 | ||||||
7.13%, 6/15/24 | 259,000 | 298,712 | ||||||
7.63%, 3/1/26 | 231,000 | 285,146 | ||||||
SS&C Technologies, Inc. | 463,000 | 490,965 | ||||||
SSL Robotics LLC | 521,000 | 568,833 | ||||||
Starwood Property Trust, Inc. | 57,000 | 57,141 | ||||||
Station Casinos LLC | 225,000 | 228,623 | ||||||
Stericycle, Inc. | 458,000 | 471,154 | ||||||
Suburban Propane Partners L.P. | 240,000 | 247,738 | ||||||
Summit Materials LLC | 203,000 | 215,290 | ||||||
Sunoco L.P. | 218,000 | 221,946 | ||||||
Surgery Center Holdings, Inc. | 200,000 | 217,692 | ||||||
Syneos Health, Inc. | 158,000 | 157,487 | ||||||
T-Mobile USA, Inc. | 684,000 | 695,840 | ||||||
2.88%, 2/15/31 | 430,000 | 442,470 | ||||||
Taylor Morrison Communities, Inc. | 228,000 | 249,696 | ||||||
TEGNA, Inc. | 288,000 | 299,218 | ||||||
5.00%, 9/15/29 | 536,000 | 568,235 | ||||||
Tempur Sealy International, Inc. | 228,000 | 235,820 | ||||||
Tenet Healthcare Corp. | 567,000 | 614,617 | ||||||
4.63%, 7/15/24 | 180,000 | 182,707 | ||||||
4.63%, 9/1/24(a) | 475,000 | 487,421 | ||||||
4.88%, 1/1/26(a) | 358,000 | 371,557 | ||||||
6.25%, 2/1/27(a) | 292,000 | 305,158 | ||||||
6.13%, 10/1/28(a) | 818,000 | 865,428 | ||||||
See Notes to Financial Statements.
| 46 | WisdomTree Trust |
Table of Contents
Schedule of Investments (continued)
WisdomTree Interest Rate Hedged High Yield Bond Fund (HYZD)
August 31, 2021
| Investments | Principal Amount | Value | ||||||
Tenneco, Inc. | $ | 319,000 | $ | 319,070 | ||||
7.88%, 1/15/29(a) | 426,000 | 481,150 | ||||||
Terex Corp. | 184,000 | 194,004 | ||||||
TerraForm Power Operating LLC | 709,000 | 730,780 | ||||||
4.75%, 1/15/30(a) | 320,000 | 337,056 | ||||||
TransDigm, Inc. | 56,000 | 60,012 | ||||||
6.25%, 3/15/26(a) | 569,000 | 597,973 | ||||||
6.38%, 6/15/26 | 742,000 | 770,062 | ||||||
7.50%, 3/15/27 | 328,000 | 347,296 | ||||||
5.50%, 11/15/27 | 73,000 | 74,726 | ||||||
4.88%, 5/1/29(a) | 1,233,000 | 1,227,982 | ||||||
Transocean, Inc. | 906,000 | 912,659 | ||||||
Travel & Leisure Co. | 90,000 | 102,653 | ||||||
TreeHouse Foods, Inc. | 198,000 | 191,383 | ||||||
TriNet Group, Inc. | 85,000 | 85,749 | ||||||
Tronox, Inc. | 413,000 | 420,186 | ||||||
TTM Technologies, Inc. | 70,000 | 70,991 | ||||||
Tutor Perini Corp. | 310,000 | 319,666 | ||||||
United Natural Foods, Inc. | 250,000 | 270,665 | ||||||
United Rentals North America, Inc. | 193,000 | 203,681 | ||||||
3.88%, 11/15/27 | 313,000 | 329,151 | ||||||
4.88%, 1/15/28 | 243,000 | 257,782 | ||||||
5.25%, 1/15/30 | 343,000 | 377,516 | ||||||
3.88%, 2/15/31 | 80,000 | 82,978 | ||||||
Uniti Group L.P. | 668,000 | 687,385 | ||||||
7.88%, 2/15/25(a) | 824,000 | 878,541 | ||||||
4.75%, 4/15/28(a) | 340,000 | 347,551 | ||||||
Urban One, Inc. | 351,000 | 380,316 | ||||||
US Foods, Inc. | 330,000 | 338,940 | ||||||
USA Compression Partners L.P. | 602,000 | 626,929 | ||||||
Valvoline, Inc. | 243,000 | 242,307 | ||||||
Vector Group Ltd. | 350,000 | 356,367 | ||||||
VeriSign, Inc. | 1,000 | 1,131 | ||||||
4.75%, 7/15/27 | 38,000 | 40,342 | ||||||
ViacomCBS, Inc. | ||||||||
5.88%, 2/28/57, (5.875% fixed rate until 2/28/22; 3-month U.S. dollar London Interbank Offered Rate + 3.895% thereafter)(c) | 517,800 | 526,484 | ||||||
VICI Properties LP | 358,000 | 367,569 | ||||||
3.75%, 2/15/27(a) | 252,000 | 262,584 | ||||||
4.13%, 8/15/30(a) | 308,000 | 329,190 | ||||||
Victors Merger Corp. | 261,000 | 259,961 | ||||||
Vine Energy Holdings LLC | 300,000 | 324,699 | ||||||
Vista Outdoor, Inc. | 186,000 | 188,340 | ||||||
Vistra Operations Co. LLC | 550,000 | 572,990 | ||||||
5.00%, 7/31/27(a) | 229,000 | 238,602 | ||||||
4.38%, 5/1/29(a) | 588,000 | 597,296 | ||||||
W&T Offshore, Inc. | 433,000 | 406,189 | ||||||
WESCO Distribution, Inc. | 889,000 | 990,373 | ||||||
Western Digital Corp. | 469,000 | 524,426 | ||||||
Western Midstream Operating L.P. | 266,000 | 298,292 | ||||||
5.30%, 3/1/48 | 670,000 | 759,257 | ||||||
6.50%, 2/1/50 | 100,000 | 117,989 | ||||||
William Carter Co. (The) | 326,000 | 341,619 | ||||||
Williams Scotsman International, Inc. | 196,000 | 203,323 | ||||||
Xerox Corp. | 58,000 | 60,805 | ||||||
Xerox Holdings Corp. | 551,000 | 576,908 | ||||||
XHR L.P. | 150,000 | 159,560 | ||||||
XPO Logistics, Inc. | 341,000 | 360,631 | ||||||
Yum! Brands, Inc. | 209,000 | 225,434 | ||||||
3.63%, 3/15/31 | 80,000 | 82,355 | ||||||
TOTAL U.S. CORPORATE BONDS (Cost: $155,268,697) |
| 159,811,287 | ||||||
| FOREIGN CORPORATE BONDS – 0.7% |
| |||||||
| Canada – 0.4% |
| |||||||
Open Text Holdings, Inc. | 250,000 | 263,405 | ||||||
Primo Water Holdings, Inc. | 299,000 | 302,280 | ||||||
|
| |||||||
| Total Canada |
| 565,685 | ||||||
| Germany – 0.3% |
| |||||||
Deutsche Bank AG | ||||||||
4.88%, 12/1/32, (4.875% fixed rate until 12/1/27; 5-year U.S. dollar ICE Swap Rate + 2.553% thereafter)(c) | 470,000 | 515,548 | ||||||
| TOTAL FOREIGN CORPORATE BONDS (Cost: $1,037,836) |
| 1,081,233 | ||||||
See Notes to Financial Statements.
| WisdomTree Trust | 47 |
Table of Contents
Schedule of Investments (concluded)
WisdomTree Interest Rate Hedged High Yield Bond Fund (HYZD)
August 31, 2021
| Investments | Shares | Value | ||||||
| INVESTMENT OF CASH COLLATERAL FOR SECURITIES LOANED – 3.7% |
| |||||||
| United States – 3.7% |
| |||||||
State Street Navigator Securities Lending |
| |||||||
| (Cost: $6,181,380) | 6,181,380 | $ | 6,181,380 | |||||
TOTAL INVESTMENTS IN SECURITIES – 100.4% (Cost: $162,487,913) |
| 167,073,900 | ||||||
Other Assets less Liabilities – (0.4)% |
| (626,739 | ) | |||||
|
| |||||||
| NET ASSETS – 100.0% |
| $ | 166,447,161 | |||||
| (a) | This security is exempt from registration under rule 144A of the Securities Act of 1933. This security may be sold in transactions that are exempt from registration, normally to qualified institutional buyers. |
| (b) | Security, or portion thereof, was on loan at August 31, 2021 (See Note 2). At August 31, 2021, the total market value of the Fund’s securities on loan identified in the Schedule of Investments was $7,975,951 and the total market value of the collateral held by the Fund was $8,916,781. The Fund also had securities on loan having a total market value of $443,603 that were sold and pending settlement. The total market value of the collateral includes non-cash U.S. Government securities collateral having a value of $2,735,401. |
| (c) | Rate shown reflects the accrual rate as of August 31, 2021 on securities with variable or step rates. |
| (d) | Rate shown represents annualized 7-day yield as of August 31, 2021. |
| FINANCIAL DERIVATIVE INSTRUMENTS | ||||||||||||||||
| FUTURES CONTRACTS (EXCHANGE-TRADED) | ||||||||||||||||
| Short Exposure | Contracts | Expiration Date | Notional Value | Unrealized Appreciation/ (Depreciation) | ||||||||||||
2 Year U.S. Treasury Note | 153 | 12/31/21 | $ | (33,710,203 | ) | $ | (22,811 | ) | ||||||||
5 Year U.S. Treasury Note | 598 | 12/31/21 | (73,983,813 | ) | (200,891 | ) | ||||||||||
10 Year U.S. Treasury Note | 34 | 12/21/21 | (4,537,406 | ) | (14,123 | ) | ||||||||||
U.S. Treasury Long Bond | 2 | 12/21/21 | (325,937 | ) | (1,156 | ) | ||||||||||
U.S. Treasury Ultra Long Term Bond | 15 | 12/21/21 | (2,959,219 | ) | (9,955 | ) | ||||||||||
Ultra 10 Year U.S. Treasury Note | 100 | 12/21/21 | (14,801,563 | ) | (57,031 | ) | ||||||||||
| $ | (130,318,141 | ) | $ | (305,967 | ) | |||||||||||
| FAIR VALUATION SUMMARY | ||||||||||||||
The following is a summary of the fair valuations according to the inputs used as of August 31, 2021 in valuing the Fund’s investments (See Note 2 — Fair Value Measurement):
| Quoted Prices in Active Markets (Level 1) | Other Significant Observable Inputs (Level 2) | Significant Unobservable Inputs (Level 3) | Total | |||||||||||||
Assets: |
| |||||||||||||||
Investments in Securities | ||||||||||||||||
U.S. Corporate Bonds | $ | — | $ | 159,811,287 | $ | — | $ | 159,811,287 | ||||||||
Foreign Corporate Bonds | — | 1,081,233 | — | 1,081,233 | ||||||||||||
Investment of Cash Collateral for Securities Loaned | — | 6,181,380 | — | 6,181,380 | ||||||||||||
Total Investments in Securities | $ | — | $ | 167,073,900 | $ | — | $ | 167,073,900 | ||||||||
Liabilities: |
| |||||||||||||||
Financial Derivative Instruments | ||||||||||||||||
Futures Contracts1 | $ | (305,967 | ) | $ | — | $ | — | $ | (305,967 | ) | ||||||
Total – Net | $ | (305,967 | ) | $ | 167,073,900 | $ | — | $ | 166,767,933 | |||||||
1 Amount shown represents the unrealized appreciation (depreciation) on the financial instrument. |
| |||||||||||||||
See Notes to Financial Statements.
| 48 | WisdomTree Trust |
Table of Contents
Schedule of Investments
WisdomTree Interest Rate Hedged U.S. Aggregate Bond Fund (AGZD)
August 31, 2021
| Investments | Principal Amount | Value | ||||||
| U.S. GOVERNMENT AGENCIES – 28.2% |
| |||||||
| Federal Home Loan Bank – 0.1% |
| |||||||
3.38%, 9/8/23 | $ | 70,000 | $ | 74,451 | ||||
3.38%, 12/8/23 | 65,000 | 69,560 | ||||||
1.50%, 8/15/24 | 85,000 | 87,814 | ||||||
3.25%, 11/16/28 | 65,000 | 74,456 | ||||||
5.50%, 7/15/36 | 15,000 | 22,450 | ||||||
|
| |||||||
| Total Federal Home Loan Bank |
| 328,731 | ||||||
| Federal Home Loan Mortgage Corporation – 5.7% |
| |||||||
3.00%, 4/1/27 | 25,513 | 26,884 | ||||||
3.00%, 7/1/27 | 42,512 | 44,781 | ||||||
2.50%, 3/1/28 | 23,201 | 24,288 | ||||||
2.50%, 4/1/28 | 59,649 | 62,556 | ||||||
3.50%, 1/1/29 | 22,928 | 24,494 | ||||||
2.50%, 6/1/29 | 40,080 | 41,977 | ||||||
3.00%, 8/1/29 | 22,254 | 23,588 | ||||||
2.50%, 1/1/30 | 23,595 | 24,712 | ||||||
2.50%, 2/1/30 | 34,014 | 35,641 | ||||||
3.00%, 4/1/30 | 36,037 | 38,113 | ||||||
2.50%, 5/1/30 | 136,988 | 143,516 | ||||||
3.00%, 3/1/31 | 103,731 | 109,691 | ||||||
2.50%, 12/1/31 | 36,901 | 38,712 | ||||||
3.00%, 12/1/31 | 33,914 | 35,866 | ||||||
3.00%, 7/1/32 | 226,819 | 239,527 | ||||||
6.25%, 7/15/32 | 294,000 | 436,916 | ||||||
3.50%, 9/1/32 | 105,800 | 113,327 | ||||||
2.50%, 11/1/32 | 18,305 | 19,182 | ||||||
3.00%, 1/1/33 | 16,994 | 17,947 | ||||||
4.00%, 11/1/33 | 13,008 | 13,815 | ||||||
4.00%, 5/1/34 | 32,636 | 35,587 | ||||||
3.50%, 8/1/34 | 17,690 | 19,009 | ||||||
3.00%, 3/1/35 | 46,689 | 49,167 | ||||||
3.00%, 5/1/35 | 27,474 | 28,959 | ||||||
3.50%, 6/1/35 | 22,600 | 24,283 | ||||||
2.50%, 8/1/35 | 95,030 | 99,514 | ||||||
2.00%, 9/1/35 | 77,287 | 80,013 | ||||||
2.50%, 10/1/35 | 76,266 | 79,911 | ||||||
2.50%, 1/1/36 | 44,632 | 47,145 | ||||||
1.50%, 5/1/36 | 24,289 | 24,727 | ||||||
1.00%, 8/1/36 | 49,614 | 49,393 | ||||||
4.00%, 10/1/37 | 42,917 | 46,605 | ||||||
5.50%, 4/1/38 | 27,925 | 32,272 | ||||||
2.00%, 11/1/40 | 45,337 | 46,567 | ||||||
4.50%, 12/1/40 | 38,369 | 42,836 | ||||||
1.50%, 1/1/41 | 104,005 | 104,472 | ||||||
2.00%, 1/1/41 | 23,508 | 24,144 | ||||||
2.00%, 2/1/41 | 47,543 | 48,833 | ||||||
4.00%, 2/1/41 | 168,493 | 186,409 | ||||||
2.00%, 3/1/41 | 72,215 | 74,208 | ||||||
2.00%, 4/1/41 | 170,447 | 175,151 | ||||||
2.00%, 8/1/41 | 224,096 | 230,281 | ||||||
3.50%, 3/1/42 | 34,027 | 36,797 | ||||||
3.50%, 6/1/42 | 421,041 | 455,321 | ||||||
3.00%, 6/1/43 | 43,947 | 46,802 | ||||||
3.00%, 7/1/43 | 62,863 | 67,899 | ||||||
3.00%, 8/1/43 | 67,478 | 71,861 | ||||||
4.00%, 12/1/43 | 12,356 | 13,551 | ||||||
3.00%, 1/1/44 | 66,882 | 71,232 | ||||||
3.50%, 9/1/44 | 59,229 | 64,117 | ||||||
4.00%, 9/1/44 | 38,195 | 41,812 | ||||||
3.50%, 1/1/45 | 21,312 | 22,950 | ||||||
4.00%, 4/1/45 | 135,176 | 147,202 | ||||||
4.50%, 7/1/45 | 21,371 | 23,859 | ||||||
3.50%, 8/1/45 | 36,523 | 39,156 | ||||||
4.00%, 8/1/45 | 22,774 | 24,803 | ||||||
3.50%, 9/1/45 | 46,107 | 49,422 | ||||||
4.00%, 11/1/45 | 24,634 | 26,828 | ||||||
3.00%, 1/1/46 | 281,801 | 298,232 | ||||||
3.50%, 3/1/46 | 25,175 | 26,983 | ||||||
3.00%, 4/1/46 | 7,844 | 8,292 | ||||||
3.50%, 4/1/46 | 42,517 | 45,362 | ||||||
3.00%, 5/1/46 | 98,284 | 105,066 | ||||||
3.50%, 5/1/46 | 11,140 | 11,886 | ||||||
3.00%, 9/1/46 | 225,886 | 238,867 | ||||||
4.50%, 9/1/46 | 52,971 | 59,121 | ||||||
3.00%, 10/1/46 | 47,292 | 50,011 | ||||||
3.00%, 11/1/46 | 45,108 | 47,685 | ||||||
4.00%, 11/1/46 | 14,944 | 16,212 | ||||||
3.50%, 12/1/46 | 57,129 | 60,938 | ||||||
3.00%, 2/1/47 | 9,908 | 10,475 | ||||||
3.50%, 2/1/47 | 103,486 | 110,411 | ||||||
4.00%, 2/1/47 | 12,226 | 13,264 | ||||||
4.50%, 4/1/47 | 12,064 | 13,192 | ||||||
3.50%, 5/1/47 | 11,099 | 11,786 | ||||||
4.50%, 5/1/47 | 19,650 | 21,488 | ||||||
4.00%, 7/1/47 | 70,297 | 75,626 | ||||||
3.50%, 8/1/47 | 63,115 | 67,024 | ||||||
4.00%, 8/1/47 | 30,054 | 32,339 | ||||||
3.00%, 10/1/47 | 36,622 | 38,684 | ||||||
3.50%, 10/1/47 | 83,727 | 88,912 | ||||||
3.50%, 11/1/47 | 208,818 | 225,092 | ||||||
3.50%, 12/1/47 | 68,649 | 72,895 | ||||||
4.00%, 2/1/48 | 25,808 | 27,759 | ||||||
4.00%, 7/1/48 | 107,929 | 118,627 | ||||||
4.00%, 8/1/48 | 75,012 | 81,502 | ||||||
3.00%, 11/1/48 | 273,484 | 289,113 | ||||||
5.00%, 3/1/49 | 50,847 | 55,640 | ||||||
3.50%, 7/1/49 | 337,577 | 361,617 | ||||||
3.50%, 8/1/49 | 208,496 | 222,966 | ||||||
3.50%, 10/1/49 | 106,151 | 113,711 | ||||||
5.00%, 10/1/49 | 21,157 | 23,152 | ||||||
3.00%, 12/1/49 | 372,183 | 394,155 | ||||||
3.00%, 1/1/50 | 92,649 | 98,119 | ||||||
3.00%, 2/1/50 | 76,843 | 81,172 | ||||||
3.00%, 4/1/50 | 114,775 | 122,216 | ||||||
3.50%, 4/1/50 | 160,666 | 172,890 | ||||||
2.50%, 5/1/50 | 151,513 | 157,443 | ||||||
2.50%, 6/1/50 | 240,554 | 250,288 | ||||||
3.00%, 6/1/50 | 686,425 | 726,482 | ||||||
2.50%, 7/1/50 | 328,317 | 342,099 | ||||||
2.50%, 8/1/50 | 117,405 | 122,410 | ||||||
2.00%, 9/1/50 | 69,409 | 70,547 | ||||||
2.00%, 10/1/50 | 32,868 | 33,407 | ||||||
2.50%, 10/1/50 | 134,705 | 140,691 | ||||||
1.50%, 12/1/50 | 72,485 | 71,276 | ||||||
2.00%, 1/1/51 | 190,478 | 193,219 | ||||||
2.50%, 1/1/51 | 89,630 | 93,109 | ||||||
See Notes to Financial Statements.
| WisdomTree Trust | 49 |
Table of Contents
Schedule of Investments (continued)
WisdomTree Interest Rate Hedged U.S. Aggregate Bond Fund (AGZD)
August 31, 2021
| Investments | Principal Amount | Value | ||||||
3.00%, 1/1/51 | $ | 126,007 | $ | 131,984 | ||||
2.00%, 2/1/51 | 414,530 | 420,762 | ||||||
2.00%, 3/1/51 | 145,723 | 148,114 | ||||||
2.50%, 3/1/51 | 141,486 | 146,982 | ||||||
1.50%, 4/1/51 | 293,583 | 288,627 | ||||||
2.00%, 5/1/51 | 245,325 | 248,863 | ||||||
1.50%, 6/1/51 | 495,373 | 487,009 | ||||||
|
| |||||||
| Total Federal Home Loan Mortgage Corporation |
| 12,254,425 | ||||||
| Federal National Mortgage Association – 10.7% |
| |||||||
4.00%, 9/1/25 | 13,589 | 14,455 | ||||||
5.50%, 10/1/25 | 23,573 | 25,370 | ||||||
4.00%, 7/1/26 | 3,649 | 3,879 | ||||||
1.88%, 9/24/26 | 914,000 | 963,621 | ||||||
3.50%, 10/1/26 | 29,538 | 31,505 | ||||||
3.00%, 11/1/26 | 20,573 | 21,671 | ||||||
3.50%, 12/1/26 | 6,033 | 6,435 | ||||||
3.00%, 6/1/27 | 47,974 | 50,623 | ||||||
3.00%, 9/1/27 | 22,394 | 23,594 | ||||||
2.50%, 8/1/28 | 19,396 | 20,302 | ||||||
3.00%, 9/1/28 | 41,160 | 43,341 | ||||||
3.00%, 11/1/28 | 9,966 | 10,523 | ||||||
3.00%, 7/1/29 | 38,567 | 40,687 | ||||||
7.25%, 5/15/30 | 100,000 | 148,867 | ||||||
0.88%, 8/5/30 | 35,000 | 33,548 | ||||||
3.00%, 9/1/30 | 20,198 | 21,355 | ||||||
3.50%, 4/1/31 | 22,970 | 24,608 | ||||||
2.50%, 6/1/31 | 16,294 | 17,090 | ||||||
2.50%, 7/1/31 | 17,540 | 18,396 | ||||||
2.50%, 10/1/31 | 415,550 | 435,871 | ||||||
3.50%, 11/1/31 | 46,796 | 49,987 | ||||||
2.50%, 4/1/32 | 21,288 | 22,422 | ||||||
3.50%, 4/1/32 | 34,444 | 37,035 | ||||||
2.50%, 9/1/32 | 58,204 | 61,439 | ||||||
3.00%, 10/1/32 | 63,925 | 67,488 | ||||||
3.50%, 11/1/32 | 55,951 | 59,914 | ||||||
2.50%, 12/1/32 | 9,399 | 9,846 | ||||||
2.50%, 1/1/33 | 58,028 | 60,790 | ||||||
3.50%, 1/1/33 | 19,231 | 20,594 | ||||||
3.50%, 2/1/33 | 43,105 | 46,232 | ||||||
3.00%, 4/1/33 | 32,238 | 33,982 | ||||||
3.00%, 6/1/33 | 47,884 | 50,995 | ||||||
6.00%, 2/1/34 | 39,167 | 45,620 | ||||||
4.00%, 3/1/34 | 42,690 | 45,410 | ||||||
2.50%, 5/1/34 | 29,382 | 30,729 | ||||||
3.00%, 6/1/34 | 12,701 | 13,375 | ||||||
4.00%, 8/1/34 | 11,749 | 12,809 | ||||||
3.00%, 12/1/34 | 33,023 | 35,165 | ||||||
3.00%, 1/1/35 | 14,300 | 15,060 | ||||||
2.50%, 5/1/35 | 28,154 | 29,460 | ||||||
2.00%, 7/1/35 | 71,316 | 73,831 | ||||||
2.50%, 7/1/35 | 68,263 | 71,471 | ||||||
2.50%, 8/1/35 | 66,097 | 69,444 | ||||||
2.00%, 9/1/35 | 18,408 | 19,057 | ||||||
2.50%, 9/1/35 | 36,570 | 38,311 | ||||||
3.50%, 9/1/35 | 33,299 | 35,760 | ||||||
1.50%, 10/1/35 | 50,207 | 51,063 | ||||||
2.00%, 10/1/35 | 88,372 | 91,594 | ||||||
1.50%, 11/1/35 | 21,929 | 22,301 | ||||||
1.50%, 12/1/35 | 147,949 | 150,471 | ||||||
2.00%, 12/1/35 | 408,878 | 423,709 | ||||||
3.50%, 1/1/36 | 11,334 | 12,171 | ||||||
2.50%, 2/1/36 | 21,481 | 22,540 | ||||||
1.50%, 3/1/36 | 23,724 | 24,108 | ||||||
2.00%, 3/1/36 | 95,685 | 99,244 | ||||||
1.50%, 4/1/36 | 251,885 | 256,091 | ||||||
2.00%, 5/1/36 | 48,636 | 50,428 | ||||||
3.00%, 6/1/36 | 58,718 | 62,232 | ||||||
3.50%, 7/1/36 | 28,112 | 30,107 | ||||||
3.00%, 9/1/36 | 123,307 | 130,688 | ||||||
3.00%, 11/1/36 | 64,867 | 69,966 | ||||||
3.00%, 2/1/37 | 47,830 | 50,693 | ||||||
3.50%, 7/1/37 | 27,016 | 28,846 | ||||||
5.50%, 8/1/37 | 233,522 | 268,638 | ||||||
3.50%, 4/1/38 | 15,408 | 16,429 | ||||||
4.50%, 9/1/39 | 13,380 | 14,940 | ||||||
2.50%, 3/1/40 | 32,791 | 34,175 | ||||||
3.00%, 4/1/40 | 50,556 | 52,934 | ||||||
2.50%, 5/1/40 | 26,689 | 27,815 | ||||||
3.00%, 6/1/40 | 21,236 | 22,235 | ||||||
4.50%, 8/1/40 | 26,094 | 29,125 | ||||||
2.00%, 9/1/40 | 20,789 | 21,350 | ||||||
2.50%, 9/1/40 | 77,915 | 81,204 | ||||||
5.50%, 9/1/40 | 48,575 | 56,179 | ||||||
2.00%, 11/1/40 | 45,219 | 46,435 | ||||||
2.50%, 12/1/40 | 45,098 | 46,999 | ||||||
3.50%, 12/1/40 | 93,031 | 100,674 | ||||||
1.50%, 3/1/41 | 24,217 | 24,352 | ||||||
2.00%, 3/1/41 | 24,110 | 24,771 | ||||||
2.50%, 3/1/41 | 48,499 | 51,049 | ||||||
2.00%, 4/1/41 | 24,356 | 25,028 | ||||||
1.50%, 5/1/41 | 73,566 | 74,002 | ||||||
2.50%, 5/1/41 | 83,346 | 87,059 | ||||||
1.50%, 6/1/41 | 49,295 | 49,587 | ||||||
2.00%, 6/1/41 | 73,865 | 75,897 | ||||||
1.50%, 7/1/41 | 49,531 | 49,825 | ||||||
3.50%, 6/1/42 | 8,735 | 9,445 | ||||||
4.00%, 7/1/42 | 62,198 | 68,616 | ||||||
4.00%, 9/1/42 | 186,351 | 205,059 | ||||||
3.50%, 12/1/42 | 41,526 | 45,051 | ||||||
3.00%, 1/1/43 | 69,416 | 74,489 | ||||||
3.00%, 4/1/43 | 53,928 | 57,419 | ||||||
3.00%, 5/1/43 | 164,498 | 175,531 | ||||||
3.50%, 5/1/43 | 15,975 | 17,289 | ||||||
3.00%, 6/1/43 | 82,782 | 89,383 | ||||||
4.00%, 6/1/43 | 5,648 | 6,212 | ||||||
3.00%, 8/1/43 | 224,863 | 240,498 | ||||||
3.50%, 8/1/43 | 131,913 | 142,760 | ||||||
3.00%, 9/1/43 | 59,256 | 63,352 | ||||||
4.00%, 11/1/43 | 10,737 | 11,774 | ||||||
3.00%, 2/1/44 | 49,100 | 52,369 | ||||||
4.00%, 2/1/44 | 74,551 | 82,052 | ||||||
4.50%, 2/1/44 | 109,009 | 122,704 | ||||||
4.50%, 5/1/44 | 8,566 | 9,542 | ||||||
4.00%, 9/1/44 | 51,382 | 56,241 | ||||||
4.00%, 10/1/44 | 84,751 | 92,765 | ||||||
3.50%, 2/1/45 | 81,530 | 88,155 | ||||||
5.00%, 2/1/45 | 43,736 | 49,342 | ||||||
See Notes to Financial Statements.
| 50 | WisdomTree Trust |
Table of Contents
Schedule of Investments (continued)
WisdomTree Interest Rate Hedged U.S. Aggregate Bond Fund (AGZD)
August 31, 2021
| Investments | Principal Amount | Value | ||||||
3.50%, 3/1/45 | $ | 47,935 | $ | 51,375 | ||||
3.50%, 4/1/45 | 53,260 | 57,446 | ||||||
3.50%, 6/1/45 | 88,137 | 95,556 | ||||||
3.50%, 8/1/45 | 49,893 | 53,814 | ||||||
3.50%, 12/1/45 | 135,119 | 144,818 | ||||||
3.00%, 1/1/46 | 72,230 | 76,439 | ||||||
3.50%, 1/1/46 | 112,506 | 120,580 | ||||||
3.50%, 2/1/46 | 26,489 | 28,390 | ||||||
3.50%, 4/1/46 | 9,567 | 10,204 | ||||||
3.00%, 5/1/46 | 58,910 | 62,283 | ||||||
3.50%, 5/1/46 | 20,328 | 21,682 | ||||||
4.50%, 5/1/46 | 53,212 | 58,396 | ||||||
3.50%, 6/1/46 | 112,763 | 120,273 | ||||||
4.00%, 7/1/46 | 15,044 | 16,317 | ||||||
3.00%, 9/1/46 | 48,562 | 51,343 | ||||||
3.00%, 10/1/46 | 16,205 | 17,132 | ||||||
4.00%, 10/1/46 | 17,041 | 18,539 | ||||||
2.50%, 11/1/46 | 10,981 | 11,489 | ||||||
3.00%, 11/1/46 | 117,242 | 124,509 | ||||||
3.50%, 11/1/46 | 16,915 | 18,129 | ||||||
4.50%, 11/1/46 | 25,920 | 28,803 | ||||||
3.00%, 1/1/47 | 38,327 | 40,522 | ||||||
4.00%, 1/1/47 | 130,443 | 141,474 | ||||||
3.00%, 2/1/47 | 21,032 | 22,236 | ||||||
4.00%, 2/1/47 | 14,477 | 15,702 | ||||||
4.00%, 3/1/47 | 13,088 | 14,077 | ||||||
4.00%, 5/1/47 | 34,435 | 37,038 | ||||||
4.00%, 8/1/47 | 46,528 | 50,546 | ||||||
3.50%, 11/1/47 | 13,765 | 14,614 | ||||||
4.50%, 11/1/47 | 86,895 | 95,016 | ||||||
3.00%, 12/1/47 | 75,743 | 80,081 | ||||||
3.50%, 12/1/47 | 52,284 | 55,510 | ||||||
3.50%, 1/1/48 | 124,294 | 134,485 | ||||||
4.00%, 1/1/48 | 81,661 | 87,831 | ||||||
3.00%, 4/1/48 | 64,267 | 68,428 | ||||||
4.00%, 4/1/48 | 295,867 | 321,428 | ||||||
4.50%, 5/1/48 | 28,095 | 30,460 | ||||||
4.50%, 6/1/48 | 306,323 | 332,113 | ||||||
4.50%, 7/1/48 | 48,194 | 52,094 | ||||||
4.00%, 8/1/48 | 29,489 | 31,568 | ||||||
4.00%, 9/1/48 | 400,189 | 434,764 | ||||||
4.50%, 9/1/48 | 19,967 | 21,583 | ||||||
4.00%, 11/1/48 | 27,782 | 30,533 | ||||||
3.00%, 12/1/48 | 71,079 | 75,149 | ||||||
4.00%, 1/1/49 | 61,417 | 66,057 | ||||||
5.00%, 5/1/49 | 69,486 | 76,065 | ||||||
4.00%, 6/1/49 | 113,450 | 123,251 | ||||||
4.50%, 7/1/49 | 23,127 | 25,165 | ||||||
3.00%, 9/1/49 | 157,333 | 167,160 | ||||||
4.00%, 9/1/49 | 162,719 | 175,155 | ||||||
3.00%, 10/1/49 | 98,184 | 103,710 | ||||||
4.00%, 10/1/49 | 221,815 | 237,485 | ||||||
2.50%, 1/1/50 | 81,066 | 84,174 | ||||||
3.00%, 1/1/50 | 57,461 | 60,074 | ||||||
3.50%, 1/1/50 | 126,408 | 135,176 | ||||||
4.50%, 1/1/50 | 125,429 | 136,888 | ||||||
3.00%, 3/1/50 | 65,452 | 69,540 | ||||||
4.00%, 3/1/50 | 97,442 | 105,757 | ||||||
4.50%, 3/1/50 | 122,778 | 134,098 | ||||||
5.00%, 3/1/50 | 220,619 | 241,345 | ||||||
3.00%, 4/1/50 | 131,057 | 137,039 | ||||||
3.50%, 4/1/50 | 727,633 | 778,490 | ||||||
3.50%, 5/1/50 | 184,995 | 198,301 | ||||||
4.50%, 5/1/50 | 112,385 | 121,954 | ||||||
2.50%, 6/1/50 | 734,511 | 763,360 | ||||||
4.00%, 6/1/50 | 216,857 | 234,939 | ||||||
2.50%, 7/1/50 | 275,072 | 286,363 | ||||||
3.00%, 7/1/50 | 194,459 | 204,865 | ||||||
2.50%, 8/1/50 | 152,334 | 158,291 | ||||||
3.00%, 8/1/50 | 36,260 | 39,051 | ||||||
2.00%, 9/1/50 | 238,671 | 242,105 | ||||||
2.50%, 9/1/50 | 257,624 | 268,956 | ||||||
2.00%, 10/1/50 | 383,193 | 390,170 | ||||||
1.50%, 12/1/50 | 96,030 | 94,417 | ||||||
2.00%, 12/1/50 | 318,292 | 323,119 | ||||||
2.50%, 12/1/50 | 400,826 | 418,689 | ||||||
3.00%, 12/1/50 | 89,095 | 93,302 | ||||||
2.00%, 1/1/51 | 96,577 | 97,967 | ||||||
2.50%, 1/1/51 | 497,081 | 519,271 | ||||||
2.00%, 2/1/51 | 257,562 | 261,332 | ||||||
2.50%, 2/1/51 | 579,410 | 604,235 | ||||||
3.00%, 2/1/51 | 475,766 | 500,910 | ||||||
1.50%, 3/1/51 | 34,113 | 33,541 | ||||||
2.00%, 3/1/51 | 683,500 | 696,794 | ||||||
1.50%, 4/1/51 | 83,217 | 81,812 | ||||||
2.00%, 4/1/51 | 881,670 | 894,866 | ||||||
2.00%, 5/1/51 | 737,646 | 749,776 | ||||||
3.00%, 5/1/51 | 147,756 | 155,932 | ||||||
1.50%, 6/1/51 | 494,975 | 486,665 | ||||||
2.00%, 6/1/51 | 247,350 | 251,412 | ||||||
|
| |||||||
| Total Federal National Mortgage Association |
| 23,032,762 | ||||||
| Government National Mortgage Association – 5.9% |
| |||||||
3.00%, 4/20/33 | 34,935 | 36,820 | ||||||
4.00%, 11/20/40 | 120,304 | 132,906 | ||||||
3.00%, 11/20/42 | 181,945 | 194,120 | ||||||
5.00%, 2/20/43 | 27,440 | 31,438 | ||||||
3.50%, 3/20/43 | 133,114 | 144,639 | ||||||
4.00%, 5/20/43 | 26,714 | 29,406 | ||||||
4.00%, 6/20/43 | 54,188 | 59,648 | ||||||
3.00%, 8/20/43 | 122,591 | 130,577 | ||||||
5.00%, 4/20/44 | 58,113 | 66,569 | ||||||
3.50%, 7/20/44 | 71,912 | 77,368 | ||||||
4.00%, 7/20/44 | 15,653 | 17,067 | ||||||
5.00%, 7/20/44 | 11,034 | 12,639 | ||||||
3.50%, 8/20/44 | 91,595 | 98,544 | ||||||
5.00%, 8/20/44 | 9,900 | 11,342 | ||||||
3.00%, 9/20/44 | 42,270 | 44,821 | ||||||
4.50%, 9/20/44 | 37,374 | 41,553 | ||||||
3.50%, 10/20/44 | 136,406 | 146,755 | ||||||
3.00%, 1/20/45 | 16,014 | 16,981 | ||||||
4.00%, 4/20/45 | 93,992 | 102,479 | ||||||
3.00%, 7/20/45 | 118,404 | 125,401 | ||||||
3.50%, 11/20/45 | 73,463 | 78,560 | ||||||
3.00%, 12/20/45 | 90,480 | 95,827 | ||||||
3.50%, 12/20/45 | 132,365 | 141,550 | ||||||
4.50%, 12/20/45 | 36,634 | 40,730 | ||||||
3.50%, 1/20/46 | 249,493 | 266,805 | ||||||
See Notes to Financial Statements.
| WisdomTree Trust | 51 |
Table of Contents
Schedule of Investments (continued)
WisdomTree Interest Rate Hedged U.S. Aggregate Bond Fund (AGZD)
August 31, 2021
| Investments | Principal Amount | Value | ||||||
3.00%, 5/20/46 | $ | 14,880 | $ | 15,690 | ||||
3.00%, 9/20/46 | 144,252 | 152,105 | ||||||
3.50%, 9/20/46 | 80,732 | 86,049 | ||||||
3.00%, 10/20/46 | 21,916 | 23,109 | ||||||
3.00%, 12/20/46 | 10,648 | 11,227 | ||||||
4.00%, 12/20/46 | 25,521 | 27,571 | ||||||
4.00%, 1/20/47 | 23,320 | 25,193 | ||||||
4.50%, 1/20/47 | 29,876 | 33,043 | ||||||
3.00%, 2/20/47 | 217,583 | 229,429 | ||||||
3.50%, 2/20/47 | 29,562 | 31,509 | ||||||
3.50%, 3/20/47 | 78,367 | 83,198 | ||||||
3.50%, 4/20/47 | 41,742 | 44,315 | ||||||
3.00%, 5/20/47 | 46,377 | 48,843 | ||||||
4.00%, 7/20/47 | 29,626 | 31,780 | ||||||
4.00%, 8/20/47 | 25,001 | 26,808 | ||||||
3.50%, 9/20/47 | 69,565 | 73,853 | ||||||
4.50%, 10/20/47 | 11,722 | 12,729 | ||||||
3.50%, 1/20/48 | 158,267 | 169,546 | ||||||
4.00%, 1/20/48 | 12,819 | 13,719 | ||||||
3.00%, 2/20/48 | 68,211 | 71,838 | ||||||
3.50%, 3/20/48 | 24,136 | 25,624 | ||||||
3.50%, 4/20/48 | 42,317 | 44,925 | ||||||
4.50%, 6/20/48 | 25,898 | 27,756 | ||||||
3.50%, 7/20/48 | 43,761 | 46,287 | ||||||
4.00%, 9/20/48 | 39,384 | 41,914 | ||||||
4.50%, 9/20/48 | 24,231 | 25,928 | ||||||
4.50%, 1/20/49 | 25,469 | 27,198 | ||||||
3.50%, 3/20/49 | 11,700 | 12,375 | ||||||
4.00%, 3/20/49 | 42,750 | 45,392 | ||||||
4.50%, 3/20/49 | 12,028 | 12,845 | ||||||
5.00%, 3/20/49 | 22,167 | 24,242 | ||||||
4.00%, 4/20/49 | 18,831 | 20,045 | ||||||
4.50%, 6/20/49 | 76,058 | 81,251 | ||||||
3.00%, 8/20/49 | 22,543 | 23,609 | ||||||
3.00%, 9/20/49 | 395,282 | 413,758 | ||||||
4.00%, 10/20/49 | 53,055 | 56,442 | ||||||
3.00%, 11/15/49 | 17,262 | 18,122 | ||||||
3.00%, 1/20/50 | 10,740 | 11,234 | ||||||
3.50%, 1/20/50 | 9,023 | 9,488 | ||||||
4.50%, 1/20/50 | 19,187 | 20,497 | ||||||
3.00%, 2/20/50 | 41,887 | 43,802 | ||||||
4.00%, 2/20/50 | 284,470 | 302,632 | ||||||
3.00%, 5/20/50 | 160,971 | 168,328 | ||||||
3.00%, 6/20/50 | 73,971 | 77,353 | ||||||
3.50%, 7/20/50 | 204,988 | 215,728 | ||||||
5.00%, 7/20/50 | 90,954 | 99,629 | ||||||
2.00%, 8/20/50 | 177,028 | 180,850 | ||||||
2.50%, 8/20/50 | 91,150 | 94,512 | ||||||
3.00%, 8/20/50 | 378,311 | 395,622 | ||||||
3.50%, 8/20/50 | 153,654 | 161,833 | ||||||
4.00%, 8/20/50 | 63,424 | 67,473 | ||||||
2.50%, 9/20/50 | 82,693 | 85,743 | ||||||
4.00%, 9/20/50 | 66,765 | 70,945 | ||||||
4.50%, 9/20/50 | 96,494 | 103,129 | ||||||
3.50%, 10/20/50 | 37,737 | 39,682 | ||||||
4.50%, 10/20/50 | 71,801 | 76,830 | ||||||
3.00%, 11/20/50 | 122,780 | 128,401 | ||||||
2.00%, 12/20/50 | 238,429 | 243,576 | ||||||
2.50%, 12/20/50 | 93,097 | 96,531 | ||||||
3.50%, 12/20/50 | 337,369 | 356,032 | ||||||
2.00%, 3/20/51 | 389,937 | 398,338 | ||||||
2.50%, 3/20/51 | 604,718 | 627,716 | ||||||
2.00%, 6/20/51 | 99,282 | 101,421 | ||||||
2.00%, 9/1/51(a) | 1,550,000 | 1,581,945 | ||||||
2.50%, 9/1/51(a) | 1,825,000 | 1,892,390 | ||||||
3.00%, 9/1/51(a) | 300,000 | 313,640 | ||||||
3.50%, 9/1/51(a) | 25,000 | 26,308 | ||||||
4.50%, 9/1/51(a) | 50,000 | 53,410 | ||||||
2.00%, 10/1/51(a) | 150,000 | 152,823 | ||||||
2.50%, 10/1/51(a) | 125,000 | 129,383 | ||||||
3.00%, 10/1/51(a) | 75,000 | 78,284 | ||||||
|
| |||||||
| Total Government National Mortgage Association |
| 12,709,320 | ||||||
| Tennessee Valley Authority – 0.1% |
| |||||||
5.25%, 9/15/39 | 180,000 | 262,346 | ||||||
| Uniform Mortgage-Backed Securities – 5.7% |
| |||||||
1.50%, 9/1/36(a) | 700,000 | 711,000 | ||||||
2.00%, 9/1/36(a) | 1,375,000 | 1,423,249 | ||||||
2.50%, 9/1/36(a) | 125,000 | 130,772 | ||||||
2.00%, 10/1/36(a) | 100,000 | 103,349 | ||||||
2.50%, 10/1/36(a) | 50,000 | 52,283 | ||||||
1.50%, 9/1/51(a) | 200,000 | 196,496 | ||||||
2.00%, 9/1/51(a) | 5,400,000 | 5,474,492 | ||||||
2.50%, 9/1/51(a) | 2,675,000 | 2,778,820 | ||||||
3.00%, 9/1/51(a) | 150,000 | 156,905 | ||||||
4.50%, 9/1/51(a) | 125,000 | 135,240 | ||||||
2.00%, 10/1/51(a) | 450,000 | 455,372 | ||||||
2.50%, 10/1/51(a) | 450,000 | 466,571 | ||||||
5.00%, 10/1/51(a) | 100,000 | 109,706 | ||||||
|
| |||||||
| Total Uniform Mortgage-Backed Securities |
| 12,194,255 | ||||||
TOTAL U.S. GOVERNMENT AGENCIES (Cost: $60,237,823) |
| 60,781,839 | ||||||
| U.S. GOVERNMENT OBLIGATIONS – 37.7% |
| |||||||
| U.S. Treasury Bonds – 8.1% |
| |||||||
7.63%, 11/15/22 | 188,000 | 205,048 | ||||||
6.88%, 8/15/25 | 277,000 | 345,092 | ||||||
5.25%, 2/15/29 | 259,000 | 336,012 | ||||||
1.63%, 8/15/29 | 541,000 | 560,273 | ||||||
6.13%, 8/15/29 | 75,000 | 103,670 | ||||||
6.25%, 5/15/30 | 244,000 | 346,518 | ||||||
0.63%, 8/15/30 | 715,000 | 677,407 | ||||||
5.38%, 2/15/31 | 128,500 | 176,186 | ||||||
4.50%, 2/15/36 | 322,000 | 450,347 | ||||||
4.75%, 2/15/37 | 100,000 | 144,680 | ||||||
5.00%, 5/15/37 | 128,000 | 190,150 | ||||||
4.38%, 2/15/38 | 200,000 | 281,156 | ||||||
4.50%, 5/15/38 | 54,000 | 77,068 | ||||||
3.50%, 2/15/39 | 122,000 | 156,284 | ||||||
4.25%, 5/15/39 | 110,000 | 154,034 | ||||||
4.50%, 8/15/39 | 92,000 | 132,674 | ||||||
4.38%, 11/15/39 | 106,000 | 150,876 | ||||||
4.63%, 2/15/40 | 57,000 | 83,688 | ||||||
4.38%, 5/15/40 | 25,000 | 35,742 | ||||||
1.13%, 8/15/40 | 600,000 | 532,969 | ||||||
1.38%, 11/15/40 | 520,000 | 481,691 | ||||||
4.25%, 11/15/40 | 5,000 | 7,062 | ||||||
1.88%, 2/15/41 | 650,000 | 655,383 | ||||||
2.25%, 5/15/41 | 250,000 | 267,578 | ||||||
See Notes to Financial Statements.
| 52 | WisdomTree Trust |
Table of Contents
Schedule of Investments (continued)
WisdomTree Interest Rate Hedged U.S. Aggregate Bond Fund (AGZD)
August 31, 2021
| Investments | Principal Amount | Value | ||||||
3.75%, 8/15/41 | $ | 150,000 | $ | 199,805 | ||||
3.13%, 11/15/41 | 150,000 | 183,586 | ||||||
3.13%, 2/15/42 | 200,000 | 245,281 | ||||||
3.00%, 5/15/42 | 100,000 | 120,266 | ||||||
2.75%, 8/15/42 | 150,000 | 173,672 | ||||||
2.75%, 11/15/42 | 250,000 | 289,453 | ||||||
3.13%, 2/15/43 | 200,000 | 245,203 | ||||||
2.88%, 5/15/43 | 271,000 | 320,119 | ||||||
3.63%, 8/15/43 | 152,500 | 201,395 | ||||||
3.75%, 11/15/43 | 346,000 | 465,911 | ||||||
3.63%, 2/15/44 | 134,000 | 177,644 | ||||||
3.38%, 5/15/44 | 118,000 | 151,058 | ||||||
3.13%, 8/15/44 | 182,000 | 224,500 | ||||||
3.00%, 11/15/44 | 137,000 | 165,781 | ||||||
2.50%, 2/15/45 | 71,000 | 79,143 | ||||||
3.00%, 5/15/45 | 94,000 | 114,115 | ||||||
2.88%, 8/15/45 | 94,000 | 111,867 | ||||||
3.00%, 11/15/45 | 141,000 | 171,645 | ||||||
2.50%, 2/15/46 | 141,000 | 157,579 | ||||||
2.50%, 5/15/46 | 205,000 | 229,248 | ||||||
2.25%, 8/15/46 | 128,000 | 136,700 | ||||||
2.88%, 11/15/46 | 94,000 | 112,484 | ||||||
3.00%, 2/15/47 | 240,000 | 293,812 | ||||||
3.00%, 5/15/47 | 221,000 | 270,915 | ||||||
2.75%, 8/15/47 | 219,000 | 257,000 | ||||||
2.75%, 11/15/47 | 169,000 | 198,496 | ||||||
3.00%, 2/15/48 | 291,000 | 357,612 | ||||||
3.13%, 5/15/48 | 334,000 | 419,979 | ||||||
3.00%, 8/15/48 | 341,000 | 419,856 | ||||||
3.38%, 11/15/48 | 395,000 | 519,672 | ||||||
3.00%, 2/15/49 | 377,000 | 465,566 | ||||||
2.25%, 8/15/49 | 450,000 | 482,168 | ||||||
2.00%, 2/15/50 | 477,000 | 485,124 | ||||||
1.38%, 8/15/50 | 650,000 | 569,105 | ||||||
1.63%, 11/15/50 | 625,000 | 582,129 | ||||||
1.88%, 2/15/51 | 675,000 | 666,984 | ||||||
2.38%, 5/15/51 | 565,000 | 624,148 | ||||||
|
| |||||||
| Total U.S. Treasury Bonds |
| 17,440,609 | ||||||
| U.S. Treasury Notes – 29.6% |
| |||||||
2.00%, 10/31/22 | 350,000 | 357,725 | ||||||
1.63%, 11/15/22 | 426,000 | 433,796 | ||||||
0.13%, 11/30/22 | 800,000 | 800,156 | ||||||
2.00%, 11/30/22 | 500,000 | 511,816 | ||||||
1.63%, 12/15/22 | 500,000 | 509,766 | ||||||
0.13%, 12/31/22 | 275,000 | 275,011 | ||||||
2.13%, 12/31/22 | 200,000 | 205,324 | ||||||
1.50%, 1/15/23 | 620,000 | 631,722 | ||||||
0.13%, 1/31/23 | 500,000 | 500,000 | ||||||
1.75%, 1/31/23 | 132,000 | 135,024 | ||||||
2.38%, 1/31/23 | 132,000 | 136,197 | ||||||
1.38%, 2/15/23 | 100,000 | 101,812 | ||||||
0.13%, 2/28/23 | 700,000 | 699,863 | ||||||
1.50%, 2/28/23 | 100,000 | 102,045 | ||||||
0.13%, 3/31/23 | 300,000 | 299,889 | ||||||
1.50%, 3/31/23 | 212,000 | 216,542 | ||||||
2.50%, 3/31/23 | 115,000 | 119,270 | ||||||
0.25%, 4/15/23 | 700,000 | 701,094 | ||||||
0.13%, 4/30/23 | 750,000 | 749,604 | ||||||
1.63%, 4/30/23 | 300,000 | 307,336 | ||||||
2.75%, 4/30/23 | 188,000 | 196,100 | ||||||
0.13%, 5/15/23 | 450,000 | 449,745 | ||||||
1.75%, 5/15/23 | 406,000 | 417,022 | ||||||
1.63%, 5/31/23 | 500,000 | 512,773 | ||||||
2.75%, 5/31/23 | 188,000 | 196,475 | ||||||
0.25%, 6/15/23 | 400,000 | 400,547 | ||||||
0.13%, 6/30/23 | 500,000 | 499,629 | ||||||
1.38%, 6/30/23 | 377,000 | 385,284 | ||||||
2.63%, 6/30/23 | 250,000 | 261,157 | ||||||
0.13%, 7/15/23 | 400,000 | 399,578 | ||||||
0.13%, 7/31/23 | 485,000 | 484,451 | ||||||
1.25%, 7/31/23 | 354,000 | 361,198 | ||||||
2.75%, 7/31/23 | 250,000 | 262,227 | ||||||
0.13%, 8/15/23 | 400,000 | 399,484 | ||||||
2.50%, 8/15/23 | 738,000 | 771,138 | ||||||
1.38%, 8/31/23 | 340,000 | 347,916 | ||||||
2.75%, 8/31/23 | 250,000 | 262,671 | ||||||
0.13%, 9/15/23 | 400,000 | 399,281 | ||||||
1.38%, 9/30/23 | 338,000 | 346,120 | ||||||
2.88%, 9/30/23 | 250,000 | 263,740 | ||||||
0.13%, 10/15/23 | 525,000 | 523,852 | ||||||
1.63%, 10/31/23 | 344,000 | 354,333 | ||||||
2.88%, 10/31/23 | 250,000 | 264,228 | ||||||
0.25%, 11/15/23 | 450,000 | 450,070 | ||||||
2.75%, 11/15/23 | 550,000 | 580,336 | ||||||
2.13%, 11/30/23 | 250,000 | 260,518 | ||||||
2.88%, 11/30/23 | 250,000 | 264,707 | ||||||
0.13%, 12/15/23 | 671,600 | 669,554 | ||||||
2.25%, 12/31/23 | 411,000 | 429,945 | ||||||
2.63%, 12/31/23 | 250,000 | 263,691 | ||||||
0.13%, 1/15/24 | 650,000 | 647,664 | ||||||
2.25%, 1/31/24 | 354,000 | 370,815 | ||||||
2.50%, 1/31/24 | 250,000 | 263,340 | ||||||
0.13%, 2/15/24 | 500,000 | 498,086 | ||||||
2.75%, 2/15/24 | 382,000 | 405,069 | ||||||
2.13%, 2/29/24 | 329,000 | 344,011 | ||||||
2.38%, 2/29/24 | 250,000 | 262,939 | ||||||
0.25%, 3/15/24 | 550,000 | 549,269 | ||||||
2.13%, 3/31/24 | 612,000 | 640,544 | ||||||
0.38%, 4/15/24 | 500,000 | 500,547 | ||||||
2.00%, 4/30/24 | 341,000 | 356,145 | ||||||
0.25%, 5/15/24 | 200,000 | 199,477 | ||||||
2.50%, 5/15/24 | 282,000 | 298,424 | ||||||
2.00%, 5/31/24 | 235,000 | 245,603 | ||||||
0.25%, 6/15/24 | 750,000 | 747,656 | ||||||
1.75%, 6/30/24 | 300,000 | 311,742 | ||||||
2.00%, 6/30/24 | �� | 500,000 | 523,066 | |||||
0.38%, 7/15/24 | 500,000 | 499,863 | ||||||
2.38%, 8/15/24 | 629,000 | 665,806 | ||||||
1.25%, 8/31/24 | 400,000 | 410,156 | ||||||
1.50%, 9/30/24 | 150,000 | 154,998 | ||||||
2.13%, 9/30/24 | 250,000 | 263,076 | ||||||
1.50%, 10/31/24 | 300,000 | 310,090 | ||||||
2.25%, 10/31/24 | 250,000 | 264,268 | ||||||
2.25%, 11/15/24 | 719,000 | 760,455 | ||||||
2.13%, 11/30/24 | 321,000 | 338,266 | ||||||
2.25%, 12/31/24 | 349,000 | 369,531 | ||||||
2.50%, 1/31/25 | 99,000 | 105,744 | ||||||
See Notes to Financial Statements.
| WisdomTree Trust | 53 |
Table of Contents
Schedule of Investments (continued)
WisdomTree Interest Rate Hedged U.S. Aggregate Bond Fund (AGZD)
August 31, 2021
| Investments | Principal Amount | Value | ||||||
2.00%, 2/15/25 | $ | 485,000 | $ | 509,894 | ||||
1.13%, 2/28/25 | 500,000 | 510,566 | ||||||
2.75%, 2/28/25 | 99,000 | 106,703 | ||||||
0.50%, 3/31/25 | 470,000 | 469,468 | ||||||
2.63%, 3/31/25 | 275,000 | 295,432 | ||||||
2.88%, 4/30/25 | 188,000 | 203,885 | ||||||
2.13%, 5/15/25 | 282,000 | 298,182 | ||||||
0.25%, 5/31/25 | 500,000 | 493,965 | ||||||
2.88%, 5/31/25 | 410,000 | 445,042 | ||||||
0.25%, 6/30/25 | 500,000 | 493,633 | ||||||
2.75%, 6/30/25 | 350,000 | 378,766 | ||||||
0.25%, 7/31/25 | 580,000 | 572,138 | ||||||
2.00%, 8/15/25 | 454,000 | 478,864 | ||||||
0.25%, 8/31/25 | 300,000 | 295,629 | ||||||
0.25%, 9/30/25 | 250,000 | 246,123 | ||||||
0.25%, 10/31/25 | 100,000 | 98,348 | ||||||
2.25%, 11/15/25 | 272,000 | 290,084 | ||||||
0.38%, 11/30/25 | 500,000 | 493,965 | ||||||
0.38%, 12/31/25 | 400,000 | 394,797 | ||||||
0.38%, 1/31/26 | 350,000 | 345,119 | ||||||
1.63%, 2/15/26 | 300,000 | 312,211 | ||||||
0.50%, 2/28/26 | 650,000 | 644,211 | ||||||
0.75%, 3/31/26 | 800,000 | 801,156 | ||||||
2.25%, 3/31/26 | 150,000 | 160,395 | ||||||
0.75%, 4/30/26 | 500,000 | 500,488 | ||||||
1.63%, 5/15/26 | 623,000 | 648,577 | ||||||
0.75%, 5/31/26 | 500,000 | 500,195 | ||||||
2.13%, 5/31/26 | 200,000 | 212,937 | ||||||
0.88%, 6/30/26 | 900,000 | 905,062 | ||||||
1.88%, 6/30/26 | 750,000 | 789,932 | ||||||
0.63%, 7/31/26 | 200,000 | 198,633 | ||||||
1.88%, 7/31/26 | 450,000 | 474,240 | ||||||
1.50%, 8/15/26 | 550,000 | 569,443 | ||||||
1.38%, 8/31/26 | 350,000 | 360,350 | ||||||
1.63%, 9/30/26 | 450,000 | 468,773 | ||||||
1.63%, 10/31/26 | 250,000 | 260,469 | ||||||
2.00%, 11/15/26 | 500,000 | 530,508 | ||||||
1.63%, 11/30/26 | 500,000 | 520,879 | ||||||
1.75%, 12/31/26 | 300,000 | 314,496 | ||||||
1.50%, 1/31/27 | 250,000 | 258,799 | ||||||
2.25%, 2/15/27 | 500,000 | 537,500 | ||||||
1.13%, 2/28/27 | 450,000 | 456,680 | ||||||
0.63%, 3/31/27 | 500,000 | 493,555 | ||||||
0.50%, 4/30/27 | 150,000 | 146,848 | ||||||
2.38%, 5/15/27 | 675,000 | 731,004 | ||||||
0.50%, 5/31/27 | 450,000 | 439,980 | ||||||
0.50%, 6/30/27 | 500,000 | 488,496 | ||||||
0.38%, 7/31/27 | 500,000 | 484,453 | ||||||
2.25%, 8/15/27 | 507,000 | 546,154 | ||||||
0.50%, 8/31/27 | 350,000 | 341,182 | ||||||
2.25%, 11/15/27 | 58,000 | 62,522 | ||||||
0.63%, 11/30/27 | 300,000 | 293,602 | ||||||
0.63%, 12/31/27 | 300,000 | 293,297 | ||||||
0.75%, 1/31/28 | 300,000 | 295,254 | ||||||
2.75%, 2/15/28 | 693,000 | 769,176 | ||||||
1.13%, 2/29/28 | 300,000 | 302,227 | ||||||
1.25%, 3/31/28 | 200,000 | 202,859 | ||||||
2.88%, 5/15/28 | 218,000 | 244,092 | ||||||
1.00%, 7/31/28 | 500,000 | 497,539 | ||||||
2.88%, 8/15/28 | 337,000 | 377,967 | ||||||
1.13%, 8/31/28 | 500,000 | 501,445 | ||||||
3.13%, 11/15/28 | 151,000 | 172,341 | ||||||
2.63%, 2/15/29 | 400,000 | 443,187 | ||||||
2.38%, 5/15/29 | 375,000 | 409,189 | ||||||
1.75%, 11/15/29 | 400,000 | 418,125 | ||||||
1.50%, 2/15/30 | 365,000 | 373,754 | ||||||
0.63%, 5/15/30 | 880,000 | 836,000 | ||||||
0.88%, 11/15/30 | 1,150,000 | 1,111,637 | ||||||
1.13%, 2/15/31 | 850,000 | 838,777 | ||||||
1.63%, 5/15/31 | 875,000 | 902,139 | ||||||
1.13%, 5/15/40 | 725,000 | 646,326 | ||||||
2.88%, 5/15/49 | 510,000 | 616,423 | ||||||
2.38%, 11/15/49 | 400,000 | 440,344 | ||||||
1.25%, 5/15/50 | 540,000 | 458,325 | ||||||
|
| |||||||
| Total U.S. Treasury Notes |
| 63,803,168 | ||||||
TOTAL U.S. GOVERNMENT OBLIGATIONS (Cost: $79,092,437) |
| 81,243,777 | ||||||
| U.S. CORPORATE BONDS – 23.0% |
| |||||||
| United States – 23.0% |
| |||||||
3M Co. | 30,000 | 31,756 | ||||||
2.88%, 10/15/27 | 65,000 | 71,112 | ||||||
3.38%, 3/1/29 | 35,000 | 39,157 | ||||||
3.05%, 4/15/30(b) | 25,000 | 27,510 | ||||||
3.13%, 9/19/46 | 23,000 | 24,766 | ||||||
3.63%, 10/15/47 | 18,000 | 20,980 | ||||||
Abbott Laboratories | 14,000 | 14,867 | ||||||
6.15%, 11/30/37 | 53,000 | 78,978 | ||||||
4.75%, 4/15/43 | 10,000 | 13,362 | ||||||
AbbVie, Inc. | 27,000 | 27,799 | ||||||
3.20%, 11/6/22 | 25,000 | 25,715 | ||||||
3.60%, 5/14/25 | 59,000 | 64,186 | ||||||
2.95%, 11/21/26 | 115,000 | 123,955 | ||||||
4.55%, 3/15/35 | 10,000 | 12,188 | ||||||
4.50%, 5/14/35 | 125,000 | 152,119 | ||||||
4.40%, 11/6/42 | 15,000 | 18,329 | ||||||
4.75%, 3/15/45 | 5,000 | 6,318 | ||||||
4.70%, 5/14/45 | 48,000 | 60,509 | ||||||
4.25%, 11/21/49 | 14,000 | 17,017 | ||||||
Activision Blizzard, Inc. | 82,000 | 90,915 | ||||||
2.50%, 9/15/50 | 10,000 | 8,943 | ||||||
Adobe, Inc. | 25,000 | 26,136 | ||||||
Advance Auto Parts, Inc. | 25,000 | 27,975 | ||||||
Aetna, Inc. | 60,000 | 75,635 | ||||||
3.88%, 8/15/47 | 43,000 | 48,835 | ||||||
Aflac, Inc. | 75,000 | 81,191 | ||||||
Air Lease Corp. | 5,000 | 5,282 | ||||||
4.25%, 9/15/24 | 5,000 | 5,443 | ||||||
See Notes to Financial Statements.
| 54 | WisdomTree Trust |
Table of Contents
Schedule of Investments (continued)
WisdomTree Interest Rate Hedged U.S. Aggregate Bond Fund (AGZD)
August 31, 2021
| Investments | Principal Amount | Value | ||||||
3.25%, 3/1/25 | $ | 25,000 | $ | 26,569 | ||||
3.63%, 4/1/27 | 23,000 | 24,864 | ||||||
3.63%, 12/1/27 | 219,000 | 237,000 | ||||||
Air Products and Chemicals, Inc. | 50,000 | 51,500 | ||||||
Aircastle Ltd. | 5,000 | 5,324 | ||||||
Alabama Power Co. | 20,000 | 25,319 | ||||||
3.45%, 10/1/49 | 9,000 | 9,970 | ||||||
Alexandria Real Estate Equities, Inc. | 18,000 | 19,548 | ||||||
4.90%, 12/15/30 | 51,000 | 62,838 | ||||||
Allstate Corp. (The) | 30,000 | 29,034 | ||||||
Ally Financial, Inc. | 100,000 | 101,563 | ||||||
8.00%, 11/1/31 | 263,000 | 376,747 | ||||||
Alphabet, Inc. | 25,000 | 22,780 | ||||||
Altria Group, Inc. | 25,000 | 29,081 | ||||||
2.45%, 2/4/32 | 65,000 | 63,530 | ||||||
3.40%, 2/4/41 | 31,000 | 29,882 | ||||||
5.38%, 1/31/44 | 148,000 | 178,540 | ||||||
Amazon.com, Inc. | 19,000 | 22,243 | ||||||
1.50%, 6/3/30 | 60,000 | 59,056 | ||||||
3.88%, 8/22/37 | 15,000 | 17,916 | ||||||
4.05%, 8/22/47 | 66,000 | 81,587 | ||||||
4.25%, 8/22/57 | 27,000 | 35,227 | ||||||
2.70%, 6/3/60 | 40,000 | 38,886 | ||||||
Ameren Illinois Co. | 48,000 | 54,444 | ||||||
1.55%, 11/15/30 | 50,000 | 48,506 | ||||||
American Express Co. | 10,000 | 10,609 | ||||||
3.00%, 10/30/24 | 95,000 | 101,770 | ||||||
3.63%, 12/5/24 | 44,000 | 47,975 | ||||||
4.05%, 12/3/42 | 18,000 | 21,895 | ||||||
American Express Credit Corp. | 10,000 | 11,086 | ||||||
American Financial Group, Inc. | 25,000 | 31,215 | ||||||
American Homes 4 Rent L.P. | 10,000 | 11,464 | ||||||
American Honda Finance Corp. | 40,000 | 41,063 | ||||||
2.90%, 2/16/24 | 5,000 | 5,281 | ||||||
1.00%, 9/10/25 | 15,000 | 15,035 | ||||||
2.30%, 9/9/26 | 5,000 | 5,275 | ||||||
American International Group, Inc. | 45,000 | 49,380 | ||||||
4.70%, 7/10/35 | 5,000 | 6,167 | ||||||
4.75%, 4/1/48 | 28,000 | 36,572 | ||||||
8.18%, 5/15/68, (8.175% fixed rate until 5/15/38; 3-month U.S. dollar London Interbank Offered Rate + 4.195% thereafter)(c) | 25,000 | 37,281 | ||||||
American Tower Corp. | 20,000 | 19,995 | ||||||
2.95%, 1/15/25 | 50,000 | 53,074 | ||||||
4.00%, 6/1/25 | 45,000 | 49,447 | ||||||
3.60%, 1/15/28 | 58,000 | 63,944 | ||||||
3.80%, 8/15/29 | 25,000 | 27,934 | ||||||
3.10%, 6/15/50 | 20,000 | 19,892 | ||||||
American Water Capital Corp. | 64,000 | 69,484 | ||||||
3.75%, 9/1/47 | 15,000 | 17,244 | ||||||
AmerisourceBergen Corp. | 18,000 | 19,138 | ||||||
3.45%, 12/15/27 | 25,000 | 27,485 | ||||||
4.30%, 12/15/47 | 50,000 | 59,098 | ||||||
Amgen, Inc. | 5,000 | 5,168 | ||||||
3.63%, 5/22/24 | 16,000 | 17,179 | ||||||
2.30%, 2/25/31(b) | 105,000 | 107,032 | ||||||
4.66%, 6/15/51 | 132,000 | 171,500 | ||||||
Anthem, Inc. | 155,000 | 166,493 | ||||||
3.65%, 12/1/27 | 25,000 | 28,018 | ||||||
6.38%, 6/15/37 | 18,000 | 25,950 | ||||||
4.63%, 5/15/42 | 85,000 | 106,508 | ||||||
4.65%, 1/15/43 | 40,000 | 50,314 | ||||||
4.65%, 8/15/44 | 15,000 | 18,965 | ||||||
3.13%, 5/15/50 | 202,000 | 210,880 | ||||||
Aon Corp. | 15,000 | 15,909 | ||||||
Apple, Inc. | 25,000 | 25,219 | ||||||
3.00%, 2/9/24 | 18,000 | 19,041 | ||||||
2.85%, 5/11/24 | 48,000 | 50,889 | ||||||
1.13%, 5/11/25 | 10,000 | 10,123 | ||||||
3.25%, 2/23/26 | 75,000 | 82,221 | ||||||
3.00%, 6/20/27 | 23,000 | 25,363 | ||||||
2.20%, 9/11/29 | 75,000 | 78,340 | ||||||
1.65%, 5/11/30 | 55,000 | 54,833 | ||||||
4.45%, 5/6/44 | 18,000 | 23,438 | ||||||
4.38%, 5/13/45 | 18,000 | 23,106 | ||||||
3.85%, 8/4/46 | 36,000 | 43,170 | ||||||
3.75%, 11/13/47 | 48,000 | 56,659 | ||||||
2.65%, 5/11/50 | 60,000 | 59,515 | ||||||
2.55%, 8/20/60 | 120,000 | 112,928 | ||||||
Applied Materials, Inc. | 25,000 | 37,185 | ||||||
Aptiv Corp. | 5,000 | 5,393 | ||||||
Ares Capital Corp. | 25,000 | 25,888 | ||||||
4.25%, 3/1/25 | 43,000 | 46,481 | ||||||
Arizona Public Service Co. | 50,000 | 52,749 | ||||||
See Notes to Financial Statements.
| WisdomTree Trust | 55 |
Table of Contents
Schedule of Investments (continued)
WisdomTree Interest Rate Hedged U.S. Aggregate Bond Fund (AGZD)
August 31, 2021
| Investments | Principal Amount | Value | ||||||
Ascension Health | $ | 49,000 | $ | 71,757 | ||||
Assurant, Inc. | 18,000 | 19,250 | ||||||
AT&T, Inc. | 25,000 | 26,853 | ||||||
3.80%, 2/15/27 | 64,000 | 71,491 | ||||||
4.25%, 3/1/27 | 25,000 | 28,518 | ||||||
4.30%, 2/15/30 | 250,000 | 290,652 | ||||||
2.75%, 6/1/31 | 100,000 | 104,860 | ||||||
2.25%, 2/1/32 | 21,000 | 20,888 | ||||||
4.30%, 12/15/42 | 125,000 | 144,736 | ||||||
4.35%, 6/15/45 | 121,000 | 140,309 | ||||||
4.75%, 5/15/46 | 10,000 | 12,277 | ||||||
5.45%, 3/1/47 | 10,000 | 13,369 | ||||||
3.65%, 6/1/51 | 12,000 | 12,720 | ||||||
3.50%, 9/15/53(d) | 100,000 | 102,786 | ||||||
3.55%, 9/15/55(d) | 55,000 | 56,314 | ||||||
3.80%, 12/1/57(d) | 75,000 | 79,976 | ||||||
3.50%, 2/1/61 | 10,000 | 9,945 | ||||||
Atmos Energy Corp. | 45,000 | 43,232 | ||||||
AutoNation, Inc. | 18,000 | 19,336 | ||||||
4.50%, 10/1/25 | 18,000 | 20,108 | ||||||
AutoZone, Inc. | 18,000 | 19,364 | ||||||
3.63%, 4/15/25 | 100,000 | 108,914 | ||||||
4.00%, 4/15/30 | 50,000 | 57,374 | ||||||
AvalonBay Communities, Inc. | 205,000 | 211,195 | ||||||
Avangrid, Inc. | 25,000 | 28,249 | ||||||
Avnet, Inc. | 100,000 | 101,091 | ||||||
AXIS Specialty Finance LLC | 50,000 | 55,640 | ||||||
Baker Hughes a GE Co. LLC | 48,000 | 52,666 | ||||||
Bank of America Corp. | 10,000 | 10,031 | ||||||
4.10%, 7/24/23 | 25,000 | 26,767 | ||||||
3.00%, 12/20/23, (3.004% fixed rate until 12/20/22; 3-month U.S. dollar London Interbank Offered Rate + 0.79% thereafter)(c) | 30,000 | 30,976 | ||||||
4.13%, 1/22/24 | 48,000 | 52,097 | ||||||
3.55%, 3/5/24, (3.55% fixed rate until 3/5/23; 3-month U.S. dollar London Interbank Offered Rate + 0.78% thereafter)(c) | 60,000 | 62,689 | ||||||
4.00%, 4/1/24 | 50,000 | 54,381 | ||||||
1.49%, 5/19/24, (1.486% fixed rate until 5/19/23; Secured Overnight Financing Rate + 1.46% thereafter)(c) | 40,000 | 40,670 | ||||||
3.86%, 7/23/24, (3.864% fixed rate until 7/23/23; 3-month U.S. dollar London Interbank Offered Rate + 0.94% thereafter)(c) | 155,000 | 164,359 | ||||||
4.20%, 8/26/24 | 48,000 | 52,655 | ||||||
0.81%, 10/24/24, (0.81% fixed rate until 10/24/23; Secured Overnight Financing Rate + 0.74% thereafter)(c) | 105,000 | 105,445 | ||||||
3.46%, 3/15/25, (3.458% fixed rate until 3/15/24; 3-month U.S. dollar London Interbank Offered Rate + 0.97% thereafter)(c) | 105,000 | 112,156 | ||||||
3.95%, 4/21/25, Series L | 29,000 | 31,774 | ||||||
2.46%, 10/22/25, (2.456% fixed rate until 10/22/24; 3-month U.S. dollar London Interbank Offered Rate + 0.87% thereafter)(c) | 50,000 | 52,396 | ||||||
3.50%, 4/19/26 | 71,000 | 78,217 | ||||||
1.32%, 6/19/26, (1.319% fixed rate until 6/19/25; Secured Overnight Financing Rate + 1.15% thereafter)(c) | 13,000 | 13,050 | ||||||
1.20%, 10/24/26, (1.197% fixed rate until 10/24/25; Secured Overnight Financing Rate + 1.01% thereafter)(c) | 60,000 | 59,783 | ||||||
1.66%, 3/11/27, Series N, (1.658% fixed rate until 3/11/26; Secured Overnight Financing Rate + 0.91% thereafter)(c) | 20,000 | 20,233 | ||||||
3.42%, 12/20/28, (3.419% fixed rate until 12/20/27; 3-month U.S. dollar London Interbank Offered Rate + 1.04% thereafter)(c) | 144,000 | 158,289 | ||||||
4.27%, 7/23/29, (4.271% fixed rate until 7/23/28; 3-month U.S. dollar London Interbank Offered Rate + 1.31% thereafter)(c) | 45,000 | 51,729 | ||||||
2.88%, 10/22/30, (2.884% fixed rate until 10/22/29; 3-month U.S. dollar London Interbank Offered Rate + 1.19% thereafter)(c) | 10,000 | 10,596 | ||||||
1.92%, 10/24/31, (1.922% fixed rate until 10/24/30; Secured Overnight Financing Rate + 1.37% thereafter)(c) | 10,000 | 9,805 | ||||||
4.24%, 4/24/38, (4.244% fixed rate until 4/24/37; 3-month U.S. dollar London Interbank Offered Rate + 1.814% thereafter)(c) | 10,000 | 11,878 | ||||||
2.68%, 6/19/41, (2.676% fixed rate until 6/19/40; Secured Overnight Financing Rate + 1.93% thereafter)(c) | 25,000 | 24,659 | ||||||
5.88%, 2/7/42 | 10,000 | 14,623 | ||||||
5.00%, 1/21/44 | 45,000 | 60,482 | ||||||
4.75%, 4/21/45, Series L | 10,000 | 12,743 | ||||||
4.44%, 1/20/48, (4.443% fixed rate until 1/20/47; 3-month U.S. dollar London Interbank Offered Rate + 1.99% thereafter)(c) | 10,000 | 12,648 | ||||||
See Notes to Financial Statements.
| 56 | WisdomTree Trust |
Table of Contents
Schedule of Investments (continued)
WisdomTree Interest Rate Hedged U.S. Aggregate Bond Fund (AGZD)
August 31, 2021
| Investments | Principal Amount | Value | ||||||
3.95%, 1/23/49, (3.946% fixed rate until 1/23/48; 3-month U.S. dollar London Interbank Offered Rate + 1.19% thereafter)(c) | $ | 18,000 | $ | 21,235 | ||||
2.83%, 10/24/51, (2.831% fixed rate until 10/24/50; Secured Overnight Financing Rate + 1.88% thereafter)(c) | 5,000 | 4,921 | ||||||
BankUnited, Inc. | 18,000 | 20,504 | ||||||
Baxalta, Inc. | 15,000 | 16,538 | ||||||
Baylor Scott & White Holdings | 24,000 | 29,872 | ||||||
Becton Dickinson and Co. | 37,000 | 39,238 | ||||||
4.69%, 12/15/44 | 25,000 | 31,828 | ||||||
Berkshire Hathaway Energy Co. | 95,000 | 105,111 | ||||||
3.25%, 4/15/28 | 23,000 | 25,365 | ||||||
3.70%, 7/15/30 | 50,000 | 57,012 | ||||||
6.13%, 4/1/36 | 25,000 | 35,286 | ||||||
5.15%, 11/15/43 | 25,000 | 33,222 | ||||||
3.80%, 7/15/48 | 36,000 | 41,199 | ||||||
Berkshire Hathaway Finance Corp. | 150,000 | 152,250 | ||||||
1.45%, 10/15/30 | 50,000 | 48,973 | ||||||
4.20%, 8/15/48 | 20,000 | 25,080 | ||||||
4.25%, 1/15/49 | 38,000 | 47,938 | ||||||
2.85%, 10/15/50 | 5,000 | 5,058 | ||||||
BGC Partners, Inc. | 10,000 | 10,640 | ||||||
Biogen, Inc. | 25,000 | 25,850 | ||||||
Black Hills Corp. | 25,000 | 29,484 | ||||||
BlackRock, Inc. | 18,000 | 19,413 | ||||||
Boardwalk Pipelines L.P. | ||||||||
4.95%, 12/15/24 | 5,000 | 5,570 | ||||||
4.45%, 7/15/27 | 18,000 | 20,357 | ||||||
3.40%, 2/15/31 | 15,000 | 16,045 | ||||||
Boeing Co. (The) | ||||||||
4.88%, 5/1/25 | 85,000 | 95,064 | ||||||
2.25%, 6/15/26 | 5,000 | 5,117 | ||||||
5.15%, 5/1/30 | 220,000 | 261,023 | ||||||
5.88%, 2/15/40 | 10,000 | 12,983 | ||||||
3.90%, 5/1/49 | 10,000 | 10,530 | ||||||
5.81%, 5/1/50 | 25,000 | 34,058 | ||||||
3.83%, 3/1/59 | 175,000 | 177,567 | ||||||
5.93%, 5/1/60 | 30,000 | 41,744 | ||||||
Booking Holdings, Inc. | 15,000 | 15,537 | ||||||
BorgWarner, Inc. | 12,000 | 12,766 | ||||||
Boston Properties L.P. | 5,000 | 5,193 | ||||||
3.13%, 9/1/23 | 19,000 | 19,877 | ||||||
3.65%, 2/1/26 | 5,000 | 5,507 | ||||||
2.75%, 10/1/26 | 24,000 | 25,657 | ||||||
2.90%, 3/15/30 | 25,000 | 26,291 | ||||||
BP Capital Markets America, Inc. | 78,000 | 81,183 | ||||||
3.41%, 2/11/26 | 25,000 | 27,365 | ||||||
3.12%, 5/4/26 | 5,000 | 5,429 | ||||||
3.59%, 4/14/27 | 15,000 | 16,664 | ||||||
4.23%, 11/6/28 | 10,000 | 11,578 | ||||||
3.38%, 2/8/61 | 120,000 | 124,598 | ||||||
Bristol-Myers Squibb Co. | 14,000 | 14,575 | ||||||
3.20%, 6/15/26 | 10,000 | 10,978 | ||||||
3.45%, 11/15/27 | 28,000 | 31,360 | ||||||
3.40%, 7/26/29 | 125,000 | 140,514 | ||||||
1.45%, 11/13/30 | 5,000 | 4,874 | ||||||
4.13%, 6/15/39 | 60,000 | 73,222 | ||||||
4.25%, 10/26/49 | 50,000 | 63,760 | ||||||
2.55%, 11/13/50(b) | 5,000 | 4,862 | ||||||
Brixmor Operating Partnership L.P. | 5,000 | 5,363 | ||||||
3.90%, 3/15/27 | 50,000 | 55,275 | ||||||
Broadcom Corp. | 81,000 | 86,120 | ||||||
3.13%, 1/15/25 | 5,000 | 5,318 | ||||||
3.88%, 1/15/27 | 23,000 | 25,394 | ||||||
3.50%, 1/15/28 | 5,000 | 5,442 | ||||||
Broadcom, Inc. | 70,000 | 78,842 | ||||||
2.45%, 2/15/31(d) | 70,000 | 69,383 | ||||||
Bunge Ltd. Finance Corp. | 15,000 | 15,247 | ||||||
Burlington Northern Santa Fe LLC | 18,000 | 19,339 | ||||||
7.00%, 12/15/25 | 22,000 | 27,386 | ||||||
6.15%, 5/1/37 | 10,000 | 14,564 | ||||||
5.15%, 9/1/43 | 48,000 | 66,066 | ||||||
3.90%, 8/1/46 | 5,000 | 5,948 | ||||||
Burlington Resources LLC | 14,000 | 20,668 | ||||||
Camden Property Trust | 25,000 | 27,415 | ||||||
2.80%, 5/15/30 | 25,000 | 26,721 | ||||||
Campbell Soup Co. | 20,000 | 22,806 | ||||||
Capital One Financial Corp. | 95,000 | 98,385 | ||||||
3.50%, 6/15/23 | 48,000 | 50,583 | ||||||
4.20%, 10/29/25 | 25,000 | 27,889 | ||||||
3.75%, 3/9/27 | 20,000 | 22,386 | ||||||
Cardinal Health, Inc. | 25,000 | 26,036 | ||||||
4.90%, 9/15/45 | 50,000 | 60,880 | ||||||
Carlisle Cos., Inc. | 18,000 | 20,088 | ||||||
Carrier Global Corp. | 25,000 | 26,268 | ||||||
See Notes to Financial Statements.
| WisdomTree Trust | 57 |
Table of Contents
Schedule of Investments (continued)
WisdomTree Interest Rate Hedged U.S. Aggregate Bond Fund (AGZD)
August 31, 2021
| Investments | Principal Amount | Value | ||||||
Caterpillar Financial Services Corp. | $ | 33,000 | $ | 35,492 | ||||
Caterpillar, Inc. | 35,000 | 37,528 | ||||||
3.80%, 8/15/42(b) | 25,000 | 29,953 | ||||||
3.25%, 9/19/49 | 40,000 | 44,582 | ||||||
Cboe Global Markets, Inc. | 5,000 | 5,578 | ||||||
CBRE Services, Inc. | 30,000 | 34,565 | ||||||
CC Holdings GS V LLC | 30,000 | 31,613 | ||||||
CenterPoint Energy Resources Corp. | 9,000 | 9,415 | ||||||
4.10%, 9/1/47 | 5,000 | 5,922 | ||||||
Charles Schwab Corp. (The) | 25,000 | 27,693 | ||||||
1.65%, 3/11/31 | 70,000 | 68,539 | ||||||
Charter Communications Operating LLC 4.50%, 2/1/24 | 18,000 | 19,549 | ||||||
5.05%, 3/30/29 | 150,000 | 177,817 | ||||||
2.30%, 2/1/32 | 105,000 | 102,496 | ||||||
6.38%, 10/23/35 | 5,000 | 6,688 | ||||||
6.48%, 10/23/45 | 15,000 | 20,973 | ||||||
5.13%, 7/1/49 | 20,000 | 24,186 | ||||||
3.70%, 4/1/51 | 24,000 | 24,188 | ||||||
6.83%, 10/23/55 | 73,000 | 109,104 | ||||||
3.85%, 4/1/61 | 14,000 | 13,946 | ||||||
Cheniere Corpus Christi Holdings LLC | 25,000 | 29,159 | ||||||
Chevron Corp. | 100,000 | 103,406 | ||||||
Chevron USA, Inc. | 100,000 | 100,263 | ||||||
3.90%, 11/15/24 | 5,000 | 5,483 | ||||||
0.69%, 8/12/25 | 15,000 | 14,924 | ||||||
3.25%, 10/15/29 | 26,000 | 28,839 | ||||||
Children’s Hospital Corp. (The) | 25,000 | 32,283 | ||||||
Chubb INA Holdings, Inc. | 68,000 | 70,496 | ||||||
3.15%, 3/15/25 | 18,000 | 19,455 | ||||||
Church & Dwight Co., Inc. | 5,000 | 5,136 | ||||||
Cigna Corp. | 15,000 | 15,659 | ||||||
3.75%, 7/15/23 | 8,000 | 8,472 | ||||||
0.61%, 3/15/24 | 100,000 | 100,028 | ||||||
3.40%, 3/1/27 | 10,000 | 11,026 | ||||||
3.05%, 10/15/27 | 200,000 | 217,012 | ||||||
6.13%, 11/15/41 | 14,000 | 20,207 | ||||||
3.88%, 10/15/47 | 5,000 | 5,693 | ||||||
4.90%, 12/15/48 | 30,000 | 39,260 | ||||||
Cintas Corp. No. 2 | 5,000 | 5,067 | ||||||
3.25%, 6/1/22 | 28,000 | 28,419 | ||||||
3.70%, 4/1/27 | 23,000 | 25,827 | ||||||
Cisco Systems, Inc. | 5,000 | 5,178 | ||||||
2.20%, 9/20/23 | 36,000 | 37,340 | ||||||
3.63%, 3/4/24 | 35,000 | 37,798 | ||||||
5.90%, 2/15/39 | 40,000 | 58,305 | ||||||
Citigroup, Inc. | 200,000 | 205,240 | ||||||
3.30%, 4/27/25 | 9,000 | 9,766 | ||||||
5.50%, 9/13/25 | 10,000 | 11,621 | ||||||
3.70%, 1/12/26 | 9,000 | 9,952 | ||||||
3.40%, 5/1/26 | 10,000 | 10,963 | ||||||
3.20%, 10/21/26 | 55,000 | 59,896 | ||||||
1.12%, 1/28/27, (1.122% fixed rate until 1/28/26; Secured Overnight Financing Rate + 0.765% thereafter)(c) | 10,000 | 9,928 | ||||||
4.45%, 9/29/27 | 114,000 | 130,707 | ||||||
3.52%, 10/27/28, (3.52% fixed rate until 10/27/27; 3-month U.S. dollar London Interbank Offered Rate + 1.151% thereafter)(c) | 74,000 | 81,406 | ||||||
4.08%, 4/23/29, (4.075% fixed rate until 4/23/28; 3-month U.S. dollar London Interbank Offered Rate + 1.192% thereafter)(c) | 10,000 | 11,349 | ||||||
3.98%, 3/20/30, (3.98% fixed rate until 3/20/29; 3-month U.S. dollar London Interbank Offered Rate + 1.338% thereafter)(c) | 150,000 | 170,569 | ||||||
4.41%, 3/31/31, (4.412% fixed rate until 3/31/30; Secured Overnight Financing Rate + 3.914% thereafter)(c) | 20,000 | 23,472 | ||||||
2.57%, 6/3/31, (2.572% fixed rate until 6/3/30; Secured Overnight Financing Rate + 2.107% thereafter)(c) | 8,000 | 8,271 | ||||||
6.63%, 6/15/32 | 105,000 | 143,791 | ||||||
8.13%, 7/15/39 | 10,000 | 17,255 | ||||||
6.68%, 9/13/43 | 19,000 | 29,652 | ||||||
4.28%, 4/24/48, (4.281% fixed rate until 4/24/47; 3-month U.S. dollar London Interbank Offered Rate + 1.839% thereafter)(c) | 10,000 | 12,642 | ||||||
4.65%, 7/23/48 | 10,000 | 13,285 | ||||||
Citizens Financial Group, Inc. | 25,000 | 27,273 | ||||||
Citrix Systems, Inc. | 30,000 | 31,630 | ||||||
Cleco Corporate Holdings LLC | 23,000 | 25,135 | ||||||
Clorox Co. (The) | 40,000 | 43,339 | ||||||
CME Group, Inc. | 105,000 | 112,530 | ||||||
5.30%, 9/15/43 | 5,000 | 7,194 | ||||||
4.15%, 6/15/48 | 5,000 | 6,529 | ||||||
CNH Industrial Capital LLC | 5,000 | 5,113 | ||||||
See Notes to Financial Statements.
| 58 | WisdomTree Trust |
Table of Contents
Schedule of Investments (continued)
WisdomTree Interest Rate Hedged U.S. Aggregate Bond Fund (AGZD)
August 31, 2021
| Investments | Principal Amount | Value | ||||||
Coca-Cola Co. (The) | $ | 98,000 | $ | 101,925 | ||||
2.60%, 6/1/50 | 5,000 | 4,963 | ||||||
2.50%, 3/15/51 | 5,000 | 4,856 | ||||||
2.75%, 6/1/60 | 50,000 | 50,426 | ||||||
Comcast Cable Communications Holdings, Inc. | 5,000 | 5,554 | ||||||
Comcast Corp. | 40,000 | 43,071 | ||||||
3.70%, 4/15/24 | 23,000 | 24,841 | ||||||
2.35%, 1/15/27 | 20,000 | 21,104 | ||||||
3.30%, 2/1/27 | 28,000 | 30,776 | ||||||
3.55%, 5/1/28 | 99,000 | 110,909 | ||||||
6.45%, 3/15/37 | 27,000 | 40,084 | ||||||
4.60%, 10/15/38 | 15,000 | 18,821 | ||||||
4.50%, 1/15/43 | 22,000 | 27,510 | ||||||
3.40%, 7/15/46 | 10,000 | 10,926 | ||||||
4.00%, 8/15/47 | 40,000 | 47,444 | ||||||
3.97%, 11/1/47 | 78,000 | 92,080 | ||||||
4.70%, 10/15/48(b) | 17,000 | 22,433 | ||||||
4.05%, 11/1/52 | 128,000 | 154,286 | ||||||
4.95%, 10/15/58 | 28,000 | 40,224 | ||||||
CommonSpirit Health | 27,000 | 29,358 | ||||||
4.35%, 11/1/42 | 10,000 | 11,880 | ||||||
Commonwealth Edison Co. | 15,000 | 19,551 | ||||||
Conagra Brands, Inc. | 25,000 | 24,536 | ||||||
7.00%, 10/1/28 | 19,000 | 25,254 | ||||||
Connecticut Light & Power Co. (The) | 15,000 | 18,884 | ||||||
ConocoPhillips | ||||||||
4.95%, 3/15/26 | 25,000 | 28,991 | ||||||
6.50%, 2/1/39 | 54,000 | 79,740 | ||||||
Consolidated Edison Co. of New York, Inc. 3.88%, 6/15/47, Series 2017 | 20,000 | 22,832 | ||||||
4.00%, 11/15/57, Series C | 43,000 | 49,957 | ||||||
Constellation Brands, Inc. | 75,000 | 81,062 | ||||||
5.25%, 11/15/48 | 19,000 | 25,758 | ||||||
Consumers Energy Co. | 50,000 | 60,634 | ||||||
Corning, Inc. | 50,000 | 61,636 | ||||||
5.85%, 11/15/68(b) | 18,000 | 26,987 | ||||||
5.45%, 11/15/79 | 10,000 | 14,218 | ||||||
Costco Wholesale Corp. | 5,000 | 5,503 | ||||||
1.60%, 4/20/30 | 40,000 | 39,737 | ||||||
1.75%, 4/20/32 | 30,000 | 29,917 | ||||||
Crown Castle International Corp. | 18,000 | 18,854 | ||||||
4.30%, 2/15/29 | 55,000 | 63,461 | ||||||
3.30%, 7/1/30 | 25,000 | 27,025 | ||||||
4.75%, 5/15/47 | 50,000 | 62,702 | ||||||
3.25%, 1/15/51 | 15,000 | 15,242 | ||||||
CSX Corp. | 50,000 | 51,752 | ||||||
4.30%, 3/1/48 | 45,000 | 55,579 | ||||||
4.50%, 8/1/54 | 18,000 | 23,203 | ||||||
CVS Health Corp. | 48,000 | 59,848 | ||||||
3.25%, 8/15/29 | 25,000 | 27,299 | ||||||
1.88%, 2/28/31 | 105,000 | 102,984 | ||||||
4.88%, 7/20/35 | 48,000 | 59,179 | ||||||
4.78%, 3/25/38 | 25,000 | 31,115 | ||||||
5.30%, 12/5/43 | 48,000 | 64,493 | ||||||
5.05%, 3/25/48 | 60,000 | 79,460 | ||||||
CyrusOne L.P. | 25,000 | 26,332 | ||||||
D.R. Horton, Inc. | 18,000 | 18,541 | ||||||
Danaher Corp. | 5,000 | 4,891 | ||||||
Darden Restaurants, Inc. | 68,000 | 75,546 | ||||||
Dell International LLC | 110,000 | 118,593 | ||||||
6.02%, 6/15/26 | 15,000 | 17,956 | ||||||
4.90%, 10/1/26 | 25,000 | 28,968 | ||||||
8.35%, 7/15/46 | 48,000 | 79,337 | ||||||
Devon Energy Corp. | 15,000 | 18,787 | ||||||
Digital Realty Trust L.P. | 50,000 | 55,633 | ||||||
Dignity Health | 25,000 | 35,317 | ||||||
Discover Financial Services | 35,000 | 39,402 | ||||||
Discovery Communications LLC | 10,000 | 12,602 | ||||||
4.00%, 9/15/55 | 47,000 | 50,545 | ||||||
Dollar Tree, Inc. | 50,000 | 56,927 | ||||||
Dominion Energy South Carolina, Inc. | 34,000 | 50,566 | ||||||
Dominion Energy, Inc. | 5,000 | 5,510 | ||||||
5.95%, 6/15/35, Series B | 5,000 | 6,842 | ||||||
4.60%, 3/15/49, Series A | 25,000 | 32,204 | ||||||
Dover Corp. | 23,000 | 24,788 | ||||||
Dow Chemical Co. (The) | 3,000 | 4,194 | ||||||
4.25%, 10/1/34 | 17,000 | 19,899 | ||||||
9.40%, 5/15/39 | 15,000 | 27,539 | ||||||
4.38%, 11/15/42 | 5,000 | 6,033 | ||||||
DTE Electric Co. | 65,000 | 66,609 | ||||||
3.75%, 8/15/47 | 50,000 | 58,911 | ||||||
Duke Energy Carolinas LLC | 48,000 | 54,960 | ||||||
See Notes to Financial Statements.
| WisdomTree Trust | 59 |
Table of Contents
Schedule of Investments (continued)
WisdomTree Interest Rate Hedged U.S. Aggregate Bond Fund (AGZD)
August 31, 2021
| Investments | Principal Amount | Value | ||||||
Duke Energy Corp. | $ | 145,000 | $ | 157,631 | ||||
Duke Energy Florida LLC | 43,500 | 64,326 | ||||||
Duke Energy Indiana LLC | 140,000 | 137,346 | ||||||
Duke Energy Ohio, Inc. | 18,000 | 19,066 | ||||||
Duke Realty L.P. | 46,000 | 46,274 | ||||||
DXC Technology Co. | 45,000 | 49,411 | ||||||
4.75%, 4/15/27 | 10,000 | 11,469 | ||||||
Eastman Chemical Co. | 48,000 | 59,958 | ||||||
Eaton Vance Corp. | 18,000 | 19,705 | ||||||
eBay, Inc. | 50,000 | 51,584 | ||||||
4.00%, 7/15/42 | 15,000 | 17,113 | ||||||
Ecolab, Inc. | 18,000 | 18,629 | ||||||
2.70%, 11/1/26 | 5,000 | 5,378 | ||||||
3.25%, 12/1/27(b) | 25,000 | 27,691 | ||||||
Eli Lilly & Co. | 40,000 | 49,126 | ||||||
3.95%, 3/15/49 | 20,000 | 24,686 | ||||||
Emerson Electric Co. | 5,000 | 5,145 | ||||||
1.80%, 10/15/27 | 35,000 | 35,988 | ||||||
Enable Midstream Partners L.P. | 48,000 | 51,081 | ||||||
Enbridge Energy Partners L.P. | 5,000 | 5,874 | ||||||
Energy Transfer L.P. |
| |||||||
4.25%, 3/15/23 | 25,000 | 26,118 | ||||||
4.20%, 9/15/23, Series 5Y | 5,000 | 5,324 | ||||||
5.88%, 1/15/24 | 40,000 | 44,080 | ||||||
4.25%, 4/1/24 | 20,000 | 21,463 | ||||||
4.50%, 4/15/24 | 30,000 | 32,569 | ||||||
3.90%, 7/15/26 | 5,000 | 5,496 | ||||||
4.20%, 4/15/27 | 20,000 | 22,236 | ||||||
4.90%, 3/15/35 | 38,000 | 43,805 | ||||||
6.63%, 10/15/36 | 94,000 | 124,818 | ||||||
Entergy Louisiana LLC | 15,000 | 16,391 | ||||||
4.00%, 3/15/33 | 85,000 | 99,814 | ||||||
4.20%, 9/1/48 | 40,000 | 49,222 | ||||||
Entergy Texas, Inc. | 50,000 | 48,251 | ||||||
3.55%, 9/30/49 | 25,000 | 27,398 | ||||||
Enterprise Products Operating LLC | 82,000 | 85,046 | ||||||
6.88%, 3/1/33, Series D | 44,000 | 62,214 | ||||||
4.45%, 2/15/43 | 65,000 | 76,824 | ||||||
4.25%, 2/15/48 | 194,000 | 224,638 | ||||||
Equinix, Inc. | 30,000 | 29,039 | ||||||
Equitable Holdings, Inc. | 164,000 | 188,639 | ||||||
ERP Operating L.P. | 19,000 | 19,688 | ||||||
3.00%, 7/1/29 | 50,000 | 54,268 | ||||||
Essex Portfolio L.P. | 25,000 | 23,850 | ||||||
2.65%, 9/1/50 | 30,000 | 27,473 | ||||||
Estee Lauder Cos., Inc. (The) | 25,000 | 26,151 | ||||||
1.95%, 3/15/31 | 40,000 | 40,561 | ||||||
Eversource Energy | 15,000 | 17,485 | ||||||
Exelon Corp. | 33,000 | 44,138 | ||||||
4.70%, 4/15/50 | 25,000 | 32,087 | ||||||
Expedia Group, Inc. | 5,000 | 5,402 | ||||||
Exxon Mobil Corp. | 25,000 | 25,803 | ||||||
1.57%, 4/15/23 | 25,000 | 25,506 | ||||||
3.04%, 3/1/26 | 23,000 | 24,951 | ||||||
2.28%, 8/16/26 | 50,000 | 52,757 | ||||||
2.44%, 8/16/29 | 15,000 | 15,770 | ||||||
2.61%, 10/15/30 | 60,000 | 63,632 | ||||||
4.33%, 3/19/50 | 200,000 | 251,366 | ||||||
FedEx Corp. | 18,000 | 20,946 | ||||||
3.90%, 2/1/35 | 19,000 | 21,916 | ||||||
3.88%, 8/1/42 | 5,000 | 5,670 | ||||||
4.75%, 11/15/45 | 5,000 | 6,314 | ||||||
4.40%, 1/15/47 | 63,000 | 76,301 | ||||||
Fifth Third Bancorp | 20,000 | 21,231 | ||||||
3.95%, 3/14/28 | 25,000 | 28,825 | ||||||
8.25%, 3/1/38 | 20,000 | 33,697 | ||||||
Fiserv, Inc. | ||||||||
3.20%, 7/1/26 | 55,000 | 59,808 | ||||||
4.20%, 10/1/28 | 15,000 | 17,245 | ||||||
Flex Ltd. | 5,000 | 5,301 | ||||||
Florida Power & Light Co. | 5,000 | 5,962 | ||||||
4.13%, 6/1/48 | 53,000 | 66,803 | ||||||
Fortune Brands Home & Security, Inc. | 25,000 | 26,695 | ||||||
3.25%, 9/15/29 | 15,000 | 16,332 | ||||||
Fox Corp. | 25,000 | 32,503 | ||||||
Franklin Resources, Inc. | 25,000 | 26,739 | ||||||
GE Capital International Funding Co. Unlimited Co. | 100,000 | 121,590 | ||||||
See Notes to Financial Statements.
| 60 | WisdomTree Trust |
Table of Contents
Schedule of Investments (continued)
WisdomTree Interest Rate Hedged U.S. Aggregate Bond Fund (AGZD)
August 31, 2021
| Investments | Principal Amount | Value | ||||||
General Dynamics Corp. | $ | 40,000 | $ | 40,766 | ||||
3.75%, 5/15/28 | 23,000 | 26,213 | ||||||
4.25%, 4/1/40 | 35,000 | 43,558 | ||||||
General Electric Co. | 128,000 | 177,843 | ||||||
5.88%, 1/14/38 | 24,000 | 32,997 | ||||||
General Mills, Inc. | 15,000 | 15,977 | ||||||
3.00%, 2/1/51(b)(d) | 28,000 | 29,134 | ||||||
General Motors Co. | 71,000 | 79,587 | ||||||
General Motors Financial Co., Inc. | 5,000 | 5,067 | ||||||
4.00%, 1/15/25 | 101,000 | 109,848 | ||||||
4.35%, 4/9/25 | 215,000 | 237,145 | ||||||
4.30%, 7/13/25 | 30,000 | 33,129 | ||||||
4.35%, 1/17/27 | 30,000 | 33,831 | ||||||
2.35%, 1/8/31(b) | 100,000 | 99,042 | ||||||
George Washington University (The) | 26,000 | 32,892 | ||||||
Georgia Power Co. | 22,000 | 22,714 | ||||||
3.25%, 4/1/26 | 25,000 | 27,105 | ||||||
4.30%, 3/15/43 | 164,000 | 197,781 | ||||||
Georgia-Pacific LLC | 5,000 | 7,209 | ||||||
Gilead Sciences, Inc. | 5,000 | 5,414 | ||||||
3.65%, 3/1/26 | 69,000 | 76,122 | ||||||
1.20%, 10/1/27 | 50,000 | 49,297 | ||||||
5.65%, 12/1/41 | 38,000 | 53,303 | ||||||
4.80%, 4/1/44 | 25,000 | 32,183 | ||||||
4.50%, 2/1/45 | 138,000 | 171,130 | ||||||
Global Payments, Inc. | 23,000 | 24,094 | ||||||
GLP Capital L.P. | 18,000 | 19,537 | ||||||
5.25%, 6/1/25 | 15,000 | 16,854 | ||||||
5.75%, 6/1/28 | 18,000 | 21,506 | ||||||
Goldman Sachs Capital I | 19,000 | 27,000 | ||||||
Goldman Sachs Group, Inc. (The) | 43,000 | 44,981 | ||||||
0.48%, 1/27/23 | 10,000 | 10,003 | ||||||
3.20%, 2/23/23 | 78,000 | 81,061 | ||||||
0.63%, 11/17/23, (0.627% fixed rate until 11/17/22; Secured Overnight Financing Rate + 0.538% thereafter)(c) | 100,000 | 100,164 | ||||||
4.00%, 3/3/24 | 15,000 | 16,245 | ||||||
3.50%, 1/23/25 | 25,000 | 26,940 | ||||||
3.27%, 9/29/25, (3.272% fixed rate until 9/29/24; 3-month U.S. dollar London Interbank Offered Rate + 1.201% thereafter)(c) | 25,000 | 26,796 | ||||||
3.75%, 2/25/26 | 50,000 | 55,282 | ||||||
5.95%, 1/15/27 | 23,000 | 28,026 | ||||||
3.85%, 1/26/27 | 15,000 | 16,599 | ||||||
3.69%, 6/5/28, (3.691% fixed rate until 6/5/27; 3-month U.S. dollar London Interbank Offered Rate + 1.51% thereafter)(c) | 23,000 | 25,570 | ||||||
3.81%, 4/23/29, (3.814% fixed rate until 4/23/28; 3-month U.S. dollar London Interbank Offered Rate + 1.158% thereafter)(c) | 21,000 | 23,548 | ||||||
4.22%, 5/1/29, (4.223% fixed rate until 5/1/28; 3-month U.S. dollar London Interbank Offered Rate + 1.301% thereafter)(c) | 100,000 | 114,682 | ||||||
3.80%, 3/15/30 | 10,000 | 11,288 | ||||||
6.13%, 2/15/33 | 9,000 | 12,229 | ||||||
6.45%, 5/1/36 | 22,000 | 31,175 | ||||||
6.75%, 10/1/37 | 25,000 | 36,477 | ||||||
4.02%, 10/31/38, (4.017% fixed rate until 10/31/37; 3-month U.S. dollar London Interbank Offered Rate + 1.373% thereafter)(c) | 10,000 | 11,723 | ||||||
4.41%, 4/23/39, (4.411% fixed rate until 4/23/38; 3-month U.S. dollar London Interbank Offered Rate + 1.43% thereafter)(c) | 5,000 | 6,141 | ||||||
6.25%, 2/1/41 | 10,000 | 14,863 | ||||||
5.15%, 5/22/45 | 53,000 | 71,177 | ||||||
Hackensack Meridian Health, Inc. | 40,000 | 40,200 | ||||||
Halliburton Co. | 18,000 | 24,893 | ||||||
4.50%, 11/15/41 | 140,000 | 156,309 | ||||||
Hasbro, Inc. | 20,000 | 21,946 | ||||||
3.50%, 9/15/27 | 15,000 | 16,490 | ||||||
HCA, Inc. | 36,000 | 38,394 | ||||||
4.13%, 6/15/29 | 50,000 | 56,641 | ||||||
Healthcare Trust of America Holdings L.P. | 5,000 | 5,585 | ||||||
Healthpeak Properties, Inc. | 40,000 | 61,449 | ||||||
Hershey Co. (The) | 93,000 | 98,757 | ||||||
Hess Corp. | 30,000 | 33,375 | ||||||
7.88%, 10/1/29 | 100,000 | 136,903 | ||||||
7.13%, 3/15/33 | 25,000 | 33,896 | ||||||
6.00%, 1/15/40 | 48,000 | 61,896 | ||||||
Hewlett Packard Enterprise Co. | 48,000 | 49,791 | ||||||
6.20%, 10/15/35(b) | 23,000 | 31,360 | ||||||
Home Depot, Inc. (The) | 23,000 | 25,056 | ||||||
5.88%, 12/16/36 | 15,000 | 21,544 | ||||||
4.20%, 4/1/43 | 25,000 | 30,930 | ||||||
4.88%, 2/15/44 | 11,000 | 14,851 | ||||||
See Notes to Financial Statements.
| WisdomTree Trust | 61 |
Table of Contents
Schedule of Investments (continued)
WisdomTree Interest Rate Hedged U.S. Aggregate Bond Fund (AGZD)
August 31, 2021
| Investments | Principal Amount | Value | ||||||
Honeywell International, Inc. | $ | 10,000 | $ | 10,671 | ||||
2.70%, 8/15/29 | 110,000 | 118,235 | ||||||
Hormel Foods Corp. | 30,000 | 30,153 | ||||||
HP, Inc. | 25,000 | 26,928 | ||||||
Hubbell, Inc. | 48,000 | 51,702 | ||||||
Hudson Pacific Properties L.P. | 5,000 | 5,533 | ||||||
Humana, Inc. | 23,000 | 29,732 | ||||||
Huntington Bancshares, Inc. | 25,000 | 27,684 | ||||||
Huntington Ingalls Industries, Inc. | 15,000 | 16,359 | ||||||
Hyatt Hotels Corp. | 48,000 | 49,908 | ||||||
Illinois Tool Works, Inc. | 65,000 | 69,933 | ||||||
Intel Corp. | 25,000 | 27,542 | ||||||
3.75%, 3/25/27 | 50,000 | 56,601 | ||||||
3.90%, 3/25/30(b) | 25,000 | 29,079 | ||||||
4.10%, 5/19/46 | 45,000 | 54,483 | ||||||
4.10%, 5/11/47 | 18,000 | 21,767 | ||||||
3.25%, 11/15/49 | 20,000 | 21,384 | ||||||
4.75%, 3/25/50 | 45,000 | 60,434 | ||||||
Intercontinental Exchange, Inc. | 5,000 | 5,527 | ||||||
3.10%, 9/15/27 | 5,000 | 5,464 | ||||||
International Business Machines Corp. 6.22%, 8/1/27 | 49,000 | 62,113 | ||||||
5.88%, 11/29/32 | 24,000 | 32,683 | ||||||
4.00%, 6/20/42 | 50,000 | 59,304 | ||||||
4.25%, 5/15/49(b) | 20,000 | 25,019 | ||||||
International Flavors & Fragrances, Inc. | 5,000 | 6,663 | ||||||
International Paper Co. | 2,000 | 2,222 | ||||||
7.30%, 11/15/39 | 25,000 | 39,458 | ||||||
4.80%, 6/15/44 | 5,000 | 6,448 | ||||||
4.35%, 8/15/48(b) | 19,000 | 23,875 | ||||||
Invesco Finance PLC | 18,000 | 19,415 | ||||||
ITC Holdings Corp. | 15,000 | 20,170 | ||||||
Jabil, Inc. | 5,000 | 5,219 | ||||||
3.95%, 1/12/28 | 50,000 | 55,543 | ||||||
Janus Capital Group, Inc. | 18,000 | 20,300 | ||||||
Jefferies Group LLC | 25,000 | 26,547 | ||||||
6.45%, 6/8/27 | 25,000 | 31,339 | ||||||
John Deere Capital Corp. | 24,000 | 24,932 | ||||||
3.45%, 6/7/23 | 5,000 | 5,276 | ||||||
3.45%, 3/13/25 | 25,000 | 27,365 | ||||||
2.80%, 9/8/27 | 37,000 | 40,224 | ||||||
2.45%, 1/9/30 | 35,000 | 37,015 | ||||||
Johnson & Johnson | 48,000 | 51,008 | ||||||
2.95%, 3/3/27 | 21,000 | 23,030 | ||||||
3.55%, 3/1/36 | 14,000 | 16,499 | ||||||
3.40%, 1/15/38 | 25,000 | 28,724 | ||||||
4.50%, 9/1/40 | 19,000 | 24,941 | ||||||
3.70%, 3/1/46 | 22,000 | 26,549 | ||||||
Johnson Controls International PLC | 18,000 | 25,633 | ||||||
JPMorgan Chase & Co. | 142,000 | 147,877 | ||||||
3.88%, 2/1/24 | 50,000 | 54,048 | ||||||
3.56%, 4/23/24, (3.559% fixed rate until 4/23/23; 3-month U.S. dollar London Interbank Offered Rate + 0.73% thereafter)(c) | 5,000 | 5,252 | ||||||
3.80%, 7/23/24, (3.797% fixed rate until 7/23/23; 3-month U.S. dollar London Interbank Offered Rate + 0.89% thereafter)(c) | 10,000 | 10,613 | ||||||
0.56%, 2/16/25, (0.563% fixed rate until 2/16/24; Secured Overnight Financing Rate + 0.42% thereafter)(c) | 100,000 | 99,750 | ||||||
3.22%, 3/1/25, (3.22% fixed rate until 3/1/24; 3-month U.S. dollar London Interbank Offered Rate + 1.155% thereafter)(c) | 40,000 | 42,443 | ||||||
2.01%, 3/13/26, (2.005% fixed rate until 3/13/25; Secured Overnight Financing Rate + 1.585% thereafter)(c) | 125,000 | 128,965 | ||||||
3.30%, 4/1/26 | 10,000 | 10,921 | ||||||
1.05%, 11/19/26, (1.045% fixed rate until 11/19/25; Secured Overnight Financing Rate + 0.80% thereafter)(c) | 50,000 | 49,568 | ||||||
3.54%, 5/1/28, (3.54% fixed rate until 5/1/27; 3-month U.S. dollar London Interbank Offered Rate + 1.38% thereafter)(c) | 50,000 | 55,127 | ||||||
3.51%, 1/23/29, (3.509% fixed rate until 1/23/28; 3-month U.S. dollar London Interbank Offered Rate + 0.945% thereafter)(c) | 23,000 | 25,429 | ||||||
4.20%, 7/23/29, (4.203% fixed rate until 7/23/28; 3-month U.S. dollar London Interbank Offered Rate + 1.26% thereafter)(c) | 45,000 | 51,778 | ||||||
4.45%, 12/5/29, (4.452% fixed rate until 12/5/28; 3-month U.S. dollar London Interbank Offered Rate + 1.33% thereafter)(c) | 18,000 | 21,063 | ||||||
3.70%, 5/6/30, (3.702% fixed rate until 5/6/29; 3-month U.S. dollar London Interbank Offered Rate + 1.16% thereafter)(c) | 15,000 | 16,809 | ||||||
See Notes to Financial Statements.
| 62 | WisdomTree Trust |
Table of Contents
Schedule of Investments (continued)
WisdomTree Interest Rate Hedged U.S. Aggregate Bond Fund (AGZD)
August 31, 2021
| Investments | Principal Amount | Value | ||||||
4.49%, 3/24/31, (4.493% fixed rate until 3/24/30; Secured Overnight Financing Rate + 3.79% thereafter)(c) | $ | 15,000 | $ | 17,801 | ||||
2.52%, 4/22/31, (2.522% fixed rate until 4/22/30; Secured Overnight Financing Rate + 2.04% thereafter)(c) | 15,000 | 15,551 | ||||||
1.76%, 11/19/31, (1.764% fixed rate until 11/19/30; Secured Overnight Financing Rate + 1.105% thereafter)(c) | 5,000 | 4,852 | ||||||
6.40%, 5/15/38 | 10,000 | 14,844 | ||||||
2.53%, 11/19/41, (2.525% fixed rate until 11/19/40; Secured Overnight Financing Rate + 1.51% thereafter)(c) | 65,000 | 63,237 | ||||||
5.63%, 8/16/43 | 218,000 | 307,720 | ||||||
4.85%, 2/1/44 | 25,000 | 33,283 | ||||||
3.90%, 1/23/49, (3.897% fixed rate until 1/23/48; 3-month U.S. dollar London Interbank Offered Rate + 1.22% thereafter)(c) | 48,000 | 56,364 | ||||||
3.11%, 4/22/51, (3.109% fixed rate until 4/22/50; Secured Overnight Financing Rate + 2.44% thereafter)(c) | 80,000 | 83,936 | ||||||
Kaiser Foundation Hospitals | 24,000 | 26,372 | ||||||
4.15%, 5/1/47 | 9,000 | 11,349 | ||||||
3.00%, 6/1/51, Series 2021 | 10,000 | 10,497 | ||||||
Kansas City Southern | 205,000 | 263,956 | ||||||
Kellogg Co. | 100,000 | 110,420 | ||||||
Keurig Dr. Pepper, Inc. | 25,000 | 26,393 | ||||||
2.55%, 9/15/26 | 8,000 | 8,503 | ||||||
4.42%, 12/15/46 | 48,000 | 58,829 | ||||||
KeyCorp | 169,000 | 190,118 | ||||||
2.55%, 10/1/29 | 13,000 | 13,708 | ||||||
Keysight Technologies, Inc. | 25,000 | 29,167 | ||||||
Kimberly-Clark Corp. | 35,000 | 34,775 | ||||||
3.90%, 5/4/47 | 50,000 | 61,521 | ||||||
Kimco Realty Corp. | 18,000 | 19,344 | ||||||
2.80%, 10/1/26 | 5,000 | 5,349 | ||||||
Kinder Morgan Energy Partners L.P. | 5,000 | 5,177 | ||||||
3.50%, 9/1/23 | 5,000 | 5,253 | ||||||
4.30%, 5/1/24 | 10,000 | 10,839 | ||||||
5.50%, 3/1/44 | 18,000 | 23,030 | ||||||
5.40%, 9/1/44 | 19,000 | 24,082 | ||||||
Kinder Morgan, Inc. | 30,000 | 34,319 | ||||||
7.75%, 1/15/32 | 5,000 | 7,241 | ||||||
5.30%, 12/1/34 | 75,000 | 93,280 | ||||||
5.55%, 6/1/45 | 15,000 | 19,496 | ||||||
KLA Corp. | $ | 15,000 | $ | 16,655 | ||||
3.30%, 3/1/50 | 25,000 | 27,335 | ||||||
Kroger Co. (The) | 64,000 | 71,963 | ||||||
5.15%, 8/1/43 | 18,000 | 23,774 | ||||||
5.40%, 1/15/49 | 19,000 | 26,484 | ||||||
Laboratory Corp. of America Holdings | 261,000 | 272,661 | ||||||
Lam Research Corp. | 15,000 | 17,412 | ||||||
Legg Mason, Inc. | 5,000 | 7,128 | ||||||
Linde, Inc. | 25,000 | 27,300 | ||||||
2.00%, 8/10/50 | 15,000 | 13,244 | ||||||
Lockheed Martin Corp. | 39,000 | 56,669 | ||||||
4.09%, 9/15/52 | 24,000 | 30,381 | ||||||
Lowe’s Cos., Inc. | 5,000 | 5,054 | ||||||
2.50%, 4/15/26 | 30,000 | 31,919 | ||||||
2.63%, 4/1/31 | 10,000 | 10,436 | ||||||
4.05%, 5/3/47 | 15,000 | 17,566 | ||||||
Lubrizol Corp. (The) | 39,000 | 57,950 | ||||||
LYB International Finance B.V. | 5,000 | 6,354 | ||||||
LYB International Finance II B.V. | 38,000 | 41,841 | ||||||
LYB International Finance III LLC | 5,000 | 5,490 | ||||||
LyondellBasell Industries N.V. | 20,000 | 25,242 | ||||||
Magellan Midstream Partners L.P. | 13,000 | 14,694 | ||||||
Main Street Capital Corp. | 25,000 | 27,155 | ||||||
Marathon Oil Corp. | 5,000 | 5,524 | ||||||
6.80%, 3/15/32 | 5,000 | 6,582 | ||||||
Marathon Petroleum Corp. | 25,000 | 34,793 | ||||||
5.00%, 9/15/54 | 50,000 | 61,098 | ||||||
Marriott International, Inc. | 95,000 | 101,622 | ||||||
Marsh & McLennan Cos., Inc. | 18,000 | 18,732 | ||||||
3.75%, 3/14/26 | 40,000 | 44,438 | ||||||
4.20%, 3/1/48 | 5,000 | 6,266 | ||||||
4.90%, 3/15/49 | 20,000 | 27,603 | ||||||
Martin Marietta Materials, Inc. | 35,000 | 38,135 | ||||||
3.50%, 12/15/27 | 5,000 | 5,554 | ||||||
Marvell Technology, Inc. | 5,000 | 5,299 | ||||||
4.88%, 6/22/28(d) | 15,000 | 17,487 | ||||||
See Notes to Financial Statements.
| WisdomTree Trust | 63 |
Table of Contents
Schedule of Investments (continued)
WisdomTree Interest Rate Hedged U.S. Aggregate Bond Fund (AGZD)
August 31, 2021
| Investments | Principal Amount | Value | ||||||
Mass General Brigham, Inc. | $ | 100,000 | $ | 108,080 | ||||
3.34%, 7/1/60, Series 2020 | 25,000 | 28,099 | ||||||
Massachusetts Institute of Technology | 19,000 | 24,303 | ||||||
Mastercard, Inc. | 20,000 | 23,657 | ||||||
McCormick & Co., Inc. | 50,000 | 60,874 | ||||||
McDonald’s Corp. | 5,000 | 5,418 | ||||||
6.30%, 10/15/37 | 19,000 | 27,449 | ||||||
3.70%, 2/15/42 | 159,000 | 179,746 | ||||||
4.45%, 3/1/47 | 15,000 | 18,757 | ||||||
3.63%, 9/1/49 | 40,000 | 45,085 | ||||||
4.20%, 4/1/50 | 110,000 | 135,302 | ||||||
Medtronic, Inc. | 10,000 | 12,561 | ||||||
Merck & Co., Inc. | 5,000 | 5,087 | ||||||
2.80%, 5/18/23 | 25,000 | 26,054 | ||||||
6.50%, 12/1/33 | 50,000 | 74,589 | ||||||
2.35%, 6/24/40 | 5,000 | 4,911 | ||||||
2.45%, 6/24/50(b) | 5,000 | 4,812 | ||||||
MetLife, Inc. | 69,000 | 76,171 | ||||||
Micron Technology, Inc. | 30,000 | 32,658 | ||||||
Microsoft Corp. | 69,000 | 73,822 | ||||||
3.30%, 2/6/27 | 92,000 | 102,689 | ||||||
4.10%, 2/6/37 | 48,000 | 59,846 | ||||||
4.50%, 10/1/40 | 75,000 | 100,003 | ||||||
3.70%, 8/8/46 | 12,000 | 14,615 | ||||||
4.25%, 2/6/47 | 18,000 | 23,861 | ||||||
2.53%, 6/1/50 | 115,000 | 114,915 | ||||||
2.92%, 3/17/52 | 50,000 | 53,821 | ||||||
4.50%, 2/6/57 | 18,000 | 25,592 | ||||||
MidAmerican Energy Co. | 15,000 | 19,741 | ||||||
3.15%, 4/15/50 | 9,000 | 9,639 | ||||||
Molson Coors Beverage Co. | 30,000 | 37,474 | ||||||
Mondelez International, Inc. | 50,000 | 50,955 | ||||||
Moody’s Corp. | 18,000 | 19,757 | ||||||
2.55%, 8/18/60 | 10,000 | 9,041 | ||||||
Morgan Stanley | 194,000 | 203,979 | ||||||
3.13%, 1/23/23 | 54,000 | 56,085 | ||||||
3.75%, 2/25/23 | 37,000 | 38,852 | ||||||
4.10%, 5/22/23 | 50,000 | 53,023 | ||||||
3.74%, 4/24/24, (3.737% fixed rate until 4/24/23; 3-month U.S. dollar London Interbank Offered Rate + 0.847% thereafter)(c) | 30,000 | 31,583 | ||||||
3.88%, 4/29/24, Series F | 15,000 | 16,246 | ||||||
3.70%, 10/23/24 | 67,000 | 72,982 | ||||||
2.72%, 7/22/25, (2.72% fixed rate until 7/22/24; Secured Overnight Financing Rate + 1.152% thereafter)(c) | 100,000 | 105,130 | ||||||
4.00%, 7/23/25 | 9,000 | 9,986 | ||||||
3.88%, 1/27/26 | 9,000 | 10,036 | ||||||
3.13%, 7/27/26 | 9,000 | 9,770 | ||||||
4.35%, 9/8/26 | 165,000 | 187,491 | ||||||
3.59%, 7/22/28, (3.591% fixed rate until 7/22/27; 3-month U.S. dollar London Interbank Offered Rate + 1.34% thereafter)(c) | 97,000 | 107,813 | ||||||
3.77%, 1/24/29, (3.772% fixed rate until 1/24/28; 3-month U.S. dollar London Interbank Offered Rate + 1.14% thereafter)(c) | 89,000 | 99,612 | ||||||
4.43%, 1/23/30, (4.431% fixed rate until 1/23/29; 3-month U.S. dollar London Interbank Offered Rate + 1.628% thereafter)(c) | 45,000 | 52,627 | ||||||
2.70%, 1/22/31, (2.699% fixed rate until 1/22/30; Secured Overnight Financing Rate + 1.143% thereafter)(c) | 15,000 | 15,726 | ||||||
3.62%, 4/1/31, (3.622% fixed rate until 4/1/30; Secured Overnight Financing Rate + 3.12% thereafter)(c) | 15,000 | 16,820 | ||||||
3.97%, 7/22/38, (3.971% fixed rate until 7/22/37; 3-month U.S. dollar London Interbank Offered Rate + 1.455% thereafter)(c) | 19,000 | 22,280 | ||||||
4.38%, 1/22/47 | 14,000 | 17,746 | ||||||
5.60%, 3/24/51, (5.597% fixed rate until 3/24/50; Secured Overnight Financing Rate + 4.84% thereafter)(c) | 8,000 | 12,089 | ||||||
2.80%, 1/25/52, (2.802% fixed rate until 1/25/51; Secured Overnight Financing Rate + 1.43% thereafter)(c) | 10,000 | 9,975 | ||||||
Mosaic Co. (The) | 10,000 | 11,945 | ||||||
5.63%, 11/15/43 | 25,000 | 33,524 | ||||||
Motorola Solutions, Inc. | 25,000 | 24,894 | ||||||
Mount Sinai Hospitals Group, Inc. | 5,000 | 5,666 | ||||||
3.74%, 7/1/49, Series 2019 | 25,000 | 28,361 | ||||||
MPLX L.P. | 100,000 | 112,250 | ||||||
4.00%, 3/15/28 | 18,000 | 20,108 | ||||||
4.70%, 4/15/48 | 50,000 | 58,233 | ||||||
National Rural Utilities Cooperative Finance Corp. | 11,000 | 11,345 | ||||||
3.25%, 11/1/25 | 10,000 | 10,863 | ||||||
3.40%, 2/7/28 | 5,000 | 5,530 | ||||||
3.90%, 11/1/28 | 18,000 | 20,559 | ||||||
4.02%, 11/1/32 | 18,000 | 21,386 | ||||||
NBCUniversal Media LLC | 5,000 | 7,432 | ||||||
4.45%, 1/15/43 | 50,000 | 62,344 | ||||||
See Notes to Financial Statements.
| 64 | WisdomTree Trust |
Table of Contents
Schedule of Investments (continued)
WisdomTree Interest Rate Hedged U.S. Aggregate Bond Fund (AGZD)
August 31, 2021
| Investments | Principal Amount | Value | ||||||
NetApp, Inc. | $ | 45,000 | $ | 48,088 | ||||
New York and Presbyterian Hospital (The) | 25,000 | 24,107 | ||||||
Newmont Corp. | 45,000 | 57,769 | ||||||
NextEra Energy Capital Holdings, Inc. | 255,000 | 256,020 | ||||||
2.75%, 5/1/25 | 15,000 | 15,925 | ||||||
3.50%, 4/1/29 | 20,000 | 22,201 | ||||||
NIKE, Inc. | 200,000 | 211,928 | ||||||
2.85%, 3/27/30 | 17,000 | 18,578 | ||||||
3.88%, 11/1/45 | 5,000 | 6,134 | ||||||
3.38%, 11/1/46 | 20,000 | 22,832 | ||||||
NiSource, Inc. | 10,000 | 11,050 | ||||||
5.25%, 2/15/43 | 20,000 | 26,631 | ||||||
5.65%, 2/1/45 | 5,000 | 7,019 | ||||||
4.38%, 5/15/47 | 25,000 | 30,589 | ||||||
3.95%, 3/30/48 | 18,000 | 20,922 | ||||||
Norfolk Southern Corp. | 10,000 | 10,303 | ||||||
3.15%, 6/1/27 | 23,000 | 25,086 | ||||||
4.05%, 8/15/52 | 5,000 | 5,993 | ||||||
Northrop Grumman Corp. | 48,000 | 50,583 | ||||||
3.20%, 2/1/27 | 53,000 | 57,875 | ||||||
Nucor Corp. | 25,000 | 26,450 | ||||||
NVIDIA Corp. | 10,000 | 10,837 | ||||||
3.70%, 4/1/60 | 20,000 | 23,890 | ||||||
NVR, Inc. | 5,000 | 5,141 | ||||||
NY Society for Relief of Ruptured & Crippled Maintaining Hospital Special Surgery | 135,000 | 130,337 | ||||||
NYU Langone Hospitals | 25,000 | 26,718 | ||||||
O’Reilly Automotive, Inc. | 25,000 | 27,609 | ||||||
3.90%, 6/1/29 | 13,000 | 14,782 | ||||||
Office Properties Income Trust | 25,000 | 26,697 | ||||||
Omega Healthcare Investors, Inc. | 18,000 | 20,226 | ||||||
4.75%, 1/15/28 | 23,000 | 26,123 | ||||||
3.63%, 10/1/29 | 49,000 | 52,369 | ||||||
Oncor Electric Delivery Co. LLC | 25,000 | 24,540 | ||||||
5.75%, 3/15/29 | 34,000 | 43,037 | ||||||
ONEOK, Inc. | 18,000 | 18,887 | ||||||
4.00%, 7/13/27 | 18,000 | 19,997 | ||||||
4.55%, 7/15/28 | 78,000 | 89,241 | ||||||
Oracle Corp. | 50,000 | 51,221 | ||||||
2.63%, 2/15/23 | 15,000 | 15,461 | ||||||
3.63%, 7/15/23 | 23,000 | 24,357 | ||||||
2.40%, 9/15/23 | 50,000 | 51,822 | ||||||
2.50%, 4/1/25 | 50,000 | 52,474 | ||||||
2.65%, 7/15/26 | 161,000 | 170,591 | ||||||
3.25%, 11/15/27 | 17,000 | 18,571 | ||||||
2.30%, 3/25/28 | 150,000 | 154,939 | ||||||
2.95%, 4/1/30 | 91,000 | 96,708 | ||||||
5.38%, 7/15/40 | 10,000 | 12,981 | ||||||
4.50%, 7/8/44 | 40,000 | 47,408 | ||||||
4.00%, 11/15/47 | 28,000 | 30,855 | ||||||
4.38%, 5/15/55 | 75,000 | 88,161 | ||||||
Orlando Health Obligated Group | 128,000 | 139,579 | ||||||
Owens Corning | 23,000 | 27,197 | ||||||
Pacific Gas and Electric Co. | 145,000 | 150,185 | ||||||
2.95%, 3/1/26 | 20,000 | 20,317 | ||||||
2.10%, 8/1/27 | 20,000 | 19,387 | ||||||
2.50%, 2/1/31 | 175,000 | 165,480 | ||||||
4.50%, 7/1/40 | 25,000 | 25,420 | ||||||
3.50%, 8/1/50 | 80,000 | 72,284 | ||||||
PacifiCorp | 50,000 | 59,257 | ||||||
Packaging Corp. of America | 43,000 | 46,259 | ||||||
3.40%, 12/15/27 | 25,000 | 27,569 | ||||||
Parker-Hannifin Corp. | 5,000 | 5,159 | ||||||
3.30%, 11/21/24 | 18,000 | 19,337 | ||||||
3.25%, 6/14/29 | 13,000 | 14,146 | ||||||
6.25%, 5/15/38 | 15,000 | 21,306 | ||||||
PayPal Holdings, Inc. | 50,000 | 51,046 | ||||||
1.65%, 6/1/25 | 100,000 | 103,000 | ||||||
PeaceHealth Obligated Group | 50,000 | 68,679 | ||||||
PECO Energy Co. | 20,000 | 24,103 | ||||||
2.80%, 6/15/50 | 175,000 | 177,285 | ||||||
People’s United Financial, Inc. | 155,000 | 160,044 | ||||||
PepsiCo, Inc. | 40,000 | 42,849 | ||||||
2.63%, 3/19/27 | 25,000 | 26,932 | ||||||
3.00%, 10/15/27 | 53,000 | 58,510 | ||||||
2.75%, 3/19/30 | 30,000 | 32,541 | ||||||
4.25%, 10/22/44 | 23,000 | 28,905 | ||||||
3.38%, 7/29/49 | 20,000 | 22,704 | ||||||
Pfizer, Inc. | 18,000 | 19,097 | ||||||
3.00%, 12/15/26 | 10,000 | 11,013 | ||||||
7.20%, 3/15/39 | 89,000 | 146,110 | ||||||
4.30%, 6/15/43 | 5,000 | 6,318 | ||||||
See Notes to Financial Statements.
| WisdomTree Trust | 65 |
Table of Contents
Schedule of Investments (continued)
WisdomTree Interest Rate Hedged U.S. Aggregate Bond Fund (AGZD)
August 31, 2021
| Investments | Principal Amount | Value | ||||||
Philip Morris International, Inc. | $ | 21,000 | $ | 22,689 | ||||
2.10%, 5/1/30 | 100,000 | 101,128 | ||||||
4.88%, 11/15/43 | 32,000 | 40,249 | ||||||
Phillips 66 | 11,000 | 12,328 | ||||||
5.88%, 5/1/42 | 40,000 | 55,156 | ||||||
Piedmont Natural Gas Co., Inc. | 25,000 | 25,618 | ||||||
Plains All American Pipeline L.P. | 39,500 | 40,125 | ||||||
4.50%, 12/15/26 | 15,000 | 16,847 | ||||||
6.65%, 1/15/37 | 48,000 | 63,609 | ||||||
PNC Financial Services Group, Inc. (The) 3.90%, 4/29/24 | 78,000 | 84,410 | ||||||
3.45%, 4/23/29 | 50,000 | 55,865 | ||||||
2.55%, 1/22/30 | 10,000 | 10,522 | ||||||
Procter & Gamble Co. (The) | 105,000 | 114,292 | ||||||
3.00%, 3/25/30 | 50,000 | 55,539 | ||||||
Progressive Corp. (The) | 25,000 | 30,931 | ||||||
Prologis L.P. | 25,000 | 25,794 | ||||||
1.25%, 10/15/30(b) | 60,000 | 57,183 | ||||||
4.38%, 9/15/48 | 5,000 | 6,502 | ||||||
Prudential Financial, Inc. | 5,000 | 6,938 | ||||||
6.63%, 12/1/37 | 19,000 | 28,255 | ||||||
5.88%, 9/15/42, (5.875% fixed rate until 9/15/22; 3-month U.S. dollar London Interbank Offered Rate + 4.175% thereafter)(c) | 5,000 | 5,253 | ||||||
4.60%, 5/15/44 | 5,000 | 6,455 | ||||||
5.38%, 5/15/45, (5.375% fixed rate until 5/15/25; 3-month U.S. dollar London Interbank Offered Rate + 3.031% thereafter)(c) | 5,000 | 5,559 | ||||||
5.70%, 9/15/48, (5.70% fixed rate until 9/15/28; 3-month U.S. dollar London Interbank Offered Rate + 2.665% thereafter)(b)(c) | 5,000 | 5,892 | ||||||
3.94%, 12/7/49 | 20,000 | 23,976 | ||||||
4.35%, 2/25/50 | 20,000 | 25,651 | ||||||
PSEG Power LLC | 5,000 | 5,279 | ||||||
Public Service Co. of Colorado | 90,000 | 102,938 | ||||||
4.30%, 3/15/44 | 29,000 | 35,781 | ||||||
Public Service Electric & Gas Co. | 43,000 | 44,315 | ||||||
3.00%, 5/15/27 | 19,000 | 20,700 | ||||||
3.95%, 5/1/42 | 30,000 | 36,004 | ||||||
3.60%, 12/1/47 | 125,000 | 144,320 | ||||||
Public Service Enterprise Group, Inc. | 25,000 | 26,446 | ||||||
PVH Corp. | 25,000 | 27,821 | ||||||
QUALCOMM, Inc. | 10,000 | 10,317 | ||||||
2.90%, 5/20/24 | 22,000 | 23,355 | ||||||
1.65%, 5/20/32 | 30,000 | 29,013 | ||||||
3.25%, 5/20/50(b) | 20,000 | 22,047 | ||||||
Raymond James Financial, Inc. | 25,000 | 30,064 | ||||||
Raytheon Technologies Corp. | 25,000 | 27,724 | ||||||
3.50%, 3/15/27 | 50,000 | 55,291 | ||||||
5.70%, 4/15/40 | 25,000 | 34,995 | ||||||
4.50%, 6/1/42 | 100,000 | 125,051 | ||||||
4.80%, 12/15/43 | 10,000 | 12,861 | ||||||
3.75%, 11/1/46 | 48,000 | 54,676 | ||||||
4.35%, 4/15/47 | 30,000 | 37,145 | ||||||
Realty Income Corp. | 5,000 | 5,417 | ||||||
Regeneron Pharmaceuticals, Inc. | 80,000 | 75,969 | ||||||
Reliance Steel & Aluminum Co. | 25,000 | 25,106 | ||||||
Rockwell Automation, Inc. | 35,000 | 44,708 | ||||||
Roper Technologies, Inc. | 15,000 | 15,705 | ||||||
3.80%, 12/15/26 | 30,000 | 33,585 | ||||||
1.40%, 9/15/27 | 25,000 | 24,925 | ||||||
RWJ Barnabas Health, Inc. | 24,000 | 29,077 | ||||||
Ryder System, Inc. | 100,000 | 101,963 | ||||||
3.75%, 6/9/23 | 23,000 | 24,265 | ||||||
Sabine Pass Liquefaction LLC | 25,000 | 29,556 | ||||||
5.00%, 3/15/27 | 25,000 | 28,936 | ||||||
4.20%, 3/15/28 | 25,000 | 28,110 | ||||||
Sabra Health Care L.P. | 18,000 | 20,319 | ||||||
salesforce.com, Inc. | 25,000 | 28,450 | ||||||
San Diego Gas & Electric Co. | 50,000 | 48,779 | ||||||
Santander Holdings USA, Inc. | 88,000 | 99,370 | ||||||
Sempra Energy | 5,000 | 5,098 | ||||||
4.05%, 12/1/23 | 55,000 | 58,827 | ||||||
3.55%, 6/15/24 | 25,000 | 26,757 | ||||||
3.25%, 6/15/27 | 46,000 | 50,100 | ||||||
Sherwin-Williams Co. (The) | 10,000 | 10,763 | ||||||
4.00%, 12/15/42 | 55,000 | 64,305 | ||||||
4.50%, 6/1/47 | 5,000 | 6,299 | ||||||
3.80%, 8/15/49 | 20,000 | 23,169 | ||||||
Shire Acquisitions Investments Ireland DAC 2.88%, 9/23/23 | 15,000 | 15,663 | ||||||
3.20%, 9/23/26 | 110,000 | 119,447 | ||||||
See Notes to Financial Statements.
| 66 | WisdomTree Trust |
Table of Contents
Schedule of Investments (continued)
WisdomTree Interest Rate Hedged U.S. Aggregate Bond Fund (AGZD)
August 31, 2021
| Investments | Principal Amount | Value | ||||||
Simon Property Group L.P. | $ | 5,000 | $ | 5,141 | ||||
3.75%, 2/1/24 | 5,000 | 5,347 | ||||||
3.30%, 1/15/26 | 5,000 | 5,425 | ||||||
3.25%, 11/30/26 | 23,000 | 25,144 | ||||||
3.38%, 6/15/27 | 100,000 | 109,991 | ||||||
2.45%, 9/13/29 | 25,000 | 25,843 | ||||||
SITE Centers Corp. | 68,000 | 76,620 | ||||||
Southern California Edison Co. | 100,000 | 100,089 | ||||||
4.65%, 10/1/43 | 124,000 | 142,844 | ||||||
4.88%, 3/1/49, Series B | 8,000 | 9,598 | ||||||
3.65%, 2/1/50 | 20,000 | 20,423 | ||||||
Southern California Gas Co. | 5,000 | 6,092 | ||||||
Southern Co. (The) | 10,000 | 10,418 | ||||||
3.25%, 7/1/26 | 67,000 | 72,637 | ||||||
Southern Co. Gas Capital Corp. | 5,000 | 6,025 | ||||||
Southern Power Co. | 19,000 | 23,744 | ||||||
Southwest Airlines Co. | 45,000 | 48,077 | ||||||
5.13%, 6/15/27 | 50,000 | 58,547 | ||||||
Southwest Gas Corp. | 50,000 | 55,336 | ||||||
Spectra Energy Partners L.P. | 18,000 | 19,637 | ||||||
3.50%, 3/15/25 | 5,000 | 5,386 | ||||||
Stanford Health Care | 18,000 | 21,758 | ||||||
Starbucks Corp. | 5,000 | 5,195 | ||||||
2.45%, 6/15/26 | 5,000 | 5,299 | ||||||
2.00%, 3/12/27 | 70,000 | 72,407 | ||||||
4.00%, 11/15/28 | 5,000 | 5,778 | ||||||
4.30%, 6/15/45 | 25,000 | 30,313 | ||||||
3.50%, 11/15/50 | 75,000 | 82,388 | ||||||
State Street Corp. | 48,000 | 50,264 | ||||||
2.35%, 11/1/25, (2.354% fixed rate until 11/1/24; Secured Overnight Financing Rate + 0.94% thereafter)(c) | 50,000 | 52,570 | ||||||
4.14%, 12/3/29, (4.141% fixed rate until 12/3/28; 3-month U.S. dollar London Interbank Offered Rate + 1.03% thereafter)(c) | 50,000 | 58,784 | ||||||
2.40%, 1/24/30(b) | 62,000 | 65,352 | ||||||
Steel Dynamics, Inc. | 90,000 | 98,718 | ||||||
Stryker Corp. | 5,000 | 5,350 | ||||||
Sutter Health | 95,000 | 101,522 | ||||||
Synchrony Financial | 5,000 | 5,482 | ||||||
5.15%, 3/19/29 | 100,000 | 118,880 | ||||||
Synovus Financial Corp. | 5,000 | 5,123 | ||||||
Sysco Corp. | 45,000 | 51,929 | ||||||
3.30%, 7/15/26 | 73,000 | 79,403 | ||||||
T-Mobile USA, Inc. | 90,000 | 97,332 | ||||||
3.75%, 4/15/27 | 20,000 | 22,203 | ||||||
4.50%, 4/15/50 | 20,000 | 24,034 | ||||||
Tampa Electric Co. | 18,000 | 22,591 | ||||||
Tapestry, Inc. | 55,000 | 60,295 | ||||||
Target Corp. | 135,000 | 145,140 | ||||||
4.00%, 7/1/42 | 60,000 | 75,565 | ||||||
TC PipeLines L.P. | 44,000 | 48,393 | ||||||
TD Ameritrade Holding Corp. | 10,000 | 10,114 | ||||||
Teledyne FLIR LLC | 25,000 | 25,634 | ||||||
Texas Instruments, Inc. | 27,000 | 29,570 | ||||||
4.15%, 5/15/48 | 14,000 | 17,765 | ||||||
Thermo Fisher Scientific, Inc. | 75,000 | 89,715 | ||||||
Time Warner Cable LLC | 80,500 | 112,886 | ||||||
5.50%, 9/1/41 | 7,000 | 8,772 | ||||||
4.50%, 9/15/42 | 10,000 | 11,240 | ||||||
TJX Cos., Inc. (The) | 25,000 | 28,892 | ||||||
Toyota Motor Credit Corp. | 100,000 | 100,168 | ||||||
1.35%, 8/25/23 | 40,000 | 40,788 | ||||||
0.45%, 1/11/24 | 32,000 | 31,989 | ||||||
2.90%, 4/17/24 | 5,000 | 5,305 | ||||||
3.05%, 1/11/28 | 15,000 | 16,493 | ||||||
2.15%, 2/13/30 | 50,000 | 51,706 | ||||||
1.65%, 1/10/31(b) | 30,000 | 29,780 | ||||||
Trane Technologies Global Holding Co., Ltd. 3.75%, 8/21/28 | 45,000 | 50,677 | ||||||
Trane Technologies Luxembourg Finance S.A. | 50,000 | 53,958 | ||||||
Transcontinental Gas Pipe Line Co. LLC | 15,000 | 17,925 | ||||||
Travelers Cos., Inc. (The) | 30,000 | 44,372 | ||||||
3.75%, 5/15/46 | 25,000 | 29,640 | ||||||
4.00%, 5/30/47 | 48,000 | 59,116 | ||||||
2.55%, 4/27/50 | 20,000 | 19,617 | ||||||
Trimble, Inc. | 5,000 | 5,286 | ||||||
See Notes to Financial Statements.
| WisdomTree Trust | 67 |
Table of Contents
Schedule of Investments (continued)
WisdomTree Interest Rate Hedged U.S. Aggregate Bond Fund (AGZD)
August 31, 2021
| Investments | Principal Amount | Value | ||||||
Trinity Health Corp. | $ | 40,000 | $ | 40,061 | ||||
Truist Bank | 25,000 | 28,079 | ||||||
Truist Financial Corp. | 144,000 | 153,809 | ||||||
1.13%, 8/3/27 | 15,000 | 14,815 | ||||||
TWDC Enterprises 18 Corp. | 15,000 | 16,250 | ||||||
2.95%, 6/15/27(b) | 23,000 | 25,212 | ||||||
3.70%, 12/1/42 | 5,000 | 5,757 | ||||||
3.00%, 7/30/46(b) | 48,000 | 50,051 | ||||||
Tyson Foods, Inc. | 50,000 | 62,807 | ||||||
U.S. Bancorp | 25,000 | 27,174 | ||||||
1.45%, 5/12/25 | 25,000 | 25,591 | ||||||
2.38%, 7/22/26, Series V | 125,000 | 133,045 | ||||||
3.90%, 4/26/28 | 78,000 | 90,035 | ||||||
1.38%, 7/22/30 | 11,000 | 10,665 | ||||||
UDR, Inc. | 25,000 | 24,435 | ||||||
Union Electric Co. | 18,000 | 19,537 | ||||||
Union Pacific Corp. | 52,000 | 54,784 | ||||||
3.75%, 7/15/25 | 5,000 | 5,524 | ||||||
3.25%, 8/15/25 | 5,000 | 5,427 | ||||||
2.75%, 3/1/26 | 5,000 | 5,357 | ||||||
4.00%, 4/15/47 | 19,000 | 22,463 | ||||||
3.84%, 3/20/60 | 108,000 | 125,686 | ||||||
3.75%, 2/5/70 | 25,000 | 28,547 | ||||||
3.80%, 4/6/71(d) | 5,000 | 5,754 | ||||||
United Airlines Pass Through Trust | 16,324 | 17,555 | ||||||
United Parcel Service, Inc. | 5,000 | 5,120 | ||||||
2.40%, 11/15/26 | 5,000 | 5,334 | ||||||
3.05%, 11/15/27 | 53,000 | 58,854 | ||||||
6.20%, 1/15/38 | 15,000 | 22,343 | ||||||
3.40%, 11/15/46 | 5,000 | 5,693 | ||||||
UnitedHealth Group, Inc. | 5,000 | 5,152 | ||||||
3.70%, 12/15/25 | 90,000 | 100,354 | ||||||
3.10%, 3/15/26 | 34,000 | 37,166 | ||||||
3.88%, 12/15/28 | 18,000 | 20,775 | ||||||
5.80%, 3/15/36 | 25,000 | 35,436 | ||||||
3.95%, 10/15/42 | 5,000 | 6,005 | ||||||
4.75%, 7/15/45 | 100,000 | 133,498 | ||||||
3.75%, 10/15/47 | 15,000 | 17,555 | ||||||
University of Southern California | 24,000 | 26,124 | ||||||
3.84%, 10/1/47, Series 2017 | 120,000 | 148,846 | ||||||
Utah Acquisition Sub, Inc. | 40,000 | 44,344 | ||||||
Valero Energy Corp. | 29,000 | 29,974 | ||||||
3.40%, 9/15/26 | 50,000 | 53,897 | ||||||
Valero Energy Partners L.P. | 58,000 | 65,524 | ||||||
Ventas Realty L.P. | 14,000 | 16,706 | ||||||
4.38%, 2/1/45 | 24,000 | 28,085 | ||||||
VEREIT Operating Partnership L.P. | 18,000 | 19,507 | ||||||
3.95%, 8/15/27 | 5,000 | 5,660 | ||||||
Verisk Analytics, Inc. | 147,000 | 168,444 | ||||||
Verizon Communications, Inc. | 20,000 | 20,085 | ||||||
3.38%, 2/15/25 | 10,000 | 10,837 | ||||||
0.85%, 11/20/25 | 10,000 | 9,927 | ||||||
4.33%, 9/21/28 | 25,000 | 29,183 | ||||||
4.02%, 12/3/29 | 20,000 | 23,045 | ||||||
1.68%, 10/30/30 | 76,000 | 73,413 | ||||||
2.65%, 11/20/40 | 70,000 | 67,877 | ||||||
3.40%, 3/22/41 | 150,000 | 160,738 | ||||||
6.55%, 9/15/43 | 8,000 | 12,838 | ||||||
4.86%, 8/21/46 | 50,000 | 65,297 | ||||||
4.52%, 9/15/48 | 20,000 | 25,208 | ||||||
5.01%, 4/15/49 | 23,000 | 30,792 | ||||||
2.88%, 11/20/50 | 85,000 | 81,848 | ||||||
2.99%, 10/30/56 | 11,000 | 10,627 | ||||||
3.00%, 11/20/60 | 15,000 | 14,463 | ||||||
3.70%, 3/22/61 | 107,000 | 117,663 | ||||||
ViacomCBS, Inc. | 5,000 | 5,503 | ||||||
6.88%, 4/30/36 | 5,000 | 7,233 | ||||||
4.90%, 8/15/44 | 5,000 | 6,173 | ||||||
4.60%, 1/15/45 | 50,000 | 60,369 | ||||||
4.95%, 5/19/50(b) | 20,000 | 25,481 | ||||||
Viatris, Inc. | 10,000 | 10,233 | ||||||
3.85%, 6/22/40(d) | 30,000 | 32,525 | ||||||
4.00%, 6/22/50(d) | 60,000 | 65,374 | ||||||
Virginia Electric & Power Co. | 15,000 | 27,005 | ||||||
Visa, Inc. | 50,000 | 51,458 | ||||||
1.90%, 4/15/27(b) | 34,000 | 35,366 | ||||||
2.75%, 9/15/27 | 22,000 | 23,937 | ||||||
3.65%, 9/15/47 | 65,000 | 76,759 | ||||||
VMware, Inc. | 25,000 | 27,936 | ||||||
Vulcan Materials Co. | 18,000 | 20,042 | ||||||
Wachovia Corp. | 5,000 | 6,547 | ||||||
Walgreens Boots Alliance, Inc. | 128,000 | 139,036 | ||||||
Walmart, Inc. | 69,000 | 75,984 | ||||||
3.70%, 6/26/28 | 15,000 | 17,143 | ||||||
5.25%, 9/1/35 | 50,000 | 68,987 | ||||||
6.50%, 8/15/37 | 48,000 | 73,360 | ||||||
4.05%, 6/29/48 | 65,000 | 82,499 | ||||||
See Notes to Financial Statements.
| 68 | WisdomTree Trust |
Table of Contents
Schedule of Investments (continued)
WisdomTree Interest Rate Hedged U.S. Aggregate Bond Fund (AGZD)
August 31, 2021
| Investments | Principal Amount | Value | ||||||
Walt Disney Co. (The) | $ | 50,000 | $ | 54,359 | ||||
2.20%, 1/13/28 | 75,000 | 78,265 | ||||||
2.65%, 1/13/31(b) | 10,000 | 10,644 | ||||||
6.40%, 12/15/35 | 4,000 | 5,913 | ||||||
6.65%, 11/15/37 | 20,000 | 30,576 | ||||||
3.50%, 5/13/40 | 60,000 | 67,504 | ||||||
4.95%, 10/15/45 | 5,000 | 6,768 | ||||||
3.80%, 5/13/60 | 15,000 | 17,945 | ||||||
Wells Fargo & Co. | 10,000 | 10,443 | ||||||
4.13%, 8/15/23 | 69,000 | 73,824 | ||||||
3.00%, 4/22/26 | 125,000 | 135,431 | ||||||
3.58%, 5/22/28, (3.584% fixed rate until 5/22/27; 3-month U.S. dollar London Interbank Offered Rate + 1.31% thereafter)(c) | 139,000 | 154,275 | ||||||
2.39%, 6/2/28, (2.393% fixed rate until 6/2/27; Secured Overnight Financing Rate + 2.10% thereafter)(c) | 115,000 | 119,931 | ||||||
4.15%, 1/24/29 | 10,000 | 11,517 | ||||||
4.48%, 4/4/31, (4.478% fixed rate until 4/4/30; Secured Overnight Financing Rate + 4.032% thereafter)(c) | 50,000 | 59,393 | ||||||
3.07%, 4/30/41, (3.068% fixed rate until 4/30/40; Secured Overnight Financing Rate + 2.53% thereafter)(c) | 15,000 | 15,774 | ||||||
5.38%, 11/2/43 | 47,000 | 63,485 | ||||||
4.75%, 12/7/46 | 96,000 | 122,606 | ||||||
5.01%, 4/4/51, (5.013% fixed rate until 4/4/50; Secured Overnight Financing Rate + 4.502% thereafter)(c) | 105,000 | 146,336 | ||||||
Welltower, Inc. | 23,000 | 25,857 | ||||||
4.25%, 4/15/28 | 15,000 | 17,253 | ||||||
Western Union Co. (The) | 55,000 | 58,320 | ||||||
2.75%, 3/15/31 | 250,000 | 253,132 | ||||||
Westinghouse Air Brake Technologies Corp. | 50,000 | 53,768 | ||||||
Westlake Chemical Corp. | 10,000 | 12,828 | ||||||
WestRock MWV LLC | 14,000 | 20,077 | ||||||
Whirlpool Corp. | 30,000 | 36,820 | ||||||
Williams Cos., Inc. (The) | 10,000 | 11,112 | ||||||
7.50%, 1/15/31, Series A | 50,000 | 70,170 | ||||||
6.30%, 4/15/40 | 10,000 | 13,743 | ||||||
5.75%, 6/24/44 | 50,000 | 66,806 | ||||||
Wisconsin Public Service Corp. | 38,000 | 44,200 | ||||||
WRKCo, Inc. | 45,000 | 49,027 | ||||||
4.65%, 3/15/26 | 25,000 | 28,514 | ||||||
WW Grainger, Inc. | 85,000 | 99,891 | ||||||
Wyeth LLC | 10,000 | 14,376 | ||||||
Xilinx, Inc. | 73,000 | 77,130 | ||||||
Xylem, Inc. | 5,000 | 5,480 | ||||||
Zimmer Biomet Holdings, Inc. | 5,000 | 5,059 | ||||||
3.55%, 4/1/25 | 60,000 | 64,888 | ||||||
Zoetis, Inc. | 25,000 | 32,558 | ||||||
TOTAL U.S. CORPORATE BONDS (Cost: $46,956,961) |
| 49,528,882 | ||||||
| FOREIGN CORPORATE BONDS – 3.4% |
| |||||||
| Australia – 0.1% |
| |||||||
BHP Billiton Finance USA Ltd. | 23,000 | 31,824 | ||||||
Westpac Banking Corp. | 50,000 | 51,728 | ||||||
3.35%, 3/8/27 | 23,000 | 25,558 | ||||||
4.32%, 11/23/31, (4.322% fixed rate until 11/23/26; 5-year U.S. dollar ICE Swap Rate + 2.236% thereafter)(c) | 10,000 | 11,126 | ||||||
2.67%, 11/15/35, (2.668% fixed rate until 11/15/30; 5-year Constant Maturity Treasury Rate + 1.75% thereafter)(c) | 30,000 | 29,802 | ||||||
4.42%, 7/24/39(b) | 25,000 | 29,984 | ||||||
|
| |||||||
| Total Australia |
| 180,022 | ||||||
| Belgium – 0.3% |
| |||||||
Anheuser-Busch Cos. LLC | 129,000 | 142,571 | ||||||
4.70%, 2/1/36 | 25,000 | 30,885 | ||||||
Anheuser-Busch InBev Finance, Inc. | 128,000 | 145,568 | ||||||
Anheuser-Busch InBev Worldwide, Inc. | 90,000 | 110,954 | ||||||
4.60%, 4/15/48 | 119,000 | 146,999 | ||||||
4.44%, 10/6/48 | 19,000 | 22,979 | ||||||
|
| |||||||
| Total Belgium |
| 599,956 | ||||||
| Bermuda – 0.0% |
| |||||||
Aspen Insurance Holdings Ltd. | 18,000 | 19,513 | ||||||
| Brazil – 0.0% |
| |||||||
Vale Overseas Ltd. | 10,000 | 14,064 | ||||||
| Canada – 0.8% |
| |||||||
Bank of Montreal | 44,000 | 44,979 | ||||||
3.30%, 2/5/24, Series E | 40,000 | 42,680 | ||||||
3.80%, 12/15/32, (3.803% fixed rate until 12/15/27; 5-year U.S. dollar Swap Rate + 1.432% thereafter)(c) | 49,000 | 54,229 | ||||||
Bank of Nova Scotia (The) | 48,000 | 49,133 | ||||||
2.00%, 11/15/22 | 50,000 | 51,061 | ||||||
1.63%, 5/1/23 | 40,000 | 40,893 | ||||||
See Notes to Financial Statements.
| WisdomTree Trust | 69 |
Table of Contents
Schedule of Investments (continued)
WisdomTree Interest Rate Hedged U.S. Aggregate Bond Fund (AGZD)
August 31, 2021
| Investments | Principal Amount | Value | ||||||
Brookfield Finance, Inc. | $ | 18,000 | $ | 20,265 | ||||
4.85%, 3/29/29 | 25,000 | 29,874 | ||||||
4.70%, 9/20/47 | 50,000 | 62,065 | ||||||
Canadian Imperial Bank of Commerce | 40,000 | 40,377 | ||||||
Canadian National Railway Co. | 25,000 | 26,599 | ||||||
2.75%, 3/1/26 | 100,000 | 107,138 | ||||||
Canadian Natural Resources Ltd. | 50,000 | 53,460 | ||||||
3.85%, 6/1/27 | 25,000 | 27,561 | ||||||
CNOOC Petroleum North America ULC | 65,000 | 81,356 | ||||||
6.40%, 5/15/37 | 25,000 | 33,532 | ||||||
7.50%, 7/30/39 | 63,000 | 96,071 | ||||||
Enbridge, Inc. | 25,000 | 28,224 | ||||||
Kinross Gold Corp. | 55,000 | 63,260 | ||||||
Magna International, Inc. | 5,000 | 5,398 | ||||||
Nutrien Ltd. | 43,000 | 44,000 | ||||||
2.95%, 5/13/30 | 90,000 | 96,284 | ||||||
5.63%, 12/1/40 | 5,000 | 6,973 | ||||||
5.25%, 1/15/45 | 18,000 | 24,309 | ||||||
3.95%, 5/13/50 | 50,000 | 58,825 | ||||||
Rogers Communications, Inc. | 23,000 | 23,745 | ||||||
4.50%, 3/15/43 | 25,000 | 29,393 | ||||||
5.00%, 3/15/44 | 25,000 | 31,463 | ||||||
Royal Bank of Canada | 50,000 | 50,519 | ||||||
2.80%, 4/29/22 | 50,000 | 50,865 | ||||||
3.70%, 10/5/23 | 25,000 | 26,710 | ||||||
2.25%, 11/1/24 | 25,000 | 26,226 | ||||||
TELUS Corp. | 50,000 | 53,681 | ||||||
4.60%, 11/16/48 | 5,000 | 6,464 | ||||||
Toronto-Dominion Bank (The) | 10,000 | 10,076 | ||||||
0.75%, 9/11/25 | 25,000 | 24,823 | ||||||
TransCanada PipeLines Ltd. | 64,000 | 73,596 | ||||||
4.63%, 3/1/34 | 28,000 | 33,126 | ||||||
5.85%, 3/15/36 | 29,000 | 38,435 | ||||||
|
| |||||||
| Total Canada |
| 1,667,668 | ||||||
| China – 0.1% |
| |||||||
Alibaba Group Holding Ltd. | 25,000 | 27,257 | ||||||
Baidu, Inc. | 200,000 | 202,422 | ||||||
|
| |||||||
| Total China |
| 229,679 | ||||||
| France – 0.0% |
| |||||||
Sanofi | 5,000 | 5,721 | ||||||
TotalEnergies Capital International S.A. | 20,000 | 21,969 | ||||||
|
| |||||||
| Total France |
| 27,690 | ||||||
| Germany – 0.1% |
| |||||||
Deutsche Bank AG | 25,000 | 26,758 | ||||||
Deutsche Telekom International Finance B.V. 8.75%, 6/15/30 | 15,000 | 22,579 | ||||||
9.25%, 6/1/32 | 50,000 | 82,200 | ||||||
|
| |||||||
| Total Germany |
| 131,537 | ||||||
| Japan – 0.3% |
| |||||||
Mitsubishi UFJ Financial Group, Inc. | 25,000 | 26,170 | ||||||
3.76%, 7/26/23 | 54,000 | 57,432 | ||||||
3.41%, 3/7/24 | 25,000 | 26,737 | ||||||
3.78%, 3/2/25 | 5,000 | 5,477 | ||||||
3.96%, 3/2/28 | 45,000 | 51,246 | ||||||
3.74%, 3/7/29 | 40,000 | 45,183 | ||||||
4.15%, 3/7/39(b) | 25,000 | 30,093 | ||||||
Sumitomo Mitsui Financial Group, Inc. | 50,000 | 51,427 | ||||||
3.45%, 1/11/27(b) | 25,000 | 27,624 | ||||||
3.35%, 10/18/27 | 23,000 | 25,384 | ||||||
3.20%, 9/17/29 | 50,000 | 53,581 | ||||||
2.14%, 9/23/30 | 155,000 | 152,119 | ||||||
Takeda Pharmaceutical Co., Ltd. | 25,000 | 25,745 | ||||||
|
| |||||||
| Total Japan |
| 578,218 | ||||||
| Netherlands – 0.2% |
| |||||||
Cooperatieve Rabobank UA | 109,000 | 153,750 | ||||||
Shell International Finance B.V. | 47,000 | 49,825 | ||||||
3.25%, 5/11/25 | 100,000 | 108,495 | ||||||
2.38%, 11/7/29 | 100,000 | 104,531 | ||||||
5.50%, 3/25/40 | 27,000 | 37,746 | ||||||
|
| |||||||
| Total Netherlands |
| 454,347 | ||||||
| Norway – 0.2% |
| |||||||
Equinor ASA | 106,000 | 109,144 | ||||||
2.65%, 1/15/24 | 5,000 | 5,247 | ||||||
3.70%, 3/1/24 | 137,000 | 147,712 | ||||||
3.00%, 4/6/27 | 25,000 | 27,148 | ||||||
3.63%, 9/10/28 | 149,000 | 168,759 | ||||||
5.10%, 8/17/40 | 19,000 | 25,595 | ||||||
4.80%, 11/8/43 | 25,000 | 32,940 | ||||||
|
| |||||||
| Total Norway |
| 516,545 | ||||||
| Peru – 0.0% |
| |||||||
Southern Copper Corp. | 5,000 | 7,140 | ||||||
See Notes to Financial Statements.
| 70 | WisdomTree Trust |
Table of Contents
Schedule of Investments (continued)
WisdomTree Interest Rate Hedged U.S. Aggregate Bond Fund (AGZD)
August 31, 2021
| Investments | Principal Amount | Value | ||||||
| Spain – 0.1% |
| |||||||
Telefonica Emisiones S.A. | $ | 9,000 | $ | 13,114 | ||||
Telefonica Europe B.V. | 147,000 | 215,525 | ||||||
|
| |||||||
| Total Spain |
| 228,639 | ||||||
| Switzerland – 0.1% |
| |||||||
Credit Suisse Group AG | 192,000 | 217,642 | ||||||
Novartis Capital Corp. | 60,000 | 65,831 | ||||||
3.70%, 9/21/42 | 15,000 | 17,752 | ||||||
Syngenta Finance N.V. | 19,000 | 19,249 | ||||||
|
| |||||||
| Total Switzerland |
| 320,474 | ||||||
| United Kingdom – 1.1% |
| |||||||
AstraZeneca PLC | 15,000 | 16,444 | ||||||
4.00%, 1/17/29 | 25,000 | 28,881 | ||||||
4.38%, 11/16/45 | 50,000 | 64,671 | ||||||
Barclays PLC | ||||||||
4.34%, 5/16/24, (4.338% fixed rate until 5/16/23; 3-month U.S. dollar London Interbank Offered Rate + 1.356% thereafter)(c) | 200,000 | 212,306 | ||||||
BAT Capital Corp. | 150,000 | 159,237 | ||||||
3.22%, 9/6/26 | 25,000 | 26,727 | ||||||
4.39%, 8/15/37 | 50,000 | 54,474 | ||||||
BP Capital Markets PLC | 95,000 | 103,025 | ||||||
3.28%, 9/19/27(b) | 24,000 | 26,508 | ||||||
3.72%, 11/28/28 | 45,000 | 50,748 | ||||||
British Telecommunications PLC | 124,000 | 191,759 | ||||||
CNH Industrial N.V. | 20,000 | 21,453 | ||||||
Diageo Capital PLC | 30,000 | 30,340 | ||||||
GlaxoSmithKline Capital, Inc. | 100,000 | 103,886 | ||||||
3.38%, 5/15/23 | 19,000 | 19,993 | ||||||
HSBC Holdings PLC | 25,000 | 27,808 | ||||||
4.95%, 3/31/30 | 175,000 | 211,745 | ||||||
7.63%, 5/17/32 | 64,000 | 90,871 | ||||||
6.80%, 6/1/38 | 100,000 | 144,520 | ||||||
Lloyds Banking Group PLC | ||||||||
1.63%, 5/11/27, (1.627% fixed rate until 5/11/26; 1-year Constant Maturity Treasury Rate + 0.85% thereafter)(c) | 200,000 | 200,976 | ||||||
3.57%, 11/7/28, (3.574% fixed rate until 11/7/27; 3-month U.S. dollar London Interbank Offered Rate + 1.205% thereafter)(c) | 50,000 | 54,944 | ||||||
Reynolds American, Inc. | 23,000 | 31,571 | ||||||
5.85%, 8/15/45 | 10,000 | 12,404 | ||||||
Santander UK Group Holdings PLC | ||||||||
1.09%, 3/15/25, (1.089% fixed rate until 3/15/24; Secured Overnight Financing Rate + 0.787% thereafter)(c) | 250,000 | 250,950 | ||||||
Unilever Capital Corp. | 5,000 | 6,918 | ||||||
Vodafone Group PLC | 50,000 | 55,694 | ||||||
4.38%, 2/19/43 | 34,000 | 40,429 | ||||||
5.25%, 5/30/48 | 30,000 | 40,011 | ||||||
|
| |||||||
| Total United Kingdom |
| 2,279,293 | ||||||
TOTAL FOREIGN CORPORATE BONDS (Cost: $6,962,006) |
| 7,254,785 | ||||||
| FOREIGN GOVERNMENT AGENCIES – 0.7% |
| |||||||
| Canada – 0.3% |
| |||||||
Export Development Canada | 10,000 | 10,325 | ||||||
1.38%, 2/24/23 | 50,000 | 50,891 | ||||||
2.75%, 3/15/23 | 30,000 | 31,175 | ||||||
Province of Alberta Canada | 95,000 | 107,107 | ||||||
Province of British Columbia Canada | 110,000 | 112,283 | ||||||
2.25%, 6/2/26 | 25,000 | 26,650 | ||||||
Province of New Brunswick Canada | 20,000 | 23,013 | ||||||
Province of Ontario Canada | 110,000 | 118,068 | ||||||
Province of Quebec Canada | 9,000 | 9,315 | ||||||
2.88%, 10/16/24, Series QO | 55,000 | 59,010 | ||||||
1.50%, 2/11/25, Series QX | 20,000 | 20,591 | ||||||
2.50%, 4/20/26 | 50,000 | 53,809 | ||||||
7.50%, 9/15/29, Series PD | 31,000 | 44,992 | ||||||
|
| |||||||
| Total Canada |
| 667,229 | ||||||
| Germany – 0.4% |
| |||||||
Kreditanstalt fuer Wiederaufbau | 133,000 | 136,608 | ||||||
2.63%, 2/28/24 | 225,000 | 237,659 | ||||||
2.50%, 11/20/24 | 33,000 | 35,103 | ||||||
0.63%, 1/22/26 | 100,000 | 99,559 | ||||||
2.88%, 4/3/28 | 40,000 | 44,605 | ||||||
Landwirtschaftliche Rentenbank | 90,000 | 94,020 | ||||||
0.88%, 9/3/30 | 105,000 | 100,965 | ||||||
|
| |||||||
| Total Germany |
| 748,519 | ||||||
TOTAL FOREIGN GOVERNMENT AGENCIES (Cost: $1,395,786) |
| 1,415,748 | ||||||
| FOREIGN GOVERNMENT OBLIGATIONS – 1.0% |
| |||||||
| Canada – 0.0% |
| |||||||
Canada Government International Bond | 20,000 | 20,447 | ||||||
See Notes to Financial Statements.
| WisdomTree Trust | 71 |
Table of Contents
Schedule of Investments (continued)
WisdomTree Interest Rate Hedged U.S. Aggregate Bond Fund (AGZD)
August 31, 2021
| Investments | Principal Amount | Value | ||||||
| Hungary – 0.0% |
| |||||||
Hungary Government International Bond 5.38%, 2/21/23 | $ | 50,000 | $ | 53,667 | ||||
5.38%, 3/25/24 | 18,000 | 20,173 | ||||||
|
| |||||||
| Total Hungary |
| 73,840 | ||||||
| Indonesia – 0.1% |
| |||||||
Indonesia Government International Bond | 165,000 | 172,707 | ||||||
| Italy – 0.1% |
| |||||||
Republic of Italy Government International Bond | 136,000 | 174,854 | ||||||
| Mexico – 0.1% |
| |||||||
Mexico Government International Bond 4.00%, 10/2/23 | 31,000 | 33,391 | ||||||
6.75%, 9/27/34, Series MTNA | 25,000 | 33,879 | ||||||
5.75%, 10/12/2110 | 168,000 | 205,506 | ||||||
|
| |||||||
| Total Mexico |
| 272,776 | ||||||
| Panama – 0.2% |
| |||||||
Panama Government International Bond 8.88%, 9/30/27 | 219,000 | 303,503 | ||||||
6.70%, 1/26/36 | 50,000 | 68,728 | ||||||
|
| |||||||
| Total Panama |
| 372,231 | ||||||
| Peru – 0.1% |
| |||||||
Peruvian Government International Bond 4.13%, 8/25/27 | 144,000 | 162,323 | ||||||
2.78%, 1/23/31 | 50,000 | 51,182 | ||||||
8.75%, 11/21/33 | 25,000 | 39,428 | ||||||
5.63%, 11/18/50 | 50,000 | 69,769 | ||||||
|
| |||||||
| Total Peru |
| 322,702 | ||||||
| Philippines – 0.2% |
| |||||||
Philippine Government International Bond 7.75%, 1/14/31 | 100,000 | 148,366 | ||||||
3.95%, 1/20/40 | 200,000 | 228,130 | ||||||
|
| |||||||
| Total Philippines |
| 376,496 | ||||||
| Poland – 0.1% |
| |||||||
Republic of Poland Government International Bond | 99,000 | 103,177 | ||||||
3.25%, 4/6/26 | 72,000 | 79,481 | ||||||
|
| |||||||
| Total Poland |
| 182,658 | ||||||
| Uruguay – 0.1% |
| |||||||
Uruguay Government International Bond 5.10%, 6/18/50 | 53,000 | 70,966 | ||||||
4.98%, 4/20/55 | 124,000 | 163,746 | ||||||
|
| |||||||
| Total Uruguay |
| 234,712 | ||||||
TOTAL FOREIGN GOVERNMENT OBLIGATIONS (Cost: $2,095,091) |
| 2,203,423 | ||||||
| SUPRANATIONAL BONDS – 1.5% |
| |||||||
Asian Development Bank | 9,000 | 9,358 | ||||||
1.50%, 10/18/24 | 275,000 | 283,673 | ||||||
2.00%, 1/22/25 | 5,000 | 5,246 | ||||||
0.63%, 4/29/25 | 150,000 | 150,198 | ||||||
0.50%, 2/4/26 | 300,000 | 296,862 | ||||||
2.50%, 11/2/27 | 20,000 | 21,779 | ||||||
Asian Infrastructure Investment Bank (The) | 200,000 | 209,870 | ||||||
Corporacion Andina de Fomento | 50,000 | 50,641 | ||||||
European Investment Bank | 14,000 | 14,162 | ||||||
2.50%, 3/15/23 | 291,000 | 301,403 | ||||||
0.25%, 9/15/23 | 250,000 | 249,993 | ||||||
3.25%, 1/29/24 | 14,000 | 14,977 | ||||||
0.38%, 12/15/25 | 15,000 | 14,804 | ||||||
2.13%, 4/13/26 | 25,000 | 26,566 | ||||||
2.38%, 5/24/27 | 94,000 | 101,547 | ||||||
4.88%, 2/15/36 | 25,000 | 35,213 | ||||||
Inter-American Development Bank | 141,000 | 143,360 | ||||||
2.50%, 1/18/23 | 9,000 | 9,292 | ||||||
1.75%, 3/14/25 | 65,000 | 67,683 | ||||||
0.63%, 7/15/25 | 200,000 | 200,006 | ||||||
3.88%, 10/28/41 | 80,000 | 104,885 | ||||||
3.20%, 8/7/42 | 25,000 | 29,752 | ||||||
International Bank for Reconstruction & Development | 5,000 | 5,142 | ||||||
2.50%, 11/25/24, Series GDIF | 114,000 | 121,321 | ||||||
2.13%, 3/3/25, Series GDIF | 50,000 | 52,719 | ||||||
0.63%, 4/22/25 | 250,000 | 250,405 | ||||||
2.50%, 7/29/25, Series GDIF | 184,000 | 197,235 | ||||||
0.50%, 10/28/25 | 10,000 | 9,930 | ||||||
2.50%, 11/22/27, Series GDIF | 154,000 | 167,889 | ||||||
International Finance Corp. | 60,000 | 61,652 | ||||||
TOTAL SUPRANATIONAL BONDS (Cost: $3,167,931) |
| 3,207,563 | ||||||
| COMMERCIAL MORTGAGE-BACKED SECURITIES – 2.0% |
| |||||||
| United States – 2.0% |
| |||||||
Banc of America Commercial Mortgage Trust | ||||||||
3.17%, 7/15/49, Series 2016-UB10, Class A4 | 100,000 | 108,073 | ||||||
Bank | ||||||||
2.85%, 10/17/52, Series 2019-BN21, Class A5 | 75,000 | 81,048 | ||||||
3.44%, 9/15/60, Series 2017-BNK7, Class A5 | 105,000 | 116,456 | ||||||
2.40%, 1/15/63, Series 2020-BN25, Class A4 | 150,000 | 156,710 | ||||||
2.14%, 3/15/63, Series 2020-BN28, Class AS | 100,000 | 101,039 | ||||||
Benchmark Mortgage Trust | ||||||||
2.91%, 9/15/43, Series 2020-IG1, Class AS^(c) | 60,000 | 64,272 | ||||||
4.02%, 3/15/52, Series 2019-B9, Class A5 | 60,000 | 69,191 | ||||||
See Notes to Financial Statements.
| 72 | WisdomTree Trust |
Table of Contents
Schedule of Investments (continued)
WisdomTree Interest Rate Hedged U.S. Aggregate Bond Fund (AGZD)
August 31, 2021
| Investments | Principal Amount | Value | ||||||
Commercial Mortgage Trust | ||||||||
3.60%, 5/10/47, Series 2014-CR17, Class ASB | $ | 29,452 | $ | 30,506 | ||||
3.21%, 3/10/48, Series 2015-CR22, Class A3 | 95,000 | 95,746 | ||||||
3.63%, 10/10/48, Series 2015-CR26, Class A4 | 250,000 | 274,190 | ||||||
CSAIL Commercial Mortgage Trust | ||||||||
4.10%, 4/15/51, Series 2018-CX11, Class A3 | 100,000 | 108,355 | ||||||
Federal Home Loan Mortgage Corp. Multifamily Structured Pass Through Certificates | 41,304 | 41,418 | ||||||
2.48%, 3/25/25, Series K049, Class A1 | 10,177 | 10,488 | ||||||
3.75%, 8/25/25, Series K733, Class A2 | 100,000 | 109,894 | ||||||
3.00%, 12/25/25, Series K053, Class A2 | 200,000 | 216,831 | ||||||
2.62%, 8/25/26, Series K057, Class AM | 100,000 | 107,104 | ||||||
3.43%, 1/25/27, Series K063, Class A2^(c) | 70,000 | 78,270 | ||||||
3.69%, 1/25/29, Series K088, Class A2 | 115,000 | 133,370 | ||||||
2.52%, 10/25/29, Series K101, Class A2 | 50,000 | 54,393 | ||||||
3.99%, 8/25/33, Series K157, Class A3^(c) | 70,000 | 85,419 | ||||||
1.24%, 1/25/35, Series K-1516, Class A1 | 294,922 | 287,318 | ||||||
Federal National Mortgage Association Alternative Credit Enhancement Securities | ||||||||
3.19%, 7/25/23, Series 2014-M1, Class A2^(c) | 68,115 | 70,283 | ||||||
2.49%, 5/25/26, Series 2016-M6, Class A2 | 57,210 | 61,014 | ||||||
2.56%, 12/25/26, Series 2017-M3, Class A2^(c) | 44,502 | 47,651 | ||||||
3.15%, 3/25/28, Series 2018-M4, Class A2^(c) | 24,046 | 26,727 | ||||||
2.44%, 10/25/29, Series 2020-M1, Class A2 | 200,000 | 216,841 | ||||||
3.09%, 2/25/30, Series 2018-M3, Class A1^(c) | 18,280 | 19,703 | ||||||
1.78%, 5/25/30, Series 2020-M14, Class A2 | 125,000 | 128,544 | ||||||
3.61%, 2/25/31, Series 2019-M4, Class A2 | 250,000 | 294,529 | ||||||
GS Mortgage Securities Trust | ||||||||
3.00%, 9/1/52, Series 2019-GC42, Class A4 | 50,000 | 54,325 | ||||||
2.66%, 2/13/53, Series 2020-GC45, Class A4 | 100,000 | 106,060 | ||||||
JPMBB Commercial Mortgage Securities Trust | ||||||||
4.08%, 2/15/47, Series 2014-C18, Class A5 | 50,000 | 53,541 | ||||||
Morgan Stanley Bank of America Merrill Lynch Trust | ||||||||
3.10%, 5/15/46, Series 2013-C9, Class A4 | 105,000 | 108,991 | ||||||
3.60%, 5/15/50, Series 2017-C33, Class A5 | 250,000 | 277,970 | ||||||
Morgan Stanley Capital I Trust | ||||||||
3.52%, 7/15/52, Series 2019-H7, Class AS | 100,000 | 110,375 | ||||||
UBS Commercial Mortgage Trust | ||||||||
4.30%, 8/15/51, Series 2018-C12, Class A5 | 50,000 | 58,139 | ||||||
4.08%, 12/15/51, Series 2018-C15, Class A3 | 50,000 | 56,506 | ||||||
Wells Fargo Commercial Mortgage Trust | ||||||||
3.79%, 9/15/48, Series 2015-SG1, Class A4 | 98,674 | 106,710 | ||||||
3.64%, 3/15/50, Series 2017-RB1, Class A5 | 68,000 | 75,840 | ||||||
2.40%, 7/15/53, Series 2020-C58, Class AS | 100,000 | 102,200 | ||||||
WFRBS Commercial Mortgage Trust | ||||||||
4.02%, 12/15/46, Series 2013-C17, Class A4 | 100,000 | 106,701 | ||||||
TOTAL COMMERCIAL MORTGAGE-BACKED SECURITIES (Cost: $4,312,033) |
| 4,412,741 | ||||||
| MUNICIPAL BONDS – 0.6% |
| |||||||
| United States – 0.6% |
| |||||||
Bay Area Toll Authority | 25,000 | 45,175 | ||||||
Chicago Transit Authority Sales & Transfer Tax Receipts Revenue | 50,000 | 72,404 | ||||||
City of Houston, TX | 100,000 | 120,744 | ||||||
New Jersey Transportation Trust Fund Authority | 45,000 | 54,138 | ||||||
New York City Water & Sewer System | 100,000 | 149,281 | ||||||
Port Authority of New York & New Jersey 5.65%, 11/1/40 | 100,000 | 143,564 | ||||||
4.81%, 10/15/65, Series 192 | 25,000 | 35,762 | ||||||
Port of Morrow, OR | 20,000 | 20,376 | ||||||
Sales Tax Securitization Corp. | 150,000 | 169,972 | ||||||
State of California | 190,000 | 327,098 | ||||||
State of Mississippi | 75,000 | 97,884 | ||||||
Texas Transportation Commission | 20,000 | 20,288 | ||||||
Texas Transportation Commission State Highway Fund | 50,000 | 62,008 | ||||||
4.00%, 10/1/33 | 20,000 | 24,492 | ||||||
University of California | 10,000 | 11,384 | ||||||
TOTAL MUNICIPAL BONDS (Cost: $1,274,733) |
| 1,354,570 | ||||||
See Notes to Financial Statements.
| WisdomTree Trust | 73 |
Table of Contents
Schedule of Investments (continued)
WisdomTree Interest Rate Hedged U.S. Aggregate Bond Fund (AGZD)
August 31, 2021
| Investments | Principal Amount | Value | ||||||
| ASSET-BACKED SECURITIES – 0.4% |
| |||||||
| United States – 0.4% |
| |||||||
BMW Vehicle Owner Trust | ||||||||
2.51%, 6/25/24, Series 2018-A, Class A4 | $ | 4,933 | $ | 4,960 | ||||
CarMax Auto Owner Trust | ||||||||
2.64%, 6/15/23, Series 2018-1, Class A4 | 29,000 | 29,206 | ||||||
1.89%, 12/16/24, Series 2020-1, Class A3 | 5,000 | 5,075 | ||||||
Ford Credit Auto Lease Trust | ||||||||
2.22%, 10/15/22, Series 2019-B, Class A3 | 4,419 | 4,426 | ||||||
Ford Credit Auto Owner Trust | ||||||||
1.04%, 8/15/24, Series 2020-A, Class A3 | 60,000 | 60,367 | ||||||
GM Financial Consumer Automobile Receivables Trust | ||||||||
2.46%, 7/17/23, Series 2018-1, Class A4 | 13,955 | 13,990 | ||||||
2.65%, 2/16/24, Series 2019-2, Class A3 | 8,525 | 8,605 | ||||||
1.49%, 12/16/24, Series 2020-2, Class A3 | 50,000 | 50,503 | ||||||
Honda Auto Receivables Owner Trust | ||||||||
1.83%, 1/18/24, Series 2019-4, Class A3 | 46,608 | 47,060 | ||||||
0.82%, 7/15/24, Series 2020-2, Class A3 | 26,000 | 26,152 | ||||||
Santander Drive Auto Receivables Trust 0.48%, 7/15/24, Series 2020-4, Class A3 | 75,000 | 75,081 | ||||||
World Omni Auto Receivables Trust | ||||||||
0.82%, 1/15/26, Series 2020-B, Class A4 | 500,000 | 504,666 | ||||||
TOTAL ASSET-BACKED SECURITIES (Cost: $830,026) |
| 830,091 | ||||||
| REPURCHASE AGREEMENT – 7.2% |
| |||||||
| United States – 7.2% |
| |||||||
Citigroup, Inc., tri-party repurchase agreement dated 8/31/21 (tri-party custodian: The Bank of New York Mellon Corp.), 0.06% due 9/1/21; Proceeds at maturity – $15,426,526 (fully collateralized by Freddie Mac Pool, 1.50% – 4.00% due 8/1/51; Market value including accrued interest – $16,198,430) | ||||||||
| (Cost: $15,426,500) | 15,426,500 | 15,426,500 | ||||||
| INVESTMENT OF CASH COLLATERAL FOR SECURITIES LOANED – 0.4% |
| |||||||
| United States – 0.4% |
| |||||||
State Street Navigator Securities Lending Government Money Market Portfolio, 0.03%(e) | ||||||||
| (Cost: $878,573) | 878,573 | 878,573 | ||||||
TOTAL INVESTMENTS IN SECURITIES – 106.1% (Cost: $222,629,900) |
| 228,538,492 | ||||||
Other Assets less Liabilities – (6.1)% |
| (13,208,899 | ) | |||||
|
| |||||||
| NET ASSETS – 100.0% |
| $ | 215,329,593 | |||||
| ^ | Variable coupon rate based on weighted average interest rate of underlying mortgage. |
| (a) | To-be-announced (“TBA”) security (See Note 2). TBA securities are non-income producing. |
| (b) | Security, or portion thereof, was on loan at August 31, 2021 (See Note 2). At August 31, 2021, the total market value of the Fund’s securities on loan identified in the Schedule of Investments was $1,200,542 and the total market value of the collateral held by the Fund was $1,235,966. The total market value of the collateral includes non-cash U.S. Government securities collateral having a value of $357,393. |
| (c) | Rate shown reflects the accrual rate as of August 31, 2021 on securities with variable or step rates. |
| (d) | This security is exempt from registration under rule 144A of the Securities Act of 1933. This security may be sold in transactions that are exempt from registration, normally to qualified institutional buyers. |
| (e) | Rate shown represents annualized 7-day yield as of August 31, 2021. |
See Notes to Financial Statements.
| 74 | WisdomTree Trust |
Table of Contents
Schedule of Investments (concluded)
WisdomTree Interest Rate Hedged U.S. Aggregate Bond Fund (AGZD)
August 31, 2021
| FINANCIAL DERIVATIVE INSTRUMENTS | ||||||||||||||||
| FUTURES CONTRACTS (EXCHANGE-TRADED) | ||||||||||||||||
| Short Exposure | Contracts | Expiration Date | Notional Value | Unrealized Appreciation/ (Depreciation) | ||||||||||||
2 Year U.S. Treasury Note | 300 | 12/31/21 | $ | (66,098,438 | ) | $ | (24,493 | ) | ||||||||
5 Year U.S. Treasury Note | 851 | 12/31/21 | (105,284,656 | ) | (182,470 | ) | ||||||||||
U.S. Treasury Ultra Long Term Bond | 140 | 12/21/21 | (27,619,375 | ) | (57,000 | ) | ||||||||||
Ultra 10 Year U.S. Treasury Note | 216 | 12/21/21 | (31,971,375 | ) | (152,078 | ) | ||||||||||
| $ | (230,973,844 | ) | $ | (416,041 | ) | |||||||||||
| FAIR VALUATION SUMMARY | ||||||||||||||
The following is a summary of the fair valuations according to the inputs used as of August 31, 2021 in valuing the Fund’s investments (See Note 2 — Fair Value Measurement):
| Quoted Prices in Active Markets (Level 1) | Other Significant Observable Inputs (Level 2) | Significant Unobservable Inputs (Level 3) | Total | |||||||||||||
Assets: |
| |||||||||||||||
Investments in Securities | ||||||||||||||||
U.S. Government Agencies | $ | — | $ | 60,781,839 | $ | — | $ | 60,781,839 | ||||||||
U.S. Government Obligations | — | 81,243,777 | — | 81,243,777 | ||||||||||||
U.S. Corporate Bonds | — | 49,528,882 | — | 49,528,882 | ||||||||||||
Foreign Corporate Bonds | — | 7,254,785 | — | 7,254,785 | ||||||||||||
Foreign Government Agencies | — | 1,415,748 | — | 1,415,748 | ||||||||||||
Foreign Government Obligations | — | 2,203,423 | — | 2,203,423 | ||||||||||||
Supranational Bonds | — | 3,207,563 | — | 3,207,563 | ||||||||||||
Commercial Mortgage-Backed Securities | — | 4,412,741 | — | 4,412,741 | ||||||||||||
Municipal Bonds | — | 1,354,570 | — | 1,354,570 | ||||||||||||
Asset-Backed Securities | — | 830,091 | — | 830,091 | ||||||||||||
Repurchase Agreement | — | 15,426,500 | — | 15,426,500 | ||||||||||||
Investment of Cash Collateral for Securities Loaned | — | 878,573 | — | 878,573 | ||||||||||||
Total Investments in Securities | $ | — | $ | 228,538,492 | $ | — | $ | 228,538,492 | ||||||||
Liabilities: |
| |||||||||||||||
Financial Derivative Instruments | ||||||||||||||||
Futures Contracts1 | $ | (416,041 | ) | $ | — | $ | — | $ | (416,041 | ) | ||||||
Total – Net | $ | (416,041 | ) | $ | 228,538,492 | $ | — | $ | 228,122,451 | |||||||
| 1 | Amount shown represents the unrealized appreciation (depreciation) on the financial instrument. |
See Notes to Financial Statements.
| WisdomTree Trust | 75 |
Table of Contents
Schedule of Investments
WisdomTree Mortgage Plus Bond Fund (MTGP)
August 31, 2021
| Investments | Principal Amount | Value | ||||||
| ASSET-BACKED SECURITIES – 1.5% |
| |||||||
| United States – 1.5% |
| |||||||
Navient Private Education Refi Loan Trust | $ | 284,000 | $ | 295,143 | ||||
Sofi Consumer Loan Program Trust | 129,074 | 130,543 | ||||||
3.79%, 4/26/27, Series 2018-2, Class B(a) | 132,555 | 133,518 | ||||||
4.02%, 8/25/27, Series 2018-3, Class B(a) | 57,609 | 58,218 | ||||||
TOTAL ASSET-BACKED SECURITIES (Cost: $618,419) |
| 617,422 | ||||||
| COLLATERALIZED LOAN OBLIGATIONS – 5.3% |
| |||||||
| Cayman Islands – 4.7% |
| |||||||
Apidos XXXVI | ||||||||
1.00%, 7/20/34, Series 2021-36A, Class C (3-month U.S. dollar London Interbank Offered Rate + 2.000%)(a)(b) | 350,000 | 350,210 | ||||||
Ares XLVII Ltd. | ||||||||
1.88%, 4/15/30, Series 2018-47A, Class C, (3-month U.S. dollar London Interbank Offered Rate + 1.75%)(a)(b) | 400,000 | 400,202 | ||||||
LCM 28 Ltd. | ||||||||
2.28%, 10/20/30, Series 28A, Class C, (3-month U.S. dollar London Interbank Offered Rate + 2.15%)(a)(b) | 400,000 | 400,241 | ||||||
Neuberger Berman Loan Advisers Ltd. | ||||||||
1.83%, 1/20/32, Series 2019-32A, Class CR, (3-month U.S. dollar London Interbank Offered Rate + 1.70%)(a)(b) | 500,000 | 500,254 | ||||||
TCW Ltd. | ||||||||
2.53%, 4/25/31, Series 2018-1A, Class B2R2, (3-month U.S. dollar London Interbank Offered Rate + 2.40%)(a)(b) | 250,000 | 250,237 | ||||||
|
| |||||||
| Total Cayman Islands |
| 1,901,144 | ||||||
| Morocco – 0.6% |
| |||||||
OCP S.A. | ||||||||
1.21%, 4/26/31, Series 2014-5A, Class A1R, (3-month U.S. dollar London Interbank Offered Rate + 1.08%)(a)(b) | 250,000 | 250,276 | ||||||
TOTAL COLLATERALIZED LOAN OBLIGATIONS (Cost: $2,110,780) |
| 2,151,420 | ||||||
| COLLATERALIZED MORTGAGE OBLIGATIONS – 43.3% |
| |||||||
CSMC Trust | ||||||||
3.90%, 10/25/44, Series 2014-WIN2, Class B1^(a)(b) | 164,821 | 167,867 | ||||||
Federal Home Loan Mortgage Corp. REMIC 6.00%, 2/15/22, Series 2416, Class PG | 13,414 | 13,517 | ||||||
6.00%, 2/15/22, Series 2418, Class MB | 2,418 | 2,433 | ||||||
7.40%, 5/15/23, Series 1517, Class J | 8,351 | 8,643 | ||||||
4.50%, 7/15/25, Series 3000, Class BC | 32,699 | 34,109 | ||||||
4.00%, 5/15/28, Series 4669, Class EV | 196,875 | 205,912 | ||||||
6.00%, 7/15/29, Series 2175, Class TH | 49,935 | 55,905 | ||||||
6.00%, 5/15/32, Series 2448, Class ZQ | 67,559 | 76,151 | ||||||
3.00%, 8/15/32, Series 4092, Class AY | 200,000 | 216,398 | ||||||
6.00%, 8/15/32, Series 2485, Class WG | 22,289 | 25,705 | ||||||
5.00%, 11/15/32, Series 2519, Class NU | 917,663 | 1,010,219 | ||||||
5.50%, 11/15/32, Series 2519, Class ZD | 8,501 | 9,651 | ||||||
5.50%, 11/15/32, Series 2520, Class PH | 160,336 | 184,254 | ||||||
2.50%, 1/15/33, Series 4332, Class CU | 168,365 | 170,913 | ||||||
0.55%, 6/15/34, Series 2812, Class MF, (1-month U.S. dollar London Interbank Offered Rate + 0.450%)^(b) | 196,148 | 198,139 | ||||||
5.50%, 9/15/34, Series 2861, Class Z | 10,755 | 12,604 | ||||||
5.00%, 11/15/34, Series 2893, Class PE | 47,900 | 54,300 | ||||||
6.00%, 11/15/36, Series 3244, Class LZ | 262 | 300 | ||||||
0.41%, 3/15/37, Series 3284, Class LF, (1-month U.S. dollar London Interbank Offered Rate + 0.310%)^(b) | 546,812 | 550,117 | ||||||
5.00%, 1/15/40, Series 3626, Class ME | 467,000 | 532,209 | ||||||
5.00%, 4/15/40, Series 3658, Class CZ | 369,665 | 448,969 | ||||||
4.00%, 1/15/41, Series 4179, Class AZ | 598,514 | 655,426 | ||||||
3.50%, 5/15/41, Series 4229, Class MA | 80,239 | 84,132 | ||||||
3.00%, 12/15/41, Series 4273, Class GM | 91,151 | 95,319 | ||||||
2.00%, 1/15/42, Series 4112, Class CP | 27,222 | 27,866 | ||||||
4.50%, 9/15/42, Series 4671, Class JM | 128,183 | 133,966 | ||||||
3.50%, 3/15/43, Series 4402, Class PE | 12,851 | 13,047 | ||||||
3.00%, 5/15/43, Series 4322, Class DJ | 110,468 | 114,042 | ||||||
3.00%, 6/15/44, Series 4483, Class CA | 258,921 | 271,305 | ||||||
2.25%, 8/15/44, Series 4406, Class AC | 98,425 | 100,689 | ||||||
3.50%, 9/15/46, Series 4774, Class LP | 109,845 | 114,141 | ||||||
3.00%, 4/25/49, Series 4908, Class BD | 381,280 | 394,691 | ||||||
Federal Home Loan Mortgage Corp. STRIPS | 414,098 | 445,002 | ||||||
Federal Home Loan Mortgage Corp. Structured Agency Credit Risk Debt Notes | ||||||||
2.38%, 9/25/30, Series 2018-HQA1, Class M2, (1-month U.S. dollar London Interbank Offered Rate + 2.30%)^(b) | 154,381 | 156,533 | ||||||
Federal National Mortgage Association REMIC 6.68%, 1/25/23, Series G93-1, Class K | 4,323 | 4,420 | ||||||
6.00%, 8/25/23, Series 1996-8, Class C | 6,492 | 6,663 | ||||||
6.50%, 9/25/23, Series 1993-169, Class L | 11,754 | 12,350 | ||||||
3.50%, 8/25/26, Series 2011-80, Class HE | 268,164 | 281,443 | ||||||
2.00%, 11/25/30, Series 2015-93, Class AD | 164,213 | 170,351 | ||||||
6.50%, 10/25/31, Series 2001-52, Class YZ | 1,340 | 1,571 | ||||||
3.00%, 6/25/33, Series 2014-36, Class QA | 70,464 | 73,635 | ||||||
4.00%, 8/25/33, Series 2014-58, Class VM | 100,000 | 106,622 | ||||||
4.50%, 10/25/34, Series 2004-75, Class ZG | 7,879 | 8,792 | ||||||
0.33%, 5/25/35, Series 2005-40, Class FB, (1-month U.S. dollar London Interbank Offered Rate + 0.250%)^(b) | 104,144 | 103,791 | ||||||
4.75%, 8/25/35, Series 2005-80, Class SZ | 106,754 | 123,218 | ||||||
6.00%, 7/25/36, Series 2006-62, Class PZ | 131,371 | 199,080 | ||||||
4.50%, 10/25/36, Series 2009-19, Class PW | 40,908 | 45,827 | ||||||
0.33%, 12/25/36, Series 2006-120, Class PF, (1-month U.S. dollar London Interbank Offered Rate + 0.250%)^(b) | 100,664 | 100,226 | ||||||
5.50%, 2/25/37, Series 2007-6, Class PA | 17,648 | 19,283 | ||||||
4.25%, 4/25/37, Series 2007-30, Class ZM | 252,549 | 306,792 | ||||||
5.00%, 4/25/37, Series 2007-26, Class JZ | 261,486 | 295,491 | ||||||
5.00%, 3/25/38, Series 2008-16, Class EA | 7,667 | 8,733 | ||||||
6.00%, 8/25/39, Series 2009-62, Class Z | 265,664 | 322,556 | ||||||
5.00%, 11/25/39, Series 2009-89, Class PH | 118,000 | 137,300 | ||||||
See Notes to Financial Statements.
| 76 | WisdomTree Trust |
Table of Contents
Schedule of Investments (continued)
WisdomTree Mortgage Plus Bond Fund (MTGP)
August 31, 2021
| Investments | Principal Amount | Value | ||||||
5.00%, 7/25/40, Series 2010-80, Class PZ | $ | 261,860 | $ | 311,505 | ||||
5.00%, 9/25/40, Series 2010-102, Class PN | 173,762 | 197,393 | ||||||
1.75%, 11/25/40, Series 2012-51, Class GU | 400,000 | 412,158 | ||||||
3.00%, 2/25/41, Series 2011-134, Class NJ | 106,338 | 110,051 | ||||||
2.50%, 5/25/41, Series 2012-131, Class DZ | 42,922 | 43,755 | ||||||
5.00%, 6/25/41, Series 2011-52, Class GB | 188,837 | 215,825 | ||||||
2.50%, 9/25/41, Series 2011-127, Class JC | 42,034 | 42,590 | ||||||
5.25%, 9/25/41, Series 2011-84, Class PZ | 337,705 | 398,868 | ||||||
3.00%, 3/25/42, Series 2016-21, Class BA | 100,212 | 101,690 | ||||||
1.75%, 6/25/42, Series 2013-37, Class JA | 226,888 | 230,096 | ||||||
2.50%, 11/25/42, Series 2012-152, Class TB | 231,000 | 247,506 | ||||||
3.00%, 2/25/43, Series 2013-1, Class JZ | 109,165 | 115,377 | ||||||
3.00%, 3/25/44, Series 2015-42, Class CA | 268,935 | 276,268 | ||||||
3.00%, 4/25/45, Series 2015-23, Class HZ | 484,794 | 521,887 | ||||||
3.00%, 3/25/46, Series 2016-9, Class D | 206,040 | 218,231 | ||||||
2.50%, 9/25/46, Series 2016-63, Class CA | 100,975 | 101,710 | ||||||
Government National Mortgage Association 5.00%, 7/16/33, Series 2003-60, Class ZG | 62,316 | 69,549 | ||||||
5.00%, 6/20/35, Series 2005-46, Class YX | 154,880 | 180,439 | ||||||
5.50%, 4/20/37, Series 2007-24, Class PC | 75,927 | 81,511 | ||||||
5.50%, 5/20/38, Series 2008-42, Class QB | 76,233 | 87,396 | ||||||
2.00%, 8/20/39, Series 2011-52, Class KY | 86,390 | 88,272 | ||||||
4.50%, 9/16/40, Series 2010-125, Class BZ, REMIC | 311,954 | 341,904 | ||||||
3.00%, 7/16/41, Series 2011-135, Class WH | 170,628 | 176,142 | ||||||
4.00%, 3/20/44, Series 2014-43, Class Z | 605,116 | 725,891 | ||||||
3.75%, 4/16/44, Series 2014-60, Class AL | 250,000 | 282,511 | ||||||
3.00%, 11/20/45, Series 2015-165, Class ZE | 118,802 | 130,822 | ||||||
GS Mortgage-Backed Securities Trust | ||||||||
3.50%, 5/25/50, Series 2020-PJ1, Class A6^(a)(b) | 14,575 | 14,574 | ||||||
JP Morgan Mortgage Trust | ||||||||
3.59%, 5/25/45, Series 2015-3, Class B3^(a)(b) | 154,858 | 157,339 | ||||||
3.92%, 12/25/48, Series 2018-6, Class B2^(a)(b) | 276,664 | 283,488 | ||||||
3.45%, 5/25/50, Series 2019-9, Class B2A^(a)(b) | 290,240 | 300,136 | ||||||
4.43%, 5/25/50, Series 2019-INV3, Class B3^(a)(b) | 224,489 | 233,671 | ||||||
3.73%, 11/25/50, Series 2020-4, Class B2^(a)(b) | 292,891 | 302,021 | ||||||
3.65%, 12/25/50, Series 2020-5, Class B1^(a)(b) | 244,315 | 254,804 | ||||||
Provident Funding Mortgage Trust | ||||||||
3.27%, 2/25/50, Series 2020-1, Class B1^(a)(b) | 386,922 | 399,582 | ||||||
RCKT Mortgage Trust | ||||||||
3.00%, 2/25/50, Series 2020-1, Class A13^(a)(b) | 263,447 | 267,422 | ||||||
Seasoned Loans Structured Transaction Trust | 455,000 | 477,586 | ||||||
Sequoia Mortgage Trust | ||||||||
4.00%, 2/25/48, Series 2018-CH1, Class A1^(a)(b) | 50,671 | 51,461 | ||||||
Verus Securitization Trust | ||||||||
2.99%, 5/25/60, Series 2020-2, Class A2^(a)(b) | 300,000 | 305,988 | ||||||
TOTAL COLLATERALIZED MORTGAGE OBLIGATIONS (Cost: $17,621,464) |
| 17,670,037 | ||||||
| COMMERCIAL MORTGAGE-BACKED SECURITIES – 4.9% |
| |||||||
| United States – 4.9% |
| |||||||
Bank | ||||||||
2.90%, 8/15/31, Series 2021-BN35, Class C^(b) | 350,000 | 358,506 | ||||||
1.46%, 11/15/53, Series 2020-BN29, Class XA^(b)(c) | 4,475,348 | 456,362 | ||||||
Benchmark Mortgage Trust | ||||||||
2.50%, 12/15/62, Series 2019-B14, Class D(a) | 380,000 | 353,344 | ||||||
Cantor Commercial Real Estate Lending | ||||||||
2.50%, 1/15/53, Series 2019-CF3, Class D^(a)(b) | 250,000 | 224,868 | ||||||
Washington State Housing Finance Commission | ||||||||
0.73%, 12/20/35, Series 2021-1, Class X^(b)(c) | 6,278,184 | 391,256 | ||||||
WFRBS Commercial Mortgage Trust | ||||||||
4.23%, 8/15/47, Series 2014-C21, Class C^(b) | 200,000 | 202,917 | ||||||
TOTAL COMMERCIAL MORTGAGE-BACKED SECURITIES (Cost: $1,959,658) |
| 1,987,253 | ||||||
| U.S. GOVERNMENT AGENCIES – 44.4% |
| |||||||
| Federal Home Loan Mortgage Corporation – 2.7% |
| |||||||
4.00%, 1/1/42 | 297,462 | 329,235 | ||||||
3.50%, 8/1/46 | 316,615 | 342,625 | ||||||
3.50%, 9/1/47 | 395,524 | 428,398 | ||||||
|
| |||||||
| Total Federal Home Loan Mortgage Corporation |
| 1,100,258 | ||||||
| Federal National Mortgage Association – 7.3% |
| |||||||
4.00%, 11/1/43 | 364,566 | 402,377 | ||||||
4.00%, 5/1/47 | 305,344 | 336,463 | ||||||
4.00%, 12/1/47 | 315,218 | 347,449 | ||||||
4.00%, 10/1/48 | 1,124,913 | 1,238,094 | ||||||
4.00%, 4/1/55 | 481,757 | 549,768 | ||||||
4.50%, 6/1/56 | 96,270 | 108,917 | ||||||
|
| |||||||
| Total Federal National Mortgage Association |
| 2,983,068 | ||||||
| Government National Mortgage Association – 17.6% |
| |||||||
3.50%, 7/20/47 | 600,436 | 649,347 | ||||||
4.50%, 5/20/49 | 118,711 | 126,493 | ||||||
2.50%, 9/21/51(d) | 2,000,000 | 2,074,219 | ||||||
2.50%, 10/21/51(d) | 1,690,000 | 1,749,260 | ||||||
3.00%, 10/21/51(d) | 2,450,000 | 2,557,283 | ||||||
|
| |||||||
| Total Government National Mortgage Association |
| 7,156,602 | ||||||
See Notes to Financial Statements.
| WisdomTree Trust | 77 |
Table of Contents
Schedule of Investments (concluded)
WisdomTree Mortgage Plus Bond Fund (MTGP)
August 31, 2021
| Investments | Principal Amount | Value | ||||||
| Uniform Mortgage-Backed Securities – 16.8% |
| |||||||
2.00%, 10/14/51(d) | $ | 3,288,000 | $ | 3,326,921 | ||||
2.50%, 10/14/51(d) | 3,393,000 | 3,517,591 | ||||||
|
| |||||||
| Total Uniform Mortgage-Backed Securities |
| 6,844,512 | ||||||
TOTAL U.S. GOVERNMENT AGENCIES (Cost: $17,934,022) |
| 18,084,440 | ||||||
TOTAL INVESTMENTS IN SECURITIES – 99.4% (Cost: $40,244,343) |
| 40,510,572 | ||||||
Other Assets less Liabilities – 0.6% |
| 242,978 | ||||||
|
| |||||||
| NET ASSETS – 100.0% |
| $ | 40,753,550 | |||||
| ^ | Variable coupon rate based on weighted average interest rate of underlying mortgage. |
| (a) | This security is exempt from registration under rule 144A of the Securities Act of 1933. This security may be sold in transactions that are exempt from registration, normally to qualified institutional buyers. |
| (b) | Rate shown reflects the accrual rate as of August 31, 2021 on securities with variable or step rates. |
| (c) | Interest-only security. The principal amount shown is a notional amount representing the outstanding principal of the underlying debt obligation(s). Holders of interest-only securities do not receive principal payments on the underlying debt obligation(s). |
| (d) | To-be-announced (“TBA”) security (See Note 2). TBA securities are non-income producing. |
| FINANCIAL DERIVATIVE INSTRUMENTS | ||||||||||||||||
| FUTURES CONTRACTS (EXCHANGE-TRADED) | ||||||||||||||||
| Short Exposure | Contracts | Expiration Date | Notional Value | Unrealized Appreciation/ (Depreciation) | ||||||||||||
5 Year U.S. Treasury Note | 2 | 12/31/21 | $ | (247,438 | ) | $ | (672 | ) | ||||||||
10 Year U.S. Treasury Note | 15 | 12/21/21 | (2,001,797 | ) | (6,230 | ) | ||||||||||
| $ | (2,249,235 | ) | $ | (6,902 | ) | |||||||||||
| Long Exposure | ||||||||||||||||
2 Year U.S. Treasury Note | 5 | 12/31/21 | $ | 1,101,641 | $ | 781 | ||||||||||
| $ | 1,101,641 | $ | 781 | |||||||||||||
Total – Net |
| $ | (1,147,594 | ) | $ | (6,121 | ) | |||||||||
| FAIR VALUATION SUMMARY | ||||||||||||||
The following is a summary of the fair valuations according to the inputs used as of August 31, 2021 in valuing the Fund’s investments (See Note 2 — Fair Value Measurement):
| Quoted Prices in Active Markets (Level 1) | Other Significant Observable Inputs (Level 2) | Significant Unobservable Inputs (Level 3) | Total | |||||||||||||
Assets: | ||||||||||||||||
Investments in Securities | ||||||||||||||||
Asset-Backed Securities | $ | — | $ | 617,422 | $ | — | $ | 617,422 | ||||||||
Collateralized Loan Obligations | — | 2,151,420 | — | 2,151,420 | ||||||||||||
Collateralized Mortgage Obligations | — | 17,670,037 | — | 17,670,037 | ||||||||||||
Commercial Mortgage-Backed Securities | — | 1,987,253 | — | 1,987,253 | ||||||||||||
U.S. Government Agencies | — | 18,084,440 | — | 18,084,440 | ||||||||||||
Total Investments in Securities | $ | — | $ | 40,510,572 | $ | — | $ | 40,510,572 | ||||||||
Financial Derivative Instruments | ||||||||||||||||
Futures Contracts1 | $ | 781 | $ | — | $ | — | $ | 781 | ||||||||
Liabilities: | ||||||||||||||||
Financial Derivative Instruments | ||||||||||||||||
Futures Contracts1 | $ | (6,902 | ) | $ | — | $ | — | $ | (6,902 | ) | ||||||
Total – Net | $ | (6,121 | ) | $ | 40,510,572 | $ | — | $ | 40,504,451 | |||||||
| 1 | Amount shown represents the unrealized appreciation (depreciation) on the financial instrument. |
See Notes to Financial Statements.
| 78 | WisdomTree Trust |
Table of Contents
Schedule of Investments
WisdomTree Yield Enhanced U.S. Aggregate Bond Fund (AGGY)
August 31, 2021
| Investments in Long Securities | Principal Amount | Value | ||||||
| U.S. GOVERNMENT AGENCIES – 45.3% | ||||||||
| Federal Farm Credit Bank – 0.5% | ||||||||
2.02%, 4/1/31 | $ | 2,000,000 | $ | 2,018,760 | ||||
1.79%, 6/22/35 | 500,000 | 489,845 | ||||||
1.65%, 7/23/35 | 1,500,000 | 1,450,200 | ||||||
1.95%, 8/13/40 | 1,500,000 | 1,446,300 | ||||||
|
| |||||||
| Total Federal Farm Credit Bank | 5,405,105 | |||||||
| Federal Home Loan Bank – 0.9% | ||||||||
3.25%, 11/16/28 | 1,200,000 | 1,374,576 | ||||||
5.50%, 7/15/36 | 5,900,000 | 8,830,412 | ||||||
|
| |||||||
| Total Federal Home Loan Bank | 10,204,988 | |||||||
| Federal Home Loan Mortgage Corporation – 7.5% |
| |||||||
6.75%, 9/15/29, Series GDIF | 280,000 | 402,702 | ||||||
2.50%, 4/1/30 | 2,182,581 | 2,286,592 | ||||||
3.00%, 5/1/30 | 663,254 | 698,832 | ||||||
6.75%, 3/15/31 | 5,500,000 | 8,144,070 | ||||||
6.25%, 7/15/32 | 13,109,000 | 19,481,416 | ||||||
3.00%, 1/1/33 | 1,699,449 | 1,794,464 | ||||||
3.00%, 5/1/33 | 2,312,705 | 2,438,086 | ||||||
4.00%, 11/1/33 | 51,523 | 54,767 | ||||||
5.50%, 12/1/33 | 305,465 | 350,582 | ||||||
6.50%, 3/1/36 | 204,624 | 236,803 | ||||||
5.00%, 6/1/37 | 1,749 | 1,996 | ||||||
6.00%, 9/1/37 | 167,023 | 194,370 | ||||||
5.50%, 2/1/40 | 6,773 | 7,843 | ||||||
4.50%, 8/1/40 | 128,953 | 143,971 | ||||||
4.00%, 11/1/40 | 10,161 | 11,177 | ||||||
5.00%, 3/1/41 | 209,764 | 239,486 | ||||||
5.50%, 6/1/41 | 200,480 | 231,763 | ||||||
5.00%, 7/1/41 | 5,839 | 6,666 | ||||||
3.50%, 10/1/41 | 344,595 | 372,960 | ||||||
3.50%, 2/1/42 | 142,090 | 153,820 | ||||||
5.00%, 2/1/42 | 282,901 | 322,052 | ||||||
4.00%, 4/1/42 | 501,332 | 553,114 | ||||||
4.50%, 5/1/42 | 205,189 | 228,891 | ||||||
3.50%, 6/1/42 | 35,106 | 37,965 | ||||||
3.50%, 8/1/42 | 162,954 | 176,221 | ||||||
3.50%, 9/1/42 | 205,355 | 222,072 | ||||||
3.00%, 3/1/43 | 286,804 | 305,435 | ||||||
3.00%, 4/1/43 | 182,510 | 194,366 | ||||||
3.00%, 7/1/43 | 740,059 | 799,343 | ||||||
3.50%, 7/1/43 | 235,833 | 255,293 | ||||||
3.00%, 8/1/43 | 55,516 | 59,122 | ||||||
4.00%, 8/1/43 | 19,685 | 21,602 | ||||||
3.50%, 1/1/44 | 1,221,635 | 1,322,274 | ||||||
3.00%, 2/1/44 | 133,840 | 142,544 | ||||||
3.50%, 2/1/44 | 97,333 | 105,364 | ||||||
4.00%, 3/1/44 | 35,690 | 39,080 | ||||||
4.00%, 4/1/44 | 362,541 | 399,021 | ||||||
3.50%, 5/1/44 | 144,906 | 156,045 | ||||||
4.00%, 5/1/44 | 134,144 | 146,885 | ||||||
4.50%, 5/1/44 | 7,794 | 8,683 | ||||||
3.50%, 7/1/44 | 40,588 | 43,709 | ||||||
4.50%, 7/1/44 | 111,632 | 124,360 | ||||||
4.00%, 8/1/44 | 453,459 | 505,506 | ||||||
3.50%, 10/1/44 | 14,897 | 16,043 | ||||||
4.50%, 11/1/44 | 108,120 | 120,452 | ||||||
3.50%, 12/1/44 | 193,906 | 208,816 | ||||||
3.50%, 1/1/45 | 39,000 | 41,998 | ||||||
4.00%, 2/1/45 | 73,094 | 79,606 | ||||||
4.00%, 3/1/45 | 8,643 | 9,413 | ||||||
3.00%, 4/1/45 | 12,960 | 13,715 | ||||||
4.00%, 4/1/45 | 43,405 | 47,267 | ||||||
3.00%, 5/1/45 | 53,361 | 56,490 | ||||||
3.50%, 5/1/45 | 85,806 | 91,991 | ||||||
3.50%, 6/1/45 | 42,581 | 45,640 | ||||||
4.00%, 6/1/45 | 123,350 | 134,339 | ||||||
3.00%, 7/1/45 | 14,100 | 14,923 | ||||||
3.00%, 8/1/45 | 59,374 | 62,856 | ||||||
3.50%, 8/1/45 | 577,705 | 625,019 | ||||||
4.00%, 9/1/45 | 71,605 | 77,975 | ||||||
3.50%, 10/1/45 | 85,193 | 91,335 | ||||||
4.00%, 10/1/45 | 75,359 | 82,073 | ||||||
3.50%, 11/1/45 | 42,765 | 45,848 | ||||||
4.00%, 11/1/45 | 59,953 | 65,294 | ||||||
4.50%, 11/1/45 | 492,438 | 548,523 | ||||||
3.00%, 12/1/45 | 55,524 | 58,780 | ||||||
4.50%, 12/1/45 | 163,997 | 182,703 | ||||||
4.00%, 1/1/46 | 19,255 | 21,231 | ||||||
4.00%, 2/1/46 | 99,843 | 108,735 | ||||||
4.00%, 3/1/46 | 77,037 | 83,577 | ||||||
3.00%, 4/1/46 | 260,937 | 275,849 | ||||||
3.50%, 4/1/46 | 399,160 | 425,871 | ||||||
4.50%, 4/1/46 | 427,814 | 476,489 | ||||||
3.50%, 5/1/46 | 135,458 | 144,507 | ||||||
3.00%, 6/1/46 | 59,395 | 62,810 | ||||||
3.50%, 6/1/46 | 137,297 | 146,457 | ||||||
3.00%, 9/1/46 | 1,300,837 | 1,378,940 | ||||||
3.50%, 9/1/46 | 108,641 | 115,889 | ||||||
2.50%, 10/1/46 | 61,647 | 64,519 | ||||||
3.00%, 10/1/46 | 71,226 | 76,422 | ||||||
3.50%, 10/1/46 | 43,839 | 46,764 | ||||||
3.00%, 11/1/46 | 548,773 | 580,135 | ||||||
3.50%, 11/1/46 | 15,291 | 16,310 | ||||||
4.00%, 11/1/46 | 29,888 | 32,424 | ||||||
4.50%, 11/1/46 | 310,067 | 345,433 | ||||||
3.00%, 12/1/46 | 241,371 | 255,165 | ||||||
3.00%, 1/1/47 | 428,592 | 453,139 | ||||||
4.00%, 1/1/47 | 129,989 | 141,019 | ||||||
4.50%, 1/1/47 | 401,963 | 447,744 | ||||||
3.00%, 2/1/47 | 370,198 | 391,395 | ||||||
3.00%, 4/1/47 | 527,728 | 557,929 | ||||||
3.50%, 4/1/47 | 237,945 | 252,667 | ||||||
4.00%, 4/1/47 | 95,669 | 102,893 | ||||||
4.00%, 5/1/47 | 77,407 | 83,252 | ||||||
4.50%, 5/1/47 | 19,650 | 21,488 | ||||||
4.00%, 6/1/47 | 117,998 | 126,908 | ||||||
3.50%, 7/1/47 | 118,012 | 125,320 | ||||||
4.00%, 7/1/47 | 210,890 | 226,879 | ||||||
3.50%, 8/1/47 | 123,146 | 130,772 | ||||||
4.00%, 8/1/47 | 445,566 | 479,433 | ||||||
4.50%, 8/1/47 | 109,374 | 119,607 | ||||||
3.50%, 9/1/47 | 290,580 | 308,575 | ||||||
4.50%, 9/1/47 | 141,108 | 154,309 | ||||||
4.00%, 10/1/47 | 364,380 | 392,007 | ||||||
4.50%, 10/1/47 | 57,481 | 62,859 | ||||||
See Notes to Financial Statements.
| WisdomTree Trust | 79 |
Table of Contents
Schedule of Investments (continued)
WisdomTree Yield Enhanced U.S. Aggregate Bond Fund (AGGY)
August 31, 2021
| Investments in Long Securities | Principal Amount | Value | ||||||
3.50%, 11/1/47 | $ | 399,910 | $ | 424,659 | ||||
3.50%, 12/1/47 | 206,768 | 219,573 | ||||||
3.50%, 1/1/48 | 109,415 | 116,182 | ||||||
4.50%, 2/1/48 | 86,569 | 94,668 | ||||||
3.50%, 5/1/48 | 162,042 | 171,988 | ||||||
3.00%, 9/1/48 | 389,222 | 411,465 | ||||||
4.00%, 9/1/48 | 83,784 | 89,696 | ||||||
4.00%, 10/1/48 | 477,634 | 517,944 | ||||||
4.50%, 10/1/48 | 216,114 | 233,640 | ||||||
3.00%, 12/1/48 | 82,596 | 87,223 | ||||||
4.50%, 2/1/49 | 952,646 | 1,040,823 | ||||||
4.50%, 3/1/49 | 38,324 | 41,432 | ||||||
5.00%, 3/1/49 | 22,132 | 24,206 | ||||||
4.50%, 5/1/49 | 136,941 | 148,014 | ||||||
4.00%, 7/1/49 | 722,879 | 794,949 | ||||||
4.50%, 7/1/49 | 153,986 | 166,438 | ||||||
5.50%, 7/1/49 | 150,405 | 167,572 | ||||||
3.50%, 8/1/49 | 489,965 | 523,970 | ||||||
3.00%, 10/1/49 | 765,706 | 810,909 | ||||||
5.00%, 10/1/49 | 1,321,399 | 1,445,969 | ||||||
5.50%, 10/1/49 | 231,894 | 258,536 | ||||||
3.00%, 12/1/49 | 764,195 | 807,731 | ||||||
3.00%, 2/1/50 | 550,195 | 581,189 | ||||||
3.00%, 3/1/50 | 408,024 | 431,711 | ||||||
3.00%, 4/1/50 | 2,344,027 | 2,467,077 | ||||||
3.50%, 4/1/50 | 722,326 | 763,681 | ||||||
2.50%, 5/1/50 | 686,107 | 717,941 | ||||||
3.00%, 5/1/50 | 91,299 | 95,522 | ||||||
2.50%, 6/1/50 | 1,723,134 | 1,792,515 | ||||||
4.00%, 6/1/50 | 841,890 | 904,034 | ||||||
2.50%, 7/1/50 | 323,793 | 338,106 | ||||||
3.50%, 7/1/50 | 849,587 | 898,641 | ||||||
2.50%, 8/1/50 | 1,427,639 | 1,483,837 | ||||||
2.50%, 9/1/50 | 1,515,692 | 1,574,526 | ||||||
2.00%, 1/1/51 | 952,390 | 966,093 | ||||||
2.50%, 2/1/51 | 916,017 | 951,604 | ||||||
2.00%, 5/1/51 | 490,651 | 497,726 | ||||||
2.50%, 5/1/51 | 488,531 | 507,829 | ||||||
1.50%, 6/1/51 | 2,326,689 | 2,287,409 | ||||||
|
| |||||||
| Total Federal Home Loan Mortgage Corporation |
| 81,235,162 | ||||||
| Federal National Mortgage Association – 14.0% |
| |||||||
4.00%, 9/1/25 | 815,364 | 867,307 | ||||||
1.88%, 9/24/26 | 60,000 | 63,257 | ||||||
0.75%, 10/8/27 | 60,000 | 59,154 | ||||||
2.50%, 11/1/30 | 325,803 | 342,639 | ||||||
6.63%, 11/15/30 | 1,945,000 | 2,826,513 | ||||||
2.50%, 1/1/32 | 789,955 | 827,568 | ||||||
2.50%, 2/1/32 | 135,034 | 141,623 | ||||||
3.00%, 5/1/32 | 229,405 | 242,192 | ||||||
2.50%, 6/1/32 | 954,305 | 1,000,874 | ||||||
6.00%, 9/1/32 | 157,023 | 181,895 | ||||||
3.00%, 11/1/32 | 226,547 | 239,175 | ||||||
6.00%, 12/1/32 | 309,888 | 348,790 | ||||||
2.50%, 1/1/33 | 335,300 | 351,113 | ||||||
5.00%, 8/1/33 | 248,717 | 281,759 | ||||||
5.50%, 10/1/35 | 32,115 | 36,991 | ||||||
5.50%, 4/1/37 | 294,938 | 339,143 | ||||||
5.63%, 7/15/37 | 3,405,000 | 5,238,763 | ||||||
5.00%, 5/1/38 | 10,411 | 11,879 | ||||||
6.00%, 5/1/38 | 28,691 | 33,706 | ||||||
5.50%, 6/1/38 | 84,055 | 96,980 | ||||||
5.50%, 11/1/38 | 2,086 | 2,413 | ||||||
4.00%, 8/1/39 | 59,566 | 65,513 | ||||||
4.50%, 9/1/39 | 349,331 | 390,056 | ||||||
5.00%, 9/1/39 | 173,180 | 197,295 | ||||||
4.50%, 11/1/39 | 87,524 | 97,727 | ||||||
5.50%, 4/1/40 | 12,470 | 14,357 | ||||||
4.50%, 8/1/40 | 194,145 | 216,696 | ||||||
4.50%, 9/1/40 | 125,206 | 139,748 | ||||||
4.00%, 10/1/40 | 102,864 | 113,116 | ||||||
4.00%, 12/1/40 | 22,738 | 25,287 | ||||||
3.50%, 1/1/41 | 182,579 | 197,579 | ||||||
4.00%, 1/1/41 | 18,777 | 20,648 | ||||||
4.00%, 2/1/41 | 538,543 | 592,339 | ||||||
4.50%, 2/1/41 | 58,142 | 64,895 | ||||||
4.00%, 3/1/41 | 428,810 | 471,697 | ||||||
6.00%, 7/1/41 | 434,950 | 510,287 | ||||||
4.50%, 8/1/41 | 153,171 | 170,836 | ||||||
4.00%, 9/1/41 | 48,968 | 53,848 | ||||||
4.50%, 9/1/41 | 191,415 | 213,649 | ||||||
5.50%, 9/1/41 | 45,532 | 52,641 | ||||||
4.00%, 10/1/41 | 677,763 | 759,514 | ||||||
4.00%, 11/1/41 | 93,008 | 102,310 | ||||||
4.00%, 12/1/41 | 80,673 | 89,739 | ||||||
4.00%, 1/1/42 | 150,936 | 166,509 | ||||||
4.50%, 1/1/42 | 139,790 | 156,027 | ||||||
6.00%, 1/1/42 | 259,049 | 304,376 | ||||||
4.00%, 3/1/42 | 205,686 | 226,820 | ||||||
4.00%, 5/1/42 | 23,626 | 25,980 | ||||||
3.50%, 6/1/42 | 276,615 | 299,092 | ||||||
4.00%, 6/1/42 | 348,795 | 383,679 | ||||||
4.00%, 9/1/42 | 243,277 | 273,411 | ||||||
3.00%, 10/1/42 | 313,934 | 336,876 | ||||||
4.00%, 12/1/42 | 82,934 | 91,228 | ||||||
2.50%, 2/1/43 | 182,893 | 191,624 | ||||||
4.00%, 2/1/43 | 135,951 | 149,500 | ||||||
2.50%, 3/1/43 | 15,727 | 16,478 | ||||||
3.00%, 4/1/43 | 500,595 | 533,007 | ||||||
2.50%, 5/1/43 | 60,533 | 63,341 | ||||||
3.00%, 5/1/43 | 128,830 | 137,171 | ||||||
3.50%, 5/1/43 | 31,950 | 34,577 | ||||||
3.00%, 6/1/43 | 301,664 | 325,700 | ||||||
3.00%, 7/1/43 | 451,844 | 488,741 | ||||||
3.50%, 7/1/43 | 1,117,346 | 1,222,985 | ||||||
3.00%, 8/1/43 | 1,722,552 | 1,855,933 | ||||||
3.50%, 8/1/43 | 686,089 | 744,272 | ||||||
4.00%, 8/1/43 | 37,863 | 41,523 | ||||||
3.00%, 9/1/43 | 2,396,467 | 2,551,632 | ||||||
4.00%, 9/1/43 | 248,598 | 273,923 | ||||||
4.50%, 9/1/43 | 20,923 | 23,353 | ||||||
3.50%, 10/1/43 | 156,653 | 169,533 | ||||||
3.50%, 11/1/43 | 248,274 | 268,448 | ||||||
4.00%, 11/1/43 | 292,240 | 325,083 | ||||||
3.50%, 12/1/43 | 337,602 | 365,035 | ||||||
4.00%, 1/1/44 | 465,314 | 516,064 | ||||||
4.00%, 2/1/44 | 127,007 | 140,329 | ||||||
4.00%, 3/1/44 | 103,578 | 114,162 | ||||||
See Notes to Financial Statements.
| 80 | WisdomTree Trust |
Table of Contents
Schedule of Investments (continued)
WisdomTree Yield Enhanced U.S. Aggregate Bond Fund (AGGY)
August 31, 2021
| Investments in Long Securities | Principal Amount | Value | ||||||
4.50%, 5/1/44 | $ | 95,698 | $ | 106,596 | ||||
3.50%, 6/1/44 | 138,542 | 149,958 | ||||||
4.00%, 6/1/44 | 45,821 | 50,710 | ||||||
4.00%, 7/1/44 | 550,844 | 608,204 | ||||||
3.50%, 8/1/44 | 25,576 | 27,866 | ||||||
4.00%, 8/1/44 | 40,463 | 44,289 | ||||||
4.00%, 9/1/44 | 137,983 | 151,032 | ||||||
3.00%, 10/1/44 | 419,380 | 446,535 | ||||||
4.00%, 11/1/44 | 219,294 | 242,618 | ||||||
5.00%, 11/1/44 | 178,660 | 203,185 | ||||||
4.00%, 12/1/44 | 91,942 | 100,975 | ||||||
3.00%, 1/1/45 | 4,796 | 5,096 | ||||||
3.50%, 2/1/45 | 905,693 | 979,287 | ||||||
4.00%, 2/1/45 | 481,994 | 529,997 | ||||||
4.50%, 2/1/45 | 508,836 | 567,432 | ||||||
3.00%, 4/1/45 | 115,538 | 122,271 | ||||||
3.00%, 5/1/45 | 403,456 | 431,348 | ||||||
3.00%, 6/1/45 | 120,979 | 128,028 | ||||||
3.50%, 6/1/45 | 121,371 | 130,082 | ||||||
4.00%, 6/1/45 | 614,322 | 672,731 | ||||||
3.50%, 7/1/45 | 801,376 | 858,893 | ||||||
3.50%, 8/1/45 | 474,784 | 515,854 | ||||||
3.50%, 9/1/45 | 1,206,313 | 1,292,895 | ||||||
4.00%, 9/1/45 | 287,386 | 312,964 | ||||||
3.00%, 10/1/45 | 54,687 | 57,873 | ||||||
3.50%, 10/1/45 | 77,260 | 82,805 | ||||||
4.00%, 10/1/45 | 233,121 | 253,870 | ||||||
4.50%, 10/1/45 | 142,387 | 158,808 | ||||||
3.00%, 11/1/45 | 47,327 | 50,085 | ||||||
3.50%, 11/1/45 | 53,933 | 57,804 | ||||||
4.00%, 11/1/45 | 75,206 | 81,900 | ||||||
3.00%, 12/1/45 | 854,294 | 913,430 | ||||||
3.50%, 12/1/45 | 88,302 | 94,640 | ||||||
3.50%, 1/1/46 | 1,695,072 | 1,816,735 | ||||||
4.00%, 1/1/46 | 103,823 | 114,692 | ||||||
3.00%, 2/1/46 | 126,112 | 133,460 | ||||||
3.50%, 2/1/46 | 375,060 | 400,780 | ||||||
3.50%, 3/1/46 | 1,795,531 | 1,954,282 | ||||||
4.00%, 3/1/46 | 35,522 | 38,684 | ||||||
3.00%, 4/1/46 | 578,188 | 611,879 | ||||||
3.50%, 4/1/46 | 983,955 | 1,049,490 | ||||||
3.50%, 5/1/46 | 190,726 | 203,429 | ||||||
4.50%, 5/1/46 | 45,570 | 50,763 | ||||||
3.00%, 6/1/46 | 701,532 | 749,085 | ||||||
3.50%, 6/1/46 | 75,879 | 80,932 | ||||||
3.50%, 7/1/46 | 313,686 | 334,578 | ||||||
4.00%, 7/1/46 | 51,069 | 55,387 | ||||||
2.50%, 8/1/46 | 16,578 | 17,346 | ||||||
3.00%, 8/1/46 | 121,592 | 128,555 | ||||||
2.50%, 9/1/46 | 23,326 | 24,405 | ||||||
3.00%, 9/1/46 | 585,712 | 620,121 | ||||||
4.00%, 9/1/46 | 631,502 | 695,164 | ||||||
2.50%, 10/1/46 | 28,413 | 29,728 | ||||||
3.00%, 10/1/46 | 1,280,721 | 1,354,774 | ||||||
4.00%, 10/1/46 | 102,246 | 111,233 | ||||||
2.50%, 11/1/46 | 21,961 | 22,978 | ||||||
3.00%, 11/1/46 | 1,746,805 | 1,847,807 | ||||||
2.50%, 12/1/46 | 51,339 | 53,715 | ||||||
3.00%, 12/1/46 | 1,120,928 | 1,185,862 | ||||||
3.50%, 12/1/46 | 1,169,424 | 1,255,457 | ||||||
2.50%, 1/1/47 | 65,200 | 68,218 | ||||||
3.00%, 1/1/47 | 208,945 | 223,298 | ||||||
3.50%, 1/1/47 | 401,486 | 428,227 | ||||||
4.50%, 1/1/47 | 101,360 | 111,235 | ||||||
5.50%, 1/1/47 | 328,062 | 378,147 | ||||||
3.00%, 2/1/47 | 712,889 | 753,714 | ||||||
3.50%, 2/1/47 | 3,460,463 | 3,732,409 | ||||||
4.00%, 2/1/47 | 613,592 | 676,292 | ||||||
4.50%, 3/1/47 | 62,436 | 68,271 | ||||||
3.00%, 4/1/47 | 1,268,871 | 1,341,535 | ||||||
4.00%, 4/1/47 | 145,181 | 156,151 | ||||||
4.50%, 4/1/47 | 178,279 | 194,941 | ||||||
3.00%, 5/1/47 | 669,682 | 718,270 | ||||||
3.50%, 5/1/47 | 288,983 | 308,230 | ||||||
4.00%, 5/1/47 | 526,192 | 568,812 | ||||||
4.50%, 5/1/47 | 999,255 | 1,111,510 | ||||||
3.50%, 6/1/47 | 101,486 | 107,749 | ||||||
4.00%, 6/1/47 | 430,890 | 465,636 | ||||||
3.50%, 7/1/47 | 1,449,529 | 1,573,841 | ||||||
4.00%, 7/1/47 | 333,577 | 362,016 | ||||||
4.50%, 7/1/47 | 302,771 | 331,068 | ||||||
5.00%, 7/1/47 | 257,602 | 293,916 | ||||||
3.50%, 8/1/47 | 413,303 | 440,915 | ||||||
4.00%, 8/1/47 | 1,205,915 | 1,306,867 | ||||||
3.00%, 9/1/47 | 790,601 | 843,955 | ||||||
3.50%, 9/1/47 | 356,600 | 378,606 | ||||||
4.00%, 9/1/47 | 182,317 | 196,093 | ||||||
4.50%, 9/1/47 | 183,118 | 200,232 | ||||||
3.50%, 10/1/47 | 83,924 | 89,103 | ||||||
4.00%, 10/1/47 | 216,759 | 233,137 | ||||||
4.50%, 10/1/47 | 196,788 | 215,179 | ||||||
3.50%, 11/1/47 | 206,472 | 219,214 | ||||||
4.00%, 11/1/47 | 742,622 | 798,734 | ||||||
4.50%, 11/1/47 | 263,166 | 287,762 | ||||||
3.00%, 12/1/47 | 293,237 | 309,750 | ||||||
3.50%, 12/1/47 | 137,050 | 146,177 | ||||||
4.00%, 12/1/47 | 263,878 | 283,817 | ||||||
3.00%, 1/1/48 | 1,036,206 | 1,094,557 | ||||||
3.50%, 1/1/48 | 1,230,970 | 1,306,938 | ||||||
3.00%, 2/1/48 | 132,441 | 139,899 | ||||||
3.50%, 2/1/48 | 659,216 | 699,899 | ||||||
4.50%, 4/1/48 | 389,117 | 420,600 | ||||||
4.00%, 5/1/48 | 323,080 | 351,634 | ||||||
5.00%, 5/1/48 | 153,318 | 167,806 | ||||||
4.00%, 6/1/48 | 103,458 | 110,754 | ||||||
4.50%, 6/1/48 | 33,633 | 36,354 | ||||||
5.00%, 6/1/48 | 38,012 | 41,585 | ||||||
3.50%, 7/1/48 | 699,295 | 744,528 | ||||||
4.00%, 7/1/48 | 397,712 | 425,759 | ||||||
3.00%, 8/1/48 | 887,188 | 948,032 | ||||||
3.50%, 8/1/48 | 286,394 | 308,277 | ||||||
4.50%, 8/1/48 | 283,430 | 307,918 | ||||||
5.00%, 8/1/48 | 145,851 | 159,562 | ||||||
3.00%, 9/1/48 | 258,888 | 273,713 | ||||||
4.00%, 9/1/48 | 957,943 | 1,031,075 | ||||||
4.00%, 10/1/48 | 2,198,699 | 2,407,597 | ||||||
3.00%, 11/1/48 | 1,520,717 | 1,608,840 | ||||||
3.50%, 11/1/48 | 1,513,351 | 1,606,744 | ||||||
See Notes to Financial Statements.
| WisdomTree Trust | 81 |
Table of Contents
Schedule of Investments (continued)
WisdomTree Yield Enhanced U.S. Aggregate Bond Fund (AGGY)
August 31, 2021
| Investments in Long Securities | Principal Amount | Value | ||||||
4.00%, 11/1/48 | $ | 216,278 | $ | 236,519 | ||||
4.50%, 11/1/48 | 355,114 | 388,647 | ||||||
5.00%, 11/1/48 | 179,572 | 196,453 | ||||||
4.50%, 12/1/48 | 473,050 | 511,324 | ||||||
4.00%, 1/1/49 | 275,940 | 296,790 | ||||||
4.50%, 1/1/49 | 393,209 | 429,958 | ||||||
5.00%, 2/1/49 | 252,827 | 276,594 | ||||||
4.00%, 3/1/49 | 69,128 | 74,011 | ||||||
4.50%, 3/1/49 | 325,457 | 351,632 | ||||||
5.00%, 3/1/49 | 19,093 | 20,888 | ||||||
4.00%, 4/1/49 | 381,776 | 408,746 | ||||||
4.50%, 4/1/49 | 158,392 | 171,131 | ||||||
3.50%, 5/1/49 | 68,886 | 72,836 | ||||||
4.00%, 5/1/49 | 934,006 | 1,016,166 | ||||||
4.50%, 5/1/49 | 227,742 | 246,058 | ||||||
3.50%, 6/1/49 | 844,977 | 900,218 | ||||||
4.00%, 7/1/49 | 217,880 | 233,271 | ||||||
3.50%, 8/1/49 | 1,324,227 | 1,416,580 | ||||||
4.00%, 8/1/49 | 454,069 | 486,145 | ||||||
3.00%, 9/1/49 | 1,807,072 | 1,900,230 | ||||||
3.50%, 9/1/49 | 172,921 | 183,352 | ||||||
3.00%, 10/1/49 | 740,474 | 774,146 | ||||||
4.00%, 10/1/49 | 353,087 | 378,030 | ||||||
4.50%, 10/1/49 | 215,707 | 233,055 | ||||||
3.00%, 12/1/49 | 1,007,623 | 1,053,444 | ||||||
3.00%, 1/1/50 | 1,393,258 | 1,468,875 | ||||||
3.00%, 2/1/50 | 1,050,157 | 1,112,101 | ||||||
3.50%, 2/1/50 | 843,304 | 903,325 | ||||||
4.50%, 2/1/50 | 331,727 | 358,405 | ||||||
3.00%, 3/1/50 | 2,710,010 | 2,855,287 | ||||||
3.50%, 3/1/50 | 334,444 | 358,248 | ||||||
4.00%, 3/1/50 | 270,550 | 289,629 | ||||||
3.50%, 4/1/50 | 366,546 | 393,885 | ||||||
5.50%, 4/1/50 | 224,760 | 255,040 | ||||||
2.50%, 5/1/50 | 2,485,291 | 2,600,164 | ||||||
3.50%, 5/1/50 | 924,973 | 991,507 | ||||||
2.50%, 6/1/50 | 4,027,935 | 4,184,630 | ||||||
2.50%, 7/1/50 | 386,088 | 401,186 | ||||||
3.00%, 7/1/50 | 1,619,030 | 1,704,645 | ||||||
2.50%, 8/1/50 | 3,242,248 | 3,379,373 | ||||||
3.00%, 8/1/50 | 1,015,682 | 1,062,429 | ||||||
2.00%, 9/1/50 | 1,865,969 | 1,892,818 | ||||||
2.50%, 9/1/50 | 842,741 | 877,941 | ||||||
2.00%, 10/1/50 | 7,962,400 | 8,093,353 | ||||||
3.00%, 10/1/50 | 668,995 | 700,190 | ||||||
3.50%, 11/1/50 | 316,332 | 334,562 | ||||||
1.50%, 12/1/50 | 1,939,798 | 1,907,218 | ||||||
2.00%, 12/1/50 | 2,858,084 | 2,899,208 | ||||||
2.00%, 1/1/51 | 965,771 | 979,667 | ||||||
2.00%, 2/1/51 | 3,146,785 | 3,194,425 | ||||||
2.50%, 2/1/51 | 929,673 | 970,425 | ||||||
3.00%, 4/1/51 | 392,339 | 413,806 | ||||||
2.00%, 5/1/51 | 737,377 | 748,015 | ||||||
1.50%, 6/1/51 | 1,138,562 | 1,119,434 | ||||||
2.00%, 6/1/51 | 744,579 | 756,868 | ||||||
2.00%, 7/1/51 | 595,597 | 607,706 | ||||||
2.50%, 7/1/51 | 498,175 | 519,575 | ||||||
2.00%, 8/1/51 | 598,747 | 609,714 | ||||||
2.50%, 8/1/51 | 698,767 | 728,838 | ||||||
|
| |||||||
| Total Federal National Mortgage Association |
| 152,325,119 | ||||||
| Government National Mortgage Association – 7.0% |
| |||||||
4.00%, 11/20/40 | 1,780,495 | 1,967,003 | ||||||
2.50%, 3/20/43 | 120,164 | 125,754 | ||||||
3.50%, 12/20/45 | 832,799 | 890,588 | ||||||
3.50%, 1/20/46 | 330,418 | 353,346 | ||||||
3.00%, 9/20/46 | 259,653 | 273,789 | ||||||
3.00%, 1/20/47 | 370,640 | 390,818 | ||||||
2.50%, 2/20/47 | 189,233 | 197,248 | ||||||
3.00%, 2/20/47 | 435,166 | 458,858 | ||||||
4.50%, 8/20/47 | 525,739 | 571,226 | ||||||
3.00%, 9/20/47 | 99,815 | 105,122 | ||||||
3.50%, 10/20/47 | 100,910 | 107,131 | ||||||
3.50%, 1/20/48 | 340,564 | 361,559 | ||||||
4.00%, 1/20/48 | 468,024 | 500,853 | ||||||
3.00%, 3/20/48 | 154,922 | 163,160 | ||||||
3.50%, 3/20/48 | 579,274 | 614,985 | ||||||
3.50%, 4/20/48 | 244,026 | 259,070 | ||||||
3.50%, 1/20/49 | 26,164 | 27,777 | ||||||
4.00%, 2/20/49 | 128,567 | 136,574 | ||||||
4.50%, 2/20/49 | 233,058 | 248,878 | ||||||
3.50%, 3/20/49 | 229,317 | 242,553 | ||||||
4.00%, 3/20/49 | 214,793 | 228,065 | ||||||
4.50%, 3/20/49 | 54,894 | 58,620 | ||||||
3.00%, 8/20/49 | 138,723 | 145,287 | ||||||
5.00%, 9/20/49 | 43,115 | 46,570 | ||||||
4.50%, 10/20/49 | 204,954 | 218,954 | ||||||
3.00%, 11/20/49 | 490,366 | 513,032 | ||||||
3.00%, 1/20/50 | 66,588 | 69,649 | ||||||
3.50%, 1/20/50 | 187,679 | 197,352 | ||||||
5.00%, 1/20/50 | 37,300 | 40,791 | ||||||
3.00%, 2/20/50 | 401,030 | 419,359 | ||||||
3.50%, 2/20/50 | 38,939 | 40,930 | ||||||
3.50%, 4/20/50 | 13,232 | 13,903 | ||||||
4.00%, 4/20/50 | 49,777 | 52,893 | ||||||
2.50%, 5/15/50 | 137,031 | 141,702 | ||||||
5.00%, 5/20/50 | 11,656 | 12,767 | ||||||
3.00%, 6/20/50 | 414,236 | 433,176 | ||||||
3.50%, 6/20/50 | 234,018 | 246,279 | ||||||
4.00%, 6/20/50 | 173,549 | 184,630 | ||||||
2.50%, 7/15/50 | 82,439 | 85,249 | ||||||
3.00%, 7/20/50 | 127,519 | 133,352 | ||||||
3.00%, 8/20/50 | 171,959 | 179,828 | ||||||
4.50%, 8/20/50 | 138,288 | 147,731 | ||||||
3.50%, 12/20/50 | 227,834 | 240,437 | ||||||
2.00%, 3/20/51 | 974,842 | 995,844 | ||||||
2.50%, 5/20/51 | 49,317 | 51,192 | ||||||
2.00%, 9/1/51(a) | 10,600,000 | 10,818,464 | ||||||
2.50%, 9/1/51(a) | 12,075,000 | 12,520,879 | ||||||
3.00%, 9/1/51(a) | 9,650,000 | 10,088,739 | ||||||
3.50%, 9/1/51(a) | 7,425,000 | 7,813,557 | ||||||
4.00%, 9/1/51(a) | 1,500,000 | 1,589,699 | ||||||
4.50%, 9/1/51(a) | 500,000 | 534,103 | ||||||
5.00%, 9/1/51(a) | 300,000 | 322,547 | ||||||
2.00%, 10/1/51(a) | 4,275,000 | 4,355,465 | ||||||
2.50%, 10/1/51(a) | 4,400,000 | 4,554,286 | ||||||
3.00%, 10/1/51(a) | 3,600,000 | 3,757,641 | ||||||
3.50%, 10/1/51(a) | 3,000,000 | 3,156,160 | ||||||
4.00%, 10/1/51(a) | 1,500,000 | 1,590,881 | ||||||
4.50%, 10/1/51(a) | 1,600,000 | 1,711,161 | ||||||
See Notes to Financial Statements.
| 82 | WisdomTree Trust |
Table of Contents
Schedule of Investments (continued)
WisdomTree Yield Enhanced U.S. Aggregate Bond Fund (AGGY)
August 31, 2021
| Investments in Long Securities | Principal Amount | Value | ||||||
5.00%, 10/21/51 | $ | 500,000 | $ | 538,378 | ||||
|
| |||||||
| Total Government National Mortgage Association |
| 76,245,844 | ||||||
| Tennessee Valley Authority – 4.8% |
| |||||||
4.70%, 7/15/33, Series B | 3,450,000 | 4,543,064 | ||||||
4.65%, 6/15/35 | 2,000,000 | 2,672,800 | ||||||
5.88%, 4/1/36 | 4,300,000 | 6,450,129 | ||||||
6.15%, 1/15/38 | 100,000 | 155,150 | ||||||
5.50%, 6/15/38 | 2,000,000 | 2,951,820 | ||||||
5.25%, 9/15/39 | 8,156,000 | 11,887,207 | ||||||
3.50%, 12/15/42 | 4,519,000 | 5,454,071 | ||||||
4.88%, 1/15/48 | 1,995,000 | 2,958,066 | ||||||
5.38%, 4/1/56 | 3,790,000 | 6,321,493 | ||||||
4.63%, 9/15/60 | 2,700,000 | 4,120,362 | ||||||
4.25%, 9/15/65 | 3,350,000 | 4,879,945 | ||||||
|
| |||||||
| Total Tennessee Valley Authority |
| 52,394,107 | ||||||
| Uniform Mortgage-Backed Securities – 10.6% |
| |||||||
1.50%, 9/1/51(a) | 8,925,000 | 8,768,644 | ||||||
2.00%, 9/1/51(a) | 63,275,000 | 64,147,861 | ||||||
2.50%, 9/1/51(a) | 35,800,000 | 37,189,441 | ||||||
3.00%, 9/1/51(a) | 200,000 | 209,206 | ||||||
5.00%, 9/1/51(a) | 300,000 | 328,796 | ||||||
2.00%, 10/1/51(a) | 2,750,000 | 2,782,830 | ||||||
2.50%, 10/1/51(a) | 2,400,000 | 2,488,376 | ||||||
|
| |||||||
| Total Uniform Mortgage-Backed Securities |
| 115,915,154 | ||||||
TOTAL U.S. GOVERNMENT AGENCIES (Cost: $492,918,957) |
| 493,725,479 | ||||||
| U.S. GOVERNMENT OBLIGATIONS – 17.9% |
| |||||||
| U.S. Treasury Bonds – 4.2% |
| |||||||
7.13%, 2/15/23 | 55,000 | 60,600 | ||||||
6.25%, 8/15/23 | 175,000 | 195,723 | ||||||
7.50%, 11/15/24 | 175,000 | 214,648 | ||||||
6.25%, 5/15/30 | 115,000 | 163,318 | ||||||
0.63%, 8/15/30 | 1,950,000 | 1,847,473 | ||||||
5.38%, 2/15/31 | 475,000 | 651,269 | ||||||
4.50%, 2/15/36 | 655,000 | 916,079 | ||||||
4.38%, 2/15/38 | 290,000 | 407,677 | ||||||
4.50%, 5/15/38 | 580,000 | 827,769 | ||||||
3.50%, 2/15/39 | 85,000 | 108,886 | ||||||
4.25%, 5/15/39 | 300,000 | 420,094 | ||||||
4.50%, 8/15/39 | 476,000 | 686,444 | ||||||
4.38%, 11/15/39 | 525,000 | 747,264 | ||||||
4.63%, 2/15/40 | 245,000 | 359,710 | ||||||
4.38%, 5/15/40 | 625,000 | 893,555 | ||||||
1.13%, 8/15/40 | 1,050,000 | 932,695 | ||||||
3.88%, 8/15/40 | 178,000 | 239,855 | ||||||
1.38%, 11/15/40 | 1,260,000 | 1,167,173 | ||||||
4.25%, 11/15/40 | 500,000 | 706,250 | ||||||
1.88%, 2/15/41 | 1,300,000 | 1,310,766 | ||||||
4.75%, 2/15/41 | 425,000 | 638,562 | ||||||
2.25%, 5/15/41 | 1,500,000 | 1,605,469 | ||||||
4.38%, 5/15/41 | 165,000 | 237,381 | ||||||
1.75%, 8/15/41 | 1,400,000 | 1,378,125 | ||||||
3.75%, 8/15/41 | 299,000 | 398,277 | ||||||
3.13%, 11/15/41 | 300,000 | 367,172 | ||||||
3.13%, 2/15/42 | 215,000 | 263,677 | ||||||
3.00%, 5/15/42 | 300,000 | 360,797 | ||||||
2.75%, 8/15/42 | 153,000 | 177,145 | ||||||
2.75%, 11/15/42 | 450,000 | 521,016 | ||||||
3.13%, 2/15/43 | 600,000 | 735,609 | ||||||
2.88%, 5/15/43 | 614,000 | 725,287 | ||||||
3.63%, 8/15/43 | 549,000 | 725,023 | ||||||
3.75%, 11/15/43 | 285,000 | 383,770 | ||||||
3.63%, 2/15/44 | 740,000 | 981,020 | ||||||
3.38%, 5/15/44 | 440,000 | 563,269 | ||||||
3.13%, 8/15/44 | 500,000 | 616,758 | ||||||
3.00%, 11/15/44 | 500,000 | 605,039 | ||||||
2.50%, 2/15/45 | 500,000 | 557,344 | ||||||
3.00%, 5/15/45 | 820,000 | 995,467 | ||||||
2.88%, 8/15/45 | 305,000 | 362,974 | ||||||
3.00%, 11/15/45 | 500,000 | 608,672 | ||||||
2.50%, 2/15/46 | 565,000 | 631,432 | ||||||
2.50%, 5/15/46 | 560,000 | 626,237 | ||||||
2.25%, 8/15/46 | 1,025,000 | 1,094,668 | ||||||
2.88%, 11/15/46 | 440,000 | 526,522 | ||||||
3.00%, 2/15/47 | 890,000 | 1,089,555 | ||||||
3.00%, 5/15/47 | 500,000 | 612,930 | ||||||
2.75%, 8/15/47 | 350,000 | 410,730 | ||||||
2.75%, 11/15/47 | 510,000 | 599,011 | ||||||
3.00%, 2/15/48 | 705,000 | 866,379 | ||||||
3.13%, 5/15/48 | 925,000 | 1,163,115 | ||||||
3.00%, 8/15/48 | 1,295,000 | 1,594,469 | ||||||
3.38%, 11/15/48 | 1,215,000 | 1,598,484 | ||||||
3.00%, 2/15/49 | 330,000 | 407,524 | ||||||
2.25%, 8/15/49 | 1,110,000 | 1,189,348 | ||||||
2.00%, 2/15/50 | 855,000 | 869,562 | ||||||
1.38%, 8/15/50 | 1,305,000 | 1,142,589 | ||||||
1.63%, 11/15/50 | 1,350,000 | 1,257,398 | ||||||
1.88%, 2/15/51 | 1,250,000 | 1,235,156 | ||||||
2.38%, 5/15/51 | 1,550,000 | 1,712,266 | ||||||
|
| |||||||
| Total U.S. Treasury Bonds |
| 45,292,476 | ||||||
| U.S. Treasury Notes – 13.7% |
| |||||||
1.50%, 9/15/22 | 1,085,000 | 1,100,957 | ||||||
1.75%, 9/30/22 | 45,000 | 45,807 | ||||||
1.88%, 9/30/22 | 1,950,000 | 1,987,591 | ||||||
0.13%, 10/31/22 | 500,000 | 500,156 | ||||||
1.88%, 10/31/22 | 1,325,000 | 1,352,458 | ||||||
2.00%, 10/31/22 | 800,000 | 817,656 | ||||||
1.63%, 11/15/22 | 1,905,000 | 1,939,863 | ||||||
0.13%, 11/30/22 | 2,000,000 | 2,000,391 | ||||||
2.00%, 11/30/22 | 1,785,000 | 1,827,185 | ||||||
1.63%, 12/15/22 | 800,000 | 815,625 | ||||||
0.13%, 12/31/22 | 200,000 | 200,008 | ||||||
2.13%, 12/31/22 | 1,340,000 | 1,375,672 | ||||||
1.50%, 1/15/23 | 500,000 | 509,453 | ||||||
0.13%, 1/31/23 | 1,000,000 | 1,000,000 | ||||||
2.38%, 1/31/23 | 400,000 | 412,719 | ||||||
1.38%, 2/15/23 | 970,000 | 987,581 | ||||||
2.00%, 2/15/23 | 845,000 | 868,039 | ||||||
1.50%, 2/28/23 | 720,000 | 734,723 | ||||||
2.63%, 2/28/23 | 750,000 | 778,008 | ||||||
0.50%, 3/15/23 | 5,000 | 5,028 | ||||||
0.13%, 3/31/23 | 1,100,000 | 1,099,592 | ||||||
1.50%, 3/31/23 | 300,000 | 306,428 | ||||||
0.25%, 4/15/23 | 365,000 | 365,570 | ||||||
See Notes to Financial Statements.
| WisdomTree Trust | 83 |
Table of Contents
Schedule of Investments (continued)
WisdomTree Yield Enhanced U.S. Aggregate Bond Fund (AGGY)
August 31, 2021
| Investments in Long Securities | Principal Amount | Value | ||||||
1.63%, 4/30/23 | $ | 770,000 | $ | 788,829 | ||||
2.75%, 4/30/23 | 600,000 | 625,852 | ||||||
0.13%, 5/15/23 | 1,140,000 | 1,139,354 | ||||||
1.75%, 5/15/23 | 1,515,000 | 1,556,130 | ||||||
1.63%, 5/31/23 | 435,000 | 446,113 | ||||||
2.75%, 5/31/23 | 230,000 | 240,368 | ||||||
0.25%, 6/15/23 | 850,000 | 851,162 | ||||||
1.38%, 6/30/23 | 480,000 | 490,547 | ||||||
2.63%, 6/30/23 | 215,000 | 224,595 | ||||||
0.13%, 7/15/23 | 1,350,000 | 1,348,576 | ||||||
0.13%, 7/31/23 | 1,000,000 | 998,867 | ||||||
1.25%, 7/31/23 | 820,000 | 836,672 | ||||||
0.13%, 8/15/23 | 350,000 | 349,549 | ||||||
2.50%, 8/15/23 | 50,000 | 52,245 | ||||||
0.13%, 8/31/23 | 1,000,000 | 998,379 | ||||||
1.38%, 8/31/23 | 680,000 | 695,831 | ||||||
2.75%, 8/31/23 | 625,000 | 656,677 | ||||||
0.13%, 9/15/23 | 250,000 | 249,551 | ||||||
1.38%, 9/30/23 | 500,000 | 512,012 | ||||||
2.88%, 9/30/23 | 1,210,000 | 1,276,503 | ||||||
0.13%, 10/15/23 | 1,000,000 | 997,813 | ||||||
1.63%, 10/31/23 | 675,000 | 695,276 | ||||||
2.88%, 10/31/23 | 245,000 | 258,944 | ||||||
0.25%, 11/15/23 | 1,850,000 | 1,850,289 | ||||||
2.75%, 11/15/23 | 450,000 | 474,820 | ||||||
2.13%, 11/30/23 | 580,000 | 604,401 | ||||||
2.88%, 11/30/23 | 745,000 | 788,827 | ||||||
0.13%, 12/15/23 | 750,000 | 747,715 | ||||||
2.25%, 12/31/23 | 415,000 | 434,129 | ||||||
2.63%, 12/31/23 | 740,000 | 780,527 | ||||||
0.13%, 1/15/24 | 500,000 | 498,203 | ||||||
2.25%, 1/31/24 | 750,000 | 785,625 | ||||||
2.50%, 1/31/24 | 660,000 | 695,217 | ||||||
0.13%, 2/15/24 | 1,590,000 | 1,583,913 | ||||||
2.75%, 2/15/24 | 1,135,000 | 1,203,543 | ||||||
2.38%, 2/29/24 | 1,000,000 | 1,051,758 | ||||||
2.13%, 3/31/24 | 1,923,000 | 2,012,690 | ||||||
2.00%, 4/30/24 | 170,000 | 177,550 | ||||||
2.25%, 4/30/24 | 1,000,000 | 1,050,898 | ||||||
0.25%, 5/15/24 | 1,000,000 | 997,383 | ||||||
2.50%, 5/15/24 | 1,900,000 | 2,010,660 | ||||||
2.00%, 5/31/24 | 1,780,000 | 1,860,309 | ||||||
1.75%, 6/30/24 | 1,000,000 | 1,039,141 | ||||||
2.00%, 6/30/24 | 964,000 | 1,008,472 | ||||||
0.38%, 7/15/24 | 1,000,000 | 999,727 | ||||||
1.75%, 7/31/24 | 1,000,000 | 1,039,922 | ||||||
2.13%, 7/31/24 | 576,000 | 605,205 | ||||||
2.38%, 8/15/24 | 2,250,000 | 2,381,660 | ||||||
1.25%, 8/31/24 | 1,605,000 | 1,645,752 | ||||||
1.88%, 8/31/24 | 1,100,000 | 1,148,512 | ||||||
1.50%, 9/30/24 | 1,615,000 | 1,668,812 | ||||||
2.13%, 9/30/24 | 894,000 | 940,760 | ||||||
1.50%, 10/31/24 | 1,000,000 | 1,033,633 | ||||||
2.25%, 10/31/24 | 1,310,000 | 1,384,762 | ||||||
2.25%, 11/15/24 | 1,150,000 | 1,216,305 | ||||||
1.50%, 11/30/24 | 975,000 | 1,008,021 | ||||||
1.75%, 12/31/24 | 525,000 | 547,230 | ||||||
2.25%, 12/31/24 | 972,000 | 1,029,181 | ||||||
1.38%, 1/31/25 | 1,104,000 | 1,136,818 | ||||||
2.50%, 1/31/25 | 750,000 | 801,094 | ||||||
2.00%, 2/15/25 | 1,000,000 | 1,051,328 | ||||||
7.63%, 2/15/25 | 500,000 | 622,617 | ||||||
1.13%, 2/28/25 | 250,000 | 255,283 | ||||||
2.75%, 2/28/25 | 622,000 | 670,399 | ||||||
0.50%, 3/31/25 | 175,000 | 174,802 | ||||||
2.63%, 3/31/25 | 702,000 | 754,156 | ||||||
0.38%, 4/30/25 | 458,000 | 455,084 | ||||||
2.13%, 5/15/25 | 375,000 | 396,519 | ||||||
0.25%, 5/31/25 | 670,000 | 661,913 | ||||||
2.88%, 5/31/25 | 565,000 | 613,290 | ||||||
0.25%, 6/30/25 | 250,000 | 246,816 | ||||||
2.75%, 6/30/25 | 311,000 | 336,560 | ||||||
0.25%, 7/31/25 | 400,000 | 394,578 | ||||||
2.00%, 8/15/25 | 500,000 | 527,383 | ||||||
0.25%, 8/31/25 | 250,000 | 246,357 | ||||||
0.25%, 9/30/25 | 972,000 | 956,926 | ||||||
0.25%, 10/31/25 | 2,000,000 | 1,966,953 | ||||||
2.25%, 11/15/25 | 835,000 | 890,514 | ||||||
0.38%, 11/30/25 | 1,425,000 | 1,407,800 | ||||||
0.38%, 12/31/25 | 2,400,000 | 2,368,781 | ||||||
0.38%, 1/31/26 | 1,610,000 | 1,587,548 | ||||||
1.63%, 2/15/26 | 700,000 | 728,492 | ||||||
0.50%, 2/28/26 | 2,000,000 | 1,982,188 | ||||||
0.75%, 3/31/26 | 2,120,000 | 2,123,064 | ||||||
2.25%, 3/31/26 | 2,000,000 | 2,138,594 | ||||||
0.75%, 4/30/26 | 1,400,000 | 1,401,367 | ||||||
1.63%, 5/15/26 | 1,170,000 | 1,218,034 | ||||||
0.75%, 5/31/26 | 2,500,000 | 2,500,977 | ||||||
2.13%, 5/31/26 | 1,000,000 | 1,064,688 | ||||||
0.88%, 6/30/26 | 1,500,000 | 1,508,438 | ||||||
1.88%, 6/30/26 | 1,850,000 | 1,948,498 | ||||||
0.63%, 7/31/26 | 500,000 | 496,582 | ||||||
1.88%, 7/31/26 | 1,570,000 | 1,654,571 | ||||||
1.50%, 8/15/26 | 1,624,000 | 1,681,411 | ||||||
1.38%, 8/31/26 | 650,000 | 669,221 | ||||||
1.63%, 9/30/26 | 850,000 | 885,461 | ||||||
1.63%, 10/31/26 | 1,000,000 | 1,041,875 | ||||||
2.00%, 11/15/26 | 1,500,000 | 1,591,523 | ||||||
2.25%, 2/15/27 | 500,000 | 537,500 | ||||||
1.13%, 2/28/27 | 500,000 | 507,422 | ||||||
0.63%, 3/31/27 | 490,000 | 483,684 | ||||||
0.50%, 4/30/27 | 500,000 | 489,492 | ||||||
2.38%, 5/15/27 | 2,000,000 | 2,165,938 | ||||||
0.50%, 5/31/27 | 910,000 | 889,738 | ||||||
0.50%, 6/30/27 | 750,000 | 732,744 | ||||||
0.38%, 7/31/27 | 1,000,000 | 968,906 | ||||||
0.50%, 8/31/27 | 500,000 | 487,402 | ||||||
0.38%, 9/30/27 | 500,000 | 483,086 | ||||||
1.25%, 4/30/28 | 400,000 | 405,531 | ||||||
1.25%, 5/31/28 | 1,000,000 | 1,013,203 | ||||||
2.88%, 8/15/28 | 1,000,000 | 1,121,563 | ||||||
3.13%, 11/15/28 | 1,300,000 | 1,483,727 | ||||||
2.63%, 2/15/29 | 1,300,000 | 1,440,359 | ||||||
2.38%, 5/15/29 | 500,000 | 545,586 | ||||||
1.50%, 2/15/30 | 1,000,000 | 1,023,984 | ||||||
0.63%, 5/15/30 | 2,075,000 | 1,971,250 | ||||||
0.88%, 11/15/30 | 1,960,000 | 1,894,616 | ||||||
1.13%, 2/15/31 | 3,445,000 | 3,399,515 | ||||||
See Notes to Financial Statements.
| 84 | WisdomTree Trust |
Table of Contents
Schedule of Investments (continued)
WisdomTree Yield Enhanced U.S. Aggregate Bond Fund (AGGY)
August 31, 2021
| Investments in Long Securities | Principal Amount | Value | ||||||
1.63%, 5/15/31 | $ | 3,000,000 | $ | 3,093,047 | ||||
1.25%, 8/15/31 | 2,000,000 | 1,989,844 | ||||||
1.13%, 5/15/40 | 700,000 | 624,039 | ||||||
2.88%, 5/15/49 | 1,250,000 | 1,510,840 | ||||||
2.38%, 11/15/49 | 900,000 | 990,773 | ||||||
1.25%, 5/15/50 | 758,000 | 643,353 | ||||||
|
| |||||||
| Total U.S. Treasury Notes |
| 149,681,552 | ||||||
TOTAL U.S. GOVERNMENT OBLIGATIONS (Cost: $194,297,297) |
| 194,974,028 | ||||||
| U.S. CORPORATE BONDS – 27.7% |
| |||||||
| United States – 27.7% |
| |||||||
3M Co. |
| |||||||
2.25%, 9/19/26 | 130,000 | 137,608 | ||||||
2.88%, 10/15/27 | 180,000 | 196,925 | ||||||
Abbott Laboratories | 251,000 | 284,019 | ||||||
AbbVie, Inc. |
| |||||||
2.95%, 11/21/26 | 31,000 | 33,414 | ||||||
4.25%, 11/14/28 | 100,000 | 115,997 | ||||||
3.20%, 11/21/29 | 1,364,000 | 1,491,466 | ||||||
4.55%, 3/15/35 | 625,000 | 761,719 | ||||||
4.50%, 5/14/35 | 234,000 | 284,766 | ||||||
4.30%, 5/14/36 | 71,000 | 84,866 | ||||||
4.05%, 11/21/39 | 400,000 | 469,768 | ||||||
4.85%, 6/15/44 | 25,000 | 32,081 | ||||||
4.75%, 3/15/45 | 208,000 | 262,823 | ||||||
4.70%, 5/14/45 | 250,000 | 315,152 | ||||||
4.45%, 5/14/46 | 200,000 | 245,820 | ||||||
4.88%, 11/14/48 | 29,000 | 37,988 | ||||||
4.25%, 11/21/49 | 750,000 | 911,632 | ||||||
Activision Blizzard, Inc. |
| |||||||
3.40%, 9/15/26 | 189,000 | 208,274 | ||||||
1.35%, 9/15/30 | 350,000 | 329,532 | ||||||
Adobe, Inc. | 59,000 | 61,680 | ||||||
Adventist Health System | 50,000 | 53,272 | ||||||
AEP Texas, Inc. | 100,000 | 112,926 | ||||||
AES Corp. (The) | 250,000 | 252,507 | ||||||
Aetna, Inc. | 75,000 | 109,533 | ||||||
4.75%, 3/15/44 | 500,000 | 630,290 | ||||||
3.88%, 8/15/47 | 34,000 | 38,613 | ||||||
Agilent Technologies, Inc. | 33,000 | 34,912 | ||||||
2.30%, 3/12/31 | 250,000 | 253,657 | ||||||
Air Lease Corp. | ||||||||
3.63%, 4/1/27 | 201,000 | 217,289 | ||||||
3.63%, 12/1/27 | 120,000 | 129,863 | ||||||
4.63%, 10/1/28 | 86,000 | 97,774 | ||||||
Alexandria Real Estate Equities, Inc. | 95,000 | 107,707 | ||||||
3.38%, 8/15/31 | 675,000 | 748,116 | ||||||
3.00%, 5/18/51 | 150,000 | 149,643 | ||||||
Allstate Corp. (The) | 108,000 | 119,452 | ||||||
Ally Financial, Inc. | 456,000 | 666,837 | ||||||
Altria Group, Inc. | 237,000 | 250,187 | ||||||
4.80%, 2/14/29 | 127,000 | 147,731 | ||||||
3.40%, 5/6/30 | 400,000 | 429,108 | ||||||
5.80%, 2/14/39 | 150,000 | 187,955 | ||||||
3.40%, 2/4/41 | 250,000 | 240,985 | ||||||
5.38%, 1/31/44 | 257,000 | 310,032 | ||||||
3.88%, 9/16/46 | 32,000 | 32,361 | ||||||
5.95%, 2/14/49 | 191,000 | 249,085 | ||||||
4.45%, 5/6/50 | 250,000 | 273,182 | ||||||
3.70%, 2/4/51 | 200,000 | 194,354 | ||||||
4.00%, 2/4/61 | 90,000 | 88,523 | ||||||
Amcor Flexibles North America, Inc. | 300,000 | 313,224 | ||||||
Ameren Illinois Co. | 250,000 | 242,530 | ||||||
American Airlines Pass Through Trust | ||||||||
3.15%, 8/15/33, Series 2019-1, Class AA | 229,679 | 235,233 | ||||||
American Campus Communities Operating Partnership L.P. | 61,000 | 66,855 | ||||||
2.85%, 2/1/30 | 244,000 | 253,687 | ||||||
American Electric Power Co., Inc. | 50,000 | 57,762 | ||||||
American Equity Investment Life Holding Co. | 75,000 | 85,811 | ||||||
American Express Credit Corp. | 125,000 | 138,580 | ||||||
American Homes 4 Rent L.P. | 337,000 | 386,327 | ||||||
American Honda Finance Corp. | 65,000 | 72,795 | ||||||
1.80%, 1/13/31 | 250,000 | 248,940 | ||||||
American International Group, Inc. | 518,000 | 596,265 | ||||||
3.88%, 1/15/35 | 708,000 | 811,191 | ||||||
4.50%, 7/16/44 | 250,000 | 310,255 | ||||||
4.38%, 6/30/50 | 250,000 | 314,447 | ||||||
American Tower Corp. | 150,000 | 163,355 | ||||||
3.13%, 1/15/27 | 145,000 | 155,971 | ||||||
3.55%, 7/15/27 | 140,000 | 154,162 | ||||||
1.50%, 1/31/28 | 72,000 | 70,628 | ||||||
3.80%, 8/15/29 | 554,000 | 619,023 | ||||||
2.90%, 1/15/30 | 415,000 | 437,107 | ||||||
2.95%, 1/15/51 | 100,000 | 97,329 | ||||||
American Water Capital Corp. | 132,000 | 143,311 | ||||||
3.75%, 9/1/28 | 624,000 | 708,789 | ||||||
4.00%, 12/1/46 | 13,000 | 15,595 | ||||||
3.75%, 9/1/47 | 125,000 | 143,701 | ||||||
4.20%, 9/1/48 | 80,000 | 98,890 | ||||||
Ameriprise Financial, Inc. | 70,000 | 75,485 | ||||||
See Notes to Financial Statements.
| WisdomTree Trust | 85 |
Table of Contents
Schedule of Investments (continued)
WisdomTree Yield Enhanced U.S. Aggregate Bond Fund (AGGY)
August 31, 2021
| Investments in Long Securities | Principal Amount | Value | ||||||
AmerisourceBergen Corp. | $ | 75,000 | $ | 82,454 | ||||
2.70%, 3/15/31 | 250,000 | 259,705 | ||||||
Amgen, Inc. | 100,000 | 104,286 | ||||||
3.20%, 11/2/27 | 301,000 | 330,378 | ||||||
2.45%, 2/21/30 | 417,000 | 431,716 | ||||||
3.15%, 2/21/40 | 500,000 | 524,320 | ||||||
2.80%, 8/15/41 | 250,000 | 247,660 | ||||||
4.40%, 5/1/45 | 269,000 | 328,863 | ||||||
4.56%, 6/15/48 | 200,000 | 252,906 | ||||||
3.38%, 2/21/50 | 250,000 | 266,307 | ||||||
4.66%, 6/15/51 | 250,000 | 324,810 | ||||||
2.77%, 9/1/53 | 250,000 | 239,843 | ||||||
Amphenol Corp. | 230,000 | 244,179 | ||||||
Analog Devices, Inc. | 183,000 | 202,683 | ||||||
Anthem, Inc. | 292,000 | 327,244 | ||||||
2.25%, 5/15/30 | 500,000 | 509,550 | ||||||
2.55%, 3/15/31(b) | 400,000 | 416,488 | ||||||
4.63%, 5/15/42 | 30,000 | 37,591 | ||||||
5.10%, 1/15/44 | 242,000 | 320,302 | ||||||
4.65%, 8/15/44 | 26,000 | 32,873 | ||||||
4.38%, 12/1/47 | 79,000 | 98,015 | ||||||
4.55%, 3/1/48 | 30,000 | 38,018 | ||||||
3.13%, 5/15/50 | 202,000 | 210,880 | ||||||
3.60%, 3/15/51 | 250,000 | 281,010 | ||||||
Aon Corp. | 499,000 | 585,212 | ||||||
2.90%, 8/23/51 | 150,000 | 148,193 | ||||||
Appalachian Power Co. | 100,000 | 108,982 | ||||||
Apple, Inc. | 63,000 | 80,144 | ||||||
Aptiv PLC | ||||||||
4.35%, 3/15/29 | 75,000 | 87,130 | ||||||
5.40%, 3/15/49 | 125,000 | 174,673 | ||||||
Arch Capital Group Ltd. | 197,000 | 219,746 | ||||||
Arch Capital Group US, Inc. | 50,000 | 66,892 | ||||||
Archer-Daniels-Midland Co. | 110,000 | 117,248 | ||||||
Ares Capital Corp. | 250,000 | 255,070 | ||||||
Arrow Electronics, Inc. | 212,000 | 233,550 | ||||||
Arthur J Gallagher & Co. | 250,000 | 272,040 | ||||||
Assurant, Inc. | 25,000 | 29,275 | ||||||
AT&T, Inc. | 315,000 | 351,868 | ||||||
4.25%, 3/1/27 | 209,000 | 238,413 | ||||||
2.30%, 6/1/27 | 550,000 | 573,743 | ||||||
4.10%, 2/15/28 | 409,000 | 466,865 | ||||||
4.35%, 3/1/29 | 510,000 | 592,171 | ||||||
4.30%, 2/15/30 | 480,000 | 558,053 | ||||||
2.75%, 6/1/31 | 350,000 | 367,010 | ||||||
2.25%, 2/1/32 | 290,000 | 288,448 | ||||||
2.55%, 12/1/33(c) | 450,000 | 452,529 | ||||||
4.50%, 5/15/35 | 314,000 | 372,709 | ||||||
5.25%, 3/1/37 | 173,000 | 219,765 | ||||||
4.85%, 3/1/39 | 130,000 | 159,480 | ||||||
5.35%, 9/1/40 | 50,000 | 64,972 | ||||||
6.25%, 3/29/41 | 190,000 | 269,078 | ||||||
3.50%, 6/1/41 | 350,000 | 369,845 | ||||||
5.15%, 3/15/42 | 200,000 | 254,692 | ||||||
4.90%, 6/15/42 | 79,000 | 98,853 | ||||||
4.30%, 12/15/42 | 350,000 | 405,261 | ||||||
3.10%, 2/1/43 | 300,000 | 298,332 | ||||||
5.15%, 11/15/46 | 70,000 | 90,754 | ||||||
4.55%, 3/9/49 | 29,000 | 34,810 | ||||||
5.15%, 2/15/50 | 70,000 | 90,984 | ||||||
3.65%, 6/1/51 | 400,000 | 424,016 | ||||||
3.30%, 2/1/52 | 150,000 | 149,627 | ||||||
3.50%, 9/15/53(c) | 500,000 | 513,930 | ||||||
3.55%, 9/15/55(c) | 528,000 | 540,614 | ||||||
3.80%, 12/1/57(c) | 772,000 | 823,222 | ||||||
3.65%, 9/15/59(c) | 1,109,000 | 1,142,880 | ||||||
3.85%, 6/1/60 | 150,000 | 160,320 | ||||||
3.50%, 2/1/61 | 500,000 | 497,235 | ||||||
Athene Holding Ltd. | 403,000 | 453,464 | ||||||
Autodesk, Inc. | 165,000 | 182,909 | ||||||
AutoNation, Inc. | 115,000 | 127,260 | ||||||
AutoZone, Inc. | 113,000 | 127,117 | ||||||
3.75%, 4/18/29 | 175,000 | 196,716 | ||||||
1.65%, 1/15/31 | 250,000 | 240,670 | ||||||
AvalonBay Communities, Inc. | 50,000 | 53,904 | ||||||
3.20%, 1/15/28 | 75,000 | 82,112 | ||||||
3.30%, 6/1/29 | 320,000 | 353,430 | ||||||
Avangrid, Inc. | 150,000 | 169,493 | ||||||
Avery Dennison Corp. | 31,000 | 37,241 | ||||||
AXIS Specialty Finance LLC | 225,000 | 250,380 | ||||||
AXIS Specialty Finance PLC | 25,000 | 27,895 | ||||||
Baker Hughes a GE Co. LLC | 50,000 | 54,861 | ||||||
3.14%, 11/7/29 | 75,000 | 81,282 | ||||||
Baltimore Gas & Electric Co. | 90,000 | 95,051 | ||||||
2.25%, 6/15/31 | 450,000 | 460,449 | ||||||
Bank of America Corp. | 50,000 | 56,791 | ||||||
3.25%, 10/21/27 | 67,000 | 73,145 | ||||||
4.18%, 11/25/27, Series L | 909,000 | 1,022,316 | ||||||
See Notes to Financial Statements.
| 86 | WisdomTree Trust |
Table of Contents
Schedule of Investments (continued)
WisdomTree Yield Enhanced U.S. Aggregate Bond Fund (AGGY)
August 31, 2021
| Investments in Long Securities | Principal Amount | Value | ||||||
3.82%, 1/20/28, (3.824% fixed rate until 1/20/27; 3-month U.S. dollar London Interbank Offered Rate + 1.575% thereafter)(d) | $ | 100,000 | $ | 111,381 | ||||
3.71%, 4/24/28, (3.705% fixed rate until 4/24/27; 3-month U.S. dollar London Interbank Offered Rate + 1.512% thereafter)(d) | 350,000 | 388,230 | ||||||
3.59%, 7/21/28, (3.593% fixed rate until 7/21/27; 3-month U.S. dollar London Interbank Offered Rate + 1.37% thereafter)(d) | 331,000 | 366,248 | ||||||
3.42%, 12/20/28, (3.419% fixed rate until 12/20/27; 3-month U.S. dollar London Interbank Offered Rate + 1.04% thereafter)(d) | 201,000 | 220,945 | ||||||
3.97%, 3/5/29, (3.97% fixed rate until 3/5/28; 3-month U.S. dollar London Interbank Offered Rate + 1.07% thereafter)(d) | 250,000 | 281,975 | ||||||
4.27%, 7/23/29, (4.271% fixed rate until 7/23/28; 3-month U.S. dollar London Interbank Offered Rate + 1.31% thereafter)(d) | 296,000 | 340,261 | ||||||
3.97%, 2/7/30, (3.974% fixed rate until 2/7/29; 3-month U.S. dollar London Interbank Offered Rate + 1.21% thereafter)(d) | 311,000 | 353,392 | ||||||
2.50%, 2/13/31, (2.496% fixed rate until 2/13/30; 3-month U.S. dollar London Interbank Offered Rate + 0.99% thereafter)(d) | 1,052,000 | 1,083,002 | ||||||
2.65%, 3/11/32, Series N, (2.651% fixed rate until 3/11/31; Secured Overnight Financing Rate + 1.22% thereafter)(d) | 500,000 | 518,695 | ||||||
2.69%, 4/22/32, (2.687% fixed rate until 4/22/31; Secured Overnight Financing Rate + 1.32% thereafter)(d) | 1,150,000 | 1,197,334 | ||||||
7.75%, 5/14/38 | 250,000 | 396,662 | ||||||
BankUnited, Inc. | 50,000 | 58,454 | ||||||
Baxalta, Inc. | 60,000 | 82,415 | ||||||
Baxter International, Inc. | 49,000 | 52,181 | ||||||
3.95%, 4/1/30 | 200,000 | 230,726 | ||||||
Becton Dickinson and Co. | 175,000 | 195,230 | ||||||
1.96%, 2/11/31 | 250,000 | 246,555 | ||||||
4.69%, 12/15/44 | 87,000 | 110,761 | ||||||
4.67%, 6/6/47 | 124,000 | 157,764 | ||||||
3.79%, 5/20/50 | 250,000 | 284,320 | ||||||
Berkshire Hathaway Energy Co. | 248,000 | 273,499 | ||||||
Berkshire Hathaway Finance Corp. | 81,000 | 118,276 | ||||||
4.40%, 5/15/42 | 52,000 | 65,866 | ||||||
4.30%, 5/15/43 | 55,000 | 69,042 | ||||||
4.20%, 8/15/48 | 84,000 | 105,336 | ||||||
4.25%, 1/15/49 | 52,000 | 65,600 | ||||||
2.85%, 10/15/50 | 55,000 | 55,643 | ||||||
Berkshire Hathaway, Inc. | 66,000 | 85,046 | ||||||
Biogen, Inc. | 100,000 | 101,124 | ||||||
3.15%, 5/1/50 | 300,000 | 297,183 | ||||||
3.25%, 2/15/51(c) | 52,000 | 52,401 | ||||||
Black Hills Corp. | 180,000 | 212,283 | ||||||
3.88%, 10/15/49 | 40,000 | 44,586 | ||||||
Boardwalk Pipelines L.P. | 100,000 | 113,093 | ||||||
Boeing Co. (The) | 285,000 | 296,694 | ||||||
5.15%, 5/1/30 | 725,000 | 860,191 | ||||||
3.63%, 2/1/31 | 400,000 | 434,096 | ||||||
3.60%, 5/1/34 | 275,000 | 291,582 | ||||||
3.55%, 3/1/38 | 50,000 | 51,453 | ||||||
5.71%, 5/1/40 | 700,000 | 906,668 | ||||||
3.38%, 6/15/46 | 50,000 | 49,018 | ||||||
3.85%, 11/1/48 | 50,000 | 52,066 | ||||||
5.81%, 5/1/50 | 400,000 | 544,924 | ||||||
5.93%, 5/1/60 | 842,000 | 1,171,601 | ||||||
Booking Holdings, Inc. | 90,000 | 100,535 | ||||||
4.63%, 4/13/30 | 150,000 | 179,651 | ||||||
BorgWarner, Inc. | 111,000 | 132,676 | ||||||
Boston Properties L.P. | 450,000 | 526,716 | ||||||
2.90%, 3/15/30 | 77,000 | 80,976 | ||||||
Boston Scientific Corp. | 290,000 | 332,299 | ||||||
7.00%, 11/15/35 | 165,000 | 238,549 | ||||||
7.38%, 1/15/40 | 2,000 | 3,209 | ||||||
4.70%, 3/1/49 | 47,000 | 61,192 | ||||||
BP Capital Markets America, Inc. | 142,000 | 153,635 | ||||||
4.23%, 11/6/28 | 50,000 | 57,890 | ||||||
Brandywine Operating Partnership L.P. | 290,000 | 328,698 | ||||||
Brighthouse Financial, Inc. | 250,000 | 304,925 | ||||||
Bristol-Myers Squibb Co. | 100,000 | 112,001 | ||||||
3.90%, 2/20/28 | 357,000 | 409,433 | ||||||
3.40%, 7/26/29 | 363,000 | 408,052 | ||||||
1.45%, 11/13/30 | 110,000 | 107,230 | ||||||
Brixmor Operating Partnership L.P. | 250,000 | 283,240 | ||||||
Broadcom Corp. | 430,000 | 474,763 | ||||||
3.50%, 1/15/28 | 637,000 | 693,311 | ||||||
See Notes to Financial Statements.
| WisdomTree Trust | 87 |
Table of Contents
Schedule of Investments (continued)
WisdomTree Yield Enhanced U.S. Aggregate Bond Fund (AGGY)
August 31, 2021
| Investments in Long Securities | Principal Amount | Value | ||||||
Broadcom, Inc. | $ | 143,000 | $ | 155,347 | ||||
1.95%, 2/15/28(c) | 500,000 | 499,060 | ||||||
4.11%, 9/15/28 | 40,000 | 44,902 | ||||||
4.75%, 4/15/29 | 500,000 | 581,345 | ||||||
5.00%, 4/15/30 | 250,000 | 296,650 | ||||||
4.15%, 11/15/30 | 715,000 | 805,312 | ||||||
3.42%, 4/15/33(c) | 500,000 | 530,685 | ||||||
3.47%, 4/15/34(c) | 250,000 | 265,072 | ||||||
3.50%, 2/15/41(c) | 400,000 | 409,808 | ||||||
3.75%, 2/15/51(c) | 150,000 | 156,921 | ||||||
Broadridge Financial Solutions, Inc. | 275,000 | 291,967 | ||||||
Brown & Brown, Inc. | 250,000 | 253,022 | ||||||
Bunge Ltd. Finance Corp. | 91,000 | 98,496 | ||||||
3.75%, 9/25/27 | 164,000 | 182,302 | ||||||
2.75%, 5/14/31 | 75,000 | 77,063 | ||||||
CA, Inc. | 55,000 | 62,178 | ||||||
Campbell Soup Co. | 250,000 | 254,457 | ||||||
4.80%, 3/15/48 | 143,000 | 181,368 | ||||||
Capital One Financial Corp. | 257,000 | 287,660 | ||||||
3.80%, 1/31/28 | 349,000 | 392,185 | ||||||
Cardinal Health, Inc. | 184,000 | 201,986 | ||||||
4.50%, 11/15/44 | 52,000 | 60,078 | ||||||
4.37%, 6/15/47 | 105,000 | 119,243 | ||||||
Carlisle Cos., Inc. | 41,000 | 45,756 | ||||||
Carrier Global Corp. | 535,000 | 559,102 | ||||||
3.38%, 4/5/40 | 300,000 | 321,069 | ||||||
3.58%, 4/5/50 | 250,000 | 272,900 | ||||||
Caterpillar Financial Services Corp. | 90,000 | 96,006 | ||||||
1.10%, 9/14/27 | 100,000 | 99,737 | ||||||
CenterPoint Energy Houston Electric LLC | 100,000 | 108,799 | ||||||
CenterPoint Energy Resources Corp. | 290,000 | 328,051 | ||||||
CenterPoint Energy, Inc. | 270,000 | 311,029 | ||||||
CF Industries, Inc. | 350,000 | 432,267 | ||||||
Charles Schwab Corp. (The) | 181,000 | 199,578 | ||||||
3.25%, 5/22/29 | 200,000 | 221,546 | ||||||
Charter Communications Operating LLC | 150,000 | 169,722 | ||||||
5.05%, 3/30/29 | 100,000 | 118,545 | ||||||
2.80%, 4/1/31 | 520,000 | 533,562 | ||||||
6.38%, 10/23/35 | 505,000 | 675,458 | ||||||
3.50%, 6/1/41 | 250,000 | 253,055 | ||||||
6.48%, 10/23/45 | 278,000 | 388,708 | ||||||
5.38%, 5/1/47 | 374,000 | 461,460 | ||||||
5.75%, 4/1/48 | 113,000 | 146,145 | ||||||
5.13%, 7/1/49 | 97,000 | 117,302 | ||||||
4.80%, 3/1/50 | 500,000 | 587,625 | ||||||
3.70%, 4/1/51 | 250,000 | 251,962 | ||||||
3.90%, 6/1/52 | 150,000 | 155,234 | ||||||
3.85%, 4/1/61 | 275,000 | 273,941 | ||||||
Cheniere Corpus Christi Holdings LLC | 400,000 | 466,548 | ||||||
3.70%, 11/15/29 | 75,000 | 82,450 | ||||||
Chevron USA, Inc. | 69,000 | 94,551 | ||||||
Chubb INA Holdings, Inc. | 250,000 | 240,255 | ||||||
Church & Dwight Co., Inc. | 90,000 | 98,545 | ||||||
Cigna Corp. | 120,000 | 132,314 | ||||||
3.05%, 10/15/27 | 155,000 | 168,184 | ||||||
4.38%, 10/15/28 | 941,000 | 1,099,041 | ||||||
4.80%, 8/15/38 | 152,000 | 190,499 | ||||||
3.20%, 3/15/40 | 135,000 | 141,935 | ||||||
6.13%, 11/15/41 | 21,000 | 30,310 | ||||||
4.80%, 7/15/46 | 125,000 | 160,208 | ||||||
3.88%, 10/15/47 | 146,000 | 166,221 | ||||||
4.90%, 12/15/48 | 200,000 | 261,732 | ||||||
3.40%, 3/15/50 | 250,000 | 266,832 | ||||||
3.40%, 3/15/51 | 150,000 | 160,206 | ||||||
Cimarex Energy Co. | 245,000 | 270,896 | ||||||
Cintas Corp. No. 2 | 85,000 | 95,448 | ||||||
Cisco Systems, Inc. | 40,000 | 43,058 | ||||||
Citigroup, Inc. | 44,000 | 47,916 | ||||||
4.45%, 9/29/27 | 470,000 | 538,878 | ||||||
3.89%, 1/10/28, (3.887% fixed rate until 1/10/27; 3-month U.S. dollar London Interbank Offered Rate + 1.563% thereafter)(d) | 120,000 | 133,823 | ||||||
6.63%, 1/15/28 | 200,000 | 259,144 | ||||||
3.67%, 7/24/28, (3.668% fixed rate until 7/24/27; 3-month U.S. dollar London Interbank Offered Rate + 1.39% thereafter)(d) | 297,000 | 329,320 | ||||||
4.13%, 7/25/28 | 329,000 | 372,310 | ||||||
3.52%, 10/27/28, (3.52% fixed rate until 10/27/27; 3-month U.S. dollar London Interbank Offered Rate + 1.151% thereafter)(d) | 208,000 | 228,817 | ||||||
4.08%, 4/23/29, (4.075% fixed rate until 4/23/28; 3-month U.S. dollar London Interbank Offered Rate + 1.192% thereafter)(d) | 265,000 | 300,741 | ||||||
See Notes to Financial Statements.
| 88 | WisdomTree Trust |
Table of Contents
Schedule of Investments (continued)
WisdomTree Yield Enhanced U.S. Aggregate Bond Fund (AGGY)
August 31, 2021
| Investments in Long Securities | Principal Amount | Value | ||||||
3.98%, 3/20/30, (3.98% fixed rate until 3/20/29; 3-month U.S. dollar London Interbank Offered Rate + 1.338% thereafter)(d) | $ | 329,000 | $ | 374,116 | ||||
2.98%, 11/5/30, (2.976% fixed rate until 11/5/29; Secured Overnight Financing Rate + 1.422% thereafter)(d) | 240,000 | 255,727 | ||||||
2.67%, 1/29/31, (2.666% fixed rate until 1/29/30; Secured Overnight Financing Rate + 1.146% thereafter)(d) | 382,000 | 397,502 | ||||||
4.41%, 3/31/31, (4.412% fixed rate until 3/31/30; Secured Overnight Financing Rate + 3.914% thereafter)(d) | 446,000 | 523,417 | ||||||
6.63%, 6/15/32 | 500,000 | 684,720 | ||||||
6.00%, 10/31/33 | 50,000 | 66,801 | ||||||
6.68%, 9/13/43 | 158,000 | 246,576 | ||||||
4.75%, 5/18/46 | 250,000 | 321,832 | ||||||
Citizens Financial Group, Inc. | 359,000 | 384,123 | ||||||
Citrix Systems, Inc. | 25,000 | 28,525 | ||||||
Clorox Co. (The) | 325,000 | 354,916 | ||||||
CME Group, Inc. | 86,000 | 123,733 | ||||||
CMS Energy Corp. | 157,000 | 174,009 | ||||||
4.75%, 6/1/50, (4.75% fixed rate until 3/1/30; 5-year Constant Maturity Treasury Rate + 4.116% thereafter)(d) | 72,000 | 81,284 | ||||||
CNA Financial Corp. | 250,000 | 248,795 | ||||||
Coca-Cola Co. (The) | 145,000 | 150,807 | ||||||
3.45%, 3/25/30 | 300,000 | 341,178 | ||||||
2.00%, 3/5/31 | 250,000 | 254,987 | ||||||
1.38%, 3/15/31 | 50,000 | 48,261 | ||||||
Comcast Corp. | 635,000 | 670,065 | ||||||
3.30%, 2/1/27 | 175,000 | 192,348 | ||||||
3.15%, 2/15/28 | 264,000 | 290,033 | ||||||
2.65%, 2/1/30 | 56,000 | 59,025 | ||||||
1.95%, 1/15/31 | 250,000 | 249,082 | ||||||
CommonSpirit Health | 320,000 | 380,173 | ||||||
3.91%, 10/1/50 | 100,000 | 112,288 | ||||||
Conagra Brands, Inc. | 23,000 | 30,570 | ||||||
4.85%, 11/1/28 | 387,000 | 462,121 | ||||||
8.25%, 9/15/30 | 335,000 | 496,855 | ||||||
Connecticut Light & Power Co. (The) | 100,000 | 110,351 | ||||||
ConocoPhillips |
| |||||||
6.95%, 4/15/29 | 100,000 | 135,422 | ||||||
2.40%, 2/15/31(c) | 150,000 | 154,323 | ||||||
Consolidated Edison Co. of New York, Inc. | 250,000 | 256,837 | ||||||
Constellation Brands, Inc. |
| |||||||
3.70%, 12/6/26 | 340,000 | 377,961 | ||||||
3.50%, 5/9/27 | 162,000 | 179,311 | ||||||
2.88%, 5/1/30 | 250,000 | 263,817 | ||||||
4.50%, 5/9/47 | 100,000 | 121,980 | ||||||
4.10%, 2/15/48 | 65,000 | 75,258 | ||||||
Consumers Energy Co. | 100,000 | 114,382 | ||||||
Continental Airlines Pass Through Trust | 10,339 | 10,915 | ||||||
Corning, Inc. |
| |||||||
4.75%, 3/15/42 | 250,000 | 319,552 | ||||||
5.45%, 11/15/79 | 250,000 | 355,442 | ||||||
Costco Wholesale Corp. |
| |||||||
3.00%, 5/18/27 | 74,000 | 81,445 | ||||||
1.60%, 4/20/30 | 350,000 | 347,700 | ||||||
Crown Castle International Corp. |
| |||||||
4.00%, 3/1/27 | 220,000 | 247,205 | ||||||
3.65%, 9/1/27 | 144,000 | 159,625 | ||||||
3.80%, 2/15/28 | 100,000 | 111,394 | ||||||
4.30%, 2/15/29 | 250,000 | 288,457 | ||||||
3.10%, 11/15/29 | 102,000 | 108,945 | ||||||
2.25%, 1/15/31 | 50,000 | 49,715 | ||||||
4.75%, 5/15/47 | 95,000 | 119,134 | ||||||
5.20%, 2/15/49 | 50,000 | 65,754 | ||||||
3.25%, 1/15/51 | 250,000 | 254,040 | ||||||
CSX Corp. |
| |||||||
3.25%, 6/1/27 | 99,000 | 108,602 | ||||||
3.80%, 3/1/28 | 212,000 | 239,002 | ||||||
2.40%, 2/15/30 | 250,000 | 258,762 | ||||||
6.00%, 10/1/36 | 250,000 | 349,392 | ||||||
3.80%, 11/1/46 | 87,000 | 100,115 | ||||||
4.30%, 3/1/48 | 155,000 | 191,439 | ||||||
4.75%, 11/15/48 | 100,000 | 131,683 | ||||||
4.50%, 3/15/49 | 250,000 | 317,690 | ||||||
3.80%, 4/15/50 | 250,000 | 290,215 | ||||||
3.95%, 5/1/50 | 15,000 | 17,875 | ||||||
4.25%, 11/1/66 | 55,000 | 68,877 | ||||||
CubeSmart L.P. |
| |||||||
3.13%, 9/1/26 | 35,000 | 37,577 | ||||||
4.38%, 2/15/29 | 25,000 | 28,843 | ||||||
CVS Health Corp. |
| |||||||
6.25%, 6/1/27 | 75,000 | 93,512 | ||||||
4.30%, 3/25/28 | 1,297,000 | 1,495,363 | ||||||
3.25%, 8/15/29 | 572,000 | 624,590 | ||||||
4.88%, 7/20/35 | 653,000 | 805,077 | ||||||
4.78%, 3/25/38 | 136,000 | 169,267 | ||||||
4.13%, 4/1/40 | 250,000 | 292,997 | ||||||
2.70%, 8/21/40 | 205,000 | 201,413 | ||||||
5.13%, 7/20/45 | 250,000 | 330,192 | ||||||
5.05%, 3/25/48 | 500,000 | 662,165 | ||||||
4.25%, 4/1/50 | 400,000 | 486,536 | ||||||
Danaher Corp. | 150,000 | 146,736 | ||||||
See Notes to Financial Statements.
| WisdomTree Trust | 89 |
Table of Contents
Schedule of Investments (continued)
WisdomTree Yield Enhanced U.S. Aggregate Bond Fund (AGGY)
August 31, 2021
| Investments in Long Securities | Principal Amount | Value | ||||||
Dayton Power & Light Co. (The) | $ | 100,000 | $ | 115,319 | ||||
Dell International LLC |
| |||||||
4.90%, 10/1/26 | 100,000 | 115,870 | ||||||
6.10%, 7/15/27 | 322,000 | 397,883 | ||||||
5.30%, 10/1/29 | 240,000 | 292,397 | ||||||
8.10%, 7/15/36 | 530,000 | 815,818 | ||||||
Devon Energy Corp. |
| |||||||
7.95%, 4/15/32 | 75,000 | 107,807 | ||||||
4.75%, 5/15/42 | 200,000 | 228,252 | ||||||
5.00%, 6/15/45 | 306,000 | 362,812 | ||||||
DH Europe Finance II Sarl |
| |||||||
3.25%, 11/15/39 | 250,000 | 272,565 | ||||||
3.40%, 11/15/49 | 50,000 | 55,795 | ||||||
Diamondback Energy, Inc. |
| |||||||
3.50%, 12/1/29 | 300,000 | 323,571 | ||||||
3.13%, 3/24/31 | 150,000 | 156,867 | ||||||
Digital Realty Trust L.P. |
| |||||||
3.70%, 8/15/27 | 288,000 | 323,029 | ||||||
4.45%, 7/15/28 | 152,000 | 176,673 | ||||||
3.60%, 7/1/29 | 100,000 | 111,266 | ||||||
Dignity Health | 10,000 | 14,127 | ||||||
Discover Bank |
| |||||||
3.45%, 7/27/26 | 250,000 | 272,947 | ||||||
4.65%, 9/13/28 | 358,000 | 420,557 | ||||||
Discovery Communications LLC |
| |||||||
3.95%, 3/20/28 | 85,000 | 95,093 | ||||||
4.13%, 5/15/29 | 350,000 | 395,790 | ||||||
5.00%, 9/20/37 | 250,000 | 306,127 | ||||||
4.00%, 9/15/55 | 456,000 | 490,396 | ||||||
Dollar General Corp. |
| |||||||
3.88%, 4/15/27 | 112,000 | 126,047 | ||||||
3.50%, 4/3/30 | 268,000 | 298,978 | ||||||
Dominion Energy, Inc. |
| |||||||
4.25%, 6/1/28 | 75,000 | 86,438 | ||||||
3.38%, 4/1/30, Series C | 600,000 | 657,822 | ||||||
5.25%, 8/1/33, Series F | 45,000 | 57,224 | ||||||
7.00%, 6/15/38 | 25,000 | 37,706 | ||||||
4.60%, 3/15/49, Series A | 72,000 | 92,748 | ||||||
Dow Chemical Co. (The) |
| |||||||
4.80%, 11/30/28 | 157,000 | 188,694 | ||||||
7.38%, 11/1/29 | 205,000 | 286,567 | ||||||
4.25%, 10/1/34 | 120,000 | 140,461 | ||||||
5.25%, 11/15/41 | 55,000 | 72,948 | ||||||
5.55%, 11/30/48 | 250,000 | 355,767 | ||||||
DTE Electric Co. | 250,000 | 265,747 | ||||||
Duke Energy Carolinas LLC |
| |||||||
2.95%, 12/1/26 | 20,000 | 21,676 | ||||||
3.95%, 11/15/28 | 354,000 | 406,937 | ||||||
Duke Energy Corp. |
| |||||||
2.65%, 9/1/26 | 137,000 | 145,752 | ||||||
3.15%, 8/15/27 | 237,000 | 257,645 | ||||||
3.40%, 6/15/29 | 42,000 | 46,095 | ||||||
2.45%, 6/1/30 | 250,000 | 256,385 | ||||||
2.55%, 6/15/31 | 250,000 | 257,382 | ||||||
4.80%, 12/15/45 | 35,000 | 43,989 | ||||||
3.75%, 9/1/46 | 250,000 | 271,920 | ||||||
3.95%, 8/15/47 | 250,000 | 280,237 | ||||||
Duke Energy Florida LLC | 55,000 | 60,332 | ||||||
Duke Energy Progress LLC | 50,000 | 56,720 | ||||||
3.45%, 3/15/29 | 54,000 | 60,455 | ||||||
Duke Realty L.P. | 41,000 | 44,602 | ||||||
4.00%, 9/15/28 | 60,000 | 68,768 | ||||||
1.75%, 2/1/31 | 250,000 | 242,353 | ||||||
DuPont de Nemours, Inc. | 517,000 | 616,605 | ||||||
5.32%, 11/15/38 | 250,000 | 331,210 | ||||||
5.42%, 11/15/48 | 152,000 | 215,458 | ||||||
DXC Technology Co. | 247,000 | 283,277 | ||||||
E*TRADE Financial Corp. | 100,000 | 112,046 | ||||||
Eastman Chemical Co. | 40,000 | 46,842 | ||||||
4.65%, 10/15/44 | 40,000 | 49,198 | ||||||
Eaton Corp. | 226,000 | 246,641 | ||||||
eBay, Inc. | 240,000 | 268,164 | ||||||
4.00%, 7/15/42 | 300,000 | 342,258 | ||||||
Ecolab, Inc. | 150,000 | 161,325 | ||||||
3.25%, 12/1/27 | 25,000 | 27,691 | ||||||
4.80%, 3/24/30 | 186,000 | 228,627 | ||||||
Edison International | 145,000 | 155,405 | ||||||
Eli Lilly & Co. | 187,000 | 210,541 | ||||||
Enable Midstream Partners L.P. | 35,000 | 38,965 | ||||||
4.95%, 5/15/28 | 170,000 | 193,533 | ||||||
4.15%, 9/15/29 | 100,000 | 109,733 | ||||||
5.00%, 5/15/44 | 60,000 | 65,714 | ||||||
Energy Transfer L.P. | 100,000 | 117,973 | ||||||
4.00%, 10/1/27 | 711,000 | 790,077 | ||||||
5.25%, 4/15/29 | 175,000 | 206,432 | ||||||
3.75%, 5/15/30 | 150,000 | 163,209 | ||||||
6.63%, 10/15/36 | 50,000 | 66,393 | ||||||
5.80%, 6/15/38, Series 20Y | 250,000 | 310,307 | ||||||
7.50%, 7/1/38 | 50,000 | 70,254 | ||||||
6.10%, 2/15/42 | 50,000 | 63,153 | ||||||
4.95%, 1/15/43 | 254,000 | 279,512 | ||||||
5.35%, 5/15/45 | 225,000 | 265,342 | ||||||
6.13%, 12/15/45 | 50,000 | 64,410 | ||||||
5.30%, 4/15/47 | 25,000 | 29,512 | ||||||
5.40%, 10/1/47 | 60,000 | 72,483 | ||||||
6.25%, 4/15/49 | 300,000 | 397,896 | ||||||
5.00%, 5/15/50 | 280,000 | 328,432 | ||||||
See Notes to Financial Statements.
| 90 | WisdomTree Trust |
Table of Contents
Schedule of Investments (continued)
WisdomTree Yield Enhanced U.S. Aggregate Bond Fund (AGGY)
August 31, 2021
| Investments in Long Securities | Principal Amount | Value | ||||||
Enstar Group Ltd. | $ | 196,000 | $ | 225,051 | ||||
Entergy Corp. | 309,000 | 331,857 | ||||||
2.80%, 6/15/30 | 315,000 | 330,010 | ||||||
Enterprise Products Operating LLC | 371,000 | 427,288 | ||||||
3.13%, 7/31/29 | 152,000 | 164,780 | ||||||
6.65%, 10/15/34, Series H | 290,000 | 413,424 | ||||||
5.95%, 2/1/41 | 200,000 | 278,090 | ||||||
4.45%, 2/15/43 | 200,000 | 236,382 | ||||||
4.85%, 3/15/44 | 250,000 | 309,705 | ||||||
5.10%, 2/15/45 | 250,000 | 317,090 | ||||||
4.25%, 2/15/48 | 216,000 | 250,113 | ||||||
4.95%, 10/15/54 | 175,000 | 227,036 | ||||||
3.95%, 1/31/60 | 250,000 | 279,005 | ||||||
5.25%, 8/16/77, Series E, (5.25% fixed rate until 8/16/27; 3-month U.S. dollar London Interbank Offered Rate + 3.033% thereafter)(d) | 118,000 | 123,108 | ||||||
Equinix, Inc. | 100,000 | 107,146 | ||||||
1.80%, 7/15/27 | 48,000 | 48,785 | ||||||
3.20%, 11/18/29 | 500,000 | 539,125 | ||||||
2.95%, 9/15/51 | 225,000 | 217,796 | ||||||
Equitable Holdings, Inc. | 529,000 | 608,477 | ||||||
5.00%, 4/20/48 | 95,000 | 123,776 | ||||||
ERP Operating L.P. | 88,000 | 96,809 | ||||||
3.50%, 3/1/28 | 112,000 | 124,452 | ||||||
4.15%, 12/1/28 | 153,000 | 176,897 | ||||||
Essential Utilities, Inc. | 362,000 | 403,673 | ||||||
Essex Portfolio L.P. | 100,000 | 113,959 | ||||||
3.00%, 1/15/30 | 175,000 | 186,694 | ||||||
1.65%, 1/15/31 | 250,000 | 238,498 | ||||||
Estee Lauder Cos., Inc. (The) | 60,000 | 66,205 | ||||||
1.95%, 3/15/31 | 250,000 | 253,507 | ||||||
Everest Reinsurance Holdings, Inc. | 250,000 | 272,555 | ||||||
Evergy, Inc. | 150,000 | 159,870 | ||||||
Eversource Energy | 290,000 | 280,453 | ||||||
Exelon Corp. | 51,000 | 63,344 | ||||||
Exelon Generation Co. LLC | 395,000 | 491,538 | ||||||
5.60%, 6/15/42 | 97,000 | 115,595 | ||||||
Expedia Group, Inc. | 500,000 | 566,015 | ||||||
3.25%, 2/15/30 | 100,000 | 103,689 | ||||||
Extra Space Storage L.P. | 50,000 | 50,887 | ||||||
Federal Realty Investment Trust | 71,000 | 76,799 | ||||||
4.50%, 12/1/44 | 250,000 | 306,612 | ||||||
FedEx Corp. | 90,000 | 100,017 | ||||||
3.10%, 8/5/29 | 277,000 | 300,318 | ||||||
4.25%, 5/15/30 | 240,000 | 280,634 | ||||||
4.90%, 1/15/34 | 25,000 | 31,412 | ||||||
3.25%, 5/15/41 | 250,000 | 261,535 | ||||||
4.75%, 11/15/45 | 250,000 | 315,687 | ||||||
4.40%, 1/15/47 | 170,000 | 205,890 | ||||||
4.05%, 2/15/48 | 100,000 | 116,666 | ||||||
5.25%, 5/15/50(b) | 235,000 | 324,838 | ||||||
Fidelity National Financial, Inc. | 220,000 | 254,025 | ||||||
Fidelity National Information Services, Inc. | 500,000 | 500,365 | ||||||
Fifth Third Bancorp | 250,000 | 421,215 | ||||||
First Republic Bank | 75,000 | 93,962 | ||||||
Fiserv, Inc. | 337,000 | 387,429 | ||||||
2.65%, 6/1/30 | 423,000 | 439,738 | ||||||
4.40%, 7/1/49 | 576,000 | 707,432 | ||||||
Flex Ltd. | 100,000 | 116,314 | ||||||
Florida Power & Light Co. | 100,000 | 137,100 | ||||||
4.05%, 6/1/42 | 60,000 | 73,551 | ||||||
3.80%, 12/15/42 | 133,000 | 158,645 | ||||||
Flowers Foods, Inc. | 8,000 | 8,749 | ||||||
FMC Corp. | 110,000 | 120,168 | ||||||
4.50%, 10/1/49 | 272,000 | 326,457 | ||||||
Ford Foundation (The) | 75,000 | 74,009 | ||||||
Fox Corp. | 333,000 | 392,690 | ||||||
5.48%, 1/25/39 | 185,000 | 240,524 | ||||||
5.58%, 1/25/49 | 50,000 | 68,808 | ||||||
GATX Corp. | 160,000 | 176,922 | ||||||
3.50%, 3/15/28 | 100,000 | 110,541 | ||||||
4.55%, 11/7/28 | 90,000 | 105,311 | ||||||
4.70%, 4/1/29 | 40,000 | 47,030 | ||||||
GE Capital Funding LLC | 750,000 | 879,990 | ||||||
GE Capital International Funding Co. Unlimited Co. | 970,000 | 1,179,423 | ||||||
General Dynamics Corp. | 114,000 | 119,902 | ||||||
2.63%, 11/15/27 | 62,000 | 66,728 | ||||||
3.75%, 5/15/28 | 200,000 | 227,938 | ||||||
See Notes to Financial Statements.
| WisdomTree Trust | 91 |
Table of Contents
Schedule of Investments (continued)
WisdomTree Yield Enhanced U.S. Aggregate Bond Fund (AGGY)
August 31, 2021
| Investments in Long Securities | Principal Amount | Value | ||||||
General Electric Co. | $ | 150,000 | $ | 165,492 | ||||
3.63%, 5/1/30 | 350,000 | 393,750 | ||||||
6.75%, 3/15/32, Series MTNA | 353,000 | 490,458 | ||||||
5.88%, 1/14/38 | 157,000 | 215,856 | ||||||
6.88%, 1/10/39 | 85,000 | 128,825 | ||||||
4.35%, 5/1/50 | 450,000 | 555,556 | ||||||
General Mills, Inc. | 53,000 | 57,908 | ||||||
4.20%, 4/17/28 | 385,000 | 443,628 | ||||||
3.00%, 2/1/51(b)(c) | 145,000 | 150,874 | ||||||
General Motors Co. | 112,000 | 125,545 | ||||||
6.80%, 10/1/27 | 50,000 | 63,008 | ||||||
5.00%, 4/1/35 | 90,000 | 108,490 | ||||||
6.60%, 4/1/36 | 660,000 | 904,246 | ||||||
5.15%, 4/1/38 | 450,000 | 545,814 | ||||||
6.25%, 10/2/43 | 250,000 | 342,515 | ||||||
General Motors Financial Co., Inc. | 120,000 | 132,851 | ||||||
4.35%, 1/17/27 | 273,000 | 307,862 | ||||||
3.85%, 1/5/28 | 206,000 | 226,137 | ||||||
Georgia Power Co. | 110,000 | 119,792 | ||||||
Gilead Sciences, Inc. | 62,000 | 67,007 | ||||||
1.65%, 10/1/30 | 450,000 | 439,398 | ||||||
2.60%, 10/1/40 | 250,000 | 243,740 | ||||||
4.80%, 4/1/44 | 600,000 | 772,392 | ||||||
2.80%, 10/1/50 | 450,000 | 439,456 | ||||||
Global Payments, Inc. | 85,000 | 98,143 | ||||||
3.20%, 8/15/29 | 449,000 | 482,531 | ||||||
Globe Life, Inc. | 200,000 | 235,656 | ||||||
GLP Capital L.P. | 192,000 | 229,398 | ||||||
4.00%, 1/15/30 | 250,000 | 271,907 | ||||||
Goldman Sachs Group, Inc. (The) | 125,000 | 136,158 | ||||||
5.95%, 1/15/27 | 150,000 | 182,781 | ||||||
3.85%, 1/26/27 | 70,000 | 77,460 | ||||||
3.69%, 6/5/28, (3.691% fixed rate until 6/5/27; 3-month U.S. dollar London Interbank Offered Rate + 1.51% thereafter)(d) | 96,000 | 106,728 | ||||||
3.81%, 4/23/29, (3.814% fixed rate until 4/23/28; 3-month U.S. dollar London Interbank Offered Rate + 1.158% thereafter)(d) | 643,000 | 721,022 | ||||||
2.60%, 2/7/30 | 350,000 | 365,148 | ||||||
2.62%, 4/22/32, (2.615% fixed rate until 4/22/31; Secured Overnight Financing Rate + 1.281% thereafter)(d) | 850,000 | 876,851 | ||||||
6.75%, 10/1/37 | 446,000 | 650,745 | ||||||
5.15%, 5/22/45 | 430,000 | 577,473 | ||||||
Halliburton Co. | 150,000 | 156,306 | ||||||
4.85%, 11/15/35 | 55,000 | 65,181 | ||||||
6.70%, 9/15/38 | 56,000 | 77,446 | ||||||
7.45%, 9/15/39 | 78,000 | 114,389 | ||||||
4.50%, 11/15/41 | 2,000 | 2,233 | ||||||
4.75%, 8/1/43 | 200,000 | 229,690 | ||||||
5.00%, 11/15/45 | 207,000 | 249,934 | ||||||
Harley-Davidson, Inc. | 40,000 | 43,629 | ||||||
Hartford Financial Services Group, Inc. (The) | 65,000 | 78,850 | ||||||
4.40%, 3/15/48 | 120,000 | 150,331 | ||||||
Hasbro, Inc. | 74,000 | 81,201 | ||||||
3.50%, 9/15/27 | 174,000 | 191,280 | ||||||
6.35%, 3/15/40 | 341,000 | 478,556 | ||||||
HCA, Inc. | 452,000 | 512,812 | ||||||
4.13%, 6/15/29 | 300,000 | 339,849 | ||||||
5.13%, 6/15/39 | 60,000 | 75,518 | ||||||
5.50%, 6/15/47 | 113,000 | 149,482 | ||||||
5.25%, 6/15/49 | 233,000 | 304,188 | ||||||
3.50%, 7/15/51 | 150,000 | 153,314 | ||||||
Healthcare Realty Trust, Inc. | 25,000 | 27,634 | ||||||
Healthcare Trust of America Holdings L.P. | 325,000 | 347,539 | ||||||
2.00%, 3/15/31 | 250,000 | 243,170 | ||||||
Healthpeak Properties, Inc. | 168,000 | 182,915 | ||||||
6.75%, 2/1/41 | 32,000 | 49,159 | ||||||
Hershey Co. (The) | 85,000 | 90,262 | ||||||
1.70%, 6/1/30 | 50,000 | 50,152 | ||||||
Hess Corp. | 100,000 | 111,249 | ||||||
7.13%, 3/15/33 | 100,000 | 135,582 | ||||||
5.60%, 2/15/41 | 250,000 | 312,220 | ||||||
Hewlett Packard Enterprise Co. | 100,000 | 136,349 | ||||||
6.35%, 10/15/45 | 150,000 | 207,792 | ||||||
Highwoods Realty L.P. | 25,000 | 28,197 | ||||||
4.20%, 4/15/29 | 75,000 | 85,169 | ||||||
3.05%, 2/15/30 | 115,000 | 121,892 | ||||||
HollyFrontier Corp. | 50,000 | 53,850 | ||||||
Home Depot, Inc. (The) | 101,000 | 106,379 | ||||||
2.80%, 9/14/27 | 105,000 | 114,384 | ||||||
3.90%, 12/6/28 | 35,000 | 40,657 | ||||||
2.95%, 6/15/29 | 295,000 | 323,155 | ||||||
1.38%, 3/15/31 | 250,000 | 241,440 | ||||||
Honeywell International, Inc. | 201,000 | 214,479 | ||||||
Hormel Foods Corp. | 150,000 | 150,765 | ||||||
See Notes to Financial Statements.
| 92 | WisdomTree Trust |
Table of Contents
Schedule of Investments (continued)
WisdomTree Yield Enhanced U.S. Aggregate Bond Fund (AGGY)
August 31, 2021
| Investments in Long Securities | Principal Amount | Value | ||||||
Host Hotels & Resorts L.P. | $ | 250,000 | $ | 263,680 | ||||
HP, Inc. | 300,000 | 321,435 | ||||||
6.00%, 9/15/41 | 185,000 | 243,371 | ||||||
Hubbell, Inc. | 8,000 | 8,617 | ||||||
3.50%, 2/15/28 | 96,000 | 106,003 | ||||||
Hudson Pacific Properties L.P. | 185,000 | 215,623 | ||||||
3.25%, 1/15/30 | 200,000 | 213,378 | ||||||
Humana, Inc. | 71,000 | 79,864 | ||||||
2.15%, 2/3/32 | 500,000 | 499,020 | ||||||
4.95%, 10/1/44 | 117,000 | 153,456 | ||||||
Huntington Ingalls Industries, Inc. | 25,000 | 27,291 | ||||||
4.20%, 5/1/30 | 250,000 | 286,785 | ||||||
Huntsman International LLC | 379,000 | 435,092 | ||||||
Illinois Tool Works, Inc. | 99,000 | 106,514 | ||||||
Indiana Michigan Power Co. | 92,000 | 103,850 | ||||||
Indiana University Health, Inc. Obligated Group | 45,000 | 56,270 | ||||||
Ingredion, Inc. | 109,000 | 118,648 | ||||||
Intel Corp. | 100,000 | 110,251 | ||||||
2.45%, 11/15/29 | 55,000 | 58,061 | ||||||
3.90%, 3/25/30(b) | 365,000 | 424,550 | ||||||
Intercontinental Exchange, Inc. | 90,000 | 98,357 | ||||||
3.75%, 9/21/28 | 208,000 | 235,052 | ||||||
2.10%, 6/15/30 | 320,000 | 321,488 | ||||||
2.65%, 9/15/40 | 250,000 | 244,555 | ||||||
3.00%, 6/15/50 | 150,000 | 152,031 | ||||||
3.00%, 9/15/60 | 100,000 | 99,292 | ||||||
International Business Machines Corp. | 150,000 | 165,555 | ||||||
1.70%, 5/15/27 | 100,000 | 102,028 | ||||||
3.50%, 5/15/29 | 450,000 | 504,328 | ||||||
International Flavors & Fragrances, Inc. | 27,000 | 32,928 | ||||||
5.00%, 9/26/48 | 50,000 | 66,629 | ||||||
International Paper Co. | 250,000 | 336,537 | ||||||
4.35%, 8/15/48 | 134,000 | 168,379 | ||||||
Interpublic Group of Cos., Inc. (The) | 125,000 | 170,781 | ||||||
Interstate Power & Light Co. | 250,000 | 289,065 | ||||||
6.25%, 7/15/39 | 10,000 | 14,405 | ||||||
3.70%, 9/15/46 | 100,000 | 115,435 | ||||||
ITC Holdings Corp. | 75,000 | 81,740 | ||||||
Jabil, Inc. | 209,000 | 232,172 | ||||||
Janus Capital Group, Inc. | 2,000 | 2,256 | ||||||
Jefferies Group LLC | 53,000 | 61,794 | ||||||
4.15%, 1/23/30 | 503,000 | 570,633 | ||||||
6.25%, 1/15/36 | 268,000 | 363,810 | ||||||
6.50%, 1/20/43 | 61,000 | 85,445 | ||||||
JetBlue Pass Through Trust | ||||||||
2.75%, 11/15/33, Series 2019-1, Class AA | 94,843 | 95,704 | ||||||
JM Smucker Co. (The) | 222,000 | 264,235 | ||||||
4.38%, 3/15/45 | 5,000 | 6,104 | ||||||
John Deere Capital Corp. | 25,000 | 27,546 | ||||||
3.45%, 3/7/29 | 250,000 | 282,532 | ||||||
2.80%, 7/18/29 | 175,000 | 190,215 | ||||||
2.45%, 1/9/30 | 45,000 | 47,590 | ||||||
Johnson & Johnson | 30,000 | 37,706 | ||||||
3.40%, 1/15/38 | 50,000 | 57,447 | ||||||
3.70%, 3/1/46 | 103,000 | 124,295 | ||||||
Johnson Controls International PLC | 400,000 | 569,616 | ||||||
5.13%, 9/14/45 | 11,000 | 14,778 | ||||||
4.50%, 2/15/47 | 120,000 | 152,552 | ||||||
JPMorgan Chase & Co. | 97,000 | 104,610 | ||||||
7.63%, 10/15/26 | 167,000 | 217,902 | ||||||
4.13%, 12/15/26 | 27,000 | 30,676 | ||||||
8.00%, 4/29/27 | 1,000 | 1,342 | ||||||
4.25%, 10/1/27 | 244,000 | 280,310 | ||||||
3.63%, 12/1/27 | 35,000 | 38,511 | ||||||
3.78%, 2/1/28, (3.782% fixed rate until 2/1/27; 3-month U.S. dollar London Interbank Offered Rate + 1.337% thereafter)(d) | 129,000 | 143,660 | ||||||
3.54%, 5/1/28, (3.54% fixed rate until 5/1/27; 3-month U.S. dollar London Interbank Offered Rate + 1.38% thereafter)(d) | 268,000 | 295,481 | ||||||
3.51%, 1/23/29, (3.509% fixed rate until 1/23/28; 3-month U.S. dollar London Interbank Offered Rate + 0.945% thereafter)(d) | 110,000 | 121,619 | ||||||
4.01%, 4/23/29, (4.005% fixed rate until 4/23/28; 3-month U.S. dollar London Interbank Offered Rate + 1.12% thereafter)(d) | 490,000 | 556,464 | ||||||
4.20%, 7/23/29, (4.203% fixed rate until 7/23/28; 3-month U.S. dollar London Interbank Offered Rate + 1.26% thereafter)(d) | 355,000 | 408,470 | ||||||
4.45%, 12/5/29, (4.452% fixed rate until 12/5/28; 3-month U.S. dollar London Interbank Offered Rate + 1.33% thereafter)(d) | 211,000 | 246,906 | ||||||
See Notes to Financial Statements.
| WisdomTree Trust | 93 |
Table of Contents
Schedule of Investments (continued)
WisdomTree Yield Enhanced U.S. Aggregate Bond Fund (AGGY)
August 31, 2021
| Investments in Long Securities | Principal Amount | Value | ||||||
2.52%, 4/22/31, (2.522% fixed rate until 4/22/30; Secured Overnight Financing Rate + 2.04% thereafter)(d) | $ | 350,000 | $ | 362,855 | ||||
2.96%, 5/13/31, (2.956% fixed rate until 5/13/30; Secured Overnight Financing Rate + 2.515% thereafter)(d) | 550,000 | 582,708 | ||||||
1.95%, 2/4/32, (1.953% fixed rate until 2/4/31; Secured Overnight Financing Rate + 1.065% thereafter)(d) | 500,000 | 491,370 | ||||||
2.58%, 4/22/32, (2.58% fixed rate until 4/22/31; Secured Overnight Financing Rate + 1.25% thereafter)(d) | 500,000 | 517,510 | ||||||
Juniper Networks, Inc. | 50,000 | 48,426 | ||||||
Kansas City Southern | 200,000 | 211,928 | ||||||
4.70%, 5/1/48 | 125,000 | 156,358 | ||||||
4.20%, 11/15/69 | 50,000 | 58,664 | ||||||
Kellogg Co. | 155,000 | 171,151 | ||||||
7.45%, 4/1/31, Series B | 150,000 | 217,626 | ||||||
Kennametal, Inc. | 240,000 | 273,178 | ||||||
Keurig Dr. Pepper, Inc. | 50,000 | 53,144 | ||||||
3.43%, 6/15/27 | 90,000 | 99,670 | ||||||
4.60%, 5/25/28 | 170,000 | 199,626 | ||||||
3.20%, 5/1/30 | 550,000 | 599,720 | ||||||
5.09%, 5/25/48 | 125,000 | 167,819 | ||||||
KeyBank NA | 75,000 | 84,860 | ||||||
KeyCorp | 290,000 | 335,846 | ||||||
2.55%, 10/1/29 | 90,000 | 94,901 | ||||||
Kilroy Realty L.P. | 150,000 | 171,570 | ||||||
3.05%, 2/15/30 | 120,000 | 128,014 | ||||||
Kimberly-Clark Corp. | 117,000 | 130,436 | ||||||
Kimco Realty Corp. | 50,000 | 51,855 | ||||||
3.70%, 10/1/49 | 250,000 | 276,920 | ||||||
Kinder Morgan Energy Partners L.P. | 1,000 | 1,426 | ||||||
5.80%, 3/15/35 | 50,000 | 64,800 | ||||||
6.95%, 1/15/38 | 90,000 | 129,020 | ||||||
6.38%, 3/1/41 | 8,000 | 11,145 | ||||||
5.00%, 8/15/42 | 200,000 | 242,364 | ||||||
5.00%, 3/1/43 | 350,000 | 425,022 | ||||||
5.40%, 9/1/44 | 75,000 | 95,060 | ||||||
Kinder Morgan, Inc. | 192,000 | 219,640 | ||||||
2.00%, 2/15/31(b) | 150,000 | 146,397 | ||||||
7.75%, 1/15/32 | 187,000 | 270,810 | ||||||
5.30%, 12/1/34 | 168,000 | 208,947 | ||||||
5.55%, 6/1/45 | 148,000 | 192,357 | ||||||
5.05%, 2/15/46 | 80,000 | 98,582 | ||||||
5.20%, 3/1/48 | 100,000 | 126,938 | ||||||
3.25%, 8/1/50 | 150,000 | 148,049 | ||||||
Kirby Corp. | 80,000 | 89,374 | ||||||
KLA Corp. | 250,000 | 273,347 | ||||||
Kohl’s Corp. | 177,000 | 220,108 | ||||||
Kroger Co. (The) | 55,000 | 58,645 | ||||||
3.70%, 8/1/27 | 295,000 | 331,704 | ||||||
5.40%, 7/15/40 | 50,000 | 66,921 | ||||||
5.00%, 4/15/42 | 66,000 | 85,570 | ||||||
5.15%, 8/1/43 | 25,000 | 33,019 | ||||||
4.45%, 2/1/47 | 51,000 | 62,315 | ||||||
4.65%, 1/15/48 | 69,000 | 86,830 | ||||||
5.40%, 1/15/49 | 250,000 | 348,480 | ||||||
L3Harris Technologies, Inc. | 381,000 | 440,554 | ||||||
4.85%, 4/27/35 | 67,000 | 84,983 | ||||||
Laboratory Corp. of America Holdings | 225,000 | 249,385 | ||||||
4.70%, 2/1/45 | 75,000 | 93,276 | ||||||
Lam Research Corp. | 217,000 | 251,889 | ||||||
Las Vegas Sands Corp. | 100,000 | 105,010 | ||||||
3.90%, 8/8/29 | 137,000 | 144,316 | ||||||
Lear Corp. | 498,000 | 565,584 | ||||||
Leggett & Platt, Inc. | 25,000 | 27,391 | ||||||
Leidos, Inc. | 350,000 | 346,811 | ||||||
LifeStorage L.P. | 60,000 | 65,977 | ||||||
3.88%, 12/15/27 | 25,000 | 28,235 | ||||||
Lincoln National Corp. | 38,000 | 42,718 | ||||||
3.05%, 1/15/30 | 200,000 | 215,978 | ||||||
4.35%, 3/1/48 | 303,000 | 369,802 | ||||||
Lowe’s Cos., Inc. | 60,000 | 65,611 | ||||||
3.65%, 4/5/29 | 500,000 | 561,625 | ||||||
4.50%, 4/15/30 | 250,000 | 296,967 | ||||||
5.00%, 4/15/40 | 350,000 | 454,685 | ||||||
5.13%, 4/15/50 | 250,000 | 343,397 | ||||||
3.00%, 10/15/50 | 350,000 | 351,239 | ||||||
LYB International Finance B.V. | 100,000 | 131,744 | ||||||
4.88%, 3/15/44 | 195,000 | 247,786 | ||||||
LYB International Finance III LLC | 100,000 | 106,001 | ||||||
4.20%, 10/15/49 | 300,000 | 352,836 | ||||||
3.80%, 10/1/60 | 310,000 | 340,374 | ||||||
See Notes to Financial Statements.
| 94 | WisdomTree Trust |
Table of Contents
Schedule of Investments (continued)
WisdomTree Yield Enhanced U.S. Aggregate Bond Fund (AGGY)
August 31, 2021
| Investments in Long Securities | Principal Amount | Value | ||||||
Magellan Midstream Partners L.P. | $ | 250,000 | $ | 269,557 | ||||
5.15%, 10/15/43 | 72,000 | 89,805 | ||||||
4.20%, 10/3/47 | 160,000 | 180,843 | ||||||
Marathon Oil Corp. | 165,000 | 186,722 | ||||||
6.60%, 10/1/37 | 79,000 | 105,083 | ||||||
Marathon Petroleum Corp. | 240,000 | 334,008 | ||||||
4.75%, 9/15/44 | 51,000 | 60,467 | ||||||
4.50%, 4/1/48 | 25,000 | 28,615 | ||||||
5.00%, 9/15/54 | 40,000 | 48,878 | ||||||
Markel Corp. | 100,000 | 110,701 | ||||||
5.00%, 4/5/46 | 250,000 | 328,702 | ||||||
Marriott International, Inc. | 250,000 | 288,242 | ||||||
Marsh & McLennan Cos., Inc. | 171,000 | 201,123 | ||||||
2.25%, 11/15/30 | 450,000 | 461,821 | ||||||
Martin Marietta Materials, Inc. | 25,000 | 27,452 | ||||||
4.25%, 12/15/47 | 180,000 | 214,398 | ||||||
3.20%, 7/15/51 | 250,000 | 256,675 | ||||||
Marvell Technology, Inc. | 300,000 | 312,012 | ||||||
Masco Corp. | 500,000 | 493,365 | ||||||
Massachusetts Institute of Technology | 60,000 | 107,375 | ||||||
Mastercard, Inc. | 50,000 | 54,662 | ||||||
3.50%, 2/26/28 | 52,000 | 58,542 | ||||||
2.95%, 6/1/29 | 145,000 | 159,103 | ||||||
1.90%, 3/15/31 | 250,000 | 255,737 | ||||||
McCormick & Co., Inc. | 110,000 | 122,276 | ||||||
McDonald’s Corp. | 328,000 | 371,404 | ||||||
2.63%, 9/1/29 | 100,000 | 105,664 | ||||||
2.13%, 3/1/30 | 150,000 | 152,814 | ||||||
3.60%, 7/1/30 | 250,000 | 282,567 | ||||||
4.70%, 12/9/35 | 81,000 | 101,555 | ||||||
6.30%, 3/1/38 | 18,000 | 26,148 | ||||||
4.88%, 7/15/40 | 150,000 | 193,230 | ||||||
3.70%, 2/15/42 | 150,000 | 169,572 | ||||||
4.60%, 5/26/45 | 92,000 | 116,692 | ||||||
4.88%, 12/9/45 | 88,000 | 116,057 | ||||||
4.45%, 3/1/47 | 69,000 | 86,282 | ||||||
4.45%, 9/1/48 | 40,000 | 50,298 | ||||||
3.63%, 9/1/49 | 250,000 | 281,780 | ||||||
MDC Holdings, Inc. | 50,000 | 54,393 | ||||||
Medtronic Global Holdings SCA | 143,000 | 157,883 | ||||||
Memorial Health Services | 47,000 | 52,854 | ||||||
Merck & Co., Inc. | 288,000 | 324,187 | ||||||
Mercury General Corp. | 160,000 | 181,670 | ||||||
MetLife, Inc. | 140,000 | 179,760 | ||||||
Micron Technology, Inc. | 337,000 | 408,023 | ||||||
Microsoft Corp. | 250,000 | 294,102 | ||||||
4.50%, 10/1/40 | 50,000 | 66,669 | ||||||
Mid-America Apartments L.P. | 340,000 | 388,042 | ||||||
1.70%, 2/15/31(b) | 100,000 | 96,363 | ||||||
MidAmerican Energy Co. | 200,000 | 219,272 | ||||||
Molson Coors Beverage Co. | 167,000 | 179,543 | ||||||
5.00%, 5/1/42 | 60,000 | 74,947 | ||||||
4.20%, 7/15/46 | 315,000 | 356,624 | ||||||
Mondelez International, Inc. | 50,000 | 53,019 | ||||||
1.50%, 2/4/31 | 500,000 | 479,350 | ||||||
1.88%, 10/15/32 | 25,000 | 24,470 | ||||||
2.63%, 9/4/50 | 150,000 | 143,291 | ||||||
Moody’s Corp. | 33,000 | 36,221 | ||||||
5.25%, 7/15/44 | 250,000 | 343,997 | ||||||
Morgan Stanley | 535,000 | 607,926 | ||||||
3.63%, 1/20/27 | 249,000 | 277,067 | ||||||
3.95%, 4/23/27 | 350,000 | 393,393 | ||||||
3.59%, 7/22/28, (3.591% fixed rate until 7/22/27; 3-month U.S. dollar London Interbank Offered Rate + 1.34% thereafter)(d) | 163,000 | 181,170 | ||||||
3.77%, 1/24/29, (3.772% fixed rate until 1/24/28; 3-month U.S. dollar London Interbank Offered Rate + 1.14% thereafter)(d) | 518,000 | 579,766 | ||||||
4.43%, 1/23/30, (4.431% fixed rate until 1/23/29; 3-month U.S. dollar London Interbank Offered Rate + 1.628% thereafter)(d) | 275,000 | 321,607 | ||||||
2.70%, 1/22/31, (2.699% fixed rate until 1/22/30; Secured Overnight Financing Rate + 1.143% thereafter)(d) | 450,000 | 471,793 | ||||||
1.79%, 2/13/32, (1.794% fixed rate until 2/13/31; Secured Overnight Financing Rate + 1.034% thereafter)(d) | 500,000 | 484,695 | ||||||
1.93%, 4/28/32, (1.928% fixed rate until 4/28/31; Secured Overnight Financing Rate + 1.02% thereafter)(d) | 500,000 | 489,080 | ||||||
Mosaic Co. (The) | 223,000 | 252,523 | ||||||
5.63%, 11/15/43 | 38,000 | 50,957 | ||||||
See Notes to Financial Statements.
| WisdomTree Trust | 95 |
Table of Contents
Schedule of Investments (continued)
WisdomTree Yield Enhanced U.S. Aggregate Bond Fund (AGGY)
August 31, 2021
| Investments in Long Securities | Principal Amount | Value | ||||||
Motorola Solutions, Inc. | $ | 50,000 | $ | 58,206 | ||||
4.60%, 5/23/29 | 75,000 | 88,016 | ||||||
2.30%, 11/15/30 | 75,000 | 74,683 | ||||||
5.50%, 9/1/44 | 250,000 | 328,952 | ||||||
MPLX L.P. | 50,000 | 56,715 | ||||||
4.00%, 3/15/28 | 280,000 | 312,785 | ||||||
4.80%, 2/15/29(b) | 60,000 | 70,357 | ||||||
2.65%, 8/15/30 | 200,000 | 203,510 | ||||||
5.20%, 3/1/47 | 35,000 | 43,075 | ||||||
5.20%, 12/1/47 | 275,000 | 336,341 | ||||||
4.70%, 4/15/48 | 500,000 | 582,335 | ||||||
Mylan, Inc. | 166,000 | 191,703 | ||||||
5.20%, 4/15/48 | 150,000 | 187,130 | ||||||
Nasdaq, Inc. | 650,000 | 620,210 | ||||||
National Fuel Gas Co. | 150,000 | 162,371 | ||||||
4.75%, 9/1/28 | 65,000 | 73,701 | ||||||
National Retail Properties, Inc. | 15,000 | 16,437 | ||||||
2.50%, 4/15/30 | 200,000 | 205,842 | ||||||
3.50%, 4/15/51 | 150,000 | 160,592 | ||||||
National Rural Utilities Cooperative Finance Corp. | 100,000 | 110,603 | ||||||
3.70%, 3/15/29 | 167,000 | 189,797 | ||||||
NewMarket Corp. | 50,000 | 50,823 | ||||||
Newmont Corp. | 110,000 | 115,873 | ||||||
6.25%, 10/1/39 | 93,000 | 134,677 | ||||||
5.45%, 6/9/44 | 250,000 | 347,330 | ||||||
NextEra Energy Capital Holdings, Inc. | 327,000 | 362,990 | ||||||
2.75%, 11/1/29 | 500,000 | 529,935 | ||||||
4.80%, 12/1/77, (4.80% fixed rate until 12/1/27; 3-month U.S. dollar London Interbank Offered Rate + 2.409% thereafter)(d) | 33,000 | 37,232 | ||||||
NIKE, Inc. | 49,000 | 52,252 | ||||||
2.85%, 3/27/30 | 420,000 | 458,976 | ||||||
NiSource, Inc. | 110,000 | 121,553 | ||||||
3.60%, 5/1/30 | 515,000 | 574,251 | ||||||
5.95%, 6/15/41 | 2,000 | 2,861 | ||||||
4.80%, 2/15/44 | 40,000 | 50,998 | ||||||
5.65%, 2/1/45 | 224,000 | 314,467 | ||||||
4.38%, 5/15/47 | 181,000 | 221,461 | ||||||
3.95%, 3/30/48 | 75,000 | 87,174 | ||||||
Nordstrom, Inc. | 250,000 | 248,630 | ||||||
Norfolk Southern Corp. | 100,000 | 109,069 | ||||||
3.80%, 8/1/28 | 149,000 | 169,094 | ||||||
4.84%, 10/1/41 | 120,000 | 156,551 | ||||||
3.95%, 10/1/42 | 250,000 | 294,047 | ||||||
3.94%, 11/1/47 | 71,000 | 82,911 | ||||||
3.05%, 5/15/50 | 250,000 | 255,772 | ||||||
3.16%, 5/15/55 | 40,000 | 41,357 | ||||||
4.10%, 5/15/2121 | 100,000 | 115,470 | ||||||
Northern Trust Corp. | 181,000 | 200,705 | ||||||
3.38%, 5/8/32, (3.375% fixed rate until 5/8/27; 3-month U.S. dollar London Interbank Offered Rate + 1.131% thereafter)(d) | 30,000 | 32,772 | ||||||
Northrop Grumman Corp. | 100,000 | 109,199 | ||||||
3.25%, 1/15/28 | 100,000 | 109,376 | ||||||
5.15%, 5/1/40 | 250,000 | 331,867 | ||||||
5.05%, 11/15/40 | 26,000 | 34,354 | ||||||
4.75%, 6/1/43 | 60,000 | 77,971 | ||||||
5.25%, 5/1/50 | 372,000 | 530,431 | ||||||
Northrop Grumman Systems Corp. | 170,000 | 249,319 | ||||||
NOV, Inc. | 105,000 | 104,990 | ||||||
NSTAR Electric Co. | 150,000 | 164,961 | ||||||
Nucor Corp. | 200,000 | 273,264 | ||||||
2.98%, 12/15/55(c) | 27,000 | 27,411 | ||||||
NVIDIA Corp. | 250,000 | 270,930 | ||||||
O’Reilly Automotive, Inc. | 100,000 | 112,382 | ||||||
4.20%, 4/1/30 | 250,000 | 290,805 | ||||||
1.75%, 3/15/31 | 250,000 | 242,667 | ||||||
Oglethorpe Power Corp. | 255,000 | 334,019 | ||||||
Oklahoma Gas & Electric Co. | 135,000 | 153,504 | ||||||
Omega Healthcare Investors, Inc. | 90,000 | 101,132 | ||||||
4.75%, 1/15/28 | 60,000 | 68,148 | ||||||
3.63%, 10/1/29 | 100,000 | 106,876 | ||||||
Omnicom Group, Inc. | 525,000 | 538,891 | ||||||
ONEOK Partners L.P. | 100,000 | 129,393 | ||||||
6.20%, 9/15/43 | 25,000 | 32,690 | ||||||
ONEOK, Inc. | 430,000 | 477,713 | ||||||
4.55%, 7/15/28 | 357,000 | 408,447 | ||||||
4.45%, 9/1/49 | 150,000 | 169,409 | ||||||
7.15%, 1/15/51 | 150,000 | 221,171 | ||||||
Oracle Corp. | 125,000 | 132,446 | ||||||
2.80%, 4/1/27 | 310,000 | 331,002 | ||||||
3.25%, 11/15/27 | 414,000 | 452,258 | ||||||
2.30%, 3/25/28 | 275,000 | 284,056 | ||||||
See Notes to Financial Statements.
| 96 | WisdomTree Trust |
Table of Contents
Schedule of Investments (continued)
WisdomTree Yield Enhanced U.S. Aggregate Bond Fund (AGGY)
August 31, 2021
| Investments in Long Securities | Principal Amount | Value | ||||||
2.95%, 4/1/30 | $ | 600,000 | $ | 637,632 | ||||
2.88%, 3/25/31 | 633,000 | 667,017 | ||||||
3.80%, 11/15/37 | 400,000 | 439,064 | ||||||
6.50%, 4/15/38 | 250,000 | 356,142 | ||||||
3.60%, 4/1/40 | 400,000 | 426,004 | ||||||
5.38%, 7/15/40 | 350,000 | 454,317 | ||||||
3.65%, 3/25/41 | 200,000 | 213,824 | ||||||
4.13%, 5/15/45 | 250,000 | 280,880 | ||||||
4.00%, 7/15/46 | 250,000 | 275,920 | ||||||
4.00%, 11/15/47 | 500,000 | 550,975 | ||||||
3.60%, 4/1/50 | 250,000 | 261,365 | ||||||
3.95%, 3/25/51 | 500,000 | 554,465 | ||||||
3.85%, 4/1/60 | 300,000 | 323,058 | ||||||
4.10%, 3/25/61 | 150,000 | 169,305 | ||||||
Oshkosh Corp. | 32,000 | 37,193 | ||||||
Otis Worldwide Corp. | 200,000 | 209,626 | ||||||
2.57%, 2/15/30 | 478,000 | 500,045 | ||||||
Owens Corning | 260,000 | 282,805 | ||||||
7.00%, 12/1/36 | 32,000 | 47,047 | ||||||
Owl Rock Capital Corp. | 350,000 | 352,026 | ||||||
Pacific Gas and Electric Co. | 150,000 | 154,839 | ||||||
2.10%, 8/1/27 | 50,000 | 48,467 | ||||||
4.55%, 7/1/30 | 250,000 | 268,142 | ||||||
2.50%, 2/1/31 | 400,000 | 378,240 | ||||||
4.50%, 7/1/40 | 432,000 | 439,262 | ||||||
4.20%, 6/1/41 | 75,000 | 74,027 | ||||||
4.60%, 6/15/43 | 540,000 | 550,762 | ||||||
4.95%, 7/1/50 | 350,000 | 370,821 | ||||||
Packaging Corp. of America | 242,000 | 259,119 | ||||||
Parker-Hannifin Corp. | 100,000 | 108,800 | ||||||
3.25%, 6/14/29 | 422,000 | 459,199 | ||||||
4.00%, 6/14/49 | 150,000 | 176,531 | ||||||
PayPal Holdings, Inc. | 79,000 | 84,940 | ||||||
2.85%, 10/1/29 | 350,000 | 377,905 | ||||||
2.30%, 6/1/30 | 350,000 | 364,259 | ||||||
Pentair Finance Sarl | 233,000 | 271,545 | ||||||
PepsiCo, Inc. | 125,000 | 133,870 | ||||||
3.00%, 10/15/27 | 103,000 | 113,708 | ||||||
1.40%, 2/25/31(b) | 300,000 | 294,153 | ||||||
PerkinElmer, Inc. | 200,000 | 206,116 | ||||||
Perrigo Finance Unlimited Co. | 50,000 | 52,497 | ||||||
Pfizer, Inc. | 160,000 | 176,210 | ||||||
3.60%, 9/15/28 | 94,000 | 107,085 | ||||||
3.45%, 3/15/29 | 293,000 | 330,943 | ||||||
2.63%, 4/1/30 | 100,000 | 107,358 | ||||||
1.70%, 5/28/30(b) | 100,000 | 100,193 | ||||||
Philip Morris International, Inc. | 73,000 | 79,682 | ||||||
3.38%, 8/15/29 | 50,000 | 55,474 | ||||||
1.75%, 11/1/30 | 250,000 | 244,292 | ||||||
Phillips 66 | 322,000 | 382,539 | ||||||
5.88%, 5/1/42 | 300,000 | 413,667 | ||||||
Phillips 66 Partners L.P. | 245,000 | 267,878 | ||||||
4.90%, 10/1/46 | 100,000 | 119,592 | ||||||
Physicians Realty L.P. | 25,000 | 27,682 | ||||||
Piedmont Natural Gas Co., Inc. | 578,000 | 638,366 | ||||||
Pioneer Natural Resources Co. | 455,000 | 439,630 | ||||||
Plains All American Pipeline L.P. | 171,000 | 192,059 | ||||||
3.55%, 12/15/29 | 50,000 | 53,097 | ||||||
6.65%, 1/15/37 | 250,000 | 331,297 | ||||||
4.70%, 6/15/44 | 47,000 | 50,172 | ||||||
PNC Financial Services Group, Inc. (The) | 250,000 | 267,830 | ||||||
3.45%, 4/23/29 | 335,000 | 374,299 | ||||||
2.55%, 1/22/30 | 350,000 | 368,263 | ||||||
PPG Industries, Inc. | 82,000 | 87,314 | ||||||
PPL Capital Funding, Inc. | 99,000 | 106,566 | ||||||
4.13%, 4/15/30 | 100,000 | 116,834 | ||||||
President & Fellows of Harvard College | 125,000 | 127,328 | ||||||
Principal Financial Group, Inc. | 25,000 | 27,170 | ||||||
3.70%, 5/15/29 | 21,000 | 23,747 | ||||||
Progressive Corp. (The) | 25,000 | 26,736 | ||||||
6.63%, 3/1/29 | 105,000 | 139,351 | ||||||
Prologis L.P. | 60,000 | 70,936 | ||||||
Prudential Financial, Inc. | ||||||||
4.50%, 9/15/47, (4.50% fixed rate until 9/15/27; 3-month U.S. dollar London Interbank Offered Rate + 2.38% thereafter)(d) | 283,000 | 310,411 | ||||||
5.70%, 9/15/48, (5.70% fixed rate until 9/15/28; 3-month U.S. dollar London Interbank Offered Rate + 2.665% thereafter)(b)(d) | 150,000 | 176,762 | ||||||
Public Service Co. of Colorado | 126,000 | 142,553 | ||||||
Public Service Electric & Gas Co. | 29,000 | 30,536 | ||||||
3.00%, 5/15/27 | 35,000 | 38,131 | ||||||
3.20%, 5/15/29 | 270,000 | 298,709 | ||||||
See Notes to Financial Statements.
| WisdomTree Trust | 97 |
Table of Contents
Schedule of Investments (continued)
WisdomTree Yield Enhanced U.S. Aggregate Bond Fund (AGGY)
August 31, 2021
| Investments in Long Securities | Principal Amount | Value | ||||||
Public Storage | $ | 90,000 | $ | 99,201 | ||||
PulteGroup, Inc. | 350,000 | 462,955 | ||||||
QUALCOMM, Inc. | 162,000 | 179,456 | ||||||
1.30%, 5/20/28 | 88,000 | 86,954 | ||||||
Quest Diagnostics, Inc. | 405,000 | 433,978 | ||||||
Raymond James Financial, Inc. | 155,000 | 203,720 | ||||||
Raytheon Technologies Corp. | 190,000 | 210,108 | ||||||
3.13%, 5/4/27 | 208,000 | 226,851 | ||||||
7.20%, 8/15/27 | 21,000 | 27,636 | ||||||
4.13%, 11/16/28 | 588,000 | 677,335 | ||||||
7.50%, 9/15/29 | 78,000 | 109,560 | ||||||
2.25%, 7/1/30 | 325,000 | 332,475 | ||||||
6.13%, 7/15/38 | 123,000 | 176,050 | ||||||
4.45%, 11/16/38 | 152,000 | 186,249 | ||||||
5.70%, 4/15/40 | 125,000 | 174,976 | ||||||
4.88%, 10/15/40 | 250,000 | 322,320 | ||||||
4.50%, 6/1/42 | 261,000 | 326,383 | ||||||
4.15%, 5/15/45 | 119,000 | 142,372 | ||||||
3.75%, 11/1/46 | 106,000 | 120,744 | ||||||
4.35%, 4/15/47 | 27,000 | 33,430 | ||||||
4.05%, 5/4/47 | 25,000 | 29,688 | ||||||
4.63%, 11/16/48 | 45,000 | 58,319 | ||||||
3.13%, 7/1/50 | 250,000 | 260,827 | ||||||
Realty Income Corp. | 95,000 | 107,712 | ||||||
3.00%, 1/15/27 | 146,000 | 158,172 | ||||||
3.65%, 1/15/28 | 136,000 | 152,810 | ||||||
Regency Centers L.P. | 40,000 | 45,453 | ||||||
2.95%, 9/15/29 | 272,000 | 289,620 | ||||||
4.40%, 2/1/47 | 13,000 | 15,663 | ||||||
Regeneron Pharmaceuticals, Inc. | 100,000 | 96,325 | ||||||
Regions Financial Corp. | 50,000 | 77,489 | ||||||
Reinsurance Group of America, Inc. | 250,000 | 269,297 | ||||||
Republic Services, Inc. | 90,000 | 102,488 | ||||||
1.45%, 2/15/31 | 250,000 | 238,148 | ||||||
1.75%, 2/15/32 | 350,000 | 338,754 | ||||||
Rockwell Automation, Inc. | 68,000 | 76,716 | ||||||
Roper Technologies, Inc. | 90,000 | 100,755 | ||||||
1.40%, 9/15/27 | 99,000 | 98,703 | ||||||
2.00%, 6/30/30 | 400,000 | 398,772 | ||||||
Ross Stores, Inc. | 250,000 | 244,965 | ||||||
Royalty Pharma PLC | 290,000 | 287,555 | ||||||
3.30%, 9/2/40 | 250,000 | 253,972 | ||||||
RPM International, Inc. | 73,000 | 80,407 | ||||||
4.55%, 3/1/29 | 100,000 | 115,876 | ||||||
S&P Global, Inc. | 5,000 | 5,418 | ||||||
Sabine Pass Liquefaction LLC | 250,000 | 295,557 | ||||||
5.00%, 3/15/27 | 50,000 | 57,872 | ||||||
4.20%, 3/15/28 | 302,000 | 339,569 | ||||||
4.50%, 5/15/30 | 232,000 | 269,482 | ||||||
Sabra Health Care L.P. | 50,000 | 56,441 | ||||||
3.90%, 10/15/29 | 265,000 | 284,220 | ||||||
Santander Holdings USA, Inc. | 102,000 | 115,178 | ||||||
Sempra Energy | 40,000 | 43,565 | ||||||
3.40%, 2/1/28 | 246,000 | 268,617 | ||||||
3.80%, 2/1/38 | 150,000 | 168,414 | ||||||
ServiceNow, Inc. | 250,000 | 237,840 | ||||||
Sherwin-Williams Co. (The) | 116,000 | 128,373 | ||||||
2.95%, 8/15/29 | 110,000 | 118,390 | ||||||
2.30%, 5/15/30(b) | 290,000 | 297,131 | ||||||
4.55%, 8/1/45 | 12,000 | 15,127 | ||||||
4.50%, 6/1/47 | 200,000 | 251,970 | ||||||
Shire Acquisitions Investments Ireland DAC | 278,000 | 301,875 | ||||||
Simon Property Group L.P. | 175,000 | 192,484 | ||||||
2.45%, 9/13/29 | 142,000 | 146,785 | ||||||
SITE Centers Corp. | 30,000 | 33,803 | ||||||
Snap-on, Inc. | 150,000 | 164,657 | ||||||
Southern California Edison Co. | 70,000 | 76,893 | ||||||
4.20%, 3/1/29, Series A | 100,000 | 113,465 | ||||||
6.65%, 4/1/29 | 208,000 | 261,152 | ||||||
Southern California Gas Co. | 135,000 | 170,563 | ||||||
3.95%, 2/15/50, Series WW | 76,000 | 91,534 | ||||||
Southern Co. (The) | 64,000 | 69,384 | ||||||
3.70%, 4/30/30, Series A | 100,000 | 111,547 | ||||||
4.25%, 7/1/36 | 257,000 | 302,350 | ||||||
4.40%, 7/1/46 | 250,000 | 300,960 | ||||||
Southern Co. Gas Capital Corp. | 350,000 | 493,059 | ||||||
4.40%, 5/30/47 | 3,000 | 3,602 | ||||||
Southern Power Co. | 15,000 | 19,164 | ||||||
4.95%, 12/15/46, Series F | 160,000 | 197,906 | ||||||
Southwest Airlines Co. | 225,000 | 263,464 | ||||||
3.45%, 11/16/27 | 100,000 | 108,566 | ||||||
See Notes to Financial Statements.
| 98 | WisdomTree Trust |
Table of Contents
Schedule of Investments (continued)
WisdomTree Yield Enhanced U.S. Aggregate Bond Fund (AGGY)
August 31, 2021
| Investments in Long Securities | Principal Amount | Value | ||||||
Southwestern Electric Power Co. | $ | 110,000 | $ | 116,998 | ||||
4.10%, 9/15/28, Series M | 229,000 | 262,258 | ||||||
3.85%, 2/1/48, Series L | 250,000 | 281,630 | ||||||
Spectra Energy Partners L.P. | 250,000 | 346,932 | ||||||
Spirit Airlines Pass Through Trust | 119,691 | 125,099 | ||||||
Spirit Realty L.P. | 150,000 | 161,195 | ||||||
Stanford Health Care | 35,000 | 42,308 | ||||||
Stanley Black & Decker, Inc. | 125,000 | 146,886 | ||||||
Starbucks Corp. | 383,000 | 442,618 | ||||||
3.55%, 8/15/29 | 379,000 | 425,644 | ||||||
4.30%, 6/15/45 | 150,000 | 181,878 | ||||||
4.45%, 8/15/49 | 150,000 | 189,546 | ||||||
3.50%, 11/15/50 | 150,000 | 164,777 | ||||||
State Street Corp. | ||||||||
3.03%, 11/1/34, (3.031% fixed rate until 11/1/29; Secured Overnight Financing Rate + 1.49% thereafter)(d) | 310,000 | 332,769 | ||||||
Steel Dynamics, Inc. | 24,000 | 26,325 | ||||||
3.25%, 1/15/31 | 50,000 | 54,373 | ||||||
Steelcase, Inc. | 70,000 | 82,013 | ||||||
STERIS Irish FinCo Unlimited Co. | 200,000 | 206,746 | ||||||
STORE Capital Corp. | 30,000 | 34,227 | ||||||
4.63%, 3/15/29 | 25,000 | 28,819 | ||||||
Stryker Corp. | 575,000 | 756,895 | ||||||
Synchrony Financial | 99,000 | 108,549 | ||||||
3.95%, 12/1/27 | 223,000 | 248,977 | ||||||
Sysco Corp. | 170,000 | 184,911 | ||||||
3.25%, 7/15/27 | 210,000 | 229,490 | ||||||
5.95%, 4/1/30 | 160,000 | 206,438 | ||||||
5.38%, 9/21/35 | 22,000 | 28,867 | ||||||
6.60%, 4/1/50 | 227,000 | 363,892 | ||||||
T-Mobile USA, Inc. | 787,000 | 873,688 | ||||||
2.05%, 2/15/28 | 250,000 | 254,405 | ||||||
3.88%, 4/15/30 | 1,000,000 | 1,120,400 | ||||||
2.55%, 2/15/31 | 153,000 | 156,371 | ||||||
2.25%, 11/15/31 | 150,000 | 149,406 | ||||||
4.38%, 4/15/40 | 200,000 | 234,246 | ||||||
3.00%, 2/15/41 | 400,000 | 397,388 | ||||||
4.50%, 4/15/50 | 300,000 | 360,516 | ||||||
3.30%, 2/15/51 | 250,000 | 251,087 | ||||||
3.40%, 10/15/52(c) | 250,000 | 253,975 | ||||||
Tanger Properties L.P. | 90,000 | 94,300 | ||||||
Tapestry, Inc. | 84,000 | 92,088 | ||||||
Target Corp. | 280,000 | 315,028 | ||||||
TC PipeLines L.P. | 217,000 | 241,334 | ||||||
TD Ameritrade Holding Corp. | 135,000 | 149,035 | ||||||
Teledyne FLIR LLC | 200,000 | 205,072 | ||||||
Teledyne Technologies, Inc. | 75,000 | 77,227 | ||||||
2.75%, 4/1/31 | 50,000 | 52,229 | ||||||
Texas Instruments, Inc. | 65,000 | 71,187 | ||||||
2.25%, 9/4/29 | 100,000 | 104,614 | ||||||
Textron, Inc. | 450,000 | 490,297 | ||||||
Thermo Fisher Scientific, Inc. | 590,000 | 647,690 | ||||||
2.00%, 10/15/31 | 200,000 | 199,798 | ||||||
2.80%, 10/15/41 | 250,000 | 255,635 | ||||||
4.10%, 8/15/47 | 40,000 | 49,760 | ||||||
Time Warner Cable LLC | 401,000 | 548,644 | ||||||
7.30%, 7/1/38 | 50,000 | 72,941 | ||||||
6.75%, 6/15/39 | 77,000 | 107,978 | ||||||
4.50%, 9/15/42 | 500,000 | 562,010 | ||||||
Timken Co. (The) | 256,000 | 290,371 | ||||||
TJX Cos., Inc. (The) | 80,000 | 84,486 | ||||||
1.60%, 5/15/31(b) | 315,000 | 308,426 | ||||||
Toyota Motor Credit Corp. | 500,000 | 517,065 | ||||||
Trane Technologies Global Holding Co., Ltd. | 83,000 | 93,471 | ||||||
5.75%, 6/15/43 | 50,000 | 73,483 | ||||||
Trane Technologies Luxembourg Finance S.A. | 140,000 | 158,873 | ||||||
Transatlantic Holdings, Inc. | 30,000 | 47,105 | ||||||
Transcontinental Gas Pipe Line Co. LLC | 295,000 | 333,521 | ||||||
3.95%, 5/15/50 | 250,000 | 284,427 | ||||||
Trimble, Inc. | 120,000 | 140,128 | ||||||
Truist Bank | 40,000 | 44,014 | ||||||
2.25%, 3/11/30 | 250,000 | 256,327 | ||||||
Trustees of Princeton University (The) | 90,000 | 134,213 | ||||||
TWDC Enterprises 18 Corp. | 31,000 | 32,166 | ||||||
2.95%, 6/15/27 | 112,000 | 122,773 | ||||||
Tyco Electronics Group S.A. | 120,000 | 131,635 | ||||||
See Notes to Financial Statements.
| WisdomTree Trust | 99 |
Table of Contents
Schedule of Investments (continued)
WisdomTree Yield Enhanced U.S. Aggregate Bond Fund (AGGY)
August 31, 2021
| Investments in Long Securities | Principal Amount | Value | ||||||
Tyson Foods, Inc. | $ | 385,000 | $ | 450,677 | ||||
4.88%, 8/15/34 | 126,000 | 158,274 | ||||||
5.15%, 8/15/44 | 100,000 | 133,327 | ||||||
4.55%, 6/2/47 | 50,000 | 62,876 | ||||||
5.10%, 9/28/48 | 54,000 | 74,001 | ||||||
U.S. Bancorp | 339,000 | 373,737 | ||||||
3.00%, 7/30/29 | 175,000 | 190,792 | ||||||
UDR, Inc. | 40,000 | 42,931 | ||||||
3.50%, 1/15/28 | 25,000 | 27,572 | ||||||
4.40%, 1/26/29 | 79,000 | 91,766 | ||||||
3.20%, 1/15/30 | 210,000 | 228,348 | ||||||
3.00%, 8/15/31 | 73,000 | 77,544 | ||||||
Union Pacific Corp. | 100,000 | 114,507 | ||||||
2.38%, 5/20/31 | 350,000 | 362,358 | ||||||
3.20%, 5/20/41 | 250,000 | 267,157 | ||||||
4.05%, 3/1/46 | 99,000 | 117,020 | ||||||
4.00%, 4/15/47 | 65,000 | 76,846 | ||||||
4.50%, 9/10/48 | 159,000 | 202,272 | ||||||
3.25%, 2/5/50 | 350,000 | 373,786 | ||||||
3.80%, 10/1/51 | 85,000 | 99,221 | ||||||
3.88%, 2/1/55 | 30,000 | 34,708 | ||||||
2.97%, 9/16/62 | 160,000 | 158,218 | ||||||
3.75%, 2/5/70 | 250,000 | 285,472 | ||||||
3.80%, 4/6/71(c) | 205,000 | 235,922 | ||||||
United Airlines Pass Through Trust | 290,567 | 312,472 | ||||||
4.00%, 10/11/27, Series A | 44,859 | 47,487 | ||||||
3.75%, 3/3/28, Series A | 11,738 | 12,419 | ||||||
3.45%, 1/7/30, Series A | 23,668 | 23,979 | ||||||
United Parcel Service, Inc. | 49,000 | 54,412 | ||||||
3.40%, 3/15/29 | 150,000 | 168,638 | ||||||
UnitedHealth Group, Inc. | 103,000 | 114,687 | ||||||
3.38%, 4/15/27 | 95,000 | 105,729 | ||||||
2.95%, 10/15/27 | 100,000 | 109,620 | ||||||
3.85%, 6/15/28 | 95,000 | 108,986 | ||||||
3.88%, 12/15/28 | 190,000 | 219,290 | ||||||
Universal Health Services, Inc. | 250,000 | 251,580 | ||||||
University of Notre Dame du Lac | 12,000 | 14,127 | ||||||
University of Southern California | 49,000 | 53,336 | ||||||
Unum Group | 122,000 | 153,104 | ||||||
4.50%, 12/15/49 | 75,000 | 80,363 | ||||||
Utah Acquisition Sub, Inc. | 50,000 | 62,217 | ||||||
Valero Energy Corp. | 60,000 | 64,676 | ||||||
4.35%, 6/1/28 | 583,000 | 658,609 | ||||||
4.00%, 4/1/29 | 150,000 | 166,338 | ||||||
6.63%, 6/15/37 | 100,000 | 136,632 | ||||||
4.90%, 3/15/45 | 23,000 | 27,964 | ||||||
Valero Energy Partners L.P. | 162,000 | 183,016 | ||||||
4.50%, 3/15/28 | 50,000 | 56,732 | ||||||
Valmont Industries, Inc. | 105,000 | 129,229 | ||||||
Ventas Realty L.P. | 115,000 | 129,526 | ||||||
4.40%, 1/15/29 | 60,000 | 69,170 | ||||||
3.00%, 1/15/30 | 200,000 | 211,054 | ||||||
VEREIT Operating Partnership L.P. | 195,000 | 220,721 | ||||||
3.10%, 12/15/29 | 450,000 | 484,956 | ||||||
Verisk Analytics, Inc. | 25,000 | 34,235 | ||||||
Verizon Communications, Inc. | 281,000 | 299,254 | ||||||
4.13%, 3/16/27 | 213,000 | 243,517 | ||||||
4.33%, 9/21/28 | 543,000 | 633,849 | ||||||
3.88%, 2/8/29 | 105,000 | 119,770 | ||||||
4.02%, 12/3/29 | 773,000 | 890,689 | ||||||
1.68%, 10/30/30 | 209,000 | 201,886 | ||||||
1.75%, 1/20/31 | 180,000 | 174,242 | ||||||
2.55%, 3/21/31 | 1,150,000 | 1,188,364 | ||||||
4.50%, 8/10/33 | 376,000 | 455,750 | ||||||
4.40%, 11/1/34 | 466,000 | 562,513 | ||||||
4.81%, 3/15/39 | 560,000 | 711,995 | ||||||
2.65%, 11/20/40 | 380,000 | 368,475 | ||||||
3.40%, 3/22/41 | 500,000 | 535,795 | ||||||
6.55%, 9/15/43 | 25,000 | 40,119 | ||||||
4.13%, 8/15/46 | 288,000 | 338,976 | ||||||
4.86%, 8/21/46 | 215,000 | 280,777 | ||||||
4.52%, 9/15/48 | 200,000 | 252,076 | ||||||
5.01%, 4/15/49 | 52,000 | 69,618 | ||||||
4.00%, 3/22/50 | 630,000 | 733,036 | ||||||
2.88%, 11/20/50 | 700,000 | 674,044 | ||||||
5.01%, 8/21/54 | 50,000 | 69,011 | ||||||
2.99%, 10/30/56 | 400,000 | 386,452 | ||||||
3.00%, 11/20/60 | 245,000 | 236,234 | ||||||
3.70%, 3/22/61 | 600,000 | 659,790 | ||||||
VF Corp. | 110,000 | 117,928 | ||||||
2.95%, 4/23/30 | 100,000 | 106,821 | ||||||
ViacomCBS, Inc. | 92,000 | 98,271 | ||||||
3.38%, 2/15/28 | 170,000 | 187,088 | ||||||
3.70%, 6/1/28 | 134,000 | 149,760 | ||||||
7.88%, 7/30/30 | 147,000 | 209,963 | ||||||
4.95%, 1/15/31 | 436,000 | 527,782 | ||||||
4.20%, 5/19/32 | 100,000 | 115,707 | ||||||
4.38%, 3/15/43 | 150,000 | 175,938 | ||||||
5.85%, 9/1/43 | 141,000 | 195,804 | ||||||
5.25%, 4/1/44 | 30,000 | 38,731 | ||||||
4.95%, 5/19/50(b) | 185,000 | 235,697 | ||||||
Viatris, Inc. | 250,000 | 255,815 | ||||||
3.85%, 6/22/40(c) | 150,000 | 162,626 | ||||||
4.00%, 6/22/50(c) | 250,000 | 272,392 | ||||||
See Notes to Financial Statements.
| 100 | WisdomTree Trust |
Table of Contents
Schedule of Investments (continued)
WisdomTree Yield Enhanced U.S. Aggregate Bond Fund (AGGY)
August 31, 2021
| Investments in Long Securities | Principal Amount | Value | ||||||
Virginia Electric & Power Co. | $ | 135,000 | $ | 146,120 | ||||
3.50%, 3/15/27, Series A | 107,000 | 118,904 | ||||||
Visa, Inc. | 95,000 | 116,886 | ||||||
VMware, Inc. | 212,000 | 237,703 | ||||||
2.20%, 8/15/31 | 500,000 | 496,705 | ||||||
Vulcan Materials Co. | 20,000 | 22,647 | ||||||
4.50%, 6/15/47 | 80,000 | 98,850 | ||||||
4.70%, 3/1/48 | 30,000 | 38,187 | ||||||
W.R. Berkley Corp. | 8,000 | 10,258 | ||||||
4.00%, 5/12/50 | 250,000 | 293,890 | ||||||
Walgreens Boots Alliance, Inc. | 250,000 | 270,365 | ||||||
4.80%, 11/18/44 | 52,000 | 64,189 | ||||||
Walmart, Inc. | 68,000 | 103,926 | ||||||
6.20%, 4/15/38 | 25,000 | 37,516 | ||||||
3.95%, 6/28/38 | 83,000 | 100,804 | ||||||
Walt Disney Co. (The) | 65,000 | 71,879 | ||||||
2.00%, 9/1/29 | 200,000 | 203,886 | ||||||
3.80%, 3/22/30 | 50,000 | 57,768 | ||||||
2.65%, 1/13/31(b) | 250,000 | 266,102 | ||||||
Waste Connections, Inc. | 75,000 | 83,307 | ||||||
Waste Management, Inc. | 175,000 | 192,456 | ||||||
1.15%, 3/15/28 | 80,000 | 78,048 | ||||||
1.50%, 3/15/31 | 300,000 | 288,009 | ||||||
2.50%, 11/15/50 | 40,000 | 38,120 | ||||||
WEC Energy Group, Inc. | 100,000 | 98,994 | ||||||
Wells Fargo & Co. | 86,000 | 93,033 | ||||||
4.30%, 7/22/27 | 313,000 | 359,283 | ||||||
3.58%, 5/22/28, (3.584% fixed rate until 5/22/27; 3-month U.S. dollar London Interbank Offered Rate + 1.31% thereafter)(d) | 234,000 | 259,714 | ||||||
2.39%, 6/2/28, (2.393% fixed rate until 6/2/27; Secured Overnight Financing Rate + 2.10% thereafter)(d) | 500,000 | 521,440 | ||||||
4.15%, 1/24/29 | 784,000 | 902,909 | ||||||
4.48%, 4/4/31, (4.478% fixed rate until 4/4/30; Secured Overnight Financing Rate + 4.032% thereafter)(d) | 450,000 | 534,541 | ||||||
Welltower, Inc. | 75,000 | 86,264 | ||||||
4.13%, 3/15/29 | 150,000 | 171,281 | ||||||
3.10%, 1/15/30 | 364,000 | 389,207 | ||||||
Westinghouse Air Brake Technologies Corp. | 70,000 | 75,275 | ||||||
4.95%, 9/15/28 | 293,000 | 341,919 | ||||||
Westlake Chemical Corp. | 108,000 | 119,222 | ||||||
5.00%, 8/15/46 | 55,000 | 70,556 | ||||||
4.38%, 11/15/47 | 35,000 | 41,193 | ||||||
3.13%, 8/15/51 | 150,000 | 145,478 | ||||||
WestRock MWV LLC | 36,000 | 51,022 | ||||||
Weyerhaeuser Co. | 75,000 | 97,289 | ||||||
4.00%, 11/15/29 | 70,000 | 80,343 | ||||||
7.38%, 3/15/32 | 215,000 | 310,617 | ||||||
Whirlpool Corp. | 100,000 | 102,070 | ||||||
4.60%, 5/15/50 | 150,000 | 189,845 | ||||||
Williams Cos., Inc. (The) | 214,000 | 237,790 | ||||||
8.75%, 3/15/32 | 45,000 | 69,624 | ||||||
6.30%, 4/15/40 | 55,000 | 75,586 | ||||||
5.75%, 6/24/44 | 102,000 | 136,285 | ||||||
5.10%, 9/15/45 | 300,000 | 375,807 | ||||||
Willis North America, Inc. | 150,000 | 173,517 | ||||||
2.95%, 9/15/29 | 250,000 | 264,842 | ||||||
WRKCo, Inc. | 85,000 | 96,313 | ||||||
4.90%, 3/15/29 | 162,000 | 194,534 | ||||||
3.00%, 6/15/33 | 250,000 | 266,547 | ||||||
Xcel Energy, Inc. | 150,000 | 166,427 | ||||||
6.50%, 7/1/36 | 250,000 | 365,550 | ||||||
Xylem, Inc. | 500,000 | 509,015 | ||||||
Zimmer Biomet Holdings, Inc. | 200,000 | 272,734 | ||||||
Zoetis, Inc. | 236,000 | 256,539 | ||||||
3.90%, 8/20/28 | 111,000 | 126,726 | ||||||
4.70%, 2/1/43 | 25,000 | 32,558 | ||||||
3.95%, 9/12/47 | 25,000 | 30,066 | ||||||
4.45%, 8/20/48 | 100,000 | 130,003 | ||||||
TOTAL U.S. CORPORATE BONDS (Cost: $288,519,221) |
| 301,366,739 | ||||||
| FOREIGN CORPORATE BONDS – 5.1% |
| |||||||
| Australia – 0.1% |
| |||||||
Rio Tinto Finance USA Ltd. | 148,000 | 200,504 | ||||||
Westpac Banking Corp. | ||||||||
4.32%, 11/23/31, (4.322% fixed rate until 11/23/26; 5-year U.S. dollar ICE Swap Rate + 2.236% thereafter)(d) | 455,000 | 506,233 | ||||||
4.11%, 7/24/34, (4.11% fixed rate until 7/24/29; 5-year Constant Maturity Treasury Rate + 2.00% thereafter)(d) | 265,000 | 292,995 | ||||||
See Notes to Financial Statements.
| WisdomTree Trust | 101 |
Table of Contents
Schedule of Investments (continued)
WisdomTree Yield Enhanced U.S. Aggregate Bond Fund (AGGY)
August 31, 2021
| Investments in Long Securities | Principal Amount | Value | ||||||
2.67%, 11/15/35, (2.668% fixed rate until 11/15/30; 5-year Constant Maturity Treasury Rate + 1.75% thereafter)(d) | $ | 250,000 | $ | 248,348 | ||||
|
| |||||||
| Total Australia |
| 1,248,080 | ||||||
| Austria – 0.1% |
| |||||||
Suzano Austria GmbH | 250,000 | 299,233 | ||||||
5.00%, 1/15/30 | 425,000 | 483,943 | ||||||
3.75%, 1/15/31 | 250,000 | 263,225 | ||||||
|
| |||||||
| Total Austria |
| 1,046,401 | ||||||
| Belgium – 0.6% |
| |||||||
Anheuser-Busch Cos. LLC | 300,000 | 370,626 | ||||||
4.90%, 2/1/46 | 840,000 | 1,074,704 | ||||||
Anheuser-Busch InBev Worldwide, Inc. | 662,000 | 788,608 | ||||||
4.90%, 1/23/31 | 410,000 | 505,456 | ||||||
4.38%, 4/15/38 | 80,000 | 95,765 | ||||||
8.20%, 1/15/39 | 150,000 | 252,416 | ||||||
5.45%, 1/23/39 | 10,000 | 13,220 | ||||||
8.00%, 11/15/39 | 346,000 | 572,775 | ||||||
4.35%, 6/1/40 | 350,000 | 420,476 | ||||||
4.95%, 1/15/42 | 250,000 | 317,133 | ||||||
4.60%, 4/15/48 | 250,000 | 308,823 | ||||||
4.44%, 10/6/48 | 36,000 | 43,538 | ||||||
5.55%, 1/23/49 | 490,000 | 683,535 | ||||||
4.50%, 6/1/50 | 500,000 | 620,840 | ||||||
5.80%, 1/23/59 | 250,000 | 371,405 | ||||||
4.60%, 6/1/60 | 440,000 | 550,405 | ||||||
|
| |||||||
| Total Belgium |
| 6,989,725 | ||||||
| Bermuda – 0.0% |
| |||||||
RenaissanceRe Holdings Ltd. | 125,000 | 139,008 | ||||||
XLIT Ltd. | 53,000 | 74,249 | ||||||
|
| |||||||
| Total Bermuda |
| 213,257 | ||||||
| Brazil – 0.1% |
| |||||||
Vale Overseas Ltd. | 50,000 | 60,349 | ||||||
3.75%, 7/8/30 | 500,000 | 533,295 | ||||||
6.88%, 11/21/36 | 400,000 | 562,548 | ||||||
6.88%, 11/10/39 | 139,000 | 199,437 | ||||||
|
| |||||||
| Total Brazil |
| 1,355,629 | ||||||
| Canada – 0.9% |
| |||||||
Bank of Montreal |
| |||||||
3.80%, 12/15/32, (3.803% fixed rate until 12/15/27; 5-year U.S. dollar Swap Rate + 1.432% thereafter)(d) | 304,000 | 336,443 | ||||||
Barrick Gold Corp. | 100,000 | 132,185 | ||||||
Barrick North America Finance LLC | 82,000 | 115,242 | ||||||
Barrick PD Australia Finance Pty Ltd. | 50,000 | 70,161 | ||||||
Bell Canada | 150,000 | 182,267 | ||||||
3.20%, 2/15/52, Series US-6 | 250,000 | 258,276 | ||||||
Brookfield Finance, Inc. | 50,000 | 56,291 | ||||||
Canadian National Railway Co. | 140,000 | 187,015 | ||||||
Canadian Natural Resources Ltd. | 106,000 | 116,859 | ||||||
2.95%, 7/15/30 | 30,000 | 31,297 | ||||||
7.20%, 1/15/32 | 409,000 | 562,293 | ||||||
6.50%, 2/15/37 | 4,000 | 5,428 | ||||||
Canadian Pacific Railway Co. | 46,000 | 52,374 | ||||||
7.13%, 10/15/31 | 313,000 | 446,135 | ||||||
4.80%, 9/15/35 | 95,000 | 117,824 | ||||||
6.13%, 9/15/2115 | 150,000 | 238,147 | ||||||
Cenovus Energy, Inc. | 600,000 | 717,168 | ||||||
CI Financial Corp. | 250,000 | 270,855 | ||||||
Enbridge, Inc. | 15,000 | 16,935 | ||||||
3.70%, 7/15/27(b) | 150,000 | 166,392 | ||||||
3.13%, 11/15/29 | 107,000 | 115,035 | ||||||
5.50%, 12/1/46 | 250,000 | 342,592 | ||||||
4.00%, 11/15/49(b) | 150,000 | 170,106 | ||||||
Fairfax Financial Holdings Ltd. | 157,000 | 181,035 | ||||||
Fortis, Inc. | 220,000 | 237,554 | ||||||
Manulife Financial Corp. | ||||||||
4.06%, 2/24/32, (4.061% fixed rate until 2/24/27; 5-year U.S. dollar ICE Swap Rate + 1.647% thereafter)(d) | 25,000 | 27,552 | ||||||
Nutrien Ltd. | 182,000 | 210,234 | ||||||
4.13%, 3/15/35 | 55,000 | 63,669 | ||||||
5.88%, 12/1/36 | 60,000 | 82,445 | ||||||
5.25%, 1/15/45 | 350,000 | 472,671 | ||||||
Rogers Communications, Inc. | 63,000 | 79,287 | ||||||
4.30%, 2/15/48 | 100,000 | 115,469 | ||||||
4.35%, 5/1/49 | 300,000 | 351,906 | ||||||
Suncor Energy, Inc. | 122,000 | 171,804 | ||||||
5.95%, 12/1/34 | 191,000 | 254,475 | ||||||
5.95%, 5/15/35 | 36,000 | 47,628 | ||||||
6.80%, 5/15/38 | 18,000 | 25,855 | ||||||
6.50%, 6/15/38 | 250,000 | 351,980 | ||||||
Teck Resources Ltd. | 215,000 | 278,524 | ||||||
TELUS Corp. | 120,000 | 135,546 | ||||||
4.60%, 11/16/48 | 200,000 | 258,576 | ||||||
Thomson Reuters Corp. | 90,000 | 125,240 | ||||||
See Notes to Financial Statements.
| 102 | WisdomTree Trust |
Table of Contents
Schedule of Investments (continued)
WisdomTree Yield Enhanced U.S. Aggregate Bond Fund (AGGY)
August 31, 2021
| Investments in Long Securities | Principal Amount | Value | ||||||
Toronto-Dominion Bank (The) | ||||||||
3.63%, 9/15/31, (3.625% fixed rate until 9/15/26; 5-year U.S. dollar Swap Rate + 2.205% thereafter)(d) | $ | 137,000 | $ | 152,049 | ||||
TransCanada PipeLines Ltd. | 152,000 | 174,789 | ||||||
4.63%, 3/1/34 | 640,000 | 757,171 | ||||||
4.75%, 5/15/38 | 210,000 | 254,295 | ||||||
6.10%, 6/1/40 | 50,000 | 69,154 | ||||||
4.88%, 5/15/48 | 250,000 | 320,817 | ||||||
5.10%, 3/15/49 | 97,000 | 129,001 | ||||||
|
| |||||||
| Total Canada |
| 10,036,046 | ||||||
| Chile – 0.1% |
| |||||||
Celulosa Arauco y Constitucion S.A. | 200,000 | 242,002 | ||||||
Enel Chile S.A. | 250,000 | 289,155 | ||||||
|
| |||||||
| Total Chile |
| 531,157 | ||||||
| China – 0.2% |
| |||||||
Alibaba Group Holding Ltd. | 230,000 | 250,764 | ||||||
Baidu, Inc. | 200,000 | 221,872 | ||||||
CNOOC Finance 2015 USA LLC | 540,000 | 613,829 | ||||||
JD.com, Inc. | 250,000 | 268,043 | ||||||
NXP B.V. | 250,000 | 287,610 | ||||||
3.40%, 5/1/30(c) | 350,000 | 384,419 | ||||||
3.25%, 5/11/41(c) | 100,000 | 106,175 | ||||||
Tencent Music Entertainment Group | 400,000 | 385,692 | ||||||
|
| |||||||
| Total China |
| 2,518,404 | ||||||
| France – 0.1% |
| |||||||
AXA S.A. | 200,000 | 303,218 | ||||||
Orange S.A. | 234,000 | 370,366 | ||||||
5.38%, 1/13/42 | 50,000 | 68,527 | ||||||
5.50%, 2/6/44 | 250,000 | 352,472 | ||||||
TotalEnergies Capital International S.A. | 150,000 | 161,530 | ||||||
Veolia Environnement S.A. | 33,000 | 50,326 | ||||||
|
| |||||||
| Total France |
| 1,306,439 | ||||||
| Germany – 0.2% |
| |||||||
Daimler Finance North America LLC | 450,000 | 690,719 | ||||||
Deutsche Bank AG | 75,000 | 82,406 | ||||||
3.55%, 9/18/31, (3.547% fixed rate until 9/18/30; Secured Overnight Financing Rate + 3.043% thereafter)(d) | 440,000 | 475,433 | ||||||
Deutsche Telekom International Finance B.V. | ||||||||
8.75%, 6/15/30 | 521,000 | 784,230 | ||||||
9.25%, 6/1/32 | 48,000 | 78,912 | ||||||
|
| |||||||
| Total Germany |
| 2,111,700 | ||||||
| Ireland – 0.0% |
| |||||||
AerCap Ireland Capital DAC | 200,000 | 212,908 | ||||||
| Japan – 0.5% |
| |||||||
Mitsubishi UFJ Financial Group, Inc. | 275,000 | 304,725 | ||||||
3.96%, 3/2/28 | 115,000 | 130,963 | ||||||
4.05%, 9/11/28 | 10,000 | 11,509 | ||||||
3.74%, 3/7/29 | 406,000 | 458,606 | ||||||
Mizuho Financial Group, Inc. | 325,000 | 353,984 | ||||||
4.02%, 3/5/28 | 225,000 | 257,895 | ||||||
Nomura Holdings, Inc. | 390,000 | 412,031 | ||||||
ORIX Corp. | 80,000 | 89,754 | ||||||
Sumitomo Mitsui Financial Group, Inc. | 36,000 | 38,382 | ||||||
3.45%, 1/11/27(b) | 153,000 | 169,057 | ||||||
3.36%, 7/12/27 | 8,000 | 8,826 | ||||||
3.54%, 1/17/28 | 150,000 | 167,025 | ||||||
3.94%, 7/19/28(b) | 379,000 | 433,299 | ||||||
4.31%, 10/16/28(b) | 136,000 | 158,999 | ||||||
3.04%, 7/16/29 | 250,000 | 269,060 | ||||||
2.14%, 9/23/30 | 425,000 | 417,099 | ||||||
Takeda Pharmaceutical Co., Ltd. | 366,000 | 442,260 | ||||||
2.05%, 3/31/30 | 350,000 | 348,964 | ||||||
3.18%, 7/9/50 | 250,000 | 259,450 | ||||||
3.38%, 7/9/60 | 200,000 | 213,232 | ||||||
|
| |||||||
| Total Japan |
| 4,945,120 | ||||||
| Macau – 0.1% |
| |||||||
Sands China Ltd. | 450,000 | 520,848 | ||||||
| Mexico – 0.1% |
| |||||||
America Movil S.A.B. de C.V. | 215,000 | 236,708 | ||||||
Grupo Televisa S.A.B. | 100,000 | 144,358 | ||||||
5.00%, 5/13/45 | 200,000 | 248,360 | ||||||
5.25%, 5/24/49(b) | 250,000 | 331,100 | ||||||
|
| |||||||
| Total Mexico |
| 960,526 | ||||||
| Netherlands – 0.1% |
| |||||||
Cooperatieve Rabobank UA | 325,000 | 360,090 | ||||||
5.25%, 5/24/41 | 115,000 | 162,213 | ||||||
5.25%, 8/4/45 | 250,000 | 339,688 | ||||||
ING Groep N.V. | 250,000 | 294,783 | ||||||
See Notes to Financial Statements.
| WisdomTree Trust | 103 |
Table of Contents
Schedule of Investments (continued)
WisdomTree Yield Enhanced U.S. Aggregate Bond Fund (AGGY)
August 31, 2021
| Investments in Long Securities | Principal Amount | Value | ||||||
Koninklijke Ahold Delhaize N.V. | $ | 40,000 | $ | 55,812 | ||||
Shell International Finance B.V. | 134,000 | 160,139 | ||||||
3.13%, 11/7/49 | 5,000 | 5,296 | ||||||
|
| |||||||
| Total Netherlands |
| 1,378,021 | ||||||
| Norway – 0.1% |
| |||||||
Equinor ASA | 75,000 | 98,820 | ||||||
3.25%, 11/18/49 | 379,000 | 410,654 | ||||||
3.70%, 4/6/50 | 190,000 | 223,056 | ||||||
|
| |||||||
| Total Norway |
| 732,530 | ||||||
| Peru – 0.1% |
| |||||||
Southern Copper Corp. | 35,000 | 49,979 | ||||||
5.25%, 11/8/42 | 350,000 | 449,596 | ||||||
5.88%, 4/23/45 | 150,000 | 208,979 | ||||||
|
| |||||||
| Total Peru |
| 708,554 | ||||||
| Spain – 0.2% |
| |||||||
Banco Santander S.A. | 200,000 | 226,710 | ||||||
3.80%, 2/23/28 | 200,000 | 221,906 | ||||||
2.75%, 12/3/30 | 400,000 | 402,336 | ||||||
Telefonica Emisiones S.A. | 500,000 | 565,075 | ||||||
7.05%, 6/20/36 | 195,000 | 284,134 | ||||||
4.67%, 3/6/38 | 200,000 | 237,796 | ||||||
5.52%, 3/1/49 | 400,000 | 528,424 | ||||||
|
| |||||||
| Total Spain |
| 2,466,381 | ||||||
| Switzerland – 0.0% |
| |||||||
Credit Suisse Group AG | 100,000 | 113,355 | ||||||
4.88%, 5/15/45 | 250,000 | 321,772 | ||||||
|
| |||||||
| Total Switzerland |
| 435,127 | ||||||
| United Kingdom – 1.5% |
| |||||||
AstraZeneca PLC | 457,000 | 500,040 | ||||||
1.38%, 8/6/30 | 250,000 | 240,398 | ||||||
6.45%, 9/15/37 | 250,000 | 376,692 | ||||||
4.00%, 9/18/42 | 205,000 | 250,034 | ||||||
4.38%, 11/16/45 | 250,000 | 323,355 | ||||||
4.38%, 8/17/48 | 20,000 | 25,999 | ||||||
Barclays PLC | 240,000 | 272,131 | ||||||
4.97%, 5/16/29, (4.972% fixed rate until 5/16/28; 3-month U.S. dollar London Interbank Offered Rate + 1.902% thereafter)(d) | 575,000 | 676,539 | ||||||
5.09%, 6/20/30, (5.088% fixed rate until 6/20/29; 3-month U.S. dollar London Interbank Offered Rate + 3.054% thereafter)(d) | 300,000 | 350,616 | ||||||
2.65%, 6/24/31, (3.073% fixed rate until 6/24/30; 1-year Constant Maturity Treasury Rate + 2.55% thereafter)(d) | 250,000 | 255,278 | ||||||
5.25%, 8/17/45 | 100,000 | 136,057 | ||||||
4.95%, 1/10/47 | 330,000 | 435,346 | ||||||
BAT Capital Corp. | 95,000 | 108,044 | ||||||
3.56%, 8/15/27 | 755,000 | 817,431 | ||||||
4.39%, 8/15/37 | 500,000 | 544,745 | ||||||
3.73%, 9/25/40 | 350,000 | 347,806 | ||||||
3.98%, 9/25/50 | 250,000 | 248,048 | ||||||
BP Capital Markets PLC | 156,000 | 172,300 | ||||||
3.72%, 11/28/28 | 125,000 | 140,966 | ||||||
British Telecommunications PLC | 365,000 | 432,784 | ||||||
9.63%, 12/15/30 | 281,000 | 434,550 | ||||||
CNH Industrial N.V. | 25,000 | 27,926 | ||||||
Diageo Capital PLC | 250,000 | 252,293 | ||||||
GlaxoSmithKline Capital, Inc. | 111,000 | 127,622 | ||||||
HSBC Holdings PLC | 432,000 | 486,549 | ||||||
4.04%, 3/13/28, (4.041% fixed rate until 3/13/27; 3-month U.S. dollar London Interbank Offered Rate + 1.546% thereafter)(d) | 118,000 | 131,674 | ||||||
4.95%, 3/31/30 | 350,000 | 423,489 | ||||||
3.97%, 5/22/30, (3.973% fixed rate until 5/22/29; 3-month U.S. dollar London Interbank Offered Rate + 1.61% thereafter)(d) | 415,000 | 466,024 | ||||||
6.50%, 9/15/37 | 500,000 | 701,210 | ||||||
6.80%, 6/1/38 | 250,000 | 361,300 | ||||||
Lloyds Banking Group PLC | 225,000 | 262,964 | ||||||
3.57%, 11/7/28, (3.574% fixed rate until 11/7/27; 3-month U.S. dollar London Interbank Offered Rate + 1.205% thereafter)(d) | 305,000 | 335,158 | ||||||
4.34%, 1/9/48 | 264,000 | 317,251 | ||||||
4.89%, 5/18/29, (4.892% fixed rate until 5/18/28; 3-month U.S. dollar London Interbank Offered Rate + 1.754% thereafter)(d) | 257,000 | 302,497 | ||||||
5.08%, 1/27/30, (5.076% fixed rate until 1/27/29; 3-month U.S. dollar London Interbank Offered Rate + 1.905% thereafter)(d) | 200,000 | 239,590 | ||||||
3.03%, 11/28/35, (3.032% fixed rate until 8/28/30; 5-year Constant Maturity Treasury Rate + 2.35% thereafter)(d) | 250,000 | 251,608 | ||||||
nVent Finance Sarl | 84,000 | 93,477 | ||||||
RELX Capital, Inc. | 46,000 | 52,040 | ||||||
3.00%, 5/22/30 | 250,000 | 268,480 | ||||||
See Notes to Financial Statements.
| 104 | WisdomTree Trust |
Table of Contents
Schedule of Investments (continued)
WisdomTree Yield Enhanced U.S. Aggregate Bond Fund (AGGY)
August 31, 2021
| Investments in Long Securities | Principal Amount | Value | ||||||
Reynolds American, Inc. | $ | 125,000 | $ | 152,920 | ||||
7.25%, 6/15/37 | 250,000 | 343,163 | ||||||
6.15%, 9/15/43 | 220,000 | 279,057 | ||||||
5.85%, 8/15/45 | 134,000 | 166,215 | ||||||
Santander UK Group Holdings PLC | ||||||||
3.82%, 11/3/28, (3.823% fixed rate until 11/3/27; 3-month U.S. dollar London Interbank Offered Rate + 1.40% thereafter)(d) | 200,000 | 220,948 | ||||||
Unilever Capital Corp. | 120,000 | 130,583 | ||||||
3.50%, 3/22/28 | 245,000 | 275,676 | ||||||
Vodafone Group PLC | 402,000 | 467,365 | ||||||
7.88%, 2/15/30 | 149,000 | 215,108 | ||||||
5.00%, 5/30/38 | 332,000 | 423,473 | ||||||
5.25%, 5/30/48 | 355,000 | 473,463 | ||||||
4.88%, 6/19/49 | 373,000 | 478,895 | ||||||
4.25%, 9/17/50 | 30,000 | 35,532 | ||||||
|
| |||||||
| Total United Kingdom |
| 15,852,709 | ||||||
TOTAL FOREIGN CORPORATE BONDS (Cost: $53,160,420) |
| 55,569,562 | ||||||
| FOREIGN GOVERNMENT AGENCIES – 0.2% |
| |||||||
| Canada – 0.0% |
| |||||||
Hydro-Quebec | 10,000 | 15,911 | ||||||
Province of New Brunswick Canada | 229,000 | 263,501 | ||||||
|
| |||||||
| Total Canada |
| 279,412 | ||||||
| Germany – 0.0% |
| |||||||
Kreditanstalt fuer Wiederaufbau | 177,000 | 135,226 | ||||||
| Japan – 0.2% |
| |||||||
Japan Bank for International Cooperation | 250,000 | 260,685 | ||||||
2.88%, 6/1/27 | 770,000 | 844,667 | ||||||
2.88%, 7/21/27 | 250,000 | 274,527 | ||||||
3.50%, 10/31/28 | 200,000 | 230,298 | ||||||
1.88%, 4/15/31 | 200,000 | 206,900 | ||||||
Japan International Cooperation Agency | 250,000 | 263,868 | ||||||
|
| |||||||
| Total Japan |
| 2,080,945 | ||||||
TOTAL FOREIGN GOVERNMENT AGENCIES (Cost: $2,350,756) |
| 2,495,583 | ||||||
| FOREIGN GOVERNMENT OBLIGATIONS – 1.8% |
| |||||||
| Chile – 0.1% |
| |||||||
Chile Government International Bond | 318,000 | 346,102 | ||||||
2.45%, 1/31/31 | 200,000 | 205,552 | ||||||
|
| |||||||
| Total Chile |
| 551,654 | ||||||
| Hungary – 0.0% |
| |||||||
Hungary Government International Bond | 200,000 | 340,938 | ||||||
| Indonesia – 0.2% |
| |||||||
Indonesia Government International Bond | 200,000 | 220,490 | ||||||
4.10%, 4/24/28 | 460,000 | 524,193 | ||||||
2.85%, 2/14/30 | 240,000 | 252,326 | ||||||
3.85%, 10/15/30 | 300,000 | 339,918 | ||||||
4.35%, 1/11/48 | 450,000 | 522,383 | ||||||
5.35%, 2/11/49 | 200,000 | 263,482 | ||||||
4.45%, 4/15/70 | 200,000 | 238,924 | ||||||
|
| |||||||
| Total Indonesia |
| 2,361,716 | ||||||
| Italy – 0.1% |
| |||||||
Republic of Italy Government International Bond | ||||||||
2.88%, 10/17/29 | 350,000 | 369,754 | ||||||
5.38%, 6/15/33 | 233,000 | 299,566 | ||||||
4.00%, 10/17/49 | 350,000 | 401,445 | ||||||
|
| |||||||
| Total Italy |
| 1,070,765 | ||||||
| Mexico – 0.6% |
| |||||||
Mexico Government International Bond | 6,000 | 6,463 | ||||||
4.15%, 3/28/27 | 457,000 | 522,675 | ||||||
3.75%, 1/11/28 | 250,000 | 277,148 | ||||||
4.50%, 4/22/29 | 370,000 | 424,401 | ||||||
3.25%, 4/16/30 | 250,000 | 263,273 | ||||||
2.66%, 5/24/31 | 450,000 | 446,485 | ||||||
4.75%, 4/27/32 | 350,000 | 406,213 | ||||||
7.50%, 4/8/33, Series MTNA | 105,000 | 149,876 | ||||||
6.75%, 9/27/34, Series MTNA | 380,000 | 514,961 | ||||||
6.05%, 1/11/40 | 126,000 | 161,086 | ||||||
4.28%, 8/14/41 | 500,000 | 536,875 | ||||||
4.75%, 3/8/44 | 214,000 | 241,257 | ||||||
5.55%, 1/21/45 | 200,000 | 246,788 | ||||||
4.35%, 1/15/47 | 305,000 | 325,789 | ||||||
4.60%, 2/10/48 | 200,000 | 219,506 | ||||||
4.50%, 1/31/50 | 500,000 | 544,965 | ||||||
3.77%, 5/24/61 | 750,000 | 716,700 | ||||||
5.75%, 10/12/2110 | 260,000 | 318,045 | ||||||
|
| |||||||
| Total Mexico |
| 6,322,506 | ||||||
| Panama – 0.2% |
| |||||||
Panama Government International Bond | 356,000 | 493,366 | ||||||
3.88%, 3/17/28 | 200,000 | 221,768 | ||||||
9.38%, 4/1/29 | 305,000 | 453,480 | ||||||
6.70%, 1/26/36 | 185,000 | 254,292 | ||||||
4.50%, 5/15/47 | 200,000 | 230,126 | ||||||
4.50%, 4/16/50 | 200,000 | 229,556 | ||||||
4.30%, 4/29/53 | 240,000 | 269,165 | ||||||
4.50%, 4/1/56 | 550,000 | 629,821 | ||||||
|
| |||||||
| Total Panama |
| 2,781,574 | ||||||
| Peru – 0.2% |
| |||||||
Peruvian Government International Bond | 204,000 | 229,957 | ||||||
2.84%, 6/20/30 | 520,000 | 538,314 | ||||||
8.75%, 11/21/33 | 261,000 | 411,634 | ||||||
6.55%, 3/14/37 | 80,000 | 111,017 | ||||||
See Notes to Financial Statements.
| WisdomTree Trust | 105 |
Table of Contents
Schedule of Investments (continued)
WisdomTree Yield Enhanced U.S. Aggregate Bond Fund (AGGY)
August 31, 2021
| Investments in Long Securities | Principal Amount | Value | ||||||
5.63%, 11/18/50 | $ | 200,000 | $ | 279,076 | ||||
2.78%, 12/1/60 | 250,000 | 225,327 | ||||||
3.23%, 7/28/2121 | 100,000 | 88,202 | ||||||
|
| |||||||
| Total Peru |
| 1,883,527 | ||||||
| Philippines – 0.3% |
| |||||||
Philippine Government International Bond | 550,000 | 599,302 | ||||||
3.75%, 1/14/29 | 300,000 | 342,459 | ||||||
9.50%, 2/2/30 | 282,000 | 446,696 | ||||||
7.75%, 1/14/31 | 125,000 | 185,458 | ||||||
6.38%, 1/15/32 | 285,000 | 395,848 | ||||||
3.95%, 1/20/40 | 600,000 | 684,390 | ||||||
3.70%, 3/1/41 | 200,000 | 221,460 | ||||||
3.70%, 2/2/42 | 630,000 | 698,065 | ||||||
|
| |||||||
| Total Philippines |
| 3,573,678 | ||||||
| Uruguay – 0.1% |
| |||||||
Uruguay Government International Bond | 135,000 | 156,773 | ||||||
4.38%, 1/23/31 | 290,000 | 342,525 | ||||||
7.63%, 3/21/36 | 30,000 | 46,053 | ||||||
4.13%, 11/20/45 | 60,000 | 72,315 | ||||||
5.10%, 6/18/50 | 350,000 | 468,646 | ||||||
4.98%, 4/20/55 | 190,000 | 250,901 | ||||||
|
| |||||||
| Total Uruguay |
| 1,337,213 | ||||||
TOTAL FOREIGN GOVERNMENT OBLIGATIONS (Cost: $19,376,661) |
| 20,223,571 | ||||||
| SUPRANATIONAL BONDS – 0.1% |
| |||||||
European Investment Bank | 150,000 | 211,276 | ||||||
Inter-American Development Bank | 100,000 | 131,106 | ||||||
3.20%, 8/7/42 | 372,000 | 442,710 | ||||||
4.38%, 1/24/44 | 100,000 | 140,970 | ||||||
International Bank for Reconstruction & Development | 55,000 | 74,928 | ||||||
TOTAL SUPRANATIONAL BONDS (Cost: $1,012,558) |
| 1,000,990 | ||||||
| COMMERCIAL MORTGAGE-BACKED SECURITIES – 1.9% |
| |||||||
| United States – 1.9% |
| |||||||
Banc of America Commercial Mortgage Trust | ||||||||
3.57%, 2/15/50, Series 2017-BNK3, Class A4 | 100,000 | 111,146 | ||||||
Bank 4.23%, 9/15/60, Series 2018-BN14, Class A4^(d) | 577,767 | 671,843 | ||||||
3.43%, 2/15/61, Series 2018-BN10, Class A4 | 10,000 | 10,991 | ||||||
Benchmark Mortgage Trust 3.62%, 2/15/51, Series 2018-B2, Class A4 | 350,000 | 390,726 | ||||||
3.88%, 2/15/51, Series 2018-B2, Class A5^(d) | 230,000 | 261,803 | ||||||
3.75%, 3/15/52, Series 2019-B9, Class A4 | 118,000 | 133,355 | ||||||
2.29%, 3/15/53, Series 2020-B17, Class A5 | 450,000 | 465,339 | ||||||
CD Mortgage Trust 2.46%, 8/10/49, Series 2016-CD1, Class A3 | 340,000 | 356,316 | ||||||
3.33%, 11/13/50, Series 2017-CD6, Class ASB | 104,000 | 112,216 | ||||||
Citigroup Commercial Mortgage Trust 2.94%, 4/10/48, Series 2015-GC29, Class A3 | 64,685 | 67,678 | ||||||
3.72%, 12/10/49, Series 2016-P6, Class A5^(d) | 100,000 | 111,780 | ||||||
3.04%, 11/10/52, Series 2019-GC43, Class A4 | 380,000 | 414,012 | ||||||
3.52%, 9/10/58, Series 2015-GC33, Class AAB | 255,844 | 270,719 | ||||||
Commercial Mortgage Trust 3.92%, 8/10/46, Series 2013-CR10, Class A3 | 47,334 | 50,042 | ||||||
3.78%, 4/10/47, Series 2014-CR16, Class A3 | 394,856 | 420,858 | ||||||
3.50%, 8/10/47, Series 2014-CR19, Class ASB | 184,177 | 192,165 | ||||||
3.50%, 5/10/48, Series 2015-CR23, Class A4 | 50,000 | 54,377 | ||||||
3.51%, 8/10/48, Series 2015-CR25, Class A3 | 524,241 | 558,556 | ||||||
CSAIL Commercial Mortgage Trust 3.49%, 11/15/48, Series 2016-C5, Class A4 | 225,078 | 237,803 | ||||||
3.79%, 4/15/50, Series 2015-C1, Class AS^(d) | 82,000 | 88,483 | ||||||
3.02%, 9/15/52, Series 2019-C17, Class A5 | 343,000 | 373,604 | ||||||
Federal Home Loan Mortgage Corp. Multifamily Structured Pass Through Certificates 2.87%, 12/25/21, Series K017, Class A2 | 20,652 | 20,709 | ||||||
2.51%, 11/25/22, Series K026, Class A2 | 250,000 | 255,398 | ||||||
2.62%, 3/25/23, Series K035, Class A1 | 29,013 | 29,272 | ||||||
3.30%, 4/25/23, Series K031, Class A2^(d) | 370,000 | 386,085 | ||||||
2.49%, 11/25/24, Series K045, Class A1 | 133,569 | 135,639 | ||||||
3.06%, 12/25/24, Series K043, Class A2 | 199,000 | 213,766 | ||||||
3.02%, 11/25/25, Series K045, Class A2 | 55,000 | 59,104 | ||||||
3.15%, 11/25/25, Series K052, Class A2 | 125,000 | 136,108 | ||||||
2.34%, 7/25/26, Series K058, Class A1 | 475,284 | 493,930 | ||||||
See Notes to Financial Statements.
| 106 | WisdomTree Trust |
Table of Contents
Schedule of Investments (continued)
WisdomTree Yield Enhanced U.S. Aggregate Bond Fund (AGGY)
August 31, 2021
| Investments in Long Securities | Principal Amount | Value | ||||||
2.86%, 10/25/26, Series K065, Class A1 | $ | 280,389 | $ | 295,234 | ||||
3.33%, 5/25/27, Series K065, Class AM | 59,000 | 65,738 | ||||||
3.93%, 6/25/28, Series K079, Class A2 | 400,000 | 467,387 | ||||||
3.93%, 7/25/28, Series K080, Class A2^(d) | 685,000 | 801,400 | ||||||
3.77%, 12/25/28, Series K087, Class A2 | 450,000 | 524,056 | ||||||
3.29%, 3/25/29, Series K153, Class A2^(d) | 615,000 | 698,580 | ||||||
3.75%, 11/25/29, Series K155, Class A1 | 418,476 | 472,472 | ||||||
3.95%, 12/25/29, Series K159, Class A1 | 197,525 | 224,683 | ||||||
1.24%, 1/25/35, Series K-1516, Class A1 | 756,966 | 737,449 | ||||||
Federal National Mortgage Association Alternative Credit Enhancement Securities 2.73%, 10/25/21, Series 2012-M1, Class A2 | 39,108 | 39,108 | ||||||
2.72%, 2/25/22, Series 2012-M2, Class A2 | 134,094 | 134,613 | ||||||
2.38%, 5/25/22, Series 2012-M13, Class A2 | 34,720 | 34,830 | ||||||
2.30%, 9/25/22, Series 2012-M14, Class A2^(d) | 21,926 | 22,086 | ||||||
2.63%, 4/25/23, Series 2013-M14, Class APT^(d) | 17,777 | 17,964 | ||||||
2.16%, 10/25/23, Series 2016-M7, Class AV2 | 382,283 | 388,811 | ||||||
3.33%, 10/25/23, Series 2013-M14, Class A2^(d) | 66,224 | 69,875 | ||||||
3.50%, 1/25/24, Series 2014-M3, Class A2^(d) | 59,109 | 62,385 | ||||||
2.14%, 5/25/26, Series 2016-M6, Class A1 | 91,972 | 94,022 | ||||||
2.00%, 6/25/26, Series 2016-M9, Class A1 | 329,965 | 338,481 | ||||||
2.50%, 9/25/26, Series 2016-M7, Class A2 | 164,828 | 169,941 | ||||||
2.50%, 10/25/26, Series 2017-M1, Class A2^(d) | 223,170 | 237,110 | ||||||
3.44%, 6/25/28, Series 2018-M8, Class A2^(d) | 80,000 | 90,760 | ||||||
3.67%, 9/25/28, Series 2019-M1, Class A2^(d) | 400,000 | 458,117 | ||||||
3.23%, 4/25/29, Series 2017-M5, Class A2^(d) | 60,386 | 67,990 | ||||||
3.09%, 2/25/30, Series 2018-M3, Class A1^(d) | 229,245 | 247,094 | ||||||
2.94%, 7/25/39, Series 2016-M11, Class AL | 303,432 | 310,416 | ||||||
GS Mortgage Securities Trust 4.24%, 8/10/46, Series 2013-GC14, Class A5 | 85,000 | 90,358 | ||||||
3.86%, 6/10/47, Series 2014-GC22, Class A5 | 70,000 | 75,435 | ||||||
3.67%, 9/10/47, Series 2014-GC24, Class A4 | 298,084 | 311,922 | ||||||
3.43%, 8/10/50, Series 2017-GS7, Class A4 | 170,000 | 188,141 | ||||||
JP Morgan Chase Commercial Mortgage Securities Trust 2.87%, 8/15/49, Series 2016-JP3, Class A5 | 375,000 | 401,151 | ||||||
JPMBB Commercial Mortgage Securities Trust 3.66%, 7/15/45, Series 2013-C12, Class A5 | 100,000 | 104,913 | ||||||
4.13%, 8/15/46, Series 2013-C14, Class A4^(d) | 71,610 | 75,724 | ||||||
3.93%, 1/15/47, Series 2013-C17, Class A3 | 85,875 | 90,690 | ||||||
3.29%, 1/15/48, Series 2014-C26, Class ASB | 96,481 | 100,315 | ||||||
3.34%, 5/15/48, Series 2015-C29, Class A3A1 | 176,335 | 185,388 | ||||||
JPMCC Commercial Mortgage Securities Trust 3.46%, 3/15/50, Series 2017-JP5, Class A4 | 50,000 | 54,954 | ||||||
Morgan Stanley Bank of America Merrill Lynch Trust 3.48%, 11/15/45, Series 2012-C6, Class AS | 100,000 | 102,503 | ||||||
3.89%, 6/15/47, Series 2014-C16, Class A5 | 70,000 | 75,246 | ||||||
3.07%, 2/15/48, Series 2015-C20, Class ASB | 148,051 | 153,396 | ||||||
3.08%, 3/15/48, Series 2015-C21, Class A3 | 117,466 | 122,062 | ||||||
3.04%, 4/15/48, Series 2015-C22, Class ASB | 150,870 | 156,420 | ||||||
3.31%, 4/15/48, Series 2015-C22, Class A4 | 95,000 | 101,979 | ||||||
Morgan Stanley Capital I Trust 3.81%, 3/15/52, Series 2019-L2, Class A3 | 275,000 | 307,079 | ||||||
2.70%, 2/15/53, Series 2020-L4, Class A3 | 400,000 | 426,342 | ||||||
UBS Commercial Mortgage Trust 3.47%, 11/15/50, Series 2017-C5, Class A5 | 300,000 | 332,279 | ||||||
3.78%, 11/15/50, Series 2017-C5, Class AS^(d) | 400,000 | 443,244 | ||||||
UBS-Citigroup Commercial Mortgage Trust 3.60%, 1/10/45, Series 2011-C1, Class A3 | 12,441 | 12,471 | ||||||
See Notes to Financial Statements.
| WisdomTree Trust | 107 |
Table of Contents
Schedule of Investments (continued)
WisdomTree Yield Enhanced U.S. Aggregate Bond Fund (AGGY)
August 31, 2021
| Investments in Long Securities | Principal Amount | Value | ||||||
Wells Fargo Commercial Mortgage Trust 2.92%, 10/15/45, Series 2012-LC5, Class A3 | $ | 176,445 | $ | 180,239 | ||||
2.91%, 2/15/48, Series 2015-C26, Class A3 | 431,511 | 455,772 | ||||||
2.92%, 11/15/49, Series 2016-NXS6, Class A4 | 265,000 | 284,660 | ||||||
3.47%, 11/15/50, Series 2017-C41, Class A4 | 250,000 | 277,071 | ||||||
2.73%, 2/15/53, Series 2020-C55, Class A5 | 450,000 | 480,661 | ||||||
WFRBS Commercial Mortgage Trust 4.15%, 8/15/46, Series 2013-C15, Class A4^(d) | 200,000 | 211,216 | ||||||
4.42%, 9/15/46, Series 2013-C16, Class A5 | 100,000 | 107,144 | ||||||
4.02%, 12/15/46, Series 2013-C17, Class A4 | 60,000 | 64,021 | ||||||
3.41%, 8/15/47, Series 2014-C21, Class A4 | 206,213 | 218,412 | ||||||
3.63%, 11/15/47, Series 2014-C25, Class A5 | 100,000 | 108,346 | ||||||
| TOTAL COMMERCIAL MORTGAGE-BACKED SECURITIES (Cost: $19,765,514) |
| 20,453,979 | ||||||
| MUNICIPAL BONDS – 0.6% |
| |||||||
| United States – 0.6% |
| |||||||
Alameda County Joint Powers Authority | 150,000 | 249,015 | ||||||
Commonwealth of Massachusetts | 150,000 | 161,506 | ||||||
Dallas Area Rapid Transit | 175,000 | 271,045 | ||||||
5.02%, 12/1/48 | 130,000 | 188,183 | ||||||
Grand Parkway Transportation Corp. | 250,000 | 343,716 | ||||||
Los Angeles County Public Works Financing Authority | 100,000 | 168,435 | ||||||
Los Angeles Department of Water & Power Power System Revenue | 70,000 | 116,059 | ||||||
Metropolitan Government Nashville & Davidson County Health & Educational Facilities Board | 100,000 | 111,085 | ||||||
Metropolitan Transportation Authority | 275,000 | 454,902 | ||||||
Municipal Electric Authority of Georgia | 216,000 | 330,890 | ||||||
New Jersey Transportation Trust Fund Authority | 595,000 | 715,818 | ||||||
Port Authority of New York & New Jersey | 130,000 | 186,634 | ||||||
4.46%, 10/1/62 | 200,000 | 275,444 | ||||||
Regional Transportation District Sales Tax Revenue | 205,000 | 333,459 | ||||||
Sales Tax Securitization Corp. | 100,000 | 122,992 | ||||||
3.82%, 1/1/48 | 255,000 | 288,953 | ||||||
San Jose Redevelopment Agency Successor Agency | 60,000 | 66,236 | ||||||
State of Illinois | 157,818 | 167,335 | ||||||
5.10%, 6/1/33 | 595,000 | 707,241 | ||||||
6.63%, 2/1/35 | 100,000 | 126,392 | ||||||
Texas Private Activity Bond Surface Transportation Corp. | 500,000 | 576,372 | ||||||
University of California | 230,000 | 326,603 | ||||||
4.86%, 5/15/2112, Series AD | 56,000 | 83,793 | ||||||
University of Pittsburgh of the Commonwealth System of Higher Education | 120,000 | 134,186 | ||||||
University of Virginia | 150,000 | 157,147 | ||||||
TOTAL MUNICIPAL BONDS (Cost: $6,120,292) |
| 6,663,441 | ||||||
| ASSET-BACKED SECURITIES – 0.1% |
| |||||||
| United States – 0.1% |
| |||||||
Ally Auto Receivables Trust 3.09%, 6/15/23, Series 2018-2, Class A4 | 283,108 | 284,858 | ||||||
American Express Credit Account Master Trust 3.18%, 4/15/24, Series 2018-8, Class A | 100,000 | 100,110 | ||||||
GM Financial Consumer Automobile Receivables Trust 3.32%, 6/17/24, Series 2018-4, Class A4 | 74,000 | 76,042 | ||||||
Honda Auto Receivables Owner Trust 3.16%, 8/19/24, Series 2018-2, Class A4 | 127,667 | 128,113 | ||||||
Synchrony Card Funding LLC 2.95%, 3/15/25, Series 2019-A1, Class A | 140,000 | 142,067 | ||||||
2.34%, 6/15/25, Series 2019-A2, Class A | 125,000 | 127,126 | ||||||
World Omni Auto Receivables Trust 3.33%, 4/15/24, Series 2018-D, Class A3 | 114,166 | 115,593 | ||||||
3.04%, 5/15/24, Series 2019-A, Class A3 | 52,167 | 52,807 | ||||||
TOTAL ASSET-BACKED SECURITIES (Cost: $1,025,804) |
| 1,026,716 | ||||||
See Notes to Financial Statements.
| 108 | WisdomTree Trust |
Table of Contents
Schedule of Investments (continued)
WisdomTree Yield Enhanced U.S. Aggregate Bond Fund (AGGY)
August 31, 2021
| Investments in Long Securities | Principal Amount | Value | ||||||
| REPURCHASE AGREEMENT – 13.5% |
| |||||||
| United States – 13.5% |
| |||||||
Citigroup, Inc., tri-party repurchase agreement dated 8/31/21 (tri-party custodian: The Bank of New York Mellon Corp.), 0.06% due 9/1/21; Proceeds at maturity – $146,660,244 (fully collateralized by Fannie Mae Pool, 2.00% – 4.00% due 8/1/51, Fannie Mae Interest STRIPS, zero coupon – 5.00% due 3/1/34 – 2/1/47, Freddie Mac Pool, 2.00% – 3.50% due 8/1/51, zero coupon – 6.00% due 9/15/27 – 9/15/48; Market value including accrued interest – $153,629,167) | ||||||||
| (Cost: $146,660,000) | $ | 146,660,000 | $ | 146,660,000 | ||||
| Shares | ||||||||
| INVESTMENT OF CASH COLLATERAL FOR SECURITIES LOANED – 0.5% |
| |||||||
| United States – 0.5% |
| |||||||
State Street Navigator Securities Lending Government Money Market Portfolio, 0.03%(f) | ||||||||
| (Cost: $5,202,955) | 5,202,955 | 5,202,955 | ||||||
TOTAL INVESTMENTS IN LONG SECURITIES BEFORE SECURITIES SOLD SHORT – 114.7% (Cost: $1,230,410,435) |
| 1,249,363,043 | ||||||
| Securities Sold Short | Principal Amount | Value | ||||||
| U.S. GOVERNMENT AGENCIES SOLD SHORT – (1.4)% |
| |||||||
| Uniform Mortgage-Backed Securities – (1.4)% |
| |||||||
2.50%, 9/1/36(a) | (4,700,000 | ) | (4,917,028 | ) | ||||
3.00%, 9/1/36(a) | (5,100,000 | ) | (5,368,887 | ) | ||||
4.00%, 9/1/36(a) | (850,000 | ) | (902,393 | ) | ||||
3.50%, 9/1/51(a) | (3,175,000 | ) | (3,359,088 | ) | ||||
4.50%, 10/1/51(a) | (700,000 | ) | (757,602 | ) | ||||
| TOTAL INVESTMENTS IN SECURITIES SOLD SHORT (Proceeds: $15,294,578) |
| (15,304,998 | ) | |||||
Other Assets less Liabilities – (13.3)% |
| (144,982,976 | ) | |||||
|
| |||||||
| NET ASSETS – 100.0% |
| $ | 1,089,075,069 | |||||
| ^ | Variable coupon rate based on weighted average interest rate of underlying mortgage. |
| (a) | To-be-announced (“TBA”) security (See Note 2). TBA securities are non-income producing. |
| (b) | Security, or portion thereof, was on loan at August 31, 2021 (See Note 2). At August 31, 2021, the total market value of the Fund’s securities on loan identified in the Schedule of Investments was $5,495,890. The Fund also had securities on loan having a total market value of $22,774 that were sold and pending settlement. The total market value of the collateral held by the Fund was $5,675,824. The total market value of the collateral includes non-cash U.S. Government securities collateral having a value of $472,869. |
| (c) | This security is exempt from registration under rule 144A of the Securities Act of 1933. This security may be sold in transactions that are exempt from registration, normally to qualified institutional buyers. |
| (d) | Rate shown reflects the accrual rate as of August 31, 2021 on securities with variable or step rates. |
| (e) | Represents a zero coupon bond. Rate shown reflects the effective yield as of August 31, 2021. |
| (f) | Rate shown represents annualized 7-day yield as of August 31, 2021. |
See Notes to Financial Statements.
| WisdomTree Trust | 109 |
Table of Contents
Schedule of Investments (concluded)
WisdomTree Yield Enhanced U.S. Aggregate Bond Fund (AGGY)
August 31, 2021
| FAIR VALUATION SUMMARY | ||||||||||||||
The following is a summary of the fair valuations according to the inputs used as of August 31, 2021 in valuing the Fund’s investments (See Note 2 — Fair Value Measurement):
| Quoted Prices in Active Markets (Level 1) | Other Inputs | Significant Unobservable Inputs (Level 3) | Total | |||||||||||||
Assets: |
| |||||||||||||||
Investments in Securities |
| |||||||||||||||
U.S. Government Agencies | $ | — | $ | 493,725,479 | $ | — | $ | 493,725,479 | ||||||||
U.S. Government Obligations | — | 194,974,028 | — | 194,974,028 | ||||||||||||
U.S. Corporate Bonds | — | 301,366,739 | — | 301,366,739 | ||||||||||||
Foreign Corporate Bonds | — | 55,569,562 | — | 55,569,562 | ||||||||||||
Foreign Government Agencies | — | 2,495,583 | — | 2,495,583 | ||||||||||||
Foreign Government Obligations | — | 20,223,571 | — | 20,223,571 | ||||||||||||
Supranational Bonds | — | 1,000,990 | — | 1,000,990 | ||||||||||||
Commercial Mortgage-Backed Securities | — | 20,453,979 | — | 20,453,979 | ||||||||||||
Municipal Bonds | — | 6,663,441 | — | 6,663,441 | ||||||||||||
Asset-Backed Securities | — | 1,026,716 | — | 1,026,716 | ||||||||||||
Repurchase Agreement | — | 146,660,000 | — | 146,660,000 | ||||||||||||
Investment of Cash Collateral for Securities Loaned | — | 5,202,955 | — | 5,202,955 | ||||||||||||
Total Investments in Securities | $ | — | $ | 1,249,363,043 | $ | — | $ | 1,249,363,043 | ||||||||
Liabilities: |
| |||||||||||||||
Investments in Securities Sold Short | ||||||||||||||||
U.S. Government Agencies | $ | — | $ | (15,304,998 | ) | $ | — | $ | (15,304,998 | ) | ||||||
Total – Net | $ | — | $ | 1,234,058,045 | $ | — | $ | 1,234,058,045 | ||||||||
See Notes to Financial Statements.
| 110 | WisdomTree Trust |
Table of Contents
Schedule of Investments
WisdomTree Yield Enhanced U.S. Short-Term Aggregate Bond Fund (SHAG)
August 31, 2021
| Investments | Principal Amount | Value | ||||||
| U.S. GOVERNMENT AGENCIES – 22.4% |
| |||||||
| Federal Home Loan Bank – 0.1% |
| |||||||
0.38%, 9/4/25 | $ | 200,000 | $ | 198,148 | ||||
| Federal Home Loan Mortgage Corporation – 1.9% |
| |||||||
0.38%, 4/20/23 | 3,500,000 | 3,513,825 | ||||||
0.38%, 7/21/25 | 200,000 | 198,384 | ||||||
|
| |||||||
| Total Federal Home Loan Mortgage Corporation |
| 3,712,209 | ||||||
| Federal National Mortgage Association – 1.1% |
| |||||||
2.63%, 9/6/24 | 1,850,000 | 1,975,227 | ||||||
1.63%, 1/7/25 | 175,000 | 181,970 | ||||||
|
| |||||||
| Total Federal National Mortgage Association |
| 2,157,197 | ||||||
| Tennessee Valley Authority – 0.0% |
| |||||||
0.75%, 5/15/25 | 86,000 | 86,504 | ||||||
| Uniform Mortgage-Backed Securities – 19.3% |
| |||||||
2.00%, 9/16/36(a) | 30,769,000 | 31,848,694 | ||||||
2.50%, 9/16/36(a) | 6,427,000 | 6,723,775 | ||||||
|
| |||||||
| Total Uniform Mortgage-Backed Securities |
| 38,572,469 | ||||||
TOTAL U.S. GOVERNMENT AGENCIES (Cost: $44,712,811) |
| 44,726,527 | ||||||
| U.S. GOVERNMENT OBLIGATIONS – 72.5% |
| |||||||
| U.S. Treasury Bills – 44.4% |
| |||||||
0.02%, 9/2/21* | 38,875,000 | 38,874,973 | ||||||
0.06%, 11/1/21* | 2,925,000 | 2,924,738 | ||||||
0.04%, 12/2/21* | 37,000,000 | 36,996,454 | ||||||
0.05%, 3/3/22* | 9,875,000 | 9,872,379 | ||||||
|
| |||||||
| Total U.S. Treasury Bills |
| 88,668,544 | ||||||
| U.S. Treasury Bonds – 0.6% |
| |||||||
7.63%, 11/15/22 | 106,000 | 115,612 | ||||||
7.13%, 2/15/23 | 300,000 | 330,545 | ||||||
6.88%, 8/15/25 | 500,000 | 622,910 | ||||||
6.00%, 2/15/26 | 100,000 | 123,395 | ||||||
|
| |||||||
| Total U.S. Treasury Bonds |
| 1,192,462 | ||||||
| U.S. Treasury Notes – 27.5% |
| |||||||
1.75%, 9/30/22 | 1,429,000 | 1,454,622 | ||||||
1.63%, 11/15/22 | 2,215,000 | 2,255,536 | ||||||
1.63%, 12/15/22 | 840,000 | 856,406 | ||||||
0.25%, 4/15/23 | 1,230,000 | 1,231,922 | ||||||
0.13%, 5/15/23 | 490,000 | 489,722 | ||||||
2.63%, 6/30/23 | 232,800 | 243,190 | ||||||
0.13%, 8/31/23 | 6,000,000 | 5,990,273 | ||||||
2.75%, 8/31/23 | 859,200 | 902,747 | ||||||
2.13%, 3/31/24 | 735,000 | 769,281 | ||||||
2.00%, 5/31/24 | 1,000,000 | 1,045,117 | ||||||
1.50%, 10/31/24 | 1,535,000 | 1,586,626 | ||||||
1.50%, 11/30/24 | 400,000 | 413,547 | ||||||
1.75%, 12/31/24 | 1,300,000 | 1,355,047 | ||||||
1.13%, 2/28/25 | 238,000 | 243,030 | ||||||
0.50%, 3/31/25 | 22,000,000 | 21,975,078 | ||||||
0.75%, 3/31/26 | 2,200,000 | 2,203,180 | ||||||
0.75%, 4/30/26 | 3,000,000 | 3,002,930 | ||||||
0.75%, 5/31/26 | 6,000,000 | 6,002,344 | ||||||
0.63%, 7/31/26 | 3,000,000 | 2,979,492 | ||||||
|
| |||||||
| Total U.S. Treasury Notes |
| 55,000,090 | ||||||
TOTAL U.S. GOVERNMENT OBLIGATIONS (Cost: $144,570,375) |
| 144,861,096 | ||||||
| U.S. CORPORATE BONDS – 26.5% |
| |||||||
| United States – 26.5% |
| |||||||
3M Co. | 113,000 | 116,196 | ||||||
2.65%, 4/15/25 | 50,000 | 53,143 | ||||||
Abbott Laboratories | 1,209,000 | 1,345,206 | ||||||
AbbVie, Inc. | 449,000 | 462,286 | ||||||
3.85%, 6/15/24 | 5,000 | 5,399 | ||||||
2.60%, 11/21/24 | 200,000 | 210,924 | ||||||
3.60%, 5/14/25 | 35,000 | 38,076 | ||||||
Adobe, Inc. | 322,000 | 334,278 | ||||||
3.25%, 2/1/25 | 187,000 | 201,760 | ||||||
Aetna, Inc. | 27,000 | 29,106 | ||||||
Affiliated Managers Group, Inc. | 25,000 | 27,153 | ||||||
Aflac, Inc. | 200,000 | 216,510 | ||||||
Air Lease Corp. | 200,000 | 204,732 | ||||||
3.00%, 9/15/23 | 50,000 | 52,128 | ||||||
Air Products and Chemicals, Inc. | 264,000 | 271,001 | ||||||
Ally Financial, Inc. | 270,000 | 274,220 | ||||||
Amazon.com, Inc. | 50,000 | 50,135 | ||||||
American Express Co. | 76,000 | 81,416 | ||||||
3.63%, 12/5/24 | 226,000 | 246,417 | ||||||
American Honda Finance Corp. | 50,000 | 52,442 | ||||||
2.15%, 9/10/24 | 150,000 | 156,454 | ||||||
1.20%, 7/8/25 | 200,000 | 201,950 | ||||||
1.00%, 9/10/25 | 111,000 | 111,256 | ||||||
American International Group, Inc. | 42,000 | 45,512 | ||||||
American Tower Corp. | 358,000 | 373,505 | ||||||
1.30%, 9/15/25 | 10,000 | 10,054 | ||||||
1.60%, 4/15/26 | 10,000 | 10,109 | ||||||
Ameriprise Financial, Inc. | 47,000 | 51,345 | ||||||
3.00%, 4/2/25 | 50,000 | 53,410 | ||||||
AmerisourceBergen Corp. | 100,000 | 107,081 | ||||||
Amgen, Inc. | 149,000 | 159,978 | ||||||
Amphenol Corp. | 50,000 | 52,931 | ||||||
Anthem, Inc. | 219,000 | 227,747 | ||||||
Appalachian Power Co. | 52,000 | 56,133 | ||||||
Ares Capital Corp. | 90,000 | 93,198 | ||||||
3.88%, 1/15/26 | 30,000 | 32,321 | ||||||
See Notes to Financial Statements.
| WisdomTree Trust | 111 |
Table of Contents
Schedule of Investments (continued)
WisdomTree Yield Enhanced U.S. Short-Term Aggregate Bond Fund (SHAG)
August 31, 2021
| Investments | Principal Amount | Value | ||||||
Assurant, Inc. | $ | 64,000 | $ | 68,443 | ||||
AT&T, Inc. | 216,000 | 235,099 | ||||||
AutoZone, Inc. | 250,000 | 272,285 | ||||||
AvalonBay Communities, Inc. | 101,000 | 110,084 | ||||||
Bank of America Corp. | ||||||||
3.00%, 12/20/23, (3.004% fixed rate until 12/20/22; 3-month U.S. dollar London Interbank Offered Rate + 0.79% thereafter)(b) | 150,000 | 154,878 | ||||||
4.13%, 1/22/24 | 72,000 | 78,145 | ||||||
3.55%, 3/5/24, (3.55% fixed rate until 3/5/23; 3-month U.S. dollar London Interbank Offered Rate + 0.78% thereafter)(b) | 157,000 | 164,037 | ||||||
4.00%, 4/1/24 | 117,000 | 127,252 | ||||||
4.20%, 8/26/24 | 22,000 | 24,134 | ||||||
3.88%, 8/1/25 | 513,000 | 569,907 | ||||||
0.98%, 9/25/25, (0.981% fixed rate until 9/25/24; Secured Overnight Financing Rate + 0.91% thereafter)(b) | 50,000 | 50,173 | ||||||
3.09%, 10/1/25, (3.093% fixed rate until 10/1/24; 3-month U.S. dollar London Interbank Offered Rate + 1.09% thereafter)(b) | 207,000 | 220,536 | ||||||
3.37%, 1/23/26, (3.366% fixed rate until 1/23/25; 3-month U.S. dollar London Interbank Offered Rate + 0.81% thereafter)(b) | 200,000 | 214,936 | ||||||
2.02%, 2/13/26, (2.015% fixed rate until 2/13/25; 3-month U.S. dollar London Interbank Offered Rate + 0.64% thereafter)(b) | 871,000 | 897,008 | ||||||
3.50%, 4/19/26 | 134,000 | 147,621 | ||||||
1.32%, 6/19/26, (1.319% fixed rate until 6/19/25; Secured Overnight Financing Rate + 1.15% thereafter)(b) | 30,000 | 30,114 | ||||||
Bank of New York Mellon Corp. (The) | 111,000 | 114,992 | ||||||
3.40%, 5/15/24 | 4,000 | 4,297 | ||||||
3.00%, 2/24/25, Series G | 50,000 | 53,820 | ||||||
1.60%, 4/24/25 | 50,000 | 51,401 | ||||||
Berkshire Hathaway Energy Co. | 200,000 | 216,146 | ||||||
4.05%, 4/15/25 | 187,000 | 206,902 | ||||||
Berry Global, Inc. | 120,000 | 121,104 | ||||||
BGC Partners, Inc. | 231,000 | 248,875 | ||||||
Biogen, Inc. | 50,000 | 51,700 | ||||||
4.05%, 9/15/25 | 184,000 | 204,593 | ||||||
Black Hills Corp. | 121,000 | 129,766 | ||||||
BlackRock, Inc. | 34,000 | 36,669 | ||||||
Blackstone Secured Lending Fund | 120,000 | 125,334 | ||||||
Block Financial LLC | 43,000 | 44,385 | ||||||
Boardwalk Pipelines L.P. | 67,000 | 74,636 | ||||||
Boeing Co. (The) | 200,000 | 203,688 | ||||||
4.88%, 5/1/25 | 12,000 | 13,421 | ||||||
2.75%, 2/1/26 | 407,000 | 425,555 | ||||||
Boston Properties L.P. | 100,000 | 110,138 | ||||||
BP Capital Markets America, Inc. | 200,000 | 211,432 | ||||||
3.19%, 4/6/25 | 209,000 | 224,713 | ||||||
3.80%, 9/21/25 | 136,000 | 150,313 | ||||||
Bristol-Myers Squibb Co. | 675,000 | 719,732 | ||||||
Broadcom, Inc. | 19,000 | 21,272 | ||||||
3.15%, 11/15/25 | 107,000 | 114,656 | ||||||
4.25%, 4/15/26 | 125,000 | 139,845 | ||||||
3.46%, 9/15/26 | 100,000 | 108,634 | ||||||
Brown-Forman Corp. | 316,000 | 345,091 | ||||||
Campbell Soup Co. | 35,000 | 36,609 | ||||||
Capital One Financial Corp. | 498,000 | 524,797 | ||||||
Cardinal Health, Inc. | 93,000 | 94,499 | ||||||
Carrier Global Corp. | 100,000 | 104,153 | ||||||
Caterpillar Financial Services Corp. | 74,000 | 77,581 | ||||||
Caterpillar, Inc. | 81,000 | 86,851 | ||||||
Charles Schwab Corp. (The) | 111,000 | 118,979 | ||||||
4.20%, 3/24/25 | 452,000 | 504,030 | ||||||
3.85%, 5/21/25 | 50,000 | 55,208 | ||||||
Charter Communications Operating LLC | 36,000 | 39,098 | ||||||
Chubb INA Holdings, Inc. | 97,000 | 104,841 | ||||||
Cigna Corp. | 62,000 | 65,657 | ||||||
4.13%, 11/15/25 | 70,000 | 78,270 | ||||||
1.25%, 3/15/26 | 57,000 | 57,367 | ||||||
Cisco Systems, Inc. | 211,000 | 227,869 | ||||||
3.50%, 6/15/25 | 200,000 | 220,482 | ||||||
Citigroup, Inc. | 680,000 | 714,360 | ||||||
3.88%, 10/25/23 | 110,000 | 118,253 | ||||||
3.75%, 6/16/24 | 50,000 | 54,256 | ||||||
3.88%, 3/26/25 | 9,000 | 9,853 | ||||||
See Notes to Financial Statements.
| 112 | WisdomTree Trust |
Table of Contents
Schedule of Investments (continued)
WisdomTree Yield Enhanced U.S. Short-Term Aggregate Bond Fund (SHAG)
August 31, 2021
| Investments | Principal Amount | Value | ||||||
3.35%, 4/24/25, (3.352% fixed rate until 4/24/24; 3-month U.S. dollar London Interbank Offered Rate + 0.897% thereafter)(b) | $ | 95,000 | $ | 101,299 | ||||
3.11%, 4/8/26, (3.106% fixed rate until 4/8/25; Secured Overnight Financing Rate + 2.842% thereafter)(b) | 257,000 | 274,887 | ||||||
1.12%, 1/28/27, (1.122% fixed rate until 1/28/26; Secured Overnight Financing Rate + 0.765% thereafter)(b) | 251,000 | 249,188 | ||||||
Citrix Systems, Inc. | 25,000 | 24,722 | ||||||
Cleveland Electric Illuminating Co. (The) | 180,000 | 204,210 | ||||||
CNH Industrial Capital LLC | 50,000 | 51,129 | ||||||
Coca-Cola Co. (The) | 100,000 | 104,100 | ||||||
Columbia Pipeline Group, Inc. | 250,000 | 280,082 | ||||||
Comcast Corp. | 50,000 | 53,839 | ||||||
3.38%, 2/15/25 | 50,000 | 54,088 | ||||||
3.10%, 4/1/25 | 400,000 | 430,144 | ||||||
3.38%, 8/15/25 | 178,000 | 193,915 | ||||||
3.95%, 10/15/25 | 106,000 | 118,265 | ||||||
3.15%, 3/1/26 | 5,000 | 5,438 | ||||||
Comerica, Inc. | 83,000 | 87,982 | ||||||
Constellation Brands, Inc. | 72,000 | 76,324 | ||||||
Costco Wholesale Corp. | 42,000 | 44,467 | ||||||
Crown Castle International Corp. | 48,000 | 51,236 | ||||||
Cummins, Inc. | 200,000 | 199,370 | ||||||
CVS Health Corp. | 8,000 | 8,343 | ||||||
3.70%, 3/9/23 | 33,000 | 34,558 | ||||||
4.10%, 3/25/25 | 100,000 | 110,313 | ||||||
3.88%, 7/20/25 | 50,000 | 55,062 | ||||||
D.R. Horton, Inc. | 140,000 | 152,243 | ||||||
Dell International LLC | 5,000 | 5,843 | ||||||
Devon Energy Corp. | 110,000 | 128,155 | ||||||
Discover Financial Services | 50,000 | 52,092 | ||||||
Discovery Communications LLC | 50,000 | 51,790 | ||||||
Dollar General Corp. | 40,000 | 41,556 | ||||||
Dominion Energy, Inc. | 16,000 | 16,981 | ||||||
3.90%, 10/1/25 | 40,000 | 44,076 | ||||||
Dow Chemical Co. (The) | 2,000 | 2,275 | ||||||
Duke Energy Corp. | 100,000 | 99,272 | ||||||
DuPont de Nemours, Inc. | 30,000 | 33,893 | ||||||
E*TRADE Financial Corp. | 50,000 | 51,225 | ||||||
Edison International | 100,000 | 101,620 | ||||||
3.55%, 11/15/24 | 9,000 | 9,571 | ||||||
EI du Pont de Nemours and Co. | 175,000 | 179,693 | ||||||
Electronic Arts, Inc. | 9,000 | 10,350 | ||||||
Eli Lilly & Co. | 177,000 | 188,730 | ||||||
Enable Midstream Partners L.P. | 8,000 | 8,514 | ||||||
Energy Transfer L.P. | 79,000 | 79,604 | ||||||
2.90%, 5/15/25 | 100,000 | 105,119 | ||||||
Entergy Arkansas LLC | 20,000 | 21,526 | ||||||
Entergy Corp. | 25,000 | 24,719 | ||||||
Entergy Gulf States Louisiana LLC | 107,000 | 122,621 | ||||||
Entergy Louisiana LLC | 50,000 | 57,188 | ||||||
Enterprise Products Operating LLC | 50,000 | 51,858 | ||||||
EOG Resources, Inc. | 100,000 | 112,265 | ||||||
Equinix, Inc. | 189,000 | 198,673 | ||||||
1.25%, 7/15/25 | 44,000 | 44,049 | ||||||
ERP Operating L.P. | 77,000 | 83,419 | ||||||
Estee Lauder Cos., Inc. (The) | 50,000 | 52,302 | ||||||
Evergy Metro, Inc. | 200,000 | 219,024 | ||||||
Exelon Corp. | 41,000 | 44,760 | ||||||
Fidelity National Information Services, Inc. | 23,000 | 22,919 | ||||||
Fifth Third Bancorp | 100,000 | 104,696 | ||||||
FNB Corp. | 50,000 | 50,810 | ||||||
Fox Corp. | 29,000 | 31,251 | ||||||
Franklin Resources, Inc. | 210,000 | 224,610 | ||||||
FS KKR Capital Corp. | 130,000 | 135,915 | ||||||
General Dynamics Corp. | 150,000 | 162,105 | ||||||
3.50%, 5/15/25 | 209,000 | 228,458 | ||||||
General Electric Co. | 50,000 | 51,286 | ||||||
See Notes to Financial Statements.
| WisdomTree Trust | 113 |
Table of Contents
Schedule of Investments (continued)
WisdomTree Yield Enhanced U.S. Short-Term Aggregate Bond Fund (SHAG)
August 31, 2021
| Investments | Principal Amount | Value | ||||||
General Mills, Inc. | $ | 84,000 | $ | 89,473 | ||||
General Motors Co. | 99,000 | 116,875 | ||||||
General Motors Financial Co., Inc. | 155,000 | 156,362 | ||||||
3.45%, 4/10/22 | 80,000 | 81,077 | ||||||
3.15%, 6/30/22 | 161,000 | 164,249 | ||||||
Georgia Power Co. | 235,000 | 244,872 | ||||||
Georgia-Pacific LLC | 66,000 | 77,514 | ||||||
Gilead Sciences, Inc. | 111,000 | 113,798 | ||||||
3.70%, 4/1/24 | 118,000 | 126,469 | ||||||
3.65%, 3/1/26 | 57,000 | 62,884 | ||||||
Global Payments, Inc. | 100,000 | 114,463 | ||||||
Goldman Sachs BDC, Inc. | 50,000 | 51,785 | ||||||
Goldman Sachs Group, Inc. (The) | 307,000 | 332,478 | ||||||
3.85%, 7/8/24 | 50,000 | 54,068 | ||||||
3.50%, 1/23/25 | 164,000 | 176,726 | ||||||
3.50%, 4/1/25 | 209,000 | 226,357 | ||||||
3.75%, 5/22/25 | 250,000 | 272,645 | ||||||
1.09%, 12/9/26, (1.093% fixed rate until 12/9/25; Secured Overnight Financing Rate + 0.789% thereafter)(b) | 680,000 | 675,308 | ||||||
1.43%, 3/9/27, (1.431% fixed rate until 3/9/26; Secured Overnight Financing Rate + 0.798% thereafter)(b) | 10,000 | 10,030 | ||||||
Halliburton Co. | 100,000 | 110,159 | ||||||
Harley-Davidson, Inc. | 17,000 | 18,265 | ||||||
Hasbro, Inc. | 124,000 | 131,831 | ||||||
HCA, Inc. | 205,000 | 234,102 | ||||||
Hershey Co. (The) | 264,000 | 264,974 | ||||||
Hess Corp. | 135,000 | 143,321 | ||||||
Hewlett Packard Enterprise Co. | 72,000 | 74,686 | ||||||
2.25%, 4/1/23 | 100,000 | 102,605 | ||||||
4.65%, 10/1/24 | 125,000 | 138,666 | ||||||
1.75%, 4/1/26 | 70,000 | 71,446 | ||||||
Host Hotels & Resorts L.P. | 170,000 | 178,906 | ||||||
HP, Inc. | 212,000 | 220,069 | ||||||
Humana, Inc. | 50,000 | 51,387 | ||||||
4.50%, 4/1/25 | 83,000 | 92,654 | ||||||
Intel Corp. | 65,000 | 70,729 | ||||||
3.70%, 7/29/25 | 100,000 | 110,167 | ||||||
Intercontinental Exchange, Inc. | 260,000 | 261,196 | ||||||
International Business Machines Corp. | 487,000 | 518,397 | ||||||
Intuit, Inc. | 291,000 | 292,298 | ||||||
Invesco Finance PLC | 118,000 | 127,278 | ||||||
Jabil, Inc. | 2,000 | 2,088 | ||||||
1.70%, 4/15/26 | 100,000 | 101,060 | ||||||
Jefferies Financial Group, Inc. | 180,000 | 192,449 | ||||||
John Deere Capital Corp. | 200,000 | 209,066 | ||||||
3.45%, 3/13/25 | 200,000 | 218,918 | ||||||
JPMorgan Chase & Co. | 169,000 | 182,752 | ||||||
3.80%, 7/23/24, (3.797% fixed rate until 7/23/23; 3-month U.S. dollar London Interbank Offered Rate + 0.89% thereafter)(b) | 100,000 | 106,128 | ||||||
3.88%, 9/10/24 | 889,000 | 967,845 | ||||||
4.02%, 12/5/24, (4.023% fixed rate until 12/5/23; 3-month U.S. dollar London Interbank Offered Rate + 1.00% thereafter)(b) | 170,000 | 182,677 | ||||||
3.13%, 1/23/25 | 200,000 | 214,232 | ||||||
3.22%, 3/1/25, (3.22% fixed rate until 3/1/24; 3-month U.S. dollar London Interbank Offered Rate + 1.155% thereafter)(b) | 29,000 | 30,771 | ||||||
2.01%, 3/13/26, (2.005% fixed rate until 3/13/25; Secured Overnight Financing Rate + 1.585% thereafter)(b) | 34,000 | 35,078 | ||||||
3.30%, 4/1/26 | 23,000 | 25,119 | ||||||
2.08%, 4/22/26, (2.083% fixed rate until 4/22/25; Secured Overnight Financing Rate + 1.85% thereafter)(b) | 464,000 | 479,405 | ||||||
3.96%, 1/29/27, (3.96% fixed rate until 1/29/26; 3-month U.S. dollar London Interbank Offered Rate + 1.245% thereafter)(b) | 109,000 | 121,345 | ||||||
Juniper Networks, Inc. | 115,000 | 114,982 | ||||||
KeyBank NA | 250,000 | 273,102 | ||||||
Kilroy Realty L.P. | 249,000 | 266,577 | ||||||
Kinder Morgan Energy Partners L.P. | 47,000 | 50,420 | ||||||
Kroger Co. (The) | 50,000 | 52,843 | ||||||
Lam Research Corp. | 49,000 | 53,768 | ||||||
3.75%, 3/15/26 | 7,000 | 7,825 | ||||||
Leidos, Inc. | 133,000 | 137,969 | ||||||
Lennar Corp. | 160,000 | 166,408 | ||||||
See Notes to Financial Statements.
| 114 | WisdomTree Trust |
Table of Contents
Schedule of Investments (continued)
WisdomTree Yield Enhanced U.S. Short-Term Aggregate Bond Fund (SHAG)
August 31, 2021
| Investments | Principal Amount | Value | ||||||
Lennox International, Inc. | $ | 100,000 | $ | 100,804 | ||||
Linde, Inc. | 81,000 | 88,452 | ||||||
Lockheed Martin Corp. | 75,000 | 77,514 | ||||||
2.90%, 3/1/25 | 100,000 | 106,813 | ||||||
M&T Bank Corp. | 150,000 | 158,784 | ||||||
Marvell Technology, Inc. | 120,000 | 127,166 | ||||||
Mastercard, Inc. | 50,000 | 52,242 | ||||||
McDonald’s Corp. | 93,000 | 93,825 | ||||||
MetLife, Inc. | 124,000 | 133,076 | ||||||
Microsoft Corp. | 138,000 | 147,624 | ||||||
Morgan Stanley | 258,000 | 271,272 | ||||||
3.75%, 2/25/23 | 103,000 | 108,155 | ||||||
4.10%, 5/22/23 | 370,000 | 392,374 | ||||||
3.88%, 4/29/24, Series F | 141,000 | 152,711 | ||||||
4.00%, 7/23/25 | 334,000 | 370,586 | ||||||
3.88%, 1/27/26 | 100,000 | 111,515 | ||||||
2.19%, 4/28/26, (2.188% fixed rate until 4/28/25; Secured Overnight Financing Rate + 1.99% thereafter)(b) | 400,000 | 415,716 | ||||||
MPLX L.P. | 100,000 | 101,314 | ||||||
MUFG Americas Holdings Corp. | 50,000 | 53,389 | ||||||
National Rural Utilities Cooperative Finance Corp. | 50,000 | 53,127 | ||||||
NetApp, Inc. | 100,000 | 103,073 | ||||||
NiSource, Inc. | 260,000 | 258,320 | ||||||
Northern Trust Corp. | 100,000 | 112,759 | ||||||
Northrop Grumman Corp. | 78,000 | 82,198 | ||||||
Omega Healthcare Investors, Inc. | 27,000 | 28,684 | ||||||
Oncor Electric Delivery Co. LLC | 379,000 | 372,023 | ||||||
ONEOK, Inc. | 228,000 | 268,372 | ||||||
Oracle Corp. | 95,000 | 101,202 | ||||||
2.50%, 4/1/25 | 684,000 | 717,851 | ||||||
2.95%, 5/15/25 | 59,000 | 62,805 | ||||||
Owl Rock Capital Corp. | 30,000 | 32,375 | ||||||
Pacific Gas and Electric Co. | 170,000 | 177,810 | ||||||
3.45%, 7/1/25 | 163,000 | 168,829 | ||||||
PECO Energy Co. | 35,000 | 37,946 | ||||||
PepsiCo, Inc. | 40,000 | 42,049 | ||||||
3.50%, 7/17/25 | 40,000 | 43,888 | ||||||
Pfizer, Inc. | 167,000 | 177,180 | ||||||
3.40%, 5/15/24 | 33,000 | 35,588 | ||||||
0.80%, 5/28/25 | 126,000 | 126,257 | ||||||
Philip Morris International, Inc. | 85,000 | 85,794 | ||||||
2.88%, 5/1/24 | 50,000 | 52,926 | ||||||
1.50%, 5/1/25 | 50,000 | 51,005 | ||||||
3.38%, 8/11/25 | 50,000 | 54,395 | ||||||
Piedmont Operating Partnership L.P. | 110,000 | 114,205 | ||||||
Pinnacle West Capital Corp. | 143,000 | 144,499 | ||||||
Plains All American Pipeline L.P. | 133,000 | 141,839 | ||||||
4.65%, 10/15/25 | 7,000 | 7,804 | ||||||
PNC Financial Services Group, Inc. (The) | 100,000 | 108,218 | ||||||
2.20%, 11/1/24 | 2,000 | 2,102 | ||||||
PPG Industries, Inc. | 64,000 | 67,088 | ||||||
Precision Castparts Corp. | 15,000 | 16,279 | ||||||
Primerica, Inc. | 120,000 | 124,486 | ||||||
Private Export Funding Corp. | 50,000 | 52,673 | ||||||
1.75%, 11/15/24 | 100,000 | 103,255 | ||||||
Public Service Electric & Gas Co. | 592,000 | 592,018 | ||||||
Public Service Enterprise Group, Inc. | 10,000 | 9,900 | ||||||
PulteGroup, Inc. | 45,000 | 52,660 | ||||||
QUALCOMM, Inc. | 61,000 | 64,757 | ||||||
3.45%, 5/20/25 | 200,000 | 217,822 | ||||||
Ralph Lauren Corp. | 259,000 | 285,547 | ||||||
Realty Income Corp. | 88,000 | 95,176 | ||||||
RenaissanceRe Finance, Inc. | 50,000 | 54,269 | ||||||
Republic Services, Inc. | 54,000 | 57,380 | ||||||
Roper Technologies, Inc. | 50,000 | 51,320 | ||||||
Ross Stores, Inc. | 100,000 | 98,452 | ||||||
Sabine Pass Liquefaction LLC | 100,000 | 101,640 | ||||||
Santander Holdings USA, Inc. | 264,000 | 283,549 | ||||||
See Notes to Financial Statements.
| WisdomTree Trust | 115 |
Table of Contents
Schedule of Investments (continued)
WisdomTree Yield Enhanced U.S. Short-Term Aggregate Bond Fund (SHAG)
August 31, 2021
| Investments | Principal Amount | Value | ||||||
Schlumberger Finance Canada Ltd. | $ | 15,000 | $ | 15,226 | ||||
Sempra Energy | 56,000 | 59,897 | ||||||
Simon Property Group L.P. | 290,000 | 300,530 | ||||||
3.50%, 9/1/25 | 15,000 | 16,370 | ||||||
3.30%, 1/15/26 | 64,000 | 69,445 | ||||||
Southern California Edison Co. | 49,000 | 51,622 | ||||||
3.70%, 8/1/25, Series E | 148,000 | 162,076 | ||||||
Southern Power Co. | 84,000 | 82,897 | ||||||
Southwest Airlines Co. | 69,000 | 70,684 | ||||||
4.75%, 5/4/23 | 50,000 | 53,418 | ||||||
5.25%, 5/4/25 | 34,000 | 38,557 | ||||||
Southwestern Electric Power Co. | 100,000 | 101,653 | ||||||
Starbucks Corp. | 30,000 | 33,154 | ||||||
State Street Corp. | 94,000 | 102,152 | ||||||
3.55%, 8/18/25 | 218,000 | 241,016 | ||||||
2.35%, 11/1/25, (2.354% fixed rate until 11/1/24; Secured Overnight Financing Rate + 0.94% thereafter)(b) | 361,000 | 379,559 | ||||||
Stryker Corp. | 10,000 | 10,992 | ||||||
Synchrony Financial | 150,000 | 153,126 | ||||||
Synovus Financial Corp. | 50,000 | 51,230 | ||||||
Sysco Corp. | 100,000 | 110,025 | ||||||
Timken Co. (The) | 100,000 | 107,269 | ||||||
Toyota Motor Credit Corp. | 50,000 | 53,667 | ||||||
0.80%, 10/16/25 | 250,000 | 248,487 | ||||||
Trane Technologies Global Holding Co., Ltd. | 114,000 | 121,490 | ||||||
Transcontinental Gas Pipe Line Co. LLC | 100,000 | 125,941 | ||||||
Trimble, Inc. | 48,000 | 53,292 | ||||||
Truist Bank | ||||||||
3.69%, 8/2/24, (3.689% fixed rate until 8/2/23; 3-month U.S. dollar London Interbank Offered Rate + 0.735% thereafter)(b) | 83,000 | 88,285 | ||||||
1.50%, 3/10/25 | 250,000 | 255,992 | ||||||
Truist Financial Corp. | 113,000 | 121,204 | ||||||
2.50%, 8/1/24 | 600,000 | 632,454 | ||||||
2.85%, 10/26/24 | 32,000 | 34,180 | ||||||
4.00%, 5/1/25 | 355,000 | 393,805 | ||||||
1.27%, 3/2/27, (1.267% fixed rate until 3/2/26; Secured Overnight Financing Rate + 0.609% thereafter)(b) | 20,000 | 20,069 | ||||||
Tucson Electric Power Co. | 50,000 | 53,480 | ||||||
TWDC Enterprises 18 Corp. | 618,000 | 672,038 | ||||||
U.S. Bancorp | 100,000 | 102,364 | ||||||
United Parcel Service, Inc. | 250,000 | 261,680 | ||||||
3.90%, 4/1/25 | 100,000 | 110,373 | ||||||
UnitedHealth Group, Inc. | 100,000 | 105,389 | ||||||
UPMC | 300,000 | 326,436 | ||||||
US Bancorp | 50,000 | 52,630 | ||||||
VEREIT Operating Partnership L.P. | 100,000 | 113,370 | ||||||
Verizon Communications, Inc. | 262,000 | 283,916 | ||||||
0.85%, 11/20/25 | 227,000 | 225,336 | ||||||
ViacomCBS, Inc. | 105,000 | 113,078 | ||||||
Walt Disney Co. (The) | 409,000 | 451,663 | ||||||
Waste Management, Inc. | 87,000 | 89,724 | ||||||
Wells Fargo & Co. | 33,000 | 35,932 | ||||||
3.00%, 2/19/25 | 824,000 | 879,241 | ||||||
3.55%, 9/29/25 | 92,000 | 100,978 | ||||||
2.41%, 10/30/25, (2.406% fixed rate until 10/30/24; Secured Overnight Financing Rate + 1.087% thereafter)(b) | 416,000 | 434,841 | ||||||
2.16%, 2/11/26, (2.164% fixed rate until 2/11/25; 3-month U.S. dollar London Interbank Offered Rate + 0.75% thereafter)(b) | 322,000 | 334,320 | ||||||
3.00%, 4/22/26 | 73,000 | 79,092 | ||||||
2.19%, 4/30/26, (2.188% fixed rate until 4/30/25; Secured Overnight Financing Rate + 2.00% thereafter)(b) | 100,000 | 103,908 | ||||||
Western Union Co. (The) | 100,000 | 99,444 | ||||||
Willis North America, Inc. | 155,000 | 166,041 | ||||||
Wisconsin Electric Power Co. | 15,000 | 15,672 | ||||||
WW Grainger, Inc. | 100,000 | 103,374 | ||||||
Xilinx, Inc. | 84,000 | 88,753 | ||||||
Zoetis, Inc. | 100,000 | 113,423 | ||||||
TOTAL U.S. CORPORATE BONDS (Cost: $52,492,347) |
| 52,952,686 | ||||||
See Notes to Financial Statements.
| 116 | WisdomTree Trust |
Table of Contents
Schedule of Investments (continued)
WisdomTree Yield Enhanced U.S. Short-Term Aggregate Bond Fund (SHAG)
August 31, 2021
| Investments | Principal Amount | Value | ||||||
| FOREIGN CORPORATE BONDS – 5.8% |
| |||||||
| Canada – 1.3% |
| |||||||
Bank of Montreal | $ | 150,000 | $ | 160,050 | ||||
1.85%, 5/1/25 | 251,000 | 259,529 | ||||||
4.34%, 10/5/28, (4.338% fixed rate until 10/5/23; 5-year U.S. dollar Swap Rate + 1.28% thereafter)(b) | 90,000 | 96,278 | ||||||
Bank of Nova Scotia (The) | 206,000 | 215,336 | ||||||
4.50%, 12/16/25 | 58,000 | 65,755 | ||||||
1.05%, 3/2/26 | 40,000 | 39,810 | ||||||
Brookfield Asset Management, Inc. | 50,000 | 54,743 | ||||||
Brookfield Finance, Inc. | 150,000 | 161,869 | ||||||
Canadian Imperial Bank of Commerce | 220,000 | 233,719 | ||||||
2.25%, 1/28/25 | 50,000 | 52,258 | ||||||
Cenovus Energy, Inc. | 34,000 | 38,610 | ||||||
Enbridge, Inc. | 42,000 | 44,024 | ||||||
Magna International, Inc. | 50,000 | 55,985 | ||||||
Rogers Communications, Inc. | 100,000 | 109,817 | ||||||
Royal Bank of Canada | 120,000 | 125,884 | ||||||
1.15%, 6/10/25 | 527,000 | 530,605 | ||||||
Toronto-Dominion Bank (The) | 343,000 | 346,255 | ||||||
TransCanada PipeLines Ltd. | 30,000 | 34,440 | ||||||
|
| |||||||
| Total Canada |
| 2,624,967 | ||||||
| China – 0.4% |
| |||||||
Alibaba Group Holding Ltd. | 378,000 | 407,783 | ||||||
Baidu, Inc. | 200,000 | 211,886 | ||||||
4.13%, 6/30/25 | 90,000 | 99,289 | ||||||
Tencent Music Entertainment Group | 110,000 | 108,713 | ||||||
|
| |||||||
| Total China |
| 827,671 | ||||||
| Colombia – 0.2% |
| |||||||
Ecopetrol S.A. | 276,000 | 297,790 | ||||||
| France – 0.1% |
| |||||||
BPCE S.A. | 170,000 | 185,326 | ||||||
| Germany – 0.1% |
| |||||||
Deutsche Bank AG | ||||||||
2.22%, 9/18/24, (2.222% fixed rate until 9/18/23; Secured Overnight Financing Rate + 2.159% thereafter)(b) | 140,000 | 143,695 | ||||||
| Ireland – 0.2% |
| |||||||
AerCap Ireland Capital DAC | 130,000 | 138,809 | ||||||
6.50%, 7/15/25 | 150,000 | 175,311 | ||||||
|
| |||||||
| Total Ireland |
| 314,120 | ||||||
| Japan – 0.8% |
| |||||||
Mitsubishi UFJ Financial Group, Inc. | 536,000 | 557,660 | ||||||
1.41%, 7/17/25 | 50,000 | 50,625 | ||||||
Mizuho Financial Group, Inc. | 190,000 | 192,552 | ||||||
ORIX Corp. | 150,000 | 161,563 | ||||||
Sumitomo Mitsui Financial Group, Inc. | 290,000 | 290,867 | ||||||
2.70%, 7/16/24 | 315,000 | 332,076 | ||||||
Toyota Motor Corp. | 73,000 | 73,986 | ||||||
|
| |||||||
| Total Japan |
| 1,659,329 | ||||||
| Netherlands – 0.1% |
| |||||||
Cooperatieve Rabobank UA | 100,000 | 108,815 | ||||||
ING Groep N.V. | 140,000 | 150,500 | ||||||
|
| |||||||
| Total Netherlands |
| 259,315 | ||||||
| Peru – 0.0% |
| |||||||
Southern Copper Corp. | 91,000 | 94,184 | ||||||
| Spain – 0.3% |
| |||||||
Banco Bilbao Vizcaya Argentaria S.A. | 250,000 | 248,855 | ||||||
Banco Santander S.A. | 200,000 | 211,374 | ||||||
2.75%, 5/28/25 | 200,000 | 210,936 | ||||||
|
| |||||||
| Total Spain |
| 671,165 | ||||||
| Switzerland – 0.5% |
| |||||||
Credit Suisse Group AG | 560,000 | 590,777 | ||||||
3.75%, 3/26/25 | 250,000 | 271,320 | ||||||
Syngenta Finance N.V. | 120,000 | 121,570 | ||||||
|
| |||||||
| Total Switzerland |
| 983,667 | ||||||
| United Kingdom – 1.8% |
| |||||||
Barclays PLC | ||||||||
1.01%, 12/10/24, (1.007% fixed rate until 12/10/23; 1-year Constant Maturity Treasury Rate + 0.80% thereafter)(b) | 360,000 | 361,764 | ||||||
BAT Capital Corp. | 55,000 | 58,387 | ||||||
BAT International Finance PLC | 100,000 | 100,690 | ||||||
BP Capital Markets PLC | 90,000 | 97,037 | ||||||
Diageo Capital PLC | 200,000 | 203,338 | ||||||
See Notes to Financial Statements.
| WisdomTree Trust | 117 |
Table of Contents
Schedule of Investments (continued)
WisdomTree Yield Enhanced U.S. Short-Term Aggregate Bond Fund (SHAG)
August 31, 2021
| Investments | Principal Amount | Value | ||||||
GlaxoSmithKline Capital, Inc. | $ | 127,000 | $ | 131,935 | ||||
HSBC Holdings PLC | 524,000 | 565,296 | ||||||
1.65%, 4/18/26, (1.645% fixed rate until 4/18/25; Secured Overnight Financing Rate + 1.538% thereafter)(b) | 50,000 | 50,633 | ||||||
2.10%, 6/4/26, (2.099% fixed rate until 6/4/25; Secured Overnight Financing Rate + 1.929% thereafter)(b) | 500,000 | 514,245 | ||||||
Lloyds Bank PLC | 200,000 | 217,376 | ||||||
Lloyds Banking Group PLC | ||||||||
2.91%, 11/7/23, (2.907% fixed rate until 11/7/22; 3-month U.S. dollar London Interbank Offered Rate + 0.81% thereafter)(b) | 63,000 | 64,758 | ||||||
3.90%, 3/12/24 | 50,000 | 53,998 | ||||||
Natwest Group PLC | 550,000 | 585,277 | ||||||
RELX Capital, Inc. | 50,000 | 52,221 | ||||||
Reynolds American, Inc. | 25,000 | 27,726 | ||||||
Santander UK Group Holdings PLC | ||||||||
4.80%, 11/15/24, (4.796% fixed rate until 11/15/23; 3-month U.S. dollar London Interbank Offered Rate + 1.57% thereafter)(b) | 220,000 | 239,248 | ||||||
1.09%, 3/15/25, (1.089% fixed rate until 3/15/24; Secured Overnight Financing Rate + 0.787% thereafter)(b) | 41,000 | 41,156 | ||||||
Unilever Capital Corp. | 125,000 | 133,374 | ||||||
|
| |||||||
| Total United Kingdom |
| 3,498,459 | ||||||
TOTAL FOREIGN CORPORATE BONDS (Cost: $11,511,163) |
| 11,559,688 | ||||||
| FOREIGN GOVERNMENT AGENCIES – 0.4% |
| |||||||
| Canada – 0.1% |
| |||||||
Province of Manitoba Canada | 184,000 | 196,482 | ||||||
| Japan – 0.3% |
| |||||||
Japan Bank for International Cooperation | 430,000 | 445,042 | ||||||
2.13%, 2/10/25, Series DTC | 140,000 | 146,815 | ||||||
|
| |||||||
| Total Japan |
| 591,857 | ||||||
TOTAL FOREIGN GOVERNMENT AGENCIES (Cost: $788,588) |
| 788,339 | ||||||
| FOREIGN GOVERNMENT OBLIGATIONS – 0.5% |
| |||||||
| Chile – 0.1% |
| |||||||
Chile Government International Bond | 110,000 | 117,985 | ||||||
| Colombia – 0.1% |
| |||||||
Colombia Government International Bond | 100,000 | 101,932 | ||||||
4.00%, 2/26/24 | 78,000 | 82,151 | ||||||
|
| |||||||
| Total Colombia |
| 184,083 | ||||||
| Indonesia – 0.1% |
| |||||||
Indonesia Government International Bond | 150,000 | 155,067 | ||||||
| Italy – 0.1% |
| |||||||
Republic of Italy Government International Bond | 280,000 | 315,431 | ||||||
| Mexico – 0.0% |
| |||||||
Mexico Government International Bond | 18,000 | 19,388 | ||||||
| Uruguay – 0.1% |
| |||||||
Uruguay Government International Bond | 130,000 | 137,045 | ||||||
TOTAL FOREIGN GOVERNMENT OBLIGATIONS (Cost: $927,998) |
| 928,999 | ||||||
| SUPRANATIONAL BONDS – 0.5% |
| |||||||
Corporacion Andina de Fomento | 96,000 | 102,178 | ||||||
1.63%, 9/23/25 | 200,000 | 202,936 | ||||||
European Investment Bank | 750,000 | 749,992 | ||||||
TOTAL SUPRANATIONAL BONDS (Cost: $1,056,515) |
| 1,055,106 | ||||||
| COMMERCIAL MORTGAGE-BACKED SECURITIES – 8.0% |
| |||||||
| United States – 8.0% |
| |||||||
Benchmark Mortgage Trust | ||||||||
3.75%, 3/15/52, Series 2019-B9, Class A4 | 850,000 | 960,611 | ||||||
2.03%, 10/15/53, Series 2020-B20, Class A5 | 1,128,000 | 1,142,173 | ||||||
2.58%, 4/15/54, Series 2021-B25, Class A5 | 2,200,000 | 2,321,109 | ||||||
Commercial Mortgage Trust | ||||||||
3.29%, 12/10/44, Series 2012-LC4, Class A4 | 349,658 | 350,601 | ||||||
3.42%, 8/10/47, Series 2014-UBS4, Class A4 | 900,000 | 950,193 | ||||||
4.73%, 10/10/47, Series 2014-LC17, Class C^(b) | 400,000 | 418,342 | ||||||
2.85%, 5/10/48, Series 2015-CR23, Class A2 | 27,231 | 27,554 | ||||||
4.04%, 2/10/49, Series 2016-CR28, Class D^(b) | 820,000 | 856,512 | ||||||
3.04%, 11/10/49, Series 2016-CD2, Class A2 | 39,980 | 40,120 | ||||||
CSAIL Commercial Mortgage Trust | ||||||||
3.77%, 4/15/51, Series 2018-CX11, Class A4 | 2,000,000 | 2,220,819 | ||||||
Deutsche Bank Commercial Mortgage Trust | 28,438 | 28,623 | ||||||
Federal Home Loan Mortgage Corp. Multifamily Structured Pass Through Certificates | 242,929 | 244,134 | ||||||
GS Mortgage Securities Trust | ||||||||
5.49%, 11/10/46, Series 2013-GC16, Class C^(b) | 200,000 | 207,754 | ||||||
See Notes to Financial Statements.
| 118 | WisdomTree Trust |
Table of Contents
Schedule of Investments (concluded)
WisdomTree Yield Enhanced U.S. Short-Term Aggregate Bond Fund (SHAG)
August 31, 2021
| Investments | Principal Amount | Value | ||||||
JP Morgan Chase Commercial Mortgage Securities Trust | ||||||||
4.17%, 12/15/46, Series 2013-C16, Class A4 | $ | 1,075,000 | $ | 1,149,829 | ||||
JPMBB Commercial Mortgage Securities Trust | ||||||||
3.61%, 5/15/48, Series 2015-C29, Class A4 | 2,100,000 | 2,280,549 | ||||||
Morgan Stanley Bank of America Merrill Lynch Trust | ||||||||
3.18%, 8/15/45, Series 2012-C5, Class A4 | 505,700 | 510,503 | ||||||
2.74%, 4/15/48, Series 2015-C22, Class A2 | 316,186 | 316,186 | ||||||
Morgan Stanley Capital I | ||||||||
4.36%, 12/15/50, Series 2017-HR2, Class C^(b) | 160,000 | 179,766 | ||||||
Wells Fargo Commercial Mortgage Trust | ||||||||
2.60%, 6/15/49, Series 2016-C34, Class A2 | 49,515 | 50,277 | ||||||
2.63%, 4/15/54, Series 2021-C59, Class A5 | 376,000 | 398,394 | ||||||
3.12%, 1/15/60, Series 2017-RC1, Class A2 | 435,517 | 438,624 | ||||||
WFRBS Commercial Mortgage Trust | ||||||||
3.50%, 8/15/47, Series 2014-C21, Class D(c) | 627,000 | 549,611 | ||||||
3.98%, 11/15/47, Series 2014-C25, Class AS | 395,000 | 429,187 | ||||||
TOTAL COMMERCIAL MORTGAGE-BACKED SECURITIES (Cost: $15,923,482) |
| 16,071,471 | ||||||
| ASSET-BACKED SECURITIES – 1.7% |
| |||||||
| United States – 1.7% |
| |||||||
Ally Auto Receivables Trust | 169,537 | 171,166 | ||||||
Capital One Prime Auto Receivables Trust | 450,000 | 460,564 | ||||||
CarMax Auto Owner Trust | 118,000 | 121,878 | ||||||
Chase Issuance Trust | 400,000 | 407,113 | ||||||
Citibank Credit Card Issuance Trust | 430,000 | 446,288 | ||||||
Discover Card Execution Note Trust | 285,000 | 290,449 | ||||||
Ford Credit Auto Owner Trust | 100,000 | 103,035 | ||||||
GM Financial Consumer Automobile Receivables Trust | 1,100,000 | 1,127,854 | ||||||
Honda Auto Receivables Owner Trust | 200,000 | 203,837 | ||||||
Synchrony Card Funding LLC | 100,000 | 101,476 | ||||||
TOTAL ASSET-BACKED SECURITIES (Cost: $3,424,801) |
| 3,433,660 | ||||||
TOTAL INVESTMENTS IN SECURITIES – 138.3% (Cost: $275,408,080) |
| 276,377,572 | ||||||
Other Assets less Liabilities – (38.3)% |
| (76,575,587 | ) | |||||
|
| |||||||
| NET ASSETS – 100.0% |
| $ | 199,801,985 | |||||
| * | Interest rate shown reflects the yield to maturity at the time of purchase. |
| ^ | Variable coupon rate based on weighted average interest rate of underlying mortgage. |
| (a) | To-be-announced (“TBA”) security (See Note 2). TBA securities are non-income producing. |
| (b) | Rate shown reflects the accrual rate as of August 31, 2021 on securities with variable or step rates. |
| (c) | This security is exempt from registration under rule 144A of the Securities Act of 1933. This security may be sold in transactions that are exempt from registration, normally to qualified institutional buyers. |
| FAIR VALUATION SUMMARY |
The following is a summary of the fair valuations according to the inputs used as of August 31, 2021 in valuing the Fund’s investments (See Note 2 – Fair Value Measurement):
| Quoted Prices in Active Markets (Level 1) | Other Significant Observable Inputs (Level 2) | Significant Unobservable Inputs (Level 3) | Total | |||||||||||||
Assets: |
| |||||||||||||||
Investments in Securities | ||||||||||||||||
U.S. Government Agencies | $ | — | $ | 44,726,527 | $ | — | $ | 44,726,527 | ||||||||
U.S. Government Obligations | — | 144,861,096 | — | 144,861,096 | ||||||||||||
U.S. Corporate Bonds | — | 52,952,686 | — | 52,952,686 | ||||||||||||
Foreign Corporate Bonds | — | 11,559,688 | — | 11,559,688 | ||||||||||||
Foreign Government Agencies | — | 788,339 | — | 788,339 | ||||||||||||
Foreign Government Obligations | — | 928,999 | — | 928,999 | ||||||||||||
Supranational Bonds | — | 1,055,106 | — | 1,055,106 | ||||||||||||
Commercial Mortgage-Backed Securities | — | 16,071,471 | — | 16,071,471 | ||||||||||||
Asset-Backed Securities | — | 3,433,660 | — | 3,433,660 | ||||||||||||
Total Investments in Securities | $ | — | $ | 276,377,572 | $ | — | $ | 276,377,572 | ||||||||
See Notes to Financial Statements.
| WisdomTree Trust | 119 |
Table of Contents
Schedule of Investments
WisdomTree Alternative Income Fund (HYIN)
August 31, 2021
| Investments | Shares | Value | ||||||
| COMMON STOCKS – 70.8% |
| |||||||
| United States – 70.8% |
| |||||||
| Capital Markets – 23.0% |
| |||||||
Ares Capital Corp. | 15,489 | $ | 308,231 | |||||
FS KKR Capital Corp. | 13,858 | 319,981 | ||||||
Goldman Sachs BDC, Inc. | 14,818 | 282,431 | ||||||
Golub Capital BDC, Inc. | 19,192 | 301,507 | ||||||
Hercules Capital, Inc. | 17,252 | 291,559 | ||||||
Main Street Capital Corp. | 7,119 | 296,079 | ||||||
Owl Rock Capital Corp. | 20,468 | 298,833 | ||||||
Prospect Capital Corp. | 34,095 | 270,714 | ||||||
|
| |||||||
| Total Capital Markets |
| 2,369,335 | ||||||
| Mortgage Real Estate Investment Trusts (REITs) – 47.8% |
| |||||||
AGNC Investment Corp. | 17,494 | 285,327 | ||||||
Annaly Capital Management, Inc. | 32,531 | 282,694 | ||||||
Apollo Commercial Real Estate Finance, Inc. | 18,165 | 282,466 | ||||||
Arbor Realty Trust, Inc. | 16,628 | 303,960 | ||||||
Blackstone Mortgage Trust, Inc., Class A | 9,214 | 302,311 | ||||||
Broadmark Realty Capital, Inc. | 27,677 | 290,885 | ||||||
Chimera Investment Corp. | 19,354 | 296,503 | ||||||
Great Ajax Corp. | 23,422 | 330,953 | ||||||
Invesco Mortgage Capital, Inc. | 73,813 | 230,297 | ||||||
KKR Real Estate Finance Trust, Inc. | 13,161 | 280,724 | ||||||
Ladder Capital Corp., Class A | 24,990 | 285,136 | ||||||
MFA Financial, Inc. | 62,606 | 300,509 | ||||||
New Residential Investment Corp. | 27,936 | 305,061 | ||||||
New York Mortgage Trust, Inc. | 63,404 | 280,246 | ||||||
PennyMac Mortgage Investment Trust | 14,193 | 275,486 | ||||||
Redwood Trust, Inc. | 24,200 | 301,774 | ||||||
Starwood Property Trust, Inc. | 11,398 | 294,068 | ||||||
|
| |||||||
| Total Mortgage Real Estate Investment Trusts (REITs) |
| 4,928,400 | ||||||
TOTAL COMMON STOCKS (Cost: $7,266,331) |
| 7,297,735 | ||||||
| CLOSED-END MUTUAL FUNDS – 29.1% |
| |||||||
| United States – 29.1% |
| |||||||
BlackRock Corporate High Yield Fund, Inc. | 24,393 | 307,352 | ||||||
Eaton Vance Limited Duration Income Fund | 22,727 | 302,951 | ||||||
Highland Income Fund | 27,549 | 302,488 | ||||||
Invesco Dynamic Credit Opportunities Fund | 25,590 | 299,403 | ||||||
Nuveen Credit Strategies Income Fund | 44,975 | 292,338 | ||||||
PIMCO Corporate & Income Opportunity Fund | 15,121 | 309,224 | ||||||
PIMCO Dynamic Credit and Mortgage Income Fund | 13,416 | 301,323 | ||||||
PIMCO Dynamic Income Fund | 10,413 | 296,562 | ||||||
Saba Capital Income & Opportunities Fund | 63,689 | 291,696 | ||||||
Western Asset High Income Opportunity Fund, Inc. | 57,319 | 300,925 | ||||||
TOTAL CLOSED-END MUTUAL FUNDS (Cost: $2,984,097)) |
| 3,004,262 | ||||||
TOTAL INVESTMENTS IN SECURITIES – 99.9% (Cost: $10,250,428)) |
| 10,301,997 | ||||||
Other Assets less Liabilities – 0.1% |
| 13,051 | ||||||
|
| |||||||
| NET ASSETS – 100.0% |
| $ | 10,315,048 | |||||
| FAIR VALUATION SUMMARY |
The following is a summary of the fair valuations according to the inputs used as of August 31, 2021 in valuing the Fund’s investments (See Note 2 – Fair Value Measurement):
| Quoted Prices in Active Markets (Level 1) | Other Significant Observable Inputs (Level 2) | Significant Unobservable Inputs (Level 3) | Total | |||||||||||||
Assets: | ||||||||||||||||
Investments in Securities | ||||||||||||||||
Common Stocks | $ | 7,297,735 | $ | — | $ | — | $ | 7,297,735 | ||||||||
Closed-End Mutual Funds | 3,004,262 | — | — | 3,004,262 | ||||||||||||
Total Investments in Securities | $ | 10,301,997 | $ | — | $ | — | $ | 10,301,997 | ||||||||
See Notes to Financial Statements.
| 120 | WisdomTree Trust |
Table of Contents
Schedule of Investments
WisdomTree CBOE S&P 500 PutWrite Strategy Fund (PUTW)
August 31, 2021
| Investments | Principal Amount | Value | ||||||
| U.S. GOVERNMENT OBLIGATIONS – 91.3% |
| |||||||
| U.S. Treasury Bills – 91.3% |
| |||||||
0.04%, 11/18/21* | $ | 43,000,000 | $ | 42,996,040 | ||||
0.05%, 11/26/21* | 15,400,000 | 15,398,369 | ||||||
TOTAL U.S. GOVERNMENT OBLIGATIONS (Cost: $58,394,261) |
| 58,394,409 | ||||||
| Investments | Shares | Value | ||||||
| EXCHANGE-TRADED FUND – 4.5% |
| |||||||
| United States – 4.5% |
| |||||||
| WisdomTree Floating Rate Treasury Fund(a) (Cost: $2,865,100) | 114,375 | $ | 2,870,813 | |||||
TOTAL INVESTMENTS IN SECURITIES – 95.8% (Cost: $61,259,361) |
| 61,265,222 | ||||||
Other Assets less Liabilities – 4.2% |
| 2,674,859 | ||||||
|
| |||||||
| NET ASSETS – 100.0% |
| $ | 63,940,081 | |||||
| * | Interest rate shown reflects the yield to maturity at the time of purchase. |
| (a) | Affiliated holding. See “Investment in Affiliates” supplementary table included in this Schedule of Investments for additional information. |
| INVESTMENT IN AFFILIATES | ||||||||||||||
Affiliated holdings are investments in entities in which the Fund owns 5% or more of the outstanding voting securities or are investments in entities which are under common ownership or control. Investments in affiliates during the fiscal year ended August 31, 2021 were as follows:
| Affiliate | Value at 8/31/2020 | Purchases/ Additions | Sales/ Reductions | Realized Gain/ (Loss) | Change in Unrealized Appreciation/ Depreciation | Value at 8/31/2021 | Dividend Income | Capital Gain Distributions | ||||||||||||||||||||||||
WisdomTree Floating Rate Treasury Fund | $ | 5,271,368 | $ | 774,767 | $ | 3,172,856 | $ | 5,467 | $ | (7,933 | ) | $ | 2,870,813 | $ | 1,157 | $ | 999 | |||||||||||||||
| FINANCIAL DERIVATIVE INSTRUMENTS | ||||||||||||||||||||||||||||
| WRITTEN PUT OPTION CONTRACTS (EXCHANGE-TRADED) | ||||||||||||||||||||||||||||
| Description | Number of Contracts | Notional Amount1 | Strike Price | Expiration Date | Premiums Paid/ (Received) | Unrealized Appreciation | Value | |||||||||||||||||||||
S&P 500 Index | (145 | ) | $ | (64,162,500 | ) | $ | 4,425 | 9/17/2021 | $ | (970,820 | ) | $ | 705,470 | $ | (265,350 | ) | ||||||||||||
| 1 | Notional amount is derived by multiplying the number of contracts, the contract size (typically 100), and the contract strike price. |
| FAIR VALUATION SUMMARY | ||||||||||||||
The following is a summary of the fair valuations according to the inputs used as of August 31, 2021 in valuing the Fund’s investments (See Note 2 — Fair Value Measurement):
| Quoted Prices in Active Markets (Level 1) | Other Significant Observable Inputs (Level 2) | Significant Unobservable Inputs (Level 3) | Total | |||||||||||||
Assets: | ||||||||||||||||
Investments in Securities | ||||||||||||||||
U.S. Government Obligations | $ | — | $ | 58,394,409 | $ | — | $ | 58,394,409 | ||||||||
Exchange-Traded Fund | 2,870,813 | — | — | 2,870,813 | ||||||||||||
Total Investments in Securities | $ | 2,870,813 | $ | 58,394,409 | $ | — | $ | 61,265,222 | ||||||||
Financial Derivative Instruments | ||||||||||||||||
Written Options1 | $ | — | $ | (265,350 | ) | $ | — | $ | (265,350 | ) | ||||||
Total – Net | $ | 2,870,813 | $ | 58,129,059 | $ | — | $ | 60,999,872 | ||||||||
| 1 | Amount shown represents the market value of the financial instrument. |
See Notes to Financial Statements.
| WisdomTree Trust | 121 |
Table of Contents
Schedule of Investments
WisdomTree Enhanced Commodity Strategy Fund (GCC) (consolidated)
August 31, 2021
| Investments | Principal Amount | Value | ||||||
| U.S. GOVERNMENT OBLIGATIONS – 80.4% |
| |||||||
| U.S. Treasury Bills – 80.4% |
| |||||||
0.03%, 9/16/21* | $ | 145,000,000 | $ | 144,998,489 | ||||
0.01%, 12/2/21*(a) | 246,000 | 245,976 | ||||||
0.02%, 4/21/22*(a) | 1,130,000 | 1,129,691 | ||||||
0.06%, 5/19/22*(a) | 9,213,000 | 9,209,673 | ||||||
TOTAL U.S. GOVERNMENT OBLIGATIONS (Cost: $155,582,891) |
| 155,583,829 | ||||||
Shares | Value | |||||||
| EXCHANGE-TRADED FUND – 4.2% |
| |||||||
| United States – 4.2% |
| |||||||
WisdomTree Floating Rate Treasury Fund(b) | ||||||||
| (Cost: $8,146,461) | 324,373 | 8,141,762 | ||||||
TOTAL INVESTMENTS IN SECURITIES – 84.6% (Cost: $163,729,352) | 163,725,591 | |||||||
Other Assets less Liabilities – 15.4% |
| 29,826,072 | ||||||
|
| |||||||
| NET ASSETS – 100.0% |
| $ | 193,551,663 | |||||
| * | Interest rate shown reflects the yield to maturity at the time of purchase. |
| (a) | All or a portion of this security is held by the broker as collateral for open futures contracts. The securities collateral posted was comprised entirely of U.S. Treasury securities having a market value of $10,585,340 as of August 31, 2021. |
| (b) | Affiliated holding. See “Investment in Affiliates” supplementary table included in this Schedule of Investments for additional information. |
| INVESTMENT IN AFFILIATES |
Affiliated holdings are investments in entities in which the Fund owns 5% or more of the outstanding voting securities or are investments in entities which are under common ownership or control. Investments in affiliates during the fiscal period ended August 31, 2021 were as follows:
| Affiliate | Value at 12/18/2020 | Purchases/ Additions | Sales/ Reductions | Realized Gain/ (Loss) | Change in Unrealized Appreciation/ Depreciation | Value at 8/31/2021 | Dividend Income | Capital Gain Distributions | ||||||||||||||||||||||||
WisdomTree Floating Rate Treasury Fund | $ | — | $ | 9,691,138 | $ | 1,543,289 | $ | (1,388 | ) | $ | (4,699 | ) | $ | 8,141,762 | $ | 162 | $ | — | ||||||||||||||
See Notes to Financial Statements.
| 122 | WisdomTree Trust |
Table of Contents
Schedule of Investments (continued)
WisdomTree Enhanced Commodity Strategy Fund (GCC) (consolidated)
August 31, 2021
| FINANCIAL DERIVATIVE INSTRUMENTS | ||||||||||||||||
| FUTURES CONTRACTS (EXCHANGE-TRADED) | ||||||||||||||||
| Short Exposure | Contracts | Expiration Date | Notional Value | Unrealized Appreciation/ (Depreciation) | ||||||||||||
Aluminum | 197 | 12/15/21 | $ | (13,379,994 | ) | $ | (1,388,850 | ) | ||||||||
Aluminum | 23 | 6/13/22 | (1,551,350 | ) | (112,344 | ) | ||||||||||
Copper | 75 | 12/15/21 | (17,852,344 | ) | 729,375 | |||||||||||
Copper | 9 | 12/19/22 | (2,128,781 | ) | (48,138 | ) | ||||||||||
Nickel | 10 | 12/13/21 | (1,172,760 | ) | (61,722 | ) | ||||||||||
Zinc | 3 | 10/18/21 | (225,187 | ) | (3,106 | ) | ||||||||||
Zinc | 101 | 12/13/21 | (7,589,519 | ) | (57,295 | ) | ||||||||||
| $ | (43,899,935 | ) | $ | (942,080 | ) | |||||||||||
| Long Exposure | ||||||||||||||||
Aluminum | 197 | 12/15/21 | $ | 13,379,994 | $ | 2,782,295 | ||||||||||
Aluminum | 209 | 6/13/22 | 14,097,050 | 1,333,588 | ||||||||||||
Brent Crude | 229 | 10/29/21 | 16,259,000 | 1,014,794 | ||||||||||||
Cocoa | 119 | 3/16/22 | 3,049,970 | 78,799 | ||||||||||||
Coffee “C” | 68 | 3/21/22 | 5,061,750 | 1,373,118 | ||||||||||||
Copper | 75 | 12/15/21 | 17,852,343 | 1,942,969 | ||||||||||||
Copper | 80 | 12/19/22 | 18,922,500 | (830,581 | ) | |||||||||||
Corn | 420 | 12/14/22 | 10,652,250 | (154,566 | ) | |||||||||||
Cotton No. 2 | 38 | 3/09/22 | 1,743,630 | 115,994 | ||||||||||||
Feeder Cattle | 16 | 11/18/21 | 1,357,200 | 18,688 | ||||||||||||
Gasoline RBOB | 59 | 9/30/21 | 5,307,628 | 767,736 | ||||||||||||
Gold 100 Ounce | 155 | 4/27/22 | 28,242,550 | 209,720 | ||||||||||||
HRW Wheat | 82 | 7/14/22 | 2,913,050 | 6,863 | ||||||||||||
Lean Hogs | 98 | 10/14/21 | 3,480,960 | (116,782 | ) | |||||||||||
Live Cattle | 80 | 2/28/22 | 4,408,000 | 95,000 | ||||||||||||
Low Sulphur Gasoil | 76 | 12/10/21 | 4,523,900 | 811,881 | ||||||||||||
Nickel | 66 | 12/13/21 | 7,740,216 | 646,223 | ||||||||||||
NY Harbor ULSD | 53 | 5/31/22 | 4,566,194 | 133,136 | ||||||||||||
Platinum | 64 | 10/27/21 | 3,245,120 | (506,307 | ) | |||||||||||
Silver | 100 | 12/29/21 | 12,003,000 | (1,526,841 | ) | |||||||||||
Soybean Meal | 140 | 12/14/21 | 4,838,400 | (622,060 | ) | |||||||||||
Soybean Oil | 117 | 12/14/21 | 4,124,250 | (454,218 | ) | |||||||||||
Soybeans | 154 | 11/12/21 | 9,952,250 | 700,733 | ||||||||||||
Sugar No.11 | 222 | 4/29/22 | 4,928,045 | 732,411 | ||||||||||||
Wheat | 106 | 7/14/22 | 3,839,850 | 14,563 | ||||||||||||
WTI Crude Oil | 239 | 11/19/21 | 16,237,660 | 2,026,193 | ||||||||||||
Zinc | 96 | 10/18/21 | 7,206,000 | 43,626 | ||||||||||||
Zinc | 101 | 12/13/21 | 7,589,519 | 553,881 | ||||||||||||
| $ | 237,522,279 | $ | 11,190,856 | |||||||||||||
Total – Net |
| $ | 193,622,344 | $ | 10,248,776 | |||||||||||
See Notes to Financial Statements.
| WisdomTree Trust | 123 |
Table of Contents
Schedule of Investments (concluded)
WisdomTree Enhanced Commodity Strategy Fund (GCC) (consolidated)
August 31, 2021
| FAIR VALUATION SUMMARY | ||||||||||||||
The following is a summary of the fair valuations according to the inputs used as of August 31, 2021 in valuing the Fund’s investments (See Note 2 — Fair Value Measurement):
Quoted Markets | Other Significant Observable Inputs (Level 2) | Significant Unobservable Inputs (Level 3) | Total | |||||||||||||
Assets: |
| |||||||||||||||
Investments in Securities | ||||||||||||||||
U.S. Government Obligations | $ | — | $ | 155,583,829 | $ | — | $ | 155,583,829 | ||||||||
Exchange-Traded Fund | 8,141,762 | — | — | 8,141,762 | ||||||||||||
Total Investments in Securities | $ | 8,141,762 | $ | 155,583,829 | $ | — | $ | 163,725,591 | ||||||||
Financial Derivative Instruments | ||||||||||||||||
Futures Contracts1 | $ | 16,131,586 | $ | — | $ | — | $ | 16,131,586 | ||||||||
Liabilities: |
| |||||||||||||||
Financial Derivative Instruments | ||||||||||||||||
Futures Contracts1 | $ | (5,882,810 | ) | $ | — | $ | — | $ | (5,882,810 | ) | ||||||
Total – Net | $ | 18,390,538 | $ | 155,583,829 | $ | — | $ | 173,974,367 | ||||||||
| 1 | Amount shown represents the unrealized appreciation (depreciation) on the financial instrument. |
See Notes to Financial Statements.
| 124 | WisdomTree Trust |
Table of Contents
Schedule of Investments
WisdomTree Managed Futures Strategy Fund (WTMF) (consolidated)
August 31, 2021
| Investments | Principal Amount | Value | ||||||
| U.S. GOVERNMENT OBLIGATIONS – 72.9% |
| |||||||
| U.S. Treasury Bills – 72.9% |
| |||||||
0.02%, 9/16/21* | $ | 101,000,000 | $ | 100,998,947 | ||||
0.05%, 5/19/22*(a) | 6,214,000 | 6,211,756 | ||||||
TOTAL U.S. GOVERNMENT OBLIGATIONS (Cost: $107,211,096) |
| 107,210,703 | ||||||
| Investments | Shares | Value | ||||||
| EXCHANGE-TRADED FUND – 4.1% |
| |||||||
| United States – 4.1% |
| |||||||
WisdomTree Floating Rate Treasury Fund(b) | ||||||||
| (Cost: $5,991,597) | 238,956 | 5,997,796 | ||||||
TOTAL INVESTMENTS IN SECURITIES – 77.0% (Cost: $113,202,693) |
| 113,208,499 | ||||||
Other Assets less Liabilities – 23.0% |
| 33,792,008 | ||||||
|
| |||||||
| NET ASSETS – 100.0% |
| $ | 147,000,507 | |||||
| * | Interest rate shown reflects the yield to maturity at the time of purchase. |
| (a) | All or a portion of this security is held by the broker as collateral for open futures contracts. The securities collateral posted was comprised entirely of U.S. Treasury securities having a market value of $6,211,756 as of August 31, 2021. |
| (b) | Affiliated holding. See “Investment in Affiliates” supplementary table included in this Schedule of Investments for additional information. |
| INVESTMENT IN AFFILIATES |
Affiliated holdings are investments in entities in which the Fund owns 5% or more of the outstanding voting securities or are investments in entities which are under common ownership or control. Investments in affiliates during the fiscal year ended August 31, 2021 were as follows:
| Affiliate | Value at 8/31/2020 | Purchases/ Additions | Sales/ Reductions | Realized Gain/ (Loss) | Change in Unrealized Appreciation/ Depreciation | Value at 8/31/2021 | Dividend Income | Capital Gain Distributions | ||||||||||||||||||||||||
WisdomTree Floating Rate Treasury Fund | $ | 5,069,835 | $ | 2,274,735 | $ | 1,343,226 | $ | (1,414 | ) | $ | (2,134 | ) | $ | 5,997,796 | $ | 1,143 | $ | 1,048 | ||||||||||||||
| FINANCIAL DERIVATIVE INSTRUMENTS | ||||||||||||||||
| FUTURES CONTRACTS (EXCHANGE-TRADED) | ||||||||||||||||
| Long Exposure | Contracts | Expiration Date | Notional Value | Unrealized Appreciation/ (Depreciation) | ||||||||||||
10 Year U.S. Treasury Note | 79 | 12/21/21 | $ | 10,542,797 | $ | (35,297 | ) | |||||||||
Aluminum | 44 | 9/13/21 | 2,984,300 | 138,638 | ||||||||||||
Cattle Feeder | 34 | 9/30/21 | 2,771,000 | 31,051 | ||||||||||||
Corn | 101 | 12/14/21 | 2,697,963 | (94,300 | ) | |||||||||||
Euro Stoxx 50 | 237 | 9/17/21 | 11,698,436 | 277,724 | ||||||||||||
Gasoline RBOB | 31 | 9/30/21 | 2,788,754 | 5,859 | ||||||||||||
HRW Wheat | 78 | 12/14/21 | 2,776,800 | 34,388 | ||||||||||||
Lead | 47 | 9/13/21 | 2,686,050 | (98,106 | ) | |||||||||||
Lean Hogs | 77 | 10/14/21 | 2,735,040 | 51,660 | ||||||||||||
Live Cattle | 54 | 10/29/21 | 2,741,040 | 2,320 | ||||||||||||
Natural Gas | 67 | 9/28/21 | 2,932,590 | 155,750 | ||||||||||||
Nickel | 24 | 9/13/21 | 2,817,720 | 14,076 | ||||||||||||
Nikkei 225 | 23 | 12/09/21 | 5,857,819 | 102,585 | ||||||||||||
NY Harbor ULSD | 31 | 9/30/21 | 2,773,520 | 27,993 | ||||||||||||
Russell 2000 E-Mini Index | 53 | 9/17/21 | 6,018,680 | (76,138 | ) | |||||||||||
S&P 500 E-Mini Index | 53 | 9/17/21 | 11,979,325 | 785,592 | ||||||||||||
S&P/TSX 60 Index | 60 | 9/16/21 | 11,679,500 | 361,448 | ||||||||||||
Silver | 21 | 12/29/21 | 2,520,630 | (140,280 | ) | |||||||||||
Sugar No. 11 | 138 | 9/30/21 | 3,066,470 | 186,413 | ||||||||||||
Tin | 15 | 9/13/21 | 2,573,775 | (77,550 | ) | |||||||||||
U.S. Dollar Index | 157 | 9/13/21 | 14,543,695 | (2,240 | ) | |||||||||||
U.S. Treasury Long Bond | 65 | 12/21/21 | 10,592,969 | (75,250 | ) | |||||||||||
Wheat | 76 | 12/14/21 | 2,744,550 | (11,750 | ) | |||||||||||
| $ | 124,523,423 | $ | 1,564,586 | |||||||||||||
See Notes to Financial Statements.
| WisdomTree Trust | 125 |
Table of Contents
Schedule of Investments (concluded)
WisdomTree Managed Futures Strategy Fund (WTMF) (consolidated)
August 31, 2021
| FAIR VALUATION SUMMARY |
The following is a summary of the fair valuations according to the inputs used as of August 31, 2021 in valuing the Fund’s investments (See Note 2 — Fair Value Measurement):
| Quoted Prices in Active Markets (Level 1) | Other Significant Observable Inputs (Level 2) | Significant Unobservable Inputs (Level 3) | Total | |||||||||||||
Assets: |
| |||||||||||||||
Investments in Securities | ||||||||||||||||
U.S. Government Obligations | $ | — | $ | 107,210,703 | $ | — | $ | 107,210,703 | ||||||||
Exchange-Traded Fund | 5,997,796 | — | — | 5,997,796 | ||||||||||||
Total Investments in Securities | $ | 5,997,796 | $ | 107,210,703 | $ | — | $ | 113,208,499 | ||||||||
Financial Derivative Instruments | ||||||||||||||||
Futures Contracts1 | $ | 2,175,497 | $ | — | $ | — | $ | 2,175,497 | ||||||||
Liabilities: |
| |||||||||||||||
Financial Derivative Instruments | ||||||||||||||||
Futures Contracts1 | $ | (610,911 | ) | $ | — | $ | — | $ | (610,911 | ) | ||||||
Total – Net | $ | 7,562,382 | $ | 107,210,703 | $ | — | $ | 114,773,085 | ||||||||
| 1 | Amount shown represents the unrealized appreciation (depreciation) on the financial instrument. |
See Notes to Financial Statements.
| 126 | WisdomTree Trust |
Table of Contents
Statements of Assets and Liabilities
WisdomTree Trust
August 31, 2021
WisdomTree U.S. Dollar | WisdomTree Chinese Yuan Strategy Fund | WisdomTree Emerging Currency Strategy Fund | WisdomTree Emerging Markets Corporate Bond Fund | WisdomTree Emerging Markets Local Debt Fund | ||||||||||||||||
ASSETS: | ||||||||||||||||||||
Investments, at cost | $ | 135,799,184 | $ | 28,216,200 | $ | 7,975,766 | $ | 53,098,631 | $ | 134,124,404 | ||||||||||
Investment in affiliates, at cost (Note 3) | 5,901,568 | 1,822,572 | 567,356 | — | — | |||||||||||||||
Repurchase agreements, at cost | — | 12,960,000 | 4,000,000 | — | 6,860,000 | |||||||||||||||
Foreign currency, at cost | — | 65 | — | — | 571,434 | |||||||||||||||
Investments in securities, at value1,2 (Note 2) | 135,799,767 | 28,216,327 | 7,975,802 | 54,246,367 | 124,024,070 | |||||||||||||||
Investment in affiliates, at value (Note 3) | 5,898,500 | 1,822,260 | 567,260 | — | — | |||||||||||||||
Repurchase agreements, at value (Note 2) | — | 12,960,000 | 4,000,000 | — | 6,860,000 | |||||||||||||||
Cash | 813,690 | 118,263 | 92,068 | 704,383 | 306,901 | |||||||||||||||
Deposits at broker for futures contracts | — | — | — | 102,945 | — | |||||||||||||||
Foreign currency, at value | — | 65 | — | — | 578,368 | |||||||||||||||
Unrealized appreciation on foreign currency contracts | 855,222 | 144,520 | 172,547 | — | 17,853 | |||||||||||||||
Receivables: | ||||||||||||||||||||
Investment securities sold | — | — | — | — | 1,876,850 | |||||||||||||||
Securities lending income | — | — | — | 899 | — | |||||||||||||||
Interest | — | 22 | 7 | 591,890 | 2,161,847 | |||||||||||||||
Foreign tax reclaims | — | — | — | — | 140,305 | |||||||||||||||
Net variation margin on futures contracts | — | — | — | 8,391 | — | |||||||||||||||
Total Assets | 143,367,179 | 43,261,457 | 12,807,684 | 55,654,875 | 135,966,194 | |||||||||||||||
LIABILITIES: | ||||||||||||||||||||
Unrealized depreciation on foreign currency contracts | 138,445 | 76,809 | 69,521 | — | 225,853 | |||||||||||||||
Payables: | ||||||||||||||||||||
Cash collateral received for securities loaned (Note 2) | — | — | — | 2,348,675 | — | |||||||||||||||
Investment securities purchased | — | — | — | — | 764,879 | |||||||||||||||
Advisory fees (Note 3) | 60,119 | 18,763 | 6,081 | 27,075 | 62,140 | |||||||||||||||
Service fees (Note 2) | 536 | 187 | 50 | 198 | 499 | |||||||||||||||
Foreign capital gains tax | — | — | — | — | 129,284 | |||||||||||||||
Total Liabilities | 199,100 | 95,759 | 75,652 | 2,375,948 | 1,182,655 | |||||||||||||||
NET ASSETS | $ | 143,168,079 | $ | 43,165,698 | $ | 12,732,032 | $ | 53,278,927 | $ | 134,783,539 | ||||||||||
NET ASSETS: | ||||||||||||||||||||
Paid-in capital | $ | 157,903,096 | $ | 41,324,556 | $ | 60,179,387 | $ | 60,597,368 | $ | 166,441,152 | ||||||||||
Total distributable earnings (loss) | (14,735,017 | ) | 1,841,142 | (47,447,355 | ) | (7,318,441 | ) | (31,657,613 | ) | |||||||||||
NET ASSETS | $ | 143,168,079 | $ | 43,165,698 | $ | 12,732,032 | $ | 53,278,927 | $ | 134,783,539 | ||||||||||
Outstanding beneficial interest shares of $0.001 par value | 5,600,000 | 1,550,000 | 700,000 | 700,000 | 4,150,000 | |||||||||||||||
Net asset value per share | $ | 25.57 | $ | 27.85 | $ | 18.19 | $ | 76.11 | $ | 32.48 | ||||||||||
1 Includes market value of securities out on loan of: | — | — | — | $ | 3,565,545 | — | ||||||||||||||
2 Investments in securities include investment of cash collateral for securities loaned (see Schedule of Investments for additional information). |
| |||||||||||||||||||
See Notes to Financial Statements.
| WisdomTree Trust | 127 |
Table of Contents
Statements of Assets and Liabilities (continued)
WisdomTree Trust
August 31, 2021
| WisdomTree Floating Rate Treasury Fund | WisdomTree Interest Rate Hedged High Yield Bond Fund | WisdomTree Interest Rate Hedged U.S. Aggregate Bond Fund | WisdomTree Mortgage Plus Bond Fund | WisdomTree Yield Enhanced U.S. Aggregate Bond Fund | ||||||||||||||||
ASSETS: | ||||||||||||||||||||
Investments, at cost | $ | 1,086,163,211 | $ | 162,487,913 | $ | 207,203,400 | $ | 40,244,343 | $ | 1,083,750,435 | ||||||||||
Repurchase agreements, at cost | — | — | 15,426,500 | — | 146,660,000 | |||||||||||||||
Investments in securities, at value1,2 (Note 2) | 1,086,453,832 | 167,073,900 | 213,111,992 | 40,510,572 | 1,102,703,043 | |||||||||||||||
Repurchase agreements, at value (Note 2) | — | — | 15,426,500 | — | 146,660,000 | |||||||||||||||
Cash | 174,489 | 1,188,037 | 500,401 | 13,910,943 | 2,738,150 | |||||||||||||||
Deposits at broker for futures contracts | — | 931,798 | 3,012,175 | 23,527 | — | |||||||||||||||
Receivables: | ||||||||||||||||||||
Investment securities sold3 | 94,925,137 | 884,821 | 105,425 | 12,726,653 | 34,242,402 | |||||||||||||||
Due from broker for securities sold short (Note 2) | — | — | — | — | 15,312,415 | |||||||||||||||
Due from custodian | — | 209,923 | — | — | — | |||||||||||||||
Capital shares sold | — | — | 204,283 | — | — | |||||||||||||||
Securities lending income | — | 2,238 | 189 | — | 842 | |||||||||||||||
Interest | 94,512 | 2,346,146 | 972,680 | 79,544 | 6,223,825 | |||||||||||||||
Net variation margin on futures contracts | — | 51,995 | 214,583 | 1,149 | — | |||||||||||||||
Total Assets | 1,181,647,970 | 172,688,858 | 233,548,228 | 67,252,388 | 1,307,880,677 | |||||||||||||||
LIABILITIES: | ||||||||||||||||||||
Securities sold short, at value4 | — | — | — | — | 15,304,998 | |||||||||||||||
Payables: | ||||||||||||||||||||
Cash collateral received for securities loaned (Note 2) | — | 6,181,380 | 878,573 | — | 5,202,955 | |||||||||||||||
Investment securities purchased | 88,143,834 | — | 17,297,217 | 26,483,091 | 198,165,211 | |||||||||||||||
Capital shares redeemed | 6,904,141 | — | — | — | — | |||||||||||||||
Advisory fees (Note 3) | 140,753 | 59,708 | 42,041 | 15,594 | 110,553 | |||||||||||||||
Service fees (Note 2) | 4,129 | 609 | 804 | 153 | 4,054 | |||||||||||||||
Interest on securities sold short | — | — | — | — | 17,837 | |||||||||||||||
Total Liabilities | 95,192,857 | 6,241,697 | 18,218,635 | 26,498,838 | 218,805,608 | |||||||||||||||
NET ASSETS | $ | 1,086,455,113 | $ | 166,447,161 | $ | 215,329,593 | $ | 40,753,550 | $ | 1,089,075,069 | ||||||||||
NET ASSETS: | ||||||||||||||||||||
Paid-in capital | $ | 1,086,010,298 | $ | 192,353,047 | $ | 221,725,351 | $ | 40,587,416 | $ | 1,069,663,638 | ||||||||||
Total distributable earnings (loss) | 444,815 | (25,905,886 | ) | (6,395,758 | ) | 166,134 | 19,411,431 | |||||||||||||
NET ASSETS | $ | 1,086,455,113 | $ | 166,447,161 | $ | 215,329,593 | $ | 40,753,550 | $ | 1,089,075,069 | ||||||||||
Outstanding beneficial interest shares of $0.001 par value (unlimited number of shares authorized) | 43,275,000 | 7,500,000 | 4,600,000 | 800,000 | 20,700,000 | |||||||||||||||
Net asset value per share | $ | 25.11 | $ | 22.19 | $ | 46.81 | $ | 50.94 | $ | 52.61 | ||||||||||
1 Includes market value of securities out on loan of: | — | $ | 7,975,951 | $ | 1,200,542 | — | $ | 5,495,890 | ||||||||||||
2 Investments in securities include investment of cash collateral for securities loaned (see Schedule of Investments for additional information). |
| |||||||||||||||||||
3 Includes market value of securities out on loan, which were sold and pending settlement, of: | — | $ | 443,603 | — | — | $ | 22,774 | |||||||||||||
4 Securities sold short, proceeds: | — | — | — | — | $ | 15,294,578 | ||||||||||||||
See Notes to Financial Statements.
| 128 | WisdomTree Trust |
Table of Contents
Statements of Assets and Liabilities (concluded)
WisdomTree Trust
August 31, 2021
| WisdomTree Yield Enhanced U.S. Short-Term Aggregate Bond Fund | WisdomTree Alternative Income Fund | WisdomTree CBOE S&P 500 PutWrite Strategy Fund | WisdomTree Enhanced Commodity Strategy Fund (consolidated) | WisdomTree Managed Futures Strategy Fund (consolidated) | ||||||||||||||||
ASSETS: | ||||||||||||||||||||
Investments, at cost | $ | 275,408,080 | $ | 10,250,428 | $ | 58,394,261 | $ | 155,582,891 | $ | 107,211,096 | ||||||||||
Investment in affiliates, at cost (Note 3) | — | — | 2,865,100 | 8,146,461 | 5,991,597 | |||||||||||||||
Investments in securities, at value | 276,377,572 | 10,301,997 | 58,394,409 | 155,583,829 | 107,210,703 | |||||||||||||||
Investment in affiliates, at value (Note 3) | — | — | 2,870,813 | 8,141,762 | 5,997,796 | |||||||||||||||
Cash | 145,493 | 8,273 | 2,963,387 | 24,637,160 | 34,090,254 | |||||||||||||||
Deposits at broker for futures contracts | — | — | — | 4,891,873 | — | |||||||||||||||
Foreign currency, at value | — | — | — | — | 757 | |||||||||||||||
Receivables: | ||||||||||||||||||||
Investment securities sold | 36,971,820 | — | — | — | — | |||||||||||||||
Capital shares sold | — | 6,161,013 | — | 4,424,038 | — | |||||||||||||||
Dividends | — | 7,923 | — | — | — | |||||||||||||||
Interest | 749,928 | — | — | — | — | |||||||||||||||
Total Assets | 314,244,813 | 16,479,206 | 64,228,609 | 197,678,662 | 147,299,510 | |||||||||||||||
LIABILITIES: | ||||||||||||||||||||
Written options, at value1 | — | — | 265,350 | — | — | |||||||||||||||
Payables: | ||||||||||||||||||||
Investment securities purchased | 114,422,138 | 6,162,290 | — | 3,999,963 | — | |||||||||||||||
Due to broker | — | — | — | — | 145,787 | |||||||||||||||
Advisory fees (Note 3) | 19,957 | 1,852 | 22,945 | 87,263 | 79,058 | |||||||||||||||
Service fees (Note 2) | 733 | 16 | 233 | — | 539 | |||||||||||||||
Net variation margin on futures contracts | — | — | — | 39,773 | 73,619 | |||||||||||||||
Total Liabilities | 114,442,828 | 6,164,158 | 288,528 | 4,126,999 | 299,003 | |||||||||||||||
NET ASSETS | $ | 199,801,985 | $ | 10,315,048 | $ | 63,940,081 | $ | 193,551,663 | $ | 147,000,507 | ||||||||||
NET ASSETS: | ||||||||||||||||||||
Paid-in capital | $ | 198,603,807 | $ | 10,195,773 | $ | 74,883,814 | $ | 181,654,811 | $ | 162,254,421 | ||||||||||
Total distributable earnings (loss) | 1,198,178 | 119,275 | (10,943,733 | ) | 11,896,852 | (15,253,914 | ) | |||||||||||||
NET ASSETS | $ | 199,801,985 | $ | 10,315,048 | $ | 63,940,081 | $ | 193,551,663 | $ | 147,000,507 | ||||||||||
Outstanding beneficial interest shares of $0.001 par value (unlimited number of shares authorized) | 3,900,000 | 400,000 | 1,950,000 | 8,750,000 | 3,550,000 | |||||||||||||||
Net asset value per share | $ | 51.23 | $ | 25.79 | $ | 32.79 | $ | 22.12 | $ | 41.41 | ||||||||||
1 Premiums received on written options: | — | — | $ | 970,820 | — | — | ||||||||||||||
See Notes to Financial Statements.
| WisdomTree Trust | 129 |
Table of Contents
WisdomTree Trust
For the Year Ended August 31, 2021
| WisdomTree Bloomberg U.S. Dollar Bullish Fund | WisdomTree Chinese Yuan Strategy Fund | WisdomTree Emerging Currency Strategy Fund | WisdomTree Emerging Markets Corporate Bond Fund | WisdomTree Emerging Markets Local Debt Fund | ||||||||||||||||
INVESTMENT INCOME: | ||||||||||||||||||||
Dividends from affiliates (Note 3) | $ | 866 | $ | 302 | $ | 126 | $ | — | $ | — | ||||||||||
Interest1 | 42,952 | 16,314 | 6,105 | 1,894,566 | 7,356,756 | |||||||||||||||
Securities lending income, net (Note 2) | — | — | — | 8,035 | 146 | |||||||||||||||
Total investment income | 43,818 | 16,616 | 6,231 | 1,902,601 | 7,356,902 | |||||||||||||||
EXPENSES: | ||||||||||||||||||||
Advisory fees (Note 3) | 489,531 | 190,341 | 82,364 | 279,758 | 732,105 | |||||||||||||||
Service fees (Note 2) | 4,307 | 1,862 | 659 | 2,052 | 5,857 | |||||||||||||||
Total expenses | 493,838 | 192,203 | 83,023 | 281,810 | 737,962 | |||||||||||||||
Expense waivers (Note 3) | (6,068 | ) | (2,623 | ) | (903 | ) | — | — | ||||||||||||
Net expenses | 487,770 | 189,580 | 82,120 | 281,810 | 737,962 | |||||||||||||||
Net investment income (loss) | (443,952 | ) | (172,964 | ) | (75,889 | ) | 1,620,791 | 6,618,940 | ||||||||||||
NET REALIZED AND UNREALIZED GAIN (LOSS) ON INVESTMENTS: | ||||||||||||||||||||
Net realized gain (loss) from: | ||||||||||||||||||||
Investment transactions2 | 365 | 39 | 5 | 660,200 | (5,193,163 | ) | ||||||||||||||
Investment transactions in affiliates (Note 3) | (3,198 | ) | (400 | ) | (91 | ) | — | — | ||||||||||||
In-kind redemptions | — | — | — | 167,741 | (297,343 | ) | ||||||||||||||
Capital gain distributions from affiliates (Note 3) | 822 | 282 | 148 | — | — | |||||||||||||||
Futures contracts | — | — | — | 141,658 | — | |||||||||||||||
Foreign currency contracts | (2,823,672 | ) | 3,481,247 | 511,502 | — | 291,961 | ||||||||||||||
Foreign currency related transactions | (15 | ) | — | — | — | 88,845 | ||||||||||||||
Net realized gain (loss) | (2,825,698 | ) | 3,481,168 | 511,564 | 969,599 | (5,109,700 | ) | |||||||||||||
Net increase (decrease) in unrealized appreciation/depreciation: | ||||||||||||||||||||
Investment transactions3 | 1,261 | 373 | 157 | (420,395 | ) | 3,493,072 | ||||||||||||||
Investment transactions in affiliates (Note 3) | (2,123 | ) | (646 | ) | (236 | ) | — | — | ||||||||||||
Futures contracts | — | — | — | (29,531 | ) | — | ||||||||||||||
Foreign currency contracts | 1,985,485 | (766,938 | ) | 74,208 | — | (305,833 | ) | |||||||||||||
Translation of assets and liabilities denominated in foreign currencies | — | (1 | ) | — | — | 15,511 | ||||||||||||||
Net increase (decrease) in unrealized appreciation/depreciation | 1,984,623 | (767,212 | ) | 74,129 | (449,926 | ) | 3,202,750 | |||||||||||||
Net realized and unrealized gain (loss) on investments | (841,075 | ) | 2,713,956 | 585,693 | 519,673 | (1,906,950 | ) | |||||||||||||
NET INCREASE (DECREASE) IN NET ASSETS RESULTING FROM OPERATIONS | $ | (1,285,027 | ) | $ | 2,540,992 | $ | 509,804 | $ | 2,140,464 | $ | 4,711,990 | |||||||||
1 Net of foreign withholding tax of: | — | — | — | $ | 1,763 | $ | 189,487 | |||||||||||||
2 Net of foreign capital gains tax of: | — | — | — | — | $ | 27,382 | ||||||||||||||
3 Includes net increase (decrease) in accrued foreign capital gain taxes of: | — | — | — | — | $ | 5,659 | ||||||||||||||
See Notes to Financial Statements.
| 130 | WisdomTree Trust |
Table of Contents
Statements of Operations (continued)
WisdomTree Trust
For the Year Ended August 31, 2021
| WisdomTree Floating Rate Treasury Fund | WisdomTree Interest Rate Hedged High Yield Bond Fund | WisdomTree Interest Rate | WisdomTree Mortgage Plus Bond Fund | WisdomTree Yield Enhanced U.S. Aggregate Bond Fund | ||||||||||||||||
INVESTMENT INCOME: | ||||||||||||||||||||
Interest | $ | 1,609,384 | $ | 6,504,475 | $ | 2,314,929 | $ | 467,968 | $ | 20,217,729 | ||||||||||
Securities lending income, net (Note 2) | — | 27,226 | 1,647 | — | 10,334 | |||||||||||||||
Total investment income | 1,609,384 | 6,531,701 | 2,316,576 | 467,968 | 20,228,063 | |||||||||||||||
EXPENSES: | ||||||||||||||||||||
Advisory fees (Note 3) | 1,791,611 | 581,510 | 312,725 | 158,008 | 1,742,686 | |||||||||||||||
Service fees (Note 2) | 52,554 | 5,950 | 5,983 | 1,546 | 51,310 | |||||||||||||||
Total expenses | 1,844,165 | 587,460 | 318,708 | 159,554 | 1,793,996 | |||||||||||||||
Expense waivers (Note 3) | — | — | — | — | (343,335 | ) | ||||||||||||||
Net expenses | 1,844,165 | 587,460 | 318,708 | 159,554 | 1,450,661 | |||||||||||||||
Net investment income (loss) | (234,781 | ) | 5,944,241 | 1,997,868 | 308,414 | 18,777,402 | ||||||||||||||
NET REALIZED AND UNREALIZED GAIN (LOSS) ON INVESTMENTS: | ||||||||||||||||||||
Net realized gain (loss) from: | ||||||||||||||||||||
Investment transactions | 1,157,128 | 230,165 | 396,108 | 70,621 | 6,526,033 | |||||||||||||||
In-kind redemptions | 539,869 | 3,435,561 | 896,000 | — | 6,414,222 | |||||||||||||||
Futures contracts | — | 700,661 | (451,575 | ) | 133,841 | — | ||||||||||||||
Securities sold short | — | — | 169 | — | (1,556 | ) | ||||||||||||||
Net realized gain | 1,696,997 | 4,366,387 | 840,702 | 204,462 | 12,938,699 | |||||||||||||||
Net increase (decrease) in unrealized appreciation/depreciation: | ||||||||||||||||||||
Investment transactions | (1,459,432 | ) | 492,837 | (1,104,886 | ) | (166,487 | ) | (32,412,889 | ) | |||||||||||
Futures contracts | — | (262,936 | ) | (374,340 | ) | (16,127 | ) | — | ||||||||||||
Securities sold short | — | — | 137 | — | (9,776 | ) | ||||||||||||||
Net increase (decrease) in unrealized appreciation/depreciation | (1,459,432 | ) | 229,901 | (1,479,089 | ) | (182,614 | ) | (32,422,665 | ) | |||||||||||
Net realized and unrealized gain (loss) on investments | 237,565 | 4,596,288 | (638,387 | ) | 21,848 | (19,483,966 | ) | |||||||||||||
Net increase from payment by affiliate (Note 3) | — | 53,005 | — | — | — | |||||||||||||||
NET INCREASE (DECREASE) IN NET ASSETS RESULTING FROM OPERATIONS | $ | 2,784 | $ | 10,593,534 | $ | 1,359,481 | $ | 330,262 | $ | (706,564 | ) | |||||||||
See Notes to Financial Statements.
| WisdomTree Trust | 131 |
Table of Contents
Statements of Operations (continued)
WisdomTree Trust
For the Year or Period Ended August 31, 2021 (except where noted)
| WisdomTree Enhanced Commodity Strategy Fund (consolidated)2 | ||||||||||||||||||||
| WisdomTree Yield Enhanced U.S. Short-Term Aggregate Bond Fund | WisdomTree Alternative Income Fund1 | WisdomTree CBOE S&P 500 PutWrite Strategy Fund | For the Period December 19, 2020 through August 31, 2021 | For the Period January 1, 2020 through December 18, 2020 | ||||||||||||||||
INVESTMENT INCOME: | ||||||||||||||||||||
Dividends | $ | — | $ | 66,770 | $ | — | $ | — | $ | — | ||||||||||
Dividends from affiliates (Note 3) | — | — | 1,157 | 162 | — | |||||||||||||||
Interest | 1,760,090 | — | 50,694 | 31,628 | 478,451 | |||||||||||||||
Non-cash dividends | — | 2,847 | — | — | — | |||||||||||||||
Total investment income | 1,760,090 | 69,617 | 51,851 | 31,790 | 478,451 | |||||||||||||||
EXPENSES: | ||||||||||||||||||||
Advisory fees (Note 3) | 227,741 | 5,910 | 429,329 | 608,698 | 711,393 | |||||||||||||||
Service fees (Note 2) | 7,079 | 52 | 4,293 | 4,870 | — | |||||||||||||||
Total expenses | 234,820 | 5,962 | 433,622 | 613,568 | 711,393 | |||||||||||||||
Expense waivers (Note 3) | (34,676 | ) | — | (6,427 | ) | (7,269 | ) | (83,693 | ) | |||||||||||
Net expenses | 200,144 | 5,962 | 427,195 | 606,299 | 627,700 | |||||||||||||||
Net investment income (loss) | 1,559,946 | 63,655 | (375,344 | ) | (574,509 | ) | (149,249 | ) | ||||||||||||
NET REALIZED AND UNREALIZED GAIN (LOSS) ON INVESTMENTS: | ||||||||||||||||||||
Net realized gain (loss) from: | ||||||||||||||||||||
Investment transactions | 208,942 | 3,938 | (8,628 | ) | 1,000 | 14,441 | ||||||||||||||
Investment transactions in affiliates (Note 3) | — | — | 5,467 | (1,388 | ) | — | ||||||||||||||
In-kind redemptions | 1,451,813 | 13,363 | — | — | — | |||||||||||||||
Capital gain distributions from affiliates (Note 3) | — | — | 999 | — | — | |||||||||||||||
Futures contracts | (400 | ) | — | — | 11,589,626 | 1,642,503 | ||||||||||||||
Written options | — | — | 22,767,275 | — | — | |||||||||||||||
Net realized gain | 1,660,355 | 17,301 | 22,765,113 | 11,589,238 | 1,656,944 | |||||||||||||||
Net increase (decrease) in unrealized appreciation/depreciation: | ||||||||||||||||||||
Investment transactions | (2,119,466 | ) | 51,569 | 2,225 | 938 | (10,304 | ) | |||||||||||||
Investment transactions in affiliates (Note 3) | — | — | (7,933 | ) | (4,699 | ) | — | |||||||||||||
Futures contracts | 586 | — | — | 10,248,776 | (6,162,155 | ) | ||||||||||||||
Written options | — | — | (522,269 | ) | — | — | ||||||||||||||
Net increase (decrease) in unrealized appreciation/depreciation | (2,118,880 | ) | 51,569 | (527,977 | ) | 10,245,015 | (6,172,459 | ) | ||||||||||||
Net realized and unrealized gain (loss) on investments | (458,525 | ) | 68,870 | 22,237,136 | 21,834,253 | (4,515,515 | ) | |||||||||||||
Net increase from payment by affiliate (Note 3) | — | — | — | 6,934 | 13,626 | |||||||||||||||
NET INCREASE (DECREASE) IN NET ASSETS RESULTING FROM OPERATIONS | $ | 1,101,421 | $ | 132,525 | $ | 21,861,792 | $ | 21,266,678 | $ | (4,651,138 | ) | |||||||||
1 For the period May 6, 2021 (commencement of operations) through August 31, 2021. |
| |||||||||||||||||||
2 After the close of business on December 18, 2020, the WisdomTree Continuous Commodity Index Fund (the “Predecessor Fund”), a commodity pool that was not registered under the Investment Company Act of 1940, as amended (“1940 Act”), was reorganized into the WisdomTree Enhanced Commodity Strategy Fund (the “Successor Fund”), an investment company registered under the 1940 Act. The Successor Fund adopted the financial information for the Predecessor Fund. Accordingly, information presented prior to the close of business on December 18, 2020 is that of the Predecessor Fund prior to the reorganization into a regulated investment company under the 1940 Act. |
| |||||||||||||||||||
See Notes to Financial Statements.
| 132 | WisdomTree Trust |
Table of Contents
Statements of Operations (concluded)
WisdomTree Trust
For the Year Ended August 31, 2021
| WisdomTree Managed Futures Strategy Fund (consolidated) | ||||
INVESTMENT INCOME: | ||||
Dividends from affiliates (Note 3) | $ | 1,143 | ||
Interest | 53,495 | |||
Total investment income | 54,638 | |||
EXPENSES: | ||||
Advisory fees (Note 3) | 844,296 | |||
Service fees (Note 2) | 5,461 | |||
Total expenses | 849,757 | |||
Expense waivers (Note 3) | (45,687 | ) | ||
Net expenses | 804,070 | |||
Net investment loss | (749,432 | ) | ||
NET REALIZED AND UNREALIZED GAIN (LOSS) ON INVESTMENTS: | ||||
Net realized gain (loss) from: | ||||
Investment transactions | 25 | |||
Investment transactions in affiliates (Note 3) | (1,414 | ) | ||
Capital gain distributions from affiliates (Note 3) | 1,048 | |||
Futures contracts | 19,178,971 | |||
Foreign currency contracts | 102,816 | |||
Foreign currency related transactions | 125 | |||
Net realized gain | 19,281,571 | |||
Net increase (decrease) in unrealized appreciation/depreciation: | ||||
Investment transactions | (163 | ) | ||
Investment transactions in affiliates (Note 3) | (2,134 | ) | ||
Futures contracts | 1,301,502 | |||
Foreign currency contracts | (53,425 | ) | ||
Translation of assets and liabilities denominated in foreign currencies | 757 | |||
Net increase in unrealized appreciation/depreciation | 1,246,537 | |||
Net realized and unrealized gain on investments | 20,528,108 | |||
Net increase from payment by affiliate (Note 3) | 1,478 | |||
NET INCREASE IN NET ASSETS RESULTING FROM OPERATIONS | $ | 19,780,154 | ||
See Notes to Financial Statements.
| WisdomTree Trust | 133 |
Table of Contents
Statements of Changes in Net Assets
WisdomTree Trust
WisdomTree Bloomberg U.S. Dollar Bullish Fund | WisdomTree Chinese Yuan Strategy Fund | WisdomTree Emerging Currency Strategy Fund | ||||||||||||||||||||||
| For the Year Ended August 31, 2021 | For the Year Ended August 31, 2020 | For the Year Ended August 31, 2021 | For the Year Ended August 31, 2020 | For the Year Ended August 31, 2021 | For the Year Ended August 31, 2020 | |||||||||||||||||||
INCREASE (DECREASE) IN NET ASSETS RESULTING FROM OPERATIONS: |
| |||||||||||||||||||||||
Net investment income (loss) | $ | (443,952 | ) | $ | 136,271 | $ | (172,964 | ) | $ | 150,972 | $ | (75,889 | ) | $ | 106,267 | |||||||||
Net realized gain (loss) on investments, foreign currency contracts and foreign currency related transactions | (2,825,698 | ) | (3,200,565 | ) | 3,481,168 | (415,447 | ) | 511,564 | (1,110,629 | ) | ||||||||||||||
Net increase (decrease) in unrealized appreciation/depreciation on investments, foreign currency contracts and translation of assets and liabilities denominated in foreign currencies | 1,984,623 | (1,553,432 | ) | (767,212 | ) | 1,782,332 | 74,129 | 712,729 | ||||||||||||||||
Net increase (decrease) in net assets resulting from operations | (1,285,027 | ) | (4,617,726 | ) | 2,540,992 | 1,517,857 | 509,804 | (291,633 | ) | |||||||||||||||
DISTRIBUTIONS TO SHAREHOLDERS: | ||||||||||||||||||||||||
Distributable earnings | (526,430 | ) | (1,101,951 | ) | (150,971 | ) | (535,878 | ) | (106,263 | ) | (352,930 | ) | ||||||||||||
CAPITAL SHARE TRANSACTIONS: | ||||||||||||||||||||||||
Net proceeds from sale of shares | 153,829,112 | 234,606,294 | 30,039,799 | — | 9,013,146 | — | ||||||||||||||||||
Cost of shares redeemed | (92,800,455 | ) | (189,909,518 | ) | (13,771,152 | ) | (2,519,020 | ) | (7,216,742 | ) | (8,832,378 | ) | ||||||||||||
Net increase (decrease) in net assets resulting from capital share transactions | 61,028,657 | 44,696,776 | 16,268,647 | (2,519,020 | ) | 1,796,404 | (8,832,378 | ) | ||||||||||||||||
Net Increase (Decrease) in Net Assets | 59,217,200 | 38,977,099 | 18,658,668 | (1,537,041 | ) | 2,199,945 | (9,476,941 | ) | ||||||||||||||||
NET ASSETS: | ||||||||||||||||||||||||
Beginning of year | $ | 83,950,879 | $ | 44,973,780 | $ | 24,507,030 | $ | 26,044,071 | $ | 10,532,087 | $ | 20,009,028 | ||||||||||||
End of year | $ | 143,168,079 | $ | 83,950,879 | $ | 43,165,698 | $ | 24,507,030 | $ | 12,732,032 | $ | 10,532,087 | ||||||||||||
SHARES CREATED AND REDEEMED: | ||||||||||||||||||||||||
Shares outstanding, beginning of year | 3,200,000 | 1,600,000 | 950,000 | 1,050,000 | 600,000 | 1,100,000 | ||||||||||||||||||
Shares created | 6,050,000 | 8,350,000 | 1,100,000 | — | 500,000 | — | ||||||||||||||||||
Shares redeemed | (3,650,000 | ) | (6,750,000 | ) | (500,000 | ) | (100,000 | ) | (400,000 | ) | (500,000 | ) | ||||||||||||
Shares outstanding, end of year | 5,600,000 | 3,200,000 | 1,550,000 | 950,000 | 700,000 | 600,000 | ||||||||||||||||||
See Notes to Financial Statements.
| 134 | WisdomTree Trust |
Table of Contents
Statements of Changes in Net Assets (continued)
WisdomTree Trust
| WisdomTree Emerging Markets Corporate Bond Fund | WisdomTree Emerging Markets Local Debt Fund | WisdomTree Floating Rate Treasury Fund | ||||||||||||||||||||||
| For the Year Ended August 31, 2021 | For the Year Ended August 31, 2020 | For the Year Ended August 31, 2021 | For the Year Ended August 31, 2020 | For the Year Ended August 31, 2021 | For the Year Ended August 31, 2020 | |||||||||||||||||||
INCREASE (DECREASE) IN NET ASSETS RESULTING FROM OPERATIONS: |
| |||||||||||||||||||||||
Net investment income (loss) | $ | 1,620,791 | $ | 1,356,943 | $ | 6,618,940 | $ | 9,009,643 | $ | (234,781 | ) | $ | 16,052,845 | |||||||||||
Net realized gain (loss) on investments, futures contracts, foreign currency contracts and foreign currency related transactions | 969,599 | (325,614 | ) | (5,109,700 | ) | (20,937,023 | ) | 1,696,997 | 1,929,606 | |||||||||||||||
Net increase (decrease) in unrealized appreciation/depreciation on investments, futures contracts, foreign currency contracts and translation of assets and liabilities denominated in foreign currencies | (449,926 | ) | 254,225 | 3,202,750 | 10,111,423 | (1,459,432 | ) | 3,008,156 | ||||||||||||||||
Net increase (decrease) in net assets resulting from operations | 2,140,464 | 1,285,554 | 4,711,990 | (1,815,957 | ) | 2,784 | 20,990,607 | |||||||||||||||||
DISTRIBUTIONS TO SHAREHOLDERS: | ||||||||||||||||||||||||
Distributable earnings | (1,598,500 | ) | (1,368,000 | ) | (2,002,000 | ) | (3,300,000 | ) | (570,446 | ) | (16,637,462 | ) | ||||||||||||
Tax return of capital | — | — | (4,188,000 | ) | (5,048,500 | ) | — | — | ||||||||||||||||
Total distributions to shareholders | (1,598,500 | ) | (1,368,000 | ) | (6,190,000 | ) | (8,348,500 | ) | (570,446 | ) | (16,637,462 | ) | ||||||||||||
CAPITAL SHARE TRANSACTIONS: | ||||||||||||||||||||||||
Net proceeds from sale of shares | 30,620,672 | — | 25,096,209 | — | 367,233,859 | 559,326,304 | ||||||||||||||||||
Cost of shares redeemed | (7,539,093 | ) | (6,624,034 | ) | (16,353,201 | ) | (58,099,951 | ) | (772,150,883 | ) | (724,101,028 | ) | ||||||||||||
Net increase (decrease) in net assets resulting from capital share transactions | 23,081,579 | (6,624,034 | ) | 8,743,008 | (58,099,951 | ) | (404,917,024 | ) | (164,774,724 | ) | ||||||||||||||
Net Increase (Decrease) in Net Assets | 23,623,543 | (6,706,480 | ) | 7,264,998 | (68,264,408 | ) | (405,484,686 | ) | (160,421,579 | ) | ||||||||||||||
NET ASSETS: | ||||||||||||||||||||||||
Beginning of year | $ | 29,655,384 | $ | 36,361,864 | $ | 127,518,541 | $ | 195,782,949 | $ | 1,491,939,799 | $ | 1,652,361,378 | ||||||||||||
End of year | $ | 53,278,927 | $ | 29,655,384 | $ | 134,783,539 | $ | 127,518,541 | $ | 1,086,455,113 | $ | 1,491,939,799 | ||||||||||||
SHARES CREATED AND REDEEMED: | ||||||||||||||||||||||||
Shares outstanding, beginning of year | 400,000 | 500,000 | 3,900,000 | 5,700,000 | 59,400,000 | 65,950,000 | ||||||||||||||||||
Shares created | 400,000 | — | 750,000 | — | 14,625,000 | 22,300,000 | ||||||||||||||||||
Shares redeemed | (100,000 | ) | (100,000 | ) | (500,000 | ) | (1,800,000 | ) | (30,750,000 | ) | (28,850,000 | ) | ||||||||||||
Shares outstanding, end of year | 700,000 | 400,000 | 4,150,000 | 3,900,000 | 43,275,000 | 59,400,000 | ||||||||||||||||||
See Notes to Financial Statements.
| WisdomTree Trust | 135 |
Table of Contents
Statements of Changes in Net Assets (continued)
WisdomTree Trust
| WisdomTree Interest Rate Hedged High Yield Bond Fund | WisdomTree Interest Rate Hedged U.S. Aggregate Bond Fund | WisdomTree Mortgage Plus Bond Fund | ||||||||||||||||||||||
| For the Year Ended August 31, 2021 | For the Year Ended August 31, 2020 | For the Year Ended August 31, 2021 | For the Year Ended August 31, 2020 | For the Year Ended August 31, 2021 | For the Period November 14, 2019* through August 31, 2020 | |||||||||||||||||||
INCREASE (DECREASE) IN NET ASSETS RESULTING FROM OPERATIONS: |
| |||||||||||||||||||||||
Net investment income | $ | 5,944,241 | $ | 9,902,432 | $ | 1,997,868 | $ | 2,036,987 | $ | 308,414 | $ | 281,918 | ||||||||||||
Net realized gain (loss) on investments, futures contracts and securities sold short | 4,366,387 | (24,248,806 | ) | 840,702 | (3,318,919 | ) | 204,462 | 302,893 | ||||||||||||||||
Net increase (decrease) in unrealized appreciation/depreciation on investments, futures contracts and securities sold short | 229,901 | 5,306,785 | (1,479,089 | ) | 2,143,832 | (182,614 | ) | 442,722 | ||||||||||||||||
Net increase from payment by affiliate | 53,005 | — | — | — | — | — | ||||||||||||||||||
Net increase (decrease) in net assets resulting from operations | 10,593,534 | (9,039,589 | ) | 1,359,481 | 861,900 | 330,262 | 1,027,533 | |||||||||||||||||
DISTRIBUTIONS TO SHAREHOLDERS: | ||||||||||||||||||||||||
Distributable earnings | (5,948,000 | ) | (9,953,950 | ) | (2,402,000 | ) | (2,155,990 | ) | (825,209 | ) | (366,452 | ) | ||||||||||||
Tax return of capital | — | — | — | — | (3,401 | ) | — | |||||||||||||||||
Total distributions to shareholders | (5,948,000 | ) | (9,953,950 | ) | (2,402,000 | ) | (2,155,990 | ) | (828,610 | ) | (366,452 | ) | ||||||||||||
CAPITAL SHARE TRANSACTIONS: | ||||||||||||||||||||||||
Net proceeds from sale of shares | 94,738,737 | 6,894,337 | 145,849,677 | 32,755,346 | 10,265,975 | 30,324,844 | ||||||||||||||||||
Cost of shares redeemed | (61,314,239 | ) | (106,989,172 | ) | (23,565,595 | ) | (13,710,340 | ) | (102 | ) | — | |||||||||||||
Net increase (decrease) in net assets resulting from capital share transactions | 33,424,498 | (100,094,835 | ) | 122,284,082 | 19,045,006 | 10,265,873 | 30,324,844 | |||||||||||||||||
Net Increase (Decrease) in Net Assets | 38,070,032 | (119,088,374 | ) | 121,241,563 | 17,750,916 | 9,767,525 | 30,985,925 | |||||||||||||||||
NET ASSETS: | ||||||||||||||||||||||||
Beginning of period | $ | 128,377,129 | $ | 247,465,503 | $ | 94,088,030 | $ | 76,337,114 | $ | 30,986,025 | $ | 100 | ||||||||||||
End of period | $ | 166,447,161 | $ | 128,377,129 | $ | 215,329,593 | $ | 94,088,030 | $ | 40,753,550 | $ | 30,986,025 | ||||||||||||
SHARES CREATED AND REDEEMED: | ||||||||||||||||||||||||
Shares outstanding, beginning of period | 6,000,000 | 10,700,000 | 2,000,000 | 1,600,000 | 600,002 | 2 | ||||||||||||||||||
Shares created | 4,300,000 | 300,000 | 3,100,000 | 700,000 | 200,000 | 600,000 | ||||||||||||||||||
Shares redeemed | (2,800,000 | ) | (5,000,000 | ) | (500,000 | ) | (300,000 | ) | (2 | ) | — | |||||||||||||
Shares outstanding, end of period | 7,500,000 | 6,000,000 | 4,600,000 | 2,000,000 | 800,000 | 600,002 | ||||||||||||||||||
| * | Commencement of operations. The commencement of operations date is considered to be the date that the Fund began trading in the secondary market. |
See Notes to Financial Statements.
| 136 | WisdomTree Trust |
Table of Contents
Statements of Changes in Net Assets (continued)
WisdomTree Trust
| WisdomTree Yield Enhanced U.S. Aggregate Bond Fund | WisdomTree Yield Enhanced U.S. Short-Term Aggregate Bond Fund | WisdomTree Alternative | ||||||||||||||||||
| For the Year Ended August 31, 2021 | For the Year Ended August 31, 2020 | For the Year Ended August 31, 2021 | For the Year Ended August 31, 2020 | For the Period May 6, 2021* through August 31, 2021 | ||||||||||||||||
INCREASE (DECREASE) IN NET ASSETS RESULTING FROM OPERATIONS: |
| |||||||||||||||||||
Net investment income | $ | 18,777,402 | $ | 26,705,132 | $ | 1,559,946 | $ | 2,101,230 | $ | 63,655 | ||||||||||
Net realized gain on investments, futures contracts and securities sold short | 12,938,699 | 17,156,980 | 1,660,355 | 958,297 | 17,301 | |||||||||||||||
Net increase (decrease) in unrealized appreciation/depreciation on investments, futures contracts and securities sold short | (32,422,665 | ) | 8,440,085 | (2,118,880 | ) | 809,003 | 51,569 | |||||||||||||
Net increase (decrease) in net assets resulting from operations | (706,564 | ) | 52,302,197 | 1,101,421 | 3,868,530 | 132,525 | ||||||||||||||
DISTRIBUTIONS TO SHAREHOLDERS: | ||||||||||||||||||||
Distributable earnings | (31,052,127 | ) | (29,771,450 | ) | (2,117,289 | ) | (2,124,600 | ) | — | |||||||||||
CAPITAL SHARE TRANSACTIONS: | ||||||||||||||||||||
Net proceeds from sale of shares | 132,305,854 | 758,734,591 | 128,299,583 | 51,149,463 | 10,694,617 | |||||||||||||||
Cost of shares redeemed | (327,328,491 | ) | (345,601,912 | ) | (41,010,874 | ) | (30,416,013 | ) | (512,194 | ) | ||||||||||
Net increase (decrease) in net assets resulting from capital share transactions | (195,022,637 | ) | 413,132,679 | 87,288,709 | 20,733,450 | 10,182,423 | ||||||||||||||
Net Increase (Decrease) in Net Assets | (226,781,328 | ) | 435,663,426 | 86,272,841 | 22,477,380 | 10,314,948 | ||||||||||||||
NET ASSETS: | ||||||||||||||||||||
Beginning of period | $ | 1,315,856,397 | $ | 880,192,971 | $ | 113,529,144 | $ | 91,051,764 | $ | 100 | ||||||||||
End of period | $ | 1,089,075,069 | $ | 1,315,856,397 | $ | 199,801,985 | $ | 113,529,144 | $ | 10,315,048 | ||||||||||
SHARES CREATED AND REDEEMED: | ||||||||||||||||||||
Shares outstanding, beginning of period | 24,400,000 | 16,700,000 | 2,200,000 | 1,800,000 | 4 | |||||||||||||||
Shares created | 2,500,000 | 14,300,000 | 2,500,000 | 1,000,000 | 420,000 | |||||||||||||||
Shares redeemed | (6,200,000 | ) | (6,600,000 | ) | (800,000 | ) | (600,000 | ) | (20,004 | ) | ||||||||||
Shares outstanding, end of period | 20,700,000 | 24,400,000 | 3,900,000 | 2,200,000 | 400,000 | |||||||||||||||
| * | Commencement of operations. The commencement of operations date is considered to be the date that the Fund began trading in the secondary market. |
See Notes to Financial Statements.
| WisdomTree Trust | 137 |
Table of Contents
Statements of Changes in Net Assets (continued)
WisdomTree Trust
WisdomTree CBOE S&P 500 PutWrite Strategy Fund | WisdomTree Enhanced Commodity Strategy Fund (consolidated)1 | |||||||||||||||||||
| For the Year Ended August 31, 2021 | For the Year Ended August 31, 2020 | For the Period December 19, 2020 through August 31, 2021 | For the Period January 1, 2020 through December 18, 2020 | For the Year Ended December 31, 2019 | ||||||||||||||||
INCREASE (DECREASE) IN NET ASSETS RESULTING FROM OPERATIONS: |
| |||||||||||||||||||
Net investment income (loss) | $ | (375,344 | ) | $ | 1,532,239 | $ | (574,509 | ) | $ | (149,249 | ) | $ | 1,747,917 | |||||||
Net realized gain (loss) on investments, futures contracts and written options | 22,765,113 | (14,965,883 | ) | 11,589,238 | 1,656,944 | (5,894,771 | ) | |||||||||||||
Net increase (decrease) in unrealized appreciation/depreciation on investments, futures contracts and written options | (527,977 | ) | (778,833 | ) | 10,245,015 | (6,172,459 | ) | 13,728,495 | ||||||||||||
Net increase from payment by affiliate | — | — | 6,934 | 13,626 | — | |||||||||||||||
Net increase (decrease) in net assets resulting from operations | 21,861,792 | (14,212,477 | ) | 21,266,678 | (4,651,138 | ) | 9,581,641 | |||||||||||||
DISTRIBUTIONS TO SHAREHOLDERS: | ||||||||||||||||||||
Distributable earnings | (1,532,213 | ) | (3,011,616 | ) | — | — | — | |||||||||||||
CAPITAL SHARE TRANSACTIONS: | ||||||||||||||||||||
Net proceeds from sale of shares | 7,868,162 | 21,298,290 | 95,736,950 | 29,910,736 | 18,530,911 | |||||||||||||||
Cost of shares redeemed | (81,482,203 | ) | (98,199,850 | ) | (22,784,541 | ) | (53,762,865 | ) | (55,131,710 | ) | ||||||||||
Net increase (decrease) in net assets resulting from capital share transactions | (73,614,041 | ) | (76,901,560 | ) | 72,952,409 | (23,852,129 | ) | (36,600,799 | ) | |||||||||||
Net Increase (Decrease) in Net Assets | (53,284,462 | ) | (94,125,653 | ) | 94,219,087 | (28,503,267 | ) | (27,019,158 | ) | |||||||||||
NET ASSETS: | ||||||||||||||||||||
Beginning of period | $ | 117,224,543 | $ | 211,350,196 | $ | 99,332,576 | $ | 127,835,843 | $ | 154,855,001 | ||||||||||
End of period | $ | 63,940,081 | $ | 117,224,543 | $ | 193,551,663 | $ | 99,332,576 | $ | 127,835,843 | ||||||||||
SHARES CREATED AND REDEEMED: | ||||||||||||||||||||
Shares outstanding, beginning of period | 4,400,000 | 7,700,000 | 5,300,050 | 6,800,050 | 8,850,050 | |||||||||||||||
Shares created | 250,000 | 800,000 | 4,500,000 | 1,600,000 | 1,050,000 | |||||||||||||||
Shares redeemed | (2,700,000 | ) | (4,100,000 | ) | (1,050,050 | ) | (3,100,000 | ) | (3,100,000 | ) | ||||||||||
Shares outstanding, end of period | 1,950,000 | 4,400,000 | 8,750,000 | 5,300,050 | 6,800,050 | |||||||||||||||
| 1 | After the close of business on December 18, 2020, the WisdomTree Continuous Commodity Index Fund (the “Predecessor Fund”), a commodity pool that was not registered under the Investment Company Act of 1940, as amended (“1940 Act”), was reorganized into the WisdomTree Enhanced Commodity Strategy Fund (the “Successor Fund”), an investment company registered under the 1940 Act. The Successor Fund adopted the financial information for the Predecessor Fund. Accordingly, information presented prior to the close of business on December 18, 2020 is that of the Predecessor Fund prior to the reorganization into a regulated investment company under the 1940 Act. |
See Notes to Financial Statements.
| 138 | WisdomTree Trust |
Table of Contents
Statements of Changes in Net Assets (concluded)
WisdomTree Trust
WisdomTree Managed (consolidated) | ||||||||
| For the Year Ended August 31, 2021 | For the Year Ended August 31, 2020 | |||||||
INCREASE (DECREASE) IN NET ASSETS RESULTING FROM OPERATIONS: |
| |||||||
Net investment income (loss) | $ | (749,432 | ) | $ | 656,894 | |||
Net realized gain (loss) on investments, futures contracts, foreign currency contracts and foreign currency related transactions | 19,281,571 | (7,553,718 | ) | |||||
Net increase (decrease) in unrealized appreciation/depreciation on investments, futures contracts, foreign currency contracts and translation of assets and liabilities denominated in foreign currencies | 1,246,537 | (6,941,998 | ) | |||||
Net increase from payment by affiliate | 1,478 | — | ||||||
Net increase (decrease) in net assets resulting from operations | 19,780,154 | (13,838,822 | ) | |||||
DISTRIBUTIONS TO SHAREHOLDERS: | ||||||||
Distributable earnings | (535,804 | ) | (2,475,949 | ) | ||||
CAPITAL SHARE TRANSACTIONS: | ||||||||
Net proceeds from sale of shares | 55,450,686 | 26,370,052 | ||||||
Cost of shares redeemed | (40,687,188 | ) | (113,937,192 | ) | ||||
Net increase (decrease) in net assets resulting from capital share transactions | 14,763,498 | (87,567,140 | ) | |||||
Net Increase (Decrease) in Net Assets | 34,007,848 | (103,881,911 | ) | |||||
NET ASSETS: | ||||||||
Beginning of year | $ | 112,992,659 | $ | 216,874,570 | ||||
End of year | $ | 147,000,507 | $ | 112,992,659 | ||||
SHARES CREATED AND REDEEMED: | ||||||||
Shares outstanding, beginning of year | 3,200,000 | 5,550,000 | ||||||
Shares created | 1,400,000 | 750,000 | ||||||
Shares redeemed | (1,050,000 | ) | (3,100,000 | ) | ||||
Shares outstanding, end of year | 3,550,000 | 3,200,000 | ||||||
See Notes to Financial Statements.
| WisdomTree Trust | 139 |
Table of Contents
WisdomTree Trust
Selected data for a share of beneficial interest outstanding throughout the period is presented below:
| WisdomTree Bloomberg U.S. Dollar Bullish Fund | For the Year Ended August 31, 2021 | For the Year Ended August 31, 2020 | For the Year Ended August 31, 2019 | For the Year Ended August 31, 2018 | For the Year Ended August 31, 2017 | |||||||||||||||
Net asset value, beginning of year | $ | 26.23 | $ | 28.11 | $ | 26.73 | $ | 25.64 | $ | 26.34 | ||||||||||
Investment operations: |
| |||||||||||||||||||
Net investment income (loss)1 | (0.12 | ) | 0.05 | 0.47 | 0.21 | 0.002 | ||||||||||||||
Net realized and unrealized gain (loss) | (0.37 | ) | (1.11 | ) | 1.15 | 0.88 | ^ | (0.70 | ) | |||||||||||
Total from investment operations | (0.49 | ) | (1.06 | ) | 1.62 | 1.09 | (0.70 | ) | ||||||||||||
Dividends to shareholders: |
| |||||||||||||||||||
Net investment income | (0.17 | ) | (0.82 | ) | (0.24 | ) | — | — | ||||||||||||
Net asset value, end of year | $ | 25.57 | $ | 26.23 | $ | 28.11 | $ | 26.73 | $ | 25.64 | ||||||||||
TOTAL RETURN3 | (1.85 | )% | (3.87 | )% | 6.09 | % | 4.25 | %4 | (2.66 | )% | ||||||||||
RATIOS/SUPPLEMENTAL DATA: |
| |||||||||||||||||||
Net assets, end of year (000’s omitted) | $ | 143,168 | $ | 83,951 | $ | 44,974 | $ | 90,884 | $ | 138,462 | ||||||||||
Ratios to average net assets of: |
| |||||||||||||||||||
Expenses | 0.50 | %5,6 | 0.50 | %5,6 | 0.50 | %5,6 | 0.50 | %5,6 | 0.50 | % | ||||||||||
Net investment income (loss) | (0.45 | )%6 | 0.19 | %6 | 1.71 | %6 | 0.83 | %6 | 0.00 | %7 | ||||||||||
Portfolio turnover rate8 | 55 | %9 | 266 | %9 | 23 | %9 | 0 | % | 0 | % | ||||||||||
| WisdomTree Chinese Yuan Strategy Fund | For the Year Ended August 31, 2021 | For the Year Ended August 31, 2020 | For the Year Ended August 31, 2019 | For the Year Ended August 31, 2018 | For the Year Ended August 31, 2017 | |||||||||||||||
Net asset value, beginning of year | $ | 25.80 | $ | 24.80 | $ | 25.49 | $ | 25.54 | $ | 24.42 | ||||||||||
Investment operations: |
| |||||||||||||||||||
Net investment income (loss)1 | (0.11 | ) | 0.15 | 0.47 | 0.24 | 0.02 | ||||||||||||||
Net realized and unrealized gain (loss) | 2.27 | 1.36 | (0.87 | ) | (0.29 | ) | 1.10 | |||||||||||||
Total from investment operations | 2.16 | 1.51 | (0.40 | ) | (0.05 | ) | 1.12 | |||||||||||||
Dividends to shareholders: |
| |||||||||||||||||||
Net investment income | (0.11 | ) | (0.51 | ) | (0.29 | ) | — | — | ||||||||||||
Net asset value, end of year | $ | 27.85 | $ | 25.80 | $ | 24.80 | $ | 25.49 | $ | 25.54 | ||||||||||
TOTAL RETURN3 | 8.39 | % | 6.16 | % | (1.59 | )% | (0.20 | )% | 4.59 | % | ||||||||||
RATIOS/SUPPLEMENTAL DATA: |
| |||||||||||||||||||
Net assets, end of year (000’s omitted) | $ | 43,166 | $ | 24,507 | $ | 26,044 | $ | 31,861 | $ | 38,312 | ||||||||||
Ratios to average net assets of: |
| |||||||||||||||||||
Expenses | 0.45 | %5,6 | 0.45 | %5,6 | 0.45 | %5,6 | 0.45 | %5,6 | 0.45 | % | ||||||||||
Net investment income (loss) | (0.41 | )%6 | 0.60 | %6 | 1.82 | %6 | 0.92 | %6 | 0.09 | % | ||||||||||
Portfolio turnover rate8 | 25 | %10 | 0 | % | 0 | % | 0 | % | 0 | % | ||||||||||
| ^ | Includes a voluntary reimbursement from the sub-advisor of less than $0.01 per share for investment losses on certain foreign currency contract transactions during the fiscal year ended August 31, 2018. |
| 1 | Based on average shares outstanding. |
| 2 | Amount represents less than $0.005. |
| 3 | Total return is calculated assuming an initial investment made at the net asset value at the beginning of the period, reinvestment of all dividends and distributions at net asset value during the period and redemption on the last day of the period. For the periods in which the investment advisor waived advisory fees, the total return would have been lower if certain expenses had not been waived (Notes 2 and 3). |
| 4 | Includes a voluntary reimbursement from the sub-advisor for investment losses on certain foreign currency contract transactions during the period. Excluding this voluntary reimbursement, total return would have been unchanged. |
| 5 | The expense ratio includes investment advisory fee waivers. Without these investment advisory fee waivers, the expense ratio would have been unchanged. |
| 6 | The ratios to average net assets do not include net investment income (loss) or expenses of other funds in which the Fund invests. |
| 7 | Amount represents less than 0.005%. |
| 8 | Portfolio turnover rate excludes the value of the portfolio securities received or delivered as a result of in-kind creations or redemptions of the Fund’s capital shares. Short-term securities with maturities less than or equal to 365 days are excluded from the portfolio turnover calculation. |
| 9 | During the fiscal years ended August 31, 2021, August 31, 2020 and August 31, 2019, the Fund invested in the WisdomTree Floating Rate Treasury Fund which is considered a long term security for purposes of computing the portfolio turnover rate. During the fiscal years ended August 31, 2021, August 31, 2020 and August 31, 2019, the WisdomTree Floating Rate Fund was the only long-term security held or transacted in the portfolio, as a result, the variability in the portfolio turnover was primarily driven by the transaction activity during the fiscal year for this security only (see the “Investment in Affiliates” supplementary table included in the Schedule of Investments for transaction activity related to this security for the current fiscal year). |
| 10 | During the fiscal year ended August 31, 2021, the Fund invested in the WisdomTree Floating Rate Treasury Fund which is considered a long term security for purposes of computing the portfolio turnover rate. During the fiscal year ended August 31, 2021, the WisdomTree Floating Rate Fund was the only long-term security held or transacted in the portfolio, as a result, the variability in the portfolio turnover was primarily driven by the transaction activity during the fiscal year for this security only (see the “Investment in Affiliates” supplementary table included in the Schedule of Investments for transaction activity related to this security for the current fiscal year). |
See Notes to Financial Statements.
| 140 | WisdomTree Trust |
Table of Contents
Financial Highlights (continued)
WisdomTree Trust
Selected data for a share of beneficial interest outstanding throughout the period is presented below:
| WisdomTree Emerging Currency Strategy Fund | For the Year Ended August 31, 2021 | For the Year Ended August 31, 2020 | For the Year Ended August 31, 2019 | For the Year Ended August 31, 2018 | For the Year Ended August 31, 2017 | |||||||||||||||
Net asset value, beginning of year | $ | 17.55 | $ | 18.19 | $ | 17.97 | $ | 19.14 | $ | 17.97 | ||||||||||
Investment operations: |
| |||||||||||||||||||
Net investment income (loss)1 | (0.09 | ) | 0.12 | 0.31 | 0.16 | 0.002 | ||||||||||||||
Net realized and unrealized gain (loss) | 0.85 | (0.41 | ) | 0.25 | (1.33 | ) | 1.17 | |||||||||||||
Total from investment operations | 0.76 | (0.29 | ) | 0.56 | (1.17 | ) | 1.17 | |||||||||||||
Dividends to shareholders: |
| |||||||||||||||||||
Net investment income | (0.12 | ) | (0.35 | ) | (0.34 | ) | — | — | ||||||||||||
Net asset value, end of year | $ | 18.19 | $ | 17.55 | $ | 18.19 | $ | 17.97 | $ | 19.14 | ||||||||||
TOTAL RETURN3 | 4.31 | % | (1.68 | )% | 3.12 | % | (6.11 | )% | 6.51 | % | ||||||||||
RATIOS/SUPPLEMENTAL DATA: |
| |||||||||||||||||||
Net assets, end of year (000’s omitted) | $ | 12,732 | $ | 10,532 | $ | 20,009 | $ | 28,746 | $ | 49,755 | ||||||||||
Ratios to average net assets of: |
| |||||||||||||||||||
Expenses | 0.55 | %4,5 | 0.55 | %4,5 | 0.55 | %4,5 | 0.55 | %4,5 | 0.55 | % | ||||||||||
Net investment income (loss) | (0.51 | )%5 | 0.65 | %5 | 1.68 | %5 | 0.82 | %5 | 0.01 | % | ||||||||||
Portfolio turnover rate6 | 26 | %7 | 0 | % | 0 | % | 0 | % | 0 | % | ||||||||||
| WisdomTree Emerging Markets Corporate Bond Fund | For the Year Ended August 31, 2021 | For the Year Ended August 31, 2020 | For the Year Ended August 31, 2019 | For the Year Ended August 31, 2018 | For the Year Ended August 31, 2017 | |||||||||||||||
Net asset value, beginning of year | $ | 74.14 | $ | 72.72 | $ | 68.58 | $ | 72.91 | $ | 71.93 | ||||||||||
Investment operations: |
| |||||||||||||||||||
Net investment income1 | 2.63 | 2.99 | 3.00 | 2.84 | 2.87 | |||||||||||||||
Net realized and unrealized gain (loss) | 1.94 | 1.478 | 4.17 | (4.30 | ) | 0.98 | ||||||||||||||
Total from investment operations | 4.57 | 4.46 | 7.17 | (1.46 | ) | 3.85 | ||||||||||||||
Dividends to shareholders: |
| |||||||||||||||||||
Net investment income | (2.60 | ) | (3.04 | ) | (3.03 | ) | (2.87 | ) | (2.87 | ) | ||||||||||
Net asset value, end of year | $ | 76.11 | $ | 74.14 | $ | 72.72 | $ | 68.58 | $ | 72.91 | ||||||||||
TOTAL RETURN3 | 6.26 | % | 6.37 | % | 10.69 | % | (2.08 | )% | 5.51 | % | ||||||||||
RATIOS/SUPPLEMENTAL DATA: |
| |||||||||||||||||||
Net assets, end of year (000’s omitted) | $ | 53,279 | $ | 29,655 | $ | 36,362 | $ | 41,150 | $ | 51,035 | ||||||||||
Ratios to average net assets of: |
| |||||||||||||||||||
Expenses | 0.60 | % | 0.60 | % | 0.60 | % | 0.60 | % | 0.60 | % | ||||||||||
Net investment income | 3.48 | % | 4.13 | % | 4.26 | % | 3.96 | % | 4.03 | % | ||||||||||
Portfolio turnover rate6 | 56 | % | 43 | % | 54 | % | 132 | % | 36 | % | ||||||||||
| 1 | Based on average shares outstanding. |
| 2 | Amount represents less than $0.005. |
| 3 | Total return is calculated assuming an initial investment made at the net asset value at the beginning of the period, reinvestment of all dividends and distributions at net asset value during the period and redemption on the last day of the period. For the periods in which the investment advisor waived advisory fees for the WisdomTree Emerging Currency Strategy Fund, the total return would have been lower if certain expenses had not been waived (Notes 2 and 3). |
| 4 | The expense ratio includes investment advisory fee waivers. Without these investment advisory fee waivers, the expense ratio would have been unchanged. |
| 5 | The ratios to average net assets do not include net investment income (loss) or expenses of other funds in which the Fund invests. |
| 6 | Portfolio turnover rate excludes the value of the portfolio securities received or delivered as a result of in-kind creations or redemptions of the Fund’s capital shares. Short-term securities with maturities less than or equal to 365 days are excluded from the portfolio turnover calculation. |
| 7 | During the fiscal year ended August 31, 2021, the Fund invested in the WisdomTree Floating Rate Treasury Fund which is considered a long term security for purposes of computing the portfolio turnover rate. During the fiscal year ended August 31, 2021, the WisdomTree Floating Rate Fund was the only long-term security held or transacted in the portfolio, as a result, the variability in the portfolio turnover was primarily driven by the transaction activity during the fiscal year for this security only (see the “Investment in Affiliates” supplementary table included in the Schedule of Investments for transaction activity related to this security for the current fiscal year). |
| 8 | The amount of net realized and unrealized gain per share does not correspond with the amounts reported within the Statements of Changes due to the timing of capital share transactions of Fund shares and fluctuating market values during the fiscal year. |
See Notes to Financial Statements.
| WisdomTree Trust | 141 |
Table of Contents
Financial Highlights (continued)
WisdomTree Trust
Selected data for a share of beneficial interest outstanding throughout the period is presented below:
| WisdomTree Emerging Markets Local Debt Fund | For the Year Ended August 31, 2021 | For the Year Ended August 31, 2020 | For the Year Ended August 31, 2019 | For the Year Ended August 31, 2018 | For the Year Ended August 31, 2017 | |||||||||||||||
Net asset value, beginning of year | $ | 32.70 | $ | 34.35 | $ | 32.47 | $ | 38.92 | $ | 37.59 | ||||||||||
Investment operations: |
| |||||||||||||||||||
Net investment income1 | 1.64 | 1.83 | 1.96 | 2.15 | 2.07 | |||||||||||||||
Net realized and unrealized gain (loss) | (0.33 | ) | (1.76 | )2 | 1.72 | (6.48 | ) | 1.00 | ||||||||||||
Total from investment operations | 1.31 | 0.07 | 3.68 | (4.33 | ) | 3.07 | ||||||||||||||
Dividends and distributions to shareholders: |
| |||||||||||||||||||
Net investment income | (0.52 | ) | (0.60 | ) | (0.82 | ) | (2.06 | ) | (0.82 | ) | ||||||||||
Tax return of capital | (1.01 | ) | (1.12 | ) | (0.98 | ) | (0.06 | ) | (0.92 | ) | ||||||||||
Total dividends and distributions to shareholders | (1.53 | ) | (1.72 | ) | (1.80 | ) | (2.12 | ) | (1.74 | ) | ||||||||||
Net asset value, end of year | $ | 32.48 | $ | 32.70 | $ | 34.35 | $ | 32.47 | $ | 38.92 | ||||||||||
TOTAL RETURN3 | 4.06 | % | 0.20 | % | 11.54 | % | (11.66 | )% | 8.46 | % | ||||||||||
RATIOS/SUPPLEMENTAL DATA: |
| |||||||||||||||||||
Net assets, end of year (000’s omitted) | $ | 134,784 | $ | 127,519 | $ | 195,783 | $ | 172,083 | $ | 256,851 | ||||||||||
Ratios to average net assets of: |
| |||||||||||||||||||
Expenses | 0.55 | % | 0.55 | % | 0.55 | % | 0.55 | % | 0.55 | % | ||||||||||
Net investment income | 4.97 | % | 5.42 | % | 5.77 | % | 5.71 | % | 5.51 | % | ||||||||||
Portfolio turnover rate4 | 31 | % | 29 | % | 27 | % | 44 | % | 39 | % | ||||||||||
| WisdomTree Floating Rate Treasury Fund | For the Year Ended August 31, 2021 | For the Year Ended August 31, 2020 | For the Year Ended August 31, 2019 | For the Year Ended August 31, 2018 | For the Year Ended August 31, 2017 | |||||||||||||||
Net asset value, beginning of year | $ | 25.12 | $ | 25.05 | $ | 25.07 | $ | 25.07 | $ | 25.03 | ||||||||||
Investment operations: |
| |||||||||||||||||||
Net investment income (loss)1 | (0.00 | )5 | 0.24 | 0.56 | 0.45 | 0.17 | ||||||||||||||
Net realized and unrealized gain (loss) | 0.01 | 0.07 | (0.05 | ) | (0.07 | ) | 0.04 | |||||||||||||
Total from investment operations | 0.01 | 0.31 | 0.51 | 0.38 | 0.21 | |||||||||||||||
Dividends and distributions to shareholders: |
| |||||||||||||||||||
Net investment income | (0.01 | ) | (0.24 | ) | (0.53 | ) | (0.35 | ) | (0.17 | ) | ||||||||||
Capital gains | (0.01 | ) | — | — | (0.03 | ) | — | |||||||||||||
Total dividends and distributions to shareholders | (0.02 | ) | (0.24 | ) | (0.53 | ) | (0.38 | ) | (0.17 | ) | ||||||||||
Net asset value, end of year | $ | 25.11 | $ | 25.12 | $ | 25.05 | $ | 25.07 | $ | 25.07 | ||||||||||
TOTAL RETURN3 | 0.00 | %6 | 1.26 | % | 2.06 | % | 1.53 | % | 0.85 | % | ||||||||||
RATIOS/SUPPLEMENTAL DATA: |
| |||||||||||||||||||
Net assets, end of year (000’s omitted) | $ | 1,086,455 | $ | 1,491,940 | $ | 1,652,361 | $ | 272,044 | $ | 1,254 | ||||||||||
Ratios to average net assets of: |
| |||||||||||||||||||
Expenses, net of expense waivers | 0.15 | % | 0.15 | % | 0.15 | % | 0.15 | % | 0.15 | % | ||||||||||
Expenses, prior to expense waivers | 0.15 | % | 0.15 | % | 0.15 | % | 0.17 | % | 0.20 | % | ||||||||||
Net investment income (loss) | (0.02 | )% | 0.95 | % | 2.22 | % | 1.83 | % | 0.68 | % | ||||||||||
Portfolio turnover rate4 | 147 | % | 163 | % | 170 | % | 170 | % | 160 | % | ||||||||||
| 1 | Based on average shares outstanding. |
| 2 | The amount of net realized and unrealized loss per share does not correspond with the amounts reported within the Statements of Changes due to the timing of capital share transactions of Fund shares and fluctuating market values during the fiscal year. |
| 3 | Total return is calculated assuming an initial investment made at the net asset value at the beginning of the period, reinvestment of all dividends and distributions at net asset value during the period and redemption on the last day of the period. For the periods in which the investment advisor waived advisory fees for the WisdomTree Floating Rate Treasury Fund, the total return would have been lower if certain expenses had not been waived (Notes 2 and 3). |
| 4 | Portfolio turnover rate excludes the value of the portfolio securities received or delivered as a result of in-kind creations or redemptions of the Fund’s capital shares. Short-term securities with maturities less than or equal to 365 days are excluded from the portfolio turnover calculation. |
| 5 | Amount represents less than $0.005. |
| 6 | Amount represents less than 0.005%. |
See Notes to Financial Statements.
| 142 | WisdomTree Trust |
Table of Contents
Financial Highlights (continued)
WisdomTree Trust
Selected data for a share of beneficial interest outstanding throughout the period is presented below:
| WisdomTree Interest Rate Hedged High Yield Bond Fund | For the Year Ended August 31, 2021 | For the Year Ended August 31, 2020 | For the Year Ended August 31, 2019 | For the Year Ended August 31, 2018 | For the Year Ended August 31, 2017 | |||||||||||||||
Net asset value, beginning of year | $ | 21.40 | $ | 23.13 | $ | 24.07 | $ | 23.91 | $ | 23.39 | ||||||||||
Investment operations: |
| |||||||||||||||||||
Net investment income1 | 0.96 | 1.20 | 1.30 | 1.23 | 1.24 | |||||||||||||||
Net realized and unrealized gain (loss) | 0.78 | (1.73 | ) | (0.91 | ) | 0.10 | 0.53 | |||||||||||||
Net increase from payment by affiliate | 0.01 | — | — | — | — | |||||||||||||||
Total from investment operations | 1.75 | (0.53 | ) | 0.39 | 1.33 | 1.77 | ||||||||||||||
Dividends and distributions to shareholders: |
| |||||||||||||||||||
Net investment income | (0.96 | ) | (1.20 | ) | (1.30 | ) | (1.17 | ) | (1.25 | ) | ||||||||||
Capital gains | — | — | (0.03 | ) | — | — | ||||||||||||||
Total dividends and distributions to shareholders | (0.96 | ) | (1.20 | ) | (1.33 | ) | (1.17 | ) | (1.25 | ) | ||||||||||
Net asset value, end of year | $ | 22.19 | $ | 21.40 | $ | 23.13 | $ | 24.07 | $ | 23.91 | ||||||||||
TOTAL RETURN2 | 8.33 | %3 | (2.26 | )% | 1.68 | % | 5.68 | % | 7.73 | % | ||||||||||
RATIOS/SUPPLEMENTAL DATA: |
| |||||||||||||||||||
Net assets, end of year (000’s omitted) | $ | 166,447 | $ | 128,377 | $ | 247,466 | $ | 262,332 | $ | 54,997 | ||||||||||
Ratios to average net assets of: |
| |||||||||||||||||||
Expenses | 0.43 | % | 0.43 | % | 0.43 | % | 0.43 | % | 0.43 | % | ||||||||||
Net investment income | 4.40 | % | 5.43 | % | 5.52 | % | 5.14 | % | 5.19 | % | ||||||||||
Portfolio turnover rate4 | 40 | % | 101 | %5,6 | 61 | % | 60 | % | 57 | % | ||||||||||
| WisdomTree Interest Rate Hedged U.S. Aggregate Bond Fund | For the Year Ended August 31, 2021 | For the Year Ended August 31, 2020 | For the Year Ended August 31, 2019 | For the Year Ended August 31, 2018 | For the Year Ended August 31, 2017 | |||||||||||||||
Net asset value, beginning of year | $ | 47.04 | $ | 47.71 | $ | 47.82 | $ | 47.89 | $ | 48.01 | ||||||||||
Investment operations: |
| |||||||||||||||||||
Net investment income1 | 0.69 | 1.11 | 1.36 | 1.18 | 0.95 | |||||||||||||||
Net realized and unrealized loss | (0.06 | ) | (0.60 | ) | (0.10 | ) | (0.07 | ) | (0.03 | ) | ||||||||||
Total from investment operations | 0.63 | 0.51 | 1.26 | 1.11 | 0.92 | |||||||||||||||
Dividends to shareholders: |
| |||||||||||||||||||
Net investment income | (0.86 | ) | (1.18 | ) | (1.37 | ) | (1.18 | ) | (1.04 | ) | ||||||||||
Net asset value, end of year | $ | 46.81 | $ | 47.04 | $ | 47.71 | $ | 47.82 | $ | 47.89 | ||||||||||
TOTAL RETURN2 | 1.34 | % | 1.08 | % | 2.69 | % | 2.35 | % | 1.93 | % | ||||||||||
RATIOS/SUPPLEMENTAL DATA: |
| |||||||||||||||||||
Net assets, end of year (000’s omitted) | $ | 215,330 | $ | 94,088 | $ | 76,337 | $ | 52,606 | $ | 23,945 | ||||||||||
Ratios to average net assets of: |
| |||||||||||||||||||
Expenses | 0.23 | % | 0.23 | % | 0.23 | % | 0.23 | % | 0.23 | % | ||||||||||
Net investment income | 1.47 | % | 2.36 | % | 2.86 | % | 2.46 | % | 1.99 | % | ||||||||||
Portfolio turnover rate4,7 | 81 | % | 70 | % | 39 | % | 81 | % | 187 | % | ||||||||||
| 1 | Based on average shares outstanding. |
| 2 | Total return is calculated assuming an initial investment made at the net asset value at the beginning of the period, reinvestment of all dividends and distributions at net asset value during the period and redemption on the last day of the period. |
| 3 | Includes a voluntary reimbursement from the sub-advisor for an operational error that resulted in investment transaction losses. Excluding the voluntary reimbursement, total return would have been 0.05% lower (Note 3). |
| 4 | Portfolio turnover rate excludes the value of the portfolio securities received or delivered as a result of in-kind creations or redemptions of the Fund’s capital shares. Short-term securities with maturities less than or equal to 365 days are excluded from the portfolio turnover calculation. |
| 5 | The increase in the portfolio turnover rate was primarily a result of the change in investment objective and strategy on June 1, 2020. |
| 6 | On June 4, 2020, Voya Investment Management Co., LLC replaced Mellon Investments Corporation as sub-advisor to the Fund. |
| 7 | The portfolio turnover rates excluding TBA roll transactions for the years ended August 31, 2021, August 31, 2020, August 31, 2019, August 31, 2018 and August 31, 2017 were 23%, 33%, 12%, 28% and 45%, respectively. |
See Notes to Financial Statements.
| WisdomTree Trust | 143 |
Table of Contents
Financial Highlights (continued)
WisdomTree Trust
Selected data for a share of beneficial interest outstanding throughout the period is presented below:
| WisdomTree Mortgage Plus Bond Fund | For the Year Ended August 31, 2021 | For the Period November 14, 2019* through August 31, 2020 | ||||||||||||||||||
Net asset value, beginning of period | $ | 51.64 | $ | 50.26 | ||||||||||||||||
Investment operations: | ||||||||||||||||||||
Net investment income1 | 0.45 | 0.66 | ||||||||||||||||||
Net realized and unrealized gain | 0.06 | 1.55 | ||||||||||||||||||
Total from investment operations | 0.51 | 2.21 | ||||||||||||||||||
Dividends and distributions to shareholders: | ||||||||||||||||||||
Net investment income | (0.88 | ) | (0.83 | ) | ||||||||||||||||
Capital gains | (0.32 | ) | — | |||||||||||||||||
Tax return of capital | (0.01 | ) | — | |||||||||||||||||
Total dividends and distributions to shareholders | (1.21 | ) | (0.83 | ) | ||||||||||||||||
Net asset value, end of period | $ | 50.94 | $ | 51.64 | ||||||||||||||||
TOTAL RETURN2 | 0.99 | % | 4.45 | % | ||||||||||||||||
RATIOS/SUPPLEMENTAL DATA: | ||||||||||||||||||||
Net assets, end of period (000’s omitted) | $ | 40,754 | $ | 30,986 | ||||||||||||||||
Ratios to average net assets of: | ||||||||||||||||||||
Expenses | 0.45 | % | 0.45 | %3 | ||||||||||||||||
Net investment income | 0.88 | % | 1.64 | %3 | ||||||||||||||||
Portfolio turnover rate4,5 | 430 | % | 278 | % | ||||||||||||||||
| WisdomTree Yield Enhanced U.S. Aggregate Bond Fund | For the Year Ended August 31, 2021 | For the Year Ended August 31, 2020 | For the Year Ended August 31, 2019 | For the Year Ended August 31, 2018 | For the Year Ended August 31, 2017 | |||||||||||||||
Net asset value, beginning of year | $ | 53.93 | $ | 52.71 | $ | 48.68 | $ | 50.94 | $ | 52.04 | ||||||||||
Investment operations: |
| |||||||||||||||||||
Net investment income1 | 0.85 | 1.28 | 1.61 | 1.53 | 1.35 | |||||||||||||||
Net realized and unrealized gain (loss) | (0.76 | ) | 1.38 | 4.05 | (2.26 | ) | (0.85 | ) | ||||||||||||
Total from investment operations | 0.09 | ^ | 2.66 | 5.66 | (0.73 | ) | 0.50 | |||||||||||||
Dividends and distributions to shareholders: |
| |||||||||||||||||||
Net investment income | (1.14 | ) | (1.44 | ) | (1.63 | ) | (1.53 | ) | (1.38 | ) | ||||||||||
Capital gains | (0.27 | ) | — | — | — | (0.22 | ) | |||||||||||||
Total dividends and distributions to shareholders | (1.41 | ) | (1.44 | ) | (1.63 | ) | (1.53 | ) | (1.60 | ) | ||||||||||
Net asset value, end of year | $ | 52.61 | $ | 53.93 | $ | 52.71 | $ | 48.68 | $ | 50.94 | ||||||||||
TOTAL RETURN2 | 0.18 | % | 5.14 | % | 11.92 | % | (1.44 | )% | 1.05 | % | ||||||||||
RATIOS/SUPPLEMENTAL DATA: |
| |||||||||||||||||||
Net assets, end of year (000’s omitted) | $ | 1,089,075 | $ | 1,315,856 | $ | 880,193 | $ | 418,662 | $ | 168,105 | ||||||||||
Ratios to average net assets of: |
| |||||||||||||||||||
Expenses, net of expense waivers | 0.12 | %6 | 0.12 | % | 0.12 | % | 0.12 | % | 0.12 | % | ||||||||||
Expenses, prior to expense waivers | 0.15 | % | 0.20 | % | 0.20 | % | 0.20 | % | 0.20 | % | ||||||||||
Net investment income | 1.61 | % | 2.43 | % | 3.25 | % | 3.10 | % | 2.69 | % | ||||||||||
Portfolio turnover rate4,7 | 148 | % | 88 | % | 54 | % | 82 | % | 134 | % | ||||||||||
| * | Commencement of operations. The commencement of operations date is considered to be the date that the Fund began trading in the secondary market. |
| ^ | The total from investment operations per share does not correspond with the amount reported within the Statements of Changes due to the timing of capital share transactions of Fund shares and fluctuating market values during the fiscal year. |
| 1 | Based on average shares outstanding. |
| 2 | Total return is calculated assuming an initial investment made at the net asset value at the beginning of the period, reinvestment of all dividends and distributions at net asset value during the period and redemption on the last day of the period. Total return calculated for a period of less than one year is not annualized. For the periods in which the investment advisor waived advisory fees for the WisdomTree Yield Enhanced U.S. Aggregate Bond Fund, the total return would have been lower if certain expenses had not been waived (Notes 2 and 3). |
| 3 | Annualized. |
| 4 | Portfolio turnover rate is not annualized for fiscal periods less than one year and excludes the value of the portfolio securities received or delivered as a result of in-kind creations or redemptions of the Fund’s capital shares. Short-term securities with maturities less than or equal to 365 days are excluded from the portfolio turnover calculation. |
| 5 | The portfolio turnover rates excluding TBA roll transactions for the periods ended August 31, 2021 and August 31, 2020 were 47% and 70%, respectively. |
| 6 | The investment advisor had contractually agreed to limit the advisory fee to 0.12% through December 31, 2020. On December 31, 2020, the contractual waiver expired and the advisory fee was permanently reduced to 0.12%. |
| 7 | The portfolio turnover rates excluding TBA roll transactions for the years ended August 31, 2021, August 31, 2020, August 31, 2019, August 31, 2018 and August 31, 2017, were 41%, 65%, 44%, 38% and 59%, respectively. |
See Notes to Financial Statements.
| 144 | WisdomTree Trust |
Table of Contents
Financial Highlights (continued)
WisdomTree Trust
Selected data for a share of beneficial interest outstanding throughout the period is presented below:
| WisdomTree Yield Enhanced U.S. Short-Term Aggregate Bond Fund | For the Year Ended August 31, 2021 | For the Year Ended August 31, 2020 | For the Year Ended August 31, 2019 | For the Year Ended August 31, 2018 | For the Period May 18, 2017* through August 31, 2017 | |||||||||||||||
Net asset value, beginning of period | $ | 51.60 | $ | 50.58 | $ | 48.88 | $ | 50.25 | $ | 50.06 | ||||||||||
Investment operations: |
| |||||||||||||||||||
Net investment income1 | 0.50 | 1.19 | 1.40 | 1.17 | 0.26 | |||||||||||||||
Net realized and unrealized gain (loss) | (0.14 | ) | 1.05 | 1.69 | (1.41 | ) | 0.17 | |||||||||||||
Total from investment operations | 0.36 | 2.24 | 3.09 | (0.24 | ) | 0.43 | ||||||||||||||
Dividends and distributions to shareholders: |
| |||||||||||||||||||
Net investment income | (0.51 | ) | (1.22 | ) | (1.39 | ) | (1.07 | ) | (0.24 | ) | ||||||||||
Capital gains | (0.22 | ) | — | — | (0.06 | ) | — | |||||||||||||
Total dividends and distributions to shareholders | (0.73 | ) | (1.22 | ) | (1.39 | ) | (1.13 | ) | (0.24 | ) | ||||||||||
Net asset value, end of period | $ | 51.23 | $ | 51.60 | $ | 50.58 | $ | 48.88 | $ | 50.25 | ||||||||||
TOTAL RETURN2 | 0.69 | % | 4.51 | % | 6.43 | % | (0.47 | )% | 0.86 | % | ||||||||||
RATIOS/SUPPLEMENTAL DATA: |
| |||||||||||||||||||
Net assets, end of year (000’s omitted) | $ | 199,802 | $ | 113,529 | $ | 91,052 | $ | 39,104 | $ | 5,025 | ||||||||||
Ratios to average net assets of: |
| |||||||||||||||||||
Expenses, net of expense waivers | 0.12 | %3 | 0.12 | % | 0.12 | % | 0.12 | % | 0.12 | %4 | ||||||||||
Expenses, prior to expense waivers | 0.15 | % | 0.20 | % | 0.20 | % | 0.20 | % | 0.20 | %4 | ||||||||||
Net investment income | 0.97 | % | 2.34 | % | 2.83 | % | 2.40 | % | 1.76 | %4 | ||||||||||
Portfolio turnover rate5,6 | 224 | % | 106 | % | 49 | % | 177 | % | 44 | % | ||||||||||
| WisdomTree Alternative Income Fund | For the Period May 6, 2021* through August 31, 2021 | |||||||||||||||||||
Net asset value, beginning of period | $ | 24.96 | ||||||||||||||||||
Investment operations: | ||||||||||||||||||||
Net investment income1 | 0.43 | |||||||||||||||||||
Net realized and unrealized gain | 0.40 | |||||||||||||||||||
Total from investment operations | 0.83 | |||||||||||||||||||
Net asset value, end of period | $ | 25.79 | ||||||||||||||||||
TOTAL RETURN2 | 3.33 | % | ||||||||||||||||||
RATIOS/SUPPLEMENTAL DATA: | ||||||||||||||||||||
Net assets, end of period (000’s omitted) | $ | 10,315 | ||||||||||||||||||
Ratios to average net assets7 of: | ||||||||||||||||||||
Expenses | 0.50 | %4 | ||||||||||||||||||
Net investment income | 5.39 | %4 | ||||||||||||||||||
Portfolio turnover rate5 | 2 | % | ||||||||||||||||||
| * | Commencement of operations. The commencement of operations date is considered to be the date that the Fund began trading in the secondary market. |
| 1 | Based on average shares outstanding. |
| 2 | Total return is calculated assuming an initial investment made at the net asset value at the beginning of the period, reinvestment of all dividends and distributions at net asset value during the period and redemption on the last day of the period. Total return calculated for a period of less than one year is not annualized. For the periods in which the investment advisor waived advisory fees for the WisdomTree Yield Enhanced U.S. Short-Term Aggregate Bond Fund, the total return would have been lower if certain expenses had not been waived (Notes 2 and 3). |
| 3 | The investment advisor had contractually agreed to limit the advisory fee to 0.12% through December 31, 2020. On December 31, 2020, the contractual waiver expired and the advisory fee was permanently reduced to 0.12%. |
| 4 | Annualized. |
| 5 | Portfolio turnover rate is not annualized for fiscal periods less than one year and excludes the value of the portfolio securities received or delivered as a result of in-kind creations or redemptions of the Fund’s capital shares. Short-term securities with maturities less than or equal to 365 days are excluded from the portfolio turnover calculation. |
| 6 | The portfolio turnover rates excluding TBA roll transactions for the periods ended August 31, 2021, August 31, 2020, August 31, 2019, August 31, 2018 and August 31, 2017 were 49%, 46%, 24%, 120% and 22%, respectively. |
| 7 | The ratios to average net assets do not include net investment income (loss) or expenses of other funds in which the Fund invests. |
See Notes to Financial Statements.
| WisdomTree Trust | 145 |
Table of Contents
Financial Highlights (continued)
WisdomTree Trust
Selected data for a share of beneficial interest outstanding throughout the period is presented below:
| WisdomTree CBOE S&P 500 PutWrite Strategy Fund | For the Year Ended August 31, 2021 | For the Year Ended August 31, 2020 | For the Year Ended August 31, 2019 | For the Year Ended August 31, 2018 | For the Year Ended August 31, 2017 | |||||||||||||||||||
Net asset value, beginning of year | $ | 26.64 | $ | 27.45 | $ | 30.57 | $ | 29.23 | $ | 27.05 | ||||||||||||||
Investment operations: | ||||||||||||||||||||||||
Net investment income (loss)1 | (0.11 | ) | 0.24 | 0.49 | 0.22 | 0.06 | ||||||||||||||||||
Net realized and unrealized gain (loss) | 6.67 | (0.63 | )2 | (1.96 | ) | 2.15 | 2.74 | |||||||||||||||||
Total from investment operations | 6.56 | (0.39 | ) | (1.47 | ) | 2.37 | 2.80 | |||||||||||||||||
Dividends and distributions to shareholders: | ||||||||||||||||||||||||
Net investment income | (0.41 | ) | (0.42 | ) | (0.25 | ) | (0.06 | ) | — | |||||||||||||||
Capital gains | — | — | (1.40 | ) | (0.97 | ) | (0.62 | ) | ||||||||||||||||
Total dividends and distributions to shareholders | (0.41 | ) | (0.42 | ) | (1.65 | ) | (1.03 | ) | (0.62 | ) | ||||||||||||||
Net asset value, end of year | $ | 32.79 | $ | 26.64 | $ | 27.45 | $ | 30.57 | $ | 29.23 | ||||||||||||||
TOTAL RETURN3 | 24.87 | % | (1.52 | )% | (4.72 | )% | 8.28 | % | 10.52 | % | ||||||||||||||
RATIOS/SUPPLEMENTAL DATA: |
| |||||||||||||||||||||||
Net assets, end of year (000’s omitted) | $ | 63,940 | $ | 117,225 | $ | 211,350 | $ | 238,434 | $ | 204,635 | ||||||||||||||
Ratios to average net assets of: | ||||||||||||||||||||||||
Expenses, net of expense waivers | 0.44 | %4 | 0.41 | %4 | 0.38 | % | 0.38 | % | 0.38 | % | ||||||||||||||
Expenses, prior to expense waivers | 0.44 | %4 | 0.44 | %4 | 0.44 | % | 0.44 | % | 0.44 | % | ||||||||||||||
Net investment income (loss) | (0.38 | )%4 | 0.90 | %4 | 1.78 | % | 0.76 | % | 0.21 | % | ||||||||||||||
Portfolio turnover rate5 | 18 | %6 | 72 | %6 | 0 | % | 0 | % | 0 | % | ||||||||||||||
| 1 | Based on average shares outstanding. |
| 2 | The amount of net realized and unrealized loss per share does not correspond with the amounts reported within the Statements of Changes due to the timing of capital share transactions of Fund shares and fluctuating market values during the fiscal year. |
| 3 | Total return is calculated assuming an initial investment made at the net asset value at the beginning of the period, reinvestment of all dividends and distributions at net asset value during the period and redemption on the last day of the period. Total return calculated for a period of less than one year is not annualized. For the periods in which the investment advisor waived advisory fees, the total return would have been lower if certain expenses had not been waived (Notes 2 and 3). |
| 4 | The ratios to average net assets do not include net investment income (loss) or expenses of other funds in which the Fund invests. |
| 5 | Portfolio turnover rate is not annualized for fiscal periods less than one year and excludes the value of the portfolio securities received or delivered as a result of in-kind creations or redemptions of the Fund’s capital shares. Short-term securities with maturities less than or equal to 365 days are excluded from the portfolio turnover calculation. |
| 6 | During the fiscal years ended August 31, 2021 and August 31, 2020, the Fund invested in the WisdomTree Floating Rate Treasury Fund which is considered a long-term security for purposes of computing the portfolio turnover rate. During the fiscal years ended August 31, 2021 and August 31, 2020, the WisdomTree Floating Rate Treasury Fund was the only long-term security held or transacted in the portfolio, as a result, the variability in the portfolio turnover rate was primarily driven by the transaction activity during the fiscal year for this security only (see the “Investment in Affiliates” supplementary table included in the Schedule of Investments for transaction activity related to this security for the current fiscal year). |
See Notes to Financial Statements.
| 146 | WisdomTree Trust |
Table of Contents
Financial Highlights (continued)
WisdomTree Trust
Selected data for a share of beneficial interest outstanding throughout the period is presented below:
| Post-Reorganization | Pre-Reorganization | |||||||||||||||||||||||||||
WisdomTree Enhanced Fund (consolidated)^ | For the Period December 19, 2020 through August 31, 2021 | For the Period January 1, 2020 through December 18, 2020 | For the Year Ended December 31, 2019 | For the Year Ended December 31, 2018 | For the Year Ended December 31, 2017 | For the Year Ended December 31, 2016 | ||||||||||||||||||||||
Net asset value, beginning of period | $ | 18.74 | $ | 18.80 | $ | 17.50 | $ | 19.25 | $ | 19.35 | $ | 18.56 | ||||||||||||||||
Investment operations: |
| |||||||||||||||||||||||||||
Net investment income (loss)1 | (0.08 | ) | (0.03 | ) | 0.23 | 0.18 | 0.00 | 2 | (0.16 | ) | ||||||||||||||||||
Net realized and unrealized gain (loss) | 3.46 | (0.03 | ) | 1.07 | (1.93 | ) | (0.10 | ) | 0.95 | |||||||||||||||||||
Net increase from payment by affiliate | 0.00 | 2 | 0.00 | 2 | — | — | — | — | ||||||||||||||||||||
Total from investment operations | 3.38 | (0.06 | ) | 1.30 | (1.75 | ) | (0.10 | ) | 0.79 | |||||||||||||||||||
Net asset value, end of period | $ | 22.12 | $ | 18.74 | $ | 18.80 | $ | 17.50 | $ | 19.25 | $ | 19.35 | ||||||||||||||||
TOTAL RETURN3 | 18.04 | %4 | (0.32 | )%4 | 7.43 | % | (9.09 | )% | (0.52 | )% | 4.26 | % | ||||||||||||||||
RATIOS/SUPPLEMENTAL DATA: | ||||||||||||||||||||||||||||
Net assets, end of period (000’s omitted) | $ | 193,552 | $ | 99,333 | $ | 127,836 | $ | 154,855 | $ | 154,956 | $ | 219,661 | ||||||||||||||||
Ratios to average net assets of: |
| |||||||||||||||||||||||||||
Expenses, net of expense waivers | 0.55 | %5,6 | 0.75 | %6 | 0.75 | % | 0.75 | % | 0.75 | % | 1.05 | % | ||||||||||||||||
Expenses, prior to expense waivers | 0.55 | %5,6 | 0.85 | %6 | 0.85 | % | 0.85 | % | 0.85 | % | 1.05 | % | ||||||||||||||||
Net investment income (loss) | (0.52 | )%5,6 | (0.18 | )%6 | 1.30 | % | 0.94 | % | 0.01 | % | (0.83 | )% | ||||||||||||||||
Portfolio turnover rate7 | 22 | %8 | 0 | % | 0 | % | 0 | % | 0 | % | 0 | % | ||||||||||||||||
| ^ | After the close of business on December 18, 2020, the WisdomTree Continuous Commodity Index Fund (the “Predecessor Fund”), a commodity pool that was not registered under the Investment Company Act of 1940, as amended (“1940 Act”), was reorganized into the WisdomTree Enhanced Commodity Strategy Fund (the “Successor Fund”), an investment company registered under the 1940 Act. The Successor Fund adopted the financial information for the Predecessor Fund. Accordingly, information presented prior to the close of business on December 18, 2020 is that of the Predecessor Fund prior to the reorganization into a regulated investment company under the 1940 Act. |
| 1 | Based on average shares outstanding. |
| 2 | Amount represents less than $0.005. |
| 3 | Total return is calculated assuming an initial investment made at the net asset value at the beginning of the period, reinvestment of all dividends and distributions at net asset value during the period and redemption on the last day of the period. Total return calculated for a period of less than one year is not annualized. For the periods in which the investment advisor (or the Managing Owner, with respect to the Predecessor Fund) waived advisory fees, the total return would have been lower if certain expenses had not been waived (Notes 2 and 3). |
| 4 | Includes a voluntary reimbursement from the advisor for brokerage commissions incurred in connection with the Reorganization. Excluding this voluntary reimbursement, total return would have been unchanged (Note 3). |
| 5 | The ratios to average net assets do not include net investment income (loss) or expenses of other funds in which the Fund invests. |
| 6 | Annualized. |
| 7 | Portfolio turnover rate is not annualized for fiscal periods less than one year and excludes the value of the portfolio securities received or delivered as a result of in-kind creations or redemptions of the Fund’s capital shares. Short-term securities with maturities less than or equal to 365 days are excluded from the portfolio turnover calculation. |
| 8 | During the fiscal period ended August 31, 2021, the Fund invested in the WisdomTree Floating Rate Treasury Fund which is considered a long-term security for purposes of computing the portfolio turnover rate. During the fiscal period ended August 31, 2021, the WisdomTree Floating Rate Treasury Fund was the only long-term security held or transacted in the portfolio, as a result, the variability in the portfolio turnover rate was primarily driven by the transaction activity during the fiscal period for this security only (see the “Investment in Affiliates” supplementary table included in the Schedule of Investments for transaction activity related to this security for the current fiscal period). |
See Notes to Financial Statements.
| WisdomTree Trust | 147 |
Table of Contents
Financial Highlights (concluded)
WisdomTree Trust
Selected data for a share of beneficial interest outstanding throughout the period is presented below:
| WisdomTree Managed Futures Strategy Fund (consolidated) | For the Year Ended August 31, 2021 | For the Year Ended August 31, 2020 | For the Year Ended August 31, 2019 | For the Year Ended August 31, 2018 | For the Year Ended August 31, 2017 | |||||||||||||||
Net asset value, beginning of year | $ | 35.31 | $ | 39.08 | $ | 40.57 | $ | 38.84 | $ | 41.12 | ||||||||||
Investment operations: |
| |||||||||||||||||||
Net investment income (loss)1 | (0.23 | ) | 0.17 | 0.55 | 0.26 | (0.07 | ) | |||||||||||||
Net realized and unrealized gain (loss) | 6.50 | (3.34 | ) | (0.65 | ) | 1.47 | (2.21 | ) | ||||||||||||
Net increase from payment by affiliate | 0.00 | 2 | — | — | — | — | ||||||||||||||
Total from investment operations | 6.27 | (3.17 | ) | (0.10 | ) | 1.73 | (2.28 | ) | ||||||||||||
Dividends to shareholders: |
| |||||||||||||||||||
Net investment income | (0.17 | ) | (0.60 | ) | (1.39 | ) | — | — | ||||||||||||
Net asset value, end of year | $ | 41.41 | $ | 35.31 | $ | 39.08 | $ | 40.57 | $ | 38.84 | ||||||||||
TOTAL RETURN3 | 17.83 | %6 | (8.17 | )% | (0.22 | )%4 | 4.45 | % | (5.54 | )%5 | ||||||||||
RATIOS/SUPPLEMENTAL DATA: |
| |||||||||||||||||||
Net assets, end of year (000’s omitted) | $ | 147,001 | $ | 112,993 | $ | 216,875 | $ | 160,250 | $ | 170,879 | ||||||||||
Ratios to average net assets of: |
| |||||||||||||||||||
Expenses, net of expense waivers | 0.65 | %7,8 | 0.65 | %7 | 0.65 | % | 0.65 | % | 0.65 | % | ||||||||||
Expenses, prior to expense waivers | 0.68 | %7 | 0.75 | %7 | 0.75 | % | 0.75 | % | 0.75 | % | ||||||||||
Net investment income (loss) | (0.60 | )%7 | 0.46 | %7 | 1.40 | % | 0.66 | % | (0.18 | )% | ||||||||||
Portfolio turnover rate9 | 25 | %10 | 97 | %10 | 0 | % | 0 | % | 0 | % | ||||||||||
| 1 | Based on average shares outstanding. |
| 2 | Amount represents less than $0.005. |
| 3 | Total return is calculated assuming an initial investment made at the net asset value at the beginning of the period, reinvestment of all dividends and distributions at net asset value during the period and redemption on the last day of the period. For the periods in which the investment advisor waived advisory fees, the total return would have been lower if certain expenses had not been waived (Notes 2 and 3). |
| 4 | Includes a voluntary reimbursement from the sub-advisor for investment losses on certain futures contract transactions during the period. Excluding this voluntary reimbursement, total return would have been unchanged. |
| 5 | Includes a voluntary reimbursement from the sub-advisor for investment losses on certain futures contract transactions during the period. Excluding this voluntary reimbursement, total return would have been 0.08% lower. |
| 6 | Includes a voluntary reimbursement from the sub-advisor for investment losses on certain futures contract transactions during the period. Excluding this voluntary reimbursement, total return would have been unchanged (Note 3). |
| 7 | The ratios to average net assets do not include net investment income (loss) or expenses of other funds in which the Fund invests. |
| 8 | The investment advisor had contractually agreed to limit the advisory fee to 0.65% through December 31, 2020. On December 31, 2020, the contractual waiver expired and the advisory fee was permanently reduced to 0.65%. |
| 9 | Portfolio turnover rate excludes the value of the portfolio securities received or delivered as a result of in-kind creations or redemptions of the Fund’s capital shares. Short-term securities with maturities less than or equal to 365 days are excluded from the portfolio turnover calculation. |
| 10 | During the fiscal years ended August 31, 2021 and August 31, 2020, the Fund invested in the WisdomTree Floating Rate Treasury Fund which is considered a long term security for purposes of computing the portfolio turnover rate. During the fiscal years ended August 31, 2021 and August 31, 2020, the WisdomTree Floating Rate Fund was the only long-term security held or transacted in the portfolio, as a result, the variability in the portfolio turnover was primarily driven by the transaction activity during the fiscal year for this security only (see the “Investment in Affiliates” supplementary table included in the Schedule of Investments for transaction activity related to this security for the current fiscal year). |
See Notes to Financial Statements.
| 148 | WisdomTree Trust |
Table of Contents
1. ORGANIZATION
WisdomTree Trust (the “Trust”) is registered under the Investment Company Act of 1940, as amended (the “1940 Act”), as an open-end management investment company. The Trust was established as a Delaware statutory trust on December 15, 2005 and is authorized to have multiple series of portfolios (each a “Fund”, collectively, the “Funds”). These notes relate only to the Funds listed below. In accordance with Accounting Standards Codification Topic 946, Financial Services-Investment Companies, each Fund listed below qualifies as an investment company and is applying the accounting and reporting guidance for investment companies.
| Fund | Commencement of Operations | |||
WisdomTree Bloomberg U.S. Dollar Bullish Fund (“U.S. Dollar Bullish Fund” and also referred to herein as “Currency Strategy Funds”) | December 18, 2013 | |||
WisdomTree Chinese Yuan Strategy Fund (“Chinese Yuan Strategy Fund” and also referred to herein as “Currency Strategy Funds”) | May 14, 2008 | |||
WisdomTree Emerging Currency Strategy Fund (“Emerging Currency Strategy Fund” and also referred to herein as “Currency Strategy Funds”) | May 6, 2009 | |||
WisdomTree Emerging Markets Corporate Bond Fund (“Emerging Markets Corporate Bond Fund”) | March 8, 2012 | |||
WisdomTree Emerging Markets Local Debt Fund (“Emerging Markets Local Debt Fund”) | August 9, 2010 | |||
WisdomTree Floating Rate Treasury Fund (“Floating Rate Treasury Fund”) | February 4, 2014 | |||
WisdomTree Interest Rate Hedged High Yield Bond Fund (“Interest Rate Hedged High Yield Bond Fund” and also referred to herein as “Duration Funds”) | December 18, 2013 | |||
WisdomTree Interest Rate Hedged U.S. Aggregate Bond Fund (“Interest Rate Hedged U.S. Aggregate Bond Fund” and also referred to herein as “Duration Funds”) | December 18, 2013 | |||
WisdomTree Mortgage Plus Bond Fund (“Mortgage Plus Bond Fund”) | November 14, 2019 | |||
WisdomTree Yield Enhanced U.S. Aggregate Bond Fund (“Yield Enhanced U.S. Aggregate Bond Fund”) | July 9, 2015 | |||
WisdomTree Yield Enhanced U.S. Short-Term Aggregate Bond Fund (“Yield Enhanced U.S. Short-Term Aggregate Bond Fund”) | May 18, 2017 | |||
WisdomTree Alternative Income Fund (“Alternative Income Fund”) | May 6, 2021 | |||
WisdomTree CBOE S&P 500 PutWrite Strategy Fund (“CBOE S&P 500 PutWrite Strategy Fund”) | February 24, 2016 | |||
WisdomTree Enhanced Commodity Strategy Fund (“Enhanced Commodity Strategy Fund”) (consolidated) (predecessor, WisdomTree Continuous Commodity Index Fund) | January 23, 2008 | * | ||
WisdomTree Managed Futures Strategy Fund (“Managed Futures Strategy Fund”) (consolidated) | January 5, 2011 | |||
| * | Commencement of operations date shown is that of the predecessor fund. After the close of business December 18, 2020, the predecessor fund was reorganized into the Enhanced Commodity Strategy Fund. |
Each Fund, except for the U.S. Dollar Bullish Fund, Chinese Yuan Strategy Fund, Emerging Currency Strategy Fund, Emerging Markets Corporate Bond Fund, Emerging Markets Local Debt Fund, Mortgage Plus Bond Fund, Enhanced Commodity Strategy Fund and Managed Futures Strategy Fund, seeks to track the price and yield performance, before fees and expenses, of a particular index (“Index”) developed by WisdomTree Investments, Inc. (“WisdomTree Investments”) or an Index developed by a third party. The U.S. Dollar Bullish Fund, Chinese Yuan Strategy Fund, Emerging Currency Strategy Fund, Emerging Markets Corporate Bond Fund, Emerging Markets Local Debt Fund, Mortgage Plus Bond Fund, Enhanced Commodity Strategy Fund and Managed Futures Strategy Fund are each actively managed. WisdomTree Investments is the parent company of WisdomTree Asset Management, Inc. (“WTAM”), the investment adviser to each Fund and the Trust. “WisdomTree” is a registered trademark of WisdomTree Investments and has been licensed for use by the Trust. Each Fund described herein is considered to be non-diversified as defined under the 1940 Act.
The Enhanced Commodity Strategy Fund (the “Successor Fund”) acquired all of the assets totaling $101,247,117 and all of the stated liabilities totaling $1,914,541 having a net asset value of $99,332,576 of the WisdomTree Continuous Commodity Index Fund (the “Predecessor Fund”) after the close of business on December 18, 2020 (the “Reorganization”). The Predecessor Fund was a commodity pool organized as a Delaware statutory trust on October 27, 2006. Shareholders in the Predecessor Fund each received 1 share of the Successor Fund in exchange for 1 share of the Predecessor Fund each having a net value per share equivalent to the net asset value per share of the Predecessor Fund at the close of business on December 18, 2020. The Predecessor Fund was not registered as an investment company under the Investment Company Act of 1940, as amended, and was not required to register under such Act. The Successor Fund adopted the financial information of the Predecessor Fund as the Predecessor Fund was determined to be the accounting survivor. Accordingly, the information presented prior to the Reorganization is that of the Predecessor Fund.
In the normal course of business, the Funds may enter into contracts that contain a variety of representations or that provide indemnification for certain liabilities. The Funds’ maximum exposure under these arrangements is unknown, as this would involve future claims that may be made against the Funds that have not yet occurred. However, the Funds have not had prior claims or losses pursuant to these contracts and believes such exposure to be remote.
2. SIGNIFICANT ACCOUNTING POLICIES
The Financial Accounting Standards Board (“FASB”) Accounting Standards Codification (the “Codification”) is the exclusive reference of authoritative U.S. generally accepted accounting principles (“GAAP”) recognized by the FASB to be applied by
| WisdomTree Trust | 149 |
Table of Contents
Notes to Financial Statements (continued)
nongovernmental entities. Rules and interpretive releases of the Securities and Exchange Commission (“SEC”) under authority of federal laws are also sources of authoritative GAAP for SEC registrants.
The following is a summary of significant accounting policies followed by the Funds:
Basis of Consolidation — The financial statements of the Enhanced Commodity Strategy Fund and Managed Futures Strategy Fund (each a “Parent Fund”), include the accounts of WisdomTree Enhanced Commodity Strategy Portfolio I and WisdomTree Managed Futures Portfolio I, respectively, each a wholly-owned and controlled Cayman Islands subsidiary (each a “Subsidiary”). For each Parent Fund, the accompanying financial statements reflect the financial position and results of operations on a consolidated basis with its Subsidiary. All intercompany accounts and transactions have been eliminated in consolidation. Each Parent Fund seeks to gain exposure to commodity markets, in whole or in part, through investments in its Subsidiary. Each Parent Fund’s investment in its Subsidiary may not exceed 25% of the respective Parent Fund’s total assets at the end of each fiscal quarter in order to meet the requirements for qualification as a regulated investment company under the Internal Revenue Code of 1986, as amended (the “Code”).
Use of Estimates — The preparation of financial statements in conformity with GAAP, requires management to make certain estimates and assumptions that affect the reported amounts of assets and liabilities and disclosure of contingent assets and liabilities at the date of the financial statements and the reported amounts of increases and decreases in the net assets from operations during the reporting period. Actual results could differ from those estimates.
Investment Valuation — The net asset value (“NAV”) of each Fund’s shares is calculated each day a Fund is open for business as of the regularly scheduled close of regular trading on the New York Stock Exchange, normally 4:00 p.m. Eastern time (the “NAV Calculation Time”). NAV per share is calculated by dividing a Fund’s net assets by the number of Fund shares outstanding. Each Fund issues and redeems shares at NAV only in large blocks of shares known as creation units, which only certain institutions (e.g., broker-dealers) may purchase or redeem. Shares of each Fund are listed on a national securities exchange and trade at market prices. Most investors will buy and sell shares in the secondary market through brokers. Because Fund shares trade at market prices rather than NAV, shares may trade at a price greater than NAV or less than NAV. In calculating each Fund’s NAV, investments are valued under policies approved by the Board of Trustees of the Trust (the “Board of Trustees”). Fixed income securities (including short-term debt securities with remaining maturities of 60 days or less and to-be-announced (“TBA”) securities) generally are valued at current market quotations or mean prices obtained from broker-dealers or independent pricing service providers. Broker-dealers or independent pricing service providers, in determining the value of securities, may consider such factors as recent transactions, indications from yields and quoted prices from broker-dealers on similar securities, and market sentiment for the type of security. U.S. fixed income securities may be valued as of the announced closing time for such securities on any day that the Securities Industry and Financial Markets Association announces an early closing time. Repurchase agreements are valued at par which represents their fair value. Except for U.S. Dollar Bullish Fund, foreign currency contracts that settle within two business days after the trade date (“Spot Contracts”) and foreign currency contracts having a settlement period greater than two business days after the trade date (“Forward Contracts”) are valued daily using WM/Reuters closing spot and forward rates, respectively, as of 4:00 p.m. London time for all Funds except for Forward Contracts in certain Asian currencies (Chinese renminbi, Chinese yuan, Hong Kong dollar, Indian rupee, Indonesian rupiah, Malaysian ringgit, Philippine peso, Singapore dollar, South Korean won, New Taiwan dollar, and the Thai baht) which are valued daily using WM/Reuters closing forward rates as of 2:00 p.m. Singapore time. U.S. Dollar Bullish Fund uses WM/Reuters closing spot and forward rates as of 4:00 p.m. Eastern time to value foreign currency contracts daily. Futures contracts generally are valued at the settlement price, the price at which a futures contract settles once a given trading day has ended, on the primary exchange on which they trade. Option contracts generally are valued at the mean of the closing bid/ask price on the primary exchange on which they trade. Equity securities (including preferred stock) traded on any recognized U.S. or non-U.S. exchange are valued at the last sale price or official closing price on the exchange on which they are principally traded. Unlisted equity securities (including preferred stock) are valued at the last sale price or, if no sale price is available, at the mean between the highest bid and lowest ask price. Each Fund may invest in money market funds which are valued at their NAV per share and exchange-traded funds (“ETFs” or “ETF”), or exchange-traded notes (“ETNs” or “ETN”) or closed-end mutual funds (“CEF” or “CEFs”) which are valued at their last sale or official closing price on the exchange on which they are principally traded or at their NAV per share in instances where the ETF, ETN or CEF has not traded on its principal exchange.
In certain instances, such as when reliable market valuations are not readily available, a Fund’s investments, which include derivatives, will be fair valued in accordance with the Fund’s pricing policy. The Board of Trustees has established a pricing committee (the “Pricing Committee”) which is comprised of senior representatives of WTAM and which reports to the Board of Trustees on a quarterly basis. In the event that a financial instrument cannot be valued based upon a price from a national securities exchange, independent pricing service provider or broker-dealer quotation, or such prices are deemed to not reflect current market value, the Pricing Committee may value the financial instrument in good faith under the policies and procedures approved by the Board of Trustees based on current facts and circumstances. Securities that may be valued using “fair value” pricing may include, but are not limited to, securities for which there are no current market quotations, securities whose issuer is in default or bankruptcy, securities subject to corporate actions (such as mergers or reorganizations), securities subject to non-U.S. investment limits or currency
| 150 | WisdomTree Trust |
Table of Contents
Notes to Financial Statements (continued)
controls, and securities affected by “significant events.” An example of a significant event is an event occurring after the close of the market in which a security trades but before a Fund’s next NAV Calculation Time that may materially affect the value of a Fund’s investment (e.g., government action, natural disaster, or significant market fluctuation). When fair value pricing is employed, the prices of securities used by a Fund to calculate its NAV may differ from quoted or published prices for the same securities.
Fair Value Measurement — In accordance with Codification Topic 820 (“ASC 820”), Fair Value Measurements and Disclosures, fair value is defined as the price that would be received to sell an asset or paid to transfer a liability in an orderly transaction between market participants at the measurement date. The Pricing Committee will perform other procedures (consistent with GAAP) to value an investment when a market quote is not available. ASC 820 established a three-tier hierarchy of inputs to be used when determining fair value measurements for disclosure purposes. Inputs refer broadly to the assumptions that market participants would use in pricing the asset or liability, including assumptions about risk — for example, the risk inherent in a particular valuation technique used to measure fair value (such as a pricing model) and/or the risk inherent in the inputs to the valuation technique. Inputs may be observable or unobservable. Observable inputs reflect the assumptions market participants would use in pricing the asset or liability. Observable inputs are based on market data obtained from sources independent of the reporting entity. Unobservable inputs reflect the reporting entity’s own assumptions about the assumptions market participants would use in pricing the asset or liability. Unobservable inputs are based on the best information available in the circumstances. The three-tier hierarchy of inputs is summarized in the three broad levels listed below:
Level 1 – quoted prices in active markets for identical securities
Level 2 – other significant observable inputs (including quoted prices for similar securities, interest rates,
prepayment speeds, credit risk, etc.)
Level 3 – significant unobservable inputs (including each Fund’s assumptions in determining the fair value of investments)
The inputs or methodology used for valuation are not necessarily an indication of the risk associated with investing in those investments.
Investments that use Level 2 or Level 3 inputs may include, but are not limited to: (i) an unlisted security related to corporate actions; (ii) a restricted security (e.g., one that may not be publicly sold without registration under the Securities Act of 1933, as amended); (iii) a security whose trading has been suspended (either due to events affecting the issuer of the security specifically or events affecting the primary trading exchange more broadly) or which has been de-listed from its primary trading exchange; (iv) a security that is thinly traded; (v) a security in default or bankruptcy proceedings for which there is no current market quotation or market activity; (vi) a security affected by currency controls or restrictions; and (vii) a security affected by a significant event (e.g., an event that occurs after the close of the markets in which the security is traded but before the time as of which a Fund’s NAV is computed and that may materially affect the value of the Fund’s investments).
The valuation techniques and significant inputs used in determining the fair market value measurements for Level 2 and Level 3 positions are as follows:
Financial instruments, such as fixed income securities, are generally valued by independent pricing service providers that use broker-dealer quotations, reported trades or valuation estimates from their internal pricing models. Depending on the type of financial instrument, the independent pricing service providers’ internal pricing models may use inputs that are observable such as issuer details (e.g., credit rating, debt ranking, coupon date, maturity date, etc.), interest rates, yield curves, prepayment speeds, credit risks/spreads, default rates and quoted prices for similar assets. Financial instruments that use similar valuation techniques and observable inputs as described above and have an appropriate level of market activity are categorized as Level 2 of the fair value hierarchy, otherwise a Level 3 fair value classification is appropriate. Over-the-counter financial derivative instruments derive their value from underlying asset prices, indices, reference rates, and other inputs or a combination of these factors. These instruments are normally valued on the basis of broker-dealer quotations or prices obtained from independent pricing service providers. Depending on the product and the terms of the transaction, the value of the financial derivative instruments can be estimated by an independent pricing service provider using a series of techniques including simulation pricing models. The pricing models may use inputs that are observed from actively quoted markets such as issuer details, indices, credit risks/spreads, interest rates, yield curves, default and exchange rates. Derivative contracts that use similar valuation techniques and observable inputs as described above and have an appropriate level of market activity are categorized as Level 2 of the fair value hierarchy, otherwise a Level 3 fair value classification is appropriate.
Determination of a fair value by the Pricing Committee may include significant unobservable inputs and therefore such financial instruments would be reflected as a Level 3 of the fair value hierarchy. The Pricing Committee may employ a market-based valuation approach which may use, among other potential considerations, related or comparable securities, recent transactions, market multiples, and other relevant information to determine fair value. The Pricing Committee may also use an income-based valuation approach in which anticipated future cash flows of the financial instrument are discounted to calculate fair value.
| WisdomTree Trust | 151 |
Table of Contents
Notes to Financial Statements (continued)
The summary of fair valuations according to the inputs used in valuing each Fund’s assets as of the measurement date is included in a “Fair Valuation Summary” supplementary table in each applicable Fund’s Schedule of Investments.
During the fiscal year or period ended August 31, 2021, there were no significant transfers into or out of Level 3 of the fair value hierarchy.
Derivatives and Hedging Disclosure — Codification Topic 815 (“ASC 815”), Derivatives and Hedging, requires qualitative disclosures about objectives and strategies for using derivatives, quantitative disclosures about fair value amounts as well as gains and losses on derivative instruments, and disclosures about credit-risk-related contingent features in derivative agreements. The Funds have invested in derivatives, specifically foreign currency contracts, foreign currency futures contracts, commodity futures contracts, interest rate futures contracts, equity futures contracts and equity options contracts during the fiscal year or period ended August 31, 2021 and open positions in such derivatives as of August 31, 2021 are detailed in each Fund’s Schedule of Investments. All of the derivative instruments disclosed and described herein are subject to credit risk. Credit risk is where the financial condition of an issuer of a security or instrument may cause it to default or become unable to pay interest or principal due on the security or where the counterparty to a derivative contract might default on its obligations. The Funds’ derivative agreements may also contain credit-risk related contingent features which include, but are not limited to, a percentage decline in the Funds’ NAV over a specified time period. If an event occurred at August 31, 2021 that triggered a contingent feature, the counterparty to the agreement may require the Funds to post additional collateral or terminate the derivative positions and demand payment. Any collateral posted with respect to the derivative positions would be used to offset or reduce the payment. The maximum exposure to derivatives agreements with credit-risk related contingent features would be the total value of derivatives in net liability positions for each Fund, as disclosed in the table included in Note 2—Master Netting Arrangements. Information with respect to the amounts and types of collateral received and/or posted for derivative instruments as of August 31, 2021, if any, is reflected as a footnote within each Fund’s Schedule of Investments.
As of August 31, 2021, the effects of such derivative instruments on each Fund’s financial position as reflected in the Statements of Assets and Liabilities are presented in the summary below:
| Asset Derivatives | Liability Derivatives | |||||||||||
| Fund | Balance Sheet Location | Value | Balance Sheet Location | Value | ||||||||
U.S. Dollar Bullish Fund | ||||||||||||
Foreign currency risk | Unrealized appreciation on foreign currency contracts | $ | 855,222 | Unrealized depreciation on foreign currency contracts | $ | 138,445 | ||||||
Chinese Yuan Strategy Fund | ||||||||||||
Foreign currency risk | Unrealized appreciation on foreign currency contracts | 144,520 | Unrealized depreciation on foreign currency contracts | 76,809 | ||||||||
Emerging Currency Strategy Fund | ||||||||||||
Foreign currency risk | Unrealized appreciation on foreign currency contracts | 172,547 | Unrealized depreciation on foreign currency contracts | 69,521 | ||||||||
Emerging Markets Corporate Bond Fund | ||||||||||||
Interest rate risk | Unrealized appreciation on futures contracts* | 10,175 | Unrealized depreciation on futures contracts* | 31,028 | ||||||||
Emerging Markets Local Debt Fund | ||||||||||||
Foreign currency risk | Unrealized appreciation on foreign currency contracts | 17,853 | Unrealized depreciation on foreign currency contracts | 225,853 | ||||||||
Interest Rate Hedged High Yield Bond Fund | ||||||||||||
Interest rate risk | Unrealized appreciation on futures contracts* | — | Unrealized depreciation on futures contracts* | 305,967 | ||||||||
Interest Rate Hedged U.S. Aggregate Bond Fund | ||||||||||||
Interest rate risk | Unrealized appreciation on futures contracts* | — | Unrealized depreciation on futures contracts* | 416,041 | ||||||||
Mortgage Plus Bond Fund | ||||||||||||
Interest rate risk | Unrealized appreciation on futures contracts* | 781 | Unrealized depreciation on futures contracts* | 6,902 | ||||||||
CBOE S&P 500 PutWrite Strategy Fund | ||||||||||||
Equity risk | Written options, at value | 265,350 | ||||||||||
Enhanced Commodity Strategy Fund (consolidated) | ||||||||||||
Commodity risk | Unrealized appreciation on futures contracts* | 16,131,586 | Unrealized depreciation on futures contracts* | 5,882,810 | ||||||||
| 152 | WisdomTree Trust |
Table of Contents
Notes to Financial Statements (continued)
| Asset Derivatives | Liability Derivatives | |||||||||||
| Fund | Balance Sheet Location | Value | Balance Sheet Location | Value | ||||||||
Managed Futures Strategy Fund (consolidated) | ||||||||||||
Commodity risk | Unrealized appreciation on futures contracts* | $ | 648,148 | Unrealized depreciation on futures contracts* | $ | 421,986 | ||||||
Equity risk | Unrealized appreciation on futures contracts* | 1,527,349 | Unrealized depreciation on futures contracts* | 76,138 | ||||||||
Foreign currency risk | Unrealized appreciation on futures contracts* | — | Unrealized depreciation on futures contracts* | 2,240 | ||||||||
Interest rate risk | Unrealized appreciation on futures contracts* | — | Unrealized depreciation on futures contracts* | 110,547 | ||||||||
| * | Includes cumulative appreciation (depreciation) of futures contracts as reported in each Fund’s Schedule of Investments. Only current day’s variation margin is reported within the Statements of Assets and Liabilities. Please see Note 2 (Futures Contracts) on page 156 for additional information regarding balance sheet location of balances associated with futures contracts. |
For the fiscal year or period ended August 31, 2021, the effects of derivative instruments on each applicable Fund’s financial performance as reflected in the Statements of Operations are presented in the summary below:
| Fund | Amount of Realized Gain or (Loss) on Derivatives Recognized1 | Change in Unrealized (Depreciation) on | ||||||
U.S. Dollar Bullish Fund |
| |||||||
Foreign currency risk | $(2,823,672) | $ | 1,985,485 | |||||
Chinese Yuan Strategy Fund |
| |||||||
Foreign currency risk | 3,481,247 | (766,938 | ) | |||||
Emerging Currency Strategy Fund |
| |||||||
Foreign currency risk | 511,502 | 74,208 | ||||||
Emerging Markets Corporate Bond Fund |
| |||||||
Interest rate risk | 141,658 | (29,531 | ) | |||||
Emerging Markets Local Debt Fund |
| |||||||
Foreign currency risk | 291,961 | (305,833 | ) | |||||
Interest Rate Hedged High Yield Bond Fund |
| |||||||
Interest rate risk | 700,661 | (262,936 | ) | |||||
Interest Rate Hedged U.S. Aggregate Bond Fund |
| |||||||
Interest rate risk | (451,575 | ) | (374,340 | ) | ||||
Mortgage Plus Bond Fund |
| |||||||
Interest rate risk | 133,841 | (16,127 | ) | |||||
Yield Enhanced U.S. Short-Term Aggregate Bond Fund | ||||||||
Interest rate risk | (400 | ) | 586 | |||||
CBOE S&P 500 PutWrite Strategy Fund |
| |||||||
Equity risk | 22,767,275 | (522,269 | ) | |||||
Enhanced Commodity Strategy Fund (consolidated) |
| |||||||
Commodity risk3 | 11,589,626 | 10,248,776 | ||||||
Commodity risk4 | 1,642,503 | (6,162,155 | ) | |||||
Managed Futures Strategy Fund (consolidated) |
| |||||||
Commodity risk | 19,669,287 | (180,884 | ) | |||||
Equity risk | (512,007 | ) | 1,451,211 | |||||
Foreign currency risk | 280,305 | (51,647 | ) | |||||
Interest rate risk | (155,798 | ) | 29,397 | |||||
| 1 | Realized gains (losses) on derivatives are located on the Statements of Operations as follows: |
Commodity risk | Net realized gain (loss) from futures contracts | |
Equity risk | Net realized gain (loss) from written options | |
| Net realized gain (loss) from futures contracts | ||
Foreign currency risk | Net realized gain (loss) from foreign currency contracts | |
| Net realized gain (loss) from futures contracts | ||
Interest rate risk | Net realized gain (loss) from futures contracts |
| WisdomTree Trust | 153 |
Table of Contents
Notes to Financial Statements (continued)
| 2 | Change in unrealized appreciation (depreciation) is located on the Statements of Operations as follows: |
Commodity contracts | Net increase (decrease) in unrealized appreciation/depreciation from futures contracts | |
Equity risk | Net increase (decrease) in unrealized appreciation/depreciation from written options | |
| Net increase (decrease) in unrealized appreciation/depreciation from futures contracts | ||
Foreign currency risk | Net increase (decrease) in unrealized appreciation/depreciation from foreign currency contracts | |
| Net increase (decrease) in unrealized appreciation/depreciation from futures contracts | ||
Interest rate risk | Net increase (decrease) in unrealized appreciation/depreciation from futures contracts |
| 3 | For the period December 19, 2020 (post-reorganization) through August 31, 2021. |
| 4 | For the period January 1, 2020 (pre-reorganization) through December 18, 2020. |
During the fiscal year or period ended August 31, 2021, the volume of derivative activity (based on the average of month-end balances, except where footnoted) for each Fund was as follows:
| Average Notional | ||||||||||||||||||||
| Fund | Foreign currency contracts (to deliver USD) | Foreign currency contracts (to receive USD) | Futures contracts (long) | Futures contracts (short) | Written options | |||||||||||||||
U.S. Dollar Bullish Fund |
| |||||||||||||||||||
Foreign currency risk | $ | 107,080,082 | $ | 205,676,032 | $ | — | $ | — | $ | — | ||||||||||
Chinese Yuan Strategy Fund |
| |||||||||||||||||||
Foreign currency risk | 55,699,146 | 15,015,112 | — | — | — | |||||||||||||||
Emerging Currency Strategy Fund |
| |||||||||||||||||||
Foreign currency risk | 19,177,009 | 4,864,118 | — | — | — | |||||||||||||||
Emerging Markets Corporate Bond Fund |
| |||||||||||||||||||
Interest rate risk | — | — | 8,080,376 | 8,138,689 | — | |||||||||||||||
Emerging Markets Local Debt Fund |
| |||||||||||||||||||
Foreign currency risk | 8,243,013 | 2,409,107 | — | — | — | |||||||||||||||
Interest Rate Hedged High Yield Bond Fund |
| |||||||||||||||||||
Interest rate risk | — | — | 3,721,709 | 115,442,460 | — | |||||||||||||||
Interest Rate Hedged U.S. Aggregate Bond Fund |
| |||||||||||||||||||
Interest rate risk | — | — | — | 148,502,799 | — | |||||||||||||||
Mortgage Plus Bond Fund |
| |||||||||||||||||||
Interest rate risk | — | — | 882,728 | 1,682,793 | — | |||||||||||||||
Yield Enhanced U.S. Short-Term Aggregate Bond Fund |
| |||||||||||||||||||
Interest rate risk1 | — | — | — | 96,902 | — | |||||||||||||||
CBOE S&P 500 PutWrite Strategy Fund |
| |||||||||||||||||||
Equity risk | — | — | — | — | 98,902,615 | |||||||||||||||
Enhanced Commodity Strategy Fund (consolidated) |
| |||||||||||||||||||
Commodity risk2 | — | — | 170,959,079 | 12,390,643 | — | |||||||||||||||
Commodity risk3 | — | — | 88,818,556 | — | — | |||||||||||||||
Managed Futures Strategy Fund (consolidated) |
| |||||||||||||||||||
Commodity risk | — | — | 55,831,353 | 2,949,721 | — | |||||||||||||||
Equity risk | — | — | 12,338,245 | — | — | |||||||||||||||
Foreign currency risk | 4,170,334 | 3,418,425 | 23,413,427 | 950,145 | — | |||||||||||||||
Interest rate risk | — | — | 3,233,047 | 7,932,892 | — | |||||||||||||||
| 1 | The volume of derivatives for the period is based on intra-month balances. |
| 2 | For the period December 19, 2020 (post-reorganization) through August 31, 2021. |
| 3 | For the period January 1, 2020 (pre-reorganization) through December 18, 2020. |
Investment Transactions and Investment Income — Investment transactions are recorded as of the date that the securities are purchased or sold (trade date). Realized gains and losses on sales of portfolio securities are calculated using the identified-cost method. Interest income (including amortization of premiums and accretion of discounts), net of any foreign taxes withheld, is accrued daily. Generally,
| 154 | WisdomTree Trust |
Table of Contents
Notes to Financial Statements (continued)
amortization of premiums and accretion of discounts are recognized daily using the effective interest method (also known as scientific amortization method). Payment-in-kind (“PIK”) interest income is accrued daily and the increase in a security’s principal amount related to such PIK interest income is recorded on the coupon payment date. Dividend income is recognized on the ex-dividend date. On each measurement date, the Funds evaluate the collectability of receivable balances. Generally, the Funds will write-off interest receivable balances in default by the issuer as of the date any applicable interest payment grace period or forbearance period expires or as of the date any interest payment cancellation notification was publicly made available or when it becomes probable that interest will not be collected and the amount of uncollectable interest can be reasonably estimated.
Foreign Currency Translation — The accounting records of the Funds are maintained in U.S. dollars. Foreign currencies, as well as investment securities and other assets and liabilities denominated in foreign currencies, are translated into U.S. dollars using exchange rates prevailing on the respective dates of such transactions that are deemed appropriate by WTAM. Realized and unrealized foreign exchange gains and losses on investments are included as a component of “net realized gain (loss) from investment transactions” and “net increase (decrease) in unrealized appreciation/depreciation from investment transactions”, respectively, on the Statements of Operations. Realized and unrealized foreign exchange gains or losses from foreign currency contracts are included in “net realized gain (loss) from foreign currency contracts” and “net increase (decrease) in unrealized appreciation/depreciation from foreign currency contracts”, respectively, on the Statements of Operations. Realized and unrealized foreign exchange gains or losses arising from sales of foreign currencies, currency gains or losses recognized between the trade and settlement dates on investment transactions, and the difference between the amounts of dividends/interest and foreign withholding taxes recorded on the Funds’ books and the U.S. dollar equivalent of the amounts actually received or paid are included in “net realized gain (loss) from foreign currency related transactions” and/or “net increase (decrease) in unrealized appreciation/depreciation from translation of assets and liabilities denominated in foreign currencies” in the Statements of Operations. Certain foreign exchange gains and losses included in realized and unrealized gains or losses are included in, or are a reduction of, ordinary income in accordance with U.S. Federal income tax regulations.
Expenses — Under the investment advisory agreement for each Fund, except for Funds that commenced operations on or after March 26, 2013, WTAM has agreed to pay all expenses of the Trust, except for: (i) brokerage expenses and other expenses (such as stamp taxes) connected with the execution of portfolio transactions or in connection with creation and redemption transactions; (ii) legal fees or expenses in connection with any arbitration, litigation or pending or threatened arbitration or litigation, including any settlements in connection therewith; (iii) compensation and expenses of trustees who are not interested persons of the Funds (“Independent Trustees”); (iv) compensation and expenses of counsel to the Independent Trustees; (v) compensation and expenses of the Trust’s Chief Compliance Officer (“CCO”); (vi) extraordinary expenses; (vii) distribution fees and expenses paid by the Trust under any distribution plan adopted pursuant to Rule 12b-1 under the 1940 Act; and (viii) the advisory fee payable to WTAM.
Under the investment advisory agreement for Funds that commenced operations on or after March 26, 2013, WTAM has agreed to pay all expenses of the Trust, except for: (i) brokerage expenses and other fees, charges, taxes, levies or expenses (such as stamp taxes) incurred in connection with the execution of portfolio transactions or in connection with creation and redemption transactions (including without limitation any fees, charges, taxes, levies or expenses related to the purchase or sale of an amount of any currency, or the patriation or repatriation of any security or other asset, related to the execution of portfolio transactions or any creation or redemption transactions); (ii) legal fees or expenses in connection with any arbitration, litigation or pending or threatened arbitration or litigation, including any settlements in connection therewith; (iii) compensation and expenses of each Independent Trustee; (iv) compensation and expenses of counsel to the Independent Trustees; (v) compensation and expenses of the Trust’s CCO; (vi) extraordinary expenses (in each case as determined by a majority of the Independent Trustees); (vii) distribution fees and expenses paid by the Trust under any distribution plan adopted pursuant to Rule 12b-1 under the 1940 Act; (viii) interest and taxes of any kind or nature (including, but not limited to, income, excise, transfer and withholding taxes); (ix) fees and expenses related to the provision of securities lending services; and (x) the advisory fee payable to WTAM.
Acquired fund fees and expenses (“AFFEs”) (which are fees and expenses incurred indirectly by a Fund through its investments in certain underlying investment companies) are not operating expenses of the Funds and are not paid by WTAM.
Pursuant to a separate contractual arrangement, WTAM arranges for the provision of CCO services with respect to each Fund, and is liable and responsible for, and administers, payments to the CCO, the Independent Trustees and counsel to the Independent Trustees. WTAM receives a fee, as shown on the Statements of Operations under “Service fees”, of up to 0.0044% per annum of each Fund’s average daily net assets for providing such services and paying such expenses. WTAM provides CCO services to the Trust.
Repurchase Agreements — Each Fund may enter into repurchase agreements with counterparties that are deemed to present acceptable credit risks. A repurchase agreement is a transaction in which a Fund acquires securities or other obligations as collateral from a commercial bank or securities broker-dealer and simultaneously commits to resell them to the counterparty at an agreed upon date or upon demand and at a price reflecting a market rate of interest unrelated to the coupon rate or maturity of the acquired obligations. This is designed to result in a fixed rate of return for the Fund insulated from market fluctuations during the holding period. Each Fund maintains custody of the acquired collateral prior to their repurchase, either through its regular custodian or through a special “tri-party” custodian or sub-custodian that maintains separate accounts for both the Fund and the
| WisdomTree Trust | 155 |
Table of Contents
Notes to Financial Statements (continued)
counterparty. Because repurchase agreements are collateralized by securities, they are subject to market and credit risk on the acquired collateral in addition to counterparty credit risk. The acquired collateral is valued on a daily basis at fair value to ensure that the value, including accrued interest, is at least equal to the repurchase price. If the acquired collateral declines in value and becomes less than the repurchase price, plus any agreed-upon additional amount, the counterparty must provide additional collateral so that at all times the collateral value is at least equal to the repurchase price plus any agreed-upon additional amount. In the event of default of the obligation to repurchase, a Fund has the right to liquidate the collateral and apply the proceeds in satisfaction of the obligations. Under certain circumstances, in the event of default or bankruptcy by the other party to the agreement, realization and/or retention of the collateral may be subject to legal proceedings.
Foreign Currency Contracts — The Currency Strategy Funds, except the U.S. Dollar Bullish Fund, utilized foreign currency contracts to obtain net long exposure to foreign currencies consistent with each Currency Strategy Fund’s investment strategy. The U.S. Dollar Bullish Fund utilized foreign currency contracts to obtain net short exposure to foreign currencies consistent with its investment strategy. The Emerging Markets Local Debt Fund utilized foreign currency contracts to obtain long and short exposures to foreign currencies consistent with its investment objective. The Managed Futures Strategy Fund utilized foreign currency contracts to obtain long and short exposures to the Japanese Yen consistent with its investment objective. A foreign currency contract involves an obligation to purchase or sell a specific currency at a future date, which may be any fixed number of days from the date of the contract agreed upon by the parties, at a price set at the time of the contract. These contracts are principally traded in the inter-bank market conducted directly between currency traders (usually large, commercial banks) and their customers. A foreign currency contract generally does not require an initial margin deposit and no commissions are charged at any stage for trades. However, if a Fund is in an unrealized loss position on a foreign currency contract, it may be required to pledge collateral (or additional collateral) to the counterparty. If a Fund is in an unrealized gain position on a foreign currency contract, it may receive collateral from the counterparty. In the event of a default or inability of counterparties to meet the terms of their contracts, the non-defaulting party generally has the right to liquidate the collateral and apply the proceeds in satisfaction of the contract terms.
Risks may arise upon entering into foreign currency contracts from the potential inability of counterparties to meet the terms of their contracts and from unanticipated movements in the value of foreign currencies relative to the U.S. dollar or each other.
Fluctuations in the value of open foreign currency contracts are recorded for book purposes as unrealized gains or losses on foreign currency contracts by the Funds and are included in “net increase (decrease) in unrealized appreciation/depreciation from foreign currency contracts” on the Statements of Operations. Realized gains and losses on foreign currency contracts include net gains or losses recognized by the Funds on contracts which have settled are included in “net realized gain (loss) from foreign currency contracts” on the Statements of Operations.
Futures Contracts — The Duration Funds and the Yield Enhanced U.S. Short-Term Aggregate Bond Fund utilized futures contracts to obtain net short exposure to U.S. Treasury bonds to hedge against a rise in interest rates. The Emerging Markets Corporate Bond Fund and the Mortgage Plus Bond Fund each utilized futures contracts on U.S. Treasury bonds to manage interest rate risk. The Enhanced Commodity Strategy Fund utilized futures contracts to obtain long and short exposures to commodities consistent with its investment objective. The Managed Futures Strategy Fund utilized futures contracts to obtain long and short exposures to currencies, commodities, interest rates and equity indexes consistent with its investment objective. When a Fund purchases a listed futures contract, it agrees to purchase a specified reference asset (e.g., commodity, currency, equity or U.S. Treasury security) at a specified future date. When a Fund sells a listed futures contract, it agrees to sell a specified reference asset (e.g., commodity, currency, equity or U.S. Treasury security) at a specified future date. The price at which the purchase and sale will take place is fixed when the Fund enters into the contract. The exchange clearing corporation is the ultimate counterparty for all exchange-listed contracts, so credit risk is limited to the creditworthiness of the exchange clearing corporation.
Upon entering into a futures contract, a Fund is required to deliver to a broker an amount of cash and/or U.S. government securities equal to a certain percentage of the contract amount. This amount is known as the “initial margin”. Cash deposited as initial margin is shown as “Deposits at broker for futures contracts” in the Statement of Assets and Liabilities and U.S. government securities deposited are designated in the Schedule of Investments. Subsequent payments, known as “variation margin”, generally are made or received by the Fund each day or at other agreed-upon time periods depending on the fluctuations in the value of the underlying futures contracts, except that in the case of certain futures contracts, variation margin payments may be made or received when the futures contract expires. Variation margin is recorded for financial statement purposes on a daily basis as an unrealized gain or loss on futures until the financial futures contract is closed, at which time the net gain or loss is reclassified to realized gain or loss on futures. The current one-day variation margin on open futures contracts is shown on the Statements of Assets and Liabilities as either a receivable or a payable for “Net variation margin on futures contracts”. The variation margins received or paid by the Funds on both open and closed futures contracts are shown in the Statements of Assets and Liabilities, in whole or in part, as a component of, or an offset to, “Deposits at broker for futures contracts”. Deposits at broker utilized for futures contract margin requirements generally are restricted from withdrawal. When a Fund purchases or sells a futures contract, the Fund is required to “cover” its position in order to limit the risk associated with the use of leverage and other related risks. To cover its position, a Fund will segregate assets consisting of, or take other measures with respect to, cash or liquid securities that, when added to any amounts deposited with a
| 156 | WisdomTree Trust |
Table of Contents
Notes to Financial Statements (continued)
futures commission merchant as margin, will “cover” its position in a manner consistent with the 1940 Act or the rules and SEC interpretations thereunder. This will function as a practical limit on the amount of leverage which a Fund may undertake and on the potential increase in the speculative character of a Fund’s outstanding portfolio securities.
Options Contracts — The CBOE S&P 500 PutWrite Strategy Fund utilized option contracts by writing put options on the S&P 500 Index consistent with its investment objective. A put option gives the purchaser of the option the right to sell, and the writer of the option the obligation to buy, the underlying security or financial instrument. A call option gives the purchaser of the option the right to buy, and the writer of the option the obligation to sell, the underlying security or financial instrument. A premium is paid to the writer of an option as consideration for undertaking the obligation in the contract. The CBOE S&P 500 PutWrite Strategy Fund may purchase and write options on an exchange or over the counter (“OTC”). OTC options differ from exchange-traded options in several respects. They are transacted directly with dealers and not with a clearing corporation, and therefore entail the risk of nonperformance by the dealer. OTC options are available for a greater variety of securities and for a wider range of expiration dates and exercise prices than are available for exchange-traded options. Because OTC options are not traded on an exchange, pricing is done normally by reference to information from a market maker.
When an option is purchased, an amount equal to the premium paid is recorded as an asset, the value of which is marked-to-market to reflect the current market value of the option purchased. If the purchased option expires, a loss equal to the amount of premium paid is realized. When a security or financial instrument is purchased or sold through the exercise of an option, the related premium paid is added to the basis of the security or financial instrument acquired or deducted from the proceeds of the security or financial instrument sold.
When an option is written, an amount equal to the premium received is recorded as a liability, the value of which is marked-to-market daily to reflect the current market value of the option written. If the option expires, the premium received is recorded as a realized gain. When a written call option is exercised, the difference between the premium received plus the option exercise price and the basis in the underlying security (in the case of a covered written call option), or the cost to purchase the underlying security (in the case of an uncovered written call option), including brokerage commission, is recognized as a realized gain or loss. When a written put option is exercised, the amount of the premium received is subtracted from the cost of the security purchased from the exercise of the written put option to form the basis in the underlying security purchased.
The purchaser or writer of an option may close the position before the exercise of the option by entering into a closing transaction. In the case of a written option, the cost of a closing transaction is deducted from the original premium received resulting in a realized gain or loss. With respect to a purchased option, the original premium paid is deducted from the proceeds received from a closing transaction resulting in a realized gain or loss.
The maximum payout for written put options is limited to the number of contracts written and the associated strike prices. At August 31, 2021, the maximum payout for written put options for the CBOE S&P 500 PutWrite Strategy Fund was $64,162,500. The maximum payout for written call options is potentially unlimited to the extent that the written call option is uncovered.
The risk associated with purchasing put and call options is limited to the premiums paid. The risk in writing a covered call option is that the writer of the option may forego the opportunity of profit if the market price of the underlying security increases and the option is exercised. The risk in writing an uncovered call option is that the writer of the option is exposed to the risk of loss if the market price of the underlying security increases. The risk in writing a put option is that the writer of the option may incur a loss if the market price of the underlying security decreases and the option is exercised. In addition, there is the risk that the purchaser or writer of an option may not be able to enter into a closing transaction because of an illiquid secondary market.
Other significant risks associated with the use of options contracts may include the following: (1) the success of a strategy may depend on the investment adviser’s ability to predict movements in the prices of individual commodities, currencies or securities, fluctuations in markets and movements in interest rates; (2) there may be an imperfect or no correlation between the changes in market value of the commodities, currencies or securities and the price of options; (3) although the CBOE S&P 500 PutWrite Strategy Fund intends to enter into options contracts only if there is an active market for such contracts, there is no assurance that an active market will exist for the contracts at any particular time; (4) trading restrictions or limitations may be imposed by an exchange; and (5) government regulations may restrict trading in options contracts.
Securities Lending — Each Fund may lend portfolio securities to certain creditworthy borrowers, including the Funds’ securities lending agent. It is the Funds’ policy that, at origination, all loans are secured by collateral of at least 102% of the value of U.S. securities loaned and 105% of the value of foreign securities loaned. Collateral in the form of cash and/or securities issued or guaranteed by the U.S. government or its agencies, equivalent to at least 100% of the market value of securities, is maintained at all times. The cash collateral can be invested in certain money market mutual funds which also have exposure to the fluctuations of the market. The values of the investments of cash collateral for securities on loan along with the obligations to return such collateral are included on the Statements of Assets and Liabilities. The total value of securities received as collateral for securities on loan is included in a footnote following each Schedule of Investments, but is not included within the Statements of Assets and Liabilities because the receiving Fund does not have the right to sell or repledge the securities received as collateral. As compensation for
| WisdomTree Trust | 157 |
Table of Contents
Notes to Financial Statements (continued)
lending its securities, each Fund retains all or a portion of the interest received on investment of cash collateral or receives a fee from the borrower (net of any fee rebates paid to the borrower). The lending agent receives a portion of the income earned by the Funds in connection with the lending program. The net securities lending income earned by the Funds is disclosed on the Statements of Operations. The dividend and interest income earned on the securities loaned is accounted for in the same manner as other dividend and interest income. The borrower pays to the Funds an amount equal to any dividends or interest received on loaned securities. Dividends received while a security is out on loan are not considered Qualified Dividend Income (“QDI”) under the specific criteria issued by the Internal Revenue Service and are subject to taxation at the shareholder’s ordinary income tax rate instead of the lower long-term capital gains tax rate. Lending portfolio securities could result in a loss or delay in recovering each Fund’s securities if the borrower defaults. In the event of a borrower default with respect to the failure to return to each Fund some or all of the securities loaned, the securities lending agent shall indemnify each Fund against the failure of the borrower if the value of the collateral received is insufficient to cover the market value of the securities loaned.
Master Netting Arrangements — Codification Topic 210 (“ASC 210”), Balance Sheet, requires disclosures generally intended to (i) help investors and other financial statement users to better assess the effect or potential effect of offsetting arrangements on a company’s financial position, (ii) improve transparency in the reporting of how companies mitigate credit risk, and (iii) facilitate comparisons between those entities that prepare their financial statements on the basis of GAAP and those entities that prepare their financial statements on the basis of international financial reporting standards. ASC 210 requires entities to disclose (i) gross and net information about both instruments and transactions eligible for offset in the financial statements, and (ii) instruments and transactions subject to an agreement similar to a master netting agreement. ASC 210 is limited in scope to the following financial instruments, to the extent they are offset in the financial statements or subject to an enforceable master netting arrangement or similar agreement: (i) recognized derivative instruments accounted for under ASC 815 (Derivatives and Hedging); (ii) repurchase agreements and reverse repurchase agreements; and (iii) securities borrowing and securities lending transactions.
In order to better define its contractual rights and to secure rights that will help a Fund mitigate its counterparty risk, a Fund enters into an International Swaps and Derivatives Association, Inc. Master Agreement (“ISDA Master Agreement”) with its counterparties. An ISDA Master Agreement is a bilateral agreement between a Fund and a counterparty that governs over-the-counter derivatives (“OTC”), such as foreign currency contracts, and typically contains, among other things, collateral posting terms, netting and rights of set-off provisions in the event of a default and/or termination event. Under an ISDA Master Agreement, a Fund may, under certain circumstances, offset with the counterparty certain derivative financial instruments’ payables and receivables to create a single net payment. The provisions of the ISDA Master Agreement typically permit a single net payment in the event of a default (close-out netting) or similar event, including the bankruptcy or insolvency of the counterparty.
Collateral requirements generally differ by type of derivative. Collateral terms are contract-specific for OTC derivatives (e.g., foreign currency contracts, options and certain swaps). Generally, for transactions traded under an ISDA Master Agreement, the collateral requirements are calculated by netting the marked to market amount for each transaction under such agreement and comparing that amount to the value of any collateral currently pledged by a Fund and the counterparty. Generally, the amount of collateral due from or to a counterparty must exceed a minimum transfer amount threshold before a transfer is required to be made. To the extent amounts due to a Fund from its derivatives counterparties are not fully collateralized, contractually or otherwise, the Fund bears the risk of loss from a counterparty’s non-performance.
Repurchase agreements are subject to the terms and conditions of a Master Repurchase Agreement (“Master Repurchase Agreement”) between a Fund and a counterparty. In the event of a default or failure by a party to perform an obligation with respect to a repurchase transaction, the Master Repurchase Agreement gives the non-defaulting party the right to set-off claims and to apply collateral held by it in connection with a repurchase transaction against obligations owed to the non-defaulting party.
The Funds’ securities lending activities are governed by a Securities Lending Authorization Agreement (“Lending Agreement”) between the Funds and the lending agent. The Lending Agreement authorizes the lending agent to lend qualifying U.S. and foreign securities held by a Fund to approved borrowers (each a “Borrower”). To mitigate borrower risk, a Fund typically receives from a Borrower collateral in the form of U.S. dollar cash and/or securities issued or guaranteed by the U.S. government or its agencies in excess of the market value of the securities loaned. Under the provisions of the Lending Agreement, a Fund shall have, as to the collateral, all of the rights and remedies of a secured party under applicable law. A Fund is exposed to risk of loss if a Borrower defaults on its obligation to return borrowed securities and the value of the collateral a Fund received is insufficient to cover the market value of the securities loaned. Also, the lending agent is permitted to invest the cash collateral it receives from a Borrower into a money market fund which is subject to market fluctuation. Therefore, a Fund is exposed to risk of loss if the value of invested cash collateral is insufficient to satisfy the Fund’s obligation to return the full amount owed to such Borrower.
The Funds’ futures contracts and option contracts are all exchange traded and are not subject to master netting arrangements. Therefore, all futures contracts and option contracts are excluded from the netting table.
For financial reporting purposes, the Funds elect to not offset assets and liabilities subject to an ISDA Master Agreement, Master Repurchase Agreement or Lending Agreement, if any, in the Statements of Assets and Liabilities. Therefore, all qualifying
| 158 | WisdomTree Trust |
Table of Contents
Notes to Financial Statements (continued)
transactions are presented on a gross basis in the Statements of Assets and Liabilities. As of August 31, 2021, the impact of netting of assets and liabilities and the offsetting of collateral pledged or received based on contractual netting/set-off provisions in the ISDA Master Agreement, Master Repurchase Agreement and the Lending Agreement are detailed in the following table:
| Assets | Liabilities | |||||||||||||||||||||||||||||||||||
Gross Amounts Assets and | Gross Amounts Not Offset in the Statements of Assets and Liabilities | Gross Amounts Assets and | Gross Amounts Not Offset in the Statements of Assets and Liabilities | |||||||||||||||||||||||||||||||||
| Fund | Financial Instruments | Collateral Received | Net Amount | Financial Instruments | Collateral Posted | Net Amount | ||||||||||||||||||||||||||||||
U.S. Dollar Bullish Fund |
| |||||||||||||||||||||||||||||||||||
Foreign Currency Contracts | $ | 855,222 | $ | (114,019 | ) | $ | — | $ | 741,203 | $ | 138,445 | $ | (114,019 | ) | $ | — | $ | 24,426 | ||||||||||||||||||
Chinese Yuan Strategy Fund |
| |||||||||||||||||||||||||||||||||||
Repurchase Agreements | 12,960,000 | — | (12,960,000 | )1 | — | — | — | — | — | |||||||||||||||||||||||||||
Foreign Currency Contracts | 144,520 | (37,228 | ) | — | 107,292 | 76,809 | (37,228 | ) | — | 39,581 | ||||||||||||||||||||||||||
Emerging Currency Strategy Fund |
| |||||||||||||||||||||||||||||||||||
Repurchase Agreements | 4,000,000 | — | (4,000,000 | )1 | — | — | — | — | — | |||||||||||||||||||||||||||
Foreign Currency Contracts | 172,547 | (64,259 | ) | — | 108,288 | 69,521 | (64,259 | ) | — | 5,262 | ||||||||||||||||||||||||||
Emerging Markets Corporate Bond Fund |
| |||||||||||||||||||||||||||||||||||
Securities Lending | 3,565,545 | — | (3,565,545 | )1 | — | — | — | — | — | |||||||||||||||||||||||||||
Emerging Markets Local Debt Fund |
| |||||||||||||||||||||||||||||||||||
Repurchase Agreements | 6,860,000 | — | (6,860,000 | )1 | — | — | — | — | — | |||||||||||||||||||||||||||
Foreign Currency Contracts | 17,853 | (17,797 | ) | — | 56 | 225,853 | (17,797 | ) | — | 208,056 | ||||||||||||||||||||||||||
Interest Rate Hedged High Yield Bond Fund |
| |||||||||||||||||||||||||||||||||||
Securities Lending | 8,419,554 | — | (8,419,554 | )1 | — | — | — | — | — | |||||||||||||||||||||||||||
Interest Rate Hedged U.S. Aggregate Bond Fund | ||||||||||||||||||||||||||||||||||||
Securities Lending | 1,200,542 | — | (1,200,542 | )1 | — | — | — | — | — | |||||||||||||||||||||||||||
Repurchase Agreements | 15,426,500 | — | (15,426,500 | )1 | — | — | — | — | — | |||||||||||||||||||||||||||
Yield Enhanced U.S. Aggregate Bond Fund |
| |||||||||||||||||||||||||||||||||||
Securities Lending | 5,518,664 | — | (5,518,664 | )1 | — | — | — | — | — | |||||||||||||||||||||||||||
Repurchase Agreements | 146,660,000 | — | (146,660,000 | )1 | — | — | — | — | — | |||||||||||||||||||||||||||
| 1 | The amount of collateral presented has been limited such that the net amount by counterparty cannot be less than zero. |
Short-Term Investments — Each Fund may invest a portion of its assets in high-quality money market instruments on an ongoing basis to provide liquidity or for other reasons. The instruments include short-term obligations issued by the U.S. government, its agencies, non-U.S. government agencies, negotiable certificates of deposit (“CDs”), fixed time deposits and bankers’ acceptances of U.S. and foreign banks and similar institutions, commercial papers, repurchase agreements and money market funds. CDs are short-term negotiable obligations of commercial banks. Time deposits are non-negotiable deposits maintained in banking institutions for specified periods of time at stated interest rates. Banker’s acceptances are time drafts drawn on commercial banks by borrowers, usually in connection with international transactions.
Interest-Only and Principal-Only Securities — The Funds may invest in interest-only (“IO”) and principal-only (“PO”) securities which are typically created by splitting a traditional mortgage-backed security or pool of loans into an IO and a PO security. In general, the IO security is entitled to receive the interest payments on the underlying debt obligation(s) and the PO security is entitled to receive the principal payments of the underlying debt obligation(s). Both IO and PO securities are subject to prepayments and therefore prepayment risk. IO securities are at risk for faster than anticipated prepayments and PO securities are at risk for slower than anticipated prepayments. Assumptions regarding the rates of prepayment play a significant role in the value of these securities. If the underlying debt obligation experiences greater than anticipated prepayments of principal, a Fund may not fully recoup its initial investment in the IO security.
Collateralized Loan Obligations — The Funds may invest in the debt tranche of collateralized loan obligations (“CLOs”). CLOs bear many of the same risks as other forms of asset-backed securities, including interest rate risk, credit risk and default risk. As CLOs are backed by pools of loans, they also bear similar risks to investing in loans directly. CLOs issue classes or “tranches” that vary in risk profile and yield. CLOs may experience substantial losses attributable to loan defaults. Losses caused by defaults on underlying assets are borne first by the holders of subordinate tranches. The value of an investment in a CLO may decline as a result of, but not limited to, underlying loan defaults and/or market anticipation of defaults, credit impairment on the underlying loans or the disappearance of one of more subordinate tranches resulting from changes in the credit profile of the underlying loans.
To-be-announced Transactions — Interest Rate Hedged U.S. Aggregate Bond Fund, Mortgage Plus Bond Fund, Yield Enhanced U.S. Aggregate Bond Fund and the Yield Enhanced U.S. Short-Term Aggregate Bond Fund invest in U.S. agency mortgage-backed pass-through securities which are securities issued by entities such as Government National Mortgage Association and Federal National
| WisdomTree Trust | 159 |
Table of Contents
Notes to Financial Statements (continued)
Mortgage Association that are backed by pools of mortgages. Most transactions in mortgage-backed pass-through securities occur for future delivery in which the exact mortgage pools to be delivered are not specified until a few days prior to settlement, referred to as a “to-be-announced transaction” or “TBA Transaction.” In a TBA Transaction, the buyer and seller agree upon general trade parameters such as agency, settlement date, par amount and price. The actual pools delivered generally are determined a few days prior to the settlement date; however, it is not anticipated that the Interest Rate Hedged U.S. Aggregate Bond Fund, Mortgage Plus Bond Fund, Yield Enhanced U.S. Aggregate Bond Fund and the Yield Enhanced U.S. Short-Term Aggregate Bond Fund will take delivery of pools, but instead will participate in rolling TBA Transactions whereby instead of receiving pools on the purchase settlement date, the position is offset by a current sale of the TBA security with a simultaneous forward purchase of a substantially similar TBA security (i.e., same type, coupon, maturity) to settle on a specified future date.
Short Sale Transactions — Each Fund may enter into “short sale” transactions in which a Fund sells a security that it does not own in anticipation of a decline in the market price of that security. When a Fund enters into a short sale transaction, the Fund will borrow the security and deliver it to the counterparty to which the Fund sold the security short. An amount equal to the proceeds to be received by the Fund is reflected as an asset in “Receivables: Due from broker for securities sold short” and an equivalent liability in “Securities sold short, at value” on the Statement of Assets and Liabilities. The amount of the liability is subsequently marked-to-market to reflect the current market value of the securities sold short. Any interest or dividends that accrue on the securities borrowed are shown as an interest expense or dividend expense in the Statement of Operations of the Fund. A realized gain, limited to the proceeds received at which the Fund sold the security short, or a realized loss, unlimited as to the dollar amount, will be recognized upon the termination of a short sale if the cost to close out the short sale transaction is either less than (in the case of a gain) or greater than (in the case of a loss) the proceeds received. The risk of loss on a short sale transaction is potentially unlimited unlike the risk of loss on a long position, which is limited to the amount paid for the investment plus transaction costs. Funds entering into short sale transactions are exposed to the risk that they may be unable to close out a short sale position at any particular time or at an acceptable price.
Tax Information and Dividends and Distributions to Shareholders — It is each Fund’s policy to comply with all requirements of the Internal Revenue Code of 1986, as amended (the “Code”). A portion of the Code, known as subchapter M (“Subchapter M”), addresses the ways by which investment companies and investment trusts may pass income through to shareholders in order to avoid double taxation. Each Fund intends to qualify for and to elect treatment as a separate Regulated Investment Company (“RIC”) under Subchapter M of the Code so that it will not be subject to federal income tax on income and gains that are timely distributed to Fund shareholders. Accordingly, no provision for U.S. federal income taxes is required. In order to qualify for the special tax treatment accorded to RICs and their shareholders, each Fund must, among other things, distribute with respect to each taxable year an amount equal to or greater than the sum of 90% of its investment company taxable income and 90% of its net tax-exempt interest income. There can be no guarantee that a Fund will pay dividends. Taxable net realized gains from investment transactions, reduced by capital loss carryforwards, if any, are declared and distributed to shareholders at least annually. The capital loss carryforward amount, if any, is available to offset future net capital gains. The Funds may occasionally be required to make supplemental distributions at some other time during the year. The Trust reserves the right to declare special distributions if, in its reasonable discretion, such action is necessary or advisable to preserve the status of each Fund as a RIC or to avoid imposition of income or excise taxes on undistributed income. Dividends and distributions to shareholders are recorded on the ex-dividend date. The amount of dividends and distributions from net investment income and net realized capital gains is determined in accordance with the requirements of the Code and the U.S. Treasury regulations. These book/tax differences are either considered temporary or permanent in nature. To the extent these differences are permanent in nature, such amounts are reclassified within the components of net assets based on their Federal tax basis treatment; temporary differences do not require reclassification. Dividends and distributions that exceed earnings and profit for tax purposes are reported for tax purposes as a return of capital.
3. ADVISORY FEES AND OTHER TRANSACTIONS WITH AFFILIATES
WTAM has overall responsibility for the general management and administration of the Trust. WTAM provides an investment program for each Fund. WTAM has arranged for Mellon Investments Corporation (“Mellon”) to provide sub-advisory services to the Funds, except for Emerging Markets Corporate Bond Fund, Interest Rate Hedged High Yield Bond Fund, Mortgage Plus Bond Fund and Yield Enhanced U.S. Short-Term Aggregate Bond Fund, which are sub-advised by Voya Investment Management Co., LLC (“Voya IM”). Mellon and Voya IM are compensated by WTAM at no additional cost to the Funds. WTAM also arranges for transfer agency, custody, fund accounting, fund administration, securities lending and all other non-distribution related services necessary for the Funds to operate, which are generally under separate agreements entered into between the Trust on behalf of the Funds and the applicable service provider. Under the investment advisory agreement for each Fund, WTAM agrees to pay all expenses of the Funds, except for certain expenses described in Note 2.
Pursuant to a separate contractual arrangement, as also described in Note 2, WTAM arranges for the provision of CCO services with respect to each Fund, and is liable and responsible for, and administers, payments to the CCO, the Independent Trustees and counsel to the Independent Trustees in exchange for a fee, accrued daily and paid monthly in arrears, of up to 0.0044% per annum of each Fund’s average daily net assets.
| 160 | WisdomTree Trust |
Table of Contents
Notes to Financial Statements (continued)
WTAM expects to receive annual advisory fees from each Fund, based on a percentage of the Fund’s average daily net assets, as shown in the following table:
| Fund | Advisory Fee Rate | |
U.S. Dollar Bullish Fund | 0.50% | |
Chinese Yuan Strategy Fund | 0.45% | |
Emerging Currency Strategy Fund | 0.55% | |
Emerging Markets Corporate Bond Fund | 0.60% | |
Emerging Markets Local Debt Fund | 0.55% | |
Floating Rate Treasury Fund | 0.15% | |
Interest Rate Hedged High Yield Bond Fund | 0.43% | |
Interest Rate Hedged U.S. Aggregate Bond Fund | 0.23% | |
Mortgage Plus Bond Fund | 0.45% | |
Yield Enhanced U.S. Aggregate Bond Fund | 0.12%1 | |
Yield Enhanced U.S. Short-Term Aggregate Bond Fund | 0.12%1 | |
Alternative Income Fund | 0.50% | |
CBOE S&P 500 PutWrite Strategy Fund | 0.44% | |
Enhanced Commodity Strategy Fund (consolidated) | 0.55% | |
Managed Futures Strategy Fund (consolidated) | 0.65%2 | |
| 1 | Prior to the close of business on December 31, 2020, WTAM received an annual advisory fee of 0.20% (before fee waivers) based on the Fund’s average daily net assets and had contractually agreed to limit the advisory fee to 0.12% through December 31, 2020 (the advisory fee waiver expiration date). Effective the close of business on December 31, 2020, the contractual advisory fee waiver expired and the advisory fee annual rate (before fee waivers) was lowered to 0.12%. |
| 2 | Prior to the close of business on December 31, 2020, WTAM received an annual advisory fee of 0.75% (before fee waivers) based on the Fund’s average daily net assets and had contractually agreed to limit the advisory fee to 0.65% through December 31, 2020 (the advisory fee waiver expiration date). Effective the close of business on December 31, 2020, the contractual advisory fee waiver expired and the advisory fee annual rate (before fee waivers) was lowered to 0.65%. |
During the year ended August 31, 2021, the Interest Rate Hedged High Yield Bond Fund and Managed Futures Strategy Fund received a voluntary reimbursement of $53,005 and $1,478, respectively, from Voya IM and Mellon, respectively, resulting from an operational error that resulted in investment transaction losses. During the fiscal period January 1, 2020 through December 18, 2020, the Enhanced Commodity Strategy Fund received a voluntary reimbursement of $13,626 from WTAM, and for the period December 19, 2020 through August 31, 2021, received a voluntary reimbursement of $6,934 from WTAM, each for brokerage commissions incurred in connection with the Reorganization. The dollar amount of the voluntary reimbursements are shown in the Statements of Operations in “Net increase from payment by affiliate”.
Affiliated holdings are investments in entities in which the Fund owns 5% or more of the outstanding voting securities or are investments in entities which are under common ownership or control. Transactions in shares of affiliated ETFs for the fiscal year or period ended August 31, 2021, as applicable, are included in an “Investment in Affiliates” supplementary table in each applicable Fund’s Schedule of Investments. For these transactions, WTAM voluntarily waives a portion of the advisory fees, that it would otherwise charge, in an amount equal to the indirect AFFE (which are fees and expenses incurred indirectly by a Fund through its investments in certain underlying investment companies) attributable to each Fund’s investment in affiliated ETFs. The dollar amount of advisory fees waived during the period for the Funds, if any, are included in the Statement of Operations in “Expense waivers”.
| WisdomTree Trust | 161 |
Table of Contents
Notes to Financial Statements (continued)
WTAM and/or WisdomTree Investments (collectively herein, “WT”) may from time to time own shares of a Fund. As of and for the fiscal year or period ended August 31, 2021, WT held shares of and received distributions from the following Funds, which were purchased through an unaffiliated broker in ordinary brokerage transactions in the secondary market in which the Funds’ shares trade:
| At August 31, 2021 | For the year or period ended August 31, 2021 | |||||||||||
| Fund | Fund Shares held by WT | Market Value of Fund Shares held by WT | Dividends paid to | |||||||||
Emerging Markets Corporate Bond Fund | — | $ | — | $ | 42 | |||||||
Emerging Markets Local Debt Fund | 206 | 6,668 | 228 | |||||||||
Floating Rate Treasury Fund | 37,033 | 929,528 | 406 | |||||||||
Interest Rate Hedged High Yield Bond Fund | 483 | 10,737 | 220 | |||||||||
Interest Rate Hedged U.S. Aggregate Bond Fund | 21,355 | 999,628 | 18,184 | |||||||||
Mortgage Plus Bond Fund | 169,053 | 8,624,239 | 257,637 | |||||||||
Yield Enhanced U.S. Aggregate Bond Fund | 62,929 | 3,310,607 | 83,029 | |||||||||
Yield Enhanced U.S. Short-Term Aggregate Bond Fund | 58,203 | 2,980,285 | 41,888 | |||||||||
CBOE S&P 500 PutWrite Strategy Fund | 185 | 6,069 | 97 | |||||||||
Enhanced Commodity Strategy Fund (consolidated) | 135 | 2,973 | — | 1 | ||||||||
| 1 | For the period December 19, 2020 (post-reorganization) through August 31, 2021. Prior to December 19, 2020, WisdomTree Commodity Services, LLC (“WCS”), the former commodity pool operator and managing owner of the Predecessor Fund and also a subsidiary of WTAM, was issued 50 general units of the Predecessor Fund in exchange for a capital contribution of $1,500 upon inception of the Predecessor Fund. In connection with the reorganization at the close of business December 18, 2020, WCS received 50 shares of the Enhanced Commodity Strategy Fund in exchange for 50 general units of the Predecessor Fund having an net asset value equal to $937. Prior to December 19, 2020, WCS did not receive any dividends or distributions on the 50 general units that it held in the Predecessor Fund. |
During the fiscal period ended August 31, 2021, in connection with the organization of the Alternative Income Fund, a newly launched fund, WTAM contributed $100 in exchange for 4 shares in the Alternative Income Fund. Prior to August 31, 2021, WTAM redeemed the aforementioned shares as follows: 4 shares of the Alternative Income Fund for proceeds of $100. During the fiscal period ended August 31, 2021, WTAM also redeemed 2 shares of the Mortgage Plus Bond Fund for proceeds of $102. Additionally, during the fiscal period ended August 31, 2021, WCS redeemed 50 shares the Enhanced Commodity Strategy Fund for proceeds of $1,102.
4. CAPITAL SHARE TRANSACTIONS
As of August 31, 2021, there were an unlimited number of $0.001 par value shares of beneficial interest authorized by the Trust. Shares are issued and redeemed by each Fund only in creation units or multiples thereof. Except when aggregated in creation units, shares of each Fund are not redeemable. Transactions in shares for each Fund are disclosed in detail in the Statements of Changes in Net Assets. Generally, Funds issue and redeem shares on a cash basis, however, shares may also be issued or redeemed in kind. Investors purchasing and redeeming creation units may be charged a purchase transaction fee and a redemption transaction fee to offset transfer and other transaction costs associated with the issuance and redemption of creation units.
5. INVESTMENT PORTFOLIO TRANSACTIONS
Purchases and sales of investments (excluding purchases and sales resulting from in-kind capital share transactions and short-term investments) and the cost of purchases and the proceeds from sales resulting from in-kind capital share transactions (excluding short-term investments) for the fiscal year or period ended August 31, 2021 are shown in the following table. Realized gains and losses on sales resulting from in-kind capital share redemptions, as shown on the Statements of Operations, are not recognized by the Funds for tax purposes.
| Non-U.S. Government Securities | U.S. Government Securities | In-kind Capital Share Transactions | ||||||||||||||||||||||
| Fund | Purchases | Sales | Purchases | Sales | Purchases | Sales | ||||||||||||||||||
U.S. Dollar Bullish Fund | $ | 4,697,240 | $ | 2,258,599 | $ | — | $ | — | $ | — | $ | — | ||||||||||||
Chinese Yuan Strategy Fund | 1,130,013 | 426,613 | — | — | — | — | ||||||||||||||||||
Emerging Currency Strategy Fund | 251,125 | 150,584 | — | — | — | — | ||||||||||||||||||
Emerging Markets Corporate Bond Fund | 31,224,986 | 22,596,158 | 2,216,545 | 2,429,367 | 21,314,186 | 7,211,333 | ||||||||||||||||||
Emerging Markets Local Debt Fund | 41,905,221 | 37,644,249 | — | — | 13,491,202 | 8,699,060 | ||||||||||||||||||
Floating Rate Treasury Fund | — | — | 1,756,454,870 | 1,802,093,677 | 367,328,338 | 726,990,140 | ||||||||||||||||||
Interest Rate Hedged High Yield Bond Fund | 36,202,213 | 37,768,888 | 16,042,762 | 15,669,724 | 89,484,668 | 54,771,764 | ||||||||||||||||||
Interest Rate Hedged U.S. Aggregate Bond Fund | 5,962,204 | 4,769,058 | 147,500,554 | 105,419,354 | 95,413,285 | 16,230,692 | ||||||||||||||||||
| 162 | WisdomTree Trust |
Table of Contents
Notes to Financial Statements (continued)
| Non-U.S. Government Securities | U.S. Government Securities | In-kind Capital Share Transactions | ||||||||||||||||||||||
| Fund | Purchases | Sales | Purchases | Sales | Purchases | Sales | ||||||||||||||||||
Mortgage Plus Bond Fund | 5,141,909 | 3,218,014 | 153,603,965 | 148,029,094 | — | — | ||||||||||||||||||
Yield Enhanced U.S. Aggregate Bond Fund | 163,852,330 | 201,757,651 | 1,552,112,055 | 1,593,319,053 | 72,167,045 | 187,407,610 | ||||||||||||||||||
Yield Enhanced U.S. Short-Term Aggregate Bond Fund | $ | 22,349,776 | $ | 22,384,117 | $ | 347,613,488 | $ | 324,581,980 | $ | 90,913,982 | $ | 37,548,524 | ||||||||||||
Alternative Income Fund | 308,653 | 94,255 | — | — | 10,546,811 | 502,656 | ||||||||||||||||||
CBOE S&P 500 PutWrite Strategy Fund | 774,767 | 3,172,856 | — | — | — | — | ||||||||||||||||||
Enhanced Commodity Strategy Fund (consolidated)1 | 9,691,138 | 1,543,289 | — | — | — | — | ||||||||||||||||||
Managed Futures Strategy Fund (consolidated) | 2,274,735 | 1,343,226 | — | — | — | — | ||||||||||||||||||
| 1 | For the period December 19, 2020 (post-reorganization) through August 31, 2021. There were no purchases and sales (excluding purchases and sales of short-term investments) for the fiscal period prior to December 19, 2020. |
6. FEDERAL INCOME TAXES
At August 31, 2021, the cost of investments (including securities on loan, derivatives and securities sold short) for Federal income tax purposes was as follows:
Investments in Long Securities | Investments in Securities Sold Short and Financial Derivatives1 | |||||||||||||||||||||||||||||||||||
| Fund | Tax Cost | Gross Unrealized Appreciation | Gross Unrealized Depreciation | Net Unrealized Appreciation/ (Depreciation) | Gross Unrealized Appreciation | Gross Unrealized Depreciation | Net Unrealized Appreciation/ (Depreciation) | Total Net (Depreciation) | ||||||||||||||||||||||||||||
U.S. Dollar Bullish Fund | $ | 141,703,582 | $ | 583 | $ | (5,898 | ) | $ | (5,315 | ) | $ | — | $ | — | $ | — | $ | (5,315 | ) | |||||||||||||||||
Chinese Yuan Strategy Fund | 42,998,772 | 126 | (311 | ) | (185 | ) | — | — | — | (185 | ) | |||||||||||||||||||||||||
Emerging Currency Strategy Fund | 12,543,122 | 37 | (97 | ) | (60 | ) | 64,935 | (11,086 | ) | 53,849 | 53,789 | |||||||||||||||||||||||||
Emerging Markets Corporate Bond Fund | 53,098,631 | 1,528,074 | (380,338 | ) | 1,147,736 | — | — | — | 1,147,736 | |||||||||||||||||||||||||||
Emerging Markets Local Debt Fund | 141,054,726 | 2,755,489 | (12,926,145 | ) | (10,170,656 | ) | — | (26,628 | ) | (26,628 | ) | (10,197,284 | ) | |||||||||||||||||||||||
Floating Rate Treasury Fund | 1,086,163,575 | 290,257 | — | 290,257 | — | — | — | 290,257 | ||||||||||||||||||||||||||||
Interest Rate Hedged High Yield Bond Fund | 162,494,831 | 5,356,018 | (776,949 | ) | 4,579,069 | — | — | — | 4,579,069 | |||||||||||||||||||||||||||
Interest Rate Hedged U.S. Aggregate Bond Fund | 222,631,891 | 6,190,128 | (283,527 | ) | 5,906,601 | — | — | — | 5,906,601 | |||||||||||||||||||||||||||
Mortgage Plus Bond Fund | 40,244,343 | 388,486 | (122,257 | ) | 266,229 | — | — | — | 266,229 | |||||||||||||||||||||||||||
Yield Enhanced U.S. Aggregate Bond Fund | 1,230,601,621 | 26,222,918 | (7,461,496 | ) | 18,761,422 | — | (10,420 | ) | (10,420 | ) | 18,751,002 | |||||||||||||||||||||||||
Yield Enhanced U.S. Short-Term Aggregate Bond Fund | 275,408,310 | 1,112,259 | (142,997 | ) | 969,262 | — | — | — | 969,262 | |||||||||||||||||||||||||||
Alternative Income Fund | 10,250,558 | 116,009 | (64,570 | ) | 51,439 | — | — | — | 51,439 | |||||||||||||||||||||||||||
CBOE S&P 500 PutWrite Strategy Fund | 61,259,361 | 5,861 | — | 5,861 | — | — | — | 5,861 | ||||||||||||||||||||||||||||
Enhanced Commodity Strategy Fund (consolidated)2 | 179,187,238 | 3,186,509 | (4,951 | ) | 3,181,558 | — | — | — | 3,181,558 | |||||||||||||||||||||||||||
Managed Futures Strategy Fund (consolidated)2 | 179,350,688 | 4,972 | (61,355,815 | ) | (61,350,843 | ) | 464,034 | — | 464,034 | (60,886,809 | ) | |||||||||||||||||||||||||
| 1 | Certain financial derivatives may be considered section 1256 contracts under the Code. Each section 1256 contract held at the close of a taxable year shall be treated as sold for its fair market value on the last business day of such taxable year (and any realized gain and loss shall be taken into account for the taxable year). As such, the unrealized appreciation/(depreciation) for financial derivatives on a tax basis may not correspond to the unrealized appreciation/ (depreciation) on a GAAP basis. The unrealized appreciation/(depreciation) for financial derivatives on a GAAP basis is located in the respective financial derivatives tables in each Fund’s Schedule of Investments. |
| 2 | “Tax Cost” under “Investments in Long Securities” is presented on a non-consolidated basis and includes the Parent Fund’s investment in the Subsidiary. “Gross Unrealized Depreciation” under “Investments in Long Securities” is presented on a non-consolidated basis and includes the tax-basis unrealized depreciation associated with the Parent Fund’s investment in the Subsidiary. |
| WisdomTree Trust | 163 |
Table of Contents
Notes to Financial Statements (continued)
At August 31, 2021, the components of total distributable earnings (loss) on a tax-basis were as follows:
| Fund | Undistributed Ordinary Income | Undistributed Capital and Other Gains/(Losses) | Net Unrealized (Depreciation) | Currency and Other Unrealized Appreciation/ (Depreciation) | Total Distributable Earnings (Loss) | |||||||||||||||
U.S. Dollar Bullish Fund | $ | — | $ | (14,729,702 | ) | $ | (5,315 | ) | $ | — | $ | (14,735,017 | ) | |||||||
Chinese Yuan Strategy Fund | 639,016 | 1,202,312 | (185 | ) | (1 | ) | 1,841,142 | |||||||||||||
Emerging Currency Strategy Fund | — | (47,501,144 | ) | (60 | ) | 53,849 | (47,447,355 | ) | ||||||||||||
Emerging Markets Corporate Bond Fund | 26,773 | (8,492,950 | ) | 1,147,736 | — | (7,318,441 | ) | |||||||||||||
Emerging Markets Local Debt Fund | — | (21,350,895 | ) | (10,170,656 | ) | (136,062 | ) | (31,657,613 | ) | |||||||||||
Floating Rate Treasury Fund | 154,558 | — | 290,257 | — | 444,815 | |||||||||||||||
Interest Rate Hedged High Yield Bond Fund | 27,243 | (30,512,198 | ) | 4,579,069 | — | (25,905,886 | ) | |||||||||||||
Interest Rate Hedged U.S. Aggregate Bond Fund | 106,870 | (12,409,228 | ) | 5,906,601 | (1 | ) | (6,395,758 | ) | ||||||||||||
Mortgage Plus Bond Fund | — | (100,096 | ) | 266,229 | 1 | 166,134 | ||||||||||||||
Yield Enhanced U.S. Aggregate Bond Fund | 208,820 | 451,609 | 18,761,422 | (10,420 | ) | 19,411,431 | ||||||||||||||
Yield Enhanced U.S. Short-Term Aggregate Bond Fund | 228,802 | 114 | 969,262 | — | 1,198,178 | |||||||||||||||
Alternative Income Fund | 63,655 | 4,181 | 51,439 | — | 119,275 | |||||||||||||||
CBOE S&P 500 PutWrite Strategy Fund | — | (10,949,594 | ) | 5,861 | — | (10,943,733 | ) | |||||||||||||
Enhanced Commodity Strategy Fund (consolidated)1 | 18,086,282 | — | 3,181,558 | — | 21,267,840 | |||||||||||||||
Managed Futures Strategy Fund (consolidated)1 | 18,716,023 | (4,307,910 | ) | (61,350,843 | ) | 464,791 | (46,477,939 | ) | ||||||||||||
| 1 | “Net Unrealized Appreciation/(Depreciation)” is presented on a non-consolidated basis and includes the tax-basis unrealized depreciation associated with the Parent Fund’s investment in the Subsidiary. The total distributable earnings (loss) reported herein differs from the amount shown on the Statement of Assets and Liabilities due to the tax treatment of the wholly-owned foreign subsidiary. |
The tax character of distributions paid during the fiscal years or periods ended August 31, 2021 and August 31, 2020, was as follows:
| Year or Period Ended August 31, 2021 | Year or Period Ended August 31, 2020 | |||||||||||||||||||||||
| Fund | Distributions Paid from Ordinary Income* | Distributions Paid from Long-Term Capital Gains | Distributions Paid from Return of Capital | Distributions Paid from Ordinary Income* | Distributions Paid from Long-Term Capital Gains | Distributions Paid from Return of Capital | ||||||||||||||||||
U.S. Dollar Bullish Fund | $ | 526,430 | $ | — | $ | — | $ | 1,101,951 | $ | — | $ | — | ||||||||||||
Chinese Yuan Strategy Fund | 150,971 | — | — | 535,878 | — | — | ||||||||||||||||||
Emerging Currency Strategy Fund | 106,263 | — | — | 352,930 | — | — | ||||||||||||||||||
Emerging Markets Corporate Bond Fund | 1,598,500 | — | — | 1,368,000 | — | — | ||||||||||||||||||
Emerging Markets Local Debt Fund | 2,002,000 | — | 4,188,000 | 3,300,000 | — | 5,048,500 | ||||||||||||||||||
Floating Rate Treasury Fund | 570,446 | — | — | 16,637,462 | — | — | ||||||||||||||||||
Interest Rate Hedged High Yield Bond Fund | 5,948,000 | — | — | 9,953,950 | — | — | ||||||||||||||||||
Interest Rate Hedged U.S. Aggregate Bond Fund | 2,402,000 | — | — | 2,155,990 | — | — | ||||||||||||||||||
Mortgage Plus Bond Fund | 811,484 | 13,725 | 3,401 | 366,452 | 1 | — | — | |||||||||||||||||
Yield Enhanced U.S. Aggregate Bond Fund | 27,227,454 | 3,824,673 | — | 29,771,450 | — | — | ||||||||||||||||||
Yield Enhanced U.S. Short-Term Aggregate Bond Fund | 1,803,117 | 314,172 | — | 2,124,600 | — | — | ||||||||||||||||||
Alternative Income Fund2 | — | — | — | — | — | — | ||||||||||||||||||
CBOE S&P 500 PutWrite Strategy Fund | 1,532,213 | — | — | 3,011,616 | — | — | ||||||||||||||||||
Enhanced Commodity Strategy Fund (consolidated)3 | — | — | — | — | — | — | ||||||||||||||||||
Managed Futures Strategy Fund (consolidated) | 535,804 | — | — | 2,475,949 | — | — | ||||||||||||||||||
| * | Includes short-term capital gains, if any. |
| 1 | For the period November 14, 2019 (commencement of operations) through August 31, 2020. |
| 2 | For the period May 6, 2021 (commencement of operations) through August 31, 2021. |
| 3 | For the period December 19, 2020 (post-reorganization) through August 31, 2021. |
| 164 | WisdomTree Trust |
Table of Contents
Notes to Financial Statements (continued)
At August 31, 2021, for Federal tax purposes, the Funds have capital loss carryforwards available to offset future capital gains as indicated in the table. The loss carryforward amounts do not have an expiration date and, therefore, can be carried forward indefinitely until utilized. To the extent that these loss carryforwards are utilized, capital gains so offset will not be distributed to shareholders.
| Fund | Short-Term | Long-Term | Capital Loss Available Total | |||||||||
U.S. Dollar Bullish Fund | $ | 5,705,403 | $ | 8,706,181 | $ | 14,411,584 | ||||||
Chinese Yuan Strategy Fund | — | — | — | |||||||||
Emerging Currency Strategy Fund | 30,716,513 | 16,728,599 | 47,445,112 | |||||||||
Emerging Markets Corporate Bond Fund | 548,620 | 7,944,330 | 8,492,950 | |||||||||
Emerging Markets Local Debt Fund | 11,069,183 | 9,415,681 | 20,484,864 | |||||||||
Floating Rate Treasury Fund | — | — | — | |||||||||
Interest Rate Hedged High Yield Bond Fund | 12,993,162 | 17,519,036 | 30,512,198 | |||||||||
Interest Rate Hedged U.S. Aggregate Bond Fund | 3,738,559 | 6,422,403 | 10,160,962 | |||||||||
Mortgage Plus Bond Fund | 77,103 | 22,993 | 100,096 | |||||||||
Yield Enhanced U.S. Aggregate Bond Fund | — | — | — | |||||||||
Yield Enhanced U.S. Short-Term Aggregate Bond Fund | — | — | — | |||||||||
Alternative Income Fund | — | — | — | |||||||||
CBOE S&P 500 PutWrite Strategy Fund | 4,168,597 | 6,539,076 | 10,707,673 | |||||||||
Enhanced Commodity Strategy Fund (consolidated) | — | — | — | |||||||||
Managed Futures Strategy Fund (consolidated) | 2,008,815 | 2,299,095 | 4,307,910 | |||||||||
Capital losses incurred after October 31 (“post-October capital losses”) and late year ordinary losses incurred after December 31 within the taxable year are deemed to arise on the first business day of each Fund’s next taxable year. At August 31, 2021, the Funds did not have any post-October capital losses to defer.
During the fiscal year or period ended August 31, 2021, the following Funds incurred and will elect to defer late year ordinary losses as follows:
| Fund | Late Year Ordinary Loss | |||
U.S. Dollar Bullish Fund | $ | 318,118 | ||
Chinese Yuan Strategy Fund | — | |||
Emerging Currency Strategy Fund | 56,032 | |||
Emerging Markets Corporate Bond Fund | — | |||
Emerging Markets Local Debt Fund | 866,031 | |||
Floating Rate Treasury Fund | — | |||
Interest Rate Hedged High Yield Bond Fund | — | |||
Interest Rate Hedged U.S. Aggregate Bond Fund | — | |||
Mortgage Plus Bond Fund | — | |||
Yield Enhanced U.S. Aggregate Bond Fund | — | |||
Yield Enhanced U.S. Short-Term Aggregate Bond Fund | — | |||
Alternative Income Fund1 | — | |||
CBOE S&P 500 PutWrite Strategy Fund | 241,921 | |||
Enhanced Commodity Strategy Fund (consolidated)2 | — | |||
Managed Futures Strategy Fund (consolidated) | — | |||
| 1 | For the period May 6, 2021 (commencement of operations) through August 31, 2021. |
| 2 | For the period December 19, 2020 (post-reorganization) through August 31, 2021. |
During the fiscal year or period ended August 31, 2021, the amount of capital loss carryforwards used to offset realized gains are shown in the following table:
| Fund | Utilized Capital Loss Carryforward | |||
U.S. Dollar Bullish Fund | $ | — | ||
Chinese Yuan Strategy Fund | 699,935 | |||
Emerging Currency Strategy Fund | 573,680 | |||
Emerging Markets Corporate Bond Fund | 772,327 | |||
Emerging Markets Local Debt Fund | 242,337 | |||
Floating Rate Treasury Fund | 340,837 | |||
| WisdomTree Trust | 165 |
Table of Contents
Notes to Financial Statements (continued)
| Fund | Utilized Capital Loss Carryforward | |||
Interest Rate Hedged High Yield Bond Fund | $ | 679,189 | ||
Interest Rate Hedged U.S. Aggregate Bond Fund | — | |||
Mortgage Plus Bond Fund | — | |||
Yield Enhanced U.S. Aggregate Bond Fund | — | |||
Yield Enhanced U.S. Short-Term Aggregate Bond Fund | — | |||
Alternative Income Fund1 | — | |||
CBOE S&P 500 PutWrite Strategy Fund | 22,241,845 | |||
Enhanced Commodity Strategy Fund (consolidated)2 | — | |||
Managed Futures Strategy Fund (consolidated) | 625,787 | |||
| 1 | For the period May 6, 2021 (commencement of operations) through August 31, 2021. |
| 2 | For the period December 19, 2020 (post-reorganization) through August 31, 2021. |
At August 31, 2021, the effect of permanent “book/tax” reclassifications resulted in increases (decreases) to the components of net assets as shown in the following table. The differences are primarily due to the calculation of realized book income from wholly owned foreign subsidiaries, redemptions-in-kind and net operating losses.
| Fund | Total Distributable Earnings (Loss) | Paid-in Capital | ||||||
U.S. Dollar Bullish Fund | $ | 125,038 | $ | (125,038 | ) | |||
Chinese Yuan Strategy Fund | — | — | ||||||
Emerging Currency Strategy Fund | 19,708 | (19,708 | ) | |||||
Emerging Markets Corporate Bond Fund | (167,741 | ) | 167,741 | |||||
Emerging Markets Local Debt Fund | 356,330 | (356,330 | ) | |||||
Floating Rate Treasury Fund | (536,114 | ) | 536,114 | |||||
Interest Rate Hedged High Yield Bond Fund | (3,331,024 | ) | 3,331,024 | |||||
Interest Rate Hedged U.S. Aggregate Bond Fund | (895,885 | ) | 895,885 | |||||
Mortgage Plus Bond Fund | — | — | ||||||
Yield Enhanced U.S. Aggregate Bond Fund | (6,329,573 | ) | 6,329,573 | |||||
Yield Enhanced U.S. Short-Term Aggregate Bond Fund | (1,448,860 | ) | 1,448,860 | |||||
Alternative Income Fund | (13,250 | ) | 13,250 | |||||
CBOE S&P 500 PutWrite Strategy Fund | 132,439 | (132,439 | ) | |||||
Enhanced Commodity Strategy Fund (consolidated) | (9,369,826 | ) | 9,369,826 | |||||
Managed Futures Strategy Fund (consolidated) | (19,525,812 | ) | 19,525,812 | |||||
GAAP provides guidance on tax provisions that prescribe a minimum threshold for financial statement recognition of the benefit of a tax position taken or expected to be taken in a tax return. Foreign withholding taxes, as applicable, are accrued based on each Fund’s understanding of the tax rules and rates that exist in the foreign markets in which it invests. Foreign withholding taxes are accrued and applied to foreign income, net realized capital gains and net unrealized appreciation, as applicable, as the foreign income is earned or capital gains and unrealized appreciation are recorded.
As of and during the fiscal year or period ended August 31, 2021, the Funds did not have any liabilities for unrecognized tax benefits relating to uncertain income tax positions they have taken or expect to take in the future. If applicable, the Funds will recognize interest accrued related to unrecognized tax benefits in interest expense and penalties in “Other” expenses on the Statements of Operations. The Funds file tax returns with the Internal Revenue Service, the State of New York, and various other states. Specific to U.S. federal and state taxes, generally, each of the tax years in the four-year period ended August 31, 2021, remains subject to examination by taxing authorities. Specific to foreign countries in which the Funds invest, all open tax years remain subject to examination by taxing authorities in the respective jurisdictions.
7. ADDITIONAL INFORMATION
The respiratory disease caused by a novel coronavirus (“COVID-19”) has spread globally for over a year, resulting in a global pandemic and major disruption to global markets and economies. In an organized attempt to contain and mitigate the effects of COVID-19, governments and businesses world-wide took aggressive measures, including businesses canceling dividends to preserve cash, governments closing borders, restricting international and domestic travel, and the imposition of prolonged quarantines of
| 166 | WisdomTree Trust |
Table of Contents
Notes to Financial Statements (concluded)
large populations. COVID-19 has resulted in the disruption of and delays in the delivery of healthcare services and processes, the cancellation of organized events and educational institutions, the disruption of production and supply chains, a decline in consumer demand for certain goods and services, and general concern and uncertainty, all of which have contributed to increased volatility in global markets. In recent months, however, the rapid COVID-19 vaccination rollout in the United States and certain other developed countries, coupled with the passage of stimulus programs in the U.S. and abroad, have resulted in a reversal of many of these trends including the re-opening of businesses, a reduction in quarantine requirements, increased consumer demand, and the resumption of certain in-person schooling, travel and events. Despite these positive trends, the prevalence of new COVID-19 variants, a failure to achieve herd immunity, or other unforeseen circumstances may result in the continued spread of the virus throughout unvaccinated populations or a resurgence in infections among vaccinated populations. As a result, it remains unclear if recent positive trends will continue in developed markets and whether such trends will spread world-wide to countries with limited access to vaccines that are still experiencing rising COVID-19 cases, hospitalizations and deaths.
The effects of COVID-19 have affected and are likely to continue to affect certain sectors and industries more dramatically than others, and the effects borne by some will negatively affect the value of the issuers in those sectors and industries, which may adversely affect the value of a Fund’s investments in those sectors or industries. It is also true that the speed at which global economies recover, or fail to recover, from the COVID-19 pandemic will affect certain sectors, industries, and issuers more dramatically than others, which in turn may adversely affect certain Fund investments.
COVID-19, and other epidemics and pandemics that may arise in the future, could adversely affect the economies of many nations, the global economy, individual companies and capital markets in ways that cannot be foreseen at the present time. In addition, the impact of infectious diseases in developing or emerging market countries may be greater due to limited health care resources, including access to COVID-19 vaccinations and treatments. Political, economic and social stresses caused by COVID-19 also may exacerbate other pre-existing political, social and economic risks in certain countries. The duration of COVID-19 and its effects cannot be determined fully at this time, but the effects could be present for an extended period of time. It is impossible to predict the effects on the Funds of these or similar events and market conditions in the future. However, it is possible that these or similar events and market conditions could have a significant and adverse effect on the NAV and/or risk profile of a Fund.
8. SUBSEQUENT EVENT
Effective September 1, 2021, Newton Investment Management North America, LLC (“Newton”) replaced Mellon, each a subsidiary of The Bank of New York Mellon Corporation, as the investment sub-adviser with respect to the CBOE S&P 500 PutWrite Strategy Fund, Enhanced Commodity Strategy Fund, and Managed Futures Strategy Fund (the “Affected Funds”). However, the portfolio managers of the Affected Funds also transitioned from Mellon to Newton and, therefore, the current portfolio managers of the Affected Funds will continue to be responsible for the day-to-day management of each respective Affected Fund’s portfolio after the transition effective date as employees of Newton. Additionally, the Affected Funds’ investment objective, and principal investment strategies and risks did not change.
| WisdomTree Trust | 167 |
Table of Contents
Report of Independent Registered Public Accounting Firm
To the Shareholders of WisdomTree Bloomberg U.S. Dollar Bullish Fund, WisdomTree Chinese Yuan Strategy Fund, WisdomTree Emerging Currency Strategy Fund, WisdomTree Emerging Markets Corporate Bond Fund, WisdomTree Emerging Markets Local Debt Fund, WisdomTree Floating Rate Treasury Fund, WisdomTree Interest Rate Hedged High Yield Bond Fund, WisdomTree Interest Rate Hedged U.S. Aggregate Bond Fund, WisdomTree Mortgage Plus Bond Fund, WisdomTree Yield Enhanced U.S. Aggregate Bond Fund, WisdomTree Yield Enhanced U.S. Short-Term Aggregate Bond Fund, WisdomTree Alternative Income Fund, WisdomTree CBOE S&P 500 PutWrite Strategy Fund, WisdomTree Enhanced Commodity Strategy Fund and WisdomTree Managed Futures Strategy Fund and the Board of Trustees of WisdomTree Trust
Opinion on the Financial Statements
We have audited the accompanying statements of assets and liabilities (consolidated as it relates to WisdomTree Enhanced Commodity Strategy Fund and WisdomTree Managed Futures Strategy Fund) of WisdomTree Bloomberg U.S. Dollar Bullish Fund, WisdomTree Chinese Yuan Strategy Fund, WisdomTree Emerging Currency Strategy Fund, WisdomTree Emerging Markets Corporate Bond Fund, WisdomTree Emerging Markets Local Debt Fund, WisdomTree Floating Rate Treasury Fund, WisdomTree Interest Rate Hedged High Yield Bond Fund, WisdomTree Interest Rate Hedged U.S. Aggregate Bond Fund, WisdomTree Mortgage Plus Bond Fund, WisdomTree Yield Enhanced U.S. Aggregate Bond Fund, WisdomTree Yield Enhanced U.S. Short-Term Aggregate Bond Fund, WisdomTree Alternative Income Fund, WisdomTree CBOE S&P 500 PutWrite Strategy Fund, WisdomTree Enhanced Commodity Strategy Fund and WisdomTree Managed Futures Strategy Fund (collectively referred to as the “Funds”), (fifteen of the funds constituting WisdomTree Trust (the “Trust”)), including the schedules of investments (consolidated as it relates to WisdomTree Enhanced Commodity Strategy Fund and WisdomTree Managed Futures Strategy Fund), as of August 31, 2021, and the related statements of operations and changes in net assets (consolidated as it relates to WisdomTree Enhanced Commodity Strategy Fund and WisdomTree Managed Futures Strategy Fund), and the financial highlights (consolidated as it relates to WisdomTree Enhanced Commodity Strategy Fund and WisdomTree Managed Futures Strategy Fund) for each of the periods indicated in the table below and the related notes (collectively referred to as the “financial statements”). In our opinion, the financial statements present fairly, in all material respects, the financial position (consolidated as it relates to WisdomTree Enhanced Commodity Strategy Fund and WisdomTree Managed Futures Strategy Fund) of each of the Funds (fifteen of the funds constituting WisdomTree Trust) at August 31, 2021, and the results of their operations (consolidated as it relates to WisdomTree Enhanced Commodity Strategy Fund and WisdomTree Managed Futures Strategy Fund), changes in net assets (consolidated as it relates to WisdomTree Enhanced Commodity Strategy Fund and WisdomTree Managed Futures Strategy Fund) and financial highlights (consolidated as it relates to WisdomTree Enhanced Commodity Strategy Fund and WisdomTree Managed Futures Strategy Fund) for each of the periods indicated in the table below, in conformity with U.S. generally accepted accounting principles.
| Individual fund constituting the WisdomTree Trust | Statement of operations | Statements of changes in net assets | Financial highlights | |||
WisdomTree Bloomberg U.S. Dollar Bullish Fund WisdomTree Chinese Yuan Strategy Fund WisdomTree Emerging Currency Strategy Fund WisdomTree Emerging Markets Corporate Bond Fund WisdomTree Emerging Markets Local Debt Fund WisdomTree Floating Rate Treasury Fund WisdomTree Interest Rate Hedged High Yield Bond Fund WisdomTree Interest Rate Hedged U.S. Aggregate Bond Fund WisdomTree Yield Enhanced U.S. Aggregate Bond Fund WisdomTree CBOE S&P 500 PutWrite Strategy Fund WisdomTree Managed Futures Strategy Fund | For the year ended August 31, 2021 | For each of the two years in the period ended August 31, 2021 | For each of the five years in the period ended August 31, 2021 | |||
WisdomTree Mortgage Plus Bond Fund | For the year ended August 31, 2021 | For the year ended August 31, 2021 and the period from November 14, 2019 (commencement of operations) through August 31, 2020 | ||||
WisdomTree Yield Enhanced U.S. Short-Term Aggregate Bond Fund | For the year ended August 31, 2021 | For each of the two years in the period ended August 31, 2021 | For each of the four years in the period ended August 31, 2021 and the period from May 18, 2017 (commencement of operations) through August 31, 2017 | |||
WisdomTree Alternative Income Fund | For the period from May 6, 2021 (commencement of operations) through August 31, 2021 | |||||
WisdomTree Enhanced Commodity Strategy Fund | For the period from December 19, 2020 through August 31, 2021 and for the period from January 1, 2020 through December 18, 2020 | For the period from December 19, 2020 through August 31, 2021, the period from January 1, 2020 through December 18, 2020 and for the year ended December 31, 2019 | For the period from December 19, 2020 through August 31, 2021, the period from January 1, 2020 through December 18, 2020 and each of the four years in the period ended December 31, 2019 | |||
| 168 | WisdomTree Trust |
Table of Contents
Report of Independent Registered Public Accounting Firm (concluded)
Basis for Opinion
These financial statements are the responsibility of the Trust’s management. Our responsibility is to express an opinion on each of the Funds’ financial statements based on our audits. We are a public accounting firm registered with the Public Company Accounting Oversight Board (United States) (“PCAOB”) and are required to be independent with respect to the Trust in accordance with the U.S. federal securities laws and the applicable rules and regulations of the Securities and Exchange Commission and the PCAOB.
We conducted our audits in accordance with the standards of the PCAOB. Those standards require that we plan and perform the audit to obtain reasonable assurance about whether the financial statements are free of material misstatement, whether due to error or fraud. The Trust is not required to have, nor were we engaged to perform, an audit of the Trust’s internal control over financial reporting. As part of our audits, we are required to obtain an understanding of internal control over financial reporting, but not for the purpose of expressing an opinion on the effectiveness of the Trust’s internal control over financial reporting. Accordingly, we express no such opinion.
Our audits included performing procedures to assess the risks of material misstatement of the financial statements, whether due to error or fraud, and performing procedures that respond to those risks. Such procedures included examining, on a test basis, evidence regarding the amounts and disclosures in the financial statements. Our procedures included confirmation of securities owned as of August 31, 2021, by correspondence with the custodian and brokers or by other appropriate auditing procedures where replies from brokers were not received. Our audits also included evaluating the accounting principles used and significant estimates made by management, as well as evaluating the overall presentation of the financial statements. We believe that our audits provide a reasonable basis for our opinion.

We have served as the auditor of one or more WisdomTree investment companies since 2006.
New York, New York
October 27, 2021
| WisdomTree Trust | 169 |
Table of Contents
Approval of Investment Advisory and Sub-Advisory Agreements (unaudited)
Consideration of the Approval of Sub-Advisory Agreements
WisdomTree Managed Futures Strategy Fund
WisdomTree CBOE S&P 500 PutWrite Strategy Fund
WisdomTree Enhanced Commodity Strategy Fund
(each, a “Fund” and collectively, the “Funds”)
At a meeting of the Board of Trustees (the “Board”) of the WisdomTree Trust (the “Trust”) held on August 19, 2021, the Trustees (the “Trustees”), including those Trustees who are not “interested persons” (as defined in the Investment Company Act of 1940, as amended) of the Trust (the “Independent Trustees”), considered the approval of the Sub-Advisory Agreements (each, a “Sub-Advisory Agreement”), by and between WisdomTree Asset Management, Inc. (“WTAM”) and Newton Investment Management North America, LLC (the “Newton”) on behalf of the Funds, pursuant to which Newton would coordinate the investment and reinvestment of the assets of the Funds. Representatives of WTAM stated that the Funds were currently sub-advised by Mellon Investments Corporation (“Mellon”), and discussed plans to realign Mellon’s equities and multi-asset capabilities with Newton (the “Firm Realignment”), with such realignment scheduled to occur, subject to regulatory requirements, as of September 1, 2021 (the “Effective Date”). WTAM representatives noted that, as a result of the Firm Realignment, the senior portfolio managers who are currently responsible for managing the investments of the Funds as employees of Mellon will become employees of Newton as of the Effective Date. It was also noted that two new portfolio managers would be responsible for providing services to the Funds. Consequently, WTAM proposed to engage Newton to serve as each Fund’s sub-adviser, pursuant to a Sub-Advisory Agreement, to be effective on the Effective Date. The Independent Trustees were assisted in their review by independent legal counsel and met with counsel in executive session separate from WTAM representatives and the Sub-Adviser. In considering the approval of the Sub-Advisory Agreements, the Board considered all factors that it believed to be relevant, including those discussed below. The Board did not identify any one factor as dispositive, and each Trustee may have attributed different weights to the factors considered. Each Fund was considered separately.
At the meeting, WTAM recommended the approval of each Sub-Advisory Agreement based on the following considerations, among others: (i) approval of the Sub-Advisory Agreement would permit the Fund’s current senior portfolio managers to continue to be responsible for the day-to-day management of the Fund’s portfolio after the Effective Date as employees of Newton; (ii) there will be no material changes to the Fund’s investment objective, strategies or policies, no reduction in the nature or level of services provided to the Fund, and no increases in the management fee payable by the Fund as a result of the proposed changes to the sub-investment advisory arrangements; and (iii) WTAM (and not the Fund) will pay Newton for its sub-investment advisory services. The Board also considered the fact that WTAM stated that it believes there are no material changes to the information the Board had previously considered at a Board meeting held on September 29-30, 2020 (the “September Meeting”), at which the Board re-approved each sub-advisory agreement between WTAM and Mellon on behalf of the Funds for the ensuing year, other than the information about the Firm Realignment and Newton.
In determining whether to approve each Sub-Advisory Agreement, the Board considered the materials prepared by WTAM and Newton received in advance of the meeting and other information presented at the meeting, which included: (i) a form of the Sub-Advisory Agreement; (ii) a memorandum providing an overview of Newton; and (iii) Newton’s response to a 15(c) questionnaire provided by Fund counsel. The Board also considered the substance of discussions with representatives of WTAM and Mellon at the meeting and the September Meeting.
Nature, Extent and Quality of Services to be Provided. In examining the nature, extent and quality of the services that were expected to be provided by Newton to each Fund under the Sub-Advisory Agreements, the Board considered: (i) Newton’s organization, qualification and background, as well as the qualifications of its personnel; (ii) the expertise of the personnel providing portfolio management services, which would remain the same after the Effective Date; and (iii) the investment strategy for each Fund, which would remain the same after the Effective Date. The Board also considered the review process undertaken by WTAM and WTAM’s favorable assessment of the nature and quality of the sub-investment advisory services expected to be provided to the Funds by Newton after the Effective Date. Based on their consideration and review of the foregoing information, the Board concluded that the nature, extent and quality of the sub-investment advisory services to be provided by Newton under each Sub-Advisory Agreement, as well as Newton’s ability to render such services based on its resources and the experience of the investment team, which will include each Fund’s current senior portfolio managers, were adequate and appropriate for the Funds in light of each Fund’s investment objective, and supported a decision to approve the Sub-Advisory Agreements.
Comparative Analysis of the Funds’ Performance and Management Fee and Expense Ratio. The Board had considered each Fund’s investment performance and that of the investment team managing each Fund’s portfolio at the September Meeting (including comparative data provided by Broadridge Financial Solutions, Inc.). The Board considered the performance and that certain of the same investment professionals would continue to manage each Fund’s assets after the Effective Date as factors in evaluating the services to be provided by Newton under the Sub-Advisory Agreement after the Effective Date, and determined that these factors, when viewed together with the other factors considered by the Board, supported a decision to approve the Sub-Advisory Agreements.
| 170 | WisdomTree Trust |
Table of Contents
Approval of Investment Advisory and Sub-Advisory Agreements (unaudited) (continued)
The Board considered the fees to Newton in relation to the fees paid to WTAM by the Funds and the respective services to be provided by Newton and WTAM. The Board also noted that Newton’s fees will be paid by WTAM (out of its fee paid by the relevant Funds) and not the Funds. The Board considered the meaningful differences in the services that WTAM provides to the Funds as compared to Newton, including that Newton’s role in making investment recommendations with respect to a Fund tracking an index is a rules-based function, with oversight by WTAM in seeking to ensure compliance with such rules. The Board also considered Newton’s role in making investment recommendations with respect to a Fund that is model-based, with oversight by WTAM in seeking to ensure consistency with such quantitative models.
Based on this review and the other factors considered at the meeting, the Board concluded that, with respect to each Fund, the Fund’s performance, the fees paid to WTAM and Newton and the Fund’s total expenses supported the Board’s approval of the Sub-Advisory Agreements.
Economies of Scale to be Realized. The Board recognized that, because the fee payable to Newton would be paid by WTAM, and not the Funds, an analysis of economies of scale was more appropriate in the context of the Board’s consideration of each Fund’s Investment Advisory Agreement between WTAM and the Trust, on behalf of each Fund, which had been done at the September Meeting.
* * * * * *
At the conclusion of these discussions, the Board agreed that it had been furnished with sufficient information to make an informed business decision with respect to the approval of the Sub-Advisory Agreements. In evaluating the Sub-Advisory Agreements, the Board considered the conclusions and determinations discussed above and also relied on its previous knowledge, gained through meetings and other interactions with WTAM and Mellon, of the Funds and the services provided to the Funds by WTAM and Mellon, and to be provided by Newton. The Board also relied on information received on a routine and regular basis throughout the year relating to the operations of the Funds and the investment advisory and other services provided under the Agreements. In light of the foregoing, the Board, including a majority of the Independent Trustees, determined to approve the Sub-Advisory Agreements.
Consideration of the Approval of Investment Advisory and Sub-Advisory Agreements
WisdomTree Alternative Income Fund (the “Fund”)
At a meeting of the Board of Trustees (the “Board”) of the WisdomTree Trust (the “Trust”) held on December 3-4, 2020, the Trustees (the “Trustees”), including those Trustees who are not “interested persons” (as defined in the Investment Company Act of 1940, as amended) of the Trust (the “Independent Trustees”), considered the approval of the Investment Advisory Agreement (the “Advisory Agreement”), pursuant to which WisdomTree Asset Management, Inc. (“WTAM”) will provide the Fund with investment advisory services, and the Sub-Advisory Agreement (together with the Advisory Agreement, the “Agreements”), pursuant to which Mellon Investments Corporation (the “Sub-Adviser”) will coordinate the investment and reinvestment of the assets of the Fund.
In considering whether to approve the Agreements, the Trustees considered and discussed information and analysis provided by WTAM and Broadridge Financial Solutions, Inc., an independent provider of investment company data. The Trustees noted that representatives from WTAM presented preliminary information to the Trustees regarding the Fund’s proposed investment objective and principal investment strategies and risks at a meeting of the Trust’s Investment Committee, a committee of Independent Trustees, held on December 3, 2020. The Independent Trustees were assisted in their review by independent legal counsel and met with counsel in executive session separate from WTAM representatives and the Sub-Adviser. In considering the approval of the Agreements, the Board considered all factors that it believed to be relevant, including those discussed below. The Board did not identify any one factor as dispositive, and each Trustee may have attributed different weights to the factors considered.
Analysis of Nature, Extent, and Quality of Services to be Provided to the Fund. The Board considered information provided to them at the meeting and in previous presentations throughout the year from WTAM representatives regarding the nature, extent, and quality of the services provided to the WisdomTree funds, recognizing WTAM’s and the Sub-Adviser’s operational capabilities and resources. It was noted that the Fund would be passively managed. The Board noted WTAM’s belief that shareholders will invest in the Fund on the strength of WTAM’s industry standing and reputation and with the expectation that WTAM will have a continuing role in providing advisory services to the Fund. The Board also noted the extensive responsibilities that WTAM will have as investment adviser to the Fund, including: the selection of, and supervisory responsibilities and activities over, the Sub-Adviser, including oversight of the Sub-Adviser’s adherence to the Fund’s investment strategy and restrictions, monitoring of the Sub-Adviser’s buying and selling of securities and derivatives transactions, review of Sub-Adviser performance, review of proxies voted by the Sub-Adviser and oversight of, and the provision of consultation to, the Sub-Adviser with respect to the creation of custom creation or redemption baskets for authorized participants; oversight of the daily valuation of the Fund’s portfolio holdings; oversight of general Fund compliance with federal and state laws; and implementation of Board directives as they relate to the Fund.
| WisdomTree Trust | 171 |
Table of Contents
Approval of Investment Advisory and Sub-Advisory Agreements (unaudited) (concluded)
The Board also considered research support available to, and management capabilities of, the Fund’s management personnel and that WTAM will provide oversight of day-to-day Fund operations, including fund accounting, tax matters, administration, compliance and legal assistance in meeting disclosure and regulatory requirements.
Based on review of this information and the other factors considered at the meeting, the Board concluded that the nature, extent and quality of services to be provided by WTAM and the Sub-Adviser under the Advisory Agreement and Sub-Advisory Agreement, respectively, are adequate and appropriate and supported the Board’s approval of the Agreements.
Comparative Analysis of the Fund’s Performance, Advisory Fees and Fund Expenses. As the Fund had not yet commenced operations, the Board was not able to review the Fund’s performance. The Board discussed with WTAM representatives the portfolio management team and the investment strategies to be employed in the management of the Fund’s assets. The Board noted the reputation and experience of WTAM and the Sub-Adviser.
The Board considered the fees to be paid to WTAM by the Fund. The Board examined the fee to be paid by the Fund in light of fees paid to other investment advisers by comparable funds and the method of computing the Fund’s fee. The Board also considered the fee to be paid to the Sub-Adviser in relation to the fee to be paid to WTAM by the Fund and the respective services to be provided by the Sub-Adviser and WTAM. The Board also noted the Sub-Adviser’s fee will be paid by WTAM (out of its fee paid by the Fund) and not by the Fund. The Board considered the meaningful differences in the services that WTAM will provide to the Fund as compared to the Sub-Adviser, including that the role of the Sub-Adviser in making investment recommendations with respect to the Fund tracking an index is a rules-based function, with oversight by WTAM in seeking to ensure compliance with such rules. The Board also considered the entrepreneurial and expense risk to be borne by WTAM that is associated with the Fund’s unitary fee structure, which includes minimum fees (such as those to the Sub-Adviser), regardless of whether the asset size of the Fund grows to a sufficient size. Based on this review, the Board concluded that the fees to be paid to WTAM and the Sub-Adviser supported the Board’s approval of the Agreements.
Analysis of Profitability and Economies of Scale. As the Fund had not yet commenced operations, WTAM representatives were not able to review the dollar amount of expenses allocated and profit received by WTAM, or any economies of scale. The Board considered potential benefits to WTAM and the Sub-Adviser from acting as investment adviser and sub-adviser, respectively. The Board also considered the uncertainty of the estimated asset levels and the renewal requirements for advisory agreements and their ability to review the advisory fees annually after the initial term of the Agreements. The Board determined that because the Fund had not yet commenced operations, economies of scale were not a factor, but, to the extent in the future it were determined that material economies of scale had not been shared with the Fund, the Board would seek to have those economies of scale shared with the Fund in connection with future renewals.
* * * * * *
In evaluating the Agreements, the Board considered the conclusions and determinations discussed above and also relied on its knowledge, gained through meetings and other interactions with WTAM and the Sub-Adviser, of other funds advised by WTAM and the Sub-Adviser. In light of the foregoing, the Board, including a majority of the Independent Trustees, determined to approve the Agreements.
| 172 | WisdomTree Trust |
Table of Contents
Liquidity Risk Management Program (unaudited)
The Funds adopted a liquidity risk management program (the “Program”) pursuant to the requirements of Rule 22e-4 (the “Rule”) under the Investment Company Act of 1940, as amended. The Rule requires registered open-end funds, including exchange-traded funds such as the Funds, to establish liquidity risk management programs in order to effectively manage fund liquidity and shareholder redemptions. The Rule is designed to mitigate the risk that a Fund could not meet redemption requests without significantly diluting the interest of remaining investors. The Board has appointed WisdomTree Asset Management, Inc., the investment advisor to the Funds, as the Program Administrator for each Fund’s Program.
The Rule requires the Funds to assess, manage and review their liquidity risk at least annually considering applicable factors such as investment strategy and liquidity during normal and foreseeable stressed conditions, including whether the strategy is appropriate for an open-ended fund and whether the Fund has a relatively concentrated portfolio or large positions in particular issuers. The Funds must also assess their use of borrowings and derivatives, short-term and long-term cash flow projections in normal and stressed conditions, holdings of cash and cash equivalents, and borrowing arrangements and other funding sources.
The Rule also requires the Funds to classify their investments into one of four liquidity categories: highly liquid, moderately liquid, less liquid or illiquid based on the number of days a Fund expects it would take to liquidate the investment, and to review these classifications at least monthly or more often under certain conditions. The periods range from three or fewer business days for a highly liquid investment to greater than seven calendar days for settlement of a less liquid investment. Illiquid investments are those a Fund does not expect to be able to sell or dispose of within seven calendar days without significantly changing the market value of the investment. A Fund is prohibited from acquiring an investment if, after the acquisition, its holdings of illiquid assets will exceed 15% of its net assets. In addition, if a Fund permits redemptions in-kind, the Rule requires the Fund to establish redemption in-kind policies and procedures governing how and when it will engage in such redemptions.
Pursuant to the Rule’s requirements, the Program has been reviewed and approved by the Fund’s Board. Furthermore, the Board has received a written report prepared by the Program Administrator that addresses the operation of the Program, assesses its adequacy and effectiveness and describes any material changes made to the Program. The Program Administrator has monitored the Fund’s liquidity risk and the liquidity classifications of the securities held by the Fund and has determined that the Program is operating effectively.
During the period from January 1, 2020 to December 31, 2020, there were no material changes to the Program and no material liquidity events that impacted the Funds. During the period, the Funds held sufficient highly liquid assets to meet fund redemptions.
Under normal expected foreseeable Fund redemption forecasts and foreseeable stressed Fund redemption forecasts, the Program Administrator believes that the Funds maintain sufficient highly liquid assets to meet Fund redemptions.
| WisdomTree Trust | 173 |
Table of Contents
Trustees and Officers Information (unaudited)
Name | Position(s) Held with | Principal Occupation(s) | Number of Portfolios in Fund Complex Overseen by Trustee/ Officer+ | Other | ||||||
| Trustees Who Are Interested Persons of the Trust | ||||||||||
| Jonathan Steinberg (1964) | Trustee, 2005- present; President, 2005- present | Chief Executive Officer, WisdomTree Investments, Inc. and WisdomTree Asset Management since 2005; President, WisdomTree Investments and WisdomTree Asset Management from 2012 to 2019. | 73 | Director, WisdomTree Investments, Inc. and WisdomTree Asset Management. | ||||||
| Trustees Who Are Not Interested Persons of the Trust | ||||||||||
| David G. Chrencik* (1948) | Trustee, 2014- present | Chief Financial Officer of Sarus Indochina Select LP (hedge fund) since 2012; Chief Financial Officer of GeoGreen BioFuels, Inc. (biodiesel fuel producer) from 2010 to 2014; Audit Partner at PricewaterhouseCoopers LLP (public accounting firm) from 1972 to 2009 (includes positions prior to becoming Audit Partner and predecessor firms). | 73 | None | ||||||
| Joel Goldberg**, *** (1945) | Trustee, 2012- present | Attorney, Partner at Stroock & Stroock & Lavan LLP from 2010 to 2018; Attorney, Partner at Willkie Farr & Gallagher LLP from 2006 to 2010. | 73 | Director, Better Business Bureau (Metropolitan New York, Long Island and the Mid-Hudson Region). | ||||||
| Toni Massaro*** (1955) | Trustee, 2006- present | Dean Emerita at the University of Arizona James E. Rogers College of Law (“Rogers College of Law”) since 2009 (distinguished Emerita in July 2009); Dean of the Rogers College of Law from 1999 to 2009; Regents’ Professor since 2006; Milton O. Riepe Chair in Constitutional Law since 1997; Professor at the Rogers College of Law since 1990. | 73 | None | ||||||
| Melinda A. Raso Kirstein**** (1955) | Trustee, 2014- present | Retired since 2004, Merrill Lynch Investment Management, Vice President; Senior Portfolio Manager, Fixed Income Management; Director, Tax Exempt Fund Management. | 73 | Associate Alumnae of Douglass College, Chair of Investment Committee. | ||||||
| Victor Ugolyn (1947) | Trustee, 2006- present; Chairman of the Board, 2006- present | Private Investor, from 2005 to present; President and Chief Executive Officer of William D. Witter, Inc. from 2005 to 2006; Consultant to AXA Enterprise in 2004; Chairman, President and Chief Executive Officer of Enterprise Capital Management (subsidiary of The MONY Group, Inc.) and Enterprise Group of Funds, Chairman of MONY Securities Corporation, and Chairman of the Fund Board of Enterprise Group of Funds from 1991 to 2004. | 73 | Member of the Board of Governors of Naismith Memorial Basketball Hall of Fame (2001- 2016). | ||||||
| 174 | WisdomTree Trust |
Table of Contents
Trustees and Officers Information (unaudited) (concluded)
Name | Position(s) Held with | Principal Occupation(s) | Number of Portfolios in Fund Complex Overseen by Trustee/ Officer+ | Other | ||||||
| Officers of the Trust | ||||||||||
| Jonathan Steinberg***** (1964) | President, 2005- present; Trustee, 2005-present | Chief Executive Officer, WisdomTree Investments, Inc. and WisdomTree Asset Management since 2005; President, WisdomTree Investments and WisdomTree Asset Management from 2012 to 2019. | 73 | Director, WisdomTree Investments, Inc. and WisdomTree Asset Management. | ||||||
| David Castano***** (1971) | Treasurer, 2013- present | Head of Fund Accounting & Administration, WisdomTree Asset Management, since 2020; Director of Fund Accounting & Administration, WisdomTree Asset Management, 2011 to 2020. | 73 | None | ||||||
| Terry Jane Feld***** (1960) | Chief Compliance Officer, 2012- present | Chief Compliance Officer WisdomTree Asset Management since 2012; Senior Compliance Officer, WisdomTree Asset Management since 2011. | 73 | None | ||||||
| Ryan Louvar***** (1972) | Secretary and Chief Legal Officer, 2013- present | General Counsel, WisdomTree Asset Management since 2013; Vice President and Senior Managing Counsel, State Street, 2005 to 2013. | 73 | None | ||||||
| Joanne Antico***** (1975) | Assistant Secretary, 2018- present | Assistant General Counsel, WisdomTree Asset Management since 2016; Executive Director and Assistant Secretary, Morgan Stanley Investment Management Inc., 2005 to 2016. | 73 | None | ||||||
| Clint Martin***** (1977) | Assistant Treasurer, 2015- present | Director of Fund Accounting & Administration, WisdomTree Asset Management, since 2020; Fund Manager, Fund Accounting & Administration, WisdomTree Asset Management, 2012 to 2020. | 73 | None | ||||||
| + | As of August 31, 2021. |
| * | Chair of the Audit Committee. |
| ** | Chair of the Contracts Review Committee. |
| *** | Co-Chair of the Governance, Nominating and Compliance Committee. |
| **** | Chair of the Investment Committee. |
| ***** | Elected by and serves at the pleasure of the Board. |
| WisdomTree Trust | 175 |
Table of Contents
Supplemental Information (unaudited)
Federal Income Tax Information
The following Federal tax information related to the Funds’ fiscal year or period ended August 31, 2021, is provided for information purposes only and should not be used for reporting to federal or state revenue agencies. Federal tax information for the calendar year will be reported to you on Form 1099-DIV in January 2022.
The Funds designate the following amount of ordinary income distributions paid during the fiscal year or period ended August 31, 2021 from qualified short-term gains and qualified interest income:
| Fund | Qualified Short-Term Gains | Qualified Interest Income | ||||||
U.S. Dollar Bullish Fund | 0.00 | % | 99.97 | % | ||||
Chinese Yuan Strategy Fund | 0.00 | % | 100.00 | % | ||||
Emerging Currency Strategy Fund | 0.00 | % | 100.00 | % | ||||
Emerging Markets Corporate Bond Fund | 0.00 | % | 2.42 | % | ||||
Emerging Markets Local Debt Fund | 0.00 | % | 0.03 | % | ||||
Floating Rate Treasury Fund | 100.00 | % | 100.00 | % | ||||
Interest Rate Hedged High Yield Bond Fund | 0.00 | % | 97.40 | % | ||||
Interest Rate Hedged U.S. Aggregate Bond Fund | 0.00 | % | 99.99 | % | ||||
Mortgage Plus Bond Fund | 100.00 | % | 99.21 | % | ||||
Yield Enhanced U.S. Aggregate Bond Fund | 100.00 | % | 91.30 | % | ||||
Yield Enhanced U.S. Short-Term Aggregate Bond Fund | 100.00 | % | 89.90 | % | ||||
Alternative Income Fund1 | 0.00 | % | 0.00 | % | ||||
CBOE S&P 500 PutWrite Strategy Fund | 0.00 | % | 86.03 | % | ||||
Enhanced Commodity Strategy Fund (consolidated)2 | 0.00 | % | 0.00 | % | ||||
Managed Futures Strategy Fund (consolidated) | 0.00 | % | 98.52 | % | ||||
| 1 | For the period May 6, 2021 (commencement of operations) through August 31, 2021. |
| 2 | For the period December 19, 2020 (post-reorganization) through August 31, 2021. |
The Funds intend to elect to pass through to shareholders the credit for taxes paid to foreign countries during the fiscal year or period ended August 31, 2021. The gross foreign source income and foreign taxes paid are as follows:
| Fund | Gross Foreign Income | ForeignTaxes Paid | ||||||
U.S. Dollar Bullish Fund | $ | — | $ | — | ||||
Chinese Yuan Strategy Fund | — | — | ||||||
Emerging Currency Strategy Fund | — | — | ||||||
Emerging Markets Corporate Bond Fund | — | — | ||||||
Emerging Markets Local Debt Fund | 6,757,494 | 216,839 | ||||||
Floating Rate Treasury Fund | — | — | ||||||
Interest Rate Hedged High Yield Bond Fund | — | — | ||||||
Interest Rate Hedged U.S. Aggregate Bond Fund | — | — | ||||||
Mortgage Plus Bond Fund | — | — | ||||||
Yield Enhanced U.S. Aggregate Bond Fund | — | — | ||||||
Yield Enhanced U.S. Short-Term Aggregate Bond Fund | — | — | ||||||
Alternative Income Fund1 | — | — | ||||||
CBOE S&P 500 PutWrite Strategy Fund | — | — | ||||||
Enhanced Commodity Strategy Fund (consolidated)2 | — | — | ||||||
Managed Futures Strategy Fund (consolidated) | — | — | ||||||
| 1 | For the period May 6, 2021 (commencement of operations) through August 31, 2021. |
| 2 | For the period December 19, 2020 (post-reorganization) through August 31, 2021. |
| 176 | WisdomTree Trust |
Table of Contents
General Information (unaudited)
Proxy Voting Policies, Procedures and Record
A complete copy of the Proxy Voting Policy may be obtained upon request, at no charge, by calling 1-866-909-WISE (9473) or writing to: WisdomTree Trust, c/o Foreside Fund Services, LLC, Three Canal Plaza Suite 100, Portland, ME, 04101.
The Trust is required to disclose annually the Funds’ complete proxy voting record on Form N-PX covering the most recent
12-month period ended June 30 and to file Form N-PX with the SEC no later than August 31 of each year. The current Form N-PX for the Funds is available at no charge upon request by calling 1-866-909-WISE (9473) or through the Trust’s website at www.wisdomtree.com. The Funds’ Form N-PX is also available on the SEC’s website at www.sec.gov.
Shareholder Reports and Quarterly Portfolio Disclosure
The Funds file their complete schedule of portfolio holdings with the SEC for their first and third fiscal quarters as an exhibit to their reports on Form N-PORT. Copies of the filings are available, without charge, on the SEC’s website at www.sec.gov and are also available by calling the Trust at 1-866-909-WISE (9473). Copies of the filings may also be obtained, after paying a duplicating fee, by electronic request at the following E-mail address: publicinfo@sec.gov.
Information about each Fund’s portfolio holdings is available daily, without charge, at www.wisdomtree.com.
The Statement of Additional Information (“SAI”) has additional information about the Funds’ Trustees and Officers and is available without charge upon request. Contact your financial representative for a free prospectus or SAI.
Frequency Distribution of Discounts & Premiums
Information about differences between the per share net asset value of each Fund and the market trading price of shares of each Fund are available, without charge, at www.wisdomtree.com.
| WisdomTree Trust | 177 |
Table of Contents
The WisdomTree Funds are exchange traded funds (“ETFs”) registered with the United States Securities and Exchange Commission as separate series (“Funds”) of WisdomTree Trust (“Trust”). WisdomTree Asset Management, Inc., a wholly owned subsidiary of WisdomTree Investments, Inc., serves as the investment adviser to the Trust. None of the WisdomTree entities are affiliated with Foreside Fund Services, LLC, the Funds’ distributor. WisdomTree Investments, its affiliates and their independent providers are not liable for any informational errors, incompleteness, delays, or for any actions taken in reliance on information contained herein.
Investors should consider the investment objectives, risks, charges and expenses of the Funds carefully before investing. A prospectus, containing this and other information, is available at www.wisdomtree.com, or by calling 1-866-909-WISE (9473). Investors should read the prospectus carefully before investing.
There are risks associated with investing including possible loss of principal. Foreign investing involves special risks, such as risk of loss from currency fluctuation or political or economic uncertainty. Investments in real estate involve additional special risks, such as credit risk, interest rate fluctuations and the effect of varied economic conditions. Funds that focus their investments in one country or region may be significantly impacted by events and developments associated with the region which can adversely affect performance. Funds focusing on a single sector and/or smaller companies generally experience greater price volatility. Investments in emerging, offshore or frontier markets are generally less liquid and less efficient than investments in developed markets and are subject to additional risks, such as risks of adverse governmental regulation and intervention or political developments. Investments in currency involve additional special risks, such as credit risk and interest rate fluctuations. Derivative investments can be volatile and these investments may be less liquid than other securities, and more sensitive to the effect of varied economic conditions. As these Funds can have a high concentration in some issuers the Funds can be adversely impacted by changes affecting such issuers.
Fixed income investments are subject to interest rate risk; their value will normally decline as interest rates rise. In addition, when interest rates fall, income may decline. Fixed income investments are also subject to credit risk, the risk that the issuer of a bond will fail to pay interest and principal in a timely manner, or that negative perceptions of the issuer’s ability to make such payments will cause the price of that bond to decline. High-yield or “junk” bonds have lower credit ratings and involve a greater risk to principal. One of the risks associated with the Enhanced Commodity Strategy Fund (GCC) and the Managed Futures Strategy Fund (WTMF) is the complexity of the different factors which contribute to the Funds’ performance, as well as their correlation (or non-correlation) to other asset classes. These factors include use of long and short positions in commodity futures contracts, foreign currency contracts, swaps and other derivatives. An investment in GCC and WTMF is speculative and involves a substantial degree of risk. GCC and WTMF should not be used as a proxy for taking long only (or short only) positions in commodities or currencies. In markets without sustained price trends or markets that quickly reverse or “whipsaw” GCC and WTMF may suffer significant losses. Unlike typical exchange-traded funds, there are no indexes that the actively managed Currency Strategy Funds, actively managed Fixed Income Funds or GCC and WTMF attempt to track or replicate. Thus, the ability of these Funds to achieve their objectives will depend on the effectiveness of the portfolio manager. Due to the investment strategy of certain Funds they may make higher capital gain distributions than other ETFs. Please read the Fund’s prospectus for specific details regarding the Fund’s risk profile.
Commodities and futures are generally volatile and are not suitable for all investors. Investments in commodities may be affected by overall market movements, changes in interest rates and other factors such as weather, disease, embargoes and international economic and political developments.
Indexes are unmanaged and you cannot invest directly in an index.
Transactions in Fund shares will result in brokerage commissions and will generate tax consequences. Shares may be sold through brokerage accounts, but may be redeemed from the Funds by Authorized Participants in large creation unit sizes of shares.
This report is intended for the Funds’ shareholders. It may not be distributed to prospective investors unless it is preceded or accompanied by the current prospectus.
Table of Contents
WisdomTree Fund shares are distributed by Foreside Fund Services, LLC, in the U.S. only.
WTGM-5474
Table of Contents
Item 2. Code of Ethics.
| (a) | The registrant, as of the end of the period covered by this report, has adopted a code of ethics that applies to the registrant’s principal executive officer, principal financial officer, principal accounting officer or controller, or persons performing similar functions, regardless of whether these individuals are employed by the registrant or a third party. |
| (c) | There have been no amendments, during the period covered by this report, to a provision of the code of ethics that applies to the registrant’s principal executive officer, principal financial officer, principal accounting officer or controller, or persons performing similar functions, regardless of whether these individuals are employed by the registrant or a third party, and that relates to any element of the code of ethics description. |
| (d) | The registrant has not granted any waivers, including an implicit waiver, from a provision of the code of ethics that applies to the registrant’s principal executive officer, principal financial officer, principal accounting officer or controller, or persons performing similar functions, regardless of whether these individuals are employed by the registrant or a third party, that relates to one or more of the items set forth in paragraph (b) of this item’s instructions. |
| (f) | The code of ethics is attached hereto as exhibit 13(a)(1). |
Item 3. Audit Committee Financial Expert.
The registrant’s Board of Trustees has determined that the registrant has one audit committee financial expert, as that term is defined under Item 3(b) and 3(c), serving on its audit committee. The audit committee financial expert serving on the registrant’s audit committee is David Chrencik, who is an independent trustee of the registrant, as that term is defined under Item 3(a) (2).
Item 4. Principal Accountant Fees and Services.
Audit Fees
| (a) | The aggregate fees billed for each of the last two fiscal years for professional services rendered by the principal accountant for the audit of the registrant’s annual financial statements or services that are normally provided by the accountant in connection with statutory and regulatory filings or engagements for those fiscal years were $341,971 for 2021 and $295,431 for 2020. |
Audit-Related Fees
| (b) | The aggregate fees billed for each of the last two fiscal years for assurance and related services by the principal accountant that are reasonably related to the performance of the audit of the registrant’s financial statements and are not reported under paragraph (a) of this Item were $0 for 2021 and $0 for 2020. |
Table of Contents
| Tax Fees | ||||
| (c) | The aggregate fees billed for each of the last two fiscal years for professional services rendered by the principal accountant for tax compliance, tax advice, and tax planning were $128,157 for 2021 and $137,240 for 2020. | |||
| All Other Fees | ||||
| (d) | The aggregate fees billed for each of the last two fiscal years for products and services provided by the principal accountant, other than the services reported in paragraphs (a) through (c) of this Item were $0 for 2021 and $0 for 2020. | |||
| (e)(1) | Disclose the audit committee’s pre-approval policies and procedures described in paragraph (c)(7) of Rule 2-01 of Regulation S-X. | |||
| Per Rule 2-01(c) (7) (A), the registrant’s audit committee charter provides that the audit committee shall select and approve in advance the retention of independent accountants to annually audit and provide their opinion on the registrant’s financial statements. The audit committee must also approve prior to appointment the engagement of the principal accountant to provide other audit services to the registrant or to provide non-audit services to the registrant, its investment adviser, or any entity controlling, controlled by, or under common control with its investment adviser (“adviser/affiliate”) that provides ongoing services to the registrant, if the engagement by the investment adviser or adviser affiliate relates directly to the operations and financial reporting of the registrant. The audit committee must also, prior to appointment of the engagement of the principal accountant, review and approve the fees proposed to be charged to the registrant by the auditors for each audit and non-audit service. The audit committee must also consider whether non-audit services provided by the registrant’s principal accountant to the registrant’s investment adviser, or adviser/affiliate that provides ongoing services to the registrant are compatible with maintaining the auditor’s independence. | ||||
| (e)(2) | The registrant’s audit committee has approved 100% of services described in each of Items 4(b) through (d) pursuant to paragraph (c)(7)(i)(C) of Rule 2-01 of Regulation S-X. | |||
| (f) | The percentage of hours expended on the principal accountant’s engagement to audit the registrant’s financial statements for the most recent fiscal year that were attributed to work performed by persons other than the principal accountant’s full-time, permanent employees was 0%. | |||
| (g) | The aggregate non-audit fees billed by the registrant’s accountant for services rendered to the registrant, and rendered to the registrant’s investment adviser (not including any sub-adviser whose role is primarily portfolio management and is subcontracted with or overseen by another investment adviser), and any entity controlling, controlled by, or under common control with the adviser that provides ongoing services to the registrant for each of the last two fiscal years of the registrant was $128,157 for 2021 and $137,240 for 2020. | |||
| (h) | Not applicable. | |||
| (i) | Not applicable. | |||
| (j) | Not applicable. | |||
| Item 5. Audit Committee of Listed Registrants. | ||||
| The registrant is an issuer as defined in Rule 10A-3 under the Securities Exchange Act of 1934, as amended (the “Exchange Act”) and has a separately-designated standing audit committee established in accordance with Section 3(a)(58)A of the Exchange Act. The registrant’s audit committee members are David Chrencik, Melinda Raso Kirstein and Victor Ugolyn. | ||||
Table of Contents
Item 6. Investments.
| (a) | Schedule of Investments in securities of unaffiliated issuers as of the close of the reporting period is included as part of the report to shareholders filed under Item 1 of this form. |
| (b) | Not applicable. |
Item 7. Disclosure of Proxy Voting Policies and Procedures for Closed-End Management Investment Companies.
Not applicable.
Item 8. Portfolio Managers of Closed-End Management Investment Companies.
Not applicable.
Item 9. Purchases of Equity Securities by Closed-End Management Investment Company and Affiliated Purchasers.
Not applicable.
Item 10. Submission of Matters to a Vote of Security Holders.
There have been no material changes to the procedures by which the shareholders may recommend nominees to the registrant’s board of trustees, where those changes were implemented after the registrant last provided disclosure in response to the requirements of Item 407(c)(2)(iv) of Regulation S-K (17 CFR 229.407) (as required by Item 22(b)(15) of Schedule 14A (17 CFR 240.14a-101)), or this Item.
Item 11. Controls and Procedures.
| (a) | The registrant’s principal executive and principal financial officers, or persons performing similar functions, have concluded that the registrant’s disclosure controls and procedures (as defined in Rule 30a-3(c) under the Investment Company Act of 1940, as amended (the “1940 Act”) (17 CFR 270.30a-3(c))) are effective, as of a date within 90 days of the filing date of the report that includes the disclosure required by this paragraph, based on their evaluation of these controls and procedures required by Rule 30a-3(b) under the 1940 Act (17 CFR 270.30a-3(b)) and Rules 13a-15(b) or 15d-15(b) under the Securities Exchange Act of 1934, as amended (17 CFR 240.13a-15(b) or 240.15d-15(b)). |
| (b) | There were no changes in the registrant’s internal control over financial reporting (as defined in Rule 30a-3(d) under the 1940 Act (17 CFR 270.30a-3(d)) that occurred during the period covered by this report that has materially affected, or is reasonably likely to materially affect, the registrant’s internal control over financial reporting. |
Table of Contents
Item 12. Disclosure of Securities Lending Activities for Closed-End Management Investment Companies.
Not applicable.
Item 13. Exhibits.
Table of Contents
SIGNATURES
Pursuant to the requirements of the Securities Exchange Act of 1934 and the Investment Company Act of 1940, the registrant has duly caused this report to be signed on its behalf by the undersigned, thereunto duly authorized.
| (Registrant) | WisdomTree Trust | |
| By (Signature and Title) | /s/Jonathan Steinberg | |
| Jonathan L. Steinberg, President | ||
| (principal executive officer) | ||
| Date: November 3, 2021 | ||
Pursuant to the requirements of the Securities Exchange Act of 1934 and the Investment Company Act of 1940, this report has been signed below by the following persons on behalf of the registrant and in the capacities and on the dates indicated.
| By (Signature and Title) | /s/Jonathan Steinberg | |
| Jonathan L. Steinberg, President | ||
| (principal executive officer) | ||
| Date: November 3, 2021 | ||
| By (Signature and Title) | /s/David Castano | |
| David Castano, Treasurer | ||
| (principal financial officer) | ||
| Date: November 3, 2021 | ||