UNITED STATES
SECURITIES AND EXCHANGE COMMISSION
Washington, D.C. 20549
FORM N-CSR
CERTIFIED SHAREHOLDER REPORT OF REGISTERED
MANAGEMENT INVESTMENT COMPANIES
Investment Company Act file number 811-21864
WisdomTree Trust
(Exact name of registrant as specified in charter)
250 West 34th Street, 3rd Floor
New York, NY 10119
(Address of principal executive offices) (Zip code)
The Corporation Trust Company
1209 Orange Street
Wilmington, DE 19801
(Name and address of agent for service)
Registrant’s telephone number, including area code: (866) 909-9473
Date of fiscal year end: March 31
Date of reporting period: March 31, 2024
Form N-CSR is to be used by management investment companies to file reports with the Commission not later than 10 days after the transmission to stockholders of any report that is required to be transmitted to stockholders under Rule 30e-1 under the Investment Company Act of 1940 (17 CFR 270.30e-1). The Commission may use the information provided on Form N-CSR in its regulatory, disclosure review, inspection, and policymaking roles.
A registrant is required to disclose the information specified by Form N-CSR, and the Commission will make this information public. A registrant is not required to respond to the collection of information contained in Form N-CSR unless the Form displays a currently valid Office of Management and Budget (“OMB”) control number. Please direct comments concerning the accuracy of the information collection burden estimate and any suggestions for reducing the burden to Secretary, Securities and Exchange Commission, 100 F Street, NE, Washington, DC 20549. The OMB has reviewed this collection of information under the clearance requirements of 44 U.S.C. § 3507.
Item 1. Reports to Stockholders.
| (a) | The Annual Reports to Shareholders of WisdomTree Trust (the “Registrant”) for the fiscal year ended March 31, 2024 (collectively, the “Shareholder Reports”) are attached hereto. |
| (b) | Not applicable. |


WisdomTree Trust
Annual Report
March 31, 2024
WisdomTree U.S. AI Enhanced Value Fund (AIVL)
WisdomTree U.S. High Dividend Fund (DHS)
WisdomTree U.S. LargeCap Dividend Fund (DLN)
WisdomTree U.S. LargeCap Fund (EPS)
WisdomTree U.S. MidCap Dividend Fund (DON)
WisdomTree U.S. MidCap Fund (EZM)
WisdomTree U.S. MidCap Quality Growth Fund (QMID)
WisdomTree U.S. Multifactor Fund (USMF)
WisdomTree U.S. Quality Dividend Growth Fund (DGRW)
WisdomTree U.S. Quality Growth Fund (QGRW)
WisdomTree U.S. SmallCap Dividend Fund (DES)
WisdomTree U.S. SmallCap Fund (EES)
WisdomTree U.S. SmallCap Quality Dividend Growth Fund (DGRS)
WisdomTree U.S. SmallCap Quality Growth Fund (QSML)
WisdomTree U.S. Total Dividend Fund (DTD)
WisdomTree U.S. Value Fund (WTV)
| 1 | ||||
Information about Performance and Shareholder Expense Examples (unaudited) | 3 | |||
| 4 | ||||
| 20 | ||||
| Schedules of Investments |
| |||
| 23 | ||||
| 26 | ||||
| 32 | ||||
| 37 | ||||
| 44 | ||||
| 49 | ||||
| 57 | ||||
| 60 | ||||
| 64 | ||||
| 69 | ||||
| 71 | ||||
| 79 | ||||
| 90 | ||||
| 94 | ||||
| 99 | ||||
| 109 | ||||
| 112 | ||||
| 116 | ||||
| 120 | ||||
| 126 | ||||
| 134 | ||||
| 147 | ||||
Approval of Investment Advisory and Sub-Advisory Agreements (unaudited) | 149 | |||
| 151 | ||||
| 152 | ||||
| 154 | ||||
| 155 | ||||
“WisdomTree” is a registered mark of WisdomTree, Inc. and is licensed for use by the WisdomTree Trust.
(unaudited)
U.S. equity markets, as measured by the S&P 500 Index, returned 29.88% in U.S. dollar terms for the 12-month fiscal period ending March 31, 2024 (the “period”).
U.S. markets fluctuated during the period with most of the nearly 30% gain coming from October 2023 through March 2024. Optimism pervaded the market as investors grew convinced that the U.S. Federal Reserve (“Fed”) was near the end of its rate hike cycle, which provided a significant tailwind to equities. Monthly non-farm payrolls and inflation reports characterized the entire period as investors digested each data point’s implication for the direction of monetary policy over the near-term, and equity markets followed accordingly. Consumer Price Index (“CPI”) inflation fell from 5% year-over-year at the start of the period to about 3.5% by its end, which was a welcome deceleration for the markets. Meanwhile, labor markets remained relatively steady with the headline unemployment rate ranging from 3.4-3.9% during the period. The combination of disinflation and a robust labor market prompted the Fed to increase the Federal Funds rate by only 50 basis points total between the May and July 2023 Federal Open Market Committee (“FOMC”) meetings. At the end of the period, it remains at 5.50%.
During the first quarter of the period, from April to June 2023, U.S. markets climbed 8.74% with virtually all the gains coming in June. Small cap equities (proxied by the Russell 2000 Index) grew slightly less at 5.21%. During the May FOMC meeting, the Fed increased the Federal Funds rate by 0.25% to end the quarter at 5.25%. This would eventually become the penultimate increase in its rate hike cycle, though it did little to discourage investors. Markets were propelled higher by continued disinflation in the CPI, which fell from 5% to 3% year-over-year during the quarter. Investors embraced this news and interpreted it as a continuation of an economic data trend that would soon lead to a pivot to accommodative monetary policy from the Fed. Meanwhile, labor markets remained on solid footing and real Gross Domestic Product (“GDP”) climbed 2.1% quarter-over-quarter from April through June 2023. Excitement about economic data and monetary policy implications outweighed the negative impact of S&P 500 earnings, which declined 4.1% quarter-over-quarter.
The second quarter of the period, from July to September 2023, was more tempered than the previous. U.S. markets declined by 3.27% while small caps suffered a bit more, falling 5.13%. A summertime spike in CPI inflation prompted the declines. Inflation rose from 3% at the start of the quarter to 3.7% year-over-year at its end. This scared investors into believing that the Fed would be forced to either raise the Federal Funds rate further, or at least leave rates higher for a longer period before pivoting to rate cuts. Despite the scare, the Fed only raised rates an additional 25 basis points (to 5.50%) during the July 2023 FOMC meeting, which would prove to be the final rate hike for the remainder of the period. The economy remained on solid footing during the quarter, as real GDP rose by a surprisingly high 4.9% quarter-over-quarter, despite a slight pickup in the unemployment rate from 3.5% to 3.8%. Once again, monetary policy implications had the greatest impact on markets during the quarter, as they declined despite 6% growth in quarterly earnings for the S&P 500.
The third quarter of the period kickstarted most of the equity market’s gains that would finish the period. U.S. markets returned 11.69% while small caps enjoyed a rally of their own, climbing 14.03% higher. The summertime spike in inflation proved to be temporary and the CPI resumed its deceleration, falling from 3.7% to 3.4% year-over-year. The unemployment rate remained in the 3.7% to 3.8% range, while real GDP grew 3.4% to conclude 2023. Investors were relieved by the renewed consistency in disinflation, steady economic growth, and robust labor markets, and propelled equities higher on restored optimism. Earnings added a positive tailwind, as S&P 500 earnings climbed 4.8% higher during the three months.
Investors entered 2024 with the same optimism that concluded 2023. U.S. markets climbed by over 10.5% while small caps enjoyed a modest 5.18% rally of their own. The Fed concluded the period by leaving the Federal Funds rates unchanged at 5.50%, which was supported by CPI inflation falling to about 3.5% year-over-year. The labor market has not showed many signs of weakness yet, which investors are interpreting as an
| WisdomTree Trust | 1 |
Market Environment Overview
(unaudited) (concluded)
achievement of the “soft economic landing” scenario (where the Fed is able to raise interest rates to subdue inflation without drastically harming the economy in the process). The headline unemployment rate remains at 3.8%. Real GDP has not yet been released as of the date of this report, and S&P 500 companies have not yet begun to report earnings for Q1 2024.
Entering the new period, markets are fixated on each economic data release so they may parse it for insights about the future direction of monetary policy. As of now, they are anticipating a pivot to rate cuts in the final few months of 2024, although the number and magnitude of cuts have been reduced since the start of the calendar year. The ongoing economic picture will continue to be assessed so that markets may adjust their expectations accordingly. Earnings results will also impact the direction of U.S. markets over the near-term.
Each WisdomTree Fund’s performance as set forth in “Management’s Discussion of Funds’ Performance” in the pages that follow should also be viewed in light of the foregoing market environment.
| 2 | WisdomTree Trust |
Information about Performance and Shareholder Expense Examples (unaudited)
Performance
The performance tables on the following pages are provided for comparative purposes and represent the period noted. Each Fund’s per share net asset value (“NAV”) is the value of one share of the Fund and is calculated by dividing the value of total assets less total liabilities by the number of shares outstanding. The NAV return is based on the NAV of the Fund and the market price return is based on the market price per share of the Fund. The price used to calculate market price returns is the midpoint of the bid and ask price for Fund shares as of the close of trading on the exchange where Fund shares are listed. NAV and market price returns assume that dividends and capital gain distributions have been reinvested in the Fund at NAV and market price, respectively. As with other exchange traded funds (“ETFs”), NAV returns and market price returns may differ because of factors such as the supply and demand for Fund shares and investors’ assessments of the underlying value of a Fund’s portfolio securities.
Fund shares are bought and sold at market price (not NAV) and are not individually redeemed from a Fund. Fund NAV returns are calculated using a Fund’s daily 4:00 p.m. eastern time NAV. Market price returns reflect the midpoint of the bid and ask price as of the close of trading on the exchange where Fund shares are listed. Market price returns do not represent the returns you would receive if you traded shares at other times. The returns do not reflect the deduction of taxes that a shareholder would pay on Fund distributions or on the redemption of Fund shares. Total returns for a period of less than one year are cumulative.
Performance is historical and does not guarantee future results. Current performance may be lower or higher than quoted. Investment returns and the principal value of an investment will fluctuate so that an investor’s shares, when redeemed, may be worth more or less than their original cost. For the most recent month-end performance information visit www.wisdomtree.com/investments.
An index is a statistical measure of a specified financial market or sector. An index does not actually hold a portfolio of securities, incur expenses or pay any transaction costs. Therefore, index returns do not reflect deductions for fees or expenses and an index is not available for direct investment. In comparison, the Funds’ performance is negatively impacted by these deductions. Fund returns do not reflect brokerage commissions or taxes on transactions in Fund shares or taxes that a shareholder would pay on Fund distributions. Past performance is no guarantee of future results.
Shareholder Expense Examples
Each Fund’s performance table is accompanied by a shareholder expense example. As a shareholder of a WisdomTree Fund, you incur two types of cost: (1) transaction costs, including brokerage commissions on purchases and sales of your Fund shares and (2) ongoing costs, including management fees and other Fund expenses. The examples are intended to help you understand your ongoing costs (in dollars and cents) of investing in a Fund and to compare these costs with the ongoing costs of investing in other funds.
The examples are based on an investment of $1,000 invested at the beginning of the period and held for the entire period from October 1, 2023 to March 31, 2024. Except where noted, expenses are calculated using each Fund’s annualized expense ratio (after the effect of contractual or voluntary fee waivers, if any), multiplied by the average account value for the period, multiplied by 183/366 (to reflect the one-half year period). The annualized expense ratio does not include acquired fund fees and expenses (“AFFEs”), which are fees and expenses incurred indirectly by a Fund through its investments in certain underlying investment companies.
Actual expenses
The first line in the shareholder expense example table shown on the following pages provides information about actual account values and actual expenses. You may use the information in this line, together with the amount you invested, to estimate the expenses that you paid over the period. Simply divide your account value by $1,000 (for example, an $8,600 account value divided by $1,000 = 8.6), then multiply the result by the number in the first line for your Fund under the heading entitled “Expenses Paid During the Period” to estimate the expenses you paid on your account during the period.
Hypothetical example for comparison purposes
The second line in the shareholder expense example table shown on the following pages provides information about hypothetical account values and hypothetical expenses based on the Fund’s actual expense ratio and an assumed rate of return of 5% per year before expenses, which is not the Fund’s actual return. The hypothetical account values and expenses may not be used to estimate the actual ending account balance or expenses you paid for the period. You may use this information to compare the ongoing costs of investing in your Fund and other funds. To do so, compare this 5% hypothetical example with the 5% hypothetical examples that appear in the shareholder reports of the other funds.
Please note that the expenses shown in the table are meant to highlight your ongoing costs only and do not reflect any transactional costs, such as brokerage commissions paid on purchases and sales of Fund shares. Therefore, the second line in the table is useful in comparing ongoing Fund costs only and will not help you determine the relative total costs of owning different funds. In addition, if these transactional costs were included, your costs would have been higher.
| WisdomTree Trust | 3 |
Management’s Discussion of Funds’ Performance
as of March 31, 2024 (unaudited)
WisdomTree U.S. AI Enhanced Value Fund (AIVL)
Sector Breakdown†
| Sector | % of Net Assets | |||
Financials | 21.2% | |||
Industrials | 19.2% | |||
Health Care | 13.6% | |||
Energy | 9.0% | |||
Information Technology | 7.7% | |||
Consumer Staples | 7.6% | |||
Utilities | 6.4% | |||
Materials | 5.6% | |||
Communication Services | 3.8% | |||
Real Estate | 2.6% | |||
Consumer Discretionary | 2.5% | |||
Investment Company | 0.2% | |||
Other Assets less Liabilities‡ | 0.6% | |||
Total | 100.0% | |||
| † | The Fund’s sector breakdown is expressed as a percentage of net assets and may change over time. In addition, a sector may be comprised of several industries. |
| ‡ | Other assets less liabilities may include investment of cash collateral for securities on loan and/or receivables/payables on derivatives (if any). |
Top Ten Holdings*
| Description | % of Net Assets | |||
Exxon Mobil Corp. | 3.3% | |||
Intercontinental Exchange, Inc. | 3.2% | |||
Otis Worldwide Corp. | 3.2% | |||
Medtronic PLC | 3.1% | |||
Fortive Corp. | 3.0% | |||
Comcast Corp., Class A | 3.0% | |||
Bank of America Corp. | 3.0% | |||
Nasdaq, Inc. | 2.9% | |||
Abbott Laboratories | 2.9% | |||
PPL Corp. | 2.5% | |||
| * | The ten largest holdings are subject to change, and there are no guarantees the Fund will remain invested in any particular company. Excludes derivatives and investment of cash collateral for securities on loan (if any). |
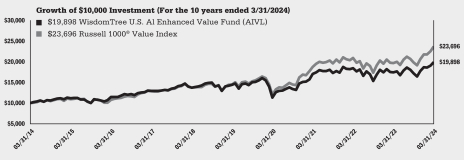
The WisdomTree U.S. AI Enhanced Value Fund (the “Fund”) seeks income and capital appreciation by investing primarily in equity securities selected from a universe of U.S. equities that exhibit value characteristics based on the selection results of a proprietary, quantitative artificial intelligence (“AI”) model developed by the Fund’s sub-adviser, Voya Investment Management Co., LLC.
The Fund returned 13.93% at net asset value (“NAV”) for the fiscal year ended March 31, 2024 (for more complete performance information please see the table below). Only two sectors provided relative positive Fund performance impacts during the period. Energy benefited due to strong stock selection and allocation effects, while Real Estate benefited solely from allocation effects. Consumer Discretionary, Materials and Industrials sectors all lagged due to negative stock selection impacts. Across price-to-earnings quintiles, all five contributed to relative Fund underperformance primarily due to poor stock selection.
Shareholder Expense Example (for the six-month period ended March 31, 2024)
| Beginning Account Value | Ending Account Value | Annualized Expense Ratio | Expenses Paid During the Period | |||||||||||||
Actual | $ | 1,000.00 | $ | 1,156.90 | 0.38 | % | $ | 2.05 | ||||||||
Hypothetical (5% return before expenses) | $ | 1,000.00 | $ | 1,023.10 | 0.38 | % | $ | 1.92 | ||||||||
Performance
| Average Annual Total Return | ||||||||||||||||
| 1 Year | 3 Year | 5 Year | 10 Year | |||||||||||||
Fund NAV Returns1 | 13.93 | % | 5.31 | % | 6.68 | % | 7.12 | % | ||||||||
Fund Market Price Returns1 | 13.91 | % | 5.21 | % | 6.66 | % | 7.11 | % | ||||||||
Russell 1000® Value Index | 20.27 | % | 8.11 | % | 10.32 | % | 9.01 | % | ||||||||
| 1 | The Fund’s investment objective changed effective January 18, 2022. Prior to January 18, 2022, the Fund’s investment objective sought to track the price and yield performance, before fees and expenses, of the WisdomTree U.S. Dividend ex-Financials Index. |
Performance is historical and does not guarantee future results. The returns do not reflect the deduction of taxes that a shareholder would pay on Fund distributions or on the redemption of Fund shares.
| 4 | WisdomTree Trust |
Management’s Discussion of Funds’ Performance
as of March 31, 2024 (unaudited)
WisdomTree U.S. High Dividend Fund (DHS)
Sector Breakdown†
| Sector | % of Net Assets | |||
Financials | 24.8% | |||
Energy | 18.2% | |||
Utilities | 13.6% | |||
Consumer Staples | 12.5% | |||
Health Care | 10.2% | |||
Information Technology | 5.6% | |||
Real Estate | 4.7% | |||
Consumer Discretionary | 3.8% | |||
Materials | 2.7% | |||
Industrials | 2.6% | |||
Communication Services | 0.9% | |||
Other Assets less Liabilities‡ | 0.4% | |||
Total | 100.0% | |||
| † | The Fund’s sector breakdown is expressed as a percentage of net assets and may change over time. In addition, a sector may be comprised of several industries. |
| ‡ | Other assets less liabilities may include investment of cash collateral for securities on loan and/or receivables/payables on derivatives (if any). |
Top Ten Holdings*
| Description | % of Net Assets | |||
AbbVie, Inc. | 5.7% | |||
Exxon Mobil Corp. | 5.2% | |||
Chevron Corp. | 5.0% | |||
Altria Group, Inc. | 4.4% | |||
International Business Machines Corp. | 4.4% | |||
Philip Morris International, Inc. | 3.3% | |||
Morgan Stanley | 2.7% | |||
Citigroup, Inc. | 2.3% | |||
Bristol-Myers Squibb Co. | 2.1% | |||
United Parcel Service, Inc., Class B | 1.9% | |||
| * | The ten largest holdings are subject to change, and there are no guarantees the Fund will remain invested in any particular company. Excludes derivatives and investment of cash collateral for securities on loan (if any). |
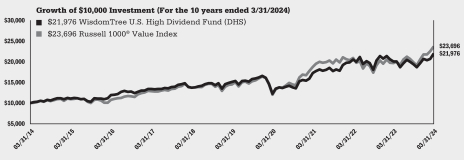
The WisdomTree U.S. High Dividend Fund (the “Fund”) seeks to track the price and yield performance, before fees and expenses, of the WisdomTree U.S. High Dividend Index (the “Index”). In seeking to track the Index, the Fund invests in high dividend yielding companies in the U.S. equity market. The Fund generally uses a representative sampling strategy to achieve its investment objective, meaning it generally will invest in a sample of securities in the Index.
The Fund returned 9.68% at net asset value (“NAV”) for the fiscal year ended March 31, 2024 (for more complete performance information please see the table below). The Fund benefited from its position in the Materials sector, primarily due to stock selection effects. Most other sectors contributed to relative Fund underperformance, with Financials, Utilities and Industrials being the largest detractors due to a mixture of stock selection and allocation effects across all three sectors. Across dividend yield quintiles, all five contributed to relative Fund underperformance primarily due to poor stock selection. For the period ended March 31, 2024, the equity market environment in the United States favored growth as an investment style, and products with an emphasis on dividends were not rewarded by investors to a similar extent.
Shareholder Expense Example (for the six-month period ended March 31, 2024)
| Beginning Account Value | Ending Account Value | Annualized Net Expense Ratio | Expenses Paid During the Period | |||||||||||||
Actual | $ | 1,000.00 | $ | 1,132.70 | 0.38 | % | $ | 2.03 | ||||||||
Hypothetical (5% return before expenses) | $ | 1,000.00 | $ | 1,023.10 | 0.38 | % | $ | 1.92 | ||||||||
Performance
| Average Annual Total Return | ||||||||||||||||
| 1 Year | 3 Year | 5 Year | 10 Year | |||||||||||||
Fund NAV Returns | 9.68 | % | 8.36 | % | 7.76 | % | 8.19 | % | ||||||||
Fund Market Price Returns | 9.66 | % | 8.27 | % | 7.74 | % | 8.17 | % | ||||||||
WisdomTree U.S. High Dividend Index | 10.16 | % | 8.83 | % | 8.20 | % | 8.62 | % | ||||||||
Russell 1000® Value Index | 20.27 | % | 8.11 | % | 10.32 | % | 9.01 | % | ||||||||
Performance is historical and does not guarantee future results. The returns do not reflect the deduction of taxes that a shareholder would pay on Fund distributions or on the redemption of Fund shares.
| WisdomTree Trust | 5 |
Management’s Discussion of Funds’ Performance
as of March 31, 2024 (unaudited)
WisdomTree U.S. LargeCap Dividend Fund (DLN)
Sector Breakdown†
| Sector | % of Net Assets | |||
Information Technology | 19.0% | |||
Financials | 17.2% | |||
Health Care | 14.0% | |||
Consumer Staples | 13.1% | |||
Industrials | 9.0% | |||
Energy | 8.1% | |||
Consumer Discretionary | 6.3% | |||
Real Estate | 4.4% | |||
Utilities | 4.2% | |||
Communication Services | 3.0% | |||
Materials | 1.5% | |||
Investment Company | 0.0% | * | ||
Other Assets less Liabilities‡ | 0.2% | |||
Total | 100.0% | |||
| † | The Fund’s sector breakdown is expressed as a percentage of net assets and may change over time. In addition, a sector may be comprised of several industries. |
| ‡ | Other assets less liabilities may include investment of cash collateral for securities on loan and/or receivables/payables on derivatives (if any). |
| * | Represents less than 0.1%. |
Top Ten Holdings*
| Description | % of Net Assets | |||
Microsoft Corp. | 3.7% | |||
JPMorgan Chase & Co. | 3.3% | |||
Apple, Inc. | 3.1% | |||
AbbVie, Inc. | 2.8% | |||
Broadcom, Inc. | 2.5% | |||
Exxon Mobil Corp. | 2.5% | |||
Johnson & Johnson | 2.5% | |||
Home Depot, Inc. | 2.2% | |||
NVIDIA Corp. | 2.1% | |||
Procter & Gamble Co. | 2.1% | |||
| * | The ten largest holdings are subject to change, and there are no guarantees the Fund will remain invested in any particular company. Excludes derivatives and investment of cash collateral for securities on loan (if any). |
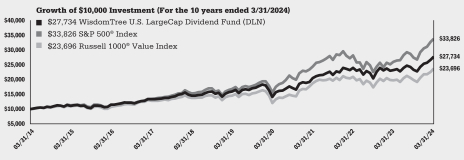
The WisdomTree U.S. LargeCap Dividend Fund (the “Fund”) seeks to track the price and yield performance, before fees and expenses, of the WisdomTree U.S. LargeCap Dividend Index (the “Index”). In seeking to track the Index, the Fund invests in dividend-paying large-cap companies in the U.S. equity market. The Fund generally uses a representative sampling strategy to achieve its investment objective, meaning it generally will invest in a sample of securities in the Index.
The Fund returned 19.57% at net asset value (“NAV”) for the fiscal year ended March 31, 2024 (for more complete performance information please see the table below). The Fund benefited predominantly from positions in Information Technology and Health Care sectors primarily due to stock selection effects. Communications Services and Industrials sectors were the main detractors mostly due to stock selection impacts. Across dividend yield quintiles, performance impacts were mixed. The first, third, and fifth quintiles all had positive impacts due to a mixture of allocation and stock selection effects. The second and fourth quintiles had negative impacts due to a combination of both effects as well.
Shareholder Expense Example (for the six-month period ended March 31, 2024)
| Beginning Account Value | Ending Account Value | Annualized Net Expense Ratio | Expenses Paid During the Period | |||||||||||||
Actual | $ | 1,000.00 | $ | 1,188.30 | 0.28 | % | $ | 1.53 | ||||||||
Hypothetical (5% return before expenses) | $ | 1,000.00 | $ | 1,023.60 | 0.28 | % | $ | 1.42 | ||||||||
Performance
| Average Annual Total Return | ||||||||||||||||
| 1 Year | 3 Year | 5 Year | 10 Year | |||||||||||||
Fund NAV Returns | 19.57 | % | 10.68 | % | 11.74 | % | 10.74 | % | ||||||||
Fund Market Price Returns | 19.59 | % | 10.59 | % | 11.73 | % | 10.72 | % | ||||||||
WisdomTree U.S. LargeCap Dividend Index | 19.93 | % | 11.03 | % | 12.09 | % | 11.07 | % | ||||||||
S&P 500® Index | 29.88 | % | 11.49 | % | 15.05 | % | 12.96 | % | ||||||||
Russell 1000® Value Index | 20.27 | % | 8.11 | % | 10.32 | % | 9.01 | % | ||||||||
Performance is historical and does not guarantee future results. The returns do not reflect the deduction of taxes that a shareholder would pay on Fund distributions or on the redemption of Fund shares.
| 6 | WisdomTree Trust |
Management’s Discussion of Funds’ Performance
as of March 31, 2024 (unaudited)
WisdomTree U.S. LargeCap Fund (EPS)
Sector Breakdown†
| Sector | % of Net Assets | |||
Information Technology | 24.1% | |||
Financials | 17.2% | |||
Communication Services | 12.5% | |||
Health Care | 11.1% | |||
Consumer Discretionary | 9.0% | |||
Industrials | 7.7% | |||
Energy | 7.6% | |||
Consumer Staples | 5.8% | |||
Utilities | 1.8% | |||
Materials | 1.8% | |||
Real Estate | 1.2% | |||
Investment Company | 0.1% | |||
Other Assets less Liabilities‡ | 0.1% | |||
Total | 100.0% | |||
| † | The Fund’s sector breakdown is expressed as a percentage of net assets and may change over time. In addition, a sector may be comprised of several industries. |
| ‡ | Other assets less liabilities may include investment of cash collateral for securities on loan and/or receivables/payables on derivatives (if any). |
Top Ten Holdings*
| Description | % of Net Assets | |||
Microsoft Corp. | 5.7% | |||
Alphabet, Inc., Class A | 4.8% | |||
Apple, Inc. | 4.4% | |||
Meta Platforms, Inc., Class A | 3.6% | |||
Amazon.com, Inc. | 3.2% | |||
JPMorgan Chase & Co. | 2.7% | |||
NVIDIA Corp. | 2.5% | |||
Exxon Mobil Corp. | 2.1% | |||
Berkshire Hathaway, Inc., Class B | 1.8% | |||
Bank of America Corp. | 1.5% | |||
| * | The ten largest holdings are subject to change, and there are no guarantees the Fund will remain invested in any particular company. Excludes derivatives and investment of cash collateral for securities on loan (if any). |
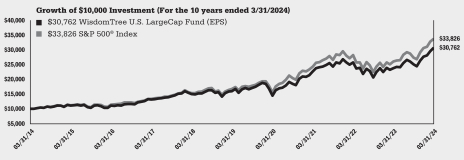
The WisdomTree U.S. LargeCap Fund (the “Fund”) seeks to track the price and yield performance, before fees and expenses, of the WisdomTree U.S. LargeCap Index (the “Index”). In seeking to track the Index, the Fund invests in earnings-generating large-cap companies in the U.S. equity market. The Fund generally uses a representative sampling strategy to achieve its investment objective, meaning it generally will invest in a sample of securities in the Index.
The Fund returned 28.94% at net asset value (“NAV”) for the fiscal year ended March 31, 2024 (for more complete performance information please see the table below). The Fund exhibited strong performance, with sector contributions led by Communication Services, Information Technology, and Consumer Discretionary. Stock selection was additive across all three sectors, while Information Technology also contributed positively to performance due to asset allocation effects. Only Energy, Financials and Industrials had negative impacts, primarily due to allocation effects across all three sectors. Across price-to-earnings quintiles, the Fund benefited from positive stock selection within the bottom three quintiles (i.e. those with the highest valuations). Only the first quintile (i.e. those with the lowest valuations) had a negative impact, although its overall effect was negligible. This was due to modestly poor allocation effects.
Shareholder Expense Example (for the six-month period ended March 31, 2024)
| Beginning Account Value | Ending Account Value | Annualized Expense Ratio | Expenses Paid During the Period | |||||||||||||
Actual | $ | 1,000.00 | $ | 1,222.80 | 0.08 | % | $ | 0.44 | ||||||||
Hypothetical (5% return before expenses) | $ | 1,000.00 | $ | 1,024.60 | 0.08 | % | $ | 0.40 | ||||||||
Performance
| Average Annual Total Return | ||||||||||||||||
| 1 Year | 3 Year | 5 Year | 10 Year | |||||||||||||
Fund NAV Returns | 28.94 | % | 10.55 | % | 13.91 | % | 11.89 | % | ||||||||
Fund Market Price Returns | 28.94 | % | 10.45 | % | 13.90 | % | 11.88 | % | ||||||||
WisdomTree U.S. LargeCap Index | 29.00 | % | 10.62 | % | 14.01 | % | 12.10 | % | ||||||||
S&P 500® Index | 29.88 | % | 11.49 | % | 15.05 | % | 12.96 | % | ||||||||
Performance is historical and does not guarantee future results. The returns do not reflect the deduction of taxes that a shareholder would pay on Fund distributions or on the redemption of Fund shares.
| WisdomTree Trust | 7 |
Management’s Discussion of Funds’ Performance
as of March 31, 2024 (unaudited)
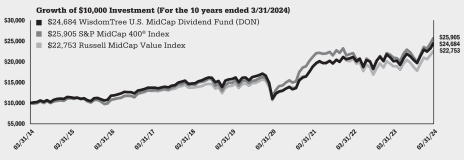
WisdomTree U.S. MidCap Dividend Fund (DON)
Sector Breakdown†
| Sector | % of Net Assets | |||
Financials | 24.5% | |||
Industrials | 16.8% | |||
Consumer Discretionary | 12.2% | |||
Materials | 9.3% | |||
Real Estate | 8.6% | |||
Utilities | 7.9% | |||
Energy | 7.3% | |||
Consumer Staples | 5.5% | |||
Information Technology | 3.4% | |||
Health Care | 2.2% | |||
Communication Services | 2.1% | |||
Other Assets less Liabilities‡ | 0.2% | |||
Total | 100.0% | |||
| † | The Fund’s sector breakdown is expressed as a percentage of net assets and may change over time. In addition, a sector may be comprised of several industries. |
| ‡ | Other assets less liabilities may include investment of cash collateral for securities on loan and/or receivables/payables on derivatives (if any). |
Top Ten Holdings*
| Description | % of Net Assets | |||
Vistra Corp. | 1.2% | |||
Corebridge Financial, Inc. | 1.1% | |||
Packaging Corp. of America | 1.0% | |||
Viatris, Inc. | 1.0% | |||
Conagra Brands, Inc. | 0.9% | |||
Carlyle Group, Inc. | 0.9% | |||
International Paper Co. | 0.9% | |||
Franklin Resources, Inc. | 0.9% | |||
Snap-on, Inc. | 0.8% | |||
Evergy, Inc. | 0.8% | |||
| * | The ten largest holdings are subject to change, and there are no guarantees the Fund will remain invested in any particular company. Excludes derivatives and investment of cash collateral for securities on loan (if any). |
The WisdomTree U.S. MidCap Dividend Fund (the “Fund”) seeks to track the price and yield performance, before fees and expenses, of the WisdomTree U.S. MidCap Dividend Index (the “Index”). In seeking to track the Index, the Fund invests in dividend-paying mid-cap companies in the U.S. equity market. The Fund generally uses a representative sampling strategy to achieve its investment objective, meaning it generally will invest in a sample of securities in the Index.
The Fund returned 22.17% at net asset value (“NAV”) for the fiscal year ended March 31, 2024 (for more complete performance information please see the table below). The Fund benefited from positions across most sectors, with Health Care, Information Technology, and Materials having the most pronounced effects. Allocation effects dominated the contributions from Health Care, while stock selection provided the support from Information Technology and Materials. Industrials, Real Estate and Communication Services were the only sectors to have a negative impact, with poor stock selection as the driving force in all three sectors. Across dividend yield quintiles, the second and third quintiles provided the strongest positive support primarily due to stock selection. The fourth and fifth quintiles featuring the lowest-yielding stocks had negative impacts on Fund performance due to poor stock selection and allocation effects.
Shareholder Expense Example (for the six-month period ended March 31, 2024)
| Beginning Account Value | Ending Account Value | Annualized Net Expense Ratio | Expenses Paid During the Period | |||||||||||||
Actual | $ | 1,000.00 | $ | 1,207.20 | 0.38 | % | $ | 2.10 | ||||||||
Hypothetical (5% return before expenses) | $ | 1,000.00 | $ | 1,023.10 | 0.38 | % | $ | 1.92 | ||||||||
Performance
| Average Annual Total Return | ||||||||||||||||
| 1 Year | 3 Year | 5 Year | 10 Year | |||||||||||||
Fund NAV Returns | 22.17 | % | 9.32 | % | 9.33 | % | 9.46 | % | ||||||||
Fund Market Price Returns | 22.12 | % | 9.10 | % | 9.30 | % | 9.44 | % | ||||||||
WisdomTree U.S. MidCap Dividend Index | 22.67 | % | 9.79 | % | 9.75 | % | 9.86 | % | ||||||||
S&P MidCap 400® Index | 23.33 | % | 6.96 | % | 11.71 | % | 9.99 | % | ||||||||
Russell MidCap Value Index | 20.40 | % | 6.80 | % | 9.94 | % | 8.57 | % | ||||||||
Performance is historical and does not guarantee future results. The returns do not reflect the deduction of taxes that a shareholder would pay on Fund distributions or on the redemption of Fund shares.
| 8 | WisdomTree Trust |
Management’s Discussion of Funds’ Performance
as of March 31, 2024 (unaudited)
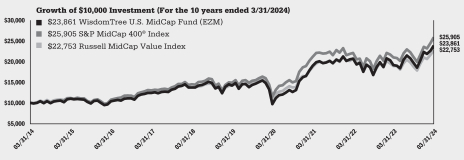
WisdomTree U.S. MidCap Fund (EZM)
Sector Breakdown†
| Sector | % of Net Assets | |||
Industrials | 19.9% | |||
Financials | 19.9% | |||
Consumer Discretionary | 19.1% | |||
Information Technology | 9.3% | |||
Energy | 8.0% | |||
Materials | 6.9% | |||
Health Care | 6.8% | |||
Real Estate | 2.9% | |||
Consumer Staples | 2.4% | |||
Communication Services | 2.3% | |||
Utilities | 2.3% | |||
Investment Company | 0.1% | |||
Other Assets less Liabilities‡ | 0.1% | |||
Total | 100.0% | |||
| † | The Fund’s sector breakdown is expressed as a percentage of net assets and may change over time. In addition, a sector may be comprised of several industries. |
| ‡ | Other assets less liabilities may include investment of cash collateral for securities on loan and/or receivables/payables on derivatives (if any). |
Top Ten Holdings*
| Description | % of Net Assets | |||
Toll Brothers, Inc. | 1.0% | |||
American Airlines Group, Inc. | 0.9% | |||
Unum Group | 0.8% | |||
Dick’s Sporting Goods, Inc. | 0.8% | |||
PBF Energy, Inc., Class A | 0.7% | |||
Ally Financial, Inc. | 0.6% | |||
East West Bancorp, Inc. | 0.6% | |||
U.S. Steel Corp. | 0.6% | |||
Tapestry, Inc. | 0.6% | |||
AutoNation, Inc. | 0.6% | |||
| * | The ten largest holdings are subject to change, and there are no guarantees the Fund will remain invested in any particular company. Excludes derivatives and investment of cash collateral for securities on loan (if any). |
The WisdomTree U.S. MidCap Fund (the “Fund”) seeks to track the price and yield performance, before fees and expenses, of the WisdomTree U.S. MidCap Index (the “Index”). In seeking to track the Index, the Fund invests in earnings-generating mid-cap companies in the U.S. equity market. The Fund generally uses a representative sampling strategy to achieve its investment objective, meaning it generally will invest in a sample of securities in the Index.
The Fund returned 24.47% at net asset value (“NAV”) for the fiscal year ended March 31, 2024 (for more complete performance information please see the table below). The Fund benefited from positions in the Consumer Staples and Health Care sectors due to positive stock selection in the former and allocation effects in the latter. Consumer Discretionary sector also had a positive impact to a combination of both effects. Financials and Information Technology negatively impacted performance, which were primarily due to poor stock selection in each sector. Across price-to-earnings (P/E) quintiles, the Fund benefited from the first and third quintiles due to a mix of positive stock selection and allocation effects in the former and solely stock selection in the latter. The fifth quintile, representing the highest P/E stocks, weighed on performance due to poor stock selection.
Shareholder Expense Example (for the six-month period ended March 31, 2024)
| Beginning Account Value | Ending Account Value | Annualized Net Expense Ratio | Expenses Paid During the Period | |||||||||||||
Actual | $ | 1,000.00 | $ | 1,212.30 | 0.38 | % | $ | 2.10 | ||||||||
Hypothetical (5% return before expenses) | $ | 1,000.00 | $ | 1,023.10 | 0.38 | % | $ | 1.92 | ||||||||
Performance
| Average Annual Total Return | ||||||||||||||||
| 1 Year | 3 Year | 5 Year | 10 Year | |||||||||||||
Fund NAV Returns | 24.47 | % | 7.84 | % | 10.92 | % | 9.09 | % | ||||||||
Fund Market Price Returns | 24.28 | % | 7.53 | % | 10.86 | % | 9.07 | % | ||||||||
WisdomTree U.S. MidCap Index | 25.00 | % | 8.25 | % | 11.33 | % | 9.45 | % | ||||||||
S&P MidCap 400® Index | 23.33 | % | 6.96 | % | 11.71 | % | 9.99 | % | ||||||||
Russell MidCap Value Index | 20.40 | % | 6.80 | % | 9.94 | % | 8.57 | % | ||||||||
Performance is historical and does not guarantee future results. The returns do not reflect the deduction of taxes that a shareholder would pay on Fund distributions or on the redemption of Fund shares.
| WisdomTree Trust | 9 |
Management’s Discussion of Funds’ Performance
as of March 31, 2024 (unaudited)
WisdomTree U.S. MidCap Quality Growth Fund (QMID)
Sector Breakdown†
| Sector | % of Net Assets | |||
Industrials | 24.0% | |||
Consumer Discretionary | 20.5% | |||
Information Technology | 13.8% | |||
Health Care | 12.7% | |||
Energy | 9.7% | |||
Consumer Staples | 7.0% | |||
Financials | 5.1% | |||
Materials | 4.5% | |||
Communication Services | 2.6% | |||
Other Assets less Liabilities‡ | 0.1% | |||
Total | 100.0% | |||
| † | The Fund’s sector breakdown is expressed as a percentage of net assets and may change over time. In addition, a sector may be comprised of several industries. |
| ‡ | Other assets less liabilities may include investment of cash collateral for securities on loan and/or receivables/payables on derivatives (if any). |
Top Ten Holdings*
| Description | % of Net Assets | |||
Celsius Holdings, Inc. | 1.8% | |||
Dick’s Sporting Goods, Inc. | 1.8% | |||
Saia, Inc. | 1.5% | |||
Pure Storage, Inc., Class A | 1.5% | |||
Lincoln Electric Holdings, Inc. | 1.4% | |||
Floor & Decor Holdings, Inc., Class A | 1.3% | |||
TopBuild Corp. | 1.3% | |||
Charles River Laboratories International, Inc. | 1.3% | |||
Toll Brothers, Inc. | 1.3% | |||
Advanced Drainage Systems, Inc. | 1.3% | |||
| * | The ten largest holdings are subject to change, and there are no guarantees the Fund will remain invested in any particular company. Excludes derivatives and investment of cash collateral for securities on loan (if any). |
The WisdomTree U.S. MidCap Quality Growth Fund seeks to track the price and yield performance, before fees and expenses, of the WisdomTree U.S. MidCap Quality Growth Index (the “Index”). In seeking to track the Index, the Fund invests in the top scoring 30% of companies that comprise the top 60% of U.S. companies by market capitalization, after the 500 largest companies have been removed, with the highest composite scores based on two fundamental factors: growth and quality, which are equally weighted. The Fund generally uses a representative sampling strategy to achieve its investment objective, meaning it generally will invest in a sample of securities in the Index.
The Fund had less than six months of operating history at the end of the reporting period and therefore no comparative performance information is shown in this shareholder report. Comparative performance information for the most recent month-end is available at www.wisdomtree.com/investments.
Shareholder Expense Example (for the period1 ended March 31, 2024)
| Beginning Account Value | Ending Account Value | Annualized Expense Ratio | Expenses Paid During the Period | |||||||||||||
Actual1 | $ | 1,000.00 | $ | 1,124.00 | 0.38 | % | $ | 0.74 | ||||||||
Hypothetical (5% return before expenses) | $ | 1,000.00 | $ | 1,023.10 | 0.38 | % | $ | 1.92 | ||||||||
| 1 | Fund commenced operations on January 25, 2024. Actual expenses are calculated using the Fund’s annualized expense ratio, multiplied by the average account value for the period, multiplied by 67/366 (to reflect the period since commencement of operations). |
| 10 | WisdomTree Trust |
Management’s Discussion of Funds’ Performance
as of March 31, 2024 (unaudited)
WisdomTree U.S. Multifactor Fund (USMF)
Sector Breakdown†
| Sector | % of Net Assets | |||
Information Technology | 28.9% | |||
Financials | 12.9% | |||
Health Care | 12.3% | |||
Consumer Discretionary | 10.9% | |||
Industrials | 9.1% | |||
Communication Services | 8.9% | |||
Consumer Staples | 6.0% | |||
Energy | 4.0% | |||
Materials | 2.4% | |||
Real Estate | 2.3% | |||
Utilities | 2.2% | |||
Other Assets less Liabilities‡ | 0.1% | |||
Total | 100.0% | |||
| † | The Fund’s sector breakdown is expressed as a percentage of net assets and may change over time. In addition, a sector may be comprised of several industries. |
| ‡ | Other assets less liabilities may include investment of cash collateral for securities on loan and/or receivables/payables on derivatives (if any). |
Top Ten Holdings*
| Description | % of Net Assets | |||
International Business Machines Corp. | 1.4% | |||
VeriSign, Inc. | 1.4% | |||
Roper Technologies, Inc. | 1.3% | |||
Motorola Solutions, Inc. | 1.3% | |||
Cisco Systems, Inc. | 1.3% | |||
F5, Inc. | 1.3% | |||
GoDaddy, Inc., Class A | 1.3% | |||
TD SYNNEX Corp. | 1.2% | |||
Akamai Technologies, Inc. | 1.2% | |||
Cognizant Technology Solutions Corp., Class A | 1.1% | |||
| * | The ten largest holdings are subject to change, and there are no guarantees the Fund will remain invested in any particular company. Excludes derivatives and investment of cash collateral for securities on loan (if any). |
The WisdomTree U.S. Multifactor Fund (the “Fund”) seeks to track the price and yield performance, before fees and expenses, of the WisdomTree U.S. Multifactor Index (the “Index”). In seeking to track the Index, the Fund invests in U.S. companies with the highest composite scores based on two fundamental factors, value and quality measures, and two technical factors, momentum and correlation. The Fund generally uses a representative sampling strategy to achieve its investment objective, meaning it generally will invest in a sample of securities in the Index.
The Fund returned 25.84% at net asset value (“NAV”) for the fiscal year ended March 31, 2024 (for more complete performance information please see the table below). The Fund benefited from positions in Consumer Discretionary, Energy, and Industrials due to positive stock selection in all three sectors. Communication Services, Information Technology and Financials sectors were the largest detractors from performance due to poor stock selection. Across volatility quintiles, the Fund benefited from the first and second quintiles, representing the least volatile stocks, due to strong stock selection. The fourth and fifth quintiles, which represent the most volatile, were laggards due to a mix of negative allocation and stock selection effects in both.
Shareholder Expense Example (for the six-month period ended March 31, 2024)
| Beginning Account Value | Ending Account Value | Annualized Expense Ratio | Expenses Paid During the Period | |||||||||||||
Actual | $ | 1,000.00 | $ | 1,219.30 | 0.28 | % | $ | 1.55 | ||||||||
Hypothetical (5% return before expenses) | $ | 1,000.00 | $ | 1,023.60 | 0.28 | % | $ | 1.42 | ||||||||
Performance
| Average Annual Total Return | ||||||||||||||||
| 1 Year | 3 Year | 5 Year | Since Inception1 | |||||||||||||
Fund NAV Returns | 25.84 | % | 8.80 | % | 11.67 | % | 11.47 | % | ||||||||
Fund Market Price Returns | 25.99 | % | 8.69 | % | 11.68 | % | 11.46 | % | ||||||||
WisdomTree U.S. Multifactor Index | 25.67 | % | 8.95 | % | 11.82 | % | 11.59 | % | ||||||||
S&P 500® Index | 29.88 | % | 11.49 | % | 15.05 | % | 14.14 | % | ||||||||
S&P 500® Equal Weight Index | 19.38 | % | 8.16 | % | 12.35 | % | 11.58 | % | ||||||||
Russell 3000® Index | 29.29 | % | 9.78 | % | 14.34 | % | 13.49 | % | ||||||||
| 1 | Total returns are calculated based on the commencement of Fund trading on the Cboe BZX Exchange, Inc. on June 29, 2017. |

Performance is historical and does not guarantee future results. The returns do not reflect the deduction of taxes that a shareholder would pay on Fund distributions or on the redemption of Fund shares.
| WisdomTree Trust | 11 |
Management’s Discussion of Funds’ Performance
as of March 31, 2024 (unaudited)
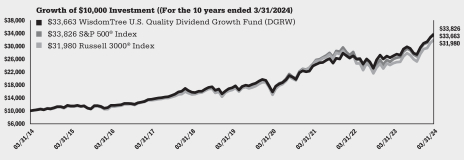
WisdomTree U.S. Quality Dividend Growth Fund (DGRW)
Sector Breakdown†
| Sector | % of Net Assets | |||
Information Technology | 28.3% | |||
Health Care | 17.1% | |||
Industrials | 12.9% | |||
Financials | 11.8% | |||
Consumer Staples | 11.2% | |||
Consumer Discretionary | 9.7% | |||
Energy | 3.8% | |||
Communication Services | 2.4% | |||
Materials | 2.2% | |||
Real Estate | 0.3% | |||
Utilities | 0.2% | |||
Other Assets less Liabilities‡ | 0.1% | |||
Total | 100.0% | |||
| † | The Fund’s sector breakdown is expressed as a percentage of net assets and may change over time. In addition, a sector may be comprised of several industries. |
| ‡ | Other assets less liabilities may include investment of cash collateral for securities on loan and/or receivables/payables on derivatives (if any). |
Top Ten Holdings*
| Description | % of Net Assets | |||
Microsoft Corp. | 7.8% | |||
Apple, Inc. | 4.4% | |||
AbbVie, Inc. | 3.9% | |||
Broadcom, Inc. | 3.6% | |||
Johnson & Johnson | 3.5% | |||
Home Depot, Inc. | 3.1% | |||
Procter & Gamble Co. | 2.9% | |||
NVIDIA Corp. | 2.8% | |||
Coca-Cola Co. | 2.6% | |||
PepsiCo, Inc. | 2.2% | |||
| * | The ten largest holdings are subject to change, and there are no guarantees the Fund will remain invested in any particular company. Excludes derivatives and investment of cash collateral for securities on loan (if any). |
The WisdomTree U.S. Quality Dividend Growth Fund (the “Fund”) seeks to track the price and yield performance, before fees and expenses, of the WisdomTree U.S. Quality Dividend Growth Index (the “Index”). In seeking to track the Index, the Fund invests in dividend-paying large-cap companies with growth characteristics in the U.S. equity market. The Fund generally uses a representative sampling strategy to achieve its investment objective, meaning it generally will invest in a sample of securities in the Index.
The Fund returned 24.48% at net asset value (“NAV”) for the fiscal year ended March 31, 2024 (for more complete performance information please see the table below). The Fund benefited from positions in Utilities, Health Care, and Energy due to strong stock selection in Health Care and positive allocation effects in the two other sectors. Consumer Staples, Communication Services, and Industrials sectors weighed on performance during the period. Industrials featured poor stock selection, while Consumer Staples exhibited poor allocation effects, and Communication Services provided poor impacts from both effects. Across return-on-equity (“ROE”) quintiles, only the fourth quintile (featuring lower ROE stocks) was additive due to a mix of allocation and stock selection impacts. The remaining other four quintiles detracted from Fund performance primarily due to poor stock selection, with negative allocation effects exacerbating the impact specifically in the first (highest ROE) and fifth (lowest ROE) quintiles.
Shareholder Expense Example (for the six-month period ended March 31, 2024)
| Beginning Account Value | Ending Account Value | Annualized Expense Ratio | Expenses Paid During the Period | |||||||||||||
Actual | $ | 1,000.00 | $ | 1,211.60 | 0.28 | % | $ | 1.55 | ||||||||
Hypothetical (5% return before expenses) | $ | 1,000.00 | $ | 1,023.60 | 0.28 | % | $ | 1.42 | ||||||||
Performance
| Average Annual Total Return | ||||||||||||||||
| 1 Year | 3 Year | 5 Year | 10 Year | |||||||||||||
Fund NAV Returns | 24.48 | % | 12.27 | % | 14.48 | % | 12.91 | % | ||||||||
Fund Market Price Returns | 24.46 | % | 12.17 | % | 14.45 | % | 12.89 | % | ||||||||
WisdomTree U.S. Quality Dividend Growth Index | 24.90 | % | 12.60 | % | 14.83 | % | 13.24 | % | ||||||||
S&P 500® Index | 29.88 | % | 11.49 | % | 15.05 | % | 12.96 | % | ||||||||
Russell 3000® Index | 29.29 | % | 9.78 | % | 14.34 | % | 12.33 | % | ||||||||
Performance is historical and does not guarantee future results. The returns do not reflect the deduction of taxes that a shareholder would pay on Fund distributions or on the redemption of Fund shares.
| 12 | WisdomTree Trust |
Management’s Discussion of Funds’ Performance
as of March 31, 2024 (unaudited)
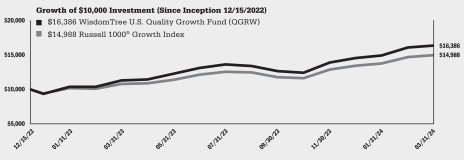
WisdomTree U.S. Quality Growth Fund (QGRW)
Sector Breakdown†
| Sector | % of Net Assets | |||
Information Technology | 49.7% | |||
Consumer Discretionary | 14.9% | |||
Communication Services | 14.4% | |||
Financials | 8.5% | |||
Health Care | 5.7% | |||
Industrials | 2.5% | |||
Energy | 2.0% | |||
Materials | 1.1% | |||
Consumer Staples | 0.6% | |||
Real Estate | 0.5% | |||
Other Assets less Liabilities‡ | 0.1% | |||
Total | 100.0% | |||
| † | The Fund’s sector breakdown is expressed as a percentage of net assets and may change over time. In addition, a sector may be comprised of several industries. |
| ‡ | Other assets less liabilities may include investment of cash collateral for securities on loan and/or receivables/payables on derivatives (if any). |
Top Ten Holdings*
| Description | % of Net Assets | |||
Microsoft Corp. | 11.1% | |||
NVIDIA Corp. | 9.3% | |||
Apple, Inc. | 9.0% | |||
Meta Platforms, Inc., Class A | 6.1% | |||
Alphabet, Inc., Class A | 5.8% | |||
Amazon.com, Inc. | 5.6% | |||
Broadcom, Inc. | 3.2% | |||
Visa, Inc., Class A | 2.8% | |||
Tesla, Inc. | 2.6% | |||
Mastercard, Inc., Class A | 2.3% | |||
| * | The ten largest holdings are subject to change, and there are no guarantees the Fund will remain invested in any particular company. Excludes derivatives and investment of cash collateral for securities on loan (if any). |
The WisdomTree U.S. Quality Growth Fund (the “Fund”) seeks to track the price and yield performance, before fees and expenses, of the WisdomTree U.S. Quality Growth Index (the “Index”). In seeking to track the Index, the Fund invests in U.S. large-capitalization and mid-capitalization companies with the highest composite scores based on two fundamental factors: growth and quality, which are equally weighted. The Fund generally uses a representative sampling strategy to achieve its investment objective, meaning it generally will invest in a sample of securities in the Index.
The Fund returned 44.93% at net asset value (“NAV”) for the fiscal year ended March 31, 2024 (for more complete performance information please see the table below). The Fund benefited primarily from an outsized impact in the Information Technology sector, where both allocation and stock selection effects were overwhelmingly positive. Communication Services and Consumer Staples sectors were also additive to a lesser extent due to positive stock selection in the former and allocation effects in the latter. The only sectors to provide a negative impact were Industrials and Financials, due to poor stock selection in both sectors. Across return-on-equity (“ROE”) quintiles, all five quintiles exhibited positive performance effects during the period due to strong stock selection in each along with positive allocation effects in the first (highest ROE) and fourth (second-lowest ROE) quintiles. The latter impacts were due to an overweight and underweight to the first and fourth quintiles, respectively.
Shareholder Expense Example (for the six-month period ended March 31, 2024)
| Beginning Account Value | Ending Account Value | Annualized Expense Ratio | Expenses Paid During the Period | |||||||||||||
Actual | $ | 1,000.00 | $ | 1,295.90 | 0.28 | % | $ | 1.61 | ||||||||
Hypothetical (5% return before expenses) | $ | 1,000.00 | $ | 1,023.60 | 0.28 | % | $ | 1.42 | ||||||||
Performance
| Average Annual Total Return | ||||||||
| 1 Year | Since Inception1 | |||||||
Fund NAV Returns | 44.93 | % | 46.50 | % | ||||
Fund Market Price Returns | 44.86 | % | 46.45 | % | ||||
WisdomTree U.S. Quality Growth Index | 45.28 | % | 46.74 | % | ||||
Russell 1000® Growth Index | 39.00 | % | 36.66 | % | ||||
| 1 | Total returns are calculated based on the commencement of Fund trading on the NYSE Arca, Inc. on December 15, 2022. |
Performance is historical and does not guarantee future results. The returns do not reflect the deduction of taxes that a shareholder would pay on Fund distributions or on the redemption of Fund shares.
| WisdomTree Trust | 13 |
Management’s Discussion of Funds’ Performance
as of March 31, 2024 (unaudited)
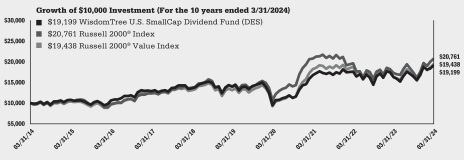
WisdomTree U.S. SmallCap Dividend Fund (DES)
Sector Breakdown†
| Sector | % of Net Assets | |||
Financials | 24.6% | |||
Consumer Discretionary | 14.9% | |||
Industrials | 14.8% | |||
Real Estate | 9.4% | |||
Energy | 9.0% | |||
Utilities | 6.2% | |||
Materials | 6.0% | |||
Consumer Staples | 4.7% | |||
Health Care | 3.7% | |||
Information Technology | 3.6% | |||
Communication Services | 2.7% | |||
Investment Company | 0.1% | |||
Other Assets less Liabilities‡ | 0.3% | |||
Total | 100.0% | |||
| † | The Fund’s sector breakdown is expressed as a percentage of net assets and may change over time. In addition, a sector may be comprised of several industries. |
| ‡ | Other assets less liabilities may include investment of cash collateral for securities on loan and/or receivables/payables on derivatives (if any). |
Top Ten Holdings*
| Description | % of Net Assets | |||
Organon & Co. | 1.3% | |||
CVR Energy, Inc. | 1.0% | |||
Kohl’s Corp. | 0.9% | |||
TFS Financial Corp. | 0.8% | |||
EPR Properties | 0.7% | |||
ALLETE, Inc. | 0.7% | |||
MDC Holdings, Inc. | 0.7% | |||
Xerox Holdings Corp. | 0.7% | |||
Carter’s, Inc. | 0.7% | |||
Archrock, Inc. | 0.6% | |||
| * | The ten largest holdings are subject to change, and there are no guarantees the Fund will remain invested in any particular company. Excludes derivatives and investment of cash collateral for securities on loan (if any). |
The WisdomTree U.S. SmallCap Dividend Fund (the “Fund”) seeks to track the price and yield performance, before fees and expenses, of the WisdomTree U.S. SmallCap Dividend Index (the “Index”). In seeking to track the Index, the Fund invests in dividend-paying small-cap companies in the U.S. equity market. The Fund generally uses a representative sampling strategy to achieve its investment objective, meaning it generally will invest in a sample of securities in the Index.
The Fund returned 17.79% at net asset value (“NAV”) for the fiscal year ended March 31, 2024 (for more complete performance information please see the table below). The Fund benefited from positions in the Real Estate and Energy sectors, primarily due to stock selection effects. Consumer Discretionary, Consumer Staples, and Financials weighed on Fund performance due to poor allocation effects in Consumer Staples and negative stock selection effects in the other two sectors. Most other sectors had negligibly positive or negative impacts to relative Fund performance. Across dividend yield quintiles, each one had mostly positive impacts to relative Fund performance. The top two quintiles, representing the highest-yielding stocks, had the most positive effects due to stock selection effects. The bottom three quintiles contributed to relative Fund underperformance but none were very pronounced. These were mainly due to poor stock selection as well.
Shareholder Expense Example (for the six-month period ended March 31, 2024)
| Beginning Account Value | Ending Account Value | Annualized Net Expense Ratio | Expenses Paid During the Period | |||||||||||||
Actual | $ | 1,000.00 | $ | 1,174.70 | 0.38 | % | $ | 2.07 | ||||||||
Hypothetical (5% return before expenses) | $ | 1,000.00 | $ | 1,023.10 | 0.38 | % | $ | 1.92 | ||||||||
Performance
| Average Annual Total Return | ||||||||||||||||
| 1 Year | 3 Year | 5 Year | 10 Year | |||||||||||||
Fund NAV Returns | 17.79 | % | 4.61 | % | 6.52 | % | 6.74 | % | ||||||||
Fund Market Price Returns | 17.74 | % | 4.34 | % | 6.48 | % | 6.73 | % | ||||||||
WisdomTree U.S. SmallCap Dividend Index | 18.24 | % | 5.02 | % | 6.95 | % | 7.07 | % | ||||||||
Russell 2000® Index | 19.71 | % | -0.10 | % | 8.10 | % | 7.58 | % | ||||||||
Russell 2000® Value Index | 18.75 | % | 2.22 | % | 8.17 | % | 6.87 | % | ||||||||
Performance is historical and does not guarantee future results. The returns do not reflect the deduction of taxes that a shareholder would pay on Fund distributions or on the redemption of Fund shares.
| 14 | WisdomTree Trust |
Management’s Discussion of Funds’ Performance
as of March 31, 2024 (unaudited)
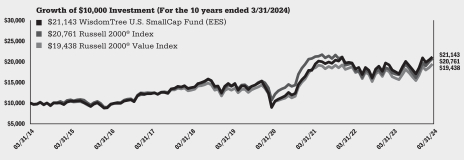
WisdomTree U.S. SmallCap Fund (EES)
Sector Breakdown†
| Sector | % of Net Assets | |||
Financials | 24.4% | |||
Consumer Discretionary | 17.2% | |||
Industrials | 17.2% | |||
Information Technology | 10.0% | |||
Health Care | 7.0% | |||
Energy | 6.3% | |||
Materials | 4.7% | |||
Consumer Staples | 4.3% | |||
Communication Services | 4.2% | |||
Real Estate | 3.7% | |||
Utilities | 0.9% | |||
Investment Company | 0.0% | * | ||
Other Assets less Liabilities‡ | 0.1% | |||
Total | 100.0% | |||
| † | The Fund’s sector breakdown is expressed as a percentage of net assets and may change over time. In addition, a sector may be comprised of several industries. |
| ‡ | Other assets less liabilities may include investment of cash collateral for securities on loan and/or receivables/payables on derivatives (if any). |
| * | Represents less than 0.1%. |
Top Ten Holdings*
| Description | % of Net Assets | |||
Cal-Maine Foods, Inc. | 0.7% | |||
TPG, Inc. | 0.7% | |||
O-I Glass, Inc. | 0.7% | |||
Par Pacific Holdings, Inc. | 0.7% | |||
Levi Strauss & Co., Class A | 0.6% | |||
Xerox Holdings Corp. | 0.6% | |||
Bread Financial Holdings, Inc. | 0.5% | |||
BGC Group, Inc., Class A | 0.5% | |||
Nordstrom, Inc. | 0.5% | |||
Sphere Entertainment Co. | 0.5% | |||
| * | The ten largest holdings are subject to change, and there are no guarantees the Fund will remain invested in any particular company. Excludes derivatives and investment of cash collateral for securities on loan (if any). |
The WisdomTree U.S. SmallCap Fund (the “Fund”) seeks to track the price and yield performance, before fees and expenses, of the WisdomTree U.S. SmallCap Index (the “Index”). In seeking to track the Index, the Fund invests in earnings-generating small-cap companies in the U.S. equity market. The Fund generally uses a representative sampling strategy to achieve its investment objective, meaning it generally will invest in a sample of securities in the Index.
The Fund returned 17.43% at net asset value (“NAV”) for the fiscal year ended March 31, 2024 (for more complete performance information please see the table below). The Fund benefited from positions in the Consumer Discretionary, Industrials and Utilities sectors due to strong stock selection in the former two sectors and allocation effects in the latter. Information Technology, Health Care, and Consumer Staples all lagged due to poor stock selection within each sector. Across price-to-earnings quintiles, the first quintile, representing stocks with the lowest valuations, had a positive effect mostly due to positive allocation effects. The other four quintiles exhibited negative impacts mostly resulting from poor stock selection.
Shareholder Expense Example (for the six-month period ended March 31, 2024)
| Beginning Account Value | Ending Account Value | Annualized Net Expense Ratio | Expenses Paid During the Period | |||||||||||||
Actual | $ | 1,000.00 | $ | 1,165.90 | 0.38 | % | $ | 2.06 | ||||||||
Hypothetical (5% return before expenses) | $ | 1,000.00 | $ | 1,023.10 | 0.38 | % | $ | 1.92 | ||||||||
Performance
| Average Annual Total Return | ||||||||||||||||
| 1 Year | 3 Year | 5 Year | 10 Year | |||||||||||||
Fund NAV Returns | 17.43 | % | 3.47 | % | 8.37 | % | 7.77 | % | ||||||||
Fund Market Price Returns | 17.47 | % | 3.15 | % | 8.33 | % | 7.73 | % | ||||||||
WisdomTree U.S. SmallCap Index | 18.00 | % | 3.86 | % | 8.74 | % | 8.06 | % | ||||||||
Russell 2000® Index | 19.71 | % | -0.10 | % | 8.10 | % | 7.58 | % | ||||||||
Russell 2000® Value Index | 18.75 | % | 2.22 | % | 8.17 | % | 6.87 | % | ||||||||
Performance is historical and does not guarantee future results. The returns do not reflect the deduction of taxes that a shareholder would pay on Fund distributions or on the redemption of Fund shares.
| WisdomTree Trust | 15 |
Management’s Discussion of Funds’ Performance
as of March 31, 2024 (unaudited)
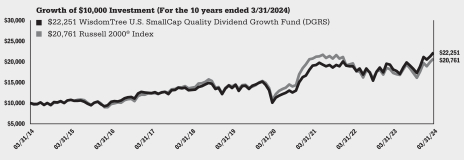
WisdomTree U.S. SmallCap Quality Dividend Growth Fund (DGRS)
Sector Breakdown†
| Sector | % of Net Assets | |||
Consumer Discretionary | 23.6% | |||
Industrials | 23.2% | |||
Financials | 17.9% | |||
Materials | 7.2% | |||
Energy | 6.9% | |||
Consumer Staples | 5.6% | |||
Information Technology | 4.0% | |||
Communication Services | 3.9% | |||
Health Care | 3.9% | |||
Utilities | 2.4% | |||
Real Estate | 1.2% | |||
Other Assets less Liabilities‡ | 0.2% | |||
Total | 100.0% | |||
| † | The Fund’s sector breakdown is expressed as a percentage of net assets and may change over time. In addition, a sector may be comprised of several industries. |
| ‡ | Other assets less liabilities may include investment of cash collateral for securities on loan and/or receivables/payables on derivatives (if any). |
Top Ten Holdings*
| Description | % of Net Assets | |||
MDC Holdings, Inc. | 2.5% | |||
Marriott Vacations Worldwide Corp. | 2.0% | |||
Cohen & Steers, Inc. | 1.8% | |||
Carter’s, Inc. | 1.7% | |||
SLM Corp. | 1.7% | |||
Kontoor Brands, Inc. | 1.6% | |||
Viper Energy, Inc. | 1.5% | |||
Patterson Cos., Inc. | 1.4% | |||
Victory Capital Holdings, Inc., Class A | 1.4% | |||
Bloomin’ Brands, Inc. | 1.3% | |||
| * | The ten largest holdings are subject to change, and there are no guarantees the Fund will remain invested in any particular company. Excludes derivatives and investment of cash collateral for securities on loan (if any). |
The WisdomTree U.S. SmallCap Quality Dividend Growth Fund (the “Fund”) seeks to track the price and yield performance, before fees and expenses, of the WisdomTree U.S. SmallCap Quality Dividend Growth Index (the “Index”). In seeking to track the Index, the Fund invests in dividend-paying small-cap companies with growth characteristics in the U.S. equity market. The Fund generally uses a representative sampling strategy to achieve its investment objective, meaning it generally will invest in a sample of securities in the Index.
The Fund returned 22.40% at net asset value (“NAV”) for the fiscal year ended March 31, 2024 (for more complete performance information please see the table below). The Fund benefited from positions in the Financials, Real Estate and Energy sectors due to strong stock selection and allocation effects in each sector. The primary detractors were the Consumer Staples and Information Technology sectors due to negative stock selection in the former and a mix of poor stock selection and allocation effects in the latter. Across return-on-equity (“ROE”) quintiles, the first (representing the highest ROE) and fourth (representing the second-lowest ROE) quintiles exhibited positive performance impacts due to allocation effects in the former and stock selection effects in the latter. The other three quintiles detracted from performance due to a mix of negative stock selection effects.
Shareholder Expense Example (for the six-month period ended March 31, 2024)
| Beginning Account Value | Ending Account Value | Annualized Expense Ratio | Expenses Paid During the Period | |||||||||||||
Actual | $ | 1,000.00 | $ | 1,216.00 | 0.38 | % | $ | 2.11 | ||||||||
Hypothetical (5% return before expenses) | $ | 1,000.00 | $ | 1,023.10 | 0.38 | % | $ | 1.92 | ||||||||
Performance
| Average Annual Total Return | ||||||||||||||||
| 1 Year | 3 Year | 5 Year | 10 Year | |||||||||||||
Fund NAV Returns | 22.40 | % | 5.31 | % | 10.20 | % | 8.33 | % | ||||||||
Fund Market Price Returns | 22.38 | % | 5.05 | % | 10.18 | % | 8.32 | % | ||||||||
WisdomTree U.S. SmallCap Quality Dividend Growth Index | 23.06 | % | 5.74 | % | 10.63 | % | 8.65 | % | ||||||||
Russell 2000® Index | 19.71 | % | -0.10 | % | 8.10 | % | 7.58 | % | ||||||||
Performance is historical and does not guarantee future results. The returns do not reflect the deduction of taxes that a shareholder would pay on Fund distributions or on the redemption of Fund shares.
| 16 | WisdomTree Trust |
Management’s Discussion of Funds’ Performance
as of March 31, 2024 (unaudited)
WisdomTree U.S. SmallCap Quality Growth Fund (QSML)
Sector Breakdown†
| Sector | % of Net Assets | |||
Consumer Discretionary | 23.2% | |||
Industrials | 22.0% | |||
Information Technology | 13.2% | |||
Financials | 10.3% | |||
Health Care | 9.7% | |||
Energy | 6.9% | |||
Materials | 6.3% | |||
Consumer Staples | 5.1% | |||
Communication Services | 2.8% | |||
Other Assets less Liabilities‡ | 0.5% | |||
Total | 100.0% | |||
| † | The Fund’s sector breakdown is expressed as a percentage of net assets and may change over time. In addition, a sector may be comprised of several industries. |
| ‡ | Other assets less liabilities may include investment of cash collateral for securities on loan and/or receivables/payables on derivatives (if any). |
Top Ten Holdings*
| Description | % of Net Assets | |||
Armstrong World Industries, Inc. | 0.9% | |||
Hilton Grand Vacations, Inc. | 0.8% | |||
Academy Sports & Outdoors, Inc. | 0.8% | |||
Mr. Cooper Group, Inc. | 0.8% | |||
Euronet Worldwide, Inc. | 0.8% | |||
Skyline Champion Corp. | 0.8% | |||
Herc Holdings, Inc. | 0.8% | |||
Cirrus Logic, Inc. | 0.8% | |||
MDC Holdings, Inc. | 0.7% | |||
CorVel Corp. | 0.7% | |||
| * | The ten largest holdings are subject to change, and there are no guarantees the Fund will remain invested in any particular company. Excludes derivatives and investment of cash collateral for securities on loan (if any). |
The WisdomTree U.S. SmallCap Quality Growth Fund seeks to track the price and yield performance, before fees and expenses, of the WisdomTree U.S. SmallCap Quality Growth Index (the “Index”). In seeking to track the Index, the Fund invests in the top scoring 30% of companies that comprise the bottom 40% of U.S. companies by market capitalization, after the 500 largest companies have been removed, with the highest composite scores based on two fundamental factors: growth and quality, which are equally weighted. The Fund generally uses a representative sampling strategy to achieve its investment objective, meaning it generally will invest in a sample of securities in the Index.
The Fund had less than six months of operating history at the end of the reporting period and therefore no comparative performance information is shown in this shareholder report. Comparative performance information for the most recent month-end is available at www.wisdomtree.com/investments.
Shareholder Expense Example (for the period1 ended March 31, 2024)
| Beginning Account Value | Ending Account Value | Annualized Expense Ratio | Expenses Paid During the Period | |||||||||||||
Actual1 | $ | 1,000.00 | $ | 1,058.50 | 0.38 | % | $ | 0.72 | ||||||||
Hypothetical (5% return before expenses) | $ | 1,000.00 | $ | 1,023.10 | 0.38 | % | $ | 1.92 | ||||||||
| 1 | Fund commenced operations on January 25, 2024. Actual expenses are calculated using the Fund’s annualized expense ratio, multiplied by the average account value for the period, multiplied by 67/366 (to reflect the period since commencement of operations). |
| WisdomTree Trust | 17 |
Management’s Discussion of Funds’ Performance
as of March 31, 2024 (unaudited)
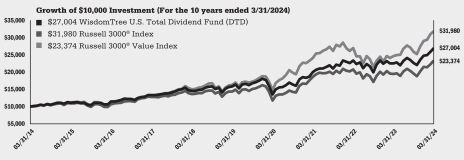
WisdomTree U.S. Total Dividend Fund (DTD)
Sector Breakdown†
| Sector | % of Net Assets | |||
Financials | 18.6% | |||
Information Technology | 16.9% | |||
Health Care | 12.5% | |||
Consumer Staples | 12.1% | |||
Industrials | 10.0% | |||
Energy | 8.1% | |||
Consumer Discretionary | 7.1% | |||
Utilities | 4.6% | |||
Real Estate | 4.5% | |||
Communication Services | 3.0% | |||
Materials | 2.4% | |||
Other Assets less Liabilities‡ | 0.2% | |||
Total | 100.0% | |||
| † | The Fund’s sector breakdown is expressed as a percentage of net assets and may change over time. In addition, a sector may be comprised of several industries. |
| ‡ | Other assets less liabilities may include investment of cash collateral for securities on loan and/or receivables/payables on derivatives (if any). |
Top Ten Holdings*
| Description | % of Net Assets | |||
Microsoft Corp. | 3.2% | |||
JPMorgan Chase & Co. | 2.9% | |||
Apple, Inc. | 2.7% | |||
AbbVie, Inc. | 2.5% | |||
Broadcom, Inc. | 2.2% | |||
Exxon Mobil Corp. | 2.2% | |||
Johnson & Johnson | 2.1% | |||
NVIDIA Corp. | 1.9% | |||
Home Depot, Inc. | 1.9% | |||
Procter & Gamble Co. | 1.8% | |||
| * | The ten largest holdings are subject to change, and there are no guarantees the Fund will remain invested in any particular company. Excludes derivatives and investment of cash collateral for securities on loan (if any). |
The WisdomTree U.S. Total Dividend Fund (the “Fund”) seeks to track the price and yield performance, before fees and expenses, of the WisdomTree U.S. Dividend Index (the “Index”). In seeking to track the Index, the Fund invests in U.S. equities from a broad range of dividend-paying companies. The Fund generally uses a representative sampling strategy to achieve its investment objective, meaning it generally will invest in a sample of securities in the Index.
The Fund returned 19.75% at net asset value (“NAV”) for the fiscal year ended March 31, 2024 (for more complete performance information please see the table below). The Fund benefited the most from its position in the Information Technology sector, which featured overwhelmingly positive allocation and stock selection effects. Health Care and Materials sectors also contributed positively, albeit to a lesser extent, mainly due to positive stock selection. Communication Services, Industrials and Financials sectors all detracted from performance, with Industrials’ impact due to poor stock selection, Financials’ impact due to negative allocation effects, and Communication Services’ impact due to a negative mix of both effects. Across dividend yield quintiles, the fifth (i.e. lowest dividend yield) quintile had a significantly positive performance impact due to an approximately equal mix of both positive allocation and strong stock selection effects. The third quintile was also additive, though primarily due to stock selection. The second and fourth quintiles detracted from Fund performance mainly due to poor stock selection in the latter and a mix of negative stock selection and allocation effects in the former.
Shareholder Expense Example (for the six-month period ended March 31, 2024)
| Beginning Account Value | Ending Account Value | Annualized Expense Ratio | Expenses Paid During the Period | |||||||||||||
Actual | $ | 1,000.00 | $ | 1,190.30 | 0.28 | % | $ | 1.53 | ||||||||
Hypothetical (5% return before expenses) | $ | 1,000.00 | $ | 1,023.60 | 0.28 | % | $ | 1.42 | ||||||||
Performance
| Average Annual Total Return | ||||||||||||||||
| 1 Year | 3 Year | 5 Year | 10 Year | |||||||||||||
Fund NAV Returns | 19.75 | % | 10.51 | % | 11.26 | % | 10.44 | % | ||||||||
Fund Market Price Returns | 19.64 | % | 10.40 | % | 11.22 | % | 10.43 | % | ||||||||
WisdomTree U.S. Dividend Index | 20.17 | % | 10.88 | % | 11.63 | % | 10.78 | % | ||||||||
Russell 3000® Index | 29.29 | % | 9.78 | % | 14.34 | % | 12.33 | % | ||||||||
Russell 3000® Value Index | 20.18 | % | 7.74 | % | 10.18 | % | 8.86 | % | ||||||||
Performance is historical and does not guarantee future results. The returns do not reflect the deduction of taxes that a shareholder would pay on Fund distributions or on the redemption of Fund shares.
| 18 | WisdomTree Trust |
Management’s Discussion of Funds’ Performance
as of March 31, 2024 (unaudited)
WisdomTree U.S. Value Fund (WTV)
Sector Breakdown†
| Sector | % of Net Assets | |||
Financials | 21.4% | |||
Consumer Discretionary | 15.2% | |||
Industrials | 14.8% | |||
Energy | 11.3% | |||
Information Technology | 9.7% | |||
Health Care | 8.1% | |||
Materials | 7.9% | |||
Communication Services | 4.7% | |||
Consumer Staples | 3.0% | |||
Utilities | 2.0% | |||
Real Estate | 1.8% | |||
Other Assets less Liabilities‡ | 0.1% | |||
Total | 100.0% | |||
| † | The Fund’s sector breakdown is expressed as a percentage of net assets and may change over time. In addition, a sector may be comprised of several industries. |
| ‡ | Other assets less liabilities may include investment of cash collateral for securities on loan and/or receivables/payables on derivatives (if any). |
Top Ten Holdings*
| Description | % of Net Assets | |||
Vistra Corp. | 1.5% | |||
AppLovin Corp., Class A | 1.3% | |||
Builders FirstSource, Inc. | 1.1% | |||
Marathon Petroleum Corp. | 1.1% | |||
Valero Energy Corp. | 1.1% | |||
Discover Financial Services | 1.0% | |||
Evercore, Inc., Class A | 1.0% | |||
Phillips 66 | 1.0% | |||
Synchrony Financial | 1.0% | |||
Marathon Oil Corp. | 1.0% | |||
| * | The ten largest holdings are subject to change, and there are no guarantees the Fund will remain invested in any particular company. Excludes derivatives and investment of cash collateral for securities on loan (if any). |
The WisdomTree U.S. Value Fund (the “Fund”) is actively managed using a model-based approach seeking income and capital appreciation by investing primarily in U.S. equity securities that provide a high total shareholder yield with favorable relative quality characteristics.
The Fund returned 31.10% at net asset value (“NAV”) for the fiscal year ended March 31, 2024 (for more complete performance information please see the table below). Most sectors contributed positively to performance during the period. Health Care, Consumer Discretionary and Utilities sectors all benefited due to strong stock selection effects. Only Financials and Communication Services detracted from performance due to poor allocation effects in Financials and negative stock selection within Communication Services. Across price-to-earnings quintiles, all five contributed positively exclusively due to strong stock selection.
Shareholder Expense Example (for the six-month period ended March 31, 2024)
| Beginning Account Value | Ending Account Value | Annualized Expense Ratio | Expenses Paid During the Period | |||||||||||||
Actual | $ | 1,000.00 | $ | 1,233.60 | 0.12 | % | $ | 0.67 | ||||||||
Hypothetical (5% return before expenses) | $ | 1,000.00 | $ | 1,024.40 | 0.12 | % | $ | 0.61 | ||||||||
Performance
| Average Annual Total Return | ||||||||||||||||
| 1 Year | 3 Year | 5 Year | 10 Year | |||||||||||||
Fund NAV Returns | 31.10 | % | 12.41 | % | 14.34 | % | 11.78 | % | ||||||||
Fund Market Price Returns | 31.09 | % | 12.25 | % | 14.33 | % | 11.78 | % | ||||||||
Russell 1000® Value Index | 20.27 | % | 8.11 | % | 10.32 | % | 9.01 | % | ||||||||
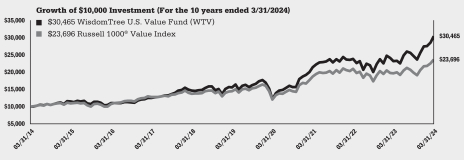
Performance is historical and does not guarantee future results. The returns do not reflect the deduction of taxes that a shareholder would pay on Fund distributions or on the redemption of Fund shares.
| WisdomTree Trust | 19 |
Description of Terms and Indexes (unaudited)
Below are descriptions of certain terms and of each Index referenced in this report:
Allocation Effect measures an investment manager’s ability to effectively allocate a portfolio’s assets to various segments. A segment refers to assets or securities that are grouped within a certain classification such as sectors, industries, or countries. The allocation effect determines whether the overweighting or underweighting of segments relative to a benchmark contributes positively or negatively to the overall portfolio return. Positive allocation occurs when the portfolio is overweighted in a segment that outperforms the benchmark and underweighted in a segment that underperforms the benchmark. Negative allocation occurs when the portfolio is overweighted in a segment that underperforms the benchmark and underweighted in a segment that outperforms the benchmark.
Correlation is a statistical measure of how two sets of returns move in relation to each other. Correlation coefficients range from -1 to 1. A correlation of 1 means the two subjects of analysis move in lockstep with each other. A correlation of -1 means the two subjects of analysis have moved in exactly the opposite direction.
Factors generally are attributes that are based on fundamentals or share price behavior.
Gross Domestic Product (GDP) is the total monetary or market value of all the finished goods and services produced within a country’s borders in a specific time period. As a broad measure of overall domestic production, it functions as a comprehensive scorecard of a country’s economic health.
Growth is generally characterized by higher price levels relative to fundamentals, such as dividends or earnings. Price levels are higher because investors are willing to pay more due to their expectations of future improvements in these fundamentals.
Momentum is generally characterized by assets with recent price increase trends over time. This term is also associated with the momentum factor which associates these stock characteristics with excess return vs. the market over time.
Price-to-earnings (P/E) ratio measures a company’s share price relative to its earnings per share.
Quality is generally characterized by higher efficiency and profitability. Typical measures include earnings, return-on-equity, return on assets, operating profitability as well as others. This term is also related to the quality factor, which associates these stock characteristics with excess returns vs. the market over time.
Quintiles refers to separating a universe of companies into five groups of equal size on the basis of dividend yield, price-to-earnings, or return-on-equity, as applicable.
Return-on-Equity (ROE) measures a corporation’s profitability by revealing how much profit a company generates with the money shareholders have invested.
The Russell 1000® Growth Index measures the performance of the large-cap growth segment of the U.S. equity universe. It includes those Russell 1000® companies with higher price-to-book ratios and higher forcasted growth values. The Russell 1000® Growth Index is constructed to provide a comprehensive and unbiased barometer for the large-cap growth segment.
The Russell 1000® Index represents the top 1,000 companies by market capitalization in the United States.
The Russell 1000® Value Index is a capitalization-weighted index that is comprised of the large-capitalization value segment of the U.S. equity universe, selecting from the Russell 1000 Index.
The Russell 2000® Index is a capitalization-weighted index that is comprised of the smallest 2,000 securities in the Russell 3000 Index, based on total market capitalization.
The Russell 2000® Value Index is a capitalization-weighted index that is comprised of the small-capitalization value segment of the U.S. equity universe, selecting from the Russell 2000 Index.
The Russell 3000® Index is a capitalization-weighted index that is comprised of the 3,000 largest U.S. companies, based on total market capitalization.
The Russell 3000® Value Index is a capitalization-weighted index that measures the performance of the value segment of the broad U.S. equity market, selecting from the Russell 3000 Index.
| 20 | WisdomTree Trust |
Description of Terms and Indexes (unaudited) (continued)
The Russell MidCap® Index is a market capitalization-weighted index that is comprised of the smallest 800 stocks of the Russell 1000 Index.
The Russell MidCap® Value Index is a capitalization-weighted index that measures the midcap value segment of the U.S. equity universe, selecting from the Russell MidCap Index.
The S&P 500® Equal Weight Index is the equal-weight version of the widely used S&P 500® Index. The index includes the same constituents as the capitalization-weighted S&P 500 Index, but each company is allocated a fixed weight—or 0.2% of the index total at each quarterly rebalance.
The S&P 500® Index is a capitalization-weighted index of 500 stocks selected by the Standard & Poor’s Index Committee, designed to represent the performance of the leading industries in the United States economy.
The S&P MidCap 400® Index is a capitalization-weighted index that is comprised of the mid-capitalization range of the U.S. stock market, with stocks selected by the Standard & Poor’s Index Committee.
Selection Effect measures an investment manager’s ability to select securities within a given segment relative to a benchmark. The over or underperformance of the portfolio is weighted by the benchmark weight, therefore, selection is not affected by the investment manager’s allocation to the segment. The weight of the segment in the portfolio determines the size of the effect—the larger the segment, the larger the effect is, positive or negative. A positive selection effect occurs when the portfolio return is greater than the benchmark return. Thus, the investment manager made good decisions in selecting securities that, as a whole, outperformed similar securities in the benchmark. A negative selection effect occurs when the portfolio return is less than the benchmark return. Thus, the investment manager made poor decisions in selecting securities that, as a whole, underperformed similar securities in the benchmark.
Shareholder Yield generally refers to a data point that references a combination of dividend yield and buyback yield.
Value is generally characterized by lower price levels relative to fundamentals, such as earnings or dividends. Prices are lower because investors are less certain of the performance of these fundamentals in the future. This term is also related to the value factor, which associates these stock characteristics with excess returns vs. the market over time.
Volatility is a statistical measure of the dispersion of returns for a given security or market index around a particular average level. If the price stays relatively stable, the security has low volatility. A highly volatile security hits new highs and lows quickly, moves erratically, and has rapid increases and dramatic falls.
The WisdomTree U.S. Dividend Index defines the dividend-paying portion of the U.S. stock market.
The WisdomTree U.S. High Dividend Index is comprised of companies with high dividend yields, selected from the WisdomTree U.S. Dividend Index.
The WisdomTree U.S. LargeCap Dividend Index is comprised of the large-capitalization segment of the U.S. dividend-paying market, selected from the WisdomTree U.S. Dividend Index.
The WisdomTree U.S. LargeCap Index is a fundamentally weighted index that measures the performance of earnings-generating companies within the large-capitalization segment of the U.S. stock market.
The WisdomTree U.S. MidCap Dividend Index is comprised of the mid-capitalization segment of the U.S. dividend-paying market, selected from the WisdomTree U.S. Dividend Index.
The WisdomTree U.S. MidCap Index is a fundamentally weighted index that measures the performance of earnings-generating companies within the mid-capitalization segment of the U.S. stock market.
The WisdomTree U.S. MidCap Quality Growth Index is composed of the top scoring 30% of companies that comprise the top 60% of U.S. companies by market capitalization, after the 500 largest companies have been removed, that are ranked on a composite score of two fundamental factors: growth and quality, which are equally weighted.
The WisdomTree U.S. Multifactor Index is comprised of 200 U.S. companies with the highest composite scores based on two fundamental factors, value and quality measures, and two technical factors, momentum and correlation.
| WisdomTree Trust | 21 |
Description of Terms and Indexes (unaudited) (concluded)
The WisdomTree U.S. Quality Growth Index is a market-cap weighted index that consists of companies with quality and growth characteristics. The top 500 U.S. companies by market capitalization are ranked on a composite score of two fundamental factors: growth and quality, which are equally weighted.
The WisdomTree U.S. Quality Dividend Growth Index is comprised of dividend-paying stocks with growth characteristics.
The WisdomTree U.S. SmallCap Dividend Index is comprised of the small-capitalization segment of the U.S. dividend-paying market, selected from the WisdomTree U.S. Dividend Index.
The WisdomTree U.S. SmallCap Index is a fundamentally weighted index that measures the performance of earnings-generating companies within the small-capitalization segment of the U.S. stock market.
The WisdomTree U.S. SmallCap Quality Dividend Growth Index is comprised of the small-capitalization segment of dividend-paying stocks with growth characteristics.
The WisdomTree U.S. SmallCap Quality Growth Index is composed of the top scoring 30% of companies that comprise the bottom 40% of U.S. companies by market capitalization, after the 500 largest companies have been removed, that are ranked on a composite score of two fundamental factors: growth and quality, which are equally weighted.
Index performance information assumes the reinvestment of dividends and excludes management fees, transaction costs and expenses. You cannot directly invest in an index.
The Dow Jones U.S. Select Dividend Index is calculated, distributed and marketed by Dow Jones Indexes, a licensed trademark of CME Group Index Services LLC, and has been licensed for use.
The Global Industry Classification Standard (“GICS”) was developed by and is the exclusive property and a service mark of MSCI Inc. (“MSCI”) and Standard & Poor’s (“S&P”), a division of The McGraw-Hill Companies, Inc., and is licensed for use by WisdomTree, Inc. Neither MSCI, S&P nor any other party involved in making or compiling the GICS or any GICS classifications makes any express or implied warranties or representations with respect to such standard or classification (or the results to be obtained by the use thereof), and all such parties hereby expressly disclaim all warranties of originality, accuracy, completeness, merchantability and fitness for a particular purpose with respect to any such standard or classification. Without limiting any of the foregoing, in no event shall MSCI, S&P, any of their affiliates or any third party involved in making or compiling the GICS or any GICS classifications have any liability for any direct, indirect, special, punitive, consequential or any other damages (including lost profits) even if notified of the possibility of such damages.
Neither MSCI nor any other party involved in or related to compiling, computing or creating the MSCI data makes any express or implied warranties or representations with respect to such data (or the results to be obtained by the use thereof), and all such parties hereby expressly disclaim all warranties of originality, accuracy, completeness, merchantability or fitness for a particular purpose with respect to any such data. Without limiting any of the foregoing, in no event shall MSCI, any of its affiliates or any third party involved in or related to compiling, computing or creating the data have any liability for any direct, indirect, special, punitive, consequential or any other damages (including lost profits) even if notified of the possibility of such damages. No further distribution or dissemination of the MSCI data is permitted without MSCI’s express written consent.
WisdomTree, Inc. and WisdomTree Asset Management, Inc. (together, “WisdomTree”) and the Funds make no representation or warranty, express or implied, to the owners of shares of the Funds or any member of the public regarding the advisability of investing in securities generally or in the Funds particularly or the ability of the underlying Indexes to track the performance of their underlying securities. WisdomTree is the licensor of certain trademarks, service marks and trade names of the Funds. WisdomTree has no obligation to take the needs of the Funds or the owners of shares of the Funds into consideration in determining, composing, or calculating the underlying WisdomTree Indexes of the applicable Funds. WisdomTree is not responsible for, and has not participated in, the determination of the timing of, prices of, or quantities of shares of the Funds to be issued or in the determination or calculation of the equation by which the shares of the Funds are redeemable. WisdomTree and the Funds do not guarantee the accuracy, completeness, or performance of the underlying Indexes or the data included therein and shall have no liability in connection with the underlying Indexes or their calculation.
| 22 | WisdomTree Trust |
Schedule of Investments
WisdomTree U.S. AI Enhanced Value Fund (AIVL)
March 31, 2024
| Investments | Shares | Value | ||||||
| COMMON STOCKS – 99.2% | ||||||||
| United States – 98.1% | ||||||||
| Aerospace & Defense – 6.2% | ||||||||
HEICO Corp. | 17,727 | $ | 3,385,857 | |||||
Hexcel Corp. | 12,195 | 888,406 | ||||||
Howmet Aerospace, Inc. | 80,485 | 5,507,588 | ||||||
L3Harris Technologies, Inc. | 4,396 | 936,788 | ||||||
RTX Corp. | 47,165 | 4,600,002 | ||||||
Textron, Inc. | 84,500 | 8,106,085 | ||||||
|
| |||||||
| Total Aerospace & Defense | 23,424,726 | |||||||
| Banks – 5.7% | ||||||||
Bank of America Corp. | 299,100 | 11,341,872 | ||||||
Citigroup, Inc. | 104,338 | 6,598,335 | ||||||
Wells Fargo & Co. | 60,827 | 3,525,533 | ||||||
|
| |||||||
| Total Banks | 21,465,740 | |||||||
| Beverages – 4.0% | ||||||||
Coca-Cola Co. | 138,161 | 8,452,690 | ||||||
Keurig Dr. Pepper, Inc. | 219,150 | 6,721,330 | ||||||
|
| |||||||
| Total Beverages | 15,174,020 | |||||||
| Biotechnology – 0.9% | ||||||||
Exelixis, Inc.* | 74,198 | 1,760,719 | ||||||
Incyte Corp.* | 25,596 | 1,458,204 | ||||||
|
| |||||||
| Total Biotechnology | 3,218,923 | |||||||
| Building Products – 1.7% | ||||||||
Carrier Global Corp. | 94,315 | 5,482,531 | ||||||
Johnson Controls International PLC | 15,321 | 1,000,768 | ||||||
|
| |||||||
| Total Building Products | 6,483,299 | |||||||
| Capital Markets – 9.8% | ||||||||
CME Group, Inc. | 34,478 | 7,422,769 | ||||||
FactSet Research Systems, Inc. | 3,187 | 1,448,141 | ||||||
Intercontinental Exchange, Inc. | 88,605 | 12,176,985 | ||||||
Invesco Ltd. | 168,700 | 2,798,733 | ||||||
MSCI, Inc. | 3,798 | 2,128,589 | ||||||
Nasdaq, Inc. | 177,015 | 11,169,646 | ||||||
|
| |||||||
| Total Capital Markets | 37,144,863 | |||||||
| Chemicals – 5.0% | ||||||||
Ashland, Inc. | 9,699 | 944,392 | ||||||
Dow, Inc. | 160,052 | 9,271,812 | ||||||
Eastman Chemical Co. | 10,466 | 1,048,903 | ||||||
Element Solutions, Inc. | 39,900 | 996,702 | ||||||
Huntsman Corp. | 169,411 | 4,409,768 | ||||||
PPG Industries, Inc. | 15,708 | 2,276,089 | ||||||
|
| |||||||
| Total Chemicals | 18,947,666 | |||||||
| Commercial Services & Supplies – 0.4% | ||||||||
Rollins, Inc. | 33,431 | 1,546,852 | ||||||
| Construction & Engineering – 0.5% | ||||||||
MDU Resources Group, Inc. | 79,119 | 1,993,799 | ||||||
| Containers & Packaging – 0.6% | ||||||||
Amcor PLC | 239,131 | 2,274,136 | ||||||
| Distributors – 1.3% | ||||||||
LKQ Corp. | 94,516 | 5,048,099 | ||||||
| Electric Utilities – 2.8% | ||||||||
OGE Energy Corp. | 27,591 | 946,371 | ||||||
PPL Corp. | 346,479 | 9,538,567 | ||||||
|
| |||||||
| Total Electric Utilities | 10,484,938 | |||||||
| Electrical Equipment – 0.4% | ||||||||
AMETEK, Inc. | 7,402 | 1,353,826 | ||||||
| Electronic Equipment, Instruments & Components – 1.6% |
| |||||||
Corning, Inc. | 156,996 | 5,174,588 | ||||||
Teledyne Technologies, Inc.* | 2,298 | 986,577 | ||||||
|
| |||||||
| Total Electronic Equipment, Instruments & Components |
| 6,161,165 | ||||||
| Entertainment – 0.3% | ||||||||
ROBLOX Corp., Class A* | 26,709 | 1,019,750 | ||||||
| Financial Services – 0.6% | ||||||||
Equitable Holdings, Inc. | 62,161 | 2,362,740 | ||||||
| Food Products – 1.1% | ||||||||
Flowers Foods, Inc. | 40,500 | 961,875 | ||||||
Kraft Heinz Co. | 90,686 | 3,346,313 | ||||||
|
| |||||||
| Total Food Products | 4,308,188 | |||||||
| Ground Transportation – 0.2% | ||||||||
CSX Corp. | 24,966 | 925,490 | ||||||
| Health Care Equipment & Supplies – 7.4% | ||||||||
Abbott Laboratories | 96,067 | 10,918,975 | ||||||
Edwards Lifesciences Corp.* | 13,789 | 1,317,677 | ||||||
Hologic, Inc.* | 36,731 | 2,863,549 | ||||||
Medtronic PLC | 133,325 | 11,619,274 | ||||||
Zimmer Biomet Holdings, Inc. | 10,636 | 1,403,739 | ||||||
|
| |||||||
| Total Health Care Equipment & Supplies | 28,123,214 | |||||||
| Health Care Providers & Services – 1.4% | ||||||||
Elevance Health, Inc. | 10,481 | 5,434,818 | ||||||
| Hotels, Restaurants & Leisure – 0.7% | ||||||||
Norwegian Cruise Line Holdings Ltd.*(a) | 46,827 | 980,089 | ||||||
Wendy’s Co. | 93,644 | 1,764,253 | ||||||
|
| |||||||
| Total Hotels, Restaurants & Leisure | 2,744,342 | |||||||
| Household Products – 0.5% | ||||||||
Kimberly-Clark Corp. | 7,493 | 969,220 | ||||||
Reynolds Consumer Products, Inc. | 33,856 | 966,927 | ||||||
|
| |||||||
| Total Household Products | 1,936,147 | |||||||
| Industrial Conglomerates – 1.8% | ||||||||
3M Co. | 23,905 | 2,535,603 | ||||||
Honeywell International, Inc. | 20,379 | 4,182,790 | ||||||
|
| |||||||
| Total Industrial Conglomerates | 6,718,393 | |||||||
| Industrial REITs – 0.4% | ||||||||
First Industrial Realty Trust, Inc. | 26,254 | 1,379,385 | ||||||
| Insurance – 4.4% | ||||||||
Axis Capital Holdings Ltd. | 19,119 | 1,243,117 | ||||||
Lincoln National Corp. | 63,716 | 2,034,452 | ||||||
Marsh & McLennan Cos., Inc. | 39,501 | 8,136,416 | ||||||
See Notes to Financial Statements.
| WisdomTree Trust | 23 |
Schedule of Investments (continued)
WisdomTree U.S. AI Enhanced Value Fund (AIVL)
March 31, 2024
| Investments | Shares | Value | ||||||
Old Republic International Corp. | 142,633 | $ | 4,381,686 | |||||
Reinsurance Group of America, Inc. | 5,133 | 990,053 | ||||||
|
| |||||||
| Total Insurance | 16,785,724 | |||||||
| IT Services – 0.2% | ||||||||
DXC Technology Co.* | 41,537 | 881,000 | ||||||
| Life Sciences Tools & Services – 2.8% | ||||||||
Agilent Technologies, Inc. | 42,782 | 6,225,209 | ||||||
Bio-Techne Corp. | 33,654 | 2,368,905 | ||||||
Qiagen NV* | 50,512 | 2,171,511 | ||||||
|
| |||||||
| Total Life Sciences Tools & Services | 10,765,625 | |||||||
| Machinery – 6.8% | ||||||||
Donaldson Co., Inc. | 13,223 | 987,494 | ||||||
Fortive Corp. | 134,226 | 11,546,121 | ||||||
Gates Industrial Corp. PLC* | 71,324 | 1,263,148 | ||||||
Otis Worldwide Corp. | 121,013 | 12,012,960 | ||||||
|
| |||||||
| Total Machinery | 25,809,723 | |||||||
| Media – 3.5% | ||||||||
Comcast Corp., Class A | 264,326 | 11,458,532 | ||||||
Fox Corp., Class B | 41,144 | 1,177,542 | ||||||
Sirius XM Holdings, Inc.(a) | 205,423 | 797,041 | ||||||
|
| |||||||
| Total Media | 13,433,115 | |||||||
| Multi-Utilities – 3.6% | ||||||||
CenterPoint Energy, Inc. | 121,020 | 3,447,860 | ||||||
CMS Energy Corp. | 15,826 | 954,941 | ||||||
NiSource, Inc. | 299,498 | 8,284,114 | ||||||
Public Service Enterprise Group, Inc. | 15,160 | 1,012,385 | ||||||
|
| |||||||
| Total Multi-Utilities | 13,699,300 | |||||||
| Oil, Gas & Consumable Fuels – 9.0% | ||||||||
Antero Midstream Corp. | 129,415 | 1,819,575 | ||||||
Chevron Corp. | 26,887 | 4,241,155 | ||||||
Exxon Mobil Corp. | 106,598 | 12,390,952 | ||||||
Kinder Morgan, Inc. | 259,069 | 4,751,326 | ||||||
Occidental Petroleum Corp. | 35,158 | 2,284,918 | ||||||
Williams Cos., Inc. | 218,962 | 8,532,949 | ||||||
|
| |||||||
| Total Oil, Gas & Consumable Fuels | 34,020,875 | |||||||
| Pharmaceuticals – 1.1% | ||||||||
Pfizer, Inc. | 144,798 | 4,018,144 | ||||||
| Professional Services – 0.8% | ||||||||
Dun & Bradstreet Holdings, Inc. | 86,146 | 864,906 | ||||||
Genpact Ltd. | 26,707 | 879,995 | ||||||
Paychex, Inc. | 11,125 | 1,366,150 | ||||||
|
| |||||||
| Total Professional Services | 3,111,051 | |||||||
| Residential REITs – 0.9% | ||||||||
Equity Residential | 52,869 | 3,336,563 | ||||||
| Software – 3.2% | ||||||||
DocuSign, Inc.* | 19,772 | 1,177,423 | ||||||
Dropbox, Inc., Class A* | 174,874 | 4,249,438 | ||||||
HashiCorp, Inc., Class A* | 71,379 | 1,923,664 | ||||||
Palantir Technologies, Inc., Class A* | 94,805 | 2,181,463 | ||||||
RingCentral, Inc., Class A* | 27,171 | 943,921 | ||||||
Teradata Corp.* | 24,135 | 933,300 | ||||||
Zoom Video Communications, Inc., Class A* | 12,836 | 839,089 | ||||||
|
| |||||||
| Total Software | 12,248,298 | |||||||
| Specialized REITs – 1.4% | ||||||||
Weyerhaeuser Co. | 144,023 | 5,171,866 | ||||||
| Technology Hardware, Storage & Peripherals – 2.6% |
| |||||||
Hewlett Packard Enterprise Co. | 435,806 | 7,726,840 | ||||||
HP, Inc. | 68,663 | 2,074,996 | ||||||
|
| |||||||
| Total Technology Hardware, Storage & Peripherals |
| 9,801,836 | ||||||
| Textiles, Apparel & Luxury Goods – 0.5% | ||||||||
NIKE, Inc., Class B | 19,640 | 1,845,767 | ||||||
| Tobacco – 2.0% | ||||||||
Altria Group, Inc. | 88,392 | 3,855,659 | ||||||
Philip Morris International, Inc. | 38,864 | 3,560,720 | ||||||
|
| |||||||
| Total Tobacco | 7,416,379 | |||||||
| Total United States | 372,019,785 | |||||||
| Brazil – 0.8% | ||||||||
| Capital Markets – 0.8% | ||||||||
XP, Inc., Class A | 117,013 | 3,002,554 | ||||||
| United Kingdom – 0.3% | ||||||||
| Machinery – 0.3% | ||||||||
CNH Industrial NV | 101,771 | 1,318,952 | ||||||
TOTAL COMMON STOCKS (Cost: $349,308,862) | 376,341,291 | |||||||
| EXCHANGE-TRADED FUND – 0.2% | ||||||||
| United States – 0.2% | ||||||||
| iShares Russell 1000 Value ETF(a) (Cost: $724,658) | 4,205 | 753,158 | ||||||
| INVESTMENT OF CASH COLLATERAL FOR SECURITIES LOANED – 0.2% |
| |||||||
| United States – 0.2% | ||||||||
State Street Navigator Securities Lending Government Money Market Portfolio, 5.34%(b) | ||||||||
| (Cost: $739,520) | 739,520 | 739,520 | ||||||
TOTAL INVESTMENTS IN SECURITIES – 99.6% (Cost: $350,773,040) | 377,833,969 | |||||||
Other Assets less Liabilities – 0.4% | 1,341,296 | |||||||
|
| |||||||
| NET ASSETS – 100.0% | $ | 379,175,265 | ||||||
| * | Non-income producing security. |
| (a) | Security, or portion thereof, was on loan at March 31, 2024 (See Note 2). At March 31, 2024, the total market value of the Fund’s securities on loan identified in the Schedule of Investments was $2,277,161 and the total market value of the collateral held by the Fund was $2,329,856. The total market value of the collateral includes non-cash U.S. Government securities collateral having a value of $1,590,336. |
| (b) | Rate shown represents annualized 7-day yield as of March 31, 2024. |
See Notes to Financial Statements.
| 24 | WisdomTree Trust |
Schedule of Investments (concluded)
WisdomTree U.S. AI Enhanced Value Fund (AIVL)
March 31, 2024
| FAIR VALUATION SUMMARY |
The following is a summary of the fair valuations according to the inputs used in valuing the Fund’s investments (See Note 2 — Fair Value Measurement):
| Quoted Prices in Active Markets (Level 1) | Other Significant Observable Inputs (Level 2) | Significant Unobservable Inputs (Level 3) | Total | |||||||||||||
Assets: | ||||||||||||||||
Investments in Securities | ||||||||||||||||
Common Stocks | $ | 376,341,291 | $ | — | $ | — | $ | 376,341,291 | ||||||||
Exchange-Traded Fund | 753,158 | — | — | 753,158 | ||||||||||||
Investment of Cash Collateral for Securities Loaned | — | 739,520 | — | 739,520 | ||||||||||||
Total Investments in Securities | $ | 377,094,449 | $ | 739,520 | $ | — | $ | 377,833,969 | ||||||||
See Notes to Financial Statements.
| WisdomTree Trust | 25 |
Schedule of Investments
WisdomTree U.S. High Dividend Fund (DHS)
March 31, 2024
| Investments | Shares | Value | ||||||
| COMMON STOCKS – 99.6% | ||||||||
| United States – 99.5% | ||||||||
| Aerospace & Defense – 0.1% | ||||||||
Kaman Corp. | 18,505 | $ | 848,825 | |||||
National Presto Industries, Inc. | 4,659 | 390,424 | ||||||
|
| |||||||
| Total Aerospace & Defense | 1,239,249 | |||||||
| Air Freight & Logistics – 1.9% | ||||||||
United Parcel Service, Inc., Class B | 141,681 | 21,058,047 | ||||||
| Automobile Components – 0.2% | ||||||||
LCI Industries | 11,314 | 1,392,301 | ||||||
Phinia, Inc. | 31,533 | 1,211,813 | ||||||
|
| |||||||
| Total Automobile Components | 2,604,114 | |||||||
| Banks – 13.5% | ||||||||
Arrow Financial Corp.(a) | 10,553 | 264,036 | ||||||
Associated Banc-Corp. | 73,435 | 1,579,587 | ||||||
Atlantic Union Bankshares Corp. | 37,892 | 1,337,967 | ||||||
Bank of Hawaii Corp.(a) | 20,378 | 1,271,383 | ||||||
Bank of Marin Bancorp | 11,194 | 187,723 | ||||||
BankUnited, Inc. | 39,469 | 1,105,132 | ||||||
Banner Corp. | 21,478 | 1,030,944 | ||||||
Bar Harbor Bankshares | 10,644 | 281,853 | ||||||
Brookline Bancorp, Inc. | 59,340 | 591,026 | ||||||
Burke & Herbert Financial Services Corp.(a) | 4,865 | 272,586 | ||||||
Cambridge Bancorp | 5,133 | 349,865 | ||||||
Camden National Corp. | 9,406 | 315,289 | ||||||
Capitol Federal Financial, Inc. | 91,137 | 543,177 | ||||||
Central Pacific Financial Corp. | 17,585 | 347,304 | ||||||
Citigroup, Inc. | 404,816 | 25,600,564 | ||||||
Citizens & Northern Corp. | 10,576 | 198,617 | ||||||
Civista Bancshares, Inc. | 10,532 | 161,982 | ||||||
Columbia Banking System, Inc. | 86,906 | 1,681,631 | ||||||
Comerica, Inc. | 47,847 | 2,631,107 | ||||||
Community Bank System, Inc. | 25,782 | 1,238,309 | ||||||
Community Trust Bancorp, Inc. | 12,175 | 519,264 | ||||||
CVB Financial Corp. | 68,398 | 1,220,220 | ||||||
Dime Community Bancshares, Inc. | 25,296 | 487,201 | ||||||
Eagle Bancorp, Inc. | 18,815 | 441,964 | ||||||
Farmers & Merchants Bancorp, Inc. | 9,255 | 206,294 | ||||||
Farmers National Banc Corp. | 25,367 | 338,903 | ||||||
Fifth Third Bancorp | 165,139 | 6,144,822 | ||||||
Financial Institutions, Inc. | 10,197 | 191,908 | ||||||
First Bancorp, Inc. | 7,931 | 195,420 | ||||||
First Busey Corp. | 36,127 | 868,854 | ||||||
First Commonwealth Financial Corp. | 65,976 | 918,386 | ||||||
First Community Bankshares, Inc. | 12,279 | 425,222 | ||||||
First Financial Bancorp | 61,031 | 1,368,315 | ||||||
First Financial Corp. | 8,012 | 307,100 | ||||||
First Hawaiian, Inc. | 68,129 | 1,496,113 | ||||||
First Interstate BancSystem, Inc., Class A | 62,423 | 1,698,530 | ||||||
First Merchants Corp. | 35,427 | 1,236,402 | ||||||
First of Long Island Corp. | 5,965 | 66,152 | ||||||
Flushing Financial Corp. | 17,253 | 217,560 | ||||||
FNB Corp. | 120,629 | 1,700,869 | ||||||
Fulton Financial Corp. | 84,003 | 1,334,808 | ||||||
Glacier Bancorp, Inc. | 40,226 | 1,620,303 | ||||||
Hanmi Financial Corp. | 13,508 | 215,047 | ||||||
HBT Financial, Inc. | 21,362 | 406,732 | ||||||
Heartland Financial USA, Inc. | 27,376 | 962,266 | ||||||
Heritage Commerce Corp. | 14,922 | 128,031 | ||||||
Heritage Financial Corp. | 23,260 | 451,011 | ||||||
Hope Bancorp, Inc. | 79,301 | 912,755 | ||||||
Horizon Bancorp, Inc. | 30,436 | 390,494 | ||||||
Huntington Bancshares, Inc. | 414,832 | 5,786,906 | ||||||
Independent Bank Corp. | 33,878 | 1,404,795 | ||||||
Independent Bank Group, Inc. | 25,483 | 1,163,299 | ||||||
Kearny Financial Corp. | 32,551 | 209,628 | ||||||
Lakeland Bancorp, Inc. | 43,437 | 525,588 | ||||||
M&T Bank Corp. | 35,045 | 5,096,945 | ||||||
Mercantile Bank Corp. | 10,607 | 408,263 | ||||||
Mid Penn Bancorp, Inc. | 11,355 | 227,214 | ||||||
Midland States Bancorp, Inc. | 13,930 | 350,061 | ||||||
MidWestOne Financial Group, Inc. | 10,556 | 247,433 | ||||||
New York Community Bancorp, Inc.(a) | 304,690 | 981,102 | ||||||
Northrim BanCorp, Inc. | 3,741 | 188,958 | ||||||
Northwest Bancshares, Inc. | 84,436 | 983,679 | ||||||
Norwood Financial Corp. | 4,949 | 134,662 | ||||||
OceanFirst Financial Corp. | 39,159 | 642,599 | ||||||
Pacific Premier Bancorp, Inc. | 53,908 | 1,293,792 | ||||||
Park National Corp. | 9,117 | 1,238,544 | ||||||
Parke Bancorp, Inc. | 8,372 | 144,208 | ||||||
PCB Bancorp | 9,060 | 147,950 | ||||||
Peoples Bancorp, Inc. | 23,501 | 695,865 | ||||||
Peoples Financial Services Corp. | 4,761 | 205,247 | ||||||
PNC Financial Services Group, Inc. | 85,175 | 13,764,280 | ||||||
Premier Financial Corp. | 22,969 | 466,271 | ||||||
Primis Financial Corp. | 13,575 | 165,208 | ||||||
Provident Financial Services, Inc. | 59,844 | 871,927 | ||||||
RBB Bancorp | 12,662 | 228,043 | ||||||
Regions Financial Corp. | 280,419 | 5,900,016 | ||||||
S&T Bancorp, Inc. | 25,550 | 819,644 | ||||||
Sandy Spring Bancorp, Inc. | 29,999 | 695,377 | ||||||
Shore Bancshares, Inc. | 21,987 | 252,851 | ||||||
Sierra Bancorp | 9,861 | 199,192 | ||||||
Simmons First National Corp., Class A | 73,169 | 1,423,869 | ||||||
Southside Bancshares, Inc. | 18,785 | 549,086 | ||||||
Synovus Financial Corp. | 53,523 | 2,144,131 | ||||||
TFS Financial Corp. | 169,945 | 2,134,509 | ||||||
Tompkins Financial Corp. | 9,568 | 481,175 | ||||||
Towne Bank | 39,964 | 1,121,390 | ||||||
TrustCo Bank Corp. | 12,990 | 365,798 | ||||||
Trustmark Corp. | 38,378 | 1,078,806 | ||||||
U.S. Bancorp | 354,435 | 15,843,245 | ||||||
United Bankshares, Inc. | 48,341 | 1,730,124 | ||||||
Univest Financial Corp. | 19,902 | 414,360 | ||||||
Valley National Bancorp | 185,686 | 1,478,061 | ||||||
Veritex Holdings, Inc. | 34,958 | 716,289 | ||||||
Washington Trust Bancorp, Inc. | 5,865 | 157,651 | ||||||
See Notes to Financial Statements.
| 26 | WisdomTree Trust |
Schedule of Investments (continued)
WisdomTree U.S. High Dividend Fund (DHS)
March 31, 2024
| Investments | Shares | Value | ||||||
Webster Financial Corp. | 42,972 | $ | 2,181,688 | |||||
WesBanco, Inc. | 38,770 | 1,155,734 | ||||||
West BanCorp, Inc. | 11,257 | 200,712 | ||||||
Zions Bancorp NA | 49,831 | 2,162,665 | ||||||
|
| |||||||
| Total Banks | 148,239,868 | |||||||
| Biotechnology – 7.1% | ||||||||
AbbVie, Inc. | 344,332 | 62,702,857 | ||||||
Gilead Sciences, Inc. | 216,413 | 15,852,252 | ||||||
|
| |||||||
| Total Biotechnology | 78,555,109 | |||||||
| Broadline Retail – 0.5% | ||||||||
Kohl’s Corp. | 75,438 | 2,199,018 | ||||||
Macy’s, Inc. | 95,834 | 1,915,721 | ||||||
Nordstrom, Inc.(a) | 83,296 | 1,688,410 | ||||||
|
| |||||||
| Total Broadline Retail | 5,803,149 | |||||||
| Capital Markets – 6.8% | ||||||||
Bank of New York Mellon Corp. | 135,164 | 7,788,150 | ||||||
Blue Owl Capital, Inc. | 144,297 | 2,721,441 | ||||||
Bridge Investment Group Holdings, Inc., Class A | 20,966 | 143,617 | ||||||
Carlyle Group, Inc. | 85,559 | 4,013,573 | ||||||
Cohen & Steers, Inc. | 25,075 | 1,928,017 | ||||||
Diamond Hill Investment Group, Inc. | 1,991 | 306,953 | ||||||
Franklin Resources, Inc. | 135,930 | 3,820,992 | ||||||
GCM Grosvenor, Inc., Class A(a) | 28,661 | 276,865 | ||||||
Moelis & Co., Class A | 29,796 | 1,691,519 | ||||||
Morgan Stanley | 320,967 | 30,222,253 | ||||||
Northern Trust Corp. | 43,694 | 3,885,271 | ||||||
State Street Corp. | 63,595 | 4,917,165 | ||||||
T Rowe Price Group, Inc. | 56,889 | 6,935,907 | ||||||
TPG, Inc. | 38,494 | 1,720,682 | ||||||
Victory Capital Holdings, Inc., Class A | 39,808 | 1,689,053 | ||||||
Virtu Financial, Inc., Class A | 61,791 | 1,267,951 | ||||||
Virtus Investment Partners, Inc. | 4,800 | 1,190,304 | ||||||
|
| |||||||
| Total Capital Markets | 74,519,713 | |||||||
| Chemicals – 1.8% | ||||||||
Chemours Co. | 49,666 | 1,304,229 | ||||||
Dow, Inc. | 186,062 | 10,778,572 | ||||||
Eastman Chemical Co. | 29,551 | 2,961,601 | ||||||
Huntsman Corp. | 61,574 | 1,602,771 | ||||||
Kronos Worldwide, Inc.(a) | 81,417 | 960,721 | ||||||
Scotts Miracle-Gro Co.(a) | 24,227 | 1,807,092 | ||||||
|
| |||||||
| Total Chemicals | 19,414,986 | |||||||
| Commercial Services & Supplies – 0.2% | ||||||||
ACCO Brands Corp. | 66,260 | 371,718 | ||||||
Aris Water Solutions, Inc., Class A(a) | 21,871 | 309,475 | ||||||
Deluxe Corp. | 29,175 | 600,713 | ||||||
Ennis, Inc. | 17,340 | 355,643 | ||||||
Pitney Bowes, Inc.(a) | 120,917 | 523,571 | ||||||
|
| |||||||
| Total Commercial Services & Supplies | 2,161,120 | |||||||
| Consumer Finance – 0.8% | ||||||||
Ally Financial, Inc. | 77,492 | 3,145,400 | ||||||
Navient Corp. | 63,180 | 1,099,332 | ||||||
OneMain Holdings, Inc. | 81,118 | 4,144,319 | ||||||
Regional Management Corp. | 6,665 | 161,360 | ||||||
|
| |||||||
| Total Consumer Finance | 8,550,411 | |||||||
| Consumer Staples Distribution & Retail – 0.1% | ||||||||
SpartanNash Co. | 22,832 | 461,434 | ||||||
Village Super Market, Inc., Class A | 7,393 | 211,514 | ||||||
|
| |||||||
| Total Consumer Staples Distribution & Retail | 672,948 | |||||||
| Containers & Packaging – 0.8% | ||||||||
Greif, Inc., Class B | 14,291 | 993,510 | ||||||
International Paper Co. | 97,569 | 3,807,143 | ||||||
Pactiv Evergreen, Inc. | 91,597 | 1,311,669 | ||||||
Sonoco Products Co. | 38,699 | 2,238,350 | ||||||
|
| |||||||
| Total Containers & Packaging | 8,350,672 | |||||||
| Diversified REITs – 0.1% | ||||||||
Alexander & Baldwin, Inc. | 5,302 | 87,324 | ||||||
American Assets Trust, Inc. | 3,037 | 66,541 | ||||||
Armada Hoffler Properties, Inc. | 4,384 | 45,594 | ||||||
Broadstone Net Lease, Inc. | 13,804 | 216,309 | ||||||
CTO Realty Growth, Inc. | 2,543 | 43,104 | ||||||
Essential Properties Realty Trust, Inc. | 11,310 | 301,524 | ||||||
NexPoint Diversified Real Estate Trust(a) | 49 | 323 | ||||||
WP Carey, Inc. | 15,996 | 902,814 | ||||||
|
| |||||||
| Total Diversified REITs | 1,663,533 | |||||||
| Diversified Telecommunication Services – 0.1% |
| |||||||
Cogent Communications Holdings, Inc. | 24,661 | 1,611,103 | ||||||
| Electric Utilities – 8.2% | ||||||||
ALLETE, Inc. | 30,118 | 1,796,238 | ||||||
Alliant Energy Corp. | 53,085 | 2,675,484 | ||||||
American Electric Power Co., Inc. | 111,304 | 9,583,274 | ||||||
Duke Energy Corp. | 158,712 | 15,349,038 | ||||||
Edison International | 86,406 | 6,111,496 | ||||||
Entergy Corp. | 71,708 | 7,578,101 | ||||||
Evergy, Inc. | 65,033 | 3,471,462 | ||||||
Eversource Energy | 80,314 | 4,800,368 | ||||||
Exelon Corp. | 183,986 | 6,912,354 | ||||||
FirstEnergy Corp. | 134,376 | 5,189,601 | ||||||
OGE Energy Corp. | 82,088 | 2,815,618 | ||||||
Pinnacle West Capital Corp. | 45,908 | 3,430,705 | ||||||
Portland General Electric Co. | 39,609 | 1,663,578 | ||||||
PPL Corp. | 154,661 | 4,257,817 | ||||||
Southern Co. | 202,235 | 14,508,339 | ||||||
|
| |||||||
| Total Electric Utilities | 90,143,473 | |||||||
| Electronic Equipment, Instruments & Components – 0.5% | ||||||||
Corning, Inc. | 176,485 | 5,816,946 | ||||||
| Energy Equipment & Services – 0.3% | ||||||||
Archrock, Inc. | 97,111 | 1,910,173 | ||||||
Kodiak Gas Services, Inc. | 50,402 | 1,377,991 | ||||||
Solaris Oilfield Infrastructure, Inc., Class A | 23,370 | 202,618 | ||||||
|
| |||||||
| Total Energy Equipment & Services | 3,490,782 | |||||||
See Notes to Financial Statements.
| WisdomTree Trust | 27 |
Schedule of Investments (continued)
WisdomTree U.S. High Dividend Fund (DHS)
March 31, 2024
| Investments | Shares | Value | ||||||
| Financial Services – 1.2% | ||||||||
Alerus Financial Corp.(a) | 13,582 | $ | 296,495 | |||||
Corebridge Financial, Inc. | 166,314 | 4,778,201 | ||||||
Jackson Financial, Inc., Class A | 35,815 | 2,368,804 | ||||||
NewtekOne, Inc. | 16,369 | 180,059 | ||||||
Radian Group, Inc. | 68,338 | 2,287,273 | ||||||
UWM Holdings Corp.(a) | 62,752 | 455,580 | ||||||
Waterstone Financial, Inc. | 16,237 | 197,604 | ||||||
Western Union Co. | 205,166 | 2,868,221 | ||||||
|
| |||||||
| Total Financial Services | 13,432,237 | |||||||
| Food Products – 2.7% | ||||||||
B&G Foods, Inc. | 49,346 | 564,518 | ||||||
Conagra Brands, Inc. | 126,949 | 3,762,768 | ||||||
Flowers Foods, Inc. | 97,364 | 2,312,395 | ||||||
JM Smucker Co. | 23,896 | 3,007,790 | ||||||
John B Sanfilippo & Son, Inc. | 6,148 | 651,196 | ||||||
Kellanova | 76,225 | 4,366,930 | ||||||
Kraft Heinz Co. | 267,179 | 9,858,905 | ||||||
Tyson Foods, Inc., Class A | 66,118 | 3,883,110 | ||||||
WK Kellogg Co. | 58,708 | 1,103,711 | ||||||
|
| |||||||
| Total Food Products | 29,511,323 | |||||||
| Gas Utilities – 1.1% | ||||||||
National Fuel Gas Co. | 39,801 | 2,138,110 | ||||||
New Jersey Resources Corp. | 35,002 | 1,501,936 | ||||||
Northwest Natural Holding Co. | 24,465 | 910,587 | ||||||
ONE Gas, Inc. | 24,006 | 1,549,107 | ||||||
Southwest Gas Holdings, Inc. | 26,084 | 1,985,775 | ||||||
Spire, Inc. | 24,268 | 1,489,327 | ||||||
UGI Corp. | 92,728 | 2,275,545 | ||||||
|
| |||||||
| Total Gas Utilities | 11,850,387 | |||||||
| Health Care Providers & Services – 0.2% | ||||||||
Patterson Cos., Inc. | 46,447 | 1,284,260 | ||||||
Premier, Inc., Class A | 59,484 | 1,314,596 | ||||||
|
| |||||||
| Total Health Care Providers & Services | 2,598,856 | |||||||
| Health Care REITs – 0.2% | ||||||||
CareTrust REIT, Inc. | 8,612 | 209,874 | ||||||
Community Healthcare Trust, Inc. | 1,963 | 52,118 | ||||||
Global Medical REIT, Inc. | 6,411 | 56,096 | ||||||
LTC Properties, Inc. | 2,686 | 87,322 | ||||||
National Health Investors, Inc. | 3,470 | 218,020 | ||||||
Sabra Health Care REIT, Inc. | 17,867 | 263,896 | ||||||
Ventas, Inc. | 29,949 | 1,303,979 | ||||||
|
| |||||||
| Total Health Care REITs | 2,191,305 | |||||||
| Hotel & Resort REITs – 0.2% | ||||||||
Host Hotels & Resorts, Inc. | 53,873 | 1,114,093 | ||||||
Park Hotels & Resorts, Inc. | 16,367 | 286,259 | ||||||
Ryman Hospitality Properties, Inc. | 4,498 | 520,014 | ||||||
Service Properties Trust | 12,315 | 83,496 | ||||||
Summit Hotel Properties, Inc. | 9,446 | 61,493 | ||||||
|
| |||||||
| Total Hotel & Resort REITs | 2,065,355 | |||||||
| Hotels, Restaurants & Leisure – 1.0% | ||||||||
Bloomin’ Brands, Inc. | 48,344 | 1,386,506 | ||||||
Cracker Barrel Old Country Store, Inc. | 14,574 | 1,059,967 | ||||||
Dine Brands Global, Inc. | 10,303 | 478,883 | ||||||
Marriott Vacations Worldwide Corp. | 17,245 | 1,857,804 | ||||||
Travel & Leisure Co. | 38,129 | 1,866,796 | ||||||
Vail Resorts, Inc. | 10,173 | 2,266,850 | ||||||
Wendy’s Co. | 112,931 | 2,127,620 | ||||||
|
| |||||||
| Total Hotels, Restaurants & Leisure | 11,044,426 | |||||||
| Household Durables – 0.4% | ||||||||
Ethan Allen Interiors, Inc. | 17,374 | 600,619 | ||||||
Leggett & Platt, Inc. | 73,827 | 1,413,787 | ||||||
MDC Holdings, Inc. | 32,167 | 2,023,626 | ||||||
|
| |||||||
| Total Household Durables | 4,038,032 | |||||||
| Household Products – 1.2% | ||||||||
Energizer Holdings, Inc. | 37,984 | 1,118,249 | ||||||
Kimberly-Clark Corp. | 92,778 | 12,000,834 | ||||||
|
| |||||||
| Total Household Products | 13,119,083 | |||||||
| Independent Power & Renewable Electricity Producers – 0.2% |
| |||||||
Clearway Energy, Inc., Class A | 24,248 | 521,575 | ||||||
Clearway Energy, Inc., Class C | 53,844 | 1,241,104 | ||||||
|
| |||||||
| Total Independent Power & Renewable Electricity Producers |
| 1,762,679 | ||||||
| Industrial REITs – 0.1% | ||||||||
Innovative Industrial Properties, Inc. | 2,220 | 229,859 | ||||||
LXP Industrial Trust | 21,440 | 193,389 | ||||||
Plymouth Industrial REIT, Inc. | 3,450 | 77,625 | ||||||
STAG Industrial, Inc. | 13,708 | 526,935 | ||||||
|
| |||||||
| Total Industrial REITs | 1,027,808 | |||||||
| Insurance – 2.4% | ||||||||
AMERISAFE, Inc. | 14,206 | 712,715 | ||||||
CNA Financial Corp. | 64,076 | 2,910,332 | ||||||
Donegal Group, Inc., Class A | 18,794 | 265,747 | ||||||
Fidelity National Financial, Inc. | 66,081 | 3,508,901 | ||||||
First American Financial Corp. | 27,184 | 1,659,583 | ||||||
Horace Mann Educators Corp. | 27,353 | 1,011,787 | ||||||
Investors Title Co. | 1,327 | 216,553 | ||||||
Lincoln National Corp. | 91,202 | 2,912,080 | ||||||
Prudential Financial, Inc. | 91,086 | 10,693,496 | ||||||
Safety Insurance Group, Inc. | 9,841 | 808,832 | ||||||
Stewart Information Services Corp. | 16,530 | 1,075,442 | ||||||
Universal Insurance Holdings, Inc. | 20,658 | 419,771 | ||||||
|
| |||||||
| Total Insurance | 26,195,239 | |||||||
| IT Services – 4.4% | ||||||||
Information Services Group, Inc. | 32,863 | 132,767 | ||||||
International Business Machines Corp. | 251,348 | 47,997,414 | ||||||
|
| |||||||
| Total IT Services | 48,130,181 | |||||||
| Leisure Products – 0.1% | ||||||||
Marine Products Corp. | 21,627 | 254,117 | ||||||
Smith & Wesson Brands, Inc. | 30,884 | 536,146 | ||||||
|
| |||||||
| Total Leisure Products | 790,263 | |||||||
See Notes to Financial Statements.
| 28 | WisdomTree Trust |
Schedule of Investments (continued)
WisdomTree U.S. High Dividend Fund (DHS)
March 31, 2024
| Investments | Shares | Value | ||||||
| Machinery – 0.1% | ||||||||
Douglas Dynamics, Inc. | 15,399 | $ | 371,424 | |||||
Trinity Industries, Inc. | 45,315 | 1,262,023 | ||||||
|
| |||||||
| Total Machinery | 1,633,447 | |||||||
| Media – 0.6% | ||||||||
Entravision Communications Corp., Class A | 35,795 | 58,704 | ||||||
Gray Television, Inc. | 58,486 | 369,631 | ||||||
Interpublic Group of Cos., Inc. | 94,364 | 3,079,097 | ||||||
John Wiley & Sons, Inc., Class A | 31,466 | 1,199,799 | ||||||
Nexstar Media Group, Inc. | 11,547 | 1,989,433 | ||||||
Sinclair, Inc.(a) | 26,674 | 359,299 | ||||||
|
| |||||||
| Total Media | 7,055,963 | |||||||
| Metals & Mining – 0.2% | ||||||||
Kaiser Aluminum Corp. | 10,268 | 917,548 | ||||||
Mesabi Trust | 9,248 | 163,690 | ||||||
SunCoke Energy, Inc. | 56,021 | 631,357 | ||||||
|
| |||||||
| Total Metals & Mining | 1,712,595 | |||||||
| Multi-Utilities – 4.2% | ||||||||
Avista Corp. | 40,929 | 1,433,334 | ||||||
Black Hills Corp. | 27,978 | 1,527,599 | ||||||
Consolidated Edison, Inc. | 90,634 | 8,230,474 | ||||||
Dominion Energy, Inc. | 234,809 | 11,550,255 | ||||||
DTE Energy Co. | 40,474 | 4,538,754 | ||||||
NiSource, Inc. | 103,205 | 2,854,650 | ||||||
Northwestern Energy Group, Inc. | 28,658 | 1,459,552 | ||||||
Public Service Enterprise Group, Inc. | 136,125 | 9,090,427 | ||||||
WEC Energy Group, Inc. | 61,352 | 5,038,226 | ||||||
|
| |||||||
| Total Multi-Utilities | 45,723,271 | |||||||
| Office REITs – 0.3% | ||||||||
Alexandria Real Estate Equities, Inc. | 12,210 | 1,573,991 | ||||||
COPT Defense Properties | 8,374 | 202,399 | ||||||
Cousins Properties, Inc. | 9,951 | 239,222 | ||||||
Douglas Emmett, Inc. | 10,045 | 139,324 | ||||||
Easterly Government Properties, Inc. | 9,168 | 105,524 | ||||||
JBG SMITH Properties | 8,460 | 135,783 | ||||||
Kilroy Realty Corp. | 7,751 | 282,369 | ||||||
Peakstone Realty Trust | 2,647 | 42,696 | ||||||
Postal Realty Trust, Inc., Class A | 2,578 | 36,917 | ||||||
SL Green Realty Corp. | 4,128 | 227,577 | ||||||
|
| |||||||
| Total Office REITs | 2,985,802 | |||||||
| Oil, Gas & Consumable Fuels – 17.9% | ||||||||
Antero Midstream Corp. | 279,079 | 3,923,851 | ||||||
Berry Corp. | 58,512 | 471,022 | ||||||
Chevron Corp. | 348,474 | 54,968,289 | ||||||
Chord Energy Corp. | 25,727 | 4,585,580 | ||||||
Civitas Resources, Inc. | 57,943 | 4,398,453 | ||||||
Crescent Energy Co., Class A | 59,696 | 710,382 | ||||||
CVR Energy, Inc. | 67,987 | 2,424,416 | ||||||
DT Midstream, Inc. | 34,886 | 2,131,535 | ||||||
EOG Resources, Inc. | 132,271 | 16,909,525 | ||||||
Equitrans Midstream Corp. | 191,102 | 2,386,864 | ||||||
Exxon Mobil Corp. | 495,760 | 57,627,142 | ||||||
FutureFuel Corp. | 30,446 | 245,090 | ||||||
Granite Ridge Resources, Inc. | 100,088 | 650,572 | ||||||
Kinetik Holdings, Inc. | 35,993 | 1,435,041 | ||||||
Northern Oil & Gas, Inc. | 41,356 | 1,641,006 | ||||||
ONEOK, Inc. | 151,959 | 12,182,553 | ||||||
Pioneer Natural Resources Co. | 62,134 | 16,310,175 | ||||||
Riley Exploration Permian, Inc. | 12,236 | 403,788 | ||||||
Sitio Royalties Corp., Class A | 56,580 | 1,398,658 | ||||||
VAALCO Energy, Inc. | 73,240 | 510,483 | ||||||
Vitesse Energy, Inc. | 19,256 | 456,945 | ||||||
Williams Cos., Inc. | 287,825 | 11,216,540 | ||||||
|
| |||||||
| Total Oil, Gas & Consumable Fuels | 196,987,910 | |||||||
| Passenger Airlines – 0.0% | ||||||||
Spirit Airlines, Inc.(a) | 72,837 | 352,531 | ||||||
| Personal Care Products – 0.7% | ||||||||
Kenvue, Inc. | 372,917 | 8,002,799 | ||||||
Nu Skin Enterprises, Inc., Class A | 21,385 | 295,754 | ||||||
|
| |||||||
| Total Personal Care Products | 8,298,553 | |||||||
| Pharmaceuticals – 2.8% | ||||||||
Bristol-Myers Squibb Co. | 434,073 | 23,539,778 | ||||||
Organon & Co. | 179,691 | 3,378,191 | ||||||
Viatris, Inc. | 348,503 | 4,161,126 | ||||||
|
| |||||||
| Total Pharmaceuticals | 31,079,095 | |||||||
| Professional Services – 0.2% | ||||||||
ManpowerGroup, Inc. | 18,956 | 1,471,744 | ||||||
Resources Connection, Inc. | 22,886 | 301,180 | ||||||
|
| |||||||
| Total Professional Services | 1,772,924 | |||||||
| Real Estate Management & Development – 0.0% |
| |||||||
Kennedy-Wilson Holdings, Inc. | 5,927 | 50,854 | ||||||
RMR Group, Inc., Class A | 1,668 | 40,032 | ||||||
|
| |||||||
| Total Real Estate Management & Development | 90,886 | |||||||
| Residential REITs – 0.8% | �� | |||||||
Apartment Income REIT Corp. | 11,455 | 371,944 | ||||||
AvalonBay Communities, Inc. | 10,629 | 1,972,317 | ||||||
BRT Apartments Corp. | 1,588 | 26,678 | ||||||
Camden Property Trust | 8,886 | 874,382 | ||||||
Centerspace | 635 | 36,284 | ||||||
Elme Communities | 8,222 | 114,450 | ||||||
Equity Residential | 29,469 | 1,859,789 | ||||||
Essex Property Trust, Inc. | 4,732 | 1,158,441 | ||||||
Independence Realty Trust, Inc. | 11,529 | 185,963 | ||||||
Mid-America Apartment Communities, Inc. | 9,484 | 1,247,905 | ||||||
UDR, Inc. | 24,747 | 925,785 | ||||||
UMH Properties, Inc. | 6,753 | 109,669 | ||||||
|
| |||||||
| Total Residential REITs | 8,883,607 | |||||||
| Retail REITs – 1.1% | ||||||||
Acadia Realty Trust | 9,386 | 159,656 | ||||||
Agree Realty Corp. | 7,237 | 413,377 | ||||||
Alexander’s, Inc. | 498 | 108,136 | ||||||
Brixmor Property Group, Inc. | 20,274 | 475,425 | ||||||
CBL & Associates Properties, Inc.(a) | 3,404 | 77,986 | ||||||
See Notes to Financial Statements.
| WisdomTree Trust | 29 |
Schedule of Investments (continued)
WisdomTree U.S. High Dividend Fund (DHS)
March 31, 2024
| Investments | Shares | Value | ||||||
Federal Realty Investment Trust | 6,078 | $ | 620,685 | |||||
Getty Realty Corp. | 4,293 | 117,414 | ||||||
Kimco Realty Corp. | 49,472 | 970,146 | ||||||
Macerich Co. | 15,894 | 273,854 | ||||||
NETSTREIT Corp.(a) | 2,632 | 48,350 | ||||||
NNN REIT, Inc. | 13,787 | 589,256 | ||||||
Realty Income Corp. | 61,146 | 3,307,999 | ||||||
Regency Centers Corp. | 13,667 | 827,673 | ||||||
Retail Opportunity Investments Corp. | 6,215 | 79,676 | ||||||
Saul Centers, Inc. | 1,367 | 52,616 | ||||||
Simon Property Group, Inc. | 24,922 | 3,900,044 | ||||||
SITE Centers Corp. | 15,327 | 224,540 | ||||||
Tanger, Inc. | 7,741 | 228,592 | ||||||
Urban Edge Properties | 10,302 | 177,915 | ||||||
Whitestone REIT | 4,954 | 62,173 | ||||||
|
| |||||||
| Total Retail REITs | 12,715,513 | |||||||
| Semiconductors & Semiconductor Equipment – 0.0% |
| |||||||
NVE Corp. | 2,982 | 268,917 | ||||||
| Software – 0.0% | ||||||||
American Software, Inc., Class A | 22,152 | 253,640 | ||||||
| Specialized REITs – 1.9% | ||||||||
Crown Castle, Inc. | 32,358 | 3,424,447 | ||||||
CubeSmart | 16,483 | 745,361 | ||||||
Digital Realty Trust, Inc. | 23,122 | 3,330,493 | ||||||
EPR Properties | 5,373 | 228,084 | ||||||
Extra Space Storage, Inc. | 15,428 | 2,267,916 | ||||||
Four Corners Property Trust, Inc. | 6,504 | 159,153 | ||||||
Gaming & Leisure Properties, Inc. | 19,662 | 905,828 | ||||||
Gladstone Land Corp. | 4,304 | 57,415 | ||||||
Iron Mountain, Inc. | 19,003 | 1,524,231 | ||||||
Lamar Advertising Co., Class A | 6,474 | 773,060 | ||||||
National Storage Affiliates Trust | 6,854 | 268,403 | ||||||
PotlatchDeltic Corp. | 6,224 | 292,653 | ||||||
Public Storage | 12,959 | 3,758,888 | ||||||
Rayonier, Inc. | 11,606 | 385,783 | ||||||
Safehold, Inc. | 2,774 | 57,144 | ||||||
VICI Properties, Inc. | 76,555 | 2,280,574 | ||||||
|
| |||||||
| Total Specialized REITs | 20,459,433 | |||||||
| Specialty Retail – 0.9% | ||||||||
Aaron’s Co., Inc. | 18,046 | 135,345 | ||||||
Best Buy Co., Inc. | 58,996 | 4,839,442 | ||||||
Buckle, Inc. | 31,027 | 1,249,457 | ||||||
Guess?, Inc. | 37,415 | 1,177,450 | ||||||
Haverty Furniture Cos., Inc. | 9,752 | 332,738 | ||||||
Monro, Inc. | 21,707 | 684,639 | ||||||
Upbound Group, Inc. | 35,275 | 1,242,033 | ||||||
|
| |||||||
| Total Specialty Retail | 9,661,104 | |||||||
| Technology Hardware, Storage & Peripherals – 0.7% |
| |||||||
HP, Inc. | 190,701 | 5,762,984 | ||||||
Xerox Holdings Corp. | 104,823 | 1,876,332 | ||||||
|
| |||||||
| Total Technology Hardware, Storage & Peripherals |
| 7,639,316 | ||||||
| Textiles, Apparel & Luxury Goods – 0.7% | ||||||||
Carter’s, Inc. | 21,557 | 1,825,447 | ||||||
Kontoor Brands, Inc. | 23,827 | 1,435,577 | ||||||
Movado Group, Inc. | 10,656 | 297,622 | ||||||
Tapestry, Inc. | 68,863 | 3,269,615 | ||||||
Wolverine World Wide, Inc. | 53,874 | 603,927 | ||||||
|
| |||||||
| Total Textiles, Apparel & Luxury Goods | 7,432,188 | |||||||
| Tobacco – 7.9% | ||||||||
Altria Group, Inc. | 1,102,404 | 48,086,863 | ||||||
Philip Morris International, Inc. | 398,284 | 36,490,780 | ||||||
Universal Corp. | 15,631 | 808,435 | ||||||
Vector Group Ltd. | 105,682 | 1,158,275 | ||||||
|
| |||||||
| Total Tobacco | 86,544,353 | |||||||
| Wireless Telecommunication Services – 0.1% | ||||||||
Spok Holdings, Inc. | 15,707 | 250,527 | ||||||
Telephone & Data Systems, Inc. | 59,393 | 951,476 | ||||||
|
| |||||||
| Total Wireless Telecommunication Services | 1,202,003 | |||||||
| Total United States | 1,094,405,448 | |||||||
| Puerto Rico – 0.1% | ||||||||
| Banks – 0.1% | ||||||||
First BanCorp | 91,094 | 1,597,789 | ||||||
TOTAL COMMON STOCKS (Cost: $1,037,256,821) |
| 1,096,003,237 | ||||||
| INVESTMENT OF CASH COLLATERAL FOR SECURITIES LOANED – 0.2% |
| |||||||
| United States – 0.2% |
| |||||||
State Street Navigator Securities Lending |
| |||||||
| (Cost: $1,688,037) | 1,688,037 | 1,688,037 | ||||||
TOTAL INVESTMENTS IN SECURITIES – 99.8% (Cost: $1,038,944,858) |
| 1,097,691,274 | ||||||
Other Assets less Liabilities – 0.2% |
| 2,515,721 | ||||||
|
| |||||||
| NET ASSETS – 100.0% |
| $ | 1,100,206,995 | |||||
| (a) | Security, or portion thereof, was on loan at March 31, 2024 (See Note 2). At March 31, 2024, the total market value of the Fund’s securities on loan identified in the Schedule of Investments was $7,121,895 and the total market value of the collateral held by the Fund was $7,266,791. The total market value of the collateral includes non-cash U.S. Government securities collateral having a value of $5,578,754. |
| (b) | Rate shown represents annualized 7-day yield as of March 31, 2024. |
See Notes to Financial Statements.
| 30 | WisdomTree Trust |
Schedule of Investments (concluded)
WisdomTree U.S. High Dividend Fund (DHS)
March 31, 2024
| INVESTMENT IN AFFILIATES |
Affiliated holdings are investments in entities in which the Fund owns 5% or more of the outstanding voting securities or are investments in entities which are under common ownership or control. Investments in affiliates during the fiscal year ended March 31, 2024 were as follows:
| Affiliate | Value at 3/31/2023 | Purchases/ Additions | Sales/ Reductions | Realized Gain/(Loss) | Change in Unrealized Appreciation/ Depreciation | Value at 3/31/2024 | Dividend Income | |||||||||||||||||||||
WisdomTree U.S. Total Dividend Fund^ | $ | 70,042 | $ | 4,810,835 | $ | 4,896,348 | $ | 22,274 | $ | (6,803 | ) | $ | — | $ | 14,061 | |||||||||||||
| ^ | As of March 31, 2024, the Fund did not hold a position in this affiliate. |
| FAIR VALUATION SUMMARY | ||||||||||
The following is a summary of the fair valuations according to the inputs used in valuing the Fund’s investments (See Note 2 — Fair Value Measurement):
| Quoted Prices in Active Markets (Level 1) | Other Significant Observable Inputs (Level 2) | Significant Unobservable Inputs (Level 3) | Total | |||||||||||||
Assets: | ||||||||||||||||
Investments in Securities | ||||||||||||||||
Common Stocks | $ | 1,096,003,237 | $ | — | $ | — | $ | 1,096,003,237 | ||||||||
Investment of Cash Collateral for Securities Loaned | — | 1,688,037 | — | 1,688,037 | ||||||||||||
Total Investments in Securities | $ | 1,096,003,237 | $ | 1,688,037 | $ | — | $ | 1,097,691,274 | ||||||||
See Notes to Financial Statements.
| WisdomTree Trust | 31 |
Schedule of Investments
WisdomTree U.S. LargeCap Dividend Fund (DLN)
March 31, 2024
| Investments | Shares | Value | ||||||
| COMMON STOCKS – 99.8% | ||||||||
| United States – 99.8% | ||||||||
| Aerospace & Defense – 1.6% | ||||||||
General Dynamics Corp. | 31,831 | $ | 8,991,939 | |||||
HEICO Corp. | 2,378 | 454,198 | ||||||
HEICO Corp., Class A | 3,299 | 507,848 | ||||||
Howmet Aerospace, Inc. | 17,353 | 1,187,466 | ||||||
L3Harris Technologies, Inc. | 24,432 | 5,206,459 | ||||||
Lockheed Martin Corp. | 40,941 | 18,622,833 | ||||||
Northrop Grumman Corp. | 13,351 | 6,390,590 | ||||||
RTX Corp. | 238,352 | 23,246,471 | ||||||
Textron, Inc. | 8,578 | 822,887 | ||||||
|
| |||||||
| Total Aerospace & Defense | 65,430,691 | |||||||
| Air Freight & Logistics – 0.9% | ||||||||
Expeditors International of Washington, Inc. | 13,824 | 1,680,584 | ||||||
FedEx Corp. | 26,977 | 7,816,316 | ||||||
United Parcel Service, Inc., Class B | 171,289 | 25,458,684 | ||||||
|
| |||||||
| Total Air Freight & Logistics | 34,955,584 | |||||||
| Automobiles – 0.1% | ||||||||
General Motors Co. | 84,617 | 3,837,381 | ||||||
| Banks – 7.8% | ||||||||
Bank of America Corp. | 1,396,891 | 52,970,107 | ||||||
Citigroup, Inc. | 483,686 | 30,588,303 | ||||||
Fifth Third Bancorp | 166,992 | 6,213,772 | ||||||
First Citizens BancShares, Inc., Class A | 559 | 913,965 | ||||||
Huntington Bancshares, Inc. | 417,572 | 5,825,129 | ||||||
JPMorgan Chase & Co. | 660,898 | 132,377,869 | ||||||
M&T Bank Corp. | 36,677 | 5,334,303 | ||||||
PNC Financial Services Group, Inc. | 101,174 | 16,349,718 | ||||||
Regions Financial Corp. | 295,040 | 6,207,642 | ||||||
U.S. Bancorp | 421,477 | 18,840,022 | ||||||
Wells Fargo & Co. | 640,030 | 37,096,139 | ||||||
|
| |||||||
| Total Banks | 312,716,969 | |||||||
| Beverages – 3.8% | ||||||||
Brown-Forman Corp., Class A | 12,692 | 672,041 | ||||||
Brown-Forman Corp., Class B | 23,130 | 1,193,971 | ||||||
Coca-Cola Co. | 1,191,916 | 72,921,421 | ||||||
Constellation Brands, Inc., Class A | 23,364 | 6,349,401 | ||||||
Keurig Dr. Pepper, Inc. | 214,436 | 6,576,752 | ||||||
PepsiCo, Inc. | 363,212 | 63,565,732 | ||||||
|
| |||||||
| Total Beverages | 151,279,318 | |||||||
| Biotechnology – 4.0% | ||||||||
AbbVie, Inc. | 626,463 | 114,078,912 | ||||||
Amgen, Inc. | 96,205 | 27,353,006 | ||||||
Gilead Sciences, Inc. | 263,557 | 19,305,550 | ||||||
|
| |||||||
| Total Biotechnology | 160,737,468 | |||||||
| Broadline Retail – 0.1% | ||||||||
eBay, Inc. | 70,123 | 3,701,092 | ||||||
| Building Products – 0.1% | ||||||||
Carrier Global Corp. | 62,208 | 3,616,151 | ||||||
| Capital Markets – 4.7% | ||||||||
Ameriprise Financial, Inc. | 13,226 | 5,798,807 | ||||||
Ares Management Corp., Class A | 27,915 | 3,712,137 | ||||||
Bank of New York Mellon Corp. | 153,792 | 8,861,495 | ||||||
BlackRock, Inc. | 22,247 | 18,547,324 | ||||||
Blackstone, Inc.(a) | 112,377 | 14,762,967 | ||||||
Cboe Global Markets, Inc. | 10,089 | 1,853,652 | ||||||
Charles Schwab Corp. | 158,722 | 11,481,949 | ||||||
CME Group, Inc. | 42,335 | 9,114,302 | ||||||
FactSet Research Systems, Inc. | 1,738 | 789,730 | ||||||
Goldman Sachs Group, Inc. | 61,092 | 25,517,517 | ||||||
Intercontinental Exchange, Inc. | 71,457 | 9,820,336 | ||||||
KKR & Co., Inc. | 41,685 | 4,192,677 | ||||||
LPL Financial Holdings, Inc. | 3,337 | 881,635 | ||||||
Moody’s Corp. | 12,596 | 4,950,606 | ||||||
Morgan Stanley | 402,681 | 37,916,443 | ||||||
MSCI, Inc. | 4,665 | 2,614,499 | ||||||
Nasdaq, Inc. | 42,136 | 2,658,782 | ||||||
Northern Trust Corp. | 42,710 | 3,797,773 | ||||||
Raymond James Financial, Inc. | 16,977 | 2,180,186 | ||||||
S&P Global, Inc. | 15,857 | 6,746,361 | ||||||
State Street Corp. | 67,439 | 5,214,383 | ||||||
T Rowe Price Group, Inc. | 61,615 | 7,512,101 | ||||||
Tradeweb Markets, Inc., Class A | 4,968 | 517,517 | ||||||
|
| |||||||
| Total Capital Markets | 189,443,179 | |||||||
| Chemicals – 1.1% | ||||||||
Air Products & Chemicals, Inc. | 32,061 | 7,767,418 | ||||||
Dow, Inc. | 218,769 | 12,673,288 | ||||||
DuPont de Nemours, Inc. | 52,774 | 4,046,183 | ||||||
Ecolab, Inc. | 26,477 | 6,113,539 | ||||||
PPG Industries, Inc. | 35,763 | 5,182,059 | ||||||
Sherwin-Williams Co. | 18,278 | 6,348,498 | ||||||
Westlake Corp. | 10,334 | 1,579,035 | ||||||
|
| |||||||
| Total Chemicals | 43,710,020 | |||||||
| Commercial Services & Supplies – 0.6% | ||||||||
Cintas Corp. | 8,660 | 5,949,680 | ||||||
Republic Services, Inc. | 23,092 | 4,420,733 | ||||||
Rollins, Inc. | 36,737 | 1,699,821 | ||||||
Waste Management, Inc. | 55,876 | 11,909,969 | ||||||
|
| |||||||
| Total Commercial Services & Supplies | 23,980,203 | |||||||
| Communications Equipment – 1.6% | ||||||||
Cisco Systems, Inc. | 1,137,027 | 56,749,017 | ||||||
Motorola Solutions, Inc. | 16,909 | 6,002,357 | ||||||
|
| |||||||
| Total Communications Equipment | 62,751,374 | |||||||
| Construction & Engineering – 0.0% | ||||||||
Quanta Services, Inc. | 6,386 | 1,659,083 | ||||||
| Construction Materials – 0.1% | ||||||||
Martin Marietta Materials, Inc. | 2,779 | 1,706,139 | ||||||
Vulcan Materials Co. | 8,910 | 2,431,717 | ||||||
|
| |||||||
| Total Construction Materials | 4,137,856 | |||||||
See Notes to Financial Statements.
| 32 | WisdomTree Trust |
Schedule of Investments (continued)
WisdomTree U.S. LargeCap Dividend Fund (DLN)
March 31, 2024
| Investments | Shares | Value | ||||||
| Consumer Finance – 0.6% | ||||||||
American Express Co. | 56,820 | $ | 12,937,346 | |||||
Capital One Financial Corp. | 44,175 | 6,577,216 | ||||||
Discover Financial Services | 37,963 | 4,976,569 | ||||||
|
| |||||||
| Total Consumer Finance | 24,491,131 | |||||||
| Consumer Staples Distribution & Retail – 2.7% |
| |||||||
Costco Wholesale Corp. | 24,320 | 17,817,562 | ||||||
Kroger Co. | 141,663 | 8,093,207 | ||||||
Sysco Corp. | 117,515 | 9,539,868 | ||||||
Target Corp. | 77,108 | 13,664,309 | ||||||
Walmart, Inc. | 1,004,620 | 60,447,985 | ||||||
|
| |||||||
| Total Consumer Staples Distribution & Retail | 109,562,931 | |||||||
| Containers & Packaging – 0.1% | ||||||||
Avery Dennison Corp. | 7,266 | 1,622,134 | ||||||
Ball Corp. | 24,057 | 1,620,480 | ||||||
|
| |||||||
| Total Containers & Packaging | 3,242,614 | |||||||
| Distributors – 0.1% | ||||||||
Genuine Parts Co. | 22,620 | 3,504,517 | ||||||
| Electric Utilities – 2.5% | ||||||||
American Electric Power Co., Inc. | 130,527 | 11,238,375 | ||||||
Constellation Energy Corp. | 16,540 | 3,057,419 | ||||||
Duke Energy Corp. | 189,039 | 18,281,962 | ||||||
Edison International | 93,611 | 6,621,106 | ||||||
Entergy Corp. | 80,036 | 8,458,205 | ||||||
Eversource Energy | 86,855 | 5,191,323 | ||||||
Exelon Corp. | 211,618 | 7,950,488 | ||||||
FirstEnergy Corp. | 140,012 | 5,407,263 | ||||||
PG&E Corp. | 91,615 | 1,535,467 | ||||||
PPL Corp. | 151,550 | 4,172,172 | ||||||
Southern Co. | 245,560 | 17,616,474 | ||||||
Xcel Energy, Inc. | 159,222 | 8,558,183 | ||||||
|
| |||||||
| Total Electric Utilities | 98,088,437 | |||||||
| Electrical Equipment – 0.4% | ||||||||
AMETEK, Inc. | 12,157 | 2,223,516 | ||||||
Emerson Electric Co. | 74,967 | 8,502,757 | ||||||
Hubbell, Inc. | 4,461 | 1,851,538 | ||||||
Rockwell Automation, Inc. | 11,237 | 3,273,675 | ||||||
Vertiv Holdings Co. | 14,506 | 1,184,705 | ||||||
|
| |||||||
| Total Electrical Equipment | 17,036,191 | |||||||
| Electronic Equipment, Instruments & Components – 0.4% |
| |||||||
Amphenol Corp., Class A | 47,989 | 5,535,531 | ||||||
CDW Corp. | 8,791 | 2,248,562 | ||||||
Corning, Inc. | 190,359 | 6,274,233 | ||||||
|
| |||||||
| Total Electronic Equipment, Instruments & Components |
| 14,058,326 | ||||||
| Energy Equipment & Services – 0.2% | ||||||||
Baker Hughes Co. | 138,892 | 4,652,882 | ||||||
Halliburton Co. | 90,386 | 3,563,016 | ||||||
|
| |||||||
| Total Energy Equipment & Services | 8,215,898 | |||||||
| Entertainment – 0.1% | ||||||||
Electronic Arts, Inc. | 13,763 | 1,825,937 | ||||||
Warner Music Group Corp., Class A | 13,084 | 432,034 | ||||||
|
| |||||||
| Total Entertainment | 2,257,971 | |||||||
| Financial Services – 1.8% | ||||||||
Apollo Global Management, Inc. | 61,738 | 6,942,438 | ||||||
Fidelity National Information Services, Inc. | 117,263 | 8,698,569 | ||||||
Global Payments, Inc. | 12,808 | 1,711,917 | ||||||
Mastercard, Inc., Class A | 44,699 | 21,525,698 | ||||||
Visa, Inc., Class A(a) | 114,274 | 31,891,588 | ||||||
|
| |||||||
| Total Financial Services | 70,770,210 | |||||||
| Food Products – 1.6% | ||||||||
Archer-Daniels-Midland Co. | 74,015 | 4,648,882 | ||||||
General Mills, Inc. | 120,025 | 8,398,149 | ||||||
Hershey Co. | 21,339 | 4,150,436 | ||||||
Hormel Foods Corp. | 109,021 | 3,803,743 | ||||||
Kellanova | 79,235 | 4,539,373 | ||||||
Kraft Heinz Co. | 314,436 | 11,602,688 | ||||||
McCormick & Co., Inc., Non-Voting Shares | 35,056 | 2,692,651 | ||||||
Mondelez International, Inc., Class A | 287,314 | 20,111,980 | ||||||
Tyson Foods, Inc., Class A | 62,350 | 3,661,816 | ||||||
|
| |||||||
| Total Food Products | 63,609,718 | |||||||
| Gas Utilities – 0.1% | ||||||||
Atmos Energy Corp. | 35,313 | 4,197,656 | ||||||
| Ground Transportation – 0.9% | ||||||||
CSX Corp. | 146,728 | 5,439,207 | ||||||
JB Hunt Transport Services, Inc. | 4,914 | 979,115 | ||||||
Norfolk Southern Corp. | 30,714 | 7,828,077 | ||||||
Old Dominion Freight Line, Inc. | 9,194 | 2,016,336 | ||||||
Union Pacific Corp. | 77,401 | 19,035,228 | ||||||
|
| |||||||
| Total Ground Transportation | 35,297,963 | |||||||
| Health Care Equipment & Supplies – 1.1% | ||||||||
Abbott Laboratories | 194,676 | 22,126,874 | ||||||
Becton Dickinson & Co. | 26,722 | 6,612,359 | ||||||
GE HealthCare Technologies, Inc. | 18,740 | 1,703,653 | ||||||
ResMed, Inc. | 9,285 | 1,838,709 | ||||||
Stryker Corp. | 33,490 | 11,985,066 | ||||||
Zimmer Biomet Holdings, Inc. | 9,700 | 1,280,206 | ||||||
|
| |||||||
| Total Health Care Equipment & Supplies | 45,546,867 | |||||||
| Health Care Providers & Services – 2.8% | ||||||||
Cardinal Health, Inc. | 25,658 | 2,871,130 | ||||||
Cencora, Inc. | 16,452 | 3,997,672 | ||||||
Cigna Group | 32,338 | 11,744,838 | ||||||
CVS Health Corp. | 248,186 | 19,795,315 | ||||||
Elevance Health, Inc. | 16,014 | 8,303,900 | ||||||
HCA Healthcare, Inc. | 14,429 | 4,812,504 | ||||||
Humana, Inc. | 5,208 | 1,805,718 | ||||||
Laboratory Corp. of America Holdings | 6,228 | 1,360,569 | ||||||
McKesson Corp. | 5,749 | 3,086,351 | ||||||
Quest Diagnostics, Inc. | 12,748 | 1,696,886 | ||||||
UnitedHealth Group, Inc. | 110,241 | 54,536,223 | ||||||
|
| |||||||
| Total Health Care Providers & Services | 114,011,106 | |||||||
See Notes to Financial Statements.
| WisdomTree Trust | 33 |
Schedule of Investments (continued)
WisdomTree U.S. LargeCap Dividend Fund (DLN)
March 31, 2024
| Investments | Shares | Value | ||||||
| Health Care REITs – 0.3% | ||||||||
Ventas, Inc. | 86,775 | $ | 3,778,183 | |||||
Welltower, Inc. | 85,584 | 7,996,969 | ||||||
|
| |||||||
| Total Health Care REITs | 11,775,152 | |||||||
| Hotels, Restaurants & Leisure – 2.0% | ||||||||
Darden Restaurants, Inc. | 33,862 | 5,660,033 | ||||||
Hilton Worldwide Holdings, Inc. | 11,547 | 2,463,091 | ||||||
Las Vegas Sands Corp. | 76,054 | 3,931,992 | ||||||
Marriott International, Inc., Class A | 25,714 | 6,487,899 | ||||||
McDonald’s Corp. | 148,033 | 41,737,904 | ||||||
Starbucks Corp. | 163,695 | 14,960,086 | ||||||
Yum! Brands, Inc. | 46,406 | 6,434,192 | ||||||
|
| |||||||
| Total Hotels, Restaurants & Leisure | 81,675,197 | |||||||
| Household Durables – 0.2% | ||||||||
DR Horton, Inc. | 17,979 | 2,958,444 | ||||||
Lennar Corp., Class A | 16,099 | 2,768,706 | ||||||
Lennar Corp., Class B(a) | 2,343 | 361,244 | ||||||
PulteGroup, Inc. | 15,343 | 1,850,673 | ||||||
|
| |||||||
| Total Household Durables | 7,939,067 | |||||||
| Household Products – 2.9% | ||||||||
Church & Dwight Co., Inc. | 15,511 | 1,617,952 | ||||||
Clorox Co. | 23,347 | 3,574,659 | ||||||
Colgate-Palmolive Co. | 170,918 | 15,391,166 | ||||||
Kimberly-Clark Corp. | 107,873 | 13,953,373 | ||||||
Procter & Gamble Co. | 514,478 | 83,474,056 | ||||||
|
| |||||||
| Total Household Products | 118,011,206 | |||||||
| Industrial Conglomerates – 0.8% | ||||||||
General Electric Co. | 43,048 | 7,556,215 | ||||||
Honeywell International, Inc. | 125,564 | 25,772,011 | ||||||
|
| |||||||
| Total Industrial Conglomerates | 33,328,226 | |||||||
| Industrial REITs – 0.5% | ||||||||
Prologis, Inc. | 153,686 | 20,012,991 | ||||||
| Insurance – 2.4% | ||||||||
Aflac, Inc. | 125,015 | 10,733,788 | ||||||
Allstate Corp. | 38,992 | 6,746,006 | ||||||
American International Group, Inc. | 86,718 | 6,778,746 | ||||||
Arthur J Gallagher & Co. | 10,560 | 2,640,422 | ||||||
Brown & Brown, Inc. | 15,687 | 1,373,240 | ||||||
Cincinnati Financial Corp. | 24,724 | 3,069,979 | ||||||
Erie Indemnity Co., Class A | 3,562 | 1,430,392 | ||||||
Hartford Financial Services Group, Inc. | 59,520 | 6,133,536 | ||||||
Loews Corp. | 10,095 | 790,338 | ||||||
Marsh & McLennan Cos., Inc. | 60,620 | 12,486,508 | ||||||
MetLife, Inc. | 138,812 | 10,287,357 | ||||||
Principal Financial Group, Inc. | 48,615 | 4,195,961 | ||||||
Progressive Corp. | 24,653 | 5,098,733 | ||||||
Prudential Financial, Inc. | 104,835 | 12,307,629 | ||||||
Travelers Cos., Inc. | 28,012 | 6,446,682 | ||||||
WR Berkley Corp. | 40,219 | 3,556,968 | ||||||
|
| |||||||
| Total Insurance | 94,076,285 | |||||||
| Interactive Media & Services – 1.0% | ||||||||
Meta Platforms, Inc., Class A | 84,945 | 41,247,593 | ||||||
| IT Services – 1.5% | ||||||||
Cognizant Technology Solutions Corp., Class A | 46,145 | 3,381,967 | ||||||
International Business Machines Corp. | 303,682 | 57,991,115 | ||||||
|
| |||||||
| Total IT Services | 61,373,082 | |||||||
| Life Sciences Tools & Services – 0.5% | ||||||||
Agilent Technologies, Inc. | 13,016 | 1,893,958 | ||||||
Danaher Corp. | 31,808 | 7,943,094 | ||||||
Thermo Fisher Scientific, Inc. | 15,679 | 9,112,792 | ||||||
West Pharmaceutical Services, Inc. | 3,288 | 1,301,094 | ||||||
|
| |||||||
| Total Life Sciences Tools & Services | 20,250,938 | |||||||
| Machinery – 2.3% | ||||||||
Caterpillar, Inc. | 58,725 | 21,518,602 | ||||||
Cummins, Inc. | 23,799 | 7,012,375 | ||||||
Deere & Co. | 24,476 | 10,053,272 | ||||||
Dover Corp. | 11,056 | 1,959,013 | ||||||
Fortive Corp. | 15,546 | 1,337,267 | ||||||
Illinois Tool Works, Inc. | 59,559 | 15,981,466 | ||||||
Ingersoll Rand, Inc. | 17,055 | 1,619,372 | ||||||
Otis Worldwide Corp. | 54,410 | 5,401,281 | ||||||
PACCAR, Inc. | 138,944 | 17,213,772 | ||||||
Parker-Hannifin Corp. | 14,701 | 8,170,669 | ||||||
Westinghouse Air Brake Technologies Corp. | 8,489 | 1,236,678 | ||||||
Xylem, Inc. | 15,693 | 2,028,163 | ||||||
|
| |||||||
| Total Machinery | 93,531,930 | |||||||
| Media – 1.2% | ||||||||
Comcast Corp., Class A | 1,015,949 | 44,041,389 | ||||||
Omnicom Group, Inc. | 37,334 | 3,612,438 | ||||||
Sirius XM Holdings, Inc.(a) | 507,092 | 1,967,517 | ||||||
|
| |||||||
| Total Media | 49,621,344 | |||||||
| Metals & Mining – 0.2% | ||||||||
Nucor Corp. | 16,689 | 3,302,753 | ||||||
Reliance, Inc. | 6,999 | 2,338,926 | ||||||
Steel Dynamics, Inc. | 12,411 | 1,839,682 | ||||||
|
| |||||||
| Total Metals & Mining | 7,481,361 | |||||||
| Multi-Utilities – 1.6% | ||||||||
Ameren Corp. | 70,416 | 5,207,967 | ||||||
CenterPoint Energy, Inc. | 95,871 | 2,731,365 | ||||||
CMS Energy Corp. | 53,136 | 3,206,226 | ||||||
Consolidated Edison, Inc. | 102,398 | 9,298,762 | ||||||
Dominion Energy, Inc. | 287,538 | 14,143,994 | ||||||
DTE Energy Co. | 41,346 | 4,636,541 | ||||||
Public Service Enterprise Group, Inc. | 152,173 | 10,162,113 | ||||||
Sempra | 121,807 | 8,749,397 | ||||||
WEC Energy Group, Inc. | 64,005 | 5,256,091 | ||||||
|
| |||||||
| Total Multi-Utilities | 63,392,456 | |||||||
| Office REITs – 0.1% | ||||||||
Alexandria Real Estate Equities, Inc. | 40,252 | 5,188,885 | ||||||
| Oil, Gas & Consumable Fuels – 7.9% | ||||||||
Cheniere Energy, Inc. | 20,677 | 3,334,787 | ||||||
See Notes to Financial Statements.
| 34 | WisdomTree Trust |
Schedule of Investments (continued)
WisdomTree U.S. LargeCap Dividend Fund (DLN)
March 31, 2024
| Investments | Shares | Value | ||||||
Chevron Corp. | 477,374 | $ | 75,300,975 | |||||
ConocoPhillips | 140,166 | 17,840,328 | ||||||
Diamondback Energy, Inc. | 22,571 | 4,472,895 | ||||||
EOG Resources, Inc. | 158,347 | 20,243,080 | ||||||
Exxon Mobil Corp. | 864,217 | 100,456,584 | ||||||
Hess Corp. | 21,517 | 3,284,355 | ||||||
Marathon Oil Corp. | 59,664 | 1,690,878 | ||||||
Marathon Petroleum Corp. | 71,591 | 14,425,586 | ||||||
Occidental Petroleum Corp. | 61,024 | 3,965,950 | ||||||
ONEOK, Inc. | 176,018 | 14,111,363 | ||||||
Phillips 66 | 76,399 | 12,479,013 | ||||||
Pioneer Natural Resources Co. | 73,973 | 19,417,912 | ||||||
Targa Resources Corp. | 25,014 | 2,801,318 | ||||||
Valero Energy Corp. | 61,855 | 10,558,030 | ||||||
Williams Cos., Inc. | 343,468 | 13,384,948 | ||||||
|
| |||||||
| Total Oil, Gas & Consumable Fuels | 317,768,002 | |||||||
| Passenger Airlines – 0.0% | ||||||||
Delta Air Lines, Inc. | 36,661 | 1,754,962 | ||||||
| Personal Care Products – 0.2% | ||||||||
Kenvue, Inc. | 430,221 | 9,232,543 | ||||||
| Pharmaceuticals – 5.5% | ||||||||
Bristol-Myers Squibb Co. | 517,235 | 28,049,654 | ||||||
Eli Lilly & Co. | 40,936 | 31,846,571 | ||||||
Johnson & Johnson | 629,562 | 99,590,413 | ||||||
Merck & Co., Inc. | 431,209 | 56,898,027 | ||||||
Zoetis, Inc. | 32,497 | 5,498,817 | ||||||
|
| |||||||
| Total Pharmaceuticals | 221,883,482 | |||||||
| Professional Services – 0.9% | ||||||||
Automatic Data Processing, Inc. | 57,122 | 14,265,648 | ||||||
Booz Allen Hamilton Holding Corp. | 9,865 | 1,464,361 | ||||||
Broadridge Financial Solutions, Inc. | 15,875 | 3,252,153 | ||||||
Equifax, Inc. | 6,048 | 1,617,961 | ||||||
Jacobs Solutions, Inc. | 5,592 | 859,658 | ||||||
Paychex, Inc. | 89,199 | 10,953,637 | ||||||
Verisk Analytics, Inc. | 7,132 | 1,681,226 | ||||||
|
| |||||||
| Total Professional Services | 34,094,644 | |||||||
| Residential REITs – 0.5% | ||||||||
AvalonBay Communities, Inc. | 43,400 | 8,053,304 | ||||||
Equity Residential | 93,680 | 5,912,145 | ||||||
Invitation Homes, Inc. | 105,943 | 3,772,630 | ||||||
Sun Communities, Inc. | 17,459 | 2,244,878 | ||||||
|
| |||||||
| Total Residential REITs | 19,982,957 | |||||||
| Retail REITs – 0.8% | ||||||||
Realty Income Corp. | 226,720 | 12,265,552 | ||||||
Simon Property Group, Inc. | 116,909 | 18,295,089 | ||||||
|
| |||||||
| Total Retail REITs | 30,560,641 | |||||||
| Semiconductors & Semiconductor Equipment – 7.4% |
| |||||||
Analog Devices, Inc. | 54,508 | 10,781,137 | ||||||
Applied Materials, Inc. | 39,725 | 8,192,487 | ||||||
Broadcom, Inc. | 77,183 | 102,299,120 | ||||||
Intel Corp. | 270,333 | 11,940,609 | ||||||
KLA Corp. | 7,898 | 5,517,306 | ||||||
Lam Research Corp. | 8,211 | 7,977,561 | ||||||
Microchip Technology, Inc. | 58,417 | 5,240,589 | ||||||
Micron Technology, Inc. | 44,457 | 5,241,036 | ||||||
Monolithic Power Systems, Inc. | 2,223 | 1,505,905 | ||||||
NVIDIA Corp. | 92,557 | 83,630,803 | ||||||
QUALCOMM, Inc. | 140,881 | 23,851,153 | ||||||
Skyworks Solutions, Inc. | 23,637 | 2,560,360 | ||||||
Texas Instruments, Inc. | 166,912 | 29,077,739 | ||||||
|
| |||||||
| Total Semiconductors & Semiconductor Equipment |
| 297,815,805 | ||||||
| Software – 4.6% | ||||||||
Intuit, Inc. | 11,926 | 7,751,900 | ||||||
Microsoft Corp. | 351,774 | 147,998,358 | ||||||
Oracle Corp. | 214,490 | 26,942,089 | ||||||
Roper Technologies, Inc. | 4,517 | 2,533,314 | ||||||
|
| |||||||
| Total Software | 185,225,661 | |||||||
| Specialized REITs – 2.3% | ||||||||
American Tower Corp. | 79,721 | 15,752,072 | ||||||
Crown Castle, Inc. | 131,769 | 13,945,113 | ||||||
Digital Realty Trust, Inc. | 61,085 | 8,798,684 | ||||||
Equinix, Inc. | 11,100 | 9,161,163 | ||||||
Extra Space Storage, Inc. | 55,247 | 8,121,309 | ||||||
Iron Mountain, Inc. | 64,658 | 5,186,218 | ||||||
Public Storage | 45,227 | 13,118,544 | ||||||
SBA Communications Corp. | 8,186 | 1,773,906 | ||||||
VICI Properties, Inc. | 377,441 | 11,243,967 | ||||||
Weyerhaeuser Co. | 94,551 | 3,395,327 | ||||||
|
| |||||||
| Total Specialized REITs | 90,496,303 | |||||||
| Specialty Retail – 3.5% | ||||||||
Best Buy Co., Inc. | 61,169 | 5,017,693 | ||||||
Home Depot, Inc. | 227,578 | 87,298,921 | ||||||
Lowe’s Cos., Inc. | 109,024 | 27,771,683 | ||||||
Ross Stores, Inc. | 19,476 | 2,858,298 | ||||||
TJX Cos., Inc. | 155,828 | 15,804,076 | ||||||
Tractor Supply Co.(a) | 11,635 | 3,045,112 | ||||||
|
| |||||||
| Total Specialty Retail | 141,795,783 | |||||||
| Technology Hardware, Storage & Peripherals – 3.5% |
| |||||||
Apple, Inc. | 723,241 | 124,021,367 | ||||||
Dell Technologies, Inc., Class C | 23,112 | 2,637,310 | ||||||
Hewlett Packard Enterprise Co. | 192,702 | 3,416,607 | ||||||
HP, Inc. | 203,939 | 6,163,037 | ||||||
NetApp, Inc. | 32,885 | 3,451,938 | ||||||
|
| |||||||
| Total Technology Hardware, Storage & Peripherals |
| 139,690,259 | ||||||
| Textiles, Apparel & Luxury Goods – 0.2% | ||||||||
NIKE, Inc., Class B | 95,918 | 9,014,374 | ||||||
| Tobacco – 1.9% | ||||||||
Altria Group, Inc. | 661,506 | 28,854,892 | ||||||
Philip Morris International, Inc. | 506,968 | 46,448,408 | ||||||
|
| |||||||
| Total Tobacco | 75,303,300 | |||||||
| Trading Companies & Distributors – 0.4% | ||||||||
Fastenal Co. | 108,107 | 8,339,374 | ||||||
See Notes to Financial Statements.
| WisdomTree Trust | 35 |
Schedule of Investments (concluded)
WisdomTree U.S. LargeCap Dividend Fund (DLN)
March 31, 2024
| Investments | Shares | Value | ||||||
United Rentals, Inc. | 4,610 | $ | 3,324,317 | |||||
WW Grainger, Inc. | 3,909 | 3,976,626 | ||||||
|
| |||||||
| Total Trading Companies & Distributors | 15,640,317 | |||||||
| Water Utilities – 0.1% | ||||||||
American Water Works Co., Inc. | 23,597 | 2,883,789 | ||||||
| Wireless Telecommunication Services – 0.7% |
| |||||||
T-Mobile U.S., Inc. | 171,069 | 27,921,882 | ||||||
TOTAL COMMON STOCKS (Cost: $2,949,166,172) |
| 4,005,818,322 | ||||||
| EXCHANGE-TRADED FUND – 0.0% | ||||||||
| United States – 0.0% | ||||||||
| WisdomTree U.S. Total Dividend Fund(b) (Cost: $266,014) | 4,100 | 289,952 | ||||||
| INVESTMENT OF CASH COLLATERAL FOR SECURITIES LOANED – 0.1% |
| |||||||
| United States – 0.1% |
| |||||||
State Street Navigator Securities Lending Government Money Market Portfolio, 5.34%(c) | ||||||||
| (Cost: $1,603,144) | 1,603,144 | 1,603,144 | ||||||
TOTAL INVESTMENTS IN SECURITIES – 99.9% (Cost: $2,951,035,330) |
| 4,007,711,418 | ||||||
Other Assets less Liabilities – 0.1% |
| 5,950,331 | ||||||
|
| |||||||
| NET ASSETS – 100.0% |
| $ | 4,013,661,749 | |||||
| (a) | Security, or portion thereof, was on loan at March 31, 2024 (See Note 2). At March 31, 2024, the total market value of the Fund’s securities on loan identified in the Schedule of Investments was $43,566,319 and the total market value of the collateral held by the Fund was $44,914,273. The total market value of the collateral includes non-cash U.S. Government securities collateral having a value of $43,311,129. |
| (b) | Affiliated holding. See “Investment in Affiliates” supplementary table included in this Schedule of Investments for additional information. |
| (c) | Rate shown represents annualized 7-day yield as of March 31, 2024. |
| INVESTMENT IN AFFILIATES | ||||||||||
Affiliated holdings are investments in entities in which the Fund owns 5% or more of the outstanding voting securities or are investments in entities which are under common ownership or control. Investments in affiliates during the fiscal year ended March 31, 2024 were as follows:
| Affiliate | Value at 3/31/2023 | Purchases/ Additions | Sales/ Reductions | Realized Gain/(Loss) | Change in Unrealized Appreciation/ Depreciation | Value at 3/31/2024 | Dividend Income | |||||||||||||||||||||
WisdomTree U.S. Total Dividend Fund | $ | 3,180,975 | $ | 21,223,386 | $ | 24,268,418 | $ | 163,356 | $ | (9,347 | ) | $ | 289,952 | $ | 72,489 | |||||||||||||
| FAIR VALUATION SUMMARY | ||||||||||
The following is a summary of the fair valuations according to the inputs used in valuing the Fund’s investments (See Note 2 — Fair Value Measurement):
| Quoted Prices in Active Markets (Level 1) | Other Significant Observable Inputs (Level 2) | Significant Unobservable Inputs (Level 3) | Total | |||||||||||||
Assets: |
| |||||||||||||||
Investments in Securities | ||||||||||||||||
Common Stocks | $ | 4,005,818,322 | $ | — | $ | — | $ | 4,005,818,322 | ||||||||
Exchange-Traded Fund | 289,952 | — | — | 289,952 | ||||||||||||
Investment of Cash Collateral for Securities Loaned | — | 1,603,144 | — | 1,603,144 | ||||||||||||
Total Investments in Securities | $ | 4,006,108,274 | $ | 1,603,144 | $ | — | $ | 4,007,711,418 | ||||||||
See Notes to Financial Statements.
| 36 | WisdomTree Trust |
Schedule of Investments
WisdomTree U.S. LargeCap Fund (EPS)
March 31, 2024
| Investments | Shares | Value | ||||||
| COMMON STOCKS – 99.8% |
| |||||||
| United States – 99.8% |
| |||||||
| Aerospace & Defense – 1.2% |
| |||||||
Axon Enterprise, Inc.* | 579 | $ | 181,158 | |||||
General Dynamics Corp. | 4,510 | 1,274,030 | ||||||
HEICO Corp. | 967 | 184,697 | ||||||
Howmet Aerospace, Inc. | 4,166 | 285,079 | ||||||
L3Harris Technologies, Inc. | 3,863 | 823,205 | ||||||
Lockheed Martin Corp. | 5,521 | 2,511,337 | ||||||
Northrop Grumman Corp. | 2,660 | 1,273,236 | ||||||
RTX Corp. | 31,725 | 3,094,139 | ||||||
Textron, Inc. | 3,903 | 374,415 | ||||||
TransDigm Group, Inc. | 519 | 639,200 | ||||||
|
| |||||||
| Total Aerospace & Defense | 10,640,496 | |||||||
| Air Freight & Logistics – 0.6% | ||||||||
CH Robinson Worldwide, Inc. | 1,355 | 103,170 | ||||||
Expeditors International of Washington, Inc. | 2,405 | 292,376 | ||||||
FedEx Corp. | 5,387 | 1,560,829 | ||||||
United Parcel Service, Inc., Class B | 19,487 | 2,896,353 | ||||||
|
| |||||||
| Total Air Freight & Logistics | 4,852,728 | |||||||
| Automobiles – 1.2% | ||||||||
Ford Motor Co. | 225,444 | 2,993,896 | ||||||
General Motors Co. | 73,949 | 3,353,587 | ||||||
Tesla, Inc.* | 20,572 | 3,616,352 | ||||||
|
| |||||||
| Total Automobiles | 9,963,835 | |||||||
| Banks – 7.1% | ||||||||
Bank of America Corp. | 346,135 | 13,125,439 | ||||||
Citigroup, Inc. | 95,576 | 6,044,226 | ||||||
Citizens Financial Group, Inc. | 22,279 | 808,505 | ||||||
Fifth Third Bancorp | 26,695 | 993,321 | ||||||
First Citizens BancShares, Inc., Class A | 491 | 802,785 | ||||||
Huntington Bancshares, Inc. | 63,154 | 880,998 | ||||||
JPMorgan Chase & Co. | 114,927 | 23,019,878 | ||||||
KeyCorp | 23,204 | 366,855 | ||||||
M&T Bank Corp. | 7,426 | 1,080,038 | ||||||
PNC Financial Services Group, Inc. | 14,714 | 2,377,782 | ||||||
Regions Financial Corp. | 43,938 | 924,456 | ||||||
U.S. Bancorp | 45,878 | 2,050,747 | ||||||
Wells Fargo & Co. | 141,055 | 8,175,548 | ||||||
|
| |||||||
| Total Banks | 60,650,578 | |||||||
| Beverages – 1.3% | ||||||||
Brown-Forman Corp., Class B | 3,894 | 201,008 | ||||||
Celsius Holdings, Inc.* | 1,424 | 118,078 | ||||||
Coca-Cola Co. | 70,081 | 4,287,556 | ||||||
Constellation Brands, Inc., Class A | 2,897 | 787,289 | ||||||
Keurig Dr. Pepper, Inc. | 25,598 | 785,091 | ||||||
Molson Coors Beverage Co., Class B | 5,338 | 358,980 | ||||||
Monster Beverage Corp.* | 8,821 | 522,909 | ||||||
PepsiCo, Inc. | 22,097 | 3,867,196 | ||||||
|
| |||||||
| Total Beverages | 10,928,107 | |||||||
| Biotechnology – 2.5% | ||||||||
AbbVie, Inc. | 53,318 | 9,709,208 | ||||||
Alnylam Pharmaceuticals, Inc.* | 758 | 113,283 | ||||||
Amgen, Inc. | 12,714 | 3,614,844 | ||||||
Biogen, Inc.* | 3,277 | 706,620 | ||||||
BioMarin Pharmaceutical, Inc.* | 1,134 | 99,044 | ||||||
Exact Sciences Corp.* | 1,275 | 88,051 | ||||||
Gilead Sciences, Inc. | 37,347 | 2,735,668 | ||||||
Incyte Corp.* | 1,830 | 104,255 | ||||||
Neurocrine Biosciences, Inc.* | 667 | 91,993 | ||||||
Regeneron Pharmaceuticals, Inc.* | 2,211 | 2,128,065 | ||||||
United Therapeutics Corp.* | 863 | 198,248 | ||||||
Vertex Pharmaceuticals, Inc.* | 3,792 | 1,585,094 | ||||||
|
| |||||||
| Total Biotechnology | 21,174,373 | |||||||
| Broadline Retail – 3.3% | ||||||||
Amazon.com, Inc.* | 151,527 | 27,332,440 | ||||||
eBay, Inc. | 18,095 | 955,054 | ||||||
|
| |||||||
| Total Broadline Retail | 28,287,494 | |||||||
| Building Products – 0.4% | ||||||||
Advanced Drainage Systems, Inc. | 702 | 120,912 | ||||||
Builders FirstSource, Inc.* | 4,289 | 894,471 | ||||||
Carlisle Cos., Inc. | 839 | 328,762 | ||||||
Carrier Global Corp. | 14,098 | 819,517 | ||||||
Lennox International, Inc. | 194 | 94,819 | ||||||
Masco Corp. | 4,068 | 320,884 | ||||||
Owens Corning | 2,682 | 447,358 | ||||||
|
| |||||||
| Total Building Products | 3,026,723 | |||||||
| Capital Markets – 2.8% | ||||||||
Ameriprise Financial, Inc. | 2,867 | 1,257,007 | ||||||
Bank of New York Mellon Corp. | 22,918 | 1,320,535 | ||||||
BlackRock, Inc. | 2,620 | 2,184,294 | ||||||
Cboe Global Markets, Inc. | 1,518 | 278,902 | ||||||
Charles Schwab Corp. | 36,932 | 2,671,661 | ||||||
CME Group, Inc. | 4,947 | 1,065,040 | ||||||
FactSet Research Systems, Inc. | 369 | 167,670 | ||||||
Franklin Resources, Inc. | 14,906 | 419,008 | ||||||
Goldman Sachs Group, Inc. | 7,884 | 3,293,068 | ||||||
Intercontinental Exchange, Inc. | 9,029 | 1,240,855 | ||||||
LPL Financial Holdings, Inc. | 1,668 | 440,686 | ||||||
Moody’s Corp. | 1,764 | 693,305 | ||||||
Morgan Stanley | 42,356 | 3,988,241 | ||||||
Morningstar, Inc. | 287 | 88,502 | ||||||
MSCI, Inc. | 647 | 362,611 | ||||||
Nasdaq, Inc. | 7,139 | 450,471 | ||||||
Northern Trust Corp. | 4,633 | 411,966 | ||||||
Raymond James Financial, Inc. | 5,164 | 663,161 | ||||||
S&P Global, Inc. | 3,125 | 1,329,531 | ||||||
State Street Corp. | 11,460 | 886,087 | ||||||
T Rowe Price Group, Inc. | 5,555 | 677,266 | ||||||
Tradeweb Markets, Inc., Class A | 800 | 83,336 | ||||||
|
| |||||||
| Total Capital Markets | 23,973,203 | |||||||
| Chemicals – 0.9% | ||||||||
Air Products & Chemicals, Inc. | 3,152 | 763,635 | ||||||
Albemarle Corp. | 7,352 | 968,553 | ||||||
See Notes to Financial Statements.
| WisdomTree Trust | 37 |
Schedule of Investments (continued)
WisdomTree U.S. LargeCap Fund (EPS)
March 31, 2024
| Investments | Shares | Value | ||||||
Celanese Corp. | 2,126 | $ | 365,374 | |||||
CF Industries Holdings, Inc. | 9,343 | 777,431 | ||||||
Dow, Inc. | 10,809 | 626,165 | ||||||
DuPont de Nemours, Inc. | 7,063 | 541,520 | ||||||
Eastman Chemical Co. | 2,645 | 265,082 | ||||||
Ecolab, Inc. | 2,456 | 567,090 | ||||||
Mosaic Co. | 13,527 | 439,086 | ||||||
PPG Industries, Inc. | 3,685 | 533,957 | ||||||
RPM International, Inc. | 1,594 | 189,606 | ||||||
Sherwin-Williams Co. | 2,957 | 1,027,055 | ||||||
Westlake Corp. | 3,392 | 518,298 | ||||||
|
| |||||||
| Total Chemicals | 7,582,852 | |||||||
| Commercial Services & Supplies – 0.3% | ||||||||
Cintas Corp. | 861 | 591,533 | ||||||
Copart, Inc.* | 10,024 | 580,590 | ||||||
Republic Services, Inc. | 3,570 | 683,441 | ||||||
Rollins, Inc. | 3,760 | 173,975 | ||||||
Waste Management, Inc. | 4,433 | 944,894 | ||||||
|
| |||||||
| Total Commercial Services & Supplies | 2,974,433 | |||||||
| Communications Equipment – 1.1% | ||||||||
Arista Networks, Inc.* | 4,514 | 1,308,970 | ||||||
Cisco Systems, Inc. | 135,711 | 6,773,336 | ||||||
F5, Inc.* | 2,929 | 555,309 | ||||||
Motorola Solutions, Inc. | 3,011 | 1,068,845 | ||||||
|
| |||||||
| Total Communications Equipment | 9,706,460 | |||||||
| Construction & Engineering – 0.1% | ||||||||
AECOM | 1,768 | 173,405 | ||||||
EMCOR Group, Inc. | 283 | 99,107 | ||||||
Quanta Services, Inc. | 1,651 | 428,930 | ||||||
|
| |||||||
| Total Construction & Engineering | 701,442 | |||||||
| Construction Materials – 0.1% | ||||||||
Martin Marietta Materials, Inc. | 741 | 454,929 | ||||||
Vulcan Materials Co. | 1,376 | 375,538 | ||||||
|
| |||||||
| Total Construction Materials | 830,467 | |||||||
| Consumer Finance – 1.0% | ||||||||
American Express Co. | 16,519 | 3,761,211 | ||||||
Capital One Financial Corp. | 15,103 | 2,248,686 | ||||||
Discover Financial Services | 11,975 | 1,569,803 | ||||||
Synchrony Financial | 20,118 | 867,488 | ||||||
|
| |||||||
| Total Consumer Finance | 8,447,188 | |||||||
| Consumer Staples Distribution & Retail – 1.8% | ||||||||
Albertsons Cos., Inc., Class A | 25,107 | 538,294 | ||||||
Casey’s General Stores, Inc. | 261 | 83,116 | ||||||
Costco Wholesale Corp. | 3,866 | 2,832,348 | ||||||
Kroger Co. | 23,952 | 1,368,378 | ||||||
Performance Food Group Co.* | 1,971 | 147,115 | ||||||
Sysco Corp. | 9,546 | 774,944 | ||||||
Target Corp. | 9,417 | 1,668,787 | ||||||
U.S. Foods Holding Corp.* | 2,794 | 150,792 | ||||||
Walmart, Inc. | 122,755 | 7,386,168 | ||||||
|
| |||||||
| Total Consumer Staples Distribution & Retail | 14,949,942 | |||||||
| Containers & Packaging – 0.2% | ||||||||
Avery Dennison Corp. | 1,033 | 230,617 | ||||||
Ball Corp. | 3,541 | 238,522 | ||||||
Crown Holdings, Inc. | 1,520 | 120,475 | ||||||
International Paper Co. | 6,445 | 251,484 | ||||||
Packaging Corp. of America | 1,521 | 288,655 | ||||||
Westrock Co. | 4,150 | 205,218 | ||||||
|
| |||||||
| Total Containers & Packaging | 1,334,971 | |||||||
| Distributors – 0.1% | ||||||||
Genuine Parts Co. | 2,891 | 447,903 | ||||||
LKQ Corp. | 6,323 | 337,711 | ||||||
Pool Corp. | 500 | 201,750 | ||||||
|
| |||||||
| Total Distributors | 987,364 | |||||||
| Diversified REITs – 0.0% | ||||||||
WP Carey, Inc. | 2,864 | 161,644 | ||||||
| Diversified Telecommunication Services – 1.7% | ||||||||
AT&T, Inc. | 378,708 | 6,665,261 | ||||||
Verizon Communications, Inc. | 192,493 | 8,077,006 | ||||||
|
| |||||||
| Total Diversified Telecommunication Services | 14,742,267 | |||||||
| Electric Utilities – 1.1% | ||||||||
Alliant Energy Corp. | 4,208 | 212,083 | ||||||
American Electric Power Co., Inc. | 10,678 | 919,376 | ||||||
Constellation Energy Corp. | 4,205 | 777,294 | ||||||
Duke Energy Corp. | 14,126 | 1,366,125 | ||||||
Edison International | 8,842 | 625,395 | ||||||
Entergy Corp. | 4,028 | 425,679 | ||||||
Evergy, Inc. | 3,862 | 206,154 | ||||||
Eversource Energy | 8,317 | 497,107 | ||||||
Exelon Corp. | 18,798 | 706,241 | ||||||
FirstEnergy Corp. | 11,242 | 434,166 | ||||||
PG&E Corp. | 44,034 | 738,010 | ||||||
PPL Corp. | 11,592 | 319,128 | ||||||
Southern Co. | 19,350 | 1,388,169 | ||||||
Xcel Energy, Inc. | 8,670 | 466,012 | ||||||
|
| |||||||
| Total Electric Utilities | 9,080,939 | |||||||
| Electrical Equipment – 0.3% | ||||||||
AMETEK, Inc. | 2,948 | 539,189 | ||||||
Emerson Electric Co. | 9,787 | 1,110,042 | ||||||
Hubbell, Inc. | 636 | 263,972 | ||||||
Rockwell Automation, Inc. | 1,448 | 421,846 | ||||||
Vertiv Holdings Co. | 2,826 | 230,799 | ||||||
|
| |||||||
| Total Electrical Equipment | 2,565,848 | |||||||
| Electronic Equipment, Instruments & Components – 0.6% |
| |||||||
Amphenol Corp., Class A | 10,328 | 1,191,335 | ||||||
CDW Corp. | 3,462 | 885,510 | ||||||
Corning, Inc. | 29,567 | 974,528 | ||||||
Jabil, Inc. | 5,883 | 788,028 | ||||||
Keysight Technologies, Inc.* | 5,883 | 919,984 | ||||||
Teledyne Technologies, Inc.* | 1,461 | 627,236 | ||||||
|
| |||||||
| Total Electronic Equipment, Instruments & Components |
| 5,386,621 | ||||||
See Notes to Financial Statements.
| 38 | WisdomTree Trust |
Schedule of Investments (continued)
WisdomTree U.S. LargeCap Fund (EPS)
March 31, 2024
| Investments | Shares | Value | ||||||
| Energy Equipment & Services – 0.2% | ||||||||
Baker Hughes Co. | 12,929 | $ | 433,121 | |||||
Halliburton Co. | 24,723 | 974,581 | ||||||
|
| |||||||
| Total Energy Equipment & Services | 1,407,702 | |||||||
| Entertainment – 0.9% | ||||||||
Electronic Arts, Inc. | 4,458 | 591,443 | ||||||
Liberty Media Corp.-Liberty Formula One, Class C* | 1,667 | 109,355 | ||||||
Live Nation Entertainment, Inc.* | 1,981 | 209,530 | ||||||
Netflix, Inc.* | 5,120 | 3,109,530 | ||||||
Take-Two Interactive Software, Inc.* | 1,119 | 166,160 | ||||||
Walt Disney Co. | 26,941 | 3,296,501 | ||||||
|
| |||||||
| Total Entertainment | 7,482,519 | |||||||
| Financial Services – 4.3% | ||||||||
Berkshire Hathaway, Inc., Class B* | 36,545 | 15,367,904 | ||||||
Corebridge Financial, Inc. | 35,721 | 1,026,264 | ||||||
Corpay, Inc.* | 1,580 | 487,493 | ||||||
Equitable Holdings, Inc. | 16,727 | 635,793 | ||||||
Fidelity National Information Services, Inc. | 18,990 | 1,408,678 | ||||||
Fiserv, Inc.* | 12,395 | 1,980,969 | ||||||
Global Payments, Inc. | 8,034 | 1,073,825 | ||||||
Jack Henry & Associates, Inc. | 744 | 129,255 | ||||||
Mastercard, Inc., Class A | 9,718 | 4,679,897 | ||||||
PayPal Holdings, Inc.* | 33,533 | 2,246,376 | ||||||
Visa, Inc., Class A | 25,802 | 7,200,822 | ||||||
|
| |||||||
| Total Financial Services | 36,237,276 | |||||||
| Food Products – 0.9% | ||||||||
Archer-Daniels-Midland Co. | 19,354 | 1,215,625 | ||||||
Campbell Soup Co. | 6,087 | 270,567 | ||||||
Conagra Brands, Inc. | 15,301 | 453,522 | ||||||
General Mills, Inc. | 13,283 | 929,411 | ||||||
Hershey Co. | 3,445 | 670,052 | ||||||
Hormel Foods Corp. | 8,222 | 286,866 | ||||||
JM Smucker Co. | 2,481 | 312,283 | ||||||
Kellanova | 8,233 | 471,669 | ||||||
Kraft Heinz Co. | 35,601 | 1,313,677 | ||||||
Lamb Weston Holdings, Inc. | 1,839 | 195,909 | ||||||
McCormick & Co., Inc., Non-Voting Shares | 2,800 | 215,068 | ||||||
Mondelez International, Inc., Class A | 20,989 | 1,469,230 | ||||||
Tyson Foods, Inc., Class A | 2,708 | 159,041 | ||||||
|
| |||||||
| Total Food Products | 7,962,920 | |||||||
| Gas Utilities – 0.0% | ||||||||
Atmos Energy Corp. | 2,210 | 262,703 | ||||||
| Ground Transportation – 0.8% | ||||||||
CSX Corp. | 39,528 | 1,465,303 | ||||||
JB Hunt Transport Services, Inc. | 1,287 | 256,435 | ||||||
Norfolk Southern Corp. | 4,029 | 1,026,871 | ||||||
Old Dominion Freight Line, Inc. | 2,082 | 456,603 | ||||||
Saia, Inc.* | 101 | 59,085 | ||||||
Uber Technologies, Inc.* | 12,244 | 942,665 | ||||||
Union Pacific Corp. | 9,703 | 2,386,259 | ||||||
XPO, Inc.* | 754 | 92,011 | ||||||
|
| |||||||
| Total Ground Transportation | 6,685,232 | |||||||
| Health Care Equipment & Supplies – 1.4% | ||||||||
Abbott Laboratories | 25,127 | 2,855,935 | ||||||
Align Technology, Inc.* | 777 | 254,794 | ||||||
Becton Dickinson & Co. | 5,100 | 1,261,995 | ||||||
Boston Scientific Corp.* | 18,082 | 1,238,436 | ||||||
Cooper Cos., Inc. | 2,043 | 207,283 | ||||||
Dexcom, Inc.* | 2,458 | 340,925 | ||||||
Edwards Lifesciences Corp.* | 6,006 | 573,933 | ||||||
GE HealthCare Technologies, Inc. | 8,532 | 775,644 | ||||||
Hologic, Inc.* | 4,433 | 345,597 | ||||||
IDEXX Laboratories, Inc.* | 593 | 320,178 | ||||||
Insulet Corp.* | 489 | 83,815 | ||||||
Intuitive Surgical, Inc.* | 2,243 | 895,159 | ||||||
ResMed, Inc. | 1,725 | 341,602 | ||||||
Stryker Corp. | 4,569 | 1,635,108 | ||||||
Teleflex, Inc. | 562 | 127,107 | ||||||
Zimmer Biomet Holdings, Inc. | 3,955 | 521,981 | ||||||
|
| |||||||
| Total Health Care Equipment & Supplies | 11,779,492 | |||||||
| Health Care Providers & Services – 3.2% | ||||||||
Cardinal Health, Inc. | 5,462 | 611,198 | ||||||
Cencora, Inc. | 4,337 | 1,053,848 | ||||||
Centene Corp.* | 17,988 | 1,411,698 | ||||||
Cigna Group | 9,618 | 3,493,161 | ||||||
CVS Health Corp. | 56,342 | 4,493,838 | ||||||
Elevance Health, Inc. | 5,762 | 2,987,827 | ||||||
HCA Healthcare, Inc. | 6,946 | 2,316,699 | ||||||
Humana, Inc. | 2,361 | 818,606 | ||||||
Laboratory Corp. of America Holdings | 1,811 | 395,631 | ||||||
McKesson Corp. | 2,970 | 1,594,445 | ||||||
Molina Healthcare, Inc.* | 900 | 369,747 | ||||||
Quest Diagnostics, Inc. | 2,279 | 303,358 | ||||||
UnitedHealth Group, Inc. | 15,030 | 7,435,341 | ||||||
|
| |||||||
| Total Health Care Providers & Services | 27,285,397 | |||||||
| Health Care REITs – 0.0% | ||||||||
Ventas, Inc. | 2,234 | 97,269 | ||||||
Welltower, Inc. | 3,328 | 310,968 | ||||||
|
| |||||||
| Total Health Care REITs | 408,237 | |||||||
| Health Care Technology – 0.0% | ||||||||
Veeva Systems, Inc., Class A* | 1,113 | 257,871 | ||||||
| Hotel & Resort REITs – 0.0% | ||||||||
Host Hotels & Resorts, Inc. | 12,238 | 253,082 | ||||||
| Hotels, Restaurants & Leisure – 1.5% | ||||||||
Airbnb, Inc., Class A* | 14,307 | 2,360,083 | ||||||
Booking Holdings, Inc. | 602 | 2,183,984 | ||||||
Chipotle Mexican Grill, Inc.* | 212 | 616,235 | ||||||
Darden Restaurants, Inc. | 2,168 | 362,381 | ||||||
Domino’s Pizza, Inc. | 395 | 196,268 | ||||||
Expedia Group, Inc.* | 3,321 | 457,468 | ||||||
Hilton Worldwide Holdings, Inc. | 3,071 | 655,075 | ||||||
Las Vegas Sands Corp. | 5,916 | 305,857 | ||||||
Marriott International, Inc., Class A | 4,107 | 1,036,237 | ||||||
McDonald’s Corp. | 10,398 | 2,931,716 | ||||||
See Notes to Financial Statements.
| WisdomTree Trust | 39 |
Schedule of Investments (continued)
WisdomTree U.S. LargeCap Fund (EPS)
March 31, 2024
| Investments | Shares | Value | ||||||
MGM Resorts International* | 2,193 | $ | 103,532 | |||||
Starbucks Corp. | 14,768 | 1,349,647 | ||||||
Yum! Brands, Inc. | 3,474 | 481,670 | ||||||
|
| |||||||
| Total Hotels, Restaurants & Leisure | 13,040,153 | |||||||
| Household Durables – 0.7% | ||||||||
DR Horton, Inc. | 12,829 | 2,111,012 | ||||||
Lennar Corp., Class A | 10,342 | 1,778,617 | ||||||
NVR, Inc.* | 78 | 631,797 | ||||||
PulteGroup, Inc. | 10,128 | 1,221,639 | ||||||
TopBuild Corp.* | 344 | 151,611 | ||||||
|
| |||||||
| Total Household Durables | 5,894,676 | |||||||
| Household Products – 1.0% | ||||||||
Church & Dwight Co., Inc. | 2,744 | 286,227 | ||||||
Clorox Co. | 1,130 | 173,014 | ||||||
Colgate-Palmolive Co. | 10,569 | 951,739 | ||||||
Kimberly-Clark Corp. | 6,009 | 777,264 | ||||||
Procter & Gamble Co. | 37,321 | 6,055,332 | ||||||
|
| |||||||
| Total Household Products | 8,243,576 | |||||||
| Independent Power & Renewable Electricity Producers – 0.1% |
| |||||||
Vistra Corp. | 10,594 | 737,872 | ||||||
| Industrial Conglomerates – 0.7% | ||||||||
3M Co. | 17,359 | 1,841,269 | ||||||
General Electric Co. | 9,599 | 1,684,913 | ||||||
Honeywell International, Inc. | 10,740 | 2,204,385 | ||||||
|
| |||||||
| Total Industrial Conglomerates | 5,730,567 | |||||||
| Industrial REITs – 0.2% | ||||||||
Prologis, Inc. | 9,477 | 1,234,095 | ||||||
Rexford Industrial Realty, Inc. | 1,641 | 82,542 | ||||||
|
| |||||||
| Total Industrial REITs | 1,316,637 | |||||||
| Insurance – 2.0% | ||||||||
Aflac, Inc. | 17,479 | 1,500,747 | ||||||
American International Group, Inc. | 24,175 | 1,889,760 | ||||||
Arthur J Gallagher & Co. | 2,221 | 555,339 | ||||||
Brown & Brown, Inc. | 3,313 | 290,020 | ||||||
Cincinnati Financial Corp. | 2,291 | 284,474 | ||||||
CNA Financial Corp. | 8,141 | 369,764 | ||||||
Erie Indemnity Co., Class A | 342 | 137,337 | ||||||
Fidelity National Financial, Inc. | 7,564 | 401,648 | ||||||
Globe Life, Inc. | 1,836 | 213,655 | ||||||
Hartford Financial Services Group, Inc. | 10,838 | 1,116,856 | ||||||
Loews Corp. | 5,503 | 430,830 | ||||||
Markel Group, Inc.* | 468 | 712,053 | ||||||
Marsh & McLennan Cos., Inc. | 6,381 | 1,314,358 | ||||||
MetLife, Inc. | 29,731 | 2,203,364 | ||||||
Principal Financial Group, Inc. | 6,895 | 595,108 | ||||||
Progressive Corp. | 5,559 | 1,149,712 | ||||||
Prudential Financial, Inc. | 14,892 | 1,748,321 | ||||||
Reinsurance Group of America, Inc. | 1,857 | 358,178 | ||||||
Travelers Cos., Inc. | 4,796 | 1,103,752 | ||||||
WR Berkley Corp. | 4,578 | 404,878 | ||||||
|
| |||||||
| Total Insurance | 16,780,154 | |||||||
| Interactive Media & Services – 8.4% | ||||||||
Alphabet, Inc., Class A* | 268,729 | 40,559,268 | ||||||
Meta Platforms, Inc., Class A | 63,263 | 30,719,248 | ||||||
Pinterest, Inc., Class A* | 4,938 | 171,200 | ||||||
|
| |||||||
| Total Interactive Media & Services | 71,449,716 | |||||||
| IT Services – 1.1% | ||||||||
Akamai Technologies, Inc.* | 4,997 | 543,474 | ||||||
Cloudflare, Inc., Class A* | 4,024 | 389,644 | ||||||
Cognizant Technology Solutions Corp., Class A | 15,200 | 1,114,008 | ||||||
EPAM Systems, Inc.* | 1,985 | 548,177 | ||||||
Gartner, Inc.* | 1,359 | 647,794 | ||||||
GoDaddy, Inc., Class A* | 3,620 | 429,622 | ||||||
International Business Machines Corp. | 21,031 | 4,016,080 | ||||||
MongoDB, Inc.* | 730 | 261,807 | ||||||
Okta, Inc.* | 4,685 | 490,145 | ||||||
Snowflake, Inc., Class A* | 2,197 | 355,035 | ||||||
Twilio, Inc., Class A* | 5,742 | 351,123 | ||||||
VeriSign, Inc.* | 2,339 | 443,264 | ||||||
|
| |||||||
| Total IT Services | 9,590,173 | |||||||
| Life Sciences Tools & Services – 1.0% | ||||||||
Agilent Technologies, Inc. | 3,803 | 553,375 | ||||||
Avantor, Inc.* | 8,989 | 229,849 | ||||||
Bio-Techne Corp. | 1,246 | 87,706 | ||||||
Charles River Laboratories International, Inc.* | 658 | 178,285 | ||||||
Danaher Corp. | 10,083 | 2,517,927 | ||||||
IQVIA Holdings, Inc.* | 2,766 | 699,494 | ||||||
Mettler-Toledo International, Inc.* | 238 | 316,847 | ||||||
Thermo Fisher Scientific, Inc. | 5,992 | 3,482,610 | ||||||
Waters Corp.* | 627 | 215,832 | ||||||
West Pharmaceutical Services, Inc. | 658 | 260,377 | ||||||
|
| |||||||
| Total Life Sciences Tools & Services | 8,542,302 | |||||||
| Machinery – 2.2% | ||||||||
Caterpillar, Inc. | 14,308 | 5,242,880 | ||||||
Cummins, Inc. | 4,254 | 1,253,441 | ||||||
Deere & Co. | 10,044 | 4,125,473 | ||||||
Dover Corp. | 2,870 | 508,535 | ||||||
Fortive Corp. | 5,246 | 451,261 | ||||||
Graco, Inc. | 2,021 | 188,883 | ||||||
IDEX Corp. | 775 | 189,116 | ||||||
Illinois Tool Works, Inc. | 4,377 | 1,174,480 | ||||||
Ingersoll Rand, Inc. | 5,741 | 545,108 | ||||||
Lincoln Electric Holdings, Inc. | 74 | 18,903 | ||||||
Nordson Corp. | 670 | 183,942 | ||||||
Otis Worldwide Corp. | 5,593 | 555,217 | ||||||
PACCAR, Inc. | 16,902 | 2,093,989 | ||||||
Parker-Hannifin Corp. | 2,538 | 1,410,595 | ||||||
Snap-on, Inc. | 1,056 | 312,808 | ||||||
Stanley Black & Decker, Inc. | 865 | 84,709 | ||||||
Westinghouse Air Brake Technologies Corp. | 3,099 | 451,462 | ||||||
Xylem, Inc. | 1,728 | 223,327 | ||||||
|
| |||||||
| Total Machinery | 19,014,129 | |||||||
See Notes to Financial Statements.
| 40 | WisdomTree Trust |
Schedule of Investments (continued)
WisdomTree U.S. LargeCap Fund (EPS)
March 31, 2024
| Investments | Shares | Value | ||||||
| Media – 1.2% | ||||||||
Charter Communications, Inc., Class A* | 4,349 | $ | 1,263,950 | |||||
Comcast Corp., Class A | 144,889 | 6,280,938 | ||||||
Fox Corp., Class A | 18,024 | 563,610 | ||||||
Interpublic Group of Cos., Inc. | 9,905 | 323,200 | ||||||
Liberty Broadband Corp., Class C* | 2,259 | 129,283 | ||||||
News Corp., Class A | 6,567 | 171,924 | ||||||
Omnicom Group, Inc. | 5,754 | 556,757 | ||||||
Sirius XM Holdings, Inc.(a) | 82,218 | 319,006 | ||||||
Trade Desk, Inc., Class A* | 3,256 | 284,640 | ||||||
|
| |||||||
| Total Media | 9,893,308 | |||||||
| Metals & Mining – 0.6% | ||||||||
Nucor Corp. | 10,683 | 2,114,166 | ||||||
Reliance, Inc. | 1,525 | 509,624 | ||||||
Southern Copper Corp.(a) | 13,615 | 1,450,270 | ||||||
Steel Dynamics, Inc. | 8,515 | 1,262,178 | ||||||
|
| |||||||
| Total Metals & Mining | 5,336,238 | |||||||
| Multi-Utilities – 0.6% | ||||||||
Ameren Corp. | 3,658 | 270,546 | ||||||
CenterPoint Energy, Inc. | 10,652 | 303,476 | ||||||
CMS Energy Corp. | 4,356 | 262,841 | ||||||
Consolidated Edison, Inc. | 5,919 | 537,504 | ||||||
Dominion Energy, Inc. | 20,575 | 1,012,084 | ||||||
DTE Energy Co. | 3,070 | 344,270 | ||||||
NiSource, Inc. | 6,797 | 188,005 | ||||||
Public Service Enterprise Group, Inc. | 8,423 | 562,488 | ||||||
Sempra | 14,015 | 1,006,697 | ||||||
WEC Energy Group, Inc. | 4,628 | 380,051 | ||||||
|
| |||||||
| Total Multi-Utilities | 4,867,962 | |||||||
| Office REITs – 0.0% | ||||||||
Alexandria Real Estate Equities, Inc. | 1,037 | 133,680 | ||||||
| Oil, Gas & Consumable Fuels – 7.4% | ||||||||
APA Corp. | 12,566 | 432,019 | ||||||
Cheniere Energy, Inc. | 14,434 | 2,327,916 | ||||||
Chesapeake Energy Corp. | 3,895 | 345,993 | ||||||
Chevron Corp. | 66,492 | 10,488,448 | ||||||
ConocoPhillips | 35,490 | 4,517,167 | ||||||
Coterra Energy, Inc. | 30,446 | 848,835 | ||||||
Devon Energy Corp. | 30,096 | 1,510,217 | ||||||
Diamondback Energy, Inc. | 8,093 | 1,603,790 | ||||||
EOG Resources, Inc. | 19,643 | 2,511,161 | ||||||
EQT Corp. | 6,553 | 242,920 | ||||||
Exxon Mobil Corp. | 155,670 | 18,095,081 | ||||||
Hess Corp. | 3,677 | 561,257 | ||||||
HF Sinclair Corp. | 10,293 | 621,388 | ||||||
Kinder Morgan, Inc. | 45,610 | 836,487 | ||||||
Marathon Oil Corp. | 22,059 | 625,152 | ||||||
Marathon Petroleum Corp. | 21,904 | 4,413,656 | ||||||
Occidental Petroleum Corp. | 26,860 | 1,745,631 | ||||||
ONEOK, Inc. | 11,422 | 915,702 | ||||||
Ovintiv, Inc. | 9,669 | 501,821 | ||||||
Phillips 66 | 21,905 | 3,577,963 | ||||||
Pioneer Natural Resources Co. | 8,262 | 2,168,775 | ||||||
Targa Resources Corp. | 1,957 | 219,165 | ||||||
Valero Energy Corp. | 19,399 | 3,311,215 | ||||||
Williams Cos., Inc. | 21,856 | 851,728 | ||||||
|
| |||||||
| Total Oil, Gas & Consumable Fuels | 63,273,487 | |||||||
| Passenger Airlines – 0.3% | ||||||||
Delta Air Lines, Inc. | 34,611 | 1,656,828 | ||||||
Southwest Airlines Co. | 6,268 | 182,963 | ||||||
United Airlines Holdings, Inc.* | 18,828 | 901,485 | ||||||
|
| |||||||
| Total Passenger Airlines | 2,741,276 | |||||||
| Personal Care Products – 0.1% | ||||||||
Coty, Inc., Class A* | 7,270 | 86,949 | ||||||
Kenvue, Inc. | 38,914 | 835,095 | ||||||
|
| |||||||
| Total Personal Care Products | 922,044 | |||||||
| Pharmaceuticals – 3.0% | ||||||||
Bristol-Myers Squibb Co. | 112,402 | 6,095,561 | ||||||
Eli Lilly & Co. | 6,164 | 4,795,345 | ||||||
Johnson & Johnson | 62,837 | 9,940,185 | ||||||
Merck & Co., Inc. | 27,894 | 3,680,613 | ||||||
Zoetis, Inc. | 4,341 | 734,541 | ||||||
|
| |||||||
| Total Pharmaceuticals | 25,246,245 | |||||||
| Professional Services – 0.5% | ||||||||
Automatic Data Processing, Inc. | 5,165 | 1,289,907 | ||||||
Booz Allen Hamilton Holding Corp. | 1,579 | 234,387 | ||||||
Broadridge Financial Solutions, Inc. | 1,455 | 298,071 | ||||||
Dayforce, Inc.*(a) | 1,317 | 87,199 | ||||||
Equifax, Inc. | 1,151 | 307,916 | ||||||
Jacobs Solutions, Inc. | 2,056 | 316,069 | ||||||
Leidos Holdings, Inc. | 2,771 | 363,250 | ||||||
Paychex, Inc. | 3,938 | 483,586 | ||||||
Paycom Software, Inc. | 613 | 121,993 | ||||||
SS&C Technologies Holdings, Inc. | 5,934 | 381,972 | ||||||
Verisk Analytics, Inc. | 1,402 | 330,493 | ||||||
|
| |||||||
| Total Professional Services | 4,214,843 | |||||||
| Real Estate Management & Development – 0.1% | ||||||||
CBRE Group, Inc., Class A* | 4,773 | 464,126 | ||||||
CoStar Group, Inc.* | 2,810 | 271,446 | ||||||
|
| |||||||
| Total Real Estate Management & Development | 735,572 | |||||||
| Residential REITs – 0.2% | ||||||||
American Homes 4 Rent, Class A | 2,387 | 87,794 | ||||||
AvalonBay Communities, Inc. | 1,561 | 289,659 | ||||||
Camden Property Trust | 772 | 75,965 | ||||||
Equity LifeStyle Properties, Inc. | 1,849 | 119,076 | ||||||
Equity Residential | 3,105 | 195,956 | ||||||
Essex Property Trust, Inc. | 486 | 118,978 | ||||||
Invitation Homes, Inc. | 4,368 | 155,544 | ||||||
Mid-America Apartment Communities, Inc. | 954 | 125,527 | ||||||
Sun Communities, Inc. | 755 | 97,078 | ||||||
UDR, Inc. | 2,588 | 96,817 | ||||||
|
| |||||||
| Total Residential REITs | 1,362,394 | |||||||
See Notes to Financial Statements.
| WisdomTree Trust | 41 |
Schedule of Investments (continued)
WisdomTree U.S. LargeCap Fund (EPS)
March 31, 2024
| Investments | Shares | Value | ||||||
| Retail REITs – 0.2% | ||||||||
Kimco Realty Corp. | 4,277 | $ | 83,872 | |||||
Realty Income Corp. | 4,846 | 262,169 | ||||||
Regency Centers Corp. | 1,927 | 116,699 | ||||||
Simon Property Group, Inc. | 5,363 | 839,256 | ||||||
|
| |||||||
| Total Retail REITs | 1,301,996 | |||||||
| Semiconductors & Semiconductor Equipment – 6.7% |
| |||||||
Analog Devices, Inc. | 11,892 | 2,352,119 | ||||||
Applied Materials, Inc. | 19,191 | 3,957,760 | ||||||
Broadcom, Inc. | 7,551 | 10,008,171 | ||||||
Enphase Energy, Inc.* | 5,034 | 609,013 | ||||||
Intel Corp. | 29,640 | 1,309,199 | ||||||
KLA Corp. | 2,848 | 1,989,527 | ||||||
Lam Research Corp. | 2,633 | 2,558,144 | ||||||
Microchip Technology, Inc. | 18,310 | 1,642,590 | ||||||
Monolithic Power Systems, Inc. | 836 | 566,323 | ||||||
NVIDIA Corp. | 23,905 | 21,599,602 | ||||||
ON Semiconductor Corp.* | 15,535 | 1,142,599 | ||||||
QUALCOMM, Inc. | 28,937 | 4,899,034 | ||||||
Skyworks Solutions, Inc. | 7,439 | 805,793 | ||||||
Teradyne, Inc. | 4,556 | 514,053 | ||||||
Texas Instruments, Inc. | 18,051 | 3,144,665 | ||||||
|
| |||||||
| Total Semiconductors & Semiconductor Equipment |
| 57,098,592 | ||||||
| Software – 9.3% | ||||||||
Adobe, Inc.* | 4,847 | 2,445,796 | ||||||
ANSYS, Inc.* | 1,874 | 650,578 | ||||||
AppLovin Corp., Class A* | 8,163 | 565,043 | ||||||
Atlassian Corp., Class A* | 2,120 | 413,633 | ||||||
Autodesk, Inc.* | 3,893 | 1,013,815 | ||||||
Bentley Systems, Inc., Class B | 6,869 | 358,699 | ||||||
Cadence Design Systems, Inc.* | 2,833 | 881,856 | ||||||
Crowdstrike Holdings, Inc., Class A* | 2,018 | 646,951 | ||||||
Datadog, Inc., Class A* | 3,631 | 448,792 | ||||||
Dynatrace, Inc.* | 6,874 | 319,229 | ||||||
Fair Isaac Corp.* | 362 | 452,359 | ||||||
Fortinet, Inc.* | 13,829 | 944,659 | ||||||
Gen Digital, Inc. | 31,074 | 696,058 | ||||||
HubSpot, Inc.* | 692 | 433,580 | ||||||
Intuit, Inc. | 3,243 | 2,107,950 | ||||||
Manhattan Associates, Inc.* | 1,291 | 323,047 | ||||||
Microsoft Corp. | 115,142 | 48,442,542 | ||||||
Nutanix, Inc., Class A* | 7,277 | 449,136 | ||||||
Oracle Corp. | 50,272 | 6,314,666 | ||||||
Palantir Technologies, Inc., Class A* | 24,010 | 552,470 | ||||||
Palo Alto Networks, Inc.* | 3,017 | 857,220 | ||||||
PTC, Inc.* | 2,667 | 503,903 | ||||||
Roper Technologies, Inc. | 1,703 | 955,110 | ||||||
Salesforce, Inc. | 12,188 | 3,670,782 | ||||||
ServiceNow, Inc.* | 1,495 | 1,139,788 | ||||||
Synopsys, Inc.* | 1,694 | 968,121 | ||||||
Tyler Technologies, Inc.* | 919 | 390,584 | ||||||
Unity Software, Inc.*(a) | 11,367 | 303,499 | ||||||
Workday, Inc., Class A* | 2,822 | 769,700 | ||||||
Zoom Video Communications, Inc., Class A* | 12,251 | 800,848 | ||||||
Zscaler, Inc.* | 1,906 | 367,153 | ||||||
|
| |||||||
| Total Software | 79,187,567 | |||||||
| Specialized REITs – 0.5% | ||||||||
American Tower Corp. | 2,921 | 577,160 | ||||||
Crown Castle, Inc. | 4,111 | 435,067 | ||||||
Digital Realty Trust, Inc. | 2,488 | 358,372 | ||||||
Equinix, Inc. | 601 | 496,023 | ||||||
Extra Space Storage, Inc. | 1,727 | 253,869 | ||||||
Gaming & Leisure Properties, Inc. | 3,422 | 157,652 | ||||||
Iron Mountain, Inc. | 2,887 | 231,566 | ||||||
Public Storage | 2,400 | 696,144 | ||||||
SBA Communications Corp. | 658 | 142,589 | ||||||
VICI Properties, Inc. | 26,070 | 776,625 | ||||||
Weyerhaeuser Co. | 6,782 | 243,542 | ||||||
|
| |||||||
| Total Specialized REITs | 4,368,609 | |||||||
| Specialty Retail – 2.0% | ||||||||
AutoZone, Inc.* | 322 | 1,014,831 | ||||||
Best Buy Co., Inc. | 5,531 | 453,708 | ||||||
Burlington Stores, Inc.* | 476 | 110,522 | ||||||
Five Below, Inc.* | 319 | 57,860 | ||||||
Floor & Decor Holdings, Inc., Class A* | 576 | 74,661 | ||||||
Home Depot, Inc. | 17,613 | 6,756,347 | ||||||
Lowe’s Cos., Inc. | 13,779 | 3,509,925 | ||||||
O’Reilly Automotive, Inc.* | 835 | 942,615 | ||||||
Penske Automotive Group, Inc. | 2,061 | 333,861 | ||||||
Ross Stores, Inc. | 4,168 | 611,696 | ||||||
TJX Cos., Inc. | 15,504 | 1,572,416 | ||||||
Tractor Supply Co. | 1,533 | 401,217 | ||||||
Ulta Beauty, Inc.* | 792 | 414,121 | ||||||
Williams-Sonoma, Inc. | 1,261 | 400,405 | ||||||
|
| |||||||
| Total Specialty Retail | 16,654,185 | |||||||
| Technology Hardware, Storage & Peripherals – 5.2% |
| |||||||
Apple, Inc. | 219,864 | 37,702,279 | ||||||
Hewlett Packard Enterprise Co. | 73,555 | 1,304,130 | ||||||
HP, Inc. | 51,011 | 1,541,552 | ||||||
NetApp, Inc. | 7,564 | 793,993 | ||||||
Pure Storage, Inc., Class A* | 13,324 | 692,715 | ||||||
Super Micro Computer, Inc.* | 1,908 | 1,927,137 | ||||||
|
| |||||||
| Total Technology Hardware, Storage & Peripherals |
| 43,961,806 | ||||||
| Textiles, Apparel & Luxury Goods – 0.2% | ||||||||
Deckers Outdoor Corp.* | 277 | 260,729 | ||||||
NIKE, Inc., Class B | 15,014 | 1,411,016 | ||||||
|
| |||||||
| Total Textiles, Apparel & Luxury Goods | 1,671,745 | |||||||
| Tobacco – 0.8% | ||||||||
Altria Group, Inc. | 74,076 | 3,231,195 | ||||||
Philip Morris International, Inc. | 36,316 | 3,327,272 | ||||||
|
| |||||||
| Total Tobacco | 6,558,467 | |||||||
| Trading Companies & Distributors – 0.3% | ||||||||
Fastenal Co. | 6,004 | 463,148 | ||||||
See Notes to Financial Statements.
| 42 | WisdomTree Trust |
Schedule of Investments (concluded)
WisdomTree U.S. LargeCap Fund (EPS)
March 31, 2024
| Investments | Shares | Value | ||||||
United Rentals, Inc. | 1,979 | $ | 1,427,077 | |||||
Watsco, Inc. | 492 | 212,529 | ||||||
WW Grainger, Inc. | 732 | 744,664 | ||||||
|
| |||||||
| Total Trading Companies & Distributors | 2,847,418 | |||||||
| Water Utilities – 0.0% | ||||||||
American Water Works Co., Inc. | 1,972 | 240,998 | ||||||
Essential Utilities, Inc. | 3,802 | 140,864 | ||||||
|
| |||||||
| Total Water Utilities | 381,862 | |||||||
| Wireless Telecommunication Services – 0.3% | ||||||||
T-Mobile U.S., Inc. | 17,788 | 2,903,357 | ||||||
| Total United States | 848,975,014 | |||||||
| South Korea – 0.0% | ||||||||
| Broadline Retail – 0.0% | ||||||||
Coupang, Inc.* | 11,664 | 207,503 | ||||||
TOTAL COMMON STOCKS (Cost: $642,011,822) |
| 849,182,517 | ||||||
| EXCHANGE-TRADED FUND – 0.1% |
| |||||||
| United States – 0.1% |
| |||||||
| WisdomTree U.S. High Dividend Fund(b) (Cost: $603,835) | 7,978 | 691,373 | ||||||
| INVESTMENT OF CASH COLLATERAL FOR SECURITIES LOANED – 0.0% |
| |||||||
| United States – 0.0% |
| |||||||
State Street Navigator Securities Lending Government Money Market Portfolio, 5.34%(c) | ||||||||
| (Cost: $1,928) | 1,928 | 1,928 | ||||||
TOTAL INVESTMENTS IN SECURITIES – 99.9% (Cost: $642,617,585) |
| 849,875,818 | ||||||
Other Assets less Liabilities – 0.1% |
| 872,412 | ||||||
|
| |||||||
| NET ASSETS – 100.0% |
| $ | 850,748,230 | |||||
| * | Non-income producing security. |
| (a) | Security, or portion thereof, was on loan at March 31, 2024 (See Note 2). At March 31, 2024, the total market value of the Fund’s securities on loan identified in the Schedule of Investments was $1,746,410 and the total market value of the collateral held by the Fund was $1,782,415. The total market value of the collateral includes non-cash U.S. Government securities collateral having a value of $1,780,487. |
| (b) | Affiliated holding. See “Investment in Affiliates” supplementary table included in this Schedule of Investments for additional information. |
| (c) | Rate shown represents annualized 7-day yield as of March 31, 2024. |
| INVESTMENT IN AFFILIATES | ||||||||||
Affiliated holdings are investments in entities in which the Fund owns 5% or more of the outstanding voting securities or are investments in entities which are under common ownership or control. Investments in affiliates during the fiscal year ended March 31, 2024 were as follows:
| Affiliate | Value at 3/31/2023 | Purchases/ Additions | Sales/ Reductions | Realized Gain/(Loss) | Change in Unrealized Appreciation/ Depreciation | Value at 3/31/2024 | Dividend Income | |||||||||||||||||||||
WisdomTree U.S. High Dividend Fund | $ | 151,624 | $ | 5,870,965 | $ | 5,437,207 | $ | 43,699 | $ | 62,292 | $ | 691,373 | $ | 71,000 | ||||||||||||||
| FAIR VALUATION SUMMARY | ||||||||||||||
The following is a summary of the fair valuations according to the inputs used in valuing the Fund’s investments (See Note 2 — Fair Value Measurement):
| Quoted Prices in Active Markets (Level 1) | Other Significant Observable Inputs (Level 2) | Significant Unobservable Inputs (Level 3) | Total | |||||||||||||
Assets: |
| |||||||||||||||
Investments in Securities | ||||||||||||||||
Common Stocks | $ | 849,182,517 | $ | — | $ | — | $ | 849,182,517 | ||||||||
Exchange-Traded Fund | 691,373 | — | — | 691,373 | ||||||||||||
Investment of Cash Collateral for Securities Loaned | — | 1,928 | — | 1,928 | ||||||||||||
Total Investments in Securities | $ | 849,873,890 | $ | 1,928 | $ | — | $ | 849,875,818 | ||||||||
See Notes to Financial Statements.
| WisdomTree Trust | 43 |
Schedule of Investments
WisdomTree U.S. MidCap Dividend Fund (DON)
March 31, 2024
| Investments | Shares | Value | ||||||
| COMMON STOCKS – 99.8% |
| |||||||
| United States – 99.5% |
| |||||||
| Aerospace & Defense – 1.1% |
| |||||||
BWX Technologies, Inc. | 88,925 | $ | 9,125,484 | |||||
Curtiss-Wright Corp. | 18,764 | 4,802,458 | ||||||
Hexcel Corp. | 55,490 | 4,042,447 | ||||||
Huntington Ingalls Industries, Inc. | 44,722 | 13,035,121 | ||||||
Moog, Inc., Class A | 17,579 | 2,806,487 | ||||||
Woodward, Inc. | 34,357 | 5,295,101 | ||||||
|
| |||||||
| Total Aerospace & Defense | 39,107,098 | |||||||
| Air Freight & Logistics – 0.4% | ||||||||
CH Robinson Worldwide, Inc. | 168,519 | 12,831,037 | ||||||
| Automobile Components – 0.7% | ||||||||
BorgWarner, Inc. | 181,628 | 6,309,757 | ||||||
Gentex Corp. | 292,116 | 10,551,230 | ||||||
Lear Corp. | 71,578 | 10,370,220 | ||||||
|
| |||||||
| Total Automobile Components | 27,231,207 | |||||||
| Automobiles – 0.4% | ||||||||
Harley-Davidson, Inc. | 179,696 | 7,859,903 | ||||||
Thor Industries, Inc. | 58,588 | 6,874,716 | ||||||
|
| |||||||
| Total Automobiles | 14,734,619 | |||||||
| Banks – 7.6% | ||||||||
Bank OZK | 291,503 | 13,251,726 | ||||||
BOK Financial Corp. | 104,494 | 9,613,448 | ||||||
Cadence Bank | 337,381 | 9,784,049 | ||||||
Columbia Banking System, Inc. | 633,202 | 12,252,459 | ||||||
Comerica, Inc. | 392,997 | 21,610,905 | ||||||
Commerce Bancshares, Inc. | 147,997 | 7,873,440 | ||||||
Cullen/Frost Bankers, Inc. | 120,476 | 13,561,983 | ||||||
East West Bancorp, Inc. | 304,227 | 24,067,398 | ||||||
First Financial Bankshares, Inc. | 218,242 | 7,160,520 | ||||||
FNB Corp. | 760,023 | 10,716,324 | ||||||
Glacier Bancorp, Inc. | 222,728 | 8,971,484 | ||||||
Home BancShares, Inc. | 493,508 | 12,125,492 | ||||||
New York Community Bancorp, Inc.(a) | 2,277,733 | 7,334,300 | ||||||
Old National Bancorp | 550,147 | 9,578,059 | ||||||
Pinnacle Financial Partners, Inc. | 54,682 | 4,696,090 | ||||||
Prosperity Bancshares, Inc. | 174,572 | 11,483,346 | ||||||
SouthState Corp. | 107,462 | 9,137,494 | ||||||
Synovus Financial Corp. | 346,116 | 13,865,407 | ||||||
United Bankshares, Inc. | 304,721 | 10,905,965 | ||||||
Valley National Bancorp | 1,216,377 | 9,682,361 | ||||||
Webster Financial Corp. | 299,954 | 15,228,665 | ||||||
Western Alliance Bancorp | 161,411 | 10,360,972 | ||||||
Wintrust Financial Corp. | 88,349 | 9,222,752 | ||||||
Zions Bancorp NA | 331,667 | 14,394,348 | ||||||
|
| |||||||
| Total Banks | 276,878,987 | |||||||
| Beverages – 0.6% | ||||||||
Coca-Cola Consolidated, Inc. | 4,193 | 3,548,997 | ||||||
Molson Coors Beverage Co., Class B | 273,905 | 18,420,111 | ||||||
|
| |||||||
| Total Beverages | 21,969,108 | |||||||
| Broadline Retail – 0.4% | ||||||||
Dillard’s, Inc., Class A | 6,229 | 2,937,846 | ||||||
Macy’s, Inc. | 571,598 | 11,426,244 | ||||||
|
| |||||||
| Total Broadline Retail | 14,364,090 | |||||||
| Building Products – 3.1% | ||||||||
AAON, Inc. | 45,206 | 3,982,649 | ||||||
Advanced Drainage Systems, Inc. | 40,094 | 6,905,790 | ||||||
AO Smith Corp. | 113,915 | 10,190,836 | ||||||
Armstrong World Industries, Inc. | 49,276 | 6,121,065 | ||||||
Carlisle Cos., Inc. | 30,848 | 12,087,789 | ||||||
Fortune Brands Innovations, Inc. | 90,898 | 7,696,334 | ||||||
Lennox International, Inc. | 29,150 | 14,247,354 | ||||||
Masco Corp. | 309,388 | 24,404,525 | ||||||
Owens Corning | 71,726 | 11,963,897 | ||||||
Simpson Manufacturing Co., Inc. | 24,772 | 5,082,719 | ||||||
UFP Industries, Inc. | 57,147 | 7,029,652 | ||||||
Zurn Elkay Water Solutions Corp. | 126,257 | 4,225,822 | ||||||
|
| |||||||
| Total Building Products | 113,938,432 | |||||||
| Capital Markets – 4.5% | ||||||||
Affiliated Managers Group, Inc. | 17,321 | 2,900,748 | ||||||
Blue Owl Capital, Inc. | 987,866 | 18,631,153 | ||||||
Carlyle Group, Inc. | 705,882 | 33,112,924 | ||||||
Evercore, Inc., Class A | 44,993 | 8,665,202 | ||||||
Franklin Resources, Inc. | 1,156,689 | 32,514,528 | ||||||
Hamilton Lane, Inc., Class A | 59,675 | 6,728,953 | ||||||
Houlihan Lokey, Inc. | 58,714 | 7,526,548 | ||||||
Interactive Brokers Group, Inc., Class A | 52,921 | 5,911,805 | ||||||
Jefferies Financial Group, Inc. | 367,863 | 16,222,758 | ||||||
MarketAxess Holdings, Inc. | 24,115 | 5,287,214 | ||||||
Morningstar, Inc. | 22,052 | 6,800,175 | ||||||
SEI Investments Co. | 150,351 | 10,810,237 | ||||||
Stifel Financial Corp. | 129,006 | 10,084,399 | ||||||
|
| |||||||
| Total Capital Markets | 165,196,644 | |||||||
| Chemicals – 4.3% | ||||||||
Albemarle Corp. | 88,665 | 11,680,727 | ||||||
Ashland, Inc. | 57,749 | 5,623,020 | ||||||
Balchem Corp. | 17,466 | 2,706,357 | ||||||
Cabot Corp. | 94,782 | 8,738,900 | ||||||
Celanese Corp. | 109,969 | 18,899,272 | ||||||
CF Industries Holdings, Inc. | 213,537 | 17,768,414 | ||||||
Chemours Co. | 271,883 | 7,139,648 | ||||||
Eastman Chemical Co. | 223,907 | 22,439,959 | ||||||
Element Solutions, Inc. | 233,616 | 5,835,728 | ||||||
HB Fuller Co. | 39,816 | 3,174,928 | ||||||
Huntsman Corp. | 371,795 | 9,677,824 | ||||||
Mosaic Co. | 394,330 | 12,799,952 | ||||||
NewMarket Corp. | 13,120 | 8,326,214 | ||||||
Olin Corp. | 122,897 | 7,226,344 | ||||||
RPM International, Inc. | 115,954 | 13,792,728 | ||||||
|
| |||||||
| Total Chemicals | 155,830,015 | |||||||
| Commercial Services & Supplies – 0.3% | ||||||||
MSA Safety, Inc. | 26,091 | 5,050,957 | ||||||
See Notes to Financial Statements.
| 44 | WisdomTree Trust |
Schedule of Investments (continued)
WisdomTree U.S. MidCap Dividend Fund (DON)
March 31, 2024
| Investments | Shares | Value | ||||||
Tetra Tech, Inc. | 26,623 | $ | 4,917,534 | |||||
|
| |||||||
| Total Commercial Services & Supplies | 9,968,491 | |||||||
| Communications Equipment – 0.7% | ||||||||
Juniper Networks, Inc. | 496,949 | 18,416,930 | ||||||
Ubiquiti, Inc.(a) | 75,821 | 8,783,863 | ||||||
|
| |||||||
| Total Communications Equipment | 27,200,793 | |||||||
| Construction & Engineering – 0.9% | ||||||||
AECOM | 73,859 | 7,244,091 | ||||||
Comfort Systems USA, Inc. | 19,316 | 6,136,886 | ||||||
EMCOR Group, Inc. | 23,766 | 8,322,853 | ||||||
MDU Resources Group, Inc. | 301,718 | 7,603,294 | ||||||
Valmont Industries, Inc. | 15,338 | 3,501,359 | ||||||
|
| |||||||
| Total Construction & Engineering | 32,808,483 | |||||||
| Construction Materials – 0.1% | ||||||||
Eagle Materials, Inc. | 19,863 | 5,397,770 | ||||||
| Consumer Finance – 2.0% | ||||||||
Ally Financial, Inc. | 581,065 | 23,585,429 | ||||||
FirstCash Holdings, Inc. | 48,204 | 6,147,938 | ||||||
OneMain Holdings, Inc. | 380,380 | 19,433,614 | ||||||
Synchrony Financial | 594,985 | 25,655,753 | ||||||
|
| |||||||
| Total Consumer Finance | 74,822,734 | |||||||
| Consumer Staples Distribution & Retail – 0.7% |
| |||||||
Albertsons Cos., Inc., Class A | 924,206 | 19,814,977 | ||||||
Casey’s General Stores, Inc. | 20,353 | 6,481,413 | ||||||
|
| |||||||
| Total Consumer Staples Distribution & Retail | 26,296,390 | |||||||
| Containers & Packaging – 4.2% | ||||||||
AptarGroup, Inc. | 67,819 | 9,758,476 | ||||||
Berry Global Group, Inc. | 108,331 | 6,551,859 | ||||||
Crown Holdings, Inc. | 72,698 | 5,762,043 | ||||||
Graphic Packaging Holding Co.(a) | 428,567 | 12,505,585 | ||||||
International Paper Co. | 837,651 | 32,685,142 | ||||||
Packaging Corp. of America | 193,137 | 36,653,540 | ||||||
Sealed Air Corp. | 203,780 | 7,580,616 | ||||||
Silgan Holdings, Inc. | 115,422 | 5,604,892 | ||||||
Sonoco Products Co. | 279,971 | 16,193,523 | ||||||
Westrock Co. | 380,614 | 18,821,362 | ||||||
|
| |||||||
| Total Containers & Packaging | 152,117,038 | |||||||
| Distributors – 0.8% | ||||||||
LKQ Corp. | 367,374 | 19,621,445 | ||||||
Pool Corp. | 25,630 | 10,341,705 | ||||||
|
| |||||||
| Total Distributors | 29,963,150 | |||||||
| Diversified Consumer Services – 0.9% | ||||||||
ADT, Inc. | 1,080,899 | 7,263,641 | ||||||
H&R Block, Inc. | 329,071 | 16,160,677 | ||||||
Service Corp. International | 142,628 | 10,584,424 | ||||||
|
| |||||||
| Total Diversified Consumer Services | 34,008,742 | |||||||
| Diversified REITs – 0.8% | ||||||||
WP Carey, Inc. | 504,745 | 28,487,808 | ||||||
| Diversified Telecommunication Services – 0.1% |
| |||||||
Iridium Communications, Inc. | 102,197 | 2,673,474 | ||||||
| Electric Utilities – 3.9% | ||||||||
Alliant Energy Corp. | 439,285 | 22,139,964 | ||||||
Evergy, Inc. | 569,768 | 30,414,216 | ||||||
IDACORP, Inc. | 89,199 | 8,285,695 | ||||||
NRG Energy, Inc. | 353,270 | 23,912,846 | ||||||
OGE Energy Corp. | 634,323 | 21,757,279 | ||||||
Pinnacle West Capital Corp. | 364,210 | 27,217,413 | ||||||
Portland General Electric Co. | 243,009 | 10,206,378 | ||||||
|
| |||||||
| Total Electric Utilities | 143,933,791 | |||||||
| Electrical Equipment – 0.3% | ||||||||
Acuity Brands, Inc. | 15,587 | 4,188,695 | ||||||
Regal Rexnord Corp. | 43,161 | 7,773,296 | ||||||
|
| |||||||
| Total Electrical Equipment | 11,961,991 | |||||||
| Electronic Equipment, Instruments & Components – 1.0% |
| |||||||
Avnet, Inc. | 140,099 | 6,946,108 | ||||||
Badger Meter, Inc. | 21,765 | 3,521,795 | ||||||
Jabil, Inc. | 68,522 | 9,178,522 | ||||||
Littelfuse, Inc. | 17,360 | 4,207,196 | ||||||
TD SYNNEX Corp. | 71,502 | 8,086,876 | ||||||
Vontier Corp. | 78,470 | 3,559,399 | ||||||
|
| |||||||
| Total Electronic Equipment, Instruments & Components |
| 35,499,896 | ||||||
| Energy Equipment & Services – 0.5% | ||||||||
ChampionX Corp. | 207,648 | 7,452,487 | ||||||
NOV, Inc. | 257,110 | 5,018,787 | ||||||
Patterson-UTI Energy, Inc. | 608,539 | 7,265,956 | ||||||
|
| |||||||
| Total Energy Equipment & Services | 19,737,230 | |||||||
| Entertainment – 0.2% | ||||||||
Endeavor Group Holdings, Inc., Class A | 183,949 | 4,733,008 | ||||||
TKO Group Holdings, Inc. | 44,135 | 3,813,705 | ||||||
|
| |||||||
| Total Entertainment | 8,546,713 | |||||||
| Financial Services – 4.1% | ||||||||
Corebridge Financial, Inc. | 1,410,241 | 40,516,224 | ||||||
Enact Holdings, Inc. | 296,595 | 9,247,832 | ||||||
Equitable Holdings, Inc. | 486,036 | 18,474,228 | ||||||
Jack Henry & Associates, Inc. | 49,453 | 8,591,470 | ||||||
Jackson Financial, Inc., Class A | 223,031 | 14,751,270 | ||||||
MGIC Investment Corp. | 578,498 | 12,935,215 | ||||||
PennyMac Financial Services, Inc. | 36,499 | 3,324,694 | ||||||
Radian Group, Inc. | 425,401 | 14,238,172 | ||||||
Voya Financial, Inc. | 125,302 | 9,262,324 | ||||||
Western Union Co. | 1,226,756 | 17,150,049 | ||||||
|
| |||||||
| Total Financial Services | 148,491,478 | |||||||
| Food Products – 3.7% | ||||||||
Campbell Soup Co. | 539,817 | 23,994,866 | ||||||
Conagra Brands, Inc. | 1,132,178 | 33,557,756 | ||||||
Flowers Foods, Inc. | 656,353 | 15,588,384 | ||||||
Ingredion, Inc. | 147,641 | 17,251,851 | ||||||
JM Smucker Co. | 191,930 | 24,158,229 | ||||||
Lamb Weston Holdings, Inc. | 87,353 | 9,305,715 | ||||||
Lancaster Colony Corp. | 46,718 | 9,700,058 | ||||||
Seaboard Corp. | 588 | 1,895,665 | ||||||
|
| |||||||
| Total Food Products | 135,452,524 | |||||||
See Notes to Financial Statements.
| WisdomTree Trust | 45 |
Schedule of Investments (continued)
WisdomTree U.S. MidCap Dividend Fund (DON)
March 31, 2024
| Investments | Shares | Value | ||||||
| Gas Utilities – 1.4% | ||||||||
National Fuel Gas Co. | 277,127 | $ | 14,887,262 | |||||
New Jersey Resources Corp. | 198,663 | 8,524,629 | ||||||
Southwest Gas Holdings, Inc. | 154,797 | 11,784,696 | ||||||
UGI Corp. | 649,676 | 15,943,049 | ||||||
|
| |||||||
| Total Gas Utilities | 51,139,636 | |||||||
| Ground Transportation – 0.6% | ||||||||
Landstar System, Inc. | 51,671 | 9,960,102 | ||||||
Ryder System, Inc. | 69,583 | 8,363,181 | ||||||
Schneider National, Inc., Class B | 107,941 | 2,443,784 | ||||||
|
| |||||||
| Total Ground Transportation | 20,767,067 | |||||||
| Health Care Equipment & Supplies – 0.3% | ||||||||
Dentsply Sirona, Inc. | 204,341 | 6,782,078 | ||||||
Teleflex, Inc. | 23,506 | 5,316,352 | ||||||
|
| |||||||
| Total Health Care Equipment & Supplies | 12,098,430 | |||||||
| Health Care Providers & Services – 0.6% | ||||||||
Chemed Corp. | 7,665 | 4,920,393 | ||||||
Encompass Health Corp. | 80,462 | 6,644,552 | ||||||
Ensign Group, Inc. | 28,702 | 3,571,103 | ||||||
Universal Health Services, Inc., Class B | 31,839 | 5,809,344 | ||||||
|
| |||||||
| Total Health Care Providers & Services | 20,945,392 | |||||||
| Hotel & Resort REITs – 0.6% | ||||||||
Host Hotels & Resorts, Inc. | 751,715 | 15,545,466 | ||||||
Ryman Hospitality Properties, Inc. | 57,125 | 6,604,221 | ||||||
|
| |||||||
| Total Hotel & Resort REITs | 22,149,687 | |||||||
| Hotels, Restaurants & Leisure – 2.8% | ||||||||
Aramark | 208,008 | 6,764,420 | ||||||
Boyd Gaming Corp. | 94,129 | 6,336,764 | ||||||
Choice Hotels International, Inc. | 46,388 | 5,861,124 | ||||||
Churchill Downs, Inc. | 38,186 | 4,725,517 | ||||||
Domino’s Pizza, Inc. | 33,054 | 16,423,872 | ||||||
Hyatt Hotels Corp., Class A | 22,942 | 3,662,002 | ||||||
Texas Roadhouse, Inc. | 101,900 | 15,740,493 | ||||||
Vail Resorts, Inc. | 74,548 | 16,611,531 | ||||||
Wendy’s Co. | 657,252 | 12,382,628 | ||||||
Wingstop, Inc. | 15,277 | 5,597,493 | ||||||
Wyndham Hotels & Resorts, Inc. | 121,106 | 9,294,885 | ||||||
|
| |||||||
| Total Hotels, Restaurants & Leisure | 103,400,729 | |||||||
| Household Durables – 1.0% | ||||||||
Installed Building Products, Inc. | 23,947 | 6,195,807 | ||||||
KB Home | 111,066 | 7,872,358 | ||||||
Meritage Homes Corp. | 19,216 | 3,371,639 | ||||||
Tempur Sealy International, Inc. | 105,636 | 6,002,238 | ||||||
Toll Brothers, Inc. | 90,811 | 11,748,219 | ||||||
|
| |||||||
| Total Household Durables | 35,190,261 | |||||||
| Household Products – 0.3% | ||||||||
Reynolds Consumer Products, Inc. | 387,459 | 11,065,829 | ||||||
| Independent Power & Renewable Electricity Producers – 1.5% |
| |||||||
Clearway Energy, Inc., Class A | 112,150 | 2,412,347 | ||||||
Clearway Energy, Inc., Class C | 274,587 | 6,329,230 | ||||||
Ormat Technologies, Inc. | 35,873 | 2,374,434 | ||||||
Vistra Corp. | 617,116 | 42,982,129 | ||||||
|
| |||||||
| Total Independent Power & Renewable Electricity Producers |
| 54,098,140 | ||||||
| Industrial REITs – 0.7% | ||||||||
Americold Realty Trust, Inc. | 138,087 | 3,441,128 | ||||||
EastGroup Properties, Inc. | 24,635 | 4,428,634 | ||||||
First Industrial Realty Trust, Inc. | 64,523 | 3,390,038 | ||||||
Rexford Industrial Realty, Inc. | 100,417 | 5,050,975 | ||||||
STAG Industrial, Inc. | 209,556 | 8,055,333 | ||||||
Terreno Realty Corp. | 42,660 | 2,832,624 | ||||||
|
| |||||||
| Total Industrial REITs | 27,198,732 | |||||||
| Insurance – 6.0% | ||||||||
American Financial Group, Inc. | 103,289 | 14,096,883 | ||||||
Assurant, Inc. | 68,002 | 12,800,697 | ||||||
CNA Financial Corp. | 514,853 | 23,384,623 | ||||||
F&G Annuities & Life, Inc.(a) | 142,846 | 5,792,405 | ||||||
Fidelity National Financial, Inc. | 559,174 | 29,692,139 | ||||||
First American Financial Corp. | 185,163 | 11,304,201 | ||||||
Globe Life, Inc. | 55,055 | 6,406,750 | ||||||
Hanover Insurance Group, Inc. | 49,827 | 6,784,943 | ||||||
Kinsale Capital Group, Inc. | 12,154 | 6,377,690 | ||||||
Lincoln National Corp. | 554,731 | 17,712,561 | ||||||
Old Republic International Corp. | 704,372 | 21,638,308 | ||||||
Primerica, Inc. | 37,403 | 9,461,463 | ||||||
Reinsurance Group of America, Inc. | 103,024 | 19,871,269 | ||||||
RLI Corp. | 56,128 | 8,333,324 | ||||||
Selective Insurance Group, Inc. | 65,924 | 7,196,923 | ||||||
Unum Group | 338,467 | 18,162,139 | ||||||
|
| |||||||
| Total Insurance | 219,016,318 | |||||||
| Leisure Products – 0.6% | ||||||||
Acushnet Holdings Corp. | 86,021 | 5,673,085 | ||||||
Brunswick Corp. | 78,580 | 7,584,542 | ||||||
Polaris, Inc. | 95,935 | 9,605,012 | ||||||
|
| |||||||
| Total Leisure Products | 22,862,639 | |||||||
| Life Sciences Tools & Services – 0.3% | ||||||||
Bio-Techne Corp. | 78,897 | 5,553,560 | ||||||
Bruker Corp. | 74,402 | 6,989,324 | ||||||
|
| |||||||
| Total Life Sciences Tools & Services | 12,542,884 | |||||||
| Machinery – 5.7% | ||||||||
AGCO Corp. | 61,991 | 7,626,133 | ||||||
Allison Transmission Holdings, Inc. | 128,310 | 10,413,640 | ||||||
Crane Co. | 28,424 | 3,840,935 | ||||||
Donaldson Co., Inc. | 156,852 | 11,713,707 | ||||||
Esab Corp. | 29,926 | 3,308,918 | ||||||
Federal Signal Corp. | 39,356 | 3,340,144 | ||||||
Flowserve Corp. | 214,449 | 9,796,030 | ||||||
Franklin Electric Co., Inc. | 44,016 | 4,701,349 | ||||||
Graco, Inc. | 103,042 | 9,630,305 | ||||||
IDEX Corp. | 50,023 | 12,206,612 | ||||||
ITT, Inc. | 73,410 | 9,985,962 | ||||||
Lincoln Electric Holdings, Inc. | 62,777 | 16,035,757 | ||||||
See Notes to Financial Statements.
| 46 | WisdomTree Trust |
Schedule of Investments (continued)
WisdomTree U.S. MidCap Dividend Fund (DON)
March 31, 2024
| Investments | Shares | Value | ||||||
Mueller Industries, Inc. | 136,479 | $ | 7,360,313 | |||||
Nordson Corp. | 34,846 | 9,566,621 | ||||||
Oshkosh Corp. | 61,843 | 7,712,441 | ||||||
Snap-on, Inc. | 103,332 | 30,609,005 | ||||||
Stanley Black & Decker, Inc. | 271,039 | 26,542,849 | ||||||
Timken Co. | 106,706 | 9,329,306 | ||||||
Toro Co. | 93,063 | 8,527,363 | ||||||
Watts Water Technologies, Inc., Class A | 20,468 | 4,350,473 | ||||||
|
| |||||||
| Total Machinery | 206,597,863 | |||||||
| Media – 1.8% | ||||||||
Fox Corp., Class A | 254,191 | 7,948,553 | ||||||
Fox Corp., Class B | 250,028 | 7,155,801 | ||||||
Interpublic Group of Cos., Inc. | 759,644 | 24,787,184 | ||||||
New York Times Co., Class A | 127,161 | 5,495,898 | ||||||
News Corp., Class A | 224,489 | 5,877,122 | ||||||
News Corp., Class B(a) | 133,296 | 3,606,990 | ||||||
Nexstar Media Group, Inc. | 71,290 | 12,282,554 | ||||||
|
| |||||||
| Total Media | 67,154,102 | |||||||
| Metals & Mining – 0.5% | ||||||||
Alpha Metallurgical Resources, Inc. | 9,596 | 3,177,907 | ||||||
Commercial Metals Co. | 100,423 | 5,901,860 | ||||||
Royal Gold, Inc. | 50,688 | 6,174,305 | ||||||
U.S. Steel Corp. | 112,950 | 4,606,101 | ||||||
|
| |||||||
| Total Metals & Mining | 19,860,173 | |||||||
| Multi-Utilities – 0.6% | ||||||||
NiSource, Inc. | 796,264 | 22,024,662 | ||||||
| Office REITs – 0.1% | ||||||||
Kilroy Realty Corp. | 60,088 | 2,189,006 | ||||||
| Oil, Gas & Consumable Fuels – 6.7% | ||||||||
Antero Midstream Corp. | 1,559,627 | 21,928,356 | ||||||
APA Corp. | 457,498 | 15,728,781 | ||||||
Chesapeake Energy Corp. | 202,808 | 18,015,435 | ||||||
Chord Energy Corp. | 136,674 | 24,360,774 | ||||||
Civitas Resources, Inc. | 308,378 | 23,408,974 | ||||||
DT Midstream, Inc. | 237,129 | 14,488,582 | ||||||
EQT Corp. | 307,906 | 11,414,075 | ||||||
Equitrans Midstream Corp. | 1,270,670 | 15,870,668 | ||||||
HF Sinclair Corp. | 310,349 | 18,735,769 | ||||||
Magnolia Oil & Gas Corp., Class A(a) | 243,589 | 6,321,135 | ||||||
Matador Resources Co. | 98,106 | 6,550,538 | ||||||
Murphy Oil Corp. | 218,395 | 9,980,651 | ||||||
New Fortress Energy, Inc.(a) | 124,096 | 3,796,097 | ||||||
Ovintiv, Inc. | 388,016 | 20,138,030 | ||||||
PBF Energy, Inc., Class A | 161,609 | 9,303,830 | ||||||
Permian Resources Corp. | 437,838 | 7,732,219 | ||||||
Range Resources Corp. | 148,787 | 5,122,736 | ||||||
SM Energy Co. | 122,042 | 6,083,794 | ||||||
Texas Pacific Land Corp. | 13,077 | 7,565,175 | ||||||
|
| |||||||
| Total Oil, Gas & Consumable Fuels | 246,545,619 | |||||||
| Paper & Forest Products – 0.2% | ||||||||
Louisiana-Pacific Corp. | 67,871 | 5,695,056 | ||||||
| Passenger Airlines – 0.6% | ||||||||
Southwest Airlines Co. | 775,246 | 22,629,431 | ||||||
| Personal Care Products – 0.2% | ||||||||
Inter Parfums, Inc. | 50,748 | 7,130,601 | ||||||
| Pharmaceuticals – 1.0% | ||||||||
Viatris, Inc. | 2,942,098 | 35,128,650 | ||||||
| Professional Services – 2.3% | ||||||||
Concentrix Corp. | 39,077 | 2,587,679 | ||||||
Dun & Bradstreet Holdings, Inc. | 487,701 | 4,896,518 | ||||||
Exponent, Inc. | 42,279 | 3,496,051 | ||||||
Insperity, Inc. | 60,799 | 6,664,178 | ||||||
KBR, Inc. | 84,267 | 5,364,437 | ||||||
Leidos Holdings, Inc. | 97,243 | 12,747,585 | ||||||
ManpowerGroup, Inc. | 107,606 | 8,354,530 | ||||||
Maximus, Inc. | 52,885 | 4,437,051 | ||||||
Paycom Software, Inc. | 29,610 | 5,892,686 | ||||||
Robert Half, Inc. | 128,179 | 10,162,031 | ||||||
Science Applications International Corp. | 51,212 | 6,677,533 | ||||||
SS&C Technologies Holdings, Inc. | 221,014 | 14,226,671 | ||||||
|
| |||||||
| Total Professional Services | 85,506,950 | |||||||
| Residential REITs – 2.4% | ||||||||
American Homes 4 Rent, Class A | 185,326 | 6,816,290 | ||||||
Apartment Income REIT Corp. | 240,499 | 7,809,003 | ||||||
Camden Property Trust | 98,610 | 9,703,224 | ||||||
Equity LifeStyle Properties, Inc. | 92,984 | 5,988,170 | ||||||
Essex Property Trust, Inc. | 76,781 | 18,796,757 | ||||||
Mid-America Apartment Communities, Inc. | 158,161 | 20,810,824 | ||||||
UDR, Inc. | 436,823 | 16,341,548 | ||||||
|
| |||||||
| Total Residential REITs | 86,265,816 | |||||||
| Retail REITs – 2.1% | ||||||||
Agree Realty Corp. | 48,108 | 2,747,929 | ||||||
Brixmor Property Group, Inc. | 537,566 | 12,605,923 | ||||||
Federal Realty Investment Trust | 139,218 | 14,216,942 | ||||||
Kimco Realty Corp. | 822,804 | 16,135,186 | ||||||
NNN REIT, Inc. | 426,708 | 18,237,500 | ||||||
Phillips Edison & Co., Inc. | 59,465 | 2,133,010 | ||||||
Regency Centers Corp. | 186,004 | 11,264,402 | ||||||
|
| |||||||
| Total Retail REITs | 77,340,892 | |||||||
| Semiconductors & Semiconductor Equipment – 0.8% |
| |||||||
Amkor Technology, Inc. | 167,267 | 5,392,688 | ||||||
MKS Instruments, Inc. | 47,128 | 6,268,024 | ||||||
Power Integrations, Inc. | 42,117 | 3,013,471 | ||||||
Teradyne, Inc. | 80,938 | 9,132,235 | ||||||
Universal Display Corp. | 24,812 | 4,179,581 | ||||||
|
| |||||||
| Total Semiconductors & Semiconductor Equipment |
| 27,985,999 | ||||||
| Software – 0.9% | ||||||||
Bentley Systems, Inc., Class B | 144,486 | 7,545,059 | ||||||
Dolby Laboratories, Inc., Class A | 69,304 | 5,805,596 | ||||||
Gen Digital, Inc. | 720,138 | 16,131,091 | ||||||
Pegasystems, Inc. | 42,027 | 2,716,625 | ||||||
|
| |||||||
| Total Software | 32,198,371 | |||||||
See Notes to Financial Statements.
| WisdomTree Trust | 47 |
Schedule of Investments (concluded)
WisdomTree U.S. MidCap Dividend Fund (DON)
March 31, 2024
| Investments | Shares | Value | ||||||
| Specialized REITs – 2.0% | ||||||||
CubeSmart | 486,081 | $ | 21,980,583 | |||||
Gaming & Leisure Properties, Inc. | 524,356 | 24,157,081 | ||||||
Lamar Advertising Co., Class A | 191,230 | 22,834,774 | ||||||
Rayonier, Inc. | 75,976 | 2,525,442 | ||||||
|
| |||||||
| Total Specialized REITs | 71,497,880 | |||||||
| Specialty Retail – 3.1% | ||||||||
Academy Sports & Outdoors, Inc. | 42,264 | 2,854,511 | ||||||
American Eagle Outfitters, Inc. | 340,484 | 8,781,082 | ||||||
Bath & Body Works, Inc. | 272,045 | 13,607,691 | ||||||
Dick’s Sporting Goods, Inc. | 92,983 | 20,908,157 | ||||||
Gap, Inc. | 552,151 | 15,211,760 | ||||||
Group 1 Automotive, Inc. | 7,922 | 2,315,046 | ||||||
Lithia Motors, Inc. | 14,247 | 4,286,353 | ||||||
Murphy USA, Inc. | 11,172 | 4,683,302 | ||||||
Penske Automotive Group, Inc. | 73,559 | 11,915,823 | ||||||
Williams-Sonoma, Inc. | 89,104 | 28,293,193 | ||||||
|
| |||||||
| Total Specialty Retail | 112,856,918 | |||||||
| Textiles, Apparel & Luxury Goods – 1.4% | ||||||||
Columbia Sportswear Co.(a) | 77,734 | 6,310,446 | ||||||
Levi Strauss & Co., Class A(a) | 213,528 | 4,268,425 | ||||||
PVH Corp. | 28,339 | 3,984,747 | ||||||
Ralph Lauren Corp. | 74,989 | 14,079,935 | ||||||
Tapestry, Inc. | 508,630 | 24,149,752 | ||||||
|
| |||||||
| Total Textiles, Apparel & Luxury Goods | 52,793,305 | |||||||
| Trading Companies & Distributors – 1.6% | ||||||||
Air Lease Corp. | 139,189 | 7,159,882 | ||||||
Applied Industrial Technologies, Inc. | 29,493 | 5,826,342 | ||||||
Boise Cascade Co. | 29,754 | 4,563,371 | ||||||
GATX Corp. | 43,005 | 5,763,960 | ||||||
MSC Industrial Direct Co., Inc., Class A | 125,001 | 12,130,097 | ||||||
Watsco, Inc.(a) | 42,270 | 18,259,372 | ||||||
WESCO International, Inc. | 29,416 | 5,038,373 | ||||||
|
| |||||||
| Total Trading Companies & Distributors | 58,741,397 | |||||||
| Water Utilities – 0.5% | ||||||||
Essential Utilities, Inc. | 457,149 | 16,937,370 | ||||||
| Total United States | 3,639,005,538 | |||||||
| Puerto Rico – 0.3% |
| |||||||
| Banks – 0.3% |
| |||||||
Popular, Inc. | 126,773 | 11,167,434 | ||||||
TOTAL COMMON STOCKS (Cost: $3,022,853,971) |
| 3,650,172,972 | ||||||
| INVESTMENT OF CASH COLLATERAL FOR SECURITIES LOANED – 0.3% |
| |||||||
| United States – 0.3% |
| |||||||
State Street Navigator Securities Lending |
| |||||||
| (Cost: $11,185,491) | 11,185,491 | 11,185,491 | ||||||
TOTAL INVESTMENTS IN SECURITIES – 100.1% (Cost: $3,034,039,462) |
| 3,661,358,463 | ||||||
Other Assets less Liabilities – (0.1)% |
| (3,240,441 | ) | |||||
|
| |||||||
| NET ASSETS – 100.0% |
| $ | 3,658,118,022 | |||||
| (a) | Security, or portion thereof, was on loan at March 31, 2024 (See Note 2). At March 31, 2024, the total market value of the Fund’s securities on loan identified in the Schedule of Investments was $22,142,217 and the total market value of the collateral held by the Fund was $22,628,382. The total market value of the collateral includes non-cash U.S. Government securities collateral having a value of $11,442,891. |
| (b) | Rate shown represents annualized 7-day yield as of March 31, 2024. |
| INVESTMENT IN AFFILIATES | ||||||||||
Affiliated holdings are investments in entities in which the Fund owns 5% or more of the outstanding voting securities or are investments in entities which are under common ownership or control. Investments in affiliates during the fiscal year ended March 31, 2024 were as follows:
| Affiliate | Value at 3/31/2023 | Purchases/ Additions | Sales/ Reductions | Realized Gain/(Loss) | Change in Unrealized Appreciation/ Depreciation | Value at 3/31/2024 | Dividend Income | |||||||||||||||||||||
WisdomTree U.S. LargeCap Dividend Fund^ | $ | — | $ | 53,920,391 | $ | 54,336,765 | $ | 416,374 | $ | — | $ | — | $ | 190,251 | ||||||||||||||
| ^ | As of March 31, 2024, the Fund did not hold a position in this affiliate. |
| FAIR VALUATION SUMMARY | ||||||||||||||
The following is a summary of the fair valuations according to the inputs used in valuing the Fund’s investments (See Note 2 — Fair Value Measurement):
| Quoted Prices in Active Markets (Level 1) | Other Significant Observable Inputs (Level 2) | Significant Unobservable Inputs (Level 3) | Total | |||||||||||||
Assets: |
| |||||||||||||||
Investments in Securities | ||||||||||||||||
Common Stocks | $ | 3,650,172,972 | $ | — | $ | — | $ | 3,650,172,972 | ||||||||
Investment of Cash Collateral for Securities Loaned | — | 11,185,491 | — | 11,185,491 | ||||||||||||
Total Investments in Securities | $ | 3,650,172,972 | $ | 11,185,491 | $ | — | $ | 3,661,358,463 | ||||||||
See Notes to Financial Statements.
| 48 | WisdomTree Trust |
Schedule of Investments
WisdomTree U.S. MidCap Fund (EZM)
March 31, 2024
| Investments | Shares | Value | ||||||
| COMMON STOCKS – 99.8% | ||||||||
| United States – 99.5% | ||||||||
| Aerospace & Defense – 1.1% | ||||||||
AeroVironment, Inc.* | 2,314 | $ | 354,690 | |||||
BWX Technologies, Inc. | 13,268 | 1,361,562 | ||||||
Curtiss-Wright Corp. | 5,764 | 1,475,238 | ||||||
Hexcel Corp. | 8,263 | 601,960 | ||||||
Huntington Ingalls Industries, Inc. | 7,792 | 2,271,134 | ||||||
Leonardo DRS, Inc.* | 36,839 | 813,774 | ||||||
Moog, Inc., Class A | 5,674 | 905,854 | ||||||
Woodward, Inc. | 7,066 | 1,089,012 | ||||||
|
| |||||||
| Total Aerospace & Defense | 8,873,224 | |||||||
| Air Freight & Logistics – 0.1% | ||||||||
GXO Logistics, Inc.* | 20,908 | 1,124,014 | ||||||
| Automobile Components – 1.3% | ||||||||
BorgWarner, Inc. | 105,257 | 3,656,628 | ||||||
Fox Factory Holding Corp.* | 12,416 | 646,501 | ||||||
Gentex Corp. | 46,339 | 1,673,765 | ||||||
LCI Industries | 2,434 | 299,528 | ||||||
Lear Corp. | 18,730 | 2,713,603 | ||||||
Modine Manufacturing Co.* | 10,627 | 1,011,584 | ||||||
Visteon Corp.* | 5,558 | 653,676 | ||||||
|
| |||||||
| Total Automobile Components | 10,655,285 | |||||||
| Automobiles – 0.7% | ||||||||
Harley-Davidson, Inc. | 86,130 | 3,767,326 | ||||||
Thor Industries, Inc. | 13,858 | 1,626,098 | ||||||
|
| |||||||
| Total Automobiles | 5,393,424 | |||||||
| Banks – 8.5% | ||||||||
Ameris Bancorp | 20,372 | 985,597 | ||||||
Associated Banc-Corp. | 67,253 | 1,446,612 | ||||||
BancFirst Corp. | 7,723 | 679,856 | ||||||
Bank OZK | 50,937 | 2,315,596 | ||||||
BOK Financial Corp. | 28,107 | 2,585,844 | ||||||
Cadence Bank | 46,150 | 1,338,350 | ||||||
Cathay General Bancorp | 32,218 | 1,218,807 | ||||||
Columbia Banking System, Inc. | 69,394 | 1,342,774 | ||||||
Comerica, Inc. | 86,196 | 4,739,918 | ||||||
Commerce Bancshares, Inc. | 32,952 | 1,753,046 | ||||||
Cullen/Frost Bankers, Inc. | 23,309 | 2,623,894 | ||||||
East West Bancorp, Inc. | 66,041 | 5,224,504 | ||||||
First Financial Bankshares, Inc. | 25,538 | 837,902 | ||||||
First Interstate BancSystem, Inc., Class A | 35,789 | 973,819 | ||||||
FNB Corp.(a) | 161,514 | 2,277,347 | ||||||
Glacier Bancorp, Inc.(a) | 23,056 | 928,696 | ||||||
Hancock Whitney Corp. | 38,705 | 1,781,978 | ||||||
Home BancShares, Inc.(a) | 59,211 | 1,454,814 | ||||||
International Bancshares Corp. | 27,998 | 1,571,808 | ||||||
New York Community Bancorp, Inc.(a) | 559,187 | 1,800,582 | ||||||
Old National Bancorp | 134,930 | 2,349,131 | ||||||
Pinnacle Financial Partners, Inc.(a) | 23,584 | 2,025,394 | ||||||
Prosperity Bancshares, Inc. | 25,038 | 1,647,000 | ||||||
ServisFirst Bancshares, Inc. | 13,672 | 907,274 | ||||||
SouthState Corp. | 22,674 | 1,927,970 | ||||||
Synovus Financial Corp. | 72,441 | 2,901,986 | ||||||
Texas Capital Bancshares, Inc.* | 21,805 | 1,342,098 | ||||||
TFS Financial Corp. | 25,511 | 320,418 | ||||||
UMB Financial Corp. | 17,136 | 1,490,661 | ||||||
United Bankshares, Inc. | 37,732 | 1,350,428 | ||||||
United Community Banks, Inc. | 34,360 | 904,355 | ||||||
Valley National Bancorp(a) | 220,085 | 1,751,877 | ||||||
Webster Financial Corp. | 79,499 | 4,036,164 | ||||||
Western Alliance Bancorp | 55,131 | 3,538,859 | ||||||
Wintrust Financial Corp. | 23,914 | 2,496,382 | ||||||
Zions Bancorp NA | 74,367 | 3,227,528 | ||||||
|
| |||||||
| Total Banks | 70,099,269 | |||||||
| Beverages – 0.4% | ||||||||
Boston Beer Co., Inc., Class A* | 1,013 | 308,377 | ||||||
Coca-Cola Consolidated, Inc. | 3,179 | 2,690,737 | ||||||
National Beverage Corp.* | 11,875 | 563,588 | ||||||
|
| |||||||
| Total Beverages | 3,562,702 | |||||||
| Biotechnology – 0.4% | ||||||||
ACADIA Pharmaceuticals, Inc.* | 18,156 | 335,705 | ||||||
Exelixis, Inc.* | 29,673 | 704,140 | ||||||
Halozyme Therapeutics, Inc.*(a) | 29,508 | 1,200,386 | ||||||
Ionis Pharmaceuticals, Inc.* | 13,141 | 569,662 | ||||||
Krystal Biotech, Inc.* | 2,553 | 454,255 | ||||||
|
| |||||||
| Total Biotechnology | 3,264,148 | |||||||
| Broadline Retail – 1.0% | ||||||||
Dillard’s, Inc., Class A | 7,330 | 3,457,121 | ||||||
Etsy, Inc.* | 15,351 | 1,054,921 | ||||||
Macy’s, Inc. | 171,444 | 3,427,166 | ||||||
Ollie’s Bargain Outlet Holdings, Inc.* | 7,248 | 576,723 | ||||||
|
| |||||||
| Total Broadline Retail | 8,515,931 | |||||||
| Building Products – 1.6% | ||||||||
AAON, Inc. | 9,990 | 880,119 | ||||||
AO Smith Corp. | 26,067 | 2,331,954 | ||||||
Armstrong World Industries, Inc.(a) | 8,749 | 1,086,801 | ||||||
AZEK Co., Inc.* | 13,911 | 698,610 | ||||||
CSW Industrials, Inc. | 2,276 | 533,950 | ||||||
Fortune Brands Innovations, Inc. | 26,907 | 2,278,216 | ||||||
Simpson Manufacturing Co., Inc. | 7,769 | 1,594,043 | ||||||
Trex Co., Inc.* | 11,314 | 1,128,571 | ||||||
UFP Industries, Inc. | 17,106 | 2,104,209 | ||||||
Zurn Elkay Water Solutions Corp. | 19,878 | 665,317 | ||||||
|
| |||||||
| Total Building Products | 13,301,790 | |||||||
| Capital Markets – 2.3% | ||||||||
Affiliated Managers Group, Inc. | 22,130 | 3,706,111 | ||||||
Blue Owl Capital, Inc. | 70,834 | 1,335,929 | ||||||
Cohen & Steers, Inc. | 6,934 | 533,155 | ||||||
Evercore, Inc., Class A | 7,513 | 1,446,929 | ||||||
Hamilton Lane, Inc., Class A | 6,224 | 701,818 | ||||||
Houlihan Lokey, Inc.(a) | 9,201 | 1,179,476 | ||||||
Interactive Brokers Group, Inc., Class A | 24,779 | 2,768,062 | ||||||
Jefferies Financial Group, Inc. | 32,347 | 1,426,503 | ||||||
See Notes to Financial Statements.
| WisdomTree Trust | 49 |
Schedule of Investments (continued)
WisdomTree U.S. MidCap Fund (EZM)
March 31, 2024
| Investments | Shares | Value | ||||||
MarketAxess Holdings, Inc. | 3,357 | $ | 736,022 | |||||
Moelis & Co., Class A | 6,185 | 351,123 | ||||||
Piper Sandler Cos. | 2,852 | 566,094 | ||||||
SEI Investments Co. | 26,160 | 1,880,904 | ||||||
Stifel Financial Corp. | 30,224 | 2,362,610 | ||||||
|
| |||||||
| Total Capital Markets | 18,994,736 | |||||||
| Chemicals – 1.7% | ||||||||
Ashland, Inc. | 10,701 | 1,041,956 | ||||||
Avient Corp. | 19,631 | 851,985 | ||||||
Balchem Corp. | 4,112 | 637,154 | ||||||
Cabot Corp. | 15,007 | 1,383,645 | ||||||
Chemours Co. | 51,599 | 1,354,990 | ||||||
Element Solutions, Inc. | 54,755 | 1,367,780 | ||||||
HB Fuller Co. | 9,798 | 781,293 | ||||||
Huntsman Corp. | 17,863 | 464,974 | ||||||
Innospec, Inc. | 5,160 | 665,330 | ||||||
NewMarket Corp. | 2,704 | 1,716,012 | ||||||
Olin Corp. | 48,307 | 2,840,452 | ||||||
Quaker Chemical Corp. | 2,727 | 559,717 | ||||||
Scotts Miracle-Gro Co.(a) | 5,262 | 392,493 | ||||||
|
| |||||||
| Total Chemicals | 14,057,781 | |||||||
| Commercial Services & Supplies – 0.9% | ||||||||
ABM Industries, Inc. | 19,449 | 867,814 | ||||||
Brink’s Co. | 12,768 | 1,179,508 | ||||||
Casella Waste Systems, Inc., Class A* | 4,645 | 459,251 | ||||||
Clean Harbors, Inc.* | 8,303 | 1,671,477 | ||||||
MSA Safety, Inc. | 5,489 | 1,062,616 | ||||||
Stericycle, Inc.* | 13,786 | 727,211 | ||||||
Tetra Tech, Inc. | 6,569 | 1,213,360 | ||||||
UniFirst Corp. | 2,662 | 461,671 | ||||||
|
| |||||||
| Total Commercial Services & Supplies | 7,642,908 | |||||||
| Communications Equipment – 0.8% | ||||||||
Calix, Inc.* | 10,362 | 343,604 | ||||||
Ciena Corp.* | 30,637 | 1,514,999 | ||||||
Juniper Networks, Inc. | 94,485 | 3,501,614 | ||||||
Ubiquiti, Inc. | 13,422 | 1,554,939 | ||||||
|
| |||||||
| Total Communications Equipment | 6,915,156 | |||||||
| Construction & Engineering – 1.3% | ||||||||
API Group Corp.* | 47,876 | 1,880,091 | ||||||
Arcosa, Inc. | 6,504 | 558,433 | ||||||
Comfort Systems USA, Inc. | 5,250 | 1,667,977 | ||||||
Dycom Industries, Inc.* | 7,292 | 1,046,621 | ||||||
Fluor Corp.* | 36,785 | 1,555,270 | ||||||
MDU Resources Group, Inc. | 45,440 | 1,145,088 | ||||||
Valmont Industries, Inc. | 5,625 | 1,284,075 | ||||||
WillScot Mobile Mini Holdings Corp.* | 31,298 | 1,455,357 | ||||||
|
| |||||||
| Total Construction & Engineering | 10,592,912 | |||||||
| Construction Materials – 0.6% | ||||||||
Eagle Materials, Inc. | 9,613 | 2,612,333 | ||||||
Knife River Corp.* | 15,932 | 1,291,766 | ||||||
Summit Materials, Inc., Class A* | 20,107 | 896,169 | ||||||
|
| |||||||
| Total Construction Materials | 4,800,268 | |||||||
| Consumer Finance – 1.4% | ||||||||
Ally Financial, Inc. | 129,280 | 5,247,475 | ||||||
Credit Acceptance Corp.*(a) | 2,554 | 1,408,659 | ||||||
FirstCash Holdings, Inc. | 7,673 | 978,614 | ||||||
OneMain Holdings, Inc. | 54,642 | 2,791,660 | ||||||
SLM Corp. | 67,954 | 1,480,718 | ||||||
|
| |||||||
| Total Consumer Finance | 11,907,126 | |||||||
| Consumer Staples Distribution & Retail – 0.5% | ||||||||
BJ’s Wholesale Club Holdings, Inc.* | 28,513 | 2,157,008 | ||||||
Grocery Outlet Holding Corp.* | 15,264 | 439,298 | ||||||
Sprouts Farmers Market, Inc.* | 23,968 | 1,545,457 | ||||||
|
| |||||||
| Total Consumer Staples Distribution & Retail | 4,141,763 | |||||||
| Containers & Packaging – 1.9% | ||||||||
AptarGroup, Inc. | 8,642 | 1,243,497 | ||||||
Berry Global Group, Inc. | 49,937 | 3,020,190 | ||||||
Graphic Packaging Holding Co.(a) | 134,515 | 3,925,148 | ||||||
Greif, Inc., Class A | 19,564 | 1,350,894 | ||||||
Sealed Air Corp. | 55,536 | 2,065,939 | ||||||
Silgan Holdings, Inc. | 35,484 | 1,723,103 | ||||||
Sonoco Products Co.(a) | 36,435 | 2,107,401 | ||||||
|
| |||||||
| Total Containers & Packaging | 15,436,172 | |||||||
| Diversified Consumer Services – 1.2% | ||||||||
ADT, Inc. | 256,258 | 1,722,054 | ||||||
Bright Horizons Family Solutions, Inc.*(a) | 5,948 | 674,265 | ||||||
Coursera, Inc.* | 13,947 | 195,537 | ||||||
Duolingo, Inc.* | 3,315 | 731,222 | ||||||
Frontdoor, Inc.* | 18,893 | 615,534 | ||||||
Grand Canyon Education, Inc.* | 5,687 | 774,626 | ||||||
H&R Block, Inc. | 47,135 | 2,314,800 | ||||||
Service Corp. International | 30,275 | 2,246,708 | ||||||
Stride, Inc.* | 9,355 | 589,833 | ||||||
|
| |||||||
| Total Diversified Consumer Services | 9,864,579 | |||||||
| Diversified REITs – 0.2% | ||||||||
Broadstone Net Lease, Inc. | 45,411 | 711,590 | ||||||
Essential Properties Realty Trust, Inc. | 28,230 | 752,612 | ||||||
|
| |||||||
| Total Diversified REITs | 1,464,202 | |||||||
| Diversified Telecommunication Services – 0.4% | ||||||||
Cogent Communications Holdings, Inc. | 37,529 | 2,451,770 | ||||||
Frontier Communications Parent, Inc.* | 24,783 | 607,183 | ||||||
Globalstar, Inc.*(a) | 186,454 | 274,087 | ||||||
|
| |||||||
| Total Diversified Telecommunication Services | 3,333,040 | |||||||
| Electric Utilities – 1.0% | ||||||||
ALLETE, Inc. | 14,785 | 881,777 | ||||||
IDACORP, Inc. | 10,151 | 942,926 | ||||||
MGE Energy, Inc. | 6,123 | 482,003 | ||||||
OGE Energy Corp. | 41,075 | 1,408,873 | ||||||
Otter Tail Corp. | 13,631 | 1,177,718 | ||||||
Pinnacle West Capital Corp. | 22,850 | 1,707,580 | ||||||
PNM Resources, Inc. | 21,173 | 796,952 | ||||||
Portland General Electric Co. | 19,319 | 811,398 | ||||||
|
| |||||||
| Total Electric Utilities | 8,209,227 | |||||||
See Notes to Financial Statements.
| 50 | WisdomTree Trust |
Schedule of Investments (continued)
WisdomTree U.S. MidCap Fund (EZM)
March 31, 2024
| Investments | Shares | Value | ||||||
| Electrical Equipment – 1.6% | ||||||||
Acuity Brands, Inc. | 8,875 | $ | 2,384,979 | |||||
Atkore, Inc. | 21,375 | 4,068,945 | ||||||
Encore Wire Corp. | 9,291 | 2,441,489 | ||||||
EnerSys | 11,720 | 1,107,071 | ||||||
Regal Rexnord Corp. | 18,601 | 3,350,040 | ||||||
|
| |||||||
| Total Electrical Equipment | 13,352,524 | |||||||
| Electronic Equipment, Instruments & Components – 3.2% |
| |||||||
Advanced Energy Industries, Inc. | 7,148 | 728,953 | ||||||
Arrow Electronics, Inc.* | 34,023 | 4,404,618 | ||||||
Avnet, Inc. | 54,158 | 2,685,154 | ||||||
Badger Meter, Inc. | 2,692 | 435,593 | ||||||
Belden, Inc. | 16,317 | 1,511,117 | ||||||
Coherent Corp.* | 27,862 | 1,688,994 | ||||||
Crane NXT Co. | 15,451 | 956,417 | ||||||
Insight Enterprises, Inc.*(a) | 7,661 | 1,421,269 | ||||||
IPG Photonics Corp.* | 4,317 | 391,509 | ||||||
Itron, Inc.* | 6,949 | 642,921 | ||||||
Littelfuse, Inc. | 4,677 | 1,133,471 | ||||||
Plexus Corp.* | 5,904 | 559,817 | ||||||
Sanmina Corp.* | 27,835 | 1,730,780 | ||||||
TD SYNNEX Corp. | 40,074 | 4,532,369 | ||||||
Vishay Intertechnology, Inc.(a) | 62,113 | 1,408,723 | ||||||
Vontier Corp. | 50,283 | 2,280,837 | ||||||
|
| |||||||
| Total Electronic Equipment, Instruments & Components |
| 26,512,542 | ||||||
| Energy Equipment & Services – 1.3% | ||||||||
Cactus, Inc., Class A(a) | 19,388 | 971,145 | ||||||
ChampionX Corp. | 43,402 | 1,557,698 | ||||||
Helmerich & Payne, Inc. | 47,190 | 1,984,811 | ||||||
Liberty Energy, Inc.(a) | 117,272 | 2,429,876 | ||||||
NOV, Inc. | 77,240 | 1,507,725 | ||||||
Patterson-UTI Energy, Inc. | 112,643 | 1,344,957 | ||||||
Tidewater, Inc.* | 5,928 | 545,376 | ||||||
|
| |||||||
| Total Energy Equipment & Services | 10,341,588 | |||||||
| Entertainment – 0.4% | ||||||||
Endeavor Group Holdings, Inc., Class A | 29,172 | 750,596 | ||||||
Madison Square Garden Sports Corp.* | 1,440 | 265,709 | ||||||
TKO Group Holdings, Inc. | 6,718 | 580,502 | ||||||
Warner Music Group Corp., Class A | 45,077 | 1,488,442 | ||||||
|
| |||||||
| Total Entertainment | 3,085,249 | |||||||
| Financial Services – 3.3% | ||||||||
Enact Holdings, Inc. | 81,088 | 2,528,324 | ||||||
Euronet Worldwide, Inc.* | 13,932 | 1,531,545 | ||||||
Jackson Financial, Inc., Class A | 62,719 | 4,148,235 | ||||||
MGIC Investment Corp. | 147,419 | 3,296,289 | ||||||
Mr. Cooper Group, Inc.* | 24,707 | 1,925,911 | ||||||
PennyMac Financial Services, Inc. | 9,764 | 889,403 | ||||||
Radian Group, Inc. | 88,894 | 2,975,282 | ||||||
Remitly Global, Inc.* | 18,991 | 393,873 | ||||||
Shift4 Payments, Inc., Class A*(a) | 8,377 | 553,468 | ||||||
Voya Financial, Inc. | 39,939 | 2,952,291 | ||||||
Walker & Dunlop, Inc. | 5,798 | 585,946 | ||||||
Western Union Co. | 190,193 | 2,658,898 | ||||||
WEX, Inc.* | 12,261 | 2,912,355 | ||||||
|
| |||||||
| Total Financial Services | 27,351,820 | |||||||
| Food Products – 1.1% | ||||||||
Flowers Foods, Inc. | 47,346 | 1,124,467 | ||||||
Ingredion, Inc. | 20,523 | 2,398,113 | ||||||
J & J Snack Foods Corp. | 2,086 | 301,552 | ||||||
Lancaster Colony Corp. | 3,507 | 728,158 | ||||||
Pilgrim’s Pride Corp.* | 23,202 | 796,293 | ||||||
Post Holdings, Inc.* | 14,538 | 1,545,099 | ||||||
Seaboard Corp. | 436 | 1,405,629 | ||||||
Simply Good Foods Co.* | 15,351 | 522,395 | ||||||
|
| |||||||
| Total Food Products | 8,821,706 | |||||||
| Gas Utilities – 0.8% | ||||||||
National Fuel Gas Co. | 35,249 | 1,893,576 | ||||||
New Jersey Resources Corp. | 22,229 | 953,847 | ||||||
ONE Gas, Inc. | 14,341 | 925,425 | ||||||
Spire, Inc. | 12,817 | 786,579 | ||||||
UGI Corp. | 99,750 | 2,447,865 | ||||||
|
| |||||||
| Total Gas Utilities | 7,007,292 | |||||||
| Ground Transportation – 1.2% | ||||||||
ArcBest Corp.(a) | 6,683 | 952,328 | ||||||
Avis Budget Group, Inc.(a) | 26,953 | 3,300,664 | ||||||
Hertz Global Holdings, Inc.*(a) | 220,367 | 1,725,474 | ||||||
Landstar System, Inc. | 6,523 | 1,257,373 | ||||||
Ryder System, Inc. | 22,510 | 2,705,477 | ||||||
|
| |||||||
| Total Ground Transportation | 9,941,316 | |||||||
| Health Care Equipment & Supplies – 1.6% | ||||||||
CONMED Corp. | 3,416 | 273,553 | ||||||
Dentsply Sirona, Inc. | 44,820 | 1,487,576 | ||||||
Enovis Corp.* | 10,569 | 660,034 | ||||||
Envista Holdings Corp.* | 50,966 | 1,089,653 | ||||||
Globus Medical, Inc., Class A* | 20,579 | 1,103,858 | ||||||
Haemonetics Corp.* | 8,520 | 727,182 | ||||||
Inari Medical, Inc.*(a) | 8,973 | 430,524 | ||||||
Integer Holdings Corp.*(a) | 6,316 | 736,951 | ||||||
Integra LifeSciences Holdings Corp.* | 23,397 | 829,424 | ||||||
Lantheus Holdings, Inc.* | 20,180 | 1,256,003 | ||||||
Masimo Corp.*(a) | 6,946 | 1,020,020 | ||||||
Merit Medical Systems, Inc.*(a) | 10,013 | 758,485 | ||||||
Penumbra, Inc.* | 3,490 | 778,898 | ||||||
QuidelOrtho Corp.* | 16,249 | 778,977 | ||||||
Shockwave Medical, Inc.* | 5,124 | 1,668,528 | ||||||
|
| |||||||
| Total Health Care Equipment & Supplies | 13,599,666 | |||||||
| Health Care Providers & Services – 3.0% | ||||||||
Acadia Healthcare Co., Inc.* | 15,023 | 1,190,122 | ||||||
Amedisys, Inc.* | 5,146 | 474,255 | ||||||
AMN Healthcare Services, Inc.* | 19,877 | 1,242,511 | ||||||
Chemed Corp. | 1,917 | 1,230,580 | ||||||
CorVel Corp.* | 1,637 | 430,466 | ||||||
DaVita, Inc.* | 24,586 | 3,394,097 | ||||||
Encompass Health Corp. | 20,466 | 1,690,082 | ||||||
See Notes to Financial Statements.
| WisdomTree Trust | 51 |
Schedule of Investments (continued)
WisdomTree U.S. MidCap Fund (EZM)
March 31, 2024
| Investments | Shares | Value | ||||||
Ensign Group, Inc. | 8,725 | $ | 1,085,565 | |||||
HealthEquity, Inc.* | 8,423 | 687,570 | ||||||
Henry Schein, Inc.* | 35,957 | 2,715,473 | ||||||
Option Care Health, Inc.* | 32,014 | 1,073,750 | ||||||
Progyny, Inc.* | 6,629 | 252,896 | ||||||
R1 RCM, Inc.*(a) | 35,109 | 452,204 | ||||||
Select Medical Holdings Corp. | 37,063 | 1,117,449 | ||||||
Surgery Partners, Inc.*(a) | 12,353 | 368,490 | ||||||
Tenet Healthcare Corp.* | 34,776 | 3,655,305 | ||||||
Universal Health Services, Inc., Class B | 19,761 | 3,605,592 | ||||||
|
| |||||||
| Total Health Care Providers & Services | 24,666,407 | |||||||
| Health Care REITs – 0.0% | ||||||||
CareTrust REIT, Inc. | 12,542 | 305,649 | ||||||
| Health Care Technology – 0.3% | ||||||||
Doximity, Inc., Class A* | 29,458 | 792,715 | ||||||
Evolent Health, Inc., Class A*(a) | 13,287 | 435,681 | ||||||
Teladoc Health, Inc.* | 55,177 | 833,172 | ||||||
|
| |||||||
| Total Health Care Technology | 2,061,568 | |||||||
| Hotel & Resort REITs – 0.1% | ||||||||
Ryman Hospitality Properties, Inc. | 8,526 | 985,691 | ||||||
| Hotels, Restaurants & Leisure – 3.1% | ||||||||
Aramark | 59,056 | 1,920,501 | ||||||
Boyd Gaming Corp. | 41,088 | 2,766,044 | ||||||
Cava Group, Inc.* | 9,671 | 677,454 | ||||||
Choice Hotels International, Inc. | 10,016 | 1,265,522 | ||||||
Churchill Downs, Inc. | 11,717 | 1,449,979 | ||||||
Hilton Grand Vacations, Inc.* | 41,409 | 1,954,919 | ||||||
Hyatt Hotels Corp., Class A | 14,966 | 2,388,873 | ||||||
Life Time Group Holdings, Inc.* | 21,124 | 327,844 | ||||||
Light & Wonder, Inc.* | 8,384 | 855,923 | ||||||
Marriott Vacations Worldwide Corp. | 19,322 | 2,081,559 | ||||||
Planet Fitness, Inc., Class A* | 10,078 | 631,185 | ||||||
Red Rock Resorts, Inc., Class A | 16,163 | 966,871 | ||||||
Texas Roadhouse, Inc. | 8,912 | 1,376,637 | ||||||
Travel & Leisure Co. | 38,939 | 1,906,453 | ||||||
United Parks & Resorts, Inc.* | 18,428 | 1,035,838 | ||||||
Vail Resorts, Inc. | 4,605 | 1,026,132 | ||||||
Wendy’s Co. | 41,593 | 783,612 | ||||||
Wingstop, Inc. | 2,563 | 939,083 | ||||||
Wyndham Hotels & Resorts, Inc. | 15,366 | 1,179,340 | ||||||
|
| |||||||
| Total Hotels, Restaurants & Leisure | 25,533,769 | |||||||
| Household Durables – 4.0% | ||||||||
Installed Building Products, Inc. | 6,514 | 1,685,367 | ||||||
KB Home | 44,285 | 3,138,921 | ||||||
Leggett & Platt, Inc. | 28,715 | 549,892 | ||||||
LGI Homes, Inc.* | 5,688 | 661,913 | ||||||
M/I Homes, Inc.* | 16,184 | 2,205,717 | ||||||
MDC Holdings, Inc. | 27,801 | 1,748,961 | ||||||
Meritage Homes Corp. | 20,132 | 3,532,361 | ||||||
Skyline Champion Corp.*(a) | 14,107 | 1,199,236 | ||||||
Taylor Morrison Home Corp.* | 69,305 | 4,308,692 | ||||||
Tempur Sealy International, Inc. | 37,204 | 2,113,931 | ||||||
Toll Brothers, Inc. | 64,561 | 8,352,257 | ||||||
Tri Pointe Homes, Inc.* | 48,303 | 1,867,394 | ||||||
Worthington Enterprises, Inc. | 21,983 | 1,368,002 | ||||||
|
| |||||||
| Total Household Durables | 32,732,644 | |||||||
| Household Products – 0.2% | ||||||||
Reynolds Consumer Products, Inc. | 38,640 | 1,103,558 | ||||||
WD-40 Co. | 1,271 | 321,957 | ||||||
|
| |||||||
| Total Household Products | 1,425,515 | |||||||
| Independent Power & Renewable Electricity Producers – 0.1% |
| |||||||
Clearway Energy, Inc., Class C | 15,472 | 356,630 | ||||||
Ormat Technologies, Inc.(a) | 6,727 | 445,260 | ||||||
|
| |||||||
| Total Independent Power & Renewable Electricity Producers |
| 801,890 | ||||||
| Industrial REITs – 0.4% | ||||||||
EastGroup Properties, Inc. | 4,343 | 780,741 | ||||||
First Industrial Realty Trust, Inc. | 18,453 | 969,521 | ||||||
LXP Industrial Trust | 19,835 | 178,912 | ||||||
STAG Industrial, Inc. | 19,624 | 754,346 | ||||||
Terreno Realty Corp. | 11,178 | 742,219 | ||||||
|
| |||||||
| Total Industrial REITs | 3,425,739 | |||||||
| Insurance – 4.2% | ||||||||
American Equity Investment Life Holding Co.* | 31,296 | 1,759,461 | ||||||
American Financial Group, Inc. | 27,377 | 3,736,413 | ||||||
Assurant, Inc. | 15,196 | 2,860,495 | ||||||
Brighthouse Financial, Inc.* | 49,559 | 2,554,271 | ||||||
CNO Financial Group, Inc. | 38,368 | 1,054,353 | ||||||
F&G Annuities & Life, Inc.(a) | 29,589 | 1,199,834 | ||||||
First American Financial Corp. | 13,959 | 852,197 | ||||||
Genworth Financial, Inc., Class A* | 209,552 | 1,347,419 | ||||||
Kinsale Capital Group, Inc. | 2,528 | 1,326,543 | ||||||
Lincoln National Corp. | 118,391 | 3,780,225 | ||||||
Old Republic International Corp. | 96,734 | 2,971,668 | ||||||
Primerica, Inc. | 8,860 | 2,241,226 | ||||||
RLI Corp. | 4,994 | 741,459 | ||||||
Ryan Specialty Holdings, Inc. | 16,693 | 926,461 | ||||||
Selective Insurance Group, Inc. | 10,529 | 1,149,451 | ||||||
Unum Group | 119,489 | 6,411,780 | ||||||
|
| |||||||
| Total Insurance | 34,913,256 | |||||||
| Interactive Media & Services – 0.6% | ||||||||
Match Group, Inc.* | 58,446 | 2,120,421 | ||||||
Yelp, Inc.* | 8,786 | 346,168 | ||||||
Ziff Davis, Inc.* | 17,905 | 1,128,731 | ||||||
ZoomInfo Technologies, Inc.* | 105,354 | 1,688,825 | ||||||
|
| |||||||
| Total Interactive Media & Services | 5,284,145 | |||||||
| IT Services – 0.4% | ||||||||
DigitalOcean Holdings, Inc.*(a) | 17,319 | 661,239 | ||||||
DXC Technology Co.* | 111,226 | 2,359,104 | ||||||
|
| |||||||
| Total IT Services | 3,020,343 | |||||||
| Leisure Products – 1.0% | ||||||||
Acushnet Holdings Corp. | 14,916 | 983,710 | ||||||
Brunswick Corp. | 29,302 | 2,828,229 | ||||||
Mattel, Inc.* | 77,581 | 1,536,880 | ||||||
See Notes to Financial Statements.
| 52 | WisdomTree Trust |
Schedule of Investments (continued)
WisdomTree U.S. MidCap Fund (EZM)
March 31, 2024
| Investments | Shares | Value | ||||||
Polaris, Inc. | 26,370 | $ | 2,640,164 | |||||
YETI Holdings, Inc.* | 13,934 | 537,156 | ||||||
|
| |||||||
| Total Leisure Products | 8,526,139 | |||||||
| Life Sciences Tools & Services – 0.6% | ||||||||
Azenta, Inc.* | 3,684 | 222,071 | ||||||
Bruker Corp. | 21,216 | 1,993,031 | ||||||
Fortrea Holdings, Inc.* | 13,552 | 543,977 | ||||||
Medpace Holdings, Inc.* | 3,557 | 1,437,562 | ||||||
Sotera Health Co.*(a) | 62,004 | 744,668 | ||||||
|
| |||||||
| Total Life Sciences Tools & Services | 4,941,309 | |||||||
| Machinery – 4.7% | ||||||||
AGCO Corp.(a) | 38,026 | 4,677,959 | ||||||
Albany International Corp., Class A | 5,465 | 511,032 | ||||||
Allison Transmission Holdings, Inc. | 42,477 | 3,447,433 | ||||||
Chart Industries, Inc.*(a) | 6,789 | 1,118,284 | ||||||
Crane Co. | 5,369 | 725,513 | ||||||
Donaldson Co., Inc. | 21,810 | 1,628,771 | ||||||
Enpro, Inc. | 3,977 | 671,198 | ||||||
Esab Corp. | 12,610 | 1,394,288 | ||||||
ESCO Technologies, Inc. | 3,460 | 370,393 | ||||||
Federal Signal Corp. | 7,388 | 627,020 | ||||||
Flowserve Corp. | 25,489 | 1,164,338 | ||||||
Franklin Electric Co., Inc. | 7,705 | 822,971 | ||||||
Hillenbrand, Inc. | 23,757 | 1,194,740 | ||||||
ITT, Inc. | 13,662 | 1,858,442 | ||||||
John Bean Technologies Corp. | 5,294 | 555,288 | ||||||
Kadant, Inc. | 1,691 | 554,817 | ||||||
Middleby Corp.* | 14,886 | 2,393,520 | ||||||
Mueller Industries, Inc. | 54,112 | 2,918,260 | ||||||
Oshkosh Corp. | 21,692 | 2,705,209 | ||||||
RBC Bearings, Inc.*(a) | 3,278 | 886,207 | ||||||
SPX Technologies, Inc.* | 7,901 | 972,850 | ||||||
Terex Corp. | 34,851 | 2,244,404 | ||||||
Timken Co. | 24,348 | 2,128,746 | ||||||
Toro Co. | 21,942 | 2,010,545 | ||||||
Watts Water Technologies, Inc., Class A | 4,782 | 1,016,414 | ||||||
|
| |||||||
| Total Machinery | 38,598,642 | |||||||
| Marine Transportation – 0.3% | ||||||||
Kirby Corp.* | 10,183 | 970,644 | ||||||
Matson, Inc. | 11,945 | 1,342,618 | ||||||
|
| |||||||
| Total Marine Transportation | 2,313,262 | |||||||
| Media – 0.9% | ||||||||
Cable One, Inc. | 614 | 259,802 | ||||||
Liberty Media Corp.-Liberty SiriusXM, Class C*(a) | 82,238 | 2,443,291 | ||||||
New York Times Co., Class A | 19,430 | 839,765 | ||||||
Nexstar Media Group, Inc.(a) | 11,539 | 1,988,054 | ||||||
TEGNA, Inc. | 121,711 | 1,818,362 | ||||||
|
| |||||||
| Total Media | 7,349,274 | |||||||
| Metals & Mining – 2.6% | ||||||||
Alpha Metallurgical Resources, Inc. | 9,427 | 3,121,940 | ||||||
Arch Resources, Inc. | 14,111 | 2,268,908 | ||||||
ATI, Inc.*(a) | 29,319 | 1,500,253 | ||||||
Carpenter Technology Corp. | 6,313 | 450,874 | ||||||
Cleveland-Cliffs, Inc.* | 65,969 | 1,500,135 | ||||||
Commercial Metals Co. | 70,126 | 4,121,305 | ||||||
Hecla Mining Co. | 42,118 | 202,588 | ||||||
MP Materials Corp.*(a) | 40,227 | 575,246 | ||||||
Royal Gold, Inc. | 7,398 | 901,150 | ||||||
U.S. Steel Corp. | 126,179 | 5,145,580 | ||||||
Warrior Met Coal, Inc. | 28,862 | 1,751,923 | ||||||
|
| |||||||
| Total Metals & Mining | 21,539,902 | |||||||
| Multi-Utilities – 0.3% | ||||||||
Avista Corp. | 18,653 | 653,228 | ||||||
Black Hills Corp. | 18,832 | 1,028,227 | ||||||
Northwestern Energy Group, Inc. | 13,447 | 684,856 | ||||||
|
| |||||||
| Total Multi-Utilities | 2,366,311 | |||||||
| Office REITs – 0.2% | ||||||||
Cousins Properties, Inc. | 16,705 | 401,588 | ||||||
Kilroy Realty Corp. | 23,201 | 845,212 | ||||||
Vornado Realty Trust(a) | 13,614 | 391,675 | ||||||
|
| |||||||
| Total Office REITs | 1,638,475 | |||||||
| Oil, Gas & Consumable Fuels – 6.6% | ||||||||
Antero Midstream Corp. | 99,829 | 1,403,596 | ||||||
Antero Resources Corp.* | 69,255 | 2,008,395 | ||||||
California Resources Corp. | 29,677 | 1,635,203 | ||||||
Chord Energy Corp. | 18,022 | 3,212,241 | ||||||
Civitas Resources, Inc. | 44,167 | 3,352,717 | ||||||
CNX Resources Corp.*(a) | 104,132 | 2,470,011 | ||||||
Comstock Resources, Inc.(a) | 150,734 | 1,398,811 | ||||||
CONSOL Energy, Inc. | 22,129 | 1,853,525 | ||||||
CVR Energy, Inc.(a) | 76,550 | 2,729,773 | ||||||
DT Midstream, Inc. | 22,407 | 1,369,068 | ||||||
Equitrans Midstream Corp. | 113,769 | 1,420,975 | ||||||
Magnolia Oil & Gas Corp., Class A(a) | 81,265 | 2,108,827 | ||||||
Matador Resources Co. | 51,307 | 3,425,768 | ||||||
Murphy Oil Corp. | 64,811 | 2,961,863 | ||||||
New Fortress Energy, Inc.(a) | 38,041 | 1,163,674 | ||||||
Northern Oil & Gas, Inc. | 56,188 | 2,229,540 | ||||||
PBF Energy, Inc., Class A | 100,496 | 5,785,555 | ||||||
Peabody Energy Corp.(a) | 102,836 | 2,494,801 | ||||||
Permian Resources Corp. | 90,276 | 1,594,274 | ||||||
Range Resources Corp. | 86,495 | 2,978,023 | ||||||
SM Energy Co. | 67,639 | 3,371,804 | ||||||
Southwestern Energy Co.* | 479,919 | 3,637,786 | ||||||
|
| |||||||
| Total Oil, Gas & Consumable Fuels | 54,606,230 | |||||||
| Paper & Forest Products – 0.1% | ||||||||
Louisiana-Pacific Corp. | 13,666 | 1,146,714 | ||||||
| Passenger Airlines – 1.2% | ||||||||
Alaska Air Group, Inc.* | 67,089 | 2,884,156 | ||||||
American Airlines Group, Inc.* | 478,199 | 7,340,355 | ||||||
|
| |||||||
| Total Passenger Airlines | 10,224,511 | |||||||
| Personal Care Products – 0.3% | ||||||||
BellRing Brands, Inc.* | 13,289 | 784,450 | ||||||
See Notes to Financial Statements.
| WisdomTree Trust | 53 |
Schedule of Investments (continued)
WisdomTree U.S. MidCap Fund (EZM)
March 31, 2024
| Investments | Shares | Value | ||||||
elf Beauty, Inc.* | 4,906 | $ | 961,723 | |||||
Inter Parfums, Inc. | 4,439 | 623,724 | ||||||
|
| |||||||
| Total Personal Care Products | 2,369,897 | |||||||
| Pharmaceuticals – 1.0% | ||||||||
Amphastar Pharmaceuticals, Inc.*(a) | 10,410 | 457,103 | ||||||
Corcept Therapeutics, Inc.*(a) | 15,691 | 395,256 | ||||||
Elanco Animal Health, Inc.* | 141,075 | 2,296,701 | ||||||
Organon & Co. | 208,047 | 3,911,284 | ||||||
Prestige Consumer Healthcare, Inc.* | 13,089 | 949,738 | ||||||
|
| |||||||
| Total Pharmaceuticals | 8,010,082 | |||||||
| Professional Services – 3.0% | ||||||||
Alight, Inc., Class A* | 144,428 | 1,422,616 | ||||||
ASGN, Inc.* | 12,203 | 1,278,386 | ||||||
CACI International, Inc., Class A* | 4,755 | 1,801,337 | ||||||
CBIZ, Inc.* | 7,945 | 623,682 | ||||||
Concentrix Corp. | 21,212 | 1,404,659 | ||||||
Dun & Bradstreet Holdings, Inc. | 151,583 | 1,521,893 | ||||||
ExlService Holdings, Inc.* | 30,315 | 964,017 | ||||||
Exponent, Inc. | 5,167 | 427,259 | ||||||
FTI Consulting, Inc.* | 4,206 | 884,480 | ||||||
ICF International, Inc. | 3,312 | 498,887 | ||||||
Insperity, Inc. | 7,122 | 780,642 | ||||||
KBR, Inc. | 28,946 | 1,842,702 | ||||||
Korn Ferry | 15,909 | 1,046,176 | ||||||
ManpowerGroup, Inc. | 16,773 | 1,302,256 | ||||||
Maximus, Inc. | 7,920 | 664,488 | ||||||
Parsons Corp.* | 14,580 | 1,209,411 | ||||||
Paycor HCM, Inc.*(a) | 16,771 | 326,028 | ||||||
Paylocity Holding Corp.* | 7,606 | 1,307,167 | ||||||
Robert Half, Inc. | 21,509 | 1,705,234 | ||||||
Science Applications International Corp. | 12,306 | 1,604,579 | ||||||
TriNet Group, Inc. | 14,079 | 1,865,327 | ||||||
Verra Mobility Corp.*(a) | 30,043 | 750,174 | ||||||
|
| |||||||
| Total Professional Services | 25,231,400 | |||||||
| Real Estate Management & Development – 0.3% | ||||||||
DigitalBridge Group, Inc. | 16,431 | 316,625 | ||||||
Jones Lang LaSalle, Inc.* | 7,969 | 1,554,672 | ||||||
St. Joe Co. | 6,973 | 404,225 | ||||||
|
| |||||||
| Total Real Estate Management & Development | 2,275,522 | |||||||
| Residential REITs – 0.4% | ||||||||
Apartment Income REIT Corp. | 110,110 | 3,575,272 | ||||||
| Retail REITs – 0.6% | ||||||||
Agree Realty Corp. | 11,039 | 630,548 | ||||||
Brixmor Property Group, Inc. | 57,840 | 1,356,348 | ||||||
Federal Realty Investment Trust | 9,495 | 969,629 | ||||||
NNN REIT, Inc. | 35,078 | 1,499,234 | ||||||
Phillips Edison & Co., Inc. | 10,371 | 372,008 | ||||||
Tanger, Inc. | 14,372 | 424,405 | ||||||
|
| |||||||
| Total Retail REITs | 5,252,172 | |||||||
| Semiconductors & Semiconductor Equipment – 1.8% |
| |||||||
Allegro MicroSystems, Inc.* | 40,223 | 1,084,412 | ||||||
Amkor Technology, Inc. | 54,905 | 1,770,137 | ||||||
Axcelis Technologies, Inc.* | 6,691 | 746,180 | ||||||
Cirrus Logic, Inc.* | 15,306 | 1,416,723 | ||||||
Diodes, Inc.* | 15,447 | 1,089,013 | ||||||
FormFactor, Inc.* | 7,776 | 354,819 | ||||||
Lattice Semiconductor Corp.*(a) | 17,150 | 1,341,644 | ||||||
MACOM Technology Solutions Holdings, Inc.* | 9,178 | 877,784 | ||||||
MKS Instruments, Inc. | 15,900 | 2,114,700 | ||||||
Onto Innovation, Inc.* | 5,836 | 1,056,783 | ||||||
Power Integrations, Inc. | 5,355 | 383,150 | ||||||
Rambus, Inc.* | 9,886 | 611,054 | ||||||
Silicon Laboratories, Inc.* | 4,694 | 674,622 | ||||||
Synaptics, Inc.* | 7,003 | 683,213 | ||||||
Universal Display Corp. | 4,768 | 803,170 | ||||||
|
| |||||||
| Total Semiconductors & Semiconductor Equipment |
| 15,007,404 | ||||||
| Software – 3.0% | ||||||||
ACI Worldwide, Inc.* | 12,949 | 430,036 | ||||||
Alarm.com Holdings, Inc.* | 7,242 | 524,828 | ||||||
Altair Engineering, Inc., Class A*(a) | 5,243 | 451,684 | ||||||
Appfolio, Inc., Class A* | 2,124 | 524,076 | ||||||
Bill Holdings, Inc.* | 11,811 | 811,652 | ||||||
Blackbaud, Inc.* | 8,105 | 600,905 | ||||||
BlackLine, Inc.* | 7,607 | 491,260 | ||||||
Box, Inc., Class A* | 28,214 | 799,020 | ||||||
Braze, Inc., Class A* | 5,567 | 246,618 | ||||||
CCC Intelligent Solutions Holdings, Inc.* | 61,111 | 730,888 | ||||||
CommVault Systems, Inc.* | 5,928 | 601,277 | ||||||
DocuSign, Inc.* | 42,567 | 2,534,865 | ||||||
Dolby Laboratories, Inc., Class A | 8,193 | 686,328 | ||||||
DoubleVerify Holdings, Inc.* | 15,083 | 530,318 | ||||||
Dropbox, Inc., Class A* | 82,680 | 2,009,124 | ||||||
Five9, Inc.* | 6,999 | 434,708 | ||||||
Freshworks, Inc., Class A* | 17,873 | 325,467 | ||||||
Gitlab, Inc., Class A* | 8,109 | 472,917 | ||||||
Guidewire Software, Inc.* | 6,751 | 787,909 | ||||||
Informatica, Inc., Class A* | 35,289 | 1,235,115 | ||||||
Instructure Holdings, Inc.* | 18,627 | 398,245 | ||||||
Intapp, Inc.* | 6,075 | 208,373 | ||||||
InterDigital, Inc. | 7,606 | 809,735 | ||||||
MicroStrategy, Inc., Class A*(a) | 952 | 1,622,741 | ||||||
nCino, Inc.*(a) | 10,913 | 407,928 | ||||||
Pegasystems, Inc. | 9,420 | 608,909 | ||||||
PowerSchool Holdings, Inc., Class A* | 25,672 | 546,557 | ||||||
Procore Technologies, Inc.* | 11,291 | 927,781 | ||||||
Qualys, Inc.* | 3,654 | 609,743 | ||||||
Rapid7, Inc.* | 5,906 | 289,630 | ||||||
Smartsheet, Inc., Class A* | 11,075 | 426,388 | ||||||
Sprout Social, Inc., Class A*(a) | 4,676 | 279,204 | ||||||
SPS Commerce, Inc.* | 2,938 | 543,236 | ||||||
Tenable Holdings, Inc.* | 10,690 | 528,407 | ||||||
Teradata Corp.* | 15,787 | 610,483 | ||||||
Varonis Systems, Inc.*(a) | 9,389 | 442,879 | ||||||
Workiva, Inc.*(a) | 4,265 | 361,672 | ||||||
|
| |||||||
| Total Software | 24,850,906 | |||||||
See Notes to Financial Statements.
| 54 | WisdomTree Trust |
Schedule of Investments (continued)
WisdomTree U.S. MidCap Fund (EZM)
March 31, 2024
| Investments | Shares | Value | ||||||
| Specialized REITs – 0.6% | ||||||||
CubeSmart | 34,049 | $ | 1,539,696 | |||||
EPR Properties | 11,278 | 478,751 | ||||||
Lamar Advertising Co., Class A | 13,641 | 1,628,872 | ||||||
National Storage Affiliates Trust | 14,250 | 558,030 | ||||||
PotlatchDeltic Corp. | 5,545 | 260,726 | ||||||
Rayonier, Inc. | 14,206 | 472,207 | ||||||
|
| |||||||
| Total Specialized REITs | 4,938,282 | |||||||
| Specialty Retail – 4.4% | ||||||||
Abercrombie & Fitch Co., Class A* | 9,899 | 1,240,642 | ||||||
Academy Sports & Outdoors, Inc. | 36,547 | 2,468,384 | ||||||
American Eagle Outfitters, Inc. | 47,116 | 1,215,122 | ||||||
Asbury Automotive Group, Inc.* | 12,422 | 2,928,859 | ||||||
AutoNation, Inc.* | 30,493 | 5,049,031 | ||||||
Bath & Body Works, Inc. | 72,378 | 3,620,348 | ||||||
Dick’s Sporting Goods, Inc. | 28,033 | 6,303,500 | ||||||
Gap, Inc. | 31,667 | 872,426 | ||||||
Group 1 Automotive, Inc. | 8,357 | 2,442,166 | ||||||
Lithia Motors, Inc. | 14,012 | 4,215,650 | ||||||
Murphy USA, Inc. | 5,375 | 2,253,200 | ||||||
RH* | 4,949 | 1,723,539 | ||||||
Urban Outfitters, Inc.* | 29,002 | 1,259,267 | ||||||
Valvoline, Inc.* | 21,229 | 946,176 | ||||||
|
| |||||||
| Total Specialty Retail | 36,538,310 | |||||||
| Textiles, Apparel & Luxury Goods – 2.5% | ||||||||
Columbia Sportswear Co.(a) | 14,911 | 1,210,475 | ||||||
Crocs, Inc.* | 26,415 | 3,798,477 | ||||||
Kontoor Brands, Inc. | 15,283 | 920,801 | ||||||
PVH Corp. | 21,249 | 2,987,822 | ||||||
Ralph Lauren Corp. | 16,433 | 3,085,460 | ||||||
Skechers USA, Inc., Class A* | 31,738 | 1,944,270 | ||||||
Steven Madden Ltd. | 18,337 | 775,288 | ||||||
Tapestry, Inc. | 106,509 | 5,057,047 | ||||||
Under Armour, Inc., Class A* | 111,133 | 820,162 | ||||||
|
| |||||||
| Total Textiles, Apparel & Luxury Goods | 20,599,802 | |||||||
| Trading Companies & Distributors – 2.8% | ||||||||
Air Lease Corp. | 45,957 | 2,364,028 | ||||||
Applied Industrial Technologies, Inc. | 7,752 | 1,531,408 | ||||||
Beacon Roofing Supply, Inc.* | 20,522 | 2,011,567 | ||||||
Boise Cascade Co. | 16,636 | 2,551,463 | ||||||
Core & Main, Inc., Class A* | 51,534 | 2,950,322 | ||||||
GATX Corp. | 8,281 | 1,109,902 | ||||||
GMS, Inc.* | 19,613 | 1,909,129 | ||||||
Herc Holdings, Inc. | 10,949 | 1,842,717 | ||||||
MSC Industrial Direct Co., Inc., Class A | 12,783 | 1,240,462 | ||||||
Rush Enterprises, Inc., Class A | 33,333 | 1,783,982 | ||||||
SiteOne Landscape Supply, Inc.* | 4,866 | 849,360 | ||||||
WESCO International, Inc. | 19,006 | 3,255,348 | ||||||
|
| |||||||
| Total Trading Companies & Distributors | 23,399,688 | |||||||
| Water Utilities – 0.1% | ||||||||
American States Water Co. | 5,829 | 421,087 | ||||||
California Water Service Group | 3,705 | 172,208 | ||||||
|
| |||||||
| Total Water Utilities | 593,295 | |||||||
| Total United States | 823,212,777 | |||||||
| Ghana – 0.1% | ||||||||
| Oil, Gas & Consumable Fuels – 0.1% | ||||||||
Kosmos Energy Ltd.*(a) | 194,873 | 1,161,443 | ||||||
| Puerto Rico – 0.1% | ||||||||
| Banks – 0.1% | ||||||||
First BanCorp | 62,512 | 1,096,460 | ||||||
| Singapore – 0.1% | ||||||||
| Semiconductors & Semiconductor Equipment – 0.1% |
| |||||||
Kulicke & Soffa Industries, Inc. | 9,354 | 470,600 | ||||||
TOTAL COMMON STOCKS (Cost: $685,593,569) |
| 825,941,280 | ||||||
| EXCHANGE-TRADED FUND – 0.1% | ||||||||
| United States – 0.1% | ||||||||
WisdomTree U.S. MidCap Dividend Fund(b) | ||||||||
| (Cost: $688,191) | 17,368 | 847,037 | ||||||
| INVESTMENT OF CASH COLLATERAL FOR SECURITIES LOANED – 0.9% |
| |||||||
| United States – 0.9% |
| |||||||
State Street Navigator Securities Lending Government Money Market Portfolio, 5.34%(c) | ||||||||
| (Cost: $7,552,922) | 7,552,922 | 7,552,922 | ||||||
TOTAL INVESTMENTS IN SECURITIES – 100.8% (Cost: $693,834,682) |
| 834,341,239 | ||||||
Other Assets less Liabilities – (0.8)% | (6,649,011 | ) | ||||||
|
| |||||||
| NET ASSETS – 100.0% |
| $ | 827,692,228 | |||||
| * | Non-income producing security. |
| (a) | Security, or portion thereof, was on loan at March 31, 2024 (See Note 2). At March 31, 2024, the total market value of the Fund’s securities on loan identified in the Schedule of Investments was $63,296,188 and the total market value of the collateral held by the Fund was $64,609,000. The total market value of the collateral includes non-cash U.S. Government securities collateral having a value of $57,056,078. |
| (b) | Affiliated holding. See “Investment in Affiliates” supplementary table included in this Schedule of Investments for additional information. |
| (c) | Rate shown represents annualized 7-day yield as of March 31, 2024. |
| INVESTMENT IN AFFILIATES |
Affiliated holdings are investments in entities in which the Fund owns 5% or more of the outstanding voting securities or are investments in entities which are under common ownership or control. Investments in affiliates during the fiscal year ended March 31, 2024 were as follows:
| Affiliate | Value at 3/31/2023 | Purchases/ Additions | Sales/ Reductions | Realized Gain/(Loss) | Change in Unrealized Appreciation/ Depreciation | Value at 3/31/2024 | Dividend Income | |||||||||||||||||||||
WisdomTree U.S. MidCap Dividend Fund | $ | 685,145 | $ | 5,938,645 | $ | 6,022,193 | $ | 107,167 | $ | 138,273 | $ | 847,037 | $ | 42,181 | ||||||||||||||
See Notes to Financial Statements.
| WisdomTree Trust | 55 |
Schedule of Investments (concluded)
WisdomTree U.S. MidCap Fund (EZM)
March 31, 2024
| FAIR VALUATION SUMMARY |
The following is a summary of the fair valuations according to the inputs used in valuing the Fund’s investments (See Note 2 — Fair Value Measurement):
| Quoted Prices in Active Markets (Level 1) | Other Significant Observable Inputs (Level 2) | Significant Unobservable Inputs (Level 3) | Total | |||||||||||||
Assets: |
| |||||||||||||||
Investments in Securities | ||||||||||||||||
Common Stocks | $ | 825,941,280 | $ | — | $ | — | $ | 825,941,280 | ||||||||
Exchange-Traded Fund | 847,037 | — | — | 847,037 | ||||||||||||
Investment of Cash Collateral for Securities Loaned | — | 7,552,922 | — | 7,552,922 | ||||||||||||
Total Investments in Securities | $ | 826,788,317 | $ | 7,552,922 | $ | — | $ | 834,341,239 | ||||||||
See Notes to Financial Statements.
| 56 | WisdomTree Trust |
Schedule of Investments
WisdomTree U.S. MidCap Quality Growth Fund (QMID)
March 31, 2024
| Investments | Shares | Value | ||||||
| COMMON STOCKS – 99.9% | ||||||||
| United States – 99.9% |
| |||||||
| Aerospace & Defense – 0.5% |
| |||||||
Leonardo DRS, Inc.* | 1,032 | $ | 22,797 | |||||
| Beverages – 2.6% |
| |||||||
Celsius Holdings, Inc.* | 930 | 77,115 | ||||||
Coca-Cola Consolidated, Inc. | 36 | 30,471 | ||||||
|
| |||||||
| Total Beverages |
| 107,586 | ||||||
| Biotechnology – 2.4% |
| |||||||
Exelixis, Inc.* | 1,182 | 28,049 | ||||||
Halozyme Therapeutics, Inc.* | 522 | 21,235 | ||||||
Neurocrine Biosciences, Inc.* | 377 | 51,996 | ||||||
|
| |||||||
| Total Biotechnology |
| 101,280 | ||||||
| Broadline Retail – 0.8% |
| |||||||
Etsy, Inc.* | 497 | 34,154 | ||||||
| Building Products – 4.4% |
| |||||||
AAON, Inc. | 306 | 26,959 | ||||||
Advanced Drainage Systems, Inc. | 306 | 52,706 | ||||||
Simpson Manufacturing Co., Inc. | 168 | 34,470 | ||||||
Trex Co., Inc.* | 420 | 41,895 | ||||||
UFP Industries, Inc. | 240 | 29,522 | ||||||
|
| |||||||
| Total Building Products |
| 185,552 | ||||||
| Capital Markets – 2.2% |
| |||||||
Evercore, Inc., Class A | 149 | 28,696 | ||||||
Houlihan Lokey, Inc. | 264 | 33,842 | ||||||
MarketAxess Holdings, Inc. | 141 | 30,914 | ||||||
|
| |||||||
| Total Capital Markets |
| 93,452 | ||||||
| Chemicals – 0.5% |
| |||||||
Cabot Corp. | 216 | 19,915 | ||||||
| Commercial Services & Supplies – 0.9% |
| |||||||
Tetra Tech, Inc. | 210 | 38,789 | ||||||
| Communications Equipment – 0.7% |
| |||||||
Ubiquiti, Inc. | 240 | 27,804 | ||||||
| Construction & Engineering – 1.9% |
| |||||||
Comfort Systems USA, Inc. | 138 | 43,844 | ||||||
WillScot Mobile Mini Holdings Corp.* | 749 | 34,828 | ||||||
|
| |||||||
| Total Construction & Engineering |
| 78,672 | ||||||
| Construction Materials – 0.9% |
| |||||||
Eagle Materials, Inc. | 137 | 37,230 | ||||||
| Consumer Finance – 1.2% |
| |||||||
Credit Acceptance Corp.* | 48 | 26,474 | ||||||
OneMain Holdings, Inc. | 474 | 24,217 | ||||||
|
| |||||||
| Total Consumer Finance |
| 50,691 | ||||||
| Consumer Staples Distribution & Retail – 2.0% |
| |||||||
BJ’s Wholesale Club Holdings, Inc.* | 516 | 39,036 | ||||||
Performance Food Group Co.* | 594 | 44,336 | ||||||
|
| |||||||
| Total Consumer Staples Distribution & Retail |
| 83,372 | ||||||
| Electrical Equipment – 1.4% |
| |||||||
Atkore, Inc. | 144 | 27,412 | ||||||
Generac Holdings, Inc.* | 246 | 31,030 | ||||||
|
| |||||||
| Total Electrical Equipment |
| 58,442 | ||||||
| Electronic Equipment, Instruments & Components – 1.9% |
| |||||||
Badger Meter, Inc. | 114 | 18,446 | ||||||
Coherent Corp.* | 599 | 36,311 | ||||||
Vontier Corp. | 599 | 27,171 | ||||||
|
| |||||||
| Total Electronic Equipment, Instruments & Components |
| 81,928 | ||||||
| Energy Equipment & Services – 0.6% |
| |||||||
ChampionX Corp. | 750 | 26,917 | ||||||
| Entertainment – 0.7% |
| |||||||
TKO Group Holdings, Inc. | 324 | 27,997 | ||||||
| Food Products – 0.7% |
| |||||||
Darling Ingredients, Inc.* | 630 | 29,301 | ||||||
| Ground Transportation – 2.6% |
| |||||||
Avis Budget Group, Inc. | 148 | 18,124 | ||||||
Landstar System, Inc. | 143 | 27,565 | ||||||
Saia, Inc.* | 108 | 63,180 | ||||||
|
| |||||||
| Total Ground Transportation |
| 108,869 | ||||||
| Health Care Equipment & Supplies – 3.2% |
| |||||||
Inspire Medical Systems, Inc.* | 119 | 25,560 | ||||||
Lantheus Holdings, Inc.* | 270 | 16,805 | ||||||
Penumbra, Inc.* | 145 | 32,361 | ||||||
QuidelOrtho Corp.* | 251 | 12,033 | ||||||
Shockwave Medical, Inc.* | 149 | 48,519 | ||||||
|
| |||||||
| Total Health Care Equipment & Supplies |
| 135,278 | ||||||
| Health Care Providers & Services – 2.6% |
| |||||||
Chemed Corp. | 58 | 37,232 | ||||||
Ensign Group, Inc. | 216 | 26,875 | ||||||
Option Care Health, Inc.* | 684 | 22,941 | ||||||
R1 RCM, Inc.* | 1,644 | 21,175 | ||||||
|
| |||||||
| Total Health Care Providers & Services |
| 108,223 | ||||||
| Hotels, Restaurants & Leisure – 4.0% |
| |||||||
Boyd Gaming Corp. | 390 | 26,255 | ||||||
Choice Hotels International, Inc. | 197 | 24,891 | ||||||
Churchill Downs, Inc. | 288 | 35,640 | ||||||
Texas Roadhouse, Inc. | 258 | 39,853 | ||||||
Wingstop, Inc. | 114 | 41,770 | ||||||
|
| |||||||
| Total Hotels, Restaurants & Leisure |
| 168,409 | ||||||
| Household Durables – 6.0% |
| |||||||
Installed Building Products, Inc. | 113 | 29,237 | ||||||
KB Home | 312 | 22,115 | ||||||
Meritage Homes Corp. | 144 | 25,266 | ||||||
Taylor Morrison Home Corp.* | 426 | 26,484 | ||||||
Tempur Sealy International, Inc. | 690 | 39,206 | ||||||
Toll Brothers, Inc. | 414 | 53,559 | ||||||
TopBuild Corp.* | 126 | 55,532 | ||||||
|
| |||||||
| Total Household Durables |
| 251,399 | ||||||
| Insurance – 1.7% |
| |||||||
Kinsale Capital Group, Inc. | 84 | 44,078 | ||||||
RLI Corp. | 174 | 25,834 | ||||||
|
| |||||||
| Total Insurance |
| 69,912 | ||||||
See Notes to Financial Statements.
| WisdomTree Trust | 57 |
Schedule of Investments (continued)
WisdomTree U.S. MidCap Quality Growth Fund (QMID)
March 31, 2024
| Investments | Shares | Value | ||||||
| Interactive Media & Services – 1.3% |
| |||||||
IAC, Inc.* | 336 | $ | 17,922 | |||||
Match Group, Inc.* | 1,068 | 38,747 | ||||||
|
| |||||||
| Total Interactive Media & Services |
| 56,669 | ||||||
| Leisure Products – 0.5% |
| |||||||
Polaris, Inc. | 228 | 22,827 | ||||||
| Life Sciences Tools & Services – 4.5% |
| |||||||
Bio-Techne Corp. | 618 | 43,501 | ||||||
Charles River Laboratories International, Inc.* | 203 | 55,003 | ||||||
Medpace Holdings, Inc.* | 120 | 48,498 | ||||||
Repligen Corp.* | 222 | 40,830 | ||||||
|
| |||||||
| Total Life Sciences Tools & Services |
| 187,832 | ||||||
| Machinery – 5.0% |
| |||||||
AGCO Corp. | 294 | 36,168 | ||||||
Donaldson Co., Inc. | 468 | 34,950 | ||||||
Franklin Electric Co., Inc. | 180 | 19,226 | ||||||
Lincoln Electric Holdings, Inc. | 222 | 56,708 | ||||||
Mueller Industries, Inc. | 444 | 23,945 | ||||||
Toro Co. | 408 | 37,385 | ||||||
|
| |||||||
| Total Machinery |
| 208,382 | ||||||
| Media – 0.6% |
| |||||||
Nexstar Media Group, Inc. | 137 | 23,604 | ||||||
| Metals & Mining – 2.6% |
| |||||||
Cleveland-Cliffs, Inc.* | 2,040 | 46,390 | ||||||
Commercial Metals Co. | 456 | 26,799 | ||||||
U.S. Steel Corp. | 848 | 34,581 | ||||||
|
| |||||||
| Total Metals & Mining |
| 107,770 | ||||||
| Oil, Gas & Consumable Fuels – 9.0% |
| |||||||
Antero Midstream Corp. | 1,842 | 25,898 | ||||||
APA Corp. | 1,170 | 40,225 | ||||||
Chesapeake Energy Corp. | 498 | 44,237 | ||||||
Chord Energy Corp. | 156 | 27,805 | ||||||
Civitas Resources, Inc. | 360 | 27,328 | ||||||
HF Sinclair Corp. | 713 | 43,044 | ||||||
Magnolia Oil & Gas Corp., Class A | 804 | 20,864 | ||||||
Matador Resources Co. | 456 | 30,447 | ||||||
New Fortress Energy, Inc. | 810 | 24,778 | ||||||
PBF Energy, Inc., Class A | 474 | 27,288 | ||||||
Permian Resources Corp. | 1,962 | 34,649 | ||||||
Range Resources Corp. | 930 | 32,020 | ||||||
|
| |||||||
| Total Oil, Gas & Consumable Fuels |
| 378,583 | ||||||
| Paper & Forest Products – 0.6% |
| |||||||
Louisiana-Pacific Corp. | 282 | 23,663 | ||||||
| Personal Care Products – 1.7% |
| |||||||
BellRing Brands, Inc.* | 504 | 29,751 | ||||||
elf Beauty, Inc.* | 218 | 42,735 | ||||||
|
| |||||||
| Total Personal Care Products |
| 72,486 | ||||||
| Professional Services – 4.2% |
| |||||||
ExlService Holdings, Inc.* | 648 | 20,606 | ||||||
Insperity, Inc. | 144 | 15,784 | ||||||
Paycom Software, Inc. | 235 | 46,767 | ||||||
Paylocity Holding Corp.* | 221 | 37,981 | ||||||
Science Applications International Corp. | 209 | 27,252 | ||||||
TriNet Group, Inc. | 198 | 26,233 | ||||||
|
| |||||||
| Total Professional Services |
| 174,623 | ||||||
| Semiconductors & Semiconductor Equipment – 3.8% |
| |||||||
Allegro MicroSystems, Inc.* | 737 | 19,870 | ||||||
Amkor Technology, Inc. | 948 | 30,563 | ||||||
Lattice Semiconductor Corp.* | 540 | 42,244 | ||||||
Onto Innovation, Inc.* | 186 | 33,681 | ||||||
Universal Display Corp. | 191 | 32,174 | ||||||
|
| |||||||
| Total Semiconductors & Semiconductor Equipment |
| 158,532 | ||||||
| Software – 6.0% |
| |||||||
Appfolio, Inc., Class A* | 137 | 33,803 | ||||||
DocuSign, Inc.* | 825 | 49,129 | ||||||
DoubleVerify Holdings, Inc.* | 616 | 21,658 | ||||||
Dropbox, Inc., Class A* | 1,332 | 32,368 | ||||||
Procore Technologies, Inc.* | 558 | 45,851 | ||||||
Qualys, Inc.* | 135 | 22,527 | ||||||
SPS Commerce, Inc.* | 144 | 26,626 | ||||||
Vertex, Inc., Class A* | 582 | 18,484 | ||||||
|
| |||||||
| Total Software |
| 250,446 | ||||||
| Specialty Retail – 7.4% |
| |||||||
Asbury Automotive Group, Inc.* | 83 | 19,570 | ||||||
Chewy, Inc., Class A* | 1,722 | 27,397 | ||||||
Dick’s Sporting Goods, Inc. | 330 | 74,204 | ||||||
Five Below, Inc.* | 222 | 40,266 | ||||||
Floor & Decor Holdings, Inc., Class A* | 432 | 55,996 | ||||||
Lithia Motors, Inc. | 108 | 32,493 | ||||||
Murphy USA, Inc. | 83 | 34,793 | ||||||
RH* | 77 | 26,816 | ||||||
|
| |||||||
| Total Specialty Retail |
| 311,535 | ||||||
| Technology Hardware, Storage & Peripherals – 1.5% |
| |||||||
Pure Storage, Inc., Class A* | 1,188 | 61,764 | ||||||
| Textiles, Apparel & Luxury Goods – 1.7% |
| |||||||
Crocs, Inc.* | 234 | 33,649 | ||||||
Skechers USA, Inc., Class A* | 588 | 36,021 | ||||||
|
| |||||||
| Total Textiles, Apparel & Luxury Goods |
| 69,670 | ||||||
| Trading Companies & Distributors – 3.1% |
| |||||||
Boise Cascade Co. | 156 | 23,926 | ||||||
Core & Main, Inc., Class A* | 672 | 38,472 | ||||||
SiteOne Landscape Supply, Inc.* | 180 | 31,419 | ||||||
WESCO International, Inc. | 204 | 34,941 | ||||||
|
| |||||||
| Total Trading Companies & Distributors |
| 128,758 | ||||||
| TOTAL INVESTMENTS IN SECURITIES – 99.9% (Cost: $3,877,058) |
| 4,185,113 | ||||||
Other Assets less Liabilities – 0.1% |
| 2,336 | ||||||
|
| |||||||
| NET ASSETS – 100.0% |
| $ | 4,187,449 | |||||
| * | Non-income producing security. |
See Notes to Financial Statements.
| 58 | WisdomTree Trust |
Schedule of Investments (concluded)
WisdomTree U.S. MidCap Quality Growth Fund (QMID)
March 31, 2024
| FAIR VALUATION SUMMARY | ||||||||
The following is a summary of the fair valuations according to the inputs used in valuing the Fund’s investments (See Note 2 — Fair Value Measurement):
| Quoted Prices in Active Markets (Level 1) | Other Significant Observable Inputs (Level 2) | Significant Unobservable Inputs (Level 3) | Total | |||||||||||||
Assets: |
| |||||||||||||||
Investments in Securities | ||||||||||||||||
Common Stocks | $ | 4,185,113 | $ | — | $ | — | $ | 4,185,113 | ||||||||
Total Investments in Securities | $ | 4,185,113 | $ | — | $ | — | $ | 4,185,113 | ||||||||
See Notes to Financial Statements.
| WisdomTree Trust | 59 |
Schedule of Investments
WisdomTree U.S. Multifactor Fund (USMF)
March 31, 2024
| Investments | Shares | Value | ||||||
| COMMON STOCKS – 99.9% |
| |||||||
| United States – 99.9% |
| |||||||
| Aerospace & Defense – 1.6% |
| |||||||
Curtiss-Wright Corp. | 4,682 | $ | 1,198,311 | |||||
Huntington Ingalls Industries, Inc. | 3,663 | 1,067,655 | ||||||
Lockheed Martin Corp. | 2,831 | 1,287,737 | ||||||
Textron, Inc. | 10,916 | 1,047,172 | ||||||
|
| |||||||
| Total Aerospace & Defense |
| 4,600,875 | ||||||
| Automobile Components – 0.9% |
| |||||||
BorgWarner, Inc. | 34,822 | 1,209,716 | ||||||
Lear Corp. | 9,851 | 1,427,213 | ||||||
|
| |||||||
| Total Automobile Components |
| 2,636,929 | ||||||
| Automobiles – 0.4% |
| |||||||
General Motors Co. | 26,778 | 1,214,382 | ||||||
| Banks – 1.0% |
| |||||||
First Citizens BancShares, Inc., Class A | 386 | 631,110 | ||||||
JPMorgan Chase & Co. | 6,495 | 1,300,949 | ||||||
Wells Fargo & Co. | 15,943 | 924,056 | ||||||
|
| |||||||
| Total Banks |
| 2,856,115 | ||||||
| Beverages – 0.6% |
| |||||||
Coca-Cola Consolidated, Inc. | 788 | 666,971 | ||||||
Molson Coors Beverage Co., Class B | 15,497 | 1,042,173 | ||||||
|
| |||||||
| Total Beverages |
| 1,709,144 | ||||||
| Biotechnology – 3.1% |
| |||||||
AbbVie, Inc. | 6,865 | 1,250,116 | ||||||
Amgen, Inc. | 3,587 | 1,019,856 | ||||||
Exelixis, Inc.* | 39,993 | 949,034 | ||||||
Gilead Sciences, Inc. | 14,118 | 1,034,143 | ||||||
Incyte Corp.* | 14,683 | 836,491 | ||||||
Neurocrine Biosciences, Inc.* | 7,191 | 991,783 | ||||||
Regeneron Pharmaceuticals, Inc.* | 1,104 | 1,062,589 | ||||||
United Therapeutics Corp.* | 4,300 | 987,796 | ||||||
Vertex Pharmaceuticals, Inc.* | 2,188 | 914,606 | ||||||
|
| |||||||
| Total Biotechnology |
| 9,046,414 | ||||||
| Broadline Retail – 0.4% |
| |||||||
Dillard’s, Inc., Class A | 2,255 | 1,063,548 | ||||||
| Building Products – 1.0% |
| |||||||
AO Smith Corp. | 11,925 | 1,066,811 | ||||||
Masco Corp. | 11,657 | 919,504 | ||||||
Owens Corning | 5,184 | 864,691 | ||||||
|
| |||||||
| Total Building Products |
| 2,851,006 | ||||||
| Capital Markets – 2.3% |
| |||||||
Ameriprise Financial, Inc. | 2,497 | 1,094,784 | ||||||
Bank of New York Mellon Corp. | 19,347 | 1,114,774 | ||||||
Cboe Global Markets, Inc. | 7,612 | 1,398,553 | ||||||
CME Group, Inc. | 6,144 | 1,322,742 | ||||||
Interactive Brokers Group, Inc., Class A | 9,441 | 1,054,654 | ||||||
LPL Financial Holdings, Inc. | 3,045 | 804,489 | ||||||
|
| |||||||
| Total Capital Markets |
| 6,789,996 | ||||||
| Chemicals – 0.8% |
| |||||||
CF Industries Holdings, Inc. | 11,372 | 946,264 | ||||||
Ecolab, Inc. | 6,128 | 1,414,955 | ||||||
|
| |||||||
| Total Chemicals |
| 2,361,219 | ||||||
| Commercial Services & Supplies – 0.4% |
| |||||||
Waste Management, Inc. | 5,884 | 1,254,175 | ||||||
| Communications Equipment – 4.8% |
| |||||||
Cisco Systems, Inc. | 76,068 | 3,796,554 | ||||||
F5, Inc.* | 19,990 | 3,789,904 | ||||||
Juniper Networks, Inc. | 64,956 | 2,407,270 | ||||||
Motorola Solutions, Inc. | 10,988 | 3,900,520 | ||||||
|
| |||||||
| Total Communications Equipment |
| 13,894,248 | ||||||
| Construction & Engineering – 0.6% |
| |||||||
Comfort Systems USA, Inc. | 1,960 | 622,712 | ||||||
EMCOR Group, Inc. | 2,910 | 1,019,082 | ||||||
|
| |||||||
| Total Construction & Engineering |
| 1,641,794 | ||||||
| Consumer Finance – 0.4% |
| |||||||
American Express Co. | 4,854 | 1,105,207 | ||||||
| Consumer Staples Distribution & Retail – 2.1% |
| |||||||
Albertsons Cos., Inc., Class A | 51,753 | 1,109,584 | ||||||
Casey’s General Stores, Inc. | 3,095 | 985,603 | ||||||
Kroger Co. | 20,605 | 1,177,164 | ||||||
Sysco Corp. | 12,422 | 1,008,418 | ||||||
U.S. Foods Holding Corp.* | 16,831 | 908,369 | ||||||
Walmart, Inc. | 16,611 | 999,484 | ||||||
|
| |||||||
| Total Consumer Staples Distribution & Retail |
| 6,188,622 | ||||||
| Containers & Packaging – 0.9% |
| |||||||
Graphic Packaging Holding Co. | 48,673 | 1,420,278 | ||||||
Packaging Corp. of America | 6,654 | 1,262,796 | ||||||
|
| |||||||
| Total Containers & Packaging |
| 2,683,074 | ||||||
| Diversified Consumer Services – 0.6% |
| |||||||
H&R Block, Inc. | 33,519 | 1,646,118 | ||||||
| Diversified Telecommunication Services – 0.8% |
| |||||||
AT&T, Inc. | 141,624 | 2,492,582 | ||||||
| Electric Utilities – 1.5% |
| |||||||
Entergy Corp. | 10,593 | 1,119,468 | ||||||
NRG Energy, Inc. | 14,513 | 982,385 | ||||||
OGE Energy Corp. | 30,850 | 1,058,155 | ||||||
Pinnacle West Capital Corp. | 14,729 | 1,100,698 | ||||||
|
| |||||||
| Total Electric Utilities |
| 4,260,706 | ||||||
| Electrical Equipment – 0.3% |
| |||||||
Acuity Brands, Inc. | 3,145 | 845,156 | ||||||
| Electronic Equipment, Instruments & Components – 2.9% |
| |||||||
Jabil, Inc. | 13,094 | 1,753,941 | ||||||
TD SYNNEX Corp. | 31,409 | 3,552,358 | ||||||
Vontier Corp. | 69,342 | 3,145,353 | ||||||
|
| |||||||
| Total Electronic Equipment, Instruments & Components |
| 8,451,652 | ||||||
See Notes to Financial Statements.
| 60 | WisdomTree Trust |
Schedule of Investments (continued)
WisdomTree U.S. Multifactor Fund (USMF)
March 31, 2024
| Investments | Shares | Value | ||||||
| Entertainment – 2.5% |
| |||||||
Electronic Arts, Inc. | 23,391 | $ | 3,103,284 | |||||
Netflix, Inc.* | 2,732 | 1,659,226 | ||||||
Walt Disney Co. | 20,178 | 2,468,980 | ||||||
|
| |||||||
| Total Entertainment |
| 7,231,490 | ||||||
| Financial Services – 1.2% |
| |||||||
Apollo Global Management, Inc. | 7,635 | 858,556 | ||||||
Berkshire Hathaway, Inc., Class B* | 3,389 | 1,425,142 | ||||||
Fiserv, Inc.* | 8,352 | 1,334,817 | ||||||
|
| |||||||
| Total Financial Services |
| 3,618,515 | ||||||
| Food Products – 1.7% |
| |||||||
Conagra Brands, Inc. | 33,597 | 995,815 | ||||||
General Mills, Inc. | 15,111 | 1,057,317 | ||||||
Ingredion, Inc. | 8,819 | 1,030,500 | ||||||
Kraft Heinz Co. | 28,351 | 1,046,152 | ||||||
Post Holdings, Inc.* | 9,305 | 988,935 | ||||||
|
| |||||||
| Total Food Products |
| 5,118,719 | ||||||
| Health Care Equipment & Supplies – 1.5% |
| |||||||
Boston Scientific Corp.* | 16,429 | 1,125,222 | ||||||
Hologic, Inc.* | 14,623 | 1,140,009 | ||||||
Stryker Corp. | 2,903 | 1,038,897 | ||||||
Zimmer Biomet Holdings, Inc. | 8,520 | 1,124,469 | ||||||
|
| |||||||
| Total Health Care Equipment & Supplies |
| 4,428,597 | ||||||
| Health Care Providers & Services – 5.7% |
| |||||||
Cardinal Health, Inc. | 9,963 | 1,114,860 | ||||||
Cencora, Inc. | 5,365 | 1,303,641 | ||||||
Centene Corp.* | 12,703 | 996,931 | ||||||
Chemed Corp. | 1,681 | 1,079,084 | ||||||
Cigna Group | 2,159 | 784,127 | ||||||
CVS Health Corp. | 11,992 | 956,482 | ||||||
DaVita, Inc.* | 4,779 | 659,741 | ||||||
Elevance Health, Inc. | 2,049 | 1,062,489 | ||||||
Encompass Health Corp. | 14,394 | 1,188,657 | ||||||
HCA Healthcare, Inc. | 3,110 | 1,037,278 | ||||||
Laboratory Corp. of America Holdings | 5,047 | 1,102,568 | ||||||
McKesson Corp. | 2,017 | 1,082,827 | ||||||
Molina Healthcare, Inc.* | 2,427 | 997,084 | ||||||
Quest Diagnostics, Inc. | 9,176 | 1,221,417 | ||||||
UnitedHealth Group, Inc. | 2,410 | 1,192,227 | ||||||
Universal Health Services, Inc., Class B | 4,793 | 874,531 | ||||||
|
| |||||||
| Total Health Care Providers & Services |
| 16,653,944 | ||||||
| Hotel & Resort REITs – 1.5% |
| |||||||
Host Hotels & Resorts, Inc. | 107,504 | 2,223,183 | ||||||
Ryman Hospitality Properties, Inc. | 19,032 | 2,200,289 | ||||||
|
| |||||||
| Total Hotel & Resort REITs |
| 4,423,472 | ||||||
| Hotels, Restaurants & Leisure – 3.4% |
| |||||||
Aramark | 44,874 | 1,459,302 | ||||||
Chipotle Mexican Grill, Inc.* | 560 | 1,627,791 | ||||||
Darden Restaurants, Inc. | 10,953 | 1,830,794 | ||||||
Domino’s Pizza, Inc. | 2,962 | 1,471,758 | ||||||
Expedia Group, Inc.* | 6,525 | 898,819 | ||||||
Texas Roadhouse, Inc. | 10,640 | 1,643,561 | ||||||
Wingstop, Inc. | 3,142 | 1,151,229 | ||||||
|
| |||||||
| Total Hotels, Restaurants & Leisure |
| 10,083,254 | ||||||
| Household Durables – 0.5% |
| |||||||
PulteGroup, Inc. | 11,724 | 1,414,149 | ||||||
| Household Products – 1.1% |
| |||||||
Colgate-Palmolive Co. | 12,352 | 1,112,297 | ||||||
Kimberly-Clark Corp. | 8,728 | 1,128,967 | ||||||
Procter & Gamble Co. | 6,424 | 1,042,294 | ||||||
|
| |||||||
| Total Household Products |
| 3,283,558 | ||||||
| Independent Power & Renewable Electricity Producers – 0.3% |
| |||||||
Vistra Corp. | 13,606 | 947,658 | ||||||
| Insurance – 8.0% |
| |||||||
Aflac, Inc. | 14,700 | 1,262,142 | ||||||
American Financial Group, Inc. | 9,073 | 1,238,283 | ||||||
Assurant, Inc. | 5,950 | 1,120,028 | ||||||
Brown & Brown, Inc. | 14,889 | 1,303,383 | ||||||
CNA Financial Corp. | 28,115 | 1,276,983 | ||||||
Erie Indemnity Co., Class A | 2,042 | 820,006 | ||||||
Globe Life, Inc. | 10,989 | 1,278,790 | ||||||
Hartford Financial Services Group, Inc. | 13,683 | 1,410,033 | ||||||
Loews Corp. | 18,833 | 1,474,436 | ||||||
Markel Group, Inc.* | 811 | 1,233,920 | ||||||
Marsh & McLennan Cos., Inc. | 6,622 | 1,364,000 | ||||||
Old Republic International Corp. | 42,370 | 1,301,606 | ||||||
Progressive Corp. | 5,025 | 1,039,271 | ||||||
Reinsurance Group of America, Inc. | 6,610 | 1,274,937 | ||||||
RLI Corp. | 7,150 | 1,061,560 | ||||||
Selective Insurance Group, Inc. | 10,743 | 1,172,813 | ||||||
Travelers Cos., Inc. | 5,868 | 1,350,462 | ||||||
Unum Group | 18,402 | 987,451 | ||||||
WR Berkley Corp. | 14,690 | 1,299,184 | ||||||
|
| |||||||
| Total Insurance |
| 23,269,288 | ||||||
| IT Services – 7.4% |
| |||||||
Akamai Technologies, Inc.* | 31,343 | 3,408,865 | ||||||
Cognizant Technology Solutions Corp., Class A | 43,897 | 3,217,211 | ||||||
Gartner, Inc.* | 6,542 | 3,118,375 | ||||||
GoDaddy, Inc., Class A* | 31,409 | 3,727,620 | ||||||
International Business Machines Corp. | 21,435 | 4,093,228 | ||||||
VeriSign, Inc.* | 20,896 | 3,960,001 | ||||||
|
| |||||||
| Total IT Services |
| 21,525,300 | ||||||
| Life Sciences Tools & Services – 0.5% |
| |||||||
Agilent Technologies, Inc. | 5,774 | 840,175 | ||||||
Medpace Holdings, Inc.* | 1,349 | 545,198 | ||||||
|
| |||||||
| Total Life Sciences Tools & Services |
| 1,385,373 | ||||||
| Machinery – 1.4% |
| |||||||
Allison Transmission Holdings, Inc. | 10,456 | 848,609 | ||||||
Donaldson Co., Inc. | 14,466 | 1,080,321 | ||||||
PACCAR, Inc. | 9,669 | 1,197,892 | ||||||
Snap-on, Inc. | 3,621 | 1,072,613 | ||||||
|
| |||||||
| Total Machinery |
| 4,199,435 | ||||||
See Notes to Financial Statements.
| WisdomTree Trust | 61 |
Schedule of Investments (continued)
WisdomTree U.S. Multifactor Fund (USMF)
March 31, 2024
| Investments | Shares | Value | ||||||
| Media – 4.5% |
| |||||||
Comcast Corp., Class A | 64,228 | $ | 2,784,284 | |||||
Fox Corp., Class A | 89,305 | 2,792,567 | ||||||
Liberty Media Corp.-Liberty SiriusXM, Class C* | 67,752 | 2,012,912 | ||||||
New York Times Co., Class A | 58,450 | 2,526,209 | ||||||
Omnicom Group, Inc. | 30,033 | 2,905,993 | ||||||
|
| |||||||
| Total Media |
| 13,021,965 | ||||||
| Metals & Mining – 0.7% |
| |||||||
Reliance, Inc. | 3,276 | 1,094,774 | ||||||
Steel Dynamics, Inc. | 6,288 | 932,070 | ||||||
|
| |||||||
| Total Metals & Mining |
| 2,026,844 | ||||||
| Multi-Utilities – 0.4% |
| |||||||
Consolidated Edison, Inc. | 12,077 | 1,096,712 | ||||||
| Oil, Gas & Consumable Fuels – 4.0% |
| |||||||
APA Corp. | 25,253 | 868,198 | ||||||
Chord Energy Corp. | 6,168 | 1,099,384 | ||||||
Diamondback Energy, Inc. | 5,726 | 1,134,722 | ||||||
EOG Resources, Inc. | 8,593 | 1,098,529 | ||||||
Exxon Mobil Corp. | 11,171 | 1,298,517 | ||||||
HF Sinclair Corp. | 16,082 | 970,870 | ||||||
Marathon Petroleum Corp. | 6,312 | 1,271,868 | ||||||
Ovintiv, Inc. | 14,667 | 761,217 | ||||||
Phillips 66 | 7,944 | 1,297,573 | ||||||
Southwestern Energy Co.* | 106,758 | 809,226 | ||||||
Valero Energy Corp. | 6,950 | 1,186,296 | ||||||
|
| |||||||
| Total Oil, Gas & Consumable Fuels |
| 11,796,400 | ||||||
| Pharmaceuticals – 1.5% |
| |||||||
Bristol-Myers Squibb Co. | 22,338 | 1,211,390 | ||||||
Johnson & Johnson | 8,137 | 1,287,192 | ||||||
Merck & Co., Inc. | 9,222 | 1,216,843 | ||||||
Viatris, Inc. | 63,951 | 763,575 | ||||||
|
| |||||||
| Total Pharmaceuticals |
| 4,479,000 | ||||||
| Professional Services – 3.1% |
| |||||||
Broadridge Financial Solutions, Inc. | 5,522 | 1,131,237 | ||||||
CACI International, Inc., Class A* | 3,070 | 1,163,008 | ||||||
FTI Consulting, Inc.* | 3,086 | 648,955 | ||||||
Jacobs Solutions, Inc. | 6,983 | 1,073,497 | ||||||
Leidos Holdings, Inc. | 7,766 | 1,018,045 | ||||||
Parsons Corp.* | 12,350 | 1,024,433 | ||||||
Science Applications International Corp. | 7,632 | 995,136 | ||||||
TriNet Group, Inc. | 6,464 | 856,415 | ||||||
Verisk Analytics, Inc. | 4,685 | 1,104,395 | ||||||
|
| |||||||
| Total Professional Services |
| 9,015,121 | ||||||
| Retail REITs – 0.8% |
| |||||||
Simon Property Group, Inc. | 14,799 | 2,315,895 | ||||||
| Semiconductors & Semiconductor Equipment – 0.5% |
| |||||||
ON Semiconductor Corp.* | 19,782 | 1,454,966 | ||||||
| Software – 10.7% |
| |||||||
AppLovin Corp., Class A* | 28,526 | 1,974,570 | ||||||
DocuSign, Inc.* | 32,489 | 1,934,720 | ||||||
Dolby Laboratories, Inc., Class A | 36,987 | 3,098,401 | ||||||
Dropbox, Inc., Class A* | 91,377 | 2,220,461 | ||||||
Fair Isaac Corp.* | 2,261 | 2,825,368 | ||||||
Fortinet, Inc.* | 26,828 | 1,832,621 | ||||||
Gen Digital, Inc. | 102,556 | 2,297,254 | ||||||
Manhattan Associates, Inc.* | 11,018 | 2,757,034 | ||||||
Nutanix, Inc., Class A* | 29,742 | 1,835,676 | ||||||
Palo Alto Networks, Inc.* | 5,295 | 1,504,468 | ||||||
Qualys, Inc.* | 14,293 | 2,385,073 | ||||||
Roper Technologies, Inc. | 7,022 | 3,938,219 | ||||||
Salesforce, Inc. | 9,080 | 2,734,715 | ||||||
|
| |||||||
| Total Software |
| 31,338,580 | ||||||
| Specialty Retail – 3.5% |
| |||||||
Abercrombie & Fitch Co., Class A* | 7,068 | 885,832 | ||||||
AutoZone, Inc.* | 518 | 1,632,555 | ||||||
Dick’s Sporting Goods, Inc. | 5,088 | 1,144,088 | ||||||
Murphy USA, Inc. | 4,452 | 1,866,278 | ||||||
TJX Cos., Inc. | 19,070 | 1,934,079 | ||||||
Ulta Beauty, Inc.* | 2,454 | 1,283,148 | ||||||
Williams-Sonoma, Inc. | 4,373 | 1,388,559 | ||||||
|
| |||||||
| Total Specialty Retail |
| 10,134,539 | ||||||
| Technology Hardware, Storage & Peripherals – 2.7% |
| |||||||
Dell Technologies, Inc., Class C | 16,463 | 1,878,593 | ||||||
HP, Inc. | 102,873 | 3,108,822 | ||||||
NetApp, Inc. | 27,376 | 2,873,659 | ||||||
|
| |||||||
| Total Technology Hardware, Storage & Peripherals |
| 7,861,074 | ||||||
| Textiles, Apparel & Luxury Goods – 1.2% |
| |||||||
Deckers Outdoor Corp.* | 1,123 | 1,057,035 | ||||||
Ralph Lauren Corp. | 6,467 | 1,214,244 | ||||||
Skechers USA, Inc., Class A* | 20,264 | 1,241,373 | ||||||
|
| |||||||
| Total Textiles, Apparel & Luxury Goods |
| 3,512,652 | ||||||
| Tobacco – 0.4% |
| |||||||
Altria Group, Inc. | 24,859 | 1,084,350 | ||||||
| Trading Companies & Distributors – 0.7% |
| |||||||
Applied Industrial Technologies, Inc. | 5,052 | 998,023 | ||||||
Core & Main, Inc., Class A* | 18,082 | 1,035,194 | ||||||
|
| |||||||
| Total Trading Companies & Distributors |
| 2,033,217 | ||||||
| Wireless Telecommunication Services – 1.1% |
| |||||||
T-Mobile U.S., Inc. | 19,415 | 3,168,916 | ||||||
| TOTAL INVESTMENTS IN SECURITIES – 99.9% (Cost: $251,306,589) |
| 291,515,945 | ||||||
Other Assets less Liabilities – 0.1% |
| 414,095 | ||||||
|
| |||||||
| NET ASSETS – 100.0% |
| $ | 291,930,040 | |||||
| * | Non-income producing security. |
See Notes to Financial Statements.
| 62 | WisdomTree Trust |
Schedule of Investments (concluded)
WisdomTree U.S. Multifactor Fund (USMF)
March 31, 2024
| FAIR VALUATION SUMMARY | ||||||||||
The following is a summary of the fair valuations according to the inputs used in valuing the Fund’s investments (See Note 2 — Fair Value Measurement):
| Quoted Prices in Active Markets (Level 1) | Other Significant Observable Inputs (Level 2) | Significant Unobservable Inputs (Level 3) | Total | |||||||||||||
Assets: |
| |||||||||||||||
Investments in Securities | ||||||||||||||||
Common Stocks | $ | 291,515,945 | $ | — | $ | — | $ | 291,515,945 | ||||||||
Total Investments in Securities | $ | 291,515,945 | $ | — | $ | — | $ | 291,515,945 | ||||||||
See Notes to Financial Statements.
| WisdomTree Trust | 63 |
Schedule of Investments
WisdomTree U.S. Quality Dividend Growth Fund (DGRW)
March 31, 2024
| Investments | Shares | Value | ||||||
| COMMON STOCKS – 99.9% |
| |||||||
| United States – 99.9% |
| |||||||
| Aerospace & Defense – 2.0% |
| |||||||
BWX Technologies, Inc. | 34,578 | $ | 3,548,394 | |||||
Curtiss-Wright Corp. | 9,435 | 2,414,794 | ||||||
General Dynamics Corp. | 218,028 | 61,590,730 | ||||||
HEICO Corp. | 13,300 | 2,540,300 | ||||||
HEICO Corp., Class A | 11,202 | 1,724,436 | ||||||
Hexcel Corp. | 22,347 | 1,627,979 | ||||||
Howmet Aerospace, Inc. | 72,304 | 4,947,763 | ||||||
Huntington Ingalls Industries, Inc. | 30,498 | 8,889,252 | ||||||
Lockheed Martin Corp. | 272,355 | 123,886,119 | ||||||
Moog, Inc., Class A | 4,389 | 700,704 | ||||||
Northrop Grumman Corp. | 89,840 | 43,002,814 | ||||||
Woodward, Inc. | 13,218 | 2,037,158 | ||||||
|
| |||||||
| Total Aerospace & Defense |
| 256,910,443 | ||||||
| Air Freight & Logistics – 1.9% |
| |||||||
CH Robinson Worldwide, Inc. | 132,972 | 10,124,488 | ||||||
Expeditors International of Washington, Inc. | 62,531 | 7,601,894 | ||||||
FedEx Corp. | 176,960 | 51,272,390 | ||||||
United Parcel Service, Inc., Class B | 1,125,115 | 167,225,843 | ||||||
|
| |||||||
| Total Air Freight & Logistics |
| 236,224,615 | ||||||
| Automobile Components – 0.1% |
| |||||||
BorgWarner, Inc. | 120,224 | 4,176,582 | ||||||
Gentex Corp. | 125,581 | 4,535,986 | ||||||
Lear Corp. | 41,787 | 6,054,100 | ||||||
|
| |||||||
| Total Automobile Components |
| 14,766,668 | ||||||
| Automobiles – 0.0% |
| |||||||
Thor Industries, Inc. | 33,849 | 3,971,842 | ||||||
| Banks – 0.1% |
| |||||||
Western Alliance Bancorp | 95,875 | 6,154,216 | ||||||
| Beverages – 5.2% |
| |||||||
Brown-Forman Corp., Class A | 88,500 | 4,686,075 | ||||||
Brown-Forman Corp., Class B | 191,401 | 9,880,119 | ||||||
Coca-Cola Co. | 5,315,132 | 325,179,776 | ||||||
Coca-Cola Consolidated, Inc. | 1,151 | 974,218 | ||||||
Constellation Brands, Inc., Class A | 102,982 | 27,986,388 | ||||||
PepsiCo, Inc. | 1,629,668 | 285,208,197 | ||||||
|
| |||||||
| Total Beverages |
| 653,914,773 | ||||||
| Biotechnology – 6.3% |
| |||||||
AbbVie, Inc. | 2,697,608 | 491,234,417 | ||||||
Amgen, Inc. | 648,337 | 184,335,176 | ||||||
Gilead Sciences, Inc. | 1,765,186 | 129,299,874 | ||||||
|
| |||||||
| Total Biotechnology |
| 804,869,467 | ||||||
| Broadline Retail – 0.2% |
| |||||||
eBay, Inc. | 460,252 | 24,292,101 | ||||||
| Building Products – 0.6% |
| |||||||
AAON, Inc. | 16,931 | 1,491,621 | ||||||
Advanced Drainage Systems, Inc. | 16,687 | 2,874,169 | ||||||
AO Smith Corp. | 77,067 | 6,894,414 | ||||||
Armstrong World Industries, Inc. | 15,132 | 1,879,697 | ||||||
Carlisle Cos., Inc. | 20,816 | 8,156,750 | ||||||
Carrier Global Corp. | 431,709 | 25,095,244 | ||||||
Fortune Brands Innovations, Inc. | 51,939 | 4,397,675 | ||||||
Lennox International, Inc. | 14,036 | 6,860,235 | ||||||
Masco Corp. | 144,839 | 11,424,900 | ||||||
UFP Industries, Inc. | 14,888 | 1,831,373 | ||||||
Zurn Elkay Water Solutions Corp. | 53,040 | 1,775,249 | ||||||
|
| |||||||
| Total Building Products |
| 72,681,327 | ||||||
| Capital Markets – 5.6% |
| |||||||
Affiliated Managers Group, Inc. | 8,147 | 1,364,378 | ||||||
Ameriprise Financial, Inc. | 58,464 | 25,632,956 | ||||||
Charles Schwab Corp. | 1,039,472 | 75,195,404 | ||||||
Evercore, Inc., Class A | 27,641 | 5,323,380 | ||||||
FactSet Research Systems, Inc. | 12,419 | 5,643,069 | ||||||
Franklin Resources, Inc. | 796,459 | 22,388,462 | ||||||
Goldman Sachs Group, Inc. | 413,549 | 172,735,282 | ||||||
Hamilton Lane, Inc., Class A | 15,630 | 1,762,439 | ||||||
Houlihan Lokey, Inc. | 36,046 | 4,620,737 | ||||||
Jefferies Financial Group, Inc. | 245,614 | 10,831,577 | ||||||
KKR & Co., Inc. | 282,525 | 28,416,365 | ||||||
LPL Financial Holdings, Inc. | 15,465 | 4,085,853 | ||||||
MarketAxess Holdings, Inc. | 15,148 | 3,321,199 | ||||||
Moody’s Corp. | 53,252 | 20,929,634 | ||||||
Morgan Stanley | 2,643,014 | 248,866,198 | ||||||
Morningstar, Inc. | 8,947 | 2,758,986 | ||||||
MSCI, Inc. | 31,290 | 17,536,481 | ||||||
S&P Global, Inc. | 105,393 | 44,839,452 | ||||||
SEI Investments Co. | 55,329 | 3,978,155 | ||||||
Stifel Financial Corp. | 89,339 | 6,983,630 | ||||||
|
| |||||||
| Total Capital Markets |
| 707,213,637 | ||||||
| Chemicals – 1.7% |
| |||||||
Air Products & Chemicals, Inc. | 213,289 | 51,673,526 | ||||||
Ashland, Inc. | 34,974 | 3,405,418 | ||||||
Cabot Corp. | 38,662 | 3,564,636 | ||||||
Celanese Corp. | 81,251 | 13,963,797 | ||||||
DuPont de Nemours, Inc. | 336,637 | 25,809,959 | ||||||
Eastman Chemical Co. | 167,977 | 16,834,655 | ||||||
Ecolab, Inc. | 116,380 | 26,872,142 | ||||||
HB Fuller Co. | 10,539 | 840,380 | ||||||
NewMarket Corp. | 4,355 | 2,763,770 | ||||||
Olin Corp. | 72,275 | 4,249,770 | ||||||
PPG Industries, Inc. | 157,073 | 22,759,878 | ||||||
RPM International, Inc. | 83,056 | 9,879,511 | ||||||
Sherwin-Williams Co. | 81,020 | 28,140,677 | ||||||
Westlake Corp. | 70,901 | 10,833,673 | ||||||
|
| |||||||
| Total Chemicals |
| 221,591,792 | ||||||
| Commercial Services & Supplies – 1.0% |
| |||||||
Cintas Corp. | 36,745 | 25,244,917 | ||||||
Republic Services, Inc. | 156,754 | 30,008,986 | ||||||
Rollins, Inc. | 259,444 | 12,004,474 | ||||||
Tetra Tech, Inc. | 11,256 | 2,079,096 | ||||||
Waste Management, Inc. | 251,706 | 53,651,134 | ||||||
|
| |||||||
| Total Commercial Services & Supplies |
| 122,988,607 | ||||||
See Notes to Financial Statements.
| 64 | WisdomTree Trust |
Schedule of Investments (continued)
WisdomTree U.S. Quality Dividend Growth Fund (DGRW)
March 31, 2024
| Investments | Shares | Value | ||||||
| Communications Equipment – 2.2% |
| |||||||
Cisco Systems, Inc. | 5,069,347 | $ | 253,011,109 | |||||
Motorola Solutions, Inc. | 75,744 | 26,887,605 | ||||||
|
| |||||||
| Total Communications Equipment |
| 279,898,714 | ||||||
| Construction & Engineering – 0.1% |
| |||||||
Comfort Systems USA, Inc. | 7,601 | 2,414,914 | ||||||
Quanta Services, Inc. | 23,368 | 6,071,006 | ||||||
|
| |||||||
| Total Construction & Engineering |
| 8,485,920 | ||||||
| Construction Materials – 0.2% |
| |||||||
Eagle Materials, Inc. | 9,581 | 2,603,637 | ||||||
Martin Marietta Materials, Inc. | 14,741 | 9,050,089 | ||||||
Vulcan Materials Co. | 37,311 | 10,182,918 | ||||||
|
| |||||||
| Total Construction Materials |
| 21,836,644 | ||||||
| Consumer Finance – 1.7% |
| |||||||
Ally Financial, Inc. | 421,406 | 17,104,870 | ||||||
American Express Co. | 388,930 | 88,555,472 | ||||||
Capital One Financial Corp. | 296,090 | 44,084,840 | ||||||
Discover Financial Services | 256,706 | 33,651,589 | ||||||
FirstCash Holdings, Inc. | 18,161 | 2,316,254 | ||||||
OneMain Holdings, Inc. | 189,862 | 9,700,050 | ||||||
Synchrony Financial | 445,753 | 19,220,869 | ||||||
|
| |||||||
| Total Consumer Finance |
| 214,633,944 | ||||||
| Consumer Staples Distribution & Retail – 1.7% |
| |||||||
Casey’s General Stores, Inc. | 7,891 | 2,512,889 | ||||||
Costco Wholesale Corp. | 109,570 | 80,274,269 | ||||||
Sysco Corp. | 526,728 | 42,759,779 | ||||||
Target Corp. | 522,280 | 92,553,239 | ||||||
|
| |||||||
| Total Consumer Staples Distribution & Retail |
| 218,100,176 | ||||||
| Containers & Packaging – 0.2% |
| |||||||
Avery Dennison Corp. | 46,189 | 10,311,694 | ||||||
Ball Corp. | 160,493 | 10,810,809 | ||||||
Berry Global Group, Inc. | 64,602 | 3,907,129 | ||||||
Sealed Air Corp. | 103,679 | 3,856,859 | ||||||
|
| |||||||
| Total Containers & Packaging |
| 28,886,491 | ||||||
| Distributors – 0.3% |
| |||||||
Genuine Parts Co. | 146,416 | 22,684,231 | ||||||
LKQ Corp. | 258,899 | 13,827,795 | ||||||
Pool Corp. | 16,098 | 6,495,543 | ||||||
|
| |||||||
| Total Distributors |
| 43,007,569 | ||||||
| Electric Utilities – 0.1% |
| |||||||
NRG Energy, Inc. | 248,267 | 16,805,193 | ||||||
| Electrical Equipment – 0.3% |
| |||||||
Hubbell, Inc. | 31,441 | 13,049,587 | ||||||
Rockwell Automation, Inc. | 73,233 | 21,334,970 | ||||||
Vertiv Holdings Co. | 65,599 | 5,357,470 | ||||||
|
| |||||||
| Total Electrical Equipment |
| 39,742,027 | ||||||
| Electronic Equipment, Instruments & Components – 0.4% |
| |||||||
Amphenol Corp., Class A | 217,224 | 25,056,788 | ||||||
Avnet, Inc. | 81,679 | 4,049,645 | ||||||
Badger Meter, Inc. | 2,427 | 392,713 | ||||||
CDW Corp. | 56,984 | 14,575,368 | ||||||
Jabil, Inc. | 25,600 | 3,429,120 | ||||||
Littelfuse, Inc. | 5,314 | 1,287,848 | ||||||
Vontier Corp. | 42,159 | 1,912,332 | ||||||
|
| |||||||
| Total Electronic Equipment, Instruments & Components |
| 50,703,814 | ||||||
| Energy Equipment & Services – 0.4% |
| |||||||
Baker Hughes Co. | 880,365 | 29,492,227 | ||||||
ChampionX Corp. | 64,212 | 2,304,569 | ||||||
Halliburton Co. | 569,752 | 22,459,624 | ||||||
|
| |||||||
| Total Energy Equipment & Services |
| 54,256,420 | ||||||
| Entertainment – 0.0% |
| |||||||
TKO Group Holdings, Inc. | 21,450 | 1,853,495 | ||||||
| Financial Services – 2.1% |
| |||||||
Equitable Holdings, Inc. | 345,261 | 13,123,371 | ||||||
Jack Henry & Associates, Inc. | 34,253 | 5,950,774 | ||||||
Mastercard, Inc., Class A | 202,460 | 97,498,662 | ||||||
PennyMac Financial Services, Inc. | 14,319 | 1,304,318 | ||||||
Visa, Inc., Class A | 511,607 | 142,779,281 | ||||||
Voya Financial, Inc. | 82,345 | 6,086,942 | ||||||
|
| |||||||
| Total Financial Services |
| 266,743,348 | ||||||
| Food Products – 0.3% |
| |||||||
Hershey Co. | 136,822 | 26,611,879 | ||||||
Lamb Weston Holdings, Inc. | 52,888 | 5,634,159 | ||||||
|
| |||||||
| Total Food Products |
| 32,246,038 | ||||||
| Gas Utilities – 0.1% |
| |||||||
National Fuel Gas Co. | 110,478 | 5,934,878 | ||||||
| Ground Transportation – 1.9% |
| |||||||
CSX Corp. | 983,120 | 36,444,259 | ||||||
JB Hunt Transport Services, Inc. | 31,063 | 6,189,303 | ||||||
Landstar System, Inc. | 21,340 | 4,113,498 | ||||||
Norfolk Southern Corp. | 206,975 | 52,751,718 | ||||||
Old Dominion Freight Line, Inc. | 38,263 | 8,391,459 | ||||||
Schneider National, Inc., Class B | 60,522 | 1,370,218 | ||||||
Union Pacific Corp. | 529,241 | 130,156,239 | ||||||
|
| |||||||
| Total Ground Transportation |
| 239,416,694 | ||||||
| Health Care Equipment & Supplies – 1.7% |
| |||||||
Abbott Laboratories | 1,292,482 | 146,903,504 | ||||||
ResMed, Inc. | 55,358 | 10,962,545 | ||||||
Stryker Corp. | 148,252 | 53,054,943 | ||||||
|
| |||||||
| Total Health Care Equipment & Supplies |
| 210,920,992 | ||||||
| Health Care Providers & Services – 3.6% |
| |||||||
Chemed Corp. | 2,870 | 1,842,339 | ||||||
Cigna Group | 215,988 | 78,444,682 | ||||||
Elevance Health, Inc. | 107,240 | 55,608,230 | ||||||
Encompass Health Corp. | 33,985 | 2,806,481 | ||||||
HCA Healthcare, Inc. | 95,021 | 31,692,354 | ||||||
Humana, Inc. | 35,601 | 12,343,579 | ||||||
Laboratory Corp. of America Holdings | 39,000 | 8,519,940 | ||||||
McKesson Corp. | 26,342 | 14,141,703 | ||||||
UnitedHealth Group, Inc. | 491,302 | 243,047,099 | ||||||
Universal Health Services, Inc., Class B | 13,372 | 2,439,855 | ||||||
|
| |||||||
| Total Health Care Providers & Services |
| 450,886,262 | ||||||
See Notes to Financial Statements.
| WisdomTree Trust | 65 |
Schedule of Investments (continued)
WisdomTree U.S. Quality Dividend Growth Fund (DGRW)
March 31, 2024
| Investments | Shares | Value | ||||||
| Hotels, Restaurants & Leisure – 3.5% |
| |||||||
Aramark | 103,324 | $ | 3,360,096 | |||||
Boyd Gaming Corp. | 42,300 | 2,847,636 | ||||||
Churchill Downs, Inc. | 15,468 | 1,914,165 | ||||||
Darden Restaurants, Inc. | 145,611 | 24,338,879 | ||||||
Domino’s Pizza, Inc. | 15,087 | 7,496,428 | ||||||
Hilton Worldwide Holdings, Inc. | 49,245 | 10,504,451 | ||||||
Hyatt Hotels Corp., Class A | 10,176 | 1,624,293 | ||||||
Las Vegas Sands Corp. | 540,889 | 27,963,961 | ||||||
Marriott International, Inc., Class A | 119,203 | 30,076,109 | ||||||
McDonald’s Corp. | 659,402 | 185,918,394 | ||||||
Starbucks Corp. | 1,121,182 | 102,464,823 | ||||||
Texas Roadhouse, Inc. | 47,192 | 7,289,748 | ||||||
Wendy’s Co. | 348,650 | 6,568,566 | ||||||
Wyndham Hotels & Resorts, Inc. | 43,633 | 3,348,833 | ||||||
Yum! Brands, Inc. | 207,844 | 28,817,571 | ||||||
|
| |||||||
| Total Hotels, Restaurants & Leisure |
| 444,533,953 | ||||||
| Household Durables – 0.4% |
| |||||||
DR Horton, Inc. | 115,738 | 19,044,688 | ||||||
Installed Building Products, Inc. | 6,864 | 1,775,923 | ||||||
Lennar Corp., Class A | 106,384 | 18,295,920 | ||||||
Lennar Corp., Class B | 9,227 | 1,422,619 | ||||||
PulteGroup, Inc. | 67,530 | 8,145,468 | ||||||
|
| |||||||
| Total Household Durables |
| 48,684,618 | ||||||
| Household Products – 4.0% |
| |||||||
Colgate-Palmolive Co. | 772,056 | 69,523,643 | ||||||
Kimberly-Clark Corp. | 476,740 | 61,666,319 | ||||||
Procter & Gamble Co. | 2,301,760 | 373,460,560 | ||||||
Reynolds Consumer Products, Inc. | 270,626 | 7,729,078 | ||||||
|
| |||||||
| Total Household Products |
| 512,379,600 | ||||||
| Independent Power & Renewable Electricity Producers – 0.0% |
| |||||||
Ormat Technologies, Inc. | 24,997 | 1,654,551 | ||||||
| Industrial Conglomerates – 1.1% |
| |||||||
General Electric Co. | 187,813 | 32,966,816 | ||||||
Honeywell International, Inc. | 547,439 | 112,361,855 | ||||||
|
| |||||||
| Total Industrial Conglomerates |
| 145,328,671 | ||||||
| Insurance – 2.4% |
| |||||||
American International Group, Inc. | 580,090 | 45,345,635 | ||||||
Arthur J Gallagher & Co. | 72,391 | 18,100,646 | ||||||
Erie Indemnity Co., Class A | 25,790 | 10,356,490 | ||||||
Fidelity National Financial, Inc. | 422,208 | 22,419,245 | ||||||
First American Financial Corp. | 135,647 | 8,281,249 | ||||||
Hartford Financial Services Group, Inc. | 268,883 | 27,708,393 | ||||||
Kinsale Capital Group, Inc. | 3,278 | 1,720,098 | ||||||
Marsh & McLennan Cos., Inc. | 272,061 | 56,039,125 | ||||||
Primerica, Inc. | 15,663 | 3,962,113 | ||||||
Principal Financial Group, Inc. | 329,185 | 28,411,957 | ||||||
Progressive Corp. | 104,927 | 21,701,002 | ||||||
RLI Corp. | 31,736 | 4,711,844 | ||||||
Selective Insurance Group, Inc. | 23,438 | 2,558,726 | ||||||
Travelers Cos., Inc. | 186,759 | 42,980,716 | ||||||
WR Berkley Corp. | 175,297 | 15,503,267 | ||||||
|
| |||||||
| Total Insurance |
| 309,800,506 | ||||||
| Interactive Media & Services – 1.4% |
| |||||||
Meta Platforms, Inc., Class A | 362,175 | 175,864,937 | ||||||
| Life Sciences Tools & Services – 0.2% |
| |||||||
Agilent Technologies, Inc. | 77,904 | 11,335,811 | ||||||
Bio-Techne Corp. | 21,882 | 1,540,274 | ||||||
Bruker Corp. | 18,942 | 1,779,411 | ||||||
West Pharmaceutical Services, Inc. | 13,694 | 5,418,853 | ||||||
|
| |||||||
| Total Life Sciences Tools & Services |
| 20,074,349 | ||||||
| Machinery – 1.5% |
| |||||||
Allison Transmission Holdings, Inc. | 45,078 | 3,658,530 | ||||||
Donaldson Co., Inc. | 63,348 | 4,730,829 | ||||||
Dover Corp. | 74,592 | 13,216,956 | ||||||
Federal Signal Corp. | 7,651 | 649,340 | ||||||
Flowserve Corp. | 97,729 | 4,464,261 | ||||||
Graco, Inc. | 69,098 | 6,457,899 | ||||||
Illinois Tool Works, Inc. | 264,811 | 71,056,736 | ||||||
ITT, Inc. | 29,194 | 3,971,260 | ||||||
Lincoln Electric Holdings, Inc. | 30,561 | 7,806,502 | ||||||
Nordson Corp. | 23,440 | 6,435,218 | ||||||
Otis Worldwide Corp. | 245,364 | 24,357,284 | ||||||
Parker-Hannifin Corp. | 66,101 | 36,738,275 | ||||||
Toro Co. | 63,523 | 5,820,612 | ||||||
|
| |||||||
| Total Machinery |
| 189,363,702 | ||||||
| Media – 0.1% |
| |||||||
Nexstar Media Group, Inc. | 49,310 | 8,495,620 | ||||||
| Metals & Mining – 0.0% |
| |||||||
Alpha Metallurgical Resources, Inc. | 3,159 | 1,046,166 | ||||||
Royal Gold, Inc. | 23,744 | 2,892,257 | ||||||
|
| |||||||
| Total Metals & Mining |
| 3,938,423 | ||||||
| Oil, Gas & Consumable Fuels – 3.3% |
| |||||||
Civitas Resources, Inc. | 155,412 | 11,797,325 | ||||||
ConocoPhillips | 943,797 | 120,126,482 | ||||||
Diamondback Energy, Inc. | 150,985 | 29,920,697 | ||||||
EOG Resources, Inc. | 938,924 | 120,032,044 | ||||||
EQT Corp. | 195,086 | 7,231,838 | ||||||
Equitrans Midstream Corp. | 636,439 | 7,949,123 | ||||||
Hess Corp. | 144,923 | 22,121,047 | ||||||
Magnolia Oil & Gas Corp., Class A(a) | 151,472 | 3,930,698 | ||||||
Marathon Oil Corp. | 410,159 | 11,623,906 | ||||||
Matador Resources Co. | 60,781 | 4,058,347 | ||||||
Murphy Oil Corp. | 126,335 | 5,773,509 | ||||||
New Fortress Energy, Inc.(a) | 59,128 | 1,808,725 | ||||||
Occidental Petroleum Corp. | 430,945 | 28,007,116 | ||||||
Ovintiv, Inc. | 277,642 | 14,409,620 | ||||||
Permian Resources Corp. | 248,650 | 4,391,159 | ||||||
Range Resources Corp. | 78,999 | 2,719,936 | ||||||
SM Energy Co. | 67,035 | 3,341,695 | ||||||
Targa Resources Corp. | 180,911 | 20,260,223 | ||||||
Texas Pacific Land Corp. | 6,403 | 3,704,200 | ||||||
|
| |||||||
| Total Oil, Gas & Consumable Fuels |
| 423,207,690 | ||||||
| Paper & Forest Products – 0.0% |
| |||||||
Louisiana-Pacific Corp. | 28,532 | 2,394,120 | ||||||
See Notes to Financial Statements.
| 66 | WisdomTree Trust |
Schedule of Investments (continued)
WisdomTree U.S. Quality Dividend Growth Fund (DGRW)
March 31, 2024
| Investments | Shares | Value | ||||||
| Personal Care Products – 0.0% |
| |||||||
Inter Parfums, Inc. | 17,915 | $ | 2,517,237 | |||||
| Pharmaceuticals – 5.4% |
| |||||||
Eli Lilly & Co. | 275,739 | 214,513,913 | ||||||
Johnson & Johnson | 2,816,186 | 445,492,463 | ||||||
Zoetis, Inc. | 159,535 | 26,994,917 | ||||||
|
| |||||||
| Total Pharmaceuticals |
| 687,001,293 | ||||||
| Professional Services – 1.7% |
| |||||||
Automatic Data Processing, Inc. | 393,785 | 98,343,866 | ||||||
Booz Allen Hamilton Holding Corp. | 70,804 | 10,510,146 | ||||||
Broadridge Financial Solutions, Inc. | 73,354 | 15,027,300 | ||||||
Concentrix Corp. | 30,683 | 2,031,828 | ||||||
Equifax, Inc. | 31,514 | 8,430,625 | ||||||
Exponent, Inc. | 17,085 | 1,412,759 | ||||||
Insperity, Inc. | 18,279 | 2,003,561 | ||||||
ManpowerGroup, Inc. | 68,946 | 5,352,967 | ||||||
Maximus, Inc. | 27,024 | 2,267,314 | ||||||
Paychex, Inc. | 399,710 | 49,084,388 | ||||||
Paycom Software, Inc. | 17,664 | 3,515,313 | ||||||
Robert Half, Inc. | 81,033 | 6,424,296 | ||||||
SS&C Technologies Holdings, Inc. | 151,989 | 9,783,532 | ||||||
Verisk Analytics, Inc. | 30,963 | 7,298,908 | ||||||
|
| |||||||
| Total Professional Services |
| 221,486,803 | ||||||
| Semiconductors & Semiconductor Equipment – 11.2% |
| |||||||
Amkor Technology, Inc. | 83,686 | 2,698,037 | ||||||
Analog Devices, Inc. | 356,703 | 70,552,286 | ||||||
Applied Materials, Inc. | 270,915 | 55,870,801 | ||||||
Broadcom, Inc. | 345,480 | 457,902,647 | ||||||
KLA Corp. | 54,140 | 37,820,580 | ||||||
Lam Research Corp. | 56,033 | 54,439,982 | ||||||
Monolithic Power Systems, Inc. | 11,628 | 7,877,040 | ||||||
NVIDIA Corp. | 396,534 | 358,292,261 | ||||||
Power Integrations, Inc. | 7,326 | 524,175 | ||||||
QUALCOMM, Inc. | 949,734 | 160,789,966 | ||||||
Skyworks Solutions, Inc. | 152,773 | 16,548,371 | ||||||
Teradyne, Inc. | 23,687 | 2,672,604 | ||||||
Texas Instruments, Inc. | 1,116,970 | 194,587,344 | ||||||
Universal Display Corp. | 13,523 | 2,277,949 | ||||||
|
| |||||||
| Total Semiconductors & Semiconductor Equipment |
| 1,422,854,043 | ||||||
| Software – 9.7% |
| |||||||
Bentley Systems, Inc., Class B | 42,776 | 2,233,763 | ||||||
Dolby Laboratories, Inc., Class A | 23,351 | 1,956,113 | ||||||
Gen Digital, Inc. | 486,909 | 10,906,761 | ||||||
Intuit, Inc. | 69,312 | 45,052,800 | ||||||
Microsoft Corp. | 2,361,861 | 993,682,160 | ||||||
Oracle Corp. | 1,445,116 | 181,521,021 | ||||||
|
| |||||||
| Total Software |
| 1,235,352,618 | ||||||
| Specialized REITs – 0.3% |
| |||||||
SBA Communications Corp. | 53,798 | 11,658,026 | ||||||
Weyerhaeuser Co. | 666,048 | 23,917,784 | ||||||
|
| |||||||
| Total Specialized REITs |
| 35,575,810 | ||||||
| Specialty Retail – 4.4% |
| |||||||
Academy Sports & Outdoors, Inc. | 14,527 | 981,153 | ||||||
American Eagle Outfitters, Inc. | 127,060 | 3,276,877 | ||||||
Best Buy Co., Inc. | 346,328 | 28,409,286 | ||||||
Dick’s Sporting Goods, Inc. | 64,788 | 14,568,230 | ||||||
Home Depot, Inc. | 1,015,092 | 389,389,291 | ||||||
Murphy USA, Inc. | 3,670 | 1,538,464 | ||||||
Ross Stores, Inc. | 131,018 | 19,228,202 | ||||||
TJX Cos., Inc. | 689,077 | 69,886,189 | ||||||
Tractor Supply Co.(a) | 81,664 | 21,373,102 | ||||||
Williams-Sonoma, Inc. | 42,971 | 13,644,582 | ||||||
|
| |||||||
| Total Specialty Retail |
| 562,295,376 | ||||||
| Technology Hardware, Storage & Peripherals – 4.8% |
| |||||||
Apple, Inc. | 3,228,210 | 553,573,451 | ||||||
HP, Inc. | 1,311,236 | 39,625,552 | ||||||
NetApp, Inc. | 152,427 | 16,000,262 | ||||||
|
| |||||||
| Total Technology Hardware, Storage & Peripherals |
| 609,199,265 | ||||||
| Textiles, Apparel & Luxury Goods – 0.7% |
| |||||||
Columbia Sportswear Co.(a) | 25,809 | 2,095,175 | ||||||
NIKE, Inc., Class B | 647,323 | 60,835,415 | ||||||
PVH Corp. | 11,742 | 1,651,043 | ||||||
Ralph Lauren Corp. | 36,143 | 6,786,210 | ||||||
Tapestry, Inc. | 363,919 | 17,278,874 | ||||||
|
| |||||||
| Total Textiles, Apparel & Luxury Goods |
| 88,646,717 | ||||||
| Trading Companies & Distributors – 0.8% |
| |||||||
Applied Industrial Technologies, Inc. | 10,199 | 2,014,812 | ||||||
Boise Cascade Co. | 7,966 | 1,221,745 | ||||||
Fastenal Co. | 489,233 | 37,739,434 | ||||||
MSC Industrial Direct Co., Inc., Class A | 50,062 | 4,858,016 | ||||||
United Rentals, Inc. | 32,705 | 23,583,903 | ||||||
Watsco, Inc.(a) | 28,378 | 12,258,445 | ||||||
WESCO International, Inc. | 10,251 | 1,755,791 | ||||||
WW Grainger, Inc. | 17,339 | 17,638,965 | ||||||
|
| |||||||
| Total Trading Companies & Distributors |
| 101,071,111 | ||||||
| Wireless Telecommunication Services – 1.0% |
| |||||||
T-Mobile U.S., Inc. | 763,291 | 124,584,358 | ||||||
TOTAL COMMON STOCKS (Cost: $10,239,682,988) |
| 12,686,243,478 | ||||||
| INVESTMENT OF CASH COLLATERAL FOR SECURITIES LOANED – 0.0% |
| |||||||
| United States – 0.0% |
| |||||||
State Street Navigator Securities Lending Government Money Market Portfolio, 5.34%(b) | ||||||||
| (Cost: $5,269,346) | 5,269,346 | 5,269,346 | ||||||
TOTAL INVESTMENTS IN SECURITIES – 99.9% (Cost: $10,244,952,334) |
| 12,691,512,824 | ||||||
Other Assets less Liabilities – 0.1% |
| 10,074,355 | ||||||
|
| |||||||
| NET ASSETS – 100.0% |
| $ | 12,701,587,179 | |||||
| (a) | Security, or portion thereof, was on loan at March 31, 2024 (See Note 2). At March 31, 2024, the total market value of the Fund’s securities on loan identified in the Schedule of Investments was $25,456,706 and the total market value of the collateral held by the Fund was $26,061,116. The total market value of the collateral includes non-cash U.S. Government securities collateral having a value of $20,791,770. |
| (b) | Rate shown represents annualized 7-day yield as of March 31, 2024. |
See Notes to Financial Statements.
| WisdomTree Trust | 67 |
Schedule of Investments (concluded)
WisdomTree U.S. Quality Dividend Growth Fund (DGRW)
March 31, 2024
| FAIR VALUATION SUMMARY | ||||||||
The following is a summary of the fair valuations according to the inputs used in valuing the Fund’s investments (See Note 2 — Fair Value Measurement):
| Quoted Prices in Active Markets (Level 1) | Other Significant Observable Inputs (Level 2) | Significant Unobservable Inputs (Level 3) | Total | |||||||||||||
Assets: |
| |||||||||||||||
Investments in Securities | ||||||||||||||||
Common Stocks | $ | 12,686,243,478 | $ | — | $ | — | $ | 12,686,243,478 | ||||||||
Investment of Cash Collateral for Securities Loaned | — | 5,269,346 | — | 5,269,346 | ||||||||||||
Total Investments in Securities | $ | 12,686,243,478 | $ | 5,269,346 | $ | — | $ | 12,691,512,824 | ||||||||
See Notes to Financial Statements.
| 68 | WisdomTree Trust |
Schedule of Investments
WisdomTree U.S. Quality Growth Fund (QGRW)
March 31, 2024
Investments | Shares | Value | ||||||
| COMMON STOCKS – 99.9% |
| |||||||
| United States – 99.5% |
| |||||||
| Aerospace & Defense – 0.4% |
| |||||||
Axon Enterprise, Inc.* | 4,748 | $ | 1,485,554 | |||||
| Automobiles – 2.6% |
| |||||||
Tesla, Inc.* | 52,371 | 9,206,298 | ||||||
| Beverages – 0.5% |
| |||||||
Monster Beverage Corp.* | 31,973 | 1,895,359 | ||||||
| Biotechnology – 1.3% |
| |||||||
Incyte Corp.* | 3,687 | 210,049 | ||||||
Moderna, Inc.* | 16,647 | 1,773,904 | ||||||
Vertex Pharmaceuticals, Inc.* | 6,436 | 2,690,312 | ||||||
|
| |||||||
| Total Biotechnology |
| 4,674,265 | ||||||
| Broadline Retail – 5.6% |
| |||||||
Amazon.com, Inc.* | 107,797 | 19,444,423 | ||||||
| Building Products – 0.2% |
| |||||||
Builders FirstSource, Inc.* | 2,078 | 433,367 | ||||||
Lennox International, Inc. | 647 | 316,228 | ||||||
|
| |||||||
| Total Building Products |
| 749,595 | ||||||
| Capital Markets – 2.7% |
| |||||||
Blackstone, Inc. | 26,203 | 3,442,288 | ||||||
FactSet Research Systems, Inc. | 2,487 | 1,130,068 | ||||||
LPL Financial Holdings, Inc. | 1,332 | 351,914 | ||||||
MSCI, Inc. | 2,860 | 1,602,887 | ||||||
S&P Global, Inc. | 6,939 | 2,952,198 | ||||||
|
| |||||||
| Total Capital Markets |
| 9,479,355 | ||||||
| Chemicals – 0.6% |
| |||||||
Celanese Corp. | 2,006 | 344,751 | ||||||
CF Industries Holdings, Inc. | 3,387 | 281,832 | ||||||
Dow, Inc. | 27,257 | 1,578,998 | ||||||
|
| |||||||
| Total Chemicals |
| 2,205,581 | ||||||
| Commercial Services & Supplies – 0.9% |
| |||||||
Copart, Inc.* | 32,602 | 1,888,308 | ||||||
Rollins, Inc. | 27,832 | 1,287,787 | ||||||
|
| |||||||
| Total Commercial Services & Supplies |
| 3,176,095 | ||||||
| Communications Equipment – 0.7% |
| |||||||
Arista Networks, Inc.* | 8,821 | 2,557,914 | ||||||
| Distributors – 0.1% |
| |||||||
Pool Corp. | 675 | 272,363 | ||||||
| Electrical Equipment – 0.1% |
| |||||||
Vertiv Holdings Co. | 6,161 | 503,169 | ||||||
| Electronic Equipment, Instruments & Components – 0.4% |
| |||||||
Keysight Technologies, Inc.* | 8,920 | 1,394,910 | ||||||
| Entertainment – 1.6% |
| |||||||
Netflix, Inc.* | 8,861 | 5,381,551 | ||||||
Roku, Inc.* | 1,341 | 87,393 | ||||||
|
| |||||||
| Total Entertainment |
| 5,468,944 | ||||||
| Financial Services – 5.7% |
| |||||||
Block, Inc.* | 22,417 | 1,896,030 | ||||||
Mastercard, Inc., Class A | 17,000 | 8,186,690 | ||||||
Visa, Inc., Class A | 35,406 | 9,881,106 | ||||||
|
| |||||||
| Total Financial Services |
| 19,963,826 | ||||||
| Food Products – 0.1% |
| |||||||
Lamb Weston Holdings, Inc. | 2,376 | 253,115 | ||||||
| Ground Transportation – 0.8% |
| |||||||
JB Hunt Transport Services, Inc. | 6,077 | 1,210,842 | ||||||
Old Dominion Freight Line, Inc. | 7,716 | 1,692,196 | ||||||
|
| |||||||
| Total Ground Transportation |
| 2,903,038 | ||||||
| Health Care Equipment & Supplies – 2.6% |
| |||||||
Dexcom, Inc.* | 13,213 | 1,832,643 | ||||||
Edwards Lifesciences Corp.* | 21,451 | 2,049,858 | ||||||
IDEXX Laboratories, Inc.* | 2,794 | 1,508,564 | ||||||
Insulet Corp.* | 1,242 | 212,879 | ||||||
Intuitive Surgical, Inc.* | 8,432 | 3,365,127 | ||||||
|
| |||||||
| Total Health Care Equipment & Supplies |
| 8,969,071 | ||||||
| Health Care Providers & Services – 0.4% |
| |||||||
Molina Healthcare, Inc.* | 3,150 | 1,294,115 | ||||||
| Health Care Technology – 0.5% |
| |||||||
Veeva Systems, Inc., Class A* | 7,152 | 1,657,047 | ||||||
| Hotels, Restaurants & Leisure – 3.3% |
| |||||||
Booking Holdings, Inc. | 806 | 2,924,071 | ||||||
Chipotle Mexican Grill, Inc.* | 799 | 2,322,509 | ||||||
Domino’s Pizza, Inc. | 643 | 319,494 | ||||||
DoorDash, Inc., Class A* | 14,937 | 2,057,124 | ||||||
Starbucks Corp. | 25,414 | 2,322,585 | ||||||
Yum! Brands, Inc. | 11,324 | 1,570,073 | ||||||
|
| |||||||
| Total Hotels, Restaurants & Leisure |
| 11,515,856 | ||||||
| Household Durables – 0.6% |
| |||||||
DR Horton, Inc. | 11,811 | 1,943,500 | ||||||
| Insurance – 0.1% |
| |||||||
Erie Indemnity Co., Class A | 751 | 301,579 | ||||||
| Interactive Media & Services – 12.2% |
| |||||||
Alphabet, Inc., Class A* | 134,370 | 20,280,464 | ||||||
Meta Platforms, Inc., Class A | 43,813 | 21,274,716 | ||||||
Pinterest, Inc., Class A* | 35,019 | 1,214,109 | ||||||
|
| |||||||
| Total Interactive Media & Services |
| 42,769,289 | ||||||
| IT Services – 0.8% |
| |||||||
EPAM Systems, Inc.* | 1,010 | 278,922 | ||||||
Gartner, Inc.* | 3,138 | 1,495,790 | ||||||
GoDaddy, Inc., Class A* | 2,339 | 277,592 | ||||||
VeriSign, Inc.* | 4,488 | 850,521 | ||||||
|
| |||||||
| Total IT Services |
| 2,902,825 | ||||||
| Life Sciences Tools & Services – 0.4% |
| |||||||
West Pharmaceutical Services, Inc. | 3,689 | 1,459,774 | ||||||
| Media – 0.6% |
| |||||||
Liberty Broadband Corp., Class C* | 3,131 | 179,187 | ||||||
Trade Desk, Inc., Class A* | 20,097 | 1,756,880 | ||||||
|
| |||||||
| Total Media |
| 1,936,067 | ||||||
See Notes to Financial Statements.
| WisdomTree Trust | 69 |
Schedule of Investments (concluded)
WisdomTree U.S. Quality Growth Fund (QGRW)
March 31, 2024
Investments | Shares | Value | ||||||
| Metals & Mining – 0.4% |
| |||||||
Steel Dynamics, Inc. | 9,891 | $ | 1,466,143 | |||||
| Oil, Gas & Consumable Fuels – 2.0% |
| |||||||
Coterra Energy, Inc. | 45,874 | 1,278,967 | ||||||
Diamondback Energy, Inc. | 8,463 | 1,677,113 | ||||||
Occidental Petroleum Corp. | 29,146 | 1,894,199 | ||||||
Ovintiv, Inc. | 4,716 | 244,760 | ||||||
Targa Resources Corp. | 13,280 | 1,487,227 | ||||||
Texas Pacific Land Corp. | 423 | 244,710 | ||||||
|
| |||||||
| Total Oil, Gas & Consumable Fuels |
| 6,826,976 | ||||||
| Pharmaceuticals – 0.6% |
| |||||||
Zoetis, Inc. | 11,854 | 2,005,815 | ||||||
| Semiconductors & Semiconductor Equipment – 18.9% |
| |||||||
Advanced Micro Devices, Inc.* | 33,012 | 5,958,336 | ||||||
Applied Materials, Inc. | 19,411 | 4,003,131 | ||||||
Broadcom, Inc. | 8,441 | 11,187,786 | ||||||
Enphase Energy, Inc.* | 2,357 | 285,150 | ||||||
Entegris, Inc. | 2,685 | 377,350 | ||||||
KLA Corp. | 3,741 | 2,613,350 | ||||||
Lam Research Corp. | 3,385 | 3,288,764 | ||||||
Monolithic Power Systems, Inc. | 2,243 | 1,519,453 | ||||||
NVIDIA Corp. | 35,805 | 32,351,966 | ||||||
QUALCOMM, Inc. | 23,793 | 4,028,155 | ||||||
Teradyne, Inc. | 2,670 | 301,256 | ||||||
|
| |||||||
| Total Semiconductors & Semiconductor Equipment |
| 65,914,697 | ||||||
| Software – 19.6% |
| |||||||
Adobe, Inc.* | 8,619 | 4,349,147 | ||||||
AppLovin Corp., Class A* | 6,114 | 423,211 | ||||||
Atlassian Corp., Class A* | 8,570 | 1,672,093 | ||||||
Bentley Systems, Inc., Class B | 5,101 | 266,374 | ||||||
Cadence Design Systems, Inc.* | 7,604 | 2,366,973 | ||||||
Crowdstrike Holdings, Inc., Class A* | 7,164 | 2,296,707 | ||||||
Datadog, Inc., Class A* | 12,226 | 1,511,134 | ||||||
Dynatrace, Inc.* | 5,123 | 237,912 | ||||||
Fair Isaac Corp.* | 1,106 | 1,382,069 | ||||||
Fortinet, Inc.* | 27,879 | 1,904,414 | ||||||
HubSpot, Inc.* | 2,447 | 1,533,192 | ||||||
Intuit, Inc. | 5,878 | 3,820,700 | ||||||
Microsoft Corp. | 92,065 | 38,733,587 | ||||||
Palo Alto Networks, Inc.* | 7,853 | 2,231,273 | ||||||
ServiceNow, Inc.* | 4,440 | 3,385,056 | ||||||
Synopsys, Inc.* | 4,034 | 2,305,431 | ||||||
|
| |||||||
| Total Software |
| 68,419,273 | ||||||
| Specialized REITs – 0.5% |
| |||||||
Public Storage | 5,885 | 1,707,003 | ||||||
| Specialty Retail – 1.9% |
| |||||||
AutoZone, Inc.* | 601 | 1,894,142 | ||||||
O’Reilly Automotive, Inc.* | 1,782 | 2,011,664 | ||||||
Tractor Supply Co. | 5,809 | 1,520,331 | ||||||
Ulta Beauty, Inc.* | 2,501 | 1,307,723 | ||||||
|
| |||||||
| Total Specialty Retail |
| 6,733,860 | ||||||
| Technology Hardware, Storage & Peripherals – 9.3% |
| |||||||
Apple, Inc. | 184,259 | 31,596,733 | ||||||
Super Micro Computer, Inc.* | 986 | 995,890 | ||||||
|
| |||||||
| Total Technology Hardware, Storage & Peripherals |
| 32,592,623 | ||||||
| Textiles, Apparel & Luxury Goods – 0.5% |
| |||||||
Deckers Outdoor Corp.* | 1,662 | 1,564,374 | ||||||
| Total United States |
| 347,613,691 | ||||||
| South Korea – 0.4% |
| |||||||
| Broadline Retail – 0.4% |
| |||||||
| Coupang, Inc.* | 84,023 | 1,494,769 | ||||||
TOTAL INVESTMENTS IN SECURITIES – 99.9% (Cost: $315,878,122) |
| 349,108,460 | ||||||
Other Assets less Liabilities—0.1% | 224,099 | |||||||
|
| |||||||
| NET ASSETS – 100.0% |
| $ | 349,332,559 | |||||
| * | Non-income producing security. |
| FAIR VALUATION SUMMARY | ||||||||
The following is a summary of the fair valuations according to the inputs used in valuing the Fund’s investments (See Note 2 — Fair Value Measurement):
| Quoted Prices in Active Markets (Level 1) | Other Significant Observable Inputs (Level 2) | Significant Unobservable Inputs (Level 3) | Total | |||||||||||||
Assets: |
| |||||||||||||||
Investments in Securities | ||||||||||||||||
Common Stocks | $ | 349,108,460 | $ | — | $ | — | $ | 349,108,460 | ||||||||
Total Investments in Securities | $ | 349,108,460 | $ | — | $ | — | $ | 349,108,460 | ||||||||
See Notes to Financial Statements.
| 70 | WisdomTree Trust |
Schedule of Investments
WisdomTree U.S. SmallCap Dividend Fund (DES)
March 31, 2024
| Investments | Shares | Value | ||||||
| COMMON STOCKS – 99.6% |
| |||||||
| United States – 98.7% |
| |||||||
| Aerospace & Defense – 0.6% |
| |||||||
Cadre Holdings, Inc. | 65,951 | $ | 2,387,426 | |||||
Kaman Corp. | 91,404 | 4,192,702 | ||||||
National Presto Industries, Inc. | 35,423 | 2,968,447 | ||||||
Park Aerospace Corp. | 107,738 | 1,791,683 | ||||||
|
| |||||||
| Total Aerospace & Defense |
| 11,340,258 | ||||||
| Air Freight & Logistics – 0.1% |
| |||||||
Forward Air Corp. | 40,379 | 1,256,191 | ||||||
| Automobile Components – 1.4% |
| |||||||
Dana, Inc.(a) | 350,006 | 4,445,076 | ||||||
LCI Industries | 64,274 | 7,909,558 | ||||||
Patrick Industries, Inc.(a) | 64,161 | 7,665,315 | ||||||
Phinia, Inc. | 145,797 | 5,602,979 | ||||||
Standard Motor Products, Inc. | 67,296 | 2,257,781 | ||||||
|
| |||||||
| Total Automobile Components |
| 27,880,709 | ||||||
| Automobiles – 0.2% |
| |||||||
Winnebago Industries, Inc. | 51,969 | 3,845,706 | ||||||
| Banks – 17.2% |
| |||||||
1st Source Corp. | 49,110 | 2,574,346 | ||||||
Amalgamated Financial Corp. | 35,338 | 848,112 | ||||||
Amerant Bancorp, Inc.(a) | 35,114 | 817,805 | ||||||
Ameris Bancorp | 59,370 | 2,872,321 | ||||||
Arrow Financial Corp. | 17,274 | 432,195 | ||||||
Associated Banc-Corp.(a) | 401,439 | 8,634,953 | ||||||
Atlantic Union Bankshares Corp. | 162,057 | 5,722,233 | ||||||
Banc of California, Inc. | 256,080 | 3,894,977 | ||||||
BancFirst Corp. | 48,245 | 4,247,007 | ||||||
Bank First Corp. | 9,471 | 820,852 | ||||||
Bank of Hawaii Corp.(a) | 94,976 | 5,925,553 | ||||||
Bank of Marin Bancorp | 30,856 | 517,455 | ||||||
Bank7 Corp. | 19,766 | 557,401 | ||||||
BankUnited, Inc. | 151,282 | 4,235,896 | ||||||
Banner Corp. | 65,517 | 3,144,816 | ||||||
Bar Harbor Bankshares | 18,595 | 492,396 | ||||||
Berkshire Hills Bancorp, Inc. | 74,150 | 1,699,518 | ||||||
Brookline Bancorp, Inc. | 147,671 | 1,470,803 | ||||||
Burke & Herbert Financial Services Corp.(a) | 16,709 | 936,205 | ||||||
Byline Bancorp, Inc. | 51,285 | 1,113,910 | ||||||
Cambridge Bancorp | 8,295 | 565,387 | ||||||
Camden National Corp. | 17,167 | 575,438 | ||||||
Capital Bancorp, Inc. | 15,470 | 322,240 | ||||||
Capitol Federal Financial, Inc. | 419,148 | 2,498,122 | ||||||
Cathay General Bancorp | 214,175 | 8,102,240 | ||||||
Central Pacific Financial Corp. | 46,762 | 923,549 | ||||||
Citizens & Northern Corp. | 29,510 | 554,198 | ||||||
City Holding Co. | 33,847 | 3,527,534 | ||||||
Civista Bancshares, Inc. | 34,429 | 529,518 | ||||||
CNB Financial Corp. | 44,295 | 903,175 | ||||||
Community Bank System, Inc. | 109,997 | 5,283,156 | ||||||
Community Trust Bancorp, Inc. | 59,493 | 2,537,376 | ||||||
ConnectOne Bancorp, Inc. | 55,079 | 1,074,040 | ||||||
CVB Financial Corp. | 321,432 | 5,734,347 | ||||||
Dime Community Bancshares, Inc. | 74,565 | 1,436,122 | ||||||
Eagle Bancorp, Inc. | 110,036 | 2,584,746 | ||||||
Eastern Bankshares, Inc. | 329,692 | 4,543,156 | ||||||
Enterprise Financial Services Corp. | 42,733 | 1,733,250 | ||||||
Equity Bancshares, Inc., Class A | 20,628 | 708,984 | ||||||
Farmers National Banc Corp. | 48,783 | 651,741 | ||||||
FB Financial Corp. | 44,870 | 1,689,804 | ||||||
Fidelity D&D Bancorp, Inc. | 4,612 | 223,359 | ||||||
Financial Institutions, Inc. | 71,580 | 1,347,136 | ||||||
First Bancorp/Southern Pines NC | 55,372 | 2,000,037 | ||||||
First Bancshares, Inc. | 53,762 | 1,395,124 | ||||||
First Bank | 33,973 | 466,789 | ||||||
First Busey Corp. | 120,228 | 2,891,483 | ||||||
First Business Financial Services, Inc. | 9,413 | 352,988 | ||||||
First Commonwealth Financial Corp. | 190,719 | 2,654,808 | ||||||
First Community Bankshares, Inc. | 41,316 | 1,430,773 | ||||||
First Financial Bancorp | 347,965 | 7,801,375 | ||||||
First Financial Corp. | 38,648 | 1,481,378 | ||||||
First Hawaiian, Inc. | 365,702 | 8,030,816 | ||||||
First Internet Bancorp | 7,283 | 253,011 | ||||||
First Interstate BancSystem, Inc., Class A | 420,711 | 11,447,546 | ||||||
First Merchants Corp. | 140,106 | 4,889,699 | ||||||
First Mid Bancshares, Inc. | 27,428 | 896,347 | ||||||
First Northwest Bancorp | 8,500 | 133,025 | ||||||
First of Long Island Corp. | 72,175 | 800,421 | ||||||
Five Star Bancorp | 28,400 | 639,000 | ||||||
Flushing Financial Corp. | 70,223 | 885,512 | ||||||
FS Bancorp, Inc. | 12,493 | 433,632 | ||||||
Fulton Financial Corp. | 383,348 | 6,091,400 | ||||||
German American Bancorp, Inc. | 75,874 | 2,628,275 | ||||||
Great Southern Bancorp, Inc. | 13,065 | 716,223 | ||||||
Guaranty Bancshares, Inc. | 18,621 | 565,334 | ||||||
Hancock Whitney Corp. | 129,355 | 5,955,504 | ||||||
Hanmi Financial Corp. | 50,511 | 804,135 | ||||||
HarborOne Bancorp, Inc. | 53,217 | 567,293 | ||||||
HBT Financial, Inc. | 76,752 | 1,461,358 | ||||||
Heartland Financial USA, Inc. | 52,680 | 1,851,702 | ||||||
Heritage Commerce Corp. | 197,516 | 1,694,687 | ||||||
Heritage Financial Corp. | 87,250 | 1,691,777 | ||||||
Hilltop Holdings, Inc. | 63,195 | 1,979,267 | ||||||
Hope Bancorp, Inc. | 359,384 | 4,136,510 | ||||||
Horizon Bancorp, Inc. | 111,298 | 1,427,953 | ||||||
Independent Bank Corp. | 128,688 | 5,636,831 | ||||||
Independent Bank Group, Inc. | 79,801 | 3,642,916 | ||||||
International Bancshares Corp. | 131,111 | 7,360,572 | ||||||
Investar Holding Corp. | 21,924 | 358,677 | ||||||
Kearny Financial Corp. | 161,272 | 1,038,592 | ||||||
Lakeland Bancorp, Inc. | 159,606 | 1,931,233 | ||||||
Lakeland Financial Corp.(a) | 36,228 | 2,402,641 | ||||||
Live Oak Bancshares, Inc. | 38,001 | 1,577,422 | ||||||
Macatawa Bank Corp. | 85,227 | 834,372 | ||||||
Mercantile Bank Corp. | 39,262 | 1,511,194 | ||||||
See Notes to Financial Statements.
| WisdomTree Trust | 71 |
Schedule of Investments (continued)
WisdomTree U.S. SmallCap Dividend Fund (DES)
March 31, 2024
| Investments | Shares | Value | ||||||
Metrocity Bankshares, Inc. | 52,920 | $ | 1,320,883 | |||||
Middlefield Banc Corp.(a) | 10,289 | 245,701 | ||||||
Midland States Bancorp, Inc. | 42,229 | 1,061,215 | ||||||
National Bank Holdings Corp., Class A | 60,882 | 2,196,014 | ||||||
NBT Bancorp, Inc. | 83,464 | 3,061,460 | ||||||
Nicolet Bankshares, Inc. | 12,715 | 1,093,363 | ||||||
Northeast Bank | 4,875 | 269,783 | ||||||
Northeast Community Bancorp, Inc. | 19,015 | 299,106 | ||||||
Northfield Bancorp, Inc. | 112,870 | 1,097,096 | ||||||
Northrim BanCorp, Inc. | 15,129 | 764,166 | ||||||
Northwest Bancshares, Inc. | 500,464 | 5,830,406 | ||||||
OceanFirst Financial Corp. | 170,225 | 2,793,392 | ||||||
Old Second Bancorp, Inc. | 48,964 | 677,662 | ||||||
Orange County Bancorp, Inc. | 4,026 | 185,196 | ||||||
Origin Bancorp, Inc. | 17,340 | 541,702 | ||||||
Orrstown Financial Services, Inc. | 21,987 | 588,592 | ||||||
Pacific Premier Bancorp, Inc. | 236,459 | 5,675,016 | ||||||
Park National Corp.(a) | 30,699 | 4,170,459 | ||||||
Pathward Financial, Inc. | 23,814 | 1,202,131 | ||||||
Peapack-Gladstone Financial Corp. | 29,078 | 707,468 | ||||||
Peoples Bancorp, Inc.(a) | 141,531 | 4,190,733 | ||||||
Plumas Bancorp | 7,118 | 261,871 | ||||||
Preferred Bank | 35,925 | 2,757,962 | ||||||
Premier Financial Corp. | 103,222 | 2,095,407 | ||||||
Primis Financial Corp. | 63,283 | 770,154 | ||||||
Princeton Bancorp, Inc. | 8,137 | 250,457 | ||||||
Provident Financial Services, Inc. | 266,861 | 3,888,165 | ||||||
QCR Holdings, Inc. | 13,607 | 826,489 | ||||||
Red River Bancshares, Inc. | 6,484 | 322,838 | ||||||
Renasant Corp. | 89,020 | 2,788,106 | ||||||
Republic Bancorp, Inc., Class A | 35,990 | 1,835,490 | ||||||
S&T Bancorp, Inc. | 79,763 | 2,558,797 | ||||||
Sandy Spring Bancorp, Inc. | 143,729 | 3,331,638 | ||||||
Seacoast Banking Corp. of Florida | 126,012 | 3,199,445 | ||||||
ServisFirst Bancshares, Inc. | 54,842 | 3,639,315 | ||||||
Shore Bancshares, Inc. | 52,443 | 603,095 | ||||||
Sierra Bancorp | 33,731 | 681,366 | ||||||
Simmons First National Corp., Class A | 330,674 | 6,434,916 | ||||||
SmartFinancial, Inc. | 28,016 | 590,297 | ||||||
South Plains Financial, Inc. | 14,225 | 380,661 | ||||||
Southern Missouri Bancorp, Inc. | 12,755 | 557,521 | ||||||
Southern States Bancshares, Inc. | 10,630 | 275,530 | ||||||
Southside Bancshares, Inc. | 62,385 | 1,823,514 | ||||||
Stellar Bancorp, Inc. | 33,813 | 823,685 | ||||||
Stock Yards Bancorp, Inc. | 36,445 | 1,782,525 | ||||||
Summit Financial Group, Inc. | 26,309 | 714,552 | ||||||
TFS Financial Corp. | 1,272,468 | 15,982,198 | ||||||
Towne Bank | 143,250 | 4,019,595 | ||||||
TriCo Bancshares | 42,251 | 1,553,992 | ||||||
TrustCo Bank Corp. | 48,856 | 1,375,785 | ||||||
Trustmark Corp. | 120,615 | 3,390,488 | ||||||
UMB Financial Corp. | 50,840 | 4,422,572 | ||||||
United Community Banks, Inc. | 234,085 | 6,161,117 | ||||||
Unity Bancorp, Inc. | 6,052 | 167,035 | ||||||
Veritex Holdings, Inc. | 114,675 | 2,349,691 | ||||||
WaFd, Inc. | 110,424 | 3,205,609 | ||||||
Washington Trust Bancorp, Inc. | 67,764 | 1,821,496 | ||||||
WesBanco, Inc. | 169,693 | 5,058,548 | ||||||
West BanCorp, Inc. | 31,935 | 569,401 | ||||||
Westamerica BanCorp | 67,183 | 3,283,905 | ||||||
WSFS Financial Corp. | 50,927 | 2,298,845 | ||||||
|
| |||||||
| Total Banks |
| 342,582,621 | ||||||
| Beverages – 0.1% |
| |||||||
MGP Ingredients, Inc. | 18,911 | 1,628,804 | ||||||
| Broadline Retail – 1.4% |
| |||||||
Kohl’s Corp.(a) | 598,715 | 17,452,542 | ||||||
Nordstrom, Inc.(a) | 527,144 | 10,685,209 | ||||||
|
| |||||||
| Total Broadline Retail |
| 28,137,751 | ||||||
| Building Products – 1.0% |
| |||||||
Apogee Enterprises, Inc. | 65,060 | 3,851,552 | ||||||
AZZ, Inc. | 40,439 | 3,126,339 | ||||||
CSW Industrials, Inc. | 13,381 | 3,139,183 | ||||||
Griffon Corp. | 81,842 | 6,002,292 | ||||||
Insteel Industries, Inc. | 34,645 | 1,324,132 | ||||||
Quanex Building Products Corp. | 54,966 | 2,112,343 | ||||||
|
| |||||||
| Total Building Products |
| 19,555,841 | ||||||
| Capital Markets – 3.2% |
| |||||||
BGC Group, Inc., Class A | 341,653 | 2,654,644 | ||||||
Brightsphere Investment Group, Inc. | 35,120 | 802,141 | ||||||
Cohen & Steers, Inc. | 151,093 | 11,617,541 | ||||||
Diamond Hill Investment Group, Inc. | 6,531 | 1,006,884 | ||||||
GCM Grosvenor, Inc., Class A | 140,844 | 1,360,553 | ||||||
Moelis & Co., Class A | 171,013 | 9,708,408 | ||||||
Oppenheimer Holdings, Inc., Class A | 13,570 | 541,715 | ||||||
Piper Sandler Cos. | 15,790 | 3,134,157 | ||||||
PJT Partners, Inc., Class A(a) | 18,552 | 1,748,712 | ||||||
StepStone Group, Inc., Class A | 101,311 | 3,620,855 | ||||||
TPG, Inc. | 204,929 | 9,160,326 | ||||||
Victory Capital Holdings, Inc., Class A | 199,070 | 8,446,540 | ||||||
Virtu Financial, Inc., Class A | 263,793 | 5,413,032 | ||||||
Virtus Investment Partners, Inc. | 21,095 | 5,231,138 | ||||||
|
| |||||||
| Total Capital Markets |
| 64,446,646 | ||||||
| Chemicals – 2.8% |
| |||||||
AdvanSix, Inc. | 85,622 | 2,448,789 | ||||||
Avient Corp. | 185,966 | 8,070,925 | ||||||
Hawkins, Inc. | 35,766 | 2,746,829 | ||||||
Innospec, Inc. | 37,906 | 4,887,600 | ||||||
Koppers Holdings, Inc. | 35,307 | 1,947,887 | ||||||
Kronos Worldwide, Inc. | 638,224 | 7,531,043 | ||||||
Minerals Technologies, Inc. | 29,830 | 2,245,602 | ||||||
Quaker Chemical Corp. | 16,274 | 3,340,239 | ||||||
Scotts Miracle-Gro Co.(a) | 163,651 | 12,206,728 | ||||||
Sensient Technologies Corp. | 85,281 | 5,900,592 | ||||||
Stepan Co. | 36,100 | 3,250,444 | ||||||
Valhi, Inc. | 112,632 | 1,935,018 | ||||||
|
| |||||||
| Total Chemicals |
| 56,511,696 | ||||||
See Notes to Financial Statements.
| 72 | WisdomTree Trust |
Schedule of Investments (continued)
WisdomTree U.S. SmallCap Dividend Fund (DES)
March 31, 2024
| Investments | Shares | Value | ||||||
| Commercial Services & Supplies – 2.8% |
| |||||||
ABM Industries, Inc. | 106,816 | $ | 4,766,130 | |||||
ACCO Brands Corp. | 421,496 | 2,364,593 | ||||||
Acme United Corp. | 15,378 | 722,612 | ||||||
ARC Document Solutions, Inc. | 246,420 | 682,583 | ||||||
Aris Water Solutions, Inc., Class A | 177,608 | 2,513,153 | ||||||
Brady Corp., Class A | 83,575 | 4,954,326 | ||||||
Brink’s Co. | 55,690 | 5,144,642 | ||||||
Deluxe Corp. | 187,163 | 3,853,686 | ||||||
Ennis, Inc. | 155,473 | 3,188,751 | ||||||
HNI Corp. | 114,162 | 5,152,131 | ||||||
Interface, Inc. | 123,155 | 2,071,467 | ||||||
Matthews International Corp., Class A | 81,385 | 2,529,446 | ||||||
MillerKnoll, Inc. | 163,381 | 4,045,314 | ||||||
Pitney Bowes, Inc. | 764,957 | 3,312,264 | ||||||
Steelcase, Inc., Class A | 346,925 | 4,537,779 | ||||||
UniFirst Corp. | 12,739 | 2,209,325 | ||||||
Vestis Corp. | 122,930 | 2,368,861 | ||||||
VSE Corp.(a) | 25,209 | 2,016,720 | ||||||
|
| |||||||
| Total Commercial Services & Supplies |
| 56,433,783 | ||||||
| Construction & Engineering – 0.6% |
| |||||||
Arcosa, Inc. | 39,199 | 3,365,626 | ||||||
Argan, Inc. | 42,664 | 2,156,239 | ||||||
Granite Construction, Inc. | 50,645 | 2,893,349 | ||||||
Primoris Services Corp. | 62,500 | 2,660,625 | ||||||
|
| |||||||
| Total Construction & Engineering |
| 11,075,839 | ||||||
| Construction Materials – 0.1% |
| |||||||
U.S. Lime & Minerals, Inc. | 6,729 | 2,006,184 | ||||||
| Consumer Finance – 0.8% |
| |||||||
Bread Financial Holdings, Inc. | 67,402 | 2,510,050 | ||||||
Navient Corp. | 226,145 | 3,934,923 | ||||||
Nelnet, Inc., Class A | 23,089 | 2,185,374 | ||||||
Regional Management Corp. | 28,201 | 682,746 | ||||||
SLM Corp. | 313,392 | 6,828,812 | ||||||
|
| |||||||
| Total Consumer Finance |
| 16,141,905 | ||||||
| Consumer Staples Distribution & Retail – 0.8% |
| |||||||
Andersons, Inc. | 48,281 | 2,769,881 | ||||||
Ingles Markets, Inc., Class A | 18,938 | 1,452,166 | ||||||
Natural Grocers by Vitamin Cottage, Inc. | 114,489 | 2,066,526 | ||||||
PriceSmart, Inc. | 37,108 | 3,117,072 | ||||||
SpartanNash Co. | 124,389 | 2,513,902 | ||||||
Village Super Market, Inc., Class A | 53,176 | 1,521,365 | ||||||
Weis Markets, Inc. | 53,284 | 3,431,490 | ||||||
|
| |||||||
| Total Consumer Staples Distribution & Retail |
| 16,872,402 | ||||||
| Containers & Packaging – 0.9% |
| |||||||
Greif, Inc., Class A | 81,749 | 5,644,768 | ||||||
Myers Industries, Inc. | 158,050 | 3,662,019 | ||||||
Pactiv Evergreen, Inc. | 436,663 | 6,253,014 | ||||||
TriMas Corp. | 50,637 | 1,353,527 | ||||||
|
| |||||||
| Total Containers & Packaging |
| 16,913,328 | ||||||
| Distributors – 0.1% |
| |||||||
Weyco Group, Inc. | 50,885 | 1,622,214 | ||||||
| Diversified Consumer Services – 0.7% |
| |||||||
Carriage Services, Inc. | 56,165 | 1,518,702 | ||||||
Graham Holdings Co., Class B | 4,056 | 3,113,710 | ||||||
Perdoceo Education Corp.(a) | 201,462 | 3,537,673 | ||||||
Strategic Education, Inc. | 50,328 | 5,240,151 | ||||||
|
| |||||||
| Total Diversified Consumer Services |
| 13,410,236 | ||||||
| Diversified REITs – 1.4% |
| |||||||
Alexander & Baldwin, Inc. | 87,088 | 1,434,339 | ||||||
Alpine Income Property Trust, Inc. | 18,429 | 281,595 | ||||||
American Assets Trust, Inc. | 62,449 | 1,368,258 | ||||||
Armada Hoffler Properties, Inc. | 57,229 | 595,182 | ||||||
Broadstone Net Lease, Inc. | 771,424 | 12,088,214 | ||||||
CTO Realty Growth, Inc. | 50,887 | 862,535 | ||||||
Empire State Realty Trust, Inc., Class A | 140,897 | 1,427,287 | ||||||
Essential Properties Realty Trust, Inc. | 374,423 | 9,982,117 | ||||||
One Liberty Properties, Inc. | 24,265 | 548,146 | ||||||
|
| |||||||
| Total Diversified REITs |
| 28,587,673 | ||||||
| Diversified Telecommunication Services – 0.7% |
| |||||||
ATN International, Inc. | 62,497 | 1,968,968 | ||||||
Cogent Communications Holdings, Inc. | 179,833 | 11,748,490 | ||||||
Shenandoah Telecommunications Co. | 59,965 | 1,041,592 | ||||||
|
| |||||||
| Total Diversified Telecommunication Services |
| 14,759,050 | ||||||
| Electric Utilities – 1.9% |
| |||||||
ALLETE, Inc. | 241,401 | 14,397,156 | ||||||
Genie Energy Ltd., Class B | 72,663 | 1,095,758 | ||||||
MGE Energy, Inc. | 84,193 | 6,627,673 | ||||||
Otter Tail Corp. | 96,963 | 8,377,603 | ||||||
PNM Resources, Inc. | 213,710 | 8,044,044 | ||||||
|
| |||||||
| Total Electric Utilities |
| 38,542,234 | ||||||
| Electrical Equipment – 0.8% |
| |||||||
Allient, Inc. | 32,240 | 1,150,323 | ||||||
Encore Wire Corp. | 13,933 | 3,661,314 | ||||||
EnerSys | 47,486 | 4,485,528 | ||||||
LSI Industries, Inc. | 115,808 | 1,751,017 | ||||||
Powell Industries, Inc. | 24,056 | 3,423,169 | ||||||
Preformed Line Products Co. | 10,593 | 1,363,001 | ||||||
|
| |||||||
| Total Electrical Equipment |
| 15,834,352 | ||||||
| Electronic Equipment, Instruments & Components – 1.4% |
| |||||||
Advanced Energy Industries, Inc. | 33,616 | 3,428,160 | ||||||
Bel Fuse, Inc., Class B | 23,245 | 1,401,906 | ||||||
Belden, Inc. | 34,582 | 3,202,639 | ||||||
Benchmark Electronics, Inc. | 97,366 | 2,921,954 | ||||||
Climb Global Solutions, Inc. | 21,611 | 1,531,788 | ||||||
Crane NXT Co. | 71,996 | 4,456,552 | ||||||
CTS Corp. | 36,402 | 1,703,250 | ||||||
Methode Electronics, Inc. | 98,785 | 1,203,201 | ||||||
Napco Security Technologies, Inc. | 54,147 | 2,174,543 | ||||||
PC Connection, Inc. | 27,500 | 1,813,075 | ||||||
Richardson Electronics Ltd.(a) | 63,276 | 582,772 | ||||||
Vishay Intertechnology, Inc.(a) | 184,022 | 4,173,619 | ||||||
|
| |||||||
| Total Electronic Equipment, Instruments & Components |
| 28,593,459 | ||||||
See Notes to Financial Statements.
| WisdomTree Trust | 73 |
Schedule of Investments (continued)
WisdomTree U.S. SmallCap Dividend Fund (DES)
March 31, 2024
| Investments | Shares | Value | ||||||
| Energy Equipment & Services – 2.9% |
| |||||||
Archrock, Inc. | 650,451 | $ | 12,794,371 | |||||
Atlas Energy Solutions, Inc.(a) | 226,880 | 5,132,026 | ||||||
Cactus, Inc., Class A(a) | 90,974 | 4,556,888 | ||||||
Core Laboratories, Inc.(a) | 72,498 | 1,238,266 | ||||||
Helmerich & Payne, Inc. | 199,801 | 8,403,630 | ||||||
Kodiak Gas Services, Inc. | 399,872 | 10,932,500 | ||||||
Liberty Energy, Inc.(a) | 272,928 | 5,655,068 | ||||||
Ranger Energy Services, Inc. | 124,418 | 1,404,679 | ||||||
RPC, Inc.(a) | 435,442 | 3,370,321 | ||||||
Select Water Solutions, Inc. | 346,378 | 3,197,069 | ||||||
Solaris Oilfield Infrastructure, Inc., Class A | 162,204 | 1,406,309 | ||||||
|
| |||||||
| Total Energy Equipment & Services |
| 58,091,127 | ||||||
| Entertainment – 0.1% |
| |||||||
Marcus Corp.(a) | 125,272 | 1,786,379 | ||||||
| Financial Services – 0.8% |
| |||||||
A-Mark Precious Metals, Inc.(a) | 20,356 | 624,726 | ||||||
Alerus Financial Corp. | 46,511 | 1,015,335 | ||||||
Cass Information Systems, Inc. | 17,598 | 847,696 | ||||||
Federal Agricultural Mortgage Corp., Class C | 18,520 | 3,646,217 | ||||||
Merchants Bancorp | 39,190 | 1,692,224 | ||||||
NewtekOne, Inc. | 89,432 | 983,752 | ||||||
UWM Holdings Corp.(a) | 298,307 | 2,165,709 | ||||||
Walker & Dunlop, Inc.(a) | 48,530 | 4,904,442 | ||||||
|
| |||||||
| Total Financial Services |
| 15,880,101 | ||||||
| Food Products – 1.6% |
| |||||||
Alico, Inc. | 38,662 | 1,132,023 | ||||||
B&G Foods, Inc. | 388,486 | 4,444,280 | ||||||
Cal-Maine Foods, Inc. | 36,619 | 2,155,028 | ||||||
Calavo Growers, Inc. | 55,797 | 1,551,715 | ||||||
J & J Snack Foods Corp. | 34,591 | 5,000,475 | ||||||
John B Sanfilippo & Son, Inc. | 38,396 | 4,066,904 | ||||||
Limoneira Co. | 75,527 | 1,477,308 | ||||||
Tootsie Roll Industries, Inc. | 70,740 | 2,265,789 | ||||||
Utz Brands, Inc. | 170,307 | 3,140,461 | ||||||
WK Kellogg Co. | 376,079 | 7,070,285 | ||||||
|
| |||||||
| Total Food Products |
| 32,304,268 | ||||||
| Gas Utilities – 1.5% |
| |||||||
Chesapeake Utilities Corp. | 39,945 | 4,286,099 | ||||||
Northwest Natural Holding Co. | 119,977 | 4,465,544 | ||||||
ONE Gas, Inc. | 160,500 | 10,357,065 | ||||||
RGC Resources, Inc. | 53,508 | 1,083,002 | ||||||
Spire, Inc. | 166,477 | 10,216,693 | ||||||
|
| |||||||
| Total Gas Utilities |
| 30,408,403 | ||||||
| Ground Transportation – 0.8% |
| |||||||
ArcBest Corp.(a) | 21,519 | 3,066,458 | ||||||
Covenant Logistics Group, Inc. | 32,891 | 1,524,827 | ||||||
FTAI Infrastructure, Inc. | 458,758 | 2,881,000 | ||||||
Heartland Express, Inc. | 87,492 | 1,044,654 | ||||||
Marten Transport Ltd. | 119,526 | 2,208,840 | ||||||
Universal Logistics Holdings, Inc.(a) | 76,887 | 2,834,824 | ||||||
Werner Enterprises, Inc. | 73,297 | 2,867,379 | ||||||
|
| |||||||
| Total Ground Transportation |
| 16,427,982 | ||||||
| Health Care Equipment & Supplies – 0.6% |
| |||||||
Atrion Corp.(a) | 6,575 | 3,047,841 | ||||||
CONMED Corp. | 26,500 | 2,122,120 | ||||||
Embecta Corp. | 174,366 | 2,313,837 | ||||||
LeMaitre Vascular, Inc. | 34,438 | 2,285,306 | ||||||
Utah Medical Products, Inc. | 17,110 | 1,216,692 | ||||||
|
| |||||||
| Total Health Care Equipment & Supplies |
| 10,985,796 | ||||||
| Health Care Providers & Services – 1.6% |
| |||||||
National HealthCare Corp. | 49,782 | 4,704,897 | ||||||
National Research Corp. | 51,619 | 2,044,628 | ||||||
Patterson Cos., Inc. | 264,910 | 7,324,761 | ||||||
Premier, Inc., Class A | 335,262 | 7,409,290 | ||||||
Select Medical Holdings Corp. | 207,038 | 6,242,196 | ||||||
U.S. Physical Therapy, Inc. | 28,895 | 3,261,379 | ||||||
|
| |||||||
| Total Health Care Providers & Services |
| 30,987,151 | ||||||
| Health Care REITs – 1.4% |
| |||||||
CareTrust REIT, Inc. | 165,576 | 4,035,087 | ||||||
Community Healthcare Trust, Inc. | 29,801 | 791,217 | ||||||
Diversified Healthcare Trust | 179,035 | 440,426 | ||||||
Global Medical REIT, Inc. | 78,748 | 689,045 | ||||||
LTC Properties, Inc.(a) | 55,912 | 1,817,699 | ||||||
National Health Investors, Inc. | 140,460 | 8,825,102 | ||||||
Sabra Health Care REIT, Inc. | 702,111 | 10,370,179 | ||||||
|
| |||||||
| Total Health Care REITs |
| 26,968,755 | ||||||
| Health Care Technology – 0.1% |
| |||||||
HealthStream, Inc. | 49,327 | 1,315,058 | ||||||
Simulations Plus, Inc.(a) | 35,966 | 1,480,001 | ||||||
|
| |||||||
| Total Health Care Technology |
| 2,795,059 | ||||||
| Hotel & Resort REITs – 0.7% |
| |||||||
Chatham Lodging Trust | 62,457 | 631,440 | ||||||
DiamondRock Hospitality Co. | 169,829 | 1,632,057 | ||||||
Park Hotels & Resorts, Inc. | 186,766 | 3,266,538 | ||||||
Pebblebrook Hotel Trust | 102,476 | 1,579,155 | ||||||
RLJ Lodging Trust | 130,017 | 1,536,801 | ||||||
Service Properties Trust | 273,154 | 1,851,984 | ||||||
Sunstone Hotel Investors, Inc. | 179,252 | 1,996,867 | ||||||
Xenia Hotels & Resorts, Inc. | 84,104 | 1,262,401 | ||||||
|
| |||||||
| Total Hotel & Resort REITs |
| 13,757,243 | ||||||
| Hotels, Restaurants & Leisure – 3.6% |
| |||||||
Bloomin’ Brands, Inc. | 249,430 | 7,153,652 | ||||||
Carrols Restaurant Group, Inc. | 192,635 | 1,831,959 | ||||||
Cheesecake Factory, Inc.(a) | 136,911 | 4,949,333 | ||||||
Cracker Barrel Old Country Store, Inc. | 112,188 | 8,159,433 | ||||||
Dine Brands Global, Inc. | 67,907 | 3,156,317 | ||||||
Jack in the Box, Inc. | 41,359 | 2,832,264 | ||||||
Krispy Kreme, Inc. | 192,705 | 2,935,861 | ||||||
Marriott Vacations Worldwide Corp. | 100,443 | 10,820,724 | ||||||
Monarch Casino & Resort, Inc. | 50,799 | 3,809,417 | ||||||
Nathan’s Famous, Inc. | 21,360 | 1,512,288 | ||||||
Papa John’s International, Inc.(a) | 67,135 | 4,471,191 | ||||||
RCI Hospitality Holdings, Inc. | 21,836 | 1,266,488 | ||||||
Red Rock Resorts, Inc., Class A | 103,581 | 6,196,216 | ||||||
See Notes to Financial Statements.
| 74 | WisdomTree Trust |
Schedule of Investments (continued)
WisdomTree U.S. SmallCap Dividend Fund (DES)
March 31, 2024
| Investments | Shares | Value | ||||||
Travel & Leisure Co. | 243,956 | $ | 11,944,086 | |||||
|
| |||||||
| Total Hotels, Restaurants & Leisure |
| 71,039,229 | ||||||
| Household Durables – 2.5% |
| |||||||
Bassett Furniture Industries, Inc. | 41,564 | 613,485 | ||||||
Century Communities, Inc. | 44,321 | 4,276,976 | ||||||
Ethan Allen Interiors, Inc. | 123,863 | 4,281,944 | ||||||
Hamilton Beach Brands Holding Co., Class A | 56,235 | 1,369,885 | ||||||
Hooker Furnishings Corp. | 45,710 | 1,097,497 | ||||||
La-Z-Boy, Inc. | 84,455 | 3,177,197 | ||||||
Leggett & Platt, Inc. | 650,659 | 12,460,120 | ||||||
Lifetime Brands, Inc. | 121,875 | 1,277,250 | ||||||
MDC Holdings, Inc. | 220,349 | 13,862,155 | ||||||
Worthington Enterprises, Inc.(a) | 127,790 | 7,952,372 | ||||||
|
| |||||||
| Total Household Durables |
| 50,368,881 | ||||||
| Household Products – 0.9% |
| |||||||
Energizer Holdings, Inc. | 199,479 | 5,872,662 | ||||||
Oil-Dri Corp. of America | 25,518 | 1,902,622 | ||||||
Spectrum Brands Holdings, Inc.(a) | 62,766 | 5,586,801 | ||||||
WD-40 Co. | 20,406 | 5,169,044 | ||||||
|
| |||||||
| Total Household Products |
| 18,531,129 | ||||||
| Industrial REITs – 0.6% |
| |||||||
Innovative Industrial Properties, Inc. | 68,850 | 7,128,729 | ||||||
LXP Industrial Trust | 354,050 | 3,193,531 | ||||||
Plymouth Industrial REIT, Inc. | 34,159 | 768,577 | ||||||
|
| |||||||
| Total Industrial REITs |
| 11,090,837 | ||||||
| Insurance – 1.8% |
| |||||||
AMERISAFE, Inc. | 109,631 | 5,500,187 | ||||||
CNO Financial Group, Inc. | 130,219 | 3,578,418 | ||||||
Donegal Group, Inc., Class A | 52,936 | 748,515 | ||||||
Employers Holdings, Inc. | 50,868 | 2,308,899 | ||||||
HCI Group, Inc. | 7,761 | 900,897 | ||||||
Horace Mann Educators Corp. | 82,849 | 3,064,584 | ||||||
Investors Title Co. | 5,463 | 891,507 | ||||||
Kemper Corp. | 86,756 | 5,371,931 | ||||||
Mercury General Corp. | 85,806 | 4,427,590 | ||||||
National Western Life Group, Inc., Class A | 3,056 | 1,503,430 | ||||||
Safety Insurance Group, Inc.(a) | 32,379 | 2,661,230 | ||||||
Stewart Information Services Corp. | 48,303 | 3,142,593 | ||||||
Tiptree, Inc. | 36,242 | 626,262 | ||||||
United Fire Group, Inc. | 23,613 | 514,055 | ||||||
Universal Insurance Holdings, Inc. | 64,652 | 1,313,729 | ||||||
|
| |||||||
| Total Insurance |
| 36,553,827 | ||||||
| Interactive Media & Services – 0.2% |
| |||||||
Shutterstock, Inc.(a) | 76,284 | 3,494,570 | ||||||
| IT Services – 0.2% |
| |||||||
CSP, Inc. | 47,024 | 868,063 | ||||||
Hackett Group, Inc. | 100,255 | 2,436,196 | ||||||
Information Services Group, Inc. | 130,714 | 528,085 | ||||||
|
| |||||||
| Total IT Services |
| 3,832,344 | ||||||
| Leisure Products – 0.5% |
| |||||||
Clarus Corp.(a) | 185,193 | 1,250,053 | ||||||
Escalade, Inc. | 70,716 | 972,345 | ||||||
Johnson Outdoors, Inc., Class A | 26,838 | 1,237,500 | ||||||
Marine Products Corp. | 178,480 | 2,097,140 | ||||||
Smith & Wesson Brands, Inc. | 166,964 | 2,898,495 | ||||||
Sturm Ruger & Co., Inc. | 34,649 | 1,599,051 | ||||||
|
| |||||||
| Total Leisure Products |
| 10,054,584 | ||||||
| Life Sciences Tools & Services – 0.1% |
| |||||||
Mesa Laboratories, Inc. | 14,414 | 1,581,648 | ||||||
| Machinery – 4.5% |
| |||||||
Alamo Group, Inc. | 11,175 | 2,551,588 | ||||||
Albany International Corp., Class A | 34,234 | 3,201,221 | ||||||
Astec Industries, Inc. | 57,386 | 2,508,342 | ||||||
Columbus McKinnon Corp. | 50,329 | 2,246,183 | ||||||
Douglas Dynamics, Inc. | 99,429 | 2,398,227 | ||||||
Eastern Co. | 37,324 | 1,272,375 | ||||||
Enerpac Tool Group Corp. | 50,618 | 1,805,038 | ||||||
Enpro, Inc.(a) | 25,040 | 4,226,001 | ||||||
ESCO Technologies, Inc. | 21,208 | 2,270,316 | ||||||
Gorman-Rupp Co. | 70,866 | 2,802,750 | ||||||
Greenbrier Cos., Inc. | 83,322 | 4,341,076 | ||||||
Helios Technologies, Inc. | 45,184 | 2,019,273 | ||||||
Hillenbrand, Inc. | 116,117 | 5,839,524 | ||||||
Hurco Cos., Inc. | 42,191 | 850,571 | ||||||
Hyster-Yale Materials Handling, Inc. | 52,926 | 3,396,261 | ||||||
John Bean Technologies Corp. | 29,585 | 3,103,171 | ||||||
Kadant, Inc. | 9,716 | 3,187,820 | ||||||
Kennametal, Inc. | 156,554 | 3,904,457 | ||||||
Lindsay Corp. | 15,827 | 1,862,205 | ||||||
Miller Industries, Inc. | 48,592 | 2,434,459 | ||||||
Mueller Water Products, Inc., Class A | 258,990 | 4,167,149 | ||||||
Omega Flex, Inc. | 24,752 | 1,755,659 | ||||||
Park-Ohio Holdings Corp. | 56,732 | 1,513,610 | ||||||
REV Group, Inc. | 113,054 | 2,497,363 | ||||||
Shyft Group, Inc. | 141,914 | 1,762,572 | ||||||
Standex International Corp.(a) | 17,385 | 3,167,895 | ||||||
Tennant Co. | 33,711 | 4,099,595 | ||||||
Terex Corp. | 73,810 | 4,753,364 | ||||||
Trinity Industries, Inc. | 237,870 | 6,624,679 | ||||||
Twin Disc, Inc. | 69,830 | 1,154,290 | ||||||
Wabash National Corp. | 86,731 | 2,596,726 | ||||||
|
| |||||||
| Total Machinery |
| 90,313,760 | ||||||
| Marine Transportation – 0.2% |
| |||||||
Matson, Inc. | 38,699 | 4,349,768 | ||||||
| Media – 1.3% |
| |||||||
Cable One, Inc. | 9,989 | 4,226,646 | ||||||
Entravision Communications Corp., Class A | 441,306 | 723,742 | ||||||
Gray Television, Inc. | 350,863 | 2,217,454 | ||||||
John Wiley & Sons, Inc., Class A | 161,224 | 6,147,471 | ||||||
Saga Communications, Inc., Class A | 37,215 | 830,267 | ||||||
Scholastic Corp. | 63,654 | 2,400,392 | ||||||
Sinclair, Inc.(a) | 197,935 | 2,666,184 | ||||||
TEGNA, Inc. | 433,964 | 6,483,422 | ||||||
Townsquare Media, Inc., Class A | 70,712 | 776,418 | ||||||
|
| |||||||
| Total Media |
| 26,471,996 | ||||||
See Notes to Financial Statements.
| WisdomTree Trust | 75 |
Schedule of Investments (continued)
WisdomTree U.S. SmallCap Dividend Fund (DES)
March 31, 2024
| Investments | Shares | Value | ||||||
| Metals & Mining – 1.9% |
| |||||||
Arch Resources, Inc. | 15,957 | $ | 2,565,726 | |||||
Carpenter Technology Corp. | 61,545 | 4,395,544 | ||||||
Compass Minerals International, Inc.(a) | 112,896 | 1,776,983 | ||||||
Haynes International, Inc. | 38,361 | 2,306,263 | ||||||
Hecla Mining Co. | 557,759 | 2,682,821 | ||||||
Kaiser Aluminum Corp. | 66,966 | 5,984,082 | ||||||
Materion Corp. | 18,008 | 2,372,554 | ||||||
Mesabi Trust(a) | 70,230 | 1,243,071 | ||||||
Olympic Steel, Inc. | 27,824 | 1,972,165 | ||||||
Radius Recycling, Inc. | 89,593 | 1,893,100 | ||||||
Ramaco Resources, Inc., Class A | 134,909 | 2,271,868 | ||||||
Ryerson Holding Corp. | 84,507 | 2,830,984 | ||||||
SunCoke Energy, Inc. | 330,343 | 3,722,966 | ||||||
Warrior Met Coal, Inc. | 42,930 | 2,605,851 | ||||||
|
| |||||||
| Total Metals & Mining |
| 38,623,978 | ||||||
| Multi-Utilities – 1.7% |
| |||||||
Avista Corp. | 268,963 | 9,419,084 | ||||||
Black Hills Corp. | 204,287 | 11,154,070 | ||||||
Northwestern Energy Group, Inc. | 195,223 | 9,942,707 | ||||||
Unitil Corp. | 71,124 | 3,723,342 | ||||||
|
| |||||||
| Total Multi-Utilities |
| 34,239,203 | ||||||
| Office REITs – 1.3% |
| |||||||
COPT Defense Properties | 219,123 | 5,296,203 | ||||||
Cousins Properties, Inc. | 257,864 | 6,199,051 | ||||||
Douglas Emmett, Inc. | 128,894 | 1,787,760 | ||||||
Easterly Government Properties, Inc. | 109,189 | 1,256,765 | ||||||
JBG SMITH Properties | 83,964 | 1,347,622 | ||||||
Paramount Group, Inc. | 184,198 | 863,889 | ||||||
Peakstone Realty Trust | 29,117 | 469,657 | ||||||
Postal Realty Trust, Inc., Class A | 41,104 | 588,609 | ||||||
SL Green Realty Corp. | 163,201 | 8,997,271 | ||||||
|
| |||||||
| Total Office REITs |
| 26,806,827 | ||||||
| Oil, Gas & Consumable Fuels – 6.1% |
| |||||||
Berry Corp. | 424,603 | 3,418,054 | ||||||
California Resources Corp. | 168,033 | 9,258,618 | ||||||
Crescent Energy Co., Class A | 319,133 | 3,797,683 | ||||||
CVR Energy, Inc.(a) | 551,964 | 19,683,036 | ||||||
Delek U.S. Holdings, Inc. | 177,925 | 5,469,415 | ||||||
Evolution Petroleum Corp.(a) | 160,962 | 988,307 | ||||||
Excelerate Energy, Inc., Class A | 82,817 | 1,326,728 | ||||||
FutureFuel Corp. | 239,162 | 1,925,254 | ||||||
Granite Ridge Resources, Inc. | 769,837 | 5,003,941 | ||||||
HighPeak Energy, Inc.(a) | 132,194 | 2,084,699 | ||||||
Kinetik Holdings, Inc.(a) | 275,954 | 11,002,286 | ||||||
NACCO Industries, Inc., Class A | 32,598 | 984,460 | ||||||
Northern Oil & Gas, Inc. | 280,136 | 11,115,796 | ||||||
Peabody Energy Corp.(a) | 139,541 | 3,385,265 | ||||||
PHX Minerals, Inc. | 207,154 | 706,395 | ||||||
Riley Exploration Permian, Inc. | 107,258 | 3,539,514 | ||||||
SandRidge Energy, Inc. | 148,909 | 2,169,604 | ||||||
Sitio Royalties Corp., Class A(a) | 473,152 | 11,696,317 | ||||||
VAALCO Energy, Inc. | 516,005 | 3,596,555 | ||||||
Viper Energy, Inc. | 304,709 | 11,719,108 | ||||||
Vitesse Energy, Inc. | 161,605 | 3,834,887 | ||||||
Voc Energy Trust | 91,178 | 551,627 | ||||||
W&T Offshore, Inc.(a) | 535,559 | 1,419,231 | ||||||
World Kinect Corp. | 144,068 | 3,810,599 | ||||||
|
| |||||||
| Total Oil, Gas & Consumable Fuels |
| 122,487,379 | ||||||
| Paper & Forest Products – 0.3% |
| |||||||
Sylvamo Corp. | 104,339 | 6,441,890 | ||||||
| Passenger Airlines – 0.4% |
| |||||||
Allegiant Travel Co. | 54,485 | 4,097,817 | ||||||
Spirit Airlines, Inc.(a) | 646,117 | 3,127,206 | ||||||
|
| |||||||
| Total Passenger Airlines |
| 7,225,023 | ||||||
| Personal Care Products – 0.4% |
| |||||||
Edgewell Personal Care Co. | 81,742 | 3,158,511 | ||||||
Nu Skin Enterprises, Inc., Class A | 274,842 | 3,801,065 | ||||||
|
| |||||||
| Total Personal Care Products |
| 6,959,576 | ||||||
| Pharmaceuticals – 1.4% |
| |||||||
Organon & Co. | 1,424,368 | 26,778,119 | ||||||
Phibro Animal Health Corp., Class A | 44,198 | 571,480 | ||||||
|
| |||||||
| Total Pharmaceuticals |
| 27,349,599 | ||||||
| Professional Services – 1.4% |
| |||||||
Barrett Business Services, Inc. | 16,941 | 2,146,764 | ||||||
BGSF, Inc. | 70,547 | 734,394 | ||||||
CRA International, Inc. | 20,306 | 3,037,371 | ||||||
CSG Systems International, Inc.(a) | 82,391 | 4,246,432 | ||||||
Heidrick & Struggles International, Inc. | 68,604 | 2,309,211 | ||||||
HireQuest, Inc.(a) | 65,724 | 851,126 | ||||||
ICF International, Inc. | 15,842 | 2,386,280 | ||||||
Kelly Services, Inc., Class A | 82,749 | 2,072,035 | ||||||
Kforce, Inc. | 51,609 | 3,639,467 | ||||||
Korn Ferry | 62,598 | 4,116,445 | ||||||
Resources Connection, Inc. | 115,801 | 1,523,941 | ||||||
|
| |||||||
| Total Professional Services |
| 27,063,466 | ||||||
| Real Estate Management & Development – 0.6% |
| |||||||
DigitalBridge Group, Inc. | 152,634 | 2,941,257 | ||||||
eXp World Holdings, Inc.(a) | 130,171 | 1,344,666 | ||||||
Kennedy-Wilson Holdings, Inc. | 189,093 | 1,622,418 | ||||||
Marcus & Millichap, Inc. | 33,575 | 1,147,258 | ||||||
Newmark Group, Inc., Class A | 133,223 | 1,477,443 | ||||||
RMR Group, Inc., Class A | 19,373 | 464,952 | ||||||
St. Joe Co. | 49,332 | 2,859,776 | ||||||
|
| |||||||
| Total Real Estate Management & Development |
| 11,857,770 | ||||||
| Residential REITs – 0.4% |
| |||||||
BRT Apartments Corp. | 37,137 | 623,901 | ||||||
Centerspace | 15,112 | 863,500 | ||||||
Independence Realty Trust, Inc. | 200,888 | 3,240,323 | ||||||
UMH Properties, Inc. | 79,700 | 1,294,328 | ||||||
Veris Residential, Inc. | 75,327 | 1,145,724 | ||||||
|
| |||||||
| Total Residential REITs |
| 7,167,776 | ||||||
See Notes to Financial Statements.
| 76 | WisdomTree Trust |
Schedule of Investments (continued)
WisdomTree U.S. SmallCap Dividend Fund (DES)
March 31, 2024
| Investments | Shares | Value | ||||||
| Retail REITs – 1.3% |
| |||||||
Acadia Realty Trust | 91,472 | $ | 1,555,939 | |||||
Alexander’s, Inc.(a) | 12,844 | 2,788,946 | ||||||
CBL & Associates Properties, Inc.(a) | 34,072 | 780,589 | ||||||
Getty Realty Corp. | 72,700 | 1,988,345 | ||||||
InvenTrust Properties Corp. | 50,954 | 1,310,027 | ||||||
Macerich Co. | 228,786 | 3,941,983 | ||||||
NETSTREIT Corp.(a) | 73,415 | 1,348,633 | ||||||
Retail Opportunity Investments Corp. | 98,951 | 1,268,552 | ||||||
Saul Centers, Inc. | 26,499 | 1,019,946 | ||||||
SITE Centers Corp. | 264,409 | 3,873,592 | ||||||
Tanger, Inc. | 140,913 | 4,161,161 | ||||||
Urban Edge Properties | 99,106 | 1,711,561 | ||||||
Whitestone REIT | 71,185 | 893,372 | ||||||
|
| |||||||
| Total Retail REITs |
| 26,642,646 | ||||||
| Semiconductors & Semiconductor Equipment – 0.1% |
| |||||||
NVE Corp. | 25,464 | 2,296,343 | ||||||
| Software – 1.0% |
| |||||||
A10 Networks, Inc. | 161,511 | 2,211,086 | ||||||
Adeia, Inc. | 251,535 | 2,746,762 | ||||||
American Software, Inc., Class A | 174,766 | 2,001,071 | ||||||
Clear Secure, Inc., Class A | 140,483 | 2,988,073 | ||||||
InterDigital, Inc. | 45,873 | 4,883,639 | ||||||
Progress Software Corp. | 54,158 | 2,887,163 | ||||||
ReposiTrak, Inc.(a) | 81,421 | 1,290,523 | ||||||
|
| |||||||
| Total Software |
| 19,008,317 | ||||||
| Specialized REITs – 1.7% |
| |||||||
EPR Properties | 344,448 | 14,621,818 | ||||||
Farmland Partners, Inc. | 45,020 | 499,722 | ||||||
Four Corners Property Trust, Inc. | 81,332 | 1,990,194 | ||||||
Gladstone Land Corp. | 37,673 | 502,558 | ||||||
National Storage Affiliates Trust | 324,733 | 12,716,544 | ||||||
PotlatchDeltic Corp. | 68,077 | 3,200,980 | ||||||
Safehold, Inc. | 59,180 | 1,219,108 | ||||||
|
| |||||||
| Total Specialized REITs |
| 34,750,924 | ||||||
| Specialty Retail – 2.5% |
| |||||||
Aaron’s Co., Inc. | 109,108 | 818,310 | ||||||
Arko Corp. | 224,941 | 1,282,164 | ||||||
Buckle, Inc. | 184,366 | 7,424,419 | ||||||
Caleres, Inc. | 68,819 | 2,823,644 | ||||||
Camping World Holdings, Inc., Class A(a) | 108,685 | 3,026,877 | ||||||
Cato Corp., Class A | 125,321 | 723,102 | ||||||
Designer Brands, Inc., Class A | 204,607 | 2,236,354 | ||||||
Guess?, Inc. | 223,040 | 7,019,069 | ||||||
Haverty Furniture Cos., Inc. | 79,757 | 2,721,309 | ||||||
Hibbett, Inc. | 27,640 | 2,123,028 | ||||||
Monro, Inc. | 118,675 | 3,743,009 | ||||||
Shoe Carnival, Inc. | 79,373 | 2,908,227 | ||||||
Sonic Automotive, Inc., Class A | 54,641 | 3,111,259 | ||||||
Upbound Group, Inc. | 184,312 | 6,489,625 | ||||||
Winmark Corp. | 11,363 | 4,109,997 | ||||||
|
| |||||||
| Total Specialty Retail |
| 50,560,393 | ||||||
| Technology Hardware, Storage & Peripherals – 0.7% |
| |||||||
Immersion Corp. | 175,550 | 1,313,114 | ||||||
Xerox Holdings Corp. | 737,743 | 13,205,600 | ||||||
|
| |||||||
| Total Technology Hardware, Storage & Peripherals |
| 14,518,714 | ||||||
| Textiles, Apparel & Luxury Goods – 2.0% |
| |||||||
Carter’s, Inc. | 154,175 | 13,055,539 | ||||||
Kontoor Brands, Inc. | 140,005 | 8,435,301 | ||||||
Lakeland Industries, Inc. | 39,591 | 724,515 | ||||||
Movado Group, Inc.(a) | 55,919 | 1,561,818 | ||||||
Oxford Industries, Inc. | 40,101 | 4,507,352 | ||||||
Rocky Brands, Inc. | 37,111 | 1,006,822 | ||||||
Steven Madden Ltd. | 171,521 | 7,251,908 | ||||||
Superior Group of Cos., Inc. | 75,363 | 1,244,997 | ||||||
Wolverine World Wide, Inc. | 269,610 | 3,022,328 | ||||||
|
| |||||||
| Total Textiles, Apparel & Luxury Goods |
| 40,810,580 | ||||||
| Tobacco – 0.9% |
| |||||||
Turning Point Brands, Inc. | 66,365 | 1,944,495 | ||||||
Universal Corp. | 122,407 | 6,330,890 | ||||||
Vector Group Ltd. | 824,341 | 9,034,777 | ||||||
|
| |||||||
| Total Tobacco |
| 17,310,162 | ||||||
| Trading Companies & Distributors – 1.8% |
| |||||||
Alta Equipment Group, Inc. | 132,798 | 1,719,734 | ||||||
Global Industrial Co. | 102,468 | 4,588,517 | ||||||
H&E Equipment Services, Inc. | 77,571 | 4,978,507 | ||||||
Herc Holdings, Inc. | 43,645 | 7,345,453 | ||||||
Karat Packaging, Inc. | 98,806 | 2,826,840 | ||||||
McGrath RentCorp | 38,078 | 4,697,683 | ||||||
Rush Enterprises, Inc., Class A | 140,335 | 7,510,729 | ||||||
Rush Enterprises, Inc., Class B | 30,020 | 1,599,766 | ||||||
|
| |||||||
| Total Trading Companies & Distributors |
| 35,267,229 | ||||||
| Water Utilities – 1.0% |
| |||||||
American States Water Co. | 80,191 | 5,792,998 | ||||||
Artesian Resources Corp., Class A | 38,251 | 1,419,495 | ||||||
California Water Service Group | 87,557 | 4,069,649 | ||||||
Global Water Resources, Inc. | 122,869 | 1,577,638 | ||||||
Middlesex Water Co. | 31,444 | 1,650,810 | ||||||
SJW Group | 76,785 | 4,345,263 | ||||||
York Water Co.(a) | 52,140 | 1,891,118 | ||||||
|
| |||||||
| Total Water Utilities |
| 20,746,971 | ||||||
| Wireless Telecommunication Services – 0.3% |
| |||||||
Spok Holdings, Inc. | 120,751 | 1,925,978 | ||||||
Telephone & Data Systems, Inc. | 293,877 | 4,707,910 | ||||||
|
| |||||||
| Total Wireless Telecommunication Services |
| 6,633,888 | ||||||
| Total United States |
| 1,970,822,373 | ||||||
| Puerto Rico – 0.7% |
| |||||||
| Banks – 0.6% |
| |||||||
First BanCorp | 518,072 | 9,086,983 | ||||||
OFG Bancorp | 92,517 | 3,405,551 | ||||||
|
| |||||||
| Total Banks |
| 12,492,534 | ||||||
See Notes to Financial Statements.
| WisdomTree Trust | 77 |
Schedule of Investments (concluded)
WisdomTree U.S. SmallCap Dividend Fund (DES)
March 31, 2024
| Investments | Shares | Value | ||||||
| Financial Services – 0.1% |
| |||||||
EVERTEC, Inc. | 51,328 | $ | 2,047,987 | |||||
| Total Puerto Rico |
| 14,540,521 | ||||||
| Singapore – 0.2% |
| |||||||
| Semiconductors & Semiconductor Equipment – 0.2% |
| |||||||
Kulicke & Soffa Industries, Inc. | 71,613 | 3,602,850 | ||||||
| TOTAL COMMON STOCKS (Cost: $1,801,198,201) |
| 1,988,965,744 | ||||||
| EXCHANGE-TRADED FUND – 0.1% |
| |||||||
| United States – 0.1% |
| |||||||
WisdomTree U.S. MidCap Dividend Fund(b) | ||||||||
| (Cost: $1,944,815) | 41,094 | 2,004,154 | ||||||
| INVESTMENT OF CASH COLLATERAL FOR SECURITIES LOANED – 0.4% |
| |||||||
| United States – 0.4% |
| |||||||
State Street Navigator Securities Lending Government Money Market Portfolio, 5.34%(c) | ||||||||
| (Cost: $6,916,162) | 6,916,162 | 6,916,162 | ||||||
| TOTAL INVESTMENTS IN SECURITIES – 100.1% (Cost: $1,810,059,178) |
| 1,997,886,060 | ||||||
Other Assets less Liabilities – (0.1)% |
| (1,447,562 | ) | |||||
|
| |||||||
| NET ASSETS – 100.0% |
| $ | 1,996,438,498 | |||||
| (a) | Security, or portion thereof, was on loan at March 31, 2024 (See Note 2). At March 31, 2024, the total market value of the Fund’s securities on loan identified in the Schedule of Investments was $128,552,679 and the total market value of the collateral held by the Fund was $130,790,538. The total market value of the collateral includes non-cash U.S. Government securities collateral having a value of $123,874,376. |
| (b) | Affiliated holding. See “Investment in Affiliates” supplementary table included in this Schedule of Investments for additional information. |
| (c) | Rate shown represents annualized 7-day yield as of March 31, 2024. |
| INVESTMENT IN AFFILIATES |
Affiliated holdings are investments in entities in which the Fund owns 5% or more of the outstanding voting securities or are investments in entities which are under common ownership or control. Investments in affiliates during the fiscal year ended March 31, 2024 were as follows:
| Affiliate | Value at 3/31/2023 | Purchases/ Additions | Sales/ Reductions | Realized Gain/(Loss) | Change in Unrealized Appreciation/ Depreciation | Value at 3/31/2024 | Dividend Income | |||||||||||||||||||||
WisdomTree U.S. MidCap Dividend Fund | $ | 546,263 | $ | 29,856,239 | $ | 28,664,946 | $ | 220,789 | $ | 45,809 | $ | 2,004,154 | $ | 124,593 | ||||||||||||||
| FAIR VALUATION SUMMARY | ||||||||
The following is a summary of the fair valuations according to the inputs used in valuing the Fund’s investments (See Note 2 — Fair Value Measurement):
| Quoted Prices in Active Markets (Level 1) | Other Significant Observable Inputs (Level 2) | Significant Unobservable Inputs (Level 3) | Total | |||||||||||||
Assets: |
| |||||||||||||||
Investments in Securities | ||||||||||||||||
Common Stocks | $ | 1,988,965,744 | $ | — | $ | — | $ | 1,988,965,744 | ||||||||
Exchange-Traded Fund | 2,004,154 | — | — | 2,004,154 | ||||||||||||
Investment of Cash Collateral for Securities Loaned | — | 6,916,162 | — | 6,916,162 | ||||||||||||
Total Investments in Securities | $ | 1,990,969,898 | $ | 6,916,162 | $ | — | $ | 1,997,886,060 | ||||||||
See Notes to Financial Statements.
| 78 | WisdomTree Trust |
Schedule of Investments
WisdomTree U.S. SmallCap Fund (EES)
March 31, 2024
| Investments | Shares | Value | ||||||
| COMMON STOCKS – 99.9% |
| |||||||
| United States – 98.9% |
| |||||||
| Aerospace & Defense – 0.7% |
| |||||||
AAR Corp.* | 13,110 | $ | 784,896 | |||||
AerSale Corp.*(a) | 12,631 | 90,691 | ||||||
Cadre Holdings, Inc. | 10,207 | 369,493 | ||||||
Ducommun, Inc.* | 3,884 | 199,249 | ||||||
Kaman Corp. | 10,689 | 490,304 | ||||||
Kratos Defense & Security Solutions, Inc.* | 26,075 | 479,259 | ||||||
Mercury Systems, Inc.* | 12,027 | 354,797 | ||||||
National Presto Industries, Inc. | 3,445 | 288,691 | ||||||
Park Aerospace Corp. | 8,884 | 147,741 | ||||||
Triumph Group, Inc.* | 23,161 | 348,341 | ||||||
V2X, Inc.* | 19,799 | 924,811 | ||||||
|
| |||||||
| Total Aerospace & Defense |
| 4,478,273 | ||||||
| Air Freight & Logistics – 0.6% |
| |||||||
Air Transport Services Group, Inc.* | 73,673 | 1,013,741 | ||||||
Forward Air Corp. | 16,056 | 499,502 | ||||||
Hub Group, Inc., Class A | 43,877 | 1,896,364 | ||||||
Radiant Logistics, Inc.* | 29,363 | 159,147 | ||||||
|
| |||||||
| Total Air Freight & Logistics |
| 3,568,754 | ||||||
| Automobile Components – 0.9% |
| |||||||
Dana, Inc. | 69,974 | 888,670 | ||||||
Dorman Products, Inc.* | 13,361 | 1,287,867 | ||||||
Gentherm, Inc.* | 13,316 | 766,735 | ||||||
Holley, Inc.*(a) | 29,419 | 131,209 | ||||||
Motorcar Parts of America, Inc.* | 14,481 | 116,427 | ||||||
Patrick Industries, Inc. | 14,889 | 1,778,789 | ||||||
Standard Motor Products, Inc. | 16,492 | 553,306 | ||||||
XPEL, Inc.* | 9,286 | 501,630 | ||||||
|
| |||||||
| Total Automobile Components |
| 6,024,633 | ||||||
| Automobiles – 0.4% |
| |||||||
Winnebago Industries, Inc. | 31,790 | 2,352,460 | ||||||
| Banks – 16.0% |
| |||||||
1st Source Corp. | 16,719 | 876,410 | ||||||
ACNB Corp. | 4,668 | 175,517 | ||||||
Amalgamated Financial Corp. | 27,084 | 650,016 | ||||||
Amerant Bancorp, Inc. | 19,026 | 443,116 | ||||||
American National Bankshares, Inc. | 2,893 | 138,170 | ||||||
Ames National Corp. | 2,747 | 55,434 | ||||||
Arrow Financial Corp. | 5,041 | 126,126 | ||||||
Atlantic Union Bankshares Corp. | 51,315 | 1,811,933 | ||||||
Axos Financial, Inc.* | 55,917 | 3,021,755 | ||||||
Banc of California, Inc. | 53,415 | 812,442 | ||||||
Bancorp, Inc.* | 33,426 | 1,118,434 | ||||||
Bank First Corp. | 3,566 | 309,065 | ||||||
Bank of Hawaii Corp.(a) | 21,600 | 1,347,624 | ||||||
Bank of Marin Bancorp | 6,061 | 101,643 | ||||||
BankUnited, Inc. | 56,494 | 1,581,832 | ||||||
Banner Corp. | 28,540 | 1,369,920 | ||||||
Bar Harbor Bankshares | 9,019 | 238,823 | ||||||
BayCom Corp. | 5,320 | 109,645 | ||||||
BCB Bancorp, Inc. | 12,849 | 134,272 | ||||||
Berkshire Hills Bancorp, Inc. | 29,483 | 675,750 | ||||||
Bridgewater Bancshares, Inc.* | 16,975 | 197,589 | ||||||
Brookline Bancorp, Inc. | 50,694 | 504,912 | ||||||
Burke & Herbert Financial Services Corp.(a) | 2,157 | 120,857 | ||||||
Business First Bancshares, Inc. | 17,280 | 384,998 | ||||||
Byline Bancorp, Inc. | 33,347 | 724,297 | ||||||
C&F Financial Corp. | 1,655 | 81,095 | ||||||
Cambridge Bancorp | 3,793 | 258,531 | ||||||
Camden National Corp. | 7,794 | 261,255 | ||||||
Capital Bancorp, Inc. | 6,290 | 131,021 | ||||||
Capital City Bank Group, Inc. | 10,549 | 292,207 | ||||||
Capitol Federal Financial, Inc. | 37,958 | 226,230 | ||||||
Capstar Financial Holdings, Inc. | 7,160 | 143,916 | ||||||
Carter Bankshares, Inc.* | 14,397 | 181,978 | ||||||
Central Pacific Financial Corp. | 19,798 | 391,011 | ||||||
Central Valley Community Bancorp | 4,825 | 95,969 | ||||||
Citizens & Northern Corp. | 4,495 | 84,416 | ||||||
Citizens Financial Services, Inc. | 1,694 | 83,345 | ||||||
City Holding Co. | 7,702 | 802,702 | ||||||
Civista Bancshares, Inc. | 14,248 | 219,134 | ||||||
CNB Financial Corp. | 14,719 | 300,120 | ||||||
Coastal Financial Corp.* | 6,328 | 245,969 | ||||||
Colony Bankcorp, Inc. | 3,475 | 39,963 | ||||||
Columbia Financial, Inc.* | 21,888 | 376,692 | ||||||
Community Bank System, Inc. | 29,336 | 1,409,008 | ||||||
Community Trust Bancorp, Inc. | 12,147 | 518,070 | ||||||
ConnectOne Bancorp, Inc. | 29,039 | 566,261 | ||||||
CrossFirst Bankshares, Inc.* | 35,779 | 495,181 | ||||||
Customers Bancorp, Inc.* | 29,350 | 1,557,311 | ||||||
CVB Financial Corp. | 89,646 | 1,599,285 | ||||||
Dime Community Bancshares, Inc. | 36,537 | 703,703 | ||||||
Eagle Bancorp, Inc. | 32,256 | 757,693 | ||||||
Eastern Bankshares, Inc. | 121,956 | 1,680,554 | ||||||
Enterprise Bancorp, Inc. | 5,959 | 154,755 | ||||||
Enterprise Financial Services Corp. | 35,672 | 1,446,856 | ||||||
Equity Bancshares, Inc., Class A | 9,071 | 311,770 | ||||||
Esquire Financial Holdings, Inc. | 3,208 | 152,284 | ||||||
Farmers & Merchants Bancorp, Inc. | 3,438 | 76,633 | ||||||
Farmers National Banc Corp. | 18,089 | 241,669 | ||||||
FB Financial Corp. | 27,520 | 1,036,403 | ||||||
Fidelity D&D Bancorp, Inc. | 1,473 | 71,337 | ||||||
Financial Institutions, Inc. | 14,788 | 278,310 | ||||||
First Bancorp, Inc. | 3,948 | 97,279 | ||||||
First Bancorp/Southern Pines NC | 22,617 | 816,926 | ||||||
First Bancshares, Inc. | 22,602 | 586,522 | ||||||
First Bank | 7,226 | 99,285 | ||||||
First Busey Corp. | 38,039 | 914,838 | ||||||
First Business Financial Services, Inc. | 4,496 | 168,600 | ||||||
First Commonwealth Financial Corp. | 71,370 | 993,470 | ||||||
First Community Bankshares, Inc. | 8,115 | 281,022 | ||||||
First Financial Bancorp | 89,058 | 1,996,680 | ||||||
First Financial Corp. | 9,763 | 374,216 | ||||||
First Hawaiian, Inc. | 94,946 | 2,085,014 | ||||||
First Internet Bancorp | 2,261 | 78,547 | ||||||
See Notes to Financial Statements.
| WisdomTree Trust | 79 |
Schedule of Investments (continued)
WisdomTree U.S. SmallCap Fund (EES)
March 31, 2024
| Investments | Shares | Value | ||||||
First Merchants Corp. | 55,228 | $ | 1,927,457 | |||||
First Mid Bancshares, Inc. | 13,265 | 433,500 | ||||||
First of Long Island Corp. | 11,253 | 124,796 | ||||||
Five Star Bancorp | 11,689 | 263,003 | ||||||
Flushing Financial Corp. | 10,135 | 127,802 | ||||||
FS Bancorp, Inc. | 4,544 | 157,722 | ||||||
Fulton Financial Corp. | 140,817 | 2,237,582 | ||||||
German American Bancorp, Inc. | 19,262 | 667,236 | ||||||
Great Southern Bancorp, Inc. | 9,749 | 534,440 | ||||||
Guaranty Bancshares, Inc. | 3,442 | 104,499 | ||||||
Hanmi Financial Corp. | 33,592 | 534,785 | ||||||
HarborOne Bancorp, Inc. | 12,995 | 138,527 | ||||||
HBT Financial, Inc. | 23,228 | 442,261 | ||||||
Heartland Financial USA, Inc. | 43,197 | 1,518,375 | ||||||
Heritage Commerce Corp. | 50,828 | 436,104 | ||||||
Heritage Financial Corp. | 26,011 | 504,353 | ||||||
Hilltop Holdings, Inc. | 22,193 | 695,085 | ||||||
Home Bancorp, Inc. | 5,217 | 199,863 | ||||||
HomeTrust Bancshares, Inc. | 11,881 | 324,827 | ||||||
Hope Bancorp, Inc. | 104,639 | 1,204,395 | ||||||
Horizon Bancorp, Inc. | 38,229 | 490,478 | ||||||
Independent Bank Corp. | 46,125 | 2,009,907 | ||||||
Independent Bank Group, Inc. | 27,030 | 1,233,920 | ||||||
Kearny Financial Corp. | 13,739 | 88,479 | ||||||
Lakeland Bancorp, Inc. | 48,976 | 592,610 | ||||||
Lakeland Financial Corp. | 9,521 | 631,433 | ||||||
LCNB Corp. | 4,477 | 71,363 | ||||||
Live Oak Bancshares, Inc. | 10,741 | 445,859 | ||||||
Macatawa Bank Corp. | 22,946 | 224,641 | ||||||
Mercantile Bank Corp. | 14,087 | 542,209 | ||||||
Metrocity Bankshares, Inc. | 13,967 | 348,616 | ||||||
Metropolitan Bank Holding Corp.* | 12,344 | 475,244 | ||||||
Mid Penn Bancorp, Inc. | 11,704 | 234,197 | ||||||
Middlefield Banc Corp.(a) | 1,881 | 44,918 | ||||||
Midland States Bancorp, Inc. | 21,252 | 534,063 | ||||||
MidWestOne Financial Group, Inc. | 5,934 | 139,093 | ||||||
MVB Financial Corp. | 2,911 | 64,944 | ||||||
National Bank Holdings Corp., Class A | 27,934 | 1,007,579 | ||||||
National Bankshares, Inc. | 1,947 | 65,049 | ||||||
NBT Bancorp, Inc. | 25,650 | 940,842 | ||||||
Nicolet Bankshares, Inc. | 7,729 | 664,617 | ||||||
Northeast Bank | 5,514 | 305,145 | ||||||
Northeast Community Bancorp, Inc. | 12,022 | 189,106 | ||||||
Northfield Bancorp, Inc. | 19,659 | 191,085 | ||||||
Northrim BanCorp, Inc. | 2,291 | 115,718 | ||||||
Northwest Bancshares, Inc. | 87,889 | 1,023,907 | ||||||
Norwood Financial Corp. | 2,471 | 67,236 | ||||||
Oak Valley Bancorp | 4,320 | 107,050 | ||||||
OceanFirst Financial Corp. | 54,067 | 887,239 | ||||||
Old Second Bancorp, Inc. | 40,726 | 563,648 | ||||||
Orange County Bancorp, Inc.(a) | 3,116 | 143,336 | ||||||
Origin Bancorp, Inc. | 19,515 | 609,649 | ||||||
Orrstown Financial Services, Inc. | 6,440 | 172,399 | ||||||
Pacific Premier Bancorp, Inc. | 67,352 | 1,616,448 | ||||||
Park National Corp. | 7,250 | 984,913 | ||||||
Parke Bancorp, Inc. | 5,670 | 97,666 | ||||||
Pathward Financial, Inc. | 21,488 | 1,084,714 | ||||||
PCB Bancorp | 7,138 | 116,564 | ||||||
Peapack-Gladstone Financial Corp. | 13,782 | 335,316 | ||||||
Peoples Bancorp, Inc. | 29,364 | 869,468 | ||||||
Peoples Financial Services Corp. | 2,811 | 121,182 | ||||||
Preferred Bank | 16,532 | 1,269,162 | ||||||
Premier Financial Corp. | 36,379 | 738,494 | ||||||
Primis Financial Corp. | 8,670 | 105,514 | ||||||
Princeton Bancorp, Inc. | 2,651 | 81,598 | ||||||
Provident Bancorp, Inc.* | 4,231 | 38,502 | ||||||
Provident Financial Services, Inc. | 65,425 | 953,242 | ||||||
QCR Holdings, Inc. | 14,129 | 858,195 | ||||||
RBB Bancorp | 14,128 | 254,445 | ||||||
Red River Bancshares, Inc. | 2,966 | 147,677 | ||||||
Renasant Corp. | 38,740 | 1,213,337 | ||||||
Republic Bancorp, Inc., Class A | 11,662 | 594,762 | ||||||
S&T Bancorp, Inc. | 34,493 | 1,106,535 | ||||||
Sandy Spring Bancorp, Inc. | 37,858 | 877,548 | ||||||
Seacoast Banking Corp. of Florida | 43,024 | 1,092,379 | ||||||
Shore Bancshares, Inc. | 6,758 | 77,717 | ||||||
Sierra Bancorp | 7,219 | 145,824 | ||||||
Simmons First National Corp., Class A | 100,559 | 1,956,878 | ||||||
SmartFinancial, Inc. | 8,272 | 174,291 | ||||||
South Plains Financial, Inc. | 13,052 | 349,272 | ||||||
Southern First Bancshares, Inc.* | 1,743 | 55,358 | ||||||
Southern Missouri Bancorp, Inc. | 4,494 | 196,433 | ||||||
Southside Bancshares, Inc. | 21,558 | 630,140 | ||||||
Stellar Bancorp, Inc. | 37,653 | 917,227 | ||||||
Stock Yards Bancorp, Inc. | 15,842 | 774,832 | ||||||
Summit Financial Group, Inc. | 10,858 | 294,903 | ||||||
Third Coast Bancshares, Inc.* | 5,366 | 107,427 | ||||||
Timberland Bancorp, Inc. | 3,129 | 84,233 | ||||||
Tompkins Financial Corp. | 3,358 | 168,874 | ||||||
Towne Bank | 43,892 | 1,231,610 | ||||||
TriCo Bancshares | 22,972 | 844,910 | ||||||
Triumph Financial, Inc.* | 4,969 | 394,141 | ||||||
TrustCo Bank Corp. | 15,132 | 426,117 | ||||||
Trustmark Corp. | 47,668 | 1,339,948 | ||||||
Univest Financial Corp. | 25,124 | 523,082 | ||||||
Veritex Holdings, Inc. | 48,357 | 990,835 | ||||||
WaFd, Inc. | 59,299 | 1,721,450 | ||||||
Washington Trust Bancorp, Inc. | 9,436 | 253,640 | ||||||
WesBanco, Inc. | 42,514 | 1,267,342 | ||||||
West BanCorp, Inc. | 16,284 | 290,344 | ||||||
Westamerica BanCorp | 20,878 | 1,020,517 | ||||||
WSFS Financial Corp. | 52,821 | 2,384,340 | ||||||
|
| |||||||
| Total Banks |
| 103,777,153 | ||||||
| Beverages – 0.3% |
| |||||||
Duckhorn Portfolio, Inc.*(a) | 63,591 | 592,032 | ||||||
MGP Ingredients, Inc. | 10,152 | 874,392 | ||||||
Vita Coco Co., Inc.* | 13,114 | 320,375 | ||||||
|
| |||||||
| Total Beverages |
| 1,786,799 | ||||||
See Notes to Financial Statements.
| 80 | WisdomTree Trust |
Schedule of Investments (continued)
WisdomTree U.S. SmallCap Fund (EES)
March 31, 2024
| Investments | Shares | Value | ||||||
| Biotechnology – 1.1% |
| |||||||
Arcturus Therapeutics Holdings, Inc.* | 36,001 | $ | 1,215,754 | |||||
Avid Bioservices, Inc.* | 15,800 | 105,860 | ||||||
Cartesian Therapeutics, Inc.*†(a) | 242,132 | 43,584 | ||||||
Catalyst Pharmaceuticals, Inc.* | 36,364 | 579,642 | ||||||
Dynavax Technologies Corp.* | 39,570 | 491,064 | ||||||
Entrada Therapeutics, Inc.* | 35,719 | 506,138 | ||||||
iTeos Therapeutics, Inc.* | 33,251 | 453,544 | ||||||
MacroGenics, Inc.* | 51,306 | 755,224 | ||||||
Organogenesis Holdings, Inc.* | 75,141 | 213,400 | ||||||
Puma Biotechnology, Inc.* | 23,866 | 126,490 | ||||||
Vanda Pharmaceuticals, Inc.* | 38,906 | 159,904 | ||||||
Voyager Therapeutics, Inc.* | 60,766 | 565,732 | ||||||
Xencor, Inc.* | 16,517 | 365,521 | ||||||
Zymeworks, Inc.* | 134,322 | 1,413,067 | ||||||
|
| |||||||
| Total Biotechnology |
| 6,994,924 | ||||||
| Broadline Retail – 0.5% |
| |||||||
Nordstrom, Inc.(a) | 157,366 | 3,189,809 | ||||||
| Building Products – 2.5% |
| |||||||
American Woodmark Corp.* | 14,094 | 1,432,796 | ||||||
Apogee Enterprises, Inc. | 16,291 | 964,427 | ||||||
AZZ, Inc. | 16,056 | 1,241,289 | ||||||
Gibraltar Industries, Inc.* | 14,170 | 1,141,110 | ||||||
Griffon Corp. | 39,399 | 2,889,523 | ||||||
Hayward Holdings, Inc.* | 66,974 | 1,025,372 | ||||||
Insteel Industries, Inc. | 8,616 | 329,304 | ||||||
Janus International Group, Inc.* | 100,239 | 1,516,616 | ||||||
JELD-WEN Holding, Inc.* | 74,019 | 1,571,423 | ||||||
Masterbrand, Inc.* | 93,840 | 1,758,562 | ||||||
Quanex Building Products Corp. | 21,907 | 841,886 | ||||||
Resideo Technologies, Inc.* | 79,519 | 1,782,816 | ||||||
|
| |||||||
| Total Building Products |
| 16,495,124 | ||||||
| Capital Markets – 3.3% |
| |||||||
AssetMark Financial Holdings, Inc.* | 42,101 | 1,490,796 | ||||||
BGC Group, Inc., Class A | 414,289 | 3,219,025 | ||||||
Bridge Investment Group Holdings, Inc., Class A | 16,032 | 109,819 | ||||||
Brightsphere Investment Group, Inc. | 23,719 | 541,742 | ||||||
Diamond Hill Investment Group, Inc. | 1,223 | 188,550 | ||||||
Donnelley Financial Solutions, Inc.* | 9,133 | 566,337 | ||||||
GCM Grosvenor, Inc., Class A | 69,313 | 669,564 | ||||||
Heritage Global, Inc.* | 12,574 | 33,195 | ||||||
Open Lending Corp., Class A* | 24,783 | 155,142 | ||||||
Oppenheimer Holdings, Inc., Class A | 5,401 | 215,608 | ||||||
P10, Inc., Class A(a) | 70,518 | 593,762 | ||||||
Perella Weinberg Partners | 13,869 | 195,969 | ||||||
PJT Partners, Inc., Class A | 6,197 | 584,129 | ||||||
Silvercrest Asset Management Group, Inc., Class A | 2,127 | 33,628 | ||||||
StepStone Group, Inc., Class A | 15,814 | 565,192 | ||||||
StoneX Group, Inc.* | 24,338 | 1,709,988 | ||||||
TPG, Inc. | 104,714 | 4,680,716 | ||||||
Victory Capital Holdings, Inc., Class A | 66,782 | 2,833,560 | ||||||
Virtu Financial, Inc., Class A | 71,705 | 1,471,387 | ||||||
Virtus Investment Partners, Inc. | 5,250 | 1,301,895 | ||||||
|
| |||||||
| Total Capital Markets |
| 21,160,004 | ||||||
| Chemicals – 1.6% |
| |||||||
AdvanSix, Inc. | 31,210 | 892,606 | ||||||
Core Molding Technologies, Inc.* | 13,197 | 249,819 | ||||||
Ecovyst, Inc.* | 81,448 | 908,145 | ||||||
Hawkins, Inc. | 9,289 | 713,395 | ||||||
Ingevity Corp.* | 32,505 | 1,550,488 | ||||||
Intrepid Potash, Inc.*(a) | 7,741 | 161,477 | ||||||
Koppers Holdings, Inc. | 19,371 | 1,068,698 | ||||||
LSB Industries, Inc.* | 93,264 | 818,858 | ||||||
Mativ Holdings, Inc. | 52,610 | 986,438 | ||||||
Minerals Technologies, Inc. | 19,217 | 1,446,656 | ||||||
Sensient Technologies Corp. | 16,993 | 1,175,746 | ||||||
Stepan Co. | 5,716 | 514,669 | ||||||
|
| |||||||
| Total Chemicals |
| 10,486,995 | ||||||
| Commercial Services & Supplies – 2.3% |
| |||||||
ACCO Brands Corp. | 156,812 | 879,715 | ||||||
ARC Document Solutions, Inc. | 50,292 | 139,309 | ||||||
Aris Water Solutions, Inc., Class A | 29,813 | 421,854 | ||||||
Brady Corp., Class A | 26,097 | 1,547,030 | ||||||
BrightView Holdings, Inc.* | 58,775 | 699,423 | ||||||
CECO Environmental Corp.* | 12,643 | 291,042 | ||||||
CoreCivic, Inc.* | 40,380 | 630,332 | ||||||
Deluxe Corp. | 66,538 | 1,370,018 | ||||||
Ennis, Inc. | 19,179 | 393,361 | ||||||
GEO Group, Inc.* | 99,935 | 1,411,082 | ||||||
Healthcare Services Group, Inc.* | 45,655 | 569,774 | ||||||
HNI Corp. | 20,547 | 927,286 | ||||||
Interface, Inc. | 42,599 | 716,515 | ||||||
Liquidity Services, Inc.* | 13,192 | 245,371 | ||||||
Matthews International Corp., Class A | 21,277 | 661,289 | ||||||
MillerKnoll, Inc. | 40,673 | 1,007,064 | ||||||
OPENLANE, Inc.* | 59,727 | 1,033,277 | ||||||
Pitney Bowes, Inc. | 38,673 | 167,454 | ||||||
Quad/Graphics, Inc. | 34,361 | 182,457 | ||||||
SP Plus Corp.* | 9,242 | 482,617 | ||||||
Steelcase, Inc., Class A | 59,883 | 783,270 | ||||||
VSE Corp.(a) | 6,433 | 514,640 | ||||||
|
| |||||||
| Total Commercial Services & Supplies |
| 15,074,180 | ||||||
| Communications Equipment – 1.1% |
| |||||||
Aviat Networks, Inc.*(a) | 11,817 | 453,064 | ||||||
Clearfield, Inc.*(a) | 11,991 | 369,802 | ||||||
CommScope Holding Co., Inc.* | 403,740 | 528,899 | ||||||
Digi International, Inc.* | 27,072 | 864,409 | ||||||
Extreme Networks, Inc.* | 83,509 | 963,694 | ||||||
Harmonic, Inc.* | 41,172 | 553,352 | ||||||
Infinera Corp.*(a) | 114,953 | 693,167 | ||||||
Lantronix, Inc.* | 21,066 | 74,995 | ||||||
NetScout Systems, Inc.* | 65,832 | 1,437,771 | ||||||
Ribbon Communications, Inc.* | 122,861 | 393,155 | ||||||
Viavi Solutions, Inc.* | 91,142 | 828,481 | ||||||
|
| |||||||
| Total Communications Equipment |
| 7,160,789 | ||||||
| Construction & Engineering – 1.2% |
| |||||||
Argan, Inc. | 7,110 | 359,339 | ||||||
See Notes to Financial Statements.
| WisdomTree Trust | 81 |
Schedule of Investments (continued)
WisdomTree U.S. SmallCap Fund (EES)
March 31, 2024
| Investments | Shares | Value | ||||||
Bowman Consulting Group Ltd.* | 3,728 | $ | 129,697 | |||||
Concrete Pumping Holdings, Inc.* | 35,086 | 277,179 | ||||||
Construction Partners, Inc., Class A* | 10,600 | 595,190 | ||||||
Granite Construction, Inc. | 9,373 | 535,480 | ||||||
IES Holdings, Inc.* | 8,671 | 1,054,741 | ||||||
Limbach Holdings, Inc.* | 5,197 | 215,260 | ||||||
MYR Group, Inc.* | 5,962 | 1,053,784 | ||||||
Northwest Pipe Co.*(a) | 8,937 | 309,935 | ||||||
Primoris Services Corp. | 40,623 | 1,729,321 | ||||||
Sterling Infrastructure, Inc.* | 14,972 | 1,651,561 | ||||||
|
| |||||||
| Total Construction & Engineering |
| 7,911,487 | ||||||
| Construction Materials – 0.1% |
| |||||||
U.S. Lime & Minerals, Inc. | 2,628 | 783,512 | ||||||
| Consumer Finance – 2.1% |
| |||||||
Atlanticus Holdings Corp.* | 15,159 | 448,555 | ||||||
Bread Financial Holdings, Inc. | 90,514 | 3,370,741 | ||||||
Enova International, Inc.* | 36,322 | 2,282,111 | ||||||
EZCORP, Inc., Class A* | 50,798 | 575,541 | ||||||
Green Dot Corp., Class A* | 67,013 | 625,231 | ||||||
LendingClub Corp.* | 40,100 | 352,479 | ||||||
Navient Corp. | 164,093 | 2,855,218 | ||||||
Nelnet, Inc., Class A | 13,105 | 1,240,388 | ||||||
PROG Holdings, Inc. | 44,170 | 1,521,215 | ||||||
Regional Management Corp. | 3,060 | 74,083 | ||||||
World Acceptance Corp.* | 1,874 | 271,693 | ||||||
|
| |||||||
| Total Consumer Finance |
| 13,617,255 | ||||||
| Consumer Staples Distribution & Retail – 0.9% |
| |||||||
Andersons, Inc. | 9,694 | 556,145 | ||||||
Chefs’ Warehouse, Inc.* | 17,066 | 642,706 | ||||||
Ingles Markets, Inc., Class A | 20,262 | 1,553,690 | ||||||
Natural Grocers by Vitamin Cottage, Inc. | 14,340 | 258,837 | ||||||
PriceSmart, Inc. | 12,788 | 1,074,192 | ||||||
SpartanNash Co. | 26,726 | 540,132 | ||||||
Village Super Market, Inc., Class A | 16,641 | 476,099 | ||||||
Weis Markets, Inc. | 14,829 | 954,988 | ||||||
|
| |||||||
| Total Consumer Staples Distribution & Retail |
| 6,056,789 | ||||||
| Containers & Packaging – 1.1% |
| |||||||
Myers Industries, Inc. | 25,563 | 592,295 | ||||||
O-I Glass, Inc.* | 271,108 | 4,497,682 | ||||||
Pactiv Evergreen, Inc. | 95,344 | 1,365,326 | ||||||
TriMas Corp. | 27,979 | 747,878 | ||||||
|
| |||||||
| Total Containers & Packaging |
| 7,203,181 | ||||||
| Distributors – 0.0% |
| |||||||
Weyco Group, Inc. | 10,172 | 324,283 | ||||||
| Diversified Consumer Services – 1.3% |
| |||||||
Adtalem Global Education, Inc.* | 25,611 | 1,316,405 | ||||||
Carriage Services, Inc. | 12,727 | 344,138 | ||||||
Chegg, Inc.* | 114,352 | 865,645 | ||||||
European Wax Center, Inc., Class A* | 28,238 | 366,529 | ||||||
Graham Holdings Co., Class B | 1,972 | 1,513,865 | ||||||
Laureate Education, Inc. | 65,383 | 952,630 | ||||||
Lincoln Educational Services Corp.* | 17,247 | 178,162 | ||||||
Mister Car Wash, Inc.*(a) | 114,866 | 890,212 | ||||||
Perdoceo Education Corp. | 65,295 | 1,146,580 | ||||||
Strategic Education, Inc. | 6,648 | 692,190 | ||||||
Universal Technical Institute, Inc.* | 9,844 | 156,913 | ||||||
|
| |||||||
| Total Diversified Consumer Services |
| 8,423,269 | ||||||
| Diversified REITs – 0.4% |
| |||||||
Alexander & Baldwin, Inc. | 24,382 | 401,572 | ||||||
Alpine Income Property Trust, Inc.(a) | 7,126 | 108,885 | ||||||
American Assets Trust, Inc. | 25,537 | 559,516 | ||||||
Armada Hoffler Properties, Inc. | 25,608 | 266,323 | ||||||
Empire State Realty Trust, Inc., Class A | 78,733 | 797,565 | ||||||
One Liberty Properties, Inc. | 10,325 | 233,242 | ||||||
|
| |||||||
| Total Diversified REITs |
| 2,367,103 | ||||||
| Diversified Telecommunication Services – 0.6% |
| |||||||
Anterix, Inc.* | 4,018 | 135,045 | ||||||
Bandwidth, Inc., Class A* | 15,764 | 287,850 | ||||||
IDT Corp., Class B | 14,001 | 529,378 | ||||||
Lumen Technologies, Inc.*(a) | 1,710,471 | 2,668,335 | ||||||
Ooma, Inc.* | 15,216 | 129,792 | ||||||
Shenandoah Telecommunications Co. | 11,172 | 194,058 | ||||||
|
| |||||||
| Total Diversified Telecommunication Services |
| 3,944,458 | ||||||
| Electric Utilities – 0.3% |
| |||||||
Genie Energy Ltd., Class B | 22,808 | 343,945 | ||||||
Hawaiian Electric Industries, Inc.(a) | 137,975 | 1,554,978 | ||||||
|
| |||||||
| Total Electric Utilities |
| 1,898,923 | ||||||
| Electrical Equipment – 1.1% |
| |||||||
Allient, Inc. | 11,577 | 413,067 | ||||||
Array Technologies, Inc.* | 78,960 | 1,177,293 | ||||||
LSI Industries, Inc. | 21,173 | 320,136 | ||||||
NEXTracker, Inc., Class A* | 44,143 | 2,483,927 | ||||||
Powell Industries, Inc. | 3,934 | 559,808 | ||||||
Preformed Line Products Co. | 4,785 | 615,686 | ||||||
Shoals Technologies Group, Inc., Class A*(a) | 59,796 | 668,519 | ||||||
Thermon Group Holdings, Inc.* | 17,676 | 578,359 | ||||||
Vicor Corp.* | 12,203 | 466,643 | ||||||
|
| |||||||
| Total Electrical Equipment |
| 7,283,438 | ||||||
| Electronic Equipment, Instruments & Components – 1.9% |
| |||||||
Arlo Technologies, Inc.* | 21,645 | 273,809 | ||||||
Bel Fuse, Inc., Class B | 12,410 | 748,447 | ||||||
Benchmark Electronics, Inc. | 24,486 | 734,825 | ||||||
Climb Global Solutions, Inc. | 3,372 | 239,007 | ||||||
CTS Corp. | 15,928 | 745,271 | ||||||
Daktronics, Inc.* | 35,566 | 354,237 | ||||||
ePlus, Inc.* | 17,790 | 1,397,227 | ||||||
Iteris, Inc.* | 14,492 | 71,591 | ||||||
Kimball Electronics, Inc.* | 19,844 | 429,623 | ||||||
Knowles Corp.* | 43,436 | 699,320 | ||||||
Luna Innovations, Inc.*(a) | 17,977 | 57,616 | ||||||
Methode Electronics, Inc. | 19,939 | 242,857 | ||||||
Mirion Technologies, Inc.*(a) | 57,635 | 655,310 | ||||||
Napco Security Technologies, Inc. | 11,257 | 452,081 | ||||||
OSI Systems, Inc.* | 7,128 | 1,018,021 | ||||||
See Notes to Financial Statements.
| 82 | WisdomTree Trust |
Schedule of Investments (continued)
WisdomTree U.S. SmallCap Fund (EES)
March 31, 2024
| Investments | Shares | Value | ||||||
PC Connection, Inc. | 10,771 | $ | 710,132 | |||||
Richardson Electronics Ltd.(a) | 12,454 | 114,701 | ||||||
Rogers Corp.* | 5,068 | 601,521 | ||||||
ScanSource, Inc.* | 20,897 | 920,304 | ||||||
TTM Technologies, Inc.* | 77,285 | 1,209,510 | ||||||
Vishay Precision Group, Inc.* | 10,012 | 353,724 | ||||||
|
| |||||||
| Total Electronic Equipment, Instruments & Components |
| 12,029,134 | ||||||
| Energy Equipment & Services – 1.8% |
| |||||||
Archrock, Inc. | 46,389 | 912,472 | ||||||
Atlas Energy Solutions, Inc.(a) | 46,424 | 1,050,111 | ||||||
Core Laboratories, Inc. | 19,380 | 331,010 | ||||||
Diamond Offshore Drilling, Inc.* | 36,955 | 504,066 | ||||||
DMC Global, Inc.* | 19,693 | 383,817 | ||||||
Helix Energy Solutions Group, Inc.* | 32,619 | 353,590 | ||||||
KLX Energy Services Holdings, Inc.*(a) | 30,648 | 237,216 | ||||||
Kodiak Gas Services, Inc. | 17,878 | 488,784 | ||||||
Mammoth Energy Services, Inc.* | 29,070 | 105,815 | ||||||
Natural Gas Services Group, Inc.* | 6,993 | 135,874 | ||||||
Newpark Resources, Inc.* | 37,065 | 267,609 | ||||||
Oceaneering International, Inc.* | 29,118 | 681,361 | ||||||
Oil States International, Inc.* | 20,860 | 128,498 | ||||||
ProFrac Holding Corp., Class A*(a) | 35,889 | 300,032 | ||||||
ProPetro Holding Corp.* | 107,994 | 872,591 | ||||||
Ranger Energy Services, Inc. | 27,078 | 305,711 | ||||||
RPC, Inc.(a) | 279,234 | 2,161,271 | ||||||
Select Water Solutions, Inc. | 78,241 | 722,164 | ||||||
Solaris Oilfield Infrastructure, Inc., Class A | 30,725 | 266,386 | ||||||
TETRA Technologies, Inc.* | 67,121 | 297,346 | ||||||
U.S. Silica Holdings, Inc.* | 117,233 | 1,454,862 | ||||||
|
| |||||||
| Total Energy Equipment & Services |
| 11,960,586 | ||||||
| Entertainment – 0.9% |
| |||||||
Cinemark Holdings, Inc.* | 66,516 | 1,195,293 | ||||||
Marcus Corp. | 9,577 | 136,568 | ||||||
Playstudios, Inc.* | 218,110 | 606,346 | ||||||
Sphere Entertainment Co.*(a) | 64,906 | 3,185,586 | ||||||
Vivid Seats, Inc., Class A*(a) | 105,557 | 632,286 | ||||||
|
| |||||||
| Total Entertainment |
| 5,756,079 | ||||||
| Financial Services – 1.5% |
| |||||||
A-Mark Precious Metals, Inc.(a) | 42,785 | 1,313,072 | ||||||
Alerus Financial Corp. | 8,374 | 182,804 | ||||||
Cantaloupe, Inc.* | 17,032 | 109,516 | ||||||
Cass Information Systems, Inc. | 3,239 | 156,022 | ||||||
Federal Agricultural Mortgage Corp., Class C | 6,532 | 1,286,020 | ||||||
I3 Verticals, Inc., Class A* | 10,500 | 240,345 | ||||||
International Money Express, Inc.* | 19,055 | 435,026 | ||||||
Merchants Bancorp | 45,128 | 1,948,627 | ||||||
NewtekOne, Inc. | 7,482 | 82,302 | ||||||
NMI Holdings, Inc., Class A* | 82,905 | 2,681,148 | ||||||
Paymentus Holdings, Inc., Class A* | 5,437 | 123,692 | ||||||
Payoneer Global, Inc.* | 79,649 | 387,094 | ||||||
Repay Holdings Corp.* | 60,801 | 668,811 | ||||||
UWM Holdings Corp.(a) | 55,258 | 401,173 | ||||||
Waterstone Financial, Inc. | 2,913 | 35,451 | ||||||
|
| |||||||
| Total Financial Services |
| 10,051,103 | ||||||
| Food Products – 1.5% |
| |||||||
B&G Foods, Inc. | 69,504 | 795,126 | ||||||
Cal-Maine Foods, Inc. | 82,080 | 4,830,408 | ||||||
Calavo Growers, Inc. | 3,893 | 108,264 | ||||||
Hain Celestial Group, Inc.* | 27,273 | 214,366 | ||||||
John B Sanfilippo & Son, Inc. | 5,875 | 622,280 | ||||||
Mama’s Creations, Inc.* | 25,878 | 129,390 | ||||||
Seneca Foods Corp., Class A* | 6,976 | 396,934 | ||||||
Tootsie Roll Industries, Inc. | 21,357 | 684,079 | ||||||
TreeHouse Foods, Inc.* | 29,392 | 1,144,819 | ||||||
Utz Brands, Inc. | 31,028 | 572,156 | ||||||
Vital Farms, Inc.* | 14,425 | 335,381 | ||||||
|
| |||||||
| Total Food Products |
| 9,833,203 | ||||||
| Gas Utilities – 0.3% |
| |||||||
Chesapeake Utilities Corp. | 7,598 | 815,265 | ||||||
Northwest Natural Holding Co. | 21,782 | 810,726 | ||||||
RGC Resources, Inc. | 7,453 | 150,849 | ||||||
|
| |||||||
| Total Gas Utilities |
| 1,776,840 | ||||||
| Ground Transportation – 1.1% |
| |||||||
Covenant Logistics Group, Inc. | 12,614 | 584,785 | ||||||
Daseke, Inc.* | 23,555 | 195,506 | ||||||
Heartland Express, Inc. | 18,812 | 224,615 | ||||||
Marten Transport Ltd. | 36,897 | 681,857 | ||||||
RXO, Inc.* | 25,573 | 559,281 | ||||||
Schneider National, Inc., Class B | 108,823 | 2,463,753 | ||||||
Universal Logistics Holdings, Inc.(a) | 34,534 | 1,273,269 | ||||||
Werner Enterprises, Inc. | 32,252 | 1,261,698 | ||||||
|
| |||||||
| Total Ground Transportation |
| 7,244,764 | ||||||
| Health Care Equipment & Supplies – 1.3% |
| |||||||
Atrion Corp.(a) | 757 | 350,907 | ||||||
Avanos Medical, Inc.* | 26,380 | 525,226 | ||||||
Axogen, Inc.* | 18,551 | 149,707 | ||||||
Embecta Corp. | 76,972 | 1,021,419 | ||||||
ICU Medical, Inc.* | 14,895 | 1,598,532 | ||||||
iRadimed Corp. | 4,763 | 209,524 | ||||||
LeMaitre Vascular, Inc. | 5,183 | 343,944 | ||||||
Omnicell, Inc.* | 21,780 | 636,629 | ||||||
OraSure Technologies, Inc.* | 57,736 | 355,076 | ||||||
Orthofix Medical, Inc.* | 10,110 | 146,797 | ||||||
OrthoPediatrics Corp.* | 5,638 | 164,404 | ||||||
Sanara Medtech, Inc.* | 3,643 | 134,791 | ||||||
Semler Scientific, Inc.* | 4,830 | 141,084 | ||||||
STAAR Surgical Co.* | 14,297 | 547,289 | ||||||
Surmodics, Inc.* | 3,199 | 93,859 | ||||||
Tactile Systems Technology, Inc.* | 19,638 | 319,118 | ||||||
UFP Technologies, Inc.* | 2,214 | 558,371 | ||||||
Utah Medical Products, Inc. | 2,321 | 165,046 | ||||||
Varex Imaging Corp.* | 27,385 | 495,669 | ||||||
Zimvie, Inc.* | 17,815 | 293,769 | ||||||
Zynex, Inc.*(a) | 21,452 | 265,361 | ||||||
|
| |||||||
| Total Health Care Equipment & Supplies |
| 8,516,522 | ||||||
| Health Care Providers & Services – 2.3% |
| |||||||
AdaptHealth Corp.* | 98,981 | 1,139,271 | ||||||
See Notes to Financial Statements.
| WisdomTree Trust | 83 |
Schedule of Investments (continued)
WisdomTree U.S. SmallCap Fund (EES)
March 31, 2024
| Investments | Shares | Value | ||||||
Addus HomeCare Corp.* | 6,422 | $ | 663,649 | |||||
Agiliti, Inc.* | 90,637 | 917,246 | ||||||
AirSculpt Technologies, Inc.*(a) | 36,004 | 221,065 | ||||||
Astrana Health, Inc.* | 12,472 | 523,699 | ||||||
Community Health Systems, Inc.* | 228,823 | 800,881 | ||||||
Cross Country Healthcare, Inc.* | 42,226 | 790,471 | ||||||
DocGo, Inc.*(a) | 27,240 | 110,050 | ||||||
Enhabit, Inc.* | 21,841 | 254,448 | ||||||
InfuSystem Holdings, Inc.* | 6,792 | 58,207 | ||||||
Joint Corp.*(a) | 8,617 | 112,538 | ||||||
National HealthCare Corp. | 3,638 | 343,827 | ||||||
National Research Corp. | 6,651 | 263,446 | ||||||
Owens & Minor, Inc.* | 27,546 | 763,300 | ||||||
Patterson Cos., Inc. | 68,164 | 1,884,735 | ||||||
Pediatrix Medical Group, Inc.* | 104,023 | 1,043,351 | ||||||
Pennant Group, Inc.* | 15,778 | 309,722 | ||||||
PetIQ, Inc.* | 21,121 | 386,092 | ||||||
Premier, Inc., Class A | 115,586 | 2,554,451 | ||||||
Privia Health Group, Inc.* | 25,659 | 502,660 | ||||||
RadNet, Inc.* | 13,552 | 659,440 | ||||||
U.S. Physical Therapy, Inc. | 3,713 | 419,086 | ||||||
|
| |||||||
| Total Health Care Providers & Services |
| 14,721,635 | ||||||
| Health Care REITs – 0.3% |
| |||||||
Community Healthcare Trust, Inc. | 5,748 | 152,609 | ||||||
LTC Properties, Inc. | 20,290 | 659,628 | ||||||
National Health Investors, Inc. | 15,683 | 985,363 | ||||||
Universal Health Realty Income Trust | 4,448 | 163,286 | ||||||
|
| |||||||
| Total Health Care REITs |
| 1,960,886 | ||||||
| Health Care Technology – 0.5% |
| |||||||
Certara, Inc.* | 46,780 | 836,426 | ||||||
Definitive Healthcare Corp.*(a) | 39,323 | 317,337 | ||||||
GoodRx Holdings, Inc., Class A* | 151,803 | 1,077,801 | ||||||
Health Catalyst, Inc.* | 14,437 | 108,711 | ||||||
HealthStream, Inc. | 6,649 | 177,262 | ||||||
OptimizeRx Corp.*(a) | 7,670 | 93,191 | ||||||
Schrodinger, Inc.* | 13,577 | 366,579 | ||||||
Simulations Plus, Inc.(a) | 4,534 | 186,574 | ||||||
|
| |||||||
| Total Health Care Technology |
| 3,163,881 | ||||||
| Hotel & Resort REITs – 0.4% |
| |||||||
Chatham Lodging Trust | 11,129 | 112,514 | ||||||
DiamondRock Hospitality Co. | 82,955 | 797,197 | ||||||
RLJ Lodging Trust | 41,024 | 484,904 | ||||||
Sunstone Hotel Investors, Inc. | 70,265 | 782,752 | ||||||
Xenia Hotels & Resorts, Inc. | 32,964 | 494,790 | ||||||
|
| |||||||
| Total Hotel & Resort REITs |
| 2,672,157 | ||||||
| Hotels, Restaurants & Leisure – 3.7% |
| |||||||
Accel Entertainment, Inc.* | 67,288 | 793,325 | ||||||
Biglari Holdings, Inc., Class B* | 1,618 | 306,902 | ||||||
BJ’s Restaurants, Inc.* | 5,642 | 204,128 | ||||||
Bloomin’ Brands, Inc. | 91,797 | 2,632,738 | ||||||
Bowlero Corp., Class A(a) | 77,480 | 1,061,476 | ||||||
Brinker International, Inc.* | 35,095 | 1,743,520 | ||||||
Carrols Restaurant Group, Inc. | 31,058 | 295,362 | ||||||
Cheesecake Factory, Inc. | 30,102 | 1,088,187 | ||||||
Chuy’s Holdings, Inc.* | 8,085 | 272,707 | ||||||
Cracker Barrel Old Country Store, Inc. | 12,844 | 934,144 | ||||||
Dave & Buster’s Entertainment, Inc.* | 26,629 | 1,666,975 | ||||||
Denny’s Corp.* | 34,292 | 307,256 | ||||||
Dine Brands Global, Inc. | 18,310 | 851,049 | ||||||
El Pollo Loco Holdings, Inc.* | 29,419 | 286,541 | ||||||
Everi Holdings, Inc.* | 89,188 | 896,339 | ||||||
First Watch Restaurant Group, Inc.* | 13,388 | 329,613 | ||||||
Golden Entertainment, Inc. | 43,650 | 1,607,629 | ||||||
Jack in the Box, Inc. | 15,405 | 1,054,934 | ||||||
Krispy Kreme, Inc. | 36,552 | 556,870 | ||||||
Kura Sushi USA, Inc., Class A*(a) | 2,235 | 257,383 | ||||||
Monarch Casino & Resort, Inc. | 11,416 | 856,086 | ||||||
Nathan’s Famous, Inc. | 3,083 | 218,276 | ||||||
ONE Group Hospitality, Inc.*(a) | 25,973 | 144,670 | ||||||
Papa John’s International, Inc. | 10,140 | 675,324 | ||||||
PlayAGS, Inc.* | 11,102 | 99,696 | ||||||
Portillo’s, Inc., Class A* | 13,128 | 186,155 | ||||||
Potbelly Corp.* | 12,730 | 154,160 | ||||||
RCI Hospitality Holdings, Inc. | 7,108 | 412,264 | ||||||
Sabre Corp.* | 497,690 | 1,204,410 | ||||||
Shake Shack, Inc., Class A* | 8,423 | 876,245 | ||||||
Six Flags Entertainment Corp.* | 24,981 | 657,500 | ||||||
Target Hospitality Corp.*(a) | 128,418 | 1,395,904 | ||||||
Xponential Fitness, Inc., Class A*(a) | 9,530 | 157,626 | ||||||
|
| |||||||
| Total Hotels, Restaurants & Leisure |
| 24,185,394 | ||||||
| Household Durables – 3.0% |
| |||||||
Beazer Homes USA, Inc.* | 46,178 | 1,514,638 | ||||||
Cavco Industries, Inc.* | 5,276 | 2,105,441 | ||||||
Century Communities, Inc. | 27,092 | 2,614,378 | ||||||
Cricut, Inc., Class A | 65,097 | 309,862 | ||||||
Dream Finders Homes, Inc., Class A*(a) | 60,287 | 2,636,350 | ||||||
Ethan Allen Interiors, Inc. | 27,314 | 944,245 | ||||||
Green Brick Partners, Inc.* | 42,135 | 2,537,791 | ||||||
Hovnanian Enterprises, Inc., Class A* | 8,549 | 1,341,680 | ||||||
La-Z-Boy, Inc. | 31,754 | 1,194,585 | ||||||
Landsea Homes Corp.* | 33,856 | 491,928 | ||||||
Legacy Housing Corp.* | 26,212 | 564,082 | ||||||
Lovesac Co.* | 7,900 | 178,540 | ||||||
Snap One Holdings Corp.* | 48,922 | 421,708 | ||||||
Sonos, Inc.* | 97,614 | 1,860,523 | ||||||
Universal Electronics, Inc.* | 8,064 | 80,721 | ||||||
Vizio Holding Corp., Class A* | 31,747 | 347,312 | ||||||
|
| |||||||
| Total Household Durables |
| 19,143,784 | ||||||
| Household Products – 0.6% |
| |||||||
Central Garden & Pet Co., Class A* | 35,692 | 1,317,749 | ||||||
Energizer Holdings, Inc. | 58,050 | 1,708,992 | ||||||
Oil-Dri Corp. of America | 5,214 | 388,756 | ||||||
Spectrum Brands Holdings, Inc.(a) | 7,732 | 688,225 | ||||||
|
| |||||||
| Total Household Products |
| 4,103,722 | ||||||
See Notes to Financial Statements.
| 84 | WisdomTree Trust |
Schedule of Investments (continued)
WisdomTree U.S. SmallCap Fund (EES)
March 31, 2024
| Investments | Shares | Value | ||||||
| Independent Power & Renewable Electricity Producers – 0.0% |
| |||||||
Montauk Renewables, Inc.* | 32,905 | $ | 136,885 | |||||
| Industrial REITs – 0.2% |
| |||||||
Innovative Industrial Properties, Inc. | 15,557 | 1,610,772 | ||||||
| Insurance – 1.1% |
| |||||||
Ambac Financial Group, Inc.* | 86,853 | 1,357,512 | ||||||
AMERISAFE, Inc. | 6,968 | 349,585 | ||||||
Crawford & Co., Class A | 25,677 | 242,134 | ||||||
Donegal Group, Inc., Class A | 7,956 | 112,498 | ||||||
Employers Holdings, Inc. | 16,557 | 751,522 | ||||||
Goosehead Insurance, Inc., Class A* | 5,440 | 362,413 | ||||||
HCI Group, Inc. | 2,585 | 300,067 | ||||||
Heritage Insurance Holdings, Inc.* | 10,529 | 112,134 | ||||||
Horace Mann Educators Corp. | 8,622 | 318,928 | ||||||
Investors Title Co. | 483 | 78,821 | ||||||
National Western Life Group, Inc., Class A | 1,639 | 806,322 | ||||||
Palomar Holdings, Inc.* | 8,438 | 707,358 | ||||||
ProAssurance Corp.* | 9,720 | 124,999 | ||||||
Safety Insurance Group, Inc. | 3,057 | 251,255 | ||||||
Skyward Specialty Insurance Group, Inc.*(a) | 12,023 | 449,780 | ||||||
Stewart Information Services Corp. | 5,346 | 347,811 | ||||||
Universal Insurance Holdings, Inc. | 24,517 | 498,185 | ||||||
|
| |||||||
| Total Insurance |
| 7,171,324 | ||||||
| Interactive Media & Services – 1.1% |
| |||||||
Cargurus, Inc.* | 48,934 | 1,129,397 | ||||||
Cars.com, Inc.* | 94,418 | 1,622,101 | ||||||
DHI Group, Inc.* | 34,762 | 88,643 | ||||||
QuinStreet, Inc.* | 11,895 | 210,066 | ||||||
Shutterstock, Inc.(a) | 30,108 | 1,379,247 | ||||||
Travelzoo* | 15,821 | 161,058 | ||||||
TripAdvisor, Inc.* | 69,615 | 1,934,601 | ||||||
Vimeo, Inc.* | 37,523 | 153,469 | ||||||
ZipRecruiter, Inc., Class A* | 41,460 | 476,375 | ||||||
|
| |||||||
| Total Interactive Media & Services |
| 7,154,957 | ||||||
| IT Services – 0.6% |
| |||||||
Grid Dynamics Holdings, Inc.* | 23,212 | 285,276 | ||||||
Hackett Group, Inc. | 16,814 | 408,580 | ||||||
Information Services Group, Inc. | 35,662 | 144,074 | ||||||
Perficient, Inc.* | 19,101 | 1,075,195 | ||||||
Squarespace, Inc., Class A* | 25,514 | 929,730 | ||||||
Thoughtworks Holding, Inc.*(a) | 132,411 | 335,000 | ||||||
Unisys Corp.* | 131,122 | 643,809 | ||||||
|
| |||||||
| Total IT Services |
| 3,821,664 | ||||||
| Leisure Products – 1.3% |
| |||||||
American Outdoor Brands, Inc.* | 15,297 | 134,614 | ||||||
AMMO, Inc.* | 55,159 | 151,687 | ||||||
Escalade, Inc. | 7,460 | 102,575 | ||||||
JAKKS Pacific, Inc.* | 12,754 | 315,024 | ||||||
Johnson Outdoors, Inc., Class A | 7,513 | 346,425 | ||||||
Latham Group, Inc.* | 47,549 | 188,294 | ||||||
Malibu Boats, Inc., Class A* | 30,735 | 1,330,211 | ||||||
Marine Products Corp. | 40,510 | 475,993 | ||||||
MasterCraft Boat Holdings, Inc.* | 31,682 | 751,497 | ||||||
Smith & Wesson Brands, Inc. | 27,484 | 477,122 | ||||||
Solo Brands, Inc., Class A*(a) | 102,208 | 221,791 | ||||||
Sturm Ruger & Co., Inc. | 10,980 | 506,727 | ||||||
Topgolf Callaway Brands Corp.* | 68,772 | 1,112,043 | ||||||
Vista Outdoor, Inc.*(a) | 73,930 | 2,423,425 | ||||||
|
| |||||||
| Total Leisure Products |
| 8,537,428 | ||||||
| Life Sciences Tools & Services – 0.3% |
| |||||||
Cytek Biosciences, Inc.*(a) | 26,471 | 177,620 | ||||||
Harvard Bioscience, Inc.* | 22,153 | 93,929 | ||||||
Maravai LifeSciences Holdings, Inc., Class A* | 81,743 | 708,712 | ||||||
Mesa Laboratories, Inc. | 3,824 | 419,607 | ||||||
OmniAb, Inc.* | 65,314 | 354,002 | ||||||
|
| |||||||
| Total Life Sciences Tools & Services |
| 1,753,870 | ||||||
| Machinery – 3.5% |
| |||||||
Alamo Group, Inc. | 5,913 | 1,350,115 | ||||||
Astec Industries, Inc. | 13,321 | 582,261 | ||||||
Atmus Filtration Technologies, Inc.* | 69,459 | 2,240,053 | ||||||
Columbus McKinnon Corp. | 19,406 | 866,090 | ||||||
Commercial Vehicle Group, Inc.* | 40,532 | 260,621 | ||||||
Douglas Dynamics, Inc. | 10,591 | 255,455 | ||||||
Energy Recovery, Inc.* | 12,899 | 203,675 | ||||||
Enerpac Tool Group Corp. | 24,375 | 869,212 | ||||||
Gorman-Rupp Co. | 8,431 | 333,446 | ||||||
Greenbrier Cos., Inc. | 21,256 | 1,107,438 | ||||||
Helios Technologies, Inc. | 18,852 | 842,496 | ||||||
Hillman Solutions Corp.* | 74,241 | 789,924 | ||||||
Hyster-Yale Materials Handling, Inc. | 17,869 | 1,146,654 | ||||||
Kennametal, Inc. | 43,033 | 1,073,243 | ||||||
Lindsay Corp. | 5,062 | 595,595 | ||||||
Manitowoc Co., Inc.*(a) | 43,315 | 612,474 | ||||||
Mayville Engineering Co., Inc.* | 12,004 | 172,017 | ||||||
Miller Industries, Inc. | 11,065 | 554,356 | ||||||
Mueller Water Products, Inc., Class A | 53,819 | 865,948 | ||||||
Omega Flex, Inc.(a) | 2,919 | 207,045 | ||||||
Park-Ohio Holdings Corp. | 12,041 | 321,254 | ||||||
Proto Labs, Inc.* | 9,361 | 334,656 | ||||||
REV Group, Inc. | 35,106 | 775,491 | ||||||
Shyft Group, Inc. | 32,894 | 408,543 | ||||||
Standex International Corp. | 5,014 | 913,651 | ||||||
Tennant Co. | 11,003 | 1,338,075 | ||||||
Titan International, Inc.* | 64,173 | 799,596 | ||||||
Trinity Industries, Inc. | 27,156 | 756,295 | ||||||
Wabash National Corp. | 74,567 | 2,232,536 | ||||||
|
| |||||||
| Total Machinery |
| 22,808,215 | ||||||
| Media – 1.3% |
| |||||||
Advantage Solutions, Inc.* | 204,457 | 885,299 | ||||||
AMC Networks, Inc., Class A* | 59,473 | 721,407 | ||||||
EchoStar Corp., Class A* | 66,637 | 949,577 | ||||||
Emerald Holding, Inc.* | 26,722 | 181,977 | ||||||
Entravision Communications Corp., Class A | 22,066 | 36,188 | ||||||
Gannett Co., Inc.* | 187,591 | 457,722 | ||||||
Gray Television, Inc. | 71,129 | 449,535 | ||||||
See Notes to Financial Statements.
| WisdomTree Trust | 85 |
Schedule of Investments (continued)
WisdomTree U.S. SmallCap Fund (EES)
March 31, 2024
| Investments | Shares | Value | ||||||
John Wiley & Sons, Inc., Class A | 27,845 | $ | 1,061,730 | |||||
Magnite, Inc.* | 68,378 | 735,064 | ||||||
PubMatic, Inc., Class A* | 8,748 | 207,503 | ||||||
Scholastic Corp. | 12,615 | 475,712 | ||||||
Sinclair, Inc.(a) | 66,134 | 890,825 | ||||||
Stagwell, Inc.*(a) | 164,147 | 1,020,994 | ||||||
TechTarget, Inc.* | 16,926 | 559,912 | ||||||
|
| |||||||
| Total Media |
| 8,633,445 | ||||||
| Metals & Mining – 0.8% |
| |||||||
Compass Minerals International, Inc. | 9,503 | 149,577 | ||||||
Haynes International, Inc. | 7,641 | 459,377 | ||||||
Kaiser Aluminum Corp. | 4,556 | 407,124 | ||||||
Materion Corp. | 8,660 | 1,140,955 | ||||||
Metallus, Inc.* | 29,481 | 655,952 | ||||||
Olympic Steel, Inc. | 6,928 | 491,057 | ||||||
Radius Recycling, Inc. | 8,078 | 170,688 | ||||||
Ramaco Resources, Inc., Class A | 30,783 | 518,386 | ||||||
Ryerson Holding Corp. | 26,114 | 874,819 | ||||||
SunCoke Energy, Inc. | 51,181 | 576,810 | ||||||
|
| |||||||
| Total Metals & Mining |
| 5,444,745 | ||||||
| Multi-Utilities – 0.1% |
| |||||||
Unitil Corp. | 8,069 | 422,412 | ||||||
| Office REITs – 0.8% |
| |||||||
Brandywine Realty Trust | 320,100 | 1,536,480 | ||||||
Douglas Emmett, Inc. | 33,071 | 458,695 | ||||||
Easterly Government Properties, Inc. | 23,586 | 271,475 | ||||||
Equity Commonwealth* | 33,678 | 635,840 | ||||||
Highwoods Properties, Inc. | 53,982 | 1,413,249 | ||||||
Piedmont Office Realty Trust, Inc., Class A | 74,408 | 523,088 | ||||||
Postal Realty Trust, Inc., Class A | 6,472 | 92,679 | ||||||
|
| |||||||
| Total Office REITs |
| 4,931,506 | ||||||
| Oil, Gas & Consumable Fuels – 4.5% |
| |||||||
Amplify Energy Corp.*(a) | 77,833 | 514,476 | ||||||
Berry Corp. | 125,026 | 1,006,459 | ||||||
Centrus Energy Corp., Class A*(a) | 8,224 | 341,543 | ||||||
Crescent Energy Co., Class A | 46,491 | 553,243 | ||||||
Delek U.S. Holdings, Inc. | 102,926 | 3,163,945 | ||||||
Evolution Petroleum Corp.(a) | 42,062 | 258,261 | ||||||
Excelerate Energy, Inc., Class A | 19,308 | 309,314 | ||||||
FutureFuel Corp. | 46,899 | 377,537 | ||||||
Granite Ridge Resources, Inc. | 185,902 | 1,208,363 | ||||||
Gulfport Energy Corp.* | 17,553 | 2,810,587 | ||||||
Hallador Energy Co.*(a) | 58,355 | 311,032 | ||||||
HighPeak Energy, Inc.(a) | 93,848 | 1,479,983 | ||||||
Kinetik Holdings, Inc. | 12,195 | 486,215 | ||||||
NACCO Industries, Inc., Class A | 5,646 | 170,509 | ||||||
OPAL Fuels, Inc., Class A* | 20,203 | 101,419 | ||||||
Overseas Shipholding Group, Inc., Class A | 94,701 | 606,087 | ||||||
Par Pacific Holdings, Inc.* | 119,582 | 4,431,709 | ||||||
REX American Resources Corp.* | 9,961 | 584,810 | ||||||
Riley Exploration Permian, Inc. | 35,261 | 1,163,613 | ||||||
Ring Energy, Inc.*(a) | 413,782 | 811,013 | ||||||
SandRidge Energy, Inc.(a) | 73,176 | 1,066,174 | ||||||
SilverBow Resources, Inc.* | 47,599 | 1,625,030 | ||||||
Sitio Royalties Corp., Class A | 19,188 | 474,327 | ||||||
Talos Energy, Inc.* | 32,210 | 448,685 | ||||||
VAALCO Energy, Inc. | 91,468 | 637,532 | ||||||
Vital Energy, Inc.* | 54,480 | 2,862,379 | ||||||
W&T Offshore, Inc.(a) | 28,960 | 76,744 | ||||||
World Kinect Corp. | 46,689 | 1,234,924 | ||||||
|
| |||||||
| Total Oil, Gas & Consumable Fuels |
| 29,115,913 | ||||||
| Paper & Forest Products – 0.6% |
| |||||||
Clearwater Paper Corp.* | 20,211 | 883,827 | ||||||
Sylvamo Corp. | 48,608 | 3,001,058 | ||||||
|
| |||||||
| Total Paper & Forest Products |
| 3,884,885 | ||||||
| Passenger Airlines – 0.3% |
| |||||||
Allegiant Travel Co. | 21,467 | 1,614,533 | ||||||
Sun Country Airlines Holdings, Inc.* | 41,023 | 619,037 | ||||||
|
| |||||||
| Total Passenger Airlines |
| 2,233,570 | ||||||
| Personal Care Products – 0.6% |
| |||||||
Edgewell Personal Care Co. | 31,339 | 1,210,939 | ||||||
Medifast, Inc. | 15,966 | 611,817 | ||||||
Nature’s Sunshine Products, Inc.* | 8,144 | 169,151 | ||||||
Nu Skin Enterprises, Inc., Class A | 30,172 | 417,279 | ||||||
Olaplex Holdings, Inc.*(a) | 442,304 | 849,223 | ||||||
USANA Health Sciences, Inc.* | 10,842 | 525,837 | ||||||
|
| |||||||
| Total Personal Care Products |
| 3,784,246 | ||||||
| Pharmaceuticals – 1.6% |
| |||||||
Amneal Pharmaceuticals, Inc.* | 197,881 | 1,199,159 | ||||||
Amylyx Pharmaceuticals, Inc.* | 15,904 | 45,167 | ||||||
ANI Pharmaceuticals, Inc.* | 13,398 | 926,204 | ||||||
Arvinas, Inc.* | 12,962 | 535,071 | ||||||
Assertio Holdings, Inc.*(a) | 161,243 | 154,681 | ||||||
Biote Corp., Class A*(a) | 18,183 | 105,461 | ||||||
Collegium Pharmaceutical, Inc.* | 57,982 | 2,250,861 | ||||||
Harmony Biosciences Holdings, Inc.* | 37,795 | 1,269,156 | ||||||
Innoviva, Inc.* | 32,563 | 496,260 | ||||||
Ligand Pharmaceuticals, Inc.* | 13,338 | 975,008 | ||||||
Pacira BioSciences, Inc.* | 39,155 | 1,144,109 | ||||||
Phibro Animal Health Corp., Class A | 33,182 | 429,043 | ||||||
SIGA Technologies, Inc. | 18,344 | 157,025 | ||||||
Supernus Pharmaceuticals, Inc.* | 12,281 | 418,905 | ||||||
|
| |||||||
| Total Pharmaceuticals |
| 10,106,110 | ||||||
| Professional Services – 1.7% |
| |||||||
Asure Software, Inc.*(a) | 22,257 | 173,160 | ||||||
Barrett Business Services, Inc. | 3,872 | 490,660 | ||||||
CRA International, Inc. | 3,476 | 519,940 | ||||||
CSG Systems International, Inc. | 17,704 | 912,464 | ||||||
First Advantage Corp.(a) | 76,877 | 1,246,945 | ||||||
Forrester Research, Inc.* | 14,286 | 308,006 | ||||||
Franklin Covey Co.* | 4,931 | 193,591 | ||||||
Heidrick & Struggles International, Inc. | 18,693 | 629,206 | ||||||
HireRight Holdings Corp.* | 56,348 | 804,086 | ||||||
Huron Consulting Group, Inc.* | 7,318 | 707,065 | ||||||
Kelly Services, Inc., Class A | 22,181 | 555,412 | ||||||
See Notes to Financial Statements.
| 86 | WisdomTree Trust |
Schedule of Investments (continued)
WisdomTree U.S. SmallCap Fund (EES)
March 31, 2024
| Investments | Shares | Value | ||||||
Kforce, Inc. | 8,890 | $ | 626,923 | |||||
Legalzoom.com, Inc.* | 55,686 | 742,851 | ||||||
Mistras Group, Inc.* | 15,407 | 147,291 | ||||||
NV5 Global, Inc.* | 6,175 | 605,212 | ||||||
RCM Technologies, Inc.* | 6,306 | 134,759 | ||||||
Resources Connection, Inc. | 35,265 | 464,088 | ||||||
Sterling Check Corp.* | 59,851 | 962,404 | ||||||
TrueBlue, Inc.* | 15,390 | 192,683 | ||||||
Upwork, Inc.* | 31,301 | 383,750 | ||||||
Willdan Group, Inc.* | 9,101 | 263,838 | ||||||
|
| |||||||
| Total Professional Services |
| 11,064,334 | ||||||
| Real Estate Management & Development – 0.8% |
| |||||||
eXp World Holdings, Inc.(a) | 31,938 | 329,920 | ||||||
Forestar Group, Inc.* | 44,128 | 1,773,504 | ||||||
FRP Holdings, Inc.* | 2,105 | 129,247 | ||||||
Newmark Group, Inc., Class A | 184,410 | 2,045,107 | ||||||
RMR Group, Inc., Class A | 26,141 | 627,384 | ||||||
Tejon Ranch Co.* | 7,814 | 120,414 | ||||||
|
| |||||||
| Total Real Estate Management & Development |
| 5,025,576 | ||||||
| Residential REITs – 0.1% |
| |||||||
NexPoint Residential Trust, Inc. | 23,691 | 762,613 | ||||||
| Retail REITs – 0.6% |
| |||||||
Acadia Realty Trust | 36,595 | 622,481 | ||||||
Alexander’s, Inc. | 3,481 | 755,864 | ||||||
Getty Realty Corp. | 18,984 | 519,213 | ||||||
NETSTREIT Corp.(a) | 14,020 | 257,547 | ||||||
Retail Opportunity Investments Corp. | 27,088 | 347,268 | ||||||
Saul Centers, Inc. | 9,492 | 365,347 | ||||||
Urban Edge Properties | 25,198 | 435,170 | ||||||
Whitestone REIT | 31,284 | 392,614 | ||||||
|
| |||||||
| Total Retail REITs |
| 3,695,504 | ||||||
| Semiconductors & Semiconductor Equipment – 1.4% |
| |||||||
ACM Research, Inc., Class A*(a) | 46,854 | 1,365,326 | ||||||
Aehr Test Systems*(a) | 8,768 | 108,723 | ||||||
CEVA, Inc.* | 5,508 | 125,087 | ||||||
Cohu, Inc.* | 25,773 | 859,014 | ||||||
Everspin Technologies, Inc.* | 14,559 | 115,307 | ||||||
Impinj, Inc.*(a) | 5,894 | 756,848 | ||||||
inTEST Corp.*(a) | 11,636 | 154,177 | ||||||
MaxLinear, Inc.* | 75,957 | 1,418,117 | ||||||
NVE Corp. | 2,945 | 265,580 | ||||||
PDF Solutions, Inc.* | 9,562 | 321,953 | ||||||
Photronics, Inc.* | 50,048 | 1,417,359 | ||||||
SiTime Corp.* | 5,238 | 488,339 | ||||||
Ultra Clean Holdings, Inc.* | 18,265 | 839,094 | ||||||
Veeco Instruments, Inc.* | 28,064 | 987,011 | ||||||
|
| |||||||
| Total Semiconductors & Semiconductor Equipment |
| 9,221,935 | ||||||
| Software – 4.1% |
| |||||||
8x8, Inc.* | 141,996 | 383,389 | ||||||
A10 Networks, Inc. | 36,694 | 502,341 | ||||||
Adeia, Inc. | 142,845 | 1,559,867 | ||||||
Agilysys, Inc.* | 5,253 | 442,618 | ||||||
American Software, Inc., Class A | 16,857 | 193,013 | ||||||
Amplitude, Inc., Class A* | 16,634 | 180,978 | ||||||
AvePoint, Inc.* | 40,988 | 324,625 | ||||||
Cerence, Inc.* | 11,029 | 173,707 | ||||||
Clear Secure, Inc., Class A | 20,758 | 441,523 | ||||||
Clearwater Analytics Holdings, Inc., Class A* | 26,632 | 471,120 | ||||||
Consensus Cloud Solutions, Inc.* | 32,046 | 508,250 | ||||||
CoreCard Corp.*(a) | 6,094 | 67,339 | ||||||
Daily Journal Corp.* | 434 | 156,939 | ||||||
E2open Parent Holdings, Inc.* | 147,423 | 654,558 | ||||||
eGain Corp.* | 17,996 | 116,074 | ||||||
Enfusion, Inc., Class A*(a) | 22,200 | 205,350 | ||||||
Envestnet, Inc.* | 22,346 | 1,294,057 | ||||||
Everbridge, Inc.* | 24,832 | 864,899 | ||||||
EverCommerce, Inc.*(a) | 92,581 | 872,113 | ||||||
Jamf Holding Corp.*(a) | 25,973 | 476,604 | ||||||
LivePerson, Inc.*(a) | 57,533 | 57,383 | ||||||
LiveRamp Holdings, Inc.* | 21,506 | 741,957 | ||||||
MeridianLink, Inc.* | 15,854 | 296,470 | ||||||
Mitek Systems, Inc.*(a) | 35,016 | 493,726 | ||||||
Model N, Inc.* | 16,137 | 459,420 | ||||||
N-able, Inc.* | 46,213 | 604,004 | ||||||
NCR Voyix Corp.* | 167,503 | 2,115,563 | ||||||
Olo, Inc., Class A* | 41,362 | 227,077 | ||||||
PagerDuty, Inc.*(a) | 20,544 | 465,938 | ||||||
Progress Software Corp. | 29,134 | 1,553,133 | ||||||
PROS Holdings, Inc.*(a) | 9,538 | 346,515 | ||||||
Q2 Holdings, Inc.* | 12,439 | 653,794 | ||||||
Rimini Street, Inc.*(a) | 125,939 | 410,561 | ||||||
RingCentral, Inc., Class A* | 72,334 | 2,512,883 | ||||||
SolarWinds Corp.* | 94,293 | 1,189,978 | ||||||
SoundThinking, Inc.* | 5,344 | 84,863 | ||||||
Sprinklr, Inc., Class A*(a) | 32,869 | 403,303 | ||||||
Upland Software, Inc.* | 60,561 | 187,133 | ||||||
Verint Systems, Inc.* | 53,386 | 1,769,746 | ||||||
Vertex, Inc., Class A* | 15,299 | 485,896 | ||||||
Xperi, Inc.* | 84,541 | 1,019,564 | ||||||
Yext, Inc.* | 35,895 | 216,447 | ||||||
Zuora, Inc., Class A* | 28,066 | 255,962 | ||||||
|
| |||||||
| Total Software |
| 26,440,680 | ||||||
| Specialized REITs – 0.1% |
| |||||||
Farmland Partners, Inc. | 17,009 | 188,800 | ||||||
Four Corners Property Trust, Inc. | 32,005 | 783,162 | ||||||
|
| |||||||
| Total Specialized REITs |
| 971,962 | ||||||
| Specialty Retail – 4.6% |
| |||||||
1-800-Flowers.com, Inc., Class A*(a) | 19,773 | 214,142 | ||||||
Aaron’s Co., Inc. | 33,488 | 251,160 | ||||||
America’s Car-Mart, Inc.* | 1,998 | 127,612 | ||||||
Arhaus, Inc.(a) | 101,365 | 1,560,007 | ||||||
Arko Corp. | 46,652 | 265,916 | ||||||
Big 5 Sporting Goods Corp.(a) | 12,252 | 43,127 | ||||||
Boot Barn Holdings, Inc.* | 16,989 | 1,616,503 | ||||||
Buckle, Inc. | 44,928 | 1,809,251 | ||||||
See Notes to Financial Statements.
| WisdomTree Trust | 87 |
Schedule of Investments (continued)
WisdomTree U.S. SmallCap Fund (EES)
March 31, 2024
| Investments | Shares | Value | ||||||
Build-A-Bear Workshop, Inc. | 18,609 | $ | 555,851 | |||||
Caleres, Inc. | 37,119 | 1,522,993 | ||||||
Camping World Holdings, Inc., Class A | 27,288 | 759,971 | ||||||
Chewy, Inc., Class A*(a) | 25,007 | 397,861 | ||||||
Designer Brands, Inc., Class A | 100,232 | 1,095,536 | ||||||
Destination XL Group, Inc.*(a) | 93,726 | 337,414 | ||||||
Genesco, Inc.* | 9,318 | 262,208 | ||||||
Guess?, Inc. | 73,286 | 2,306,310 | ||||||
Haverty Furniture Cos., Inc. | 17,350 | 591,982 | ||||||
Hibbett, Inc. | 14,381 | 1,104,605 | ||||||
J Jill, Inc.* | 14,275 | 456,372 | ||||||
MarineMax, Inc.* | 30,236 | 1,005,649 | ||||||
Monro, Inc. | 12,620 | 398,035 | ||||||
National Vision Holdings, Inc.* | 22,506 | 498,733 | ||||||
ODP Corp.* | 38,637 | 2,049,693 | ||||||
OneWater Marine, Inc., Class A* | 20,939 | 589,433 | ||||||
Revolve Group, Inc.*(a) | 21,917 | 463,983 | ||||||
Sally Beauty Holdings, Inc.*(a) | 160,471 | 1,993,050 | ||||||
Shoe Carnival, Inc. | 27,178 | 995,802 | ||||||
Sonic Automotive, Inc., Class A | 43,343 | 2,467,950 | ||||||
Sportsman’s Warehouse Holdings, Inc.* | 23,306 | 72,482 | ||||||
Torrid Holdings, Inc.*(a) | 51,433 | 250,993 | ||||||
Upbound Group, Inc. | 52,063 | 1,833,138 | ||||||
Victoria’s Secret & Co.*(a) | 54,232 | 1,051,016 | ||||||
Warby Parker, Inc., Class A* | 20,881 | 284,190 | ||||||
Winmark Corp. | 917 | 331,679 | ||||||
|
| |||||||
| Total Specialty Retail |
| 29,564,647 | ||||||
| Technology Hardware, Storage & Peripherals – 0.9% |
| |||||||
Corsair Gaming, Inc.* | 36,829 | 454,470 | ||||||
CPI Card Group, Inc.* | 20,444 | 365,129 | ||||||
Eastman Kodak Co.* | 159,783 | 790,926 | ||||||
Immersion Corp. | 53,575 | 400,741 | ||||||
Xerox Holdings Corp. | 199,601 | 3,572,858 | ||||||
|
| |||||||
| Total Technology Hardware, Storage & Peripherals |
| 5,584,124 | ||||||
| Textiles, Apparel & Luxury Goods – 1.5% |
| |||||||
Carter’s, Inc. | 23,904 | 2,024,191 | ||||||
Figs, Inc., Class A*(a) | 39,818 | 198,294 | ||||||
G-III Apparel Group Ltd.* | 29,558 | 857,477 | ||||||
Levi Strauss & Co., Class A(a) | 197,167 | 3,941,368 | ||||||
Movado Group, Inc. | 18,804 | 525,196 | ||||||
Oxford Industries, Inc. | 16,116 | 1,811,438 | ||||||
Rocky Brands, Inc. | 5,761 | 156,296 | ||||||
Vera Bradley, Inc.* | 30,111 | 204,755 | ||||||
Wolverine World Wide, Inc. | 18,598 | 208,484 | ||||||
|
| |||||||
| Total Textiles, Apparel & Luxury Goods |
| 9,927,499 | ||||||
| Tobacco – 0.4% |
| |||||||
Turning Point Brands, Inc. | 6,890 | 201,877 | ||||||
Universal Corp. | 16,613 | 859,225 | ||||||
Vector Group Ltd. | 127,243 | 1,394,583 | ||||||
|
| |||||||
| Total Tobacco |
| 2,455,685 | ||||||
| Trading Companies & Distributors – 2.0% |
| |||||||
Alta Equipment Group, Inc. | 20,357 | 263,623 | ||||||
BlueLinx Holdings, Inc.* | 9,813 | 1,278,045 | ||||||
Custom Truck One Source, Inc.* | 97,757 | 568,946 | ||||||
Distribution Solutions Group, Inc.*(a) | 9,768 | 346,569 | ||||||
DNOW, Inc.* | 86,197 | 1,310,194 | ||||||
DXP Enterprises, Inc.* | 21,463 | 1,153,207 | ||||||
EVI Industries, Inc. | 4,610 | 114,789 | ||||||
Global Industrial Co. | 15,873 | 710,793 | ||||||
H&E Equipment Services, Inc. | 29,183 | 1,872,965 | ||||||
Hudson Technologies, Inc.* | 37,577 | 413,723 | ||||||
Karat Packaging, Inc. | 15,283 | 437,247 | ||||||
McGrath RentCorp | 14,312 | 1,765,671 | ||||||
MRC Global, Inc.* | 85,319 | 1,072,460 | ||||||
Titan Machinery, Inc.*(a) | 34,536 | 856,838 | ||||||
Transcat, Inc.* | 2,277 | 253,726 | ||||||
Willis Lease Finance Corp.* | 8,591 | 426,285 | ||||||
|
| |||||||
| Total Trading Companies & Distributors |
| 12,845,081 | ||||||
| Water Utilities – 0.2% |
| |||||||
Artesian Resources Corp., Class A | 3,985 | 147,883 | ||||||
Middlesex Water Co. | 4,651 | 244,178 | ||||||
Pure Cycle Corp.* | 9,429 | 89,576 | ||||||
SJW Group | 11,838 | 669,912 | ||||||
York Water Co. | 6,333 | 229,698 | ||||||
|
| |||||||
| Total Water Utilities |
| 1,381,247 | ||||||
| Wireless Telecommunication Services – 0.3% |
| |||||||
Gogo, Inc.* | 121,508 | 1,066,840 | ||||||
Spok Holdings, Inc. | 22,040 | 351,538 | ||||||
U.S. Cellular Corp.* | 11,967 | 436,795 | ||||||
|
| |||||||
| Total Wireless Telecommunication Services |
| 1,855,173 | ||||||
| Total United States |
| 641,831,292 | ||||||
| Canada – 0.0% |
| |||||||
| Insurance – 0.0% |
| |||||||
Kingsway Financial Services, Inc.* | 4,193 | 34,970 | ||||||
| China – 0.1% |
| |||||||
| Semiconductors & Semiconductor Equipment – 0.1% |
| |||||||
indie Semiconductor, Inc., Class A*(a) | 42,995 | 304,405 | ||||||
| Jersey – 0.4% |
| |||||||
| Chemicals – 0.4% |
| |||||||
Arcadium Lithium PLC*(a) | 598,976 | 2,581,586 | ||||||
| Philippines – 0.1% |
| |||||||
| Professional Services – 0.1% |
| |||||||
TaskUS, Inc., Class A*(a) | 36,260 | 422,429 | ||||||
| Puerto Rico – 0.4% |
| |||||||
| Banks – 0.2% |
| |||||||
OFG Bancorp | 35,900 | 1,321,479 | ||||||
| Financial Services – 0.2% |
| |||||||
EVERTEC, Inc. | 34,600 | 1,380,540 | ||||||
| Total Puerto Rico |
| 2,702,019 | ||||||
| TOTAL COMMON STOCKS (Cost: $606,486,954) |
| 647,876,701 | ||||||
See Notes to Financial Statements.
| 88 | WisdomTree Trust |
Schedule of Investments (concluded)
WisdomTree U.S. SmallCap Fund (EES)
March 31, 2024
| Investments | Shares | Value | ||||||
| WARRANTS – 0.0% |
| |||||||
| United States – 0.0% |
| |||||||
OmniAb, Inc., exercise price $12.50, expiring 11/1/27*† | 2,562 | $ | 0 | |||||
OmniAb, Inc., exercise price $15.00, expiring 11/1/27*† | 2,562 | 0 | ||||||
| TOTAL WARRANTS (Cost: $0) |
| 0 | ||||||
| EXCHANGE-TRADED FUND – 0.0% |
| |||||||
| United States – 0.0% |
| |||||||
WisdomTree U.S. MidCap Fund(b) | ||||||||
| (Cost: $179,190) | 3,380 | 206,248 | ||||||
| INVESTMENT OF CASH COLLATERAL FOR SECURITIES LOANED – 1.3% |
| |||||||
| United States – 1.3% |
| |||||||
State Street Navigator Securities Lending Government Money Market Portfolio, 5.34%(c) | ||||||||
| (Cost: $8,453,346) | 8,453,346 | 8,453,346 | ||||||
| TOTAL INVESTMENTS IN SECURITIES – 101.2% (Cost: $615,119,490) |
| 656,536,295 | ||||||
Other Assets less Liabilities – (1.2)% |
| (7,721,502 | ) | |||||
|
| |||||||
| NET ASSETS – 100.0% |
| $ | 648,814,793 | |||||
| * | Non-income producing security. |
| † | This security is being fair valued using significant unobservable inputs (i.e., Level 3 on the fair value hierarchy) by WisdomTree Asset Management, Inc., as valuation designee, in accordance with valuation procedures approved by the Board of Trustees of WisdomTree Trust. The aggregate value of Level 3 fair valued securities is $43,584, which represents 0.01% of net assets. |
| (a) | Security, or portion thereof, was on loan at March 31, 2024 (See Note 2). At March 31, 2024, the total market value of the Fund’s securities on loan identified in the Schedule of Investments was $41,498,328 and the total market value of the collateral held by the Fund was $42,609,873. The total market value of the collateral includes non-cash U.S. Government securities collateral having a value of $34,156,527. |
| (b) | Affiliated holding. See “Investment in Affiliates” supplementary table included in this Schedule of Investments for additional information. |
| (c) | Rate shown represents annualized 7-day yield as of March 31, 2024. |
| INVESTMENT IN AFFILIATES |
Affiliated holdings are investments in entities in which the Fund owns 5% or more of the outstanding voting securities or are investments in entities which are under common ownership or control. Investments in affiliates during the fiscal year ended March 31, 2024 were as follows:
| Affiliate | Value at 3/31/2023 | Purchases/ Additions | Sales/ Reductions | Realized Gain/(Loss) | Change in Unrealized Appreciation/ Depreciation | Value at 3/31/2024 | Dividend Income | |||||||||||||||||||||
WisdomTree U.S. MidCap Fund | $ | 1,253,597 | $ | 2,300,724 | $ | 3,531,467 | $ | 52,081 | $ | 131,313 | $ | 206,248 | $ | 13,057 | ||||||||||||||
| FAIR VALUATION SUMMARY | ||||||||||||
The following is a summary of the fair valuations according to the inputs used in valuing the Fund’s investments (See Note 2 — Fair Value Measurement):
| Quoted Prices in Active Markets (Level 1) | Other Significant Observable Inputs (Level 2) | Significant Unobservable Inputs (Level 3) | Total | |||||||||||||
Assets: | ||||||||||||||||
Investments in Securities | ||||||||||||||||
Common Stocks | ||||||||||||||||
Biotechnology | $ | 6,951,340 | $ | — | $ | 43,584 | * | $ | 6,994,924 | |||||||
Other | 640,881,777 | — | — | 640,881,777 | ||||||||||||
Warrants | — | — | 0 | * | 0 | |||||||||||
Exchange-Traded Fund | 206,248 | — | — | 206,248 | ||||||||||||
Investment of Cash Collateral for Securities Loaned | — | 8,453,346 | — | 8,453,346 | ||||||||||||
Total Investments in Securities | $ | 648,039,365 | $ | 8,453,346 | $ | 43,584 | $ | 656,536,295 | ||||||||
| * | Fair valuations using significant unobservable inputs were determined by WisdomTree Asset Management, Inc., as valuation designee, in accordance with valuation procedures approved by the Board of Trustees of WisdomTree Trust. |
See Notes to Financial Statements.
| WisdomTree Trust | 89 |
Schedule of Investments
WisdomTree U.S. SmallCap Quality Dividend Growth Fund (DGRS)
March 31, 2024
| Investments | Shares | Value | ||||||
| COMMON STOCKS – 99.8% |
| |||||||
| United States – 99.0% |
| |||||||
| Air Freight & Logistics – 0.1% |
| |||||||
Forward Air Corp. | 17,057 | $ | 530,643 | |||||
| Automobile Components – 1.2% |
| |||||||
Patrick Industries, Inc. | 25,771 | 3,078,861 | ||||||
Standard Motor Products, Inc. | 30,020 | 1,007,171 | ||||||
|
| |||||||
| Total Automobile Components |
| 4,086,032 | ||||||
| Automobiles – 0.5% |
| |||||||
Winnebago Industries, Inc. | 25,304 | 1,872,496 | ||||||
| Banks – 4.3% |
| |||||||
Arrow Financial Corp. | 29,308 | 733,286 | ||||||
Banc of California, Inc. | 228,223 | 3,471,272 | ||||||
Bank7 Corp. | 7,506 | 211,669 | ||||||
Brookline Bancorp, Inc. | 194,781 | 1,940,019 | ||||||
Capital Bancorp, Inc. | 8,339 | 173,701 | ||||||
Central Valley Community Bancorp | 9,346 | 185,892 | ||||||
Citizens Financial Services, Inc. | 6,621 | 325,753 | ||||||
Esquire Financial Holdings, Inc. | 3,691 | 175,212 | ||||||
First Bank | 16,832 | 231,272 | ||||||
First Internet Bancorp | 4,039 | 140,315 | ||||||
International Bancshares Corp. | 72,842 | 4,089,350 | ||||||
Live Oak Bancshares, Inc. | 15,182 | 630,205 | ||||||
MidWestOne Financial Group, Inc. | 14,206 | 332,989 | ||||||
MVB Financial Corp. | 14,447 | 322,312 | ||||||
Northeast Bank | 2,793 | 154,565 | ||||||
Parke Bancorp, Inc. | 10,695 | 184,221 | ||||||
Pathward Financial, Inc. | 9,316 | 470,272 | ||||||
Peoples Financial Services Corp. | 8,978 | 387,042 | ||||||
Plumas Bancorp | 4,898 | 180,197 | ||||||
Shore Bancshares, Inc. | 42,966 | 494,109 | ||||||
Unity Bancorp, Inc. | 7,042 | 194,359 | ||||||
|
| |||||||
| Total Banks |
| 15,028,012 | ||||||
| Beverages – 0.2% |
| |||||||
MGP Ingredients, Inc. | 7,827 | 674,140 | ||||||
| Building Products – 1.6% |
| |||||||
Apogee Enterprises, Inc. | 19,235 | 1,138,712 | ||||||
CSW Industrials, Inc. | 5,649 | 1,325,255 | ||||||
Griffon Corp. | 29,323 | 2,150,549 | ||||||
Insteel Industries, Inc. | 6,781 | 259,170 | ||||||
Quanex Building Products Corp. | 14,190 | 545,322 | ||||||
|
| |||||||
| Total Building Products |
| 5,419,008 | ||||||
| Capital Markets – 8.0% |
| |||||||
BGC Group, Inc., Class A | 145,924 | 1,133,829 | ||||||
Cohen & Steers, Inc. | 82,663 | 6,355,958 | ||||||
Diamond Hill Investment Group, Inc. | 4,755 | 733,078 | ||||||
Oppenheimer Holdings, Inc., Class A | 6,399 | 255,448 | ||||||
Piper Sandler Cos. | 11,940 | 2,369,971 | ||||||
PJT Partners, Inc., Class A | 10,956 | 1,032,713 | ||||||
Silvercrest Asset Management Group, Inc., Class A | 15,832 | 250,304 | ||||||
StepStone Group, Inc., Class A | 94,289 | 3,369,889 | ||||||
Victory Capital Holdings, Inc., Class A | 112,490 | 4,772,951 | ||||||
Virtu Financial, Inc., Class A | 214,538 | 4,402,320 | ||||||
Virtus Investment Partners, Inc. | 12,239 | 3,035,027 | ||||||
|
| |||||||
| Total Capital Markets |
| 27,711,488 | ||||||
| Chemicals – 3.3% |
| |||||||
AdvanSix, Inc. | 29,563 | 845,502 | ||||||
Hawkins, Inc. | 9,261 | 711,245 | ||||||
Innospec, Inc. | 14,742 | 1,900,833 | ||||||
Koppers Holdings, Inc. | 7,733 | 426,630 | ||||||
Minerals Technologies, Inc. | 11,805 | 888,680 | ||||||
Quaker Chemical Corp. | 7,703 | 1,581,041 | ||||||
Sensient Technologies Corp. | 52,322 | 3,620,159 | ||||||
Stepan Co. | 17,414 | 1,567,957 | ||||||
|
| |||||||
| Total Chemicals |
| 11,542,047 | ||||||
| Commercial Services & Supplies – 3.8% |
| |||||||
ACCO Brands Corp. | 220,133 | 1,234,946 | ||||||
Acme United Corp. | 2,055 | 96,564 | ||||||
ARC Document Solutions, Inc. | 59,622 | 165,153 | ||||||
Brady Corp., Class A | 33,394 | 1,979,596 | ||||||
Brink’s Co. | 21,825 | 2,016,194 | ||||||
Deluxe Corp. | 96,952 | 1,996,242 | ||||||
Ennis, Inc. | 48,820 | 1,001,298 | ||||||
Interface, Inc. | 20,325 | 341,867 | ||||||
MillerKnoll, Inc. | 94,399 | 2,337,319 | ||||||
Steelcase, Inc., Class A | 132,978 | 1,739,352 | ||||||
VSE Corp. | 5,631 | 450,480 | ||||||
|
| |||||||
| Total Commercial Services & Supplies |
| 13,359,011 | ||||||
| Construction & Engineering – 0.8% |
| |||||||
Argan, Inc. | 14,653 | 740,563 | ||||||
Granite Construction, Inc. | 21,349 | 1,219,668 | ||||||
Primoris Services Corp. | 18,811 | 800,784 | ||||||
|
| |||||||
| Total Construction & Engineering |
| 2,761,015 | ||||||
| Construction Materials – 0.2% |
| |||||||
U.S. Lime & Minerals, Inc. | 2,107 | 628,181 | ||||||
| Consumer Finance – 2.3% |
| |||||||
Nelnet, Inc., Class A | 15,726 | 1,488,466 | ||||||
Regional Management Corp. | 19,982 | 483,764 | ||||||
SLM Corp. | 270,047 | 5,884,324 | ||||||
|
| |||||||
| Total Consumer Finance |
| 7,856,554 | ||||||
| Consumer Staples Distribution & Retail – 1.0% |
| |||||||
Andersons, Inc. | 20,737 | 1,189,682 | ||||||
Ingles Markets, Inc., Class A | 5,415 | 415,222 | ||||||
Natural Grocers by Vitamin Cottage, Inc. | 18,055 | 325,893 | ||||||
PriceSmart, Inc. | 18,379 | 1,543,836 | ||||||
|
| |||||||
| Total Consumer Staples Distribution & Retail |
| 3,474,633 | ||||||
| Containers & Packaging – 1.1% |
| |||||||
Greif, Inc., Class A | 33,377 | 2,304,682 | ||||||
Myers Industries, Inc. | 47,894 | 1,109,704 | ||||||
TriMas Corp. | 14,885 | 397,876 | ||||||
|
| |||||||
| Total Containers & Packaging |
| 3,812,262 | ||||||
| Distributors – 0.1% |
| |||||||
Weyco Group, Inc. | 9,935 | 316,728 | ||||||
See Notes to Financial Statements.
| 90 | WisdomTree Trust |
Schedule of Investments (continued)
WisdomTree U.S. SmallCap Quality Dividend Growth Fund (DGRS)
March 31, 2024
| Investments | Shares | Value | ||||||
| Diversified Consumer Services – 1.0% |
| |||||||
Carriage Services, Inc. | 12,185 | $ | 329,482 | |||||
Strategic Education, Inc. | 29,370 | 3,058,005 | ||||||
|
| |||||||
| Total Diversified Consumer Services |
| 3,387,487 | ||||||
| Diversified Telecommunication Services – 0.1% |
| |||||||
Shenandoah Telecommunications Co. | 18,993 | 329,908 | ||||||
| Electric Utilities – 0.8% |
| |||||||
MGE Energy, Inc. | 37,463 | 2,949,087 | ||||||
| Electrical Equipment – 1.2% |
| |||||||
Allient, Inc. | 5,480 | 195,526 | ||||||
Encore Wire Corp. | 6,145 | 1,614,783 | ||||||
EnerSys | 18,464 | 1,744,110 | ||||||
LSI Industries, Inc. | 17,304 | 261,637 | ||||||
Preformed Line Products Co. | 1,926 | 247,818 | ||||||
|
| |||||||
| Total Electrical Equipment |
| 4,063,874 | ||||||
| Electronic Equipment, Instruments & Components – 2.3% |
| |||||||
Advanced Energy Industries, Inc. | 14,343 | 1,462,699 | ||||||
Bel Fuse, Inc., Class B | 3,978 | 239,913 | ||||||
Belden, Inc. | 15,082 | 1,396,744 | ||||||
Benchmark Electronics, Inc. | 42,520 | 1,276,025 | ||||||
Climb Global Solutions, Inc. | 2,612 | 185,139 | ||||||
Crane NXT Co. | 27,104 | 1,677,738 | ||||||
Methode Electronics, Inc. | 37,156 | 452,560 | ||||||
Napco Security Technologies, Inc. | 16,145 | 648,383 | ||||||
PC Connection, Inc. | 9,214 | 607,479 | ||||||
Richardson Electronics Ltd. | 8,131 | 74,887 | ||||||
|
| |||||||
| Total Electronic Equipment, Instruments & Components |
| 8,021,567 | ||||||
| Energy Equipment & Services – 2.3% |
| |||||||
Cactus, Inc., Class A | 32,957 | 1,650,816 | ||||||
Core Laboratories, Inc. | 16,898 | 288,618 | ||||||
Liberty Energy, Inc. | 111,164 | 2,303,318 | ||||||
Ranger Energy Services, Inc. | 20,451 | 230,892 | ||||||
RPC, Inc.(a) | 212,051 | 1,641,275 | ||||||
Select Water Solutions, Inc. | 150,909 | 1,392,890 | ||||||
Solaris Oilfield Infrastructure, Inc., Class A | 72,027 | 624,474 | ||||||
|
| |||||||
| Total Energy Equipment & Services |
| 8,132,283 | ||||||
| Financial Services – 2.1% |
| |||||||
A-Mark Precious Metals, Inc.(a) | 27,844 | 854,532 | ||||||
Cass Information Systems, Inc. | 17,081 | 822,792 | ||||||
UWM Holdings Corp. | 210,273 | 1,526,582 | ||||||
Walker & Dunlop, Inc. | 41,547 | 4,198,740 | ||||||
|
| |||||||
| Total Financial Services |
| 7,402,646 | ||||||
| Food Products – 1.3% |
| |||||||
Cal-Maine Foods, Inc. | 15,563 | 915,883 | ||||||
J & J Snack Foods Corp. | 14,758 | 2,133,416 | ||||||
John B Sanfilippo & Son, Inc. | 14,487 | 1,534,463 | ||||||
|
| |||||||
| Total Food Products |
| 4,583,762 | ||||||
| Gas Utilities – 0.7% |
| |||||||
Chesapeake Utilities Corp. | 22,366 | 2,399,872 | ||||||
| Ground Transportation – 1.4% |
| |||||||
ArcBest Corp. | 9,282 | 1,322,685 | ||||||
Covenant Logistics Group, Inc. | 4,717 | 218,680 | ||||||
Heartland Express, Inc. | 28,281 | 337,675 | ||||||
Marten Transport Ltd. | 44,393 | 820,383 | ||||||
Universal Logistics Holdings, Inc. | 17,333 | 639,068 | ||||||
Werner Enterprises, Inc. | 38,869 | 1,520,555 | ||||||
|
| |||||||
| Total Ground Transportation |
| 4,859,046 | ||||||
| Health Care Equipment & Supplies – 0.8% |
| |||||||
Atrion Corp. | 2,139 | 991,533 | ||||||
CONMED Corp. | 11,147 | 892,652 | ||||||
LeMaitre Vascular, Inc. | 10,068 | 668,113 | ||||||
Utah Medical Products, Inc. | 2,248 | 159,855 | ||||||
|
| |||||||
| Total Health Care Equipment & Supplies |
| 2,712,153 | ||||||
| Health Care Providers & Services – 3.0% |
| |||||||
National Research Corp. | 12,582 | 498,373 | ||||||
Patterson Cos., Inc. | 172,625 | 4,773,081 | ||||||
Select Medical Holdings Corp. | 123,830 | 3,733,474 | ||||||
U.S. Physical Therapy, Inc. | 13,072 | 1,475,437 | ||||||
|
| |||||||
| Total Health Care Providers & Services |
| 10,480,365 | ||||||
| Health Care Technology – 0.1% |
| |||||||
Simulations Plus, Inc.(a) | 7,508 | 308,954 | ||||||
| Hotels, Restaurants & Leisure – 5.6% |
| |||||||
Bloomin’ Brands, Inc. | 157,558 | 4,518,764 | ||||||
Cheesecake Factory, Inc. | 78,328 | 2,831,557 | ||||||
Marriott Vacations Worldwide Corp. | 65,556 | 7,062,348 | ||||||
Monarch Casino & Resort, Inc. | 16,274 | 1,220,387 | ||||||
RCI Hospitality Holdings, Inc. | 3,311 | 192,038 | ||||||
Red Rock Resorts, Inc., Class A | 59,667 | 3,569,280 | ||||||
|
| |||||||
| Total Hotels, Restaurants & Leisure |
| 19,394,374 | ||||||
| Household Durables – 4.1% |
| |||||||
Bassett Furniture Industries, Inc. | 11,050 | 163,098 | ||||||
Century Communities, Inc. | 17,750 | 1,712,875 | ||||||
Ethan Allen Interiors, Inc. | 57,720 | 1,995,380 | ||||||
Hamilton Beach Brands Holding Co., Class A | 10,947 | 266,669 | ||||||
La-Z-Boy, Inc. | 38,602 | 1,452,207 | ||||||
MDC Holdings, Inc. | 137,202 | 8,631,378 | ||||||
|
| |||||||
| Total Household Durables |
| 14,221,607 | ||||||
| Household Products – 2.6% |
| |||||||
Energizer Holdings, Inc. | 126,229 | 3,716,182 | ||||||
Spectrum Brands Holdings, Inc. | 37,181 | 3,309,481 | ||||||
WD-40 Co. | 8,407 | 2,129,577 | ||||||
|
| |||||||
| Total Household Products |
| 9,155,240 | ||||||
| Insurance – 1.0% |
| |||||||
CNO Financial Group, Inc. | 112,314 | 3,086,389 | ||||||
Crawford & Co., Class A | 29,284 | 276,148 | ||||||
|
| |||||||
| Total Insurance |
| 3,362,537 | ||||||
| Interactive Media & Services – 0.5% |
| |||||||
Shutterstock, Inc. | 39,393 | 1,804,593 | ||||||
See Notes to Financial Statements.
| WisdomTree Trust | 91 |
Schedule of Investments (continued)
WisdomTree U.S. SmallCap Quality Dividend Growth Fund (DGRS)
March 31, 2024
| Investments | Shares | Value | ||||||
| IT Services – 0.2% |
| |||||||
Hackett Group, Inc. | 23,344 | $ | 567,259 | |||||
Information Services Group, Inc. | 48,761 | 196,995 | ||||||
|
| |||||||
| Total IT Services |
| 764,254 | ||||||
| Leisure Products – 0.8% |
| |||||||
Escalade, Inc. | 12,120 | 166,650 | ||||||
Johnson Outdoors, Inc., Class A | 9,552 | 440,443 | ||||||
Marine Products Corp. | 42,461 | 498,917 | ||||||
Smith & Wesson Brands, Inc. | 69,770 | 1,211,207 | ||||||
Sturm Ruger & Co., Inc. | 11,793 | 544,247 | ||||||
|
| |||||||
| Total Leisure Products |
| 2,861,464 | ||||||
| Machinery – 7.7% |
| |||||||
Alamo Group, Inc. | 4,365 | 996,661 | ||||||
Albany International Corp., Class A | 15,791 | 1,476,616 | ||||||
Columbus McKinnon Corp. | 10,617 | 473,837 | ||||||
Douglas Dynamics, Inc. | 42,869 | 1,034,000 | ||||||
Enerpac Tool Group Corp. | 19,663 | 701,183 | ||||||
Enpro, Inc. | 8,186 | 1,381,551 | ||||||
ESCO Technologies, Inc. | 9,302 | 995,779 | ||||||
Gorman-Rupp Co. | 25,346 | 1,002,434 | ||||||
Helios Technologies, Inc. | 13,167 | 588,433 | ||||||
Hillenbrand, Inc. | 69,912 | 3,515,875 | ||||||
John Bean Technologies Corp. | 11,778 | 1,235,394 | ||||||
Kadant, Inc. | 4,208 | 1,380,645 | ||||||
Kennametal, Inc. | 119,929 | 2,991,029 | ||||||
Lindsay Corp. | 5,670 | 667,132 | ||||||
Mueller Water Products, Inc., Class A | 132,865 | 2,137,798 | ||||||
Omega Flex, Inc. | 7,570 | 536,940 | ||||||
REV Group, Inc. | 31,735 | 701,026 | ||||||
Shyft Group, Inc. | 26,576 | 330,074 | ||||||
Standex International Corp. | 4,592 | 836,754 | ||||||
Tennant Co. | 10,800 | 1,313,388 | ||||||
Terex Corp. | 40,582 | 2,613,481 | ||||||
|
| |||||||
| Total Machinery |
| 26,910,030 | ||||||
| Marine Transportation – 0.7% |
| |||||||
Matson, Inc. | 20,708 | 2,327,579 | ||||||
| Media – 3.3% |
| |||||||
Cable One, Inc. | 5,765 | 2,439,344 | ||||||
Gray Television, Inc. | 155,256 | 981,218 | ||||||
John Wiley & Sons, Inc., Class A | 95,517 | 3,642,063 | ||||||
Saga Communications, Inc., Class A | 6,864 | 153,136 | ||||||
TEGNA, Inc. | 273,788 | 4,090,393 | ||||||
Townsquare Media, Inc., Class A | 17,088 | 187,626 | ||||||
|
| |||||||
| Total Media |
| 11,493,780 | ||||||
| Metals & Mining – 1.8% |
| |||||||
Arch Resources, Inc. | 6,567 | 1,055,908 | ||||||
Haynes International, Inc. | 10,268 | 617,312 | ||||||
Materion Corp. | 7,548 | 994,449 | ||||||
Olympic Steel, Inc. | 4,490 | 318,251 | ||||||
Ramaco Resources, Inc., Class A | 54,772 | 922,360 | ||||||
Ryerson Holding Corp. | 37,031 | 1,240,539 | ||||||
Warrior Met Coal, Inc. | 18,270 | 1,108,989 | ||||||
|
| |||||||
| Total Metals & Mining |
| 6,257,808 | ||||||
| Oil, Gas & Consumable Fuels – 4.5% |
| |||||||
Berry Corp. | 181,682 | 1,462,540 | ||||||
Evolution Petroleum Corp. | 75,844 | 465,682 | ||||||
HighPeak Energy, Inc. | 50,210 | 791,812 | ||||||
Peabody Energy Corp. | 74,357 | 1,803,901 | ||||||
PHX Minerals, Inc. | 42,549 | 145,092 | ||||||
Riley Exploration Permian, Inc. | 42,201 | 1,392,633 | ||||||
SandRidge Energy, Inc. | 48,137 | 701,356 | ||||||
VAALCO Energy, Inc. | 244,752 | 1,705,921 | ||||||
Viper Energy, Inc. | 138,987 | 5,345,440 | ||||||
Voc Energy Trust | 20,309 | 122,869 | ||||||
World Kinect Corp. | 71,881 | 1,901,253 | ||||||
|
| |||||||
| Total Oil, Gas & Consumable Fuels |
| 15,838,499 | ||||||
| Paper & Forest Products – 0.8% |
| |||||||
Sylvamo Corp. | 43,213 | 2,667,971 | ||||||
| Personal Care Products – 0.4% |
| |||||||
Edgewell Personal Care Co. | 39,465 | 1,524,928 | ||||||
| Professional Services – 2.5% |
| |||||||
Barrett Business Services, Inc. | 3,067 | 388,650 | ||||||
CRA International, Inc. | 5,265 | 787,539 | ||||||
CSG Systems International, Inc. | 29,865 | 1,539,242 | ||||||
Heidrick & Struggles International, Inc. | 18,739 | 630,755 | ||||||
HireQuest, Inc. | 8,896 | 115,203 | ||||||
ICF International, Inc. | 6,666 | 1,004,100 | ||||||
Kforce, Inc. | 18,491 | 1,303,985 | ||||||
Korn Ferry | 32,024 | 2,105,898 | ||||||
Resources Connection, Inc. | 59,744 | 786,231 | ||||||
|
| |||||||
| Total Professional Services |
| 8,661,603 | ||||||
| Real Estate Management & Development – 0.9% |
| |||||||
Newmark Group, Inc., Class A | 97,202 | 1,077,970 | ||||||
RMR Group, Inc., Class A | 34,028 | 816,672 | ||||||
St. Joe Co. | 24,270 | 1,406,932 | ||||||
|
| |||||||
| Total Real Estate Management & Development |
| 3,301,574 | ||||||
| Retail REITs – 0.3% |
| |||||||
Alexander’s, Inc. | 4,097 | 889,623 | ||||||
| Semiconductors & Semiconductor Equipment – 0.3% |
| |||||||
NVE Corp. | 10,723 | 967,000 | ||||||
| Software – 0.7% |
| |||||||
A10 Networks, Inc. | 61,002 | 835,117 | ||||||
Progress Software Corp. | 25,057 | 1,335,789 | ||||||
ReposiTrak, Inc.(a) | 7,939 | 125,833 | ||||||
|
| |||||||
| Total Software |
| 2,296,739 | ||||||
| Specialty Retail – 5.1% |
| |||||||
Aaron’s Co., Inc. | 63,484 | 476,130 | ||||||
Arko Corp. | 81,273 | 463,256 | ||||||
Buckle, Inc. | 79,243 | 3,191,116 | ||||||
Caleres, Inc. | 15,616 | 640,724 | ||||||
Camping World Holdings, Inc., Class A | 46,381 | 1,291,711 | ||||||
Designer Brands, Inc., Class A | 57,863 | 632,443 | ||||||
Guess?, Inc. | 125,636 | 3,953,765 | ||||||
Hibbett, Inc. | 8,798 | 675,774 | ||||||
See Notes to Financial Statements.
| 92 | WisdomTree Trust |
Schedule of Investments (concluded)
WisdomTree U.S. SmallCap Quality Dividend Growth Fund (DGRS)
March 31, 2024
| Investments | Shares | Value | ||||||
Shoe Carnival, Inc. | 23,239 | $ | 851,477 | |||||
Sonic Automotive, Inc., Class A | 25,175 | 1,433,464 | ||||||
Upbound Group, Inc. | 112,798 | 3,971,618 | ||||||
|
| |||||||
| Total Specialty Retail |
| 17,581,478 | ||||||
| Textiles, Apparel & Luxury Goods – 5.2% |
| |||||||
Carter’s, Inc. | 70,711 | 5,987,808 | ||||||
Kontoor Brands, Inc. | 92,413 | 5,567,883 | ||||||
Lakeland Industries, Inc. | 3,241 | 59,310 | ||||||
Movado Group, Inc. | 34,119 | 952,944 | ||||||
Oxford Industries, Inc. | 21,145 | 2,376,698 | ||||||
Rocky Brands, Inc. | 6,934 | 188,119 | ||||||
Steven Madden Ltd. | 73,290 | 3,098,701 | ||||||
|
| |||||||
| Total Textiles, Apparel & Luxury Goods |
| 18,231,463 | ||||||
| Tobacco – 0.1% |
| |||||||
Turning Point Brands, Inc. | 8,334 | 244,186 | ||||||
| Trading Companies & Distributors – 3.4% |
| |||||||
Global Industrial Co. | 32,631 | 1,461,216 | ||||||
H&E Equipment Services, Inc. | 38,763 | 2,487,809 | ||||||
Herc Holdings, Inc. | 26,688 | 4,491,591 | ||||||
Karat Packaging, Inc. | 32,048 | 916,893 | ||||||
McGrath RentCorp | 19,752 | 2,436,804 | ||||||
|
| |||||||
| Total Trading Companies & Distributors |
| 11,794,313 | ||||||
| Water Utilities – 0.9% |
| |||||||
American States Water Co. | 34,745 | 2,509,979 | ||||||
Artesian Resources Corp., Class A | 10,858 | 402,940 | ||||||
Global Water Resources, Inc. | 11,996 | 154,029 | ||||||
|
| |||||||
| Total Water Utilities |
| 3,066,948 | ||||||
| Total United States |
| 344,322,845 | ||||||
| Puerto Rico – 0.2% |
| |||||||
| Financial Services – 0.2% |
| |||||||
EVERTEC, Inc. | 22,238 | 887,296 | ||||||
| Singapore – 0.6% |
| |||||||
| Semiconductors & Semiconductor Equipment – 0.6% |
| |||||||
Kulicke & Soffa Industries, Inc. | 40,103 | 2,017,582 | ||||||
| TOTAL COMMON STOCKS (Cost: $307,903,340) |
| 347,227,723 | ||||||
| INVESTMENT OF CASH COLLATERAL FOR SECURITIES LOANED – 0.1% |
| |||||||
| United States – 0.1% |
| |||||||
State Street Navigator Securities Lending Government Money Market Portfolio, 5.34%(b) | ||||||||
| (Cost: $197,883) | 197,883 | 197,883 | ||||||
| TOTAL INVESTMENTS IN SECURITIES – 99.9% (Cost: $308,101,223) |
| 347,425,606 | ||||||
Other Assets less Liabilities – 0.1% | 395,356 | |||||||
|
| |||||||
| NET ASSETS – 100.0% |
| $ | 347,820,962 | |||||
| (a) | Security, or portion thereof, was on loan at March 31, 2024 (See Note 2). At March 31, 2024, the total market value of the Fund’s securities on loan identified in the Schedule of Investments was $1,979,708 and the total market value of the collateral held by the Fund was $2,018,144. The total market value of the collateral includes non-cash U.S. Government securities collateral having a value of $1,820,261. |
| (b) | Rate shown represents annualized 7-day yield as of March 31, 2024. |
| FAIR VALUATION SUMMARY |
The following is a summary of the fair valuations according to the inputs used in valuing the Fund’s investments (See Note 2 — Fair Value Measurement):
| Quoted Prices in Active Markets (Level 1) | Other Significant Observable Inputs (Level 2) | Significant Unobservable Inputs (Level 3) | Total | |||||||||||||
Assets: |
| |||||||||||||||
Investments in Securities | ||||||||||||||||
Common Stocks | $ | 347,227,723 | $ | — | $ | — | $ | 347,227,723 | ||||||||
Investment of Cash Collateral for Securities Loaned | — | 197,883 | — | 197,883 | ||||||||||||
Total Investments in Securities | $ | 347,227,723 | $ | 197,883 | $ | — | $ | 347,425,606 | ||||||||
See Notes to Financial Statements.
| WisdomTree Trust | 93 |
Schedule of Investments
WisdomTree U.S. SmallCap Quality Growth Fund (QSML)
March 31, 2024
| Investments | Shares | Value | ||||||
| COMMON STOCKS – 99.5% |
| |||||||
| United States – 98.0% |
| |||||||
| Aerospace & Defense – 0.4% |
| |||||||
AerSale Corp.* | 109 | $ | 783 | |||||
Ducommun, Inc.* | 30 | 1,539 | ||||||
V2X, Inc.* | 64 | 2,989 | ||||||
|
| |||||||
| Total Aerospace & Defense |
| 5,311 | ||||||
| Air Freight & Logistics – 0.7% |
| |||||||
Air Transport Services Group, Inc.* | 132 | 1,816 | ||||||
Forward Air Corp. | 50 | 1,556 | ||||||
Hub Group, Inc., Class A | 132 | 5,705 | ||||||
|
| |||||||
| Total Air Freight & Logistics |
| 9,077 | ||||||
| Automobile Components – 2.0% |
| |||||||
Dorman Products, Inc.* | 64 | 6,169 | ||||||
Fox Factory Holding Corp.* | 87 | 4,530 | ||||||
LCI Industries | 53 | 6,522 | ||||||
Patrick Industries, Inc. | 46 | 5,496 | ||||||
XPEL, Inc.* | 57 | 3,079 | ||||||
|
| |||||||
| Total Automobile Components |
| 25,796 | ||||||
| Automobiles – 0.3% |
| |||||||
Winnebago Industries, Inc. | 62 | 4,588 | ||||||
| Beverages – 0.3% |
| |||||||
MGP Ingredients, Inc. | 46 | 3,962 | ||||||
| Biotechnology – 1.1% |
| |||||||
Avid Bioservices, Inc.* | 122 | 817 | ||||||
Catalyst Pharmaceuticals, Inc.* | 218 | 3,475 | ||||||
Dynavax Technologies Corp.* | 262 | 3,251 | ||||||
Novavax, Inc.* | 238 | 1,138 | ||||||
Organogenesis Holdings, Inc.* | 265 | 753 | ||||||
Vir Biotechnology, Inc.* | 277 | 2,806 | ||||||
Voyager Therapeutics, Inc.* | 90 | 838 | ||||||
Zymeworks, Inc.* | 148 | 1,557 | ||||||
|
| |||||||
| Total Biotechnology |
| 14,635 | ||||||
| Building Products – 3.7% |
| |||||||
Armstrong World Industries, Inc. | 90 | 11,180 | ||||||
AZZ, Inc. | 52 | 4,020 | ||||||
CSW Industrials, Inc. | 32 | 7,507 | ||||||
Hayward Holdings, Inc.* | 443 | 6,782 | ||||||
Insteel Industries, Inc. | 40 | 1,529 | ||||||
Janus International Group, Inc.* | 301 | 4,554 | ||||||
JELD-WEN Holding, Inc.* | 176 | 3,737 | ||||||
Quanex Building Products Corp. | 66 | 2,536 | ||||||
Resideo Technologies, Inc.* | 299 | 6,704 | ||||||
|
| |||||||
| Total Building Products |
| 48,549 | ||||||
| Capital Markets – 4.8% |
| |||||||
AssetMark Financial Holdings, Inc.* | 152 | 5,382 | ||||||
B Riley Financial, Inc. | 68 | 1,440 | ||||||
Brightsphere Investment Group, Inc. | 86 | 1,964 | ||||||
Cohen & Steers, Inc. | 102 | 7,843 | ||||||
Donnelley Financial Solutions, Inc.* | 58 | 3,597 | ||||||
Hamilton Lane, Inc., Class A | 77 | 8,682 | ||||||
Open Lending Corp., Class A* | 252 | 1,577 | ||||||
P10, Inc., Class A | 197 | 1,659 | ||||||
Perella Weinberg Partners | 84 | 1,187 | ||||||
Piper Sandler Cos. | 36 | 7,146 | ||||||
PJT Partners, Inc., Class A | 49 | 4,619 | ||||||
StepStone Group, Inc., Class A | 129 | 4,610 | ||||||
StoneX Group, Inc.* | 63 | 4,426 | ||||||
Victory Capital Holdings, Inc., Class A | 133 | 5,643 | ||||||
Virtus Investment Partners, Inc. | 15 | 3,720 | ||||||
|
| |||||||
| Total Capital Markets |
| 63,495 | ||||||
| Chemicals – 2.1% |
| |||||||
AdvanSix, Inc. | 56 | 1,602 | ||||||
Core Molding Technologies, Inc.* | 18 | 341 | ||||||
Hawkins, Inc. | 43 | 3,302 | ||||||
Ingevity Corp.* | 77 | 3,673 | ||||||
Innospec, Inc. | 50 | 6,447 | ||||||
Intrepid Potash, Inc.* | 28 | 584 | ||||||
Koppers Holdings, Inc. | 42 | 2,317 | ||||||
LSB Industries, Inc.* | 156 | 1,370 | ||||||
Quaker Chemical Corp. | 37 | 7,594 | ||||||
|
| |||||||
| Total Chemicals |
| 27,230 | ||||||
| Commercial Services & Supplies – 0.4% |
| |||||||
Driven Brands Holdings, Inc.* | 341 | 5,384 | ||||||
| Communications Equipment – 0.9% |
| |||||||
Aviat Networks, Inc.* | 24 | 920 | ||||||
Calix, Inc.* | 135 | 4,477 | ||||||
Clearfield, Inc.* | 32 | 987 | ||||||
Digi International, Inc.* | 72 | 2,299 | ||||||
Extreme Networks, Inc.* | 262 | 3,023 | ||||||
|
| |||||||
| Total Communications Equipment |
| 11,706 | ||||||
| Construction & Engineering – 3.5% |
| |||||||
Arcosa, Inc. | 98 | 8,414 | ||||||
Construction Partners, Inc., Class A* | 104 | 5,840 | ||||||
Dycom Industries, Inc.* | 60 | 8,612 | ||||||
IES Holdings, Inc.* | 42 | 5,109 | ||||||
MYR Group, Inc.* | 34 | 6,009 | ||||||
Primoris Services Corp. | 109 | 4,640 | ||||||
Sterling Infrastructure, Inc.* | 63 | 6,950 | ||||||
|
| |||||||
| Total Construction & Engineering |
| 45,574 | ||||||
| Construction Materials – 0.3% |
| |||||||
U.S. Lime & Minerals, Inc. | 12 | 3,578 | ||||||
| Consumer Finance – 0.4% |
| |||||||
Enova International, Inc.* | 62 | 3,895 | ||||||
World Acceptance Corp.* | 13 | 1,885 | ||||||
|
| |||||||
| Total Consumer Finance |
| 5,780 | ||||||
| Consumer Staples Distribution & Retail – 1.3% |
| |||||||
Andersons, Inc. | 69 | 3,959 | ||||||
Chefs’ Warehouse, Inc.* | 81 | 3,050 | ||||||
Grocery Outlet Holding Corp.* | 199 | 5,727 | ||||||
Ingles Markets, Inc., Class A | 38 | 2,914 | ||||||
United Natural Foods, Inc.* | 126 | 1,448 | ||||||
|
| |||||||
| Total Consumer Staples Distribution & Retail |
| 17,098 | ||||||
See Notes to Financial Statements.
| 94 | WisdomTree Trust |
Schedule of Investments (continued)
WisdomTree U.S. SmallCap Quality Growth Fund (QSML)
March 31, 2024
| Investments | Shares | Value | ||||||
| Containers & Packaging – 0.7% |
| |||||||
Greif, Inc., Class A | 115 | $ | 7,941 | |||||
Myers Industries, Inc. | 72 | 1,668 | ||||||
|
| |||||||
| Total Containers & Packaging |
| 9,609 | ||||||
| Diversified Consumer Services – 1.7% |
| |||||||
European Wax Center, Inc., Class A* | 107 | 1,389 | ||||||
Frontdoor, Inc.* | 161 | 5,246 | ||||||
Mister Car Wash, Inc.* | 667 | 5,169 | ||||||
Strategic Education, Inc. | 49 | 5,102 | ||||||
Stride, Inc.* | 87 | 5,485 | ||||||
|
| |||||||
| Total Diversified Consumer Services |
| 22,391 | ||||||
| Diversified Telecommunication Services – 0.6% |
| |||||||
Bandwidth, Inc., Class A* | 56 | 1,022 | ||||||
Cogent Communications Holdings, Inc. | 100 | 6,533 | ||||||
|
| |||||||
| Total Diversified Telecommunication Services |
| 7,555 | ||||||
| Electrical Equipment – 1.4% |
| |||||||
Array Technologies, Inc.* | 318 | 4,741 | ||||||
Encore Wire Corp. | 32 | 8,409 | ||||||
LSI Industries, Inc. | 60 | 907 | ||||||
Preformed Line Products Co. | 10 | 1,287 | ||||||
Vicor Corp.* | 94 | 3,595 | ||||||
|
| |||||||
| Total Electrical Equipment |
| 18,939 | ||||||
| Electronic Equipment, Instruments & Components – 2.1% |
| |||||||
Advanced Energy Industries, Inc. | 75 | 7,649 | ||||||
ePlus, Inc.* | 56 | 4,398 | ||||||
Kimball Electronics, Inc.* | 52 | 1,126 | ||||||
Napco Security Technologies, Inc. | 75 | 3,012 | ||||||
Plexus Corp.* | 56 | 5,310 | ||||||
Vishay Intertechnology, Inc. | 280 | 6,350 | ||||||
|
| |||||||
| Total Electronic Equipment, Instruments & Components |
| 27,845 | ||||||
| Energy Equipment & Services – 1.2% |
| |||||||
Bristow Group, Inc.* | 60 | 1,632 | ||||||
Cactus, Inc., Class A | 131 | 6,562 | ||||||
Liberty Energy, Inc. | 338 | 7,003 | ||||||
Ranger Energy Services, Inc. | 50 | 565 | ||||||
|
| |||||||
| Total Energy Equipment & Services |
| 15,762 | ||||||
| Financial Services – 4.1% |
| |||||||
A-Mark Precious Metals, Inc. | 48 | 1,473 | ||||||
Cantaloupe, Inc.* | 148 | 952 | ||||||
Euronet Worldwide, Inc.* | 95 | 10,443 | ||||||
International Money Express, Inc.* | 68 | 1,552 | ||||||
Merchants Bancorp | 88 | 3,800 | ||||||
Mr. Cooper Group, Inc.* | 136 | 10,601 | ||||||
NewtekOne, Inc. | 52 | 572 | ||||||
NMI Holdings, Inc., Class A* | 162 | 5,239 | ||||||
PennyMac Financial Services, Inc. | 103 | 9,382 | ||||||
Shift4 Payments, Inc., Class A* | 121 | 7,995 | ||||||
UWM Holdings Corp. | 199 | 1,445 | ||||||
|
| |||||||
| Total Financial Services |
| 53,454 | ||||||
| Food Products – 1.8% |
| |||||||
Cal-Maine Foods, Inc. | 101 | 5,944 | ||||||
John B Sanfilippo & Son, Inc. | 24 | 2,542 | ||||||
Seaboard Corp. | 2 | 6,448 | ||||||
Simply Good Foods Co.* | 197 | 6,704 | ||||||
Vital Farms, Inc.* | 86 | 1,999 | ||||||
|
| |||||||
| Total Food Products |
| 23,637 | ||||||
| Ground Transportation – 0.9% |
| |||||||
ArcBest Corp. | 50 | 7,125 | ||||||
Heartland Express, Inc. | 165 | 1,970 | ||||||
Marten Transport Ltd. | 167 | 3,086 | ||||||
|
| |||||||
| Total Ground Transportation |
| 12,181 | ||||||
| Health Care Equipment & Supplies – 3.1% |
| |||||||
Axonics, Inc.* | 104 | 7,173 | ||||||
Inari Medical, Inc.* | 117 | 5,614 | ||||||
iRadimed Corp. | 24 | 1,056 | ||||||
LeMaitre Vascular, Inc. | 46 | 3,053 | ||||||
Neogen Corp.* | 446 | 7,038 | ||||||
OraSure Technologies, Inc.* | 142 | 873 | ||||||
Semler Scientific, Inc.* | 10 | 292 | ||||||
STAAR Surgical Co.* | 103 | 3,943 | ||||||
Tactile Systems Technology, Inc.* | 48 | 780 | ||||||
Tandem Diabetes Care, Inc.* | 137 | 4,851 | ||||||
Treace Medical Concepts, Inc.* | 130 | 1,696 | ||||||
UFP Technologies, Inc.* | 16 | 4,035 | ||||||
Zynex, Inc.* | 66 | 816 | ||||||
|
| |||||||
| Total Health Care Equipment & Supplies |
| 41,220 | ||||||
| Health Care Providers & Services – 3.1% |
| |||||||
Addus HomeCare Corp.* | 34 | 3,514 | ||||||
AMN Healthcare Services, Inc.* | 77 | 4,813 | ||||||
Astrana Health, Inc.* | 98 | 4,115 | ||||||
CorVel Corp.* | 36 | 9,467 | ||||||
Cross Country Healthcare, Inc.* | 72 | 1,348 | ||||||
Fulgent Genetics, Inc.* | 60 | 1,302 | ||||||
Hims & Hers Health, Inc.* | 420 | 6,497 | ||||||
National Research Corp. | 50 | 1,980 | ||||||
Progyny, Inc.* | 193 | 7,363 | ||||||
|
| |||||||
| Total Health Care Providers & Services |
| 40,399 | ||||||
| Health Care Technology – 0.9% |
| |||||||
GoodRx Holdings, Inc., Class A* | 856 | 6,078 | ||||||
Schrodinger, Inc.* | 150 | 4,050 | ||||||
Simulations Plus, Inc. | 40 | 1,646 | ||||||
|
| |||||||
| Total Health Care Technology |
| 11,774 | ||||||
| Hotels, Restaurants & Leisure – 4.3% |
| |||||||
Accel Entertainment, Inc.* | 170 | 2,004 | ||||||
Bloomin’ Brands, Inc. | 179 | 5,134 | ||||||
Dave & Buster’s Entertainment, Inc.* | 91 | 5,697 | ||||||
Everi Holdings, Inc.* | 183 | 1,839 | ||||||
Golden Entertainment, Inc. | 56 | 2,062 | ||||||
Hilton Grand Vacations, Inc.* | 232 | 10,953 | ||||||
Jack in the Box, Inc. | 42 | 2,876 | ||||||
Monarch Casino & Resort, Inc. | 40 | 3,000 | ||||||
Papa John’s International, Inc. | 67 | 4,462 | ||||||
RCI Hospitality Holdings, Inc. | 20 | 1,160 | ||||||
See Notes to Financial Statements.
| WisdomTree Trust | 95 |
Schedule of Investments (continued)
WisdomTree U.S. SmallCap Quality Growth Fund (QSML)
March 31, 2024
| Investments | Shares | Value | ||||||
Red Rock Resorts, Inc., Class A | 121 | $ | 7,238 | |||||
Target Hospitality Corp.* | 206 | 2,239 | ||||||
United Parks & Resorts, Inc.* | 133 | 7,476 | ||||||
|
| |||||||
| Total Hotels, Restaurants & Leisure |
| 56,140 | ||||||
| Household Durables – 5.8% |
| |||||||
Cavco Industries, Inc.* | 17 | 6,784 | ||||||
Century Communities, Inc. | 66 | 6,369 | ||||||
Cricut, Inc., Class A | 462 | 2,199 | ||||||
Green Brick Partners, Inc.* | 93 | 5,602 | ||||||
Hovnanian Enterprises, Inc., Class A* | 13 | 2,040 | ||||||
Landsea Homes Corp.* | 78 | 1,133 | ||||||
LGI Homes, Inc.* | 49 | 5,702 | ||||||
Lovesac Co.* | 32 | 723 | ||||||
M/I Homes, Inc.* | 58 | 7,905 | ||||||
MDC Holdings, Inc. | 156 | 9,814 | ||||||
Skyline Champion Corp.* | 119 | 10,116 | ||||||
Sonos, Inc.* | 258 | 4,918 | ||||||
Tri Pointe Homes, Inc.* | 199 | 7,693 | ||||||
Vizio Holding Corp., Class A* | 410 | 4,486 | ||||||
|
| |||||||
| Total Household Durables |
| 75,484 | ||||||
| Household Products – 0.5% |
| |||||||
WD-40 Co. | 27 | 6,839 | ||||||
| Insurance – 0.6% |
| |||||||
Goosehead Insurance, Inc., Class A* | 49 | 3,264 | ||||||
Palomar Holdings, Inc.* | 50 | 4,192 | ||||||
|
| |||||||
| Total Insurance |
| 7,456 | ||||||
| Interactive Media & Services – 1.2% |
| |||||||
Cargurus, Inc.* | 227 | 5,239 | ||||||
EverQuote, Inc., Class A* | 68 | 1,262 | ||||||
Shutterstock, Inc. | 75 | 3,436 | ||||||
Yelp, Inc.* | 139 | 5,477 | ||||||
|
| |||||||
| Total Interactive Media & Services |
| 15,414 | ||||||
| IT Services – 1.2% |
| |||||||
Couchbase, Inc.* | 97 | 2,552 | ||||||
DigitalOcean Holdings, Inc.* | 179 | 6,834 | ||||||
Grid Dynamics Holdings, Inc.* | 148 | 1,819 | ||||||
Perficient, Inc.* | 71 | 3,997 | ||||||
|
| |||||||
| Total IT Services |
| 15,202 | ||||||
| Leisure Products – 2.6% |
| |||||||
Acushnet Holdings Corp. | 135 | 8,903 | ||||||
Funko, Inc., Class A* | 110 | 686 | ||||||
Johnson Outdoors, Inc., Class A | 22 | 1,015 | ||||||
Malibu Boats, Inc., Class A* | 44 | 1,904 | ||||||
MasterCraft Boat Holdings, Inc.* | 36 | 854 | ||||||
Smith & Wesson Brands, Inc. | 92 | 1,597 | ||||||
Sturm Ruger & Co., Inc. | 36 | 1,661 | ||||||
Topgolf Callaway Brands Corp.* | 393 | 6,355 | ||||||
Vista Outdoor, Inc.* | 116 | 3,803 | ||||||
YETI Holdings, Inc.* | 181 | 6,978 | ||||||
|
| |||||||
| Total Leisure Products |
| 33,756 | ||||||
| Machinery – 2.9% |
| |||||||
Alamo Group, Inc. | 25 | 5,708 | ||||||
Helios Technologies, Inc. | 69 | 3,084 | ||||||
Hillenbrand, Inc. | 144 | 7,242 | ||||||
John Bean Technologies Corp. | 65 | 6,818 | ||||||
Kadant, Inc. | 24 | 7,874 | ||||||
Lindsay Corp. | 22 | 2,588 | ||||||
Shyft Group, Inc. | 73 | 907 | ||||||
Titan International, Inc.* | 130 | 1,620 | ||||||
Wabash National Corp. | 94 | 2,814 | ||||||
|
| |||||||
| Total Machinery |
| 38,655 | ||||||
| Marine Transportation – 0.6% |
| |||||||
Matson, Inc. | 71 | 7,980 | ||||||
| Media – 1.1% |
| |||||||
Boston Omaha Corp., Class A* | 64 | 989 | ||||||
Gray Television, Inc. | 191 | 1,207 | ||||||
PubMatic, Inc., Class A* | 104 | 2,467 | ||||||
Sinclair, Inc. | 136 | 1,832 | ||||||
TEGNA, Inc. | 403 | 6,021 | ||||||
Thryv Holdings, Inc.* | 72 | 1,601 | ||||||
|
| |||||||
| Total Media |
| 14,117 | ||||||
| Metals & Mining – 2.9% |
| |||||||
Alpha Metallurgical Resources, Inc. | 27 | 8,942 | ||||||
Arch Resources, Inc. | 38 | 6,110 | ||||||
Materion Corp. | 42 | 5,533 | ||||||
MP Materials Corp.* | 380 | 5,434 | ||||||
Olympic Steel, Inc. | 22 | 1,559 | ||||||
Ramaco Resources, Inc., Class A | 112 | 1,886 | ||||||
Ryerson Holding Corp. | 69 | 2,312 | ||||||
Warrior Met Coal, Inc. | 109 | 6,616 | ||||||
|
| |||||||
| Total Metals & Mining |
| 38,392 | ||||||
| Oil, Gas & Consumable Fuels – 5.3% |
| |||||||
Amplify Energy Corp.* | 84 | 555 | ||||||
Berry Corp. | 155 | 1,248 | ||||||
Comstock Resources, Inc. | 567 | 5,262 | ||||||
CONSOL Energy, Inc. | 65 | 5,444 | ||||||
CVR Energy, Inc. | 204 | 7,275 | ||||||
Evolution Petroleum Corp. | 66 | 405 | ||||||
Hallador Energy Co.* | 50 | 267 | ||||||
HighPeak Energy, Inc. | 260 | 4,100 | ||||||
Kinetik Holdings, Inc. | 109 | 4,346 | ||||||
Northern Oil & Gas, Inc. | 206 | 8,174 | ||||||
Par Pacific Holdings, Inc.* | 124 | 4,595 | ||||||
Peabody Energy Corp. | 270 | 6,550 | ||||||
REX American Resources Corp.* | 34 | 1,996 | ||||||
Riley Exploration Permian, Inc. | 42 | 1,386 | ||||||
Ring Energy, Inc.* | 384 | 753 | ||||||
SandRidge Energy, Inc. | 74 | 1,078 | ||||||
SilverBow Resources, Inc.* | 52 | 1,775 | ||||||
Sitio Royalties Corp., Class A | 166 | 4,104 | ||||||
VAALCO Energy, Inc. | 214 | 1,492 | ||||||
Viper Energy, Inc. | 143 | 5,500 | ||||||
See Notes to Financial Statements.
| 96 | WisdomTree Trust |
Schedule of Investments (continued)
WisdomTree U.S. SmallCap Quality Growth Fund (QSML)
March 31, 2024
| Investments | Shares | Value | ||||||
Vital Energy, Inc.* | 56 | $ | 2,942 | |||||
|
| |||||||
| Total Oil, Gas & Consumable Fuels |
| 69,247 | ||||||
| Passenger Airlines – 0.1% |
| |||||||
Sun Country Airlines Holdings, Inc.* | 113 | 1,705 | ||||||
| Personal Care Products – 0.8% |
| |||||||
Inter Parfums, Inc. | 65 | 9,133 | ||||||
Medifast, Inc. | 23 | 881 | ||||||
|
| |||||||
| Total Personal Care Products |
| 10,014 | ||||||
| Pharmaceuticals – 1.4% |
| |||||||
Amphastar Pharmaceuticals, Inc.* | 99 | 4,347 | ||||||
Collegium Pharmaceutical, Inc.* | 64 | 2,484 | ||||||
Corcept Therapeutics, Inc.* | 210 | 5,290 | ||||||
Harmony Biosciences Holdings, Inc.* | 122 | 4,097 | ||||||
Pacira BioSciences, Inc.* | 95 | 2,776 | ||||||
|
| |||||||
| Total Pharmaceuticals |
| 18,994 | ||||||
| Professional Services – 4.1% |
| |||||||
Barrett Business Services, Inc. | 14 | 1,774 | ||||||
CBIZ, Inc.* | 100 | 7,850 | ||||||
CRA International, Inc. | 14 | 2,094 | ||||||
Exponent, Inc. | 103 | 8,517 | ||||||
Heidrick & Struggles International, Inc. | 42 | 1,414 | ||||||
Huron Consulting Group, Inc.* | 39 | 3,768 | ||||||
Korn Ferry | 107 | 7,036 | ||||||
Legalzoom.com, Inc.* | 374 | 4,989 | ||||||
NV5 Global, Inc.* | 33 | 3,235 | ||||||
TTEC Holdings, Inc. | 70 | 726 | ||||||
Upwork, Inc.* | 277 | 3,396 | ||||||
Verra Mobility Corp.* | 336 | 8,390 | ||||||
|
| |||||||
| Total Professional Services |
| 53,189 | ||||||
| Semiconductors & Semiconductor Equipment – 3.8% |
| |||||||
ACM Research, Inc., Class A* | 122 | 3,555 | ||||||
Aehr Test Systems* | 63 | 781 | ||||||
Axcelis Technologies, Inc.* | 64 | 7,137 | ||||||
Cirrus Logic, Inc.* | 108 | 9,996 | ||||||
Cohu, Inc.* | 96 | 3,200 | ||||||
Diodes, Inc.* | 94 | 6,627 | ||||||
Impinj, Inc.* | 56 | 7,191 | ||||||
inTEST Corp.* | 26 | 345 | ||||||
MaxLinear, Inc.* | 166 | 3,099 | ||||||
NVE Corp. | 10 | 902 | ||||||
Photronics, Inc.* | 126 | 3,568 | ||||||
SiTime Corp.* | 42 | 3,916 | ||||||
|
| |||||||
| Total Semiconductors & Semiconductor Equipment |
| 50,317 | ||||||
| Software – 4.6% |
| |||||||
Alarm.com Holdings, Inc.* | 103 | 7,464 | ||||||
AvePoint, Inc.* | 370 | 2,930 | ||||||
BlackLine, Inc.* | 127 | 8,202 | ||||||
Box, Inc., Class A* | 292 | 8,269 | ||||||
CS Disco, Inc.* | 128 | 1,041 | ||||||
Intapp, Inc.* | 141 | 4,836 | ||||||
MeridianLink, Inc.* | 167 | 3,123 | ||||||
Mitek Systems, Inc.* | 90 | 1,269 | ||||||
N-able, Inc.* | 374 | 4,888 | ||||||
Olo, Inc., Class A* | 354 | 1,943 | ||||||
ON24, Inc. | 82 | 586 | ||||||
Progress Software Corp. | 90 | 4,798 | ||||||
SEMrush Holdings, Inc., Class A* | 292 | 3,872 | ||||||
Sprout Social, Inc., Class A* | 118 | 7,046 | ||||||
|
| |||||||
| Total Software |
| 60,267 | ||||||
| Specialty Retail – 5.1% |
| |||||||
Aaron’s Co., Inc. | 69 | 518 | ||||||
Academy Sports & Outdoors, Inc. | 161 | 10,874 | ||||||
America’s Car-Mart, Inc.* | 12 | 766 | ||||||
Boot Barn Holdings, Inc.* | 65 | 6,185 | ||||||
Buckle, Inc. | 104 | 4,188 | ||||||
Build-A-Bear Workshop, Inc. | 30 | 896 | ||||||
Camping World Holdings, Inc., Class A | 94 | 2,618 | ||||||
CarParts.com, Inc.* | 49 | 79 | ||||||
Group 1 Automotive, Inc. | 29 | 8,475 | ||||||
Guess?, Inc. | 110 | 3,462 | ||||||
Haverty Furniture Cos., Inc. | 34 | 1,160 | ||||||
Hibbett, Inc. | 26 | 1,997 | ||||||
Leslie’s, Inc.* | 392 | 2,548 | ||||||
MarineMax, Inc.* | 48 | 1,596 | ||||||
National Vision Holdings, Inc.* | 164 | 3,634 | ||||||
OneWater Marine, Inc., Class A* | 30 | 845 | ||||||
Petco Health & Wellness Co., Inc.* | 626 | 1,427 | ||||||
Revolve Group, Inc.* | 158 | 3,345 | ||||||
Shoe Carnival, Inc. | 58 | 2,125 | ||||||
Sonic Automotive, Inc., Class A | 71 | 4,043 | ||||||
Sportsman’s Warehouse Holdings, Inc.* | 91 | 283 | ||||||
Victoria’s Secret & Co.* | 164 | 3,178 | ||||||
Winmark Corp. | 7 | 2,532 | ||||||
|
| |||||||
| Total Specialty Retail |
| 66,774 | ||||||
| Technology Hardware, Storage & Peripherals – 0.2% |
| |||||||
Corsair Gaming, Inc.* | 206 | 2,542 | ||||||
| Textiles, Apparel & Luxury Goods – 1.5% |
| |||||||
Figs, Inc., Class A* | 346 | 1,723 | ||||||
Kontoor Brands, Inc. | 110 | 6,627 | ||||||
Movado Group, Inc. | 45 | 1,257 | ||||||
Oxford Industries, Inc. | 32 | 3,597 | ||||||
Steven Madden Ltd. | 153 | 6,469 | ||||||
|
| |||||||
| Total Textiles, Apparel & Luxury Goods |
| 19,673 | ||||||
| Tobacco – 0.4% |
| |||||||
Turning Point Brands, Inc. | 36 | 1,055 | ||||||
Vector Group Ltd. | 324 | 3,551 | ||||||
|
| |||||||
| Total Tobacco |
| 4,606 | ||||||
| Trading Companies & Distributors – 3.2% |
| |||||||
Alta Equipment Group, Inc. | 68 | 881 | ||||||
BlueLinx Holdings, Inc.* | 18 | 2,344 | ||||||
GMS, Inc.* | 84 | 8,177 | ||||||
Herc Holdings, Inc. | 60 | 10,098 | ||||||
Hudson Technologies, Inc.* | 95 | 1,046 | ||||||
Karat Packaging, Inc. | 42 | 1,202 | ||||||
See Notes to Financial Statements.
| WisdomTree Trust | 97 |
Schedule of Investments (concluded)
WisdomTree U.S. SmallCap Quality Growth Fund (QSML)
March 31, 2024
| Investments | Shares | Value | ||||||
McGrath RentCorp | 50 | $ | 6,168 | |||||
Rush Enterprises, Inc., Class A | 164 | 8,777 | ||||||
Titan Machinery, Inc.* | 50 | 1,240 | ||||||
Transcat, Inc.* | 18 | 2,006 | ||||||
|
| |||||||
| Total Trading Companies & Distributors |
| 41,939 | ||||||
| Total United States |
| 1,285,231 | ||||||
| Ghana – 0.4% |
| |||||||
| Oil, Gas & Consumable Fuels – 0.4% |
| |||||||
Kosmos Energy Ltd.* | 923 | 5,501 | ||||||
| Jersey – 0.3% |
| |||||||
| Chemicals – 0.3% |
| |||||||
Arcadium Lithium PLC* | 904 | 3,896 | ||||||
| Puerto Rico – 0.4% |
| |||||||
| Financial Services – 0.4% |
| |||||||
EVERTEC, Inc. | 132 | 5,267 | ||||||
| Singapore – 0.4% |
| |||||||
| Semiconductors & Semiconductor Equipment – 0.4% |
| |||||||
Kulicke & Soffa Industries, Inc. | 115 | 5,786 | ||||||
| TOTAL INVESTMENTS IN SECURITIES – 99.5% (Cost: $1,245,189) |
| 1,305,681 | ||||||
Other Assets less Liabilities – 0.5% | 6,397 | |||||||
|
| |||||||
| NET ASSETS – 100.0% |
| $ | 1,312,078 | |||||
| * | Non-income producing security. |
| FAIR VALUATION SUMMARY |
The following is a summary of the fair valuations according to the inputs used in valuing the Fund’s investments (See Note 2 — Fair Value Measurement):
| Quoted Prices in Active Markets (Level 1) | Other Significant Observable Inputs (Level 2) | Significant Unobservable Inputs (Level 3) | Total | |||||||||||||
Assets: |
| |||||||||||||||
Investments in Securities | ||||||||||||||||
Common Stocks | $ | 1,305,681 | $ | — | $ | — | $ | 1,305,681 | ||||||||
Total Investments in Securities | $ | 1,305,681 | $ | — | $ | — | $ | 1,305,681 | ||||||||
See Notes to Financial Statements.
| 98 | WisdomTree Trust |
Schedule of Investments
WisdomTree U.S. Total Dividend Fund (DTD)
March 31, 2024
| Investments | Shares | Value | ||||||
| COMMON STOCKS – 99.8% |
| |||||||
| United States – 99.7% |
| |||||||
| Aerospace & Defense – 1.5% |
| |||||||
BWX Technologies, Inc. | 3,121 | $ | 320,277 | |||||
General Dynamics Corp. | 8,725 | 2,464,725 | ||||||
HEICO Corp., Class A | 2,170 | 334,050 | ||||||
Howmet Aerospace, Inc. | 4,860 | 332,570 | ||||||
Huntington Ingalls Industries, Inc. | 1,554 | 452,944 | ||||||
L3Harris Technologies, Inc. | 6,615 | 1,409,657 | ||||||
Lockheed Martin Corp. | 10,974 | 4,991,743 | ||||||
Northrop Grumman Corp. | 3,545 | 1,696,850 | ||||||
RTX Corp. | 63,059 | 6,150,144 | ||||||
Textron, Inc. | 2,837 | 272,154 | ||||||
Woodward, Inc. | 1,694 | 261,079 | ||||||
|
| |||||||
| Total Aerospace & Defense |
| 18,686,193 | ||||||
| Air Freight & Logistics – 0.8% |
| |||||||
CH Robinson Worldwide, Inc. | 4,792 | 364,863 | ||||||
Expeditors International of Washington, Inc. | 4,730 | 575,026 | ||||||
FedEx Corp. | 7,343 | 2,127,561 | ||||||
United Parcel Service, Inc., Class B | 45,909 | 6,823,454 | ||||||
|
| |||||||
| Total Air Freight & Logistics |
| 9,890,904 | ||||||
| Automobile Components – 0.1% |
| |||||||
BorgWarner, Inc. | 6,958 | 241,721 | ||||||
Dana, Inc. | 10,001 | 127,013 | ||||||
Gentex Corp. | 7,818 | 282,386 | ||||||
LCI Industries | 2,285 | 281,192 | ||||||
Lear Corp. | 2,508 | 363,359 | ||||||
Patrick Industries, Inc. | 3,176 | 379,437 | ||||||
Phinia, Inc. | 3,702 | 142,268 | ||||||
|
| |||||||
| Total Automobile Components |
| 1,817,376 | ||||||
| Automobiles – 0.2% |
| |||||||
General Motors Co. | 25,136 | 1,139,918 | ||||||
Harley-Davidson, Inc. | 4,264 | 186,507 | ||||||
Thor Industries, Inc. | 3,009 | 353,076 | ||||||
Winnebago Industries, Inc. | 3,220 | 238,280 | ||||||
|
| |||||||
| Total Automobiles |
| 1,917,781 | ||||||
| Banks – 8.4% |
| |||||||
1st Source Corp. | 2,762 | 144,784 | ||||||
Ameris Bancorp | 2,940 | 142,237 | ||||||
Associated Banc-Corp. | 10,313 | 221,833 | ||||||
Atlantic Union Bankshares Corp. | 3,949 | 139,439 | ||||||
Banc of California, Inc. | 13,175 | 200,392 | ||||||
BancFirst Corp. | 1,208 | 106,340 | ||||||
Bank of America Corp. | 367,270 | 13,926,878 | ||||||
Bank of Hawaii Corp.(a) | 3,173 | 197,963 | ||||||
Bank OZK | 8,636 | 392,593 | ||||||
BankUnited, Inc. | 5,773 | 161,644 | ||||||
Berkshire Hills Bancorp, Inc. | 7,436 | 170,433 | ||||||
BOK Financial Corp. | 3,110 | 286,120 | ||||||
Cadence Bank | 8,315 | 241,135 | ||||||
Capitol Federal Financial, Inc. | 9,101 | 54,242 | ||||||
Cathay General Bancorp | 7,546 | 285,465 | ||||||
Citigroup, Inc. | 127,960 | 8,092,190 | ||||||
City Holding Co. | 2,925 | 304,843 | ||||||
Columbia Banking System, Inc. | 18,591 | 359,736 | ||||||
Comerica, Inc. | 9,834 | 540,772 | ||||||
Commerce Bancshares, Inc. | 4,267 | 227,004 | ||||||
Community Bank System, Inc. | 4,424 | 212,485 | ||||||
Community Trust Bancorp, Inc. | 2,925 | 124,751 | ||||||
Cullen/Frost Bankers, Inc. | 3,696 | 416,059 | ||||||
CVB Financial Corp. | 5,801 | 103,490 | ||||||
Eagle Bancorp, Inc. | 1,297 | 30,467 | ||||||
East West Bancorp, Inc. | 9,339 | 738,808 | ||||||
Eastern Bankshares, Inc. | 15,570 | 214,555 | ||||||
Enterprise Financial Services Corp. | 5,973 | 242,265 | ||||||
FB Financial Corp. | 4,336 | 163,294 | ||||||
Fifth Third Bancorp | 47,939 | 1,783,810 | ||||||
First Bancorp/Southern Pines NC | 2,528 | 91,311 | ||||||
First Busey Corp. | 12,134 | 291,823 | ||||||
First Citizens BancShares, Inc., Class A | 176 | 287,760 | ||||||
First Commonwealth Financial Corp. | 13,845 | 192,722 | ||||||
First Financial Bancorp | 9,380 | 210,300 | ||||||
First Financial Bankshares, Inc. | 6,843 | 224,519 | ||||||
First Hawaiian, Inc. | 7,716 | 169,443 | ||||||
First Interstate BancSystem, Inc., Class A | 7,550 | 205,436 | ||||||
First Merchants Corp. | 8,243 | 287,681 | ||||||
Five Star Bancorp | 5,921 | 133,223 | ||||||
FNB Corp. | 35,109 | 495,037 | ||||||
Fulton Financial Corp. | 15,141 | 240,590 | ||||||
German American Bancorp, Inc. | 4,618 | 159,968 | ||||||
Glacier Bancorp, Inc. | 5,731 | 230,845 | ||||||
Hancock Whitney Corp. | 3,780 | 174,031 | ||||||
Heartland Financial USA, Inc. | 3,162 | 111,144 | ||||||
Heritage Commerce Corp. | 16,423 | 140,909 | ||||||
Heritage Financial Corp. | 8,217 | 159,328 | ||||||
Hilltop Holdings, Inc. | 6,487 | 203,173 | ||||||
Home BancShares, Inc. | 14,754 | 362,506 | ||||||
Hope Bancorp, Inc. | 13,691 | 157,583 | ||||||
Huntington Bancshares, Inc. | 118,472 | 1,652,684 | ||||||
Independent Bank Corp. | 3,431 | 178,481 | ||||||
Independent Bank Group, Inc. | 1,879 | 85,776 | ||||||
International Bancshares Corp. | 4,241 | 238,090 | ||||||
JPMorgan Chase & Co. | 174,194 | 34,891,058 | ||||||
Lakeland Financial Corp. | 2,418 | 160,362 | ||||||
M&T Bank Corp. | 10,068 | 1,464,290 | ||||||
National Bank Holdings Corp., Class A | 5,322 | 191,965 | ||||||
NBT Bancorp, Inc. | 5,079 | 186,298 | ||||||
New York Community Bancorp, Inc.(a) | 103,788 | 334,197 | ||||||
Northwest Bancshares, Inc. | 18,678 | 217,599 | ||||||
Old National Bancorp | 12,248 | 213,238 | ||||||
Origin Bancorp, Inc. | 4,365 | 136,363 | ||||||
Pacific Premier Bancorp, Inc. | 7,942 | 190,608 | ||||||
Park National Corp. | 1,019 | 138,431 | ||||||
Peapack-Gladstone Financial Corp. | 5,480 | 133,328 | ||||||
Peoples Bancorp, Inc. | 9,591 | 283,990 | ||||||
Pinnacle Financial Partners, Inc. | 1,638 | 140,671 | ||||||
See Notes to Financial Statements.
| WisdomTree Trust | 99 |
Schedule of Investments (continued)
WisdomTree U.S. Total Dividend Fund (DTD)
March 31, 2024
| Investments | Shares | Value | ||||||
PNC Financial Services Group, Inc. | 25,057 | $ | 4,049,211 | |||||
Preferred Bank | 1,984 | 152,312 | ||||||
Prosperity Bancshares, Inc. | 3,499 | 230,164 | ||||||
Provident Financial Services, Inc. | 7,449 | 108,532 | ||||||
QCR Holdings, Inc. | 3,802 | 230,933 | ||||||
Regions Financial Corp. | 78,367 | 1,648,842 | ||||||
Renasant Corp. | 6,017 | 188,452 | ||||||
S&T Bancorp, Inc. | 7,127 | 228,634 | ||||||
Seacoast Banking Corp. of Florida | 6,273 | 159,271 | ||||||
ServisFirst Bancshares, Inc. | 1,585 | 105,181 | ||||||
Simmons First National Corp., Class A | 7,971 | 155,116 | ||||||
Southern States Bancshares, Inc. | 4,876 | 126,386 | ||||||
Southside Bancshares, Inc. | 3,656 | 106,865 | ||||||
SouthState Corp. | 3,478 | 295,734 | ||||||
Stock Yards Bancorp, Inc. | 3,011 | 147,268 | ||||||
Synovus Financial Corp. | 7,970 | 319,278 | ||||||
TFS Financial Corp. | 21,027 | 264,099 | ||||||
Towne Bank | 5,178 | 145,295 | ||||||
TriCo Bancshares | 2,131 | 78,378 | ||||||
Trustmark Corp. | 7,579 | 213,046 | ||||||
U.S. Bancorp | 112,692 | 5,037,332 | ||||||
UMB Financial Corp. | 1,719 | 149,536 | ||||||
United Bankshares, Inc. | 8,974 | 321,179 | ||||||
United Community Banks, Inc. | 8,469 | 222,904 | ||||||
Univest Financial Corp. | 7,279 | 151,549 | ||||||
Valley National Bancorp | 28,438 | 226,366 | ||||||
Veritex Holdings, Inc. | 4,907 | 100,544 | ||||||
WaFd, Inc. | 9,253 | 268,615 | ||||||
Webster Financial Corp. | 8,518 | 432,459 | ||||||
Wells Fargo & Co. | 168,391 | 9,759,942 | ||||||
WesBanco, Inc. | 4,353 | 129,763 | ||||||
Westamerica BanCorp | 2,859 | 139,748 | ||||||
Western Alliance Bancorp | 3,665 | 235,256 | ||||||
Wintrust Financial Corp. | 1,522 | 158,882 | ||||||
WSFS Financial Corp. | 4,078 | 184,081 | ||||||
Zions Bancorp NA | 9,076 | 393,898 | ||||||
|
| |||||||
| Total Banks |
| 102,457,839 | ||||||
| Beverages – 3.3% |
| |||||||
Brown-Forman Corp., Class A | 2,436 | 128,986 | ||||||
Brown-Forman Corp., Class B | 9,418 | 486,157 | ||||||
Coca-Cola Co. | 308,403 | 18,868,096 | ||||||
Constellation Brands, Inc., Class A | 6,248 | 1,697,956 | ||||||
Keurig Dr. Pepper, Inc. | 62,571 | 1,919,053 | ||||||
Molson Coors Beverage Co., Class B | 9,629 | 647,550 | ||||||
PepsiCo, Inc. | 95,000 | 16,625,950 | ||||||
|
| |||||||
| Total Beverages |
| 40,373,748 | ||||||
| Biotechnology – 3.5% |
| |||||||
AbbVie, Inc. | 165,681 | 30,170,510 | ||||||
Amgen, Inc. | 25,455 | 7,237,366 | ||||||
Gilead Sciences, Inc. | 70,853 | 5,189,982 | ||||||
|
| |||||||
| Total Biotechnology |
| 42,597,858 | ||||||
| Broadline Retail – 0.2% |
| |||||||
eBay, Inc. | 20,004 | 1,055,811 | ||||||
Kohl’s Corp. | 12,887 | 375,656 | ||||||
Macy’s, Inc. | 13,837 | 276,602 | ||||||
Nordstrom, Inc. | 18,720 | 379,454 | ||||||
|
| |||||||
| Total Broadline Retail |
| 2,087,523 | ||||||
| Building Products – 0.4% |
| |||||||
Advanced Drainage Systems, Inc. | 1,461 | 251,643 | ||||||
AO Smith Corp. | 4,501 | 402,659 | ||||||
Apogee Enterprises, Inc. | 2,886 | 170,851 | ||||||
Armstrong World Industries, Inc. | 2,184 | 271,296 | ||||||
AZZ, Inc. | 2,387 | 184,539 | ||||||
Carlisle Cos., Inc. | 1,336 | 523,512 | ||||||
Carrier Global Corp. | 18,092 | 1,051,688 | ||||||
Fortune Brands Innovations, Inc. | 3,681 | 311,670 | ||||||
Lennox International, Inc. | 1,035 | 505,867 | ||||||
Masco Corp. | 9,128 | 720,017 | ||||||
Owens Corning | 2,691 | 448,859 | ||||||
Simpson Manufacturing Co., Inc. | 1,129 | 231,648 | ||||||
UFP Industries, Inc. | 2,255 | 277,387 | ||||||
Zurn Elkay Water Solutions Corp. | 5,264 | 176,186 | ||||||
|
| |||||||
| Total Building Products |
| 5,527,822 | ||||||
| Capital Markets – 4.7% |
| |||||||
Ameriprise Financial, Inc. | 3,510 | 1,538,924 | ||||||
Ares Management Corp., Class A | 8,921 | 1,186,315 | ||||||
Bank of New York Mellon Corp. | 40,247 | 2,319,032 | ||||||
BlackRock, Inc. | 6,092 | 5,078,900 | ||||||
Blackstone, Inc. | 29,464 | 3,870,686 | ||||||
Blue Owl Capital, Inc. | 32,740 | 617,476 | ||||||
Carlyle Group, Inc. | 17,678 | 829,275 | ||||||
Cboe Global Markets, Inc. | 3,757 | 690,274 | ||||||
Charles Schwab Corp. | 42,403 | 3,067,433 | ||||||
CME Group, Inc. | 10,836 | 2,332,882 | ||||||
Cohen & Steers, Inc. | 3,544 | 272,498 | ||||||
Evercore, Inc., Class A | 2,234 | 430,246 | ||||||
FactSet Research Systems, Inc. | 625 | 283,994 | ||||||
Franklin Resources, Inc. | 32,735 | 920,181 | ||||||
Goldman Sachs Group, Inc. | 16,064 | 6,709,772 | ||||||
Hamilton Lane, Inc., Class A | 2,045 | 230,594 | ||||||
Houlihan Lokey, Inc. | 2,880 | 369,187 | ||||||
Interactive Brokers Group, Inc., Class A | 1,414 | 157,958 | ||||||
Intercontinental Exchange, Inc. | 18,674 | 2,566,368 | ||||||
Jefferies Financial Group, Inc. | 12,247 | 540,093 | ||||||
KKR & Co., Inc. | 10,748 | 1,081,034 | ||||||
LPL Financial Holdings, Inc. | 1,086 | 286,921 | ||||||
MarketAxess Holdings, Inc. | 599 | 131,331 | ||||||
Moelis & Co., Class A | 5,939 | 337,157 | ||||||
Moody’s Corp. | 3,284 | 1,290,710 | ||||||
Morgan Stanley | 105,869 | 9,968,625 | ||||||
Morningstar, Inc. | 486 | 149,868 | ||||||
MSCI, Inc. | 1,226 | 687,112 | ||||||
Nasdaq, Inc. | 13,968 | 881,381 | ||||||
Northern Trust Corp. | 10,693 | 950,822 | ||||||
See Notes to Financial Statements.
| 100 | WisdomTree Trust |
Schedule of Investments (continued)
WisdomTree U.S. Total Dividend Fund (DTD)
March 31, 2024
| Investments | Shares | Value | ||||||
Raymond James Financial, Inc. | 5,076 | $ | 651,860 | |||||
S&P Global, Inc. | 4,382 | 1,864,322 | ||||||
SEI Investments Co. | 2,954 | 212,393 | ||||||
State Street Corp. | 18,483 | 1,429,106 | ||||||
StepStone Group, Inc., Class A | 1,656 | 59,185 | ||||||
Stifel Financial Corp. | 3,883 | 303,534 | ||||||
T Rowe Price Group, Inc. | 16,598 | 2,023,628 | ||||||
TPG, Inc. | 4,682 | 209,285 | ||||||
Tradeweb Markets, Inc., Class A | 2,283 | 237,820 | ||||||
Victory Capital Holdings, Inc., Class A | 8,035 | 340,925 | ||||||
Virtu Financial, Inc., Class A | 7,383 | 151,499 | ||||||
Virtus Investment Partners, Inc. | 1,359 | 337,005 | ||||||
|
| |||||||
| Total Capital Markets |
| 57,597,611 | ||||||
| Chemicals – 1.5% |
| |||||||
Air Products & Chemicals, Inc. | 8,477 | 2,053,723 | ||||||
Albemarle Corp. | 2,957 | 389,555 | ||||||
Ashland, Inc. | 938 | 91,333 | ||||||
Avient Corp. | 6,054 | 262,744 | ||||||
Cabot Corp. | 3,368 | 310,530 | ||||||
Celanese Corp. | 3,796 | 652,381 | ||||||
CF Industries Holdings, Inc. | 6,918 | 575,647 | ||||||
Chemours Co. | 8,315 | 218,352 | ||||||
Dow, Inc. | 56,164 | 3,253,580 | ||||||
DuPont de Nemours, Inc. | 13,982 | 1,072,000 | ||||||
Eastman Chemical Co. | 7,092 | 710,760 | ||||||
Ecolab, Inc. | 7,087 | 1,636,388 | ||||||
Element Solutions, Inc. | 10,486 | 261,940 | ||||||
Huntsman Corp. | 11,244 | 292,681 | ||||||
Innospec, Inc. | 1,769 | 228,095 | ||||||
Kronos Worldwide, Inc. | 12,614 | 148,845 | ||||||
Mosaic Co. | 12,901 | 418,766 | ||||||
NewMarket Corp. | 442 | 280,502 | ||||||
Olin Corp. | 5,076 | 298,469 | ||||||
PPG Industries, Inc. | 9,654 | 1,398,865 | ||||||
RPM International, Inc. | 4,168 | 495,784 | ||||||
Scotts Miracle-Gro Co.(a) | 4,821 | 359,598 | ||||||
Sensient Technologies Corp. | 2,486 | 172,006 | ||||||
Sherwin-Williams Co. | 4,904 | 1,703,306 | ||||||
Stepan Co. | 1,497 | 134,790 | ||||||
Westlake Corp. | 2,687 | 410,574 | ||||||
|
| |||||||
| Total Chemicals |
| 17,831,214 | ||||||
| Commercial Services & Supplies – 0.6% |
| |||||||
ABM Industries, Inc. | 3,241 | 144,613 | ||||||
Brady Corp., Class A | 4,590 | 272,095 | ||||||
Brink’s Co. | 1,875 | 173,213 | ||||||
Cintas Corp. | 2,281 | 1,567,115 | ||||||
Deluxe Corp. | 5,799 | 119,401 | ||||||
HNI Corp. | 4,681 | 211,254 | ||||||
MillerKnoll, Inc. | 4,532 | 112,212 | ||||||
MSA Safety, Inc. | 1,256 | 243,149 | ||||||
Pitney Bowes, Inc. | 16,865 | 73,026 | ||||||
Republic Services, Inc. | 6,483 | 1,241,106 | ||||||
Rollins, Inc. | 11,341 | 524,748 | ||||||
Tetra Tech, Inc. | 1,153 | 212,971 | ||||||
Waste Management, Inc. | 14,469 | 3,084,067 | ||||||
|
| |||||||
| Total Commercial Services & Supplies |
| 7,978,970 | ||||||
| Communications Equipment – 1.4% |
| |||||||
Cisco Systems, Inc. | 300,613 | 15,003,595 | ||||||
Juniper Networks, Inc. | 16,818 | 623,275 | ||||||
Motorola Solutions, Inc. | 4,060 | 1,441,219 | ||||||
Ubiquiti, Inc. | 1,789 | 207,255 | ||||||
|
| |||||||
| Total Communications Equipment |
| 17,275,344 | ||||||
| Construction & Engineering – 0.1% |
| |||||||
AECOM | 3,340 | 327,587 | ||||||
MDU Resources Group, Inc. | 12,111 | 305,197 | ||||||
Quanta Services, Inc. | 1,799 | 467,381 | ||||||
Valmont Industries, Inc. | 547 | 124,869 | ||||||
|
| |||||||
| Total Construction & Engineering |
| 1,225,034 | ||||||
| Construction Materials – 0.1% |
| |||||||
Eagle Materials, Inc. | 1,195 | 324,741 | ||||||
Martin Marietta Materials, Inc. | 988 | 606,573 | ||||||
Vulcan Materials Co. | 2,274 | 620,620 | ||||||
|
| |||||||
| Total Construction Materials |
| 1,551,934 | ||||||
| Consumer Finance – 0.8% |
| |||||||
Ally Financial, Inc. | 15,524 | 630,119 | ||||||
American Express Co. | 15,359 | 3,497,091 | ||||||
Bread Financial Holdings, Inc. | 3,868 | 144,044 | ||||||
Capital One Financial Corp. | 11,520 | 1,715,213 | ||||||
Discover Financial Services | 9,543 | 1,250,992 | ||||||
FirstCash Holdings, Inc. | 2,061 | 262,860 | ||||||
Navient Corp. | 10,117 | 176,036 | ||||||
OneMain Holdings, Inc. | 12,542 | 640,771 | ||||||
SLM Corp. | 12,153 | 264,814 | ||||||
Synchrony Financial | 18,811 | 811,130 | ||||||
|
| |||||||
| Total Consumer Finance |
| 9,393,070 | ||||||
| Consumer Staples Distribution & Retail – 2.5% |
| |||||||
Albertsons Cos., Inc., Class A | 26,489 | 567,924 | ||||||
Casey’s General Stores, Inc. | 727 | 231,513 | ||||||
Costco Wholesale Corp. | 6,892 | 5,049,286 | ||||||
Kroger Co. | 36,134 | 2,064,335 | ||||||
SpartanNash Co. | 4,912 | 99,272 | ||||||
Sysco Corp. | 32,079 | 2,604,173 | ||||||
Target Corp. | 20,865 | 3,697,487 | ||||||
Walmart, Inc. | 259,807 | 15,632,587 | ||||||
Weis Markets, Inc. | 2,369 | 152,564 | ||||||
|
| |||||||
| Total Consumer Staples Distribution & Retail |
| 30,099,141 | ||||||
| Containers & Packaging – 0.5% |
| |||||||
AptarGroup, Inc. | 1,991 | 286,485 | ||||||
Avery Dennison Corp. | 1,902 | 424,622 | ||||||
Ball Corp. | 7,155 | 481,961 | ||||||
Berry Global Group, Inc. | 3,221 | 194,806 | ||||||
Crown Holdings, Inc. | 2,198 | 174,214 | ||||||
Graphic Packaging Holding Co. | 13,242 | 386,402 | ||||||
Greif, Inc., Class A | 4,719 | 325,847 | ||||||
See Notes to Financial Statements.
| WisdomTree Trust | 101 |
Schedule of Investments (continued)
WisdomTree U.S. Total Dividend Fund (DTD)
March 31, 2024
| Investments | Shares | Value | ||||||
International Paper Co. | 24,595 | $ | 959,697 | |||||
Packaging Corp. of America | 6,169 | 1,170,753 | ||||||
Pactiv Evergreen, Inc. | 12,863 | 184,198 | ||||||
Sealed Air Corp. | 3,632 | 135,110 | ||||||
Silgan Holdings, Inc. | 1,588 | 77,113 | ||||||
Sonoco Products Co. | 7,504 | 434,031 | ||||||
Westrock Co. | 12,763 | 631,130 | ||||||
|
| |||||||
| Total Containers & Packaging |
| 5,866,369 | ||||||
| Distributors – 0.2% |
| |||||||
Genuine Parts Co. | 6,161 | 954,524 | ||||||
LKQ Corp. | 11,886 | 634,831 | ||||||
Pool Corp. | 995 | 401,483 | ||||||
|
| |||||||
| Total Distributors |
| 1,990,838 | ||||||
| Diversified Consumer Services – 0.1% |
| |||||||
ADT, Inc. | 24,436 | 164,210 | ||||||
H&R Block, Inc. | 10,759 | 528,374 | ||||||
Service Corp. International | 4,771 | 354,056 | ||||||
Strategic Education, Inc. | 1,866 | 194,288 | ||||||
|
| |||||||
| Total Diversified Consumer Services |
| 1,240,928 | ||||||
| Diversified REITs – 0.1% |
| |||||||
Alexander & Baldwin, Inc. | 11,823 | 194,725 | ||||||
Broadstone Net Lease, Inc. | 13,073 | 204,854 | ||||||
WP Carey, Inc. | 16,911 | 954,457 | ||||||
|
| |||||||
| Total Diversified REITs |
| 1,354,036 | ||||||
| Diversified Telecommunication Services – 0.0% |
| |||||||
Cogent Communications Holdings, Inc. | 6,206 | 405,438 | ||||||
Iridium Communications, Inc. | 3,521 | 92,109 | ||||||
|
| |||||||
| Total Diversified Telecommunication Services |
| 497,547 | ||||||
| Electric Utilities – 2.6% |
| |||||||
ALLETE, Inc. | 6,011 | 358,496 | ||||||
Alliant Energy Corp. | 12,776 | 643,910 | ||||||
American Electric Power Co., Inc. | 33,181 | 2,856,884 | ||||||
Constellation Energy Corp. | 4,802 | 887,650 | ||||||
Duke Energy Corp. | 50,401 | 4,874,281 | ||||||
Edison International | 24,686 | 1,746,041 | ||||||
Entergy Corp. | 21,403 | 2,261,869 | ||||||
Evergy, Inc. | 14,443 | 770,967 | ||||||
Eversource Energy | 21,682 | 1,295,933 | ||||||
Exelon Corp. | 56,744 | 2,131,872 | ||||||
FirstEnergy Corp. | 37,421 | 1,445,199 | ||||||
IDACORP, Inc. | 3,303 | 306,816 | ||||||
MGE Energy, Inc. | 2,011 | 158,306 | ||||||
NRG Energy, Inc. | 10,651 | 720,966 | ||||||
OGE Energy Corp. | 22,052 | 756,384 | ||||||
Otter Tail Corp. | 2,840 | 245,376 | ||||||
PG&E Corp. | 23,270 | 390,005 | ||||||
Pinnacle West Capital Corp. | 11,236 | 839,666 | ||||||
PNM Resources, Inc. | 4,624 | 174,047 | ||||||
Portland General Electric Co. | 4,969 | 208,698 | ||||||
PPL Corp. | 44,014 | 1,211,706 | ||||||
Southern Co. | 64,522 | 4,628,808 | ||||||
Xcel Energy, Inc. | 45,716 | 2,457,235 | ||||||
|
| |||||||
| Total Electric Utilities |
| 31,371,115 | ||||||
| Electrical Equipment – 0.4% |
| |||||||
AMETEK, Inc. | 3,253 | 594,974 | ||||||
Emerson Electric Co. | 20,373 | 2,310,706 | ||||||
Hubbell, Inc. | 1,486 | 616,764 | ||||||
Regal Rexnord Corp. | 1,562 | 281,316 | ||||||
Rockwell Automation, Inc. | 3,330 | 970,129 | ||||||
Vertiv Holdings Co. | 3,684 | 300,872 | ||||||
|
| |||||||
| Total Electrical Equipment |
| 5,074,761 | ||||||
| Electronic Equipment, Instruments & Components – 0.5% |
| |||||||
Amphenol Corp., Class A | 14,064 | 1,622,282 | ||||||
Avnet, Inc. | 6,308 | 312,751 | ||||||
Benchmark Electronics, Inc. | 5,639 | 169,226 | ||||||
CDW Corp. | 2,809 | 718,486 | ||||||
Climb Global Solutions, Inc. | 905 | 64,146 | ||||||
Corning, Inc. | 51,247 | 1,689,101 | ||||||
Crane NXT Co. | 2,638 | 163,292 | ||||||
Jabil, Inc. | 1,756 | 235,216 | ||||||
Littelfuse, Inc. | 826 | 200,181 | ||||||
Richardson Electronics Ltd. | 1,874 | 17,260 | ||||||
TD SYNNEX Corp. | 1,707 | 193,062 | ||||||
Vishay Intertechnology, Inc. | 6,483 | 147,035 | ||||||
|
| |||||||
| Total Electronic Equipment, Instruments & Components |
| 5,532,038 | ||||||
| Energy Equipment & Services – 0.3% |
| |||||||
Archrock, Inc. | 19,514 | 383,840 | ||||||
Baker Hughes Co. | 38,358 | 1,284,993 | ||||||
ChampionX Corp. | 5,707 | 204,824 | ||||||
Halliburton Co. | 23,087 | 910,090 | ||||||
Helmerich & Payne, Inc. | 4,594 | 193,224 | ||||||
Kodiak Gas Services, Inc. | 11,059 | 302,353 | ||||||
NOV, Inc. | 11,887 | 232,034 | ||||||
Patterson-UTI Energy, Inc. | 9,834 | 117,418 | ||||||
RPC, Inc.(a) | 25,705 | 198,957 | ||||||
|
| |||||||
| Total Energy Equipment & Services |
| 3,827,733 | ||||||
| Entertainment – 0.1% |
| |||||||
Electronic Arts, Inc. | 3,837 | 509,055 | ||||||
Endeavor Group Holdings, Inc., Class A | 5,976 | 153,762 | ||||||
TKO Group Holdings, Inc. | 1,900 | 164,179 | ||||||
Warner Music Group Corp., Class A | 4,895 | 161,633 | ||||||
|
| |||||||
| Total Entertainment |
| 988,629 | ||||||
| Financial Services – 1.9% |
| |||||||
Apollo Global Management, Inc. | 16,766 | 1,885,337 | ||||||
Corebridge Financial, Inc. | 43,400 | 1,246,882 | ||||||
Enact Holdings, Inc. | 10,574 | 329,697 | ||||||
Equitable Holdings, Inc. | 15,385 | 584,784 | ||||||
Fidelity National Information Services, Inc. | 31,497 | 2,336,447 | ||||||
Global Payments, Inc. | 4,460 | 596,124 | ||||||
Jack Henry & Associates, Inc. | 2,141 | 371,956 | ||||||
Jackson Financial, Inc., Class A | 7,012 | 463,774 | ||||||
Mastercard, Inc., Class A | 11,681 | 5,625,219 | ||||||
MGIC Investment Corp. | 21,206 | 474,166 | ||||||
PennyMac Financial Services, Inc. | 1,889 | 172,069 | ||||||
Radian Group, Inc. | 15,168 | 507,673 | ||||||
See Notes to Financial Statements.
| 102 | WisdomTree Trust |
Schedule of Investments (continued)
WisdomTree U.S. Total Dividend Fund (DTD)
March 31, 2024
| Investments | Shares | Value | ||||||
UWM Holdings Corp. | 10,595 | $ | 76,920 | |||||
Visa, Inc., Class A | 29,498 | 8,232,302 | ||||||
Voya Financial, Inc. | 2,084 | 154,049 | ||||||
Walker & Dunlop, Inc. | 1,804 | 182,312 | ||||||
Western Union Co. | 38,991 | 545,094 | ||||||
|
| |||||||
| Total Financial Services |
| 23,784,805 | ||||||
| Food Products – 1.8% |
| |||||||
Archer-Daniels-Midland Co. | 18,881 | 1,185,916 | ||||||
Campbell Soup Co. | 18,111 | 805,034 | ||||||
Conagra Brands, Inc. | 38,814 | 1,150,447 | ||||||
Flowers Foods, Inc. | 18,290 | 434,387 | ||||||
General Mills, Inc. | 30,382 | 2,125,829 | ||||||
Hershey Co. | 5,640 | 1,096,980 | ||||||
Hormel Foods Corp. | 31,981 | 1,115,817 | ||||||
Ingredion, Inc. | 3,718 | 434,448 | ||||||
J & J Snack Foods Corp. | 884 | 127,791 | ||||||
JM Smucker Co. | 6,291 | 791,848 | ||||||
Kellanova | 19,345 | 1,108,275 | ||||||
Kraft Heinz Co. | 84,652 | 3,123,659 | ||||||
Lamb Weston Holdings, Inc. | 3,166 | 337,274 | ||||||
Lancaster Colony Corp. | 1,503 | 312,068 | ||||||
McCormick & Co., Inc., Non-Voting Shares | 10,189 | 782,617 | ||||||
Mondelez International, Inc., Class A | 77,447 | 5,421,290 | ||||||
Tyson Foods, Inc., Class A | 18,076 | 1,061,603 | ||||||
Utz Brands, Inc. | 10,539 | 194,339 | ||||||
WK Kellogg Co. | 11,911 | 223,927 | ||||||
|
| |||||||
| Total Food Products |
| 21,833,549 | ||||||
| Gas Utilities – 0.3% |
| |||||||
Atmos Energy Corp. | 9,346 | 1,110,959 | ||||||
Chesapeake Utilities Corp. | 1,424 | 152,795 | ||||||
National Fuel Gas Co. | 7,453 | 400,375 | ||||||
New Jersey Resources Corp. | 8,989 | 385,718 | ||||||
Northwest Natural Holding Co. | 6,462 | 240,516 | ||||||
ONE Gas, Inc. | 3,881 | 250,441 | ||||||
Southwest Gas Holdings, Inc. | 3,969 | 302,160 | ||||||
Spire, Inc. | 3,190 | 195,770 | ||||||
UGI Corp. | 19,970 | 490,064 | ||||||
|
| |||||||
| Total Gas Utilities |
| 3,528,798 | ||||||
| Ground Transportation – 0.8% |
| |||||||
CSX Corp. | 39,298 | 1,456,777 | ||||||
JB Hunt Transport Services, Inc. | 2,224 | 443,132 | ||||||
Landstar System, Inc. | 974 | 187,748 | ||||||
Norfolk Southern Corp. | 7,939 | 2,023,413 | ||||||
Old Dominion Freight Line, Inc. | 3,262 | 715,389 | ||||||
Ryder System, Inc. | 2,950 | 354,561 | ||||||
Union Pacific Corp. | 20,482 | 5,037,138 | ||||||
Werner Enterprises, Inc. | 4,210 | 164,695 | ||||||
|
| |||||||
| Total Ground Transportation |
| 10,382,853 | ||||||
| Health Care Equipment & Supplies – 1.0% |
| |||||||
Abbott Laboratories | 50,559 | 5,746,536 | ||||||
Becton Dickinson & Co. | 7,264 | 1,797,477 | ||||||
Dentsply Sirona, Inc. | 3,710 | 123,135 | ||||||
GE HealthCare Technologies, Inc. | 5,289 | 480,823 | ||||||
ResMed, Inc. | 2,556 | 506,165 | ||||||
Stryker Corp. | 8,889 | 3,181,106 | ||||||
Teleflex, Inc. | 788 | 178,222 | ||||||
Zimmer Biomet Holdings, Inc. | 2,769 | 365,452 | ||||||
|
| |||||||
| Total Health Care Equipment & Supplies |
| 12,378,916 | ||||||
| Health Care Providers & Services – 2.6% |
| |||||||
Cardinal Health, Inc. | 7,846 | 877,967 | ||||||
Cencora, Inc. | 3,925 | 953,736 | ||||||
Chemed Corp. | 293 | 188,086 | ||||||
Cigna Group | 8,681 | 3,152,852 | ||||||
CVS Health Corp. | 66,355 | 5,292,475 | ||||||
Elevance Health, Inc. | 4,421 | 2,292,465 | ||||||
Encompass Health Corp. | 3,641 | 300,674 | ||||||
HCA Healthcare, Inc. | 4,202 | 1,401,493 | ||||||
Humana, Inc. | 1,478 | 512,452 | ||||||
Laboratory Corp. of America Holdings | 1,974 | 431,240 | ||||||
McKesson Corp. | 1,662 | 892,245 | ||||||
Patterson Cos., Inc. | 7,705 | 213,043 | ||||||
Premier, Inc., Class A | 11,626 | 256,935 | ||||||
Quest Diagnostics, Inc. | 3,632 | 483,456 | ||||||
Select Medical Holdings Corp. | 5,915 | 178,337 | ||||||
UnitedHealth Group, Inc. | 29,029 | 14,360,646 | ||||||
Universal Health Services, Inc., Class B | 1,267 | 231,177 | ||||||
|
| |||||||
| Total Health Care Providers & Services |
| 32,019,279 | ||||||
| Health Care REITs – 0.2% |
| |||||||
LTC Properties, Inc. | 5,089 | 165,443 | ||||||
Sabra Health Care REIT, Inc. | 14,661 | 216,543 | ||||||
Ventas, Inc. | 18,923 | 823,908 | ||||||
Welltower, Inc. | 19,148 | 1,789,189 | ||||||
|
| |||||||
| Total Health Care REITs |
| 2,995,083 | ||||||
| Hotel & Resort REITs – 0.1% |
| |||||||
Host Hotels & Resorts, Inc. | 26,824 | 554,721 | ||||||
Ryman Hospitality Properties, Inc. | 2,289 | 264,631 | ||||||
|
| |||||||
| Total Hotel & Resort REITs |
| 819,352 | ||||||
| Hotels, Restaurants & Leisure – 2.2% |
| |||||||
Aramark | 5,749 | 186,957 | ||||||
Bloomin’ Brands, Inc. | 10,817 | 310,232 | ||||||
Boyd Gaming Corp. | 3,312 | 222,964 | ||||||
Cheesecake Factory, Inc. | 6,651 | 240,434 | ||||||
Choice Hotels International, Inc. | 982 | 124,076 | ||||||
Churchill Downs, Inc. | 1,938 | 239,827 | ||||||
Cracker Barrel Old Country Store, Inc. | 2,372 | 172,516 | ||||||
Darden Restaurants, Inc. | 9,380 | 1,567,867 | ||||||
Domino’s Pizza, Inc. | 908 | 451,167 | ||||||
Hilton Worldwide Holdings, Inc. | 3,064 | 653,582 | ||||||
Jack in the Box, Inc. | 1,820 | 124,634 | ||||||
Las Vegas Sands Corp. | 22,964 | 1,187,239 | ||||||
Marriott International, Inc., Class A | 7,026 | 1,772,730 | ||||||
Marriott Vacations Worldwide Corp. | 2,738 | 294,965 | ||||||
McDonald’s Corp. | 38,093 | 10,740,321 | ||||||
Monarch Casino & Resort, Inc. | 1,647 | 123,509 | ||||||
See Notes to Financial Statements.
| WisdomTree Trust | 103 |
Schedule of Investments (continued)
WisdomTree U.S. Total Dividend Fund (DTD)
March 31, 2024
| Investments | Shares | Value | ||||||
Papa John’s International, Inc. | 887 | $ | 59,074 | |||||
Red Rock Resorts, Inc., Class A | 2,938 | 175,751 | ||||||
Starbucks Corp. | 44,301 | 4,048,668 | ||||||
Texas Roadhouse, Inc. | 4,034 | 623,132 | ||||||
Travel & Leisure Co. | 6,520 | 319,219 | ||||||
Vail Resorts, Inc. | 1,903 | 424,045 | ||||||
Wendy’s Co. | 21,353 | 402,290 | ||||||
Wyndham Hotels & Resorts, Inc. | 5,113 | 392,423 | ||||||
Yum! Brands, Inc. | 12,589 | 1,745,465 | ||||||
|
| |||||||
| Total Hotels, Restaurants & Leisure |
| 26,603,087 | ||||||
| Household Durables – 0.4% |
| |||||||
Century Communities, Inc. | 2,923 | 282,070 | ||||||
DR Horton, Inc. | 5,349 | 880,178 | ||||||
KB Home | 4,441 | 314,778 | ||||||
La-Z-Boy, Inc. | 5,742 | 216,014 | ||||||
Leggett & Platt, Inc. | 12,237 | 234,339 | ||||||
Lennar Corp., Class A | 5,171 | 889,309 | ||||||
MDC Holdings, Inc. | 5,018 | 315,682 | ||||||
PulteGroup, Inc. | 5,294 | 638,562 | ||||||
Tempur Sealy International, Inc. | 5,281 | 300,066 | ||||||
Toll Brothers, Inc. | 735 | 95,087 | ||||||
Worthington Enterprises, Inc. | 2,660 | 165,532 | ||||||
|
| |||||||
| Total Household Durables |
| 4,331,617 | ||||||
| Household Products – 2.6% |
| |||||||
Church & Dwight Co., Inc. | 5,389 | 562,126 | ||||||
Clorox Co. | 5,871 | 898,909 | ||||||
Colgate-Palmolive Co. | 46,434 | 4,181,382 | ||||||
Energizer Holdings, Inc. | 6,051 | 178,141 | ||||||
Kimberly-Clark Corp. | 29,320 | 3,792,542 | ||||||
Procter & Gamble Co. | 135,112 | 21,921,922 | ||||||
Reynolds Consumer Products, Inc. | 9,903 | 282,830 | ||||||
Spectrum Brands Holdings, Inc. | 2,371 | 211,043 | ||||||
|
| |||||||
| Total Household Products |
| 32,028,895 | ||||||
| Independent Power & Renewable Electricity Producers – 0.1% |
| |||||||
Clearway Energy, Inc., Class A | 5,070 | 109,056 | ||||||
Clearway Energy, Inc., Class C | 8,005 | 184,515 | ||||||
Ormat Technologies, Inc. | 1,768 | 117,024 | ||||||
Vistra Corp. | 17,289 | 1,204,179 | ||||||
|
| |||||||
| Total Independent Power & Renewable Electricity Producers |
| 1,614,774 | ||||||
| Industrial Conglomerates – 0.7% |
| |||||||
General Electric Co. | 11,952 | 2,097,935 | ||||||
Honeywell International, Inc. | 32,844 | 6,741,231 | ||||||
|
| |||||||
| Total Industrial Conglomerates |
| 8,839,166 | ||||||
| Industrial REITs – 0.5% |
| |||||||
Americold Realty Trust, Inc. | 4,654 | 115,978 | ||||||
EastGroup Properties, Inc. | 863 | 155,141 | ||||||
First Industrial Realty Trust, Inc. | 5,714 | 300,214 | ||||||
Innovative Industrial Properties, Inc. | 689 | 71,339 | ||||||
LXP Industrial Trust | 11,358 | 102,449 | ||||||
Prologis, Inc. | 37,973 | 4,944,844 | ||||||
Rexford Industrial Realty, Inc. | 3,970 | 199,691 | ||||||
STAG Industrial, Inc. | 7,634 | 293,451 | ||||||
|
| |||||||
| Total Industrial REITs |
| 6,183,107 | ||||||
| Insurance – 2.7% |
| |||||||
Aflac, Inc. | 32,186 | 2,763,490 | ||||||
Allstate Corp. | 10,542 | 1,823,871 | ||||||
American Financial Group, Inc. | 3,077 | 419,949 | ||||||
American International Group, Inc. | 23,882 | 1,866,856 | ||||||
AMERISAFE, Inc. | 2,930 | 146,998 | ||||||
Arthur J Gallagher & Co. | 3,203 | 800,878 | ||||||
Assurant, Inc. | 1,899 | 357,468 | ||||||
Brown & Brown, Inc. | 4,726 | 413,714 | ||||||
Cincinnati Financial Corp. | 7,012 | 870,680 | ||||||
CNA Financial Corp. | 15,045 | 683,344 | ||||||
CNO Financial Group, Inc. | 9,251 | 254,217 | ||||||
Erie Indemnity Co., Class A | 1,200 | 481,884 | ||||||
F&G Annuities & Life, Inc. | 3,888 | 157,658 | ||||||
Fidelity National Financial, Inc. | 16,710 | 887,301 | ||||||
First American Financial Corp. | 6,563 | 400,671 | ||||||
Globe Life, Inc. | 1,288 | 149,885 | ||||||
Hanover Insurance Group, Inc. | 1,274 | 173,481 | ||||||
Hartford Financial Services Group, Inc. | 15,434 | 1,590,474 | ||||||
Horace Mann Educators Corp. | 6,529 | 241,508 | ||||||
Kemper Corp. | 2,947 | 182,478 | ||||||
Lincoln National Corp. | 18,091 | 577,646 | ||||||
Loews Corp. | 2,187 | 171,220 | ||||||
Marsh & McLennan Cos., Inc. | 15,376 | 3,167,148 | ||||||
Mercury General Corp. | 3,924 | 202,478 | ||||||
MetLife, Inc. | 36,888 | 2,733,770 | ||||||
Old Republic International Corp. | 24,406 | 749,752 | ||||||
Primerica, Inc. | 1,587 | 401,448 | ||||||
Principal Financial Group, Inc. | 13,977 | 1,206,355 | ||||||
Progressive Corp. | 6,650 | 1,375,353 | ||||||
Prudential Financial, Inc. | 26,829 | 3,149,725 | ||||||
Reinsurance Group of America, Inc. | 4,041 | 779,428 | ||||||
RLI Corp. | 935 | 138,819 | ||||||
Safety Insurance Group, Inc. | 3,250 | 267,117 | ||||||
Selective Insurance Group, Inc. | 1,706 | 186,244 | ||||||
Stewart Information Services Corp. | 3,334 | 216,910 | ||||||
Travelers Cos., Inc. | 7,834 | 1,802,917 | ||||||
Unum Group | 11,319 | 607,378 | ||||||
WR Berkley Corp. | 10,412 | 920,837 | ||||||
|
| |||||||
| Total Insurance |
| 33,321,350 | ||||||
| Interactive Media & Services – 0.9% |
| |||||||
Meta Platforms, Inc., Class A | 23,290 | 11,309,158 | ||||||
Shutterstock, Inc. | 2,846 | 130,375 | ||||||
|
| |||||||
| Total Interactive Media & Services |
| 11,439,533 | ||||||
| IT Services – 1.3% |
| |||||||
Cognizant Technology Solutions Corp., Class A | 12,028 | 881,532 | ||||||
International Business Machines Corp. | 80,589 | 15,389,276 | ||||||
|
| |||||||
| Total IT Services |
| 16,270,808 | ||||||
| Leisure Products – 0.1% |
| |||||||
Acushnet Holdings Corp. | 2,692 | 177,537 | ||||||
See Notes to Financial Statements.
| 104 | WisdomTree Trust |
Schedule of Investments (continued)
WisdomTree U.S. Total Dividend Fund (DTD)
March 31, 2024
| Investments | Shares | Value | ||||||
Brunswick Corp. | 2,699 | $ | 260,508 | |||||
Polaris, Inc. | 2,319 | 232,178 | ||||||
|
| |||||||
| Total Leisure Products |
| 670,223 | ||||||
| Life Sciences Tools & Services – 0.5% |
| |||||||
Agilent Technologies, Inc. | 4,255 | 619,145 | ||||||
Bio-Techne Corp. | 2,289 | 161,123 | ||||||
Bruker Corp. | 2,092 | 196,523 | ||||||
Danaher Corp. | 8,774 | 2,191,043 | ||||||
Thermo Fisher Scientific, Inc. | 4,396 | 2,554,999 | ||||||
West Pharmaceutical Services, Inc. | 1,135 | 449,131 | ||||||
|
| |||||||
| Total Life Sciences Tools & Services |
| 6,171,964 | ||||||
| Machinery – 2.7% |
| |||||||
AGCO Corp. | 1,325 | 163,002 | ||||||
Albany International Corp., Class A | 1,459 | 136,431 | ||||||
Allison Transmission Holdings, Inc. | 3,960 | 321,394 | ||||||
Caterpillar, Inc. | 15,894 | 5,824,038 | ||||||
Cummins, Inc. | 6,263 | 1,845,393 | ||||||
Deere & Co. | 6,656 | 2,733,885 | ||||||
Donaldson Co., Inc. | 5,058 | 377,731 | ||||||
Dover Corp. | 4,483 | 794,343 | ||||||
Flowserve Corp. | 7,358 | 336,113 | ||||||
Fortive Corp. | 5,619 | 483,346 | ||||||
Graco, Inc. | 3,734 | 348,980 | ||||||
Hillenbrand, Inc. | 3,874 | 194,824 | ||||||
IDEX Corp. | 883 | 215,470 | ||||||
Illinois Tool Works, Inc. | 15,727 | 4,220,026 | ||||||
Ingersoll Rand, Inc. | 6,883 | 653,541 | ||||||
ITT, Inc. | 4,080 | 555,002 | ||||||
Kennametal, Inc. | 9,403 | 234,511 | ||||||
Lincoln Electric Holdings, Inc. | 2,453 | 626,594 | ||||||
Mueller Industries, Inc. | 6,752 | 364,135 | ||||||
Mueller Water Products, Inc., Class A | 12,016 | 193,337 | ||||||
Nordson Corp. | 956 | 262,460 | ||||||
Oshkosh Corp. | 2,287 | 285,212 | ||||||
Otis Worldwide Corp. | 14,010 | 1,390,773 | ||||||
PACCAR, Inc. | 35,614 | 4,412,219 | ||||||
Parker-Hannifin Corp. | 3,823 | 2,124,785 | ||||||
Snap-on, Inc. | 3,320 | 983,450 | ||||||
Stanley Black & Decker, Inc. | 8,281 | 810,958 | ||||||
Timken Co. | 5,089 | 444,931 | ||||||
Toro Co. | 3,377 | 309,435 | ||||||
Trinity Industries, Inc. | 9,364 | 260,787 | ||||||
Westinghouse Air Brake Technologies Corp. | 3,045 | 443,596 | ||||||
Xylem, Inc. | 4,507 | 582,485 | ||||||
|
| |||||||
| Total Machinery |
| 32,933,187 | ||||||
| Marine Transportation – 0.0% |
| |||||||
Matson, Inc. | 1,974 | 221,878 | ||||||
| Media – 1.3% |
| |||||||
Cable One, Inc. | 268 | 113,399 | ||||||
Comcast Corp., Class A | 268,362 | 11,633,493 | ||||||
Fox Corp., Class B | 17,966 | 514,187 | ||||||
Gray Television, Inc. | 4,555 | 28,788 | ||||||
Interpublic Group of Cos., Inc. | 22,136 | 722,298 | ||||||
John Wiley & Sons, Inc., Class A | 3,731 | 142,263 | ||||||
New York Times Co., Class A | 4,730 | 204,430 | ||||||
News Corp., Class A | 12,505 | 327,381 | ||||||
News Corp., Class B | 37 | 1,001 | ||||||
Nexstar Media Group, Inc. | 2,115 | 364,393 | ||||||
Omnicom Group, Inc. | 11,624 | 1,124,738 | ||||||
Sirius XM Holdings, Inc.(a) | 143,881 | 558,258 | ||||||
TEGNA, Inc. | 13,386 | 199,987 | ||||||
|
| |||||||
| Total Media |
| 15,934,616 | ||||||
| Metals & Mining – 0.3% |
| |||||||
Commercial Metals Co. | 4,299 | 252,652 | ||||||
Kaiser Aluminum Corp. | 1,896 | 169,427 | ||||||
Nucor Corp. | 4,883 | 966,346 | ||||||
Reliance, Inc. | 2,191 | 732,188 | ||||||
Royal Gold, Inc. | 1,977 | 240,818 | ||||||
Steel Dynamics, Inc. | 4,273 | 633,387 | ||||||
U.S. Steel Corp. | 3,993 | 162,835 | ||||||
|
| |||||||
| Total Metals & Mining |
| 3,157,653 | ||||||
| Multi-Utilities – 1.5% |
| |||||||
Ameren Corp. | 19,290 | 1,426,688 | ||||||
Avista Corp. | 5,225 | 182,980 | ||||||
Black Hills Corp. | 4,278 | 233,579 | ||||||
CenterPoint Energy, Inc. | 24,601 | 700,883 | ||||||
CMS Energy Corp. | 15,542 | 937,804 | ||||||
Consolidated Edison, Inc. | 27,110 | 2,461,859 | ||||||
Dominion Energy, Inc. | 72,023 | 3,542,811 | ||||||
DTE Energy Co. | 10,167 | 1,140,127 | ||||||
NiSource, Inc. | 23,343 | 645,667 | ||||||
Northwestern Energy Group, Inc. | 3,714 | 189,154 | ||||||
Public Service Enterprise Group, Inc. | 40,374 | 2,696,176 | ||||||
Sempra | 31,906 | 2,291,808 | ||||||
Unitil Corp. | 3,194 | 167,206 | ||||||
WEC Energy Group, Inc. | 17,667 | 1,450,814 | ||||||
|
| |||||||
| Total Multi-Utilities |
| 18,067,556 | ||||||
| Office REITs – 0.1% |
| |||||||
Alexandria Real Estate Equities, Inc. | 8,065 | 1,039,659 | ||||||
Easterly Government Properties, Inc. | 13,043 | 150,125 | ||||||
Kilroy Realty Corp. | 25 | 911 | ||||||
SL Green Realty Corp. | 2,583 | 142,401 | ||||||
|
| |||||||
| Total Office REITs |
| 1,333,096 | ||||||
| Oil, Gas & Consumable Fuels – 7.8% |
| |||||||
Antero Midstream Corp. | 58,313 | 819,881 | ||||||
APA Corp. | 14,234 | 489,365 | ||||||
California Resources Corp. | 4,566 | 251,587 | ||||||
Cheniere Energy, Inc. | 5,660 | 912,845 | ||||||
Chesapeake Energy Corp. | 6,023 | 535,023 | ||||||
Chevron Corp. | 125,330 | 19,769,554 | ||||||
Chord Energy Corp. | 4,473 | 797,268 | ||||||
Civitas Resources, Inc. | 10,183 | 772,992 | ||||||
ConocoPhillips | 39,111 | 4,978,048 | ||||||
CVR Energy, Inc. | 10,850 | 386,911 | ||||||
See Notes to Financial Statements.
| WisdomTree Trust | 105 |
Schedule of Investments (continued)
WisdomTree U.S. Total Dividend Fund (DTD)
March 31, 2024
| Investments | Shares | Value | ||||||
Delek U.S. Holdings, Inc. | 5,029 | $ | 154,591 | |||||
Diamondback Energy, Inc. | 6,806 | 1,348,745 | ||||||
DT Midstream, Inc. | 7,481 | 457,089 | ||||||
EOG Resources, Inc. | 42,078 | 5,379,252 | ||||||
EQT Corp. | 9,642 | 357,429 | ||||||
Equitrans Midstream Corp. | 41,339 | 516,324 | ||||||
Exxon Mobil Corp. | 228,190 | 26,524,806 | ||||||
Hess Corp. | 6,057 | 924,540 | ||||||
HF Sinclair Corp. | 11,116 | 671,073 | ||||||
Kinetik Holdings, Inc. | 5,153 | 205,450 | ||||||
Magnolia Oil & Gas Corp., Class A(a) | 9,161 | 237,728 | ||||||
Marathon Oil Corp. | 16,836 | 477,132 | ||||||
Marathon Petroleum Corp. | 19,394 | 3,907,891 | ||||||
Matador Resources Co. | 2,794 | 186,555 | ||||||
Murphy Oil Corp. | 8,189 | 374,237 | ||||||
New Fortress Energy, Inc.(a) | 3,990 | 122,054 | ||||||
Northern Oil & Gas, Inc. | 8,050 | 319,424 | ||||||
Occidental Petroleum Corp. | 18,695 | 1,214,988 | ||||||
ONEOK, Inc. | 47,508 | 3,808,716 | ||||||
Ovintiv, Inc. | 13,077 | 678,696 | ||||||
PBF Energy, Inc., Class A | 5,881 | 338,569 | ||||||
Permian Resources Corp. | 14,037 | 247,893 | ||||||
Phillips 66 | 21,032 | 3,435,367 | ||||||
Pioneer Natural Resources Co. | 20,175 | 5,295,938 | ||||||
Range Resources Corp. | 6,223 | 214,258 | ||||||
Sitio Royalties Corp., Class A | 7,969 | 196,994 | ||||||
SM Energy Co. | 4,184 | 208,572 | ||||||
Targa Resources Corp. | 7,532 | 843,509 | ||||||
Texas Pacific Land Corp. | 399 | 230,826 | ||||||
Valero Energy Corp. | 16,254 | 2,774,395 | ||||||
Viper Energy, Inc. | 7,591 | 291,950 | ||||||
Williams Cos., Inc. | 86,396 | 3,366,852 | ||||||
|
| |||||||
| Total Oil, Gas & Consumable Fuels |
| 95,025,317 | ||||||
| Paper & Forest Products – 0.0% |
| |||||||
Louisiana-Pacific Corp. | 2,460 | 206,419 | ||||||
Sylvamo Corp. | 2,441 | 150,707 | ||||||
|
| |||||||
| Total Paper & Forest Products |
| 357,126 | ||||||
| Passenger Airlines – 0.1% |
| |||||||
Delta Air Lines, Inc. | 10,843 | 519,055 | ||||||
Southwest Airlines Co. | 27,536 | 803,776 | ||||||
Spirit Airlines, Inc.(a) | 12,560 | 60,790 | ||||||
|
| |||||||
| Total Passenger Airlines |
| 1,383,621 | ||||||
| Personal Care Products – 0.2% |
| |||||||
Edgewell Personal Care Co. | 5,778 | 223,262 | ||||||
Inter Parfums, Inc. | 1,954 | 274,557 | ||||||
Kenvue, Inc. | 116,148 | 2,492,536 | ||||||
|
| |||||||
| Total Personal Care Products |
| 2,990,355 | ||||||
| Pharmaceuticals – 4.9% |
| |||||||
Bristol-Myers Squibb Co. | 134,695 | 7,304,510 | ||||||
Eli Lilly & Co. | 10,989 | 8,549,002 | ||||||
Johnson & Johnson | 164,229 | 25,979,385 | ||||||
Merck & Co., Inc. | 112,206 | 14,805,582 | ||||||
Organon & Co. | 25,635 | 481,938 | ||||||
Viatris, Inc. | 105,211 | 1,256,219 | ||||||
Zoetis, Inc. | 10,112 | 1,711,052 | ||||||
|
| |||||||
| Total Pharmaceuticals |
| 60,087,688 | ||||||
| Professional Services – 1.1% |
| |||||||
Automatic Data Processing, Inc. | 15,652 | 3,908,931 | ||||||
Booz Allen Hamilton Holding Corp. | 3,556 | 527,853 | ||||||
Broadridge Financial Solutions, Inc. | 4,247 | 870,040 | ||||||
Concentrix Corp. | 2,217 | 146,810 | ||||||
CSG Systems International, Inc. | 3,104 | 159,980 | ||||||
Dun & Bradstreet Holdings, Inc. | 14,965 | 150,249 | ||||||
Equifax, Inc. | 1,787 | 478,058 | ||||||
Exponent, Inc. | 1,719 | 142,144 | ||||||
Insperity, Inc. | 2,286 | 250,568 | ||||||
Jacobs Solutions, Inc. | 2,074 | 318,836 | ||||||
KBR, Inc. | 2,594 | 165,134 | ||||||
Korn Ferry | 2,919 | 191,953 | ||||||
Leidos Holdings, Inc. | 3,074 | 402,971 | ||||||
ManpowerGroup, Inc. | 3,981 | 309,085 | ||||||
Maximus, Inc. | 1,971 | 165,367 | ||||||
Paychex, Inc. | 23,289 | 2,859,889 | ||||||
Paycom Software, Inc. | 892 | 177,517 | ||||||
Robert Half, Inc. | 4,459 | 353,510 | ||||||
Science Applications International Corp. | 2,434 | 317,369 | ||||||
SS&C Technologies Holdings, Inc. | 7,297 | 469,708 | ||||||
Verisk Analytics, Inc. | 2,358 | 555,851 | ||||||
|
| |||||||
| Total Professional Services |
| 12,921,823 | ||||||
| Real Estate Management & Development – 0.0% |
| |||||||
Kennedy-Wilson Holdings, Inc. | 54 | 463 | ||||||
| Residential REITs – 0.6% |
| |||||||
American Homes 4 Rent, Class A | 6,684 | 245,838 | ||||||
AvalonBay Communities, Inc. | 10,112 | 1,876,383 | ||||||
Camden Property Trust | 2,902 | 285,557 | ||||||
Elme Communities | 9,244 | 128,677 | ||||||
Equity LifeStyle Properties, Inc. | 4,546 | 292,762 | ||||||
Equity Residential | 20,873 | 1,317,295 | ||||||
Essex Property Trust, Inc. | 2,483 | 607,863 | ||||||
Invitation Homes, Inc. | 18,177 | 647,283 | ||||||
Mid-America Apartment Communities, Inc. | 4,421 | 581,715 | ||||||
Sun Communities, Inc. | 2,380 | 306,020 | ||||||
UDR, Inc. | 16,239 | 607,501 | ||||||
|
| |||||||
| Total Residential REITs |
| 6,896,894 | ||||||
| Retail REITs – 0.9% |
| |||||||
Brixmor Property Group, Inc. | 22,660 | 531,377 | ||||||
Federal Realty Investment Trust | 3,487 | 356,093 | ||||||
Kimco Realty Corp. | 31,626 | 620,186 | ||||||
Macerich Co. | 18 | 310 | ||||||
NETSTREIT Corp.(a) | 8,976 | 164,889 | ||||||
NNN REIT, Inc. | 15,142 | 647,169 | ||||||
Realty Income Corp. | 65,310 | 3,533,271 | ||||||
Regency Centers Corp. | 6,679 | 404,480 | ||||||
Retail Opportunity Investments Corp. | 6,888 | 88,304 | ||||||
See Notes to Financial Statements.
| 106 | WisdomTree Trust |
Schedule of Investments (continued)
WisdomTree U.S. Total Dividend Fund (DTD)
March 31, 2024
| Investments | Shares | Value | ||||||
Simon Property Group, Inc. | 30,990 | $ | 4,849,625 | |||||
Tanger, Inc. | 5,600 | 165,368 | ||||||
|
| |||||||
| Total Retail REITs |
| 11,361,072 | ||||||
| Semiconductors & Semiconductor Equipment – 6.6% |
| |||||||
Amkor Technology, Inc. | 6,286 | 202,661 | ||||||
Analog Devices, Inc. | 14,314 | 2,831,166 | ||||||
Applied Materials, Inc. | 11,081 | 2,285,235 | ||||||
Broadcom, Inc. | 20,349 | 26,970,768 | ||||||
Intel Corp. | 71,983 | 3,179,489 | ||||||
KLA Corp. | 2,211 | 1,544,538 | ||||||
Lam Research Corp. | 2,322 | 2,255,985 | ||||||
Microchip Technology, Inc. | 14,970 | 1,342,959 | ||||||
Micron Technology, Inc. | 11,673 | 1,376,130 | ||||||
MKS Instruments, Inc. | 1,823 | 242,459 | ||||||
Monolithic Power Systems, Inc. | 694 | 470,129 | ||||||
NVIDIA Corp. | 25,343 | 22,898,921 | ||||||
Power Integrations, Inc. | 9 | 644 | ||||||
QUALCOMM, Inc. | 37,121 | 6,284,585 | ||||||
Skyworks Solutions, Inc. | 6,935 | 751,199 | ||||||
Teradyne, Inc. | 2,520 | 284,332 | ||||||
Texas Instruments, Inc. | 43,013 | 7,493,295 | ||||||
Universal Display Corp. | 1,048 | 176,536 | ||||||
|
| |||||||
| Total Semiconductors & Semiconductor Equipment |
| 80,591,031 | ||||||
| Software – 4.1% |
| |||||||
A10 Networks, Inc. | 8,070 | 110,478 | ||||||
Bentley Systems, Inc., Class B | 4,781 | 249,664 | ||||||
Dolby Laboratories, Inc., Class A | 2,056 | 172,231 | ||||||
Gen Digital, Inc. | 21,403 | 479,427 | ||||||
InterDigital, Inc. | 1,593 | 169,591 | ||||||
Intuit, Inc. | 3,298 | 2,143,700 | ||||||
Microsoft Corp. | 92,314 | 38,838,346 | ||||||
Oracle Corp. | 56,547 | 7,102,869 | ||||||
Roper Technologies, Inc. | 1,267 | 710,584 | ||||||
|
| |||||||
| Total Software |
| 49,976,890 | ||||||
| Specialized REITs – 2.0% |
| |||||||
American Tower Corp. | 19,520 | 3,856,957 | ||||||
Crown Castle, Inc. | 30,637 | 3,242,314 | ||||||
CubeSmart | 15,709 | 710,361 | ||||||
Digital Realty Trust, Inc. | 13,974 | 2,012,815 | ||||||
EPR Properties | 5,557 | 235,895 | ||||||
Equinix, Inc. | 2,470 | 2,038,565 | ||||||
Extra Space Storage, Inc. | 13,007 | 1,912,029 | ||||||
Four Corners Property Trust, Inc. | 8,835 | 216,192 | ||||||
Gaming & Leisure Properties, Inc. | 18,211 | 838,981 | ||||||
Gladstone Land Corp. | 11,578 | 154,450 | ||||||
Iron Mountain, Inc. | 13,425 | 1,076,819 | ||||||
Lamar Advertising Co., Class A | 6,208 | 741,297 | ||||||
National Storage Affiliates Trust | 5,322 | 208,409 | ||||||
PotlatchDeltic Corp. | 2,634 | 123,851 | ||||||
Public Storage | 10,781 | 3,127,137 | ||||||
Rayonier, Inc. | 4,265 | 141,769 | ||||||
SBA Communications Corp. | 48 | 10,402 | ||||||
VICI Properties, Inc. | 101,967 | 3,037,597 | ||||||
Weyerhaeuser Co. | 15,932 | 572,118 | ||||||
|
| |||||||
| Total Specialized REITs |
| 24,257,958 | ||||||
| Specialty Retail – 3.4% |
| |||||||
American Eagle Outfitters, Inc. | 10,409 | 268,448 | ||||||
Bath & Body Works, Inc. | 8,746 | 437,475 | ||||||
Best Buy Co., Inc. | 17,008 | 1,395,166 | ||||||
Buckle, Inc. | 5,763 | 232,076 | ||||||
Camping World Holdings, Inc., Class A | 2,641 | 73,552 | ||||||
Dick’s Sporting Goods, Inc. | 2,110 | 474,455 | ||||||
Gap, Inc. | 17,468 | 481,243 | ||||||
Guess?, Inc. | 9,236 | 290,657 | ||||||
Home Depot, Inc. | 59,574 | 22,852,587 | ||||||
Lithia Motors, Inc. | 649 | 195,258 | ||||||
Lowe’s Cos., Inc. | 28,895 | 7,360,423 | ||||||
Monro, Inc. | 5,121 | 161,516 | ||||||
Penske Automotive Group, Inc. | 2,912 | 471,715 | ||||||
Ross Stores, Inc. | 5,867 | 861,041 | ||||||
TJX Cos., Inc. | 39,569 | 4,013,088 | ||||||
Tractor Supply Co. | 4,096 | 1,072,005 | ||||||
Upbound Group, Inc. | 7,144 | 251,540 | ||||||
Williams-Sonoma, Inc. | 2,832 | 899,245 | ||||||
Winmark Corp. | 293 | 105,978 | ||||||
|
| |||||||
| Total Specialty Retail |
| 41,897,468 | ||||||
| Technology Hardware, Storage & Peripherals – 3.0% |
| |||||||
Apple, Inc. | 190,499 | 32,666,769 | ||||||
Dell Technologies, Inc., Class C | 6,577 | 750,501 | ||||||
Hewlett Packard Enterprise Co. | 53,728 | 952,597 | ||||||
HP, Inc. | 55,967 | 1,691,323 | ||||||
NetApp, Inc. | 9,442 | 991,127 | ||||||
Xerox Holdings Corp. | 16,085 | 287,921 | ||||||
|
| |||||||
| Total Technology Hardware, Storage & Peripherals |
| 37,340,238 | ||||||
| Textiles, Apparel & Luxury Goods – 0.4% |
| |||||||
Carter’s, Inc. | 4,061 | 343,886 | ||||||
Columbia Sportswear Co. | 1,747 | 141,821 | ||||||
Kontoor Brands, Inc. | 5,377 | 323,964 | ||||||
Levi Strauss & Co., Class A | 9,715 | 194,203 | ||||||
NIKE, Inc., Class B | 25,888 | 2,432,954 | ||||||
Oxford Industries, Inc. | 1,447 | 162,643 | ||||||
Ralph Lauren Corp. | 1,842 | 345,854 | ||||||
Steven Madden Ltd. | 4,483 | 189,541 | ||||||
Tapestry, Inc. | 13,435 | 637,894 | ||||||
Wolverine World Wide, Inc. | 8,638 | 96,832 | ||||||
|
| |||||||
| Total Textiles, Apparel & Luxury Goods |
| 4,869,592 | ||||||
| Tobacco – 1.7% |
| |||||||
Altria Group, Inc. | 180,277 | 7,863,683 | ||||||
Philip Morris International, Inc. | 133,472 | 12,228,705 | ||||||
Universal Corp. | 3,753 | 194,105 | ||||||
Vector Group Ltd. | 26,411 | 289,464 | ||||||
|
| |||||||
| Total Tobacco |
| 20,575,957 | ||||||
See Notes to Financial Statements.
| WisdomTree Trust | 107 |
Schedule of Investments (concluded)
WisdomTree U.S. Total Dividend Fund (DTD)
March 31, 2024
| Investments | Shares | Value | ||||||
| Trading Companies & Distributors – 0.6% |
| |||||||
Air Lease Corp. | 5,536 | $ | 284,772 | |||||
Applied Industrial Technologies, Inc. | 2,188 | 432,239 | ||||||
Fastenal Co. | 30,337 | 2,340,196 | ||||||
GATX Corp. | 1,258 | 168,610 | ||||||
H&E Equipment Services, Inc. | 5,009 | 321,478 | ||||||
Herc Holdings, Inc. | 1,438 | 242,015 | ||||||
MSC Industrial Direct Co., Inc., Class A | 5,112 | 496,068 | ||||||
Rush Enterprises, Inc., Class A | 6,553 | 350,717 | ||||||
United Rentals, Inc. | 1,227 | 884,802 | ||||||
Watsco, Inc. | 1,603 | 692,448 | ||||||
WESCO International, Inc. | 790 | 135,311 | ||||||
WW Grainger, Inc. | 1,149 | 1,168,878 | ||||||
|
| |||||||
| Total Trading Companies & Distributors |
| 7,517,534 | ||||||
| Water Utilities – 0.2% |
| |||||||
American States Water Co. | 1,362 | 98,391 | ||||||
American Water Works Co., Inc. | 6,628 | 810,008 | ||||||
California Water Service Group | 2,632 | 122,335 | ||||||
Essential Utilities, Inc. | 16,669 | 617,586 | ||||||
Middlesex Water Co. | 1,995 | 104,738 | ||||||
SJW Group | 3,143 | 177,862 | ||||||
York Water Co. | 4,681 | 169,780 | ||||||
|
| |||||||
| Total Water Utilities |
| 2,100,700 | ||||||
| Wireless Telecommunication Services – 0.6% |
| |||||||
T-Mobile U.S., Inc. | 45,182 | 7,374,606 | ||||||
Telephone & Data Systems, Inc. | 7,319 | 117,250 | ||||||
|
| |||||||
| Total Wireless Telecommunication Services |
| 7,491,856 | ||||||
| Total United States |
| 1,220,562,084 | ||||||
| Puerto Rico – 0.1% |
| |||||||
| Banks – 0.1% |
| |||||||
First BanCorp | 19,622 | 344,170 | ||||||
OFG Bancorp | 8,339 | 306,958 | ||||||
Popular, Inc. | 4,775 | 420,630 | ||||||
| Total Puerto Rico |
| 1,071,758 | ||||||
| TOTAL COMMON STOCKS (Cost: $902,551,804) |
| 1,221,633,842 | ||||||
| INVESTMENT OF CASH COLLATERAL FOR SECURITIES LOANED – 0.1% |
| |||||||
| United States – 0.1% |
| |||||||
State Street Navigator Securities Lending Government Money Market Portfolio, 5.34%(b) | ||||||||
| (Cost: $538,667) | 538,667 | 538,667 | ||||||
| TOTAL INVESTMENTS IN SECURITIES – 99.9% (Cost: $903,090,471) |
| 1,222,172,509 | ||||||
Other Assets less Liabilities – 0.1% | 1,800,831 | |||||||
|
| |||||||
| NET ASSETS – 100.0% |
| $ | 1,223,973,340 | |||||
| (a) | Security, or portion thereof, was on loan at March 31, 2024 (See Note 2). At March 31, 2024, the total market value of the Fund’s securities on loan identified in the Schedule of Investments was $1,696,857 and the total market value of the collateral held by the Fund was $1,734,572. The total market value of the collateral includes non-cash U.S. Government securities collateral having a value of $1,195,905. |
| (b) | Rate shown represents annualized 7-day yield as of March 31, 2024. |
| FAIR VALUATION SUMMARY |
The following is a summary of the fair valuations according to the inputs used in valuing the Fund’s investments (See Note 2 — Fair Value Measurement):
Quoted Active | Other Significant Observable Inputs (Level 2) | Significant Unobservable Inputs (Level 3) | Total | |||||||||||||
Assets: |
| |||||||||||||||
Investments in Securities | ||||||||||||||||
Common Stocks | $ | 1,221,633,842 | $ | — | $ | — | $ | 1,221,633,842 | ||||||||
Investment of Cash Collateral for Securities Loaned | — | 538,667 | — | 538,667 | ||||||||||||
Total Investments in Securities | $ | 1,221,633,842 | $ | 538,667 | $ | — | $ | 1,222,172,509 | ||||||||
See Notes to Financial Statements.
| 108 | WisdomTree Trust |
Schedule of Investments
WisdomTree U.S. Value Fund (WTV)
March 31, 2024
| Investments | Shares | Value | ||||||
| COMMON STOCKS – 99.9% |
| |||||||
| United States – 99.9% |
| |||||||
| Aerospace & Defense – 1.4% |
| |||||||
Lockheed Martin Corp. | 4,533 | $ | 2,061,926 | |||||
Textron, Inc. | 20,057 | 1,924,068 | ||||||
|
| |||||||
| Total Aerospace & Defense |
| 3,985,994 | ||||||
| Air Freight & Logistics – 1.8% |
| |||||||
CH Robinson Worldwide, Inc. | 18,950 | 1,442,853 | ||||||
Expeditors International of Washington, Inc. | 18,396 | 2,236,402 | ||||||
United Parcel Service, Inc., Class B | 9,494 | 1,411,093 | ||||||
|
| |||||||
| Total Air Freight & Logistics |
| 5,090,348 | ||||||
| Banks – 1.6% |
| |||||||
Bank of America Corp. | 37,761 | 1,431,897 | ||||||
Fifth Third Bancorp | 42,278 | 1,573,165 | ||||||
JPMorgan Chase & Co. | 7,681 | 1,538,504 | ||||||
|
| |||||||
| Total Banks |
| 4,543,566 | ||||||
| Biotechnology – 1.2% |
| |||||||
AbbVie, Inc. | 7,060 | 1,285,626 | ||||||
Exelixis, Inc.* | 45,727 | 1,085,101 | ||||||
Gilead Sciences, Inc. | 14,315 | 1,048,574 | ||||||
|
| |||||||
| Total Biotechnology |
| 3,419,301 | ||||||
| Broadline Retail – 0.7% |
| |||||||
Dillard’s, Inc., Class A | 2,207 | 1,040,909 | ||||||
Etsy, Inc.* | 13,651 | 938,097 | ||||||
|
| |||||||
| Total Broadline Retail |
| 1,979,006 | ||||||
| Building Products – 3.1% |
| |||||||
Advanced Drainage Systems, Inc. | 9,417 | 1,621,984 | ||||||
Builders FirstSource, Inc.* | 15,102 | 3,149,522 | ||||||
Carlisle Cos., Inc. | 4,913 | 1,925,159 | ||||||
Owens Corning | 10,985 | 1,832,298 | ||||||
|
| |||||||
| Total Building Products |
| 8,528,963 | ||||||
| Capital Markets – 7.0% |
| |||||||
Ameriprise Financial, Inc. | 4,698 | 2,059,791 | ||||||
Bank of New York Mellon Corp. | 41,205 | 2,374,232 | ||||||
BlackRock, Inc. | 1,318 | 1,098,817 | ||||||
Evercore, Inc., Class A | 14,410 | 2,775,222 | ||||||
Goldman Sachs Group, Inc. | 5,244 | 2,190,366 | ||||||
Jefferies Financial Group, Inc. | 40,275 | 1,776,127 | ||||||
LPL Financial Holdings, Inc. | 6,689 | 1,767,234 | ||||||
Raymond James Financial, Inc. | 11,292 | 1,450,119 | ||||||
Stifel Financial Corp. | 28,607 | 2,236,209 | ||||||
T Rowe Price Group, Inc. | 13,188 | 1,607,881 | ||||||
|
| |||||||
| Total Capital Markets |
| 19,335,998 | ||||||
| Chemicals – 3.5% |
| |||||||
CF Industries Holdings, Inc. | 17,996 | 1,497,447 | ||||||
Dow, Inc. | 29,152 | 1,688,775 | ||||||
DuPont de Nemours, Inc. | 31,334 | 2,402,378 | ||||||
Eastman Chemical Co. | 13,688 | 1,371,811 | ||||||
Olin Corp. | 44,452 | 2,613,778 | ||||||
|
| |||||||
| Total Chemicals |
| 9,574,189 | ||||||
| Communications Equipment – 1.3% |
| |||||||
Cisco Systems, Inc. | 26,552 | 1,325,210 | ||||||
Juniper Networks, Inc. | 58,973 | 2,185,540 | ||||||
|
| |||||||
| Total Communications Equipment |
| 3,510,750 | ||||||
| Construction & Engineering – 0.9% |
| |||||||
WillScot Mobile Mini Holdings Corp.* | 54,780 | 2,547,270 | ||||||
| Construction Materials – 0.6% |
| |||||||
Eagle Materials, Inc. | 6,448 | 1,752,244 | ||||||
| Consumer Finance – 2.0% |
| |||||||
Discover Financial Services | 21,669 | 2,840,589 | ||||||
Synchrony Financial | 63,346 | 2,731,480 | ||||||
|
| |||||||
| Total Consumer Finance |
| 5,572,069 | ||||||
| Containers & Packaging – 1.9% |
| |||||||
Berry Global Group, Inc. | 30,053 | 1,817,605 | ||||||
International Paper Co. | 49,423 | 1,928,486 | ||||||
Packaging Corp. of America | 7,828 | 1,485,598 | ||||||
|
| |||||||
| Total Containers & Packaging |
| 5,231,689 | ||||||
| Diversified Consumer Services – 1.1% |
| |||||||
H&R Block, Inc. | 37,629 | 1,847,960 | ||||||
Service Corp. International | 15,568 | 1,155,301 | ||||||
|
| |||||||
| Total Diversified Consumer Services |
| 3,003,261 | ||||||
| Electrical Equipment – 1.3% |
| |||||||
Acuity Brands, Inc. | 5,849 | 1,571,802 | ||||||
Emerson Electric Co. | 16,625 | 1,885,607 | ||||||
|
| |||||||
| Total Electrical Equipment |
| 3,457,409 | ||||||
| Electronic Equipment, Instruments & Components – 1.2% |
| |||||||
Arrow Electronics, Inc.* | 15,300 | 1,980,738 | ||||||
TD SYNNEX Corp. | 11,471 | 1,297,370 | ||||||
|
| |||||||
| Total Electronic Equipment, Instruments & Components |
| 3,278,108 | ||||||
| Energy Equipment & Services – 0.5% |
| |||||||
ChampionX Corp. | 39,266 | 1,409,257 | ||||||
| Financial Services – 1.9% |
| |||||||
Equitable Holdings, Inc. | 69,426 | 2,638,882 | ||||||
Fiserv, Inc.* | 9,592 | 1,532,993 | ||||||
Global Payments, Inc. | 8,451 | 1,129,561 | ||||||
|
| |||||||
| Total Financial Services |
| 5,301,436 | ||||||
| Food Products – 2.2% |
| |||||||
Archer-Daniels-Midland Co. | 17,544 | 1,101,939 | ||||||
Conagra Brands, Inc. | 39,583 | 1,173,240 | ||||||
General Mills, Inc. | 22,350 | 1,563,830 | ||||||
JM Smucker Co. | 17,904 | 2,253,576 | ||||||
|
| |||||||
| Total Food Products |
| 6,092,585 | ||||||
| Ground Transportation – 1.6% |
| |||||||
Avis Budget Group, Inc.(a) | 11,628 | 1,423,965 | ||||||
CSX Corp. | 47,946 | 1,777,358 | ||||||
Norfolk Southern Corp. | 4,834 | 1,232,042 | ||||||
|
| |||||||
| Total Ground Transportation |
| 4,433,365 | ||||||
| Health Care Providers & Services – 6.0% |
| |||||||
Cardinal Health, Inc. | 15,782 | 1,766,006 | ||||||
See Notes to Financial Statements.
| WisdomTree Trust | 109 |
Schedule of Investments (continued)
WisdomTree U.S. Value Fund (WTV)
March 31, 2024
| Investments | Shares | Value | ||||||
Centene Corp.* | 21,878 | $ | 1,716,985 | |||||
Cigna Group | 5,208 | 1,891,494 | ||||||
HCA Healthcare, Inc. | 6,521 | 2,174,949 | ||||||
Henry Schein, Inc.* | 17,556 | 1,325,829 | ||||||
Laboratory Corp. of America Holdings | 8,204 | 1,792,246 | ||||||
McKesson Corp. | 3,033 | 1,628,266 | ||||||
Quest Diagnostics, Inc. | 7,346 | 977,826 | ||||||
Tenet Healthcare Corp.* | 15,024 | 1,579,173 | ||||||
Universal Health Services, Inc., Class B | 9,270 | 1,691,404 | ||||||
|
| |||||||
| Total Health Care Providers & Services |
| 16,544,178 | ||||||
| Hotel & Resort REITs – 0.4% |
| |||||||
Host Hotels & Resorts, Inc. | 58,097 | 1,201,446 | ||||||
| Hotels, Restaurants & Leisure – 5.4% |
| |||||||
Booking Holdings, Inc. | 483 | 1,752,266 | ||||||
Boyd Gaming Corp. | 23,487 | 1,581,145 | ||||||
Choice Hotels International, Inc. | 14,662 | 1,852,544 | ||||||
Darden Restaurants, Inc. | 5,304 | 886,564 | ||||||
Hilton Worldwide Holdings, Inc. | 5,170 | 1,102,813 | ||||||
Light & Wonder, Inc.* | 9,995 | 1,020,389 | ||||||
Marriott International, Inc., Class A | 6,633 | 1,673,572 | ||||||
MGM Resorts International* | 43,312 | 2,044,759 | ||||||
Vail Resorts, Inc. | 7,723 | 1,720,916 | ||||||
Wyndham Hotels & Resorts, Inc. | 16,925 | 1,298,994 | ||||||
|
| |||||||
| Total Hotels, Restaurants & Leisure |
| 14,933,962 | ||||||
| Household Durables – 0.4% |
| |||||||
PulteGroup, Inc. | 8,678 | 1,046,740 | ||||||
| Independent Power & Renewable Electricity Producers – 1.5% |
| |||||||
Vistra Corp. | 59,442 | 4,140,135 | ||||||
| Industrial Conglomerates – 0.9% |
| |||||||
General Electric Co. | 8,513 | 1,494,287 | ||||||
Honeywell International, Inc. | 5,168 | 1,060,732 | ||||||
|
| |||||||
| Total Industrial Conglomerates |
| 2,555,019 | ||||||
| Insurance – 8.8% |
| |||||||
Aflac, Inc. | 20,553 | 1,764,680 | ||||||
American International Group, Inc. | 26,890 | 2,101,991 | ||||||
Fidelity National Financial, Inc. | 22,128 | 1,174,997 | ||||||
First American Financial Corp. | 17,293 | 1,055,738 | ||||||
Hartford Financial Services Group, Inc. | 23,109 | 2,381,382 | ||||||
Loews Corp. | 18,446 | 1,444,137 | ||||||
MetLife, Inc. | 32,315 | 2,394,865 | ||||||
Old Republic International Corp. | 76,158 | 2,339,574 | ||||||
Primerica, Inc. | 6,145 | 1,554,439 | ||||||
Principal Financial Group, Inc. | 20,424 | 1,762,795 | ||||||
Prudential Financial, Inc. | 17,604 | 2,066,710 | ||||||
Reinsurance Group of America, Inc. | 6,343 | 1,223,438 | ||||||
Travelers Cos., Inc. | 6,285 | 1,446,430 | ||||||
Unum Group | 31,203 | 1,674,353 | ||||||
|
| |||||||
| Total Insurance |
| 24,385,529 | ||||||
| Interactive Media & Services – 0.8% |
| |||||||
Match Group, Inc.* | 64,190 | 2,328,813 | ||||||
| IT Services – 2.1% |
| |||||||
Akamai Technologies, Inc.* | 7,790 | 847,240 | ||||||
Cognizant Technology Solutions Corp., Class A | 13,989 | 1,025,254 | ||||||
GoDaddy, Inc., Class A* | 19,301 | 2,290,643 | ||||||
Twilio, Inc., Class A* | 13,322 | 814,640 | ||||||
VeriSign, Inc.* | 4,043 | 766,189 | ||||||
|
| |||||||
| Total IT Services |
| 5,743,966 | ||||||
| Leisure Products – 0.5% |
| |||||||
Brunswick Corp. | 14,982 | 1,446,063 | ||||||
| Machinery – 0.8% |
| |||||||
Deere & Co. | 5,051 | 2,074,648 | ||||||
| Media – 3.2% |
| |||||||
Charter Communications, Inc., Class A*(a) | 3,020 | 877,703 | ||||||
Comcast Corp., Class A | 49,338 | 2,138,802 | ||||||
Fox Corp., Class A | 75,371 | 2,356,851 | ||||||
Interpublic Group of Cos., Inc. | 47,602 | 1,553,253 | ||||||
Omnicom Group, Inc. | 19,833 | 1,919,041 | ||||||
|
| |||||||
| Total Media |
| 8,845,650 | ||||||
| Metals & Mining – 1.9% |
| |||||||
Nucor Corp. | 7,366 | 1,457,731 | ||||||
Steel Dynamics, Inc. | 17,492 | 2,592,839 | ||||||
U.S. Steel Corp. | 28,147 | 1,147,835 | ||||||
|
| |||||||
| Total Metals & Mining |
| 5,198,405 | ||||||
| Multi-Utilities – 0.5% |
| |||||||
Consolidated Edison, Inc. | 15,689 | 1,424,718 | ||||||
| Oil, Gas & Consumable Fuels – 10.8% |
| |||||||
APA Corp. | 62,426 | 2,146,206 | ||||||
Chevron Corp. | 14,924 | 2,354,112 | ||||||
Chord Energy Corp. | 6,834 | 1,218,092 | ||||||
ConocoPhillips | 17,356 | 2,209,072 | ||||||
EOG Resources, Inc. | 10,919 | 1,395,885 | ||||||
Exxon Mobil Corp. | 17,972 | 2,089,065 | ||||||
HF Sinclair Corp. | 42,204 | 2,547,855 | ||||||
Marathon Oil Corp. | 93,608 | 2,652,851 | ||||||
Marathon Petroleum Corp. | 15,627 | 3,148,840 | ||||||
Occidental Petroleum Corp. | 33,601 | 2,183,729 | ||||||
Phillips 66 | 16,780 | 2,740,845 | ||||||
Pioneer Natural Resources Co. | 8,324 | 2,185,050 | ||||||
Valero Energy Corp. | 18,166 | 3,100,755 | ||||||
|
| |||||||
| Total Oil, Gas & Consumable Fuels |
| 29,972,357 | ||||||
| Pharmaceuticals – 0.9% |
| |||||||
Bristol-Myers Squibb Co. | 43,381 | 2,352,552 | ||||||
| Professional Services – 3.1% |
| |||||||
CACI International, Inc., Class A* | 3,760 | 1,424,401 | ||||||
Robert Half, Inc. | 14,041 | 1,113,171 | ||||||
Science Applications International Corp. | 10,998 | 1,434,029 | ||||||
TriNet Group, Inc. | 19,313 | 2,558,779 | ||||||
Verisk Analytics, Inc. | 8,231 | 1,940,294 | ||||||
|
| |||||||
| Total Professional Services |
| 8,470,674 | ||||||
| Real Estate Management & Development – 0.4% |
| |||||||
CBRE Group, Inc., Class A* | 11,693 | 1,137,027 | ||||||
See Notes to Financial Statements.
| 110 | WisdomTree Trust |
Schedule of Investments (concluded)
WisdomTree U.S. Value Fund (WTV)
March 31, 2024
| Investments | Shares | Value | ||||||
| Residential REITs – 0.4% |
| |||||||
Essex Property Trust, Inc. | 4,898 | $ | 1,199,079 | |||||
| Retail REITs – 0.6% |
| |||||||
Simon Property Group, Inc. | 9,910 | 1,550,816 | ||||||
| Semiconductors & Semiconductor Equipment – 2.2% |
| |||||||
Analog Devices, Inc. | 5,906 | 1,168,148 | ||||||
Lam Research Corp. | 1,178 | 1,144,509 | ||||||
Microchip Technology, Inc. | 10,036 | 900,330 | ||||||
QUALCOMM, Inc. | 6,929 | 1,173,080 | ||||||
Skyworks Solutions, Inc. | 7,978 | 864,177 | ||||||
Texas Instruments, Inc. | 5,421 | 944,392 | ||||||
|
| |||||||
| Total Semiconductors & Semiconductor Equipment |
| 6,194,636 | ||||||
| Software – 2.2% |
| |||||||
AppLovin Corp., Class A* | 52,781 | 3,653,501 | ||||||
Dropbox, Inc., Class A* | 48,233 | 1,172,062 | ||||||
Gen Digital, Inc. | 58,905 | 1,319,472 | ||||||
|
| |||||||
| Total Software |
| 6,145,035 | ||||||
| Specialty Retail – 5.3% |
| |||||||
AutoNation, Inc.* | 12,566 | 2,080,678 | ||||||
AutoZone, Inc.* | 374 | 1,178,717 | ||||||
Best Buy Co., Inc. | 22,778 | 1,868,479 | ||||||
Home Depot, Inc. | 2,607 | 1,000,045 | ||||||
Lowe’s Cos., Inc. | 7,201 | 1,834,311 | ||||||
Murphy USA, Inc. | 2,709 | 1,135,613 | ||||||
O’Reilly Automotive, Inc.* | 901 | 1,017,121 | ||||||
Penske Automotive Group, Inc. | 9,051 | 1,466,172 | ||||||
Tractor Supply Co.(a) | 3,720 | 973,599 | ||||||
Ulta Beauty, Inc.* | 1,774 | 927,589 | ||||||
Williams-Sonoma, Inc. | 4,057 | 1,288,219 | ||||||
|
| |||||||
| Total Specialty Retail |
| 14,770,543 | ||||||
| Technology Hardware, Storage & Peripherals – 0.7% |
| |||||||
NetApp, Inc. | 17,757 | 1,863,952 | ||||||
| Textiles, Apparel & Luxury Goods – 1.8% |
| |||||||
PVH Corp. | 7,999 | 1,124,739 | ||||||
Ralph Lauren Corp. | 7,502 | 1,408,576 | ||||||
Tapestry, Inc. | 51,900 | 2,464,212 | ||||||
|
| |||||||
| Total Textiles, Apparel & Luxury Goods |
| 4,997,527 | ||||||
| Tobacco – 0.8% |
| |||||||
Altria Group, Inc. | 53,325 | 2,326,037 | ||||||
| Wireless Telecommunication Services – 0.7% |
| |||||||
T-Mobile U.S., Inc. | 11,266 | 1,838,837 | ||||||
| TOTAL INVESTMENTS IN SECURITIES – 99.9% (Cost: $240,356,355) |
| 276,735,152 | ||||||
Other Assets less Liabilities – 0.1% | 410,558 | |||||||
|
| |||||||
| NET ASSETS – 100.0% |
| $ | 277,145,710 | |||||
| * | Non-income producing security. |
| (a) | Security, or portion thereof, was on loan at March 31, 2024 (See Note 2). At March 31, 2024, the total market value of the Fund’s securities on loan identified in the Schedule of Investments was $1,685,595 and the total market value of the collateral held by the Fund was $1,712,036, which was entirely composed of non-cash U.S. Government securities. |
| FAIR VALUATION SUMMARY |
The following is a summary of the fair valuations according to the inputs used in valuing the Fund’s investments (See Note 2 — Fair Value Measurement):
| Quoted Prices in Active Markets (Level 1) | Other Significant Observable Inputs (Level 2) | Significant Unobservable Inputs (Level 3) | Total | |||||||||||||
Assets: |
| |||||||||||||||
Investments in Securities | ||||||||||||||||
Common Stocks | $ | 276,735,152 | $ | — | $ | — | $ | 276,735,152 | ||||||||
Total Investments in Securities | $ | 276,735,152 | $ | — | $ | — | $ | 276,735,152 | ||||||||
See Notes to Financial Statements.
| WisdomTree Trust | 111 |
Statements of Assets and Liabilities
WisdomTree Trust
March 31, 2024
| WisdomTree U.S. AI Enhanced Value Fund | WisdomTree U.S. High Dividend Fund | WisdomTree U.S. LargeCap Dividend Fund | WisdomTree U.S. LargeCap Fund | WisdomTree U.S. MidCap Dividend Fund | ||||||||||||||||
ASSETS: | ||||||||||||||||||||
Investments, at cost | $ | 350,773,040 | $ | 1,038,944,858 | $ | 2,950,769,316 | $ | 642,013,750 | $ | 3,034,039,462 | ||||||||||
Investment in affiliates, at cost (Note 3) | — | — | 266,014 | 603,835 | — | |||||||||||||||
Investments in securities, at value1,2 (Note 2) | 377,833,969 | 1,097,691,274 | 4,007,421,466 | 849,184,445 | 3,661,358,463 | |||||||||||||||
Investment in affiliates, at value (Note 3) | — | — | 289,952 | 691,373 | — | |||||||||||||||
Cash | 1,526,963 | 1,238,888 | 3,153,651 | 396,789 | 3,363,289 | |||||||||||||||
Receivables: | ||||||||||||||||||||
Investment securities sold | 7,639,994 | — | — | — | — | |||||||||||||||
Capital shares sold | — | — | 7,218,801 | — | — | |||||||||||||||
Dividends | 640,051 | 3,311,473 | 5,292,661 | 529,748 | 5,734,127 | |||||||||||||||
Securities lending income | 17,310 | 3,019 | 43,889 | 6,795 | 4,293 | |||||||||||||||
Total Assets | 387,658,287 | 1,102,244,654 | 4,023,420,420 | 850,809,150 | 3,670,460,172 | |||||||||||||||
LIABILITIES: |
| |||||||||||||||||||
Payables: | ||||||||||||||||||||
Cash collateral received for securities loaned (Note 2) | 739,520 | 1,688,037 | 1,603,144 | 1,928 | 11,185,491 | |||||||||||||||
Investment securities purchased | — | — | 7,208,853 | — | — | |||||||||||||||
Capital shares redeemed | 7,618,679 | — | — | — | — | |||||||||||||||
Advisory fees (Note 3) | 123,394 | 345,620 | 932,018 | 55,916 | 1,143,414 | |||||||||||||||
Service fees (Note 2) | 1,429 | 4,002 | 14,656 | 3,076 | 13,245 | |||||||||||||||
Total Liabilities | 8,483,022 | 2,037,659 | 9,758,671 | 60,920 | 12,342,150 | |||||||||||||||
NET ASSETS | $ | 379,175,265 | $ | 1,100,206,995 | $ | 4,013,661,749 | $ | 850,748,230 | $ | 3,658,118,022 | ||||||||||
NET ASSETS: | ||||||||||||||||||||
Paid-in capital | $ | 480,498,891 | $ | 1,194,545,488 | $ | 3,255,358,887 | $ | 718,324,258 | $ | 3,573,422,429 | ||||||||||
Total distributable earnings (loss) | (101,323,626 | ) | (94,338,493 | ) | 758,302,862 | 132,423,972 | 84,695,593 | |||||||||||||
NET ASSETS | $ | 379,175,265 | $ | 1,100,206,995 | $ | 4,013,661,749 | $ | 850,748,230 | $ | 3,658,118,022 | ||||||||||
Outstanding beneficial interest shares of $0.001 par value (unlimited number of shares authorized) | 3,725,000 | 12,700,000 | 55,600,000 | 15,350,000 | 74,950,000 | |||||||||||||||
Net asset value per share | $ | 101.79 | $ | 86.63 | $ | 72.19 | $ | 55.42 | $ | 48.81 | ||||||||||
1 Includes market value of securities out on loan of: | $ | 2,277,161 | $ | 7,121,895 | $ | 43,566,319 | $ | 1,746,410 | $ | 22,142,217 | ||||||||||
2 Investments in securities include investment of cash collateral for securities loaned (see Schedule of Investments for additional information). |
| |||||||||||||||||||
See Notes to Financial Statements.
| 112 | WisdomTree Trust |
Statements of Assets and Liabilities (continued)
WisdomTree Trust
March 31, 2024
WisdomTree Fund | WisdomTree U.S. MidCap Quality Growth Fund | WisdomTree U.S. Multifactor Fund | WisdomTree U.S. Quality Dividend Growth Fund | WisdomTree U.S. Quality Growth Fund | ||||||||||||||||
ASSETS: | ||||||||||||||||||||
Investments, at cost | $ | 693,146,491 | $ | 3,877,058 | $ | 251,306,589 | $ | 10,244,952,334 | $ | 315,878,122 | ||||||||||
Investment in affiliates, at cost (Note 3) | 688,191 | — | — | — | — | |||||||||||||||
Investments in securities, at value1,2 (Note 2) | 833,494,202 | 4,185,113 | 291,515,945 | 12,691,512,824 | 349,108,460 | |||||||||||||||
Investment in affiliates, at value (Note 3) | 847,037 | — | — | — | — | |||||||||||||||
Cash | 391,592 | 10,411 | 837,156 | 8,958,952 | 172,142 | |||||||||||||||
Deposits at broker | — | — | 95,000 | — | — | |||||||||||||||
Receivables: | ||||||||||||||||||||
Investment securities sold | — | — | — | 3,809,999 | — | |||||||||||||||
Capital shares sold | — | — | — | 11,408,614 | 24,658,750 | |||||||||||||||
Dividends | 768,468 | 1,141 | 199,142 | 9,380,350 | 14,235 | |||||||||||||||
Securities lending income | 6,095 | — | 34 | 2,257 | — | |||||||||||||||
Total Assets | 835,507,394 | 4,196,665 | 292,647,277 | 12,725,072,996 | 373,953,587 | |||||||||||||||
LIABILITIES: |
| |||||||||||||||||||
Payables: |
| |||||||||||||||||||
Cash collateral received for securities loaned (Note 2) | 7,552,922 | — | — | 5,269,346 | — | |||||||||||||||
Investment securities purchased | — | 8,066 | 647,834 | 11,406,738 | 24,564,661 | |||||||||||||||
Capital shares redeemed | — | — | — | 3,810,851 | — | |||||||||||||||
Advisory fees (Note 3) | 259,239 | 1,137 | 68,329 | 2,952,486 | 55,495 | |||||||||||||||
Service fees (Note 2) | 3,005 | 13 | 1,074 | 46,396 | 872 | |||||||||||||||
Total Liabilities | 7,815,166 | 9,216 | 717,237 | 23,485,817 | 24,621,028 | |||||||||||||||
NET ASSETS | $ | 827,692,228 | $ | 4,187,449 | $ | 291,930,040 | $ | 12,701,587,179 | $ | 349,332,559 | ||||||||||
NET ASSETS: | ||||||||||||||||||||
Paid-in capital | $ | 801,756,407 | $ | 3,879,479 | $ | 287,372,207 | $ | 10,832,782,463 | $ | 316,527,092 | ||||||||||
Total distributable earnings (loss) | 25,935,821 | 307,970 | 4,557,833 | 1,868,804,716 | 32,805,467 | |||||||||||||||
NET ASSETS | $ | 827,692,228 | $ | 4,187,449 | $ | 291,930,040 | $ | 12,701,587,179 | $ | 349,332,559 | ||||||||||
Outstanding beneficial interest shares of $0.001 par value (unlimited number of shares authorized) | 13,550,000 | 150,000 | 6,275,000 | 166,650,000 | 8,500,000 | |||||||||||||||
Net asset value per share | $ | 61.08 | $ | 27.92 | $ | 46.52 | $ | 76.22 | $ | 41.10 | ||||||||||
1 Includes market value of securities out on loan of: | $ | 63,296,188 | — | — | $ | 25,456,706 | — | |||||||||||||
2 Investments in securities include investment of cash collateral for securities loaned (see Schedule of Investments for additional information). |
| |||||||||||||||||||
See Notes to Financial Statements.
| WisdomTree Trust | 113 |
Statements of Assets and Liabilities (continued)
WisdomTree Trust
March 31, 2024
| WisdomTree U.S. SmallCap Dividend Fund | WisdomTree U.S. SmallCap Fund | WisdomTree U.S. SmallCap Quality Dividend Growth Fund | WisdomTree U.S. SmallCap Quality Growth Fund | WisdomTree U.S. Total Dividend Fund | ||||||||||||||||
ASSETS: | ||||||||||||||||||||
Investments, at cost | $ | 1,808,114,363 | $ | 614,940,300 | $ | 308,101,223 | $ | 1,245,189 | $ | 903,090,471 | ||||||||||
Investment in affiliates, at cost (Note 3) | 1,944,815 | 179,190 | — | — | — | |||||||||||||||
Investments in securities, at value1,2 (Note 2) | 1,995,881,906 | 656,330,047 | 347,425,606 | 1,305,681 | 1,222,172,509 | |||||||||||||||
Investment in affiliates, at value (Note 3) | 2,004,154 | 206,248 | — | — | — | |||||||||||||||
Cash | 1,949,769 | 1,513,140 | 451,586 | 5,821 | 955,852 | |||||||||||||||
Receivables: | ||||||||||||||||||||
Investment securities sold | — | 4,858,154 | — | 6,808 | — | |||||||||||||||
Dividends | 4,119,391 | 550,567 | 249,983 | 539 | 1,662,128 | |||||||||||||||
Securities lending income | 29,310 | 49,207 | 524 | — | 11,529 | |||||||||||||||
Total Assets | 2,003,984,530 | 663,507,363 | 348,127,699 | 1,318,849 | 1,224,802,018 | |||||||||||||||
LIABILITIES: |
| |||||||||||||||||||
Payables: |
| |||||||||||||||||||
Cash collateral received for securities loaned (Note 2) | 6,916,162 | 8,453,346 | 197,883 | — | 538,667 | |||||||||||||||
Investment securities purchased | — | 6,033,816 | — | 6,355 | 192 | |||||||||||||||
Advisory fees (Note 3) | 622,656 | 203,055 | 107,608 | 411 | 285,335 | |||||||||||||||
Service fees (Note 2) | 7,214 | 2,353 | 1,246 | 5 | 4,484 | |||||||||||||||
Total Liabilities | 7,546,032 | 14,692,570 | 306,737 | 6,771 | 828,678 | |||||||||||||||
NET ASSETS | $ | 1,996,438,498 | $ | 648,814,793 | $ | 347,820,962 | $ | 1,312,078 | $ | 1,223,973,340 | ||||||||||
NET ASSETS: | ||||||||||||||||||||
Paid-in capital | $ | 2,216,735,632 | $ | 688,894,479 | $ | 345,538,631 | $ | 1,250,001 | $ | 1,029,394,867 | ||||||||||
Total distributable earnings (loss) | (220,297,134 | ) | (40,079,686 | ) | 2,282,331 | 62,077 | 194,578,473 | |||||||||||||
NET ASSETS | $ | 1,996,438,498 | $ | 648,814,793 | $ | 347,820,962 | $ | 1,312,078 | $ | 1,223,973,340 | ||||||||||
Outstanding beneficial interest shares of $0.001 par value (unlimited number of shares authorized) | 61,050,000 | 12,950,000 | 7,005,000 | 50,000 | 17,300,000 | |||||||||||||||
Net asset value per share | $ | 32.70 | $ | 50.10 | $ | 49.65 | $ | 26.24 | $ | 70.75 | ||||||||||
1 Includes market value of securities out on loan of: | $ | 128,552,679 | $ | 41,498,328 | $ | 1,979,708 | — | $ | 1,696,857 | |||||||||||
2 Investments in securities include investment of cash collateral for securities loaned (see Schedule of Investments for additional information). |
| |||||||||||||||||||
See Notes to Financial Statements.
| 114 | WisdomTree Trust |
Statements of Assets and Liabilities (concluded)
WisdomTree Trust
March 31, 2024
| WisdomTree U.S. Value Fund | ||||
ASSETS: | ||||
Investments, at cost | $ | 240,356,355 | ||
Investments in securities, at value1 (Note 2) | 276,735,152 | |||
Cash | 168,215 | |||
Receivables: | ||||
Capital shares sold | 1,502,844 | |||
Dividends | 263,791 | |||
Securities lending income | 129 | |||
Total Assets | 278,670,131 | |||
LIABILITIES: |
| |||
Payables: |
| |||
Investment securities purchased | 1,496,728 | |||
Advisory fees (Note 3) | 26,714 | |||
Service fees (Note 2) | 979 | |||
Total Liabilities | 1,524,421 | |||
NET ASSETS | $ | 277,145,710 | ||
NET ASSETS: | ||||
Paid-in capital | $ | 255,969,298 | ||
Total distributable earnings (loss) | 21,176,412 | |||
NET ASSETS | $ | 277,145,710 | ||
Outstanding beneficial interest shares of $0.001 par value (unlimited number of shares authorized) | 3,670,000 | |||
Net asset value per share | $ | 75.52 | ||
1 Includes market value of securities out on loan of: | $ | 1,685,595 | ||
See Notes to Financial Statements.
| WisdomTree Trust | 115 |
WisdomTree Trust
For the Year Ended March 31, 2024
| WisdomTree U.S. AI Enhanced Value Fund | WisdomTree U.S. High Dividend Fund | WisdomTree U.S. LargeCap Dividend Fund | WisdomTree U.S. LargeCap Fund | WisdomTree U.S. MidCap Dividend Fund | ||||||||||||||||
INVESTMENT INCOME: | ||||||||||||||||||||
Dividends | $ | 10,588,974 | $ | 52,515,863 | $ | 98,854,754 | $ | 13,477,794 | $ | 100,044,302 | ||||||||||
Dividends from affiliates (Note 3) | — | 14,061 | 72,489 | 71,000 | 190,251 | |||||||||||||||
Interest | 19,542 | 18,923 | 37,464 | 11,387 | 94,047 | |||||||||||||||
Non-cash dividends | — | 19,944 | 75,692 | 1,979 | — | |||||||||||||||
Securities lending income, net (Note 2) | 425,314 | 53,088 | 595,561 | 70,629 | 120,406 | |||||||||||||||
Less: Foreign withholding taxes on dividends | (729 | ) | (5,593 | ) | — | — | (39,890 | ) | ||||||||||||
Total investment income | 11,033,101 | 52,616,286 | 99,635,960 | 13,632,789 | 100,409,116 | |||||||||||||||
EXPENSES: | ||||||||||||||||||||
Advisory fees (Note 3) | 1,440,091 | 4,332,098 | 10,049,494 | 570,823 | 12,491,123 | |||||||||||||||
Service fees (Note 2) | 16,675 | 50,161 | 157,921 | 31,395 | 144,634 | |||||||||||||||
Total expenses | 1,456,766 | 4,382,259 | 10,207,415 | 602,218 | 12,635,757 | |||||||||||||||
Expense waivers (Note 3) | — | (822 | ) | (3,158 | ) | — | (10,297 | ) | ||||||||||||
Net expenses | 1,456,766 | 4,381,437 | 10,204,257 | 602,218 | 12,625,460 | |||||||||||||||
Net investment income | 9,576,335 | 48,234,849 | 89,431,703 | 13,030,571 | 87,783,656 | |||||||||||||||
NET REALIZED AND UNREALIZED GAIN (LOSS) ON INVESTMENTS: |
| |||||||||||||||||||
Net realized gain (loss) from: | ||||||||||||||||||||
Investment transactions | (15,533,337 | ) | (47,392,032 | ) | (67,003,669 | ) | (14,781,925 | ) | (74,462,846 | ) | ||||||||||
Investment transactions in affiliates (Note 3) | — | 22,274 | 163,356 | 43,699 | 416,374 | |||||||||||||||
In-kind redemptions | 4,365,369 | 29,549,519 | 249,882,556 | 30,149,174 | 174,842,873 | |||||||||||||||
Net realized gain (loss) | (11,167,968 | ) | (17,820,239 | ) | 183,042,243 | 15,410,948 | 100,796,401 | |||||||||||||
Net increase (decrease) in unrealized appreciation/depreciation: | ||||||||||||||||||||
Investment transactions | 50,518,694 | 57,515,797 | 393,404,354 | 159,974,069 | 493,614,763 | |||||||||||||||
Investment transactions in affiliates (Note 3) | — | (6,803 | ) | (9,347 | ) | 62,292 | — | |||||||||||||
Net increase in unrealized appreciation/depreciation | 50,518,694 | 57,508,994 | 393,395,007 | 160,036,361 | 493,614,763 | |||||||||||||||
Net realized and unrealized gain on investments | 39,350,726 | 39,688,755 | 576,437,250 | 175,447,309 | 594,411,164 | |||||||||||||||
NET INCREASE IN NET ASSETS RESULTING FROM OPERATIONS | $ | 48,927,061 | $ | 87,923,604 | $ | 665,868,953 | $ | 188,477,880 | $ | 682,194,820 | ||||||||||
See Notes to Financial Statements.
| 116 | WisdomTree Trust |
Statements of Operations (continued)
WisdomTree Trust
For the Year or Period Ended March 31, 2024
WisdomTree Fund | WisdomTree U.S. MidCap Quality Growth Fund1 | WisdomTree U.S. Multifactor Fund | WisdomTree U.S. Quality Dividend Growth Fund | WisdomTree U.S. Quality Growth Fund | ||||||||||||||||
INVESTMENT INCOME: | ||||||||||||||||||||
Dividends | $ | 13,319,090 | $ | 5,237 | $ | 4,551,719 | $ | 213,459,121 | $ | 468,195 | ||||||||||
Dividends from affiliates (Note 3) | 42,181 | — | — | — | — | |||||||||||||||
Interest | 9,627 | — | 9,160 | 183,355 | 762 | |||||||||||||||
Non-cash dividends | — | — | 21,202 | — | — | |||||||||||||||
Securities lending income, net (Note 2) | 102,679 | — | 600 | 1,533,098 | — | |||||||||||||||
Less: Foreign withholding taxes on dividends | (1,015 | ) | — | — | — | — | ||||||||||||||
Total investment income | 13,472,562 | 5,237 | 4,582,681 | 215,175,574 | 468,957 | |||||||||||||||
EXPENSES: | ||||||||||||||||||||
Advisory fees (Note 3) | 2,830,051 | 1,765 | 734,215 | 28,409,075 | 230,251 | |||||||||||||||
Service fees (Note 2) | 32,769 | 20 | 11,538 | 446,429 | 3,618 | |||||||||||||||
Total expenses | 2,862,820 | 1,785 | 745,753 | 28,855,504 | 233,869 | |||||||||||||||
Expense waivers (Note 3) | (2,105 | ) | — | — | — | — | ||||||||||||||
Net expenses | 2,860,715 | 1,785 | 745,753 | 28,855,504 | 233,869 | |||||||||||||||
Net investment income | 10,611,847 | 3,452 | 3,836,928 | 186,320,070 | 235,088 | |||||||||||||||
NET REALIZED AND UNREALIZED GAIN (LOSS) ON INVESTMENTS: |
| |||||||||||||||||||
Net realized gain (loss) from: | ||||||||||||||||||||
Investment transactions | (28,572,931 | ) | (3,537 | ) | (1,120,055 | ) | (102,194,016 | ) | (537,210 | ) | ||||||||||
Investment transactions in affiliates (Note 3) | 107,167 | — | — | — | — | |||||||||||||||
In-kind redemptions | 58,227,449 | — | 24,602,965 | 600,686,113 | 1,780,817 | |||||||||||||||
Futures contracts | — | — | 101,091 | — | — | |||||||||||||||
Net realized gain (loss) | 29,761,685 | (3,537 | ) | 23,584,001 | 498,492,097 | 1,243,607 | ||||||||||||||
Net increase (decrease) in unrealized appreciation/depreciation: | ||||||||||||||||||||
Investment transactions | 126,340,779 | 308,055 | 32,536,228 | 1,704,745,882 | 32,943,614 | |||||||||||||||
Investment transactions in affiliates (Note 3) | 138,273 | — | — | — | — | |||||||||||||||
Net increase in unrealized appreciation/depreciation | 126,479,052 | 308,055 | 32,536,228 | 1,704,745,882 | 32,943,614 | |||||||||||||||
Net realized and unrealized gain on investments | 156,240,737 | 304,518 | 56,120,229 | 2,203,237,979 | 34,187,221 | |||||||||||||||
NET INCREASE IN NET ASSETS RESULTING FROM OPERATIONS | $ | 166,852,584 | $ | 307,970 | $ | 59,957,157 | $ | 2,389,558,049 | $ | 34,422,309 | ||||||||||
1 For the period January 25, 2024 (commencement of operations) through March 31, 2024. |
| |||||||||||||||||||
See Notes to Financial Statements.
| WisdomTree Trust | 117 |
Statements of Operations (continued)
WisdomTree Trust
For the Year or Period Ended March 31, 2024
| WisdomTree U.S. SmallCap Dividend Fund | WisdomTree U.S. SmallCap Fund | WisdomTree U.S. SmallCap Quality Dividend Growth Fund | WisdomTree U.S. SmallCap Quality Growth Fund1 | WisdomTree U.S. Total Dividend Fund | ||||||||||||||||
INVESTMENT INCOME: | ||||||||||||||||||||
Dividends | $ | 60,348,397 | $ | 9,955,897 | $ | 7,660,164 | $ | 2,836 | $ | 31,014,183 | ||||||||||
Dividends from affiliates (Note 3) | 124,593 | 13,057 | — | — | — | |||||||||||||||
Interest | 28,167 | 8,316 | 7,113 | — | 23,998 | |||||||||||||||
Non-cash dividends | — | 14,851 | 11,309 | — | 16,482 | |||||||||||||||
Securities lending income, net (Note 2) | 437,927 | 363,089 | 31,015 | — | 149,297 | |||||||||||||||
Less: Foreign withholding taxes on dividends | (41,304 | ) | (1,645 | ) | — | — | (3,199 | ) | ||||||||||||
Total investment income | 60,897,780 | 10,353,565 | 7,709,601 | 2,836 | 31,200,761 | |||||||||||||||
EXPENSES: | ||||||||||||||||||||
Advisory fees (Note 3) | 6,974,296 | 2,251,919 | 1,019,423 | 882 | 3,090,408 | |||||||||||||||
Service fees (Note 2) | 80,755 | 26,075 | 11,804 | 10 | 48,563 | |||||||||||||||
Total expenses | 7,055,051 | 2,277,994 | 1,031,227 | 892 | 3,138,971 | |||||||||||||||
Expense waivers (Note 3) | (5,903 | ) | (1,297 | ) | — | — | — | |||||||||||||
Net expenses | 7,049,148 | 2,276,697 | 1,031,227 | 892 | 3,138,971 | |||||||||||||||
Net investment income | 53,848,632 | 8,076,868 | 6,678,374 | 1,944 | 28,061,790 | |||||||||||||||
NET REALIZED AND UNREALIZED GAIN (LOSS) ON INVESTMENTS: |
| |||||||||||||||||||
Net realized gain (loss) from: | ||||||||||||||||||||
Investment transactions | (45,333,737 | ) | 1,553,260 | (8,574,135 | ) | (359 | ) | (17,635,239 | ) | |||||||||||
Investment transactions in affiliates (Note 3) | 220,789 | 52,081 | — | — | — | |||||||||||||||
In-kind redemptions | 99,158,233 | 12,536,862 | 17,651,589 | — | 68,718,557 | |||||||||||||||
Futures contracts | — | — | 72,103 | — | — | |||||||||||||||
Net realized gain (loss) | 54,045,285 | 14,142,203 | 9,149,557 | (359 | ) | 51,083,318 | ||||||||||||||
Net increase (decrease) in unrealized appreciation/depreciation: | ||||||||||||||||||||
Investment transactions | 200,006,931 | 71,297,363 | 45,130,468 | 60,492 | 127,478,453 | |||||||||||||||
Investment transactions in affiliates (Note 3) | 45,809 | 131,313 | — | — | — | |||||||||||||||
Net increase in unrealized appreciation/depreciation | 200,052,740 | 71,428,676 | 45,130,468 | 60,492 | 127,478,453 | |||||||||||||||
Net realized and unrealized gain on investments | 254,098,025 | 85,570,879 | 54,280,025 | 60,133 | 178,561,771 | |||||||||||||||
NET INCREASE IN NET ASSETS RESULTING FROM OPERATIONS | $ | 307,946,657 | $ | 93,647,747 | $ | 60,958,399 | $ | 62,077 | $ | 206,623,561 | ||||||||||
1 For the period January 25, 2024 (commencement of operations) through March 31, 2024. |
| |||||||||||||||||||
See Notes to Financial Statements.
| 118 | WisdomTree Trust |
Statements of Operations (concluded)
WisdomTree Trust
For the Year Ended March 31, 2024
| WisdomTree U.S. Value Fund | ||||
INVESTMENT INCOME: | ||||
Dividends | $ | 3,651,671 | ||
Interest | 3,648 | |||
Securities lending income, net (Note 2) | 3,818 | |||
Total investment income | 3,659,137 | |||
EXPENSES: | ||||
Advisory fees (Note 3) | 209,702 | |||
Service fees (Note 2) | 7,689 | |||
Total expenses | 217,391 | |||
Net investment income | 3,441,746 | |||
NET REALIZED AND UNREALIZED GAIN (LOSS) ON INVESTMENTS: |
| |||
Net realized gain (loss) from: | ||||
Investment transactions | 964,011 | |||
In-kind redemptions | 17,958,873 | |||
Futures contracts | 11,285 | |||
Net realized gain | 18,934,169 | |||
Net increase in unrealized appreciation/depreciation | 31,931,551 | |||
Net realized and unrealized gain on investments | 50,865,720 | |||
NET INCREASE IN NET ASSETS RESULTING FROM OPERATIONS | $ | 54,307,466 | ||
See Notes to Financial Statements.
| WisdomTree Trust | 119 |
Statements of Changes in Net Assets
WisdomTree Trust
| WisdomTree U.S. AI Enhanced Value Fund | WisdomTree U.S. High Dividend Fund | WisdomTree U.S. LargeCap Dividend Fund | ||||||||||||||||||||||
| For the Year Ended March 31, 2024 | For the Year Ended March 31, 2023 | For the Year Ended March 31, 2024 | For the Year Ended March 31, 2023 | For the Year Ended March 31, 2024 | For the Year Ended March 31, 2023 | |||||||||||||||||||
INCREASE (DECREASE) IN NET ASSETS RESULTING FROM OPERATIONS: |
| |||||||||||||||||||||||
Net investment income | $ | 9,576,335 | $ | 9,294,205 | $ | 48,234,849 | $ | 48,742,351 | $ | 89,431,703 | $ | 91,646,751 | ||||||||||||
Net realized gain (loss) on investments | (11,167,968 | ) | (18,469,063 | ) | (17,820,239 | ) | 82,444,487 | 183,042,243 | 134,565,950 | |||||||||||||||
Net increase (decrease) in unrealized appreciation/depreciation on investments | 50,518,694 | (17,105,029 | ) | 57,508,994 | (158,410,618 | ) | 393,395,007 | (330,156,213 | ) | |||||||||||||||
Net increase (decrease) in net assets resulting from operations | 48,927,061 | (26,279,887 | ) | 87,923,604 | (27,223,780 | ) | 665,868,953 | (103,943,512 | ) | |||||||||||||||
DISTRIBUTIONS TO SHAREHOLDERS: |
| |||||||||||||||||||||||
Distributable earnings | (9,644,875 | ) | (9,454,072 | ) | (46,034,088 | ) | (52,764,847 | ) | (87,184,000 | ) | (94,641,498 | ) | ||||||||||||
CAPITAL SHARE TRANSACTIONS: |
| |||||||||||||||||||||||
Net proceeds from sale of shares | 2,392,093 | — | 126,562,641 | 983,982,222 | 479,309,291 | 663,360,233 | ||||||||||||||||||
Cost of shares redeemed | (58,865,569 | ) | (60,535,501 | ) | (405,345,333 | ) | (591,853,425 | ) | (514,740,098 | ) | (421,607,267 | ) | ||||||||||||
Net increase (decrease) in net assets resulting from capital share transactions | (56,473,476 | ) | (60,535,501 | ) | (278,782,692 | ) | 392,128,797 | (35,430,807 | ) | 241,752,966 | ||||||||||||||
Net Increase (Decrease) in Net Assets | (17,191,290 | ) | (96,269,460 | ) | (236,893,176 | ) | 312,140,170 | 543,254,146 | 43,167,956 | |||||||||||||||
NET ASSETS: |
| |||||||||||||||||||||||
Beginning of year | $ | 396,366,555 | $ | 492,636,015 | $ | 1,337,100,171 | $ | 1,024,960,001 | $ | 3,470,407,603 | $ | 3,427,239,647 | ||||||||||||
End of year | $ | 379,175,265 | $ | 396,366,555 | $ | 1,100,206,995 | $ | 1,337,100,171 | $ | 4,013,661,749 | $ | 3,470,407,603 | ||||||||||||
SHARES CREATED AND REDEEMED: |
| |||||||||||||||||||||||
Shares outstanding, beginning of year | 4,325,000 | 4,975,000 | 16,250,000 | 11,650,000 | 56,100,000 | 52,200,000 | ||||||||||||||||||
Shares created | 25,000 | — | 1,550,000 | 11,400,000 | 7,400,000 | 10,800,000 | ||||||||||||||||||
Shares redeemed | (625,000 | ) | (650,000 | ) | (5,100,000 | ) | (6,800,000 | ) | (7,900,000 | ) | (6,900,000 | ) | ||||||||||||
Shares outstanding, end of year | 3,725,000 | 4,325,000 | 12,700,000 | 16,250,000 | 55,600,000 | 56,100,000 | ||||||||||||||||||
See Notes to Financial Statements.
| 120 | WisdomTree Trust |
Statements of Changes in Net Assets (continued)
WisdomTree Trust
| WisdomTree U.S. LargeCap Fund | WisdomTree U.S. MidCap Dividend Fund | WisdomTree U.S. MidCap Fund | ||||||||||||||||||||||
| For the Year Ended March 31, 2024 | For the Year Ended March 31, 2023 | For the Year Ended March 31, 2024 | For the Year Ended March 31, 2023 | For the Year Ended March 31, 2024 | For the Year Ended March 31, 2023 | |||||||||||||||||||
INCREASE (DECREASE) IN NET ASSETS RESULTING FROM OPERATIONS: |
| |||||||||||||||||||||||
Net investment income | $ | 13,030,571 | $ | 12,395,831 | $ | 87,783,656 | $ | 90,229,129 | $ | 10,611,847 | $ | 11,048,091 | ||||||||||||
Net realized gain (loss) on investments | 15,410,948 | (11,118,901 | ) | 100,796,401 | 130,848,348 | 29,761,685 | 9,427,278 | |||||||||||||||||
Net increase (decrease) in unrealized appreciation/depreciation on investments | 160,036,361 | (53,705,837 | ) | 493,614,763 | (364,718,988 | ) | 126,479,052 | (80,659,749 | ) | |||||||||||||||
Net increase (decrease) in net assets resulting from operations | 188,477,880 | (52,428,907 | ) | 682,194,820 | (143,641,511 | ) | 166,852,584 | (60,184,380 | ) | |||||||||||||||
DISTRIBUTIONS TO SHAREHOLDERS: |
| |||||||||||||||||||||||
Distributable earnings | (13,196,000 | ) | (12,389,635 | ) | (87,033,724 | ) | (92,020,134 | ) | (10,749,500 | ) | (10,959,568 | ) | ||||||||||||
CAPITAL SHARE TRANSACTIONS: |
| |||||||||||||||||||||||
Net proceeds from sale of shares | 96,388,715 | 108,501,573 | 368,472,134 | 1,051,013,414 | 135,096,251 | 68,005,567 | ||||||||||||||||||
Cost of shares redeemed | (79,557,122 | ) | (82,001,123 | ) | (525,518,367 | ) | (805,947,349 | ) | (180,198,918 | ) | (91,842,306 | ) | ||||||||||||
Net increase (decrease) in net assets resulting from capital share transactions | 16,831,593 | 26,500,450 | (157,046,233 | ) | 245,066,065 | (45,102,667 | ) | (23,836,739 | ) | |||||||||||||||
Net Increase (Decrease) in Net Assets | 192,113,473 | (38,318,092 | ) | 438,114,863 | 9,404,420 | 111,000,417 | (94,980,687 | ) | ||||||||||||||||
NET ASSETS: |
| |||||||||||||||||||||||
Beginning of year | $ | 658,634,757 | $ | 696,952,849 | $ | 3,220,003,159 | $ | 3,210,598,739 | $ | 716,691,811 | $ | 811,672,498 | ||||||||||||
End of year | $ | 850,748,230 | $ | 658,634,757 | $ | 3,658,118,022 | $ | 3,220,003,159 | $ | 827,692,228 | $ | 716,691,811 | ||||||||||||
SHARES CREATED AND REDEEMED: |
| |||||||||||||||||||||||
Shares outstanding, beginning of year | 15,050,000 | 14,450,000 | 78,500,000 | 72,450,000 | 14,400,000 | 14,850,000 | ||||||||||||||||||
Shares created | 1,950,000 | 2,500,000 | 8,400,000 | 25,100,000 | 2,450,000 | 1,400,000 | ||||||||||||||||||
Shares redeemed | (1,650,000 | ) | (1,900,000 | ) | (11,950,000 | ) | (19,050,000 | ) | (3,300,000 | ) | (1,850,000 | ) | ||||||||||||
Shares outstanding, end of year | 15,350,000 | 15,050,000 | 74,950,000 | 78,500,000 | 13,550,000 | 14,400,000 | ||||||||||||||||||
See Notes to Financial Statements.
| WisdomTree Trust | 121 |
Statements of Changes in Net Assets (continued)
WisdomTree Trust
| WisdomTree U.S. MidCap Quality Growth Fund | WisdomTree U.S. Multifactor Fund | WisdomTree U.S. Quality Dividend Growth Fund | ||||||||||||||||||
| For the Period January 25, 2024* through March 31, 2024 | For the Year Ended March 31, 2024 | For the Year Ended March 31, 2023 | For the Year Ended March 31, 2024 | For the Year Ended March 31, 2023 | ||||||||||||||||
INCREASE (DECREASE) IN NET ASSETS RESULTING FROM OPERATIONS: |
| |||||||||||||||||||
Net investment income | $ | 3,452 | $ | 3,836,928 | $ | 3,947,424 | $ | 186,320,070 | $ | 149,064,486 | ||||||||||
Net realized gain (loss) on investments and futures contracts | (3,537 | ) | 23,584,001 | (10,834,147 | ) | 498,492,097 | 396,875,294 | |||||||||||||
Net increase (decrease) in unrealized appreciation/depreciation on investments | 308,055 | 32,536,228 | (8,414,869 | ) | 1,704,745,882 | (444,753,271 | ) | |||||||||||||
Net increase (decrease) in net assets resulting from operations | 307,970 | 59,957,157 | (15,301,592 | ) | 2,389,558,049 | 101,186,509 | ||||||||||||||
DISTRIBUTIONS TO SHAREHOLDERS: |
| |||||||||||||||||||
Distributable earnings | — | (3,764,250 | ) | (3,948,786 | ) | (186,113,500 | ) | (154,296,995 | ) | |||||||||||
CAPITAL SHARE TRANSACTIONS: |
| |||||||||||||||||||
Net proceeds from sale of shares | 3,879,478 | 126,083,309 | 101,414,445 | 4,572,299,322 | 3,232,420,927 | |||||||||||||||
Cost of shares redeemed | (99 | ) | (152,910,032 | ) | (43,549,334 | ) | (2,201,065,814 | ) | (2,085,719,771 | ) | ||||||||||
Net increase (decrease) in net assets resulting from capital share transactions | 3,879,379 | (26,826,723 | ) | 57,865,111 | 2,371,233,508 | 1,146,701,156 | ||||||||||||||
Net Increase in Net Assets | 4,187,349 | 29,366,184 | 38,614,733 | 4,574,678,057 | 1,093,590,670 | |||||||||||||||
NET ASSETS: |
| |||||||||||||||||||
Beginning of period | $ | 100 | $ | 262,563,856 | $ | 223,949,123 | $ | 8,126,909,122 | $ | 7,033,318,452 | ||||||||||
End of period | $ | 4,187,449 | $ | 291,930,040 | $ | 262,563,856 | $ | 12,701,587,179 | $ | 8,126,909,122 | ||||||||||
SHARES CREATED AND REDEEMED: |
| |||||||||||||||||||
Shares outstanding, beginning of period | 4 | 7,000,000 | 5,475,000 | 130,350,000 | 110,650,000 | |||||||||||||||
Shares created | 150,000 | 3,000,000 | 2,675,000 | 68,000,000 | 53,700,000 | |||||||||||||||
Shares redeemed | (4 | ) | (3,725,000 | ) | (1,150,000 | ) | (31,700,000 | ) | (34,000,000 | ) | ||||||||||
Shares outstanding, end of period | 150,000 | 6,275,000 | 7,000,000 | 166,650,000 | 130,350,000 | |||||||||||||||
* Commencement of operations. The commencement of operations date is considered to be the date that the Fund began trading in the secondary market. |
| |||||||||||||||||||
See Notes to Financial Statements.
| 122 | WisdomTree Trust |
Statements of Changes in Net Assets (continued)
WisdomTree Trust
| WisdomTree U.S. Quality Growth Fund | WisdomTree U.S. SmallCap Dividend Fund | WisdomTree U.S. SmallCap Fund | ||||||||||||||||||||||
| For the Year Ended March 31, 2024 | For the Period December 15, 2022* through March 31, 2023 | For the Year Ended March 31, 2024 | For the Year Ended March 31, 2023 | For the Year Ended March 31, 2024 | For the Year Ended March 31, 2023 | |||||||||||||||||||
INCREASE (DECREASE) IN NET ASSETS RESULTING FROM OPERATIONS: |
| |||||||||||||||||||||||
Net investment income | $ | 235,088 | $ | 2,614 | $ | 53,848,632 | $ | 54,588,187 | $ | 8,076,868 | $ | 8,733,864 | ||||||||||||
Net realized gain (loss) on investments | 1,243,607 | (2,363 | ) | 54,045,285 | 3,151,249 | 14,142,203 | 13,786,257 | |||||||||||||||||
Net increase (decrease) in unrealized appreciation/depreciation on investments | 32,943,614 | 286,724 | 200,052,740 | (202,544,682 | ) | 71,428,676 | (78,845,215 | ) | ||||||||||||||||
Net increase (decrease) in net assets resulting from operations | 34,422,309 | 286,975 | 307,946,657 | (144,805,246 | ) | 93,647,747 | (56,325,094 | ) | ||||||||||||||||
DISTRIBUTIONS TO SHAREHOLDERS: |
| |||||||||||||||||||||||
Distributable earnings | (123,000 | ) | — | (52,081,069 | ) | (54,457,954 | ) | (8,097,830 | ) | (8,368,109 | ) | |||||||||||||
CAPITAL SHARE TRANSACTIONS: |
| |||||||||||||||||||||||
Net proceeds from sale of shares | 326,524,836 | 2,552,390 | 218,376,026 | 217,678,287 | 77,369,133 | 160,150,131 | ||||||||||||||||||
Cost of shares redeemed | (14,330,951 | ) | (100 | ) | (334,484,277 | ) | (43,279,395 | ) | (84,869,482 | ) | (217,424,064 | ) | ||||||||||||
Net increase (decrease) in net assets resulting from capital share transactions | 312,193,885 | 2,552,290 | (116,108,251 | ) | 174,398,892 | (7,500,349 | ) | (57,273,933 | ) | |||||||||||||||
Net Increase (Decrease) in Net Assets | 346,493,194 | 2,839,265 | 139,757,337 | (24,864,308 | ) | 78,049,568 | (121,967,136 | ) | ||||||||||||||||
NET ASSETS: |
| |||||||||||||||||||||||
Beginning of period | $ | 2,839,365 | $ | 100 | $ | 1,856,681,161 | $ | 1,881,545,469 | $ | 570,765,225 | $ | 692,732,361 | ||||||||||||
End of period | $ | 349,332,559 | $ | 2,839,365 | $ | 1,996,438,498 | $ | 1,856,681,161 | $ | 648,814,793 | $ | 570,765,225 | ||||||||||||
SHARES CREATED AND REDEEMED: |
| |||||||||||||||||||||||
Shares outstanding, beginning of period | 100,000 | 4 | 65,000,000 | 59,050,000 | 13,200,000 | 14,450,000 | ||||||||||||||||||
Shares created | 8,825,000 | 100,000 | 7,150,000 | 7,450,000 | 1,650,000 | 3,650,000 | ||||||||||||||||||
Shares redeemed | (425,000 | ) | (4 | ) | (11,100,000 | ) | (1,500,000 | ) | (1,900,000 | ) | (4,900,000 | ) | ||||||||||||
Shares outstanding, end of period | 8,500,000 | 100,000 | 61,050,000 | 65,000,000 | 12,950,000 | 13,200,000 | ||||||||||||||||||
* Commencement of operations. The commencement of operations date is considered to be the date that the Fund began trading in the secondary market. |
| |||||||||||||||||||||||
See Notes to Financial Statements.
| WisdomTree Trust | 123 |
Statements of Changes in Net Assets (continued)
WisdomTree Trust
WisdomTree U.S. SmallCap Quality Dividend Growth Fund | WisdomTree U.S. SmallCap Quality Growth Fund | WisdomTree U.S. Total Dividend Fund | ||||||||||||||||||
| For the Year Ended March 31, 2024 | For the Year Ended March 31, 2023 | For the Period January 25, 2024* through March 31, 2024 | For the Year Ended March 31, 2024 | For the Year Ended March 31, 2023 | ||||||||||||||||
INCREASE (DECREASE) IN NET ASSETS RESULTING FROM OPERATIONS: |
| |||||||||||||||||||
Net investment income | $ | 6,678,374 | $ | 6,132,472 | $ | 1,944 | $ | 28,061,790 | $ | 28,310,458 | ||||||||||
Net realized gain (loss) on investments and futures contracts | 9,149,557 | (1,401,252 | ) | (359 | ) | 51,083,318 | 41,077,780 | |||||||||||||
Net increase (decrease) in unrealized appreciation/depreciation on investments | 45,130,468 | (15,294,977 | ) | 60,492 | 127,478,453 | (103,960,735 | ) | |||||||||||||
Net increase (decrease) in net assets resulting from operations | 60,958,399 | (10,563,757 | ) | 62,077 | 206,623,561 | (34,572,497 | ) | |||||||||||||
DISTRIBUTIONS TO SHAREHOLDERS: |
| |||||||||||||||||||
Distributable earnings | (6,675,150 | ) | (6,156,770 | ) | — | (27,138,000 | ) | (30,260,035 | ) | |||||||||||
CAPITAL SHARE TRANSACTIONS: |
| |||||||||||||||||||
Net proceeds from sale of shares | 129,464,343 | 86,682,667 | 1,250,000 | 108,406,714 | 222,869,091 | |||||||||||||||
Cost of shares redeemed | (61,551,198 | ) | (69,170,357 | ) | (99 | ) | (141,706,706 | ) | (160,877,872 | ) | ||||||||||
Net increase (decrease) in net assets resulting from capital share transactions | 67,913,145 | 17,512,310 | 1,249,901 | (33,299,992 | ) | 61,991,219 | ||||||||||||||
Net Increase (Decrease) in Net Assets | 122,196,394 | 791,783 | 1,311,978 | 146,185,569 | (2,841,313 | ) | ||||||||||||||
NET ASSETS: |
| |||||||||||||||||||
Beginning of period | $ | 225,624,568 | $ | 224,832,785 | $ | 100 | $ | 1,077,787,771 | $ | 1,080,629,084 | ||||||||||
End of period | $ | 347,820,962 | $ | 225,624,568 | $ | 1,312,078 | $ | 1,223,973,340 | $ | 1,077,787,771 | ||||||||||
SHARES CREATED AND REDEEMED: |
| |||||||||||||||||||
Shares outstanding, beginning of period | 5,425,000 | 5,035,000 | 4 | 17,800,000 | 16,750,000 | |||||||||||||||
Shares created | 2,950,000 | 2,080,000 | 50,000 | 1,750,000 | 3,650,000 | |||||||||||||||
Shares redeemed | (1,370,000 | ) | (1,690,000 | ) | (4 | ) | (2,250,000 | ) | (2,600,000 | ) | ||||||||||
Shares outstanding, end of period | 7,005,000 | 5,425,000 | 50,000 | 17,300,000 | 17,800,000 | |||||||||||||||
* Commencement of operations. The commencement of operations date is considered to be the date that the Fund began trading in the secondary market. |
| |||||||||||||||||||
See Notes to Financial Statements.
| 124 | WisdomTree Trust |
Statements of Changes in Net Assets (concluded)
WisdomTree Trust
| WisdomTree U.S. Value Fund | ||||||||
| For the Year Ended March 31, 2024 | For the Year Ended March 31, 2023 | |||||||
INCREASE (DECREASE) IN NET ASSETS RESULTING FROM OPERATIONS: |
| |||||||
Net investment income | $ | 3,441,746 | $ | 2,367,699 | ||||
Net realized gain (loss) on investments and futures contracts | 18,934,169 | (3,265,108 | ) | |||||
Net increase (decrease) in unrealized appreciation/depreciation on investments | 31,931,551 | (2,246,805 | ) | |||||
Net increase (decrease) in net assets resulting from operations | 54,307,466 | (3,144,214 | ) | |||||
DISTRIBUTIONS TO SHAREHOLDERS: |
| |||||||
Distributable earnings | (3,370,724 | ) | (2,373,350 | ) | ||||
CAPITAL SHARE TRANSACTIONS: |
| |||||||
Net proceeds from sale of shares | 141,980,130 | 75,822,780 | ||||||
Cost of shares redeemed | (62,985,076 | ) | (36,805,721 | ) | ||||
Net increase in net assets resulting from capital share transactions | 78,995,054 | 39,017,059 | ||||||
Net Increase in Net Assets | 129,931,796 | 33,499,495 | ||||||
NET ASSETS: |
| |||||||
Beginning of year | $ | 147,213,914 | $ | 113,714,419 | ||||
End of year | $ | 277,145,710 | $ | 147,213,914 | ||||
SHARES CREATED AND REDEEMED: |
| |||||||
Shares outstanding, beginning of year | 2,510,000 | 1,850,000 | ||||||
Shares created | 2,130,000 | 1,290,000 | ||||||
Shares redeemed | (970,000 | ) | (630,000 | ) | ||||
Shares outstanding, end of year | 3,670,000 | 2,510,000 | ||||||
See Notes to Financial Statements.
| WisdomTree Trust | 125 |
WisdomTree Trust
Selected data for a share of beneficial interest outstanding throughout the period is presented below:
| WisdomTree U.S. AI Enhanced Value Fund | For the Year Ended March 31, 2024 | For the Year Ended March 31, 2023 | For the Year Ended March 31, 20221 | For the Year Ended March 31, 20211 | For the Year Ended March 31, 20201 | |||||||||||||||
Net asset value, beginning of year | $ | 91.65 | $ | 99.02 | $ | 94.15 | $ | 64.64 | $ | 85.52 | ||||||||||
Investment operations: |
| |||||||||||||||||||
Net investment income2 | 2.35 | 2.01 | 2.70 | 2.67 | 3.11 | |||||||||||||||
Net realized and unrealized gain (loss) | 10.19 | (7.31 | ) | 4.95 | 29.49 | (20.83 | ) | |||||||||||||
Total from investment operations | 12.54 | (5.30 | ) | 7.65 | 32.16 | (17.72 | ) | |||||||||||||
Dividends to shareholders: |
| |||||||||||||||||||
Net investment income | (2.40 | ) | (2.07 | ) | (2.78 | ) | (2.65 | ) | (3.16 | ) | ||||||||||
Net asset value, end of year | $ | 101.79 | $ | 91.65 | $ | 99.02 | $ | 94.15 | $ | 64.64 | ||||||||||
TOTAL RETURN3 | 13.93 | % | (5.25 | )% | 8.19 | % | 50.69 | % | (21.49 | )% | ||||||||||
RATIOS/SUPPLEMENTAL DATA: |
| |||||||||||||||||||
Net assets, end of year (000’s omitted) | $ | 379,175 | $ | 396,367 | $ | 492,636 | $ | 555,491 | $ | 543,010 | ||||||||||
Ratios to average net assets of: |
| |||||||||||||||||||
Expenses4,5 | 0.38 | % | 0.38 | % | 0.38 | % | 0.38 | % | 0.38 | % | ||||||||||
Net investment income | 2.53 | % | 2.17 | % | 2.76 | % | 3.40 | % | 3.61 | % | ||||||||||
Portfolio turnover rate6 | 127 | % | 150 | % | 96 | %7,8 | 47 | % | 46 | % | ||||||||||
| WisdomTree U.S. High Dividend Fund | For the Year Ended March 31, 2024 | For the Year Ended March 31, 2023 | For the Year Ended March 31, 2022 | For the Year Ended March 31, 2021 | For the Year Ended March 31, 2020 | |||||||||||||||
Net asset value, beginning of year | $ | 82.28 | $ | 87.98 | $ | 76.26 | $ | 56.58 | $ | 72.49 | ||||||||||
Investment operations: |
| |||||||||||||||||||
Net investment income2 | 3.40 | 3.26 | 2.88 | 2.71 | 2.65 | |||||||||||||||
Net realized and unrealized gain (loss) | 4.23 | (5.45 | ) | 11.30 | 19.94 | (15.81 | ) | |||||||||||||
Total from investment operations | 7.63 | (2.19 | ) | 14.18 | 22.65 | (13.16 | ) | |||||||||||||
Dividends to shareholders: |
| |||||||||||||||||||
Net investment income | (3.28 | ) | (3.51 | ) | (2.46 | ) | (2.97 | ) | (2.75 | ) | ||||||||||
Net asset value, end of year | $ | 86.63 | $ | 82.28 | $ | 87.98 | $ | 76.26 | $ | 56.58 | ||||||||||
TOTAL RETURN3 | 9.68 | % | (2.49 | )% | 18.96 | % | 40.97 | % | (18.99 | )% | ||||||||||
RATIOS/SUPPLEMENTAL DATA: |
| |||||||||||||||||||
Net assets, end of year (000’s omitted) | $ | 1,100,207 | $ | 1,337,100 | $ | 1,024,960 | $ | 774,034 | $ | 678,935 | ||||||||||
Ratios to average net assets of: |
| |||||||||||||||||||
Expenses4,5 | 0.38 | % | 0.38 | % | 0.38 | % | 0.38 | % | 0.38 | % | ||||||||||
Net investment income | 4.23 | % | 3.84 | % | 3.56 | % | 4.13 | % | 3.63 | % | ||||||||||
Portfolio turnover rate6 | 30 | % | 47 | % | 38 | % | 43 | % | 39 | % | ||||||||||
| 1 | The information reflects the investment objective and strategy of the WisdomTree U.S. Dividend ex-Financials Fund through January 17, 2022 and the investment objective and strategy of the WisdomTree U.S. AI Enhanced Value Fund thereafter. |
| 2 | Based on average shares outstanding. |
| 3 | Total return is calculated assuming an initial investment made at the net asset value at the beginning of the period, reinvestment of all dividends and distributions at net asset value during the period and redemption on the last day of the period. For the periods in which the investment advisor waived advisory fees, the total return would have been lower if certain expenses had not been waived (Notes 2 and 3). |
| 4 | Does not include expenses of the Underlying Funds in which the Fund invests. |
| 5 | The expense ratio includes investment advisory fee waivers. Without these investment advisory fee waivers, the expense ratio would have been unchanged. |
| 6 | Portfolio turnover rate excludes the value of the portfolio securities received or delivered as a result of in-kind creations or redemptions of the Fund’s capital shares. Short-term securities with maturities less than or equal to 365 days are excluded from the portfolio turnover calculation. |
| 7 | The increase in the portfolio turnover rate was primarily a result of the change in investment objective and strategy on January 18, 2022. |
| 8 | On January 7, 2022, Voya Investment Management Co., LLC replaced Mellon Investments Corporation as sub-advisor to the Fund. |
See Notes to Financial Statements.
| 126 | WisdomTree Trust |
Financial Highlights (continued)
WisdomTree Trust
Selected data for a share of beneficial interest outstanding throughout the period is presented below:
| WisdomTree U.S. LargeCap Dividend Fund | For the Year Ended March 31, 2024 | For the Year Ended March 31, 2023 | For the Year Ended March 31, 20221 | For the Year Ended March 31, 20211 | For the Year Ended March 31, 20201 | |||||||||||||||
Net asset value, beginning of year | $ | 61.86 | $ | 65.66 | $ | 57.27 | $ | 40.47 | $ | 47.11 | ||||||||||
Investment operations: |
| |||||||||||||||||||
Net investment income2 | 1.60 | 1.59 | 1.42 | 1.36 | 1.36 | |||||||||||||||
Net realized and unrealized gain (loss) | 10.30 | (3.74 | ) | 8.33 | 16.79 | (6.64 | ) | |||||||||||||
Total from investment operations | 11.90 | (2.15 | ) | 9.75 | 18.15 | (5.28 | ) | |||||||||||||
Dividends to shareholders: |
| |||||||||||||||||||
Net investment income | (1.57 | ) | (1.65 | ) | (1.36 | ) | (1.35 | ) | (1.36 | ) | ||||||||||
Net asset value, end of year | $ | 72.19 | $ | 61.86 | $ | 65.66 | $ | 57.27 | $ | 40.47 | ||||||||||
TOTAL RETURN3 | 19.57 | % | (3.22 | )% | 17.16 | % | 45.40 | % | (11.62 | )% | ||||||||||
RATIOS/SUPPLEMENTAL DATA: |
| |||||||||||||||||||
Net assets, end of year (000’s omitted) | $ | 4,013,662 | $ | 3,470,408 | $ | 3,427,240 | $ | 2,823,467 | $ | 1,849,693 | ||||||||||
Ratios to average net assets of: |
| |||||||||||||||||||
Expenses4,5 | 0.28 | % | 0.28 | % | 0.28 | % | 0.28 | % | 0.28 | % | ||||||||||
Net investment income | 2.49 | % | 2.58 | % | 2.28 | % | 2.73 | % | 2.76 | % | ||||||||||
Portfolio turnover rate6 | 15 | % | 20 | % | 19 | % | 20 | % | 13 | % | ||||||||||
| WisdomTree U.S. LargeCap Fund | For the Year Ended March 31, 2024 | For the Year Ended March 31, 2023 | For the Year Ended March 31, 2022 | For the Year Ended March 31, 2021 | For the Year Ended March 31, 2020 | |||||||||||||||
Net asset value, beginning of year | $ | 43.76 | $ | 48.23 | $ | 43.29 | $ | 28.10 | $ | 31.77 | ||||||||||
Investment operations: |
| |||||||||||||||||||
Net investment income2 | 0.87 | 0.84 | 0.78 | 0.73 | 0.73 | |||||||||||||||
Net realized and unrealized gain (loss) | 11.67 | (4.48 | ) | 4.92 | 15.19 | (3.72 | ) | |||||||||||||
Total from investment operations | 12.54 | (3.64 | ) | 5.70 | 15.92 | (2.99 | ) | |||||||||||||
Dividends to shareholders: |
| |||||||||||||||||||
Net investment income | (0.88 | ) | (0.83 | ) | (0.76 | ) | (0.73 | ) | (0.68 | ) | ||||||||||
Net asset value, end of year | $ | 55.42 | $ | 43.76 | $ | 48.23 | $ | 43.29 | $ | 28.10 | ||||||||||
TOTAL RETURN3 | 28.94 | % | (7.42 | )% | 13.19 | % | 57.11 | % | (9.65 | )% | ||||||||||
RATIOS/SUPPLEMENTAL DATA: |
| |||||||||||||||||||
Net assets, end of year (000’s omitted) | $ | 850,748 | $ | 658,635 | $ | 696,953 | $ | 510,794 | $ | 341,423 | ||||||||||
Ratios to average net assets of: |
| |||||||||||||||||||
Expenses4 | 0.08 | % | 0.08 | % | 0.08 | % | 0.08 | % | 0.08 | %5 | ||||||||||
Net investment income | 1.83 | % | 1.95 | % | 1.65 | % | 2.00 | % | 2.16 | % | ||||||||||
Portfolio turnover rate6 | 14 | % | 22 | % | 22 | % | 21 | % | 22 | % | ||||||||||
| 1 | Per share amounts were adjusted to reflect a 2:1 share split effective December 23, 2021. |
| 2 | Based on average shares outstanding. |
| 3 | Total return is calculated assuming an initial investment made at the net asset value at the beginning of the period, reinvestment of all dividends and distributions at net asset value during the period and redemption on the last day of the period. For the periods in which the investment advisor waived advisory fees, the total return would have been lower if certain expenses had not been waived (Notes 2 and 3). |
| 4 | Does not include expenses of the Underlying Funds in which the Fund invests. |
| 5 | The expense ratio includes investment advisory fee waivers. Without these investment advisory fee waivers, the expense ratio would have been unchanged. |
| 6 | Portfolio turnover rate excludes the value of the portfolio securities received or delivered as a result of in-kind creations or redemptions of the Fund’s capital shares. Short-term securities with maturities less than or equal to 365 days are excluded from the portfolio turnover calculation. |
See Notes to Financial Statements.
| WisdomTree Trust | 127 |
Financial Highlights (continued)
WisdomTree Trust
Selected data for a share of beneficial interest outstanding throughout the period is presented below:
| WisdomTree U.S. MidCap Dividend Fund | For the Year Ended March 31, 2024 | For the Year Ended March 31, 2023 | For the Year Ended March 31, 2022 | For the Year Ended March 31, 2021 | For the Year Ended March 31, 2020 | |||||||||||||||
Net asset value, beginning of year | $ | 41.02 | $ | 44.31 | $ | 40.40 | $ | 24.19 | $ | 35.76 | ||||||||||
Investment operations: |
| |||||||||||||||||||
Net investment income1 | 1.14 | 1.19 | 0.99 | 0.80 | 1.01 | |||||||||||||||
Net realized and unrealized gain (loss) | 7.78 | (3.27 | ) | 3.89 | 16.24 | (11.56 | ) | |||||||||||||
Total from investment operations | 8.92 | (2.08 | ) | 4.88 | 17.04 | (10.55 | ) | |||||||||||||
Dividends to shareholders: |
| |||||||||||||||||||
Net investment income | (1.13 | ) | (1.21 | ) | (0.97 | ) | (0.83 | ) | (1.02 | ) | ||||||||||
Net asset value, end of year | $ | 48.81 | $ | 41.02 | $ | 44.31 | $ | 40.40 | $ | 24.19 | ||||||||||
TOTAL RETURN2 | 22.17 | % | (4.65 | )% | 12.17 | % | 71.52 | % | (30.28 | )% | ||||||||||
RATIOS/SUPPLEMENTAL DATA: |
| |||||||||||||||||||
Net assets, end of year (000’s omitted) | $ | 3,658,118 | $ | 3,220,003 | $ | 3,210,599 | $ | 2,904,494 | $ | 2,485,261 | ||||||||||
Ratios to average net assets of: |
| |||||||||||||||||||
Expenses3,4 | 0.38 | % | 0.38 | % | 0.38 | % | 0.38 | % | 0.38 | % | ||||||||||
Net investment income | 2.67 | % | 2.85 | % | 2.31 | % | 2.55 | % | 2.84 | % | ||||||||||
Portfolio turnover rate5 | 26 | % | 40 | % | 38 | % | 57 | % | 33 | % | ||||||||||
| WisdomTree U.S. MidCap Fund | For the Year Ended March 31, 2024 | For the Year Ended March 31, 2023 | For the Year Ended March 31, 2022 | For the Year Ended March 31, 2021 | For the Year Ended March 31, 2020 | |||||||||||||||
Net asset value, beginning of year | $ | 49.77 | $ | 54.66 | $ | 50.86 | $ | 26.44 | $ | 39.30 | ||||||||||
Investment operations: |
| |||||||||||||||||||
Net investment income1 | 0.76 | 0.75 | 0.72 | 0.56 | 0.62 | |||||||||||||||
Net realized and unrealized gain (loss) | 11.32 | (4.90 | ) | 3.81 | 24.45 | (12.83 | ) | |||||||||||||
Total from investment operations | 12.08 | (4.15 | ) | 4.53 | 25.01 | (12.21 | ) | |||||||||||||
Dividends to shareholders: |
| |||||||||||||||||||
Net investment income | (0.77 | ) | (0.74 | ) | (0.73 | ) | (0.59 | ) | (0.65 | ) | ||||||||||
Net asset value, end of year | $ | 61.08 | $ | 49.77 | $ | 54.66 | $ | 50.86 | $ | 26.44 | ||||||||||
TOTAL RETURN2 | 24.47 | % | (7.50 | )% | 8.93 | % | 95.30 | % | (31.45 | )% | ||||||||||
RATIOS/SUPPLEMENTAL DATA: |
| |||||||||||||||||||
Net assets, end of year (000’s omitted) | $ | 827,692 | $ | 716,692 | $ | 811,672 | $ | 706,997 | $ | 560,609 | ||||||||||
Ratios to average net assets of: |
| |||||||||||||||||||
Expenses3,4 | 0.38 | % | 0.38 | % | 0.38 | % | 0.38 | % | 0.38 | % | ||||||||||
Net investment income | 1.42 | % | 1.50 | % | 1.34 | % | 1.49 | % | 1.58 | % | ||||||||||
Portfolio turnover rate5 | 32 | % | 40 | % | 50 | % | 50 | % | 41 | % | ||||||||||
| 1 | Based on average shares outstanding. |
| 2 | Total return is calculated assuming an initial investment made at the net asset value at the beginning of the period, reinvestment of all dividends and distributions at net asset value during the period and redemption on the last day of the period. For the periods in which the investment advisor waived advisory fees, the total return would have been lower if certain expenses had not been waived (Notes 2 and 3). |
| 3 | Does not include expenses of the Underlying Funds in which the Fund invests. |
| 4 | The expense ratio includes investment advisory fee waivers. Without these investment advisory fee waivers, the expense ratio would have been unchanged. |
| 5 | Portfolio turnover rate excludes the value of the portfolio securities received or delivered as a result of in-kind creations or redemptions of the Fund’s capital shares. Short-term securities with maturities less than or equal to 365 days are excluded from the portfolio turnover calculation. |
See Notes to Financial Statements.
| 128 | WisdomTree Trust |
Financial Highlights (continued)
WisdomTree Trust
Selected data for a share of beneficial interest outstanding throughout the period is presented below:
| WisdomTree U.S. MidCap Quality Growth Fund | For the Period January 25, 2024* through March 31, 2024 | |||
Net asset value, beginning of period | $ | 24.84 | ||
Investment operations: |
| |||
Net investment income1 | 0.04 | |||
Net realized and unrealized gain | 3.04 | |||
Total from investment operations | 3.08 | |||
Net asset value, end of period | $ | 27.92 | ||
TOTAL RETURN2 | 12.40 | % | ||
RATIOS/SUPPLEMENTAL DATA: |
| |||
Net assets, end of period (000’s omitted) | $ | 4,187 | ||
Ratios to average net assets of: |
| |||
Expenses | 0.38 | %3 | ||
Net investment income | 0.74 | %3 | ||
Portfolio turnover rate4 | 0 | %5 | ||
| WisdomTree U.S. Multifactor Fund | For the Year Ended March 31, 2024 | For the Year Ended March 31, 2023 | For the Year Ended March 31, 2022 | For the Year Ended March 31, 2021 | For the Year Ended March 31, 2020 | |||||||||||||||
Net asset value, beginning of year | $ | 37.51 | $ | 40.90 | $ | 37.83 | $ | 24.58 | $ | 28.98 | ||||||||||
Investment operations: |
| |||||||||||||||||||
Net investment income1 | 0.59 | 0.65 | 0.63 | 0.39 | 0.59 | |||||||||||||||
Net realized and unrealized gain (loss) | 9.02 | (3.40 | ) | 3.03 | 13.26 | (4.43 | ) | |||||||||||||
Total from investment operations | 9.61 | (2.75 | ) | 3.66 | 13.65 | (3.84 | ) | |||||||||||||
Dividends to shareholders: |
| |||||||||||||||||||
Net investment income | (0.60 | ) | (0.64 | ) | (0.59 | ) | (0.40 | ) | (0.56 | ) | ||||||||||
Net asset value, end of year | $ | 46.52 | $ | 37.51 | $ | 40.90 | $ | 37.83 | $ | 24.58 | ||||||||||
TOTAL RETURN2 | 25.84 | % | (6.68 | )% | 9.68 | % | 55.76 | % | (13.43 | )% | ||||||||||
RATIOS/SUPPLEMENTAL DATA: |
| |||||||||||||||||||
Net assets, end of year (000’s omitted) | $ | 291,930 | $ | 262,564 | $ | 223,949 | $ | 148,490 | $ | 141,308 | ||||||||||
Ratios to average net assets of: |
| |||||||||||||||||||
Expenses | 0.28 | % | 0.28 | % | 0.28 | % | 0.28 | % | 0.28 | %6,7 | ||||||||||
Net investment income | 1.46 | % | 1.72 | % | 1.58 | % | 1.21 | % | 1.94 | % | ||||||||||
Portfolio turnover rate4 | 115 | % | 102 | % | 152 | % | 147 | % | 145 | % | ||||||||||
| * | Commencement of operations. The commencement of operations date is considered to be the date that the Fund began trading in the secondary market. |
| 1 | Based on average shares outstanding. |
| 2 | Total return is calculated assuming an initial investment made at the net asset value at the beginning of the period, reinvestment of all dividends and distributions at net asset value during the period and redemption on the last day of the period. For the periods in which the investment advisor waived advisory fees for the WisdomTree U.S. Multifactor Fund, the total return would have been lower if certain expenses had not been waived (Notes 2 and 3). |
| 3 | Annualized. |
| 4 | Portfolio turnover rate is not annualized for fiscal periods less than one year and excludes the value of the portfolio securities received or delivered as a result of in-kind creations or redemptions of the Fund’s capital shares. Short-term securities with maturities less than or equal to 365 days are excluded from the portfolio turnover calculation. |
| 5 | Amount represents less than 1%. |
| 6 | Does not include expenses of the Underlying Funds in which the Fund invests. |
| 7 | The expense ratio includes investment advisory fee waivers. Without these investment advisory fee waivers, the expense ratio would have been unchanged. |
See Notes to Financial Statements.
| WisdomTree Trust | 129 |
Financial Highlights (continued)
WisdomTree Trust
Selected data for a share of beneficial interest outstanding throughout the period is presented below:
| WisdomTree U.S. Quality Dividend Growth Fund | For the Year Ended March 31, 2024 | For the Year Ended March 31, 2023 | For the Year Ended March 31, 2022 | For the Year Ended March 31, 2021 | For the Year Ended March 31, 2020 | |||||||||||||||
Net asset value, beginning of year | $ | 62.35 | $ | 63.56 | $ | 57.14 | $ | 38.85 | $ | 43.04 | ||||||||||
Investment operations: |
| |||||||||||||||||||
Net investment income1 | 1.24 | 1.28 | 1.22 | 1.07 | 1.09 | |||||||||||||||
Net realized and unrealized gain (loss) | 13.86 | (1.17 | ) | 6.37 | 18.27 | (4.21 | ) | |||||||||||||
Total from investment operations | 15.10 | 0.11 | 7.59 | 19.34 | (3.12 | ) | ||||||||||||||
Dividends to shareholders: |
| |||||||||||||||||||
Net investment income | (1.23 | ) | (1.32 | ) | (1.17 | ) | (1.05 | ) | (1.07 | ) | ||||||||||
Net asset value, end of year | $ | 76.22 | $ | 62.35 | $ | 63.56 | $ | 57.14 | $ | 38.85 | ||||||||||
TOTAL RETURN2 | 24.48 | % | 0.29 | % | 13.36 | % | 50.24 | % | (7.52 | )% | ||||||||||
RATIOS/SUPPLEMENTAL DATA: |
| |||||||||||||||||||
Net assets, end of year (000’s omitted) | $ | 12,701,587 | $ | 8,126,909 | $ | 7,033,318 | $ | 5,576,647 | $ | 2,723,483 | ||||||||||
Ratios to average net assets of: |
| |||||||||||||||||||
Expenses | 0.28 | % | 0.28 | % | 0.28 | % | 0.28 | % | 0.28 | % | ||||||||||
Net investment income | 1.84 | % | 2.12 | % | 1.98 | % | 2.15 | % | 2.43 | % | ||||||||||
Portfolio turnover rate3 | 25 | % | 28 | % | 30 | % | 30 | % | 41 | % | ||||||||||
| WisdomTree U.S. Quality Growth Fund | For the Year Ended March 31, 2024 | For the Period December 15, 2022* through March 31, 2023 | ||||||
Net asset value, beginning of period | $ | 28.39 | $ | 25.11 | ||||
Investment operations: |
| |||||||
Net investment income1 | 0.10 | 0.03 | ||||||
Net realized and unrealized gain | 12.65 | 3.25 | ||||||
Total from investment operations | 12.75 | 3.28 | ||||||
Dividends to shareholders: |
| |||||||
Net investment income | (0.04 | ) | — | |||||
Net asset value, end of period | $ | 41.10 | $ | 28.39 | ||||
TOTAL RETURN2 | 44.93 | % | 13.06 | % | ||||
RATIOS/SUPPLEMENTAL DATA: |
| |||||||
Net assets, end of period (000’s omitted) | $ | 349,333 | $ | 2,839 | ||||
Ratios to average net assets of: |
| |||||||
Expenses | 0.28 | % | 0.28 | %4 | ||||
Net investment income | 0.29 | % | 0.45 | %4 | ||||
Portfolio turnover rate3 | 27 | % | 1 | % | ||||
| * | Commencement of operations. The commencement of operations date is considered to be the date that the Fund began trading in the secondary market. |
| 1 | Based on average shares outstanding. |
| 2 | Total return is calculated assuming an initial investment made at the net asset value at the beginning of the period, reinvestment of all dividends and distributions at net asset value during the period and redemption on the last day of the period. Total return calculated for a period of less than one year is not annualized. |
| 3 | Portfolio turnover rate is not annualized for fiscal periods less than one year and excludes the value of the portfolio securities received or delivered as a result of in-kind creations or redemptions of the Fund’s capital shares. Short-term securities with maturities less than or equal to 365 days are excluded from the portfolio turnover calculation. |
| 4 | Annualized. |
See Notes to Financial Statements.
| 130 | WisdomTree Trust |
Financial Highlights (continued)
WisdomTree Trust
Selected data for a share of beneficial interest outstanding throughout the period is presented below:
| WisdomTree U.S. SmallCap Dividend Fund | For the Year Ended March 31, 2024 | For the Year Ended March 31, 2023 | For the Year Ended March 31, 2022 | For the Year Ended March 31, 2021 | For the Year Ended March 31, 2020 | |||||||||||||||
Net asset value, beginning of year | $ | 28.56 | $ | 31.86 | $ | 31.09 | $ | 18.11 | $ | 27.54 | ||||||||||
Investment operations: |
| |||||||||||||||||||
Net investment income1 | 0.86 | 0.88 | 0.85 | 0.66 | 0.79 | |||||||||||||||
Net realized and unrealized gain (loss) | 4.12 | (3.31 | ) | 0.76 | 12.99 | (9.40 | ) | |||||||||||||
Total from investment operations | 4.98 | (2.43 | ) | 1.61 | 13.65 | (8.61 | ) | |||||||||||||
Dividends to shareholders: |
| |||||||||||||||||||
Net investment income | (0.84 | ) | (0.87 | ) | (0.84 | ) | (0.67 | ) | (0.82 | ) | ||||||||||
Net asset value, end of year | $ | 32.70 | $ | 28.56 | $ | 31.86 | $ | 31.09 | $ | 18.11 | ||||||||||
TOTAL RETURN2 | 17.79 | % | (7.59 | )% | 5.18 | % | 76.76 | % | (32.22 | )% | ||||||||||
RATIOS/SUPPLEMENTAL DATA: |
| |||||||||||||||||||
Net assets, end of year (000’s omitted) | $ | 1,996,438 | $ | 1,856,681 | $ | 1,881,545 | $ | 1,829,823 | $ | 1,316,919 | ||||||||||
Ratios to average net assets of: |
| |||||||||||||||||||
Expenses3,4 | 0.38 | % | 0.38 | % | 0.38 | % | 0.38 | % | 0.38 | % | ||||||||||
Net investment income | 2.93 | % | 2.98 | % | 2.66 | % | 2.78 | % | 2.94 | % | ||||||||||
Portfolio turnover rate5 | 33 | % | 38 | % | 39 | % | 53 | % | 50 | % | ||||||||||
| WisdomTree U.S. SmallCap Fund | For the Year Ended March 31, 2024 | For the Year Ended March 31, 2023 | For the Year Ended March 31, 2022 | For the Year Ended March 31, 2021 | For the Year Ended March 31, 2020 | |||||||||||||||
Net asset value, beginning of year | $ | 43.24 | $ | 47.94 | $ | 47.23 | $ | 22.38 | $ | 36.08 | ||||||||||
Investment operations: |
| |||||||||||||||||||
Net investment income1 | 0.62 | 0.62 | 0.73 | 0.44 | 0.51 | |||||||||||||||
Net realized and unrealized gain (loss) | 6.86 | (4.73 | ) | 0.78 | 24.85 | (13.66 | ) | |||||||||||||
Total from investment operations | 7.48 | (4.11 | ) | 1.51 | 25.29 | (13.15 | ) | |||||||||||||
Dividends to shareholders: |
| |||||||||||||||||||
Net investment income | (0.62 | ) | (0.59 | ) | (0.80 | ) | (0.44 | ) | (0.55 | ) | ||||||||||
Net asset value, end of year | $ | 50.10 | $ | 43.24 | $ | 47.94 | $ | 47.23 | $ | 22.38 | ||||||||||
TOTAL RETURN2 | 17.43 | % | (8.51 | )% | 3.11 | % | 113.74 | % | (36.87 | )% | ||||||||||
RATIOS/SUPPLEMENTAL DATA: |
| |||||||||||||||||||
Net assets, end of year (000’s omitted) | $ | 648,815 | $ | 570,765 | $ | 692,732 | $ | 609,327 | $ | 419,676 | ||||||||||
Ratios to average net assets of: |
| |||||||||||||||||||
Expenses3,4 | 0.38 | % | 0.38 | % | 0.38 | % | 0.38 | % | 0.38 | % | ||||||||||
Net investment income | 1.36 | % | 1.40 | % | 1.47 | % | 1.33 | % | 1.45 | % | ||||||||||
Portfolio turnover rate5 | 47 | % | 51 | % | 54 | % | 56 | % | 55 | % | ||||||||||
| 1 | Based on average shares outstanding. |
| 2 | Total return is calculated assuming an initial investment made at the net asset value at the beginning of the period, reinvestment of all dividends and distributions at net asset value during the period and redemption on the last day of the period. For the periods in which the investment advisor waived advisory fees, the total return would have been lower if certain expenses had not been waived (Notes 2 and 3). |
| 3 | Does not include expenses of the Underlying Funds in which the Fund invests. |
| 4 | The expense ratio includes investment advisory fee waivers. Without these investment advisory fee waivers, the expense ratio would have been unchanged. |
| 5 | Portfolio turnover rate excludes the value of the portfolio securities received or delivered as a result of in-kind creations or redemptions of the Fund’s capital shares. Short-term securities with maturities less than or equal to 365 days are excluded from the portfolio turnover calculation. |
See Notes to Financial Statements.
| WisdomTree Trust | 131 |
Financial Highlights (continued)
WisdomTree Trust
Selected data for a share of beneficial interest outstanding throughout the period is presented below:
| WisdomTree U.S. SmallCap Quality Dividend Growth Fund | For the Year Ended March 31, 2024 | For the Year Ended March 31, 2023 | For the Year Ended March 31, 2022 | For the Year Ended March 31, 2021 | For the Year Ended March 31, 2020 | |||||||||||||||
Net asset value, beginning of year | $ | 41.59 | $ | 44.65 | $ | 45.96 | $ | 25.02 | $ | 34.70 | ||||||||||
Investment operations: |
| |||||||||||||||||||
Net investment income1 | 1.08 | 1.17 | 1.14 | 0.94 | 0.80 | |||||||||||||||
Net realized and unrealized gain (loss) | 8.06 | (3.06 | ) | (1.32 | ) | 20.92 | (9.68 | ) | ||||||||||||
Total from investment operations | 9.14 | (1.89 | ) | (0.18 | ) | 21.86 | (8.88 | ) | ||||||||||||
Dividends to shareholders: |
| |||||||||||||||||||
Net investment income | (1.08 | ) | (1.17 | ) | (1.13 | ) | (0.92 | ) | (0.80 | ) | ||||||||||
Net asset value, end of year | $ | 49.65 | $ | 41.59 | $ | 44.65 | $ | 45.96 | $ | 25.02 | ||||||||||
TOTAL RETURN2 | 22.40 | % | (4.14 | )% | (0.45 | )% | 88.65 | % | (26.22 | )% | ||||||||||
RATIOS/SUPPLEMENTAL DATA: |
| |||||||||||||||||||
Net assets, end of year (000’s omitted) | $ | 347,821 | $ | 225,625 | $ | 224,833 | $ | 187,733 | $ | 73,802 | ||||||||||
Ratios to average net assets of: |
| |||||||||||||||||||
Expenses | 0.38 | % | 0.38 | % | 0.38 | % | 0.38 | % | 0.38 | % | ||||||||||
Net investment income | 2.49 | % | 2.81 | % | 2.49 | % | 2.67 | % | 2.29 | % | ||||||||||
Portfolio turnover rate3 | 51 | % | 51 | % | 60 | % | 83 | % | 51 | % | ||||||||||
| WisdomTree U.S. SmallCap Quality Growth Fund | For the Period January 25, 2024* through March 31, 2024 | |||
Net asset value, beginning of period | $ | 24.79 | ||
Investment operations: |
| |||
Net investment income1 | 0.04 | |||
Net realized and unrealized gain | 1.41 | |||
Total from investment operations | 1.45 | |||
Net asset value, end of period | $ | 26.24 | ||
TOTAL RETURN2 | 5.85 | % | ||
RATIOS/SUPPLEMENTAL DATA: |
| |||
Net assets, end of period (000’s omitted) | $ | 1,312 | ||
Ratios to average net assets of: |
| |||
Expenses | 0.38 | %4 | ||
Net investment income | 0.84 | %4 | ||
Portfolio turnover rate3 | 1 | % | ||
| * | Commencement of operations. The commencement of operations date is considered to be the date that the Fund began trading in the secondary market. |
| 1 | Based on average shares outstanding. |
| 2 | Total return is calculated assuming an initial investment made at the net asset value at the beginning of the period, reinvestment of all dividends and distributions at net asset value during the period and redemption on the last day of the period. Total return calculated for a period of less than one year is not annualized. |
| 3 | Portfolio turnover rate is not annualized for fiscal periods less than one year and excludes the value of the portfolio securities received or delivered as a result of in-kind creations or redemptions of the Fund’s capital shares. Short-term securities with maturities less than or equal to 365 days are excluded from the portfolio turnover calculation. |
| 4 | Annualized. |
See Notes to Financial Statements.
| 132 | WisdomTree Trust |
Financial Highlights (concluded)
WisdomTree Trust
Selected data for a share of beneficial interest outstanding throughout the period is presented below:
| WisdomTree U.S. Total Dividend Fund | For the Year Ended March 31, 2024 | For the Year Ended March 31, 2023 | For the Year Ended March 31, 20221 | For the Year Ended March 31, 20211 | For the Year Ended March 31, 20201 | |||||||||||||||
Net asset value, beginning of year | $ | 60.55 | $ | 64.52 | $ | 56.49 | $ | 39.19 | $ | 47.31 | ||||||||||
Investment operations: |
| |||||||||||||||||||
Net investment income2 | 1.60 | 1.60 | 1.43 | 1.33 | 1.38 | |||||||||||||||
Net realized and unrealized gain (loss) | 10.15 | (3.86 | ) | 7.94 | 17.30 | (8.13 | ) | |||||||||||||
Total from investment operations | 11.75 | (2.26 | ) | 9.37 | 18.63 | (6.75 | ) | |||||||||||||
Dividends to shareholders: |
| |||||||||||||||||||
Net investment income | (1.55 | ) | (1.71 | ) | (1.34 | ) | (1.33 | ) | (1.37 | ) | ||||||||||
Net asset value, end of year | $ | 70.75 | $ | 60.55 | $ | 64.52 | $ | 56.49 | $ | 39.19 | ||||||||||
TOTAL RETURN3 | 19.75 | % | (3.44 | )% | 16.73 | % | 48.15 | % | (14.75 | )% | ||||||||||
RATIOS/SUPPLEMENTAL DATA: |
| |||||||||||||||||||
Net assets, end of year (000’s omitted) | $ | 1,223,973 | $ | 1,077,788 | $ | 1,080,629 | $ | 875,531 | $ | 634,956 | ||||||||||
Ratios to average net assets of: |
| |||||||||||||||||||
Expenses | 0.28 | % | 0.28 | % | 0.28 | % | 0.28 | % | 0.28 | %4,5 | ||||||||||
Net investment income | 2.54 | % | 2.64 | % | 2.33 | % | 2.73 | % | 2.82 | % | ||||||||||
Portfolio turnover rate6 | 15 | % | 19 | % | 22 | % | 22 | % | 16 | % | ||||||||||
| WisdomTree U.S. Value Fund | For the Year Ended March 31, 2024 | For the Year Ended March 31, 2023 | For the Year Ended March 31, 20227 | For the Year Ended March 31, 20217 | For the Year Ended March 31, 20207 | |||||||||||||||
Net asset value, beginning of year | $ | 58.65 | $ | 61.47 | $ | 56.19 | $ | 32.52 | $ | 42.35 | ||||||||||
Investment operations: |
| |||||||||||||||||||
Net investment income2 | 1.27 | 1.17 | 1.08 | 0.76 | 0.76 | |||||||||||||||
Net realized and unrealized gain (loss) | 16.79 | (2.83 | ) | 5.19 | 23.79 | (9.88 | ) | |||||||||||||
Total from investment operations | 18.06 | (1.66 | ) | 6.27 | 24.55 | (9.12 | ) | |||||||||||||
Dividends to shareholders: |
| |||||||||||||||||||
Net investment income | (1.19 | ) | (1.16 | ) | (0.99 | ) | (0.88 | ) | (0.71 | ) | ||||||||||
Net asset value, end of year | $ | 75.52 | $ | 58.65 | $ | 61.47 | $ | 56.19 | $ | 32.52 | ||||||||||
TOTAL RETURN3 | 31.10 | % | (2.54 | )% | 11.16 | % | 76.07 | % | (21.86 | )% | ||||||||||
RATIOS/SUPPLEMENTAL DATA: |
| |||||||||||||||||||
Net assets, end of year (000’s omitted) | $ | 277,146 | $ | 147,214 | $ | 113,714 | $ | 58,441 | $ | 61,795 | ||||||||||
Ratios to average net assets of: |
| |||||||||||||||||||
Expenses | 0.12 | % | 0.12 | %4,5 | 0.30 | %8 | 0.38 | % | 0.38 | % | ||||||||||
Net investment income | 1.97 | % | 2.02 | % | 1.77 | % | 1.76 | % | 1.75 | % | ||||||||||
Portfolio turnover rate6 | 64 | % | 66 | % | 62 | % | 59 | % | 101 | % | ||||||||||
| 1 | Per share amounts were adjusted to reflect a 2:1 share split effective December 23, 2021. |
| 2 | Based on average shares outstanding. |
| 3 | Total return is calculated assuming an initial investment made at the net asset value at the beginning of the period, reinvestment of all dividends and distributions at net asset value during the period and redemption on the last day of the period. For the periods in which the investment advisor waived advisory fees, the total return would have been lower if certain expenses had not been waived (Notes 2 and 3). |
| 4 | Does not include expenses of the Underlying Funds in which the Fund invests. |
| 5 | The expense ratio includes investment advisory fee waivers. Without these investment advisory fee waivers, the expense ratio would have been unchanged. |
| 6 | Portfolio turnover rate excludes the value of the portfolio securities received or delivered as a result of in-kind creations or redemptions of the Fund’s capital shares. Short-term securities with maturities less than or equal to 365 days are excluded from the portfolio turnover calculation. |
| 7 | Per share amounts were adjusted to reflect a 2:1 share split effective June 10, 2021. |
| 8 | Prior to January 3, 2022, the Fund’s annual advisory fee rate was 0.38% and, thereafter, was reduced to 0.12% per annum. |
See Notes to Financial Statements.
| WisdomTree Trust | 133 |
1. ORGANIZATION
WisdomTree Trust (the “Trust”) is registered under the Investment Company Act of 1940, as amended (the “1940 Act”), as an open-end management investment company. The Trust was established as a Delaware statutory trust on December 15, 2005 and is authorized to have multiple series of portfolios (each a “Fund”, collectively, the “Funds”). These notes relate only to the Funds listed below. In accordance with Accounting Standards Codification Topic 946, Financial Services-Investment Companies, each Fund listed below qualifies as an investment company and is applying the accounting and reporting guidance for investment companies.
| Fund | Commencement of Operations | |||
WisdomTree U.S. AI Enhanced Value Fund (“U.S. AI Enhanced Value Fund”) | June 16, 2006 | |||
WisdomTree U.S. High Dividend Fund (“U.S. High Dividend Fund”) | June 16, 2006 | |||
WisdomTree U.S. LargeCap Dividend Fund (“U.S. LargeCap Dividend Fund”) | June 16, 2006 | |||
WisdomTree U.S. LargeCap Fund (“U.S. LargeCap Fund”) | February 23, 2007 | |||
WisdomTree U.S. MidCap Dividend Fund (“U.S. MidCap Dividend Fund”) | June 16, 2006 | |||
WisdomTree U.S. MidCap Fund (“U.S. MidCap Fund”) | February 23, 2007 | |||
WisdomTree U.S. MidCap Quality Growth Fund (“U.S. MidCap Quality Growth Fund”) | January 25, 2024 | |||
WisdomTree U.S. Multifactor Fund (“U.S. Multifactor Fund”) | June 29, 2017 | |||
WisdomTree U.S. Quality Dividend Growth Fund (“U.S. Quality Dividend Growth Fund”) | May 22, 2013 | |||
WisdomTree U.S. Quality Growth Fund (“U.S. Quality Growth Fund”) | December 15, 2022 | |||
WisdomTree U.S. SmallCap Dividend Fund (“U.S. SmallCap Dividend Fund”) | June 16, 2006 | |||
WisdomTree U.S. SmallCap Fund (“U.S. SmallCap Fund”) | February 23, 2007 | |||
WisdomTree U.S. SmallCap Quality Dividend Growth Fund (“U.S. SmallCap Quality Dividend Growth Fund”) | July 25, 2013 | |||
WisdomTree U.S. SmallCap Quality Growth Fund (“U.S. SmallCap Quality Growth Fund”) | January 25, 2024 | |||
WisdomTree U.S. Total Dividend Fund (“U.S. Total Dividend Fund”) | June 16, 2006 | |||
WisdomTree U.S. Value Fund (“U.S. Value Fund”) | February 23, 2007 | |||
Each Fund, except the U.S. AI Enhanced Value Fund and U.S. Value Fund, seeks to track the price and yield performance, before fees and expenses, of a particular index (“Index”) developed by WisdomTree, Inc. (“WisdomTree”) or an Index developed by a third party. The U.S. AI Enhanced Value Fund and the U.S. Value Fund are actively managed using a model-based approach seeking income and capital appreciation. WisdomTree is the parent company of WisdomTree Asset Management, Inc. (“WTAM”), the investment adviser to each Fund and the Trust. “WisdomTree” is a registered trademark of WisdomTree and has been licensed for use by the Trust. Each Fund described herein is considered to be non-diversified as defined under the 1940 Act.
In the normal course of business, the Funds may enter into contracts that contain a variety of representations or that provide indemnification for certain liabilities. The Funds’ maximum exposure under these arrangements is unknown, as this would involve future claims that may be made against the Funds that have not yet occurred. However, the Funds have not had prior claims or losses pursuant to these contracts and believe such exposure to be remote.
2. SIGNIFICANT ACCOUNTING POLICIES
The Financial Accounting Standards Board (“FASB”) Accounting Standards Codification (the “Codification”) is the exclusive reference of authoritative U.S. generally accepted accounting principles (“GAAP”) recognized by the FASB to be applied by nongovernmental entities. Rules and interpretive releases of the Securities and Exchange Commission (“SEC”) under authority of federal laws are also sources of authoritative GAAP for SEC registrants.
The following is a summary of significant accounting policies followed by the Funds:
Use of Estimates — The preparation of financial statements in conformity with GAAP requires management to make certain estimates and assumptions that affect the reported amounts of assets and liabilities and disclosure of contingent assets and liabilities at the date of the financial statements and the reported amounts of increases and decreases in the net assets from operations during the reporting period. Actual results could differ from those estimates.
Investment Valuation — The net asset value (“NAV”) of each Fund’s shares is calculated each day a Fund is open for business as of the regularly scheduled close of regular trading on the New York Stock Exchange, normally 4:00 p.m. Eastern time (the “NAV Calculation Time”). NAV per share is calculated by dividing a Fund’s net assets by the number of Fund shares outstanding. Each Fund issues and redeems shares at NAV only in large blocks of shares known as creation units, which only certain institutions (e.g., broker-dealers) may purchase or redeem. Shares of each Fund are listed on a national securities exchange and trade at market prices. Most investors will buy and sell shares in the secondary market through brokers. Because Fund shares trade at market prices rather than NAV, shares may trade at a price greater than NAV or less than NAV. In calculating each Fund’s NAV, investments are
| 134 | WisdomTree Trust |
Notes to Financial Statements (continued)
valued under policies approved by the Board of Trustees of the Trust (the “Board” or “Board of Trustees”). Equity securities (including preferred stock) traded on any recognized U.S. or non-U.S. exchange are valued at the last sale price or official closing price on the exchange on which they are principally traded. Unlisted equity securities (including preferred stock) are valued at the last sale price or, if no sale price is available, at the mean between the highest bid and lowest ask price. Each Fund may invest in money market funds which are valued at their NAV per share and exchange-traded funds (“ETFs” or “ETF”) or exchange-traded notes (“ETNs” or “ETN”) which are valued at their last sale or official closing price on the exchange on which they are principally traded or at their NAV per share in instances where the ETF or ETN has not traded on its principal exchange.
Pursuant to Board-approved valuation procedures established by the Trust and WTAM, the Board has appointed WTAM as the Funds’ valuation designee (the “Valuation Designee”) to perform all fair valuations of the Funds’ portfolio investments, subject to the Board’s oversight. As the Valuation Designee, WTAM has established procedures for its fair valuation of a Fund’s portfolio investments. These procedures address, among other things, determining when market quotations are not readily available or reliable and the methodologies to be used for determining the fair value of investments, as well as the use and oversight of third-party pricing services for fair valuation. The Valuation Designee is comprised of senior representatives of WTAM and reports to the Board of Trustees on a quarterly basis. In the event that a financial instrument cannot be valued based upon a price from the exchange or system on which it is principally traded, independent pricing service provider or broker-dealer quotation, or such prices are deemed to not reflect current market value, the Valuation Designee may value the financial instrument in good faith under the policies and procedures approved by the Board of Trustees based on current facts and circumstances. Securities that may be valued using “fair value” pricing may include, but are not limited to, securities for which there are no current market quotations, securities whose issuer is in default or bankruptcy, securities subject to corporate actions (such as mergers or reorganizations), securities subject to non-U.S. investment limits or currency controls, and securities affected by “significant events”. An example of a significant event is an event occurring after the close of the market in which a security trades but before a Fund’s next NAV Calculation Time that may materially affect the value of a Fund’s investment (e.g., government action, natural disaster, or significant market fluctuation). When fair value pricing is employed, the prices of securities used by a Fund to calculate its NAV may differ from quoted or published prices for the same securities.
Fair Value Measurement — In accordance with Codification Topic 820 (“ASC 820”), Fair Value Measurements and Disclosures, fair value is defined as the price that would be received to sell an asset or paid to transfer a liability in an orderly transaction between market participants at the measurement date. The Valuation Designee will perform other procedures (consistent with GAAP) to value an investment when a market quote is not available. ASC 820 established a three-tier hierarchy of inputs to be used when determining fair value measurements for disclosure purposes. Inputs refer broadly to the assumptions that market participants would use in pricing the asset or liability, including assumptions about risk — for example, the risk inherent in a particular valuation technique used to measure fair value (such as a pricing model) and/or the risk inherent in the inputs to the valuation technique. Inputs may be observable or unobservable. Observable inputs reflect the assumptions market participants would use in pricing the asset or liability. Observable inputs are based on market data obtained from sources independent of the reporting entity. Unobservable inputs reflect the reporting entity’s own assumptions about the assumptions market participants would use in pricing the asset or liability. Unobservable inputs are based on the best information available in the circumstances. The three-tier hierarchy of inputs is summarized in the three broad levels listed below:
Level 1 – quoted prices in active markets for identical securities
Level 2 – other significant observable inputs (including quoted prices for similar securities, interest rates,
prepayment speeds, credit risk, etc.)
Level 3 – significant unobservable inputs (including each Fund’s assumptions in determining the fair value of investments)
The inputs or methodology used for valuation are not necessarily an indication of the risk associated with investing in those investments.
Investments that use Level 2 or Level 3 inputs may include, but are not limited to: (i) an unlisted security related to corporate actions; (ii) a restricted security (e.g., one that may not be publicly sold without registration under the Securities Act of 1933, as amended); (iii) a security whose trading has been suspended (either due to events affecting the issuer of the security specifically or events affecting the primary trading exchange more broadly) or which has been de-listed from its primary trading exchange; (iv) a security that is thinly traded; (v) a security in default or bankruptcy proceedings for which there is no current market quotation or market activity; (vi) a security affected by currency controls or restrictions; and (vii) a security affected by a significant event (e.g., an event that occurs after the close of the markets in which the security is traded but before the time as of which a Fund’s NAV is computed and that may materially affect the value of the Fund’s investments).
| WisdomTree Trust | 135 |
Notes to Financial Statements (continued)
The valuation techniques and significant inputs used in determining the fair market value measurements for Level 2 and Level 3 positions are as follows:
Financial instruments are generally valued by independent pricing service providers that use broker-dealer quotations, reported trades or valuation estimates from their internal pricing models. Depending on the type of financial instrument, the independent pricing service providers’ internal pricing models may use inputs that are observable such as issuer details (e.g., credit rating, debt ranking, coupon date, maturity date, etc.), interest rates, yield curves, prepayment speeds, credit risks/spreads, default rates and quoted prices for similar assets. Financial instruments that use similar valuation techniques and observable inputs as described above and have an appropriate level of market activity are categorized as Level 2 of the fair value hierarchy, otherwise a Level 3 fair value classification is appropriate.
Determination of a fair value by the Valuation Designee may include significant unobservable inputs and therefore such financial instruments would be reflected as a Level 3 of the fair value hierarchy. The Valuation Designee may employ a market-based valuation approach which may use, among other potential considerations, related or comparable securities, recent transactions, market multiples, and other relevant information to determine fair value. The Valuation Designee may also use an income-based valuation approach in which anticipated future cash flows of the financial instrument are discounted to calculate fair value.
The summary of fair valuations according to the inputs used in valuing each Fund’s assets as of the measurement date is included in a “Fair Valuation Summary” supplementary table in each applicable Fund’s Schedule of Investments.
During the fiscal year or period ended March 31, 2024, there were no significant transfers into or out of Level 3 of the fair value hierarchy.
Derivatives and Hedging Disclosure — Codification Topic 815 (“ASC 815”), Derivatives and Hedging, requires qualitative disclosures about objectives and strategies for using derivatives, quantitative disclosures about fair value amounts of gains and losses on derivative instruments, and disclosures about credit-risk-related contingent features in derivative agreements. All of the derivative instruments disclosed and described herein are subject to risk.
For the fiscal year ended March 31, 2024, the effects of derivative instruments on each applicable Fund’s financial performance as reflected in the Statements of Operations are presented in the summary below:
| Fund | Amount of Realized Gain on Derivatives Recognized1 | |||
U.S. Multifactor Fund |
| |||
Equity risk | $ | 101,091 | ||
U.S. SmallCap Quality Dividend Growth Fund |
| |||
Equity risk | 72,103 | |||
U.S. Value Fund |
| |||
Equity risk | 11,285 | |||
| 1 | Realized gains on derivatives are located on the Statements of Operations as follows: |
Equity risk | Net realized gain from futures contracts |
During the fiscal year ended March 31, 2024, the volume of derivative activity (based on the average of month-end notional balances, except where footnoted) for each Fund was as follows:
| Average Notional | ||||
| Fund | Futures contracts (long) | |||
U.S. Multifactor Fund |
| |||
Equity risk1 | $ | 970,373 | ||
U.S. SmallCap Quality Dividend Growth Fund |
| |||
Equity risk1 | 215,906 | |||
U.S. Value Fund |
| |||
Equity risk1 | 135,221 | |||
| 1 | The volume of derivative activity for the period is based on intra-month balances. |
Investment Transactions and Investment Income — Investment transactions are recorded as of the date that the securities are purchased or sold (trade date). Realized gains and losses on sales of portfolio securities are calculated using the identified-cost method. Dividend income (less foreign taxes withheld, if any) is recognized on the ex-dividend date. Non-cash dividend income is recognized on the ex-dividend date at the fair value of securities to be received. Upon notification from real estate investment trust (“REIT”) issuers or as estimated by management, all or a portion of the dividend income received from a REIT may be redesignated
| 136 | WisdomTree Trust |
Notes to Financial Statements (continued)
as a reduction of cost of the related investment and/or as a realized gain. On each measurement date, the Funds evaluate the collectability of receivable balances. Generally, the Funds will write-off dividend receivable balances that are canceled by the issuer as of the date that the dividend receivable cancellation notification was publicly made available or when it becomes probable that dividends will not be collected and the amount of uncollectable dividends can be reasonably estimated. Income earned from securities lending activities (i.e., securities lending income), net of fees payable to the securities borrower and/or securities lending agent, is accrued daily.
Foreign Taxes — The Funds may be subject to foreign taxes (a portion of which may be reclaimable or refundable) on foreign income. All foreign taxes are recorded in accordance with the applicable foreign tax regulations and tax rates that exist in the foreign jurisdictions in which the Funds invest. These foreign taxes, if any, are accrued and applied to foreign income as the foreign income is earned and are reflected on the Statements of Operations as follows: foreign taxes withheld on dividends are presented as a reduction to investment income in “Less: Foreign withholding taxes on dividends”, foreign taxes on capital gains from investment transactions, if any, are included in “Net realized gain (loss) from investment transactions”, and deferred foreign taxes on net unrealized appreciation on investments, if any, are included in “Net increase (decrease) in unrealized appreciation/depreciation on investment transactions”. Foreign taxes payable or deferred as of March 31, 2024, if any, are disclosed in the Statements of Assets and Liabilities in “Payables: Foreign capital gains tax”.
Expenses — Under the investment advisory agreement for each Fund, except for Funds that commenced operations on or after March 26, 2013, WTAM has agreed to pay all expenses of the Trust, except for: (i) brokerage expenses and other expenses (such as stamp taxes) connected with the execution of portfolio transactions or in connection with creation and redemption transactions; (ii) legal fees or expenses in connection with any arbitration, litigation or pending or threatened arbitration or litigation, including any settlements in connection therewith; (iii) compensation and expenses of trustees who are not interested persons of the Funds (“Independent Trustees”); (iv) compensation and expenses of counsel to the Independent Trustees; (v) compensation and expenses of the Trust’s Chief Compliance Officer (“CCO”); (vi) extraordinary expenses; (vii) distribution fees and expenses paid by the Trust under any distribution plan adopted pursuant to Rule 12b-1 under the 1940 Act; and (viii) the advisory fee payable to WTAM.
Under the investment advisory agreement for Funds that commenced operations on or after March 26, 2013, WTAM has agreed to pay all expenses of the Trust, except for: (i) brokerage expenses and other fees, charges, taxes, levies or expenses (such as stamp taxes) incurred in connection with the execution of portfolio transactions or in connection with creation and redemption transactions (including without limitation any fees, charges, taxes, levies or expenses related to the purchase or sale of an amount of any currency, or the patriation or repatriation of any security or other asset, related to the execution of portfolio transactions or any creation or redemption transactions); (ii) legal fees or expenses in connection with any arbitration, litigation or pending or threatened arbitration or litigation, including any settlements in connection therewith; (iii) compensation and expenses of each Independent Trustee; (iv) compensation and expenses of counsel to the Independent Trustees; (v) compensation and expenses of the Trust’s CCO; (vi) extraordinary expenses (in each case as determined by a majority of the Independent Trustees); (vii) distribution fees and expenses paid by the Trust under any distribution plan adopted pursuant to Rule 12b-1 under the 1940 Act; (viii) interest and taxes of any kind or nature (including, but not limited to, income, excise, transfer and withholding taxes); (ix) fees and expenses related to the provision of securities lending services; and (x) the advisory fee payable to WTAM.
Acquired fund fees and expenses (“AFFEs”) (which are fees and expenses incurred indirectly by a Fund through its investments in certain underlying investment companies) are not operating expenses of the Funds and are not paid by WTAM.
Pursuant to a separate contractual arrangement, WTAM arranges for the provision of CCO services with respect to each Fund, and is liable and responsible for, and administers, payments to the CCO, the Independent Trustees and counsel to the Independent Trustees. WTAM receives a fee, as shown on the Statements of Operations under “Service fees”, of up to 0.0044% per annum of each Fund’s average daily net assets for providing such services and paying such expenses. WTAM provides CCO services to the Trust.
Futures Contracts — The U.S. Multifactor Fund, U.S. SmallCap Quality Dividend Growth Fund and U.S. Value Fund each utilized equity futures contracts on a temporary basis during the fiscal year to obtain market exposure consistent with their investment objective during each Fund’s periodic portfolio rebalance. When a Fund purchases a listed futures contract, it agrees to purchase a specified reference asset (e.g., commodity, currency, equity, digital asset or U.S. Treasury security, collectively herein, “Reference Asset”) at a specified future date. When a Fund sells a listed futures contract, it agrees to sell a specified Reference Asset at a future date. The price at which the purchase and sale will take place is fixed when the Fund enters into the contract. A Fund may also cash settle upon the expiration date of a futures contract in which no physical delivery (or receipt) of the specified Reference Asset comprising the futures contract is made. Instead, settlement in cash would occur upon the expiration of the contract, with the cash settlement being the difference between the contract price and the actual price of the specified Reference Asset at the expiration date. The exchange clearing corporation is the ultimate counterparty for all exchange-listed contracts, so credit risk is limited to the creditworthiness of the exchange clearing corporation.
Upon entering into a futures contract, a Fund is required to deliver to a broker an amount of cash and/or U.S. government securities equal to a certain percentage of the contract amount. This amount is known as the “initial margin”. Cash deposited as
| WisdomTree Trust | 137 |
Notes to Financial Statements (continued)
initial margin, if any, is shown as “Deposits at broker for futures contracts” in the Statements of Assets and Liabilities, and U.S. government securities deposited, if any, are designated in the Schedule of Investments. Subsequent payments, known as “variation margin”, generally are made or received by the Fund each day or at other agreed-upon time periods depending on the fluctuations in the value of the underlying futures contracts, except that in the case of certain futures contracts, variation margin payments may be made or received when the futures contract expires. Variation margin is recorded for financial statement purposes on a daily basis as an unrealized gain or loss on futures until the financial futures contract is closed, at which time the unrealized net gain or loss is reclassified to realized gain or loss on futures. The Funds have adopted a derivatives risk management program pursuant to Rule 18f-4 under the 1940 Act to assess and manage the Funds’ derivatives risk. Rule 18f-4 limits the amount of derivatives a fund can enter into and replaces the asset segregation framework previously used by the Funds to comply with Section 18 of the 1940 Act.
As of March 31, 2024, there were no open futures contracts in the Funds.
Securities Lending — Each Fund may lend portfolio securities to certain creditworthy borrowers, including the Funds’ securities lending agent. It is the Funds’ policy that, at origination, all loans are secured by collateral of at least 102% of the value of U.S. securities loaned and 105% of the value of foreign securities loaned. Collateral in the form of cash and/or securities issued or guaranteed by the U.S. government or its agencies, equivalent to at least 100% of the market value of securities, is maintained at all times. The cash collateral can be invested in certain money market mutual funds which also have exposure to the fluctuations of the market. The values of the investments of cash collateral for securities on loan along with the obligations to return such collateral are included on the Statements of Assets and Liabilities. The total value of securities received as collateral for securities on loan is included in a footnote following each Schedule of Investments, but is not included within the Statements of Assets and Liabilities because the receiving Fund does not have the right to sell or repledge the securities received as collateral. As compensation for lending its securities, each Fund retains all or a portion of the interest received on investment of cash collateral or receives a fee from the borrower (net of any fee rebates paid to the borrower). The lending agent receives a portion of the income earned by the Funds in connection with the lending program. The net securities lending income earned by the Funds is disclosed on the Statements of Operations. The dividend and interest income earned on the securities loaned is accounted for in the same manner as other dividend and interest income. The borrower pays to the Funds an amount equal to any dividends or interest received on loaned securities. Dividends received while a security is out on loan are not considered Qualified Dividend Income (“QDI”) under the specific criteria issued by the Internal Revenue Service and are subject to taxation at the shareholder’s ordinary income tax rate instead of the lower long-term capital gains tax rate. Lending portfolio securities could result in a loss or delay in recovering each Fund’s securities if the borrower defaults. In the event of a borrower default with respect to the failure to return to each Fund some or all of the securities loaned, the securities lending agent shall indemnify each Fund against the failure of the borrower if the value of the collateral received is insufficient to cover the market value of the securities loaned.
Master Netting Arrangements — Codification Topic 210 (“ASC 210”), Balance Sheet, requires disclosures generally intended to (i) help investors and other financial statement users to better assess the effect or potential effect of offsetting arrangements on a company’s financial position, (ii) improve transparency in the reporting of how companies mitigate credit risk, and (iii) facilitate comparisons between those entities that prepare their financial statements on the basis of GAAP and those entities that prepare their financial statements on the basis of international financial reporting standards. ASC 210 requires entities to disclose (i) gross and net information about both instruments and transactions eligible for offset in the financial statements, and (ii) instruments and transactions subject to an agreement similar to a master netting agreement. ASC 210 is limited in scope to the following financial instruments, to the extent they are offset in the financial statements or subject to an enforceable master netting arrangement or similar agreement: (i) recognized derivative instruments accounted for under ASC 815 (Derivatives and Hedging); (ii) repurchase agreements and reverse repurchase agreements; and (iii) securities borrowing and securities lending transactions.
The Funds’ securities lending activities are governed by a Securities Lending Authorization Agreement (“Lending Agreement”) between the Funds and the lending agent. The Lending Agreement authorizes the lending agent to lend qualifying U.S. and foreign securities held by a Fund to approved borrowers (each a “Borrower”). To mitigate borrower risk, a Fund typically receives from a Borrower collateral in the form of U.S. dollar cash and/or securities issued or guaranteed by the U.S. government or its agencies in excess of the market value of the securities loaned. Under the provisions of the Lending Agreement, a Fund shall have, as to the collateral, all of the rights and remedies of a secured party under applicable law. A Fund is exposed to risk of loss if a Borrower defaults on its obligation to return borrowed securities and the value of the collateral a Fund received is insufficient to cover the market value of the securities loaned. Also, the lending agent is permitted to invest the cash collateral it receives from a Borrower into a money market fund which is subject to market fluctuation. Therefore, a Fund is exposed to risk of loss if the value of invested cash collateral is insufficient to satisfy the Fund’s obligation to return the full amount owed to such Borrower. However, in the event of a borrower default with respect to the failure to return to each Fund some or all of the securities loaned, the securities lending agent shall indemnify each Fund against the failure of the borrower if the value of the collateral received is insufficient to cover the market value of the securities loaned.
For financial reporting purposes, the Funds elect to not offset assets and liabilities subject to the Lending Agreement or similar arrangements in the Statements of Assets and Liabilities. Therefore, all qualifying transactions, if any at March 31, 2024, are
| 138 | WisdomTree Trust |
Notes to Financial Statements (continued)
presented on a gross basis in the Statements of Assets and Liabilities. As of March 31, 2024, certain of the Funds had securities on loan and the value of the related collateral received by each of those Funds exceeded the value of the securities loaned by each of those Funds. The value of the securities loaned by each Fund is located in the Statements of Assets and Liabilities in “Investments in securities, at value” and also in the footnotes below the Schedules of Investments. In addition, a breakout of the total amount of cash and non-cash securities lending collateral received is located in the footnotes below the Schedules of Investments.
Short-Term Investments — Each Fund may invest a portion of its assets in high-quality money market instruments on an ongoing basis to provide liquidity or for other reasons. The instruments include short-term obligations issued by the U.S. government, its agencies, non-U.S. government agencies, negotiable certificates of deposit (“CDs”), fixed time deposits and bankers’ acceptances of U.S. and foreign banks and similar institutions, commercial papers, repurchase agreements and money market funds. CDs are short-term negotiable obligations of commercial banks. Time deposits are non-negotiable deposits maintained in banking institutions for specified periods of time at stated interest rates. Banker’s acceptances are time drafts drawn on commercial banks by borrowers, usually in connection with international transactions.
Tax Information and Dividends and Distributions to Shareholders — It is each Fund’s policy to comply with all requirements of the Internal Revenue Code of 1986, as amended (the “Code”). A portion of the Code, known as subchapter M (“Subchapter M”), addresses the ways by which investment companies and investment trusts may pass income through to shareholders in order to avoid double taxation. Each Fund intends to qualify for and to elect treatment as a separate Regulated Investment Company (“RIC”) under Subchapter M of the Code so that it will not be subject to federal income tax on income and gains that are timely distributed to Fund shareholders. Accordingly, no provision for U.S. federal income taxes is required. In order to qualify for the special tax treatment accorded to RICs and their shareholders, each Fund must, among other things, distribute with respect to each taxable year an amount equal to or greater than the sum of 90% of its investment company taxable income and 90% of its net tax-exempt interest income. There can be no guarantee that a Fund will pay dividends. Taxable net realized gains from investment transactions, reduced by capital loss carryforwards, if any, are declared and distributed to shareholders at least annually. The capital loss carryforward amount, if any, is available to offset future net capital gains. The Funds may occasionally be required to make supplemental distributions at some other time during the year. The Trust reserves the right to declare special distributions if, in its reasonable discretion, such action is necessary or advisable to preserve the status of each Fund as a RIC or to avoid imposition of income or excise taxes on undistributed income. Dividends and distributions to shareholders are recorded on the ex-dividend date. The amount of dividends and distributions from net investment income and net realized capital gains is determined in accordance with the requirements of the Code and the U.S. Treasury regulations (i.e., tax basis) which may differ to amounts determined under GAAP (i.e., book basis). These book/tax differences are either considered temporary or permanent in nature. To the extent these differences are permanent in nature, such amounts are reclassified within the components of net assets based on their Federal tax basis treatment; temporary differences do not require reclassification. Dividends and distributions that exceed earnings and profit for tax purposes are reported for tax purposes as a return of capital.
3. ADVISORY FEES AND OTHER TRANSACTIONS WITH AFFILIATES
WTAM has overall responsibility for the general management and administration of the Trust. WTAM provides an investment program for each Fund. WTAM has arranged for Mellon Investments Corporation (“Mellon”) to provide sub-advisory services to the Funds, except for U.S. AI Enhanced Value Fund. Prior to January 7, 2022, sub-advisory services for the U.S. AI Enhanced Value Fund were provided by Mellon and thereafter Voya Investment Management Co., LLC (“Voya IM”). Mellon and Voya IM are compensated by WTAM at no additional cost to the Funds. WTAM also arranges for transfer agency, custody, fund accounting, fund administration, securities lending and all other non-distribution related services necessary for the Funds to operate, which are generally under separate agreements entered into between the Trust on behalf of the Funds and the applicable service provider. Under the investment advisory agreement for each Fund, WTAM agrees to pay all expenses of the Funds, except for certain expenses described in Note 2.
Pursuant to a separate contractual arrangement, as also described in Note 2, WTAM arranges for the provision of CCO services with respect to each Fund, and is liable and responsible for, and administers, payments to the CCO, the Independent Trustees and counsel to the Independent Trustees in exchange for a fee, accrued daily and paid monthly in arrears, of up to 0.0044% per annum of each Fund’s average daily net assets.
| WisdomTree Trust | 139 |
Notes to Financial Statements (continued)
WTAM expects to receive annual advisory fees from each Fund, based on a percentage of the Fund’s average daily net assets, as shown in the following table:
| Fund | Advisory Fee Rate | |||
U.S. AI Enhanced Value Fund | 0.38 | % | ||
U.S. High Dividend Fund | 0.38 | % | ||
U.S. LargeCap Dividend Fund | 0.28 | % | ||
U.S. LargeCap Fund | 0.08 | % | ||
U.S. MidCap Dividend Fund | 0.38 | % | ||
U.S. MidCap Fund | 0.38 | % | ||
U.S. MidCap Quality Growth Fund1 | 0.38 | % | ||
U.S. Multifactor Fund | 0.28 | % | ||
U.S. Quality Dividend Growth Fund | 0.28 | % | ||
U.S. Quality Growth Fund | 0.28 | % | ||
U.S. SmallCap Dividend Fund | 0.38 | % | ||
U.S. SmallCap Fund | 0.38 | % | ||
U.S. SmallCap Quality Dividend Growth Fund | 0.38 | % | ||
U.S. SmallCap Quality Growth Fund1 | 0.38 | % | ||
U.S. Total Dividend Fund | 0.28 | % | ||
U.S. Value Fund | 0.12 | % | ||
| 1 | Since the commencement of operations on January 25, 2024. |
Affiliated holdings are investments in entities in which the Fund owns 5% or more of the outstanding voting securities or are investments in entities which are under common ownership or control. Transactions in shares of affiliated ETFs for the fiscal year ended March 31, 2024, as applicable, are included in an “Investment in Affiliates” supplementary table in each applicable Fund’s Schedule of Investments. For these transactions, WTAM voluntarily waives a portion of its advisory fees, that it would otherwise charge, for each Fund’s investment in affiliated funds. The waivers may be reduced to offset the incremental costs related to these investments (e.g., fund accounting, safekeeping, transaction fees, etc.) that are paid by WTAM out of its advisory fee. The dollar amount of advisory fees waived during the period for the Funds, if any, are included in the Statements of Operations in “Expense waivers”.
During the fiscal year ended March 31, 2024, certain Funds engaged in purchase and sale transactions with funds that have a common investment adviser, WTAM. These interfund purchase and sale transactions were effected in accordance with Rule 17a-7 under the 1940 Act. For the fiscal year ended March 31, 2024, the cost of purchases, proceeds from sales and the net realized gain or loss recognized upon the disposal of securities resulting from interfund transactions are shown in the following table:
| Fund | Purchases | Sales | Net Realized Gain/(Loss) | |||||||||
U.S. High Dividend Fund | $ | 83,651,132 | $ | 28,920,750 | $ | 2,847,239 | ||||||
U.S. LargeCap Dividend Fund | 85,356,369 | 82,394,885 | (10,434,135 | ) | ||||||||
U.S. LargeCap Fund | 24,598,820 | 20,792,632 | (2,417,067 | ) | ||||||||
U.S. MidCap Dividend Fund | 142,718,688 | 300,537,030 | (54,073,636 | ) | ||||||||
U.S. MidCap Fund | 85,239,914 | 78,078,305 | (12,992,204 | ) | ||||||||
U.S. Quality Dividend Growth Fund | 176,554,489 | 206,469,975 | (8,756,796 | ) | ||||||||
U.S. SmallCap Dividend Fund | 216,757,816 | 163,688,117 | 3,940,400 | |||||||||
U.S. SmallCap Fund | 77,659,283 | 46,554,478 | 9,559,743 | |||||||||
U.S. SmallCap Quality Dividend Growth Fund | 69,700,593 | 30,817,565 | (2,187,510 | ) | ||||||||
U.S. Total Dividend Fund | 24,580,163 | 28,563,530 | (2,289,675 | ) | ||||||||
| 140 | WisdomTree Trust |
Notes to Financial Statements (continued)
WTAM and/or WisdomTree (collectively herein, “WT”) may from time to time own shares of a Fund. As of and for the fiscal year ended March 31, 2024, WT held shares of and received distributions from the following Funds, which were purchased through an unaffiliated broker in ordinary brokerage transactions in the secondary market in which the Funds’ shares trade:
| At March 31, 2024 | For the Fiscal Year Ended March 31, 2024 | |||||||||||
| Fund | Fund Shares held by WT | Market Value of Fund Shares held by WT | Dividends and Distributions paid to WT on Fund Shares held by WT | |||||||||
U.S. High Dividend Fund | 137 | $ | 11,872 | $ | 397 | |||||||
U.S. LargeCap Dividend Fund | — | — | 17 | |||||||||
U.S. LargeCap Fund | 1,023 | 56,674 | 1,221 | |||||||||
U.S. MidCap Dividend Fund | 669 | 32,627 | 582 | |||||||||
U.S. Multifactor Fund | 1,143 | 53,212 | 670 | |||||||||
U.S. Quality Dividend Growth Fund | 1,101 | 83,885 | 1,192 | |||||||||
U.S. Quality Growth Fund | 701 | 28,811 | — | |||||||||
U.S. SmallCap Dividend Fund | 126 | 4,118 | 21 | |||||||||
U.S. SmallCap Fund | 242 | 12,129 | 158 | |||||||||
U.S. SmallCap Quality Dividend Growth Fund | 381 | 18,913 | 363 | |||||||||
U.S. Total Dividend Fund | 325 | 22,984 | 545 | |||||||||
U.S. Value Fund | 74 | 5,595 | 86 | |||||||||
In connection with the organization of the U.S. MidCap Quality Growth Fund and U.S. SmallCap Quality Growth Fund, each a newly launched Fund, WTAM contributed $100 to each Fund in exchange for 4 shares of each Fund. Prior to March 31, 2024, WTAM redeemed the aforementioned shares as 4 shares of each Fund for proceeds of $99.
4. CAPITAL SHARE TRANSACTIONS
As of March 31, 2024, there were an unlimited number of $0.001 par value shares of beneficial interest authorized by the Trust. Shares are issued and redeemed by each Fund only in creation units or multiples thereof to an authorized participant (“AP”). Except when aggregated in creation units (“Creation Unit Aggregations”), shares of each Fund are not redeemable. Transactions in shares for each Fund are disclosed in detail in the Statements of Changes in Net Assets. The consideration for the purchase of creation units of a Fund generally consists of the in-kind contribution of a basket of securities (“Deposit Securities”) and/or an amount of cash (“Cash Component”). Creation Unit Aggregations may be created in advance of receipt by a Fund of all or a portion of the applicable Deposit Securities from APs. In these circumstances, the initial deposit received from the AP will have a value greater than the NAV of the applicable Fund’s shares on the date the order is placed in proper form since, in addition to available Deposit Securities, U.S. cash must be deposited by the AP in an amount equal to the sum of (i) the Cash Component, plus (ii) generally between 102%-110%, as directed by the Trust or WTAM, which the Trust or WTAM may change from time to time, of the market value of the undelivered Deposit Securities (the “Additional Cash Deposit”) with the Fund pending delivery of any missing Deposit Securities. The Fund will return any unused portion of the Additional Cash Deposit once all of the missing Deposit Securities have been properly received from the AP or purchased by the Fund. Amounts due to be returned to an AP as of March 31, 2024, if any, is shown in the Statements of Assets and Liabilities in “Payables: Deposit due to authorized participant”. APs purchasing and redeeming creation units may be charged a purchase transaction fee and a redemption transaction fee to offset transfer and other transaction costs associated with the issuance and redemption of creation units.
| WisdomTree Trust | 141 |
Notes to Financial Statements (continued)
5. INVESTMENT PORTFOLIO TRANSACTIONS
Purchases and sales of investments (excluding purchases and sales resulting from in-kind capital share transactions and short-term investments) and the cost of purchases and the proceeds from sales resulting from in-kind capital share transactions (excluding short-term investments) for the fiscal year or period ended March 31, 2024 are shown in the following table. Realized gains and losses on sales resulting from in-kind capital share redemptions, as shown on the Statements of Operations, are not recognized by the Funds for tax purposes.
| In-kind Capital Share Transactions | ||||||||||||||||
| Fund | Purchases | Sales | Purchases | Sales | ||||||||||||
U.S. AI Enhanced Value Fund | $ | 478,937,601 | $ | 478,541,375 | $ | 2,385,250 | $ | 58,699,954 | ||||||||
U.S. High Dividend Fund | 350,912,696 | 347,044,915 | 126,365,786 | 404,509,632 | ||||||||||||
U.S. LargeCap Dividend Fund | 552,813,717 | 554,552,738 | 471,985,970 | 505,504,034 | ||||||||||||
U.S. LargeCap Fund | 99,091,777 | 98,327,692 | 96,080,372 | 79,487,851 | ||||||||||||
U.S. MidCap Dividend Fund | 865,748,805 | 862,982,679 | 362,871,633 | 518,511,322 | ||||||||||||
U.S. MidCap Fund | 236,757,258 | 236,003,492 | 134,778,318 | 180,048,159 | ||||||||||||
U.S. MidCap Quality Growth Fund1 | 1,257,617 | 11,716 | 2,634,694 | — | ||||||||||||
U.S. Multifactor Fund | 301,665,437 | 300,153,682 | 125,848,181 | 152,281,142 | ||||||||||||
U.S. Quality Dividend Growth Fund | 2,574,957,115 | 2,550,003,978 | 4,514,844,094 | 2,167,133,939 | ||||||||||||
U.S. Quality Growth Fund | 25,008,281 | 24,272,281 | 325,457,338 | 14,103,702 | ||||||||||||
U.S. SmallCap Dividend Fund | 613,152,922 | 608,912,579 | 217,471,030 | 325,907,926 | ||||||||||||
U.S. SmallCap Fund | 280,397,051 | 279,657,016 | 77,255,257 | 84,746,186 | ||||||||||||
U.S. SmallCap Quality Dividend Growth Fund | 137,820,191 | 137,717,375 | 129,150,653 | 60,566,716 | ||||||||||||
U.S. SmallCap Quality Growth Fund1 | 1,257,708 | 12,160 | — | — | ||||||||||||
U.S. Total Dividend Fund | 167,367,402 | 166,691,762 | 108,285,805 | 140,777,117 | ||||||||||||
U.S. Value Fund | 113,441,214 | 113,375,363 | 141,605,109 | 62,730,750 | ||||||||||||
| 1 | For the period January 25, 2024 (commencement of operations) through March 31, 2024. |
6. FEDERAL INCOME TAXES
At March 31, 2024, the cost of investments (including securities on loan) for Federal income tax purposes was as follows:
| Fund | Tax Cost | Gross Unrealized Appreciation | Gross Unrealized Depreciation | Net Unrealized Appreciation | ||||||||||||
U.S. AI Enhanced Value Fund | $ | 352,527,580 | $ | 32,114,274 | $ | (6,807,885 | ) | $ | 25,306,389 | |||||||
U.S. High Dividend Fund | 1,046,101,189 | 96,385,745 | (44,795,660 | ) | 51,590,085 | |||||||||||
U.S. LargeCap Dividend Fund | 2,957,380,509 | 1,084,487,874 | (34,156,965 | ) | 1,050,330,909 | |||||||||||
U.S. LargeCap Fund | 644,213,265 | 219,731,558 | (14,069,005 | ) | 205,662,553 | |||||||||||
U.S. MidCap Dividend Fund | 3,055,471,298 | 730,477,503 | (124,590,338 | ) | 605,887,165 | |||||||||||
U.S. MidCap Fund | 694,577,029 | 174,660,856 | (34,896,646 | ) | 139,764,210 | |||||||||||
U.S. MidCap Quality Growth Fund | 3,880,570 | 345,527 | (40,984 | ) | 304,543 | |||||||||||
U.S. Multifactor Fund | 251,762,485 | 41,500,635 | (1,747,175 | ) | 39,753,460 | |||||||||||
U.S. Quality Dividend Growth Fund | 10,288,041,573 | 2,520,110,989 | (116,639,738 | ) | 2,403,471,251 | |||||||||||
U.S. Quality Growth Fund | 316,299,205 | 35,604,754 | (2,795,499 | ) | 32,809,255 | |||||||||||
U.S. SmallCap Dividend Fund | 1,814,473,921 | 317,849,264 | (134,437,125 | ) | 183,412,139 | |||||||||||
U.S. SmallCap Fund | 616,810,793 | 96,392,685 | (56,667,183 | ) | 39,725,502 | |||||||||||
U.S. SmallCap Quality Dividend Growth Fund | 309,724,824 | 48,966,516 | (11,265,734 | ) | 37,700,782 | |||||||||||
U.S. SmallCap Quality Growth Fund | 1,246,195 | 112,269 | (52,783 | ) | 59,486 | |||||||||||
U.S. Total Dividend Fund | 908,919,282 | 330,448,477 | (17,195,250 | ) | 313,253,227 | |||||||||||
U.S. Value Fund | 240,588,897 | 39,019,709 | (2,873,454 | ) | 36,146,255 | |||||||||||
| 142 | WisdomTree Trust |
Notes to Financial Statements (continued)
At March 31, 2024, the components of total distributable earnings (loss) on a tax-basis were as follows:
| Fund | Undistributed Ordinary Income | Undistributed Capital and Other Losses | Net Unrealized Appreciation | Total Distributable Earnings (Loss) | ||||||||||||
U.S. AI Enhanced Value Fund | $ | 139,994 | $ | (126,770,009 | ) | $ | 25,306,389 | $ | (101,323,626 | ) | ||||||
U.S. High Dividend Fund | 2,552,192 | (148,480,770 | ) | 51,590,085 | (94,338,493 | ) | ||||||||||
U.S. LargeCap Dividend Fund | 3,886,885 | (295,914,932 | ) | 1,050,330,909 | 758,302,862 | |||||||||||
U.S. LargeCap Fund | 206,041 | (73,444,622 | ) | 205,662,553 | 132,423,972 | |||||||||||
U.S. MidCap Dividend Fund | 2,643,366 | (523,834,938 | ) | 605,887,165 | 84,695,593 | |||||||||||
U.S. MidCap Fund | 126,268 | (113,954,657 | ) | 139,764,210 | 25,935,821 | |||||||||||
U.S. MidCap Quality Growth Fund | 3,452 | (25 | ) | 304,543 | 307,970 | |||||||||||
U.S. Multifactor Fund | 163,746 | (35,359,373 | ) | 39,753,460 | 4,557,833 | |||||||||||
U.S. Quality Dividend Growth Fund | 3,508,241 | (538,174,776 | ) | 2,403,471,251 | 1,868,804,716 | |||||||||||
U.S. Quality Growth Fund | 114,702 | (118,490 | ) | 32,809,255 | 32,805,467 | |||||||||||
U.S. SmallCap Dividend Fund | 2,898,429 | (406,607,702 | ) | 183,412,139 | (220,297,134 | ) | ||||||||||
U.S. SmallCap Fund | 209,083 | (80,014,271 | ) | 39,725,502 | (40,079,686 | ) | ||||||||||
U.S. SmallCap Quality Dividend Growth Fund | 126,473 | (35,544,924 | ) | 37,700,782 | 2,282,331 | |||||||||||
U.S. SmallCap Quality Growth Fund | 2,591 | — | 59,486 | 62,077 | ||||||||||||
U.S. Total Dividend Fund | 947,268 | (119,622,022 | ) | 313,253,227 | 194,578,473 | |||||||||||
U.S. Value Fund | 134,564 | (15,104,407 | ) | 36,146,255 | 21,176,412 | |||||||||||
The tax character of distributions paid during the fiscal years or periods ended March 31, 2024 and March 31, 2023, was as follows:
| Year or Period Ended March 31, 2024 | Year or Period Ended March 31, 2023 | |||||||
| Fund | Distributions Paid from Ordinary Income* | Distributions Paid from Ordinary Income* | ||||||
U.S. AI Enhanced Value Fund | $ | 9,644,875 | $ | 9,454,072 | ||||
U.S. High Dividend Fund | 46,034,088 | 52,764,847 | ||||||
U.S. LargeCap Dividend Fund | 87,184,000 | 94,641,498 | ||||||
U.S. LargeCap Fund | 13,196,000 | 12,389,635 | ||||||
U.S. MidCap Dividend Fund | 87,033,724 | 92,020,134 | ||||||
U.S. MidCap Fund | 10,749,500 | 10,959,568 | ||||||
U.S. MidCap Quality Growth Fund | — | 1 | N/A | |||||
U.S. Multifactor Fund | 3,764,250 | 3,948,786 | ||||||
U.S. Quality Dividend Growth Fund | 186,113,500 | 154,296,995 | ||||||
U.S. Quality Growth Fund | 123,000 | — | 2 | |||||
U.S. SmallCap Dividend Fund | 52,081,069 | 54,457,954 | ||||||
U.S. SmallCap Fund | 8,097,830 | 8,368,109 | ||||||
U.S. SmallCap Quality Dividend Growth Fund | 6,675,150 | 6,156,770 | ||||||
U.S. SmallCap Quality Growth Fund | — | 1 | N/A | |||||
U.S. Total Dividend Fund | 27,138,000 | 30,260,035 | ||||||
U.S. Value Fund | 3,370,724 | 2,373,350 | ||||||
| * | Includes short-term capital gains, if any. |
| 1 | For the period January 25, 2024 (commencement of operations) through March 31, 2024. |
| 2 | For the period December 15, 2022 (commencement of operations) through March 31, 2023. |
| WisdomTree Trust | 143 |
Notes to Financial Statements (continued)
At March 31, 2024, for Federal tax purposes, the Funds have capital loss carryforwards available to offset future capital gains as indicated in the following table. The loss carryforward amounts do not have an expiration date and, therefore, can be carried forward indefinitely until utilized. To the extent that these loss carryforwards are utilized, capital gains so offset will not be distributed to shareholders.
| Fund | Short-Term | Long-Term | Capital Loss Available Total | |||||||||
U.S. AI Enhanced Value Fund | $ | 48,126,260 | $ | 78,643,749 | $ | 126,770,009 | ||||||
U.S. High Dividend Fund | 33,607,520 | 114,873,250 | 148,480,770 | |||||||||
U.S. LargeCap Dividend Fund | 49,559,183 | 246,355,749 | 295,914,932 | |||||||||
U.S. LargeCap Fund | 35,087,651 | 38,356,971 | 73,444,622 | |||||||||
U.S. MidCap Dividend Fund | 208,974,257 | 314,860,681 | 523,834,938 | |||||||||
U.S. MidCap Fund | 53,001,015 | 60,953,642 | 113,954,657 | |||||||||
U.S. MidCap Quality Growth Fund | 25 | — | 25 | |||||||||
U.S. Multifactor Fund | 32,644,163 | 2,715,210 | 35,359,373 | |||||||||
U.S. Quality Dividend Growth Fund | 257,671,152 | 280,503,624 | 538,174,776 | |||||||||
U.S. Quality Growth Fund | 118,307 | 183 | 118,490 | |||||||||
U.S. SmallCap Dividend Fund | 66,711,742 | 339,895,960 | 406,607,702 | |||||||||
U.S. SmallCap Fund | 27,080,638 | 52,933,633 | 80,014,271 | |||||||||
U.S. SmallCap Quality Dividend Growth Fund | 11,430,743 | 24,114,181 | 35,544,924 | |||||||||
U.S. SmallCap Quality Growth Fund | — | — | — | |||||||||
U.S. Total Dividend Fund | 37,261,017 | 82,361,005 | 119,622,022 | |||||||||
U.S. Value Fund | 6,368,325 | 8,736,082 | 15,104,407 | |||||||||
Capital losses incurred after October 31 (“post-October capital losses”) and late year ordinary losses incurred after December 31 within the taxable year are deemed to arise on the first business day of each Fund’s next taxable year. At March 31, 2024, the Funds did not have any post-October capital losses or late year ordinary losses to defer.
During the fiscal year or period ended March 31, 2024, the amount of capital loss carryforwards used to offset realized gains are shown in the following table:
| Fund | Utilized Capital Loss Carryforward | |||||||
U.S. AI Enhanced Value Fund | $ | — | ||||||
U.S. High Dividend Fund | — | |||||||
U.S. LargeCap Dividend Fund | — | |||||||
U.S. LargeCap Fund | — | |||||||
U.S. MidCap Dividend Fund | — | |||||||
U.S. MidCap Fund | — | |||||||
U.S. MidCap Quality Growth Fund1 | — | |||||||
U.S. Multifactor Fund | — | |||||||
U.S. Quality Dividend Growth Fund | — | |||||||
U.S. Quality Growth Fund | — | |||||||
U.S. SmallCap Dividend Fund | — | |||||||
U.S. SmallCap Fund | 2,600,683 | |||||||
U.S. SmallCap Quality Dividend Growth Fund | — | |||||||
U.S. SmallCap Quality Growth Fund1 | — | |||||||
U.S. Total Dividend Fund | — | |||||||
U.S. Value Fund | 810,180 | |||||||
| 1 | For the period January 25, 2024 (commencement of operations) through March 31, 2024. |
| 144 | WisdomTree Trust |
Notes to Financial Statements (continued)
At March 31, 2024, the effect of permanent “book/tax” reclassifications resulted in increases (decreases) to the components of net assets as shown in the following table. These differences are primarily due to redemptions-in-kind.
| Fund | Total Distributable Earnings (Loss) | Paid-in Capital | ||||||
U.S. AI Enhanced Value Fund | $ | (2,883,748 | ) | $ | 2,883,748 | |||
U.S. High Dividend Fund | (26,192,405 | ) | 26,192,405 | |||||
U.S. LargeCap Dividend Fund | (248,413,988 | ) | 248,413,988 | |||||
U.S. LargeCap Fund | (29,655,576 | ) | 29,655,576 | |||||
U.S. MidCap Dividend Fund | (173,177,509 | ) | 173,177,509 | |||||
U.S. MidCap Fund | (58,015,232 | ) | 58,015,232 | |||||
U.S. MidCap Quality Growth Fund | — | — | ||||||
U.S. Multifactor Fund | (23,920,016 | ) | 23,920,016 | |||||
U.S. Quality Dividend Growth Fund | (597,429,998 | ) | 597,429,998 | |||||
U.S. Quality Growth Fund | (1,780,817 | ) | 1,780,817 | |||||
U.S. SmallCap Dividend Fund | (98,574,550 | ) | 98,574,550 | |||||
U.S. SmallCap Fund | (12,105,524 | ) | 12,105,524 | |||||
U.S. SmallCap Quality Dividend Growth Fund | (17,395,155 | ) | 17,395,155 | |||||
U.S. SmallCap Quality Growth Fund | — | — | ||||||
U.S. Total Dividend Fund | (68,169,292 | ) | 68,169,292 | |||||
U.S. Value Fund | (17,348,173 | ) | 17,348,173 | |||||
GAAP provides guidance on tax provisions that prescribe a minimum threshold for financial statement recognition of the benefit of a tax position taken or expected to be taken in a tax return. As of and during the fiscal year or period ended March 31, 2024, the Funds did not have any liabilities for unrecognized tax benefits relating to uncertain income tax positions they have taken or expect to take in the future. If applicable, the Funds will recognize interest accrued related to unrecognized tax benefits in interest expense and penalties in “Other” expenses on the Statements of Operations. The Funds file tax returns with the Internal Revenue Service, the State of New York, and various other states. Specific to U.S. federal and state taxes, generally, each of the tax years in the four-year period ended March 31, 2024, remains subject to examination by taxing authorities.
7. SUBSEQUENT EVENTS
WTAM has evaluated all subsequent transactions and events through the date on which these financial statements were issued and has determined that no additional items require disclosure in these financial statements.
8. ADDITIONAL INFORMATION
Russia’s military invasion of Ukraine initiated in February 2022 and the economic and diplomatic responses by the United States and other countries have led to increased volatility and uncertainty in the financial markets and could continue to adversely affect regional and global economies for the foreseeable future. In response to Russia’s actions, the governments of the United States, the European Union, the United Kingdom, and many other countries collectively imposed heavy and broad-ranging economic sanctions on certain Russian individuals, corporate and banking entities, and other industries and businesses. The sanctions restrict companies from doing business with Russia and Russian companies, prohibit transactions with the Russian central bank and other key Russian financial institutions and entities, ban Russian airlines and ships from using many other countries’ airspace and ports, respectively, and place a freeze on certain Russian assets. The sanctions also removed some Russian banks from the Society for Worldwide Interbank Financial Telecommunications (SWIFT), the electronic network that connects banks globally to facilitate cross-border payments. In addition, the United States has banned oil and other energy imports from Russia, as well as other popular Russian exports, such as diamonds, seafood and vodka. The European Union, the United Kingdom and other countries have also placed restrictions on certain oil, energy and luxury goods imports from Russia.
These sanctions, as well as other economic consequences related to the invasion, such as additional sanctions, boycotts, changes in consumer or purchaser preferences, or cyberattacks on governments, companies or individuals, may further decrease the value and liquidity of certain Russian securities as well as securities of issuers in other countries that are subject to or otherwise adversely affected by economic sanctions related to Russia’s invasion of Ukraine, including Russian counter measures. To the extent a Fund has exposure to Russian investments or investments in countries affected by the invasion or the sanctions, the Fund’s ability to price, buy, sell, receive or deliver, or receive dividends and interest payments on such investments may be impaired. In certain circumstances, such as when there is no market for a security or other means of valuing or disposing of a security, a Fund may determine to value the affected security at zero. In addition, any exposure a Fund may have to counterparties in Russia or in
| WisdomTree Trust | 145 |
Notes to Financial Statements (concluded)
countries affected by the invasion could negatively affect the Fund’s portfolio. The extent and duration of Russia’s military actions and the repercussions of such actions are impossible to predict, but could result in continued significant market disruptions, including in the oil and natural gas markets, and may negatively affect global supply chains, inflation and global growth. Further, an escalation of the military conflict beyond Ukraine’s borders could result in significant, long-lasting damage to the economies of Eastern and Western Europe as well as the global economy. These and any related events could significantly and adversely affect a Fund’s performance and the value of an investment in the Fund, even in the absence of direct exposure to Russian issuers or issuers in other countries affected by the invasion.
* * * * * *
Financial markets around the world may experience extreme volatility, depressed valuations, decreased liquidity and heightened uncertainty and turmoil resulting from major cybersecurity events, geopolitical events (including wars, such as Russia’s invasion of Ukraine, terror attacks, and disruptions to foreign economic and trade relationships), public health emergencies, such as the COVID-19 pandemic, measures to address budget deficits, downgrading of sovereign debt, and public sentiment, among other events. Resulting market volatility, dramatic changes to interest rates, and otherwise unfavorable economic conditions may negatively impact Fund performance or impair a Fund’s ability to achieve its investment objective.
In March 2023, the financial distress of certain financial institutions raised economic concerns over disruption in the U.S. banking system and regarding the solvency of certain financial services firms. There can be no certainty that the actions taken by the U.S. government to strengthen public confidence in the U.S. banking system will be effective in mitigating the effects of financial institution failures on the economy and restoring public confidence in the U.S. banking system.
In October 2023, Hamas terrorists infiltrated Israel’s southern border from the Gaza Strip and conducted a series of attacks on civilian and military targets. Hamas also launched extensive rocket attacks on the Israeli population and industrial centers located along Israel’s border with the Gaza Strip and in other areas within the State of Israel. Following the attack, Israel’s security cabinet declared war against Hamas, and a military campaign was initiated. These events may result in significant market disruptions and may adversely affect regional and global economies.
* * * * * *
Raising the ceiling on U.S. government debt has become increasingly politicized. Any failure to increase the total amount that the U.S. government is authorized to borrow could lead to a default on U.S. government obligations, with unpredictable consequences for economies and markets in the U.S. and elsewhere. On August 1, 2023, Fitch Ratings, Inc. downgraded its U.S. debt rating from the highest AAA rating to AA+, citing “a high and growing general government debt burden, and the erosion of governance relative to ‘AA’ and ‘AAA’ rated peers over the last two decades that has manifested in repeated debt limit standoffs and last-minute resolutions”. The impacts, if any, of the downgrade on financial markets are unknown at this time. The downgrade has potential market impacts, including but not limited to, steep stock market declines and rising bond yields.
| 146 | WisdomTree Trust |
Report of Independent Registered Public Accounting Firm
To the Shareholders of WisdomTree U.S. Al Enhanced Value Fund, WisdomTree U.S. High Dividend Fund, WisdomTree U.S. LargeCap Dividend Fund, WisdomTree U.S. LargeCap Fund, WisdomTree U.S. MidCap Dividend Fund, WisdomTree U.S. MidCap Fund, WisdomTree U.S. MidCap Quality Growth Fund, WisdomTree U.S. Multifactor Fund, WisdomTree U.S. Quality Dividend Growth Fund, WisdomTree U.S. Quality Growth Fund, WisdomTree U.S. SmallCap Dividend Fund, WisdomTree U.S. SmallCap Fund, WisdomTree U.S. SmallCap Quality Dividend Growth Fund, WisdomTree U.S. SmallCap Quality Growth Fund, WisdomTree U.S. Total Dividend Fund and WisdomTree U.S. Value Fund, and the Board of Trustees of WisdomTree Trust
Opinion on the Financial Statements
We have audited the accompanying statements of assets and liabilities of WisdomTree U.S. Al Enhanced Value Fund, WisdomTree U.S. High Dividend Fund, WisdomTree U.S. LargeCap Dividend Fund, WisdomTree U.S. LargeCap Fund, WisdomTree U.S. MidCap Dividend Fund, WisdomTree U.S. MidCap Fund, WisdomTree U.S. MidCap Quality Growth Fund, WisdomTree U.S. Multifactor Fund, WisdomTree U.S. Quality Dividend Growth Fund, WisdomTree U.S. Quality Growth Fund, WisdomTree U.S. SmallCap Dividend Fund, WisdomTree U.S. SmallCap Fund, WisdomTree U.S. SmallCap Quality Dividend Growth Fund, WisdomTree U.S. SmallCap Quality Growth Fund, WisdomTree U.S. Total Dividend Fund and WisdomTree U.S. Value Fund (collectively referred to as the “Funds”), (sixteen of the funds constituting WisdomTree Trust (the “Trust”)), including the schedules of investments, as of March 31, 2024, and the related statements of operations and changes in net assets, and the financial highlights for each of the periods indicated in the table below and the related notes (collectively referred to as the “financial statements”). In our opinion, the financial statements present fairly, in all material respects, the financial position of each of the Funds (sixteen of the funds constituting WisdomTree Trust) at March 31, 2024, and the results of their operations, changes in net assets and financial highlights for each of the periods indicated in the table below, in conformity with U.S. generally accepted accounting principles.
| Individual fund constituting the WisdomTree Trust | Statement of operations | Statements of changes in net assets | Financial highlights | |||
WisdomTree U.S. Al Enhanced Value Fund WisdomTree U.S. High Dividend Fund WisdomTree U.S. LargeCap Dividend Fund WisdomTree U.S. LargeCap Fund WisdomTree U.S. MidCap Dividend Fund WisdomTree U.S. MidCap Fund WisdomTree U.S. Multifactor Fund WisdomTree U.S. Quality Dividend Growth Fund WisdomTree U.S. SmallCap Dividend Fund WisdomTree U.S. SmallCap Fund WisdomTree U.S. SmallCap Quality Dividend Growth Fund WisdomTree U.S. Total Dividend Fund WisdomTree U.S. Value Fund | For the year ended March 31, 2024 | For each of the two years in the period ended March 31, 2024 | For each of the five years in the period ended March 31, 2024 | |||
WisdomTree U.S. Quality Growth Fund | For the year ended March 31, 2024 | For the year ended March 31, 2024 and for the period December 15, 2022 (commencement of operations) through March 31, 2023 | ||||
WisdomTree U.S. MidCap Quality Growth Fund WisdomTree U.S. SmallCap Quality Growth Fund | For the period January 25, 2024 (commencement of operations) through March 31, 2024 | |||||
Basis for Opinion
These financial statements are the responsibility of the Trust’s management. Our responsibility is to express an opinion on each of the Funds’ financial statements based on our audits. We are a public accounting firm registered with the Public Company Accounting Oversight Board (United States) (“PCAOB”) and are required to be independent with respect to the Trust in accordance with the U.S. federal securities laws and the applicable rules and regulations of the Securities and Exchange Commission and the PCAOB.
We conducted our audits in accordance with the standards of the PCAOB. Those standards require that we plan and perform the audit to obtain reasonable assurance about whether the financial statements are free of material misstatement, whether due to error or fraud. The Trust is not required to have, nor were we engaged to perform, an audit of the Trust’s internal control over financial reporting. As part of our audits, we are required to obtain an understanding of internal control over financial reporting, but not for the purpose of expressing an opinion on the effectiveness of the Trust’s internal control over financial reporting. Accordingly, we express no such opinion.
Our audits included performing procedures to assess the risks of material misstatement of the financial statements, whether due to error or fraud, and performing procedures that respond to those risks. Such procedures included examining, on a test basis, evidence regarding the amounts and disclosures in the financial statements. Our procedures included confirmation of securities
| WisdomTree Trust | 147 |
Report of Independent Registered Public Accounting Firm (concluded)
owned as of March 31, 2024, by correspondence with the custodian, brokers and others; when replies were not received from brokers, we performed other auditing procedures. Our audits also included evaluating the accounting principles used and significant estimates made by management, as well as evaluating the overall presentation of the financial statements. We believe that our audits provide a reasonable basis for our opinion.

We have served as the auditor of one or more WisdomTree investment companies since 2006.
New York, New York
May 30, 2024
| 148 | WisdomTree Trust |
Approval of Investment Advisory and Sub-Advisory Agreements (unaudited)
Consideration of the Approval of Investment Advisory and Sub-Advisory Agreements
WisdomTree U.S. MidCap Quality Growth Fund and WisdomTree U.S. SmallCap Quality Growth Fund
(each a “Fund,” and together the “Funds”)
At a meeting of the Board of Trustees (the “Board” or the “Trustees”) of the WisdomTree Trust (the “Trust”) held on December 11-12, 2023, the Trustees, including those Trustees who are not “interested persons” (as defined in the Investment Company Act of 1940, as amended) of the Trust (the “Independent Trustees”), considered the approval of the investment advisory agreements (the “Advisory Agreement”), pursuant to which WisdomTree Asset Management, Inc. (“WTAM”) will provide the Funds with investment advisory services, and the Sub-Advisory Agreement (together with the Advisory Agreement, the “Agreements”), pursuant to which Mellon Investments Corporation (the “Sub-Adviser”) will coordinate the investment and reinvestment of the assets of the WisdomTree U.S. MidCap Quality Growth Fund and WisdomTree U.S. SmallCap Quality Growth Fund.
In considering whether to approve the Agreements, the Trustees considered and discussed information and analysis provided by WTAM and Broadridge Financial Solutions, Inc. (“Broadridge”), an independent provider of investment company data. The Trustees noted that representatives from WTAM presented preliminary information to the Trustees regarding each Fund’s proposed investment objective and principal investment strategies and risks at a meeting of the Trust’s Investment Committee, a committee of Independent Trustees, on September 14, 2023. The Independent Trustees were assisted in their review by independent legal counsel and met with counsel in executive session separate from WTAM representatives and the Sub-Adviser. In considering the approval of the Agreements, the Board considered all factors that it believed to be relevant, including those discussed below. The Board did not identify any one factor as dispositive, and each Trustee may have attributed different weights to the factors considered.
Analysis of Nature, Extent, and Quality of Services to be Provided to the Funds. The Board considered information provided to them at the meeting and in previous presentations throughout the year from WTAM representatives regarding the nature, extent, and quality of the services provided to the WisdomTree funds, recognizing WTAM’s and the Sub-Adviser’s operational capabilities and resources. It was noted that the Funds would be passively managed. The Board noted WTAM’s belief that shareholders will invest in the Funds on the strength of WTAM’s industry standing and reputation and with the expectation that WTAM will have a continuing role in providing advisory services to the Funds. The Board also noted the extensive responsibilities that WTAM will have as investment adviser to the Funds, including: the selection of, and supervisory responsibilities and activities over, the Sub-Adviser, including oversight of the Sub-Adviser’s adherence to each Fund’s investment strategy and restrictions, monitoring of the Sub-Adviser’s buying and selling of securities and derivatives transactions, review of the Sub-Adviser’s performance, review of proxies voted by the Sub-Adviser and oversight of, and the provision of consultation to, the Sub-Adviser with respect to the creation of custom creation or redemption baskets for authorized participants; oversight of the daily valuation of each Fund’s portfolio holdings; oversight of general Fund compliance with federal and state laws; and implementation of Board directives as they relate to the Funds. The Board also considered research support available to, and management capabilities of, each Fund’s management personnel and that WTAM will provide oversight of day-to-day Fund operations, including fund accounting, tax matters, administration, compliance and legal assistance in meeting disclosure and regulatory requirements.
Based on review of this information and the other factors considered at the meeting, the Board concluded that the nature, extent and quality of services to be provided by WTAM and the Sub-Adviser under the Advisory Agreement and Sub-Advisory Agreement, respectively, are adequate and appropriate and supported the Board’s approval of the Agreements.
Comparative Analysis of each Fund’s Performance, Advisory Fees and Fund Expenses. As the Funds have not yet commenced operations, the Board was not able to review each Fund’s performance. The Board discussed with WTAM representatives the portfolio management team and the investment strategies to be employed in the management of each Fund’s assets. The Board noted the reputation and experience of WTAM and the Sub-Adviser.
The Board considered the fees to be paid to WTAM by the Funds. The Board examined the fee to be paid by the Funds in light of fees paid to other investment advisers by comparable funds and the method of computing each Fund’s fee. The Board also considered the fee to be paid to the Sub-Adviser in relation to the fee to be paid to WTAM by the Funds and the respective services to be provided by the Sub-Adviser and WTAM. The Board also noted the Sub-Adviser’s fees will be paid by WTAM (out of its fee paid by the Fund) and not by the Funds. The Board considered the meaningful differences in the services that WTAM will provide to the Funds as compared to the Sub-Adviser, including that the role of the Sub-Adviser in making investment recommendations with respect to the passively managed Fund tracking an index is a rules-based function, with oversight by WTAM in seeking to ensure compliance with such rules. The Board also considered the entrepreneurial and expense risk to be borne by WTAM that is associated with each Fund’s unitary fee structure, which includes minimum fees (such as those to the Sub-Adviser), regardless of whether the asset size of the Funds grows to a sufficient size. Based on this review, the Board concluded that the fees to be paid to WTAM and the Sub-Adviser supported the Board’s approval of the Agreements.
| WisdomTree Trust | 149 |
Approval of Investment Advisory and Sub-Advisory Agreements (unaudited) (concluded)
Analysis of Profitability and Economies of Scale. As the Funds have not yet commenced operations, WTAM representatives were not able to review the dollar amount of expenses allocated and profit received by WTAM, or any economies of scale. The Board considered potential benefits to WTAM and the Sub-Adviser from acting as investment adviser and sub-adviser, respectively. The Board also considered the uncertainty of the estimated asset levels and the renewal requirements for advisory agreements and their ability to review the advisory fees annually after the initial term of the Agreements. The Board determined that because the Funds have not yet commenced operations, economies of scale were not a factor, but, to the extent in the future it were determined that material economies of scale had not been shared with the Funds, the Board would seek to have those economies of scale shared with the Funds in connection with future renewals.
* * * * * *
In evaluating the Agreements, the Board considered the conclusions and determinations discussed above and also relied on its knowledge, gained through meetings and other interactions with WTAM and the Sub-Adviser, of other funds advised by WTAM and the Sub-Adviser. In light of the foregoing, the Board, including a majority of the Independent Trustees, determined to approve the Agreements.
| 150 | WisdomTree Trust |
Liquidity Risk Management Program (unaudited)
The Funds adopted a liquidity risk management program (the “Program”) pursuant to the requirements of Rule 22e-4 (the “Rule”) under the Investment Company Act of 1940, as amended. The Rule requires registered open-end funds, including exchange-traded funds such as the Funds, to establish liquidity risk management programs in order to effectively manage fund liquidity and shareholder redemptions. The Rule is designed to mitigate the risk that a Fund could not meet redemption requests without significantly diluting the interest of remaining investors. The Board has appointed WisdomTree Asset Management, Inc., the investment advisor to the Funds, as the Program Administrator for each Fund’s Program.
The Rule requires the Funds to assess, manage and review their liquidity risk at least annually considering applicable factors such as investment strategy and liquidity during normal and foreseeable stressed conditions, including whether the strategy is appropriate for an open-ended fund and whether the Fund has a relatively concentrated portfolio or large positions in particular issuers. The Funds must also assess their use of borrowings and derivatives, short-term and long-term cash flow projections in normal and stressed conditions, holdings of cash and cash equivalents, and borrowing arrangements and other funding sources.
The Rule also requires the Funds to classify their investments into one of four liquidity categories: highly liquid, moderately liquid, less liquid or illiquid based on the number of days a Fund expects it would take to liquidate the investment, and to review these classifications at least monthly or more often under certain conditions. The periods range from three or fewer business days for a highly liquid investment to greater than seven calendar days for settlement of a less liquid investment. Illiquid investments are those a Fund does not expect to be able to sell or dispose of within seven calendar days without significantly changing the market value of the investment. A Fund is prohibited from acquiring an investment if, after the acquisition, its holdings of illiquid assets will exceed 15% of its net assets. In addition, if a Fund permits redemptions in-kind, the Rule requires the Fund to establish redemption in-kind policies and procedures governing how and when it will engage in such redemptions.
Pursuant to the Rule’s requirements, the Program has been reviewed and approved by the Fund’s Board. Furthermore, the Board has received a written report prepared by the Program Administrator that addresses the operation of the Program, assesses its adequacy and effectiveness and describes any material changes made to the Program. The Program Administrator has monitored the Fund’s liquidity risk and the liquidity classifications of the securities held by the Fund and has determined that the Program is operating effectively.
During the period from January 1, 2023 to December 31, 2023, there were no material changes to the Program and no material liquidity events that impacted the Funds. During the period, the Funds held sufficient highly liquid assets to meet fund redemptions.
Under normal expected foreseeable Fund redemption forecasts and foreseeable stressed Fund redemption forecasts, the Program Administrator believes that the Funds maintain sufficient highly liquid assets to meet Fund redemptions.
| WisdomTree Trust | 151 |
Trustees and Officers Information (unaudited)
Name | Position(s) Held with | Principal Occupation(s) During Past 5 Years | Number of Portfolios in Fund Complex Overseen by Trustee/ Officer+ | Other | ||||||
| Trustees Who Are Interested Persons of the Trust | ||||||||||
Jonathan Steinberg (1964) | Trustee, 2005- present; President, 2005-present | Chief Executive Officer of WisdomTree and WisdomTree Asset Management since 2005; President of WisdomTree and WisdomTree Asset Management from 2012 to 2019. | 77 | Director, WisdomTree and WisdomTree Asset Management. | ||||||
| Trustees Who Are Not Interested Persons of the Trust | ||||||||||
David G. Chrencik1 (1948) | Trustee, 2014-present | Chief Financial Officer of Sarus Indochina Select LP (a hedge fund) from 2012 to 2022. | 77 | None | ||||||
Phillip Goff2 (1963) | Trustee, 2024-present | Private Investor from 2017 to present; Trustee of RBC Funds Trust from 2020 to 2024; Senior Vice President/ Corporate Controller and Funds Treasurer at TIAA from 2006 to 2017. | 77 | None | ||||||
Joel Goldberg3,4 (1945) | Trustee, 2012-present | Attorney, Partner at Stroock & Stroock & Lavan LLP from 2010 to 2018; Attorney, Partner at Willkie Farr & Gallagher LLP from 2006 to 2010. | 77 | Director, Better Business Bureau (Metropolitan New York, Long Island and the Mid-Hudson Region). | ||||||
Toni Massaro4 (1955) | Trustee, 2006-present | Regents Professor of Law Emerita since 2024; Executive Director of the Agnese Nelms Haury Program since 2021; Dean Emerita at the University of Arizona James E. Rogers College of Law (“Rogers College of Law”) from 2009 to 2024 (distinguished Emerita in July 2009); Dean of the Rogers College of Law from 1999 to 2009; Regents Professor since 2006; Milton O. Riepe Chair in Constitutional Law from 1997 to 2022; Professor at the Rogers College of Law from 1990 to 2024. | 77 | None | ||||||
Melinda A. Raso Kirstein5 (1955) | Trustee, 2014-present | Retired since 2004; Vice President, Senior Portfolio Manager, Fixed Income Management, and Director of Tax Exempt Fund Management at Merrill Lynch Investment Management from 1982 to 2004. | 77 | Associate Alumnae of Douglass College, Chair of Investment Committee. | ||||||
Victor Ugolyn (1947) | Trustee, 2006-present; Chairman of the Board, 2006-present | Private Investor from 2005 to present; President and Chief Executive Officer at William D. Witter, Inc. from 2005 to 2006; Chairman of MONY Securities Corporation, and Chairman, President and Chief Executive Officer at Enterprise Capital Management from 1999 to 2004. | 77 | None | ||||||
| 152 | WisdomTree Trust |
Trustees and Officers Information (unaudited) (concluded)
Name | Position(s) Held with | Principal Occupation(s) During Past 5 Years | Number of Portfolios in Fund Complex Overseen by Trustee/ Officer+ | Other | ||||||
| Officers of the Trust | ||||||||||
Jonathan Steinberg (1964) | President, 2005- present; Trustee, 2005-present | Chief Executive Officer of WisdomTree and WisdomTree Asset Management since 2005; President of WisdomTree and WisdomTree Asset Management from 2012 to 2019. | 77 | See Interested Trustees Table Above. | ||||||
David Castano* (1971) | Treasurer, 2013-present | Head of Fund Accounting & Administration at WisdomTree Asset Management since 2020; Director of Fund Accounting & Administration at WisdomTree Asset Management from 2011 to 2020. | 77 | None | ||||||
Terry Jane Feld* (1960) | Chief Compliance Officer, 2012-present | Head of U.S. Compliance at WisdomTree Asset Management since 2022; Chief Compliance Officer at WisdomTree Asset Management since 2012. | 77 | None | ||||||
Joanne Antico* (1975) | Chief Legal Officer and Secretary, 2021-present | General Counsel at WisdomTree Asset Management since 2021; Assistant General Counsel at WisdomTree Asset Management from 2016 to 2021; Executive Director and Assistant Secretary at Morgan Stanley Investment Management Inc. from 2005 to 2016. | 77 | None | ||||||
Clint Martin* (1977) | Assistant Treasurer, 2015-present | Director of Fund Accounting & Administration at WisdomTree Asset Management since 2020; Fund Manager, Fund Accounting & Administration at WisdomTree Asset Management from 2012 to 2020. | 77 | None | ||||||
Angela Borreggine* (1964) | Assistant Secretary, 2022-present | Assistant General Counsel at WisdomTree Asset Management since 2022; Vice President and Senior Counsel at Virtus Investment Partners from 2021 to 2022; Secretary and Chief Legal Officer at Allianz Global Investors family of funds from 2016 to 2021 and of The Korea Fund, Inc. from 2016 to 2020; Director, Senior Counsel at Allianz Global Investors from 2007 to 2021. | 77 | None | ||||||
TJ Darnowski* (1984) | Assistant Secretary, 2021-present | Senior Investment Management Paralegal at WisdomTree Asset Management since 2021; Senior Legal Administrator at Ultimus Fund Solutions from 2019 to 2021; Assistant Vice President at State Street Bank & Trust Company from 2010 to 2019. | 77 | None | ||||||
Sherry Scarvey* (1967) | Assistant Secretary, 2023-present | Senior Investment Management Paralegal at WisdomTree Asset Management since 2023; Senior Legal Analyst at Eagle Point Credit Management, LLC from 2021 to 2023; Senior Legal Analyst at Jennison & Associates LLC from 2019 to 2021; Senior Legal Specialist at Legg Mason & Co. LLC from 2005 to 2019. | 77 | None | ||||||
| + | As of March 31, 2024. |
| 1 | Chair of the Audit Committee. |
| 2 | Appointed to the Board on February 27, 2024. |
| 3 | Chair of the Contracts Review Committee. |
| 4 | Co-Chair of the Governance, Nominating and Compliance Committee. |
| 5 | Chair of the Investment Committee. |
| * | Elected by and serves at the pleasure of the Board. |
| WisdomTree Trust | 153 |
Supplemental Information (unaudited)
Federal Income Tax Information
The following Federal tax information related to the Funds’ fiscal year or period ended March 31, 2024, is provided for information purposes only and should not be used for reporting to federal or state revenue agencies. Federal tax information for the calendar year will be reported to you on Form 1099-DIV in January 2025.
Certain dividends paid by the Funds may be subject to a maximum tax rate of 15%, as provided by the Jobs and Growth Tax Relief Reconciliation Act of 2003. Of the distributions paid during the fiscal year or period ended March 31, 2024, the following represents the maximum amount of ordinary income distributions that may be considered qualified dividend income:
| Fund | Qualified Dividend Income | |||
U.S. AI Enhanced Value Fund | $ | 9,644,875 | ||
U.S. High Dividend Fund | 46,034,088 | |||
U.S. LargeCap Dividend Fund | 87,184,000 | |||
U.S. LargeCap Fund | 13,196,000 | |||
U.S. MidCap Dividend Fund | 87,033,724 | |||
U.S. MidCap Fund | 10,749,500 | |||
U.S. MidCap Quality Growth Fund1 | — | |||
U.S. Multifactor Fund | 3,764,250 | |||
U.S. Quality Dividend Growth Fund | 186,113,500 | |||
U.S. Quality Growth Fund | 123,000 | |||
U.S. SmallCap Dividend Fund | 52,081,069 | |||
U.S. SmallCap Fund | 8,097,830 | |||
U.S. SmallCap Quality Dividend Growth Fund | 6,675,150 | |||
U.S. SmallCap Quality Growth Fund1 | — | |||
U.S. Total Dividend Fund | 27,138,000 | |||
U.S. Value Fund | 3,370,724 | |||
| 1 | For the period January 25, 2024 (commencement of operations) through March 31, 2024. |
The following represents the percentage of dividends paid during the fiscal year or period ended March 31, 2024, that qualify for the 70% dividends received deduction for corporate shareholders:
| Fund | Dividends-Received Deduction | |||
U.S. AI Enhanced Value Fund | 97.98 | % | ||
U.S. High Dividend Fund | 100.00 | % | ||
U.S. LargeCap Dividend Fund | 100.00 | % | ||
U.S. LargeCap Fund | 100.00 | % | ||
U.S. MidCap Dividend Fund | 100.00 | % | ||
U.S. MidCap Fund | 100.00 | % | ||
U.S. MidCap Quality Growth Fund1 | — | |||
U.S. Multifactor Fund | 100.00 | % | ||
U.S. Quality Dividend Growth Fund | 100.00 | % | ||
U.S. Quality Growth Fund | 100.00 | % | ||
U.S. SmallCap Dividend Fund | 100.00 | % | ||
U.S. SmallCap Fund | 100.00 | % | ||
U.S. SmallCap Quality Dividend Growth Fund | 100.00 | % | ||
U.S. SmallCap Quality Growth Fund1 | — | |||
U.S. Total Dividend Fund | 100.00 | % | ||
U.S. Value Fund | 100.00 | % | ||
| 1 | For the period January 25, 2024 (commencement of operations) through March 31, 2024. |
| 154 | WisdomTree Trust |
General Information (unaudited)
Proxy Voting Policies, Procedures and Record
A complete copy of the Proxy Voting Policy may be obtained upon request, at no charge, by calling 1-866-909-WISE (9473) or writing to: WisdomTree Trust, c/o Foreside Fund Services, LLC, Three Canal Plaza Suite 100, Portland, ME, 04101.
The Trust is required to disclose annually the Funds’ complete proxy voting record on Form N-PX covering the most recent 12-month period ended June 30 and to file Form N-PX with the SEC no later than August 31 of each year. The current Form N-PX for the Funds is available at no charge upon request by calling 1-866-909-WISE (9473) or through the SEC’s website at www.sec.gov.
Shareholder Reports and Quarterly Portfolio Disclosure
The Funds file their complete schedule of portfolio holdings with the SEC for their first and third fiscal quarters as an exhibit to their reports on Form N-PORT. Copies of the filings are available, without charge, on the SEC’s website at www.sec.gov and are also available by calling the Trust at 1-866-909-WISE (9473). Copies of the filings may also be obtained, after paying a duplicating fee, by electronic request at the following E-mail address: publicinfo@sec.gov.
Information about each Fund’s portfolio holdings is available daily, without charge, at www.wisdomtree.com/investments.
The Statement of Additional Information (“SAI”) has additional information about the Funds’ Trustees and Officers and is available without charge upon request. Contact your financial representative for a free prospectus or SAI.
Frequency Distribution of Discounts & Premiums
Information about differences between the per share net asset value of each Fund and the market trading price of shares of each Fund are available, without charge, at www.wisdomtree.com/investments.
| WisdomTree Trust | 155 |
The WisdomTree Funds are exchange traded funds (“ETFs”) registered with the United States Securities and Exchange Commission as separate series (“Funds”) of WisdomTree Trust (“Trust”). WisdomTree Asset Management, Inc., a wholly owned subsidiary of WisdomTree, Inc., serves as the investment adviser to the Trust. None of the WisdomTree entities are affiliated with Foreside Fund Services, LLC, the Funds’ distributor. WisdomTree, Inc., its affiliates and their independent providers are not liable for any informational errors, incompleteness, delays, or for any actions taken in reliance on information contained herein.
There are risks associated with investing, including possible loss of principal. Funds focusing their investments on certain sectors and/or smaller companies increase their vulnerability to any single economic or regulatory development. This may result in greater share price volatility. Dividends are not guaranteed, and a company currently paying dividends may cease paying dividends at any time. Due to the investment strategy of certain Funds they may make higher capital gain distributions than other ETFs. Please read the Fund’s prospectus for specific details regarding the Fund’s risk profile.
Indexes are unmanaged and you cannot invest directly in an index.
Transactions in Fund shares will result in brokerage commissions and will generate tax consequences. Shares may be sold through brokerage accounts, but may be redeemed from the Funds only by Authorized Participants in large creation unit sizes of shares.
This report is intended for the Funds’ shareholders. It may not be distributed to prospective investors unless it is preceded or accompanied by the current prospectus.
Scan the QR code with your
smartphone camera to

learn more at
WisdomTree.com/investments
WisdomTree Fund shares are distributed by Foreside Fund Services, LLC, in the U.S.
WGM-517666


WisdomTree Trust
Annual Report
March 31, 2024
WisdomTree Europe Quality Dividend Growth Fund (EUDG)
WisdomTree Europe SmallCap Dividend Fund (DFE)
WisdomTree International AI Enhanced Value Fund (AIVI)
WisdomTree International Equity Fund (DWM)
WisdomTree International High Dividend Fund (DTH)
WisdomTree International LargeCap Dividend Fund (DOL)
WisdomTree International MidCap Dividend Fund (DIM)
WisdomTree International Multifactor Fund (DWMF)
WisdomTree International Quality Dividend Growth Fund (IQDG)
WisdomTree International SmallCap Dividend Fund (DLS)
WisdomTree Japan SmallCap Dividend Fund (DFJ)
| 1 | ||||
Information about Performance and Shareholder Expense Examples (unaudited) | 3 | |||
| 4 | ||||
| 15 | ||||
| Schedules of Investments | ||||
| 18 | ||||
| 22 | ||||
| 26 | ||||
| 28 | ||||
| 39 | ||||
| 46 | ||||
| 50 | ||||
| 57 | ||||
| 62 | ||||
| 66 | ||||
| 76 | ||||
| 85 | ||||
| 88 | ||||
| 91 | ||||
| 95 | ||||
| 101 | ||||
| 116 | ||||
| 117 | ||||
| 118 | ||||
| 120 | ||||
| 121 | ||||
“WisdomTree” is a registered mark of WisdomTree, Inc. and is licensed for use by the WisdomTree Trust.
(unaudited)
Developed international equity markets, as measured by the MSCI EAFE Index, returned 15.32% in U.S. dollar (“USD”) terms during the 12-month fiscal period ending March 31, 2024 (the “period”).
Most developed market currencies modestly weakened versus the USD during the period, as higher interest rates in the U.S. relative to the rest of developed world lent support to the USD at the expense of other currencies. The euro slightly weakened against the USD during the period by -0.45%, while the Australian dollar, New Zealand dollar and Norwegian krone suffered a bit more, falling between 2.45-4.44% apiece. The most pronounced decline was in the Japanese yen (“JPY”), which remains suppressed by the Bank of Japan’s commitment to accommodative monetary policy in an effort to stimulate economic growth. Low interest rates in Japan caused the JPY to weaken by more than 12% versus the USD. The two currency exceptions that strengthened versus the USD were the British pound sterling (“GBP”) and Swiss franc (“CHF”), which appreciated by 2.32% and 1.54%, respectively. The GBP’s movement was the result of relatively aggressive interest rate hikes by the Bank of England, while the CHF likely benefited from its status as a global safe-haven currency.
Similar to the rest of the world, developed international equity markets continued to combat high inflation for most of the period. Most central banks continued to raise interest rates and then pause their policy activity to assess the effects of tighter monetary policy on the economy. Markets fluctuated during the first seven months of the period (April through October 2023) before ultimately delivering the entirety of their gains in the latter five months. Investors propelled markets higher as economic data releases continued to show progress in combating inflation without adversely affecting the labor markets. As it became clear that a “soft economic landing” could be attained, equity markets rallied.
During the first quarter of the period, from April to June 2023, the MSCI EAFE Index returned 2.95% in USD terms. As the most influential central bank in the developed international universe, the European Central Bank (“ECB”) steadily raised its benchmark refinancing rate in 25 basis point increments, beginning the period at 3.5% and ending it at 4%. The policy tightening continued despite initial declines in European Monetary Union Index of Consumer Price inflation, which fell from about 7% to 5.5% year-over-year during the period. Inflation readings simply remained too high for investors to believe that the rate hike campaign could be ended early, and markets fluctuated before ending the quarter in slightly positive territory. Economic growth was flat during the quarter, only growing by 0.2% compared to the prior quarter. Currency performance was mixed during these three months with only the JPY making outsized moves versus the USD, weakening by about 8%. Earnings for the MSCI EAFE Index grew 18% during the quarter.
The second quarter of the period, July to September 2023, was poor for developed equity markets, as the MSCI EAFE Index fell over 4% in USD terms. As the largest equity region within the developed international equity universe, real Gross Domestic Product (“GDP”) in Europe fell 0.1% quarter-over-quarter despite continued disinflation, from 5.5% to 4.3% year-over-year. The ECB continued to raise rates in two 25 basis point increments, ending the quarter at 4.5%. This contributed to relatively poor sentiment in the region and prompted a slight equity market selloff. Virtually all the European currencies, plus the others in the developed market universe within the G10, weakened versus the USD by about 2% to 4%. Earnings growth exacerbated the declines in equity markets, falling nearly 19% during the three-month period.
Markets finally rebounded during the third quarter of the period, October to December 2023, as the MSCI EAFE Index rallied 10.42% in USD terms. Every G10 currency strengthened significantly versus the USD during this quarter, as U.S. investors began to anticipate a pivot to rate cuts in 2024. This put new pressure on the USD and bolstered the developed international currencies that had been relatively weak for most of the year. The ECB finally paused its rate hike campaign during the quarter to assess the economic impact of its policy activity. It opted to hold rates at 4.5%, which is where they
| WisdomTree Trust | 1 |
Market Environment Overview
(unaudited) (concluded)
remain as of the date of this report. Inflation fell to under 3% year-over-year, which provided investors with renewed optimism. Despite the positive signs in the inflation battle, the economy stalled during the quarter with real GDP registering 0% growth quarter-over-quarter. Markets mostly shrugged off a slight decline in company profits during the quarter, with the MSCI EAFE Index registering a 1.7% decline in earnings.
Optimism from the end of 2023 continued into the first quarter of 2024, the final quarter of the period. Disinflation continued in Europe, falling slightly from 2.9% down to 2.4% through March, as the ECB maintained its pause on rate hikes. At 4.5%, rates have not been this high since mid-2001. Markets began to believe the end of the fight against inflation was in sight, and the MSCI EAFE Index returned 5.78% in USD terms. Despite a rebound in developed market currencies in the prior quarter, they resumed their decline against the USD during these three months as investors began to believe that international central banks would have to cut rates more quickly and in greater magnitude than the Federal Reserve in the U.S. This assumed policy rate gap once again weighed on international currencies and supported USD strength. As of the date of this report, GDP growth for the Eurozone is not yet available.
Entering the new period, developed equity markets remain fixated on the future path of monetary policy. Much like in the U.S., each country or region’s individual economic data releases will have significant implications for the direction of equity markets based on their immediate impact to policy rate setting. They may likely require both rate cuts and stronger economic growth than what has been observed in the last 12 months to generate prolonged growth in the equity market.
Each WisdomTree Fund’s performance as set forth in “Management’s Discussion of Funds’ Performance” in the pages that follow should also be viewed in light of the foregoing market performance.
| 2 | WisdomTree Trust |
Information about Performance and Shareholder Expense Examples (unaudited)
Performance
The performance tables on the following pages are provided for comparative purposes and represent the period noted. Each Fund’s per share net asset value (“NAV”) is the value of one share of the Fund and is calculated by dividing the value of total assets less total liabilities by the number of shares outstanding. The NAV return is based on the NAV of the Fund and the market price return is based on the market price per share of the Fund. The price used to calculate market price returns is the midpoint of the bid and ask price for Fund shares as of the close of trading on the exchange where Fund shares are listed. NAV and market price returns assume that dividends and capital gain distributions have been reinvested in the Fund at NAV and market price, respectively. As with other exchange traded funds (“ETFs”), NAV returns and market price returns may differ because of factors such as the supply and demand for Fund shares and investors’ assessments of the underlying value of a Fund’s portfolio securities.
Fund shares are bought and sold at market price (not NAV) and are not individually redeemed from a Fund. Fund NAV returns are calculated using a Fund’s daily 4:00 p.m. eastern time NAV. Market price returns reflect the midpoint of the bid and ask price as of the close of trading on the exchange where Fund shares are listed. Market price returns do not represent the returns you would receive if you traded shares at other times. The returns do not reflect the deduction of taxes that a shareholder would pay on Fund distributions or on the redemption of Fund shares. Total returns for a period of less than one year are cumulative.
Performance is historical and does not guarantee future results. Current performance may be lower or higher than quoted. Investment returns and the principal value of an investment will fluctuate so that an investor’s shares, when redeemed, may be worth more or less than their original cost. For the most recent month-end performance information visit www.wisdomtree.com/investments.
An index is a statistical measure of a specified financial market or sector. An index does not actually hold a portfolio of securities, incur expenses or pay any transaction costs. Therefore, index returns do not reflect deductions for fees or expenses and an index is not available for direct investment. In comparison, the Funds’ performance is negatively impacted by these deductions. Fund returns do not reflect brokerage commissions or taxes on transactions in Fund shares or taxes that a shareholder would pay on Fund distributions. Past performance is no guarantee of future results.
Shareholder Expense Examples
Each Fund’s performance table is accompanied by a shareholder expense example. As a shareholder of a WisdomTree Fund, you incur two types of cost: (1) transaction costs, including brokerage commissions on purchases and sales of your Fund shares and (2) ongoing costs, including management fees and other Fund expenses. The examples are intended to help you understand your ongoing costs (in dollars and cents) of investing in a Fund and to compare these costs with the ongoing costs of investing in other funds.
The examples are based on an investment of $1,000 invested at the beginning of the period and held for the entire period from October 1, 2023 to March 31, 2024. Except where noted, expenses are calculated using each Fund’s annualized expense ratio (after the effect of contractual or voluntary fee waivers, if any), multiplied by the average account value for the period, multiplied by 183/366 (to reflect the one-half year period). The annualized expense ratio does not include acquired fund fees and expenses (“AFFEs”), which are fees and expenses incurred indirectly by a Fund through its investments in certain underlying investment companies.
Actual expenses
The first line in the shareholder expense example table shown on the following pages provides information about actual account values and actual expenses. You may use the information in this line, together with the amount you invested, to estimate the expenses that you paid over the period. Simply divide your account value by $1,000 (for example, an $8,600 account value divided by $1,000 = 8.6), then multiply the result by the number in the first line for your Fund under the heading entitled “Expenses Paid During the Period” to estimate the expenses you paid on your account during the period.
Hypothetical example for comparison purposes
The second line in the shareholder expense example table shown on the following pages provides information about hypothetical account values and hypothetical expenses based on the Fund’s actual expense ratio and an assumed rate of return of 5% per year before expenses, which is not the Fund’s actual return. The hypothetical account values and expenses may not be used to estimate the actual ending account balance or expenses you paid for the period. You may use this information to compare the ongoing costs of investing in your Fund and other funds. To do so, compare this 5% hypothetical example with the 5% hypothetical examples that appear in the shareholder reports of the other funds.
Please note that the expenses shown in the table are meant to highlight your ongoing costs only and do not reflect any transactional costs, such as brokerage commissions paid on purchases and sales of Fund shares. Therefore, the second line in the table is useful in comparing ongoing Fund costs only and will not help you determine the relative total costs of owning different funds. In addition, if these transactional costs were included, your costs would have been higher.
| WisdomTree Trust | 3 |
Management’s Discussion of Funds’ Performance
as of March 31, 2024 (unaudited)
WisdomTree Europe Quality Dividend Growth Fund (EUDG)
Sector Breakdown†
| Sector | % of Net Assets | |||
Industrials | 21.2% | |||
Health Care | 18.3% | |||
Consumer Discretionary | 18.0% | |||
Consumer Staples | 17.4% | |||
Materials | 5.8% | |||
Communication Services | 5.7% | |||
Information Technology | 5.4% | |||
Financials | 4.9% | |||
Utilities | 2.0% | |||
Energy | 0.4% | |||
Real Estate | 0.1% | |||
Other Assets less Liabilities‡ | 0.8% | |||
Total | 100.0% | |||
| † | The Fund’s sector breakdown is expressed as a percentage of net assets and may change over time. In addition, a sector may be comprised of several industries. It does not include derivatives (if any). |
| ‡ | Other assets less liabilities may include investment of cash collateral for securities on loan and/or receivables/payables on derivatives (if any). |
Top Ten Holdings*
| Description | % of Net Assets | |||
LVMH Moet Hennessy Louis Vuitton SE | 5.8% | |||
Nestle SA, Registered Shares | 4.2% | |||
Industria de Diseno Textil SA | 4.1% | |||
Novartis AG, Registered Shares | 3.3% | |||
Unilever PLC | 3.1% | |||
Roche Holding AG, Bearer Shares | 3.0% | |||
Deutsche Telekom AG, Registered Shares | 2.9% | |||
ASML Holding NV | 2.9% | |||
L’Oreal SA | 2.5% | |||
Sanofi SA | 2.4% | |||
| * | The ten largest holdings are subject to change, and there are no guarantees the Fund will remain invested in any particular company. Excludes derivatives and investment of cash collateral for securities on loan (if any). |
The WisdomTree Europe Quality Dividend Growth Fund (the “Fund”) seeks to track the price and yield performance, before fees and expenses, of the WisdomTree Europe Quality Dividend Growth Index (the “Index”). In seeking to track the Index, the Fund invests in dividend-paying companies with growth characteristics in the European equity market. The Fund generally uses a representative sampling strategy to achieve its investment objective, meaning it generally will invest in a sample of securities in the Index.
The Fund returned 10.22% at net asset value (“NAV”) for the fiscal year ended March 31, 2024 (for more complete performance information please see the table below). Positions in the Materials and Utilities sectors had the strongest, albeit modest, performance impacts due to stock selection in the former and allocation effects in the latter. Consumer Staples, Industrials, and Financials sectors detracted from Fund performance. Industrials were negatively affected by poor stock selection, while Consumer Staples suffered from negative allocation effects. Financials suffered roughly equally from both effects. Within Europe, Spain had the only notable performance impact due to positive stock selection. France and Sweden had the most negative performance impacts due to negative stock selection in each. Within return-on-equity quintiles, each one, except the fifth, had a negative performance impact attributable to poor stock selection. The fifth quintile, however, was the lone group with positive stock selection that resulted in a positive performance effect in aggregate.
Shareholder Expense Example (for the six-month period ended March 31, 2024)
| Beginning Account Value | Ending Account Value | Annualized Expense Ratio1 | Expenses Paid During the Period1 | |||||||||||||
Actual | $ | 1,000.00 | $ | 1,141.90 | 0.59 | % | $ | 3.16 | ||||||||
Hypothetical (5% return before expenses) | $ | 1,000.00 | $ | 1,022.05 | 0.59 | % | $ | 2.98 | ||||||||
| 1 | Included in the expense ratio are “Other fees” described in Note 6 which are not annualized. Without these expenses, the expense ratio would have been 0.58% and the actual and hypothetical expenses paid during the period would have been $3.11 and $2.93, respectively. |
Performance
| Average Annual Total Return | ||||||||||||||||
| 1 Year | 3 Year | 5 Year | Since Inception1 | |||||||||||||
Fund NAV Returns | 10.22 | % | 4.09 | % | 8.08 | % | 5.06 | % | ||||||||
Fund Market Price Returns | 10.56 | % | 4.22 | % | 8.20 | % | 5.05 | % | ||||||||
WisdomTree Europe Quality Dividend Growth Index | 10.56 | % | 4.51 | % | 8.54 | % | 5.54 | % | ||||||||
MSCI Europe Index | 14.11 | % | 6.19 | % | 7.96 | % | 4.22 | % | ||||||||
| 1 | Total returns are calculated based on the commencement of Fund trading on the NYSE Arca, Inc. on May 7, 2014. |
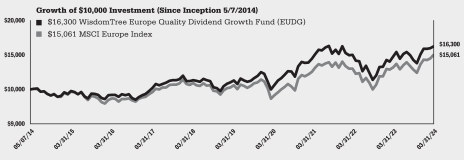
Performance is historical and does not guarantee future results. The returns do not reflect the deduction of taxes that a shareholder would pay on Fund distributions or on the redemption of Fund shares.
| 4 | WisdomTree Trust |
Management’s Discussion of Funds’ Performance
as of March 31, 2024 (unaudited)
WisdomTree Europe SmallCap Dividend Fund (DFE)
Sector Breakdown†
| Sector | % of Net Assets | |||
Industrials | 29.6% | |||
Consumer Discretionary | 12.7% | |||
Financials | 12.0% | |||
Information Technology | 8.7% | |||
Materials | 8.2% | |||
Real Estate | 6.7% | |||
Energy | 5.5% | |||
Consumer Staples | 4.9% | |||
Communication Services | 4.6% | |||
Health Care | 3.3% | |||
Utilities | 1.9% | |||
Investment Company | 0.3% | |||
Other Assets less Liabilities‡ | 1.6% | |||
Total | 100.0% | |||
| † | The Fund’s sector breakdown is expressed as a percentage of net assets and may change over time. In addition, a sector may be comprised of several industries. It does not include derivatives (if any). |
| ‡ | Other assets less liabilities may include investment of cash collateral for securities on loan and/or receivables/payables on derivatives (if any). |
Top Ten Holdings*
| Description | % of Net Assets | |||
Saras SpA | 2.3% | |||
4imprint Group PLC | 1.6% | |||
Outokumpu OYJ | 1.4% | |||
Bank of Georgia Group PLC | 1.4% | |||
Redrow PLC | 1.3% | |||
D/S Norden AS | 1.2% | |||
Sacyr SA | 1.1% | |||
OC Oerlikon Corp. AG, Registered Shares | 1.1% | |||
Peab AB, Class B | 1.0% | |||
Anima Holding SpA | 1.0% | |||
| * | The ten largest holdings are subject to change, and there are no guarantees the Fund will remain invested in any particular company. Excludes derivatives and investment of cash collateral for securities on loan (if any). |
The WisdomTree Europe SmallCap Dividend Fund (the “Fund”) seeks to track the price and yield performance, before fees and expenses, of the WisdomTree Europe SmallCap Dividend Index (the “Index”). In seeking to track the Index, the Fund invests in dividend-paying small-cap companies in the European equity market. The Fund generally uses a representative sampling strategy to achieve its investment objective, meaning it generally will invest in a sample of securities in the Index.
The Fund returned 7.40% at net asset value (“NAV”) for the fiscal year ended March 31, 2024 (for more complete performance information please see the table below). Positions in the Information Technology and Consumer Discretionary sectors contributed positively to performance for the Fund due to a mix of allocation and stock selection effects. Financials sector was the main detractor primarily due to poor stock selection. France and Belgium were positive country contributors during the period due to allocation effects in each, with an additional boost from positive stock selection in France. Positions in Italy and the Netherlands weighed on performance due to a mix of allocation and stock selection effects in both. Within dividend yield quintiles, the fourth quintile (representing the second-lowest-yielding quintile) performed positively due to positive stock selection. The top three quintiles, representing the highest-yielding stocks, all weighed on Fund performance, primarily due to negative stock selection in each.
Shareholder Expense Example (for the six-month period ended March 31, 2024)
| Beginning Account Value | Ending Account Value | Annualized Net Expense Ratio1 | Expenses Paid During the Period1 | |||||||||||||
Actual | $ | 1,000.00 | $ | 1,144.00 | 0.61 | % | $ | 3.27 | ||||||||
Hypothetical (5% return before expenses) | $ | 1,000.00 | $ | 1,021.95 | 0.61 | % | $ | 3.08 | ||||||||
| 1 | Included in the expense ratio are “Other fees” described in Note 6 which are not annualized. Without these expenses, the expense ratio would have been 0.58% and the actual and hypothetical expenses paid during the period would have been $3.11 and $2.93, respectively. |
Performance
| Average Annual Total Return | ||||||||||||||||
| 1 Year | 3 Year | 5 Year | 10 Year | |||||||||||||
Fund NAV Returns | 7.40 | % | -0.52 | % | 4.67 | % | 3.36 | % | ||||||||
Fund Market Price Returns | 7.38 | % | -0.48 | % | 4.70 | % | 3.34 | % | ||||||||
WisdomTree Europe SmallCap Dividend Index | 7.55 | % | -0.45 | % | 5.01 | % | 3.86 | % | ||||||||
MSCI Europe Small Cap Index | 9.54 | % | -2.10 | % | 5.33 | % | 4.20 | % | ||||||||
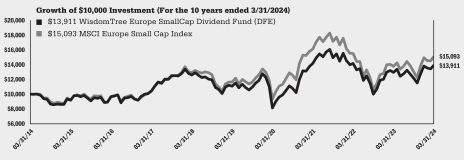
Performance is historical and does not guarantee future results. The returns do not reflect the deduction of taxes that a shareholder would pay on Fund distributions or on the redemption of Fund shares.
| WisdomTree Trust | 5 |
Management’s Discussion of Funds’ Performance
as of March 31, 2024 (unaudited)
WisdomTree International AI Enhanced Value Fund (AIVI)
Sector Breakdown†
| Sector | % of Net Assets | |||
Financials | 29.3% | |||
Industrials | 18.4% | |||
Materials | 10.0% | |||
Consumer Staples | 9.8% | |||
Real Estate | 7.2% | |||
Health Care | 6.7% | |||
Energy | 6.7% | |||
Utilities | 5.1% | |||
Consumer Discretionary | 3.4% | |||
Communication Services | 1.6% | |||
Investment Company | 0.6% | |||
Other Assets less Liabilities‡ | 1.2% | |||
Total | 100.0% | |||
| † | The Fund’s sector breakdown is expressed as a percentage of net assets and may change over time. In addition, a sector may be comprised of several industries. It does not include derivatives (if any). |
| ‡ | Other assets less liabilities may include investment of cash collateral for securities on loan and/or receivables/payables on derivatives (if any). |
Top Ten Holdings*
| Description | % of Net Assets | |||
Shell PLC | 3.5% | |||
Zurich Insurance Group AG | 3.1% | |||
Swiss Re AG | 3.1% | |||
Vinci SA | 3.0% | |||
Groupe Bruxelles Lambert NV | 2.9% | |||
Takeda Pharmaceutical Co. Ltd. | 2.8% | |||
AXA SA | 2.4% | |||
Enagas SA | 2.4% | |||
Aviva PLC | 2.3% | |||
Eiffage SA | 2.3% | |||
| * | The ten largest holdings are subject to change, and there are no guarantees the Fund will remain invested in any particular company. Excludes derivatives and investment of cash collateral for securities on loan (if any). |
The WisdomTree International AI Enhanced Value Fund (the “Fund”) seeks income and capital appreciation by investing primarily in equity securities selected from a universe of developed market equities, excluding the United States and Canada, that exhibit value characteristics based on the selection results of a proprietary, quantitative artificial intelligence (AI) model developed by Voya Investment Management Co., LLC., the Fund’s sub-adviser. Prior to January 18, 2022, Fund performance reflects the investment objective of the Fund when it was the WisdomTree International Dividend ex-Financials Fund and tracked the price and yield performance, before fees and expenses, of the WisdomTree International Dividend ex-Financials Index (the “Former Index”). In seeking to track the Former Index, the Fund invested in high-dividend-yielding companies in the developed world excluding the U.S. and Canada, and excluding the Financials sector.
The Fund returned 10.93% at net asset value (“NAV”) for the fiscal year ended March 31, 2024 (for more complete performance information please see the table below). The Fund benefited from positions in the Consumer Discretionary, Communication Services, and Health Care sectors due to strong stock selection in the former two and positive stock selection in the latter. Industrials and Financials sectors weighed on performance due to negative stock selection effects in each. France and Switzerland were the best country contributors due to positive stock selection, while the Netherlands, Spain and Japan all hampered performance due to poor stock selection effects. Across price-to-earnings quintiles, each negatively affected performance except for the third. The four detractors were due to poor stock selection while the success in the third quintile was the result of strong stock selection.
Shareholder Expense Example (for the six-month period ended March 31, 2024)
| Beginning Account Value | Ending Account Value | Annualized Expense Ratio1 | Expenses Paid During the Period1 | |||||||||||||
Actual | $ | 1,000.00 | $ | 1,103.80 | 0.59 | % | $ | 3.10 | ||||||||
Hypothetical (5% return before expenses) | $ | 1,000.00 | $ | 1,022.05 | 0.59 | % | $ | 2.98 | ||||||||
| 1 | Included in the expense ratio are “Other fees” described in Note 6 which are not annualized. Without these expenses, the expense ratio would have been 0.58% and the actual and hypothetical expenses paid during the period would have been $3.05 and $2.93, respectively. |
Performance
| Average Annual Total Return | ||||||||||||||||
| 1 Year | 3 Year | 5 Year | 10 Year | |||||||||||||
Fund NAV Returns1 | 10.93 | % | 3.90 | % | 4.71 | % | 2.52 | % | ||||||||
Fund Market Price Returns1 | 10.71 | % | 3.81 | % | 4.66 | % | 2.52 | % | ||||||||
MSCI EAFE Value Index | 17.32 | % | 6.59 | % | 6.39 | % | 3.49 | % | ||||||||
| 1 | The Fund’s investment objective changed effective January 18, 2022. Prior to January 18, 2022, the Fund’s investment objective sought to track the price and yield performance, before fees and expenses, of the WisdomTree International Dividend ex-Financials Index. |
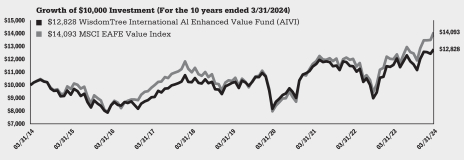
Performance is historical and does not guarantee future results. The returns do not reflect the deduction of taxes that a shareholder would pay on Fund distributions or on the redemption of Fund shares.
| 6 | WisdomTree Trust |
Management’s Discussion of Funds’ Performance
as of March 31, 2024 (unaudited)
WisdomTree International Equity Fund (DWM)
Sector Breakdown†
| Sector | % of Net Assets | |||
Financials | 25.7% | |||
Industrials | 15.4% | |||
Consumer Discretionary | 12.8% | |||
Consumer Staples | 8.8% | |||
Health Care | 8.0% | |||
Energy | 5.8% | |||
Materials | 5.7% | |||
Communication Services | 5.4% | |||
Utilities | 5.1% | |||
Information Technology | 3.6% | |||
Real Estate | 2.7% | |||
Other Assets less Liabilities‡ | 1.0% | |||
Total | 100.0% | |||
| † | The Fund’s sector breakdown is expressed as a percentage of net assets and may change over time. In addition, a sector may be comprised of several industries. It does not include derivatives (if any). |
| ‡ | Other assets less liabilities may include investment of cash collateral for securities on loan and/or receivables/payables on derivatives (if any). |
Top Ten Holdings*
| Description | % of Net Assets | |||
HSBC Holdings PLC | 1.6% | |||
Nestle SA, Registered Shares | 1.5% | |||
Novartis AG, Registered Shares | 1.5% | |||
TotalEnergies SE | 1.5% | |||
Stellantis NV | 1.3% | |||
Toyota Motor Corp. | 1.2% | |||
Bayerische Motoren Werke AG | 1.2% | |||
Allianz SE, Registered Shares | 1.1% | |||
Industria de Diseno Textil SA | 1.1% | |||
LVMH Moet Hennessy Louis Vuitton SE | 1.0% | |||
| * | The ten largest holdings are subject to change, and there are no guarantees the Fund will remain invested in any particular company. Excludes derivatives and investment of cash collateral for securities on loan (if any). |
The WisdomTree International Equity Fund (the “Fund”) seeks to track the price and yield performance, before fees and expenses, of the WisdomTree International Equity Index (the “Index”). In seeking to track the Index, the Fund invests in dividend-paying companies in the developed world excluding the U.S. and Canada. The Fund generally uses a representative sampling strategy to achieve its investment objective, meaning it generally will invest in a sample of securities in the Index.
The Fund returned 14.83% at net asset value (“NAV”) for the fiscal year ended March 31, 2024 (for more complete performance information please see the table below). The Fund benefited from exposures to Consumer Discretionary, Financials, and Consumer Staples due to a mix of positive stock selection and allocation effects within these sectors. Industrials and Information Technology sectors lagged, primarily due to poor stock selection in the former and negative allocation effects in the latter. From a country perspective, Japan contributed to the Fund’s performance due to positive stock selection. Germany and the Netherlands detracted due to negative allocation effects. Across dividend yield quintiles, the top four detracted with most of the negative impact from the group coming from poor stock selection. The fifth quintile, representing the lowest-yielding stocks, contributed positively due to allocation effects.
Shareholder Expense Example (for the six-month period ended March 31, 2024)
| Beginning Account Value | Ending Account Value | Annualized Expense Ratio1 | Expenses Paid During the Period1 | |||||||||||||
Actual | $ | 1,000.00 | $ | 1,144.00 | 0.49 | % | $ | 2.63 | ||||||||
Hypothetical (5% return before expenses) | $ | 1,000.00 | $ | 1,022.55 | 0.49 | % | $ | 2.48 | ||||||||
| 1 | Included in the expense ratio are “Other fees” described in Note 6 which are not annualized. Without these expenses, the expense ratio would have been 0.48% and the actual and hypothetical expenses paid during the period would have been $2.57 and $2.43, respectively. |
Performance
| Average Annual Total Return | ||||||||||||||||
| 1 Year | 3 Year | 5 Year | 10 Year | |||||||||||||
Fund NAV Returns | 14.83 | % | 5.75 | % | 5.63 | % | 3.76 | % | ||||||||
Fund Market Price Returns | 14.70 | % | 5.70 | % | 5.57 | % | 3.72 | % | ||||||||
WisdomTree International Equity Index | 14.88 | % | 5.97 | % | 5.86 | % | 3.99 | % | ||||||||
MSCI EAFE Index | 15.32 | % | 4.78 | % | 7.33 | % | 4.80 | % | ||||||||
MSCI EAFE Value Index | 17.32 | % | 6.59 | % | 6.39 | % | 3.49 | % | ||||||||
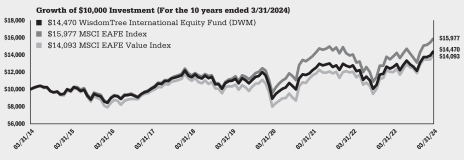
Performance is historical and does not guarantee future results. The returns do not reflect the deduction of taxes that a shareholder would pay on Fund distributions or on the redemption of Fund shares.
| WisdomTree Trust | 7 |
Management’s Discussion of Funds’ Performance
as of March 31, 2024 (unaudited)
WisdomTree International High Dividend Fund (DTH)
Sector Breakdown†
| Sector | % of Net Assets | |||
Financials | 26.5% | |||
Utilities | 11.8% | |||
Consumer Discretionary | 11.7% | |||
Energy | 10.8% | |||
Industrials | 10.0% | |||
Communication Services | 7.5% | |||
Materials | 7.1% | |||
Consumer Staples | 6.0% | |||
Real Estate | 4.0% | |||
Health Care | 2.9% | |||
Information Technology | 0.6% | |||
Other Assets less Liabilities‡ | 1.1% | |||
Total | 100.0% | |||
| † | The Fund’s sector breakdown is expressed as a percentage of net assets and may change over time. In addition, a sector may be comprised of several industries. It does not include derivatives (if any). |
| ‡ | Other assets less liabilities may include investment of cash collateral for securities on loan and/or receivables/payables on derivatives (if any). |
Top Ten Holdings*
| Description | % of Net Assets | |||
TotalEnergies SE | 3.7% | |||
Stellantis NV | 3.2% | |||
Bayerische Motoren Werke AG | 3.0% | |||
Mercedes-Benz Group AG | 2.4% | |||
British American Tobacco PLC | 2.2% | |||
HSBC Holdings PLC | 2.1% | |||
Enel SpA | 2.1% | |||
Iberdrola SA | 1.8% | |||
GSK PLC | 1.6% | |||
Rio Tinto PLC | 1.5% | |||
| * | The ten largest holdings are subject to change, and there are no guarantees the Fund will remain invested in any particular company. Excludes derivatives and investment of cash collateral for securities on loan (if any). |
The WisdomTree International High Dividend Fund (the “Fund”) seeks to track the price and yield performance, before fees and expenses, of the WisdomTree International High Dividend Index (the “Index”). In seeking to track the Index, the Fund invests in high-dividend-yielding companies in the developed world excluding the U.S. and Canada. The Fund generally uses a representative sampling strategy to achieve its investment objective, meaning it generally will invest in a sample of securities in the Index.
The Fund returned 11.45% at net asset value (“NAV”) for the fiscal year ended March 31, 2024 (for more complete performance information please see the table below). Positions in the Consumer Staples and Financials sectors were additive due to a mix of strong allocation and selection effects in the former and mostly allocation impacts in the latter. Industrials and Utilities sectors lagged due to poor stock selection in the former and negative allocation effects in the latter. Information Technology sector was also a headwind due to a poor mix of both effects. Switzerland and France were positive contributors from a country standpoint largely due to strong stock selection. Japan and Germany weighed on performance due to negative allocation effects in the former and negative stock selection in the latter. The United Kingdom was also a headwind due to negative allocation and stock selection. Across dividend yield quintiles, the top four detracted with most of the negative impact from the group coming from both poor stock selection and allocation effects. The fifth quintile, representing the lowest-yielding stocks, positively contributed due to allocation effects.
Shareholder Expense Example (for the six-month period ended March 31, 2024)
| Beginning Account Value | Ending Account Value | Annualized Net Expense Ratio1 | Expenses Paid During the Period1 | |||||||||||||
Actual | $ | 1,000.00 | $ | 1,108.30 | 0.59 | % | $ | 3.11 | ||||||||
Hypothetical (5% return before expenses) | $ | 1,000.00 | $ | 1,022.05 | 0.59 | % | $ | 2.98 | ||||||||
| 1 | Included in the expense ratio are “Other fees” described in Note 6 which are not annualized. Without these expenses, the expense ratio would have been 0.58% and the actual and hypothetical expenses paid during the period would have been $3.06 and $2.93, respectively. |
Performance
| Average Annual Total Return | ||||||||||||||||
| 1 Year | 3 Year | 5 Year | 10 Year | |||||||||||||
Fund NAV Returns | 11.45 | % | 5.92 | % | 4.78 | % | 2.74 | % | ||||||||
Fund Market Price Returns | 11.18 | % | 5.84 | % | 4.75 | % | 2.73 | % | ||||||||
WisdomTree International High Dividend Index | 11.71 | % | 6.20 | % | 5.10 | % | 3.05 | % | ||||||||
MSCI EAFE Value Index | 17.32 | % | 6.59 | % | 6.39 | % | 3.49 | % | ||||||||
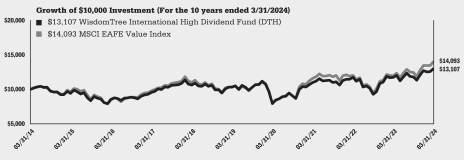
Performance is historical and does not guarantee future results. The returns do not reflect the deduction of taxes that a shareholder would pay on Fund distributions or on the redemption of Fund shares.
| 8 | WisdomTree Trust |
Management’s Discussion of Funds’ Performance
as of March 31, 2024 (unaudited)
WisdomTree International LargeCap Dividend Fund (DOL)
Sector Breakdown†
| Sector | % of Net Assets | |||
Financials | 25.7% | |||
Consumer Discretionary | 14.0% | |||
Industrials | 13.1% | |||
Consumer Staples | 10.3% | |||
Health Care | 10.0% | |||
Energy | 6.6% | |||
Communication Services | 5.7% | |||
Utilities | 5.3% | |||
Materials | 4.3% | |||
Information Technology | 3.1% | |||
Real Estate | 0.9% | |||
Other Assets less Liabilities‡ | 1.0% | |||
Total | 100.0% | |||
| † | The Fund’s sector breakdown is expressed as a percentage of net assets and may change over time. In addition, a sector may be comprised of several industries. It does not include derivatives (if any). |
| ‡ | Other assets less liabilities may include investment of cash collateral for securities on loan and/or receivables/payables on derivatives (if any). |
Top Ten Holdings*
| Description | % of Net Assets | |||
Nestle SA, Registered Shares | 2.1% | |||
Novartis AG, Registered Shares | 2.1% | |||
TotalEnergies SE | 2.0% | |||
HSBC Holdings PLC | 2.0% | |||
Stellantis NV | 1.8% | |||
Toyota Motor Corp. | 1.7% | |||
Bayerische Motoren Werke AG | 1.6% | |||
Industria de Diseno Textil SA | 1.4% | |||
LVMH Moet Hennessy Louis Vuitton SE | 1.4% | |||
Roche Holding AG, Bearer Shares | 1.4% | |||
| * | The ten largest holdings are subject to change, and there are no guarantees the Fund will remain invested in any particular company. Excludes derivatives and investment of cash collateral for securities on loan (if any). |
The WisdomTree International LargeCap Dividend Fund (the “Fund”) seeks to track the price and yield performance, before fees and expenses, of the WisdomTree International LargeCap Dividend Index (the “Index”). In seeking to track the Index, the Fund invests in dividend-paying large-cap companies in the developed world excluding the U.S. and Canada. The Fund generally uses a representative sampling strategy to achieve its investment objective, meaning it generally will invest in a sample of securities in the Index.
The Fund returned 15.35% at net asset value (“NAV”) for the fiscal year ended March 31, 2024 (for more complete performance information please see the table below). The Fund benefited from exposures to the Consumer Discretionary and Financials sectors due to stock selection in the former and allocation effects in the latter. Industrials sector lagged due to a poor mix of both effects, while Information Technology sector also detracted from performance due to negative allocation effects. Within countries, Japan was the lone, notable positive contributor due to strong stock selection effects. Conversely, Germany was the sole, notable negative contributor due to poor stock selection effects. Across dividend yield quintiles, the top four detracted with the majority of negative impact from the group coming from poor stock selection. The fifth quintile, representing the lowest-yielding stocks, contributed positively due to a combination of allocation and stock selection impacts.
Shareholder Expense Example (for the six-month period ended March 31, 2024)
| Beginning Account Value | Ending Account Value | Annualized Net Expense Ratio1 | Expenses Paid During the Period1 | |||||||||||||
Actual | $ | 1,000.00 | $ | 1,145.20 | 0.49 | % | $ | 2.63 | ||||||||
Hypothetical (5% return before expenses) | $ | 1,000.00 | $ | 1,022.55 | 0.49 | % | $ | 2.48 | ||||||||
| 1 | Included in the expense ratio are “Other fees” described in Note 6 which are not annualized. Without these expenses, the expense ratio would have been 0.48% and the actual and hypothetical expenses paid during the period would have been $2.57 and $2.43, respectively. |
Performance
| Average Annual Total Return | ||||||||||||||||
| 1 Year | 3 Year | 5 Year | 10 Year | |||||||||||||
Fund NAV Returns | 15.35 | % | 7.34 | % | 6.21 | % | 3.75 | % | ||||||||
Fund Market Price Returns | 14.95 | % | 7.28 | % | 6.17 | % | 3.71 | % | ||||||||
WisdomTree International LargeCap Dividend Index | 15.30 | % | 7.47 | % | 6.39 | % | 3.96 | % | ||||||||
MSCI EAFE Index | 15.32 | % | 4.78 | % | 7.33 | % | 4.80 | % | ||||||||
MSCI EAFE Value Index | 17.32 | % | 6.59 | % | 6.39 | % | 3.49 | % | ||||||||
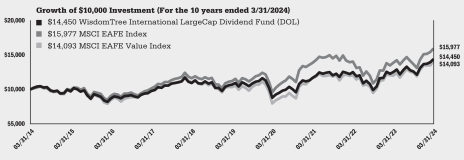
Performance is historical and does not guarantee future results. The returns do not reflect the deduction of taxes that a shareholder would pay on Fund distributions or on the redemption of Fund shares.
| WisdomTree Trust | 9 |
Management’s Discussion of Funds’ Performance
as of March 31, 2024 (unaudited)
WisdomTree International MidCap Dividend Fund (DIM)
Sector Breakdown†
| Sector | % of Net Assets | |||
Industrials | 22.0% | |||
Financials | 19.9% | |||
Consumer Discretionary | 10.8% | |||
Materials | 10.0% | |||
Real Estate | 8.8% | |||
Utilities | 5.9% | |||
Consumer Staples | 5.5% | |||
Information Technology | 4.6% | |||
Communication Services | 4.5% | |||
Energy | 4.1% | |||
Health Care | 3.2% | |||
Other Assets less Liabilities‡ | 0.7% | |||
Total | 100.0% | |||
| † | The Fund’s sector breakdown is expressed as a percentage of net assets and may change over time. In addition, a sector may be comprised of several industries. It does not include derivatives (if any). |
| ‡ | Other assets less liabilities may include investment of cash collateral for securities on loan and/or receivables/payables on derivatives (if any). |
Top Ten Holdings*
| Description | % of Net Assets | |||
Amundi SA | 0.8% | |||
Koninklijke KPN NV | 0.7% | |||
Coles Group Ltd. | 0.7% | |||
Mediobanca Banca di Credito Finanziario SpA | 0.6% | |||
Power Assets Holdings Ltd. | 0.6% | |||
Bank Hapoalim BM | 0.6% | |||
Hong Kong & China Gas Co. Ltd. | 0.6% | |||
Var Energi ASA | 0.6% | |||
Julius Baer Group Ltd. | 0.6% | |||
Bouygues SA | 0.6% | |||
| * | The ten largest holdings are subject to change, and there are no guarantees the Fund will remain invested in any particular company. Excludes derivatives and investment of cash collateral for securities on loan (if any). |
The WisdomTree International MidCap Dividend Fund (the “Fund”) seeks to track the price and yield performance, before fees and expenses, of the WisdomTree International MidCap Dividend Index (the “Index”). In seeking to track the Index, the Fund invests in dividend-paying mid-cap companies in the developed world excluding the U.S. and Canada. The Fund generally uses a representative sampling strategy to achieve its investment objective, meaning it generally will invest in a sample of securities in the Index.
The Fund returned 12.80% at net asset value (“NAV”) for the fiscal year ended March 31, 2024 (for more complete performance information please see the table below). The Fund benefited from positions in the Consumer Discretionary, Financials and Health Care sectors, primarily due to strong stock selection in the former two and positive allocation effects in the latter. Information Technology and Materials sectors were the two main laggards, due to negative stock selection in Materials and a roughly equal blend of poor stock selection and allocation effects in Information Technology. From a country perspective, Japan, Germany and Italy were all additive due to strong stock selection in each. The United Kingdom, Israel, and the Netherlands lagged due to negative stock selection. Within dividend yield quintiles, all five contributed positively during the period due to strong stock selection in quintiles two through four, and allocation effects in quintiles one and five.
Shareholder Expense Example (for the six-month period ended March 31, 2024)
| Beginning Account Value | Ending Account Value | Annualized Expense Ratio1 | Expenses Paid During the Period1 | |||||||||||||
Actual | $ | 1,000.00 | $ | 1,134.70 | 0.59 | % | $ | 3.15 | ||||||||
Hypothetical (5% return before expenses) | $ | 1,000.00 | $ | 1,022.05 | 0.59 | % | $ | 2.98 | ||||||||
| 1 | Included in the expense ratio are “Other fees” described in Note 6 which are not annualized. Without these expenses, the expense ratio would have been 0.58% and the actual and hypothetical expenses paid during the period would have been $3.10 and $2.93, respectively. |
Performance
| Average Annual Total Return | ||||||||||||||||
| 1 Year | 3 Year | 5 Year | 10 Year | |||||||||||||
Fund NAV Returns | 12.80 | % | 2.04 | % | 4.11 | % | 3.84 | % | ||||||||
Fund Market Price Returns | 12.09 | % | 1.99 | % | 4.02 | % | 3.79 | % | ||||||||
WisdomTree International MidCap Dividend Index | 13.06 | % | 2.21 | % | 4.48 | % | 4.19 | % | ||||||||
MSCI EAFE Mid Cap Index | 12.31 | % | 0.28 | % | 5.19 | % | 4.45 | % | ||||||||
MSCI EAFE Mid Cap Value Index | 13.30 | % | 1.84 | % | 3.97 | % | 4.05 | % | ||||||||
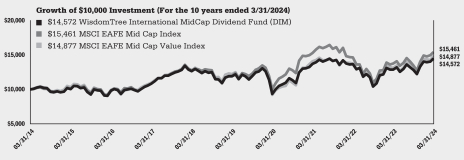
Performance is historical and does not guarantee future results. The returns do not reflect the deduction of taxes that a shareholder would pay on Fund distributions or on the redemption of Fund shares.
| 10 | WisdomTree Trust |
Management’s Discussion of Funds’ Performance
as of March 31, 2024 (unaudited)
WisdomTree International Multifactor Fund (DWMF)
Sector Breakdown†
| Sector | % of Net Assets | |||
Financials | 16.8% | |||
Industrials | 16.4% | |||
Consumer Staples | 13.3% | |||
Health Care | 10.1% | |||
Consumer Discretionary | 9.0% | |||
Utilities | 7.8% | |||
Communication Services | 7.7% | |||
Information Technology | 7.3% | |||
Energy | 6.2% | |||
Materials | 4.3% | |||
Other Assets less Liabilities‡ | 1.1% | |||
Total | 100.0% | |||
| † | The Fund’s sector breakdown is expressed as a percentage of net assets and may change over time. In addition, a sector may be comprised of several industries. It does not include derivatives (if any). |
| ‡ | Other assets less liabilities may include investment of cash collateral for securities on loan and/or receivables/payables on derivatives (if any). |
Top Ten Holdings*
| Description | % of Net Assets | |||
TotalEnergies SE | 1.3% | |||
National Grid PLC | 1.1% | |||
BP PLC | 1.1% | |||
Check Point Software Technologies Ltd. | 1.0% | |||
Novartis AG, Registered Shares | 1.0% | |||
Tryg AS | 1.0% | |||
Zurich Insurance Group AG | 1.0% | |||
Ampol Ltd. | 1.0% | |||
GSK PLC | 1.0% | |||
Roche Holding AG | 0.9% | |||
| * | The ten largest holdings are subject to change, and there are no guarantees the Fund will remain invested in any particular company. Excludes derivatives and investment of cash collateral for securities on loan (if any). |
The WisdomTree International Multifactor Fund (the “Fund”) seeks capital appreciation by investing primarily in equity securities of developed countries, excluding the U.S. and Canada, with the highest composite scores based on two fundamental factors, value and quality measures, and two technical factors, momentum and correlation. The Fund seeks to manage its currency risk by dynamically hedging currency fluctuations in the relative value of the applicable international currencies against the U.S. dollar (“USD”), ranging from a 0% to 100% hedge.
The Fund returned 10.07% at net asset value (“NAV”) for the fiscal year ended March 31, 2024 (for more complete performance information please see the table below). Investments in the Health Care and Energy sectors contributed positively to Fund performance during the period. Health Care was led higher by stock selection, while Energy benefited from positive allocation effects. The most notable detractors were the Utilities, Information Technology, and Industrials sectors. The latter two underperformed due to poor stock selection, while Utilities suffered due to negative allocation effects. Across countries, Hong Kong and France were the two greatest country contributors, primarily due to positive stock selection. Japan and the Netherlands were the primary laggards, both due to negative stock selection. The Fund also utilizes dynamic currency hedges of developed market currencies as part of its investment strategy. The currency basket was roughly 53% hedged in aggregate during the period. At the currency-level, the Japanese yen was 67% hedged during the period, which was additive for Fund performance since the yen depreciated by over 12% versus the USD. The Australian dollar was about 73% hedged as well, which was also positive for performance since it depreciated by about 2.45% versus the USD. The Swiss franc however, appreciated by over 1.5% versus the USD during the period, so the average currency hedge of 70% negatively impacted Fund performance.
Shareholder Expense Example (for the six-month period ended March 31, 2024)
| Beginning Account Value | Ending Account Value | Annualized Expense Ratio | Expenses Paid During the Period | |||||||||||||
Actual | $ | 1,000.00 | $ | 1,089.40 | 0.38 | % | $ | 1.98 | ||||||||
Hypothetical (5% return before expenses) | $ | 1,000.00 | $ | 1,023.10 | 0.38 | % | $ | 1.92 | ||||||||
Performance
| Average Annual Total Return | ||||||||||||||||
| 1 Year | 3 Year | 5 Year | Since Inception1 | |||||||||||||
Fund NAV Returns | 10.07 | % | 5.23 | % | 4.78 | % | 4.45 | % | ||||||||
Fund Market Price Returns | 9.87 | % | 5.16 | % | 4.67 | % | 4.47 | % | ||||||||
MSCI EAFE Local Currency Index | 18.82 | % | 9.43 | % | 9.36 | % | 7.91 | % | ||||||||
MSCI EAFE Index | 15.32 | % | 4.78 | % | 7.33 | % | 6.03 | % | ||||||||
| 1 | Total returns are calculated based on the commencement of Fund trading on the NYSE Arca, Inc. on August 10, 2018. |
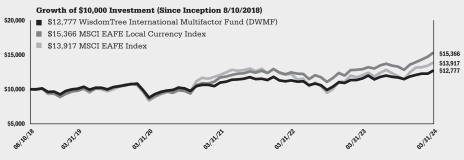
Performance is historical and does not guarantee future results. The returns do not reflect the deduction of taxes that a shareholder would pay on Fund distributions or on the redemption of Fund shares.
| WisdomTree Trust | 11 |
Management’s Discussion of Funds’ Performance
as of March 31, 2024 (unaudited)
WisdomTree International Quality Dividend Growth Fund (IQDG)
Sector Breakdown†
| Sector | % of Net Assets | |||
Consumer Discretionary | 21.1% | |||
Health Care | 18.4% | |||
Industrials | 18.0% | |||
Information Technology | 12.7% | |||
Materials | 9.7% | |||
Consumer Staples | 7.9% | |||
Financials | 4.8% | |||
Communication Services | 3.1% | |||
Utilities | 1.9% | |||
Real Estate | 1.0% | |||
Energy | 0.9% | |||
Other Assets less Liabilities‡ | 0.5% | |||
Total | 100.0% | |||
| † | The Fund’s sector breakdown is expressed as a percentage of net assets and may change over time. In addition, a sector may be comprised of several industries. It does not include derivatives (if any). |
| ‡ | Other assets less liabilities may include investment of cash collateral for securities on loan and/or receivables/payables on derivatives (if any). |
Top Ten Holdings*
| Description | % of Net Assets | |||
LVMH Moet Hennessy Louis Vuitton SE | 4.8% | |||
Industria de Diseno Textil SA | 4.8% | |||
ASML Holding NV | 4.0% | |||
AstraZeneca PLC | 3.2% | |||
Novartis AG, Registered Shares | 3.2% | |||
Novo Nordisk AS, Class B | 3.1% | |||
Roche Holding AG, Bearer Shares | 2.9% | |||
Deutsche Post AG, Registered Shares | 2.6% | |||
Tokyo Electron Ltd. | 2.5% | |||
UBS Group AG, Registered Shares | 2.5% | |||
| * | The ten largest holdings are subject to change, and there are no guarantees the Fund will remain invested in any particular company. Excludes derivatives and investment of cash collateral for securities on loan (if any). |
The WisdomTree International Quality Dividend Growth Fund (the “Fund”) seeks to track the price and yield performance, before fees and expenses, of the WisdomTree International Quality Dividend Growth Index (the “Index”). In seeking to track the Index, the Fund invests in dividend-paying companies with growth characteristics in the developed world excluding the U.S. and Canada. The Fund generally uses a representative sampling strategy to achieve its investment objective, meaning it generally will invest in a sample of securities in the Index.
The Fund returned 14.81% at net asset value (“NAV”) for the fiscal year ended March 31, 2024 (for more complete performance information please see the table below). The Fund benefited from positions in Information Technology, Health Care, and Real Estate sectors primarily due to stock selection in each. Industrials and Financials sectors were the two most significant detractors due to poor stock selection in the former and a blend of poor stock selection and negative allocation effects in the latter. Across countries, Spain, Hong Kong and Australia were additive to the Fund’s performance due to stock selection. France and Japan were the two greatest detractors mainly due to poor stock selection as well. Within return-on-equity (ROE) quintiles, positive performance was (ironically) driven by the first and fifth quintiles, representing the highest and lowest ROE stocks, respectively. This was primarily due to stock selection in both. The second and fourth quintiles were the worst performing groups due to stock selection in the former and allocation effects in the latter.
Shareholder Expense Example (for the six-month period ended March 31, 2024)
| Beginning Account Value | Ending Account Value | Annualized Expense Ratio1 | Expenses Paid During the Period1 | |||||||||||||
Actual | $ | 1,000.00 | $ | 1,195.00 | 0.43 | % | $ | 2.36 | ||||||||
Hypothetical (5% return before expenses) | $ | 1,000.00 | $ | 1,022.85 | 0.43 | % | $ | 2.17 | ||||||||
| 1 | Included in the expense ratio are “Other fees” described in Note 6 which are not annualized. Without these expenses, the expense ratio would have been 0.42% and the actual and hypothetical expenses paid during the period would have been $2.30 and $2.12, respectively. |
Performance
| Average Annual Total Return | ||||||||||||||||
| 1 Year | 3 Year | 5 Year | Since Inception1 | |||||||||||||
Fund NAV Returns | 14.81 | % | 3.83 | % | 8.67 | % | 7.90 | % | ||||||||
Fund Market Price Returns | 14.47 | % | 3.73 | % | 8.59 | % | 7.96 | % | ||||||||
WisdomTree International Quality Dividend Growth Index | 15.35 | % | 4.27 | % | 9.06 | % | 8.28 | % | ||||||||
MSCI EAFE Index | 15.32 | % | 4.78 | % | 7.33 | % | 7.67 | % | ||||||||
| 1 | Total returns are calculated based on the commencement of Fund trading on the Cboe BZX Exchange, Inc. on April 7, 2016. |
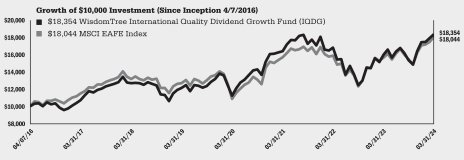
Performance is historical and does not guarantee future results. The returns do not reflect the deduction of taxes that a shareholder would pay on Fund distributions or on the redemption of Fund shares.
| 12 | WisdomTree Trust |
Management’s Discussion of Funds’ Performance
as of March 31, 2024 (unaudited)
WisdomTree International SmallCap Dividend Fund (DLS)
Sector Breakdown†
| Sector | % of Net Assets | |||
Industrials | 26.1% | |||
Financials | 13.1% | |||
Consumer Discretionary | 12.5% | |||
Materials | 10.2% | |||
Real Estate | 7.8% | |||
Information Technology | 7.3% | |||
Consumer Staples | 5.8% | |||
Communication Services | 5.0% | |||
Energy | 4.4% | |||
Utilities | 3.5% | |||
Health Care | 3.0% | |||
Investment Company | 0.0% | * | ||
Other Assets less Liabilities‡ | 1.3% | |||
Total | 100.0% | |||
| † | The Fund’s sector breakdown is expressed as a percentage of net assets and may change over time. In addition, a sector may be comprised of several industries. It does not include derivatives (if any). |
| ‡ | Other assets less liabilities may include investment of cash collateral for securities on loan and/or receivables/payables on derivatives (if any). |
| * | Represents less than 0.1%. |
Top Ten Holdings*
| Description | % of Net Assets | |||
Rubis SCA | 1.1% | |||
Bank of Georgia Group PLC | 0.9% | |||
TORM PLC, Class A | 0.8% | |||
ACEA SpA | 0.7% | |||
CSR Ltd. | 0.7% | |||
SBM Offshore NV | 0.7% | |||
D/S Norden AS | 0.6% | |||
Cofinimmo SA | 0.6% | |||
Hoegh Autoliners ASA | 0.6% | |||
PageGroup PLC | 0.6% | |||
| * | The ten largest holdings are subject to change, and there are no guarantees the Fund will remain invested in any particular company. Excludes derivatives and investment of cash collateral for securities on loan (if any). |
The WisdomTree International SmallCap Dividend Fund (the “Fund”) seeks to track the price and yield performance, before fees and expenses, of the WisdomTree International SmallCap Dividend Index (the “Index”). In seeking to track the Index, the Fund invests in dividend-paying small-cap companies in the developed world excluding the U.S. and Canada. The Fund generally uses a representative sampling strategy to achieve its investment objective, meaning it generally will invest in a sample of securities in the Index.
The Fund returned 12.36% at net asset value (“NAV”) for the fiscal year ended March 31, 2024 (for more complete performance information please see the table below). Positions in the Industrials and Materials sectors were additive to Fund performance largely due to stock selection effects. Energy and Real Estate sectors detracted from performance due to poor stock selection. From a country perspective, Japan and France were also additive due to positive stock selection effects. Denmark and Singapore detracted due to negative stock selection. Across dividend yield quintiles, performance was mixed. Both the first and fifth quintiles, corresponding to the highest- and lowest-yielding quintiles, respectively, were positive contributors due to allocation effects. The second through fourth quintiles lagged, however, mostly due to negative stock selection.
Shareholder Expense Example (for the six-month period ended March 31, 2024)
| Beginning Account Value | Ending Account Value | Annualized Net Expense Ratio1 | Expenses Paid During the Period1 | |||||||||||||
Actual | $ | 1,000.00 | $ | 1,147.70 | 0.59 | % | $ | 3.17 | ||||||||
Hypothetical (5% return before expenses) | $ | 1,000.00 | $ | 1,022.05 | 0.59 | % | $ | 2.98 | ||||||||
| 1 | Included in the expense ratio are “Other fees” described in Note 6 which are not annualized. Without these expenses, the expense ratio would have been 0.58% and the actual and hypothetical expenses paid during the period would have been $3.11 and $2.93, respectively. |
Performance
| Average Annual Total Return | ||||||||||||||||
| 1 Year | 3 Year | 5 Year | 10 Year | |||||||||||||
Fund NAV Returns | 12.36 | % | 1.13 | % | 3.93 | % | 3.66 | % | ||||||||
Fund Market Price Returns | 11.51 | % | 0.94 | % | 3.82 | % | 3.59 | % | ||||||||
WisdomTree International SmallCap Dividend Index | 12.55 | % | 1.53 | % | 4.78 | % | 4.38 | % | ||||||||
MSCI EAFE Small Cap Index | 10.45 | % | -1.36 | % | 4.94 | % | 4.70 | % | ||||||||
MSCI EAFE Small Cap Value Index | 13.60 | % | 1.59 | % | 5.25 | % | 4.28 | % | ||||||||
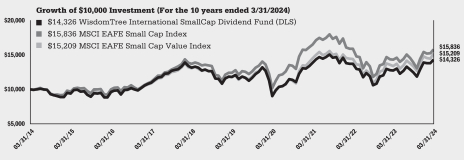
Performance is historical and does not guarantee future results. The returns do not reflect the deduction of taxes that a shareholder would pay on Fund distributions or on the redemption of Fund shares.
| WisdomTree Trust | 13 |
Management’s Discussion of Funds’ Performance
as of March 31, 2024 (unaudited)
WisdomTree Japan SmallCap Dividend Fund (DFJ)
Sector Breakdown†
| Sector | % of Net Assets | |||
Industrials | 25.0% | |||
Consumer Discretionary | 16.4% | |||
Materials | 15.2% | |||
Information Technology | 14.8% | |||
Financials | 8.7% | |||
Consumer Staples | 8.0% | |||
Health Care | 4.1% | |||
Real Estate | 2.6% | |||
Communication Services | 1.8% | |||
Utilities | 1.2% | |||
Energy | 0.8% | |||
Investment Company | 0.0% | * | ||
Other Assets less Liabilities‡ | 1.4% | |||
Total | 100.0% | |||
| † | The Fund’s sector breakdown is expressed as a percentage of net assets and may change over time. In addition, a sector may be comprised of several industries. It does not include derivatives (if any). |
| ‡ | Other assets less liabilities may include investment of cash collateral for securities on loan and/or receivables/payables on derivatives (if any). |
| * | Represents less than 0.1%. |
Top Ten Holdings*
| Description | % of Net Assets | |||
Horiba Ltd. | 1.1% | |||
Daido Steel Co. Ltd. | 0.8% | |||
Toyo Tire Corp. | 0.8% | |||
Tokyo Seimitsu Co. Ltd. | 0.7% | |||
DMG Mori Co. Ltd. | 0.6% | |||
Gunma Bank Ltd. | 0.5% | |||
Amano Corp. | 0.5% | |||
Nippon Electric Glass Co. Ltd. | 0.5% | |||
Mitsui Mining & Smelting Co. Ltd. | 0.5% | |||
Sumitomo Bakelite Co. Ltd. | 0.5% | |||
| * | The ten largest holdings are subject to change, and there are no guarantees the Fund will remain invested in any particular company. Excludes derivatives and investment of cash collateral for securities on loan (if any). |
The WisdomTree Japan SmallCap Dividend Fund (the “Fund”) seeks to track the price and yield performance, before fees and expenses, of the WisdomTree Japan SmallCap Dividend Index (the “Index”). In seeking to track the Index, the Fund invests in dividend-paying small-cap companies in the Japanese equity market. The Fund generally uses a representative sampling strategy to achieve its investment objective, meaning it generally will invest in a sample of securities in the Index.
The Fund returned 20.44% at net asset value (“NAV”) for the fiscal year ended March 31, 2024 (for more complete performance information please see the table below). Positions in the Real Estate, Industrials, and Financials sectors were additive primarily due to stock selection in Industrials and Real Estate and allocation effects in Financials. Only Energy and Utilities were detrimental from a sector perspective. Energy’s impact was negligible, while Utilities were driven lower by a mix of poor allocation and poor stock selection effects. Across dividend yield quintiles, each was additive except for the third quintile. Positive impacts across the other four were mostly attributable to allocation effects. The third quintile detracted from performance mainly due to poor stock selection.
Shareholder Expense Example (for the six-month period ended March 31, 2024)
| Beginning Account Value | Ending Account Value | Annualized Net Expense Ratio | Expenses Paid During the Period | |||||||||||||
Actual | $ | 1,000.00 | $ | 1,148.60 | 0.58 | % | $ | 3.12 | ||||||||
Hypothetical (5% return before expenses) | $ | 1,000.00 | $ | 1,022.10 | 0.58 | % | $ | 2.93 | ||||||||
Performance
| Average Annual Total Return | ||||||||||||||||
| 1 Year | 3 Year | 5 Year | 10 Year | |||||||||||||
Fund NAV Returns | 20.44 | % | 3.71 | % | 5.56 | % | 6.76 | % | ||||||||
Fund Market Price Returns | 18.40 | % | 3.19 | % | 5.29 | % | 6.70 | % | ||||||||
WisdomTree Japan SmallCap Dividend Index | 20.84 | % | 3.96 | % | 5.86 | % | 7.22 | % | ||||||||
MSCI Japan Small Cap Index | 14.39 | % | -0.36 | % | 3.94 | % | 6.11 | % | ||||||||
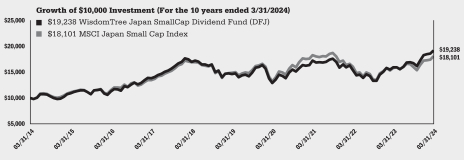
Performance is historical and does not guarantee future results. The returns do not reflect the deduction of taxes that a shareholder would pay on Fund distributions or on the redemption of Fund shares.
| 14 | WisdomTree Trust |
Description of Terms and Indexes (unaudited)
Below are descriptions of certain terms and of each Index referenced in this report:
Allocation Effect measures an investment manager’s ability to effectively allocate a portfolio’s assets to various segments. A segment refers to assets or securities that are grouped within a certain classification such as sectors, industries, or countries. The allocation effect determines whether the overweighting or underweighting of segments relative to a benchmark contributes positively or negatively to the overall portfolio return. Positive allocation occurs when the portfolio is overweighted in a segment that outperforms the benchmark and underweighted in a segment that underperforms the benchmark. Negative allocation occurs when the portfolio is overweighted in a segment that underperforms the benchmark and underweighted in a segment that outperforms the benchmark.
Growth is generally characterized by higher price levels relative to fundamentals, such as dividends or earnings. Price levels are higher because investors are willing to pay more due to their expectations of future improvements in these fundamentals.
Gross Domestic Product (GDP) is the total monetary or market value of all the finished goods and services produced within a country’s borders in a specific time period. As a broad measure of overall domestic production, it functions as a comprehensive scorecard of a country’s economic health.
The MSCI EAFE Index is a market cap-weighted index composed of companies representative of the developed market structure of developed countries in Europe, Australasia and Japan.
The MSCI EAFE Local Currency Index is a free float-adjusted market capitalization weighted index that is designed to measure developed market equity performance, excluding the U.S. and Canada, calculated in local currency.
The MSCI EAFE Mid Cap Index is a free float-adjusted market capitalization index that is designed to measure the performance of mid-capitalization equities in the developed markets, excluding the U.S. and Canada.
The MSCI EAFE Mid Cap Value Index captures mid cap securities exhibiting overall value style characteristics across Developed Markets countries, excluding the U.S. and Canada.
The MSCI EAFE Small Cap Index is a free float-adjusted market capitalization equity index that is designed to measure the performance of small-cap stocks within the developed equity market, excluding the U.S. and Canada.
The MSCI EAFE Small Cap Value Index captures small cap securities exhibiting overall value style characteristics across Developed Markets countries, excluding the U.S. and Canada.
The MSCI EAFE Value Index is a free float-adjusted market capitalization index that is designed to measure the performance of the “value” stocks within the developed equity market, excluding the U.S. and Canada.
The MSCI Europe Index is a free float-adjusted market capitalization index that is designed to measure the performance of large- and mid-cap stocks within developed market European countries.
The MSCI Europe Small Cap Index is a free float-adjusted market capitalization index that is designed to measure the performance of “small” stocks within developed market European countries.
The MSCI Japan Small Cap Index is a free float-adjusted market capitalization index that is designed to measure the performance of small cap stocks within Japan.
Price-to-earnings (P/E) ratio measures a company’s share price relative to its earnings per share.
Quality is generally characterized by higher efficiency and profitability. Typical measures include earnings, return-on-equity, return on assets, operating profitability as well as others. This term is also related to the quality factor, which associates these stock characteristics with excess returns vs. the market over time.
| WisdomTree Trust | 15 |
Description of Terms and Indexes (unaudited) (continued)
Quintiles refers to separating a universe of companies into five groups of equal size on the basis of dividend yield, price-to-earnings, or return-on-equity, as applicable.
Return-on-Equity (ROE) measures a corporation’s profitability by revealing how much profit a company generates with the money shareholders have invested.
Selection Effect measures an investment manager’s ability to select securities within a given segment relative to a benchmark. The over or underperformance of the portfolio is weighted by the benchmark weight, therefore, selection is not affected by the investment manager’s allocation to the segment. The weight of the segment in the portfolio determines the size of the effect — the larger the segment, the larger the effect is, positive or negative. A positive selection effect occurs when the portfolio return is greater than the benchmark return. Thus, the investment manager made good decisions in selecting securities that, as a whole, outperformed similar securities in the benchmark. A negative selection effect occurs when the portfolio return is less than the benchmark return. Thus, the investment manager made poor decisions in selecting securities that, as a whole, underperformed similar securities in the benchmark.
The WisdomTree Europe Quality Dividend Growth Index is a fundamentally weighted index that measures the performance of dividend-paying common stocks with growth characteristics selected from the WisdomTree International Equity Index.
The WisdomTree Europe SmallCap Dividend Index is a fundamentally weighted index that measures the performance of the small-capitalization segment of the European dividend-paying market.
The WisdomTree International Dividend ex-Financials Index measures the performance of high dividend-yielding international stocks outside the financial sector.
The WisdomTree International Equity Index is a fundamentally weighted Index that measures the performance of dividend-paying companies in the industrialized world, excluding Canada and the United States.
The WisdomTree International High Dividend Index is comprised of companies with high dividend yields selected from the WisdomTree International Equity Index.
The WisdomTree International LargeCap Dividend Index is comprised of the large-capitalization segment of the dividend-paying market in the industrialized world outside the U.S. and Canada.
The WisdomTree International MidCap Dividend Index is comprised of the mid-capitalization segment of the dividend-paying market in the industrialized world outside the U.S. and Canada.
The WisdomTree International Quality Dividend Growth Index is a fundamentally weighted index designed to provide exposure to dividend paying developed market companies.
The WisdomTree International SmallCap Dividend Index is comprised of the small-capitalization segment of the dividend-paying market in the industrialized world outside the U.S. and Canada.
The WisdomTree Japan SmallCap Dividend Index is comprised of dividend-paying small-capitalization companies in Japan.
The Global Industry Classification Standard (“GICS”) was developed by and is the exclusive property and a service mark of MSCI Inc. (“MSCI”) and Standard & Poor’s (“S&P”), a division of The McGraw-Hill Companies, Inc. and is licensed for use by WisdomTree, Inc. Neither MSCI, S&P nor any other party involved in making or compiling the GICS or any GICS classifications makes any express or implied warranties or representations with respect to such standard or classification (or the results to be obtained by the use thereof), and all such parties hereby expressly disclaim all warranties of originality, accuracy, completeness, merchantability and fitness for a particular purpose with respect to any such standard or classification. Without limiting any of the foregoing, in no event shall MSCI, S&P, any of their affiliates or any third party involved in making or compiling the GICS or any GICS classifications have any liability for any direct, indirect, special, punitive, consequential or any other damages (including lost profits) even if notified of the possibility of such damages.
| 16 | WisdomTree Trust |
Description of Terms and Indexes (unaudited) (concluded)
Neither MSCI nor any other party involved in or related to compiling, computing or creating the MSCI data makes any express or implied warranties or representations with respect to such data (or the results to be obtained by the use thereof), and all such parties hereby expressly disclaim all warranties of originality, accuracy, completeness, merchantability or fitness for a particular purpose with respect to any such data. Without limiting any of the foregoing, in no event shall MSCI, any of its affiliates or any third party involved in or related to compiling, computing or creating the data have any liability for any direct, indirect, special, punitive, consequential or any other damages (including lost profits) even if notified of the possibility of such damages. No further distribution or dissemination of the MSCI data is permitted without MSCI’s express written consent.
WisdomTree, Inc. and WisdomTree Asset Management, Inc. (together, “WisdomTree”) and the Funds make no representation or warranty, express or implied, to the owners of shares of the Funds or any member of the public regarding the advisability of investing in securities generally or in the Funds particularly or the ability of the underlying Indexes to track the performance of their underlying securities. WisdomTree is the licensor of certain trademarks, service marks and trade names of the Funds. WisdomTree has no obligation to take the needs of the Funds or the owners of shares of the Funds into consideration in determining, composing, or calculating the underlying WisdomTree Indexes of the applicable Funds. WisdomTree is not responsible for, and has not participated in, the determination of the timing of, prices of, or quantities of shares of the Funds to be issued or in the determination or calculation of the equation by which the shares of the Funds are redeemable. WisdomTree and the Funds do not guarantee the accuracy, completeness, or performance of the underlying Indexes or the data included therein and shall have no liability in connection with the underlying Indexes or their calculation.
Index performance information assumes the reinvestment of dividends and excludes management fees, transaction costs and expenses. You cannot directly invest in an index.
* * * * * *
Abbreviations used in the schedules of investments and related tables included in this report are as follows:
| Currency abbreviations: | ||||||
| AUD | Australian dollar | JPY | Japanese yen | |||
| CHF | Swiss franc | NOK | Norwegian krone | |||
| DKK | Danish krone | NZD | New Zealand dollar | |||
| EUR | Euro | SEK | Swedish krona | |||
| GBP | British pound | SGD | Singapore dollar | |||
| HKD | Hong Kong dollar | USD | U.S. dollar | |||
| Other abbreviations: | ||||||
| ADR | American Depositary Receipt | |||||
| CVA | Certificaten Van Aandelen (Certificate of Stock) | |||||
| RSP | Risparmio Italian Savings Shares | |||||
| WisdomTree Trust | 17 |
Schedule of Investments
WisdomTree Europe Quality Dividend Growth Fund (EUDG)
March 31, 2024
| Investments | Shares | Value | ||||||
| COMMON STOCKS – 99.2% |
| |||||||
| Austria – 0.7% |
| |||||||
CA Immobilien Anlagen AG | 2,120 | $ | 74,870 | |||||
Kontron AG | 1,618 | 35,718 | ||||||
Mondi PLC | 11,162 | 196,771 | ||||||
Telekom Austria AG* | 16,841 | 140,959 | ||||||
Wienerberger AG | 2,440 | 88,964 | ||||||
|
| |||||||
| Total Austria |
| 537,282 | ||||||
| Belgium – 1.9% |
| |||||||
Ackermans & van Haaren NV | 379 | 66,310 | ||||||
Anheuser-Busch InBev SA | 11,404 | 695,379 | ||||||
Bekaert SA | 1,550 | 79,582 | ||||||
bpost SA | 8,038 | 30,071 | ||||||
Colruyt Group NV | 1,390 | 64,281 | ||||||
D’ieteren Group | 689 | 152,991 | ||||||
Melexis NV(a) | 1,090 | 88,467 | ||||||
Tessenderlo Group SA | 1,375 | 36,011 | ||||||
UCB SA | 1,380 | 170,502 | ||||||
|
| |||||||
| Total Belgium |
| 1,383,594 | ||||||
| China – 0.3% |
| |||||||
Prosus NV | 6,340 | 199,082 | ||||||
| Denmark – 3.5% |
| |||||||
Alm Brand AS | 26,125 | 49,780 | ||||||
Coloplast AS, Class B | 1,921 | 259,341 | ||||||
DSV AS | 750 | 121,842 | ||||||
FLSmidth & Co. AS* | 402 | 20,034 | ||||||
Novo Nordisk AS, Class B | 12,449 | 1,588,548 | ||||||
Novonesis (Novozymes) B, Class B | 3,820 | 224,117 | ||||||
Pandora AS | 1,016 | 163,952 | ||||||
Royal Unibrew AS | 679 | 44,900 | ||||||
Topdanmark AS | 1,409 | 60,183 | ||||||
|
| |||||||
| Total Denmark |
| 2,532,697 | ||||||
| Finland – 1.6% |
| |||||||
Elisa OYJ | 4,586 | 204,802 | ||||||
Huhtamaki OYJ(a) | 1,849 | 77,540 | ||||||
Kesko OYJ, Class B | 9,073 | 169,667 | ||||||
Metsa Board OYJ, Class B(a) | 13,798 | 104,611 | ||||||
Orion OYJ, Class B | 1,795 | 67,017 | ||||||
UPM-Kymmene OYJ | 12,858 | 428,681 | ||||||
Wartsila OYJ Abp | 8,504 | 129,407 | ||||||
|
| |||||||
| Total Finland |
| 1,181,725 | ||||||
| France – 20.1% |
| |||||||
Airbus SE | 5,758 | 1,061,646 | ||||||
Arkema SA | 1,610 | 169,603 | ||||||
Bouygues SA | 11,098 | 453,424 | ||||||
Bureau Veritas SA | 8,802 | 268,834 | ||||||
Capgemini SE | 1,910 | 439,995 | ||||||
Carrefour SA | 11,131 | 190,841 | ||||||
Cie Plastic Omnium SE | 2,209 | 28,820 | ||||||
Dassault Aviation SA | 695 | 153,122 | ||||||
Edenred SE | 2,859 | 152,719 | ||||||
Eramet SA | 836 | 63,608 | ||||||
Gaztransport & Technigaz SA | 585 | 87,504 | ||||||
Hermes International SCA | 402 | 1,027,222 | ||||||
Imerys SA | 2,666 | 90,928 | ||||||
Interparfums SA | 1,060 | 59,759 | ||||||
Ipsen SA | 354 | 42,170 | ||||||
Kering SA | 2,350 | 929,796 | ||||||
L’Oreal SA | 3,821 | 1,810,168 | ||||||
La Francaise des Jeux SAEM(b) | 4,693 | 191,486 | ||||||
LVMH Moet Hennessy Louis Vuitton SE | 4,713 | 4,243,566 | ||||||
Remy Cointreau SA | 499 | 50,357 | ||||||
Sanofi SA | 18,008 | 1,769,048 | ||||||
SEB SA | 846 | 108,362 | ||||||
Societe BIC SA | 1,072 | 76,644 | ||||||
Sopra Steria Group | 291 | 70,524 | ||||||
Technip Energies NV | 2,413 | 61,007 | ||||||
Teleperformance SE | 1,122 | 109,155 | ||||||
Thales SA | 2,344 | 400,107 | ||||||
Valeo SE | 4,337 | 54,287 | ||||||
Veolia Environnement SA | 16,232 | 528,196 | ||||||
|
| |||||||
| Total France |
| 14,692,898 | ||||||
| Georgia – 0.2% |
| |||||||
Bank of Georgia Group PLC | 2,082 | 132,819 | ||||||
| Germany – 8.8% |
| |||||||
AIXTRON SE | 688 | 18,204 | ||||||
Aurubis AG | 566 | 39,843 | ||||||
Bayer AG, Registered Shares | 19,736 | 605,982 | ||||||
Bechtle AG | 1,204 | 63,690 | ||||||
Beiersdorf AG | 702 | 102,314 | ||||||
Bilfinger SE | 774 | 36,195 | ||||||
Carl Zeiss Meditec AG, Bearer Shares | 635 | 79,416 | ||||||
Continental AG | 2,724 | 196,814 | ||||||
CTS Eventim AG & Co. KGaA | 1,165 | 103,739 | ||||||
Deutsche Post AG, Registered Shares | 31,906 | 1,375,410 | ||||||
Deutsche Telekom AG, Registered Shares | 87,449 | 2,125,011 | ||||||
Fresenius Medical Care AG | 3,689 | 142,034 | ||||||
Hugo Boss AG | 846 | 49,905 | ||||||
K & S AG, Registered Shares | 6,129 | 95,715 | ||||||
Knorr-Bremse AG | 2,398 | 181,548 | ||||||
Merck KGaA | 759 | 134,106 | ||||||
Nemetschek SE | 437 | 43,288 | ||||||
Puma SE | 1,253 | 56,863 | ||||||
Rheinmetall AG | 384 | 216,069 | ||||||
Scout24 SE(b) | 755 | 56,964 | ||||||
Siemens Healthineers AG*(b) | 8,212 | 503,047 | ||||||
Siltronic AG | 639 | 56,728 | ||||||
Stroeer SE & Co. KGaA | 1,446 | 88,079 | ||||||
Symrise AG | 834 | 99,935 | ||||||
|
| |||||||
| Total Germany |
| 6,470,899 | ||||||
| Ireland – 1.2% |
| |||||||
CRH PLC | 8,845 | 762,923 | ||||||
Kerry Group PLC, Class A | 1,214 | 104,155 | ||||||
|
| |||||||
| Total Ireland |
| 867,078 | ||||||
See Notes to Financial Statements.
| 18 | WisdomTree Trust |
Schedule of Investments (continued)
WisdomTree Europe Quality Dividend Growth Fund (EUDG)
March 31, 2024
| Investments | Shares | Value | ||||||
| Israel – 0.1% |
| |||||||
Plus500 Ltd. | 2,900 | $ | 66,125 | |||||
| Italy – 1.7% |
| |||||||
Azimut Holding SpA | 5,937 | 161,453 | ||||||
Brembo SpA | 5,760 | 73,841 | ||||||
Davide Campari-Milano NV(a) | 4,806 | 48,344 | ||||||
De’ Longhi SpA(a) | 2,168 | 75,066 | ||||||
Ferrari NV | 682 | 297,570 | ||||||
Leonardo SpA | 3,691 | 92,801 | ||||||
Moncler SpA | 3,580 | 267,477 | ||||||
Piaggio & C SpA(a) | 20,256 | 64,142 | ||||||
RAI Way SpA(b) | 11,039 | 61,876 | ||||||
Recordati Industria Chimica & Farmaceutica SpA | 2,487 | 137,629 | ||||||
|
| |||||||
| Total Italy |
| 1,280,199 | ||||||
| Netherlands – 7.1% |
| |||||||
Arcadis NV(a) | 1,168 | 71,587 | ||||||
ASM International NV | 190 | 116,123 | ||||||
ASML Holding NV | 2,172 | 2,092,887 | ||||||
Heineken Holding NV | 3,622 | 292,600 | ||||||
Heineken NV(a) | 6,014 | 580,274 | ||||||
IMCD NV | 721 | 127,197 | ||||||
Koninklijke KPN NV | 95,360 | 356,959 | ||||||
Randstad NV(a) | 5,643 | 298,140 | ||||||
RHI Magnesita NV | 1,275 | 56,888 | ||||||
SBM Offshore NV(a) | 7,552 | 120,629 | ||||||
Signify NV(b) | 4,406 | 135,997 | ||||||
Universal Music Group NV | 20,265 | 610,187 | ||||||
Wolters Kluwer NV | 2,040 | 319,905 | ||||||
|
| |||||||
| Total Netherlands |
| 5,179,373 | ||||||
| Norway – 1.0% |
| |||||||
Aker ASA, Class A | 1,959 | 112,589 | ||||||
Atea ASA* | 2,997 | 35,858 | ||||||
DNO ASA | 53,782 | 48,336 | ||||||
Gjensidige Forsikring ASA | 13,509 | 195,750 | ||||||
Kongsberg Gruppen ASA | 2,784 | 192,339 | ||||||
TOMRA Systems ASA | 4,173 | 65,219 | ||||||
Veidekke ASA | 5,178 | 56,321 | ||||||
|
| |||||||
| Total Norway |
| 706,412 | ||||||
| Portugal – 0.2% |
| |||||||
Jeronimo Martins SGPS SA | 7,326 | 145,424 | ||||||
| Spain – 5.5% |
| |||||||
CIE Automotive SA | 2,018 | 57,973 | ||||||
Endesa SA | 47,774 | 885,644 | ||||||
Gestamp Automocion SA(b) | 13,642 | 43,905 | ||||||
Industria de Diseno Textil SA | 58,835 | 2,965,496 | ||||||
Viscofan SA(a) | 1,054 | 67,047 | ||||||
|
| |||||||
| Total Spain |
| 4,020,065 | ||||||
| Sweden – 4.6% |
| |||||||
Alfa Laval AB | 3,905 | 153,679 | ||||||
Assa Abloy AB, Class B | 12,525 | 359,728 | ||||||
Atlas Copco AB, Class A | 27,583 | 466,398 | ||||||
Atlas Copco AB, Class B | 14,989 | 221,696 | ||||||
Axfood AB | 3,794 | 110,422 | ||||||
Billerud Aktiebolag | 7,903 | 70,969 | ||||||
Epiroc AB, Class A | 7,458 | 140,266 | ||||||
Epiroc AB, Class B | 4,969 | 84,253 | ||||||
Evolution AB(b) | 2,668 | 332,009 | ||||||
Husqvarna AB, Class B | 10,454 | 89,595 | ||||||
Indutrade AB* | 3,096 | 84,519 | ||||||
Investment AB Latour, Class B | 7,503 | 197,529 | ||||||
Loomis AB | 1,723 | 48,148 | ||||||
Mycronic AB | 787 | 27,822 | ||||||
Nibe Industrier AB, Class B(a) | 12,127 | 59,611 | ||||||
Saab AB, Class B | 823 | 73,275 | ||||||
Sandvik AB | 18,432 | 409,749 | ||||||
Securitas AB, Class B(a) | 11,734 | 121,097 | ||||||
Skanska AB, Class B(a) | 9,910 | 176,557 | ||||||
Sweco AB, Class B | 5,419 | 61,069 | ||||||
Trelleborg AB, Class B | 2,980 | 106,713 | ||||||
|
| |||||||
| Total Sweden |
| 3,395,104 | ||||||
| Switzerland – 20.9% |
| |||||||
ABB Ltd., Registered Shares | 27,142 | 1,262,328 | ||||||
Clariant AG, Registered Shares* | 6,006 | 81,285 | ||||||
Coca-Cola HBC AG* | 5,639 | 178,300 | ||||||
Galenica AG(b) | 702 | 58,610 | ||||||
Geberit AG, Registered Shares | 559 | 330,795 | ||||||
Georg Fischer AG, Registered Shares | 1,431 | 106,288 | ||||||
Givaudan SA, Registered Shares | 105 | 468,169 | ||||||
Kuehne & Nagel International AG, Registered Shares | 3,547 | 988,450 | ||||||
Landis & Gyr Group AG* | 665 | 51,128 | ||||||
Logitech International SA, Registered Shares | 1,439 | 129,026 | ||||||
Nestle SA, Registered Shares | 29,112 | 3,094,786 | ||||||
Novartis AG, Registered Shares | 24,634 | 2,389,555 | ||||||
Partners Group Holding AG | 522 | 746,459 | ||||||
Roche Holding AG | 7,378 | 1,881,566 | ||||||
Roche Holding AG, Bearer Shares | 1,132 | 305,403 | ||||||
Schindler Holding AG, Participation Certificate | 436 | 109,932 | ||||||
Schindler Holding AG, Registered Shares | 772 | 188,565 | ||||||
SFS Group AG | 556 | 73,212 | ||||||
SGS SA, Registered Shares*(a) | 4,117 | 399,953 | ||||||
Sika AG, Registered Shares | 1,193 | 355,768 | ||||||
Sonova Holding AG, Registered Shares | 482 | 139,725 | ||||||
Stadler Rail AG(a) | 1,601 | 51,050 | ||||||
STMicroelectronics NV | 3,231 | 139,300 | ||||||
Straumann Holding AG, Registered Shares | 561 | 89,690 | ||||||
Sulzer AG, Registered Shares | 978 | 119,115 | ||||||
UBS Group AG, Registered Shares | 41,712 | 1,284,657 | ||||||
VAT Group AG(b) | 307 | 159,277 | ||||||
Vontobel Holding AG, Registered Shares | 1,809 | 109,862 | ||||||
|
| |||||||
| Total Switzerland |
| 15,292,254 | ||||||
| United Kingdom – 18.1% |
| |||||||
Admiral Group PLC | 6,577 | 235,709 | ||||||
Airtel Africa PLC(b) | 80,517 | 107,612 | ||||||
Antofagasta PLC | 18,743 | 482,776 | ||||||
Ashtead Group PLC | 4,236 | 301,804 | ||||||
See Notes to Financial Statements.
| WisdomTree Trust | 19 |
Schedule of Investments (continued)
WisdomTree Europe Quality Dividend Growth Fund (EUDG)
March 31, 2024
| Investments | Shares | Value | ||||||
AstraZeneca PLC | 12,232 | $ | 1,649,972 | |||||
Auto Trader Group PLC(b) | 7,706 | 68,162 | ||||||
BAE Systems PLC | 43,484 | 741,296 | ||||||
Bellway PLC | 4,604 | 154,938 | ||||||
Britvic PLC | 5,438 | 56,468 | ||||||
Burberry Group PLC | 7,449 | 114,143 | ||||||
Compass Group PLC | 16,482 | 483,669 | ||||||
Computacenter PLC | 2,030 | 69,136 | ||||||
Diageo PLC | 30,035 | 1,109,985 | ||||||
Dr. Martens PLC | 27,960 | 30,994 | ||||||
Dunelm Group PLC | 4,890 | 69,927 | ||||||
Greggs PLC | 1,601 | 58,126 | ||||||
Halma PLC | 3,298 | 98,656 | ||||||
Hargreaves Lansdown PLC(a) | 14,506 | 134,870 | ||||||
Hays PLC | 63,331 | 75,563 | ||||||
Howden Joinery Group PLC | 8,756 | 100,301 | ||||||
IMI PLC | 3,046 | 69,839 | ||||||
Imperial Brands PLC | 37,255 | 833,004 | ||||||
Inchcape PLC | 11,316 | 103,495 | ||||||
InterContinental Hotels Group PLC | 1,869 | 194,595 | ||||||
Intertek Group PLC | 2,442 | 153,780 | ||||||
ITV PLC | 176,695 | 164,952 | ||||||
Johnson Matthey PLC | 5,321 | 120,252 | ||||||
Moneysupermarket.com Group PLC | 15,577 | 43,251 | ||||||
Next PLC | 2,117 | 246,891 | ||||||
Pets at Home Group PLC | 12,589 | 42,684 | ||||||
Reckitt Benckiser Group PLC | 11,541 | 657,812 | ||||||
Redrow PLC | 12,405 | 104,288 | ||||||
RELX PLC | 19,514 | 844,052 | ||||||
Renishaw PLC | 1,325 | 71,137 | ||||||
Rentokil Initial PLC | 24,967 | 148,772 | ||||||
Rightmove PLC | 7,146 | 49,614 | ||||||
RS Group PLC | 8,671 | 79,611 | ||||||
Sage Group PLC | 12,578 | 201,077 | ||||||
Smith & Nephew PLC | 11,629 | 145,669 | ||||||
Spectris PLC | 1,597 | 66,716 | ||||||
Spirax-Sarco Engineering PLC | 826 | 104,866 | ||||||
St. James’s Place PLC | 23,824 | 139,794 | ||||||
Tate & Lyle PLC | 6,745 | 52,615 | ||||||
TBC Bank Group PLC | 1,952 | 79,278 | ||||||
Telecom Plus PLC | 2,401 | 49,378 | ||||||
Travis Perkins PLC | 6,576 | 60,592 | ||||||
Unilever PLC | 44,775 | 2,248,623 | ||||||
Victrex PLC | 2,128 | 34,920 | ||||||
|
| |||||||
| Total United Kingdom |
| 13,255,664 | ||||||
| United States – 1.7% |
| |||||||
GSK PLC | 56,006 | 1,208,827 | ||||||
TOTAL COMMON STOCKS (Cost: $62,526,183) |
| 72,547,521 | ||||||
| INVESTMENT OF CASH COLLATERAL FOR SECURITIES LOANED – 1.8% |
| |||||||
| United States – 1.8% |
| |||||||
State Street Navigator Securities Lending Government Money Market Portfolio, 5.34%(c) | ||||||||
| (Cost: $1,279,862) | 1,279,862 | 1,279,862 | ||||||
TOTAL INVESTMENTS IN SECURITIES – 101.0% (Cost: $63,806,045) |
| 73,827,383 | ||||||
Other Assets less Liabilities – (1.0)% |
| (731,213 | ) | |||||
|
| |||||||
| NET ASSETS – 100.0% |
| $ | 73,096,170 | |||||
| * | Non-income producing security. |
| (a) | Security, or portion thereof, was on loan at March 31, 2024 (See Note 2). At March 31, 2024, the total market value of the Fund’s securities on loan identified in the Schedule of Investments was $1,824,913 and the total market value of the collateral held by the Fund was $1,923,300. The total market value of the collateral includes non-cash U.S. Government securities collateral having a value of $643,438. |
| (b) | This security is exempt from registration under rule 144A of the Securities Act of 1933. This security may be sold in transactions that are exempt from registration, normally to qualified institutional buyers. |
| (c) | Rate shown represents annualized 7-day yield as of March 31, 2024. |
| FINANCIAL DERIVATIVE INSTRUMENTS | ||||||||||||||||||||||||||||
| FOREIGN CURRENCY CONTRACTS (OTC – OVER THE COUNTER) | ||||||||||||||||||||||||||||
| Counterparty | Settlement Date | Amount and be Purchased | Amount and be Sold | Unrealized Appreciation | Unrealized Depreciation | |||||||||||||||||||||||
Bank of America NA | 4/3/2024 | 3,599 | USD | 3,247 | CHF | $ | — | $ | (6 | ) | ||||||||||||||||||
See Notes to Financial Statements.
| 20 | WisdomTree Trust |
Schedule of Investments (concluded)
WisdomTree Europe Quality Dividend Growth Fund (EUDG)
March 31, 2024
| FAIR VALUATION SUMMARY | ||||||||||||||
The following is a summary of the fair valuations according to the inputs used in valuing the Fund’s investments (See Note 2 – Fair Value Measurement):
| Quoted Prices in Active Markets (Level 1) | Other Significant Observable Inputs (Level 2) | Significant Unobservable Inputs (Level 3) | Total | |||||||||||||
Assets: | ||||||||||||||||
Investments in Securities | ||||||||||||||||
Common Stocks | $ | 72,547,521 | $ | — | $ | — | $ | 72,547,521 | ||||||||
Investment of Cash Collateral for Securities Loaned | — | 1,279,862 | — | 1,279,862 | ||||||||||||
Total Investments in Securities | $ | 72,547,521 | $ | 1,279,862 | $ | — | $ | 73,827,383 | ||||||||
Liabilities: | ||||||||||||||||
Financial Derivative Instruments | ||||||||||||||||
Foreign Currency Contracts1 | $ | — | $ | (6 | ) | $ | — | $ | (6 | ) | ||||||
Total – Net | $ | 72,547,521 | $ | 1,279,856 | $ | — | $ | 73,827,377 | ||||||||
| 1 | Amount shown represents the unrealized appreciation (depreciation) on the financial instrument. |
See Notes to Financial Statements.
| WisdomTree Trust | 21 |
Schedule of Investments
WisdomTree Europe SmallCap Dividend Fund (DFE)
March 31, 2024
| Investments | Shares | Value | ||||||
| COMMON STOCKS – 98.1% |
| |||||||
| Austria – 0.8% |
| |||||||
Kontron AG | 42,190 | $ | 931,353 | |||||
Schoeller-Bleckmann Oilfield Equipment AG | 10,291 | 492,362 | ||||||
|
| |||||||
| Total Austria |
| 1,423,715 | ||||||
| Belgium – 1.6% |
| |||||||
Barco NV | 59,915 | 988,094 | ||||||
Deceuninck NV | 47,325 | 115,255 | ||||||
Econocom Group SA | 80,640 | 185,069 | ||||||
Fagron | 23,551 | 449,183 | ||||||
Kinepolis Group NV(a) | 3,293 | 151,327 | ||||||
Recticel SA(a) | 39,261 | 463,029 | ||||||
Xior Student Housing NV(b) | 20,300 | 613,872 | ||||||
|
| |||||||
| Total Belgium |
| 2,965,829 | ||||||
| Denmark – 3.0% |
| |||||||
Cementir Holding NV | 35,696 | 404,022 | ||||||
Chemometec AS | 8,034 | 492,986 | ||||||
D/S Norden AS | 56,169 | 2,288,562 | ||||||
Dfds AS | 23,898 | 693,428 | ||||||
Matas AS | 17,927 | 303,693 | ||||||
Scandinavian Tobacco Group AS(c) | 34,686 | 621,752 | ||||||
Spar Nord Bank AS | 53,633 | 894,595 | ||||||
|
| |||||||
| Total Denmark |
| 5,699,038 | ||||||
| Finland – 3.7% |
| |||||||
Aktia Bank OYJ | 10,120 | 109,515 | ||||||
Citycon OYJ*(a) | 145,150 | 599,771 | ||||||
F-Secure OYJ(a) | 107,813 | 218,438 | ||||||
Harvia OYJ(b) | 15,983 | 661,466 | ||||||
Kamux Corp.(a)(b) | 26,258 | 164,338 | ||||||
Marimekko OYJ | 12,744 | 171,081 | ||||||
Musti Group OYJ* | 13,311 | 359,109 | ||||||
Oriola OYJ, Class B(a) | 195,507 | 214,526 | ||||||
Outokumpu OYJ(a) | 624,722 | 2,719,040 | ||||||
Puuilo OYJ | 45,506 | 486,796 | ||||||
Revenio Group OYJ(a) | 9,375 | 258,187 | ||||||
Talenom OYJ(a) | 25,735 | 165,095 | ||||||
Terveystalo OYJ(a)(c) | 27,546 | 224,313 | ||||||
Tokmanni Group Corp. | 36,595 | 599,953 | ||||||
|
| |||||||
| Total Finland |
| 6,951,628 | ||||||
| France – 3.9% |
| |||||||
Beneteau SACA(a) | 42,612 | 629,567 | ||||||
Chargeurs SA(a) | 43,193 | 557,915 | ||||||
Coface SA | 107,631 | 1,702,938 | ||||||
Derichebourg SA | 118,160 | 561,751 | ||||||
Etablissements Maurel & Prom SA | 144,967 | 875,977 | ||||||
Fnac Darty SA(a) | 17,657 | 553,399 | ||||||
Lectra(a) | 11,170 | 390,257 | ||||||
Mersen SA | 18,648 | 734,097 | ||||||
Quadient SA | 17,998 | 370,485 | ||||||
Television Francaise 1 SA(a) | 115,167 | 1,053,502 | ||||||
|
| |||||||
| Total France |
| 7,429,888 | ||||||
| Georgia – 1.4% |
| |||||||
Bank of Georgia Group PLC | 42,506 | $ | 2,711,633 | |||||
| Germany – 5.7% |
| |||||||
7C Solarparken AG | 66,930 | 224,804 | ||||||
Bilfinger SE | 22,279 | 1,041,855 | ||||||
Deutz AG | 121,298 | 770,946 | ||||||
Duerr AG | 40,751 | 942,717 | ||||||
Eckert & Ziegler SE | 5,816 | 235,422 | ||||||
Elmos Semiconductor SE | 4,483 | 357,797 | ||||||
ElringKlinger AG | 38,339 | 251,335 | ||||||
GFT Technologies SE | 8,710 | 253,984 | ||||||
Hamborner REIT AG | 39,268 | 290,929 | ||||||
Hamburger Hafen und Logistik AG* | 18,882 | 338,516 | ||||||
Instone Real Estate Group SE(c) | 45,437 | 438,213 | ||||||
Jenoptik AG | 16,931 | 526,622 | ||||||
Kloeckner & Co. SE | 67,703 | 493,555 | ||||||
Mutares SE & Co. KGaA | 11,604 | 462,443 | ||||||
Norma Group SE | 17,055 | 317,366 | ||||||
ProSiebenSat.1 Media SE | 45,928 | 323,010 | ||||||
SAF-Holland SE | 45,422 | 926,663 | ||||||
Salzgitter AG | 55,094 | 1,439,937 | ||||||
Stabilus SE | 11,414 | 727,300 | ||||||
Wacker Neuson SE | 21,735 | 402,810 | ||||||
|
| |||||||
| Total Germany |
| 10,766,224 | ||||||
| Ireland – 0.7% |
| |||||||
C&C Group PLC | 143,773 | 297,496 | ||||||
Dalata Hotel Group PLC | 51,456 | 250,354 | ||||||
Kenmare Resources PLC | 59,344 | 244,765 | ||||||
Origin Enterprises PLC(a) | 85,787 | 291,847 | ||||||
Uniphar PLC(a) | 51,458 | 144,494 | ||||||
|
| |||||||
| Total Ireland |
| 1,228,956 | ||||||
| Israel – 0.9% |
| |||||||
Plus500 Ltd. | 72,154 | 1,645,231 | ||||||
| Italy – 10.7% |
| |||||||
Anima Holding SpA(c) | 390,926 | 1,857,680 | ||||||
Aquafil SpA(a) | 53,960 | 176,870 | ||||||
Biesse SpA(a) | 15,121 | 202,500 | ||||||
Cairo Communication SpA(a) | 108,471 | 234,297 | ||||||
Danieli & C Officine Meccaniche SpA(a) | 10,677 | 379,375 | ||||||
Danieli & C Officine Meccaniche SpA, RSP | 15,598 | 411,881 | ||||||
Datalogic SpA(a) | 64,284 | 398,509 | ||||||
El.En. SpA(a) | 43,464 | 551,089 | ||||||
Intercos SpA(a) | 27,623 | 400,357 | ||||||
Italian Sea Group SpA(a) | 33,546 | 364,471 | ||||||
Maire Tecnimont SpA | 225,659 | 1,770,565 | ||||||
MARR SpA | 46,773 | 595,065 | ||||||
Orsero SpA | 9,845 | 152,259 | ||||||
OVS SpA(a)(c) | 212,497 | 559,054 | ||||||
Piaggio & C SpA(a) | 366,104 | 1,159,290 | ||||||
RAI Way SpA(c) | 128,070 | 717,858 | ||||||
Salcef Group SpA | 17,077 | 422,348 | ||||||
Sanlorenzo SpA | 14,664 | 667,535 | ||||||
See Notes to Financial Statements.
| 22 | WisdomTree Trust |
Schedule of Investments (continued)
WisdomTree Europe SmallCap Dividend Fund (DFE)
March 31, 2024
| Investments | Shares | Value | ||||||
Saras SpA | 2,294,732 | $ | 4,391,566 | |||||
Spaxs SpA*(a) | 63,014 | 330,748 | ||||||
Technogym SpA(c) | 140,480 | 1,395,809 | ||||||
Tinexta SpA(a) | 24,868 | 510,560 | ||||||
Unieuro SpA(a)(c) | 23,510 | 224,328 | ||||||
Webuild SpA(a) | 568,974 | 1,377,691 | ||||||
Wiit SpA(a) | 12,170 | 237,373 | ||||||
Zignago Vetro SpA | 45,155 | 646,656 | ||||||
|
| |||||||
| Total Italy |
| 20,135,734 | ||||||
| Netherlands – 2.4% |
| |||||||
AMG Critical Materials NV(a) | 21,666 | 492,321 | ||||||
Brunel International NV(a) | 15,542 | 170,875 | ||||||
Corbion NV(a) | 42,121 | 902,990 | ||||||
ForFarmers NV(a) | 67,015 | 187,816 | ||||||
Koninklijke BAM Groep NV | 349,717 | 1,326,462 | ||||||
Koninklijke Heijmans NV | 29,851 | 553,223 | ||||||
RHI Magnesita NV | 16,931 | 755,427 | ||||||
Sligro Food Group NV | 14,392 | 217,918 | ||||||
|
| |||||||
| Total Netherlands |
| 4,607,032 | ||||||
| Norway – 5.4% |
| |||||||
Atea ASA* | 26,957 | 322,532 | ||||||
Austevoll Seafood ASA | 132,303 | 1,039,048 | ||||||
Borregaard ASA | 34,789 | 606,721 | ||||||
DNO ASA | 1,244,969 | 1,118,895 | ||||||
Elmera Group ASA(c) | 113,044 | 357,828 | ||||||
Europris ASA(c) | 121,086 | 870,592 | ||||||
Grieg Seafood ASA | 132,159 | 828,385 | ||||||
Kitron ASA | 110,485 | 346,265 | ||||||
MPC Container Ships ASA | 1,508,494 | 1,744,378 | ||||||
Panoro Energy ASA | 117,021 | 288,222 | ||||||
SpareBank 1 Nord Norge | 46,916 | 413,433 | ||||||
SpareBank 1 SMN | 57,623 | 731,933 | ||||||
Sparebanken Vest | 34,598 | 371,219 | ||||||
TGS ASA | 104,915 | 1,143,092 | ||||||
|
| |||||||
| Total Norway |
| 10,182,543 | ||||||
| Portugal – 2.2% |
| |||||||
Altri SGPS SA(a) | 242,270 | 1,368,438 | ||||||
Corticeira Amorim SGPS SA(a) | 22,796 | 242,012 | ||||||
CTT-Correios de Portugal SA | 79,173 | 353,143 | ||||||
Mota-Engil SGPS SA | 244,626 | 1,272,104 | ||||||
Sonae SGPS SA | 944,593 | 897,741 | ||||||
|
| |||||||
| Total Portugal |
| 4,133,438 | ||||||
| Spain – 2.4% |
| |||||||
Construcciones y Auxiliar de Ferrocarriles SA(a) | 17,618 | 643,127 | ||||||
Ercros SA(a) | 50,073 | 189,817 | ||||||
Faes Farma SA | 138,033 | 468,843 | ||||||
Global Dominion Access SA(c) | 39,802 | 144,648 | ||||||
Pharma Mar SA(a) | 8,151 | 253,001 | ||||||
Sacyr SA | 585,156 | 2,161,332 | ||||||
Talgo SA(a)(c) | 54,009 | 262,192 | ||||||
Tubacex SA | 84,600 | 304,712 | ||||||
|
| |||||||
| Total Spain |
| 4,427,672 | ||||||
| Sweden – 14.0% |
| |||||||
AcadeMedia AB(c) | 58,932 | 267,527 | ||||||
Addnode Group AB | 40,237 | 430,495 | ||||||
AFRY AB | 86,371 | 1,381,277 | ||||||
Alimak Group AB(c) | 28,473 | 260,961 | ||||||
Alleima AB | 109,896 | 741,438 | ||||||
Alligo AB, Class B | 25,940 | 373,600 | ||||||
Ambea AB(c) | 57,888 | 345,132 | ||||||
Arjo AB, Class B | 126,721 | 606,193 | ||||||
Beijer Alma AB | 18,846 | 340,873 | ||||||
Bilia AB, Class A | 44,584 | 572,071 | ||||||
BioGaia AB, Class B | 29,480 | 344,355 | ||||||
Bravida Holding AB(c) | 134,264 | 1,179,076 | ||||||
Bufab AB | 11,611 | 455,857 | ||||||
Catena AB(a) | 22,354 | 1,093,386 | ||||||
Clas Ohlson AB, Class B | 24,816 | 336,524 | ||||||
Cloetta AB, Class B | 293,578 | 499,428 | ||||||
Dios Fastigheter AB | 86,731 | 698,789 | ||||||
Duni AB | 31,569 | 326,537 | ||||||
Electrolux Professional AB, Class B | 71,268 | 466,562 | ||||||
Fagerhult Group AB | 51,234 | 354,095 | ||||||
Ferronordic AB(a) | 12,821 | 82,855 | ||||||
G5 Entertainment AB | 10,272 | 124,790 | ||||||
Granges AB | 53,397 | 578,285 | ||||||
Hemnet Group AB | 10,208 | 312,944 | ||||||
HMS Networks AB(a) | 10,557 | 457,721 | ||||||
Instalco AB(a)(b) | 90,998 | 359,818 | ||||||
Inwido AB | 55,387 | 755,753 | ||||||
Lagercrantz Group AB, Class B | 102,425 | 1,569,049 | ||||||
Lindab International AB | 40,846 | 878,606 | ||||||
Medicover AB, Class B | 18,121 | 233,872 | ||||||
MEKO AB | 22,436 | 253,052 | ||||||
MIPS AB(b) | 10,919 | 358,432 | ||||||
Mycronic AB | 30,452 | 1,076,525 | ||||||
NCAB Group AB | 82,625 | 542,071 | ||||||
NCC AB, Class B(a) | 74,701 | 1,029,072 | ||||||
New Wave Group AB, Class B(a) | 85,897 | 1,028,907 | ||||||
Nordic Waterproofing Holding AB(a) | 12,083 | 185,326 | ||||||
Peab AB, Class B(a) | 302,909 | 1,907,948 | ||||||
Platzer Fastigheter Holding AB, Class B(a) | 43,364 | 373,107 | ||||||
Prevas AB, Class B | 17,199 | 197,202 | ||||||
Ratos AB, Class B(a) | 137,096 | 451,063 | ||||||
Rvrc Holding AB | 48,902 | 312,823 | ||||||
Scandi Standard AB | 29,604 | 198,235 | ||||||
SkiStar AB(a) | 29,860 | 450,444 | ||||||
Storskogen Group AB, Class B(a) | 305,457 | 162,833 | ||||||
Tethys Oil AB | 37,977 | 126,281 | ||||||
Troax Group AB | 21,844 | 502,964 | ||||||
VBG Group AB, Class B | 10,427 | 305,713 | ||||||
Vitec Software Group AB, Class B | 3,938 | 204,770 | ||||||
Volati AB(b) | 18,535 | 216,334 | ||||||
|
| |||||||
| Total Sweden |
| 26,310,971 | ||||||
See Notes to Financial Statements.
| WisdomTree Trust | 23 |
Schedule of Investments (continued)
WisdomTree Europe SmallCap Dividend Fund (DFE)
March 31, 2024
| Investments | Shares | Value | ||||||
| Switzerland – 4.2% |
| |||||||
Ascom Holding AG, Registered Shares | 23,494 | $ | 214,673 | |||||
Comet Holding AG, Registered Shares | 3,413 | 1,190,590 | ||||||
Huber & Suhner AG, Registered Shares(a) | 10,993 | 930,017 | ||||||
Implenia AG, Registered Shares(a) | 4,237 | 153,825 | ||||||
Landis & Gyr Group AG* | 19,879 | 1,528,390 | ||||||
Medmix AG(c) | 22,628 | 402,465 | ||||||
Mobilezone Holding AG, Registered Shares(a) | 39,763 | 656,021 | ||||||
OC Oerlikon Corp. AG, Registered Shares | 460,625 | 2,031,312 | ||||||
u-blox Holding AG*(a) | 3,578 | 344,810 | ||||||
Zehnder Group AG | 6,286 | 417,345 | ||||||
|
| |||||||
| Total Switzerland |
| 7,869,448 | ||||||
| United Kingdom – 35.1% |
| |||||||
4imprint Group PLC | 37,539 | 3,006,500 | ||||||
AG Barr PLC | 52,092 | 382,986 | ||||||
AJ Bell PLC | 194,175 | 741,762 | ||||||
Alliance Pharma PLC(a) | 341,477 | 171,254 | ||||||
Alpha Financial Markets Consulting PLC | 55,742 | 228,148 | ||||||
Alpha Group International PLC(b) | 6,193 | 148,643 | ||||||
Ashmore Group PLC | 513,867 | 1,270,372 | ||||||
Assura PLC | 3,310,951 | 1,770,059 | ||||||
Avon Protection PLC | 15,540 | 212,406 | ||||||
Bloomsbury Publishing PLC | 52,319 | 348,966 | ||||||
Bodycote PLC | 123,404 | 1,085,775 | ||||||
Bridgepoint Group PLC(c) | 524,126 | 1,722,790 | ||||||
Bytes Technology Group PLC | 51,375 | 331,636 | ||||||
Chemring Group PLC | 72,816 | 333,905 | ||||||
Chesnara PLC | 87,083 | 289,320 | ||||||
Clarkson PLC | 18,602 | 942,309 | ||||||
CMC Markets PLC(c) | 305,727 | 840,006 | ||||||
Coats Group PLC | 656,447 | 672,527 | ||||||
Concentric AB | 17,954 | 321,381 | ||||||
Craneware PLC | 8,194 | 227,724 | ||||||
DiscoverIE Group PLC | 22,131 | 211,634 | ||||||
Domino’s Pizza Group PLC | 259,348 | 1,128,983 | ||||||
Dowlais Group PLC | 312,329 | 307,749 | ||||||
Dr. Martens PLC | 693,775 | 769,051 | ||||||
Empiric Student Property PLC | 364,152 | 437,014 | ||||||
FDM Group Holdings PLC | 130,930 | 567,313 | ||||||
Fevertree Drinks PLC | 27,915 | 423,516 | ||||||
Firstgroup PLC | 209,757 | 478,016 | ||||||
FRP Advisory Group PLC | 95,345 | 137,307 | ||||||
Fuller Smith & Turner PLC, Class A | 22,440 | 167,249 | ||||||
Galliford Try Holdings PLC | 67,425 | 204,419 | ||||||
Gamma Communications PLC | 22,248 | 384,473 | ||||||
Genuit Group PLC | 127,410 | 709,792 | ||||||
Genus PLC | 14,018 | 312,550 | ||||||
H&T Group PLC(a) | 35,249 | 165,645 | ||||||
Halfords Group PLC | 153,270 | 310,757 | ||||||
Hammerson PLC | 2,224,837 | 836,974 | ||||||
Hargreaves Services PLC | 26,155 | 164,541 | ||||||
Helical PLC | 75,452 | 198,255 | ||||||
Hill & Smith PLC | 39,633 | 979,298 | ||||||
Hilton Food Group PLC | 61,465 | 654,553 | ||||||
Hollywood Bowl Group PLC | 113,563 | 472,696 | ||||||
Hunting PLC | 62,085 | 259,207 | ||||||
Ibstock PLC(c) | 422,495 | 804,311 | ||||||
Impax Asset Management Group PLC | 134,661 | 790,163 | ||||||
IntegraFin Holdings PLC(b) | 227,413 | 798,637 | ||||||
James Halstead PLC(a) | 108,096 | 274,470 | ||||||
Johnson Service Group PLC | 105,187 | 174,601 | ||||||
Jupiter Fund Management PLC | 677,141 | 757,455 | ||||||
Just Group PLC | 357,393 | 474,953 | ||||||
Kainos Group PLC | 38,394 | 468,279 | ||||||
Keller Group PLC | 41,550 | 550,075 | ||||||
Kitwave Group PLC | 65,269 | 305,893 | ||||||
Learning Technologies Group PLC | 238,213 | 256,988 | ||||||
Marshalls PLC | 210,175 | 729,604 | ||||||
Me Group International PLC | 248,057 | 521,428 | ||||||
Mears Group PLC | 80,040 | 373,098 | ||||||
Mitie Group PLC | 685,131 | 908,766 | ||||||
MJ Gleeson PLC | 29,736 | 179,932 | ||||||
Moneysupermarket.com Group PLC | 349,046 | 969,169 | ||||||
Morgan Advanced Materials PLC | 184,915 | 665,743 | ||||||
Morgan Sindall Group PLC | 31,457 | 921,923 | ||||||
Mortgage Advice Bureau Holdings Ltd.(a) | 30,445 | 350,752 | ||||||
MP Evans Group PLC | 26,905 | 275,301 | ||||||
Next 15 Group PLC | 32,900 | 384,023 | ||||||
Odfjell Technology Ltd. | 45,467 | 271,161 | ||||||
Oxford Instruments PLC | 15,318 | 411,197 | ||||||
PageGroup PLC | 326,442 | 1,849,927 | ||||||
Pan African Resources PLC | 1,339,760 | 380,802 | ||||||
PayPoint PLC | 62,910 | 386,229 | ||||||
Pennon Group PLC | 210,677 | 1,723,242 | ||||||
Pets at Home Group PLC | 306,153 | 1,038,031 | ||||||
Polar Capital Holdings PLC | 90,078 | 518,318 | ||||||
Premier Foods PLC | 244,508 | 461,459 | ||||||
Primary Health Properties PLC | 1,442,392 | 1,708,220 | ||||||
PZ Cussons PLC(a) | 288,648 | 327,077 | ||||||
Reach PLC | 431,652 | 427,503 | ||||||
Redde Northgate PLC | 297,368 | 1,433,105 | ||||||
Redrow PLC | 280,596 | 2,358,950 | ||||||
Renew Holdings PLC | 37,547 | 438,265 | ||||||
Restore PLC(a) | 53,427 | 145,782 | ||||||
Robert Walters PLC | 32,718 | 168,217 | ||||||
RWS Holdings PLC | 252,769 | 599,026 | ||||||
Safestore Holdings PLC | 138,283 | 1,318,006 | ||||||
Savills PLC | 94,730 | 1,275,657 | ||||||
Secure Trust Bank PLC | 20,530 | 171,168 | ||||||
Senior PLC | 76,641 | 171,172 | ||||||
Serica Energy PLC | 543,217 | 1,293,523 | ||||||
Severfield PLC | 314,738 | 217,881 | ||||||
Spirent Communications PLC | 523,606 | 1,322,891 | ||||||
SThree PLC | 104,049 | 565,192 | ||||||
TBC Bank Group PLC | 22,912 | 930,536 | ||||||
Telecom Plus PLC | 57,961 | 1,192,009 | ||||||
See Notes to Financial Statements.
| 24 | WisdomTree Trust |
Schedule of Investments (concluded)
WisdomTree Europe SmallCap Dividend Fund (DFE)
March 31, 2024
| Investments | Shares | Value | ||||||
Tyman PLC | 131,940 | $ | 482,519 | |||||
Vertu Motors PLC | 161,824 | 137,986 | ||||||
Vesuvius PLC | 160,643 | 1,004,921 | ||||||
Victrex PLC | 55,002 | 902,562 | ||||||
Volution Group PLC | 48,294 | 265,138 | ||||||
Warpaint London PLC | 44,571 | 232,255 | ||||||
Wickes Group PLC | 214,576 | 420,419 | ||||||
Wincanton PLC | 69,585 | 527,419 | ||||||
Workspace Group PLC | 150,248 | 972,729 | ||||||
XPS Pensions Group PLC(b) | 154,663 | 451,323 | ||||||
YouGov PLC | 13,765 | 173,886 | ||||||
Young & Co.’s Brewery PLC, Class A(a) | 11,378 | 140,570 | ||||||
|
| |||||||
| Total United Kingdom |
| 66,081,298 | ||||||
TOTAL COMMON STOCKS (Cost: $172,851,744) |
| 184,570,278 | ||||||
| EXCHANGE-TRADED FUND – 0.3% |
| |||||||
| United States – 0.3% | ||||||||
WisdomTree International MidCap Dividend Fund(d) | ||||||||
| (Cost: $585,657) | 9,700 | 610,227 | ||||||
| INVESTMENT OF CASH COLLATERAL FOR SECURITIES LOANED – 8.3% |
| |||||||
| United States – 8.3% |
| |||||||
State Street Navigator Securities Lending Government Money Market Portfolio, 5.34%(e) | ||||||||
| (Cost: $15,484,216) | 15,484,216 | 15,484,216 | ||||||
TOTAL INVESTMENTS IN SECURITIES – 106.7% (Cost: $188,921,617) |
| 200,664,721 | ||||||
Other Assets less Liabilities – (6.7)% |
| (12,513,311 | ) | |||||
|
| |||||||
| NET ASSETS – 100.0% |
| $ | 188,151,410 | |||||
| * | Non-income producing security. |
| (a) | Security, or portion thereof, was on loan at March 31, 2024 (See Note 2). At March 31, 2024, the total market value of the Fund’s securities on loan identified in the Schedule of Investments was $20,380,112 and the total market value of the collateral held by the Fund was $21,585,512. The total market value of the collateral includes non-cash U.S. Government securities collateral having a value of $6,101,296. |
| (b) | This security is exempt from registration under Regulation S of the Securities Act of 1933, which exempts from registration securities offered and sold outside the United States. This security may not be offered or sold in the United States except pursuant to an exemption from, or in a transaction not subject to, the registration requirements of the Securities Act of 1933. |
| (c) | This security is exempt from registration under rule 144A of the Securities Act of 1933. This security may be sold in transactions that are exempt from registration, normally to qualified institutional buyers. |
| (d) | Affiliated holding. See “Investment in Affiliates” supplementary table included in this Schedule of Investments for additional information. |
| (e) | Rate shown represents annualized 7-day yield as of March 31, 2024. |
| INVESTMENT IN AFFILIATES | ||||||||||
Affiliated holdings are investments in entities in which the Fund owns 5% or more of the outstanding voting securities or are investments in entities which are under common ownership or control. Investments in affiliates during the fiscal year ended March 31, 2024 were as follows:
| Affiliate | Value at 3/31/2023 | Purchases/ Additions | Sales/ Reductions | Realized Gain/(Loss) | Change in Unrealized Appreciation/ Depreciation | Value at 3/31/2024 | Dividend Income | |||||||||||||||||||||
WisdomTree International MidCap Dividend Fund | $ | 64,306 | $ | 8,656,401 | $ | 8,085,805 | $ | (46,899 | ) | $ | 22,224 | $ | 610,227 | $ | 66,368 | |||||||||||||
| FAIR VALUATION SUMMARY | ||||||||||||||
The following is a summary of the fair valuations according to the inputs used in valuing the Fund’s investments (See Note 2 – Fair Value Measurement):
| Quoted Prices in Active Markets (Level 1) | Other Significant Observable Inputs (Level 2) | Significant Unobservable Inputs (Level 3) | Total | |||||||||||||
Assets: | ||||||||||||||||
Investments in Securities | ||||||||||||||||
Common Stocks | $ | 184,570,278 | $ | — | $ | — | $ | 184,570,278 | ||||||||
Exchange-Traded Fund | 610,227 | — | — | 610,227 | ||||||||||||
Investment of Cash Collateral for Securities Loaned | — | 15,484,216 | — | 15,484,216 | ||||||||||||
Total Investments in Securities | $ | 185,180,505 | $ | 15,484,216 | $ | — | $ | 200,664,721 | ||||||||
See Notes to Financial Statements.
| WisdomTree Trust | 25 |
Schedule of Investments
WisdomTree International AI Enhanced Value Fund (AIVI)
March 31, 2024
| Investments | Shares | Value | ||||||
| COMMON STOCKS – 98.2% |
| |||||||
| Australia – 9.9% | ||||||||
APA Group | 34,562 | $ | 189,631 | |||||
Aurizon Holdings Ltd. | 295,401 | 770,878 | ||||||
Coles Group Ltd. | 36,660 | 405,154 | ||||||
Dexus(a) | 76,685 | 395,732 | ||||||
Lottery Corp. Ltd. | 53,408 | 179,443 | ||||||
Scentre Group | 374,851 | 829,034 | ||||||
Sonic Healthcare Ltd. | 44,852 | 860,579 | ||||||
Telstra Group Ltd. | 71,022 | 178,852 | ||||||
Transurban Group | 145,980 | 1,268,561 | ||||||
Vicinity Ltd.(a) | 537,451 | 746,848 | ||||||
Washington H Soul Pattinson & Co. Ltd.(a) | 7,856 | 172,260 | ||||||
Woodside Energy Group Ltd. | 57,192 | 1,138,018 | ||||||
Woolworths Group Ltd.(a) | 9,776 | 211,554 | ||||||
|
| |||||||
| Total Australia | 7,346,544 | |||||||
| Austria – 0.4% | ||||||||
OMV AG | 6,411 | 303,681 | ||||||
| Belgium – 3.7% | ||||||||
Ageas SA | 7,950 | 368,511 | ||||||
Groupe Bruxelles Lambert NV | 28,458 | 2,153,269 | ||||||
Umicore SA | 8,463 | 182,755 | ||||||
|
| |||||||
| Total Belgium | 2,704,535 | |||||||
| China – 0.2% | ||||||||
BOC Hong Kong Holdings Ltd. | 67,000 | 179,347 | ||||||
| Denmark – 0.6% | ||||||||
Carlsberg AS, Class B | 3,125 | 426,953 | ||||||
| Finland – 2.7% | ||||||||
Fortum OYJ(a) | 28,268 | 349,409 | ||||||
Sampo OYJ, Class A | 34,539 | 1,473,993 | ||||||
Wartsila OYJ Abp | 12,157 | 184,996 | ||||||
|
| |||||||
| Total Finland | 2,008,398 | |||||||
| France – 10.2% | ||||||||
AXA SA | 47,363 | 1,780,858 | ||||||
Eiffage SA | 14,675 | 1,666,522 | ||||||
EssilorLuxottica SA | 895 | 202,696 | ||||||
Klepierre SA(a) | 7,216 | 187,039 | ||||||
Orange SA | 16,356 | 192,331 | ||||||
Societe Generale SA | 17,468 | 468,051 | ||||||
Thales SA | 2,520 | 430,149 | ||||||
Vinci SA | 17,030 | 2,184,281 | ||||||
Vivendi SE | 21,296 | 232,297 | ||||||
Worldline SA*(b) | 15,366 | 190,514 | ||||||
|
| |||||||
| Total France | 7,534,738 | |||||||
| Germany – 6.1% | ||||||||
BASF SE | 18,241 | 1,042,736 | ||||||
Evonik Industries AG | 43,284 | 856,633 | ||||||
Fresenius Medical Care AG | 4,615 | 177,687 | ||||||
Heidelberg Materials AG | 12,086 | 1,330,741 | ||||||
Mercedes-Benz Group AG | 4,661 | 371,551 | ||||||
Siemens Energy AG* | 31,151 | 572,100 | ||||||
Talanx AG | 2,474 | 196,119 | ||||||
|
| |||||||
| Total Germany | 4,547,567 | |||||||
| Hong Kong – 2.7% | ||||||||
CK Asset Holdings Ltd. | 85,500 | 351,769 | ||||||
Henderson Land Development Co. Ltd. | 196,000 | 558,465 | ||||||
Hongkong Land Holdings Ltd. | 54,600 | 167,622 | ||||||
Sino Land Co. Ltd. | 166,000 | 172,438 | ||||||
Sun Hung Kai Properties Ltd. | 60,500 | 583,244 | ||||||
Wharf Real Estate Investment Co. Ltd. | 53,446 | 173,795 | ||||||
|
| |||||||
| Total Hong Kong | 2,007,333 | |||||||
| Italy – 0.7% | ||||||||
Snam SpA | 70,587 | 333,600 | ||||||
Terna – Rete Elettrica Nazionale | 22,536 | 186,436 | ||||||
|
| |||||||
| Total Italy | 520,036 | |||||||
| Japan – 19.0% | ||||||||
AGC, Inc. | 41,500 | 1,515,821 | ||||||
Asahi Group Holdings Ltd. | 13,100 | 483,162 | ||||||
Astellas Pharma, Inc.(a) | 16,100 | 174,835 | ||||||
FANUC Corp. | 47,900 | 1,324,533 | ||||||
GLP J-REIT | 234 | 194,195 | ||||||
Honda Motor Co. Ltd. | 89,600 | 1,119,519 | ||||||
Inpex Corp. | 36,800 | 569,100 | ||||||
ITOCHU Corp.(a) | 4,700 | 200,801 | ||||||
Japan Metropolitan Fund Invest | 299 | 187,091 | ||||||
Kirin Holdings Co. Ltd. | 24,400 | 338,242 | ||||||
Koito Manufacturing Co. Ltd. | 35,500 | 594,618 | ||||||
Makita Corp. | 9,400 | 265,209 | ||||||
MEIJI Holdings Co. Ltd. | 7,900 | 176,744 | ||||||
Mitsubishi Chemical Group Corp. | 267,100 | 1,616,595 | ||||||
Mitsui & Co. Ltd. | 4,300 | 201,895 | ||||||
Nippon Express Holdings, Inc. | 10,700 | 546,648 | ||||||
Nissan Chemical Corp. | 4,800 | 181,572 | ||||||
Nissan Motor Co. Ltd.(a) | 65,700 | 264,068 | ||||||
Ono Pharmaceutical Co. Ltd.(a) | 12,800 | 207,589 | ||||||
Takeda Pharmaceutical Co. Ltd.(a) | 75,300 | 2,081,702 | ||||||
Toho Co. Ltd. | 5,600 | 183,084 | ||||||
Toray Industries, Inc. | 232,700 | 1,137,938 | ||||||
TOTO Ltd. | 6,600 | 186,297 | ||||||
Unicharm Corp. | 10,000 | 319,403 | ||||||
|
| |||||||
| Total Japan | 14,070,661 | |||||||
| Netherlands – 3.0% | ||||||||
Aegon Ltd. | 104,997 | 640,692 | ||||||
JDE Peet’s NV | 35,451 | 745,066 | ||||||
Koninklijke Philips NV | 15,174 | 304,913 | ||||||
NN Group NV | 6,238 | 288,480 | ||||||
Randstad NV(a) | 4,275 | 225,864 | ||||||
|
| |||||||
| Total Netherlands | 2,205,015 | |||||||
| Norway – 1.4% | ||||||||
DNB Bank ASA | 43,772 | 867,887 | ||||||
Gjensidige Forsikring ASA | 11,173 | 161,901 | ||||||
|
| |||||||
| Total Norway | 1,029,788 | |||||||
See Notes to Financial Statements.
| 26 | WisdomTree Trust |
Schedule of Investments (concluded)
WisdomTree International AI Enhanced Value Fund (AIVI)
March 31, 2024
| Investments | Shares | Value | ||||||
| Singapore – 3.3% | ||||||||
CapitaLand Integrated Commercial Trust | 150,800 | $ | 221,239 | |||||
DBS Group Holdings Ltd. | 10,600 | 282,986 | ||||||
Mapletree Pan Asia Commercial Trust | 176,000 | 166,924 | ||||||
Oversea-Chinese Banking Corp. Ltd. | 113,800 | 1,137,494 | ||||||
Seatrium Ltd.* | 2,829,000 | 165,598 | ||||||
United Overseas Bank Ltd. | 20,600 | 447,381 | ||||||
|
| |||||||
| Total Singapore | 2,421,622 | |||||||
| Spain – 3.9% | ||||||||
Aena SME SA(b) | 2,673 | 526,704 | ||||||
Enagas SA(a) | 119,243 | 1,772,690 | ||||||
Redeia Corp. SA | 12,556 | 214,324 | ||||||
Repsol SA | 22,173 | 369,739 | ||||||
|
| |||||||
| Total Spain | 2,883,457 | |||||||
| Sweden – 0.5% | ||||||||
Boliden AB | 6,968 | 193,708 | ||||||
Essity AB, Class B(a) | 7,563 | 179,798 | ||||||
|
| |||||||
| Total Sweden | 373,506 | |||||||
| Switzerland – 9.0% | ||||||||
Baloise Holding AG, Registered Shares | 1,970 | 309,050 | ||||||
Clariant AG, Registered Shares* | 49,936 | 675,830 | ||||||
Holcim AG, Registered Shares | 2,257 | 204,626 | ||||||
SGS SA, Registered Shares*(a) | 1,835 | 178,264 | ||||||
Sonova Holding AG, Registered Shares | 1,261 | 365,546 | ||||||
Swiss Prime Site AG, Registered Shares | 4,115 | 388,565 | ||||||
Swiss Re AG | 17,751 | 2,285,143 | ||||||
Zurich Insurance Group AG | 4,237 | 2,287,613 | ||||||
|
| |||||||
| Total Switzerland | 6,694,637 | |||||||
| United Kingdom – 20.1% | ||||||||
Aviva PLC | 274,722 | 1,723,413 | ||||||
BAE Systems PLC | 11,245 | 191,700 | ||||||
British American Tobacco PLC | 54,791 | 1,665,306 | ||||||
Centrica PLC | 88,777 | 143,156 | ||||||
CK Hutchison Holdings Ltd. | 108,000 | 521,616 | ||||||
Coca-Cola Europacific Partners PLC | 2,874 | 201,036 | ||||||
Haleon PLC | 42,195 | 177,552 | ||||||
Imperial Brands PLC | 56,747 | 1,268,836 | ||||||
Legal & General Group PLC | 167,119 | 537,072 | ||||||
M&G PLC | 255,001 | 710,297 | ||||||
Phoenix Group Holdings PLC | 190,472 | 1,329,631 | ||||||
Reckitt Benckiser Group PLC | 8,265 | 471,087 | ||||||
RELX PLC | 6,346 | 274,488 | ||||||
Rolls-Royce Holdings PLC* | 37,839 | 203,963 | ||||||
Schroders PLC | 197,700 | 940,538 | ||||||
Shell PLC | 77,474 | 2,569,062 | ||||||
St. James’s Place PLC | 132,964 | 780,205 | ||||||
Unilever PLC | 3,708 | 186,218 | ||||||
United Utilities Group PLC | 44,892 | 583,544 | ||||||
Vodafone Group PLC | 207,319 | 184,532 | ||||||
WPP PLC | 19,749 | 188,007 | ||||||
|
| |||||||
| Total United Kingdom | 14,851,259 | |||||||
| United States – 0.8% | ||||||||
GSK PLC | 26,848 | 579,484 | ||||||
TOTAL COMMON STOCKS (Cost: $71,365,654) | 72,688,561 | |||||||
| EXCHANGE-TRADED FUND – 0.6% |
| |||||||
| United States – 0.6% | ||||||||
| iShares MSCI EAFE Value ETF (Cost: $467,942) | 8,820 | 479,808 | ||||||
| INVESTMENT OF CASH COLLATERAL FOR SECURITIES LOANED – 4.5% |
| |||||||
| United States – 4.5% |
| |||||||
State Street Navigator Securities Lending Government Money Market Portfolio, 5.34%(c) | ||||||||
| (Cost: $3,358,202) | 3,358,202 | 3,358,202 | ||||||
TOTAL INVESTMENTS IN SECURITIES – 103.3% (Cost: $75,191,798) |
| 76,526,571 | ||||||
Other Assets less Liabilities – (3.3)% |
| (2,497,489 | ) | |||||
|
| |||||||
| NET ASSETS – 100.0% |
| $ | 74,029,082 | |||||
| * | Non-income producing security. |
| (a) | Security, or portion thereof, was on loan at March 31, 2024 (See Note 2). At March 31, 2024, the total market value of the Fund’s securities on loan identified in the Schedule of Investments was $6,139,415 and the total market value of the collateral held by the Fund was $6,505,412. The total market value of the collateral includes non-cash U.S. Government securities collateral having a value of $3,147,210. |
| (b) | This security is exempt from registration under rule 144A of the Securities Act of 1933. This security may be sold in transactions that are exempt from registration, normally to qualified institutional buyers. |
| (c) | Rate shown represents annualized 7-day yield as of March 31, 2024. |
| FAIR VALUATION SUMMARY | ||||||||||||||
The following is a summary of the fair valuations according to the inputs used in valuing the Fund’s investments (See Note 2 — Fair Value Measurement):
| Quoted Prices in Active Markets (Level 1) | Other Significant Observable Inputs (Level 2) | Significant Unobservable Inputs (Level 3) | Total | |||||||||||||
Assets: |
| |||||||||||||||
Investments in Securities | ||||||||||||||||
Common Stocks | $ | 72,688,561 | $ | — | $ | — | $ | 72,688,561 | ||||||||
Exchange-Traded Fund | 479,808 | — | — | 479,808 | ||||||||||||
Investment of Cash Collateral for Securities Loaned | — | 3,358,202 | — | 3,358,202 | ||||||||||||
Total Investments in Securities | $ | 73,168,369 | $ | 3,358,202 | $ | — | $ | 76,526,571 | ||||||||
See Notes to Financial Statements.
| WisdomTree Trust | 27 |
Schedule of Investments
WisdomTree International Equity Fund (DWM)
March 31, 2024
| Investments | Shares | Value | ||||||
| COMMON STOCKS – 99.0% |
| |||||||
| Australia – 7.6% |
| |||||||
AGL Energy Ltd. | 26,059 | $ | 141,787 | |||||
ALS Ltd. | 12,427 | 106,450 | ||||||
Ampol Ltd. | 14,553 | 377,781 | ||||||
ANZ Group Holdings Ltd. | 118,535 | 2,273,568 | ||||||
APA Group | 44,866 | 246,166 | ||||||
Aristocrat Leisure Ltd. | 7,137 | 200,216 | ||||||
AUB Group Ltd. | 3,994 | 77,493 | ||||||
Aurizon Holdings Ltd. | 50,838 | 132,667 | ||||||
Australian Clinical Labs Ltd.(a)(b) | 34,039 | 59,737 | ||||||
Bank of Queensland Ltd.(b) | 28,475 | 117,407 | ||||||
Bapcor Ltd.(b) | 19,528 | 80,390 | ||||||
Bendigo & Adelaide Bank Ltd.(b) | 44,297 | 296,218 | ||||||
BlueScope Steel Ltd. | 11,271 | 175,374 | ||||||
Brambles Ltd. | 46,698 | 492,022 | ||||||
Brickworks Ltd. | 8,858 | 164,585 | ||||||
CAR Group Ltd. | 11,833 | 278,532 | ||||||
Centuria Capital Group(b) | 126,018 | 143,875 | ||||||
Challenger Ltd. | 16,491 | 76,495 | ||||||
Champion Iron Ltd.(b) | 20,400 | 98,619 | ||||||
Charter Hall Group(b) | 18,618 | 167,013 | ||||||
Cleanaway Waste Management Ltd. | 80,395 | 142,663 | ||||||
Cochlear Ltd. | 722 | 158,983 | ||||||
Coles Group Ltd. | 60,195 | 665,254 | ||||||
Commonwealth Bank of Australia | 52,066 | 4,087,692 | ||||||
Computershare Ltd. | 8,978 | 152,933 | ||||||
CSL Ltd. | 5,818 | 1,092,847 | ||||||
CSR Ltd. | 41,143 | 236,744 | ||||||
Dexus(b) | 44,721 | 230,782 | ||||||
Eagers Automotive Ltd.(b) | 13,120 | 121,202 | ||||||
Endeavour Group Ltd.(b) | 70,815 | 254,560 | ||||||
First Resources Ltd. | 99,300 | 100,801 | ||||||
Goodman Group | 20,567 | 453,660 | ||||||
GPT Group | 81,069 | 241,705 | ||||||
GUD Holdings Ltd.(b) | 8,069 | 62,118 | ||||||
Harvey Norman Holdings Ltd.(b) | 92,673 | 311,368 | ||||||
Helia Group Ltd. | 49,348 | 125,881 | ||||||
IDP Education Ltd.(b) | 6,699 | 78,318 | ||||||
IGO Ltd.(b) | 34,723 | 160,159 | ||||||
Iluka Resources Ltd. | 12,111 | 56,968 | ||||||
Incitec Pivot Ltd. | 155,984 | 294,098 | ||||||
Insignia Financial Ltd.(b) | 44,527 | 73,205 | ||||||
Insurance Australia Group Ltd. | 45,734 | 190,956 | ||||||
IPH Ltd. | 21,840 | 89,907 | ||||||
IVE Group Ltd.(b) | 44,397 | 63,143 | ||||||
JB Hi-Fi Ltd.(b) | 9,807 | 411,077 | ||||||
Lottery Corp. Ltd. | 87,745 | 294,811 | ||||||
Lovisa Holdings Ltd.(b) | 5,021 | 109,310 | ||||||
Macquarie Group Ltd. | 11,740 | 1,529,537 | ||||||
McMillan Shakespeare Ltd. | 8,540 | 109,368 | ||||||
Medibank Pvt Ltd. | 88,151 | 216,237 | ||||||
Metcash Ltd. | 64,173 | 163,698 | ||||||
Mineral Resources Ltd.(b) | 4,961 | 229,375 | ||||||
Mirvac Group(b) | 129,202 | 198,928 | ||||||
Monadelphous Group Ltd.(b) | 8,103 | 74,961 | ||||||
MyState Ltd. | 44,573 | 106,431 | ||||||
National Australia Bank Ltd. | 115,580 | 2,612,008 | ||||||
New Hope Corp. Ltd. | 71,204 | 216,009 | ||||||
Nine Entertainment Co. Holdings Ltd.(b) | 137,756 | 153,681 | ||||||
Northern Star Resources Ltd. | 16,120 | 152,176 | ||||||
NRW Holdings Ltd. | 47,716 | 91,211 | ||||||
Orica Ltd. | 11,180 | 133,185 | ||||||
Origin Energy Ltd. | 47,839 | 287,133 | ||||||
Orora Ltd. | 42,278 | 75,023 | ||||||
Pilbara Minerals Ltd.(b) | 142,340 | 355,664 | ||||||
Premier Investments Ltd. | 6,333 | 135,559 | ||||||
QBE Insurance Group Ltd. | 43,632 | 516,080 | ||||||
Qube Holdings Ltd.(b) | 78,355 | 174,315 | ||||||
Ramsay Health Care Ltd.(b) | 3,251 | 119,855 | ||||||
REA Group Ltd.(b) | 1,520 | 183,921 | ||||||
Reece Ltd.(b) | 7,990 | 146,476 | ||||||
Reliance Worldwide Corp. Ltd. | 40,232 | 150,922 | ||||||
Rio Tinto Ltd. | 15,015 | 1,192,735 | ||||||
Rio Tinto PLC | 52,981 | 3,357,790 | ||||||
Santos Ltd. | 113,007 | 571,375 | ||||||
Scentre Group | 294,606 | 651,561 | ||||||
SEEK Ltd.(b) | 8,048 | 131,525 | ||||||
Seven Group Holdings Ltd.(b) | 9,009 | 239,624 | ||||||
SmartGroup Corp. Ltd.(b) | 14,787 | 93,673 | ||||||
Sonic Healthcare Ltd. | 14,050 | 269,579 | ||||||
Steadfast Group Ltd. | 36,152 | 138,683 | ||||||
Stockland | 113,244 | 358,320 | ||||||
Suncorp Group Ltd. | 34,101 | 364,414 | ||||||
Super Retail Group Ltd. | 18,479 | 194,097 | ||||||
Telstra Group Ltd. | 530,001 | 1,334,682 | ||||||
TPG Telecom Ltd.(b) | 47,848 | 140,784 | ||||||
Transurban Group | 113,989 | 990,561 | ||||||
Treasury Wine Estates Ltd.(b) | 12,899 | 104,771 | ||||||
Ventia Services Group Pty. Ltd. | 71,715 | 180,129 | ||||||
Vicinity Ltd. | 225,602 | 313,499 | ||||||
Viva Energy Group Ltd.(c) | 96,667 | 233,343 | ||||||
Waypoint REIT Ltd. | 35,878 | 59,687 | ||||||
Wesfarmers Ltd. | 46,033 | 2,054,184 | ||||||
Westpac Banking Corp. | 152,489 | 2,596,528 | ||||||
Whitehaven Coal Ltd. | 57,203 | 264,967 | ||||||
Woodside Energy Group Ltd. | 136,422 | 2,714,552 | ||||||
Woolworths Group Ltd. | 23,528 | 509,148 | ||||||
Worley Ltd. | 21,762 | 237,809 | ||||||
Yancoal Australia Ltd.(b) | 122,709 | 419,490 | ||||||
|
| |||||||
| Total Australia |
| 43,816,803 | ||||||
| Austria – 0.8% |
| |||||||
ANDRITZ AG | 4,608 | 287,650 | ||||||
BAWAG Group AG*(c) | 4,716 | 298,976 | ||||||
CA Immobilien Anlagen AG | 2,975 | 105,065 | ||||||
Erste Group Bank AG | 23,575 | 1,051,539 | ||||||
Mondi PLC | 17,570 | 309,735 | ||||||
Oesterreichische Post AG | 4,172 | 142,607 | ||||||
See Notes to Financial Statements.
| 28 | WisdomTree Trust |
Schedule of Investments (continued)
WisdomTree International Equity Fund (DWM)
March 31, 2024
| Investments | Shares | Value | ||||||
OMV AG | 16,052 | $ | 760,364 | |||||
Telekom Austria AG* | 40,336 | 337,612 | ||||||
UNIQA Insurance Group AG | 27,003 | 233,598 | ||||||
Verbund AG | 5,137 | 375,874 | ||||||
Vienna Insurance Group AG Wiener Versicherung Gruppe | 5,581 | 174,194 | ||||||
voestalpine AG | 7,384 | 207,343 | ||||||
Wienerberger AG | 3,210 | 117,039 | ||||||
|
| |||||||
| Total Austria |
| 4,401,596 | ||||||
| Belgium – 0.9% |
| |||||||
Ackermans & van Haaren NV | 574 | 100,427 | ||||||
Aedifica SA | 2,776 | 170,741 | ||||||
Ageas SA | 13,241 | 613,768 | ||||||
Anheuser-Busch InBev SA | 17,082 | 1,041,606 | ||||||
Bekaert SA | 2,215 | 113,725 | ||||||
bpost SA | 13,564 | 50,745 | ||||||
Cofinimmo SA | 746 | 48,864 | ||||||
Colruyt Group NV | 2,488 | 115,059 | ||||||
D’ieteren Group | 869 | 192,960 | ||||||
KBC Group NV | 21,157 | 1,586,216 | ||||||
Melexis NV | 1,766 | 143,332 | ||||||
Solvay SA(b) | 4,642 | 126,838 | ||||||
Tessenderlo Group SA | 3,621 | 94,834 | ||||||
UCB SA | 2,841 | 351,011 | ||||||
Warehouses De Pauw CVA | 6,807 | 194,522 | ||||||
Xior Student Housing NV(a) | 3,508 | 106,082 | ||||||
|
| |||||||
| Total Belgium |
| 5,050,730 | ||||||
| China – 0.4% |
| |||||||
BOC Aviation Ltd.(c) | 25,200 | 194,157 | ||||||
BOC Hong Kong Holdings Ltd. | 463,444 | 1,240,556 | ||||||
CITIC Telecom International Holdings Ltd. | 522,000 | 168,743 | ||||||
Prosus NV | 9,909 | 311,153 | ||||||
Qingdao Port International Co. Ltd., Class H(b)(c) | 166,000 | 97,567 | ||||||
Wilmar International Ltd. | 207,700 | 527,868 | ||||||
|
| |||||||
| Total China |
| 2,540,044 | ||||||
| Denmark – 1.6% |
| |||||||
Alm Brand AS | 60,579 | 115,430 | ||||||
Carlsberg AS, Class B | 3,704 | 506,059 | ||||||
Coloplast AS, Class B | 3,442 | 464,681 | ||||||
D/S Norden AS | 4,641 | 189,094 | ||||||
Danske Bank AS | 24,305 | 727,056 | ||||||
Dfds AS | 3,569 | 103,559 | ||||||
DSV AS | 1,312 | 213,142 | ||||||
H Lundbeck AS | 20,606 | 99,114 | ||||||
Novo Nordisk AS, Class B | 37,793 | 4,822,554 | ||||||
Novonesis (Novozymes) B, Class B | 4,883 | 286,482 | ||||||
Pandora AS | 2,236 | 360,823 | ||||||
Royal Unibrew AS | 8 | 529 | ||||||
Scandinavian Tobacco Group AS(c) | 7,325 | 131,302 | ||||||
Spar Nord Bank AS | 7,709 | 128,586 | ||||||
Sydbank AS | 3,415 | 176,424 | ||||||
Topdanmark AS | 3,457 | 147,660 | ||||||
Tryg AS | 21,315 | 438,861 | ||||||
|
| |||||||
| Total Denmark |
| 8,911,356 | ||||||
| Egypt – 0.0% |
| |||||||
Energean PLC(b) | 17,721 | 244,680 | ||||||
| Finland – 1.4% |
| |||||||
Cargotec OYJ, Class B | 2,187 | 152,464 | ||||||
Citycon OYJ*(b) | 24,087 | 99,529 | ||||||
Elisa OYJ | 9,873 | 440,908 | ||||||
Huhtamaki OYJ(b) | 1,721 | 72,173 | ||||||
Kemira OYJ | 6,638 | 125,602 | ||||||
Kesko OYJ, Class B | 16,460 | 307,805 | ||||||
Kone OYJ, Class B | 13,434 | 625,906 | ||||||
Konecranes OYJ | 4,397 | 228,463 | ||||||
Metsa Board OYJ, Class B(b) | 20,444 | 154,998 | ||||||
Metso OYJ(b) | 18,385 | 218,513 | ||||||
Nokia OYJ | 123,938 | 440,510 | ||||||
Nordea Bank Abp(b) | 280,843 | 3,130,809 | ||||||
Orion OYJ, Class B | 3,545 | 132,355 | ||||||
Outokumpu OYJ(b) | 23,691 | 103,113 | ||||||
Sampo OYJ, Class A | 14,506 | 619,061 | ||||||
TietoEVRY OYJ(b) | 5,991 | 126,882 | ||||||
UPM-Kymmene OYJ | 17,487 | 583,009 | ||||||
Valmet OYJ(b) | 9,776 | 257,512 | ||||||
Wartsila OYJ Abp(b) | 12,343 | 187,826 | ||||||
|
| |||||||
| Total Finland |
| 8,007,438 | ||||||
| France – 12.4% |
| |||||||
Accor SA | 5,350 | 250,187 | ||||||
Aeroports de Paris SA | 2,458 | 337,405 | ||||||
Air Liquide SA | 9,526 | 1,983,953 | ||||||
Airbus SE | 7,080 | 1,305,393 | ||||||
Alten SA | 719 | 104,986 | ||||||
Amundi SA(c) | 11,316 | 777,884 | ||||||
Antin Infrastructure Partners SA | 7,441 | 108,008 | ||||||
Arkema SA | 2,427 | 255,668 | ||||||
AXA SA | 135,116 | 5,080,388 | ||||||
BioMerieux | 1,122 | 123,902 | ||||||
BNP Paribas SA | 59,290 | 4,217,226 | ||||||
Bollore SE | 36,401 | 243,348 | ||||||
Bouygues SA | 15,221 | 621,875 | ||||||
Bureau Veritas SA | 17,357 | 530,124 | ||||||
Capgemini SE | 2,346 | 540,434 | ||||||
Carrefour SA | 17,183 | 294,603 | ||||||
Cie de Saint-Gobain SA | 14,364 | 1,115,859 | ||||||
Cie Generale des Etablissements Michelin SCA | 32,758 | 1,256,649 | ||||||
Coface SA | 19,232 | 304,289 | ||||||
Credit Agricole SA | 183,440 | 2,737,159 | ||||||
Danone SA | 24,770 | 1,602,153 | ||||||
Dassault Aviation SA | 903 | 198,949 | ||||||
Dassault Systemes SE | 6,144 | 272,322 | ||||||
Edenred SE | 4,297 | 229,532 | ||||||
Eiffage SA | 4,679 | 531,357 | ||||||
Eramet SA(b) | 1,263 | 96,097 | ||||||
EssilorLuxottica SA | 6,043 | 1,368,594 | ||||||
Eurazeo SE | 2,647 | 232,274 | ||||||
Gaztransport & Technigaz SA(b) | 1,473 | 220,331 | ||||||
See Notes to Financial Statements.
| WisdomTree Trust | 29 |
Schedule of Investments (continued)
WisdomTree International Equity Fund (DWM)
March 31, 2024
| Investments | Shares | Value | ||||||
Gecina SA | 3,095 | $ | 316,377 | |||||
Getlink SE | 20,242 | 344,972 | ||||||
Hermes International SCA | 782 | 1,998,229 | ||||||
Imerys SA | 4,438 | 151,364 | ||||||
Interparfums SA | 2,960 | 166,873 | ||||||
Ipsen SA | 965 | 114,955 | ||||||
IPSOS SA | 2,796 | 197,336 | ||||||
Kering SA | 3,105 | 1,228,518 | ||||||
Klepierre SA(b) | 16,185 | 419,515 | ||||||
L’Oreal SA | 8,490 | 4,022,069 | ||||||
La Francaise des Jeux SAEM(c) | 7,656 | 312,383 | ||||||
Legrand SA | 6,525 | 692,156 | ||||||
LVMH Moet Hennessy Louis Vuitton SE | 6,339 | 5,707,610 | ||||||
Metropole Television SA | 8,396 | 125,315 | ||||||
Nexans SA | 1,369 | 143,269 | ||||||
Orange SA | 109,543 | 1,288,120 | ||||||
Pernod Ricard SA | 4,952 | 801,957 | ||||||
Publicis Groupe SA | 10,589 | 1,155,620 | ||||||
Remy Cointreau SA | 745 | 75,182 | ||||||
Rexel SA | 21,304 | 575,898 | ||||||
Rubis SCA | 11,631 | 411,263 | ||||||
Safran SA | 4,039 | 916,263 | ||||||
Sanofi SA | 36,649 | 3,600,280 | ||||||
Schneider Electric SE | 13,168 | 2,981,525 | ||||||
SCOR SE | 6,272 | 217,234 | ||||||
SEB SA | 1,116 | 142,946 | ||||||
Societe BIC SA | 1,635 | 116,896 | ||||||
Societe Generale SA | 44,604 | 1,195,155 | ||||||
Sodexo SA | 2,397 | 205,755 | ||||||
Sopra Steria Group | 664 | 160,922 | ||||||
SPIE SA | 5,547 | 208,598 | ||||||
Teleperformance SE | 1,353 | 131,628 | ||||||
Television Francaise 1 SA(b) | 15,370 | 140,599 | ||||||
Thales SA | 3,195 | 545,367 | ||||||
TotalEnergies SE(b) | 122,834 | 8,419,975 | ||||||
Valeo SE | 6,088 | 76,205 | ||||||
Veolia Environnement SA | 33,201 | 1,080,374 | ||||||
Verallia SA(c) | 5,422 | 211,042 | ||||||
Vinci SA | 23,885 | 3,063,509 | ||||||
Vivendi SE | 30,178 | 329,182 | ||||||
Wendel SE | 1,952 | 199,432 | ||||||
|
| |||||||
| Total France |
| 71,132,817 | ||||||
| Georgia – 0.1% |
| |||||||
Bank of Georgia Group PLC | 4,150 | 264,746 | ||||||
| Germany – 9.1% |
| |||||||
Allianz SE, Registered Shares | 20,499 | 6,150,191 | ||||||
Aurubis AG | 563 | 39,632 | ||||||
Bayer AG, Registered Shares | 37,670 | 1,156,635 | ||||||
Bayerische Motoren Werke AG | 58,761 | 6,787,882 | ||||||
Beiersdorf AG | 1,442 | 210,166 | ||||||
Bilfinger SE | 2,753 | 128,741 | ||||||
Brenntag SE | 3,641 | 307,032 | ||||||
Carl Zeiss Meditec AG, Bearer Shares | 1,574 | 196,851 | ||||||
Commerzbank AG | 16,925 | 232,692 | ||||||
Continental AG | 3,819 | 275,930 | ||||||
CTS Eventim AG & Co. KGaA | 2,236 | 199,107 | ||||||
Daimler Truck Holding AG | 25,651 | 1,300,937 | ||||||
Dermapharm Holding SE | 2,387 | 84,145 | ||||||
Deutsche Bank AG, Registered Shares | 37,971 | 597,989 | ||||||
Deutsche Boerse AG | 2,769 | 567,152 | ||||||
Deutsche Post AG, Registered Shares | 43,643 | 1,881,371 | ||||||
Deutsche Telekom AG, Registered Shares | 176,742 | 4,294,830 | ||||||
Deutz AG | 23,653 | 150,334 | ||||||
DWS Group GmbH & Co. KGaA(c) | 10,140 | 446,590 | ||||||
E.ON SE | 122,515 | 1,704,894 | ||||||
Evonik Industries AG | 18,328 | 362,729 | ||||||
Fielmann Group AG | 727 | 33,416 | ||||||
Freenet AG | 8,518 | 239,921 | ||||||
Fresenius Medical Care AG | 7,756 | 298,621 | ||||||
GEA Group AG | 2,664 | 112,754 | ||||||
Hamborner REIT AG | 15,719 | 116,459 | ||||||
Hannover Rueck SE | 3,699 | 1,013,511 | ||||||
Heidelberg Materials AG | 7,227 | 795,736 | ||||||
Henkel AG & Co. KGaA | 5,478 | 394,968 | ||||||
HochTief AG | 3,531 | 410,712 | ||||||
Infineon Technologies AG | 10,440 | 355,338 | ||||||
K&S AG, Registered Shares | 8,891 | 138,849 | ||||||
Kloeckner & Co. SE | 12,815 | 93,421 | ||||||
Knorr-Bremse AG | 3,412 | 258,316 | ||||||
Lanxess AG | 4,383 | 117,442 | ||||||
Mercedes-Benz Group AG | 69,196 | 5,515,945 | ||||||
Merck KGaA | 1,402 | 247,717 | ||||||
MTU Aero Engines AG | 729 | 185,178 | ||||||
Muenchener Rueckversicherungs-Gesellschaft AG in Muenchen, Registered Shares | 3,974 | 1,941,235 | ||||||
Mutares SE & Co. KGaA | 2,725 | 108,597 | ||||||
Puma SE | 2,679 | 121,577 | ||||||
Rheinmetall AG | 613 | 344,923 | ||||||
RWE AG | 11,705 | 397,698 | ||||||
SAP SE | 13,810 | 2,691,525 | ||||||
Siemens AG, Registered Shares | 28,714 | 5,487,727 | ||||||
Siemens Healthineers AG*(c) | 16,618 | 1,017,979 | ||||||
Siltronic AG | 1,452 | 128,903 | ||||||
Sixt SE | 1,136 | 113,425 | ||||||
Stroeer SE & Co. KGaA | 3,419 | 208,258 | ||||||
Suedzucker AG | 8,820 | 126,595 | ||||||
Symrise AG | 1,508 | 180,698 | ||||||
Talanx AG | 8,920 | 707,106 | ||||||
thyssenkrupp AG | 12,683 | 68,132 | ||||||
Traton SE | 12,848 | 462,620 | ||||||
United Internet AG, Registered Shares | 2,421 | 54,542 | ||||||
Vonovia SE | 22,960 | 679,432 | ||||||
Wacker Neuson SE | 3,526 | 65,347 | ||||||
|
| |||||||
| Total Germany |
| 52,310,453 | ||||||
| Hong Kong – 1.5% |
| |||||||
AIA Group Ltd. | 164,365 | 1,103,614 | ||||||
Bank of East Asia Ltd. | 114,600 | 136,470 | ||||||
See Notes to Financial Statements.
| 30 | WisdomTree Trust |
Schedule of Investments (continued)
WisdomTree International Equity Fund (DWM)
March 31, 2024
| Investments | Shares | Value | ||||||
CLP Holdings Ltd. | 90,500 | $ | 720,975 | |||||
Dah Sing Financial Holdings Ltd. | 50,400 | 115,786 | ||||||
Hang Lung Group Ltd. | 106,000 | 122,030 | ||||||
Hang Seng Bank Ltd. | 68,800 | 752,924 | ||||||
Hong Kong & China Gas Co. Ltd. | 701,570 | 531,570 | ||||||
Hong Kong Exchanges & Clearing Ltd. | 23,229 | 676,113 | ||||||
Kowloon Development Co. Ltd. | 106,000 | 65,146 | ||||||
Link REIT | 109,073 | 468,962 | ||||||
MTR Corp. Ltd. | 176,053 | 580,361 | ||||||
Power Assets Holdings Ltd. | 120,000 | 702,234 | ||||||
Sun Hung Kai Properties Ltd. | 112,500 | 1,084,543 | ||||||
Swire Pacific Ltd., Class A | 44,500 | 366,169 | ||||||
Swire Pacific Ltd., Class B | 207,500 | 270,429 | ||||||
Swire Properties Ltd. | 224,600 | 471,788 | ||||||
Techtronic Industries Co. Ltd. | 37,000 | 501,594 | ||||||
|
| |||||||
| Total Hong Kong |
| 8,670,708 | ||||||
| Indonesia – 0.0% |
| |||||||
Bumitama Agri Ltd. | 246,700 | 125,215 | ||||||
| Ireland – 0.5% | ||||||||
AIB Group PLC | 37,997 | 193,037 | ||||||
Bank of Ireland Group PLC | 19,528 | 199,303 | ||||||
CRH PLC | 18,357 | 1,583,377 | ||||||
Glanbia PLC | 9,273 | 183,071 | ||||||
Kenmare Resources PLC | 16,976 | 70,018 | ||||||
Kerry Group PLC, Class A | 1,348 | 115,652 | ||||||
Kingspan Group PLC | 1,390 | 126,791 | ||||||
Smurfit Kappa Group PLC | 7,788 | 355,535 | ||||||
|
| |||||||
| Total Ireland |
| 2,826,784 | ||||||
| Israel – 0.8% |
| |||||||
Amot Investments Ltd. | 40,900 | 194,470 | ||||||
Ashtrom Group Ltd.* | 4,883 | 72,531 | ||||||
Azrieli Group Ltd. | 4,340 | 314,510 | ||||||
Bank Hapoalim BM | 61,905 | 582,603 | ||||||
Bank Leumi Le-Israel BM | 46,927 | 391,560 | ||||||
Bezeq The Israeli Telecommunication Corp. Ltd. | 111,707 | 144,158 | ||||||
Delek Group Ltd. | 1,594 | 209,230 | ||||||
Elbit Systems Ltd. | 675 | 141,515 | ||||||
FIBI Holdings Ltd. | 3,659 | 163,989 | ||||||
First International Bank of Israel Ltd. | 7,617 | 318,094 | ||||||
Gav-Yam Lands Corp. Ltd. | 19,055 | 145,733 | ||||||
Harel Insurance Investments & Financial Services Ltd.* | 9,427 | 91,061 | ||||||
ICL Group Ltd. | 106,951 | 567,494 | ||||||
Israel Discount Bank Ltd., Class A | 65,099 | 338,137 | ||||||
Mivne Real Estate KD Ltd. | 41,157 | 102,002 | ||||||
Mizrahi Tefahot Bank Ltd. | 11,563 | 435,226 | ||||||
Newmed Energy LP | 50,616 | 129,562 | ||||||
Oil Refineries Ltd. | 379,252 | 126,290 | ||||||
Phoenix Holdings Ltd. | 11,207 | 112,324 | ||||||
Plus500 Ltd. | 7,557 | 172,312 | ||||||
|
| |||||||
| Total Israel |
| 4,752,801 | ||||||
| Italy – 4.4% |
| |||||||
A2A SpA | 176,607 | 319,196 | ||||||
ACEA SpA | 12,120 | 214,931 | ||||||
Amplifon SpA(b) | 2,152 | 78,557 | ||||||
Anima Holding SpA(c) | 20,189 | 95,938 | ||||||
Assicurazioni Generali SpA | 93,964 | 2,380,747 | ||||||
Azimut Holding SpA | 7,384 | 200,803 | ||||||
Banca Generali SpA | 4,480 | 178,150 | ||||||
Banca IFIS SpA | 5,703 | 111,790 | ||||||
Banca Mediolanum SpA | 50,420 | 554,338 | ||||||
Banca Popolare di Sondrio SpA | 21,489 | 161,064 | ||||||
Banco BPM SpA | 70,268 | 468,086 | ||||||
BPER Banca | 46,363 | 219,316 | ||||||
Brembo SpA | 11,467 | 147,002 | ||||||
Credito Emiliano SpA | 31,156 | 311,921 | ||||||
De’ Longhi SpA | 2,312 | 80,053 | ||||||
DiaSorin SpA(b) | 293 | 28,321 | ||||||
Enav SpA(c) | 38,012 | 159,285 | ||||||
Enel SpA | 711,776 | 4,703,786 | ||||||
Eni SpA(b) | 136,373 | 2,157,399 | ||||||
ERG SpA(b) | 7,784 | 195,708 | ||||||
Ferrari NV | 1,349 | 588,596 | ||||||
FinecoBank Banca Fineco SpA(b) | 20,092 | 301,296 | ||||||
Hera SpA | 58,908 | 207,785 | ||||||
Infrastrutture Wireless Italiane SpA(b)(c) | 27,233 | 309,705 | ||||||
Intesa Sanpaolo SpA | 809,166 | 2,938,923 | ||||||
Iren SpA | 73,104 | 149,536 | ||||||
Italgas SpA | 65,611 | 382,643 | ||||||
Mediobanca Banca di Credito Finanziario SpA | 48,543 | 724,009 | ||||||
Moncler SpA | 4,687 | 350,186 | ||||||
Piaggio & C SpA | 38,518 | 121,970 | ||||||
Poste Italiane SpA(b)(c) | 88,076 | 1,103,892 | ||||||
PRADA SpA | 33,800 | 267,759 | ||||||
Prysmian SpA | 5,092 | 266,114 | ||||||
Recordati Industria Chimica & Farmaceutica SpA | 5,740 | 317,647 | ||||||
Saras SpA | 80,360 | 153,790 | ||||||
Snam SpA(b) | 142,917 | 675,437 | ||||||
Technogym SpA(c) | 12,901 | 128,184 | ||||||
Terna – Rete Elettrica Nazionale | 59,121 | 489,096 | ||||||
UniCredit SpA | 52,781 | 2,005,097 | ||||||
Unieuro SpA(c) | 2,751 | 26,249 | ||||||
Unipol Gruppo SpA | 33,445 | 280,513 | ||||||
UnipolSai Assicurazioni SpA | 109,746 | 318,123 | ||||||
Zignago Vetro SpA | 8,246 | 118,089 | ||||||
|
| |||||||
| Total Italy |
| 24,991,030 | ||||||
| Japan – 18.9% |
| |||||||
77 Bank Ltd. | 5,500 | 150,633 | ||||||
ABC-Mart, Inc. | 4,200 | 80,437 | ||||||
ADEKA Corp. | 7,600 | 161,898 | ||||||
Advantest Corp. | 5,100 | 229,786 | ||||||
Aeon Co. Ltd. | 10,300 | 244,663 | ||||||
Aeon Delight Co. Ltd. | 1,400 | 32,746 | ||||||
AGC, Inc. | 6,300 | 230,113 | ||||||
Air Water, Inc. | 10,400 | 164,578 | ||||||
Aisin Corp. | 7,100 | 291,844 | ||||||
Ajinomoto Co., Inc. | 7,600 | 284,225 | ||||||
See Notes to Financial Statements.
| WisdomTree Trust | 31 |
Schedule of Investments (continued)
WisdomTree International Equity Fund (DWM)
March 31, 2024
| Investments | Shares | Value | ||||||
Amada Co. Ltd.(b) | 15,900 | $ | 180,542 | |||||
Amano Corp. | 4,800 | 122,803 | ||||||
ARE Holdings, Inc.(b) | 6,000 | 76,593 | ||||||
Asahi Group Holdings Ltd. | 8,200 | 302,438 | ||||||
Asahi Kasei Corp. | 35,373 | 259,901 | ||||||
Astellas Pharma, Inc. | 46,200 | 501,699 | ||||||
Azbil Corp.(b) | 1,000 | 27,712 | ||||||
Bandai Namco Holdings, Inc. | 14,200 | 265,338 | ||||||
Bridgestone Corp. | 24,800 | 1,090,679 | ||||||
Canon Marketing Japan, Inc. | 4,200 | 124,547 | ||||||
Canon, Inc. | 32,600 | 969,524 | ||||||
Capcom Co. Ltd. | 2,000 | 36,936 | ||||||
Casio Computer Co. Ltd.(b) | 10,800 | 92,483 | ||||||
Central Japan Railway Co. | 4,500 | 110,787 | ||||||
Chiba Bank Ltd. | 20,300 | 169,206 | ||||||
Chubu Electric Power Co., Inc. | 25,000 | 328,554 | ||||||
Chugai Pharmaceutical Co. Ltd. | 22,900 | 873,664 | ||||||
Citizen Watch Co. Ltd.(b) | 16,100 | 105,422 | ||||||
CKD Corp.(b) | 2,000 | 39,843 | ||||||
COMSYS Holdings Corp. | 5,300 | 124,249 | ||||||
Concordia Financial Group Ltd. | 32,400 | 164,799 | ||||||
Cosmo Energy Holdings Co. Ltd.(b) | 3,500 | 177,492 | ||||||
Dai-ichi Life Holdings, Inc. | 19,133 | 487,095 | ||||||
Daicel Corp. | 10,400 | 104,038 | ||||||
Daido Steel Co. Ltd. | 18,600 | 223,244 | ||||||
Daifuku Co. Ltd. | 6,400 | 151,558 | ||||||
Daiichi Sankyo Co. Ltd. | 10,800 | 340,887 | ||||||
Daiichikosho Co. Ltd. | 3,100 | 39,706 | ||||||
Daikin Industries Ltd.(b) | 3,200 | 435,561 | ||||||
Daishi Hokuetsu Financial Group, Inc.(b) | 6,400 | 188,602 | ||||||
Daito Trust Construction Co. Ltd. | 2,100 | 242,129 | ||||||
Daiwa House Industry Co. Ltd. | 19,800 | 592,384 | ||||||
Daiwa Securities Group, Inc. | 41,600 | 316,374 | ||||||
DCM Holdings Co. Ltd. | 10,600 | 103,447 | ||||||
Denka Co. Ltd.(b) | 1,900 | 29,458 | ||||||
Denso Corp. | 72,700 | 1,384,876 | ||||||
Dentsu Group, Inc. | 7,000 | 194,027 | ||||||
Dentsu Soken, Inc. | 2,600 | 86,240 | ||||||
Disco Corp. | 1,400 | 529,030 | ||||||
DMG Mori Co. Ltd.(b) | 7,800 | 209,347 | ||||||
Doutor Nichires Holdings Co. Ltd. | 9,900 | 136,060 | ||||||
Dowa Holdings Co. Ltd.(b) | 2,100 | 73,943 | ||||||
East Japan Railway Co. | 9,000 | 173,584 | ||||||
Ebara Corp. | 3,200 | 291,572 | ||||||
EDION Corp.(b) | 10,300 | 105,351 | ||||||
Electric Power Development Co. Ltd. | 8,500 | 140,183 | ||||||
ENEOS Holdings, Inc. | 79,700 | 385,111 | ||||||
Exedy Corp.(b) | 10,600 | 214,318 | ||||||
FANUC Corp. | 16,800 | 464,555 | ||||||
Fast Retailing Co. Ltd. | 2,400 | 747,537 | ||||||
Fuji Electric Co. Ltd. | 3,300 | 223,496 | ||||||
FUJIFILM Holdings Corp. | 21,000 | 467,607 | ||||||
Fujikura Ltd. | 13,100 | 197,177 | ||||||
Fujitec Co. Ltd.(b) | 5,300 | 132,828 | ||||||
Fujitsu Ltd.(b) | 26,000 | 427,764 | ||||||
Fukuoka Financial Group, Inc.(b) | 5,900 | 157,728 | ||||||
Furuya Metal Co. Ltd. | 300 | 22,478 | ||||||
G-Tekt Corp. | 9,600 | 134,030 | ||||||
GS Yuasa Corp.(b) | 3,000 | 62,361 | ||||||
Gunze Ltd. | 5,200 | 189,659 | ||||||
Hachijuni Bank Ltd. | 25,200 | 173,167 | ||||||
Hakuhodo DY Holdings, Inc.(b) | 9,400 | 86,053 | ||||||
Hamamatsu Photonics KK | 2,700 | 95,498 | ||||||
Hankyu Hanshin Holdings, Inc. | 3,300 | 95,896 | ||||||
Haseko Corp.(b) | 22,900 | 286,884 | ||||||
Heiwa Corp. | 8,600 | 113,989 | ||||||
Hioki EE Corp.(b) | 2,000 | 95,675 | ||||||
Hirose Electric Co. Ltd. | 700 | 71,621 | ||||||
Hitachi Construction Machinery Co. Ltd. | 6,700 | 200,055 | ||||||
Hitachi Ltd. | 15,700 | 1,442,456 | ||||||
Honda Motor Co. Ltd. | 107,500 | 1,343,173 | ||||||
Horiba Ltd. | 2,000 | 211,834 | ||||||
Hoya Corp. | 3,100 | 383,851 | ||||||
HU Group Holdings, Inc.(b) | 1,900 | 30,670 | ||||||
Hulic Co. Ltd. | 15,200 | 157,830 | ||||||
Ichibanya Co. Ltd. | 18,200 | 144,426 | ||||||
Idemitsu Kosan Co. Ltd. | 35,955 | 247,548 | ||||||
IHI Corp.(b) | 5,100 | 138,127 | ||||||
Iida Group Holdings Co. Ltd.(b) | 5,000 | 65,859 | ||||||
Iino Kaiun Kaisha Ltd.(b) | 12,800 | 103,689 | ||||||
INFRONEER Holdings, Inc.(b) | 11,700 | 111,592 | ||||||
Inpex Corp. | 44,500 | 688,178 | ||||||
Isetan Mitsukoshi Holdings Ltd.(b) | 5,200 | 85,708 | ||||||
Isuzu Motors Ltd.(b) | 27,100 | 367,971 | ||||||
ITOCHU Corp.(b) | 36,300 | 1,550,866 | ||||||
IwaiCosmo Holdings, Inc.(b) | 17,700 | 262,088 | ||||||
Izumi Co. Ltd. | 900 | 20,879 | ||||||
Japan Airlines Co. Ltd. | 10,000 | 192,772 | ||||||
Japan Exchange Group, Inc. | 10,800 | 293,290 | ||||||
Japan Post Holdings Co. Ltd. | 126,400 | 1,279,493 | ||||||
Japan Post Insurance Co. Ltd.(b) | 9,000 | 172,781 | ||||||
Japan Tobacco, Inc. | 108,844 | 2,915,548 | ||||||
JFE Holdings, Inc.(b) | 17,200 | 288,665 | ||||||
Joshin Denki Co. Ltd.(b) | 10,100 | 155,359 | ||||||
JTEKT Corp. | 14,700 | 138,700 | ||||||
K’s Holdings Corp.(b) | 10,600 | 93,817 | ||||||
Kaga Electronics Co. Ltd.(b) | 2,100 | 88,526 | ||||||
Kajima Corp. | 14,900 | 307,756 | ||||||
Kakaku.com, Inc. | 9,000 | 111,887 | ||||||
Kamigumi Co. Ltd.(b) | 8,400 | 186,432 | ||||||
Kaneka Corp. | 3,800 | 95,763 | ||||||
Kansai Electric Power Co., Inc. | 18,605 | 269,772 | ||||||
Kao Corp. | 10,200 | 379,977 | ||||||
Kawasaki Heavy Industries Ltd.(b) | 4,600 | 154,919 | ||||||
KDDI Corp. | 51,100 | 1,513,299 | ||||||
Keyence Corp. | 1,100 | 505,428 | ||||||
Kikkoman Corp. | 8,000 | 104,080 | ||||||
Kintetsu Group Holdings Co. Ltd.(b) | 3,400 | 100,015 | ||||||
See Notes to Financial Statements.
| 32 | WisdomTree Trust |
Schedule of Investments (continued)
WisdomTree International Equity Fund (DWM)
March 31, 2024
| Investments | Shares | Value | ||||||
Kirin Holdings Co. Ltd. | 17,900 | $ | 248,136 | |||||
Kobayashi Pharmaceutical Co. Ltd. | 2,200 | 74,063 | ||||||
Kobe Steel Ltd.(b) | 20,400 | 277,131 | ||||||
Koei Tecmo Holdings Co. Ltd.(b) | 7,600 | 81,351 | ||||||
Komatsu Ltd. | 44,600 | 1,303,418 | ||||||
Konami Group Corp. | 2,800 | 189,910 | ||||||
Kose Corp. | 1,300 | 68,451 | ||||||
Kubota Corp. | 20,400 | 321,343 | ||||||
Kurabo Industries Ltd. | 2,500 | 57,815 | ||||||
Kuraray Co. Ltd. | 13,400 | 145,338 | ||||||
KYB Corp.(b) | 3,600 | 122,977 | ||||||
Kyowa Kirin Co. Ltd. | 9,600 | 170,662 | ||||||
Kyudenko Corp. | 4,100 | 172,539 | ||||||
Kyushu Financial Group, Inc. | 16,000 | 120,731 | ||||||
Kyushu Railway Co. | 8,000 | 187,281 | ||||||
Lawson, Inc. | 2,300 | 157,062 | ||||||
Lintec Corp. | 7,800 | 163,117 | ||||||
M3, Inc. | 7,800 | 110,136 | ||||||
Macnica Holdings, Inc.(b) | 2,500 | 122,716 | ||||||
Marubeni Corp. | 70,300 | 1,221,175 | ||||||
Marui Group Co. Ltd.(b) | 7,200 | 116,341 | ||||||
Mazda Motor Corp. | 21,500 | 249,386 | ||||||
Medipal Holdings Corp. | 6,700 | 102,706 | ||||||
MEIJI Holdings Co. Ltd. | 6,400 | 143,185 | ||||||
MEITEC Group Holdings, Inc. | 6,800 | 134,207 | ||||||
Minebea Mitsumi, Inc. | 6,700 | 130,640 | ||||||
Mitsubishi Chemical Group Corp. | 47,100 | 285,068 | ||||||
Mitsubishi Corp. | 137,200 | 3,161,098 | ||||||
Mitsubishi Electric Corp. | 40,800 | 677,192 | ||||||
Mitsubishi Estate Co. Ltd. | 20,100 | 369,807 | ||||||
Mitsubishi Gas Chemical Co., Inc.(b) | 10,100 | 172,844 | ||||||
Mitsubishi Heavy Industries Ltd. | 60,000 | 574,251 | ||||||
Mitsubishi Logistics Corp. | 3,700 | 121,626 | ||||||
Mitsubishi Materials Corp.(b) | 3,000 | 57,831 | ||||||
Mitsubishi Shokuhin Co. Ltd. | 3,100 | 115,115 | ||||||
Mitsubishi UFJ Financial Group, Inc. | 383,500 | 3,945,353 | ||||||
Mitsuboshi Belting Ltd.(b) | 3,700 | 114,170 | ||||||
Mitsui Chemicals, Inc.(b) | 5,900 | 168,839 | ||||||
Mitsui Fudosan Co. Ltd. | 38,700 | 421,278 | ||||||
Mitsui High-Tec, Inc. | 500 | 28,818 | ||||||
Mitsui Mining & Smelting Co. Ltd.(b) | 2,000 | 62,202 | ||||||
Miura Co. Ltd. | 4,500 | 86,985 | ||||||
Mizuho Financial Group, Inc.(b) | 86,230 | 1,735,482 | ||||||
Mizuho Medy Co. Ltd.(b) | 3,000 | 66,702 | ||||||
Mizuno Corp. | 2,400 | 100,856 | ||||||
MS&AD Insurance Group Holdings, Inc. | 44,790 | 802,311 | ||||||
Murata Manufacturing Co. Ltd. | 24,200 | 451,556 | ||||||
Musashi Seimitsu Industry Co. Ltd. | 3,500 | 38,967 | ||||||
Nabtesco Corp. | 2,000 | 33,830 | ||||||
NEC Corp. | 4,300 | 312,247 | ||||||
NGK Insulators Ltd. | 4,900 | 66,048 | ||||||
NHK Spring Co. Ltd. | 15,500 | 153,315 | ||||||
Nichirei Corp. | 5,500 | 150,560 | ||||||
Nikkon Holdings Co. Ltd.(b) | 6,300 | 122,986 | ||||||
Nikon Corp.(b) | 9,000 | 91,044 | ||||||
Nintendo Co. Ltd. | 25,900 | 1,402,599 | ||||||
Nippon Denko Co. Ltd. | 22,200 | 47,966 | ||||||
Nippon Electric Glass Co. Ltd. | 8,300 | 212,347 | ||||||
Nippon Express Holdings, Inc. | 3,900 | 199,245 | ||||||
Nippon Gas Co. Ltd. | 7,900 | 134,124 | ||||||
Nippon Kayaku Co. Ltd. | 16,400 | 141,520 | ||||||
Nippon Light Metal Holdings Co. Ltd. | 7,900 | 94,949 | ||||||
Nippon Paint Holdings Co. Ltd. | 23,200 | 164,559 | ||||||
Nippon Shinyaku Co. Ltd. | 2,300 | 67,931 | ||||||
Nippon Steel Corp.(b) | 51,500 | 1,248,155 | ||||||
Nippon Telegraph & Telephone Corp. | 1,805,000 | 2,144,366 | ||||||
Nishi-Nippon Financial Holdings, Inc. | 5,500 | 69,629 | ||||||
Nishimatsu Construction Co. Ltd.(b) | 4,600 | 135,710 | ||||||
Nissan Chemical Corp. | 3,400 | 128,613 | ||||||
Nissan Motor Co. Ltd.(b) | 56,400 | 226,688 | ||||||
Nisshin Oillio Group Ltd. | 3,300 | 112,293 | ||||||
Nisshin Seifun Group, Inc. | 9,500 | 131,787 | ||||||
Nisshinbo Holdings, Inc. | 19,200 | 156,295 | ||||||
Nissin Foods Holdings Co. Ltd.(b) | 5,400 | 149,856 | ||||||
Niterra Co. Ltd.(b) | 12,800 | 429,979 | ||||||
Nitto Denko Corp. | 5,000 | 455,251 | ||||||
Noevir Holdings Co. Ltd. | 500 | 17,278 | ||||||
NOF Corp. | 12,900 | 177,759 | ||||||
Nomura Holdings, Inc. | 75,000 | 484,456 | ||||||
Nomura Real Estate Holdings, Inc. | 10,500 | 305,263 | ||||||
Nomura Research Institute Ltd. | 10,600 | 297,174 | ||||||
Noritake Co. Ltd. | 6,800 | 192,752 | ||||||
NSK Ltd. | 18,000 | 105,102 | ||||||
Obayashi Corp. | 15,500 | 190,748 | ||||||
Obic Co. Ltd. | 600 | 90,290 | ||||||
Oji Holdings Corp.(b) | 22,600 | 95,256 | ||||||
Okamura Corp. | 9,800 | 146,989 | ||||||
Oki Electric Industry Co. Ltd.(b) | 17,200 | 131,149 | ||||||
OKUMA Corp.(b) | 2,200 | 103,484 | ||||||
Okuwa Co. Ltd.(b) | 17,200 | 112,738 | ||||||
Olympus Corp. | 8,800 | 128,647 | ||||||
Omron Corp. | 3,600 | 128,710 | ||||||
Ono Pharmaceutical Co. Ltd.(b) | 11,700 | 189,750 | ||||||
Open House Group Co. Ltd. | 2,900 | 94,830 | ||||||
Oracle Corp. | 3,400 | 257,339 | ||||||
Oriental Land Co. Ltd. | 4,000 | 128,158 | ||||||
Osaka Gas Co. Ltd. | 9,100 | 203,953 | ||||||
OSG Corp. | 8,900 | 128,609 | ||||||
Otsuka Corp. | 10,000 | 211,239 | ||||||
Otsuka Holdings Co. Ltd. | 10,100 | 421,098 | ||||||
Panasonic Holdings Corp. | 41,300 | 394,457 | ||||||
Penta-Ocean Construction Co. Ltd. | 16,400 | 84,186 | ||||||
Persol Holdings Co. Ltd. | 96,000 | 135,426 | ||||||
Pigeon Corp. | 9,900 | 95,078 | ||||||
Pola Orbis Holdings, Inc. | 6,300 | 60,421 | ||||||
Recruit Holdings Co. Ltd. | 9,200 | 407,707 | ||||||
Resona Holdings, Inc. | 49,000 | 307,673 | ||||||
Resonac Holdings Corp. | 5,300 | 126,980 | ||||||
See Notes to Financial Statements.
| WisdomTree Trust | 33 |
Schedule of Investments (continued)
WisdomTree International Equity Fund (DWM)
March 31, 2024
| Investments | Shares | Value | ||||||
Ricoh Co. Ltd. | 10,400 | $ | 92,871 | |||||
Rohm Co. Ltd. | 4,800 | 77,021 | ||||||
San-In Godo Bank Ltd. | 19,600 | 156,313 | ||||||
Sankyo Co. Ltd. | 18,700 | 206,837 | ||||||
Santen Pharmaceutical Co. Ltd. | 10,100 | 102,538 | ||||||
Sanwa Holdings Corp. | 11,500 | 203,717 | ||||||
SBI Holdings, Inc. | 13,000 | 339,377 | ||||||
SCREEN Holdings Co. Ltd.(b) | 2,900 | 382,560 | ||||||
SCSK Corp. | 9,500 | 178,111 | ||||||
Secom Co. Ltd. | 4,500 | 325,878 | ||||||
Sega Sammy Holdings, Inc. | 10,600 | 140,988 | ||||||
Seiko Epson Corp.(b) | 10,100 | 176,547 | ||||||
Sekisui Chemical Co. Ltd. | 12,200 | 179,762 | ||||||
Sekisui House Ltd. | 17,600 | 408,761 | ||||||
Senko Group Holdings Co. Ltd.(b) | 10,500 | 79,576 | ||||||
Seria Co. Ltd. | 7,900 | 157,118 | ||||||
Seven & i Holdings Co. Ltd. | 38,700 | 564,090 | ||||||
SG Holdings Co. Ltd. | 10,300 | 129,511 | ||||||
Shibusawa Warehouse Co. Ltd. | 10,400 | 212,680 | ||||||
Shiga Bank Ltd. | 4,300 | 119,188 | ||||||
Shimadzu Corp. | 5,800 | 162,106 | ||||||
Shimano, Inc. | 800 | 120,784 | ||||||
Shin-Etsu Chemical Co. Ltd. | 49,900 | 2,170,812 | ||||||
Shionogi & Co. Ltd. | 7,000 | 358,453 | ||||||
Shiseido Co. Ltd. | 4,100 | 110,881 | ||||||
SMC Corp. | 600 | 336,304 | ||||||
Sodick Co. Ltd. | 19,100 | 90,991 | ||||||
SoftBank Corp.(b) | 163,500 | 2,107,691 | ||||||
Sojitz Corp.(b) | 14,100 | 371,447 | ||||||
Sompo Holdings, Inc. | 30,300 | 638,653 | ||||||
Sony Group Corp. | 5,900 | 506,204 | ||||||
St. Marc Holdings Co. Ltd.(b) | 11,800 | 169,346 | ||||||
Starts Corp., Inc. | 6,000 | 135,188 | ||||||
Subaru Corp. | 24,500 | 558,168 | ||||||
SUMCO Corp.(b) | 8,200 | 130,413 | ||||||
Sumitomo Bakelite Co. Ltd. | 5,600 | 171,243 | ||||||
Sumitomo Corp. | 54,800 | 1,322,340 | ||||||
Sumitomo Electric Industries Ltd. | 21,000 | 325,729 | ||||||
Sumitomo Forestry Co. Ltd. | 7,900 | 256,504 | ||||||
Sumitomo Heavy Industries Ltd. | 3,600 | 112,297 | ||||||
Sumitomo Mitsui Financial Group, Inc. | 31,500 | 1,854,263 | ||||||
Sumitomo Mitsui Trust Holdings, Inc. | 23,614 | 516,139 | ||||||
Sumitomo Realty & Development Co. Ltd. | 7,400 | 283,444 | ||||||
Sumitomo Rubber Industries Ltd. | 6,700 | 83,139 | ||||||
Sun Frontier Fudousan Co. Ltd. | 16,500 | 213,793 | ||||||
Sundrug Co. Ltd. | 4,800 | 148,017 | ||||||
Suzuki Motor Corp.(b) | 34,000 | 390,558 | ||||||
Sysmex Corp. | 7,800 | 137,168 | ||||||
T&D Holdings, Inc. | 11,500 | 197,372 | ||||||
Taiheiyo Cement Corp. | 5,400 | 125,558 | ||||||
Taisei Corp. | 6,200 | 230,229 | ||||||
Taiyo Yuden Co. Ltd.(b) | 3,100 | 74,251 | ||||||
Takara Holdings, Inc.(b) | 16,700 | 118,123 | ||||||
Takara Standard Co. Ltd.(b) | 11,300 | 145,819 | ||||||
Takashimaya Co. Ltd. | 13,800 | 222,622 | ||||||
Takeda Pharmaceutical Co. Ltd.(b) | 47,300 | 1,307,630 | ||||||
TDK Corp. | 6,400 | 316,353 | ||||||
Teijin Ltd. | 6,600 | 61,489 | ||||||
Terumo Corp. | 14,600 | 263,262 | ||||||
TIS, Inc. | 5,400 | 117,352 | ||||||
Tobu Railway Co. Ltd. | 3,800 | 94,934 | ||||||
Tocalo Co. Ltd. | 12,800 | 151,389 | ||||||
Toda Corp. | 15,800 | 106,746 | ||||||
Toho Co. Ltd. | 1,900 | 62,118 | ||||||
Tokio Marine Holdings, Inc. | 46,600 | 1,448,081 | ||||||
Tokuyama Corp. | 9,900 | 177,598 | ||||||
Tokyo Electron Ltd. | 7,200 | 1,882,480 | ||||||
Tokyo Gas Co. Ltd. | 9,900 | 229,667 | ||||||
Tokyo Ohka Kogyo Co. Ltd. | 3,600 | 108,919 | ||||||
Tokyo Seimitsu Co. Ltd. | 2,300 | 185,024 | ||||||
Tokyo Steel Manufacturing Co. Ltd.(b) | 4,300 | 47,277 | ||||||
Tokyo Tatemono Co. Ltd. | 6,200 | 107,802 | ||||||
Tokyu Corp.(b) | 8,400 | 102,346 | ||||||
Tokyu Fudosan Holdings Corp. | 16,800 | 138,589 | ||||||
Toray Industries, Inc. | 22,900 | 111,985 | ||||||
Tosoh Corp.(b) | 15,400 | 209,817 | ||||||
Toyo Seikan Group Holdings Ltd. | 12,200 | 196,569 | ||||||
Toyo Suisan Kaisha Ltd. | 1,400 | 87,647 | ||||||
Toyo Tire Corp. | 7,000 | 130,801 | ||||||
Toyoda Gosei Co. Ltd.(b) | 6,300 | 135,079 | ||||||
Toyota Boshoku Corp. | 3,100 | 52,621 | ||||||
Toyota Motor Corp. | 279,650 | 7,006,725 | ||||||
Toyota Tsusho Corp. | 10,600 | 718,947 | ||||||
Transcosmos, Inc.(b) | 4,000 | 82,989 | ||||||
Trend Micro, Inc.(b) | 3,100 | 160,402 | ||||||
Tsumura & Co. | 3,200 | 80,833 | ||||||
Tsuruha Holdings, Inc. | 600 | 42,658 | ||||||
UBE Corp.(b) | 7,400 | 133,312 | ||||||
Ulvac, Inc. | 900 | 58,628 | ||||||
Unicharm Corp. | 4,700 | 150,119 | ||||||
USS Co. Ltd. | 23,400 | 195,200 | ||||||
Wacoal Holdings Corp. | 5,900 | 144,786 | ||||||
Welcia Holdings Co. Ltd. | 5,300 | 89,807 | ||||||
West Japan Railway Co. | 6,000 | 124,365 | ||||||
Yakult Honsha Co. Ltd.(b) | 7,400 | 152,503 | ||||||
Yamada Holdings Co. Ltd. | 23,500 | 68,507 | ||||||
Yamaguchi Financial Group, Inc. | 14,500 | 149,316 | ||||||
Yamaha Motor Co. Ltd. | 33,800 | 317,911 | ||||||
Yamato Holdings Co. Ltd. | 7,300 | 104,089 | ||||||
Yaskawa Electric Corp. | 3,800 | 159,261 | ||||||
Yokogawa Electric Corp. | 6,600 | 152,370 | ||||||
Yokohama Rubber Co. Ltd. | 6,000 | 159,609 | ||||||
Yondoshi Holdings, Inc.(b) | 10,600 | 131,042 | ||||||
ZOZO, Inc.(b) | 5,500 | 138,313 | ||||||
|
| |||||||
| Total Japan |
| 108,318,860 | ||||||
| Jersey – 0.0% |
| |||||||
Ithaca Energy PLC | 139,275 | 233,999 | ||||||
See Notes to Financial Statements.
| 34 | WisdomTree Trust |
Schedule of Investments (continued)
WisdomTree International Equity Fund (DWM)
March 31, 2024
| Investments | Shares | Value | ||||||
| Jordan – 0.0% |
| |||||||
Hikma Pharmaceuticals PLC | 7,974 | $ | 193,253 | |||||
| Netherlands – 2.7% |
| |||||||
Aalberts NV | 3,830 | 184,442 | ||||||
Aegon Ltd.(b) | 70,103 | 427,769 | ||||||
Akzo Nobel NV | 4,032 | 301,248 | ||||||
ASM International NV | 228 | 139,347 | ||||||
ASML Holding NV | 2,854 | 2,750,046 | ||||||
BE Semiconductor Industries NV | 2,803 | 429,565 | ||||||
CTP NV(c) | 10,913 | 194,705 | ||||||
Euronext NV(c) | 2,588 | 246,523 | ||||||
Ferrovial SE | 15,259 | 604,476 | ||||||
Heineken Holding NV | 5,983 | 483,331 | ||||||
Heineken NV(b) | 8,538 | 823,808 | ||||||
IMCD NV | 1,198 | 211,349 | ||||||
ING Groep NV, Series N | 220,144 | 3,624,820 | ||||||
JDE Peet’s NV | 9,026 | 189,698 | ||||||
Koninklijke Ahold Delhaize NV | 38,857 | 1,163,285 | ||||||
Koninklijke Heijmans NV | 7,434 | 137,773 | ||||||
Koninklijke KPN NV | 196,428 | 735,285 | ||||||
Koninklijke Vopak NV | 5,995 | 231,337 | ||||||
Randstad NV(b) | 6,281 | 331,848 | ||||||
RHI Magnesita NV | 3,426 | 152,861 | ||||||
SBM Offshore NV(b) | 11,887 | 189,873 | ||||||
Signify NV(c) | 4,247 | 131,090 | ||||||
Universal Music Group NV(b) | 27,093 | 815,781 | ||||||
Wolters Kluwer NV | 4,644 | 728,253 | ||||||
|
| |||||||
| Total Netherlands |
| 15,228,513 | ||||||
| Norway – 1.7% |
| |||||||
Aker ASA, Class A | 3,661 | 210,408 | ||||||
Aker BP ASA | 35,212 | 875,707 | ||||||
Atea ASA* | 6,685 | 79,984 | ||||||
Austevoll Seafood ASA | 13,062 | 102,583 | ||||||
DNB Bank ASA | 101,487 | 2,012,228 | ||||||
DNO ASA | 109,065 | 98,020 | ||||||
Equinor ASA | 68,744 | 1,814,822 | ||||||
Gjensidige Forsikring ASA | 15,092 | 218,688 | ||||||
Hoegh Autoliners ASA | 23,074 | 196,101 | ||||||
Kongsberg Gruppen ASA | 5,534 | 382,329 | ||||||
Leroy Seafood Group ASA | 26,652 | 117,333 | ||||||
Mowi ASA | 14,269 | 261,676 | ||||||
MPC Container Ships ASA | 61,332 | 70,923 | ||||||
Orkla ASA | 31,426 | 221,720 | ||||||
Protector Forsikring ASA | 6,765 | 141,553 | ||||||
Rana Gruber ASA | 13,648 | 99,134 | ||||||
SpareBank 1 Nord Norge | 19,827 | 174,719 | ||||||
SpareBank 1 Oestlandet | 8,153 | 93,490 | ||||||
SpareBank 1 SR-Bank ASA | 20,189 | 253,093 | ||||||
Sparebanken Vest | 11,920 | 127,896 | ||||||
Storebrand ASA | 15,191 | 140,027 | ||||||
Telenor ASA | 82,524 | 918,531 | ||||||
Var Energi ASA | 182,291 | 599,033 | ||||||
Veidekke ASA | 11,764 | 127,957 | ||||||
Wallenius Wilhelmsen ASA | 46,148 | 375,825 | ||||||
|
| |||||||
| Total Norway |
| 9,713,780 | ||||||
| Portugal – 0.4% |
| |||||||
Altri SGPS SA(b) | 18,374 | 103,784 | ||||||
EDP – Energias de Portugal SA | 125,391 | 488,874 | ||||||
Galp Energia SGPS SA | 22,227 | 367,639 | ||||||
Jeronimo Martins SGPS SA | 11,385 | 225,997 | ||||||
Navigator Co. SA | 87,508 | 382,760 | ||||||
NOS SGPS SA(b) | 38,632 | 151,286 | ||||||
REN – Redes Energeticas Nacionais SGPS SA | 62,490 | 148,476 | ||||||
Semapa-Sociedade de Investimento & Gestao | 11,905 | 191,575 | ||||||
Sonae SGPS SA | 136,532 | 129,760 | ||||||
|
| |||||||
| Total Portugal |
| 2,190,151 | ||||||
| Singapore – 2.3% |
| |||||||
CapitaLand Investment Ltd. | 149,000 | 295,880 | ||||||
City Developments Ltd.(b) | 24,900 | 107,932 | ||||||
ComfortDelGro Corp. Ltd. | 127,400 | 132,158 | ||||||
DBS Group Holdings Ltd. | 126,276 | 3,371,165 | ||||||
Genting Singapore Ltd. | 321,300 | 210,692 | ||||||
Keppel Infrastructure Trust | 370,320 | 135,824 | ||||||
Keppel Ltd. | 104,500 | 568,339 | ||||||
Netlink NBN Trust(a) | 348,000 | 220,465 | ||||||
Oversea-Chinese Banking Corp. Ltd. | 259,795 | 2,596,795 | ||||||
Raffles Medical Group Ltd. | 119,500 | 92,086 | ||||||
Sembcorp Industries Ltd. | 39,100 | 156,446 | ||||||
Sheng Siong Group Ltd. | 165,900 | 188,076 | ||||||
Singapore Airlines Ltd.(b) | 197,500 | 936,574 | ||||||
Singapore Exchange Ltd. | 50,800 | 346,672 | ||||||
Singapore Technologies Engineering Ltd. | 95,426 | 284,242 | ||||||
Singapore Telecommunications Ltd. | 713,700 | 1,337,923 | ||||||
United Overseas Bank Ltd. | 94,901 | 2,061,017 | ||||||
Venture Corp. Ltd.(b) | 21,900 | 231,560 | ||||||
Wing Tai Holdings Ltd. | 105,200 | 109,908 | ||||||
|
| |||||||
| Total Singapore |
| 13,383,754 | ||||||
| Spain – 5.1% |
| |||||||
Acciona SA(b) | 1,483 | 180,745 | ||||||
Acerinox SA | 14,393 | 158,009 | ||||||
ACS Actividades de Construccion y Servicios SA | 12,715 | 532,535 | ||||||
Aena SME SA(c) | 5,453 | 1,074,492 | ||||||
Amadeus IT Group SA | 7,062 | 453,346 | ||||||
Atresmedia Corp. de Medios de Comunicacion SA | 42,307 | 202,505 | ||||||
Banco Bilbao Vizcaya Argentaria SA | 366,243 | 4,366,788 | ||||||
Banco de Sabadell SA | 145,416 | 228,507 | ||||||
Banco Santander SA | 335,543 | 1,638,530 | ||||||
Bankinter SA(b) | 34,354 | 251,628 | ||||||
CaixaBank SA(b) | 292,255 | 1,418,150 | ||||||
Cia de Distribucion Integral Logista Holdings SA | 8,646 | 241,846 | ||||||
CIE Automotive SA | 4,939 | 141,888 | ||||||
Corp. ACCIONA Energias Renovables SA(b) | 6,786 | 147,897 | ||||||
Enagas SA | 12,866 | 191,268 | ||||||
Endesa SA | 94,322 | 1,748,560 | ||||||
Faes Farma SA | 40,967 | 139,148 | ||||||
See Notes to Financial Statements.
| WisdomTree Trust | 35 |
Schedule of Investments (continued)
WisdomTree International Equity Fund (DWM)
March 31, 2024
| Investments | Shares | Value | ||||||
Fluidra SA | 10,673 | $ | 252,668 | |||||
Fomento de Construcciones y Contratas SA | 14,433 | 197,028 | ||||||
Gestamp Automocion SA(c) | 26,257 | 84,506 | ||||||
Grupo Catalana Occidente SA | 7,065 | 270,491 | ||||||
Iberdrola SA | 310,284 | 3,852,051 | ||||||
Industria de Diseno Textil SA | 119,684 | 6,032,504 | ||||||
Inmobiliaria Colonial Socimi SA(b) | 20,803 | 123,345 | ||||||
Mapfre SA(b) | 163,972 | 414,744 | ||||||
Merlin Properties Socimi SA | 47,233 | 508,841 | ||||||
Naturgy Energy Group SA(b) | 51,350 | 1,114,706 | ||||||
Redeia Corp. SA | 21,273 | 363,117 | ||||||
Repsol SA | 46,755 | 779,649 | ||||||
Sacyr SA | 40,716 | 150,389 | ||||||
Telefonica SA | 335,139 | 1,480,014 | ||||||
Unicaja Banco SA(c) | 105,433 | 130,606 | ||||||
Viscofan SA(b) | 2,308 | 146,816 | ||||||
|
| |||||||
| Total Spain |
| 29,017,317 | ||||||
| Sweden – 2.4% |
| |||||||
AAK AB | 5,113 | 121,649 | ||||||
AFRY AB | 6,937 | 110,939 | ||||||
Alfa Laval AB | 6,330 | 249,113 | ||||||
Assa Abloy AB, Class B | 13,831 | 397,237 | ||||||
Atlas Copco AB, Class A | 37,517 | 634,371 | ||||||
Atlas Copco AB, Class B | 22,657 | 335,111 | ||||||
Avanza Bank Holding AB(b) | 5,264 | 113,673 | ||||||
Axfood AB | 8,124 | 236,443 | ||||||
Billerud Aktiebolag | 9,819 | 88,175 | ||||||
Dometic Group AB(c) | 12,192 | 98,675 | ||||||
Epiroc AB, Class A | 17,821 | 335,167 | ||||||
Essity AB, Class B(b) | 14,113 | 335,515 | ||||||
Evolution AB(c) | 3,775 | 469,766 | ||||||
H & M Hennes & Mauritz AB, Class B | 45,398 | 741,221 | ||||||
Hexpol AB | 17,304 | 211,352 | ||||||
Hufvudstaden AB, Class A(b) | 9,574 | 116,400 | ||||||
Husqvarna AB, Class B(b) | 24,950 | 213,832 | ||||||
Indutrade AB* | 5,644 | 154,077 | ||||||
Investment AB Latour, Class B(b) | 7,869 | 207,164 | ||||||
Lifco AB, Class B | 8,047 | 210,420 | ||||||
Lindab International AB | 3,338 | 71,801 | ||||||
Loomis AB | 4,341 | 121,307 | ||||||
NCC AB, Class B | 9,591 | 132,125 | ||||||
Nibe Industrier AB, Class B(b) | 8,035 | 39,496 | ||||||
Nordnet AB publ(b) | 10,857 | 199,420 | ||||||
Peab AB, Class B(b) | 28,207 | 177,669 | ||||||
Saab AB, Class B | 2,155 | 191,867 | ||||||
Sagax AB, Class B | 5,377 | 142,011 | ||||||
Sandvik AB | 21,532 | 478,663 | ||||||
Securitas AB, Class B(b) | 13,924 | 143,699 | ||||||
Skandinaviska Enskilda Banken AB, Class A(b) | 113,894 | 1,543,959 | ||||||
Skanska AB, Class B(b) | 13,292 | 236,811 | ||||||
SKF AB, Class B(b) | 12,436 | 254,126 | ||||||
Svenska Cellulosa AB SCA, Class B | 4,604 | 70,744 | ||||||
Svenska Handelsbanken AB, Class A | 74,238 | 751,572 | ||||||
Sweco AB, Class B | 9,161 | 103,240 | ||||||
Swedbank AB, Class A(b) | 63,525 | 1,261,280 | ||||||
Thule Group AB(b)(c) | 6,116 | 184,579 | ||||||
Trelleborg AB, Class B | 6,870 | 246,013 | ||||||
Volvo AB, Class A(b) | 11,703 | 322,657 | ||||||
Volvo AB, Class B(b) | 54,191 | 1,470,251 | ||||||
Wihlborgs Fastigheter AB | 18,324 | 170,000 | ||||||
|
| |||||||
| Total Sweden |
| 13,693,590 | ||||||
| Switzerland – 9.3% |
| |||||||
ABB Ltd., Registered Shares | 54,415 | 2,530,748 | ||||||
Accelleron Industries AG | 4,620 | 173,269 | ||||||
Adecco Group AG, Registered Shares | 8,920 | 353,156 | ||||||
Allreal Holding AG, Registered Shares | 868 | 149,180 | ||||||
Baloise Holding AG, Registered Shares | 2,094 | 328,503 | ||||||
Banque Cantonale Vaudoise, Registered Shares(b) | 3,415 | 397,349 | ||||||
BKW AG | 1,391 | 213,739 | ||||||
Cembra Money Bank AG(b) | 1,151 | 96,481 | ||||||
Cie Financiere Richemont SA, Class A, Registered Shares | 8,358 | 1,275,924 | ||||||
Clariant AG, Registered Shares*(b) | 4,059 | 54,934 | ||||||
Coca-Cola HBC AG* | 12,934 | 408,962 | ||||||
DKSH Holding AG | 2,172 | 147,943 | ||||||
DSM-Firmenich AG | 3,807 | 433,358 | ||||||
EFG International AG* | 16,409 | 205,135 | ||||||
Flughafen Zurich AG, Registered Shares | 818 | 185,814 | ||||||
Galenica AG(c) | 1,982 | 165,478 | ||||||
Geberit AG, Registered Shares | 808 | 478,144 | ||||||
Georg Fischer AG, Registered Shares | 3,049 | 226,466 | ||||||
Givaudan SA, Registered Shares | 123 | 548,427 | ||||||
Helvetia Holding AG, Registered Shares(b) | 3,052 | 421,188 | ||||||
Holcim AG, Registered Shares | 25,967 | 2,354,241 | ||||||
Julius Baer Group Ltd. | 9,926 | 573,938 | ||||||
Kuehne & Nagel International AG, Registered Shares(b) | 7,224 | 2,013,128 | ||||||
Logitech International SA, Registered Shares | 2,738 | 245,499 | ||||||
Nestle SA, Registered Shares | 81,028 | 8,613,779 | ||||||
Novartis AG, Registered Shares | 88,443 | 8,579,177 | ||||||
OC Oerlikon Corp. AG, Registered Shares(b) | 39,022 | 172,083 | ||||||
Partners Group Holding AG | 698 | 998,139 | ||||||
PSP Swiss Property AG, Registered Shares | 1,639 | 215,088 | ||||||
Roche Holding AG | 18,102 | 4,616,442 | ||||||
Roche Holding AG, Bearer Shares | 3,382 | 912,430 | ||||||
Schindler Holding AG, Participation Certificate | 1,082 | 272,813 | ||||||
Schindler Holding AG, Registered Shares | 670 | 163,651 | ||||||
SFS Group AG(b) | 1,648 | 217,001 | ||||||
SGS SA, Registered Shares*(b) | 8,353 | 811,466 | ||||||
SIG Group AG*(b) | 6,178 | 137,182 | ||||||
Sika AG, Registered Shares | 1,479 | 441,056 | ||||||
Sonova Holding AG, Registered Shares | 772 | 223,792 | ||||||
Stadler Rail AG(b) | 2,822 | 89,983 | ||||||
STMicroelectronics NV | 6,172 | 266,097 | ||||||
Straumann Holding AG, Registered Shares | 980 | 156,678 | ||||||
Sulzer AG, Registered Shares | 2,262 | 275,498 | ||||||
Swatch Group AG, Bearer Shares(b) | 1,137 | 264,336 | ||||||
See Notes to Financial Statements.
| 36 | WisdomTree Trust |
Schedule of Investments (continued)
WisdomTree International Equity Fund (DWM)
March 31, 2024
| Investments | Shares | Value | ||||||
Swiss Life Holding AG, Registered Shares | 1,460 | $ | 1,024,772 | |||||
Swiss Prime Site AG, Registered Shares | 3,414 | 322,372 | ||||||
Swiss Re AG | 18,278 | 2,352,986 | ||||||
Swisscom AG, Registered Shares* | 2,223 | 1,360,900 | ||||||
UBS Group AG, Registered Shares | 80,100 | 2,466,941 | ||||||
VAT Group AG(c) | 630 | 326,856 | ||||||
Vontobel Holding AG, Registered Shares | 3,143 | 190,876 | ||||||
Zurich Insurance Group AG | 7,702 | 4,158,413 | ||||||
|
| |||||||
| Total Switzerland |
| 53,611,811 | ||||||
| United Kingdom – 12.8% |
| |||||||
4imprint Group PLC | 2,136 | 171,072 | ||||||
Admiral Group PLC | 8,520 | 305,343 | ||||||
Airtel Africa PLC(c) | 168,496 | 225,198 | ||||||
Antofagasta PLC | 26,328 | 678,148 | ||||||
Ashmore Group PLC | 51,104 | 126,338 | ||||||
Ashtead Group PLC | 6,046 | 430,761 | ||||||
Associated British Foods PLC | 12,195 | 384,825 | ||||||
Assura PLC | 19,265 | 10,299 | ||||||
AstraZeneca PLC | 36,943 | 4,983,235 | ||||||
Auto Trader Group PLC(c) | 19,018 | 168,219 | ||||||
BAE Systems PLC | 86,427 | 1,473,369 | ||||||
Balfour Beatty PLC | 19,758 | 95,394 | ||||||
Barclays PLC | 613,530 | 1,419,876 | ||||||
Beazley PLC | 17,139 | 144,086 | ||||||
Bellway PLC | 6,605 | 222,278 | ||||||
Berkeley Group Holdings PLC | 3,500 | 210,369 | ||||||
Big Yellow Group PLC | 10,233 | 137,542 | ||||||
Bodycote PLC | 13,888 | 122,194 | ||||||
BP PLC | 540,500 | 3,384,573 | ||||||
British American Tobacco PLC | 160,762 | 4,886,167 | ||||||
British Land Co. PLC | 50,978 | 254,501 | ||||||
Britvic PLC | 14,154 | 146,974 | ||||||
BT Group PLC(b) | 484,497 | 671,103 | ||||||
Bunzl PLC | 7,459 | 287,200 | ||||||
Burberry Group PLC | 9,189 | 140,805 | ||||||
Centrica PLC | 134,434 | 216,780 | ||||||
Clarkson PLC | 2,057 | 104,200 | ||||||
Compass Group PLC | 33,239 | 975,408 | ||||||
Computacenter PLC | 3,622 | 123,355 | ||||||
ConvaTec Group PLC(c) | 46,170 | 167,041 | ||||||
Cranswick PLC | 2,571 | 133,031 | ||||||
DCC PLC | 3,295 | 239,755 | ||||||
Derwent London PLC | 2,992 | 81,943 | ||||||
Diageo PLC | 45,419 | 1,678,522 | ||||||
Diploma PLC | 3,981 | 187,179 | ||||||
Drax Group PLC | 17,005 | 107,709 | ||||||
DS Smith PLC | 103,861 | 520,480 | ||||||
Dunelm Group PLC | 7,975 | 114,042 | ||||||
Games Workshop Group PLC | 1,582 | 200,646 | ||||||
Genus PLC | 777 | 17,324 | ||||||
Grainger PLC | 38,250 | 124,567 | ||||||
Greggs PLC | 5,553 | 201,606 | ||||||
Haleon PLC | 65,099 | 273,929 | ||||||
Halma PLC | 4,714 | 141,013 | ||||||
Harbour Energy PLC(b) | 50,474 | 175,854 | ||||||
Hargreaves Lansdown PLC(b) | 15,866 | 147,514 | ||||||
Hays PLC | 132,554 | 158,155 | ||||||
Helical PLC(b) | 40,917 | 107,512 | ||||||
Howden Joinery Group PLC | 17,528 | 200,786 | ||||||
HSBC Holdings PLC | 1,188,849 | 9,296,225 | ||||||
IMI PLC | 8,399 | 192,572 | ||||||
Imperial Brands PLC | 55,768 | 1,246,946 | ||||||
Inchcape PLC | 11,542 | 105,562 | ||||||
Informa PLC | 34,304 | 360,197 | ||||||
InterContinental Hotels Group PLC | 3,391 | 353,061 | ||||||
Intertek Group PLC | 3,146 | 198,113 | ||||||
Investec PLC | 25,286 | 169,807 | ||||||
ITV PLC | 196,691 | 183,619 | ||||||
J Sainsbury PLC | 101,240 | 345,818 | ||||||
Johnson Matthey PLC | 8,594 | 194,220 | ||||||
Land Securities Group PLC | 30,158 | 250,755 | ||||||
Lloyds Banking Group PLC | 2,826,116 | 1,847,879 | ||||||
London Stock Exchange Group PLC | 4,540 | 544,266 | ||||||
LondonMetric Property PLC | 33,151 | 85,096 | ||||||
Morgan Sindall Group PLC | 4,411 | 129,275 | ||||||
National Grid PLC | 218,757 | 2,945,835 | ||||||
NatWest Group PLC | 533,328 | 1,788,744 | ||||||
Next PLC | 3,127 | 364,681 | ||||||
PageGroup PLC | 23,337 | 132,249 | ||||||
Pan African Resources PLC | 107,207 | 30,472 | ||||||
Pearson PLC | 14,917 | 196,353 | ||||||
Pennon Group PLC | 11,592 | 94,817 | ||||||
Primary Health Properties PLC(b) | 152,006 | 180,020 | ||||||
Prudential PLC | 36,750 | 344,934 | ||||||
PZ Cussons PLC(b) | 66,078 | 74,875 | ||||||
QinetiQ Group PLC | 26,720 | 123,270 | ||||||
Reckitt Benckiser Group PLC | 25,617 | 1,460,114 | ||||||
Redde Northgate PLC | 21,992 | 105,986 | ||||||
Redrow PLC | 17,905 | 150,526 | ||||||
RELX PLC | 40,196 | 1,738,625 | ||||||
Renishaw PLC | 2,565 | 137,710 | ||||||
Rentokil Initial PLC | 31,355 | 186,837 | ||||||
Rightmove PLC | 15,196 | 105,503 | ||||||
Rotork PLC | 32,779 | 136,150 | ||||||
RS Group PLC | 9,009 | 82,714 | ||||||
RWS Holdings PLC | 37,511 | 88,896 | ||||||
Safestore Holdings PLC | 7,113 | 67,796 | ||||||
Sage Group PLC | 25,961 | 415,024 | ||||||
Savills PLC | 8,013 | 107,905 | ||||||
Schroders PLC | 55,408 | 263,598 | ||||||
Serco Group PLC | 52,840 | 126,625 | ||||||
Serica Energy PLC | 33,118 | 78,861 | ||||||
Severn Trent PLC | 8,417 | 262,630 | ||||||
Shell PLC | 167,946 | 5,569,142 | ||||||
Smith & Nephew PLC | 19,215 | 240,695 | ||||||
Smiths Group PLC | 13,252 | 274,797 | ||||||
Spectris PLC | 3,482 | 145,463 | ||||||
Spirax-Sarco Engineering PLC | 1,243 | 157,807 | ||||||
See Notes to Financial Statements.
| WisdomTree Trust | 37 |
Schedule of Investments (concluded)
WisdomTree International Equity Fund (DWM)
March 31, 2024
| Investments | Shares | Value | ||||||
Spirent Communications PLC | 25,852 | $ | 65,315 | |||||
SSE PLC | 68,198 | 1,421,493 | ||||||
St. James’s Place PLC | 31,393 | 184,208 | ||||||
Standard Chartered PLC | 44,193 | 374,821 | ||||||
Tate & Lyle PLC | 14,326 | 111,751 | ||||||
TBC Bank Group PLC | 4,861 | 197,422 | ||||||
Telecom Plus PLC | 2,970 | 61,080 | ||||||
Tesco PLC | 303,591 | 1,137,495 | ||||||
TORM PLC, Class A | 6,707 | 227,435 | ||||||
Travis Perkins PLC | 22,162 | 204,204 | ||||||
Unilever PLC | 100,289 | 5,036,564 | ||||||
Unite Group PLC | 13,804 | 170,543 | ||||||
United Utilities Group PLC | 23,915 | 310,867 | ||||||
Vesuvius PLC | 18,685 | 116,886 | ||||||
Victrex PLC | 3,407 | 55,908 | ||||||
Virgin Money U.K. PLC | 86,251 | 233,058 | ||||||
Vodafone Group PLC | 2,082,903 | 1,853,963 | ||||||
Weir Group PLC | 4,873 | 124,471 | ||||||
WH Smith PLC | 9,470 | 157,552 | ||||||
Whitbread PLC | 4,582 | 191,821 | ||||||
Wincanton PLC | 5,997 | 45,454 | ||||||
Workspace Group PLC(b) | 4,165 | 26,965 | ||||||
|
| |||||||
| Total United Kingdom | 73,470,561 | |||||||
| United States – 1.9% | ||||||||
GSK PLC | 170,571 | 3,681,585 | ||||||
Stellantis NV | 256,907 | 7,309,672 | ||||||
|
| |||||||
| Total United States | 10,991,257 | |||||||
TOTAL COMMON STOCKS (Cost: $442,294,544) | 568,094,047 | |||||||
| INVESTMENT OF CASH COLLATERAL FOR SECURITIES LOANED – 8.2% |
| |||||||
| United States – 8.2% |
| |||||||
State Street Navigator Securities Lending Government Money Market Portfolio, 5.34%(d) | ||||||||
| (Cost: $47,002,513) | 47,002,513 | 47,002,513 | ||||||
TOTAL INVESTMENTS IN SECURITIES – 107.2% (Cost: $489,297,057) |
| 615,096,560 | ||||||
Other Assets less Liabilities – (7.2)% |
| (41,201,618 | ) | |||||
|
| |||||||
| NET ASSETS – 100.0% |
| $ | 573,894,942 | |||||
| * | Non-income producing security. |
| (a) | This security is exempt from registration under Regulation S of the Securities Act of 1933, which exempts from registration securities offered and sold outside the United States. This security may not be offered or sold in the United States except pursuant to an exemption from, or in a transaction not subject to, the registration requirements of the Securities Act of 1933. |
| (b) | Security, or portion thereof, was on loan at March 31, 2024 (See Note 2). At March 31, 2024, the total market value of the Fund’s securities on loan identified in the Schedule of Investments was $58,538,673 and the total market value of the collateral held by the Fund was $62,030,876. The total market value of the collateral includes non-cash U.S. Government securities collateral having a value of $15,028,363. |
| (c) | This security is exempt from registration under rule 144A of the Securities Act of 1933. This security may be sold in transactions that are exempt from registration, normally to qualified institutional buyers. |
| (d) | Rate shown represents annualized 7-day yield as of March 31, 2024. |
| FAIR VALUATION SUMMARY | ||||||||||||||
The following is a summary of the fair valuations according to the inputs used in valuing the Fund’s investments (See Note 2 — Fair Value Measurement):
| Quoted Prices in Active Markets (Level 1) | Other Significant Observable Inputs (Level 2) | Significant Unobservable Inputs (Level 3) | Total | |||||||||||||
Assets: |
| |||||||||||||||
Investments in Securities | ||||||||||||||||
Common Stocks | $ | 568,094,047 | $ | — | $ | — | $ | 568,094,047 | ||||||||
Investment of Cash Collateral for Securities Loaned | — | 47,002,513 | — | 47,002,513 | ||||||||||||
Total Investments in Securities | $ | 568,094,047 | $ | 47,002,513 | $ | — | $ | 615,096,560 | ||||||||
See Notes to Financial Statements.
| 38 | WisdomTree Trust |
Schedule of Investments
WisdomTree International High Dividend Fund (DTH)
March 31, 2024
| Investments | Shares | Value | ||||||
| COMMON STOCKS – 98.9% |
| |||||||
| Australia – 11.6% |
| |||||||
Accent Group Ltd.(a) | 58,086 | $ | 76,927 | |||||
AMP Ltd. | 76,451 | 58,356 | ||||||
Ampol Ltd. | 16,171 | 419,783 | ||||||
ANZ Group Holdings Ltd. | 96,768 | 1,856,064 | ||||||
APA Group | 89,934 | 493,439 | ||||||
Aurizon Holdings Ltd.(a) | 85,699 | 223,640 | ||||||
Bank of Queensland Ltd.(a) | 32,209 | 132,803 | ||||||
Bendigo & Adelaide Bank Ltd.(a) | 33,241 | 222,286 | ||||||
Centuria Capital Group(a) | 96,611 | 110,301 | ||||||
Champion Iron Ltd.(a) | 17,525 | 84,721 | ||||||
Charter Hall Group(a) | 27,197 | 243,971 | ||||||
Coles Group Ltd. | 93,018 | 1,028,003 | ||||||
Commonwealth Bank of Australia | 40,730 | 3,197,705 | ||||||
CSR Ltd. | 49,186 | 283,024 | ||||||
Dalrymple Bay Infrastructure Ltd. | 65,354 | 116,825 | ||||||
Dexus(a) | 92,515 | 477,422 | ||||||
Dicker Data Ltd. | 6,571 | 46,170 | ||||||
Eagers Automotive Ltd.(a) | 15,456 | 142,782 | ||||||
Endeavour Group Ltd.(a) | 85,576 | 307,622 | ||||||
First Resources Ltd. | 160,600 | 163,028 | ||||||
GPT Group(a) | 141,535 | 421,982 | ||||||
GrainCorp Ltd., Class A | 10,741 | 57,741 | ||||||
GWA Group Ltd. | 36,950 | 64,605 | ||||||
Harvey Norman Holdings Ltd.(a) | 93,277 | 313,398 | ||||||
Helia Group Ltd. | 19,899 | 50,760 | ||||||
IGO Ltd.(a) | 46,782 | 215,780 | ||||||
Incitec Pivot Ltd. | 203,637 | 383,945 | ||||||
Inghams Group Ltd.(a) | 25,954 | 60,787 | ||||||
IPH Ltd.(a) | 14,292 | 58,835 | ||||||
JB Hi-Fi Ltd.(a) | 12,531 | 525,258 | ||||||
Macquarie Group Ltd. | 9,321 | 1,214,380 | ||||||
Magellan Financial Group Ltd. | 13,311 | 85,886 | ||||||
McMillan Shakespeare Ltd. | 8,683 | 111,200 | ||||||
Medibank Pvt Ltd. | 62,837 | 154,141 | ||||||
Metcash Ltd. | 97,572 | 248,895 | ||||||
Mirvac Group(a) | 240,295 | 369,974 | ||||||
Myer Holdings Ltd.(a) | 79,931 | 42,500 | ||||||
National Australia Bank Ltd. | 92,497 | 2,090,352 | ||||||
New Hope Corp. Ltd. | 93,808 | 284,582 | ||||||
Nick Scali Ltd.(a) | 6,677 | 67,084 | ||||||
Nine Entertainment Co. Holdings Ltd.(a) | 120,139 | 134,028 | ||||||
NRW Holdings Ltd. | 26,669 | 50,979 | ||||||
Origin Energy Ltd. | 72,344 | 434,214 | ||||||
Orora Ltd. | 98,324 | 174,479 | ||||||
Perenti Ltd. | 54,665 | 34,950 | ||||||
Pilbara Minerals Ltd.(a) | 205,140 | 512,582 | ||||||
Premier Investments Ltd. | 8,260 | 176,807 | ||||||
Rio Tinto Ltd.(a) | 21,167 | 1,681,426 | ||||||
Rio Tinto PLC | 82,880 | 5,252,706 | ||||||
Santos Ltd. | 165,624 | 837,411 | ||||||
Scentre Group | 389,666 | 861,799 | ||||||
SmartGroup Corp. Ltd.(a) | 10,252 | 64,944 | ||||||
Stockland | 180,180 | 570,115 | ||||||
Suncorp Group Ltd. | 29,458 | 314,797 | ||||||
Super Retail Group Ltd. | 22,691 | 238,338 | ||||||
Telstra Group Ltd. | 810,623 | 2,041,363 | ||||||
Terracom Ltd.(a) | 116,932 | 18,309 | ||||||
Transurban Group | 160,753 | 1,396,938 | ||||||
Ventia Services Group Pty. Ltd. | 87,588 | 219,998 | ||||||
Vicinity Ltd. | 344,170 | 478,263 | ||||||
Viva Energy Group Ltd.(b) | 127,255 | 307,178 | ||||||
Waypoint REIT Ltd.(a) | 62,830 | 104,525 | ||||||
Westpac Banking Corp. | 118,982 | 2,025,983 | ||||||
Whitehaven Coal Ltd. | 92,676 | 429,279 | ||||||
Woodside Energy Group Ltd. | 202,568 | 4,030,738 | ||||||
Yancoal Australia Ltd.(a) | 178,863 | 611,457 | ||||||
|
| |||||||
| Total Australia |
| 39,510,563 | ||||||
| Austria – 1.4% |
| |||||||
ANDRITZ AG | 5,446 | 339,961 | ||||||
BAWAG Group AG*(b) | 3,440 | 218,082 | ||||||
Erste Group Bank AG | 18,564 | 828,029 | ||||||
Kontron AG | 3,737 | 82,495 | ||||||
Mondi PLC | 22,441 | 395,605 | ||||||
Oesterreichische Post AG | 3,284 | 112,254 | ||||||
OMV AG | 23,431 | 1,109,898 | ||||||
Telekom Austria AG* | 50,590 | 423,438 | ||||||
UNIQA Insurance Group AG | 21,385 | 184,997 | ||||||
Verbund AG | 7,803 | 570,946 | ||||||
Vienna Insurance Group AG Wiener Versicherung Gruppe | 3,765 | 117,513 | ||||||
voestalpine AG | 12,366 | 347,237 | ||||||
|
| |||||||
| Total Austria |
| 4,730,455 | ||||||
| Belgium – 0.9% |
| |||||||
Aedifica SA | 3,691 | 227,019 | ||||||
Ageas SA | 7,797 | 361,419 | ||||||
Bekaert SA | 4,057 | 208,299 | ||||||
bpost SA | 14,665 | 54,863 | ||||||
Cofinimmo SA | 3,802 | 249,039 | ||||||
Exmar NV(a) | 7,799 | 64,604 | ||||||
KBC Group NV | 16,527 | 1,239,089 | ||||||
Melexis NV | 2,354 | 191,055 | ||||||
Solvay SA(a) | 6,801 | 185,830 | ||||||
Warehouses De Pauw CVA | 9,651 | 275,795 | ||||||
Xior Student Housing NV(c) | 3,426 | 103,602 | ||||||
|
| |||||||
| Total Belgium |
| 3,160,614 | ||||||
| China – 0.7% |
| |||||||
BOC Aviation Ltd.(b) | 33,200 | 255,794 | ||||||
BOC Hong Kong Holdings Ltd. | 378,047 | 1,011,964 | ||||||
CITIC Telecom International Holdings Ltd. | 532,000 | 171,976 | ||||||
Qingdao Port International Co. Ltd., Class H(a)(b) | 145,000 | 85,224 | ||||||
Wilmar International Ltd. | 310,600 | 789,388 | ||||||
|
| |||||||
| Total China |
| 2,314,346 | ||||||
| Denmark – 0.4% |
| |||||||
D/S Norden AS | 6,345 | 258,522 | ||||||
See Notes to Financial Statements.
| WisdomTree Trust | 39 |
Schedule of Investments (continued)
WisdomTree International High Dividend Fund (DTH)
March 31, 2024
| Investments | Shares | Value | ||||||
Danske Bank AS | 19,045 | $ | 569,709 | |||||
Scandinavian Tobacco Group AS(b) | 7,845 | 140,623 | ||||||
Spar Nord Bank AS | 4,547 | 75,844 | ||||||
Sydbank AS | 2,452 | 126,674 | ||||||
Tryg AS | 16,263 | 334,844 | ||||||
|
| |||||||
| Total Denmark |
| 1,506,216 | ||||||
| Egypt – 0.1% |
| |||||||
Energean PLC | 22,850 | 315,497 | ||||||
| Finland – 2.2% |
| |||||||
Citycon OYJ*(a) | 19,196 | 79,319 | ||||||
Elisa OYJ | 14,092 | 629,321 | ||||||
Kemira OYJ | 9,885 | 187,040 | ||||||
Kesko OYJ, Class B | 19,665 | 367,739 | ||||||
Kone OYJ, Class B | 20,405 | 950,693 | ||||||
Konecranes OYJ | 5,308 | 275,797 | ||||||
Metsa Board OYJ, Class B(a) | 26,565 | 201,405 | ||||||
Nordea Bank Abp(a) | 220,340 | 2,456,328 | ||||||
Orion OYJ, Class B | 4,779 | 178,427 | ||||||
Outokumpu OYJ(a) | 32,012 | 139,329 | ||||||
Puuilo OYJ | 6,233 | 66,677 | ||||||
Sampo OYJ, Class A | 11,708 | 499,653 | ||||||
Sanoma OYJ(a) | 4,235 | 31,148 | ||||||
TietoEVRY OYJ(a) | 9,833 | 208,251 | ||||||
UPM-Kymmene OYJ | 25,848 | 861,762 | ||||||
Valmet OYJ(a) | 12,708 | 334,744 | ||||||
|
| |||||||
| Total Finland |
| 7,467,633 | ||||||
| France – 11.0% |
| |||||||
Amundi SA(b) | 8,988 | 617,853 | ||||||
Antin Infrastructure Partners SA | 5,329 | 77,351 | ||||||
AXA SA | 106,753 | 4,013,934 | ||||||
BNP Paribas SA | 45,812 | 3,258,552 | ||||||
Bouygues SA | 22,253 | 909,177 | ||||||
Cie des Alpes | 3,662 | 53,392 | ||||||
Cie Generale des Etablissements Michelin SCA | 49,619 | 1,903,464 | ||||||
Coface SA | 15,608 | 246,950 | ||||||
Credit Agricole SA | 146,448 | 2,185,191 | ||||||
Derichebourg SA | 14,831 | 70,509 | ||||||
Eiffage SA | 6,677 | 758,253 | ||||||
Eramet SA | 1,632 | 124,172 | ||||||
Etablissements Maurel & Prom SA | 9,311 | 56,263 | ||||||
Fnac Darty SA(a) | 1,420 | 44,505 | ||||||
Gecina SA | 4,629 | 473,186 | ||||||
Imerys SA | 5,586 | 190,518 | ||||||
Klepierre SA(a) | 22,889 | 593,283 | ||||||
La Francaise des Jeux SAEM(b) | 13,565 | 553,485 | ||||||
Metropole Television SA | 10,879 | 162,376 | ||||||
Orange SA | 171,681 | 2,018,804 | ||||||
Publicis Groupe SA | 15,990 | 1,745,053 | ||||||
Rexel SA | 30,055 | 812,459 | ||||||
Rubis SCA | 15,805 | 558,852 | ||||||
SCOR SE | 4,714 | 163,272 | ||||||
Societe BIC SA | 2,104 | 150,428 | ||||||
Societe Generale SA | 33,774 | 904,968 | ||||||
Television Francaise 1 SA(a) | 17,148 | 156,863 | ||||||
TotalEnergies SE | 183,872 | 12,603,983 | ||||||
Veolia Environnement SA | 48,859 | 1,589,891 | ||||||
Verallia SA(b) | 8,628 | 335,829 | ||||||
Vicat SACA | 2,286 | 90,238 | ||||||
Wendel SE | 1,234 | 126,075 | ||||||
|
| |||||||
| Total France |
| 37,549,129 | ||||||
| Georgia – 0.1% |
| |||||||
Bank of Georgia Group PLC | 2,957 | 188,639 | ||||||
| Germany – 10.5% |
| |||||||
Allianz SE, Registered Shares | 16,104 | 4,831,586 | ||||||
Bayer AG, Registered Shares | 60,243 | 1,849,725 | ||||||
Bayerische Motoren Werke AG | 88,576 | 10,232,015 | ||||||
Bilfinger SE | 1,684 | 78,751 | ||||||
Daimler Truck Holding AG | 38,419 | 1,948,489 | ||||||
Deutsche Post AG, Registered Shares | 64,696 | 2,788,928 | ||||||
DWS Group GmbH & Co. KGaA(b) | 7,650 | 336,924 | ||||||
E.ON SE | 187,269 | 2,605,998 | ||||||
Evonik Industries AG | 33,534 | 663,671 | ||||||
Freenet AG | 9,693 | 273,017 | ||||||
Hamborner REIT AG | 8,921 | 66,094 | ||||||
Hamburger Hafen und Logistik AG* | 3,823 | 68,539 | ||||||
HochTief AG | 5,156 | 599,725 | ||||||
Instone Real Estate Group SE(b) | 1,713 | 16,521 | ||||||
K&S AG, Registered Shares | 12,452 | 194,460 | ||||||
Lanxess AG | 4,702 | 125,989 | ||||||
Mercedes-Benz Group AG | 103,884 | 8,281,092 | ||||||
SAF-Holland SE | 3,631 | 74,077 | ||||||
Salzgitter AG | 2,955 | 77,232 | ||||||
Siltronic AG | 1,137 | 100,938 | ||||||
Sixt SE | 1,749 | 174,631 | ||||||
Stroeer SE & Co. KGaA | 4,105 | 250,044 | ||||||
Suedzucker AG | 10,531 | 151,153 | ||||||
Wacker Neuson SE | 6,855 | 127,042 | ||||||
|
| |||||||
| Total Germany |
| 35,916,641 | ||||||
| Hong Kong – 2.5% |
| |||||||
Bank of East Asia Ltd. | 57,600 | 68,592 | ||||||
CLP Holdings Ltd. | 138,500 | 1,103,371 | ||||||
Dah Sing Financial Holdings Ltd. | 18,800 | 43,190 | ||||||
Hang Lung Group Ltd. | 94,000 | 108,215 | ||||||
Hang Seng Bank Ltd. | 53,300 | 583,297 | ||||||
Hong Kong & China Gas Co. Ltd. | 1,197,000 | 906,951 | ||||||
Link REIT | 191,250 | 822,284 | ||||||
MTR Corp. Ltd. | 284,500 | 937,858 | ||||||
Power Assets Holdings Ltd. | 163,018 | 953,973 | ||||||
Sun Hung Kai Properties Ltd. | 173,500 | 1,672,607 | ||||||
Swire Pacific Ltd., Class B | 330,000 | 430,080 | ||||||
Swire Properties Ltd. | 397,800 | 835,607 | ||||||
|
| |||||||
| Total Hong Kong |
| 8,466,025 | ||||||
| Indonesia – 0.0% |
| |||||||
Bumitama Agri Ltd. | 278,400 | 141,304 | ||||||
See Notes to Financial Statements.
| 40 | WisdomTree Trust |
Schedule of Investments (continued)
WisdomTree International High Dividend Fund (DTH)
March 31, 2024
| Investments | Shares | Value | ||||||
| Ireland – 0.2% |
| |||||||
Cairn Homes PLC | 45,638 | $ | 78,665 | |||||
Kenmare Resources PLC | 20,635 | 85,109 | ||||||
Smurfit Kappa Group PLC | 12,892 | 588,541 | ||||||
|
| |||||||
| Total Ireland |
| 752,315 | ||||||
| Israel – 1.2% |
| |||||||
Amot Investments Ltd. | 47,251 | 224,667 | ||||||
Ashtrom Group Ltd.* | 9,081 | 134,888 | ||||||
Bank Hapoalim BM | 48,857 | 459,805 | ||||||
Bank Leumi Le-Israel BM | 38,087 | 317,799 | ||||||
Bezeq The Israeli Telecommunication Corp. Ltd. | 151,572 | 195,603 | ||||||
Delek Group Ltd. | 2,150 | 282,233 | ||||||
FIBI Holdings Ltd. | 2,816 | 126,208 | ||||||
First International Bank of Israel Ltd. | 5,788 | 241,713 | ||||||
Harel Insurance Investments & Financial Services Ltd.* | 9,621 | 92,935 | ||||||
ICL Group Ltd. | 151,859 | 805,781 | ||||||
Israel Discount Bank Ltd., Class A | 50,615 | 262,904 | ||||||
Isramco Negev 2 LP | 143,604 | 70,162 | ||||||
Magic Software Enterprises Ltd. | 5,590 | 64,739 | ||||||
Mega Or Holdings Ltd. | 2,766 | 74,161 | ||||||
Mivne Real Estate KD Ltd. | 43,212 | 107,095 | ||||||
Mizrahi Tefahot Bank Ltd. | 6,909 | 260,052 | ||||||
Oil Refineries Ltd. | 711,238 | 236,840 | ||||||
Plus500 Ltd. | 2,974 | 67,812 | ||||||
|
| |||||||
| Total Israel |
| 4,025,397 | ||||||
| Italy – 7.2% |
| |||||||
A2A SpA | 247,894 | 448,039 | ||||||
ACEA SpA | 16,707 | 296,275 | ||||||
Anima Holding SpA(b) | 6,556 | 31,154 | ||||||
Arnoldo Mondadori Editore SpA | 27,259 | 68,594 | ||||||
Assicurazioni Generali SpA | 74,253 | 1,881,333 | ||||||
Azimut Holding SpA | 4,463 | 121,369 | ||||||
Banca Generali SpA | 4,821 | 191,710 | ||||||
Banca IFIS SpA | 4,058 | 79,545 | ||||||
Banca Mediolanum SpA | 37,038 | 407,210 | ||||||
Banca Popolare di Sondrio SpA | 18,587 | 139,313 | ||||||
Banco BPM SpA | 56,455 | 376,072 | ||||||
BPER Banca | 30,574 | 144,627 | ||||||
Credito Emiliano SpA | 13,135 | 131,502 | ||||||
Enav SpA(b) | 38,413 | 160,966 | ||||||
Enel SpA | 1,077,712 | 7,122,081 | ||||||
Eni SpA(a) | 205,993 | 3,258,776 | ||||||
ERG SpA(a) | 6,751 | 169,736 | ||||||
FinecoBank Banca Fineco SpA(a) | 14,573 | 218,534 | ||||||
Hera SpA | 75,373 | 265,862 | ||||||
Intesa Sanpaolo SpA | 647,101 | 2,350,296 | ||||||
Iren SpA | 75,541 | 154,521 | ||||||
Italgas SpA | 84,213 | 491,130 | ||||||
Mediobanca Banca di Credito Finanziario SpA | 34,988 | 521,839 | ||||||
Piaggio & C SpA | 47,551 | 150,573 | ||||||
Poste Italiane SpA(b) | 69,056 | 865,506 | ||||||
RAI Way SpA(b) | 25,725 | 144,194 | ||||||
Saras SpA | 115,378 | 220,806 | ||||||
Snam SpA | 218,180 | 1,031,136 | ||||||
Terna – Rete Elettrica Nazionale | 89,454 | 740,035 | ||||||
UniCredit SpA | 41,814 | 1,588,472 | ||||||
Unipol Gruppo SpA | 28,075 | 235,473 | ||||||
UnipolSai Assicurazioni SpA | 106,589 | 308,972 | ||||||
Zignago Vetro SpA | 6,347 | 90,894 | ||||||
|
| |||||||
| Total Italy |
| 24,406,545 | ||||||
| Japan – 7.5% |
| |||||||
AGC, Inc. | 9,300 | 339,690 | ||||||
ARE Holdings, Inc.(a) | 4,700 | 59,998 | ||||||
Artience Co. Ltd. | 4,500 | 86,584 | ||||||
Autobacs Seven Co. Ltd.(a) | 14,700 | 155,746 | ||||||
Citizen Watch Co. Ltd.(a) | 12,200 | 79,885 | ||||||
Cosmo Energy Holdings Co. Ltd. | 4,400 | 223,133 | ||||||
Daido Steel Co. Ltd.(a) | 18,800 | 225,645 | ||||||
Eagle Industry Co. Ltd. | 6,500 | 78,681 | ||||||
Elematec Corp. | 7,400 | 93,829 | ||||||
ENEOS Holdings, Inc. | 129,800 | 627,194 | ||||||
Exedy Corp.(a) | 4,700 | 95,028 | ||||||
Godo Steel Ltd. | 2,400 | 90,707 | ||||||
Hakuto Co. Ltd.(a) | 3,200 | 119,251 | ||||||
Haseko Corp.(a) | 16,000 | 200,443 | ||||||
Hazama Ando Corp.(a) | 15,500 | 121,464 | ||||||
Iino Kaiun Kaisha Ltd.(a) | 9,400 | 76,147 | ||||||
Inaba Denki Sangyo Co. Ltd. | 7,400 | 171,377 | ||||||
Inabata & Co. Ltd. | 4,400 | 92,306 | ||||||
Isuzu Motors Ltd.(a) | 42,600 | 578,433 | ||||||
Japan Post Holdings Co. Ltd. | 105,600 | 1,068,943 | ||||||
Japan Post Insurance Co. Ltd. | 8,600 | 165,102 | ||||||
Japan Tobacco, Inc. | 172,500 | 4,620,668 | ||||||
Kanematsu Corp. | 8,600 | 147,287 | ||||||
Ki-Star Real Estate Co. Ltd. | 700 | 17,853 | ||||||
Kumagai Gumi Co. Ltd. | 3,000 | 82,758 | ||||||
KYB Corp.(a) | 3,700 | 126,393 | ||||||
Kyoei Steel Ltd. | 5,000 | 79,685 | ||||||
Matsui Securities Co. Ltd.(a) | 18,700 | 102,060 | ||||||
Mitsubishi Gas Chemical Co., Inc.(a) | 10,600 | 181,400 | ||||||
Mitsuboshi Belting Ltd.(a) | 4,700 | 145,026 | ||||||
Mitsui DM Sugar Holdings Co. Ltd. | 4,600 | 94,678 | ||||||
Mitsui Matsushima Holdings Co. Ltd.(a) | 2,900 | 55,837 | ||||||
Mitsui Mining & Smelting Co. Ltd.(a) | 4,100 | 127,515 | ||||||
Mitsui-Soko Holdings Co. Ltd. | 2,100 | 65,285 | ||||||
MS&AD Insurance Group Holdings, Inc. | 34,800 | 623,363 | ||||||
Nippon Electric Glass Co. Ltd. | 5,800 | 148,387 | ||||||
Nippon Soda Co. Ltd.(a) | 2,900 | 116,119 | ||||||
Nippon Steel Corp.(a) | 78,100 | 1,892,833 | ||||||
Nippon Yakin Kogyo Co. Ltd.(a) | 2,000 | 63,365 | ||||||
Nishimatsu Construction Co. Ltd.(a) | 2,900 | 85,556 | ||||||
Niterra Co. Ltd.(a) | 15,200 | 510,600 | ||||||
Nittoc Construction Co. Ltd. | 12,000 | 93,085 | ||||||
Noevir Holdings Co. Ltd. | 4,600 | 158,961 | ||||||
NS United Kaiun Kaisha Ltd. | 2,300 | 70,058 | ||||||
See Notes to Financial Statements.
| WisdomTree Trust | 41 |
Schedule of Investments (continued)
WisdomTree International High Dividend Fund (DTH)
March 31, 2024
| Investments | Shares | Value | ||||||
Okumura Corp. | 3,500 | $ | 117,711 | |||||
PHC Holdings Corp.(a) | 8,600 | 70,234 | ||||||
Pigeon Corp. | 8,600 | 82,593 | ||||||
Roland Corp. | 2,100 | 63,273 | ||||||
San-Ai Obbli Co. Ltd. | 6,600 | 91,056 | ||||||
Sangetsu Corp. | 5,600 | 123,585 | ||||||
SBI Holdings, Inc.(a) | 8,500 | 221,900 | ||||||
Seino Holdings Co. Ltd.(a) | 8,400 | 117,387 | ||||||
Sekisui House Ltd. | 27,900 | 647,980 | ||||||
SoftBank Corp.(a) | 256,100 | 3,301,405 | ||||||
Sojitz Corp.(a) | 16,680 | 439,414 | ||||||
Sompo Holdings, Inc. | 25,500 | 537,481 | ||||||
SUMCO Corp.(a) | 20,100 | 319,672 | ||||||
Sumitomo Corp. | 80,000 | 1,930,424 | ||||||
Sumitomo Mitsui Trust Holdings, Inc. | 16,400 | 358,460 | ||||||
Takeda Pharmaceutical Co. Ltd.(a) | 76,100 | 2,103,818 | ||||||
Tama Home Co. Ltd. | 2,600 | 77,994 | ||||||
Tokyu Construction Co. Ltd. | 18,300 | 100,965 | ||||||
Tosoh Corp.(a) | 14,900 | 203,005 | ||||||
Toyo Seikan Group Holdings Ltd. | 8,400 | 135,342 | ||||||
UACJ Corp. | 2,900 | 84,407 | ||||||
UBE Corp.(a) | 7,000 | 126,106 | ||||||
Yuasa Trading Co. Ltd. | 2,800 | 98,979 | ||||||
|
| |||||||
| Total Japan |
| 25,711,549 | ||||||
| Jersey – 0.1% |
| |||||||
Ithaca Energy PLC | 201,184 | 338,014 | ||||||
| Netherlands – 1.8% |
| |||||||
Aegon Ltd.(a) | 59,775 | 364,747 | ||||||
Brunel International NV(a) | 4,336 | 47,672 | ||||||
ING Groep NV, Series N | 173,265 | 2,852,926 | ||||||
Koninklijke BAM Groep NV | 25,144 | 95,370 | ||||||
Koninklijke Heijmans NV | 4,516 | 83,694 | ||||||
Koninklijke KPN NV | 289,618 | 1,084,121 | ||||||
Koninklijke Vopak NV | 8,070 | 311,408 | ||||||
Randstad NV(a) | 10,573 | 558,610 | ||||||
RHI Magnesita NV | 2,598 | 115,918 | ||||||
SBM Offshore NV(a) | 17,312 | 276,528 | ||||||
Signify NV(b) | 8,554 | 264,031 | ||||||
Wereldhave NV | 5,390 | 84,058 | ||||||
|
| |||||||
| Total Netherlands |
| 6,139,083 | ||||||
| Norway – 2.3% |
| |||||||
Aker ASA, Class A | 3,641 | 209,259 | ||||||
Aker BP ASA | 50,546 | 1,257,057 | ||||||
Atea ASA* | 6,919 | 82,784 | ||||||
Austevoll Seafood ASA | 16,725 | 131,351 | ||||||
Belships ASA | 26,731 | 51,498 | ||||||
DNB Bank ASA | 77,336 | 1,533,375 | ||||||
DNO ASA | 108,040 | 97,099 | ||||||
Europris ASA(b) | 11,490 | 82,612 | ||||||
Gjensidige Forsikring ASA | 11,771 | 170,566 | ||||||
Gram Car Carriers ASA | 2,538 | 46,602 | ||||||
Grieg Seafood ASA | 8,003 | 50,164 | ||||||
Hoegh Autoliners ASA | 33,610 | 285,645 | ||||||
Klaveness Combination Carriers ASA(b) | 11,169 | 96,982 | ||||||
Leroy Seafood Group ASA | 37,738 | 166,138 | ||||||
MPC Container Ships ASA | 97,541 | 112,794 | ||||||
Protector Forsikring ASA | 3,387 | 70,871 | ||||||
Rana Gruber ASA | 9,650 | 70,094 | ||||||
SpareBank 1 Nord Norge | 10,616 | 93,550 | ||||||
SpareBank 1 SMN | 4,259 | 54,098 | ||||||
SpareBank 1 SR-Bank ASA | 12,813 | 160,626 | ||||||
Sparebanken Vest | 5,980 | 64,162 | ||||||
Storebrand ASA | 6,889 | 63,501 | ||||||
Telenor ASA | 119,786 | 1,333,274 | ||||||
TGS ASA | 5,441 | 59,282 | ||||||
Var Energi ASA | 273,460 | 898,627 | ||||||
Veidekke ASA | 18,173 | 197,667 | ||||||
Wallenius Wilhelmsen ASA | 68,441 | 557,377 | ||||||
|
| |||||||
| Total Norway |
| 7,997,055 | ||||||
| Portugal – 0.8% |
| |||||||
Altri SGPS SA | 18,057 | 101,993 | ||||||
EDP – Energias de Portugal SA | 210,230 | 819,645 | ||||||
Galp Energia SGPS SA | 29,272 | 484,165 | ||||||
Navigator Co. SA | 121,129 | 529,818 | ||||||
NOS SGPS SA | 66,091 | 258,818 | ||||||
REN – Redes Energeticas Nacionais SGPS SA | 63,877 | 151,772 | ||||||
Semapa-Sociedade de Investimento & Gestao | 10,885 | 175,161 | ||||||
Sonae SGPS SA | 184,268 | 175,128 | ||||||
|
| |||||||
| Total Portugal |
| 2,696,500 | ||||||
| Singapore – 3.7% |
| |||||||
Aztech Global Ltd.(c) | 67,000 | 50,637 | ||||||
DBS Group Holdings Ltd. | 102,300 | 2,731,083 | ||||||
Delfi Ltd. | 42,400 | 28,275 | ||||||
Digital Core REIT Management Pte. Ltd. | 94,700 | 56,820 | ||||||
Genting Singapore Ltd. | 521,100 | 341,711 | ||||||
Geo Energy Resources Ltd. | 172,000 | 43,969 | ||||||
Keppel Infrastructure Trust | 521,936 | 191,433 | ||||||
Keppel Ltd. | 153,300 | 833,745 | ||||||
Netlink NBN Trust(c) | 167,100 | 105,861 | ||||||
Oversea-Chinese Banking Corp. Ltd. | 218,092 | 2,179,950 | ||||||
Propnex Ltd.(c) | 106,100 | 72,327 | ||||||
Sheng Siong Group Ltd. | 71,900 | 81,511 | ||||||
Singapore Airlines Ltd.(a) | 295,800 | 1,402,727 | ||||||
Singapore Technologies Engineering Ltd. | 138,895 | 413,721 | ||||||
Singapore Telecommunications Ltd. | 1,213,300 | 2,274,488 | ||||||
StarHub Ltd. | 88,900 | 77,728 | ||||||
United Overseas Bank Ltd. | 76,000 | 1,650,533 | ||||||
Venture Corp. Ltd. | 23,000 | 243,191 | ||||||
|
| |||||||
| Total Singapore |
| 12,779,710 | ||||||
| Spain – 6.7% |
| |||||||
Acerinox SA | 15,637 | 171,666 | ||||||
ACS Actividades de Construccion y Servicios SA | 16,856 | 705,970 | ||||||
Atresmedia Corp. de Medios de Comunicacion SA | 45,574 | 218,143 | ||||||
Banco Bilbao Vizcaya Argentaria SA | 286,549 | 3,416,581 | ||||||
Bankinter SA(a) | 29,988 | 219,649 | ||||||
See Notes to Financial Statements.
| 42 | WisdomTree Trust |
Schedule of Investments (continued)
WisdomTree International High Dividend Fund (DTH)
March 31, 2024
| Investments | Shares | Value | ||||||
CaixaBank SA(a) | 227,958 | $ | 1,106,152 | |||||
Cia de Distribucion Integral Logista Holdings SA | 13,089 | 366,125 | ||||||
Enagas SA | 29,682 | 441,259 | ||||||
Endesa SA | 144,574 | 2,680,141 | ||||||
Faes Farma SA | 28,018 | 95,166 | ||||||
Fomento de Construcciones y Contratas SA | 19,795 | 270,225 | ||||||
Iberdrola SA | 481,676 | 5,979,814 | ||||||
Inmobiliaria Colonial Socimi SA(a) | 27,806 | 164,867 | ||||||
Mapfre SA(a) | 118,330 | 299,299 | ||||||
Merlin Properties Socimi SA | 59,217 | 637,945 | ||||||
Naturgy Energy Group SA(a) | 78,575 | 1,705,706 | ||||||
Neinor Homes SA(a)(b) | 8,618 | 94,564 | ||||||
Prosegur Cash SA(a)(b) | 88,917 | 45,999 | ||||||
Redeia Corp. SA | 37,755 | 644,455 | ||||||
Repsol SA | 67,064 | 1,118,306 | ||||||
Sacyr SA(a) | 36,672 | 135,452 | ||||||
Telefonica SA | 495,166 | 2,186,712 | ||||||
Unicaja Banco SA(b) | 73,644 | 91,227 | ||||||
|
| |||||||
| Total Spain |
| 22,795,423 | ||||||
| Sweden – 1.4% |
| |||||||
AFRY AB | 6,853 | 109,596 | ||||||
Avanza Bank Holding AB(a) | 3,303 | 71,326 | ||||||
Bilia AB, Class A | 9,580 | 122,924 | ||||||
Billerud Aktiebolag | 14,204 | 127,552 | ||||||
Bravida Holding AB(b) | 10,990 | 96,512 | ||||||
Cloetta AB, Class B | 10,020 | 17,046 | ||||||
H & M Hennes & Mauritz AB, Class B | 67,072 | 1,095,097 | ||||||
Hexpol AB | 10,192 | 124,486 | ||||||
Inwido AB | 3,573 | 48,753 | ||||||
Loomis AB | 3,434 | 95,962 | ||||||
NCC AB, Class B | 4,443 | 61,206 | ||||||
Peab AB, Class B | 29,667 | 186,865 | ||||||
Sagax AB, Class D(a) | 18,338 | 51,279 | ||||||
Securitas AB, Class B(a) | 22,356 | 230,719 | ||||||
Skanska AB, Class B(a) | 19,389 | 345,435 | ||||||
SKF AB, Class B(a) | 17,503 | 357,668 | ||||||
Svenska Handelsbanken AB, Class A | 59,593 | 603,309 | ||||||
Swedbank AB, Class A(a) | 48,563 | 964,211 | ||||||
Wihlborgs Fastigheter AB | 16,223 | 150,508 | ||||||
|
| |||||||
| Total Sweden |
| 4,860,454 | ||||||
| Switzerland – 5.5% |
| |||||||
Adecco Group AG, Registered Shares | 12,925 | 511,719 | ||||||
Allreal Holding AG, Registered Shares | 754 | 129,587 | ||||||
Baloise Holding AG, Registered Shares | 1,280 | 200,804 | ||||||
Cembra Money Bank AG(a) | 1,257 | 105,367 | ||||||
EFG International AG* | 10,918 | 136,490 | ||||||
Helvetia Holding AG, Registered Shares(a) | 2,075 | 286,358 | ||||||
Holcim AG, Registered Shares | 39,607 | 3,590,882 | ||||||
Julius Baer Group Ltd. | 7,650 | 442,336 | ||||||
Kuehne & Nagel International AG, Registered Shares(a) | 10,782 | 3,004,643 | ||||||
Mobilezone Holding AG, Registered Shares(a) | 3,536 | 58,338 | ||||||
OC Oerlikon Corp. AG, Registered Shares(a) | 37,865 | 166,981 | ||||||
SGS SA, Registered Shares*(a) | 12,527 | 1,216,956 | ||||||
Sulzer AG, Registered Shares | 2,552 | 310,819 | ||||||
Swiss Life Holding AG, Registered Shares | 1,151 | 807,885 | ||||||
Swiss Prime Site AG, Registered Shares | 4,989 | 471,094 | ||||||
Swiss Re AG | 14,478 | 1,863,799 | ||||||
Swisscom AG, Registered Shares* | 3,244 | 1,985,946 | ||||||
Vontobel Holding AG, Registered Shares | 1,564 | 94,983 | ||||||
Zurich Insurance Group AG | 6,268 | 3,384,177 | ||||||
|
| |||||||
| Total Switzerland |
| 18,769,164 | ||||||
| United Kingdom – 14.2% |
| |||||||
4imprint Group PLC | 2,859 | 228,977 | ||||||
Admiral Group PLC | 6,708 | 240,404 | ||||||
Ashmore Group PLC | 42,859 | 105,955 | ||||||
Assura PLC | 271,662 | 145,233 | ||||||
Barclays PLC | 478,619 | 1,107,655 | ||||||
Bellway PLC | 8,659 | 291,401 | ||||||
Big Yellow Group PLC | 10,174 | 136,749 | ||||||
BP PLC | 796,558 | 4,987,990 | ||||||
Bridgepoint Group PLC(b) | 21,706 | 71,347 | ||||||
British American Tobacco PLC | 242,726 | 7,377,364 | ||||||
British Land Co. PLC | 76,962 | 384,222 | ||||||
BT Group PLC(a) | 712,094 | 986,360 | ||||||
DCC PLC | 4,648 | 338,203 | ||||||
Derwent London PLC | 5,323 | 145,782 | ||||||
Dr. Martens PLC(a) | 53,854 | 59,697 | ||||||
Drax Group PLC | 23,184 | 146,846 | ||||||
DS Smith PLC | 137,891 | 691,015 | ||||||
Dunelm Group PLC | 14,398 | 205,891 | ||||||
FDM Group Holdings PLC | 11,375 | 49,287 | ||||||
Games Workshop Group PLC | 2,434 | 308,705 | ||||||
Halfords Group PLC | 13,151 | 26,664 | ||||||
Harbour Energy PLC | 68,158 | 237,465 | ||||||
Hargreaves Lansdown PLC(a) | 15,704 | 146,008 | ||||||
Hays PLC | 110,020 | 131,269 | ||||||
Hilton Food Group PLC | 3,814 | 40,616 | ||||||
Hollywood Bowl Group PLC | 17,342 | 72,185 | ||||||
HSBC Holdings PLC | 932,715 | 7,293,381 | ||||||
Ibstock PLC(b) | 24,794 | 47,201 | ||||||
Imperial Brands PLC | 82,025 | 1,834,040 | ||||||
Inchcape PLC | 21,501 | 196,647 | ||||||
Investec PLC | 25,600 | 171,915 | ||||||
ITV PLC | 346,829 | 323,779 | ||||||
J Sainsbury PLC | 128,396 | 438,579 | ||||||
Johnson Matthey PLC | 10,725 | 242,380 | ||||||
Keller Group PLC | 4,311 | 57,073 | ||||||
Land Securities Group PLC | 54,123 | 450,017 | ||||||
Lloyds Banking Group PLC | 2,191,954 | 1,433,227 | ||||||
LondonMetric Property PLC | 57,194 | 146,813 | ||||||
Marshalls PLC | 17,561 | 60,961 | ||||||
Me Group International PLC | 25,279 | 53,138 | ||||||
Moneysupermarket.com Group PLC | 31,226 | 86,703 | ||||||
Morgan Advanced Materials PLC | 21,627 | 77,863 | ||||||
Morgan Sindall Group PLC | 3,411 | 99,968 | ||||||
See Notes to Financial Statements.
| WisdomTree Trust | 43 |
Schedule of Investments (continued)
WisdomTree International High Dividend Fund (DTH)
March 31, 2024
| Investments | Shares | Value | ||||||
National Grid PLC | 346,784 | $ | 4,669,878 | |||||
NatWest Group PLC | 415,129 | 1,392,313 | ||||||
PageGroup PLC | 45,546 | 258,106 | ||||||
Pennon Group PLC | 16,603 | 135,805 | ||||||
Pets at Home Group PLC | 24,618 | 83,469 | ||||||
Primary Health Properties PLC(a) | 121,377 | 143,746 | ||||||
PZ Cussons PLC(a) | 33,478 | 37,935 | ||||||
Redde Northgate PLC | 30,955 | 149,181 | ||||||
Redrow PLC | 23,066 | 193,914 | ||||||
RWS Holdings PLC | 26,931 | 63,823 | ||||||
Safestore Holdings PLC | 11,282 | 107,531 | ||||||
Savills PLC | 7,970 | 107,326 | ||||||
Schroders PLC | 54,780 | 260,610 | ||||||
Serica Energy PLC | 41,192 | 98,087 | ||||||
Severn Trent PLC | 10,667 | 332,835 | ||||||
Spirent Communications PLC | 44,421 | 112,230 | ||||||
SSE PLC | 102,870 | 2,144,184 | ||||||
St. James’s Place PLC | 14,916 | 87,524 | ||||||
SThree PLC | 11,676 | 63,424 | ||||||
TBC Bank Group PLC | 2,928 | 118,916 | ||||||
Telecom Plus PLC | 4,546 | 93,492 | ||||||
Tesco PLC | 455,088 | 1,705,123 | ||||||
TORM PLC, Class A | 9,890 | 335,371 | ||||||
Travis Perkins PLC | 13,144 | 121,111 | ||||||
Tyman PLC | 9,408 | 34,406 | ||||||
United Utilities Group PLC | 29,531 | 383,869 | ||||||
Vesuvius PLC | 26,981 | 168,783 | ||||||
Victrex PLC | 4,550 | 74,664 | ||||||
Virgin Money U.K. PLC | 57,336 | 154,927 | ||||||
Vodafone Group PLC | 3,120,751 | 2,777,736 | ||||||
Wickes Group PLC | 31,789 | 62,284 | ||||||
Workspace Group PLC(a) | 12,026 | 77,858 | ||||||
|
| |||||||
| Total United Kingdom |
| 48,227,436 | ||||||
| United States – 4.9% |
| |||||||
GSK PLC | 259,610 | 5,603,393 | ||||||
Noram Drilling AS* | 10,263 | 35,429 | ||||||
Stellantis NV | 386,735 | 11,003,615 | ||||||
|
| |||||||
| Total United States |
| 16,642,437 | ||||||
TOTAL COMMON STOCKS (Cost: $303,887,111) |
| 337,408,144 | ||||||
| INVESTMENT OF CASH COLLATERAL FOR SECURITIES LOANED – 7.4% |
| |||||||
| United States – 7.4% |
| |||||||
State Street Navigator Securities Lending Government Money Market Portfolio, 5.34%(d) | ||||||||
| (Cost: $25,323,176) | 25,323,176 | 25,323,176 | ||||||
TOTAL INVESTMENTS IN SECURITIES – 106.3% (Cost: $329,210,287) |
| 362,731,320 | ||||||
Other Assets less Liabilities – (6.3)% |
| (21,679,272 | ) | |||||
|
| |||||||
| NET ASSETS – 100.0% |
| $ | 341,052,048 | |||||
| * | Non-income producing security. |
| (a) | Security, or portion thereof, was on loan at March 31, 2024 (See Note 2). At March 31, 2024, the total market value of the Fund’s securities on loan identified in the Schedule of Investments was $37,547,501 and the total market value of the collateral held by the Fund was $39,813,240. The total market value of the collateral includes non-cash U.S. Government securities collateral having a value of $14,490,064. |
| (b) | This security is exempt from registration under rule 144A of the Securities Act of 1933. This security may be sold in transactions that are exempt from registration, normally to qualified institutional buyers. |
| (c) | This security is exempt from registration under Regulation S of the Securities Act of 1933, which exempts from registration securities offered and sold outside the United States. This security may not be offered or sold in the United States except pursuant to an exemption from, or in a transaction not subject to, the registration requirements of the Securities Act of 1933. |
| (d) | Rate shown represents annualized 7-day yield as of March 31, 2024. |
| INVESTMENT IN AFFILIATES | ||||||||||
Affiliated holdings are investments in entities in which the Fund owns 5% or more of the outstanding voting securities or are investments in entities which are under common ownership or control. Investments in affiliates during the fiscal year ended March 31, 2024 were as follows:
| Affiliate | Value at 3/31/2023 | Purchases/ Additions | Sales/ Reductions | Realized Gain/(Loss) | Change in Unrealized Appreciation/ Depreciation | Value at 3/31/2024 | Dividend Income | |||||||||||||||||||||
WisdomTree International LargeCap Dividend Fund^ | $ | 1,054,486 | $ | 13,948,070 | $ | 14,845,754 | $ | 3,404 | $ | (160,206 | ) | $ | — | $ | 142,778 | |||||||||||||
| ^ | As of March 31, 2024, the Fund did not hold a position in this affiliate. |
See Notes to Financial Statements.
| 44 | WisdomTree Trust |
Schedule of Investments (concluded)
WisdomTree International High Dividend Fund (DTH)
March 31, 2024
| FINANCIAL DERIVATIVE INSTRUMENTS | ||||||||||||||||||||||||||||
| FOREIGN CURRENCY CONTRACTS (OTC – OVER THE COUNTER) | ||||||||||||||||||||||||||||
| Counterparty | Settlement Date | Amount and Description of Currency to be Purchased | Amount and be Sold | Unrealized Appreciation | Unrealized Depreciation | |||||||||||||||||||||||
Barclays Bank PLC | 4/2/2024 | 130,301 | USD | 200,000 | AUD | $ | — | $ | (179 | ) | ||||||||||||||||||
| FAIR VALUATION SUMMARY | ||||||||||||||
The following is a summary of the fair valuations according to the inputs used in valuing the Fund’s investments (See Note 2 — Fair Value Measurement):
| Quoted Prices in Active Markets (Level 1) | Other Significant Observable Inputs (Level 2) | Significant Unobservable Inputs (Level 3) | Total | |||||||||||||
Assets: | ||||||||||||||||
Investments in Securities | ||||||||||||||||
Common Stocks | $ | 337,408,144 | $ | — | $ | — | $ | 337,408,144 | ||||||||
Investment of Cash Collateral for Securities Loaned | — | 25,323,176 | — | 25,323,176 | ||||||||||||
Total Investments in Securities | $ | 337,408,144 | $ | 25,323,176 | $ | — | $ | 362,731,320 | ||||||||
Liabilities: | ||||||||||||||||
Financial Derivative Instruments | ||||||||||||||||
Foreign Currency Contracts1 | $ | — | $ | (179 | ) | $ | — | $ | (179 | ) | ||||||
Total – Net | $ | 337,408,144 | $ | 25,322,997 | $ | — | $ | 362,731,141 | ||||||||
1 Amount shown represents the unrealized appreciation (depreciation) on the financial instrument.
See Notes to Financial Statements.
| WisdomTree Trust | 45 |
Schedule of Investments
WisdomTree International LargeCap Dividend Fund (DOL)
March 31, 2024
| Investments | Shares | Value | ||||||
| COMMON STOCKS – 99.0% |
| |||||||
| Australia – 6.4% |
| |||||||
ANZ Group Holdings Ltd. | 126,066 | $ | 2,418,016 | |||||
Aristocrat Leisure Ltd. | 14,294 | 400,992 | ||||||
Commonwealth Bank of Australia | 58,363 | 4,582,068 | ||||||
CSL Ltd. | 7,117 | 1,336,850 | ||||||
Goodman Group | 22,169 | 488,996 | ||||||
Macquarie Group Ltd. | 11,375 | 1,481,984 | ||||||
National Australia Bank Ltd. | 111,521 | 2,520,278 | ||||||
QBE Insurance Group Ltd. | 50,174 | 593,459 | ||||||
Rio Tinto Ltd.(a) | 19,792 | 1,572,202 | ||||||
Rio Tinto PLC | 65,712 | 4,164,646 | ||||||
Santos Ltd. | 142,933 | 722,684 | ||||||
Telstra Group Ltd. | 653,314 | 1,645,217 | ||||||
Transurban Group | 150,935 | 1,311,620 | ||||||
Wesfarmers Ltd. | 58,153 | 2,595,029 | ||||||
Westpac Banking Corp. | 172,879 | 2,943,721 | ||||||
Woodside Energy Group Ltd. | 167,221 | 3,327,397 | ||||||
Woolworths Group Ltd. | 35,100 | 759,568 | ||||||
|
| |||||||
| Total Australia |
| 32,864,727 | ||||||
| Austria – 0.5% |
| |||||||
Erste Group Bank AG | 26,306 | 1,173,353 | ||||||
OMV AG | 19,168 | 907,965 | ||||||
Verbund AG | 6,450 | 471,946 | ||||||
|
| |||||||
| Total Austria |
| 2,553,264 | ||||||
| Belgium – 0.6% |
| |||||||
Anheuser-Busch InBev SA | 22,295 | 1,359,478 | ||||||
KBC Group NV | 24,067 | 1,804,389 | ||||||
|
| |||||||
| Total Belgium |
| 3,163,867 | ||||||
| China – 0.4% |
| |||||||
BOC Hong Kong Holdings Ltd. | 449,634 | 1,203,589 | ||||||
Prosus NV | 11,250 | 353,261 | ||||||
Wilmar International Ltd. | 264,200 | 671,463 | ||||||
|
| |||||||
| Total China |
| 2,228,313 | ||||||
| Denmark – 1.6% |
| |||||||
Carlsberg AS, Class B | 4,522 | 617,818 | ||||||
Coloplast AS, Class B | 5,255 | 709,442 | ||||||
Danske Bank AS | 26,379 | 789,097 | ||||||
DSV AS | 1,933 | 314,027 | ||||||
Novo Nordisk AS, Class B | 46,709 | 5,960,275 | ||||||
|
| |||||||
| Total Denmark |
| 8,390,659 | ||||||
| Finland – 1.2% |
| |||||||
Kone OYJ, Class B | 17,096 | 796,523 | ||||||
Nokia OYJ | 175,119 | 622,422 | ||||||
Nordea Bank Abp(a) | 309,586 | 3,451,233 | ||||||
Sampo OYJ, Class A | 14,063 | 600,155 | ||||||
UPM-Kymmene OYJ | 22,483 | 749,574 | ||||||
|
| |||||||
| Total Finland |
| 6,219,907 | ||||||
| France – 14.4% |
| |||||||
Air Liquide SA | 12,568 | 2,617,502 | ||||||
Airbus SE | 9,754 | 1,798,419 | ||||||
AXA SA | 148,516 | 5,584,231 | ||||||
BNP Paribas SA | 60,277 | 4,287,430 | ||||||
Capgemini SE | 3,277 | 754,903 | ||||||
Cie de Saint-Gobain SA | 17,510 | 1,360,254 | ||||||
Cie Generale des Etablissements Michelin SCA | 41,558 | 1,594,231 | ||||||
Credit Agricole SA | 205,460 | 3,065,726 | ||||||
Danone SA | 31,442 | 2,033,706 | ||||||
Dassault Aviation SA | 1,128 | 248,521 | ||||||
Dassault Systemes SE | 6,966 | 308,755 | ||||||
EssilorLuxottica SA | 7,790 | 1,764,248 | ||||||
Hermes International SCA | 1,011 | 2,583,388 | ||||||
Kering SA | 3,877 | 1,533,966 | ||||||
L’Oreal SA | 10,631 | 5,036,351 | ||||||
Legrand SA | 8,499 | 901,553 | ||||||
LVMH Moet Hennessy Louis Vuitton SE | 8,032 | 7,231,980 | ||||||
Orange SA | 149,790 | 1,761,387 | ||||||
Pernod Ricard SA | 6,341 | 1,026,900 | ||||||
Publicis Groupe SA | 13,778 | 1,503,648 | ||||||
Safran SA | 5,161 | 1,170,793 | ||||||
Sanofi SA | 46,451 | 4,563,197 | ||||||
Schneider Electric SE | 16,624 | 3,764,039 | ||||||
Societe Generale SA | 40,672 | 1,089,798 | ||||||
Sodexo SA | 3,136 | 269,189 | ||||||
Thales SA | 4,270 | 728,863 | ||||||
TotalEnergies SE(a) | 153,154 | 10,498,338 | ||||||
Veolia Environnement SA | 41,123 | 1,338,159 | ||||||
Vinci SA | 30,241 | 3,878,735 | ||||||
|
| |||||||
| Total France |
| 74,298,210 | ||||||
| Germany – 10.8% |
| |||||||
Allianz SE, Registered Shares | 22,368 | 6,710,936 | ||||||
Bayer AG, Registered Shares | 44,287 | 1,359,806 | ||||||
Bayerische Motoren Werke AG | 73,204 | 8,456,291 | ||||||
Beiersdorf AG | 1,972 | 287,411 | ||||||
Commerzbank AG | 14,546 | 199,984 | ||||||
Continental AG | 4,542 | 328,169 | ||||||
Daimler Truck Holding AG | 32,100 | 1,628,009 | ||||||
Deutsche Bank AG, Registered Shares | 42,323 | 666,526 | ||||||
Deutsche Boerse AG | 3,113 | 637,611 | ||||||
Deutsche Post AG, Registered Shares | 54,284 | 2,340,085 | ||||||
Deutsche Telekom AG, Registered Shares | 221,223 | 5,375,718 | ||||||
E.ON SE | 153,262 | 2,132,763 | ||||||
Hannover Rueck SE | 3,918 | 1,073,516 | ||||||
Heidelberg Materials AG | 9,538 | 1,050,191 | ||||||
Henkel AG & Co. KGaA | 4,473 | 322,507 | ||||||
Infineon Technologies AG | 14,252 | 485,084 | ||||||
Mercedes-Benz Group AG | 86,763 | 6,916,295 | ||||||
Merck KGaA | 1,713 | 302,667 | ||||||
Muenchener Rueckversicherungs-Gesellschaft AG in Muenchen, Registered Shares | 4,483 | 2,189,874 | ||||||
RWE AG | 16,151 | 548,759 | ||||||
SAP SE | 17,615 | 3,433,107 | ||||||
Siemens AG, Registered Shares | 35,679 | 6,818,856 | ||||||
Siemens Healthineers AG*(b) | 20,939 | 1,282,673 | ||||||
See Notes to Financial Statements.
| 46 | WisdomTree Trust |
Schedule of Investments (continued)
WisdomTree International LargeCap Dividend Fund (DOL)
March 31, 2024
| Investments | Shares | Value | ||||||
Talanx AG | 8,756 | $ | 694,106 | |||||
Vonovia SE | 28,077 | 830,854 | ||||||
|
| |||||||
| Total Germany |
| 56,071,798 | ||||||
| Hong Kong – 1.2% |
| |||||||
AIA Group Ltd. | 180,804 | 1,213,992 | ||||||
CLP Holdings Ltd. | 125,500 | 999,805 | ||||||
Hang Seng Bank Ltd. | 76,018 | 831,915 | ||||||
Hong Kong Exchanges & Clearing Ltd. | 29,624 | 862,249 | ||||||
MTR Corp. Ltd. | 172,938 | 570,093 | ||||||
Sun Hung Kai Properties Ltd. | 133,442 | 1,286,432 | ||||||
Techtronic Industries Co. Ltd. | 46,500 | 630,382 | ||||||
|
| |||||||
| Total Hong Kong |
| 6,394,868 | ||||||
| Ireland – 0.4% |
| |||||||
CRH PLC | 21,910 | 1,889,841 | ||||||
Kerry Group PLC, Class A | 3,230 | 277,118 | ||||||
|
| |||||||
| Total Ireland |
| 2,166,959 | ||||||
| Italy – 4.0% |
| |||||||
Assicurazioni Generali SpA | 105,118 | 2,663,353 | ||||||
Enel SpA | 886,029 | 5,855,340 | ||||||
Eni SpA | 174,779 | 2,764,976 | ||||||
Ferrari NV | 1,726 | 753,088 | ||||||
Intesa Sanpaolo SpA | 908,716 | 3,300,493 | ||||||
Moncler SpA | 5,788 | 432,447 | ||||||
Poste Italiane SpA(b) | 99,106 | 1,242,135 | ||||||
PRADA SpA | 44,300 | 350,938 | ||||||
Snam SpA | 133,555 | 631,192 | ||||||
Terna – Rete Elettrica Nazionale(a) | 85,827 | 710,029 | ||||||
UniCredit SpA(a) | 57,842 | 2,197,360 | ||||||
|
| |||||||
| Total Italy |
| 20,901,351 | ||||||
| Japan – 16.1% |
| |||||||
Aeon Co. Ltd. | 11,045 | 262,359 | ||||||
Ajinomoto Co., Inc. | 7,600 | 284,225 | ||||||
Asahi Group Holdings Ltd. | 9,935 | 366,429 | ||||||
Astellas Pharma, Inc.(a) | 52,100 | 565,769 | ||||||
Bridgestone Corp. | 32,555 | 1,431,736 | ||||||
Canon, Inc. | 40,136 | 1,193,645 | ||||||
Central Japan Railway Co. | 10,800 | 265,888 | ||||||
Chugai Pharmaceutical Co. Ltd. | 30,100 | 1,148,352 | ||||||
Dai-ichi Life Holdings, Inc. | 20,800 | 529,535 | ||||||
Daiichi Sankyo Co. Ltd. | 15,300 | 482,924 | ||||||
Daikin Industries Ltd.(a) | 3,400 | 462,784 | ||||||
Daiwa House Industry Co. Ltd. | 30,500 | 912,511 | ||||||
Denso Corp. | 88,500 | 1,685,854 | ||||||
Disco Corp. | 1,700 | 642,393 | ||||||
East Japan Railway Co. | 15,000 | 289,306 | ||||||
FANUC Corp. | 10,275 | 284,125 | ||||||
Fast Retailing Co. Ltd. | 2,700 | 840,979 | ||||||
FUJIFILM Holdings Corp. | 23,700 | 527,728 | ||||||
Fujitsu Ltd.(a) | 28,000 | 460,669 | ||||||
Hitachi Ltd. | 21,400 | 1,966,150 | ||||||
Honda Motor Co. Ltd. | 143,900 | 1,797,977 | ||||||
Hoya Corp. | 2,600 | 321,940 | ||||||
Inpex Corp. | 40,700 | 629,412 | ||||||
ITOCHU Corp.(a) | 43,100 | 1,841,386 | ||||||
Japan Post Holdings Co. Ltd. | 148,500 | 1,503,201 | ||||||
Japan Tobacco, Inc. | 143,909 | 3,854,816 | ||||||
Kao Corp. | 9,700 | 361,351 | ||||||
KDDI Corp. | 68,480 | 2,027,998 | ||||||
Keyence Corp. | 1,300 | 597,324 | ||||||
Komatsu Ltd. | 56,367 | 1,647,304 | ||||||
Kubota Corp. | 25,800 | 406,404 | ||||||
Marubeni Corp. | 86,200 | 1,497,372 | ||||||
Mitsubishi Corp. | 170,415 | 3,926,374 | ||||||
Mitsubishi Electric Corp. | 33,681 | 559,032 | ||||||
Mitsubishi Estate Co. Ltd. | 27,500 | 505,955 | ||||||
Mitsubishi Heavy Industries Ltd. | 68,000 | 650,818 | ||||||
Mitsubishi UFJ Financial Group, Inc. | 417,700 | 4,297,194 | ||||||
Mitsui Fudosan Co. Ltd. | 49,200 | 535,578 | ||||||
Mizuho Financial Group, Inc.(a) | 102,714 | 2,067,243 | ||||||
MS&AD Insurance Group Holdings, Inc. | 53,100 | 951,165 | ||||||
Murata Manufacturing Co. Ltd. | 34,630 | 646,173 | ||||||
Nintendo Co. Ltd. | 32,200 | 1,743,772 | ||||||
Nippon Steel Corp.(a) | 66,300 | 1,606,848 | ||||||
Nippon Telegraph & Telephone Corp. | 2,358,000 | 2,801,337 | ||||||
Nissan Motor Co. Ltd.(a) | 69,600 | 279,743 | ||||||
Otsuka Holdings Co. Ltd. | 7,600 | 316,865 | ||||||
Panasonic Holdings Corp. | 49,984 | 477,398 | ||||||
Recruit Holdings Co. Ltd. | 8,000 | 354,528 | ||||||
Secom Co. Ltd. | 5,600 | 405,537 | ||||||
Seven & i Holdings Co. Ltd. | 55,800 | 813,339 | ||||||
Shin-Etsu Chemical Co. Ltd. | 62,900 | 2,736,355 | ||||||
Shionogi & Co. Ltd. | 9,300 | 476,230 | ||||||
SMC Corp. | 650 | 364,330 | ||||||
SoftBank Corp.(a) | 208,700 | 2,690,368 | ||||||
Sompo Holdings, Inc. | 34,800 | 733,503 | ||||||
Sony Group Corp. | 8,100 | 694,959 | ||||||
Subaru Corp. | 31,800 | 724,480 | ||||||
Sumitomo Corp. | 69,110 | 1,667,645 | ||||||
Sumitomo Mitsui Financial Group, Inc. | 35,894 | 2,112,918 | ||||||
Sumitomo Mitsui Trust Holdings, Inc. | 24,500 | 535,505 | ||||||
Suzuki Motor Corp.(a) | 32,868 | 377,555 | ||||||
Takeda Pharmaceutical Co. Ltd.(a) | 50,000 | 1,382,272 | ||||||
TDK Corp. | 7,600 | 375,669 | ||||||
Terumo Corp. | 19,800 | 357,027 | ||||||
Tokio Marine Holdings, Inc. | 51,200 | 1,591,024 | ||||||
Tokyo Electron Ltd. | 9,950 | 2,601,483 | ||||||
Toyota Motor Corp. | 350,265 | 8,776,008 | ||||||
Toyota Tsusho Corp. | 12,200 | 827,467 | ||||||
|
| |||||||
| Total Japan |
| 83,053,543 | ||||||
| Netherlands – 2.6% |
| |||||||
ASML Holding NV | 3,720 | 3,584,502 | ||||||
Ferrovial SE | 16,542 | 655,301 | ||||||
Heineken Holding NV | 7,081 | 572,032 | ||||||
Heineken NV(a) | 11,237 | 1,084,227 | ||||||
ING Groep NV, Series N | 240,910 | 3,966,747 | ||||||
See Notes to Financial Statements.
| WisdomTree Trust | 47 |
Schedule of Investments (continued)
WisdomTree International LargeCap Dividend Fund (DOL)
March 31, 2024
| Investments | Shares | Value | ||||||
JDE Peet’s NV(a) | 12,228 | $ | 256,993 | |||||
Koninklijke Ahold Delhaize NV | 48,667 | 1,456,973 | ||||||
Universal Music Group NV(a) | 34,541 | 1,040,043 | ||||||
Wolters Kluwer NV | 5,227 | 819,677 | ||||||
|
| |||||||
| Total Netherlands |
| 13,436,495 | ||||||
| Norway – 1.2% |
| |||||||
Aker BP ASA | 42,021 | 1,045,044 | ||||||
DNB Bank ASA | 112,127 | 2,223,192 | ||||||
Equinor ASA | 85,791 | 2,264,858 | ||||||
Telenor ASA | 67,410 | 750,305 | ||||||
|
| |||||||
| Total Norway |
| 6,283,399 | ||||||
| Portugal – 0.2% |
| |||||||
EDP – Energias de Portugal SA | 176,514 | 688,193 | ||||||
Jeronimo Martins SGPS SA | 14,886 | 295,493 | ||||||
|
| |||||||
| Total Portugal |
| 983,686 | ||||||
| Singapore – 2.3% |
| |||||||
DBS Group Holdings Ltd. | 142,534 | 3,805,202 | ||||||
Oversea-Chinese Banking Corp. Ltd. | 313,312 | 3,131,727 | ||||||
Singapore Airlines Ltd.(a) | 240,600 | 1,140,960 | ||||||
Singapore Telecommunications Ltd. | 856,900 | 1,606,370 | ||||||
United Overseas Bank Ltd. | 108,486 | 2,356,050 | ||||||
|
| |||||||
| Total Singapore |
| 12,040,309 | ||||||
| Spain – 5.6% |
| |||||||
Aena SME SA(b) | 6,860 | 1,351,735 | ||||||
Amadeus IT Group SA | 9,216 | 591,623 | ||||||
Banco Bilbao Vizcaya Argentaria SA | 399,113 | 4,758,704 | ||||||
Banco Santander SA | 369,650 | 1,805,082 | ||||||
CaixaBank SA(a) | 322,152 | 1,563,223 | ||||||
Endesa SA | 121,077 | 2,244,550 | ||||||
Iberdrola SA | 397,771 | 4,938,168 | ||||||
Industria de Diseno Textil SA | 147,058 | 7,412,252 | ||||||
Naturgy Energy Group SA(a) | 64,937 | 1,409,652 | ||||||
Repsol SA | 58,561 | 976,516 | ||||||
Telefonica SA | 422,647 | 1,866,460 | ||||||
|
| |||||||
| Total Spain |
| 28,917,965 | ||||||
| Sweden – 2.2% |
| |||||||
Alfa Laval AB | 6,339 | 249,467 | ||||||
Assa Abloy AB, Class B | 19,152 | 550,061 | ||||||
Atlas Copco AB, Class A | 43,112 | 728,976 | ||||||
Atlas Copco AB, Class B | 30,407 | 449,738 | ||||||
Epiroc AB, Class A | 20,292 | 381,640 | ||||||
Essity AB, Class B(a) | 13,084 | 311,052 | ||||||
Evolution AB(b) | 4,583 | 570,314 | ||||||
H & M Hennes & Mauritz AB, Class B | 55,178 | 900,901 | ||||||
Sandvik AB | 30,972 | 688,518 | ||||||
Skandinaviska Enskilda Banken AB, Class A(a) | 129,754 | 1,758,959 | ||||||
Svenska Handelsbanken AB, Class A | 88,639 | 897,365 | ||||||
Swedbank AB, Class A(a) | 64,014 | 1,270,988 | ||||||
Volvo AB, Class A(a) | 8,052 | 221,997 | ||||||
Volvo AB, Class B(a) | 77,494 | 2,102,483 | ||||||
|
| |||||||
| Total Sweden |
| 11,082,459 | ||||||
| Switzerland – 11.0% |
| |||||||
ABB Ltd., Registered Shares | 68,626 | 3,191,677 | ||||||
Cie Financiere Richemont SA, Class A, Registered Shares | 10,576 | 1,614,522 | ||||||
DSM-Firmenich AG | 3,906 | 444,628 | ||||||
Geberit AG, Registered Shares | 937 | 554,481 | ||||||
Givaudan SA, Registered Shares | 177 | 789,199 | ||||||
Holcim AG, Registered Shares | 32,847 | 2,978,002 | ||||||
Kuehne & Nagel International AG, Registered Shares(a) | 9,032 | 2,516,967 | ||||||
Nestle SA, Registered Shares | 102,000 | 10,843,233 | ||||||
Novartis AG, Registered Shares | 111,039 | 10,771,042 | ||||||
Partners Group Holding AG | 743 | 1,062,489 | ||||||
Roche Holding AG | 21,941 | 5,595,479 | ||||||
Roche Holding AG, Bearer Shares | 5,435 | 1,466,309 | ||||||
Schindler Holding AG, Participation Certificate | 1,045 | 263,483 | ||||||
Schindler Holding AG, Registered Shares | 1,073 | 262,085 | ||||||
SGS SA, Registered Shares*(a) | 10,555 | 1,025,383 | ||||||
Sika AG, Registered Shares | 2,088 | 622,668 | ||||||
Sonova Holding AG, Registered Shares | 830 | 240,605 | ||||||
Swiss Life Holding AG, Registered Shares | 1,613 | 1,132,162 | ||||||
Swiss Re AG | 20,003 | 2,575,050 | ||||||
Swisscom AG, Registered Shares* | 2,883 | 1,764,945 | ||||||
UBS Group AG, Registered Shares | 87,068 | 2,681,544 | ||||||
Zurich Insurance Group AG | 8,637 | 4,663,232 | ||||||
|
| |||||||
| Total Switzerland |
| 57,059,185 | ||||||
| United Kingdom – 13.6% |
| |||||||
Antofagasta PLC | 31,860 | 820,639 | ||||||
Ashtead Group PLC | 7,234 | 515,403 | ||||||
Associated British Foods PLC | 14,547 | 459,045 | ||||||
AstraZeneca PLC | 47,055 | 6,347,241 | ||||||
BAE Systems PLC | 108,617 | 1,851,655 | ||||||
Barclays PLC | 678,301 | 1,569,774 | ||||||
BP PLC | 668,491 | 4,186,044 | ||||||
British American Tobacco PLC | 201,127 | 6,113,012 | ||||||
BT Group PLC(a) | 604,126 | 836,807 | ||||||
Compass Group PLC | 42,467 | 1,246,207 | ||||||
Diageo PLC | 50,990 | 1,884,406 | ||||||
Haleon PLC | 110,098 | 463,280 | ||||||
HSBC Holdings PLC | 1,296,397 | 10,137,198 | ||||||
Imperial Brands PLC | 69,971 | 1,564,518 | ||||||
Lloyds Banking Group PLC | 3,168,793 | 2,071,941 | ||||||
London Stock Exchange Group PLC | 5,031 | 603,128 | ||||||
National Grid PLC | 286,643 | 3,860,005 | ||||||
NatWest Group PLC | 582,224 | 1,952,738 | ||||||
Prudential PLC | 38,341 | 359,867 | ||||||
Reckitt Benckiser Group PLC | 31,387 | 1,788,991 | ||||||
RELX PLC | 49,901 | 2,158,402 | ||||||
Rentokil Initial PLC | 44,025 | 262,334 | ||||||
Shell PLC | 209,783 | 6,956,469 | ||||||
SSE PLC | 85,080 | 1,773,375 | ||||||
Standard Chartered PLC | 54,233 | 459,975 | ||||||
Tesco PLC | 376,081 | 1,409,100 | ||||||
Unilever PLC | 125,816 | 6,318,542 | ||||||
See Notes to Financial Statements.
| 48 | WisdomTree Trust |
Schedule of Investments (concluded)
WisdomTree International LargeCap Dividend Fund (DOL)
March 31, 2024
| Investments | Shares | Value | ||||||
Vodafone Group PLC | 2,582,920 | $ | 2,299,021 | |||||
|
| |||||||
| Total United Kingdom | 70,269,117 | |||||||
| United States – 2.7% | ||||||||
GSK PLC | 217,882 | 4,702,741 | ||||||
Stellantis NV | 320,248 | 9,111,887 | ||||||
|
| |||||||
| Total United States | 13,814,628 | |||||||
TOTAL COMMON STOCKS (Cost: $386,600,785) | 512,194,709 | |||||||
| INVESTMENT OF CASH COLLATERAL FOR SECURITIES LOANED – 7.1% |
| |||||||
| United States – 7.1% |
| |||||||
State Street Navigator Securities Lending Government Money Market Portfolio, 5.34%(c) | ||||||||
| (Cost: $37,005,699) | 37,005,699 | 37,005,699 | ||||||
TOTAL INVESTMENTS IN SECURITIES – 106.1% (Cost: $423,606,484) |
| 549,200,408 | ||||||
Other Assets less Liabilities – (6.1)% |
| (31,781,480 | ) | |||||
|
| |||||||
| NET ASSETS – 100.0% |
| $ | 517,418,928 | |||||
| * | Non-income producing security. |
| (a) | Security, or portion thereof, was on loan at March 31, 2024 (See Note 2). At March 31, 2024, the total market value of the Fund’s securities on loan identified in the Schedule of Investments was $41,407,871 and the total market value of the collateral held by the Fund was $43,910,063. The total market value of the collateral includes non-cash U.S. Government securities collateral having a value of $6,904,364. |
| (b) | This security is exempt from registration under rule 144A of the Securities Act of 1933. This security may be sold in transactions that are exempt from registration, normally to qualified institutional buyers. |
| (c) | Rate shown represents annualized 7-day yield as of March 31, 2024. |
| INVESTMENT IN AFFILIATES | ||||||||||
Affiliated holdings are investments in entities in which the Fund owns 5% or more of the outstanding voting securities or are investments in entities which are under common ownership or control. Investments in affiliates during the fiscal year ended March 31, 2024 were as follows:
| Affiliate | Value at 3/31/2023 | Purchases/ Additions | Sales/ Reductions | Realized Gain/(Loss) | Change in Unrealized Appreciation/ Depreciation | Value at 3/31/2024 | Dividend Income | |||||||||||||||||||||
WisdomTree International MidCap Dividend Fund^ | $ | 344,680 | $ | 5,161,771 | $ | 5,580,571 | $ | 93,724 | $ | (19,604 | ) | $ | — | $ | 48,092 | |||||||||||||
| ^ | As of March 31, 2024, the Fund did not hold a position in this affiliate. |
| FAIR VALUATION SUMMARY | ||||||||||||||
The following is a summary of the fair valuations according to the inputs used in valuing the Fund’s investments (See Note 2 — Fair Value Measurement):
| Quoted Prices in Active Markets (Level 1) | Other Significant Observable Inputs (Level 2) | Significant Unobservable Inputs (Level 3) | Total | |||||||||||||
Assets: |
| |||||||||||||||
Investments in Securities | ||||||||||||||||
Common Stocks | $ | 512,194,709 | $ | — | $ | — | $ | 512,194,709 | ||||||||
Investment of Cash Collateral for Securities Loaned | — | 37,005,699 | — | 37,005,699 | ||||||||||||
Total Investments in Securities | $ | 512,194,709 | $ | 37,005,699 | $ | — | $ | 549,200,408 | ||||||||
See Notes to Financial Statements.
| WisdomTree Trust | 49 |
Schedule of Investments
WisdomTree International MidCap Dividend Fund (DIM)
March 31, 2024
| Investments | Shares | Value | ||||||
| COMMON STOCKS – 99.3% | ||||||||
| Australia – 11.7% |
| |||||||
AGL Energy Ltd. | 27,420 | $ | 149,193 | |||||
ALS Ltd. | 24,795 | 212,394 | ||||||
Altium Ltd. | 1,659 | 70,590 | ||||||
Ampol Ltd. | 14,045 | 364,594 | ||||||
APA Group | 77,844 | 427,105 | ||||||
Aurizon Holdings Ltd. | 74,885 | 195,420 | ||||||
Bank of Queensland Ltd.(a) | 45,809 | 188,878 | ||||||
Beach Energy Ltd. | 55,021 | 65,869 | ||||||
Bendigo & Adelaide Bank Ltd. | 55,943 | 374,096 | ||||||
BlueScope Steel Ltd. | 13,487 | 209,854 | ||||||
Brambles Ltd. | 59,975 | 631,912 | ||||||
Brickworks Ltd.(a) | 3,768 | 70,011 | ||||||
CAR Group Ltd. | 9,381 | 220,816 | ||||||
Challenger Ltd. | 24,936 | 115,667 | ||||||
Charter Hall Group(a) | 21,934 | 196,759 | ||||||
Cleanaway Waste Management Ltd. | 47,043 | 83,479 | ||||||
Cochlear Ltd. | 1,312 | 288,900 | ||||||
Coles Group Ltd. | 81,219 | 897,604 | ||||||
Computershare Ltd. | 15,880 | 270,503 | ||||||
Dexus(a) | 74,672 | 385,344 | ||||||
Domino’s Pizza Enterprises Ltd.(a) | 1,800 | 50,954 | ||||||
Endeavour Group Ltd.(a) | 74,149 | 266,545 | ||||||
GPT Group(a) | 120,418 | 359,022 | ||||||
Harvey Norman Holdings Ltd.(a) | 80,616 | 270,859 | ||||||
IDP Education Ltd.(a) | 5,663 | 66,206 | ||||||
IGO Ltd.(a) | 40,488 | 186,750 | ||||||
Incitec Pivot Ltd. | 178,599 | 336,737 | ||||||
Insurance Australia Group Ltd. | 61,322 | 256,041 | ||||||
JB Hi-Fi Ltd.(a) | 11,027 | 462,215 | ||||||
Lottery Corp. Ltd. | 104,507 | 351,129 | ||||||
Medibank Pvt Ltd. | 110,998 | 272,281 | ||||||
Mineral Resources Ltd.(a) | 5,585 | 258,226 | ||||||
Mirvac Group(a) | 213,487 | 328,698 | ||||||
New Hope Corp. Ltd.(a) | 81,839 | 248,272 | ||||||
Northern Star Resources Ltd. | 25,312 | 238,951 | ||||||
Orica Ltd. | 11,662 | 138,927 | ||||||
Origin Energy Ltd. | 64,444 | 386,798 | ||||||
Pilbara Minerals Ltd.(a) | 177,085 | 442,481 | ||||||
Premier Investments Ltd. | 7,023 | 150,329 | ||||||
Qube Holdings Ltd.(a) | 49,919 | 111,054 | ||||||
Ramsay Health Care Ltd.(a) | 3,319 | 122,362 | ||||||
REA Group Ltd.(a) | 1,722 | 208,363 | ||||||
Reece Ltd.(a) | 12,677 | 232,400 | ||||||
Scentre Group | 335,791 | 742,648 | ||||||
SEEK Ltd.(a) | 7,507 | 122,684 | ||||||
Seven Group Holdings Ltd.(a) | 8,100 | 215,447 | ||||||
Sonic Healthcare Ltd. | 14,645 | 280,995 | ||||||
Steadfast Group Ltd. | 34,862 | 133,735 | ||||||
Stockland | 159,542 | 504,813 | ||||||
Suncorp Group Ltd. | 53,025 | 566,642 | ||||||
TPG Telecom Ltd.(a) | 64,772 | 190,580 | ||||||
Treasury Wine Estates Ltd.(a) | 18,248 | 148,217 | ||||||
Vicinity Ltd. | 302,756 | 420,713 | ||||||
Viva Energy Group Ltd.(b) | 110,491 | 266,712 | ||||||
Whitehaven Coal Ltd. | 80,758 | 374,074 | ||||||
Worley Ltd. | 15,969 | 174,504 | ||||||
Yancoal Australia Ltd.(a) | 154,963 | 529,753 | ||||||
|
| |||||||
| Total Australia |
| 15,836,105 | ||||||
| Austria – 1.7% |
| |||||||
ANDRITZ AG | 4,629 | 288,961 | ||||||
BAWAG Group AG*(b) | 6,400 | 405,734 | ||||||
CA Immobilien Anlagen AG | 3,101 | 109,515 | ||||||
Mondi PLC | 19,173 | 337,994 | ||||||
Telekom Austria AG* | 34,372 | 287,694 | ||||||
UNIQA Insurance Group AG | 28,962 | 250,544 | ||||||
Vienna Insurance Group AG Wiener Versicherung Gruppe | 5,550 | 173,227 | ||||||
voestalpine AG | 10,460 | 293,717 | ||||||
Wienerberger AG | 3,994 | 145,624 | ||||||
|
| |||||||
| Total Austria |
| 2,293,010 | ||||||
| Belgium – 1.6% |
| |||||||
Ackermans & van Haaren NV | 685 | 119,848 | ||||||
Aedifica SA | 3,171 | 195,035 | ||||||
Ageas SA | 14,275 | 661,697 | ||||||
Azelis Group NV | 3,784 | 80,059 | ||||||
Bekaert SA | 3,266 | 167,687 | ||||||
Colruyt Group NV | 2,392 | 110,619 | ||||||
D’ieteren Group | 1,062 | 235,815 | ||||||
Melexis NV(a) | 1,950 | 158,266 | ||||||
Solvay SA(a) | 5,981 | 163,425 | ||||||
Tessenderlo Group SA | 3,290 | 86,165 | ||||||
Warehouses De Pauw CVA | 8,155 | 233,044 | ||||||
|
| |||||||
| Total Belgium |
| 2,211,660 | ||||||
| China – 0.2% |
| |||||||
BOC Aviation Ltd.(b) | 29,300 | 225,746 | ||||||
Qingdao Port International Co. Ltd., Class H(a)(b) | 115,000 | 67,591 | ||||||
|
| |||||||
| Total China |
| 293,337 | ||||||
| Denmark – 1.6% |
| |||||||
H Lundbeck AS | 17,342 | 83,414 | ||||||
ISS AS | 3,622 | 65,921 | ||||||
Novonesis (Novozymes) B, Class B | 6,800 | 398,952 | ||||||
Pandora AS | 2,509 | 404,877 | ||||||
Rockwool AS, Class B* | 213 | 69,977 | ||||||
Royal Unibrew AS | 1,543 | 102,033 | ||||||
Sydbank AS | 4,216 | 217,805 | ||||||
Topdanmark AS | 4,309 | 184,052 | ||||||
Tryg AS | 28,750 | 591,942 | ||||||
|
| |||||||
| Total Denmark |
| 2,118,973 | ||||||
| Egypt – 0.2% |
| |||||||
Energean PLC(a) | 19,526 | 269,602 | ||||||
| Finland – 2.2% |
| |||||||
Cargotec OYJ, Class B | 1,827 | 127,367 | ||||||
Elisa OYJ | 12,213 | 545,408 | ||||||
See Notes to Financial Statements.
| 50 | WisdomTree Trust |
Schedule of Investments (continued)
WisdomTree International MidCap Dividend Fund (DIM)
March 31, 2024
| Investments | Shares | Value | ||||||
Huhtamaki OYJ(a) | 3,009 | $ | 126,187 | |||||
Kemira OYJ | 8,624 | 163,180 | ||||||
Kesko OYJ, Class A(a) | 3,406 | 64,594 | ||||||
Kesko OYJ, Class B | 19,892 | 371,984 | ||||||
Konecranes OYJ | 4,483 | 232,931 | ||||||
Metsa Board OYJ, Class B(a) | 23,352 | 177,046 | ||||||
Metso OYJ | 27,173 | 322,962 | ||||||
Orion OYJ, Class B | 4,114 | 153,599 | ||||||
TietoEVRY OYJ(a) | 8,067 | 170,849 | ||||||
Valmet OYJ(a) | 10,786 | 284,116 | ||||||
Wartsila OYJ Abp | 14,151 | 215,339 | ||||||
|
| |||||||
| Total Finland |
| 2,955,562 | ||||||
| France – 7.9% |
| |||||||
Accor SA | 5,654 | 264,404 | ||||||
Aeroports de Paris SA | 2,700 | 370,624 | ||||||
Alten SA | 612 | 89,362 | ||||||
Amundi SA(b) | 15,451 | 1,062,133 | ||||||
Arkema SA | 2,755 | 290,220 | ||||||
BioMerieux | 1,079 | 119,154 | ||||||
Bouygues SA | 19,035 | 777,702 | ||||||
Bureau Veritas SA | 22,098 | 674,926 | ||||||
Carrefour SA | 22,062 | 378,253 | ||||||
Eiffage SA | 5,808 | 659,568 | ||||||
Elis SA | 8,283 | 188,395 | ||||||
Eurazeo SE | 3,024 | 265,356 | ||||||
Gaztransport & Technigaz SA | 956 | 142,998 | ||||||
Gecina SA | 4,033 | 412,261 | ||||||
Getlink SE | 24,838 | 423,299 | ||||||
Imerys SA | 4,767 | 162,585 | ||||||
Interparfums SA | 2,565 | 144,604 | ||||||
Ipsen SA | 918 | 109,356 | ||||||
Klepierre SA(a) | 19,824 | 513,838 | ||||||
La Francaise des Jeux SAEM(b) | 11,853 | 483,631 | ||||||
Nexans SA | 1,251 | 130,920 | ||||||
Remy Cointreau SA | 857 | 86,484 | ||||||
Renault SA | 2,062 | 104,211 | ||||||
Rexel SA | 25,897 | 700,058 | ||||||
SCOR SE | 8,283 | 286,887 | ||||||
SEB SA | 1,334 | 170,869 | ||||||
Societe BIC SA | 1,758 | 125,690 | ||||||
Sopra Steria Group | 468 | 113,421 | ||||||
SPIE SA | 6,981 | 262,525 | ||||||
Technip Energies NV | 4,767 | 120,523 | ||||||
Teleperformance SE | 1,917 | 186,498 | ||||||
Valeo SE | 6,047 | 75,691 | ||||||
Verallia SA(b) | 7,538 | 293,403 | ||||||
Vivendi SE | 27,728 | 302,457 | ||||||
Wendel SE | 1,764 | 180,224 | ||||||
|
| |||||||
| Total France |
| 10,672,530 | ||||||
| Germany – 4.8% |
| |||||||
AIXTRON SE | 1,299 | 34,372 | ||||||
Aurubis AG | 961 | 67,649 | ||||||
Bechtle AG | 1,840 | 97,333 | ||||||
Brenntag SE | 4,050 | 341,522 | ||||||
Carl Zeiss Meditec AG, Bearer Shares | 1,250 | 156,330 | ||||||
CTS Eventim AG & Co. KGaA | 2,596 | 231,163 | ||||||
DWS Group GmbH & Co. KGaA(b) | 13,030 | 573,873 | ||||||
Evonik Industries AG | 28,143 | 556,978 | ||||||
Fielmann Group AG | 1,452 | 66,741 | ||||||
Freenet AG | 7,535 | 212,234 | ||||||
Fresenius Medical Care AG | 9,565 | 368,272 | ||||||
GEA Group AG | 4,894 | 207,140 | ||||||
Gerresheimer AG | 440 | 49,611 | ||||||
HochTief AG | 4,436 | 515,978 | ||||||
Hugo Boss AG | 1,835 | 108,246 | ||||||
K&S AG, Registered Shares | 10,170 | 158,823 | ||||||
Knorr-Bremse AG | 3,855 | 291,854 | ||||||
Krones AG | 566 | 75,004 | ||||||
MTU Aero Engines AG | 950 | 241,315 | ||||||
Nemetschek SE | 641 | 63,496 | ||||||
Puma SE | 2,312 | 104,922 | ||||||
Rheinmetall AG | 687 | 386,561 | ||||||
Scout24 SE(b) | 1,335 | 100,724 | ||||||
Siltronic AG | 1,003 | 89,042 | ||||||
Sixt SE | 1,403 | 140,084 | ||||||
Softwareone Holding AG* | 2,802 | 51,703 | ||||||
Stroeer SE & Co. KGaA | 3,359 | 204,603 | ||||||
Suedzucker AG | 9,018 | 129,437 | ||||||
Symrise AG | 1,406 | 168,475 | ||||||
thyssenkrupp AG | 13,087 | 70,302 | ||||||
Traton SE | 16,774 | 603,985 | ||||||
United Internet AG, Registered Shares | 4,237 | 95,455 | ||||||
|
| |||||||
| Total Germany |
| 6,563,227 | ||||||
| Hong Kong – 2.9% |
| |||||||
Bank of East Asia Ltd. | 128,580 | 153,117 | ||||||
Hong Kong & China Gas Co. Ltd. | 1,034,000 | 783,448 | ||||||
Link REIT | 167,400 | 719,740 | ||||||
Power Assets Holdings Ltd. | 143,000 | 836,829 | ||||||
Swire Pacific Ltd., Class A | 47,000 | 386,740 | ||||||
Swire Pacific Ltd., Class B | 267,500 | 348,626 | ||||||
Swire Properties Ltd. | 347,000 | 728,898 | ||||||
|
| |||||||
| Total Hong Kong |
| 3,957,398 | ||||||
| Ireland – 0.9% |
| |||||||
AIB Group PLC | 52,935 | 268,927 | ||||||
Bank of Ireland Group PLC | 23,429 | 239,116 | ||||||
Glanbia PLC | 8,119 | 160,289 | ||||||
Smurfit Kappa Group PLC | 11,006 | 502,441 | ||||||
|
| |||||||
| Total Ireland |
| 1,170,773 | ||||||
| Israel – 3.3% |
| |||||||
Azrieli Group Ltd. | 4,052 | 294,303 | ||||||
Bank Hapoalim BM | 85,399 | 815,832 | ||||||
Bank Leumi Le-Israel BM | 75,156 | 635,924 | ||||||
Bezeq The Israeli Telecommunication Corp. Ltd. | 129,945 | 167,765 | ||||||
Delek Group Ltd. | 1,852 | 244,662 | ||||||
Elbit Systems Ltd. | 422 | 89,268 | ||||||
See Notes to Financial Statements.
| WisdomTree Trust | 51 |
Schedule of Investments (continued)
WisdomTree International MidCap Dividend Fund (DIM)
March 31, 2024
| Investments | Shares | Value | ||||||
First International Bank of Israel Ltd. | 9,824 | $ | 414,015 | |||||
ICL Group Ltd. | 129,980 | 692,172 | ||||||
Israel Discount Bank Ltd., Class A | 87,439 | 464,438 | ||||||
Mizrahi Tefahot Bank Ltd. | 11,619 | 443,994 | ||||||
Newmed Energy LP | 60,536 | 154,541 | ||||||
Phoenix Holdings Ltd. | 7,524 | 78,244 | ||||||
|
| |||||||
| Total Israel |
| 4,495,158 | ||||||
| Italy – 5.9% |
| |||||||
A2A SpA | 215,579 | 389,633 | ||||||
Amplifon SpA(a) | 2,726 | 99,510 | ||||||
Azimut Holding SpA | 8,601 | 233,899 | ||||||
Banca Generali SpA(a) | 8,681 | 345,205 | ||||||
Banca Mediolanum SpA | 66,621 | 732,458 | ||||||
Banco BPM SpA | 102,158 | 680,519 | ||||||
BPER Banca | 51,530 | 243,757 | ||||||
Brembo SpA | 12,721 | 163,078 | ||||||
Brunello Cucinelli SpA(a) | 935 | 107,039 | ||||||
Buzzi SpA | 4,767 | 187,400 | ||||||
Credito Emiliano SpA | 20,403 | 204,267 | ||||||
De’ Longhi SpA | 3,439 | 119,075 | ||||||
DiaSorin SpA(a) | 711 | 68,725 | ||||||
ERG SpA(a) | 5,716 | 143,714 | ||||||
FinecoBank Banca Fineco SpA(a) | 24,795 | 371,821 | ||||||
Hera SpA | 62,048 | 218,861 | ||||||
Infrastrutture Wireless Italiane SpA(a)(b) | 29,856 | 339,534 | ||||||
Interpump Group SpA | 1,136 | 55,443 | ||||||
Iren SpA | 70,493 | 144,195 | ||||||
Italgas SpA | 74,438 | 434,122 | ||||||
Leonardo SpA | 9,058 | 227,740 | ||||||
Mediobanca Banca di Credito Finanziario SpA | 56,292 | 839,584 | ||||||
Prysmian SpA | 6,481 | 338,705 | ||||||
Recordati Industria Chimica & Farmaceutica SpA | 5,352 | 296,175 | ||||||
Reply SpA | 562 | 79,633 | ||||||
Unipol Gruppo SpA | 47,869 | 401,491 | ||||||
UnipolSai Assicurazioni SpA | 180,728 | 523,880 | ||||||
|
| |||||||
| Total Italy |
| 7,989,463 | ||||||
| Japan – 23.8% |
| |||||||
ABC-Mart, Inc. | 8,534 | 163,440 | ||||||
Aeon Mall Co. Ltd.(a) | 6,500 | 76,963 | ||||||
AGC, Inc. | 8,828 | 322,450 | ||||||
Air Water, Inc. | 6,800 | 107,608 | ||||||
Aisin Corp. | 9,300 | 382,274 | ||||||
Alfresa Holdings Corp. | 6,900 | 101,326 | ||||||
Amada Co. Ltd.(a) | 17,500 | 198,710 | ||||||
Asahi Kasei Corp. | 50,620 | 371,928 | ||||||
Asics Corp. | 3,400 | 164,019 | ||||||
Azbil Corp.(a) | 2,200 | 60,965 | ||||||
Bandai Namco Holdings, Inc. | 14,200 | 265,338 | ||||||
BIPROGY, Inc. | 2,200 | 65,864 | ||||||
Canon Marketing Japan, Inc. | 5,300 | 157,167 | ||||||
Capcom Co. Ltd. | 7,000 | 129,274 | ||||||
Chiba Bank Ltd. | 21,200 | 176,708 | ||||||
Chubu Electric Power Co., Inc. | 29,900 | 392,951 | ||||||
Coca-Cola Bottlers Japan Holdings, Inc. | 5,600 | 82,069 | ||||||
COMSYS Holdings Corp. | 6,300 | 147,692 | ||||||
Concordia Financial Group Ltd. | 36,100 | 183,619 | ||||||
Cosmo Energy Holdings Co. Ltd.(a) | 3,000 | 152,136 | ||||||
Daicel Corp. | 8,800 | 88,032 | ||||||
Daifuku Co. Ltd. | 4,900 | 116,037 | ||||||
Daito Trust Construction Co. Ltd. | 2,020 | 232,905 | ||||||
Daiwa Securities Group, Inc. | 46,500 | 353,639 | ||||||
Dentsu Group, Inc. | 9,500 | 263,322 | ||||||
Dentsu Soken, Inc. | 1,700 | 56,388 | ||||||
Ebara Corp. | 3,900 | 355,354 | ||||||
Electric Power Development Co. Ltd. | 10,700 | 176,466 | ||||||
ENEOS Holdings, Inc. | 113,400 | 547,949 | ||||||
Fuji Electric Co. Ltd. | 2,775 | 187,940 | ||||||
Fukuoka Financial Group, Inc.(a) | 6,100 | 163,075 | ||||||
Hachijuni Bank Ltd. | 13,700 | 94,143 | ||||||
Hakuhodo DY Holdings, Inc.(a) | 8,600 | 78,729 | ||||||
Hamamatsu Photonics KK | 2,200 | 77,813 | ||||||
Hankyu Hanshin Holdings, Inc. | 2,400 | 69,743 | ||||||
Haseko Corp.(a) | 13,600 | 170,376 | ||||||
Hirose Electric Co. Ltd. | 1,075 | 109,990 | ||||||
Hitachi Construction Machinery Co. Ltd. | 6,700 | 200,055 | ||||||
Hoshizaki Corp. | 2,200 | 81,738 | ||||||
Hulic Co. Ltd. | 36,100 | 374,847 | ||||||
Idemitsu Kosan Co. Ltd. | 50,530 | 347,896 | ||||||
IHI Corp.(a) | 5,400 | 146,253 | ||||||
Iida Group Holdings Co. Ltd.(a) | 9,900 | 130,402 | ||||||
INFRONEER Holdings, Inc.(a) | 13,400 | 127,807 | ||||||
Internet Initiative Japan, Inc. | 3,700 | 69,333 | ||||||
Isuzu Motors Ltd.(a) | 36,400 | 494,248 | ||||||
J Front Retailing Co. Ltd. | 8,600 | 96,089 | ||||||
Japan Airlines Co. Ltd. | 10,200 | 196,627 | ||||||
Japan Exchange Group, Inc. | 11,000 | 298,721 | ||||||
Japan Post Insurance Co. Ltd.(a) | 12,600 | 241,893 | ||||||
JFE Holdings, Inc.(a) | 22,400 | 375,936 | ||||||
JTEKT Corp. | 13,700 | 129,265 | ||||||
Kajima Corp. | 15,376 | 317,588 | ||||||
Kansai Electric Power Co., Inc. | 22,388 | 324,626 | ||||||
Kansai Paint Co. Ltd.(a) | 5,100 | 73,326 | ||||||
Kawasaki Heavy Industries Ltd.(a) | 4,900 | 165,022 | ||||||
Kikkoman Corp. | 9,000 | 117,090 | ||||||
Kintetsu Group Holdings Co. Ltd.(a) | 2,200 | 64,716 | ||||||
Kirin Holdings Co. Ltd. | 29,000 | 402,009 | ||||||
Kobe Steel Ltd.(a) | 22,600 | 307,018 | ||||||
Koei Tecmo Holdings Co. Ltd.(a) | 8,320 | 89,057 | ||||||
Koito Manufacturing Co. Ltd. | 3,800 | 63,649 | ||||||
Konami Group Corp. | 2,200 | 149,215 | ||||||
Kose Corp. | 1,100 | 57,920 | ||||||
Kuraray Co. Ltd. | 13,500 | 146,422 | ||||||
Kurita Water Industries Ltd. | 2,100 | 87,430 | ||||||
Kyowa Kirin Co. Ltd. | 11,800 | 209,772 | ||||||
Kyushu Railway Co. | 6,800 | 159,189 | ||||||
Lawson, Inc. | 2,300 | 157,062 | ||||||
Lion Corp. | 5,100 | 45,762 | ||||||
See Notes to Financial Statements.
| 52 | WisdomTree Trust |
Schedule of Investments (continued)
WisdomTree International MidCap Dividend Fund (DIM)
March 31, 2024
| Investments | Shares | Value | ||||||
M3, Inc. | 6,100 | $ | 86,132 | |||||
Macnica Holdings, Inc.(a) | 1,900 | 93,264 | ||||||
Marui Group Co. Ltd.(a) | 6,500 | 105,030 | ||||||
MatsukiyoCocokara & Co. | 5,600 | 90,265 | ||||||
Mazda Motor Corp. | 27,800 | 322,461 | ||||||
Mebuki Financial Group, Inc. | 29,300 | 99,044 | ||||||
Medipal Holdings Corp. | 4,900 | 75,113 | ||||||
MEIJI Holdings Co. Ltd. | 6,900 | 154,372 | ||||||
Minebea Mitsumi, Inc. | 6,300 | 122,841 | ||||||
MISUMI Group, Inc. | 2,200 | 30,017 | ||||||
Mitsubishi Chemical Group Corp. | 77,700 | 470,271 | ||||||
Mitsubishi Gas Chemical Co., Inc.(a) | 8,000 | 136,906 | ||||||
Mitsubishi Motors Corp.(a) | 28,800 | 96,251 | ||||||
Mitsui Chemicals, Inc.(a) | 6,300 | 180,285 | ||||||
Miura Co. Ltd. | 2,900 | 56,057 | ||||||
MonotaRO Co. Ltd. | 6,600 | 79,259 | ||||||
NGK Insulators Ltd. | 8,500 | 114,573 | ||||||
NH Foods Ltd.(a) | 2,200 | 73,961 | ||||||
Nichirei Corp. | 4,700 | 128,660 | ||||||
Nifco, Inc. | 2,500 | 63,778 | ||||||
Nikon Corp.(a) | 11,400 | 115,322 | ||||||
Nippon Express Holdings, Inc. | 5,000 | 255,443 | ||||||
Nippon Sanso Holdings Corp. | 5,400 | 169,409 | ||||||
Nippon Shinyaku Co. Ltd. | 1,800 | 53,163 | ||||||
Nissan Chemical Corp. | 3,000 | 113,482 | ||||||
Nisshin Seifun Group, Inc. | 9,100 | 126,238 | ||||||
Nissin Foods Holdings Co. Ltd.(a) | 5,600 | 155,407 | ||||||
Niterra Co. Ltd.(a) | 14,400 | 483,727 | ||||||
Nitori Holdings Co. Ltd. | 1,100 | 171,529 | ||||||
Nitto Denko Corp. | 5,500 | 500,776 | ||||||
NOF Corp. | 7,200 | 99,214 | ||||||
Nomura Holdings, Inc. | 115,300 | 744,770 | ||||||
Nomura Real Estate Holdings, Inc. | 9,768 | 283,982 | ||||||
NS Solutions Corp. | 2,200 | 71,809 | ||||||
NSK Ltd. | 20,500 | 119,699 | ||||||
Obayashi Corp. | 24,300 | 299,044 | ||||||
Odakyu Electric Railway Co. Ltd. | 5,300 | 72,700 | ||||||
Oji Holdings Corp.(a) | 25,262 | 106,476 | ||||||
Omron Corp. | 3,500 | 125,135 | ||||||
Ono Pharmaceutical Co. Ltd.(a) | 14,600 | 236,782 | ||||||
Open House Group Co. Ltd. | 4,000 | 130,800 | ||||||
Oracle Corp. | 2,600 | 196,789 | ||||||
Osaka Gas Co. Ltd. | 9,500 | 212,917 | ||||||
Otsuka Corp. | 8,200 | 173,216 | ||||||
Pan Pacific International Holdings Corp. | 4,500 | 120,212 | ||||||
Persol Holdings Co. Ltd. | 82,400 | 116,240 | ||||||
Pola Orbis Holdings, Inc. | 6,400 | 61,380 | ||||||
Resona Holdings, Inc. | 60,500 | 379,881 | ||||||
Resonac Holdings Corp. | 5,000 | 119,793 | ||||||
Ricoh Co. Ltd. | 15,800 | 141,093 | ||||||
Rinnai Corp. | 2,900 | 66,759 | ||||||
Rohm Co. Ltd. | 7,500 | 120,346 | ||||||
Rohto Pharmaceutical Co. Ltd. | 2,600 | 50,971 | ||||||
Ryohin Keikaku Co. Ltd. | 4,900 | 81,718 | ||||||
Sankyo Co. Ltd. | 18,000 | 199,095 | ||||||
Santen Pharmaceutical Co. Ltd. | 9,400 | 95,432 | ||||||
Sanwa Holdings Corp. | 10,100 | 178,916 | ||||||
SBI Holdings, Inc.(a) | 12,600 | 328,935 | ||||||
SCREEN Holdings Co. Ltd.(a) | 3,200 | 422,135 | ||||||
SCSK Corp. | 9,100 | 170,612 | ||||||
Sega Sammy Holdings, Inc. | 9,200 | 122,367 | ||||||
Seibu Holdings, Inc. | 6,400 | 102,441 | ||||||
Seiko Epson Corp.(a) | 13,600 | 237,727 | ||||||
Seino Holdings Co. Ltd.(a) | 6,900 | 96,425 | ||||||
Sekisui Chemical Co. Ltd. | 20,000 | 294,691 | ||||||
Sekisui House Ltd. | 24,900 | 578,305 | ||||||
Seven Bank Ltd.(a) | 44,900 | 87,726 | ||||||
SG Holdings Co. Ltd. | 16,200 | 203,697 | ||||||
Shimadzu Corp. | 4,300 | 120,182 | ||||||
Shimano, Inc. | 1,400 | 211,371 | ||||||
Shimizu Corp. | 15,800 | 104,449 | ||||||
Shinko Electric Industries Co. Ltd. | 1,900 | 70,516 | ||||||
Shizuoka Financial Group, Inc. | 14,300 | 136,721 | ||||||
Socionext, Inc.(a) | 5,100 | 142,879 | ||||||
Sohgo Security Services Co. Ltd. | 15,200 | 83,550 | ||||||
Sojitz Corp.(a) | 14,380 | 378,824 | ||||||
SUMCO Corp.(a) | 14,700 | 233,790 | ||||||
Sumitomo Electric Industries Ltd. | 23,612 | 366,244 | ||||||
Sumitomo Forestry Co. Ltd. | 7,000 | 227,282 | ||||||
Sumitomo Heavy Industries Ltd. | 3,300 | 102,939 | ||||||
Sumitomo Realty & Development Co. Ltd. | 6,600 | 252,801 | ||||||
Sumitomo Rubber Industries Ltd. | 6,400 | 79,416 | ||||||
Sundrug Co. Ltd. | 2,900 | 89,427 | ||||||
Suzuken Co. Ltd. | 2,100 | 64,369 | ||||||
Sysmex Corp. | 6,900 | 121,341 | ||||||
T&D Holdings, Inc. | 14,751 | 253,168 | ||||||
Taisei Corp. | 4,475 | 166,173 | ||||||
Taiyo Yuden Co. Ltd.(a) | 3,100 | 74,251 | ||||||
TIS, Inc. | 4,200 | 91,274 | ||||||
Tobu Railway Co. Ltd. | 2,400 | 59,958 | ||||||
Toho Co. Ltd. | 2,100 | 68,656 | ||||||
Tokyo Gas Co. Ltd. | 11,300 | 262,145 | ||||||
Tokyo Ohka Kogyo Co. Ltd. | 2,200 | 66,562 | ||||||
Tokyo Tatemono Co. Ltd. | 9,000 | 156,487 | ||||||
Tokyu Corp. | 6,100 | 74,323 | ||||||
Tokyu Fudosan Holdings Corp. | 33,300 | 274,704 | ||||||
Toray Industries, Inc. | 36,300 | 177,512 | ||||||
Tosoh Corp.(a) | 12,900 | 175,756 | ||||||
Toyo Seikan Group Holdings Ltd. | 6,600 | 106,340 | ||||||
Toyo Suisan Kaisha Ltd. | 1,600 | 100,168 | ||||||
Toyoda Gosei Co. Ltd.(a) | 3,700 | 79,332 | ||||||
Toyota Boshoku Corp. | 7,300 | 123,914 | ||||||
Trend Micro, Inc.(a) | 3,530 | 182,652 | ||||||
Tsuruha Holdings, Inc. | 1,200 | 85,315 | ||||||
USS Co. Ltd. | 19,800 | 165,169 | ||||||
Welcia Holdings Co. Ltd. | 4,600 | 77,946 | ||||||
West Japan Railway Co. | 10,200 | 211,420 | ||||||
Yakult Honsha Co. Ltd.(a) | 5,000 | 103,043 | ||||||
See Notes to Financial Statements.
| WisdomTree Trust | 53 |
Schedule of Investments (continued)
WisdomTree International MidCap Dividend Fund (DIM)
March 31, 2024
| Investments | Shares | Value | ||||||
Yamada Holdings Co. Ltd. | 22,000 | $ | 64,134 | |||||
Yamaha Motor Co. Ltd. | 36,480 | 343,119 | ||||||
Yamato Holdings Co. Ltd. | 6,700 | 95,534 | ||||||
Yamazaki Baking Co. Ltd. | 2,200 | 56,997 | ||||||
Yaskawa Electric Corp. | 3,700 | 155,070 | ||||||
Yokogawa Electric Corp. | 4,100 | 94,654 | ||||||
Yokohama Rubber Co. Ltd. | 4,500 | 119,707 | ||||||
Zeon Corp.(a) | 6,200 | 54,116 | ||||||
ZOZO, Inc.(a) | 8,600 | 216,271 | ||||||
|
| |||||||
| Total Japan |
| 32,187,622 | ||||||
| Jordan – 0.1% |
| |||||||
Hikma Pharmaceuticals PLC | 8,462 | 205,080 | ||||||
| Netherlands – 3.3% |
| |||||||
Aalberts NV | 3,878 | 186,753 | ||||||
Aegon Ltd.(a) | 103,255 | 630,062 | ||||||
Akzo Nobel NV | 4,885 | 364,980 | ||||||
Arcadis NV | 1,572 | 96,348 | ||||||
BE Semiconductor Industries NV(a) | 3,268 | 500,827 | ||||||
CTP NV(b) | 14,514 | 258,953 | ||||||
Euronext NV(b) | 3,249 | 309,487 | ||||||
IMCD NV(a) | 1,127 | 198,823 | ||||||
Koninklijke KPN NV | 251,200 | 940,312 | ||||||
Koninklijke Vopak NV | 6,829 | 263,520 | ||||||
Randstad NV(a) | 9,446 | 499,066 | ||||||
Signify NV(b) | 7,000 | 216,065 | ||||||
|
| |||||||
| Total Netherlands |
| 4,465,196 | ||||||
| Norway – 2.5% |
| |||||||
Aker ASA, Class A | 3,115 | 179,028 | ||||||
Gjensidige Forsikring ASA | 22,286 | 322,932 | ||||||
Kongsberg Gruppen ASA | 6,502 | 449,205 | ||||||
Leroy Seafood Group ASA | 32,480 | 142,990 | ||||||
Mowi ASA | 20,521 | 376,330 | ||||||
Orkla ASA | 37,802 | 266,704 | ||||||
SpareBank 1 SR-Bank ASA | 20,837 | 261,217 | ||||||
Storebrand ASA | 16,550 | 152,554 | ||||||
TOMRA Systems ASA | 6,808 | 106,401 | ||||||
Var Energi ASA | 236,876 | 778,407 | ||||||
Wallenius Wilhelmsen ASA | 41,614 | 338,901 | ||||||
|
| |||||||
| Total Norway |
| 3,374,669 | ||||||
| Portugal – 0.7% |
| |||||||
Galp Energia SGPS SA | 26,089 | 431,517 | ||||||
Navigator Co. SA | 105,685 | 462,266 | ||||||
|
| |||||||
| Total Portugal |
| 893,783 | ||||||
| Singapore – 2.0% |
| |||||||
CapitaLand Investment Ltd. | 191,500 | 380,276 | ||||||
City Developments Ltd.(a) | 23,300 | 100,997 | ||||||
Genting Singapore Ltd. | 453,400 | 297,317 | ||||||
Keppel Ltd. | 132,300 | 719,533 | ||||||
Sembcorp Industries Ltd. | 53,300 | 213,263 | ||||||
Singapore Exchange Ltd. | 50,400 | 343,942 | ||||||
Singapore Technologies Engineering Ltd. | 120,704 | 359,536 | ||||||
UOL Group Ltd. | 19,700 | 83,932 | ||||||
Venture Corp. Ltd.(a) | 18,100 | 191,380 | ||||||
|
| |||||||
| Total Singapore |
| 2,690,176 | ||||||
| Spain – 4.3% |
| |||||||
Acciona SA | 1,963 | 239,246 | ||||||
Acerinox SA | 14,440 | 158,525 | ||||||
ACS Actividades de Construccion y Servicios SA | 14,640 | 613,158 | ||||||
Banco de Sabadell SA | 174,815 | 274,704 | ||||||
Bankinter SA(a) | 53,802 | 394,076 | ||||||
Cia de Distribucion Integral Logista Holdings SA | 10,886 | 304,503 | ||||||
CIE Automotive SA | 5,762 | 165,531 | ||||||
Corp. ACCIONA Energias Renovables SA(a) | 8,291 | 180,697 | ||||||
Ebro Foods SA(a) | 5,191 | 86,561 | ||||||
Enagas SA(a) | 23,857 | 354,663 | ||||||
Fluidra SA | 7,054 | 166,994 | ||||||
Fomento de Construcciones y Contratas SA | 13,285 | 181,356 | ||||||
Gestamp Automocion SA(b) | 31,259 | 100,604 | ||||||
Grupo Catalana Occidente SA(a) | 4,943 | 189,248 | ||||||
Indra Sistemas SA(a) | 5,712 | 118,506 | ||||||
Inmobiliaria Colonial Socimi SA | 23,707 | 140,564 | ||||||
Laboratorios Farmaceuticos Rovi SA | 1,546 | 135,077 | ||||||
Mapfre SA(a) | 211,925 | 536,035 | ||||||
Merlin Properties Socimi SA | 52,638 | 567,069 | ||||||
Redeia Corp. SA | 31,379 | 535,621 | ||||||
Unicaja Banco SA(a)(b) | 120,196 | 148,894 | ||||||
Vidrala SA(a) | 739 | 76,779 | ||||||
Viscofan SA(a) | 1,868 | 118,827 | ||||||
|
| |||||||
| Total Spain |
| 5,787,238 | ||||||
| Sweden – 2.5% |
| |||||||
AAK AB | 4,659 | 110,848 | ||||||
AddTech AB, Class B | 3,693 | 84,203 | ||||||
Avanza Bank Holding AB(a) | 5,675 | 122,548 | ||||||
Axfood AB | 7,278 | 211,821 | ||||||
Elekta AB, Class B(a) | 10,867 | 82,016 | ||||||
Hexpol AB | 10,552 | 128,883 | ||||||
Holmen AB, Class B* | 1,877 | 76,431 | ||||||
Husqvarna AB, Class B(a) | 19,154 | 164,158 | ||||||
Indutrade AB* | 4,519 | 123,365 | ||||||
Investment AB Latour, Class B(a) | 10,687 | 281,353 | ||||||
L E Lundbergforetagen AB, Class B | 1,279 | 69,305 | ||||||
Lifco AB, Class B | 4,446 | 116,258 | ||||||
Nibe Industrier AB, Class B(a) | 16,904 | 83,092 | ||||||
Nordnet AB publ(a) | 8,248 | 151,498 | ||||||
Saab AB, Class B | 1,356 | 120,729 | ||||||
Sagax AB, Class B | 3,790 | 100,097 | ||||||
Securitas AB, Class B | 18,324 | 189,108 | ||||||
Skanska AB, Class B(a) | 16,855 | 300,290 | ||||||
SKF AB, Class B(a) | 15,002 | 306,561 | ||||||
Svenska Cellulosa AB SCA, Class B(a) | 9,590 | 147,358 | ||||||
Sweco AB, Class B(a) | 8,765 | 98,777 | ||||||
Thule Group AB(a)(b) | 4,145 | 125,095 | ||||||
Trelleborg AB, Class B | 6,800 | 243,507 | ||||||
|
| |||||||
| Total Sweden |
| 3,437,301 | ||||||
See Notes to Financial Statements.
| 54 | WisdomTree Trust |
Schedule of Investments (continued)
WisdomTree International MidCap Dividend Fund (DIM)
March 31, 2024
| Investments | Shares | Value | ||||||
| Switzerland – 5.2% |
| |||||||
Accelleron Industries AG | 4,155 | $ | 155,830 | |||||
Adecco Group AG, Registered Shares | 11,117 | 440,138 | ||||||
Allreal Holding AG, Registered Shares | 685 | 117,728 | ||||||
Baloise Holding AG, Registered Shares | 2,332 | 365,839 | ||||||
Banque Cantonale Vaudoise, Registered Shares(a) | 4,418 | 514,052 | ||||||
BKW AG | 1,299 | 199,602 | ||||||
Clariant AG, Registered Shares* | 9,826 | 132,984 | ||||||
Coca-Cola HBC AG* | 16,292 | 515,139 | ||||||
DKSH Holding AG | 2,354 | 160,340 | ||||||
EFG International AG* | 17,063 | 213,311 | ||||||
Flughafen Zurich AG, Registered Shares | 912 | 207,167 | ||||||
Galenica AG(b) | 2,055 | 171,573 | ||||||
Georg Fischer AG, Registered Shares | 3,189 | 236,865 | ||||||
Helvetia Holding AG, Registered Shares(a) | 3,519 | 485,635 | ||||||
Julius Baer Group Ltd. | 13,461 | 778,338 | ||||||
Logitech International SA, Registered Shares | 2,517 | 225,683 | ||||||
PSP Swiss Property AG, Registered Shares | 1,400 | 183,724 | ||||||
SFS Group AG(a) | 1,419 | 186,847 | ||||||
SIG Group AG*(a) | 8,030 | 178,306 | ||||||
Stadler Rail AG(a) | 2,698 | 86,029 | ||||||
Sulzer AG, Registered Shares | 2,164 | 263,563 | ||||||
Swatch Group AG, Bearer Shares(a) | 668 | 155,301 | ||||||
Swatch Group AG, Registered Shares | 3,013 | 136,818 | ||||||
Swiss Prime Site AG, Registered Shares | 4,238 | 400,180 | ||||||
Swissquote Group Holding SA, Registered Shares | 175 | 49,195 | ||||||
VAT Group AG(b) | 584 | 302,990 | ||||||
Vontobel Holding AG, Registered Shares | 2,742 | 166,523 | ||||||
|
| |||||||
| Total Switzerland |
| 7,029,700 | ||||||
| United Kingdom – 10.0% |
| |||||||
Admiral Group PLC | 11,710 | 419,668 | ||||||
Airtel Africa PLC(b) | 134,294 | 179,486 | ||||||
Auto Trader Group PLC(b) | 17,530 | 155,058 | ||||||
Beazley PLC | 24,174 | 203,229 | ||||||
Bellway PLC | 7,406 | 249,234 | ||||||
Berkeley Group Holdings PLC | 3,360 | 201,954 | ||||||
British Land Co. PLC | 62,658 | 312,812 | ||||||
Britvic PLC | 13,111 | 136,143 | ||||||
Bunzl PLC | 9,995 | 384,846 | ||||||
Burberry Group PLC | 12,508 | 191,663 | ||||||
Centrica PLC | 172,840 | 278,711 | ||||||
Computacenter PLC | 3,214 | 109,460 | ||||||
ConvaTec Group PLC(b) | 46,733 | 169,078 | ||||||
DCC PLC | 3,870 | 281,594 | ||||||
Derwent London PLC | 3,953 | 108,262 | ||||||
Diploma PLC | 3,581 | 168,372 | ||||||
DS Smith PLC | 116,023 | 581,427 | ||||||
Dunelm Group PLC | 11,838 | 169,283 | ||||||
Games Workshop Group PLC | 2,032 | 257,719 | ||||||
Greggs PLC | 3,552 | 128,958 | ||||||
Halma PLC | 3,872 | 115,826 | ||||||
Harbour Energy PLC | 57,508 | 200,360 | ||||||
Hargreaves Lansdown PLC(a) | 24,747 | 230,086 | ||||||
Howden Joinery Group PLC | 24,372 | 279,185 | ||||||
IMI PLC | 6,822 | 156,415 | ||||||
Inchcape PLC | 16,463 | 150,569 | ||||||
Informa PLC | 33,657 | 353,403 | ||||||
InterContinental Hotels Group PLC | 4,719 | 491,328 | ||||||
Intertek Group PLC | 4,228 | 266,250 | ||||||
Investec PLC | 43,570 | 292,592 | ||||||
ITV PLC | 290,510 | 271,203 | ||||||
J Sainsbury PLC | 107,526 | 367,290 | ||||||
JD Sports Fashion PLC | 34,373 | 58,402 | ||||||
JET2 PLC | 3,233 | 58,893 | ||||||
Johnson Matthey PLC | 9,171 | 207,260 | ||||||
Land Securities Group PLC | 46,804 | 389,162 | ||||||
Melrose Industries PLC | 15,965 | 135,729 | ||||||
Next PLC | 5,251 | 612,389 | ||||||
Pearson PLC | 15,206 | 200,158 | ||||||
Renishaw PLC | 1,691 | 90,787 | ||||||
Rightmove PLC | 20,996 | 145,771 | ||||||
Rotork PLC | 27,555 | 114,452 | ||||||
RS Group PLC | 13,458 | 123,562 | ||||||
Sage Group PLC | 21,113 | 337,521 | ||||||
Schroders PLC | 86,980 | 413,799 | ||||||
Severn Trent PLC | 9,141 | 285,220 | ||||||
Smith & Nephew PLC | 27,204 | 340,768 | ||||||
Smiths Group PLC | 12,476 | 258,705 | ||||||
Softcat PLC | 4,308 | 86,420 | ||||||
Spectris PLC | 3,741 | 156,283 | ||||||
Spirax-Sarco Engineering PLC | 1,296 | 164,536 | ||||||
St. James’s Place PLC | 39,095 | 229,401 | ||||||
Tate & Lyle PLC | 10,148 | 79,160 | ||||||
Unite Group PLC | 15,189 | 187,654 | ||||||
United Utilities Group PLC | 25,931 | 337,073 | ||||||
Virgin Money U.K. PLC | 89,010 | 240,513 | ||||||
Weir Group PLC | 7,816 | 199,643 | ||||||
Whitbread PLC | 4,253 | 178,048 | ||||||
|
| |||||||
| Total United Kingdom |
| 13,492,773 | ||||||
TOTAL COMMON STOCKS (Cost: $118,513,802) |
| 134,390,336 | ||||||
| INVESTMENT OF CASH COLLATERAL FOR SECURITIES LOANED – 9.8% |
| |||||||
| United States – 9.8% |
| |||||||
State Street Navigator Securities Lending Government Money Market Portfolio, 5.34%(c) | ||||||||
| (Cost: $13,310,172) | 13,310,172 | 13,310,172 | ||||||
TOTAL INVESTMENTS IN SECURITIES – 109.1% (Cost: $131,823,974) |
| 147,700,508 | ||||||
Other Assets less Liabilities – (9.1)% |
| (12,312,231 | ) | |||||
|
| |||||||
| NET ASSETS – 100.0% |
| $ | 135,388,277 | |||||
| * | Non-income producing security. |
| (a) | Security, or portion thereof, was on loan at March 31, 2024 (See Note 2). At March 31, 2024, the total market value of the Fund’s securities on loan identified in the Schedule of Investments was $21,350,166 and the total market value of the collateral held by the Fund was $22,548,534. The total market value of the collateral includes non-cash U.S. Government securities collateral having a value of $9,238,362. |
See Notes to Financial Statements.
| WisdomTree Trust | 55 |
Schedule of Investments (concluded)
WisdomTree International MidCap Dividend Fund (DIM)
March 31, 2024
| (b) | This security is exempt from registration under rule 144A of the Securities Act of 1933. This security may be sold in transactions that are exempt from registration, normally to qualified institutional buyers. |
| (c) | Rate shown represents annualized 7-day yield as of March 31, 2024. |
FINANCIAL DERIVATIVE INSTRUMENTS | ||||||||||||||||||||||||||||
| FOREIGN CURRENCY CONTRACTS (OTC - OVER THE COUNTER) | ||||||||||||||||||||||||||||
| Counterparty | Settlement Date | Amount and Description of Currency to be Purchased | Amount and Description of Currency to be Sold | Unrealized Appreciation | Unrealized Depreciation | |||||||||||||||||||||||
HSBC Holdings PLC | 4/2/2024 | 26,062 | USD | 40,000 | AUD | $ | — | $ | (34 | ) | ||||||||||||||||||
JP Morgan Chase Bank NA | 4/1/2024 | 33,031 | USD | 5,000,000 | JPY | — | (7 | ) | ||||||||||||||||||||
| $ | — | $ | (41 | ) | ||||||||||||||||||||||||
| FAIR VALUATION SUMMARY |
The following is a summary of the fair valuations according to the inputs used in valuing the Fund’s investments (See Note 2 - Fair Value Measurement):
| Quoted Prices in Active Markets (Level 1) | Other Significant Observable Inputs (Level 2) | Significant Unobservable Inputs (Level 3) | Total | |||||||||||||
Assets: | ||||||||||||||||
Investments in Securities | ||||||||||||||||
Common Stocks | $ | 134,390,336 | $ | — | $ | — | $ | 134,390,336 | ||||||||
Investment of Cash Collateral for Securities Loaned | — | 13,310,172 | — | 13,310,172 | ||||||||||||
Total Investments in Securities | $ | 134,390,336 | $ | 13,310,172 | $ | — | $ | 147,700,508 | ||||||||
Liabilities: | ||||||||||||||||
Financial Derivative Instruments | ||||||||||||||||
Foreign Currency Contracts1 | $ | — | $ | (41 | ) | $ | — | $ | (41 | ) | ||||||
Total – Net | $ | 134,390,336 | $ | 13,310,131 | $ | — | $ | 147,700,467 | ||||||||
| 1 | Amount shown represents the unrealized appreciation (depreciation) on the financial instrument. |
See Notes to Financial Statements.
| 56 | WisdomTree Trust |
Schedule of Investments
WisdomTree International Multifactor Fund (DWMF)
March 31, 2024
| Investments | Shares | Value | ||||||
| COMMON STOCKS – 98.5% |
| |||||||
| Australia – 10.0% |
| |||||||
Ampol Ltd.(a) | 15,985 | $ | 414,955 | |||||
Aristocrat Leisure Ltd. | 5,020 | 140,827 | ||||||
ASX Ltd.(a) | 6,086 | 263,721 | ||||||
BHP Group Ltd. | 8,813 | 254,535 | ||||||
BlueScope Steel Ltd. | 6,361 | 98,975 | ||||||
Brambles Ltd. | 19,424 | 204,656 | ||||||
Cochlear Ltd.(a) | 1,225 | 269,743 | ||||||
Coles Group Ltd. | 10,451 | 115,501 | ||||||
Computershare Ltd. | 8,505 | 144,876 | ||||||
EBOS Group Ltd.(a) | 8,196 | 167,908 | ||||||
Lottery Corp. Ltd.(a) | 41,919 | 140,842 | ||||||
Medibank Pvt Ltd. | 113,889 | 279,372 | ||||||
Orica Ltd. | 14,070 | 167,613 | ||||||
Origin Energy Ltd. | 31,692 | 190,218 | ||||||
Qantas Airways Ltd.* | 35,896 | 127,631 | ||||||
QBE Insurance Group Ltd. | 22,852 | 270,294 | ||||||
Sonic Healthcare Ltd. | 14,374 | 275,795 | ||||||
Suncorp Group Ltd. | 25,432 | 271,774 | ||||||
Telstra Group Ltd. | 70,020 | 176,329 | ||||||
Wesfarmers Ltd. | 3,715 | 165,779 | ||||||
Woolworths Group Ltd.(a) | 5,018 | 108,590 | ||||||
|
| |||||||
| Total Australia |
| 4,249,934 | ||||||
| Austria – 0.7% |
| |||||||
Erste Group Bank AG | 5,506 | 245,590 | ||||||
Verbund AG | 973 | 71,194 | ||||||
|
| |||||||
| Total Austria |
| 316,784 | ||||||
| China – 0.3% |
| |||||||
BOC Hong Kong Holdings Ltd. | 53,000 | 141,871 | ||||||
| Denmark – 2.5% |
| |||||||
Novo Nordisk AS, Class B | 2,868 | 365,969 | ||||||
Rockwool AS, Class B* | 761 | 250,012 | ||||||
Tryg AS | 21,082 | 434,064 | ||||||
|
| |||||||
| Total Denmark |
| 1,050,045 | ||||||
| France – 11.1% |
| |||||||
Bouygues SA | 7,937 | 324,277 | ||||||
Carrefour SA | 15,743 | 269,914 | ||||||
Cie Generale des Etablissements Michelin SCA | 8,356 | 320,550 | ||||||
Danone SA | 4,435 | 286,861 | ||||||
Dassault Aviation SA | 1,174 | 258,656 | ||||||
Eiffage SA | 2,773 | 314,907 | ||||||
Engie SA | 21,437 | 359,087 | ||||||
La Francaise des Jeux SAEM(b) | 7,797 | 318,136 | ||||||
Orange SA | 29,776 | 350,137 | ||||||
Publicis Groupe SA | 2,807 | 306,339 | ||||||
Sanofi SA | 3,823 | 375,559 | ||||||
Sodexo SA | 4,069 | 349,277 | ||||||
Thales SA | 1,775 | 302,982 | ||||||
TotalEnergies SE | 8,271 | 566,957 | ||||||
|
| |||||||
| Total France |
| 4,703,639 | ||||||
| Germany – 5.3% |
| |||||||
Beiersdorf AG | 1,122 | 163,527 | ||||||
Brenntag SE | 1,989 | 167,725 | ||||||
Deutsche Telekom AG, Registered Shares | 15,436 | 375,095 | ||||||
E.ON SE | 16,191 | 225,311 | ||||||
GEA Group AG | 3,959 | 167,566 | ||||||
Hannover Rueck SE | 1,219 | 334,001 | ||||||
Heidelberg Materials AG | 1,579 | 173,857 | ||||||
Muenchener Rueckversicherungs-Gesellschaft AG in Muenchen, Registered Shares | 664 | 324,353 | ||||||
Talanx AG | 4,067 | 322,399 | ||||||
|
| |||||||
| Total Germany |
| 2,253,834 | ||||||
| Hong Kong – 0.6% |
| |||||||
Jardine Matheson Holdings Ltd. | 4,500 | 167,850 | ||||||
WH Group Ltd.(b) | 156,000 | 102,851 | ||||||
|
| |||||||
| Total Hong Kong |
| 270,701 | ||||||
| Ireland – 0.7% |
| |||||||
AerCap Holdings NV* | 2,415 | 209,888 | ||||||
Kerry Group PLC, Class A | 1,033 | 88,626 | ||||||
|
| |||||||
| Total Ireland |
| 298,514 | ||||||
| Israel – 1.8% |
| |||||||
Check Point Software Technologies Ltd.* | 2,691 | 441,351 | ||||||
Teva Pharmaceutical Industries Ltd., ADR* | 21,914 | 309,206 | ||||||
|
| |||||||
| Total Israel |
| 750,557 | ||||||
| Italy – 1.7% |
| |||||||
Assicurazioni Generali SpA | 11,185 | 283,392 | ||||||
Enel SpA | 24,630 | 162,768 | ||||||
Leonardo SpA | 4,001 | 100,595 | ||||||
Terna – Rete Elettrica Nazionale(a) | 19,457 | 160,964 | ||||||
|
| |||||||
| Total Italy |
| 707,719 | ||||||
| Japan – 24.4% |
| |||||||
AGC, Inc. | 4,200 | 153,408 | ||||||
ANA Holdings, Inc.(a) | 8,600 | 182,404 | ||||||
Asahi Group Holdings Ltd. | 1,700 | 62,700 | ||||||
Bridgestone Corp. | 3,600 | 158,324 | ||||||
Brother Industries Ltd. | 12,300 | 229,307 | ||||||
Canon, Inc. | 9,400 | 279,556 | ||||||
Central Japan Railway Co. | 6,200 | 152,639 | ||||||
Chubu Electric Power Co., Inc. | 6,800 | 89,367 | ||||||
East Japan Railway Co.(a) | 7,800 | 150,439 | ||||||
Hankyu Hanshin Holdings, Inc. | 4,400 | 127,862 | ||||||
Hitachi Ltd. | 1,000 | 91,876 | ||||||
Inpex Corp. | 20,000 | 309,293 | ||||||
Japan Airlines Co. Ltd. | 9,200 | 177,350 | ||||||
Japan Tobacco, Inc. | 4,500 | 120,539 | ||||||
JFE Holdings, Inc. | 2,900 | 48,670 | ||||||
Kansai Electric Power Co., Inc. | 6,302 | 91,379 | ||||||
KDDI Corp. | 5,200 | 153,995 | ||||||
Kintetsu Group Holdings Co. Ltd.(a) | 5,400 | 158,848 | ||||||
Kirin Holdings Co. Ltd. | 10,200 | 141,396 | ||||||
Komatsu Ltd. | 2,400 | 70,139 | ||||||
Konami Group Corp. | 1,200 | 81,390 | ||||||
See Notes to Financial Statements.
| WisdomTree Trust | 57 |
Schedule of Investments (continued)
WisdomTree International Multifactor Fund (DWMF)
March 31, 2024
| Investments | Shares | Value | ||||||
Kyowa Kirin Co. Ltd. | 9,000 | $ | 159,995 | |||||
Mazda Motor Corp. | 3,600 | 41,758 | ||||||
McDonald’s Holdings Co. Japan Ltd.(a) | 3,900 | 176,775 | ||||||
MEIJI Holdings Co. Ltd. | 3,500 | 78,305 | ||||||
Mitsubishi Chemical Group Corp. | 15,700 | 95,023 | ||||||
Mitsubishi Corp. | 2,600 | 59,904 | ||||||
Mitsubishi UFJ Financial Group, Inc. | 16,500 | 169,748 | ||||||
Mizuho Financial Group, Inc. | 9,800 | 197,237 | ||||||
MS&AD Insurance Group Holdings, Inc. | 11,100 | 198,831 | ||||||
Nippon Express Holdings, Inc. | 2,700 | 137,939 | ||||||
Nippon Steel Corp.(a) | 3,000 | 72,708 | ||||||
Nippon Telegraph & Telephone Corp. | 140,200 | 166,560 | ||||||
Nissin Foods Holdings Co. Ltd. | 2,300 | 63,828 | ||||||
Obayashi Corp. | 11,700 | 143,984 | ||||||
Oji Holdings Corp.(a) | 54,500 | 229,711 | ||||||
Ono Pharmaceutical Co. Ltd.(a) | 15,500 | 251,378 | ||||||
Oracle Corp. | 2,600 | 196,789 | ||||||
Osaka Gas Co. Ltd. | 6,400 | 143,439 | ||||||
Otsuka Corp. | 11,600 | 245,038 | ||||||
Otsuka Holdings Co. Ltd. | 6,200 | 258,495 | ||||||
Renesas Electronics Corp. | 9,700 | 171,158 | ||||||
Ricoh Co. Ltd. | 24,700 | 220,569 | ||||||
SBI Holdings, Inc. | 8,400 | 219,290 | ||||||
SCSK Corp. | 15,700 | 294,352 | ||||||
Secom Co. Ltd. | 1,800 | 130,351 | ||||||
Seiko Epson Corp. | 13,600 | 237,727 | ||||||
Sekisui Chemical Co. Ltd. | 9,800 | 144,399 | ||||||
Sekisui House Ltd. | 6,300 | 146,318 | ||||||
Shionogi & Co. Ltd. | 5,400 | 276,521 | ||||||
SoftBank Corp. | 12,400 | 159,849 | ||||||
Sompo Holdings, Inc. | 11,700 | 246,609 | ||||||
Subaru Corp. | 2,800 | 63,791 | ||||||
Sumitomo Corp. | 3,800 | 91,695 | ||||||
Sumitomo Mitsui Financial Group, Inc.(a) | 3,200 | 188,370 | ||||||
Suntory Beverage & Food Ltd. | 3,400 | 113,202 | ||||||
TIS, Inc. | 9,700 | 210,799 | ||||||
Tobu Railway Co. Ltd. | 4,900 | 122,415 | ||||||
Toho Co. Ltd. | 4,400 | 143,851 | ||||||
Tokio Marine Holdings, Inc.(a) | 6,000 | 186,448 | ||||||
Tokyo Electric Power Co. Holdings, Inc.* | 6,500 | 40,543 | ||||||
Tokyo Gas Co. Ltd. | 4,100 | 95,114 | ||||||
Toyota Tsusho Corp. | 800 | 54,260 | ||||||
USS Co. Ltd. | 17,200 | 143,480 | ||||||
West Japan Railway Co. | 7,400 | 153,383 | ||||||
Yakult Honsha Co. Ltd. | 7,600 | 156,625 | ||||||
Yokogawa Electric Corp. | 9,600 | 221,629 | ||||||
|
| |||||||
| Total Japan |
| 10,351,074 | ||||||
| Jordan – 0.7% |
| |||||||
Hikma Pharmaceuticals PLC | 13,067 | 316,685 | ||||||
| Netherlands – 2.9% |
| |||||||
Heineken Holding NV | 2,531 | 204,464 | ||||||
JDE Peet’s NV(a) | 9,352 | 196,549 | ||||||
Koninklijke Ahold Delhaize NV | 8,717 | 260,966 | ||||||
Koninklijke KPN NV | 74,783 | 279,934 | ||||||
Wolters Kluwer NV | 1,757 | 275,526 | ||||||
|
| |||||||
| Total Netherlands |
| 1,217,439 | ||||||
| New Zealand – 0.4% |
| |||||||
Spark New Zealand Ltd. | 55,204 | 157,342 | ||||||
| Norway – 2.6% |
| |||||||
DNB Bank ASA | 13,070 | 259,145 | ||||||
Equinor ASA | 12,404 | 327,462 | ||||||
Kongsberg Gruppen ASA | 1,362 | 94,097 | ||||||
Mowi ASA | 3,830 | 70,237 | ||||||
Orkla ASA | 34,913 | 246,321 | ||||||
Yara International ASA | 3,639 | 115,021 | ||||||
|
| |||||||
| Total Norway |
| 1,112,283 | ||||||
| Portugal – 1.1% |
| |||||||
Galp Energia SGPS SA | 11,953 | 197,705 | ||||||
Jeronimo Martins SGPS SA | 12,921 | 256,487 | ||||||
|
| |||||||
| Total Portugal |
| 454,192 | ||||||
| Russia – 0.0% |
| |||||||
Evraz PLC*† | 17,300 | 0 | ||||||
| Singapore – 2.4% |
| |||||||
DBS Group Holdings Ltd. | 11,900 | 317,692 | ||||||
Genting Singapore Ltd. | 141,800 | 92,985 | ||||||
Keppel Ltd. | 25,000 | 135,966 | ||||||
Sembcorp Industries Ltd. | 15,600 | 62,419 | ||||||
Singapore Airlines Ltd.(a) | 30,300 | 143,687 | ||||||
Singapore Exchange Ltd. | 42,000 | 286,618 | ||||||
|
| |||||||
| Total Singapore |
| 1,039,367 | ||||||
| Spain – 3.6% |
| |||||||
ACS Actividades de Construccion y Servicios SA | 3,366 | 140,976 | ||||||
Banco Bilbao Vizcaya Argentaria SA | 18,469 | 220,209 | ||||||
Endesa SA | 7,525 | 139,500 | ||||||
Iberdrola SA | 14,493 | 179,925 | ||||||
Industria de Diseno Textil SA | 3,872 | 195,163 | ||||||
Naturgy Energy Group SA(a) | 6,229 | 135,219 | ||||||
Repsol SA | 21,970 | 366,354 | ||||||
Telefonica SA | 35,578 | 157,117 | ||||||
|
| |||||||
| Total Spain |
| 1,534,463 | ||||||
| Sweden – 2.0% |
| |||||||
Essity AB, Class B(a) | 4,124 | 98,042 | ||||||
Svenska Handelsbanken AB, Class A(a) | 19,414 | 196,544 | ||||||
Swedbank AB, Class A(a) | 9,014 | 178,971 | ||||||
Tele2 AB, Class B | 12,934 | 106,326 | ||||||
Telia Co. AB | 51,510 | 132,140 | ||||||
Volvo AB, Class B(a) | 4,541 | 123,201 | ||||||
|
| |||||||
| Total Sweden |
| 835,224 | ||||||
| Switzerland – 8.9% |
| |||||||
BKW AG | 1,699 | 261,065 | ||||||
Chocoladefabriken Lindt & Spruengli AG | 19 | 227,612 | ||||||
Coca-Cola HBC AG* | 6,938 | 219,374 | ||||||
Givaudan SA, Registered Shares | 63 | 280,902 | ||||||
Helvetia Holding AG, Registered Shares(a) | 2,706 | 373,438 | ||||||
See Notes to Financial Statements.
| 58 | WisdomTree Trust |
Schedule of Investments (continued)
WisdomTree International Multifactor Fund (DWMF)
March 31, 2024
| Investments | Shares | Value | ||||||
Holcim AG, Registered Shares | 3,287 | $ | 298,009 | |||||
Kuehne & Nagel International AG, Registered Shares | 844 | 235,199 | ||||||
Nestle SA, Registered Shares | 2,513 | 267,147 | ||||||
Novartis AG, Registered Shares | 4,531 | 439,518 | ||||||
Roche Holding AG | 1,577 | 402,173 | ||||||
Swisscom AG, Registered Shares* | 556 | 340,378 | ||||||
Zurich Insurance Group AG | 781 | 421,672 | ||||||
|
| |||||||
| Total Switzerland |
| 3,766,487 | ||||||
| United Kingdom – 13.6% |
| |||||||
Associated British Foods PLC | 6,621 | 208,932 | ||||||
BAE Systems PLC | 15,723 | 268,039 | ||||||
BP PLC | 72,106 | 451,523 | ||||||
British American Tobacco PLC | 5,960 | 181,147 | ||||||
Bunzl PLC | 6,339 | 244,076 | ||||||
Centrica PLC | 123,875 | 199,753 | ||||||
Coca-Cola Europacific Partners PLC | 3,496 | 244,545 | ||||||
Compass Group PLC | 10,351 | 303,753 | ||||||
HSBC Holdings PLC | 40,766 | 318,771 | ||||||
Imperial Brands PLC | 10,748 | 240,320 | ||||||
JD Sports Fashion PLC | 70,711 | 120,143 | ||||||
National Grid PLC | 33,854 | 455,886 | ||||||
Next PLC | 2,069 | 241,294 | ||||||
Pearson PLC | 16,570 | 218,112 | ||||||
Reckitt Benckiser Group PLC | 2,812 | 160,278 | ||||||
RELX PLC | 5,831 | 252,212 | ||||||
Rolls-Royce Holdings PLC* | 25,641 | 138,212 | ||||||
Sage Group PLC | 22,334 | 357,041 | ||||||
SSE PLC | 12,052 | 251,207 | ||||||
Tesco PLC | 72,435 | 271,399 | ||||||
Unilever PLC | 4,730 | 237,543 | ||||||
Vodafone Group PLC | 210,460 | 187,328 | ||||||
Whitbread PLC | 4,951 | 207,269 | ||||||
|
| |||||||
| Total United Kingdom |
| 5,758,783 | ||||||
| United States – 1.2% |
| |||||||
GSK PLC | 18,831 | 406,446 | ||||||
Stellantis NV | 4,117 | 117,140 | ||||||
|
| |||||||
| Total United States |
| 523,586 | ||||||
TOTAL COMMON STOCKS (Cost: $38,734,076) |
| 41,810,523 | ||||||
| PREFERRED STOCK – 0.4% |
| |||||||
| Germany – 0.4% |
| |||||||
Henkel AG & Co. KGaA(c) | ||||||||
(Cost: $186,492) | 2,321 | 186,748 | ||||||
| INVESTMENT OF CASH COLLATERAL FOR SECURITIES LOANED – 2.9% |
| |||||||
| United States – 2.9% |
| |||||||
State Street Navigator Securities Lending Government Money Market Portfolio, 5.34%(d) | ||||||||
(Cost: $1,221,857) | 1,221,857 | 1,221,857 | ||||||
TOTAL INVESTMENTS IN SECURITIES – 101.8% (Cost: $40,142,425) |
| 43,219,128 | ||||||
Other Assets less Liabilities – (1.8)% |
| (778,135 | ) | |||||
|
| |||||||
| NET ASSETS – 100.0% |
| $ | 42,440,993 | |||||
| * | Non-income producing security. |
| † | This security is being fair valued using significant unobservable inputs (i.e., Level 3 on the fair value hierarchy) by WisdomTree Asset Management, Inc., as valuation designee, in accordance with valuation procedures approved by the Board of Trustees of WisdomTree Trust. The aggregate value of Level 3 fair valued securities is $0, which represents 0.0% of net assets. |
| (a) | Security, or portion thereof, was on loan at March 31, 2024 (See Note 2). At March 31, 2024, the total market value of the Fund’s securities on loan identified in the Schedule of Investments was $2,678,068 and the total market value of the collateral held by the Fund was $2,799,669. The total market value of the collateral includes non-cash U.S. Government securities collateral having a value of $1,577,812. |
| (b) | This security is exempt from registration under rule 144A of the Securities Act of 1933. This security may be sold in transactions that are exempt from registration, normally to qualified institutional buyers. |
| (c) | Rate shown reflects the accrual rate as of March 31, 2024 on securities with variable or step rates. |
| (d) | Rate shown represents annualized 7-day yield as of March 31, 2024. |
| FINANCIAL DERIVATIVE INSTRUMENTS | ||||||||||||||||||||||||||||
| FOREIGN CURRENCY CONTRACTS (OTC – OVER THE COUNTER) | ||||||||||||||||||||||||||||
| Counterparty | Settlement Date | Amount and Description of be Purchased | Amount and Description of be Sold | Unrealized Appreciation | Unrealized Depreciation | |||||||||||||||||||||||
Bank of America NA | 4/4/2024 | 1,147,281 | USD | 12,149,241 | NOK | $ | 27,361 | $ | — | |||||||||||||||||||
Bank of America NA | 4/4/2024 | 378,684 | USD | 3,909,348 | SEK | 13,057 | — | |||||||||||||||||||||
Barclays Bank PLC | 4/3/2024 | 60,000 | NOK | 4,404 | GBP | — | (32 | ) | ||||||||||||||||||||
Barclays Bank PLC | 4/3/2024 | 1,083,826 | USD | 158,823,125 | JPY | 34,255 | — | |||||||||||||||||||||
Barclays Bank PLC | 4/3/2024 | 82,058 | USD | 109,030 | SGD | 1,267 | — | |||||||||||||||||||||
Barclays Bank PLC | 4/4/2024 | 8,241,624 | SEK | 773,774 | USD | — | (2,965 | ) | ||||||||||||||||||||
Barclays Bank PLC | 4/4/2024 | 413,080 | USD | 621,729 | AUD | 7,453 | — | |||||||||||||||||||||
Barclays Bank PLC | 4/4/2024 | 395,357 | USD | 345,260 | CHF | 11,991 | — | |||||||||||||||||||||
Barclays Bank PLC | 4/4/2024 | 102,053 | USD | 693,308 | DKK | 1,663 | — | |||||||||||||||||||||
Barclays Bank PLC | 4/4/2024 | 1,159,976 | USD | 1,057,396 | EUR | 17,944 | — | |||||||||||||||||||||
Barclays Bank PLC | 4/4/2024 | 709,372 | USD | 550,619 | GBP | 13,798 | — | |||||||||||||||||||||
Barclays Bank PLC | 4/4/2024 | 145,938 | USD | 1,513,345 | NOK | 6,437 | — | |||||||||||||||||||||
Barclays Bank PLC | 4/4/2024 | 36,354 | USD | 58,708 | NZD | 1,238 | — | |||||||||||||||||||||
Barclays Bank PLC | 4/4/2024 | 48,170 | USD | 490,163 | SEK | 2,327 | — | |||||||||||||||||||||
See Notes to Financial Statements.
| WisdomTree Trust | 59 |
Schedule of Investments (continued)
WisdomTree International Multifactor Fund (DWMF)
March 31, 2024
| FINANCIAL DERIVATIVE INSTRUMENTS | ||||||||||||||||||||||||||||
| FOREIGN CURRENCY CONTRACTS (OTC – OVER THE COUNTER) | ||||||||||||||||||||||||||||
| Counterparty | Settlement Date | Amount and Description of be Purchased | Amount and Description of be Sold | Unrealized Appreciation | Unrealized Depreciation | |||||||||||||||||||||||
Barclays Bank PLC | 5/6/2024 | 645,976 | USD | 6,871,620 | SEK | $ | 2,467 | $ | — | |||||||||||||||||||
Citibank NA | 4/3/2024 | 892,387 | SGD | 661,499 | USD | — | (245 | ) | ||||||||||||||||||||
Citibank NA | 4/4/2024 | 5,314,716 | AUD | 3,462,998 | USD | 4,419 | — | |||||||||||||||||||||
Citibank NA | 4/4/2024 | 802,280 | USD | 5,512,624 | DKK | 4,062 | — | |||||||||||||||||||||
Citibank NA | 4/4/2024 | 9,119,044 | USD | 8,408,524 | EUR | 37,487 | — | |||||||||||||||||||||
Citibank NA | 5/3/2024 | 3,560,293 | USD | 5,459,505 | AUD | — | (4,540 | ) | ||||||||||||||||||||
Citibank NA | 5/6/2024 | 523,994 | USD | 705,803 | SGD | 198 | — | |||||||||||||||||||||
Goldman Sachs | 4/3/2024 | 167,016,357 | JPY | 1,134,417 | USD | — | (30,701 | ) | ||||||||||||||||||||
Goldman Sachs | 4/3/2024 | 84,673 | SGD | 63,583 | USD | — | (841 | ) | ||||||||||||||||||||
Goldman Sachs | 4/3/2024 | 500,718 | USD | 73,719,008 | JPY | 13,551 | — | |||||||||||||||||||||
Goldman Sachs | 4/4/2024 | 665,753 | AUD | 439,654 | USD | — | (5,305 | ) | ||||||||||||||||||||
Goldman Sachs | 4/4/2024 | 338,089 | CHF | 385,829 | USD | — | (10,425 | ) | ||||||||||||||||||||
Goldman Sachs | 4/4/2024 | 682,384 | DKK | 100,028 | USD | — | (1,220 | ) | ||||||||||||||||||||
Goldman Sachs | 4/4/2024 | 606,700 | EUR | 662,971 | USD | — | (7,710 | ) | ||||||||||||||||||||
Goldman Sachs | 4/4/2024 | 989,169 | EUR | 1,080,914 | USD | — | (12,571 | ) | ||||||||||||||||||||
Goldman Sachs | 4/4/2024 | 540,534 | GBP | 691,144 | USD | — | (8,311 | ) | ||||||||||||||||||||
Goldman Sachs | 4/4/2024 | 1,468,579 | NOK | 139,573 | USD | — | (4,199 | ) | ||||||||||||||||||||
Goldman Sachs | 4/4/2024 | 63,264 | NZD | 38,900 | USD | — | (1,058 | ) | ||||||||||||||||||||
Goldman Sachs | 4/4/2024 | 999,550 | SEK | 97,701 | USD | — | (4,217 | ) | ||||||||||||||||||||
Goldman Sachs | 4/4/2024 | 256,465 | USD | 388,356 | AUD | 3,094 | — | |||||||||||||||||||||
Goldman Sachs | 4/4/2024 | 447,796 | USD | 4,581,267 | SEK | 19,327 | — | |||||||||||||||||||||
HSBC Holdings PLC | 4/1/2024 | 5,200,000 | JPY | 34,359 | USD | — | (0 | ) ^ | ||||||||||||||||||||
HSBC Holdings PLC | 4/2/2024 | 500 | EUR | 540 | USD | 0 | ^ | — | ||||||||||||||||||||
HSBC Holdings PLC | 4/2/2024 | 6,400,000 | JPY | 42,340 | USD | — | (52 | ) | ||||||||||||||||||||
HSBC Holdings PLC | 4/2/2024 | 5,500 | SGD | 4,075 | USD | — | (0 | ) ^ | ||||||||||||||||||||
HSBC Holdings PLC | 4/3/2024 | 5,572,871 | JPY | 36,867 | USD | — | (39 | ) | ||||||||||||||||||||
HSBC Holdings PLC | 4/3/2024 | 1,351,005,261 | JPY | 8,933,656 | USD | — | (5,635 | ) | ||||||||||||||||||||
HSBC Holdings PLC | 4/3/2024 | 2,787 | SGD | 2,066 | USD | — | (1 | ) | ||||||||||||||||||||
HSBC Holdings PLC | 4/4/2024 | 21,910 | AUD | 14,289 | USD | 6 | — | |||||||||||||||||||||
HSBC Holdings PLC | 4/4/2024 | 11,252 | CHF | 12,539 | USD | — | (46 | ) | ||||||||||||||||||||
HSBC Holdings PLC | 4/4/2024 | 2,798,597 | CHF | 3,105,058 | USD | 2,419 | — | |||||||||||||||||||||
HSBC Holdings PLC | 4/4/2024 | 22,401 | DKK | 3,250 | USD | — | (6 | ) | ||||||||||||||||||||
HSBC Holdings PLC | 4/4/2024 | 5,524,564 | DKK | 801,055 | USD | — | (1,108 | ) | ||||||||||||||||||||
HSBC Holdings PLC | 4/4/2024 | 32,467 | EUR | 35,128 | USD | — | (63 | ) | ||||||||||||||||||||
HSBC Holdings PLC | 4/4/2024 | 7,860,031 | EUR | 8,500,007 | USD | — | (10,845 | ) | ||||||||||||||||||||
HSBC Holdings PLC | 4/4/2024 | 17,822 | GBP | 22,461 | USD | 53 | — | |||||||||||||||||||||
HSBC Holdings PLC | 4/4/2024 | 4,405,651 | GBP | 5,572,428 | USD | — | (6,960 | ) | ||||||||||||||||||||
HSBC Holdings PLC | 4/4/2024 | 48,729 | NOK | 4,536 | USD | — | (44 | ) | ||||||||||||||||||||
HSBC Holdings PLC | 4/4/2024 | 2,108 | NZD | 1,264 | USD | — | (3 | ) | ||||||||||||||||||||
HSBC Holdings PLC | 4/4/2024 | 471,641 | NZD | 281,990 | USD | 122 | — | |||||||||||||||||||||
HSBC Holdings PLC | 4/4/2024 | 33,488 | SEK | 3,175 | USD | — | (43 | ) | ||||||||||||||||||||
HSBC Holdings PLC | 4/4/2024 | 5,576,661 | USD | 4,408,949 | GBP | 7,026 | — | |||||||||||||||||||||
HSBC Holdings PLC | 5/3/2024 | 805,083 | USD | 5,544,234 | DKK | 1,124 | — | |||||||||||||||||||||
HSBC Holdings PLC | 5/3/2024 | 4,036,023 | USD | 3,190,432 | GBP | 5,040 | — | |||||||||||||||||||||
HSBC Holdings PLC | 5/3/2024 | 293,288 | USD | 490,523 | NZD | — | (128 | ) | ||||||||||||||||||||
HSBC Holdings PLC | 5/6/2024 | 2,647,546 | USD | 2,377,784 | CHF | — | (2,050 | ) | ||||||||||||||||||||
HSBC Holdings PLC | 5/6/2024 | 9,037,298 | USD | 8,346,147 | EUR | 11,522 | — | |||||||||||||||||||||
HSBC Holdings PLC | 5/7/2024 | 9,155,038 | USD | 1,377,322,276 | JPY | 5,641 | — | |||||||||||||||||||||
JP Morgan Chase Bank NA | 4/2/2024 | 13,800 | CHF | 2,305,165 | JPY | 90 | — | |||||||||||||||||||||
JP Morgan Chase Bank NA | 4/2/2024 | 16,200 | EUR | 186,002 | SEK | 101 | — | |||||||||||||||||||||
JP Morgan Chase Bank NA | 4/2/2024 | 21,200 | HKD | 2,710 | USD | — | (1 | ) | ||||||||||||||||||||
Morgan Stanley & Co. International | 4/3/2024 | 35,000 | AUD | 3,450,195 | JPY | 37 | — | |||||||||||||||||||||
Morgan Stanley & Co. International | 4/3/2024 | 24,300 | CHF | 26,949 | USD | 30 | — | |||||||||||||||||||||
Morgan Stanley & Co. International | 4/3/2024 | 72,000 | EUR | 11,755,512 | JPY | 86 | — | |||||||||||||||||||||
See Notes to Financial Statements.
| 60 | WisdomTree Trust |
Schedule of Investments (concluded)
WisdomTree International Multifactor Fund (DWMF)
March 31, 2024
| FINANCIAL DERIVATIVE INSTRUMENTS | ||||||||||||||||||||||||||||
| FOREIGN CURRENCY CONTRACTS (OTC – OVER THE COUNTER) | ||||||||||||||||||||||||||||
| Counterparty | Settlement Date | Amount and Description of be Purchased | Amount and Description of be Sold | Unrealized Appreciation | Unrealized Depreciation | |||||||||||||||||||||||
Morgan Stanley & Co. International | 4/3/2024 | 18,400 | GBP | 3,513,148 | JPY | $ | 31 | $ | — | |||||||||||||||||||
Morgan Stanley & Co. International | 4/3/2024 | 125,000 | SEK | 11,698 | USD | — | (8 | ) | ||||||||||||||||||||
Morgan Stanley & Co. International | 4/3/2024 | 8,520,396 | USD | 1,271,529,027 | JPY | 117,588 | — | |||||||||||||||||||||
Morgan Stanley & Co. International | 4/3/2024 | 645,090 | USD | 866,444 | SGD | 3,060 | — | |||||||||||||||||||||
Morgan Stanley & Co. International | 4/4/2024 | 12,428,107 | NOK | 1,149,110 | USD | — | (3,485 | ) | ||||||||||||||||||||
Morgan Stanley & Co. International | 4/4/2024 | 3,247,396 | USD | 4,989,066 | AUD | — | (7,560 | ) | ||||||||||||||||||||
Morgan Stanley & Co. International | 4/4/2024 | 3,108,069 | USD | 2,726,996 | CHF | 80,095 | — | |||||||||||||||||||||
Morgan Stanley & Co. International | 4/4/2024 | 285,800 | USD | 469,235 | NZD | 5,127 | — | |||||||||||||||||||||
Morgan Stanley & Co. International | 5/6/2024 | 994,951 | USD | 10,752,026 | NOK | 3,030 | — | |||||||||||||||||||||
UBS AG | 4/3/2024 | 10,200 | SGD | 7,559 | USD | — | (1 | ) | ||||||||||||||||||||
| $ | 465,624 | $ | (132,418 | ) | ||||||||||||||||||||||||
| ^ | Amount represents less than $1. |
| FAIR VALUATION SUMMARY | ||||||||||||||
The following is a summary of the fair valuations according to the inputs used in valuing the Fund’s investments (See Note 2 — Fair Value Measurement):
Quoted Prices in Active Markets (Level 1) | Other (Level 2) | Significant (Level 3) | Total | |||||||||||||
Assets: | ||||||||||||||||
Investments in Securities | ||||||||||||||||
Common Stocks | ||||||||||||||||
Russia | $ | — | $ | — | $ | 0 | * | $ | 0 | |||||||
Other | 41,810,523 | — | — | 41,810,523 | ||||||||||||
Preferred Stock | 186,748 | — | — | 186,748 | ||||||||||||
Investment of Cash Collateral for Securities Loaned | — | 1,221,857 | — | 1,221,857 | ||||||||||||
Total Investments in Securities | $ | 41,997,271 | $ | 1,221,857 | $ | 0 | $ | 43,219,128 | ||||||||
Financial Derivative Instruments | ||||||||||||||||
Foreign Currency Contracts1 | $ | — | $ | 465,624 | $ | — | $ | 465,624 | ||||||||
Liabilities: | ||||||||||||||||
Financial Derivative Instruments | ||||||||||||||||
Foreign Currency Contracts1 | $ | — | $ | (132,418 | ) | $ | — | $ | (132,418 | ) | ||||||
Total –Net | $ | 41,997,271 | $ | 1,555,063 | $ | 0 | $ | 43,552,334 | ||||||||
| * | Fair valuations using significant unobservable inputs were determined by WisdomTree Asset Management, Inc., as valuation designee, in accordance with valuation procedures approved by the Board of Trustees of WisdomTree Trust. |
| 1 | Amount shown represents the unrealized appreciation (depreciation) on the financial instrument. |
See Notes to Financial Statements.
| WisdomTree Trust | 61 |
Schedule of Investments
WisdomTree International Quality Dividend Growth Fund (IQDG)
March 31, 2024
| Investments | Shares | Value | ||||||
| COMMON STOCKS – 99.5% |
| |||||||
| Australia – 7.1% |
| |||||||
Altium Ltd. | 22,561 | $ | 959,960 | |||||
Aristocrat Leisure Ltd. | 70,581 | 1,980,023 | ||||||
Beach Energy Ltd. | 485,743 | 581,509 | ||||||
Brambles Ltd. | 436,492 | 4,598,993 | ||||||
Breville Group Ltd.(a) | 42,638 | 764,690 | ||||||
Brickworks Ltd. | 42,517 | 789,981 | ||||||
CAR Group Ltd. | 91,865 | 2,162,373 | ||||||
Champion Iron Ltd.(a) | 170,967 | 826,503 | ||||||
Charter Hall Group | 275,977 | 2,475,652 | ||||||
Cochlear Ltd. | 6,705 | 1,476,428 | ||||||
Coles Group Ltd. | 585,016 | 6,465,395 | ||||||
CSL Ltd. | 51,518 | 9,677,090 | ||||||
Dicker Data Ltd. | 65,427 | 459,713 | ||||||
Goodman Group | 278,237 | 6,137,252 | ||||||
IDP Education Ltd.(a) | 59,704 | 698,000 | ||||||
Mineral Resources Ltd.(a) | 61,304 | 2,834,426 | ||||||
Pilbara Minerals Ltd.(a) | 1,895,382 | 4,735,976 | ||||||
REA Group Ltd.(a) | 14,555 | 1,761,164 | ||||||
SEEK Ltd.(a) | 92,959 | 1,519,194 | ||||||
Seven Group Holdings Ltd.(a) | 74,078 | 1,970,352 | ||||||
Tabcorp Holdings Ltd. | 584,688 | 287,995 | ||||||
Technology One Ltd. | 39,333 | 435,465 | ||||||
Wesfarmers Ltd. | 356,315 | 15,900,257 | ||||||
|
| |||||||
| Total Australia |
| 69,498,391 | ||||||
| Austria – 0.6% |
| |||||||
Kontron AG | 32,913 | 726,561 | ||||||
Mondi PLC | 200,743 | 3,538,829 | ||||||
Wienerberger AG | 42,839 | 1,561,944 | ||||||
|
| |||||||
| Total Austria |
| 5,827,334 | ||||||
| Belgium – 0.8% |
| |||||||
Bekaert SA | 23,709 | 1,217,296 | ||||||
bpost SA | 148,513 | 555,605 | ||||||
D’ieteren Group | 10,680 | 2,371,473 | ||||||
Fagron | 9,552 | 182,183 | ||||||
Tessenderlo Group SA | 20,871 | 546,611 | ||||||
UCB SA | 25,932 | 3,203,950 | ||||||
|
| |||||||
| Total Belgium |
| 8,077,118 | ||||||
| China – 0.4% |
| |||||||
Prosus NV | 110,697 | 3,475,996 | ||||||
| Denmark – 4.4% |
| |||||||
Coloplast AS, Class B | 25,816 | 3,485,244 | ||||||
Dfds AS | 20,590 | 597,442 | ||||||
Novo Nordisk AS, Class B | 240,183 | 30,648,415 | ||||||
Novonesis (Novozymes) B, Class B | 75,617 | 4,436,402 | ||||||
Pandora AS | 18,083 | 2,918,049 | ||||||
Royal Unibrew AS | 9,584 | 633,753 | ||||||
|
| |||||||
| Total Denmark |
| 42,719,305 | ||||||
| Finland – 1.2% |
| |||||||
Metsa Board OYJ, Class B(a) | 251,155 | 1,904,157 | ||||||
Orion OYJ, Class B | 33,061 | 1,234,352 | ||||||
UPM-Kymmene OYJ | 242,394 | 8,081,318 | ||||||
|
| |||||||
| Total Finland |
| 11,219,827 | ||||||
| France – 12.0% |
| |||||||
Airbus SE | 108,143 | 19,939,145 | ||||||
Alten SA | 4,917 | 717,960 | ||||||
Arkema SA | 31,095 | 3,275,646 | ||||||
BioMerieux | 12,653 | 1,397,271 | ||||||
Carrefour SA | 237,478 | 4,071,560 | ||||||
Eramet SA | 15,370 | 1,169,442 | ||||||
Gaztransport & Technigaz SA | 10,578 | 1,582,257 | ||||||
Hermes International SCA | 6,725 | 17,184,257 | ||||||
Interparfums SA | 22,234 | 1,253,464 | ||||||
Ipsen SA | 7,153 | 852,094 | ||||||
Kering SA | 38,088 | 15,069,821 | ||||||
La Francaise des Jeux SAEM(b) | 47,048 | 1,919,671 | ||||||
LVMH Moet Hennessy Louis Vuitton SE | 52,587 | 47,349,121 | ||||||
SEB SA | 14,255 | 1,825,894 | ||||||
|
| |||||||
| Total France |
| 117,607,603 | ||||||
| Germany – 4.8% |
| |||||||
AIXTRON SE | 12,698 | 335,989 | ||||||
Aurubis AG | 9,245 | 650,796 | ||||||
Bechtle AG | 20,752 | 1,097,748 | ||||||
Bilfinger SE | 13,892 | 649,645 | ||||||
Carl Zeiss Meditec AG, Bearer Shares | 12,274 | 1,535,035 | ||||||
Deutsche Post AG, Registered Shares | 600,194 | 25,873,281 | ||||||
Fielmann Group AG | 14,048 | 645,713 | ||||||
Gerresheimer AG | 4,723 | 532,528 | ||||||
Hugo Boss AG | 13,378 | 789,163 | ||||||
Knorr-Bremse AG | 42,133 | 3,189,805 | ||||||
Merck KGaA | 14,098 | 2,490,947 | ||||||
Nemetschek SE | 7,569 | 749,767 | ||||||
Puma SE | 21,353 | 969,033 | ||||||
Rheinmetall AG | 6,863 | 3,861,673 | ||||||
Siltronic AG | 10,643 | 944,843 | ||||||
Stroeer SE & Co. KGaA | 19,425 | 1,183,216 | ||||||
Symrise AG | 14,751 | 1,767,553 | ||||||
|
| |||||||
| Total Germany |
| 47,266,735 | ||||||
| Hong Kong – 0.6% |
| |||||||
Techtronic Industries Co. Ltd. | 395,500 | 5,361,633 | ||||||
| Ireland – 0.2% |
| |||||||
Kerry Group PLC, Class A | 26,105 | 2,239,683 | ||||||
| Israel – 0.5% |
| |||||||
Hilan Ltd. | 4,351 | 277,660 | ||||||
Isramco Negev 2 LP | 1,960,418 | 957,815 | ||||||
Newmed Energy LP | 481,786 | 1,233,231 | ||||||
Oil Refineries Ltd. | 4,279,714 | 1,425,131 | ||||||
Plus500 Ltd. | 54,351 | 1,239,293 | ||||||
|
| |||||||
| Total Israel |
| 5,133,130 | ||||||
| Italy – 1.5% |
| |||||||
Brunello Cucinelli SpA | 5,769 | 660,435 | ||||||
Carel Industries SpA(a)(b) | 14,372 | 315,868 | ||||||
See Notes to Financial Statements.
| 62 | WisdomTree Trust |
Schedule of Investments (continued)
WisdomTree International Quality Dividend Growth Fund (IQDG)
March 31, 2024
| Investments | Shares | Value | ||||||
Davide Campari-Milano NV | 49,316 | $ | 496,076 | |||||
De’ Longhi SpA(a) | 33,483 | 1,159,342 | ||||||
DiaSorin SpA | 7,783 | 752,305 | ||||||
Ferrari NV | 11,084 | 4,836,170 | ||||||
Moncler SpA | 58,522 | 4,372,436 | ||||||
Piaggio & C SpA | 287,501 | 910,389 | ||||||
Salcef Group SpA | 15,051 | 372,241 | ||||||
Salvatore Ferragamo SpA(a) | 51,911 | 631,840 | ||||||
|
| |||||||
| Total Italy |
| 14,507,102 | ||||||
| Japan – 15.5% |
| |||||||
Advantest Corp. | 63,600 | 2,865,561 | ||||||
ARE Holdings, Inc.(a) | 46,800 | 597,427 | ||||||
ASKUL Corp.(a) | 11,500 | 174,310 | ||||||
BayCurrent Consulting, Inc. | 10,700 | 210,225 | ||||||
Capcom Co. Ltd. | 60,200 | 1,111,758 | ||||||
Casio Computer Co. Ltd.(a) | 50,000 | 428,161 | ||||||
Daiwabo Holdings Co. Ltd. | 35,900 | 609,027 | ||||||
Dentsu Soken, Inc. | 17,900 | 593,730 | ||||||
Dexerials Corp. | 9,700 | 428,583 | ||||||
Dip Corp. | 17,300 | 314,462 | ||||||
Disco Corp. | 11,300 | 4,270,025 | ||||||
FANUC Corp. | 239,300 | 6,617,136 | ||||||
Fast Retailing Co. Ltd. | 23,900 | 7,444,223 | ||||||
Food & Life Cos. Ltd. | 19,400 | 368,913 | ||||||
Fujimi, Inc.(a) | 20,100 | 467,488 | ||||||
Fujitsu Ltd.(a) | 268,000 | 4,409,264 | ||||||
Goldwin, Inc.(a) | 4,800 | 312,843 | ||||||
Hoya Corp. | 15,400 | 1,906,875 | ||||||
Ibiden Co. Ltd.(a) | 11,000 | 483,260 | ||||||
Internet Initiative Japan, Inc. | 17,100 | 320,431 | ||||||
Japan Material Co. Ltd. | 10,600 | 168,723 | ||||||
Kakaku.com, Inc. | 77,400 | 962,226 | ||||||
Keyence Corp. | 13,400 | 6,157,032 | ||||||
Koei Tecmo Holdings Co. Ltd.(a) | 107,700 | 1,152,823 | ||||||
Lasertec Corp. | 6,800 | 1,878,093 | ||||||
M3, Inc. | 47,100 | 665,055 | ||||||
MEITEC Group Holdings, Inc. | 41,800 | 824,980 | ||||||
Minebea Mitsumi, Inc. | 79,000 | 1,540,381 | ||||||
Mitsui Chemicals, Inc.(a) | 74,400 | 2,129,085 | ||||||
MonotaRO Co. Ltd. | 44,900 | 539,204 | ||||||
Murata Manufacturing Co. Ltd. | 398,300 | 7,432,021 | ||||||
NET One Systems Co. Ltd. | 23,200 | 413,889 | ||||||
Nextage Co. Ltd.(a) | 13,500 | 259,037 | ||||||
NGK Insulators Ltd. | 109,300 | 1,473,270 | ||||||
NHK Spring Co. Ltd. | 86,200 | 852,631 | ||||||
Nihon M&A Center Holdings, Inc. | 125,500 | 818,451 | ||||||
Nippon Gas Co. Ltd. | 42,600 | 723,253 | ||||||
Nippon Steel Corp.(a) | 484,700 | 11,747,197 | ||||||
Nomura Research Institute Ltd. | 81,500 | 2,284,876 | ||||||
NSD Co. Ltd. | 26,500 | 521,088 | ||||||
Obic Co. Ltd. | 13,700 | 2,061,631 | ||||||
Oracle Corp. | 21,800 | 1,649,998 | ||||||
Pan Pacific International Holdings Corp. | 46,500 | 1,242,192 | ||||||
Persol Holdings Co. Ltd. | 1,000,500 | 1,411,390 | ||||||
Relo Group, Inc. | 57,400 | 472,376 | ||||||
Sanrio Co. Ltd. | 12,300 | 247,877 | ||||||
SG Holdings Co. Ltd. | 159,500 | 2,005,540 | ||||||
Shin-Etsu Chemical Co. Ltd. | 458,900 | 19,963,643 | ||||||
Shinko Electric Industries Co. Ltd.(a) | 14,400 | 534,440 | ||||||
SMC Corp. | 8,900 | 4,988,516 | ||||||
SMS Co. Ltd. | 24,500 | 418,950 | ||||||
Sysmex Corp. | 69,300 | 1,218,685 | ||||||
Taiyo Yuden Co. Ltd.(a) | 39,800 | 953,286 | ||||||
Takara Bio, Inc. | 38,400 | 246,113 | ||||||
Takara Holdings, Inc.(a) | 88,700 | 627,397 | ||||||
TDK Corp. | 75,000 | 3,707,258 | ||||||
TechnoPro Holdings, Inc. | 33,800 | 691,879 | ||||||
Toei Animation Co. Ltd. | 34,000 | 696,422 | ||||||
Tokyo Electron Ltd. | 93,700 | 24,498,391 | ||||||
Tokyo Ohka Kogyo Co. Ltd. | 17,100 | 517,367 | ||||||
Tokyo Seimitsu Co. Ltd. | 11,000 | 884,899 | ||||||
Topcon Corp. | 27,000 | 317,999 | ||||||
Tosoh Corp. | 150,800 | 2,054,575 | ||||||
Yaskawa Electric Corp. | 38,000 | 1,592,613 | ||||||
ZOZO, Inc.(a) | 77,400 | 1,946,443 | ||||||
|
| |||||||
| Total Japan |
| 151,426,897 | ||||||
| Netherlands – 8.4% |
| |||||||
ASM International NV | 3,360 | 2,053,538 | ||||||
ASML Holding NV | 41,061 | 39,565,391 | ||||||
Corbion NV | 718 | 15,392 | ||||||
Heineken Holding NV | 75,921 | 6,133,201 | ||||||
Heineken NV | 127,163 | 12,269,601 | ||||||
SBM Offshore NV | 141,235 | 2,255,975 | ||||||
Signify NV(b) | 77,761 | 2,400,202 | ||||||
Universal Music Group NV | 387,071 | 11,654,862 | ||||||
Wolters Kluwer NV | 39,052 | 6,123,978 | ||||||
|
| |||||||
| Total Netherlands |
| 82,472,140 | ||||||
| Norway – 0.8% |
| |||||||
Aker ASA, Class A | 32,474 | 1,866,374 | ||||||
Atea ASA* | 91,512 | 1,094,912 | ||||||
DNO ASA | 904,046 | 812,496 | ||||||
Kongsberg Gruppen ASA | 47,163 | 3,258,362 | ||||||
Veidekke ASA | 84,649 | 920,725 | ||||||
|
| |||||||
| Total Norway |
| 7,952,869 | ||||||
| Portugal – 0.0% |
| |||||||
Corticeira Amorim SGPS SA(a) | 35,624 | 378,199 | ||||||
| Singapore – 0.5% |
| |||||||
Singapore Technologies Engineering Ltd. | 1,396,653 | 4,160,155 | ||||||
StarHub Ltd. | 952,300 | 832,627 | ||||||
|
| |||||||
| Total Singapore |
| 4,992,782 | ||||||
| Spain – 6.8% |
| |||||||
CIE Automotive SA | 32,731 | 940,296 | ||||||
Endesa SA | 898,215 | 16,651,288 | ||||||
Industria de Diseno Textil SA | 934,182 | 47,086,132 | ||||||
Laboratorios Farmaceuticos Rovi SA | 11,427 | 998,400 | ||||||
See Notes to Financial Statements.
| WisdomTree Trust | 63 |
Schedule of Investments (continued)
WisdomTree International Quality Dividend Growth Fund (IQDG)
March 31, 2024
| Investments | Shares | Value | ||||||
Viscofan SA(a) | 19,754 | $ | 1,256,591 | |||||
|
| |||||||
| Total Spain |
| 66,932,707 | ||||||
| Sweden – 3.6% |
| |||||||
Alfa Laval AB | 63,229 | 2,488,334 | ||||||
Assa Abloy AB, Class B | 232,619 | 6,681,003 | ||||||
Billerud Aktiebolag | 140,268 | 1,259,613 | ||||||
Evolution AB(b) | 44,134 | 5,492,088 | ||||||
Husqvarna AB, Class B | 135,076 | 1,157,657 | ||||||
Investment AB Latour, Class B | 136,444 | 3,592,109 | ||||||
Lindab International AB | 13,164 | 283,161 | ||||||
Nibe Industrier AB, Class B(a) | 195,496 | 960,970 | ||||||
Paradox Interactive AB | 15,040 | 264,578 | ||||||
Sandvik AB | 344,137 | 7,650,278 | ||||||
Sectra AB, Class B | 20,112 | 389,634 | ||||||
Securitas AB, Class B | 207,582 | 2,142,292 | ||||||
Skanska AB, Class B(a) | 184,462 | 3,286,386 | ||||||
|
| |||||||
| Total Sweden |
| 35,648,103 | ||||||
| Switzerland – 13.1% |
| |||||||
Clariant AG, Registered Shares* | 113,613 | 1,537,629 | ||||||
Comet Holding AG, Registered Shares | 2,210 | 770,936 | ||||||
Givaudan SA, Registered Shares | 2,046 | 9,122,611 | ||||||
Huber & Suhner AG, Registered Shares(a) | 7,342 | 621,140 | ||||||
Logitech International SA, Registered Shares | 25,541 | 2,290,098 | ||||||
Novartis AG, Registered Shares | 317,712 | 30,818,805 | ||||||
Partners Group Holding AG | 10,042 | 14,360,049 | ||||||
Roche Holding AG | 100,779 | 25,701,051 | ||||||
Roche Holding AG, Bearer Shares | 11,183 | 3,017,063 | ||||||
SFS Group AG(a) | 11,368 | 1,496,886 | ||||||
Sika AG, Registered Shares | 22,811 | 6,802,525 | ||||||
Sonova Holding AG, Registered Shares | 7,156 | 2,074,422 | ||||||
Stadler Rail AG(a) | 25,122 | 801,048 | ||||||
Straumann Holding AG, Registered Shares | 4,050 | 647,496 | ||||||
Swissquote Group Holding SA, Registered Shares | 2,774 | 779,812 | ||||||
Tecan Group AG, Registered Shares | 18 | 7,470 | ||||||
UBS Group AG, Registered Shares | 787,013 | 24,238,637 | ||||||
VAT Group AG(b) | 5,850 | 3,035,089 | ||||||
|
| |||||||
| Total Switzerland |
| 128,122,767 | ||||||
| United Kingdom – 14.3% |
| |||||||
Admiral Group PLC | 124,055 | 4,445,933 | ||||||
Airtel Africa PLC(b) | 1,483,530 | 1,982,765 | ||||||
AJ Bell PLC | 109,986 | 420,154 | ||||||
Ashtead Group PLC | 79,203 | 5,642,999 | ||||||
AstraZeneca PLC | 234,838 | 31,677,257 | ||||||
Bellway PLC | 75,950 | 2,555,944 | ||||||
Britvic PLC | 106,146 | 1,102,211 | ||||||
Burberry Group PLC | 122,368 | 1,875,072 | ||||||
Bytes Technology Group PLC | 48,179 | 311,005 | ||||||
Coats Group PLC | 386,049 | 395,505 | ||||||
Diageo PLC | 626,495 | 23,152,985 | ||||||
Dr. Martens PLC(a) | 448,362 | 497,010 | ||||||
Dunelm Group PLC | 81,337 | 1,163,118 | ||||||
Greggs PLC | 16,953 | 615,492 | ||||||
Hays PLC | 934,590 | 1,115,096 | ||||||
Howden Joinery Group PLC | 190,441 | 2,181,530 | ||||||
IMI PLC | 53,437 | 1,225,203 | ||||||
Imperial Brands PLC | 767,345 | 17,157,468 | ||||||
ITV PLC | 3,329,637 | 3,108,355 | ||||||
JD Sports Fashion PLC | 400,842 | 681,059 | ||||||
Kainos Group PLC | 12,473 | 152,129 | ||||||
Moneysupermarket.com Group PLC | 277,358 | 770,119 | ||||||
Next PLC | 32,918 | 3,839,004 | ||||||
Redrow PLC | 200,954 | 1,689,406 | ||||||
RELX PLC | 367,009 | 15,874,489 | ||||||
Renishaw PLC | 22,298 | 1,197,138 | ||||||
Rentokil Initial PLC | 471,952 | 2,812,244 | ||||||
Rightmove PLC | 90,370 | 627,423 | ||||||
RS Group PLC | 148,636 | 1,364,672 | ||||||
Sage Group PLC | 214,618 | 3,430,975 | ||||||
Savills PLC | 76,983 | 1,036,672 | ||||||
Softcat PLC | 46,391 | 930,622 | ||||||
Spirax-Sarco Engineering PLC | 14,820 | 1,881,497 | ||||||
TBC Bank Group PLC | 34,475 | 1,400,150 | ||||||
Telecom Plus PLC | 40,623 | 835,441 | ||||||
Victrex PLC | 38,267 | 627,947 | ||||||
|
| |||||||
| Total United Kingdom |
| 139,776,089 | ||||||
| United States – 2.4% |
| |||||||
GSK PLC | 1,073,206 | 23,163,958 | ||||||
TOTAL COMMON STOCKS (Cost: $819,298,818) |
| 973,800,368 | ||||||
| INVESTMENT OF CASH COLLATERAL FOR SECURITIES LOANED – 2.0% |
| |||||||
| United States – 2.0% |
| |||||||
State Street Navigator Securities Lending Government Money Market Portfolio, 5.34%(c) | ||||||||
| (Cost: $19,628,962) | 19,628,962 | 19,628,962 | ||||||
TOTAL INVESTMENTS IN SECURITIES – 101.5% (Cost: $838,927,780) |
| 993,429,330 | ||||||
Other Assets less Liabilities – (1.5)% |
| (15,248,701 | ) | |||||
|
| |||||||
| NET ASSETS – 100.0% |
| $ | 978,180,629 | |||||
| * | Non-income producing security. |
| (a) | Security, or portion thereof, was on loan at March 31, 2024 (See Note 2). At March 31, 2024, the total market value of the Fund’s securities on loan identified in the Schedule of Investments was $46,257,159 and the total market value of the collateral held by the Fund was $49,029,653. The total market value of the collateral includes non-cash U.S. Government securities collateral having a value of $29,400,691. |
| (b) | This security is exempt from registration under rule 144A of the Securities Act of 1933. This security may be sold in transactions that are exempt from registration, normally to qualified institutional buyers. |
| (c) | Rate shown represents annualized 7-day yield as of March 31, 2024. |
See Notes to Financial Statements.
| 64 | WisdomTree Trust |
Schedule of Investments (concluded)
WisdomTree International Quality Dividend Growth Fund (IQDG)
March 31, 2024
| FAIR VALUATION SUMMARY |
The following is a summary of the fair valuations according to the inputs used in valuing the Fund’s investments (See Note 2 — Fair Value Measurement):
Quoted (Level 1) | Other Significant Observable Inputs (Level 2) | Significant Unobservable Inputs (Level 3) | Total | |||||||||||||
Assets: | ||||||||||||||||
Investments in Securities | ||||||||||||||||
Common Stocks | $ | 973,800,368 | $ | — | $ | — | $ | 973,800,368 | ||||||||
Investment of Cash Collateral for Securities Loaned | — | 19,628,962 | — | 19,628,962 | ||||||||||||
Total Investments in Securities | $ | 973,800,368 | $ | 19,628,962 | $ | — | $ | 993,429,330 | ||||||||
See Notes to Financial Statements.
| WisdomTree Trust | 65 |
Schedule of Investments
WisdomTree International SmallCap Dividend Fund (DLS)
March 31, 2024
| Investments | Shares | Value | ||||||
| COMMON STOCKS – 98.7% |
| |||||||
| Australia – 12.1% |
| |||||||
Accent Group Ltd. | 1,469,270 | $ | 1,945,860 | |||||
Acrow Ltd. | 823,927 | 642,348 | ||||||
AMP Ltd. | 3,774,721 | 2,881,275 | ||||||
Ansell Ltd. | 101,713 | 1,631,069 | ||||||
ARB Corp. Ltd.(a) | 44,559 | 1,202,057 | ||||||
AUB Group Ltd. | 73,926 | 1,434,340 | ||||||
Australian Clinical Labs Ltd.(a)(b) | 242,632 | 425,808 | ||||||
Baby Bunting Group Ltd.(a)(b) | 291,450 | 399,298 | ||||||
Bapcor Ltd. | 379,080 | 1,560,537 | ||||||
Base Resources Ltd. | 3,505,846 | 263,030 | ||||||
Breville Group Ltd.(a) | 72,335 | 1,297,290 | ||||||
Capitol Health Ltd. | 2,621,646 | 410,487 | ||||||
Cedar Woods Properties Ltd.(a) | 253,335 | 793,324 | ||||||
Centuria Capital Group(a) | 2,315,546 | 2,643,659 | ||||||
Champion Iron Ltd.(a) | 452,114 | 2,185,647 | ||||||
Codan Ltd. | 130,276 | 923,864 | ||||||
Collins Foods Ltd. | 115,708 | 765,447 | ||||||
Corporate Travel Management Ltd.(a) | 78,127 | 865,981 | ||||||
CSR Ltd. | 1,317,283 | 7,579,868 | ||||||
Dalrymple Bay Infrastructure Ltd. | 710,040 | 1,269,250 | ||||||
Data#3 Ltd. | 150,304 | 811,923 | ||||||
Dicker Data Ltd.(a) | 172,592 | 1,212,691 | ||||||
Domain Holdings Australia Ltd.(a) | 416,651 | 891,580 | ||||||
Eagers Automotive Ltd. | 414,951 | 3,833,311 | ||||||
EVT Ltd.(a) | 170,630 | 1,382,582 | ||||||
First Resources Ltd. | 2,568,800 | 2,607,629 | ||||||
G8 Education Ltd. | 1,233,334 | 965,553 | ||||||
GR Engineering Services Ltd. | 374,138 | 556,520 | ||||||
GrainCorp Ltd., Class A | 257,633 | 1,384,977 | ||||||
GUD Holdings Ltd.(a) | 218,857 | 1,684,831 | ||||||
GWA Group Ltd. | 653,317 | 1,142,280 | ||||||
Hansen Technologies Ltd. | 220,752 | 701,371 | ||||||
Helia Group Ltd. | 734,789 | 1,874,361 | ||||||
Helloworld Travel Ltd. | 215,678 | 424,939 | ||||||
HMC Capital Ltd. | 276,348 | 1,296,281 | ||||||
HUB24 Ltd. | 23,417 | 648,061 | ||||||
Iluka Resources Ltd. | 358,710 | 1,687,301 | ||||||
Imdex Ltd.(a) | 124,239 | 188,855 | ||||||
Infomedia Ltd. | 545,320 | 633,265 | ||||||
Ingenia Communities Group(a) | 367,477 | 1,253,851 | ||||||
Inghams Group Ltd.(a) | 626,904 | 1,468,282 | ||||||
Insignia Financial Ltd.(a) | 1,606,583 | 2,641,300 | ||||||
Integral Diagnostics Ltd.(a) | 272,914 | 400,610 | ||||||
IPH Ltd. | 300,276 | 1,236,129 | ||||||
IVE Group Ltd. | 513,996 | 731,022 | ||||||
Johns Lyng Group Ltd. | 119,711 | 500,618 | ||||||
Jumbo Interactive Ltd. | 66,349 | 741,924 | ||||||
Kelsian Group Ltd.(a) | 222,626 | 839,494 | ||||||
Lindsay Australia Ltd. | 619,330 | 450,517 | ||||||
Lovisa Holdings Ltd.(a) | 120,552 | 2,624,488 | ||||||
Lycopodium Ltd. | 97,566 | 744,729 | ||||||
MA Financial Group Ltd.(a) | 247,735 | 790,333 | ||||||
Macmahon Holdings Ltd. | 3,093,557 | 454,103 | ||||||
Magellan Financial Group Ltd. | 686,766 | 4,431,176 | ||||||
McMillan Shakespeare Ltd. | 207,456 | 2,656,808 | ||||||
Metcash Ltd. | 2,242,023 | 5,719,140 | ||||||
Monadelphous Group Ltd. | 87,160 | 806,320 | ||||||
Monash IVF Group Ltd. | 969,202 | 913,684 | ||||||
Myer Holdings Ltd.(a) | 2,212,423 | 1,176,359 | ||||||
MyState Ltd. | 350,213 | 836,233 | ||||||
Netwealth Group Ltd. | 129,043 | 1,778,043 | ||||||
nib holdings Ltd. | 506,793 | 2,598,766 | ||||||
Nick Scali Ltd.(a) | 185,400 | 1,862,706 | ||||||
Nine Entertainment Co. Holdings Ltd.(a) | 2,865,565 | 3,196,836 | ||||||
NRW Holdings Ltd. | 957,667 | 1,830,611 | ||||||
Nufarm Ltd. | 142,502 | 511,326 | ||||||
oOh!media Ltd. | 534,726 | 620,962 | ||||||
Orora Ltd.(a) | 2,521,011 | 4,473,604 | ||||||
PeopleIN Ltd. | 471,226 | 338,171 | ||||||
Perenti Ltd. | 1,266,645 | 809,832 | ||||||
Perseus Mining Ltd. | 958,003 | 1,343,752 | ||||||
Pinnacle Investment Management Group Ltd.(a) | 253,874 | 1,926,247 | ||||||
PointsBet Holdings Ltd. | 1,254,971 | 675,463 | ||||||
Propel Funeral Partners Ltd. | 33,408 | 121,836 | ||||||
PSC Insurance Group Ltd.(a) | 244,935 | 866,092 | ||||||
PWR Holdings Ltd. | 66,354 | 499,126 | ||||||
Ramelius Resources Ltd. | 257,853 | 312,895 | ||||||
Regis Healthcare Ltd. | 303,239 | 793,311 | ||||||
Reliance Worldwide Corp. Ltd. | 962,364 | 3,610,116 | ||||||
Ridley Corp. Ltd. | 480,477 | 780,523 | ||||||
SG Fleet Group Ltd. | 416,886 | 802,330 | ||||||
SmartGroup Corp. Ltd. | 189,815 | 1,202,441 | ||||||
SRG Global Ltd. | 1,093,690 | 570,819 | ||||||
Super Retail Group Ltd. | 576,305 | 6,053,300 | ||||||
Tabcorp Holdings Ltd. | 2,021,492 | 995,710 | ||||||
Terracom Ltd.(a) | 2,529,184 | 396,010 | ||||||
Ventia Services Group Pty. Ltd. | 2,035,151 | 5,111,770 | ||||||
Waypoint REIT Ltd. | 1,772,524 | 2,948,806 | ||||||
|
| |||||||
| Total Australia |
| 133,497,274 | ||||||
| Austria – 0.4% |
| |||||||
Kontron AG | 90,693 | 2,002,066 | ||||||
Oesterreichische Post AG | 39,786 | 1,359,965 | ||||||
Porr AG | 44,262 | 678,802 | ||||||
Schoeller-Bleckmann Oilfield Equipment AG | 19,631 | 939,225 | ||||||
|
| |||||||
| Total Austria |
| 4,980,058 | ||||||
| Belgium – 1.3% |
| |||||||
Barco NV(a) | 88,140 | 1,453,570 | ||||||
bpost SA(a) | 453,493 | 1,696,572 | ||||||
Cofinimmo SA(a) | 97,079 | 6,358,868 | ||||||
Deceuninck NV | 154,074 | 375,232 | ||||||
Econocom Group SA(a) | 277,738 | 637,409 | ||||||
Exmar NV(a) | 102,343 | 847,768 | ||||||
Fagron | 32,877 | 627,056 | ||||||
Recticel SA(a) | 47,740 | 563,026 | ||||||
Xior Student Housing NV(a)(b) | 73,229 | 2,214,445 | ||||||
|
| |||||||
| Total Belgium |
| 14,773,946 | ||||||
See Notes to Financial Statements.
| 66 | WisdomTree Trust |
Schedule of Investments (continued)
WisdomTree International SmallCap Dividend Fund (DLS)
March 31, 2024
| Investments | Shares | Value | ||||||
| China – 0.2% |
| |||||||
CITIC Telecom International Holdings Ltd. | 6,275,822 | $ | 2,028,739 | |||||
CPMC Holdings Ltd. | 459,009 | 401,742 | ||||||
|
| |||||||
| Total China |
| 2,430,481 | ||||||
| Denmark – 1.6% |
| |||||||
Alm Brand AS | 1,271,968 | 2,423,673 | ||||||
Cementir Holding NV | 124,648 | 1,410,816 | ||||||
Chemometec AS | 13,529 | 830,173 | ||||||
D/S Norden AS | 158,831 | 6,471,446 | ||||||
Dfds AS | 40,470 | 1,174,283 | ||||||
Matas AS | 16,384 | 277,554 | ||||||
Scandinavian Tobacco Group AS(c) | 117,664 | 2,109,144 | ||||||
Spar Nord Bank AS | 192,402 | 3,209,254 | ||||||
|
| |||||||
| Total Denmark |
| 17,906,343 | ||||||
| Finland – 1.3% |
| |||||||
Aktia Bank OYJ | 63,376 | 685,830 | ||||||
Citycon OYJ*(a) | 454,225 | 1,876,894 | ||||||
F-Secure OYJ(a) | 228,513 | 462,986 | ||||||
Harvia OYJ(b) | 22,171 | 917,560 | ||||||
Marimekko OYJ | 38,183 | 512,584 | ||||||
Musti Group OYJ* | 24,086 | 649,802 | ||||||
Oriola OYJ, Class B | 209,206 | 229,557 | ||||||
Outokumpu OYJ(a) | 776,561 | 3,379,904 | ||||||
Puuilo OYJ | 130,173 | 1,392,512 | ||||||
Revenio Group OYJ | 12,011 | 330,783 | ||||||
Sanoma OYJ(a) | 132,910 | 977,526 | ||||||
Scanfil OYJ | 55,267 | 498,995 | ||||||
Talenom OYJ(a) | 77,582 | 497,704 | ||||||
Terveystalo OYJ(a)(c) | 83,668 | 681,325 | ||||||
Tokmanni Group Corp. | 53,065 | 869,969 | ||||||
|
| |||||||
| Total Finland |
| 13,963,931 | ||||||
| France – 4.1% |
| |||||||
Beneteau SACA | 80,451 | 1,188,615 | ||||||
Bonduelle SCA(a) | 26,724 | 216,753 | ||||||
Chargeurs SA | 74,265 | 959,266 | ||||||
Cie des Alpes | 77,405 | 1,128,565 | ||||||
Cie Plastic Omnium SE | 145,138 | 1,893,528 | ||||||
Coface SA | 372,523 | 5,894,058 | ||||||
Derichebourg SA | 313,687 | 1,491,318 | ||||||
Eramet SA(a) | 42,180 | 3,209,307 | ||||||
Etablissements Maurel & Prom SA | 244,568 | 1,477,827 | ||||||
Fnac Darty SA(a) | 44,887 | 1,406,830 | ||||||
IPSOS SA | 42,166 | 2,975,992 | ||||||
Lectra(a) | 21,752 | 759,971 | ||||||
Mersen SA | 38,717 | 1,524,133 | ||||||
Metropole Television SA | 156,980 | 2,343,021 | ||||||
Quadient SA | 34,790 | 716,145 | ||||||
Rubis SCA | 352,839 | 12,476,104 | ||||||
Television Francaise 1 SA(a) | 412,680 | 3,775,031 | ||||||
Vicat SACA | 37,664 | 1,486,749 | ||||||
|
| |||||||
| Total France |
| 44,923,213 | ||||||
| Georgia – 0.9% |
| |||||||
Bank of Georgia Group PLC | 149,986 | 9,568,225 | ||||||
| Germany – 2.4% |
| |||||||
7C Solarparken AG | 92,532 | 310,796 | ||||||
Bilfinger SE | 40,886 | 1,911,993 | ||||||
CompuGroup Medical SE & Co. KGaA | 22,212 | 684,165 | ||||||
Dermapharm Holding SE | 40,743 | 1,436,239 | ||||||
Deutz AG | 186,486 | 1,185,268 | ||||||
Duerr AG | 66,830 | 1,546,018 | ||||||
Eckert & Ziegler SE | 7,301 | 295,533 | ||||||
Elmos Semiconductor SE | 7,172 | 572,412 | ||||||
ElringKlinger AG | 43,298 | 283,844 | ||||||
GFT Technologies SE | 12,710 | 370,624 | ||||||
Hamborner REIT AG | 141,790 | 1,050,494 | ||||||
Hamburger Hafen und Logistik AG* | 67,097 | 1,202,915 | ||||||
Instone Real Estate Group SE(c) | 98,485 | 949,829 | ||||||
Jenoptik AG | 20,533 | 638,658 | ||||||
Kloeckner & Co. SE | 185,127 | 1,349,576 | ||||||
Lanxess AG | 116,601 | 3,124,300 | ||||||
MLP SE | 109,341 | 662,475 | ||||||
Mutares SE & Co. KGaA | 35,324 | 1,407,732 | ||||||
Norma Group SE | 25,974 | 483,335 | ||||||
ProSiebenSat.1 Media SE | 77,843 | 547,467 | ||||||
SAF-Holland SE | 87,586 | 1,786,859 | ||||||
Salzgitter AG | 69,202 | 1,808,663 | ||||||
Stabilus SE | 26,104 | 1,663,347 | ||||||
Wacker Neuson SE | 73,599 | 1,363,995 | ||||||
|
| |||||||
| Total Germany |
| 26,636,537 | ||||||
| Hong Kong – 0.2% |
| |||||||
Dah Sing Banking Group Ltd. | 986,400 | 702,010 | ||||||
Dah Sing Financial Holdings Ltd. | 301,029 | 691,565 | ||||||
Guotai Junan International Holdings Ltd.(a) | 7,128,000 | 482,702 | ||||||
Nissin Foods Co. Ltd.(a) | 994,000 | 628,676 | ||||||
|
| |||||||
| Total Hong Kong |
| 2,504,953 | ||||||
| Indonesia – 0.1% |
| |||||||
Bumitama Agri Ltd. | 1,530,400 | 776,766 | ||||||
| Ireland – 0.4% |
| |||||||
C&C Group PLC | 285,742 | 591,258 | ||||||
Cairn Homes PLC | 1,285,362 | 2,215,553 | ||||||
Kenmare Resources PLC | 205,629 | 848,119 | ||||||
Origin Enterprises PLC(a) | 171,549 | 583,610 | ||||||
|
| |||||||
| Total Ireland |
| 4,238,540 | ||||||
| Israel – 4.6% |
| |||||||
Altshuler Shaham Finance Ltd. | 920,135 | 1,305,975 | ||||||
Amot Investments Ltd. | 1,073,251 | 5,123,553 | ||||||
Arad Ltd. | 27,908 | 388,489 | ||||||
Ashdod Refinery Ltd. | 1 | 14 | ||||||
Ashtrom Group Ltd.* | 208,258 | 3,113,887 | ||||||
AudioCodes Ltd. | 36,981 | 491,270 | ||||||
Electra Consumer Products 1970 Ltd. | 22,536 | 512,576 | ||||||
Electra Real Estate Ltd. | 83,282 | 881,989 | ||||||
Energix-Renewable Energies Ltd. | 301,827 | 1,113,820 | ||||||
See Notes to Financial Statements.
| WisdomTree Trust | 67 |
Schedule of Investments (continued)
WisdomTree International SmallCap Dividend Fund (DLS)
March 31, 2024
| Investments | Shares | Value | ||||||
FIBI Holdings Ltd. | 74,187 | $ | 3,391,741 | |||||
Gav-Yam Lands Corp. Ltd. | 112,743 | 855,489 | ||||||
Harel Insurance Investments & Financial Services Ltd.* | 438,728 | 4,203,224 | ||||||
Inrom Construction Industries Ltd. | 171,235 | 551,512 | ||||||
Israel Canada TR Ltd. | 217,785 | 876,799 | ||||||
Israel Land Development Co. Ltd. | 41,827 | 386,680 | ||||||
Isramco Negev 2 LP | 3,929,285 | 1,919,759 | ||||||
Kardan Real Estate Enterprise & Development Ltd. | 282,980 | 354,372 | ||||||
Kvutzat Acro Ltd. | 56,765 | 701,874 | ||||||
Lapidoth Capital Ltd. | 33,900 | 578,494 | ||||||
Magic Software Enterprises Ltd. | 51,947 | 610,682 | ||||||
Matrix IT Ltd. | 97,963 | 2,181,887 | ||||||
Max Stock Ltd. | 420,962 | 967,005 | ||||||
Maytronics Ltd. | 90,990 | 899,548 | ||||||
Mediterranean Towers Ltd. | 255,937 | 672,448 | ||||||
Mega Or Holdings Ltd. | 53,366 | 1,429,522 | ||||||
Menora Mivtachim Holdings Ltd. | 63,049 | 1,686,492 | ||||||
Migdal Insurance & Financial Holdings Ltd. | 360,437 | 499,872 | ||||||
Mivne Real Estate KD Ltd. | 955,259 | 2,365,138 | ||||||
Next Vision Stabilized Systems Ltd. | 15,774 | 183,973 | ||||||
Novolog Ltd. | 1,105,819 | 456,671 | ||||||
Oil Refineries Ltd. | 17,388,045 | 5,790,162 | ||||||
One Software Technologies Ltd. | 60,003 | 921,246 | ||||||
Paz Oil Co. Ltd. | 1 | 61 | ||||||
Plus500 Ltd. | 141,195 | 3,219,480 | ||||||
Ratio Energies Finance LP | 637,105 | 526,559 | ||||||
Retailors Ltd. | 46,726 | 1,179,342 | ||||||
Sisram Medical Ltd.(c) | 436,800 | 197,012 | ||||||
|
| |||||||
| Total Israel |
| 50,538,617 | ||||||
| Italy – 5.6% |
| |||||||
ACEA SpA(a) | 430,517 | 7,634,616 | ||||||
Anima Holding SpA(c) | 499,728 | 2,374,707 | ||||||
Aquafil SpA | 206,568 | 677,089 | ||||||
Ariston Holding NV(a) | 60,461 | 339,875 | ||||||
Arnoldo Mondadori Editore SpA(a) | 612,986 | 1,542,518 | ||||||
Ascopiave SpA(a) | 332,174 | 848,439 | ||||||
Banca IFIS SpA | 182,692 | 3,581,128 | ||||||
Banca Popolare di Sondrio SpA | 698,900 | 5,238,395 | ||||||
Biesse SpA(a) | 34,933 | 467,823 | ||||||
Cairo Communication SpA | 404,589 | 873,912 | ||||||
Danieli & C Officine Meccaniche SpA(a) | 26,323 | 935,309 | ||||||
Danieli & C Officine Meccaniche SpA, RSP | 9,722 | 256,719 | ||||||
Datalogic SpA(a) | 112,532 | 697,608 | ||||||
El.En. SpA(a) | 44,607 | 565,581 | ||||||
Enav SpA(c) | 815,313 | 3,416,487 | ||||||
IMMSI SpA | 678,795 | 403,204 | ||||||
Intercos SpA(a) | 50,689 | 734,666 | ||||||
Italian Sea Group SpA(a) | 96,072 | 1,043,803 | ||||||
Maire Tecnimont SpA | 341,964 | 2,683,118 | ||||||
MARR SpA | 79,224 | 1,007,919 | ||||||
Orsero SpA | 17,761 | 274,685 | ||||||
OVS SpA(a)(c) | 172,677 | 454,292 | ||||||
Piaggio & C SpA | 1,216,558 | 3,852,304 | ||||||
RAI Way SpA(c) | 443,916 | 2,488,238 | ||||||
Salcef Group SpA | 49,542 | 1,225,273 | ||||||
Salvatore Ferragamo SpA(a) | 117,830 | 1,434,180 | ||||||
Sanlorenzo SpA | 18,351 | 835,374 | ||||||
Saras SpA | 3,004,550 | 5,749,987 | ||||||
Spaxs SpA*(a) | 97,364 | 511,044 | ||||||
Technogym SpA(c) | 287,195 | 2,853,569 | ||||||
Tinexta SpA(a) | 46,208 | 948,687 | ||||||
Unieuro SpA(a)(c) | 51,817 | 494,427 | ||||||
Webuild SpA(a) | 1,026,824 | 2,486,310 | ||||||
Wiit SpA(a) | 27,202 | 530,570 | ||||||
Zignago Vetro SpA | 163,177 | 2,336,825 | ||||||
|
| |||||||
| Total Italy |
| 61,798,681 | ||||||
| Japan – 27.6% |
| |||||||
77 Bank Ltd. | 45,200 | 1,237,927 | ||||||
Adastria Co. Ltd. | 22,500 | 573,111 | ||||||
ADEKA Corp. | 58,001 | 1,235,556 | ||||||
Aeon Delight Co. Ltd. | 24,700 | 577,740 | ||||||
Ai Holdings Corp. | 42,100 | 684,304 | ||||||
Aica Kogyo Co. Ltd.(a) | 40,900 | 1,005,306 | ||||||
Aisan Industry Co. Ltd. | 74,700 | 840,557 | ||||||
AIT Corp. | 24,700 | 295,561 | ||||||
Alinco, Inc. | 62,600 | 429,756 | ||||||
Alleanza Holdings Co. Ltd.(a) | 27,600 | 189,659 | ||||||
Alps Alpine Co. Ltd.(a) | 99,200 | 785,236 | ||||||
Amano Corp. | 53,400 | 1,366,182 | ||||||
Anritsu Corp. | 65,200 | 532,689 | ||||||
Arcs Co. Ltd. | 51,200 | 1,058,879 | ||||||
ARE Holdings, Inc.(a) | 74,800 | 954,862 | ||||||
Ariake Japan Co. Ltd. | 15,400 | 535,227 | ||||||
Artience Co. Ltd. | 29,900 | 575,300 | ||||||
As One Corp. | 31,000 | 544,029 | ||||||
Asanuma Corp.(a) | 35,200 | 924,510 | ||||||
ASKUL Corp.(a) | 37,900 | 574,466 | ||||||
Autobacs Seven Co. Ltd.(a) | 83,903 | 888,952 | ||||||
Bando Chemical Industries Ltd. | 83,000 | 1,036,506 | ||||||
Bank of Nagoya Ltd. | 10,200 | 448,855 | ||||||
Baroque Japan Ltd.(a) | 54,600 | 274,182 | ||||||
Bell System24 Holdings, Inc. | 75,600 | 802,231 | ||||||
Bunka Shutter Co. Ltd. | 54,400 | 625,432 | ||||||
C Uyemura & Co. Ltd. | 13,600 | 944,438 | ||||||
Canon Electronics, Inc. | 18,900 | 302,585 | ||||||
Casio Computer Co. Ltd.(a) | 146,800 | 1,257,080 | ||||||
Central Glass Co. Ltd. | 21,500 | 412,257 | ||||||
Chori Co. Ltd. | 38,200 | 859,434 | ||||||
Chugin Financial Group, Inc. | 82,900 | 720,024 | ||||||
Chugoku Marine Paints Ltd. | 9,000 | 134,811 | ||||||
Citizen Watch Co. Ltd.(a) | 169,800 | 1,111,842 | ||||||
CKD Corp.(a) | 54,500 | 1,085,715 | ||||||
Computer Engineering & Consulting Ltd. | 19,000 | 195,216 | ||||||
Daido Steel Co. Ltd. | 187,155 | 2,246,305 | ||||||
Daiei Kankyo Co. Ltd. | 20,300 | 358,397 | ||||||
See Notes to Financial Statements.
| 68 | WisdomTree Trust |
Schedule of Investments (continued)
WisdomTree International SmallCap Dividend Fund (DLS)
March 31, 2024
| Investments | Shares | Value | ||||||
Daihen Corp. | 16,400 | $ | 1,006,680 | |||||
Daiho Corp.(a) | 22,900 | 516,723 | ||||||
Daiichikosho Co. Ltd. | 63,800 | 817,181 | ||||||
Dainichiseika Color & Chemicals Manufacturing Co. Ltd. | 12,800 | 252,456 | ||||||
Daio Paper Corp. | 46,200 | 354,563 | ||||||
Daiseki Co. Ltd. | 14,100 | 339,585 | ||||||
Daishi Hokuetsu Financial Group, Inc.(a) | 35,140 | 1,035,544 | ||||||
Daiwabo Holdings Co. Ltd.(a) | 59,800 | 1,014,480 | ||||||
DCM Holdings Co. Ltd. | 71,500 | 697,780 | ||||||
Denka Co. Ltd.(a) | 55,400 | 858,939 | ||||||
Dexerials Corp. | 28,200 | 1,245,984 | ||||||
DIC Corp. | 54,900 | 1,047,614 | ||||||
Dip Corp. | 17,800 | 323,551 | ||||||
DMG Mori Co. Ltd.(a) | 82,600 | 2,216,930 | ||||||
Dowa Holdings Co. Ltd.(a) | 18,700 | 658,445 | ||||||
DTS Corp. | 34,500 | 916,383 | ||||||
Eagle Industry Co. Ltd. | 61,700 | 746,866 | ||||||
Earth Corp.(a) | 18,800 | 536,007 | ||||||
EDION Corp.(a) | 96,100 | 982,938 | ||||||
Eiken Chemical Co. Ltd.(a) | 48,100 | 635,634 | ||||||
Elecom Co. Ltd. | 56,100 | 572,324 | ||||||
Elematec Corp. | 68,900 | 873,627 | ||||||
en Japan, Inc.(a) | 21,700 | 386,842 | ||||||
ES-Con Japan Ltd. | 120,500 | 828,042 | ||||||
Exedy Corp.(a) | 83,200 | 1,682,196 | ||||||
EXEO Group, Inc. | 140,000 | 1,497,638 | ||||||
Ezaki Glico Co. Ltd. | 23,300 | 651,683 | ||||||
Fancl Corp. | 36,600 | 484,389 | ||||||
Feed One Co. Ltd. | 37,000 | 238,852 | ||||||
Ferrotec Holdings Corp.(a) | 33,400 | 652,795 | ||||||
Financial Partners Group Co. Ltd. | 88,700 | 1,267,101 | ||||||
Food & Life Cos. Ltd. | 21,800 | 414,552 | ||||||
FP Corp.(a) | 23,600 | 429,913 | ||||||
FP Partner, Inc. | 8,800 | 372,130 | ||||||
France Bed Holdings Co. Ltd. | 38,700 | 329,351 | ||||||
Fudo Tetra Corp. | 33,300 | 453,256 | ||||||
Fuji Corp. Ltd.(a) | 121,300 | 620,346 | ||||||
Fuji Oil Holdings, Inc. | 33,600 | 530,713 | ||||||
Fuji Pharma Co. Ltd.(a) | 71,400 | 781,251 | ||||||
Fuji Soft, Inc.(a) | 16,400 | 651,254 | ||||||
Fujikura Ltd. | 211,600 | 3,184,940 | ||||||
Fujimi, Inc.(a) | 36,523 | 849,456 | ||||||
Fujitec Co. Ltd.(a) | 39,000 | 977,416 | ||||||
Fukuyama Transporting Co. Ltd. | 21,200 | 507,780 | ||||||
Funai Soken Holdings, Inc. | 38,300 | 624,562 | ||||||
Furukawa Electric Co. Ltd.(a) | 34,400 | 735,755 | ||||||
Furyu Corp.(a) | 30,300 | 257,463 | ||||||
Futaba Industrial Co. Ltd. | 42,300 | 327,846 | ||||||
Future Corp. | 47,500 | 528,841 | ||||||
Gecoss Corp. | 102,300 | 780,034 | ||||||
Glory Ltd.(a) | 32,577 | 611,310 | ||||||
Godo Steel Ltd. | 24,300 | 918,405 | ||||||
GS Yuasa Corp.(a) | 30,500 | 634,002 | ||||||
Gunma Bank Ltd. | 311,800 | 1,809,262 | ||||||
H2O Retailing Corp. | 58,800 | 755,664 | ||||||
Hakuto Co. Ltd.(a) | 34,600 | 1,289,398 | ||||||
Hanwa Co. Ltd. | 21,500 | 842,413 | ||||||
Hazama Ando Corp.(a) | 136,900 | 1,072,803 | ||||||
Heiwa Corp. | 75,419 | 999,640 | ||||||
Heiwa Real Estate Co. Ltd.(a) | 23,100 | 622,736 | ||||||
Hirogin Holdings, Inc. | 201,500 | 1,452,552 | ||||||
Hochiki Corp. | 62,500 | 923,387 | ||||||
Hogy Medical Co. Ltd.(a) | 16,200 | 401,401 | ||||||
Hokkaido Gas Co. Ltd. | 49,700 | 830,167 | ||||||
Hokuetsu Corp.(a) | 31,200 | 396,636 | ||||||
Hokuhoku Financial Group, Inc. | 58,100 | 743,981 | ||||||
Horiba Ltd. | 26,700 | 2,827,982 | ||||||
HU Group Holdings, Inc.(a) | 55,700 | 899,105 | ||||||
Hyakugo Bank Ltd. | 24,200 | 103,775 | ||||||
Hyakujushi Bank Ltd. | 29,100 | 572,405 | ||||||
Ichibanya Co. Ltd. | 95,700 | 759,428 | ||||||
Ichigo, Inc. | 201,000 | 614,906 | ||||||
Idec Corp.(a) | 27,700 | 494,352 | ||||||
IDOM, Inc. | 64,300 | 441,002 | ||||||
Iino Kaiun Kaisha Ltd.(a) | 139,600 | 1,130,857 | ||||||
Inaba Denki Sangyo Co. Ltd. | 59,300 | 1,373,329 | ||||||
Inabata & Co. Ltd. | 48,900 | 1,025,852 | ||||||
Inui Global Logistics Co. Ltd.(a) | 58,700 | 402,206 | ||||||
Itochu Enex Co. Ltd. | 100,401 | 1,041,525 | ||||||
Itoham Yonekyu Holdings, Inc. | 39,600 | 1,049,232 | ||||||
Iyogin Holdings, Inc. | 99,400 | 770,400 | ||||||
Izumi Co. Ltd. | 36,900 | 856,030 | ||||||
JAC Recruitment Co. Ltd. | 199,600 | 1,056,392 | ||||||
Japan Aviation Electronics Industry Ltd.(a) | 49,700 | 814,076 | ||||||
Japan Lifeline Co. Ltd. | 64,600 | 519,890 | ||||||
Japan Securities Finance Co. Ltd. | 50,200 | 555,585 | ||||||
Japan Steel Works Ltd. | 25,400 | 568,603 | ||||||
Japan Transcity Corp. | 49,700 | 221,006 | ||||||
Jeol Ltd.(a) | 12,200 | 504,461 | ||||||
Joyful Honda Co. Ltd.(a) | 70,400 | 1,019,171 | ||||||
Juroku Financial Group, Inc. | 35,500 | 1,123,559 | ||||||
JVCKenwood Corp. | 75,700 | 472,172 | ||||||
K’s Holdings Corp. | 93,400 | 826,650 | ||||||
Kaga Electronics Co. Ltd.(a) | 27,000 | 1,138,194 | ||||||
Kakaku.com, Inc. | 112,300 | 1,396,098 | ||||||
Kamigumi Co. Ltd.(a) | 79,300 | 1,760,010 | ||||||
Kanamoto Co. Ltd. | 44,800 | 797,161 | ||||||
Kandenko Co. Ltd. | 99,600 | 1,151,015 | ||||||
Kaneka Corp. | 30,900 | 778,702 | ||||||
Kanematsu Corp. | 84,300 | 1,443,758 | ||||||
Katitas Co. Ltd.(a) | 26,200 | 346,056 | ||||||
Kato Sangyo Co. Ltd. | 32,300 | 978,529 | ||||||
Kewpie Corp. | 38,300 | 716,172 | ||||||
KH Neochem Co. Ltd. | 35,000 | 543,923 | ||||||
Ki-Star Real Estate Co. Ltd.(a) | 15,200 | 387,671 | ||||||
Kitz Corp. | 113,700 | 1,025,475 | ||||||
Koatsu Gas Kogyo Co. Ltd. | 18,200 | 107,268 | ||||||
See Notes to Financial Statements.
| WisdomTree Trust | 69 |
Schedule of Investments (continued)
WisdomTree International SmallCap Dividend Fund (DLS)
March 31, 2024
| Investments | Shares | Value | ||||||
Kojima Co. Ltd.(a) | 29,400 | $ | 159,874 | |||||
Kokuyo Co. Ltd. | 80,600 | 1,324,472 | ||||||
KOMEDA Holdings Co. Ltd. | 46,300 | 836,089 | ||||||
Komeri Co. Ltd.(a) | 31,900 | 729,287 | ||||||
Konoike Transport Co. Ltd. | 10,600 | 153,385 | ||||||
Krosaki Harima Corp. | 35,600 | 824,461 | ||||||
Kumagai Gumi Co. Ltd. | 29,100 | 802,752 | ||||||
Kumiai Chemical Industry Co. Ltd. | 69,600 | 382,157 | ||||||
Kurabo Industries Ltd. | 26,595 | 615,035 | ||||||
Kureha Corp. | 32,800 | 588,837 | ||||||
KYB Corp. | 31,900 | 1,089,716 | ||||||
Kyoei Steel Ltd. | 50,200 | 800,042 | ||||||
Kyorin Pharmaceutical Co. Ltd. | 40,690 | 487,167 | ||||||
Kyudenko Corp. | 31,400 | 1,321,396 | ||||||
Kyushu Financial Group, Inc. | 179,300 | 1,352,939 | ||||||
LEC, Inc. | 16,400 | 120,823 | ||||||
Life Corp. | 29,100 | 747,953 | ||||||
Lintec Corp. | 28,630 | 598,724 | ||||||
Mabuchi Motor Co. Ltd. | 58,200 | 1,067,131 | ||||||
Makino Milling Machine Co. Ltd. | 12,400 | 512,894 | ||||||
Mani, Inc. | 24,200 | 317,321 | ||||||
Marubun Corp.(a) | 67,300 | 687,919 | ||||||
Maruha Nichiro Corp. | 46,100 | 905,734 | ||||||
Matsui Securities Co. Ltd.(a) | 182,740 | 997,345 | ||||||
Max Co. Ltd. | 45,200 | 972,123 | ||||||
MCJ Co. Ltd. | 82,700 | 747,521 | ||||||
Megmilk Snow Brand Co. Ltd. | 31,200 | 561,763 | ||||||
MEITEC Group Holdings, Inc. | 66,100 | 1,304,574 | ||||||
Micronics Japan Co. Ltd. | 20,500 | 1,208,233 | ||||||
Mirait One Corp. | 65,600 | 827,883 | ||||||
Mitsubishi Logistics Corp. | 35,000 | 1,150,517 | ||||||
Mitsubishi Materials Corp. | 59,900 | 1,154,701 | ||||||
Mitsubishi Shokuhin Co. Ltd. | 33,000 | 1,225,412 | ||||||
Mitsuboshi Belting Ltd.(a) | 49,700 | 1,533,576 | ||||||
Mitsui DM Sugar Holdings Co. Ltd. | 47,900 | 985,883 | ||||||
Mitsui High-Tec, Inc. | 8,000 | 461,092 | ||||||
Mitsui Matsushima Holdings Co. Ltd.(a) | 25,200 | 485,201 | ||||||
Mitsui Mining & Smelting Co. Ltd. | 49,764 | 1,547,716 | ||||||
Mitsui-Soko Holdings Co. Ltd.(a) | 34,200 | 1,063,207 | ||||||
Mizuho Medy Co. Ltd.(a) | 19,700 | 438,009 | ||||||
Mizuno Corp. | 13,900 | 584,122 | ||||||
Mochida Pharmaceutical Co. Ltd. | 24,500 | 521,259 | ||||||
Morinaga & Co. Ltd. | 35,200 | 610,642 | ||||||
Morinaga Milk Industry Co. Ltd. | 33,400 | 689,870 | ||||||
Musashi Seimitsu Industry Co. Ltd. | 47,800 | 532,181 | ||||||
Musashino Bank Ltd. | 36,200 | 705,846 | ||||||
Nabtesco Corp. | 55,700 | 942,165 | ||||||
Nachi-Fujikoshi Corp.(a) | 27,300 | 629,535 | ||||||
Nagase & Co. Ltd. | 65,600 | 1,107,023 | ||||||
Nakanishi, Inc. | 31,200 | 485,487 | ||||||
Nakayama Steel Works Ltd.(a) | 78,000 | 489,610 | ||||||
NEC Networks & System Integration Corp. | 63,200 | 1,058,588 | ||||||
NET One Systems Co. Ltd. | 35,900 | 640,457 | ||||||
NHK Spring Co. Ltd. | 114,700 | 1,134,533 | ||||||
Nichias Corp. | 58,200 | 1,565,126 | ||||||
Nichicon Corp. | 49,700 | 421,980 | ||||||
Nichiha Corp. | 32,600 | 742,060 | ||||||
Nihon Kohden Corp. | 22,500 | 595,262 | ||||||
Nihon M&A Center Holdings, Inc. | 170,800 | 1,113,876 | ||||||
Nihon Nohyaku Co. Ltd.(a) | 31,500 | 171,502 | ||||||
Nikkon Holdings Co. Ltd. | 49,700 | 970,225 | ||||||
Nippn Corp. | 77,800 | 1,219,344 | ||||||
Nippon Air Conditioning Services Co. Ltd. | 75,000 | 464,336 | ||||||
Nippon Carbon Co. Ltd. | 26,100 | 919,178 | ||||||
Nippon Denko Co. Ltd. | 207,300 | 447,898 | ||||||
Nippon Electric Glass Co. Ltd. | 74,500 | 1,906,003 | ||||||
Nippon Gas Co. Ltd. | 75,400 | 1,280,124 | ||||||
Nippon Kanzai Holdings Co. Ltd. | 39,800 | 674,795 | ||||||
Nippon Kayaku Co. Ltd. | 119,999 | 1,035,506 | ||||||
Nippon Pillar Packing Co. Ltd. | 34,400 | 1,450,144 | ||||||
Nippon Road Co. Ltd. | 14,600 | 183,483 | ||||||
Nippon Shokubai Co. Ltd. | 55,600 | 538,568 | ||||||
Nippon Soda Co. Ltd.(a) | 31,600 | 1,265,295 | ||||||
Nippon Yakin Kogyo Co. Ltd.(a) | 21,300 | 674,839 | ||||||
Nipro Corp.(a) | 65,600 | 531,189 | ||||||
Nishi-Nippon Financial Holdings, Inc. | 78,900 | 998,860 | ||||||
Nishi-Nippon Railroad Co. Ltd.(a) | 38,700 | 644,126 | ||||||
Nishimatsu Construction Co. Ltd.(a) | 26,200 | 772,956 | ||||||
Nishio Holdings Co. Ltd. | 33,900 | 866,847 | ||||||
Nisshin Oillio Group Ltd. | 26,900 | 915,359 | ||||||
Nisshinbo Holdings, Inc. | 70,492 | 573,829 | ||||||
Nissui Corp. | 199,200 | 1,263,682 | ||||||
Nitto Kogyo Corp.(a) | 29,000 | 793,287 | ||||||
Noevir Holdings Co. Ltd. | 34,400 | 1,188,754 | ||||||
Nomura Micro Science Co. Ltd. | 18,800 | 737,864 | ||||||
Noritake Co. Ltd. | 38,000 | 1,077,142 | ||||||
North Pacific Bank Ltd. | 200,300 | 588,942 | ||||||
NS United Kaiun Kaisha Ltd.(a) | 28,700 | 874,208 | ||||||
NSD Co. Ltd. | 65,200 | 1,282,072 | ||||||
NTN Corp.(a) | 242,200 | 502,020 | ||||||
Ogaki Kyoritsu Bank Ltd. | 59,300 | 855,343 | ||||||
Ohsho Food Service Corp. | 16,400 | 848,472 | ||||||
Okamura Corp. | 78,600 | 1,178,909 | ||||||
Okasan Securities Group, Inc.(a) | 148,200 | 800,022 | ||||||
Okinawa Cellular Telephone Co. | 49,600 | 1,163,435 | ||||||
OKUMA Corp.(a) | 19,700 | 926,653 | ||||||
Okumura Corp. | 30,600 | 1,029,132 | ||||||
Onward Holdings Co. Ltd. | 108,600 | 409,730 | ||||||
Open Up Group, Inc. | 49,700 | 691,915 | ||||||
Organo Corp. | 15,700 | 798,771 | ||||||
Osaka Soda Co. Ltd.(a) | 4,500 | 287,225 | ||||||
OSG Corp. | 60,100 | 868,471 | ||||||
PAL GROUP Holdings Co. Ltd. | 52,300 | 897,095 | ||||||
PALTAC Corp. | 17,900 | 486,693 | ||||||
Paramount Bed Holdings Co. Ltd. | 37,800 | 650,376 | ||||||
Penta-Ocean Construction Co. Ltd. | 149,500 | 767,429 | ||||||
PHC Holdings Corp.(a) | 91,300 | 745,626 | ||||||
Pigeon Corp. | 78,300 | 751,984 | ||||||
See Notes to Financial Statements.
| 70 | WisdomTree Trust |
Schedule of Investments (continued)
WisdomTree International SmallCap Dividend Fund (DLS)
March 31, 2024
| Investments | Shares | Value | ||||||
Pilot Corp. | 16,400 | $ | 431,280 | |||||
Press Kogyo Co. Ltd. | 219,700 | 1,037,930 | ||||||
Prima Meat Packers Ltd. | 52,400 | 797,365 | ||||||
Raito Kogyo Co. Ltd. | 48,200 | 648,739 | ||||||
Raiznext Corp. | 78,900 | 1,131,798 | ||||||
Relo Group, Inc. | 76,000 | 625,445 | ||||||
Rengo Co. Ltd. | 124,800 | 964,789 | ||||||
Resorttrust, Inc. | 50,100 | 878,889 | ||||||
Riso Kagaku Corp.(a) | 34,100 | 698,470 | ||||||
Roland Corp. | 17,800 | 536,311 | ||||||
Rorze Corp. | 1,000 | 142,720 | ||||||
Round One Corp. | 86,200 | 448,243 | ||||||
Ryobi Ltd. | 19,300 | 381,932 | ||||||
S Foods, Inc. | 27,700 | 613,136 | ||||||
Sakai Chemical Industry Co. Ltd.(a) | 25,700 | 328,414 | ||||||
Sakai Moving Service Co. Ltd. | 29,600 | 499,902 | ||||||
Sakata Seed Corp. | 16,500 | 406,654 | ||||||
SAMTY Co. Ltd. | 47,200 | 874,796 | ||||||
San-Ai Obbli Co. Ltd. | 49,600 | 684,296 | ||||||
San-In Godo Bank Ltd. | 129,000 | 1,028,795 | ||||||
Sangetsu Corp. | 65,500 | 1,445,505 | ||||||
Sanki Engineering Co. Ltd. | 87,700 | 1,238,329 | ||||||
Sankyu, Inc. | 27,200 | 938,507 | ||||||
Sanshin Electronics Co. Ltd. | 34,700 | 493,176 | ||||||
Sanyo Chemical Industries Ltd. | 18,700 | 526,360 | ||||||
Sanyo Special Steel Co. Ltd. | 34,700 | 515,416 | ||||||
Sawai Group Holdings Co. Ltd. | 16,500 | 657,405 | ||||||
Scroll Corp. | 103,200 | 654,610 | ||||||
Seika Corp. | 20,800 | 509,194 | ||||||
Seiko Group Corp.(a) | 19,000 | 523,506 | ||||||
Seiren Co. Ltd.(a) | 46,400 | 845,559 | ||||||
Senko Group Holdings Co. Ltd. | 125,200 | 948,855 | ||||||
Senshu Ikeda Holdings, Inc. | 184,600 | 481,793 | ||||||
Seria Co. Ltd. | 47,000 | 934,752 | ||||||
Shibaura Machine Co. Ltd.(a) | 16,500 | 395,206 | ||||||
Shibaura Mechatronics Corp.(a) | 8,200 | 347,299 | ||||||
Shiga Bank Ltd. | 24,300 | 673,551 | ||||||
Shin-Etsu Polymer Co. Ltd. | 66,800 | 679,277 | ||||||
Shinagawa Refractories Co. Ltd.(a) | 29,500 | 375,609 | ||||||
Shinsho Corp. | 16,400 | 782,371 | ||||||
Ship Healthcare Holdings, Inc. | 26,100 | 362,498 | ||||||
Shoei Co. Ltd.(a) | 30,500 | 454,039 | ||||||
Sinfonia Technology Co. Ltd. | 42,200 | 903,419 | ||||||
SKY Perfect JSAT Holdings, Inc. | 183,000 | 1,280,498 | ||||||
Sotetsu Holdings, Inc. | 45,200 | 821,004 | ||||||
ST Corp. | 8,900 | 90,914 | ||||||
Star Micronics Co. Ltd. | 49,500 | 607,364 | ||||||
Starts Corp., Inc.(a) | 48,000 | 1,081,503 | ||||||
Sumida Corp. | 42,600 | 345,371 | ||||||
Sumitomo Bakelite Co. Ltd. | 45,400 | 1,388,293 | ||||||
Sumitomo Mitsui Construction Co. Ltd. | 182,700 | 519,086 | ||||||
Sumitomo Osaka Cement Co. Ltd.(a) | 20,300 | 516,671 | ||||||
Sun Frontier Fudousan Co. Ltd. | 85,800 | 1,111,724 | ||||||
Sun-Wa Technos Corp. | 39,100 | 617,457 | ||||||
Suruga Bank Ltd.(a) | 104,000 | 613,644 | ||||||
Suzuden Corp. | 49,500 | 706,465 | ||||||
Systena Corp. | 217,500 | 390,895 | ||||||
T Hasegawa Co. Ltd.(a) | 22,800 | 456,467 | ||||||
T-Gaia Corp. | 51,600 | 703,024 | ||||||
Tachi-S Co. Ltd. | 46,900 | 619,466 | ||||||
Tachibana Eletech Co. Ltd. | 18,100 | 386,888 | ||||||
Taiheiyo Cement Corp. | 60,000 | 1,395,091 | ||||||
Taikisha Ltd. | 22,000 | 675,212 | ||||||
Taiyo Holdings Co. Ltd. | 35,600 | 797,410 | ||||||
Takaoka Toko Co. Ltd. | 16,400 | 278,706 | ||||||
Takara Bio, Inc. | 46,800 | 299,950 | ||||||
Takara Holdings, Inc.(a) | 148,500 | 1,050,377 | ||||||
Takara Standard Co. Ltd.(a) | 79,400 | 1,024,601 | ||||||
Takasago Thermal Engineering Co. Ltd.(a) | 43,800 | 1,412,296 | ||||||
Takeuchi Manufacturing Co. Ltd. | 38,600 | 1,555,783 | ||||||
Takuma Co. Ltd. | 55,800 | 701,993 | ||||||
Tama Home Co. Ltd. | 29,200 | 875,932 | ||||||
Tamron Co. Ltd. | 15,500 | 704,615 | ||||||
Tayca Corp. | 18,200 | 182,908 | ||||||
TechnoPro Holdings, Inc. | 45,500 | 931,375 | ||||||
Teijin Ltd. | 42,200 | 393,155 | ||||||
Teikoku Electric Manufacturing Co. Ltd. | 41,900 | 707,354 | ||||||
THK Co. Ltd. | 54,100 | 1,262,196 | ||||||
TKC Corp.(a) | 32,300 | 794,988 | ||||||
Tocalo Co. Ltd. | 83,000 | 981,664 | ||||||
Toda Corp. | 182,600 | 1,233,662 | ||||||
Toho Bank Ltd.(a) | 241,900 | 575,401 | ||||||
Toho Gas Co. Ltd. | 49,600 | 1,135,250 | ||||||
Tokai Carbon Co. Ltd. | 106,700 | 702,685 | ||||||
TOKAI Holdings Corp. | 75,900 | 495,485 | ||||||
Tokai Rika Co. Ltd. | 56,122 | 970,811 | ||||||
Tokai Tokyo Financial Holdings, Inc. | 250,200 | 1,006,785 | ||||||
Tokuyama Corp. | 41,000 | 735,505 | ||||||
Tokyo Electron Device Ltd.(a) | 21,200 | 965,133 | ||||||
Tokyo Kiraboshi Financial Group, Inc. | 27,300 | 879,365 | ||||||
Tokyo Seimitsu Co. Ltd. | 29,500 | 2,373,138 | ||||||
Tokyo Steel Manufacturing Co. Ltd. | 82,900 | 911,465 | ||||||
Tokyotokeiba Co. Ltd.(a) | 16,600 | 489,735 | ||||||
Tokyu Construction Co. Ltd. | 53,800 | 296,825 | ||||||
Tomoku Co. Ltd. | 26,300 | 460,157 | ||||||
Tomy Co. Ltd. | 50,800 | 944,371 | ||||||
Topcon Corp. | 59,600 | 701,953 | ||||||
Topy Industries Ltd. | 26,100 | 467,349 | ||||||
Tosei Corp. | 27,700 | 452,988 | ||||||
Totetsu Kogyo Co. Ltd. | 32,100 | 637,355 | ||||||
Towa Pharmaceutical Co. Ltd. | 28,700 | 550,694 | ||||||
Toyo Tanso Co. Ltd. | 18,100 | 986,653 | ||||||
Toyo Tire Corp. | 116,500 | 2,176,894 | ||||||
Toyobo Co. Ltd. | 74,700 | 556,258 | ||||||
Transcosmos, Inc.(a) | 39,300 | 815,369 | ||||||
Trusco Nakayama Corp. | 37,700 | 643,923 | ||||||
Tsubakimoto Chain Co. | 41,000 | 1,395,157 | ||||||
Tsumura & Co. | 40,201 | 1,015,484 | ||||||
See Notes to Financial Statements.
| WisdomTree Trust | 71 |
Schedule of Investments (continued)
WisdomTree International SmallCap Dividend Fund (DLS)
March 31, 2024
| Investments | Shares | Value | ||||||
UACJ Corp. | 32,900 | $ | 957,577 | |||||
UBE Corp.(a) | 68,500 | 1,234,036 | ||||||
Ulvac, Inc. | 20,500 | 1,335,422 | ||||||
Universal Entertainment Corp. | 27,300 | 362,389 | ||||||
Valor Holdings Co. Ltd. | 52,600 | 871,656 | ||||||
Valqua Ltd. | 38,200 | 1,294,830 | ||||||
VT Holdings Co. Ltd. | 179,300 | 633,820 | ||||||
Wacoal Holdings Corp. | 29,500 | 723,929 | ||||||
West Holdings Corp. | 16,500 | 313,876 | ||||||
Xebio Holdings Co. Ltd. | 76,800 | 502,375 | ||||||
YAMABIKO Corp. | 51,300 | 676,904 | ||||||
Yamagata Bank Ltd.(a) | 50,500 | 393,403 | ||||||
Yamaguchi Financial Group, Inc.(a) | 113,900 | 1,172,904 | ||||||
Yamaichi Electronics Co. Ltd. | 45,300 | 745,297 | ||||||
Yamazen Corp. | 92,700 | 824,436 | ||||||
Yaoko Co. Ltd.(a) | 14,800 | 894,288 | ||||||
Yellow Hat Ltd. | 64,900 | 853,784 | ||||||
Yokogawa Bridge Holdings Corp. | 49,700 | 968,419 | ||||||
Yokorei Co. Ltd.(a) | 36,500 | 251,059 | ||||||
Yuasa Trading Co. Ltd. | 23,600 | 834,253 | ||||||
Yurtec Corp. | 64,100 | 642,927 | ||||||
|
| |||||||
| Total Japan |
| 303,061,548 | ||||||
| Malaysia – 0.1% |
| |||||||
Frencken Group Ltd. | 559,900 | 692,822 | ||||||
| Netherlands – 1.8% |
| |||||||
AMG Critical Materials NV(a) | 25,309 | 575,101 | ||||||
Brunel International NV(a) | 56,390 | 619,974 | ||||||
Corbion NV | 63,260 | 1,356,168 | ||||||
ForFarmers NV(a) | 174,197 | 488,205 | ||||||
Koninklijke BAM Groep NV | 565,420 | 2,144,615 | ||||||
Koninklijke Heijmans NV | 91,641 | 1,698,364 | ||||||
RHI Magnesita NV | 58,241 | 2,598,596 | ||||||
SBM Offshore NV(a) | 451,704 | 7,215,158 | ||||||
Sligro Food Group NV | 33,873 | 512,891 | ||||||
Wereldhave NV | 139,901 | 2,181,784 | ||||||
|
| |||||||
| Total Netherlands |
| 19,390,856 | ||||||
| Norway – 3.6% |
| |||||||
ABG Sundal Collier Holding ASA | 1,236,518 | 692,995 | ||||||
Aker Solutions ASA | 301,761 | 1,079,804 | ||||||
Atea ASA* | 99,622 | 1,191,945 | ||||||
Austevoll Seafood ASA | 401,451 | 3,152,815 | ||||||
Awilco LNG AS | 578,655 | 362,173 | ||||||
Belships ASA | 805,106 | 1,551,050 | ||||||
Borregaard ASA | 88,645 | 1,545,972 | ||||||
Bouvet ASA | 97,460 | 556,088 | ||||||
DNO ASA | 2,542,025 | 2,284,603 | ||||||
Elmera Group ASA(c) | 208,296 | 659,337 | ||||||
Europris ASA(c) | 273,359 | 1,965,415 | ||||||
Gram Car Carriers ASA | 41,156 | 755,699 | ||||||
Grieg Seafood ASA | 200,772 | 1,258,457 | ||||||
Hoegh Autoliners ASA | 722,340 | 6,139,018 | ||||||
Kitron ASA | 178,468 | 559,327 | ||||||
MPC Container Ships ASA | 2,388,779 | 2,762,313 | ||||||
Panoro Energy ASA | 185,106 | 455,914 | ||||||
Protector Forsikring ASA | 148,136 | 3,099,651 | ||||||
Rana Gruber ASA | 188,904 | 1,372,125 | ||||||
SpareBank 1 Nord Norge | 153,164 | 1,349,711 | ||||||
SpareBank 1 Oestlandet | 63,932 | 733,103 | ||||||
SpareBank 1 SMN | 187,952 | 2,387,385 | ||||||
Sparebanken Vest | 111,033 | 1,191,328 | ||||||
TGS ASA | 134,533 | 1,465,793 | ||||||
Veidekke ASA | 118,074 | 1,284,288 | ||||||
|
| |||||||
| Total Norway |
| 39,856,309 | ||||||
| Portugal – 1.4% |
| |||||||
Altri SGPS SA(a) | 460,027 | 2,598,416 | ||||||
Corticeira Amorim SGPS SA(a) | 100,905 | 1,071,248 | ||||||
CTT-Correios de Portugal SA | 180,929 | 807,016 | ||||||
Mota-Engil SGPS SA | 382,716 | 1,990,200 | ||||||
NOS SGPS SA(a) | 901,326 | 3,529,664 | ||||||
REN – Redes Energeticas Nacionais SGPS SA | 1,062,598 | 2,524,733 | ||||||
Sonae SGPS SA | 3,228,999 | 3,068,840 | ||||||
|
| |||||||
| Total Portugal |
| 15,590,117 | ||||||
| Singapore – 2.7% |
| |||||||
Aztech Global Ltd.(b) | 1,117,200 | 844,357 | ||||||
China Aviation Oil Singapore Corp. Ltd. | 548,000 | 367,472 | ||||||
ComfortDelGro Corp. Ltd. | 1,869,700 | 1,939,523 | ||||||
CSE Global Ltd. | 1,853,000 | 590,390 | ||||||
Delfi Ltd.(a) | 945,100 | 630,253 | ||||||
Digital Core REIT Management Pte. Ltd.(a) | 2,422,300 | 1,453,380 | ||||||
Food Empire Holdings Ltd. | 979,000 | 986,544 | ||||||
Geo Energy Resources Ltd.(a) | 3,117,100 | 796,828 | ||||||
Hong Fok Corp. Ltd. | 693,300 | 426,377 | ||||||
Hour Glass Ltd.(a) | 590,700 | 700,296 | ||||||
iFAST Corp. Ltd. | 78,800 | 388,862 | ||||||
Keppel Infrastructure Trust | 13,346,841 | 4,895,292 | ||||||
Netlink NBN Trust(b) | 8,903,100 | 5,640,301 | ||||||
Propnex Ltd.(b) | 1,702,700 | 1,160,702 | ||||||
Raffles Medical Group Ltd. | 2,463,000 | 1,897,985 | ||||||
Sheng Siong Group Ltd. | 2,483,200 | 2,815,128 | ||||||
SIA Engineering Co. Ltd. | 500,800 | 838,625 | ||||||
StarHub Ltd. | 1,947,100 | 1,702,414 | ||||||
UMS Holdings Ltd. | 946,698 | 946,979 | ||||||
Wing Tai Holdings Ltd. | 324,700 | 339,232 | ||||||
|
| |||||||
| Total Singapore |
| 29,360,940 | ||||||
| Spain – 1.1% |
| |||||||
Almirall SA | 100,049 | 893,057 | ||||||
Atresmedia Corp. de Medios de Comunicacion SA | 518,244 | 2,480,606 | ||||||
Construcciones y Auxiliar de Ferrocarriles SA | 34,790 | 1,269,974 | ||||||
Ercros SA(a) | 155,066 | 587,824 | ||||||
Faes Farma SA | 416,532 | 1,414,792 | ||||||
Global Dominion Access SA(c) | 170,694 | 620,336 | ||||||
Pharma Mar SA(a) | 8,665 | 268,955 | ||||||
Prosegur Cash SA(a)(c) | 1,410,220 | 729,535 | ||||||
Sacyr SA | 853,633 | 3,152,979 | ||||||
Talgo SA(a)(c) | 67,971 | 329,972 | ||||||
See Notes to Financial Statements.
| 72 | WisdomTree Trust |
Schedule of Investments (continued)
WisdomTree International SmallCap Dividend Fund (DLS)
March 31, 2024
| Investments | Shares | Value | ||||||
Tubacex SA | 122,833 | $ | 442,420 | |||||
|
| |||||||
| Total Spain |
| 12,190,450 | ||||||
| Sweden – 6.2% |
| |||||||
AcadeMedia AB(c) | 142,836 | 648,417 | ||||||
Addnode Group AB | 60,303 | 645,181 | ||||||
AFRY AB(a) | 132,224 | 2,114,575 | ||||||
Alimak Group AB(c) | 88,413 | 810,324 | ||||||
Alleima AB | 131,242 | 885,453 | ||||||
Alligo AB, Class B | 52,355 | 754,042 | ||||||
Ambea AB(c) | 55,726 | 332,242 | ||||||
Arjo AB, Class B | 153,979 | 736,587 | ||||||
Atrium Ljungberg AB, Class B | 128,715 | 2,518,300 | ||||||
Bahnhof AB, Class B(a) | 114,886 | 475,979 | ||||||
Beijer Alma AB | 45,202 | 817,581 | ||||||
Bilia AB, Class A(a) | 166,621 | 2,137,965 | ||||||
Billerud Aktiebolag | 357,460 | 3,210,006 | ||||||
BioGaia AB, Class B | 38,755 | 452,696 | ||||||
Bravida Holding AB(c) | 256,140 | 2,249,364 | ||||||
Bufab AB | 14,838 | 582,552 | ||||||
Catena AB(a) | 30,411 | 1,487,473 | ||||||
Clas Ohlson AB, Class B(a) | 27,838 | 377,505 | ||||||
Cloetta AB, Class B | 442,964 | 753,560 | ||||||
Dios Fastigheter AB(a) | 89,625 | 722,106 | ||||||
Dometic Group AB(c) | 164,864 | 1,334,318 | ||||||
Duni AB | 53,215 | 550,435 | ||||||
Electrolux Professional AB, Class B | 105,018 | 687,509 | ||||||
Fagerhult Group AB | 124,980 | 863,777 | ||||||
Fasadgruppen Group AB(a) | 71,890 | 488,787 | ||||||
FastPartner AB, Class A(a) | 167,097 | 1,203,306 | ||||||
Granges AB | 95,604 | 1,035,384 | ||||||
Hemnet Group AB | 3,538 | 108,463 | ||||||
HMS Networks AB(a) | 18,205 | 789,316 | ||||||
Hufvudstaden AB, Class A(a) | 137,780 | 1,675,121 | ||||||
Instalco AB(a)(b) | 146,169 | 577,972 | ||||||
Inwido AB | 107,020 | 1,460,283 | ||||||
Lagercrantz Group AB, Class B | 103,805 | 1,590,189 | ||||||
Lindab International AB | 72,649 | 1,562,695 | ||||||
Loomis AB | 76,689 | 2,143,040 | ||||||
Medicover AB, Class B(a) | 27,787 | 358,622 | ||||||
MEKO AB | 53,483 | 603,226 | ||||||
MIPS AB(b) | 13,771 | 452,053 | ||||||
Munters Group AB(c) | 61,124 | 1,098,135 | ||||||
Mycronic AB | 50,733 | 1,793,490 | ||||||
NCAB Group AB | 119,676 | 785,148 | ||||||
NCC AB, Class B | 96,983 | 1,336,026 | ||||||
New Wave Group AB, Class B | 100,456 | 1,203,300 | ||||||
Nordic Paper Holding AB | 201,447 | 1,000,396 | ||||||
Nordic Waterproofing Holding AB(a) | 32,840 | 503,690 | ||||||
NP3 Fastigheter AB | 50,729 | 1,048,492 | ||||||
OEM International AB, Class B | 88,909 | 873,075 | ||||||
Paradox Interactive AB | 33,757 | 593,840 | ||||||
Peab AB, Class B(a) | 620,813 | 3,910,345 | ||||||
Platzer Fastigheter Holding AB, Class B(a) | 110,756 | 952,954 | ||||||
Prevas AB, Class B(a) | 53,347 | 611,670 | ||||||
Ratos AB, Class B(a) | 231,188 | 760,638 | ||||||
Resurs Holding AB(a)(c) | 584,432 | 847,740 | ||||||
Rvrc Holding AB | 49,712 | 318,005 | ||||||
Sectra AB, Class B(a) | 41,443 | 802,884 | ||||||
SkiStar AB(a) | 41,317 | 623,275 | ||||||
Storskogen Group AB, Class B(a) | 555,595 | 296,176 | ||||||
Synsam AB | 108,169 | 587,754 | ||||||
Systemair AB(a) | 112,017 | 800,376 | ||||||
Tethys Oil AB | 68,940 | 229,239 | ||||||
Troax Group AB | 34,055 | 784,125 | ||||||
VBG Group AB, Class B | 20,745 | 608,230 | ||||||
Volati AB(a)(b) | 46,149 | 538,634 | ||||||
Wallenstam AB, Class B(a) | 268,814 | 1,316,089 | ||||||
Wihlborgs Fastigheter AB | 354,441 | 3,288,307 | ||||||
|
| |||||||
| Total Sweden |
| 67,708,437 | ||||||
| Switzerland – 1.5% |
| |||||||
Ascom Holding AG, Registered Shares | 30,195 | 275,902 | ||||||
Cembra Money Bank AG(a) | 50,152 | 4,203,926 | ||||||
Comet Holding AG, Registered Shares | 5,168 | 1,802,804 | ||||||
Huber & Suhner AG, Registered Shares(a) | 18,674 | 1,579,837 | ||||||
Landis & Gyr Group AG* | 28,900 | 2,221,966 | ||||||
Medmix AG(c) | 34,235 | 608,910 | ||||||
Mobilezone Holding AG, Registered Shares(a) | 95,856 | 1,581,459 | ||||||
OC Oerlikon Corp. AG, Registered Shares(a) | 796,042 | 3,510,468 | ||||||
u-blox Holding AG*(a) | 3,394 | 327,078 | ||||||
Zehnder Group AG | 8,796 | 583,991 | ||||||
|
| |||||||
| Total Switzerland |
| 16,696,341 | ||||||
| United Kingdom – 17.4% |
| |||||||
4imprint Group PLC | 74,732 | 5,985,289 | ||||||
AG Barr PLC | 93,410 | 686,761 | ||||||
AJ Bell PLC | 411,021 | 1,570,128 | ||||||
Alfa Financial Software Holdings PLC(c) | 469,209 | 1,004,674 | ||||||
Alliance Pharma PLC(a) | 514,536 | 258,045 | ||||||
Alpha Financial Markets Consulting PLC | 132,965 | 544,216 | ||||||
Ashmore Group PLC | 1,823,995 | 4,509,244 | ||||||
Assura PLC | 6,145,820 | 3,285,601 | ||||||
Avon Protection PLC | 36,040 | 492,608 | ||||||
Balfour Beatty PLC | 749,142 | 3,616,963 | ||||||
Big Yellow Group PLC | 240,192 | 3,228,416 | ||||||
Bloomsbury Publishing PLC | 127,208 | 848,472 | ||||||
Bodycote PLC | 295,442 | 2,599,457 | ||||||
Brickability Group PLC | 449,708 | 343,697 | ||||||
Bridgepoint Group PLC(c) | 1,031,035 | 3,388,988 | ||||||
Bytes Technology Group PLC | 124,360 | 802,770 | ||||||
Chemring Group PLC | 203,627 | 933,751 | ||||||
Chesnara PLC | 263,505 | 875,455 | ||||||
Clarkson PLC | 45,605 | 2,310,182 | ||||||
CMC Markets PLC(c) | 602,740 | 1,656,069 | ||||||
Coats Group PLC | 1,234,667 | 1,264,911 | ||||||
Concentric AB | 26,290 | 470,597 | ||||||
Craneware PLC | 19,466 | 540,989 | ||||||
Cranswick PLC | 31,347 | 1,621,979 | ||||||
See Notes to Financial Statements.
| WisdomTree Trust | 73 |
Schedule of Investments (continued)
WisdomTree International SmallCap Dividend Fund (DLS)
March 31, 2024
| Investments | Shares | Value | ||||||
CVS Group PLC | 7,614 | $ | 93,779 | |||||
DFS Furniture PLC | 428,792 | 599,089 | ||||||
DiscoverIE Group PLC | 46,281 | 442,576 | ||||||
Domino’s Pizza Group PLC | 503,303 | 2,190,958 | ||||||
Dowlais Group PLC | 545,605 | 537,604 | ||||||
Dr. Martens PLC | 1,391,292 | 1,542,250 | ||||||
Drax Group PLC | 587,560 | 3,721,567 | ||||||
Empiric Student Property PLC(a) | 1,267,030 | 1,520,547 | ||||||
Essentra PLC | 192,151 | 426,728 | ||||||
FDM Group Holdings PLC | 258,876 | 1,121,696 | ||||||
Fevertree Drinks PLC | 54,346 | 824,517 | ||||||
Firstgroup PLC | 489,019 | 1,114,427 | ||||||
Fonix Mobile PLC | 162,641 | 518,777 | ||||||
FRP Advisory Group PLC | 257,608 | 370,983 | ||||||
Fuller Smith & Turner PLC, Class A | 46,977 | 350,128 | ||||||
Galliford Try Holdings PLC | 255,920 | 775,898 | ||||||
Gamma Communications PLC | 40,131 | 693,514 | ||||||
Gateley Holdings PLC | 222,582 | 354,283 | ||||||
Genuit Group PLC | 289,574 | 1,613,197 | ||||||
Genus PLC | 24,596 | 548,401 | ||||||
Grainger PLC | 609,976 | 1,986,483 | ||||||
H&T Group PLC(a) | 77,312 | 363,312 | ||||||
Halfords Group PLC | 300,761 | 609,798 | ||||||
Hammerson PLC | 4,313,621 | 1,622,766 | ||||||
Hargreaves Services PLC | 61,335 | 385,858 | ||||||
Hays PLC | 2,321,138 | 2,769,442 | ||||||
Helical PLC | 278,536 | 731,870 | ||||||
Hill & Smith PLC | 76,924 | 1,900,728 | ||||||
Hilton Food Group PLC | 110,862 | 1,180,591 | ||||||
Hollywood Bowl Group PLC | 413,828 | 1,722,521 | ||||||
Hunting PLC | 155,739 | 650,217 | ||||||
Ibstock PLC(c) | 884,118 | 1,683,111 | ||||||
Impax Asset Management Group PLC | 275,235 | 1,615,023 | ||||||
IntegraFin Holdings PLC(b) | 433,834 | 1,523,553 | ||||||
James Halstead PLC(a) | 247,837 | 629,291 | ||||||
Johnson Service Group PLC | 256,581 | 425,901 | ||||||
Jupiter Fund Management PLC | 1,397,944 | 1,563,751 | ||||||
Just Group PLC | 645,229 | 857,470 | ||||||
Kainos Group PLC | 74,993 | 914,665 | ||||||
Keller Group PLC | 104,948 | 1,389,392 | ||||||
Kitwave Group PLC(a) | 143,363 | 671,893 | ||||||
Learning Technologies Group PLC | 470,316 | 507,384 | ||||||
LondonMetric Property PLC | 1,850,863 | 4,751,024 | ||||||
Luceco PLC(c) | 211,453 | 371,828 | ||||||
Marshalls PLC | 430,451 | 1,494,272 | ||||||
Mattioli Woods PLC | 65,839 | 658,715 | ||||||
Me Group International PLC | 872,009 | 1,833,005 | ||||||
Mears Group PLC | 188,195 | 877,251 | ||||||
Midwich Group PLC | 112,304 | 610,032 | ||||||
Mitie Group PLC | 1,618,830 | 2,147,236 | ||||||
Moneysupermarket.com Group PLC | 674,580 | 1,873,055 | ||||||
Morgan Advanced Materials PLC | 319,452 | 1,150,111 | ||||||
Morgan Sindall Group PLC | 72,769 | 2,132,670 | ||||||
Mortgage Advice Bureau Holdings Ltd. | 75,306 | 867,588 | ||||||
MP Evans Group PLC | 70,548 | 721,870 | ||||||
Next 15 Group PLC | 60,129 | 701,852 | ||||||
Nichols PLC(a) | 43,071 | 526,683 | ||||||
Odfjell Technology Ltd. | 62,312 | 371,623 | ||||||
Oxford Instruments PLC | 26,770 | 718,616 | ||||||
PageGroup PLC | 1,075,978 | 6,097,502 | ||||||
Pan African Resources PLC | 3,581,844 | 1,018,072 | ||||||
PayPoint PLC | 215,778 | 1,324,746 | ||||||
Pennon Group PLC | 406,391 | 3,324,093 | ||||||
Pets at Home Group PLC | 571,469 | 1,937,602 | ||||||
Polar Capital Holdings PLC | 334,593 | 1,925,283 | ||||||
Premier Foods PLC | 256,875 | 484,799 | ||||||
Primary Health Properties PLC(a) | 2,433,463 | 2,881,942 | ||||||
PZ Cussons PLC(a) | 672,060 | 761,535 | ||||||
QinetiQ Group PLC | 313,291 | 1,445,333 | ||||||
Reach PLC | 903,310 | 894,627 | ||||||
Redde Northgate PLC | 674,932 | 3,252,699 | ||||||
Redrow PLC | 579,709 | 4,873,572 | ||||||
Renew Holdings PLC | 66,191 | 772,610 | ||||||
Restore PLC(a) | 129,367 | 352,993 | ||||||
Robert Walters PLC | 114,052 | 586,390 | ||||||
RWS Holdings PLC | 623,346 | 1,477,241 | ||||||
Safestore Holdings PLC | 266,122 | 2,536,468 | ||||||
Savills PLC | 190,895 | 2,570,639 | ||||||
Secure Trust Bank PLC | 44,599 | 371,842 | ||||||
Senior PLC | 173,879 | 388,346 | ||||||
Serco Group PLC | 651,574 | 1,561,422 | ||||||
Serica Energy PLC | 1,053,886 | 2,509,541 | ||||||
Severfield PLC | 590,529 | 408,800 | ||||||
Speedy Hire PLC | 1,583,347 | 508,041 | ||||||
Spirent Communications PLC | 1,111,557 | 2,808,349 | ||||||
SThree PLC | 241,904 | 1,314,016 | ||||||
Tatton Asset Management PLC(a) | 69,511 | 498,759 | ||||||
TBC Bank Group PLC | 81,252 | 3,299,927 | ||||||
Telecom Plus PLC | 115,788 | 2,381,262 | ||||||
TORM PLC, Class A | 259,087 | 8,785,662 | ||||||
Travis Perkins PLC | 279,892 | 2,578,965 | ||||||
TT Electronics PLC | 258,021 | 516,949 | ||||||
Tyman PLC | 343,755 | 1,257,149 | ||||||
Vertu Motors PLC | 388,327 | 331,124 | ||||||
Vesuvius PLC | 495,977 | 3,102,640 | ||||||
Victrex PLC | 102,355 | 1,679,606 | ||||||
Volution Group PLC | 118,313 | 649,548 | ||||||
Warpaint London PLC | 96,128 | 500,914 | ||||||
WH Smith PLC | 89,612 | 1,490,875 | ||||||
Wickes Group PLC | 658,990 | 1,291,160 | ||||||
Wincanton PLC | 187,143 | 1,418,450 | ||||||
Workspace Group PLC(a) | 282,366 | 1,828,081 | ||||||
XPS Pensions Group PLC(b) | 353,003 | 1,030,101 | ||||||
YouGov PLC | 30,525 | 385,607 | ||||||
|
| |||||||
| Total United Kingdom |
| 191,127,914 | ||||||
See Notes to Financial Statements.
| 74 | WisdomTree Trust |
Schedule of Investments (concluded)
WisdomTree International SmallCap Dividend Fund (DLS)
March 31, 2024
| Investments | Shares | Value | ||||||
| United States – 0.1% |
| |||||||
Noram Drilling AS* | 223,216 | $ | 770,555 | |||||
TOTAL COMMON STOCKS (Cost: $978,084,010) |
| 1,084,983,854 | ||||||
| EXCHANGE-TRADED FUNDS – 0.0% |
| |||||||
| United States – 0.0% |
| |||||||
WisdomTree Europe SmallCap Dividend Fund(d) | 3,929 | 234,751 | ||||||
WisdomTree Japan SmallCap Dividend Fund(d) | 2,452 | 189,540 | ||||||
TOTAL EXCHANGE-TRADED FUNDS (Cost: $318,025) |
| 424,291 | ||||||
| INVESTMENT OF CASH COLLATERAL FOR SECURITIES LOANED – 5.5% |
| |||||||
| United States – 5.5% |
| |||||||
State Street Navigator Securities Lending Government Money Market Portfolio, 5.34%(e) |
| |||||||
| (Cost: $59,942,222) | 59,942,222 | 59,942,222 | ||||||
TOTAL INVESTMENTS IN SECURITIES – 104.2% (Cost: $1,038,344,257) |
| 1,145,350,367 | ||||||
Other Assets less Liabilities – (4.2)% |
| (46,087,958 | ) | |||||
|
| |||||||
| NET ASSETS – 100.0% |
| $ | 1,099,262,409 | |||||
| * | Non-income producing security. |
| (a) | Security, or portion thereof, was on loan at March 31, 2024 (See Note 2). At March 31, 2024, the total market value of the Fund’s securities on loan identified in the Schedule of Investments was $129,254,151 and the total market value of the collateral held by the Fund was $137,014,256. The total market value of the collateral includes non-cash U.S. Government securities collateral having a value of $77,072,034. |
| (b) | This security is exempt from registration under Regulation S of the Securities Act of 1933, which exempts from registration securities offered and sold outside the United States. This security may not be offered or sold in the United States except pursuant to an exemption from, or in a transaction not subject to, the registration requirements of the Securities Act of 1933. |
| (c) | This security is exempt from registration under rule 144A of the Securities Act of 1933. This security may be sold in transactions that are exempt from registration, normally to qualified institutional buyers. |
| (d) | Affiliated holding. See “Investment in Affiliates” supplementary table included in this Schedule of Investments for additional information. |
| (e) | Rate shown represents annualized 7-day yield as of March 31, 2024. |
| INVESTMENT IN AFFILIATES | ||||||||||
Affiliated holdings are investments in entities in which the Fund owns 5% or more of the outstanding voting securities or are investments in entities which are under common ownership or control. Investments in affiliates during the fiscal year ended March 31, 2024 were as follows:
| Affiliate | Value at 3/31/2023 | Purchases/ Additions | Sales/ Reductions | Realized Gain/(Loss) | Change in Unrealized Appreciation/ Depreciation | Value at 3/31/2024 | Dividend Income | |||||||||||||||||||||
WisdomTree Europe SmallCap Dividend Fund | $ | 1,967,678 | $ | 12,175,951 | $ | 13,601,715 | $ | (74,712 | ) | $ | (232,451 | ) | $ | 234,751 | $ | 179,724 | ||||||||||||
WisdomTree Japan SmallCap Dividend Fund | 1,615,590 | 9,806,595 | 11,413,481 | 318,117 | (137,281 | ) | 189,540 | 57,569 | ||||||||||||||||||||
Total | $ | 3,583,268 | $ | 21,982,546 | $ | 25,015,196 | $ | 243,405 | $ | (369,732 | ) | $ | 424,291 | $ | 237,293 | |||||||||||||
| FAIR VALUATION SUMMARY | ||||||||||||||
The following is a summary of the fair valuations according to the inputs used in valuing the Fund’s investments (See Note 2 – Fair Value Measurement):
Quoted Prices in Active Markets (Level 1) | Other (Level 2) | Significant (Level 3) | Total | |||||||||||||
Assets: | ||||||||||||||||
Investments in Securities | ||||||||||||||||
Common Stocks | $ | 1,084,983,854 | $ | — | $ | — | $ | 1,084,983,854 | ||||||||
Exchange-Traded Funds | 424,291 | — | — | 424,291 | ||||||||||||
Investment of Cash Collateral for Securities Loaned | — | 59,942,222 | — | 59,942,222 | ||||||||||||
Total Investments in Securities | $ | 1,085,408,145 | $ | 59,942,222 | $ | — | $ | 1,145,350,367 | ||||||||
See Notes to Financial Statements.
| WisdomTree Trust | 75 |
Schedule of Investments
WisdomTree Japan SmallCap Dividend Fund (DFJ)
March 31, 2024
| Investments | Shares | Value | ||||||
| COMMON STOCKS – 98.6% |
| |||||||
| Japan – 98.6% |
| |||||||
| Air Freight & Logistics – 1.0% |
| |||||||
AIT Corp. | 18,000 | $ | 215,389 | |||||
AZ-COM MARUWA Holdings, Inc. | 13,900 | 123,988 | ||||||
Hamakyorex Co. Ltd. | 5,400 | 137,368 | ||||||
Konoike Transport Co. Ltd. | 18,200 | 263,358 | ||||||
Mitsui-Soko Holdings Co. Ltd.(a) | 14,300 | 444,557 | ||||||
Sankyu, Inc. | 17,000 | 586,567 | ||||||
SBS Holdings, Inc. | 11,900 | 206,556 | ||||||
Senko Group Holdings Co. Ltd. | 41,056 | 311,152 | ||||||
Shibusawa Warehouse Co. Ltd. | 10,000 | 204,500 | ||||||
Trancom Co. Ltd. | 2,100 | 83,670 | ||||||
|
| |||||||
| Total Air Freight & Logistics |
| 2,577,105 | ||||||
| Automobile Components – 4.2% |
| |||||||
Aisan Industry Co. Ltd. | 43,800 | 492,857 | ||||||
Daikyonishikawa Corp. | 46,900 | 238,924 | ||||||
Eagle Industry Co. Ltd. | 29,200 | 353,460 | ||||||
Exedy Corp.(a) | 26,725 | 540,345 | ||||||
Fujikura Composites, Inc.(a) | 16,500 | 156,992 | ||||||
FuKoKu Co. Ltd. | 15,100 | 186,973 | ||||||
Futaba Industrial Co. Ltd. | 36,200 | 280,568 | ||||||
G-Tekt Corp. | 19,600 | 273,645 | ||||||
Ichikoh Industries Ltd. | 37,600 | 137,387 | ||||||
KYB Corp.(a) | 25,800 | 881,337 | ||||||
Musashi Seimitsu Industry Co. Ltd. | 13,600 | 151,416 | ||||||
NHK Spring Co. Ltd. | 99,700 | 986,163 | ||||||
Nichirin Co. Ltd. | 10,000 | 253,064 | ||||||
Pacific Industrial Co. Ltd. | 21,000 | 236,995 | ||||||
Press Kogyo Co. Ltd. | 80,500 | 380,307 | ||||||
Seiren Co. Ltd.(a) | 25,211 | 459,427 | ||||||
Shoei Co. Ltd.(a) | 26,900 | 400,447 | ||||||
Sumitomo Riko Co. Ltd. | 30,900 | 272,158 | ||||||
Tachi-S Co. Ltd. | 34,500 | 455,684 | ||||||
Tokai Rika Co. Ltd. | 49,758 | 860,725 | ||||||
Topre Corp. | 18,000 | 310,654 | ||||||
Toyo Tire Corp. | 103,200 | 1,928,373 | ||||||
Unipres Corp. | 23,100 | 178,884 | ||||||
|
| |||||||
| Total Automobile Components |
| 10,416,785 | ||||||
| Banks – 6.6% |
| |||||||
77 Bank Ltd. | 30,900 | 846,282 | ||||||
Aichi Financial Group, Inc. | 19,400 | 340,072 | ||||||
Akita Bank Ltd. | 8,600 | 119,898 | ||||||
Awa Bank Ltd. | 12,775 | 232,380 | ||||||
Bank of Iwate Ltd. | 8,100 | 137,761 | ||||||
Bank of Nagoya Ltd. | 6,969 | 306,674 | ||||||
Bank of Saga Ltd. | 9,200 | 130,026 | ||||||
Bank of the Ryukyus Ltd. | 26,508 | 209,654 | ||||||
Chugin Financial Group, Inc. | 64,500 | 560,212 | ||||||
Daishi Hokuetsu Financial Group, Inc.(a) | 17,455 | 514,383 | ||||||
Ehime Bank Ltd. | 16,299 | 122,341 | ||||||
FIDEA Holdings Co. Ltd. | 9,880 | 104,319 | ||||||
First Bank of Toyama Ltd.(a) | 36,400 | 229,447 | ||||||
Fukui Bank Ltd. | 11,448 | 147,350 | ||||||
Gunma Bank Ltd. | 233,200 | 1,353,175 | ||||||
Hirogin Holdings, Inc. | 132,600 | 955,873 | ||||||
Hokuhoku Financial Group, Inc. | 34,700 | 444,340 | ||||||
Hyakugo Bank Ltd. | 120,500 | 516,730 | ||||||
Hyakujushi Bank Ltd. | 17,600 | 346,197 | ||||||
Iyogin Holdings, Inc. | 74,400 | 576,637 | ||||||
Juroku Financial Group, Inc. | 15,400 | 487,403 | ||||||
Keiyo Bank Ltd. | 56,842 | 286,191 | ||||||
Kiyo Bank Ltd.(a) | 22,790 | 278,880 | ||||||
Miyazaki Bank Ltd. | 11,300 | 213,837 | ||||||
Musashino Bank Ltd. | 23,400 | 456,265 | ||||||
Nanto Bank Ltd.(a) | 17,600 | 356,431 | ||||||
Nishi-Nippon Financial Holdings, Inc. | 55,900 | 707,684 | ||||||
North Pacific Bank Ltd. | 131,215 | 385,812 | ||||||
Ogaki Kyoritsu Bank Ltd. | 18,242 | 263,123 | ||||||
Oita Bank Ltd. | 10,800 | 215,508 | ||||||
Okinawa Financial Group, Inc. | 8,980 | 155,991 | ||||||
Procrea Holdings, Inc.(a) | 8,862 | 108,854 | ||||||
San ju San Financial Group, Inc. | 18,600 | 256,119 | ||||||
San-In Godo Bank Ltd. | 69,100 | 551,083 | ||||||
Senshu Ikeda Holdings, Inc. | 138,040 | 360,275 | ||||||
Shiga Bank Ltd. | 19,284 | 534,516 | ||||||
Shikoku Bank Ltd. | 20,900 | 169,028 | ||||||
Suruga Bank Ltd.(a) | 74,000 | 436,631 | ||||||
Toho Bank Ltd.(a) | 79,000 | 187,915 | ||||||
Tokyo Kiraboshi Financial Group, Inc. | 18,400 | 592,686 | ||||||
TOMONY Holdings, Inc. | 60,177 | 166,203 | ||||||
Yamagata Bank Ltd.(a) | 14,700 | 114,515 | ||||||
Yamaguchi Financial Group, Inc.(a) | 80,400 | 827,932 | ||||||
Yamanashi Chuo Bank Ltd. | 19,400 | 241,370 | ||||||
|
| |||||||
| Total Banks |
| 16,548,003 | ||||||
| Beverages – 0.3% |
| |||||||
Takara Holdings, Inc.(a) | 120,211 | 850,282 | ||||||
| Biotechnology – 0.1% |
| |||||||
Takara Bio, Inc. | 49,400 | 316,614 | ||||||
| Broadline Retail – 0.8% |
| |||||||
ASKUL Corp. | 18,930 | 286,930 | ||||||
Belluna Co. Ltd. | 37,384 | 153,147 | ||||||
Izumi Co. Ltd. | 31,900 | 740,037 | ||||||
Mr. Max Holdings Ltd. | 37,100 | 155,661 | ||||||
Seria Co. Ltd. | 32,400 | 644,382 | ||||||
|
| |||||||
| Total Broadline Retail |
| 1,980,157 | ||||||
| Building Products – 1.4% |
| |||||||
Bunka Shutter Co. Ltd. | 33,100 | 380,548 | ||||||
Central Glass Co. Ltd. | 10,686 | 204,901 | ||||||
Kondotec, Inc. | 20,100 | 171,324 | ||||||
Nichias Corp. | 27,213 | 731,817 | ||||||
Nichiha Corp. | 9,700 | 220,797 | ||||||
Nippon Aqua Co. Ltd. | 15,300 | 106,755 | ||||||
Nitto Boseki Co. Ltd.(a) | 5,900 | 232,733 | ||||||
Noritz Corp. | 18,500 | 213,182 | ||||||
Okabe Co. Ltd. | 23,400 | 121,371 | ||||||
See Notes to Financial Statements.
| 76 | WisdomTree Trust |
Schedule of Investments (continued)
WisdomTree Japan SmallCap Dividend Fund (DFJ)
March 31, 2024
| Investments | Shares | Value | ||||||
Shin Nippon Air Technologies Co. Ltd. | 12,600 | $ | 288,473 | |||||
Takara Standard Co. Ltd.(a) | 16,731 | 215,902 | ||||||
Takasago Thermal Engineering Co. Ltd.(a) | 22,472 | 724,592 | ||||||
|
| |||||||
| Total Building Products |
| 3,612,395 | ||||||
| Capital Markets – 1.3% |
| |||||||
GMO Financial Holdings, Inc. | 43,900 | 230,312 | ||||||
Ichiyoshi Securities Co. Ltd. | 21,088 | 118,158 | ||||||
IwaiCosmo Holdings, Inc. | 17,200 | 254,684 | ||||||
M&A Capital Partners Co. Ltd. | 6,500 | 98,352 | ||||||
Matsui Securities Co. Ltd.(a) | 176,900 | 965,472 | ||||||
Okasan Securities Group, Inc.(a) | 90,500 | 488,543 | ||||||
SBI Global Asset Management Co. Ltd.(a) | 39,344 | 191,072 | ||||||
Sparx Group Co. Ltd.(a) | 22,700 | 281,978 | ||||||
Tokai Tokyo Financial Holdings, Inc. | 132,300 | 532,365 | ||||||
|
| |||||||
| Total Capital Markets |
| 3,160,936 | ||||||
| Chemicals – 8.7% |
| |||||||
ADEKA Corp. | 39,825 | 848,365 | ||||||
Aica Kogyo Co. Ltd.(a) | 41,915 | 1,030,254 | ||||||
Artience Co. Ltd. | 22,802 | 438,729 | ||||||
Asahi Yukizai Corp. | 8,100 | 282,586 | ||||||
C Uyemura & Co. Ltd. | 8,300 | 576,385 | ||||||
Chugoku Marine Paints Ltd. | 40,900 | 612,642 | ||||||
CI Takiron Corp. | 34,600 | 157,974 | ||||||
Dai Nippon Toryo Co. Ltd. | 24,400 | 195,561 | ||||||
Dainichiseika Color & Chemicals Manufacturing Co. Ltd. | 12,742 | 251,312 | ||||||
Denka Co. Ltd.(a) | 37,200 | 576,760 | ||||||
DIC Corp. | 36,600 | 698,410 | ||||||
Fujimi, Inc.(a) | 27,700 | 644,250 | ||||||
Fujimori Kogyo Co. Ltd. | 4,000 | 114,573 | ||||||
Fuso Chemical Co. Ltd.(a) | 7,700 | 234,289 | ||||||
Harima Chemicals Group, Inc. | 31,700 | 193,746 | ||||||
Ishihara Sangyo Kaisha Ltd. | 15,300 | 178,834 | ||||||
JCU Corp. | 7,000 | 182,695 | ||||||
JSP Corp.(a) | 16,523 | 251,101 | ||||||
Kaneka Corp. | 26,300 | 662,778 | ||||||
Kanto Denka Kogyo Co. Ltd.(a) | 29,600 | 197,144 | ||||||
KeePer Technical Laboratory Co. Ltd.(a) | 3,200 | 105,190 | ||||||
KH Neochem Co. Ltd. | 19,000 | 295,272 | ||||||
Konishi Co. Ltd.(a) | 35,600 | 368,126 | ||||||
Kumiai Chemical Industry Co. Ltd. | 66,424 | 364,719 | ||||||
Kureha Corp. | 22,292 | 400,194 | ||||||
Lintec Corp. | 34,965 | 731,205 | ||||||
MEC Co. Ltd.(a) | 5,300 | 143,054 | ||||||
Moriroku Holdings Co. Ltd. | 15,100 | 260,305 | ||||||
Nihon Nohyaku Co. Ltd.(a) | 30,900 | 168,235 | ||||||
Nippon Kayaku Co. Ltd. | 71,200 | 614,406 | ||||||
Nippon Pillar Packing Co. Ltd. | 17,000 | 716,641 | ||||||
Nippon Shokubai Co. Ltd. | 55,200 | 534,694 | ||||||
Nippon Soda Co. Ltd.(a) | 18,618 | 745,483 | ||||||
Okura Industrial Co. Ltd. | 7,700 | 159,500 | ||||||
Osaka Organic Chemical Industry Ltd.(a) | 6,500 | 135,931 | ||||||
Osaka Soda Co. Ltd.(a) | 4,300 | 274,459 | ||||||
Riken Technos Corp. | 50,000 | 331,692 | ||||||
Sakai Chemical Industry Co. Ltd.(a) | 11,100 | 141,844 | ||||||
Sakata INX Corp. | 14,100 | 146,641 | ||||||
Sanyo Chemical Industries Ltd. | 13,135 | 369,719 | ||||||
Shin-Etsu Polymer Co. Ltd. | 32,800 | 333,537 | ||||||
Stella Chemifa Corp.(a) | 5,500 | 134,098 | ||||||
Sumitomo Bakelite Co. Ltd. | 37,236 | 1,138,645 | ||||||
Sumitomo Seika Chemicals Co. Ltd. | 7,500 | 252,238 | ||||||
T Hasegawa Co. Ltd.(a) | 11,400 | 228,234 | ||||||
Taiyo Holdings Co. Ltd. | 27,482 | 615,574 | ||||||
Takasago International Corp. | 5,100 | 116,595 | ||||||
Tayca Corp. | 8,300 | 83,414 | ||||||
Teijin Ltd. | 49,700 | 463,028 | ||||||
Tokai Carbon Co. Ltd. | 81,600 | 537,386 | ||||||
Tokuyama Corp. | 29,800 | 534,587 | ||||||
Toyobo Co. Ltd. | 38,353 | 285,598 | ||||||
UBE Corp.(a) | 56,893 | 1,024,935 | ||||||
Valqua Ltd.(a) | 16,337 | 553,760 | ||||||
|
| |||||||
| Total Chemicals |
| 21,637,327 | ||||||
| Commercial Services & Supplies – 1.3% |
| |||||||
Aeon Delight Co. Ltd. | 12,800 | 299,395 | ||||||
CTS Co. Ltd. | 28,400 | 149,558 | ||||||
Daiei Kankyo Co. Ltd. | 14,500 | 255,998 | ||||||
Daiseki Co. Ltd. | 6,988 | 168,299 | ||||||
Inui Global Logistics Co. Ltd.(a) | 30,100 | 206,242 | ||||||
Itoki Corp.(a) | 13,300 | 156,600 | ||||||
Kimura Unity Co. Ltd. | 12,600 | 142,031 | ||||||
Kokuyo Co. Ltd. | 45,000 | 739,469 | ||||||
Nippon Kanzai Holdings Co. Ltd. | 6,700 | 113,596 | ||||||
Nippon Parking Development Co. Ltd.(a) | 78,900 | 107,914 | ||||||
Okamura Corp. | 40,076 | 601,094 | ||||||
Pilot Corp. | 7,300 | 191,972 | ||||||
Prestige International, Inc.(a) | 25,100 | 115,097 | ||||||
Sato Holdings Corp. | 8,238 | 125,085 | ||||||
|
| |||||||
| Total Commercial Services & Supplies |
| 3,372,350 | ||||||
| Construction & Engineering – 5.0% |
| |||||||
Asanuma Corp.(a) | 12,300 | 323,053 | ||||||
CTI Engineering Co. Ltd. | 4,400 | 147,689 | ||||||
Dai-Dan Co. Ltd. | 21,600 | 355,516 | ||||||
Daiho Corp.(a) | 8,900 | 200,823 | ||||||
EXEO Group, Inc. | 66,200 | 708,169 | ||||||
Fudo Tetra Corp. | 8,900 | 121,140 | ||||||
Hazama Ando Corp.(a) | 101,200 | 793,044 | ||||||
JDC Corp.(a) | 37,700 | 133,767 | ||||||
Kandenko Co. Ltd. | 66,538 | 768,938 | ||||||
Kumagai Gumi Co. Ltd. | 11,800 | 325,515 | ||||||
Kyudenko Corp. | 13,690 | 576,112 | ||||||
Mirait One Corp. | 24,100 | 304,146 | ||||||
Nippon Road Co. Ltd. | 16,900 | 212,388 | ||||||
Nishimatsu Construction Co. Ltd.(a) | 20,507 | 605,000 | ||||||
Nittoc Construction Co. Ltd. | 26,700 | 207,115 | ||||||
Okumura Corp. | 16,770 | 564,005 | ||||||
Oriental Shiraishi Corp. | 75,900 | 201,604 | ||||||
See Notes to Financial Statements.
| WisdomTree Trust | 77 |
Schedule of Investments (continued)
WisdomTree Japan SmallCap Dividend Fund (DFJ)
March 31, 2024
| Investments | Shares | Value | ||||||
Penta-Ocean Construction Co. Ltd. | 67,293 | $ | 345,436 | |||||
PS Mitsubishi Construction Co. Ltd. | 25,200 | 176,497 | ||||||
Raito Kogyo Co. Ltd. | 22,800 | 306,872 | ||||||
Raiznext Corp. | 14,100 | 202,260 | ||||||
Sanki Engineering Co. Ltd. | 23,700 | 334,645 | ||||||
Seikitokyu Kogyo Co. Ltd.(a) | 15,200 | 193,634 | ||||||
SHO-BOND Holdings Co. Ltd. | 11,100 | 471,151 | ||||||
Sumitomo Mitsui Construction Co. Ltd. | 38,960 | 110,693 | ||||||
Taihei Dengyo Kaisha Ltd. | 6,200 | 188,648 | ||||||
Taikisha Ltd. | 12,265 | 376,431 | ||||||
Takamatsu Construction Group Co. Ltd.(a) | 9,600 | 180,145 | ||||||
Tekken Corp. | 7,000 | 125,019 | ||||||
Tess Holdings Co. Ltd. | 27,000 | 84,027 | ||||||
Toa Corp.(a) | 24,800 | 199,586 | ||||||
Tobishima Corp. | 19,800 | 195,455 | ||||||
Toda Corp. | 86,749 | 586,084 | ||||||
Tokyu Construction Co. Ltd. | 66,400 | 366,342 | ||||||
Totetsu Kogyo Co. Ltd. | 7,279 | 144,527 | ||||||
Toyo Construction Co. Ltd. | 24,600 | 213,256 | ||||||
Wakachiku Construction Co. Ltd. | 6,100 | 145,300 | ||||||
Yahagi Construction Co. Ltd. | 15,500 | 159,358 | ||||||
Yokogawa Bridge Holdings Corp. | 19,800 | 385,809 | ||||||
Yondenko Corp. | 8,100 | 215,418 | ||||||
Yurtec Corp. | 26,500 | 265,797 | ||||||
|
| |||||||
| Total Construction & Engineering |
| 12,520,414 | ||||||
| Construction Materials – 1.1% |
| |||||||
Asia Pile Holdings Corp. | 33,900 | 194,649 | ||||||
Krosaki Harima Corp. | 24,400 | 565,080 | ||||||
Maeda Kosen Co. Ltd.(a) | 4,500 | 107,783 | ||||||
Shinagawa Refractories Co. Ltd.(a) | 33,400 | 425,265 | ||||||
Sumitomo Osaka Cement Co. Ltd.(a) | 14,740 | 375,159 | ||||||
Taiheiyo Cement Corp. | 42,100 | 978,889 | ||||||
Yotai Refractories Co. Ltd. | 16,400 | 159,292 | ||||||
|
| |||||||
| Total Construction Materials |
| 2,806,117 | ||||||
| Consumer Finance – 0.1% |
| |||||||
J Trust Co. Ltd.(a) | 61,100 | 183,690 | ||||||
| Consumer Staples Distribution & Retail – 2.6% |
| |||||||
Aeon Hokkaido Corp. | 26,500 | 165,641 | ||||||
Ain Holdings, Inc. | 7,900 | 288,450 | ||||||
Arcs Co. Ltd. | 13,794 | 285,277 | ||||||
Axial Retailing, Inc. | 27,200 | 186,731 | ||||||
Cawachi Ltd. | 6,200 | 108,806 | ||||||
Create SD Holdings Co. Ltd. | 14,200 | 309,624 | ||||||
Fuji Co. Ltd. | 18,400 | 226,740 | ||||||
G-7 Holdings, Inc. | 20,900 | 199,133 | ||||||
H2O Retailing Corp. | 37,000 | 475,503 | ||||||
Heiwado Co. Ltd. | 11,963 | 160,777 | ||||||
JM Holdings Co. Ltd.(a) | 10,900 | 201,226 | ||||||
Kansai Food Market Ltd.(a) | 15,300 | 179,441 | ||||||
Kato Sangyo Co. Ltd. | 10,416 | 315,553 | ||||||
Life Corp. | 13,100 | 336,707 | ||||||
Mitsubishi Shokuhin Co. Ltd. | 27,000 | 1,002,610 | ||||||
Okuwa Co. Ltd.(a) | 24,900 | 163,208 | ||||||
Qol Holdings Co. Ltd. | 13,100 | 152,947 | ||||||
Retail Partners Co. Ltd. | 8,100 | 98,745 | ||||||
San-A Co. Ltd. | 10,200 | 316,760 | ||||||
United Super Markets Holdings, Inc.(a) | 29,900 | 197,957 | ||||||
Valor Holdings Co. Ltd. | 26,191 | 434,022 | ||||||
Yaoko Co. Ltd.(a) | 9,300 | 561,951 | ||||||
Yokorei Co. Ltd.(a) | 17,000 | 116,931 | ||||||
|
| |||||||
| Total Consumer Staples Distribution & Retail |
| 6,484,740 | ||||||
| Containers & Packaging – 0.6% |
| |||||||
FP Corp.(a) | 19,000 | 346,116 | ||||||
Fuji Seal International, Inc. | 16,410 | 224,879 | ||||||
Rengo Co. Ltd. | 81,500 | 630,051 | ||||||
Tomoku Co. Ltd. | 11,100 | 194,211 | ||||||
|
| |||||||
| Total Containers & Packaging |
| 1,395,257 | ||||||
| Distributors – 0.5% |
| |||||||
Arata Corp. | 13,200 | 287,819 | ||||||
Happinet Corp.(a) | 12,300 | 245,846 | ||||||
Optimus Group Co. Ltd. | 24,400 | 176,053 | ||||||
PALTAC Corp. | 15,900 | 432,314 | ||||||
Yamae Group Holdings Co. Ltd.(a) | 6,700 | 123,689 | ||||||
|
| |||||||
| Total Distributors |
| 1,265,721 | ||||||
| Diversified Consumer Services – 0.3% |
| |||||||
Aucnet, Inc. | 14,200 | 229,122 | ||||||
Gakkyusha Co. Ltd. | 12,000 | 169,123 | ||||||
Step Co. Ltd. | 17,500 | 231,722 | ||||||
Tokyo Individualized Educational Institute, Inc.(a) | 59,500 | 169,837 | ||||||
|
| |||||||
| Total Diversified Consumer Services |
| 799,804 | ||||||
| Diversified Telecommunication Services – 0.1% |
| |||||||
U-Next Holdings Co. Ltd. | 4,600 | 161,089 | ||||||
| Electric Utilities – 0.2% |
| |||||||
Hokkaido Electric Power Co., Inc. | 24,000 | 133,237 | ||||||
Shikoku Electric Power Co., Inc. | 39,700 | 314,384 | ||||||
|
| |||||||
| Total Electric Utilities |
| 447,621 | ||||||
| Electrical Equipment – 1.6% |
| |||||||
Daihen Corp. | 8,600 | 527,893 | ||||||
Furukawa Electric Co. Ltd.(a) | 26,700 | 571,065 | ||||||
GS Yuasa Corp.(a) | 12,900 | 268,152 | ||||||
Idec Corp.(a) | 14,336 | 255,849 | ||||||
Mabuchi Motor Co. Ltd. | 34,300 | 628,911 | ||||||
Nippon Carbon Co. Ltd. | 7,400 | 260,610 | ||||||
Nitto Kogyo Corp.(a) | 14,100 | 385,702 | ||||||
Sanyo Denki Co. Ltd. | 4,100 | 190,988 | ||||||
Sinfonia Technology Co. Ltd. | 19,700 | 421,738 | ||||||
SWCC Corp. | 6,800 | 174,330 | ||||||
Toyo Tanso Co. Ltd. | 5,300 | 288,909 | ||||||
|
| |||||||
| Total Electrical Equipment |
| 3,974,147 | ||||||
| Electronic Equipment, Instruments & Components – 8.9% |
| |||||||
A&D HOLON Holdings Co. Ltd.(a) | 12,500 | 239,519 | ||||||
Ai Holdings Corp. | 23,700 | 385,226 | ||||||
Alps Alpine Co. Ltd.(a) | 91,800 | 726,660 | ||||||
Amano Corp. | 52,835 | 1,351,727 | ||||||
See Notes to Financial Statements.
| 78 | WisdomTree Trust |
Schedule of Investments (continued)
WisdomTree Japan SmallCap Dividend Fund (DFJ)
March 31, 2024
| Investments | Shares | Value | ||||||
Anritsu Corp.(a) | 62,700 | $ | 512,264 | |||||
Canon Electronics, Inc.(a) | 25,300 | 405,047 | ||||||
Citizen Watch Co. Ltd.(a) | 141,600 | 927,190 | ||||||
Daitron Co. Ltd. | 10,500 | 249,761 | ||||||
Daiwabo Holdings Co. Ltd.(a) | 29,395 | 498,673 | ||||||
Dexerials Corp. | 16,600 | 733,451 | ||||||
Elematec Corp. | 40,754 | 516,746 | ||||||
ESPEC Corp. | 14,700 | 296,244 | ||||||
Hagiwara Electric Holdings Co. Ltd. | 6,400 | 189,237 | ||||||
Hakuto Co. Ltd.(a) | 26,434 | 985,085 | ||||||
Hioki EE Corp.(a) | 5,000 | 239,189 | ||||||
Hochiki Corp. | 12,900 | 190,587 | ||||||
Horiba Ltd. | 26,900 | 2,849,166 | ||||||
Innotech Corp. | 14,900 | 199,264 | ||||||
Iriso Electronics Co. Ltd. | 6,700 | 134,137 | ||||||
Japan Aviation Electronics Industry Ltd.(a) | 23,900 | 391,477 | ||||||
Kaga Electronics Co. Ltd.(a) | 20,500 | 864,184 | ||||||
Koa Corp.(a) | 18,500 | 178,466 | ||||||
Kyosan Electric Manufacturing Co. Ltd. | 37,100 | 127,716 | ||||||
Marubun Corp.(a) | 42,300 | 432,377 | ||||||
Maruwa Co. Ltd. | 800 | 171,264 | ||||||
Maxell Ltd. | 16,500 | 173,673 | ||||||
Meiko Electronics Co. Ltd.(a) | 5,400 | 193,386 | ||||||
Nichicon Corp.(a) | 24,300 | 206,320 | ||||||
Nippon Electric Glass Co. Ltd. | 51,400 | 1,315,014 | ||||||
Nippon Signal Co. Ltd. | 28,000 | 192,038 | ||||||
Nissha Co. Ltd. | 21,100 | 205,221 | ||||||
Nohmi Bosai Ltd. | 18,191 | 275,849 | ||||||
Oki Electric Industry Co. Ltd. | 32,300 | 246,286 | ||||||
Optex Group Co. Ltd. | 11,300 | 147,834 | ||||||
Osaki Electric Co. Ltd. | 32,000 | 144,412 | ||||||
Restar Corp. | 18,600 | 372,995 | ||||||
Riken Keiki Co. Ltd. | 9,200 | 232,515 | ||||||
RYODEN Corp.(a) | 16,561 | 296,543 | ||||||
Sanshin Electronics Co. Ltd.(a) | 16,600 | 235,929 | ||||||
Santec Holdings Corp. | 8,300 | 292,306 | ||||||
Satori Electric Co. Ltd. | 13,100 | 230,156 | ||||||
Shibaura Electronics Co. Ltd. | 5,300 | 214,318 | ||||||
Siix Corp. | 11,000 | 125,521 | ||||||
Sumida Corp. | 26,500 | 214,844 | ||||||
Sun-Wa Technos Corp. | 14,700 | 232,139 | ||||||
Suzuden Corp. | 23,500 | 335,393 | ||||||
Tachibana Eletech Co. Ltd. | 17,900 | 382,613 | ||||||
Takachiho Koheki Co. Ltd.(a) | 10,100 | 253,593 | ||||||
TAKEBISHI Corp. | 13,400 | 180,620 | ||||||
Tokyo Electron Device Ltd.(a) | 17,800 | 810,347 | ||||||
Tomen Devices Corp. | 5,800 | 251,782 | ||||||
Topcon Corp. | 46,100 | 542,953 | ||||||
Yokowo Co. Ltd. | 11,400 | 119,013 | ||||||
|
| |||||||
| Total Electronic Equipment, Instruments & Components |
| 22,218,270 | ||||||
| Energy Equipment & Services – 0.1% |
| |||||||
Toyo Kanetsu KK | 6,400 | 190,717 | ||||||
| Entertainment – 0.3% |
| |||||||
Daiichikosho Co. Ltd. | 53,500 | 685,254 | ||||||
Marvelous, Inc. | 40,400 | 185,523 | ||||||
|
| |||||||
| Total Entertainment |
| 870,777 | ||||||
| Financial Services – 0.6% |
| |||||||
eGuarantee, Inc. | 12,800 | 151,558 | ||||||
Financial Partners Group Co. Ltd. | 51,800 | 739,976 | ||||||
Japan Investment Adviser Co. Ltd. | 11,600 | 82,701 | ||||||
Japan Securities Finance Co. Ltd. | 38,800 | 429,416 | ||||||
|
| |||||||
| Total Financial Services |
| 1,403,651 | ||||||
| Food Products – 4.1% |
| |||||||
Ariake Japan Co. Ltd. | 7,728 | 268,587 | ||||||
Chubu Shiryo Co. Ltd. | 20,700 | 162,350 | ||||||
DyDo Group Holdings, Inc. | 3,600 | 64,629 | ||||||
Ezaki Glico Co. Ltd. | 16,400 | 458,695 | ||||||
Fuji Oil Holdings, Inc.(a) | 23,800 | 375,922 | ||||||
Fujicco Co. Ltd. | 10,500 | 132,997 | ||||||
Hokuto Corp.(a) | 12,291 | 151,541 | ||||||
House Foods Group, Inc. | 19,100 | 390,721 | ||||||
Itoham Yonekyu Holdings, Inc. | 21,600 | 572,308 | ||||||
Kagome Co. Ltd.(a) | 23,100 | 561,684 | ||||||
Kakiyasu Honten Co. Ltd.(a) | 10,600 | 222,723 | ||||||
Kameda Seika Co. Ltd.(a) | 5,000 | 141,068 | ||||||
Kewpie Corp. | 34,000 | 635,766 | ||||||
Kyokuyo Co. Ltd.(a) | 5,900 | 145,799 | ||||||
Maruha Nichiro Corp. | 26,332 | 517,349 | ||||||
Megmilk Snow Brand Co. Ltd. | 22,300 | 401,516 | ||||||
Mitsui DM Sugar Holdings Co. Ltd. | 23,698 | 487,755 | ||||||
Morinaga & Co. Ltd. | 22,074 | 382,935 | ||||||
Morinaga Milk Industry Co. Ltd. | 28,900 | 596,924 | ||||||
Nippn Corp. | 27,083 | 424,466 | ||||||
Nisshin Oillio Group Ltd. | 22,000 | 748,621 | ||||||
Nissui Corp. | 110,500 | 700,988 | ||||||
Prima Meat Packers Ltd. | 19,200 | 292,164 | ||||||
Riken Vitamin Co. Ltd. | 19,500 | 332,162 | ||||||
S Foods, Inc. | 9,800 | 216,922 | ||||||
Sakata Seed Corp. | 8,600 | 211,953 | ||||||
Showa Sangyo Co. Ltd. | 8,100 | 187,320 | ||||||
Starzen Co. Ltd. | 12,100 | 226,578 | ||||||
Warabeya Nichiyo Holdings Co. Ltd. | 7,400 | 136,368 | ||||||
|
| |||||||
| Total Food Products |
| 10,148,811 | ||||||
| Gas Utilities – 0.9% |
| |||||||
Hokkaido Gas Co. Ltd. | 10,300 | 172,046 | ||||||
Nippon Gas Co. Ltd. | 65,500 | 1,112,044 | ||||||
Saibu Gas Holdings Co. Ltd. | 20,100 | 255,525 | ||||||
Shizuoka Gas Co. Ltd. | 18,992 | 119,465 | ||||||
Toho Gas Co. Ltd. | 30,700 | 702,665 | ||||||
|
| |||||||
| Total Gas Utilities |
| 2,361,745 | ||||||
| Ground Transportation – 0.9% |
| |||||||
Alps Logistics Co. Ltd.(a) | 12,000 | 233,824 | ||||||
Fukuyama Transporting Co. Ltd. | 6,811 | 163,136 | ||||||
Ichinen Holdings Co. Ltd. | 13,800 | 160,116 | ||||||
See Notes to Financial Statements.
| WisdomTree Trust | 79 |
Schedule of Investments (continued)
WisdomTree Japan SmallCap Dividend Fund (DFJ)
March 31, 2024
| Investments | Shares | Value | ||||||
Keikyu Corp. | 25,100 | $ | 231,024 | |||||
Maruzen Showa Unyu Co. Ltd. | 8,000 | 247,382 | ||||||
Nankai Electric Railway Co. Ltd. | 8,900 | 187,650 | ||||||
Nikkon Holdings Co. Ltd. | 25,960 | 506,781 | ||||||
Nishi-Nippon Railroad Co. Ltd. | 9,000 | 149,797 | ||||||
Sakai Moving Service Co. Ltd. | 7,200 | 121,598 | ||||||
Sotetsu Holdings, Inc. | 15,800 | 286,988 | ||||||
|
| |||||||
| Total Ground Transportation |
| 2,288,296 | ||||||
| Health Care Equipment & Supplies – 1.7% |
| |||||||
Eiken Chemical Co. Ltd.(a) | 20,170 | 266,543 | ||||||
Hogy Medical Co. Ltd.(a) | 5,600 | 138,756 | ||||||
Japan Lifeline Co. Ltd. | 50,100 | 403,197 | ||||||
Jeol Ltd.(a) | 10,500 | 434,167 | ||||||
Mani, Inc. | 21,600 | 283,228 | ||||||
Menicon Co. Ltd. | 15,000 | 156,943 | ||||||
Mizuho Medy Co. Ltd.(a) | 14,200 | 315,722 | ||||||
Nagaileben Co. Ltd. | 9,126 | 143,512 | ||||||
Nakanishi, Inc. | 17,600 | 273,864 | ||||||
Nihon Kohden Corp. | 21,700 | 574,098 | ||||||
Nipro Corp.(a) | 33,100 | 268,024 | ||||||
Paramount Bed Holdings Co. Ltd. | 20,442 | 351,719 | ||||||
PHC Holdings Corp.(a) | 79,600 | 650,075 | ||||||
Shofu, Inc. | 6,000 | 116,476 | ||||||
|
| |||||||
| Total Health Care Equipment & Supplies |
| 4,376,324 | ||||||
| Health Care Providers & Services – 1.0% |
| |||||||
As One Corp. | 24,600 | 431,713 | ||||||
France Bed Holdings Co. Ltd. | 18,600 | 158,293 | ||||||
HU Group Holdings, Inc.(a) | 35,800 | 577,881 | ||||||
Ship Healthcare Holdings, Inc. | 24,614 | 341,859 | ||||||
Solasto Corp. | 32,600 | 118,686 | ||||||
Toho Holdings Co. Ltd.(a) | 11,800 | 284,737 | ||||||
Tokai Corp. | 13,300 | 192,454 | ||||||
Vital KSK Holdings, Inc. | 39,100 | 324,488 | ||||||
|
| |||||||
| Total Health Care Providers & Services |
| 2,430,111 | ||||||
| Health Care Technology – 0.0% |
| |||||||
EM Systems Co. Ltd. | 20,800 | 97,441 | ||||||
| Hotels, Restaurants & Leisure – 2.1% |
| |||||||
Create Restaurants Holdings, Inc. | 23,800 | 165,119 | ||||||
Curves Holdings Co. Ltd. | 21,900 | 116,196 | ||||||
Doutor Nichires Holdings Co. Ltd. | 14,400 | 197,905 | ||||||
Food & Life Cos. Ltd. | 13,400 | 254,816 | ||||||
Heiwa Corp. | 74,400 | 986,134 | ||||||
Hiday Hidaka Corp. | 8,398 | 149,321 | ||||||
Ichibanya Co. Ltd.(a) | 40,480 | 321,230 | ||||||
KFC Holdings Japan Ltd.(a) | 7,400 | 219,783 | ||||||
KOMEDA Holdings Co. Ltd. | 17,700 | 319,628 | ||||||
Koshidaka Holdings Co. Ltd.(a) | 12,700 | 79,131 | ||||||
Kura Sushi, Inc. | 3,600 | 113,700 | ||||||
Kyoritsu Maintenance Co. Ltd.(a) | 6,400 | 148,218 | ||||||
Monogatari Corp. | 4,900 | 152,007 | ||||||
Ohsho Food Service Corp. | 9,300 | 481,146 | ||||||
Resorttrust, Inc. | 32,308 | 566,770 | ||||||
Round One Corp. | 45,400 | 236,082 | ||||||
Royal Holdings Co. Ltd. | 7,800 | 129,463 | ||||||
Saizeriya Co. Ltd. | 4,200 | 147,081 | ||||||
St. Marc Holdings Co. Ltd. | 12,700 | 182,262 | ||||||
Tokyotokeiba Co. Ltd.(a) | 5,942 | 175,302 | ||||||
|
| |||||||
| Total Hotels, Restaurants & Leisure |
| 5,141,294 | ||||||
| Household Durables – 2.5% |
| |||||||
Casio Computer Co. Ltd.(a) | 117,000 | 1,001,896 | ||||||
ES-Con Japan Ltd. | 56,000 | 384,816 | ||||||
Eslead Corp. | 9,000 | 209,620 | ||||||
Fuji Corp. Ltd. | 40,300 | 206,100 | ||||||
Fujitsu General Ltd.(a) | 19,100 | 237,764 | ||||||
Hoosiers Holdings Co. Ltd. | 37,500 | 279,246 | ||||||
JVCKenwood Corp. | 59,400 | 370,502 | ||||||
Ki-Star Real Estate Co. Ltd.(a) | 11,100 | 283,102 | ||||||
Meiwa Estate Co. Ltd.(a) | 18,400 | 129,357 | ||||||
Pressance Corp.(a) | 21,488 | 257,552 | ||||||
Sangetsu Corp. | 51,100 | 1,127,715 | ||||||
Tama Home Co. Ltd. | 29,700 | 890,931 | ||||||
Tamron Co. Ltd. | 13,566 | 616,698 | ||||||
Zojirushi Corp.(a) | 20,500 | 195,864 | ||||||
|
| |||||||
| Total Household Durables |
| 6,191,163 | ||||||
| Household Products – 0.4% |
| |||||||
Earth Corp.(a) | 7,000 | 199,577 | ||||||
Pigeon Corp. | 61,900 | 594,481 | ||||||
ST Corp. | 18,000 | 183,871 | ||||||
Transaction Co. Ltd. | 8,800 | 131,641 | ||||||
|
| |||||||
| Total Household Products |
| 1,109,570 | ||||||
| Independent Power & Renewable Electricity Producers – 0.1% |
| |||||||
West Holdings Corp. | 10,147 | 193,024 | ||||||
| Industrial Conglomerates – 0.3% |
| |||||||
Gakken Holdings Co. Ltd. | 21,200 | 131,673 | ||||||
Mie Kotsu Group Holdings, Inc.(a) | 27,300 | 113,641 | ||||||
Nisshinbo Holdings, Inc. | 43,700 | 355,733 | ||||||
TOKAI Holdings Corp. | 41,000 | 267,653 | ||||||
|
| |||||||
| Total Industrial Conglomerates |
| 868,700 | ||||||
| Insurance – 0.2% |
| |||||||
FP Partner, Inc. | 9,900 | 418,646 | ||||||
| Interactive Media & Services – 0.5% |
| |||||||
Infocom Corp. | 14,200 | 258,395 | ||||||
Kakaku.com, Inc. | 75,600 | 939,849 | ||||||
|
| |||||||
| Total Interactive Media & Services |
| 1,198,244 | ||||||
| IT Services – 2.1% |
| |||||||
Base Co. Ltd. | 5,300 | 126,070 | ||||||
Business Brain Showa-Ota, Inc. | 7,500 | 107,585 | ||||||
Business Engineering Corp. | 5,200 | 129,016 | ||||||
Comture Corp. | 7,200 | 96,241 | ||||||
DTS Corp. | 23,282 | 618,412 | ||||||
Future Corp. | 27,700 | 308,398 | ||||||
I-NET Corp. | 13,900 | 225,016 | ||||||
ID Holdings Corp. | 13,800 | 141,242 | ||||||
Japan Business Systems, Inc. | 8,800 | 81,927 | ||||||
See Notes to Financial Statements.
| 80 | WisdomTree Trust |
Schedule of Investments (continued)
WisdomTree Japan SmallCap Dividend Fund (DFJ)
March 31, 2024
| Investments | Shares | Value | ||||||
JBCC Holdings, Inc. | 10,700 | $ | 231,187 | |||||
Mitsubishi Research Institute, Inc. | 6,700 | 219,578 | ||||||
NEC Networks & System Integration Corp. | 42,237 | 707,462 | ||||||
NET One Systems Co. Ltd. | 36,500 | 651,161 | ||||||
NSD Co. Ltd. | 41,000 | 806,211 | ||||||
SB Technology Corp. | 7,100 | 98,892 | ||||||
Simplex Holdings, Inc. | 8,000 | 149,803 | ||||||
TDC Soft, Inc. | 29,000 | 222,465 | ||||||
TechMatrix Corp. | 10,200 | 124,817 | ||||||
Uchida Yoko Co. Ltd. | 5,700 | 263,636 | ||||||
|
| |||||||
| Total IT Services |
| 5,309,119 | ||||||
| Leisure Products – 0.8% |
| |||||||
Daikoku Denki Co. Ltd.(a) | 5,400 | 136,476 | ||||||
Furyu Corp.(a) | 8,800 | 74,775 | ||||||
GLOBERIDE, Inc.(a) | 10,300 | 138,223 | ||||||
Mizuno Corp. | 6,723 | 282,522 | ||||||
Roland Corp. | 13,600 | 409,766 | ||||||
Tomy Co. Ltd. | 28,000 | 520,519 | ||||||
Universal Entertainment Corp.(a) | 19,400 | 257,522 | ||||||
Yonex Co. Ltd.(a) | 10,900 | 80,375 | ||||||
|
| |||||||
| Total Leisure Products |
| 1,900,178 | ||||||
| Life Sciences Tools & Services – 0.1% |
| |||||||
Shin Nippon Biomedical Laboratories Ltd.(a) | 16,500 | 165,496 | ||||||
| Machinery – 6.6% |
| |||||||
Aida Engineering Ltd.(a) | 17,700 | 103,970 | ||||||
Anest Iwata Corp. | 20,700 | 185,328 | ||||||
Bando Chemical Industries Ltd. | 25,900 | 323,440 | ||||||
CKD Corp.(a) | 19,941 | 397,252 | ||||||
Daihatsu Diesel Manufacturing Co. Ltd. | 14,700 | 146,082 | ||||||
DMG Mori Co. Ltd.(a) | 53,100 | 1,425,169 | ||||||
Fujitec Co. Ltd.(a) | 16,461 | 412,545 | ||||||
Fukushima Galilei Co. Ltd. | 4,900 | 191,021 | ||||||
Furukawa Co. Ltd. | 8,500 | 101,711 | ||||||
Glory Ltd.(a) | 12,600 | 236,440 | ||||||
Harmonic Drive Systems, Inc. | 6,800 | 179,048 | ||||||
Hitachi Zosen Corp. | 38,500 | 335,535 | ||||||
Hokuetsu Industries Co. Ltd.(a) | 13,300 | 177,163 | ||||||
Hosokawa Micron Corp. | 5,200 | 163,203 | ||||||
Iwaki Co. Ltd. | 8,300 | 159,041 | ||||||
Japan Steel Works Ltd. | 16,604 | 371,696 | ||||||
Kitz Corp. | 43,489 | 392,233 | ||||||
Kyokuto Kaihatsu Kogyo Co. Ltd. | 11,380 | 195,124 | ||||||
Makino Milling Machine Co. Ltd. | 5,700 | 235,766 | ||||||
Max Co. Ltd. | 20,500 | 440,897 | ||||||
Meidensha Corp. | 8,700 | 168,832 | ||||||
METAWATER Co. Ltd. | 8,700 | 131,812 | ||||||
Mitsubishi Logisnext Co. Ltd. | 11,900 | 148,922 | ||||||
Mitsuboshi Belting Ltd.(a) | 26,146 | 806,778 | ||||||
Morita Holdings Corp. | 9,105 | 98,483 | ||||||
Nabtesco Corp. | 31,500 | 532,822 | ||||||
Nachi-Fujikoshi Corp.(a) | 7,300 | 168,337 | ||||||
Nikkiso Co. Ltd. | 17,600 | 149,782 | ||||||
Nippon Thompson Co. Ltd.(a) | 40,100 | 170,103 | ||||||
Nissei ASB Machine Co. Ltd. | 3,800 | 133,576 | ||||||
Nomura Micro Science Co. Ltd.(a) | 12,400 | 486,676 | ||||||
Noritake Co. Ltd. | 14,600 | 413,849 | ||||||
NTN Corp.(a) | 135,700 | 281,272 | ||||||
Obara Group, Inc.(a) | 10,879 | 273,152 | ||||||
Oiles Corp. | 13,200 | 197,810 | ||||||
OKUMA Corp.(a) | 13,370 | 628,901 | ||||||
Organo Corp. | 7,600 | 386,666 | ||||||
OSG Corp. | 50,500 | 729,747 | ||||||
Rheon Automatic Machinery Co. Ltd. | 11,400 | 117,732 | ||||||
Ryobi Ltd. | 11,400 | 225,597 | ||||||
Shibaura Machine Co. Ltd.(a) | 9,261 | 221,819 | ||||||
Shibuya Corp. | 4,700 | 109,158 | ||||||
Shinmaywa Industries Ltd. | 29,085 | 240,221 | ||||||
Shinwa Co. Ltd. | 8,400 | 153,408 | ||||||
Star Micronics Co. Ltd. | 17,634 | 216,369 | ||||||
Tadano Ltd. | 14,600 | 124,589 | ||||||
Takeuchi Manufacturing Co. Ltd. | 15,100 | 608,610 | ||||||
Takuma Co. Ltd. | 38,000 | 478,060 | ||||||
Techno Smart Corp. | 11,000 | 148,925 | ||||||
Teikoku Electric Manufacturing Co. Ltd. | 11,400 | 192,454 | ||||||
Tocalo Co. Ltd. | 30,400 | 359,549 | ||||||
Torishima Pump Manufacturing Co. Ltd.(a) | 14,800 | 278,016 | ||||||
Tsubakimoto Chain Co. | 13,945 | 474,523 | ||||||
Tsugami Corp. | 19,000 | 144,372 | ||||||
Union Tool Co. | 3,800 | 112,736 | ||||||
YAMABIKO Corp. | 14,700 | 193,967 | ||||||
|
| |||||||
| Total Machinery |
| 16,480,289 | ||||||
| Marine Transportation – 0.4% |
| |||||||
Iino Kaiun Kaisha Ltd.(a) | 75,600 | 612,413 | ||||||
NS United Kaiun Kaisha Ltd.(a) | 14,100 | 429,489 | ||||||
|
| |||||||
| Total Marine Transportation |
| 1,041,902 | ||||||
| Media – 0.7% |
| |||||||
Carta Holdings, Inc. | 15,000 | 156,001 | ||||||
Intage Holdings, Inc.(a) | 19,300 | 203,399 | ||||||
Macromill, Inc. | 25,700 | 135,679 | ||||||
Proto Corp. | 18,600 | 176,113 | ||||||
SKY Perfect JSAT Holdings, Inc. | 115,000 | 804,685 | ||||||
ValueCommerce Co. Ltd.(a) | 21,400 | 153,700 | ||||||
Zenrin Co. Ltd. | 22,880 | 128,350 | ||||||
|
| |||||||
| Total Media |
| 1,757,927 | ||||||
| Metals & Mining – 4.6% |
| |||||||
Aichi Steel Corp. | 6,400 | 168,516 | ||||||
ARE Holdings, Inc.(a) | 50,800 | 648,489 | ||||||
Daido Steel Co. Ltd. | 167,100 | 2,005,597 | ||||||
Daiki Aluminium Industry Co. Ltd.(a) | 31,800 | 261,384 | ||||||
Dowa Holdings Co. Ltd.(a) | 17,800 | 626,755 | ||||||
Godo Steel Ltd. | 21,100 | 797,463 | ||||||
Kurimoto Ltd. | 7,700 | 206,816 | ||||||
Kyoei Steel Ltd. | 38,814 | 618,583 | ||||||
Mitsubishi Materials Corp. | 49,800 | 960,002 | ||||||
Mitsubishi Steel Manufacturing Co. Ltd.(a) | 16,700 | 162,868 | ||||||
Mitsui Mining & Smelting Co. Ltd. | 39,000 | 1,212,944 | ||||||
See Notes to Financial Statements.
| WisdomTree Trust | 81 |
Schedule of Investments (continued)
WisdomTree Japan SmallCap Dividend Fund (DFJ)
March 31, 2024
| Investments | Shares | Value | ||||||
Nakayama Steel Works Ltd.(a) | 58,700 | $ | 368,463 | |||||
Nippon Denko Co. Ltd. | 57,700 | 124,668 | ||||||
Nippon Light Metal Holdings Co. Ltd. | 7,100 | 85,334 | ||||||
Nippon Yakin Kogyo Co. Ltd.(a) | 17,500 | 554,445 | ||||||
OSAKA Titanium Technologies Co. Ltd.(a) | 6,600 | 114,692 | ||||||
Sanyo Special Steel Co. Ltd. | 21,500 | 319,350 | ||||||
Toho Titanium Co. Ltd.(a) | 12,000 | 123,849 | ||||||
Toho Zinc Co. Ltd.* | 7,500 | 56,791 | ||||||
Tokyo Steel Manufacturing Co. Ltd. | 70,200 | 771,831 | ||||||
Tokyo Tekko Co. Ltd. | 7,400 | 256,209 | ||||||
Topy Industries Ltd. | 19,000 | 340,216 | ||||||
UACJ Corp. | 25,200 | 733,463 | ||||||
|
| |||||||
| Total Metals & Mining |
| 11,518,728 | ||||||
| Oil, Gas & Consumable Fuels – 0.7% |
| |||||||
Fuji Oil Co. Ltd. | 41,800 | 130,914 | ||||||
Itochu Enex Co. Ltd. | 76,181 | 790,275 | ||||||
Sala Corp. | 33,400 | 183,833 | ||||||
San-Ai Obbli Co. Ltd. | 53,616 | 739,702 | ||||||
|
| |||||||
| Total Oil, Gas & Consumable Fuels |
| 1,844,724 | ||||||
| Paper & Forest Products – 0.4% |
| |||||||
Daio Paper Corp.(a) | 30,000 | 230,235 | ||||||
Hokuetsu Corp.(a) | 37,732 | 479,675 | ||||||
Tokushu Tokai Paper Co. Ltd. | 6,400 | 169,573 | ||||||
|
| |||||||
| Total Paper & Forest Products |
| 879,483 | ||||||
| Personal Care Products – 0.5% |
| |||||||
Fancl Corp. | 26,200 | 346,748 | ||||||
Mandom Corp. | 18,700 | 166,805 | ||||||
Noevir Holdings Co. Ltd. | 23,100 | 798,262 | ||||||
|
| |||||||
| Total Personal Care Products |
| 1,311,815 | ||||||
| Pharmaceuticals – 1.1% |
| |||||||
Daito Pharmaceutical Co. Ltd. | 7,800 | 120,805 | ||||||
Fuji Pharma Co. Ltd.(a) | 15,500 | 169,599 | ||||||
Kyorin Pharmaceutical Co. Ltd. | 25,585 | 306,320 | ||||||
Mochida Pharmaceutical Co. Ltd. | 11,022 | 234,503 | ||||||
Sawai Group Holdings Co. Ltd. | 15,924 | 634,456 | ||||||
Towa Pharmaceutical Co. Ltd. | 15,200 | 291,657 | ||||||
Tsumura & Co. | 24,700 | 623,926 | ||||||
ZERIA Pharmaceutical Co. Ltd. | 25,300 | 356,401 | ||||||
|
| |||||||
| Total Pharmaceuticals |
| 2,737,667 | ||||||
| Professional Services – 2.6% |
| |||||||
Altech Corp. | 11,060 | 202,426 | ||||||
Bell System24 Holdings, Inc. | 37,000 | 392,626 | ||||||
Careerlink Co. Ltd. | 7,500 | 127,804 | ||||||
Dip Corp. | 13,000 | 236,301 | ||||||
en Japan, Inc.(a) | 14,200 | 253,141 | ||||||
Forum Engineering, Inc. | 31,400 | 198,759 | ||||||
FULLCAST Holdings Co. Ltd. | 12,900 | 122,654 | ||||||
Funai Soken Holdings, Inc. | 11,610 | 189,326 | ||||||
IR Japan Holdings Ltd.(a) | 10,100 | 88,958 | ||||||
JAC Recruitment Co. Ltd. | 73,200 | 387,414 | ||||||
LIKE, Inc. | 6,000 | 66,642 | ||||||
Link & Motivation, Inc.(a) | 31,300 | 113,954 | ||||||
Matching Service Japan Co. Ltd. | 15,300 | 119,189 | ||||||
MEITEC Group Holdings, Inc. | 42,500 | 838,795 | ||||||
Nihon M&A Center Holdings, Inc.(a) | 98,000 | 639,109 | ||||||
Nomura Co. Ltd. | 33,700 | 203,743 | ||||||
Open Up Group, Inc. | 22,800 | 317,418 | ||||||
Pasona Group, Inc. | 12,500 | 230,269 | ||||||
Quick Co. Ltd. | 10,900 | 171,770 | ||||||
TechnoPro Holdings, Inc. | 24,500 | 501,510 | ||||||
TKC Corp. | 19,000 | 467,640 | ||||||
Transcosmos, Inc.(a) | 16,800 | 348,555 | ||||||
Weathernews, Inc. | 3,200 | 108,256 | ||||||
World Holdings Co. Ltd. | 8,900 | 150,367 | ||||||
|
| |||||||
| Total Professional Services |
| 6,476,626 | ||||||
| Real Estate Management & Development – 2.6% |
| |||||||
Aoyama Zaisan Networks Co. Ltd. | 19,500 | 164,406 | ||||||
Arealink Co. Ltd. | 7,400 | 134,461 | ||||||
Dear Life Co. Ltd. | 47,300 | 339,721 | ||||||
Good Com Asset Co. Ltd. | 18,200 | 110,755 | ||||||
Grandy House Corp. | 36,800 | 151,241 | ||||||
Heiwa Real Estate Co. Ltd.(a) | 20,968 | 565,261 | ||||||
Ichigo, Inc. | 159,700 | 488,560 | ||||||
Japan Property Management Center Co. Ltd. | 25,600 | 212,622 | ||||||
JINUSHI Co. Ltd. | 8,600 | 145,639 | ||||||
Katitas Co. Ltd.(a) | 23,100 | 305,110 | ||||||
Keihanshin Building Co. Ltd. | 14,300 | 154,485 | ||||||
LA Holdings Co. Ltd. | 5,700 | 191,324 | ||||||
Loadstar Capital KK | 11,300 | 212,867 | ||||||
Mirarth Holdings, Inc. | 80,700 | 274,608 | ||||||
Raysum Co. Ltd. | 9,900 | 235,161 | ||||||
Relo Group, Inc. | 43,400 | 357,162 | ||||||
SAMTY Co. Ltd. | 32,900 | 609,763 | ||||||
Starts Corp., Inc. | 35,900 | 808,874 | ||||||
Sun Frontier Fudousan Co. Ltd. | 31,100 | 402,967 | ||||||
Tosei Corp. | 31,400 | 513,496 | ||||||
|
| |||||||
| Total Real Estate Management & Development |
| 6,378,483 | ||||||
| Semiconductors & Semiconductor Equipment – 2.5% |
| |||||||
Ferrotec Holdings Corp.(a) | 23,100 | 451,484 | ||||||
Furuya Metal Co. Ltd. | 2,100 | 157,349 | ||||||
Japan Material Co. Ltd.(a) | 11,900 | 189,416 | ||||||
Micronics Japan Co. Ltd. | 13,200 | 777,984 | ||||||
Mimasu Semiconductor Industry Co. Ltd. | 10,727 | 223,619 | ||||||
Mitsui High-Tec, Inc. | 5,500 | 317,001 | ||||||
Optorun Co. Ltd. | 16,400 | 224,092 | ||||||
Rorze Corp. | 2,700 | 385,345 | ||||||
Shibaura Mechatronics Corp.(a) | 6,800 | 288,004 | ||||||
Shindengen Electric Manufacturing Co. Ltd. | 6,600 | 132,789 | ||||||
Tokyo Seimitsu Co. Ltd. | 22,800 | 1,834,154 | ||||||
Towa Corp.(a) | 3,000 | 211,503 | ||||||
Tri Chemical Laboratories, Inc. | 3,100 | 99,855 | ||||||
Ulvac, Inc. | 12,500 | 814,282 | ||||||
Yamaichi Electronics Co. Ltd. | 14,700 | 241,851 | ||||||
|
| |||||||
| Total Semiconductors & Semiconductor Equipment |
| 6,348,728 | ||||||
See Notes to Financial Statements.
| 82 | WisdomTree Trust |
Schedule of Investments (continued)
WisdomTree Japan SmallCap Dividend Fund (DFJ)
March 31, 2024
| Investments | Shares | Value | ||||||
| Software – 0.8% |
| |||||||
Computer Engineering & Consulting Ltd. | 12,800 | $ | 131,514 | |||||
Cresco Ltd. | 13,700 | 192,358 | ||||||
Digital Arts, Inc. | 4,200 | 121,689 | ||||||
Fuji Soft, Inc.(a) | 12,600 | 500,353 | ||||||
Fukui Computer Holdings, Inc. | 5,100 | 87,513 | ||||||
I’ll, Inc. | 3,160 | 62,743 | ||||||
Justsystems Corp.(a) | 6,300 | 111,102 | ||||||
Miroku Jyoho Service Co. Ltd. | 17,000 | 203,647 | ||||||
Systena Corp. | 178,400 | 320,624 | ||||||
UNITED, Inc. | 30,600 | 181,160 | ||||||
WingArc1st, Inc. | 7,400 | 149,863 | ||||||
|
| |||||||
| Total Software |
| 2,062,566 | ||||||
| Specialty Retail – 4.2% |
| |||||||
Adastria Co. Ltd. | 18,700 | 476,319 | ||||||
Alleanza Holdings Co. Ltd.(a) | 21,200 | 145,680 | ||||||
Alpen Co. Ltd.(a) | 13,000 | 172,996 | ||||||
AOKI Holdings, Inc. | 43,500 | 329,961 | ||||||
Aoyama Trading Co. Ltd. | 17,200 | 199,452 | ||||||
ARCLANDS Corp. | 21,036 | 248,104 | ||||||
Asahi Co. Ltd. | 29,800 | 263,257 | ||||||
Autobacs Seven Co. Ltd.(a) | 56,300 | 596,498 | ||||||
Bic Camera, Inc.(a) | 32,400 | 274,451 | ||||||
DCM Holdings Co. Ltd. | 65,045 | 634,785 | ||||||
EDION Corp.(a) | 39,739 | 406,462 | ||||||
Hard Off Corp. Co. Ltd. | 13,900 | 156,133 | ||||||
Honeys Holdings Co. Ltd.(a) | 18,100 | 212,878 | ||||||
IDOM, Inc. | 58,600 | 401,908 | ||||||
Joshin Denki Co. Ltd. | 11,400 | 175,356 | ||||||
Joyful Honda Co. Ltd.(a) | 20,600 | 298,223 | ||||||
K’s Holdings Corp.(a) | 78,000 | 690,350 | ||||||
Kohnan Shoji Co. Ltd. | 10,600 | 308,170 | ||||||
Kojima Co. Ltd. | 19,900 | 108,214 | ||||||
Komehyo Holdings Co. Ltd.(a) | 3,800 | 100,056 | ||||||
Komeri Co. Ltd.(a) | 10,037 | 229,463 | ||||||
KU Holdings Co. Ltd. | 17,700 | 135,196 | ||||||
Nafco Co. Ltd.(a) | 7,100 | 124,506 | ||||||
New Art Holdings Co. Ltd.(a) | 18,600 | 209,172 | ||||||
Nextage Co. Ltd.(a) | 15,800 | 303,170 | ||||||
Nishimatsuya Chain Co. Ltd. | 12,300 | 202,203 | ||||||
Nissan Tokyo Sales Holdings Co. Ltd. | 54,900 | 217,648 | ||||||
Nojima Corp. | 28,200 | 317,878 | ||||||
PAL GROUP Holdings Co. Ltd. | 30,200 | 518,016 | ||||||
Scroll Corp. | 44,900 | 284,806 | ||||||
T-Gaia Corp. | 29,400 | 400,560 | ||||||
United Arrows Ltd. | 10,700 | 140,833 | ||||||
VT Holdings Co. Ltd. | 57,300 | 202,554 | ||||||
World Co. Ltd. | 26,000 | 369,011 | ||||||
Xebio Holdings Co. Ltd. | 17,500 | 114,474 | ||||||
Yellow Hat Ltd. | 32,500 | 427,550 | ||||||
|
| |||||||
| Total Specialty Retail |
| 10,396,293 | ||||||
| Technology Hardware, Storage & Peripherals – 0.4% |
| |||||||
Elecom Co. Ltd. | 26,900 | 274,430 | ||||||
MCJ Co. Ltd. | 36,200 | 327,210 | ||||||
Riso Kagaku Corp.(a) | 18,000 | 368,694 | ||||||
Toshiba TEC Corp. | 5,800 | 116,502 | ||||||
|
| |||||||
| Total Technology Hardware, Storage & Peripherals |
| 1,086,836 | ||||||
| Textiles, Apparel & Luxury Goods – 1.2% |
| |||||||
Baroque Japan Ltd.(a) | 40,500 | 203,377 | ||||||
Descente Ltd. | 9,500 | 216,872 | ||||||
Fujibo Holdings, Inc.(a) | 4,700 | 138,660 | ||||||
Gunze Ltd. | 4,583 | 167,156 | ||||||
Japan Wool Textile Co. Ltd. | 21,725 | 212,161 | ||||||
Kurabo Industries Ltd. | 7,076 | 163,639 | ||||||
Morito Co. Ltd. | 23,700 | 246,325 | ||||||
Onward Holdings Co. Ltd. | 82,033 | 309,497 | ||||||
Seiko Group Corp.(a) | 18,100 | 498,708 | ||||||
Wacoal Holdings Corp. | 20,600 | 505,523 | ||||||
Yondoshi Holdings, Inc.(a) | 20,800 | 257,140 | ||||||
|
| |||||||
| Total Textiles, Apparel & Luxury Goods |
| 2,919,058 | ||||||
| Trading Companies & Distributors – 3.4% |
| |||||||
Advan Group Co. Ltd. | 27,100 | 207,890 | ||||||
Alconix Corp. | 2,000 | 19,333 | ||||||
Chori Co. Ltd. | 13,200 | 296,977 | ||||||
Daiichi Jitsugyo Co. Ltd. | 14,200 | 199,754 | ||||||
Hanwa Co. Ltd. | 20,522 | 804,093 | ||||||
Inaba Denki Sangyo Co. Ltd. | 31,588 | 731,547 | ||||||
Inabata & Co. Ltd. | 27,741 | 581,966 | ||||||
Japan Pulp & Paper Co. Ltd. | 4,100 | 140,328 | ||||||
JK Holdings Co. Ltd. | 16,600 | 117,580 | ||||||
Kamei Corp. | 13,100 | 184,973 | ||||||
Kanaden Corp. | 10,500 | 104,761 | ||||||
Kanamoto Co. Ltd. | 8,128 | 144,628 | ||||||
Kanematsu Corp. | 48,700 | 834,057 | ||||||
KPP Group Holdings Co. Ltd.(a) | 21,000 | 102,957 | ||||||
Kyokuto Boeki Kaisha Ltd. | 10,800 | 147,430 | ||||||
MARUKA FURUSATO Corp. | 5,400 | 78,461 | ||||||
Mitsui Matsushima Holdings Co. Ltd.(a) | 17,600 | 338,871 | ||||||
Nagase & Co. Ltd. | 37,104 | 626,143 | ||||||
Nichiden Corp.(a) | 11,000 | 193,042 | ||||||
Nishio Holdings Co. Ltd. | 10,500 | 268,493 | ||||||
Onoken Co. Ltd. | 10,300 | 127,878 | ||||||
Sanyo Trading Co. Ltd.(a) | 14,900 | 142,556 | ||||||
Sato Shoji Corp. | 14,700 | 171,821 | ||||||
Seika Corp. | 8,100 | 198,292 | ||||||
Senshu Electric Co. Ltd. | 7,600 | 250,329 | ||||||
Shinsho Corp. | 7,100 | 338,710 | ||||||
Trusco Nakayama Corp. | 18,000 | 307,443 | ||||||
Wakita & Co. Ltd. | 12,200 | 128,413 | ||||||
Yamazen Corp.(a) | 42,006 | 373,584 | ||||||
Yuasa Trading Co. Ltd. | 12,200 | 431,266 | ||||||
|
| |||||||
| Total Trading Companies & Distributors |
| 8,593,576 | ||||||
| Transportation Infrastructure – 0.3% |
| |||||||
Mitsubishi Logistics Corp. | 17,900 | 588,407 | ||||||
Nissin Corp. | 10,200 | 195,246 | ||||||
|
| |||||||
| Total Transportation Infrastructure |
| 783,653 | ||||||
See Notes to Financial Statements.
| WisdomTree Trust | 83 |
Schedule of Investments (concluded)
WisdomTree Japan SmallCap Dividend Fund (DFJ)
March 31, 2024
| Investments | Shares | Value | ||||||
| Wireless Telecommunication Services – 0.2% |
| |||||||
Okinawa Cellular Telephone Co. | 25,800 | $ | 605,174 | |||||
TOTAL COMMON STOCKS (Cost: $237,919,773) | 246,615,659 | |||||||
| EXCHANGE-TRADED FUND – 0.0% | ||||||||
| United States – 0.0% | ||||||||
| WisdomTree Japan Hedged Equity Fund(b) (Cost: $30,878) | 332 | 36,022 | ||||||
| INVESTMENT OF CASH COLLATERAL FOR SECURITIES LOANED – 9.8% |
| |||||||
| United States – 9.8% |
| |||||||
State Street Navigator Securities Lending Government Money Market Portfolio, 5.34%(c) | ||||||||
| (Cost: $24,558,678) | 24,558,678 | 24,558,678 | ||||||
TOTAL INVESTMENTS IN SECURITIES – 108.4% (Cost: $262,509,329) |
| 271,210,359 | ||||||
Other Assets less Liabilities – (8.4)% |
| (21,190,786 | ) | |||||
|
| |||||||
| NET ASSETS – 100.0% |
| $ | 250,019,573 | |||||
| * | Non-income producing security. |
| (a) | Security, or portion thereof, was on loan at March 31, 2024 (See Note 2). At March 31, 2024, the total market value of the Fund’s securities on loan identified in the Schedule of Investments was $52,747,857 and the total market value of the collateral held by the Fund was $56,379,827. The total market value of the collateral includes non-cash U.S. Government securities collateral having a value of $31,821,149. |
| (b) | Affiliated holding. See “Investment in Affiliates” supplementary table included in this Schedule of Investments for additional information. |
| (c) | Rate shown represents annualized 7-day yield as of March 31, 2024. |
| INVESTMENT IN AFFILIATES |
Affiliated holdings are investments in entities in which the Fund owns 5% or more of the outstanding voting securities or are investments in entities which are under common ownership or control. Investments in affiliates during the fiscal year ended March 31, 2024 were as follows:
| Affiliate | Value at 3/31/2023 | Purchases/ Additions | Sales/ Reductions | Realized Gain/(Loss) | Change in Unrealized Appreciation/ Depreciation | Value at 3/31/2024 | Dividend Income | |||||||||||||||||||||
WisdomTree Japan Hedged Equity Fund | $ | 237,973 | $ | 3,611,074 | $ | 4,018,306 | $ | 211,580 | $ | (6,299 | ) | $ | 36,022 | $ | 31,127 | |||||||||||||
| FAIR VALUATION SUMMARY |
The following is a summary of the fair valuations according to the inputs used in valuing the Fund’s investments (See Note 2 – Fair Value Measurement):
| Quoted Prices in Active Markets (Level 1) | Other Significant Observable Inputs (Level 2) | Significant Unobservable Inputs | Total | |||||||||||||
Assets: | ||||||||||||||||
Investments in Securities | ||||||||||||||||
Common Stocks | $ | 246,615,659 | $ | — | $ | — | $ | 246,615,659 | ||||||||
Exchange-Traded Fund | 36,022 | — | — | 36,022 | ||||||||||||
Investment of Cash Collateral for Securities Loaned | — | 24,558,678 | — | 24,558,678 | ||||||||||||
Total Investments in Securities | $ | 246,651,681 | $ | 24,558,678 | $ | — | $ | 271,210,359 | ||||||||
See Notes to Financial Statements.
| 84 | WisdomTree Trust |
Statements of Assets and Liabilities
WisdomTree Trust
March 31, 2024
| WisdomTree Europe Quality Dividend Growth Fund | WisdomTree Europe SmallCap Dividend Fund | WisdomTree Value Fund | WisdomTree International Equity Fund | WisdomTree High Dividend Fund | ||||||||||||||||
ASSETS: | ||||||||||||||||||||
Investments, at cost | $ | 63,806,045 | $ | 188,335,960 | $ | 75,191,798 | $ | 489,297,057 | $ | 329,210,287 | ||||||||||
Investment in affiliates, at cost (Note 3) | — | 585,657 | — | — | — | |||||||||||||||
Foreign currency, at cost | 4,750 | 23,987 | 133,603 | 463,371 | 375,380 | |||||||||||||||
Investments in securities, at value1,2 (Note 2) | 73,827,383 | 200,054,494 | 76,526,571 | 615,096,560 | 362,731,320 | |||||||||||||||
Investment in affiliates, at value (Note 3) | — | 610,227 | — | — | — | |||||||||||||||
Cash | 118,961 | 71,456 | 236,619 | 220,384 | 97,772 | |||||||||||||||
Foreign currency, at value | 4,683 | 23,857 | 133,535 | 462,918 | 374,933 | |||||||||||||||
Receivables: | ||||||||||||||||||||
Investment securities sold | — | 3,949,109 | — | — | 113,118 | |||||||||||||||
Dividends | 73,233 | 427,771 | 337,821 | 2,914,410 | 2,106,859 | |||||||||||||||
Securities lending income | 242 | 8,233 | 1,511 | 58,522 | 41,123 | |||||||||||||||
Foreign tax reclaims | 384,085 | 1,287,335 | 331,201 | 2,339,943 | 1,068,000 | |||||||||||||||
Other (Note 6) | 5,046 | 428,808 | 25,664 | 57,518 | 19,738 | |||||||||||||||
Total Assets | 74,413,633 | 206,861,290 | 77,592,922 | 621,150,255 | 366,552,863 | |||||||||||||||
LIABILITIES: | ||||||||||||||||||||
Unrealized depreciation on foreign currency contracts | 6 | — | — | — | 179 | |||||||||||||||
Payables: | ||||||||||||||||||||
Cash collateral received for securities loaned (Note 2) | 1,279,862 | 15,484,216 | 3,358,202 | 47,002,513 | 25,323,176 | |||||||||||||||
Investment securities purchased | — | — | 161,649 | — | — | |||||||||||||||
Capital shares redeemed | — | 2,986,508 | — | — | — | |||||||||||||||
Advisory fees (Note 3) | 35,809 | 92,726 | 36,017 | 233,405 | 170,246 | |||||||||||||||
Service fees (Note 2) | 272 | 705 | 273 | 2,139 | 1,293 | |||||||||||||||
Other (Note 6) | 1,514 | 145,725 | 7,699 | 17,256 | 5,921 | |||||||||||||||
Total Liabilities | 1,317,463 | 18,709,880 | 3,563,840 | 47,255,313 | 25,500,815 | |||||||||||||||
NET ASSETS | $ | 73,096,170 | $ | 188,151,410 | $ | 74,029,082 | $ | 573,894,942 | $ | 341,052,048 | ||||||||||
NET ASSETS: | ||||||||||||||||||||
Paid-in capital | $ | 76,715,589 | $ | 495,949,784 | $ | 142,173,409 | $ | 655,522,210 | $ | 410,730,206 | ||||||||||
Total distributable earnings (loss) | (3,619,419 | ) | (307,798,374 | ) | (68,144,327 | ) | (81,627,268 | ) | (69,678,158 | ) | ||||||||||
NET ASSETS | $ | 73,096,170 | $ | 188,151,410 | $ | 74,029,082 | $ | 573,894,942 | $ | 341,052,048 | ||||||||||
Outstanding beneficial interest shares of $0.001 par value (unlimited number of shares authorized) | 2,250,000 | 3,150,000 | 1,800,000 | 10,450,000 | 8,600,000 | |||||||||||||||
Net asset value per share | $ | 32.49 | $ | 59.73 | $ | 41.13 | $ | 54.92 | $ | 39.66 | ||||||||||
1 Includes market value of securities out on loan of: | $ | 1,824,913 | $ | 20,380,112 | $ | 6,139,415 | $ | 58,538,673 | $ | 37,547,501 | ||||||||||
2 Investments in securities include investment of cash collateral for securities loaned (see Schedule of Investments for additional information). |
| |||||||||||||||||||
See Notes to Financial Statements.
| WisdomTree Trust | 85 |
Statements of Assets and Liabilities (continued)
WisdomTree Trust
March 31, 2024
WisdomTree International LargeCap Dividend Fund | WisdomTree International MidCap Dividend Fund | WisdomTree International Multifactor | WisdomTree International Quality Dividend | WisdomTree International SmallCap Dividend Fund | ||||||||||||||||
ASSETS: |
| |||||||||||||||||||
Investments, at cost | $ | 423,606,484 | $ | 131,823,974 | $ | 40,142,425 | $ | 838,927,780 | $ | 1,038,026,232 | ||||||||||
Investment in affiliates, at cost (Note 3) | — | — | — | — | 318,025 | |||||||||||||||
Foreign currency, at cost | 272,183 | 170,317 | 80,753 | 83,892 | 810,896 | |||||||||||||||
Investments in securities, at value1,2 (Note 2) | 549,200,408 | 147,700,508 | 43,219,128 | 993,429,330 | 1,144,926,076 | |||||||||||||||
Investment in affiliates, at value (Note 3) | — | — | — | — | 424,291 | |||||||||||||||
Cash | 293,865 | 8,673 | 46,269 | 207,876 | 627,444 | |||||||||||||||
Deposits at broker | — | — | 10,000 | — | — | |||||||||||||||
Foreign currency, at value | 272,207 | 170,227 | 80,431 | 83,601 | 809,908 | |||||||||||||||
Unrealized appreciation on foreign currency contracts | — | — | 465,624 | — | — | |||||||||||||||
Receivables: | ||||||||||||||||||||
Investment securities sold | — | — | — | — | 2,219,304 | |||||||||||||||
Capital shares sold | — | — | 19,664 | — | — | |||||||||||||||
Dividends | 2,551,445 | 590,655 | 188,308 | 2,331,672 | 6,910,447 | |||||||||||||||
Securities lending income | 59,814 | 4,814 | 1,288 | 10,468 | 39,031 | |||||||||||||||
Foreign tax reclaims | 2,245,001 | 285,969 | 109,712 | 2,043,200 | 3,169,885 | |||||||||||||||
Other (Note 6) | 18,142 | 5,336 | 722 | 78,671 | 885,048 | |||||||||||||||
Total Assets | 554,640,882 | 148,766,182 | 44,141,146 | 998,184,818 | 1,160,011,434 | |||||||||||||||
LIABILITIES: |
| |||||||||||||||||||
Unrealized depreciation on foreign currency contracts | — | 41 | 132,418 | — | — | |||||||||||||||
Payables: | ||||||||||||||||||||
Cash collateral received for securities loaned (Note 2) | 37,005,699 | 13,310,172 | 1,221,857 | 19,628,962 | 59,942,222 | |||||||||||||||
Investment securities purchased | — | — | 331,960 | — | — | |||||||||||||||
Advisory fees (Note 3) | 208,897 | 65,596 | 13,545 | 347,981 | 537,208 | |||||||||||||||
Service fees (Note 2) | 1,915 | 498 | 157 | 3,646 | 4,080 | |||||||||||||||
Other (Note 6) | 5,443 | 1,598 | 216 | 23,600 | 265,515 | |||||||||||||||
Total Liabilities | 37,221,954 | 13,377,905 | 1,700,153 | 20,004,189 | 60,749,025 | |||||||||||||||
NET ASSETS | $ | 517,418,928 | $ | 135,388,277 | $ | 42,440,993 | $ | 978,180,629 | $ | 1,099,262,409 | ||||||||||
NET ASSETS: |
| |||||||||||||||||||
Paid-in capital | $ | 522,156,504 | $ | 166,484,263 | $ | 43,185,953 | $ | 891,045,823 | $ | 1,420,534,598 | ||||||||||
Total distributable earnings (loss) | (4,737,576 | ) | (31,095,986 | ) | (744,960 | ) | 87,134,806 | (321,272,189 | ) | |||||||||||
NET ASSETS | $ | 517,418,928 | $ | 135,388,277 | $ | 42,440,993 | $ | 978,180,629 | $ | 1,099,262,409 | ||||||||||
Outstanding beneficial interest shares of $0.001 par value (unlimited number of shares authorized) | 10,000,000 | 2,150,000 | 1,600,000 | 25,750,000 | 16,800,000 | |||||||||||||||
Net asset value per share | $ | 51.74 | $ | 62.97 | $ | 26.53 | $ | 37.99 | $ | 65.43 | ||||||||||
1 Includes market value of securities out on loan of: | $ | 41,407,871 | $ | 21,350,166 | $ | 2,678,068 | $ | 46,257,159 | $ | 129,254,151 | ||||||||||
2 Investments in securities include investment of cash collateral for securities loaned (see Schedule of Investments for additional information). |
| |||||||||||||||||||
See Notes to Financial Statements.
| 86 | WisdomTree Trust |
Statements of Assets and Liabilities (concluded)
WisdomTree Trust
March 31, 2024
WisdomTree SmallCap | ||||
ASSETS: |
| |||
Investments, at cost | $ | 262,478,451 | ||
Investment in affiliates, at cost (Note 3) | 30,878 | |||
Foreign currency, at cost | 12,079 | |||
Investments in securities, at value1,2 (Note 2) | 271,174,337 | |||
Investment in affiliates, at value (Note 3) | 36,022 | |||
Cash | 128,909 | |||
Foreign currency, at value | 12,095 | |||
Receivables: |
| |||
Dividends | 3,123,080 | |||
Securities lending income | 14,894 | |||
Foreign tax reclaims | 221,984 | |||
Total Assets | 274,711,321 | |||
LIABILITIES: |
| |||
Payables: | ||||
Cash collateral received for securities loaned (Note 2) | 24,558,678 | |||
Advisory fees (Note 3) | 132,067 | |||
Service fees (Note 2) | 1,003 | |||
Total Liabilities | 24,691,748 | |||
NET ASSETS | $ | 250,019,573 | ||
NET ASSETS: |
| |||
Paid-in capital | $ | 367,699,020 | ||
Total distributable earnings (loss) | (117,679,447 | ) | ||
NET ASSETS | $ | 250,019,573 | ||
Outstanding beneficial interest shares of $0.001 par value (unlimited number of shares authorized) | 3,200,000 | |||
Net asset value per share | $ | 78.13 | ||
1 Includes market value of securities out on loan of: | $ | 52,747,857 | ||
2 Investments in securities include investment of cash collateral for securities loaned (see Schedule of Investments for additional information). |
| |||
See Notes to Financial Statements.
| WisdomTree Trust | 87 |
WisdomTree Trust
For the Year Ended March 31, 2024
| WisdomTree Europe Quality Dividend Growth Fund | WisdomTree Europe SmallCap Dividend Fund | WisdomTree International AI Enhanced Value Fund | WisdomTree International Equity Fund | WisdomTree International High Dividend Fund | ||||||||||||||||
INVESTMENT INCOME: |
| |||||||||||||||||||
Dividends | $ | 2,112,433 | $ | 10,812,548 | $ | 3,569,728 | $ | 26,212,722 | $ | 23,649,327 | ||||||||||
Dividends from affiliates (Note 3) | — | 66,368 | — | — | 142,778 | |||||||||||||||
Interest | 6,278 | 43,267 | 4,909 | 15,970 | 1,406 | |||||||||||||||
Non-cash dividends | 7,625 | 231,105 | — | 177,003 | 176,880 | |||||||||||||||
Other income (Note 6) | 4,068 | 174,186 | 27,562 | 59,730 | 20,446 | |||||||||||||||
Securities lending income, net (Note 2) | 10,816 | 375,652 | 31,576 | 597,670 | 714,816 | |||||||||||||||
Less: Foreign withholding taxes on dividends | (225,066 | ) | (1,209,079 | ) | (297,250 | ) | (2,531,938 | ) | (2,107,931 | ) | ||||||||||
Total investment income | 1,916,154 | 10,494,047 | 3,336,525 | 24,531,157 | 22,597,722 | |||||||||||||||
EXPENSES: |
| |||||||||||||||||||
Advisory fees (Note 3) | 414,518 | 1,175,625 | 428,303 | 2,746,435 | 2,230,628 | |||||||||||||||
Service fees (Note 2) | 3,144 | 8,919 | 3,249 | 25,176 | 16,922 | |||||||||||||||
Other fees (Note 6) | 1,141 | 46,104 | 7,626 | 16,836 | 5,794 | |||||||||||||||
Total expenses | 418,803 | 1,230,648 | 439,178 | 2,788,447 | 2,253,344 | |||||||||||||||
Expense waivers (Note 3) | — | (3,109 | ) | — | — | (3,324 | ) | |||||||||||||
Net expenses | 418,803 | 1,227,539 | 439,178 | 2,788,447 | 2,250,020 | |||||||||||||||
Net investment income | 1,497,351 | 9,266,508 | 2,897,347 | 21,742,710 | 20,347,702 | |||||||||||||||
NET REALIZED AND UNREALIZED GAIN (LOSS) ON INVESTMENTS: |
| |||||||||||||||||||
Net realized gain (loss) from: |
| |||||||||||||||||||
Investment transactions | 790,131 | (17,139,251 | ) | 162,592 | (7,524,839 | ) | (9,499,608 | ) | ||||||||||||
Investment transactions in affiliates (Note 3) | — | (46,899 | ) | — | — | 3,404 | ||||||||||||||
In-kind redemptions | 1,491,880 | 7,513,606 | 928,821 | 19,211,265 | 19,588,460 | |||||||||||||||
Foreign currency contracts | (11,174 | ) | (8,703 | ) | 21,260 | 78,005 | 121,731 | |||||||||||||
Foreign currency related transactions | 11,361 | (12,790 | ) | (37,207 | ) | (220,918 | ) | (161,824 | ) | |||||||||||
Net realized gain (loss) | 2,282,198 | (9,694,037 | ) | 1,075,466 | 11,543,513 | 10,052,163 | ||||||||||||||
Net increase (decrease) in unrealized appreciation/depreciation: |
| |||||||||||||||||||
Investment transactions | 3,320,969 | 11,489,061 | 3,787,649 | 45,216,318 | 6,926,864 | |||||||||||||||
Investment transactions in affiliates (Note 3) | — | 22,224 | — | — | (160,206 | ) | ||||||||||||||
Foreign currency contracts | (6 | ) | 573 | (113 | ) | — | (13 | ) | ||||||||||||
Translation of assets and liabilities denominated in foreign currencies | 1,426 | 26,904 | (4,363 | ) | (300 | ) | (23,519 | ) | ||||||||||||
Net increase in unrealized appreciation/depreciation | 3,322,389 | 11,538,762 | 3,783,173 | 45,216,018 | 6,743,126 | |||||||||||||||
Net realized and unrealized gain on investments | 5,604,587 | 1,844,725 | 4,858,639 | 56,759,531 | 16,795,289 | |||||||||||||||
NET INCREASE IN NET ASSETS RESULTING FROM OPERATIONS | $ | 7,101,938 | $ | 11,111,233 | $ | 7,755,986 | $ | 78,502,241 | $ | 37,142,991 | ||||||||||
See Notes to Financial Statements.
| 88 | WisdomTree Trust |
Statements of Operations (continued)
WisdomTree Trust
For the Year Ended March 31, 2024
| WisdomTree International LargeCap Dividend Fund | WisdomTree International MidCap Dividend Fund | WisdomTree International Multifactor Fund | WisdomTree International Quality Dividend Growth Fund | WisdomTree International SmallCap Dividend Fund | ||||||||||||||||
INVESTMENT INCOME: |
| |||||||||||||||||||
Dividends | $ | 23,104,595 | $ | 5,927,551 | $ | 1,684,097 | $ | 22,369,844 | $ | 55,233,445 | ||||||||||
Dividends from affiliates (Note 3) | 48,092 | — | — | — | 237,293 | |||||||||||||||
Interest | 11,271 | 4,552 | 2,421 | 14,635 | 48,398 | |||||||||||||||
Non-cash dividends | 152,165 | 37,876 | 5,789 | — | 379,314 | |||||||||||||||
Other income (Note 6) | 18,456 | 4,877 | 761 | 55,335 | 370,282 | |||||||||||||||
Securities lending income, net (Note 2) | 598,170 | 70,077 | 15,049 | 124,719 | 835,326 | |||||||||||||||
Less: Foreign withholding taxes on dividends | (2,115,912 | ) | (582,313 | ) | (140,735 | ) | (2,137,832 | ) | (5,380,632 | ) | ||||||||||
Total investment income | 21,816,837 | 5,462,620 | 1,567,382 | 20,426,701 | 51,723,426 | |||||||||||||||
EXPENSES: |
| |||||||||||||||||||
Advisory fees (Note 3) | 2,424,166 | 779,148 | 156,763 | 3,626,637 | 6,418,430 | |||||||||||||||
Service fees (Note 2) | 22,222 | 5,911 | 1,815 | 37,993 | 48,692 | |||||||||||||||
Other fees (Note 6) | 5,456 | 1,181 | 128 | 16,369 | 103,475 | |||||||||||||||
Total expenses | 2,451,844 | 786,240 | 158,706 | 3,680,999 | 6,570,597 | |||||||||||||||
Expense waivers (Note 3) | (1,517 | ) | — | — | — | (12,268 | ) | |||||||||||||
Net expenses | 2,450,327 | 786,240 | 158,706 | 3,680,999 | 6,558,329 | |||||||||||||||
Net investment income | 19,366,510 | 4,676,380 | 1,408,676 | 16,745,702 | 45,165,097 | |||||||||||||||
NET REALIZED AND UNREALIZED GAIN (LOSS) ON INVESTMENTS: |
| |||||||||||||||||||
Net realized gain (loss) from: |
| |||||||||||||||||||
Investment transactions | (6,462,570 | ) | (2,419,489 | ) | (8,104 | ) | 1,537,970 | (34,314,524 | ) | |||||||||||
Investment transactions in affiliates (Note 3) | 93,724 | — | — | — | 243,405 | |||||||||||||||
In-kind redemptions | 16,177,218 | 2,366,912 | 1,870,437 | 13,683,837 | 23,019,788 | |||||||||||||||
Futures contracts | — | — | 11,502 | — | — | |||||||||||||||
Foreign currency contracts | 149,061 | (28,675 | ) | (327,128 | ) | (233,177 | ) | (93,295 | ) | |||||||||||
Foreign currency related transactions | (204,159 | ) | (20,735 | ) | 10,300 | 248,676 | (328,177 | ) | ||||||||||||
Net realized gain (loss) | 9,753,274 | (101,987 | ) | 1,557,007 | 15,237,306 | (11,472,803 | ) | |||||||||||||
Net increase (decrease) in unrealized appreciation/depreciation: | ||||||||||||||||||||
Investment transactions | 43,921,584 | 11,607,802 | 491,711 | 95,262,912 | 88,782,578 | |||||||||||||||
Investment transactions in affiliates (Note 3) | (19,604 | ) | — | — | — | (369,732 | ) | |||||||||||||
Foreign currency contracts | — | 61 | 576,993 | — | 9 | |||||||||||||||
Translation of assets and liabilities denominated in foreign currencies | (18,418 | ) | 3,174 | (1,312 | ) | (14,451 | ) | (729 | ) | |||||||||||
Net increase in unrealized appreciation/depreciation | 43,883,562 | 11,611,037 | 1,067,392 | 95,248,461 | 88,412,126 | |||||||||||||||
Net realized and unrealized gain on investments | 53,636,836 | 11,509,050 | 2,624,399 | 110,485,767 | 76,939,323 | |||||||||||||||
NET INCREASE IN NET ASSETS RESULTING FROM OPERATIONS | $ | 73,003,346 | $ | 16,185,430 | $ | 4,033,075 | $ | 127,231,469 | $ | 122,104,420 | ||||||||||
See Notes to Financial Statements.
| WisdomTree Trust | 89 |
Statements of Operations (concluded)
WisdomTree Trust
For the Year Ended March 31, 2024
| WisdomTree Japan SmallCap Dividend Fund | ||||
INVESTMENT INCOME: | ||||
Dividends | $ | 7,277,690 | ||
Dividends from affiliates (Note 3) | 31,127 | |||
Interest | 1,367 | |||
Securities lending income, net (Note 2) | 94,588 | |||
Less: Foreign withholding taxes on dividends | (727,597 | ) | ||
Total investment income | 6,677,175 | |||
EXPENSES: |
| |||
Advisory fees (Note 3) | 1,320,176 | |||
Service fees (Note 2) | 10,015 | |||
Total expenses | 1,330,191 | |||
Expense waivers (Note 3) | (1,238 | ) | ||
Net expenses | 1,328,953 | |||
Net investment income | 5,348,222 | |||
NET REALIZED AND UNREALIZED GAIN (LOSS) ON INVESTMENTS: |
| |||
Net realized gain (loss) from: |
| |||
Investment transactions | (5,805,923 | ) | ||
Investment transactions in affiliates (Note 3) | 211,580 | |||
In-kind redemptions | 21,509,369 | |||
Foreign currency contracts | (7,822 | ) | ||
Foreign currency related transactions | (203,393 | ) | ||
Net realized gain | 15,703,811 | |||
Net increase (decrease) in unrealized appreciation/depreciation: |
| |||
Investment transactions | 25,707,995 | |||
Investment transactions in affiliates (Note 3) | (6,299 | ) | ||
Translation of assets and liabilities denominated in foreign currencies | (32,296 | ) | ||
Net increase in unrealized appreciation/depreciation | 25,669,400 | |||
Net realized and unrealized gain on investments | 41,373,211 | |||
NET INCREASE IN NET ASSETS RESULTING FROM OPERATIONS | $ | 46,721,433 | ||
See Notes to Financial Statements.
| 90 | WisdomTree Trust |
Statements of Changes in Net Assets
WisdomTree Trust
WisdomTree Europe Quality Dividend Growth Fund | WisdomTree Europe SmallCap Dividend Fund | WisdomTree International AI Enhanced Value Fund | ||||||||||||||||||||||
| For the Year Ended March 31, 2024 | For the Year Ended March 31, 2023 | For the Year Ended March 31, 2024 | For the Year Ended March 31, 2023 | For the Year Ended March 31, 2024 | For the Year Ended March 31, 2023 | |||||||||||||||||||
INCREASE (DECREASE) IN NET ASSETS RESULTING FROM OPERATIONS: |
| |||||||||||||||||||||||
Net investment income | $ | 1,497,351 | $ | 1,632,953 | $ | 9,266,508 | $ | 13,431,740 | $ | 2,897,347 | $ | 3,709,293 | ||||||||||||
Net realized gain (loss) on investments, foreign currency contracts and foreign currency related transactions | 2,282,198 | (7,730,499 | ) | (9,694,037 | ) | (51,114,324 | ) | 1,075,466 | (13,490,823 | ) | ||||||||||||||
Net increase in unrealized appreciation/depreciation on investments, foreign currency contracts and translation of assets and liabilities denominated in foreign currencies | 3,322,389 | 3,014,323 | 11,538,762 | 3,760,195 | 3,783,173 | 6,533,136 | ||||||||||||||||||
Net increase (decrease) in net assets resulting from operations | 7,101,938 | (3,083,223 | ) | 11,111,233 | (33,922,389 | ) | $ | 7,755,986 | (3,248,394 | ) | ||||||||||||||
DISTRIBUTIONS TO SHAREHOLDERS: |
| |||||||||||||||||||||||
Distributable earnings | (1,468,000 | ) | (1,667,670 | ) | (9,431,500 | ) | (14,405,217 | ) | (3,458,250 | ) | (4,170,635 | ) | ||||||||||||
CAPITAL SHARE TRANSACTIONS: |
| |||||||||||||||||||||||
Net proceeds from sale of shares | 4,551,237 | 18,424,119 | — | 50,584,868 | 3,847,332 | — | ||||||||||||||||||
Cost of shares redeemed | (6,329,703 | ) | (16,778,882 | ) | (64,325,641 | ) | (47,265,636 | ) | (11,900,706 | ) | (36,378,090 | ) | ||||||||||||
Net increase (decrease) in net assets resulting from capital share transactions | (1,778,466 | ) | 1,645,237 | (64,325,641 | ) | 3,319,232 | (8,053,374 | ) | (36,378,090 | ) | ||||||||||||||
Net Increase (Decrease) in Net Assets | 3,855,472 | (3,105,656 | ) | (62,645,908 | ) | (45,008,374 | ) | (3,755,638 | ) | (43,797,119 | ) | |||||||||||||
NET ASSETS: |
| |||||||||||||||||||||||
Beginning of year | $ | 69,240,698 | $ | 72,346,354 | $ | 250,797,318 | $ | 295,805,692 | $ | 77,784,720 | $ | 121,581,839 | ||||||||||||
End of year | $ | 73,096,170 | $ | 69,240,698 | $ | 188,151,410 | $ | 250,797,318 | $ | 74,029,082 | $ | 77,784,720 | ||||||||||||
SHARES CREATED AND REDEEMED: |
| |||||||||||||||||||||||
Shares outstanding, beginning of year | 2,300,000 | 2,300,000 | 4,300,000 | 4,350,000 | 2,000,000 | 3,000,000 | ||||||||||||||||||
Shares created | 150,000 | 650,000 | — | 850,000 | 100,000 | — | ||||||||||||||||||
Shares redeemed | (200,000 | ) | (650,000 | ) | (1,150,000 | ) | (900,000 | ) | (300,000 | ) | (1,000,000 | ) | ||||||||||||
Shares outstanding, end of year | 2,250,000 | 2,300,000 | 3,150,000 | 4,300,000 | 1,800,000 | 2,000,000 | ||||||||||||||||||
See Notes to Financial Statements.
| WisdomTree Trust | 91 |
Statements of Changes in Net Assets (continued)
WisdomTree Trust
WisdomTree International Equity Fund | WisdomTree International High Dividend Fund | WisdomTree International LargeCap Dividend Fund | ||||||||||||||||||||||
| For the Year Ended March 31, 2024 | For the Year Ended March 31, 2023 | For the Year Ended March 31, 2024 | For the Year Ended March 31, 2023 | For the Year Ended March 31, 2024 | For the Year Ended March 31, 2023 | |||||||||||||||||||
INCREASE (DECREASE) IN NET ASSETS RESULTING FROM OPERATIONS: |
| |||||||||||||||||||||||
Net investment income | $ | 21,742,710 | $ | 25,509,784 | $ | 20,347,702 | $ | 14,495,358 | $ | 19,366,510 | $ | 17,714,031 | ||||||||||||
Net realized gain (loss) on investments, foreign currency contracts and foreign currency related transactions | 11,543,513 | (23,381,839 | ) | 10,052,163 | (13,383,670 | ) | 9,753,274 | (17,772,367 | ) | |||||||||||||||
Net increase (decrease) in unrealized appreciation/depreciation on investments, foreign currency contracts and translation of assets and liabilities denominated in foreign currencies | 45,216,018 | (24,797,741 | ) | 6,743,126 | 11,402,305 | 43,883,562 | 15,832,146 | |||||||||||||||||
Net increase (decrease) in net assets resulting from operations | 78,502,241 | (22,669,796 | ) | 37,142,991 | 12,513,993 | 73,003,346 | 15,773,810 | |||||||||||||||||
DISTRIBUTIONS TO SHAREHOLDERS: |
| |||||||||||||||||||||||
Distributable earnings | (23,081,500 | ) | (26,843,795 | ) | (21,220,750 | ) | (14,557,836 | ) | (19,529,750 | ) | (18,097,424 | ) | ||||||||||||
CAPITAL SHARE TRANSACTIONS: |
| |||||||||||||||||||||||
Net proceeds from sale of shares | 22,667,868 | 43,192,061 | 21,113,970 | 213,596,432 | 18,551,230 | 112,351,029 | ||||||||||||||||||
Cost of shares redeemed | (74,346,598 | ) | (57,953,886 | ) | (109,170,942 | ) | — | (46,440,306 | ) | — | ||||||||||||||
Net increase (decrease) in net assets resulting from capital share transactions | (51,678,730 | ) | (14,761,825 | ) | (88,056,972 | ) | 213,596,432 | (27,889,076 | ) | 112,351,029 | ||||||||||||||
Net Increase (Decrease) in Net Assets | 3,742,011 | (64,275,416 | ) | (72,134,731 | ) | 211,552,589 | 25,584,520 | 110,027,415 | ||||||||||||||||
NET ASSETS: |
| |||||||||||||||||||||||
Beginning of year | $ | 570,152,931 | $ | 634,428,347 | $ | 413,186,779 | $ | 201,634,190 | $ | 491,834,408 | $ | 381,806,993 | ||||||||||||
End of year | $ | 573,894,942 | $ | 570,152,931 | $ | 341,052,048 | $ | 413,186,779 | $ | 517,418,928 | $ | 491,834,408 | ||||||||||||
SHARES CREATED AND REDEEMED: |
| |||||||||||||||||||||||
Shares outstanding, beginning of year | 11,450,000 | 11,950,000 | 11,000,000 | 5,050,000 | 10,550,000 | 7,800,000 | ||||||||||||||||||
Shares created | 450,000 | 900,000 | 550,000 | 5,950,000 | 400,000 | 2,750,000 | ||||||||||||||||||
Shares redeemed | (1,450,000 | ) | (1,400,000 | ) | (2,950,000 | ) | — | (950,000 | ) | — | ||||||||||||||
Shares outstanding, end of year | 10,450,000 | 11,450,000 | 8,600,000 | 11,000,000 | 10,000,000 | 10,550,000 | ||||||||||||||||||
See Notes to Financial Statements.
| 92 | WisdomTree Trust |
Statements of Changes in Net Assets (continued)
WisdomTree Trust
WisdomTree International MidCap Dividend Fund | WisdomTree International Multifactor Fund | WisdomTree International Quality Dividend Growth Fund | ||||||||||||||||||||||
| For the Year Ended March 31, 2024 | For the Year Ended March 31, 2023 | For the Year Ended March 31, 2024 | For the Year Ended March 31, 2023 | For the Year Ended March 31, 2024 | For the Year Ended March 31, 2023 | |||||||||||||||||||
INCREASE (DECREASE) IN NET ASSETS RESULTING FROM OPERATIONS: |
| |||||||||||||||||||||||
Net investment income | $ | 4,676,380 | $ | 5,069,979 | $ | 1,408,676 | $ | 1,316,274 | $ | 16,745,702 | $ | 13,253,119 | ||||||||||||
Net realized gain (loss) on investments, futures contracts, foreign currency contracts and foreign currency related transactions | (101,987 | ) | (13,885,400 | ) | 1,557,007 | (539,077 | ) | 15,237,306 | (58,788,022 | ) | ||||||||||||||
Net increase in unrealized appreciation/depreciation on investments, foreign currency contracts and translation of assets and liabilities denominated in foreign currencies | 11,611,037 | 718,605 | 1,067,392 | 413,640 | 95,248,461 | 52,354,050 | ||||||||||||||||||
Net increase (decrease) in net assets resulting from operations | 16,185,430 | (8,096,816 | ) | 4,033,075 | 1,190,837 | 127,231,469 | 6,819,147 | |||||||||||||||||
DISTRIBUTIONS TO SHAREHOLDERS: |
| |||||||||||||||||||||||
Distributable earnings | (5,664,500 | ) | (5,553,560 | ) | (1,509,000 | ) | (1,277,796 | ) | (16,686,000 | ) | (13,540,674 | ) | ||||||||||||
CAPITAL SHARE TRANSACTIONS: |
| |||||||||||||||||||||||
Net proceeds from sale of shares | 8,686,299 | 11,005,333 | 10,204,509 | 9,671,353 | 258,437,278 | 330,148,196 | ||||||||||||||||||
Cost of shares redeemed | (11,994,282 | ) | (5,032,369 | ) | (10,283,441 | ) | (2,474,953 | ) | (56,717,942 | ) | (31,250,555 | ) | ||||||||||||
Net increase (decrease) in net assets resulting from capital share transactions | (3,307,983 | ) | 5,972,964 | (78,932 | ) | 7,196,400 | 201,719,336 | 298,897,641 | ||||||||||||||||
Net Increase (Decrease) in Net Assets | 7,212,947 | (7,677,412 | ) | 2,445,143 | 7,109,441 | 312,264,805 | 292,176,114 | |||||||||||||||||
NET ASSETS: |
| |||||||||||||||||||||||
Beginning of year | $ | 128,175,330 | $ | 135,852,742 | $ | 39,995,850 | $ | 32,886,409 | $ | 665,915,824 | $ | 373,739,710 | ||||||||||||
End of year | $ | 135,388,277 | $ | 128,175,330 | $ | 42,440,993 | $ | 39,995,850 | $ | 978,180,629 | $ | 665,915,824 | ||||||||||||
SHARES CREATED AND REDEEMED: |
| |||||||||||||||||||||||
Shares outstanding, beginning of year | 2,200,000 | 2,100,000 | 1,600,000 | 1,300,000 | 19,750,000 | 10,150,000 | ||||||||||||||||||
Shares created | 150,000 | 200,000 | 400,000 | 400,000 | 7,550,000 | 10,650,000 | ||||||||||||||||||
Shares redeemed | (200,000 | ) | (100,000 | ) | (400,000 | ) | (100,000 | ) | (1,550,000 | ) | (1,050,000 | ) | ||||||||||||
Shares outstanding, end of year | 2,150,000 | 2,200,000 | 1,600,000 | 1,600,000 | 25,750,000 | 19,750,000 | ||||||||||||||||||
See Notes to Financial Statements.
| WisdomTree Trust | 93 |
Statements of Changes in Net Assets (concluded)
WisdomTree Trust
| WisdomTree International SmallCap Dividend Fund | WisdomTree Japan SmallCap Dividend Fund | |||||||||||||||
| For the Year Ended March 31, 2024 | For the Year Ended March 31, 2023 | For the Year Ended March 31, 2024 | For the Year Ended March 31, 2023 | |||||||||||||
INCREASE (DECREASE) IN NET ASSETS RESULTING FROM OPERATIONS: |
| |||||||||||||||
Net investment income | $ | 45,165,097 | $ | 56,124,574 | $ | 5,348,222 | $ | 4,558,221 | ||||||||
Net realized gain (loss) on investments, foreign currency contracts and foreign currency related transactions | (11,472,803 | ) | (165,290,057 | ) | 15,703,811 | (26,812,312 | ) | |||||||||
Net increase in unrealized appreciation/depreciation on investments and translation of assets and liabilities denominated in foreign currencies | 88,412,126 | 8,194,398 | 25,669,400 | 25,168,900 | ||||||||||||
Net increase (decrease) in net assets resulting from operations | 122,104,420 | (100,971,085 | ) | 46,721,433 | 2,914,809 | |||||||||||
DISTRIBUTIONS TO SHAREHOLDERS: |
| |||||||||||||||
Distributable earnings | (46,695,750 | ) | (62,885,580 | ) | (5,686,552 | ) | (7,163,312 | ) | ||||||||
CAPITAL SHARE TRANSACTIONS: |
| |||||||||||||||
Net proceeds from sale of shares | 12,700,933 | 36,161,923 | 129,347,500 | 15,564,306 | ||||||||||||
Cost of shares redeemed | (182,639,829 | ) | (8,875,297 | ) | (102,859,528 | ) | (41,967,436 | ) | ||||||||
Net increase (decrease) in net assets resulting from capital share transactions | (169,938,896 | ) | 27,286,626 | 26,487,972 | (26,403,130 | ) | ||||||||||
Net Increase (Decrease) in Net Assets | (94,530,226 | ) | (136,570,039 | ) | 67,522,853 | (30,651,633 | ) | |||||||||
NET ASSETS: |
| |||||||||||||||
Beginning of year | $ | 1,193,792,635 | $ | 1,330,362,674 | $ | 182,496,720 | $ | 213,148,353 | ||||||||
End of year | $ | 1,099,262,409 | $ | 1,193,792,635 | $ | 250,019,573 | $ | 182,496,720 | ||||||||
SHARES CREATED AND REDEEMED: |
| |||||||||||||||
Shares outstanding, beginning of year | 19,650,000 | 19,200,000 | 2,750,000 | 3,200,000 | ||||||||||||
Shares created | 200,000 | 600,000 | 1,800,000 | 250,000 | ||||||||||||
Shares redeemed | (3,050,000 | ) | (150,000 | ) | (1,350,000 | ) | (700,000 | ) | ||||||||
Shares outstanding, end of year | 16,800,000 | 19,650,000 | 3,200,000 | 2,750,000 | ||||||||||||
See Notes to Financial Statements.
| 94 | WisdomTree Trust |
WisdomTree Trust
Selected data for a share of beneficial interest outstanding throughout the period is presented below:
| WisdomTree Europe Quality Dividend Growth Fund | For the Year Ended March 31, 2024 | For the Year Ended March 31, 2023 | For the Year Ended March 31, 2022 | For the Year Ended March 31, 2021 | For the Year Ended March 31, 2020 | |||||||||||||||
Net asset value, beginning of year | $ | 30.10 | $ | 31.45 | $ | 31.24 | $ | 22.13 | $ | 25.06 | ||||||||||
Investment operations: |
| |||||||||||||||||||
Net investment income1 | 0.64 | 0.72 | 1.08 | 0.66 | 0.62 | |||||||||||||||
Net realized and unrealized gain (loss) | 2.39 | (1.35 | ) | 0.21 | 9.10 | (2.93 | ) | |||||||||||||
Total from investment operations | 3.03 | (0.63 | ) | 1.29 | 9.76 | (2.31 | ) | |||||||||||||
Dividends to shareholders: |
| |||||||||||||||||||
Net investment income | (0.64 | ) | (0.72 | ) | (1.08 | ) | (0.65 | ) | (0.62 | ) | ||||||||||
Net asset value, end of year | $ | 32.49 | $ | 30.10 | $ | 31.45 | $ | 31.24 | $ | 22.13 | ||||||||||
TOTAL RETURN2 | 10.22 | % | (1.64 | )% | 4.02 | % | 44.43 | % | (9.46 | )% | ||||||||||
RATIOS/SUPPLEMENTAL DATA: |
| |||||||||||||||||||
Net assets, end of year (000’s omitted) | $ | 73,096 | $ | 69,241 | $ | 72,346 | $ | 46,856 | $ | 25,450 | ||||||||||
Ratios to average net assets of: |
| |||||||||||||||||||
Expenses | 0.59 | %3 | 0.59 | %3 | 0.59 | %3 | 0.58 | % | 0.58 | % | ||||||||||
Net investment income | 2.10 | % | 2.63 | % | 3.26 | % | 2.37 | % | 2.42 | % | ||||||||||
Portfolio turnover rate4 | 35 | % | 43 | % | 53 | % | 61 | % | 43 | % | ||||||||||
| WisdomTree Europe SmallCap Dividend Fund | For the Year Ended March 31, 2024 | For the Year Ended March 31, 2023 | For the Year Ended March 31, 2022 | For the Year Ended March 31, 2021 | For the Year Ended March 31, 2020 | |||||||||||||||
Net asset value, beginning of year | $ | 58.32 | $ | 68.00 | $ | 69.71 | $ | 41.06 | $ | 58.54 | ||||||||||
Investment operations: |
| |||||||||||||||||||
Net investment income1 | 2.59 | 3.42 | 2.03 | 1.31 | 2.43 | |||||||||||||||
Net realized and unrealized gain (loss) | 1.48 | (9.57 | ) | (1.79 | ) | 28.62 | (17.41 | ) | ||||||||||||
Total from investment operations | 4.07 | (6.15 | ) | 0.24 | 29.93 | (14.98 | ) | |||||||||||||
Dividends to shareholders: |
| |||||||||||||||||||
Net investment income | (2.66 | ) | (3.53 | ) | (1.95 | ) | (1.28 | ) | (2.50 | ) | ||||||||||
Net asset value, end of year | $ | 59.73 | $ | 58.32 | $ | 68.00 | $ | 69.71 | $ | 41.06 | ||||||||||
TOTAL RETURN2 | 7.40 | % | (8.50 | )% | 0.18 | % | 73.76 | % | (26.54 | )% | ||||||||||
RATIOS/SUPPLEMENTAL DATA: |
| |||||||||||||||||||
Net assets, end of year (000’s omitted) | $ | 188,151 | $ | 250,797 | $ | 295,806 | $ | 310,227 | $ | 320,231 | ||||||||||
Ratios to average net assets of: |
| |||||||||||||||||||
Expenses5,6 | 0.61 | %3 | 0.65 | %3 | 0.73 | %3 | 0.58 | % | 0.58 | % | ||||||||||
Net investment income | 4.57 | % | 6.00 | % | 2.77 | % | 2.39 | % | 4.15 | % | ||||||||||
Portfolio turnover rate4 | 41 | % | 46 | % | 68 | % | 92 | % | 50 | % | ||||||||||
| 1 | Based on average shares outstanding. |
| 2 | Total return is calculated assuming an initial investment made at the net asset value at the beginning of the period, reinvestment of all dividends and distributions at net asset value during the period and redemption on the last day of the period. For the periods in which the investment advisor waived advisory fees for the WisdomTree Europe SmallCap Dividend Fund, the total return would have been lower if certain expenses had not been waived (Notes 2 and 3). |
| 3 | Included in the expense ratio are “Other fees” described in Note 6. Without these expenses, the expense ratio would have been 0.58%. |
| 4 | Portfolio turnover rate excludes the value of the portfolio securities received or delivered as a result of in-kind creations or redemptions of the Fund’s capital shares. Short-term securities with maturities less than or equal to 365 days are excluded from the portfolio turnover calculation. |
| 5 | Does not include expenses of the Underlying Funds in which the Fund invests. |
| 6 | The expense ratio includes investment advisory fee waivers. Without these investment advisory fee waivers, the expense ratio would have been unchanged. |
See Notes to Financial Statements.
| WisdomTree Trust | 95 |
Financial Highlights (continued)
WisdomTree Trust
Selected data for a share of beneficial interest outstanding throughout the period is presented below:
| WisdomTree International AI Enhanced Value Fund | For the Year Ended March 31, 2024 | For the Year Ended March 31, 2023 | For the Year Ended March 31, 20221 | For the Year Ended March 31, 20211 | For the Year Ended March 31, 20201 | |||||||||||||||
Net asset value, beginning of year | $ | 38.89 | $ | 40.53 | $ | 42.46 | $ | 31.66 | $ | 41.19 | ||||||||||
Investment operations: |
| |||||||||||||||||||
Net investment income2 | 1.54 | 1.56 | 2.14 | 1.64 | 1.69 | |||||||||||||||
Net realized and unrealized gain (loss) | 2.58 | (1.46 | ) | (1.98 | ) | 10.78 | (9.52 | ) | ||||||||||||
Total from investment operations | 4.12 | 0.10 | 0.16 | 12.42 | (7.83 | ) | ||||||||||||||
Dividends to shareholders: |
| |||||||||||||||||||
Net investment income | (1.88 | ) | (1.74 | ) | (2.09 | ) | (1.62 | ) | (1.70 | ) | ||||||||||
Net asset value, end of year | $ | 41.13 | $ | 38.89 | $ | 40.53 | $ | 42.46 | $ | 31.66 | ||||||||||
TOTAL RETURN3 | 10.93 | % | 0.80 | % | 0.30 | % | 39.87 | % | (19.77 | )% | ||||||||||
RATIOS/SUPPLEMENTAL DATA: |
| |||||||||||||||||||
Net assets, end of year (000’s omitted) | $ | 74,029 | $ | 77,785 | $ | 121,582 | $ | 144,348 | $ | 106,061 | ||||||||||
Ratios to average net assets of: |
| |||||||||||||||||||
Expenses | 0.59 | %4 | 0.59 | %4 | 0.58 | %5,6,7 | 0.58 | %6,7 | 0.58 | %6,7 | ||||||||||
Net investment income | 3.92 | % | 4.25 | % | 5.03 | % | 4.34 | % | 4.17 | % | ||||||||||
Portfolio turnover rate8 | 138 | % | 148 | % | 99 | %9,10 | 61 | % | 45 | % | ||||||||||
| WisdomTree International Equity Fund | For the Year Ended March 31, 2024 | For the Year Ended March 31, 2023 | For the Year Ended March 31, 2022 | For the Year Ended March 31, 2021 | For the Year Ended March 31, 2020 | |||||||||||||||
Net asset value, beginning of year | $ | 49.80 | $ | 53.09 | $ | 52.63 | $ | 39.65 | $ | 50.59 | ||||||||||
Investment operations: |
| |||||||||||||||||||
Net investment income2 | 1.93 | 2.11 | 1.94 | 1.47 | 1.69 | |||||||||||||||
Net realized and unrealized gain (loss) | 5.24 | (3.19 | ) | 0.50 | 12.99 | (10.88 | ) | |||||||||||||
Total from investment operations | 7.17 | (1.08 | ) | 2.44 | 14.46 | (9.19 | ) | |||||||||||||
Dividends to shareholders: |
| |||||||||||||||||||
Net investment income | (2.05 | ) | (2.21 | ) | (1.98 | ) | (1.48 | ) | (1.75 | ) | ||||||||||
Net asset value, end of year | $ | 54.92 | $ | 49.80 | $ | 53.09 | $ | 52.63 | $ | 39.65 | ||||||||||
TOTAL RETURN3 | 14.83 | % | (1.55 | )% | 4.62 | % | 36.92 | % | (18.80 | )% | ||||||||||
RATIOS/SUPPLEMENTAL DATA: |
| |||||||||||||||||||
Net assets, end of year (000’s omitted) | $ | 573,895 | $ | 570,153 | $ | 634,428 | $ | 602,625 | $ | 580,910 | ||||||||||
Ratios to average net assets of: |
| |||||||||||||||||||
Expenses | 0.49 | %11 | 0.49 | %11 | 0.49 | %6,7,11 | 0.48 | %6,7 | 0.48 | %6,7 | ||||||||||
Net investment income | 3.80 | % | 4.49 | % | 3.58 | % | 3.13 | % | 3.36 | % | ||||||||||
Portfolio turnover rate8 | 22 | % | 24 | % | 31 | % | 47 | % | 23 | % | ||||||||||
| 1 | The information reflects the investment objective and strategy of the WisdomTree International Dividend ex-Financials Fund through January 17, 2022 and the investment objective and strategy of the WisdomTree International AI Enhanced Value Fund thereafter. |
| 2 | Based on average shares outstanding. |
| 3 | Total return is calculated assuming an initial investment made at the net asset value at the beginning of the period, reinvestment of all dividends and distributions at net asset value during the period and redemption on the last day of the period. For the periods in which the investment advisor waived advisory fees, the total return would have been lower if certain expenses had not been waived (Notes 2 and 3). |
| 4 | Included in the expense ratio are “Other fees” described in Note 6. Without these expenses, the expense ratio would have been 0.58%. |
| 5 | Included in the expense ratio are “Other fees” described in Note 6. Without these expenses, the expense ratio would have been unchanged. |
| 6 | The expense ratio includes investment advisory fee waivers. Without these investment advisory fee waivers, the expense ratio would have been unchanged. |
| 7 | Does not include expenses of the Underlying Funds in which the Fund invests. |
| 8 | Portfolio turnover rate excludes the value of the portfolio securities received or delivered as a result of in-kind creations or redemptions of the Fund’s capital shares. Short-term securities with maturities less than or equal to 365 days are excluded from the portfolio turnover calculation. |
| 9 | The increase in the portfolio turnover rate was primarily a result of the change in investment objective and strategy on January 18, 2022. |
| 10 | On January 7, 2022, Voya Investment Management Co., LLC replaced Mellon Investments Corporation as sub-advisor to the Fund. |
| 11 | Included in the expense ratio are “Other fees” described in Note 6. Without these expenses, the expense ratio would have been 0.48%. |
See Notes to Financial Statements.
| 96 | WisdomTree Trust |
Financial Highlights (continued)
WisdomTree Trust
Selected data for a share of beneficial interest outstanding throughout the period is presented below:
| WisdomTree International High Dividend Fund | For the Year Ended March 31, 2024 | For the Year Ended March 31, 2023 | For the Year Ended March 31, 2022 | For the Year Ended March 31, 2021 | For the Year Ended March 31, 2020 | |||||||||||||||
Net asset value, beginning of year | $ | 37.56 | $ | 39.93 | $ | 39.29 | $ | 29.53 | $ | 40.30 | ||||||||||
Investment operations: |
| |||||||||||||||||||
Net investment income1 | 1.99 | 2.11 | 1.90 | 1.54 | 1.65 | |||||||||||||||
Net realized and unrealized gain (loss) | 2.14 | (2.37 | ) | 0.63 | 9.73 | (10.75 | ) | |||||||||||||
Total from investment operations | 4.13 | (0.26 | ) | 2.53 | 11.27 | (9.10 | ) | |||||||||||||
Dividends to shareholders: |
| |||||||||||||||||||
Net investment income | (2.03 | ) | (2.11 | ) | (1.89 | ) | (1.51 | ) | (1.67 | ) | ||||||||||
Net asset value, end of year | $ | 39.66 | $ | 37.56 | $ | 39.93 | $ | 39.29 | $ | 29.53 | ||||||||||
TOTAL RETURN2 | 11.45 | % | 0.01 | % | 6.61 | % | 38.88 | % | (23.48 | )% | ||||||||||
RATIOS/SUPPLEMENTAL DATA: |
| |||||||||||||||||||
Net assets, end of year (000’s omitted) | $ | 341,052 | $ | 413,187 | $ | 201,634 | $ | 182,685 | $ | 174,236 | ||||||||||
Ratios to average net assets of: |
| |||||||||||||||||||
Expenses3,4 | 0.59 | %5 | 0.58 | %6 | 0.59 | %5 | 0.58 | % | 0.58 | % | ||||||||||
Net investment income | 5.29 | % | 5.89 | % | 4.80 | % | 4.43 | % | 4.18 | % | ||||||||||
Portfolio turnover rate7 | 39 | % | 36 | % | 40 | % | 57 | % | 34 | % | ||||||||||
| WisdomTree International LargeCap Dividend Fund | For the Year Ended March 31, 2024 | For the Year Ended March 31, 2023 | For the Year Ended March 31, 2022 | For the Year Ended March 31, 2021 | For the Year Ended March 31, 2020 | |||||||||||||||
Net asset value, beginning of year | $ | 46.62 | $ | 48.95 | $ | 47.34 | $ | 36.81 | $ | 46.37 | ||||||||||
Investment operations: |
| |||||||||||||||||||
Net investment income1 | 1.83 | 1.94 | 1.79 | 1.42 | 1.56 | |||||||||||||||
Net realized and unrealized gain (loss) | 5.14 | (2.23 | ) | 1.63 | 10.55 | (9.52 | ) | |||||||||||||
Total from investment operations | 6.97 | (0.29 | ) | 3.42 | 11.97 | (7.96 | ) | |||||||||||||
Dividends to shareholders: |
| |||||||||||||||||||
Net investment income | (1.85 | ) | (2.04 | ) | (1.81 | ) | (1.44 | ) | (1.60 | ) | ||||||||||
Net asset value, end of year | $ | 51.74 | $ | 46.62 | $ | 48.95 | $ | 47.34 | $ | 36.81 | ||||||||||
TOTAL RETURN2 | 15.35 | % | (0.05 | )% | 7.27 | % | 32.91 | % | (17.78 | )% | ||||||||||
RATIOS/SUPPLEMENTAL DATA: |
| |||||||||||||||||||
Net assets, end of year (000’s omitted) | $ | 517,419 | $ | 491,834 | $ | 381,807 | $ | 352,717 | $ | 327,622 | ||||||||||
Ratios to average net assets of: |
| |||||||||||||||||||
Expenses3,4 | 0.49 | %8 | 0.49 | %8 | 0.49 | %8 | 0.48 | % | 0.48 | % | ||||||||||
Net investment income | 3.83 | % | 4.43 | % | 3.63 | % | 3.33 | % | 3.38 | % | ||||||||||
Portfolio turnover rate7 | 24 | % | 23 | % | 30 | % | 38 | % | 14 | % | ||||||||||
| 1 | Based on average shares outstanding. |
| 2 | Total return is calculated assuming an initial investment made at the net asset value at the beginning of the period, reinvestment of all dividends and distributions at net asset value during the period and redemption on the last day of the period. For the periods in which the investment advisor waived advisory fees, the total return would have been lower if certain expenses had not been waived (Notes 2 and 3). |
| 3 | Does not include expenses of the Underlying Funds in which the Fund invests. |
| 4 | The expense ratio includes investment advisory fee waivers. Without these investment advisory fee waivers, the expense ratio would have been unchanged. |
| 5 | Included in the expense ratio are “Other fees” described in Note 6. Without these expenses, the expense ratio would have been 0.58%. |
| 6 | Included in the expense ratio are “Other fees” described in Note 6. Without these expenses, the expense ratio would have been unchanged. |
| 7 | Portfolio turnover rate excludes the value of the portfolio securities received or delivered as a result of in-kind creations or redemptions of the Fund’s capital shares. Short-term securities with maturities less than or equal to 365 days are excluded from the portfolio turnover calculation. |
| 8 | Included in the expense ratio are “Other fees” described in Note 6. Without these expenses, the expense ratio would have been 0.48%. |
See Notes to Financial Statements.
| WisdomTree Trust | 97 |
Financial Highlights (continued)
WisdomTree Trust
Selected data for a share of beneficial interest outstanding throughout the period is presented below:
| WisdomTree International MidCap Dividend Fund | For the Year Ended March 31, 2024 | For the Year Ended March 31, 2023 | For the Year Ended March 31, 2022 | For the Year Ended March 31, 2021 | For the Year Ended March 31, 2020 | |||||||||||||||
Net asset value, beginning of year | $ | 58.26 | $ | 64.69 | $ | 67.16 | $ | 47.06 | $ | 61.98 | ||||||||||
Investment operations: |
| |||||||||||||||||||
Net investment income1 | 2.04 | 2.31 | 2.54 | 1.51 | 2.03 | |||||||||||||||
Net realized and unrealized gain (loss) | 5.15 | (6.20 | ) | (2.53 | ) | 20.12 | (14.87 | ) | ||||||||||||
Total from investment operations | 7.19 | (3.89 | ) | 0.01 | 21.63 | (12.84 | ) | |||||||||||||
Dividends to shareholders: |
| |||||||||||||||||||
Net investment income | (2.48 | ) | (2.54 | ) | (2.48 | ) | (1.53 | ) | (2.08 | ) | ||||||||||
Net asset value, end of year | $ | 62.97 | $ | 58.26 | $ | 64.69 | $ | 67.16 | $ | 47.06 | ||||||||||
TOTAL RETURN2 | 12.80 | % | (5.68 | )% | (0.13 | )% | 46.54 | % | (21.43 | )% | ||||||||||
RATIOS/SUPPLEMENTAL DATA: |
| |||||||||||||||||||
Net assets, end of year (000’s omitted) | $ | 135,388 | $ | 128,175 | $ | 135,853 | $ | 144,404 | $ | 169,413 | ||||||||||
Ratios to average net assets of: |
| |||||||||||||||||||
Expenses | 0.59 | %3 | 0.59 | %3 | 0.59 | %3 | 0.58 | % | 0.58 | % | ||||||||||
Net investment income | 3.48 | % | 4.10 | % | 3.75 | % | 2.63 | % | 3.30 | % | ||||||||||
Portfolio turnover rate4 | 36 | % | 39 | % | 44 | % | 62 | % | 33 | % | ||||||||||
| WisdomTree International Multifactor Fund | For the Year Ended March 31, 2024 | For the Year Ended March 31, 2023 | For the Year Ended March 31, 2022 | For the Year Ended March 31, 2021 | For the Year Ended March 31, 2020 | |||||||||||||||
Net asset value, beginning of year | $ | 25.00 | $ | 25.30 | $ | 25.43 | $ | 20.88 | $ | 24.72 | ||||||||||
Investment operations: |
| |||||||||||||||||||
Net investment income1 | 0.86 | 0.95 | 0.79 | 0.59 | 0.75 | |||||||||||||||
Net realized and unrealized gain (loss) | 1.59 | (0.33 | ) | 0.00 | 5 | 4.53 | (3.88 | ) | ||||||||||||
Total from investment operations | 2.45 | 0.62 | 0.79 | 5.12 | (3.13 | ) | ||||||||||||||
Dividends to shareholders: |
| |||||||||||||||||||
Net investment income | (0.92 | ) | (0.92 | ) | (0.92 | ) | (0.57 | ) | (0.71 | ) | ||||||||||
Net asset value, end of year | $ | 26.53 | $ | 25.00 | $ | 25.30 | $ | 25.43 | $ | 20.88 | ||||||||||
TOTAL RETURN2 | 10.07 | % | 2.76 | % | 3.03 | % | 24.70 | % | (13.08 | )% | ||||||||||
RATIOS/SUPPLEMENTAL DATA: |
| |||||||||||||||||||
Net assets, end of year (000’s omitted) | $ | 42,441 | $ | 39,996 | $ | 32,886 | $ | 38,138 | $ | 33,408 | ||||||||||
Ratios to average net assets of: |
| |||||||||||||||||||
Expenses | 0.38 | %6 | 0.39 | %7 | 0.39 | %7 | 0.38 | % | 0.38 | %8,9 | ||||||||||
Net investment income | 3.41 | % | 3.98 | % | 3.01 | % | 2.47 | % | 3.04 | % | ||||||||||
Portfolio turnover rate4 | 121 | % | 118 | % | 105 | % | 123 | % | 132 | % | ||||||||||
| 1 | Based on average shares outstanding. |
| 2 | Total return is calculated assuming an initial investment made at the net asset value at the beginning of the period, reinvestment of all dividends and distributions at net asset value during the period and redemption on the last day of the period. For the periods in which the investment advisor waived advisory fees for the WisdomTree International Multifactor Fund, the total return would have been lower if certain expenses had not been waived (Notes 2 and 3). |
| 3 | Included in the expense ratio are “Other fees” described in Note 6. Without these expenses, the expense ratio would have been 0.58%. |
| 4 | Portfolio turnover rate excludes the value of the portfolio securities received or delivered as a result of in-kind creations or redemptions of the Fund’s capital shares. Short-term securities with maturities less than or equal to 365 days are excluded from the portfolio turnover calculation. |
| 5 | Amount represents less than $0.005. |
| 6 | Included in the expense ratio are “Other fees” described in Note 6. Without these expenses, the expense ratio would have been unchanged. |
| 7 | Included in the expense ratio are “Other fees” described in Note 6. Without these expenses, the expense ratio would have been 0.38%. |
| 8 | The expense ratio includes investment advisory fee waivers. Without these investment advisory fee waivers, the expense ratio would have been unchanged. |
| 9 | Does not include expenses of the Underlying Funds in which the Fund invests. |
See Notes to Financial Statements.
| 98 | WisdomTree Trust |
Financial Highlights (continued)
WisdomTree Trust
Selected data for a share of beneficial interest outstanding throughout the period is presented below:
| WisdomTree International Quality Dividend Growth Fund | For the Year Ended March 31, 2024 | For the Year Ended March 31, 2023 | For the Year Ended March 31, 2022 | For the Year Ended March 31, 2021 | For the Year Ended March 31, 2020 | |||||||||||||||
Net asset value, beginning of year | $ | 33.72 | $ | 36.82 | $ | 36.95 | $ | 25.87 | $ | 28.62 | ||||||||||
Investment operations: |
| |||||||||||||||||||
Net investment income1 | 0.67 | 1.06 | 1.22 | 0.91 | 0.70 | |||||||||||||||
Net realized and unrealized gain (loss) | 4.27 | (3.03 | ) | (0.27 | ) | 10.98 | (2.77 | ) | ||||||||||||
Total from investment operations | 4.94 | (1.97 | ) | 0.95 | 11.89 | (2.07 | ) | |||||||||||||
Dividends to shareholders: |
| |||||||||||||||||||
Net investment income | (0.67 | ) | (1.13 | ) | (1.08 | ) | (0.81 | ) | (0.68 | ) | ||||||||||
Net asset value, end of year | $ | 37.99 | $ | 33.72 | $ | 36.82 | $ | 36.95 | $ | 25.87 | ||||||||||
TOTAL RETURN2 | 14.81 | % | (4.85 | )% | 2.46 | % | 46.22 | % | (7.43 | )% | ||||||||||
RATIOS/SUPPLEMENTAL DATA: |
| |||||||||||||||||||
Net assets, end of year (000’s omitted) | $ | 978,181 | $ | 665,916 | $ | 373,740 | $ | 190,307 | $ | 68,551 | ||||||||||
Ratios to average net assets of: |
| |||||||||||||||||||
Expenses, net of expense waivers | 0.43 | %3 | 0.43 | %3 | 0.42 | % | 0.41 | %4 | 0.38 | %5 | ||||||||||
Expenses, prior to expense waivers | 0.43 | %3 | 0.43 | %3 | 0.42 | % | 0.44 | % | 0.48 | % | ||||||||||
Net investment income | 1.94 | % | 3.38 | % | 3.16 | % | 2.73 | % | 2.38 | % | ||||||||||
Portfolio turnover rate6 | 49 | % | 48 | % | 63 | % | 66 | % | 51 | % | ||||||||||
| WisdomTree International SmallCap Dividend Fund | For the Year Ended March 31, 2024 | For the Year Ended March 31, 2023 | For the Year Ended March 31, 2022 | For the Year Ended March 31, 2021 | For the Year Ended March 31, 2020 | |||||||||||||||
Net asset value, beginning of year | $ | 60.75 | $ | 69.29 | $ | 72.16 | $ | 48.29 | $ | 65.74 | ||||||||||
Investment operations: |
| |||||||||||||||||||
Net investment income1 | 2.48 | 2.91 | 2.27 | 1.55 | 2.36 | |||||||||||||||
Net realized and unrealized gain (loss) | 4.77 | (8.19 | ) | (2.72 | ) | 23.97 | (17.32 | ) | ||||||||||||
Total from investment operations | 7.25 | (5.28 | ) | (0.45 | ) | 25.52 | (14.96 | ) | ||||||||||||
Dividends to shareholders: |
| |||||||||||||||||||
Net investment income | (2.57 | ) | (3.26 | ) | (2.42 | ) | (1.65 | ) | (2.49 | ) | ||||||||||
Net asset value, end of year | $ | 65.43 | $ | 60.75 | $ | 69.29 | $ | 72.16 | $ | 48.29 | ||||||||||
TOTAL RETURN2 | 12.36 | % | (7.23 | )% | (0.79 | )% | 53.46 | % | (23.58 | )% | ||||||||||
RATIOS/SUPPLEMENTAL DATA: |
| |||||||||||||||||||
Net assets, end of year (000’s omitted) | $ | 1,099,262 | $ | 1,193,793 | $ | 1,330,363 | $ | 1,403,518 | $ | 1,161,439 | ||||||||||
Ratios to average net assets of: |
| |||||||||||||||||||
Expenses7,8 | 0.59 | %9 | 0.60 | %9 | 0.61 | %9 | 0.58 | % | 0.58 | % | ||||||||||
Net investment income | 4.08 | % | 4.87 | % | 3.08 | % | 2.54 | % | 3.63 | % | ||||||||||
Portfolio turnover rate6 | 36 | % | 51 | % | 55 | % | 74 | % | 50 | % | ||||||||||
| 1 | Based on average shares outstanding. |
| 2 | Total return is calculated assuming an initial investment made at the net asset value at the beginning of the period, reinvestment of all dividends and distributions at net asset value during the period and redemption on the last day of the period. For the periods in which the investment advisor waived advisory fees, the total return would have been lower if certain expenses had not been waived (Notes 2 and 3). |
| 3 | Included in the expense ratio are “Other fees” described in Note 6. Without these expenses, the expense ratio would have been 0.42%. |
| 4 | The investment advisor had contractually agreed to limit the advisory fee to 0.38% through July 31, 2020. On July 31, 2020, the contractual waiver expired and the advisory fee was permanently reduced to 0.42%. |
| 5 | Effective April 7, 2016, the investment advisor contractually agreed to limit the advisory fee to 0.38% through July 31, 2020, unless earlier terminated by the Board of Trustees of the Trust. |
| 6 | Portfolio turnover rate excludes the value of the portfolio securities received or delivered as a result of in-kind creations or redemptions of the Fund’s capital shares. Short-term securities with maturities less than or equal to 365 days are excluded from the portfolio turnover calculation. |
| 7 | The expense ratio includes investment advisory fee waivers. Without these investment advisory fee waivers, the expense ratio would have been unchanged. |
| 8 | Does not include expenses of the Underlying Funds in which the Fund invests. |
| 9 | Included in the expense ratio are “Other fees” described in Note 6. Without these expenses, the expense ratio would have been 0.58%. |
See Notes to Financial Statements.
| WisdomTree Trust | 99 |
Financial Highlights (concluded)
WisdomTree Trust
Selected data for a share of beneficial interest outstanding throughout the period is presented below:
| WisdomTree Japan SmallCap Dividend Fund | For the Year Ended March 31, 2024 | For the Year Ended March 31, 2023 | For the Year Ended March 31, 2022 | For the Year Ended March 31, 2021 | For the Year Ended March 31, 2020 | |||||||||||||||
Net asset value, beginning of year | $ | 66.36 | $ | 66.61 | $ | 76.06 | $ | 58.64 | $ | 68.10 | ||||||||||
Investment operations: |
| |||||||||||||||||||
Net investment income1 | 1.66 | 1.58 | 1.71 | 1.17 | 1.14 | |||||||||||||||
Net realized and unrealized gain (loss) | 11.76 | 0.61 | 2 | (9.68 | ) | 18.13 | (8.95 | ) | ||||||||||||
Total from investment operations | 13.42 | 2.19 | (7.97 | ) | 19.30 | (7.81 | ) | |||||||||||||
Dividends to shareholders: |
| |||||||||||||||||||
Net investment income | (1.65 | ) | (2.44 | ) | (1.48 | ) | (1.88 | ) | (1.65 | ) | ||||||||||
Net asset value, end of year | $ | 78.13 | $ | 66.36 | $ | 66.61 | $ | 76.06 | $ | 58.64 | ||||||||||
TOTAL RETURN3 | 20.44 | % | 3.62 | % | (10.62 | )% | 33.27 | % | (11.85 | )% | ||||||||||
RATIOS/SUPPLEMENTAL DATA: |
| |||||||||||||||||||
Net assets, end of year (000’s omitted) | $ | 250,020 | $ | 182,497 | $ | 213,148 | $ | 190,141 | $ | 237,503 | ||||||||||
Ratios to average net assets of: |
| |||||||||||||||||||
Expenses4,5 | 0.58 | % | 0.58 | % | 0.58 | % | 0.58 | % | 0.58 | % | ||||||||||
Net investment income | 2.35 | % | 2.56 | % | 2.34 | % | 1.73 | % | 1.67 | % | ||||||||||
Portfolio turnover rate6 | 28 | % | 26 | % | 36 | % | 43 | % | 38 | % | ||||||||||
| 1 | Based on average shares outstanding. |
| 2 | The amount of net realized and unrealized gain per share does not correspond with the amounts reported within the Statements of Changes due to the timing of capital share transactions of Fund shares and fluctuating market values during the fiscal year. |
| 3 | Total return is calculated assuming an initial investment made at the net asset value at the beginning of the period, reinvestment of all dividends and distributions at net asset value during the period and redemption on the last day of the period. For the periods in which the investment advisor waived advisory fees, the total return would have been lower if certain expenses had not been waived (Notes 2 and 3). |
| 4 | Does not include expenses of the Underlying Funds in which the Fund invests. |
| 5 | The expense ratio includes investment advisory fee waivers. Without these investment advisory fee waivers, the expense ratio would have been unchanged. |
| 6 | Portfolio turnover rate excludes the value of the portfolio securities received or delivered as a result of in-kind creations or redemptions of the Fund’s capital shares. Short-term securities with maturities less than or equal to 365 days are excluded from the portfolio turnover calculation. |
See Notes to Financial Statements.
| 100 | WisdomTree Trust |
1. ORGANIZATION
WisdomTree Trust (the “Trust”) is registered under the Investment Company Act of 1940, as amended (the “1940 Act”), as an open-end management investment company. The Trust was established as a Delaware statutory trust on December 15, 2005 and is authorized to have multiple series of portfolios (each a “Fund”, collectively, the “Funds”). These notes relate only to the Funds listed below. In accordance with Accounting Standards Codification Topic 946, Financial Services-Investment Companies, each Fund listed below qualifies as an investment company and is applying the accounting and reporting guidance for investment companies.
| Fund | Commencement of Operations | |||
WisdomTree Europe Quality Dividend Growth Fund (“Europe Quality Dividend Growth Fund”) | May 7, 2014 | |||
WisdomTree Europe SmallCap Dividend Fund (“Europe SmallCap Dividend Fund”) | June 16, 2006 | |||
WisdomTree International AI Enhanced Value Fund (“International AI Enhanced Value Fund”) | June 16, 2006 | |||
WisdomTree International Equity Fund (“International Equity Fund”) | June 16, 2006 | |||
WisdomTree International High Dividend Fund (“International High Dividend Fund”) | June 16, 2006 | |||
WisdomTree International LargeCap Dividend Fund (“International LargeCap Dividend Fund”) | June 16, 2006 | |||
WisdomTree International MidCap Dividend Fund (“International MidCap Dividend Fund”) | June 16, 2006 | |||
WisdomTree International Multifactor Fund (“International Multifactor Fund”) | August 10, 2018 | |||
WisdomTree International Quality Dividend Growth Fund (“International Quality Dividend Growth Fund”) | April 7, 2016 | |||
WisdomTree International SmallCap Dividend Fund (“International SmallCap Dividend Fund”) | June 16, 2006 | |||
WisdomTree Japan SmallCap Dividend Fund (“Japan SmallCap Dividend Fund”) | June 16, 2006 | |||
Each Fund, except for the International AI Enhanced Value Fund and International Multifactor Fund, seeks to track the price and yield performance, before fees and expenses, of a particular index (“Index”) developed by WisdomTree, Inc. (“WisdomTree”) or an Index developed by a third party. The International AI Enhanced Value Fund is actively managed using a model-based approach seeking income and capital appreciation. The International Multifactor Fund is actively managed using a model-based approach seeking capital appreciation. WisdomTree is the parent company of WisdomTree Asset Management, Inc. (“WTAM”), the investment adviser to each Fund and the Trust. “WisdomTree” is a registered trademark of WisdomTree and has been licensed for use by the Trust. Each Fund described herein is considered to be non-diversified as defined under the 1940 Act.
In the normal course of business, the Funds may enter into contracts that contain a variety of representations or that provide indemnification for certain liabilities. The Funds’ maximum exposure under these arrangements is unknown, as this would involve future claims that may be made against the Funds that have not yet occurred. However, the Funds have not had prior claims or losses pursuant to these contracts and believe such exposure to be remote.
2. SIGNIFICANT ACCOUNTING POLICIES
The Financial Accounting Standards Board (“FASB”) Accounting Standards Codification (the “Codification”) is the exclusive reference of authoritative U.S. generally accepted accounting principles (“GAAP”) recognized by the FASB to be applied by nongovernmental entities. Rules and interpretive releases of the Securities and Exchange Commission (“SEC”) under authority of federal laws are also sources of authoritative GAAP for SEC registrants.
The following is a summary of significant accounting policies followed by the Funds:
Use of Estimates — The preparation of financial statements in conformity with GAAP requires management to make certain estimates and assumptions that affect the reported amounts of assets and liabilities and disclosure of contingent assets and liabilities at the date of the financial statements and the reported amounts of increases and decreases in the net assets from operations during the reporting period. Actual results could differ from those estimates.
Investment Valuation — The net asset value (“NAV”) of each Fund’s shares is calculated each day a Fund is open for business as of the regularly scheduled close of regular trading on the New York Stock Exchange, normally 4:00 p.m. Eastern time (the “NAV Calculation Time”). NAV per share is calculated by dividing a Fund’s net assets by the number of Fund shares outstanding. Each Fund issues and redeems shares at NAV only in large blocks of shares known as creation units, which only certain institutions (e.g., broker-dealers) may purchase or redeem. Shares of each Fund are listed on a national securities exchange and trade at market prices. Most investors will buy and sell shares in the secondary market through brokers. Because Fund shares trade at market prices rather than NAV, shares may trade at a price greater than NAV or less than NAV. In calculating each Fund’s NAV, investments are valued under policies approved by the Board of Trustees of the Trust (the “Board” or “Board of Trustees”). Equity securities (including preferred stock) traded on any recognized U.S. or non-U.S. exchange are valued at the last sale price or official closing price on the exchange on which they are principally traded. Unlisted equity securities (including preferred stock) are valued at the last sale price or, if no sale price is available, at the mean between the highest bid and lowest ask price. Each Fund may invest in
| WisdomTree Trust | 101 |
Notes to Financial Statements (continued)
money market funds which are valued at their NAV per share and exchange-traded funds (“ETFs” or “ETF”) or exchange-traded notes (“ETNs” or “ETN”) which are valued at their last sale or official closing price on the exchange on which they are principally traded or at their NAV per share in instances where the ETF or ETN has not traded on its principal exchange. Foreign currency contracts that settle within two business days after the trade date (“Spot Contracts”) and foreign currency contracts having a settlement period greater than two business days after the trade date (“Forward Contracts”) are valued on the measurement date using an interpolated foreign exchange rate between the closest preceding and subsequent settlement period, as calculated using the 4:00 p.m. London time closing spot and forward rates provided by an independent pricing service provider.
Pursuant to Board-approved valuation procedures established by the Trust and WTAM, the Board has appointed WTAM as the Funds’ valuation designee (the “Valuation Designee”) to perform all fair valuations of the Funds’ portfolio investments, subject to the Board’s oversight. As the Valuation Designee, WTAM has established procedures for its fair valuation of a Fund’s portfolio investments. These procedures address, among other things, determining when market quotations are not readily available or reliable and the methodologies to be used for determining the fair value of investments, as well as the use and oversight of third-party pricing services for fair valuation. The Valuation Designee is comprised of senior representatives of WTAM and reports to the Board of Trustees on a quarterly basis. In the event that a financial instrument cannot be valued based upon a price from the exchange or system on which it is principally traded, independent pricing service provider or broker-dealer quotation, or such prices are deemed to not reflect current market value, the Valuation Designee may value the financial instrument in good faith under the policies and procedures approved by the Board of Trustees based on current facts and circumstances. Securities that may be valued using “fair value” pricing may include, but are not limited to, securities for which there are no current market quotations, securities whose issuer is in default or bankruptcy, securities subject to corporate actions (such as mergers or reorganizations), securities subject to non-U.S. investment limits or currency controls, and securities affected by “significant events”. An example of a significant event is an event occurring after the close of the market in which a security trades but before a Fund’s next NAV Calculation Time that may materially affect the value of a Fund’s investment (e.g., government action, natural disaster, or significant market fluctuation). When fair value pricing is employed, the prices of securities used by a Fund to calculate its NAV may differ from quoted or published prices for the same securities.
Fair Value Measurement — In accordance with Codification Topic 820 (“ASC 820”), Fair Value Measurements and Disclosures, fair value is defined as the price that would be received to sell an asset or paid to transfer a liability in an orderly transaction between market participants at the measurement date. The Valuation Designee will perform other procedures (consistent with GAAP) to value an investment when a market quote is not available. ASC 820 established a three-tier hierarchy of inputs to be used when determining fair value measurements for disclosure purposes. Inputs refer broadly to the assumptions that market participants would use in pricing the asset or liability, including assumptions about risk — for example, the risk inherent in a particular valuation technique used to measure fair value (such as a pricing model) and/or the risk inherent in the inputs to the valuation technique. Inputs may be observable or unobservable. Observable inputs reflect the assumptions market participants would use in pricing the asset or liability. Observable inputs are based on market data obtained from sources independent of the reporting entity. Unobservable inputs reflect the reporting entity’s own assumptions about the assumptions market participants would use in pricing the asset or liability. Unobservable inputs are based on the best information available in the circumstances. The three-tier hierarchy of inputs is summarized in the three broad levels listed below:
Level 1 – quoted prices in active markets for identical securities
Level 2 – other significant observable inputs (including quoted prices for similar securities, interest rates, prepayment speeds, credit risk, etc.)
Level 3 – significant unobservable inputs (including each Fund’s assumptions in determining the fair value of investments)
The inputs or methodology used for valuation are not necessarily an indication of the risk associated with investing in those investments.
Investments that use Level 2 or Level 3 inputs may include, but are not limited to: (i) an unlisted security related to corporate actions; (ii) a restricted security (e.g., one that may not be publicly sold without registration under the Securities Act of 1933, as amended); (iii) a security whose trading has been suspended (either due to events affecting the issuer of the security specifically or events affecting the primary trading exchange more broadly) or which has been de-listed from its primary trading exchange; (iv) a security that is thinly traded; (v) a security in default or bankruptcy proceedings for which there is no current market quotation or market activity; (vi) a security affected by currency controls or restrictions; and (vii) a security affected by a significant event (e.g., an event that occurs after the close of the markets in which the security is traded but before the time as of which a Fund’s NAV is computed and that may materially affect the value of the Fund’s investments).
| 102 | WisdomTree Trust |
Notes to Financial Statements (continued)
The valuation techniques and significant inputs used in determining the fair market value measurements for Level 2 and Level 3 positions are as follows:
Financial instruments are generally valued by independent pricing service providers that use broker-dealer quotations, reported trades or valuation estimates from their internal pricing models. Depending on the type of financial instrument, the independent pricing service providers’ internal pricing models may use inputs that are observable such as issuer details (e.g., credit rating, debt ranking, coupon date, maturity date, etc.), interest rates, yield curves, prepayment speeds, credit risks/spreads, default rates and quoted prices for similar assets. Financial instruments that use similar valuation techniques and observable inputs as described above and have an appropriate level of market activity are categorized as Level 2 of the fair value hierarchy, otherwise a Level 3 fair value classification is appropriate. Over-the-counter financial derivative instruments derive their value from underlying asset prices, indices, reference rates, and other inputs or a combination of these factors. These instruments are normally valued on the basis of broker-dealer quotations or prices obtained from independent pricing service providers. Depending on the product and the terms of the transaction, the value of the financial derivative instruments can be estimated by an independent pricing service provider using a series of techniques including simulation pricing models. The pricing models may use inputs that are observed from actively quoted markets such as issuer details, indices, credit risks/spreads, interest rates, yield curves, default and exchange rates. Derivative contracts that use similar valuation techniques and observable inputs as described above and have an appropriate level of market activity are categorized as Level 2 of the fair value hierarchy, otherwise a Level 3 fair value classification is appropriate.
Determination of a fair value by the Valuation Designee may include significant unobservable inputs and therefore such financial instruments would be reflected as a Level 3 of the fair value hierarchy. The Valuation Designee may employ a market-based valuation approach which may use, among other potential considerations, related or comparable securities, recent transactions, market multiples, and other relevant information to determine fair value. The Valuation Designee may also use an income-based valuation approach in which anticipated future cash flows of the financial instrument are discounted to calculate fair value.
The summary of fair valuations according to the inputs used in valuing each Fund’s assets as of the measurement date is included in a “Fair Valuation Summary” supplementary table in each applicable Fund’s Schedule of Investments.
During the fiscal year ended March 31, 2024, there were no significant transfers into or out of Level 3 of the fair value hierarchy.
Derivatives and Hedging Disclosure — Codification Topic 815 (“ASC 815”), Derivatives and Hedging, requires qualitative disclosures about objectives and strategies for using derivatives, quantitative disclosures about fair value amounts as well as gains and losses on derivative instruments, and disclosures about credit-risk-related contingent features in derivative agreements. The Funds have invested in derivatives, specifically foreign currency contracts during the fiscal year ended March 31, 2024 and open positions in such derivatives as of March 31, 2024 are detailed in each Fund’s Schedule of Investments. All of the derivative instruments disclosed and described herein are subject to risk. The Funds’ derivative agreements may also contain credit-risk related contingent features which may include, but are not limited to, a threshold in the Funds’ derivative agreements on unrealized depreciation (i.e., the Funds’ obligation to the counterparty) above a specified dollar amount. If an event occurred at March 31, 2024 that triggered a contingent feature, the counterparty to the agreement may require a Fund to post collateral (or additional collateral) or terminate the derivative positions and demand payment. Any collateral posted with respect to the derivative positions would be used to offset or reduce the payment due to a counterparty. The maximum exposure to derivatives agreements with credit-risk related contingent features would be the total value of derivatives in net liability positions for each Fund, as disclosed in Note 2—Master Netting Arrangements under the column entitled “Liabilities: Net Amount”. Information with respect to the amounts and types of collateral received and/or posted for derivative instruments as of March 31, 2024, if any, is reflected as a footnote within each Fund’s Schedule of Investments. At March 31, 2024, the Funds did not receive or post collateral with any counterparty for derivatives and no event occurred that triggered a credit-risk-related contingent feature.
As of March 31, 2024, the effects of such derivative instruments on each Fund’s financial position as reflected in the Statements of Assets and Liabilities are presented in the summary below:
| Asset Derivatives | Liability Derivatives | |||||||||||
| Fund | Balance Sheet Location | Value | Balance Sheet Location | Value | ||||||||
Europe Quality Dividend Growth Fund | ||||||||||||
Foreign currency risk | Unrealized appreciation on foreign currency contracts | $ | — | Unrealized depreciation on foreign currency contracts | $ | 6 | ||||||
International High Dividend Fund | ||||||||||||
Foreign currency risk | Unrealized appreciation on foreign currency contracts | — | Unrealized depreciation on foreign currency contracts | 179 | ||||||||
International MidCap Dividend Fund | ||||||||||||
Foreign currency risk | Unrealized appreciation on foreign currency contracts | — | Unrealized depreciation on foreign currency contracts | 41 | ||||||||
International Multifactor Fund | ||||||||||||
Foreign currency risk | Unrealized appreciation on foreign currency contracts | 465,624 | Unrealized depreciation on foreign currency contracts | 132,418 | ||||||||
| WisdomTree Trust | 103 |
Notes to Financial Statements (continued)
For the fiscal year ended March 31, 2024, the effects of derivative instruments on each applicable Fund’s financial performance as reflected in the Statements of Operations are presented in the summary below:
| Fund | Amount of Realized Gain or (Loss) on Derivatives Recognized1 | Change in Unrealized Appreciation or (Depreciation) on Derivatives Recognized2 | ||||||
Europe Quality Dividend Growth Fund | ||||||||
Foreign currency risk | $ | (11,174 | ) | $ | (6) | |||
Europe SmallCap Dividend Fund | ||||||||
Foreign currency risk | (8,703 | ) | 573 | |||||
International AI Enhanced Value Fund | ||||||||
Foreign currency risk | 21,260 | (113 | ) | |||||
International Equity Fund | ||||||||
Foreign currency risk | 78,005 | — | ||||||
International High Dividend Fund | ||||||||
Foreign currency risk | 121,731 | (13 | ) | |||||
International LargeCap Dividend Fund | ||||||||
Foreign currency risk | 149,061 | — | ||||||
International MidCap Dividend Fund | ||||||||
Foreign currency risk | (28,675 | ) | 61 | |||||
International Multifactor Fund | ||||||||
Equity risk | 11,502 | — | ||||||
Foreign currency risk | (327,128 | ) | 576,993 | |||||
International Quality Dividend Growth Fund | ||||||||
Foreign currency risk | (233,177 | ) | — | |||||
International SmallCap Dividend Fund | ||||||||
Foreign currency risk | (93,295 | ) | 9 | |||||
Japan SmallCap Dividend Fund | ||||||||
Foreign currency risk | (7,822 | ) | — | |||||
| 1 | Realized gains (losses) on derivatives are located on the Statements of Operations as follows: |
Equity risk | Net realized gain (loss) from futures contracts | |
Foreign currency risk | Net realized gain (loss) from foreign currency contracts |
| 2 | Change in unrealized appreciation (depreciation) is located on the Statements of Operations as follows: |
Foreign currency risk | Net increase (decrease) in unrealized appreciation/depreciation from foreign currency contracts |
During the fiscal year ended March 31, 2024, the volume of derivative activity (based on the average of month-end notional balances, except where footnoted) for each Fund was as follows:
| Average Notional | ||||||||||||
| Fund | Foreign currency contracts (to deliver USD) | Foreign currency contracts (to receive USD) | Futures contracts (long) | |||||||||
Europe Quality Dividend Growth Fund | ||||||||||||
Foreign currency risk | $ | 3,449 | $ | 13,395 | $ | — | ||||||
Europe SmallCap Dividend Fund | ||||||||||||
Foreign currency risk | 42,757 | 14,304 | — | |||||||||
International AI Enhanced Value Fund | ||||||||||||
Foreign currency risk | — | 10,118 | — | |||||||||
International Equity Fund | ||||||||||||
Foreign currency risk | 20,979 | 87,401 | — | |||||||||
International High Dividend Fund | ||||||||||||
Foreign currency risk | 211,817 | 125,968 | — | |||||||||
International LargeCap Dividend Fund | ||||||||||||
Foreign currency risk | 36,836 | 12,770 | — | |||||||||
International MidCap Dividend Fund | ||||||||||||
Foreign currency risk | 19,547 | 32,653 | — | |||||||||
| 104 | WisdomTree Trust |
Notes to Financial Statements (continued)
| Average Notional | ||||||||||||
| Fund | Foreign currency contracts (to deliver USD) | Foreign currency contracts (to receive USD) | Futures contracts (long) | |||||||||
International Multifactor Fund | ||||||||||||
Equity risk1 | $ | — | $ | — | $ | 51,280 | ||||||
Foreign currency risk | 21,350,725 | 42,628,365 | — | |||||||||
International Quality Dividend Growth Fund | ||||||||||||
Foreign currency risk | 26,257 | — | — | |||||||||
International SmallCap Dividend Fund | ||||||||||||
Foreign currency risk | 72,222 | 223,720 | — | |||||||||
Japan SmallCap Dividend Fund | ||||||||||||
Foreign currency risk | — | 32,855 | — | |||||||||
| 1 | The volume of derivatives for the period is based on intra-month balances. |
Investment Transactions and Investment Income — Investment transactions are recorded as of the date that the securities are purchased or sold (trade date). Realized gains and losses on sales of portfolio securities are calculated using the identified-cost method. Dividend income (less foreign taxes withheld, if any) is recognized on the ex-dividend date or as soon as practicable (with respect to foreign dividends) after the existence of a dividend declaration has been determined. Non-cash dividend income is recognized on the ex-dividend date, or, with respect to foreign dividends, as soon as practicable after the existence of a dividend declaration has been determined, at the fair value of securities to be received. Upon notification from real estate investment trust (“REIT”) issuers or as estimated by management, all or a portion of the dividend income received from a REIT may be redesignated as a reduction of cost of the related investment and/or as a realized gain. On each measurement date, the Funds evaluate the collectability of receivable balances. Generally, the Funds will write-off dividend receivable balances that are canceled by the issuer as of the date that the dividend receivable cancellation notification was publicly made available or when it becomes probable that dividends will not be collected and the amount of uncollectable dividends can be reasonably estimated. Income earned from securities lending activities (i.e., securities lending income), net of fees payable to the securities borrower and/or securities lending agent, is accrued daily.
Foreign Taxes — The Funds may be subject to foreign taxes (a portion of which may be reclaimable or refundable) on foreign income or capital gains on investment transactions. All foreign taxes are recorded in accordance with the applicable foreign tax regulations and tax rates that exist in the foreign jurisdictions in which the Funds invest. These foreign taxes, if any, are accrued and applied to foreign income as the foreign income is earned and are reflected on the Statements of Operations as follows: foreign taxes withheld on dividends are presented as a reduction to investment income in “Less: Foreign withholding taxes on dividends”, foreign taxes on capital gains from investment transactions, if any, are included in “Net realized gain (loss) from investment transactions”, and deferred foreign taxes on net unrealized appreciation on investments, if any, are included in “Net increase (decrease) in unrealized appreciation/depreciation on investment transactions”. Foreign taxes payable or deferred as of March 31, 2024, if any, are disclosed in the Statements of Assets and Liabilities in “Payables: Foreign capital gains tax”.
In certain foreign jurisdictions, when the Funds incur subsequent capital losses on investment transactions that occurred during the tax year in the applicable foreign jurisdiction, the Funds may be entitled to a refund on any foreign taxes paid on previous capital gain investment transactions that occurred during the tax year of the applicable foreign jurisdiction. Foreign capital gain tax refunds on investment transactions are included in “Net realized gain (loss) from investment transactions” on the Statements of Operations and foreign capital gain tax refunds that remain unpaid as of March 31, 2024, if any, are disclosed in the Statements of Assets and Liabilities in “Receivables: Foreign capital gains tax refund”.
The Funds file foreign tax reclaims in certain foreign jurisdictions to recover a portion of amounts previously withheld on dividend income if the tax reclaim is “more likely than not” to be sustained assuming examination by tax authorities. This determination is based on, among other things, a jurisdiction’s legal obligation to pay reclaims as well as payment history and market convention. Foreign tax reclaims recorded relating to current fiscal year investment income are included in the Statements of Operations as a reduction to the balance shown for “Foreign withholding taxes on dividends” and foreign tax reclaims recorded, but not yet received as of March 31, 2024, if any, are shown on the Statements of Assets and Liabilities in “Receivables: Foreign tax reclaims”.
Foreign Currency Translation — The accounting records of the Funds are maintained in U.S. dollars. Foreign currencies, as well as investment securities and other assets and liabilities denominated in foreign currencies, are translated into U.S. dollars using exchange rates prevailing on the respective dates of such transactions that are deemed appropriate by WTAM. Realized and unrealized foreign exchange gains and losses on investments are included as a component of “net realized gain (loss) from investment transactions” and “net increase (decrease) in unrealized appreciation/depreciation from investment transactions”, respectively, on the Statements of Operations. Realized and unrealized foreign exchange gains or losses from foreign currency contracts are included in “net realized gain (loss) from foreign currency contracts” and “net increase (decrease) in unrealized appreciation/depreciation from foreign currency contracts”,
| WisdomTree Trust | 105 |
Notes to Financial Statements (continued)
respectively, on the Statements of Operations. Realized and unrealized foreign exchange gains or losses arising from sales of foreign currencies, currency gains or losses recognized between the trade and settlement dates on investment transactions, and the difference between the amounts of dividends and foreign withholding taxes recorded on the Funds’ books and the U.S. dollar equivalent of the amounts actually received or paid are included in “net realized gain (loss) from foreign currency related transactions” and/or “net increase (decrease) in unrealized appreciation/depreciation from translation of assets and liabilities denominated in foreign currencies” in the Statements of Operations. Certain foreign exchange gains and losses included in realized and unrealized gains or losses are included in, or are a reduction of, ordinary income in accordance with U.S. Federal income tax regulations.
Expenses — Under the investment advisory agreement for each Fund, except for Funds that commenced operations on or after March 26, 2013, WTAM has agreed to pay all expenses of the Trust, except for: (i) brokerage expenses and other expenses (such as stamp taxes) connected with the execution of portfolio transactions or in connection with creation and redemption transactions; (ii) legal fees or expenses in connection with any arbitration, litigation or pending or threatened arbitration or litigation, including any settlements in connection therewith; (iii) compensation and expenses of trustees who are not interested persons of the Funds (“Independent Trustees”); (iv) compensation and expenses of counsel to the Independent Trustees; (v) compensation and expenses of the Trust’s Chief Compliance Officer (“CCO”); (vi) extraordinary expenses; (vii) distribution fees and expenses paid by the Trust under any distribution plan adopted pursuant to Rule 12b-1 under the 1940 Act; and (viii) the advisory fee payable to WTAM.
Under the investment advisory agreement for Funds that commenced operations on or after March 26, 2013, WTAM has agreed to pay all expenses of the Trust, except for: (i) brokerage expenses and other fees, charges, taxes, levies or expenses (such as stamp taxes) incurred in connection with the execution of portfolio transactions or in connection with creation and redemption transactions (including without limitation any fees, charges, taxes, levies or expenses related to the purchase or sale of an amount of any currency, or the patriation or repatriation of any security or other asset, related to the execution of portfolio transactions or any creation or redemption transactions); (ii) legal fees or expenses in connection with any arbitration, litigation or pending or threatened arbitration or litigation, including any settlements in connection therewith; (iii) compensation and expenses of each Independent Trustee; (iv) compensation and expenses of counsel to the Independent Trustees; (v) compensation and expenses of the Trust’s CCO; (vi) extraordinary expenses (in each case as determined by a majority of the Independent Trustees); (vii) distribution fees and expenses paid by the Trust under any distribution plan adopted pursuant to Rule 12b-1 under the 1940 Act; (viii) interest and taxes of any kind or nature (including, but not limited to, income, excise, transfer and withholding taxes); (ix) fees and expenses related to the provision of securities lending services; and (x) the advisory fee payable to WTAM.
Acquired fund fees and expenses (“AFFEs”) (which are fees and expenses incurred indirectly by a Fund through its investments in certain underlying investment companies) are not operating expenses of the Funds and are not paid by WTAM.
Pursuant to a separate contractual arrangement, WTAM arranges for the provision of CCO services with respect to each Fund, and is liable and responsible for, and administers, payments to the CCO, the Independent Trustees and counsel to the Independent Trustees. WTAM receives a fee, as shown on the Statements of Operations under “Service fees”, of up to 0.0044% per annum of each Fund’s average daily net assets for providing such services and paying such expenses. WTAM provides CCO services to the Trust.
Foreign Currency Contracts — The Funds may enter into foreign currency contracts to facilitate local securities settlements or to protect against currency exposure. The Funds, other than the International Multifactor Fund, do not expect to engage in currency transactions for the purpose of hedging against currency exposures of the Fund’s assets that are denominated in one or more foreign currencies. The Funds may not enter into such contracts for speculative purposes. During the fiscal year ended March 31, 2024, the Funds, except for the International Multifactor Fund, utilized foreign currency contracts primarily to facilitate foreign security settlements. The International Multifactor Fund utilized foreign currency contracts primarily to offset applicable international currency exposure from certain positions in international equities. A foreign currency contract involves an obligation to purchase or sell a specific currency at a future date, which may be any fixed number of days from the date of the contract agreed upon by the parties, at a price set at the time of the contract. These contracts are principally traded in the inter-bank market conducted directly between currency traders (usually large, commercial banks) and their customers. A foreign currency contract generally does not require an initial margin deposit and no commissions are charged at any stage for trades.
Risks may arise upon entering into foreign currency contracts from the potential inability of counterparties to meet the terms of their contracts and from unanticipated movements in the value of foreign currencies relative to the U.S. dollar or each other.
Fluctuations in the value of open foreign currency contracts are recorded for book purposes as unrealized gains or losses on foreign currency contracts by the Funds and are included in “net increase (decrease) in unrealized appreciation/depreciation from foreign currency contracts” on the Statements of Operations. Realized gains and losses on foreign currency contracts include net gains or losses recognized by the Funds on contracts which have settled and are included in “net realized gain (loss) from foreign currency contracts” on the Statements of Operations.
Futures Contracts — The International Multifactor Fund utilized equity futures contracts on a temporary basis during the fiscal year to obtain market exposure consistent with its investment objective during the Fund’s periodic portfolio rebalance. When a Fund purchases a listed futures contract, it agrees to purchase a specified reference asset (e.g., commodity, currency, equity, digital asset or
| 106 | WisdomTree Trust |
Notes to Financial Statements (continued)
U.S. Treasury security, collectively herein, “Reference Asset”) at a specified future date. When a Fund sells a listed futures contract, it agrees to sell a specified Reference Asset at a future date. The price at which the purchase and sale will take place is fixed when the Fund enters into the contract. A Fund may also cash settle upon the expiration date of a futures contract in which no physical delivery (or receipt) of the specified Reference Asset comprising the futures contract is made. Instead, settlement in cash would occur upon the expiration of the contract, with the cash settlement being the difference between the contract price and the actual price of the specified Reference Asset at the expiration date. The exchange clearing corporation is the ultimate counterparty for all exchange-listed contracts, so credit risk is limited to the creditworthiness of the exchange clearing corporation.
Upon entering into a futures contract, a Fund is required to deliver to a broker an amount of cash and/or U.S. government securities equal to a certain percentage of the contract amount. This amount is known as the “initial margin”. Cash deposited as initial margin, if any, is shown as “Deposits at broker for futures contracts” in the Statements of Assets and Liabilities, and U.S. government securities deposited, if any, are designated in the Schedule of Investments. Subsequent payments, known as “variation margin”, generally are made or received by the Fund each day or at other agreed-upon time periods depending on the fluctuations in the value of the underlying futures contracts, except that in the case of certain futures contracts, variation margin payments may be made or received when the futures contract expires. Variation margin is recorded for financial statement purposes on a daily basis as an unrealized gain or loss on futures until the financial futures contract is closed, at which time the unrealized net gain or loss is reclassified to realized gain or loss on futures. Deposits at broker utilized for futures contract margin requirements generally are restricted from withdrawal. The Funds have adopted a derivatives risk management program pursuant to Rule 18f-4 under the 1940 Act to assess and manage the Funds’ derivatives risk. Rule 18f-4 limits the amount of derivatives a fund can enter into and replaces the asset segregation framework previously used by the Funds to comply with Section 18 of the 1940 Act.
As of March 31, 2024, there were no open futures contracts in the Funds.
Securities Lending — Each Fund may lend portfolio securities to certain creditworthy borrowers, including the Funds’ securities lending agent. It is the Funds’ policy that, at origination, all loans are secured by collateral of at least 102% of the value of U.S. securities loaned and 105% of the value of foreign securities loaned. Collateral in the form of cash and/or securities issued or guaranteed by the U.S. government or its agencies, equivalent to at least 100% of the market value of securities, is maintained at all times. The cash collateral can be invested in certain money market mutual funds which also have exposure to the fluctuations of the market. The values of the investments of cash collateral for securities on loan along with the obligations to return such collateral are included on the Statements of Assets and Liabilities. The total value of securities received as collateral for securities on loan is included in a footnote following each Schedule of Investments, but is not included within the Statements of Assets and Liabilities because the receiving Fund does not have the right to sell or repledge the securities received as collateral. As compensation for lending its securities, each Fund retains all or a portion of the interest received on investment of cash collateral or receives a fee from the borrower (net of any fee rebates paid to the borrower). The lending agent receives a portion of the income earned by the Funds in connection with the lending program. The net securities lending income earned by the Funds is disclosed on the Statements of Operations. The dividend income earned on the securities loaned is accounted for in the same manner as other dividend income. The borrower pays to the Funds an amount equal to any dividends or interest received on loaned securities. Dividends received while a security is out on loan are not considered Qualified Dividend Income (“QDI”) under the specific criteria issued by the Internal Revenue Service and are subject to taxation at the shareholder’s ordinary income tax rate instead of the lower long-term capital gains tax rate. Lending portfolio securities could result in a loss or delay in recovering each Fund’s securities if the borrower defaults. In the event of a borrower default with respect to the failure to return to each Fund some or all of the securities loaned, the securities lending agent shall indemnify each Fund against the failure of the borrower if the value of the collateral received is insufficient to cover the market value of the securities loaned.
Master Netting Arrangements — Codification Topic 210 (“ASC 210”), Balance Sheet, requires disclosures generally intended to (i) help investors and other financial statement users to better assess the effect or potential effect of offsetting arrangements on a company’s financial position, (ii) improve transparency in the reporting of how companies mitigate credit risk, and (iii) facilitate comparisons between those entities that prepare their financial statements on the basis of GAAP and those entities that prepare their financial statements on the basis of international financial reporting standards. ASC 210 requires entities to disclose (i) gross and net information about both instruments and transactions eligible for offset in the financial statements, and (ii) instruments and transactions subject to an agreement similar to a master netting agreement. ASC 210 is limited in scope to the following financial instruments, to the extent they are offset in the financial statements or subject to an enforceable master netting arrangement or similar agreement: (i) recognized derivative instruments accounted for under ASC 815 (Derivatives and Hedging); (ii) repurchase agreements and reverse repurchase agreements; and (iii) securities borrowing and securities lending transactions.
In order to better define its contractual rights and to secure rights that will help a Fund mitigate its counterparty risk, a Fund enters into an International Swaps and Derivatives Association, Inc. Master Agreement (“ISDA Master Agreement”) with its counterparties. An ISDA Master Agreement is a bilateral agreement between a Fund and a counterparty that governs over-the-counter (“OTC”) derivatives, such as foreign currency contracts, and typically contains, among other things, collateral posting terms, netting and rights of set-off provisions in the event of a default and/or termination event. Under an ISDA Master Agreement, a Fund may, under
| WisdomTree Trust | 107 |
Notes to Financial Statements (continued)
certain circumstances, offset with the counterparty certain derivative financial instruments’ payables and receivables to create a single net payment. The provisions of the ISDA Master Agreement typically permit a single net payment in the event of a default (close-out netting) or similar event, including the bankruptcy or insolvency of the counterparty.
Collateral requirements generally differ by type of derivative. Collateral terms are contract-specific for OTC derivatives (e.g., foreign currency contracts, options and certain swaps). To the extent amounts due to a Fund from its derivatives counterparties are not fully collateralized, contractually or otherwise, the Fund bears the risk of loss from a counterparty’s non-performance.
The Funds’ securities lending activities are governed by a Securities Lending Authorization Agreement (“Lending Agreement”) between the Funds and the lending agent. The Lending Agreement authorizes the lending agent to lend qualifying U.S. and foreign securities held by a Fund to approved borrowers (each a “Borrower”). To mitigate borrower risk, a Fund typically receives from a Borrower collateral in the form of U.S. dollar cash and/or securities issued or guaranteed by the U.S. government or its agencies in excess of the market value of the securities loaned. Under the provisions of the Lending Agreement, a Fund shall have, as to the collateral, all of the rights and remedies of a secured party under applicable law. A Fund is exposed to risk of loss if a Borrower defaults on its obligation to return borrowed securities and the value of the collateral a Fund received is insufficient to cover the market value of the securities loaned. Also, the lending agent is permitted to invest the cash collateral it receives from a Borrower into a money market fund which is subject to market fluctuation. Therefore, a Fund is exposed to risk of loss if the value of invested cash collateral is insufficient to satisfy the Fund’s obligation to return the full amount owed to such Borrower. However, in the event of a borrower default with respect to the failure to return to each Fund some or all of the securities loaned, the securities lending agent shall indemnify each Fund against the failure of the borrower if the value of the collateral received is insufficient to cover the market value of the securities loaned.
For financial reporting purposes, the Funds elect to not offset assets and liabilities subject to an ISDA Master Agreement or Lending Agreement, if any, in the Statements of Assets and Liabilities. Therefore, all qualifying transactions are presented on a gross basis in the Statements of Assets and Liabilities. As of March 31, 2024, the impact of netting of assets and liabilities and the offsetting of collateral pledged or received based on contractual netting/set-off provisions in the ISDA Master Agreement and the Lending Agreement are detailed in the following table:
| Assets | Liabilities | |||||||||||||||||||||||||||||||
Gross Amounts Assets and | Gross Amounts Not Offset in the Statements of Assets and Liabilities | Net Amount | Gross Amounts Assets and | Gross Amounts Not Offset in the Statements of Assets and Liabilities | Net Amount | |||||||||||||||||||||||||||
| Fund | Financial Instruments | Collateral Received | Financial Instruments | Collateral Posted | ||||||||||||||||||||||||||||
Europe Quality Dividend Growth Fund | ||||||||||||||||||||||||||||||||
Securities Lending | $ | 1,824,913 | $ | — | $ | (1,824,913 | )1 | $ | — | $ | — | $ | — | $ | — | $ | — | |||||||||||||||
Foreign Currency Contracts | — | — | — | — | 6 | — | — | 6 | ||||||||||||||||||||||||
Europe SmallCap Dividend Fund | ||||||||||||||||||||||||||||||||
Securities Lending | 20,380,112 | — | (20,380,112 | )1 | — | — | — | — | — | |||||||||||||||||||||||
International AI Enhanced Value Fund | ||||||||||||||||||||||||||||||||
Securities Lending | 6,139,415 | — | (6,139,415 | )1 | — | — | — | — | — | |||||||||||||||||||||||
International Equity Fund | ||||||||||||||||||||||||||||||||
Securities Lending | 58,538,673 | — | (58,538,673 | )1 | — | — | — | — | — | |||||||||||||||||||||||
International High Dividend Fund | ||||||||||||||||||||||||||||||||
Securities Lending | 37,547,501 | — | (37,547,501 | )1 | — | — | — | — | — | |||||||||||||||||||||||
Foreign Currency Contracts | — | — | — | — | 179 | — | — | 179 | ||||||||||||||||||||||||
International LargeCap Dividend Fund | ||||||||||||||||||||||||||||||||
Securities Lending | 41,407,871 | — | (41,407,871 | )1 | — | — | — | — | — | |||||||||||||||||||||||
International MidCap Dividend Fund | ||||||||||||||||||||||||||||||||
Securities Lending | 21,350,166 | — | (21,350,166 | )1 | — | — | — | — | — | |||||||||||||||||||||||
Foreign Currency Contracts | — | — | — | — | 41 | — | — | 41 | ||||||||||||||||||||||||
International Multifactor Fund | ||||||||||||||||||||||||||||||||
Securities Lending | 2,678,068 | — | (2,678,068 | )1 | — | — | — | — | — | |||||||||||||||||||||||
Foreign Currency Contracts | 465,624 | (81,831 | ) | — | 383,793 | 132,418 | (81,831 | ) | — | 50,587 | ||||||||||||||||||||||
International Quality Dividend Growth Fund | ||||||||||||||||||||||||||||||||
Securities Lending | 46,257,159 | — | (46,257,159 | )1 | — | — | — | — | — | |||||||||||||||||||||||
International SmallCap Dividend Fund | ||||||||||||||||||||||||||||||||
Securities Lending | 129,254,151 | — | (129,254,151 | )1 | — | — | — | — | — | |||||||||||||||||||||||
Japan SmallCap Dividend Fund | ||||||||||||||||||||||||||||||||
Securities Lending | 52,747,857 | — | (52,747,857 | )1 | — | — | — | — | — | |||||||||||||||||||||||
| 1 | The amount of collateral presented has been limited such that the net amount by counterparty cannot be less than zero. |
| 108 | WisdomTree Trust |
Notes to Financial Statements (continued)
Short-Term Investments — Each Fund may invest a portion of its assets in high-quality money market instruments on an ongoing basis to provide liquidity or for other reasons. The instruments include short-term obligations issued by the U.S. government, its agencies, non-U.S. government agencies, negotiable certificates of deposit (“CDs”), fixed time deposits and bankers’ acceptances of U.S. and foreign banks and similar institutions, commercial papers, repurchase agreements and money market funds. CDs are short-term negotiable obligations of commercial banks. Time deposits are non-negotiable deposits maintained in banking institutions for specified periods of time at stated interest rates. Banker’s acceptances are time drafts drawn on commercial banks by borrowers, usually in connection with international transactions.
Restricted Securities — Each Fund may invest in securities that are subject to legal or contractual restrictions on resale. These securities generally may be resold in transactions exempt from registration or to the public if the securities are registered. Disposal of these securities may involve time-consuming negotiations and expense, and prompt sale at an acceptable price may be difficult. Information regarding restricted securities, if any, is included at the end of each Fund’s Schedule of Investments.
Tax Information and Dividends and Distributions to Shareholders — It is each Fund’s policy to comply with all requirements of the Internal Revenue Code of 1986, as amended (the “Code”). A portion of the Code, known as subchapter M (“Subchapter M”), addresses the ways by which investment companies and investment trusts may pass income through to shareholders in order to avoid double taxation. Each Fund intends to qualify for and to elect treatment as a separate Regulated Investment Company (“RIC”) under Subchapter M of the Code so that it will not be subject to federal income tax on income and gains that are timely distributed to Fund shareholders. Accordingly, no provision for U.S. federal income taxes is required. In order to qualify for the special tax treatment accorded to RICs and their shareholders, each Fund must, among other things, distribute with respect to each taxable year an amount equal to or greater than the sum of 90% of its investment company taxable income and 90% of its net tax-exempt interest income. There can be no guarantee that a Fund will pay dividends. Taxable net realized gains from investment transactions, reduced by capital loss carryforwards, if any, are declared and distributed to shareholders at least annually. The capital loss carryforward amount, if any, is available to offset future net capital gains. The Funds may occasionally be required to make supplemental distributions at some other time during the year. The Trust reserves the right to declare special distributions if, in its reasonable discretion, such action is necessary or advisable to preserve the status of each Fund as a RIC or to avoid imposition of income or excise taxes on undistributed income. Dividends and distributions to shareholders are recorded on the ex-dividend date. The amount of dividends and distributions from net investment income and net realized capital gains is determined in accordance with the requirements of the Code and the U.S. Treasury regulations (i.e., tax basis) which may differ to amounts determined under GAAP (i.e., book basis). These book/tax differences are either considered temporary or permanent in nature. To the extent these differences are permanent in nature, such amounts are reclassified within the components of net assets based on their Federal tax basis treatment; temporary differences do not require reclassification. Dividends and distributions that exceed earnings and profit for tax purposes are reported for tax purposes as a return of capital.
3. ADVISORY FEES AND OTHER TRANSACTIONS WITH AFFILIATES
WTAM has overall responsibility for the general management and administration of the Trust. WTAM provides an investment program for each Fund. WTAM has arranged for Mellon Investments Corporation (“Mellon”) to provide sub-advisory services to the Funds, except for the International AI Enhanced Value Fund. Prior to January 7, 2022, sub-advisory services for the International AI Enhanced Value Fund were provided by Mellon and thereafter by Voya Investment Management Co., LLC (“Voya IM”). Mellon and Voya IM are compensated by WTAM at no additional cost to the Funds. WTAM also arranges for transfer agency, custody, fund accounting, fund administration, securities lending and all other non-distribution related services necessary for the Funds to operate, which are generally under separate agreements entered into between the Trust on behalf of the Funds and the applicable service provider. Under the investment advisory agreement for each Fund, WTAM agrees to pay all expenses of the Funds, except for certain expenses described in Note 2.
Pursuant to a separate contractual arrangement, as also described in Note 2, WTAM arranges for the provision of CCO services with respect to each Fund, and is liable and responsible for, and administers, payments to the CCO, the Independent Trustees and counsel to the Independent Trustees in exchange for a fee, accrued daily and paid monthly in arrears, of up to 0.0044% per annum of each Fund’s average daily net assets.
WTAM expects to receive annual advisory fees from each Fund, based on a percentage of the Fund’s average daily net assets, as shown in the following table:
| Fund | Advisory Fee Rate | |||
Europe Quality Dividend Growth Fund | 0.58 | % | ||
Europe SmallCap Dividend Fund | 0.58 | % | ||
International AI Enhanced Value Fund | 0.58 | % | ||
International Equity Fund | 0.48 | % | ||
| WisdomTree Trust | 109 |
Notes to Financial Statements (continued)
| Fund | Advisory Fee Rate | |||
International High Dividend Fund | 0.58 | % | ||
International LargeCap Dividend Fund | 0.48 | % | ||
International MidCap Dividend Fund | 0.58 | % | ||
International Multifactor Fund | 0.38 | % | ||
International Quality Dividend Growth Fund | 0.42 | % | ||
International SmallCap Dividend Fund | 0.58 | % | ||
Japan SmallCap Dividend Fund | 0.58 | % | ||
Affiliated holdings are investments in entities in which the Fund owns 5% or more of the outstanding voting securities or are investments in entities which are under common ownership or control. Transactions in shares of affiliated ETFs for the fiscal year ended March 31, 2024, as applicable, are included in an “Investment in Affiliates” supplementary table in each applicable Fund’s Schedule of Investments. For these transactions, WTAM voluntarily waives a portion of its advisory fees, that it would otherwise charge, for each Fund’s investment in affiliated funds. The waivers may be reduced to offset the incremental costs related to these investments (e.g., fund accounting, safekeeping, transaction fees, etc.) that are paid by WTAM out of its advisory fee. The dollar amount of advisory fees waived during the period for the Funds, if any, are included in the Statements of Operations in “Expense waivers”.
During the fiscal year ended March 31, 2024, certain Funds engaged in purchase and sale transactions with funds that have a common investment adviser, WTAM. These interfund purchase and sale transactions were effected in accordance with Rule 17a-7 under the 1940 Act. For the fiscal year ended March 31, 2024, the cost of purchases, proceeds from sales and the net realized gain or loss recognized upon the disposal of securities resulting from interfund transactions are shown in the following table:
| Fund | Purchases | Sales | Net Realized Gain/(Loss) | |||||||||
Europe Quality Dividend Growth Fund | $ | 4,434,014 | $ | 8,871,240 | $ | 452,187 | ||||||
Europe SmallCap Dividend Fund | 2,120,900 | 7,502,608 | 126,038 | |||||||||
International Equity Fund | 13,903,740 | 6,092,261 | 213,793 | |||||||||
International High Dividend Fund | 16,486,446 | 11,767,149 | 1,807,787 | |||||||||
International LargeCap Dividend Fund | 19,757,461 | 13,585,594 | (1,747,150 | ) | ||||||||
International MidCap Dividend Fund | 11,446,676 | 10,650,761 | 790,169 | |||||||||
International Quality Dividend Growth Fund | 42,896,723 | 28,793,057 | (6,393,865 | ) | ||||||||
International SmallCap Dividend Fund | 9,919,822 | 29,061,300 | 3,345,880 | |||||||||
Japan SmallCap Dividend Fund | 3,716,189 | 5,311,218 | 632,326 | |||||||||
WTAM and/or WisdomTree (collectively herein, “WT”) may from time to time own shares of a Fund. As of and for the fiscal year ended March 31, 2024, WT held shares of and received distributions from the following Funds, which were purchased through an unaffiliated broker in ordinary brokerage transactions in the secondary market in which the Funds’ shares trade:
| At March 31, 2024 | For the Fiscal Year Ended March 31, 2024 | |||||||||||||||
| Fund | Fund Shares held by WT | Market Value of Fund Shares held by WT | Dividends and Fund Shares held by WT | |||||||||||||
International Multifactor Fund | 428 | $ | 11,361 | $ | 373 | |||||||||||
International Quality Dividend Growth Fund | 686 | 26,109 | 379 | |||||||||||||
International SmallCap Dividend Fund | 455 | 29,671 | 1,296 | |||||||||||||
Japan SmallCap Dividend Fund | 28 | 2,164 | 32 | |||||||||||||
4. CAPITAL SHARE TRANSACTIONS
As of March 31, 2024, there were an unlimited number of $0.001 par value shares of beneficial interest authorized by the Trust. Shares are issued and redeemed by each Fund only in creation units or multiples thereof to an authorized participant (“AP”). Except when aggregated in creation units (“Creation Unit Aggregations”), shares of each Fund are not redeemable. Transactions in shares for each Fund are disclosed in detail in the Statements of Changes in Net Assets. The consideration for the purchase of creation units of a Fund generally consists of the in-kind contribution of a basket of securities (“Deposit Securities”) and/or an amount of cash (“Cash Component”). Creation Unit Aggregations may be created in advance of receipt by a Fund of all or a portion of the applicable Deposit Securities from APs. In these circumstances, the initial deposit received from the AP will have a value greater than
| 110 | WisdomTree Trust |
Notes to Financial Statements (continued)
the NAV of the applicable Fund’s shares on the date the order is placed in proper form since, in addition to available Deposit Securities, U.S. cash must be deposited by the AP in an amount equal to the sum of (i) the Cash Component, plus (ii) generally between 102%-110%, as directed by the Trust or WTAM, which the Trust or WTAM may change from time to time, of the market value of the undelivered Deposit Securities (the “Additional Cash Deposit”) with the Fund pending delivery of any missing Deposit Securities. The Fund will return any unused portion of the Additional Cash Deposit once all of the missing Deposit Securities have been properly received from the AP or purchased by the Fund. Amounts due to be returned to an AP as of March 31, 2024, if any, is shown in the Statements of Assets and Liabilities in “Payables: Deposit due to authorized participant”.
5. INVESTMENT PORTFOLIO TRANSACTIONS
Purchases and sales of investments (excluding purchases and sales resulting from in-kind capital share transactions and short-term investments) and the cost of purchases and the proceeds from sales resulting from in-kind capital share transactions (excluding short-term investments) for the fiscal year ended March 31, 2024 are shown in the following table. Realized gains and losses on sales resulting from in-kind capital share redemptions, as shown on the Statements of Operations, are not recognized by the Funds for tax purposes.
| In-kind Capital Share Transactions | ||||||||||||||||
| Fund | Purchases | Sales | Purchases | Sales | ||||||||||||
Europe Quality Dividend Growth Fund | $ | 24,592,173 | $ | 24,780,367 | $ | 4,540,802 | $ | 6,198,744 | ||||||||
Europe SmallCap Dividend Fund | 83,992,583 | 82,869,027 | — | 63,353,763 | ||||||||||||
International AI Enhanced Value Fund | 100,735,892 | 101,042,647 | 3,671,806 | 11,714,115 | ||||||||||||
International Equity Fund | 126,012,572 | 122,465,680 | 14,224,735 | 70,508,983 | ||||||||||||
International High Dividend Fund | 150,597,635 | 148,658,819 | 18,117,515 | 107,852,657 | ||||||||||||
International LargeCap Dividend Fund | 127,014,417 | 118,637,556 | 8,909,465 | 45,640,235 | ||||||||||||
International MidCap Dividend Fund | 48,183,836 | 48,603,387 | 8,317,028 | 12,083,988 | ||||||||||||
International Multifactor Fund | 49,513,995 | 49,689,664 | 10,138,653 | 10,220,631 | ||||||||||||
International Quality Dividend Growth Fund | 436,921,523 | 417,539,423 | 235,904,603 | 54,520,788 | ||||||||||||
International SmallCap Dividend Fund | 403,509,708 | 396,815,046 | 12,798,417 | 183,372,456 | ||||||||||||
Japan SmallCap Dividend Fund | 64,112,822 | 64,840,211 | 128,320,878 | 102,012,008 | ||||||||||||
6. FEDERAL INCOME TAXES
At March 31, 2024, the cost of investments (including securities on loan and derivatives) for Federal income tax purposes was as follows:
| Investments in Long Securities | Investments in Financial Derivatives1 | |||||||||||||||||||||||||||||||||||
| Fund | Tax Cost | Gross Unrealized Appreciation | Gross Unrealized Depreciation | Net Unrealized Appreciation | Gross Unrealized Appreciation | Gross Unrealized Depreciation | Net Unrealized Appreciation/ (Depreciation) | Total Net Unrealized Appreciation | ||||||||||||||||||||||||||||
Europe Quality Dividend Growth Fund | $ | 63,825,938 | $ | 13,058,665 | $ | (3,057,220 | ) | $ | 10,001,445 | $ | — | $ | — | $ | — | $ | 10,001,445 | |||||||||||||||||||
Europe SmallCap Dividend Fund | 189,111,659 | 26,253,097 | (14,700,035 | ) | 11,553,062 | — | — | — | 11,553,062 | |||||||||||||||||||||||||||
International AI Enhanced Value Fund | 76,040,597 | 5,295,919 | (4,809,945 | ) | 485,974 | — | — | — | 485,974 | |||||||||||||||||||||||||||
International Equity Fund | 490,846,107 | 139,201,683 | (14,951,230 | ) | 124,250,453 | — | — | — | 124,250,453 | |||||||||||||||||||||||||||
International High Dividend Fund | 329,537,506 | 45,047,351 | (11,853,537 | ) | 33,193,814 | — | — | — | 33,193,814 | |||||||||||||||||||||||||||
International LargeCap Dividend Fund | 424,555,905 | 132,151,108 | (7,506,605 | ) | 124,644,503 | — | — | — | 124,644,503 | |||||||||||||||||||||||||||
International MidCap Dividend Fund | 132,123,509 | 21,711,064 | (6,134,065 | ) | 15,576,999 | — | (41 | ) | (41 | ) | 15,576,958 | |||||||||||||||||||||||||
International Multifactor Fund | 40,190,152 | 3,925,262 | (896,286 | ) | 3,028,976 | 4,525 | (1,142 | ) | 3,383 | 3,032,359 | ||||||||||||||||||||||||||
International Quality Dividend Growth Fund | 839,056,419 | 182,755,209 | (28,382,298 | ) | 154,372,911 | — | — | — | 154,372,911 | |||||||||||||||||||||||||||
International SmallCap Dividend Fund | 1,042,072,595 | 180,693,269 | (77,415,497 | ) | 103,277,772 | — | — | — | 103,277,772 | |||||||||||||||||||||||||||
Japan SmallCap Dividend Fund | 262,665,189 | 25,655,585 | (17,110,415 | ) | 8,545,170 | — | — | — | 8,545,170 | |||||||||||||||||||||||||||
| WisdomTree Trust | 111 |
Notes to Financial Statements (continued)
| 1 | Certain financial derivatives may be considered section 1256 contracts under the Code. Each section 1256 contract held at the close of a taxable year shall be treated as sold for its fair market value on the last business day of such taxable year (and any realized gain and loss shall be taken into account for the taxable year). As such, the unrealized appreciation/(depreciation) for financial derivatives on a tax basis may not correspond to the unrealized appreciation/(depreciation) on a GAAP basis. The unrealized appreciation/(depreciation) for financial derivatives on a GAAP basis is located in the respective financial derivatives tables in each Fund’s Schedule of Investments. |
At March 31, 2024, the components of total distributable earnings (loss) on a tax-basis were as follows:
| Fund | Undistributed Ordinary Income | Undistributed Capital and Other Losses | Net Unrealized Appreciation | Currency and Other Unrealized Appreciation/ (Depreciation) | Other Temporary Differences1 | Total Distributable Earnings (Loss) | ||||||||||||||||||
Europe Quality Dividend Growth Fund | $ | 111,134 | $ | (13,742,045 | ) | $ | 10,001,445 | $ | 6,047 | $ | 4,000 | $ | (3,619,419 | ) | ||||||||||
Europe SmallCap Dividend Fund | 120,667 | (319,739,403 | ) | 11,553,062 | (98,228 | ) | 365,528 | (307,798,374 | ) | |||||||||||||||
International AI Enhanced Value Fund | 713,856 | (69,356,127 | ) | 485,974 | (7,808 | ) | 19,778 | (68,144,327 | ) | |||||||||||||||
International Equity Fund | 1,699,632 | (207,625,302 | ) | 124,250,453 | 5,864 | 42,085 | (81,627,268 | ) | ||||||||||||||||
International High Dividend Fund | 1,073,931 | (103,947,845 | ) | 33,193,814 | (12,474 | ) | 14,416 | (69,678,158 | ) | |||||||||||||||
International LargeCap Dividend Fund | 1,731,677 | (131,149,126 | ) | 124,644,503 | 22,500 | 12,870 | (4,737,576 | ) | ||||||||||||||||
International MidCap Dividend Fund | 582,222 | (47,258,316 | ) | 15,576,999 | (1,064 | ) | 4,173 | (31,095,986 | ) | |||||||||||||||
International Multifactor Fund | 180,616 | (3,958,047 | ) | 3,028,976 | 2,910 | 585 | (744,960 | ) | ||||||||||||||||
International Quality Dividend Growth Fund | 716,134 | (68,013,038 | ) | 154,372,911 | (237 | ) | 59,036 | 87,134,806 | ||||||||||||||||
International SmallCap Dividend Fund | 3,566,455 | (428,609,379 | ) | 103,277,772 | (246,398 | ) | 739,361 | (321,272,189 | ) | |||||||||||||||
Japan SmallCap Dividend Fund | 776,782 | (126,958,749 | ) | 8,545,170 | (42,650 | ) | — | (117,679,447 | ) | |||||||||||||||
| 1 | The treatment of certain income/expense items have been recognized for GAAP but disallowed for tax purposes. |
The tax character of distributions paid during the fiscal years ended March 31, 2024 and March 31, 2023, was as follows:
| Year Ended March 31, 2024 | Year Ended March 31, 2023 | |||||||
| Fund | Distributions Paid from Ordinary Income* | Distributions Paid from Ordinary Income* | ||||||
Europe Quality Dividend Growth Fund | $ | 1,468,000 | $ | 1,667,670 | ||||
Europe SmallCap Dividend Fund | 9,431,500 | 14,405,217 | ||||||
International AI Enhanced Value Fund | 3,458,250 | 4,170,635 | ||||||
International Equity Fund | 23,081,500 | 26,843,795 | ||||||
International High Dividend Fund | 21,220,750 | 14,557,836 | ||||||
International LargeCap Dividend Fund | 19,529,750 | 18,097,424 | ||||||
International MidCap Dividend Fund | 5,664,500 | 5,553,560 | ||||||
International Multifactor Fund | 1,509,000 | 1,277,796 | ||||||
International Quality Dividend Growth Fund | 16,686,000 | 13,540,674 | ||||||
International SmallCap Dividend Fund | 46,695,750 | 62,885,580 | ||||||
Japan SmallCap Dividend Fund | 5,686,552 | 7,163,312 | ||||||
| * | Includes short-term capital gains, if any. |
At March 31, 2024, for Federal tax purposes, the Funds have capital loss carryforwards available to offset future capital gains as indicated in the following table. The loss carryforward amounts do not have an expiration date and, therefore, can be carried forward indefinitely until utilized. To the extent that these loss carryforwards are utilized, capital gains so offset will not be distributed to shareholders.
| Fund | Short-Term | Long-Term | Capital Loss Available Total | |||||||||
Europe Quality Dividend Growth Fund | $ | 9,708,160 | $ | 4,033,885 | $ | 13,742,045 | ||||||
Europe SmallCap Dividend Fund | 107,598,627 | 212,140,776 | 319,739,403 | |||||||||
International AI Enhanced Value Fund | 22,882,977 | 46,473,150 | 69,356,127 | |||||||||
International Equity Fund | 41,715,977 | 165,909,325 | 207,625,302 | |||||||||
International High Dividend Fund | 19,836,672 | 84,111,173 | 103,947,845 | |||||||||
International LargeCap Dividend Fund | 23,350,441 | 107,798,685 | 131,149,126 | |||||||||
International MidCap Dividend Fund | 10,143,214 | 37,115,102 | 47,258,316 | |||||||||
| 112 | WisdomTree Trust |
Notes to Financial Statements (continued)
| Fund | Short-Term | Long-Term | Capital Loss Available Total | |||||||||
International Multifactor Fund | $ | 3,958,047 | $ | — | $ | 3,958,047 | ||||||
International Quality Dividend Growth Fund | 62,452,880 | 5,560,158 | 68,013,038 | |||||||||
International SmallCap Dividend Fund | 243,066,659 | 185,542,720 | 428,609,379 | |||||||||
Japan SmallCap Dividend Fund | 71,569,093 | 55,389,656 | 126,958,749 | |||||||||
Capital losses incurred after October 31 (“post-October capital losses”) and late year ordinary losses incurred after December 31 within the taxable year are deemed to arise on the first business day of each Fund’s next taxable year. At March 31, 2024, the Funds did not have any post-October capital losses or late year ordinary losses to defer.
During the fiscal year ended March 31, 2024, the amount of capital loss carryforwards used to offset realized gains are shown in the following table:
| Fund | Utilized Capital Loss Carryforward | |||
Europe Quality Dividend Growth Fund | $ | 760,735 | ||
Europe SmallCap Dividend Fund | — | |||
International AI Enhanced Value Fund | 252,964 | |||
International Equity Fund | — | |||
International High Dividend Fund | — | |||
International LargeCap Dividend Fund | — | |||
International MidCap Dividend Fund | — | |||
International Multifactor Fund | — | |||
International Quality Dividend Growth Fund | 1,329,290 | |||
International SmallCap Dividend Fund | — | |||
Japan SmallCap Dividend Fund | — | |||
At March 31, 2024, the effect of permanent “book/tax” reclassifications resulted in increases (decreases) to the components of net assets as shown in the following table. The differences are primarily due to redemptions-in-kind and net operating losses.
| Fund | Total Distributable Earnings (Loss) | Paid-in Capital | ||||||
Europe Quality Dividend Growth Fund | $ | (1,488,344 | ) | $ | 1,488,344 | |||
Europe SmallCap Dividend Fund | (7,454,813 | ) | 7,454,813 | |||||
International AI Enhanced Value Fund | (475,840 | ) | 475,840 | |||||
International Equity Fund | (18,605,028 | ) | 18,605,028 | |||||
International High Dividend Fund | (19,025,540 | ) | 19,025,540 | |||||
International LargeCap Dividend Fund | (16,070,381 | ) | 16,070,381 | |||||
International MidCap Dividend Fund | (2,352,112 | ) | 2,352,112 | |||||
International Multifactor Fund | (1,804,336 | ) | 1,804,336 | |||||
International Quality Dividend Growth Fund | (13,683,777 | ) | 13,683,777 | |||||
International SmallCap Dividend Fund | (21,608,464 | ) | 21,608,464 | |||||
Japan SmallCap Dividend Fund | (21,222,187 | ) | 21,222,187 | |||||
GAAP provides guidance on tax provisions that prescribe a minimum threshold for financial statement recognition of the benefit of a tax position taken or expected to be taken in a tax return. As of and during the fiscal year ended March 31, 2024, the Funds did not have any liabilities for unrecognized tax benefits relating to uncertain income tax positions they have taken or expect to take in the future. If applicable, the Funds will recognize interest accrued related to unrecognized tax benefits in interest expense and penalties in “Other” expenses on the Statements of Operations. The Funds file tax returns with the Internal Revenue Service, the State of New York, and various other states. Specific to U.S. federal and state taxes, generally, each of the tax years in the four-year period ended March 31, 2024, remains subject to examination by taxing authorities. Specific to foreign countries in which the Funds invest, all open tax years remain subject to examination by taxing authorities in the respective jurisdictions. The open tax years vary by each jurisdiction in which each Fund invests.
As a result of several European Court of Justice (“ECJ”) court cases in certain countries across the European Union (“EU”), certain Funds have filed additional tax reclaims for previously withheld taxes on dividends earned in those countries (“ECJ tax reclaims”). These additional filings are subject to various administrative proceedings by the local jurisdictions’ tax authorities within the EU, as
| WisdomTree Trust | 113 |
Notes to Financial Statements (continued)
well as a number of related judicial proceedings. Income recognized, if any, for ECJ tax reclaims is reflected as “Other income” in the Statements of Operations and the cost to file these additional ECJ tax reclaims is reflected as “Other fees” in the Statements of Operations. When the ECJ tax reclaim is not “more likely than not” to be sustained assuming examination by tax authorities due to the uncertainty that exists as to the ultimate resolution of these proceedings, the likelihood of receipt of these ECJ tax reclaims, and the potential timing of payment, no amounts are reflected in the financial statements. For U.S. income tax purposes, ECJ tax reclaims received by the Funds, if any, reduce the amounts of foreign taxes Fund shareholders can use as tax credits in their individual income tax returns. In the event that ECJ tax reclaims received by a Fund during the fiscal year exceed foreign withholding taxes paid, and a Fund previously passed foreign tax credits on to its shareholders, a Fund must either amend historic tax reporting to shareholders or enter into a closing agreement with the Internal Revenue Service in order to pay the associated tax liability on behalf of the respective Fund’s shareholders. During the fiscal year ended March 31, 2024, the ECJ tax reclaims received by the Funds, if any, did not exceed the foreign withholding taxes of the respective Funds.
7. SUBSEQUENT EVENTS
WTAM has evaluated all subsequent transactions and events through the date on which these financial statements were issued and has determined that no additional items require disclosure in these financial statements.
8. ADDITIONAL INFORMATION
Russia’s military invasion of Ukraine initiated in February 2022 and the economic and diplomatic responses by the United States and other countries have led to increased volatility and uncertainty in the financial markets and could continue to adversely affect regional and global economies for the foreseeable future. In response to Russia’s actions, the governments of the United States, the European Union, the United Kingdom, and many other countries collectively imposed heavy and broad-ranging economic sanctions on certain Russian individuals, corporate and banking entities, and other industries and businesses. The sanctions restrict companies from doing business with Russia and Russian companies, prohibit transactions with the Russian central bank and other key Russian financial institutions and entities, ban Russian airlines and ships from using many other countries’ airspace and ports, respectively, and place a freeze on certain Russian assets. The sanctions also removed some Russian banks from the Society for Worldwide Interbank Financial Telecommunications (SWIFT), the electronic network that connects banks globally to facilitate cross-border payments. In addition, the United States has banned oil and other energy imports from Russia, as well as other popular Russian exports, such as diamonds, seafood and vodka. The European Union, the United Kingdom and other countries have also placed restrictions on certain oil, energy and luxury goods imports from Russia.
These sanctions, as well as other economic consequences related to the invasion, such as additional sanctions, boycotts, changes in consumer or purchaser preferences, or cyberattacks on governments, companies or individuals, may further decrease the value and liquidity of certain Russian securities as well as securities of issuers in other countries that are subject to or otherwise adversely affected by economic sanctions related to Russia’s invasion of Ukraine, including Russian counter measures. To the extent a Fund has exposure to Russian investments or investments in countries affected by the invasion or the sanctions, the Fund’s ability to price, buy, sell, receive or deliver, or receive dividends and interest payments on such investments may be impaired. In certain circumstances, such as when there is no market for a security or other means of valuing or disposing of a security, a Fund may determine to value the affected security at zero. In addition, any exposure a Fund may have to counterparties in Russia or in countries affected by the invasion could negatively affect the Fund’s portfolio. The extent and duration of Russia’s military actions and the repercussions of such actions are impossible to predict, but could result in continued significant market disruptions, including in the oil and natural gas markets, and may negatively affect global supply chains, inflation and global growth. Further, an escalation of the military conflict beyond Ukraine’s borders could result in significant, long-lasting damage to the economies of Eastern and Western Europe as well as the global economy. These and any related events could significantly and adversely affect a Fund’s performance and the value of an investment in the Fund, even in the absence of direct exposure to Russian issuers or issuers in other countries affected by the invasion.
* * * * * *
Financial markets around the world may experience extreme volatility, depressed valuations, decreased liquidity and heightened uncertainty and turmoil resulting from major cybersecurity events, geopolitical events (including wars, such as Russia’s invasion of Ukraine, terror attacks, and disruptions to foreign economic and trade relationships), public health emergencies, such as the COVID-19 pandemic, measures to address budget deficits, downgrading of sovereign debt, and public sentiment, among other events. Resulting market volatility, dramatic changes to interest rates, and otherwise unfavorable economic conditions may negatively impact Fund performance or impair a Fund’s ability to achieve its investment objective.
In March 2023, the financial distress of certain financial institutions raised economic concerns over disruption in the U.S. banking system and regarding the solvency of certain financial services firms. There can be no certainty that the actions taken by the U.S. government to strengthen public confidence in the U.S. banking system will be effective in mitigating the effects of financial institution failures on the economy and restoring public confidence in the U.S. banking system.
| 114 | WisdomTree Trust |
Notes to Financial Statements (concluded)
In October 2023, Hamas terrorists infiltrated Israel’s southern border from the Gaza Strip and conducted a series of attacks on civilian and military targets. Hamas also launched extensive rocket attacks on the Israeli population and industrial centers located along Israel’s border with the Gaza Strip and in other areas within the State of Israel. Following the attack, Israel’s security cabinet declared war against Hamas, and a military campaign was initiated. These events may result in significant market disruptions and may adversely affect regional and global economies.
* * * * * *
Raising the ceiling on U.S. government debt has become increasingly politicized. Any failure to increase the total amount that the U.S. government is authorized to borrow could lead to a default on U.S. government obligations, with unpredictable consequences for economies and markets in the U.S. and elsewhere. On August 1, 2023, Fitch Ratings, Inc. downgraded its U.S. debt rating from the highest AAA rating to AA+, citing “a high and growing general government debt burden, and the erosion of governance relative to ‘AA’ and ‘AAA’ rated peers over the last two decades that has manifested in repeated debt limit standoffs and last-minute resolutions”. The impacts, if any, of the downgrade on financial markets are unknown at this time. The downgrade has potential market impacts, including but not limited to, steep stock market declines and rising bond yields.
| WisdomTree Trust | 115 |
Report of Independent Registered Public Accounting Firm
To the Shareholders of WisdomTree Europe Quality Dividend Growth Fund, WisdomTree Europe SmallCap Dividend Fund, WisdomTree International Al Enhanced Value Fund, WisdomTree International Equity Fund, WisdomTree International High Dividend Fund, WisdomTree International LargeCap Dividend Fund, WisdomTree International MidCap Dividend Fund, WisdomTree International Multifactor Fund, WisdomTree International Quality Dividend Growth Fund, WisdomTree International SmallCap Dividend Fund and WisdomTree Japan SmallCap Dividend Fund, and the Board of Trustees of WisdomTree Trust
Opinion on the Financial Statements
We have audited the accompanying statements of assets and liabilities of WisdomTree Europe Quality Dividend Growth Fund, WisdomTree Europe SmallCap Dividend Fund, WisdomTree International Al Enhanced Value Fund, WisdomTree International Equity Fund, WisdomTree International High Dividend Fund, WisdomTree International LargeCap Dividend Fund, WisdomTree International MidCap Dividend Fund, WisdomTree International Multifactor Fund, WisdomTree International Quality Dividend Growth Fund, WisdomTree International SmallCap Dividend Fund and WisdomTree Japan SmallCap Dividend Fund (collectively referred to as the “Funds”), (eleven of the funds constituting WisdomTree Trust (the “Trust”)), including the schedules of investments, as of March 31, 2024, and the related statements of operations for the year then ended, the statements of changes in net assets for each of the two years in the period then ended, the financial highlights for each of the five years in the period then ended and the related notes (collectively referred to as the “financial statements”). In our opinion, the financial statements present fairly, in all material respects, the financial position of each of the Funds (eleven of the funds constituting WisdomTree Trust) at March 31, 2024, the results of their operations for the year then ended, the changes in their net assets for each of the two years in the period then ended and their financial highlights for each of the five years in the period then ended, in conformity with U.S. generally accepted accounting principles.
Basis for Opinion
These financial statements are the responsibility of the Trust’s management. Our responsibility is to express an opinion on each of the Funds’ financial statements based on our audits. We are a public accounting firm registered with the Public Company Accounting Oversight Board (United States) (“PCAOB”) and are required to be independent with respect to the Trust in accordance with the U.S. federal securities laws and the applicable rules and regulations of the Securities and Exchange Commission and the PCAOB.
We conducted our audits in accordance with the standards of the PCAOB. Those standards require that we plan and perform the audit to obtain reasonable assurance about whether the financial statements are free of material misstatement, whether due to error or fraud. The Trust is not required to have, nor were we engaged to perform, an audit of the Trust’s internal control over financial reporting. As part of our audits, we are required to obtain an understanding of internal control over financial reporting, but not for the purpose of expressing an opinion on the effectiveness of the Trust’s internal control over financial reporting. Accordingly, we express no such opinion.
Our audits included performing procedures to assess the risks of material misstatement of the financial statements, whether due to error or fraud, and performing procedures that respond to those risks. Such procedures included examining, on a test basis, evidence regarding the amounts and disclosures in the financial statements. Our procedures included confirmation of securities owned as of March 31, 2024, by correspondence with the custodian, brokers and others; when replies were not received from brokers, we performed other auditing procedures. Our audits also included evaluating the accounting principles used and significant estimates made by management, as well as evaluating the overall presentation of the financial statements. We believe that our audits provide a reasonable basis for our opinion.

We have served as the auditor of one or more WisdomTree investment companies since 2006.
New York, New York
May 30, 2024
| 116 | WisdomTree Trust |
Liquidity Risk Management Program (unaudited)
The Funds adopted a liquidity risk management program (the “Program”) pursuant to the requirements of Rule 22e-4 (the “Rule”) under the Investment Company Act of 1940, as amended. The Rule requires registered open-end funds, including exchange-traded funds such as the Funds, to establish liquidity risk management programs in order to effectively manage fund liquidity and shareholder redemptions. The Rule is designed to mitigate the risk that a Fund could not meet redemption requests without significantly diluting the interest of remaining investors. The Board has appointed WisdomTree Asset Management, Inc., the investment advisor to the Funds, as the Program Administrator for each Fund’s Program.
The Rule requires the Funds to assess, manage and review their liquidity risk at least annually considering applicable factors such as investment strategy and liquidity during normal and foreseeable stressed conditions, including whether the strategy is appropriate for an open-ended fund and whether the Fund has a relatively concentrated portfolio or large positions in particular issuers. The Funds must also assess their use of borrowings and derivatives, short-term and long-term cash flow projections in normal and stressed conditions, holdings of cash and cash equivalents, and borrowing arrangements and other funding sources.
The Rule also requires the Funds to classify their investments into one of four liquidity categories: highly liquid, moderately liquid, less liquid or illiquid based on the number of days a Fund expects it would take to liquidate the investment, and to review these classifications at least monthly or more often under certain conditions. The periods range from three or fewer business days for a highly liquid investment to greater than seven calendar days for settlement of a less liquid investment. Illiquid investments are those a Fund does not expect to be able to sell or dispose of within seven calendar days without significantly changing the market value of the investment. A Fund is prohibited from acquiring an investment if, after the acquisition, its holdings of illiquid assets will exceed 15% of its net assets. In addition, if a Fund permits redemptions in-kind, the Rule requires the Fund to establish redemption in-kind policies and procedures governing how and when it will engage in such redemptions.
Pursuant to the Rule’s requirements, the Program has been reviewed and approved by the Fund’s Board. Furthermore, the Board has received a written report prepared by the Program Administrator that addresses the operation of the Program, assesses its adequacy and effectiveness and describes any material changes made to the Program. The Program Administrator has monitored the Fund’s liquidity risk and the liquidity classifications of the securities held by the Fund and has determined that the Program is operating effectively.
During the period from January 1, 2023 to December 31, 2023, there were no material changes to the Program and no material liquidity events that impacted the Funds. During the period, the Funds held sufficient highly liquid assets to meet fund redemptions.
Under normal expected foreseeable Fund redemption forecasts and foreseeable stressed Fund redemption forecasts, the Program Administrator believes that the Funds maintain sufficient highly liquid assets to meet Fund redemptions.
| WisdomTree Trust | 117 |
Trustees and Officers Information (unaudited)
Name and Year of Birth of Trustee/Officer | Position(s) Held with | Principal Occupation(s) | Number of Portfolios in Fund Complex Overseen by Trustee/ Officer+ | Other | ||||||
Trustees Who Are Interested Persons of the Trust | ||||||||||
Jonathan Steinberg (1964) | Trustee, 2005-present; President, 2005-present | Chief Executive Officer of WisdomTree and WisdomTree Asset Management since 2005; President of WisdomTree and WisdomTree Asset Management from 2012 to 2019. | 77 | Director, WisdomTree and WisdomTree Asset Management. | ||||||
Trustees Who Are Not Interested Persons of the Trust | ||||||||||
David G. Chrencik1 (1948) | Trustee, 2014-present | Chief Financial Officer of Sarus Indochina Select LP (a hedge fund) from 2012 to 2022. | 77 | None | ||||||
Phillip Goff2 (1963) | Trustee, 2024-present | Private Investor from 2017 to present; Trustee of RBC Funds Trust from 2020 to 2024; Senior Vice President/ Corporate Controller and Funds Treasurer at TIAA from 2006 to 2017. | 77 | None | ||||||
Joel Goldberg3,4 (1945) | Trustee, 2012-present | Attorney, Partner at Stroock & Stroock & Lavan LLP from 2010 to 2018; Attorney, Partner at Willkie Farr & Gallagher LLP from 2006 to 2010. | 77 | Director, Better Business Bureau (Metropolitan New York, Long Island and the Mid- Hudson Region). | ||||||
Toni Massaro4 (1955) | Trustee, 2006-present | Regents Professor of Law Emerita since 2024; Executive Director of the Agnese Nelms Haury Program since 2021; Dean Emerita at the University of Arizona James E. Rogers College of Law (“Rogers College of Law”) from 2009 to 2024 (distinguished Emerita in July 2009); Dean of the Rogers College of Law from 1999 to 2009; Regents Professor since 2006; Milton O. Riepe Chair in Constitutional Law from 1997 to 2022; Professor at the Rogers College of Law from 1990 to 2024. | 77 | None | ||||||
| Melinda A. Raso Kirstein5 (1955) | Trustee, 2014-present | Retired since 2004; Vice President, Senior Portfolio Manager, Fixed Income Management, and Director of Tax Exempt Fund Management at Merrill Lynch Investment Management from 1982 to 2004. | 77 | Associate Alumnae of Douglass College, Chair of Investment Committee. | ||||||
Victor Ugolyn (1947) | Trustee, 2006-present; Chairman of the Board, 2006-present | Private Investor from 2005 to present; President and Chief Executive Officer at William D. Witter, Inc. from 2005 to 2006; Chairman of MONY Securities Corporation, and Chairman, President and Chief Executive Officer at Enterprise Capital Management from 1999 to 2004. | 77 | None | ||||||
| 118 | WisdomTree Trust |
Trustees and Officers Information (unaudited) (concluded)
Name and Year of Birth of Trustee/Officer | Position(s) Held with | Principal Occupation(s) | Number of Portfolios in Fund Complex Overseen by Trustee/ Officer+ | Other | ||||||
Officers of the Trust | ||||||||||
Jonathan Steinberg (1964) | President, 2005-present; Trustee, 2005-present | Chief Executive Officer of WisdomTree and WisdomTree Asset Management since 2005; President of WisdomTree and WisdomTree Asset Management from 2012 to 2019. | 77 | See Interested Trustees Table Above. | ||||||
David Castano* (1971) | Treasurer, 2013-present | Head of Fund Accounting & Administration at WisdomTree Asset Management since 2020; Director of Fund Accounting & Administration at WisdomTree Asset Management from 2011 to 2020. | 77 | None | ||||||
Terry Jane Feld* (1960) | Chief Compliance Officer, 2012-present | Head of U.S. Compliance at WisdomTree Asset Management since 2022; Chief Compliance Officer at WisdomTree Asset Management since 2012. | 77 | None | ||||||
Joanne Antico* (1975) | Chief Legal Officer and Secretary, 2021-present | General Counsel at WisdomTree Asset Management since 2021; Assistant General Counsel at WisdomTree Asset Management from 2016 to 2021; Executive Director and Assistant Secretary at Morgan Stanley Investment Management Inc. from 2005 to 2016. | 77 | None | ||||||
Clint Martin* (1977) | Assistant Treasurer, 2015-present | Director of Fund Accounting & Administration at WisdomTree Asset Management since 2020; Fund Manager, Fund Accounting & Administration at WisdomTree Asset Management from 2012 to 2020. | 77 | None | ||||||
Angela Borreggine* (1964) | Assistant Secretary, 2022-present | Assistant General Counsel at WisdomTree Asset Management since 2022; Vice President and Senior Counsel at Virtus Investment Partners from 2021 to 2022; Secretary and Chief Legal Officer at Allianz Global Investors family of funds from 2016 to 2021 and of The Korea Fund, Inc. from 2016 to 2020; Director, Senior Counsel at Allianz Global Investors from 2007 to 2021. | 77 | None | ||||||
TJ Darnowski* (1984) | Assistant Secretary, 2021-present | Senior Investment Management Paralegal at WisdomTree Asset Management since 2021; Senior Legal Administrator at Ultimus Fund Solutions from 2019 to 2021; Assistant Vice President at State Street Bank & Trust Company from 2010 to 2019. | 77 | None | ||||||
Sherry Scarvey* (1967) | Assistant Secretary, 2023-present | Senior Investment Management Paralegal at WisdomTree Asset Management since 2023; Senior Legal Analyst at Eagle Point Credit Management, LLC from 2021 to 2023; Senior Legal Analyst at Jennison & Associates LLC from 2019 to 2021; Senior Legal Specialist at Legg Mason & Co. LLC from 2005 to 2019. | 77 | None | ||||||
| + | As of March 31, 2024. |
| 1 | Chair of the Audit Committee. |
| 2 | Appointed to the Board on February 27, 2024. |
| 3 | Chair of the Contracts Review Committee. |
| 4 | Co-Chair of the Governance, Nominating and Compliance Committee. |
| 5 | Chair of the Investment Committee. |
| * | Elected by and serves at the pleasure of the Board. |
| WisdomTree Trust | 119 |
Supplemental Information (unaudited)
Federal Income Tax Information
The following Federal tax information related to the Funds’ fiscal year ended March 31, 2024, is provided for information purposes only and should not be used for reporting to federal or state revenue agencies. Federal tax information for the calendar year will be reported to you on Form 1099-DIV in January 2025.
Certain dividends paid by the Funds may be subject to a maximum tax rate of 15%, as provided by the Jobs and Growth Tax Relief Reconciliation Act of 2003. Of the distributions paid during the fiscal year ended March 31, 2024, the following represents the maximum amount of ordinary income distributions that may be considered qualified dividend income:
| Fund | Qualified Dividend Income | |||
Europe Quality Dividend Growth Fund | $ | 1,606,772 | ||
Europe SmallCap Dividend Fund | 7,680,813 | |||
International AI Enhanced Value Fund | 2,213,318 | |||
International Equity Fund | 19,029,394 | |||
International High Dividend Fund | 14,185,437 | |||
International LargeCap Dividend Fund | 15,467,029 | |||
International MidCap Dividend Fund | 3,457,039 | |||
International Multifactor Fund | 777,186 | |||
International Quality Dividend Growth Fund | 17,820,117 | |||
International SmallCap Dividend Fund | 42,684,784 | |||
Japan SmallCap Dividend Fund | 5,832,894 | |||
The Funds intend to elect to pass through to shareholders the credit for taxes paid to foreign countries during the fiscal year ended March 31, 2024. The gross foreign source income and foreign taxes paid are as follows:
| Fund | Gross Foreign Income | Foreign Taxes Paid | ||||||
Europe Quality Dividend Growth Fund | $ | 1,702,084 | $ | 138,772 | ||||
Europe SmallCap Dividend Fund | 9,975,927 | 487,298 | ||||||
International AI Enhanced Value Fund | 3,129,992 | 158,908 | ||||||
International Equity Fund | 23,642,397 | 1,465,445 | ||||||
International High Dividend Fund | 21,710,315 | 993,286 | ||||||
International LargeCap Dividend Fund | 20,915,587 | 1,128,133 | ||||||
International MidCap Dividend Fund | 5,186,005 | 267,526 | ||||||
International Multifactor Fund | 1,534,208 | 80,522 | ||||||
International Quality Dividend Growth Fund | 18,687,802 | 1,508,000 | ||||||
International SmallCap Dividend Fund | 49,213,088 | 3,921,782 | ||||||
Japan SmallCap Dividend Fund | 5,969,964 | 599,880 | ||||||
| 120 | WisdomTree Trust |
General Information (unaudited)
Proxy Voting Policies, Procedures and Record
A complete copy of the Proxy Voting Policy may be obtained upon request, at no charge, by calling 1-866-909-WISE (9473) or writing to: WisdomTree Trust, c/o Foreside Fund Services, LLC, Three Canal Plaza Suite 100, Portland, ME, 04101.
The Trust is required to disclose annually the Funds’ complete proxy voting record on Form N-PX covering the most recent 12-month period ended June 30 and to file Form N-PX with the SEC no later than August 31 of each year. The current Form N-PX for the Funds is available at no charge upon request by calling 1-866-909-WISE (9473) or through the SEC’s website at www.sec.gov.
Shareholder Reports and Quarterly Portfolio Disclosure
The Funds file their complete schedule of portfolio holdings with the SEC for their first and third fiscal quarters as an exhibit to their reports on Form N-PORT. Copies of the filings are available, without charge, on the SEC’s website at www.sec.gov and are also available by calling the Trust at 1-866-909-WISE (9473). Copies of the filings may also be obtained, after paying a duplicating fee, by electronic request at the following E-mail address: publicinfo@sec.gov.
Information about each Fund’s portfolio holdings is available daily, without charge, at www.wisdomtree.com/investments.
The Statement of Additional Information (“SAI”) has additional information about the Funds’ Trustees and Officers and is available without charge upon request. Contact your financial representative for a free prospectus or SAI.
Frequency Distribution of Discounts & Premiums
Information about differences between the per share net asset value of each Fund and the market trading price of shares of each Fund are available, without charge, at www.wisdomtree.com/investments.
| WisdomTree Trust | 121 |
The WisdomTree Funds are exchange traded funds (“ETFs”) registered with the United States Securities and Exchange Commission as separate series (“Funds”) of WisdomTree Trust (“Trust”). WisdomTree Asset Management, Inc., a wholly owned subsidiary of WisdomTree, Inc., serves as the investment adviser to the Trust. None of the WisdomTree entities are affiliated with Foreside Fund Services, LLC, the Funds’ distributor. WisdomTree, Inc., its affiliates and their independent providers are not liable for any informational errors, incompleteness, delays, or for any actions taken in reliance on information contained herein.
There are risks associated with investing including possible loss of principal. Foreign investing involves special risks, such as risk of loss from currency fluctuation or political or economic uncertainty. Investments in real estate involve additional special risks, such as credit risk, interest rate fluctuations and the effect of varied economic conditions. Funds that focus their investments in one country or region may be significantly impacted by events and developments associated with the region which can adversely affect performance. Funds focusing on a single sector and/or smaller companies generally experience greater price volatility. Investments in emerging, offshore or frontier markets are generally less liquid and less efficient than investments in developed markets and are subject to additional risks, such as risks of adverse governmental regulation and intervention or political developments. Investments in currency involve additional special risks, such as credit risk and interest rate fluctuations. Derivative investments can be volatile and these investments may be less liquid than other securities, and more sensitive to the effect of varied economic conditions. As these Funds can have a high concentration in some issuers the Funds can be adversely impacted by changes affecting such issuers. Dividends are not guaranteed, and a company currently paying dividends may cease paying dividends at any time. Due to the investment strategy of certain Funds they may make higher capital gain distributions than other ETFs. Please read the Fund’s prospectus for specific details regarding the Fund’s risk profile.
Indexes are unmanaged and you cannot invest directly in an index.
Transactions in Fund shares will result in brokerage commissions and will generate tax consequences. Shares may be sold through brokerage accounts, but may be redeemed from the Funds only by Authorized Participants in large creation unit sizes of shares.
This report is intended for the Funds’ shareholders. It may not be distributed to prospective investors unless it is preceded or accompanied by the current prospectus.
Scan the QR code with your
smartphone camera to

learn more at
WisdomTree.com/investments
WisdomTree Fund shares are distributed by Foreside Fund Services, LLC, in the U.S.
WGM-517672


WisdomTree Trust
Annual Report
March 31, 2024
WisdomTree Europe Hedged Equity Fund (HEDJ)
WisdomTree Europe Hedged SmallCap Equity Fund (EUSC)
WisdomTree International Hedged Quality Dividend Growth Fund (IHDG)
WisdomTree Japan Hedged Equity Fund (DXJ)
WisdomTree Japan Hedged SmallCap Equity Fund (DXJS)
| 1 | ||||
Information about Performance and Shareholder Expense Examples (unaudited) | 3 | |||
| 4 | ||||
| 9 | ||||
| Schedules of Investments | ||||
| 12 | ||||
| 15 | ||||
WisdomTree International Hedged Quality Dividend Growth Fund | 19 | |||
| 27 | ||||
| 34 | ||||
| 43 | ||||
| 44 | ||||
| 45 | ||||
| 47 | ||||
| 50 | ||||
| 63 | ||||
| 64 | ||||
| 65 | ||||
| 67 | ||||
| 68 | ||||
“WisdomTree” is a registered mark of WisdomTree, Inc. and is licensed for use by the WisdomTree Trust.
(unaudited)
Developed international equity markets, as measured by the MSCI EAFE Index, returned 15.32% in U.S. dollar (“USD”) terms during the 12-month fiscal period ending March 31, 2024 (the “period”).
Most developed market currencies modestly weakened versus the USD during the period, as higher interest rates in the U.S. relative to the rest of developed world lent support to the USD at the expense of other currencies. The euro slightly weakened against the USD during the period by -0.45%, while the Australian dollar, New Zealand dollar and Norwegian krone suffered a bit more, falling between 2.45-4.44% apiece. The most pronounced decline was in the Japanese yen (“JPY”), which remains suppressed by the Bank of Japan’s commitment to accommodative monetary policy in an effort to stimulate economic growth. Low interest rates in Japan caused the JPY to weaken by more than 12% versus the USD. The two currency exceptions that strengthened versus the USD were the British pound sterling (“GBP”) and Swiss franc (“CHF”), which appreciated by 2.32% and 1.54%, respectively. The GBP’s movement was the result of relatively aggressive interest rate hikes by the Bank of England, while the CHF likely benefited from its status as a global safe-haven currency.
Similar to the rest of the world, developed international equity markets continued to combat high inflation for most of the period. Most central banks continued to raise interest rates and then pause their policy activity to assess the effects of tighter monetary policy on the economy. Markets fluctuated during the first seven months of the period (April through October 2023) before ultimately delivering the entirety of their gains in the latter five months. Investors propelled markets higher as economic data releases continued to show progress in combating inflation without adversely affecting the labor markets. As it became clear that a “soft economic landing” could be attained, equity markets rallied.
During the first quarter of the period, from April to June 2023, the MSCI EAFE Index returned 2.95% in USD terms. As the most influential central bank in the developed international universe, the European Central Bank (“ECB”) steadily raised its benchmark refinancing rate in 25 basis point increments, beginning the period at 3.5% and ending it at 4%. The policy tightening continued despite initial declines in European Monetary Union Index of Consumer Price inflation, which fell from about 7% to 5.5% year-over-year during the period. Inflation readings simply remained too high for investors to believe that the rate hike campaign could be ended early, and markets fluctuated before ending the quarter in slightly positive territory. Economic growth was flat during the quarter, only growing by 0.2% compared to the prior quarter. Currency performance was mixed during these three months with only the JPY making outsized moves versus the USD, weakening by about 8%. Earnings for the MSCI EAFE Index grew 18% during the quarter.
The second quarter of the period, July to September 2023, was poor for developed equity markets, as the MSCI EAFE Index fell over 4% in USD terms. As the largest equity region within the developed international equity universe, real Gross Domestic Product (“GDP”) in Europe fell 0.1% quarter-over-quarter despite continued disinflation, from 5.5% to 4.3% year-over-year. The ECB continued to raise rates in two 25 basis point increments, ending the quarter at 4.5%. This contributed to relatively poor sentiment in the region and prompted a slight equity market selloff. Virtually all the European currencies, plus the others in the developed market universe within the G10, weakened versus the USD by about 2% to 4%. Earnings growth exacerbated the declines in equity markets, falling nearly 19% during the three-month period.
Markets finally rebounded during the third quarter of the period, October to December 2023, as the MSCI EAFE Index rallied 10.42% in USD terms. Every G10 currency strengthened significantly versus the USD during this quarter, as U.S. investors began to anticipate a pivot to rate cuts in 2024. This put new pressure on the USD and bolstered the developed international currencies that had been relatively weak for most of the year. The ECB finally paused its rate hike campaign during the quarter to assess the economic impact of its policy activity. It opted to hold rates at 4.5%, which is where they remain as of the date of this report. Inflation fell to under 3% year-over-year, which
| WisdomTree Trust | 1 |
Market Environment Overview
(unaudited) (concluded)
provided investors with renewed optimism. Despite the positive signs in the inflation battle, the economy stalled during the quarter with real GDP registering 0% growth quarter-over-quarter. Markets mostly shrugged off a slight decline in company profits during the quarter, with the MSCI EAFE Index registering a 1.7% decline in earnings.
Optimism from the end of 2023 continued into the first quarter of 2024, the final quarter of the period. Disinflation continued in Europe, falling slightly from 2.9% down to 2.4% through March, as the ECB maintained its pause on rate hikes. At 4.5%, rates have not been this high since mid-2001. Markets began to believe the end of the fight against inflation was in sight, and the MSCI EAFE Index returned 5.78% in USD terms. Despite a rebound in developed market currencies in the prior quarter, they resumed their decline against the USD during these three months as investors began to believe that international central banks would have to cut rates more quickly and in greater magnitude than the Federal Reserve in the U.S. This assumed policy rate gap once again weighed on international currencies and supported USD strength. As of the date of this report, GDP growth for the Eurozone is not yet available.
Entering the new period, developed equity markets remain fixated on the future path of monetary policy. Much like in the U.S., each country or region’s individual economic data releases will have significant implications for the direction of equity markets based on their immediate impact to policy rate setting. They may likely require both rate cuts and stronger economic growth than what has been observed in the last 12 months to generate prolonged growth in the equity market.
Each WisdomTree Fund’s performance as set forth in “Management’s Discussion of Funds’ Performance” in the pages that follow should also be viewed in light of the foregoing market performance.
| 2 | WisdomTree Trust |
Information about Performance and Shareholder Expense Examples (unaudited)
Performance
The performance tables on the following pages are provided for comparative purposes and represent the period noted. Each Fund’s per share net asset value (“NAV”) is the value of one share of the Fund and is calculated by dividing the value of total assets less total liabilities by the number of shares outstanding. The NAV return is based on the NAV of the Fund and the market price return is based on the market price per share of the Fund. The price used to calculate market price returns is the midpoint of the bid and ask price for Fund shares as of the close of trading on the exchange where Fund shares are listed. NAV and market price returns assume that dividends and capital gain distributions have been reinvested in the Fund at NAV and market price, respectively. As with other exchange traded funds (“ETFs”), NAV returns and market price returns may differ because of factors such as the supply and demand for Fund shares and investors’ assessments of the underlying value of a Fund’s portfolio securities.
Fund shares are bought and sold at market price (not NAV) and are not individually redeemed from a Fund. Fund NAV returns are calculated using a Fund’s daily 4:00 p.m. eastern time NAV. Market price returns reflect the midpoint of the bid and ask price as of the close of trading on the exchange where Fund shares are listed. Market price returns do not represent the returns you would receive if you traded shares at other times. The returns do not reflect the deduction of taxes that a shareholder would pay on Fund distributions or on the redemption of Fund shares. Total returns for a period of less than one year are cumulative.
Performance is historical and does not guarantee future results. Current performance may be lower or higher than quoted. Investment returns and the principal value of an investment will fluctuate so that an investor’s shares, when redeemed, may be worth more or less than their original cost. For the most recent month-end performance information visit www.wisdomtree.com/investments.
An index is a statistical measure of a specified financial market or sector. An index does not actually hold a portfolio of securities, incur expenses or pay any transaction costs. Therefore, index returns do not reflect deductions for fees or expenses and an index is not available for direct investment. In comparison, the Funds’ performance is negatively impacted by these deductions. Fund returns do not reflect brokerage commissions or taxes on transactions in Fund shares or taxes that a shareholder would pay on Fund distributions. Past performance is no guarantee of future results.
Shareholder Expense Examples
Each Fund’s performance table is accompanied by a shareholder expense example. As a shareholder of a WisdomTree Fund, you incur two types of cost: (1) transaction costs, including brokerage commissions on purchases and sales of your Fund shares and (2) ongoing costs, including management fees and other Fund expenses. The examples are intended to help you understand your ongoing costs (in dollars and cents) of investing in a Fund and to compare these costs with the ongoing costs of investing in other funds.
The examples are based on an investment of $1,000 invested at the beginning of the period and held for the entire period from October 1, 2023 to March 31, 2024. Except where noted, expenses are calculated using each Fund’s annualized expense ratio (after the effect of contractual or voluntary fee waivers, if any), multiplied by the average account value for the period, multiplied by 183/366 (to reflect the one-half year period). The annualized expense ratio does not include acquired fund fees and expenses (“AFFEs”), which are fees and expenses incurred indirectly by a Fund through its investments in certain underlying investment companies.
Actual expenses
The first line in the shareholder expense example table shown on the following pages provides information about actual account values and actual expenses. You may use the information in this line, together with the amount you invested, to estimate the expenses that you paid over the period. Simply divide your account value by $1,000 (for example, an $8,600 account value divided by $1,000 = 8.6), then multiply the result by the number in the first line for your Fund under the heading entitled “Expenses Paid During the Period” to estimate the expenses you paid on your account during the period.
Hypothetical example for comparison purposes
The second line in the shareholder expense example table shown on the following pages provides information about hypothetical account values and hypothetical expenses based on the Fund’s actual expense ratio and an assumed rate of return of 5% per year before expenses, which is not the Fund’s actual return. The hypothetical account values and expenses may not be used to estimate the actual ending account balance or expenses you paid for the period. You may use this information to compare the ongoing costs of investing in your Fund and other funds. To do so, compare this 5% hypothetical example with the 5% hypothetical examples that appear in the shareholder reports of the other funds.
Please note that the expenses shown in the table are meant to highlight your ongoing costs only and do not reflect any transactional costs, such as brokerage commissions paid on purchases and sales of Fund shares. Therefore, the second line in the table is useful in comparing ongoing Fund costs only and will not help you determine the relative total costs of owning different funds. In addition, if these transactional costs were included, your costs would have been higher.
| WisdomTree Trust | 3 |
Management’s Discussion of Funds’ Performance
as of March 31, 2024 (unaudited)
WisdomTree Europe Hedged Equity Fund (HEDJ)
Sector Breakdown†
| Sector | % of Net Assets | |||
Consumer Discretionary | 26.4% | |||
Industrials | 18.6% | |||
Financials | 15.2% | |||
Consumer Staples | 12.3% | |||
Information Technology | 9.4% | |||
Health Care | 6.3% | |||
Communication Services | 5.3% | |||
Materials | 4.6% | |||
Energy | 0.8% | |||
Utilities | 0.3% | |||
Other Assets less Liabilities‡ | 0.8% | |||
Total | 100.0% | |||
| † | The Fund’s sector breakdown is expressed as a percentage of net assets and may change over time. In addition, a sector may be comprised of several industries. It does not include derivatives (if any). |
| ‡ | Other assets less liabilities may include investment of cash collateral for securities on loan and/or receivables/payables on derivatives (if any). |
Top Ten Holdings*
| Description | % of Net Assets | |||
Stellantis NV | 9.7% | |||
Banco Bilbao Vizcaya Argentaria SA | 7.9% | |||
ASML Holding NV | 4.8% | |||
Siemens AG, Registered Shares | 3.8% | |||
Mercedes-Benz Group AG | 3.4% | |||
LVMH Moet Hennessy Louis Vuitton SE | 3.3% | |||
Bayerische Motoren Werke AG | 3.2% | |||
Deutsche Telekom AG, Registered Shares | 3.0% | |||
Banco Santander SA | 3.0% | |||
L’Oreal SA | 2.9% | |||
| * | The ten largest holdings are subject to change, and there are no guarantees the Fund will remain invested in any particular company. Excludes derivatives and investment of cash collateral for securities on loan (if any). |
The WisdomTree Europe Hedged Equity Fund (the “Fund”) seeks to track the price and yield performance, before fees and expenses, of the WisdomTree Europe Hedged Equity Index (the “Index”). In seeking to track the Index, the Fund invests in European dividend-paying companies while at the same time hedging exposure to the fluctuations of the value of the euro relative to the U.S. dollar. The Fund generally uses a representative sampling strategy to achieve its investment objective, meaning it generally will invest in a sample of securities in the Index.
The Fund returned 21.64% at net asset value (“NAV”) for the fiscal year ended March 31, 2024 (for more complete performance information please see the table below). Positions in the Information Technology and Financials sectors were additive, mainly due to strong stock selection in the former and positive allocation effects in the latter. Energy and Consumer Staples sectors were the main detractors due to slightly negative effects from stock selection. The Fund outperformed the MSCI European Economic and Monetary Union (EMU) Local Currency Index during the period, illustrating the success of the Fund’s tilt toward export-oriented companies. The euro slightly depreciated versus the U.S. dollar during the period, so the Fund’s static euro hedge also modestly enhanced returns.
Shareholder Expense Example (for the six-month period ended March 31, 2024)
| Beginning Account Value | Ending Account Value | Annualized Expense Ratio1 | Expenses Paid During the Period1 | |||||||||||||
Actual | $ | 1,000.00 | $ | 1,221.80 | 0.64 | % | $ | 3.55 | ||||||||
Hypothetical (5% return before expenses) | $ | 1,000.00 | $ | 1,021.80 | 0.64 | % | $ | 3.23 | ||||||||
| 1 | Included in the expense ratio are “Other fees” described in Note 6 which are not annualized. Without these expenses, the expense ratio would have been 0.58% and the actual and hypothetical expenses paid during the period would have been $3.22 and $2.93, respectively. |
Performance
| Average Annual Total Return | ||||||||||||||||
| 1 Year | 3 Year | 5 Year | 10 Year | |||||||||||||
Fund NAV Returns | 21.64 | % | 12.98 | % | 11.49 | % | 9.30 | % | ||||||||
Fund Market Price Returns | 21.84 | % | 13.03 | % | 11.53 | % | 9.31 | % | ||||||||
WisdomTree Europe Hedged Equity Index | 21.74 | % | 13.28 | % | 11.90 | % | 9.70 | % | ||||||||
MSCI European Economic and Monetary Union (EMU) Local Currency Index | 16.70 | % | 8.71 | % | 9.21 | % | 7.11 | % | ||||||||
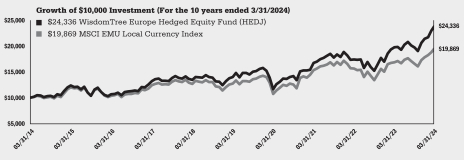
Performance is historical and does not guarantee future results. The returns do not reflect the deduction of taxes that a shareholder would pay on Fund distributions or on the redemption of Fund shares.
| 4 | WisdomTree Trust |
Management’s Discussion of Funds’ Performance
as of March 31, 2024 (unaudited)
WisdomTree Europe Hedged SmallCap Equity Fund (EUSC)
Sector Breakdown†
| Sector | % of Net Assets | |||
Industrials | 23.6% | |||
Financials | 20.1% | |||
Materials | 11.7% | |||
Utilities | 9.1% | |||
Consumer Discretionary | 7.3% | |||
Real Estate | 7.0% | |||
Information Technology | 5.7% | |||
Communication Services | 4.5% | |||
Consumer Staples | 4.2% | |||
Energy | 3.4% | |||
Health Care | 2.4% | |||
Other Assets less Liabilities‡ | 1.0% | |||
Total | 100.0% | |||
| † | The Fund’s sector breakdown is expressed as a percentage of net assets and may change over time. In addition, a sector may be comprised of several industries. It does not include derivatives (if any). |
| ‡ | Other assets less liabilities may include investment of cash collateral for securities on loan and/or receivables/payables on derivatives (if any). |
Top Ten Holdings*
| Description | % of Net Assets | |||
Banca Mediolanum SpA | 2.5% | |||
Rexel SA | 2.4% | |||
Banco BPM SpA | 2.3% | |||
HochTief AG | 1.8% | |||
Klepierre SA | 1.7% | |||
BE Semiconductor Industries NV | 1.7% | |||
Italgas SpA | 1.4% | |||
BAWAG Group AG | 1.4% | |||
Merlin Properties Socimi SA | 1.4% | |||
La Francaise des Jeux SAEM | 1.4% | |||
| * | The ten largest holdings are subject to change, and there are no guarantees the Fund will remain invested in any particular company. Excludes derivatives and investment of cash collateral for securities on loan (if any). |
The WisdomTree Europe Hedged SmallCap Equity Fund (the “Fund”) seeks to track the price and yield performance, before fees and expenses, of the WisdomTree Europe Hedged SmallCap Equity Index (the “Index”). In seeking to track the Index, the Fund invests in European small-cap dividend-paying companies while at the same time hedging exposure to fluctuations of the value of the euro relative to the U.S. dollar. The Fund generally uses a representative sampling strategy to achieve its investment objective, meaning it generally will invest in a sample of securities in the Index.
The Fund returned 17.76% at net asset value (“NAV”) for the fiscal year ended March 31, 2024 (for more complete performance information please see the table below). Positions in the Consumer Discretionary, Financials and Utilities sectors were additive, mainly due to strong stock selection in each. Health Care and Industrials sectors were the main detractors due to outsized negative effects from stock selection. Across dividend yield quintiles, all five had positive impacts on Fund performance due to a mix of allocation and stock selection effects throughout the group. The euro slightly depreciated versus the U.S. dollar during the period, so the Fund’s static euro hedge also modestly enhanced returns.
Shareholder Expense Example (for the six-month period ended March 31, 2024)
| Beginning Account Value | Ending Account Value | Annualized Expense Ratio1 | Expenses Paid During the Period1 | |||||||||||||
Actual | $ | 1,000.00 | $ | 1,167.40 | 0.60 | % | $ | 3.25 | ||||||||
Hypothetical (5% return before expenses) | $ | 1,000.00 | $ | 1,022.00 | 0.60 | % | $ | 3.03 | ||||||||
| 1 | Included in the expense ratio are “Other fees” described in Note 6 which are not annualized. Without these expenses, the expense ratio would have been 0.58% and the actual and hypothetical expenses paid during the period would have been $3.14 and $2.93, respectively. |
Performance
| Average Annual Total Return | ||||||||||||||||
| 1 Year | 3 Year | 5 Year | Since Inception1 | |||||||||||||
Fund NAV Returns | 17.76 | % | 8.18 | % | 8.90 | % | 8.32 | % | ||||||||
Fund Market Price Returns | 17.76 | % | 8.29 | % | 8.97 | % | 8.24 | % | ||||||||
WisdomTree Europe Hedged SmallCap Equity Index | 18.02 | % | 8.27 | % | 9.09 | % | 8.44 | % | ||||||||
MSCI European Economic and Monetary Union (EMU) Small Cap Local Currency Index | 9.23 | % | 2.85 | % | 7.53 | % | 7.01 | % | ||||||||
| 1 | Total returns are calculated based on the commencement of Fund trading on the NYSE Arca, Inc. on March 4, 2015. |
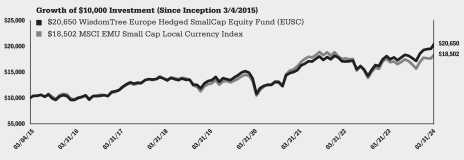
Performance is historical and does not guarantee future results. The returns do not reflect the deduction of taxes that a shareholder would pay on Fund distributions or on the redemption of Fund shares.
| WisdomTree Trust | 5 |
Management’s Discussion of Funds’ Performance
as of March 31, 2024 (unaudited)
WisdomTree International Hedged Quality Dividend Growth Fund (IHDG)
Sector Breakdown†
| Sector | % of Net Assets | |||
Consumer Discretionary | 21.0 | % | ||
Health Care | 18.3 | % | ||
Industrials | 17.8 | % | ||
Information Technology | 12.7 | % | ||
Materials | 9.6 | % | ||
Consumer Staples | 7.9 | % | ||
Financials | 4.8 | % | ||
Communication Services | 3.1 | % | ||
Utilities | 1.9 | % | ||
Real Estate | 1.0 | % | ||
Energy | 0.9 | % | ||
Investment Company | 0.1 | % | ||
Other Assets less Liabilities‡ | 0.9 | % | ||
Total | 100.0 | % | ||
| † | The Fund’s sector breakdown is expressed as a percentage of net assets and may change over time. In addition, a sector may be comprised of several industries. It does not include derivatives (if any). |
| ‡ | Other assets less liabilities may include investment of cash collateral for securities on loan and/or receivables/payables on derivatives (if any). |
Top Ten Holdings*
| Description | % of Net Assets | |||
LVMH Moet Hennessy Louis Vuitton SE | 4.9 | % | ||
Industria de Diseno Textil SA | 4.9 | % | ||
ASML Holding NV | 4.0 | % | ||
AstraZeneca PLC | 3.2 | % | ||
Novartis AG, Registered Shares | 3.1 | % | ||
Novo Nordisk AS, Class B | 3.0 | % | ||
Roche Holding AG, Bearer Shares | 2.9 | % | ||
Deutsche Post AG, Registered Shares | 2.6 | % | ||
Tokyo Electron Ltd. | 2.5 | % | ||
UBS Group AG, Registered Shares | 2.5 | % | ||
| * | The ten largest holdings are subject to change, and there are no guarantees the Fund will remain invested in any particular company. Excludes derivatives and investment of cash collateral for securities on loan (if any). |
The WisdomTree International Hedged Quality Dividend Growth Fund (the “Fund”) seeks to track the price and yield performance, before fees and expenses, of the WisdomTree International Hedged Quality Dividend Growth Index (the “Index”). In seeking to track the Index, the Fund invests in dividend-paying companies with growth characteristics in developed countries, excluding U.S. and Canada, while at the same time hedging exposure to fluctuations of the value of the applicable foreign currencies relative to the U.S. dollar. The Fund generally uses a representative sampling strategy to achieve its investment objective, meaning it generally will invest in a sample of securities in the Index.
The Fund returned 19.09% at net asset value (“NAV”) for the fiscal year ended March 31, 2024 (for more complete performance information please see the table below). The Fund benefited from positions in Information Technology, Health Care, and Real Estate sectors primarily due to stock selection in each. Industrials and Financials sectors were the two most significant detractors due to poor stock selection in the former and a blend of poor stock selection and negative allocation effects in the latter. Across countries, Spain, Hong Kong and Australia were additive all due to stock selection. France and Japan were the two greatest detractors mainly due to poor stock selection as well. Within return-on-equity (ROE) quintiles, positive performance was driven by the first and fifth quintiles, representing the highest and lowest ROE stocks, respectively. This was primarily due to stock selection in both. The second and fourth quintiles were the worst performing groups due to stock selection in the former and allocation effects in the latter. Among the G10 currencies, which comprise most of the major currencies from the developed international equity market universe, only the British pound and Swiss franc strengthened versus the U.S. dollar during the period. The Fund’s static hedge of those two currencies therefore had a negative performance effect for the Fund. The other currencies, however, all weakened relative to the U.S. dollar and resulted in a performance tailwind. This was most pronounced with the Japanese yen, which depreciated more than 12% during the period, resulting in positive effects from hedging.
Shareholder Expense Example (for the six-month period ended March 31, 2024)
| Beginning Account Value | Ending Account Value | Annualized Net Expense Ratio1 | Expenses Paid During the Period1 | |||||||||||||
Actual | $ | 1,000.00 | $ | 1,189.70 | 0.59 | % | $ | 3.23 | ||||||||
Hypothetical (5% return before expenses) | $ | 1,000.00 | $ | 1,022.05 | 0.59 | % | $ | 2.98 | ||||||||
| 1 | Included in the expense ratio are “Other fees” described in Note 6 which are not annualized. Without these expenses, the expense ratio would have been 0.58% and the actual and hypothetical expenses paid during the period would have been $3.18 and $2.93, respectively. |
Performance
| Average Annual Total Return | ||||||||||||||||
| 1 Year | 3 Year | 5 Year | Since Inception1 | |||||||||||||
Fund NAV Returns | 19.09 | % | 9.81 | % | 12.17 | % | 9.90 | % | ||||||||
Fund Market Price Returns | 18.77 | % | 9.77 | % | 12.17 | % | 9.84 | % | ||||||||
WisdomTree International Hedged Quality Dividend Growth Index | 19.84 | % | 10.46 | % | 12.83 | % | 10.57 | % | ||||||||
MSCI EAFE Local Currency Index | 18.82 | % | 9.43 | % | 9.36 | % | 7.71 | % | ||||||||
| 1 | Total returns are calculated based on the commencement of Fund trading on the NYSE Arca, Inc. on May 7, 2014. |
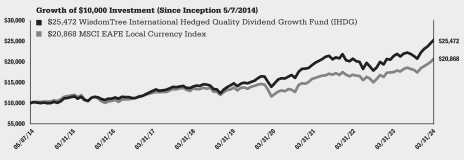
Performance is historical and does not guarantee future results. The returns do not reflect the deduction of taxes that a shareholder would pay on Fund distributions or on the redemption of Fund shares.
| 6 | WisdomTree Trust |
Management’s Discussion of Funds’ Performance
as of March 31, 2024 (unaudited)
WisdomTree Japan Hedged Equity Fund (DXJ)
Sector Breakdown†
| Sector | % of Net Assets | |||
Industrials | 24.1 | % | ||
Consumer Discretionary | 19.6 | % | ||
Financials | 15.7 | % | ||
Information Technology | 11.0 | % | ||
Materials | 10.4 | % | ||
Consumer Staples | 7.5 | % | ||
Health Care | 6.4 | % | ||
Communication Services | 2.5 | % | ||
Energy | 1.5 | % | ||
Utilities | 0.2 | % | ||
Other Assets less Liabilities‡ | 1.1 | % | ||
Total | 100.0 | % | ||
| † | The Fund’s sector breakdown is expressed as a percentage of net assets and may change over time. In addition, a sector may be comprised of several industries. It does not include derivatives (if any). |
| ‡ | Other assets less liabilities may include investment of cash collateral for securities on loan and/or receivables/payables on derivatives (if any). |
Top Ten Holdings*
| Description | % of Net Assets | |||
Toyota Motor Corp. | 5.7 | % | ||
Mitsubishi UFJ Financial Group, Inc. | 4.7 | % | ||
Mitsubishi Corp. | 3.9 | % | ||
Japan Tobacco, Inc. | 3.8 | % | ||
Shin-Etsu Chemical Co. Ltd. | 2.7 | % | ||
Sumitomo Mitsui Financial Group, Inc. | 2.5 | % | ||
Mizuho Financial Group, Inc. | 2.5 | % | ||
Tokyo Electron Ltd. | 2.2 | % | ||
Tokio Marine Holdings, Inc. | 1.9 | % | ||
Hitachi Ltd. | 1.9 | % | ||
| * | The ten largest holdings are subject to change, and there are no guarantees the Fund will remain invested in any particular company. Excludes derivatives and investment of cash collateral for securities on loan (if any). |
The WisdomTree Japan Hedged Equity Fund (the “Fund”) seeks to track the price and yield performance, before fees and expenses, of the WisdomTree Japan Hedged Equity Index (the “Index”). The Fund seeks to provide Japanese equity returns while mitigating or “hedging” against fluctuations between the value of the Japanese yen and the U.S. dollar. In seeking to track the Index, the Fund invests in Japanese dividend-paying companies with an exporter tilt while at the same time hedging exposure to fluctuations of the value of the Japanese yen relative to the U.S. dollar. The Fund generally uses a representative sampling strategy to achieve its investment objective, meaning it generally will invest in a sample of securities in the Index.
The Fund returned 58.99% at net asset value (“NAV”) for the fiscal year ended March 31, 2024 (for more complete performance information please see the table below). The Fund benefited from exposures to all sectors except for Real Estate, Utilities and Materials during the period. Most of the positive sector contributors resulted from positive stock selection. In the three laggards, Real Estate’s underperformance was attributable to poor stock selection. Utilities suffered from a mix of poor allocation and selection effects, and Materials was negatively impacted primarily by poor allocation effects. Across dividend yield quintiles, only the first quintile (representing the highest-yielding stocks) was a detractor, which was due to poor stock selection. The other four positive-contributing quintiles were driven by strong stock selection, with the fifth (lowest-yielding) quintile also getting a boost from positive allocation affects. The Japanese yen was also one of the worst performing global currencies versus the U.S. dollar over the period, declining over 12%. The Fund’s static yen hedge was very additive over the period and enhanced returns.
Shareholder Expense Example (for the six-month period ended March 31, 2024)
| Beginning Account Value | Ending Account Value | Annualized Expense Ratio | Expenses Paid During the Period | |||||||||||||
Actual | $ | 1,000.00 | $ | 1,257.10 | 0.48 | % | $ | 2.71 | ||||||||
Hypothetical (5% return before expenses) | $ | 1,000.00 | $ | 1,022.60 | 0.48 | % | $ | 2.43 | ||||||||
Performance
| Average Annual Total Return | ||||||||||||||||
| 1 Year | 3 Year | 5 Year | 10 Year | |||||||||||||
Fund NAV Returns | 58.99 | % | 25.20 | % | 20.13 | % | 12.93 | % | ||||||||
Fund Market Price Returns | 57.84 | % | 24.73 | % | 19.96 | % | 12.92 | % | ||||||||
WisdomTree Japan Hedged Equity Index | 60.33 | % | 25.90 | % | 20.73 | % | 13.67 | % | ||||||||
MSCI Japan Local Currency Index | 43.03 | % | 15.15 | % | 14.73 | % | 10.87 | % | ||||||||
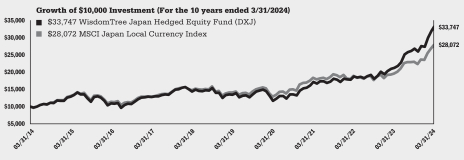
Performance is historical and does not guarantee future results. The returns do not reflect the deduction of taxes that a shareholder would pay on Fund distributions or on the redemption of Fund shares.
| WisdomTree Trust | 7 |
Management’s Discussion of Funds’ Performance
as of March 31, 2024 (unaudited)
WisdomTree Japan Hedged SmallCap Equity Fund (DXJS)
Sector Breakdown†
| Sector | % of Net Assets | |||
Industrials | 25.2% | |||
Consumer Discretionary | 16.3% | |||
Materials | 15.2% | |||
Information Technology | 14.8% | |||
Financials | 8.8% | |||
Consumer Staples | 7.9% | |||
Health Care | 4.0% | |||
Real Estate | 2.6% | |||
Communication Services | 1.9% | |||
Utilities | 1.2% | |||
Energy | 0.8% | |||
Other Assets less Liabilities‡ | 1.3% | |||
Total | 100.0% | |||
| † | The Fund’s sector breakdown is expressed as a percentage of net assets and may change over time. In addition, a sector may be comprised of several industries. It does not include derivatives (if any). |
| ‡ | Other assets less liabilities may include investment of cash collateral for securities on loan and/or receivables/payables on derivatives (if any). |
Top Ten Holdings*
| Description | % of Net Assets | |||
Horiba Ltd. | 1.2 | % | ||
Daido Steel Co. Ltd. | 0.8 | % | ||
Toyo Tire Corp. | 0.8 | % | ||
Tokyo Seimitsu Co. Ltd. | 0.7 | % | ||
DMG Mori Co. Ltd. | 0.6 | % | ||
Nippon Electric Glass Co. Ltd. | 0.6 | % | ||
Amano Corp. | 0.5 | % | ||
Gunma Bank Ltd. | 0.5 | % | ||
Mitsui Mining & Smelting Co. Ltd. | 0.5 | % | ||
Sangetsu Corp. | 0.5 | % | ||
| * | The ten largest holdings are subject to change, and there are no guarantees the Fund will remain invested in any particular company. Excludes derivatives and investment of cash collateral for securities on loan (if any). |
The WisdomTree Japan Hedged SmallCap Equity Fund (the “Fund”) seeks to track the price and yield performance, before fees and expenses, of the WisdomTree Japan Hedged SmallCap Equity Index (the “Index”). In seeking to track the Index, the Fund invests in Japanese small-cap dividend-paying companies while at the same time hedging exposure to fluctuations of the value of the Japanese yen relative to the U.S. dollar. The Fund generally uses a representative sampling strategy to achieve its investment objective, meaning it generally will invest in a sample of securities in the Index.
The Fund returned 43.87% at net asset value (“NAV”) for the fiscal year ended March 31, 2024 (for more complete performance information please see the table below). The Fund benefited from exposures to the Industrials sector due to an outsized impact in stock selection. The Real Estate sector also was a strong contributor due to a blend of allocation and stock selection effects. Utilities was the only sector detractor which resulted from poor stock selection effects. Across dividend yield quintiles, all were positive with the exception of the third quintile. These were mostly attributable to highly positive allocation effects. The third quintile’s poor impact was attributable to negative stock selection effects. The Japanese yen was also one of the worst performing global currencies versus the U.S. dollar over the period, declining over 12%. The Fund’s static yen hedge contributed positively over the period and enhanced returns.
Shareholder Expense Example (for the six-month period ended March 31, 2024)
| Beginning Account Value | Ending Account Value | Annualized Expense Ratio | Expenses Paid During the Period | |||||||||||||
Actual | $ | 1,000.00 | $ | 1,197.50 | 0.58 | % | $ | 3.19 | ||||||||
Hypothetical (5% return before expenses) | $ | 1,000.00 | $ | 1,022.10 | 0.58 | % | $ | 2.93 | ||||||||
Performance
| Average Annual Total Return | ||||||||||||||||
| 1 Year | 3 Year | 5 Year | 10 Year | |||||||||||||
Fund NAV Returns | 43.87 | % | 18.36 | % | 14.63 | % | 12.34 | % | ||||||||
Fund Market Price Returns | 41.98 | % | 17.80 | % | 14.30 | % | 12.24 | % | ||||||||
WisdomTree Japan Hedged SmallCap Equity Index | 44.99 | % | 19.00 | % | 15.28 | % | 13.06 | % | ||||||||
MSCI Japan Small Cap Local Currency Index | 30.08 | % | 10.66 | % | 10.66 | % | 10.28 | % | ||||||||
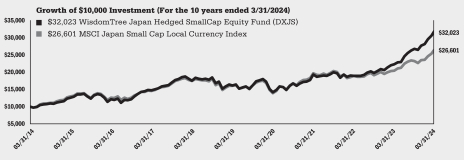
Performance is historical and does not guarantee future results. The returns do not reflect the deduction of taxes that a shareholder would pay on Fund distributions or on the redemption of Fund shares.
| 8 | WisdomTree Trust |
Description of Terms and Indexes (unaudited)
Below are descriptions of certain terms and of each Index referenced in this report:
Allocation Effect measures an investment manager’s ability to effectively allocate a portfolio’s assets to various segments. A segment refers to assets or securities that are grouped within a certain classification such as sectors, industries, or countries. The allocation effect determines whether the overweighting or underweighting of segments relative to a benchmark contributes positively or negatively to the overall portfolio return. Positive allocation occurs when the portfolio is overweighted in a segment that outperforms the benchmark and underweighted in a segment that underperforms the benchmark. Negative allocation occurs when the portfolio is overweighted in a segment that underperforms the benchmark and underweighted in a segment that outperforms the benchmark.
Growth is generally characterized by higher price levels relative to fundamentals, such as
dividends or earnings. Price levels are higher because investors are willing to pay more due to their expectations of future improvements in these fundamentals.
Gross Domestic Product (GDP) is the total monetary or market value of all the finished goods and services produced within a country’s borders in a specific time period. As a broad measure of overall domestic production, it functions as a comprehensive scorecard of a country’s economic health.
The MSCI EAFE Local Currency Index is a free float-adjusted market capitalization weighted index that is designed to measure developed market equity performance, excluding the U.S. and Canada, calculated in local currency.
The MSCI European Economic and Monetary Union (EMU) Local Currency Index is a free float-adjusted market capitalization weighted index that is designed to measure the equity market performance of the developed market countries within the EMU. The securities are priced in local currency terms with no conversion into U.S. dollars.
The MSCI European Economic and Monetary Union (EMU) Small Cap Local Currency
Index is a free float-adjusted market capitalization weighted index that captures small cap representation across the 10 Developed Market countries in the EMU and is calculated in local currency.
The MSCI Japan Local Currency Index is a free float-adjusted market capitalization index that is designed to measure developed market equity performance in Japan and calculated in local currency.
The MSCI Japan Small Cap Local Currency Index is a free float-adjusted market capitalization index that is designed to measure the performance of small cap stocks within Japan and calculated in local currency.
Price-to-earnings (P/E) ratio measures a company’s share price relative to its earnings per share.
Quality is generally characterized by higher efficiency and profitability. Typical measures include earnings, return-on-equity, return on assets, operating profitability as well as others. This term is also related to the quality factor, which associates these stock characteristics with excess returns vs. the market over time.
Quintiles refers to separating a universe of companies into five groups of equal size on the basis of dividend yield, price-to-earnings, or return-on-equity, as applicable.
Return-on-Equity (ROE) measures a corporation’s profitability by revealing how much profit a company generates with the money shareholders have invested.
Selection Effect measures an investment manager’s ability to select securities within a given segment relative to a benchmark. The over or underperformance of the portfolio is weighted by the benchmark weight, therefore, selection is not affected by the investment manager’s allocation to the segment. The weight of the segment in the portfolio determines the size of the effect — the larger the segment, the larger the effect is,
| WisdomTree Trust | 9 |
Description of Terms and Indexes (unaudited) (continued)
positive or negative. A positive selection effect occurs when the portfolio return is greater than the benchmark return. Thus, the investment manager made good decisions in selecting securities that, as a whole, outperformed similar securities in the benchmark. A
negative selection effect occurs when the portfolio return is less than the benchmark return. Thus, the investment manager made poor decisions in selecting securities that, as a whole, underperformed similar securities in the benchmark.
The WisdomTree Europe Hedged Equity Index is designed to provide exposure to European equities while at the same time neutralizing exposure to fluctuations between the Euro and the U.S. dollar.
The WisdomTree Europe Hedged SmallCap Equity Index is designed to provide exposure to the European equity markets while at the same time neutralizing exposure to fluctuations of the Euro movements relative to U.S. dollar.
The WisdomTree International Hedged Quality Dividend Growth Index is designed to provide exposure to the developed market companies while at the same time neutralizing exposure to fluctuations between the value of foreign currencies and the U.S. dollar.
The WisdomTree Japan Hedged Equity Index is designed to provide exposure to Japanese equity markets while at the same time neutralizing exposure to fluctuations of the Japanese Yen movements relative to the U.S. dollar.
The WisdomTree Japan Hedged SmallCap Equity Index is designed to provide exposure to the small-capitalization segment of the Japanese equity markets while at the same time neutralizing exposure to fluctuations of the Japanese Yen movements relative to the U.S. dollar.
The Global Industry Classification Standard (“GICS”) was developed by and is the exclusive property and a service mark of MSCI Inc. (“MSCI”) and Standard & Poor’s (“S&P”), a division of The McGraw-Hill Companies, Inc. and is licensed for use by WisdomTree, Inc. Neither MSCI, S&P nor any other party involved in making or compiling the GICS or any GICS classifications makes any express or implied warranties or representations with respect to such standard or classification (or the results to be obtained by the use thereof), and all such parties hereby expressly disclaim all warranties of originality, accuracy, completeness, merchantability and fitness for a particular purpose with respect to any such standard or classification. Without limiting any of the foregoing, in no event shall MSCI, S&P, any of their affiliates or any third party involved in making or compiling the GICS or any GICS classifications have any liability for any direct, indirect, special, punitive, consequential or any other damages (including lost profits) even if notified of the possibility of such damages.
Neither MSCI nor any other party involved in or related to compiling, computing or creating the MSCI data makes any express or implied warranties or representations with respect to such data (or the results to be obtained by the use thereof), and all such parties hereby expressly disclaim all warranties of originality, accuracy, completeness, merchantability or fitness for a particular purpose with respect to any such data. Without limiting any of the foregoing, in no event shall MSCI, any of its affiliates or any third party involved in or related to compiling, computing or creating the data have any liability for any direct, indirect, special, punitive, consequential or any other damages (including lost profits) even if notified of the possibility of such damages. No further distribution or dissemination of the MSCI data is permitted without MSCI’s express written consent.
WisdomTree, Inc. and WisdomTree Asset Management, Inc. (together, “WisdomTree”) and the Funds make no representation or warranty, express or implied, to the owners of shares of the Funds or any member of the public regarding the advisability of investing in securities generally or in the Funds particularly or the ability of the underlying Indexes to track the performance of their underlying securities. WisdomTree is the licensor of certain trademarks, service marks and trade names of the Funds. WisdomTree has no
| 10 | WisdomTree Trust |
Description of Terms and Indexes (unaudited) (concluded)
obligation to take the needs of the Funds or the owners of shares of the Funds into consideration in determining, composing, or calculating the underlying WisdomTree Indexes of the applicable Funds. WisdomTree is not responsible for, and has not participated in, the determination of the timing of, prices of, or quantities of shares of the Funds to be issued or in the determination or calculation of the equation by which the shares of the Funds are redeemable. WisdomTree and the Funds do not guarantee the accuracy, completeness, or performance of the underlying Indexes or the data included therein and shall have no liability in connection with the underlying Indexes or their calculation.
Index performance information assumes the reinvestment of dividends and excludes management fees, transaction costs and expenses. You cannot directly invest in an index.
* * * * * *
Abbreviations used in the schedules of investments and related tables included in this report are as follows:
| Currency abbreviations: | ||||||||||
| AUD | Australian dollar | ILS | Israeli new shekel | |||||||
| CHF | Swiss franc | JPY | Japanese yen | |||||||
| DKK | Danish krone | NOK | Norwegian krone | |||||||
| EUR | Euro | SEK | Swedish krona | |||||||
| GBP | British pound | SGD | Singapore dollar | |||||||
| HKD | Hong Kong dollar | USD | U.S. dollar | |||||||
| Other abbreviations: | ||||||||||
| CVA | Certificaten Van Aandelen (Certificate of Stock) | |||||||||
| WisdomTree Trust | 11 |
WisdomTree Europe Hedged Equity Fund (HEDJ)
March 31, 2024
| Investments | Shares | Value | ||||||
| COMMON STOCKS – 99.2% |
| |||||||
| Austria – 0.4% |
| |||||||
ANDRITZ AG | 114,750 | $ | 7,163,153 | |||||
| Belgium – 3.1% |
| |||||||
Anheuser-Busch InBev SA | 552,826 | 33,709,558 | ||||||
Azelis Group NV | 92,406 | 1,955,052 | ||||||
Barco NV | 63,608 | 1,048,998 | ||||||
Bekaert SA | 81,764 | 4,198,025 | ||||||
Fagron | 23,931 | 456,431 | ||||||
Melexis NV | 46,641 | 3,785,476 | ||||||
Solvay SA(a) | 143,824 | 3,929,847 | ||||||
UCB SA | 83,301 | 10,292,004 | ||||||
|
| |||||||
| Total Belgium |
| 59,375,391 | ||||||
| China – 0.4% |
| |||||||
Prosus NV | 234,208 | 7,354,365 | ||||||
| Finland – 3.7% |
| |||||||
Cargotec OYJ, Class B | 45,846 | 3,196,108 | ||||||
Huhtamaki OYJ(a) | 73,151 | 3,067,689 | ||||||
Kemira OYJ | 214,848 | 4,065,268 | ||||||
Kone OYJ, Class B | 439,971 | 20,498,775 | ||||||
Konecranes OYJ | 110,122 | 5,721,807 | ||||||
Metso OYJ(a) | 672,577 | 7,993,846 | ||||||
Nokia OYJ | 3,991,176 | 14,185,756 | ||||||
Valmet OYJ(a) | 260,878 | 6,871,839 | ||||||
Wartsila OYJ Abp(a) | 350,118 | 5,327,815 | ||||||
|
| |||||||
| Total Finland |
| 70,928,903 | ||||||
| France – 23.8% |
| |||||||
Accor SA(a) | 56,854 | 2,658,720 | ||||||
Air Liquide SA(a) | 138,626 | 28,871,247 | ||||||
Airbus SE(a) | 106,535 | 19,642,666 | ||||||
Arkema SA | 27,839 | 2,932,649 | ||||||
BioMerieux | 10,366 | 1,144,717 | ||||||
Bureau Veritas SA | 227,964 | 6,962,567 | ||||||
Cie Generale des Etablissements Michelin SCA(a) | 409,542 | 15,710,685 | ||||||
Cie Plastic Omnium SE | 48,741 | 635,895 | ||||||
Danone SA | 339,814 | 21,979,576 | ||||||
Dassault Aviation SA | 12,773 | 2,814,147 | ||||||
Dassault Systemes SE | 69,277 | 3,070,578 | ||||||
Eramet SA(a) | 15,080 | 1,147,377 | ||||||
EssilorLuxottica SA | 81,933 | 18,555,857 | ||||||
Gaztransport & Technigaz SA(a) | 10,423 | 1,559,072 | ||||||
Hermes International SCA(a) | 10,084 | 25,767,441 | ||||||
Imerys SA(a) | 53,608 | 1,828,376 | ||||||
Interparfums SA | 23,568 | 1,328,669 | ||||||
Ipsen SA | 8,408 | 1,001,595 | ||||||
IPSOS SA(a) | 12,037 | 849,547 | ||||||
Kering SA(a) | 38,536 | 15,247,075 | ||||||
L’Oreal SA(a) | 116,249 | 55,072,029 | ||||||
Lectra(a) | 5,630 | 196,701 | ||||||
Legrand SA | 85,945 | 9,116,839 | ||||||
LVMH Moet Hennessy Louis Vuitton SE(a) | 69,548 | 62,620,736 | ||||||
Neoen SA(a)(b) | 8,685 | 246,126 | ||||||
Nexans SA | 13,136 | 1,374,709 | ||||||
Pernod Ricard SA(a) | 68,345 | $ | 11,068,198 | |||||
Publicis Groupe SA(a) | 144,481 | 15,767,788 | ||||||
Remy Cointreau SA(a) | 10,054 | 1,014,601 | ||||||
Rubis SCA | 142,277 | 5,030,801 | ||||||
Safran SA | 55,554 | 12,602,646 | ||||||
Sanofi SA | 505,232 | 49,632,371 | ||||||
Schneider Electric SE(a) | 180,195 | 40,800,109 | ||||||
SCOR SE | 86,175 | 2,984,723 | ||||||
SEB SA | 12,495 | 1,600,459 | ||||||
Societe BIC SA | 20,242 | 1,447,222 | ||||||
Sodexo SA | 29,978 | 2,573,263 | ||||||
Technip Energies NV | 43,024 | 1,087,767 | ||||||
Teleperformance SE(a) | 19,681 | 1,914,694 | ||||||
Valeo SE(a) | 74,713 | 935,198 | ||||||
Vicat SACA | 23,123 | 912,757 | ||||||
|
| |||||||
| Total France |
| 451,708,193 | ||||||
| Germany – 24.0% |
| |||||||
AIXTRON SE | 10,266 | 271,638 | ||||||
Bayer AG, Registered Shares | 534,276 | 16,404,623 | ||||||
Bayerische Motoren Werke AG | 519,455 | 60,005,775 | ||||||
Beiersdorf AG | 19,169 | 2,793,805 | ||||||
Brenntag SE | 40,594 | 3,423,146 | ||||||
Continental AG | 42,479 | 3,069,192 | ||||||
Daimler Truck Holding AG | 337,849 | 17,134,619 | ||||||
Deutsche Telekom AG, Registered Shares | 2,374,119 | 57,691,087 | ||||||
Duerr AG | 21,529 | 498,043 | ||||||
Elmos Semiconductor SE | 1,662 | 132,648 | ||||||
Evonik Industries AG | 296,934 | 5,876,620 | ||||||
Fresenius Medical Care AG | 97,573 | 3,756,755 | ||||||
GEA Group AG | 52,129 | 2,206,370 | ||||||
Hannover Rueck SE | 48,710 | 13,346,344 | ||||||
Heidelberg Materials AG | 103,073 | 11,348,955 | ||||||
Henkel AG & Co. KGaA | 73,247 | 5,281,167 | ||||||
HochTief AG | 45,048 | 5,239,803 | ||||||
Hugo Boss AG | 15,738 | 928,378 | ||||||
Infineon Technologies AG | 140,286 | 4,774,802 | ||||||
Jenoptik AG | 6,237 | 193,996 | ||||||
K & S AG, Registered Shares | 107,348 | 1,676,432 | ||||||
Knorr-Bremse AG | 40,760 | 3,085,858 | ||||||
Krones AG | 6,136 | 813,118 | ||||||
Lanxess AG | 41,114 | 1,101,641 | ||||||
Mercedes-Benz Group AG | 819,447 | 65,322,048 | ||||||
Merck KGaA | 19,468 | 3,439,762 | ||||||
MTU Aero Engines AG | 9,527 | 2,420,010 | ||||||
Muenchener Rueckversicherungs-Gesellschaft AG in Muenchen, Registered Shares | 59,168 | 28,902,619 | ||||||
Puma SE | 19,649 | 891,703 | ||||||
SAP SE | 184,590 | 35,975,997 | ||||||
Siemens AG, Registered Shares | 382,714 | 73,143,069 | ||||||
Siemens Healthineers AG*(b) | 217,898 | 13,347,907 | ||||||
Siltronic AG | 10,940 | 971,209 | ||||||
Stabilus SE | 9,626 | 613,369 | ||||||
Symrise AG | 14,094 | 1,688,828 | ||||||
Talanx AG | 118,148 | 9,365,828 | ||||||
|
| |||||||
| Total Germany |
| 457,137,164 | ||||||
See Notes to Financial Statements.
| 12 | WisdomTree Trust |
Schedule of Investments (continued)
WisdomTree Europe Hedged Equity Fund (HEDJ)
March 31, 2024
| Investments | Shares | Value | ||||||
| Ireland – 0.5% |
| |||||||
Glanbia PLC(a) | 197,942 | $ | 3,907,850 | |||||
Kerry Group PLC, Class A | 58,190 | 4,992,422 | ||||||
|
| |||||||
| Total Ireland |
| 8,900,272 | ||||||
| Italy – 3.1% |
| |||||||
Brembo SpA | 288,553 | 3,699,134 | ||||||
Brunello Cucinelli SpA(a) | 17,376 | 1,989,204 | ||||||
Carel Industries SpA(a)(b) | 19,668 | 432,263 | ||||||
Davide Campari-Milano NV(a) | 155,418 | 1,563,368 | ||||||
DiaSorin SpA(a) | 17,231 | 1,665,548 | ||||||
Ferrari NV | 37,623 | 16,415,666 | ||||||
Intercos SpA(a) | 45,524 | 659,807 | ||||||
Leonardo SpA | 190,442 | 4,788,169 | ||||||
Maire Tecnimont SpA | 302,226 | 2,371,325 | ||||||
Moncler SpA | 125,850 | 9,402,807 | ||||||
Piaggio & C SpA | 949,495 | 3,006,633 | ||||||
Prysmian SpA | 157,854 | 8,249,639 | ||||||
Reply SpA | 9,449 | 1,338,885 | ||||||
Salvatore Ferragamo SpA(a) | 81,662 | 993,957 | ||||||
Webuild SpA(a) | 772,970 | 1,871,639 | ||||||
|
| |||||||
| Total Italy |
| 58,448,044 | ||||||
| Netherlands – 16.2% |
| |||||||
Aegon Ltd.(a) | 2,541,134 | 15,505,998 | ||||||
Akzo Nobel NV | 118,035 | 8,818,914 | ||||||
Arcadis NV | 39,403 | 2,415,010 | ||||||
ASM International NV | 7,195 | 4,397,382 | ||||||
ASML Holding NV | 94,987 | 91,527,186 | ||||||
BE Semiconductor Industries NV | 78,523 | 12,033,806 | ||||||
Corbion NV | 42,739 | 916,239 | ||||||
Ferrovial SE | 410,130 | 16,247,053 | ||||||
Heineken Holding NV | 171,427 | 13,848,558 | ||||||
Heineken NV(a) | 292,409 | 28,213,723 | ||||||
IMCD NV | 26,535 | 4,681,251 | ||||||
JDE Peet’s NV(a) | 299,571 | 6,296,023 | ||||||
Koninklijke Ahold Delhaize NV | 1,256,414 | 37,614,017 | ||||||
Koninklijke Vopak NV | 169,127 | 6,526,340 | ||||||
SBM Offshore NV(a) | 358,653 | 5,728,836 | ||||||
Signify NV(b) | 176,194 | 5,438,474 | ||||||
Universal Music Group NV | 880,203 | 26,503,262 | ||||||
Wolters Kluwer NV | 135,961 | 21,320,858 | ||||||
|
| |||||||
| Total Netherlands |
| 308,032,930 | ||||||
| Portugal – 0.1% |
| |||||||
Mota-Engil SGPS SA | 328,439 | 1,707,948 | ||||||
| Spain – 13.9% |
| |||||||
Acerinox SA | 379,062 | 4,161,418 | ||||||
ACS Actividades de Construccion y Servicios SA | 344,482 | 14,427,732 | ||||||
Amadeus IT Group SA | 190,314 | 12,217,244 | ||||||
Banco Bilbao Vizcaya Argentaria SA(a) | 12,537,616 | 149,488,491 | ||||||
Banco Santander SA | 11,698,024 | 57,124,020 | ||||||
CIE Automotive SA | 114,367 | 3,285,535 | ||||||
Ebro Foods SA(a) | 69,389 | 1,157,075 | ||||||
Elecnor SA | 54,252 | 1,127,899 | ||||||
Fluidra SA | 177,027 | 4,190,866 | ||||||
Gestamp Automocion SA(b) | 686,102 | 2,208,151 | ||||||
Mapfre SA(a) | 5,179,486 | 13,100,784 | ||||||
Viscofan SA(a) | 36,574 | 2,326,545 | ||||||
|
| |||||||
| Total Spain |
| 264,815,760 | ||||||
| Switzerland – 0.3% |
| |||||||
STMicroelectronics NV | 130,181 | 5,612,571 | ||||||
| United States – 9.7% |
| |||||||
Stellantis NV | 6,458,737 | 183,767,846 | ||||||
TOTAL COMMON STOCKS (Cost: $1,403,912,239) |
| 1,884,952,540 | ||||||
| INVESTMENT OF CASH COLLATERAL FOR SECURITIES LOANED – 2.6% |
| |||||||
| United States – 2.6% |
| |||||||
State Street Navigator Securities Lending Government Money Market Portfolio, 5.34%(c) | ||||||||
| (Cost: $49,889,495) | 49,889,495 | 49,889,495 | ||||||
| TOTAL INVESTMENTS IN SECURITIES – 101.8% |
| |||||||
(Cost: $1,453,801,734) |
| 1,934,842,035 | ||||||
Other Assets less Liabilities – (1.8)% |
| (34,847,338 | ) | |||||
|
| |||||||
| NET ASSETS – 100.0% |
| $ | 1,899,994,697 | |||||
| * | Non-income producing security. |
| (a) | Security, or portion thereof, was on loan at March 31, 2024 (See Note 2). At March 31, 2024, the total market value of the Fund’s securities on loan identified in the Schedule of Investments was $142,839,982 and the total market value of the collateral held by the Fund was $150,987,241. The total market value of the collateral includes non-cash U.S. Government securities collateral having a value of $101,097,746. |
| (b) | This security is exempt from registration under rule 144A of the Securities Act of 1933. This security may be sold in transactions that are exempt from registration, normally to qualified institutional buyers. |
| (c) | Rate shown represents annualized 7-day yield as of March 31, 2024. |
| FINANCIAL DERIVATIVE INSTRUMENTS | ||||||||||||||||||||||||||||
| FOREIGN CURRENCY CONTRACTS (OTC – OVER THE COUNTER) | ||||||||||||||||||||||||||||
| Counterparty | Settlement Date | Amount and Description of be Purchased | Amount and Description of be Sold | Unrealized Appreciation | Unrealized Depreciation | |||||||||||||||||||||||
Bank of America NA | 4/4/2024 | 337,472,747 | EUR | 364,484,066 | USD | $ | 594 | $ | — | |||||||||||||||||||
Bank of America NA | 4/4/2024 | 338,614,474 | USD | 312,516,358 | EUR | 1,083,756 | — | |||||||||||||||||||||
Bank of America NA | 5/6/2024 | 379,973,138 | USD | 351,365,000 | EUR | — | (3,624 | ) | ||||||||||||||||||||
Barclays Bank PLC | 4/4/2024 | 337,473,060 | EUR | 364,484,066 | USD | 932 | — | |||||||||||||||||||||
See Notes to Financial Statements.
| WisdomTree Trust | 13 |
Schedule of Investments (concluded)
WisdomTree Europe Hedged Equity Fund (HEDJ)
March 31, 2024
| FINANCIAL DERIVATIVE INSTRUMENTS | ||||||||||||||||||||||||||||
| FOREIGN CURRENCY CONTRACTS (OTC – OVER THE COUNTER) | ||||||||||||||||||||||||||||
| Counterparty | Settlement Date | Amount and Description of be Purchased | Amount and Description of be Sold | Unrealized Appreciation | Unrealized Depreciation | |||||||||||||||||||||||
Barclays Bank PLC | 4/4/2024 | 338,614,474 | USD | 312,517,973 | EUR | $ | 1,082,012 | $ | — | |||||||||||||||||||
Barclays Bank PLC | 4/4/2024 | 34,646,775 | USD | 31,833,666 | EUR | 265,087 | — | |||||||||||||||||||||
Barclays Bank PLC | 4/4/2024 | 9,239,140 | USD | 8,447,453 | EUR | 115,538 | — | |||||||||||||||||||||
Barclays Bank PLC | 5/6/2024 | 379,973,138 | USD | 351,365,325 | EUR | — | (3,976 | ) | ||||||||||||||||||||
Citibank NA | 4/4/2024 | 337,475,245 | EUR | 364,484,064 | USD | 3,294 | — | |||||||||||||||||||||
Citibank NA | 5/6/2024 | 379,973,134 | USD | 351,366,296 | EUR | — | (5,030 | ) | ||||||||||||||||||||
HSBC Holdings PLC | 4/4/2024 | 338,614,474 | USD | 312,517,973 | EUR | 1,082,012 | — | |||||||||||||||||||||
HSBC Holdings PLC | 4/4/2024 | 4,619,570 | USD | 4,269,596 | EUR | 8,229 | — | |||||||||||||||||||||
JP Morgan Chase Bank NA | 4/4/2024 | 30,027,205 | USD | 27,748,403 | EUR | 57,770 | — | |||||||||||||||||||||
Morgan Stanley & Co. International | 4/4/2024 | 337,475,560 | EUR | 364,484,066 | USD | 3,632 | — | |||||||||||||||||||||
Morgan Stanley & Co. International | 4/4/2024 | 338,614,474 | USD | 312,517,685 | EUR | 1,082,323 | — | |||||||||||||||||||||
Morgan Stanley & Co. International | 5/6/2024 | 379,973,138 | USD | 351,366,299 | EUR | — | (5,030 | ) | ||||||||||||||||||||
Royal Bank of Canada | 4/4/2024 | 337,476,184 | EUR | 364,484,066 | USD | 4,306 | — | |||||||||||||||||||||
Royal Bank of Canada | 4/4/2024 | 338,614,472 | USD | 312,517,971 | EUR | 1,082,012 | — | |||||||||||||||||||||
Royal Bank of Canada | 5/6/2024 | 379,973,138 | USD | 351,367,274 | EUR | — | (6,084 | ) | ||||||||||||||||||||
Standard Chartered Bank | 4/4/2024 | 16,168,495 | USD | 14,903,363 | EUR | 72,240 | — | |||||||||||||||||||||
Standard Chartered Bank | 4/4/2024 | 11,548,925 | USD | 10,618,334 | EUR | 80,681 | — | |||||||||||||||||||||
Standard Chartered Bank | 4/4/2024 | 23,097,850 | USD | 21,153,233 | EUR | 251,475 | — | |||||||||||||||||||||
| $ | 6,275,893 | $ | (23,744 | ) | ||||||||||||||||||||||||
| FAIR VALUATION SUMMARY |
The following is a summary of the fair valuations according to the inputs used in valuing the Fund’s investments (See Note 2 — Fair Value Measurement):
Quoted Prices in Active Markets | Other Significant Observable Inputs | Significant Unobservable Inputs | Total | |||||||||||||
Assets: | ||||||||||||||||
Investments in Securities | ||||||||||||||||
Common Stocks | $ | 1,884,952,540 | $ | — | $ | — | $ | 1,884,952,540 | ||||||||
Investment of Cash Collateral for Securities Loaned | — | 49,889,495 | — | 49,889,495 | ||||||||||||
Total Investments in Securities | $ | 1,884,952,540 | $ | 49,889,495 | $ | — | $ | 1,934,842,035 | ||||||||
Financial Derivative Instruments | ||||||||||||||||
Foreign Currency Contracts1 | $ | — | $ | 6,275,893 | $ | — | $ | 6,275,893 | ||||||||
Liabilities: | ||||||||||||||||
Financial Derivative Instruments | ||||||||||||||||
Foreign Currency Contracts1 | $ | — | $ | (23,744 | ) | $ | — | $ | (23,744 | ) | ||||||
Total – Net | $ | 1,884,952,540 | $ | 56,141,644 | $ | — | $ | 1,941,094,184 | ||||||||
| 1 | Amount shown represents the unrealized appreciation (depreciation) on the financial instrument. |
See Notes to Financial Statements.
| 14 | WisdomTree Trust |
Schedule of Investments
WisdomTree Europe Hedged SmallCap Equity Fund (EUSC)
March 31, 2024
| Investments | Shares | Value | ||||||
| COMMON STOCKS – 99.0% |
| |||||||
| Austria – 5.5% |
| |||||||
ANDRITZ AG | 6,967 | $ | 434,908 | |||||
BAWAG Group AG*(a) | 9,866 | 625,465 | ||||||
CA Immobilien Anlagen AG | 4,653 | 164,325 | ||||||
Kontron AG | 4,553 | 100,508 | ||||||
Oesterreichische Post AG | 1,841 | 62,929 | ||||||
Porr AG | 1,793 | 27,498 | ||||||
Schoeller-Bleckmann Oilfield Equipment AG | 954 | 45,643 | ||||||
Telekom Austria AG* | 13,428 | 112,392 | ||||||
UNIQA Insurance Group AG | 12,004 | 103,844 | ||||||
Vienna Insurance Group AG Wiener Versicherung Gruppe | 2,309 | 72,069 | ||||||
voestalpine AG | 15,937 | 447,511 | ||||||
Wienerberger AG | 6,024 | 219,640 | ||||||
|
| |||||||
| Total Austria |
| 2,416,732 | ||||||
| Belgium – 5.0% |
| |||||||
Ackermans & van Haaren NV | 1,016 | 177,759 | ||||||
Aedifica SA | 4,700 | 289,078 | ||||||
Azelis Group NV | 5,615 | 118,798 | ||||||
Barco NV | 4,066 | 67,055 | ||||||
Bekaert SA | 4,744 | 243,572 | ||||||
bpost SA | 17,801 | 66,596 | ||||||
Cofinimmo SA | 4,869 | 318,929 | ||||||
Colruyt Group NV | 3,679 | 170,137 | ||||||
Econocom Group SA | 12,323 | 28,281 | ||||||
Fagron | 1,693 | 32,290 | ||||||
Melexis NV | 2,822 | 229,039 | ||||||
Recticel SA(b) | 3,030 | 35,735 | ||||||
Warehouses De Pauw CVA | 12,137 | 346,837 | ||||||
Xior Student Housing NV(b)(c) | 3,145 | 95,105 | ||||||
|
| |||||||
| Total Belgium |
| 2,219,211 | ||||||
| Denmark – 0.1% |
| |||||||
Cementir Holding NV | 5,422 | 61,368 | ||||||
| Finland – 9.0% |
| |||||||
Aktia Bank OYJ | 2,796 | 30,257 | ||||||
Cargotec OYJ, Class B | 2,727 | 190,110 | ||||||
Citycon OYJ*(b) | 23,207 | 95,893 | ||||||
Harvia OYJ(c) | 1,133 | 46,890 | ||||||
Huhtamaki OYJ | 4,526 | 189,804 | ||||||
Kemira OYJ | 8,908 | 168,554 | ||||||
Kesko OYJ, Class B | 25,206 | 471,357 | ||||||
Konecranes OYJ | 6,743 | 350,358 | ||||||
Marimekko OYJ | 1,920 | 25,775 | ||||||
Metsa Board OYJ, Class B(b) | 33,308 | 252,528 | ||||||
Metso OYJ | 41,124 | 488,774 | ||||||
Musti Group OYJ* | 1,245 | 33,588 | ||||||
Orion OYJ, Class B | 6,164 | 230,137 | ||||||
Outokumpu OYJ(b) | 40,626 | 176,821 | ||||||
Puuilo OYJ | 7,161 | 76,604 | ||||||
Sanoma OYJ | 5,049 | 37,135 | ||||||
Terveystalo OYJ(a)(b) | 4,553 | 37,076 | ||||||
TietoEVRY OYJ(b) | 12,098 | 256,221 | ||||||
Tokmanni Group Corp. | 2,622 | 42,986 | ||||||
Valmet OYJ(b) | 16,235 | 427,649 | ||||||
Wartsila OYJ Abp(b) | 21,372 | 325,222 | ||||||
|
| |||||||
| Total Finland |
| 3,953,739 | ||||||
| France – 20.5% |
| |||||||
Alten SA | 678 | 98,999 | ||||||
Antin Infrastructure Partners SA | 3,060 | 44,417 | ||||||
Arkema SA | 4,090 | 430,854 | ||||||
Beneteau SACA | 4,369 | 64,549 | ||||||
Chargeurs SA | 3,671 | 47,418 | ||||||
Cie des Alpes | 3,293 | 48,012 | ||||||
Cie Plastic Omnium SE | 7,584 | 98,944 | ||||||
Coface SA | 16,138 | 255,335 | ||||||
Derichebourg SA | 17,177 | 81,662 | ||||||
Elis SA | 12,627 | 287,199 | ||||||
Eramet SA | 2,074 | 157,802 | ||||||
Etablissements Maurel & Prom SA | 11,395 | 68,855 | ||||||
Eurazeo SE | 4,479 | 393,032 | ||||||
Fnac Darty SA | 2,426 | 76,035 | ||||||
Gaztransport & Technigaz SA | 1,432 | 214,199 | ||||||
Imerys SA | 7,048 | 240,382 | ||||||
Interparfums SA | 3,140 | 177,021 | ||||||
IPSOS SA | 1,755 | 123,864 | ||||||
Klepierre SA(b) | 29,608 | 767,439 | ||||||
La Francaise des Jeux SAEM(a) | 14,606 | 595,960 | ||||||
Lectra | 1,124 | 39,270 | ||||||
Mersen SA | 2,005 | 78,929 | ||||||
Neoen SA(a) | 1,131 | 32,052 | ||||||
Nexans SA | 1,842 | 192,769 | ||||||
Quadient SA | 1,691 | 34,809 | ||||||
Remy Cointreau SA | 1,279 | 129,071 | ||||||
Rexel SA | 38,747 | 1,047,424 | ||||||
Rubis SCA | 14,784 | 522,750 | ||||||
SCOR SE | 12,423 | 430,278 | ||||||
SEB SA | 1,995 | 255,536 | ||||||
Societe BIC SA | 2,581 | 184,531 | ||||||
Sopra Steria Group | 723 | 175,220 | ||||||
SPIE SA | 10,425 | 392,038 | ||||||
Technip Energies NV | 6,211 | 157,031 | ||||||
Television Francaise 1 SA(b) | 17,052 | 155,985 | ||||||
Valeo SE | 10,687 | 133,771 | ||||||
Verallia SA(a) | 11,196 | 435,784 | ||||||
Vicat SACA | 1,985 | 78,356 | ||||||
Wendel SE | 2,733 | 279,225 | ||||||
|
| |||||||
| Total France |
| 9,026,807 | ||||||
| Germany – 12.2% |
| |||||||
7C Solarparken AG | 6,668 | 22,396 | ||||||
AIXTRON SE | 1,767 | 46,755 | ||||||
Aurubis AG | 1,410 | 99,256 | ||||||
Bechtle AG | 2,718 | 143,778 | ||||||
Bilfinger SE | 1,944 | 90,909 | ||||||
CompuGroup Medical SE & Co. KGaA | 1,130 | 34,806 | ||||||
CTS Eventim AG & Co. KGaA | 3,656 | 325,552 | ||||||
Dermapharm Holding SE | 2,006 | 70,714 | ||||||
Deutz AG | 10,185 | 64,734 | ||||||
See Notes to Financial Statements.
| WisdomTree Trust | 15 |
Schedule of Investments (continued)
WisdomTree Europe Hedged SmallCap Equity Fund (EUSC)
March 31, 2024
| Investments | Shares | Value | ||||||
Duerr AG | 3,491 | $ | 80,759 | |||||
Elmos Semiconductor SE | 288 | 22,986 | ||||||
Fielmann Group AG | 2,127 | 97,767 | ||||||
Freenet AG | 11,469 | 323,040 | ||||||
GEA Group AG | 7,306 | 309,228 | ||||||
Gerresheimer AG | 670 | 75,544 | ||||||
Hamborner REIT AG | 4,757 | 35,244 | ||||||
Hamburger Hafen und Logistik AG* | 2,737 | 49,069 | ||||||
Hensoldt AG | 1,512 | 70,936 | ||||||
HochTief AG | 6,638 | 772,105 | ||||||
Hugo Boss AG | 2,599 | 153,314 | ||||||
Instone Real Estate Group SE(a) | 4,176 | 40,275 | ||||||
Jenoptik AG | 1,150 | 35,770 | ||||||
K & S AG, Registered Shares | 15,963 | 249,291 | ||||||
KION Group AG | 1,182 | 62,271 | ||||||
Kloeckner & Co. SE | 10,093 | 73,578 | ||||||
Krones AG | 849 | 112,506 | ||||||
Lanxess AG | 5,836 | 156,374 | ||||||
MLP SE | 5,605 | 33,960 | ||||||
Mutares SE & Co. KGaA | 1,526 | 60,814 | ||||||
Nemetschek SE | 1,042 | 103,218 | ||||||
Norma Group SE | 1,515 | 28,192 | ||||||
SAF-Holland SE | 4,554 | 92,907 | ||||||
Salzgitter AG | 3,666 | 95,815 | ||||||
Scout24 SE(a) | 1,774 | 133,846 | ||||||
Siltronic AG | 1,517 | 134,673 | ||||||
Sixt SE | 2,129 | 212,572 | ||||||
Stabilus SE | 1,453 | 92,585 | ||||||
Stroeer SE & Co. KGaA | 4,446 | 270,815 | ||||||
Suedzucker AG | 13,328 | 191,299 | ||||||
thyssenkrupp AG | 20,060 | 107,761 | ||||||
United Internet AG, Registered Shares | 6,365 | 143,396 | ||||||
Wacker Neuson SE | 3,064 | 56,784 | ||||||
|
| |||||||
| Total Germany |
| 5,377,594 | ||||||
| Ireland – 0.8% |
| |||||||
Cairn Homes PLC | 47,220 | 81,392 | ||||||
Glanbia PLC | 12,210 | 241,055 | ||||||
Origin Enterprises PLC | 8,927 | 30,370 | ||||||
|
| |||||||
| Total Ireland |
| 352,817 | ||||||
| Italy – 24.2% |
| |||||||
A2A SpA | 322,362 | 582,631 | ||||||
ACEA SpA | 21,283 | 377,424 | ||||||
Amplifon SpA(b) | 3,505 | 127,946 | ||||||
Anima Holding SpA(a) | 25,930 | 123,219 | ||||||
Ariston Holding NV(b) | 4,544 | 25,544 | ||||||
Arnoldo Mondadori Editore SpA | 27,172 | 68,376 | ||||||
Ascopiave SpA | 15,142 | 38,676 | ||||||
Azimut Holding SpA | 13,027 | 354,261 | ||||||
Banca Generali SpA | 12,973 | 515,879 | ||||||
Banca IFIS SpA | 9,610 | 188,375 | ||||||
Banca Mediolanum SpA | 99,812 | 1,097,373 | ||||||
Banca Popolare di Sondrio SpA | 35,229 | 264,048 | ||||||
Banco BPM SpA | 152,967 | 1,018,980 | ||||||
BPER Banca | 77,622 | 367,183 | ||||||
Brembo SpA | 19,252 | 246,803 | ||||||
Brunello Cucinelli SpA(b) | 1,167 | 133,598 | ||||||
Buzzi SpA | 6,978 | 274,319 | ||||||
Cairo Communication SpA | 19,183 | 41,435 | ||||||
Carel Industries SpA(a) | 1,422 | 31,253 | ||||||
Credito Emiliano SpA | 17,041 | 170,608 | ||||||
Danieli & C Officine Meccaniche SpA(b) | 1,777 | 63,140 | ||||||
Datalogic SpA | 4,958 | 30,736 | ||||||
De’ Longhi SpA | 4,746 | 164,329 | ||||||
DiaSorin SpA | 1,022 | 98,786 | ||||||
El.En. SpA(b) | 3,081 | 39,065 | ||||||
Enav SpA(a) | 47,175 | 197,682 | ||||||
ERG SpA(b) | 8,603 | 216,300 | ||||||
Hera SpA | 97,033 | 342,263 | ||||||
Intercos SpA | 2,418 | 35,046 | ||||||
Interpump Group SpA | 1,803 | 87,996 | ||||||
Iren SpA | 104,538 | 213,835 | ||||||
Italgas SpA | 108,367 | 631,996 | ||||||
Italian Sea Group SpA | 4,586 | 49,826 | ||||||
Leonardo SpA | 11,744 | 295,272 | ||||||
Maire Tecnimont SpA | 18,720 | 146,881 | ||||||
MARR SpA | 3,269 | 41,589 | ||||||
OVS SpA(a) | 14,893 | 39,182 | ||||||
Piaggio & C SpA | 56,081 | 177,584 | ||||||
RAI Way SpA(a) | 19,699 | 110,417 | ||||||
Reply SpA | 591 | 83,742 | ||||||
Salcef Group SpA | 2,613 | 64,625 | ||||||
Salvatore Ferragamo SpA(b) | 5,777 | 70,315 | ||||||
Sanlorenzo SpA | 1,005 | 45,750 | ||||||
Saras SpA | 149,146 | 285,430 | ||||||
SOL SpA(b) | 2,046 | 73,251 | ||||||
Spaxs SpA* | 4,866 | 25,541 | ||||||
Technogym SpA(a) | 14,654 | 145,602 | ||||||
Tinexta SpA | 2,200 | 45,168 | ||||||
Unipol Gruppo SpA | 70,902 | 594,675 | ||||||
Webuild SpA(b) | 47,174 | 114,225 | ||||||
Zignago Vetro SpA | 6,853 | 98,140 | ||||||
|
| |||||||
| Total Italy |
| 10,676,320 | ||||||
| Netherlands – 6.8% |
| |||||||
Aalberts NV | 5,713 | 275,122 | ||||||
AMG Critical Materials NV | 1,481 | 33,653 | ||||||
Arcadis NV(b) | 2,336 | 143,174 | ||||||
BE Semiconductor Industries NV(b) | 4,775 | 731,778 | ||||||
Brunel International NV | 2,317 | 25,474 | ||||||
Corbion NV | 2,820 | 60,455 | ||||||
ForFarmers NV(b) | 9,112 | 25,537 | ||||||
IMCD NV(b) | 1,623 | 286,327 | ||||||
Koninklijke BAM Groep NV | 28,636 | 108,615 | ||||||
Koninklijke Heijmans NV | 4,549 | 84,306 | ||||||
Koninklijke Vopak NV(b) | 10,327 | 398,502 | ||||||
SBM Offshore NV(b) | 21,913 | 350,021 | ||||||
Signify NV(a) | 10,636 | 328,295 | ||||||
See Notes to Financial Statements.
| 16 | WisdomTree Trust |
Schedule of Investments (continued)
WisdomTree Europe Hedged SmallCap Equity Fund (EUSC)
March 31, 2024
| Investments | Shares | Value | ||||||
Sligro Food Group NV | 2,246 | $ | 34,008 | |||||
Wereldhave NV | 6,321 | 98,577 | ||||||
|
| |||||||
| Total Netherlands |
| 2,983,844 | ||||||
| Portugal – 2.1% |
| |||||||
Altri SGPS SA(b) | 23,110 | 130,535 | ||||||
Corticeira Amorim SGPS SA(b) | 3,398 | 36,075 | ||||||
CTT-Correios de Portugal SA | 7,424 | 33,114 | ||||||
Mota-Engil SGPS SA | 20,340 | 105,772 | ||||||
Navigator Co. SA | 53,327 | 233,252 | ||||||
NOS SGPS SA(b) | 40,230 | 157,544 | ||||||
REN – Redes Energeticas Nacionais SGPS SA | 43,214 | 102,676 | ||||||
Sonae SGPS SA | 146,891 | 139,605 | ||||||
|
| |||||||
| Total Portugal |
| 938,573 | ||||||
| Spain – 12.8% |
| |||||||
Acciona SA | 2,923 | 356,249 | ||||||
Acerinox SA | 23,578 | 258,844 | ||||||
Almirall SA | 6,415 | 57,262 | ||||||
Banco de Sabadell SA | 254,977 | 400,671 | ||||||
Bankinter SA(b) | 80,325 | 588,345 | ||||||
Cia de Distribucion Integral Logista Holdings SA | 12,865 | 359,860 | ||||||
CIE Automotive SA | 3,589 | 103,105 | ||||||
Construcciones y Auxiliar de Ferrocarriles SA | 1,543 | 56,326 | ||||||
Ebro Foods SA | 1,746 | 29,115 | ||||||
Enagas SA(b) | 38,253 | 568,677 | ||||||
Ercros SA | 6,333 | 24,007 | ||||||
Faes Farma SA | 18,371 | 62,399 | ||||||
Fluidra SA(b) | 10,834 | 256,480 | ||||||
Gestamp Automocion SA(a) | 33,145 | 106,674 | ||||||
Grupo Catalana Occidente SA | 1,784 | 68,302 | ||||||
Indra Sistemas SA | 6,956 | 144,315 | ||||||
Inmobiliaria Colonial Socimi SA | 35,736 | 211,886 | ||||||
Laboratorios Farmaceuticos Rovi SA | 1,902 | 166,181 | ||||||
Mapfre SA | 204,994 | 518,504 | ||||||
Merlin Properties Socimi SA | 56,200 | 605,442 | ||||||
Pharma Mar SA | 586 | 18,189 | ||||||
Prosegur Cash SA(a)(b) | 55,552 | 28,738 | ||||||
Sacyr SA | 48,784 | 180,189 | ||||||
Unicaja Banco SA(a)(b) | 181,012 | 224,230 | ||||||
Vidrala SA | 1,102 | 114,493 | ||||||
Viscofan SA | 2,239 | 142,427 | ||||||
|
| |||||||
| Total Spain |
| 5,650,910 | ||||||
TOTAL COMMON STOCKS (Cost: $39,817,978) |
| 43,657,915 | ||||||
| INVESTMENT OF CASH COLLATERAL FOR SECURITIES LOANED – 11.3% |
| |||||||
| United States – 11.3% |
| |||||||
State Street Navigator Securities Lending Government Money Market Portfolio, 5.34%(d) | ||||||||
| (Cost: $4,997,454) | 4,997,454 | 4,997,454 | ||||||
TOTAL INVESTMENTS IN SECURITIES – 110.3% (Cost: $44,815,432) |
| 48,655,369 | ||||||
Other Assets less Liabilities – (10.3)% |
| (4,576,072 | ) | |||||
|
| |||||||
| NET ASSETS – 100.0% |
| $ | 44,079,297 | |||||
| * | Non-income producing security. |
| (a) | This security is exempt from registration under rule 144A of the Securities Act of 1933. This security may be sold in transactions that are exempt from registration, normally to qualified institutional buyers. |
| (b) | Security, or portion thereof, was on loan at March 31, 2024 (See Note 2). At March 31, 2024, the total market value of the Fund’s securities on loan identified in the Schedule of Investments was $5,482,253 and the total market value of the collateral held by the Fund was $5,794,347. The total market value of the collateral includes non-cash U.S. Government securities collateral having a value of $796,893. |
| (c) | This security is exempt from registration under Regulation S of the Securities Act of 1933, which exempts from registration securities offered and sold outside the United States. This security may not be offered or sold in the United States except pursuant to an exemption from, or in a transaction not subject to, the registration requirements of the Securities Act of 1933. |
| (d) | Rate shown represents annualized 7-day yield as of March 31, 2024. |
| FINANCIAL DERIVATIVE INSTRUMENTS | ||||||||||||||||||||||||||||
| FOREIGN CURRENCY CONTRACTS (OTC – OVER THE COUNTER) | ||||||||||||||||||||||||||||
| Counterparty | Settlement Date | Amount and | Amount and | Unrealized Appreciation | Unrealized Depreciation | |||||||||||||||||||||||
Bank of America NA | 4/4/2024 | 7,754,446 | EUR | 8,375,112 | USD | $ | 14 | $ | — | |||||||||||||||||||
Bank of America NA | 4/4/2024 | 8,375,112 | USD | 7,729,615 | EUR | 26,805 | — | |||||||||||||||||||||
Bank of America NA | 5/6/2024 | 8,801,336 | USD | 8,138,684 | EUR | — | (84 | ) | ||||||||||||||||||||
Barclays Bank PLC | 4/4/2024 | 7,754,453 | EUR | 8,375,112 | USD | 21 | — | |||||||||||||||||||||
Barclays Bank PLC | 4/4/2024 | 8,375,112 | USD | 7,729,655 | EUR | 26,762 | — | |||||||||||||||||||||
Barclays Bank PLC | 5/6/2024 | 8,801,336 | USD | 8,138,692 | EUR | — | (92 | ) | ||||||||||||||||||||
Citibank NA | 4/4/2024 | 7,754,502 | EUR | 8,375,110 | USD | 76 | — | |||||||||||||||||||||
Citibank NA | 5/6/2024 | 8,801,332 | USD | 8,138,711 | EUR | — | (116 | ) | ||||||||||||||||||||
HSBC Holdings PLC | 4/4/2024 | 8,375,112 | USD | 7,729,655 | EUR | 26,762 | — | |||||||||||||||||||||
Morgan Stanley & Co. International | 4/4/2024 | 7,754,511 | EUR | 8,375,112 | USD | 83 | — | |||||||||||||||||||||
Morgan Stanley & Co. International | 4/4/2024 | 8,375,112 | USD | 7,729,648 | EUR | 26,770 | — | |||||||||||||||||||||
Morgan Stanley & Co. International | 5/6/2024 | 8,801,336 | USD | 8,138,714 | EUR | — | (117 | ) | ||||||||||||||||||||
Royal Bank of Canada | 4/4/2024 | 7,754,525 | EUR | 8,375,112 | USD | 99 | — | |||||||||||||||||||||
Royal Bank of Canada | 4/4/2024 | 8,375,110 | USD | 7,729,653 | EUR | 26,762 | — | |||||||||||||||||||||
Royal Bank of Canada | 5/6/2024 | 8,801,336 | USD | 8,138,737 | EUR | — | (141 | ) | ||||||||||||||||||||
| $ | 134,154 | $ | (550 | ) | ||||||||||||||||||||||||
See Notes to Financial Statements.
| WisdomTree Trust | 17 |
Schedule of Investments (concluded)
WisdomTree Europe Hedged SmallCap Equity Fund (EUSC)
March 31, 2024
| FAIR VALUATION SUMMARY |
The following is a summary of the fair valuations according to the inputs used in valuing the Fund’s investments (See Note 2 — Fair Value Measurement):
| Quoted Prices in Active Markets (Level 1) | Other Significant Observable Inputs (Level 2) | Significant Unobservable Inputs (Level 3) | Total | |||||||||||||
Assets: |
| |||||||||||||||
Investments in Securities | ||||||||||||||||
Common Stocks | $ | 43,657,915 | $ | — | $ | — | $ | 43,657,915 | ||||||||
Investment of Cash Collateral for Securities Loaned | — | 4,997,454 | — | 4,997,454 | ||||||||||||
Total Investments in Securities | $ | 43,657,915 | $ | 4,997,454 | $ | — | $ | 48,655,369 | ||||||||
Financial Derivative Instruments | ||||||||||||||||
Foreign Currency Contracts1 | $ | — | $ | 134,154 | $ | — | $ | 134,154 | ||||||||
Liabilities: |
| |||||||||||||||
Financial Derivative Instruments | ||||||||||||||||
Foreign Currency Contracts1 | $ | — | $ | (550 | ) | $ | — | $ | (550 | ) | ||||||
Total - Net | $ | 43,657,915 | $ | 5,131,058 | $ | — | $ | 48,788,973 | ||||||||
| 1 | Amount shown represents the unrealized appreciation (depreciation) on the financial instrument. |
See Notes to Financial Statements.
| 18 | WisdomTree Trust |
Schedule of Investments
WisdomTree International Hedged Quality Dividend Growth Fund (IHDG)
March 31, 2024
| Investments | Shares | Value | ||||||
| COMMON STOCKS – 99.0% |
| |||||||
| Australia – 7.0% |
| |||||||
Altium Ltd. | 43,365 | $ | 1,845,160 | |||||
ARB Corp. Ltd.(a) | 31,717 | 855,621 | ||||||
Aristocrat Leisure Ltd. | 180,697 | 5,069,129 | ||||||
Beach Energy Ltd.(a) | 1,438,593 | 1,722,217 | ||||||
Brambles Ltd. | 1,012,134 | 10,664,107 | ||||||
Breville Group Ltd.(a) | 61,016 | 1,094,290 | ||||||
Brickworks Ltd. | 86,113 | 1,600,010 | ||||||
CAR Group Ltd. | 195,384 | 4,599,064 | ||||||
Champion Iron Ltd.(a) | 364,646 | 1,762,802 | ||||||
Charter Hall Group(a) | 578,398 | 5,188,519 | ||||||
Cochlear Ltd. | 16,888 | 3,718,705 | ||||||
Coles Group Ltd. | 1,390,203 | 15,364,045 | ||||||
CSL Ltd. | 121,646 | 22,849,863 | ||||||
Dicker Data Ltd. | 141,428 | 993,722 | ||||||
Goodman Group | 667,528 | 14,724,095 | ||||||
IDP Education Ltd.(a) | 89,198 | 1,042,814 | ||||||
Mineral Resources Ltd.(a) | 144,056 | 6,660,514 | ||||||
Netwealth Group Ltd. | 130,276 | 1,795,032 | ||||||
Pilbara Minerals Ltd.(a) | 4,556,936 | 11,386,379 | ||||||
Pinnacle Investment Management Group Ltd.(a) | 248,937 | 1,888,788 | ||||||
Pro Medicus Ltd.(a) | 7,995 | 541,154 | ||||||
REA Group Ltd.(a) | 32,562 | 3,940,022 | ||||||
SEEK Ltd.(a) | 198,000 | 3,235,839 | ||||||
Seven Group Holdings Ltd.(a) | 170,865 | 4,544,727 | ||||||
Tabcorp Holdings Ltd. | 1,648,282 | 811,881 | ||||||
Technology One Ltd. | 111,342 | 1,232,693 | ||||||
Wesfarmers Ltd. | 868,512 | 38,756,617 | ||||||
|
| |||||||
| Total Australia |
| 167,887,809 | ||||||
| Austria – 0.6% |
| |||||||
Kontron AG | 75,632 | 1,669,591 | ||||||
Mondi PLC | 521,035 | 9,185,145 | ||||||
Wienerberger AG | 109,862 | 4,005,656 | ||||||
|
| |||||||
| Total Austria |
| 14,860,392 | ||||||
| Belgium – 0.8% |
| |||||||
Bekaert SA | 71,132 | 3,652,144 | ||||||
D'ieteren Group(a) | 25,527 | 5,668,219 | ||||||
Tessenderlo Group SA(a) | 71,191 | 1,864,492 | ||||||
UCB SA | 60,394 | 7,461,799 | ||||||
|
| |||||||
| Total Belgium |
| 18,646,654 | ||||||
| China – 0.4% |
| |||||||
| Prosus NV | 287,322 | 9,022,197 | ||||||
| Denmark – 4.4% |
| |||||||
Coloplast AS, Class B | 83,549 | 11,279,387 | ||||||
Dfds AS | 42,273 | 1,226,599 | ||||||
Novo Nordisk AS, Class B | 568,366 | 72,526,020 | ||||||
Novonesis (Novozymes) B, Class B | 168,911 | 9,909,902 | ||||||
Pandora AS | 43,074 | 6,950,840 | ||||||
Royal Unibrew AS | 32,336 | 2,138,254 | ||||||
|
| |||||||
| Total Denmark |
| 104,031,002 | ||||||
| Finland – 1.1% |
| |||||||
Metsa Board OYJ, Class B(a) | 604,197 | 4,580,780 | ||||||
Orion OYJ, Class B | 72,581 | 2,709,855 | ||||||
UPM-Kymmene OYJ | 582,263 | 19,412,414 | ||||||
|
| |||||||
| Total Finland |
| 26,703,049 | ||||||
| France – 12.0% |
| |||||||
Airbus SE | 263,837 | 48,645,629 | ||||||
Alten SA | 12,670 | 1,850,023 | ||||||
Arkema SA | 74,325 | 7,829,633 | ||||||
BioMerieux | 18,802 | 2,076,305 | ||||||
Carrefour SA | 597,133 | 10,237,844 | ||||||
Eramet SA(a) | 37,780 | 2,874,529 | ||||||
Gaztransport & Technigaz SA | 30,192 | 4,516,119 | ||||||
Hermes International SCA | 15,498 | 39,601,726 | ||||||
Interparfums SA | 43,164 | 2,433,414 | ||||||
Ipsen SA | 14,658 | 1,746,119 | ||||||
Kering SA | 89,860 | 35,553,825 | ||||||
La Francaise des Jeux SAEM(b) | 172,197 | 7,026,050 | ||||||
LVMH Moet Hennessy Louis Vuitton SE | 130,402 | 117,413,430 | ||||||
SEB SA | 30,688 | 3,930,764 | ||||||
|
| |||||||
| Total France |
| 285,735,410 | ||||||
| Germany – 4.8% |
| |||||||
AIXTRON SE | 32,411 | 857,595 | ||||||
Aurubis AG | 25,157 | 1,770,912 | ||||||
Bechtle AG | 45,158 | 2,388,786 | ||||||
Bilfinger SE | 35,979 | 1,682,522 | ||||||
Carl Zeiss Meditec AG, Bearer Shares | 20,366 | 2,547,053 | ||||||
Deutsche Post AG, Registered Shares | 1,459,424 | 62,913,136 | ||||||
Fielmann Group AG | 32,474 | 1,492,661 | ||||||
Gerresheimer AG | 8,932 | 1,007,101 | ||||||
Hugo Boss AG | 26,827 | 1,582,514 | ||||||
Knorr-Bremse AG | 99,680 | 7,546,573 | ||||||
Merck KGaA | 31,647 | 5,591,645 | ||||||
Nemetschek SE | 18,112 | 1,794,131 | ||||||
Puma SE | 49,619 | 2,251,789 | ||||||
Rheinmetall AG | 17,190 | 9,672,468 | ||||||
Siltronic AG | 26,119 | 2,318,740 | ||||||
Stroeer SE & Co. KGaA | 59,079 | 3,598,620 | ||||||
Symrise AG | 35,664 | 4,273,474 | ||||||
|
| |||||||
| Total Germany |
| 113,289,720 | ||||||
| Hong Kong – 0.6% |
| |||||||
| Techtronic Industries Co. Ltd. | 1,074,500 | 14,566,560 | ||||||
| Ireland – 0.2% |
| |||||||
| Kerry Group PLC, Class A | 61,071 | 5,239,598 | ||||||
| Israel – 0.5% |
| |||||||
Hilan Ltd. | 25,528 | 1,629,076 | ||||||
Isramco Negev 2 LP | 4,608,621 | 2,251,667 | ||||||
Matrix IT Ltd. | 106,818 | 2,363,367 | ||||||
Maytronics Ltd. | 65,496 | 654,120 | ||||||
Newmed Energy LP | 1,159,534 | 2,968,068 | ||||||
Plus500 Ltd. | 144,262 | 3,289,413 | ||||||
|
| |||||||
| Total Israel |
| 13,155,711 | ||||||
See Notes to Financial Statements.
| WisdomTree Trust | 19 |
Schedule of Investments (continued)
WisdomTree International Hedged Quality Dividend Growth Fund (IHDG)
March 31, 2024
| Investments | Shares | Value | ||||||
| Italy – 1.5% |
| |||||||
Amplifon SpA(a) | 33,901 | $ | 1,237,522 | |||||
Brunello Cucinelli SpA | 11,048 | 1,264,775 | ||||||
Carel Industries SpA(b) | 14,350 | 315,384 | ||||||
Davide Campari-Milano NV(a) | 201,118 | 2,023,070 | ||||||
De' Longhi SpA | 74,945 | 2,594,956 | ||||||
DiaSorin SpA | 11,511 | 1,112,653 | ||||||
Ferrari NV | 24,704 | 10,778,848 | ||||||
Moncler SpA | 120,059 | 8,970,136 | ||||||
Piaggio & C SpA | 703,683 | 2,228,254 | ||||||
Reply SpA | 10,369 | 1,469,246 | ||||||
Salcef Group SpA | 50,207 | 1,241,720 | ||||||
Salvatore Ferragamo SpA(a) | 86,155 | 1,048,644 | ||||||
Technogym SpA(b) | 157,336 | 1,563,290 | ||||||
|
| |||||||
| Total Italy |
| 35,848,498 | ||||||
| Japan – 15.4% |
| |||||||
Advantest Corp. | 150,300 | 6,771,916 | ||||||
ARE Holdings, Inc.(a) | 109,100 | 1,392,720 | ||||||
AZ-COM MARUWA Holdings, Inc. | 49,200 | 438,865 | ||||||
BayCurrent Consulting, Inc. | 38,300 | 752,486 | ||||||
C Uyemura & Co. Ltd. | 10,900 | 756,939 | ||||||
Capcom Co. Ltd. | 152,000 | 2,807,096 | ||||||
Casio Computer Co. Ltd.(a) | 186,100 | 1,593,615 | ||||||
Daiwabo Holdings Co. Ltd.(a) | 77,500 | 1,314,753 | ||||||
Dentsu Soken, Inc.(a) | 26,400 | 875,668 | ||||||
Dexerials Corp. | 29,700 | 1,312,259 | ||||||
Dip Corp. | 37,800 | 687,091 | ||||||
Disco Corp. | 25,800 | 9,749,262 | ||||||
FANUC Corp. | 583,800 | 16,143,269 | ||||||
Fast Retailing Co. Ltd. | 58,800 | 18,314,659 | ||||||
Food & Life Cos. Ltd. | 24,900 | 473,502 | ||||||
Fujimi, Inc.(a) | 49,000 | 1,139,648 | ||||||
Fujitsu Ltd.(a) | 674,400 | 11,095,550 | ||||||
Goldwin, Inc.(a) | 10,900 | 710,414 | ||||||
Hoya Corp. | 42,700 | 5,287,244 | ||||||
Ibiden Co. Ltd.(a) | 21,500 | 944,554 | ||||||
Internet Initiative Japan, Inc. | 64,900 | 1,216,138 | ||||||
Kadokawa Corp.(a) | 43,200 | 756,988 | ||||||
Kakaku.com, Inc. | 149,691 | 1,860,938 | ||||||
Katitas Co. Ltd.(a) | 56,300 | 743,623 | ||||||
Keyence Corp. | 29,800 | 13,692,504 | ||||||
Kobe Bussan Co. Ltd. | 37,700 | 930,886 | ||||||
Koei Tecmo Holdings Co. Ltd.(a) | 196,900 | 2,107,622 | ||||||
Lasertec Corp. | 15,800 | 4,363,805 | ||||||
M3, Inc. | 88,600 | 1,251,037 | ||||||
MEITEC Group Holdings, Inc. | 96,300 | 1,900,612 | ||||||
Minebea Mitsumi, Inc. | 173,500 | 3,382,989 | ||||||
MISUMI Group, Inc. | 78,000 | 1,064,257 | ||||||
Mitsui Chemicals, Inc.(a) | 180,500 | 5,165,321 | ||||||
MonotaRO Co. Ltd. | 160,600 | 1,928,643 | ||||||
Murata Manufacturing Co. Ltd. | 933,900 | 17,425,971 | ||||||
NET One Systems Co. Ltd. | 69,700 | 1,243,450 | ||||||
Nextage Co. Ltd.(a) | 24,800 | 475,861 | ||||||
NGK Insulators Ltd. | 247,900 | 3,341,478 | ||||||
NHK Spring Co. Ltd. | 210,800 | 2,085,088 | ||||||
Nihon M&A Center Holdings, Inc.(a) | 272,900 | 1,779,724 | ||||||
Nippon Gas Co. Ltd. | 91,800 | 1,558,559 | ||||||
Nippon Steel Corp.(a) | 1,202,100 | 29,134,116 | ||||||
Nomura Research Institute Ltd. | 179,900 | 5,043,548 | ||||||
NSD Co. Ltd. | 61,600 | 1,211,283 | ||||||
Obic Co. Ltd. | 28,300 | 4,258,697 | ||||||
Oracle Corp. | 46,900 | 3,549,767 | ||||||
Organo Corp. | 16,600 | 844,560 | ||||||
Pan Pacific International Holdings Corp. | 94,400 | 2,521,783 | ||||||
Persol Holdings Co. Ltd. | 2,052,600 | 2,895,570 | ||||||
Pilot Corp. | 22,900 | 602,213 | ||||||
Relo Group, Inc. | 75,700 | 622,976 | ||||||
Sanrio Co. Ltd. | 32,500 | 654,961 | ||||||
SG Holdings Co. Ltd. | 390,700 | 4,912,631 | ||||||
Shin-Etsu Chemical Co. Ltd. | 1,117,200 | 48,601,836 | ||||||
Shinko Electric Industries Co. Ltd. | 42,100 | 1,562,494 | ||||||
SMC Corp. | 20,600 | 11,546,453 | ||||||
Sysmex Corp. | 108,700 | 1,911,560 | ||||||
Taiyo Yuden Co. Ltd.(a) | 77,100 | 1,846,691 | ||||||
Takara Bio, Inc. | 84,000 | 538,373 | ||||||
Takara Holdings, Inc.(a) | 188,300 | 1,331,892 | ||||||
TDK Corp. | 180,700 | 8,932,021 | ||||||
TechnoPro Holdings, Inc. | 74,600 | 1,527,046 | ||||||
Toei Animation Co. Ltd.(a) | 59,400 | 1,216,690 | ||||||
Tokyo Electron Ltd. | 227,900 | 59,585,735 | ||||||
Tokyo Ohka Kogyo Co. Ltd. | 62,500 | 1,890,961 | ||||||
Tokyo Seimitsu Co. Ltd. | 28,800 | 2,316,826 | ||||||
Topcon Corp. | 95,800 | 1,128,306 | ||||||
Tosoh Corp. | 363,300 | 4,949,781 | ||||||
Ulvac, Inc. | 26,500 | 1,726,278 | ||||||
Yaskawa Electric Corp.(a) | 86,700 | 3,633,672 | ||||||
ZOZO, Inc.(a) | 173,200 | 4,355,606 | ||||||
|
| |||||||
| Total Japan |
| 365,691,330 | ||||||
| Netherlands – 8.4% |
| |||||||
ASM International NV | 7,573 | 4,628,405 | ||||||
ASML Holding NV | 99,786 | 96,151,387 | ||||||
Corbion NV | 39,511 | 847,037 | ||||||
Heineken Holding NV | 180,659 | 14,594,355 | ||||||
Heineken NV | 303,474 | 29,281,354 | ||||||
SBM Offshore NV(a) | 409,914 | 6,547,638 | ||||||
Signify NV(b) | 181,015 | 5,587,281 | ||||||
Universal Music Group NV(a) | 917,120 | 27,614,848 | ||||||
Wolters Kluwer NV | 94,576 | 14,831,029 | ||||||
|
| |||||||
| Total Netherlands |
| 200,083,334 | ||||||
| Norway – 0.8% |
| |||||||
Aker ASA, Class A | 88,632 | 5,093,934 | ||||||
Atea ASA* | 161,332 | 1,930,285 | ||||||
DNO ASA | 2,811,152 | 2,526,477 | ||||||
Kongsberg Gruppen ASA | 117,493 | 8,117,269 | ||||||
TOMRA Systems ASA | 159,380 | 2,490,909 | ||||||
|
| |||||||
| Total Norway |
| 20,158,874 | ||||||
See Notes to Financial Statements.
| 20 | WisdomTree Trust |
Schedule of Investments (continued)
WisdomTree International Hedged Quality Dividend Growth Fund (IHDG)
March 31, 2024
| Investments | Shares | Value | ||||||
| Singapore – 0.5% |
| |||||||
Singapore Technologies Engineering Ltd. | 3,104,356 | $ | 9,246,822 | |||||
StarHub Ltd. | 2,290,300 | 2,002,485 | ||||||
|
| |||||||
| Total Singapore |
| 11,249,307 | ||||||
| Spain – 6.9% |
| |||||||
CIE Automotive SA | 85,873 | 2,466,959 | ||||||
Endesa SA | 2,198,857 | 40,762,848 | ||||||
Industria de Diseno Textil SA | 2,296,755 | 115,764,711 | ||||||
Laboratorios Farmaceuticos Rovi SA | 23,896 | 2,087,841 | ||||||
Viscofan SA | 40,413 | 2,570,752 | ||||||
|
| |||||||
| Total Spain |
| 163,653,111 | ||||||
| Sweden – 3.6% |
| |||||||
Alfa Laval AB(a) | 163,405 | 6,430,693 | ||||||
Assa Abloy AB, Class B | 514,347 | 14,772,456 | ||||||
Billerud Aktiebolag(a) | 323,702 | 2,906,858 | ||||||
Evolution AB(b) | 99,608 | 12,395,339 | ||||||
Husqvarna AB, Class B(a) | 462,098 | 3,960,371 | ||||||
Investment AB Latour, Class B(a) | 281,066 | 7,399,517 | ||||||
Lagercrantz Group AB, Class B | 77,654 | 1,189,582 | ||||||
Lindab International AB | 65,167 | 1,401,755 | ||||||
Mycronic AB | 33,314 | 1,177,702 | ||||||
Nibe Industrier AB, Class B(a) | 430,846 | 2,117,845 | ||||||
Paradox Interactive AB | 25,095 | 441,461 | ||||||
Sandvik AB | 792,787 | 17,623,915 | ||||||
Securitas AB, Class B(a) | 521,718 | 5,384,245 | ||||||
Skanska AB, Class B(a) | 484,735 | 8,636,068 | ||||||
|
| |||||||
| Total Sweden |
| 85,837,807 | ||||||
| Switzerland – 13.0% |
| |||||||
Clariant AG, Registered Shares*(a) | 252,603 | 3,418,708 | ||||||
Comet Holding AG, Registered Shares | 4,890 | 1,705,827 | ||||||
Givaudan SA, Registered Shares | 4,811 | 21,451,067 | ||||||
Huber & Suhner AG, Registered Shares(a) | 15,431 | 1,305,476 | ||||||
Logitech International SA, Registered Shares | 60,038 | 5,383,223 | ||||||
Novartis AG, Registered Shares | 771,454 | 74,832,837 | ||||||
Partners Group Holding AG | 24,105 | 34,470,123 | ||||||
Roche Holding AG | 237,716 | 60,623,254 | ||||||
Roche Holding AG, Bearer Shares | 33,451 | 9,024,751 | ||||||
SFS Group AG | 25,064 | 3,300,311 | ||||||
SGS SA, Registered Shares* | 250 | 24,287 | ||||||
Sika AG, Registered Shares | 52,090 | 15,533,889 | ||||||
Sonova Holding AG, Registered Shares | 20,560 | 5,960,049 | ||||||
Stadler Rail AG(a) | 61,597 | 1,964,101 | ||||||
Straumann Holding AG, Registered Shares | 18,806 | 3,006,621 | ||||||
Swissquote Group Holding SA, Registered Shares | 6,619 | 1,860,698 | ||||||
Tecan Group AG, Registered Shares(a) | 2,442 | 1,013,456 | ||||||
UBS Group AG, Registered Shares | 1,911,016 | 58,855,983 | ||||||
VAT Group AG(b) | 12,868 | 6,676,159 | ||||||
|
| |||||||
| Total Switzerland |
| 310,410,820 | ||||||
| United Kingdom – 14.1% |
| |||||||
Admiral Group PLC | 304,761 | 10,922,147 | ||||||
Airtel Africa PLC(b) | 3,546,122 | 4,739,457 | ||||||
AJ Bell PLC | 341,648 | 1,305,119 | ||||||
Ashtead Group PLC | 185,999 | 13,251,926 | ||||||
AstraZeneca PLC | 564,604 | 76,159,335 | ||||||
Auto Trader Group PLC(b) | 296,974 | 2,626,817 | ||||||
Bellway PLC | 170,624 | 5,742,006 | ||||||
Britvic PLC | 254,556 | 2,643,288 | ||||||
Burberry Group PLC | 268,098 | 4,108,125 | ||||||
Bytes Technology Group PLC | 107,745 | 695,516 | ||||||
Coats Group PLC | 1,053,176 | 1,078,974 | ||||||
Diageo PLC | 1,516,135 | 56,030,855 | ||||||
Dr. Martens PLC(a) | 989,487 | 1,096,848 | ||||||
Dunelm Group PLC | 186,621 | 2,668,678 | ||||||
Greggs PLC | 58,174 | 2,112,054 | ||||||
Hays PLC | 2,344,409 | 2,797,207 | ||||||
Howden Joinery Group PLC | 444,880 | 5,096,167 | ||||||
IMI PLC | 115,662 | 2,651,897 | ||||||
Imperial Brands PLC | 1,885,693 | 42,163,197 | ||||||
ITV PLC | 7,847,679 | 7,326,135 | ||||||
JD Sports Fashion PLC | 869,395 | 1,477,164 | ||||||
Kainos Group PLC | 55,199 | 673,244 | ||||||
Moneysupermarket.com Group PLC | 603,929 | 1,676,883 | ||||||
Next PLC | 78,355 | 9,138,013 | ||||||
Redrow PLC | 455,949 | 3,833,131 | ||||||
RELX PLC | 893,801 | 38,660,180 | ||||||
Renishaw PLC | 44,198 | 2,372,908 | ||||||
Rentokil Initial PLC | 1,079,262 | 6,431,052 | ||||||
Rightmove PLC | 362,562 | 2,517,203 | ||||||
RS Group PLC | 332,589 | 3,053,600 | ||||||
Sage Group PLC | 487,434 | 7,792,328 | ||||||
Savills PLC | 182,310 | 2,455,031 | ||||||
Softcat PLC | 96,109 | 1,927,986 | ||||||
Spirax-Sarco Engineering PLC | 32,861 | 4,171,921 | ||||||
Telecom Plus PLC | 97,739 | 2,010,072 | ||||||
Victrex PLC(a) | 89,782 | 1,473,288 | ||||||
|
| |||||||
| Total United Kingdom |
| 334,879,752 | ||||||
| United States – 2.4% |
| |||||||
| GSK PLC | 2,631,395 | 56,795,735 | ||||||
TOTAL COMMON STOCKS (Cost: $1,886,497,453) |
| 2,357,746,670 | ||||||
| EXCHANGE-TRADED FUND – 0.1% |
| |||||||
| United States – 0.1% |
| |||||||
WisdomTree International Quality Dividend Growth Fund(c) | ||||||||
| (Cost: $868,179) | 30,222 | 1,150,249 | ||||||
| INVESTMENT OF CASH COLLATERAL FOR SECURITIES LOANED – 2.5% |
| |||||||
| United States – 2.5% |
| |||||||
State Street Navigator Securities Lending Government Money Market Portfolio, 5.34%(d) | ||||||||
| (Cost: $60,536,579) | 60,536,579 | 60,536,579 | ||||||
| TOTAL INVESTMENTS IN SECURITIES – 101.6% |
| |||||||
| (Cost: $1,947,902,211) | 2,419,433,498 | |||||||
Other Assets less Liabilities – (1.6)% | (38,120,921 | ) | ||||||
|
| |||||||
| NET ASSETS – 100.0% | $ | 2,381,312,577 | ||||||
See Notes to Financial Statements.
| WisdomTree Trust | 21 |
Schedule of Investments (continued)
WisdomTree International Hedged Quality Dividend Growth Fund (IHDG)
March 31, 2024
| * | Non-income producing security. |
| (a) | Security, or portion thereof, was on loan at March 31, 2024 (See Note 2). At March 31, 2024, the total market value of the Fund’s securities on loan identified in the Schedule of Investments was $138,461,692 and the total market value of the collateral held by the Fund was $145,579,168. The total market value of the collateral includes non-cash U.S. Government securities collateral having a value of $85,042,589. |
| (b) | This security is exempt from registration under rule 144A of the Securities Act of 1933. This security may be sold in transactions that are exempt from registration, normally to qualified institutional buyers. |
| (c) | Affiliated holding. See “Investment in Affiliates” supplementary table included in this Schedule of Investments for additional information. |
| (d) | Rate shown represents annualized 7-day yield as of March 31, 2024. |
| INVESTMENT IN AFFILIATES |
Affiliated holdings are investments in entities in which the Fund owns 5% or more of the outstanding voting securities or are investments in entities which are under common ownership or control. Investments in affiliates during the fiscal year ended March 31, 2024 were as follows:
| Affiliate | Value at 3/31/2023 | Purchases/ Additions | Sales/ Reductions | Realized Gain/ (Loss) | Change in Appreciation/ Depreciation | Value at 3/31/2024 | Dividend Income | |||||||||||||||||||||
WisdomTree International Quality Dividend Growth Fund | $ | 1,023,619 | $ | — | $ | — | $ | — | $ | 126,630 | $ | 1,150,249 | $ | 20,098 | ||||||||||||||
| FINANCIAL DERIVATIVE INSTRUMENTS | ||||||||||||||||||||||||||||
| FOREIGN CURRENCY CONTRACTS (OTC – OVER THE COUNTER) | ||||||||||||||||||||||||||||
| Counterparty | Settlement Date | Amount and Description of Currency to be Purchased | Amount and Description of Currency to be Sold | Unrealized Appreciation | Unrealized Depreciation | |||||||||||||||||||||||
Bank of America NA | 4/3/2024 | 7,982,872 | ILS | 2,179,080 | USD | $ | — | $ | (97) | |||||||||||||||||||
Bank of America NA | 4/3/2024 | 10,848,747,423 | JPY | 71,703,789 | USD | — | (10,621 | ) | ||||||||||||||||||||
Bank of America NA | 4/3/2024 | 3,069,953 | SGD | 2,274,809 | USD | 10 | — | |||||||||||||||||||||
Bank of America NA | 4/3/2024 | 2,143,254 | USD | 7,647,848 | ILS | 55,718 | — | |||||||||||||||||||||
Bank of America NA | 4/3/2024 | 70,524,907 | USD | 10,505,912,031 | JPY | 1,097,342 | — | |||||||||||||||||||||
Bank of America NA | 4/3/2024 | 2,237,409 | USD | 3,004,467 | SGD | 11,115 | — | |||||||||||||||||||||
Bank of America NA | 4/4/2024 | 49,719,528 | AUD | 32,437,567 | USD | 347 | — | |||||||||||||||||||||
Bank of America NA | 4/4/2024 | 55,682,406 | CHF | 61,829,426 | USD | — | (1,373 | ) | ||||||||||||||||||||
Bank of America NA | 4/4/2024 | 136,504,816 | DKK | 19,765,492 | USD | 165 | — | |||||||||||||||||||||
Bank of America NA | 4/4/2024 | 155,235,339 | EUR | 167,660,376 | USD | 273 | — | |||||||||||||||||||||
Bank of America NA | 4/4/2024 | 62,003,500 | GBP | 78,327,285 | USD | — | (944 | ) | ||||||||||||||||||||
Bank of America NA | 4/4/2024 | 42,852,105 | NOK | 3,950,161 | USD | — | (45 | ) | ||||||||||||||||||||
Bank of America NA | 4/4/2024 | 185,007,702 | SEK | 17,303,273 | USD | — | (178 | ) | ||||||||||||||||||||
Bank of America NA | 4/4/2024 | 31,904,261 | USD | 48,950,334 | AUD | — | (31,817 | ) | ||||||||||||||||||||
Bank of America NA | 4/4/2024 | 60,812,888 | USD | 53,369,877 | CHF | 1,552,597 | — | |||||||||||||||||||||
Bank of America NA | 4/4/2024 | 19,440,527 | USD | 133,700,047 | DKK | 80,996 | — | |||||||||||||||||||||
Bank of America NA | 4/4/2024 | 164,903,871 | USD | 152,194,195 | EUR | 527,785 | — | |||||||||||||||||||||
Bank of America NA | 4/4/2024 | 77,039,506 | USD | 60,892,371 | GBP | 116,806 | — | |||||||||||||||||||||
Bank of America NA | 4/4/2024 | 3,885,217 | USD | 41,148,547 | NOK | 92,135 | — | |||||||||||||||||||||
Bank of America NA | 4/4/2024 | 17,018,789 | USD | 175,876,471 | SEK | 569,705 | — | |||||||||||||||||||||
Bank of America NA | 4/5/2024 | 18,148,020 | HKD | 2,319,020 | USD | — | (48 | ) | ||||||||||||||||||||
Bank of America NA | 4/5/2024 | 2,280,893 | USD | 17,839,713 | HKD | 1,317 | — | |||||||||||||||||||||
Bank of America NA | 5/3/2024 | 33,270,784 | USD | 50,956,595 | AUD | — | (1,783 | ) | ||||||||||||||||||||
Bank of America NA | 5/3/2024 | 20,852,846 | USD | 143,811,006 | DKK | — | (919 | ) | ||||||||||||||||||||
Bank of America NA | 5/3/2024 | 81,293,822 | USD | 64,342,119 | GBP | 134 | — | |||||||||||||||||||||
Bank of America NA | 5/3/2024 | 2,052,671 | USD | 7,510,875 | ILS | 93 | — | |||||||||||||||||||||
Bank of America NA | 5/6/2024 | 61,983,226 | USD | 55,624,429 | CHF | 194 | — | |||||||||||||||||||||
Bank of America NA | 5/6/2024 | 174,042,083 | USD | 160,938,473 | EUR | — | (1,660 | ) | ||||||||||||||||||||
Bank of America NA | 5/6/2024 | 3,043,639 | USD | 23,795,255 | HKD | — | — | |||||||||||||||||||||
Bank of America NA | 5/6/2024 | 4,293,017 | USD | 46,534,123 | NOK | 41 | — | |||||||||||||||||||||
Bank of America NA | 5/6/2024 | 17,659,701 | USD | 188,579,011 | SEK | — | (216 | ) | ||||||||||||||||||||
Bank of America NA | 5/6/2024 | 2,331,964 | USD | 3,142,189 | SGD | 59 | — | |||||||||||||||||||||
Bank of America NA | 5/7/2024 | 73,549,742 | USD | 11,070,538,001 | JPY | 9,404 | — | |||||||||||||||||||||
Barclays Bank PLC | 4/1/2024 | 226,000,000 | JPY | 1,493,262 | USD | 15 | — | |||||||||||||||||||||
Barclays Bank PLC | 4/2/2024 | 757,938 | USD | 600,000 | GBP | — | (12 | ) | ||||||||||||||||||||
Barclays Bank PLC | 4/3/2024 | 436,400 | HKD | 55,759 | USD | 1 | — | |||||||||||||||||||||
Barclays Bank PLC | 4/3/2024 | 7,982,872 | ILS | 2,179,080 | USD | — | (97 | ) | ||||||||||||||||||||
See Notes to Financial Statements.
| 22 | WisdomTree Trust |
Schedule of Investments (continued)
WisdomTree International Hedged Quality Dividend Growth Fund (IHDG)
March 31, 2024
| FINANCIAL DERIVATIVE INSTRUMENTS | ||||||||||||||||||||||||||||
| FOREIGN CURRENCY CONTRACTS (OTC – OVER THE COUNTER) | ||||||||||||||||||||||||||||
| Counterparty | Settlement Date | Amount and Description of Currency to be Purchased | Amount and Description of Currency to be Sold | Unrealized Appreciation | Unrealized Depreciation | |||||||||||||||||||||||
Barclays Bank PLC | 4/3/2024 | 10,848,747,423 | JPY | 71,703,789 | USD | $ | — | $ | (10,621 | ) | ||||||||||||||||||
Barclays Bank PLC | 4/3/2024 | 3,069,968 | SGD | 2,274,809 | USD | 22 | — | |||||||||||||||||||||
Barclays Bank PLC | 4/3/2024 | 2,143,254 | USD | 7,647,872 | ILS | 55,712 | — | |||||||||||||||||||||
Barclays Bank PLC | 4/3/2024 | 70,524,907 | USD | 10,505,954,345 | JPY | 1,097,062 | — | |||||||||||||||||||||
Barclays Bank PLC | 4/3/2024 | 2,237,409 | USD | 3,004,623 | SGD | 10,999 | — | |||||||||||||||||||||
Barclays Bank PLC | 4/4/2024 | 49,719,376 | AUD | 32,437,567 | USD | 248 | — | |||||||||||||||||||||
Barclays Bank PLC | 4/4/2024 | 55,684,138 | CHF | 61,829,426 | USD | 549 | — | |||||||||||||||||||||
Barclays Bank PLC | 4/4/2024 | 136,505,212 | DKK | 19,765,492 | USD | 222 | — | |||||||||||||||||||||
Barclays Bank PLC | 4/4/2024 | 155,235,483 | EUR | 167,660,376 | USD | 429 | — | |||||||||||||||||||||
Barclays Bank PLC | 4/4/2024 | 62,004,727 | GBP | 78,327,285 | USD | 606 | — | |||||||||||||||||||||
Barclays Bank PLC | 4/4/2024 | 42,852,105 | NOK | 3,950,161 | USD | — | (45 | ) | ||||||||||||||||||||
Barclays Bank PLC | 4/4/2024 | 185,011,042 | SEK | 17,303,273 | USD | 135 | — | |||||||||||||||||||||
Barclays Bank PLC | 4/4/2024 | 31,904,261 | USD | 48,950,334 | AUD | — | (31,817 | ) | ||||||||||||||||||||
Barclays Bank PLC | 4/4/2024 | 60,812,888 | USD | 53,371,154 | CHF | 1,551,179 | — | |||||||||||||||||||||
Barclays Bank PLC | 4/4/2024 | 19,440,527 | USD | 133,700,844 | DKK | 80,880 | — | |||||||||||||||||||||
Barclays Bank PLC | 4/4/2024 | 164,903,871 | USD | 152,194,981 | EUR | 526,935 | — | |||||||||||||||||||||
Barclays Bank PLC | 4/4/2024 | 77,039,506 | USD | 60,892,612 | GBP | 116,502 | — | |||||||||||||||||||||
Barclays Bank PLC | 4/4/2024 | 3,885,217 | USD | 41,150,105 | NOK | 91,992 | — | |||||||||||||||||||||
Barclays Bank PLC | 4/4/2024 | 17,018,789 | USD | 175,878,517 | SEK | 569,513 | — | |||||||||||||||||||||
Barclays Bank PLC | 4/5/2024 | 18,148,391 | HKD | 2,319,020 | USD | — | (1 | ) | ||||||||||||||||||||
Barclays Bank PLC | 4/5/2024 | 2,280,893 | USD | 17,839,713 | HKD | 1,317 | — | |||||||||||||||||||||
Barclays Bank PLC | 5/3/2024 | 33,270,784 | USD | 50,955,581 | AUD | — | (1,120 | ) | ||||||||||||||||||||
Barclays Bank PLC | 5/3/2024 | 642,293 | USD | 983,688 | AUD | — | (15 | ) | ||||||||||||||||||||
Barclays Bank PLC | 5/3/2024 | 20,852,846 | USD | 143,814,134 | DKK | — | (1,373 | ) | ||||||||||||||||||||
Barclays Bank PLC | 5/3/2024 | 402,565 | USD | 2,776,237 | DKK | — | (12 | ) | ||||||||||||||||||||
Barclays Bank PLC | 5/3/2024 | 81,293,822 | USD | 64,343,392 | GBP | — | (1,474 | ) | ||||||||||||||||||||
Barclays Bank PLC | 5/3/2024 | 1,569,379 | USD | 1,242,146 | GBP | — | (22 | ) | ||||||||||||||||||||
Barclays Bank PLC | 5/3/2024 | 2,052,671 | USD | 7,511,263 | ILS | — | (13 | ) | ||||||||||||||||||||
Barclays Bank PLC | 5/3/2024 | 39,627 | USD | 145,007 | ILS | — | (1 | ) | ||||||||||||||||||||
Barclays Bank PLC | 5/6/2024 | 61,983,226 | USD | 55,625,545 | CHF | — | (1,049 | ) | ||||||||||||||||||||
Barclays Bank PLC | 5/6/2024 | 1,196,587 | USD | 1,073,847 | CHF | — | (15 | ) | ||||||||||||||||||||
Barclays Bank PLC | 5/6/2024 | 174,042,083 | USD | 160,938,621 | EUR | — | (1,821 | ) | ||||||||||||||||||||
Barclays Bank PLC | 5/6/2024 | 3,359,886 | USD | 3,106,941 | EUR | — | (54 | ) | ||||||||||||||||||||
Barclays Bank PLC | 5/6/2024 | 3,043,639 | USD | 23,795,711 | HKD | — | (58 | ) | ||||||||||||||||||||
Barclays Bank PLC | 5/6/2024 | 58,757 | USD | 459,376 | HKD | — | (1 | ) | ||||||||||||||||||||
Barclays Bank PLC | 5/6/2024 | 4,293,017 | USD | 46,535,411 | NOK | — | (77 | ) | ||||||||||||||||||||
Barclays Bank PLC | 5/6/2024 | 82,877 | USD | 898,432 | NOK | — | (7 | ) | ||||||||||||||||||||
Barclays Bank PLC | 5/6/2024 | 17,659,701 | USD | 188,581,890 | SEK | — | (486 | ) | ||||||||||||||||||||
Barclays Bank PLC | 5/6/2024 | 340,921 | USD | 3,640,580 | SEK | — | (10 | ) | ||||||||||||||||||||
Barclays Bank PLC | 5/6/2024 | 2,331,964 | USD | 3,142,352 | SGD | — | (63 | ) | ||||||||||||||||||||
Barclays Bank PLC | 5/6/2024 | 45,019 | USD | 60,664 | SGD | — | (1 | ) | ||||||||||||||||||||
Barclays Bank PLC | 5/7/2024 | 73,549,742 | USD | 11,070,611,551 | JPY | 8,915 | — | |||||||||||||||||||||
Barclays Bank PLC | 5/7/2024 | 1,419,879 | USD | 213,719,448 | JPY | 165 | — | |||||||||||||||||||||
Citibank NA | 4/3/2024 | 7,982,849 | ILS | 2,179,079 | USD | — | (102 | ) | ||||||||||||||||||||
Citibank NA | 4/3/2024 | 10,848,819,127 | JPY | 71,703,789 | USD | — | (10,147 | ) | ||||||||||||||||||||
Citibank NA | 4/3/2024 | 3,069,953 | SGD | 2,274,806 | USD | 13 | — | |||||||||||||||||||||
Citibank NA | 4/4/2024 | 49,719,528 | AUD | 32,437,567 | USD | 347 | — | |||||||||||||||||||||
Citibank NA | 4/4/2024 | 55,682,714 | CHF | 61,829,424 | USD | — | (1,030 | ) | ||||||||||||||||||||
Citibank NA | 4/4/2024 | 136,505,389 | DKK | 19,765,489 | USD | 251 | — | |||||||||||||||||||||
Citibank NA | 4/4/2024 | 155,236,488 | EUR | 167,660,375 | USD | 1,515 | — | |||||||||||||||||||||
Citibank NA | 4/4/2024 | 62,003,448 | GBP | 78,327,282 | USD | — | (1,006 | ) | ||||||||||||||||||||
Citibank NA | 4/4/2024 | 42,852,094 | NOK | 3,950,160 | USD | — | (45 | ) | ||||||||||||||||||||
Citibank NA | 4/4/2024 | 185,007,296 | SEK | 17,303,269 | USD | — | (212 | ) | ||||||||||||||||||||
Citibank NA | 4/5/2024 | 18,148,336 | HKD | 2,319,016 | USD | — | (3 | ) | ||||||||||||||||||||
Citibank NA | 5/3/2024 | 33,270,782 | USD | 50,954,797 | AUD | — | (611 | ) | ||||||||||||||||||||
See Notes to Financial Statements.
| WisdomTree Trust | 23 |
Schedule of Investments (continued)
WisdomTree International Hedged Quality Dividend Growth Fund (IHDG)
March 31, 2024
| FINANCIAL DERIVATIVE INSTRUMENTS | ||||||||||||||||||||||||||||
| FOREIGN CURRENCY CONTRACTS (OTC – OVER THE COUNTER) | ||||||||||||||||||||||||||||
| Counterparty | Settlement Date | Amount and Description of Currency to be Purchased | Amount and Description of Currency to be Sold | Unrealized Appreciation | Unrealized Depreciation | |||||||||||||||||||||||
Citibank NA | 5/3/2024 | 20,852,844 | USD | 143,809,741 | DKK | $ | — | $ | (738 | ) | ||||||||||||||||||
Citibank NA | 5/3/2024 | 81,293,820 | USD | 64,341,863 | GBP | 456 | — | |||||||||||||||||||||
Citibank NA | 5/3/2024 | 2,052,669 | USD | 7,511,256 | ILS | — | (13 | ) | ||||||||||||||||||||
Citibank NA | 5/6/2024 | 61,983,223 | USD | 55,624,426 | CHF | 194 | — | |||||||||||||||||||||
Citibank NA | 5/6/2024 | 174,042,080 | USD | 160,939,065 | EUR | — | (2,304 | ) | ||||||||||||||||||||
Citibank NA | 5/6/2024 | 3,043,636 | USD | 23,797,666 | HKD | — | (311 | ) | ||||||||||||||||||||
Citibank NA | 5/6/2024 | 4,293,015 | USD | 46,534,917 | NOK | — | (34 | ) | ||||||||||||||||||||
Citibank NA | 5/6/2024 | 17,659,701 | USD | 188,578,994 | SEK | — | (215 | ) | ||||||||||||||||||||
Citibank NA | 5/6/2024 | 2,331,964 | USD | 3,142,352 | SGD | — | (63 | ) | ||||||||||||||||||||
Citibank NA | 5/7/2024 | 73,549,741 | USD | 11,070,684,950 | JPY | 8,427 | — | |||||||||||||||||||||
HSBC Holdings PLC | 4/2/2024 | 58,456,345 | JPY | 306,000 | GBP | — | (309 | ) | ||||||||||||||||||||
HSBC Holdings PLC | 4/2/2024 | 279,000,000 | JPY | 1,844,506 | USD | — | (1,036 | ) | ||||||||||||||||||||
HSBC Holdings PLC | 4/3/2024 | 2,143,254 | USD | 7,648,043 | ILS | 55,665 | — | |||||||||||||||||||||
HSBC Holdings PLC | 4/3/2024 | 70,524,907 | USD | 10,505,904,978 | JPY | 1,097,389 | — | |||||||||||||||||||||
HSBC Holdings PLC | 4/3/2024 | 2,237,409 | USD | 3,004,415 | SGD | 11,153 | — | |||||||||||||||||||||
HSBC Holdings PLC | 4/4/2024 | 31,904,261 | USD | 48,950,709 | AUD | — | (32,062 | ) | ||||||||||||||||||||
HSBC Holdings PLC | 4/4/2024 | 60,812,888 | USD | 53,371,762 | CHF | 1,550,504 | — | |||||||||||||||||||||
HSBC Holdings PLC | 4/4/2024 | 19,440,527 | USD | 133,701,641 | DKK | 80,765 | — | |||||||||||||||||||||
HSBC Holdings PLC | 4/4/2024 | 164,903,871 | USD | 152,194,981 | EUR | 526,935 | — | |||||||||||||||||||||
HSBC Holdings PLC | 4/4/2024 | 77,039,506 | USD | 60,892,516 | GBP | 116,623 | — | |||||||||||||||||||||
HSBC Holdings PLC | 4/4/2024 | 3,885,217 | USD | 41,148,994 | NOK | 92,094 | — | |||||||||||||||||||||
HSBC Holdings PLC | 4/4/2024 | 17,018,789 | USD | 175,878,122 | SEK | 569,550 | — | |||||||||||||||||||||
HSBC Holdings PLC | 4/5/2024 | 2,280,893 | USD | 17,839,599 | HKD | 1,331 | — | |||||||||||||||||||||
JP Morgan Chase Bank NA | 4/3/2024 | 84,297 | USD | 307,897 | ILS | 254 | — | |||||||||||||||||||||
JP Morgan Chase Bank NA | 4/3/2024 | 2,773,841 | USD | 410,006,653 | JPY | 64,341 | — | |||||||||||||||||||||
JP Morgan Chase Bank NA | 4/3/2024 | 88,000 | USD | 117,479 | SGD | 949 | — | |||||||||||||||||||||
JP Morgan Chase Bank NA | 4/4/2024 | 1,254,838 | USD | 1,904,665 | AUD | 12,200 | — | |||||||||||||||||||||
JP Morgan Chase Bank NA | 4/4/2024 | 2,391,854 | USD | 2,109,261 | CHF | 49,795 | — | |||||||||||||||||||||
JP Morgan Chase Bank NA | 4/4/2024 | 764,622 | USD | 5,232,554 | DKK | 6,957 | — | |||||||||||||||||||||
JP Morgan Chase Bank NA | 4/4/2024 | 6,485,894 | USD | 5,952,778 | EUR | 56,645 | — | |||||||||||||||||||||
JP Morgan Chase Bank NA | 4/4/2024 | 3,030,069 | USD | 2,376,560 | GBP | 27,864 | — | |||||||||||||||||||||
JP Morgan Chase Bank NA | 4/4/2024 | 152,811 | USD | 1,612,784 | NOK | 4,144 | — | |||||||||||||||||||||
JP Morgan Chase Bank NA | 4/4/2024 | 669,372 | USD | 6,911,095 | SEK | 23,002 | — | |||||||||||||||||||||
JP Morgan Chase Bank NA | 4/5/2024 | 89,711 | USD | 701,405 | HKD | 85 | — | |||||||||||||||||||||
Morgan Stanley & Co. International | 4/3/2024 | 7,982,892 | ILS | 2,179,080 | USD | — | (92 | ) | ||||||||||||||||||||
Morgan Stanley & Co. International | 4/3/2024 | 10,848,784,207 | JPY | 71,703,789 | USD | — | (10,378 | ) | ||||||||||||||||||||
Morgan Stanley & Co. International | 4/3/2024 | 3,069,968 | SGD | 2,274,809 | USD | 22 | — | |||||||||||||||||||||
Morgan Stanley & Co. International | 4/3/2024 | 2,143,254 | USD | 7,647,951 | ILS | 55,690 | — | |||||||||||||||||||||
Morgan Stanley & Co. International | 4/3/2024 | 70,524,907 | USD | 10,505,947,081 | JPY | 1,097,110 | — | |||||||||||||||||||||
Morgan Stanley & Co. International | 4/3/2024 | 2,237,409 | USD | 3,004,489 | SGD | 11,098 | — | |||||||||||||||||||||
Morgan Stanley & Co. International | 4/4/2024 | 49,719,452 | AUD | 32,437,567 | USD | 297 | — | |||||||||||||||||||||
Morgan Stanley & Co. International | 4/4/2024 | 55,683,086 | CHF | 61,829,426 | USD | — | (618 | ) | ||||||||||||||||||||
Morgan Stanley & Co. International | 4/4/2024 | 136,505,805 | DKK | 19,765,492 | USD | 308 | — | |||||||||||||||||||||
Morgan Stanley & Co. International | 4/4/2024 | 155,236,633 | EUR | 167,660,376 | USD | 1,671 | — | |||||||||||||||||||||
Morgan Stanley & Co. International | 4/4/2024 | 62,003,598 | GBP | 78,327,285 | USD | — | (820 | ) | ||||||||||||||||||||
Morgan Stanley & Co. International | 4/4/2024 | 42,852,176 | NOK | 3,950,161 | USD | — | (38 | ) | ||||||||||||||||||||
Morgan Stanley & Co. International | 4/4/2024 | 185,007,685 | SEK | 17,303,273 | USD | — | (179 | ) | ||||||||||||||||||||
Morgan Stanley & Co. International | 4/4/2024 | 31,904,261 | USD | 48,950,859 | AUD | — | (32,160 | ) | ||||||||||||||||||||
Morgan Stanley & Co. International | 4/4/2024 | 60,812,888 | USD | 53,371,519 | CHF | 1,550,774 | — | |||||||||||||||||||||
Morgan Stanley & Co. International | 4/4/2024 | 19,440,527 | USD | 133,703,371 | DKK | 80,515 | — | |||||||||||||||||||||
Morgan Stanley & Co. International | 4/4/2024 | 164,903,871 | USD | 152,194,841 | EUR | 527,087 | — | |||||||||||||||||||||
Morgan Stanley & Co. International | 4/4/2024 | 77,039,506 | USD | 60,892,564 | GBP | 116,562 | — | |||||||||||||||||||||
Morgan Stanley & Co. International | 4/4/2024 | 3,885,217 | USD | 41,149,075 | NOK | 92,087 | — | |||||||||||||||||||||
Morgan Stanley & Co. International | 4/4/2024 | 17,018,789 | USD | 175,875,280 | SEK | 569,816 | — | |||||||||||||||||||||
Morgan Stanley & Co. International | 4/5/2024 | 18,148,495 | HKD | 2,319,020 | USD | 13 | — | |||||||||||||||||||||
See Notes to Financial Statements.
| 24 | WisdomTree Trust |
Schedule of Investments (continued)
WisdomTree International Hedged Quality Dividend Growth Fund (IHDG)
March 31, 2024
| FINANCIAL DERIVATIVE INSTRUMENTS | ||||||||||||||||||||||||||||
| FOREIGN CURRENCY CONTRACTS (OTC – OVER THE COUNTER) | ||||||||||||||||||||||||||||
| Counterparty | Settlement Date | Amount and Description of Currency to be Purchased | Amount and Description of Currency to be Sold | Unrealized Appreciation | Unrealized Depreciation | |||||||||||||||||||||||
Morgan Stanley & Co. International | 4/5/2024 | 2,280,893 | USD | 17,840,226 | HKD | $ | 1,251 | $ | — | |||||||||||||||||||
Morgan Stanley & Co. International | 5/3/2024 | 33,270,784 | USD | 50,955,659 | AUD | — | (1,171 | ) | ||||||||||||||||||||
Morgan Stanley & Co. International | 5/3/2024 | 20,852,846 | USD | 143,811,006 | DKK | — | (919 | ) | ||||||||||||||||||||
Morgan Stanley & Co. International | 5/3/2024 | 81,293,822 | USD | 64,341,762 | GBP | 585 | — | |||||||||||||||||||||
Morgan Stanley & Co. International | 5/3/2024 | 2,052,671 | USD | 7,511,181 | ILS | 10 | — | |||||||||||||||||||||
Morgan Stanley & Co. International | 5/6/2024 | 61,983,226 | USD | 55,625,607 | CHF | — | (1,119 | ) | ||||||||||||||||||||
Morgan Stanley & Co. International | 5/6/2024 | 174,042,083 | USD | 160,939,068 | EUR | — | (2,304 | ) | ||||||||||||||||||||
Morgan Stanley & Co. International | 5/6/2024 | 3,043,639 | USD | 23,796,472 | HKD | — | (155 | ) | ||||||||||||||||||||
Morgan Stanley & Co. International | 5/6/2024 | 4,293,017 | USD | 46,533,600 | NOK | 90 | — | |||||||||||||||||||||
Morgan Stanley & Co. International | 5/6/2024 | 17,659,701 | USD | 188,578,994 | SEK | — | (215 | ) | ||||||||||||||||||||
Morgan Stanley & Co. International | 5/6/2024 | 2,331,964 | USD | 3,142,314 | SGD | — | (35 | ) | ||||||||||||||||||||
Morgan Stanley & Co. International | 5/7/2024 | 73,549,742 | USD | 11,070,516,892 | JPY | 9,544 | — | |||||||||||||||||||||
Royal Bank of Canada | 4/3/2024 | 7,982,914 | ILS | 2,179,080 | USD | — | (86 | ) | ||||||||||||||||||||
Royal Bank of Canada | 4/3/2024 | 10,848,748,355 | JPY | 71,703,789 | USD | — | (10,615 | ) | ||||||||||||||||||||
Royal Bank of Canada | 4/3/2024 | 3,069,957 | SGD | 2,274,809 | USD | 13 | — | |||||||||||||||||||||
Royal Bank of Canada | 4/3/2024 | 2,143,251 | USD | 7,649,503 | ILS | 55,264 | — | |||||||||||||||||||||
Royal Bank of Canada | 4/3/2024 | 70,524,905 | USD | 10,505,932,678 | JPY | 1,097,204 | — | |||||||||||||||||||||
Royal Bank of Canada | 4/3/2024 | 2,237,406 | USD | 3,004,510 | SGD | 11,080 | — | |||||||||||||||||||||
Royal Bank of Canada | 4/4/2024 | 49,719,452 | AUD | 32,437,567 | USD | 297 | — | |||||||||||||||||||||
Royal Bank of Canada | 4/4/2024 | 55,683,025 | CHF | 61,829,426 | USD | — | (687 | ) | ||||||||||||||||||||
Royal Bank of Canada | 4/4/2024 | 136,504,342 | DKK | 19,765,492 | USD | 96 | — | |||||||||||||||||||||
Royal Bank of Canada | 4/4/2024 | 155,236,920 | EUR | 167,660,376 | USD | 1,981 | — | |||||||||||||||||||||
Royal Bank of Canada | 4/4/2024 | 62,003,549 | GBP | 78,327,285 | USD | — | (882 | ) | ||||||||||||||||||||
Royal Bank of Canada | 4/4/2024 | 42,852,026 | NOK | 3,950,161 | USD | — | (52 | ) | ||||||||||||||||||||
Royal Bank of Canada | 4/4/2024 | 185,007,131 | SEK | 17,303,273 | USD | — | (231 | ) | ||||||||||||||||||||
Royal Bank of Canada | 4/4/2024 | 31,904,260 | USD | 48,951,759 | AUD | — | (32,748 | ) | ||||||||||||||||||||
Royal Bank of Canada | 4/4/2024 | 60,812,886 | USD | 53,373,220 | CHF | 1,548,883 | — | |||||||||||||||||||||
Royal Bank of Canada | 4/4/2024 | 19,440,527 | USD | 133,700,650 | DKK | 80,909 | — | |||||||||||||||||||||
Royal Bank of Canada | 4/4/2024 | 164,903,870 | USD | 152,194,980 | EUR | 526,935 | — | |||||||||||||||||||||
Royal Bank of Canada | 4/4/2024 | 77,039,502 | USD | 60,892,176 | GBP | 117,049 | — | |||||||||||||||||||||
Royal Bank of Canada | 4/4/2024 | 3,885,213 | USD | 41,149,045 | NOK | 92,085 | — | |||||||||||||||||||||
Royal Bank of Canada | 4/4/2024 | 17,018,789 | USD | 175,877,833 | SEK | 569,577 | — | |||||||||||||||||||||
Royal Bank of Canada | 4/5/2024 | 18,148,449 | HKD | 2,319,020 | USD | 7 | — | |||||||||||||||||||||
Royal Bank of Canada | 4/5/2024 | 2,280,889 | USD | 17,840,455 | HKD | 1,218 | — | |||||||||||||||||||||
Royal Bank of Canada | 5/3/2024 | 33,270,784 | USD | 50,955,659 | AUD | — | (1,171 | ) | ||||||||||||||||||||
Royal Bank of Canada | 5/3/2024 | 20,852,846 | USD | 143,809,379 | DKK | — | (683 | ) | ||||||||||||||||||||
Royal Bank of Canada | 5/3/2024 | 81,293,822 | USD | 64,342,017 | GBP | 263 | — | |||||||||||||||||||||
Royal Bank of Canada | 5/3/2024 | 2,052,671 | USD | 7,511,366 | ILS | — | (41 | ) | ||||||||||||||||||||
Royal Bank of Canada | 5/6/2024 | 61,983,226 | USD | 55,624,739 | CHF | — | (152 | ) | ||||||||||||||||||||
Royal Bank of Canada | 5/6/2024 | 174,042,083 | USD | 160,939,514 | EUR | — | (2,787 | ) | ||||||||||||||||||||
Royal Bank of Canada | 5/6/2024 | 3,043,639 | USD | 23,795,806 | HKD | — | (70 | ) | ||||||||||||||||||||
Royal Bank of Canada | 5/6/2024 | 4,293,017 | USD | 46,534,299 | NOK | 25 | — | |||||||||||||||||||||
Royal Bank of Canada | 5/6/2024 | 17,659,701 | USD | 188,580,548 | SEK | — | (360 | ) | ||||||||||||||||||||
Royal Bank of Canada | 5/6/2024 | 2,331,964 | USD | 3,142,335 | SGD | — | (50 | ) | ||||||||||||||||||||
Royal Bank of Canada | 5/7/2024 | 73,549,742 | USD | 11,070,612,507 | JPY | 8,909 | — | |||||||||||||||||||||
Standard Chartered Bank | 4/2/2024 | 6,905,815 | JPY | 70,000 | AUD | — | (38 | ) | ||||||||||||||||||||
Standard Chartered Bank | 4/2/2024 | 33,537,162 | JPY | 200,000 | CHF | — | (455 | ) | ||||||||||||||||||||
Standard Chartered Bank | 4/3/2024 | 52,686 | USD | 188,391 | ILS | 1,263 | — | |||||||||||||||||||||
Standard Chartered Bank | 4/3/2024 | 42,149 | USD | 153,545 | ILS | 238 | — | |||||||||||||||||||||
Standard Chartered Bank | 4/3/2024 | 1,733,651 | USD | 259,761,424 | JPY | 17,036 | — | |||||||||||||||||||||
Standard Chartered Bank | 4/3/2024 | 1,386,920 | USD | 209,778,445 | JPY | 614 | — | |||||||||||||||||||||
Standard Chartered Bank | 4/3/2024 | 55,000 | USD | 73,757 | SGD | 346 | — | |||||||||||||||||||||
Standard Chartered Bank | 4/3/2024 | 44,000 | USD | 59,215 | SGD | 122 | — | |||||||||||||||||||||
Standard Chartered Bank | 4/4/2024 | 784,274 | USD | 1,201,964 | AUD | 91 | — | |||||||||||||||||||||
Standard Chartered Bank | 4/4/2024 | 627,419 | USD | 959,516 | AUD | 1,413 | — | |||||||||||||||||||||
See Notes to Financial Statements.
| WisdomTree Trust | 25 |
Schedule of Investments (concluded)
WisdomTree International Hedged Quality Dividend Growth Fund (IHDG)
March 31, 2024
| FINANCIAL DERIVATIVE INSTRUMENTS | ||||||||||||||||||||||||||||
| FOREIGN CURRENCY CONTRACTS (OTC – OVER THE COUNTER) | ||||||||||||||||||||||||||||
| Counterparty | Settlement Date | Amount and Description of Currency to be Purchased | Amount and Description of Currency to be Sold | Unrealized Appreciation | Unrealized Depreciation | |||||||||||||||||||||||
Standard Chartered Bank | 4/4/2024 | 1,494,909 | USD | 1,318,484 | CHF | $ | 30,904 | $ | — | |||||||||||||||||||
Standard Chartered Bank | 4/4/2024 | 1,195,927 | USD | 1,073,260 | CHF | 4,212 | — | |||||||||||||||||||||
Standard Chartered Bank | 4/4/2024 | 477,889 | USD | 3,274,192 | DKK | 3,792 | — | |||||||||||||||||||||
Standard Chartered Bank | 4/4/2024 | 382,311 | USD | 2,629,954 | DKK | 1,498 | — | |||||||||||||||||||||
Standard Chartered Bank | 4/4/2024 | 4,053,684 | USD | 3,727,046 | EUR | 28,319 | — | |||||||||||||||||||||
Standard Chartered Bank | 4/4/2024 | 3,242,947 | USD | 2,991,353 | EUR | 12,161 | — | |||||||||||||||||||||
Standard Chartered Bank | 4/4/2024 | 1,893,793 | USD | 1,491,077 | GBP | 10,180 | — | |||||||||||||||||||||
Standard Chartered Bank | 4/4/2024 | 1,515,034 | USD | 1,198,129 | GBP | 1,490 | — | |||||||||||||||||||||
Standard Chartered Bank | 4/4/2024 | 95,507 | USD | 1,006,958 | NOK | 2,685 | — | |||||||||||||||||||||
Standard Chartered Bank | 4/4/2024 | 76,405 | USD | 817,987 | NOK | 1,003 | — | |||||||||||||||||||||
Standard Chartered Bank | 4/4/2024 | 418,358 | USD | 4,325,941 | SEK | 13,769 | — | |||||||||||||||||||||
Standard Chartered Bank | 4/4/2024 | 334,686 | USD | 3,536,130 | SEK | 3,965 | — | |||||||||||||||||||||
Standard Chartered Bank | 4/5/2024 | 56,069 | USD | 438,386 | HKD | 52 | — | |||||||||||||||||||||
Standard Chartered Bank | 4/5/2024 | 44,855 | USD | 350,803 | HKD | 29 | — | |||||||||||||||||||||
| $ | 20,950,589 | $ | (251,518 | ) | ||||||||||||||||||||||||
| FAIR VALUATION SUMMARY |
The following is a summary of the fair valuations according to the inputs used in valuing the Fund’s investments (See Note 2 — Fair Value Measurement):
Quoted Prices in Active Markets | Other Significant Inputs | Significant Unobservable Inputs (Level 3) | Total | |||||||||||||
Assets: |
| |||||||||||||||
Investments in Securities | ||||||||||||||||
Common Stocks | $ | 2,357,746,670 | $ | — | $ | — | $ | 2,357,746,670 | ||||||||
Exchange-Traded Fund | 1,150,249 | — | — | 1,150,249 | ||||||||||||
Investment of Cash Collateral for Securities Loaned | — | 60,536,579 | — | 60,536,579 | ||||||||||||
Total Investments in Securities | $ | 2,358,896,919 | $ | 60,536,579 | $ | — | $ | 2,419,433,498 | ||||||||
Financial Derivative Instruments | ||||||||||||||||
Foreign Currency Contracts1 | $ | — | $ | 20,950,589 | $ | — | $ | 20,950,589 | ||||||||
Liabilities: |
| |||||||||||||||
Financial Derivative Instruments | ||||||||||||||||
Foreign Currency Contracts1 | $ | — | $ | (251,518 | ) | $ | — | $ | (251,518 | ) | ||||||
Total – Net | $ | 2,358,896,919 | $ | 81,235,650 | $ | — | $ | 2,440,132,569 | ||||||||
| 1 | Amount shown represents the unrealized appreciation (depreciation) on the financial instrument. |
See Notes to Financial Statements.
| 26 | WisdomTree Trust |
Schedule of Investments
WisdomTree Japan Hedged Equity Fund (DXJ)
March 31, 2024
| Investments | Shares | Value | ||||||
| COMMON STOCKS – 98.9% |
| |||||||
| Japan – 98.9% |
| |||||||
| Air Freight & Logistics – 0.3% |
| |||||||
Mitsui-Soko Holdings Co. Ltd.(a) | 71,100 | $ | 2,210,351 | |||||
Nippon Express Holdings, Inc. | 224,500 | 11,469,384 | ||||||
|
| |||||||
| Total Air Freight & Logistics |
| 13,679,735 | ||||||
| Automobile Components – 5.7% |
| |||||||
Aisan Industry Co. Ltd. | 150,100 | 1,688,991 | ||||||
Aisin Corp. | 404,808 | 16,639,536 | ||||||
Bridgestone Corp. | 1,500,485 | 65,989,812 | ||||||
Daikyonishikawa Corp. | 19,500 | 99,339 | ||||||
Denso Corp. | 4,335,516 | 82,588,078 | ||||||
Eagle Industry Co. Ltd. | 107,900 | 1,306,107 | ||||||
Exedy Corp.(a) | 118,100 | 2,387,829 | ||||||
FuKoKu Co. Ltd. | 72,400 | 896,479 | ||||||
Futaba Industrial Co. Ltd. | 159,600 | 1,236,980 | ||||||
G-Tekt Corp. | 73,600 | 1,027,565 | ||||||
JTEKT Corp. | 614,178 | 5,795,013 | ||||||
Koito Manufacturing Co. Ltd. | 172,700 | 2,892,692 | ||||||
KYB Corp. | 95,700 | 3,269,147 | ||||||
Musashi Seimitsu Industry Co. Ltd. | 31,900 | 355,159 | ||||||
NHK Spring Co. Ltd. | 326,000 | 3,224,566 | ||||||
Nifco, Inc. | 125,690 | 3,206,509 | ||||||
Niterra Co. Ltd.(a) | 608,764 | 20,449,676 | ||||||
Pacific Industrial Co. Ltd. | 97,500 | 1,100,334 | ||||||
Press Kogyo Co. Ltd. | 405,800 | 1,917,123 | ||||||
Sanoh Industrial Co. Ltd.(a) | 115,000 | 868,512 | ||||||
Seiren Co. Ltd.(a) | 101,310 | 1,846,199 | ||||||
Shoei Co. Ltd.(a) | 81,100 | 1,207,296 | ||||||
Sumitomo Electric Industries Ltd. | 1,030,083 | 15,977,534 | ||||||
Sumitomo Riko Co. Ltd. | 108,400 | 954,754 | ||||||
Sumitomo Rubber Industries Ltd. | 285,691 | 3,545,064 | ||||||
Tachi-S Co. Ltd. | 139,400 | 1,841,228 | ||||||
Tokai Rika Co. Ltd. | 178,714 | 3,091,435 | ||||||
Topre Corp. | 69,600 | 1,201,197 | ||||||
Toyo Tire Corp. | 348,500 | 6,511,996 | ||||||
Toyoda Gosei Co. Ltd. | 174,100 | 3,732,892 | ||||||
Toyota Boshoku Corp. | 318,436 | 5,405,280 | ||||||
Yokohama Rubber Co. Ltd. | 167,100 | 4,445,106 | ||||||
|
| |||||||
| Total Automobile Components |
| 266,699,428 | ||||||
| Automobiles – 10.0% |
| |||||||
Honda Motor Co. Ltd. | 6,730,941 | 84,100,627 | ||||||
Isuzu Motors Ltd.(a) | 1,617,600 | 21,964,175 | ||||||
Mazda Motor Corp. | 1,254,500 | 14,551,354 | ||||||
Mitsubishi Motors Corp.(a) | 1,272,900 | 4,254,074 | ||||||
Nissan Motor Co. Ltd.(a) | 3,127,100 | 12,568,733 | ||||||
Subaru Corp. | 1,396,767 | 31,821,683 | ||||||
Suzuki Motor Corp.(a) | 1,446,144 | 16,611,856 | ||||||
Toyota Motor Corp. | 10,705,950 | 268,241,187 | ||||||
Yamaha Motor Co. Ltd. | 1,667,900 | 15,687,705 | ||||||
|
| |||||||
| Total Automobiles |
| 469,801,394 | ||||||
| Banks – 10.3% |
| |||||||
Mitsubishi UFJ Financial Group, Inc. | 21,601,322 | 222,229,068 | ||||||
Mizuho Financial Group, Inc.(a) | 5,784,864 | 116,427,340 | ||||||
Sumitomo Mitsui Financial Group, Inc. | 1,979,900 | 116,547,815 | ||||||
Sumitomo Mitsui Trust Holdings, Inc. | 1,277,000 | 27,911,831 | ||||||
|
| |||||||
| Total Banks |
| 483,116,054 | ||||||
| Beverages – 0.8% |
| |||||||
Asahi Group Holdings Ltd. | 426,000 | 15,711,996 | ||||||
Kirin Holdings Co. Ltd. | 1,240,045 | 17,189,959 | ||||||
Sapporo Holdings Ltd. | 34,000 | 1,354,878 | ||||||
Takara Holdings, Inc.(a) | 436,200 | 3,085,349 | ||||||
|
| |||||||
| Total Beverages |
| 37,342,182 | ||||||
| Biotechnology – 0.0% |
| |||||||
Takara Bio, Inc. | 98,900 | 633,870 | ||||||
| Broadline Retail – 0.1% |
| |||||||
Ryohin Keikaku Co. Ltd. | 233,000 | 3,885,771 | ||||||
| Building Products – 1.0% |
| |||||||
AGC, Inc. | 395,647 | 14,451,330 | ||||||
Central Glass Co. Ltd. | 65,100 | 1,248,275 | ||||||
Daikin Industries Ltd.(a) | 144,849 | 19,715,811 | ||||||
Nihon Flush Co. Ltd. | 17,600 | 113,151 | ||||||
Nitto Boseki Co. Ltd.(a) | 20,100 | 792,871 | ||||||
Noritz Corp. | 113,200 | 1,304,442 | ||||||
Okabe Co. Ltd. | 1,000 | 5,187 | ||||||
Sanwa Holdings Corp. | 472,131 | 8,363,561 | ||||||
|
| |||||||
| Total Building Products |
| 45,994,628 | ||||||
| Capital Markets – 1.0% |
| |||||||
Nomura Holdings, Inc. | 4,953,900 | 31,999,291 | ||||||
SBI Holdings, Inc. | 574,300 | 14,992,628 | ||||||
Sparx Group Co. Ltd. | 111,300 | 1,382,563 | ||||||
|
| |||||||
| Total Capital Markets |
| 48,374,482 | ||||||
| Chemicals – 7.1% |
| |||||||
ADEKA Corp. | 132,800 | 2,828,948 | ||||||
Aica Kogyo Co. Ltd. | 173,700 | 4,269,477 | ||||||
Arakawa Chemical Industries Ltd. | 84,200 | 648,142 | ||||||
Artience Co. Ltd. | 91,200 | 1,754,762 | ||||||
Asahi Kasei Corp. | 2,195,894 | 16,134,224 | ||||||
Asahi Yukizai Corp. | 25,300 | 882,646 | ||||||
C Uyemura & Co. Ltd. | 20,300 | 1,409,713 | ||||||
Chugoku Marine Paints Ltd. | 161,700 | 2,422,108 | ||||||
Daicel Corp. | 372,142 | 3,722,772 | ||||||
Denka Co. Ltd. | 142,415 | 2,208,047 | ||||||
DIC Corp. | 137,153 | 2,617,185 | ||||||
Fujimi, Inc.(a) | 88,000 | 2,046,714 | ||||||
Fuso Chemical Co. Ltd.(a) | 20,800 | 632,885 | ||||||
Ishihara Sangyo Kaisha Ltd. | 86,900 | 1,015,733 | ||||||
JCU Corp. | 13,700 | 357,561 | ||||||
JSP Corp.(a) | 64,100 | 974,132 | ||||||
Kaneka Corp. | 85,400 | 2,152,140 | ||||||
Kansai Paint Co. Ltd.(a) | 225,700 | 3,245,057 | ||||||
Kanto Denka Kogyo Co. Ltd. | 148,100 | 986,387 | ||||||
KH Neochem Co. Ltd. | 58,700 | 912,236 | ||||||
See Notes to Financial Statements.
| WisdomTree Trust | 27 |
Schedule of Investments (continued)
WisdomTree Japan Hedged Equity Fund (DXJ)
March 31, 2024
| Investments | Shares | Value | ||||||
Kumiai Chemical Industry Co. Ltd. | 249,000 | $ | 1,367,201 | |||||
Kuraray Co. Ltd. | 592,837 | 6,429,958 | ||||||
Kureha Corp. | 87,400 | 1,569,036 | ||||||
Lintec Corp. | 116,147 | 2,428,922 | ||||||
MEC Co. Ltd.(a) | 24,600 | 663,986 | ||||||
Mitsubishi Chemical Group Corp. | 3,366,263 | 20,373,960 | ||||||
Mitsubishi Gas Chemical Co., Inc.(a) | 360,382 | 6,167,296 | ||||||
Mitsui Chemicals, Inc.(a) | 288,915 | 8,267,804 | ||||||
Nihon Nohyaku Co. Ltd.(a) | 89,100 | 485,106 | ||||||
Nippon Kayaku Co. Ltd. | 308,200 | 2,659,547 | ||||||
Nippon Paint Holdings Co. Ltd. | 1,174,900 | 8,333,643 | ||||||
Nippon Pillar Packing Co. Ltd. | 55,800 | 2,352,268 | ||||||
Nippon Sanso Holdings Corp. | 181,053 | 5,680,000 | ||||||
Nippon Shokubai Co. Ltd. | 238,800 | 2,313,131 | ||||||
Nippon Soda Co. Ltd. | 77,500 | 3,103,175 | ||||||
Nissan Chemical Corp. | 156,453 | 5,918,223 | ||||||
Nitto Denko Corp. | 237,274 | 21,603,857 | ||||||
NOF Corp. | 305,100 | 4,204,209 | ||||||
Osaka Soda Co. Ltd.(a) | 9,500 | 606,363 | ||||||
Resonac Holdings Corp.(a) | 207,600 | 4,973,786 | ||||||
Riken Technos Corp. | 149,800 | 993,751 | ||||||
Sakata INX Corp. | 79,400 | 825,766 | ||||||
Sanyo Chemical Industries Ltd. | 24,500 | 689,616 | ||||||
Shin-Etsu Chemical Co. Ltd. | 2,881,095 | 125,337,008 | ||||||
Shin-Etsu Polymer Co. Ltd. | 156,300 | 1,589,387 | ||||||
Sumitomo Bakelite Co. Ltd. | 128,200 | 3,920,246 | ||||||
Sumitomo Seika Chemicals Co. Ltd. | 25,000 | 840,794 | ||||||
T Hasegawa Co. Ltd.(a) | 32,000 | 640,655 | ||||||
Taiyo Holdings Co. Ltd. | 86,852 | 1,945,411 | ||||||
Takasago International Corp. | 29,000 | 662,989 | ||||||
Teijin Ltd. | 196,800 | 1,833,480 | ||||||
Tokai Carbon Co. Ltd. | 303,600 | 1,999,393 | ||||||
Tokuyama Corp. | 113,000 | 2,027,123 | ||||||
Tokyo Ohka Kogyo Co. Ltd. | 97,500 | 2,949,899 | ||||||
Toray Industries, Inc. | 1,732,418 | 8,471,787 | ||||||
Tosoh Corp.(a) | 598,507 | 8,154,359 | ||||||
Toyobo Co. Ltd. | 206,951 | 1,541,074 | ||||||
UBE Corp. | 205,500 | 3,702,109 | ||||||
Valqua Ltd.(a) | 68,800 | 2,332,049 | ||||||
Zeon Corp.(a) | 253,500 | 2,212,650 | ||||||
|
| |||||||
| Total Chemicals |
| 333,391,886 | ||||||
| Commercial Services & Supplies – 0.1% |
| |||||||
Inui Global Logistics Co. Ltd.(a) | 2,000 | 13,704 | ||||||
Pilot Corp. | 49,900 | 1,312,247 | ||||||
Sato Holdings Corp. | 61,200 | 929,251 | ||||||
|
| |||||||
| Total Commercial Services & Supplies |
| 2,255,202 | ||||||
| Construction & Engineering – 0.8% |
| |||||||
Kajima Corp. | 668,400 | 13,805,665 | ||||||
Obayashi Corp. | 978,100 | 12,036,812 | ||||||
Penta-Ocean Construction Co. Ltd. | 371,100 | 1,904,970 | ||||||
Shimizu Corp.(a) | 700,800 | 4,632,795 | ||||||
Sumitomo Mitsui Construction Co. Ltd. | 331,800 | 942,707 | ||||||
Taikisha Ltd. | 71,700 | 2,200,578 | ||||||
Toda Corp. | 452,900 | 3,059,832 | ||||||
|
| |||||||
| Total Construction & Engineering |
| 38,583,359 | ||||||
| Construction Materials – 0.2% |
| |||||||
Krosaki Harima Corp. | 86,000 | 1,991,675 | ||||||
Shinagawa Refractories Co. Ltd.(a) | 145,600 | 1,853,852 | ||||||
Taiheiyo Cement Corp. | 139,300 | 3,238,935 | ||||||
|
| |||||||
| Total Construction Materials |
| 7,084,462 | ||||||
| Consumer Finance – 0.0% |
| |||||||
| J Trust Co. Ltd.(a) | 238,300 | 716,419 | ||||||
| Consumer Staples Distribution & Retail – 0.8% |
| |||||||
| Seven & i Holdings Co. Ltd. | 2,478,472 | 36,126,131 | ||||||
| Containers & Packaging – 0.2% |
| |||||||
Fuji Seal International, Inc. | 64,300 | 881,154 | ||||||
Rengo Co. Ltd. | 281,100 | 2,173,094 | ||||||
Toyo Seikan Group Holdings Ltd. | 264,800 | 4,266,509 | ||||||
|
| |||||||
| Total Containers & Packaging |
| 7,320,757 | ||||||
| Diversified Consumer Services – 0.0% |
| |||||||
| Aucnet, Inc. | 12,200 | 196,851 | ||||||
| Electrical Equipment – 1.6% |
| |||||||
Daihen Corp. | 38,800 | 2,381,658 | ||||||
Fuji Electric Co. Ltd. | 118,773 | 8,044,027 | ||||||
Fujikura Ltd. | 662,300 | 9,968,743 | ||||||
Furukawa Electric Co. Ltd.(a) | 117,681 | 2,516,987 | ||||||
GS Yuasa Corp.(a) | 64,784 | 1,346,661 | ||||||
Idec Corp.(a) | 87,300 | 1,558,012 | ||||||
Mabuchi Motor Co. Ltd. | 186,100 | 3,412,254 | ||||||
Mitsubishi Electric Corp. | 2,392,914 | 39,717,202 | ||||||
Sanyo Denki Co. Ltd. | 24,000 | 1,117,976 | ||||||
Sinfonia Technology Co. Ltd. | 117,700 | 2,519,726 | ||||||
Toyo Tanso Co. Ltd. | 20,900 | 1,139,284 | ||||||
|
| |||||||
| Total Electrical Equipment |
| 73,722,530 | ||||||
| Electronic Equipment, Instruments & Components – 3.6% |
| |||||||
A&D HOLON Holdings Co. Ltd.(a) | 63,400 | 1,214,840 | ||||||
Ai Holdings Corp. | 103,900 | 1,688,817 | ||||||
Alps Alpine Co. Ltd.(a) | 332,900 | 2,635,133 | ||||||
Amano Corp. | 185,433 | 4,744,105 | ||||||
Anritsu Corp. | 240,700 | 1,966,537 | ||||||
Azbil Corp.(a) | 99,600 | 2,760,067 | ||||||
Canon Electronics, Inc. | 111,200 | 1,780,287 | ||||||
Citizen Watch Co. Ltd.(a) | 458,900 | 3,004,856 | ||||||
Dexerials Corp.(a) | 61,000 | 2,695,213 | ||||||
Elematec Corp. | 145,200 | 1,841,084 | ||||||
ESPEC Corp. | 67,800 | 1,366,348 | ||||||
Hagiwara Electric Holdings Co. Ltd. | 19,400 | 573,623 | ||||||
Hakuto Co. Ltd.(a) | 91,119 | 3,395,627 | ||||||
Hamamatsu Photonics KK | 96,300 | 3,406,085 | ||||||
Hioki EE Corp.(a) | 20,400 | 975,889 | ||||||
Hirose Electric Co. Ltd. | 52,660 | 5,387,955 | ||||||
Horiba Ltd. | 90,200 | 9,553,708 | ||||||
Ibiden Co. Ltd.(a) | 33,401 | 1,467,397 | ||||||
Innotech Corp. | 70,400 | 941,489 | ||||||
See Notes to Financial Statements.
| 28 | WisdomTree Trust |
Schedule of Investments (continued)
WisdomTree Japan Hedged Equity Fund (DXJ)
March 31, 2024
| Investments | Shares | Value | ||||||
Iriso Electronics Co. Ltd. | 23,300 | $ | 466,477 | |||||
Japan Aviation Electronics Industry Ltd.(a) | 73,900 | 1,210,467 | ||||||
Kaga Electronics Co. Ltd.(a) | 68,200 | 2,874,994 | ||||||
Keyence Corp. | 53,240 | 24,462,715 | ||||||
Koa Corp.(a) | 30,700 | 296,158 | ||||||
Macnica Holdings, Inc.(a) | 78,000 | 3,828,749 | ||||||
Maxell Ltd. | 77,400 | 814,683 | ||||||
Meiko Electronics Co. Ltd.(a) | 26,700 | 956,186 | ||||||
Murata Manufacturing Co. Ltd. | 1,628,104 | 30,379,370 | ||||||
Nichicon Corp. | 107,700 | 914,431 | ||||||
Nippon Electric Glass Co. Ltd. | 201,660 | 5,159,255 | ||||||
Nissha Co. Ltd. | 64,400 | 626,362 | ||||||
Omron Corp. | 161,700 | 5,781,220 | ||||||
Optex Group Co. Ltd. | 1,000 | 13,083 | ||||||
Osaki Electric Co. Ltd. | 161,000 | 726,572 | ||||||
Restar Corp. | 72,700 | 1,457,891 | ||||||
Riken Keiki Co. Ltd. | 33,000 | 834,022 | ||||||
Sanshin Electronics Co. Ltd.(a) | 64,054 | 910,371 | ||||||
Shibaura Electronics Co. Ltd. | 16,700 | 675,305 | ||||||
Shimadzu Corp. | 187,300 | 5,234,920 | ||||||
Siix Corp. | 52,100 | 594,514 | ||||||
Sumida Corp. | 93,400 | 757,222 | ||||||
Taiyo Yuden Co. Ltd.(a) | 142,600 | 3,415,541 | ||||||
TDK Corp. | 310,904 | 15,368,019 | ||||||
Tokyo Electron Device Ltd.(a) | 66,100 | 3,009,211 | ||||||
Tomen Devices Corp. | 11,400 | 494,883 | ||||||
Topcon Corp. | 150,600 | 1,773,726 | ||||||
Yokogawa Electric Corp. | 202,738 | 4,680,475 | ||||||
|
| |||||||
| Total Electronic Equipment, Instruments & Components |
| 169,115,882 | ||||||
| Entertainment – 2.1% |
| |||||||
Capcom Co. Ltd. | 273,600 | 5,052,773 | ||||||
Koei Tecmo Holdings Co. Ltd.(a) | 343,044 | 3,671,950 | ||||||
Konami Group Corp. | 96,600 | 6,551,911 | ||||||
Marvelous, Inc. | 2,000 | 9,184 | ||||||
Nexon Co. Ltd. | 117,800 | 1,953,669 | ||||||
Nintendo Co. Ltd. | 1,484,500 | 80,392,230 | ||||||
Toei Animation Co. Ltd.(a) | 90,500 | 1,853,712 | ||||||
|
| |||||||
| Total Entertainment |
| 99,485,429 | ||||||
| Food Products – 1.2% |
| |||||||
Ajinomoto Co., Inc. | 304,213 | 11,376,957 | ||||||
Calbee, Inc.(a) | 113,600 | 2,573,817 | ||||||
Fuji Oil Holdings, Inc. | 81,500 | 1,287,296 | ||||||
House Foods Group, Inc. | 73,000 | 1,493,330 | ||||||
Kagome Co. Ltd.(a) | 90,400 | 2,198,104 | ||||||
Kikkoman Corp. | 340,500 | 4,429,908 | ||||||
Maruha Nichiro Corp. | 109,600 | 2,153,329 | ||||||
Nichirei Corp. | 164,900 | 4,514,062 | ||||||
Nisshin Oillio Group Ltd. | 78,000 | 2,654,201 | ||||||
Nisshin Seifun Group, Inc. | 379,700 | 5,267,304 | ||||||
Nissin Foods Holdings Co. Ltd.(a) | 230,700 | 6,402,194 | ||||||
Nissui Corp. | 371,900 | 2,359,253 | ||||||
Riken Vitamin Co. Ltd. | 67,300 | 1,146,383 | ||||||
Toyo Suisan Kaisha Ltd. | 69,100 | 4,326,027 | ||||||
Yakult Honsha Co. Ltd.(a) | 182,174 | 3,754,341 | ||||||
|
| |||||||
| Total Food Products |
| 55,936,506 | ||||||
| Ground Transportation – 0.1% |
| |||||||
Alps Logistics Co. Ltd.(a) | 75,100 | 1,463,345 | ||||||
Kintetsu Group Holdings Co. Ltd.(a) | 111,500 | 3,279,910 | ||||||
Nishi-Nippon Railroad Co. Ltd. | 59,200 | 985,330 | ||||||
|
| |||||||
| Total Ground Transportation |
| 5,728,585 | ||||||
| Health Care Equipment & Supplies – 1.0% |
| |||||||
Asahi Intecc Co. Ltd. | 73,700 | 1,282,914 | ||||||
Eiken Chemical Co. Ltd.(a) | 62,600 | 827,249 | ||||||
Hoya Corp. | 109,157 | 13,516,153 | ||||||
Jeol Ltd.(a) | 35,300 | 1,459,628 | ||||||
Mani, Inc. | 67,000 | 878,532 | ||||||
Menicon Co. Ltd. | 69,600 | 728,214 | ||||||
Nakanishi, Inc. | 54,000 | 840,266 | ||||||
Nihon Kohden Corp. | 73,300 | 1,939,233 | ||||||
Nipro Corp.(a) | 109,300 | 885,045 | ||||||
Olympus Corp. | 415,000 | 6,066,851 | ||||||
PHC Holdings Corp.(a) | 290,000 | 2,368,364 | ||||||
Sysmex Corp. | 300,300 | 5,280,970 | ||||||
Terumo Corp. | 635,024 | 11,450,530 | ||||||
|
| |||||||
| Total Health Care Equipment & Supplies |
| 47,523,949 | ||||||
| Health Care Technology – 0.1% |
| |||||||
| M3, Inc. | 224,900 | 3,175,601 | ||||||
| Hotels, Restaurants & Leisure – 0.0% |
| |||||||
Round One Corp. | 176,200 | 916,247 | ||||||
Zensho Holdings Co. Ltd.(a) | 22,500 | 957,415 | ||||||
|
| |||||||
| Total Hotels, Restaurants & Leisure |
| 1,873,662 | ||||||
| Household Durables – 1.9% |
| |||||||
Casio Computer Co. Ltd.(a) | 401,357 | 3,436,907 | ||||||
Fujitsu General Ltd.(a) | 59,500 | 740,679 | ||||||
JVCKenwood Corp. | 178,400 | 1,112,753 | ||||||
Nikon Corp.(a) | 507,900 | 5,137,896 | ||||||
Panasonic Holdings Corp. | 2,315,870 | 22,118,934 | ||||||
Rinnai Corp. | 140,300 | 3,229,741 | ||||||
Sekisui Chemical Co. Ltd. | 911,900 | 13,436,433 | ||||||
Sony Group Corp. | 334,500 | 28,699,214 | ||||||
Sumitomo Forestry Co. Ltd. | 307,200 | 9,974,435 | ||||||
Tamron Co. Ltd. | 54,400 | 2,472,972 | ||||||
Zojirushi Corp. | 33,300 | 318,159 | ||||||
|
| |||||||
| Total Household Durables |
| 90,678,123 | ||||||
| Household Products – 0.2% |
| |||||||
Lion Corp. | 237,300 | 2,129,263 | ||||||
Pigeon Corp. | 281,300 | 2,701,573 | ||||||
Unicharm Corp. | 207,000 | 6,611,636 | ||||||
|
| |||||||
| Total Household Products |
| 11,442,472 | ||||||
| Independent Power & Renewable Electricity Producers – 0.2% |
| |||||||
| Electric Power Development Co. Ltd. | 485,300 | 8,003,626 | ||||||
| Industrial Conglomerates – 1.9% |
| |||||||
Hitachi Ltd. | 955,905 | 87,824,897 | ||||||
Nisshinbo Holdings, Inc. | 243,624 | 1,983,183 | ||||||
|
| |||||||
| Total Industrial Conglomerates |
| 89,808,080 | ||||||
See Notes to Financial Statements.
| WisdomTree Trust | 29 |
Schedule of Investments (continued)
WisdomTree Japan Hedged Equity Fund (DXJ)
March 31, 2024
| Investments | Shares | Value | ||||||
| Insurance – 4.4% |
| |||||||
Dai-ichi Life Holdings, Inc. | 1,145,300 | $ | 29,157,494 | |||||
MS&AD Insurance Group Holdings, Inc. | 2,736,600 | 49,019,939 | ||||||
Sompo Holdings, Inc. | 1,943,400 | 40,962,344 | ||||||
Tokio Marine Holdings, Inc. | 2,832,800 | 88,028,401 | ||||||
|
| |||||||
| Total Insurance |
| 207,168,178 | ||||||
| IT Services – 0.7% |
| |||||||
Fujitsu Ltd.(a) | 1,123,320 | 18,481,396 | ||||||
NEC Corp. | 172,400 | 12,518,920 | ||||||
|
| |||||||
| Total IT Services |
| 31,000,316 | ||||||
| Leisure Products – 0.7% |
| |||||||
Bandai Namco Holdings, Inc. | 636,000 | 11,884,159 | ||||||
GLOBERIDE, Inc.(a) | 28,300 | 379,777 | ||||||
Mizuno Corp. | 28,200 | 1,185,054 | ||||||
Roland Corp. | 53,100 | 1,599,894 | ||||||
Sega Sammy Holdings, Inc. | 392,700 | 5,223,199 | ||||||
Shimano, Inc. | 51,900 | 7,835,839 | ||||||
Tomy Co. Ltd. | 109,800 | 2,041,179 | ||||||
Universal Entertainment Corp. | 71,800 | 953,095 | ||||||
|
| |||||||
| Total Leisure Products |
| 31,102,196 | ||||||
| Life Sciences Tools & Services – 0.0% |
| |||||||
| Shin Nippon Biomedical Laboratories Ltd.(a) | 63,700 | 638,915 | ||||||
| Machinery – 7.0% |
| |||||||
Aida Engineering Ltd.(a) | 147,800 | 868,177 | ||||||
Amada Co. Ltd.(a) | 799,993 | 9,083,802 | ||||||
Anest Iwata Corp. | 74,700 | 668,793 | ||||||
Bando Chemical Industries Ltd. | 92,600 | 1,156,391 | ||||||
CKD Corp.(a) | 104,800 | 2,087,760 | ||||||
Daifuku Co. Ltd. | 230,300 | 5,453,733 | ||||||
DMG Mori Co. Ltd.(a) | 267,800 | 7,187,575 | ||||||
Ebara Corp. | 178,731 | 16,285,312 | ||||||
FANUC Corp. | 997,345 | 27,578,637 | ||||||
Fujitec Co. Ltd.(a) | 77,500 | 1,942,301 | ||||||
Glory Ltd.(a) | 76,500 | 1,435,528 | ||||||
Harmonic Drive Systems, Inc.(a) | 27,100 | 713,558 | ||||||
Hitachi Construction Machinery Co. Ltd. | 261,800 | 7,817,068 | ||||||
Hitachi Zosen Corp. | 188,300 | 1,641,070 | ||||||
Hokuetsu Industries Co. Ltd.(a) | 66,000 | 879,157 | ||||||
Hoshizaki Corp.(a) | 95,338 | 3,542,143 | ||||||
IHI Corp.(a) | 222,800 | 6,034,274 | ||||||
Iwaki Co. Ltd. | 64,200 | 1,230,169 | ||||||
Japan Steel Works Ltd. | 73,500 | 1,645,366 | ||||||
Kawasaki Heavy Industries Ltd.(a) | 227,100 | 7,648,278 | ||||||
Kitz Corp. | 235,800 | 2,126,710 | ||||||
Komatsu Ltd. | 2,603,706 | 76,092,316 | ||||||
Kubota Corp. | 1,128,500 | 17,776,233 | ||||||
Kurita Water Industries Ltd. | 93,000 | 3,871,902 | ||||||
Makino Milling Machine Co. Ltd. | 26,000 | 1,075,424 | ||||||
Max Co. Ltd. | 87,600 | 1,884,026 | ||||||
Meidensha Corp. | 54,800 | 1,063,448 | ||||||
Minebea Mitsumi, Inc. | 271,600 | 5,295,792 | ||||||
MISUMI Group, Inc. | 118,200 | 1,612,759 | ||||||
Mitsubishi Heavy Industries Ltd. | 2,631,190 | 25,182,720 | ||||||
Mitsuboshi Belting Ltd.(a) | 138,700 | 4,279,818 | ||||||
Miura Co. Ltd. | 139,200 | 2,690,737 | ||||||
Nabtesco Corp. | 144,300 | 2,440,834 | ||||||
Nachi-Fujikoshi Corp. | 31,300 | 721,775 | ||||||
NGK Insulators Ltd. | 405,975 | 5,472,193 | ||||||
Nippon Thompson Co. Ltd. | 249,700 | 1,059,218 | ||||||
Nissei ASB Machine Co. Ltd. | 7,000 | 246,060 | ||||||
Nomura Micro Science Co. Ltd.(a) | 58,400 | 2,292,088 | ||||||
Noritake Co. Ltd. | 82,400 | 2,335,697 | ||||||
NSK Ltd. | 921,400 | 5,380,033 | ||||||
NTN Corp.(a) | 716,500 | 1,485,124 | ||||||
Obara Group, Inc.(a) | 18,700 | 469,523 | ||||||
OKUMA Corp.(a) | 72,600 | 3,414,975 | ||||||
Organo Corp. | 25,000 | 1,271,928 | ||||||
OSG Corp. | 249,624 | 3,607,174 | ||||||
Ryobi Ltd. | 58,100 | 1,149,754 | ||||||
Shibaura Machine Co. Ltd.(a) | 51,200 | 1,226,337 | ||||||
Shinmaywa Industries Ltd. | 152,900 | 1,262,843 | ||||||
SMC Corp. | 36,151 | 20,262,905 | ||||||
Sodick Co. Ltd. | 2,000 | 9,528 | ||||||
Star Micronics Co. Ltd. | 110,000 | 1,349,698 | ||||||
Sumitomo Heavy Industries Ltd. | 166,637 | 5,198,013 | ||||||
Takeuchi Manufacturing Co. Ltd. | 75,700 | 3,051,108 | ||||||
Teikoku Electric Manufacturing Co. Ltd. | 63,700 | 1,075,381 | ||||||
THK Co. Ltd. | 168,300 | 3,926,574 | ||||||
Tocalo Co. Ltd. | 184,000 | 2,176,220 | ||||||
Torishima Pump Manufacturing Co. Ltd. | 64,200 | 1,205,990 | ||||||
Tsubaki Nakashima Co. Ltd. | 84,000 | 467,885 | ||||||
Tsubakimoto Chain Co. | 89,700 | 3,052,331 | ||||||
Tsugami Corp. | 147,000 | 1,116,984 | ||||||
YAMABIKO Corp. | 1,000 | 13,195 | ||||||
Yaskawa Electric Corp.(a) | 143,100 | 5,997,445 | ||||||
|
| |||||||
| Total Machinery |
| 330,589,790 | ||||||
| Marine Transportation – 0.1% |
| |||||||
Iino Kaiun Kaisha Ltd.(a) | 373,400 | 3,024,800 | ||||||
NS United Kaiun Kaisha Ltd. | 74,100 | 2,257,102 | ||||||
|
| |||||||
| Total Marine Transportation |
| 5,281,902 | ||||||
| Media – 0.4% |
| |||||||
Dentsu Group, Inc. | 422,700 | 11,716,453 | ||||||
Hakuhodo DY Holdings, Inc.(a) | 448,900 | 4,109,491 | ||||||
Kadokawa Corp.(a) | 74,800 | 1,310,711 | ||||||
|
| |||||||
| Total Media |
| 17,136,655 | ||||||
| Metals & Mining – 2.8% |
| |||||||
ARE Holdings, Inc.(a) | 147,300 | 1,880,363 | ||||||
Daido Steel Co. Ltd. | 572,500 | 6,871,362 | ||||||
Daiki Aluminium Industry Co. Ltd.(a) | 88,700 | 729,081 | ||||||
Dowa Holdings Co. Ltd.(a) | 59,400 | 2,091,530 | ||||||
JFE Holdings, Inc.(a) | 981,800 | 16,477,399 | ||||||
Kobe Steel Ltd.(a) | 1,007,700 | 13,689,459 | ||||||
Kyoei Steel Ltd. | 146,900 | 2,341,160 | ||||||
See Notes to Financial Statements.
| 30 | WisdomTree Trust |
Schedule of Investments (continued)
WisdomTree Japan Hedged Equity Fund (DXJ)
March 31, 2024
| Investments | Shares | Value | ||||||
Mitsubishi Materials Corp. | 172,600 | $ | 3,327,236 | |||||
Mitsui Mining & Smelting Co. Ltd. | 132,100 | 4,108,459 | ||||||
Nippon Light Metal Holdings Co. Ltd. | 94,500 | 1,135,786 | ||||||
Nippon Steel Corp.(a) | 3,053,600 | 74,007,102 | ||||||
Nippon Yakin Kogyo Co. Ltd. | 65,710 | 2,081,862 | ||||||
Sanyo Special Steel Co. Ltd. | 75,600 | 1,122,923 | ||||||
Toho Titanium Co. Ltd.(a) | 4,200 | 43,347 | ||||||
Topy Industries Ltd. | 72,900 | 1,305,355 | ||||||
UACJ Corp. | 74,900 | 2,180,016 | ||||||
|
| |||||||
| Total Metals & Mining |
| 133,392,440 | ||||||
| Oil, Gas & Consumable Fuels – 1.5% |
| |||||||
ENEOS Holdings, Inc. | 5,094,700 | 24,617,623 | ||||||
Idemitsu Kosan Co. Ltd. | 2,292,800 | 15,785,771 | ||||||
Inpex Corp. | 1,874,900 | 28,994,704 | ||||||
|
| |||||||
| Total Oil, Gas & Consumable Fuels |
| 69,398,098 | ||||||
| Paper & Forest Products – 0.1% |
| |||||||
Hokuetsu Corp.(a) | 141,100 | 1,793,759 | ||||||
Oji Holdings Corp.(a) | 1,005,900 | 4,239,741 | ||||||
|
| |||||||
| Total Paper & Forest Products |
| 6,033,500 | ||||||
| Passenger Airlines – 0.2% |
| |||||||
| Japan Airlines Co. Ltd. | 463,400 | 8,933,031 | ||||||
| Personal Care Products – 0.7% |
| |||||||
Kao Corp. | 510,280 | 19,009,275 | ||||||
Kobayashi Pharmaceutical Co. Ltd. | 59,600 | 2,006,422 | ||||||
Kose Corp.(a) | 28,700 | 1,511,185 | ||||||
Mandom Corp. | 83,700 | 746,606 | ||||||
Rohto Pharmaceutical Co. Ltd. | 120,100 | 2,354,466 | ||||||
Shiseido Co. Ltd. | 195,422 | 5,285,026 | ||||||
|
| |||||||
| Total Personal Care Products |
| 30,912,980 | ||||||
| Pharmaceuticals – 5.3% |
| |||||||
Astellas Pharma, Inc. | 2,536,504 | 27,544,645 | ||||||
Chugai Pharmaceutical Co. Ltd. | 1,260,600 | 48,093,458 | ||||||
Daiichi Sankyo Co. Ltd. | 671,400 | 21,191,832 | ||||||
Kyowa Kirin Co. Ltd. | 517,970 | 9,208,089 | ||||||
Nippon Shinyaku Co. Ltd. | 69,300 | 2,046,787 | ||||||
Ono Pharmaceutical Co. Ltd. | 614,400 | 9,964,286 | ||||||
Otsuka Holdings Co. Ltd. | 470,500 | 19,616,472 | ||||||
Santen Pharmaceutical Co. Ltd. | 401,200 | 4,073,103 | ||||||
Shionogi & Co. Ltd. | 414,977 | 21,249,937 | ||||||
Takeda Pharmaceutical Co. Ltd.(a) | 2,999,663 | 82,927,021 | ||||||
Towa Pharmaceutical Co. Ltd. | 60,100 | 1,153,196 | ||||||
ZERIA Pharmaceutical Co. Ltd. | 112,800 | 1,589,016 | ||||||
|
| |||||||
| Total Pharmaceuticals |
| 248,657,842 | ||||||
| Professional Services – 0.5% |
| |||||||
en Japan, Inc.(a) | 64,100 | 1,142,699 | ||||||
Open Up Group, Inc. | 104,800 | 1,459,008 | ||||||
Persol Holdings Co. Ltd. | 3,768,700 | 5,316,446 | ||||||
Recruit Holdings Co. Ltd. | 359,200 | 15,918,295 | ||||||
Transcosmos, Inc.(a) | 78,100 | 1,620,364 | ||||||
|
| |||||||
| Total Professional Services |
| 25,456,812 | ||||||
| Semiconductors & Semiconductor Equipment – 4.5% |
| |||||||
Advantest Corp. | 253,800 | 11,435,212 | ||||||
Disco Corp. | 66,000 | 24,939,972 | ||||||
Ferrotec Holdings Corp.(a) | 81,100 | 1,585,079 | ||||||
Furuya Metal Co. Ltd. | 7,200 | 539,483 | ||||||
Lasertec Corp. | 27,600 | 7,622,849 | ||||||
Micronics Japan Co. Ltd. | 53,900 | 3,176,768 | ||||||
Mitsui High-Tec, Inc. | 17,400 | 1,002,876 | ||||||
Optorun Co. Ltd. | 65,200 | 890,902 | ||||||
Rohm Co. Ltd. | 343,700 | 5,515,052 | ||||||
Rorze Corp. | 10,500 | 1,498,563 | ||||||
SCREEN Holdings Co. Ltd.(a) | 146,320 | 19,302,116 | ||||||
Shibaura Mechatronics Corp.(a) | 25,300 | 1,071,545 | ||||||
Shinko Electric Industries Co. Ltd. | 54,859 | 2,036,030 | ||||||
Socionext, Inc.(a) | 225,800 | 6,325,891 | ||||||
SUMCO Corp.(a) | 646,100 | 10,275,613 | ||||||
Tokyo Electron Ltd. | 391,759 | 102,427,590 | ||||||
Tokyo Seimitsu Co. Ltd. | 74,700 | 6,009,267 | ||||||
Ulvac, Inc. | 39,300 | 2,560,103 | ||||||
Yamaichi Electronics Co. Ltd. | 57,900 | 952,598 | ||||||
|
| |||||||
| Total Semiconductors & Semiconductor Equipment |
| 209,167,509 | ||||||
| Software – 0.2% |
| |||||||
| Trend Micro, Inc.(a) | 150,908 | 7,808,388 | ||||||
| Specialty Retail – 0.9% |
| |||||||
ABC-Mart, Inc. | 380,800 | 7,292,932 | ||||||
Fast Retailing Co. Ltd. | 109,400 | 34,075,232 | ||||||
Sanrio Co. Ltd. | 87,000 | 1,753,279 | ||||||
VT Holdings Co. Ltd. | 234,600 | 829,304 | ||||||
|
| |||||||
| Total Specialty Retail |
| 43,950,747 | ||||||
| Technology Hardware, Storage & Peripherals – 2.1% |
| |||||||
Canon, Inc. | 2,054,897 | 61,112,633 | ||||||
FUJIFILM Holdings Corp. | 873,885 | 19,458,802 | ||||||
MCJ Co. Ltd. | 90,200 | 815,313 | ||||||
Ricoh Co. Ltd. | 751,200 | 6,708,162 | ||||||
Riso Kagaku Corp. | 64,100 | 1,312,961 | ||||||
Seiko Epson Corp.(a) | 591,100 | 10,332,387 | ||||||
Toshiba TEC Corp. | 38,300 | 769,315 | ||||||
|
| |||||||
| Total Technology Hardware, Storage & Peripherals |
| 100,509,573 | ||||||
| Textiles, Apparel & Luxury Goods – 0.2% |
| |||||||
Asics Corp. | 140,492 | 6,777,443 | ||||||
Descente Ltd. | 18,900 | 431,461 | ||||||
Kurabo Industries Ltd. | 1,047 | 24,213 | ||||||
Morito Co. Ltd. | 83,600 | 868,894 | ||||||
Seiko Group Corp. | 56,100 | 1,545,720 | ||||||
Wacoal Holdings Corp. | 76,600 | 1,879,761 | ||||||
|
| |||||||
| Total Textiles, Apparel & Luxury Goods |
| 11,527,492 | ||||||
| Tobacco – 3.8% |
| |||||||
| Japan Tobacco, Inc. | 6,720,031 | 180,005,984 | ||||||
| Trading Companies & Distributors – 10.4% |
| |||||||
Alconix Corp. | 64,300 | 621,566 | ||||||
Chori Co. Ltd. | 72,600 | 1,633,374 | ||||||
Daiichi Jitsugyo Co. Ltd. | 72,600 | 1,021,279 | ||||||
See Notes to Financial Statements.
| WisdomTree Trust | 31 |
Schedule of Investments (continued)
WisdomTree Japan Hedged Equity Fund (DXJ)
March 31, 2024
| Investments | Shares | Value | ||||||
Hanwa Co. Ltd. | 105,000 | $ | 4,114,110 | |||||
Inabata & Co. Ltd. | 147,986 | 3,104,533 | ||||||
ITOCHU Corp.(a) | 1,924,094 | 82,204,181 | ||||||
Japan Pulp & Paper Co. Ltd. | 19,800 | 677,683 | ||||||
Kanematsu Corp. | 263,000 | 4,504,252 | ||||||
KPP Group Holdings Co. Ltd.(a) | 76,900 | 377,018 | ||||||
Marubeni Corp. | 3,937,878 | 68,404,515 | ||||||
Mitsubishi Corp. | 7,889,400 | 181,772,360 | ||||||
Mitsui Matsushima Holdings Co. Ltd.(a) | 88,300 | 1,700,130 | ||||||
Nagase & Co. Ltd. | 196,400 | 3,314,319 | ||||||
Sanyo Trading Co. Ltd.(a) | 116,500 | 1,114,619 | ||||||
Shinsho Corp. | 27,100 | 1,292,821 | ||||||
Sojitz Corp.(a) | 620,104 | 16,335,886 | ||||||
Sumitomo Corp. | 3,105,477 | 74,936,086 | ||||||
Toyota Tsusho Corp. | 591,310 | 40,105,700 | ||||||
|
| |||||||
| Total Trading Companies & Distributors |
| 487,234,432 | ||||||
| Transportation Infrastructure – 0.1% |
| |||||||
Mitsubishi Logistics Corp. | 100,700 | 3,310,202 | ||||||
Nissin Corp. | 28,500 | 545,538 | ||||||
|
| |||||||
| Total Transportation Infrastructure |
| 3,855,740 | ||||||
| TOTAL COMMON STOCKS |
| |||||||
| (Cost: $3,927,878,187) |
| 4,641,459,576 | ||||||
| INVESTMENT OF CASH COLLATERAL FOR SECURITIES LOANED – 6.6% |
| |||||||
| United States – 6.6% |
| |||||||
State Street Navigator Securities Lending Government Money Market Portfolio, 5.34%(b) | ||||||||
| (Cost: $307,769,515) | 307,769,515 | 307,769,515 | ||||||
| TOTAL INVESTMENTS IN SECURITIES – 105.5% |
| |||||||
(Cost: $4,235,647,702) |
| 4,949,229,091 | ||||||
Other Assets less Liabilities – (5.5)% |
| (257,978,787 | ) | |||||
|
| |||||||
| NET ASSETS – 100.0% |
| $ | 4,691,250,304 | |||||
| (a) | Security, or portion thereof, was on loan at March 31, 2024 (See Note 2). At March 31, 2024, the total market value of the Fund’s securities on loan identified in the Schedule of Investments was $457,812,879 and the total market value of the collateral held by the Fund was $483,185,716. The total market value of the collateral includes non-cash U.S. Government securities collateral having a value of $175,416,201. |
| (b) | Rate shown represents annualized 7-day yield as of March 31, 2024. |
| FINANCIAL DERIVATIVE INSTRUMENTS | ||||||||||||||||||||||||||||
| FOREIGN CURRENCY CONTRACTS (OTC – OVER THE COUNTER) | ||||||||||||||||||||||||||||
| Counterparty | Settlement Date | Amount and | Amount and | Unrealized Appreciation | Unrealized Depreciation | |||||||||||||||||||||||
Bank of America NA | 4/3/2024 | 134,441,133,864 | JPY | 888,576,194 | USD | $ | — | $ | (131,619 | ) | ||||||||||||||||||
Bank of America NA | 4/3/2024 | 881,351,998 | USD | 131,292,715,626 | JPY | 13,713,519 | — | |||||||||||||||||||||
Bank of America NA | 4/3/2024 | 61,921,686 | USD | 9,140,222,917 | JPY | 1,519,180 | — | |||||||||||||||||||||
Bank of America NA | 4/3/2024 | 15,480,422 | USD | 2,328,866,945 | JPY | 90,272 | — | |||||||||||||||||||||
Bank of America NA | 5/7/2024 | 939,465,520 | USD | 141,406,189,299 | JPY | 120,115 | — | |||||||||||||||||||||
Barclays Bank PLC | 4/3/2024 | 134,441,133,864 | JPY | 888,576,194 | USD | — | (131,619 | ) | ||||||||||||||||||||
Barclays Bank PLC | 4/3/2024 | 881,351,998 | USD | 131,293,244,438 | JPY | 13,710,024 | — | |||||||||||||||||||||
Barclays Bank PLC | 5/7/2024 | 939,465,520 | USD | 141,407,128,765 | JPY | 113,874 | — | |||||||||||||||||||||
Citibank NA | 4/3/2024 | 134,442,022,440 | JPY | 888,576,194 | USD | — | (125,747 | ) | ||||||||||||||||||||
Citibank NA | 5/7/2024 | 939,465,518 | USD | 141,408,067,929 | JPY | 107,634 | — | |||||||||||||||||||||
HSBC Holdings PLC | 4/3/2024 | 2,303,184,925 | JPY | 15,480,422 | USD | — | (259,990 | ) | ||||||||||||||||||||
HSBC Holdings PLC | 4/3/2024 | 6,240,116,625 | JPY | 41,281,124 | USD | — | (43,762 | ) | ||||||||||||||||||||
HSBC Holdings PLC | 4/3/2024 | 881,351,998 | USD | 131,292,627,491 | JPY | 13,714,101 | — | |||||||||||||||||||||
JP Morgan Chase Bank NA | 4/3/2024 | 2,288,190,279 | JPY | 15,480,422 | USD | — | (359,081 | ) | ||||||||||||||||||||
Morgan Stanley & Co. International | 4/3/2024 | 134,441,589,703 | JPY | 888,576,194 | USD | — | (128,606 | ) | ||||||||||||||||||||
Morgan Stanley & Co. International | 4/3/2024 | 881,351,998 | USD | 131,293,153,658 | JPY | 13,710,624 | — | |||||||||||||||||||||
Morgan Stanley & Co. International | 5/7/2024 | 939,465,520 | USD | 141,405,919,673 | JPY | 121,906 | — | |||||||||||||||||||||
Royal Bank of Canada | 4/3/2024 | 134,441,145,415 | JPY | 888,576,194 | USD | — | (131,542 | ) | ||||||||||||||||||||
Royal Bank of Canada | 4/3/2024 | 881,351,995 | USD | 131,292,976,941 | JPY | 13,711,789 | — | |||||||||||||||||||||
Royal Bank of Canada | 5/7/2024 | 939,465,520 | USD | 141,407,140,978 | JPY | 113,793 | — | |||||||||||||||||||||
Standard Chartered Bank | 4/3/2024 | 30,960,843 | USD | 4,606,388,278 | JPY | 519,857 | — | |||||||||||||||||||||
| $ | 71,266,688 | $ | (1,311,966 | ) | ||||||||||||||||||||||||
See Notes to Financial Statements.
| 32 | WisdomTree Trust |
Schedule of Investments (concluded)
WisdomTree Japan Hedged Equity Fund (DXJ)
March 31, 2024
| FAIR VALUATION SUMMARY |
The following is a summary of the fair valuations according to the inputs used in valuing the Fund’s investments (See Note 2 - Fair Value Measurement):
| Quoted Prices in Active Markets (Level 1) | Other Significant Observable Inputs (Level 2) | Significant Unobservable Inputs (Level 3) | Total | |||||||||||||
| Assets: |
| |||||||||||||||
| Investments in Securities | ||||||||||||||||
Common Stocks | $ | 4,641,459,576 | $ | — | $ | — | $ | 4,641,459,576 | ||||||||
Investment of Cash Collateral for Securities Loaned | — | 307,769,515 | — | 307,769,515 | ||||||||||||
Total Investments in Securities | $ | 4,641,459,576 | $ | 307,769,515 | $ | — | $ | 4,949,229,091 | ||||||||
| Financial Derivative Instruments | ||||||||||||||||
Foreign Currency Contracts1 | $ | — | $ | 71,266,688 | $ | — | $ | 71,266,688 | ||||||||
| Liabilities: | ||||||||||||||||
| Financial Derivative Instruments | ||||||||||||||||
Foreign Currency Contracts1 | $ | — | $ | (1,311,966 | ) | $ | — | $ | (1,311,966 | ) | ||||||
Total – Net | $ | 4,641,459,576 | $ | 377,724,237 | $ | — | $ | 5,019,183,813 | ||||||||
| 1 | Amount shown represents the unrealized appreciation (depreciation) on the financial instrument. |
See Notes to Financial Statements.
| WisdomTree Trust | 33 |
Schedule of Investments
WisdomTree Japan Hedged SmallCap Equity Fund (DXJS)
March 31, 2024
| Investments | Shares | Value | ||||||
| COMMON STOCKS – 98.7% |
| |||||||
| Japan – 98.7% |
| |||||||
| Air Freight & Logistics – 1.0% |
| |||||||
AIT Corp. | 5,000 | $ | 59,830 | |||||
AZ-COM MARUWA Holdings, Inc. | 2,800 | 24,976 | ||||||
Hamakyorex Co. Ltd. | 2,000 | 50,877 | ||||||
Konoike Transport Co. Ltd. | 5,000 | 72,351 | ||||||
Mitsui-Soko Holdings Co. Ltd.(a) | 3,900 | 121,243 | ||||||
Sankyu, Inc. | 4,500 | 155,268 | ||||||
SBS Holdings, Inc. | 3,200 | 55,545 | ||||||
Senko Group Holdings Co. Ltd.(a) | 11,400 | 86,397 | ||||||
Shibusawa Warehouse Co. Ltd. | 2,100 | 42,945 | ||||||
Trancom Co. Ltd. | 500 | 19,921 | ||||||
|
| |||||||
| Total Air Freight & Logistics |
| 689,353 | ||||||
| Automobile Components – 4.2% |
| |||||||
Aisan Industry Co. Ltd. | 11,800 | 132,779 | ||||||
Daikyonishikawa Corp. | 13,900 | 70,811 | ||||||
Eagle Industry Co. Ltd. | 8,600 | 104,101 | ||||||
Exedy Corp.(a) | 7,400 | 149,618 | ||||||
Fujikura Composites, Inc.(a) | 4,400 | 41,865 | ||||||
FuKoKu Co. Ltd. | 3,900 | 48,291 | ||||||
Futaba Industrial Co. Ltd. | 11,200 | 86,806 | ||||||
G-Tekt Corp. | 5,398 | 75,364 | ||||||
Ichikoh Industries Ltd. | 10,000 | 36,539 | ||||||
KYB Corp.(a) | 7,000 | 239,122 | ||||||
Musashi Seimitsu Industry Co. Ltd. | 3,400 | 37,854 | ||||||
NHK Spring Co. Ltd. | 26,700 | 264,098 | ||||||
Nichirin Co. Ltd. | 2,400 | 60,735 | ||||||
Pacific Industrial Co. Ltd. | 6,700 | 75,613 | ||||||
Press Kogyo Co. Ltd. | 19,200 | 90,707 | ||||||
Seiren Co. Ltd.(a) | 7,000 | 127,563 | ||||||
Shoei Co. Ltd.(a) | 7,300 | 108,671 | ||||||
Sumitomo Riko Co. Ltd. | 8,300 | 73,104 | ||||||
Tachi-S Co. Ltd. | 9,600 | 126,799 | ||||||
Tokai Rika Co. Ltd. | 13,325 | 230,499 | ||||||
Topre Corp. | 4,800 | 82,841 | ||||||
Toyo Tire Corp. | 28,300 | 528,808 | ||||||
Unipres Corp.(a) | 6,100 | 47,238 | ||||||
|
| |||||||
| Total Automobile Components |
| 2,839,826 | ||||||
| Banks – 6.6% |
| |||||||
77 Bank Ltd. | 8,800 | 241,012 | ||||||
Aichi Financial Group, Inc. | 5,200 | 91,153 | ||||||
Akita Bank Ltd. | 2,400 | 33,460 | ||||||
Awa Bank Ltd.(a) | 3,900 | 70,942 | ||||||
Bank of Iwate Ltd. | 2,200 | 37,416 | ||||||
Bank of Nagoya Ltd. | 1,200 | 52,807 | ||||||
Bank of Saga Ltd. | 2,600 | 36,747 | ||||||
Bank of the Ryukyus Ltd. | 6,800 | 53,782 | ||||||
Chugin Financial Group, Inc. | 17,200 | 149,390 | ||||||
Daishi Hokuetsu Financial Group, Inc.(a) | 5,600 | 165,027 | ||||||
Ehime Bank Ltd. | 4,200 | 31,525 | ||||||
FIDEA Holdings Co. Ltd. | 4,200 | 44,346 | ||||||
First Bank of Toyama Ltd.(a) | 8,500 | 53,580 | ||||||
Gunma Bank Ltd. | 63,300 | $ | 367,307 | |||||
Hirogin Holdings, Inc. | 36,700 | 264,559 | ||||||
Hokuhoku Financial Group, Inc.(a) | 10,300 | 131,893 | ||||||
Hyakugo Bank Ltd.(a) | 32,400 | 138,938 | ||||||
Hyakujushi Bank Ltd. | 4,000 | 78,681 | ||||||
Iyogin Holdings, Inc. | 19,900 | 154,235 | ||||||
Juroku Financial Group, Inc. | 4,500 | 142,423 | ||||||
Keiyo Bank Ltd. | 15,500 | 78,040 | ||||||
Kiyo Bank Ltd.(a) | 6,698 | 81,963 | ||||||
Miyazaki Bank Ltd. | 3,300 | 62,448 | ||||||
Musashino Bank Ltd.(a) | 6,500 | 126,740 | ||||||
Nanto Bank Ltd.(a) | 4,900 | 99,234 | ||||||
Nishi-Nippon Financial Holdings, Inc. | 15,500 | 196,227 | ||||||
North Pacific Bank Ltd. | 37,300 | 109,673 | ||||||
Ogaki Kyoritsu Bank Ltd. | 4,400 | 63,466 | ||||||
Oita Bank Ltd. | 3,200 | 63,854 | ||||||
Okinawa Financial Group, Inc. | 2,540 | 44,122 | ||||||
Procrea Holdings, Inc.(a) | 3,200 | 39,306 | ||||||
San ju San Financial Group, Inc. | 5,600 | 77,111 | ||||||
San-In Godo Bank Ltd. | 19,100 | 152,325 | ||||||
Senshu Ikeda Holdings, Inc.(a) | 28,200 | 73,600 | ||||||
Shiga Bank Ltd. | 4,400 | 121,960 | ||||||
Shikoku Bank Ltd. | 5,600 | 45,290 | ||||||
Suruga Bank Ltd.(a) | 20,700 | 122,139 | ||||||
Toho Bank Ltd.(a) | 23,100 | 54,947 | ||||||
Tokyo Kiraboshi Financial Group, Inc. | 4,900 | 157,835 | ||||||
TOMONY Holdings, Inc. | 17,100 | 47,229 | ||||||
Yamagata Bank Ltd.(a) | 4,500 | 35,056 | ||||||
Yamaguchi Financial Group, Inc.(a) | 22,600 | 232,727 | ||||||
Yamanashi Chuo Bank Ltd. | 4,900 | 60,965 | ||||||
|
| |||||||
| Total Banks |
| 4,485,480 | ||||||
| Beverages – 0.3% |
| |||||||
Takara Holdings, Inc.(a) | 32,000 | 226,344 | ||||||
| Biotechnology – 0.1% |
| |||||||
Takara Bio, Inc. | 13,400 | 85,883 | ||||||
| Broadline Retail – 0.7% |
| |||||||
ASKUL Corp.(a) | 5,100 | 77,303 | ||||||
Belluna Co. Ltd. | 12,700 | 52,027 | ||||||
Izumi Co. Ltd. | 8,700 | 201,828 | ||||||
Seria Co. Ltd. | 8,400 | 167,062 | ||||||
|
| |||||||
| Total Broadline Retail |
| 498,220 | ||||||
| Building Products – 1.4% |
| |||||||
Bunka Shutter Co. Ltd. | 8,500 | 97,724 | ||||||
Central Glass Co. Ltd.(a) | 3,100 | 59,441 | ||||||
Kondotec, Inc. | 5,900 | 50,289 | ||||||
Nichias Corp. | 7,600 | 204,381 | ||||||
Nichiha Corp. | 3,000 | 68,288 | ||||||
Nippon Aqua Co. Ltd. | 4,300 | 30,003 | ||||||
Nitto Boseki Co. Ltd.(a) | 1,300 | 51,280 | ||||||
Noritz Corp. | 4,500 | 51,855 | ||||||
Shin Nippon Air Technologies Co. Ltd. | 3,400 | 77,842 | ||||||
Takara Standard Co. Ltd.(a) | 4,817 | 62,160 | ||||||
See Notes to Financial Statements.
| 34 | WisdomTree Trust |
Schedule of Investments (continued)
WisdomTree Japan Hedged SmallCap Equity Fund (DXJS)
March 31, 2024
| Investments | Shares | Value | ||||||
Takasago Thermal Engineering Co. Ltd.(a) | 6,000 | $ | 193,465 | |||||
|
| |||||||
| Total Building Products |
| 946,728 | ||||||
| Capital Markets – 1.4% |
| |||||||
GMO Financial Holdings, Inc. | 11,500 | 60,332 | ||||||
Ichiyoshi Securities Co. Ltd. | 10,500 | 58,833 | ||||||
IwaiCosmo Holdings, Inc. | 4,600 | 68,113 | ||||||
M&A Capital Partners Co. Ltd. | 1,700 | 25,723 | ||||||
Matsui Securities Co. Ltd.(a) | 46,800 | 255,422 | ||||||
Okasan Securities Group, Inc.(a) | 25,200 | 136,036 | ||||||
SBI Global Asset Management Co. Ltd.(a) | 10,599 | 51,474 | ||||||
Sparx Group Co. Ltd.(a) | 6,339 | 78,743 | ||||||
Strike Co. Ltd. | 1,200 | 40,120 | ||||||
Tokai Tokyo Financial Holdings, Inc. | 38,600 | 155,323 | ||||||
|
| |||||||
| Total Capital Markets |
| 930,119 | ||||||
| Chemicals – 8.7% |
| |||||||
ADEKA Corp. | 10,900 | 232,195 | ||||||
Aica Kogyo Co. Ltd.(a) | 11,200 | 275,292 | ||||||
Arakawa Chemical Industries Ltd. | 7,000 | 53,883 | ||||||
Artience Co. Ltd. | 7,000 | 134,686 | ||||||
Asahi Yukizai Corp. | 2,200 | 76,752 | ||||||
C Uyemura & Co. Ltd. | 2,200 | 152,777 | ||||||
Chugoku Marine Paints Ltd.(a) | 11,400 | 170,761 | ||||||
CI Takiron Corp. | 8,500 | 38,809 | ||||||
Dai Nippon Toryo Co. Ltd. | 5,300 | 42,478 | ||||||
Dainichiseika Color & Chemicals Manufacturing Co. Ltd. | 2,500 | 49,308 | ||||||
Denka Co. Ltd.(a) | 10,100 | 156,594 | ||||||
DIC Corp. | 10,900 | 207,996 | ||||||
Fujimi, Inc.(a) | 6,800 | 158,155 | ||||||
Fujimori Kogyo Co. Ltd. | 1,600 | 45,829 | ||||||
Fuso Chemical Co. Ltd.(a) | 1,900 | 57,812 | ||||||
Harima Chemicals Group, Inc. | 7,700 | 47,061 | ||||||
Ishihara Sangyo Kaisha Ltd. | 4,400 | 51,429 | ||||||
JCU Corp. | 1,900 | 49,589 | ||||||
JSP Corp.(a) | 4,317 | 65,606 | ||||||
Kaneka Corp. | 7,148 | 180,135 | ||||||
Kanto Denka Kogyo Co. Ltd.(a) | 8,200 | 54,614 | ||||||
KeePer Technical Laboratory Co. Ltd.(a) | 700 | 23,010 | ||||||
KH Neochem Co. Ltd. | 5,000 | 77,703 | ||||||
Konishi Co. Ltd.(a) | 9,600 | 99,270 | ||||||
Kumiai Chemical Industry Co. Ltd. | 18,094 | 99,350 | ||||||
Kureha Corp. | 6,400 | 114,895 | ||||||
Lintec Corp. | 9,200 | 192,395 | ||||||
MEC Co. Ltd. | 1,500 | 40,487 | ||||||
Moriroku Holdings Co. Ltd.(a) | 4,000 | 68,955 | ||||||
Nihon Nohyaku Co. Ltd.(a) | 7,800 | 42,467 | ||||||
Nippon Kayaku Co. Ltd. | 22,200 | 191,570 | ||||||
Nippon Pillar Packing Co. Ltd. | 4,600 | 193,915 | ||||||
Nippon Shokubai Co. Ltd. | 16,000 | 154,984 | ||||||
Nippon Soda Co. Ltd.(a) | 5,100 | 204,209 | ||||||
Okura Industrial Co. Ltd. | 2,000 | 41,428 | ||||||
Osaka Organic Chemical Industry Ltd.(a) | 1,500 | 31,369 | ||||||
Osaka Soda Co. Ltd.(a) | 977 | 62,360 | ||||||
Riken Technos Corp.(a) | 13,800 | 91,547 | ||||||
Sakai Chemical Industry Co. Ltd.(a) | 2,600 | 33,225 | ||||||
Sakata INX Corp. | 4,600 | 47,840 | ||||||
Sanyo Chemical Industries Ltd.(a) | 3,300 | 92,887 | ||||||
Shin-Etsu Polymer Co. Ltd. | 8,100 | 82,367 | ||||||
Stella Chemifa Corp.(a) | 1,400 | 34,134 | ||||||
Sumitomo Bakelite Co. Ltd. | 10,000 | 305,791 | ||||||
Sumitomo Seika Chemicals Co. Ltd. | 2,100 | 70,627 | ||||||
T Hasegawa Co. Ltd.(a) | 3,200 | 64,066 | ||||||
Taiyo Holdings Co. Ltd. | 7,400 | 165,754 | ||||||
Takasago International Corp. | 1,700 | 38,865 | ||||||
Teijin Ltd. | 13,900 | 129,499 | ||||||
Tokai Carbon Co. Ltd. | 22,100 | 145,542 | ||||||
Tokuyama Corp. | 7,900 | 141,719 | ||||||
Toyobo Co. Ltd. | 9,500 | 70,742 | ||||||
UBE Corp.(a) | 15,280 | 275,271 | ||||||
Valqua Ltd.(a) | 4,100 | 138,974 | ||||||
|
| |||||||
| Total Chemicals |
| 5,868,978 | ||||||
| Commercial Services & Supplies – 1.4% |
| |||||||
Aeon Delight Co. Ltd. | 2,900 | 67,832 | ||||||
CTS Co. Ltd. | 7,600 | 40,022 | ||||||
Daiei Kankyo Co. Ltd. | 3,600 | 63,558 | ||||||
Daiseki Co. Ltd. | 1,640 | 39,498 | ||||||
Inui Global Logistics Co. Ltd.(a) | 8,600 | 58,926 | ||||||
Itoki Corp.(a) | 3,500 | 41,211 | ||||||
Japan Elevator Service Holdings Co. Ltd. | 2,000 | 31,874 | ||||||
Kimura Unity Co. Ltd. | 3,500 | 39,453 | ||||||
Kokuyo Co. Ltd. | 12,300 | 202,122 | ||||||
Nippon Kanzai Holdings Co. Ltd. | 2,000 | 33,909 | ||||||
Nippon Parking Development Co. Ltd.(a) | 22,900 | 31,321 | ||||||
Okamura Corp. | 11,100 | 166,487 | ||||||
Pilot Corp. | 2,100 | 55,225 | ||||||
Prestige International, Inc.(a) | 6,500 | 29,806 | ||||||
Sato Holdings Corp. | 2,800 | 42,515 | ||||||
|
| |||||||
| Total Commercial Services & Supplies |
| 943,759 | ||||||
| Construction & Engineering – 5.2% |
| |||||||
Asanuma Corp.(a) | 3,300 | 86,673 | ||||||
CTI Engineering Co. Ltd. | 1,100 | 36,922 | ||||||
Dai-Dan Co. Ltd. | 6,200 | 102,046 | ||||||
Daiho Corp.(a) | 2,100 | 47,385 | ||||||
EXEO Group, Inc. | 18,400 | 196,832 | ||||||
Fudo Tetra Corp. | 2,400 | 32,667 | ||||||
Hazama Ando Corp.(a) | 28,600 | 224,121 | ||||||
JDC Corp.(a) | 10,100 | 35,837 | ||||||
Kandenko Co. Ltd. | 19,000 | 219,571 | ||||||
Kumagai Gumi Co. Ltd. | 3,600 | 99,309 | ||||||
Kyudenko Corp. | 4,400 | 185,164 | ||||||
Mirait One Corp. | 7,444 | 93,945 | ||||||
Nippon Road Co. Ltd. | 5,100 | 64,093 | ||||||
Nishimatsu Construction Co. Ltd.(a) | 5,900 | 174,063 | ||||||
Nittoc Construction Co. Ltd. | 7,300 | 56,627 | ||||||
Okumura Corp. | 4,800 | 161,432 | ||||||
Oriental Shiraishi Corp. | 22,600 | 60,030 | ||||||
See Notes to Financial Statements.
| WisdomTree Trust | 35 |
Schedule of Investments (continued)
WisdomTree Japan Hedged SmallCap Equity Fund (DXJS)
March 31, 2024
| Investments | Shares | Value | ||||||
Penta-Ocean Construction Co. Ltd. | 19,700 | $ | 101,126 | |||||
PS Mitsubishi Construction Co. Ltd. | 5,400 | 37,821 | ||||||
Raito Kogyo Co. Ltd. | 5,800 | 78,064 | ||||||
Raiznext Corp. | 3,800 | 54,510 | ||||||
Sanki Engineering Co. Ltd. | 6,200 | 87,544 | ||||||
Seikitokyu Kogyo Co. Ltd.(a) | 4,600 | 58,600 | ||||||
SHO-BOND Holdings Co. Ltd. | 3,100 | 131,583 | ||||||
Sumitomo Mitsui Construction Co. Ltd. | 16,140 | 45,857 | ||||||
Taihei Dengyo Kaisha Ltd. | 1,300 | 39,555 | ||||||
Taikisha Ltd. | 3,300 | 101,282 | ||||||
Takamatsu Construction Group Co. Ltd.(a) | 2,500 | 46,913 | ||||||
Tekken Corp. | 2,300 | 41,078 | ||||||
Tess Holdings Co. Ltd. | 7,600 | 23,652 | ||||||
Toa Corp. | 5,200 | 41,849 | ||||||
Tobishima Corp. | 4,400 | 43,434 | ||||||
Toda Corp. | 25,500 | 172,280 | ||||||
Tokyu Construction Co. Ltd. | 20,700 | 114,206 | ||||||
Totetsu Kogyo Co. Ltd. | 2,800 | 55,595 | ||||||
Toyo Construction Co. Ltd.(a) | 5,000 | 43,345 | ||||||
Wakachiku Construction Co. Ltd. | 1,700 | 40,494 | ||||||
Yahagi Construction Co. Ltd. | 4,700 | 48,321 | ||||||
Yokogawa Bridge Holdings Corp. | 5,700 | 111,066 | ||||||
Yondenko Corp. | 2,200 | 58,509 | ||||||
Yurtec Corp. | 7,800 | 78,234 | ||||||
|
| |||||||
| Total Construction & Engineering |
| 3,531,635 | ||||||
| Construction Materials – 1.1% |
| |||||||
Asia Pile Holdings Corp. | 9,900 | 56,844 | ||||||
Krosaki Harima Corp. | 6,400 | 148,218 | ||||||
Shinagawa Refractories Co. Ltd.(a) | 9,700 | 123,505 | ||||||
Sumitomo Osaka Cement Co. Ltd.(a) | 3,400 | 86,536 | ||||||
Taiheiyo Cement Corp. | 11,400 | 265,067 | ||||||
Yotai Refractories Co. Ltd. | 3,600 | 34,967 | ||||||
|
| |||||||
| Total Construction Materials |
| 715,137 | ||||||
| Consumer Finance – 0.1% |
| |||||||
J Trust Co. Ltd.(a) | 14,700 | 44,194 | ||||||
| Consumer Staples Distribution & Retail – 2.5% |
| |||||||
Aeon Hokkaido Corp. | 7,800 | 48,755 | ||||||
Ain Holdings, Inc. | 1,600 | 58,420 | ||||||
Arcs Co. Ltd. | 4,200 | 86,861 | ||||||
Axial Retailing, Inc. | 7,200 | 49,429 | ||||||
Cawachi Ltd. | 1,500 | 26,324 | ||||||
Create SD Holdings Co. Ltd. | 3,900 | 85,037 | ||||||
Fuji Co. Ltd.(a) | 4,900 | 60,382 | ||||||
G-7 Holdings, Inc. | 5,100 | 48,592 | ||||||
H2O Retailing Corp. | 9,900 | 127,229 | ||||||
Heiwado Co. Ltd. | 2,700 | 36,287 | ||||||
JM Holdings Co. Ltd.(a) | 2,800 | 51,691 | ||||||
Kansai Food Market Ltd.(a) | 4,200 | 49,258 | ||||||
Kato Sangyo Co. Ltd. | 2,900 | 87,856 | ||||||
Life Corp. | 3,700 | 95,101 | ||||||
Mitsubishi Shokuhin Co. Ltd. | 7,400 | 274,789 | ||||||
Okuwa Co. Ltd.(a) | 6,200 | 40,638 | ||||||
Qol Holdings Co. Ltd. | 3,600 | 42,031 | ||||||
Retail Partners Co. Ltd. | 2,600 | 31,696 | ||||||
San-A Co. Ltd. | 2,700 | 83,848 | ||||||
United Super Markets Holdings, Inc.(a) | 7,300 | 48,331 | ||||||
Valor Holdings Co. Ltd. | 6,800 | 112,686 | ||||||
Yaoko Co. Ltd.(a) | 2,400 | 145,020 | ||||||
Yokorei Co. Ltd.(a) | 4,500 | 30,952 | ||||||
|
| |||||||
| Total Consumer Staples Distribution & Retail |
| 1,721,213 | ||||||
| Containers & Packaging – 0.5% |
| |||||||
FP Corp.(a) | 4,400 | 80,153 | ||||||
Fuji Seal International, Inc. | 4,600 | 63,038 | ||||||
Rengo Co. Ltd. | 22,081 | 170,701 | ||||||
Tomoku Co. Ltd.(a) | 2,200 | 38,492 | ||||||
|
| |||||||
| Total Containers & Packaging |
| 352,384 | ||||||
| Distributors – 0.4% |
| |||||||
Arata Corp. | 3,400 | 74,135 | ||||||
Happinet Corp.(a) | 3,400 | 67,957 | ||||||
Optimus Group Co. Ltd. | 7,200 | 51,950 | ||||||
PALTAC Corp. | 2,800 | 76,131 | ||||||
Yamae Group Holdings Co. Ltd.(a) | 1,600 | 29,538 | ||||||
|
| |||||||
| Total Distributors |
| 299,711 | ||||||
| Diversified Consumer Services – 0.3% |
| |||||||
Aucnet, Inc. | 4,100 | 66,155 | ||||||
Gakkyusha Co. Ltd. | 3,300 | 46,509 | ||||||
Step Co. Ltd. | 4,300 | 56,938 | ||||||
Tokyo Individualized Educational Institute, Inc.(a) | 18,000 | 51,379 | ||||||
|
| |||||||
| Total Diversified Consumer Services |
| 220,981 | ||||||
| Diversified Telecommunication Services – 0.1% |
| |||||||
U-Next Holdings Co. Ltd. | 1,600 | 56,031 | ||||||
| Electric Utilities – 0.2% |
| |||||||
Hokkaido Electric Power Co., Inc. | 6,200 | 34,420 | ||||||
Shikoku Electric Power Co., Inc. | 11,400 | 90,276 | ||||||
|
| |||||||
| Total Electric Utilities |
| 124,696 | ||||||
| Electrical Equipment – 1.6% |
| |||||||
Daihen Corp. | 2,300 | 141,181 | ||||||
Furukawa Electric Co. Ltd.(a) | 6,026 | 128,885 | ||||||
GS Yuasa Corp.(a) | 4,000 | 83,148 | ||||||
Idec Corp.(a) | 3,800 | 67,817 | ||||||
Mabuchi Motor Co. Ltd. | 9,900 | 181,522 | ||||||
Nippon Carbon Co. Ltd. | 1,800 | 63,392 | ||||||
Nitto Kogyo Corp.(a) | 3,700 | 101,212 | ||||||
Sanyo Denki Co. Ltd. | 1,200 | 55,899 | ||||||
Sinfonia Technology Co. Ltd. | 5,200 | 111,322 | ||||||
SWCC Corp. | 2,200 | 56,401 | ||||||
Toyo Tanso Co. Ltd. | 1,300 | 70,865 | ||||||
|
| |||||||
| Total Electrical Equipment |
| 1,061,644 | ||||||
| Electronic Equipment, Instruments & Components – 8.9% |
| |||||||
A&D HOLON Holdings Co. Ltd.(a) | 3,300 | 63,233 | ||||||
Ai Holdings Corp. | 6,600 | 107,278 | ||||||
Alps Alpine Co. Ltd.(a) | 25,000 | 197,892 | ||||||
Amano Corp. | 14,400 | 368,409 | ||||||
See Notes to Financial Statements.
| 36 | WisdomTree Trust |
Schedule of Investments (continued)
WisdomTree Japan Hedged SmallCap Equity Fund (DXJS)
March 31, 2024
| Investments | Shares | Value | ||||||
Anritsu Corp.(a) | 19,000 | $ | 155,231 | |||||
Canon Electronics, Inc.(a) | 7,000 | 112,068 | ||||||
Citizen Watch Co. Ltd.(a) | 37,100 | 242,929 | ||||||
Daishinku Corp. | 6,100 | 32,285 | ||||||
Daitron Co. Ltd. | 2,600 | 61,845 | ||||||
Daiwabo Holdings Co. Ltd.(a) | 7,000 | 118,752 | ||||||
Dexerials Corp.(a) | 4,200 | 185,572 | ||||||
Elematec Corp. | 11,558 | 146,551 | ||||||
ESPEC Corp. | 4,186 | 84,359 | ||||||
Hagiwara Electric Holdings Co. Ltd.(a) | 1,600 | 47,309 | ||||||
Hakuto Co. Ltd.(a) | 7,300 | 272,041 | ||||||
Hioki EE Corp.(a) | 1,500 | 71,757 | ||||||
Hochiki Corp. | 2,900 | 42,845 | ||||||
Horiba Ltd. | 7,400 | 783,785 | ||||||
Innotech Corp. | 4,400 | 58,843 | ||||||
Iriso Electronics Co. Ltd. | 1,600 | 32,033 | ||||||
Japan Aviation Electronics Industry Ltd.(a) | 5,600 | 91,727 | ||||||
Kaga Electronics Co. Ltd.(a) | 5,800 | 244,501 | ||||||
Koa Corp.(a) | 5,300 | 51,128 | ||||||
Kyosan Electric Manufacturing Co. Ltd. | 8,900 | 30,638 | ||||||
Marubun Corp.(a) | 11,400 | 116,527 | ||||||
Maruwa Co. Ltd. | 200 | 42,816 | ||||||
Maxell Ltd. | 4,900 | 51,576 | ||||||
Meiko Electronics Co. Ltd.(a) | 1,600 | 57,300 | ||||||
Nichicon Corp.(a) | 6,700 | 56,887 | ||||||
Nippon Electric Glass Co. Ltd. | 14,600 | 373,525 | ||||||
Nippon Signal Co. Ltd. | 7,300 | 50,067 | ||||||
Nissha Co. Ltd. | 6,100 | 59,329 | ||||||
Nohmi Bosai Ltd. | 4,966 | 75,305 | ||||||
Oki Electric Industry Co. Ltd.(a) | 6,800 | 51,850 | ||||||
Optex Group Co. Ltd. | 3,300 | 43,173 | ||||||
Osaki Electric Co. Ltd. | 6,500 | 29,334 | ||||||
Restar Corp. | 5,400 | 108,289 | ||||||
Riken Keiki Co. Ltd.(a) | 2,000 | 50,547 | ||||||
RYODEN Corp.(a) | 3,900 | 69,834 | ||||||
Sanshin Electronics Co. Ltd. | 4,400 | 62,535 | ||||||
Santec Holdings Corp. | 2,200 | 77,479 | ||||||
Satori Electric Co. Ltd. | 2,500 | 43,923 | ||||||
Shibaura Electronics Co. Ltd. | 1,400 | 56,612 | ||||||
Siix Corp. | 4,400 | 50,208 | ||||||
Sumida Corp. | 7,500 | 60,805 | ||||||
Sun-Wa Technos Corp. | 4,100 | 64,746 | ||||||
Suzuden Corp. | 6,300 | 89,914 | ||||||
Tachibana Eletech Co. Ltd. | 4,800 | 102,600 | ||||||
Takachiho Koheki Co. Ltd.(a) | 2,800 | 70,303 | ||||||
TAKEBISHI Corp. | 2,900 | 39,089 | ||||||
Tokyo Electron Device Ltd.(a) | 4,900 | 223,073 | ||||||
Tomen Devices Corp. | 1,500 | 65,116 | ||||||
Topcon Corp. | 12,600 | 148,399 | ||||||
Yokowo Co. Ltd. | 3,100 | 32,363 | ||||||
|
| |||||||
| Total Electronic Equipment, Instruments & Components |
| 6,026,535 | ||||||
| Energy Equipment & Services – 0.1% |
| |||||||
Toyo Kanetsu KK | 1,500 | 44,699 | ||||||
| Entertainment – 0.4% |
| |||||||
Daiichikosho Co. Ltd. | 14,700 | 188,285 | ||||||
Marvelous, Inc. | 12,200 | 56,024 | ||||||
|
| |||||||
| Total Entertainment |
| 244,309 | ||||||
| Financial Services – 0.6% |
| |||||||
eGuarantee, Inc. | 3,900 | 46,178 | ||||||
Financial Partners Group Co. Ltd. | 14,200 | 202,850 | ||||||
Japan Investment Adviser Co. Ltd. | 3,800 | 27,092 | ||||||
Japan Securities Finance Co. Ltd. | 10,700 | 118,422 | ||||||
|
| |||||||
| Total Financial Services |
| 394,542 | ||||||
| Food Products – 4.0% |
| |||||||
Ariake Japan Co. Ltd.(a) | 2,400 | 83,412 | ||||||
Chubu Shiryo Co. Ltd. | 4,200 | 32,941 | ||||||
DyDo Group Holdings, Inc. | 1,400 | 25,133 | ||||||
Ezaki Glico Co. Ltd. | 3,900 | 109,080 | ||||||
Feed One Co. Ltd. | 5,100 | 32,923 | ||||||
Fuji Oil Holdings, Inc.(a) | 6,651 | 105,053 | ||||||
Fujicco Co. Ltd. | 2,900 | 36,733 | ||||||
Hokuto Corp.(a) | 2,400 | 29,591 | ||||||
House Foods Group, Inc. | 4,700 | 96,146 | ||||||
Itoham Yonekyu Holdings, Inc. | 5,680 | 150,496 | ||||||
Kagome Co. Ltd.(a) | 5,800 | 141,029 | ||||||
Kakiyasu Honten Co. Ltd.(a) | 2,800 | 58,832 | ||||||
Kameda Seika Co. Ltd.(a) | 1,100 | 31,035 | ||||||
Kewpie Corp. | 9,300 | 173,901 | ||||||
Kyokuyo Co. Ltd.(a) | 1,400 | 34,596 | ||||||
Maruha Nichiro Corp. | 6,900 | 135,565 | ||||||
Megmilk Snow Brand Co. Ltd. | 6,200 | 111,632 | ||||||
Mitsui DM Sugar Holdings Co. Ltd. | 6,500 | 133,784 | ||||||
Morinaga & Co. Ltd. | 5,900 | 102,352 | ||||||
Morinaga Milk Industry Co. Ltd. | 7,700 | 159,042 | ||||||
Nippn Corp. | 7,400 | 115,979 | ||||||
Nisshin Oillio Group Ltd. | 5,800 | 197,364 | ||||||
Nissui Corp. | 29,600 | 187,776 | ||||||
Prima Meat Packers Ltd. | 4,900 | 74,563 | ||||||
Riken Vitamin Co. Ltd. | 5,300 | 90,280 | ||||||
S Foods, Inc. | 3,000 | 66,404 | ||||||
Sakata Seed Corp. | 2,500 | 61,614 | ||||||
Showa Sangyo Co. Ltd. | 2,600 | 60,127 | ||||||
Starzen Co. Ltd. | 3,200 | 59,921 | ||||||
Warabeya Nichiyo Holdings Co. Ltd. | 1,900 | 35,013 | ||||||
|
| |||||||
| Total Food Products |
| 2,732,317 | ||||||
| Gas Utilities – 1.0% |
| |||||||
Hokkaido Gas Co. Ltd. | 2,600 | 43,429 | ||||||
Nippon Gas Co. Ltd. | 18,000 | 305,600 | ||||||
Saibu Gas Holdings Co. Ltd. | 6,000 | 76,276 | ||||||
Shizuoka Gas Co. Ltd. | 4,600 | 28,935 | ||||||
Toho Gas Co. Ltd. | 8,200 | 187,683 | ||||||
|
| |||||||
| Total Gas Utilities |
| 641,923 | ||||||
| Ground Transportation – 0.9% |
| |||||||
Alps Logistics Co. Ltd.(a) | 3,400 | 66,250 | ||||||
Fukuyama Transporting Co. Ltd.(a) | 1,900 | 45,509 | ||||||
See Notes to Financial Statements.
| WisdomTree Trust | 37 |
Schedule of Investments (continued)
WisdomTree Japan Hedged SmallCap Equity Fund (DXJS)
March 31, 2024
| Investments | Shares | Value | ||||||
Ichinen Holdings Co. Ltd. | 3,600 | $ | 41,769 | |||||
Keikyu Corp. | 6,700 | 61,668 | ||||||
Maruzen Showa Unyu Co. Ltd. | 2,200 | 68,030 | ||||||
Nankai Electric Railway Co. Ltd. | 2,400 | 50,602 | ||||||
Nikkon Holdings Co. Ltd.(a) | 7,300 | 142,508 | ||||||
Nishi-Nippon Railroad Co. Ltd.(a) | 3,300 | 54,926 | ||||||
Sakai Moving Service Co. Ltd. | 1,900 | 32,088 | ||||||
Sotetsu Holdings, Inc.(a) | 4,000 | 72,655 | ||||||
|
| |||||||
| Total Ground Transportation |
| 636,005 | ||||||
| Health Care Equipment & Supplies – 1.7% |
| |||||||
Eiken Chemical Co. Ltd.(a) | 5,300 | 70,038 | ||||||
Hogy Medical Co. Ltd.(a) | 2,100 | 52,033 | ||||||
Japan Lifeline Co. Ltd. | 13,100 | 105,427 | ||||||
Jeol Ltd.(a) | 2,800 | 115,778 | ||||||
Mani, Inc. | 5,400 | 70,807 | ||||||
Menicon Co. Ltd.(a) | 3,900 | 40,805 | ||||||
Mizuho Medy Co. Ltd.(a) | 4,000 | 88,936 | ||||||
Nagaileben Co. Ltd. | 3,200 | 50,322 | ||||||
Nakanishi, Inc. | 4,300 | 66,910 | ||||||
Nihon Kohden Corp. | 6,000 | 158,737 | ||||||
Nipro Corp.(a) | 8,223 | 66,585 | ||||||
Paramount Bed Holdings Co. Ltd. | 4,806 | 82,691 | ||||||
PHC Holdings Corp.(a) | 21,700 | 177,219 | ||||||
Shofu, Inc. | 1,600 | 31,060 | ||||||
|
| |||||||
| Total Health Care Equipment & Supplies |
| 1,177,348 | ||||||
| Health Care Providers & Services – 1.0% |
| |||||||
As One Corp. | 6,800 | 119,335 | ||||||
France Bed Holdings Co. Ltd. | 5,000 | 42,552 | ||||||
HU Group Holdings, Inc.(a) | 9,900 | 159,805 | ||||||
Ship Healthcare Holdings, Inc. | 6,518 | 90,527 | ||||||
Solasto Corp. | 11,900 | 43,324 | ||||||
Toho Holdings Co. Ltd.(a) | 2,500 | 60,326 | ||||||
Tokai Corp. | 3,500 | 50,646 | ||||||
Vital KSK Holdings, Inc.(a) | 10,800 | 89,629 | ||||||
|
| |||||||
| Total Health Care Providers & Services |
| 656,144 | ||||||
| Health Care Technology – 0.0% |
| |||||||
EM Systems Co. Ltd. | 6,400 | 29,982 | ||||||
| Hotels, Restaurants & Leisure – 2.0% |
| |||||||
Create Restaurants Holdings, Inc. | 7,300 | 50,646 | ||||||
Curves Holdings Co. Ltd. | 6,100 | 32,365 | ||||||
Doutor Nichires Holdings Co. Ltd. | 4,300 | 59,097 | ||||||
Food & Life Cos. Ltd. | 3,500 | 66,556 | ||||||
Heiwa Corp.(a) | 19,600 | 259,788 | ||||||
Hiday Hidaka Corp. | 2,322 | 41,286 | ||||||
Ichibanya Co. Ltd. | 13,000 | 103,162 | ||||||
KFC Holdings Japan Ltd.(a) | 1,900 | 56,431 | ||||||
KOMEDA Holdings Co. Ltd. | 4,700 | 84,873 | ||||||
Koshidaka Holdings Co. Ltd.(a) | 3,400 | 21,185 | ||||||
Kyoritsu Maintenance Co. Ltd.(a) | 1,400 | 32,423 | ||||||
Monogatari Corp. | 1,400 | 43,430 | ||||||
Ohsho Food Service Corp. | 2,400 | 124,167 | ||||||
Resorttrust, Inc. | 8,800 | 154,376 | ||||||
Round One Corp. | 12,300 | 63,960 | ||||||
Royal Holdings Co. Ltd. | 1,600 | 26,556 | ||||||
Saizeriya Co. Ltd. | 900 | 31,517 | ||||||
St. Marc Holdings Co. Ltd. | 3,500 | 50,230 | ||||||
Tokyotokeiba Co. Ltd.(a) | 1,800 | 53,104 | ||||||
|
| |||||||
| Total Hotels, Restaurants & Leisure |
| 1,355,152 | ||||||
| Household Durables – 2.4% |
| |||||||
Casio Computer Co. Ltd.(a) | 32,300 | 276,592 | ||||||
ES-Con Japan Ltd. | 14,800 | 101,701 | ||||||
Eslead Corp. | 2,700 | 62,886 | ||||||
Fuji Corp. Ltd. | 9,900 | 50,630 | ||||||
Fujitsu General Ltd.(a) | 4,900 | 60,997 | ||||||
Hoosiers Holdings Co. Ltd. | 10,500 | 78,189 | ||||||
JVCKenwood Corp. | 16,300 | 101,670 | ||||||
Ki-Star Real Estate Co. Ltd.(a) | 2,100 | 53,560 | ||||||
Meiwa Estate Co. Ltd.(a) | 4,800 | 33,745 | ||||||
Pressance Corp.(a) | 4,917 | 58,934 | ||||||
Sangetsu Corp. | 14,000 | 308,963 | ||||||
Tama Home Co. Ltd. | 8,000 | 239,982 | ||||||
Tamron Co. Ltd. | 3,700 | 168,198 | ||||||
Zojirushi Corp. | 5,700 | 54,460 | ||||||
|
| |||||||
| Total Household Durables |
| 1,650,507 | ||||||
| Household Products – 0.5% |
| |||||||
Earth Corp.(a) | 1,600 | 45,618 | ||||||
Pigeon Corp. | 19,900 | 191,117 | ||||||
ST Corp. | 4,800 | 49,032 | ||||||
Transaction Co. Ltd. | 2,600 | 38,894 | ||||||
|
| |||||||
| Total Household Products |
| 324,661 | ||||||
| Independent Power & Renewable Electricity Producers – 0.1% |
| |||||||
West Holdings Corp. | 2,800 | 53,264 | ||||||
| Industrial Conglomerates – 0.4% |
| |||||||
Gakken Holdings Co. Ltd. | 4,800 | 29,813 | ||||||
Mie Kotsu Group Holdings, Inc.(a) | 7,800 | 32,469 | ||||||
Nisshinbo Holdings, Inc. | 13,600 | 110,708 | ||||||
TOKAI Holdings Corp.(a) | 12,200 | 79,643 | ||||||
|
| |||||||
| Total Industrial Conglomerates |
| 252,633 | ||||||
| Insurance – 0.2% |
| |||||||
FP Partner, Inc. | 2,600 | 109,947 | ||||||
| Interactive Media & Services – 0.5% |
| |||||||
Infocom Corp. | 3,600 | 65,509 | ||||||
Kakaku.com, Inc. | 20,400 | 253,610 | ||||||
|
| |||||||
| Total Interactive Media & Services |
| 319,119 | ||||||
| IT Services – 2.1% |
| |||||||
Base Co. Ltd. | 1,600 | 38,059 | ||||||
Business Brain Showa-Ota, Inc. | 2,300 | 32,993 | ||||||
Business Engineering Corp. | 1,500 | 37,216 | ||||||
Comture Corp. | 2,700 | 36,090 | ||||||
DTS Corp. | 6,300 | 167,340 | ||||||
Future Corp. | 7,800 | 86,841 | ||||||
ID Holdings Corp. | 3,600 | 36,846 | ||||||
JBCC Holdings, Inc. | 2,800 | 60,498 | ||||||
Mitsubishi Research Institute, Inc. | 1,900 | 62,268 | ||||||
NEC Networks & System Integration Corp. | 11,700 | 195,973 | ||||||
See Notes to Financial Statements.
| 38 | WisdomTree Trust |
Schedule of Investments (continued)
WisdomTree Japan Hedged SmallCap Equity Fund (DXJS)
March 31, 2024
| Investments | Shares | Value | ||||||
NET One Systems Co. Ltd. | 9,800 | $ | 174,832 | |||||
NSD Co. Ltd. | 11,400 | 224,166 | ||||||
SB Technology Corp. | 2,600 | 36,214 | ||||||
Simplex Holdings, Inc. | 1,900 | 35,578 | ||||||
TDC Soft, Inc. | 8,000 | 61,370 | ||||||
TechMatrix Corp. | 2,400 | 29,369 | ||||||
Uchida Yoko Co. Ltd. | 1,700 | 78,628 | ||||||
|
| |||||||
| Total IT Services |
| 1,394,281 | ||||||
| Leisure Products – 0.8% |
| |||||||
Daikoku Denki Co. Ltd.(a) | 1,500 | 37,910 | ||||||
Furyu Corp.(a) | 2,700 | 22,942 | ||||||
GLOBERIDE, Inc.(a) | 3,300 | 44,285 | ||||||
Mizuno Corp. | 1,600 | 67,237 | ||||||
Roland Corp. | 3,800 | 114,493 | ||||||
Tomy Co. Ltd. | 8,000 | 148,720 | ||||||
Universal Entertainment Corp.(a) | 5,300 | 70,354 | ||||||
Yonex Co. Ltd.(a) | 2,800 | 20,647 | ||||||
|
| |||||||
| Total Leisure Products |
| 526,588 | ||||||
| Life Sciences Tools & Services – 0.1% |
| |||||||
Shin Nippon Biomedical Laboratories Ltd.(a) | 3,400 | 34,102 | ||||||
| Machinery – 6.7% |
| |||||||
Aida Engineering Ltd.(a) | 6,500 | 38,181 | ||||||
Alinco, Inc. | 4,800 | 32,952 | ||||||
Anest Iwata Corp. | 4,800 | 42,975 | ||||||
Bando Chemical Industries Ltd. | 7,000 | 87,416 | ||||||
CKD Corp.(a) | 6,000 | 119,528 | ||||||
DMG Mori Co. Ltd.(a) | 14,500 | 389,170 | ||||||
Fujitec Co. Ltd.(a) | 4,700 | 117,791 | ||||||
Fukushima Galilei Co. Ltd. | 1,300 | 50,679 | ||||||
Furukawa Co. Ltd. | 2,600 | 31,112 | ||||||
Glory Ltd.(a) | 3,700 | 69,431 | ||||||
Harmonic Drive Systems, Inc. | 1,800 | 47,395 | ||||||
Hitachi Zosen Corp.(a) | 9,635 | 83,971 | ||||||
Hokuetsu Industries Co. Ltd.(a) | 2,800 | 37,297 | ||||||
Hosokawa Micron Corp. | 1,100 | 34,524 | ||||||
Iwaki Co. Ltd. | 2,300 | 44,071 | ||||||
Japan Steel Works Ltd. | 4,403 | 98,565 | ||||||
Kitz Corp. | 11,700 | 105,524 | ||||||
Kyokuto Kaihatsu Kogyo Co. Ltd. | 3,300 | 56,583 | ||||||
Makino Milling Machine Co. Ltd. | 1,300 | 53,771 | ||||||
Max Co. Ltd. | 5,300 | 113,988 | ||||||
Meidensha Corp. | 2,600 | 50,456 | ||||||
METAWATER Co. Ltd. | 3,300 | 49,998 | ||||||
Mitsubishi Logisnext Co. Ltd. | 3,200 | 40,046 | ||||||
Mitsuboshi Belting Ltd.(a) | 7,100 | 219,082 | ||||||
Morita Holdings Corp. | 3,500 | 37,857 | ||||||
Nabtesco Corp. | 8,500 | 143,777 | ||||||
Nachi-Fujikoshi Corp. | 1,900 | 43,814 | ||||||
Nikkiso Co. Ltd. | 5,300 | 45,105 | ||||||
Nippon Thompson Co. Ltd.(a) | 10,900 | 46,237 | ||||||
Nissei ASB Machine Co. Ltd. | 1,100 | 38,667 | ||||||
Nomura Micro Science Co. Ltd.(a) | 3,200 | 125,594 | ||||||
Noritake Co. Ltd. | 4,200 | 119,052 | ||||||
NTN Corp.(a) | 37,100 | 76,899 | ||||||
Obara Group, Inc.(a) | 3,400 | 85,368 | ||||||
Oiles Corp. | 4,100 | 61,441 | ||||||
OKUMA Corp.(a) | 3,400 | 159,930 | ||||||
Organo Corp. | 1,400 | 71,228 | ||||||
OSG Corp. | 14,000 | 202,306 | ||||||
Rheon Automatic Machinery Co. Ltd. | 2,800 | 28,917 | ||||||
Ryobi Ltd. | 3,000 | 59,368 | ||||||
Shibaura Machine Co. Ltd.(a) | 2,100 | 50,299 | ||||||
Shibuya Corp. | 1,900 | 44,128 | ||||||
Shinmaywa Industries Ltd. | 7,400 | 61,119 | ||||||
Shinwa Co. Ltd. | 2,000 | 36,526 | ||||||
Sodick Co. Ltd. | 6,400 | 30,489 | ||||||
Star Micronics Co. Ltd. | 4,000 | 49,080 | ||||||
Tadano Ltd. | 3,400 | 29,014 | ||||||
Takeuchi Manufacturing Co. Ltd. | 4,100 | 165,252 | ||||||
Takuma Co. Ltd. | 9,800 | 123,289 | ||||||
Techno Smart Corp. | 3,300 | 44,677 | ||||||
Teikoku Electric Manufacturing Co. Ltd. | 3,100 | 52,334 | ||||||
Tocalo Co. Ltd. | 8,900 | 105,263 | ||||||
Torishima Pump Manufacturing Co. Ltd.(a) | 3,500 | 65,747 | ||||||
Tsubakimoto Chain Co. | 4,600 | 156,530 | ||||||
Tsugami Corp. | 6,000 | 45,591 | ||||||
Union Tool Co. | 1,200 | 35,601 | ||||||
YAMABIKO Corp. | 3,900 | 51,460 | ||||||
|
| |||||||
| Total Machinery |
| 4,506,465 | ||||||
| Marine Transportation – 0.4% |
| |||||||
Iino Kaiun Kaisha Ltd.(a) | 20,500 | 166,064 | ||||||
NS United Kaiun Kaisha Ltd.(a) | 3,700 | 112,703 | ||||||
|
| |||||||
| Total Marine Transportation |
| 278,767 | ||||||
| Media – 0.8% |
| |||||||
Carta Holdings, Inc. | 5,400 | 56,160 | ||||||
Intage Holdings, Inc.(a) | 5,400 | 56,910 | ||||||
Macromill, Inc. | 7,300 | 38,539 | ||||||
Proto Corp. | 4,900 | 46,395 | ||||||
SKY Perfect JSAT Holdings, Inc.(a) | 31,200 | 218,315 | ||||||
ValueCommerce Co. Ltd.(a) | 5,800 | 41,657 | ||||||
Zenrin Co. Ltd. | 9,200 | 51,609 | ||||||
|
| |||||||
| Total Media |
| 509,585 | ||||||
| Metals & Mining – 4.6% |
| |||||||
Aichi Steel Corp.(a) | 1,700 | 44,762 | ||||||
ARE Holdings, Inc.(a) | 11,800 | 150,633 | ||||||
Daido Steel Co. Ltd. | 45,600 | 547,308 | ||||||
Daiki Aluminium Industry Co. Ltd.(a) | 8,000 | 65,757 | ||||||
Dowa Holdings Co. Ltd.(a) | 5,000 | 176,055 | ||||||
Godo Steel Ltd. | 5,600 | 211,649 | ||||||
Kurimoto Ltd. | 2,100 | 56,404 | ||||||
Kyoei Steel Ltd. | 10,400 | 165,746 | ||||||
Mitsubishi Materials Corp.(a) | 13,800 | 266,025 | ||||||
Mitsubishi Steel Manufacturing Co. Ltd.(a) | 4,300 | 41,936 | ||||||
Mitsui Mining & Smelting Co. Ltd.(a) | 10,600 | 329,672 | ||||||
Nakayama Steel Works Ltd.(a) | 15,800 | 99,177 | ||||||
Nippon Denko Co. Ltd. | 13,600 | 29,385 | ||||||
See Notes to Financial Statements.
| WisdomTree Trust | 39 |
Schedule of Investments (continued)
WisdomTree Japan Hedged SmallCap Equity Fund (DXJS)
March 31, 2024
| Investments | Shares | Value | ||||||
Nippon Light Metal Holdings Co. Ltd. | 2,700 | $ | 32,451 | |||||
Nippon Yakin Kogyo Co. Ltd.(a) | 4,800 | 152,076 | ||||||
OSAKA Titanium Technologies Co. Ltd.(a) | 1,800 | 31,280 | ||||||
Sanyo Special Steel Co. Ltd.(a) | 5,800 | 86,150 | ||||||
Toho Titanium Co. Ltd.(a) | 2,900 | 29,930 | ||||||
Toho Zinc Co. Ltd.* | 1,700 | 12,873 | ||||||
Tokyo Steel Manufacturing Co. Ltd.(a) | 18,900 | 207,801 | ||||||
Tokyo Tekko Co. Ltd.(a) | 1,900 | 65,783 | ||||||
Topy Industries Ltd. | 5,300 | 94,902 | ||||||
UACJ Corp. | 7,000 | 203,740 | ||||||
|
| |||||||
| Total Metals & Mining |
| 3,101,495 | ||||||
| Oil, Gas & Consumable Fuels – 0.7% |
| |||||||
Itochu Enex Co. Ltd. | 20,900 | 216,809 | ||||||
Sala Corp. | 8,700 | 47,885 | ||||||
San-Ai Obbli Co. Ltd. | 15,100 | 208,324 | ||||||
|
| |||||||
| Total Oil, Gas & Consumable Fuels |
| 473,018 | ||||||
| Paper & Forest Products – 0.3% |
| |||||||
Daio Paper Corp.(a) | 8,000 | 61,396 | ||||||
Hokuetsu Corp.(a) | 10,300 | 130,941 | ||||||
Tokushu Tokai Paper Co. Ltd. | 1,400 | 37,094 | ||||||
|
| |||||||
| Total Paper & Forest Products |
| 229,431 | ||||||
| Personal Care Products – 0.5% |
| |||||||
Fancl Corp. | 7,200 | 95,290 | ||||||
Mandom Corp. | 5,000 | 44,600 | ||||||
Noevir Holdings Co. Ltd. | 6,100 | 210,796 | ||||||
|
| |||||||
| Total Personal Care Products |
| 350,686 | ||||||
| Pharmaceuticals – 1.1% |
| |||||||
Daito Pharmaceutical Co. Ltd. | 2,200 | 34,073 | ||||||
Fuji Pharma Co. Ltd.(a) | 3,000 | 32,826 | ||||||
Kyorin Pharmaceutical Co. Ltd.(a) | 6,700 | 80,217 | ||||||
Mochida Pharmaceutical Co. Ltd. | 3,600 | 76,593 | ||||||
Sawai Group Holdings Co. Ltd. | 4,100 | 163,355 | ||||||
Towa Pharmaceutical Co. Ltd. | 3,900 | 74,833 | ||||||
Tsumura & Co. | 6,400 | 161,665 | ||||||
ZERIA Pharmaceutical Co. Ltd. | 6,500 | 91,566 | ||||||
|
| |||||||
| Total Pharmaceuticals |
| 715,128 | ||||||
| Professional Services – 2.4% |
| |||||||
Altech Corp. | 3,350 | 61,314 | ||||||
Bell System24 Holdings, Inc. | 10,600 | 112,482 | ||||||
Careerlink Co. Ltd. | 2,200 | 37,489 | ||||||
Dip Corp. | 3,500 | 63,620 | ||||||
en Japan, Inc.(a) | 3,800 | 67,742 | ||||||
Forum Engineering, Inc. | 7,800 | 49,373 | ||||||
FULLCAST Holdings Co. Ltd. | 1,900 | 18,065 | ||||||
Funai Soken Holdings, Inc. | 3,640 | 59,358 | ||||||
IR Japan Holdings Ltd.(a) | 2,000 | 17,615 | ||||||
JAC Recruitment Co. Ltd. | 18,700 | 98,971 | ||||||
Matching Service Japan Co. Ltd. | 4,700 | 36,614 | ||||||
MEITEC Group Holdings, Inc. | 11,600 | 228,942 | ||||||
Nihon M&A Center Holdings, Inc.(a) | 26,300 | 171,516 | ||||||
Nomura Co. Ltd. | 9,900 | 59,853 | ||||||
Open Up Group, Inc. | 6,200 | 86,315 | ||||||
Pasona Group, Inc. | 2,700 | 49,738 | ||||||
Quick Co. Ltd. | 2,900 | 45,700 | ||||||
TechnoPro Holdings, Inc. | 6,600 | 135,101 | ||||||
TKC Corp. | 4,900 | 120,602 | ||||||
Transcosmos, Inc.(a) | 4,500 | 93,363 | ||||||
World Holdings Co. Ltd. | 2,100 | 35,480 | ||||||
|
| |||||||
| Total Professional Services |
| 1,649,253 | ||||||
| Real Estate Management & Development – 2.6% |
| |||||||
Aoyama Zaisan Networks Co. Ltd. | 5,400 | 45,528 | ||||||
Arealink Co. Ltd. | 1,600 | 29,073 | ||||||
Dear Life Co. Ltd. | 12,500 | 89,778 | ||||||
Good Com Asset Co. Ltd. | 5,100 | 31,036 | ||||||
Grandy House Corp. | 9,700 | 39,865 | ||||||
Heiwa Real Estate Co. Ltd.(a) | 5,700 | 153,662 | ||||||
Ichigo, Inc. | 43,700 | 133,689 | ||||||
Japan Property Management Center Co. Ltd. | 5,500 | 45,680 | ||||||
JINUSHI Co. Ltd. | 2,700 | 45,724 | ||||||
Katitas Co. Ltd.(a) | 6,100 | 80,570 | ||||||
Keihanshin Building Co. Ltd. | 4,700 | 50,775 | ||||||
LA Holdings Co. Ltd. | 1,500 | 50,348 | ||||||
Loadstar Capital KK | 3,000 | 56,513 | ||||||
Mirarth Holdings, Inc. | 20,200 | 68,737 | ||||||
Raysum Co. Ltd. | 2,700 | 64,135 | ||||||
Relo Group, Inc. | 11,800 | 97,109 | ||||||
SAMTY Co. Ltd. | 9,000 | 166,804 | ||||||
Starts Corp., Inc. | 10,000 | 225,313 | ||||||
Sun Frontier Fudousan Co. Ltd. | 8,800 | 114,023 | ||||||
Tosei Corp. | 8,600 | 140,639 | ||||||
|
| |||||||
| Total Real Estate Management & Development |
| 1,729,001 | ||||||
| Semiconductors & Semiconductor Equipment – 2.5% |
| |||||||
Ferrotec Holdings Corp.(a) | 6,300 | 123,132 | ||||||
Furuya Metal Co. Ltd. | 700 | 52,450 | ||||||
Japan Material Co. Ltd. | 3,600 | 57,302 | ||||||
Micronics Japan Co. Ltd. | 3,400 | 200,390 | ||||||
Mimasu Semiconductor Industry Co. Ltd. | 2,600 | 54,201 | ||||||
Mitsui High-Tec, Inc. | 1,400 | 80,691 | ||||||
Optorun Co. Ltd. | 4,500 | 61,489 | ||||||
Rorze Corp. | 700 | 99,904 | ||||||
Shibaura Mechatronics Corp.(a) | 1,800 | 76,236 | ||||||
Shindengen Electric Manufacturing Co. Ltd. | 2,000 | 40,239 | ||||||
Tokyo Seimitsu Co. Ltd. | 6,100 | 490,717 | ||||||
Towa Corp.(a) | 700 | 49,351 | ||||||
Ulvac, Inc. | 3,600 | 234,513 | ||||||
Yamaichi Electronics Co. Ltd. | 4,200 | 69,100 | ||||||
|
| |||||||
| Total Semiconductors & Semiconductor Equipment |
| 1,689,715 | ||||||
| Software – 0.9% |
| |||||||
Computer Engineering & Consulting Ltd. | 3,400 | 34,934 | ||||||
Cresco Ltd. | 2,900 | 40,718 | ||||||
Digital Arts, Inc. | 1,200 | 34,768 | ||||||
Fuji Soft, Inc.(a) | 3,200 | 127,074 | ||||||
Fukui Computer Holdings, Inc. | 2,200 | 37,751 | ||||||
I’ll, Inc. | 1,090 | 21,642 | ||||||
Justsystems Corp.(a) | 1,300 | 22,926 | ||||||
See Notes to Financial Statements.
| 40 | WisdomTree Trust |
Schedule of Investments (continued)
WisdomTree Japan Hedged SmallCap Equity Fund (DXJS)
March 31, 2024
| Investments | Shares | Value | ||||||
Miroku Jyoho Service Co. Ltd. | 4,900 | $ | 58,698 | |||||
Systena Corp. | 57,200 | 102,801 | ||||||
UNITED, Inc. | 9,300 | 55,058 | ||||||
WingArc1st, Inc. | 2,000 | 40,504 | ||||||
|
| |||||||
| Total Software |
| 576,874 | ||||||
| Specialty Retail – 4.1% |
| |||||||
Adastria Co. Ltd. | 5,122 | 130,466 | ||||||
Alleanza Holdings Co. Ltd.(a) | 5,000 | 34,359 | ||||||
Alpen Co. Ltd.(a) | 2,800 | 37,261 | ||||||
AOKI Holdings, Inc. | 12,100 | 91,782 | ||||||
Aoyama Trading Co. Ltd. | 4,900 | 56,821 | ||||||
ARCLANDS Corp. | 6,179 | 72,877 | ||||||
Asahi Co. Ltd. | 7,600 | 67,139 | ||||||
Autobacs Seven Co. Ltd.(a) | 15,500 | 164,222 | ||||||
Bic Camera, Inc.(a) | 8,000 | 67,766 | ||||||
DCM Holdings Co. Ltd. | 17,600 | 171,761 | ||||||
EDION Corp.(a) | 10,800 | 110,465 | ||||||
Geo Holdings Corp.(a) | 1,400 | 17,825 | ||||||
Hard Off Corp. Co. Ltd. | 3,500 | 39,314 | ||||||
Honeys Holdings Co. Ltd.(a) | 4,900 | 57,630 | ||||||
IDOM, Inc. | 16,100 | 110,422 | ||||||
Joshin Denki Co. Ltd.(a) | 2,900 | 44,608 | ||||||
Joyful Honda Co. Ltd.(a) | 5,900 | 85,413 | ||||||
K’s Holdings Corp.(a) | 21,400 | 189,404 | ||||||
Kohnan Shoji Co. Ltd. | 2,800 | 81,403 | ||||||
Kojima Co. Ltd.(a) | 5,000 | 27,190 | ||||||
Komehyo Holdings Co. Ltd.(a) | 1,100 | 28,964 | ||||||
Komeri Co. Ltd.(a) | 3,000 | 68,585 | ||||||
KU Holdings Co. Ltd. | 4,600 | 35,136 | ||||||
Nafco Co. Ltd.(a) | 2,000 | 35,072 | ||||||
New Art Holdings Co. Ltd.(a) | 5,300 | 59,603 | ||||||
Nextage Co. Ltd.(a) | 3,800 | 72,914 | ||||||
Nishimatsuya Chain Co. Ltd. | 3,500 | 57,537 | ||||||
Nissan Tokyo Sales Holdings Co. Ltd. | 13,100 | 51,934 | ||||||
Nojima Corp. | 7,400 | 83,415 | ||||||
PAL GROUP Holdings Co. Ltd. | 7,400 | 126,931 | ||||||
Scroll Corp. | 11,400 | 72,312 | ||||||
T-Gaia Corp. | 7,900 | 107,634 | ||||||
United Arrows Ltd.(a) | 2,800 | 36,854 | ||||||
VT Holdings Co. Ltd. | 15,854 | 56,043 | ||||||
World Co. Ltd. | 7,100 | 100,768 | ||||||
Xebio Holdings Co. Ltd. | 5,000 | 32,707 | ||||||
Yellow Hat Ltd. | 8,400 | 110,505 | ||||||
|
| |||||||
| Total Specialty Retail |
| 2,795,042 | ||||||
| Technology Hardware, Storage & Peripherals – 0.5% |
| |||||||
Elecom Co. Ltd. | 7,700 | 78,554 | ||||||
MCJ Co. Ltd. | 10,400 | 94,005 | ||||||
Riso Kagaku Corp.(a) | 5,100 | 104,463 | ||||||
Toshiba TEC Corp. | 2,500 | 50,217 | ||||||
|
| |||||||
| Total Technology Hardware, Storage & Peripherals |
| 327,239 | ||||||
| Textiles, Apparel & Luxury Goods – 1.2% |
| |||||||
Baroque Japan Ltd.(a) | 11,900 | 59,757 | ||||||
Descente Ltd.(a) | 2,600 | 59,354 | ||||||
Fujibo Holdings, Inc.(a) | 1,200 | 35,403 | ||||||
Gunze Ltd. | 2,000 | 72,946 | ||||||
Japan Wool Textile Co. Ltd. | 6,000 | 58,595 | ||||||
Kurabo Industries Ltd. | 2,200 | 50,877 | ||||||
Morito Co. Ltd. | 6,200 | 64,439 | ||||||
Onward Holdings Co. Ltd. | 21,039 | 79,377 | ||||||
Seiko Group Corp.(a) | 4,600 | 126,744 | ||||||
Wacoal Holdings Corp. | 5,500 | 134,970 | ||||||
Yondoshi Holdings, Inc.(a) | 5,600 | 69,230 | ||||||
|
| |||||||
| Total Textiles, Apparel & Luxury Goods |
| 811,692 | ||||||
| Trading Companies & Distributors – 3.4% |
| |||||||
Advan Group Co. Ltd. | 6,800 | 52,164 | ||||||
Alconix Corp. | 4,000 | 38,667 | ||||||
Chori Co. Ltd. | 3,800 | 85,493 | ||||||
Daiichi Jitsugyo Co. Ltd. | 3,800 | 53,455 | ||||||
Hanwa Co. Ltd. | 5,700 | 223,337 | ||||||
Inaba Denki Sangyo Co. Ltd. | 7,600 | 176,009 | ||||||
Inabata & Co. Ltd. | 7,600 | 159,437 | ||||||
Japan Pulp & Paper Co. Ltd. | 900 | 30,804 | ||||||
Kamei Corp. | 3,700 | 52,244 | ||||||
Kanaden Corp. | 3,200 | 31,927 | ||||||
Kanamoto Co. Ltd. | 3,200 | 56,940 | ||||||
Kanematsu Corp. | 13,000 | 222,644 | ||||||
KPP Group Holdings Co. Ltd.(a) | 6,000 | 29,416 | ||||||
Kyokuto Boeki Kaisha Ltd. | 3,500 | 47,778 | ||||||
MARUKA FURUSATO Corp. | 1,400 | 20,342 | ||||||
Mitsui Matsushima Holdings Co. Ltd.(a) | 4,800 | 92,419 | ||||||
Nagase & Co. Ltd. | 9,900 | 167,066 | ||||||
Nichiden Corp.(a) | 2,900 | 50,893 | ||||||
Nishio Holdings Co. Ltd. | 3,200 | 81,826 | ||||||
Onoken Co. Ltd.(a) | 2,900 | 36,005 | ||||||
Sanyo Trading Co. Ltd.(a) | 3,500 | 33,486 | ||||||
Sato Shoji Corp. | 3,500 | 40,910 | ||||||
Seika Corp. | 2,000 | 48,961 | ||||||
Senshu Electric Co. Ltd. | 2,100 | 69,170 | ||||||
Shinsho Corp. | 1,600 | 76,329 | ||||||
Trusco Nakayama Corp. | 4,700 | 80,277 | ||||||
Wakita & Co. Ltd. | 3,200 | 33,682 | ||||||
Yamazen Corp.(a) | 10,900 | 96,940 | ||||||
Yuasa Trading Co. Ltd. | 3,200 | 113,119 | ||||||
|
| |||||||
| Total Trading Companies & Distributors |
| 2,301,740 | ||||||
| Transportation Infrastructure – 0.3% |
| |||||||
Mitsubishi Logistics Corp. | 4,800 | 157,785 | ||||||
Nissin Corp. | 3,100 | 59,339 | ||||||
|
| |||||||
| Total Transportation Infrastructure |
| 217,124 | ||||||
| Wireless Telecommunication Services – 0.2% |
| |||||||
Okinawa Cellular Telephone Co. | 7,000 | 164,194 | ||||||
TOTAL COMMON STOCKS (Cost: $59,572,061) |
| 66,672,823 | ||||||
See Notes to Financial Statements.
| WisdomTree Trust | 41 |
Schedule of Investments (concluded)
WisdomTree Japan Hedged SmallCap Equity Fund (DXJS)
March 31, 2024
| * | Non-income producing security. |
| (a) | Security, or portion thereof, was on loan at March 31, 2024 (See Note 2). At March 31, 2024, the total market value of the Fund’s securities on loan identified in the Schedule of Investments was $17,580,382 and the total market value of the collateral held by the Fund was $18,730,849. The total market value of the collateral includes non-cash U.S. Government securities collateral having a value of $10,392,685. |
| (b) | Rate shown represents annualized 7-day yield as of March 31, 2024. |
| Investments | Shares | Value | ||||||
| INVESTMENT OF CASH COLLATERAL FOR SECURITIES LOANED – 12.3% |
| |||||||
| United States – 12.3% |
| |||||||
State Street Navigator Securities Lending Government Money Market Portfolio, 5.34%(b) | ||||||||
| (Cost: $8,338,164) | 8,338,164 | $ | 8,338,164 | |||||
TOTAL INVESTMENTS IN SECURITIES – 111.0% (Cost: $67,910,225) |
| 75,010,987 | ||||||
Other Assets less Liabilities – (11.0)% |
| (7,469,942 | ) | |||||
|
| |||||||
| NET ASSETS – 100.0% |
| $ | 67,541,045 | |||||
| FINANCIAL DERIVATIVE INSTRUMENTS | ||||||||||||||||||||||||||||
| FOREIGN CURRENCY CONTRACTS (OTC – OVER THE COUNTER) | ||||||||||||||||||||||||||||
| Counterparty | Settlement Date | Amount and | Amount and | Unrealized Appreciation | Unrealized Depreciation | |||||||||||||||||||||||
Bank of America NA | 4/3/2024 | 1,945,009,389 | JPY | 12,855,359 | USD | $ | — | $ | (1,904 | ) | ||||||||||||||||||
Bank of America NA | 4/3/2024 | 11,656,162 | USD | 1,736,388,147 | JPY | 181,366 | — | |||||||||||||||||||||
Bank of America NA | 5/7/2024 | 13,480,649 | USD | 2,029,076,281 | JPY | 1,724 | — | |||||||||||||||||||||
Barclays Bank PLC | 4/3/2024 | 1,945,009,389 | JPY | 12,855,359 | USD | — | (1,904 | ) | ||||||||||||||||||||
Barclays Bank PLC | 4/3/2024 | 11,656,162 | USD | 1,736,395,140 | JPY | 181,319 | — | |||||||||||||||||||||
Barclays Bank PLC | 5/7/2024 | 13,480,649 | USD | 2,029,089,762 | JPY | 1,634 | — | |||||||||||||||||||||
Citibank NA | 4/3/2024 | 1,945,022,244 | JPY | 12,855,359 | USD | — | (1,819 | ) | ||||||||||||||||||||
Citibank NA | 4/3/2024 | 3,237,823 | USD | 482,323,922 | JPY | 50,420 | — | |||||||||||||||||||||
Citibank NA | 5/7/2024 | 13,480,649 | USD | 2,029,103,243 | JPY | 1,544 | — | |||||||||||||||||||||
HSBC Holdings PLC | 4/3/2024 | 72,506,729 | JPY | 479,664 | USD | — | (509 | ) | ||||||||||||||||||||
HSBC Holdings PLC | 4/3/2024 | 11,656,162 | USD | 1,736,386,981 | JPY | 181,373 | — | |||||||||||||||||||||
HSBC Holdings PLC | 4/3/2024 | 11,656,161 | USD | 1,736,386,832 | JPY | 181,373 | — | |||||||||||||||||||||
JP Morgan Chase Bank NA | 4/3/2024 | 1,945,012,768 | JPY | 12,855,355 | USD | — | (1,878 | ) | ||||||||||||||||||||
JP Morgan Chase Bank NA | 5/7/2024 | 13,480,646 | USD | 2,029,075,830 | JPY | 1,724 | — | |||||||||||||||||||||
Royal Bank of Canada | 4/3/2024 | 1,945,009,556 | JPY | 12,855,359 | USD | — | (1,903 | ) | ||||||||||||||||||||
Royal Bank of Canada | 4/3/2024 | 11,656,162 | USD | 1,736,391,608 | JPY | 181,343 | — | |||||||||||||||||||||
Royal Bank of Canada | 5/7/2024 | 13,480,649 | USD | 2,029,089,937 | JPY | 1,633 | — | |||||||||||||||||||||
Standard Chartered Bank | 4/3/2024 | 3,237,823 | USD | 483,858,650 | JPY | 40,278 | — | |||||||||||||||||||||
| $ | 1,005,731 | $ | (9,917 | ) | ||||||||||||||||||||||||
| FAIR VALUATION SUMMARY |
The following is a summary of the fair valuations according to the inputs used in valuing the Fund’s investments (See Note 2—Fair Value Measurement):
| Quoted Prices in Active Markets (Level 1) | Other Significant Observable Inputs (Level 2) | Significant Unobservable Inputs (Level 3) | Total | |||||||||||||
| Assets: |
| |||||||||||||||
| Investments in Securities | ||||||||||||||||
Common Stocks | $ | 66,672,823 | $ | — | $ | — | $ | 66,672,823 | ||||||||
Investment of Cash Collateral for Securities Loaned | — | 8,338,164 | — | 8,338,164 | ||||||||||||
Total Investments in Securities | $ | 66,672,823 | $ | 8,338,164 | $ | — | $ | 75,010,987 | ||||||||
| Financial Derivative Instruments | ||||||||||||||||
Foreign Currency Contracts1 | $ | — | $ | 1,005,731 | $ | — | $ | 1,005,731 | ||||||||
| Liabilities: | ||||||||||||||||
| Financial Derivative Instruments | ||||||||||||||||
Foreign Currency Contracts1 | $ | — | $ | (9,917 | ) | $ | — | $ | (9,917 | ) | ||||||
Total – Net | $ | 66,672,823 | $ | 9,333,978 | $ | — | $ | 76,006,801 | ||||||||
| 1 | Amount shown represents the unrealized appreciation (depreciation) on the financial instrument. |
See Notes to Financial Statements.
| 42 | WisdomTree Trust |
Statements of Assets and Liabilities
WisdomTree Trust
March 31, 2024
| WisdomTree Europe Hedged Equity Fund | WisdomTree Europe Hedged SmallCap Equity Fund | WisdomTree International Hedged Quality Dividend Growth Fund | WisdomTree Japan Hedged Equity Fund | WisdomTree Japan Hedged SmallCap Equity Fund | ||||||||||||||||
ASSETS: |
| |||||||||||||||||||
Investments, at cost | $ | 1,453,801,734 | $ | 44,815,432 | $ | 1,947,034,032 | $ | 4,235,647,702 | $ | 67,910,225 | ||||||||||
Investment in affiliates, at cost (Note 3) | — | — | 868,179 | — | — | |||||||||||||||
Foreign currency, at cost | 891,902 | 74,724 | 1,503,241 | 5,010,163 | 1,558 | |||||||||||||||
Investments in securities, at value1,2 (Note 2) | 1,934,842,035 | 48,655,369 | 2,418,283,249 | 4,949,229,091 | 75,010,987 | |||||||||||||||
Investment in affiliates, at value (Note 3) | — | — | 1,150,249 | — | — | |||||||||||||||
Cash | 617,287 | 1,448 | 1,328,577 | 2,088,835 | 45,903 | |||||||||||||||
Foreign currency, at value | 887,839 | 74,535 | 1,503,875 | 5,010,219 | 1,784 | |||||||||||||||
Unrealized appreciation on foreign currency contracts | 6,275,893 | 134,154 | 20,950,589 | 71,266,688 | 1,005,731 | |||||||||||||||
Receivables: |
| |||||||||||||||||||
Capital shares sold | 31,303,462 | 43,500 | 9,152,064 | — | — | |||||||||||||||
Dividends | 426,112 | 58,794 | 5,114,863 | 42,905,558 | 808,479 | |||||||||||||||
Securities lending income | 18,593 | 1,386 | 23,259 | 92,191 | 4,212 | |||||||||||||||
Foreign tax reclaims | 7,354,446 | 117,165 | 6,079,165 | 2,644,935 | 5,061 | |||||||||||||||
Other (Note 6) | 578,620 | 17,338 | 227,678 | — | — | |||||||||||||||
Total Assets | 1,982,304,287 | 49,103,689 | 2,463,813,568 | 5,073,237,517 | 76,882,157 | |||||||||||||||
LIABILITIES: |
| |||||||||||||||||||
Unrealized depreciation on foreign currency contracts | 23,744 | 550 | 251,518 | 1,311,966 | 9,917 | |||||||||||||||
Payables: |
| |||||||||||||||||||
Cash collateral received for securities loaned (Note 2) | 49,889,495 | 4,997,454 | 60,536,579 | 307,769,515 | 8,338,164 | |||||||||||||||
Investment securities purchased | 31,127,032 | — | 20,495,595 | 71,026,130 | 960,601 | |||||||||||||||
Advisory fees (Note 3) | 888,489 | 21,027 | 1,140,343 | 1,862,529 | 32,186 | |||||||||||||||
Service fees (Note 2) | 6,740 | 160 | 8,653 | 17,073 | 244 | |||||||||||||||
Other (Note 6) | 374,090 | 5,201 | 68,303 | — | — | |||||||||||||||
Total Liabilities | 82,309,590 | 5,024,392 | 82,500,991 | 381,987,213 | 9,341,112 | |||||||||||||||
NET ASSETS | $ | 1,899,994,697 | $ | 44,079,297 | $ | 2,381,312,577 | $ | 4,691,250,304 | $ | 67,541,045 | ||||||||||
NET ASSETS: |
| |||||||||||||||||||
Paid-in capital | $ | 3,495,978,299 | $ | 62,193,576 | $ | 2,073,990,181 | $ | 5,248,463,699 | $ | 77,708,953 | ||||||||||
Total distributable earnings (loss) | (1,595,983,602 | ) | (18,114,279 | ) | 307,322,396 | (557,213,395 | ) | (10,167,908 | ) | |||||||||||
NET ASSETS | $ | 1,899,994,697 | $ | 44,079,297 | $ | 2,381,312,577 | $ | 4,691,250,304 | $ | 67,541,045 | ||||||||||
Outstanding beneficial interest shares of $0.001 par value (unlimited number of shares authorized) | 39,450,000 | 1,150,000 | 52,000,000 | 43,150,000 | 2,000,000 | |||||||||||||||
Net asset value per share | $ | 48.16 | $ | 38.33 | $ | 45.79 | $ | 108.72 | $ | 33.77 | ||||||||||
1 Includes market value of securities out on loan of: | $ | 142,839,982 | $ | 5,482,253 | $ | 138,461,692 | $ | 457,812,879 | $ | 17,580,382 | ||||||||||
2 Investments in securities include investment of cash collateral for securities loaned (see Schedule of Investments for additional information). |
| |||||||||||||||||||
See Notes to Financial Statements.
| WisdomTree Trust | 43 |
WisdomTree Trust
For the Year Ended March 31, 2024
| WisdomTree Europe Hedged Equity Fund | WisdomTree Europe Hedged SmallCap Equity Fund | WisdomTree Quality Dividend Growth Fund | WisdomTree Japan Hedged Equity Fund | WisdomTree Japan Hedged SmallCap Equity Fund | ||||||||||||||||
INVESTMENT INCOME: |
| |||||||||||||||||||
Dividends | $ | 59,530,060 | $ | 2,412,231 | $ | 46,660,419 | $ | 101,210,868 | $ | 1,756,776 | ||||||||||
Dividends from affiliates (Note 3) | — | — | 20,098 | — | — | |||||||||||||||
Interest | — | — | 63,923 | — | — | |||||||||||||||
Non-cash dividends | 387,233 | 23,594 | — | — | — | |||||||||||||||
Other income (Note 6) | 2,822,416 | 17,490 | 201,725 | — | — | |||||||||||||||
Securities lending income, net (Note 2) | 2,423,012 | 36,998 | 276,530 | 526,203 | 24,302 | |||||||||||||||
Less: Foreign withholding taxes on dividends | (7,285,944 | ) | (329,359 | ) | (4,404,856 | ) | (10,127,696 | ) | (176,316 | ) | ||||||||||
Total investment income | 57,876,777 | 2,160,954 | 42,817,839 | 91,609,375 | 1,604,762 | |||||||||||||||
EXPENSES: |
| |||||||||||||||||||
Advisory fees (Note 3) | 8,410,181 | 282,076 | 10,427,133 | 13,956,299 | 278,903 | |||||||||||||||
Service fees (Note 2) | 63,801 | 2,140 | 79,102 | 127,933 | 2,116 | |||||||||||||||
Other fees (Note 6) | 809,450 | 5,018 | 58,768 | — | — | |||||||||||||||
Total expenses | 9,283,432 | 289,234 | 10,565,003 | 14,084,232 | 281,019 | |||||||||||||||
Expense waivers (Note 3) | — | — | (3,386 | ) | — | — | ||||||||||||||
Net expenses | 9,283,432 | 289,234 | 10,561,617 | 14,084,232 | 281,019 | |||||||||||||||
Net investment income | 48,593,345 | 1,871,720 | 32,256,222 | 77,525,143 | 1,323,743 | |||||||||||||||
NET REALIZED AND UNREALIZED GAIN (LOSS) ON INVESTMENTS: |
| |||||||||||||||||||
Net realized gain (loss) from: |
| |||||||||||||||||||
Investment transactions | (49,617,505 | ) | (2,481,892 | ) | 48,581,005 | (82,370,186 | ) | (1,096,573 | ) | |||||||||||
In-kind redemptions | 12,776,467 | 1,258,280 | — | 178,558,830 | 3,494,435 | |||||||||||||||
Futures contracts | — | 4,007 | — | — | — | |||||||||||||||
Foreign currency contracts | 257,478 | 221,727 | 20,456,849 | 357,812,496 | 5,191,749 | |||||||||||||||
Foreign currency related transactions | 60,992 | 4,725 | 133,775 | (2,575,207 | ) | (46,649 | ) | |||||||||||||
Net realized gain (loss) | (36,522,568 | ) | (993,153 | ) | 69,171,629 | 451,425,933 | 7,542,962 | |||||||||||||
Net increase (decrease) in unrealized appreciation/depreciation: |
| |||||||||||||||||||
Investment transactions | 251,809,026 | 3,763,609 | 209,454,218 | 720,660,847 | 7,383,640 | |||||||||||||||
Investment transactions in affiliates (Note 3) | — | — | 126,630 | — | — | |||||||||||||||
Foreign currency contracts | 37,078,496 | 1,359,681 | 44,353,215 | 99,026,901 | 1,452,754 | |||||||||||||||
Translation of assets and liabilities denominated in foreign currencies | (59,269 | ) | 29 | 10,192 | (412,045 | ) | (659 | ) | ||||||||||||
Net increase in unrealized appreciation/depreciation | 288,828,253 | 5,123,319 | 253,944,255 | 819,275,703 | 8,835,735 | |||||||||||||||
Net realized and unrealized gain on investments | 252,305,685 | 4,130,166 | 323,115,884 | 1,270,701,636 | 16,378,697 | |||||||||||||||
NET INCREASE IN NET ASSETS RESULTING FROM OPERATIONS | $ | 300,899,030 | $ | 6,001,886 | $ | 355,372,106 | $ | 1,348,226,779 | $ | 17,702,440 | ||||||||||
See Notes to Financial Statements.
| 44 | WisdomTree Trust |
Statements of Changes in Net Assets
WisdomTree Trust
WisdomTree Europe Hedged Equity Fund | WisdomTree Europe Hedged SmallCap Equity Fund | WisdomTree International Hedged Quality Dividend Growth Fund | ||||||||||||||||||||||
For the Year Ended March 31, 2024 | For the Year Ended March 31, 2023 | For the Year Ended March 31, 2024 | For the Year Ended March 31, 2023 | For the Year Ended March 31, 2024 | For the Year Ended March 31, 2023 | |||||||||||||||||||
INCREASE (DECREASE) IN NET ASSETS RESULTING FROM OPERATIONS: |
| |||||||||||||||||||||||
Net investment income | $ | 48,593,345 | $ | 41,397,465 | $ | 1,871,720 | $ | 2,357,253 | $ | 32,256,222 | $ | 40,343,152 | ||||||||||||
Net realized gain (loss) on investments, futures contracts, foreign currency contracts and foreign currency related transactions | (36,522,568 | ) | 61,473,088 | (993,153 | ) | (4,807,804 | ) | 69,171,629 | (122,646,277 | ) | ||||||||||||||
Net increase (decrease) in unrealized appreciation/depreciation on investments, foreign currency contracts and translation of assets and liabilities denominated in foreign currencies | 288,828,253 | 31,948,323 | 5,123,319 | (154,286 | ) | 253,944,255 | 132,616,560 | |||||||||||||||||
Net increase (decrease) in net assets resulting from operations | 300,899,030 | 134,818,876 | 6,001,886 | (2,604,837 | ) | 355,372,106 | 50,313,435 | |||||||||||||||||
DISTRIBUTIONS TO SHAREHOLDERS: |
| |||||||||||||||||||||||
Distributable earnings | (48,992,250 | ) | (40,224,525 | ) | (1,960,000 | ) | (2,393,909 | ) | (34,358,500 | ) | (152,589,770 | ) | ||||||||||||
CAPITAL SHARE TRANSACTIONS: |
| |||||||||||||||||||||||
Net proceeds from sale of shares | 290,026,390 | 23,922,673 | 10,188,628 | 19,411,083 | 663,713,322 | 351,881,143 | ||||||||||||||||||
Cost of shares redeemed | (44,534,131 | ) | (581,668,771 | ) | (19,117,867 | ) | (26,217,220 | ) | — | (30,111,720 | ) | |||||||||||||
Net increase (decrease) in net assets resulting from capital share transactions | 245,492,259 | (557,746,098 | ) | (8,929,239 | ) | (6,806,137 | ) | 663,713,322 | 321,769,423 | |||||||||||||||
Net Increase (Decrease) in Net Assets | 497,399,039 | (463,151,747 | ) | (4,887,353 | ) | (11,804,883 | ) | 984,726,928 | 219,493,088 | |||||||||||||||
NET ASSETS: |
| |||||||||||||||||||||||
Beginning of year | $ | 1,402,595,658 | $ | 1,865,747,405 | $ | 48,966,650 | $ | 60,771,533 | $ | 1,396,585,649 | $ | 1,177,092,561 | ||||||||||||
End of year | $ | 1,899,994,697 | $ | 1,402,595,658 | $ | 44,079,297 | $ | 48,966,650 | $ | 2,381,312,577 | $ | 1,396,585,649 | ||||||||||||
SHARES CREATED AND REDEEMED: |
| |||||||||||||||||||||||
Shares outstanding, beginning of year | 34,200,000 | 1 | 50,400,000 | 1 | 1,450,000 | 1,750,000 | 35,650,000 | 27,350,000 | ||||||||||||||||
Shares created | 6,350,000 | 1 | 600,000 | 1 | 300,000 | 550,000 | 16,350,000 | 9,100,000 | ||||||||||||||||
Shares redeemed | (1,100,000 | )1 | (16,800,000 | )1 | (600,000 | ) | (850,000 | ) | — | (800,000 | ) | |||||||||||||
Shares outstanding, end of year | 39,450,000 | 1 | 34,200,000 | 1 | 1,150,000 | 1,450,000 | 52,000,000 | 35,650,000 | ||||||||||||||||
1 Shares were adjusted to reflect a 2:1 share split effective August 10, 2023. |
| |||||||||||||||||||||||
See Notes to Financial Statements.
| WisdomTree Trust | 45 |
Statements of Changes in Net Assets (concluded)
WisdomTree Trust
WisdomTree Japan Hedged Equity Fund | WisdomTree Japan Hedged SmallCap Equity Fund | |||||||||||||||
For the Year Ended March 31, 2024 | For the Year Ended March 31, 2023 | For the Year Ended | For the Year Ended | |||||||||||||
INCREASE (DECREASE) IN NET ASSETS RESULTING FROM OPERATIONS: |
| |||||||||||||||
Net investment income | $ | 77,525,143 | $ | 54,558,772 | $ | 1,323,743 | $ | 592,040 | ||||||||
Net realized gain on investments, foreign currency contracts and foreign currency related transactions | 451,425,933 | 195,447,523 | 7,542,962 | 395,893 | ||||||||||||
Net increase (decrease) in unrealized appreciation/depreciation on investments, foreign currency contracts and translation of assets and liabilities denominated in foreign currencies | 819,275,703 | (29,443,068 | ) | 8,835,735 | 2,766,223 | |||||||||||
Net increase in net assets resulting from operations | 1,348,226,779 | 220,563,227 | 17,702,440 | 3,754,156 | ||||||||||||
DISTRIBUTIONS TO SHAREHOLDERS: |
| |||||||||||||||
Distributable earnings | (90,526,367 | ) | (70,598,895 | ) | (1,379,024 | ) | (888,720 | ) | ||||||||
CAPITAL SHARE TRANSACTIONS: |
| |||||||||||||||
Net proceeds from sale of shares | 2,710,937,218 | 425,626,096 | 44,737,147 | — | ||||||||||||
Cost of shares redeemed | (807,569,239 | ) | (965,252,969 | ) | (17,644,299 | ) | (4,344,141 | ) | ||||||||
Net increase (decrease) in net assets resulting from capital share transactions | 1,903,367,979 | (539,626,873 | ) | 27,092,848 | (4,344,141 | ) | ||||||||||
Net Increase (Decrease) in Net Assets | 3,161,068,391 | (389,662,541 | ) | 43,416,264 | (1,478,705 | ) | ||||||||||
NET ASSETS: |
| |||||||||||||||
Beginning of year | $ | 1,530,181,913 | $ | 1,919,844,454 | $ | 24,124,781 | $ | 25,603,486 | ||||||||
End of year | $ | 4,691,250,304 | $ | 1,530,181,913 | $ | 67,541,045 | $ | 24,124,781 | ||||||||
SHARES CREATED AND REDEEMED: |
| |||||||||||||||
Shares outstanding, beginning of year | 21,700,000 | 29,700,000 | 1,000,000 | 1 | 1,200,000 | 1 | ||||||||||
Shares created | 30,400,000 | 6,650,000 | 1,600,000 | 1 | — | 1 | ||||||||||
Shares redeemed | (8,950,000 | ) | (14,650,000 | ) | (600,000 | )1 | (200,000 | )1 | ||||||||
Shares outstanding, end of year | 43,150,000 | 21,700,000 | 2,000,000 | 1 | 1,000,000 | 1 | ||||||||||
1 Shares were adjusted to reflect a 2:1 share split effective August 10, 2023. |
| |||||||||||||||
See Notes to Financial Statements.
| 46 | WisdomTree Trust |
WisdomTree Trust
Selected data for a share of beneficial interest outstanding throughout the period is presented below:
| WisdomTree Europe Hedged Equity Fund | For the Year Ended | For the Year Ended | For the Year Ended | For the Year Ended March 31, 20211 | For the Year Ended March 31, 20201 | |||||||||||||||
Net asset value, beginning of year | $ | 41.01 | $ | 37.02 | $ | 36.36 | $ | 25.92 | $ | 31.95 | ||||||||||
Investment operations: |
| |||||||||||||||||||
Net investment income2 | 1.40 | 1.06 | 0.69 | 0.88 | 0.76 | |||||||||||||||
Net realized and unrealized gain (loss) | 7.17 | 3.88 | 0.81 | 10.43 | (6.10 | ) | ||||||||||||||
Total from investment operations | 8.57 | 4.94 | 1.50 | 11.31 | (5.34 | ) | ||||||||||||||
Dividends to shareholders: |
| |||||||||||||||||||
Net investment income | (1.42 | ) | (0.95 | ) | (0.84 | ) | (0.87 | ) | (0.69 | ) | ||||||||||
Net asset value, end of year | $ | 48.16 | $ | 41.01 | $ | 37.02 | $ | 36.36 | $ | 25.92 | ||||||||||
TOTAL RETURN3 | 21.64 | % | 13.94 | % | 4.04 | % | 44.22 | % | (17.15 | )% | ||||||||||
RATIOS/SUPPLEMENTAL DATA: |
| |||||||||||||||||||
Net assets, end of year (000’s omitted) | $ | 1,899,995 | $ | 1,402,596 | $ | 1,865,747 | $ | 1,937,668 | $ | 2,200,271 | ||||||||||
Ratios to average net assets of: | ||||||||||||||||||||
Expenses | 0.64 | %4 | 0.79 | %4 | 0.59 | %4 | 0.58 | % | 0.58 | % | ||||||||||
Net investment income | 3.35 | % | 2.95 | % | 1.79 | % | 2.81 | % | 2.29 | % | ||||||||||
Portfolio turnover rate5 | 30 | % | 38 | % | 34 | % | 55 | % | 26 | % | ||||||||||
| WisdomTree Europe Hedged SmallCap Equity Fund | For the Year Ended March 31, 2024 | For the Year Ended March 31, 2023 | For the Year Ended March 31, 2022 | For the Year Ended March 31, 2021 | For the Year Ended March 31, 2020 | |||||||||||||||
Net asset value, beginning of year | $ | 33.77 | $ | 34.73 | $ | 33.96 | $ | 23.43 | $ | 30.17 | ||||||||||
Investment operations: |
| |||||||||||||||||||
Net investment income2 | 1.32 | 1.73 | 0.75 | 1.02 | 1.22 | |||||||||||||||
Net realized and unrealized gain (loss) | 4.48 | (1.06 | ) | 0.91 | 10.56 | (6.92 | ) | |||||||||||||
Total from investment operations | 5.80 | 0.67 | 1.66 | 11.58 | (5.70 | ) | ||||||||||||||
Dividends to shareholders: |
| |||||||||||||||||||
Net investment income | (1.24 | ) | (1.63 | ) | (0.89 | ) | (1.05 | ) | (1.04 | ) | ||||||||||
Net asset value, end of year | $ | 38.33 | $ | 33.77 | $ | 34.73 | $ | 33.96 | $ | 23.43 | ||||||||||
TOTAL RETURN3 | 17.76 | % | 2.53 | % | 4.86 | % | 50.50 | % | (19.62 | )% | ||||||||||
RATIOS/SUPPLEMENTAL DATA: |
| |||||||||||||||||||
Net assets, end of year (000’s omitted) | $ | 44,079 | $ | 48,967 | $ | 60,772 | $ | 37,353 | $ | 49,197 | ||||||||||
Ratios to average net assets of: |
| |||||||||||||||||||
Expenses | 0.59 | %4 | 0.59 | %4 | 0.63 | %4 | 0.58 | % | 0.58 | % | ||||||||||
Net investment income | 3.85 | % | 5.34 | % | 2.08 | % | 3.59 | % | 3.99 | % | ||||||||||
Portfolio turnover rate5 | 32 | % | 44 | % | 57 | % | 77 | % | 49 | % | ||||||||||
| 1 | Per share amounts were adjusted to reflect a 2:1 share split effective August 10, 2023. |
| 2 | Based on average shares outstanding. |
| 3 | Total return is calculated assuming an initial investment made at the net asset value at the beginning of the period, reinvestment of all dividends and distributions at net asset value during the period and redemption on the last day of the period. |
| 4 | Included in the expense ratio are “Other fees” described in Note 6. Without these expenses, the expense ratio would have been 0.58%. |
| 5 | Portfolio turnover rate excludes the value of the portfolio securities received or delivered as a result of in-kind creations or redemptions of the Fund’s capital shares. Short-term securities with maturities less than or equal to 365 days are excluded from the portfolio turnover calculation. |
See Notes to Financial Statements.
| WisdomTree Trust | 47 |
Financial Highlights (continued)
WisdomTree Trust
Selected data for a share of beneficial interest outstanding throughout the period is presented below:
| WisdomTree International Hedged Quality Dividend Growth Fund | For the Year Ended March 31, 2024 | For the Year Ended March 31, 2023 | For the Year Ended March 31, 2022 | For the Year Ended March 31, 2021 | For the Year Ended March 31, 2020 | |||||||||||||||
Net asset value, beginning of year | $ | 39.17 | $ | 43.04 | $ | 41.17 | $ | 30.61 | $ | 32.14 | ||||||||||
Investment operations: |
| |||||||||||||||||||
Net investment income1 | 0.73 | 1.29 | 1.25 | 0.88 | 0.78 | |||||||||||||||
Net realized and unrealized gain (loss) | 6.66 | (0.45 | )2 | 2.03 | 10.54 | (1.59 | ) | |||||||||||||
Net increase from payment by affiliate | — | — | 0.00 | 3 | 0.08 | — | ||||||||||||||
Total from investment operations | 7.39 | 0.84 | 3.28 | 11.50 | (0.81 | ) | ||||||||||||||
Dividends and distributions to shareholders: |
| |||||||||||||||||||
Net investment income | (0.77 | ) | (1.33 | ) | (1.41 | ) | (0.94 | ) | (0.72 | ) | ||||||||||
Capital gains | — | (3.38 | ) | — | — | — | ||||||||||||||
Total dividends and distributions to shareholders | (0.77 | ) | (4.71 | ) | (1.41 | ) | (0.94 | ) | (0.72 | ) | ||||||||||
Net asset value, end of year | $ | 45.79 | $ | 39.17 | $ | 43.04 | $ | 41.17 | $ | 30.61 | ||||||||||
TOTAL RETURN4 | 19.09 | % | 3.00 | % | 7.93 | %5 | 37.85 | %6 | (2.70 | )% | ||||||||||
RATIOS/SUPPLEMENTAL DATA: |
| |||||||||||||||||||
Net assets, end of year (000’s omitted) | $ | 2,381,313 | $ | 1,396,586 | $ | 1,177,093 | $ | 899,491 | $ | 592,346 | ||||||||||
Ratios to average net assets of: |
| |||||||||||||||||||
Expenses7,8 | 0.59 | %9 | 0.59 | %9 | 0.58 | % | 0.58 | % | 0.58 | % | ||||||||||
Net investment income | 1.79 | % | 3.35 | % | 2.85 | % | 2.37 | % | 2.32 | % | ||||||||||
Portfolio turnover rate10 | 57 | % | 86 | % | 61 | % | 67 | % | 61 | % | ||||||||||
| WisdomTree Japan Hedged Equity Fund | For the Year Ended March 31, 2024 | For the Year Ended March 31, 2023 | For the Year Ended March 31, 2022 | For the Year Ended March 31, 2021 | For the Year Ended March 31, 2020 | |||||||||||||||
Net asset value, beginning of year | $ | 70.52 | $ | 64.64 | $ | 61.01 | $ | 42.64 | $ | 50.42 | ||||||||||
Investment operations: |
| |||||||||||||||||||
Net investment income1 | 2.36 | 1.91 | 1.52 | 1.02 | 1.05 | |||||||||||||||
Net realized and unrealized gain (loss) | 38.55 | 6.54 | 3.76 | 18.73 | (7.52 | ) | ||||||||||||||
Net increase from payment by affiliate | — | — | — | 0.00 | 3 | — | ||||||||||||||
Total from investment operations | 40.91 | 8.45 | 5.28 | 19.75 | (6.47 | ) | ||||||||||||||
Dividends to shareholders: |
| |||||||||||||||||||
Net investment income | (2.71 | ) | (2.57 | ) | (1.65 | ) | (1.38 | ) | (1.31 | ) | ||||||||||
Net asset value, end of year | $ | 108.72 | $ | 70.52 | $ | 64.64 | $ | 61.01 | $ | 42.64 | ||||||||||
TOTAL RETURN4 | 58.99 | % | 13.48 | % | 8.79 | % | 46.97 | %11 | (13.26 | )% | ||||||||||
RATIOS/SUPPLEMENTAL DATA: |
| |||||||||||||||||||
Net assets, end of year (000’s omitted) | $ | 4,691,250 | $ | 1,530,182 | $ | 1,919,844 | $ | 1,674,759 | $ | 1,709,801 | ||||||||||
Ratios to average net assets of: |
| |||||||||||||||||||
Expenses | 0.48 | % | 0.48 | % | 0.48 | % | 0.48 | % | 0.48 | % | ||||||||||
Net investment income | 2.67 | % | 2.93 | % | 2.45 | % | 2.03 | % | 2.08 | % | ||||||||||
Portfolio turnover rate10 | 32 | % | 37 | % | 22 | % | 25 | % | 20 | % | ||||||||||
| 1 | Based on average shares outstanding. |
| 2 | The amount of net realized and unrealized gain (loss) per share does not correspond with the amounts reported within the Statements of Changes due to the timing of capital share transactions of Fund shares and fluctuating market values during the fiscal year. |
| 3 | Amount represents less than $0.005. |
| 4 | Total return is calculated assuming an initial investment made at the net asset value at the beginning of the period, reinvestment of all dividends and distributions at net asset value during the period and redemption on the last day of the period. For the periods in which the investment advisor waived advisory fees for the WisdomTree International Hedged Quality Dividend Growth Fund, the total return would have been lower if certain expenses had not been waived (Notes 2 and 3). |
| 5 | Includes a voluntary reimbursement from the sub-advisor for investment losses on certain equity transactions during the period. Excluding the voluntary reimbursement, total return would have been unchanged. |
| 6 | Includes a voluntary reimbursement from the sub-advisor for investment losses on certain foreign exchange transactions during the period. Excluding this voluntary reimbursement, total return would have been 0.27% lower. |
| 7 | Does not include expenses of the Underlying Funds in which the Fund invests. |
| 8 | The expense ratio includes investment advisory fee waivers. Without these investment advisory fee waivers, the expense ratio would have been unchanged. |
| 9 | Included in the expense ratio are “Other fees” described in Note 6. Without these expenses, the expense ratio would have been 0.58%. |
| 10 | Portfolio turnover rate excludes the value of the portfolio securities received or delivered as a result of in-kind creations or redemptions of the Fund’s capital shares. Short-term securities with maturities less than or equal to 365 days are excluded from the portfolio turnover calculation. |
| 11 | Includes a voluntary reimbursement from the sub-advisor for investment losses on certain foreign exchange transactions during the period. Excluding this voluntary reimbursement, total return would have been unchanged. |
See Notes to Financial Statements.
| 48 | WisdomTree Trust |
Financial Highlights (concluded)
WisdomTree Trust
Selected data for a share of beneficial interest outstanding throughout the period is presented below:
| WisdomTree Japan Hedged SmallCap Equity Fund | For the Year Ended March 31, 20241 | For the Year Ended March 31, 20231 | For the Year Ended March 31, 20221 | For the Year Ended March 31, 20211 | For the Year Ended March 31, 20201 | |||||||||||||||
Net asset value, beginning of year | $ | 24.12 | $ | 21.33 | $ | 22.38 | $ | 16.94 | $ | 19.79 | ||||||||||
Investment operations: |
| |||||||||||||||||||
Net investment income2 | 0.79 | 0.56 | 0.49 | 0.32 | 0.37 | |||||||||||||||
Net realized and unrealized gain (loss) | 9.67 | 3.06 | (0.90 | ) | 5.73 | (2.76 | ) | |||||||||||||
Total from investment operations | 10.46 | 3.62 | (0.41 | ) | 6.05 | (2.39 | ) | |||||||||||||
Dividends to shareholders: |
| |||||||||||||||||||
Net investment income | (0.81 | ) | (0.83 | ) | (0.64 | ) | (0.61 | ) | (0.46 | ) | ||||||||||
Net asset value, end of year | $ | 33.77 | $ | 24.12 | $ | 21.33 | $ | 22.38 | $ | 16.94 | ||||||||||
TOTAL RETURN3 | 43.87 | % | 17.36 | % | (1.80 | )% | 36.31 | % | (12.41 | )% | ||||||||||
RATIOS/SUPPLEMENTAL DATA: |
| |||||||||||||||||||
Net assets, end of year (000’s omitted) | $ | 67,541 | $ | 24,125 | $ | 25,603 | $ | 31,332 | $ | 44,049 | ||||||||||
Ratios to average net assets of: |
| |||||||||||||||||||
Expenses | 0.58 | % | 0.58 | % | 0.58 | % | 0.58 | % | 0.58 | % | ||||||||||
Net investment income | 2.75 | % | 2.52 | % | 2.26 | % | 1.67 | % | 1.90 | % | ||||||||||
Portfolio turnover rate4 | 46 | % | 46 | % | 41 | % | 41 | % | 36 | % | ||||||||||
| 1 | Per share amounts were adjusted to reflect a 2:1 share split effective August 10, 2023. |
| 2 | Based on average shares outstanding. |
| 3 | Total return is calculated assuming an initial investment made at the net asset value at the beginning of the period, reinvestment of all dividends and distributions at net asset value during the period and redemption on the last day of the period. |
| 4 | Portfolio turnover rate excludes the value of the portfolio securities received or delivered as a result of in-kind creations or redemptions of the Fund’s capital shares. Short-term securities with maturities less than or equal to 365 days are excluded from the portfolio turnover calculation. |
See Notes to Financial Statements.
| WisdomTree Trust | 49 |
1. ORGANIZATION
WisdomTree Trust (the “Trust”) is registered under the Investment Company Act of 1940, as amended (the “1940 Act”), as an open-end management investment company. The Trust was established as a Delaware statutory trust on December 15, 2005 and is authorized to have multiple series of portfolios (each a “Fund”, collectively, the “Funds”). These notes relate only to the Funds listed below. In accordance with Accounting Standards Codification Topic 946, Financial Services-Investment Companies, each Fund listed below qualifies as an investment company and is applying the accounting and reporting guidance for investment companies.
| Fund | Commencement of Operations | |||
WisdomTree Europe Hedged Equity Fund (“Europe Hedged Equity Fund”) | December 31, 2009 | |||
WisdomTree Europe Hedged SmallCap Equity Fund (“Europe Hedged SmallCap Equity Fund”) | March 4, 2015 | |||
WisdomTree International Hedged Quality Dividend Growth Fund (“International Hedged Quality Dividend Growth Fund”) | May 7, 2014 | |||
WisdomTree Japan Hedged Equity Fund (“Japan Hedged Equity Fund”) | June 16, 2006 | |||
WisdomTree Japan Hedged SmallCap Equity Fund (“Japan Hedged SmallCap Equity Fund”) | June 28, 2013 | |||
Each Fund seeks to track the price and yield performance, before fees and expenses, of a particular index (“Index”) developed by WisdomTree, Inc. (“WisdomTree”) or an Index developed by a third party. WisdomTree is the parent company of WisdomTree Asset Management, Inc. (“WTAM”), the investment adviser to each Fund and the Trust. “WisdomTree” is a registered trademark of WisdomTree and has been licensed for use by the Trust. Each Fund described herein is considered to be non-diversified as defined under the 1940 Act.
In the normal course of business, the Funds may enter into contracts that contain a variety of representations or that provide indemnification for certain liabilities. The Funds’ maximum exposure under these arrangements is unknown, as this would involve future claims that may be made against the Funds that have not yet occurred. However, the Funds have not had prior claims or losses pursuant to these contracts and believe such exposure to be remote.
2. SIGNIFICANT ACCOUNTING POLICIES
The Financial Accounting Standards Board (“FASB”) Accounting Standards Codification (the “Codification”) is the exclusive reference of authoritative U.S. generally accepted accounting principles (“GAAP”) recognized by the FASB to be applied by nongovernmental entities. Rules and interpretive releases of the Securities and Exchange Commission (“SEC”) under authority of federal laws are also sources of authoritative GAAP for SEC registrants.
The following is a summary of significant accounting policies followed by the Funds:
Use of Estimates — The preparation of financial statements in conformity with GAAP requires management to make certain estimates and assumptions that affect the reported amounts of assets and liabilities and disclosure of contingent assets and liabilities at the date of the financial statements and the reported amounts of increases and decreases in the net assets from operations during the reporting period. Actual results could differ from those estimates.
Investment Valuation — The net asset value (“NAV”) of each Fund’s shares is calculated each day a Fund is open for business as of the regularly scheduled close of regular trading on the New York Stock Exchange, normally 4:00 p.m. Eastern time (the “NAV Calculation Time”). NAV per share is calculated by dividing a Fund’s net assets by the number of Fund shares outstanding. Each Fund issues and redeems shares at NAV only in large blocks of shares known as creation units, which only certain institutions (e.g., broker-dealers) may purchase or redeem. Shares of each Fund are listed on a national securities exchange and trade at market prices. Most investors will buy and sell shares in the secondary market through brokers. Because Fund shares trade at market prices rather than NAV, shares may trade at a price greater than NAV or less than NAV. In calculating each Fund’s NAV, investments are valued under policies approved by the Board of Trustees of the Trust (the “Board” or “Board of Trustees”). Equity securities (including preferred stock) traded on any recognized U.S. or non-U.S. exchange are valued at the last sale price or official closing price on the exchange on which they are principally traded. Unlisted equity securities (including preferred stock) are valued at the last sale price or, if no sale price is available, at the mean between the highest bid and lowest ask price. Each Fund may invest in money market funds which are valued at their NAV per share and exchange-traded funds (“ETFs” or “ETF”) or exchange-traded notes (“ETNs” or “ETN”) which are valued at their last sale or official closing price on the exchange on which they are principally traded or at their NAV per share in instances where the ETF or ETN has not traded on its principal exchange. Foreign currency contracts that settle within two business days after the trade date (“Spot Contracts”) and foreign currency contracts having a settlement period greater than two business days after the trade date (“Forward Contracts”) are valued on the measurement date using an interpolated foreign exchange rate between the closest preceding and subsequent settlement period, as calculated using the 4:00 p.m. London time closing spot and forward rates provided by an independent pricing service provider.
| 50 | WisdomTree Trust |
Notes to Financial Statements (continued)
Pursuant to Board-approved valuation procedures established by the Trust and WTAM, the Board has appointed WTAM as the Funds’ valuation designee (the “Valuation Designee”) to perform all fair valuations of the Funds’ portfolio investments, subject to the Board’s oversight. As the Valuation Designee, WTAM has established procedures for its fair valuation of a Fund’s portfolio investments. These procedures address, among other things, determining when market quotations are not readily available or reliable and the methodologies to be used for determining the fair value of investments, as well as the use and oversight of third-party pricing services for fair valuation. The Valuation Designee is comprised of senior representatives of WTAM and reports to the Board of Trustees on a quarterly basis. In the event that a financial instrument cannot be valued based upon a price from the exchange or system on which it is principally traded, independent pricing service provider or broker-dealer quotation, or such prices are deemed to not reflect current market value, the Valuation Designee may value the financial instrument in good faith under the policies and procedures approved by the Board of Trustees based on current facts and circumstances. Securities that may be valued using “fair value” pricing may include, but are not limited to, securities for which there are no current market quotations, securities whose issuer is in default or bankruptcy, securities subject to corporate actions (such as mergers or reorganizations), securities subject to non-U.S. investment limits or currency controls, and securities affected by “significant events”. An example of a significant event is an event occurring after the close of the market in which a security trades but before a Fund’s next NAV Calculation Time that may materially affect the value of a Fund’s investment (e.g., government action, natural disaster, or significant market fluctuation). When fair value pricing is employed, the prices of securities used by a Fund to calculate its NAV may differ from quoted or published prices for the same securities.
Fair Value Measurement — In accordance with Codification Topic 820 (“ASC 820”), Fair Value Measurements and Disclosures, fair value is defined as the price that would be received to sell an asset or paid to transfer a liability in an orderly transaction between market participants at the measurement date. The Valuation Designee will perform other procedures (consistent with GAAP) to value an investment when a market quote is not available. ASC 820 established a three-tier hierarchy of inputs to be used when determining fair value measurements for disclosure purposes. Inputs refer broadly to the assumptions that market participants would use in pricing the asset or liability, including assumptions about risk — for example, the risk inherent in a particular valuation technique used to measure fair value (such as a pricing model) and/or the risk inherent in the inputs to the valuation technique. Inputs may be observable or unobservable. Observable inputs reflect the assumptions market participants would use in pricing the asset or liability. Observable inputs are based on market data obtained from sources independent of the reporting entity. Unobservable inputs reflect the reporting entity’s own assumptions about the assumptions market participants would use in pricing the asset or liability. Unobservable inputs are based on the best information available in the circumstances. The three-tier hierarchy of inputs is summarized in the three broad levels listed below:
Level 1 – quoted prices in active markets for identical securities
Level 2 – other significant observable inputs (including quoted prices for similar securities, interest rates, prepayment speeds, credit risk, etc.)
Level 3 – significant unobservable inputs (including each Fund’s assumptions in determining the fair value of investments)
The inputs or methodology used for valuation are not necessarily an indication of the risk associated with investing in those investments.
Investments that use Level 2 or Level 3 inputs may include, but are not limited to: (i) an unlisted security related to corporate actions; (ii) a restricted security (e.g., one that may not be publicly sold without registration under the Securities Act of 1933, as amended); (iii) a security whose trading has been suspended (either due to events affecting the issuer of the security specifically or events affecting the primary trading exchange more broadly) or which has been de-listed from its primary trading exchange; (iv) a security that is thinly traded; (v) a security in default or bankruptcy proceedings for which there is no current market quotation or market activity; (vi) a security affected by currency controls or restrictions; and (vii) a security affected by a significant event (e.g., an event that occurs after the close of the markets in which the security is traded but before the time as of which a Fund’s NAV is computed and that may materially affect the value of the Fund’s investments).
The valuation techniques and significant inputs used in determining the fair market value measurements for Level 2 and Level 3 positions are as follows:
Financial instruments are generally valued by independent pricing service providers that use broker-dealer quotations, reported trades or valuation estimates from their internal pricing models. Depending on the type of financial instrument, the independent pricing service providers’ internal pricing models may use inputs that are observable such as issuer details (e.g., credit rating, debt ranking, coupon date, maturity date, etc.), interest rates, yield curves, prepayment speeds, credit risks/spreads, default rates and quoted prices for similar assets. Financial instruments that use similar valuation techniques and observable inputs as described above and have an appropriate level of market activity are categorized as Level 2 of the fair value hierarchy, otherwise a Level 3 fair value classification is appropriate. Over-the-counter financial derivative instruments derive their value from underlying asset prices, indices, reference rates, and other inputs or a combination of these factors. These instruments are normally valued on the basis of broker-dealer quotations or prices obtained from independent pricing service providers. Depending on the product and the terms of the
| WisdomTree Trust | 51 |
Notes to Financial Statements (continued)
transaction, the value of the financial derivative instruments can be estimated by an independent pricing service provider using a series of techniques including simulation pricing models. The pricing models may use inputs that are observed from actively quoted markets such as issuer details, indices, credit risks/spreads, interest rates, yield curves, default and exchange rates. Derivative contracts that use similar valuation techniques and observable inputs as described above and have an appropriate level of market activity are categorized as Level 2 of the fair value hierarchy, otherwise a Level 3 fair value classification is appropriate.
Determination of a fair value by the Valuation Designee may include significant unobservable inputs and therefore such financial instruments would be reflected as a Level 3 of the fair value hierarchy. The Valuation Designee may employ a market-based valuation approach which may use, among other potential considerations, related or comparable securities, recent transactions, market multiples, and other relevant information to determine fair value. The Valuation Designee may also use an income-based valuation approach in which anticipated future cash flows of the financial instrument are discounted to calculate fair value.
The summary of fair valuations according to the inputs used in valuing each Fund’s assets as of the measurement date is included in a “Fair Valuation Summary” supplementary table in each applicable Fund’s Schedule of Investments.
During the fiscal year ended March 31, 2024, there were no significant transfers into or out of Level 3 of the fair value hierarchy.
Derivatives and Hedging Disclosure — Codification Topic 815 (“ASC 815”), Derivatives and Hedging, requires qualitative disclosures about objectives and strategies for using derivatives, quantitative disclosures about fair value amounts as well as gains and losses on derivative instruments, and disclosures about credit-risk-related contingent features in derivative agreements. The Funds have invested in derivatives, specifically foreign currency contracts during the fiscal year ended March 31, 2024 and open positions in such derivatives as of March 31, 2024 are detailed in each Fund’s Schedule of Investments. All of the derivative instruments disclosed and described herein are subject to risk. Risks may arise upon entering into foreign currency contracts from potential inability of a counterparty to meet the terms of their contracts and from unanticipated movements in the value of the foreign currencies relative to the U.S. dollar or each other. The Funds’ derivative agreements may also contain credit-risk related contingent features which may include, but are not limited to, a threshold in the Funds’ derivative agreements on unrealized depreciation (i.e., the Funds’ obligation to the counterparty) above a specified dollar amount. If an event occurred at March 31, 2024 that triggered a contingent feature, the counterparty to the agreement may require a Fund to post collateral (or additional collateral) or terminate the derivative positions and demand payment. Any collateral posted with respect to the derivative positions would be used to offset or reduce the payment due to a counterparty. The maximum exposure to derivatives agreements with credit-risk related contingent features would be the total value of derivatives in net liability positions for each Fund, as disclosed in Note 2 — Master Netting Arrangements under the column entitled “Liabilities: Net Amount”. Information with respect to the amounts and types of collateral received and/or posted for derivative instruments as of March 31, 2024, if any, is reflected as a footnote within each Fund’s Schedule of Investments. At March 31, 2024, the Funds did not receive or post collateral with any counterparty for derivatives and no event occurred that triggered a credit-risk-related contingent feature.
As of March 31, 2024, the effects of such derivative instruments on each Fund’s financial position as reflected in the Statements of Assets and Liabilities are presented in the summary below:
| Asset Derivatives | Liability Derivatives | |||||||||||
| Fund | Balance Sheet Location | Value | Balance Sheet Location | Value | ||||||||
Europe Hedged Equity Fund | ||||||||||||
Foreign currency risk | Unrealized appreciation on foreign currency contracts | $ | 6,275,893 | Unrealized depreciation on foreign currency contracts | $ | 23,744 | ||||||
Europe Hedged SmallCap Equity Fund | ||||||||||||
Foreign currency risk | Unrealized appreciation on foreign currency contracts | 134,154 | Unrealized depreciation on foreign currency contracts | 550 | ||||||||
International Hedged Quality Dividend Growth Fund | ||||||||||||
Foreign currency risk | Unrealized appreciation on foreign currency contracts | 20,950,589 | Unrealized depreciation on foreign currency contracts | 251,518 | ||||||||
Japan Hedged Equity Fund | ||||||||||||
Foreign currency risk | Unrealized appreciation on foreign currency contracts | 71,266,688 | Unrealized depreciation on foreign currency contracts | 1,311,966 | ||||||||
Japan Hedged SmallCap Equity Fund | ||||||||||||
Foreign currency risk | Unrealized appreciation on foreign currency contracts | 1,005,731 | Unrealized depreciation on foreign currency contracts | 9,917 | ||||||||
| 52 | WisdomTree Trust |
Notes to Financial Statements (continued)
For the fiscal year ended March 31, 2024, the effects of derivative instruments on each applicable Fund’s financial performance as reflected in the Statements of Operations are presented in the summary below:
| Fund | Amount of Realized Gain or (Loss) on Derivatives Recognized1 | Change in Unrealized Appreciation or (Depreciation) on Derivatives Recognized2 | ||||||
Europe Hedged Equity Fund | ||||||||
Foreign currency risk | $ | 257,478 | $ | 37,078,496 | ||||
Europe Hedged SmallCap Equity Fund | ||||||||
Equity risk | 4,007 | — | ||||||
Foreign currency risk | 221,727 | 1,359,681 | ||||||
International Hedged Quality Dividend Growth Fund | ||||||||
Foreign currency risk | 20,456,849 | 44,353,215 | ||||||
Japan Hedged Equity Fund | ||||||||
Foreign currency risk | 357,812,496 | 99,026,901 | ||||||
Japan Hedged SmallCap Equity Fund | ||||||||
Foreign currency risk | 5,191,749 | 1,452,754 | ||||||
| 1 | Realized gains (losses) on derivatives are located on the Statements of Operations as follows: |
Equity risk | Net realized gain (loss) from futures contracts | |
Foreign currency risk | Net realized gain (loss) from foreign currency contracts |
| 2 | Change in unrealized appreciation (depreciation) is located on the Statements of Operations as follows: |
Foreign currency risk | Net increase (decrease) in unrealized appreciation/depreciation from foreign currency contracts |
During the fiscal year ended March 31, 2024, the volume of derivative activity (based on the average of month-end notional balances, except where footnoted) for each Fund was as follows:
| Average Notional | ||||||||||||
| Fund | Foreign currency USD) | Foreign currency contracts (to receive USD) | Futures contracts (long) | |||||||||
Europe Hedged Equity Fund | ||||||||||||
Foreign currency risk | $ | 1,448,950,437 | $ | 2,917,473,113 | $ | — | ||||||
Europe Hedged SmallCap Equity Fund | ||||||||||||
Equity risk1 | — | — | 17,093 | |||||||||
Foreign currency risk | 49,235,205 | 97,189,840 | — | |||||||||
International Hedged Quality Dividend Growth Fund | ||||||||||||
Foreign currency risk | 1,789,887,448 | 3,590,405,844 | — | |||||||||
Japan Hedged Equity Fund | ||||||||||||
Foreign currency risk | 2,877,261,895 | 5,796,479,668 | — | |||||||||
Japan Hedged SmallCap Equity Fund | ||||||||||||
Foreign currency risk | 48,147,185 | 96,387,142 | — | |||||||||
| 1 | The volume of derivatives for the period is based on intra-month balances. |
Investment Transactions and Investment Income — Investment transactions are recorded as of the date that the securities are purchased or sold (trade date). Realized gains and losses on sales of portfolio securities are calculated using the identified-cost method. Dividend income (less foreign taxes withheld, if any) is recognized on the ex-dividend date or as soon as practicable (with respect to foreign dividends) after the existence of a dividend declaration has been determined. Non-cash dividend income is recognized on the ex-dividend date, or, with respect to foreign dividends, as soon as practicable after the existence of a dividend declaration has been determined, at the fair value of securities received. Upon notification from real estate investment trust (“REIT”) issuers or as estimated by management, all or a portion of the dividend income received from a REIT may be redesignated as a reduction of cost of the related investment and/or as a realized gain. On each measurement date, the Funds evaluate the collectability of receivable balances. Generally, the Funds will write-off dividend receivable balances that are canceled by the issuer as of the date that the dividend receivable cancellation notification was publicly made available or when it becomes probable that dividends will not be collected and the amount of uncollectable dividends can be reasonably estimated. Income earned from securities lending activities (i.e., securities lending income), net of fees payable to the securities borrower and/or securities lending agent, is accrued daily.
| WisdomTree Trust | 53 |
Notes to Financial Statements (continued)
Foreign Taxes — The Funds may be subject to foreign taxes (a portion of which may be reclaimable or refundable) on foreign income or capital gains on investment transactions. All foreign taxes are recorded in accordance with the applicable foreign tax regulations and tax rates that exist in the foreign jurisdictions in which the Funds invest. These foreign taxes, if any, are accrued and applied to foreign income as the foreign income is earned and are reflected on the Statements of Operations as follows: foreign taxes withheld on dividends are presented as a reduction to investment income in “Less: Foreign withholding taxes on dividends”, foreign taxes on capital gains from investment transactions, if any, are included in “Net realized gain (loss) from investment transactions”, and deferred foreign taxes on net unrealized appreciation on investments, if any, are included in “Net increase (decrease) in unrealized appreciation/depreciation on investment transactions”. Foreign taxes payable or deferred as of March 31, 2024, if any, are disclosed in the Statements of Assets and Liabilities in “Payables: Foreign capital gains tax”.
In certain foreign jurisdictions, when the Funds incur subsequent capital losses on investment transactions that occurred during the tax year in the applicable foreign jurisdiction, the Funds may be entitled to a refund on any foreign taxes paid on previous capital gain investment transactions that occurred during the tax year of the applicable foreign jurisdiction. Foreign capital gain tax refunds on investment transactions are included in “Net realized gain (loss) from investment transactions” on the Statements of Operations and foreign capital gain tax refunds that remain unpaid as of March 31, 2024, if any, are disclosed in the Statements of Assets and Liabilities in “Receivables: Foreign capital gains tax refund”.
The Funds file foreign tax reclaims in certain foreign jurisdictions to recover a portion of amounts previously withheld on dividend income if the tax reclaim is “more likely than not” to be sustained assuming examination by tax authorities. This determination is based on, among other things, a jurisdiction’s legal obligation to pay reclaims as well as payment history and market convention. Foreign tax reclaims recorded relating to current fiscal year investment income are included in the Statements of Operations as a reduction to the balance shown for “Foreign withholding taxes on dividends” and foreign tax reclaims recorded, but not yet received as of March 31, 2024, if any, are shown on the Statements of Assets and Liabilities in “Receivables: Foreign tax reclaims”.
Foreign Currency Translation — The accounting records of the Funds are maintained in U.S. dollars. Foreign currencies, as well as investment securities and other assets and liabilities denominated in foreign currencies, are translated into U.S. dollars using exchange rates prevailing on the respective dates of such transactions that are deemed appropriate by WTAM. Realized and unrealized foreign exchange gains and losses on investments are included as a component of “net realized gain (loss) from investment transactions” and “net increase (decrease) in unrealized appreciation/depreciation from investment transactions”, respectively, on the Statements of Operations. Realized and unrealized foreign exchange gains or losses from foreign currency contracts are included in “net realized gain (loss) from foreign currency contracts” and “net increase (decrease) in unrealized appreciation/depreciation from foreign currency contracts”, respectively, on the Statements of Operations. Realized and unrealized foreign exchange gains or losses arising from sales of foreign currencies, currency gains or losses recognized between the trade and settlement dates on investment transactions, and the difference between the amounts of dividends and foreign withholding taxes recorded on the Funds’ books and the U.S. dollar equivalent of the amounts actually received or paid are included in “net realized gain (loss) from foreign currency related transactions” and/or “net increase (decrease) in unrealized appreciation/depreciation from translation of assets and liabilities denominated in foreign currencies” in the Statements of Operations. Certain foreign exchange gains and losses included in realized and unrealized gains or losses are included in, or are a reduction of, ordinary income in accordance with U.S. Federal income tax regulations.
Expenses — Under the investment advisory agreement for each Fund, except for Funds that commenced operations on or after March 26, 2013, WTAM has agreed to pay all expenses of the Trust, except for: (i) brokerage expenses and other expenses (such as stamp taxes) connected with the execution of portfolio transactions or in connection with creation and redemption transactions; (ii) legal fees or expenses in connection with any arbitration, litigation or pending or threatened arbitration or litigation, including any settlements in connection therewith; (iii) compensation and expenses of trustees who are not interested persons of the Funds (“Independent Trustees”); (iv) compensation and expenses of counsel to the Independent Trustees; (v) compensation and expenses of the Trust’s Chief Compliance Officer (“CCO”); (vi) extraordinary expenses; (vii) distribution fees and expenses paid by the Trust under any distribution plan adopted pursuant to Rule 12b-1 under the 1940 Act; and (viii) the advisory fee payable to WTAM.
Under the investment advisory agreement for Funds that commenced operations on or after March 26, 2013, WTAM has agreed to pay all expenses of the Trust, except for: (i) brokerage expenses and other fees, charges, taxes, levies or expenses (such as stamp taxes) incurred in connection with the execution of portfolio transactions or in connection with creation and redemption transactions (including without limitation any fees, charges, taxes, levies or expenses related to the purchase or sale of an amount of any currency, or the patriation or repatriation of any security or other asset, related to the execution of portfolio transactions or any creation or redemption transactions); (ii) legal fees or expenses in connection with any arbitration, litigation or pending or threatened arbitration or litigation, including any settlements in connection therewith; (iii) compensation and expenses of each Independent Trustee; (iv) compensation and expenses of counsel to the Independent Trustees; (v) compensation and expenses of the Trust’s CCO; (vi) extraordinary expenses (in each case as determined by a majority of the Independent Trustees); (vii) distribution fees and expenses paid by the Trust under any distribution plan adopted pursuant to Rule 12b-1 under the 1940 Act; (viii) interest and taxes of any kind or nature (including, but not limited to, income, excise, transfer and withholding taxes); (ix) fees and expenses related to the provision of securities lending services; and (x) the advisory fee payable to WTAM.
| 54 | WisdomTree Trust |
Notes to Financial Statements (continued)
Acquired fund fees and expenses (“AFFEs”) (which are fees and expenses incurred indirectly by a Fund through its investments in certain underlying investment companies) are not operating expenses of the Funds and are not paid by WTAM.
Pursuant to a separate contractual arrangement, WTAM arranges for the provision of CCO services with respect to each Fund, and is liable and responsible for, and administers, payments to the CCO, the Independent Trustees and counsel to the Independent Trustees. WTAM receives a fee, as shown on the Statements of Operations under “Service fees”, of up to 0.0044% per annum of each Fund’s average daily net assets for providing such services and paying such expenses. WTAM provides CCO services to the Trust.
Currency Transactions — The Funds may enter into foreign currency contracts to facilitate local securities settlements or to protect against currency exposure. The Funds may not enter into such contracts for speculative purposes.
Foreign Currency Contracts — The Funds may enter into foreign currency contracts to facilitate local securities settlements or to protect against currency exposure. The Funds may not enter into such contracts for speculative purposes. During the fiscal year ended March 31, 2024, the Funds utilized foreign currency contracts primarily to offset exposure to foreign currencies consistent with each Fund’s investment objective. A foreign currency contract involves an obligation to purchase or sell a specific currency at a future date, which may be any fixed number of days from the date of the contract agreed upon by the parties, at a price set at the time of the contract. These contracts are principally traded in the inter-bank market conducted directly between currency traders (usually large, commercial banks) and their customers. A foreign currency contract generally does not require an initial margin deposit and no commissions are charged at any stage for trades.
Risks may arise upon entering into foreign currency contracts from the potential inability of counterparties to meet the terms of their contracts and from unanticipated movements in the value of foreign currencies relative to the U.S. dollar or each other.
Fluctuations in the value of open foreign currency contracts are recorded for book purposes as unrealized gains or losses on foreign currency contracts by the Funds and are included in “net increase (decrease) in unrealized appreciation/depreciation from foreign currency contracts” on the Statements of Operations. Realized gains and losses on foreign currency contracts include net gains or losses recognized by the Funds on contracts which have settled and are included in “net realized gain (loss) from foreign currency contracts” on the Statements of Operations.
Futures Contracts — The Europe Hedged SmallCap Equity Fund utilized equity futures contracts on a temporary basis during the fiscal year to obtain market exposure consistent with its investment objectives during the Fund’s annual portfolio rebalance. When a Fund purchases a listed futures contract, it agrees to purchase a specified reference asset (e.g., commodity, currency, equity, digital asset or U.S. Treasury security, collectively herein, “Reference Asset”) at a specified future date. When a Fund sells a listed futures contract, it agrees to sell a specified Reference Asset at a future date. The price at which the purchase and sale will take place is fixed when the Fund enters into the contract. A Fund may also cash settle upon the expiration date of a futures contract in which no physical delivery (or receipt) of the specified Reference Asset comprising the futures contract is made. Instead, settlement in cash would occur upon the expiration of the contract, with the cash settlement being the difference between the contract price and the actual price of the specified Reference Asset at the expiration date. The exchange clearing corporation is the ultimate counterparty for all exchange-listed contracts, so credit risk is limited to the creditworthiness of the exchange clearing corporation.
Upon entering into a futures contract, a Fund is required to deliver to a broker an amount of cash and/or U.S. government securities equal to a certain percentage of the contract amount. This amount is known as the “initial margin”. Cash deposited as initial margin, if any, is shown as “Deposits at broker for futures contracts” in the Statements of Assets and Liabilities, and U.S. government securities deposited, if any, are designated in the Schedule of Investments. Subsequent payments, known as “variation margin”, generally are made or received by the Fund each day or at other agreed-upon time periods depending on the fluctuations in the value of the underlying futures contracts, except that in the case of certain futures contracts, variation margin payments may be made or received when the futures contract expires. Variation margin is recorded for financial statement purposes on a daily basis as an unrealized gain or loss on futures until the financial futures contract is closed, at which time the unrealized net gain or loss is reclassified to realized gain or loss on futures. The Funds have adopted a derivatives risk management program pursuant to Rule 18f-4 under the 1940 Act to assess and manage the Funds’ derivatives risk. Rule 18f-4 limits the amount of derivatives a fund can enter into and replaces the asset segregation framework previously used by the Funds to comply with Section 18 of the 1940 Act.
As of March 31, 2024, there were no open futures contracts in the Funds.
Securities Lending — Each Fund may lend portfolio securities to certain creditworthy borrowers, including the Funds’ securities lending agent. It is the Funds’ policy that, at origination, all loans are secured by collateral of at least 102% of the value of U.S. securities loaned and 105% of the value of foreign securities loaned. Collateral in the form of cash and/or securities issued or guaranteed by the U.S. government or its agencies, equivalent to at least 100% of the market value of securities, is maintained at all times. The cash collateral can be invested in certain money market mutual funds which also have exposure to the fluctuations of the market. The values of the investments of cash collateral for securities on loan along with the obligations to return such collateral are included on the Statements of Assets and Liabilities. The total value of securities received as collateral for securities on loan is included in a footnote following each Schedule of Investments, but is not included within the Statements of Assets and Liabilities
| WisdomTree Trust | 55 |
Notes to Financial Statements (continued)
because the receiving Fund does not have the right to sell or repledge the securities received as collateral. As compensation for lending its securities, each Fund retains all or a portion of the interest received on investment of cash collateral or receives a fee from the borrower (net of any fee rebates paid to the borrower). The lending agent receives a portion of the income earned by the Funds in connection with the lending program. The net securities lending income earned by the Funds is disclosed on the Statements of Operations. The dividend income earned on the securities loaned is accounted for in the same manner as other dividend income. The borrower pays to the Funds an amount equal to any dividends or interest received on loaned securities. Dividends received while a security is out on loan are not considered Qualified Dividend Income (“QDI”) under the specific criteria issued by the Internal Revenue Service and are subject to taxation at the shareholder’s ordinary income tax rate instead of the lower long-term capital gains tax rate. Lending portfolio securities could result in a loss or delay in recovering each Fund’s securities if the borrower defaults. In the event of a borrower default with respect to the failure to return to each Fund some or all of the securities loaned, the securities lending agent shall indemnify each Fund against the failure of the borrower if the value of the collateral received is insufficient to cover the market value of the securities loaned.
Master Netting Arrangements — Codification Topic 210 (“ASC 210”), Balance Sheet, requires disclosures generally intended to (i) help investors and other financial statement users to better assess the effect or potential effect of offsetting arrangements on a company’s financial position, (ii) improve transparency in the reporting of how companies mitigate credit risk, and (iii) facilitate comparisons between those entities that prepare their financial statements on the basis of GAAP and those entities that prepare their financial statements on the basis of international financial reporting standards. ASC 210 requires entities to disclose (i) gross and net information about both instruments and transactions eligible for offset in the financial statements, and (ii) instruments and transactions subject to an agreement similar to a master netting agreement. ASC 210 is limited in scope to the following financial instruments, to the extent they are offset in the financial statements or subject to an enforceable master netting arrangement or similar agreement: (i) recognized derivative instruments accounted for under ASC 815 (Derivatives and Hedging); (ii) repurchase agreements and reverse repurchase agreements; and (iii) securities borrowing and securities lending transactions.
In order to better define its contractual rights and to secure rights that will help a Fund mitigate its counterparty risk, a Fund enters into an International Swaps and Derivatives Association, Inc. Master Agreement (“ISDA Master Agreement”) with its counterparties. An ISDA Master Agreement is a bilateral agreement between a Fund and a counterparty that governs over-the-counter (“OTC”) derivatives, such as foreign currency contracts, and typically contains, among other things, collateral posting terms, netting and rights of set-off provisions in the event of a default and/or termination event. Under an ISDA Master Agreement, a Fund may, under certain circumstances, offset with the counterparty certain derivative financial instruments’ payables and receivables to create a single net payment. The provisions of the ISDA Master Agreement typically permit a single net payment in the event of a default (close-out netting) or similar event, including the bankruptcy or insolvency of the counterparty.
Collateral requirements generally differ by type of derivative. Collateral terms are contract-specific for OTC derivatives (e.g., foreign currency contracts, options and certain swaps). To the extent amounts due to a Fund from its derivatives counterparties are not fully collateralized, contractually or otherwise, the Fund bears the risk of loss from a counterparty’s non-performance.
The Funds’ securities lending activities are governed by a Securities Lending Authorization Agreement (“Lending Agreement”) between the Funds and the lending agent. The Lending Agreement authorizes the lending agent to lend qualifying U.S. and foreign securities held by a Fund to approved borrowers (each a “Borrower”). To mitigate borrower risk, a Fund typically receives from a Borrower collateral in the form of U.S. dollar cash and/or securities issued or guaranteed by the U.S. government or its agencies in excess of the market value of the securities loaned. Under the provisions of the Lending Agreement, a Fund shall have, as to the collateral, all of the rights and remedies of a secured party under applicable law. A Fund is exposed to risk of loss if a Borrower defaults on its obligation to return borrowed securities and the value of the collateral a Fund received is insufficient to cover the market value of the securities loaned. Also, the lending agent is permitted to invest the cash collateral it receives from a Borrower into a money market fund which is subject to market fluctuation. Therefore, a Fund is exposed to risk of loss if the value of invested cash collateral is insufficient to satisfy the Fund’s obligation to return the full amount owed to such Borrower. However, in the event of a borrower default with respect to the failure to return to each Fund some or all of the securities loaned, the securities lending agent shall indemnify each Fund against the failure of the borrower if the value of the collateral received is insufficient to cover the market value of the securities loaned.
| 56 | WisdomTree Trust |
Notes to Financial Statements (continued)
For financial reporting purposes, the Funds elect to not offset assets and liabilities subject to an ISDA Master Agreement or Lending Agreement, if any, in the Statements of Assets and Liabilities. Therefore, all qualifying transactions are presented on a gross basis in the Statements of Assets and Liabilities. As of March 31, 2024, the impact of netting of assets and liabilities and the offsetting of collateral pledged or received based on contractual netting/set-off provisions in the ISDA Master Agreement and the Lending Agreement are detailed in the following table:
| Assets | Liabilities | |||||||||||||||||||||||||||||||
Gross Amounts Assets and | Gross Amounts Not Offset in the Statements of Assets and Liabilities | Gross Amounts Assets and | Gross Amounts Not Offset in the Statements of Assets and Liabilities | Net Amount | ||||||||||||||||||||||||||||
| Fund | Financial Instruments | Collateral Received | Net Amount | Financial Instruments | Collateral Posted | |||||||||||||||||||||||||||
Europe Hedged Equity Fund | ||||||||||||||||||||||||||||||||
Securities Lending | $ | 142,839,982 | $ | — | $ | (142,839,982 | )1 | $ | — | $ | — | $ | — | $ | — | $ | — | |||||||||||||||
Foreign Currency Contracts | 6,275,893 | (22,008 | ) | — | 6,253,885 | 23,744 | (22,008 | ) | — | 1,736 | ||||||||||||||||||||||
Europe Hedged SmallCap Equity Fund | ||||||||||||||||||||||||||||||||
Securities Lending | 5,482,253 | — | (5,482,253 | )1 | — | — | — | — | — | |||||||||||||||||||||||
Foreign Currency Contracts | 134,154 | (510 | ) | — | 133,644 | 550 | (510 | ) | — | 40 | ||||||||||||||||||||||
International Hedged Quality Dividend Growth Fund | ||||||||||||||||||||||||||||||||
Securities Lending | 138,461,692 | — | (138,461,692 | )1 | — | — | — | — | — | |||||||||||||||||||||||
Foreign Currency Contracts | 20,950,589 | (245,887 | ) | — | 20,704,702 | 251,518 | (245,887 | ) | — | 5,631 | ||||||||||||||||||||||
Japan Hedged Equity Fund | ||||||||||||||||||||||||||||||||
Securities Lending | 457,812,879 | — | (457,812,879 | )1 | — | — | — | — | — | |||||||||||||||||||||||
Foreign Currency Contracts | 71,266,688 | (934,772 | ) | — | 70,331,916 | 1,311,966 | (934,772 | ) | — | 377,194 | ||||||||||||||||||||||
Japan Hedged SmallCap Equity Fund | ||||||||||||||||||||||||||||||||
Securities Lending | 17,580,382 | — | (17,580,382 | )1 | — | — | — | — | — | |||||||||||||||||||||||
Foreign Currency Contracts | 1,005,731 | (9,763 | ) | — | 995,968 | 9,917 | (9,763 | ) | — | 154 | ||||||||||||||||||||||
| 1 | The amount of collateral presented has been limited such that the net amount by counterparty cannot be less than zero. |
Short-Term Investments — Each Fund may invest a portion of its assets in high-quality money market instruments on an ongoing basis to provide liquidity or for other reasons. The instruments include short-term obligations issued by the U.S. government, its agencies, non-U.S. government agencies, negotiable certificates of deposit (“CDs”), fixed time deposits and bankers’ acceptances of U.S. and foreign banks and similar institutions, commercial papers, repurchase agreements and money market funds. CDs are short-term negotiable obligations of commercial banks. Time deposits are non-negotiable deposits maintained in banking institutions for specified periods of time at stated interest rates. Banker’s acceptances are time drafts drawn on commercial banks by borrowers, usually in connection with international transactions.
Restricted Securities — Each Fund may invest in securities that are subject to legal or contractual restrictions on resale. These securities generally may be resold in transactions exempt from registration or to the public if the securities are registered. Disposal of these securities may involve time-consuming negotiations and expense, and prompt sale at an acceptable price may be difficult. Information regarding restricted securities, if any, is included at the end of each Fund’s Schedule of Investments.
Tax Information and Dividends and Distributions to Shareholders — It is each Fund’s policy to comply with all requirements of the Internal Revenue Code of 1986, as amended (the “Code”). A portion of the Code, known as subchapter M (“Subchapter M”), addresses the ways by which investment companies and investment trusts may pass income through to shareholders in order to avoid double taxation. Each Fund intends to qualify for and to elect treatment as a separate Regulated Investment Company (“RIC”) under Subchapter M of the Code so that it will not be subject to federal income tax on income and gains that are timely distributed to Fund shareholders. Accordingly, no provision for U.S. federal income taxes is required. In order to qualify for the special tax treatment accorded to RICs and their shareholders, each Fund must, among other things, distribute with respect to each taxable year an amount equal to or greater than the sum of 90% of its investment company taxable income and 90% of its net tax-exempt interest income. There can be no guarantee that a Fund will pay dividends. Taxable net realized gains from investment transactions, reduced by capital loss carryforwards, if any, are declared and distributed to shareholders at least annually. The capital loss carryforward amount, if any, is available to offset future net capital gains. The Funds may occasionally be required to make supplemental distributions at some other time during the year. The Trust reserves the right to declare special distributions if, in its reasonable discretion, such action is necessary or advisable to preserve the status of each Fund as a RIC or to avoid imposition of income or excise taxes on undistributed income. Dividends and distributions to shareholders are recorded on the ex-dividend date. The amount of dividends and distributions from net investment income and net realized capital gains is determined in accordance with the requirements of the Code and the U.S. Treasury regulations (i.e., tax basis) which may differ to amounts determined under GAAP (i.e., book basis). These book/tax differences are either considered temporary or permanent in nature. To the extent these
| WisdomTree Trust | 57 |
Notes to Financial Statements (continued)
differences are permanent in nature, such amounts are reclassified within the components of net assets based on their Federal tax basis treatment; temporary differences do not require reclassification. Dividends and distributions that exceed earnings and profit for tax purposes are reported for tax purposes as a return of capital.
3. ADVISORY FEES AND OTHER TRANSACTIONS WITH AFFILIATES
WTAM has overall responsibility for the general management and administration of the Trust. WTAM provides an investment program for each Fund. WTAM has arranged for Mellon Investments Corporation (“Mellon”) to provide sub-advisory services to the Funds. Mellon is compensated by WTAM at no additional cost to the Funds. WTAM also arranges for transfer agency, custody, fund accounting, fund administration, securities lending and all other non-distribution related services necessary for the Funds to operate, which are generally under separate agreements entered into between the Trust on behalf of the Funds and the applicable service provider. Under the investment advisory agreement for each Fund, WTAM agrees to pay all expenses of the Funds, except for certain expenses described in Note 2.
Pursuant to a separate contractual arrangement, as also described in Note 2, WTAM arranges for the provision of CCO services with respect to each Fund, and is liable and responsible for, and administers, payments to the CCO, the Independent Trustees and counsel to the Independent Trustees in exchange for a fee, accrued daily and paid monthly in arrears, of up to 0.0044% per annum of each Fund’s average daily net assets.
WTAM expects to receive annual advisory fees from each Fund, based on a percentage of the Fund’s average daily net assets, as shown in the following table:
| Fund | Advisory Fee Rate | |||
Europe Hedged Equity Fund | 0.58 | % | ||
Europe Hedged SmallCap Equity Fund | 0.58 | % | ||
International Hedged Quality Dividend Growth Fund | 0.58 | % | ||
Japan Hedged Equity Fund | 0.48 | % | ||
Japan Hedged SmallCap Equity Fund | 0.58 | % | ||
Affiliated holdings are investments in entities in which the Fund owns 5% or more of the outstanding voting securities or are investments in entities which are under common ownership or control. Transactions in shares of affiliated ETFs for the fiscal year ended March 31, 2024, as applicable, are included in an “Investment in Affiliates” supplementary table in each applicable Fund’s Schedule of Investments. For these transactions, WTAM voluntarily waives a portion of its advisory fees, that it would otherwise charge, for each Fund’s investment in affiliated funds. The waivers may be reduced to offset the incremental costs related to these investments (e.g., fund accounting, safekeeping, transaction fees, etc.) that are paid by WTAM out of its advisory fee. The dollar amount of advisory fees waived during the period for the Funds, if any, are included in the Statements of Operations in “Expense waivers”.
During the fiscal year ended March 31, 2024, certain Funds engaged in purchase and sale transactions with funds that have a common investment adviser, WTAM. These interfund purchase and sale transactions were effected in accordance with Rule 17a-7 under the 1940 Act. For the fiscal year ended March 31, 2024, the cost of purchases, proceeds from sales and the net realized gain or loss recognized upon the disposal of securities resulting from interfund transactions are shown in the following table:
| Fund | Purchases | Sales | Net Realized Gain/(Loss) | |||||||||
Europe Hedged Equity Fund | $ | 13,900,727 | $ | 32,755,005 | $ | (755,807 | ) | |||||
Europe Hedged SmallCap Equity Fund | 1,435,872 | 1,332,909 | (214,367 | ) | ||||||||
International Hedged Quality Dividend Growth Fund | 89,119,738 | 47,632,980 | (2,013,525 | ) | ||||||||
Japan Hedged Equity Fund | 39,154,651 | 65,185,608 | (2,945,621 | ) | ||||||||
Japan Hedged SmallCap Equity Fund | 1,123,093 | 1,660,946 | 105,790 | |||||||||
WTAM and/or WisdomTree (collectively herein, “WT”) may from time to time own shares of a Fund. As of and for the fiscal year ended March 31, 2024, WT held shares of and received distributions from the following Funds, which were purchased through an unaffiliated broker in ordinary brokerage transactions in the secondary market in which the Funds’ shares trade:
| At March 31, 2024 | For the Fiscal Year Ended March 31, 2024 | |||||||||||
| Fund | Fund Shares held by WT | Market Value of held by WT | Dividends and WT on Fund Shares held by WT | |||||||||
Japan Hedged Equity Fund | 15 | $ | 1,628 | $ | 42 | |||||||
| 58 | WisdomTree Trust |
Notes to Financial Statements (continued)
4. CAPITAL SHARE TRANSACTIONS
As of March 31, 2024, there were an unlimited number of $0.001 par value shares of beneficial interest authorized by the Trust. Shares are issued and redeemed by each Fund only in creation units or multiples thereof to an authorized participant (“AP”). Except when aggregated in creation units (“Creation Unit Aggregations”), shares of each Fund are not redeemable. Transactions in shares for each Fund are disclosed in detail in the Statements of Changes in Net Assets. The consideration for the purchase of creation units of a Fund generally consists of the in-kind contribution of a basket of securities (“Deposit Securities”) and/or an amount of cash (“Cash Component”). Creation Unit Aggregations may be created in advance of receipt by a Fund of all or a portion of the applicable Deposit Securities from APs. In these circumstances, the initial deposit received from the AP will have a value greater than the NAV of the applicable Fund’s shares on the date the order is placed in proper form since, in addition to available Deposit Securities, U.S. cash must be deposited by the AP in an amount equal to the sum of (i) the Cash Component, plus (ii) generally between 102%-110%, as directed by the Trust or WTAM, which the Trust or WTAM may change from time to time, of the market value of the undelivered Deposit Securities (the “Additional Cash Deposit”) with the Fund pending delivery of any missing Deposit Securities. The Fund will return any unused portion of the Additional Cash Deposit once all of the missing Deposit Securities have been properly received from the AP or purchased by the Fund. Amounts due to be returned to an AP as of March 31, 2024, if any, is shown in the Statements of Assets and Liabilities in “Payables: Deposit due to authorized participant”.
5. INVESTMENT PORTFOLIO TRANSACTIONS
Purchases and sales of investments (excluding purchases and sales resulting from in-kind capital share transactions and short-term investments) and the cost of purchases and the proceeds from sales resulting from in-kind capital share transactions (excluding short-term investments) for the fiscal year ended March 31, 2024 are shown in the following table. Realized gains and losses on sales resulting from in-kind capital share redemptions, as shown on the Statements of Operations, are not recognized by the Funds for tax purposes.
| In-kind Capital Share Transactions | ||||||||||||||||
| Fund | Purchases | Sales | Purchases | Sales | ||||||||||||
Europe Hedged Equity Fund | $ | 478,581,343 | $ | 440,292,155 | $ | 276,529,954 | $ | 44,374,417 | ||||||||
Europe Hedged SmallCap Equity Fund | 16,687,747 | 15,295,856 | 10,104,104 | 19,015,947 | ||||||||||||
International Hedged Quality Dividend Growth Fund | 1,105,401,663 | 1,025,160,161 | 626,634,582 | — | ||||||||||||
Japan Hedged Equity Fund | 1,441,415,746 | 931,613,285 | 2,593,369,494 | 803,559,397 | ||||||||||||
Japan Hedged SmallCap Equity Fund | 28,909,260 | 22,254,810 | 44,515,962 | 18,384,946 | ||||||||||||
6. FEDERAL INCOME TAXES
At March 31, 2024, the cost of investments (including securities on loan and derivatives) for Federal income tax purposes was as follows:
| Investments in Long Securities | Investments in Financial Derivatives1 | |||||||||||||||||||||||||||||||||||
| Fund | Tax Cost | Gross Unrealized Appreciation | Gross Unrealized Depreciation | Net Unrealized Appreciation | Gross Unrealized Appreciation | Gross Unrealized Depreciation | Net Unrealized Appreciation | Total Net Unrealized Appreciation | ||||||||||||||||||||||||||||
Europe Hedged Equity Fund | $ | 1,482,262,708 | $ | 516,022,369 | $ | (63,443,042 | ) | $ | 452,579,327 | $ | — | $ | — | $ | — | $ | 452,579,327 | |||||||||||||||||||
Europe Hedged SmallCap Equity Fund | 45,291,176 | 5,986,085 | (2,621,892 | ) | 3,364,193 | — | — | — | 3,364,193 | |||||||||||||||||||||||||||
International Hedged Quality Dividend Growth Fund | 1,972,229,869 | 509,458,996 | (62,255,367 | ) | 447,203,629 | 63,635 | (2,711 | ) | 60,924 | 447,264,553 | ||||||||||||||||||||||||||
Japan Hedged Equity Fund | 4,268,937,697 | 780,268,831 | (99,977,437 | ) | 680,291,394 | — | — | — | 680,291,394 | |||||||||||||||||||||||||||
Japan Hedged SmallCap Equity Fund | 68,136,433 | 8,474,205 | (1,599,651 | ) | 6,874,554 | — | — | — | 6,874,554 | |||||||||||||||||||||||||||
| 1 | Certain financial derivatives may be considered section 1256 contracts under the Code. Each section 1256 contract held at the close of a taxable year shall be treated as sold for its fair market value on the last business day of such taxable year (and any realized gain and loss shall be taken into account for the taxable year). As such, the unrealized appreciation/(depreciation) for financial derivatives on a tax basis may not correspond to the unrealized appreciation/(depreciation) on a GAAP basis. The unrealized appreciation/(depreciation) for financial derivatives on a GAAP basis is located in the respective financial derivatives tables in each Fund’s Schedule of Investments. |
| WisdomTree Trust | 59 |
Notes to Financial Statements (continued)
At March 31, 2024, the components of total distributable earnings (loss) on a tax-basis were as follows:
| Fund | Undistributed Ordinary Income | Undistributed Capital and Other Losses | Net Unrealized Appreciation | Currency and Other Unrealized Appreciation/ (Depreciation) | Other Temporary Differences1 | Total Distributable Earnings (Loss) | ||||||||||||||||||
Europe Hedged Equity Fund | $ | 1,157,204 | $ | (2,049,684,104 | ) | $ | 452,579,327 | $ | (483,740 | ) | $ | 447,711 | $ | (1,595,983,602 | ) | |||||||||
Europe Hedged SmallCap Equity Fund | 80,644 | (21,567,911 | ) | 3,364,193 | (3,167 | ) | 11,962 | (18,114,279 | ) | |||||||||||||||
International Hedged Quality Dividend Growth Fund | 1,836,015 | (141,997,043 | ) | 447,203,629 | 112,489 | 167,306 | 307,322,396 | |||||||||||||||||
Japan Hedged Equity Fund | 23,575,129 | (1,260,607,164 | ) | 680,291,394 | (472,754 | ) | — | (557,213,395 | ) | |||||||||||||||
Japan Hedged SmallCap Equity Fund | 218,546 | (17,259,628 | ) | 6,874,554 | (1,380 | ) | — | (10,167,908 | ) | |||||||||||||||
| 1 | The treatment of certain income/expense items have been recognized for GAAP but disallowed for tax purposes. |
The tax character of distributions paid during the fiscal years ended March 31, 2024 and March 31, 2023, was as follows:
| Year Ended March 31, 2024 | Year Ended March 31, 2023 | |||||||||||
| Fund | Distributions Paid from Ordinary Income* | Distributions Paid from Ordinary Income* | Distributions Paid from Long-Term Capital Gains | |||||||||
Europe Hedged Equity Fund | $ | 48,992,250 | $ | 40,224,525 | $ | — | ||||||
Europe Hedged SmallCap Equity Fund | 1,960,000 | 2,393,909 | — | |||||||||
International Hedged Quality Dividend Growth Fund | 34,358,500 | 57,349,516 | 95,240,254 | |||||||||
Japan Hedged Equity Fund | 90,526,367 | 70,598,895 | — | |||||||||
Japan Hedged SmallCap Equity Fund | 1,379,024 | 888,720 | — | |||||||||
| * | Includes short-term capital gains, if any. |
At March 31, 2024, for Federal tax purposes, the Funds have capital loss carryforwards available to offset future capital gains as indicated in the following table. The loss carryforward amounts do not have an expiration date and, therefore, can be carried forward indefinitely until utilized. To the extent that these loss carryforwards are utilized, capital gains so offset will not be distributed to shareholders.
| Fund | Short-Term | Long-Term | Capital Loss Available Total | |||||||||
Europe Hedged Equity Fund | $ | 934,045,874 | $ | 1,115,638,230 | $ | 2,049,684,104 | ||||||
Europe Hedged SmallCap Equity Fund | 12,381,721 | 9,186,190 | 21,567,911 | |||||||||
International Hedged Quality Dividend Growth Fund | 141,997,043 | — | 141,997,043 | |||||||||
Japan Hedged Equity Fund | 774,958,874 | 485,648,290 | 1,260,607,164 | |||||||||
Japan Hedged SmallCap Equity Fund | 8,735,850 | 8,523,778 | 17,259,628 | |||||||||
Capital losses incurred after October 31 (“post-October capital losses”) and late year ordinary losses incurred after December 31 within the taxable year are deemed to arise on the first business day of each Fund’s next taxable year. At March 31, 2024, the Funds did not have any post-October losses or late year ordinary losses to defer.
During the fiscal year ended March 31, 2024, the amount of capital loss carryforwards used to offset realized gains are shown in the following table:
| Fund | Utilized Capital Loss | |||
Europe Hedged Equity Fund | $ | — | ||
Europe Hedged SmallCap Equity Fund | — | |||
International Hedged Quality Dividend Growth Fund | — | |||
Japan Hedged Equity Fund | 377,975,666 | |||
Japan Hedged SmallCap Equity Fund | 5,490,112 | |||
| 60 | WisdomTree Trust |
Notes to Financial Statements (continued)
At March 31, 2024, the effect of permanent “book/tax” reclassifications resulted in increases (decreases) to the components of net assets as shown in the following table. The differences are primarily due to redemptions-in-kind.
| Fund | Total Distributable Earnings (Loss) | Paid-in Capital | ||||||
Europe Hedged Equity Fund | $ | (11,055,979 | ) | $ | 11,055,979 | |||
Europe Hedged SmallCap Equity Fund | (419,656 | ) | 419,656 | |||||
International Hedged Quality Dividend Growth Fund | — | — | ||||||
Japan Hedged Equity Fund | (156,228,013 | ) | 156,228,013 | |||||
Japan Hedged SmallCap Equity Fund | (3,287,674 | ) | 3,287,674 | |||||
GAAP provides guidance on tax provisions that prescribe a minimum threshold for financial statement recognition of the benefit of a tax position taken or expected to be taken in a tax return. As of and during the fiscal year ended March 31, 2024, the Funds did not have any liabilities for unrecognized tax benefits relating to uncertain income tax positions they have taken or expect to take in the future. If applicable, the Funds will recognize interest accrued related to unrecognized tax benefits in interest expense and penalties in “Other” expenses on the Statements of Operations. The Funds file tax returns with the Internal Revenue Service, the State of New York, and various other states. Specific to U.S. federal and state taxes, generally, each of the tax years in the four-year period ended March 31, 2024, remains subject to examination by taxing authorities. Specific to foreign countries in which the Funds invest, all open tax years remain subject to examination by taxing authorities in the respective jurisdictions. The open tax years vary by each jurisdiction in which each Fund invests.
As a result of several European Court of Justice (“ECJ”) court cases in certain countries across the European Union (“EU”), certain Funds have filed additional tax reclaims for previously withheld taxes on dividends earned in those countries (“ECJ tax reclaims”). These additional filings are subject to various administrative proceedings by the local jurisdictions’ tax authorities within the EU, as well as a number of related judicial proceedings. Income recognized, if any, for ECJ tax reclaims is reflected as “Other income” in the Statements of Operations and the cost to file these additional ECJ tax reclaims is reflected as “Other fees” in the Statements of Operations. When the ECJ tax reclaim is not “more likely than not” to be sustained assuming examination by tax authorities due to the uncertainty that exists as to the ultimate resolution of these proceedings, the likelihood of receipt of these ECJ tax reclaims, and the potential timing of payment, no amounts are reflected in the financial statements. For U.S. income tax purposes, ECJ tax reclaims received by the Funds, if any, reduce the amounts of foreign taxes Fund shareholders can use as tax credits in their individual income tax returns. In the event that ECJ tax reclaims received by a Fund during the fiscal year exceed foreign withholding taxes paid, and a Fund previously passed foreign tax credits on to its shareholders, a Fund must either amend historic tax reporting to shareholders or enter into a closing agreement with the Internal Revenue Service in order to pay the associated tax liability on behalf of the respective Fund’s shareholders. During the fiscal year ended March 31, 2024, the ECJ tax reclaims received by the Funds, if any, did not exceed the foreign withholding taxes of the respective Funds.
7. SUBSEQUENT EVENTS
WTAM has evaluated all subsequent transactions and events through the date on which these financial statements were issued and has determined that no additional items require disclosure in these financial statements.
8. ADDITIONAL INFORMATION
The Board authorized a two-for-one share split for Europe Hedged Equity Fund and Japan Hedged SmallCap Equity Fund, effective after the close of trading on August 9, 2023, for the shareholders of record on August 7, 2023. The share split increased the number of shares outstanding and decreased the net asset value per share by a factor of two. The share split did not change the total value of a shareholder’s investment. The shares outstanding, NAV per share and other per share information have been updated in the accompanying financial statements and financial highlights to reflect the effect of the share split.
* * * * * *
Russia’s military invasion of Ukraine initiated in February 2022 and the economic and diplomatic responses by the United States and other countries have led to increased volatility and uncertainty in the financial markets and could continue to adversely affect regional and global economies for the foreseeable future. In response to Russia’s actions, the governments of the United States, the European Union, the United Kingdom, and many other countries collectively imposed heavy and broad-ranging economic sanctions on certain Russian individuals, corporate and banking entities, and other industries and businesses. The sanctions restrict companies from doing business with Russia and Russian companies, prohibit transactions with the Russian central bank and other key Russian financial institutions and entities, ban Russian airlines and ships from using many other countries’ airspace and ports, respectively, and place a freeze on certain Russian assets. The sanctions also removed some Russian banks from the Society for Worldwide Interbank Financial Telecommunications (SWIFT), the electronic network that connects banks globally to facilitate cross-border
| WisdomTree Trust | 61 |
Notes to Financial Statements (concluded)
payments. In addition, the United States has banned oil and other energy imports from Russia, as well as other popular Russian exports, such as diamonds, seafood and vodka. The European Union, the United Kingdom and other countries have also placed restrictions on certain oil, energy and luxury goods imports from Russia.
These sanctions, as well as other economic consequences related to the invasion, such as additional sanctions, boycotts, changes in consumer or purchaser preferences, or cyberattacks on governments, companies or individuals, may further decrease the value and liquidity of certain Russian securities as well as securities of issuers in other countries that are subject to or otherwise adversely affected by economic sanctions related to Russia’s invasion of Ukraine, including Russian counter measures. To the extent a Fund has exposure to Russian investments or investments in countries affected by the invasion or the sanctions, the Fund’s ability to price, buy, sell, receive or deliver, or receive dividends and interest payments on such investments may be impaired. In certain circumstances, such as when there is no market for a security or other means of valuing or disposing of a security, a Fund may determine to value the affected security at zero. In addition, any exposure a Fund may have to counterparties in Russia or in countries affected by the invasion could negatively affect the Fund’s portfolio. The extent and duration of Russia’s military actions and the repercussions of such actions are impossible to predict, but could result in continued significant market disruptions, including in the oil and natural gas markets, and may negatively affect global supply chains, inflation and global growth. Further, an escalation of the military conflict beyond Ukraine’s borders could result in significant, long-lasting damage to the economies of Eastern and Western Europe as well as the global economy. These and any related events could significantly and adversely affect a Fund’s performance and the value of an investment in the Fund, even in the absence of direct exposure to Russian issuers or issuers in other countries affected by the invasion.
* * * * * *
Financial markets around the world may experience extreme volatility, depressed valuations, decreased liquidity and heightened uncertainty and turmoil resulting from major cybersecurity events, geopolitical events (including wars, such as Russia’s invasion of Ukraine, terror attacks, and disruptions to foreign economic and trade relationships), public health emergencies, such as the COVID-19 pandemic, measures to address budget deficits, downgrading of sovereign debt, and public sentiment, among other events. Resulting market volatility, dramatic changes to interest rates, and otherwise unfavorable economic conditions may negatively impact Fund performance or impair a Fund’s ability to achieve its investment objective.
In March 2023, the financial distress of certain financial institutions raised economic concerns over disruption in the U.S. banking system and regarding the solvency of certain financial services firms. There can be no certainty that the actions taken by the U.S. government to strengthen public confidence in the U.S. banking system will be effective in mitigating the effects of financial institution failures on the economy and restoring public confidence in the U.S. banking system.
In October 2023, Hamas terrorists infiltrated Israel’s southern border from the Gaza Strip and conducted a series of attacks on civilian and military targets. Hamas also launched extensive rocket attacks on the Israeli population and industrial centers located along Israel’s border with the Gaza Strip and in other areas within the State of Israel. Following the attack, Israel’s security cabinet declared war against Hamas, and a military campaign was initiated. These events may result in significant market disruptions and may adversely affect regional and global economies.
* * * * * *
Raising the ceiling on U.S. government debt has become increasingly politicized. Any failure to increase the total amount that the U.S. government is authorized to borrow could lead to a default on U.S. government obligations, with unpredictable consequences for economies and markets in the U.S. and elsewhere. On August 1, 2023, Fitch Ratings, Inc. downgraded its U.S. debt rating from the highest AAA rating to AA+, citing “a high and growing general government debt burden, and the erosion of governance relative to ‘AA’ and ‘AAA’ rated peers over the last two decades that has manifested in repeated debt limit standoffs and last-minute resolutions”. The impacts, if any, of the downgrade on financial markets are unknown at this time. The downgrade has potential market impacts, including but not limited to, steep stock market declines and rising bond yields.
| 62 | WisdomTree Trust |
Report of Independent Registered Public Accounting Firm
To the Shareholders of WisdomTree Europe Hedged Equity Fund, WisdomTree Europe Hedged SmallCap Equity Fund, WisdomTree International Hedged Quality Dividend Growth Fund, WisdomTree Japan Hedged Equity Fund and WisdomTree Japan Hedged SmallCap Equity Fund, and the Board of Trustees of WisdomTree Trust
Opinion on the Financial Statements
We have audited the accompanying statements of assets and liabilities of WisdomTree Europe Hedged Equity Fund, WisdomTree Europe Hedged SmallCap Equity Fund, WisdomTree International Hedged Quality Dividend Growth Fund, WisdomTree Japan Hedged Equity Fund and WisdomTree Japan Hedged SmallCap Equity Fund (collectively referred to as the “Funds”), (five of the funds constituting WisdomTree Trust (the “Trust”)), including the schedules of investments, as of March 31, 2024, and the related statements of operations for the year then ended, the statements of changes in net assets for each of the two years in the period then ended, the financial highlights for each of the five years in the period then ended and the related notes (collectively referred to as the “financial statements”). In our opinion, the financial statements present fairly, in all material respects, the financial position of each of the Funds (five of the funds constituting WisdomTree Trust) at March 31, 2024, the results of their operations for the year then ended, the changes in their net assets for each of the two years in the period then ended and their financial highlights for each of the five years in the period then ended, in conformity with U.S. generally accepted accounting principles.
Basis for Opinion
These financial statements are the responsibility of the Trust’s management. Our responsibility is to express an opinion on each of the Funds’ financial statements based on our audits. We are a public accounting firm registered with the Public Company Accounting Oversight Board (United States) (“PCAOB”) and are required to be independent with respect to the Trust in accordance with the U.S. federal securities laws and the applicable rules and regulations of the Securities and Exchange Commission and the PCAOB.
We conducted our audits in accordance with the standards of the PCAOB. Those standards require that we plan and perform the audit to obtain reasonable assurance about whether the financial statements are free of material misstatement, whether due to error or fraud. The Trust is not required to have, nor were we engaged to perform, an audit of the Trust’s internal control over financial reporting. As part of our audits, we are required to obtain an understanding of internal control over financial reporting, but not for the purpose of expressing an opinion on the effectiveness of the Trust’s internal control over financial reporting. Accordingly, we express no such opinion.
Our audits included performing procedures to assess the risks of material misstatement of the financial statements, whether due to error or fraud, and performing procedures that respond to those risks. Such procedures included examining, on a test basis, evidence regarding the amounts and disclosures in the financial statements. Our procedures included confirmation of securities owned as of March 31, 2024, by correspondence with the custodian, brokers and others; when replies were not received from brokers, we performed other auditing procedures. Our audits also included evaluating the accounting principles used and significant estimates made by management, as well as evaluating the overall presentation of the financial statements. We believe that our audits provide a reasonable basis for our opinion.

We have served as the auditor of one or more WisdomTree investment companies since 2006.
New York, New York
May 30, 2024
| WisdomTree Trust | 63 |
Liquidity Risk Management Program (unaudited)
The Funds adopted a liquidity risk management program (the “Program”) pursuant to the requirements of Rule 22e-4 (the “Rule”) under the Investment Company Act of 1940, as amended. The Rule requires registered open-end funds, including exchange-traded funds such as the Funds, to establish liquidity risk management programs in order to effectively manage fund liquidity and shareholder redemptions. The Rule is designed to mitigate the risk that a Fund could not meet redemption requests without significantly diluting the interest of remaining investors. The Board has appointed WisdomTree Asset Management, Inc., the investment advisor to the Funds, as the Program Administrator for each Fund’s Program.
The Rule requires the Funds to assess, manage and review their liquidity risk at least annually considering applicable factors such as investment strategy and liquidity during normal and foreseeable stressed conditions, including whether the strategy is appropriate for an open-ended fund and whether the Fund has a relatively concentrated portfolio or large positions in particular issuers. The Funds must also assess their use of borrowings and derivatives, short-term and long-term cash flow projections in normal and stressed conditions, holdings of cash and cash equivalents, and borrowing arrangements and other funding sources.
The Rule also requires the Funds to classify their investments into one of four liquidity categories: highly liquid, moderately liquid, less liquid or illiquid based on the number of days a Fund expects it would take to liquidate the investment, and to review these classifications at least monthly or more often under certain conditions. The periods range from three or fewer business days for a highly liquid investment to greater than seven calendar days for settlement of a less liquid investment. Illiquid investments are those a Fund does not expect to be able to sell or dispose of within seven calendar days without significantly changing the market value of the investment. A Fund is prohibited from acquiring an investment if, after the acquisition, its holdings of illiquid assets will exceed 15% of its net assets. In addition, if a Fund permits redemptions in-kind, the Rule requires the Fund to establish redemption in-kind policies and procedures governing how and when it will engage in such redemptions.
Pursuant to the Rule’s requirements, the Program has been reviewed and approved by the Fund’s Board. Furthermore, the Board has received a written report prepared by the Program Administrator that addresses the operation of the Program, assesses its adequacy and effectiveness and describes any material changes made to the Program. The Program Administrator has monitored the Fund’s liquidity risk and the liquidity classifications of the securities held by the Fund and has determined that the Program is operating effectively.
During the period from January 1, 2023 to December 31, 2023, there were no material changes to the Program and no material liquidity events that impacted the Funds. During the period, the Funds held sufficient highly liquid assets to meet fund redemptions.
Under normal expected foreseeable Fund redemption forecasts and foreseeable stressed Fund redemption forecasts, the Program Administrator believes that the Funds maintain sufficient highly liquid assets to meet Fund redemptions.
| 64 | WisdomTree Trust |
Trustees and Officers Information (unaudited)
Name | Position(s) Held with | Principal Occupation(s) | Number of Portfolios in Fund Complex Overseen by Trustee/ Officer+ | Other | ||||
| Trustees Who Are Interested Persons of the Trust | ||||||||
| Jonathan Steinberg (1964) | Trustee, 2005- present; President, 2005-present | Chief Executive Officer of WisdomTree and WisdomTree Asset Management since 2005; President of WisdomTree and WisdomTree Asset Management from 2012 to 2019. | 77 | Director, WisdomTree and WisdomTree Asset Management. | ||||
| Trustees Who Are Not Interested Persons of the Trust | ||||||||
David G. Chrencik1 (1948) | Trustee, 2014-present | Chief Financial Officer of Sarus Indochina Select LP (a hedge fund) from 2012 to 2022. | 77 | None | ||||
Phillip Goff2 (1963) | Trustee, 2024-present | Private Investor from 2017 to present; Trustee of RBC Funds Trust from 2020 to 2024; Senior Vice President/ Corporate Controller and Funds Treasurer at TIAA from 2006 to 2017. | 77 | None | ||||
Joel Goldberg3,4 (1945) | Trustee, 2012-present | Attorney, Partner at Stroock & Stroock & Lavan LLP from 2010 to 2018; Attorney, Partner at Willkie Farr & Gallagher LLP from 2006 to 2010. | 77 | Director, Better Business Bureau (Metropolitan New York, Long Island and the Mid-Hudson Region). | ||||
Toni Massaro4 (1955) | Trustee, 2006-present | Regents Professor of Law Emerita since 2024; Executive Director of the Agnese Nelms Haury Program since 2021; Dean Emerita at the University of Arizona James E. Rogers College of Law (“Rogers College of Law”) from 2009 to 2024 (distinguished Emerita in July 2009); Dean of the Rogers College of Law from 1999 to 2009; Regents Professor since 2006; Milton O. Riepe Chair in Constitutional Law from 1997 to 2022; Professor at the Rogers College of Law from 1990 to 2024. | 77 | None | ||||
Melinda A. (1955) | Trustee, 2014-present | Retired since 2004; Vice President, Senior Portfolio Manager, Fixed Income Management, and Director of Tax Exempt Fund Management at Merrill Lynch Investment Management from 1982 to 2004. | 77 | Associate Alumnae of Douglass College, Chair of Investment Committee. | ||||
Victor Ugolyn (1947) | Trustee, 2006-present; Chairman of the Board, 2006-present | Private Investor from 2005 to present; President and Chief Executive Officer at William D. Witter, Inc. from 2005 to 2006; Chairman of MONY Securities Corporation, and Chairman, President and Chief Executive Officer at Enterprise Capital Management from 1999 to 2004. | 77 | None | ||||
| Officers of the Trust | ||||||||
Jonathan Steinberg (1964) | President, 2005- present; Trustee, 2005-present | Chief Executive Officer of WisdomTree and WisdomTree Asset Management since 2005; President of WisdomTree and WisdomTree Asset Management from 2012 to 2019. | 77 | See Interested Trustees Table Above. | ||||
| WisdomTree Trust | 65 |
Trustees and Officers Information (unaudited) (concluded)
Name | Position(s) Held with | Principal Occupation(s) | Number of Portfolios in Fund Complex Overseen by Trustee/ Officer+ | Other | ||||
David Castano* (1971) | Treasurer, 2013-present | Head of Fund Accounting & Administration at WisdomTree Asset Management since 2020; Director of Fund Accounting & Administration at WisdomTree Asset Management from 2011 to 2020. | 77 | None | ||||
Terry Jane Feld* (1960) | Chief Compliance Officer, 2012-present | Head of U.S. Compliance at WisdomTree Asset Management since 2022; Chief Compliance Officer at WisdomTree Asset Management since 2012. | 77 | None | ||||
Joanne Antico* (1975) | Chief Legal Officer and Secretary, 2021-present | General Counsel at WisdomTree Asset Management since 2021; Assistant General Counsel at WisdomTree Asset Management from 2016 to 2021; Executive Director and Assistant Secretary at Morgan Stanley Investment Management Inc. from 2005 to 2016. | 77 | None | ||||
Clint Martin* (1977) | Assistant Treasurer, 2015-present | Director of Fund Accounting & Administration at WisdomTree Asset Management since 2020; Fund Manager, Fund Accounting & Administration at WisdomTree Asset Management from 2012 to 2020. | 77 | None | ||||
Angela Borreggine* (1964) | Assistant Secretary, 2022-present | Assistant General Counsel at WisdomTree Asset Management since 2022; Vice President and Senior Counsel at Virtus Investment Partners from 2021 to 2022; Secretary and Chief Legal Officer at Allianz Global Investors family of funds from 2016 to 2021 and of The Korea Fund, Inc. from 2016 to 2020; Director, Senior Counsel at Allianz Global Investors from 2007 to 2021. | 77 | None | ||||
TJ Darnowski* (1984) | Assistant Secretary, 2021-present | Senior Investment Management Paralegal at WisdomTree Asset Management since 2021; Senior Legal Administrator at Ultimus Fund Solutions from 2019 to 2021; Assistant Vice President at State Street Bank & Trust Company from 2010 to 2019. | 77 | None | ||||
Sherry Scarvey* (1967) | Assistant Secretary, 2023-present | Senior Investment Management Paralegal at WisdomTree Asset Management since 2023; Senior Legal Analyst at Eagle Point Credit Management, LLC from 2021 to 2023; Senior Legal Analyst at Jennison & Associates LLC from 2019 to 2021; Senior Legal Specialist at Legg Mason & Co. LLC from 2005 to 2019. | 77 | None | ||||
| + | As of March 31, 2024. |
| 1 | Chair of the Audit Committee. |
| 2 | Appointed to the Board on February 27, 2024. |
| 3 | Chair of the Contracts Review Committee. |
| 4 | Co-Chair of the Governance, Nominating and Compliance Committee. |
| 5 | Chair of the Investment Committee. |
| * | Elected by and serves at the pleasure of the Board. |
| 66 | WisdomTree Trust |
Supplemental Information (unaudited)
Federal Income Tax Information
The following Federal tax information related to the Funds’ fiscal year ended March 31, 2024, is provided for information purposes only and should not be used for reporting to federal or state revenue agencies. Federal tax information for the calendar year will be reported to you on Form 1099-DIV in January 2025.
Certain dividends paid by the Funds may be subject to a maximum tax rate of 15%, as provided by the Jobs and Growth Tax Relief Reconciliation Act of 2003. Of the distributions paid during the fiscal year ended March 31, 2024, the following represents the maximum amount of ordinary income distributions that may be considered qualified dividend income:
| Fund | Qualified Dividend Income | |||
Europe Hedged Equity Fund | $ | 31,884,338 | ||
Europe Hedged SmallCap Equity Fund | 1,576,047 | |||
International Hedged Quality Dividend Growth Fund | 36,994,634 | |||
Japan Hedged Equity Fund | 82,128,625 | |||
Japan Hedged SmallCap Equity Fund | 1,356,664 | |||
The Funds intend to elect to pass through to shareholders the credit for taxes paid to foreign countries during the fiscal year ended March 31, 2024. The gross foreign source income and foreign taxes paid are as follows:
| Fund | Gross Foreign Income | Foreign Taxes Paid | ||||||
Europe Hedged Equity Fund | $ | 51,447,998 | $ | 826,306 | ||||
Europe Hedged SmallCap Equity Fund | 2,158,096 | 149,847 | ||||||
International Hedged Quality Dividend Growth Fund | 36,143,295 | 2,965,589 | ||||||
Japan Hedged Equity Fund | 87,163,748 | 8,564,107 | ||||||
Japan Hedged SmallCap Equity Fund | 1,476,305 | 141,788 | ||||||
| WisdomTree Trust | 67 |
General Information (unaudited)
Proxy Voting Policies, Procedures and Record
A complete copy of the Proxy Voting Policy may be obtained upon request, at no charge, by calling 1-866-909-WISE (9473) or writing to: WisdomTree Trust, c/o Foreside Fund Services, LLC, Three Canal Plaza Suite 100, Portland, ME, 04101.
The Trust is required to disclose annually the Funds’ complete proxy voting record on Form N-PX covering the most recent 12-month period ended June 30 and to file Form N-PX with the SEC no later than August 31 of each year. The current Form N-PX for the Funds is available at no charge upon request by calling 1-866-909-WISE (9473) or through the SEC’s website at www.sec.gov.
Shareholder Reports and Quarterly Portfolio Disclosure
The Funds file their complete schedule of portfolio holdings with the SEC for their first and third fiscal quarters as an exhibit to their reports on Form N-PORT. Copies of the filings are available, without charge, on the SEC’s website at www.sec.gov and are also available by calling the Trust at 1-866-909-WISE (9473). Copies of the filings may also be obtained, after paying a duplicating fee, by electronic request at the following E-mail address: publicinfo@sec.gov.
Information about each Fund’s portfolio holdings is available daily, without charge, at www.wisdomtree.com/investments.
The Statement of Additional Information (“SAI”) has additional information about the Funds’ Trustees and Officers and is available without charge upon request. Contact your financial representative for a free prospectus or SAI.
Frequency Distribution of Discounts & Premiums
Information about differences between the per share net asset value of each Fund and the market trading price of shares of each Fund are available, without charge, at www.wisdomtree.com/investments.
| 68 | WisdomTree Trust |
The WisdomTree Funds are exchange traded funds (“ETFs”) registered with the United States Securities and Exchange Commission as separate series (“Funds”) of WisdomTree Trust (“Trust”). WisdomTree Asset Management, Inc., a wholly owned subsidiary of WisdomTree, Inc., serves as the investment adviser to the Trust. None of the WisdomTree entities are affiliated with Foreside Fund Services, LLC, the Funds’ distributor. WisdomTree, Inc., its affiliates and their independent providers are not liable for any informational errors, incompleteness, delays, or for any actions taken in reliance on information contained herein.
There are risks associated with investing including possible loss of principal. Foreign investing involves special risks, such as risk of loss from currency fluctuation or political or economic uncertainty. Investments in real estate involve additional special risks, such as credit risk, interest rate fluctuations and the effect of varied economic conditions. Funds that focus their investments in one country or region may be significantly impacted by events and developments associated with the region which can adversely affect performance. Funds focusing on a single sector and/or smaller companies generally experience greater price volatility. Dividends are not guaranteed, and a company currently paying dividends may cease paying dividends at any time. Investments in emerging, offshore or frontier markets are generally less liquid and less efficient than investments in developed markets and are subject to additional risks, such as risks of adverse governmental regulation and intervention or political developments. Investments in currency involve additional special risks, such as credit risk and interest rate fluctuations. Derivative investments can be volatile and these investments may be less liquid than other securities, and more sensitive to the effect of varied economic conditions. As these Funds can have a high concentration in some issuers the Funds can be adversely impacted by changes affecting such issuers. Due to the investment strategy of certain Funds they may make higher capital gain distributions than other ETFs. Please read the Fund’s prospectus for specific details regarding the Fund’s risk profile.
Indexes are unmanaged and you cannot invest directly in an index.
Transactions in Fund shares will result in brokerage commissions and will generate tax consequences. Shares may be sold through brokerage accounts, but may be redeemed from the Funds only by Authorized Participants in large creation unit sizes of shares.
This report is intended for the Funds’ shareholders. It may not be distributed to prospective investors unless it is preceded or accompanied by the current prospectus.
Scan the QR code with your
smartphone camera to

learn more at
WisdomTree.com/investments
WisdomTree Fund shares are distributed by Foreside Fund Services, LLC, in the U.S.
WGM-517673


WisdomTree Trust
Annual Report
March 31, 2024
WisdomTree China ex-State-Owned Enterprises Fund (CXSE)
WisdomTree Emerging Markets ex-State-Owned Enterprises Fund (XSOE)
WisdomTree Emerging Markets High Dividend Fund (DEM)
WisdomTree Emerging Markets Multifactor Fund (EMMF)
WisdomTree Emerging Markets Quality Dividend Growth Fund (DGRE)
WisdomTree Emerging Markets SmallCap Dividend Fund (DGS)
WisdomTree Global ex-U.S. Quality Dividend Growth Fund (DNL)
WisdomTree Global High Dividend Fund (DEW)
WisdomTree India Earnings Fund (EPI)
WisdomTree New Economy Real Estate Fund (WTRE)
| 1 | ||||
Information about Performance and Shareholder Expense Examples (unaudited) | 3 | |||
| 4 | ||||
| 14 | ||||
Schedules of Investments | ||||
| 18 | ||||
| 22 | ||||
| 30 | ||||
| 37 | ||||
| 42 | ||||
| 47 | ||||
| 58 | ||||
| 63 | ||||
| 72 | ||||
| 79 | ||||
| 81 | ||||
| 83 | ||||
| 85 | ||||
| 89 | ||||
| 94 | ||||
| 110 | ||||
| 111 | ||||
| 112 | ||||
| 114 | ||||
| 115 | ||||
“WisdomTree” is a registered mark of WisdomTree, Inc. and is licensed for use by the WisdomTree Trust.
(unaudited)
Global equity markets, as measured by the MSCI All Country World Index (“ACWI”), gained 23.22% in U.S. dollar (“USD”) terms for the 12-month fiscal period ending March 31, 2024 (the “period”). Emerging markets (“EM”) (measured by the MSCI Emerging Markets Index) returned 8.15% in USD terms for the period.
Currency performance was mixed during the period. Among EM currencies, the Chinese yuan renminbi weakened by 4.83% relative to the USD. The Russian ruble weakened significantly versus the USD as a result of the ongoing economic sanctions levied against Russia by most of the world for its war with Ukraine. The South Korean won and Taiwanese dollar each weakened between 3% and 5%, while the Indian rupee dropped 1.46% versus the USD. The only major EM currency to strengthen versus the USD was the Brazilian real, which climbed by 1%.
Global equities fluctuated during the period before registering most of their gains in the back half of the 12-month period when risk-on appetite from investors was the prevailing sentiment in the markets. As the largest component of global equity markets, U.S. returns were the main growth engine for global indexes. EM benefited to a lesser extent with gains driven by Indian equity markets, though poor sentiment from Chinese equity markets continued to weigh on returns. Economic data and its implications for global monetary policy continued to be the most important catalyst for equities during the period. Investors parsed every major inflation and labor market data release to assess the health of the global economy and their impact on monetary policy. Inflation persisted throughout the period, and most central banks continued to raise interest rates, or at least hold them at higher levels, in an effort to suppress it.
The first quarter of the period, from April to June 2023, started decently for global and emerging market equity indexes. The MSCI ACWI and MSCI EM indexes rose 6.18% and 0.9% respectively, in USD terms. EM did not benefit as much as global peers, but even the slightly positive quarter was a welcome reprieve from recent volatility. Inflation rates varied throughout the world, although moderate disinflation was a common global theme. The economic growth outlook was mixed during the period, as certain EM economies managed to grow while other prominent regions either stagnated or contracted. As the two largest allocations in EM, India and China illustrated the disparity in outcomes well, as the MSCI India Index returned over 12% while the MSCI China Index fell nearly 10% (both in USD terms). From a real Gross Domestic Product (“GDP”) growth perspective, India grew 1.9% quarter-over-quarter while China grew 0.5%.
The second quarter of the period was weaker than the first. Global equities fell 3.4% in USD terms, while EM also lost 2.93% in USD terms. Many regions experienced what would become temporary spikes in inflation at this point, which discouraged investors’ of the belief that a global pivot to accommodative monetary policy was imminent. More rate hikes, or at least “higher for longer” rate regimes, would be needed to combat inflation, and central banks stayed committed to tighter policy. Equities remained under moderate pressure as a result. Chinese equities fell another 2% while India eked out a 2.7% gain, both in USD terms. China’s economy bounced back by growing real GDP by 1.5% during the July to September quarter. The Indian economy continued to exhibit consistent growth, adding 1.7% to real GDP during the three-month period.
Global equities surged during the third quarter of the period and the final quarter of 2023, returning over 11% in USD terms. EM followed suit, adding 7.9% in USD terms. As disinflationary pressures persisted, investors became encouraged that the end of policy tightening was in sight and that the possibility of a global soft economic landing could be achieved. India once again led emerging markets higher, returning 11.9% in USD terms to complement strong economic growth. China managed to grow real GDP by 1% during the quarter, but poor investor sentiment prevailed and sent Chinese shares down over 4.2% in USD terms.
Optimism persisted into the first quarter of 2024. Global equities returned 8.2% and EM returned about 2.37%, both in USD terms. Economic data releases seemed to confirm ongoing disinflationary pressures which supported investors’ sentiments that a pivot to
| WisdomTree Trust | 1 |
Market Environment Overview
(unaudited) (concluded)
accommodative monetary policy could be expected later in the year. Indian equities added another 6% in USD terms during the quarter, while China was once again the exception to the positive trend, losing 2.19% in USD terms.
Entering the new period, global markets remain fixated on each economic data release so they may parse it for insights about the future direction of monetary policy. As of now, investors are anticipating a pivot to rate cuts in the final few months of 2024, although the number and size of cuts have been reduced since the start of the calendar year. The ongoing economic picture will continue to be assessed so that markets may adjust their expectations accordingly. We may continue to see variance in policy activity across central banks as well, which will create policy rate gaps that will have implications for currency markets.
Each WisdomTree Fund’s performance as set forth in “Management’s Discussion of Funds’ Performance” in the pages that follow should also be viewed in light of the foregoing market environment.
| 2 | WisdomTree Trust |
Information about Performance and Shareholder Expense Examples (unaudited)
Performance
The performance tables on the following pages are provided for comparative purposes and represent the period noted. Each Fund’s per share net asset value (“NAV”) is the value of one share of the Fund and is calculated by dividing the value of total assets less total liabilities by the number of shares outstanding. The NAV return is based on the NAV of the Fund and the market price return is based on the market price per share of the Fund. The price used to calculate market price returns is the midpoint of the bid and ask price for Fund shares as of the close of trading on the exchange where Fund shares are listed. NAV and market price returns assume that dividends and capital gain distributions have been reinvested in the Fund at NAV and market price, respectively. As with other exchange traded funds (“ETFs”), NAV returns and market price returns may differ because of factors such as the supply and demand for Fund shares and investors’ assessments of the underlying value of a Fund’s portfolio securities.
Fund shares are bought and sold at market price (not NAV) and are not individually redeemed from a Fund. Fund NAV returns are calculated using a Fund’s daily 4:00 p.m. eastern time NAV. Market price returns reflect the midpoint of the bid and ask price as of the close of trading on the exchange where Fund shares are listed. Market price returns do not represent the returns you would receive if you traded shares at other times. The returns do not reflect the deduction of taxes that a shareholder would pay on Fund distributions or on the redemption of Fund shares. Total returns for a period of less than one year are cumulative.
Performance is historical and does not guarantee future results. Current performance may be lower or higher than quoted. Investment returns and the principal value of an investment will fluctuate so that an investor’s shares, when redeemed, may be worth more or less than their original cost. For the most recent month-end performance information visit www.wisdomtree.com/investments.
An index is a statistical measure of a specified financial market or sector. An index does not actually hold a portfolio of securities, incur expenses or pay any transaction costs. Therefore, index returns do not reflect deductions for fees or expenses and an index is not available for direct investment. In comparison, the Funds’ performance is negatively impacted by these deductions. Fund returns do not reflect brokerage commissions or taxes on transactions in Fund shares or taxes that a shareholder would pay on Fund distributions. Past performance is no guarantee of future results.
Shareholder Expense Examples
Each Fund’s performance table is accompanied by a shareholder expense example. As a shareholder of a WisdomTree Fund, you incur two types of cost: (1) transaction costs, including brokerage commissions on purchases and sales of your Fund shares and (2) ongoing costs, including management fees and other Fund expenses. The examples are intended to help you understand your ongoing costs (in dollars and cents) of investing in a Fund and to compare these costs with the ongoing costs of investing in other funds.
The examples are based on an investment of $1,000 invested at the beginning of the period and held for the entire period from October 1, 2023 to March 31, 2024. Except where noted, expenses are calculated using each Fund’s annualized expense ratio (after the effect of contractual or voluntary fee waivers, if any), multiplied by the average account value for the period, multiplied by 183/366 (to reflect the one-half year period). The annualized expense ratio does not include acquired fund fees and expenses (“AFFEs”), which are fees and expenses incurred indirectly by a Fund through its investments in certain underlying investment companies.
Actual expenses
The first line in the shareholder expense example table shown on the following pages provides information about actual account values and actual expenses. You may use the information in this line, together with the amount you invested, to estimate the expenses that you paid over the period. Simply divide your account value by $1,000 (for example, an $8,600 account value divided by $1,000 = 8.6), then multiply the result by the number in the first line for your Fund under the heading entitled “Expenses Paid During the Period” to estimate the expenses you paid on your account during the period.
Hypothetical example for comparison purposes
The second line in the shareholder expense example table shown on the following pages provides information about hypothetical account values and hypothetical expenses based on the Fund’s actual expense ratio and an assumed rate of return of 5% per year before expenses, which is not the Fund’s actual return. The hypothetical account values and expenses may not be used to estimate the actual ending account balance or expenses you paid for the period. You may use this information to compare the ongoing costs of investing in your Fund and other funds. To do so, compare this 5% hypothetical example with the 5% hypothetical examples that appear in the shareholder reports of the other funds.
Please note that the expenses shown in the table are meant to highlight your ongoing costs only and do not reflect any transactional costs, such as brokerage commissions paid on purchases and sales of Fund shares. Therefore, the second line in the table is useful in comparing ongoing Fund costs only and will not help you determine the relative total costs of owning different funds. In addition, if these transactional costs were included, your costs would have been higher.
| WisdomTree Trust | 3 |
Management’s Discussion of Funds’ Performance
as of March 31, 2024 (unaudited)
WisdomTree China ex-State-Owned Enterprises Fund (CXSE)
Sector Breakdown†
| Sector | % of Net Assets | |||
Consumer Discretionary | 32.8% | |||
Communication Services | 20.9% | |||
Information Technology | 9.9% | |||
Health Care | 9.4% | |||
Industrials | 8.9% | |||
Financials | 7.2% | |||
Consumer Staples | 5.4% | |||
Materials | 3.3% | |||
Real Estate | 1.5% | |||
Utilities | 0.5% | |||
Energy | 0.2% | |||
Other Assets less Liabilities‡ | 0.0% | * | ||
Total | 100.0% | |||
| † | The Fund’s sector breakdown is expressed as a percentage of net assets and may change over time. In addition, a sector may be comprised of several industries. It does not include derivatives (if any). |
| ‡ | Other assets less liabilities may include investment of cash collateral for securities on loan and/or receivables/payables on derivatives (if any). |
| * | Represents less than 0.1%. |
Top Ten Holdings*
| Description | % of Net Assets | |||
Tencent Holdings Ltd. | 11.0% | |||
Alibaba Group Holding Ltd. | 8.8% | |||
PDD Holdings, Inc., ADR | 5.4% | |||
Ping An Insurance Group Co. of China Ltd., Class H | 4.6% | |||
NetEase, Inc. | 3.4% | |||
Meituan, Class B | 3.1% | |||
Baidu, Inc., Class A | 2.9% | |||
Contemporary Amperex Technology Co. Ltd., Class A | 2.7% | |||
BYD Co. Ltd., Class H | 2.2% | |||
JD.com, Inc., Class A | 2.0% | |||
| * | The ten largest holdings are subject to change, and there are no guarantees the Fund will remain invested in any particular company. Excludes derivatives and investment of cash collateral for securities on loan (if any). |
The WisdomTree China ex-State-Owned Enterprises Fund (the “Fund”) seeks to track the price and yield performance, before fees and expenses, of the WisdomTree China ex-State-Owned Enterprises Index (the “Index”). In seeking to track the Index, the Fund invests in Chinese companies that are not state-owned enterprises (“SOEs”), which is defined as government ownership of greater than 20%. The Fund generally uses a representative sampling strategy to achieve its investment objective, meaning it generally will invest in a sample of securities in the Index.
The Fund returned -22.97% at net asset value (“NAV”) for the fiscal year ended March 31, 2024 (for more complete performance information please see the table below). Chinese equities struggled during the period due to negative sentiment stemming from lackluster economic growth, ongoing geopolitical disputes, and changing political preferences among investors with respect to equity investments. The confluence of these factors resulted in poor returns during the period. The only three sectors with positive performance effects were Communication Services, Consumer Discretionary, and Consumer Staples, which all benefited primarily from positive stock selection. The remaining sectors weighed on performance, with Financials, Information Technology, and Health Care negatively impacting performance due to poor stock selection in the former two and allocation effects in the latter. The Fund’s exclusive allocation to non-SOEs also harmed performance due to allocation and stock selection effects. Chinese SOEs outperformed non-SOEs last year, and the Fund would have otherwise benefited from SOE exposure.
Shareholder Expense Example (for the six-month period ended March 31, 2024)
| Beginning Account Value | Ending Account Value | Annualized Expense Ratio | Expenses Paid During the Period | |||||||||||||
Actual | $ | 1,000.00 | $ | 892.10 | 0.32 | % | $ | 1.51 | ||||||||
Hypothetical (5% return before expenses) | $ | 1,000.00 | $ | 1,023.40 | 0.32 | % | $ | 1.62 | ||||||||
Performance
| Average Annual Total Return | ||||||||||||||||
| 1 Year | 3 Year | 5 Year | 10 Year | |||||||||||||
Fund NAV Returns | -22.97 | % | -24.72 | % | -6.35 | % | 2.02 | % | ||||||||
Fund Market Price Returns | -22.93 | % | -25.16 | % | -6.48 | % | 1.97 | % | ||||||||
WisdomTree China Dividend ex-Financials/China ex-State-Owned Enterprises Spliced Index1 | -22.86 | % | -24.51 | % | -6.08 | % | 2.35 | % | ||||||||
MSCI China Index | -17.05 | % | -18.92 | % | -6.33 | % | 1.24 | % | ||||||||
| 1 | WisdomTree China Dividend ex-Financials Index through June 30, 2015; WisdomTree China ex-State-Owned Enterprises Index thereafter. |
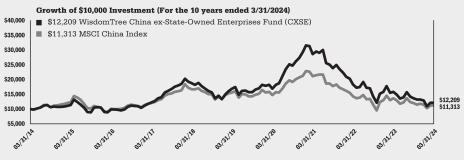
Performance is historical and does not guarantee future results. The returns do not reflect the deduction of taxes that a shareholder would pay on Fund distributions or on the redemption of Fund shares.
| 4 | WisdomTree Trust |
Management’s Discussion of Funds’ Performance
as of March 31, 2024 (unaudited)
WisdomTree Emerging Markets ex-State-Owned Enterprises Fund (XSOE)
Sector Breakdown†
| Sector | % of Net Assets | |||
Information Technology | 26.0% | |||
Financials | 17.5% | |||
Consumer Discretionary | 15.1% | |||
Communication Services | 9.2% | |||
Industrials | 8.0% | |||
Materials | 6.7% | |||
Consumer Staples | 6.4% | |||
Health Care | 5.5% | |||
Energy | 3.0% | |||
Utilities | 1.5% | |||
Real Estate | 1.3% | |||
Other Assets less Liabilities‡ | -0.2% | |||
Total | 100.0% | |||
| † | The Fund’s sector breakdown is expressed as a percentage of net assets and may change over time. In addition, a sector may be comprised of several industries. It does not include derivatives (if any). |
| ‡ | Other assets less liabilities may include investment of cash collateral for securities on loan and/or receivables/payables on derivatives (if any). |
Top Ten Holdings*
| Description | % of Net Assets | |||
Taiwan Semiconductor Manufacturing Co. Ltd. | 8.2% | |||
Samsung Electronics Co. Ltd. | 4.7% | |||
Tencent Holdings Ltd. | 4.0% | |||
Alibaba Group Holding Ltd. | 2.2% | |||
Reliance Industries Ltd., GDR | 1.8% | |||
Al Rajhi Bank | 1.7% | |||
HDFC Bank Ltd. | 1.6% | |||
PDD Holdings, Inc., ADR | 1.4% | |||
MercadoLibre, Inc. | 1.1% | |||
SK Hynix, Inc. | 1.0% | |||
| * | The ten largest holdings are subject to change, and there are no guarantees the Fund will remain invested in any particular company. Excludes derivatives and investment of cash collateral for securities on loan (if any). |
The WisdomTree Emerging Markets ex-State-Owned Enterprises Fund (the “Fund”) seeks to track the price and yield performance, before fees and expenses, of the WisdomTree Emerging Markets ex-State-Owned Enterprises Index (the “Index”). In seeking to track the Index, the Fund invests in emerging market companies that are not state-owned enterprises (“SOEs”), which is defined as government ownership of more than 20%. The Fund generally uses a representative sampling strategy to achieve its investment objective, meaning it generally will invest in a sample of securities in the Index.
The Fund returned 8.22% at net asset value (“NAV”) for the fiscal year ended March 31, 2024 (for more complete performance information please see the table below). Across sectors, it benefited from Communication Services and Information Technology due to stock selection in the former and allocation effects in the latter. Energy and Financials weighed on fund performance due to negative impacts in both effects across each sector. From a country perspective, Taiwan and India were the largest contributors to Fund performance due to allocation effects in India and both allocation and stock selection in Taiwan. China exposure negatively affected performance, primarily due to poor stock selection among Chinese non-SOEs. Similar negative effects were a result of Brazil exposure, though to a lesser extent. The Fund’s exclusive allocation to non- SOEs also harmed performance due to stock selection effects.
Shareholder Expense Example (for the six-month period ended March 31, 2024)
| Beginning Account Value | Ending Account Value | Annualized Expense Ratio1 | Expenses Paid During the Period1 | |||||||||||||
Actual | $ | 1,000.00 | $ | 1,107.10 | 0.33 | % | $ | 1.74 | ||||||||
Hypothetical (5% return before expenses) | $ | 1,000.00 | $ | 1,023.35 | 0.33 | % | $ | 1.67 | ||||||||
| 1 | Included in the expense ratio are “Other fees” described in Note 6 which are not annualized. Without these expenses, the expense ratio would have been 0.32% and the actual and hypothetical expenses paid during the period would have been $1.69 and $1.62, respectively. |
Performance
| Average Annual Total Return | ||||||||||||||||
| 1 Year | 3 Year | 5 Year | Since Inception1 | |||||||||||||
Fund NAV Returns | 8.22 | % | -8.21 | % | 2.29 | % | 3.75 | % | ||||||||
Fund Market Price Returns | 7.87 | % | -8.57 | % | 2.24 | % | 3.83 | % | ||||||||
WisdomTree Emerging Markets ex-State-Owned Enterprises Index | 9.41 | % | -7.53 | % | 2.98 | % | 4.67 | % | ||||||||
MSCI Emerging Markets Index | 8.15 | % | -5.05 | % | 2.22 | % | 3.36 | % | ||||||||
| 1 | Total returns are calculated based on the commencement of Fund trading on the NYSE Arca, Inc. on December 10, 2014. |
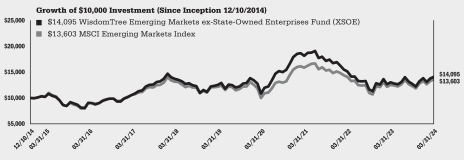
Performance is historical and does not guarantee future results. The returns do not reflect the deduction of taxes that a shareholder would pay on Fund distributions or on the redemption of Fund shares.
| WisdomTree Trust | 5 |
Management’s Discussion of Funds’ Performance
as of March 31, 2024 (unaudited)
WisdomTree Emerging Markets High Dividend Fund (DEM)
Sector Breakdown†
| Sector | % of Net Assets | |||
Financials | 24.5% | |||
Energy | 21.3% | |||
Information Technology | 21.1% | |||
Materials | 12.7% | |||
Industrials | 5.4% | |||
Utilities | 4.9% | |||
Consumer Staples | 3.6% | |||
Consumer Discretionary | 2.4% | |||
Communication Services | 2.1% | |||
Real Estate | 1.7% | |||
Health Care | 0.2% | |||
Investment Company | 0.0% | * | ||
Other Assets less Liabilities‡ | 0.1% | |||
Total | 100.0% | |||
| † | The Fund’s sector breakdown is expressed as a percentage of net assets and may change over time. In addition, a sector may be comprised of several industries. It does not include derivatives (if any). |
| ‡ | Other assets less liabilities may include investment of cash collateral for securities on loan and/or receivables/payables on derivatives (if any). |
| * | Represents less than 0.1%. |
Top Ten Holdings*
| Description | % of Net Assets | |||
MediaTek, Inc. | 6.2% | |||
Petroleo Brasileiro SA | 5.6% | |||
Hon Hai Precision Industry Co. Ltd. | 3.1% | |||
Vale SA | 2.9% | |||
PetroChina Co. Ltd., Class H | 2.7% | |||
China Shenhua Energy Co. Ltd., Class H | 2.7% | |||
China Construction Bank Corp., Class H | 2.5% | |||
ASE Technology Holding Co. Ltd. | 2.2% | |||
Grupo Financiero Banorte SAB de CV, Class O | 1.8% | |||
United Microelectronics Corp. | 1.6% | |||
| * | The ten largest holdings are subject to change, and there are no guarantees the Fund will remain invested in any particular company. Excludes derivatives and investment of cash collateral for securities on loan (if any). |
The WisdomTree Emerging Markets High Dividend Fund (the “Fund”) seeks to track the price and yield performance, before fees and expenses, of the WisdomTree Emerging Markets High Dividend Index (the “Index”). In seeking to track the Index, the Fund invests in high-dividend-yielding companies in the emerging markets region. The Fund generally uses a representative sampling strategy to achieve its investment objective, meaning it generally will invest in a sample of securities in the Index.
The Fund returned 17.69% at net asset value (“NAV”) for the fiscal year ended March 31, 2024 (for more complete performance information please see the table below). It benefited from its positions in the Information Technology, Energy and Communication Services sectors primarily due to stock selection, and asset allocation. The main detractors were the Financials and Materials sectors due to poor stock selection effects in the former and poor allocation effects in the latter. From a country perspective, Chinese equities were overwhelmingly positive due to a mix of allocation and stock selection effects. Taiwan followed the positive trend to a lesser extent and was also supported by both effects. India and South Africa weighed on performance mainly due to poor stock selection. Across dividend yield quintiles, the top two quintiles (representing the highest-yielding stock) had positive impacts on Fund performance. The first quintile was supported by allocation effects resulting from a large overweight to the highest-yielding stocks. Stock selection within the second quintile also drove the positive impact from this group. The third and fourth quintiles had slightly negative effects on the Fund, which were negligible, resulting from poor stock selection. The performance difference between the Fund NAV return and Index return for the fiscal year ended March 31, 2024 was primarily attributable to foreign capital gains taxes incurred by the Fund that are not deducted from Index performance.
Shareholder Expense Example (for the six-month period ended March 31, 2024)
| Beginning Account Value | Ending Account Value | Annualized Net Expense Ratio1 | Expenses Paid During the Period1 | |||||||||||||
Actual | $ | 1,000.00 | $ | 1,127.30 | 0.64 | % | $ | 3.40 | ||||||||
Hypothetical (5% return before expenses) | $ | 1,000.00 | $ | 1,021.80 | 0.64 | % | $ | 3.23 | ||||||||
| 1 | Included in the expense ratio are “Other fees” described in Note 6 which are not annualized. Without these expenses, the expense ratio would have been 0.63% and the actual and hypothetical expenses paid during the period would have been $3.37 and $3.20, respectively. |
Performance
| Average Annual Total Return | ||||||||||||||||
| 1 Year | 3 Year | 5 Year | 10 Year | |||||||||||||
Fund NAV Returns | 17.69 | % | 4.97 | % | 5.27 | % | 3.53 | % | ||||||||
Fund Market Price Returns | 17.50 | % | 4.93 | % | 5.25 | % | 3.58 | % | ||||||||
WisdomTree Emerging Markets High Dividend Index | 18.81 | % | 5.99 | % | 6.25 | % | 4.47 | % | ||||||||
MSCI Emerging Markets Index | 8.15 | % | -5.05 | % | 2.22 | % | 2.95 | % | ||||||||
MSCI Emerging Markets Value Index | 11.36 | % | -0.91 | % | 2.09 | % | 2.15 | % | ||||||||
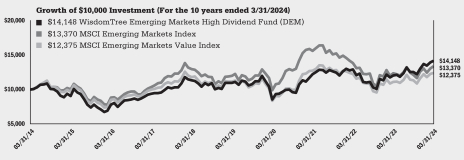
Performance is historical and does not guarantee future results. The returns do not reflect the deduction of taxes that a shareholder would pay on Fund distributions or on the redemption of Fund shares.
| 6 | WisdomTree Trust |
Management’s Discussion of Funds’ Performance
as of March 31, 2024 (unaudited)
WisdomTree Emerging Markets Multifactor Fund (EMMF)
Sector Breakdown†
| Sector | % of Net Assets | |||
Information Technology | 25.2% | |||
Financials | 15.4% | |||
Industrials | 11.6% | |||
Consumer Discretionary | 10.6% | |||
Consumer Staples | 10.1% | |||
Communication Services | 6.0% | |||
Utilities | 5.9% | |||
Energy | 5.8% | |||
Health Care | 5.6% | |||
Materials | 3.5% | |||
Real Estate | 0.1% | |||
Other Assets less Liabilities‡ | 0.2% | |||
Total | 100.0% | |||
| † | The Fund’s sector breakdown is expressed as a percentage of net assets and may change over time. In addition, a sector may be comprised of several industries. It does not include derivatives (if any). |
| ‡ | Other assets less liabilities may include investment of cash collateral for securities on loan and/or receivables/payables on derivatives (if any). |
Top Ten Holdings*
| Description | % of Net Assets | |||
Taiwan Semiconductor Manufacturing Co. Ltd. | 7.7% | |||
Samsung Electronics Co. Ltd. | 2.4% | |||
Want Want China Holdings Ltd. | 1.5% | |||
Quanta Computer, Inc. | 1.5% | |||
Wiwynn Corp. | 1.4% | |||
Meritz Financial Group, Inc. | 1.3% | |||
China Resources Power Holdings Co. Ltd. | 1.2% | |||
PICC Property & Casualty Co. Ltd., Class H | 1.2% | |||
People’s Insurance Co. Group of China Ltd., Class H | 1.2% | |||
Lite-On Technology Corp., ADR | 1.1% | |||
| * | The ten largest holdings are subject to change, and there are no guarantees the Fund will remain invested in any particular company. Excludes derivatives and investment of cash collateral for securities on loan (if any). |
The WisdomTree Emerging Markets Multifactor Fund (the “Fund”) seeks capital appreciation by investing in equity securities of emerging markets countries with the highest composite scores based on two fundamental factors, value and quality measures, and two technical factors, momentum and correlation.
The Fund returned 23.29% at net asset value (“NAV”) for the fiscal year ended March 31, 2024 (for more complete performance information please see the table below). The Fund benefited from positions in the Consumer Discretionary, Communication Services and Materials sectors due to strong stock selection in each. Health Care was the only sector to have a negative impact on the Fund due to poor allocation effects. From a country perspective, China and India were the two biggest contributors to the Fund’s performance primarily due to allocation effects, though China also benefited from strong stock selection. South Korea was the only notable country detractor, due to negative allocation effects.
Shareholder Expense Example (for the six-month period ended March 31, 2024)
| Beginning Account Value | Ending Account Value | Annualized Expense Ratio | Expenses Paid During the Period | |||||||||||||
Actual | $ | 1,000.00 | $ | 1,147.60 | 0.48 | % | $ | 2.58 | ||||||||
Hypothetical (5% return before expenses) | $ | 1,000.00 | $ | 1,022.60 | 0.48 | % | $ | 2.43 | ||||||||
Performance
| Average Annual Total Return | ||||||||||||||||
| 1 Year | 3 Year | 5 Year | Since Inception1 | |||||||||||||
Fund NAV Returns | 23.29 | % | 3.09 | % | 4.71 | % | 3.50 | % | ||||||||
Fund Market Price Returns | 24.05 | % | 3.09 | % | 4.71 | % | 3.72 | % | ||||||||
MSCI Emerging Markets Index | 8.15 | % | -5.05 | % | 2.22 | % | 2.09 | % | ||||||||
| 1 | Total returns are calculated based on the commencement of Fund trading on the NYSE Arca, Inc. on August 10, 2018. |
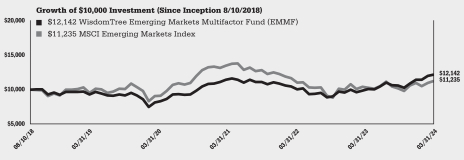
Performance is historical and does not guarantee future results. The returns do not reflect the deduction of taxes that a shareholder would pay on Fund distributions or on the redemption of Fund shares.
| WisdomTree Trust | 7 |
Management’s Discussion of Funds’ Performance
as of March 31, 2024 (unaudited)
WisdomTree Emerging Markets Quality Dividend Growth Fund (DGRE)
Sector Breakdown†
| Sector | % of Net Assets | |||
Information Technology | 23.1% | |||
Financials | 16.6% | |||
Industrials | 12.4% | |||
Consumer Discretionary | 11.0% | |||
Consumer Staples | 10.3% | |||
Materials | 7.3% | |||
Energy | 6.8% | |||
Health Care | 4.2% | |||
Utilities | 4.2% | |||
Communication Services | 4.1% | |||
Real Estate | 0.8% | |||
Other Assets less Liabilities‡ | -0.8% | |||
Total | 100.0% | |||
| † | The Fund’s sector breakdown is expressed as a percentage of net assets and may change over time. In addition, a sector may be comprised of several industries. It does not include derivatives (if any). |
| ‡ | Other assets less liabilities may include investment of cash collateral for securities on loan and/or receivables/payables on derivatives (if any). |
Top Ten Holdings*
| Description | % of Net Assets | |||
Taiwan Semiconductor Manufacturing Co. Ltd. | 7.5% | |||
Samsung Electronics Co. Ltd. | 4.8% | |||
Reliance Industries Ltd. | 1.7% | |||
Al Rajhi Bank | 1.6% | |||
Hyundai Motor Co. | 1.5% | |||
Infosys Ltd. | 1.0% | |||
Hindustan Petroleum Corp. Ltd. | 0.9% | |||
Cipla Ltd. | 0.9% | |||
Tata Consultancy Services Ltd. | 0.9% | |||
International Container Terminal Services, Inc. | 0.9% | |||
| * | The ten largest holdings are subject to change, and there are no guarantees the Fund will remain invested in any particular company. Excludes derivatives and investment of cash collateral for securities on loan (if any). |
The WisdomTree Emerging Markets Quality Dividend Growth Fund (the “Fund”) seeks income and capital appreciation by investing in dividend-paying companies with growth characteristics in the emerging markets region.
The Fund returned 16.02% at net asset value (“NAV”) for the fiscal year ended March 31, 2024 (for more complete performance information please see the table below). It benefited from positions in the Consumer Discretionary, Health Care and Industrials sectors, primarily due to stock selection within each. Information Technology was the only sector that lagged, exclusively due to poor stock selection. A large underweight to China was additive to the performance during the period and resulted in a strong, positive allocation effect. An overweight to India was also helpful and resulted in beneficial allocation effects. Taiwan and South Korea lagged due to poor stock selection effects. Across return-on-equity quintiles, all five exhibited positive effects on Fund performance due to a mixture of stock selection and allocation effects.
Shareholder Expense Example (for the six-month period ended March 31, 2024)
| Beginning Account Value | Ending Account Value | Annualized Expense Ratio | Expenses Paid During the Period | |||||||||||||
Actual | $ | 1,000.00 | $ | 1,159.80 | 0.32 | % | $ | 1.73 | ||||||||
Hypothetical (5% return before expenses) | $ | 1,000.00 | $ | 1,023.40 | 0.32 | % | $ | 1.62 | ||||||||
Performance
| Average Annual Total Return | ||||||||||||||||
| 1 Year | 3 Year | 5 Year | 10 Year | |||||||||||||
Fund NAV Returns | 16.02 | % | -1.77 | % | 3.55 | % | 2.98 | % | ||||||||
Fund Market Price Returns | 15.81 | % | -1.86 | % | 3.54 | % | 3.08 | % | ||||||||
MSCI Emerging Markets Index | 8.15 | % | -5.05 | % | 2.22 | % | 2.95 | % | ||||||||
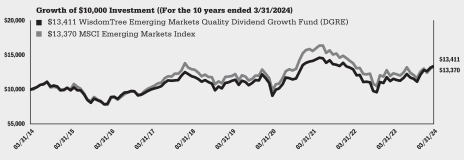
Performance is historical and does not guarantee future results. The returns do not reflect the deduction of taxes that a shareholder would pay on Fund distributions or on the redemption of Fund shares.
| 8 | WisdomTree Trust |
Management’s Discussion of Funds’ Performance
as of March 31, 2024 (unaudited)
WisdomTree Emerging Markets SmallCap Dividend Fund (DGS)
Sector Breakdown†
| Sector | % of Net Assets | |||
Information Technology | 19.1% | |||
Industrials | 14.9% | |||
Financials | 14.6% | |||
Materials | 11.8% | |||
Consumer Discretionary | 11.3% | |||
Consumer Staples | 6.1% | |||
Real Estate | 6.0% | |||
Utilities | 5.2% | |||
Energy | 5.2% | |||
Health Care | 2.9% | |||
Communication Services | 2.4% | |||
Investment Company | 0.2% | |||
Other Assets less Liabilities‡ | 0.3% | |||
Total | 100.0% | |||
| † | The Fund’s sector breakdown is expressed as a percentage of net assets and may change over time. In addition, a sector may be comprised of several industries. It does not include derivatives (if any). |
| ‡ | Other assets less liabilities may include investment of cash collateral for securities on loan and/or receivables/payables on derivatives (if any). |
Top Ten Holdings*
| Description | % of Net Assets | |||
Chicony Electronics Co. Ltd. | 1.2% | |||
Oil India Ltd. | 1.0% | |||
Banco del Bajio SA | 1.0% | |||
WPG Holdings Ltd. | 0.8% | |||
Powertech Technology, Inc. | 0.8% | |||
Old Mutual Ltd. | 0.8% | |||
Lojas Renner SA | 0.8% | |||
Truworths International Ltd. | 0.7% | |||
Tisco Financial Group PCL, NVDR | 0.7% | |||
BNK Financial Group, Inc. | 0.7% | |||
| * | The ten largest holdings are subject to change, and there are no guarantees the Fund will remain invested in any particular company. Excludes derivatives and investment of cash collateral for securities on loan (if any). |
The WisdomTree Emerging Markets SmallCap Dividend Fund (the “Fund”) seeks to track the price and yield performance, before fees and expenses, of the WisdomTree Emerging Markets SmallCap Dividend Index (the “Index”). In seeking to track the Index, the Fund invests in dividend-paying small-cap companies in the emerging markets region. The Fund generally uses a representative sampling strategy to achieve its investment objective, meaning it generally will invest in a sample of securities in the Index.
The Fund returned 16.92% at net asset value (“NAV”) for the fiscal year ended March 31, 2024 (for more complete performance information please see the table below). The Fund benefited from positions in the Information Technology, Consumer Discretionary and Industrials sectors, mainly due to positive stock selection in each. Health Care, Energy, and Materials sectors were the three main detractors due to poor stock selection in the former two and negative allocation effects in the latter. Taiwan was the most impactful country contributor due to a blend of both allocation and stock selection effects, while India, South Africa, and China all lagged due to poor allocation effects. Across dividend yield quintiles, the second and third quintiles also contributed positively to Fund performance due to stock selection effects, while fifth, first, and fourth quintiles all detracted. Negative effects from the former two were due to allocation effects while poor stock selection hampered the fourth quintile.
Shareholder Expense Example (for the six-month period ended March 31, 2024)
| Beginning Account Value | Ending Account Value | Annualized Net Expense Ratio1 | Expenses Paid During the Period1 | |||||||||||||
Actual | $ | 1,000.00 | $ | 1,114.00 | 0.59 | % | $ | 3.12 | ||||||||
Hypothetical (5% return before expenses) | $ | 1,000.00 | $ | 1,022.05 | 0.59 | % | $ | 2.98 | ||||||||
| 1 | Included in the expense ratio are “Other fees” described in Note 6 which are not annualized. Without these expenses, the expense ratio would have been 0.58% and the actual and hypothetical expenses paid during the period would have been $3.09 and $2.95, respectively. |
Performance
| Average Annual Total Return | ||||||||||||||||
| 1 Year | 3 Year | 5 Year | 10 Year | |||||||||||||
Fund NAV Returns | 16.92 | % | 4.92 | % | 6.27 | % | 4.91 | % | ||||||||
Fund Market Price Returns | 16.29 | % | 4.50 | % | 6.18 | % | 4.85 | % | ||||||||
WisdomTree Emerging Markets SmallCap Dividend Index | 18.64 | % | 6.10 | % | 7.51 | % | 6.04 | % | ||||||||
MSCI Emerging Markets Small Cap Index | 20.56 | % | 4.23 | % | 8.51 | % | 5.09 | % | ||||||||
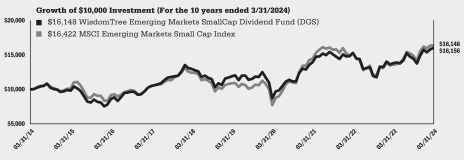
Performance is historical and does not guarantee future results. The returns do not reflect the deduction of taxes that a shareholder would pay on Fund distributions or on the redemption of Fund shares.
| WisdomTree Trust | 9 |
Management’s Discussion of Funds’ Performance
as of March 31, 2024 (unaudited)
WisdomTree Global ex-U.S. Quality Dividend Growth Fund (DNL)
Sector Breakdown†
| Sector | % of Net Assets | |||
Information Technology | 23.2% | |||
Industrials | 18.2% | |||
Health Care | 13.8% | |||
Consumer Discretionary | 9.6% | |||
Materials | 8.4% | |||
Energy | 7.2% | |||
Consumer Staples | 6.0% | |||
Communication Services | 5.8% | |||
Financials | 5.5% | |||
Utilities | 1.9% | |||
Real Estate | 0.0% | * | ||
Investment Company | 0.0% | * | ||
Other Assets less Liabilities‡ | 0.4% | |||
Total | 100.0% | |||
| † | The Fund’s sector breakdown is expressed as a percentage of net assets and may change over time. In addition, a sector may be comprised of several industries. It does not include derivatives (if any). |
| ‡ | Other assets less liabilities may include investment of cash collateral for securities on loan and/or receivables/payables on derivatives (if any). |
| * | Represents less than 0.1%. |
Top Ten Holdings*
| Description | % of Net Assets | |||
Taiwan Semiconductor Manufacturing Co. Ltd. | 5.4% | |||
Novo Nordisk AS, Class B | 5.3% | |||
Samsung Electronics Co. Ltd. | 4.6% | |||
Canadian Natural Resources Ltd. | 4.0% | |||
Roche Holding AG, Bearer Shares | 4.0% | |||
ASML Holding NV | 3.1% | |||
Deutsche Post AG, Registered Shares | 2.8% | |||
UBS Group AG, Registered Shares | 2.6% | |||
Diageo PLC | 2.5% | |||
Tencent Holdings Ltd. | 2.4% | |||
| * | The ten largest holdings are subject to change, and there are no guarantees the Fund will remain invested in any particular company. Excludes derivatives and investment of cash collateral for securities on loan (if any). |
The WisdomTree Global ex-U.S. Quality Dividend Growth Fund (the “Fund”) seeks to track the price and yield performance, before fees and expenses, of the WisdomTree Global ex-U.S. Quality Dividend Growth Index (the “Index”). In seeking to track the Index, the Fund invests in dividend-paying companies with growth characteristics in developed and emerging equity markets, excluding the U.S. The Fund generally uses a representative sampling strategy to achieve its investment objective, meaning it generally will invest in a sample of securities in the Index.
The Fund returned 12.18% at net asset value (“NAV”) for the fiscal year ended March 31, 2024 (for more complete performance information please see the table below). It benefited from exposures to Information Technology, Health Care and Materials primarily due to stock selection in the latter two sectors and a combination of allocation and stock selection in Information Technology. Consumer Discretionary, Financials and Energy sectors all detracted from performance with negative allocation effects exhibited in each. Consumer Discretionary, however, was more negatively impacted by poor stock selection. From a country perspective, exposures to Denmark, Taiwan and the Netherlands were all additive to performance due to a mix of allocation and stock selection effects in each. Japan, Canada, and France, however, detracted from performance due to poor allocation effects in Japan and negative stock selection effects in France. Across return-on-equity (ROE) quintiles, positive performance was (ironically) driven by the first and fifth quintiles, representing the highest and lowest ROE stocks, respectively. This was primarily due to stock selection in the first quintile and a blend of allocation and stock selection effects in the fifth quintile. The second and fourth quintiles were the worst performing groups, almost exclusively driven by poor stock selection.
Shareholder Expense Example (for the six-month period ended March 31, 2024)
| Beginning Account Value | Ending Account Value | Annualized Net Expense Ratio1 | Expenses Paid During the Period1 | |||||||||||||
Actual | $ | 1,000.00 | $ | 1,171.40 | 0.43 | % | $ | 2.33 | ||||||||
Hypothetical (5% return before expenses) | $ | 1,000.00 | $ | 1,022.85 | 0.43 | % | $ | 2.17 | ||||||||
| 1 | Included in the expense ratio are “Other fees” described in Note 6 which are not annualized. Without these expenses, the expense ratio would have been 0.42% and the actual and hypothetical expenses paid during the period would have been $2.28 and $2.12, respectively. |
Performance
| Average Annual Total Return | ||||||||||||||||
| 1 Year | 3 Year | 5 Year | 10 Year | |||||||||||||
Fund NAV Returns | 12.18 | % | 3.07 | % | 9.73 | % | 6.63 | % | ||||||||
Fund Market Price Returns | 11.59 | % | 2.79 | % | 9.59 | % | 6.64 | % | ||||||||
WisdomTree Global ex-U.S. Quality Dividend Growth Index | 12.66 | % | 3.52 | % | 10.28 | % | 7.26 | % | ||||||||
MSCI AC World ex-USA Growth Index | 11.06 | % | -0.81 | % | 6.20 | % | 5.10 | % | ||||||||
MSCI AC World ex-USA Index | 13.26 | % | 1.94 | % | 5.97 | % | 4.25 | % | ||||||||
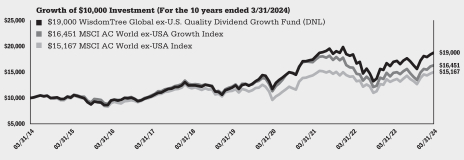
Performance is historical and does not guarantee future results. The returns do not reflect the deduction of taxes that a shareholder would pay on Fund distributions or on the redemption of Fund shares.
| 10 | WisdomTree Trust |
Management’s Discussion of Funds’ Performance
as of March 31, 2024 (unaudited)
WisdomTree Global High Dividend Fund (DEW)
Sector Breakdown†
| Sector | % of Net Assets | |||
Financials | 26.8% | |||
Consumer Staples | 12.0% | |||
Energy | 11.8% | |||
Health Care | 10.3% | |||
Utilities | 10.2% | |||
Real Estate | 9.7% | |||
Information Technology | 4.3% | |||
Consumer Discretionary | 4.1% | |||
Industrials | 3.9% | |||
Materials | 3.6% | |||
Communication Services | 2.7% | |||
Other Assets less Liabilities‡ | 0.6% | |||
Total | 100.0% | |||
| † | The Fund’s sector breakdown is expressed as a percentage of net assets and may change over time. In addition, a sector may be comprised of several industries. It does not include derivatives (if any). |
| ‡ | Other assets less liabilities may include investment of cash collateral for securities on loan and/or receivables/payables on derivatives (if any). |
Top Ten Holdings*
| Description | % of Net Assets | |||
AbbVie, Inc. | 4.2% | |||
Coca-Cola Co. | 2.9% | |||
Chevron Corp. | 2.3% | |||
Altria Group, Inc. | 2.2% | |||
Bank of America Corp. | 2.0% | |||
International Business Machines Corp. | 1.7% | |||
Philip Morris International, Inc. | 1.7% | |||
Pfizer, Inc. | 1.6% | |||
Bristol-Myers Squibb Co. | 1.5% | |||
ConocoPhillips | 1.2% | |||
| * | The ten largest holdings are subject to change, and there are no guarantees the Fund will remain invested in any particular company. Excludes derivatives and investment of cash collateral for securities on loan (if any). |
The WisdomTree Global High Dividend Fund (the “Fund”) seeks to track the price and yield performance, before fees and expenses, of the WisdomTree Global High Dividend Index (the “Index”). In seeking to track the Index, the Fund invests in high-dividend-yielding companies in the U.S. and in developed and emerging equity markets. The Fund generally uses a representative sampling strategy to achieve its investment objective, meaning it generally will invest in a sample of securities in the Index.
The Fund returned 13.73% at net asset value (“NAV”) for the fiscal year ended March 31, 2024 (for more complete performance information please see the table below). Positions in the Financials, Consumer Discretionary and Communication Services sectors were additive during the period due to strong stock selection. The Industrials and Utilities sectors detracted from performance due to poor stock selection in the former and negative allocation effects in the latter. Across countries, China had a notable performance impact due to a mix of allocation and selection effects. Switzerland was also additive, mainly due to stock selection. Japan and India lagged primarily due to negative allocation effects in both cases, as the Fund was underweight in two of the strongest performing countries during the period. Across dividend yield quintiles, only the top quintile (representing the highest-yielding stocks) had a notable negative effect on performance, primarily due to poor stock selection. The fifth quintile (representing the lowest-yielding stocks) aided performance due to a mix of allocation and stock selection effects.
Shareholder Expense Example (for the six-month period ended March 31, 2024)
| Beginning Account Value | Ending Account Value | Annualized Net Expense Ratio | Expenses Paid During the Period | |||||||||||||
Actual | $ | 1,000.00 | $ | 1,140.50 | 0.58 | % | $ | 3.10 | ||||||||
Hypothetical (5% return before expenses) | $ | 1,000.00 | $ | 1,022.10 | 0.58 | % | $ | 2.93 | ||||||||
Performance
| Average Annual Total Return | ||||||||||||||||
| 1 Year | 3 Year | 5 Year | 10 Year | |||||||||||||
Fund NAV Returns | 13.73 | % | 7.13 | % | 6.30 | % | 4.75 | % | ||||||||
Fund Market Price Returns | 13.56 | % | 7.05 | % | 6.24 | % | 4.76 | % | ||||||||
WisdomTree Global High Dividend Index | 13.45 | % | 6.87 | % | 6.02 | % | 4.55 | % | ||||||||
MSCI AC World Index | 23.22 | % | 6.96 | % | 10.92 | % | 8.66 | % | ||||||||
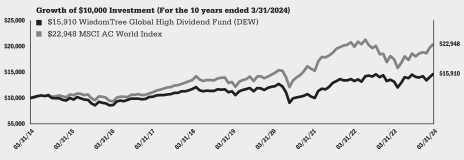
Performance is historical and does not guarantee future results. The returns do not reflect the deduction of taxes that a shareholder would pay on Fund distributions or on the redemption of Fund shares.
| WisdomTree Trust | 11 |
Management’s Discussion of Funds’ Performance
as of March 31, 2024 (unaudited)
WisdomTree India Earnings Fund (EPI)
Sector Breakdown†
| Sector | % of Net Assets | |||
Financials | 23.1% | |||
Energy | 18.7% | |||
Materials | 12.6% | |||
Information Technology | 12.0% | |||
Utilities | 8.4% | |||
Industrials | 8.2% | |||
Consumer Discretionary | 7.8% | |||
Health Care | 4.8% | |||
Consumer Staples | 3.8% | |||
Communication Services | 1.7% | |||
Real Estate | 0.9% | |||
Other Assets less Liabilities‡ | -2.0% | |||
Total | 100.0% | |||
| † | The Fund’s sector breakdown is expressed as a percentage of net assets and may change over time. In addition, a sector may be comprised of several industries. It does not include derivatives (if any). |
| ‡ | Other assets less liabilities may include investment of cash collateral for securities on loan and/or receivables/payables on derivatives (if any). |
Top Ten Holdings*
| Description | % of Net Assets | |||
Reliance Industries Ltd. | 8.5% | |||
HDFC Bank Ltd. | 5.2% | |||
ICICI Bank Ltd. | 5.1% | |||
Infosys Ltd. | 4.5% | |||
Oil & Natural Gas Corp. Ltd. | 3.4% | |||
Coal India Ltd. | 3.0% | |||
Tata Consultancy Services Ltd. | 2.7% | |||
NTPC Ltd. | 2.5% | |||
State Bank of India | 2.4% | |||
Power Grid Corp. of India Ltd. | 2.3% | |||
| * | The ten largest holdings are subject to change, and there are no guarantees the Fund will remain invested in any particular company. Excludes derivatives and investment of cash collateral for securities on loan (if any). |
The WisdomTree India Earnings Fund (the “Fund”) seeks to track the price and yield performance, before fees and expenses, of the WisdomTree India Earnings Index (the “Index”). In seeking to track the Index, the Fund invests in profitable companies in the Indian equity market. The Fund generally uses a representative sampling strategy to achieve its investment objective, meaning it generally will invest in a sample of securities in the Index.
The Fund returned 38.08% at net asset value (“NAV”) for the fiscal year ended March 31, 2024 (for more complete performance information please see the table below). Indian equity markets enjoyed strong performance during the period resulting from strong economic growth and future growth prospects. They also received a tailwind from reallocation effects within investors’ emerging markets portfolios, as many turned to India at the expense of souring sentiment toward China. The Fund benefited from its positions in the Financials and Energy sectors, mainly due to a combination of stock selection and asset allocation effects in each. Consumer Discretionary sector was the only large detractor, which was also due to a negative mix of both effects. Across price-to-earnings (P/E) quintiles, the first (lowest P/E) and third quintiles positively impacted Fund performance due to allocation effects in the former and strong stock selection in the latter. The fifth quintile, containing the highest P/E stocks, detracted from performance due to poor stock selection. The performance difference between the Fund NAV return and Index return for the fiscal year ended March 31, 2024 was primarily attributable to foreign capital gains taxes incurred by the Fund that are not deducted from Index performance.
Shareholder Expense Example (for the six-month period ended March 31, 2024)
| Beginning Account Value | Ending Account Value | Annualized Net Expense Ratio | Expenses Paid During the Period | |||||||||||||
Actual | $ | 1,000.00 | $ | 1,174.50 | 0.83 | % | $ | 4.51 | ||||||||
Hypothetical (5% return before expenses) | $ | 1,000.00 | $ | 1,020.85 | 0.83 | % | $ | 4.19 | ||||||||
Performance
| Average Annual Total Return | ||||||||||||||||
| 1 Year | 3 Year | 5 Year | 10 Year | |||||||||||||
Fund NAV Returns | 38.08 | % | 14.32 | % | 12.64 | % | 10.26 | % | ||||||||
Fund Market Price Returns | 38.16 | % | 14.16 | % | 12.73 | % | 10.30 | % | ||||||||
WisdomTree India Earnings Index | 45.47 | % | 18.10 | % | 15.54 | % | 12.31 | % | ||||||||
MSCI India Index | 36.83 | % | 12.31 | % | 11.55 | % | 9.69 | % | ||||||||
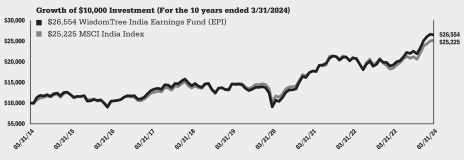
Performance is historical and does not guarantee future results. The returns do not reflect the deduction of taxes that a shareholder would pay on Fund distributions or on the redemption of Fund shares.
| 12 | WisdomTree Trust |
Management’s Discussion of Funds’ Performance
as of March 31, 2024 (unaudited)
WisdomTree New Economy Real Estate Fund (WTRE)
Sector Breakdown†
| Sector | % of Net Assets | |||
Real Estate | 87.7% | |||
Communication Services | 6.3% | |||
Consumer Discretionary | 3.8% | |||
Information Technology | 1.4% | |||
Other Assets less Liabilities‡ | 0.8% | |||
Total | 100.0% | |||
| † | The Fund’s sector breakdown is expressed as a percentage of net assets and may change over time. In addition, a sector may be comprised of several industries. It does not include derivatives (if any). |
| ‡ | Other assets less liabilities may include investment of cash collateral for securities on loan and/or receivables/payables on derivatives (if any). |
Top Ten Holdings*
| Description | % of Net Assets | |||
Goodman Group | 5.5% | |||
Cellnex Telecom SA | 5.2% | |||
Ventas, Inc. | 5.0% | |||
Segro PLC | 4.8% | |||
SBA Communications Corp. | 4.4% | |||
Iron Mountain, Inc. | 3.9% | |||
Alexandria Real Estate Equities, Inc. | 3.8% | |||
Airbnb, Inc., Class A | 3.8% | |||
Digital Realty Trust, Inc. | 3.7% | |||
Prologis, Inc. | 3.7% | |||
| * | The ten largest holdings are subject to change, and there are no guarantees the Fund will remain invested in any particular company. Excludes derivatives and investment of cash collateral for securities on loan (if any). |
The WisdomTree New Economy Real Estate Fund (the “Fund”) seeks to track the price and yield performance, before fees and expenses, of the CenterSquare New Economy Real Estate Index (the “Index”). In seeking to track the Index, the Fund invests in dividend-paying companies in global equity securities, including American Depositary Receipts, of listed real estate investment trusts and companies identified as being significantly real estate related.
The Fund returned 8.42% at net asset value (“NAV”) for the fiscal year ended March 31, 2024 (for more complete performance information please see the table below). The Fund’s overweight position in Real Estate sector securities detracted from performance during the period. This negative effect was partially offset by exposures in the Consumer Discretionary sector, which benefited due to stock selection. Though the Fund is global in exposure, it is also primarily concentrated in the U.S. As a result, the selected U.S. real estate securities have a disproportionate influence on Fund performance than other categories. Real Estate was the third-worst performing sector in the U.S. during the period, so the Fund was not able to achieve better performance that would have been experienced with a more diversified equity allocation.
Shareholder Expense Example (for the six-month period ended March 31, 2024)
| Beginning Account Value | Ending Account Value | Annualized Expense Ratio | Expenses Paid During the Period | |||||||||||||
Actual | $ | 1,000.00 | $ | 1,152.00 | 0.58 | % | $ | 3.12 | ||||||||
Hypothetical (5% return before expenses) | $ | 1,000.00 | $ | 1,022.10 | 0.58 | % | $ | 2.93 | ||||||||
Performance
| Average Annual Total Return | ||||||||||||||||
| 1 Year | 3 Year | 5 Year | 10 Year | |||||||||||||
Fund NAV Returns | 8.42 | % | -9.05 | % | -7.09 | % | 0.38 | % | ||||||||
Fund Market Price Returns | 8.91 | % | -9.03 | % | -7.07 | % | 0.42 | % | ||||||||
WisdomTree Global ex-U.S. Real Estate/CenterSquare New Economy Real Estate Spliced Index1 | 8.48 | % | -9.01 | % | -6.99 | % | 0.55 | % | ||||||||
Dow Jones Global ex-U.S. Select Real Estate Securities Index/MSCI World Real Estate Investment Trust USD Spliced Index2 | 3.99 | % | -7.83 | % | -4.84 | % | -0.58 | % | ||||||||
MSCI AC World ex-USA Index | 13.26 | % | 1.94 | % | 5.97 | % | 4.25 | % | ||||||||
| 1 | WisdomTree Global ex-U.S. Real Estate Index through April 20, 2022; CenterSquare New Economy Real Estate Index thereafter. |
| 2 | Dow Jones Global ex-U.S. Select Real Estate Securities Index through April 20, 2022; MSCI World Real Estate Investment Trust USD Index thereafter. |
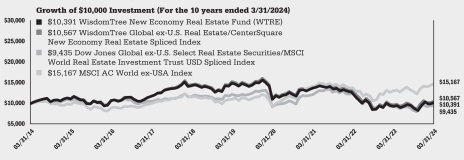
Performance is historical and does not guarantee future results. The returns do not reflect the deduction of taxes that a shareholder would pay on Fund distributions or on the redemption of Fund shares.
| WisdomTree Trust | 13 |
Description of Terms and Indexes (unaudited)
Below are descriptions of certain terms and of each Index referenced in this report:
Allocation Effect measures an investment manager’s ability to effectively allocate a portfolio’s assets to various segments. A segment refers to assets or securities that are grouped within a certain classification such as sectors, industries, or countries. The allocation effect determines whether the overweighting or underweighting of segments relative to a benchmark contributes positively or negatively to the overall portfolio return. Positive allocation occurs when the portfolio is overweighted in a segment that outperforms the benchmark and underweighted in a segment that underperforms the benchmark. Negative allocation occurs when the portfolio is overweighted in a segment that underperforms the benchmark and underweighted in a segment that outperforms the benchmark.
The CenterSquare New Economy Real Estate Index is a weighted index that consists of global stocks of real estate companies that have material direct and/or indirect exposure to technology, sciences and/or ecommerce related business models and meet specific screening requirements that consider factors including growth, valuation and leverage criteria.
Correlation is a statistical measure of how two sets of returns move in relation to each other. Correlation coefficients range from -1 to 1. A correlation of 1 means the two subjects of analysis move in lockstep with each other. A correlation of -1 means the two subjects of analysis have moved in exactly the opposite direction.
The Dow Jones Global ex-U.S. Select Real Estate Securities Index is a float-adjusted market capitalization weighted index that defines and measures the investable universe of publicly traded real estate securities in countries outside the U.S.
Factors generally are attributes that are based on fundamentals or share price behavior.
Gross Domestic Product (GDP) is the total monetary or market value of all the finished goods and services produced within a country’s borders in a specific time period. As a broad measure of overall domestic production, it functions as a comprehensive scorecard of a country’s economic health.
Growth is generally characterized by higher price levels relative to fundamentals, such as dividends or earnings. Price levels are higher because investors are willing to pay more due to their expectations of future improvements in these fundamentals.
Momentum is generally characterized by assets with recent price increase trends over time. This term is also associated with the momentum factor which associates these stock characteristics with excess return vs. the market over time.
The MSCI AC World ex-USA Growth Index is comprised of growth stocks in the developed and emerging markets covered by MSCI, excluding the U.S.
The MSCI AC World ex-USA Index is a free float-adjusted market capitalization-weighted index designed to measure the combined equity market performance of developed and emerging markets countries, excluding the U.S.
The MSCI AC World Index is comprised of the world stock market indexes covered by MSCI.
The MSCI China Index is a free float-adjusted market capitalization weighted index designed to measure the performance of the Chinese equity market.
The MSCI Emerging Markets Index is a free float-adjusted market capitalization index that is designed to measure emerging markets equity performance.
The MSCI Emerging Markets Small Cap Index is a free float-adjusted market capitalization index that is designed to measure the performance of small capitalization equities in the emerging markets.
The MSCI Emerging Markets Value Index captures large and mid cap securities exhibiting overall value style characteristics across 27 Emerging Markets countries.
The MSCI India Index is a free float-adjusted market capitalization index that is designed to measure the performance of the Indian equity market.
| 14 | WisdomTree Trust |
Description of Terms and Indexes (unaudited) (continued)
The MSCI World Real Estate Investment Trusts Index is a free float-adjusted market capitalization index that captures large and mid cap companies.
Price-to-earnings (P/E) ratio measures a company’s share price relative to its earnings per share.
Quality is generally characterized by higher efficiency and profitability. Typical measures include earnings, return-on-equity, return on assets, operating profitability as well as others. This term is also related to the quality factor, which associates these stock characteristics with excess returns vs. the market over time.
Quintiles refers to separating a universe of companies into five groups of equal size on the basis of dividend yield, price-to-earnings, or return-on-equity, as applicable.
Return-on-Equity (ROE) measures a corporation’s profitability by revealing how much profit a company generates with the money shareholders have invested.
Risk-on and Risk-off refers to investors’ appetites for risk which rise and fall over time. During periods when risk is perceived to be low, the risk-on risk-off theory states that investors tend to be engage in higher-risk investments (i.e., “Risk-on”). When risk is perceived to be high, investors have the tendency to gravitate toward lower-risk investments (i.e., “Risk-off”).
Selection Effect measures an investment manager’s ability to select securities within a given segment relative to a benchmark. The over or underperformance of the portfolio is weighted by the benchmark weight, therefore, selection is not affected by the investment manager’s allocation to the segment. The weight of the segment in the portfolio determines the size of the effect — the larger the segment, the larger the effect is, positive or negative. A positive selection effect occurs when the portfolio return is greater than the benchmark return. Thus, the investment manager made good decisions in selecting securities that, as a whole, outperformed similar securities in the benchmark. A negative selection effect occurs when the portfolio return is less than the benchmark return. Thus, the investment manager made poor decisions in selecting securities that, as a whole, underperformed similar securities in the benchmark.
The WisdomTree China Dividend ex-Financials Index is comprised of Chinese dividend paying stocks outside the Financials sector.
The WisdomTree China ex-State-Owned Enterprises Index measures the performance of Chinese stocks that are not state-owned enterprises. WisdomTree, Inc., as index provider, defines state-owned enterprises as companies with over 20% government ownership.
The WisdomTree Emerging Markets ex-State-Owned Enterprises Index is a modified market capitalization weighted index that consists of common stocks in emerging markets, excluding common stocks of “state-owned enterprises”. WisdomTree, Inc., as index provider, defines state-owned enterprises as companies with over 20% government ownership.
The WisdomTree Emerging Markets High Dividend Index is comprised of the highest dividend-yielding stocks selected from the WisdomTree Emerging Markets Dividend Index.
The WisdomTree Emerging Markets SmallCap Dividend Index is comprised of primarily small-capitalization stocks selected from the WisdomTree Emerging Markets Dividend Index.
The WisdomTree Global ex-U.S. Quality Dividend Growth Index is comprised of growth companies selected from developed and emerging markets outside the U.S.
The WisdomTree Global ex-U.S. Real Estate Index is comprised of companies in developed and emerging markets outside of Canada and the U.S., which WisdomTree classifies as being Global Real Estate securities.
The WisdomTree Global High Dividend Index is comprised of high dividend-paying companies selected from the WisdomTree Global Dividend Index.
| WisdomTree Trust | 15 |
Description of Terms and Indexes (unaudited) (continued)
The WisdomTree India Earnings Index is a fundamentally weighted index that is comprised of companies incorporated and traded in India that are profitable and that are eligible to be purchased by foreign investors as of the index measurement date.
The Dow Jones Global ex-U.S. Select Real Estate Securities Index is calculated, distributed and marketed by Dow Jones Indexes, a licensed trademark of CME Group Index Services LLC, and has been licensed for use.
The Global Industry Classification Standard (“GICS”) was developed by and is the exclusive property and a service mark of MSCI Inc. (“MSCI”) and Standard & Poor’s (“S&P”), a division of The McGraw-Hill Companies, Inc. and is licensed for use by WisdomTree, Inc. Neither MSCI, S&P nor any other party involved in making or compiling the GICS or any GICS classifications makes any express or implied warranties or representations with respect to such standard or classification (or the results to be obtained by the use thereof), and all such parties hereby expressly disclaim all warranties of originality, accuracy, completeness, merchantability and fitness for a particular purpose with respect to any such standard or classification. Without limiting any of the foregoing, in no event shall MSCI, S&P, any of their affiliates or any third party involved in making or compiling the GICS or any GICS classifications have any liability for any direct, indirect, special, punitive, consequential or any other damages (including lost profits) even if notified of the possibility of such damages.
Neither MSCI nor any other party involved in or related to compiling, computing or creating the MSCI data makes any express or implied warranties or representations with respect to such data (or the results to be obtained by the use thereof), and all such parties hereby expressly disclaim all warranties of originality, accuracy, completeness, merchantability or fitness for a particular purpose with respect to any such data. Without limiting any of the foregoing, in no event shall MSCI, any of its affiliates or any third party involved in or related to compiling, computing or creating the data have any liability for any direct, indirect, special, punitive, consequential or any other damages (including lost profits) even if notified of the possibility of such damages. No further distribution or dissemination of the MSCI data is permitted without MSCI’s express written consent.
The New Economy Real Estate Fund is not sponsored, endorsed, sold or promoted by CenterSquare Investment Management LLC (“CenterSquare”), any of its affiliates or any other third party involved in, or related to, calculating, compiling or creating the CenterSquare New Economy Real Estate Index (collectively, the “CenterSquare Parties”). The CenterSquare New Economy Real Estate Index is the exclusive property of CenterSquare and has been licensed for use by WisdomTree Asset Management and WisdomTree Trust as the Issuer of the New Economy Real Estate Fund. CenterSquare and the CenterSquare New Economy Real Estate Index’s name are trademarks of CenterSquare. None of the CenterSquare Parties makes any representation or warranty, express or implied, to the issuer or owners of shares of the New Economy Real Estate Fund, or any other person or entity, regarding the advisability of investing in funds generally, or in the New Economy Real Estate Fund particularly, or the ability of the CenterSquare New Economy Real Estate Index to track its corresponding market performance. None of the CenterSquare Parties has any obligation to take the needs of the issuer or owners of shares of the New Economy Real Estate Fund, or any other person or entity, into consideration in determining, composing or calculating the CenterSquare New Economy Real Estate Index. None of the CenterSquare Parties is responsible for, or has participated in, the determination of the timing of, prices at, or quantities of the New Economy Real Estate Fund to be issued or in the determination or calculation of the equation by, or the consideration into which, the New Economy Real Estate Fund is redeemable. Further, none of the CenterSquare Parties has any obligation or liability to the issuer or owners of shares of the New Economy Real Estate Fund, or any other person or entity, in connection with the administration, marketing or offering of the New Economy
| 16 | WisdomTree Trust |
Description of Terms and Indexes (unaudited) (concluded)
Real Estate Fund, whether as a result of statements included in the New Economy Real Estate Fund’s public offering documents or otherwise.
WisdomTree, Inc. and WisdomTree Asset Management, Inc. (together, “WisdomTree”) and the Funds make no representation or warranty, express or implied, to the owners of shares of the Funds or any member of the public regarding the advisability of investing in securities generally or in the Funds particularly or the ability of the underlying Indexes to track the performance of their underlying securities. WisdomTree is the licensor of certain trademarks, service marks and trade names of the Funds. WisdomTree has no obligation to take the needs of the Funds or the owners of shares of the Funds into consideration in determining, composing, or calculating the underlying WisdomTree Indexes of the applicable Funds. WisdomTree is not responsible for, and has not participated in, the determination of the timing of, prices of, or quantities of shares of the Funds to be issued or in the determination or calculation of the equation by which the shares of the Funds are redeemable. WisdomTree and the Funds do not guarantee the accuracy, completeness, or performance of the underlying Indexes or the data included therein and shall have no liability in connection with the underlying Indexes or their calculation.
Index performance information assumes the reinvestment of dividends and excludes management fees, transaction costs and expenses. You cannot directly invest in an index.
* * * * * *
Abbreviations used in the schedules of investments and related tables included in this report are as follows:
| CURRENCY ABBREVIATIONS: | ||||||||||
| BRL | Brazilian real | IDR | Indonesian rupiah | SAR | Saudi riyal | |||||
| CLP | Chilean peso | INR | Indian rupee | THB | Thai baht | |||||
| CNY | Chinese yuan | KRW | South Korean won | TRY | Turkish new lira | |||||
| CZK | Czech koruna | MXN | Mexican peso | TWD | New Taiwan dollar | |||||
| GBP | British pound | MYR | Malaysian ringgit | USD | U.S. dollar | |||||
| HKD | Hong Kong dollar | PHP | Philippine peso | ZAR | South African rand | |||||
| HUF | Hungary forint | PLN | Polish zloty | |||||||
| OTHER ABBREVIATIONS: | ||||||||||
| ADR | American Depositary Receipt | |||||||||
| CVA | Certificaten Van Aandelen (Certificate of Stock) | |||||||||
| GDR | Global Depositary Receipt | |||||||||
| NVDR | Non-Voting Depositary Receipt | |||||||||
| WisdomTree Trust | 17 |
Schedule of Investments
WisdomTree China ex-State-Owned Enterprises Fund (CXSE)
March 31, 2024
| Investments | Shares | Value | ||||||
| COMMON STOCKS – 100.0% |
| |||||||
| China – 99.7% |
| |||||||
| Air Freight & Logistics – 1.4% |
| |||||||
JD Logistics, Inc.*(a) | 564,900 | $ | 575,261 | |||||
SF Holding Co. Ltd., Class A | 394,161 | 1,976,125 | ||||||
ZTO Express Cayman, Inc.(b) | 113,332 | 2,458,813 | ||||||
|
| |||||||
| Total Air Freight & Logistics |
| 5,010,199 | ||||||
| Automobile Components – 0.5% |
| |||||||
Fuyao Glass Industry Group Co. Ltd., Class A | 152,167 | 906,664 | ||||||
Fuyao Glass Industry Group Co. Ltd., Class H(a) | 136,900 | 689,184 | ||||||
Minth Group Ltd. | 151,200 | 238,784 | ||||||
|
| |||||||
| Total Automobile Components |
| 1,834,632 | ||||||
| Automobiles – 5.1% |
| |||||||
BYD Co. Ltd., Class A | 89,500 | 2,503,150 | ||||||
BYD Co. Ltd., Class H | 215,000 | 5,538,143 | ||||||
Geely Automobile Holdings Ltd. | 1,189,900 | 1,404,810 | ||||||
Great Wall Motor Co. Ltd., Class A | 113,300 | 356,423 | ||||||
Great Wall Motor Co. Ltd., Class H(b) | 513,900 | 571,259 | ||||||
Li Auto, Inc., Class A* | 323,000 | 5,006,089 | ||||||
NIO, Inc., Class A*(b) | 314,840 | 1,506,527 | ||||||
XPeng, Inc., Class A*(b) | 281,200 | 1,153,335 | ||||||
Yadea Group Holdings Ltd.(a) | 232,200 | 376,198 | ||||||
|
| |||||||
| Total Automobiles |
| 18,415,934 | ||||||
| Banks – 1.5% |
| |||||||
Bank of Suzhou Co. Ltd., Class A | 486,300 | 479,575 | ||||||
China Minsheng Banking Corp. Ltd., Class A | 4,185,436 | 2,334,722 | ||||||
China Minsheng Banking Corp. Ltd., Class H(b) | 2,086,900 | 722,614 | ||||||
Ping An Bank Co. Ltd., Class A | 1,349,200 | 1,954,931 | ||||||
|
| |||||||
| Total Banks |
| 5,491,842 | ||||||
| Beverages – 0.9% |
| |||||||
Nongfu Spring Co. Ltd., Class H(a)(b) | 583,300 | 3,148,864 | ||||||
| Biotechnology – 2.8% |
| |||||||
Akeso, Inc.*(a)(b) | 159,600 | 951,305 | ||||||
BeiGene Ltd.* | 272,100 | 3,306,315 | ||||||
Chongqing Zhifei Biological Products Co. Ltd., Class A | 177,850 | 1,100,846 | ||||||
Imeik Technology Development Co. Ltd., Class A | 13,580 | 646,099 | ||||||
Innovent Biologics, Inc.*(a) | 461,200 | 2,221,600 | ||||||
Shanghai RAAS Blood Products Co. Ltd., Class A | 787,100 | 769,711 | ||||||
Walvax Biotechnology Co. Ltd., Class A | 244,600 | 518,146 | ||||||
Zai Lab Ltd.*(b) | 282,700 | 465,962 | ||||||
|
| |||||||
| Total Biotechnology |
| 9,979,984 | ||||||
| Broadline Retail – 16.7% |
| |||||||
Alibaba Group Holding Ltd. | 3,522,400 | 31,616,965 | ||||||
JD.com, Inc., Class A | 535,502 | 7,382,743 | ||||||
MINISO Group Holding Ltd. | 118,200 | 607,881 | ||||||
PDD Holdings, Inc., ADR* | 166,488 | 19,354,230 | ||||||
Vipshop Holdings Ltd., ADR | 72,382 | 1,197,922 | ||||||
|
| |||||||
| Total Broadline Retail |
| 60,159,741 | ||||||
| Building Products – 0.3% |
| |||||||
Beijing New Building Materials PLC, Class A | 142,300 | 556,037 | ||||||
Xinyi Glass Holdings Ltd. | 642,000 | 680,025 | ||||||
|
| |||||||
| Total Building Products |
| 1,236,062 | ||||||
| Capital Markets – 1.0% |
| |||||||
East Money Information Co. Ltd., Class A | 1,970,243 | 3,497,938 | ||||||
| Chemicals – 2.2% |
| |||||||
Dongyue Group Ltd.(b) | 441,900 | 414,434 | ||||||
Ganfeng Lithium Group Co. Ltd., Class A | 167,000 | 836,334 | ||||||
Ganfeng Lithium Group Co. Ltd., Class H(a)(b) | 122,340 | 374,377 | ||||||
Guangzhou Tinci Materials Technology Co. Ltd., Class A | 191,000 | 584,807 | ||||||
Hengli Petrochemical Co. Ltd., Class A* | 433,200 | 832,343 | ||||||
Jiangsu Eastern Shenghong Co. Ltd., Class A | 385,400 | 535,071 | ||||||
LB Group Co. Ltd., Class A | 193,200 | 503,995 | ||||||
Ningxia Baofeng Energy Group Co. Ltd., Class A | 352,400 | 793,584 | ||||||
Rongsheng Petrochemical Co. Ltd., Class A | 491,600 | 745,485 | ||||||
Satellite Chemical Co. Ltd., Class A* | 265,000 | 675,238 | ||||||
Tianqi Lithium Corp., Class A | 171,688 | 1,134,355 | ||||||
Yunnan Energy New Material Co. Ltd., Class A | 80,000 | 457,826 | ||||||
|
| |||||||
| Total Chemicals |
| 7,887,849 | ||||||
| Communications Equipment – 0.9% |
| |||||||
BYD Electronic International Co. Ltd. | 233,500 | 860,732 | ||||||
Hengtong Optic-electric Co. Ltd., Class A | 278,469 | 473,678 | ||||||
Zhongji Innolight Co. Ltd., Class A | 91,700 | 1,977,378 | ||||||
|
| |||||||
| Total Communications Equipment |
| 3,311,788 | ||||||
| Construction & Engineering – 0.1% |
| |||||||
China Conch Venture Holdings Ltd. | 531,663 | 369,548 | ||||||
| Construction Materials – 0.3% |
| |||||||
Beijing Oriental Yuhong Waterproof Technology Co. Ltd., Class A | 299,000 | 651,504 | ||||||
China Jushi Co. Ltd., Class A | 353,500 | 524,865 | ||||||
|
| |||||||
| Total Construction Materials |
| 1,176,369 | ||||||
| Consumer Staples Distribution & Retail – 0.3% |
| |||||||
JD Health International, Inc.*(a)(b) | 326,850 | 1,156,814 | ||||||
| Diversified Consumer Services – 0.1% |
| |||||||
East Buy Holding Ltd.*(a)(b) | 95,000 | 252,477 | ||||||
| Electrical Equipment – 4.4% |
| |||||||
Contemporary Amperex Technology Co. Ltd., Class A | 372,206 | 9,748,594 | ||||||
Eve Energy Co. Ltd., Class A | 189,100 | 1,019,938 | ||||||
Jiangsu Zhongtian Technology Co. Ltd., Class A | 382,200 | 738,563 | ||||||
Sieyuan Electric Co. Ltd., Class A | 82,100 | 674,517 | ||||||
Sungrow Power Supply Co. Ltd., Class A | 146,700 | 2,097,331 | ||||||
TBEA Co. Ltd., Class A | 584,100 | 1,232,496 | ||||||
Zhejiang Chint Electrics Co. Ltd., Class A | 172,300 | 479,139 | ||||||
|
| |||||||
| Total Electrical Equipment |
| 15,990,578 | ||||||
| Electronic Equipment, Instruments & Components – 3.4% |
| |||||||
AAC Technologies Holdings, Inc. | 204,200 | 684,889 | ||||||
Chaozhou Three-Circle Group Co. Ltd., Class A | 192,600 | 654,963 | ||||||
Eoptolink Technology, Inc. Ltd., Class A | 82,600 | 762,244 | ||||||
Foxconn Industrial Internet Co. Ltd., Class A | 600,300 | 1,882,655 | ||||||
GoerTek, Inc., Class A | 341,100 | 750,754 | ||||||
See Notes to Financial Statements.
| 18 | WisdomTree Trust |
Schedule of Investments (continued)
WisdomTree China ex-State-Owned Enterprises Fund (CXSE)
March 31, 2024
| Investments | Shares | Value | ||||||
Kingboard Holdings Ltd. | 210,300 | $ | 428,852 | |||||
Lens Technology Co. Ltd., Class A | 288,000 | 541,061 | ||||||
Luxshare Precision Industry Co. Ltd., Class A | 693,276 | 2,808,282 | ||||||
Maxscend Microelectronics Co. Ltd., Class A | 43,000 | 601,671 | ||||||
Sunny Optical Technology Group Co. Ltd. | 237,400 | 1,211,805 | ||||||
SUPCON Technology Co. Ltd., Class A | 85,986 | 551,062 | ||||||
Wingtech Technology Co. Ltd., Class A* | 126,400 | 637,188 | ||||||
WUS Printed Circuit Kunshan Co. Ltd., Class A | 177,300 | 737,000 | ||||||
|
| |||||||
| Total Electronic Equipment, Instruments & Components |
| 12,252,426 | ||||||
| Entertainment – 4.7% |
| |||||||
37 Interactive Entertainment Network Technology Group Co. Ltd., Class A | 234,800 | 563,036 | ||||||
Bilibili, Inc., Class Z*(b) | 68,965 | 778,081 | ||||||
China Ruyi Holdings Ltd.*(b) | 1,664,000 | 423,099 | ||||||
iQIYI, Inc., ADR* | 146,472 | 619,576 | ||||||
NetEase, Inc. | 594,715 | 12,370,820 | ||||||
Tencent Music Entertainment Group, ADR* | 200,491 | 2,243,494 | ||||||
|
| |||||||
| Total Entertainment |
| 16,998,106 | ||||||
| Food Products – 3.6% |
| |||||||
China Feihe Ltd.(a) | 1,123,100 | 528,082 | ||||||
Foshan Haitian Flavouring & Food Co. Ltd., Class A | 245,347 | 1,331,762 | ||||||
Guangdong Haid Group Co. Ltd., Class A | 121,403 | 737,407 | ||||||
Henan Shuanghui Investment & Development Co. Ltd., Class A | 163,200 | 590,050 | ||||||
Inner Mongolia Yili Industrial Group Co. Ltd., Class A | 847,600 | 3,257,126 | ||||||
Meihua Holdings Group Co. Ltd., Class A | 321,900 | 456,665 | ||||||
Muyuan Foods Co. Ltd., Class A | 364,774 | 2,167,925 | ||||||
Tingyi Cayman Islands Holding Corp. | 559,000 | 612,822 | ||||||
Want Want China Holdings Ltd. | 1,568,100 | 925,659 | ||||||
Wens Foodstuffs Group Co. Ltd., Class A | 840,300 | 2,199,011 | ||||||
|
| |||||||
| Total Food Products |
| 12,806,509 | ||||||
| Gas Utilities – 0.5% |
| |||||||
ENN Energy Holdings Ltd. | 247,200 | 1,904,588 | ||||||
| Health Care Equipment & Supplies – 1.2% |
| |||||||
Shandong Weigao Group Medical Polymer Co. Ltd., Class H | 792,400 | 494,083 | ||||||
Shenzhen Mindray Bio-Medical Electronics Co. Ltd., Class A | 90,574 | 3,511,233 | ||||||
Shenzhen New Industries Biomedical Engineering Co. Ltd., Class A | 51,800 | 471,882 | ||||||
|
| |||||||
| Total Health Care Equipment & Supplies |
| 4,477,198 | ||||||
| Health Care Providers & Services – 0.6% |
| |||||||
Aier Eye Hospital Group Co. Ltd., Class A | 670,280 | 1,181,696 | ||||||
Huadong Medicine Co. Ltd., Class A | 116,340 | 496,741 | ||||||
Hygeia Healthcare Holdings Co. Ltd.(a)(b) | 116,100 | 473,215 | ||||||
|
| |||||||
| Total Health Care Providers & Services |
| 2,151,652 | ||||||
| Hotels, Restaurants & Leisure – 6.5% |
| |||||||
H World Group Ltd. | 344,170 | 1,332,450 | ||||||
Haidilao International Holding Ltd.(a)(b) | 405,000 | 913,862 | ||||||
Meituan, Class B*(a) | 899,900 | 11,130,247 | ||||||
Tongcheng Travel Holdings Ltd.*(c) | 250,800 | 661,733 | ||||||
Trip.com Group Ltd.* | 129,927 | 5,730,670 | ||||||
Yum China Holdings, Inc. | 95,850 | 3,774,504 | ||||||
|
| |||||||
| Total Hotels, Restaurants & Leisure |
| 23,543,466 | ||||||
| Household Durables – 1.6% |
| |||||||
Gree Electric Appliances, Inc. of Zhuhai, Class A | 456,000 | 2,468,922 | ||||||
Haier Smart Home Co. Ltd., Class A | 425,500 | 1,462,209 | ||||||
Haier Smart Home Co. Ltd., Class H | 513,500 | 1,597,624 | ||||||
Hisense Home Appliances Group Co. Ltd., Class H | 73,000 | 227,121 | ||||||
|
| |||||||
| Total Household Durables |
| 5,755,876 | ||||||
| Household Products – 0.1% |
| |||||||
Vinda International Holdings Ltd. | 105,000 | 314,606 | ||||||
| Industrial Conglomerates – 0.1% |
| |||||||
Fosun International Ltd. | 706,700 | 368,409 | ||||||
| Insurance – 4.7% |
| |||||||
Ping An Insurance Group Co. of China Ltd., Class A | 1,446,494 | 8,130,602 | ||||||
Ping An Insurance Group Co. of China Ltd., Class H | 2,017,900 | 8,521,308 | ||||||
ZhongAn Online P&C Insurance Co. Ltd., Class H*(a)(b) | 241,300 | 385,392 | ||||||
|
| |||||||
| Total Insurance |
| 17,037,302 | ||||||
| Interactive Media & Services – 15.6% |
| |||||||
Baidu, Inc., Class A* | 794,500 | 10,425,563 | ||||||
Kanzhun Ltd., ADR | 94,056 | 1,648,802 | ||||||
Kuaishou Technology*(a) | 765,600 | 4,798,175 | ||||||
Tencent Holdings Ltd. | 1,019,000 | 39,554,613 | ||||||
|
| |||||||
| Total Interactive Media & Services |
| 56,427,153 | ||||||
| IT Services – 0.1% |
| |||||||
Isoftstone Information Technology Group Co. Ltd., Class A* | 82,200 | 526,232 | ||||||
| Life Sciences Tools & Services – 1.9% |
| |||||||
Genscript Biotech Corp.*(b) | 376,400 | 697,353 | ||||||
Hangzhou Tigermed Consulting Co. Ltd., Class A | 82,067 | 600,774 | ||||||
Pharmaron Beijing Co. Ltd., Class A | 145,825 | 409,131 | ||||||
WuXi AppTec Co. Ltd., Class A | 353,247 | 2,246,838 | ||||||
WuXi AppTec Co. Ltd., Class H(a) | 123,395 | 584,934 | ||||||
Wuxi Biologics Cayman, Inc.*(a) | 1,213,400 | 2,217,049 | ||||||
|
| |||||||
| Total Life Sciences Tools & Services |
| 6,756,079 | ||||||
| Machinery – 2.0% |
| |||||||
Haitian International Holdings Ltd. | 191,400 | 556,363 | ||||||
Jiangsu Hengli Hydraulic Co. Ltd., Class A | 67,100 | 463,297 | ||||||
Sany Heavy Industry Co. Ltd., Class A | 919,548 | 1,846,594 | ||||||
Shenzhen Inovance Technology Co. Ltd., Class A | 264,700 | 2,231,962 | ||||||
Wuxi Lead Intelligent Equipment Co. Ltd., Class A | 162,000 | 539,301 | ||||||
Yutong Bus Co. Ltd., Class A | 197,800 | 541,332 | ||||||
Zhejiang Sanhua Intelligent Controls Co. Ltd., Class A | 298,300 | 974,968 | ||||||
|
| |||||||
| Total Machinery |
| 7,153,817 | ||||||
See Notes to Financial Statements.
| WisdomTree Trust | 19 |
Schedule of Investments (continued)
WisdomTree China ex-State-Owned Enterprises Fund (CXSE)
March 31, 2024
| Investments | Shares | Value | ||||||
| Marine Transportation – 0.2% |
| |||||||
SITC International Holdings Co. Ltd. | 413,000 | $ | 754,608 | |||||
| Media – 0.5% |
| |||||||
China Literature Ltd.*(a)(b) | 125,800 | 420,327 | ||||||
Focus Media Information Technology Co. Ltd., Class A | 1,546,124 | 1,388,454 | ||||||
|
| |||||||
| Total Media |
| 1,808,781 | ||||||
| Metals & Mining – 0.8% |
| |||||||
China Hongqiao Group Ltd.(b) | 621,600 | 698,922 | ||||||
GEM Co. Ltd., Class A | 746,500 | 645,697 | ||||||
Yintai Gold Co. Ltd., Class A* | 246,000 | 612,933 | ||||||
Zhejiang Huayou Cobalt Co. Ltd., Class A | 209,350 | 781,992 | ||||||
|
| |||||||
| Total Metals & Mining |
| 2,739,544 | ||||||
| Oil, Gas & Consumable Fuels – 0.2% |
| |||||||
Guanghui Energy Co. Ltd., Class A | 586,100 | 600,598 | ||||||
| Passenger Airlines – 0.4% |
| |||||||
Hainan Airlines Holding Co. Ltd., Class A* | 3,528,700 | 665,847 | ||||||
Spring Airlines Co. Ltd., Class A* | 82,500 | 628,829 | ||||||
|
| |||||||
| Total Passenger Airlines |
| 1,294,676 | ||||||
| Personal Care Products – 0.4% |
| |||||||
Giant Biogene Holding Co. Ltd.*(a) | 129,400 | 703,508 | ||||||
Hengan International Group Co. Ltd. | 215,900 | 679,993 | ||||||
|
| |||||||
| Total Personal Care Products |
| 1,383,501 | ||||||
| Pharmaceuticals – 2.6% |
| |||||||
Asymchem Laboratories Tianjin Co. Ltd., Class A | 36,327 | 430,496 | ||||||
China Medical System Holdings Ltd. | 401,000 | 421,164 | ||||||
Hansoh Pharmaceutical Group Co. Ltd.(a) | 330,100 | 652,908 | ||||||
Humanwell Healthcare Group Co. Ltd., Class A | 164,900 | 440,845 | ||||||
HUTCHMED China Ltd.*(b) | 168,500 | 575,916 | ||||||
Jiangsu Hengrui Pharmaceuticals Co. Ltd., Class A | 614,768 | 3,892,470 | ||||||
Kangmei Pharmaceutical Co. Ltd., Class A* | 199,602 | 59,657 | ||||||
Shanghai Fosun Pharmaceutical Group Co. Ltd., Class A | 189,104 | 600,880 | ||||||
Sichuan Kelun Pharmaceutical Co. Ltd., Class A | 151,500 | 637,475 | ||||||
Sino Biopharmaceutical Ltd. | 3,275,150 | 1,263,785 | ||||||
Zhejiang NHU Co. Ltd., Class A | 245,260 | 563,121 | ||||||
|
| |||||||
| Total Pharmaceuticals |
| 9,538,717 | ||||||
| Real Estate Management & Development – 1.5% |
| |||||||
Country Garden Services Holdings Co. Ltd.(b) | 720,300 | 461,091 | ||||||
ESR Group Ltd.(a) | 800,000 | 855,560 | ||||||
KE Holdings, Inc., ADR | 229,617 | 3,152,641 | ||||||
Longfor Group Holdings Ltd.(a)(b) | 571,200 | 807,195 | ||||||
|
| |||||||
| Total Real Estate Management & Development |
| 5,276,487 | ||||||
| Semiconductors & Semiconductor Equipment – 4.0% |
| |||||||
Daqo New Energy Corp., ADR*(b) | 13,957 | 392,890 | ||||||
GCL Technology Holdings Ltd. | 5,963,000 | 975,236 | ||||||
GigaDevice Semiconductor, Inc., Class A | 87,426 | 865,422 | ||||||
JA Solar Technology Co. Ltd., Class A | 242,760 | 584,130 | ||||||
JCET Group Co. Ltd., Class A | 188,107 | 728,810 | ||||||
JinkoSolar Holding Co. Ltd., ADR(b) | 11,920 | 300,265 | ||||||
LONGi Green Energy Technology Co. Ltd., Class A | 949,468 | 2,551,391 | ||||||
Montage Technology Co. Ltd., Class A | 134,611 | 851,933 | ||||||
NAURA Technology Group Co. Ltd., Class A | 38,100 | 1,603,680 | ||||||
Sanan Optoelectronics Co. Ltd., Class A | 499,300 | 834,872 | ||||||
SG Micro Corp., Class A | 44,345 | 397,128 | ||||||
Tongwei Co. Ltd., Class A | 383,758 | 1,314,537 | ||||||
Trina Solar Co. Ltd., Class A | 180,757 | 592,532 | ||||||
Will Semiconductor Co. Ltd. Shanghai, Class A | 115,166 | 1,561,000 | ||||||
Xinyi Solar Holdings Ltd. | 1,254,765 | 971,561 | ||||||
|
| |||||||
| Total Semiconductors & Semiconductor Equipment |
| 14,525,387 | ||||||
| Software – 1.2% |
| |||||||
360 Security Technology, Inc., Class A* | 431,400 | 518,127 | ||||||
Beijing Kingsoft Office Software, Inc., Class A | 33,889 | 1,358,286 | ||||||
Hundsun Technologies, Inc., Class A | 237,210 | 737,075 | ||||||
Kingdee International Software Group Co. Ltd.* | 876,700 | 989,115 | ||||||
Yonyou Network Technology Co. Ltd., Class A | 330,813 | 544,490 | ||||||
|
| |||||||
| Total Software |
| 4,147,093 | ||||||
| Specialty Retail – 0.6% |
| |||||||
Chow Tai Fook Jewellery Group Ltd. | 541,800 | 798,877 | ||||||
Pop Mart International Group Ltd.(a)(b) | 137,300 | 504,363 | ||||||
Topsports International Holdings Ltd.(a) | 624,200 | 417,917 | ||||||
Zhongsheng Group Holdings Ltd. | 149,100 | 258,329 | ||||||
|
| |||||||
| Total Specialty Retail |
| 1,979,486 | ||||||
| Technology Hardware, Storage & Peripherals – 0.3% |
| |||||||
Shenzhen Transsion Holdings Co. Ltd., Class A | 41,016 | 950,604 | ||||||
| Textiles, Apparel & Luxury Goods – 1.8% |
| |||||||
ANTA Sports Products Ltd. | 275,300 | 2,926,609 | ||||||
Bosideng International Holdings Ltd. | 846,000 | 422,652 | ||||||
Li Ning Co. Ltd. | 549,500 | 1,460,381 | ||||||
Shenzhou International Group Holdings Ltd. | 189,400 | 1,793,219 | ||||||
|
| |||||||
| Total Textiles, Apparel & Luxury Goods |
| 6,602,861 | ||||||
| Tobacco – 0.1% |
| |||||||
Smoore International Holdings Ltd.(a)(b) | 570,000 | 485,048 | ||||||
|
| |||||||
| Total China |
| 359,481,429 | ||||||
| United States – 0.3% |
| |||||||
| Biotechnology – 0.3% |
| |||||||
| Legend Biotech Corp., ADR* | 17,591 | 986,679 | ||||||
TOTAL COMMON STOCKS (Cost: $469,788,343) |
| 360,468,108 | ||||||
| RIGHTS – 0.0% |
| |||||||
| China – 0.0% |
| |||||||
Kangmei Pharmaceutical Co. Ltd., | ||||||||
(Cost: $0) | 92,750 | 0 | ||||||
| INVESTMENT OF CASH COLLATERAL FOR SECURITIES LOANED – 0.7% |
| |||||||
| United States – 0.7% |
| |||||||
State Street Navigator Securities Lending Government Money Market Portfolio, 5.34%(d) | ||||||||
| (Cost: $2,648,553) | 2,648,553 | 2,648,553 | ||||||
TOTAL INVESTMENTS IN SECURITIES – 100.7% (Cost: $472,436,896) | 363,116,661 | |||||||
Other Assets less Liabilities – (0.7)% | (2,469,485 | ) | ||||||
|
| |||||||
| NET ASSETS – 100.0% | $ | 360,647,176 | ||||||
See Notes to Financial Statements.
| 20 | WisdomTree Trust |
Schedule of Investments (concluded)
WisdomTree China ex-State-Owned Enterprises Fund (CXSE)
March 31, 2024
| * | Non-income producing security. |
| † | This security is being fair valued using significant unobservable inputs (i.e., Level 3 on the fair value hierarchy) by WisdomTree Asset Management, Inc., as valuation designee, in accordance with valuation procedures approved by the Board of Trustees of WisdomTree Trust. The aggregate value of Level 3 fair valued securities is $0, which represents 0.0% of net assets. |
| (a) | This security is exempt from registration under rule 144A of the Securities Act of 1933. This security may be sold in transactions that are exempt from registration, normally to qualified institutional buyers. |
| (b) | Security, or portion thereof, was on loan at March 31, 2024 (See Note 2). At March 31, 2024, the total market value of the Fund’s securities on loan identified in the Schedule of Investments was $17,915,740 and the total market value of the collateral held by the Fund was $19,082,309. The total market value of the collateral includes non-cash U.S. Government securities collateral having a value of $16,433,756. |
| (c) | This security is exempt from registration under Regulation S of the Securities Act of 1933, which exempts from registration securities offered and sold outside the United States. This security may not be offered or sold in the United States except pursuant to an exemption from, or in a transaction not subject to, the registration requirements of the Securities Act of 1933. |
| (d) | Rate shown represents annualized 7-day yield as of March 31, 2024. |
| FAIR VALUATION SUMMARY | ||||||||||||
| The following is a summary of the fair valuations according to the inputs used in valuing the Fund’s investments (See Note 2 — Fair Value Measurement): | ||||||||||||
| Quoted Prices in Active Markets (Level 1) | Other Significant | Significant Unobservable Inputs (Level 3) | Total | |||||||||||||
Assets: | ||||||||||||||||
Investments in Securities | ||||||||||||||||
Common Stocks | $ | 360,468,108 | $ | — | $ | — | $ | 360,468,108 | ||||||||
Rights | — | — | 0 | * | 0 | |||||||||||
Investment of Cash Collateral for Securities Loaned | — | 2,648,553 | — | 2,648,553 | ||||||||||||
Total Investments in Securities | $ | 360,468,108 | $ | 2,648,553 | $ | 0 | $ | 363,116,661 | ||||||||
| * | Fair valuations using significant unobservable inputs were determined by a valuation committee of WisdomTree Asset Management, Inc. in accordance with valuation procedures approved by the Board of Trustees of WisdomTree Trust. |
See Notes to Financial Statements.
| WisdomTree Trust | 21 |
Schedule of Investments
WisdomTree Emerging Markets ex-State-Owned Enterprises Fund (XSOE)
March 31, 2024
| Investments | Shares | Value | ||||||
| COMMON STOCKS – 100.2% |
| |||||||
| Argentina – 0.0% |
| |||||||
Grupo Financiero Galicia SA, ADR*(a) | 36,161 | $ | 919,213 | |||||
| Brazil – 5.5% |
| |||||||
3R Petroleum Oleo & Gas SA* | 139,398 | 918,728 | ||||||
Allos SA | 305,377 | 1,459,304 | ||||||
Ambev SA | 2,010,103 | 5,015,670 | ||||||
Atacadao SA | 264,058 | 719,024 | ||||||
B3 SA – Brasil Bolsa Balcao | 2,831,569 | 6,782,574 | ||||||
Banco Bradesco SA | 641,294 | 1,632,205 | ||||||
Banco Santander Brasil SA | 234,575 | 1,336,532 | ||||||
BRF SA* | 387,914 | 1,264,748 | ||||||
CCR SA | 483,209 | 1,334,109 | ||||||
Cia Siderurgica Nacional SA | 315,690 | 990,168 | ||||||
Cosan SA | 707,787 | 2,290,687 | ||||||
Embraer SA* | 321,740 | 2,141,055 | ||||||
Energisa SA | 127,370 | 1,218,088 | ||||||
Eneva SA* | 777,925 | 1,981,509 | ||||||
Engie Brasil Energia SA | 101,381 | 815,415 | ||||||
Equatorial Energia SA | 424,241 | 2,758,747 | ||||||
GPS Participacoes & Empreendimentos SA(b) | 298,716 | 1,236,507 | ||||||
Hapvida Participacoes & Investimentos SA*(b) | 2,150,633 | 1,589,704 | ||||||
Hypera SA | 211,131 | 1,388,967 | ||||||
Itau Unibanco Holding SA | 288,189 | 1,723,762 | ||||||
Itausa SA | 540,312 | 1,129,079 | ||||||
Klabin SA | 443,482 | 2,237,987 | ||||||
Localiza Rent a Car SA | 445,446 | 4,865,996 | ||||||
Lojas Renner SA | 401,869 | 1,363,234 | ||||||
Magazine Luiza SA* | 1,849,141 | 664,953 | ||||||
MercadoLibre, Inc.* | 14,584 | 22,050,425 | ||||||
Multiplan Empreendimentos Imobiliarios SA | 136,037 | 695,465 | ||||||
Natura & Co. Holding SA | 367,451 | 1,312,548 | ||||||
PRIO SA | 389,159 | 3,789,316 | ||||||
Raia Drogasil SA | 582,127 | 3,183,030 | ||||||
Rede D’Or Sao Luiz SA(b) | 476,691 | 2,410,334 | ||||||
Rumo SA | 634,447 | 2,821,426 | ||||||
Santos Brasil Participacoes SA | 431,141 | 1,147,286 | ||||||
Sendas Distribuidora SA | 649,226 | 1,907,905 | ||||||
Suzano SA | 361,692 | 4,623,079 | ||||||
Telefonica Brasil SA | 180,415 | 1,823,775 | ||||||
TIM SA | 440,158 | 1,565,225 | ||||||
TOTVS SA | 258,260 | 1,464,259 | ||||||
Transmissora Alianca de Energia Eletrica SA | 64,853 | 470,440 | ||||||
Ultrapar Participacoes SA | 441,404 | 2,510,568 | ||||||
Vibra Energia SA | 613,811 | 3,066,878 | ||||||
WEG SA | 710,988 | 5,425,926 | ||||||
|
| |||||||
| Total Brazil |
| 109,126,637 | ||||||
| Chile – 0.4% |
| |||||||
Banco de Chile | 18,473,906 | 2,052,970 | ||||||
Banco Santander Chile | 28,493,925 | 1,417,652 | ||||||
Cencosud SA | 809,089 | 1,402,305 | ||||||
Empresas CMPC SA | 467,888 | 949,753 | ||||||
Empresas Copec SA | 168,403 | 1,208,532 | ||||||
|
| |||||||
| Total Chile |
| 7,031,212 | ||||||
| China – 23.6% |
| |||||||
360 Security Technology, Inc., Class A* | 505,500 | $ | 607,124 | |||||
37 Interactive Entertainment Network Technology Group Co. Ltd., Class A | 282,200 | 676,699 | ||||||
AAC Technologies Holdings, Inc. | 271,000 | 908,937 | ||||||
Aier Eye Hospital Group Co. Ltd., Class A | 857,085 | 1,511,031 | ||||||
Akeso, Inc.*(a)(b) | 207,000 | 1,233,835 | ||||||
Alibaba Group Holding Ltd. | 4,957,332 | 44,496,876 | ||||||
ANTA Sports Products Ltd. | 396,900 | 4,219,292 | ||||||
Asymchem Laboratories Tianjin Co. Ltd., Class A | 48,540 | 575,227 | ||||||
Baidu, Inc., Class A* | 830,350 | 10,895,993 | ||||||
BeiGene Ltd.* | 294,400 | 3,577,285 | ||||||
Beijing Kingsoft Office Software, Inc., Class A | 37,470 | 1,501,814 | ||||||
Beijing New Building Materials PLC, Class A | 192,500 | 752,193 | ||||||
Beijing Oriental Yuhong Waterproof Technology Co. Ltd., Class A | 437,800 | 953,941 | ||||||
Bilibili, Inc., Class Z*(a) | 87,114 | 982,842 | ||||||
Bosideng International Holdings Ltd. | 1,602,000 | 800,340 | ||||||
BYD Co. Ltd., Class A | 115,410 | 3,227,805 | ||||||
BYD Co. Ltd., Class H(a) | 335,500 | 8,642,079 | ||||||
BYD Electronic International Co. Ltd. | 283,500 | 1,045,043 | ||||||
Chaozhou Three-Circle Group Co. Ltd., Class A | 328,400 | 1,116,770 | ||||||
China Conch Venture Holdings Ltd. | 821,400 | 570,938 | ||||||
China Feihe Ltd.(b) | 2,552,000 | 1,199,951 | ||||||
China Hongqiao Group Ltd.(a) | 871,500 | 979,908 | ||||||
China Jushi Co. Ltd., Class A | 456,900 | 678,390 | ||||||
China Medical System Holdings Ltd. | 609,000 | 639,623 | ||||||
China Minsheng Banking Corp. Ltd., Class A | 6,002,479 | 3,348,306 | ||||||
Chongqing Zhifei Biological Products Co. Ltd., Class A | 207,050 | 1,281,586 | ||||||
Chow Tai Fook Jewellery Group Ltd. | 893,000 | 1,316,717 | ||||||
Contemporary Amperex Technology Co. Ltd., Class A | 430,850 | 11,284,562 | ||||||
Country Garden Services Holdings Co. Ltd.(a) | 1,364,000 | 873,147 | ||||||
East Money Information Co. Ltd., Class A | 2,323,853 | 4,125,732 | ||||||
ENN Energy Holdings Ltd. | 261,600 | 2,015,535 | ||||||
Eoptolink Technology, Inc. Ltd., Class A | 104,600 | 965,264 | ||||||
ESR Group Ltd.(a)(b) | 672,000 | 718,671 | ||||||
Eve Energy Co. Ltd., Class A | 240,000 | 1,294,474 | ||||||
Focus Media Information Technology Co. Ltd., Class A | 2,017,300 | 1,811,580 | ||||||
Foshan Haitian Flavouring & Food Co. Ltd., Class A | 314,966 | 1,709,659 | ||||||
Foxconn Industrial Internet Co. Ltd., Class A | 700,900 | 2,198,156 | ||||||
Fuyao Glass Industry Group Co. Ltd., Class A | 179,482 | 1,069,416 | ||||||
Fuyao Glass Industry Group Co. Ltd., Class H(b) | 273,200 | 1,375,346 | ||||||
Ganfeng Lithium Group Co. Ltd., Class A | 304,720 | 1,526,034 | ||||||
GCL Technology Holdings Ltd. | 7,591,000 | 1,241,493 | ||||||
Geely Automobile Holdings Ltd. | 1,428,000 | 1,685,914 | ||||||
GEM Co. Ltd., Class A | 1,241,800 | 1,074,115 | ||||||
Genscript Biotech Corp.*(a) | 494,000 | 915,230 | ||||||
Giant Biogene Holding Co. Ltd.*(b) | 151,400 | 823,115 | ||||||
GigaDevice Semiconductor, Inc., Class A | 115,200 | 1,140,354 | ||||||
See Notes to Financial Statements.
| 22 | WisdomTree Trust |
Schedule of Investments (continued)
WisdomTree Emerging Markets ex-State-Owned Enterprises Fund (XSOE)
March 31, 2024
| Investments | Shares | Value | ||||||
GoerTek, Inc., Class A | 392,700 | $ | 864,325 | |||||
Great Wall Motor Co. Ltd., Class H(a) | 1,137,700 | 1,264,685 | ||||||
Gree Electric Appliances, Inc. of Zhuhai, Class A | 721,000 | 3,903,712 | ||||||
Guangdong Haid Group Co. Ltd., Class A | 161,500 | 980,958 | ||||||
Guanghui Energy Co. Ltd., Class A | 736,000 | 754,206 | ||||||
Guangzhou Tinci Materials Technology Co. Ltd., Class A | 249,300 | 763,310 | ||||||
H World Group Ltd. | 580,770 | 2,248,444 | ||||||
Haidilao International Holding Ltd.(a)(b) | 466,300 | 1,052,183 | ||||||
Haier Smart Home Co. Ltd., Class A | 652,500 | 2,242,284 | ||||||
Haier Smart Home Co. Ltd., Class H | 864,000 | 2,688,115 | ||||||
Hainan Airlines Holding Co. Ltd., Class A* | 5,389,300 | 1,016,933 | ||||||
Hangzhou Tigermed Consulting Co. Ltd., Class A | 101,600 | 743,766 | ||||||
Hansoh Pharmaceutical Group Co. Ltd.(b) | 394,000 | 779,296 | ||||||
Henan Shuanghui Investment & Development Co. Ltd., Class A | 202,000 | 730,332 | ||||||
Hengli Petrochemical Co. Ltd., Class A* | 543,940 | 1,045,116 | ||||||
Huadong Medicine Co. Ltd., Class A | 144,100 | 615,269 | ||||||
Hundsun Technologies, Inc., Class A | 327,871 | 1,018,783 | ||||||
HUTCHMED China Ltd.*(a) | 202,500 | 692,124 | ||||||
Imeik Technology Development Co. Ltd., Class A | 19,500 | 927,757 | ||||||
Inner Mongolia Yili Industrial Group Co. Ltd., Class A | 966,900 | 3,715,568 | ||||||
Innovent Biologics, Inc.*(b) | 481,000 | 2,316,976 | ||||||
iQIYI, Inc., ADR* | 173,664 | 734,599 | ||||||
Isoftstone Information Technology Group Co. Ltd., Class A* | 101,500 | 649,788 | ||||||
JA Solar Technology Co. Ltd., Class A | 259,952 | 625,497 | ||||||
JCET Group Co. Ltd., Class A | 242,600 | 939,940 | ||||||
JD Health International, Inc.*(a)(b) | 341,900 | 1,210,080 | ||||||
JD Logistics, Inc.*(b) | 488,500 | 497,460 | ||||||
JD.com, Inc., Class A | 735,709 | 10,142,913 | ||||||
Jiangsu Eastern Shenghong Co. Ltd., Class A | 501,100 | 695,704 | ||||||
Jiangsu Hengli Hydraulic Co. Ltd., Class A | 95,000 | 655,935 | ||||||
Jiangsu Hengrui Pharmaceuticals Co. Ltd., Class A | 708,013 | 4,482,860 | ||||||
Jiangsu Zhongtian Technology Co. Ltd., Class A | 425,400 | 822,043 | ||||||
Kangmei Pharmaceutical Co. Ltd., Class A* | 31,038 | 9,277 | ||||||
Kanzhun Ltd., ADR | 91,017 | 1,595,528 | ||||||
KE Holdings, Inc., ADR | 214,695 | 2,947,762 | ||||||
Kingdee International Software Group Co. Ltd.* | 905,000 | 1,021,044 | ||||||
Kuaishou Technology*(b) | 805,500 | 5,048,237 | ||||||
LB Group Co. Ltd., Class A | 255,300 | 665,994 | ||||||
Lens Technology Co. Ltd., Class A | 473,200 | 888,993 | ||||||
Li Auto, Inc., Class A* | 463,900 | 7,189,859 | ||||||
Li Ning Co. Ltd. | 785,000 | 2,086,259 | ||||||
LONGi Green Energy Technology Co. Ltd., Class A | 1,128,072 | 3,031,332 | ||||||
Luxshare Precision Industry Co. Ltd., Class A | 827,200 | 3,350,773 | ||||||
Maxscend Microelectronics Co. Ltd., Class A | 53,300 | 745,792 | ||||||
Meituan, Class B*(b) | 1,270,400 | 15,712,708 | ||||||
MINISO Group Holding Ltd. | 181,400 | 932,907 | ||||||
Montage Technology Co. Ltd., Class A | 149,385 | 945,436 | ||||||
Muyuan Foods Co. Ltd., Class A | 425,876 | 2,531,066 | ||||||
NAURA Technology Group Co. Ltd., Class A | 44,461 | 1,871,423 | ||||||
NetEase, Inc. | 622,930 | 12,957,727 | ||||||
Ningxia Baofeng Energy Group Co. Ltd., Class A | 493,900 | 1,112,234 | ||||||
NIO, Inc., Class A*(a) | 451,190 | 2,158,969 | ||||||
Nongfu Spring Co. Ltd., Class H(a)(b) | 643,000 | 3,471,146 | ||||||
PDD Holdings, Inc., ADR* | 238,337 | 27,706,676 | ||||||
Pharmaron Beijing Co. Ltd., Class A | 174,966 | 490,890 | ||||||
Ping An Bank Co. Ltd., Class A | 1,571,726 | 2,277,362 | ||||||
Ping An Insurance Group Co. of China Ltd., Class A | 1,735,208 | 9,753,435 | ||||||
Ping An Insurance Group Co. of China Ltd., Class H | 1,833,500 | 7,742,613 | ||||||
Rongsheng Petrochemical Co. Ltd., Class A | 552,000 | 837,078 | ||||||
Sanan Optoelectronics Co. Ltd., Class A | 758,800 | 1,268,777 | ||||||
Sany Heavy Industry Co. Ltd., Class A | 1,099,436 | 2,207,837 | ||||||
Satellite Chemical Co. Ltd., Class A* | 351,390 | 895,366 | ||||||
SF Holding Co. Ltd., Class A | 436,973 | 2,190,763 | ||||||
Shandong Weigao Group Medical Polymer Co. Ltd., Class H | 200 | 125 | ||||||
Shanghai Fosun Pharmaceutical Group Co. Ltd., Class A | 237,973 | 756,162 | ||||||
Shanghai RAAS Blood Products Co. Ltd., Class A | 1,031,400 | 1,008,614 | ||||||
Shenzhen Inovance Technology Co. Ltd., Class A | 317,800 | 2,679,703 | ||||||
Shenzhen Mindray Bio-Medical Electronics Co. Ltd., Class A | 104,000 | 4,031,712 | ||||||
Shenzhen New Industries Biomedical Engineering Co. Ltd., Class A | 65,500 | 596,685 | ||||||
Shenzhen Transsion Holdings Co. Ltd., Class A | 51,240 | 1,187,559 | ||||||
Shenzhou International Group Holdings Ltd. | 267,100 | 2,528,875 | ||||||
Sichuan Kelun Pharmaceutical Co. Ltd., Class A | 189,500 | 797,370 | ||||||
Sieyuan Electric Co. Ltd., Class A | 100,600 | 826,510 | ||||||
Sino Biopharmaceutical Ltd. | 3,888,000 | 1,500,266 | ||||||
SITC International Holdings Co. Ltd. | 190,000 | 347,156 | ||||||
Smoore International Holdings Ltd.(a)(b) | 1,063,000 | 904,571 | ||||||
Spring Airlines Co. Ltd., Class A* | 110,300 | 840,725 | ||||||
Sungrow Power Supply Co. Ltd., Class A | 173,900 | 2,486,202 | ||||||
Sunny Optical Technology Group Co. Ltd. | 232,000 | 1,184,241 | ||||||
SUPCON Technology Co. Ltd., Class A | 95,256 | 610,471 | ||||||
TBEA Co. Ltd., Class A | 636,153 | 1,342,332 | ||||||
Tencent Holdings Ltd. | 2,031,400 | 78,853,033 | ||||||
Tencent Music Entertainment Group, ADR* | 214,981 | 2,405,637 | ||||||
Tianqi Lithium Corp., Class A | 203,200 | 1,342,557 | ||||||
Tingyi Cayman Islands Holding Corp. | 666,000 | 730,124 | ||||||
Tongcheng Travel Holdings Ltd.*(c) | 490,400 | 1,293,915 | ||||||
Tongwei Co. Ltd., Class A | 452,358 | 1,549,521 | ||||||
Trina Solar Co. Ltd., Class A | 184,566 | 605,018 | ||||||
Trip.com Group Ltd.* | 192,420 | 8,487,039 | ||||||
Vipshop Holdings Ltd., ADR | 93,302 | 1,544,148 | ||||||
Walvax Biotechnology Co. Ltd., Class A | 451,000 | 955,372 | ||||||
See Notes to Financial Statements.
| WisdomTree Trust | 23 |
Schedule of Investments (continued)
WisdomTree Emerging Markets ex-State-Owned Enterprises Fund (XSOE)
March 31, 2024
| Investments | Shares | Value | ||||||
Want Want China Holdings Ltd. | 2,126,000 | $ | 1,254,990 | |||||
Wens Foodstuffs Group Co. Ltd., Class A | 999,100 | 2,614,580 | ||||||
Will Semiconductor Co. Ltd. Shanghai, Class A | 118,640 | 1,608,088 | ||||||
Wingtech Technology Co. Ltd., Class A* | 136,970 | 690,472 | ||||||
WUS Printed Circuit Kunshan Co. Ltd., Class A | 242,500 | 1,008,023 | ||||||
WuXi AppTec Co. Ltd., Class A | 396,573 | 2,522,415 | ||||||
WuXi AppTec Co. Ltd., Class H(b) | 137,800 | 653,218 | ||||||
Wuxi Biologics Cayman, Inc.*(b) | 1,176,500 | 2,149,627 | ||||||
Wuxi Lead Intelligent Equipment Co. Ltd., Class A | 244,200 | 812,946 | ||||||
Xinyi Glass Holdings Ltd. | 548,000 | 580,457 | ||||||
Xinyi Solar Holdings Ltd. | 1,351,753 | 1,046,659 | ||||||
XPeng, Inc., Class A*(a) | 410,000 | 1,681,605 | ||||||
Yadea Group Holdings Ltd.(b) | 498,000 | 806,833 | ||||||
Yintai Gold Co. Ltd., Class A* | 330,000 | 822,227 | ||||||
Yonyou Network Technology Co. Ltd., Class A | 368,800 | 607,013 | ||||||
Yum China Holdings, Inc. | 140,044 | 5,514,833 | ||||||
Yunnan Energy New Material Co. Ltd., Class A | 112,100 | 641,529 | ||||||
Zai Lab Ltd.*(a) | 306,700 | 505,520 | ||||||
Zhejiang Chint Electrics Co. Ltd., Class A | 251,800 | 700,215 | ||||||
Zhejiang Huayou Cobalt Co. Ltd., Class A | 264,370 | 987,510 | ||||||
Zhejiang NHU Co. Ltd., Class A | 80 | 184 | ||||||
Zhejiang Sanhua Intelligent Controls Co. Ltd., Class A | 381,000 | 1,245,266 | ||||||
Zhongji Innolight Co. Ltd., Class A | 108,800 | 2,346,114 | ||||||
Zhongsheng Group Holdings Ltd. | 563,500 | 976,312 | ||||||
ZTO Express Cayman, Inc. | 131,912 | 2,861,918 | ||||||
|
| |||||||
| Total China |
| 469,088,763 | ||||||
| Czech Republic – 0.1% |
| |||||||
Komercni Banka AS | 51,978 | 1,864,841 | ||||||
Moneta Money Bank AS(b) | 249,417 | 1,086,598 | ||||||
|
| |||||||
| Total Czech Republic |
| 2,951,439 | ||||||
| Hungary – 0.3% |
| |||||||
MOL Hungarian Oil & Gas PLC | 141,813 | 1,150,512 | ||||||
OTP Bank Nyrt | 73,281 | 3,374,303 | ||||||
Richter Gedeon Nyrt | 37,481 | 951,274 | ||||||
|
| |||||||
| Total Hungary |
| 5,476,089 | ||||||
| India – 22.0% |
| |||||||
Aarti Industries Ltd. | 120,482 | 961,444 | ||||||
ABB India Ltd. | 17,983 | 1,371,508 | ||||||
ACC Ltd. | 31,560 | 942,874 | ||||||
Adani Energy Solutions Ltd.* | 121,328 | 1,493,570 | ||||||
Adani Enterprises Ltd. | 119,829 | 4,593,451 | ||||||
Adani Green Energy Ltd.* | 126,782 | 2,789,652 | ||||||
Adani Ports & Special Economic Zone Ltd. | 237,535 | 3,821,664 | ||||||
Adani Power Ltd.* | 252,485 | 1,615,977 | ||||||
Adani Total Gas Ltd. | 94,509 | 1,049,936 | ||||||
Alkem Laboratories Ltd. | 15,988 | 947,366 | ||||||
Ambuja Cements Ltd. | 240,420 | 1,765,189 | ||||||
APL Apollo Tubes Ltd. | 75,716 | 1,358,081 | ||||||
Apollo Hospitals Enterprise Ltd. | 44,578 | 3,397,661 | ||||||
Ashok Leyland Ltd. | 814,880 | 1,673,190 | ||||||
Asian Paints Ltd. | 151,436 | 5,168,915 | ||||||
Astral Ltd. | 57,701 | 1,377,622 | ||||||
AU Small Finance Bank Ltd.(b) | 142,214 | 963,411 | ||||||
Aurobindo Pharma Ltd. | 88,487 | 1,155,124 | ||||||
Avenue Supermarts Ltd.*(b) | 58,375 | 3,167,554 | ||||||
Axis Bank Ltd. | 774,492 | 9,724,505 | ||||||
Bajaj Auto Ltd. | 24,076 | 2,640,818 | ||||||
Bajaj Finserv Ltd. | 139,767 | 2,754,785 | ||||||
Bajaj Holdings & Investment Ltd. | 11,462 | 1,136,924 | ||||||
Balkrishna Industries Ltd. | 37,399 | 1,039,136 | ||||||
Berger Paints India Ltd. | 159,667 | 1,097,056 | ||||||
Bharat Forge Ltd. | 114,113 | 1,545,542 | ||||||
Bharti Airtel Ltd. | 807,731 | 11,898,664 | ||||||
Bosch Ltd. | 3,079 | 1,108,676 | ||||||
Britannia Industries Ltd. | 44,334 | 2,610,658 | ||||||
CG Power & Industrial Solutions Ltd. | 268,380 | 1,740,556 | ||||||
Cipla Ltd. | 195,542 | 3,509,686 | ||||||
Coforge Ltd. | 21,991 | 1,450,848 | ||||||
Colgate-Palmolive India Ltd. | 68,712 | 2,232,950 | ||||||
Computer Age Management Services Ltd. | 29,494 | 1,031,074 | ||||||
Crompton Greaves Consumer Electricals Ltd. | 322,089 | 1,033,048 | ||||||
Cummins India Ltd. | 52,404 | 1,888,907 | ||||||
Cyient Ltd. | 38,031 | 910,323 | ||||||
Dabur India Ltd. | 228,150 | 1,431,092 | ||||||
Deepak Nitrite Ltd. | 40,538 | 1,033,105 | ||||||
Delhivery Ltd.* | 145,236 | 775,875 | ||||||
Divi’s Laboratories Ltd. | 49,848 | 2,059,187 | ||||||
Dixon Technologies India Ltd.(c) | 11,684 | 1,047,781 | ||||||
DLF Ltd. | 267,715 | 2,879,295 | ||||||
Dr. Reddy’s Laboratories Ltd. | 43,649 | 3,222,759 | ||||||
Eicher Motors Ltd. | 52,752 | 2,542,203 | ||||||
Federal Bank Ltd. | 1,068,555 | 1,924,366 | ||||||
Fortis Healthcare Ltd. | 313,870 | 1,581,346 | ||||||
FSN E-Commerce Ventures Ltd.* | 349,199 | 678,071 | ||||||
GMR Airports Infrastructure Ltd.* | 1,026,715 | 1,004,526 | ||||||
Godrej Consumer Products Ltd. | 140,461 | 2,108,199 | ||||||
Godrej Properties Ltd.* | 61,746 | 1,702,850 | ||||||
Grasim Industries Ltd. | 153,896 | 4,220,573 | ||||||
Havells India Ltd. | 89,468 | 1,625,179 | ||||||
HCL Technologies Ltd. | 361,990 | 6,699,435 | ||||||
HDFC Asset Management Co. Ltd.(b) | 49,209 | 2,214,988 | ||||||
HDFC Bank Ltd. | 1,785,301 | 30,993,523 | ||||||
HDFC Life Insurance Co. Ltd.(b) | 334,257 | 2,538,313 | ||||||
Hero MotoCorp Ltd. | 45,697 | 2,587,392 | ||||||
Hindalco Industries Ltd. | 498,804 | 3,350,678 | ||||||
Hindustan Unilever Ltd. | 295,283 | 8,016,835 | ||||||
ICICI Bank Ltd., ADR | 709,641 | 18,741,619 | ||||||
ICICI Lombard General Insurance Co. Ltd.(b) | 94,616 | 1,910,982 | ||||||
ICICI Prudential Life Insurance Co. Ltd.(b) | 129,371 | 944,116 | ||||||
IDFC First Bank Ltd.* | 1,521,428 | 1,375,446 | ||||||
Indian Hotels Co. Ltd. | 376,640 | 2,669,593 | ||||||
Indus Towers Ltd.* | 311,741 | 1,088,258 | ||||||
IndusInd Bank Ltd. | 193,465 | 3,602,424 | ||||||
Info Edge India Ltd. | 38,470 | 2,579,350 | ||||||
Infosys Ltd., ADR(a) | 981,691 | 17,601,720 | ||||||
See Notes to Financial Statements.
| 24 | WisdomTree Trust |
Schedule of Investments (continued)
WisdomTree Emerging Markets ex-State-Owned Enterprises Fund (XSOE)
March 31, 2024
| Investments | Shares | Value | ||||||
InterGlobe Aviation Ltd.*(b) | 55,107 | $ | 2,344,719 | |||||
Jindal Stainless Ltd. | 139,796 | 1,164,010 | ||||||
Jindal Steel & Power Ltd. | 130,768 | 1,331,395 | ||||||
Jio Financial Services Ltd.* | 1,013,712 | 4,299,639 | ||||||
JSW Energy Ltd. | 157,749 | 1,000,371 | ||||||
JSW Steel Ltd. | 334,936 | 3,333,999 | ||||||
Jubilant Foodworks Ltd. | 115,271 | 620,358 | ||||||
Kotak Mahindra Bank Ltd. | 366,521 | 7,846,566 | ||||||
KPIT Technologies Ltd. | 46,330 | 825,694 | ||||||
Larsen & Toubro Ltd. | 210,835 | 9,514,845 | ||||||
Laurus Labs Ltd.(b) | 202,331 | 951,825 | ||||||
LTIMindtree Ltd.(b) | 35,644 | 2,110,540 | ||||||
Lupin Ltd. | 102,749 | 1,991,842 | ||||||
Macrotech Developers Ltd.(b) | 89,006 | 1,212,164 | ||||||
Mahindra & Mahindra Ltd. | 324,072 | 7,465,672 | ||||||
Marico Ltd. | 256,161 | 1,527,092 | ||||||
Maruti Suzuki India Ltd. | 42,287 | 6,388,669 | ||||||
Max Financial Services Ltd.* | 102,019 | 1,225,904 | ||||||
Max Healthcare Institute Ltd. | 300,624 | 2,955,327 | ||||||
Motherson Sumi Wiring India Ltd. | 1,576,570 | 1,249,498 | ||||||
Mphasis Ltd. | 34,254 | 980,789 | ||||||
MRF Ltd. | 1,327 | 2,122,299 | ||||||
Nestle India Ltd. | 136,720 | 4,298,764 | ||||||
One 97 Communications Ltd.* | 92,305 | 445,629 | ||||||
Oracle Financial Services Software Ltd. | 8,188 | 861,393 | ||||||
Page Industries Ltd. | 3,020 | 1,247,467 | ||||||
PB Fintech Ltd.* | 119,331 | 1,608,559 | ||||||
Persistent Systems Ltd. | 42,296 | 2,020,689 | ||||||
Phoenix Mills Ltd. | 34,900 | 1,164,470 | ||||||
PI Industries Ltd. | 33,418 | 1,549,663 | ||||||
Pidilite Industries Ltd. | 52,618 | 1,901,951 | ||||||
Polycab India Ltd. | 15,884 | 964,629 | ||||||
Prestige Estates Projects Ltd. | 51,629 | 724,270 | ||||||
Reliance Industries Ltd., GDR(b) | 469,041 | 33,489,527 | ||||||
Reliance Industries Ltd., GDR(a)(b) | 39,698 | 2,834,437 | ||||||
Samvardhana Motherson International Ltd. | 996,836 | 1,399,592 | ||||||
Shree Cement Ltd. | 5,403 | 1,663,792 | ||||||
Siemens Ltd. | 34,144 | 2,200,073 | ||||||
Solar Industries India Ltd. | 9,030 | 950,801 | ||||||
Sona Blw Precision Forgings Ltd.(b) | 127,922 | 1,082,780 | ||||||
SRF Ltd. | 48,115 | 1,477,011 | ||||||
Sun Pharmaceutical Industries Ltd. | 369,908 | 7,187,487 | ||||||
Supreme Industries Ltd. | 28,782 | 1,460,522 | ||||||
Suzlon Energy Ltd.* | 3,768,445 | 1,825,427 | ||||||
Tata Communications Ltd. | 47,796 | 1,152,113 | ||||||
Tata Consultancy Services Ltd. | 320,922 | 14,915,500 | ||||||
Tata Consumer Products Ltd. | 234,246 | 3,078,810 | ||||||
Tata Elxsi Ltd. | 15,466 | 1,443,663 | ||||||
Tata Motors Ltd. | 592,712 | 7,055,478 | ||||||
Tata Power Co. Ltd. | 539,194 | 2,548,488 | ||||||
Tata Steel Ltd. | 2,801,761 | 5,235,508 | ||||||
Tech Mahindra Ltd. | 245,102 | 3,667,897 | ||||||
Titan Co. Ltd. | 137,308 | 6,259,016 | ||||||
Torrent Pharmaceuticals Ltd. | 51,590 | 1,608,644 | ||||||
Torrent Power Ltd. | 65,769 | 1,070,843 | ||||||
Trent Ltd. | 66,975 | 3,170,376 | ||||||
Tube Investments of India Ltd. | 42,405 | 1,899,829 | ||||||
TVS Motor Co. Ltd. | 86,224 | 2,224,647 | ||||||
UltraTech Cement Ltd. | 40,384 | 4,720,598 | ||||||
United Spirits Ltd. | 151,228 | 2,056,657 | ||||||
UPL Ltd. | 249,352 | 1,363,323 | ||||||
Varun Beverages Ltd. | 173,729 | 2,913,311 | ||||||
Vedanta Ltd. | 485,504 | 1,581,333 | ||||||
Voltas Ltd. | 98,775 | 1,306,953 | ||||||
Wipro Ltd. | 542,117 | 3,120,654 | ||||||
Zee Entertainment Enterprises Ltd.* | 386,930 | 642,776 | ||||||
Zomato Ltd.* | 1,928,204 | 4,210,017 | ||||||
Zydus Lifesciences Ltd. | 76,202 | 920,381 | ||||||
|
| |||||||
| Total India |
| 438,708,389 | ||||||
| Indonesia – 2.0% |
| |||||||
Adaro Energy Indonesia Tbk. PT | 7,300,500 | 1,243,226 | ||||||
Amman Mineral Internasional PT* | 3,125,700 | 1,725,000 | ||||||
Astra International Tbk. PT | 10,491,200 | 3,407,738 | ||||||
Bank Central Asia Tbk. PT | 29,010,800 | 18,434,803 | ||||||
Barito Pacific Tbk. PT | 15,004,198 | 894,290 | ||||||
Chandra Asri Pacific Tbk. PT | 3,049,100 | 1,120,215 | ||||||
Charoen Pokphand Indonesia Tbk. PT | 3,950,500 | 1,308,113 | ||||||
GoTo Gojek Tokopedia Tbk. PT* | 553,002,000 | 2,406,631 | ||||||
Indah Kiat Pulp & Paper Tbk. PT | 1,650,300 | 996,633 | ||||||
Indofood CBP Sukses Makmur Tbk. PT | 1,324,600 | 969,118 | ||||||
Indofood Sukses Makmur Tbk. PT | 2,581,600 | 1,038,013 | ||||||
Indosat Tbk. PT | 1,193,600 | 841,279 | ||||||
Kalbe Farma Tbk. PT | 11,689,500 | 1,087,481 | ||||||
Merdeka Copper Gold Tbk. PT* | 6,139,300 | 882,851 | ||||||
Sarana Menara Nusantara Tbk. PT | 16,610,200 | 900,963 | ||||||
Sumber Alfaria Trijaya Tbk. PT | 11,811,300 | 2,167,826 | ||||||
United Tractors Tbk. PT | 762,800 | 1,163,084 | ||||||
|
| |||||||
| Total Indonesia |
| 40,587,264 | ||||||
| Malaysia – 1.0% |
| |||||||
Genting Malaysia Bhd. | 2,857,900 | 1,642,402 | ||||||
Hong Leong Bank Bhd. | 792,408 | 3,244,637 | ||||||
MR DIY Group M Bhd.(b) | 3,228,500 | 1,016,367 | ||||||
Nestle Malaysia Bhd. | 66,000 | 1,648,257 | ||||||
Press Metal Aluminium Holdings Bhd. | 4,150,100 | 4,077,322 | ||||||
QL Resources Bhd. | 1,241,225 | 1,547,270 | ||||||
Sunway Bhd. | 2,089,300 | 1,545,014 | ||||||
YTL Corp. Bhd. | 5,137,300 | 2,854,658 | ||||||
YTL Power International Bhd. | 2,705,500 | 2,212,188 | ||||||
|
| |||||||
| Total Malaysia |
| 19,788,115 | ||||||
| Mexico – 3.0% |
| |||||||
Alfa SAB de CV, Class A(a) | 1,854,683 | 1,380,266 | ||||||
America Movil SAB de CV(a) | 6,098,307 | 5,716,102 | ||||||
Arca Continental SAB de CV(a) | 157,800 | 1,722,611 | ||||||
Banco del Bajio SA(b) | 279,508 | 1,089,664 | ||||||
Cemex SAB de CV, Series CPO*(a) | 4,580,073 | 4,042,274 | ||||||
Coca-Cola Femsa SAB de CV | 213,495 | 2,059,971 | ||||||
See Notes to Financial Statements.
| WisdomTree Trust | 25 |
Schedule of Investments (continued)
WisdomTree Emerging Markets ex-State-Owned Enterprises Fund (XSOE)
March 31, 2024
| Investments | Shares | Value | ||||||
Corp. Inmobiliaria Vesta SAB de CV(a) | 430,494 | $ | 1,680,097 | |||||
Fibra Uno Administracion SA de CV | 1,031,825 | 1,713,940 | ||||||
Fomento Economico Mexicano SAB de CV | 569,080 | 7,382,881 | ||||||
Gruma SAB de CV, Class B(a) | 61,320 | 1,146,143 | ||||||
Grupo Aeroportuario del Centro Norte SAB de CV(a) | 111,213 | 1,093,346 | ||||||
Grupo Aeroportuario del Pacifico SAB de CV, Class B(a) | 143,609 | 2,306,919 | ||||||
Grupo Aeroportuario del Sureste SAB de CV, Class B | 60,539 | 1,909,801 | ||||||
Grupo Bimbo SAB de CV, Series A(a) | 498,635 | 2,354,017 | ||||||
Grupo Carso SAB de CV, Series A1(a) | 198,400 | 1,767,985 | ||||||
Grupo Financiero Banorte SAB de CV, Class O | 730,428 | 7,750,423 | ||||||
Grupo Financiero Inbursa SAB de CV, Class O*(a) | 497,580 | 1,530,601 | ||||||
Grupo Mexico SAB de CV, Series B | 983,920 | 5,808,779 | ||||||
Grupo Televisa SAB, Series CPO | 87 | 54 | ||||||
Industrias Penoles SAB de CV*(a) | 69,345 | 980,282 | ||||||
Kimberly-Clark de Mexico SAB de CV, Class A | 604,500 | 1,403,805 | ||||||
Wal-Mart de Mexico SAB de CV | 1,434,385 | 5,781,810 | ||||||
|
| |||||||
| Total Mexico |
| 60,621,771 | ||||||
| Philippines – 0.7% |
| |||||||
Ayala Corp. | 86,610 | 986,043 | ||||||
Ayala Land, Inc. | 1,893,500 | 1,086,282 | ||||||
Bank of the Philippine Islands | 864,247 | 1,815,664 | ||||||
BDO Unibank, Inc. | 772,838 | 2,124,050 | ||||||
International Container Terminal Services, Inc. | 226,690 | 1,282,352 | ||||||
JG Summit Holdings, Inc. | 767,540 | 496,993 | ||||||
Jollibee Foods Corp. | 237,560 | 1,067,467 | ||||||
Metropolitan Bank & Trust Co. | 1,045,760 | 1,211,977 | ||||||
SM Investments Corp. | 148,645 | 2,570,185 | ||||||
SM Prime Holdings, Inc. | 3,599,800 | 2,093,987 | ||||||
|
| |||||||
| Total Philippines |
| 14,735,000 | ||||||
| Poland – 1.0% |
| |||||||
Alior Bank SA* | 42,119 | 1,034,452 | ||||||
Asseco Poland SA | 37,817 | 734,955 | ||||||
Bank Millennium SA* | 313,781 | 812,042 | ||||||
Bank Polska Kasa Opieki SA | 98,210 | 4,478,588 | ||||||
Budimex SA | 7,766 | 1,363,225 | ||||||
CD Projekt SA(a) | 39,332 | 1,153,009 | ||||||
Dino Polska SA*(b) | 29,685 | 2,886,057 | ||||||
Grupa Kety SA | 4,920 | 937,672 | ||||||
LPP SA | 623 | 2,390,295 | ||||||
mBank SA* | 6,352 | 1,179,048 | ||||||
Santander Bank Polska SA | 20,996 | 2,998,491 | ||||||
|
| |||||||
| Total Poland |
| 19,967,834 | ||||||
| Russia – 0.0% |
| |||||||
Evraz PLC*† | 757,034 | 0 | ||||||
HeadHunter Group PLC, ADR*† | 35,535 | 0 | ||||||
LUKOIL PJSC*† | 383,480 | 0 | ||||||
LUKOIL PJSC, ADR*† | 91,105 | 0 | ||||||
Magnitogorsk Iron & Steel Works PJSC, GDR*†(c) | 101,979 | 0 | ||||||
Mobile TeleSystems PJSC, ADR*† | 777,676 | 0 | ||||||
Novatek PJSC*† | 1,138,580 | 0 | ||||||
Novolipetsk Steel PJSC*† | 948,540 | 0 | ||||||
Ozon Holdings PLC, ADR*†(a) | 43,104 | 0 | ||||||
PhosAgro PJSC*† | 43,175 | 0 | ||||||
PhosAgro PJSC, GDR*†(c) | 835 | 0 | ||||||
Polyus PJSC*† | 37,593 | 0 | ||||||
Severstal PAO, GDR*†(c) | 123,722 | 0 | ||||||
Sistema AFK PAO*† | 4,256,200 | 0 | ||||||
Surgutneftegas PJSC*† | 7,201,040 | 0 | ||||||
VK IPJSC, GDR*†(c) | 167,707 | 0 | ||||||
X5 Retail Group NV, GDR*†(c) | 166,238 | 0 | ||||||
Yandex NV, Class A*† | 402,553 | 0 | ||||||
|
| |||||||
| Total Russia |
| 0 | ||||||
| Saudi Arabia – 4.6% |
| |||||||
Abdullah Al Othaim Markets Co. | 360,197 | 1,277,328 | ||||||
Advanced Petrochemical Co. | 109,287 | 1,188,884 | ||||||
Al Hammadi Holding | 72,459 | 1,120,550 | ||||||
Al Rajhi Bank | 1,486,327 | 32,615,574 | ||||||
Aldrees Petroleum & Transport Services Co. | 28,466 | 1,252,337 | ||||||
Alinma Bank | 745,502 | 8,457,835 | ||||||
Arab National Bank | 81,114 | 631,523 | ||||||
Arabian Contracting Services Co. | 14,089 | 858,751 | ||||||
Astra Industrial Group | 25,877 | 1,317,826 | ||||||
Bank Al-Jazira* | 308,198 | 1,623,781 | ||||||
Bank AlBilad | 372,268 | 4,744,546 | ||||||
Bupa Arabia for Cooperative Insurance Co. | 18,610 | 1,275,235 | ||||||
Dallah Healthcare Co. | 23,813 | 1,062,871 | ||||||
Dar Al Arkan Real Estate Development Co.* | 401,655 | 1,465,042 | ||||||
Dr. Sulaiman Al Habib Medical Services Group Co. | 62,084 | 5,065,379 | ||||||
Etihad Etisalat Co. | 282,629 | 3,948,743 | ||||||
Jarir Marketing Co. | 419,154 | 1,620,513 | ||||||
Leejam Sports Co. JSC | 18,099 | 1,052,980 | ||||||
Middle East Healthcare Co.* | 31,415 | 829,245 | ||||||
Mobile Telecommunications Co. Saudi Arabia | 410,273 | 1,380,521 | ||||||
Mouwasat Medical Services Co. | 70,407 | 2,586,878 | ||||||
Nahdi Medical Co. | 27,214 | 1,066,647 | ||||||
National Industrialization Co.* | 303,521 | 1,126,520 | ||||||
National Medical Care Co. | 17,360 | 860,015 | ||||||
Riyadh Cables Group Co. | 27,903 | 733,565 | ||||||
Sahara International Petrochemical Co. | 268,877 | 2,247,512 | ||||||
Saudi Awwal Bank | 249,023 | 2,655,891 | ||||||
Saudi Research & Media Group* | 30,791 | 2,127,990 | ||||||
Saudia Dairy & Foodstuff Co. | 10,947 | 1,079,960 | ||||||
Savola Group | 199,569 | 2,995,796 | ||||||
Seera Group Holding* | 120,309 | 882,148 | ||||||
|
| |||||||
| Total Saudi Arabia |
| 91,152,386 | ||||||
| South Africa – 2.2% |
| |||||||
Absa Group Ltd. | 301,280 | 2,356,782 | ||||||
Anglo American Platinum Ltd.(a) | 19,715 | 800,094 | ||||||
Aspen Pharmacare Holdings Ltd. | 135,983 | 1,575,388 | ||||||
Capitec Bank Holdings Ltd. | 33,913 | 3,753,358 | ||||||
See Notes to Financial Statements.
| 26 | WisdomTree Trust |
Schedule of Investments (continued)
WisdomTree Emerging Markets ex-State-Owned Enterprises Fund (XSOE)
March 31, 2024
| Investments | Shares | Value | ||||||
Clicks Group Ltd. | 73,044 | $ | 1,142,204 | |||||
Discovery Ltd. | 175,958 | 1,120,909 | ||||||
Exxaro Resources Ltd. | 95,517 | 852,358 | ||||||
FirstRand Ltd.(a) | 1,873,170 | 6,106,319 | ||||||
Gold Fields Ltd. | 265,415 | 4,259,535 | ||||||
Harmony Gold Mining Co. Ltd. | 163,191 | 1,361,717 | ||||||
Impala Platinum Holdings Ltd. | 246,670 | 1,020,093 | ||||||
Investec Ltd. | 160,488 | 1,058,803 | ||||||
Momentum Metropolitan Holdings | 746,725 | 801,291 | ||||||
Mr. Price Group Ltd. | 79,021 | 725,309 | ||||||
MultiChoice Group* | 102,399 | 614,299 | ||||||
Nedbank Group Ltd. | 201,579 | 2,434,224 | ||||||
Old Mutual Ltd. | 1,791,296 | 1,111,505 | ||||||
Sanlam Ltd. | 640,320 | 2,346,389 | ||||||
Shoprite Holdings Ltd.(a) | 168,561 | 2,202,587 | ||||||
Sibanye Stillwater Ltd. | 646,148 | 740,112 | ||||||
Standard Bank Group Ltd. | 502,898 | 4,919,497 | ||||||
Vodacom Group Ltd. | 188,609 | 981,579 | ||||||
Woolworths Holdings Ltd. | 342,924 | 1,072,257 | ||||||
|
| |||||||
| Total South Africa |
| 43,356,609 | ||||||
| South Korea – 12.8% |
| |||||||
Alteogen, Inc.* | 15,440 | 2,263,960 | ||||||
Amorepacific Corp. | 10,635 | 959,026 | ||||||
Celltrion, Inc. | 50,207 | 7,130,606 | ||||||
CosmoAM&T Co. Ltd.* | 7,237 | 860,108 | ||||||
Coway Co. Ltd. | 28,024 | 1,165,715 | ||||||
DB Insurance Co. Ltd. | 23,653 | 1,663,836 | ||||||
Doosan Bobcat, Inc. | 24,641 | 975,573 | ||||||
Doosan Enerbility Co. Ltd.* | 160,092 | 2,047,751 | ||||||
Ecopro BM Co. Ltd.* | 14,375 | 2,925,720 | ||||||
Ecopro Co. Ltd.* | 5,820 | 2,736,535 | ||||||
GS Holdings Corp. | 34,350 | 1,231,114 | ||||||
Hana Financial Group, Inc. | 83,284 | 3,569,535 | ||||||
Hankook Tire & Technology Co. Ltd. | 31,332 | 1,261,426 | ||||||
Hanmi Semiconductor Co. Ltd. | 16,079 | 1,596,852 | ||||||
Hanwha Aerospace Co. Ltd. | 10,074 | 1,530,275 | ||||||
Hanwha Solutions Corp. | 46,119 | 971,197 | ||||||
HD Hyundai Co. Ltd. | 22,291 | 1,190,509 | ||||||
HD Korea Shipbuilding & Offshore Engineering Co. Ltd.* | 19,617 | 1,725,276 | ||||||
HLB, Inc.* | 34,180 | 2,670,927 | ||||||
HYBE Co. Ltd. | 7,931 | 1,354,971 | ||||||
Hyundai Glovis Co. Ltd. | 8,433 | 1,090,574 | ||||||
Hyundai Motor Co. | 40,570 | 7,021,586 | ||||||
Hyundai Steel Co. | 56,689 | 1,339,060 | ||||||
Kakao Corp. | 99,700 | 3,976,891 | ||||||
KakaoBank Corp. | 107,699 | 2,203,980 | ||||||
KB Financial Group, Inc. | 96,568 | 4,985,312 | ||||||
Korea Investment Holdings Co. Ltd. | 25,230 | 1,248,147 | ||||||
Korea Zinc Co. Ltd. | 4,174 | 1,401,410 | ||||||
Korean Air Lines Co. Ltd. | 77,804 | 1,254,111 | ||||||
Krafton, Inc.* | 12,277 | 2,252,493 | ||||||
KT Corp. | 50,158 | 1,404,610 | ||||||
KT&G Corp. | 37,246 | 2,586,816 | ||||||
Kum Yang Co. Ltd.* | 8,314 | 713,908 | ||||||
L&F Co. Ltd. | 8,723 | 1,128,077 | ||||||
LG Chem Ltd. | 14,420 | 4,702,232 | ||||||
LG Corp. | 37,750 | 2,453,575 | ||||||
LG Display Co. Ltd.* | 152,843 | 1,220,473 | ||||||
LG Electronics, Inc. | 35,089 | 2,478,710 | ||||||
LG Energy Solution Ltd.* | 12,350 | 3,623,584 | ||||||
LG H&H Co. Ltd. | 2,541 | 717,237 | ||||||
LG Innotek Co. Ltd. | 5,435 | 794,105 | ||||||
Meritz Financial Group, Inc. | 38,108 | 2,312,664 | ||||||
NAVER Corp. | 49,098 | 6,834,515 | ||||||
Posco DX Co. Ltd. | 18,693 | 678,988 | ||||||
POSCO Future M Co. Ltd. | 9,594 | 2,162,881 | ||||||
POSCO Holdings, Inc. | 21,855 | 6,850,741 | ||||||
S-Oil Corp. | 20,275 | 1,182,238 | ||||||
Samsung Biologics Co. Ltd.*(b) | 5,836 | 3,602,389 | ||||||
Samsung Electro-Mechanics Co. Ltd. | 20,686 | 2,284,871 | ||||||
Samsung Electronics Co. Ltd. | 1,514,991 | 92,728,140 | ||||||
Samsung Engineering Co. Ltd.* | 62,332 | 1,157,512 | ||||||
Samsung Fire & Marine Insurance Co. Ltd. | 11,072 | 2,516,644 | ||||||
Samsung Heavy Industries Co. Ltd.* | 295,214 | 1,877,090 | ||||||
Samsung Life Insurance Co. Ltd. | 27,655 | 1,896,049 | ||||||
Samsung SDI Co. Ltd. | 15,220 | 5,324,880 | ||||||
Samsung SDS Co. Ltd. | 14,395 | 1,748,251 | ||||||
Shinhan Financial Group Co. Ltd. | 131,795 | 4,503,302 | ||||||
SK Biopharmaceuticals Co. Ltd.* | 13,702 | 933,314 | ||||||
SK Hynix, Inc. | 151,853 | 20,641,856 | ||||||
SK Innovation Co. Ltd.* | 19,136 | 1,648,859 | ||||||
SK, Inc. | 12,197 | 1,618,113 | ||||||
Woori Financial Group, Inc. | 218,737 | 2,326,695 | ||||||
Yuhan Corp. | 20,480 | 1,166,809 | ||||||
|
| |||||||
| Total South Korea |
| 254,424,604 | ||||||
| Taiwan – 18.5% |
| |||||||
Accton Technology Corp. | 167,000 | 2,416,017 | ||||||
Acer, Inc.(a) | 1,019,000 | 1,490,125 | ||||||
Advantech Co. Ltd. | 174,072 | 2,197,419 | ||||||
ASE Technology Holding Co. Ltd. | 933,062 | 4,693,955 | ||||||
Asia Cement Corp. | 994,000 | 1,282,741 | ||||||
Asia Vital Components Co. Ltd.(a) | 88,000 | 1,501,336 | ||||||
ASMedia Technology, Inc. | 11,000 | 823,191 | ||||||
Asustek Computer, Inc.(a) | 214,000 | 2,871,967 | ||||||
AUO Corp.(a) | 2,887,200 | 1,614,851 | ||||||
Cathay Financial Holding Co. Ltd. | 2,876,425 | 4,372,587 | ||||||
Cheng Shin Rubber Industry Co. Ltd.(a) | 860,000 | 1,343,603 | ||||||
Chicony Electronics Co. Ltd. | 170,000 | 1,179,246 | ||||||
China Development Financial Holding Corp.*(a) | 6,650,000 | 2,898,667 | ||||||
Chroma ATE, Inc. | 114,000 | 908,338 | ||||||
Compal Electronics, Inc. | 1,388,000 | 1,570,003 | ||||||
Compeq Manufacturing Co. Ltd. | 433,000 | 1,087,794 | ||||||
CTBC Financial Holding Co. Ltd. | 5,919,672 | 6,113,243 | ||||||
Delta Electronics, Inc. | 565,500 | 6,025,450 | ||||||
E.Sun Financial Holding Co. Ltd. | 4,415,895 | 3,759,999 | ||||||
See Notes to Financial Statements.
| WisdomTree Trust | 27 |
Schedule of Investments (continued)
WisdomTree Emerging Markets ex-State-Owned Enterprises Fund (XSOE)
March 31, 2024
| Investments | Shares | Value | ||||||
Eclat Textile Co. Ltd. | 80,000 | $ | 1,382,349 | |||||
Elite Material Co. Ltd. | 97,000 | 1,222,976 | ||||||
Eva Airways Corp. | 1,006,000 | 1,004,318 | ||||||
Far Eastern International Bank | 1,246,715 | 560,960 | ||||||
Far Eastern New Century Corp. | 1,416,080 | 1,471,235 | ||||||
Far EasTone Telecommunications Co. Ltd. | 648,000 | 1,650,194 | ||||||
Faraday Technology Corp.(a) | 74,780 | 803,797 | ||||||
Feng TAY Enterprise Co. Ltd. | 210,320 | 1,054,771 | ||||||
First Financial Holding Co. Ltd. | 2,241,000 | 1,939,653 | ||||||
Formosa Petrochemical Corp. | 604,000 | 1,311,669 | ||||||
Formosa Plastics Corp. | 1,597,000 | 3,438,165 | ||||||
Fortune Electric Co. Ltd. | 57,000 | 1,216,461 | ||||||
Fubon Financial Holding Co. Ltd.(a) | 2,719,023 | 5,921,724 | ||||||
Giant Manufacturing Co. Ltd. | 146,853 | 998,032 | ||||||
Gigabyte Technology Co. Ltd.(a) | 149,000 | 1,471,214 | ||||||
Global Unichip Corp.(a) | 28,000 | 1,089,256 | ||||||
Gold Circuit Electronics Ltd. | 110,000 | 843,814 | ||||||
Great Wall Enterprise Co. Ltd. | 592 | 1,067 | ||||||
Hiwin Technologies Corp. | 110,752 | 953,401 | ||||||
Hon Hai Precision Industry Co. Ltd. | 3,429,068 | 16,071,998 | ||||||
Hotai Motor Co. Ltd. | 128,880 | 2,589,399 | ||||||
Innolux Corp. | 3,333,326 | 1,567,533 | ||||||
Inventec Corp. | 979,000 | 1,826,247 | ||||||
Jentech Precision Industrial Co. Ltd. | 31,000 | 892,121 | ||||||
King Slide Works Co. Ltd. | 20,000 | 781,165 | ||||||
King Yuan Electronics Co. Ltd. | 271,000 | 893,355 | ||||||
Largan Precision Co. Ltd. | 32,000 | 2,444,733 | ||||||
Lien Hwa Industrial Holdings Corp. | 482,382 | 1,023,442 | ||||||
Lite-On Technology Corp., ADR(a) | 704,000 | 2,221,757 | ||||||
Lotes Co. Ltd. | 27,271 | 1,192,976 | ||||||
Makalot Industrial Co. Ltd. | 73,000 | 847,392 | ||||||
MediaTek, Inc. | 432,000 | 16,130,736 | ||||||
Micro-Star International Co. Ltd. | 301,000 | 1,594,185 | ||||||
momo.com, Inc. | 320 | 3,870 | ||||||
Nan Ya Plastics Corp. | 1,904,000 | 3,331,636 | ||||||
Nanya Technology Corp. | 410,000 | 867,311 | ||||||
Novatek Microelectronics Corp. | 200,000 | 3,774,587 | ||||||
Pegatron Corp. | 720,000 | 2,294,749 | ||||||
PharmaEssentia Corp.* | 105,000 | 1,056,447 | ||||||
Pou Chen Corp. | 1,321,000 | 1,492,154 | ||||||
Powerchip Semiconductor Manufacturing Corp.*(a) | 1,494,000 | 1,204,406 | ||||||
Powertech Technology, Inc. | 218,000 | 1,365,757 | ||||||
President Chain Store Corp. | 167,000 | 1,390,645 | ||||||
Qisda Corp. | 686,000 | 957,080 | ||||||
Quanta Computer, Inc.(a) | 822,000 | 7,538,457 | ||||||
Realtek Semiconductor Corp. | 152,000 | 2,659,709 | ||||||
Ruentex Development Co. Ltd. | 624,300 | 685,680 | ||||||
Shanghai Commercial & Savings Bank Ltd.(a) | 1,959,159 | 2,959,843 | ||||||
Shin Kong Financial Holding Co. Ltd.*(a) | 6,637,000 | 1,673,585 | ||||||
SinoPac Financial Holdings Co. Ltd. | 5,459,195 | 3,693,083 | ||||||
Synnex Technology International Corp. | 607,000 | 1,496,471 | ||||||
TA Chen Stainless Pipe | 532 | 607 | ||||||
Taishin Financial Holding Co. Ltd. | 5,718,148 | 3,216,106 | ||||||
Taiwan Cement Corp.(a) | 2,336,000 | 2,346,693 | ||||||
Taiwan Mobile Co. Ltd. | 514,000 | 1,654,257 | ||||||
Taiwan Semiconductor Manufacturing Co. Ltd. | 6,711,000 | 163,353,039 | ||||||
Tatung Co. Ltd.* | 621,000 | 1,096,333 | ||||||
Tripod Technology Corp. | 161,000 | 1,028,778 | ||||||
Uni-President Enterprises Corp. | 1,424,160 | 3,448,760 | ||||||
Unimicron Technology Corp.(a) | 460,000 | 2,745,325 | ||||||
United Microelectronics Corp.(a) | 3,550,000 | 5,790,304 | ||||||
Voltronic Power Technology Corp. | 22,000 | 1,127,377 | ||||||
Walsin Lihwa Corp. | 1,155,977 | 1,356,318 | ||||||
Wan Hai Lines Ltd. | 673,750 | 928,410 | ||||||
Winbond Electronics Corp. | 1,438,904 | 1,222,935 | ||||||
Wistron Corp.(a) | 867,000 | 3,386,348 | ||||||
Wiwynn Corp. | 28,000 | 1,986,033 | ||||||
WPG Holdings Ltd. | 627,000 | 1,878,835 | ||||||
WT Microelectronics Co. Ltd.(a) | 163,000 | 751,246 | ||||||
Yageo Corp.(a) | 113,847 | 2,102,382 | ||||||
Yuanta Financial Holding Co. Ltd. | 4,409,104 | 4,188,191 | ||||||
|
| |||||||
| Total Taiwan |
| 368,616,374 | ||||||
| Thailand – 1.5% |
| |||||||
Advanced Info Service PCL, NVDR | 548,500 | 3,081,672 | ||||||
Bumrungrad Hospital PCL, NVDR | 231,800 | 1,423,041 | ||||||
Central Pattana PCL, NVDR | 1,118,900 | 1,931,914 | ||||||
Central Retail Corp. PCL, NVDR(a) | 1,513,583 | 1,482,990 | ||||||
CP ALL PCL, NVDR | 2,044,600 | 3,067,951 | ||||||
Delta Electronics Thailand PCL, NVDR(a) | 2,052,300 | 4,190,376 | ||||||
Energy Absolute PCL, NVDR(a) | 1,020,400 | 957,827 | ||||||
Gulf Energy Development PCL, NVDR | 3,046,000 | 3,652,278 | ||||||
Home Product Center PCL, NVDR | 3,081,500 | 895,208 | ||||||
Indorama Ventures PCL, NVDR(a) | 1,366,500 | 887,593 | ||||||
Intouch Holdings PCL, NVDR | 1,122,300 | 2,122,335 | ||||||
Minor International PCL, NVDR | 1,709,800 | 1,558,091 | ||||||
Tisco Financial Group PCL, NVDR(a) | 790,000 | 2,154,299 | ||||||
True Corp. PCL, NVDR* | 7,733,893 | 1,610,896 | ||||||
|
| |||||||
| Total Thailand | 29,016,471 | |||||||
| Turkey – 0.9% | ||||||||
Akbank TAS | 1,330,097 | 1,923,280 | ||||||
BIM Birlesik Magazalar AS | 167,648 | 1,870,701 | ||||||
Enka Insaat ve Sanayi AS | 814,656 | 876,299 | ||||||
Ford Otomotiv Sanayi AS | 32,073 | 1,122,238 | ||||||
Haci Omer Sabanci Holding AS | 632,697 | 1,613,424 | ||||||
KOC Holding AS* | 539,879 | 3,324,181 | ||||||
Turkcell Iletisim Hizmetleri AS | 669,472 | 1,400,941 | ||||||
Turkiye Is Bankasi AS, Class C | 3,801,818 | 1,338,486 | ||||||
Turkiye Petrol Rafinerileri AS | 365,714 | 2,000,846 | ||||||
Turkiye Sise ve Cam Fabrikalari AS | 720,357 | 1,029,591 | ||||||
Yapi ve Kredi Bankasi AS* | 1,152,304 | 973,788 | ||||||
|
| |||||||
| Total Turkey | 17,473,775 | |||||||
| United States – 0.1% | ||||||||
Legend Biotech Corp., ADR* | 18,216 | 1,021,735 | ||||||
TOTAL COMMON STOCKS (Cost: $1,813,641,944) |
| 1,994,063,680 | ||||||
See Notes to Financial Statements.
| 28 | WisdomTree Trust |
Schedule of Investments (concluded)
WisdomTree Emerging Markets ex-State-Owned Enterprises Fund (XSOE)
March 31, 2024
| Investments | Shares | Value | ||||||
| RIGHTS – 0.0% | ||||||||
| China – 0.0% | ||||||||
Kangmei Pharmaceutical Co. Ltd., expiring 11/12/24*† | ||||||||
| (Cost: $0) | 14,422 | $ | 0 | |||||
| INVESTMENT OF CASH COLLATERAL FOR SECURITIES LOANED – 0.7% |
| |||||||
| United States – 0.7% | ||||||||
State Street Navigator Securities Lending |
| |||||||
| (Cost: $13,742,102) | 13,742,102 | 13,742,102 | ||||||
| TOTAL INVESTMENTS IN SECURITIES – 100.9% (Cost: $1,827,384,046) |
| 2,007,805,782 | ||||||
Other Assets less Liabilities – (0.9)% | (17,943,973 | ) | ||||||
|
| |||||||
| NET ASSETS – 100.0% | $ | 1,989,861,809 | ||||||
| * | Non-income producing security. |
| † | This security is being fair valued using significant unobservable inputs (i.e., Level 3 on the fair value hierarchy) by WisdomTree Asset Management, Inc., as valuation designee, in accordance with valuation procedures approved by the Board of Trustees of WisdomTree Trust. The aggregate value of Level 3 fair valued securities is $0, which represents 0.0% of net assets. |
| (a) | Security, or portion thereof, was on loan at March 31, 2024 (See Note 2). At March 31, 2024, the total market value of the Fund’s securities on loan identified in the Schedule of Investments was $100,971,874 and the total market value of the collateral held by the Fund was $107,596,507. The total market value of the collateral includes non-cash U.S. Government securities collateral having a value of $93,854,405. |
| (b) | This security is exempt from registration under rule 144A of the Securities Act of 1933. This security may be sold in transactions that are exempt from registration, normally to qualified institutional buyers. |
| (c) | This security is exempt from registration under Regulation S of the Securities Act of 1933, which exempts from registration securities offered and sold outside the United States. This security may not be offered or sold in the United States except pursuant to an exemption from, or in a transaction not subject to, the registration requirements of the Securities Act of 1933. |
| (d) | Rate shown represents annualized 7-day yield as of March 31, 2024. |
| FAIR VALUATION SUMMARY | ||||||||||
The following is a summary of the fair valuations according to the inputs used in valuing the Fund’s investments (See Note 2 — Fair Value Measurement):
| Quoted Prices in Active Markets (Level 1) | Other Significant Observable Inputs (Level 2) | Significant Unobservable Inputs (Level 3) | Total | |||||||||||||
Assets: | ||||||||||||||||
Investments in Securities |
| |||||||||||||||
Common Stocks | ||||||||||||||||
Russia | $ | — | $ | — | $ | 0 | * | $ | 0 | |||||||
Other | 1,994,063,680 | — | — | 1,994,063,680 | ||||||||||||
Rights | — | — | 0 | * | 0 | |||||||||||
Investment of Cash Collateral for Securities Loaned | — | 13,742,102 | — | 13,742,102 | ||||||||||||
Total Investments in Securities | $ | 1,994,063,680 | $ | 13,742,102 | $ | 0 | $ | 2,007,805,782 | ||||||||
| * | Fair valuations using significant unobservable inputs were determined by WisdomTree Asset Management, Inc., as valuation designee, in accordance with valuation procedures approved by the Board of Trustees of WisdomTree Trust. |
See Notes to Financial Statements.
| WisdomTree Trust | 29 |
Schedule of Investments
WisdomTree Emerging Markets High Dividend Fund (DEM)
March 31, 2024
| Investments | Shares | Value | ||||||
| COMMON STOCKS – 99.9% |
| |||||||
| Brazil – 13.6% |
| |||||||
Alupar Investimento SA | 388,789 | $ | 2,373,644 | |||||
Ambev SA | 8,085,009 | 20,173,959 | ||||||
Auren Energia SA | 1,702,846 | 4,048,280 | ||||||
Banco Bradesco SA | 2,017,113 | 5,133,905 | ||||||
Banco do Brasil SA | 2,740,013 | 30,993,504 | ||||||
BB Seguridade Participacoes SA | 1,582,522 | 10,281,311 | ||||||
Blau Farmaceutica SA | 173,182 | 430,745 | ||||||
Cia de Saneamento de Minas Gerais Copasa MG | 923,177 | 4,016,900 | ||||||
Cia de Sanena do Parana | 1,000,758 | 5,204,170 | ||||||
CPFL Energia SA | 842,481 | 5,858,849 | ||||||
CSN Mineracao SA | 2,933,014 | 3,105,548 | ||||||
Dexco SA | 697,648 | 1,070,399 | ||||||
Engie Brasil Energia SA | 1,090,625 | 8,771,976 | ||||||
Grendene SA | 1,110,231 | 1,466,098 | ||||||
Kepler Weber SA | 478,253 | 1,009,906 | ||||||
Klabin SA | 2,343,513 | 11,826,301 | ||||||
Lojas Renner SA | 1,921,259 | 6,517,361 | ||||||
Mahle Metal Leve SA | 225,367 | 1,556,460 | ||||||
Neoenergia SA | 653,186 | 2,655,519 | ||||||
Petroleo Brasileiro SA | 20,501,467 | 156,785,200 | ||||||
Sao Martinho SA | 329,252 | 2,041,072 | ||||||
Telefonica Brasil SA | 690,976 | 6,984,924 | ||||||
TIM SA | 2,168,609 | 7,711,688 | ||||||
Vale SA | 6,756,442 | 82,107,734 | ||||||
|
| |||||||
| Total Brazil |
| 382,125,453 | ||||||
| Chile – 2.0% |
| |||||||
Aguas Andinas SA, Class A | 7,364,550 | 2,147,384 | ||||||
Banco de Chile | 85,920,624 | 9,548,196 | ||||||
Banco de Credito & Inversiones SA* | 80,776 | 2,306,709 | ||||||
Banco Santander Chile | 60,884,203 | 3,029,158 | ||||||
Cencosud Shopping SA | 1,409,536 | 2,155,583 | ||||||
Cia Sud Americana de Vapores SA | 56,036,003 | 4,210,484 | ||||||
Colbun SA | 31,620,574 | 4,092,605 | ||||||
Empresa Nacional de Telecomunicaciones SA | 350,838 | 1,166,384 | ||||||
Empresas CMPC SA | 4,156,245 | 8,436,646 | ||||||
Empresas Copec SA | 816,375 | 5,858,657 | ||||||
Enel Chile SA | 116,438,739 | 6,992,141 | ||||||
Quinenco SA | 1,241,874 | 4,368,115 | ||||||
SMU SA | 9,145,050 | 1,584,545 | ||||||
|
| |||||||
| Total Chile |
| 55,896,607 | ||||||
| China – 21.1% |
| |||||||
Agricultural Bank of China Ltd., Class A | 8,578,100 | 4,997,709 | ||||||
Agricultural Bank of China Ltd., Class H | 32,538,000 | 13,719,554 | ||||||
Anhui Conch Cement Co. Ltd., Class A | 1,083,000 | 3,323,404 | ||||||
Anhui Conch Cement Co. Ltd., Class H | 2,142,000 | 4,455,629 | ||||||
Anhui Expressway Co. Ltd., Class H | 1,326,000 | 1,468,919 | ||||||
BAIC Motor Corp. Ltd., Class H(a) | 6,778,500 | 1,853,457 | ||||||
Bank of Beijing Co. Ltd., Class A | 1,897,649 | 1,479,353 | ||||||
Bank of Chengdu Co. Ltd., Class A | 308,000 | 576,938 | ||||||
Bank of China Ltd., Class A | 5,866,400 | 3,555,198 | ||||||
Bank of China Ltd., Class H | 97,359,000 | 40,180,359 | ||||||
Bank of Chongqing Co. Ltd., Class H | 2,059,500 | 1,134,160 | ||||||
Bank of Communications Co. Ltd., Class A | 4,529,400 | 3,955,209 | ||||||
Bank of Communications Co. Ltd., Class H | 28,423,000 | 18,666,729 | ||||||
Bank of Guiyang Co. Ltd., Class A | 1,007,700 | 748,100 | ||||||
Bank of Jiangsu Co. Ltd., Class A | 2,370,770 | 2,579,621 | ||||||
Bank of Nanjing Co. Ltd., Class A | 1,772,400 | 2,187,304 | ||||||
Bank of Shanghai Co. Ltd., Class A | 2,524,202 | 2,336,323 | ||||||
Beijing Jingneng Clean Energy Co. Ltd., Class H | 6,352,000 | 1,412,196 | ||||||
Blue Moon Group Holdings Ltd.(a) | 2,389,500 | 610,622 | ||||||
Bros Eastern Co. Ltd., Class A | 160,400 | 121,508 | ||||||
Canmax Technologies Co. Ltd., Class A | 225,800 | 616,717 | ||||||
China Cinda Asset Management Co. Ltd., Class H | 14,851,000 | 1,233,401 | ||||||
China CITIC Bank Corp. Ltd., Class H | 20,280,000 | 10,805,359 | ||||||
China Coal Energy Co. Ltd., Class H | 4,647,000 | 4,524,419 | ||||||
China Communications Services Corp. Ltd., Class H | 3,598,000 | 1,677,989 | ||||||
China Construction Bank Corp., Class A | 1,363,500 | 1,290,183 | ||||||
China Construction Bank Corp., Class H | 113,796,054 | 68,628,481 | ||||||
China East Education Holdings Ltd.(a) | 1,086,500 | 333,178 | ||||||
China Everbright Bank Co. Ltd., Class A | 3,063,900 | 1,316,645 | ||||||
China Everbright Bank Co. Ltd., Class H | 9,048,000 | 2,601,179 | ||||||
China Feihe Ltd.(a) | 7,640,000 | 3,592,331 | ||||||
China Galaxy Securities Co. Ltd., Class H | 3,140,000 | 1,540,622 | ||||||
China Life Insurance Co. Ltd., Class H | 3,854,000 | 4,623,943 | ||||||
China Medical System Holdings Ltd. | 1,763,000 | 1,851,652 | ||||||
China Merchants Bank Co. Ltd., Class H | 2,657,500 | 10,509,187 | ||||||
China Minsheng Banking Corp. Ltd., Class A | 926,800 | 516,988 | ||||||
China Minsheng Banking Corp. Ltd., Class H(b) | 11,486,000 | 3,977,162 | ||||||
China Nonferrous Mining Corp. Ltd. | 1,586,000 | 1,325,306 | ||||||
China Pacific Insurance Group Co. Ltd., Class H | 1,600,400 | 2,801,459 | ||||||
China Petroleum & Chemical Corp., Class A | 7,934,300 | 6,983,111 | ||||||
China Railway Group Ltd., Class H | 7,551,000 | 3,733,796 | ||||||
China Railway Signal & Communication Corp. Ltd., Class H(a)(b) | 3,296,000 | 1,254,985 | ||||||
China Shenhua Energy Co. Ltd., Class A | 1,712,600 | 9,220,640 | ||||||
China Shenhua Energy Co. Ltd., Class H | 16,591,000 | 65,185,780 | ||||||
China Suntien Green Energy Corp. Ltd., Class H | 3,134,000 | 1,185,293 | ||||||
China Zheshang Bank Co. Ltd., Class A | 450,000 | 185,320 | ||||||
Chongqing Rural Commercial Bank Co. Ltd., Class A | 1,538,800 | 987,660 | ||||||
Chongqing Rural Commercial Bank Co. Ltd., Class H | 5,468,000 | 2,263,647 | ||||||
Daqin Railway Co. Ltd., Class A | 2,208,800 | 2,239,101 | ||||||
Easyhome New Retail Group Co. Ltd., Class A | 519,500 | 204,640 | ||||||
Fufeng Group Ltd.(b) | 7,142,000 | 4,626,611 | ||||||
Gree Electric Appliances, Inc. of Zhuhai, Class A | 1,315,400 | 7,121,973 | ||||||
See Notes to Financial Statements.
| 30 | WisdomTree Trust |
Schedule of Investments (continued)
WisdomTree Emerging Markets High Dividend Fund (DEM)
March 31, 2024
| Investments | Shares | Value | ||||||
Greentown Management Holdings Co. Ltd.(a) | 1,056,000 | $ | 868,930 | |||||
Guangdong Guanhao High-Tech Co. Ltd., Class A | 256,500 | 102,453 | ||||||
Guanghui Energy Co. Ltd., Class A | 2,426,600 | 2,486,627 | ||||||
Guangzhou Automobile Group Co. Ltd., Class H | 6,800,000 | 2,789,004 | ||||||
Guizhou Panjiang Refined Coal Co. Ltd., Class A | 399,800 | 335,902 | ||||||
Guotai Junan Securities Co. Ltd., Class H(a)(b) | 667,400 | 731,659 | ||||||
Hailir Pesticides & Chemicals Group Co. Ltd., Class A | 51,100 | 103,250 | ||||||
Haitong Securities Co. Ltd., Class H | 970,800 | 463,913 | ||||||
Hebei Yangyuan Zhihui Beverage Co. Ltd., Class A | 37,300 | 130,697 | ||||||
Henan Shenhuo Coal Industry & Electricity Power Co. Ltd., Class A | 502,700 | 1,377,848 | ||||||
Henan Shuanghui Investment & Development Co. Ltd., Class A | 568,100 | 2,053,967 | ||||||
Hengan International Group Co. Ltd. | 1,311,000 | 4,129,094 | ||||||
HLA Group Corp. Ltd., Class A | 116,100 | 143,918 | ||||||
Hoyuan Green Energy Co. Ltd., Class A | 98,900 | 328,286 | ||||||
Huabao Flavours & Fragrances Co. Ltd., Class A | 41,400 | 103,038 | ||||||
Huadian Power International Corp. Ltd., Class H(b) | 3,458,000 | 1,851,289 | ||||||
Huaibei Mining Holdings Co. Ltd., Class A | 506,100 | 1,158,529 | ||||||
Huatai Securities Co. Ltd., Class H(a) | 1,064,200 | 1,215,615 | ||||||
Huaxia Bank Co. Ltd., Class A | 1,287,400 | 1,149,021 | ||||||
Industrial & Commercial Bank of China Ltd., Class A | 5,739,000 | 4,173,588 | ||||||
Industrial & Commercial Bank of China Ltd., Class H | 76,139,823 | 38,330,393 | ||||||
Industrial Bank Co. Ltd., Class A | 2,503,200 | 5,440,540 | ||||||
Inner Mongolia ERDOS Resources Co. Ltd., Class A | 159,400 | 240,843 | ||||||
Jiangsu Asia-Pacific Light Alloy Technology Co. Ltd., Class A | 153,600 | 125,666 | ||||||
Jiangsu Dingsheng New Energy Materials Co. Ltd., Class A | 62,500 | 78,164 | ||||||
Jiangsu Expressway Co. Ltd., Class H | 4,573,727 | 4,680,992 | ||||||
Jiangzhong Pharmaceutical Co. Ltd., Class A | 86,900 | 295,635 | ||||||
Jinneng Holding Shanxi Coal Industry Co. Ltd., Class A | 80,900 | 171,485 | ||||||
Keda Industrial Group Co. Ltd., Class A | 377,900 | 548,081 | ||||||
Livzon Pharmaceutical Group, Inc., Class H(b) | 278,900 | 949,688 | ||||||
Luxi Chemical Group Co. Ltd., Class A | 313,300 | 409,943 | ||||||
Metallurgical Corp. of China Ltd., Class H | 3,941,000 | 840,927 | ||||||
Nanjing Iron & Steel Co. Ltd., Class A | 2,052,000 | 1,331,183 | ||||||
NetDragon Websoft Holdings Ltd. | 675,500 | 945,956 | ||||||
New China Life Insurance Co. Ltd., Class H | 840,400 | 1,488,279 | ||||||
PetroChina Co. Ltd., Class A | 4,774,600 | 6,497,307 | ||||||
PetroChina Co. Ltd., Class H | 80,006,000 | 68,388,623 | ||||||
PICC Property & Casualty Co. Ltd., Class H | 6,590,000 | 8,689,610 | ||||||
Ping An Insurance Group Co. of China Ltd., Class H | 4,632,500 | 19,562,397 | ||||||
Pingdingshan Tianan Coal Mining Co. Ltd., Class A | 591,900 | 1,000,305 | ||||||
Postal Savings Bank of China Co. Ltd., Class H(a)(b) | 5,307,000 | 2,773,368 | ||||||
Powerlong Commercial Management Holdings Ltd.(c) | 585,000 | 183,129 | ||||||
Rongan Property Co. Ltd., Class A | 363,900 | 113,274 | ||||||
Shaanxi Beiyuan Chemical Industry Group Co. Ltd., Class A | 175,900 | 108,538 | ||||||
Shaanxi Coal Industry Co. Ltd., Class A | 3,310,000 | 11,438,474 | ||||||
Shan Xi Hua Yang Group New Energy Co. Ltd., Class A | 108,800 | 140,563 | ||||||
Shandong Buchang Pharmaceuticals Co. Ltd., Class A | 147,600 | 340,315 | ||||||
Shanghai Kehua Bio-Engineering Co. Ltd., Class A | 102,000 | 111,969 | ||||||
Shanghai Pharmaceuticals Holding Co. Ltd., Class H | 1,340,400 | 1,935,299 | ||||||
Shanghai Rural Commercial Bank Co. Ltd., Class A | 235,700 | 219,780 | ||||||
Shanghai Tunnel Engineering Co. Ltd., Class A | 628,500 | 528,049 | ||||||
Shanxi Coking Coal Energy Group Co. Ltd., Class A | 1,228,300 | 1,745,917 | ||||||
Shanxi Lu’an Environmental Energy Development Co. Ltd., Class A | 1,151,600 | 3,281,721 | ||||||
Shenzhen Aisidi Co. Ltd., Class A | 238,700 | 402,743 | ||||||
Shenzhen Expressway Corp. Ltd., Class H | 1,602,000 | 1,400,083 | ||||||
Shenzhen Heungkong Holding Co. Ltd., Class A | 614,400 | 131,166 | ||||||
Shenzhen Jinjia Group Co. Ltd., Class A | 150,800 | 93,881 | ||||||
Sichuan Road & Bridge Group Co. Ltd., Class A | 1,302,800 | 1,360,149 | ||||||
Sinopec Engineering Group Co. Ltd., Class H | 3,584,500 | 2,065,572 | ||||||
Sinotrans Ltd., Class H | 5,874,000 | 2,867,032 | ||||||
Sunac Services Holdings Ltd.(a)(b) | 4,116,000 | 978,191 | ||||||
TangShan Port Group Co. Ltd., Class A | 2,763,200 | 1,556,593 | ||||||
TBEA Co. Ltd., Class A | 1,988,900 | 4,196,731 | ||||||
Tian Lun Gas Holdings Ltd. | 439,000 | 282,703 | ||||||
Tianqi Lithium Corp., Class A | 317,300 | 2,096,425 | ||||||
Tianqi Lithium Corp., Class H(b) | 346,800 | 1,612,930 | ||||||
Tingyi Cayman Islands Holding Corp. | 2,406,000 | 2,637,656 | ||||||
Tongwei Co. Ltd., Class A | 1,291,500 | 4,423,944 | ||||||
Uni-President China Holdings Ltd.(b) | 2,135,000 | 1,519,456 | ||||||
Western Mining Co. Ltd., Class A | 1,450,700 | 3,854,333 | ||||||
XCMG Construction Machinery Co. Ltd., Class A | 1,427,400 | 1,250,381 | ||||||
Xiamen C & D, Inc., Class A | 654,800 | 925,328 | ||||||
Xiamen ITG Group Corp. Ltd., Class A | 471,600 | 471,574 | ||||||
Xiamen Xiangyu Co. Ltd., Class A | 526,100 | 479,696 | ||||||
Yangtze Optical Fibre & Cable Joint Stock Co. Ltd., Class H(a)(b) | 365,500 | 415,168 | ||||||
YongXing Special Materials Technology Co. Ltd., Class A | 190,260 | 1,250,773 | ||||||
Yunnan Yuntianhua Co. Ltd., Class A | 365,500 | 955,483 | ||||||
Zangge Mining Co. Ltd., Class A | 462,400 | 2,008,081 | ||||||
Zhejiang Expressway Co. Ltd., Class H | 4,001,400 | 2,566,557 | ||||||
See Notes to Financial Statements.
| WisdomTree Trust | 31 |
Schedule of Investments (continued)
WisdomTree Emerging Markets High Dividend Fund (DEM)
March 31, 2024
| Investments | Shares | Value | ||||||
Zhejiang Jiahua Energy Chemical Industry Co. Ltd., Class A | 219,000 | $ | 239,198 | |||||
Zhejiang Meida Industrial Co. Ltd., Class A | 92,900 | 118,486 | ||||||
Zhejiang Xinan Chemical Industrial Group Co. Ltd., Class A | 391,700 | 435,918 | ||||||
Zhende Medical Co. Ltd., Class A | 34,200 | 95,058 | ||||||
Zhengzhou Coal Mining Machinery Group Co. Ltd., Class H | 686,000 | 823,924 | ||||||
Zoomlion Heavy Industry Science & Technology Co. Ltd., Class H | 4,027,000 | 2,495,506 | ||||||
|
| |||||||
| Total China |
| 592,964,810 | ||||||
| Czech Republic – 1.2% |
| |||||||
CEZ AS(b) | 748,249 | 26,749,431 | ||||||
Komercni Banka AS | 72,392 | 2,597,244 | ||||||
Moneta Money Bank AS(a) | 896,266 | 3,904,631 | ||||||
|
| |||||||
| Total Czech Republic |
| 33,251,306 | ||||||
| Hungary – 0.4% |
| |||||||
Magyar Telekom Telecommunications PLC | 768,438 | 1,889,230 | ||||||
MOL Hungarian Oil & Gas PLC | 1,102,880 | 8,947,535 | ||||||
|
| |||||||
| Total Hungary |
| 10,836,765 | ||||||
| India – 6.8% |
| |||||||
Castrol India Ltd. | 957,558 | 2,134,923 | ||||||
CESC Ltd. | 965,481 | 1,408,240 | ||||||
Coal India Ltd. | 8,577,084 | 44,642,693 | ||||||
Hindustan Zinc Ltd. | 1,359,757 | 4,765,528 | ||||||
Indian Oil Corp. Ltd. | 8,974,628 | 18,050,944 | ||||||
Mindspace Business Parks REIT(a) | 379,142 | 1,570,119 | ||||||
National Aluminium Co. Ltd. | 1,972,572 | 3,607,996 | ||||||
NMDC Ltd. | 2,468,757 | 5,971,904 | ||||||
Oil & Natural Gas Corp. Ltd. | 10,812,767 | 34,751,503 | ||||||
Oil India Ltd. | 1,037,216 | 7,464,871 | ||||||
Oracle Financial Services Software Ltd. | 69,505 | 7,312,057 | ||||||
Petronet LNG Ltd. | 1,002,284 | 3,162,988 | ||||||
Power Grid Corp. of India Ltd. | 11,817,143 | 39,233,439 | ||||||
Redington Ltd. | 952,153 | 2,379,740 | ||||||
Vedanta Ltd. | 4,191,459 | 13,651,987 | ||||||
|
| |||||||
| Total India |
| 190,108,932 | ||||||
| Indonesia – 3.4% |
| |||||||
ABM Investama Tbk. PT | 1,535,100 | 368,889 | ||||||
Adaro Energy Indonesia Tbk. PT | 53,721,800 | 9,148,462 | ||||||
AKR Corporindo Tbk. PT | 14,773,700 | 1,602,697 | ||||||
Astra Agro Lestari Tbk. PT | 149,100 | 64,887 | ||||||
Astra International Tbk. PT | 95,613,500 | 31,057,050 | ||||||
Bank BTPN Syariah Tbk. PT | 5,398,500 | 461,367 | ||||||
Bank CIMB Niaga Tbk. PT | 2,590,800 | 356,225 | ||||||
Bank Rakyat Indonesia Persero Tbk. PT | 80,819,900 | 30,839,508 | ||||||
Bukit Asam Tbk. PT | 17,554,500 | 3,288,355 | ||||||
Dharma Satya Nusantara Tbk. PT | 6,544,000 | 268,281 | ||||||
Erajaya Swasembada Tbk. PT | 16,818,500 | 456,131 | ||||||
Gudang Garam Tbk. PT | 1,275,800 | 1,601,288 | ||||||
Hanjaya Mandala Sampoerna Tbk. PT | 2,753,400 | 149,349 | ||||||
Impack Pratama Industri Tbk. PT | 21,047,700 | 509,764 | ||||||
Indo Tambangraya Megah Tbk. PT | 1,533,500 | 2,582,431 | ||||||
Perusahaan Gas Negara Tbk. PT | 25,336,600 | 2,173,306 | ||||||
Selamat Sempurna Tbk. PT | 3,240,100 | 402,586 | ||||||
Surya Esa Perkasa Tbk. PT* | 18,381,200 | 782,549 | ||||||
United Tractors Tbk. PT | 5,782,500 | 8,816,899 | ||||||
|
| |||||||
| Total Indonesia |
| 94,930,024 | ||||||
| Malaysia – 2.5% |
| |||||||
Alliance Bank Malaysia Bhd. | 1,467,900 | 1,144,422 | ||||||
AMMB Holdings Bhd. | 1,515,900 | 1,341,986 | ||||||
Astro Malaysia Holdings Bhd. | 3,009,300 | 193,923 | ||||||
Bermaz Auto Bhd. | 2,018,100 | 1,019,070 | ||||||
British American Tobacco Malaysia Bhd. | 198,200 | 339,197 | ||||||
CIMB Group Holdings Bhd. | 8,694,200 | 12,197,230 | ||||||
Gas Malaysia Bhd. | 1,198,600 | 878,754 | ||||||
HAP Seng Consolidated Bhd. | 1,296,800 | 1,224,740 | ||||||
Heineken Malaysia Bhd. | 357,100 | 1,759,470 | ||||||
Kuala Lumpur Kepong Bhd. | 764,100 | 3,622,735 | ||||||
Malayan Banking Bhd. | 10,404,083 | 21,300,563 | ||||||
Malaysia Building Society Bhd.* | 3,867,800 | 653,759 | ||||||
MISC Bhd. | 3,297,000 | 5,342,910 | ||||||
Petronas Gas Bhd. | 1,964,400 | 7,313,063 | ||||||
RHB Bank Bhd. | 3,388,145 | 4,058,902 | ||||||
Sime Darby Bhd. | 2,886,500 | 1,585,654 | ||||||
TIME dotCom Bhd. | 2,949,200 | 3,227,732 | ||||||
United Plantations Bhd. | 717,000 | 3,632,719 | ||||||
|
| |||||||
| Total Malaysia |
| 70,836,829 | ||||||
| Mexico – 4.7% |
| |||||||
Banco del Bajio SA(a) | 853,409 | 3,327,020 | ||||||
Bolsa Mexicana de Valores SAB de CV | 584,100 | 1,300,909 | ||||||
Fibra Uno Administracion SA de CV | 11,665,503 | 19,377,294 | ||||||
Grupo Aeroportuario del Centro Norte SAB de CV(b) | 914,509 | 8,990,625 | ||||||
Grupo Financiero Banorte SAB de CV, Class O | 4,758,144 | 50,487,696 | ||||||
Grupo Mexico SAB de CV, Series B(b) | 4,569,560 | 26,977,359 | ||||||
Kimberly-Clark de Mexico SAB de CV, Class A(b) | 3,299,930 | 7,663,290 | ||||||
Megacable Holdings SAB de CV, Series CPO | 852,280 | 2,369,930 | ||||||
Orbia Advance Corp. SAB de CV(b) | 2,691,276 | 5,623,236 | ||||||
Promotora y Operadora de Infraestructura SAB de CV | 468,420 | 4,960,164 | ||||||
|
| |||||||
| Total Mexico |
| 131,077,523 | ||||||
| Philippines – 0.5% |
| |||||||
Aboitiz Power Corp. | 3,943,100 | 2,490,084 | ||||||
Globe Telecom, Inc. | 62,320 | 1,961,115 | ||||||
Manila Electric Co. | 506,130 | 3,214,238 | ||||||
PLDT, Inc. | 172,744 | 4,209,895 | ||||||
Semirara Mining & Power Corp. | 2,712,000 | 1,683,693 | ||||||
|
| |||||||
| Total Philippines |
| 13,559,025 | ||||||
| Poland – 2.1% |
| |||||||
Bank Handlowy w Warszawie SA | 71,154 | 1,937,765 | ||||||
Bank Polska Kasa Opieki SA | 173,107 | 7,894,053 | ||||||
See Notes to Financial Statements.
| 32 | WisdomTree Trust |
Schedule of Investments (continued)
WisdomTree Emerging Markets High Dividend Fund (DEM)
March 31, 2024
| Investments | Shares | Value | ||||||
Orange Polska SA | 964,727 | $ | 1,960,057 | |||||
ORLEN SA | 2,440,121 | 39,822,726 | ||||||
Powszechny Zaklad Ubezpieczen SA | 635,863 | 7,782,960 | ||||||
|
| |||||||
| Total Poland |
| 59,397,561 | ||||||
| Russia – 0.0% |
| |||||||
Evraz PLC*† | 2,288,532 | 0 | ||||||
Magnit PJSC*† | 200,620 | 0 | ||||||
Magnitogorsk Iron & Steel Works PJSC, GDR*†(c) | 298,929 | 0 | ||||||
MMC Norilsk Nickel PJSC*† | 148,519 | 0 | ||||||
MMC Norilsk Nickel PJSC, ADR*† | 13 | 0 | ||||||
Mobile TeleSystems PJSC, ADR*† | 1,549,581 | 0 | ||||||
Novolipetsk Steel PJSC*† | 5,213,400 | 0 | ||||||
PhosAgro PJSC*† | 95,795 | 0 | ||||||
PhosAgro PJSC, GDR*†(c) | 1,853 | 0 | ||||||
Polyus PJSC*† | 35,478 | 0 | ||||||
Polyus PJSC, GDR*†(c) | 1 | 0 | ||||||
Sberbank of Russia PJSC*† | 9,700,476 | 0 | ||||||
Severstal PAO, GDR*†(c) | 775,843 | 0 | ||||||
Tatneft PJSC*† | 1,371,750 | 0 | ||||||
Tatneft PJSC, ADR*† | 3,217 | 0 | ||||||
|
| |||||||
| Total Russia |
| 0 | ||||||
| Saudi Arabia – 3.2% |
| |||||||
AlSaif Stores for Development & Investment Co. | 283,170 | 857,702 | ||||||
Arabian Cement Co. | 119,708 | 1,013,393 | ||||||
Arabian Centres Co. Ltd. | 315,803 | 2,096,652 | ||||||
Banque Saudi Fransi | 457,127 | 4,643,791 | ||||||
Hail Cement Co. | 303,630 | 914,816 | ||||||
Jarir Marketing Co. | 1,050,159 | 4,060,074 | ||||||
Riyad Bank | 953,243 | 7,472,429 | ||||||
SABIC Agri-Nutrients Co. | 590,557 | 19,052,765 | ||||||
Sahara International Petrochemical Co. | 790,788 | 6,610,106 | ||||||
Saudi Aramco Base Oil Co. | 166,157 | 6,849,186 | ||||||
Saudi Awwal Bank | 263,532 | 2,810,633 | ||||||
Saudi Basic Industries Corp. | 1,292,859 | 26,991,297 | ||||||
Saudi Cement Co. | 190,945 | 2,372,494 | ||||||
Saudi Investment Bank | 420,006 | 1,847,780 | ||||||
United Electronics Co. | 60,829 | 1,540,796 | ||||||
Yanbu Cement Co. | 143,529 | 1,134,685 | ||||||
|
| |||||||
| Total Saudi Arabia |
| 90,268,599 | ||||||
| South Africa – 4.8% |
| |||||||
Absa Group Ltd. | 762,886 | 5,967,724 | ||||||
AECI Ltd. | 173,254 | 850,247 | ||||||
Anglo American Platinum Ltd.(b) | 106,368 | 4,316,734 | ||||||
AVI Ltd. | 902,377 | 4,353,140 | ||||||
Barloworld Ltd. | 365,888 | 1,179,034 | ||||||
FirstRand Ltd.(b) | 4,440,859 | 14,476,690 | ||||||
Hyprop Investments Ltd. | 790,846 | 1,226,597 | ||||||
Investec Ltd. | 250,539 | 1,652,906 | ||||||
Kumba Iron Ore Ltd.(b) | 147,339 | 3,596,826 | ||||||
Momentum Metropolitan Holdings | 1,299,684 | 1,394,657 | ||||||
Motus Holdings Ltd.(b) | 441,684 | 2,040,452 | ||||||
Mr. Price Group Ltd. | 510,876 | 4,689,173 | ||||||
Nedbank Group Ltd. | 629,108 | 7,596,970 | ||||||
Northam Platinum Holdings Ltd. | 759,621 | 4,530,147 | ||||||
Old Mutual Ltd. | 5,371,385 | 3,332,961 | ||||||
Omnia Holdings Ltd. | 371,578 | 1,158,321 | ||||||
Redefine Properties Ltd. | 26,815,831 | 5,593,638 | ||||||
Resilient REIT Ltd. | 420,094 | 1,029,146 | ||||||
Reunert Ltd. | 324,563 | 1,131,225 | ||||||
Sanlam Ltd.(b) | 2,134,947 | 7,823,300 | ||||||
Sappi Ltd. | 1,102,980 | 2,929,242 | ||||||
Sasol Ltd.(b) | 1,210,950 | 9,361,461 | ||||||
Standard Bank Group Ltd. | 2,098,753 | 20,530,623 | ||||||
Sun International Ltd.(b) | 688,529 | 1,310,791 | ||||||
Thungela Resources Ltd. | 457,264 | 2,943,103 | ||||||
Tiger Brands Ltd. | 228,334 | 2,418,722 | ||||||
Truworths International Ltd.(b) | 1,658,691 | 6,686,006 | ||||||
Vodacom Group Ltd. | 950,896 | 4,948,752 | ||||||
Woolworths Holdings Ltd.(b) | 2,106,088 | 6,585,331 | ||||||
|
| |||||||
| Total South Africa |
| 135,653,919 | ||||||
| South Korea – 4.2% |
| |||||||
BNK Financial Group, Inc. | 422,976 | 2,441,243 | ||||||
Cheil Worldwide, Inc. | 222,133 | 3,098,724 | ||||||
DB Insurance Co. Ltd. | 57,483 | 4,043,558 | ||||||
DGB Financial Group, Inc. | 242,361 | 1,539,229 | ||||||
GS Holdings Corp. | 144,930 | 5,194,334 | ||||||
Hana Financial Group, Inc. | 384,418 | 16,476,077 | ||||||
HD Hyundai Co. Ltd. | 101,925 | 5,443,571 | ||||||
Hite Jinro Co. Ltd. | 103,131 | 1,562,765 | ||||||
Hyundai Marine & Fire Insurance Co. Ltd. | 58,184 | 1,318,189 | ||||||
Industrial Bank of Korea | 452,448 | 4,537,083 | ||||||
JB Financial Group Co. Ltd. | 222,323 | 2,179,880 | ||||||
KB Financial Group, Inc. | 250,532 | 12,933,685 | ||||||
KCC Glass Corp. | 5,260 | 158,630 | ||||||
Korean Reinsurance Co. | 201,117 | 1,239,941 | ||||||
KT Corp. | 144,761 | 4,053,846 | ||||||
KT&G Corp. | 230,519 | 16,010,048 | ||||||
Lotte Corp. | 98,070 | 1,977,790 | ||||||
LOTTE Fine Chemical Co. Ltd. | 39,608 | 1,378,373 | ||||||
LX Semicon Co. Ltd. | 17,346 | 1,023,044 | ||||||
Samsung Fire & Marine Insurance Co. Ltd. | 29,855 | 6,785,983 | ||||||
Samsung Securities Co. Ltd. | 86,812 | 2,585,821 | ||||||
SeAH Besteel Holdings Corp. | 23,747 | 402,178 | ||||||
Shinhan Financial Group Co. Ltd. | 332,240 | 11,352,305 | ||||||
SK Discovery Co. Ltd. | 25,243 | 828,777 | ||||||
Woori Financial Group, Inc. | 898,944 | 9,562,026 | ||||||
|
| |||||||
| Total South Korea |
| 118,127,100 | ||||||
| Taiwan – 25.6% |
| |||||||
Acer, Inc.(b) | 3,795,000 | 5,549,581 | ||||||
Advanced Power Electronics Corp.(b) | 175,000 | 475,729 | ||||||
Alltek Technology Corp.(b) | 608,000 | 687,725 | ||||||
AMPOC Far-East Co. Ltd. | 171,000 | 476,076 | ||||||
Apacer Technology, Inc. | 159,000 | 347,774 | ||||||
ASE Technology Holding Co. Ltd. | 12,282,000 | 61,787,055 | ||||||
See Notes to Financial Statements.
| WisdomTree Trust | 33 |
Schedule of Investments (continued)
WisdomTree Emerging Markets High Dividend Fund (DEM)
March 31, 2024
| Investments | Shares | Value | ||||||
Asia Cement Corp.(b) | 4,423,000 | $ | 5,707,810 | |||||
BenQ Materials Corp.(b) | 419,000 | 443,830 | ||||||
BES Engineering Corp. | 3,330,000 | 1,472,323 | ||||||
Chang Wah Electromaterials, Inc. | 807,000 | 1,011,161 | ||||||
Cheng Uei Precision Industry Co. Ltd. | 604,000 | 875,704 | ||||||
Chicony Electronics Co. Ltd.(b) | 1,927,386 | 13,369,778 | ||||||
Chicony Power Technology Co. Ltd.* | 435,000 | 2,317,481 | ||||||
Chinese Maritime Transport Ltd.(b) | 123,000 | 169,491 | ||||||
ChipMOS Technologies, Inc.(b) | 1,398,000 | 2,184,136 | ||||||
Chong Hong Construction Co. Ltd. | 350,000 | 966,769 | ||||||
Cleanaway Co. Ltd.(b) | 248,000 | 1,379,349 | ||||||
Compeq Manufacturing Co. Ltd.(b) | 1,651,000 | 4,147,684 | ||||||
Continental Holdings Corp. | 1,136,000 | 1,084,406 | ||||||
CTCI Corp. | 1,165,000 | 1,725,468 | ||||||
DA CIN Construction Co. Ltd.(b) | 1,056,000 | 1,884,094 | ||||||
Darfon Electronics Corp. | 415,000 | 807,865 | ||||||
Ennoconn Corp.(b) | 142,000 | 1,663,881 | ||||||
Far Eastern Department Stores Ltd. | 1,658,000 | 1,533,482 | ||||||
Far Eastern New Century Corp.(b) | 5,592,000 | 5,809,802 | ||||||
Farglory Land Development Co. Ltd. | 826,000 | 1,476,314 | ||||||
Feng Hsin Steel Co. Ltd.* | 1,177,000 | 2,611,183 | ||||||
FLEXium Interconnect, Inc.(b) | 581,000 | 1,655,669 | ||||||
Flytech Technology Co. Ltd. | 454,000 | 1,106,504 | ||||||
Formosa Advanced Technologies Co. Ltd. | 454,000 | 520,624 | ||||||
Formosa International Hotels Corp.(b) | 126,000 | 883,872 | ||||||
Formosa Plastics Corp.(b) | 7,790,000 | 16,771,009 | ||||||
Formosa Sumco Technology Corp.(b) | 99,000 | 515,053 | ||||||
Foxsemicon Integrated Technology, Inc.(b) | 281,000 | 2,607,746 | ||||||
Fu Hua Innovation Co. Ltd.(b) | 1,323,000 | 1,165,766 | ||||||
Fusheng Precision Co. Ltd. | 538,000 | 3,933,695 | ||||||
G Shank Enterprise Co. Ltd. | 375,573 | 849,641 | ||||||
Gemtek Technology Corp.(b) | 758,000 | 807,655 | ||||||
Getac Holdings Corp.(b) | 856,000 | 3,410,252 | ||||||
Global Brands Manufacture Ltd. | 431,000 | 979,071 | ||||||
Global Mixed Mode Technology, Inc. | 151,000 | 1,257,409 | ||||||
Goldsun Building Materials Co. Ltd.(b) | 2,384,000 | 2,823,241 | ||||||
Greatek Electronics, Inc. | 834,000 | 1,607,880 | ||||||
Holtek Semiconductor, Inc.(b) | 206,000 | 346,943 | ||||||
Holy Stone Enterprise Co. Ltd. | 361,200 | 1,089,125 | ||||||
Hon Hai Precision Industry Co. Ltd. | 18,289,000 | 85,720,312 | ||||||
Hong TAI Electric Industrial | 241,000 | 233,067 | ||||||
Huaku Development Co. Ltd. | 572,000 | 2,216,258 | ||||||
Kindom Development Co. Ltd. | 1,331,000 | 1,738,429 | ||||||
King Yuan Electronics Co. Ltd.(b) | 2,306,000 | 7,601,762 | ||||||
KMC Kuei Meng International, Inc. | 62,000 | 273,158 | ||||||
Kung Long Batteries Industrial Co. Ltd. | 152,000 | 662,553 | ||||||
Lite-On Technology Corp., ADR(b) | 4,208,000 | 13,280,047 | ||||||
Machvision, Inc.(b) | 72,000 | 923,524 | ||||||
Macronix International Co. Ltd.(b) | 3,712,000 | 3,096,861 | ||||||
MediaTek, Inc. | 4,660,000 | 174,002,843 | ||||||
Nan Ya Plastics Corp.(b) | 7,985,000 | 13,972,222 | ||||||
Nan Ya Printed Circuit Board Corp.(b) | 456,000 | 2,856,813 | ||||||
Nichidenbo Corp. | 617,000 | 1,150,965 | ||||||
Novatek Microelectronics Corp.(b) | 1,459,000 | 27,535,613 | ||||||
Nuvoton Technology Corp.(b) | 317,000 | 1,213,383 | ||||||
Pan Jit International, Inc.(b) | 508,000 | 903,189 | ||||||
Pegatron Corp.(b) | 3,212,000 | 10,237,130 | ||||||
Posiflex Technology, Inc.(b) | 191,000 | 701,251 | ||||||
Pou Chen Corp. | 3,559,000 | 4,020,118 | ||||||
Powertech Technology, Inc. | 1,498,000 | 9,384,880 | ||||||
Primax Electronics Ltd. | 1,150,000 | 3,007,640 | ||||||
Promate Electronic Co. Ltd.(b) | 628,000 | 1,720,924 | ||||||
Qisda Corp.(b) | 3,343,000 | 4,664,020 | ||||||
Realtek Semiconductor Corp. | 964,000 | 16,868,155 | ||||||
Sampo Corp. | 353,000 | 326,489 | ||||||
Sesoda Corp.(b) | 714,000 | 689,381 | ||||||
Shih Wei Navigation Co. Ltd.(b) | 799,000 | 460,623 | ||||||
Shin Zu Shing Co. Ltd.(b) | 455,000 | 2,637,290 | ||||||
Shinkong Insurance Co. Ltd. | 174,000 | 462,681 | ||||||
Sigurd Microelectronics Corp.(b) | 1,411,000 | 3,130,314 | ||||||
Sinon Corp.(b) | 1,110,000 | 1,342,259 | ||||||
Sitronix Technology Corp.(b) | 289,000 | 2,632,321 | ||||||
Sonix Technology Co. Ltd. | 309,000 | 509,794 | ||||||
Sunrex Technology Corp. | 387,000 | 764,241 | ||||||
Supreme Electronics Co. Ltd.(b) | 1,053,299 | 2,395,993 | ||||||
Swancor Holding Co. Ltd.(b) | 197,000 | 790,992 | ||||||
Synnex Technology International Corp. | 3,112,000 | 7,672,186 | ||||||
Systex Corp. | 356,000 | 1,318,168 | ||||||
TA Chen Stainless Pipe(b) | 3,154,000 | 3,597,138 | ||||||
Taiwan Hon Chuan Enterprise Co. Ltd.(b) | 513,000 | 2,308,248 | ||||||
Taiwan Mobile Co. Ltd.(b) | 3,876,000 | 12,474,511 | ||||||
Taiwan Navigation Co. Ltd. | 773,000 | 830,884 | ||||||
Taiwan Paiho Ltd.(b) | 522,000 | 937,866 | ||||||
Taiwan PCB Techvest Co. Ltd. | 848,000 | 1,160,573 | ||||||
Taiwan Secom Co. Ltd. | 513,000 | 1,955,599 | ||||||
Taiwan Surface Mounting Technology Corp. | 508,000 | 1,722,249 | ||||||
Test Research, Inc. | 484,000 | 1,323,293 | ||||||
Thye Ming Industrial Co. Ltd. | 344,000 | 798,638 | ||||||
Ton Yi Industrial Corp.(b) | 1,503,000 | 671,580 | ||||||
Topco Scientific Co. Ltd. | 470,813 | 3,221,774 | ||||||
Topkey Corp.(b) | 207,000 | 1,245,098 | ||||||
Transcend Information, Inc. | 378,000 | 1,052,379 | ||||||
TSRC Corp. | 438,000 | 316,831 | ||||||
Tung Ho Steel Enterprise Corp. | 1,282,000 | 2,768,016 | ||||||
TXC Corp. | 988,000 | 3,488,493 | ||||||
U-Ming Marine Transport Corp. | 829,000 | 1,372,881 | ||||||
Uni-President Enterprises Corp. | 6,656,000 | 16,118,237 | ||||||
Unimicron Technology Corp.(b) | 1,793,000 | 10,700,798 | ||||||
United Integrated Services Co. Ltd.(b) | 488,000 | 5,992,595 | ||||||
United Microelectronics Corp.(b) | 28,079,000 | 45,798,860 | ||||||
Universal Cement Corp. | 1,267,020 | 1,251,045 | ||||||
Wah Lee Industrial Corp. | 303,000 | 1,069,852 | ||||||
Walsin Lihwa Corp.(b) | 4,463,000 | 5,236,479 | ||||||
Weikeng Industrial Co. Ltd. | 751,000 | 742,705 | ||||||
WPG Holdings Ltd. | 3,021,280 | 9,053,408 | ||||||
Yankey Engineering Co. Ltd.(b) | 142,000 | 1,714,906 | ||||||
Yem Chio Co. Ltd. | 866,000 | 504,660 | ||||||
Zenitron Corp. | 588,000 | 649,485 | ||||||
See Notes to Financial Statements.
| 34 | WisdomTree Trust |
Schedule of Investments (continued)
WisdomTree Emerging Markets High Dividend Fund (DEM)
March 31, 2024
| Investments | Shares | Value | ||||||
Zero One Technology Co. Ltd.(b) | 448,000 | $ | 1,005,090 | |||||
|
| |||||||
| Total Taiwan |
| 718,499,126 | ||||||
| Thailand – 2.8% |
| |||||||
AAPICO Hitech PCL, NVDR(b) | 458,400 | 265,084 | ||||||
AP Thailand PCL, NVDR | 2,436,300 | 721,125 | ||||||
Banpu PCL, NVDR(b) | 12,893,900 | 1,961,251 | ||||||
Banpu Power PCL, NVDR(b) | 1,383,600 | 568,797 | ||||||
Don Muang Tollway PCL, NVDR | 2,152,300 | 713,747 | ||||||
Electricity Generating PCL, NVDR(b) | 619,200 | 1,934,602 | ||||||
Indorama Ventures PCL, NVDR(b) | 3,444,900 | 2,237,592 | ||||||
Land & Houses PCL, NVDR(b) | 10,707,100 | 2,171,498 | ||||||
Major Cineplex Group PCL, NVDR(b) | 747,500 | 295,005 | ||||||
MBK PCL, NVDR | 1,150,200 | 561,112 | ||||||
MC Group PCL, NVDR(b) | 1,142,900 | 413,464 | ||||||
Northeast Rubber PCL, NVDR | 795,425 | 129,710 | ||||||
One Enterprise Public Co. Ltd., NVDR | 3,367,000 | 439,244 | ||||||
Osotspa PCL, NVDR(b) | 3,183,100 | 1,770,933 | ||||||
Prima Marine PCL, NVDR | 2,372,000 | 497,315 | ||||||
PTT Exploration & Production PCL, NVDR(b) | 3,595,100 | 15,075,034 | ||||||
PTT PCL, NVDR(b) | 21,342,100 | 19,887,123 | ||||||
Quality Houses PCL, NVDR | 12,087,900 | 728,835 | ||||||
Sabina PCL, NVDR(b) | 380,100 | 260,432 | ||||||
Sansiri PCL, NVDR | 24,343,000 | 1,140,844 | ||||||
SC Asset Corp. PCL, NVDR | 5,387,600 | 540,421 | ||||||
SCB X PCL, NVDR | 3,982,800 | 12,443,692 | ||||||
Somboon Advance Technology PCL, NVDR(b) | 339,500 | 154,456 | ||||||
Thai Oil PCL, NVDR | 1,332,600 | 2,173,065 | ||||||
Thai Union Group PCL, NVDR(b) | 3,972,100 | 1,578,498 | ||||||
Thai Vegetable Oil PCL, NVDR | 911,315 | 472,048 | ||||||
Thanachart Capital PCL, NVDR | 1,244,500 | 1,748,013 | ||||||
Tipco Asphalt PCL, NVDR | 2,693,700 | 1,173,822 | ||||||
TMBThanachart Bank PCL, NVDR(b) | 61,895,900 | 3,087,373 | ||||||
Triple i Logistics PCL, NVDR(b) | 1,003,100 | 240,551 | ||||||
TTW PCL, NVDR(b) | 6,693,177 | 1,660,110 | ||||||
|
| |||||||
| Total Thailand |
| 77,044,796 | ||||||
| Turkey – 1.0% |
| |||||||
Akbank TAS | 2,281,611 | 3,299,139 | ||||||
Dogus Otomotiv Servis ve Ticaret AS | 142,108 | 1,383,655 | ||||||
Turkiye Petrol Rafinerileri AS | 3,739,407 | 20,458,551 | ||||||
Yapi ve Kredi Bankasi AS* | 2,012,791 | 1,700,968 | ||||||
|
| |||||||
| Total Turkey |
| 26,842,313 | ||||||
TOTAL COMMON STOCKS (Cost: $2,492,598,501) |
| 2,801,420,688 | ||||||
| EXCHANGE-TRADED FUND – 0.0% |
| |||||||
| United States – 0.0% |
| |||||||
| WisdomTree Global High Dividend Fund(d) (Cost: $897,319) | 19,303 | 981,756 | ||||||
| INVESTMENT OF CASH COLLATERAL FOR SECURITIES LOANED – 1.1% |
| |||||||
| United States – 1.1% |
| |||||||
State Street Navigator Securities Lending |
| |||||||
(Cost: $30,350,984) | 30,350,984 | 30,350,984 | ||||||
TOTAL INVESTMENTS IN SECURITIES – 101.0% (Cost: $2,523,846,804) |
| 2,832,753,428 | ||||||
Other Assets less Liabilities – (1.0)% |
| (28,704,712 | ) | |||||
|
| |||||||
| NET ASSETS – 100.0% |
| $ | 2,804,048,716 | |||||
| * | Non-income producing security. |
| † | This security is being fair valued using significant unobservable inputs (i.e., Level 3 on the fair value hierarchy) by WisdomTree Asset Management, Inc., as valuation designee, in accordance with valuation procedures approved by the Board of Trustees of WisdomTree Trust. The aggregate value of Level 3 fair valued securities is $0, which represents 0.0% of net assets. |
| (a) | This security is exempt from registration under rule 144A of the Securities Act of 1933. This security may be sold in transactions that are exempt from registration, normally to qualified institutional buyers. |
| (b) | Security, or portion thereof, was on loan at March 31, 2024 (See Note 2). At March 31, 2024, the total market value of the Fund’s securities on loan identified in the Schedule of Investments was $243,668,369 and the total market value of the collateral held by the Fund was $258,712,718. The total market value of the collateral includes non-cash U.S. Government securities collateral having a value of $228,361,734. |
| (c) | This security is exempt from registration under Regulation S of the Securities Act of 1933, which exempts from registration securities offered and sold outside the United States. This security may not be offered or sold in the United States except pursuant to an exemption from, or in a transaction not subject to, the registration requirements of the Securities Act of 1933. |
| (d) | Affiliated holding. See “Investment in Affiliates” supplementary table included in this Schedule of Investments for additional information. |
| (e) | Rate shown represents annualized 7-day yield as of March 31, 2024. |
| INVESTMENT IN AFFILIATES |
Affiliated holdings are investments in entities in which the Fund owns 5% or more of the outstanding voting securities or are investments in entities which are under common ownership or control. Investments in affiliates during the fiscal year ended March 31, 2024 were as follows:
| Affiliate | Value at 3/31/2023 | Purchases/ Additions | Sales/ Reductions | Realized Gain/(Loss) | Change in Unrealized Appreciation/ Depreciation | Value at 3/31/2024 | Dividend Income | |||||||||||||||||||||
WisdomTree Global High Dividend Fund | $ | 2,263,456 | $ | 6,228,051 | $ | 7,568,185 | $ | (100,985 | ) | $ | 159,419 | $ | 981,756 | $ | 144,788 | |||||||||||||
See Notes to Financial Statements.
| WisdomTree Trust | 35 |
Schedule of Investments (concluded)
WisdomTree Emerging Markets High Dividend Fund (DEM)
March 31, 2024
| FINANCIAL DERIVATIVE INSTRUMENTS | ||||||||||||||||||||||||||||
| FOREIGN CURRENCY CONTRACTS (OTC – OVER THE COUNTER) | ||||||||||||||||||||||||||||
| Counterparty | Settlement Date | Amount and | Amount and | Unrealized Appreciation | Unrealized Depreciation | |||||||||||||||||||||||
State Street Bank and Trust | 4/1/2024 | 2,278,994 | PHP | 40,465 | USD | $ | 76 | $ | — | |||||||||||||||||||
State Street Bank and Trust | 4/1/2024 | 194,502 | USD | 970,000 | BRL | 717 | — | |||||||||||||||||||||
State Street Bank and Trust | 4/2/2024 | 952,078 | USD | 4,500,000 | MYR | 1,307 | — | |||||||||||||||||||||
| $ | 2,100 | $ | — | |||||||||||||||||||||||||
| FAIR VALUATION SUMMARY | ||||||||||
The following is a summary of the fair valuations according to the inputs used in valuing the Fund’s investments (See Note 2 — Fair Value Measurement):
| Quoted Prices in Active Markets (Level 1) | Other Significant Observable Inputs (Level 2) | Significant Unobservable Inputs (Level 3) | Total | |||||||||||||
Assets: | ||||||||||||||||
Investments in Securities | ||||||||||||||||
Common Stocks | ||||||||||||||||
Russia | $ | — | $ | — | $ | 0 | * | $ | 0 | |||||||
Other | 2,801,420,688 | — | — | 2,801,420,688 | ||||||||||||
Exchange-Traded Fund | 981,756 | — | — | 981,756 | ||||||||||||
Investment of Cash Collateral for Securities Loaned | — | 30,350,984 | — | 30,350,984 | ||||||||||||
Total Investments in Securities | $ | 2,802,402,444 | $ | 30,350,984 | $ | 0 | $ | 2,832,753,428 | ||||||||
Financial Derivative Instruments | ||||||||||||||||
Foreign Currency Contracts1 | $ | — | $ | 2,100 | $ | — | $ | 2,100 | ||||||||
Total – Net | $ | 2,802,402,444 | $ | 30,353,084 | $ | 0 | $ | 2,832,755,528 | ||||||||
| * | Fair valuations using significant unobservable inputs were determined by WisdomTree Asset Management, Inc., as valuation designee, in accordance with valuation procedures approved by the Board of Trustees of WisdomTree Trust. |
| 1 | Amount shown represents the unrealized appreciation (depreciation) on the financial instrument. |
See Notes to Financial Statements.
| 36 | WisdomTree Trust |
Schedule of Investments
WisdomTree Emerging Markets Multifactor Fund (EMMF)
March 31, 2024
| Investments | Shares | Value | ||||||
| COMMON STOCKS – 98.7% |
| |||||||
| Brazil – 5.7% |
| |||||||
Ambev SA | 17,500 | $ | 43,667 | |||||
Banco do Brasil SA | 4,320 | 48,865 | ||||||
BB Seguridade Participacoes SA | 4,959 | 32,218 | ||||||
CCR SA | 33,743 | 93,162 | ||||||
Cia de Saneamento Basico do Estado de Sao Paulo SABESP | 3,199 | 54,131 | ||||||
CPFL Energia SA | 8,201 | 57,032 | ||||||
Energisa SA | 10,554 | 100,932 | ||||||
Engie Brasil Energia SA | 16,645 | 133,877 | ||||||
Hypera SA | 10,137 | 66,688 | ||||||
Suzano SA | 12,170 | 155,555 | ||||||
Telefonica Brasil SA | 5,180 | 52,363 | ||||||
TIM SA | 61,156 | 217,474 | ||||||
TOTVS SA | 17,199 | 97,513 | ||||||
Ultrapar Participacoes SA | 13,392 | 76,170 | ||||||
Vibra Energia SA | 11,815 | 59,033 | ||||||
WEG SA | 7,767 | 59,274 | ||||||
|
| |||||||
| Total Brazil |
| 1,347,954 | ||||||
| Chile – 0.4% |
| |||||||
Cencosud SA | 21,383 | 37,061 | ||||||
Enel Chile SA | 656,072 | 39,397 | ||||||
Latam Airlines Group SA* | 2,153,365 | 26,806 | ||||||
|
| |||||||
| Total Chile |
| 103,264 | ||||||
| China – 9.5% |
| |||||||
3SBio, Inc.(a) | 168,000 | 128,365 | ||||||
Anhui Gujing Distillery Co. Ltd., Class B | 16,500 | 233,550 | ||||||
China Medical System Holdings Ltd. | 163,000 | 171,196 | ||||||
China Resources Power Holdings Co. Ltd. | 124,000 | 289,306 | ||||||
People’s Insurance Co. Group of China Ltd., Class H | 882,000 | 281,737 | ||||||
PICC Property & Casualty Co. Ltd., Class H | 216,000 | 284,819 | ||||||
Sany Heavy Equipment International Holdings Co. Ltd. | 123,000 | 79,051 | ||||||
Sinopharm Group Co. Ltd., Class H | 93,600 | 239,787 | ||||||
Want Want China Holdings Ltd. | 607,000 | 358,316 | ||||||
Zhejiang Expressway Co. Ltd., Class H | 240,000 | 153,940 | ||||||
|
| |||||||
| Total China |
| 2,220,067 | ||||||
| Czech Republic – 0.3% |
| |||||||
CEZ AS | 1,988 | 71,070 | ||||||
| Hungary – 0.5% |
| |||||||
MOL Hungarian Oil & Gas PLC | 15,562 | 126,253 | ||||||
| India – 24.9% |
| |||||||
ABB India Ltd. | 1,540 | 117,451 | ||||||
Adani Power Ltd.* | 2,693 | 17,236 | ||||||
Ashok Leyland Ltd. | 24,725 | 50,768 | ||||||
Asian Paints Ltd. | 2,170 | 74,068 | ||||||
Aurobindo Pharma Ltd. | 7,094 | 92,606 | ||||||
Bajaj Auto Ltd. | 1,674 | 183,616 | ||||||
Bank of Baroda | 22,451 | 71,079 | ||||||
Bharat Electronics Ltd. | 45,398 | 109,681 | ||||||
Bharat Petroleum Corp. Ltd. | 18,160 | 131,166 | ||||||
Britannia Industries Ltd. | 450 | 26,499 | ||||||
CG Power & Industrial Solutions Ltd. | 12,757 | 82,735 | ||||||
Cipla Ltd. | 7,565 | 135,780 | ||||||
Coal India Ltd. | 30,454 | 158,509 | ||||||
Colgate-Palmolive India Ltd. | 3,815 | 123,977 | ||||||
Cummins India Ltd. | 539 | 19,428 | ||||||
Dr. Reddy’s Laboratories Ltd. | 1,445 | 106,689 | ||||||
Eicher Motors Ltd. | 1,769 | 85,251 | ||||||
GAIL India Ltd. | 24,779 | 53,790 | ||||||
Grasim Industries Ltd. | 5,322 | 145,955 | ||||||
HCL Technologies Ltd. | 8,853 | 163,845 | ||||||
HDFC Asset Management Co. Ltd.(a) | 786 | 35,379 | ||||||
Hero MotoCorp Ltd. | 2,541 | 143,873 | ||||||
Hindustan Aeronautics Ltd.(b) | 448 | 17,871 | ||||||
Hindustan Petroleum Corp. Ltd. | 13,441 | 76,655 | ||||||
Hindustan Unilever Ltd. | 2,233 | 60,625 | ||||||
ICICI Lombard General Insurance Co. Ltd.(a) | 3,658 | 73,882 | ||||||
Indian Hotels Co. Ltd. | 24,235 | 171,776 | ||||||
Indian Oil Corp. Ltd. | 82,134 | 165,199 | ||||||
Indraprastha Gas Ltd. | 9,483 | 48,983 | ||||||
IndusInd Bank Ltd. | 1,992 | 37,092 | ||||||
Infosys Ltd. | 4,889 | 87,815 | ||||||
InterGlobe Aviation Ltd.*(a) | 829 | 35,273 | ||||||
ITC Ltd. | 7,347 | 37,734 | ||||||
Kotak Mahindra Bank Ltd. | 394 | 8,435 | ||||||
Larsen & Toubro Ltd. | 1,129 | 50,951 | ||||||
LTIMindtree Ltd.(a) | 1,155 | 68,390 | ||||||
Lupin Ltd. | 1,595 | 30,920 | ||||||
Mahindra & Mahindra Ltd. | 7,277 | 167,641 | ||||||
Maruti Suzuki India Ltd. | 1,126 | 170,115 | ||||||
MRF Ltd. | 59 | 94,360 | ||||||
Nestle India Ltd. | 2,068 | 65,022 | ||||||
NTPC Ltd. | 39,777 | 160,153 | ||||||
Oil & Natural Gas Corp. Ltd. | 51,530 | 165,614 | ||||||
Persistent Systems Ltd. | 1,898 | 90,677 | ||||||
Petronet LNG Ltd. | 36,766 | 116,025 | ||||||
PI Industries Ltd. | 642 | 29,771 | ||||||
Pidilite Industries Ltd. | 1,347 | 48,689 | ||||||
Power Grid Corp. of India Ltd. | 52,358 | 173,831 | ||||||
SBI Cards & Payment Services Ltd. | 5,578 | 45,649 | ||||||
Siemens Ltd. | 2,009 | 129,450 | ||||||
State Bank of India | 11,004 | 99,264 | ||||||
Sun Pharmaceutical Industries Ltd. | 7,646 | 148,565 | ||||||
Tata Consultancy Services Ltd. | 2,845 | 132,227 | ||||||
Tata Elxsi Ltd. | 1,279 | 119,387 | ||||||
Tata Motors Ltd. | 12,140 | 144,511 | ||||||
Torrent Pharmaceuticals Ltd. | 3,702 | 115,433 | ||||||
Trent Ltd. | 2,045 | 96,804 | ||||||
TVS Motor Co. Ltd. | 6,962 | 179,625 | ||||||
Varun Beverages Ltd. | 3,701 | 62,063 | ||||||
Vedanta Ltd. | 17,971 | 58,533 | ||||||
Wipro Ltd. | 25,305 | 145,666 | ||||||
|
| |||||||
| Total India |
| 5,860,057 | ||||||
See Notes to Financial Statements.
| WisdomTree Trust | 37 |
Schedule of Investments (continued)
WisdomTree Emerging Markets Multifactor Fund (EMMF)
March 31, 2024
| Investments | Shares | Value | ||||||
| Indonesia – 4.5% |
| |||||||
Adaro Energy Indonesia Tbk. PT | 615,200 | $ | 104,764 | |||||
Astra International Tbk. PT | 238,000 | 77,307 | ||||||
Bank Central Asia Tbk. PT | 255,900 | 162,611 | ||||||
Bank Negara Indonesia Persero Tbk. PT | 213,100 | 79,299 | ||||||
Indah Kiat Pulp & Paper Tbk. PT | 296,200 | 178,878 | ||||||
Indofood CBP Sukses Makmur Tbk. PT | 148,900 | 108,940 | ||||||
Indofood Sukses Makmur Tbk. PT | 185,200 | 74,465 | ||||||
Telkom Indonesia Persero Tbk. PT | 647,800 | 141,777 | ||||||
Unilever Indonesia Tbk. PT | 277,300 | 47,222 | ||||||
United Tractors Tbk. PT | 58,000 | 88,436 | ||||||
|
| |||||||
| Total Indonesia |
| 1,063,699 | ||||||
| Malaysia – 3.4% |
| |||||||
AMMB Holdings Bhd. | 25,400 | 22,486 | ||||||
CIMB Group Holdings Bhd. | 97,200 | 136,363 | ||||||
Genting Malaysia Bhd. | 182,000 | 104,593 | ||||||
IHH Healthcare Bhd. | 18,800 | 24,031 | ||||||
Malaysia Airports Holdings Bhd. | 26,700 | 56,187 | ||||||
MISC Bhd. | 62,600 | 101,446 | ||||||
Nestle Malaysia Bhd. | 3,800 | 94,900 | ||||||
Petronas Gas Bhd. | 17,400 | 64,777 | ||||||
Sime Darby Bhd. | 160,200 | 88,003 | ||||||
Telekom Malaysia Bhd. | 73,900 | 94,307 | ||||||
|
| |||||||
| Total Malaysia |
| 787,093 | ||||||
| Mexico – 4.2% |
| |||||||
Alfa SAB de CV, Class A | 69,319 | 51,588 | ||||||
America Movil SAB de CV | 184,179 | 172,636 | ||||||
Arca Continental SAB de CV | 3,934 | 42,945 | ||||||
Coca-Cola Femsa SAB de CV | 11,763 | 113,499 | ||||||
Fibra Uno Administracion SA de CV | 11,700 | 19,435 | ||||||
Fomento Economico Mexicano SAB de CV | 3,075 | 39,893 | ||||||
Gruma SAB de CV, Class B | 2,780 | 51,961 | ||||||
Grupo Bimbo SAB de CV, Series A | 25,038 | 118,202 | ||||||
Grupo Financiero Inbursa SAB de CV, Class O* | 53,407 | 164,285 | ||||||
Kimberly-Clark de Mexico SAB de CV, Class A | 32,000 | 74,312 | ||||||
Wal-Mart de Mexico SAB de CV | 35,700 | 143,902 | ||||||
|
| |||||||
| Total Mexico |
| 992,658 | ||||||
| Philippines – 2.5% |
| |||||||
Bank of the Philippine Islands | 34,308 | 72,076 | ||||||
BDO Unibank, Inc. | 30,980 | 85,145 | ||||||
International Container Terminal Services, Inc. | 16,840 | 95,262 | ||||||
Jollibee Foods Corp. | 31,430 | 141,230 | ||||||
Manila Electric Co. | 4,170 | 26,482 | ||||||
Metropolitan Bank & Trust Co. | 98,710 | 114,399 | ||||||
SM Investments Corp. | 2,350 | 40,633 | ||||||
|
| |||||||
| Total Philippines |
| 575,227 | ||||||
| Poland – 1.2% |
| |||||||
Budimex SA | 126 | 22,118 | ||||||
Dino Polska SA*(a) | 442 | 42,973 | ||||||
ORLEN SA | 3,889 | 63,468 | ||||||
PGE Polska Grupa Energetyczna SA* | 1,284 | 2,319 | ||||||
Powszechna Kasa Oszczednosci Bank Polski SA | 3,768 | 56,070 | ||||||
Powszechny Zaklad Ubezpieczen SA | 1,843 | 22,558 | ||||||
Santander Bank Polska SA | 505 | 72,120 | ||||||
|
| |||||||
| Total Poland |
| 281,626 | ||||||
| Russia – 0.0% |
| |||||||
LUKOIL PJSC*† | 67 | 0 | ||||||
LUKOIL PJSC, ADR*† | 46 | 0 | ||||||
Magnit PJSC*† | 32 | 0 | ||||||
MMC Norilsk Nickel PJSC*† | 29 | 0 | ||||||
MMC Norilsk Nickel PJSC, ADR*† | 11 | 0 | ||||||
Mobile TeleSystems PJSC, ADR*† | 1,696 | 0 | ||||||
Novolipetsk Steel PJSC*† | 3,110 | 0 | ||||||
PhosAgro PJSC*† | 178 | 0 | ||||||
PhosAgro PJSC, GDR*†(b) | 4 | 0 | ||||||
Polyus PJSC*† | 59 | 0 | ||||||
Rosneft Oil Co. PJSC*† | 1,588 | 0 | ||||||
Sberbank of Russia PJSC, ADR*† | 639 | 0 | ||||||
Severstal PAO, GDR*†(b) | 475 | 0 | ||||||
VTB Bank PJSC*† | 16,536,000 | 0 | ||||||
X5 Retail Group NV, GDR*†(b) | 223 | 0 | ||||||
|
| |||||||
| Total Russia |
| 0 | ||||||
| South Africa – 2.8% |
| |||||||
Absa Group Ltd. | 8,531 | 66,734 | ||||||
Bid Corp. Ltd. | 792 | 19,315 | ||||||
Bidvest Group Ltd.(c) | 7,392 | 94,667 | ||||||
Clicks Group Ltd. | 6,365 | 99,531 | ||||||
Harmony Gold Mining Co. Ltd. | 4,412 | 36,815 | ||||||
MTN Group Ltd.(c) | 3,378 | 16,722 | ||||||
OUTsurance Group Ltd. | 44,863 | 99,505 | ||||||
Sasol Ltd. | 12,599 | 97,399 | ||||||
Standard Bank Group Ltd. | 12,762 | 124,841 | ||||||
|
| |||||||
| Total South Africa |
| 655,529 | ||||||
| South Korea – 15.2% |
| |||||||
DB Insurance Co. Ltd. | 2,689 | 189,154 | ||||||
Doosan Bobcat, Inc. | 5,033 | 199,264 | ||||||
GS Holdings Corp. | 4,318 | 154,758 | ||||||
Hankook Tire & Technology Co. Ltd. | 4,762 | 191,718 | ||||||
Hanwha Aerospace Co. Ltd. | 783 | 118,940 | ||||||
Hyundai Glovis Co. Ltd. | 1,050 | 135,788 | ||||||
Hyundai Motor Co. | 1,261 | 218,246 | ||||||
Krafton, Inc.* | 823 | 150,998 | ||||||
KT Corp. | 5,836 | 163,430 | ||||||
LG Uplus Corp. | 28,008 | 207,420 | ||||||
Meritz Financial Group, Inc. | 5,024 | 304,892 | ||||||
Orion Corp. | 1,968 | 133,027 | ||||||
Samsung Electronics Co. Ltd. | 9,371 | 573,571 | ||||||
Samsung Engineering Co. Ltd.* | 6,419 | 119,202 | ||||||
Samsung Fire & Marine Insurance Co. Ltd. | 658 | 149,562 | ||||||
Samsung Life Insurance Co. Ltd. | 1,996 | 136,847 | ||||||
Samsung SDS Co. Ltd. | 1,893 | 229,902 | ||||||
SK Telecom Co. Ltd. | 4,813 | 187,694 | ||||||
|
| |||||||
| Total South Korea |
| 3,564,413 | ||||||
See Notes to Financial Statements.
| 38 | WisdomTree Trust |
Schedule of Investments (continued)
WisdomTree Emerging Markets Multifactor Fund (EMMF)
March 31, 2024
| Investments | Shares | Value | ||||||
| Taiwan – 19.5% |
| |||||||
Accton Technology Corp. | 5,000 | $ | 72,336 | |||||
ASE Technology Holding Co. Ltd. | 36,000 | 181,105 | ||||||
Cheng Shin Rubber Industry Co. Ltd. | 69,000 | 107,801 | ||||||
Compal Electronics, Inc. | 146,000 | 165,145 | ||||||
Eva Airways Corp. | 31,000 | 30,948 | ||||||
Globalwafers Co. Ltd. | 4,000 | 72,492 | ||||||
Hon Hai Precision Industry Co. Ltd. | 37,000 | 173,419 | ||||||
Lite-On Technology Corp., ADR | 82,000 | 258,784 | ||||||
MediaTek, Inc. | 3,000 | 112,019 | ||||||
Novatek Microelectronics Corp. | 9,000 | 169,856 | ||||||
Pegatron Corp. | 46,000 | 146,609 | ||||||
Pou Chen Corp. | 116,000 | 131,029 | ||||||
President Chain Store Corp. | 13,000 | 108,254 | ||||||
Quanta Computer, Inc. | 39,000 | 357,664 | ||||||
Realtek Semiconductor Corp. | 5,000 | 87,490 | ||||||
Synnex Technology International Corp. | 59,000 | 145,456 | ||||||
Taiwan Semiconductor Manufacturing Co. Ltd. | 74,500 | 1,813,411 | ||||||
Wistron Corp. | 10,000 | 39,058 | ||||||
Wiwynn Corp. | 4,500 | 319,184 | ||||||
WPG Holdings Ltd. | 33,000 | 98,886 | ||||||
|
| |||||||
| Total Taiwan |
| 4,590,946 | ||||||
| Thailand – 0.5% |
| |||||||
Bangkok Dusit Medical Services PCL, NVDR | 50,700 | 39,601 | ||||||
Bumrungrad Hospital PCL, NVDR | 3,500 | 21,487 | ||||||
Krung Thai Bank PCL, NVDR | 100,700 | 46,917 | ||||||
|
| |||||||
| Total Thailand |
| 108,005 | ||||||
| Turkey – 3.6% |
| |||||||
Akbank TAS | 105,052 | 151,902 | ||||||
Ford Otomotiv Sanayi AS | 3,109 | 108,784 | ||||||
Haci Omer Sabanci Holding AS | 31,373 | 80,003 | ||||||
KOC Holding AS* | 16,244 | 100,019 | ||||||
Pegasus Hava Tasimaciligi AS* | 2,065 | 51,893 | ||||||
Turk Hava Yollari AO* | 7,567 | 69,643 | ||||||
Turkiye Is Bankasi AS, Class C | 486,430 | 171,255 | ||||||
Turkiye Sise ve Cam Fabrikalari AS | 56,848 | 81,252 | ||||||
Yapi ve Kredi Bankasi AS* | 33,190 | 28,048 | ||||||
|
| |||||||
| Total Turkey | 842,799 | |||||||
TOTAL COMMON STOCKS (Cost: $21,480,790) |
| 23,190,660 | ||||||
| PREFERRED STOCKS – 1.1% | ||||||||
| Brazil – 1.1% | ||||||||
Banco Bradesco SA | 841 | 2,396 | ||||||
Cia Energetica de Minas Gerais | 26,646 | 66,860 | ||||||
Companhia Paranaense de Energia | 17,548 | 33,725 | ||||||
Itau Unibanco Holding SA | 10,223 | 70,746 | ||||||
Petroleo Brasileiro SA | 12,235 | 91,319 | ||||||
| TOTAL PREFERRED STOCKS (Cost: $265,011) | 265,046 | |||||||
| INVESTMENT OF CASH COLLATERAL FOR SECURITIES LOANED – 0.0% |
| |||||||
| United States – 0.0% | ||||||||
State Street Navigator Securities Lending | ||||||||
| (Cost: $8,195) | 8,195 | 8,195 | ||||||
TOTAL INVESTMENTS IN SECURITIES – 99.8% (Cost: $21,753,996) |
| 23,463,901 | ||||||
Other Assets less Liabilities – 0.2% | 35,964 | |||||||
|
| |||||||
| NET ASSETS – 100.0% | $ | 23,499,865 | ||||||
| * | Non-income producing security. |
| † | This security is being fair valued using significant unobservable inputs (i.e., Level 3 on the fair value hierarchy) by WisdomTree Asset Management, Inc., as valuation designee, in accordance with valuation procedures approved by the Board of Trustees of WisdomTree Trust. The aggregate value of Level 3 fair valued securities is $0, which represents 0.0% of net assets. |
| (a) | This security is exempt from registration under rule 144A of the Securities Act of 1933. This security may be sold in transactions that are exempt from registration, normally to qualified institutional buyers. |
| (b) | This security is exempt from registration under Regulation S of the Securities Act of 1933, which exempts from registration securities offered and sold outside the United States. This security may not be offered or sold in the United States except pursuant to an exemption from, or in a transaction not subject to, the registration requirements of the Securities Act of 1933. |
| (c) | Security, or portion thereof, was on loan at March 31, 2024 (See Note 2). At March 31, 2024, the total market value of the Fund’s securities on loan identified in the Schedule of Investments was $83,527 and the total market value of the collateral held by the Fund was $88,002. The total market value of the collateral includes non-cash U.S. Government securities collateral having a value of $79,807. |
| (d) | Rate shown represents annualized 7-day yield as of March 31, 2024. |
| FINANCIAL DERIVATIVE INSTRUMENTS | ||||||||||||||||||||||||||||
| FOREIGN CURRENCY CONTRACTS (OTC – OVER THE COUNTER) | ||||||||||||||||||||||||||||
| Counterparty | Settlement Date | Amount and Description of Currency to be Purchased | Amount and Description of be Sold | Unrealized Appreciation | Unrealized Depreciation | |||||||||||||||||||||||
Bank of America NA | 4/1/2024 | 314,188 | TWD | 9,818 | USD | $ | — | $ | (1 | ) | ||||||||||||||||||
Bank of America NA | 4/2/2024 | 3,911,617,680 | KRW | 2,905,026 | USD | 539 | — | |||||||||||||||||||||
Bank of America NA | 4/2/2024 | 2,665,312,566 | KRW | 1,978,115 | USD | 1,690 | — | |||||||||||||||||||||
Bank of America NA | 4/2/2024 | 1,999,784 | USD | 2,665,312,566 | KRW | 19,979 | — | |||||||||||||||||||||
Bank of America NA | 4/2/2024 | 2,903,086 | USD | 3,911,617,680 | KRW | — | (2,480 | ) | ||||||||||||||||||||
Bank of America NA | 4/3/2024 | 15,819,698,877 | IDR | 996,516 | USD | 1,228 | — | |||||||||||||||||||||
Bank of America NA | 4/3/2024 | 106,512 | USD | 103,689,923 | CLP | 801 | — | |||||||||||||||||||||
See Notes to Financial Statements.
| WisdomTree Trust | 39 |
Schedule of Investments (continued)
WisdomTree Emerging Markets Multifactor Fund (EMMF)
March 31, 2024
| FINANCIAL DERIVATIVE INSTRUMENTS | ||||||||||||||||||||||||||||
| FOREIGN CURRENCY CONTRACTS (OTC – OVER THE COUNTER) | ||||||||||||||||||||||||||||
| Counterparty | Settlement Date | Amount and Description of Currency to be Purchased | Amount and Description of be Sold | Unrealized Appreciation | Unrealized Depreciation | |||||||||||||||||||||||
Bank of America NA | 4/3/2024 | 1,005,894 | USD | 15,819,698,877 | IDR | $ | 8,150 | $ | — | |||||||||||||||||||
Bank of America NA | 4/3/2024 | 649,720 | USD | 11,149,953 | MXN | — | (20,979 | ) | ||||||||||||||||||||
Bank of America NA | 4/4/2024 | 542,372 | CZK | 23,106 | USD | 59 | — | |||||||||||||||||||||
Bank of America NA | 4/4/2024 | 23,106 | USD | 539,768 | CZK | 52 | — | |||||||||||||||||||||
Bank of America NA | 5/6/2024 | 58,464 | USD | 1,372,669 | CZK | — | (152 | ) | ||||||||||||||||||||
Bank of America NA | 5/6/2024 | 1,077,731 | USD | 17,128,385,437 | IDR | — | (1,505 | ) | ||||||||||||||||||||
Bank of America NA | 5/7/2024 | 2,977,529 | USD | 4,001,948,519 | KRW | — | (890 | ) | ||||||||||||||||||||
Citibank NA | 4/2/2024 | 17,238,704 | CNY | 2,434,845 | USD | — | (49,674 | ) | ||||||||||||||||||||
Citibank NA | 4/2/2024 | 1,246,305,114 | KRW | 924,970 | USD | 790 | — | |||||||||||||||||||||
Citibank NA | 4/2/2024 | 144,534,909 | TWD | 4,517,139 | USD | — | (917 | ) | ||||||||||||||||||||
Citibank NA | 4/2/2024 | 2,429,698 | USD | 17,238,704 | CNY | 44,527 | — | |||||||||||||||||||||
Citibank NA | 4/2/2024 | 953,015 | USD | 1,246,305,114 | KRW | 27,254 | — | |||||||||||||||||||||
Citibank NA | 4/2/2024 | 549,383 | USD | 30,845,100 | PHP | 684 | — | |||||||||||||||||||||
Citibank NA | 4/2/2024 | 4,564,500 | USD | 144,534,909 | TWD | 48,279 | — | |||||||||||||||||||||
Citibank NA | 4/3/2024 | 103,689,923 | CLP | 105,639 | USD | 73 | — | |||||||||||||||||||||
Citibank NA | 4/4/2024 | 5,257,425 | USD | 436,434,631 | INR | 24,687 | — | |||||||||||||||||||||
Citibank NA | 5/6/2024 | 84,139 | USD | 82,678,614 | CLP | — | (65 | ) | ||||||||||||||||||||
Citibank NA | 5/8/2024 | 2,397,884 | USD | 16,933,858 | CNY | 46,520 | — | |||||||||||||||||||||
Goldman Sachs | 4/2/2024 | 640,495 | MYR | 137,151 | USD | — | (1,826 | ) | ||||||||||||||||||||
Goldman Sachs | 4/2/2024 | 3,073,125 | MYR | 647,655 | USD | 1,642 | — | |||||||||||||||||||||
Goldman Sachs | 4/2/2024 | 135,363 | USD | 640,495 | MYR | 37 | — | |||||||||||||||||||||
Goldman Sachs | 4/2/2024 | 649,476 | USD | 3,073,125 | MYR | 178 | — | |||||||||||||||||||||
Goldman Sachs | 4/3/2024 | 10,762,956 | MXN | 649,720 | USD | — | (2,299 | ) | ||||||||||||||||||||
Goldman Sachs | 4/3/2024 | 1,377,614 | USD | 6,893,579 | BRL | 580 | — | |||||||||||||||||||||
Goldman Sachs | 4/4/2024 | 25,580,588 | HUF | 69,946 | USD | 161 | — | |||||||||||||||||||||
Goldman Sachs | 5/6/2024 | 83,376 | USD | 30,558,296 | HUF | — | (192 | ) | ||||||||||||||||||||
Goldman Sachs | 5/6/2024 | 654,426 | USD | 10,897,243 | MXN | 2,277 | — | |||||||||||||||||||||
Goldman Sachs | 5/6/2024 | 633,972 | USD | 3,007,878 | MYR | — | (2,981 | ) | ||||||||||||||||||||
HSBC Holdings PLC | 4/2/2024 | 15,614,085 | CNY | 2,200,717 | USD | — | (40,330 | ) | ||||||||||||||||||||
HSBC Holdings PLC | 4/2/2024 | 1,624,619 | CNY | 228,981 | USD | — | (4,196 | ) | ||||||||||||||||||||
HSBC Holdings PLC | 4/2/2024 | 30,845,100 | PHP | 548,455 | USD | 244 | — | |||||||||||||||||||||
HSBC Holdings PLC | 4/2/2024 | 7,446,870 | THB | 209,848 | USD | — | (5,755 | ) | ||||||||||||||||||||
HSBC Holdings PLC | 4/2/2024 | 4,553,581 | THB | 125,176 | USD | — | (377 | ) | ||||||||||||||||||||
HSBC Holdings PLC | 4/2/2024 | 1,849,524 | TWD | 58,958 | USD | — | (1,167 | ) | ||||||||||||||||||||
HSBC Holdings PLC | 4/2/2024 | 2,195,456 | USD | 15,614,085 | CNY | 35,070 | — | |||||||||||||||||||||
HSBC Holdings PLC | 4/2/2024 | 229,158 | USD | 1,624,619 | CNY | 4,374 | — | |||||||||||||||||||||
HSBC Holdings PLC | 4/2/2024 | 57,803 | USD | 1,849,524 | TWD | 12 | — | |||||||||||||||||||||
HSBC Holdings PLC | 4/3/2024 | 29,900 | HKD | 3,821 | USD | — | — | |||||||||||||||||||||
HSBC Holdings PLC | 4/4/2024 | 23,127,000 | INR | 279,295 | USD | — | (2,008 | ) | ||||||||||||||||||||
HSBC Holdings PLC | 4/4/2024 | 413,307,631 | INR | 4,956,678 | USD | — | (1,227 | ) | ||||||||||||||||||||
HSBC Holdings PLC | 4/4/2024 | 69,946 | USD | 25,411,780 | HUF | 302 | — | |||||||||||||||||||||
HSBC Holdings PLC | 4/4/2024 | 564,184 | USD | 10,858,475 | ZAR | — | (9,195 | ) | ||||||||||||||||||||
HSBC Holdings PLC | 5/3/2024 | 481,990 | USD | 27,114,844 | PHP | — | (103 | ) | ||||||||||||||||||||
HSBC Holdings PLC | 5/6/2024 | 4,776,667 | USD | 398,655,864 | INR | 1,059 | — | |||||||||||||||||||||
HSBC Holdings PLC | 5/7/2024 | 89,583 | USD | 3,252,561 | THB | 190 | — | |||||||||||||||||||||
Merrill Lynch International | 4/1/2024 | 89,544 | MYR | 18,945 | USD | — | (26 | ) | ||||||||||||||||||||
Morgan Stanley & Co. International | 4/2/2024 | 3,713,620 | MYR | 784,838 | USD | — | (216 | ) | ||||||||||||||||||||
Morgan Stanley & Co. International | 4/2/2024 | 778,782 | USD | 3,713,620 | MYR | — | (5,841 | ) | ||||||||||||||||||||
Morgan Stanley & Co. International | 4/3/2024 | 6,893,579 | BRL | 1,382,864 | USD | — | (5,831 | ) | ||||||||||||||||||||
Morgan Stanley & Co. International | 4/3/2024 | 386,200 | MXN | 23,246 | USD | — | (11 | ) | ||||||||||||||||||||
Morgan Stanley & Co. International | 4/3/2024 | 1,063,661 | PLN | 265,794 | USD | 938 | — | |||||||||||||||||||||
Morgan Stanley & Co. International | 4/4/2024 | 112,200 | ZAR | 5,927 | USD | — | (2 | ) | ||||||||||||||||||||
Morgan Stanley & Co. International | 4/4/2024 | 10,706,317 | ZAR | 564,184 | USD | 1,160 | — | |||||||||||||||||||||
Morgan Stanley & Co. International | 5/6/2024 | 1,082,136 | USD | 5,409,059 | BRL | 5,108 | — | |||||||||||||||||||||
Morgan Stanley & Co. International | 5/6/2024 | 541,770 | USD | 10,307,192 | ZAR | — | (1,105 | ) | ||||||||||||||||||||
See Notes to Financial Statements.
| 40 | WisdomTree Trust |
Schedule of Investments (concluded)
WisdomTree Emerging Markets Multifactor Fund (EMMF)
March 31, 2024
| FINANCIAL DERIVATIVE INSTRUMENTS | ||||||||||||||||||||||||||||
| FOREIGN CURRENCY CONTRACTS (OTC – OVER THE COUNTER) | ||||||||||||||||||||||||||||
| Counterparty | Settlement Date | Amount and Description of Currency to be Purchased | Amount and Description of be Sold | Unrealized Appreciation | Unrealized Depreciation | |||||||||||||||||||||||
Morgan Stanley & Co. International | 5/7/2024 | 182,484 | USD | 730,487 | PLN | $ | — | $ | (648 | ) | ||||||||||||||||||
UBS AG | 4/1/2024 | 136,000 | TRY | 4,192 | USD | 11 | — | |||||||||||||||||||||
UBS AG | 4/2/2024 | 16,895,518 | TRY | 520,709 | USD | 1,531 | — | |||||||||||||||||||||
UBS AG | 4/2/2024 | 142,685,385 | TWD | 4,458,514 | USD | — | (84 | ) | ||||||||||||||||||||
UBS AG | 4/2/2024 | 334,113 | USD | 12,000,451 | THB | 5,221 | — | |||||||||||||||||||||
UBS AG | 4/2/2024 | 520,709 | USD | 16,849,964 | TRY | — | (123 | ) | ||||||||||||||||||||
UBS AG | 4/2/2024 | 4,459,336 | USD | 142,685,385 | TWD | 906 | — | |||||||||||||||||||||
UBS AG | 4/3/2024 | 265,794 | USD | 1,059,178 | PLN | 186 | — | |||||||||||||||||||||
UBS AG | 5/6/2024 | 553,745 | USD | 18,695,203 | TRY | — | (415 | ) | ||||||||||||||||||||
UBS AG | 5/6/2024 | 4,574,889 | USD | 146,295,357 | TWD | — | (14,625 | ) | ||||||||||||||||||||
| $ | 286,499 | $ | (177,246 | ) | ||||||||||||||||||||||||
| FAIR VALUATION SUMMARY |
The following is a summary of the fair valuations according to the inputs used in valuing the Fund’s investments (See Note 2 — Fair Value Measurement):
Quoted Prices in Active Markets | Other Significant Observable Inputs (Level 2) | Significant Unobservable Inputs (Level 3) | Total | |||||||||||||
Assets: | ||||||||||||||||
Investments in Securities | ||||||||||||||||
Common Stocks | ||||||||||||||||
Russia | $ | — | $ | — | $ | 0 | * | $ | 0 | |||||||
Other | 23,190,660 | — | — | 23,190,660 | ||||||||||||
Preferred Stocks | 265,046 | — | — | 265,046 | ||||||||||||
Investment of Cash Collateral for Securities Loaned | — | 8,195 | — | 8,195 | ||||||||||||
Total Investments in Securities | $ | 23,455,706 | $ | 8,195 | $ | 0 | $ | 23,463,901 | ||||||||
Financial Derivative Instruments | ||||||||||||||||
Foreign Currency Contracts1 | $ | — | $ | 286,499 | $ | — | $ | 286,499 | ||||||||
Liabilities: | ||||||||||||||||
Financial Derivative Instruments | ||||||||||||||||
Foreign Currency Contracts1 | $ | — | $ | (177,246 | ) | $ | — | $ | (177,246 | ) | ||||||
Total – Net | $ | 23,455,706 | $ | 117,448 | $ | 0 | $ | 23,573,154 | ||||||||
| * | Fair valuations using significant unobservable inputs were determined by WisdomTree Asset Management, Inc., as valuation designee, in accordance with valuation procedures approved by the Board of Trustees of WisdomTree Trust. |
| 1 | Amount shown represents the unrealized appreciation (depreciation) on the financial instrument. |
See Notes to Financial Statements.
| WisdomTree Trust | 41 |
Schedule of Investments
WisdomTree Emerging Markets Quality Dividend Growth Fund (DGRE)
March 31, 2024
| Investments | Shares | Value | ||||||
| COMMON STOCKS – 97.7% |
| |||||||
| Brazil – 5.0% |
| |||||||
Ambev SA | 129,284 | $ | 322,593 | |||||
Banco do Brasil SA | 29,690 | 335,837 | ||||||
BB Seguridade Participacoes SA | 44,196 | 287,132 | ||||||
CCR SA | 164,221 | 453,404 | ||||||
Cia de Saneamento Basico do Estado de Sao Paulo SABESP | 39,336 | 665,613 | ||||||
CPFL Energia SA | 26,693 | 185,631 | ||||||
Engie Brasil Energia SA | 54,640 | 439,473 | ||||||
Klabin SA | 136,913 | 690,918 | ||||||
Lojas Renner SA | 28,615 | 97,069 | ||||||
Petroleo Brasileiro SA | 50,826 | 388,692 | ||||||
Raia Drogasil SA | 51,388 | 280,986 | ||||||
Rumo SA | 46,751 | 207,905 | ||||||
Suzano SA | 24,426 | 312,208 | ||||||
TIM SA | 127,240 | 452,472 | ||||||
TOTVS SA | 41,103 | 233,042 | ||||||
Vale SA | 79,058 | 960,753 | ||||||
WEG SA | 52,387 | 399,793 | ||||||
|
| |||||||
| Total Brazil |
| 6,713,521 | ||||||
| Chile – 1.7% |
| |||||||
Banco de Chile | 2,520,167 | 280,061 | ||||||
Banco de Credito & Inversiones SA* | 14,159 | 404,337 | ||||||
Cencosud SA | 185,662 | 321,787 | ||||||
Cia Sud Americana de Vapores SA | 2,825,172 | 212,280 | ||||||
Empresas CMPC SA | 274,270 | 556,733 | ||||||
Empresas Copec SA | 37,000 | 265,528 | ||||||
Enel Chile SA | 2,973,719 | 178,572 | ||||||
|
| |||||||
| Total Chile |
| 2,219,298 | ||||||
| China – 0.3% |
| |||||||
Airtac International Group | 12,786 | 447,461 | ||||||
| Czech Republic – 0.2% |
| |||||||
CEZ AS(a) | 8,131 | 290,678 | ||||||
| Hungary – 0.4% |
| |||||||
MOL Hungarian Oil & Gas PLC | 29,764 | 241,472 | ||||||
Richter Gedeon Nyrt | 12,622 | 320,348 | ||||||
|
| |||||||
| Total Hungary |
| 561,820 | ||||||
| India – 31.3% |
| |||||||
ABB India Ltd. | 7,476 | 570,171 | ||||||
Adani Enterprises Ltd. | 15,922 | 610,344 | ||||||
Adani Ports & Special Economic Zone Ltd. | 62,319 | 1,002,641 | ||||||
Apollo Hospitals Enterprise Ltd. | 5,476 | 417,372 | ||||||
Ashok Leyland Ltd. | 90,558 | 185,942 | ||||||
Asian Paints Ltd. | 11,732 | 400,445 | ||||||
Astral Ltd. | 9,166 | 218,840 | ||||||
AU Small Finance Bank Ltd.(b) | 20,095 | 136,131 | ||||||
Bajaj Auto Ltd. | 7,622 | 836,033 | ||||||
Bajaj Holdings & Investment Ltd. | 8,171 | 810,487 | ||||||
Bank of Baroda | 59,710 | 189,040 | ||||||
Berger Paints India Ltd. | 26,711 | 183,529 | ||||||
Bharat Electronics Ltd. | 296,961 | 717,456 | ||||||
Bharat Petroleum Corp. Ltd. | 49,531 | 357,753 | ||||||
Bharti Airtel Ltd. | 33,171 | 488,641 | ||||||
Cipla Ltd. | 67,531 | 1,212,080 | ||||||
Coal India Ltd. | 90,479 | 470,932 | ||||||
Colgate-Palmolive India Ltd. | 17,129 | 556,645 | ||||||
Container Corp. of India Ltd. | 22,512 | 238,096 | ||||||
Cummins India Ltd. | 11,290 | 406,949 | ||||||
Dabur India Ltd. | 36,105 | 226,472 | ||||||
Dr. Reddy’s Laboratories Ltd. | 4,506 | 332,694 | ||||||
Eicher Motors Ltd. | 5,320 | 256,379 | ||||||
Grasim Industries Ltd. | 26,364 | 723,028 | ||||||
HCL Technologies Ltd. | 30,363 | 561,935 | ||||||
HDFC Asset Management Co. Ltd.(b) | 5,566 | 250,536 | ||||||
HDFC Bank Ltd. | 30,273 | 525,551 | ||||||
Hero MotoCorp Ltd. | 6,838 | 387,172 | ||||||
Hindalco Industries Ltd. | 56,164 | 377,278 | ||||||
Hindustan Petroleum Corp. Ltd. | 213,978 | 1,220,331 | ||||||
Hindustan Unilever Ltd. | 22,218 | 603,211 | ||||||
ICICI Bank Ltd. | 76,020 | 996,525 | ||||||
ICICI Lombard General Insurance Co. Ltd.(b) | 11,070 | 223,583 | ||||||
Indian Hotels Co. Ltd. | 78,122 | 553,722 | ||||||
Indian Railway Catering & Tourism Corp. Ltd. | 20,842 | 232,329 | ||||||
Indraprastha Gas Ltd. | 45,869 | 236,928 | ||||||
Infosys Ltd. | 75,818 | 1,361,820 | ||||||
ITC Ltd. | 139,534 | 716,638 | ||||||
Jindal Steel & Power Ltd. | 54,626 | 556,166 | ||||||
Larsen & Toubro Ltd. | 21,122 | 953,222 | ||||||
LTIMindtree Ltd.(b) | 3,146 | 186,280 | ||||||
Mahindra & Mahindra Ltd. | 20,622 | 475,071 | ||||||
Maruti Suzuki India Ltd. | 5,151 | 778,207 | ||||||
Mphasis Ltd. | 7,918 | 226,715 | ||||||
MRF Ltd. | 255 | 407,827 | ||||||
Nestle India Ltd. | 24,698 | 776,557 | ||||||
NTPC Ltd. | 179,540 | 722,874 | ||||||
Oil & Natural Gas Corp. Ltd. | 137,497 | 441,906 | ||||||
Page Industries Ltd. | 574 | 237,101 | ||||||
PI Industries Ltd. | 5,685 | 263,626 | ||||||
Pidilite Industries Ltd. | 15,780 | 570,390 | ||||||
Power Grid Corp. of India Ltd. | 274,385 | 910,970 | ||||||
Reliance Industries Ltd. | 63,510 | 2,262,914 | ||||||
Samvardhana Motherson International Ltd. | 639,861 | 898,387 | ||||||
SBI Cards & Payment Services Ltd. | 35,173 | 287,849 | ||||||
SBI Life Insurance Co. Ltd.(b) | 12,083 | 217,350 | ||||||
Shree Cement Ltd. | 2,235 | 688,243 | ||||||
Siemens Ltd. | 9,113 | 587,197 | ||||||
Sona Blw Precision Forgings Ltd.(b) | 27,287 | 230,967 | ||||||
SRF Ltd. | 8,374 | 257,061 | ||||||
State Bank of India | 76,405 | 689,228 | ||||||
Sun Pharmaceutical Industries Ltd. | 48,668 | 945,642 | ||||||
Tata Consultancy Services Ltd. | 25,370 | 1,179,122 | ||||||
Tata Consumer Products Ltd. | 27,386 | 359,948 | ||||||
Tata Elxsi Ltd. | 2,454 | 229,067 | ||||||
Tata Power Co. Ltd. | 174,342 | 824,024 | ||||||
Tech Mahindra Ltd. | 36,274 | 542,832 | ||||||
See Notes to Financial Statements.
| 42 | WisdomTree Trust |
Schedule of Investments (continued)
WisdomTree Emerging Markets Quality Dividend Growth Fund (DGRE)
March 31, 2024
| Investments | Shares | Value | ||||||
Titan Co. Ltd. | 10,140 | $ | 462,219 | |||||
Torrent Pharmaceuticals Ltd. | 16,448 | 512,870 | ||||||
Trent Ltd. | 11,949 | 565,626 | ||||||
Tube Investments of India Ltd. | 12,774 | 572,301 | ||||||
TVS Motor Co. Ltd. | 32,866 | 847,969 | ||||||
UltraTech Cement Ltd. | 5,196 | 607,375 | ||||||
Varun Beverages Ltd. | 51,637 | 865,915 | ||||||
Wipro Ltd. | 59,047 | 339,900 | ||||||
|
| |||||||
| Total India |
| 42,276,577 | ||||||
| Indonesia – 2.9% |
| |||||||
Adaro Energy Indonesia Tbk. PT | 1,082,200 | 184,291 | ||||||
Aneka Tambang Tbk. PT | 1,777,500 | 179,376 | ||||||
Astra International Tbk. PT | 614,000 | 199,439 | ||||||
Bank Central Asia Tbk. PT | 980,300 | 622,928 | ||||||
Bank Mandiri Persero Tbk. PT | 1,070,900 | 489,689 | ||||||
Bank Negara Indonesia Persero Tbk. PT | 694,900 | 258,588 | ||||||
Bank Rakyat Indonesia Persero Tbk. PT | 1,429,800 | 545,587 | ||||||
Kalbe Farma Tbk. PT | 3,623,731 | 337,118 | ||||||
Semen Indonesia Persero Tbk. PT | 410,300 | 152,682 | ||||||
Sumber Alfaria Trijaya Tbk. PT | 1,652,700 | 303,334 | ||||||
Telkom Indonesia Persero Tbk. PT | 984,100 | 215,378 | ||||||
Vale Indonesia Tbk. PT | 1,684,100 | 432,311 | ||||||
|
| |||||||
| Total Indonesia |
| 3,920,721 | ||||||
| Malaysia – 2.0% |
| |||||||
AMMB Holdings Bhd. | 212,100 | 187,767 | ||||||
CIMB Group Holdings Bhd. | 456,300 | 640,150 | ||||||
IHH Healthcare Bhd. | 157,100 | 200,815 | ||||||
IOI Corp. Bhd. | 257,600 | 216,617 | ||||||
MR DIY Group M Bhd.(b) | 346,100 | 108,956 | ||||||
Petronas Dagangan Bhd. | 68,000 | 310,044 | ||||||
Press Metal Aluminium Holdings Bhd. | 252,800 | 248,367 | ||||||
QL Resources Bhd. | 265,100 | 330,465 | ||||||
RHB Bank Bhd. | 145,078 | 173,799 | ||||||
Telekom Malaysia Bhd. | 206,500 | 263,524 | ||||||
|
| |||||||
| Total Malaysia |
| 2,680,504 | ||||||
| Mexico – 6.2% |
| |||||||
Alfa SAB de CV, Class A | 291,792 | 217,153 | ||||||
America Movil SAB de CV | 803,254 | 752,911 | ||||||
Arca Continental SAB de CV | 49,190 | 536,979 | ||||||
Coca-Cola Femsa SAB de CV | 60,224 | 581,090 | ||||||
Fibra Uno Administracion SA de CV | 266,565 | 442,785 | ||||||
Fomento Economico Mexicano SAB de CV | 74,094 | 961,248 | ||||||
Gruma SAB de CV, Class B | 11,300 | 211,210 | ||||||
Grupo Aeroportuario del Pacifico SAB de CV, Class B | 28,286 | 454,383 | ||||||
Grupo Aeroportuario del Sureste SAB de CV, Class B | 18,935 | 597,335 | ||||||
Grupo Bimbo SAB de CV, Series A | 229,799 | 1,084,863 | ||||||
Grupo Carso SAB de CV, Series A1(a) | 27,136 | 241,815 | ||||||
Grupo Financiero Banorte SAB de CV, Class O | 50,480 | 535,633 | ||||||
Grupo Mexico SAB de CV, Series B | 123,103 | 726,765 | ||||||
Kimberly-Clark de Mexico SAB de CV, Class A | 85,553 | 198,676 | ||||||
Promotora y Operadora de Infraestructura SAB de CV | 45,117 | 477,750 | ||||||
Wal-Mart de Mexico SAB de CV | 92,469 | 372,730 | ||||||
|
| |||||||
| Total Mexico |
| 8,393,326 | ||||||
| Philippines – 2.4% |
| |||||||
Bank of the Philippine Islands | 197,120 | 414,122 | ||||||
BDO Unibank, Inc. | 91,330 | 251,010 | ||||||
International Container Terminal Services, Inc. | 205,480 | 1,162,370 | ||||||
Jollibee Foods Corp. | 44,690 | 200,813 | ||||||
Manila Electric Co. | 101,470 | 644,397 | ||||||
Metropolitan Bank & Trust Co. | 213,870 | 247,863 | ||||||
SM Prime Holdings, Inc. | 424,200 | 246,755 | ||||||
|
| |||||||
| Total Philippines |
| 3,167,330 | ||||||
| Poland – 0.9% |
| |||||||
Budimex SA | 1,495 | 262,429 | ||||||
CD Projekt SA(a) | 6,566 | 192,481 | ||||||
LPP SA | 111 | 425,879 | ||||||
ORLEN SA | 21,532 | 351,402 | ||||||
|
| |||||||
| Total Poland |
| 1,232,191 | ||||||
| Russia – 0.0% |
| |||||||
MMC Norilsk Nickel PJSC*† | 993 | 0 | ||||||
MMC Norilsk Nickel PJSC, ADR*† | 3 | 0 | ||||||
Mobile TeleSystems PJSC, ADR*† | 24,869 | 0 | ||||||
Novolipetsk Steel PJSC*† | 71,650 | 0 | ||||||
PhosAgro PJSC*† | 2,975 | 0 | ||||||
PhosAgro PJSC, GDR*†(c) | 60 | 0 | ||||||
Polyus PJSC*† | 1,334 | 0 | ||||||
Severstal PAO, GDR*†(c) | 8,497 | 0 | ||||||
Surgutneftegas PJSC*† | 341,560 | 0 | ||||||
Surgutneftegas PJSC, ADR*† | 749 | 0 | ||||||
TCS Group Holding PLC, GDR*†(c) | 2,248 | 0 | ||||||
|
| |||||||
| Total Russia |
| 0 | ||||||
| Saudi Arabia – 6.6% |
| |||||||
Al Rajhi Bank | 95,582 | 2,097,428 | ||||||
Alinma Bank | 27,013 | 306,467 | ||||||
Almarai Co. JSC | 44,680 | 686,193 | ||||||
Arab National Bank | 52,353 | 407,601 | ||||||
Arabian Internet & Communications Services Co. | 2,037 | 206,388 | ||||||
Bupa Arabia for Cooperative Insurance Co. | 5,243 | 359,272 | ||||||
Co. for Cooperative Insurance | 21,373 | 895,837 | ||||||
Dallah Healthcare Co. | 8,534 | 380,907 | ||||||
Elm Co. | 1,120 | 290,504 | ||||||
Etihad Etisalat Co. | 35,552 | 496,714 | ||||||
Mouwasat Medical Services Co. | 6,531 | 239,960 | ||||||
Nahdi Medical Co. | 7,267 | 284,828 | ||||||
Riyad Bank | 32,594 | 255,503 | ||||||
SABIC Agri-Nutrients Co. | 8,128 | 262,229 | ||||||
Saudi Arabian Oil Co.(b) | 41,703 | 343,031 | ||||||
Saudi Awwal Bank | 48,187 | 513,926 | ||||||
Saudi Telecom Co. | 53,297 | 562,741 | ||||||
Savola Group | 20,133 | 302,223 | ||||||
|
| |||||||
| Total Saudi Arabia |
| 8,891,752 | ||||||
See Notes to Financial Statements.
| WisdomTree Trust | 43 |
Schedule of Investments (continued)
WisdomTree Emerging Markets Quality Dividend Growth Fund (DGRE)
March 31, 2024
| Investments | Shares | Value | ||||||
| South Africa – 4.8% |
| |||||||
Absa Group Ltd. | 56,121 | $ | 439,010 | |||||
Bid Corp. Ltd. | 24,737 | 603,276 | ||||||
Bidvest Group Ltd.(a) | 20,346 | 260,564 | ||||||
Capitec Bank Holdings Ltd. | 2,844 | 314,763 | ||||||
Clicks Group Ltd. | 16,090 | 251,603 | ||||||
FirstRand Ltd.(a) | 107,568 | 350,659 | ||||||
Gold Fields Ltd. | 28,582 | 458,701 | ||||||
MTN Group Ltd. | 162,037 | 802,131 | ||||||
OUTsurance Group Ltd. | 212,914 | 472,236 | ||||||
Pepkor Holdings Ltd.(b) | 526,868 | 525,025 | ||||||
Sanlam Ltd. | 143,716 | 526,633 | ||||||
Shoprite Holdings Ltd.(a) | 23,381 | 305,520 | ||||||
Standard Bank Group Ltd. | 68,959 | 674,577 | ||||||
Woolworths Holdings Ltd. | 153,504 | 479,977 | ||||||
|
| |||||||
| Total South Africa |
| 6,464,675 | ||||||
| South Korea – 10.8% |
| |||||||
BGF retail Co. Ltd. | 1,822 | 159,294 | ||||||
DB Insurance Co. Ltd. | 5,403 | 380,066 | ||||||
Doosan Bobcat, Inc. | 11,065 | 438,079 | ||||||
Ecopro BM Co. Ltd.* | 3,649 | 742,675 | ||||||
Ecopro Co. Ltd.* | 387 | 181,965 | ||||||
F&F Co. Ltd. | 4,484 | 234,151 | ||||||
GS Holdings Corp. | 15,200 | 544,772 | ||||||
Hana Financial Group, Inc. | 15,180 | 650,612 | ||||||
Hankook Tire & Technology Co. Ltd. | 12,820 | 516,133 | ||||||
Hanmi Pharm Co. Ltd. | 1,462 | 361,631 | ||||||
Hanmi Semiconductor Co. Ltd. | 3,996 | 396,854 | ||||||
HD Hyundai Co. Ltd. | 8,218 | 438,904 | ||||||
Hyundai Glovis Co. Ltd. | 4,041 | 522,591 | ||||||
Hyundai Motor Co. | 4,603 | 796,657 | ||||||
Industrial Bank of Korea | 26,749 | 268,235 | ||||||
JYP Entertainment Corp. | 2,575 | 137,907 | ||||||
LG Innotek Co. Ltd. | 1,919 | 280,384 | ||||||
LG Uplus Corp. | 12,300 | 91,091 | ||||||
NAVER Corp. | 2,193 | 305,269 | ||||||
Orion Corp. | 4,518 | 305,395 | ||||||
Pan Ocean Co. Ltd. | 58,329 | 179,157 | ||||||
Posco International Corp. | 4,172 | 163,936 | ||||||
S-Oil Corp. | 2,725 | 158,895 | ||||||
Samsung Electronics Co. Ltd. | 87,308 | 5,343,866 | ||||||
Samsung Fire & Marine Insurance Co. Ltd. | 937 | 212,978 | ||||||
Samsung SDS Co. Ltd. | 4,664 | 566,436 | ||||||
Woori Financial Group, Inc. | 21,155 | 225,025 | ||||||
|
| |||||||
| Total South Korea |
| 14,602,958 | ||||||
| Taiwan – 15.4% |
| |||||||
Accton Technology Corp. | 41,000 | 593,154 | ||||||
Advantech Co. Ltd. | 46,280 | 584,221 | ||||||
ASE Technology Holding Co. Ltd. | 125,000 | 628,837 | ||||||
Cheng Shin Rubber Industry Co. Ltd. | 121,000 | 189,042 | ||||||
Delta Electronics, Inc. | 63,000 | 671,270 | ||||||
Eclat Textile Co. Ltd. | 19,000 | 328,308 | ||||||
Eva Airways Corp. | 257,000 | 256,570 | ||||||
Global Unichip Corp. | 5,000 | 194,510 | ||||||
Lite-On Technology Corp., ADR | 180,000 | 568,063 | ||||||
momo.com, Inc. | 2,280 | 27,571 | ||||||
Nan Ya Printed Circuit Board Corp. | 31,000 | 194,213 | ||||||
Nien Made Enterprise Co. Ltd. | 44,000 | 483,260 | ||||||
President Chain Store Corp. | 92,000 | 766,104 | ||||||
Quanta Computer, Inc. | 112,000 | 1,027,138 | ||||||
Ruentex Development Co. Ltd. | 219,950 | 241,575 | ||||||
Synnex Technology International Corp. | 298,000 | 734,676 | ||||||
Taiwan Semiconductor Manufacturing Co. Ltd. | 417,291 | 10,157,317 | ||||||
Unimicron Technology Corp. | 68,000 | 405,830 | ||||||
United Microelectronics Corp. | 356,000 | 580,661 | ||||||
Voltronic Power Technology Corp. | 8,000 | 409,955 | ||||||
Walsin Lihwa Corp. | 158,000 | 185,383 | ||||||
Wistron Corp. | 62,000 | 242,161 | ||||||
Wiwynn Corp. | 13,000 | 922,087 | ||||||
Zhen Ding Technology Holding Ltd. | 103,000 | 402,300 | ||||||
|
| |||||||
| Total Taiwan |
| 20,794,206 | ||||||
| Thailand – 2.2% |
| |||||||
Advanced Info Service PCL, NVDR | 35,900 | 201,699 | ||||||
Asset World Corp. PCL, NVDR(a) | 1,796,300 | 201,845 | ||||||
Bangkok Dusit Medical Services PCL, NVDR | 307,900 | 240,497 | ||||||
Bangkok Expressway & Metro PCL, NVDR | 718,600 | 159,525 | ||||||
Banpu PCL, NVDR | 1,112,800 | 169,265 | ||||||
Bumrungrad Hospital PCL, NVDR | 32,100 | 197,065 | ||||||
Central Pattana PCL, NVDR | 127,800 | 220,662 | ||||||
Central Retail Corp. PCL, NVDR | 157,900 | 154,708 | ||||||
Delta Electronics Thailand PCL, NVDR | 118,800 | 242,565 | ||||||
Gulf Energy Development PCL, NVDR | 162,600 | 194,964 | ||||||
Home Product Center PCL, NVDR | 483,000 | 140,317 | ||||||
Krung Thai Bank PCL, NVDR | 290,500 | 135,348 | ||||||
Krungthai Card PCL, NVDR | 120,500 | 151,089 | ||||||
PTT Exploration & Production PCL, NVDR | 52,200 | 218,886 | ||||||
SCB X PCL, NVDR | 58,500 | 182,775 | ||||||
TMBThanachart Bank PCL, NVDR | 3,955,600 | 197,306 | ||||||
|
| |||||||
| Total Thailand |
| 3,008,516 | ||||||
| Turkey – 4.6% |
| |||||||
Akbank TAS | 163,789 | 236,834 | ||||||
Aselsan Elektronik Sanayi ve Ticaret AS | 380,095 | 659,104 | ||||||
BIM Birlesik Magazalar AS | 44,407 | 495,516 | ||||||
Ford Otomotiv Sanayi AS | 31,634 | 1,106,877 | ||||||
Haci Omer Sabanci Holding AS(a) | 158,687 | 404,663 | ||||||
KOC Holding AS* | 83,731 | 515,554 | ||||||
Tofas Turk Otomobil Fabrikasi AS(a) | 19,773 | 169,298 | ||||||
Turkcell Iletisim Hizmetleri AS(a) | 278,595 | 582,990 | ||||||
Turkiye Is Bankasi AS, Class C | 496,028 | 174,634 | ||||||
Turkiye Petrol Rafinerileri AS | 162,008 | 886,357 | ||||||
Turkiye Sise ve Cam Fabrikalari AS | 308,972 | 441,607 | ||||||
Yapi ve Kredi Bankasi AS* | 676,131 | 571,384 | ||||||
|
| |||||||
| Total Turkey |
| 6,244,818 | ||||||
TOTAL COMMON STOCKS (Cost: $105,457,038) |
| 131,910,352 | ||||||
See Notes to Financial Statements.
| 44 | WisdomTree Trust |
Schedule of Investments (continued)
WisdomTree Emerging Markets Quality Dividend Growth Fund (DGRE)
March 31, 2024
| Investments | Shares | Value | ||||||
| PREFERRED STOCKS – 3.1% |
| |||||||
| Brazil – 1.4% |
| |||||||
Cia Energetica de Minas Gerais | 139,408 | $ | 349,805 | |||||
Gerdau SA | 43,877 | 194,598 | ||||||
Itau Unibanco Holding SA | 67,102 | 464,367 | ||||||
Itausa SA | 224,215 | 470,329 | ||||||
Petroleo Brasileiro SA | 60,994 | 455,242 | ||||||
|
| |||||||
| Total Brazil |
| 1,934,341 | ||||||
| South Korea – 1.7% |
| |||||||
Hyundai Motor Co. | 10,322 | 1,186,794 | ||||||
Samsung Electronics Co. Ltd. | 22,649 | 1,144,016 | ||||||
|
| |||||||
| Total South Korea | 2,330,810 | |||||||
TOTAL PREFERRED STOCKS (Cost: $3,544,274) | 4,265,151 | |||||||
| INVESTMENT OF CASH COLLATERAL FOR SECURITIES LOANED – 0.4% |
| |||||||
| United States – 0.4% | ||||||||
State Street Navigator Securities Lending | ||||||||
| (Cost: $519,173) | 519,173 | 519,173 | ||||||
TOTAL INVESTMENTS IN SECURITIES – 101.2% (Cost: $109,520,485) | 136,694,676 | |||||||
Other Assets less Liabilities – (1.2)% | (1,646,708 | ) | ||||||
|
| |||||||
| NET ASSETS – 100.0% | $ | 135,047,968 | ||||||
| * | Non-income producing security. |
| † | This security is being fair valued using significant unobservable inputs (i.e., Level 3 on the fair value hierarchy) by WisdomTree Asset Management, Inc., as valuation designee, in accordance with valuation procedures approved by the Board of Trustees of WisdomTree Trust. The aggregate value of Level 3 fair valued securities is $0, which represents 0.0% of net assets. |
| (a) | Security, or portion thereof, was on loan at March 31, 2024 (See Note 2). At March 31, 2024, the total market value of the Fund’s securities on loan identified in the Schedule of Investments was $2,281,054 and the total market value of the collateral held by the Fund was $2,427,998. The total market value of the collateral includes non-cash U.S. Government securities collateral having a value of $1,908,825. |
| (b) | This security is exempt from registration under rule 144A of the Securities Act of 1933. This security may be sold in transactions that are exempt from registration, normally to qualified institutional buyers. |
| (c) | This security is exempt from registration under Regulation S of the Securities Act of 1933, which exempts from registration securities offered and sold outside the United States. This security may not be offered or sold in the United States except pursuant to an exemption from, or in a transaction not subject to, the registration requirements of the Securities Act of 1933. |
| (d) | Rate shown represents annualized 7-day yield as of March 31, 2024. |
| FINANCIAL DERIVATIVE INSTRUMENTS | ||||||||||||||||||||||||||||
| FOREIGN CURRENCY CONTRACTS (OTC – OVER THE COUNTER) | ||||||||||||||||||||||||||||
| Counterparty | Settlement Date | Amount and Description of Currency to be Purchased | Amount and Description of Currency to be Sold | Unrealized Appreciation | Unrealized Depreciation | |||||||||||||||||||||||
JP Morgan Chase Bank NA | 4/1/2024 | 808,982 | BRL | 162,551 | USD | $ | — | $ | (934 | ) | ||||||||||||||||||
JP Morgan Chase Bank NA | 4/1/2024 | 812,993 | BRL | 163,356 | USD | — | (938 | ) | ||||||||||||||||||||
State Street Bank and Trust | 4/1/2024 | 80,525,379 | CLP | 82,105 | USD | — | (7 | ) | ||||||||||||||||||||
State Street Bank and Trust | 4/2/2024 | 3,358,550 | PHP | 59,729 | USD | 16 | — | |||||||||||||||||||||
State Street Bank and Trust | 4/2/2024 | 3,358,550 | PHP | 59,729 | USD | 16 | — | |||||||||||||||||||||
| $ | 32 | $ | (1,879 | ) | ||||||||||||||||||||||||
See Notes to Financial Statements.
| WisdomTree Trust | 45 |
Schedule of Investments (concluded)
WisdomTree Emerging Markets Quality Dividend Growth Fund (DGRE)
March 31, 2024
| FAIR VALUATION SUMMARY | ||||||||||||
| The following is a summary of the fair valuations according to the inputs used in valuing the Fund’s investments (See Note 2 — Fair Value Measurement): | ||||||||||||
| Quoted Prices in Active Markets (Level 1) | Other Significant Observable Inputs (Level 2) | Significant Unobservable Inputs (Level 3) | Total | |||||||||||||
Assets: | ||||||||||||||||
Investments in Securities | ||||||||||||||||
Common Stocks | ||||||||||||||||
Russia | $ | — | $ | — | $ | 0 | * | $ | 0 | |||||||
Other | 131,910,352 | — | — | 131,910,352 | ||||||||||||
Preferred Stocks | 4,265,151 | — | — | 4,265,151 | ||||||||||||
Investment of Cash Collateral for Securities Loaned | — | 519,173 | — | 519,173 | ||||||||||||
Total Investments in Securities | $ | 136,175,503 | $ | 519,173 | $ | 0 | $ | 136,694,676 | ||||||||
Financial Derivative Instruments | ||||||||||||||||
Foreign Currency Contracts1 | $ | — | $ | 32 | $ | — | $ | 32 | ||||||||
Liabilities: | ||||||||||||||||
Financial Derivative Instruments | ||||||||||||||||
Foreign Currency Contracts1 | $ | — | $ | (1,879 | ) | $ | — | $ | (1,879 | ) | ||||||
Total – Net | $ | 136,175,503 | $ | 517,326 | $ | 0 | $ | 136,692,829 | ||||||||
| * | Fair valuations using significant unobservable inputs were determined by WisdomTree Asset Management, Inc., as valuation designee, in accordance with valuation procedures approved by the Board of Trustees of WisdomTree Trust. |
| 1 | Amount shown represents the unrealized appreciation (depreciation) on the financial instrument. |
See Notes to Financial Statements.
| 46 | WisdomTree Trust |
Schedule of Investments
WisdomTree Emerging Markets SmallCap Dividend Fund (DGS)
March 31, 2024
| Investments | Shares | Value | ||||||
| COMMON STOCKS – 99.5% | ||||||||
| Brazil – 6.5% | ||||||||
AES Brasil Energia SA* | 264,205 | $ | 538,381 | |||||
Allos SA | 1,595,262 | 7,623,272 | ||||||
Alupar Investimento SA | 810,163 | 4,946,226 | ||||||
Arezzo Industria & Comercio SA | 189,973 | 2,439,205 | ||||||
Auren Energia SA | 5,513,199 | 13,106,865 | ||||||
Blau Farmaceutica SA | 159,468 | 396,635 | ||||||
Cia de Saneamento de Minas Gerais Copasa MG | 3,076,052 | 13,384,426 | ||||||
Cia de Sanena do Parana | 3,196,250 | 16,621,228 | ||||||
Cielo SA | 10,253,677 | 11,061,693 | ||||||
CM Hospitalar SA* | 234,775 | 288,453 | ||||||
Cury Construtora & Incorporadora SA | 158,318 | 643,956 | ||||||
Cyrela Brazil Realty SA Empreendimentos & Participacoes | 801,264 | 3,992,273 | ||||||
Dexco SA | 1,893,535 | 2,905,245 | ||||||
Direcional Engenharia SA | 786,832 | 4,028,829 | ||||||
Even Construtora & Incorporadora SA | 424,360 | 712,134 | ||||||
Fleury SA | 755,992 | 2,265,461 | ||||||
Grendene SA | 3,840,880 | 5,072,013 | ||||||
Grupo De Moda Soma SA | 953,348 | 1,449,387 | ||||||
Grupo SBF SA | 144,768 | 374,533 | ||||||
Iguatemi SA | 259,102 | 1,206,594 | ||||||
Irani Papel & Embalagem SA | 726,706 | 1,337,108 | ||||||
Jalles Machado SA | 561,563 | 886,286 | ||||||
JHSF Participacoes SA | 2,367,284 | 2,307,907 | ||||||
Kepler Weber SA | 1,779,139 | 3,756,930 | ||||||
Lavvi Empreendimentos Imobiliarios SA | 618,837 | 1,175,723 | ||||||
LOG Commercial Properties & Participacoes SA | 170,629 | 778,569 | ||||||
Lojas Renner SA | 6,306,730 | 21,393,908 | ||||||
LWSA SA(a) | 311,670 | 363,627 | ||||||
M Dias Branco SA | 74,692 | 569,716 | ||||||
Mahle Metal Leve SA | 745,671 | 5,149,853 | ||||||
Mills Locacao Servicos & Logistica SA | 318,023 | 858,345 | ||||||
Minerva SA | 1,788,138 | 2,411,310 | ||||||
Movida Participacoes SA | 365,459 | 620,591 | ||||||
Multiplan Empreendimentos Imobiliarios SA | 1,046,015 | 5,347,569 | ||||||
Odontoprev SA | 880,667 | 2,139,407 | ||||||
Petroreconcavo SA | 779,119 | 3,665,582 | ||||||
Porto Seguro SA | 707,937 | 4,423,943 | ||||||
Romi SA | 225,273 | 602,162 | ||||||
Santos Brasil Participacoes SA | 933,763 | 2,484,786 | ||||||
Sao Martinho SA | 1,082,954 | 6,713,361 | ||||||
Simpar SA | 613,185 | 910,183 | ||||||
SLC Agricola SA | 1,685,815 | 6,661,690 | ||||||
Tegma Gestao Logistica SA | 130,187 | 720,176 | ||||||
Tres Tentos Agroindustrial SA | 114,290 | 240,200 | ||||||
Tupy SA | 261,552 | 1,454,184 | ||||||
United Parks & Resorts, Inc. | 131,155 | 453,817 | ||||||
Vamos Locacao de Caminhoes Maquinas & Equipamentos SA | 1,472,339 | 2,456,080 | ||||||
Vivara Participacoes SA | 179,966 | 913,214 | ||||||
Wilson Sons SA | 1,028,690 | 3,676,572 | ||||||
YDUQS Participacoes SA | 330,419 | 1,195,451 | ||||||
|
| |||||||
| Total Brazil | 178,725,059 | |||||||
| Chile – 1.7% | ||||||||
Aguas Andinas SA, Class A | 25,307,009 | 7,379,115 | ||||||
Banco Itau Chile SA | 548,261 | 5,652,256 | ||||||
Cencosud Shopping SA | 3,458,904 | 5,289,653 | ||||||
Cia Cervecerias Unidas SA | 439,551 | 2,606,788 | ||||||
Colbun SA | 72,709,496 | 9,410,685 | ||||||
Empresa Nacional de Telecomunicaciones SA | 896,455 | 2,980,323 | ||||||
Inversiones Aguas Metropolitanas SA | 2,744,325 | 2,057,411 | ||||||
Parque Arauco SA | 1,436,310 | 2,116,429 | ||||||
Plaza SA* | 718,394 | 985,544 | ||||||
SMU SA | 32,546,993 | 5,639,355 | ||||||
Vina Concha y Toro SA | 2,799,054 | 3,385,918 | ||||||
|
| |||||||
| Total Chile | 47,503,477 | |||||||
| China – 8.8% | ||||||||
3SBio, Inc.(a) | 2,176,000 | 1,662,629 | ||||||
AIMA Technology Group Co. Ltd., Class A | 78,300 | 336,369 | ||||||
AK Medical Holdings Ltd.(a)(b) | 534,000 | 335,692 | ||||||
Anhui Expressway Co. Ltd., Class H | 3,972,000 | 4,400,110 | ||||||
AsiaInfo Technologies Ltd.(a)(b) | 1,662,800 | 1,523,331 | ||||||
Autobio Diagnostics Co. Ltd., Class A | 162,600 | 1,275,198 | ||||||
BAIC Motor Corp. Ltd., Class H(a) | 22,940,500 | 6,272,661 | ||||||
Bank of Chongqing Co. Ltd., Class H(b) | 3,261,000 | 1,795,822 | ||||||
Bank of Suzhou Co. Ltd., Class A | 648,200 | 639,236 | ||||||
Beijing Jingneng Clean Energy Co. Ltd., Class H(b) | 15,296,000 | 3,400,653 | ||||||
Beijing United Information Technology Co. Ltd., Class A | 172,645 | 528,369 | ||||||
Chervon Holdings Ltd.(b) | 327,000 | 821,422 | ||||||
China Baoan Group Co. Ltd., Class A | 257,500 | 375,943 | ||||||
China Chunlai Education Group Co. Ltd.(b)(c) | 487,000 | 299,924 | ||||||
China Cinda Asset Management Co. Ltd., Class H | 66,380,000 | 5,512,972 | ||||||
China Communications Services Corp. Ltd., Class H | 15,760,000 | 7,349,948 | ||||||
China Datang Corp. Renewable Power Co. Ltd., Class H(b) | 6,999,000 | 1,439,783 | ||||||
China East Education Holdings Ltd.(a)(b) | 3,795,500 | 1,163,899 | ||||||
China Kepei Education Group Ltd.(c) | 1,722,000 | 334,435 | ||||||
China National Medicines Corp. Ltd., Class A | 66,800 | 303,620 | ||||||
China Nonferrous Mining Corp. Ltd.(b) | 5,357,000 | 4,476,459 | ||||||
China Railway Construction Heavy Industry Corp. Ltd., Class A | 427,425 | 228,418 | ||||||
China Resources Medical Holdings Co. Ltd. | 748,500 | 374,898 | ||||||
China Risun Group Ltd.(b)(c) | 2,669,000 | 1,036,710 | ||||||
China Suntien Green Energy Corp. Ltd., Class H | 15,572,000 | 5,889,403 | ||||||
CIMC Enric Holdings Ltd. | 2,388,000 | 2,428,749 | ||||||
DaShenLin Pharmaceutical Group Co. Ltd., Class A | 97,800 | 287,457 | ||||||
Easyhome New Retail Group Co. Ltd., Class A | 1,468,600 | 578,508 | ||||||
Ecovacs Robotics Co. Ltd., Class A | 42,200 | 207,152 | ||||||
See Notes to Financial Statements.
| WisdomTree Trust | 47 |
Schedule of Investments (continued)
WisdomTree Emerging Markets SmallCap Dividend Fund (DGS)
March 31, 2024
| Investments | Shares | Value | ||||||
EEKA Fashion Holdings Ltd.(b) | 1,062,000 | $ | 1,812,868 | |||||
Fu Shou Yuan International Group Ltd. | 6,055,000 | 3,744,507 | ||||||
Fufeng Group Ltd.(b) | 11,745,000 | 7,608,450 | ||||||
Fujian Funeng Co. Ltd., Class A | 1,017,000 | 1,474,989 | ||||||
G-bits Network Technology Xiamen Co. Ltd., Class A | 58,478 | 1,536,534 | ||||||
Giant Network Group Co. Ltd., Class A | 1,418,500 | 2,334,730 | ||||||
GoodWe Technologies Co. Ltd., Class A | 47,682 | 660,221 | ||||||
Greentown Management Holdings Co. Ltd.(a) | 3,748,000 | 3,084,044 | ||||||
Guangzhou Haige Communications Group, Inc. Co., Class A | 1,086,200 | 1,668,108 | ||||||
Han’s Laser Technology Industry Group Co. Ltd., Class A | 303,200 | 780,927 | ||||||
Hangcha Group Co. Ltd., Class A | 70,200 | 265,121 | ||||||
Hangzhou Robam Appliances Co. Ltd., Class A | 79,800 | 262,908 | ||||||
Heilongjiang Agriculture Co. Ltd., Class A | 559,200 | 948,123 | ||||||
Hengdian Group DMEGC Magnetics Co. Ltd., Class A | 855,500 | 1,709,727 | ||||||
Hesteel Co. Ltd., Class A | 3,608,400 | 1,058,604 | ||||||
Hoyuan Green Energy Co. Ltd., Class A | 772,100 | 2,562,890 | ||||||
Huaan Securities Co. Ltd., Class A | 439,100 | 277,598 | ||||||
Huaxi Securities Co. Ltd., Class A | 728,500 | 741,504 | ||||||
Huaxin Cement Co. Ltd., Class H | 1,757,700 | 1,536,159 | ||||||
Hubei Feilihua Quartz Glass Co. Ltd., Class A | 79,800 | 325,337 | ||||||
Hubei Jumpcan Pharmaceutical Co. Ltd., Class A | 558,900 | 2,881,333 | ||||||
Hubei Xingfa Chemicals Group Co. Ltd., Class A | 1,855,200 | 4,676,073 | ||||||
IKD Co. Ltd., Class A | 179,500 | 477,899 | ||||||
Inner Mongolia MengDian HuaNeng Thermal Power Corp. Ltd., Class A | 1,767,400 | 1,119,779 | ||||||
Inner Mongolia Yuan Xing Energy Co. Ltd., Class A | 2,580,380 | 2,025,807 | ||||||
iRay Technology Co. Ltd., Class A | 34,137 | 1,031,247 | ||||||
Jiangsu Nhwa Pharmaceutical Co. Ltd., Class A | 210,400 | 649,132 | ||||||
Jiangsu Phoenix Publishing & Media Corp. Ltd., Class A | 454,300 | 686,418 | ||||||
Jiangsu Yangnong Chemical Co. Ltd., Class A | 167,100 | 1,179,762 | ||||||
Jizhong Energy Resources Co. Ltd., Class A | 5,710,500 | 6,001,200 | ||||||
Joincare Pharmaceutical Group Industry Co. Ltd., Class A | 665,000 | 997,445 | ||||||
Kangji Medical Holdings Ltd.(b) | 1,198,500 | 1,035,190 | ||||||
Keda Industrial Group Co. Ltd., Class A | 3,151,800 | 4,571,161 | ||||||
Legend Holdings Corp., Class H(a) | 1,351,400 | 1,027,392 | ||||||
Lonking Holdings Ltd. | 14,716,000 | 2,688,815 | ||||||
Luxi Chemical Group Co. Ltd., Class A | 2,751,600 | 3,600,380 | ||||||
Medlive Technology Co. Ltd.(a)(b) | 479,500 | 462,563 | ||||||
Meihua Holdings Group Co. Ltd., Class A | 440,600 | 625,059 | ||||||
Meitu, Inc.(a)(b) | 1,598,000 | 669,708 | ||||||
Minth Group Ltd. | 2,254,000 | 3,559,652 | ||||||
Nanjing Iron & Steel Co. Ltd., Class A | 12,203,500 | 7,916,711 | ||||||
NetDragon Websoft Holdings Ltd. | 1,371,000 | 1,919,920 | ||||||
Ningbo Orient Wires & Cables Co. Ltd., Class A | 127,600 | 778,212 | ||||||
Ningbo Sanxing Medical Electric Co. Ltd., Class A | 1,091,500 | 4,284,578 | ||||||
Onewo, Inc., Class H(b) | 239,500 | 601,623 | ||||||
Ovctek China, Inc., Class A | 129,900 | 325,448 | ||||||
Pingdingshan Tianan Coal Mining Co. Ltd., Class A | 5,292,500 | 8,944,270 | ||||||
Poly Property Services Co. Ltd., Class H(b)(c) | 452,600 | 1,538,266 | ||||||
Powerlong Commercial Management Holdings Ltd.(c) | 1,687,500 | 528,257 | ||||||
Pylon Technologies Co. Ltd., Class A | 86,068 | 1,041,057 | ||||||
Risen Energy Co. Ltd., Class A | 321,700 | 650,454 | ||||||
S-Enjoy Service Group Co. Ltd. | 1,039,000 | 298,699 | ||||||
SciClone Pharmaceuticals Holdings Ltd.†(a)(b) | 996,000 | 2,041,263 | ||||||
Shandong Sinocera Functional Material Co. Ltd., Class A | 133,100 | 314,949 | ||||||
Shanghai Chicmax Cosmetic Co. Ltd. | 133,300 | 853,303 | ||||||
Shanghai Construction Group Co. Ltd., Class A | 3,932,000 | 1,267,269 | ||||||
Shanghai Daimay Automotive Interior Co. Ltd., Class A | 253,200 | 397,565 | ||||||
Shanghai Lingang Holdings Corp. Ltd., Class A | 890,400 | 1,200,625 | ||||||
Shenzhen Expressway Corp. Ltd., Class H | 5,430,000 | 4,745,600 | ||||||
Shenzhen MTC Co. Ltd., Class A | 268,200 | 185,070 | ||||||
Shenzhen Pagoda Industrial Group Corp. Ltd. | 1,221,500 | 511,920 | ||||||
Shenzhen Sunlord Electronics Co. Ltd., Class A | 213,000 | 782,717 | ||||||
Shenzhen YUTO Packaging Technology Co. Ltd., Class A | 510,600 | 1,743,399 | ||||||
Simcere Pharmaceutical Group Ltd.(a)(b) | 2,395,000 | 1,624,932 | ||||||
Sinomine Resource Group Co. Ltd., Class A | 689,500 | 3,487,196 | ||||||
Sun Art Retail Group Ltd.(b) | 6,331,500 | 1,262,020 | ||||||
Sunac Services Holdings Ltd.(a)(b) | 13,424,000 | 3,190,289 | ||||||
SY Holdings Group Ltd.(b)(c) | 590,000 | 315,865 | ||||||
TangShan Port Group Co. Ltd., Class A | 7,488,410 | 4,218,445 | ||||||
Tasly Pharmaceutical Group Co. Ltd., Class A | 112,600 | 249,847 | ||||||
Tian Di Science & Technology Co. Ltd., Class A | 4,843,594 | 4,696,560 | ||||||
Tian Lun Gas Holdings Ltd.(b) | 1,253,500 | 807,217 | ||||||
Tong Ren Tang Technologies Co. Ltd., Class H | 1,861,888 | 1,158,558 | ||||||
Venustech Group, Inc., Class A | 231,900 | 663,721 | ||||||
Weihai Guangwei Composites Co. Ltd., Class A | 397,700 | 1,665,209 | ||||||
Winner Medical Co. Ltd., Class A | 452,300 | 2,143,011 | ||||||
Wuchan Zhongda Group Co. Ltd., Class A | 719,200 | 436,845 | ||||||
Xiamen Faratronic Co. Ltd., Class A | 125,600 | 1,710,557 | ||||||
Xiamen Tungsten Co. Ltd., Class A | 851,100 | 2,287,059 | ||||||
Yangtze Optical Fibre & Cable Joint Stock Co. Ltd., Class H(a)(b) | 917,500 | 1,042,181 | ||||||
Yihai International Holding Ltd.(b) | 790,000 | 1,495,927 | ||||||
YongXing Special Materials Technology Co. Ltd., Class A | 1,571,260 | 10,329,491 | ||||||
Yunda Holding Co. Ltd., Class A | 373,900 | 375,939 | ||||||
See Notes to Financial Statements.
| 48 | WisdomTree Trust |
Schedule of Investments (continued)
WisdomTree Emerging Markets SmallCap Dividend Fund (DGS)
March 31, 2024
| Investments | Shares | Value | ||||||
Yunnan Chihong Zinc & Germanium Co. Ltd., Class A | 3,447,600 | $ | 2,692,399 | |||||
Yunnan Copper Co. Ltd., Class A | 3,327,900 | 6,096,230 | ||||||
Yunnan Tin Co. Ltd., Class A | 356,600 | 740,174 | ||||||
Zhejiang Dingli Machinery Co. Ltd., Class A | 104,900 | 827,884 | ||||||
Zhejiang Expressway Co. Ltd., Class H | 12,600,000 | 8,081,825 | ||||||
Zhejiang Hailiang Co. Ltd., Class A | 566,100 | 728,248 | ||||||
Zhejiang Huahai Pharmaceutical Co. Ltd., Class A | 894,000 | 1,588,425 | ||||||
Zhejiang Jiuzhou Pharmaceutical Co. Ltd., Class A | 574,633 | 1,411,177 | ||||||
Zhengzhou Coal Mining Machinery Group Co. Ltd., Class H | 2,001,000 | 2,403,312 | ||||||
Zhou Hei Ya International Holdings Co. Ltd.(a)(b) | 4,360,500 | 963,868 | ||||||
|
| |||||||
| Total China | 241,204,720 | |||||||
| Czech Republic – 0.2% | ||||||||
Moneta Money Bank AS(a) | 1,475,745 | 6,429,163 | ||||||
| Hungary – 0.1% | ||||||||
Magyar Telekom Telecommunications PLC | 1,405,458 | 3,455,364 | ||||||
| India – 10.1% | ||||||||
360 ONE WAM Ltd. | 150,269 | 1,217,251 | ||||||
Aarti Industries Ltd. | 116,085 | 926,356 | ||||||
Aegis Logistics Ltd. | 214,522 | 1,148,841 | ||||||
Ajanta Pharma Ltd. | 41,080 | 1,098,808 | ||||||
Alembic Pharmaceuticals Ltd. | 93,125 | 1,099,601 | ||||||
Alkyl Amines Chemicals | 3,436 | 74,731 | ||||||
Allcargo Logistics Ltd.* | 359,456 | 308,588 | ||||||
Anand Rathi Wealth Ltd. | 19,454 | 861,723 | ||||||
Angel One Ltd. | 152,387 | 5,563,603 | ||||||
Apar Industries Ltd. | 38,568 | 3,227,268 | ||||||
Apollo Tyres Ltd. | 625,552 | 3,498,561 | ||||||
Arvind Ltd. | 846,377 | 2,744,554 | ||||||
Asahi India Glass Ltd. | 34,868 | 224,231 | ||||||
Atul Ltd. | 7,211 | 496,325 | ||||||
Avanti Feeds Ltd. | 91,521 | 531,387 | ||||||
Bajaj Consumer Care Ltd. | 377,054 | 958,656 | ||||||
Bajaj Electricals Ltd. | 23,222 | 252,720 | ||||||
Balrampur Chini Mills Ltd. | 66,520 | 288,683 | ||||||
Bata India Ltd. | 108,072 | 1,767,715 | ||||||
BEML Ltd. | 34,216 | 1,306,118 | ||||||
Birlasoft Ltd. | 183,966 | 1,636,675 | ||||||
Blue Dart Express Ltd. | 3,139 | 232,744 | ||||||
Blue Star Ltd. | 129,356 | 1,975,489 | ||||||
Brigade Enterprises Ltd. | 72,687 | 815,133 | ||||||
Carborundum Universal Ltd. | 55,537 | 844,583 | ||||||
Care Ratings Ltd. | 117,361 | 1,575,179 | ||||||
Castrol India Ltd. | 3,855,876 | 8,596,866 | ||||||
CCL Products India Ltd. | 93,400 | 656,580 | ||||||
Ceat Ltd. | 14,316 | 460,433 | ||||||
Century Textiles & Industries Ltd. | 31,145 | 608,654 | ||||||
Cera Sanitaryware Ltd. | 6,262 | 509,242 | ||||||
CESC Ltd. | 3,614,478 | 5,272,039 | ||||||
Chambal Fertilisers & Chemicals Ltd. | 515,616 | 2,114,333 | ||||||
Chennai Petroleum Corp. Ltd. | 444,230 | 4,829,924 | ||||||
CIE Automotive India Ltd. | 62,791 | 347,674 | ||||||
City Union Bank Ltd. | 224,690 | 364,100 | ||||||
Clean Science & Technology Ltd. | 16,678 | 265,830 | ||||||
CMS Info Systems Ltd. | 177,916 | 833,343 | ||||||
Cochin Shipyard Ltd.(a) | 120,135 | 1,255,762 | ||||||
Coforge Ltd. | 139,880 | 9,228,533 | ||||||
Computer Age Management Services Ltd. | 91,531 | 3,199,812 | ||||||
CRISIL Ltd. | 50,143 | 3,046,968 | ||||||
Crompton Greaves Consumer Electricals Ltd. | 708,774 | 2,273,278 | ||||||
Cyient Ltd. | 232,409 | 5,563,019 | ||||||
DB Corp. Ltd. | 177,707 | 561,017 | ||||||
DCM Shriram Ltd. | 48,751 | 499,332 | ||||||
Deepak Fertilisers & Petrochemicals Corp. Ltd. | 117,165 | 708,167 | ||||||
Dr. Lal PathLabs Ltd.(a) | 16,445 | 446,180 | ||||||
EID Parry India Ltd. | 163,350 | 1,068,794 | ||||||
EIH Ltd. | 194,329 | 1,047,341 | ||||||
Elgi Equipments Ltd. | 92,198 | 665,154 | ||||||
Emami Ltd. | 486,399 | 2,503,947 | ||||||
Endurance Technologies Ltd.(a) | 27,122 | 594,130 | ||||||
Engineers India Ltd. | 1,067,093 | 2,583,849 | ||||||
EPL Ltd. | 362,480 | 779,265 | ||||||
Equitas Small Finance Bank Ltd.(a) | 1,002,828 | 1,112,817 | ||||||
Exide Industries Ltd. | 478,902 | 1,748,744 | ||||||
Finolex Cables Ltd. | 60,195 | 722,463 | ||||||
Finolex Industries Ltd. | 272,861 | 806,290 | ||||||
Firstsource Solutions Ltd. | 754,606 | 1,788,290 | ||||||
Galaxy Surfactants Ltd.(c) | 14,988 | 408,159 | ||||||
Garden Reach Shipbuilders & Engineers Ltd. | 23,846 | 218,639 | ||||||
GHCL Ltd. | 369,038 | 1,961,285 | ||||||
Glenmark Life Sciences Ltd. | 176,006 | 1,638,980 | ||||||
Glenmark Pharmaceuticals Ltd. | 61,057 | 701,659 | ||||||
Godawari Power & Ispat Ltd. | 65,576 | 595,434 | ||||||
Godfrey Phillips India Ltd. | 41,734 | 1,545,813 | ||||||
Godrej Agrovet Ltd.(a) | 145,411 | 849,077 | ||||||
Graphite India Ltd. | 133,041 | 962,764 | ||||||
Great Eastern Shipping Co. Ltd. | 538,892 | 6,469,418 | ||||||
Grindwell Norton Ltd. | 46,022 | 1,048,956 | ||||||
Gujarat Alkalies & Chemicals Ltd. | 68,490 | 553,036 | ||||||
Gujarat Narmada Valley Fertilizers & Chemicals Ltd. | 484,535 | 3,631,580 | ||||||
Gujarat Pipavav Port Ltd. | 2,180,805 | 5,557,748 | ||||||
Gujarat State Petronet Ltd. | 546,111 | 2,334,325 | ||||||
Happiest Minds Technologies Ltd. | 41,463 | 370,074 | ||||||
HEG Ltd. | 122,969 | 2,718,875 | ||||||
Hindustan Copper Ltd. | 386,911 | 1,289,897 | ||||||
ICICI Securities Ltd.(a) | 397,205 | 3,465,438 | ||||||
IndiaMart InterMesh Ltd.(a) | 16,640 | 527,805 | ||||||
Indian Energy Exchange Ltd.(a) | 397,121 | 639,708 | ||||||
Ingersoll Rand India Ltd. | 23,546 | 1,039,028 | ||||||
Ipca Laboratories Ltd. | 60,267 | 894,150 | ||||||
IRB Infrastructure Developers Ltd. | 1,786,270 | 1,253,992 | ||||||
Jammu & Kashmir Bank Ltd. | 222,004 | 357,219 | ||||||
See Notes to Financial Statements.
| WisdomTree Trust | 49 |
Schedule of Investments (continued)
WisdomTree Emerging Markets SmallCap Dividend Fund (DGS)
March 31, 2024
| Investments | Shares | Value | ||||||
Jamna Auto Industries Ltd. | 632,256 | $ | 1,002,558 | |||||
JB Chemicals & Pharmaceuticals Ltd. | 67,250 | 1,330,768 | ||||||
Jindal Saw Ltd. | 170,427 | 884,191 | ||||||
JK Cement Ltd. | 25,399 | 1,241,331 | ||||||
JK Lakshmi Cement Ltd. | 44,268 | 464,800 | ||||||
JK Paper Ltd. | 259,913 | 1,004,873 | ||||||
JK Tyre & Industries Ltd. | 81,019 | 419,703 | ||||||
Jubilant Ingrevia Ltd. | 82,457 | 447,568 | ||||||
Jyothy Labs Ltd. | 221,379 | 1,167,779 | ||||||
Kajaria Ceramics Ltd. | 76,474 | 1,058,913 | ||||||
Kalpataru Projects International Ltd. | 116,916 | 1,499,746 | ||||||
Karnataka Bank Ltd. | 577,915 | 1,559,769 | ||||||
Karur Vysya Bank Ltd. | 1,001,342 | 2,193,522 | ||||||
KEC International Ltd. | 58,828 | 489,690 | ||||||
Kirloskar Ferrous Industries Ltd. | 76,989 | 502,767 | ||||||
Kirloskar Oil Engines Ltd. | 85,119 | 877,138 | ||||||
KPIT Technologies Ltd. | 97,119 | 1,730,856 | ||||||
KSB Ltd. | 9,413 | 435,186 | ||||||
LA Opala RG Ltd. | 73,842 | 263,707 | ||||||
Laurus Labs Ltd.(a) | 210,194 | 988,815 | ||||||
Mahanagar Gas Ltd.(c) | 211,515 | 3,459,333 | ||||||
Maharashtra Seamless Ltd. | 55,695 | 565,047 | ||||||
Mastek Ltd. | 17,528 | 534,441 | ||||||
Mindspace Business Parks REIT(a) | 778,368 | 3,223,411 | ||||||
Mishra Dhatu Nigam Ltd.(a) | 48,612 | 229,793 | ||||||
Multi Commodity Exchange of India Ltd. | 25,731 | 1,033,405 | ||||||
Narayana Hrudayalaya Ltd.(c) | 24,051 | 370,213 | ||||||
Natco Pharma Ltd. | 156,426 | 1,785,622 | ||||||
National Aluminium Co. Ltd. | 4,428,899 | 8,100,819 | ||||||
Nava Ltd. | 359,504 | 2,093,380 | ||||||
Navin Fluorine International Ltd. | 14,862 | 554,956 | ||||||
Navneet Education Ltd. | 269,404 | 444,956 | ||||||
NBCC India Ltd. | 969,502 | 1,382,138 | ||||||
NCC Ltd. | 886,053 | 2,468,444 | ||||||
New India Assurance Co. Ltd.(a) | 398,842 | 1,086,023 | ||||||
Nippon Life India Asset Management Ltd.(a) | 932,533 | 5,267,983 | ||||||
NLC India Ltd. | 1,017,847 | 2,783,740 | ||||||
NOCIL Ltd. | 127,526 | 382,414 | ||||||
Oil India Ltd. | 3,700,286 | 26,631,056 | ||||||
PCBL Ltd. | 612,913 | 1,967,289 | ||||||
Polyplex Corp. Ltd. | 79,192 | 727,044 | ||||||
Praj Industries Ltd. | 126,022 | 805,293 | ||||||
Prestige Estates Projects Ltd. | 47,314 | 663,738 | ||||||
Quess Corp. Ltd.(a) | 199,556 | 1,245,154 | ||||||
Railtel Corp. of India Ltd. | 124,095 | 541,225 | ||||||
Rallis India Ltd. | 119,747 | 359,661 | ||||||
Ramco Cements Ltd. | 32,063 | 311,605 | ||||||
Rashtriya Chemicals & Fertilizers Ltd. | 491,077 | 755,141 | ||||||
Ratnamani Metals & Tubes Ltd. | 24,289 | 813,744 | ||||||
RBL Bank Ltd.(a) | 286,952 | 826,769 | ||||||
Redington Ltd. | 3,024,112 | 7,558,240 | ||||||
Relaxo Footwears Ltd. | 105,361 | 1,032,482 | ||||||
RITES Ltd. | 322,812 | 2,569,259 | ||||||
Sharda Cropchem Ltd. | 34,232 | 131,814 | ||||||
SJVN Ltd. | 1,385,920 | 2,017,334 | ||||||
SKF India Ltd. | 28,572 | 1,424,669 | ||||||
Sonata Software Ltd. | 330,678 | 2,864,006 | ||||||
South Indian Bank Ltd. | 1,926,609 | 629,479 | ||||||
Sula Vineyards Ltd. | 64,631 | 427,296 | ||||||
Sumitomo Chemical India Ltd. | 48,046 | 200,330 | ||||||
Sun TV Network Ltd. | 367,755 | 2,646,742 | ||||||
Sundram Fasteners Ltd. | 95,226 | 1,248,633 | ||||||
Supreme Petrochem Ltd. | 122,854 | 919,831 | ||||||
Tamilnad Mercantile Bank Ltd. | 308,542 | 1,796,445 | ||||||
Tanla Platforms Ltd. | 29,866 | 293,530 | ||||||
Tata Chemicals Ltd. | 453,072 | 5,871,833 | ||||||
Techno Electric & Engineering Co. Ltd. | 53,727 | 497,153 | ||||||
Thyrocare Technologies Ltd.(a) | 51,202 | 362,179 | ||||||
Transport Corp. of India Ltd. | 39,622 | 385,567 | ||||||
Triveni Engineering & Industries Ltd. | 106,083 | 395,701 | ||||||
TTK Prestige Ltd. | 17,365 | 139,769 | ||||||
Ujjivan Small Finance Bank Ltd.(a) | 1,833,793 | 974,036 | ||||||
Usha Martin Ltd. | 231,302 | 882,610 | ||||||
UTI Asset Management Co. Ltd. | 247,783 | 2,415,366 | ||||||
V-Guard Industries Ltd. | 88,703 | 352,408 | ||||||
Vaibhav Global Ltd. | 67,426 | 294,515 | ||||||
Vardhman Textiles Ltd. | 132,601 | 703,209 | ||||||
Vinati Organics Ltd. | 12,452 | 219,561 | ||||||
VIP Industries Ltd. | 86,597 | 545,628 | ||||||
VRL Logistics Ltd. | 28,377 | 187,252 | ||||||
Welspun Corp. Ltd. | 176,306 | 1,089,513 | ||||||
West Coast Paper Mills Ltd. | 68,911 | 488,394 | ||||||
Whirlpool of India Ltd. | 10,914 | 159,838 | ||||||
Zensar Technologies Ltd. | 182,260 | 1,325,935 | ||||||
|
| |||||||
| Total India | 276,798,826 | |||||||
| Indonesia – 3.0% | ||||||||
ABM Investama Tbk. PT | 6,229,300 | 1,496,918 | ||||||
Ace Hardware Indonesia Tbk. PT | 31,417,500 | 1,743,765 | ||||||
AKR Corporindo Tbk. PT | 57,839,425 | 6,274,602 | ||||||
Aneka Tambang Tbk. PT | 41,445,700 | 4,182,474 | ||||||
Astra Agro Lestari Tbk. PT | 1,100,700 | 479,018 | ||||||
Astra Otoparts Tbk. PT | 5,808,700 | 816,992 | ||||||
Bank BTPN Syariah Tbk. PT | 12,993,100 | 1,110,416 | ||||||
Bank CIMB Niaga Tbk. PT | 23,066,000 | 3,171,484 | ||||||
Bank Tabungan Negara Persero Tbk. PT | 19,903,800 | 1,952,091 | ||||||
Blue Bird Tbk. PT | 3,503,200 | 386,667 | ||||||
Bukit Asam Tbk. PT | 53,026,600 | 9,933,081 | ||||||
Ciputra Development Tbk. PT | 15,376,100 | 1,260,733 | ||||||
Dharma Satya Nusantara Tbk. PT | 19,205,600 | 787,363 | ||||||
Erajaya Swasembada Tbk. PT | 29,678,800 | 804,912 | ||||||
Harum Energy Tbk. PT* | 12,079,700 | 1,028,546 | ||||||
Impack Pratama Industri Tbk. PT | 96,170,300 | 2,329,196 | ||||||
Indo Tambangraya Megah Tbk. PT | 5,513,700 | 9,285,133 | ||||||
Indocement Tunggal Prakarsa Tbk. PT | 3,622,300 | 1,999,062 | ||||||
Industri Jamu Dan Farmasi Sido Muncul Tbk. PT | 47,719,170 | 1,866,029 | ||||||
Japfa Comfeed Indonesia Tbk. PT | 22,063,600 | 1,655,988 | ||||||
See Notes to Financial Statements.
| 50 | WisdomTree Trust |
Schedule of Investments (continued)
WisdomTree Emerging Markets SmallCap Dividend Fund (DGS)
March 31, 2024
| Investments | Shares | Value | ||||||
Jasa Marga Persero Tbk. PT | 4,392,300 | $ | 1,537,513 | |||||
Mayora Indah Tbk. PT | 7,955,200 | 1,274,438 | ||||||
Medco Energi Internasional Tbk. PT | 12,124,600 | 1,093,546 | ||||||
Mitra Adiperkasa Tbk. PT | 5,556,700 | 637,855 | ||||||
Mitra Keluarga Karyasehat Tbk. PT(c) | 8,144,900 | 1,407,570 | ||||||
Pabrik Kertas Tjiwi Kimia Tbk. PT | 379,200 | 170,407 | ||||||
Pakuwon Jati Tbk. PT | 40,286,300 | 1,077,350 | ||||||
Perusahaan Gas Negara Tbk. PT | 117,170,100 | 10,050,541 | ||||||
Prodia Widyahusada Tbk. PT | 1,084,300 | 266,715 | ||||||
Selamat Sempurna Tbk. PT | 16,105,300 | 2,001,100 | ||||||
Semen Indonesia Persero Tbk. PT | 14,366,100 | 5,345,947 | ||||||
Summarecon Agung Tbk. PT | 12,622,900 | 421,958 | ||||||
Surya Esa Perkasa Tbk. PT* | 69,200,400 | 2,946,091 | ||||||
XL Axiata Tbk. PT | 8,800,000 | 1,254,368 | ||||||
|
| |||||||
| Total Indonesia | 82,049,869 | |||||||
| Malaysia – 4.3% | ||||||||
Alliance Bank Malaysia Bhd. | 2,210,600 | 1,723,455 | ||||||
AMMB Holdings Bhd. | 11,836,900 | 10,478,895 | ||||||
Astro Malaysia Holdings Bhd. | 21,007,500 | 1,353,748 | ||||||
Bank Islam Malaysia Bhd. | 6,443,900 | 3,417,323 | ||||||
Bermaz Auto Bhd. | 8,280,200 | 4,181,212 | ||||||
British American Tobacco Malaysia Bhd. | 1,147,300 | 1,963,476 | ||||||
Cahya Mata Sarawak Bhd. | 2,433,600 | 478,185 | ||||||
Carlsberg Brewery Malaysia Bhd., Class B | 465,800 | 1,820,685 | ||||||
CTOS Digital Bhd. | 3,425,100 | 955,236 | ||||||
Dayang Enterprise Holdings Bhd. | 1,303,500 | 663,730 | ||||||
Dialog Group Bhd. | 6,804,500 | 3,292,268 | ||||||
Fraser & Neave Holdings Bhd. | 549,100 | 3,394,605 | ||||||
Gamuda Bhd. | 7,770,512 | 8,652,144 | ||||||
Gas Malaysia Bhd. | 3,914,100 | 2,869,623 | ||||||
HAP Seng Consolidated Bhd. | 4,532,900 | 4,281,019 | ||||||
Heineken Malaysia Bhd. | 834,100 | 4,109,700 | ||||||
Hibiscus Petroleum Bhd. | 1,782,860 | 975,620 | ||||||
IJM Corp. Bhd. | 8,460,900 | 4,343,965 | ||||||
Inari Amertron Bhd. | 10,269,075 | 7,008,052 | ||||||
KPJ Healthcare Bhd. | 11,475,300 | 4,655,097 | ||||||
Malaysia Airports Holdings Bhd. | 1,119,100 | 2,355,004 | ||||||
Malaysia Building Society Bhd.* | 30,575,828 | 5,168,110 | ||||||
Malaysian Pacific Industries Bhd. | 133,100 | 871,773 | ||||||
Malaysian Resources Corp. Bhd. | 4,849,100 | 691,558 | ||||||
My EG Services Bhd. | 9,943,143 | 1,659,641 | ||||||
QL Resources Bhd. | 2,541,700 | 3,168,398 | ||||||
SP Setia Bhd. Group | 3,649,100 | 1,133,357 | ||||||
Sunway Bhd. | 6,076,600 | 4,493,577 | ||||||
TIME dotCom Bhd. | 6,664,200 | 7,293,589 | ||||||
TSH Resources Bhd. | 9,674,000 | 2,309,660 | ||||||
United Plantations Bhd. | 965,800 | 4,893,278 | ||||||
VS Industry Bhd. | 6,153,850 | 1,144,177 | ||||||
Yinson Holdings Bhd. | 816,300 | 407,029 | ||||||
YTL Corp. Bhd. | 23,388,900 | 12,996,579 | ||||||
|
| |||||||
| Total Malaysia | 119,203,768 | |||||||
| Mexico – 4.4% | ||||||||
Banco del Bajio SA(a)(b) | 6,764,494 | 26,371,424 | ||||||
Bolsa Mexicana de Valores SAB de CV(b) | 5,633,511 | 12,546,969 | ||||||
Corp. Inmobiliaria Vesta SAB de CV(b) | 3,912,901 | 15,270,948 | ||||||
GCC SAB de CV(b) | 222,516 | 2,645,413 | ||||||
Genomma Lab Internacional SAB de CV, Class B(b) | 2,505,291 | 2,378,419 | ||||||
Gentera SAB de CV(b) | 7,305,443 | 12,504,090 | ||||||
La Comer SAB de CV(b) | 388,128 | 910,207 | ||||||
Megacable Holdings SAB de CV, Series CPO(b) | 2,704,055 | 7,519,149 | ||||||
Operadora De Sites Mexicanos SAB de CV(b) | 3,730,876 | 4,534,041 | ||||||
Promotora y Operadora de Infraestructura SAB de CV(b) | 1,573,134 | 16,658,133 | ||||||
Qualitas Controladora SAB de CV(b) | 1,289,433 | 15,006,892 | ||||||
Regional SAB de CV(b) | 457,517 | 4,505,600 | ||||||
|
| |||||||
| Total Mexico | 120,851,285 | |||||||
| Philippines – 0.3% | ||||||||
Century Pacific Food, Inc. | 775,800 | 552,024 | ||||||
GT Capital Holdings, Inc. | 82,580 | 1,034,178 | ||||||
Megaworld Corp. | 36,383,000 | 1,242,646 | ||||||
Robinsons Land Corp. | 3,692,326 | 1,095,579 | ||||||
Semirara Mining & Power Corp. | 6,547,700 | 4,065,014 | ||||||
Wilcon Depot, Inc.* | 2,636,000 | 833,729 | ||||||
|
| |||||||
| Total Philippines | 8,823,170 | |||||||
| Poland – 1.2% | ||||||||
Asseco Poland SA | 276,035 | 5,364,607 | ||||||
Budimex SA | 83,390 | 14,638,079 | ||||||
CD Projekt SA(b) | 71,661 | 2,100,726 | ||||||
Eurocash SA | 260,118 | 928,213 | ||||||
Orange Polska SA | 3,181,659 | 6,464,247 | ||||||
Warsaw Stock Exchange | 211,485 | 2,245,445 | ||||||
|
| |||||||
| Total Poland | 31,741,317 | |||||||
| Saudi Arabia – 3.6% | ||||||||
Al Hammadi Holding | 233,488 | 3,610,800 | ||||||
Al Masane Al Kobra Mining Co. | 50,574 | 745,698 | ||||||
Al Moammar Information Systems Co. | 34,917 | 1,344,358 | ||||||
Al-Dawaa Medical Services Co. | 82,367 | 2,044,625 | ||||||
Alamar Foods | 28,556 | 698,958 | ||||||
Alandalus Property Co. | 108,788 | 791,871 | ||||||
Alaseel Co. | 754,929 | 954,103 | ||||||
Aldrees Petroleum & Transport Services Co. | 61,342 | 2,698,688 | ||||||
AlKhorayef Water & Power Technologies Co.* | 19,964 | 1,160,419 | ||||||
Almunajem Foods Co. | 64,690 | 1,849,025 | ||||||
AlSaif Stores for Development & Investment Co. | 665,546 | 2,015,892 | ||||||
Arabian Cement Co. | 292,640 | 2,477,355 | ||||||
Arabian Centres Co. Ltd. | 1,565,250 | 10,391,874 | ||||||
Arabian Contracting Services Co. | 30,928 | 1,885,120 | ||||||
Arriyadh Development Co. | 216,252 | 1,354,999 | ||||||
Astra Industrial Group | 111,828 | 5,695,013 | ||||||
Ataa Educational Co. | 21,172 | 409,271 | ||||||
Bawan Co. | 138,066 | 1,732,037 | ||||||
Catrion Catering Holding Co. | 102,898 | 3,473,373 | ||||||
City Cement Co. | 396,336 | 2,168,461 | ||||||
See Notes to Financial Statements.
| WisdomTree Trust | 51 |
Schedule of Investments (continued)
WisdomTree Emerging Markets SmallCap Dividend Fund (DGS)
March 31, 2024
| Investments | Shares | Value | ||||||
East Pipes Integrated Co. for Industry | 16,779 | $ | 572,647 | |||||
Electrical Industries Co. | 2,163,462 | 2,538,124 | ||||||
Hail Cement Co. | 219,532 | 661,435 | ||||||
Leejam Sports Co. JSC | 69,863 | 4,064,553 | ||||||
Maharah Human Resources Co. | 738,431 | 1,336,874 | ||||||
Middle East Paper Co. | 50,464 | 546,957 | ||||||
National Co. for Learning & Education | 16,250 | 569,324 | ||||||
National Medical Care Co. | 22,105 | 1,095,083 | ||||||
Northern Region Cement Co. | 398,579 | 1,069,112 | ||||||
Qassim Cement Co. | 105,666 | 1,650,987 | ||||||
Retal Urban Development Co. | 378,104 | 958,744 | ||||||
Riyadh Cables Group Co. | 86,433 | 2,272,309 | ||||||
Saudi Automotive Services Co. | 48,578 | 1,005,107 | ||||||
Saudi Cement Co. | 488,752 | 6,072,749 | ||||||
Saudi Chemical Co. Holding | 556,560 | 1,017,998 | ||||||
Saudia Dairy & Foodstuff Co. | 46,903 | 4,627,146 | ||||||
Southern Province Cement Co. | 129,525 | 1,355,514 | ||||||
Sustained Infrastructure Holding Co. | 152,526 | 1,581,992 | ||||||
Tanmiah Food Co. | 27,177 | 1,021,719 | ||||||
Theeb Rent A Car Co. | 84,752 | 1,559,229 | ||||||
United Electronics Co. | 194,958 | 4,938,278 | ||||||
United International Transportation Co. | 121,497 | 2,811,876 | ||||||
Yamama Cement Co. | 325,291 | 2,862,179 | ||||||
Yanbu Cement Co. | 560,142 | 4,428,266 | ||||||
|
| |||||||
| Total Saudi Arabia | 98,120,142 | |||||||
| South Africa – 8.6% | ||||||||
AECI Ltd. | 768,416 | 3,771,016 | ||||||
Afrimat Ltd. | 434,754 | 1,327,709 | ||||||
AVI Ltd. | 2,416,117 | 11,655,544 | ||||||
Barloworld Ltd. | 928,688 | 2,992,596 | ||||||
Dis-Chem Pharmacies Ltd.(a) | 1,087,358 | 1,867,364 | ||||||
DRDGOLD Ltd. | 2,435,721 | 2,054,180 | ||||||
Foschini Group Ltd. | 1,305,511 | 6,863,218 | ||||||
Grindrod Ltd. | 3,576,454 | 2,451,508 | ||||||
Harmony Gold Mining Co. Ltd. | 606,198 | 5,058,306 | ||||||
Hyprop Investments Ltd.(b) | 3,634,275 | 5,636,737 | ||||||
Investec Ltd. | 1,878,875 | 12,395,688 | ||||||
JSE Ltd.* | 708,154 | 3,305,872 | ||||||
Life Healthcare Group Holdings Ltd. | 3,450,418 | 3,132,230 | ||||||
Momentum Metropolitan Holdings | 8,469,337 | 9,088,226 | ||||||
Motus Holdings Ltd.(b) | 1,321,499 | 6,104,943 | ||||||
Mr. Price Group Ltd. | 1,712,641 | 15,719,804 | ||||||
Netcare Ltd. | 6,785,912 | 4,260,848 | ||||||
Northam Platinum Holdings Ltd. | 2,282,402 | 13,611,547 | ||||||
Old Mutual Ltd. | 34,539,084 | 21,431,605 | ||||||
Omnia Holdings Ltd. | 1,100,652 | 3,431,064 | ||||||
OUTsurance Group Ltd. | 4,222,656 | 9,365,717 | ||||||
PSG Financial Services Ltd. | 3,026,120 | 2,445,027 | ||||||
Redefine Properties Ltd. | 84,709,093 | 17,669,862 | ||||||
Resilient REIT Ltd. | 3,509,732 | 8,598,137 | ||||||
Reunert Ltd. | 931,857 | 3,247,874 | ||||||
Santam Ltd.(b) | 296,917 | 4,670,705 | ||||||
Sappi Ltd. | 3,869,423 | 10,276,231 | ||||||
Super Group Ltd. | 1,028,519 | 1,395,891 | ||||||
Thungela Resources Ltd. | 1,822,631 | 11,731,059 | ||||||
Tiger Brands Ltd.(b) | 1,152,204 | 12,205,194 | ||||||
Truworths International Ltd.(b) | 4,926,144 | 19,856,760 | ||||||
|
| |||||||
| Total South Africa | 237,622,462 | |||||||
| South Korea – 11.5% | ||||||||
Aekyung Chemical Co. Ltd. | 86,163 | 828,189 | ||||||
Aekyung Industrial Co. Ltd. | 15,934 | 210,678 | ||||||
AfreecaTV Co. Ltd. | 8,521 | 744,974 | ||||||
Ahnlab, Inc. | 11,517 | 573,177 | ||||||
BGF retail Co. Ltd. | 33,276 | 2,909,255 | ||||||
BH Co. Ltd. | 33,149 | 420,072 | ||||||
BNK Financial Group, Inc. | 3,314,278 | 19,128,646 | ||||||
Caregen Co. Ltd. | 71,980 | 1,219,048 | ||||||
Cheil Worldwide, Inc. | 730,239 | 10,186,732 | ||||||
Chong Kun Dang Pharmaceutical Corp. | 8,385 | 686,371 | ||||||
CJ Corp.* | 50,627 | 4,881,251 | ||||||
CJ Logistics Corp. | 6,992 | 596,755 | ||||||
Classys, Inc. | 10,917 | 286,254 | ||||||
Coway Co. Ltd. | 188,174 | 7,827,479 | ||||||
Cuckoo Homesys Co. Ltd. | 41,402 | 698,106 | ||||||
Daeduck Electronics Co. Ltd. | 61,408 | 1,119,826 | ||||||
Daesang Corp. | 80,163 | 1,155,181 | ||||||
Daishin Securities Co. Ltd. | 280,101 | 3,254,061 | ||||||
DB HiTek Co. Ltd. | 109,264 | 3,510,246 | ||||||
DGB Financial Group, Inc. | 1,509,757 | 9,588,429 | ||||||
DN Automotive Corp. | 12,514 | 765,945 | ||||||
DongKook Pharmaceutical Co. Ltd. | 18,742 | 232,213 | ||||||
Dongsuh Cos., Inc. | 240,666 | 3,058,715 | ||||||
Dongwon Systems Corp. | 7,275 | 232,368 | ||||||
Doosan Bobcat, Inc. | 288,692 | 11,429,737 | ||||||
Dreamtech Co. Ltd. | 47,188 | 380,308 | ||||||
E-MART, Inc.* | 60,897 | 3,062,378 | ||||||
Echo Marketing, Inc. | 46,079 | 462,074 | ||||||
Ecopro HN Co. Ltd. | 10,485 | 613,718 | ||||||
Eo Technics Co. Ltd. | 7,720 | 1,195,632 | ||||||
Fila Holdings Corp. | 96,306 | 2,721,963 | ||||||
GOLFZON Co. Ltd. | 19,851 | 1,248,936 | ||||||
Green Cross Corp. | 6,779 | 610,802 | ||||||
GS Holdings Corp. | 529,854 | 18,990,125 | ||||||
GS Retail Co. Ltd. | 88,380 | 1,332,675 | ||||||
HAESUNG DS Co. Ltd. | 20,856 | 811,777 | ||||||
Hanil Cement Co. Ltd. | 145,474 | 1,329,122 | ||||||
Hanjin Kal Corp. | 19,979 | 883,009 | ||||||
Hankook & Co. Co. Ltd. | 173,153 | 2,056,614 | ||||||
Hanmi Science Co. Ltd. | 25,108 | 714,307 | ||||||
Hanmi Semiconductor Co. Ltd. | 22,442 | 2,228,780 | ||||||
Hansae Co. Ltd. | 42,316 | 628,336 | ||||||
Hansol Chemical Co. Ltd. | 11,948 | 1,814,942 | ||||||
Hanwha Corp. | 183,216 | 3,681,332 | ||||||
Hanwha Systems Co. Ltd. | 144,009 | 1,836,683 | ||||||
Harim Holdings Co. Ltd. | 77,399 | 385,773 | ||||||
HD Hyundai Construction Equipment Co. Ltd. | 35,918 | 1,544,774 | ||||||
See Notes to Financial Statements.
| 52 | WisdomTree Trust |
Schedule of Investments (continued)
WisdomTree Emerging Markets SmallCap Dividend Fund (DGS)
March 31, 2024
| Investments | Shares | Value | ||||||
HD Hyundai Electric Co. Ltd. | 17,265 | $ | 2,300,718 | |||||
HD Hyundai Infracore Co. Ltd. | 352,380 | 2,206,547 | ||||||
Hite Jinro Co. Ltd. | 174,302 | 2,641,234 | ||||||
HK inno N Corp. | 10,675 | 293,786 | ||||||
HL Mando Co. Ltd. | 40,375 | 998,691 | ||||||
Hotel Shilla Co. Ltd. | 10,296 | 458,875 | ||||||
Hyosung Advanced Materials Corp. | 11,449 | 2,908,492 | ||||||
Hyundai Autoever Corp. | 5,132 | 548,938 | ||||||
Hyundai Department Store Co. Ltd. | 32,617 | 1,250,167 | ||||||
Hyundai Elevator Co. Ltd. | 29,441 | 897,718 | ||||||
Hyundai Marine & Fire Insurance Co. Ltd. | 384,547 | 8,712,114 | ||||||
Hyundai Steel Co. | 261,319 | 6,172,661 | ||||||
Innocean Worldwide, Inc. | 156,984 | 2,518,741 | ||||||
Innox Advanced Materials Co. Ltd. | 22,801 | 492,857 | ||||||
ISC Co. Ltd. | 3,204 | 233,235 | ||||||
JB Financial Group Co. Ltd. | 1,448,889 | 14,206,377 | ||||||
Jusung Engineering Co. Ltd. | 28,577 | 777,974 | ||||||
JW Pharmaceutical Corp. | 19,614 | 474,961 | ||||||
JYP Entertainment Corp. | 17,006 | 910,776 | ||||||
K Car Co. Ltd. | 85,459 | 828,405 | ||||||
Kangwon Land, Inc. | 303,712 | 3,675,000 | ||||||
KCC Glass Corp. | 56,764 | 1,711,880 | ||||||
KEPCO Engineering & Construction Co., Inc. | 6,786 | 328,652 | ||||||
KEPCO Plant Service & Engineering Co. Ltd. | 93,647 | 2,479,863 | ||||||
KG Chemical Corp. | 64,210 | 281,403 | ||||||
KG Dongbusteel | 77,125 | 401,021 | ||||||
KIWOOM Securities Co. Ltd. | 48,334 | 4,369,358 | ||||||
Koh Young Technology, Inc. | 60,117 | 852,913 | ||||||
Kolmar Korea Co. Ltd. | 18,791 | 650,444 | ||||||
Kolon Industries, Inc. | 56,661 | 1,574,092 | ||||||
KoMiCo Ltd. | 15,118 | 837,737 | ||||||
Korea Aerospace Industries Ltd. | 39,261 | 1,501,906 | ||||||
Korea Electric Terminal Co. Ltd. | 10,380 | 482,665 | ||||||
Korea Investment Holdings Co. Ltd. | 201,006 | 9,943,918 | ||||||
Korean Reinsurance Co. | 852,517 | 5,256,001 | ||||||
Kumho Petrochemical Co. Ltd. | 77,757 | 7,843,566 | ||||||
Kyung Dong Navien Co. Ltd. | 7,903 | 311,717 | ||||||
LEENO Industrial, Inc. | 21,561 | 4,091,986 | ||||||
LIG Nex1 Co. Ltd. | 23,256 | 3,081,798 | ||||||
Lotte Chilsung Beverage Co. Ltd. | 10,917 | 1,030,678 | ||||||
Lotte Corp. | 257,329 | 5,189,588 | ||||||
LOTTE Fine Chemical Co. Ltd. | 94,326 | 3,282,580 | ||||||
Lotte Rental Co. Ltd. | 49,434 | 1,007,958 | ||||||
Lotte Shopping Co. Ltd. | 59,665 | 3,199,861 | ||||||
LS Corp. | 32,537 | 2,740,721 | ||||||
LS Electric Co. Ltd. | 20,934 | 1,520,776 | ||||||
LX Semicon Co. Ltd. | 66,348 | 3,913,115 | ||||||
Mcnex Co. Ltd. | 27,414 | 517,226 | ||||||
Medytox, Inc. | 2,265 | 244,797 | ||||||
MegaStudyEdu Co. Ltd. | 34,021 | 1,394,956 | ||||||
Mirae Asset Securities Co. Ltd. | 915,018 | 5,478,214 | ||||||
NH Investment & Securities Co. Ltd. | 1,001,947 | 8,707,729 | ||||||
NHN KCP Corp. | 68,457 | 629,525 | ||||||
NICE Information Service Co. Ltd. | 146,532 | 1,094,976 | ||||||
NongShim Co. Ltd. | 5,771 | 1,579,657 | ||||||
Pan Ocean Co. Ltd. | 805,346 | 2,473,616 | ||||||
Partron Co. Ltd. | 111,624 | 652,539 | ||||||
PharmaResearch Co. Ltd. | 5,343 | 400,452 | ||||||
Poongsan Corp. | 54,656 | 2,050,234 | ||||||
PSK, Inc. | 50,430 | 1,131,280 | ||||||
S-1 Corp. | 84,629 | 3,778,052 | ||||||
Samsung Securities Co. Ltd. | 326,828 | 9,735,044 | ||||||
Samyang Foods Co. Ltd. | 3,949 | 617,467 | ||||||
SeAH Besteel Holdings Corp. | 76,407 | 1,294,024 | ||||||
SFA Engineering Corp. | 28,324 | 534,395 | ||||||
SGC Energy Co. Ltd. | 44,074 | 731,702 | ||||||
Shinsegae International, Inc. | 47,298 | 625,019 | ||||||
Shinsegae, Inc. | 16,442 | 2,043,266 | ||||||
SIMMTECH Co. Ltd. | 28,786 | 681,028 | ||||||
SK D&D Co. Ltd. | 25,603 | 232,020 | ||||||
SK Discovery Co. Ltd. | 39,188 | 1,286,618 | ||||||
SK Eternix Co. Ltd.* | 38,320 | 365,485 | ||||||
SK Networks Co. Ltd. | 266,581 | 1,168,303 | ||||||
SL Corp. | 33,241 | 770,376 | ||||||
SM Entertainment Co. Ltd. | 13,049 | 851,032 | ||||||
SNT Motiv Co. Ltd. | 31,533 | 1,063,397 | ||||||
Soulbrain Co. Ltd. | 3,454 | 801,764 | ||||||
ST Pharm Co. Ltd. | 6,541 | 431,451 | ||||||
Sungwoo Hitech Co. Ltd. | 53,202 | 370,685 | ||||||
TKG Huchems Co. Ltd. | 140,090 | 2,071,823 | ||||||
Tokai Carbon Korea Co. Ltd. | 9,211 | 890,140 | ||||||
Unid Co. Ltd. | 16,437 | 993,851 | ||||||
WONIK IPS Co. Ltd.* | 19,254 | 593,531 | ||||||
Youngone Corp. | 77,487 | 2,328,207 | ||||||
|
| |||||||
| Total South Korea | 316,086,113 | |||||||
| Taiwan – 28.1% | ||||||||
Acer, Inc.(b) | 9,318,000 | 13,626,085 | ||||||
Advanced Power Electronics Corp.(b) | 309,000 | 840,002 | ||||||
Advancetek Enterprise Co. Ltd. | 1,331,000 | 1,871,514 | ||||||
Alexander Marine Co. Ltd.(b) | 46,000 | 551,221 | ||||||
Allied Supreme Corp.(b) | 170,000 | 2,236,318 | ||||||
Allis Electric Co. Ltd.(b) | 266,000 | 914,275 | ||||||
Alltek Technology Corp.(b) | 1,373,240 | 1,553,308 | ||||||
AMPOC Far-East Co. Ltd.(b) | 633,000 | 1,762,317 | ||||||
AP Memory Technology Corp.(b) | 217,000 | 2,722,374 | ||||||
Apacer Technology, Inc.(b) | 493,000 | 1,078,320 | ||||||
Arcadyan Technology Corp.(b) | 797,681 | 4,773,100 | ||||||
Asia Optical Co., Inc. | 593,000 | 1,193,282 | ||||||
ASMedia Technology, Inc.(b) | 39,000 | 2,918,587 | ||||||
ASROCK, Inc.(b) | 150,000 | 1,190,495 | ||||||
Auden Techno Corp.(b) | 75,247 | 312,711 | ||||||
Bafang Yunji International Co. Ltd.(b) | 139,000 | 736,185 | ||||||
BenQ Materials Corp.(b) | 837,000 | 886,600 | ||||||
BES Engineering Corp. | 5,469,000 | 2,418,059 | ||||||
Capital Futures Corp. | 798,000 | 1,358,945 | ||||||
Capital Securities Corp.(b) | 5,083,340 | 3,041,729 | ||||||
Cathay Real Estate Development Co. Ltd. | 2,036,000 | 1,364,607 | ||||||
See Notes to Financial Statements.
| WisdomTree Trust | 53 |
Schedule of Investments (continued)
WisdomTree Emerging Markets SmallCap Dividend Fund (DGS)
March 31, 2024
| Investments | Shares | Value | ||||||
Chang Wah Electromaterials, Inc.(b) | 2,048,000 | $ | 2,566,119 | |||||
Charoen Pokphand Enterprise | 797,100 | 2,789,545 | ||||||
CHC Healthcare Group | 267,000 | 503,073 | ||||||
Chenbro Micom Co. Ltd.(b) | 60,000 | 478,073 | ||||||
Cheng Loong Corp. | 2,925,000 | 2,650,491 | ||||||
Cheng Uei Precision Industry Co. Ltd. | 1,349,000 | 1,955,836 | ||||||
Chicony Electronics Co. Ltd.(b) | 4,892,652 | 33,939,061 | ||||||
Chicony Power Technology Co. Ltd.*(b) | 953,625 | 5,080,478 | ||||||
Chin-Poon Industrial Co. Ltd.(b) | 576,000 | 829,709 | ||||||
China Bills Finance Corp. | 3,060,000 | 1,448,560 | ||||||
China Chemical & Pharmaceutical Co. Ltd. | 623,000 | 441,892 | ||||||
China Metal Products | 612,000 | 714,241 | ||||||
China Steel Chemical Corp.(b) | 742,726 | 2,796,522 | ||||||
ChipMOS Technologies, Inc. | 2,395,000 | 3,741,778 | ||||||
Chong Hong Construction Co. Ltd. | 1,097,000 | 3,030,131 | ||||||
Chroma ATE, Inc.(b) | 1,332,132 | 10,614,266 | ||||||
Chung-Hsin Electric & Machinery Manufacturing Corp.(b) | 988,000 | 5,541,456 | ||||||
Cleanaway Co. Ltd.(b) | 431,161 | 2,398,071 | ||||||
Compeq Manufacturing Co. Ltd.(b) | 4,072,000 | 10,229,781 | ||||||
Continental Holdings Corp. | 2,397,000 | 2,288,136 | ||||||
Coremax Corp.(b) | 238,000 | 467,768 | ||||||
CTCI Corp.(b) | 2,001,190 | 2,963,939 | ||||||
Cub Elecparts, Inc.(b) | 86,000 | 322,465 | ||||||
Cyberlink Corp. | 143,000 | 393,207 | ||||||
CyberPower Systems, Inc.(b) | 109,000 | 827,628 | ||||||
DA CIN Construction Co. Ltd. | 1,884,000 | 3,361,395 | ||||||
Da-Li Development Co. Ltd. | 769,000 | 999,591 | ||||||
Darfon Electronics Corp. | 963,000 | 1,874,636 | ||||||
Daxin Materials Corp.(b) | 117,000 | 555,689 | ||||||
Delpha Construction Co. Ltd.*(b) | 827,000 | 1,142,169 | ||||||
Depo Auto Parts Ind Co. Ltd. | 392,000 | 2,688,581 | ||||||
Dynamic Holding Co. Ltd.(b) | 267,000 | 578,159 | ||||||
Elan Microelectronics Corp. | 335,409 | 1,645,420 | ||||||
Elitegroup Computer Systems Co. Ltd.*(b) | 676,000 | 665,365 | ||||||
Ennoconn Corp.(b) | 314,243 | 3,682,132 | ||||||
Episil-Precision, Inc.(b) | 266,000 | 495,371 | ||||||
Eternal Materials Co. Ltd.* | 2,710,319 | 2,654,975 | ||||||
Evergreen Aviation Technologies Corp.(b) | 332,000 | 1,130,751 | ||||||
Evergreen International Storage & Transport Corp.(b) | 2,775,000 | 2,718,335 | ||||||
Everlight Chemical Industrial Corp.(b) | 618,000 | 382,346 | ||||||
Everlight Electronics Co. Ltd. | 1,765,165 | 2,956,328 | ||||||
Far Eastern Department Stores Ltd. | 4,740,841 | 4,384,798 | ||||||
Far Eastern International Bank(b) | 14,281,017 | 6,425,755 | ||||||
Faraday Technology Corp.(b) | 271,582 | 2,919,187 | ||||||
Farglory F T Z Investment Holding Co. Ltd.(b) | 266,620 | 465,701 | ||||||
Farglory Land Development Co. Ltd. | 1,465,640 | 2,619,545 | ||||||
Feng Hsin Steel Co. Ltd.* | 1,148,950 | 2,548,954 | ||||||
Fitipower Integrated Technology, Inc.(b) | 272,000 | 2,277,751 | ||||||
FLEXium Interconnect, Inc.(b) | 1,879,028 | 5,354,644 | ||||||
Flytech Technology Co. Ltd. | 208,000 | 506,945 | ||||||
Formosa Advanced Technologies Co. Ltd.(b) | 1,127,000 | 1,292,387 | ||||||
Formosa International Hotels Corp.(b) | 237,000 | 1,662,521 | ||||||
Formosa Sumco Technology Corp.(b) | 250,000 | 1,300,639 | ||||||
Formosan Union Chemical(b) | 1,904,000 | 1,160,123 | ||||||
Fortune Electric Co. Ltd.(b) | 197,000 | 4,204,259 | ||||||
Foxsemicon Integrated Technology, Inc.(b) | 659,197 | 6,117,503 | ||||||
Fu Hua Innovation Co. Ltd.(b) | 3,211,476 | 2,829,804 | ||||||
Fusheng Precision Co. Ltd.(b) | 1,129,000 | 8,254,910 | ||||||
G Shank Enterprise Co. Ltd.(b) | 798,103 | 1,805,511 | ||||||
Gemtek Technology Corp.(b) | 1,862,000 | 1,983,977 | ||||||
Genius Electronic Optical Co. Ltd.(b) | 265,280 | 4,111,390 | ||||||
Getac Holdings Corp.(b) | 2,182,292 | 8,694,119 | ||||||
Giant Manufacturing Co. Ltd.(b) | 1,056,051 | 7,177,062 | ||||||
Global Brands Manufacture Ltd.(b) | 1,416,400 | 3,217,532 | ||||||
Global Mixed Mode Technology, Inc.(b) | 383,000 | 3,189,323 | ||||||
Global PMX Co. Ltd.(b) | 266,000 | 881,029 | ||||||
Goldsun Building Materials Co. Ltd. | 5,611,000 | 6,644,801 | ||||||
Grape King Bio Ltd. | 559,988 | 2,773,387 | ||||||
Great Wall Enterprise Co. Ltd.(b) | 2,516,259 | 4,536,633 | ||||||
Greatek Electronics, Inc.(b) | 1,712,000 | 3,300,589 | ||||||
Highwealth Construction Corp.(b) | 2,005,316 | 2,515,770 | ||||||
Hitron Technology, Inc.(b) | 403,000 | 396,660 | ||||||
Hiwin Technologies Corp.(b) | 581,000 | 5,001,500 | ||||||
Holtek Semiconductor, Inc.(b) | 798,773 | 1,345,286 | ||||||
Holy Stone Enterprise Co. Ltd. | 524,900 | 1,582,728 | ||||||
Hong TAI Electric Industrial(b) | 798,000 | 771,731 | ||||||
Hota Industrial Manufacturing Co. Ltd.(b) | 421,146 | 665,864 | ||||||
Hsin Kuang Steel Co. Ltd. | 448,000 | 860,906 | ||||||
Huaku Development Co. Ltd.(b) | 1,583,296 | 6,134,601 | ||||||
Ichia Technologies, Inc.(b) | 791,000 | 868,769 | ||||||
Iron Force Industrial Co. Ltd. | 254,000 | 791,282 | ||||||
ITE Technology, Inc.(b) | 621,000 | 3,405,424 | ||||||
ITEQ Corp.(b) | 533,000 | 1,637,130 | ||||||
J&V Energy Technology Co. Ltd. | 147,000 | 624,682 | ||||||
Jentech Precision Industrial Co. Ltd.(b) | 195,094 | 5,614,435 | ||||||
Jess-Link Products Co. Ltd.(b) | 347,000 | 1,507,116 | ||||||
Jih Lin Technology Co. Ltd.(b) | 266,000 | 515,319 | ||||||
Kindom Development Co. Ltd. | 1,581,200 | 2,065,217 | ||||||
King Slide Works Co. Ltd.(b) | 185,004 | 7,225,928 | ||||||
King Yuan Electronics Co. Ltd.(b) | 5,720,000 | 18,856,063 | ||||||
King’s Town Bank Co. Ltd.(b) | 3,039,000 | 4,899,852 | ||||||
Kinik Co.(b) | 243,495 | 1,989,593 | ||||||
Kinpo Electronics(b) | 1,676,000 | 796,013 | ||||||
KMC Kuei Meng International, Inc.(b) | 256,000 | 1,127,877 | ||||||
KS Terminals, Inc.(b) | 267,000 | 587,336 | ||||||
Kung Long Batteries Industrial Co. Ltd. | 554,000 | 2,414,830 | ||||||
L&K Engineering Co. Ltd.(b) | 622,981 | 4,681,580 | ||||||
Lelon Electronics Corp.(b) | 710,000 | 1,577,359 | ||||||
Lian HWA Food Corp. | 265,802 | 803,963 | ||||||
Lien Hwa Industrial Holdings Corp.(b) | 1,988,517 | 4,218,923 | ||||||
Lintes Technology Co. Ltd.(b) | 69,406 | 403,378 | ||||||
Lotes Co. Ltd.(b) | 236,390 | 10,340,931 | ||||||
Lotus Pharmaceutical Co. Ltd.(b) | 143,000 | 1,358,351 | ||||||
Machvision, Inc.(b) | 171,000 | 2,193,369 | ||||||
Macronix International Co. Ltd.(b) | 7,720,000 | 6,440,671 | ||||||
Makalot Industrial Co. Ltd.(b) | 1,025,881 | 11,908,535 | ||||||
See Notes to Financial Statements.
| 54 | WisdomTree Trust |
Schedule of Investments (continued)
WisdomTree Emerging Markets SmallCap Dividend Fund (DGS)
March 31, 2024
| Investments | Shares | Value | ||||||
Marketech International Corp.(b) | 267,000 | $ | 1,364,054 | |||||
Merida Industry Co. Ltd.(b) | 673,043 | 4,405,847 | ||||||
Merry Electronics Co. Ltd.(b) | 1,189,000 | 4,365,382 | ||||||
METAAGE Corp.(b) | 280,000 | 580,936 | ||||||
MSSCORPS Co. Ltd.(b) | 111,000 | 494,243 | ||||||
Nak Sealing Technologies Corp.(b) | 266,000 | 1,122,065 | ||||||
Namchow Holdings Co. Ltd. | 267,000 | 478,045 | ||||||
Nan Pao Resins Chemical Co. Ltd.(b) | 266,000 | 2,584,905 | ||||||
Nichidenbo Corp.(b) | 1,743,000 | 3,251,429 | ||||||
Nien Made Enterprise Co. Ltd. | 501,000 | 5,502,570 | ||||||
Nuvoton Technology Corp.(b) | 798,872 | 3,057,847 | ||||||
O-Bank Co. Ltd. | 3,993,000 | 1,253,914 | ||||||
Orient Semiconductor Electronics Ltd.(b) | 570,000 | 1,168,372 | ||||||
Oriental Union Chemical Corp. | 651,000 | 366,147 | ||||||
Pan German Universal Motors Ltd. | 109,000 | 1,079,663 | ||||||
Pan Jit International, Inc.(b) | 1,036,000 | 1,841,936 | ||||||
Pan-International Industrial Corp.(b) | 1,760,000 | 1,990,782 | ||||||
Panion & BF Biotech, Inc.(b) | 113,000 | 388,395 | ||||||
Pegavision Corp. | 79,000 | 1,120,690 | ||||||
Phoenix Silicon International Corp.(b) | 331,000 | 528,508 | ||||||
Posiflex Technology, Inc.(b) | 407,000 | 1,494,290 | ||||||
Pou Chen Corp.(b) | 8,455,000 | 9,550,463 | ||||||
Powertech Technology, Inc.(b) | 3,593,000 | 22,509,929 | ||||||
President Securities Corp.(b) | 1,830,520 | 1,407,058 | ||||||
Primax Electronics Ltd.(b) | 2,893,000 | 7,566,176 | ||||||
Promate Electronic Co. Ltd.(b) | 1,385,000 | 3,795,351 | ||||||
Qisda Corp.(b) | 8,325,000 | 11,614,706 | ||||||
Run Long Construction Co. Ltd.(b) | 190,000 | 736,169 | ||||||
Sampo Corp.(b) | 1,012,000 | 935,998 | ||||||
San Fu Chemical Co. Ltd.(b) | 191,000 | 939,975 | ||||||
Sanyang Motor Co. Ltd.(b) | 1,592,000 | 3,730,842 | ||||||
Scientech Corp.(b) | 80,000 | 754,917 | ||||||
ScinoPharm Taiwan Ltd. | 279,000 | 241,047 | ||||||
SDI Corp. | 313,000 | 943,787 | ||||||
Sercomm Corp.(b) | 984,488 | 4,168,235 | ||||||
Sesoda Corp.(b) | 1,462,000 | 1,411,589 | ||||||
ShenMao Technology, Inc.(b) | 253,000 | 499,620 | ||||||
Shih Wei Navigation Co. Ltd.(b) | 1,694,000 | 976,590 | ||||||
Shihlin Electric & Engineering Corp.(b) | 360,000 | 3,284,641 | ||||||
Shin Zu Shing Co. Ltd.(b) | 900,000 | 5,216,617 | ||||||
Shinkong Insurance Co. Ltd.(b) | 992,000 | 2,637,811 | ||||||
Shiny Chemical Industrial Co. Ltd. | 265,637 | 1,539,696 | ||||||
Sigurd Microelectronics Corp.(b) | 3,515,000 | 7,798,053 | ||||||
Sinbon Electronics Co. Ltd.(b) | 644,120 | 5,554,927 | ||||||
Sincere Navigation Corp.(b) | 374,000 | 281,054 | ||||||
Sinon Corp.(b) | 3,009,000 | 3,638,611 | ||||||
Sitronix Technology Corp.(b) | 680,000 | 6,193,698 | ||||||
Sonix Technology Co. Ltd. | 350,000 | 577,437 | ||||||
Standard Chemical & Pharmaceutical Co. Ltd.(b) | 339,000 | 703,348 | ||||||
Standard Foods Corp.(b) | 1,153,896 | 1,375,510 | ||||||
Stark Technology, Inc.(b) | 607,000 | 2,446,701 | ||||||
Sunonwealth Electric Machine Industry Co. Ltd.(b) | 497,000 | 2,034,371 | ||||||
Sunrex Technology Corp.(b) | 848,000 | 1,674,617 | ||||||
Supreme Electronics Co. Ltd.(b) | 2,665,868 | 6,064,186 | ||||||
Swancor Holding Co. Ltd.(b) | 467,000 | 1,875,092 | ||||||
Symtek Automation Asia Co. Ltd.(b) | 133,000 | 498,695 | ||||||
Synnex Technology International Corp.(b) | 7,720,600 | 19,034,023 | ||||||
Systex Corp.(b) | 560,000 | 2,073,523 | ||||||
TA Chen Stainless Pipe(b) | 8,110,800 | 9,250,369 | ||||||
Ta Ya Electric Wire & Cable(b) | 767,597 | 1,031,346 | ||||||
Taichung Commercial Bank Co. Ltd.(b) | 8,269,180 | 4,418,360 | ||||||
Taisun Enterprise Co. Ltd.(b) | 469,000 | 323,868 | ||||||
Taiwan Business Bank | 5,237,588 | 2,643,056 | ||||||
Taiwan Cogeneration Corp.(b) | 712,223 | 1,043,738 | ||||||
Taiwan Fertilizer Co. Ltd. | 3,459,000 | 6,809,162 | ||||||
Taiwan Hon Chuan Enterprise Co. Ltd. | 957,692 | 4,309,143 | ||||||
Taiwan Mask Corp.(b) | 513,000 | 1,090,006 | ||||||
Taiwan Navigation Co. Ltd.(b) | 1,514,000 | 1,627,372 | ||||||
Taiwan Paiho Ltd.(b) | 798,000 | 1,433,749 | ||||||
Taiwan PCB Techvest Co. Ltd. | 1,106,302 | 1,514,085 | ||||||
Taiwan Secom Co. Ltd.(b) | 925,000 | 3,526,177 | ||||||
Taiwan Surface Mounting Technology Corp.(b) | 1,523,000 | 5,163,357 | ||||||
Taiwan-Asia Semiconductor Corp.(b) | 483,000 | 592,365 | ||||||
Test Research, Inc. | 1,356,115 | 3,707,721 | ||||||
Thinking Electronic Industrial Co. Ltd.(b) | 261,000 | 1,361,945 | ||||||
Thye Ming Industrial Co. Ltd.(b) | 808,000 | 1,875,870 | ||||||
Ton Yi Industrial Corp. | 4,020,000 | 1,796,241 | ||||||
Tong Hsing Electronic Industries Ltd.(b) | 524,214 | 2,383,275 | ||||||
Tong Yang Industry Co. Ltd.(b) | 1,734,685 | 6,775,372 | ||||||
Topco Scientific Co. Ltd.(b) | 798,776 | 5,466,025 | ||||||
Topkey Corp.(b) | 499,000 | 3,001,469 | ||||||
Transcend Information, Inc. | 1,283,479 | 3,573,296 | ||||||
Tripod Technology Corp.(b) | 1,931,928 | 12,344,877 | ||||||
TSRC Corp.(b) | 1,962,000 | 1,419,229 | ||||||
Tung Ho Steel Enterprise Corp.(b) | 2,081,722 | 4,494,727 | ||||||
TXC Corp.(b) | 2,394,549 | 8,454,826 | ||||||
TYC Brother Industrial Co. Ltd.(b) | 798,000 | 1,346,478 | ||||||
U-Ming Marine Transport Corp.(b) | 1,864,420 | 3,087,608 | ||||||
Union Bank of Taiwan(b) | 1,747,050 | 832,487 | ||||||
Unitech Printed Circuit Board Corp.(b) | 1,034,000 | 861,034 | ||||||
United Integrated Services Co. Ltd.(b) | 1,330,000 | 16,332,276 | ||||||
United Renewable Energy Co. Ltd.(b) | 813,000 | 293,410 | ||||||
Universal Cement Corp.(b) | 2,396,790 | 2,366,571 | ||||||
USI Corp.(b) | 2,013,000 | 1,009,535 | ||||||
VIA Labs, Inc.(b) | 90,000 | 604,621 | ||||||
Visco Vision, Inc.(b) | 112,000 | 801,412 | ||||||
VisEra Technologies Co. Ltd.(b) | 78,000 | 736,045 | ||||||
Visual Photonics Epitaxy Co. Ltd.(b) | 254,750 | 1,349,231 | ||||||
Vivotek, Inc.(b) | 102,000 | 463,731 | ||||||
Wah Lee Industrial Corp. | 797,580 | 2,816,146 | ||||||
Walsin Technology Corp.(b) | 617,000 | 2,178,543 | ||||||
Weikeng Industrial Co. Ltd.(b) | 3,368,431 | 3,331,224 | ||||||
Weltrend Semiconductor(b) | 265,000 | 519,178 | ||||||
Winmate, Inc. | 214,000 | 969,581 | ||||||
WinWay Technology Co. Ltd.(b) | 72,000 | 1,617,573 | ||||||
Wistron NeWeb Corp.(b) | 921,587 | 4,463,449 | ||||||
See Notes to Financial Statements.
| WisdomTree Trust | 55 |
Schedule of Investments (continued)
WisdomTree Emerging Markets SmallCap Dividend Fund (DGS)
March 31, 2024
| Investments | Shares | Value | ||||||
Wowprime Corp.(b) | 130,000 | $ | 980,986 | |||||
WPG Holdings Ltd.(b) | 7,702,058 | 23,079,581 | ||||||
WT Microelectronics Co. Ltd.(b) | 1,330,190 | 6,130,674 | ||||||
Yankey Engineering Co. Ltd.(b) | 311,000 | 3,755,886 | ||||||
YC INOX Co. Ltd.(b) | 1,412,793 | 1,108,038 | ||||||
Yem Chio Co. Ltd.(b) | 3,463,000 | 2,018,059 | ||||||
YFY, Inc. | 2,921,000 | 2,738,138 | ||||||
Yulon Motor Co. Ltd.(b) | 598,496 | 1,273,535 | ||||||
Zenitron Corp. | 1,862,000 | 2,056,703 | ||||||
Zero One Technology Co. Ltd.(b) | 899,000 | 2,016,911 | ||||||
Zippy Technology Corp. | 1,092,000 | 1,825,488 | ||||||
Zyxel Group Corp.(b) | 808,000 | 1,177,784 | ||||||
|
| |||||||
| Total Taiwan | 774,961,279 | |||||||
| Thailand – 5.9% | ||||||||
Amata Corp. PCL, NVDR(b) | 4,433,000 | 2,903,698 | ||||||
Bangchak Corp. PCL, NVDR | 3,160,400 | 3,941,026 | ||||||
Bangkok Chain Hospital PCL, NVDR(b) | 6,606,700 | 3,729,990 | ||||||
Banpu PCL, NVDR(b) | 46,415,700 | 7,060,148 | ||||||
Banpu Power PCL, NVDR(b) | 6,739,927 | 2,770,782 | ||||||
BCPG PCL, NVDR(b) | 11,136,712 | 2,121,278 | ||||||
BTS Group Holdings PCL, NVDR(b) | 21,606,100 | 3,345,652 | ||||||
Chularat Hospital PCL, NVDR(b) | 37,159,000 | 2,973,738 | ||||||
Com7 PCL, NVDR(b) | 4,072,100 | 2,131,610 | ||||||
Eastern Polymer Group PCL, NVDR(b) | 8,439,500 | 1,595,959 | ||||||
Electricity Generating PCL, NVDR(b) | 712,600 | 2,226,417 | ||||||
Gunkul Engineering PCL, NVDR(b) | 41,062,400 | 3,151,071 | ||||||
Ichitan Group PCL, NVDR(b) | 7,315,300 | 3,368,196 | ||||||
KCE Electronics PCL, NVDR(b) | 2,649,700 | 2,886,621 | ||||||
Kiatnakin Phatra Bank PCL, NVDR(b) | 3,325,300 | 4,807,388 | ||||||
Land & Houses PCL, NVDR(b) | 15,875,900 | 3,219,778 | ||||||
Mega Lifesciences PCL, NVDR(b) | 2,688,400 | 3,094,561 | ||||||
MK Restaurants Group PCL, NVDR(b) | 3,166,000 | 3,058,623 | ||||||
Northeast Rubber PCL, NVDR(b) | 26,359,575 | 4,298,444 | ||||||
Origin Property PCL, NVDR | 13,871,900 | 2,680,285 | ||||||
Osotspa PCL, NVDR(b) | 8,496,100 | 4,726,847 | ||||||
Precious Shipping PCL, NVDR(b) | 10,397,600 | 2,208,466 | ||||||
Prima Marine PCL, NVDR | 15,135,300 | 3,173,280 | ||||||
PTG Energy PCL, NVDR(b) | 8,604,100 | 2,098,705 | ||||||
Quality Houses PCL, NVDR | 75,661,600 | 4,561,988 | ||||||
Ratch Group PCL, NVDR(b) | 5,141,300 | 3,910,136 | ||||||
Sansiri PCL, NVDR(b) | 128,111,600 | 6,003,997 | ||||||
Somboon Advance Technology PCL, NVDR(b) | 6,314,900 | 2,872,966 | ||||||
Supalai PCL, NVDR(b) | 11,869,900 | 6,799,066 | ||||||
Thai Oil PCL, NVDR(b) | 6,243,900 | 10,181,899 | ||||||
Thai Union Group PCL, NVDR(b) | 17,118,700 | 6,802,909 | ||||||
Thai Vegetable Oil PCL, NVDR(b) | 4,692,855 | 2,430,831 | ||||||
Thanachart Capital PCL, NVDR(b) | 6,331,700 | 8,893,446 | ||||||
Tisco Financial Group PCL, NVDR(b) | 7,064,900 | 19,265,709 | ||||||
TQM Alpha PCL, NVDR(b) | 2,772,100 | 2,032,303 | ||||||
TTW PCL, NVDR(b) | 17,946,200 | 4,451,199 | ||||||
WHA Corp. PCL, NVDR(b) | 53,300,900 | 6,953,403 | ||||||
|
| |||||||
| Total Thailand | 162,732,415 | |||||||
| Turkey – 1.2% | ||||||||
AG Anadolu Grubu Holding AS | 43,874 | 370,567 | ||||||
Aksa Akrilik Kimya Sanayii AS(b) | 288,259 | 906,155 | ||||||
Aksa Enerji Uretim AS | 424,540 | 453,777 | ||||||
Alarko Holding AS(b) | 153,326 | 618,953 | ||||||
Alkim Alkali Kimya AS | 49,029 | 48,708 | ||||||
Anadolu Efes Biracilik ve Malt Sanayii AS | 400,649 | 1,893,522 | ||||||
Aselsan Elektronik Sanayi ve Ticaret AS | 1 | 1 | ||||||
Aygaz AS* | 59,702 | 281,236 | ||||||
Brisa Bridgestone Sabanci Sanayi ve Ticaret AS* | 213,784 | 806,844 | ||||||
Cimsa Cimento Sanayi ve Ticaret AS | 542,757 | 527,792 | ||||||
Coca-Cola Icecek AS | 53,207 | 950,595 | ||||||
Dogus Otomotiv Servis ve Ticaret AS | 421,632 | 4,105,282 | ||||||
EGE Endustri ve Ticaret AS | 1,210 | 591,685 | ||||||
Emlak Konut Gayrimenkul Yatirim Ortakligi AS | 5,491,483 | 1,692,325 | ||||||
Enerjisa Enerji AS(a) | 1,726,182 | 3,116,006 | ||||||
Galata Wind Enerji AS | 386,030 | 295,680 | ||||||
GEN Ilac ve Saglik Urunleri Sanayi ve Ticaret AS | 136,857 | 283,004 | ||||||
Is Yatirim Menkul Degerler AS | 1,060,519 | 1,039,146 | ||||||
Kardemir Karabuk Demir Celik Sanayi ve Ticaret AS, Class D(b) | 542,102 | 388,748 | ||||||
Kimteks Poliuretan Sanayi ve Ticaret AS | 122,794 | 221,091 | ||||||
Koza Altin Isletmeleri AS | 1,485,679 | 1,069,990 | ||||||
Logo Yazilim Sanayi ve Ticaret AS | 95,604 | 249,117 | ||||||
Mavi Giyim Sanayi ve Ticaret AS, Class B(a) | 883,889 | 2,021,754 | ||||||
Migros Ticaret AS | 89,044 | 1,142,225 | ||||||
Nuh Cimento Sanayi AS | 313,817 | 2,943,974 | ||||||
Selcuk Ecza Deposu Ticaret ve Sanayi AS | 26,500 | 40,997 | ||||||
Sok Marketler Ticaret AS(b) | 400,000 | 729,476 | ||||||
Tekfen Holding AS | 1,028,032 | 1,295,208 | ||||||
Turk Traktor ve Ziraat Makineleri AS(b) | 97,333 | 2,972,459 | ||||||
Turkiye Petrol Rafinerileri AS‡ | 0 | 2 | ||||||
Turkiye Sise ve Cam Fabrikalari AS‡ | 0 | 1 | ||||||
Vestel Beyaz Esya Sanayi ve Ticaret AS | 3,893,827 | 2,292,823 | ||||||
Yatas Yatak ve Yorgan Sanayi ve Ticaret AS | 401,746 | 356,396 | ||||||
|
| |||||||
| Total Turkey | 33,705,539 | |||||||
TOTAL COMMON STOCKS (Cost: $2,235,983,755) | 2,740,013,968 | |||||||
| EXCHANGE-TRADED FUND – 0.2% | ||||||||
| United States – 0.2% | ||||||||
WisdomTree Emerging Markets High Dividend Fund(d) | ||||||||
| (Cost: $6,433,859) | 154,300 | 6,455,912 | ||||||
| INVESTMENT OF CASH COLLATERAL FOR SECURITIES LOANED – 1.9% |
| |||||||
| United States – 1.9% | ||||||||
State Street Navigator Securities Lending |
| |||||||
| (Cost: $52,792,787) | 52,792,787 | 52,792,787 | ||||||
TOTAL INVESTMENTS IN SECURITIES – 101.6% (Cost: $2,295,210,401) |
| 2,799,262,667 | ||||||
Other Assets less Liabilities – (1.6)% | (44,117,183 | ) | ||||||
|
| |||||||
| NET ASSETS – 100.0% | $ | 2,755,145,484 | ||||||
| * | Non-income producing security. |
See Notes to Financial Statements.
| 56 | WisdomTree Trust |
Schedule of Investments (concluded)
WisdomTree Emerging Markets SmallCap Dividend Fund (DGS)
March 31, 2024
| † | This security is being fair valued using significant unobservable inputs (i.e., Level 3 on the fair value hierarchy) by WisdomTree Asset Management, Inc., as valuation designee, in accordance with valuation procedures approved by the Board of Trustees of WisdomTree Trust. The aggregate value of Level 3 fair valued securities is $2,041,263, which represents 0.07% of net assets. |
| ‡ | Share amount represents a fractional share. |
| (a) | This security is exempt from registration under rule 144A of the Securities Act of 1933. This security may be sold in transactions that are exempt from registration, normally to qualified institutional buyers. |
| (b) | Security, or portion thereof, was on loan at March 31, 2024 (See Note 2). At March 31, 2024, the total market value of the Fund’s securities on loan identified in the Schedule of Investments was $455,444,799 and the total market value of the collateral held by the Fund was $485,912,486. The total market value of the collateral includes non-cash U.S. Government securities collateral having a value of $433,119,699. |
| (c) | This security is exempt from registration under Regulation S of the Securities Act of 1933, which exempts from registration securities offered and sold outside the United States. This security may not be offered or sold in the United States except pursuant to an exemption from, or in a transaction not subject to, the registration requirements of the Securities Act of 1933. |
| (d) | Affiliated holding. See “Investment in Affiliates” supplementary table included in this Schedule of Investments for additional information. |
| (e) | Rate shown represents annualized 7-day yield as of March 31, 2024. |
| INVESTMENT IN AFFILIATES |
Affiliated holdings are investments in entities in which the Fund owns 5% or more of the outstanding voting securities or are investments in entities which are under common ownership or control. Investments in affiliates during the fiscal year ended March 31, 2024 were as follows:
| Affiliate | Value at 3/31/2023 | Purchases/ Additions | Sales/ Reductions | Realized Gain/(Loss) | Change in Unrealized Appreciation/ Depreciation | Value at 3/31/2024 | Dividend Income | |||||||||||||||||||||
WisdomTree Emerging Markets High Dividend Fund | $ | 3,102,173 | $ | 69,526,060 | $ | 66,432,677 | $ | 680,195 | $ | (419,839 | ) | $ | 6,455,912 | $ | 1,317,106 | |||||||||||||
| FINANCIAL DERIVATIVE INSTRUMENTS | ||||||||||||||||||||||||||||
| FOREIGN CURRENCY CONTRACTS (OTC – OVER THE COUNTER) | ||||||||||||||||||||||||||||
| Counterparty | Settlement Date | Amount and Description of Currency to be Purchased | Amount and Description of Currency to be Sold | Unrealized Appreciation | Unrealized Depreciation | |||||||||||||||||||||||
HSBC Holdings PLC | 4/1/2024 | 669,094 | USD | 3,166,155 | MYR | $ | 141 | $ | — | |||||||||||||||||||
JP Morgan Chase Bank NA | 4/1/2024 | 1,002,647 | USD | 4,989,972 | BRL | 5,759 | — | |||||||||||||||||||||
State Street Bank and Trust | 4/1/2024 | 266,531 | USD | 261,403,183 | CLP | 25 | — | |||||||||||||||||||||
UBS AG | 4/1/2024 | 562,227 | USD | 2,108,706 | SAR | — | (20 | ) | ||||||||||||||||||||
| $ | 5,925 | $ | (20 | ) | ||||||||||||||||||||||||
| FAIR VALUATION SUMMARY |
The following is a summary of the fair valuations according to the inputs used in valuing the Fund’s investments (See Note 2 — Fair Value Measurement):
| Quoted Prices in Active Markets (Level 1) | Other Significant Observable Inputs (Level 2) | Significant Unobservable Inputs (Level 3) | Total | |||||||||||||
Assets: | ||||||||||||||||
Investments in Securities | ||||||||||||||||
Common Stocks | ||||||||||||||||
China | $ | 239,163,457 | $ | — | $ | 2,041,263 | * | $ | 241,204,720 | |||||||
Other | 2,498,809,248 | — | — | 2,498,809,248 | ||||||||||||
Exchange-Traded Fund | 6,455,912 | — | — | 6,455,912 | ||||||||||||
Investment of Cash Collateral for Securities Loaned | — | 52,792,787 | — | 52,792,787 | ||||||||||||
Total Investments in Securities | $ | 2,744,428,617 | $ | 52,792,787 | $ | 2,041,263 | $ | 2,799,262,667 | ||||||||
Financial Derivative Instruments | ||||||||||||||||
Foreign Currency Contracts1 | $ | — | $ | 5,925 | $ | — | $ | 5,925 | ||||||||
Liabilities: | ||||||||||||||||
Financial Derivative Instruments | ||||||||||||||||
Foreign Currency Contracts1 | $ | — | $ | (20 | ) | $ | — | $ | (20 | ) | ||||||
Total – Net | $ | 2,744,428,617 | $ | 52,798,692 | $ | 2,041,263 | $ | 2,799,268,572 | ||||||||
| * | Fair valuations using significant unobservable inputs were determined by WisdomTree Asset Management, Inc., as valuation designee, in accordance with valuation procedures approved by the Board of Trustees of WisdomTree Trust. |
| 1 | Amount shown represents the unrealized appreciation (depreciation) on the financial instrument. |
See Notes to Financial Statements.
| WisdomTree Trust | 57 |
Schedule of Investments
WisdomTree Global ex-U.S. Quality Dividend Growth Fund (DNL)
March 31, 2024
| Investments | Shares | Value | ||||||
| COMMON STOCKS – 99.6% | ||||||||
| Australia – 3.5% | ||||||||
Altium Ltd.(a) | 8,671 | $ | 368,947 | |||||
Beach Energy Ltd. | 478,437 | 572,763 | ||||||
Breville Group Ltd.(a) | 16,914 | 303,344 | ||||||
Brickworks Ltd.(a) | 26,924 | 500,257 | ||||||
CAR Group Ltd. | 55,691 | 1,310,887 | ||||||
Champion Iron Ltd.(a) | 137,572 | 665,062 | ||||||
Cochlear Ltd.(a) | 5,999 | 1,320,968 | ||||||
CSL Ltd. | 47,543 | 8,930,430 | ||||||
IDP Education Ltd.(a) | 38,777 | 453,342 | ||||||
Mineral Resources Ltd.(a) | 44,265 | 2,046,618 | ||||||
Netwealth Group Ltd. | 29,651 | 408,552 | ||||||
Pilbara Minerals Ltd.(a) | 1,383,480 | 3,456,890 | ||||||
Pro Medicus Ltd.(a) | 2,323 | 157,236 | ||||||
REA Group Ltd.(a) | 9,119 | 1,103,405 | ||||||
SEEK Ltd.(a) | 55,041 | 899,514 | ||||||
Technology One Ltd. | 13,124 | 145,299 | ||||||
|
| |||||||
| Total Australia | 22,643,514 | |||||||
| Austria – 0.4% | ||||||||
Mondi PLC | 142,216 | 2,507,076 | ||||||
| Belgium – 0.1% | ||||||||
Tessenderlo Group SA(a) | 18,144 | 475,191 | ||||||
| Brazil – 0.7% | ||||||||
Cosan SA | 251,856 | 815,109 | ||||||
Equatorial Energia SA | 85,721 | 557,425 | ||||||
Raia Drogasil SA | 69,368 | 379,300 | ||||||
Sendas Distribuidora SA | 90,103 | 264,789 | ||||||
Vamos Locacao de Caminhoes Maquinas & Equipamentos SA | 113,578 | 189,465 | ||||||
Vibra Energia SA | 408,227 | 2,039,687 | ||||||
|
| |||||||
| Total Brazil | 4,245,775 | |||||||
| Canada – 12.7% | ||||||||
Alimentation Couche-Tard, Inc.(a) | 55,004 | 3,142,331 | ||||||
Baytex Energy Corp.(a) | 36,857 | 133,184 | ||||||
Canadian National Railway Co. | 99,934 | 13,172,162 | ||||||
Canadian Natural Resources Ltd.(a) | 335,392 | 25,609,500 | ||||||
Canadian Pacific Kansas City Ltd.(a) | 49,710 | 4,387,116 | ||||||
Canadian Tire Corp. Ltd., Class A(a) | 18,711 | 1,867,989 | ||||||
Constellation Software, Inc. | 222 | 606,983 | ||||||
Crescent Point Energy Corp.(a) | 104,987 | 859,602 | ||||||
Dollarama, Inc. | 5,961 | 454,547 | ||||||
Enerplus Corp. | 23,778 | 467,565 | ||||||
Gildan Activewear, Inc. | 32,609 | 1,211,346 | ||||||
Methanex Corp.(a) | 9,859 | 439,821 | ||||||
Paramount Resources Ltd., Class A(a) | 52,987 | 1,076,381 | ||||||
Rogers Communications, Inc., Class B | 110,590 | 4,535,559 | ||||||
TFI International, Inc. | 6,801 | 1,085,547 | ||||||
Thomson Reuters Corp.(a) | 49,553 | 7,719,026 | ||||||
Tourmaline Oil Corp. | 275,581 | 12,896,763 | ||||||
Whitecap Resources, Inc.(a) | 253,276 | 1,918,403 | ||||||
|
| |||||||
| Total Canada | 81,583,825 | |||||||
| Chile – 0.2% | ||||||||
Cia Sud Americana de Vapores SA | 14,913,748 | 1,120,603 | ||||||
| China – 3.8% | ||||||||
ANTA Sports Products Ltd. | 182,400 | 1,939,025 | ||||||
BYD Electronic International Co. Ltd. | 1,000 | 3,686 | ||||||
China Resources Mixc Lifestyle Services Ltd.(b) | 1,200 | 3,795 | ||||||
Li Ning Co. Ltd. | 421,900 | 1,121,264 | ||||||
Nongfu Spring Co. Ltd., Class H(a)(b) | 247,700 | 1,337,174 | ||||||
Pop Mart International Group Ltd.(a)(b) | 40,400 | 148,407 | ||||||
Prosus NV | 80,095 | 2,515,063 | ||||||
Tencent Holdings Ltd. | 389,900 | 15,134,783 | ||||||
WuXi AppTec Co. Ltd., Class H(b) | 31,940 | 151,406 | ||||||
Yadea Group Holdings Ltd.(a)(b) | 312,000 | 505,486 | ||||||
Zijin Mining Group Co. Ltd., Class H | 878,000 | 1,752,309 | ||||||
|
| |||||||
| Total China | 24,612,398 | |||||||
| Denmark – 6.9% | ||||||||
Coloplast AS, Class B | 35,301 | 4,765,750 | ||||||
Novo Nordisk AS, Class B | 266,706 | 34,032,867 | ||||||
Novonesis (Novozymes) B, Class B | 54,222 | 3,181,171 | ||||||
Pandora AS | 12,439 | 2,007,278 | ||||||
Royal Unibrew AS | 10,504 | 694,589 | ||||||
|
| |||||||
| Total Denmark | 44,681,655 | |||||||
| Finland – 1.2% | ||||||||
Metsa Board OYJ, Class B(a) | 168,286 | 1,275,877 | ||||||
Orion OYJ, Class B | 31,255 | 1,166,924 | ||||||
UPM-Kymmene OYJ | 168,522 | 5,618,456 | ||||||
|
| |||||||
| Total Finland | 8,061,257 | |||||||
| France – 6.9% | ||||||||
Airbus SE | 79,822 | 14,717,387 | ||||||
Arkema SA | 20,351 | 2,143,839 | ||||||
Eramet SA(a) | 10,764 | 818,990 | ||||||
Gaztransport & Technigaz SA | 7,660 | 1,145,783 | ||||||
Hermes International SCA | 5,514 | 14,089,813 | ||||||
Interparfums SA | 11,301 | 637,105 | ||||||
Kering SA | 27,357 | 10,824,015 | ||||||
|
| |||||||
| Total France | 44,376,932 | |||||||
| Germany – 4.1% | ||||||||
AIXTRON SE | 5,243 | 138,730 | ||||||
Aurubis AG | 8,347 | 587,582 | ||||||
Carl Zeiss Meditec AG, Bearer Shares | 9,167 | 1,146,461 | ||||||
Deutsche Post AG, Registered Shares | 411,468 | 17,737,643 | ||||||
Fielmann Group AG | 10,572 | 485,940 | ||||||
Hugo Boss AG | 8,752 | 516,277 | ||||||
Nemetschek SE | 3,900 | 386,325 | ||||||
Puma SE | 16,107 | 730,961 | ||||||
Rheinmetall AG | 5,327 | 2,997,396 | ||||||
Siltronic AG | 5,635 | 500,253 | ||||||
Stroeer SE & Co. KGaA | 18,207 | 1,109,025 | ||||||
|
| |||||||
| Total Germany | 26,336,593 | |||||||
| Hong Kong – 0.7% | ||||||||
Techtronic Industries Co. Ltd. | 316,000 | 4,283,884 | ||||||
See Notes to Financial Statements.
| 58 | WisdomTree Trust |
Schedule of Investments (continued)
WisdomTree Global ex-U.S. Quality Dividend Growth Fund (DNL)
March 31, 2024
| Investments | Shares | Value | ||||||
| Hungary – 0.2% | ||||||||
Richter Gedeon Nyrt | 48,235 | $ | 1,224,212 | |||||
| India – 2.8% | ||||||||
Aarti Industries Ltd. | 10,706 | 85,434 | ||||||
Alkem Laboratories Ltd. | 2,531 | 149,974 | ||||||
APL Apollo Tubes Ltd. | 4,475 | 80,266 | ||||||
Astral Ltd. | 2,115 | 50,496 | ||||||
Balkrishna Industries Ltd. | 4,677 | 129,951 | ||||||
Blue Star Ltd. | 6,487 | 99,068 | ||||||
Coforge Ltd. | 4,842 | 319,449 | ||||||
CRISIL Ltd. | 2,215 | 134,596 | ||||||
Crompton Greaves Consumer Electricals Ltd. | 56,487 | 181,173 | ||||||
Deepak Nitrite Ltd. | 602 | 15,342 | ||||||
Divi’s Laboratories Ltd. | 8,448 | 348,981 | ||||||
Dr. Lal PathLabs Ltd.(b) | 584 | 15,845 | ||||||
GlaxoSmithKline Pharmaceuticals Ltd. | 6,289 | 146,784 | ||||||
Gujarat Gas Ltd. | 22,228 | 145,051 | ||||||
Havells India Ltd. | 11,242 | 204,210 | ||||||
HDFC Asset Management Co. Ltd.(b) | 14,806 | 666,445 | ||||||
IndiaMart InterMesh Ltd.(b) | 725 | 22,996 | ||||||
Ipca Laboratories Ltd. | 4,148 | 61,542 | ||||||
JB Chemicals & Pharmaceuticals Ltd. | 3,582 | 70,882 | ||||||
Jindal Stainless Ltd. | 5,810 | 48,377 | ||||||
Jindal Steel & Power Ltd. | 8,234 | 83,833 | ||||||
JSW Steel Ltd. | 41,783 | 415,914 | ||||||
Jubilant Foodworks Ltd. | 11,887 | 63,973 | ||||||
Kajaria Ceramics Ltd. | 5,195 | 71,934 | ||||||
KPIT Technologies Ltd. | 3,610 | 64,337 | ||||||
L&T Technology Services Ltd.(b) | 2,467 | 162,174 | ||||||
Laurus Labs Ltd.(b) | 19,352 | 91,038 | ||||||
LTIMindtree Ltd.(b) | 6,108 | 361,665 | ||||||
Marico Ltd. | 42,972 | 256,175 | ||||||
Mazagon Dock Shipbuilders Ltd. | 1,297 | 28,989 | ||||||
Mphasis Ltd. | 10,403 | 297,867 | ||||||
Navin Fluorine International Ltd. | 1,772 | 66,168 | ||||||
Nestle India Ltd. | 26,543 | 834,568 | ||||||
Oberoi Realty Ltd. | 4,511 | 79,824 | ||||||
Page Industries Ltd. | 433 | 178,859 | ||||||
Patanjali Foods Ltd. | 5,716 | 91,727 | ||||||
Persistent Systems Ltd. | 4,698 | 224,447 | ||||||
PI Industries Ltd. | 3,010 | 139,580 | ||||||
Polycab India Ltd. | 1,830 | 111,135 | ||||||
Relaxo Footwears Ltd. | 902 | 8,839 | ||||||
SBI Cards & Payment Services Ltd. | 14,099 | 115,383 | ||||||
Schaeffler India Ltd. | 1,681 | 56,664 | ||||||
SKF India Ltd. | 544 | 27,125 | ||||||
Sundram Fasteners Ltd. | 4,440 | 58,219 | ||||||
Supreme Industries Ltd. | 3,789 | 192,270 | ||||||
Tata Communications Ltd. | 10,475 | 252,498 | ||||||
Tata Consultancy Services Ltd. | 81,543 | 3,789,876 | ||||||
Tata Elxsi Ltd. | 1,454 | 135,723 | ||||||
Tata Steel Ltd. | 1,909,449 | 3,568,090 | ||||||
Tech Mahindra Ltd. | 152,653 | 2,284,418 | ||||||
Titan Co. Ltd. | 10,763 | 490,618 | ||||||
Torrent Pharmaceuticals Ltd. | 7,475 | 233,080 | ||||||
Tube Investments of India Ltd. | 1,364 | 61,110 | ||||||
Varun Beverages Ltd. | 4,172 | 69,961 | ||||||
Vinati Organics Ltd. | 26 | 458 | ||||||
|
| |||||||
| Total India | 17,945,401 | |||||||
| Indonesia – 0.1% | ||||||||
Indosat Tbk. PT | 419,500 | 295,674 | ||||||
Mitra Keluarga Karyasehat Tbk. PT(c) | 355,300 | 61,402 | ||||||
Sumber Alfaria Trijaya Tbk. PT | 1,369,600 | 251,374 | ||||||
|
| |||||||
| Total Indonesia | 608,450 | |||||||
| Israel – 0.1% | ||||||||
Newmed Energy LP | 285,956 | 731,964 | ||||||
| Italy – 1.3% | ||||||||
Brunello Cucinelli SpA(a) | 4,547 | 520,541 | ||||||
Carel Industries SpA(a)(b) | 7,097 | 155,978 | ||||||
DiaSorin SpA(a) | 5,520 | 533,563 | ||||||
Ferrari NV | 8,527 | 3,720,500 | ||||||
Moncler SpA | 38,723 | 2,893,165 | ||||||
Reply SpA | 1,787 | 253,211 | ||||||
|
| |||||||
| Total Italy | 8,076,958 | |||||||
| Japan – 6.1% | ||||||||
Advantest Corp. | 29,300 | 1,320,141 | ||||||
Asahi Intecc Co. Ltd. | 9,600 | 167,110 | ||||||
BayCurrent Consulting, Inc. | 6,000 | 117,883 | ||||||
Dentsu Soken, Inc. | 4,900 | 162,529 | ||||||
Disco Corp. | 5,100 | 1,927,180 | ||||||
FANUC Corp. | 158,300 | 4,377,320 | ||||||
Hoya Corp. | 17,800 | 2,204,050 | ||||||
Ibiden Co. Ltd.(a) | 2,300 | 101,045 | ||||||
Internet Initiative Japan, Inc. | 16,400 | 307,314 | ||||||
Kakaku.com, Inc. | 42,300 | 525,868 | ||||||
Keyence Corp. | 6,600 | 3,032,568 | ||||||
Kobe Bussan Co. Ltd. | 10,700 | 264,204 | ||||||
Kotobuki Spirits Co. Ltd.(a) | 2,600 | 32,933 | ||||||
Lasertec Corp. | 3,700 | 1,021,904 | ||||||
M3, Inc. | 36,300 | 512,558 | ||||||
Mitsui High-Tec, Inc. | 2,100 | 121,037 | ||||||
MonotaRO Co. Ltd. | 36,800 | 441,931 | ||||||
Murata Manufacturing Co. Ltd. | 185,300 | 3,457,578 | ||||||
Obic Co. Ltd. | 5,600 | 842,710 | ||||||
Persol Holdings Co. Ltd. | 595,400 | 839,921 | ||||||
SG Holdings Co. Ltd. | 123,600 | 1,554,137 | ||||||
Shinko Electric Industries Co. Ltd. | 4,200 | 155,878 | ||||||
Taiyo Yuden Co. Ltd.(a) | 11,000 | 263,471 | ||||||
TechnoPro Holdings, Inc. | 18,300 | 374,597 | ||||||
Toei Animation Co. Ltd.(a) | 17,500 | 358,452 | ||||||
Tokyo Electron Ltd. | 47,600 | 12,445,287 | ||||||
Tokyo Ohka Kogyo Co. Ltd. | 16,700 | 505,265 | ||||||
Tokyo Seimitsu Co. Ltd. | 6,100 | 490,716 | ||||||
Tosoh Corp. | 102,500 | 1,396,511 | ||||||
|
| |||||||
| Total Japan | 39,322,098 | |||||||
See Notes to Financial Statements.
| WisdomTree Trust | 59 |
Schedule of Investments (continued)
WisdomTree Global ex-U.S. Quality Dividend Growth Fund (DNL)
March 31, 2024
| Investments | Shares | Value | ||||||
| Malaysia – 0.3% | ||||||||
MR DIY Group M Bhd.(b) | 821,700 | $ | 258,680 | |||||
Petronas Chemicals Group Bhd. | 725,000 | 1,027,836 | ||||||
Press Metal Aluminium Holdings Bhd. | 403,700 | 396,621 | ||||||
|
| |||||||
| Total Malaysia | 1,683,137 | |||||||
| Mexico – 1.7% | ||||||||
Grupo Aeroportuario del Centro Norte SAB de CV | 169,496 | 1,666,331 | ||||||
Grupo Aeroportuario del Pacifico SAB de CV, Class B(a) | 113,573 | 1,824,424 | ||||||
Grupo Mexico SAB de CV, Series B | 1,223,439 | 7,222,830 | ||||||
|
| |||||||
| Total Mexico | 10,713,585 | |||||||
| Netherlands – 5.1% | ||||||||
ASM International NV | 1,533 | 936,927 | ||||||
ASML Holding NV | 20,658 | 19,905,551 | ||||||
Universal Music Group NV | 254,994 | 7,677,971 | ||||||
Wolters Kluwer NV | 28,443 | 4,460,317 | ||||||
|
| |||||||
| Total Netherlands | 32,980,766 | |||||||
| Norway – 0.4% | ||||||||
Kongsberg Gruppen ASA | 32,644 | 2,255,284 | ||||||
TOMRA Systems ASA | 33,148 | 518,062 | ||||||
|
| |||||||
| Total Norway | 2,773,346 | |||||||
| Poland – 0.1% | ||||||||
KGHM Polska Miedz SA | 13,449 | 384,980 | ||||||
| Russia – 0.0% | ||||||||
Evraz PLC*† | 243,480 | 0 | ||||||
LUKOIL PJSC*† | 68,533 | 0 | ||||||
LUKOIL PJSC, ADR*† | 2,107 | 0 | ||||||
Magnitogorsk Iron & Steel Works PJSC, GDR*†(c) | 54,588 | 0 | ||||||
MMC Norilsk Nickel PJSC*† | 16,209 | 0 | ||||||
MMC Norilsk Nickel PJSC, ADR*† | 12 | 0 | ||||||
Novatek PJSC*† | 97,470 | 0 | ||||||
PhosAgro PJSC*† | 8,504 | 0 | ||||||
PhosAgro PJSC, GDR*†(c) | 166 | 0 | ||||||
|
| |||||||
| Total Russia | 0 | |||||||
| Saudi Arabia – 0.3% | ||||||||
Aldrees Petroleum & Transport Services Co. | 4,327 | 197,515 | ||||||
Sahara International Petrochemical Co. | 232,728 | 1,920,526 | ||||||
|
| |||||||
| Total Saudi Arabia | 2,118,041 | |||||||
| South Africa – 1.2% | ||||||||
Capitec Bank Holdings Ltd. | 19,413 | 2,148,555 | ||||||
Gold Fields Ltd. | 259,198 | 4,159,761 | ||||||
Northam Platinum Holdings Ltd. | 167,750 | 1,000,409 | ||||||
OUTsurance Group Ltd. | 187,734 | 416,388 | ||||||
|
| |||||||
| Total South Africa | 7,725,113 | |||||||
| South Korea – 4.9% | ||||||||
Ecopro BM Co. Ltd.* | 774 | 157,531 | ||||||
Ecopro Co. Ltd.* | 2 | 940 | ||||||
JYP Entertainment Corp. | 18 | 964 | ||||||
Kumho Petrochemical Co. Ltd. | 5,985 | 603,724 | ||||||
LG Innotek Co. Ltd. | 784 | 114,550 | ||||||
NCSoft Corp. | 4,054 | 598,652 | ||||||
Samsung Electro-Mechanics Co. Ltd. | 5,059 | 558,792 | ||||||
Samsung Electronics Co. Ltd. | 479,775 | 29,365,615 | ||||||
|
| |||||||
| Total South Korea | 31,400,768 | |||||||
| Spain – 2.0% | ||||||||
Endesa SA | 606,765 | 11,248,330 | ||||||
Laboratorios Farmaceuticos Rovi SA | 9,109 | 795,872 | ||||||
Viscofan SA(a) | 11,283 | 717,734 | ||||||
|
| |||||||
| Total Spain | 12,761,936 | |||||||
| Sweden – 1.8% | ||||||||
Evolution AB(b) | 30,678 | 3,817,607 | ||||||
Fortnox AB | 9,601 | 60,106 | ||||||
Husqvarna AB, Class B(a) | 125,420 | 1,074,901 | ||||||
Investment AB Latour, Class B(a) | 79,668 | 2,097,389 | ||||||
Munters Group AB(b) | 8,955 | 160,883 | ||||||
Nibe Industrier AB, Class B(a) | 120,657 | 593,095 | ||||||
Paradox Interactive AB | 4,826 | 84,897 | ||||||
Sectra AB, Class B(a) | 11,626 | 225,233 | ||||||
Securitas AB, Class B | 140,907 | 1,454,192 | ||||||
Skanska AB, Class B(a) | 117,788 | 2,098,518 | ||||||
|
| |||||||
| Total Sweden | 11,666,821 | |||||||
| Switzerland – 10.0% | ||||||||
Clariant AG, Registered Shares*(a) | 55,160 | 746,531 | ||||||
Logitech International SA, Registered Shares | 14,091 | 1,263,450 | ||||||
Partners Group Holding AG | 6,625 | 9,473,743 | ||||||
Roche Holding AG | 89,166 | 22,739,458 | ||||||
Roche Holding AG, Bearer Shares(a) | 10,253 | 2,766,159 | ||||||
Sika AG, Registered Shares | 14,862 | 4,432,034 | ||||||
Sonova Holding AG, Registered Shares | 8,963 | 2,598,245 | ||||||
Straumann Holding AG, Registered Shares | 7,677 | 1,227,365 | ||||||
Tecan Group AG, Registered Shares(a) | 986 | 409,200 | ||||||
UBS Group AG, Registered Shares | 537,664 | 16,559,120 | ||||||
VAT Group AG(b) | 3,987 | 2,068,530 | ||||||
|
| |||||||
| Total Switzerland | 64,283,835 | |||||||
| Taiwan – 9.6% | ||||||||
Accton Technology Corp. | 46,000 | 665,490 | ||||||
ASE Technology Holding Co. Ltd. | 1,577,000 | 7,933,414 | ||||||
Asia Vital Components Co. Ltd. | 26,000 | 443,576 | ||||||
ASMedia Technology, Inc. | 3,000 | 224,507 | ||||||
Eclat Textile Co. Ltd. | 59,000 | 1,019,482 | ||||||
Elite Material Co. Ltd. | 35,000 | 441,280 | ||||||
Faraday Technology Corp. | 19,849 | 213,353 | ||||||
Fortune Electric Co. Ltd. | 15,000 | 320,121 | ||||||
Gigabyte Technology Co. Ltd. | 64,000 | 631,931 | ||||||
Global Unichip Corp. | 5,000 | 194,510 | ||||||
Hiwin Technologies Corp. | 69,000 | 593,982 | ||||||
Jentech Precision Industrial Co. Ltd. | 9,000 | 259,003 | ||||||
King Slide Works Co. Ltd. | 8,000 | 312,466 | ||||||
Lotes Co. Ltd. | 16,337 | 714,666 | ||||||
Micro-Star International Co. Ltd. | 154,000 | 815,630 | ||||||
momo.com, Inc. | 21,032 | 254,328 | ||||||
Nan Ya Printed Circuit Board Corp. | 87,000 | 545,050 | ||||||
See Notes to Financial Statements.
| 60 | WisdomTree Trust |
Schedule of Investments (continued)
WisdomTree Global ex-U.S. Quality Dividend Growth Fund (DNL)
March 31, 2024
| Investments | Shares | Value | ||||||
Nien Made Enterprise Co. Ltd. | 58,000 | $ | 637,024 | |||||
Powertech Technology, Inc. | 273,000 | 1,710,329 | ||||||
Qisda Corp. | 403,000 | 562,249 | ||||||
Quanta Computer, Inc. | 380,000 | 3,484,931 | ||||||
Sinbon Electronics Co. Ltd. | 31,000 | 267,346 | ||||||
Taiwan Semiconductor Manufacturing Co. Ltd. | 1,417,000 | 34,491,321 | ||||||
Tripod Technology Corp. | 97,000 | 619,823 | ||||||
Unimicron Technology Corp. | 350,000 | 2,088,834 | ||||||
Wiwynn Corp. | 19,000 | 1,347,665 | ||||||
WT Microelectronics Co. Ltd.(a) | 88,315 | 407,032 | ||||||
Yageo Corp. | 40,000 | 738,669 | ||||||
|
| |||||||
| Total Taiwan | 61,938,012 | |||||||
| Thailand – 0.1% | ||||||||
Carabao Group PCL, NVDR | 77,200 | 133,824 | ||||||
Delta Electronics Thailand PCL, NVDR(a) | 138,300 | 282,380 | ||||||
|
| |||||||
| Total Thailand | 416,204 | |||||||
| Turkey – 0.8% | ||||||||
Arcelik AS(a) | 31,197 | 142,716 | ||||||
Aselsan Elektronik Sanayi ve Ticaret AS | 35,696 | 61,899 | ||||||
BIM Birlesik Magazalar AS | 58,859 | 656,779 | ||||||
Coca-Cola Icecek AS | 3,369 | 60,190 | ||||||
Enerjisa Enerji AS(b) | 91,149 | 164,537 | ||||||
Ford Otomotiv Sanayi AS | 13,928 | 487,342 | ||||||
Haci Omer Sabanci Holding AS | 337,552 | 860,783 | ||||||
Is Yatirim Menkul Degerler AS | 49,613 | 48,613 | ||||||
Koza Altin Isletmeleri AS | 81,576 | 58,751 | ||||||
Migros Ticaret AS | 1,846 | 23,680 | ||||||
Tofas Turk Otomobil Fabrikasi AS | 22,959 | 196,577 | ||||||
Turk Traktor ve Ziraat Makineleri AS | 4,505 | 137,579 | ||||||
Turkcell Iletisim Hizmetleri AS | 198,067 | 414,476 | ||||||
Turkiye Garanti Bankasi AS(a) | 185,932 | 393,680 | ||||||
Turkiye Is Bankasi AS, Class C | 2,693,741 | 948,371 | ||||||
Turkiye Sise ve Cam Fabrikalari AS | 146,654 | 209,609 | ||||||
|
| |||||||
| Total Turkey | 4,865,582 | |||||||
| United Kingdom – 9.5% | ||||||||
Admiral Group PLC | 90,380 | 3,239,075 | ||||||
Airtel Africa PLC(b) | 914,179 | 1,221,817 | ||||||
Ashtead Group PLC | 52,613 | 3,748,534 | ||||||
Auto Trader Group PLC(b) | 83,101 | 735,051 | ||||||
Bellway PLC | 55,466 | 1,866,596 | ||||||
Burberry Group PLC | 78,623 | 1,204,758 | ||||||
Diageo PLC | 439,281 | 16,234,234 | ||||||
Greggs PLC | 19,284 | 700,121 | ||||||
Hays PLC | 632,309 | 754,433 | ||||||
Howden Joinery Group PLC | 118,839 | 1,361,319 | ||||||
Imperial Brands PLC | 563,096 | 12,590,558 | ||||||
JD Sports Fashion PLC | 230,249 | 391,209 | ||||||
Redrow PLC | 153,950 | 1,294,247 | ||||||
RELX PLC | 261,632 | 11,316,546 | ||||||
Rightmove PLC | 87,113 | 604,810 | ||||||
RS Group PLC | 100,637 | 923,978 | ||||||
Sage Group PLC | 104,264 | 1,666,809 | ||||||
Spirax-Sarco Engineering PLC | 9,397 | 1,193,012 | ||||||
|
| |||||||
| Total United Kingdom | 61,047,107 | |||||||
TOTAL COMMON STOCKS (Cost: $539,889,996) |
| 639,597,019 | ||||||
| WARRANTS – 0.0% |
| |||||||
| Canada – 0.0% |
| |||||||
Constellation Software, Inc., (Cost: $0) | 545 | 0 | ||||||
| EXCHANGE-TRADED FUNDS – 0.0% |
| |||||||
| United States – 0.0% |
| |||||||
WisdomTree Emerging Markets High Dividend Fund(d) | 10 | 418 | ||||||
WisdomTree International Equity Fund(d) | 10 | 548 | ||||||
TOTAL EXCHANGE-TRADED FUNDS (Cost: $845) | 966 | |||||||
| INVESTMENT OF CASH COLLATERAL FOR SECURITIES LOANED – 5.5% |
| |||||||
| United States – 5.5% |
| |||||||
State Street Navigator Securities Lending |
| |||||||
| (Cost: $35,388,732) | 35,388,732 | 35,388,732 | ||||||
TOTAL INVESTMENTS IN SECURITIES – 105.1% (Cost: $575,279,573) |
| 674,986,717 | ||||||
Other Assets less Liabilities – (5.1)% |
| (32,475,361 | ) | |||||
|
| |||||||
| NET ASSETS – 100.0% |
| $ | 642,511,356 | |||||
| * | Non-income producing security. |
| † | This security is being fair valued using significant unobservable inputs (i.e., Level 3 on the fair value hierarchy) by WisdomTree Asset Management, Inc., as valuation designee, in accordance with valuation procedures approved by the Board of Trustees of WisdomTree Trust. The aggregate value of Level 3 fair valued securities is $0, which represents 0.0% of net assets. |
| (a) | Security, or portion thereof, was on loan at March 31, 2024 (See Note 2). At March 31, 2024, the total market value of the Fund’s securities on loan identified in the Schedule of Investments was $48,910,080 and the total market value of the collateral held by the Fund was $51,283,026. The total market value of the collateral includes non-cash U.S. Government securities collateral having a value of $15,894,294. |
| (b) | This security is exempt from registration under rule 144A of the Securities Act of 1933. This security may be sold in transactions that are exempt from registration, normally to qualified institutional buyers. |
| (c) | This security is exempt from registration under Regulation S of the Securities Act of 1933, which exempts from registration securities offered and sold outside the United States. This security may not be offered or sold in the United States except pursuant to an exemption from, or in a transaction not subject to, the registration requirements of the Securities Act of 1933. |
| (d) | Affiliated holding. See “Investment in Affiliates” supplementary table included in this Schedule of Investments for additional information. |
| (e) | Rate shown represents annualized 7-day yield as of March 31, 2024. |
See Notes to Financial Statements.
| WisdomTree Trust | 61 |
Schedule of Investments (concluded)
WisdomTree Global ex-U.S. Quality Dividend Growth Fund (DNL)
March 31, 2024
| INVESTMENT IN AFFILIATES |
Affiliated holdings are investments in entities in which the Fund owns 5% or more of the outstanding voting securities or are investments in entities which are under common ownership or control. Investments in affiliates during the fiscal year ended March 31, 2024 were as follows:
| Affiliate | Value at 3/31/2023 | Purchases/ Additions | Sales/ Reductions | Realized (Loss) | Change in Unrealized Appreciation/ Depreciation | Value at 3/31/2024 | Dividend Income | |||||||||||||||||||||
WisdomTree Emerging Markets High Dividend Fund | $ | 1,023,167 | $ | 2,487,358 | $ | 3,514,901 | $ | 136,877 | $ | (132,083 | ) | $ | 418 | $ | 57,304 | |||||||||||||
WisdomTree International Equity Fund | 1,549,089 | 3,750,411 | 5,293,440 | 272,454 | (277,966 | ) | 548 | 62,273 | ||||||||||||||||||||
Total | $ | 2,572,256 | $ | 6,237,769 | $ | 8,808,341 | $ | 409,331 | $ | (410,049 | ) | $ | 966 | $ | 119,577 | |||||||||||||
| FINANCIAL DERIVATIVE INSTRUMENTS | ||||||||||||||||||||||||||||
| FOREIGN CURRENCY CONTRACTS (OTC – OVER THE COUNTER) | ||||||||||||||||||||||||||||
| Counterparty | Settlement Date | Amount and Description of Currency to be Purchased | Amount and Description of Currency to be Sold | Unrealized Appreciation | Unrealized Depreciation | |||||||||||||||||||||||
Goldman Sachs | 4/1/2024 | 38,536 | USD | 144,539 | SAR | $ | — | $ | (3 | ) | ||||||||||||||||||
| FAIR VALUATION SUMMARY |
The following is a summary of the fair valuations according to the inputs used in valuing the Fund’s investments (See Note 2 — Fair Value Measurement):
Quoted Active | Other Significant Observable Inputs (Level 2) | Significant Unobservable Inputs (Level 3) | Total | |||||||||||||
Assets: | ||||||||||||||||
Investments in Securities | ||||||||||||||||
Common Stocks | ||||||||||||||||
Russia | $ | — | $ | — | $ | 0 | * | $ | 0 | |||||||
Other | 639,597,019 | — | — | 639,597,019 | ||||||||||||
Warrants | — | — | 0 | * | 0 | |||||||||||
Exchange-Traded Funds | 966 | — | — | 966 | ||||||||||||
Investment of Cash Collateral for Securities Loaned | — | 35,388,732 | — | 35,388,732 | ||||||||||||
Total Investments in Securities | $ | 639,597,985 | $ | 35,388,732 | $ | 0 | $ | 674,986,717 | ||||||||
Liabilities: | ||||||||||||||||
Financial Derivative Instruments | ||||||||||||||||
Foreign Currency Contracts1 | $ | — | $ | (3 | ) | $ | — | $ | (3 | ) | ||||||
Total – Net | $ | 639,597,985 | $ | 35,388,729 | $ | 0 | $ | 674,986,714 | ||||||||
| * | Fair valuations using significant unobservable inputs were determined by WisdomTree Asset Management, Inc., as valuation designee, in accordance with valuation procedures approved by the Board of Trustees of WisdomTree Trust. |
| 1 | Amount shown represents the unrealized appreciation (depreciation) on the financial instrument. |
See Notes to Financial Statements.
| 62 | WisdomTree Trust |
Schedule of Investments
WisdomTree Global High Dividend Fund (DEW)
March 31, 2024
| Investments | Shares | Value | ||||||
| COMMON STOCKS – 99.4% | ||||||||
| Australia – 3.1% | ||||||||
Ampol Ltd.(a) | 2,134 | $ | 55,396 | |||||
ANZ Group Holdings Ltd. | 10,750 | 206,191 | ||||||
APA Group | 9,955 | 54,620 | ||||||
Bendigo & Adelaide Bank Ltd.(a) | 7,415 | 49,585 | ||||||
Coles Group Ltd. | 7,850 | 86,755 | ||||||
Commonwealth Bank of Australia(a) | 4,882 | 383,285 | ||||||
Dexus(a) | 3,246 | 16,751 | ||||||
Endeavour Group Ltd.(a) | 12,777 | 45,930 | ||||||
GPT Group(a) | 20,745 | 61,851 | ||||||
IGO Ltd.(a) | 4,455 | 20,549 | ||||||
Incitec Pivot Ltd. | 13,909 | 26,225 | ||||||
JB Hi-Fi Ltd. | 1,309 | 54,869 | ||||||
Macquarie Group Ltd. | 1,248 | 162,595 | ||||||
Medibank Pvt Ltd. | 19,613 | 48,111 | ||||||
Metcash Ltd. | 14,863 | 37,914 | ||||||
Mirvac Group(a) | 29,186 | 44,937 | ||||||
National Australia Bank Ltd. | 6,815 | 154,013 | ||||||
New Hope Corp. Ltd.(a) | 5,759 | 17,471 | ||||||
Origin Energy Ltd. | 7,326 | 43,971 | ||||||
Pilbara Minerals Ltd.(a) | 17,038 | 42,573 | ||||||
Rio Tinto Ltd.(a) | 1,584 | 125,827 | ||||||
Rio Tinto PLC | 5,960 | 377,728 | ||||||
Santos Ltd. | 12,354 | 62,463 | ||||||
Scentre Group | 43,012 | 95,127 | ||||||
Stockland(a) | 21,501 | 68,032 | ||||||
Suncorp Group Ltd. | 4,514 | 48,238 | ||||||
Telstra Group Ltd. | 43,419 | 109,340 | ||||||
Transurban Group(a) | 11,143 | 96,832 | ||||||
Vicinity Ltd.(a) | 40,070 | 55,682 | ||||||
Viva Energy Group Ltd.(b) | 19,329 | 46,658 | ||||||
Wesfarmers Ltd.(a) | 4,441 | 198,176 | ||||||
Westpac Banking Corp. | 10,231 | 174,210 | ||||||
Whitehaven Coal Ltd. | 7,215 | 33,420 | ||||||
Woodside Energy Group Ltd. | 13,669 | 271,988 | ||||||
Yancoal Australia Ltd.(a) | 13,307 | 45,491 | ||||||
|
| |||||||
| Total Australia | 3,422,804 | |||||||
| Austria – 0.3% | ||||||||
BAWAG Group AG*(b) | 641 | 40,637 | ||||||
Erste Group Bank AG | 2,669 | 119,048 | ||||||
Mondi PLC | 2,968 | 52,322 | ||||||
OMV AG | 2,000 | 94,738 | ||||||
Verbund AG | 609 | 44,560 | ||||||
voestalpine AG | 1,049 | 29,456 | ||||||
|
| |||||||
| Total Austria | 380,761 | |||||||
| Belgium – 0.3% | ||||||||
Aedifica SA | 610 | 37,519 | ||||||
Ageas SA | 1,065 | 49,367 | ||||||
Cofinimmo SA | 546 | 35,764 | ||||||
KBC Group NV | 2,041 | 153,021 | ||||||
Solvay SA(a) | 511 | 13,962 | ||||||
Warehouses De Pauw CVA | 1,766 | 50,467 | ||||||
|
| |||||||
| Total Belgium | 340,100 | |||||||
| Brazil – 1.5% | ||||||||
Ambev SA | 32,113 | 80,129 | ||||||
Banco Bradesco SA | 17,254 | 43,914 | ||||||
Banco do Brasil SA | 19,883 | 224,905 | ||||||
BB Seguridade Participacoes SA | 8,497 | 55,203 | ||||||
CPFL Energia SA | 6,441 | 44,793 | ||||||
Engie Brasil Energia SA | 5,753 | 46,272 | ||||||
Klabin SA | 6,697 | 33,796 | ||||||
Lojas Renner SA | 16,877 | 57,251 | ||||||
Neoenergia SA | 7,614 | 30,955 | ||||||
Petroleo Brasileiro SA | 76,877 | 587,918 | ||||||
Telefonica Brasil SA | 3,138 | 31,721 | ||||||
TIM SA | 4,433 | 15,764 | ||||||
Vale SA | 26,001 | 315,977 | ||||||
Vibra Energia SA | 10,820 | 54,062 | ||||||
|
| |||||||
| Total Brazil | 1,622,660 | |||||||
| Canada – 3.8% | ||||||||
AltaGas Ltd.(a) | 1,346 | 29,760 | ||||||
Atco Ltd., Class I(a) | 1,609 | 44,837 | ||||||
Bank of Montreal | 2,102 | 205,424 | ||||||
Bank of Nova Scotia(a) | 4,586 | 237,459 | ||||||
BCE, Inc. | 5,725 | 194,732 | ||||||
Brookfield Infrastructure Corp., Class A(a) | 1,295 | 46,699 | ||||||
Canadian Imperial Bank of Commerce(a) | 2,799 | 142,034 | ||||||
Canadian Natural Resources Ltd.(a) | 3,754 | 286,644 | ||||||
Canadian Tire Corp. Ltd., Class A(a) | 190 | 18,968 | ||||||
Canadian Utilities Ltd., Class A(a) | 65 | 1,482 | ||||||
Capital Power Corp.(a) | 1,142 | 32,245 | ||||||
Choice Properties Real Estate Investment Trust | 4,203 | 42,799 | ||||||
Emera, Inc.(a) | 372 | 13,104 | ||||||
Enbridge, Inc.(a) | 13,402 | 484,779 | ||||||
Fortis, Inc.(a) | 1,192 | 47,143 | ||||||
Great-West Lifeco, Inc.(a) | 3,270 | 104,679 | ||||||
IGM Financial, Inc.(a) | 2,107 | 54,386 | ||||||
Keyera Corp.(a) | 2,266 | 58,423 | ||||||
Manulife Financial Corp.(a) | 6,596 | 164,894 | ||||||
National Bank of Canada | 1,055 | 88,922 | ||||||
Northland Power, Inc.(a) | 2,741 | 44,824 | ||||||
Paramount Resources Ltd., Class A(a) | 809 | 16,434 | ||||||
Pembina Pipeline Corp.(a) | 2,205 | 77,902 | ||||||
Power Corp. of Canada(a) | 2,400 | 67,358 | ||||||
RioCan Real Estate Investment Trust | 3,483 | 47,538 | ||||||
Royal Bank of Canada | 5,883 | 593,930 | ||||||
Sun Life Financial, Inc. | 2,969 | 162,157 | ||||||
Suncor Energy, Inc. | 4,344 | 160,470 | ||||||
TELUS Corp. | 8,450 | 135,312 | ||||||
Toronto-Dominion Bank | 5,289 | 319,509 | ||||||
Tourmaline Oil Corp.(a) | 3,413 | 159,723 | ||||||
Whitecap Resources, Inc.(a) | 3,996 | 30,267 | ||||||
|
| |||||||
| Total Canada | 4,114,837 | |||||||
| Chile – 0.3% | ||||||||
Banco de Chile | 862,248 | 95,820 | ||||||
Banco Santander Chile | 482,180 | 23,990 | ||||||
See Notes to Financial Statements.
| WisdomTree Trust | 63 |
Schedule of Investments (continued)
WisdomTree Global High Dividend Fund (DEW)
March 31, 2024
| Investments | Shares | Value | ||||||
Cencosud SA | 15,779 | $ | 27,348 | |||||
Empresas CMPC SA | 24,468 | 49,667 | ||||||
Empresas Copec SA | 5,126 | 36,786 | ||||||
Enel Chile SA | 732,113 | 43,963 | ||||||
|
| |||||||
| Total Chile | 277,574 | |||||||
| China – 2.5% | ||||||||
Agricultural Bank of China Ltd., Class H | 266,074 | 112,189 | ||||||
Anhui Conch Cement Co. Ltd., Class H | 18,000 | 37,442 | ||||||
Bank of China Ltd., Class H | 786,000 | 324,385 | ||||||
Bank of Communications Co. Ltd., Class H | 212,000 | 139,230 | ||||||
BOC Hong Kong Holdings Ltd. | 23,000 | 61,567 | ||||||
China CITIC Bank Corp. Ltd., Class H | 142,000 | 75,659 | ||||||
China Construction Bank Corp., Class H | 825,536 | 497,867 | ||||||
China Feihe Ltd.(b) | 53,000 | 24,921 | ||||||
China Life Insurance Co. Ltd., Class H | 45,000 | 53,990 | ||||||
China Medical System Holdings Ltd. | 17,000 | 17,855 | ||||||
China Merchants Bank Co. Ltd., Class H | 25,000 | 98,863 | ||||||
China Minsheng Banking Corp. Ltd., Class H(a) | 141,000 | 48,823 | ||||||
China Pacific Insurance Group Co. Ltd., Class H | 11,000 | 19,255 | ||||||
China Railway Group Ltd., Class H | 35,000 | 17,307 | ||||||
China Shenhua Energy Co. Ltd., Class H | 59,000 | 231,810 | ||||||
CSPC Pharmaceutical Group Ltd. | 70,000 | 55,006 | ||||||
ENN Energy Holdings Ltd. | 5,500 | 42,376 | ||||||
Industrial & Commercial Bank of China Ltd., Class H | 518,000 | 260,772 | ||||||
PetroChina Co. Ltd., Class H | 332,000 | 283,792 | ||||||
PICC Property & Casualty Co. Ltd., Class H | 42,000 | 55,381 | ||||||
Ping An Insurance Group Co. of China Ltd., Class H | 29,500 | 124,574 | ||||||
Postal Savings Bank of China Co. Ltd., Class H(a)(b) | 58,000 | 30,310 | ||||||
Sinopharm Group Co. Ltd., Class H | 12,000 | 30,742 | ||||||
Tingyi Cayman Islands Holding Corp. | 28,000 | 30,696 | ||||||
Wilmar International Ltd. | 8,900 | 22,619 | ||||||
|
| |||||||
| Total China | 2,697,431 | |||||||
| Czech Republic – 0.1% | ||||||||
CEZ AS(a) | 3,384 | 120,976 | ||||||
| Denmark – 0.1% | ||||||||
Danske Bank AS | 2,422 | 72,451 | ||||||
Tryg AS | 2,769 | 57,012 | ||||||
|
| |||||||
| Total Denmark | 129,463 | |||||||
| Finland – 0.6% | ||||||||
Elisa OYJ | 1,254 | 56,001 | ||||||
Kesko OYJ, Class B | 2,497 | 46,694 | ||||||
Kone OYJ, Class B | 1,801 | 83,911 | ||||||
Nordea Bank Abp(a) | 26,714 | 297,805 | ||||||
Sampo OYJ, Class A | 727 | 31,025 | ||||||
UPM-Kymmene OYJ | 2,176 | 72,547 | ||||||
Valmet OYJ(a) | 1,875 | 49,390 | ||||||
|
| |||||||
| Total Finland | 637,373 | |||||||
| France – 2.9% | ||||||||
Amundi SA(b) | 873 | 60,012 | ||||||
AXA SA | 12,069 | 453,797 | ||||||
BNP Paribas SA | 4,087 | 290,704 | ||||||
Bouygues SA | 906 | 37,016 | ||||||
Cie Generale des Etablissements Michelin SCA | 3,363 | 129,010 | ||||||
Credit Agricole SA | 15,907 | 237,353 | ||||||
Danone SA | 2,797 | 180,913 | ||||||
Eiffage SA | 449 | 50,989 | ||||||
Gecina SA | 569 | 58,164 | ||||||
Klepierre SA(a) | 1,674 | 43,390 | ||||||
La Francaise des Jeux SAEM(b) | 1,305 | 53,247 | ||||||
Orange SA | 11,637 | 136,840 | ||||||
Publicis Groupe SA | 1,145 | 124,959 | ||||||
Rexel SA | 1,552 | 41,954 | ||||||
Rubis SCA | 1,905 | 67,359 | ||||||
Societe Generale SA | 4,131 | 110,689 | ||||||
TotalEnergies SE(a) | 13,067 | 895,712 | ||||||
Veolia Environnement SA | 3,929 | 127,851 | ||||||
Verallia SA(b) | 1,142 | 44,450 | ||||||
|
| |||||||
| Total France | 3,144,409 | |||||||
| Germany – 2.2% | ||||||||
Allianz SE, Registered Shares | 1,780 | 534,043 | ||||||
Bayer AG, Registered Shares | 4,083 | 125,366 | ||||||
Bayerische Motoren Werke AG | 5,594 | 646,201 | ||||||
Deutsche Post AG, Registered Shares | 4,142 | 178,554 | ||||||
DWS Group GmbH & Co. KGaA(b) | 1,306 | 57,519 | ||||||
E.ON SE | 13,832 | 192,483 | ||||||
Evonik Industries AG | 2,702 | 53,475 | ||||||
HochTief AG | 424 | 49,318 | ||||||
K&S AG, Registered Shares | 2,433 | 37,996 | ||||||
Mercedes-Benz Group AG | 6,532 | 520,697 | ||||||
|
| |||||||
| Total Germany | 2,395,652 | |||||||
| Hong Kong – 0.5% | ||||||||
Bank of East Asia Ltd. | 24,200 | 28,818 | ||||||
CLP Holdings Ltd. | 11,000 | 87,632 | ||||||
Hang Seng Bank Ltd. | 7,900 | 86,455 | ||||||
Hong Kong & China Gas Co. Ltd. | 108,000 | 81,830 | ||||||
Link REIT | 10,666 | 45,859 | ||||||
MTR Corp. Ltd. | 26,500 | 87,357 | ||||||
Power Assets Holdings Ltd. | 7,000 | 40,964 | ||||||
Sun Hung Kai Properties Ltd. | 8,000 | 77,123 | ||||||
Swire Pacific Ltd., Class B | 25,000 | 32,582 | ||||||
Swire Properties Ltd. | 15,800 | 33,189 | ||||||
|
| |||||||
| Total Hong Kong | 601,809 | |||||||
| Hungary – 0.0% | ||||||||
MOL Hungarian Oil & Gas PLC | 3,798 | 30,813 | ||||||
| India – 0.8% | ||||||||
Coal India Ltd. | 37,814 | 196,817 | ||||||
HCL Technologies Ltd. | 8,605 | 159,255 | ||||||
Indian Oil Corp. Ltd. | 53,115 | 106,832 | ||||||
NMDC Ltd. | 19,461 | 47,076 | ||||||
Oil & Natural Gas Corp. Ltd. | 33,561 | 107,863 | ||||||
Petronet LNG Ltd. | 11,055 | 34,887 | ||||||
Power Grid Corp. of India Ltd. | 48,030 | 159,462 | ||||||
Tech Mahindra Ltd. | 4,122 | 61,685 | ||||||
See Notes to Financial Statements.
| 64 | WisdomTree Trust |
Schedule of Investments (continued)
WisdomTree Global High Dividend Fund (DEW)
March 31, 2024
| Investments | Shares | Value | ||||||
Vedanta Ltd. | 17,840 | $ | 58,106 | |||||
|
| |||||||
| Total India | 931,983 | |||||||
| Indonesia – 0.6% | ||||||||
Adaro Energy Indonesia Tbk. PT | 216,400 | 36,851 | ||||||
Astra International Tbk. PT | 371,800 | 120,768 | ||||||
Bank Mandiri Persero Tbk. PT | 323,100 | 147,744 | ||||||
Bank Rakyat Indonesia Persero Tbk. PT | 626,400 | 239,024 | ||||||
Bukit Asam Tbk. PT | 104,500 | 19,575 | ||||||
Indo Tambangraya Megah Tbk. PT | 8,100 | 13,641 | ||||||
Indofood Sukses Makmur Tbk. PT | 48,700 | 19,581 | ||||||
Telkom Indonesia Persero Tbk. PT | 319,800 | 69,991 | ||||||
United Tractors Tbk. PT | 23,000 | 35,069 | ||||||
|
| |||||||
| Total Indonesia | 702,244 | |||||||
| Ireland – 0.1% | ||||||||
Smurfit Kappa Group PLC | 1,355 | 61,858 | ||||||
| Israel – 0.2% | ||||||||
Amot Investments Ltd. | 4,286 | 20,379 | ||||||
Bank Hapoalim BM | 7,836 | 73,747 | ||||||
Delek Group Ltd. | 354 | 46,466 | ||||||
First International Bank of Israel Ltd. | 486 | 20,296 | ||||||
Israel Discount Bank Ltd., Class A | 9,574 | 49,729 | ||||||
Mizrahi Tefahot Bank Ltd. | 1,367 | 51,453 | ||||||
|
| |||||||
| Total Israel | 262,070 | |||||||
| Italy – 1.9% | ||||||||
A2A SpA | 30,304 | 54,771 | ||||||
Assicurazioni Generali SpA | 8,320 | 210,802 | ||||||
Banca Mediolanum SpA | 6,160 | 67,726 | ||||||
Banco BPM SpA | 7,955 | 52,992 | ||||||
Enel SpA | 82,269 | 543,676 | ||||||
Eni SpA(a) | 15,054 | 238,152 | ||||||
FinecoBank Banca Fineco SpA(a) | 3,702 | 55,514 | ||||||
Hera SpA(a) | 12,240 | 43,174 | ||||||
Intesa Sanpaolo SpA | 76,171 | 276,656 | ||||||
Italgas SpA | 11,107 | 64,776 | ||||||
Mediobanca Banca di Credito Finanziario SpA(a) | 4,253 | 63,433 | ||||||
Poste Italiane SpA(a)(b) | 5,965 | 74,762 | ||||||
Snam SpA(a) | 8,272 | 39,094 | ||||||
Terna – Rete Elettrica Nazionale(a) | 7,604 | 62,906 | ||||||
UniCredit SpA | 5,005 | 190,135 | ||||||
UnipolSai Assicurazioni SpA(a) | 13,567 | 39,327 | ||||||
|
| |||||||
| Total Italy | 2,077,896 | |||||||
| Japan – 1.5% | ||||||||
AGC, Inc. | 800 | 29,221 | ||||||
ENEOS Holdings, Inc. | 3,100 | 14,979 | ||||||
Haseko Corp.(a) | 2,100 | 26,308 | ||||||
Isuzu Motors Ltd.(a) | 3,000 | 40,735 | ||||||
Japan Post Holdings Co. Ltd. | 11,700 | 118,434 | ||||||
Japan Tobacco, Inc. | 12,900 | 345,546 | ||||||
MS&AD Insurance Group Holdings, Inc. | 4,700 | 84,190 | ||||||
Nippon Steel Corp.(a) | 6,200 | 150,263 | ||||||
Niterra Co. Ltd.(a) | 2,100 | 70,543 | ||||||
SBI Holdings, Inc. | 2,100 | 54,822 | ||||||
Sekisui House Ltd. | 2,800 | 65,030 | ||||||
SoftBank Corp.(a) | 15,500 | 199,812 | ||||||
Sojitz Corp.(a) | 2,100 | 55,322 | ||||||
Sompo Holdings, Inc. | 3,500 | 73,772 | ||||||
Sumitomo Corp. | 5,986 | 144,444 | ||||||
Sumitomo Mitsui Trust Holdings, Inc. | 2,100 | 45,900 | ||||||
Takeda Pharmaceutical Co. Ltd.(a) | 5,000 | 138,227 | ||||||
Tosoh Corp.(a) | 2,600 | 35,424 | ||||||
|
| |||||||
| Total Japan | 1,692,972 | |||||||
| Malaysia – 0.6% | ||||||||
CIMB Group Holdings Bhd. | 77,300 | 108,445 | ||||||
HAP Seng Consolidated Bhd. | 13,900 | 13,128 | ||||||
Kuala Lumpur Kepong Bhd. | 6,000 | 28,447 | ||||||
Malayan Banking Bhd. | 80,793 | 165,410 | ||||||
Maxis Bhd. | 33,000 | 23,497 | ||||||
MISC Bhd. | 30,800 | 49,913 | ||||||
Petronas Gas Bhd. | 18,300 | 68,127 | ||||||
Public Bank Bhd. | 130,500 | 116,355 | ||||||
RHB Bank Bhd. | 10,667 | 12,779 | ||||||
Sime Darby Bhd. | 53,300 | 29,279 | ||||||
|
| |||||||
| Total Malaysia | 615,380 | |||||||
| Mexico – 1.0% | ||||||||
Arca Continental SAB de CV | 5,068 | 55,325 | ||||||
Banco del Bajio SA(b) | 11,307 | 44,080 | ||||||
Coca-Cola Femsa SAB de CV | 5,750 | 55,481 | ||||||
Fibra Uno Administracion SA de CV | 50,991 | 84,700 | ||||||
Grupo Aeroportuario del Centro Norte SAB de CV | 4,966 | 48,821 | ||||||
Grupo Financiero Banorte SAB de CV, Class O | 35,960 | 381,564 | ||||||
Grupo Mexico SAB de CV, Series B | 20,215 | 119,344 | ||||||
Kimberly-Clark de Mexico SAB de CV, Class A | 19,268 | 44,745 | ||||||
Orbia Advance Corp. SAB de CV | 2,039 | 4,260 | ||||||
Promotora y Operadora de Infraestructura SAB de CV | 4,965 | 52,575 | ||||||
Wal-Mart de Mexico SAB de CV | 44,492 | 179,341 | ||||||
|
| |||||||
| Total Mexico | 1,070,236 | |||||||
| Netherlands – 0.5% | ||||||||
Aegon Ltd. | 10,279 | 62,722 | ||||||
ING Groep NV, Series N(a) | 20,861 | 343,491 | ||||||
Koninklijke KPN NV | 26,959 | 100,915 | ||||||
Koninklijke Vopak NV | 722 | 27,861 | ||||||
Randstad NV(a) | 536 | 28,319 | ||||||
SBM Offshore NV(a) | 739 | 11,804 | ||||||
Signify NV(b) | 554 | 17,100 | ||||||
|
| |||||||
| Total Netherlands | 592,212 | |||||||
| Norway – 0.5% | ||||||||
Aker BP ASA | 4,063 | 101,045 | ||||||
DNB Bank ASA | 7,112 | 141,013 | ||||||
Gjensidige Forsikring ASA | 3,114 | 45,123 | ||||||
SpareBank 1 SR-Bank ASA | 3,770 | 47,261 | ||||||
Telenor ASA | 4,859 | 54,083 | ||||||
Var Energi ASA | 22,718 | 74,655 | ||||||
Wallenius Wilhelmsen ASA | 5,385 | 43,855 | ||||||
|
| |||||||
| Total Norway | 507,035 | |||||||
See Notes to Financial Statements.
| WisdomTree Trust | 65 |
Schedule of Investments (continued)
WisdomTree Global High Dividend Fund (DEW)
March 31, 2024
| Investments | Shares | Value | ||||||
| Philippines – 0.1% | ||||||||
International Container Terminal Services, Inc. | 12,290 | $ | 69,523 | |||||
PLDT, Inc. | 850 | 20,715 | ||||||
|
| |||||||
| Total Philippines | 90,238 | |||||||
| Poland – 0.3% | ||||||||
Bank Polska Kasa Opieki SA | 1,672 | 76,247 | ||||||
ORLEN SA | 9,288 | 151,580 | ||||||
Powszechny Zaklad Ubezpieczen SA | 4,431 | 54,235 | ||||||
|
| |||||||
| Total Poland | 282,062 | |||||||
| Portugal – 0.2% | ||||||||
EDP – Energias de Portugal SA | 22,609 | 88,148 | ||||||
Galp Energia SGPS SA | 2,680 | 44,328 | ||||||
Navigator Co. SA | 11,159 | 48,809 | ||||||
|
| |||||||
| Total Portugal | 181,285 | |||||||
| Russia – 0.0% | ||||||||
Evraz PLC*† | 5,263 | 0 | ||||||
Magnit PJSC*† | 447 | 0 | ||||||
Magnitogorsk Iron & Steel Works PJSC, GDR*†(c) | 1,299 | 0 | ||||||
MMC Norilsk Nickel PJSC*† | 321 | 0 | ||||||
MMC Norilsk Nickel PJSC, ADR*† | 5 | 0 | ||||||
Mobile TeleSystems PJSC, ADR*† | 3,583 | 0 | ||||||
Novolipetsk Steel PJSC*† | 11,640 | 0 | ||||||
PhosAgro PJSC*† | 247 | 0 | ||||||
PhosAgro PJSC, GDR*† | 4 | 0 | ||||||
Polyus PJSC*† | 83 | 0 | ||||||
Sberbank of Russia PJSC*† | 14,088 | 0 | ||||||
Sberbank of Russia PJSC, ADR*† | 6,465 | 0 | ||||||
Severstal PAO, GDR*†(c) | 1,737 | 0 | ||||||
Tatneft PJSC*† | 2,124 | 0 | ||||||
Tatneft PJSC, ADR*† | 85 | 0 | ||||||
|
| |||||||
| Total Russia | 0 | |||||||
| Saudi Arabia – 0.6% | ||||||||
Arabian Centres Co. Ltd. | 4,044 | 27,388 | ||||||
Banque Saudi Fransi | 4,670 | 48,499 | ||||||
Jarir Marketing Co. | 11,039 | 43,267 | ||||||
Riyad Bank | 7,389 | 58,710 | ||||||
SABIC Agri-Nutrients Co. | 2,545 | 83,193 | ||||||
Sahara International Petrochemical Co. | 989 | 8,161 | ||||||
Saudi Aramco Base Oil Co. | 1,247 | 55,659 | ||||||
Saudi Awwal Bank | 4,821 | 53,345 | ||||||
Saudi Basic Industries Corp. | 4,345 | 90,480 | ||||||
Saudi Cement Co. | 3,049 | 37,884 | ||||||
Saudi Telecom Co. | 12,035 | 127,073 | ||||||
|
| |||||||
| Total Saudi Arabia | 633,659 | |||||||
| Singapore – 1.1% | ||||||||
DBS Group Holdings Ltd. | 12,514 | 334,084 | ||||||
Genting Singapore Ltd. | 70,600 | 46,296 | ||||||
Keppel Ltd. | 6,400 | 34,807 | ||||||
Netlink NBN Trust(c) | 71,700 | 45,424 | ||||||
Oversea-Chinese Banking Corp. Ltd. | 27,813 | 278,006 | ||||||
Singapore Airlines Ltd.(a) | 19,900 | 94,369 | ||||||
Singapore Technologies Engineering Ltd. | 13,717 | 40,858 | ||||||
Singapore Telecommunications Ltd. | 92,000 | 172,466 | ||||||
United Overseas Bank Ltd. | 6,913 | 150,133 | ||||||
Venture Corp. Ltd. | 2,200 | 23,262 | ||||||
|
| |||||||
| Total Singapore | 1,219,705 | |||||||
| South Africa – 0.5% | ||||||||
Absa Group Ltd. | 1,262 | 9,872 | ||||||
Anglo American Platinum Ltd.(a) | 380 | 15,422 | ||||||
FirstRand Ltd.(a) | 28,605 | 93,249 | ||||||
Nedbank Group Ltd. | 4,292 | 51,829 | ||||||
Old Mutual Ltd. | 66,184 | 41,067 | ||||||
Sanlam Ltd. | 12,062 | 44,200 | ||||||
Sasol Ltd. | 6,309 | 48,773 | ||||||
Standard Bank Group Ltd. | 16,939 | 165,702 | ||||||
Vodacom Group Ltd. | 8,873 | 46,178 | ||||||
Woolworths Holdings Ltd. | 12,362 | 38,654 | ||||||
|
| |||||||
| Total South Africa | 554,946 | |||||||
| South Korea – 0.6% | ||||||||
DB Insurance Co. Ltd. | 657 | 46,216 | ||||||
GS Holdings Corp. | 1,105 | 39,603 | ||||||
Hana Financial Group, Inc. | 2,683 | 114,993 | ||||||
Industrial Bank of Korea | 2,360 | 23,666 | ||||||
KB Financial Group, Inc. | 1,844 | 95,196 | ||||||
KT&G Corp. | 705 | 48,964 | ||||||
Samsung Fire & Marine Insurance Co. Ltd. | 197 | 44,778 | ||||||
Samsung Life Insurance Co. Ltd. | 498 | 34,143 | ||||||
Shinhan Financial Group Co. Ltd. | 1,899 | 64,887 | ||||||
Woori Financial Group, Inc. | 16,114 | 171,404 | ||||||
|
| |||||||
| Total South Korea | 683,850 | |||||||
| Spain – 1.8% | ||||||||
Acerinox SA | 2,964 | 32,539 | ||||||
ACS Actividades de Construccion y Servicios SA | 1,542 | 64,583 | ||||||
Banco Bilbao Vizcaya Argentaria SA | 33,154 | 395,302 | ||||||
Bankinter SA(a) | 3,883 | 28,441 | ||||||
CaixaBank SA(a) | 31,975 | 155,157 | ||||||
Enagas SA(a) | 2,528 | 37,582 | ||||||
Endesa SA | 10,426 | 193,279 | ||||||
Fluidra SA | 1,430 | 33,853 | ||||||
Fomento de Construcciones y Contratas SA | 1,647 | 22,483 | ||||||
Iberdrola SA | 36,496 | 453,083 | ||||||
Inmobiliaria Colonial Socimi SA(a) | 1,781 | 10,560 | ||||||
Mapfre SA(a) | 20,766 | 52,525 | ||||||
Merlin Properties Socimi SA | 2,655 | 28,602 | ||||||
Naturgy Energy Group SA(a) | 6,520 | 141,536 | ||||||
Redeia Corp. SA | 3,814 | 65,103 | ||||||
Repsol SA | 5,614 | 93,615 | ||||||
Telefonica SA | 32,078 | 141,660 | ||||||
|
| |||||||
| Total Spain | 1,949,903 | |||||||
| Sweden – 0.4% | ||||||||
H & M Hennes & Mauritz AB, Class B | 4,563 | 74,501 | ||||||
Skandinaviska Enskilda Banken AB, Class A | 9,775 | 132,511 | ||||||
Skanska AB, Class B(a) | 2,627 | 46,803 | ||||||
SKF AB, Class B(a) | 1,554 | 31,755 | ||||||
See Notes to Financial Statements.
| 66 | WisdomTree Trust |
Schedule of Investments (continued)
WisdomTree Global High Dividend Fund (DEW)
March 31, 2024
| Investments | Shares | Value | ||||||
Svenska Handelsbanken AB, Class A(a) | 6,513 | $ | 65,936 | |||||
Swedbank AB, Class A(a) | 6,264 | 124,371 | ||||||
|
| |||||||
| Total Sweden | 475,877 | |||||||
| Switzerland – 1.6% | ||||||||
Adecco Group AG, Registered Shares | 1,295 | 51,271 | ||||||
Baloise Holding AG, Registered Shares | 150 | 23,532 | ||||||
Helvetia Holding AG, Registered Shares(a) | 405 | 55,892 | ||||||
Holcim AG, Registered Shares | 3,481 | 315,597 | ||||||
Julius Baer Group Ltd. | 1,051 | 60,771 | ||||||
Kuehne & Nagel International AG, Registered Shares | 786 | 219,036 | ||||||
SGS SA, Registered Shares*(a) | 1,124 | 109,193 | ||||||
Swiss Life Holding AG, Registered Shares | 106 | 74,401 | ||||||
Swiss Prime Site AG, Registered Shares | 737 | 69,592 | ||||||
Swiss Re AG | 1,874 | 241,246 | ||||||
Swisscom AG, Registered Shares* | 254 | 155,496 | ||||||
Zurich Insurance Group AG | 794 | 428,691 | ||||||
|
| |||||||
| Total Switzerland | 1,804,718 | |||||||
| Taiwan – 2.6% | ||||||||
ASE Technology Holding Co. Ltd. | 52,000 | 261,596 | ||||||
Asia Cement Corp. | 21,000 | 27,100 | ||||||
Asustek Computer, Inc. | 4,000 | 53,682 | ||||||
Chunghwa Telecom Co. Ltd. | 38,000 | 149,609 | ||||||
Compal Electronics, Inc. | 47,000 | 53,163 | ||||||
CTBC Financial Holding Co. Ltd. | 85,480 | 88,275 | ||||||
Far Eastern New Century Corp. | 41,000 | 42,597 | ||||||
Far EasTone Telecommunications Co. Ltd. | 2,000 | 5,093 | ||||||
Formosa Plastics Corp. | 26,000 | 55,975 | ||||||
Giant Manufacturing Co. Ltd. | 6,217 | 42,252 | ||||||
Hon Hai Precision Industry Co. Ltd. | 64,000 | 299,967 | ||||||
Lite-On Technology Corp., ADR | 19,000 | 59,962 | ||||||
MediaTek, Inc. | 19,000 | 709,454 | ||||||
Micro-Star International Co. Ltd. | 5,000 | 26,482 | ||||||
Nan Ya Plastics Corp. | 28,000 | 48,995 | ||||||
Novatek Microelectronics Corp. | 7,000 | 132,111 | ||||||
Pegatron Corp. | 21,680 | 69,097 | ||||||
Pou Chen Corp. | 38,000 | 42,923 | ||||||
Powertech Technology, Inc. | 10,000 | 62,649 | ||||||
Realtek Semiconductor Corp. | 6,000 | 104,989 | ||||||
Shanghai Commercial & Savings Bank Ltd. | 39,000 | 58,920 | ||||||
Taiwan Mobile Co. Ltd. | 21,000 | 67,586 | ||||||
Uni-President Enterprises Corp. | 30,000 | 72,648 | ||||||
Unimicron Technology Corp. | 9,000 | 53,713 | ||||||
United Microelectronics Corp. | 102,000 | 166,369 | ||||||
Walsin Lihwa Corp. | 38,000 | 44,586 | ||||||
|
| |||||||
| Total Taiwan | 2,799,793 | |||||||
| Thailand – 0.3% | ||||||||
PTT Exploration & Production PCL, NVDR | 13,300 | 55,770 | ||||||
PTT PCL, NVDR | 74,800 | 69,700 | ||||||
SCB X PCL, NVDR | 33,700 | 105,291 | ||||||
Tisco Financial Group PCL, NVDR | 11,200 | 30,542 | ||||||
TMBThanachart Bank PCL, NVDR | 402,400 | 20,072 | ||||||
|
| |||||||
| Total Thailand | 281,375 | |||||||
| Turkey – 0.1% | ||||||||
Akbank TAS | 36,197 | 52,340 | ||||||
Turkiye Petrol Rafinerileri AS | 15,907 | 87,028 | ||||||
|
| |||||||
| Total Turkey | 139,368 | |||||||
| United Kingdom – 3.3% | ||||||||
Admiral Group PLC | 1,466 | 52,539 | ||||||
Barclays PLC | 56,808 | 131,469 | ||||||
Bellway PLC | 1,398 | 47,047 | ||||||
BP PLC | 55,746 | 349,078 | ||||||
British American Tobacco PLC | 17,046 | 518,093 | ||||||
British Land Co. PLC | 10,000 | 49,924 | ||||||
BT Group PLC(a) | 51,864 | 71,840 | ||||||
DS Smith PLC | 12,435 | 62,316 | ||||||
Games Workshop Group PLC | 288 | 36,527 | ||||||
Hargreaves Lansdown PLC(a) | 4,584 | 42,620 | ||||||
HSBC Holdings PLC | 98,280 | 768,502 | ||||||
Imperial Brands PLC | 4,892 | 109,383 | ||||||
ITV PLC | 35,141 | 32,806 | ||||||
J Sainsbury PLC | 975 | 3,330 | ||||||
Land Securities Group PLC | 5,667 | 47,119 | ||||||
Lloyds Banking Group PLC | 236,087 | 154,367 | ||||||
National Grid PLC | 24,466 | 329,465 | ||||||
NatWest Group PLC | 42,558 | 142,737 | ||||||
Schroders PLC | 8,989 | 42,764 | ||||||
Severn Trent PLC | 16 | 499 | ||||||
SSE PLC | 8,880 | 185,091 | ||||||
St. James’s Place PLC | 4,341 | 25,472 | ||||||
Tesco PLC | 35,331 | 132,378 | ||||||
TORM PLC, Class A | 1,548 | 52,493 | ||||||
United Utilities Group PLC | 2,860 | 37,177 | ||||||
Vodafone Group PLC | 238,283 | 212,092 | ||||||
|
| |||||||
| Total United Kingdom | 3,637,128 | |||||||
| United States – 60.0% | ||||||||
AbbVie, Inc. | 24,980 | 4,548,858 | ||||||
AGCO Corp. | 1,346 | 165,585 | ||||||
Agree Realty Corp. | 21 | 1,200 | ||||||
Alexandria Real Estate Equities, Inc. | 2,135 | 275,223 | ||||||
ALLETE, Inc. | 1,257 | 74,967 | ||||||
Alliant Energy Corp. | 283 | 14,263 | ||||||
Altria Group, Inc. | 55,692 | 2,429,285 | ||||||
American Electric Power Co., Inc. | 5,475 | 471,397 | ||||||
American Tower Corp. | 4,396 | 868,606 | ||||||
Amgen, Inc. | 3,908 | 1,111,123 | ||||||
Antero Midstream Corp. | 5,923 | 83,277 | ||||||
Associated Banc-Corp. | 1,221 | 26,264 | ||||||
Atlantic Union Bankshares Corp. | 907 | 32,026 | ||||||
AvalonBay Communities, Inc. | 1,921 | 356,461 | ||||||
Avista Corp. | 1,347 | 47,172 | ||||||
Bank of America Corp. | 56,630 | 2,147,410 | ||||||
Bank of New York Mellon Corp. | 5,734 | 330,393 | ||||||
Bank OZK | 1,177 | 53,506 | ||||||
Best Buy Co., Inc. | 2,741 | 224,844 | ||||||
Black Hills Corp. | 726 | 39,640 | ||||||
See Notes to Financial Statements.
| WisdomTree Trust | 67 |
Schedule of Investments (continued)
WisdomTree Global High Dividend Fund (DEW)
March 31, 2024
| Investments | Shares | Value | ||||||
Bloomin’ Brands, Inc. | 1,527 | $ | 43,794 | |||||
Blue Owl Capital, Inc. | 3,298 | 62,200 | ||||||
Bristol-Myers Squibb Co. | 29,646 | 1,607,703 | ||||||
Brixmor Property Group, Inc. | 748 | 17,541 | ||||||
Broadstone Net Lease, Inc. | 5,642 | 88,410 | ||||||
Brookfield Renewable Corp., Class A(a) | 775 | 19,036 | ||||||
Cadence Bank | 1,136 | 32,944 | ||||||
Cal-Maine Foods, Inc. | 864 | 50,846 | ||||||
Camden Property Trust | 1,220 | 120,048 | ||||||
Campbell Soup Co. | 2,615 | 116,237 | ||||||
CareTrust REIT, Inc. | 2,023 | 49,300 | ||||||
Carter’s, Inc. | 656 | 55,550 | ||||||
Cathay General Bancorp | 816 | 30,869 | ||||||
Chemours Co. | 931 | 24,448 | ||||||
Chevron Corp. | 15,817 | 2,494,974 | ||||||
Chord Energy Corp. | 388 | 69,157 | ||||||
Citigroup, Inc. | 19,217 | 1,215,283 | ||||||
Clorox Co. | 344 | 52,670 | ||||||
CMS Energy Corp. | 665 | 40,126 | ||||||
CNA Financial Corp. | 2,700 | 122,634 | ||||||
Coca-Cola Co. | 51,700 | 3,163,006 | ||||||
Cogent Communications Holdings, Inc.(a) | 1,068 | 69,772 | ||||||
Cohen & Steers, Inc. | 661 | 50,824 | ||||||
Columbia Banking System, Inc. | 3,293 | 63,720 | ||||||
Comerica, Inc. | 1,850 | 101,731 | ||||||
Community Bank System, Inc. | 891 | 42,795 | ||||||
Conagra Brands, Inc. | 5,835 | 172,949 | ||||||
ConocoPhillips | 10,528 | 1,340,004 | ||||||
Consolidated Edison, Inc. | 4,549 | 413,095 | ||||||
COPT Defense Properties | 2,129 | 51,458 | ||||||
Corebridge Financial, Inc. | 5,320 | 152,844 | ||||||
Corning, Inc. | 6,826 | 224,985 | ||||||
Cousins Properties, Inc. | 1,734 | 41,685 | ||||||
CubeSmart | 4,341 | 196,300 | ||||||
Cullen/Frost Bankers, Inc. | 567 | 63,827 | ||||||
CVB Financial Corp. | 994 | 17,733 | ||||||
CVR Energy, Inc.(a) | 1,305 | 46,536 | ||||||
Darden Restaurants, Inc. | 1,479 | 247,215 | ||||||
Dick’s Sporting Goods, Inc. | 561 | 126,146 | ||||||
Digital Realty Trust, Inc. | 2,872 | 413,683 | ||||||
Dominion Energy, Inc. | 12,367 | 608,333 | ||||||
Douglas Emmett, Inc. | 1,573 | 21,817 | ||||||
Dow, Inc. | 8,970 | 519,632 | ||||||
DT Midstream, Inc. | 839 | 51,263 | ||||||
DTE Energy Co. | 2,176 | 244,017 | ||||||
Duke Energy Corp. | 8,452 | 817,393 | ||||||
East West Bancorp, Inc. | 1,134 | 89,711 | ||||||
Eastman Chemical Co. | 1,350 | 135,297 | ||||||
Edison International | 4,358 | 308,241 | ||||||
Energizer Holdings, Inc. | 957 | 28,174 | ||||||
Entergy Corp. | 2,350 | 248,348 | ||||||
EPR Properties | 1,670 | 70,891 | ||||||
Equitrans Midstream Corp. | 4,681 | 58,466 | ||||||
Equity Residential | 2,433 | 153,547 | ||||||
Essential Properties Realty Trust, Inc. | 519 | 13,837 | ||||||
Essential Utilities, Inc. | 2,503 | 92,736 | ||||||
Essex Property Trust, Inc. | 674 | 165,002 | ||||||
Evergy, Inc. | 2,817 | 150,371 | ||||||
Eversource Energy | 2,131 | 127,370 | ||||||
Exelon Corp. | 8,838 | 332,044 | ||||||
Federal Realty Investment Trust | 1,532 | 156,448 | ||||||
Fidelity National Financial, Inc. | 1,402 | 74,446 | ||||||
Fifth Third Bancorp | 7,686 | 285,996 | ||||||
First American Financial Corp. | 489 | 29,853 | ||||||
First Hawaiian, Inc. | 1,575 | 34,587 | ||||||
First Interstate BancSystem, Inc., Class A | 2,341 | 63,699 | ||||||
FirstEnergy Corp. | 4,172 | 161,123 | ||||||
Flowers Foods, Inc. | 3,513 | 83,434 | ||||||
FNB Corp.(a) | 1,904 | 26,846 | ||||||
Franklin Resources, Inc. | 1,902 | 53,465 | ||||||
Gaming & Leisure Properties, Inc. | 5,807 | 267,528 | ||||||
Gap, Inc. | 3,393 | 93,477 | ||||||
General Mills, Inc. | 5,085 | 355,797 | ||||||
Gilead Sciences, Inc. | 17,315 | 1,268,324 | ||||||
Glacier Bancorp, Inc. | 1,238 | 49,867 | ||||||
Goldman Sachs Group, Inc. | 2,245 | 937,714 | ||||||
GSK PLC | 16,572 | 357,688 | ||||||
Hannon Armstrong Sustainable Infrastructure Capital, Inc.(a) | 2,440 | 69,296 | ||||||
Hasbro, Inc. | 189 | 10,682 | ||||||
Host Hotels & Resorts, Inc. | 7,900 | 163,372 | ||||||
HP, Inc. | 9,283 | 280,532 | ||||||
Huntsman Corp. | 1,478 | 38,472 | ||||||
Independence Realty Trust, Inc. | 3,213 | 51,826 | ||||||
Independent Bank Corp. | 778 | 40,472 | ||||||
Ingredion, Inc. | 805 | 94,064 | ||||||
Innovative Industrial Properties, Inc. | 591 | 61,192 | ||||||
International Business Machines Corp. | 9,708 | 1,853,840 | ||||||
International Paper Co. | 4,051 | 158,070 | ||||||
Interpublic Group of Cos., Inc. | 3,620 | 118,121 | ||||||
Invesco Ltd. | 3,952 | 65,564 | ||||||
Iron Mountain, Inc. | 2,976 | 238,705 | ||||||
Jackson Financial, Inc., Class A | 1,051 | 69,513 | ||||||
Jefferies Financial Group, Inc. | 1,294 | 57,065 | ||||||
Juniper Networks, Inc. | 1,069 | 39,617 | ||||||
Kellanova | 3,785 | 216,843 | ||||||
Kennedy-Wilson Holdings, Inc. | 2,597 | 22,282 | ||||||
Kenvue, Inc. | 18,299 | 392,697 | ||||||
Kilroy Realty Corp. | 2,306 | 84,008 | ||||||
Kimberly-Clark Corp. | 4,532 | 586,214 | ||||||
Kimco Realty Corp. | 8,486 | 166,410 | ||||||
Kohl’s Corp. | 2,884 | 84,069 | ||||||
Kontoor Brands, Inc. | 635 | 38,259 | ||||||
Kraft Heinz Co. | 14,040 | 518,076 | ||||||
Lamar Advertising Co., Class A | 1,980 | 236,432 | ||||||
LCI Industries(a) | 195 | 23,997 | ||||||
Leggett & Platt, Inc. | 2,856 | 54,692 | ||||||
Lincoln National Corp. | 2,856 | 91,192 | ||||||
See Notes to Financial Statements.
| 68 | WisdomTree Trust |
Schedule of Investments (continued)
WisdomTree Global High Dividend Fund (DEW)
March 31, 2024
| Investments | Shares | Value | ||||||
LXP Industrial Trust | 5,017 | $ | 45,253 | |||||
M&T Bank Corp. | 1,378 | 200,416 | ||||||
Macy’s, Inc. | 2,933 | 58,631 | ||||||
ManpowerGroup, Inc. | 492 | 38,199 | ||||||
MDC Holdings, Inc. | 1,101 | 69,264 | ||||||
MetLife, Inc. | 4,754 | 352,319 | ||||||
Mid-America Apartment Communities, Inc. | 1,281 | 168,554 | ||||||
Moelis & Co., Class A | 789 | 44,792 | ||||||
Morgan Stanley | 13,630 | 1,283,401 | ||||||
MSC Industrial Direct Co., Inc., Class A | 312 | 30,276 | ||||||
National Fuel Gas Co. | 1,355 | 72,791 | ||||||
National Health Investors, Inc. | 1,251 | 78,600 | ||||||
National Storage Affiliates Trust | 1,789 | 70,057 | ||||||
Navient Corp. | 1,941 | 33,773 | ||||||
New Jersey Resources Corp. | 155 | 6,651 | ||||||
New York Community Bancorp, Inc.(a) | 8,616 | 27,744 | ||||||
Nexstar Media Group, Inc.(a) | 343 | 59,095 | ||||||
NiSource, Inc. | 2,234 | 61,792 | ||||||
NNN REIT, Inc. | 4,312 | 184,295 | ||||||
Nordstrom, Inc. | 1,126 | 22,824 | ||||||
Northern Oil & Gas, Inc.(a) | 863 | 34,244 | ||||||
Northwestern Energy Group, Inc. | 1,024 | 52,152 | ||||||
NRG Energy, Inc. | 2,235 | 151,287 | ||||||
OGE Energy Corp. | 3,769 | 129,277 | ||||||
Old National Bancorp | 1,675 | 29,162 | ||||||
Old Republic International Corp. | 393 | 12,073 | ||||||
Omnicom Group, Inc. | 1,527 | 147,753 | ||||||
ONE Gas, Inc. | 877 | 56,593 | ||||||
OneMain Holdings, Inc. | 3,704 | 189,237 | ||||||
ONEOK, Inc. | 7,888 | 632,381 | ||||||
Organon & Co. | 407 | 7,652 | ||||||
PACCAR, Inc. | 5,718 | 708,403 | ||||||
Pacific Premier Bancorp, Inc. | 918 | 22,032 | ||||||
Packaging Corp. of America | 922 | 174,977 | ||||||
Park Hotels & Resorts, Inc. | 3,575 | 62,527 | ||||||
Patterson Cos., Inc. | 588 | 16,258 | ||||||
Pfizer, Inc. | 63,195 | 1,753,661 | ||||||
Philip Morris International, Inc. | 20,164 | 1,847,426 | ||||||
Phillips 66 | 3,978 | 649,767 | ||||||
Phillips Edison & Co., Inc. | 980 | 35,153 | ||||||
Pinnacle West Capital Corp. | 1,363 | 101,857 | ||||||
Pioneer Natural Resources Co. | 3,848 | 1,010,100 | ||||||
PNC Financial Services Group, Inc. | 3,147 | 508,555 | ||||||
Portland General Electric Co. | 920 | 38,640 | ||||||
PotlatchDeltic Corp. | 887 | 41,707 | ||||||
PPL Corp. | 7,664 | 210,990 | ||||||
Premier, Inc., Class A | 2,067 | 45,681 | ||||||
Principal Financial Group, Inc. | 1,153 | 99,515 | ||||||
Prosperity Bancshares, Inc. | 1,104 | 72,621 | ||||||
Prudential Financial, Inc. | 3,545 | 416,183 | ||||||
Public Service Enterprise Group, Inc. | 6,822 | 455,573 | ||||||
Public Storage | 1,892 | 548,794 | ||||||
Radian Group, Inc. | 1,085 | 36,315 | ||||||
Rayonier, Inc. | 1,392 | 46,270 | ||||||
Realty Income Corp. | 13,590 | 735,219 | ||||||
Regency Centers Corp. | 1,987 | 120,333 | ||||||
Regions Financial Corp. | 10,866 | 228,621 | ||||||
Reynolds Consumer Products, Inc. | 1,197 | 34,186 | ||||||
Ryman Hospitality Properties, Inc. | 1,001 | 115,726 | ||||||
Sabra Health Care REIT, Inc. | 3,310 | 48,889 | ||||||
Scotts Miracle-Gro Co.(a) | 615 | 45,873 | ||||||
Sempra | 5,492 | 394,490 | ||||||
Simmons First National Corp., Class A | 639 | 12,435 | ||||||
Simon Property Group, Inc. | 8,281 | 1,295,894 | ||||||
SITE Centers Corp. | 3,562 | 52,183 | ||||||
SL Green Realty Corp. | 1,513 | 83,412 | ||||||
Sonoco Products Co.(a) | 1,268 | 73,341 | ||||||
Southern Co. | 10,190 | 731,031 | ||||||
Southwest Gas Holdings, Inc. | 416 | 31,670 | ||||||
Spire, Inc. | 895 | 54,926 | ||||||
STAG Industrial, Inc. | 2,945 | 113,206 | ||||||
State Street Corp. | 2,416 | 186,805 | ||||||
Stellantis NV(a) | 25,243 | 718,229 | ||||||
Synovus Financial Corp. | 2,276 | 91,177 | ||||||
T Rowe Price Group, Inc. | 2,113 | 257,617 | ||||||
Tanger, Inc. | 1,875 | 55,369 | ||||||
Tapestry, Inc. | 2,224 | 105,596 | ||||||
Target Corp. | 4,418 | 782,914 | ||||||
TFS Financial Corp. | 5,983 | 75,146 | ||||||
Travel & Leisure Co. | 829 | 40,588 | ||||||
Trinity Industries, Inc. | 1,225 | 34,116 | ||||||
Tronox Holdings PLC(a) | 3,158 | 54,791 | ||||||
U.S. Bancorp | 17,835 | 797,224 | ||||||
UDR, Inc. | 4,057 | 151,772 | ||||||
UGI Corp. | 289 | 7,092 | ||||||
United Bankshares, Inc. | 1,337 | 47,851 | ||||||
United Community Banks, Inc. | 1,657 | 43,612 | ||||||
United Parcel Service, Inc., Class B | 7,104 | 1,055,868 | ||||||
Vail Resorts, Inc. | 361 | 80,442 | ||||||
Valley National Bancorp(a) | 4,061 | 32,326 | ||||||
Ventas, Inc. | 4,172 | 181,649 | ||||||
Viatris, Inc. | 14,664 | 175,088 | ||||||
VICI Properties, Inc. | 20,966 | 624,577 | ||||||
Victory Capital Holdings, Inc., Class A | 447 | 18,966 | ||||||
Webster Financial Corp. | 20 | 1,015 | ||||||
WEC Energy Group, Inc. | 1,610 | 132,213 | ||||||
Wendy’s Co. | 3,027 | 57,029 | ||||||
Western Union Co. | 4,785 | 66,894 | ||||||
Williams Cos., Inc. | 13,519 | 526,835 | ||||||
WP Carey, Inc. | 4,273 | 241,168 | ||||||
Xcel Energy, Inc. | 7,235 | 388,881 | ||||||
Xerox Holdings Corp.(a) | 2,887 | 51,677 | ||||||
Zions Bancorp NA | 1,365 | 59,241 | ||||||
|
| |||||||
| Total United States | 65,646,680 | |||||||
TOTAL COMMON STOCKS (Cost: $96,585,270) | 108,811,135 | |||||||
See Notes to Financial Statements.
| WisdomTree Trust | 69 |
Schedule of Investments (continued)
WisdomTree Global High Dividend Fund (DEW)
March 31, 2024
| Investments | Shares | Value | ||||||
| INVESTMENT OF CASH COLLATERAL FOR SECURITIES LOANED – 5.4% |
| |||||||
| United States – 5.4% | ||||||||
State Street Navigator Securities Lending Government Money Market Portfolio, 5.34%(d) | ||||||||
(Cost: $5,892,928) | 5,892,928 | $ | 5,892,928 | |||||
TOTAL INVESTMENTS IN SECURITIES – 104.8% (Cost: $102,478,198) | 114,704,063 | |||||||
Other Assets less Liabilities – (4.8)% | (5,255,777 | ) | ||||||
|
| |||||||
| NET ASSETS – 100.0% | $ | 109,448,286 | ||||||
| * | Non-income producing security. |
| † | This security is being fair valued using significant unobservable inputs (i.e., Level 3 on the fair value hierarchy) by WisdomTree Asset Management, Inc., as valuation designee, in accordance with valuation procedures approved by the Board of Trustees of WisdomTree Trust. The aggregate value of Level 3 fair valued securities is $0, which represents 0.0% of net assets. |
| (a) | Security, or portion thereof, was on loan at March 31, 2024 (See Note 2). At March 31, 2024, the total market value of the Fund’s securities on loan identified in the Schedule of Investments was $8,304,858. The Fund also had seurities on loan having a total market value of $1,210 that were sold and pending settlement. The total market value of the collateral held by the Fund was $8,802,392. The total market value of the collateral includes non-cash U.S. Government securities collateral having a value of $2,909,464. |
| (b) | This security is exempt from registration under rule 144A of the Securities Act of 1933. This security may be sold in transactions that are exempt from registration, normally to qualified institutional buyers. |
| (c) | This security is exempt from registration under Regulation S of the Securities Act of 1933, which exempts from registration securities offered and sold outside the United States. This security may not be offered or sold in the United States except pursuant to an exemption from, or in a transaction not subject to, the registration requirements of the Securities Act of 1933. |
| (d) | Rate shown represents annualized 7-day yield as of March 31, 2024. |
| INVESTMENT IN AFFILIATES |
Affiliated holdings are investments in entities in which the Fund owns 5% or more of the outstanding voting securities or are investments in entities which are under common ownership or control. Investments in affiliates during the fiscal year ended March 31, 2024 were as follows:
| Affiliate | Value at 3/31/2023 | Purchases/ Additions | Sales/ Reductions | Realized Gain/ (Loss) | Change in Unrealized Appreciation/ Depreciation | Value at 3/31/2024 | Dividend Income | |||||||||||||||||||||
WisdomTree International High Dividend Fund^ | $ | 124,207 | $ | 1,064,751 | $ | 1,199,124 | $ | 26,577 | $ | (16,411 | ) | $ | — | $ | 20,024 | |||||||||||||
WisdomTree U.S. High Dividend Fund^ | 77,663 | 341,656 | 418,689 | (558 | ) | (72 | ) | — | 4,263 | |||||||||||||||||||
Total | $ | 201,870 | $ | 1,406,407 | $ | 1,617,813 | $ | 26,019 | $ | (16,483 | ) | $ | — | $ | 24,287 | |||||||||||||
| ^ | As of March 31, 2024, the Fund did not hold a position in this affiliate. |
| FINANCIAL DERIVATIVE INSTRUMENTS | ||||||||||||||||||||||||||||
| FOREIGN CURRENCY CONTRACTS (OTC – OVER THE COUNTER) | ||||||||||||||||||||||||||||
| Counterparty | Settlement Date | Amount and Description of Currency to be Purchased | Amount and Description of Currency to be Sold | Unrealized Appreciation | Unrealized Depreciation | |||||||||||||||||||||||
Bank of America NA | 4/2/2024 | 16,278 | USD | 21,921,042 | KRW | $ | — | $ | (6 | ) | ||||||||||||||||||
Goldman Sachs | 4/2/2024 | 14,795 | USD | 55,491 | SAR | — | (0 | )^ | ||||||||||||||||||||
JP Morgan Chase Bank NA | 4/1/2024 | 40,341 | USD | 1,291,434 | TWD | — | (12 | ) | ||||||||||||||||||||
JP Morgan Chase Bank NA | 4/2/2024 | 38,019 | USD | 190,304 | BRL | 0 | ^ | — | ||||||||||||||||||||
Merrill Lynch International | 4/2/2024 | 13,987 | USD | 66,116 | MYR | 18 | — | |||||||||||||||||||||
State Street Bank and Trust | 4/3/2024 | 2,074 | USD | 116,440 | PHP | 3 | — | |||||||||||||||||||||
| $ | 21 | $ | (18 | ) | ||||||||||||||||||||||||
| ^ | Amount represents less than $1. |
See Notes to Financial Statements.
| 70 | WisdomTree Trust |
Schedule of Investments (concluded)
WisdomTree Global High Dividend Fund (DEW)
March 31, 2024
| FAIR VALUATION SUMMARY |
The following is a summary of the fair valuations according to the inputs used in valuing the Fund’s investments (See Note 2 — Fair Value Measurement):
| Quoted Prices in Active Markets (Level 1) | Other Significant Observable Inputs (Level 2) | Significant Unobservable Inputs (Level 3) | Total | |||||||||||||
Assets: |
| |||||||||||||||
Investments in Securities | ||||||||||||||||
Common Stocks | ||||||||||||||||
Russia | $ | — | $ | — | $ | 0 | * | $ | 0 | |||||||
Other | 108,811,135 | — | — | 108,811,135 | ||||||||||||
Investment of Cash Collateral for Securities Loaned | — | 5,892,928 | — | 5,892,928 | ||||||||||||
Total Investments in Securities | $ | 108,811,135 | $ | 5,892,928 | $ | 0 | $ | 114,704,063 | ||||||||
Financial Derivative Instruments | ||||||||||||||||
Foreign Currency Contracts1 | $ | — | $ | 21 | $ | — | $ | 21 | ||||||||
Liabilities: | ||||||||||||||||
Financial Derivative Instruments | ||||||||||||||||
Foreign Currency Contracts1 | $ | — | $ | (18 | ) | $ | — | $ | (18 | ) | ||||||
Total – Net | $ | 108,811,135 | $ | 5,892,931 | $ | 0 | $ | 114,704,066 | ||||||||
| * | Fair valuations using significant unobservable inputs were determined by WisdomTree Asset Management, Inc., as valuation designee, in accordance with valuation procedures approved by the Board of Trustees of WisdomTree Trust. |
| 1 | Amount shown represents the unrealized appreciation (depreciation) on the financial instrument. |
See Notes to Financial Statements.
| WisdomTree Trust | 71 |
Schedule of Investments
WisdomTree India Earnings Fund (EPI) (consolidated)
March 31, 2024
| Investments | Shares | Value | ||||||
| COMMON STOCKS – 102.0% | ||||||||
| India – 102.0% | ||||||||
| Aerospace & Defense – 1.1% | ||||||||
Bharat Dynamics Ltd.(a) | 78,589 | $ | 1,650,791 | |||||
Bharat Electronics Ltd. | 5,803,793 | 14,021,933 | ||||||
Hindustan Aeronautics Ltd.(a) | 371,508 | 14,819,785 | ||||||
Mazagon Dock Shipbuilders Ltd. | 53,572 | 1,197,369 | ||||||
|
| |||||||
| Total Aerospace & Defense |
| 31,689,878 | ||||||
| Air Freight & Logistics – 0.0% | ||||||||
Allcargo Logistics Ltd.* | 320,009 | 274,724 | ||||||
Blue Dart Express Ltd. | 2,112 | 156,596 | ||||||
TCI Express Ltd. | 6,127 | 75,222 | ||||||
Transport Corp. of India Ltd. | 41,150 | 400,436 | ||||||
|
| |||||||
| Total Air Freight & Logistics |
| 906,978 | ||||||
| Automobile Components – 1.1% | ||||||||
Apollo Tyres Ltd. | 533,317 | 2,982,713 | ||||||
Asahi India Glass Ltd. | 50,091 | 322,128 | ||||||
Automotive Axles Ltd. | 2,088 | 43,998 | ||||||
Balkrishna Industries Ltd. | 103,176 | 2,866,759 | ||||||
Bharat Forge Ltd. | 232,474 | 3,148,618 | ||||||
Bosch Ltd. | 7,048 | 2,537,821 | ||||||
Ceat Ltd. | 18,409 | 592,072 | ||||||
Endurance Technologies Ltd.(b) | 36,686 | 803,637 | ||||||
Exide Industries Ltd. | 1,283,270 | 4,685,949 | ||||||
FIEM Industries Ltd. | 16,229 | 220,418 | ||||||
Gabriel India Ltd. | 12 | 48 | ||||||
JK Tyre & Industries Ltd. | 498,174 | 2,580,691 | ||||||
Minda Corp. Ltd. | 32,025 | 160,389 | ||||||
Motherson Sumi Wiring India Ltd. | 801,355 | 635,108 | ||||||
Pricol Ltd.* | 55,689 | 260,008 | ||||||
Samvardhana Motherson International Ltd. | 2,456,552 | 3,449,084 | ||||||
Sansera Engineering Ltd.(b) | 34,731 | 424,068 | ||||||
Sona Blw Precision Forgings Ltd.(b) | 14,112 | 119,449 | ||||||
Sundram Fasteners Ltd. | 107,961 | 1,415,619 | ||||||
Suprajit Engineering Ltd. | 4,296 | 21,230 | ||||||
Tube Investments of India Ltd. | 85,263 | 3,819,954 | ||||||
UNO Minda Ltd. | 147,235 | 1,208,827 | ||||||
|
| |||||||
| Total Automobile Components |
| 32,298,588 | ||||||
| Automobiles – 5.1% | ||||||||
Bajaj Auto Ltd. | 177,989 | 19,523,037 | ||||||
Eicher Motors Ltd. | 209,429 | 10,092,719 | ||||||
Hero MotoCorp Ltd. | 308,733 | 17,480,649 | ||||||
Mahindra & Mahindra Ltd. | 2,506,001 | 57,730,944 | ||||||
Maruti Suzuki India Ltd. | 170,339 | 25,734,612 | ||||||
Tata Motors Ltd. | 895,590 | 10,660,852 | ||||||
TVS Motor Co. Ltd. | 241,094 | 6,220,415 | ||||||
|
| |||||||
| Total Automobiles |
| 147,443,228 | ||||||
| Banks – 20.2% | ||||||||
AU Small Finance Bank Ltd.(b) | 440,460 | 2,983,842 | ||||||
Axis Bank Ltd. | 3,604,837 | 45,262,256 | ||||||
Bandhan Bank Ltd.(b) | 1,964,251 | 4,239,264 | ||||||
Bank of Baroda | 5,963,606 | 18,880,611 | ||||||
Bank of India | 4,130,979 | $ | 6,788,174 | |||||
Bank of Maharashtra | 4,483,725 | 3,351,941 | ||||||
Canara Bank | 2,475,713 | 17,247,841 | ||||||
Central Bank of India Ltd.* | 2,573,949 | 1,845,534 | ||||||
City Union Bank Ltd. | 1,583,364 | 2,565,770 | ||||||
DCB Bank Ltd. | 1,104,581 | 1,581,331 | ||||||
Equitas Small Finance Bank Ltd.(b) | 903,975 | 1,003,122 | ||||||
Federal Bank Ltd. | 7,496,654 | 13,500,764 | ||||||
HDFC Bank Ltd. | 8,651,480 | 150,193,074 | ||||||
ICICI Bank Ltd. | 11,098,039 | 145,481,083 | ||||||
IDBI Bank Ltd. | 2,570,788 | 2,496,734 | ||||||
IDFC First Bank Ltd.* | 3,481,335 | 3,147,300 | ||||||
Indian Bank | 1,446,853 | 9,033,019 | ||||||
Indian Overseas Bank* | 2,283,182 | 1,641,159 | ||||||
Jammu & Kashmir Bank Ltd. | 2,209,436 | 3,555,125 | ||||||
Karnataka Bank Ltd. | 1,470,379 | 3,968,494 | ||||||
Karur Vysya Bank Ltd. | 2,431,912 | 5,327,302 | ||||||
Kotak Mahindra Bank Ltd. | 1,775,060 | 38,000,895 | ||||||
Punjab National Bank | 5,897,923 | 8,797,118 | ||||||
RBL Bank Ltd.(b) | 992,924 | 2,860,821 | ||||||
South Indian Bank Ltd. | 4,396,161 | 1,436,352 | ||||||
State Bank of India | 7,757,066 | 69,974,265 | ||||||
UCO Bank* | 945,240 | 591,607 | ||||||
Ujjivan Small Finance Bank Ltd.(b) | 1,023,793 | 543,797 | ||||||
Union Bank of India Ltd. | 8,696,520 | 16,005,705 | ||||||
|
| |||||||
| Total Banks |
| 582,304,300 | ||||||
| Beverages – 0.4% | ||||||||
Globus Spirits Ltd. | 2,920 | 23,300 | ||||||
Radico Khaitan Ltd. | 116,784 | 2,419,275 | ||||||
United Breweries Ltd. | 36,591 | 761,609 | ||||||
United Spirits Ltd. | 151,067 | 2,054,468 | ||||||
Varun Beverages Ltd. | 291,097 | 4,881,487 | ||||||
|
| |||||||
| Total Beverages |
| 10,140,139 | ||||||
| Biotechnology – 0.0% | ||||||||
Biocon Ltd. | 301,645 | 955,361 | ||||||
| Broadline Retail – 0.0% | ||||||||
Shoppers Stop Ltd.* | 34,928 | 316,185 | ||||||
| Building Products – 0.2% | ||||||||
Astral Ltd. | 48,010 | 1,146,248 | ||||||
Blue Star Ltd. | 133,864 | 2,044,334 | ||||||
Carysil Ltd. | 6,726 | 79,189 | ||||||
Electrosteel Castings Ltd. | 1,251,587 | 2,674,174 | ||||||
Kajaria Ceramics Ltd. | 25,022 | 346,472 | ||||||
Prince Pipes & Fittings Ltd.* | 42,649 | 280,867 | ||||||
|
| |||||||
| Total Building Products |
| 6,571,284 | ||||||
| Capital Markets – 1.2% | ||||||||
360 ONE WAM Ltd. | 162,553 | 1,316,757 | ||||||
Anand Rathi Wealth Ltd. | 17,284 | 765,602 | ||||||
Angel One Ltd. | 79,976 | 2,919,900 | ||||||
CRISIL Ltd. | 18,981 | 1,153,391 | ||||||
HDFC Asset Management Co. Ltd.(b) | 105,866 | 4,765,223 | ||||||
ICICI Securities Ltd.(b) | 181,395 | 1,582,591 | ||||||
IDFC Ltd.* | 11,625,256 | 15,430,183 | ||||||
See Notes to Financial Statements.
| 72 | WisdomTree Trust |
Schedule of Investments (continued)
WisdomTree India Earnings Fund (EPI) (consolidated)
March 31, 2024
| Investments | Shares | Value | ||||||
Indian Energy Exchange Ltd.(b) | 452,406 | $ | 728,764 | |||||
Multi Commodity Exchange of India Ltd. | 40,628 | 1,631,696 | ||||||
Nippon Life India Asset Management Ltd.(b) | 162,657 | 918,868 | ||||||
Share India Securities Ltd.(a) | 5,958 | 114,688 | ||||||
UTI Asset Management Co. Ltd. | 161,204 | 1,571,402 | ||||||
|
| |||||||
| Total Capital Markets |
| 32,899,065 | ||||||
| Chemicals – 3.5% | ||||||||
Aarti Industries Ltd. | 292,321 | 2,332,715 | ||||||
Alkyl Amines Chemicals | 12,478 | 271,378 | ||||||
Asian Paints Ltd. | 195,290 | 6,665,769 | ||||||
Atul Ltd. | 8,635 | 594,337 | ||||||
Balaji Amines Ltd. | 47,335 | 1,160,779 | ||||||
Berger Paints India Ltd. | 340,171 | 2,337,281 | ||||||
Bhansali Engineering Polymers Ltd. | 7,046 | 7,548 | ||||||
Camlin Fine Sciences Ltd.* | 6,750 | 7,223 | ||||||
Carborundum Universal Ltd. | 13,711 | 208,511 | ||||||
Castrol India Ltd. | 1,110,884 | 2,476,771 | ||||||
Chambal Fertilisers & Chemicals Ltd. | 449,679 | 1,843,952 | ||||||
Chemplast Sanmar Ltd.* | 3,610 | 19,478 | ||||||
Coromandel International Ltd. | 246,362 | 3,175,582 | ||||||
DCM Shriram Ltd. | 220,860 | 2,262,158 | ||||||
Deepak Fertilisers & Petrochemicals Corp. Ltd. | 536,925 | 3,245,273 | ||||||
Deepak Nitrite Ltd. | 120,045 | 3,059,329 | ||||||
EID Parry India Ltd. | 372,716 | 2,438,669 | ||||||
Finolex Industries Ltd. | 693,594 | 2,049,534 | ||||||
Galaxy Surfactants Ltd.(a) | 14,982 | 407,996 | ||||||
GHCL Ltd. | 694,076 | 3,688,729 | ||||||
Gujarat Alkalies & Chemicals Ltd. | 78,178 | 631,264 | ||||||
Gujarat Fluorochemicals Ltd. | 73,973 | 2,747,163 | ||||||
Gujarat Narmada Valley Fertilizers & Chemicals Ltd. | 515,443 | 3,863,235 | ||||||
Himadri Speciality Chemical Ltd. | 436,229 | 1,581,152 | ||||||
India Glycols Ltd. | 341 | 3,095 | ||||||
Jubilant Ingrevia Ltd. | 166,717 | 904,922 | ||||||
Kansai Nerolac Paints Ltd. | 186,685 | 587,011 | ||||||
Kiri Industries Ltd.* | 48 | 174 | ||||||
Linde India Ltd. | 14,044 | 1,079,175 | ||||||
Manali Petrochemicals Ltd. | 164,544 | 110,876 | ||||||
Navin Fluorine International Ltd. | 61,674 | 2,302,945 | ||||||
NOCIL Ltd. | 13,915 | 41,727 | ||||||
PCBL Ltd. | 274,791 | 882,007 | ||||||
PI Industries Ltd. | 62,785 | 2,911,473 | ||||||
Pidilite Industries Ltd. | 82,325 | 2,975,752 | ||||||
Polyplex Corp. Ltd. | 175,747 | 1,613,495 | ||||||
Rain Industries Ltd. | 1,977,569 | 3,573,270 | ||||||
Rallis India Ltd. | 461,673 | 1,386,638 | ||||||
Rashtriya Chemicals & Fertilizers Ltd. | 715,012 | 1,099,491 | ||||||
Sharda Cropchem Ltd. | 54,238 | 208,849 | ||||||
Solar Industries India Ltd. | 8,464 | 891,205 | ||||||
SRF Ltd. | 215,217 | 6,606,628 | ||||||
Styrenix Performance Materials Ltd. | 6,089 | 104,477 | ||||||
Sudarshan Chemical Industries Ltd. | 234,040 | 1,711,752 | ||||||
Sumitomo Chemical India Ltd. | 49,214 | 205,200 | ||||||
Supreme Industries Ltd. | 69,697 | 3,536,724 | ||||||
Tata Chemicals Ltd. | 448,410 | 5,811,413 | ||||||
Thirumalai Chemicals Ltd. | 421,593 | 1,182,599 | ||||||
UPL Ltd. | 2,266,228 | 12,390,516 | ||||||
Valiant Organics Ltd.*(b) | 1,331 | 6,077 | ||||||
Vinati Organics Ltd. | 26,937 | 474,968 | ||||||
|
| |||||||
| Total Chemicals |
| 99,678,285 | ||||||
| Commercial Services & Supplies – 0.1% | ||||||||
CMS Info Systems Ltd. | 27,846 | 130,428 | ||||||
Indian Railway Catering & Tourism Corp. Ltd. | 238,461 | 2,658,160 | ||||||
|
| |||||||
| Total Commercial Services & Supplies |
| 2,788,588 | ||||||
| Communications Equipment – 0.0% | ||||||||
Sterlite Technologies Ltd. | 308,890 | 410,360 | ||||||
| Construction & Engineering – 2.4% | ||||||||
Ashoka Buildcon Ltd.* | 1,673,016 | 3,141,324 | ||||||
Engineers India Ltd. | 9,686 | 23,454 | ||||||
G R Infraprojects Ltd.* | 80,980 | 1,270,202 | ||||||
HG Infra Engineering Ltd.(a) | 13,086 | 142,608 | ||||||
IRB Infrastructure Developers Ltd. | 2,214,260 | 1,554,449 | ||||||
J Kumar Infraprojects Ltd. | 74,189 | 561,338 | ||||||
Kalpataru Projects International Ltd. | 146,517 | 1,879,455 | ||||||
KEC International Ltd. | 215,619 | 1,794,832 | ||||||
KNR Constructions Ltd. | 431,922 | 1,275,530 | ||||||
Larsen & Toubro Ltd. | 886,259 | 39,996,286 | ||||||
NBCC India Ltd. | 1,675,168 | 2,388,148 | ||||||
NCC Ltd. | 2,203,414 | 6,138,464 | ||||||
PNC Infratech Ltd.(a) | 337,301 | 1,764,711 | ||||||
Power Mech Projects Ltd. | 648 | 38,929 | ||||||
Praj Industries Ltd. | 6,154 | 39,325 | ||||||
PSP Projects Ltd.(a) | 21,306 | 175,731 | ||||||
Rail Vikas Nigam Ltd.(a) | 1,360,129 | 4,124,296 | ||||||
Voltas Ltd. | 169,246 | 2,239,398 | ||||||
Welspun Enterprises Ltd. | 439,229 | 1,601,505 | ||||||
|
| |||||||
| Total Construction & Engineering |
| 70,149,985 | ||||||
| Construction Materials – 2.3% | ||||||||
ACC Ltd. | 109,797 | 3,280,252 | ||||||
Ambuja Cements Ltd. | 1,034,600 | 7,596,143 | ||||||
Dalmia Bharat Ltd. | 124,061 | 2,888,943 | ||||||
Grasim Industries Ltd. | 1,011,959 | 27,752,811 | ||||||
JK Cement Ltd. | 43,631 | 2,132,388 | ||||||
JK Lakshmi Cement Ltd. | 217,470 | 2,283,366 | ||||||
Orient Cement Ltd. | 540,447 | 1,268,781 | ||||||
Ramco Cements Ltd. | 81,008 | 787,279 | ||||||
Shree Cement Ltd. | 6,500 | 2,001,601 | ||||||
UltraTech Cement Ltd. | 132,559 | 15,495,190 | ||||||
|
| |||||||
| Total Construction Materials |
| 65,486,754 | ||||||
| Consumer Finance – 0.2% | ||||||||
Cholamandalam Financial Holdings Ltd. | 271,802 | 3,622,288 | ||||||
SBI Cards & Payment Services Ltd. | 151,544 | 1,240,207 | ||||||
|
| |||||||
| Total Consumer Finance |
| 4,862,495 | ||||||
See Notes to Financial Statements.
| WisdomTree Trust | 73 |
Schedule of Investments (continued)
WisdomTree India Earnings Fund (EPI) (consolidated)
March 31, 2024
| Investments | Shares | Value | ||||||
| Consumer Staples Distribution & Retail – 0.2% |
| |||||||
Avenue Supermarts Ltd.*(b) | 72,005 | $ | 3,907,147 | |||||
Medplus Health Services Ltd.* | 26,516 | 218,687 | ||||||
|
| |||||||
| Total Consumer Staples Distribution & Retail |
| 4,125,834 | ||||||
| Containers & Packaging – 0.0% |
| |||||||
AGI Greenpac Ltd. | 59,787 | 520,791 | ||||||
EPL Ltd. | 21,610 | 46,457 | ||||||
Time Technoplast Ltd. | 42,703 | 127,824 | ||||||
Uflex Ltd. | 31,762 | 153,931 | ||||||
|
| |||||||
| Total Containers & Packaging |
| 849,003 | ||||||
| Diversified Telecommunication Services – 0.5% |
| |||||||
HFCL Ltd. | 1,201,254 | 1,322,204 | ||||||
Indus Towers Ltd.* | 2,257,163 | 7,879,536 | ||||||
Railtel Corp. of India Ltd. | 1,765 | 7,698 | ||||||
Tata Communications Ltd. | 221,333 | 5,335,186 | ||||||
|
| |||||||
| Total Diversified Telecommunication Services |
| 14,544,624 | ||||||
| Electric Utilities – 3.4% | ||||||||
Adani Energy Solutions Ltd.* | 183,786 | 2,262,439 | ||||||
CESC Ltd. | 3,669,734 | 5,352,635 | ||||||
Power Grid Corp. of India Ltd. | 20,137,095 | 66,856,050 | ||||||
SJVN Ltd. | 228,803 | 333,044 | ||||||
Tata Power Co. Ltd. | 3,143,985 | 14,859,973 | ||||||
Torrent Power Ltd. | 511,873 | 8,334,258 | ||||||
|
| |||||||
| Total Electric Utilities |
| 97,998,399 | ||||||
| Electrical Equipment – 1.5% | ||||||||
ABB India Ltd. | 28,061 | 2,140,125 | ||||||
Amara Raja Energy & Mobility Ltd. | 246,304 | 2,245,611 | ||||||
Bharat Heavy Electricals Ltd. | 603,461 | 1,789,346 | ||||||
CG Power & Industrial Solutions Ltd. | 103,112 | 668,724 | ||||||
Finolex Cables Ltd. | 117,307 | 1,407,923 | ||||||
Havells India Ltd. | 223,895 | 4,067,036 | ||||||
HEG Ltd. | 43,708 | 966,395 | ||||||
KEI Industries Ltd. | 139,422 | 5,783,666 | ||||||
Polycab India Ltd. | 45,321 | 2,752,326 | ||||||
Suzlon Energy Ltd.* | 42,015,467 | 20,352,206 | ||||||
|
| |||||||
| Total Electrical Equipment |
| 42,173,358 | ||||||
| Electronic Equipment, Instruments & Components – 0.3% |
| |||||||
Redington Ltd. | 2,849,324 | 7,121,388 | ||||||
| Entertainment – 0.1% | ||||||||
Saregama India Ltd. | 293,162 | 1,220,944 | ||||||
| Financial Services – 0.4% | ||||||||
Aditya Birla Capital Ltd.* | 1,889,835 | 3,974,426 | ||||||
Bajaj Finserv Ltd. | 391,748 | 7,721,291 | ||||||
Infibeam Avenues Ltd. | 1,470,457 | 601,212 | ||||||
|
| |||||||
| Total Financial Services |
| 12,296,929 | ||||||
| Food Products – 1.1% | ||||||||
Adani Wilmar Ltd.* | 150,521 | 580,048 | ||||||
Avanti Feeds Ltd. | 101,796 | 591,046 | ||||||
Balrampur Chini Mills Ltd. | 273,373 | 1,186,384 | ||||||
Britannia Industries Ltd. | 124,419 | 7,326,553 | ||||||
CCL Products India Ltd. | 167,947 | 1,180,628 | ||||||
Dalmia Bharat Sugar & Industries Ltd. | 8 | 33 | ||||||
Dhampur Sugar Mills Ltd. | 564 | 1,405 | ||||||
Dwarikesh Sugar Industries Ltd.* | 8,607 | 7,172 | ||||||
Godrej Agrovet Ltd.(b) | 4,340 | 25,342 | ||||||
Gujarat Ambuja Exports Ltd. | 476,086 | 912,471 | ||||||
Kaveri Seed Co. Ltd. | 109,658 | 819,584 | ||||||
KRBL Ltd. | 155,007 | 515,466 | ||||||
LT Foods Ltd. | 564,717 | 1,270,575 | ||||||
Marico Ltd. | 547,569 | 3,264,306 | ||||||
Mrs. Bectors Food Specialities Ltd.(a) | 43,932 | 587,165 | ||||||
Nestle India Ltd. | 167,220 | 5,257,748 | ||||||
Patanjali Foods Ltd. | 86,865 | 1,393,964 | ||||||
Tata Consumer Products Ltd. | 359,506 | 4,725,163 | ||||||
Triveni Engineering & Industries Ltd. | 628,687 | 2,345,068 | ||||||
Vadilal Industries Ltd. | 5,824 | 303,310 | ||||||
Venky’s India Ltd. | 13,920 | 256,903 | ||||||
Zydus Wellnes Ltd. | 2,910 | 51,485 | ||||||
|
| |||||||
| Total Food Products |
| 32,601,819 | ||||||
| Gas Utilities – 1.3% | ||||||||
Adani Total Gas Ltd. | 29,287 | 325,360 | ||||||
GAIL India Ltd. | 9,775,303 | 21,220,210 | ||||||
Gujarat Gas Ltd. | 408,444 | 2,665,336 | ||||||
Gujarat State Petronet Ltd. | 1,438,828 | 6,150,202 | ||||||
Indraprastha Gas Ltd. | 832,028 | 4,297,685 | ||||||
Mahanagar Gas Ltd.(a) | 218,725 | 3,577,253 | ||||||
|
| |||||||
| Total Gas Utilities |
| 38,236,046 | ||||||
| Ground Transportation – 0.1% | ||||||||
Container Corp. of India Ltd. | 274,639 | 2,904,698 | ||||||
VRL Logistics Ltd. | 1,542 | 10,175 | ||||||
|
| |||||||
| Total Ground Transportation |
| 2,914,873 | ||||||
| Health Care Equipment & Supplies – 0.0% | ||||||||
Poly Medicure Ltd. | 24,756 | 471,715 | ||||||
| Health Care Providers & Services – 0.6% | ||||||||
Apollo Hospitals Enterprise Ltd. | 49,195 | 3,749,561 | ||||||
Aster DM Healthcare Ltd.*(b) | 232,350 | 1,140,264 | ||||||
Dr. Lal PathLabs Ltd.(b) | 12,914 | 350,379 | ||||||
Fortis Healthcare Ltd. | 419,030 | 2,111,165 | ||||||
Krsnaa Diagnostics Ltd. | 3,718 | 27,398 | ||||||
Max Healthcare Institute Ltd. | 627,989 | 6,173,534 | ||||||
Metropolis Healthcare Ltd.(b) | 51,974 | 1,074,097 | ||||||
Narayana Hrudayalaya Ltd.(a) | 64,436 | 991,852 | ||||||
Rainbow Children’s Medicare Ltd. | 1,929 | 30,011 | ||||||
Thyrocare Technologies Ltd.(b) | 48,232 | 341,170 | ||||||
Vijaya Diagnostic Centre Pvt Ltd. | 1,686 | 12,869 | ||||||
|
| |||||||
| Total Health Care Providers & Services |
| 16,002,300 | ||||||
| Hotels, Restaurants & Leisure – 0.3% | ||||||||
Delta Corp. Ltd. | 640,486 | 849,732 | ||||||
Devyani International Ltd. | 17,276 | 31,164 | ||||||
Easy Trip Planners Ltd. | 734,448 | 376,900 | ||||||
EIH Ltd. | 95,390 | 514,107 | ||||||
Indian Hotels Co. Ltd. | 623,670 | 4,420,521 | ||||||
Jubilant Foodworks Ltd. | 188,436 | 1,014,112 | ||||||
See Notes to Financial Statements.
| 74 | WisdomTree Trust |
Schedule of Investments (continued)
WisdomTree India Earnings Fund (EPI) (consolidated)
March 31, 2024
| Investments | Shares | Value | ||||||
Lemon Tree Hotels Ltd.*(b) | 154,756 | $ | 242,240 | |||||
Mahindra Holidays & Resorts India Ltd.* | 3,285 | 15,450 | ||||||
Sapphire Foods India Ltd.* | 57,038 | 1,072,987 | ||||||
Westlife Foodworld Ltd. | 3,079 | 29,698 | ||||||
|
| |||||||
| Total Hotels, Restaurants & Leisure |
| 8,566,911 | ||||||
| Household Durables – 0.2% | ||||||||
Amber Enterprises India Ltd.* | 976 | 42,803 | ||||||
Bajaj Electricals Ltd. | 4 | 44 | ||||||
Crompton Greaves Consumer Electricals Ltd. | 708,696 | 2,273,028 | ||||||
Dixon Technologies India Ltd.(a) | 24,996 | 2,241,555 | ||||||
LA Opala RG Ltd. | 2,649 | 9,460 | ||||||
Orient Electric Ltd. | 145,443 | 336,741 | ||||||
Symphony Ltd. | 22,619 | 229,858 | ||||||
TTK Prestige Ltd. | 50,266 | 404,587 | ||||||
Whirlpool of India Ltd. | 21,000 | 307,550 | ||||||
|
| |||||||
| Total Household Durables |
| 5,845,626 | ||||||
| Household Products – 0.0% | ||||||||
Jyothy Labs Ltd. | 91,229 | 481,235 | ||||||
| Independent Power & Renewable Electricity Producers – 3.7% |
| |||||||
Adani Green Energy Ltd.* | 97,795 | 2,151,836 | ||||||
Adani Power Ltd.* | 2,500,924 | 16,006,633 | ||||||
JSW Energy Ltd. | 602,472 | 3,820,598 | ||||||
KPI Green Energy Ltd.(b) | 25,392 | 463,670 | ||||||
NHPC Ltd. | 10,478,334 | 11,269,525 | ||||||
NLC India Ltd. | 741,714 | 2,028,536 | ||||||
NTPC Ltd. | 17,633,117 | 70,995,482 | ||||||
|
| |||||||
| Total Independent Power & Renewable Electricity Producers |
| 106,736,280 | ||||||
| Industrial Conglomerates – 0.4% | ||||||||
Apar Industries Ltd. | 26,333 | 2,203,475 | ||||||
Godrej Industries Ltd.* | 108,607 | 1,018,909 | ||||||
Nava Ltd. | 694,753 | 4,045,524 | ||||||
Siemens Ltd. | 66,210 | 4,266,249 | ||||||
|
| |||||||
| Total Industrial Conglomerates |
| 11,534,157 | ||||||
| Insurance – 1.1% | ||||||||
General Insurance Corp. of India(b) | 1,588,699 | 6,281,268 | ||||||
HDFC Life Insurance Co. Ltd.(b) | 174,761 | 1,327,117 | ||||||
ICICI Lombard General Insurance Co. Ltd.(b) | 345,425 | 6,976,630 | ||||||
ICICI Prudential Life Insurance Co. Ltd.(b) | 212,662 | 1,551,953 | ||||||
Life Insurance Corp. of India | 799,059 | 8,777,410 | ||||||
Max Financial Services Ltd.* | 113,232 | 1,360,644 | ||||||
New India Assurance Co. Ltd.(b) | 718,539 | 1,956,539 | ||||||
SBI Life Insurance Co. Ltd.(b) | 225,291 | 4,052,550 | ||||||
Star Health & Allied Insurance Co. Ltd.* | 64,562 | 420,685 | ||||||
|
| |||||||
| Total Insurance |
| 32,704,796 | ||||||
| Interactive Media & Services – 0.1% | ||||||||
Just Dial Ltd.* | 160,583 | 1,546,383 | ||||||
| IT Services – 11.0% | ||||||||
Cigniti Technologies Ltd. | 51 | 774 | ||||||
Coforge Ltd. | 50,272 | 3,316,677 | ||||||
Cyient Ltd. | 162,415 | 3,887,620 | ||||||
Happiest Minds Technologies Ltd. | 1,566 | 13,977 | ||||||
HCL Technologies Ltd. | 2,364,755 | 43,765,086 | ||||||
Infosys Ltd. | 7,148,760 | 128,403,824 | ||||||
LTIMindtree Ltd.(b) | 105,511 | 6,247,481 | ||||||
Mphasis Ltd. | 179,993 | 5,153,710 | ||||||
Persistent Systems Ltd. | 123,836 | 5,916,258 | ||||||
Sonata Software Ltd. | 363,869 | 3,151,474 | ||||||
Tata Consultancy Services Ltd. | 1,648,349 | 76,610,356 | ||||||
Tech Mahindra Ltd. | 1,350,298 | 20,206,911 | ||||||
Wipro Ltd. | 3,178,120 | 18,294,600 | ||||||
Zensar Technologies Ltd. | 341,145 | 2,481,817 | ||||||
|
| |||||||
| Total IT Services |
| 317,450,565 | ||||||
| Life Sciences Tools & Services – 0.2% | ||||||||
Divi’s Laboratories Ltd. | 107,322 | 4,433,398 | ||||||
Syngene International Ltd.(b) | 124,881 | 1,051,949 | ||||||
Tarsons Products Ltd.* | 85,311 | 402,607 | ||||||
|
| |||||||
| Total Life Sciences Tools & Services |
| 5,887,954 | ||||||
| Machinery – 0.9% | ||||||||
AIA Engineering Ltd. | 74,611 | 3,502,541 | ||||||
Ashok Leyland Ltd. | 949,470 | 1,949,543 | ||||||
Cochin Shipyard Ltd.(b) | 245,080 | 2,561,803 | ||||||
Cummins India Ltd. | 205,026 | 7,390,179 | ||||||
Elgi Equipments Ltd. | 239,155 | 1,725,363 | ||||||
Escorts Kubota Ltd. | 42,767 | 1,424,139 | ||||||
Grindwell Norton Ltd. | 32,207 | 734,077 | ||||||
Hle Glascoat Ltd. | 24,738 | 121,106 | ||||||
ISGEC Heavy Engineering Ltd. | 10,226 | 110,092 | ||||||
Jamna Auto Industries Ltd. | 516,240 | 818,593 | ||||||
Kirloskar Brothers Ltd. | 39 | 512 | ||||||
Kirloskar Oil Engines Ltd. | 40,603 | 418,408 | ||||||
LG Balakrishnan & Bros Ltd. | 39,226 | 597,732 | ||||||
Schaeffler India Ltd. | 1,764 | 59,461 | ||||||
SKF India Ltd. | 35,572 | 1,773,706 | ||||||
Thermax Ltd. | 52,836 | 2,655,880 | ||||||
Timken India Ltd. | 21,225 | 727,711 | ||||||
|
| |||||||
| Total Machinery |
| 26,570,846 | ||||||
| Marine Transportation – 0.1% | ||||||||
Shipping Corp. of India Ltd. | 1,075,770 | 2,693,214 | ||||||
| Media – 0.1% | ||||||||
Affle India Ltd.* | 46,751 | 583,922 | ||||||
Brightcom Group Ltd.* | 2,626 | 434 | ||||||
Hathway Cable & Datacom Ltd.* | 46,312 | 10,884 | ||||||
Sun TV Network Ltd. | 201,384 | 1,449,366 | ||||||
TV18 Broadcast Ltd.* | 906,090 | 504,092 | ||||||
Zee Entertainment Enterprises Ltd.* | 82,735 | 137,441 | ||||||
|
| |||||||
| Total Media |
| 2,686,139 | ||||||
| Metals & Mining – 6.6% | ||||||||
APL Apollo Tubes Ltd. | 177,244 | 3,179,139 | ||||||
Godawari Power & Ispat Ltd. | 19,690 | 178,786 | ||||||
Hindalco Industries Ltd. | 6,088,581 | 40,899,583 | ||||||
Hindustan Zinc Ltd. | 970,661 | 3,401,867 | ||||||
Jindal Saw Ltd. | 398,268 | 2,066,252 | ||||||
Jindal Stainless Ltd. | 1,152,243 | 9,594,139 | ||||||
See Notes to Financial Statements.
| WisdomTree Trust | 75 |
Schedule of Investments (continued)
WisdomTree India Earnings Fund (EPI) (consolidated)
March 31, 2024
| Investments | Shares | Value | ||||||
Jindal Steel & Power Ltd. | 1,049,369 | $ | 10,683,993 | |||||
JSW Steel Ltd. | 1,173,423 | 11,680,415 | ||||||
Kirloskar Ferrous Industries Ltd. | 181,049 | 1,182,319 | ||||||
Maharashtra Seamless Ltd. | 209,316 | 2,123,590 | ||||||
Maithan Alloys Ltd. | 19,243 | 226,202 | ||||||
Mishra Dhatu Nigam Ltd.(b) | 6,513 | 30,787 | ||||||
National Aluminium Co. Ltd. | 4,588,811 | 8,393,311 | ||||||
NMDC Ltd. | 7,824,352 | 18,927,047 | ||||||
Ramkrishna Forgings Ltd. | 120,170 | 995,983 | ||||||
Ratnamani Metals & Tubes Ltd. | 29,645 | 993,184 | ||||||
Sandur Manganese & Iron Ores Ltd. | 270,924 | 1,167,472 | ||||||
Sarda Energy & Minerals Ltd. | 750,758 | 1,825,980 | ||||||
Shyam Metalics & Energy Ltd. | 3,672 | 26,036 | ||||||
Steel Authority of India Ltd. | 5,199,455 | 8,369,375 | ||||||
Sunflag Iron & Steel Co. Ltd.* | 388,180 | 866,397 | ||||||
Surya Roshni Ltd. | 155,852 | 949,660 | ||||||
Tata Steel Ltd. | 20,818,662 | 38,902,772 | ||||||
Usha Martin Ltd. | 405,935 | 1,548,980 | ||||||
Vedanta Ltd. | 6,138,580 | 19,993,948 | ||||||
Welspun Corp. Ltd. | 401,844 | 2,483,264 | ||||||
|
| |||||||
| Total Metals & Mining |
| 190,690,481 | ||||||
| Office REITs – 0.0% | ||||||||
Mindspace Business Parks REIT(b) | 49,005 | 202,942 | ||||||
| Oil, Gas & Consumable Fuels – 18.7% | ||||||||
Aegis Logistics Ltd. | 538,505 | 2,883,886 | ||||||
Bharat Petroleum Corp. Ltd. | 1,625,092 | 11,737,723 | ||||||
Coal India Ltd. | 16,695,307 | 86,897,069 | ||||||
Great Eastern Shipping Co. Ltd. | 975,605 | 11,712,173 | ||||||
Hindustan Oil Exploration Co. Ltd.* | 64,625 | 137,692 | ||||||
Indian Oil Corp. Ltd. | 14,870,657 | 29,909,807 | ||||||
Mangalore Refinery & Petrochemicals Ltd. | 616,526 | 1,615,560 | ||||||
Oil & Natural Gas Corp. Ltd. | 30,360,782 | 97,577,502 | ||||||
Oil India Ltd. | 5,160,601 | 37,140,982 | ||||||
Petronet LNG Ltd. | 3,746,129 | 11,821,962 | ||||||
Reliance Industries Ltd. | 6,892,155 | 245,573,178 | ||||||
|
| |||||||
| Total Oil, Gas & Consumable Fuels |
| 537,007,534 | ||||||
| Paper & Forest Products – 0.2% | ||||||||
Century Plyboards India Ltd. | 99,703 | 765,144 | ||||||
Century Textiles & Industries Ltd. | 946 | 18,487 | ||||||
JK Paper Ltd. | 632,399 | 2,444,976 | ||||||
Tamil Nadu Newsprint & Papers Ltd. | 377,758 | 1,117,161 | ||||||
West Coast Paper Mills Ltd. | 290,300 | 2,057,448 | ||||||
|
| |||||||
| Total Paper & Forest Products |
| 6,403,216 | ||||||
| Personal Care Products – 1.2% | ||||||||
Bajaj Consumer Care Ltd. | 4,833 | 12,288 | ||||||
Colgate-Palmolive India Ltd. | 147,725 | 4,800,653 | ||||||
Dabur India Ltd. | 438,918 | 2,753,154 | ||||||
Emami Ltd. | 466,964 | 2,403,897 | ||||||
Godrej Consumer Products Ltd. | 374,865 | 5,626,402 | ||||||
Hindustan Unilever Ltd. | 721,096 | 19,577,515 | ||||||
|
| |||||||
| Total Personal Care Products |
| 35,173,909 | ||||||
| Pharmaceuticals – 4.0% | ||||||||
Aarti Drugs Ltd. | 224,480 | 1,168,930 | ||||||
Aarti Pharmalabs Ltd. | 37,939 | 197,855 | ||||||
Aether Industries Ltd.* | 21,754 | 203,710 | ||||||
Ajanta Pharma Ltd. | 21,652 | 579,148 | ||||||
Alembic Pharmaceuticals Ltd. | 173,338 | 2,046,740 | ||||||
Alkem Laboratories Ltd. | 40,158 | 2,379,555 | ||||||
AMI Organics Ltd. | 4,098 | 53,739 | ||||||
Aurobindo Pharma Ltd. | 650,677 | 8,494,045 | ||||||
Caplin Point Laboratories Ltd. | 1,262 | 19,903 | ||||||
Cipla Ltd. | 700,372 | 12,570,629 | ||||||
Dr. Reddy’s Laboratories Ltd. | 290,223 | 21,428,185 | ||||||
FDC Ltd.* | 59,455 | 302,898 | ||||||
Gland Pharma Ltd.*(b) | 94,490 | 2,090,557 | ||||||
GlaxoSmithKline Pharmaceuticals Ltd. | 63,619 | 1,484,857 | ||||||
Glenmark Life Sciences Ltd. | 39,476 | 367,603 | ||||||
Glenmark Pharmaceuticals Ltd. | 247,161 | 2,840,340 | ||||||
Granules India Ltd. | 415,067 | 2,140,716 | ||||||
Hikal Ltd. | 74,382 | 236,383 | ||||||
Indoco Remedies Ltd. | 740 | 2,916 | ||||||
IOL Chemicals & Pharmaceuticals Ltd. | 162,884 | 705,907 | ||||||
Ipca Laboratories Ltd. | 154,450 | 2,291,495 | ||||||
JB Chemicals & Pharmaceuticals Ltd. | 68,706 | 1,359,580 | ||||||
Laurus Labs Ltd.(b) | 720,412 | 3,389,031 | ||||||
Lupin Ltd. | 30,698 | 595,096 | ||||||
Marksans Pharma Ltd. | 11,386 | 20,737 | ||||||
Natco Pharma Ltd. | 176,196 | 2,011,300 | ||||||
Neuland Laboratories Ltd. | 24,771 | 1,877,713 | ||||||
Sun Pharmaceutical Industries Ltd. | 1,629,181 | 31,655,757 | ||||||
Supriya Lifescience Ltd. | 7,049 | 28,140 | ||||||
Suven Pharmaceuticals Ltd.* | 300,514 | 2,439,711 | ||||||
Torrent Pharmaceuticals Ltd. | 83,345 | 2,598,807 | ||||||
Zydus Lifesciences Ltd. | 578,720 | 6,989,882 | ||||||
|
| |||||||
| Total Pharmaceuticals |
| 114,571,865 | ||||||
| Professional Services – 0.4% | ||||||||
Computer Age Management Services Ltd. | 31,394 | 1,097,496 | ||||||
Datamatics Global Services Ltd. | 4,996 | 31,916 | ||||||
eClerx Services Ltd. | 54,179 | 1,537,819 | ||||||
Firstsource Solutions Ltd. | 1,303,547 | 3,089,189 | ||||||
L&T Technology Services Ltd.(b) | 41,484 | 2,727,044 | ||||||
Quess Corp. Ltd.(b) | 146,211 | 912,301 | ||||||
RITES Ltd. | 45,299 | 360,534 | ||||||
TeamLease Services Ltd.* | 11,011 | 361,821 | ||||||
|
| |||||||
| Total Professional Services |
| 10,118,120 | ||||||
| Real Estate Management & Development – 0.9% |
| |||||||
Brigade Enterprises Ltd. | 49,725 | 557,631 | ||||||
DLF Ltd. | 677,698 | 7,288,692 | ||||||
Godrej Properties Ltd.* | 50,797 | 1,400,895 | ||||||
Macrotech Developers Ltd.(b) | 23,672 | 322,387 | ||||||
Mahindra Lifespace Developers Ltd. | 2,430 | 17,100 | ||||||
NESCO Ltd. | 63,834 | 635,833 | ||||||
Oberoi Realty Ltd. | 246,981 | 4,370,456 | ||||||
Phoenix Mills Ltd. | 157,879 | 5,267,776 | ||||||
See Notes to Financial Statements.
| 76 | WisdomTree Trust |
Schedule of Investments (continued)
WisdomTree India Earnings Fund (EPI) (consolidated)
March 31, 2024
| Investments | Shares | Value | ||||||
Prestige Estates Projects Ltd. | 296,024 | $ | 4,152,730 | |||||
Shipping Corp. of India Land & Assets Ltd.* | 519,128 | 248,352 | ||||||
Sobha Ltd. | 115,662 | 2,009,116 | ||||||
|
| |||||||
| Total Real Estate Management & Development |
| 26,270,968 | ||||||
| Semiconductors & Semiconductor Equipment – 0.0% |
| |||||||
Borosil Renewables Ltd.* | 4,011 | 23,938 | ||||||
| Software – 0.7% | ||||||||
Birlasoft Ltd. | 385,634 | 3,430,837 | ||||||
Intellect Design Arena Ltd. | 8,120 | 106,784 | ||||||
KPIT Technologies Ltd. | 106,002 | 1,889,168 | ||||||
Newgen Software Technologies Ltd. | 241,073 | 2,298,507 | ||||||
Oracle Financial Services Software Ltd. | 76,390 | 8,036,372 | ||||||
Route Mobile Ltd. | 3,299 | 63,377 | ||||||
Tanla Platforms Ltd. | 128,369 | 1,261,642 | ||||||
Tata Elxsi Ltd. | 23,527 | 2,196,112 | ||||||
|
| |||||||
| Total Software |
| 19,282,799 | ||||||
| Specialty Retail – 0.1% | ||||||||
Go Fashion India Ltd.* | 45 | 650 | ||||||
Metro Brands Ltd. | 20,869 | 288,742 | ||||||
Trent Ltd. | 19,776 | 936,131 | ||||||
|
| |||||||
| Total Specialty Retail |
| 1,225,523 | ||||||
| Textiles, Apparel & Luxury Goods – 1.0% | ||||||||
Arvind Ltd. | 324,015 | 1,050,686 | ||||||
Bata India Ltd. | 251,385 | 4,111,860 | ||||||
Campus Activewear Ltd.* | 467,795 | 1,203,106 | ||||||
Gokaldas Exports Ltd. | 58,931 | 498,779 | ||||||
Indo Count Industries Ltd. | 7,160 | 30,399 | ||||||
Kalyan Jewellers India Ltd. | 50,880 | 260,981 | ||||||
KPR Mill Ltd. | 135,167 | 1,349,118 | ||||||
LUX Industries Ltd. | 35,356 | 455,439 | ||||||
Monte Carlo Fashions Ltd. | 1,757 | 13,197 | ||||||
Page Industries Ltd. | 2,101 | 867,857 | ||||||
Rajesh Exports Ltd.* | 842,341 | 2,661,778 | ||||||
Raymond Ltd. | 24,118 | 522,917 | ||||||
Relaxo Footwears Ltd. | 141,439 | 1,386,027 | ||||||
Rupa & Co. Ltd. | 77,067 | 220,614 | ||||||
Siyaram Silk Mills Ltd. | 30,881 | 162,509 | ||||||
Titan Co. Ltd. | 209,755 | 9,561,423 | ||||||
Trident Ltd. | 1,199,379 | 525,611 | ||||||
Vaibhav Global Ltd. | 9,066 | 39,600 | ||||||
Vardhman Textiles Ltd. | 281,391 | 1,492,272 | ||||||
Vedant Fashions Ltd. | 4,338 | 48,190 | ||||||
VIP Industries Ltd. | 4,942 | 31,138 | ||||||
Welspun Living Ltd. | 978,695 | 1,614,681 | ||||||
|
| |||||||
| Total Textiles, Apparel & Luxury Goods |
| 28,108,182 | ||||||
| Tobacco – 0.9% | ||||||||
Godfrey Phillips India Ltd. | 22,045 | 816,539 | ||||||
ITC Ltd. | 5,062,553 | 26,000,954 | ||||||
|
| |||||||
| Total Tobacco |
| 26,817,493 | ||||||
| Trading Companies & Distributors – 0.2% |
| |||||||
Adani Enterprises Ltd. | 134,513 | 5,156,338 | ||||||
IndiaMart InterMesh Ltd.(b) | 1,436 | 45,549 | ||||||
MMTC Ltd. | 867,864 | 691,461 | ||||||
MSTC Ltd. | 88,106 | 878,604 | ||||||
|
| |||||||
| Total Trading Companies & Distributors |
| 6,771,952 | ||||||
| Transportation Infrastructure – 0.7% |
| |||||||
Adani Ports & Special Economic Zone Ltd. | 1,229,551 | 19,782,057 | ||||||
Dreamfolks Services Ltd. | 34,734 | 203,379 | ||||||
Gujarat Pipavav Port Ltd. | 313,436 | 798,787 | ||||||
|
| |||||||
| Total Transportation Infrastructure |
| 20,784,223 | ||||||
| Wireless Telecommunication Services – 1.0% |
| |||||||
Bharti Airtel Ltd. | 1,962,860 | 28,914,838 | ||||||
TOTAL INVESTMENTS IN SECURITIES – 102.0% (Cost: $2,179,210,380) |
| 2,934,530,794 | ||||||
Other Assets less Liabilities – (2.0)% |
| (56,182,608 | ) | |||||
|
| |||||||
| NET ASSETS – 100.0% |
| $ | 2,878,348,186 | |||||
| * | Non-income producing security. |
| (a) | This security is exempt from registration under Regulation S of the Securities Act of 1933, which exempts from registration securities offered and sold outside the United States. This security may not be offered or sold in the United States except pursuant to an exemption from, or in a transaction not subject to, the registration requirements of the Securities Act of 1933. |
| (b) | This security is exempt from registration under rule 144A of the Securities Act of 1933. This security may be sold in transactions that are exempt from registration, normally to qualified institutional buyers. |
| INVESTMENT IN AFFILIATES |
Affiliated holdings are investments in entities in which the Fund owns 5% or more of the outstanding voting securities or are investments in entities which are under common ownership or control. Investments in affiliates during the fiscal year ended March 31, 2024 were as follows:
| Affiliate | Value at 3/31/2023 | Purchases/ Additions | Sales/ Reductions | Realized Gain/(Loss) | Change in Unrealized Appreciation/ Depreciation | Value at 3/31/2024 | Dividend Income | |||||||||||||||||||||
WisdomTree India ex-State-Owned Enterprises Fund^ | $ | 32,913 | $ | — | $ | 37,392 | $ | 10,491 | $ | (6,012 | ) | $ | — | $ | 99 | |||||||||||||
| ^ | As of March 31, 2024, the Fund did not hold a position in this affiliate. |
See Notes to Financial Statements.
| WisdomTree Trust | 77 |
Schedule of Investments (concluded)
WisdomTree India Earnings Fund (EPI) (consolidated)
March 31, 2024
| FAIR VALUATION SUMMARY |
The following is a summary of the fair valuations according to the inputs used in valuing the Fund’s investments (See Note 2 — Fair Value Measurement):
| Quoted Prices in Active Markets (Level 1) | Other Significant Observable Inputs (Level 2) | Significant Unobservable Inputs (Level 3) | Total | |||||||||||||
Assets: |
| |||||||||||||||
Investments in Securities | ||||||||||||||||
Common Stocks | $ | 2,934,530,794 | $ | — | $ | — | $ | 2,934,530,794 | ||||||||
Total Investments in Securities | $ | 2,934,530,794 | $ | — | $ | — | $ | 2,934,530,794 | ||||||||
See Notes to Financial Statements.
| 78 | WisdomTree Trust |
Schedule of Investments
WisdomTree New Economy Real Estate Fund (WTRE)
March 31, 2024
| Investments | Shares | Value | ||||||
| COMMON STOCKS – 99.2% | ||||||||
| Australia – 8.1% | ||||||||
Dexus(a) | 47,953 | $ | 247,461 | |||||
Goodman Group(a) | 49,880 | 1,100,235 | ||||||
NEXTDC Ltd.*(a) | 23,215 | 269,438 | ||||||
|
| |||||||
| Total Australia |
| 1,617,134 | ||||||
| Belgium – 1.6% | ||||||||
Warehouses De Pauw CVA(a) | 10,932 | 312,401 | ||||||
| Canada – 2.4% | ||||||||
Allied Properties Real Estate Investment Trust | 7,777 | 101,548 | ||||||
Dream Industrial Real Estate Investment Trust | 17,615 | 171,562 | ||||||
Granite Real Estate Investment Trust | 3,612 | 206,350 | ||||||
|
| |||||||
| Total Canada |
| 479,460 | ||||||
| China – 0.6% | ||||||||
ESR Group Ltd.(a)(b) | 109,000 | 116,570 | ||||||
| Italy – 1.1% | ||||||||
Infrastrutture Wireless Italiane SpA(a)(b) | 19,873 | 226,004 | ||||||
| Japan – 4.6% | ||||||||
Activia Properties, Inc. | 32 | 86,372 | ||||||
GLP J-REIT | 212 | 175,937 | ||||||
Japan Logistics Fund, Inc. | 53 | 95,988 | ||||||
LaSalle Logiport REIT | 118 | 120,148 | ||||||
Mitsubishi Estate Logistics REIT Investment Corp. | 30 | 75,920 | ||||||
Mitsui Fudosan Logistics Park, Inc. | 33 | 98,338 | ||||||
Nippon Prologis REIT, Inc.(a) | 151 | 268,387 | ||||||
|
| |||||||
| Total Japan |
| 921,090 | ||||||
| Singapore – 5.9% | ||||||||
CapitaLand Ascendas REIT | 227,736 | 467,419 | ||||||
Frasers Logistics & Commercial Trust(c) | 175,000 | 137,448 | ||||||
Keppel DC REIT | 78,800 | 101,011 | ||||||
Keppel REIT | 114,500 | 73,811 | ||||||
Mapletree Industrial Trust | 94,309 | 163,517 | ||||||
Mapletree Logistics Trust | 214,558 | 232,109 | ||||||
|
| |||||||
| Total Singapore |
| 1,175,315 | ||||||
| Spain – 6.1% | ||||||||
Cellnex Telecom SA*(a)(b) | 29,328 | 1,037,965 | ||||||
Merlin Properties Socimi SA | 16,052 | 172,928 | ||||||
|
| |||||||
| Total Spain |
| 1,210,893 | ||||||
| Sweden – 2.2% | ||||||||
Fabege AB(a) | 9,087 | 85,069 | ||||||
Sagax AB, Class B | 13,320 | 351,792 | ||||||
|
| |||||||
| Total Sweden |
| 436,861 | ||||||
| United Kingdom – 7.9% | ||||||||
Derwent London PLC | 6,116 | 167,500 | ||||||
LondonMetric Property PLC | 90,375 | 231,986 | ||||||
Segro PLC | 83,720 | 955,852 | ||||||
Tritax Big Box REIT PLC | 107,767 | 214,007 | ||||||
|
| |||||||
| Total United Kingdom |
| 1,569,345 | ||||||
| United States – 58.7% | ||||||||
Airbnb, Inc., Class A* | 4,592 | 757,496 | ||||||
Alexandria Real Estate Equities, Inc. | 5,877 | 757,604 | ||||||
American Tower Corp. | 3,650 | 721,204 | ||||||
Americold Realty Trust, Inc. | 17,839 | 444,548 | ||||||
COPT Defense Properties | 7,043 | 170,229 | ||||||
Cousins Properties, Inc. | 9,430 | 226,697 | ||||||
Crown Castle, Inc. | 6,694 | 708,426 | ||||||
Digital Realty Trust, Inc. | 5,064 | 729,419 | ||||||
DigitalBridge Group, Inc. | 10,208 | 196,708 | ||||||
Douglas Emmett, Inc.(a) | 9,112 | 126,384 | ||||||
EastGroup Properties, Inc. | 2,680 | 481,784 | ||||||
Equinix, Inc. | 832 | 686,675 | ||||||
First Industrial Realty Trust, Inc. | 5,967 | 313,506 | ||||||
Healthpeak Properties, Inc. | 31,140 | 583,875 | ||||||
Iron Mountain, Inc. | 9,783 | 784,694 | ||||||
JBG SMITH Properties | 5,152 | 82,690 | ||||||
Kilroy Realty Corp. | 7,184 | 261,713 | ||||||
LXP Industrial Trust | 13,060 | 117,801 | ||||||
Prologis, Inc. | 5,597 | 728,841 | ||||||
Rexford Industrial Realty, Inc. | 13,450 | 676,535 | ||||||
SBA Communications Corp. | 4,012 | 869,400 | ||||||
Terreno Realty Corp. | 3,876 | 257,366 | ||||||
Ventas, Inc. | 22,680 | 987,487 | ||||||
|
| |||||||
| Total United States |
| 11,671,082 | ||||||
TOTAL COMMON STOCKS (Cost: $22,780,708) |
| 19,736,155 | ||||||
| INVESTMENT OF CASH COLLATERAL FOR SECURITIES LOANED – 12.3% |
| |||||||
| United States – 12.3% |
| |||||||
State Street Navigator Securities Lending Government Money Market Portfolio, 5.34%(d) | ||||||||
| (Cost: $2,436,862) | 2,436,862 | 2,436,862 | ||||||
TOTAL INVESTMENTS IN SECURITIES – 111.5% (Cost: $25,217,570) | 22,173,017 | |||||||
Other Assets less Liabilities – (11.5)% | (2,280,890 | ) | ||||||
|
| |||||||
| NET ASSETS – 100.0% |
| $ | 19,892,127 | |||||
| * | Non-income producing security. |
| (a) | Security, or portion thereof, was on loan at March 31, 2024 (See Note 2). At March 31, 2024, the total market value of the Fund’s securities on loan identified in the Schedule of Investments was $2,724,130 and the total market value of the collateral held by the Fund was $2,874,442. The total market value of the collateral includes non-cash U.S. Government securities collateral having a value of $437,580. |
| (b) | This security is exempt from registration under rule 144A of the Securities Act of 1933. This security may be sold in transactions that are exempt from registration, normally to qualified institutional buyers. |
| (c) | This security is exempt from registration under Regulation S of the Securities Act of 1933, which exempts from registration securities offered and sold outside the United States. This security may not be offered or sold in the United States except pursuant to an exemption from, or in a transaction not subject to, the registration requirements of the Securities Act of 1933. |
| (d) | Rate shown represents annualized 7-day yield as of March 31, 2024. |
See Notes to Financial Statements.
| WisdomTree Trust | 79 |
Schedule of Investments (concluded)
WisdomTree New Economy Real Estate Fund (WTRE)
March 31, 2024
| FINANCIAL DERIVATIVE INSTRUMENTS | ||||||||||||||||||||||||||||
| FOREIGN CURRENCY CONTRACTS (OTC – OVER THE COUNTER) | ||||||||||||||||||||||||||||
| Counterparty | Settlement Date | Amount and Description of Currency to be Purchased | Amount and Description of Currency to be Sold | Unrealized Appreciation | Unrealized Depreciation | |||||||||||||||||||||||
Royal Bank of Canada | 4/2/2024 | 2,644 | USD | 2,094 | GBP | $ | — | $ | (1 | ) | ||||||||||||||||||
| FAIR VALUATION SUMMARY |
The following is a summary of the fair valuations according to the inputs used in valuing the Fund’s investments (See Note 2 — Fair Value Measurement):
| Quoted Prices in Active Markets (Level 1) | Other Significant Observable Inputs (Level 2) | Significant Unobservable Inputs (Level 3) | Total | |||||||||||||
Assets: |
| |||||||||||||||
Investments in Securities | ||||||||||||||||
Common Stocks | $ | 19,736,155 | $ | — | $ | — | $ | 19,736,155 | ||||||||
Investment of Cash Collateral for Securities Loaned | — | 2,436,862 | — | 2,436,862 | ||||||||||||
Total Investments in Securities | $ | 19,736,155 | $ | 2,436,862 | $ | — | $ | 22,173,017 | ||||||||
Liabilities: | ||||||||||||||||
Financial Derivative Instruments | ||||||||||||||||
Foreign Currency Contracts1 | $ | — | $ | (1 | ) | $ | — | $ | (1 | ) | ||||||
Total – Net | $ | 19,736,155 | $ | 2,436,861 | $ | — | $ | 22,173,016 | ||||||||
| 1 | Amount shown represents the unrealized appreciation (depreciation) on the financial instrument. |
See Notes to Financial Statements.
| 80 | WisdomTree Trust |
Statements of Assets and Liabilities
WisdomTree Trust
March 31, 2024
| WisdomTree China ex-State-Owned Enterprises Fund | WisdomTree Emerging Markets ex-State-Owned Enterprises Fund | WisdomTree Emerging Markets High Dividend Fund | WisdomTree Emerging Markets Multifactor Fund | WisdomTree Emerging Markets Quality Dividend Growth Fund | ||||||||||||||||
ASSETS: | ||||||||||||||||||||
Investments, at cost | $ | 472,436,896 | $ | 1,827,384,046 | $ | 2,522,949,485 | $ | 21,753,996 | $ | 109,520,485 | ||||||||||
Investment in affiliates, at cost (Note 3) | — | — | 897,319 | — | — | |||||||||||||||
Foreign currency, at cost | — | 670,259 | 4,485,827 | 13,008 | 648,053 | |||||||||||||||
Investments in securities, at value1,2 (Note 2) | 363,116,661 | 2,007,805,782 | 2,831,771,672 | 23,463,901 | 136,694,676 | |||||||||||||||
Investment in affiliates, at value (Note 3) | — | — | 981,756 | — | — | |||||||||||||||
Cash | 195,756 | 1,172,572 | 5,839,960 | 12,494 | 2,582,242 | |||||||||||||||
Foreign currency, at value | 1,096 | 766,268 | 3,674,290 | 14,884 | 620,398 | |||||||||||||||
Unrealized appreciation on foreign currency contracts | — | — | 2,100 | 286,499 | 32 | |||||||||||||||
Receivables: |
| |||||||||||||||||||
Capital shares sold | — | — | — | — | 2,418,732 | |||||||||||||||
Dividends | 59,727 | 4,810,544 | 8,435,804 | 70,553 | 483,850 | |||||||||||||||
Securities lending income | 22,971 | 60,652 | 196,883 | 22 | 1,706 | |||||||||||||||
Interest | — | 131 | — | — | 7 | |||||||||||||||
Foreign tax reclaims | — | 78,706 | 82,796 | 314 | 2,618 | |||||||||||||||
Foreign capital gains tax refund | — | 182,150 | 290,956 | — | — | |||||||||||||||
Other (Note 6) | — | 190,638 | 166,357 | — | — | |||||||||||||||
Total Assets | 363,396,211 | 2,015,067,443 | 2,851,442,574 | 23,848,667 | 142,804,261 | |||||||||||||||
LIABILITIES: | ||||||||||||||||||||
Unrealized depreciation on foreign currency contracts | — | — | — | 177,246 | 1,879 | |||||||||||||||
Payables: | ||||||||||||||||||||
Cash collateral received for securities loaned (Note 2) | 2,648,553 | 13,742,102 | 30,350,984 | 8,195 | 519,173 | |||||||||||||||
Deposit due to authorized participant (Note 4) | — | — | 5,438,156 | — | 3,952,016 | |||||||||||||||
Investment securities purchased | — | — | 40,832 | 57,027 | 1,405,251 | |||||||||||||||
Advisory fees (Note 3) | 99,119 | 537,086 | 1,484,932 | 9,515 | 35,029 | |||||||||||||||
Service fees (Note 2) | 1,363 | 7,385 | 10,377 | 87 | 485 | |||||||||||||||
Foreign capital gains tax | — | 10,861,870 | 9,961,854 | 96,732 | 1,842,460 | |||||||||||||||
Other (Note 6) | — | 57,191 | 106,723 | — | — | |||||||||||||||
Total Liabilities | 2,749,035 | 25,205,634 | 47,393,858 | 348,802 | 7,756,293 | |||||||||||||||
NET ASSETS | $ | 360,647,176 | $ | 1,989,861,809 | $ | 2,804,048,716 | $ | 23,499,865 | $ | 135,047,968 | ||||||||||
NET ASSETS: | ||||||||||||||||||||
Paid-in capital | $ | 1,083,451,250 | $ | 2,713,895,605 | $ | 4,153,971,851 | $ | 23,027,622 | $ | 139,774,921 | ||||||||||
Total distributable earnings (loss) | (722,804,074 | ) | (724,033,796 | ) | (1,349,923,135 | ) | 472,243 | (4,726,953 | ) | |||||||||||
NET ASSETS | $ | 360,647,176 | $ | 1,989,861,809 | $ | 2,804,048,716 | $ | 23,499,865 | $ | 135,047,968 | ||||||||||
Outstanding beneficial interest shares of $0.001 par value (unlimited number of shares authorized) | 13,625,000 | 67,400,000 | 67,000,000 | 900,000 | 5,300,000 | |||||||||||||||
Net asset value per share | $ | 26.47 | $ | 29.52 | $ | 41.85 | $ | 26.11 | $ | 25.48 | ||||||||||
1 Includes market value of securities out on loan of: | $ | 17,915,740 | $ | 100,971,874 | $ | 243,668,369 | $ | 83,527 | $ | 2,281,054 | ||||||||||
2 Investments in securities include investment of cash collateral for securities loaned (see Schedule of Investments for additional information). |
| |||||||||||||||||||
See Notes to Financial Statements.
| WisdomTree Trust | 81 |
Statements of Assets and Liabilities (concluded)
WisdomTree Trust
March 31, 2024
| WisdomTree Emerging Markets SmallCap Dividend Fund | WisdomTree Global ex-U.S. Quality Dividend Growth Fund | WisdomTree Global High Dividend Fund | WisdomTree India Earnings Fund (consolidated) | WisdomTree New Economy Real Estate Fund | ||||||||||||||||
ASSETS: | ||||||||||||||||||||
Investments, at cost | $ | 2,288,776,542 | $ | 575,278,728 | $ | 102,478,198 | $ | 2,179,210,380 | $ | 25,217,570 | ||||||||||
Investment in affiliates, at cost (Note 3) | 6,433,859 | 845 | — | — | — | |||||||||||||||
Foreign currency, at cost | 4,367,752 | 371,813 | 77,032 | 19,177,574 | 241 | |||||||||||||||
Investments in securities, at value1,2 (Note 2) | 2,792,806,755 | 674,985,751 | 114,704,063 | 2,934,530,794 | 22,173,017 | |||||||||||||||
Investment in affiliates, at value (Note 3) | 6,455,912 | 966 | — | — | — | |||||||||||||||
Cash | 6,586,195 | 397,893 | 103,602 | 1,706,746 | 31,449 | |||||||||||||||
Foreign currency, at value | 3,607,220 | 372,217 | 76,802 | 19,129,317 | 156 | |||||||||||||||
Unrealized appreciation on foreign currency contracts | 5,925 | — | 21 | — | — | |||||||||||||||
Receivables: |
| |||||||||||||||||||
Investment securities sold3 | 5,328,502 | — | 2,520,833 | — | — | |||||||||||||||
Capital shares sold | 35,402 | — | — | — | — | |||||||||||||||
Dividends | 17,224,545 | 1,279,774 | 456,966 | 66,005 | 83,157 | |||||||||||||||
Securities lending income | 947,977 | 14,526 | 6,351 | — | 270 | |||||||||||||||
Interest | — | — | — | 31 | — | |||||||||||||||
Foreign tax reclaims | 68,537 | 1,466,273 | 119,432 | — | 50,073 | |||||||||||||||
Foreign capital gains tax refund | 320,923 | — | — | 61,127 | — | |||||||||||||||
Closed foreign currency contracts | — | 73 | — | — | — | |||||||||||||||
Other (Note 6) | 159,570 | 38,415 | 839 | — | 871 | |||||||||||||||
Total Assets | 2,833,547,463 | 678,555,888 | 117,988,909 | 2,955,494,020 | 22,338,993 | |||||||||||||||
LIABILITIES: | ||||||||||||||||||||
Unrealized depreciation on foreign currency contracts | 20 | 3 | 18 | — | 1 | |||||||||||||||
Payables: | ||||||||||||||||||||
Cash collateral received for securities loaned (Note 2) | 52,792,787 | 35,388,732 | 5,892,928 | — | 2,436,862 | |||||||||||||||
Investment securities purchased | 102,502 | — | — | — | — | |||||||||||||||
Capital shares redeemed | 13,686,728 | — | 2,544,471 | — | — | |||||||||||||||
Advisory fees (Note 3) | 1,390,868 | 229,966 | 54,587 | 1,973,598 | 9,668 | |||||||||||||||
Service fees (Note 2) | 10,564 | 2,412 | 414 | 10,462 | 73 | |||||||||||||||
Closed foreign currency contracts | 3,072 | — | — | — | — | |||||||||||||||
Foreign capital gains tax | 10,314,155 | 411,894 | 47,953 | 75,161,774 | — | |||||||||||||||
Other (Note 6) | 101,283 | 11,525 | 252 | — | 262 | |||||||||||||||
Total Liabilities | 78,401,979 | 36,044,532 | 8,540,623 | 77,145,834 | 2,446,866 | |||||||||||||||
NET ASSETS | $ | 2,755,145,484 | $ | 642,511,356 | $ | 109,448,286 | $ | 2,878,348,186 | $ | 19,892,127 | ||||||||||
NET ASSETS: | ||||||||||||||||||||
Paid-in capital | $ | 2,897,740,127 | $ | 649,711,510 | $ | 119,159,471 | $ | 2,226,272,996 | $ | 67,655,734 | ||||||||||
Total distributable earnings (loss) | (142,594,643 | ) | (7,200,154 | ) | (9,711,185 | ) | 652,075,190 | (47,763,607 | ) | |||||||||||
NET ASSETS | $ | 2,755,145,484 | $ | 642,511,356 | $ | 109,448,286 | $ | 2,878,348,186 | $ | 19,892,127 | ||||||||||
Outstanding beneficial interest shares of $0.001 par value (unlimited number of shares authorized) | 54,000,000 | 16,500,000 | 2,150,000 | 66,400,000 | 1,100,000 | |||||||||||||||
Net asset value per share | $ | 51.02 | $ | 38.94 | $ | 50.91 | $ | 43.35 | $ | 18.08 | ||||||||||
1 Includes market value of securities out on loan of: | $ | 455,444,799 | $ | 48,910,080 | $ | 8,304,858 | — | $ | 2,724,130 | |||||||||||
2 Investments in securities include investment of cash collateral for securities loaned (see Schedule of Investments for additional information). |
| |||||||||||||||||||
3 Includes market value of securities out on loan, which were sold and pending settlement, of: | — | — | $ | 1,210 | — | — | ||||||||||||||
See Notes to Financial Statements.
| 82 | WisdomTree Trust |
WisdomTree Trust
For the Year Ended March 31, 2024
| WisdomTree China ex-State- Owned Enterprises Fund | WisdomTree Emerging Markets ex-State-Owned Enterprises Fund | WisdomTree Emerging Markets High Dividend Fund | WisdomTree Emerging Markets Multifactor Fund | WisdomTree Emerging Markets Quality Dividend Growth Fund | ||||||||||||||||
INVESTMENT INCOME: |
| |||||||||||||||||||
Dividends | $ | 10,285,205 | $ | 47,231,349 | $ | 192,773,050 | $ | 231,888 | $ | 3,402,053 | ||||||||||
Dividends from affiliates (Note 3) | — | — | 144,788 | — | — | |||||||||||||||
Interest | 9,761 | 38,897 | 82,641 | 1,500 | 6,458 | |||||||||||||||
Non-cash dividends | 76,687 | 47,571 | 98,095 | — | 4,708 | |||||||||||||||
Other income (Note 6) | — | 183,034 | 308,837 | — | — | |||||||||||||||
Securities lending income, net (Note 2) | 495,182 | 1,168,831 | 2,198,089 | 671 | 20,922 | |||||||||||||||
Less: Foreign withholding taxes on dividends | (590,818 | ) | (6,943,904 | ) | (25,766,677 | ) | (37,052 | ) | (548,051 | ) | ||||||||||
Total investment income | 10,276,017 | 41,725,778 | 169,838,823 | 197,007 | 2,886,090 | |||||||||||||||
EXPENSES: | ||||||||||||||||||||
Advisory fees (Note 3) | 1,818,309 | 6,687,508 | 15,763,934 | 31,966 | 341,169 | |||||||||||||||
Service fees (Note 2) | 25,002 | 91,953 | 110,097 | 293 | 4,691 | |||||||||||||||
Other fees (Note 6) | — | 57,191 | 98,081 | — | — | |||||||||||||||
Total expenses | 1,843,311 | 6,836,652 | 15,972,112 | 32,259 | 345,860 | |||||||||||||||
Expense waivers (Note 3) | — | — | (8,896 | ) | — | — | ||||||||||||||
Net expenses | 1,843,311 | 6,836,652 | 15,963,216 | 32,259 | 345,860 | |||||||||||||||
Net investment income | 8,432,706 | 34,889,126 | 153,875,607 | 164,748 | 2,540,230 | |||||||||||||||
NET REALIZED AND UNREALIZED GAIN (LOSS) ON INVESTMENTS: | ||||||||||||||||||||
Net realized gain (loss) from: | ||||||||||||||||||||
Investment transactions1 | (205,676,181 | ) | (174,833,402 | ) | (28,494,726 | ) | (42,453 | ) | (2,680,196 | ) | ||||||||||
Investment transactions in affiliates (Note 3) | — | — | (100,985 | ) | — | — | ||||||||||||||
In-kind redemptions | (4,674,093 | ) | 20,229,417 | 1,387,174 | — | — | ||||||||||||||
Foreign currency contracts | 1,526,649 | 72,645 | (790,709 | ) | (30,763 | ) | (45,347 | ) | ||||||||||||
Foreign currency related transactions | (2,076,497 | ) | (1,236,105 | ) | 342,356 | 6,476 | (15,081 | ) | ||||||||||||
Net realized loss | (210,900,122 | ) | (155,767,445 | ) | (27,656,890 | ) | (66,740 | ) | (2,740,624 | ) | ||||||||||
Net increase (decrease) in unrealized appreciation/depreciation: | ||||||||||||||||||||
Investment transactions2 | 38,452,054 | 276,862,096 | 282,089,082 | 1,588,025 | 17,727,011 | |||||||||||||||
Investment transactions in affiliates (Note 3) | — | — | 159,419 | — | — | |||||||||||||||
Foreign currency contracts | (3 | ) | — | 2,060 | 124,127 | (1,695 | ) | |||||||||||||
Translation of assets and liabilities denominated in foreign currencies | 522,313 | 163,219 | (808,281 | ) | 1,623 | (33,069 | ) | |||||||||||||
Net increase in unrealized appreciation/depreciation | 38,974,364 | 277,025,315 | 281,442,280 | 1,713,775 | 17,692,247 | |||||||||||||||
Net realized and unrealized gain (loss) on investments | (171,925,758 | ) | 121,257,870 | 253,785,390 | 1,647,035 | 14,951,623 | ||||||||||||||
NET INCREASE (DECREASE) IN NET ASSETS RESULTING FROM OPERATIONS | $ | (163,493,052 | ) | $ | 156,146,996 | $ | 407,660,997 | $ | 1,811,783 | $ | 17,491,853 | |||||||||
1 Net of foreign capital gains (tax) and capital gains tax refund, if applicable, of: | — | $ | (5,108,180 | ) | $ | (956,256 | ) | $ | (30,472 | ) | $ | (124,656 | ) | |||||||
2 Includes net increase (decrease) in accrued foreign capital gain taxes of: | — | $ | 7,888,955 | $ | 9,483,635 | $ | 96,732 | $ | 1,616,373 | |||||||||||
See Notes to Financial Statements.
| WisdomTree Trust | 83 |
Statements of Operations (concluded)
WisdomTree Trust
For the Year Ended March 31, 2024
| WisdomTree Emerging Markets SmallCap Dividend Fund | WisdomTree Global ex-U.S. Quality Dividend Growth Fund | WisdomTree Global High Dividend Fund | WisdomTree India Earnings Fund (consolidated) | WisdomTree New Economy Real Estate Fund | ||||||||||||||||
INVESTMENT INCOME: | ||||||||||||||||||||
Dividends | $ | 155,977,285 | $ | 14,796,652 | $ | 5,913,252 | $ | 29,125,283 | $ | 669,686 | ||||||||||
Dividends from affiliates (Note 3) | 1,317,106 | 119,577 | 24,287 | 99 | — | |||||||||||||||
Interest | 59,952 | — | 1,529 | 58,514 | 303 | |||||||||||||||
Non-cash dividends | 759,725 | — | 18,585 | — | — | |||||||||||||||
Other income (Note 6) | 338,703 | 36,379 | — | — | — | |||||||||||||||
Securities lending income, net (Note 2) | 9,257,335 | 145,230 | 50,878 | — | 3,804 | |||||||||||||||
Less: Foreign withholding taxes on dividends | (22,170,325 | ) | (1,662,055 | ) | (360,217 | ) | (6,392,342 | ) | (33,721 | ) | ||||||||||
Total investment income | 145,539,781 | 13,435,783 | 5,648,314 | 22,791,554 | 640,072 | |||||||||||||||
EXPENSES: | ||||||||||||||||||||
Advisory fees (Note 3) | 16,501,658 | 2,483,267 | 651,941 | 12,366,884 | 126,830 | |||||||||||||||
Service fees (Note 2) | 125,185 | 26,015 | 4,946 | 65,559 | 962 | |||||||||||||||
Interest expense (Note 7) | — | — | — | 565,014 | — | |||||||||||||||
Other fees (Note 6) | 101,283 | 11,030 | — | — | — | |||||||||||||||
Total expenses | 16,728,126 | 2,520,312 | 656,887 | 12,997,457 | 127,792 | |||||||||||||||
Expense waivers (Note 3) | (26,107 | ) | (2,291 | ) | (50 | ) | (92 | ) | — | |||||||||||
Net expenses | 16,702,019 | 2,518,021 | 656,837 | 12,997,365 | 127,792 | |||||||||||||||
Net investment income | 128,837,762 | 10,917,762 | 4,991,477 | 9,794,189 | 512,280 | |||||||||||||||
NET REALIZED AND UNREALIZED GAIN (LOSS) ON INVESTMENTS: | ||||||||||||||||||||
Net realized gain (loss) from: | ||||||||||||||||||||
Investment transactions1 | 91,779,294 | (313,869 | ) | 399,362 | 16,383,254 | (843,777 | ) | |||||||||||||
Investment transactions in affiliates (Note 3) | 680,195 | 409,331 | 26,019 | 10,491 | — | |||||||||||||||
In-kind redemptions | 16,334,430 | 5,416,509 | 6,089,622 | — | (406,769 | ) | ||||||||||||||
Futures contracts | — | — | — | (2,744 | ) | — | ||||||||||||||
Foreign currency contracts | (1,099,643 | ) | (154,433 | ) | 13,138 | (1,106,581 | ) | (8,624 | ) | |||||||||||
Foreign currency related transactions | 422,941 | 146,559 | (21,687 | ) | (358,626 | ) | 5,907 | |||||||||||||
Net realized gain (loss) | 108,117,217 | 5,504,097 | 6,506,454 | 14,925,794 | (1,253,263 | ) | ||||||||||||||
Net increase (decrease) in unrealized appreciation/depreciation: | ||||||||||||||||||||
Investment transactions2 | 212,054,379 | 54,678,489 | 3,084,072 | 420,085,190 | 2,219,339 | |||||||||||||||
Investment transactions in affiliates (Note 3) | (419,839 | ) | (410,049 | ) | (16,483 | ) | (6,012 | ) | — | |||||||||||
Foreign currency contracts | 5,905 | (2,177 | ) | 3 | — | 24 | ||||||||||||||
Translation of assets and liabilities denominated in foreign currencies | (1,047,588 | ) | (11,533 | ) | (3,436 | ) | (52,815 | ) | (634 | ) | ||||||||||
Net increase in unrealized appreciation/depreciation | 210,592,857 | 54,254,730 | 3,064,156 | 420,026,363 | 2,218,729 | |||||||||||||||
Net realized and unrealized gain on investments | 318,710,074 | 59,758,827 | 9,570,610 | 434,952,157 | 965,466 | |||||||||||||||
NET INCREASE IN NET ASSETS RESULTING FROM OPERATIONS | $ | 447,547,836 | $ | 70,676,589 | $ | 14,562,087 | $ | 444,746,346 | $ | 1,477,746 | ||||||||||
1 Net of foreign capital gains (tax) and capital gains tax refund, if applicable, of: | $ | (3,770,434 | ) | $ | (449,819 | ) | $ | (16,308 | ) | $ | (15,823,314 | ) | — | |||||||
2 Includes net increase (decrease) in accrued foreign capital gain taxes of: | $ | 10,062,583 | $ | 411,894 | $ | 40,386 | $ | 55,844,330 | — | |||||||||||
See Notes to Financial Statements.
| 84 | WisdomTree Trust |
Statements of Changes in Net Assets
WisdomTree Trust
| WisdomTree China ex-State-Owned Enterprises Fund | WisdomTree Emerging Markets ex-State-Owned Enterprises Fund | WisdomTree Emerging Markets High Dividend Fund | ||||||||||||||||||||||
| For the Year Ended March 31, 2024 | For the Year Ended March 31, 2023 | For the Year Ended March 31, 2024 | For the Year Ended March 31, 2023 | For the Year Ended March 31, 2024 | For the Year Ended March 31, 2023 | |||||||||||||||||||
INCREASE (DECREASE) IN NET ASSETS RESULTING FROM OPERATIONS: |
| |||||||||||||||||||||||
Net investment income | $ | 8,432,706 | $ | 8,027,866 | $ | 34,889,126 | $ | 47,535,778 | $ | 153,875,607 | $ | 139,584,856 | ||||||||||||
Net realized loss on investments, foreign currency contracts and foreign currency related transactions | (210,900,122 | ) | (279,321,472 | ) | (155,767,445 | ) | (438,862,137 | ) | (27,656,890 | ) | (156,574,809 | ) | ||||||||||||
Net increase (decrease) in unrealized appreciation/depreciation on investments, foreign currency contracts and translation of assets and liabilities denominated in foreign currencies | 38,974,364 | 128,567,483 | 277,025,315 | (83,613,856 | ) | 281,442,280 | (150,570,055 | ) | ||||||||||||||||
Net increase (decrease) in net assets resulting from operations | (163,493,052 | ) | (142,726,123 | ) | 156,146,996 | (474,940,215 | ) | 407,660,997 | (167,560,008 | ) | ||||||||||||||
DISTRIBUTIONS TO SHAREHOLDERS: |
| |||||||||||||||||||||||
Distributable earnings | (9,480,375 | ) | (8,628,659 | ) | (38,726,000 | ) | (52,252,500 | ) | (151,734,500 | ) | (137,420,525 | ) | ||||||||||||
CAPITAL SHARE TRANSACTIONS: |
| |||||||||||||||||||||||
Net proceeds from sale of shares | 18,772,219 | 204,830,077 | 58,062,651 | 16,749,145 | 468,240,984 | 423,628,056 | ||||||||||||||||||
Cost of shares redeemed | (223,139,933 | ) | (150,767,082 | ) | (356,148,643 | ) | (638,895,275 | ) | (65,958,356 | ) | (92,653,343 | ) | ||||||||||||
Net increase (decrease) in net assets resulting from capital share transactions | (204,367,714 | ) | 54,062,995 | (298,085,992 | ) | (622,146,130 | ) | 402,282,628 | 330,974,713 | |||||||||||||||
Net Increase (Decrease) in Net Assets | (377,341,141 | ) | (97,291,787 | ) | (180,664,996 | ) | (1,149,338,845 | ) | 658,209,125 | 25,994,180 | ||||||||||||||
NET ASSETS: |
| |||||||||||||||||||||||
Beginning of year | $ | 737,988,317 | $ | 835,280,104 | $ | 2,170,526,805 | $ | 3,319,865,650 | $ | 2,145,839,591 | $ | 2,119,845,411 | ||||||||||||
End of year | $ | 360,647,176 | $ | 737,988,317 | $ | 1,989,861,809 | $ | 2,170,526,805 | $ | 2,804,048,716 | $ | 2,145,839,591 | ||||||||||||
SHARES CREATED AND REDEEMED: |
| |||||||||||||||||||||||
Shares outstanding, beginning of year | 21,125,000 | 20,425,000 | 78,100,000 | 100,300,000 | 56,800,000 | 48,200,000 | ||||||||||||||||||
Shares created | 600,000 | 5,375,000 | 2,100,000 | 500,000 | 12,000,000 | 11,300,000 | ||||||||||||||||||
Shares redeemed | (8,100,000 | ) | (4,675,000 | ) | (12,800,000 | ) | (22,700,000 | ) | (1,800,000 | ) | (2,700,000 | ) | ||||||||||||
Shares outstanding, end of year | 13,625,000 | 21,125,000 | 67,400,000 | 78,100,000 | 67,000,000 | 56,800,000 | ||||||||||||||||||
See Notes to Financial Statements.
| WisdomTree Trust | 85 |
Statements of Changes in Net Assets (continued)
WisdomTree Trust
| WisdomTree Emerging Markets Multifactor Fund | WisdomTree Emerging Markets Quality Dividend Growth Fund | WisdomTree Emerging Markets SmallCap Dividend Fund | ||||||||||||||||||||||
| For the Year Ended March 31, 2024 | For the Year Ended March 31, 2023 | For the Year Ended March 31, 2024 | For the Year Ended March 31, 2023 | For the Year Ended March 31, 2024 | For the Year Ended March 31, 2023 | |||||||||||||||||||
INCREASE (DECREASE) IN NET ASSETS RESULTING FROM OPERATIONS: |
| |||||||||||||||||||||||
Net investment income | $ | 164,748 | $ | 90,064 | $ | 2,540,230 | $ | 2,744,800 | $ | 128,837,762 | $ | 119,776,891 | ||||||||||||
Net realized gain (loss) on investments, foreign currency contracts and foreign currency related transactions | (66,740 | ) | (143,617 | ) | (2,740,624 | ) | (8,257,529 | ) | 108,117,217 | (314,610,431 | ) | |||||||||||||
Net increase (decrease) in unrealized appreciation/depreciation on investments, foreign currency contracts and translation of assets and liabilities denominated in foreign currencies | 1,713,775 | (86,997 | ) | 17,692,247 | (3,409,218 | ) | 210,592,857 | (51,650,330 | ) | |||||||||||||||
Net increase (decrease) in net assets resulting from operations | 1,811,783 | (140,550 | ) | 17,491,853 | (8,921,947 | ) | 447,547,836 | (246,483,870 | ) | |||||||||||||||
DISTRIBUTIONS TO SHAREHOLDERS: |
| |||||||||||||||||||||||
Distributable earnings | (102,000 | ) | (70,527 | ) | (2,519,500 | ) | (3,003,000 | ) | (132,233,000 | ) | (121,656,900 | ) | ||||||||||||
CAPITAL SHARE TRANSACTIONS: |
| |||||||||||||||||||||||
Net proceeds from sale of shares | 19,634,914 | — | 32,394,808 | 19,747,562 | 142,156,692 | 480,988,272 | ||||||||||||||||||
Cost of shares redeemed | — | — | — | (6,846,988 | ) | (390,765,422 | ) | — | ||||||||||||||||
Net increase (decrease) in net assets resulting from capital share transactions | 19,634,914 | — | 32,394,808 | 12,900,574 | (248,608,730 | ) | 480,988,272 | |||||||||||||||||
Net Increase (Decrease) in Net Assets | 21,344,697 | (211,077 | ) | 47,367,161 | 975,627 | 66,706,106 | 112,847,502 | |||||||||||||||||
NET ASSETS: |
| |||||||||||||||||||||||
Beginning of year | $ | 2,155,168 | $ | 2,366,245 | $ | 87,680,807 | $ | 86,705,180 | $ | 2,688,439,378 | $ | 2,575,591,876 | ||||||||||||
End of year | $ | 23,499,865 | $ | 2,155,168 | $ | 135,047,968 | $ | 87,680,807 | $ | 2,755,145,484 | $ | 2,688,439,378 | ||||||||||||
SHARES CREATED AND REDEEMED: |
| |||||||||||||||||||||||
Shares outstanding, beginning of year | 100,000 | 100,000 | 3,900,000 | 3,300,000 | 58,800,000 | 48,200,000 | ||||||||||||||||||
Shares created | 800,000 | — | 1,400,000 | 900,000 | 3,000,000 | 10,600,000 | ||||||||||||||||||
Shares redeemed | — | — | — | (300,000 | ) | (7,800,000 | ) | — | ||||||||||||||||
Shares outstanding, end of year | 900,000 | 100,000 | 5,300,000 | 3,900,000 | 54,000,000 | 58,800,000 | ||||||||||||||||||
See Notes to Financial Statements.
| 86 | WisdomTree Trust |
Statements of Changes in Net Assets (continued)
WisdomTree Trust
| WisdomTree Global ex-U.S. Quality Dividend Growth Fund | WisdomTree Global High Dividend Fund | WisdomTree India Earnings Fund (consolidated) | ||||||||||||||||||||||
| For the Year Ended March 31, 2024 | For the Year Ended March 31, 2023 | For the Year Ended March 31, 2024 | For the Year Ended March 31, 2023 | For the Year Ended March 31, 2024 | For the Year Ended March 31, 2023 | |||||||||||||||||||
INCREASE (DECREASE) IN NET ASSETS RESULTING FROM OPERATIONS: |
| |||||||||||||||||||||||
Net investment income | $ | 10,917,762 | $ | 18,640,555 | $ | 4,991,477 | $ | 4,325,526 | $ | 9,794,189 | $ | 9,368,356 | ||||||||||||
Net realized gain (loss) on investments, futures contracts, foreign currency contracts and foreign currency related transactions | 5,504,097 | (85,926,564 | ) | 6,506,454 | (4,576,626 | ) | 14,925,794 | 32,625,578 | ||||||||||||||||
Net increase (decrease) in unrealized appreciation/depreciation on investments, foreign currency contracts and translation of assets and liabilities denominated in foreign currencies | 54,254,730 | 16,306,743 | 3,064,156 | 956,107 | 420,026,363 | (121,598,313 | ) | |||||||||||||||||
Net increase (decrease) in net assets resulting from operations | 70,676,589 | (50,979,266 | ) | 14,562,087 | 705,007 | 444,746,346 | (79,604,379 | ) | ||||||||||||||||
DISTRIBUTIONS TO SHAREHOLDERS: |
| |||||||||||||||||||||||
Distributable earnings | (11,257,500 | ) | (18,475,318 | ) | (5,057,500 | ) | (4,296,367 | ) | — | (40,595,106 | ) | |||||||||||||
Tax return of capital | — | — | — | — | (1,524,000 | ) | — | |||||||||||||||||
Total distributions to shareholders | (11,257,500 | ) | (18,475,318 | ) | (5,057,500 | ) | (4,296,367 | ) | (1,524,000 | ) | (40,595,106 | ) | ||||||||||||
CAPITAL SHARE TRANSACTIONS: |
| |||||||||||||||||||||||
Net proceeds from sale of shares | 89,140,274 | 135,468,168 | — | 70,609,590 | 1,674,291,062 | 117,541,739 | ||||||||||||||||||
Cost of shares redeemed | (33,044,679 | ) | (106,255,698 | ) | (35,963,863 | ) | — | (25,399,122 | ) | (104,949,767 | ) | |||||||||||||
Net increase (decrease) in net assets resulting from capital share transactions | 56,095,595 | 29,212,470 | (35,963,863 | ) | 70,609,590 | 1,648,891,940 | 12,591,972 | |||||||||||||||||
Net Increase (Decrease) in Net Assets | 115,514,684 | (40,242,114 | ) | (26,459,276 | ) | 67,018,230 | 2,092,114,286 | (107,607,513 | ) | |||||||||||||||
NET ASSETS: |
| |||||||||||||||||||||||
Beginning of year | $ | 526,996,672 | $ | 567,238,786 | $ | 135,907,562 | $ | 68,889,332 | $ | 786,233,900 | $ | 893,841,413 | ||||||||||||
End of year | $ | 642,511,356 | $ | 526,996,672 | $ | 109,448,286 | $ | 135,907,562 | $ | 2,878,348,186 | $ | 786,233,900 | ||||||||||||
SHARES CREATED AND REDEEMED: |
| |||||||||||||||||||||||
Shares outstanding, beginning of year | 14,900,000 | 14,200,000 | 2,900,000 | 1,350,000 | 25,000,000 | 24,600,000 | ||||||||||||||||||
Shares created | 2,500,000 | 4,000,000 | — | 1,550,000 | 42,000,000 | 3,600,000 | ||||||||||||||||||
Shares redeemed | (900,000 | ) | (3,300,000 | ) | (750,000 | ) | — | (600,000 | ) | (3,200,000 | ) | |||||||||||||
Shares outstanding, end of year | 16,500,000 | 14,900,000 | 2,150,000 | 2,900,000 | 66,400,000 | 25,000,000 | ||||||||||||||||||
See Notes to Financial Statements.
| WisdomTree Trust | 87 |
Statements of Changes in Net Assets (concluded)
WisdomTree Trust
WisdomTree New Economy Real Estate Fund | ||||||||
| For the Year Ended March 31, 2024 | For the Year Ended March 31, 2023 | |||||||
INCREASE (DECREASE) IN NET ASSETS RESULTING FROM OPERATIONS: |
| |||||||
Net investment income | $ | 512,280 | $ | 684,800 | ||||
Net realized loss on investments, foreign currency contracts and foreign currency related transactions | (1,253,263 | ) | (9,384,893 | ) | ||||
Net increase (decrease) in unrealized appreciation/depreciation on investments, foreign currency contracts and translation of assets and liabilities denominated in foreign currencies | 2,218,729 | (4,613,008 | ) | |||||
Net increase (decrease) in net assets resulting from operations | 1,477,746 | (13,313,101 | ) | |||||
DISTRIBUTIONS TO SHAREHOLDERS: |
| |||||||
Distributable earnings | (558,000 | ) | (420,750 | ) | ||||
CAPITAL SHARE TRANSACTIONS: |
| |||||||
Cost of shares redeemed | (6,689,089 | ) | (15,454,996 | ) | ||||
Net decrease in net assets resulting from capital share transactions | (6,689,089 | ) | (15,454,996 | ) | ||||
Net Decrease in Net Assets | (5,769,343 | ) | (29,188,847 | ) | ||||
NET ASSETS: |
| |||||||
Beginning of year | $ | 25,661,470 | $ | 54,850,317 | ||||
End of year | $ | 19,892,127 | $ | 25,661,470 | ||||
SHARES CREATED AND REDEEMED: |
| |||||||
Shares outstanding, beginning of year | 1,500,000 | 2,350,000 | ||||||
Shares created | — | — | ||||||
Shares redeemed | (400,000 | ) | (850,000 | ) | ||||
Shares outstanding, end of year | 1,100,000 | 1,500,000 | ||||||
See Notes to Financial Statements.
| 88 | WisdomTree Trust |
WisdomTree Trust
Selected data for a share of beneficial interest outstanding throughout the period is presented below:
| WisdomTree China ex-State-Owned Enterprises Fund | For the Year Ended March 31, 2024 | For the Year Ended March 31, 2023 | For the Year Ended March 31, 2022 | For the Year Ended March 31, 20211 | For the Year Ended March 31, 20201 | |||||||||||||||
Net asset value, beginning of year | $ | 34.93 | $ | 40.89 | $ | 64.41 | $ | 38.44 | $ | 38.84 | ||||||||||
Investment operations: | ||||||||||||||||||||
Net investment income2 | 0.44 | 0.36 | 0.60 | 0.23 | 0.39 | |||||||||||||||
Net realized and unrealized gain (loss) | (8.42 | ) | (5.94 | ) | (23.54 | ) | 26.10 | (0.39 | ) | |||||||||||
Total from investment operations | (7.98 | ) | (5.58 | ) | (22.94 | ) | 26.33 | 0.00 | 3 | |||||||||||
Dividends and distributions to shareholders: | ||||||||||||||||||||
Net investment income | (0.48 | ) | (0.38 | ) | (0.58 | ) | (0.35 | ) | (0.40 | ) | ||||||||||
Tax return of capital | — | — | — | (0.01 | ) | — | ||||||||||||||
Total dividends and distributions to shareholders | (0.48 | ) | (0.38 | ) | (0.58 | ) | (0.36 | ) | (0.40 | ) | ||||||||||
Net asset value, end of year | $ | 26.47 | $ | 34.93 | $ | 40.89 | $ | 64.41 | $ | 38.44 | ||||||||||
TOTAL RETURN4 | (22.97 | )% | (13.72 | )% | (35.81 | )% | 68.71 | % | 0.07 | % | ||||||||||
RATIOS/SUPPLEMENTAL DATA: | ||||||||||||||||||||
Net assets, end of year (000’s omitted) | $ | 360,647 | $ | 737,988 | $ | 835,280 | $ | 914,692 | $ | 188,351 | ||||||||||
Ratios to average net assets of: | ||||||||||||||||||||
Expenses, net of expense waivers | 0.32 | % | 0.32 | % | 0.32 | % | 0.32 | %5 | 0.32 | %6 | ||||||||||
Expenses, prior to expense waivers | 0.32 | % | 0.32 | % | 0.32 | % | 0.38 | % | 0.63 | % | ||||||||||
Net investment income | 1.48 | % | 0.99 | % | 1.10 | % | 0.37 | % | 1.03 | % | ||||||||||
Portfolio turnover rate7 | 33 | % | 39 | % | 36 | % | 20 | % | 22 | % | ||||||||||
| WisdomTree Emerging Markets ex-State-Owned Enterprises Fund | For the Year Ended March 31, 2024 | For the Year Ended March 31, 2023 | For the Year Ended March 31, 2022 | For the Year Ended March 31, 2021 | For the Year Ended March 31, 2020 | |||||||||||||||
Net asset value, beginning of year | $ | 27.79 | $ | 33.10 | $ | 40.31 | $ | 24.40 | $ | 28.79 | ||||||||||
Investment operations: | ||||||||||||||||||||
Net investment income2 | 0.47 | 0.56 | 0.62 | 0.41 | 0.62 | |||||||||||||||
Net realized and unrealized gain (loss) | 1.78 | (5.27 | ) | (7.28 | ) | 15.91 | (4.38 | ) | ||||||||||||
Net increase from payment by affiliate | — | — | 0.00 | 3 | 0.00 | 3 | — | |||||||||||||
Total from investment operations | 2.25 | (4.71 | ) | (6.66 | ) | 16.32 | (3.76 | ) | ||||||||||||
Dividends to shareholders: | ||||||||||||||||||||
Net investment income | (0.52 | ) | (0.60 | ) | (0.55 | ) | (0.41 | ) | (0.63 | ) | ||||||||||
Net asset value, end of year | $ | 29.52 | $ | 27.79 | $ | 33.10 | $ | 40.31 | $ | 24.40 | ||||||||||
TOTAL RETURN4 | 8.22 | % | (14.20 | )% | (16.70 | )%8 | 67.18 | %9 | (13.36 | )% | ||||||||||
RATIOS/SUPPLEMENTAL DATA: | ||||||||||||||||||||
Net assets, end of year (000’s omitted) | $ | 1,989,862 | $ | 2,170,527 | $ | 3,319,866 | $ | 4,719,936 | $ | 809,991 | ||||||||||
Ratios to average net assets of: | ||||||||||||||||||||
Expenses, net of expense waivers | 0.33 | %10 | 0.32 | % | 0.32 | % | 0.32 | %5 | 0.32 | %6 | ||||||||||
Expenses, prior to expense waivers | 0.33 | %10 | 0.32 | % | 0.32 | % | 0.37 | % | 0.58 | % | ||||||||||
Net investment income | 1.67 | % | 1.97 | % | 1.62 | % | 1.11 | % | 2.14 | % | ||||||||||
Portfolio turnover rate7 | 31 | % | 28 | % | 18 | % | 34 | % | 19 | % | ||||||||||
| 1 | Shares were adjusted to reflect a 2:1 share split effective October 16, 2020. |
| 2 | Based on average shares outstanding. |
| 3 | Amount represents less than $0.005. |
| 4 | Total return is calculated assuming an initial investment made at the net asset value at the beginning of the period, reinvestment of all dividends and distributions at net asset value during the period and redemption on the last day of the period. For the periods in which the investment advisor waived advisory fees, the total return would have been lower if certain expenses had not been waived (Notes 2 and 3). |
| 5 | The investment advisor had contractually agreed to limit the advisory fee to 0.32% through July 31, 2020. On July 31, 2020, the contractual waiver expired and the advisory fee was permanently reduced to 0.32%. |
| 6 | Effective June 30, 2017, the investment advisor contractually agreed to limit the advisory fee to 0.32% through July 31, 2020, unless earlier terminated by the Board of Trustees of the Trust. |
| 7 | Portfolio turnover rate excludes the value of the portfolio securities received or delivered as a result of in-kind creations or redemptions of the Fund’s capital shares. Short-term securities with maturities less than or equal to 365 days are excluded from the portfolio turnover calculation. |
| 8 | Includes a voluntary reimbursement from the sub-advisor for investment losses on certain foreign exchange transactions during the period. Excluding this voluntary reimbursement, total return would have been unchanged. |
| 9 | Includes a reimbursement from the sub-advisor for an operational error. Excluding this reimbursement, total return would have been unchanged. |
| 10 | Included in the expense ratio are “Other fees” described in Note 6. Without these expenses, the expense ratio would have been 0.32%. |
See Notes to Financial Statements.
| WisdomTree Trust | 89 |
Financial Highlights (continued)
WisdomTree Trust
Selected data for a share of beneficial interest outstanding throughout the period is presented below:
| WisdomTree Emerging Markets High Dividend Fund | For the Year Ended March 31, 2024 | For the Year Ended March 31, 2023 | For the Year Ended March 31, 2022 | For the Year Ended March 31, 2021 | For the Year Ended March 31, 2020 | |||||||||||||||
Net asset value, beginning of year | $ | 37.78 | $ | 43.98 | $ | 44.27 | $ | 32.45 | $ | 43.72 | ||||||||||
Investment operations: | ||||||||||||||||||||
Net investment income1 | 2.40 | 2.81 | 2.75 | 1.76 | 2.10 | |||||||||||||||
Net realized and unrealized gain (loss) | 4.03 | (6.21 | ) | (0.30 | ) | 11.93 | (11.25 | ) | ||||||||||||
Total from investment operations | 6.43 | (3.40 | ) | 2.45 | 13.69 | (9.15 | ) | |||||||||||||
Dividends to shareholders: | ||||||||||||||||||||
Net investment income | (2.36 | ) | (2.80 | ) | (2.74 | ) | (1.87 | ) | (2.12 | ) | ||||||||||
Net asset value, end of year | $ | 41.85 | $ | 37.78 | $ | 43.98 | $ | 44.27 | $ | 32.45 | ||||||||||
TOTAL RETURN2 | 17.69 | % | (6.97 | )% | 5.65 | % | 43.37 | % | (22.06 | )% | ||||||||||
RATIOS/SUPPLEMENTAL DATA: | ||||||||||||||||||||
Net assets, end of year (000’s omitted) | $ | 2,804,049 | $ | 2,145,840 | $ | 2,119,845 | $ | 1,916,702 | $ | 1,638,935 | ||||||||||
Ratios to average net assets of: | ||||||||||||||||||||
Expenses3,4 | 0.64 | %5 | 0.63 | %6 | 0.64 | %5 | 0.63 | % | 0.63 | % | ||||||||||
Net investment income | 6.15 | % | 7.53 | % | 6.16 | % | 4.58 | % | 4.91 | % | ||||||||||
Portfolio turnover rate7 | 42 | % | 43 | % | 53 | % | 62 | % | 41 | % | ||||||||||
| WisdomTree Emerging Markets Multifactor Fund | For the Year Ended March 31, 2024 | For the Year Ended March 31, 2023 | For the Year Ended March 31, 2022 | For the Year Ended March 31, 2021 | For the Year Ended March 31, 2020 | |||||||||||||||
Net asset value, beginning of year | $ | 21.55 | $ | 23.66 | $ | 25.81 | $ | 17.75 | $ | 23.61 | ||||||||||
Investment operations: | ||||||||||||||||||||
Net investment income1 | 0.60 | 0.90 | 1.01 | 0.56 | 0.73 | |||||||||||||||
Net realized and unrealized gain (loss) | 4.37 | (2.30 | ) | (2.44 | ) | 7.90 | (5.91 | ) | ||||||||||||
Total from investment operations | 4.97 | (1.40 | ) | (1.43 | ) | 8.46 | (5.18 | ) | ||||||||||||
Dividends to shareholders: | ||||||||||||||||||||
Net investment income | (0.41 | ) | (0.71 | ) | (0.72 | ) | (0.40 | ) | (0.68 | ) | ||||||||||
Net asset value, end of year | $ | 26.11 | $ | 21.55 | $ | 23.66 | $ | 25.81 | $ | 17.75 | ||||||||||
TOTAL RETURN2 | 23.29 | % | (5.74 | )% | (5.72 | )% | 48.12 | % | (22.44 | )% | ||||||||||
RATIOS/SUPPLEMENTAL DATA: | ||||||||||||||||||||
Net assets, end of year (000’s omitted) | $ | 23,500 | $ | 2,155 | $ | 2,366 | $ | 5,162 | $ | 7,102 | ||||||||||
Ratios to average net assets of: | ||||||||||||||||||||
Expenses | 0.48 | % | 0.48 | % | 0.48 | %3,4 | 0.48 | %3,4 | 0.48 | % | ||||||||||
Net investment income | 2.47 | % | 4.21 | % | 3.91 | % | 2.51 | % | 3.24 | % | ||||||||||
Portfolio turnover rate7 | 112 | % | 123 | % | 115 | % | 125 | % | 166 | % | ||||||||||
| 1 | Based on average shares outstanding. |
| 2 | Total return is calculated assuming an initial investment made at the net asset value at the beginning of the period, reinvestment of all dividends and distributions at net asset value during the period and redemption on the last day of the period. For the periods in which the investment advisor waived advisory fees, the total return would have been lower if certain expenses had not been waived (Notes 2 and 3). |
| 3 | Does not include expenses of the Underlying Funds in which the Fund invests. |
| 4 | The expense ratio includes investment advisory fee waivers. Without these investment advisory fee waivers, the expense ratio would have been unchanged. |
| 5 | Included in the expense ratio are “Other fees” described in Note 6. Without these expenses, the expense ratio would have been 0.63%. |
| 6 | Included in the expense ratio are “Other fees” described in Note 6. Without these expenses, the expense ratio would have been unchanged. |
| 7 | Portfolio turnover rate excludes the value of the portfolio securities received or delivered as a result of in-kind creations or redemptions of the Fund’s capital shares. Short-term securities with maturities less than or equal to 365 days are excluded from the portfolio turnover calculation. |
See Notes to Financial Statements.
| 90 | WisdomTree Trust |
Financial Highlights (continued)
WisdomTree Trust
Selected data for a share of beneficial interest outstanding throughout the period is presented below:
| WisdomTree Emerging Markets Quality Dividend Growth Fund | For the Year Ended March 31, 2024 | For the Year Ended March 31, 2023 | For the Year Ended March 31, 2022 | For the Year Ended March 31, 2021 | For the Year Ended March 31, 2020 | |||||||||||||||
Net asset value, beginning of year | $ | 22.48 | $ | 26.27 | $ | 29.51 | $ | 19.43 | $ | 24.71 | ||||||||||
Investment operations: | ||||||||||||||||||||
Net investment income1 | 0.55 | 0.80 | 0.83 | 0.61 | 0.66 | |||||||||||||||
Net realized and unrealized gain (loss) | 3.00 | (3.69 | ) | (3.28 | ) | 10.08 | (5.32 | ) | ||||||||||||
Total from investment operations | 3.55 | (2.89 | ) | (2.45 | ) | 10.69 | (4.66 | ) | ||||||||||||
Dividends to shareholders: | ||||||||||||||||||||
Net investment income | (0.55 | ) | (0.90 | ) | (0.79 | ) | (0.61 | ) | (0.62 | ) | ||||||||||
Net asset value, end of year | $ | 25.48 | $ | 22.48 | $ | 26.27 | $ | 29.51 | $ | 19.43 | ||||||||||
TOTAL RETURN2 | 16.02 | % | (10.75 | )% | (8.48 | )% | 55.66 | % | (19.30 | )% | ||||||||||
RATIOS/SUPPLEMENTAL DATA: | ||||||||||||||||||||
Net assets, end of year (000’s omitted) | $ | 135,048 | $ | 87,681 | $ | 86,705 | $ | 94,431 | $ | 69,936 | ||||||||||
Ratios to average net assets of: | ||||||||||||||||||||
Expenses, net of expense waivers | 0.32 | % | 0.32 | % | 0.32 | % | 0.32 | %3 | 0.32 | %4 | ||||||||||
Expenses, prior to expense waivers | 0.32 | % | 0.32 | % | 0.32 | % | 0.42 | % | 0.63 | % | ||||||||||
Net investment income | 2.38 | % | 3.61 | % | 2.89 | % | 2.38 | % | 2.74 | % | ||||||||||
Portfolio turnover rate5 | 55 | % | 40 | % | 42 | % | 57 | % | 55 | % | ||||||||||
| WisdomTree Emerging Markets SmallCap Dividend Fund | For the Year Ended March 31, 2024 | For the Year Ended March 31, 2023 | For the Year Ended March 31, 2022 | For the Year Ended March 31, 2021 | For the Year Ended March 31, 2020 | |||||||||||||||
Net asset value, beginning of year | $ | 45.72 | $ | 53.44 | $ | 50.79 | $ | 32.98 | $ | 47.03 | ||||||||||
Investment operations: | ||||||||||||||||||||
Net investment income1 | 2.15 | 2.25 | 1.99 | 1.58 | 1.82 | |||||||||||||||
Net realized and unrealized gain (loss) | 5.36 | (7.65 | ) | 2.80 | 18.04 | (14.02 | ) | |||||||||||||
Total from investment operations | 7.51 | (5.40 | ) | 4.79 | 19.62 | (12.20 | ) | |||||||||||||
Dividends to shareholders: | ||||||||||||||||||||
Net investment income | (2.21 | ) | (2.32 | ) | (2.14 | ) | (1.81 | ) | (1.85 | ) | ||||||||||
Net asset value, end of year | $ | 51.02 | $ | 45.72 | $ | 53.44 | $ | 50.79 | $ | 32.98 | ||||||||||
TOTAL RETURN2 | 16.92 | % | (9.76 | )% | 9.48 | % | 60.63 | % | (26.95 | )% | ||||||||||
RATIOS/SUPPLEMENTAL DATA: | ||||||||||||||||||||
Net assets, end of year (000’s omitted) | $ | 2,755,145 | $ | 2,688,439 | $ | 2,575,592 | $ | 1,935,213 | $ | 1,216,850 | ||||||||||
Ratios to average net assets of: | ||||||||||||||||||||
Expenses6,7 | 0.59 | %8 | 0.58 | % | 0.61 | %9,10 | 0.63 | % | 0.63 | % | ||||||||||
Net investment income | 4.53 | % | 4.96 | % | 3.75 | % | 3.65 | % | 4.05 | % | ||||||||||
Portfolio turnover rate5 | 51 | % | 53 | % | 45 | % | 59 | % | 47 | % | ||||||||||
| 1 | Based on average shares outstanding. |
| 2 | Total return is calculated assuming an initial investment made at the net asset value at the beginning of the period, reinvestment of all dividends and distributions at net asset value during the period and redemption on the last day of the period. For the periods in which the investment advisor waived advisory fees, the total return would have been lower if certain expenses had not been waived (Notes 2 and 3). |
| 3 | The investment advisor had contractually agreed to limit the advisory fee to 0.32% through July 31, 2020. On July 31, 2020, the contractual waiver expired and the advisory fee was permanently reduced to 0.32%. |
| 4 | Effective June 30, 2017, the investment advisor contractually agreed to limit the advisory fee to 0.32% through July 31, 2020, unless earlier terminated by the Board of Trustees of the Trust. |
| 5 | Portfolio turnover rate excludes the value of the portfolio securities received or delivered as a result of in-kind creations or redemptions of the Fund’s capital shares. Short-term securities with maturities less than or equal to 365 days are excluded from the portfolio turnover calculation. |
| 6 | Does not include expenses of the Underlying Funds in which the Fund invests. |
| 7 | The expense ratio includes investment advisory fee waivers. Without these investment advisory fee waivers, the expense ratio would have been unchanged. |
| 8 | Included in the expense ratio are “Other fees” described in Note 6. Without these expenses, the expense ratio would have been 0.58%. |
| 9 | Prior to September 1, 2021, the Fund’s annual advisory fee rate was 0.63% and, thereafter, was reduced to 0.58% per annum. |
| 10 | Included in the expense ratio are “Other fees” described in Note 6. Without these expenses, the expense ratio would have been 0.60%. |
See Notes to Financial Statements.
| WisdomTree Trust | 91 |
Financial Highlights (continued)
WisdomTree Trust
Selected data for a share of beneficial interest outstanding throughout the period is presented below:
| WisdomTree Global ex-U.S. Quality Dividend Growth Fund | For the Year Ended March 31, 2024 | For the Year Ended March 31, 2023 | For the Year Ended March 31, 20221 | For the Year Ended March 31, 20211 | For the Year Ended March 31, 20201 | |||||||||||||||
Net asset value, beginning of year | $ | 35.37 | $ | 39.95 | $ | 38.60 | $ | 26.57 | $ | 27.80 | ||||||||||
Investment operations: |
| |||||||||||||||||||
Net investment income2 | 0.66 | 1.38 | 1.01 | 0.80 | 0.80 | |||||||||||||||
Net realized and unrealized gain (loss) | 3.59 | (4.62 | ) | 1.15 | 11.94 | (1.31 | ) | |||||||||||||
Total from investment operations | 4.25 | (3.24 | ) | 2.16 | 12.74 | (0.51 | ) | |||||||||||||
Dividends to shareholders: |
| |||||||||||||||||||
Net investment income | (0.68 | ) | (1.34 | ) | (0.81 | ) | (0.71 | ) | (0.72 | ) | ||||||||||
Net asset value, end of year | $ | 38.94 | $ | 35.37 | $ | 39.95 | $ | 38.60 | $ | 26.57 | ||||||||||
TOTAL RETURN3 | 12.18 | % | (7.53 | )% | 5.57 | % | 48.25 | % | (2.01 | )% | ||||||||||
RATIOS/SUPPLEMENTAL DATA: |
| |||||||||||||||||||
Net assets, end of year (000’s omitted) | $ | 642,511 | $ | 526,997 | $ | 567,239 | $ | 355,130 | $ | 95,661 | ||||||||||
Ratios to average net assets of: |
| |||||||||||||||||||
Expenses4 | 0.43 | %6,7 | 0.43 | %6,7 | 0.54 | %5,6,8 | 0.58 | % | 0.58 | %6 | ||||||||||
Net investment income | 1.85 | % | 4.16 | % | 2.44 | % | 2.29 | % | 2.68 | % | ||||||||||
Portfolio turnover rate9 | 66 | % | 67 | % | 59 | % | 56 | % | 56 | % | ||||||||||
| WisdomTree Global High Dividend Fund | For the Year Ended March 31, 2024 | For the Year Ended March 31, 2023 | For the Year Ended March 31, 2022 | For the Year Ended March 31, 2021 | For the Year Ended March 31, 2020 | |||||||||||||||
Net asset value, beginning of year | $ | 46.86 | $ | 51.03 | $ | 46.89 | $ | 34.33 | $ | 46.11 | ||||||||||
Investment operations: |
| |||||||||||||||||||
Net investment income2 | 2.10 | 1.91 | 1.95 | 1.63 | 1.78 | |||||||||||||||
Net realized and unrealized gain (loss) | 4.12 | (4.21 | ) | 4.02 | 12.62 | (11.79 | ) | |||||||||||||
Total from investment operations | 6.22 | (2.30 | ) | 5.97 | 14.25 | (10.01 | ) | |||||||||||||
Dividends to shareholders: |
| |||||||||||||||||||
Net investment income | (2.17 | ) | (1.87 | ) | (1.83 | ) | (1.69 | ) | (1.77 | ) | ||||||||||
Net asset value, end of year | $ | 50.91 | $ | 46.86 | $ | 51.03 | $ | 46.89 | $ | 34.33 | ||||||||||
TOTAL RETURN3 | 13.73 | % | (4.28 | )% | 12.96 | % | 42.38 | % | (22.46 | )% | ||||||||||
RATIOS/SUPPLEMENTAL DATA: |
| |||||||||||||||||||
Net assets, end of year (000’s omitted) | $ | 109,448 | $ | 135,908 | $ | 68,889 | $ | 65,641 | $ | 66,952 | ||||||||||
Ratios to average net assets of: |
| |||||||||||||||||||
Expenses4,6 | 0.58 | % | 0.58 | %5 | 0.58 | %5 | 0.58 | % | 0.58 | % | ||||||||||
Net investment income | 4.44 | % | 4.09 | % | 3.98 | % | 4.05 | % | 3.88 | % | ||||||||||
Portfolio turnover rate9 | 41 | % | 45 | % | 39 | % | 48 | % | 32 | % | ||||||||||
| 1 | Per share amounts were adjusted to reflect a 2:1 share split effective June 9, 2021. |
| 2 | Based on average shares outstanding. |
| 3 | Total return is calculated assuming an initial investment made at the net asset value at the beginning of the period, reinvestment of all dividends and distributions at net asset value during the period and redemption on the last day of the period. For the periods in which the investment advisor waived advisory fees, the total return would have been lower if certain expenses had not been waived (Notes 2 and 3). |
| 4 | Does not include expenses of the Underlying Funds in which the Fund invests. |
| 5 | Included in the expense ratio are “Other fees” described in Note 6. Without these expenses, the expense ratio would have been unchanged. |
| 6 | The expense ratio includes investment advisory fee waivers. Without these investment advisory fee waivers, the expense ratio would have been unchanged. |
| 7 | Included in the expense ratio are “Other fees” described in Note 6. Without these expenses, the expense ratio would have been 0.42%. |
| 8 | Prior to January 1, 2022, the Fund’s annual advisory fee rate was 0.58% and, thereafter, was reduced to 0.42% per annum. |
| 9 | Portfolio turnover rate excludes the value of the portfolio securities received or delivered as a result of in-kind creations or redemptions of the Fund’s capital shares. Short-term securities with maturities less than or equal to 365 days are excluded from the portfolio turnover calculation. |
See Notes to Financial Statements.
| 92 | WisdomTree Trust |
Financial Highlights (concluded)
WisdomTree Trust
Selected data for a share of beneficial interest outstanding throughout the period is presented below:
| WisdomTree India Earnings Fund (consolidated) | For the Year Ended March 31, 2024 | For the Year Ended March 31, 2023 | For the Year Ended March 31, 2022 | For the Year Ended March 31, 2021 | For the Year Ended March 31, 2020 | |||||||||||||||
Net asset value, beginning of year | $ | 31.45 | $ | 36.34 | $ | 31.26 | $ | 16.19 | $ | 26.26 | ||||||||||
Investment operations: |
| |||||||||||||||||||
Net investment income1 | 0.25 | 0.41 | 0.38 | 0.16 | 0.30 | |||||||||||||||
Net realized and unrealized gain (loss) | 11.71 | (3.45 | ) | 5.20 | 15.16 | (10.18 | ) | |||||||||||||
Net increase from payment by affiliate | — | — | 0.00 | 2 | — | — | ||||||||||||||
Total from investment operations | 11.96 | (3.04 | ) | 5.58 | 15.32 | (9.88 | ) | |||||||||||||
Dividends and distributions to shareholders: |
| |||||||||||||||||||
Net investment income | — | (1.85 | ) | (0.50 | ) | (0.25 | ) | (0.19 | ) | |||||||||||
Tax return of capital | (0.06 | ) | — | — | — | — | ||||||||||||||
Total dividends and distributions to shareholders | (0.06 | ) | (1.85 | ) | (0.50 | ) | (0.25 | ) | (0.19 | ) | ||||||||||
Net asset value, end of year | $ | 43.35 | $ | 31.45 | $ | 36.34 | $ | 31.26 | $ | 16.19 | ||||||||||
TOTAL RETURN3 | 38.08 | % | (8.05 | )% | 17.85 | %4 | 95.10 | % | (37.84 | )% | ||||||||||
RATIOS/SUPPLEMENTAL DATA: |
| |||||||||||||||||||
Net assets, end of year (000’s omitted) | $ | 2,878,348 | $ | 786,234 | $ | 893,841 | $ | 787,825 | $ | 563,317 | ||||||||||
Ratios to average net assets of: |
| |||||||||||||||||||
Expenses5,6 | 0.87 | %7 | 0.85 | %8 | 0.84 | %9 | 0.84 | %9 | 0.84 | %9 | ||||||||||
Net investment income | 0.66 | % | 1.25 | % | 1.07 | % | 0.67 | % | 1.22 | % | ||||||||||
Portfolio turnover rate10 | 29 | % | 51 | % | 30 | % | 23 | % | 32 | % | ||||||||||
| WisdomTree New Economy Real Estate Fund | For the Year Ended March 31, 2024 | For the Year Ended March 31, 202311 | For the Year Ended March 31, 2022 | For the Year Ended March 31, 2021 | For the Year Ended March 31, 2020 | |||||||||||||||
Net asset value, beginning of year | $ | 17.11 | $ | 23.34 | $ | 26.55 | $ | 22.11 | $ | 32.15 | ||||||||||
Investment operations: |
| |||||||||||||||||||
Net investment income1 | 0.40 | 0.35 | 1.14 | 0.89 | 1.13 | |||||||||||||||
Net realized and unrealized gain (loss) | 1.00 | (6.37 | ) | (2.74 | ) | 4.35 | (8.79 | ) | ||||||||||||
Total from investment operations | 1.40 | (6.02 | ) | (1.60 | ) | 5.24 | (7.66 | ) | ||||||||||||
Dividends to shareholders: |
| |||||||||||||||||||
Net investment income | (0.43 | ) | (0.21 | ) | (1.61 | ) | (0.80 | ) | (2.38 | ) | ||||||||||
Net asset value, end of year | $ | 18.08 | $ | 17.11 | $ | 23.34 | $ | 26.55 | $ | 22.11 | ||||||||||
TOTAL RETURN3 | 8.42 | % | (25.82 | )% | (6.45 | )% | 23.92 | % | (25.74 | )% | ||||||||||
RATIOS/SUPPLEMENTAL DATA: |
| |||||||||||||||||||
Net assets, end of year (000’s omitted) | $ | 19,892 | $ | 25,661 | $ | 54,850 | $ | 63,711 | $ | 80,703 | ||||||||||
Ratios to average net assets of: |
| |||||||||||||||||||
Expenses | 0.58 | % | 0.59 | %12 | 0.59 | %12 | 0.58 | % | 0.58 | %5 | ||||||||||
Net investment income | 2.34 | % | 1.90 | % | 4.48 | % | 3.59 | % | 3.75 | %5 | ||||||||||
Portfolio turnover rate10 | 20 | % | 165 | %11 | 7 | % | 39 | % | 21 | % | ||||||||||
| 1 | Based on average shares outstanding. |
| 2 | Amount represents less than $0.005. |
| 3 | Total return is calculated assuming an initial investment made at the net asset value at the beginning of the period, reinvestment of all dividends and distributions at net asset value during the period and redemption on the last day of the period. For the periods in which the investment advisor waived advisory fees, the total return would have been lower if certain expenses had not been waived (Notes 2 and 3). |
| 4 | Includes a voluntary reimbursement from the sub-advisor for investment losses on certain foreign exchange transactions during the period. Excluding this voluntary reimbursement, total return would have been 0.04% lower. |
| 5 | Does not include expenses of the Underlying Funds in which the Fund invests. |
| 6 | The expense ratio includes investment advisory fee waivers. Without these investment advisory fee waivers, the expense ratio would have been unchanged. |
| 7 | Includes interest expense of 0.04% for the fiscal year. |
| 8 | Includes interest expense of 0.02% for the fiscal year. |
| 9 | Includes interest expense of 0.01% for the fiscal year. |
| 10 | Portfolio turnover rate excludes the value of the portfolio securities received or delivered as a result of in-kind creations or redemptions of the Fund’s capital shares. Short-term securities with maturities less than or equal to 365 days are excluded from the portfolio turnover calculation. |
| 11 | The information reflects the investment objective and strategy of the WisdomTree Global ex-U.S. Real Estate Fund through April 20, 2022 and the investment objective and strategy of the WisdomTree New Economy Real Estate Fund thereafter. The increase in the portfolio turnover rate was primarily a result of the aforementioned investment objective and strategy change. |
| 12 | Included in the expense ratio are “Other fees” described in Note 6. Without these expenses, the expense ratio would have been 0.58%. |
See Notes to Financial Statements.
| WisdomTree Trust | 93 |
1. ORGANIZATION
WisdomTree Trust (the “Trust”) is registered under the Investment Company Act of 1940, as amended (the “1940 Act”), as an open-end management investment company. The Trust was established as a Delaware statutory trust on December 15, 2005 and is authorized to have multiple series of portfolios (each a “Fund”, collectively, the “Funds”). These notes relate only to the Funds listed below. In accordance with Accounting Standards Codification Topic 946, Financial Services-Investment Companies, each Fund listed below qualifies as an investment company and is applying the accounting and reporting guidance for investment companies.
| Fund | Commencement of Operations | |||
WisdomTree China ex-State-Owned Enterprises Fund (“China ex-State-Owned Enterprises Fund”) | September 19, 2012 | |||
WisdomTree Emerging Markets ex-State-Owned Enterprises Fund (“Emerging Markets ex-State-Owned Enterprises Fund”) | December 10, 2014 | |||
WisdomTree Emerging Markets High Dividend Fund (“Emerging Markets High Dividend Fund”) | July 13, 2007 | |||
WisdomTree Emerging Markets Multifactor Fund (“Emerging Markets Multifactor Fund”) | August 10, 2018 | |||
WisdomTree Emerging Markets Quality Dividend Growth Fund (“Emerging Markets Quality Dividend Growth Fund”) | August 1, 2013 | |||
WisdomTree Emerging Markets SmallCap Dividend Fund (“Emerging Markets SmallCap Dividend Fund”) | October 30, 2007 | |||
WisdomTree Global ex-U.S. Quality Dividend Growth Fund (“Global ex-U.S. Quality Dividend Growth Fund”) | June 16, 2006 | |||
WisdomTree Global High Dividend Fund (“Global High Dividend Fund”) | June 16, 2006 | |||
WisdomTree India Earnings Fund (“India Earnings Fund”) (consolidated) | February 22, 2008 | |||
WisdomTree New Economy Real Estate Fund (“New Economy Real Estate Fund”) | June 5, 2007 | |||
The India Earnings Fund makes its investments through the WisdomTree India Investment Portfolio, Inc. (the “Portfolio”), a wholly owned subsidiary organized in the Republic of Mauritius (“Mauritius”). The Portfolio was incorporated under the provisions of the Mauritius Companies Act, 2001 and holds a Global Business License Category 1 issued by the Financial Services Commission.
Each Fund, except for the Emerging Markets Multifactor Fund and Emerging Markets Quality Dividend Growth Fund, seeks to track the price and yield performance, before fees and expenses, of a particular index (“Index”) developed by WisdomTree, Inc. (“WisdomTree”) or an Index developed by a third party. The Emerging Markets Multifactor Fund is actively managed using a model-based approach seeking capital appreciation. The Emerging Markets Quality Dividend Growth Fund is actively managed using a model-based approach seeking income and capital appreciation. WisdomTree is the parent company of WisdomTree Asset Management, Inc. (“WTAM”), the investment adviser to each Fund (including the Portfolio) and the Trust. “WisdomTree” is a registered trademark of WisdomTree and has been licensed for use by the Trust. Each Fund described herein is considered to be non-diversified as defined under the 1940 Act.
In the normal course of business, the Funds may enter into contracts that contain a variety of representations or that provide indemnification for certain liabilities. The Funds’ maximum exposure under these arrangements is unknown, as this would involve future claims that may be made against the Funds that have not yet occurred. However, the Funds have not had prior claims or losses pursuant to these contracts and believe such exposure to be remote.
2. SIGNIFICANT ACCOUNTING POLICIES
The Financial Accounting Standards Board (“FASB”) Accounting Standards Codification (the “Codification”) is the exclusive reference of authoritative U.S. generally accepted accounting principles (“GAAP”) recognized by the FASB to be applied by nongovernmental entities. Rules and interpretive releases of the Securities and Exchange Commission (“SEC”) under authority of federal laws are also sources of authoritative GAAP for SEC registrants.
The following is a summary of significant accounting policies followed by the Funds:
Use of Estimates — The preparation of financial statements in conformity with GAAP requires management to make certain estimates and assumptions that affect the reported amounts of assets and liabilities and disclosure of contingent assets and liabilities at the date of the financial statements and the reported amounts of increases and decreases in the net assets from operations during the reporting period. Actual results could differ from those estimates.
Basis of Consolidation — The financial statements for the India Earnings Fund include the accounts of the Portfolio (a wholly-owned and controlled Mauritius subsidiary). The India Earnings Fund’s accompanying financial statements reflect the financial position and the results of operations on a consolidated basis with its Portfolio. All intercompany accounts and transactions have been eliminated in the consolidation.
Investment Valuation — The net asset value (“NAV”) of each Fund’s shares is calculated each day a Fund is open for business as of the regularly scheduled close of regular trading on the New York Stock Exchange, normally 4:00 p.m. Eastern time (the “NAV Calculation Time”). NAV per share is calculated by dividing a Fund’s net assets by the number of Fund shares outstanding. Each
| 94 | WisdomTree Trust |
Notes to Financial Statements (continued)
Fund issues and redeems shares at NAV only in large blocks of shares known as creation units, which only certain institutions (e.g., broker-dealers) may purchase or redeem. Shares of each Fund are listed on a national securities exchange and trade at market prices. Most investors will buy and sell shares in the secondary market through brokers. Because Fund shares trade at market prices rather than NAV, shares may trade at a price greater than NAV or less than NAV. In calculating each Fund’s NAV, investments are valued under policies approved by the Board of Trustees of the Trust (the “Board” or “Board of Trustees”). Equity securities (including preferred stock) traded on any recognized U.S. or non-U.S. exchange are valued at the last sale price or official closing price on the exchange on which they are principally traded. Unlisted equity securities (including preferred stock) are valued at the last sale price or, if no sale price is available, at the mean between the highest bid and lowest ask price. Each Fund may invest in money market funds which are valued at their NAV per share and exchange-traded funds (“ETFs” or “ETF”) or exchange-traded notes (“ETNs” or “ETN”) which are valued at their last sale or official closing price on the exchange on which they are principally traded or at their NAV per share in instances where the ETF or ETN has not traded on its principal exchange. Foreign currency contracts that settle within two business days after the trade date (“Spot Contracts”) and foreign currency contracts having a settlement period greater than two business days after the trade date (“Forward Contracts”) are valued on the measurement date using an interpolated foreign exchange rate between the closest preceding and subsequent settlement period, as calculated using the 4:00 p.m. London time closing spot and forward rates provided by an independent pricing service provider.
Pursuant to Board-approved valuation procedures established by the Trust and WTAM, the Board has appointed WTAM as the Funds’ valuation designee (the “Valuation Designee”) to perform all fair valuations of the Funds’ portfolio investments, subject to the Board’s oversight. As the Valuation Designee, WTAM has established procedures for its fair valuation of a Fund’s portfolio investments. These procedures address, among other things, determining when market quotations are not readily available or reliable and the methodologies to be used for determining the fair value of investments, as well as the use and oversight of third-party pricing services for fair valuation. The Valuation Designee is comprised of senior representatives of WTAM and reports to the Board of Trustees on a quarterly basis. In the event that a financial instrument cannot be valued based upon a price from the exchange or system on which it is principally traded, independent pricing service provider or broker-dealer quotation, or such prices are deemed to not reflect current market value, the Valuation Designee may value the financial instrument in good faith under the policies and procedures approved by the Board of Trustees based on current facts and circumstances. Securities that may be valued using “fair value” pricing may include, but are not limited to, securities for which there are no current market quotations, securities whose issuer is in default or bankruptcy, securities subject to corporate actions (such as mergers or reorganizations), securities subject to non-U.S. investment limits or currency controls, and securities affected by “significant events”. An example of a significant event is an event occurring after the close of the market in which a security trades but before a Fund’s next NAV Calculation Time that may materially affect the value of a Fund’s investment (e.g., government action, natural disaster, or significant market fluctuation). When fair value pricing is employed, the prices of securities used by a Fund to calculate its NAV may differ from quoted or published prices for the same securities.
Fair Value Measurement — In accordance with Codification Topic 820 (“ASC 820”), Fair Value Measurements and Disclosures, fair value is defined as the price that would be received to sell an asset or paid to transfer a liability in an orderly transaction between market participants at the measurement date. The Valuation Designee will perform other procedures (consistent with GAAP) to value an investment when a market quote is not available. ASC 820 established a three-tier hierarchy of inputs to be used when determining fair value measurements for disclosure purposes. Inputs refer broadly to the assumptions that market participants would use in pricing the asset or liability, including assumptions about risk — for example, the risk inherent in a particular valuation technique used to measure fair value (such as a pricing model) and/or the risk inherent in the inputs to the valuation technique. Inputs may be observable or unobservable. Observable inputs reflect the assumptions market participants would use in pricing the asset or liability. Observable inputs are based on market data obtained from sources independent of the reporting entity. Unobservable inputs reflect the reporting entity’s own assumptions about the assumptions market participants would use in pricing the asset or liability. Unobservable inputs are based on the best information available in the circumstances. The three-tier hierarchy of inputs is summarized in the three broad levels listed below:
Level 1 – quoted prices in active markets for identical securities
Level 2 – other significant observable inputs (including quoted prices for similar securities, interest rates, prepayment speeds, credit risk, etc.)
Level 3 – significant unobservable inputs (including each Fund’s assumptions in determining the fair value of investments)
The inputs or methodology used for valuation are not necessarily an indication of the risk associated with investing in those investments.
Investments that use Level 2 or Level 3 inputs may include, but are not limited to: (i) an unlisted security related to corporate actions; (ii) a restricted security (e.g., one that may not be publicly sold without registration under the Securities Act of 1933, as amended); (iii) a security whose trading has been suspended (either due to events affecting the issuer of the security specifically or events affecting the primary trading exchange more broadly) or which has been de-listed from its primary trading exchange; (iv) a
| WisdomTree Trust | 95 |
Notes to Financial Statements (continued)
security that is thinly traded; (v) a security in default or bankruptcy proceedings for which there is no current market quotation or market activity; (vi) a security affected by currency controls or restrictions; and (vii) a security affected by a significant event (e.g., an event that occurs after the close of the markets in which the security is traded but before the time as of which a Fund’s NAV is computed and that may materially affect the value of the Fund’s investments).
The valuation techniques and significant inputs used in determining the fair market value measurements for Level 2 and Level 3 positions are as follows:
Financial instruments are generally valued by independent pricing service providers that use broker-dealer quotations, reported trades or valuation estimates from their internal pricing models. Depending on the type of financial instrument, the independent pricing service providers’ internal pricing models may use inputs that are observable such as issuer details (e.g., credit rating, debt ranking, coupon date, maturity date, etc.), interest rates, yield curves, prepayment speeds, credit risks/spreads, default rates and quoted prices for similar assets. Financial instruments that use similar valuation techniques and observable inputs as described above and have an appropriate level of market activity are categorized as Level 2 of the fair value hierarchy, otherwise a Level 3 fair value classification is appropriate. Over-the-counter financial derivative instruments derive their value from underlying asset prices, indices, reference rates, and other inputs or a combination of these factors. These instruments are normally valued on the basis of broker-dealer quotations or prices obtained from independent pricing service providers. Depending on the product and the terms of the transaction, the value of the financial derivative instruments can be estimated by an independent pricing service provider using a series of techniques including simulation pricing models. The pricing models may use inputs that are observed from actively quoted markets such as issuer details, indices, credit risks/spreads, interest rates, yield curves, default and exchange rates. Derivative contracts that use similar valuation techniques and observable inputs as described above and have an appropriate level of market activity are categorized as Level 2 of the fair value hierarchy, otherwise a Level 3 fair value classification is appropriate.
Determination of a fair value by the Valuation Designee may include significant unobservable inputs and therefore such financial instruments would be reflected as a Level 3 of the fair value hierarchy. The Valuation Designee may employ a market-based valuation approach which may use, among other potential considerations, related or comparable securities, recent transactions, market multiples, and other relevant information to determine fair value. The Valuation Designee may also use an income-based valuation approach in which anticipated future cash flows of the financial instrument are discounted to calculate fair value.
The summary of fair valuations according to the inputs used in valuing each Fund’s assets as of the measurement date is included in a “Fair Valuation Summary” supplementary table in each applicable Fund’s Schedule of Investments.
During the fiscal year ended March 31, 2024, there were no significant transfers into or out of Level 3 of the fair value hierarchy.
Derivatives and Hedging Disclosure — Codification Topic 815 (“ASC 815”), Derivatives and Hedging, requires qualitative disclosures about objectives and strategies for using derivatives, quantitative disclosures about fair value amounts as well as gains and losses on derivative instruments, and disclosures about credit-risk-related contingent features in derivative agreements. The Funds have invested in derivatives, specifically foreign currency contracts during the fiscal year ended March 31, 2024 and open positions in such derivatives as of March 31, 2024 are detailed in each Fund’s Schedule of Investments. All of the derivative instruments disclosed and described herein are subject to risk. The Funds’ derivative agreements may also contain credit-risk related contingent features which may include, but are not limited to, a threshold in the Funds’ derivative agreements on unrealized depreciation (i.e., the Funds’ obligation to the counterparty) above a specified dollar amount. If an event occurred at March 31, 2024 that triggered a contingent feature, the counterparty to the agreement may require a Fund to post collateral (or additional collateral) or terminate the derivative positions and demand payment. Any collateral posted with respect to the derivative positions would be used to offset or reduce the payment due to a counterparty. The maximum exposure to derivatives agreements with credit-risk related contingent features would be the total value of derivatives in net liability positions for each Fund, as disclosed in Note 2 — Master Netting Arrangements under the column entitled “Liabilities: Net Amount”. Information with respect to the amounts and types of collateral received and/or posted for derivative instruments as of March 31, 2024, if any, is reflected as a footnote within each Fund’s Schedule of Investments. At March 31, 2024, the Funds did not receive or post collateral with any counterparty for derivatives and no event occurred that triggered a credit-risk-related contingent feature.
| 96 | WisdomTree Trust |
Notes to Financial Statements (continued)
As of March 31, 2024, the effects of such derivative instruments on each Fund’s financial position as reflected in the Statements of Assets and Liabilities are presented in the summary below:
| Asset Derivatives | Liability Derivatives | |||||||||||
| Fund | Balance Sheet Location | Value | Balance Sheet Location | Value | ||||||||
Emerging Markets High Dividend Fund | ||||||||||||
Foreign currency risk | Unrealized appreciation on foreign currency contracts | $ | 2,100 | Unrealized depreciation on foreign currency contracts | $ | — | ||||||
Emerging Markets Multifactor Fund | ||||||||||||
Foreign currency risk | Unrealized appreciation on foreign currency contracts | 286,499 | Unrealized depreciation on foreign currency contracts | 177,246 | ||||||||
Emerging Markets Quality Dividend Growth Fund | ||||||||||||
Foreign currency risk | Unrealized appreciation on foreign currency contracts | 32 | Unrealized depreciation on foreign currency contracts | 1,879 | ||||||||
Emerging Markets SmallCap Dividend Fund | ||||||||||||
Foreign currency risk | Unrealized appreciation on foreign currency contracts | 5,925 | Unrealized depreciation on foreign currency contracts | 20 | ||||||||
Global ex-U.S. Quality Dividend Growth Fund | ||||||||||||
Foreign currency risk | Unrealized appreciation on foreign currency contracts | — | Unrealized depreciation on foreign currency contracts | 3 | ||||||||
Global High Dividend Fund | ||||||||||||
Foreign currency risk | Unrealized appreciation on foreign currency contracts | 21 | Unrealized depreciation on foreign currency contracts | 18 | ||||||||
New Economy Real Estate Fund | ||||||||||||
Foreign currency risk | Unrealized appreciation on foreign currency contracts | — | Unrealized depreciation on foreign currency contracts | 1 | ||||||||
For the fiscal year ended March 31, 2024, the effects of derivative instruments on each applicable Fund’s financial performance as reflected in the Statements of Operations are presented in the summary below:
| Fund | Amount of Realized Gain or (Loss) on Derivatives Recognized1 | Change in Unrealized Appreciation or (Depreciation) on Derivatives Recognized2 | ||||||
China ex-State-Owned Enterprises Fund | ||||||||
Foreign currency risk | $ | 1,526,649 | $ | (3) | ||||
Emerging Markets ex-State-Owned Enterprises Fund | ||||||||
Foreign currency risk | 72,645 | — | ||||||
Emerging Markets High Dividend Fund | ||||||||
Foreign currency risk | (790,709 | ) | 2,060 | |||||
Emerging Markets Multifactor Fund | ||||||||
Foreign currency risk | (30,763 | ) | 124,127 | |||||
Emerging Markets Quality Dividend Growth Fund | ||||||||
Foreign currency risk | (45,347 | ) | (1,695) | |||||
Emerging Markets SmallCap Dividend Fund | ||||||||
Foreign currency risk | (1,099,643 | ) | 5,905 | |||||
Global ex-U.S. Quality Dividend Growth Fund | ||||||||
Foreign currency risk | (154,433 | ) | (2,177 | ) | ||||
Global High Dividend Fund | ||||||||
Foreign currency risk | 13,138 | 3 | ||||||
India Earnings Fund (consolidated) | ||||||||
Equity risk | (2,744 | ) | — | |||||
Foreign currency risk | (1,106,581 | ) | — | |||||
New Economy Real Estate Fund | ||||||||
Foreign currency risk | (8,624 | ) | 24 | |||||
| 1 | Realized gains (losses) on derivatives are located on the Statements of Operations as follows: |
Foreign currency risk | Net realized gain (loss) from foreign currency contracts | |
Equity risk | Net realized gain (loss) from futures contracts |
| 2 | Change in unrealized appreciation (depreciation) is located on the Statements of Operations as follows: |
Foreign currency risk | Net increase (decrease) in unrealized appreciation/depreciation from foreign currency contracts |
| WisdomTree Trust | 97 |
Notes to Financial Statements (continued)
During the fiscal year ended March 31, 2024, the volume of derivative activity (based on the average of month-end notional balances, except where footnoted) for each Fund was as follows:
| Average Notional | ||||||||||||
| Fund | Foreign currency contracts (to deliver USD) | Foreign currency contracts (to receive USD) | Futures contracts (long) | |||||||||
China ex-State-Owned Enterprises Fund | ||||||||||||
Foreign currency risk | $ | 1,572 | $ | 115,263 | $ | — | ||||||
Emerging Markets ex-State-Owned Enterprises Fund | ||||||||||||
Foreign currency risk | — | 1,089,769 | — | |||||||||
Emerging Markets High Dividend Fund | ||||||||||||
Foreign currency risk | 4,074,636 | 805,063 | — | |||||||||
Emerging Markets Multifactor Fund | ||||||||||||
Foreign currency risk | 4,775,122 | 9,652,219 | — | |||||||||
Emerging Markets Quality Dividend Growth Fund | ||||||||||||
Foreign currency risk | 110,356 | 14,987 | — | |||||||||
Emerging Markets SmallCap Dividend Fund | ||||||||||||
Foreign currency risk | — | 1,865,373 | — | |||||||||
Global ex-U.S. Quality Dividend Growth Fund | ||||||||||||
Foreign currency risk | 58,819 | 93,900 | — | |||||||||
Global High Dividend Fund | ||||||||||||
Foreign currency risk | — | 24,888 | — | |||||||||
India Earnings Fund | ||||||||||||
Equity risk1 | — | — | 4,133,410 | |||||||||
Foreign currency risk1 | 37,915,966 | 166,040,566 | — | |||||||||
New Economy Real Estate Fund | ||||||||||||
Foreign currency risk | 3,863 | 2,182 | — | |||||||||
| 1 | The volume of derivatives for the period is based on intra-month balances. |
Investment Transactions and Investment Income — Investment transactions are recorded as of the date that the securities are purchased or sold (trade date). Realized gains and losses on sales of portfolio securities are calculated using the identified-cost method. Dividend income (less foreign taxes withheld, if any) is recognized on the ex-dividend date or as soon as practicable (with respect to foreign dividends) after the existence of a dividend declaration has been determined. Non-cash dividend income is recognized on the ex-dividend date, or, with respect to foreign dividends, as soon as practicable after the existence of a dividend declaration has been determined, at the fair value of securities to be received. Upon notification from real estate investment trust (“REIT”) issuers or as estimated by management, all or a portion of the dividend income received from a REIT may be redesignated as a reduction of cost of the related investment and/or as a realized gain. On each measurement date, the Funds evaluate the collectability of receivable balances. Generally, the Funds will write-off dividend receivable balances that are canceled by the issuer as of the date that the dividend receivable cancellation notification was publicly made available or when it becomes probable that dividends will not be collected and the amount of uncollectable dividends can be reasonably estimated. In addition, the Funds generally will write-off interest receivable balances in default by the issuer as of the date any applicable interest payment grace period or forbearance period expires or as of the date any interest payment cancellation notification was publicly made available or when it becomes probable that interest will not be collected and the amount of uncollectable interest can be reasonably estimated. Interest income (including amortization of premiums and accretion of discounts), less any foreign taxes withheld, is accrued daily. Generally, amortization of premiums and accretion of discounts are recognized daily using the effective interest method (also known as the scientific amortization method). Income earned from securities lending activities (i.e., securities lending income), net of fees payable to the securities borrower and/or securities lending agent, is accrued daily.
During the fiscal year ended March 31, 2024, dividend payments denominated in Russian rubles from certain sanctioned Russian issuers were made into restricted foreign cash accounts held by the Funds’ custodian on behalf of the Emerging Markets ex-State-Owned Enterprises Fund, Emerging Markets High Dividend Fund, Emerging Markets Multifactor Fund, Emerging Markets Quality Dividend Growth Fund, Global ex-U.S. Quality Dividend Growth Fund, and Global High Dividend Fund. Under sanctions imposed by the United States (“U.S.”) and the European Union (“E.U.”) against Russia and certain Russian issuers pertaining to Russia’s invasion of Ukraine, payments (such as dividend payments or interest payments) made by sanctioned issuers to entities domiciled in the U.S., such as the Funds, or E.U. are restricted from withdrawal or use and there is no assurance these sanctioned payments will be ultimately collected by the Funds. As a result of U.S. sanctions in place against Russia and certain Russian issuers and significant uncertainty as to whether these sanctions will be removed or lifted, the Funds have not recognized these Russian dividend payments.
| 98 | WisdomTree Trust |
Notes to Financial Statements (continued)
Foreign Taxes — The Funds may be subject to foreign taxes (a portion of which may be reclaimable or refundable) on foreign income or capital gains on investment transactions. All foreign taxes are recorded in accordance with the applicable foreign tax regulations and tax rates that exist in the foreign jurisdictions in which the Funds invest. These foreign taxes, if any, are accrued and applied to foreign income as the foreign income is earned and are reflected on the Statements of Operations as follows: foreign taxes withheld on dividends are presented as a reduction to investment income in “Less: Foreign withholding taxes on dividends”, foreign taxes on capital gains from investment transactions, if any, are included in “Net realized gain (loss) from investment transactions”, and deferred foreign taxes on net unrealized appreciation on investments, if any, are included in “Net increase (decrease) in unrealized appreciation/depreciation on investment transactions”. Foreign taxes payable or deferred as of March 31, 2024, if any, are disclosed in the Statements of Assets and Liabilities in “Payables: Foreign capital gains tax”.
In certain foreign jurisdictions, when the Funds incur subsequent capital losses on investment transactions that occurred during the tax year in the applicable foreign jurisdiction, the Funds may be entitled to a refund on any foreign taxes paid on previous capital gain investment transactions that occurred during the tax year of the applicable foreign jurisdiction. Foreign capital gain tax refunds on investment transactions are included in “Net realized gain (loss) from investment transactions” on the Statements of Operations and foreign capital gain tax refunds that remain unpaid as of March 31, 2024, if any, are disclosed in the Statements of Assets and Liabilities in “Receivables: Foreign capital gains tax refund”.
The Funds file foreign tax reclaims in certain foreign jurisdictions to recover a portion of amounts previously withheld on dividend income if the tax reclaim is “more likely than not” to be sustained assuming examination by tax authorities. This determination is based on, among other things, a jurisdiction’s legal obligation to pay reclaims as well as payment history and market convention. Foreign tax reclaims recorded relating to current fiscal year investment income are included in the Statements of Operations as a reduction to the balance shown for “Foreign withholding taxes on dividends” and foreign tax reclaims recorded, but not yet received as of March 31, 2024, if any, are shown on the Statements of Assets and Liabilities in “Receivables: Foreign tax reclaims”.
The Portfolio holds a tax residency certificate issued by the Mauritian Revenue authorities as well as other tax residency related documentation prescribed by the Indian Revenue authorities and should be regarded as the beneficial owner of the investments made in Indian securities, which should entitle it to claim the benefits of the double taxation avoidance agreement entered between the Government of India and Mauritius (“tax treaty”).
The taxable profits derived from the Portfolio are subject to income tax at the rate of 15% in the Republic of Mauritius (“Mauritius”) and eligible for a presumed foreign tax credit of 80% of the Mauritian tax on the respective foreign income which effectively limits the maximum income tax payable to an effective rate of 3%. The Mauritius income tax is paid by WTAM (out of its fee paid by the India Earnings Fund), accordingly, no provision for Mauritius income taxes is required. Under the tax treaty, as amended, Mauritius entities (such as the Portfolio) are subject to tax on capital gains arising on the disposal of shares of an Indian company. However, investments in shares acquired up to March 31, 2017 are grandfathered, thus exempted from capital gains tax in India irrespective of the date of disposal (subject to the entity being eligible for the tax treaty benefits). The Indian tax rates applicable on disposal of securities would depend on the nature of securities, the holding period and the manner of disposal. Further, Indian tax laws have introduced certain General Anti-Avoidance Rules (“GAAR”) applicable to financial years beginning on or after April 1, 2017 (i.e., investments made into India on or after April 1, 2017). GAAR is applied if the “main purpose” of the arrangement is to obtain a tax benefit. With effect from April 1, 2017, the investments made by the Portfolio would be subject to GAAR if any tax benefit is claimed by the Portfolio. In the absence of any clear guidance on the applicability of the GAAR provisions to the Portfolio, and its limited benefit only with respect to dividend income, the Portfolio has elected not to claim any benefit of the tax treaty with effect from April 1, 2017 (other than on grandfathered investments). Reference to investments by the India Earnings Fund herein should be understood to refer to investments by the Portfolio.
Foreign Currency Translation — The accounting records of the Funds are maintained in U.S. dollars. Foreign currencies, as well as investment securities and other assets and liabilities denominated in foreign currencies, are translated into U.S. dollars using exchange rates prevailing on the respective dates of such transactions that are deemed appropriate by WTAM. Realized and unrealized foreign exchange gains and losses on investments are included as a component of “net realized gain (loss) from investment transactions” and “net increase (decrease) in unrealized appreciation/depreciation from investment transactions”, respectively, on the Statements of Operations. Realized and unrealized foreign exchange gains or losses from foreign currency contracts are included in “net realized gain (loss) from foreign currency contracts” and “net increase (decrease) in unrealized appreciation/depreciation from foreign currency contracts”, respectively, on the Statements of Operations. Realized and unrealized foreign exchange gains or losses arising from sales of foreign currencies, currency gains or losses recognized between the trade and settlement dates on investment transactions, and the difference between the amounts of dividends and foreign withholding taxes recorded on the Funds’ books and the U.S. dollar equivalent of the amounts actually received or paid are included in “net realized gain (loss) from foreign currency related transactions” and/or “net increase (decrease) in unrealized appreciation/depreciation from translation of assets and liabilities denominated in foreign currencies” in the Statements of Operations. Certain foreign exchange gains and losses included in realized and unrealized gains or losses are included in, or are a reduction of, ordinary income in accordance with U.S. Federal income tax regulations.
| WisdomTree Trust | 99 |
Notes to Financial Statements (continued)
Expenses — Under the investment advisory agreement for each Fund, except for Funds that commenced operations on or after March 26, 2013, WTAM has agreed to pay all expenses of the Trust, except for: (i) brokerage expenses and other expenses (such as stamp taxes) connected with the execution of portfolio transactions or in connection with creation and redemption transactions; (ii) legal fees or expenses in connection with any arbitration, litigation or pending or threatened arbitration or litigation, including any settlements in connection therewith; (iii) compensation and expenses of trustees who are not interested persons of the Funds (“Independent Trustees”); (iv) compensation and expenses of counsel to the Independent Trustees; (v) compensation and expenses of the Trust’s Chief Compliance Officer (“CCO”); (vi) extraordinary expenses; (vii) distribution fees and expenses paid by the Trust under any distribution plan adopted pursuant to Rule 12b-1 under the 1940 Act; and (viii) the advisory fee payable to WTAM.
Under the investment advisory agreement for Funds that commenced operations on or after March 26, 2013, WTAM has agreed to pay all expenses of the Trust, except for: (i) brokerage expenses and other fees, charges, taxes, levies or expenses (such as stamp taxes) incurred in connection with the execution of portfolio transactions or in connection with creation and redemption transactions (including without limitation any fees, charges, taxes, levies or expenses related to the purchase or sale of an amount of any currency, or the patriation or repatriation of any security or other asset, related to the execution of portfolio transactions or any creation or redemption transactions); (ii) legal fees or expenses in connection with any arbitration, litigation or pending or threatened arbitration or litigation, including any settlements in connection therewith; (iii) compensation and expenses of each Independent Trustee; (iv) compensation and expenses of counsel to the Independent Trustees; (v) compensation and expenses of the Trust’s CCO; (vi) extraordinary expenses (in each case as determined by a majority of the Independent Trustees); (vii) distribution fees and expenses paid by the Trust under any distribution plan adopted pursuant to Rule 12b-1 under the 1940 Act; (viii) interest and taxes of any kind or nature (including, but not limited to, income, excise, transfer and withholding taxes); (ix) fees and expenses related to the provision of securities lending services; and (x) the advisory fee payable to WTAM.
Acquired fund fees and expenses (“AFFEs”) (which are fees and expenses incurred indirectly by a Fund through its investments in certain underlying investment companies) are not operating expenses of the Funds and are not paid by WTAM. Interest expense associated with a short-term loan from a U.S. bank that is incurred in connection with the execution of portfolio rebalancing trades is not paid by WTAM.
Pursuant to a separate contractual arrangement, WTAM arranges for the provision of CCO services with respect to each Fund, and is liable and responsible for, and administers, payments to the CCO, the Independent Trustees and counsel to the Independent Trustees. WTAM receives a fee, as shown on the Statements of Operations under “Service fees”, of up to 0.0044% per annum of each Fund’s average daily net assets for providing such services and paying such expenses. WTAM provides CCO services to the Trust.
Foreign Currency Contracts — The Funds may enter into foreign currency contracts to facilitate local securities settlements or to protect against currency exposure. The Funds, other than the Emerging Markets Multifactor Fund, do not expect to engage in currency transactions for the purpose of hedging against currency exposures of the Fund’s assets that are denominated in one or more foreign currencies. The Funds may not enter into such contracts for speculative purposes. During the fiscal year ended March 31, 2024, the Funds, except for the Emerging Markets Multifactor Fund, utilized foreign currency contracts primarily to facilitate foreign security settlements. The Emerging Markets Multifactor Fund utilized foreign currency contracts primarily to offset applicable international currency exposure from certain positions in emerging market equities. A foreign currency contract involves an obligation to purchase or sell a specific currency at a future date, which may be any fixed number of days from the date of the contract agreed upon by the parties, at a price set at the time of the contract. These contracts are principally traded in the inter-bank market conducted directly between currency traders (usually large, commercial banks) and their customers. A foreign currency contract generally does not require an initial margin deposit and no commissions are charged at any stage for trades.
Risks may arise upon entering into foreign currency contracts from the potential inability of counterparties to meet the terms of their contracts and from unanticipated movements in the value of foreign currencies relative to the U.S. dollar or each other.
Fluctuations in the value of open foreign currency contracts are recorded for book purposes as unrealized gains or losses on foreign currency contracts by the Funds and are included in “net increase (decrease) in unrealized appreciation/depreciation from foreign currency contracts” on the Statements of Operations. Realized gains and losses on foreign currency contracts include net gains or losses recognized by the Funds on contracts which have settled and are included in “net realized gain (loss) from foreign currency contracts” on the Statements of Operations.
Futures Contracts — The India Earnings Fund utilized equity futures contracts on a temporary basis during the fiscal year to obtain market exposure consistent with its investment objective during the Fund’s periodic portfolio rebalance. When a Fund purchases a listed futures contract, it agrees to purchase a specified reference asset (e.g., commodity, currency, equity, digital asset or U.S. Treasury security, collectively herein, “Reference Asset”) at a specified future date. When a Fund sells a listed futures contract, it agrees to sell a specified Reference Asset at a future date. The price at which the purchase and sale will take place is fixed when the Fund enters into the contract. A Fund may also cash settle upon the expiration date of a futures contract in which no physical delivery (or receipt) of the specified Reference Asset comprising the futures contract is made. Instead, settlement in cash would occur upon the expiration of the contract, with the cash settlement being the difference between the contract price and the actual
| 100 | WisdomTree Trust |
Notes to Financial Statements (continued)
price of the specified Reference Asset at the expiration date. The exchange clearing corporation is the ultimate counterparty for all exchange-listed contracts, so credit risk is limited to the creditworthiness of the exchange clearing corporation.
Upon entering into a futures contract, a Fund is required to deliver to a broker an amount of cash and/or U.S. government securities equal to a certain percentage of the contract amount. This amount is known as the “initial margin”. Cash deposited as initial margin, if any, is shown as “Deposits at broker for futures contracts” in the Statements of Assets and Liabilities, and U.S. government securities deposited, if any, are designated in the Schedule of Investments. Subsequent payments, known as “variation margin”, generally are made or received by the Fund each day or at other agreed-upon time periods depending on the fluctuations in the value of the underlying futures contracts, except that in the case of certain futures contracts, variation margin payments may be made or received when the futures contract expires. Variation margin is recorded for financial statement purposes on a daily basis as an unrealized gain or loss on futures until the financial futures contract is closed, at which time the unrealized net gain or loss is reclassified to realized gain or loss on futures. The Funds have adopted a derivatives risk management program pursuant to Rule 18f-4 under the 1940 Act to assess and manage the Funds’ derivatives risk. Rule 18f-4 limits the amount of derivatives a fund can enter into and replaces the asset segregation framework previously used by the Funds to comply with Section 18 of the 1940 Act.
As of March 31, 2024, there were no open futures contracts in the Funds.
Securities Lending — Each Fund may lend portfolio securities to certain creditworthy borrowers, including the Funds’ securities lending agent. It is the Funds’ policy that, at origination, all loans are secured by collateral of at least 102% of the value of U.S. securities loaned and 105% of the value of foreign securities loaned. Collateral in the form of cash and/or securities issued or guaranteed by the U.S. government or its agencies, equivalent to at least 100% of the market value of securities, is maintained at all times. The cash collateral can be invested in certain money market mutual funds which also have exposure to the fluctuations of the market. The values of the investments of cash collateral for securities on loan along with the obligations to return such collateral are included on the Statements of Assets and Liabilities. The total value of securities received as collateral for securities on loan is included in a footnote following each Schedule of Investments, but is not included within the Statements of Assets and Liabilities because the receiving Fund does not have the right to sell or repledge the securities received as collateral. As compensation for lending its securities, each Fund retains all or a portion of the interest received on investment of cash collateral or receives a fee from the borrower (net of any fee rebates paid to the borrower). The lending agent receives a portion of the income earned by the Funds in connection with the lending program. The net securities lending income earned by the Funds is disclosed on the Statements of Operations. The dividend and interest income earned on the securities loaned is accounted for in the same manner as other dividend and interest income. The borrower pays to the Funds an amount equal to any dividends or interest received on loaned securities. Dividends received while a security is out on loan are not considered Qualified Dividend Income (“QDI”) under the specific criteria issued by the Internal Revenue Service and are subject to taxation at the shareholder’s ordinary income tax rate instead of the lower long-term capital gains tax rate. Lending portfolio securities could result in a loss or delay in recovering each Fund’s securities if the borrower defaults. In the event of a borrower default with respect to the failure to return to each Fund some or all of the securities loaned, the securities lending agent shall indemnify each Fund against the failure of the borrower if the value of the collateral received is insufficient to cover the market value of the securities loaned.
Master Netting Arrangements — Codification Topic 210 (“ASC 210”), Balance Sheet, requires disclosures generally intended to (i) help investors and other financial statement users to better assess the effect or potential effect of offsetting arrangements on a company’s financial position, (ii) improve transparency in the reporting of how companies mitigate credit risk, and (iii) facilitate comparisons between those entities that prepare their financial statements on the basis of GAAP and those entities that prepare their financial statements on the basis of international financial reporting standards. ASC 210 requires entities to disclose (i) gross and net information about both instruments and transactions eligible for offset in the financial statements, and (ii) instruments and transactions subject to an agreement similar to a master netting agreement. ASC 210 is limited in scope to the following financial instruments, to the extent they are offset in the financial statements or subject to an enforceable master netting arrangement or similar agreement: (i) recognized derivative instruments accounted for under ASC 815 (Derivatives and Hedging); (ii) repurchase agreements and reverse repurchase agreements; and (iii) securities borrowing and securities lending transactions.
In order to better define its contractual rights and to secure rights that will help a Fund mitigate its counterparty risk, a Fund enters into an International Swaps and Derivatives Association, Inc. Master Agreement (“ISDA Master Agreement”) with its counterparties. An ISDA Master Agreement is a bilateral agreement between a Fund and a counterparty that governs over-the-counter (“OTC”) derivatives, such as foreign currency contracts, and typically contains, among other things, collateral posting terms, netting and rights of set-off provisions in the event of a default and/or termination event. Under an ISDA Master Agreement, a Fund may, under certain circumstances, offset with the counterparty certain derivative financial instruments’ payables and receivables to create a single net payment. The provisions of the ISDA Master Agreement typically permit a single net payment in the event of a default (close-out netting) or similar event, including the bankruptcy or insolvency of the counterparty.
Collateral requirements generally differ by type of derivative. Collateral terms are contract-specific for OTC derivatives (e.g., foreign currency contracts, options and certain swaps). To the extent amounts due to a Fund from its derivatives counterparties are not fully collateralized, contractually or otherwise, the Fund bears the risk of loss from a counterparty’s non-performance.
| WisdomTree Trust | 101 |
Notes to Financial Statements (continued)
The Funds’ securities lending activities are governed by a Securities Lending Authorization Agreement (“Lending Agreement”) between the Funds and the lending agent. The Lending Agreement authorizes the lending agent to lend qualifying U.S. and foreign securities held by a Fund to approved borrowers (each a “Borrower”). To mitigate borrower risk, a Fund typically receives from a Borrower collateral in the form of U.S. dollar cash and/or securities issued or guaranteed by the U.S. government or its agencies in excess of the market value of the securities loaned. Under the provisions of the Lending Agreement, a Fund shall have, as to the collateral, all of the rights and remedies of a secured party under applicable law. A Fund is exposed to risk of loss if a Borrower defaults on its obligation to return borrowed securities and the value of the collateral a Fund received is insufficient to cover the market value of the securities loaned. Also, the lending agent is permitted to invest the cash collateral it receives from a Borrower into a money market fund which is subject to market fluctuation. Therefore, a Fund is exposed to risk of loss if the value of invested cash collateral is insufficient to satisfy the Fund’s obligation to return the full amount owed to such Borrower. However, in the event of a borrower default with respect to the failure to return to each Fund some or all of the securities loaned, the securities lending agent shall indemnify each Fund against the failure of the borrower if the value of the collateral received is insufficient to cover the market value of the securities loaned.
For financial reporting purposes, the Funds elect to not offset assets and liabilities subject to an ISDA Master Agreement or Lending Agreement, if any, in the Statements of Assets and Liabilities. Therefore, all qualifying transactions are presented on a gross basis in the Statements of Assets and Liabilities. As of March 31, 2024, the impact of netting of assets and liabilities and the offsetting of collateral pledged or received based on contractual netting/set-off provisions in the ISDA Master Agreement and the Lending Agreement are detailed in the following table:
| Assets | Liabilities | |||||||||||||||||||||||||||||||
Gross Amounts Assets and | Gross Amounts Not Offset in the Statements of Assets and Liabilities | Gross Amounts Assets and | Gross Amounts Not Offset in the Statements of Assets and Liabilities | |||||||||||||||||||||||||||||
| Fund | Financial Instruments | Collateral Received | Net Amount | Financial Instruments | Collateral Posted | Net Amount | ||||||||||||||||||||||||||
China ex-State-Owned Enterprises Fund | ||||||||||||||||||||||||||||||||
Securities Lending | $ | 17,915,740 | $ | — | $ | (17,915,740 | )1 | $ | — | $ | — | $ | — | $ | — | $ | — | |||||||||||||||
Emerging Markets ex-State-Owned Enterprises Fund | ||||||||||||||||||||||||||||||||
Securities Lending | 100,971,874 | — | (100,971,874 | )1 | — | — | — | — | — | |||||||||||||||||||||||
Emerging Markets High Dividend Fund | ||||||||||||||||||||||||||||||||
Securities Lending | 243,668,369 | — | (243,668,369 | )1 | — | — | — | — | — | |||||||||||||||||||||||
Foreign Currency Contracts | 2,100 | — | — | 2,100 | — | — | — | — | ||||||||||||||||||||||||
Emerging Markets Multifactor Fund | ||||||||||||||||||||||||||||||||
Securities Lending | 83,527 | — | (83,527 | )1 | — | — | — | — | — | |||||||||||||||||||||||
Foreign Currency Contracts | 286,499 | (137,850 | ) | — | 148,649 | 177,246 | (137,850 | ) | — | 39,396 | ||||||||||||||||||||||
Emerging Markets Quality Dividend Growth Fund | ||||||||||||||||||||||||||||||||
Securities Lending | 2,281,054 | — | (2,281,054 | )1 | — | — | — | — | — | |||||||||||||||||||||||
Foreign Currency Contracts | 32 | (7 | ) | — | 25 | 1,879 | (7 | ) | — | 1,872 | ||||||||||||||||||||||
Emerging Markets SmallCap Dividend Fund | ||||||||||||||||||||||||||||||||
Securities Lending | 455,444,799 | — | (455,444,799 | )1 | — | — | — | — | — | |||||||||||||||||||||||
Foreign Currency Contracts | 5,925 | — | — | 5,925 | 20 | — | — | 20 | ||||||||||||||||||||||||
Global ex-U.S. Quality Dividend Growth Fund | ||||||||||||||||||||||||||||||||
Securities Lending | 48,910,080 | — | (48,910,080 | )1 | — | — | — | — | — | |||||||||||||||||||||||
Foreign Currency Contracts | — | — | — | — | 3 | — | — | 3 | ||||||||||||||||||||||||
Global High Dividend Fund | ||||||||||||||||||||||||||||||||
Securities Lending | 8,306,068 | — | (8,306,068 | )1 | — | — | — | — | — | |||||||||||||||||||||||
Foreign Currency Contracts | 21 | — | — | 21 | 18 | — | — | 18 | ||||||||||||||||||||||||
New Economy Real Estate Fund | ||||||||||||||||||||||||||||||||
Securities Lending | 2,724,130 | — | (2,724,130 | )1 | — | — | — | — | — | |||||||||||||||||||||||
Foreign Currency Contracts | — | — | — | — | 1 | — | — | 1 | ||||||||||||||||||||||||
| 1 | The amount of collateral presented has been limited such that the net amount by counterparty cannot be less than zero. |
Short-Term Investments — Each Fund may invest a portion of its assets in high-quality money market instruments on an ongoing basis to provide liquidity or for other reasons. The instruments include short-term obligations issued by the U.S. government, its agencies, non-U.S. government agencies, negotiable certificates of deposit (“CDs”), fixed time deposits and bankers’ acceptances of U.S. and foreign banks and similar institutions, commercial papers, repurchase agreements and money market funds. CDs are
| 102 | WisdomTree Trust |
Notes to Financial Statements (continued)
short-term negotiable obligations of commercial banks. Time deposits are non-negotiable deposits maintained in banking institutions for specified periods of time at stated interest rates. Banker’s acceptances are time drafts drawn on commercial banks by borrowers, usually in connection with international transactions.
Restricted Securities — Each Fund may invest in securities that are subject to legal or contractual restrictions on resale. These securities generally may be resold in transactions exempt from registration or to the public if the securities are registered. Disposal of these securities may involve time-consuming negotiations and expense, and prompt sale at an acceptable price may be difficult. Information regarding restricted securities, if any, is included at the end of each Fund’s Schedule of Investments.
Emerging Market Investments — Investments in securities listed and traded in emerging markets are subject to additional risks that may not be present for U.S. investments or investments in more developed non-U.S. markets. Such risks may include: (i) greater market volatility; (ii) lower trading volume; (iii) greater social, political and economic uncertainty; (iv) governmental controls on foreign investments and limitations on repatriation of invested capital; (v) the risk that companies may be held to lower disclosure, corporate governance, auditing and financial reporting standards than companies in more developed markets; and (vi) the risk that there may be less protection of property rights than in other countries. Emerging markets are generally less liquid and less efficient than developed securities markets.
Tax Information and Dividends and Distributions to Shareholders — It is each Fund’s policy to comply with all requirements of the Internal Revenue Code of 1986, as amended (the “Code”). A portion of the Code, known as subchapter M (“Subchapter M”), addresses the ways by which investment companies and investment trusts may pass income through to shareholders in order to avoid double taxation. Each Fund intends to qualify for and to elect treatment as a separate Regulated Investment Company (“RIC”) under Subchapter M of the Code so that it will not be subject to federal income tax on income and gains that are timely distributed to Fund shareholders. Accordingly, no provision for U.S. federal income taxes is required. In order to qualify for the special tax treatment accorded to RICs and their shareholders, each Fund must, among other things, distribute with respect to each taxable year an amount equal to or greater than the sum of 90% of its investment company taxable income and 90% of its net tax-exempt interest income. There can be no guarantee that a Fund will pay dividends. Taxable net realized gains from investment transactions, reduced by capital loss carryforwards, if any, are declared and distributed to shareholders at least annually. The capital loss carryforward amount, if any, is available to offset future net capital gains. The Funds may occasionally be required to make supplemental distributions at some other time during the year. The Trust reserves the right to declare special distributions if, in its reasonable discretion, such action is necessary or advisable to preserve the status of each Fund as a RIC or to avoid imposition of income or excise taxes on undistributed income. Dividends and distributions to shareholders are recorded on the ex-dividend date. The amount of dividends and distributions from net investment income and net realized capital gains is determined in accordance with the requirements of the Code and the U.S. Treasury regulations (i.e., tax basis) which may differ to amounts determined under GAAP (i.e., book basis). These book/tax differences are either considered temporary or permanent in nature. To the extent these differences are permanent in nature, such amounts are reclassified within the components of net assets based on their Federal tax basis treatment; temporary differences do not require reclassification. Dividends and distributions that exceed earnings and profit for tax purposes are reported for tax purposes as a return of capital. The India Earnings Fund has filed an election to treat the Portfolio as a “pass-through” entity for tax purposes.
3. ADVISORY FEES AND OTHER TRANSACTIONS WITH AFFILIATES
WTAM has overall responsibility for the general management and administration of the Trust. WTAM provides an investment program for each Fund. WTAM has arranged for Mellon Investments Corporation (“Mellon”) to provide sub-advisory services to the Funds. Additionally, the Portfolio is also advised by WTAM and is sub-advised by Mellon. Mellon is compensated by WTAM at no additional cost to the Funds or the Portfolio. WTAM also arranges for transfer agency, custody, fund accounting, fund administration, securities lending and all other non-distribution related services necessary for the Funds to operate, which are generally under separate agreements entered into between the Trust on behalf of the Funds and the applicable service provider. Under the investment advisory agreement for each Fund, WTAM agrees to pay all expenses of the Funds, except for certain expenses described in Note 2.
Pursuant to a separate contractual arrangement, as also described in Note 2, WTAM arranges for the provision of CCO services with respect to each Fund, and is liable and responsible for, and administers, payments to the CCO, the Independent Trustees and counsel to the Independent Trustees in exchange for a fee, accrued daily and paid monthly in arrears, of up to 0.0044% per annum of each Fund’s average daily net assets.
| WisdomTree Trust | 103 |
Notes to Financial Statements (continued)
WTAM expects to receive annual advisory fees from each Fund, based on a percentage of the Fund’s average daily net assets and, with respect to the India Earnings Fund, based on the average daily net assets of the India Earnings Fund and the Portfolio on a consolidated basis, as shown in the following table:
| Fund | Advisory Fee Rate | |||
China ex-State-Owned Enterprises Fund | 0.32 | % | ||
Emerging Markets ex-State-Owned Enterprises Fund | 0.32 | % | ||
Emerging Markets High Dividend Fund | 0.63 | % | ||
Emerging Markets Multifactor Fund | 0.48 | % | ||
Emerging Markets Quality Dividend Growth Fund | 0.32 | % | ||
Emerging Markets SmallCap Dividend Fund | 0.58 | % | ||
Global ex-U.S. Quality Dividend Growth Fund | 0.42 | % | ||
Global High Dividend Fund | 0.58 | % | ||
India Earnings Fund (consolidated) | 0.83 | % | ||
New Economy Real Estate Fund | 0.58 | % | ||
Affiliated holdings are investments in entities in which the Fund owns 5% or more of the outstanding voting securities or are investments in entities which are under common ownership or control. Transactions in shares of affiliated ETFs for the fiscal year ended March 31, 2024, as applicable, are included in an “Investment in Affiliates” supplementary table in each applicable Fund’s Schedule of Investments. For these transactions, WTAM voluntarily waives a portion of its advisory fees, that it would otherwise charge, for each Fund’s investment in affiliated funds. The waivers may be reduced to offset the incremental costs related to these investments (e.g., fund accounting, safekeeping, transaction fees, etc.) that are paid by WTAM out of its advisory fee. The dollar amount of advisory fees waived during the period for the Funds, if any, are included in the Statements of Operations in “Expense waivers”.
WTAM and/or WisdomTree (collectively herein, “WT”) may from time to time own shares of a Fund. As of and for the fiscal year ended March 31, 2024, WT held shares of and received distributions from the following Funds, which were purchased through an unaffiliated broker in ordinary brokerage transactions in the secondary market in which the Funds’ shares trade:
| At March 31, 2024 | For the Fiscal Year Ended March 31, 2024 | |||||||||||
| Fund | Fund Shares held by WT | Market Value of Fund Shares held by WT | Dividends and Distributions paid to WT on Fund Shares held by WT | |||||||||
Emerging Markets ex-State-Owned Enterprises Fund | 806 | $ | 23,745 | $ | 579 | |||||||
Emerging Markets High Dividend Fund | 166 | 6,945 | 454 | |||||||||
Emerging Markets Quality Dividend Growth Fund | 287 | 7,376 | 159 | |||||||||
Emerging Markets SmallCap Dividend Fund | 426 | 21,666 | 989 | |||||||||
Global ex-U.S. Quality Dividend Growth Fund | 58 | 2,256 | 84 | |||||||||
4. CAPITAL SHARE TRANSACTIONS
As of March 31, 2024, there were an unlimited number of $0.001 par value shares of beneficial interest authorized by the Trust. Shares are issued and redeemed by each Fund only in creation units or multiples thereof to an authorized participant (“AP”). Except when aggregated in creation units (“Creation Unit Aggregations”), shares of each Fund are not redeemable. Transactions in shares for each Fund are disclosed in detail in the Statements of Changes in Net Assets. The consideration for the purchase of creation units of a Fund generally consists of the in-kind contribution of a basket of securities (“Deposit Securities”) and/or an amount of cash (“Cash Component”). Creation Unit Aggregations may be created in advance of receipt by a Fund of all or a portion of the applicable Deposit Securities from APs. In these circumstances, the initial deposit received from the AP will have a value greater than the NAV of the applicable Fund’s shares on the date the order is placed in proper form since, in addition to available Deposit Securities, U.S. cash must be deposited by the AP in an amount equal to the sum of (i) the Cash Component, plus (ii) generally between 102%-110%, as directed by the Trust or WTAM, which the Trust or WTAM may change from time to time, of the market value of the undelivered Deposit Securities (the “Additional Cash Deposit”) with the Fund pending delivery of any missing Deposit Securities. The Fund will return any unused portion of the Additional Cash Deposit once all of the missing Deposit Securities have been properly received from the AP or purchased by the Fund. Amounts due to be returned to an AP as of March 31, 2024, if any, is shown in the Statements of Assets and Liabilities in “Payables: Deposit due to authorized participant”. The India Earnings Fund issues and redeems shares on a cash basis only as certain securities markets in which this Fund invest does not permit in-kind transfers of securities.
| 104 | WisdomTree Trust |
Notes to Financial Statements (continued)
5. INVESTMENT PORTFOLIO TRANSACTIONS
Purchases and sales of investments (excluding purchases and sales resulting from in-kind capital share transactions and short-term investments) and the cost of purchases and the proceeds from sales resulting from in-kind capital share transactions (excluding short-term investments) for the fiscal year ended March 31, 2024 are shown in the following table. Realized gains and losses on sales resulting from in-kind capital share redemptions, as shown on the Statements of Operations, are not recognized by the Funds for tax purposes.
| In-kind Capital Share Transactions | ||||||||||||||||
| Fund | Purchases | Sales | Purchases | Sales | ||||||||||||
China ex-State-Owned Enterprises Fund | $ | 187,780,383 | $ | 269,033,447 | $ | 1,429,788 | $ | 125,587,883 | ||||||||
Emerging Markets ex-State-Owned Enterprises Fund | 645,580,375 | 860,424,540 | 12,362,496 | 101,926,687 | ||||||||||||
Emerging Markets High Dividend Fund | 1,393,264,564 | 1,032,824,666 | 59,411,508 | 15,845,426 | ||||||||||||
Emerging Markets Multifactor Fund | 22,526,341 | 7,420,741 | 4,522,190 | — | ||||||||||||
Emerging Markets Quality Dividend Growth Fund | 83,753,201 | 59,153,338 | 7,186,198 | — | ||||||||||||
Emerging Markets SmallCap Dividend Fund | 1,442,242,222 | 1,609,033,367 | 25,272,151 | 114,902,196 | ||||||||||||
Global ex-U.S. Quality Dividend Growth Fund | 405,760,635 | 389,709,103 | 64,324,782 | 26,008,411 | ||||||||||||
Global High Dividend Fund | 46,099,957 | 48,988,864 | — | 33,058,853 | ||||||||||||
India Earnings Fund (consolidated) | 2,076,625,192 | 451,117,621 | — | — | ||||||||||||
New Economy Real Estate Fund | 4,801,242 | 4,285,302 | — | 7,147,939 | ||||||||||||
6. FEDERAL INCOME TAXES
At March 31, 2024, the cost of investments (including securities on loan and derivatives) for Federal income tax purposes was as follows:
| Investments in Long Securities | Investments in Financial Derivatives1 | |||||||||||||||||||||||||||||||||||
| Fund | Tax Cost | Gross Unrealized | Gross Unrealized | Net Unrealized Appreciation/ (Depreciation) | Gross Unrealized Appreciation | Gross Unrealized Depreciation | Net Unrealized Appreciation/ (Depreciation) | Total Net Unrealized (Depreciation) | ||||||||||||||||||||||||||||
China ex-State-Owned Enterprises Fund | $ | 514,306,919 | $ | 24,821,288 | $ | (176,011,546 | ) | $ | (151,190,258 | ) | $ | — | $ | — | $ | — | $ | (151,190,258 | ) | |||||||||||||||||
Emerging Markets ex-State-Owned Enterprises Fund | 1,860,576,581 | 501,709,485 | (354,480,284 | ) | 147,229,201 | — | — | — | 147,229,201 | |||||||||||||||||||||||||||
Emerging Markets High Dividend Fund | 2,537,062,767 | 568,254,055 | (272,563,394 | ) | 295,690,661 | 2,100 | — | 2,100 | 295,692,761 | |||||||||||||||||||||||||||
Emerging Markets Multifactor Fund | 21,781,156 | 2,195,242 | (512,497 | ) | 1,682,745 | 115,860 | (132,104 | ) | (16,244 | ) | 1,666,501 | |||||||||||||||||||||||||
Emerging Markets Quality Dividend Growth Fund | 110,111,641 | 32,111,017 | (5,527,982 | ) | 26,583,035 | 32 | (1,919 | ) | (1,887 | ) | 26,581,148 | |||||||||||||||||||||||||
Emerging Markets SmallCap Dividend Fund | 2,306,678,604 | 641,158,499 | (148,574,436 | ) | 492,584,063 | 5,925 | (20 | ) | 5,905 | 492,589,968 | ||||||||||||||||||||||||||
Global ex-U.S. Quality Dividend Growth Fund | 577,211,104 | 134,342,066 | (36,566,453 | ) | 97,775,613 | — | (3 | ) | (3 | ) | 97,775,610 | |||||||||||||||||||||||||
Global High Dividend Fund | 102,611,073 | 15,798,132 | (3,705,142 | ) | 12,092,990 | 21 | (18 | ) | 3 | 12,092,993 | ||||||||||||||||||||||||||
India Earnings Fund (consolidated) | 2,202,262,615 | 783,253,083 | (50,984,904 | ) | 732,268,179 | — | — | — | 732,268,179 | |||||||||||||||||||||||||||
New Economy Real Estate Fund | 25,300,702 | 960,272 | (4,087,957 | ) | (3,127,685 | ) | — | — | — | (3,127,685 | ) | |||||||||||||||||||||||||
| 1 | Certain financial derivatives may be considered section 1256 contracts under the Code. Each section 1256 contract held at the close of a taxable year shall be treated as sold for its fair market value on the last business day of such taxable year (and any realized gain and loss shall be taken into account for the taxable year). As such, the unrealized appreciation/(depreciation) for financial derivatives on a tax basis may not correspond to the unrealized appreciation/(depreciation) on a GAAP basis. The unrealized appreciation/(depreciation) for financial derivatives on a GAAP basis is located in the respective financial derivatives tables in each Fund’s Schedule of Investments. |
| WisdomTree Trust | 105 |
Notes to Financial Statements (continued)
At March 31, 2024, the components of total distributable earnings (loss) on a tax-basis were as follows:
| Fund | Undistributed Ordinary Income | Undistributed Capital and Other | Net Unrealized (Depreciation) | Currency and Other Unrealized | Other Temporary Differences1 | Total Distributable Earnings (Loss) | ||||||||||||||||||
China ex-State-Owned Enterprises Fund | $ | 119,996 | $ | (572,169,124 | ) | $ | (151,190,258 | ) | $ | 435,312 | $ | — | $ | (722,804,074 | ) | |||||||||
Emerging Markets ex-State-Owned Enterprises Fund | — | (860,554,618 | ) | 147,229,201 | (10,834,222 | ) | 125,843 | (724,033,796 | ) | |||||||||||||||
Emerging Markets High Dividend Fund | 2,384,496 | (1,637,219,791 | ) | 295,690,661 | (10,874,828 | ) | 96,327 | (1,349,923,135 | ) | |||||||||||||||
Emerging Markets Multifactor Fund | 14,414 | (1,113,265 | ) | 1,682,745 | (111,651 | ) | — | 472,243 | ||||||||||||||||
Emerging Markets Quality Dividend Growth Fund | 89,872 | (29,521,894 | ) | 26,583,035 | (1,877,966 | ) | — | (4,726,953 | ) | |||||||||||||||
Emerging Markets SmallCap Dividend Fund | 2,971,456 | (626,884,392 | ) | 492,584,063 | (11,366,254 | ) | 100,484 | (142,594,643 | ) | |||||||||||||||
Global ex-U.S. Quality Dividend Growth Fund | 155,121 | (104,746,891 | ) | 97,775,613 | (409,961 | ) | 25,964 | (7,200,154 | ) | |||||||||||||||
Global High Dividend Fund | 242,704 | (21,999,437 | ) | 12,092,990 | (48,190 | ) | 748 | (9,711,185 | ) | |||||||||||||||
India Earnings Fund (consolidated) | — | (4,967,282 | ) | 732,268,179 | (74,598,535 | ) | (627,172 | ) | 652,075,190 | |||||||||||||||
New Economy Real Estate Fund | 53,273 | (44,689,492 | ) | (3,127,685 | ) | (460 | ) | 757 | (47,763,607 | ) | ||||||||||||||
| 1 | The treatment of certain income/expense items have been recognized for GAAP but disallowed for tax purposes. |
The tax character of distributions paid during the fiscal years ended March 31, 2024 and March 31, 2023, was as follows:
| Year Ended March 31, 2024 | Year Ended March 31, 2023 | |||||||||||
| Fund | Distributions Paid Income* | Distributions Paid from Return of Capital | Distributions Paid from Ordinary Income* | |||||||||
China ex-State-Owned Enterprises Fund | $ | 9,480,375 | $ | — | $ | 8,628,659 | ||||||
Emerging Markets ex-State-Owned Enterprises Fund | 38,726,000 | — | 52,252,500 | |||||||||
Emerging Markets High Dividend Fund | 151,734,500 | — | 137,420,525 | |||||||||
Emerging Markets Multifactor Fund | 102,000 | — | 70,527 | |||||||||
Emerging Markets Quality Dividend Growth Fund | 2,519,500 | — | 3,003,000 | |||||||||
Emerging Markets SmallCap Dividend Fund | 132,233,000 | — | 121,656,900 | |||||||||
Global ex-U.S. Quality Dividend Growth Fund | 11,257,500 | — | 18,475,318 | |||||||||
Global High Dividend Fund | 5,057,500 | — | 4,296,367 | |||||||||
India Earnings Fund (consolidated) | — | 1,524,000 | 40,595,106 | |||||||||
New Economy Real Estate Fund | 558,000 | — | 420,750 | |||||||||
| * | Includes short-term capital gains, if any. |
At March 31, 2024, for Federal tax purposes, the Funds have capital loss carryforwards available to offset future capital gains as indicated in the following table. The loss carryforward amounts do not have an expiration date and, therefore, can be carried forward indefinitely until utilized. To the extent that these loss carryforwards are utilized, capital gains so offset will not be distributed to shareholders.
| Fund | Short-Term | Long-Term | Capital Loss Available Total | |||||||||
China ex-State-Owned Enterprises Fund | $ | 181,169,929 | $ | 390,999,195 | $ | 572,169,124 | ||||||
Emerging Markets ex-State-Owned Enterprises Fund | 276,641,880 | 583,877,184 | 860,519,064 | |||||||||
Emerging Markets High Dividend Fund | 522,859,053 | 1,114,360,738 | 1,637,219,791 | |||||||||
Emerging Markets Multifactor Fund | 1,113,265 | — | 1,113,265 | |||||||||
Emerging Markets Quality Dividend Growth Fund | 14,827,345 | 14,694,549 | 29,521,894 | |||||||||
Emerging Markets SmallCap Dividend Fund | 355,906,492 | 270,977,900 | 626,884,392 | |||||||||
Global ex-U.S. Quality Dividend Growth Fund | 88,450,596 | 16,296,295 | 104,746,891 | |||||||||
Global High Dividend Fund | 5,064,096 | 16,935,341 | 21,999,437 | |||||||||
India Earnings Fund (consolidated) | 3,785,976 | — | 3,785,976 | |||||||||
New Economy Real Estate Fund | 9,544,073 | 35,145,419 | 44,689,492 | |||||||||
Capital losses incurred after October 31 (“post-October capital losses”) and late year ordinary losses incurred after December 31 within the taxable year are deemed to arise on the first business day of each Fund’s next taxable year. At March 31, 2024, the Funds did not have any post-October capital losses to defer.
| 106 | WisdomTree Trust |
Notes to Financial Statements (continued)
During the fiscal year ended March 31, 2024, the following Funds incurred and will elect to defer late year ordinary losses as follows:
| Fund | Late Year Ordinary Loss | |||
China ex-State-Owned Enterprises Fund | $ | — | ||
Emerging Markets ex-State-Owned Enterprises Fund | 35,554 | |||
Emerging Markets High Dividend Fund | — | |||
Emerging Markets Multifactor Fund | — | |||
Emerging Markets Quality Dividend Growth Fund | — | |||
Emerging Markets SmallCap Dividend Fund | — | |||
Global ex-U.S. Quality Dividend Growth Fund | — | |||
Global High Dividend Fund | — | |||
India Earnings Fund (consolidated) | 1,181,306 | |||
New Economy Real Estate Fund | — | |||
During the fiscal year ended March 31, 2024, the amount of capital loss carryforwards used to offset realized gains are shown in the following table:
| Fund | Utilized Capital Loss Carryforward | |||
China ex-State-Owned Enterprises Fund | $ | — | ||
Emerging Markets ex-State-Owned Enterprises Fund | — | |||
Emerging Markets High Dividend Fund | — | |||
Emerging Markets Multifactor Fund | 141,642 | |||
Emerging Markets Quality Dividend Growth Fund | — | |||
Emerging Markets SmallCap Dividend Fund | 86,874,406 | |||
Global ex-U.S. Quality Dividend Growth Fund | — | |||
Global High Dividend Fund | 291,910 | |||
India Earnings Fund (consolidated) | 36,163,104 | |||
New Economy Real Estate Fund | — | |||
At March 31, 2024, the effect of permanent “book/tax” reclassifications resulted in increases (decreases) to the components of net assets as shown in the following table. The differences are primarily due to redemptions-in-kind.
| Fund | Total Distributable | Paid-in Capital | ||||||
China ex-State-Owned Enterprises Fund | $ | 34,765,485 | $ | (34,765,485 | ) | |||
Emerging Markets ex-State-Owned Enterprises Fund | (19,750,265 | ) | 19,750,265 | |||||
Emerging Markets High Dividend Fund | (557,425 | ) | 557,425 | |||||
Emerging Markets Multifactor Fund | — | — | ||||||
Emerging Markets Quality Dividend Growth Fund | — | — | ||||||
Emerging Markets SmallCap Dividend Fund | (15,955,735 | ) | 15,955,735 | |||||
Global ex-U.S. Quality Dividend Growth Fund | (5,382,977 | ) | 5,382,977 | |||||
Global High Dividend Fund | (5,951,174 | ) | 5,951,174 | |||||
India Earnings Fund (consolidated) | 184,714 | (184,714 | ) | |||||
New Economy Real Estate Fund | 686,997 | (686,997 | ) | |||||
GAAP provides guidance on tax provisions that prescribe a minimum threshold for financial statement recognition of the benefit of a tax position taken or expected to be taken in a tax return. As of and during the fiscal year ended March 31, 2024, the Funds did not have any liabilities for unrecognized tax benefits relating to uncertain income tax positions they have taken or expect to take in the future. If applicable, the Funds will recognize interest accrued related to unrecognized tax benefits in interest expense and penalties in “Other” expenses on the Statements of Operations. The Funds file tax returns with the Internal Revenue Service, the State of New York, and various other states. Specific to U.S. federal and state taxes, generally, each of the tax years in the four-year period ended March 31, 2024, remains subject to examination by taxing authorities. Specific to foreign countries in which the Funds invest, all open tax years remain subject to examination by taxing authorities in the respective jurisdictions. The open tax years vary by each jurisdiction in which each Fund invests.
| WisdomTree Trust | 107 |
Notes to Financial Statements (continued)
As a result of several European Court of Justice (“ECJ”) court cases in certain countries across the European Union (“EU”), certain Funds have filed additional tax reclaims for previously withheld taxes on dividends earned in those countries (“ECJ tax reclaims”). These additional filings are subject to various administrative proceedings by the local jurisdictions’ tax authorities within the EU, as well as a number of related judicial proceedings. Income recognized, if any, for ECJ tax reclaims is reflected as “Other income” in the Statements of Operations and the cost to file these additional ECJ tax reclaims is reflected as “Other fees” in the Statements of Operations. When the ECJ tax reclaim is not “more likely than not” to be sustained assuming examination by tax authorities due to the uncertainty that exists as to the ultimate resolution of these proceedings, the likelihood of receipt of these ECJ tax reclaims, and the potential timing of payment, no amounts are reflected in the financial statements. For U.S. income tax purposes, ECJ tax reclaims received by the Funds, if any, reduce the amounts of foreign taxes Fund shareholders can use as tax credits in their individual income tax returns. In the event that ECJ tax reclaims received by a Fund during the fiscal year exceed foreign withholding taxes paid, and a Fund previously passed foreign tax credits on to its shareholders, a Fund must either amend historic tax reporting to shareholders or enter into a closing agreement with the Internal Revenue Service in order to pay the associated tax liability on behalf of the respective Fund’s shareholders. During the fiscal year ended March 31, 2024, the ECJ tax reclaims received by the Funds did not exceed the foreign withholding taxes of the respective Funds.
7. DEMAND NOTE
On September 14, 2023, the India Earnings Fund entered into a demand note agreement with Bank of America, N.A. which allowed the India Earnings Fund to borrow up to $360,000,000 with a final maturity date of September 29, 2023. During the period from September 14, 2023 through September 25, 2023, the India Earnings Fund had an average outstanding demand note balance of $213,750,000 and a weighted average interest rate of 8.04% per annum. On September 26, 2023, the India Earnings Fund fully repaid amounts borrowed under the demand note and interest expense related to the demand note was $565,014.
8. SUBSEQUENT EVENTS
WTAM has evaluated all subsequent transactions and events through the date on which these financial statements were issued and has determined that no additional items require disclosure in these financial statements.
9. ADDITIONAL INFORMATION
Russia’s military invasion of Ukraine initiated in February 2022 and the economic and diplomatic responses by the United States and other countries have led to increased volatility and uncertainty in the financial markets and could continue to adversely affect regional and global economies for the foreseeable future. In response to Russia’s actions, the governments of the United States, the European Union, the United Kingdom, and many other countries collectively imposed heavy and broad-ranging economic sanctions on certain Russian individuals, corporate and banking entities, and other industries and businesses. The sanctions restrict companies from doing business with Russia and Russian companies, prohibit transactions with the Russian central bank and other key Russian financial institutions and entities, ban Russian airlines and ships from using many other countries’ airspace and ports, respectively, and place a freeze on certain Russian assets. The sanctions also removed some Russian banks from the Society for Worldwide Interbank Financial Telecommunications (SWIFT), the electronic network that connects banks globally to facilitate cross-border payments. In addition, the United States has banned oil and other energy imports from Russia, as well as other popular Russian exports, such as diamonds, seafood and vodka. The European Union, the United Kingdom and other countries have also placed restrictions on certain oil, energy and luxury goods imports from Russia.
These sanctions, as well as other economic consequences related to the invasion, such as additional sanctions, boycotts, changes in consumer or purchaser preferences, or cyberattacks on governments, companies or individuals, may further decrease the value and liquidity of certain Russian securities as well as securities of issuers in other countries that are subject to or otherwise adversely affected by economic sanctions related to Russia’s invasion of Ukraine, including Russian counter measures. To the extent a Fund has exposure to Russian investments or investments in countries affected by the invasion or the sanctions, the Fund’s ability to price, buy, sell, receive or deliver, or receive dividends and interest payments on such investments may be impaired. In certain circumstances, such as when there is no market for a security or other means of valuing or disposing of a security, a Fund may determine to value the affected security at zero. In addition, any exposure a Fund may have to counterparties in Russia or in countries affected by the invasion could negatively affect the Fund’s portfolio. The extent and duration of Russia’s military actions and the repercussions of such actions are impossible to predict, but could result in continued significant market disruptions, including in the oil and natural gas markets, and may negatively affect global supply chains, inflation and global growth. Further, an escalation of the military conflict beyond Ukraine’s borders could result in significant, long-lasting damage to the economies of Eastern and Western Europe as well as the global economy. These and any related events could significantly and adversely affect a Fund’s performance and the value of an investment in the Fund, even in the absence of direct exposure to Russian issuers or issuers in other countries affected by the invasion.
* * * * * *
| 108 | WisdomTree Trust |
Notes to Financial Statements (concluded)
Financial markets around the world may experience extreme volatility, depressed valuations, decreased liquidity and heightened uncertainty and turmoil resulting from major cybersecurity events, geopolitical events (including wars, such as Russia’s invasion of Ukraine, terror attacks, and disruptions to foreign economic and trade relationships), public health emergencies, such as the COVID-19 pandemic, measures to address budget deficits, downgrading of sovereign debt, and public sentiment, among other events. Resulting market volatility, dramatic changes to interest rates, and otherwise unfavorable economic conditions may negatively impact Fund performance or impair a Fund’s ability to achieve its investment objective.
In March 2023, the financial distress of certain financial institutions raised economic concerns over disruption in the U.S. banking system and regarding the solvency of certain financial services firms. There can be no certainty that the actions taken by the U.S. government to strengthen public confidence in the U.S. banking system will be effective in mitigating the effects of financial institution failures on the economy and restoring public confidence in the U.S. banking system.
In October 2023, Hamas terrorists infiltrated Israel’s southern border from the Gaza Strip and conducted a series of attacks on civilian and military targets. Hamas also launched extensive rocket attacks on the Israeli population and industrial centers located along Israel’s border with the Gaza Strip and in other areas within the State of Israel. Following the attack, Israel’s security cabinet declared war against Hamas, and a military campaign was initiated. These events may result in significant market disruptions and may adversely affect regional and global economies.
* * * * * *
Raising the ceiling on U.S. government debt has become increasingly politicized. Any failure to increase the total amount that the U.S. government is authorized to borrow could lead to a default on U.S. government obligations, with unpredictable consequences for economies and markets in the U.S. and elsewhere. On August 1, 2023, Fitch Ratings, Inc. downgraded its U.S. debt rating from the highest AAA rating to AA+, citing “a high and growing general government debt burden, and the erosion of governance relative to ‘AA’ and ‘AAA’ rated peers over the last two decades that has manifested in repeated debt limit standoffs and last-minute resolutions”. The impacts, if any, of the downgrade on financial markets are unknown at this time. The downgrade has potential market impacts, including but not limited to, steep stock market declines and rising bond yields.
| WisdomTree Trust | 109 |
Report of Independent Registered Public Accounting Firm
To the Shareholders of WisdomTree China ex-State-Owned Enterprises Fund, WisdomTree Emerging Markets ex-State-Owned Enterprises Fund, WisdomTree Emerging Markets High Dividend Fund, WisdomTree Emerging Markets Multifactor Fund, WisdomTree Emerging Markets Quality Dividend Growth Fund, WisdomTree Emerging Markets SmallCap Dividend Fund, WisdomTree Global ex-U.S. Quality Dividend Growth Fund, WisdomTree Global High Dividend Fund, WisdomTree India Earnings Fund and WisdomTree New Economy Real Estate Fund, and the Board of Trustees of WisdomTree Trust
Opinion on the Financial Statements
We have audited the accompanying statements of assets and liabilities (consolidated as it relates to WisdomTree India Earnings Fund) of WisdomTree China ex-State-Owned Enterprises Fund, WisdomTree Emerging Markets ex-State-Owned Enterprises Fund, WisdomTree Emerging Markets High Dividend Fund, WisdomTree Emerging Markets Multifactor Fund, WisdomTree Emerging Markets Quality Dividend Growth Fund, WisdomTree Emerging Markets SmallCap Dividend Fund, WisdomTree Global ex-U.S. Quality Dividend Growth Fund, WisdomTree Global High Dividend Fund, WisdomTree India Earnings Fund and WisdomTree New Economy Real Estate Fund (collectively referred to as the “Funds”), (ten of the funds constituting WisdomTree Trust (the “Trust”)), including the schedules of investments (consolidated as it relates to WisdomTree India Earnings Fund), as of March 31, 2024, and the related statements of operations (consolidated as it relates to WisdomTree India Earnings Fund) for the year then ended, the statements of changes in net assets (consolidated as it relates to WisdomTree India Earnings Fund) for each of the two years in the period then ended, the financial highlights (consolidated as it relates to WisdomTree India Earnings Fund) for each of the five years in the period then ended and the related notes (collectively referred to as the “financial statements”). In our opinion, the financial statements present fairly, in all material respects, the financial position (consolidated as it relates to WisdomTree India Earnings Fund) of each of the Funds (ten of the funds constituting WisdomTree Trust) at March 31, 2024, the results of their operations (consolidated as it relates to WisdomTree India Earnings Fund) for the year then ended, the changes in their net assets (consolidated as it relates to WisdomTree India Earnings Fund) for each of the two years in the period then ended and their financial highlights (consolidated as it relates to WisdomTree India Earnings Fund) for each of the five years in the period then ended, in conformity with U.S. generally accepted accounting principles.
Basis for Opinion
These financial statements are the responsibility of the Trust’s management. Our responsibility is to express an opinion on each of the Funds’ financial statements based on our audits. We are a public accounting firm registered with the Public Company Accounting Oversight Board (United States) (“PCAOB”) and are required to be independent with respect to the Trust in accordance with the U.S. federal securities laws and the applicable rules and regulations of the Securities and Exchange Commission and the PCAOB.
We conducted our audits in accordance with the standards of the PCAOB. Those standards require that we plan and perform the audit to obtain reasonable assurance about whether the financial statements are free of material misstatement, whether due to error or fraud. The Trust is not required to have, nor were we engaged to perform, an audit of the Trust’s internal control over financial reporting. As part of our audits, we are required to obtain an understanding of internal control over financial reporting, but not for the purpose of expressing an opinion on the effectiveness of the Trust’s internal control over financial reporting. Accordingly, we express no such opinion.
Our audits included performing procedures to assess the risks of material misstatement of the financial statements, whether due to error or fraud, and performing procedures that respond to those risks. Such procedures included examining, on a test basis, evidence regarding the amounts and disclosures in the financial statements. Our procedures included confirmation of securities owned as of March 31, 2024, by correspondence with the custodian, brokers and others; when replies were not received from brokers, we performed other auditing procedures. Our audits also included evaluating the accounting principles used and significant estimates made by management, as well as evaluating the overall presentation of the financial statements. We believe that our audits provide a reasonable basis for our opinion.

We have served as the auditor of one or more WisdomTree investment companies since 2006.
New York, New York
May 30, 2024
| 110 | WisdomTree Trust |
Liquidity Risk Management Program (unaudited)
The Funds adopted a liquidity risk management program (the “Program”) pursuant to the requirements of Rule 22e-4 (the “Rule”) under the Investment Company Act of 1940, as amended. The Rule requires registered open-end funds, including exchange-traded funds such as the Funds, to establish liquidity risk management programs in order to effectively manage fund liquidity and shareholder redemptions. The Rule is designed to mitigate the risk that a Fund could not meet redemption requests without significantly diluting the interest of remaining investors. The Board has appointed WisdomTree Asset Management, Inc., the investment advisor to the Funds, as the Program Administrator for each Fund’s Program.
The Rule requires the Funds to assess, manage and review their liquidity risk at least annually considering applicable factors such as investment strategy and liquidity during normal and foreseeable stressed conditions, including whether the strategy is appropriate for an open-ended fund and whether the Fund has a relatively concentrated portfolio or large positions in particular issuers. The Funds must also assess their use of borrowings and derivatives, short-term and long-term cash flow projections in normal and stressed conditions, holdings of cash and cash equivalents, and borrowing arrangements and other funding sources.
The Rule also requires the Funds to classify their investments into one of four liquidity categories: highly liquid, moderately liquid, less liquid or illiquid based on the number of days a Fund expects it would take to liquidate the investment, and to review these classifications at least monthly or more often under certain conditions. The periods range from three or fewer business days for a highly liquid investment to greater than seven calendar days for settlement of a less liquid investment. Illiquid investments are those a Fund does not expect to be able to sell or dispose of within seven calendar days without significantly changing the market value of the investment. A Fund is prohibited from acquiring an investment if, after the acquisition, its holdings of illiquid assets will exceed 15% of its net assets. In addition, if a Fund permits redemptions in-kind, the Rule requires the Fund to establish redemption in-kind policies and procedures governing how and when it will engage in such redemptions.
Pursuant to the Rule’s requirements, the Program has been reviewed and approved by the Fund’s Board. Furthermore, the Board has received a written report prepared by the Program Administrator that addresses the operation of the Program, assesses its adequacy and effectiveness and describes any material changes made to the Program. The Program Administrator has monitored the Fund’s liquidity risk and the liquidity classifications of the securities held by the Fund and has determined that the Program is operating effectively.
During the period from January 1, 2023 to December 31, 2023, there were no material changes to the Program and no material liquidity events that impacted the Funds. During the period, the Funds held sufficient highly liquid assets to meet fund redemptions.
Under normal expected foreseeable Fund redemption forecasts and foreseeable stressed Fund redemption forecasts, the Program Administrator believes that the Funds maintain sufficient highly liquid assets to meet Fund redemptions.
| WisdomTree Trust | 111 |
Trustees and Officers Information (unaudited)
Name | Position(s) Held with | Principal Occupation(s) | Number of Portfolios in Fund Complex Overseen by Trustee/ Officer+ | Other | ||||||
| Trustees Who Are Interested Persons of the Trust | ||||||||||
| Jonathan Steinberg (1964) | Trustee, 2005- present; President, 2005-present | Chief Executive Officer of WisdomTree and WisdomTree Asset Management since 2005; President of WisdomTree and WisdomTree Asset Management from 2012 to 2019. | 77 | Director, WisdomTree and WisdomTree Asset Management. | ||||||
| Trustees Who Are Not Interested Persons of the Trust | ||||||||||
| David G. Chrencik1 (1948) | Trustee, 2014-present | Chief Financial Officer of Sarus Indochina Select LP (a hedge fund) from 2012 to 2022. | 77 | None | ||||||
| Phillip Goff2 (1963) | Trustee, 2024-present | Private Investor from 2017 to present; Trustee of RBC Funds Trust from 2020 to 2024; Senior Vice President/ Corporate Controller and Funds Treasurer at TIAA from 2006 to 2017. | 77 | None | ||||||
| Joel Goldberg3,4 (1945) | Trustee, 2012-present | Attorney, Partner at Stroock & Stroock & Lavan LLP from 2010 to 2018; Attorney, Partner at Willkie Farr & Gallagher LLP from 2006 to 2010. | 77 | Director, Better Business Bureau (Metropolitan New York, Long Island and the Mid-Hudson Region). | ||||||
| Toni Massaro4 (1955) | Trustee, 2006-present | Regents Professor of Law Emerita since 2024; Executive Director of the Agnese Nelms Haury Program since 2021; Dean Emerita at the University of Arizona James E. Rogers College of Law (“Rogers College of Law”) from 2009 to 2024 (distinguished Emerita in July 2009); Dean of the Rogers College of Law from 1999 to 2009; Regents Professor since 2006; Milton O. Riepe Chair in Constitutional Law from 1997 to 2022; Professor at the Rogers College of Law from 1990 to 2024. | 77 | None | ||||||
| Melinda A. Raso Kirstein5 (1955) | Trustee, 2014-present | Retired since 2004; Vice President, Senior Portfolio Manager, Fixed Income Management, and Director of Tax Exempt Fund Management at Merrill Lynch Investment Management from 1982 to 2004. | 77 | Associate Alumnae of Douglass College, Chair of Investment Committee. | ||||||
| Victor Ugolyn (1947) | Trustee, 2006-present; Chairman of the Board, 2006-present | Private Investor from 2005 to present; President and Chief Executive Officer at William D. Witter, Inc. from 2005 to 2006; Chairman of MONY Securities Corporation, and Chairman, President and Chief Executive Officer at Enterprise Capital Management from 1999 to 2004. | 77 | None | ||||||
| 112 | WisdomTree Trust |
Trustees and Officers Information (unaudited) (concluded)
Name | Position(s) Held with | Principal Occupation(s) | Number of Portfolios in Fund Complex Overseen by Trustee/ Officer+ | Other | ||||||
| Officers of the Trust | ||||||||||
| Jonathan Steinberg (1964) | President, 2005- present; Trustee, 2005-present | Chief Executive Officer of WisdomTree and WisdomTree Asset Management since 2005; President of WisdomTree and WisdomTree Asset Management from 2012 to 2019. | 77 | See Interested Trustees Table Above. | ||||||
| David Castano* (1971) | Treasurer, 2013-present | Head of Fund Accounting & Administration at WisdomTree Asset Management since 2020; Director of Fund Accounting & Administration at WisdomTree Asset Management from 2011 to 2020. | 77 | None | ||||||
| Terry Jane Feld* (1960) | Chief Compliance Officer, 2012-present | Head of U.S. Compliance at WisdomTree Asset Management since 2022; Chief Compliance Officer at WisdomTree Asset Management since 2012. | 77 | None | ||||||
| Joanne Antico* (1975) | Chief Legal Officer and Secretary, 2021-present | General Counsel at WisdomTree Asset Management since 2021; Assistant General Counsel at WisdomTree Asset Management from 2016 to 2021; Executive Director and Assistant Secretary at Morgan Stanley Investment Management Inc. from 2005 to 2016. | 77 | None | ||||||
| Clint Martin* (1977) | Assistant Treasurer, 2015-present | Director of Fund Accounting & Administration at WisdomTree Asset Management since 2020; Fund Manager, Fund Accounting & Administration at WisdomTree Asset Management from 2012 to 2020. | 77 | None | ||||||
| Angela Borreggine* (1964) | Assistant Secretary, 2022-present | Assistant General Counsel at WisdomTree Asset Management since 2022; Vice President and Senior Counsel at Virtus Investment Partners from 2021 to 2022; Secretary and Chief Legal Officer at Allianz Global Investors family of funds from 2016 to 2021 and of The Korea Fund, Inc. from 2016 to 2020; Director, Senior Counsel at Allianz Global Investors from 2007 to 2021. | 77 | None | ||||||
| TJ Darnowski* (1984) | Assistant Secretary, 2021-present | Senior Investment Management Paralegal at WisdomTree Asset Management since 2021; Senior Legal Administrator at Ultimus Fund Solutions from 2019 to 2021; Assistant Vice President at State Street Bank & Trust Company from 2010 to 2019. | 77 | None | ||||||
| Sherry Scarvey* (1967) | Assistant Secretary, 2023-present | Senior Investment Management Paralegal at WisdomTree Asset Management since 2023; Senior Legal Analyst at Eagle Point Credit Management, LLC from 2021 to 2023; Senior Legal Analyst at Jennison & Associates LLC from 2019 to 2021; Senior Legal Specialist at Legg Mason & Co. LLC from 2005 to 2019. | 77 | None | ||||||
| + | As of March 31, 2024. |
| 1 | Chair of the Audit Committee. |
| 2 | Appointed to the Board on February 27, 2024. |
| 3 | Chair of the Contracts Review Committee. |
| 4 | Co-Chair of the Governance, Nominating and Compliance Committee. |
| 5 | Chair of the Investment Committee. |
| * | Elected by and serves at the pleasure of the Board. |
| WisdomTree Trust | 113 |
Supplemental Information (unaudited)
Federal Income Tax Information
The following Federal tax information related to the Funds’ fiscal year ended March 31, 2024, is provided for information purposes only and should not be used for reporting to federal or state revenue agencies. Federal tax information for the calendar year will be reported to you on Form 1099-DIV in January 2025.
Certain dividends paid by the Funds may be subject to a maximum tax rate of 15%, as provided by the Jobs and Growth Tax Relief Reconciliation Act of 2003. Of the distributions paid during the fiscal year ended March 31, 2024, the following represents the maximum amount of ordinary income distributions that may be considered qualified dividend income:
| Fund | Qualified Dividend Income | |||
China ex-State-Owned Enterprises Fund | $ | 5,333,945 | ||
Emerging Markets ex-State-Owned Enterprises Fund | 18,896,225 | |||
Emerging Markets High Dividend Fund | 76,610,983 | |||
Emerging Markets Multifactor Fund | 129,723 | |||
Emerging Markets Quality Dividend Growth Fund | 1,358,781 | |||
Emerging Markets SmallCap Dividend Fund | 70,394,626 | |||
Global ex-U.S. Quality Dividend Growth Fund | 9,871,692 | |||
Global High Dividend Fund | 4,059,692 | |||
India Earnings Fund (consolidated) | 22,212,993 | |||
New Economy Real Estate Fund | 144,557 | |||
The Funds intend to elect to pass through to shareholders the credit for taxes paid to foreign countries during the fiscal year ended March 31, 2024. The gross foreign source income and foreign taxes paid are as follows:
| Fund | Gross Foreign Income | Foreign Taxes Paid | ||||||
China ex-State-Owned Enterprises Fund | $ | 8,504,525 | $ | 532,965 | ||||
Emerging Markets ex-State-Owned Enterprises Fund | 40,640,988 | 10,509,919 | ||||||
Emerging Markets High Dividend Fund | 176,146,417 | 17,619,830 | ||||||
Emerging Markets Multifactor Fund | 198,317 | 65,003 | ||||||
Emerging Markets Quality Dividend Growth Fund | 3,060,736 | 627,954 | ||||||
Emerging Markets SmallCap Dividend Fund | 141,185,520 | 18,056,876 | ||||||
Global ex-U.S. Quality Dividend Growth Fund | 12,407,196 | 1,607,733 | ||||||
Global High Dividend Fund | — | — | ||||||
India Earnings Fund (consolidated) | 32,005,212 | 22,212,993 | ||||||
New Economy Real Estate Fund | — | — | ||||||
The following represents the percentage of dividends paid during the fiscal year ended March 31, 2024, that qualify for the 70% dividends received deduction for corporate shareholders:
| Fund | Dividends-Received Deduction | |||
China ex-State-Owned Enterprises Fund | 0.82 | % | ||
Emerging Markets ex-State-Owned Enterprises Fund | 0.23 | % | ||
Emerging Markets High Dividend Fund | — | |||
Emerging Markets Multifactor Fund | 0.06 | % | ||
Emerging Markets Quality Dividend Growth Fund | — | |||
Emerging Markets SmallCap Dividend Fund | — | |||
Global ex-U.S. Quality Dividend Growth Fund | 0.09 | % | ||
Global High Dividend Fund | 48.33 | % | ||
India Earnings Fund (consolidated) | — | |||
New Economy Real Estate Fund | 0.13 | % | ||
| 114 | WisdomTree Trust |
General Information (unaudited)
Proxy Voting Policies, Procedures and Record
A complete copy of the Proxy Voting Policy may be obtained upon request, at no charge, by calling 1-866-909-WISE (9473) or writing to: WisdomTree Trust, c/o Foreside Fund Services, LLC, Three Canal Plaza Suite 100, Portland, ME, 04101.
The Trust is required to disclose annually the Funds’ complete proxy voting record on Form N-PX covering the most recent 12-month period ended June 30 and to file Form N-PX with the SEC no later than August 31 of each year. The current Form N-PX for the Funds is available at no charge upon request by calling 1-866-909-WISE (9473) or through the SEC’s website at www.sec.gov.
Shareholder Reports and Quarterly Portfolio Disclosure
The Funds file their complete schedule of portfolio holdings with the SEC for their first and third fiscal quarters as an exhibit to their reports on Form N-PORT. Copies of the filings are available, without charge, on the SEC’s website at www.sec.gov and are also available by calling the Trust at 1-866-909-WISE (9473). Copies of the filings may also be obtained, after paying a duplicating fee, by electronic request at the following E-mail address: publicinfo@sec.gov.
Information about each Fund’s portfolio holdings is available daily, without charge, at www.wisdomtree.com/investments.
The Statement of Additional Information (“SAI”) has additional information about the Funds’ Trustees and Officers and is available without charge upon request. Contact your financial representative for a free prospectus or SAI.
Frequency Distribution of Discounts & Premiums
Information about differences between the per share net asset value of each Fund and the market trading price of shares of each Fund are available, without charge, at www.wisdomtree.com/investments.
| WisdomTree Trust | 115 |
The WisdomTree Funds are exchange traded funds (“ETFs”) registered with the United States Securities and Exchange Commission as separate series (“Funds”) of WisdomTree Trust (“Trust”). WisdomTree Asset Management, Inc., a wholly owned subsidiary of WisdomTree, Inc., serves as the investment adviser to the Trust. None of the WisdomTree entities are affiliated with Foreside Fund Services, LLC, the Funds’ distributor. WisdomTree, Inc., its affiliates and their independent providers are not liable for any informational errors, incompleteness, delays, or for any actions taken in reliance on information contained herein.
There are risks associated with investing including possible loss of principal. Foreign investing involves special risks, such as risk of loss from currency fluctuation or political or economic uncertainty. Investments in real estate involve additional special risks, such as credit risk, interest rate fluctuations and the effect of varied economic conditions. Funds that focus their investments in one country or region may be significantly impacted by events and developments associated with the region which can adversely affect performance. Funds focusing on a single sector and/or smaller companies generally experience greater price volatility. Investments in emerging, offshore or frontier markets are generally less liquid and less efficient than investments in developed markets and are subject to additional risks, such as risks of adverse governmental regulation and intervention or political developments. Investments in currency involve additional special risks, such as credit risk and interest rate fluctuations. Derivative investments can be volatile and these investments may be less liquid than other securities, and more sensitive to the effect of varied economic conditions. As these Funds can have a high concentration in some issuers the Funds can be adversely impacted by changes affecting such issuers. Dividends are not guaranteed, and a company currently paying dividends may cease paying dividends at any time. Due to the investment strategy of certain Funds they may make higher capital gain distributions than other ETFs. Please read the Fund’s prospectus for specific details regarding the Fund’s risk profile.
Indexes are unmanaged and you cannot invest directly in an index.
Transactions in Fund shares will result in brokerage commissions and will generate tax consequences. Shares may be sold through brokerage accounts, but may be redeemed from the Funds only by Authorized Participants in large creation unit sizes of shares.
This report is intended for the Funds’ shareholders. It may not be distributed to prospective investors unless it is preceded or accompanied by the current prospectus.
Scan the QR code with your
smartphone camera to

learn more at
WisdomTree.com/investments
WisdomTree Fund shares are distributed by Foreside Fund Services, LLC, in the U.S.
WGM-517669
Item 2. Code of Ethics.
| (a) | The Registrant, as of the end of the period covered by the Shareholder Reports, has adopted a code of ethics (the “Code”) that applies to the Registrant’s principal executive officer, principal financial officer, principal accounting officer or controller, or persons performing similar functions, regardless of whether these individuals are employed by the Registrant or a third party. |
| (b) | There have been no amendments, during the period covered by the Shareholder Reports, to a provision of the Code, and that relates to any element of the Code description. |
| (c) | The Registrant has not granted any waivers, including any implicit waiver, from a provision of the Code that relates to one or more of the items set forth in paragraph (b) of this item’s instructions. |
| (d) | The Code is attached hereto as exhibit 13(a)(1). |
Item 3. Audit Committee Financial Expert.
The Registrant’s Board of Trustees (the “Board”) has determined that the Registrant has at least one audit committee financial expert, as that term is defined under Item 3(b) and 3(c), serving on its Audit Committee. The Board has designated David Chrencik, the Chair of the Audit Committee, as the audit committee financial expert. Mr. Chrencik is “independent” as that term is defined under Item 3(a)(2).
Item 4. Principal Accountant Fees and Services.
Audit Fees
| (a) | The aggregate fees billed for each of the last two fiscal years for professional services rendered by the principal accountant for the audit of the Registrant’s annual financial statements or services that are normally provided by the accountant in connection with statutory and regulatory filings or engagements for those fiscal years were $1,066,503 for the fiscal year ended March 31, 2024 and $1,137,838 for the fiscal year ended March 31, 2023. |
Audit-Related Fees
| (b) | The aggregate fees billed for each of the last two fiscal years for assurance and related services by the principal accountant that are reasonably related to the performance of the audit of the Registrant’s financial statements and are not reported under paragraph (a) of this Item were $0 for the fiscal year ended March 31, 2024 and $0 for the fiscal year ended March 31, 2023. |
Tax Fees
| (c) | The aggregate fees billed for each of the last two fiscal years for professional services rendered by the principal accountant for service fees for analysis of potential Passive Foreign Investment Companies, tax compliance, tax advice, and tax planning were $607,479 for the fiscal year ended March 31, 2024 and $582,220 for the fiscal year ended March 31, 2023. |
All Other Fees
| (d) | The aggregate fees billed for each of the last two fiscal years for products and services provided by the principal accountant, other than the services reported in paragraphs (a) through (c) of this Item were $0 for the fiscal year ended March 31, 2024 and $0 for the fiscal year ended March 31, 2023. |
| (e)(1) | Disclose the Audit Committee’s pre-approval policies and procedures described in paragraph (c)(7) of Rule 2-01 of Regulation S-X. |
The Registrant’s Audit Committee Charter provides that the Audit Committee shall have the following duties and powers: (a) to select and approve in advance, the retention of independent accountants to annually audit and provide their opinion on the Registrant’s financial statements; (b) to approve, prior to appointment, the engagement of the principal accountant to provide other audit services to the Registrant or to provide non-audit services to the Registrant, its investment adviser, or any entity controlling, controlled by, or under common control with its investment adviser (“adviser/affiliate”) that provides ongoing services to the Registrant, if the engagement by the investment adviser or adviser affiliate relates directly to the operations and financial reporting of the Registrant; (c) to review and approve the fees proposed to be charged to the Registrant by the principal accountant for each audit and non-audit service; and (d) to consider whether the non-audit services provided by the Registrant’s principal accountant to the Registrant’s investment adviser, or adviser/affiliate that provides ongoing services to the Registrant, which services were not pre-approved by the Audit Committee, are compatible with maintaining the principal accountant’s independence.
| (e)(2) | The Registrant’s Audit Committee has approved 100% of services described in each of Items 4(b) through (d) pursuant to paragraph (c)(7)(i)(C) of Rule 2-01 of Regulation S-X. |
| (f) | The percentage of hours expended on the principal accountant’s engagement to audit the Registrant’s financial statements for the most recent fiscal year that were attributed to work performed by persons other than the principal accountant’s full-time, permanent employees was 0%. |
| (g) | The aggregate non-audit fees billed by the Registrant’s principal accountant for services rendered to the Registrant, and rendered to the Registrant’s investment adviser (not including any sub-adviser whose role is primarily portfolio management and is subcontracted with or overseen by another investment adviser), and any entity controlling, controlled by, or under common control with the adviser that provides ongoing services to the Registrant for each of the last two fiscal years of the Registrant was $607,479 for the fiscal year ended March 31, 2024 and $582,220 for the fiscal year ended March 31, 2023. |
| (h) | Not applicable. |
| (i) | Not applicable. |
| (j) | Not applicable. |
Item 5. Audit Committee of Listed Registrants.
The Registrant is an issuer as defined in Rule 10A-3 under the Securities Exchange Act of 1934, as amended (the “Exchange Act”), and has a separately designated standing Audit Committee established in accordance with Section 3(a)(58)A of the Exchange Act. The Registrant’s Audit Committee members are David Chrencik, Philip Goff, Melinda Raso Kirstein, and Victor Ugolyn.
Item 6. Investments.
| (a) | Schedule of Investments in securities of unaffiliated issuers as of the close of the reporting period (i.e., March 31, 2024) is included as part of the Shareholder Reports filed under Item 1 of this form. |
| (b) | Not applicable. |
Item 7. Disclosure of Proxy Voting Policies and Procedures for Closed-End Management Investment Companies.
Not applicable.
Item 8. Portfolio Managers of Closed-End Management Investment Companies.
Not applicable.
Item 9. Purchases of Equity Securities by Closed-End Management Investment Company and Affiliated Purchasers.
Not applicable.
Item 10. Submission of Matters to a Vote of Security Holders.
There have been no material changes to the procedures by which the shareholders may recommend nominees to the Registrant’s Board, where those changes were implemented after the Registrant last provided disclosure in response to the requirements of Item 407(c)(2)(iv) of Regulation S-K (17 CFR 229.407) (as required by Item 22(b)(15) of Schedule 14A (17 CFR 240.14a-101)), or this Item.
Item 11. Controls and Procedures.
| (a) | The Registrant’s principal executive and principal financial officers, or persons performing similar functions, have concluded that the Registrant’s disclosure controls and procedures (as defined in Rule 30a-3(c) under the Investment Company Act of 1940, as amended (the “1940 Act”) (17 CFR 270.30a-3(c))) are effective, as of a date within 90 days of the filing date of the report that includes the disclosure required by this paragraph, based on their evaluation of these controls and procedures required by Rule 30a-3(b) under the 1940 Act (17 CFR 270.30a-3(b)) and Rules 13a-15(b) or 15d-15(b) under the Securities Exchange Act of 1934, as amended (17 CFR 240.13a-15(b) or 240.15d-15(b)). |
| (b) | There were no changes in the Registrant’s internal control over financial reporting (as defined in Rule 30a-3(d) under the 1940 Act (17 CFR 270.30a-3(d)) that occurred during the period covered by the Shareholder Reports that has materially affected, or is reasonably likely to materially affect, the Registrant’s internal control over financial reporting. |
Item 12. Disclosure of Securities Lending Activities for Closed-End Management Investment Companies.
Not applicable.
Item 13. Exhibits.
SIGNATURES
Pursuant to the requirements of the Securities Exchange Act of 1934 and the Investment Company Act of 1940, the Registrant has duly caused this report to be signed on its behalf by the undersigned, thereunto duly authorized.
| (Registrant) | WisdomTree Trust | |||
| By (Signature and Title) | /s/ Jonathan L. Steinberg | |||
| Jonathan L. Steinberg, President | ||||
| (principal executive officer) | ||||
Date: June 7, 2024
Pursuant to the requirements of the Securities Exchange Act of 1934 and the Investment Company Act of 1940, this report has been signed below by the following persons on behalf of the Registrant and in the capacities and on the dates indicated.
| By (Signature and Title) | /s/ /Jonathan L. Steinberg | |||
| Jonathan L. Steinberg, President | ||||
| (principal executive officer) | ||||
| Date: June 7, 2024 | ||||
| By (Signature and Title) | /s/ David Castano | |||
| David Castano, Treasurer | ||||
| (principal financial officer) | ||||
Date: June 7, 2024