 Bank of America/Merrill Lynch Fall Investment Conference September 14, 2010 Exhibit 99.1 |
 2 Safe Harbor Statement This presentation contains certain statements that may be deemed “forward-looking statements” within the meaning of the Private Securities Litigation Reform Act of 1995. All statements that address activities, events or developments that the Company intends, expects, plans, projects, believes or anticipates will or may occur in the future are forward-looking statements. Examples of forward-looking statements include, but are not limited to, statements the Company makes regarding general economic conditions, spending by municipalities, the outlook for the residential and non-residential construction markets, improvements related to capacity utilization, the recovery, if any, of our end markets, and the potential effect of the refinancing on the Company’s operations, and the impact of these factors on our businesses. Forward-looking statements are based on certain assumptions and assessments made by the Company in light of its experience and perception of historical trends, current conditions and expected future developments. Actual results and the timing of events may differ materially from those contemplated by the forward-looking statements due to a number of factors, including regional, national or global political, economic, business, competitive, market and regulatory conditions and the following: • the demand level of manufacturing and construction activity; • the Company’s ability to service its debt obligations; and • the other factors that are described in the section entitled “RISK FACTORS” in Item 1A of our most recently filed Annual Report on Form 10-K. Undue reliance should not be placed on any forward-looking statements. The Company does not have any intention or obligation to update forward-looking statements, except as required by law. Safe Harbor Statement |
 3 Non-GAAP Financial Measures The Company presents adjusted income (loss) from operations, adjusted EBITDA, adjusted net loss, adjusted net loss per share, free cash flow and net debt as non-GAAP measures. Adjusted income (loss) from operations represents income (loss) from operations excluding impairment and restructuring. Adjusted EBITDA represents income (loss) from operations excluding impairment, restructuring, depreciation and amortization. The Company presents adjusted EBITDA because it is a measure of performance management believes is frequently used by securities analysts, investors and interested parties in the evaluation of financial performance. Adjusted net loss and adjusted net loss per share exclude impairment, restructuring, loss on early extinguishment of debt, certain costs to settle interest rate swap contracts, the tax on the repatriation of earnings from Canada and the income tax effects of the other previously mentioned items. These items are excluded because they are not considered indicative of recurring operations. Free cash flow represents cash flows from operating activities, less certain expenditures related to the early extinguishment of notes, less capital expenditures, and is presented as a measurement of cash flow because it is commonly used by the investment community. Net debt represents total debt less cash and cash equivalents. Net debt is commonly used by the investment community as a measure of indebtedness. Adjusted income (loss) from operations, adjusted EBITDA, adjusted net loss, adjusted net loss per share, free cash flow and net debt have limitations as analytical tools, and investors should not consider any of these non- GAAP measures in isolation or as a substitute for analysis of the Company's results as reported under accounting principles generally accepted in the United States ("GAAP"). A reconciliation of non-GAAP to GAAP results is included as an attachment to this presentation and has been posted online at www.muellerwaterproducts.com. Non-GAAP Financial Measures |
 4 Leading North American provider of water infrastructure and flow control products in attractive and growing water industry One of the largest installed bases in the U.S. Investment Highlights Strong brands Leading specification positions in 99 of 100 largest U.S. metropolitan areas Low-cost manufacturing processes |
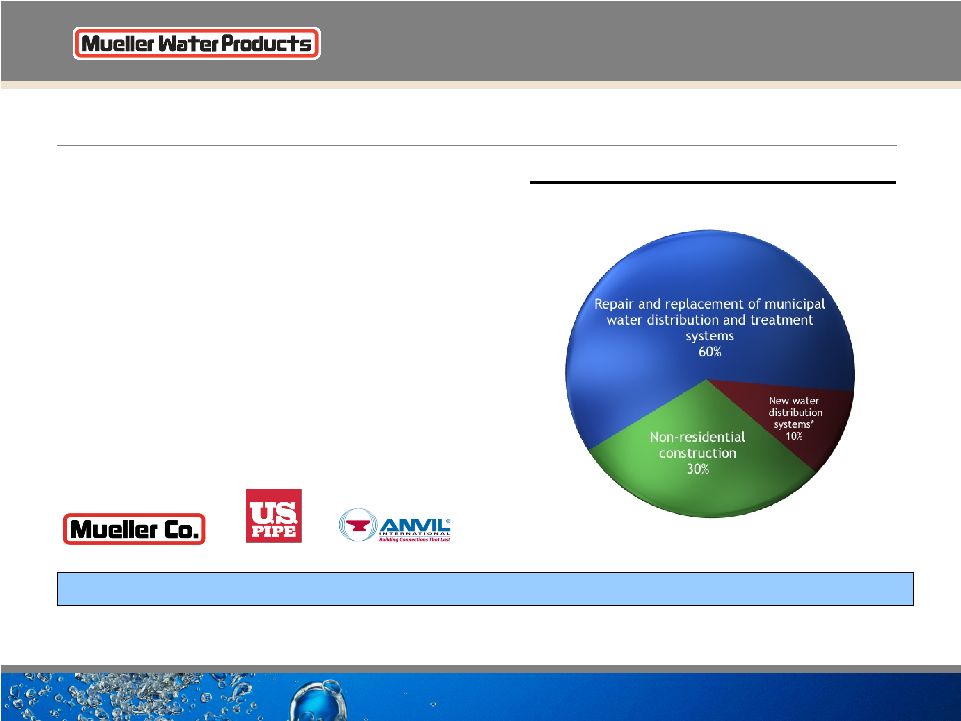 5 Our Business • $1.4B LTM net sales (as of June 30, 2010) • Portfolio includes: • Fire hydrants • Valves • Pipe fittings • Ductile iron pipe • Water meters • Specified in 99 of the largest 100 U.S. metropolitan areas • Approximately 75% of FY2009 net sales from products with #1 or #2 position (1) Based on management estimates * New water distribution systems driven primarily by community development The largest publicly traded water infrastructure company in the United States FY2009 Primary End Markets (1) |
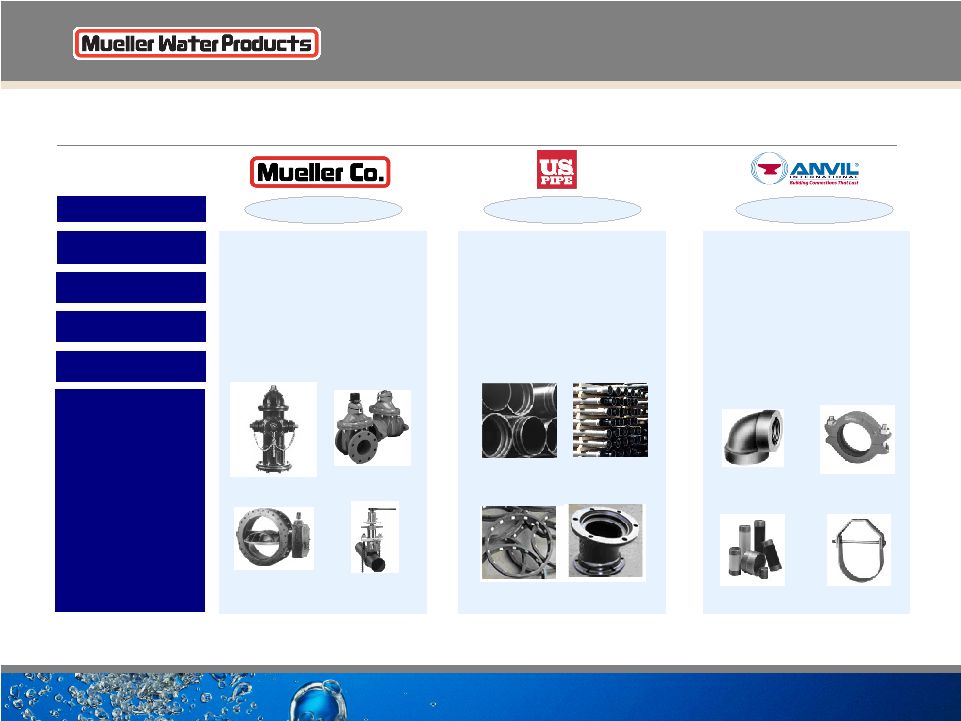 6 Broad Product Portfolio $607 $80 $50 $130 SEGMENT NET SALES PRODUCT PORTFOLIO ADJUSTED OPERATING INCOME (LOSS) (1) $388 ($49) $19 ($31) $370 $18 $16 $34 Iron Gate Valves Butterfly, Ball and Plug Valves Fittings & Couplings Cast Iron Fittings Hangers & Supports Gas Products / Tapping Machines Pipe Nipples Hydrants DEPRECIATION AND AMORTIZATION (2) Est. 1857 Est. 1899 Est. 1999 (1850) HISTORICAL ROOTS ADJUSTED EBITDA (1) (2) Note: All statistics are actuals for LTM ended June 30, 2010 (1) Segment operating income excludes corporate expenses of $33mm. Mueller Co. excludes $1mm of restructuring. U.S. Pipe excludes $12mm of restructuring. Anvil excludes $1mm of restructuring. (2) Segment depreciation and amortization excludes corporate depreciation of $1mm. ($ in millions) Restrained Joint Pipe Ductile Iron Pipe Joint Restraint Joint Fitting |
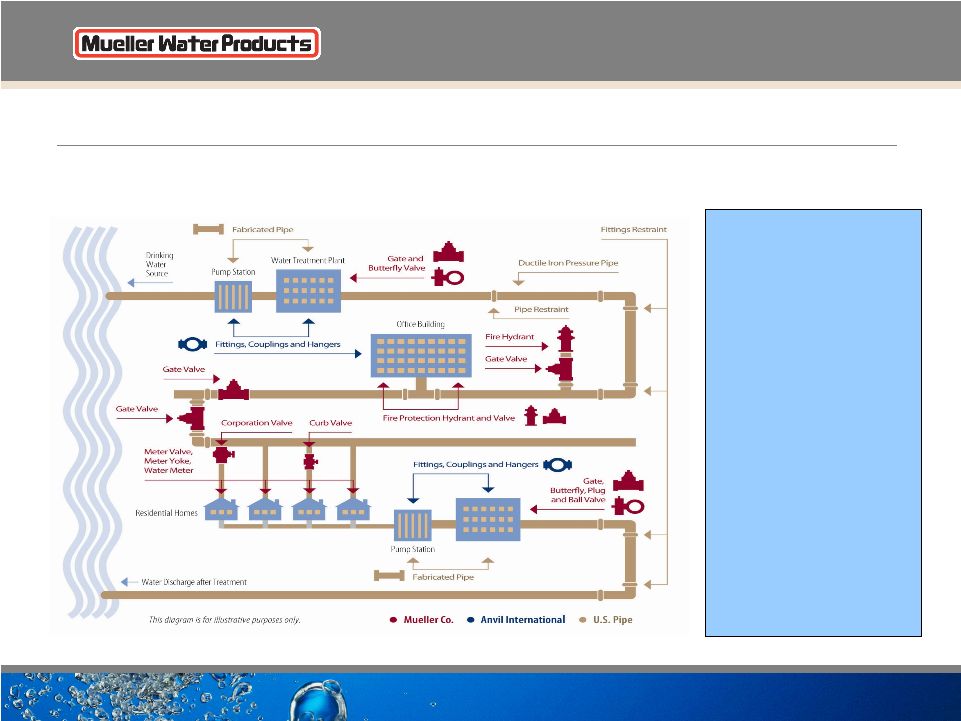 7 Complete Water Transmission Solutions As water flows from its source to treatment facilities to homes and businesses across North America, it flows through or is controlled by the type of products we manufacture, making Mueller Water Products an integral part of the water infrastructure system. |
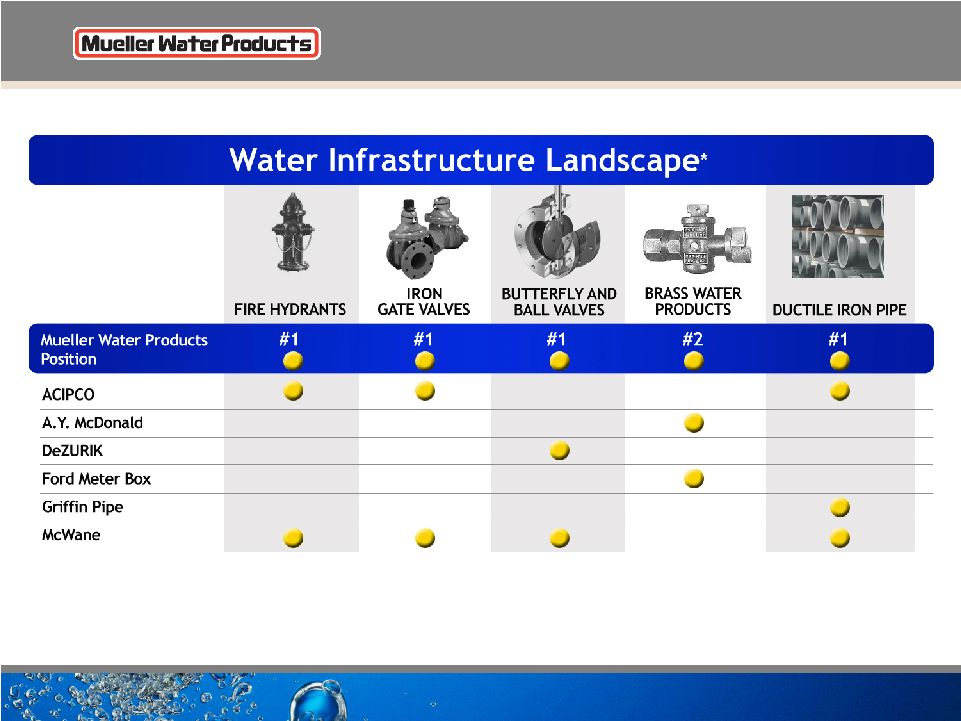 8 * Company estimates based on internal analysis and information from trade associations and our distributor networks, where available. |
 9 Strategy And Objectives • Maintain leadership positions with customers and end users • Continue to enhance operational and organizational excellence • Broaden breadth and depth of products and services • Expand internationally Capitalize on the large, attractive and growing water infrastructure markets worldwide |
 Our End Markets |
 11 Primary End Markets Non-Residential Construction $430mm 30% Repair and Replacement (Public) $850mm 85% Residential Construction* (Private) $150mm 15% FY2009 Net Sales: $1.4B Water Infrastructure $1B 70% Source: Management estimates * Residential is driven primarily by community development |
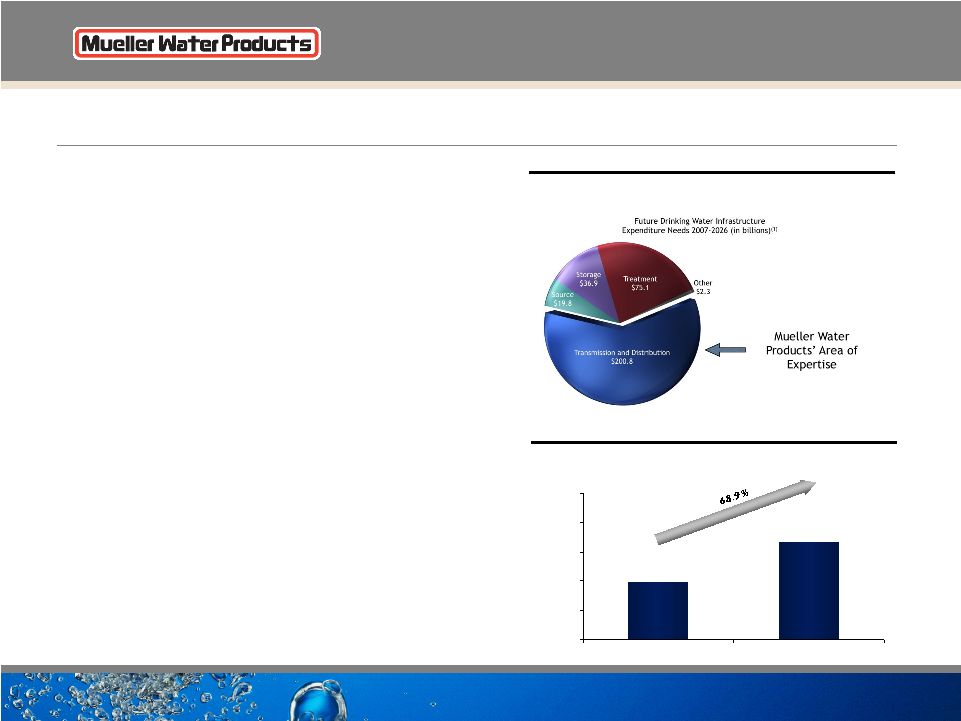 12 The Market Opportunity Is Significant And Growing Repair and Replacement Market • Aging water pipes need to be rehabilitated / replaced • Valves and hydrants typically replaced at same time as pipes • 15% - 30% of treated potable water lost in leaky pipes (2) Funding and Spending • 90% funded at local level (3) • 29% of water systems charge less than cost (4) Water Rates • Average annual rate increase between 1996 and 2006 of 4.1% (5) • Average water rates increased 14% from 2008 to 2009 (6) Source: (1) EPA 2007 Drinking Water Needs Survey and Assessment (2) Global Water Intelligence Water Technology Markets 2010 (3) EPA Clean Water and Drinking Water Infrastructure Gap Analysis (4) Government Accountability Office 2004 report on water infrastructure (5) American Water Works Association 2006 Water and Wastewater Rate Survey (6) Global Water Intelligence 20-YR Need for Water Infrastructure = $335bn $198 $335 $0 $100 $200 $300 $400 $500 As of January 1999 As of January 2007 Comparison of 20-Year U.S. Need for Water Infrastructure Investments ($ in billions) (1) Future Drinking Water Infrastructure Expenditure Needs ($ in billions) (1) |
 13 Aging Water Infrastructure • An average of 700 water mains break daily in U.S. (about one every two minutes) (1) • Los Angeles typically has up to five breaks daily; 225 major breaks each year (2) • Baltimore water main break in March 2010 left 100,000 people without water (3) (1) Saving U.S. Water and sewer systems would be costly , The New York Times, March 15, 2010 (2) More water main breaks become business as usual, Daily News, October 20, 2009 (3) Thousands in Baltimore County still without water, The Baltimore Sun, March 8, 2010 June 2010 sinkhole 20’ x 8’ and 10’ to 15’ deep caused by leak in 6” pipe installed “probably in 1920s.” Atlanta Journal-Constitution |
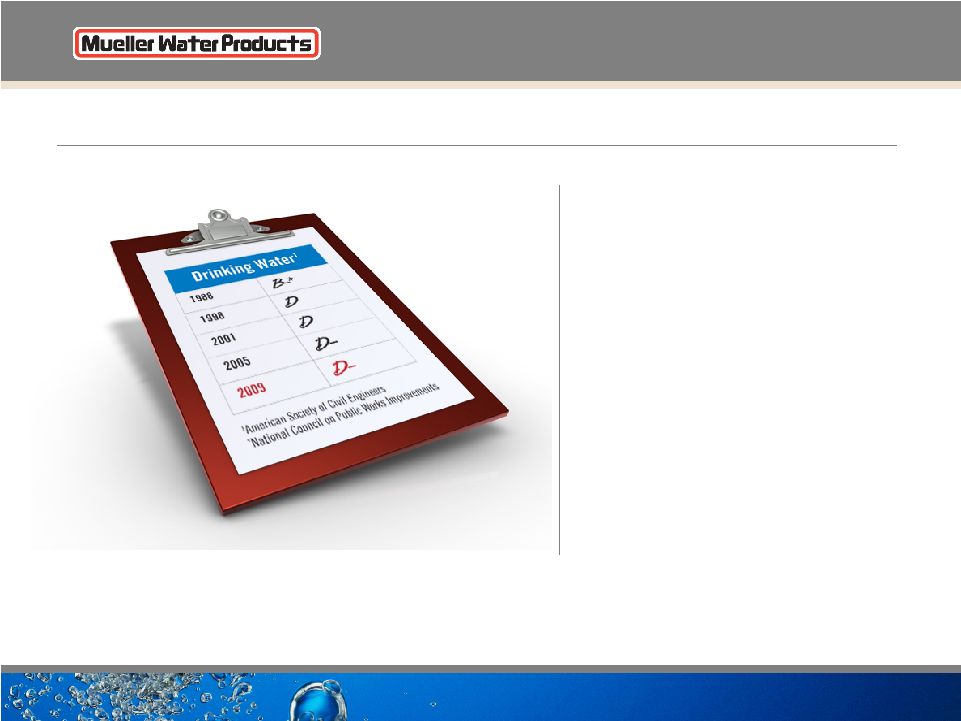 14 Aging Water Infrastructure ��Crumbling infrastructure has a direct impact on our personal and economic health, and the nation’s infrastructure crisis is endangering our future prosperity.” D. Wayne Klotz, P.E., F.ASCE President American Society of Civil Engineers |
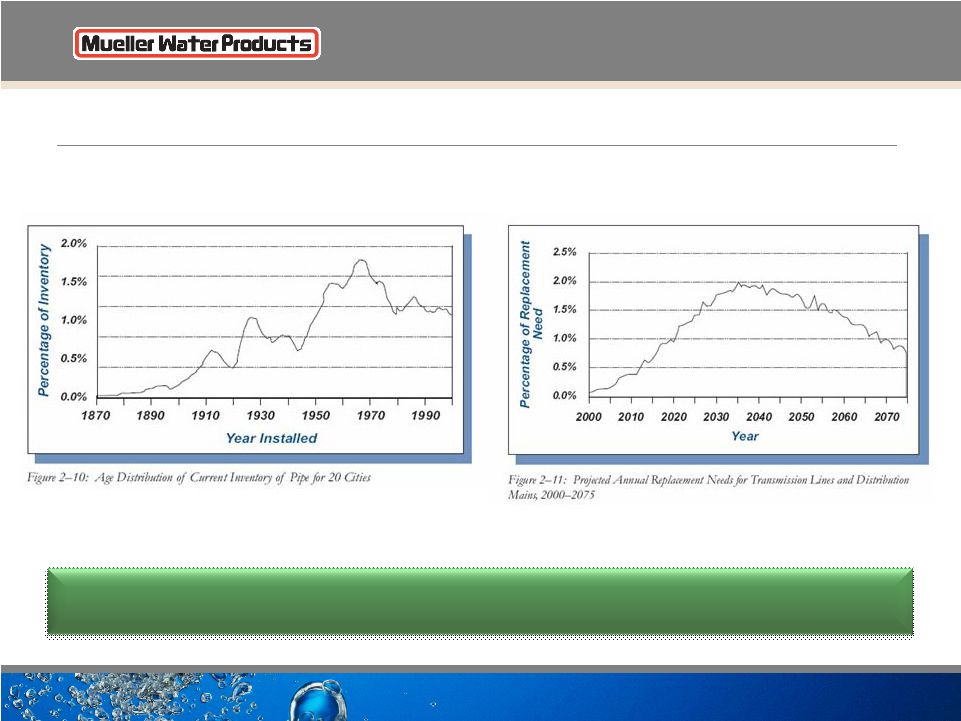 15 Aging Water Infrastructure Average life of 100 year old and 75 year old pipe is converging, contributing to accelerating need for pipe replacement. (1) The EPA Clean Water and Drinking Water Infrastructure Gap Analysis 2002 |
 16 Increasing Federal Awareness of Funding Needs • At least 30 cities under consent decrees — Atlanta $4.0B — Washington, D.C. $2.8B — Baltimore City and county $1.7B — Cincinnati $1.5B • 1974/1996 Safe Drinking Water Act • 1998 Disinfectants and Disinfection Byproducts Rule • 2011 proposed federal budget — Currently calls for $1.3B for drinking water SRF Stronger EPA regulations should lead to increased investment In 2008, 40 percent of the nation’s community water systems violated the Safe Drinking Water Act at least once, according to an analysis of E.P.A. data. The New York Times (Sept. 2009) |
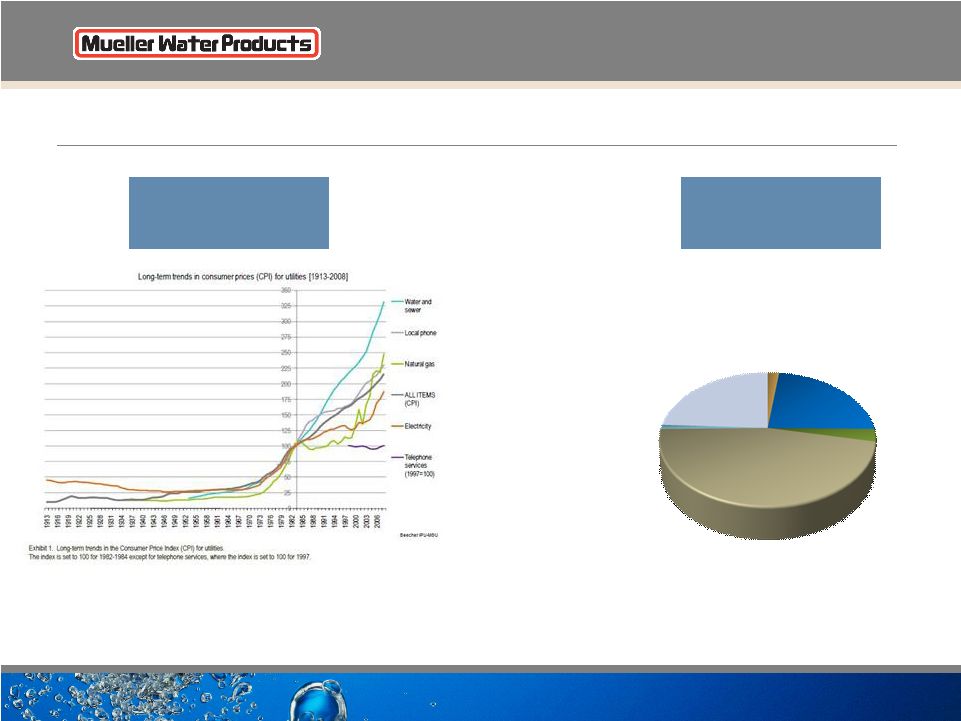 17 Funding 2010 Water Infrastructure Repair Sources: (1) Bureau of Labor Statistics (2) AWWA State of the Industry Report 2009 Other 23% Bonds 3% Loans 46% Operational Savings 24% Rate Increases 2% Grants 1% Sources of Funding Water Infrastructure Repair (2) Historical Water Rates Compared to Other Utilities (1) |
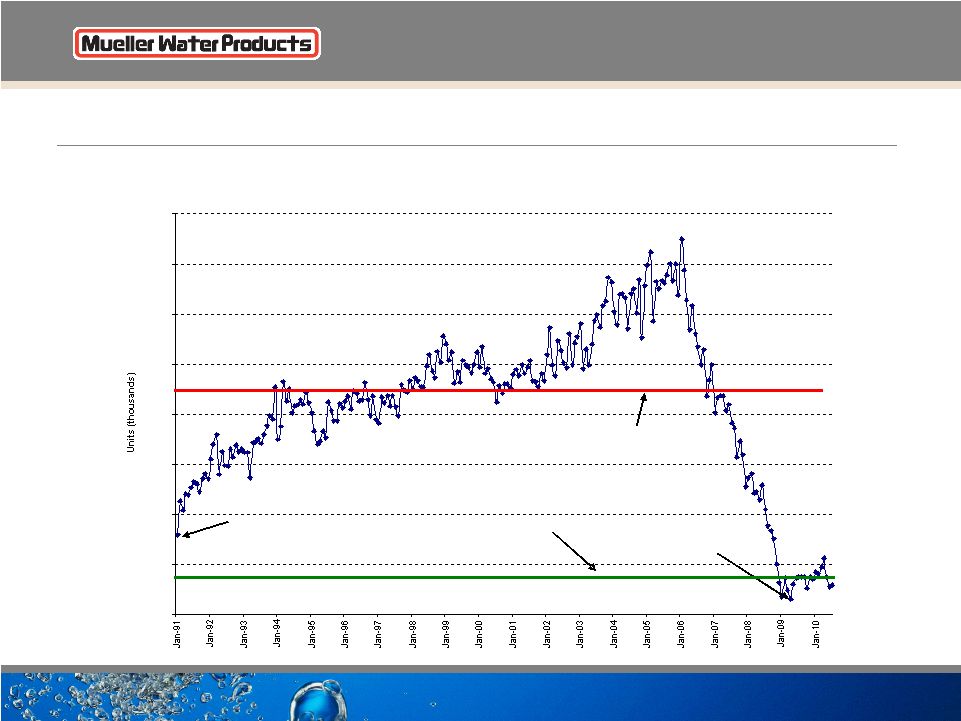 18 Historical Housing Starts Historical Housing Starts (1991 - July 2010) Seasonally Adjusted Annualized 400 650 900 1,150 1,400 1,650 1,900 2,150 2,400 1991-2009 Average 1,515 Bottom of prior down cycle (798,000) April - Lowest starts (479,000) since Census Bureau began keeping records in 1959 2010 Forecast = 600,000 8.3% increase over 2009 |
 19 Update on End Markets – Residential Construction Significant Economic Downturns (1) (1) Seasonally adjusted and annualized data from U.S. Census Bureau. Housing starts in thousands. Significant Downturns Peak Trough Length of % Decline Length of Recovery Trough + 12 Months Month Starts Month Starts Downturn From Peak To 1.6MM Starts Starts Increase Feb-1959 1,667 Dec-1960 1,063 22 months (36.2%) 23 months 1,365 28.4% Dec-1965 1,656 Oct-1966 843 10 months (49.1%) 25 months 1,491 76.9% Jan-1969 1,769 Jan-1970 1,085 12 months (38.7%) 10 months 1,828 68.5% Oct-1972 2,485 Feb-1975 904 28 months (63.6%) 19 months 1,538 70.1% Apr-1978 2,197 Nov-1981 837 44 months (61.9%) 15 months 1,372 63.9% Jan-1986 1,972 Jan-1991 798 61 months (59.5%) 38 months 1,176 47.4% Jan-2006 2,273 Apr-2009 479 39 months (78.9%) TBD TBD TBD Average 2,003 858 31 months (57.1%) 22 months 1,462 59.2% Median 1,972 843 28 months (57.3%) 21 months 1,432 66.2% |
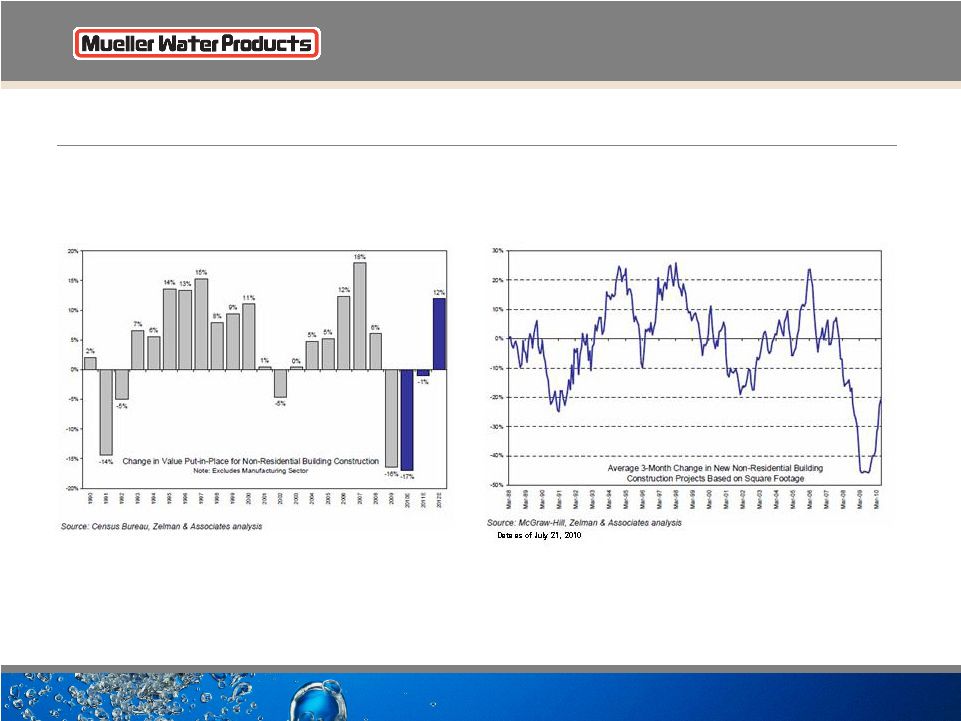 20 Non-Residential Construction Average 3-Month Change in Non-Residential Construction Non-Residential Construction Actual / Forecast |
 Actions & Business Results |
 22 Management Actions/Initiatives Objectives Cost Savings Actions Reduce costs and improve operating leverage Six plants closed between FY2006- current Sold certain non-core assets of Anvil Reduced headcount 25% from September 30, 2007 to June 30, 2010 from approximately 6,700 employees to approximately 5,000 Took actions to lower labor costs LEAN Six Sigma and other manufacturing improvements (continuous improvement) Invested in new automated ductile iron pipe operation to lower products costs Manage working capital and capital expenditures to generate free cash flow Capital spending decreased from FY2007/FY2008 levels FY2009 capital spending of $39.7 million;FY2010 capital spending projected to be $39 to $41 million Reduced inventory by $117 million in FY2009; $67million reduction 3Q10 YTD Reduced debt by $269 million from June 30, 2009 through June 30, 2010 |
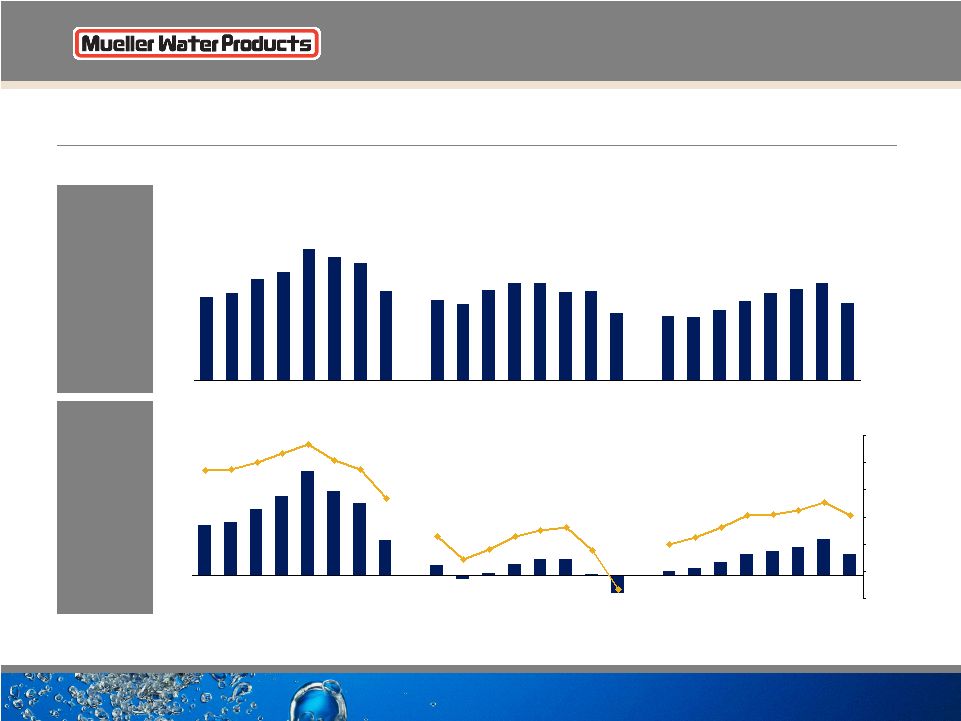 23 $509 $536 $618 $664 $804 $756 $718 $547 $492 $465 $551 $598 $595 $537 $546 $411 $393 $387 $431 $485 $535 $556 $595 $470 $0 $200 $400 $600 $800 $1,000 2002 2003 2004 2005 2006 2007 2008 2009 2002 2003 2004 2005 2006 2007 2008 2009 2002 2003 2004 2005 2006 2007 2008 2009 $107 $114 $142 $168 $222 $179 $153 $75 $4 $24 $33 $34 $2 $8 $14 $27 $45 $51 $59 $76 $45 $20 13.7% 0.7% 4.0% 5.5% 0.4% 2.0% 3.6% 6.3% 9.3% 9.5% 10.6% 12.8% 9.5% 21.3% 21.3% 23.7% 27.6% 21.0% 25.3% 23.0% 4.1% 6.3% (1.9%) (9.7%) ($50) $0 $50 $100 $150 $200 $250 $300 2002 2003 2004 2005 2006 2007 2008 2009 2002 2003 2004 2005 2006 2007 2008 2009 2002 2003 2004 2005 2006 2007 2008 2009 (12.0%) (5.0%) 2.0% 9.0% 16.0% 23.0% 30.0% ($9) ($40) NET SALES OPERATING INCOME & OPERATING MARGIN ($ in millions) History Of Strong Financial Performance |
 24 Consolidated Non-GAAP Results • Began to see the benefits of January valve and hydrant price increases • Average prices on pipe shipments at U.S. Pipe were down YOY but up sequentially. Order price up sequentially. • Significant improvement in operating margins on increased volumes, manufacturing and other cost savings, and increased capacity utilization primarily at Mueller Co. and U.S. Pipe • Continue to see signs of stabilization in most of Anvil’s end markets • We believe our distributors and our end customers are approaching the 4 th quarter with caution given uncertain economic climate FY 3Q10 results exclude restructuring $0.9 million, $0.5 million net of tax, and $2.2 million tax expense on the repatriation of Canadian earnings FY 3Q09 results exclude restructuring $3.9 million, $2.4 million net of tax, and $2.3 million, $1.4 million net of tax, on loss on early extinguishment of debt $ in millions (except per share amounts) 2010 2009 Net sales $375.9 $363.2 Adj. income (loss) from operations $13.4 ($4.6) Adj. operating income (loss) % of net sales 3.6% (1.3%) Adj. net loss per share ($0.01) ($0.13) Adj. EBITDA $34.5 $17.0 Adj. EBITDA % of net sales 9.2% 4.7% Third Quarter Fiscal |
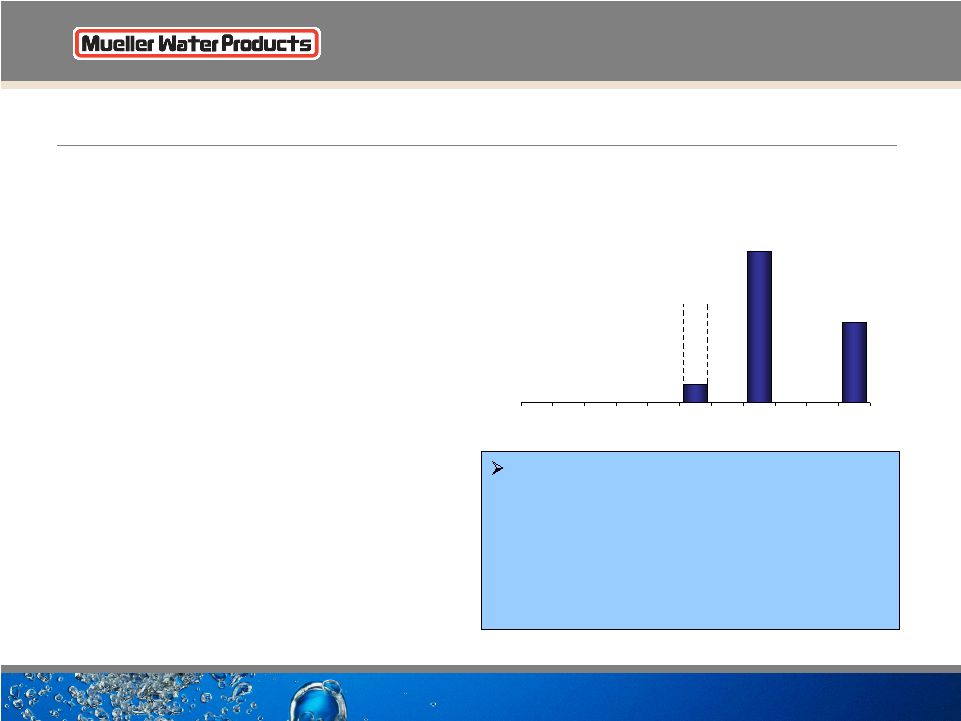 25 Refinancing Highlights • Recapitalization provides a long-term capital structure • Extends maturities with no required principal payments before 2015 • Locks in long term capital at attractive rates • Preserves deleveraging capability • Expect greater operational flexibility • Elimination of financial maintenance covenants with excess availability of $34.4mm or 12.5% of facility amount • Pro forma excess availability at June 30, 2010 of $157mm, after $49mm initial borrowing and $37.6mm letters of credit • Reduces limitation on business operations including acquisitions, investments, restricted payments and divestitures New structure: • $420mm 7 3/ 8 % Senior Subordinated Notes due 2017 • $225mm 8 3/ 4 % Senior Unsecured Notes due 2020 • $275mm ABL Revolver Credit Facility due 2015 ($49mm drawn at 8/26/10) Debt Maturity ($ in millions) $0 $0 $0 $0 $0 $0 $0 $0 $49 $225 $420 $226 $0 $50 $100 $150 $200 $250 $300 $350 $400 $450 FY2010 FY2011 FY2012 FY2013 FY2014 FY2015 FY2016 FY2017 FY2018 FY2019 FY2020 |
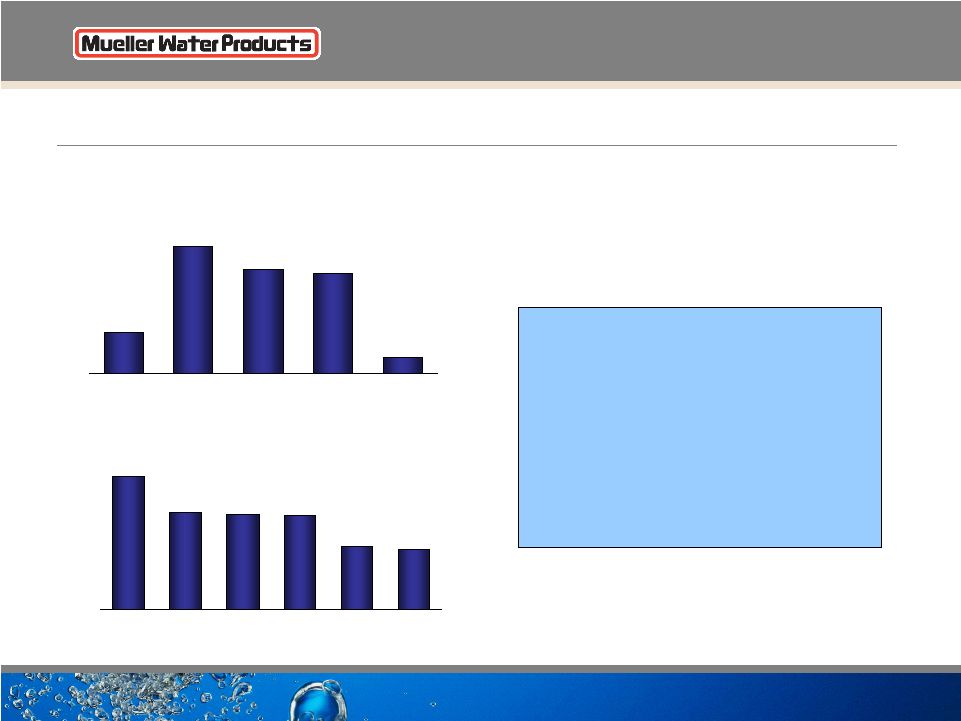 26 Capital Structure Notes: * FY 2007 excludes $48.1 million of cash costs related to debt restructuring activities. Reduced debt by $856mm from March 31, 2006 through June 30, 2010 Reduced debt by $269mm in the 12 months ended June 30, 2010 Free Cash Flow ($ in millions) $37 $115 $94 $91 $14 $0 $20 $40 $60 $80 $100 $120 $140 FY2006 FY2007* FY2008 FY2009 FYTD 6/30/2010 Total Debt ($ in millions) $1,549 $1,127 $1,101 $1,096 $740 $693 $0 $200 $400 $600 $800 $1,000 $1,200 $1,400 $1,600 $1,800 Mar-2006 FY2006 FY2007* FY2008 FY2009 Jun 2010 |
 27 Investment Highlights • Water industry has fundamentally strong long-term dynamics • Driven by new and upgraded infrastructure • Limited number of suppliers to end markets • Strong competitive position • Leading brand positions with large installed base • Leading municipal specification positions • Comprehensive distribution network • Low-cost manufacturing operations • Operating leverage when volumes improve • Growth opportunities • Organic growth • Strategic acquisitions |
 Supplemental Data |
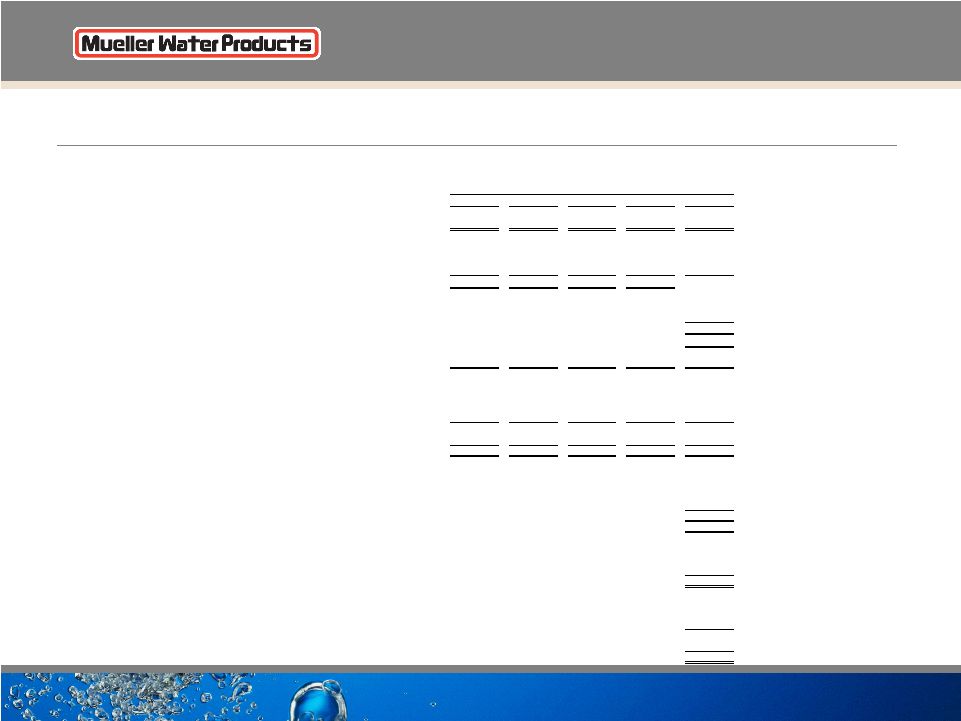
 29 Segment Results and Reconciliation of Non-GAAP to GAAP Performance Measures (in millions, except per share amounts) Three months ended June 30, 2010 Mueller Co. U.S. Pipe Anvil Corporate Total GAAP results: Net sales 174.6 $ 120.2 $ 81.1 $ - $ 375.9 $ Gross profit (loss) 52.1 $ (2.7) $ 21.1 $ 0.1 $ 70.6 $ Selling, general and administrative expenses 23.3 7.7 16.6 9.6 57.2 Restructuring - 0.9 - - 0.9 Income (loss) from operations 28.8 $ (11.3) $ 4.5 $ (9.5) $ 12.5 Interest expense, net 15.8 Income tax expense 0.5 Net loss (3.8) $ Net loss per diluted share (0.02) $ Capital expenditures 2.7 $ 2.1 $ 2.0 $ - $ 6.8 $ Non-GAAP results: Adjusted income (loss) from operations and EBITDA: Income (loss) from operations 28.8 $ (11.3) $ 4.5 $ (9.5) $ 12.5 $ Restructuring - 0.9 - - 0.9 Adjusted income (loss) from operations 28.8 (10.4) 4.5 (9.5) 13.4 Depreciation and amortization 12.3 4.6 3.9 0.3 21.1 Adjusted EBITDA 41.1 $ (5.8) $ 8.4 $ (9.2) $ 34.5 $ Adjusted net loss: Net loss (3.8) $ Tax on repatriation on Canadian earnings 2.2 Restructuring, net of tax 0.5 Adjusted net loss (1.1) $ Adjusted net loss per diluted share (0.01) $ Free cash flow: Net cash used in operating activities (8.6) $ Capital expenditures (6.8) Free cash flow (15.4) $ Net debt (end of period): Current portion of long-term debt 10.5 $ Long-term debt 682.2 Total debt 692.7 Less cash and cash equivalents (77.1) Net debt 615.6 $ |
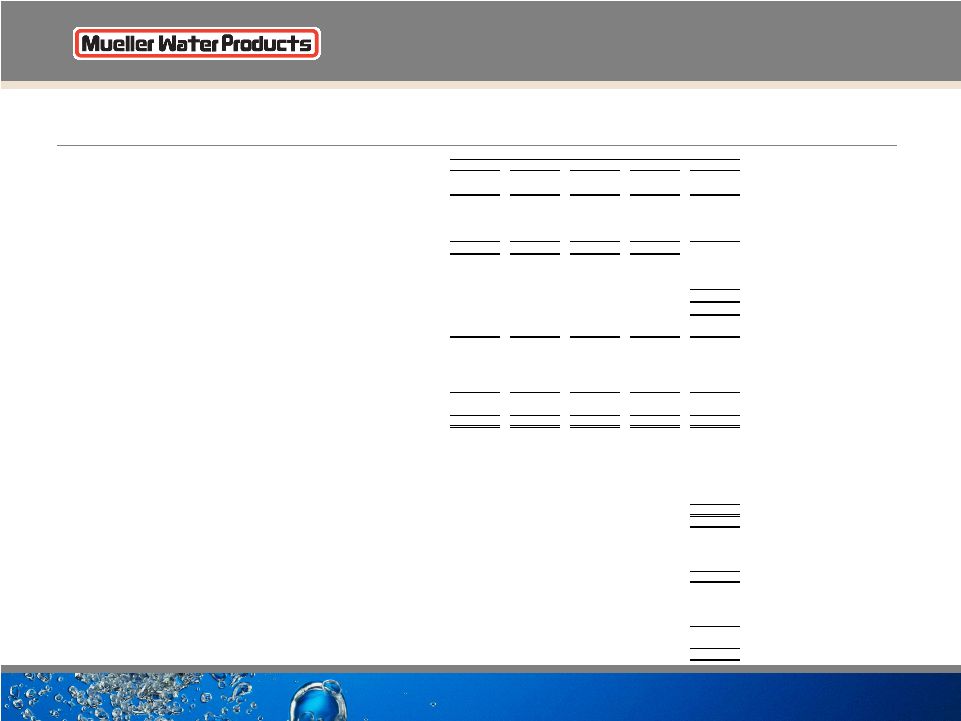
 30 Segment Results and Reconciliation of Non-GAAP to GAAP Performance Measures (in millions, except per share amounts) Three months ended June 30, 2009 Mueller Co. U.S. Pipe Anvil Corporate Total GAAP results: Net sales 154.6 $ 96.7 $ 111.9 $ - $ 363.2 $ Gross profit (loss) 35.8 $ (6.0) $ 28.1 $ (0.1) $ 57.8 $ Selling, general and administrative expenses 22.2 10.8 21.4 8.0 62.4 Impairment and restructuring 0.7 1.5 1.7 - 3.9 Income (loss) from operations 12.9 $ (18.3) $ 5.0 $ (8.1) $ (8.5) Interest expense, net 17.2 Loss on early extinguishment of debt 2.3 Income tax benefit (9.0) Net loss (19.0) $ Net loss per diluted share (0.16) $ Capital expenditures 1.7 $ 1.6 $ 1.8 $ - $ 5.1 $ Non-GAAP results: Adjusted income (loss) from operations and EBITDA: Income (loss) from operations 12.9 $ (18.3) $ 5.0 $ (8.1) $ (8.5) $ Impairment and restructuring 0.7 1.5 1.7 - 3.9 Adjusted income (loss) from operations 13.6 (16.8) 6.7 (8.1) (4.6) Depreciation and amortization 12.7 4.3 4.4 0.2 21.6 Adjusted EBITDA 26.3 $ (12.5) $ 11.1 $ (7.9) $ 17.0 $ Adjusted net loss: Net loss (19.0) $ Restructuring, net of tax 2.4 Loss on early extinguishment of debt, net of tax 1.4 Adjusted net loss (15.2) $ Adjusted net loss per diluted share (0.13) $ Free cash flow: Net cash provided by operating activities 70.5 $ Capital expenditures (5.1) Free cash flow 65.4 $ Net debt (end of period): Current portion of long-term debt 19.3 $ Long-term debt 941.9 Total debt 961.2 Less cash and cash equivalents (80.1) Net debt 881.1 $ |
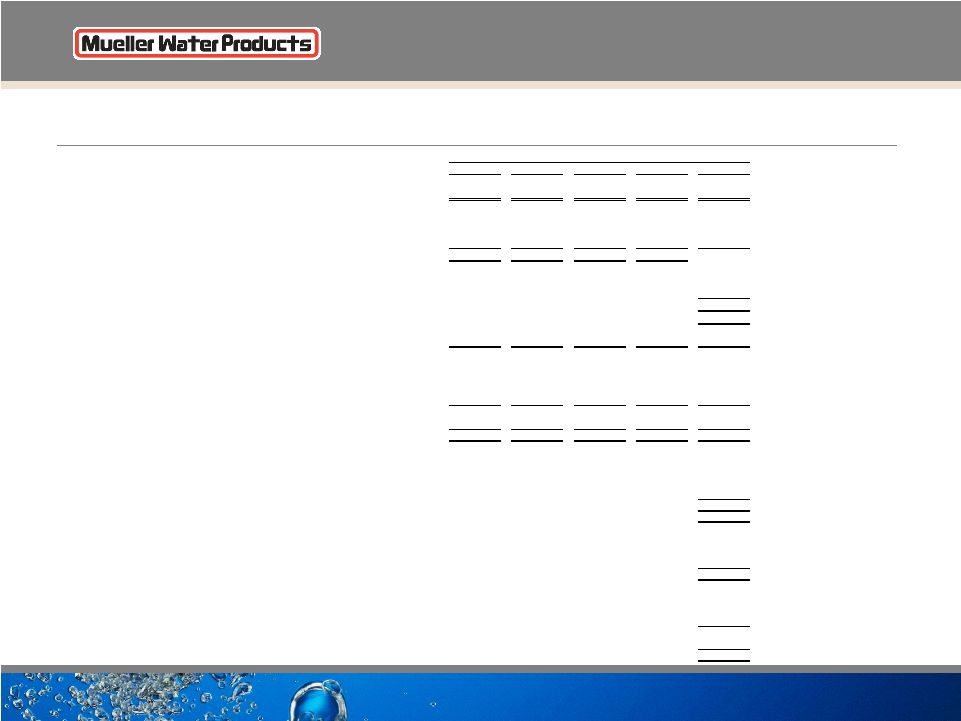
 31 Segment Results and Reconciliation of Non-GAAP to GAAP Performance Measures (in millions, except per share amounts) Nine months ended June 30, 2010 Mueller Co. U.S. Pipe Anvil Corporate Total GAAP results: Net sales 449.1 $ 282.9 $ 258.8 $ - $ 990.8 $ Gross profit (loss) 121.2 $ (19.6) $ 63.0 $ 0.1 $ 164.7 $ Selling, general and administrative expenses 66.7 22.3 48.0 26.0 163.0 Restructuring 0.1 11.6 0.1 - 11.8 Income (loss) from operations 54.4 $ (53.5) $ 14.9 $ (25.9) $ (10.1) Interest expense, net 47.4 Loss on early extinguishment of debt 0.5 Income tax benefit (19.8) Net loss (38.2) $ Net loss per diluted share (0.25) $ Capital expenditures 9.8 $ 7.4 $ 4.1 $ 0.1 $ 21.4 $ Non-GAAP results: Adjusted income (loss) from operations and EBITDA: Income (loss) from operations 54.4 $ (53.5) $ 14.9 $ (25.9) $ (10.1) $ Restructuring 0.1 11.6 0.1 - 11.8 Adjusted income (loss) from operations 54.5 (41.9) 15.0 (25.9) 1.7 Depreciation and amortization 37.2 14.0 11.5 0.6 63.3 Adjusted EBITDA 91.7 $ (27.9) $ 26.5 $ (25.3) $ 65.0 $ Adjusted net loss: Net loss (38.2) $ Restructuring, net of tax 7.1 Tax on repatriation on Canadian earnings 2.2 Interest rate settlement costs, net of tax (0.7) Loss on early extinguishment of debt, net of tax 0.3 Adjusted net loss (29.3) $ Adjusted net loss per diluted share (0.19) $ Free cash flow: Net cash provided by operating activities 35.7 $ Capital expenditures (21.4) Free cash flow 14.3 $ Net debt (end of period): Current portion of long-term debt 10.5 $ Long-term debt 682.2 Total debt 692.7 Less cash and cash equivalents (77.1) Net debt 615.6 $ |
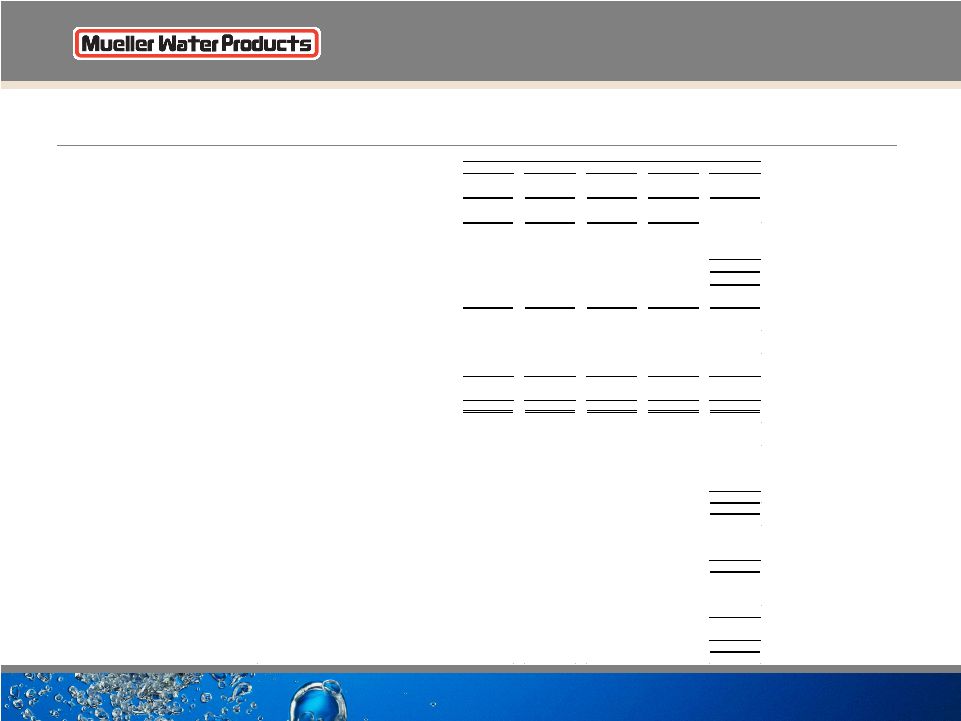
 32 Segment Results and Reconciliation of Non-GAAP to GAAP Performance Measures (in millions, except per share amounts) Nine months ended June 30, 2009 Mueller Co. U.S. Pipe Anvil Corporate Total GAAP results: Net sales 389.0 $ 305.6 $ 358.5 $ - $ 1,053.1 $ Gross profit (loss) 89.3 $ (6.3) $ 104.8 $ (0.1) $ 187.7 $ Selling, general and administrative expenses 64.6 27.9 64.7 27.5 184.7 Impairment and restructuring 820.1 100.9 95.6 0.2 1,016.8 Loss from operations (795.4) $ (135.1) $ (55.5) $ (27.8) $ (1,013.8) Interest expense, net 51.1 Loss on early extinguishment of debt 0.8 Income tax benefit (79.9) Net loss (985.8) $ Net loss per diluted share (8.52) $ Capital expenditures 7.8 $ 7.1 $ 7.5 $ 0.3 $ 22.7 $ Non-GAAP results: Adjusted income (loss) from operations and EBITDA: Loss from operations (795.4) $ (135.1) $ (55.5) $ (27.8) $ (1,013.8) $ Impairment and restructuring 820.1 100.9 95.6 0.2 1,016.8 Adjusted income (loss) from operations 24.7 (34.2) 40.1 (27.6) 3.0 Depreciation and amortization 38.2 16.6 13.0 0.5 68.3 Adjusted EBITDA 62.9 $ (17.6) $ 53.1 $ (27.1) $ 71.3 $ Adjusted net loss Net loss (985.8) $ Impairment and restructuring, net of tax 953.7 Loss on early extinguishment of debt, net of tax 0.5 Adjusted net loss (31.6) $ Adjusted net loss per diluted share (0.27) $ Free cash flow: Net cash provided by operating activities 68.3 $ Capital expenditures (22.7) Free cash flow 45.6 $ Net debt (end of period): Current portion of long-term debt 19.3 $ Long-term debt 941.9 Total debt 961.2 Less cash and cash equivalents (80.1) Net debt 881.1 $ |
 33 Segment Results And Reconciliation Of Non-GAAP To GAAP Performance Measures (in millions, except per share amounts) Year ended September 30, 2009 Mueller Co. U.S. Pipe Anvil Corporate Total GAAP results: Net sales 547.1 $ 410.9 $ 469.9 $ - $ 1,427.9 $ Loss from operations (770.6) $ (142.4) $ (53.4) $ (34.5) $ (1,000.9) $ Interest expense, net 78.3 Loss on early extinguishment of debt, net 3.8 Income tax benefit (86.3) Net loss (996.7) $ Net loss per diluted share (8.55) $ Capital expenditures 16.2 $ 11.2 $ 11.9 $ 0.4 $ 39.7 $ Non-GAAP results: Adjusted income (loss) from operations and EBITDA: Loss from operations (770.6) $ (142.4) $ (53.4) $ (34.5) $ (1,000.9) $ Impairment 818.7 59.5 92.7 - 970.9 Restructuring 2.0 41.6 4.0 0.2 47.8 Adjusted income (loss) from operations 50.1 (41.3) 43.3 (34.3) 17.8 Depreciation and amortization 50.9 21.1 17.6 0.6 90.2 Adjusted EBITDA 101.0 $ (20.2) $ 60.9 $ (33.7) $ 108.0 $ Adjusted net loss: Net loss (996.7) $ Impairment, net of tax 925.9 Restructuring, net of tax 29.0 Interest rate settlement costs, net of tax 3.8 Loss on early extinguishment of debt, net of tax 2.3 Adjusted net loss (35.7) $ Adjusted net loss per diluted share (0.31) $ Free cash flow: Net cash used in operating activities 121.9 $ Capital expenditures (39.7) Free cash flow 82.2 $ Net debt (end of period): Current portion of long-term debt 11.7 $ Long-term debt 728.5 Total debt 740.2 Less cash and cash equivalents (61.5) Net debt 678.7 $ |
 34 Segment Results And Reconciliation Of Non-GAAP To GAAP Performance Measures (in millions, except per share amounts) Year ended September 30, 2008 Mueller Co. U.S. Pipe Anvil Corporate Total GAAP results: Net sales 718.1 $ 546.0 $ 595.2 $ - $ 1,859.3 $ Income (loss) from operations 128.4 $ (17.4) $ 74.1 $ (39.0) $ 146.1 $ Interest expense, net 72.4 Income tax expense 31.7 Net income 42.0 $ Net income per diluted share 0.36 $ Capital expenditures 17.9 $ 58.5 $ 11.5 $ 0.2 $ 88.1 $ Non-GAAP results: Adjusted income (loss) from operations and EBITDA: Income (loss) from operations 128.4 $ (17.4) $ 74.1 $ (39.0) $ 146.1 $ Restructuring charges - 18.3 - - 18.3 Adjusted income (loss) from operations 128.4 0.9 74.1 (39.0) 164.4 Depreciation and amortization 50.1 22.7 19.7 0.6 93.1 Adjusted EBITDA 178.5 $ 23.6 $ 93.8 $ (38.4) $ 257.5 $ Adjusted net income: Net income 42.0 $ Restructuring charges, net of tax 11.1 Adjusted net income 53.1 $ Adjusted net income per diluted share 0.46 $ Free cash flow: Net cash provided by operating activities 182.0 $ Capital expenditures (88.1) Free cash flow 93.9 $ Net debt (end of period): Current portion of long-term debt 6.1 $ Long-term debt 1,090.6 Total debt 1,096.7 Less cash and cash equivalents (141.9) Net debt 954.8 $ |
 Questions |