Exhibit 99.1
BB&T Capital Markets Commercial and
Industrial Conference
April 7, 2011
Mueller Water Products
Safe Harbor Statement
Safe Harbor Statement
This presentation contains certain statements that may be deemed “forward-looking statements” within the meaning of the Private Securities Litigation Reform Act of 1995. All statements that address activities, events or developments that the Company intends, expects, plans, projects, believes or anticipates will or may occur in the future are forward-looking statements. Examples of forward-looking statements include, but are not limited to, statements the Company makes regarding general economic conditions, spending by municipalities, the outlook for the residential and non-residential construction markets, improvements related to capacity utilization, the recovery, if any, of the Company’s end markets, and the potential effect of the refinancing on the Company’s operations, and the impact of these factors on the Company’s businesses. Forward-looking statements are based on certain assumptions and assessments made by the Company in light of its experience and perception of historical trends, current conditions and expected future developments. Actual results and the timing of events may differ materially from those contemplated by the forward-looking statements due to a number of factors, including regional, national or global political, economic, business, competitive, market and regulatory conditions and the following:
• the spending level for water and wastewater infrastructure;
• the demand level of manufacturing and construction activity;
• the Company’s ability to service its debt obligations; and
• the other factors that are described in the section entitled “RISK FACTORS” in Item 1A of our Annual Report on Form 10-K.
Undue reliance should not be placed on any forward-looking statements. The Company does not have any intention or obligation to update forward-looking statements, except as required by law.
2
Mueller Water Products
Non-GAAP Financial Measures
Non-GAAP Financial Measures
The Company presents adjusted income (loss) from operations, adjusted EBITDA, adjusted net income (loss), adjusted net income (loss) per share, free cash flow and net debt as non-GAAP measures. Adjusted income (loss) from operations represents income (loss) from operations excluding impairment and restructuring. Adjusted EBITDA represents income (loss) from operations excluding impairment, restructuring, depreciation and amortization. The company presents adjusted EBITDA because it is a measure of performance management and believes it is frequently used by securities analysts, investors and interested parties in the evaluation of financial performance. Adjusted net income (loss) and adjusted net income (loss) per share exclude impairment, restructuring, loss on early extinguishment of debt, certain costs to settle interest rate swap contracts, the tax on the repatriation of earnings from Canada and the income tax effects of the previously mentioned items. These items are excluded because they are not considered indicative of recurring operations. Free cash flow represents cash flows from operating activities, less capital expenditures. It is presented as a measurement of cash flow because it is commonly used by the investment community. Net debt represents total debt less cash and cash equivalents. Net debt is commonly used by the investment community as a measure of indebtedness. Adjusted income (loss) from operations, adjusted EBITDA, adjusted net income (loss), adjusted net income (loss) per share, free cash flow and net debt have limitations as analytical tools, and investors should not consider any of these non-GAAP measures in isolation or as a substitute for analysis of the Company’s results as reported under accounting principles generally accepted in the United States (“GAAP”).
A reconciliation of non-GAAP to GAAP results in included as an attachment to this presentation and has been posted online at www.muellerwaterproducts.com
3
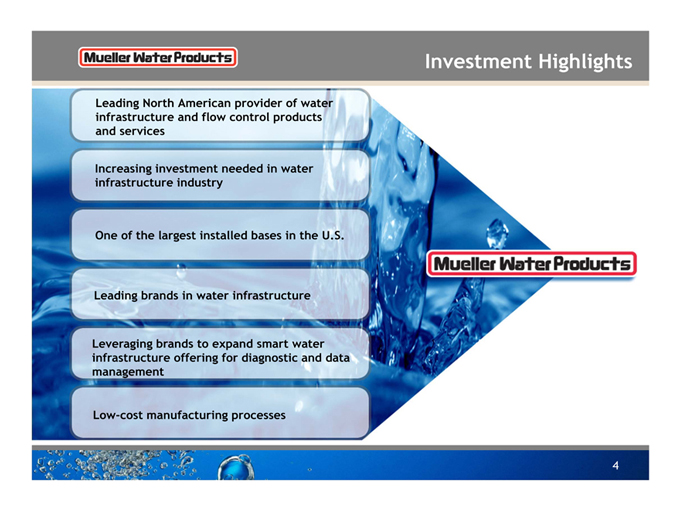
Mueller Water Products Investment Highlights
Leading North American provider of water infrastructure and flow control products and services
Increasing investment needed in water infrastructure industry
One of the largest installed bases in the U.S.
Leading brands in water infrastructure
Leveraging brands to expand smart water infrastructure offering for diagnostic and data management
Low-cost manufacturing processes
Mueller Water Products
4
Mueller Water Products
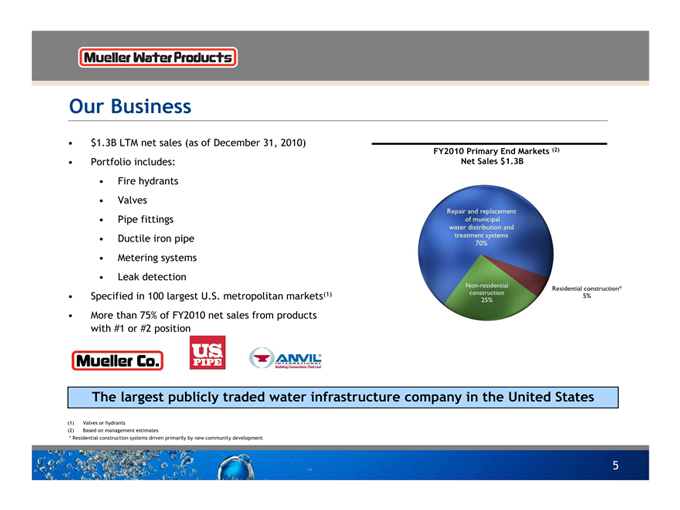
Our Business
• $1.3B LTM net sales (as of December 31, 2010)
• Portfolio includes:
• Fire hydrants
• Valves
• Pipe fittings
• Ductile iron pipe
• Metering systems
• Leak detection
• Specified in 100 largest U.S. metropolitan markets(1)
• More than 75% of FY2010 net sales from products with #1 or #2 position
Mueller Co. US PIPE ANVIL International Building Connections That Last
FY2010 Primary End Markets (2)
Net Sales $1.3B
Repair and replacement of municipal water distribution and treatment systems 70%
Non-residential construction 25%
Residential construction* 5%
The largest publicly traded water infrastructure company in the United States
(1) Valves or hydrants
(2) Based on management estimates
* Residential construction systems driven primarily by new community development
5
Mueller Water Products
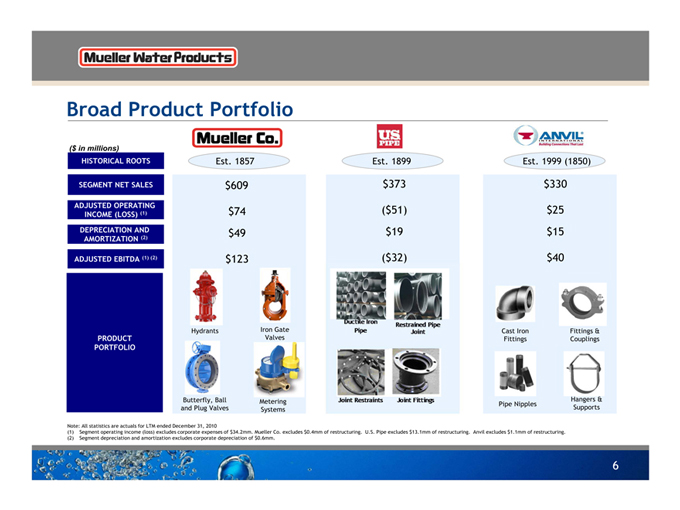
Broad Product Portfolio
($ in millions)
HISTORICAL ROOTS
SEGMENT NET SALES
ADJUSTED OPERATING INCOME (LOSS) (1)
DEPRECIATION AND AMORTIZATION (2)
ADJUSTED EBITDA (1) (2)
PRODUCT
PORTFOLIO
Mueller Co.
Est. 1857
$609
$74
$49
$123
Hydrants
Iron Gate Valves
Butterfly, Ball and Plug Valves
Metering Systems
US PIPE
Est. 1899
$373
($51)
$19
($32)
Ductile Iron Pipe
Restrained Pipe Joint
Joint Restraints
Joint Fittings
Anvil International Building Connections That Last
Est. 1999 (1850)
$330
$25
$15
$40
Cast Iron Fittings
Fittings & Couplings
Pipe Nipples
Hangers & Supports
Note: All statistics are actuals for LTM ended December 31, 2010
(1) Segment operating income (loss) excludes corporate expenses of $34.2mm. Mueller Co. excludes $0.4mm of restructuring. U.S. Pipe excludes $13.1mm of restructuring. Anvil excludes $1.1mm of restructuring.
(2) Segment depreciation and amortization excludes corporate depreciation of $0.6mm.
6
Mueller Water Products
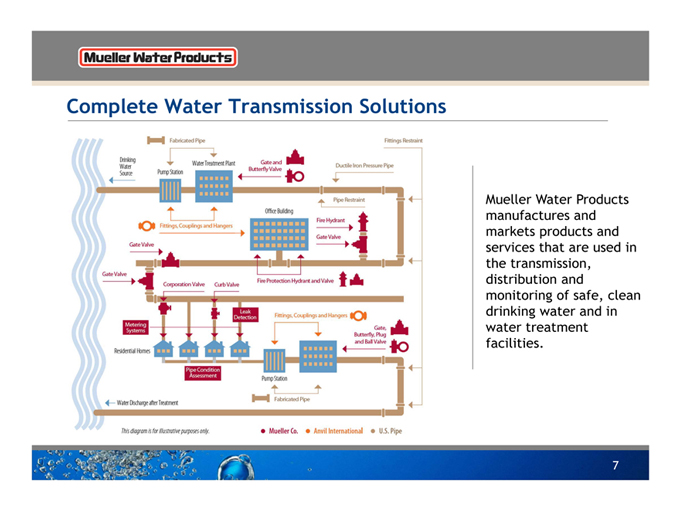
Complete Water Transmission Solutions
Fabricated Pipe Fittings Restraint
Drinking Water Source
Pump Station
Water Treatment Plant
Gate and Butterfly Valve
Ductile Iron Pressure Pipe
Pipe Restraint
Fittings, Couplings and Hangers
Office Building
Fire Hydrant
Gate Valve
Gate Valve
Gate Valve
Fire Protection Hydrant and Valve
Corporation Valve
Curb Valve
Leak Detection
Fittings, Couplings and Hangers
Metering Systems
Gate, Butterfly, Plug and Ball Valve
Residential Homes
Pipe Condition Assessment
Pump Station
Fabricated Pipe
Water Discharge after Treatment
This diagram is for illustrative purposes only.
• Muller Co.
• Anvil International
• U.S. Pipe
Mueller Water Products manufactures and markets products and services that are used in the transmission, distribution and monitoring of safe, clean drinking water and in water treatment facilities.
Mueller Water Products
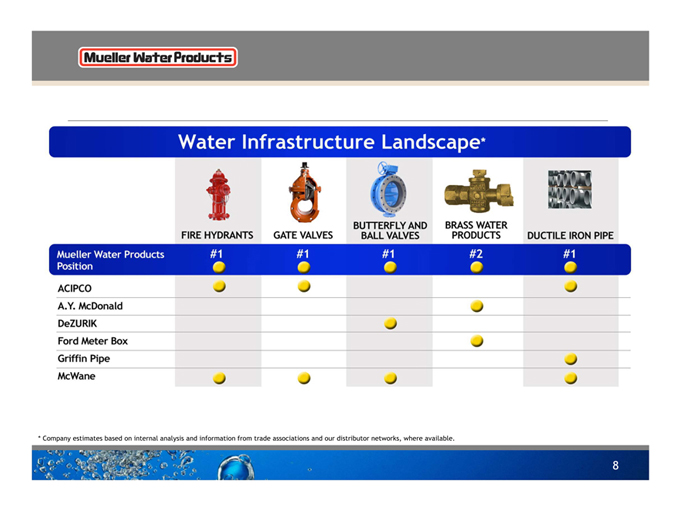
Water Infrastructure Landscape*
FIRE HYDRANTS
GATE VALVES
BUTTERFLY AND BALL VALVES
BRASS WATER PRODUCTS
DUCTILE IRON PIPE
Mueller Water Products Position #1 #1 #1 #2 #1
ACIPCO
A.Y. McDonald
DeZURIK
Ford Meter Box
Griffin Pipe
McWane
* Company estimates based on internal analysis and information from trade associations and our distributor networks, where available.
Mueller Water Products
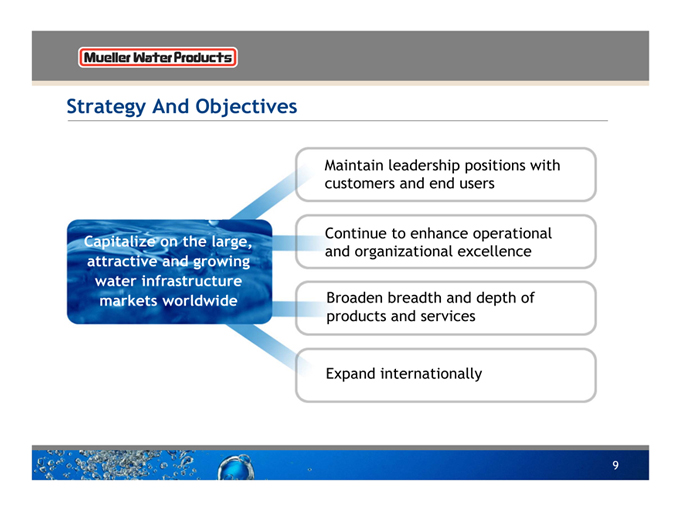
Strategy And Objectives
Capitalize on the large, attractive and growing water infrastructure markets worldwide
Maintain leadership positions with customers and end users
Continue to enhance operational and organizational excellence
Broaden breadth and depth of products and services
Expand internationally
9
Mueller Water Products
Our End Markets

Mueller Water Products
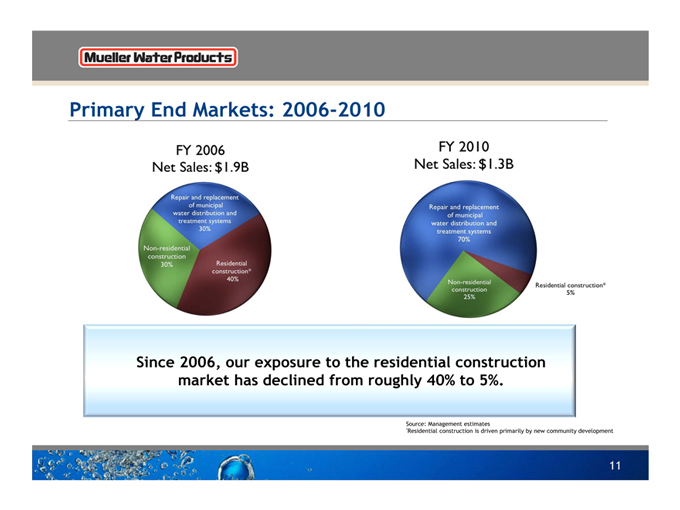
Primary End Markets: 2006-2010
FY 2006
Net Sales: $1.9B
FY 2010
Net Sales: $1.3B
Repair and replacement of municipal water distribution and treatment systems 30%
Non-residenetial construction 30%
Residential construction* 40%
Repair and replacement of municipal water distribution and treatment systems 70%
Non-residential construction 25%
Residential construction* 5%
Since 2006, our exposure to the residential construction market has declined from roughly 40% to 5%.
Source: Management estimates
*Residential construction is driven primarily by new community development
11
Mueller Water Products
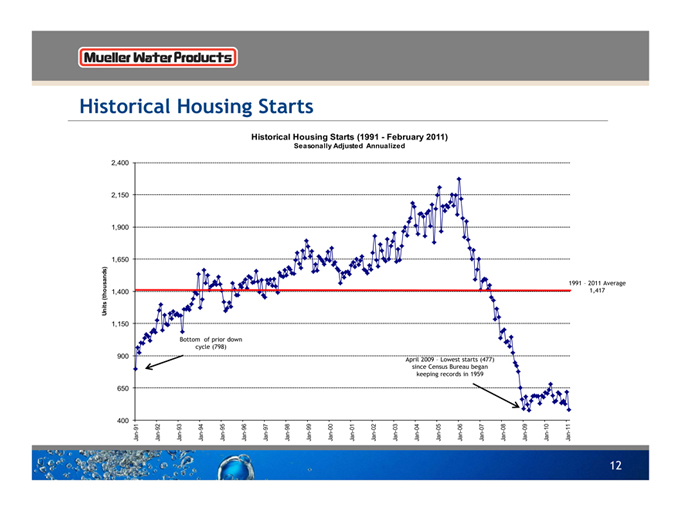
Historical Housing Starts
Historical Housing Starts (1991 - February 2011)
Seasonally Adjusted Annualized
2,400 2,150 1,900 1,650
Units (thousands)
1,400 1,150 900 650 400
Bottom of prior down cycle (798)
April 2009 – Lowest starts (477) since Census Bureau began keeping records in 1959
1991 – 2011 Average 1,417
Jan-91 Jan-92 Jan-93 Jan-94 Jan-95 Jan-96 Jan-97 Jan-98 Jan-99 Jan-00 Jan-01 Jan-02 Jan-03 Jan-04 Jan-05 Jan-06 Jan-07 Jan-08 Jan-09 Jan-10 Jan-11
12
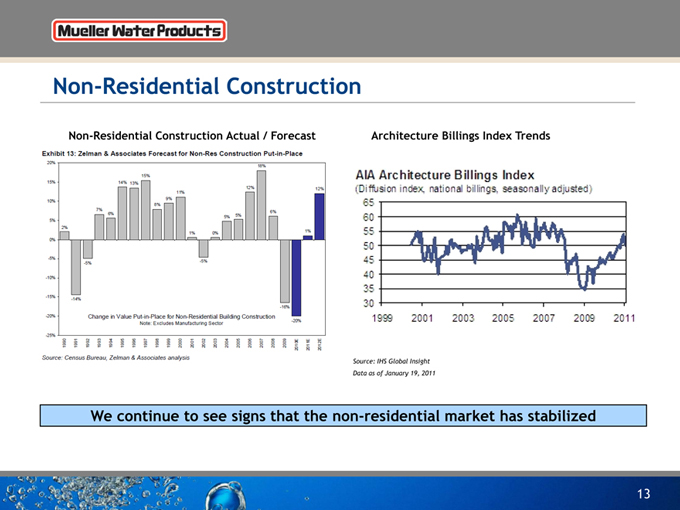
Non-Residential Construction
Non-Residential Construction Actual / Forecast
Exhibit 13: Zelman & Associates Forecast for Non-Res Construction Put-in-Place
20% 15% 10% 5% 0% -5% -10% -15% -20% -25%
2% -14% -5% 7% 6% 14% 13% 15% 8% 9% 11% 1% -5% 0% 5% 5% 12% 18% 6% -16% -20% 1% 12%
Change in Value Put-in-Place for Non-Residential Building Construction
Note: Excludes Manufacturing Sector
1990 1991 1992 1993 1994 1995 1996 1997 1998 1999 2000 2001 2002 2003 2004 2005 2006 2007 2008 2009 2010E 2011E 2012E
Source: Census Bureau, Zelman & Associates analysis
Architecture Billings Index Trends
AIA Architecture Billings Index
(Diffusion index, national billings, seasonally adjusted)
65 60 55 50 45 40 35 30
1999 2001 2003 2005 2007 2009 2011
Source: IHS Global Insight Data as of January 19, 2011
We continue to see signs that the non-residential market has stabilized
13
Mueller Water Products
A Significant Market Opportunity
Mueller Water Products
Aging Water Infrastructure
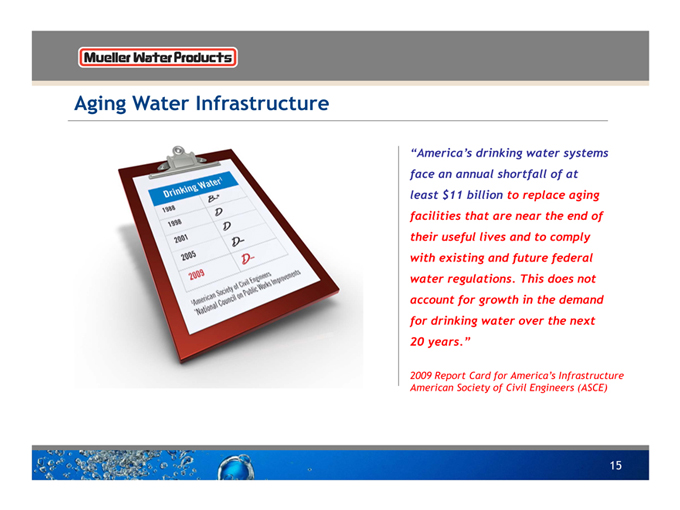
Drinking Water1
1988 B*
1998 D
2001 D
2005 D-
2009 D-
1American Society of Civil Engineers
*National Council on Public Works Improvements
“America’s drinking water systems face an annual shortfall of at least $11 billion to replace aging facilities that are near the end of their useful lives and to comply with existing and future federal water regulations. This does not account for growth in the demand for drinking water over the next 20 years.”
2009 Report Card for America’s Infrastructure American Society of Civil Engineers (ASCE)
15
Mueller Water Products
The Market Opportunity Is Significant And Growing
Repair and Replacement Market
• Aging water pipes need to be repaired/ replaced
• Valves and hydrants typically replaced at same time as pipes
• Up to 15% - 30% of treated potable water lost in leaky pipes(2)
• Emphasis on improving operational efficiencies
Funding and Spending
• 90% funded at local level(3)
• 29% of water systems charge less than cost(4)
Source: (1) EPA 2007 Drinking Water Needs Survey and Assessment
(2) Global Water Intelligence Water Technology Markets 2010
(3) EPA Clean Water and Drinking Water Infrastructure Gap Analysis
(4) Government Accountability Office 2004 report on water infrastructure
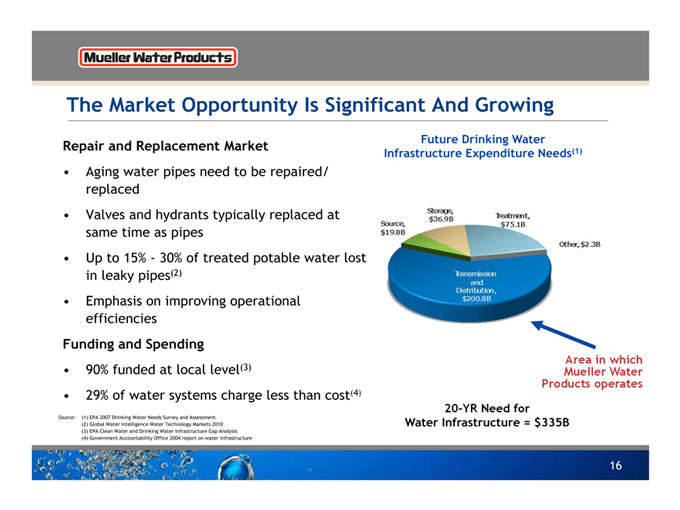
Future Drinking Water
Infrastructure Expenditure Needs(1)
Source, $19.8B
Storage, $36.9B
Treatment, $75.1B
Other, $2.3B
Transmission and Distribution, $200.8B
Area in which Mueller Water Products operates
20-YR Need for Water Infrastructure = $335B
16
Mueller Water Products
Aging Water Infrastructure
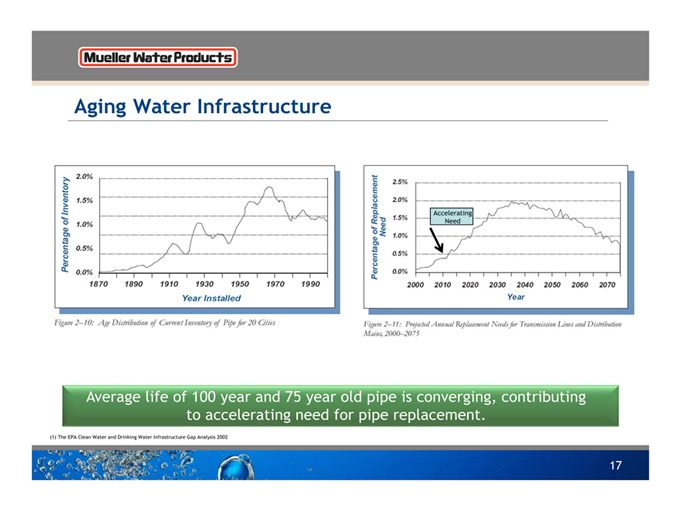
Percentage of Inventory
2.0% 1.5% 1.0% 0.5% 0.0% 1870 1890 1910 1930 1950 1970 1990
Year Installed
Figure 2–10: Age Distribution of Current Inventory of Pipe for 20 Cities
Percentage of Replacement Need
2.5% 2.0% 1.5% 1.0% 0.5% 0.0%
Accelerating Need
2000 2010 2020 2030 2040 2050 2060 2070
Year
Figure 2–11: Projected Annual Replacement Needs for Transmission Lines and Distribution Mains, 2000-2075
Average life of 100 year and 75 year old pipe is converging, contributing to accelerating need for pipe replacement.
(1) The EPA Clean Water and Drinking Water Infrastructure Gap Analysis 2002
17
Mueller Water Products
Increasing Federal Awareness of Funding Needs
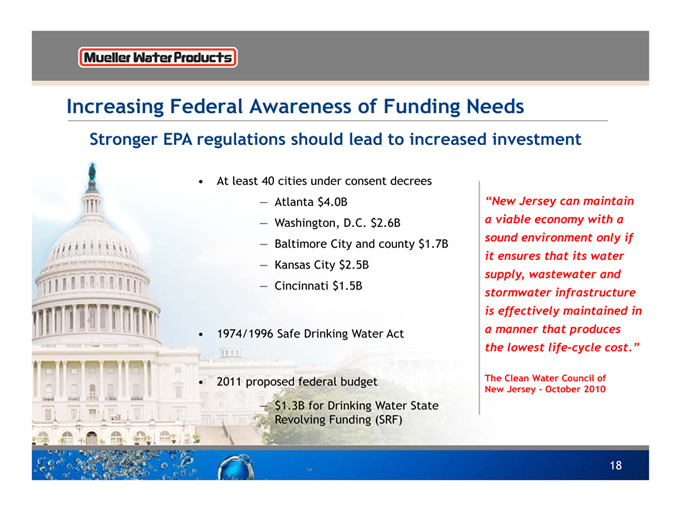
Stronger EPA regulations should lead to increased investment
• At least 40 cities under consent decrees
— Atlanta $4.0B
— Washington, D.C. $2.6B
— Baltimore City and county $1.7B
— Kansas City $2.5B
— Cincinnati $1.5B
• 1974/1996 Safe Drinking Water Act
• 2011 proposed federal budget
— $1.3B for Drinking Water State Revolving Funding (SRF)
“New Jersey can maintain a viable economy with a sound environment only if it ensures that its water supply, wastewater and stormwater infrastructure is effectively maintained in a manner that produces the lowest life-cycle cost.”
The Clean Water Council of New Jersey - October 2010
18
Mueller Water Products
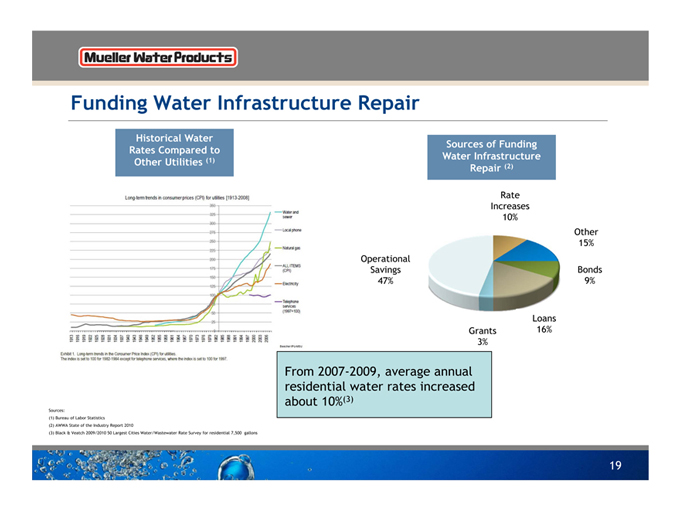
Funding Water Infrastructure Repair
Historical Water Rates Compared to Other Utilities (1)
Long-term trends in consumer prices (CPI) for utilities [1913-2008]
350 325 300 275 250 225 200 175 150 125 100 75 50 25 0
1913 1916 1919 1922 1925 1931 1934 1937 1940 1943 1946 1949 1952 1955 1958 1961 1964 1967 1970 1973 1976 1979 1982 1985 1988 1991 1994 1997 2000 2003 2006
—Water and sewer
—Local Phone
—Natural gas
—ALL ITEMS
(CPI)
—Electricity
—Telephone services (1997=100)
Exhibit 1. Long-term trends in the Consumer Price Index (CPI) for Utilities.
The index is set to 100 for 1982-1984 except for telephone services, where the index is set to 100 for 1997.
Sources:
(1) Bureau of Labor Statistics
(2) AWWA State of the Industry Report 2010
(3) Black & Veatch 2009/2010 50 Largest Cities Water/Wastewater Rate Survey for residential 7,500 gallons
Sources of Funding Water Infrastructure Repair (2)
Operational Savings 47%
Rate Increases 10%
Other 15%
Bonds 9%
Grants 3%
Loans 16%
From 2007-2009, average annual residential water rates increased about 10%(3)
19
Mueller Water Products
Actions & Business Results
Mueller Water Products
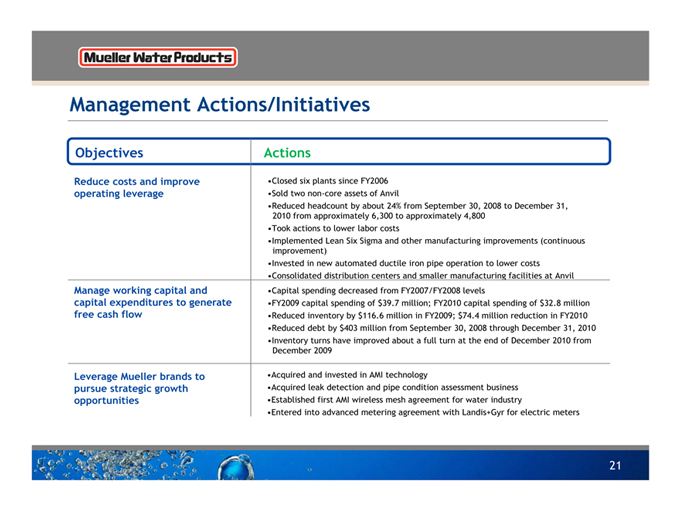
Management Actions/Initiatives
Objectives
Reduce costs and improve operating leverage
Manage working capital and capital expenditures to generate free cash flow
Leverage Mueller brands to pursue strategic growth opportunities
Actions
•Closed six plants since FY2006 •Sold two non-core assets of Anvil
•Reduced headcount by about 24% from September 30, 2008 to December 31, 2010 from approximately 6,300 to approximately 4,800 •Took actions to lower labor costs •Implemented Lean Six Sigma and other manufacturing improvements (continuous improvement) •Invested in new automated ductile iron pipe operation to lower costs •Consolidated distribution centers and smaller manufacturing facilities at Anvil •Capital spending decreased from FY2007/FY2008 levels •FY2009 capital spending of $39.7 million; FY2010 capital spending of $32.8 million •Reduced inventory by $116.6 million in FY2009; $74.4 million reduction in FY2010 •Reduced debt by $403 million from September 30, 2008 through December 31, 2010 •Inventory turns have improved about a full turn at the end of December 2010 from December 2009
•Acquired and invested in AMI technology
•Acquired leak detection and pipe condition assessment business •Established first AMI wireless mesh agreement for water industry
•Entered into advanced metering agreement with Landis+Gyr for electric meters
21
Mueller Water Products
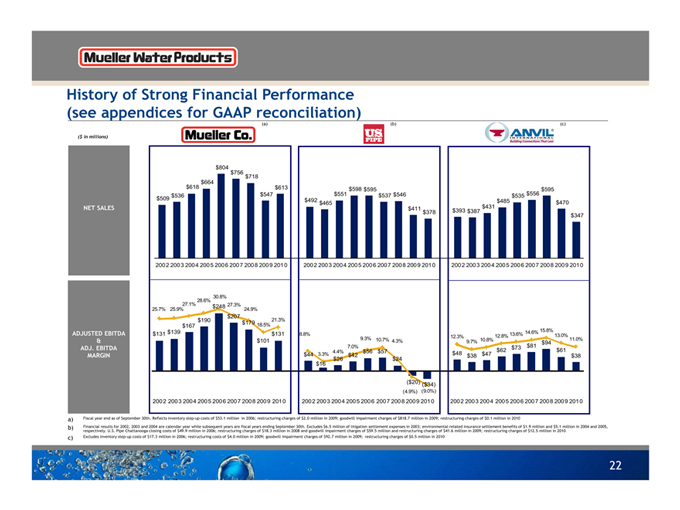
History of Strong Financial Performance
(see appendices for GAAP reconciliation)
($ in millions) Mueller Co. (a) US PIPE (b) ANVIL INTERNATIONAL Building Connections That Last
NET SALES
$509 $536 $618 $664 $804 $756 $718 $547 $613
2002 2003 2004 2005 2006 2007 2008 2009 2010
$492 $465 $551 $598 $595 $537 $546 $411 $378
2002 2003 2004 2005 2006 2007 2008 2009 2010
$393 $387 $431 $485 $535 $556 $595 $470 $347
2002 2003 2004 2005 2006 2007 2008 2009 2010
ADJUSTED EBITDA & ADJ. EBITDA MARGIN
25.7% 25.9% 27.1% 28.6% 30.8% 27.3% 24.9% 18.5% 21.3%
$131 $139 $167 $190 $248 $207 $179 $101 $131
2002 2003 2004 2005 2006 2007 2008 2009 2010
8.8% 3.3% 4.4% 7.0% 9.3% 10.7% 4.3%
$44 $16 $26 $42 $56 $57 $24 ($20) ($34) (4.9%) (9.0%)
2002 2003 2004 2005 2006 2007 2008 2009 2010
12.3% 9.7% 10.8% 12.8% 13.6% 14.6% 15.8% 13.0% 11.0%
$48 $38 $47 $62 $73 $81 $94 $61 $38
2002 2003 2004 2005 2006 2007 2008 2009 2010
a) Fiscal year end as of September 30th. Reflects inventory step-up costs of $53.1 million in 2006; restructuring charges of $2.0 million in 2009; goodwill impairment charges of $818.7 million in 2009; restructuring charges of $0.1 million in 2010
b) Financial results for 2002, 2003 and 2004 are calendar year while subsequent years are fiscal years ending September 30th. Excludes $6.5 million of litigation settlement expenses in 2003; environmental-related insurance settlement benefits of $1.9 million and $5.1 million in 2004 and 2005, respectively. U.S. Pipe Chattanooga closing costs of $49.9 million in 2006; restructuring charges of $18.3 million in 2008 and goodwill impairment charges of $59.5 million and restructuring charges of $41.6 million in 2009; restructuring charges of $12.5 million in 2010
c) Excludes inventory step-up costs of $17.3 million in 2006; restructuring costs of $4.0 million in 2009; goodwill impairment charges of $92.7 million in 2009; restructuring charges of $0.5 million in 2010
22
Mueller Water Products
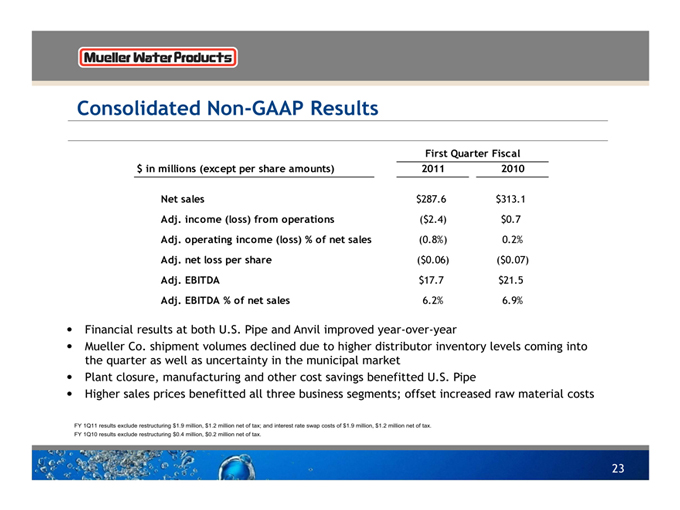
Consolidated Non-GAAP Results
First Quarter Fiscal
$ in millions (except per share amounts) 2011 2010
Net sales $287.6 $313.1
Adj. income (loss) from operations ($2.4) $0.7
Adj. operating income (loss) % of net sales (0.8%) 0.2%
Adj. net loss per share ($0.06) ($0.07)
Adj. EBITDA $17.7 $21.5
Adj. EBITDA % of net sales 6.2% 6.9%
• Financial results at both U.S. Pipe and Anvil improved year-over-year
• Mueller Co. shipment volumes declined due to higher distributor inventory levels coming into the quarter as well as uncertainty in the municipal market
• Plant closure, manufacturing and other cost savings benefitted U.S. Pipe
• Higher sales prices benefitted all three business segments; offset increased raw material costs
FY 1Q11 results exclude restructuring $1.9 million, $1.2 million net of tax; and interest rate swap costs of $1.9 million, $1.2 million net of tax.
FY 1Q10 results exclude restructuring $0.4 million, $0.2 million net of tax.
23
Mueller Water Products
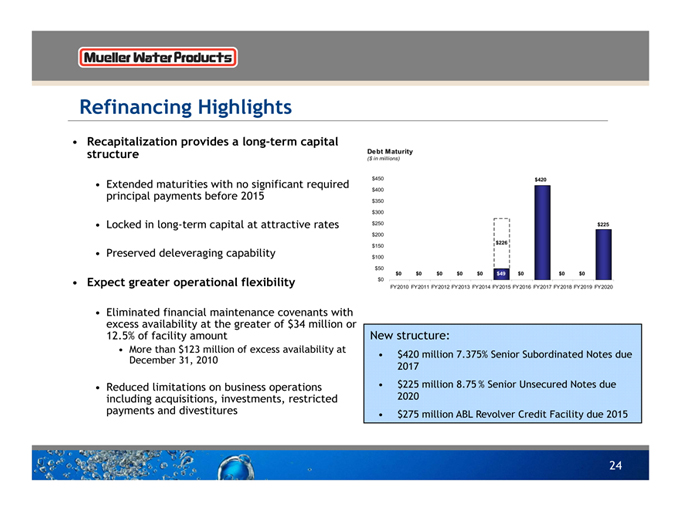
Refinancing Highlights
• Recapitalization provides a long-term capital structure
• Extended maturities with no significant required principal payments before 2015
• Locked in long-term capital at attractive rates
• Preserved deleveraging capability
• Expect greater operational flexibility
• Eliminated financial maintenance covenants with excess availability at the greater of $34 million or 12.5% of facility amount
• More than $123 million of excess availability at December 31, 2010
• Reduced limitations on business operations including acquisitions, investments, restricted payments and divestitures
Debt Maturity
($ in millions)
$450 $400 $350 $300 $250 $200 $150 $100 $50 $0
$226 $420 $225
$0 $0 $0 $0 $0 $49 $0 $0 $0
FY2010 FY2011 FY2012 FY2013 FY2014 FY2015 FY2016 FY2017 FY2018 FY2019 FY2020
New structure:
• $420 million 7.375% Senior Subordinated Notes due 2017
• $225 million 8.75% Senior Unsecured Notes due 2020
• $275 million ABL Revolver Credit Facility due 2015
24
Mueller Water Products
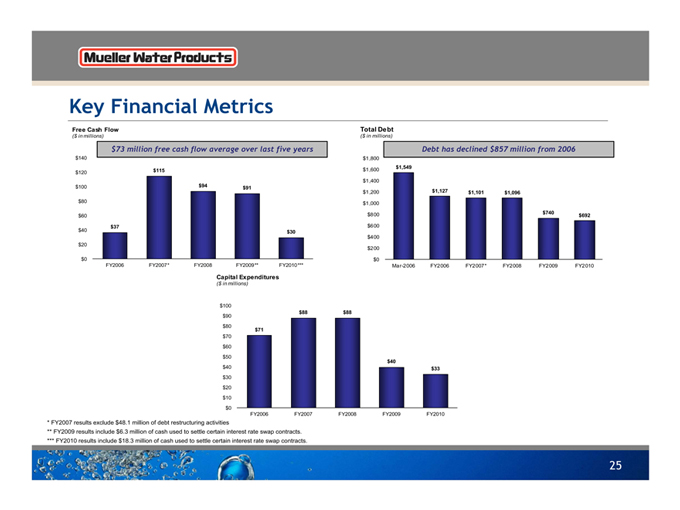
Key Financial Metrics
Free Cash Flow
($ in millions)
$73 million free cash flow average over last five years
$140 $120 $100 $80 $60 $40 $20 $0
$37 $115 $94 $91 $30
FY2006 FY2007* FY2008 FY2009** FY2010***
Total Debt
($ in millions)
Debt has declined $857 million from 2006
$1,800 $1,600 $1,400 $1,200 $1,000 $800 $600 $400 $200 $0
$1,549 $1,127 $1,101 $1,096 $740 $692
Mar-2006 FY2006 FY2007* FY2008 FY2009 FY2010
Capital Expenditures
($ in millions)
$100 $90 $80 $70 $60 $50 $40 $30 $20 $10 $0
$71 $88 $88 $40 $33
FY2006 FY2007 FY2008 FY2009 FY2010
* FY2007 results exclude $48.1 million of debt restructuring activities
** FY2009 results include $6.3 million of cash used to settle certain interest rate swap contracts.
*** FY2010 results include $18.3 million of cash used to settle certain interest rate swap contracts.
25
Mueller Water Products
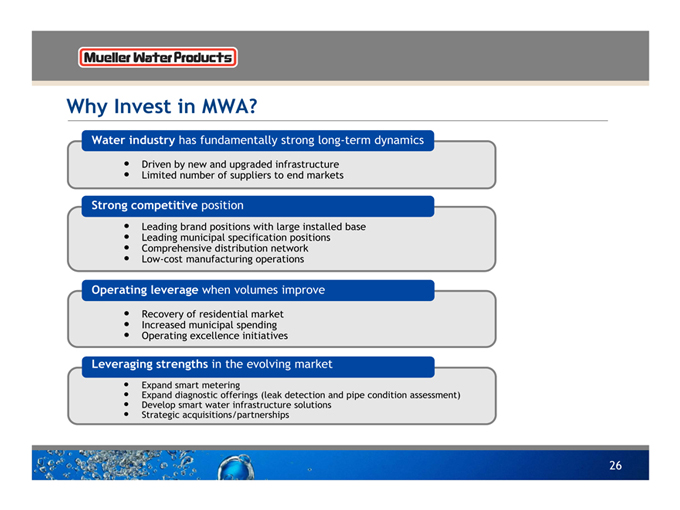
Why Invest in MWA?
Water industry has fundamentally strong long-term dynamics
• Driven by new and upgraded infrastructure
• Limited number of suppliers to end markets
Strong competitive position
• Leading brand positions with large installed base
• Leading municipal specification positions
• Comprehensive distribution network
• Low-cost manufacturing operations
Operating leverage when volumes improve
• Recovery of residential market
• Increased municipal spending
• Operating excellence initiatives
Leveraging strengths in the evolving market
• Expand smart metering
• Expand diagnostic offerings (leak detection and pipe condition assessment)
• Develop smart water infrastructure solutions
• Strategic acquisitions/partnerships
26
Mueller Water Products
Supplemental Data

Mueller Water Products
Segment Results and Reconciliation of Non-GAAP to GAAP Performance Measures
(in millions, except per share amounts)
Three months ended December 31, 2010
Mueller Co. U.S. Pipe Anvil Corporate Total
GAAP results:
Net sales $ 129.8 $ 74.4 $ 83.4 $ - $ 287.6
Gross profit (loss) $ 29.2 $ (2.4) $ 22.4 $ 0.4 $ 49.6
Selling, general and administrative expenses 20.4 7.0 15.9 8.7 52.0
Restructuring 0.4 0.9 0.6 - 1.9
Income (loss) from operations $ 8.4 $ (10.3) $ 5.9 $ (8.3) (4.3)
Interest expense, net 15.9
Income tax benefit (8.1)
Net loss $ (12.1)
Net loss per diluted share $ (0.08)
Capital expenditures $ 3.2 $ 1.4 $ 1.4 $ 0.4 $ 6.4
Non-GAAP results:
Adjusted income (loss) from operations and EBITDA:
Income (loss) from operations $ 8.4 $ (10.3) $ 5.9 $ (8.3) $ (4.3)
Impairment - - - - -
Restructuring 0.4 0.9 0.6 -1.9
Adjusted income (loss) from operations 8.8 (9.4) 6.5 (8.3) (2.4)
Depreciation and amortization 11.7 4.5 3.7 0.2 20.1
Adjusted EBITDA $ 20.5 $ (4.9) $ 10.2 $ (8.1) $ 17.7
Adjusted net loss:
Net loss $ (12.1)
Interest rate swap settlement costs, net of tax 1.2
Restructuring, net of tax 1.2
Adjusted net loss $ (9.7)
Adjusted net loss per diluted share $ (0.06)
Free cash flow:
Net cash provided by operating activities $ 5.2
Capital expenditures (6.4)
Free cash flow $ (1.2)
Net debt (end of period):
Current portion of long-term debt $ 0.8
Long-term debt 691.7
Total debt 692.5
Less cash and cash equivalents (71.9)
Net debt $ 620.6
28
Mueller Water Products
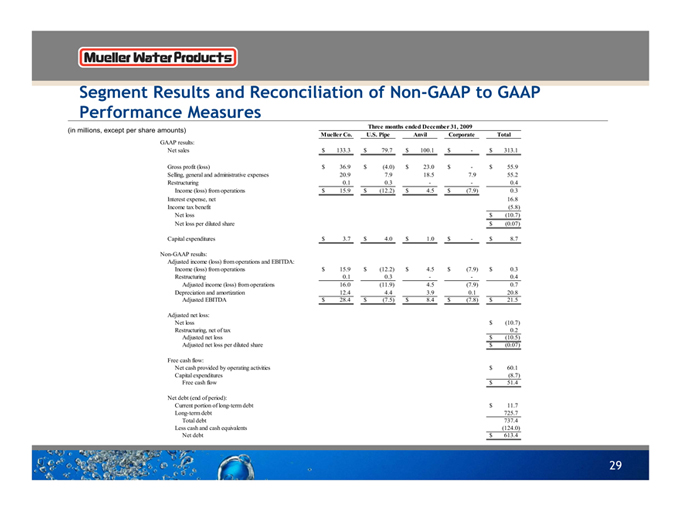
Segment Results and Reconciliation of Non-GAAP to GAAP Performance Measures
(in millions, except per share amounts)
Three months ended December 31, 2009
Mueller Co. U.S. Pipe Anvil Corporate Total
GAAP results:
Net sales $ 133.3 $ 79.7 $ 100.1 $ - $ 313.1
Gross profit (loss) $ 36.9 $ (4.0) $ 23.0 $ - $ 55.9
Selling, general and administrative expenses 20.9 7.9 18.5 7.9 55.2
Restructuring 0.1 0.3 - - 0.4
Income (loss) from operations $ 15.9 $ (12.2) $ 4.5 $ (7.9) 0.3
Interest expense, net 16.8
Income tax benefit (5.8)
Net loss $ (10.7)
Net loss per diluted share $ (0.07)
Capital expenditures $ 3.7 $ 4.0 $ 1.0 $ - $ 8.7
Non-GAAP results:
Adjusted income (loss) from operations and EBITDA:
Income (loss) from operations $ 15.9 $ (12.2) $ 4.5 $ (7.9) $ 0.3
Restructuring 0.1 0.3 - - 0.4
Adjusted income (loss) from operations 16.0 (11.9) 4.5 (7.9) 0.7
Depreciation and amortization 12.4 4.4 3.9 0.1 20.8
Adjusted EBITDA $ 28.4 $ (7.5) $ 8.4 $ (7.8) $ 21.5
Adjusted net loss:
Net loss $ (10.7)
Restructuring, net of tax 0.2
Adjusted net loss $ (10.5)
Adjusted net loss per diluted share $ (0.07)
Free cash flow:
Net cash provided by operating activities $ 60.1
Capital expenditures (8.7)
Free cash flow $ 51.4
Net debt (end of period):
Current portion of long-term debt $ 11.7
Long-term debt 725.7
Total debt 737.4
Less cash and cash equivalents (124.0)
Net debt $ 613.4
29

Mueller Water Products
Segment Results and Reconciliation of Non-GAAP to GAAP Performance Measures
(in millions, except per share amounts) Year ended September 30, 2010
Mueller Co. U.S. Pipe Anvil Corporate Total
GAAP results:
Net sales $ 612.8 $ 377.8 $ 346.9 $ - $ 1,337.5
Gross profit (loss) $ 170.3 $ (22.7) $ 88.8 $ - $ 236.4
Selling, general and administrative expenses 89.2 30.5 66.2 33.4 219.3
Restructuring 0.1 12.5 0.5 - 13.1
Income (loss) from operations $ 81.0 $ (65.7) $ 22.1 $ (33.4) 4.0
Interest expense, net 68.0
Loss on early extinguishment of debt 4.6
Income tax benefit (23.4)
Net loss $ (45.2)
Net loss per diluted share $ (0.29)
Capital expenditures $ 15.6 $ 11.0 $ 6.0 $ 0.2 $ 32.8
Non-GAAP results:
Adjusted income (loss) from operations and EBITDA:
Income (loss) from operations $ 81.0 $ (65.7) $ 22.1 $ (33.4) $ 4.0
Restructuring 0.1 12.5 0.5 - 13.1
Adjusted income (loss) from operations 81.1 (53.2) 22.6 (33.4) 17.1
Depreciation and amortization 49.7 18.9 15.4 0.6 84.6
Adjusted EBITDA $ 130.8 $ (34.3) $ 38.0 $ (32.8) $ 101.7
Adjusted net loss:
Net loss $ (45.2)
Restructuring, net of tax 7.9
Interest rate swap settlement costs, net of tax 4.8
Loss on early extinguishment of debt, net of tax 2.8
Tax on repatriation on Canadian earnings 2.2
Adjusted net loss $ (27.5)
Adjusted net loss per diluted share $ (0.18)
Free cash flow:
Net cash provided by operating activities $ 63.0
Capital expenditures (32.8)
Free cash flow $ 30.2
Net debt (end of period):
Current portion of long-term debt $ 0.7
Long-term debt 691.5
Total debt 692.2
Less cash and cash equivalents (83.7)
Net debt $ 608.5
30
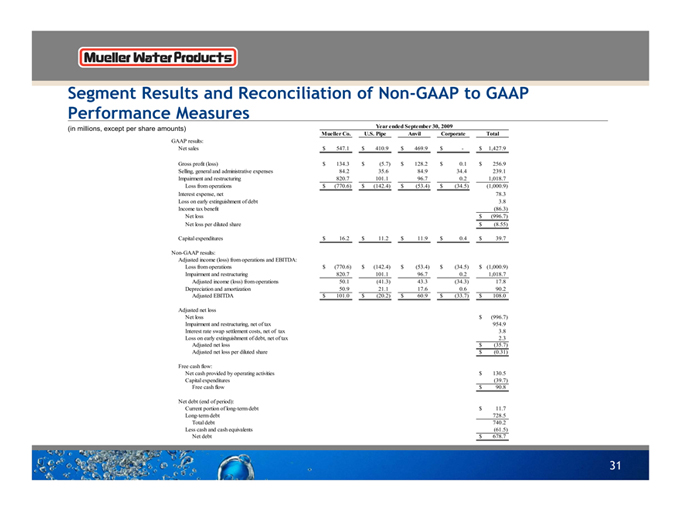
Mueller Water Products
Segment Results and Reconciliation of Non-GAAP to GAAP Performance Measures
(in millions, except per share amounts) Year ended September 30, 2009
Mueller Co. U.S. Pipe Anvil Corporate Total
GAAP results:
Net sales $ 547.1 $ 410.9 $ 469.9 $ - $ 1,427.9
Gross profit (loss) $ 134.3 $ (5.7) $ 128.2 $ 0.1 $ 256.9
Selling, general and administrative expenses 84.2 35.6 84.9 34.4 239.1
Impairment and restructuring 820.7 101.1 96.7 0.2 1,018.7
Loss from operations $ (770.6) $ (142.4) $ (53.4) $ (34.5) (1,000.9)
Interest expense, net 78.3
Loss on early extinguishment of debt 3.8
Income tax benefit (86.3)
Net loss $ (996.7)
Net loss per diluted share $ (8.55)
Capital expenditures $ 16.2 $ 11.2 $ 11.9 $ 0.4 $ 39.7
Non-GAAP results:
Adjusted income (loss) from operations and EBITDA:
Loss from operations $ (770.6) $ (142.4) $ (53.4) $ (34.5) $ (1,000.9)
Impairment and restructuring 820.7 101.1 96.7 0.2 1,018.7
Adjusted income (loss) from operations 50.1 (41.3) 43.3 (34.3) 17.8
Depreciation and amortization 50.9 21.1 17.6 0.6 90.2
Adjusted EBITDA $ 101.0 $ (20.2) $ 60.9 $ (33.7) $ 108.0
Adjusted net loss
Net loss $ (996.7)
Impairment and restructuring, net of tax 954.9
Interest rate swap settlement costs, net of tax 3.8
Loss on early extinguishment of debt, net of tax 2.3
Adjusted net loss $ (35.7)
Adjusted net loss per diluted share $ (0.31)
Free cash flow:
Net cash provided by operating activities $ 130.5
Capital expenditures (39.7)
Free cash flow $ 90.8
Net debt (end of period):
Current portion of long-term debt $ 11.7
Long-term debt 728.5
Total debt 740.2
Less cash and cash equivalents (61.5)
Net debt $ 678.7
31
Mueller Water Products
Questions