Exhibit 99.1

Exhibit 99.1
Brean Murray Carret & Co.
2011 Global Resources &
Infrastructure Conference
June 6, 2011
Non-GAAP Financial Measures
Non-GAAP Financial Measures
The Company presents adjusted income (loss) from operations, adjusted operating margin, adjusted EBITDA, adjusted EBITDA margin, adjusted net income (loss), adjusted net income (loss) per share, free cash flow and net debt as non-GAAP measures. Adjusted income (loss) from operations represents income (loss) from operations excluding restructuring. Adjusted operating margin represents adjusted income (loss) from operations as a percent of net sales. Adjusted EBITDA represents income (loss) from operations excluding restructuring, depreciation and amortization. Adjusted EBITDA margin represents adjusted EBITDA as a percent of net sales. The Company presents adjusted income ) oss (l from operations, adjusted operating margin, adjusted EBITDA and adjusted EBITDA margin because these are measures management believes are frequently used by securities analysts, investors and interested parties in the evaluation of financial performance. Adjusted net income (loss) and adjusted net income (loss) per share exclude restructuring, certain costs from settled interest rate swap contracts and the income tax effects of the previously mentioned items. These items are excluded because they are not considered indicative of recurring operations. Free cash flow represents cash flow from operating activities less capital expenditures. It is presented as a measurement of cash flow because it is commonly used by the investment community. Net debt represents total debt less cash and cash equivalents. Net debt is commonly used by the investment community as a measure of indebtedness. Adjusted income (loss) from operations, adjusted operating margin, adjusted EBITDA, adjusted EBITDA margin, adjusted net income (loss), adjusted net income (loss) per share, free cash flow and net debt have limitations as analytical tools, and securities analysts, investors and interested parties should not consider any of these non-GAAP measures in isolation or as a substitute for analysis of the Company's results as reported under accounting principles generally accepted in the United States ("GAAP") .
A reconciliation of non-GAAP to GAAP results is included as an attachment to this presentation and has been posted online at www.muellerwaterproducts. com
Safe Harbor Statement
Safe Harbor Statement
This presentation contains certain statements that may be deemed “forward -looking statements” within the meaning of the Private Securities Litigation Reform Act of 1995. All statements that address activities, events or developments that we intend, expect, plan, project, believe or anticipate will or may occur in the future are forward -looking statements. Examples of forward -looking statements include, but are not limited to, statements we make regarding expected volumes in our water infrastructure businesses for the second half of the year and benefits we expect to realize from higher pricing and our cost savings initiatives and other operational improvements and the impact of these factors on our businesses. Forward -looking statements are based on certain assumptions and assessments made by us in light of our experience and perception of historical trends, current conditions and expected future developments. Actual results and the timing of events may differ materially from those contemplated by the forward -looking statements due to a number of factors, including regional, national or global political, economic, business, competitive, market and regulatory conditions and the following:
the spending level for water and wastewater infrastructure;
the demand level of manufacturing and construction activity;
our ability to service our debt obligations; and
the other factors that are described in the section entitled “RISK FACTORS” in Item 1A of our most recently filed Annual Report on Form 10-K.
Undue reliance should not be placed on any forward-looking statements. We do not have any intention or obligation to update forward -looking statements, except as required by law.
Investment Highlights
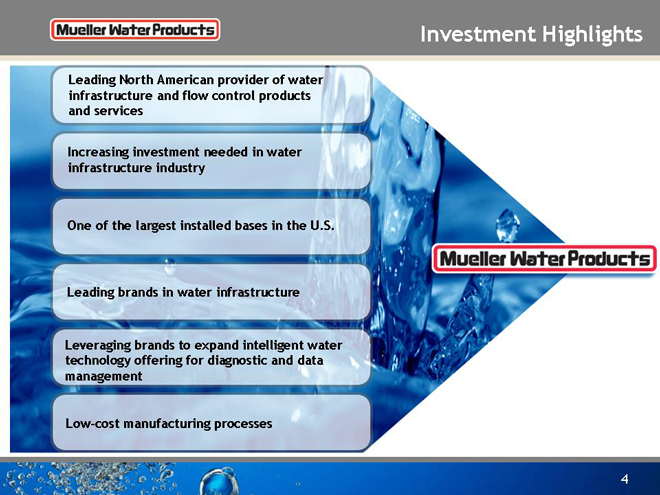
Leading North American provider of water infrastructure and flow control products and services
Increasing investment needed in water infrastructure industry
One of the largest installed bases in the U.S.
Leading brands in water infrastructure
Leveraging brands to expand intelligent water technology offering for diagnostic and data management
Low-cost manufacturing processes
Our Business
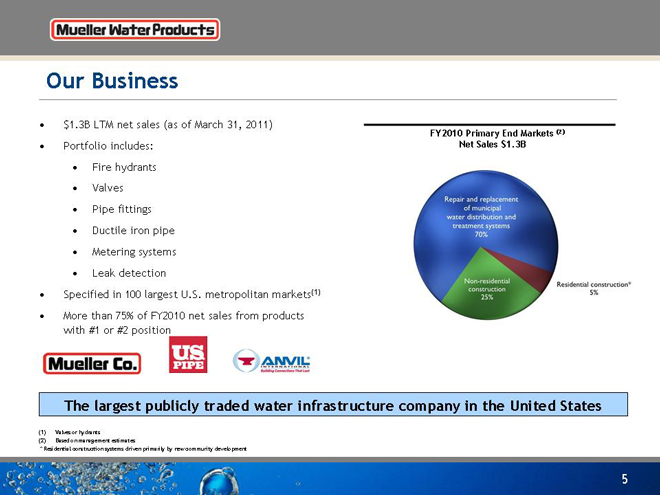
• $1.3B LTM net sales (as of March 31, 2011) FY2010 Primary End Markets (2)
• Portfolio includes: Net Sales $1.3B
• Fire hydrants
• Valves
• Pipe fittings
• Ductile iron pipe
• Metering systems
• Leak detection
• Specified in 100 largest U.S. metropolitan markets (1)
• More than 75% of FY2010 net sales from products with #1 or #2 position
The largest publicly traded water infrastructure company in the United States
Valves or hydrants
Based on management estimates
* | | Residential construction systems driven primarily by new community development |
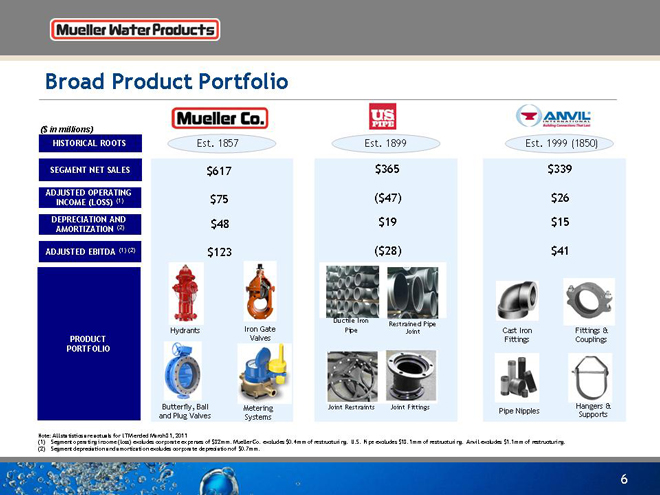
Broad Product Portfolio
($ in millions)
HISTORICAL ROOTS t t . . t . Es 1857 Es 1899 Es 1999 (1850)
SEGMENT NET SALES $617 $365 $339 ADJUSTED OPERATING ($47) $26 INCOME (LOSS) (1) $75 DEPRECIATION AND $48 $19 $15 AMORTIZATION (2)
ADJUSTED EBITDA (1) (2) $123 ($28) $41
Ductile Iron
Restrained Pipe
Hydrants Iron Gate Pipe Joint Cast Iron Fittings & PRODUCT Valves Fittings Couplings
PORTFOLIO
Butterfly, Ball Metering Joint Restraints Joint Fittings Hangers & Pipe Nipples and Plug Valves Systems Supports
Note: All statistics are actuals for LTM ended March 31, 2011
Segment operating income (loss) excludes corporate expenses of $32mm. Mueller Co. excludes $0.4mm of restructuring. U.S. Pipe excludes $13.1mm of restructuring. Anvil excludes $1.1mm of restructuring.
Segment depreciation and amortization excludes corporate depreciation of $0.7mm.
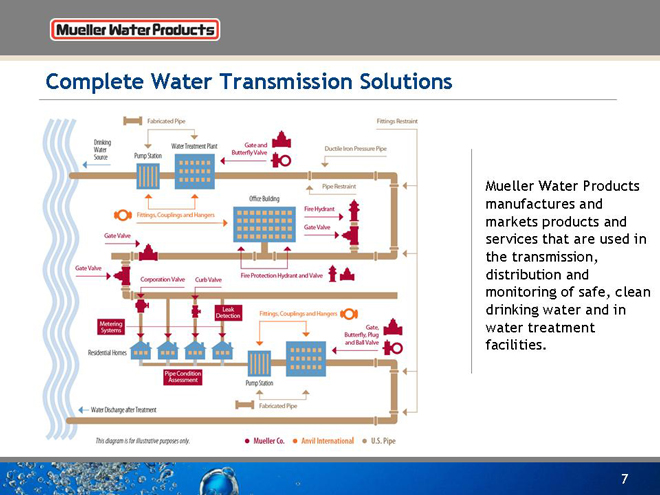
Complete Water Transmission Solutions
Mueller Water Products
manufactures and
markets products and
services that are used in
the transmission,
distribution and
monitoring of safe, clean
drinking water and in
water treatment
facilities.
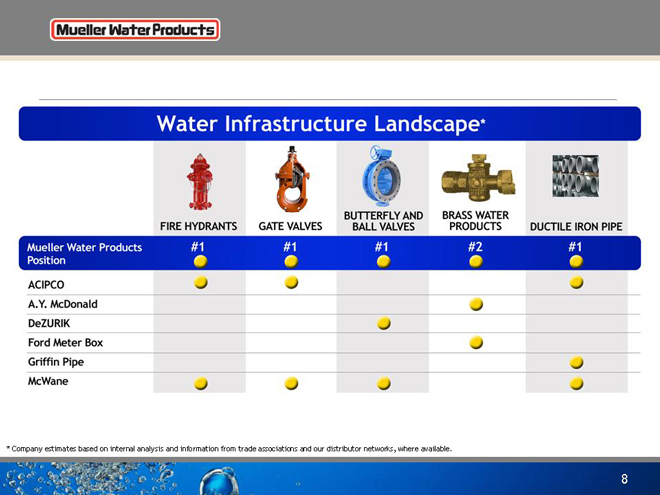
Water Infrastructure Landscape * Company estimates based on internal analysis and information from trade associations and our distributor networks, where available.
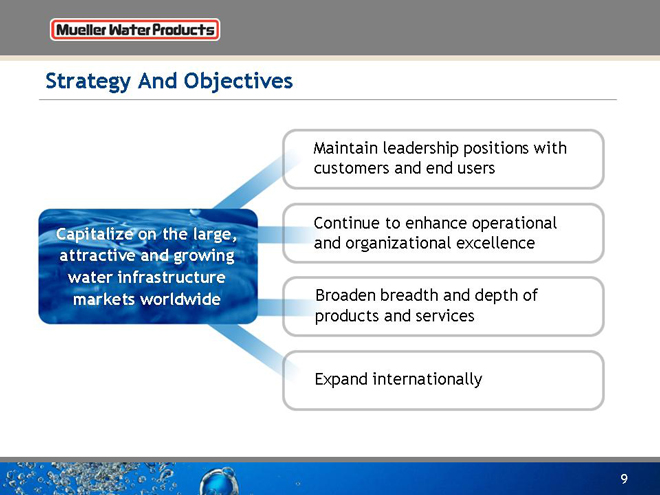
Strategy And Objectives
Maintain leadership positions with
customers and end users
Continue to enhance operational
Capitalize on the large, and organizational excellence attractive and growing water infrastructure markets worldwide Broaden breadth and depth of products and services
Expand internationally
9

Our End Markets
10
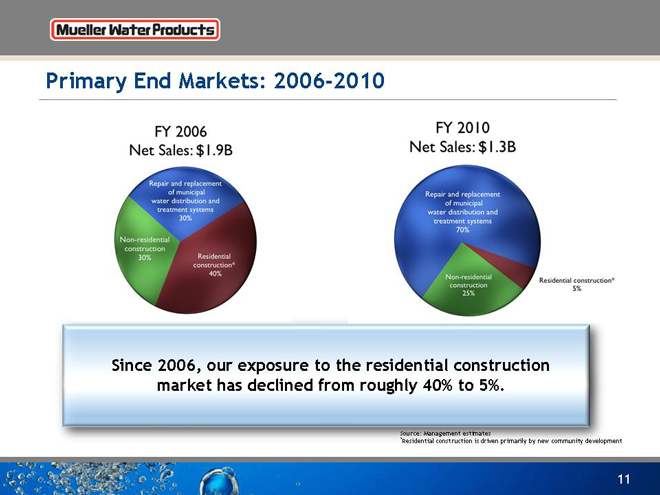
Primary End Markets: 2006-2010
Since 2006, our exposure to the residential construction market has declined from roughly 40% to 5%.
Source: Management estimates
*Residential construction is driven primarily by new community development
11
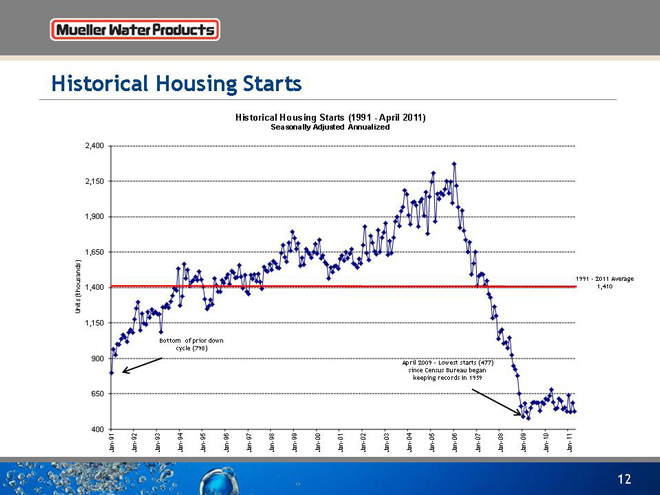
Historical Housing Starts
Historical Housing Starts (1991—April 2011) Seasonally Adjusted Annualized
2,400 2,150 1,900
1,650 sands) 1991 – 2011 Average
(thou 1,400 1,410 Units
1,150
Bottom of prior down cycle (798)
900
April 2009 – Lowest starts (477) since Census Bureau began keeping records in 1959
650
400
91—- 92—93—94—95—96 97—- 98—99 00—01—- 02—03 04—- 05 06—- 07—08 09—10—11 -Jan Jan Jan Jan Jan Jan Jan Jan Jan Jan Jan Jan Jan Jan Jan Jan Jan Jan Jan Jan Jan
12
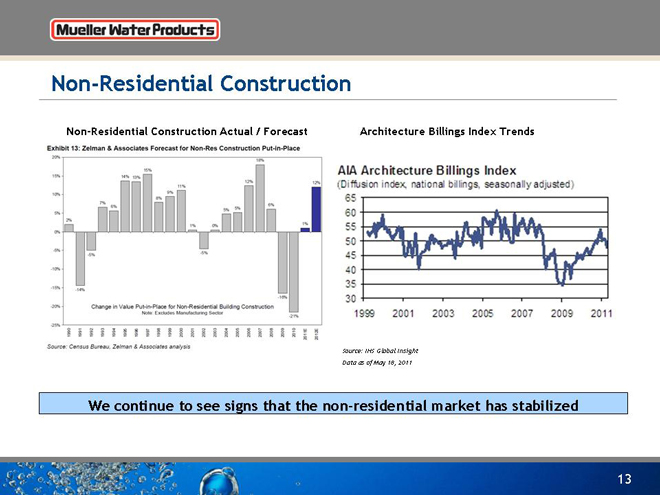
Non -Residential Construction
Non -Residential Construction Actual / Forecast Architecture Billings Index Trends
Source: IHS Global Insight Data as of May 18, 2011
We continue to see signs that the non-residential market has stabilized
13

A Significant Market Opportunity
14
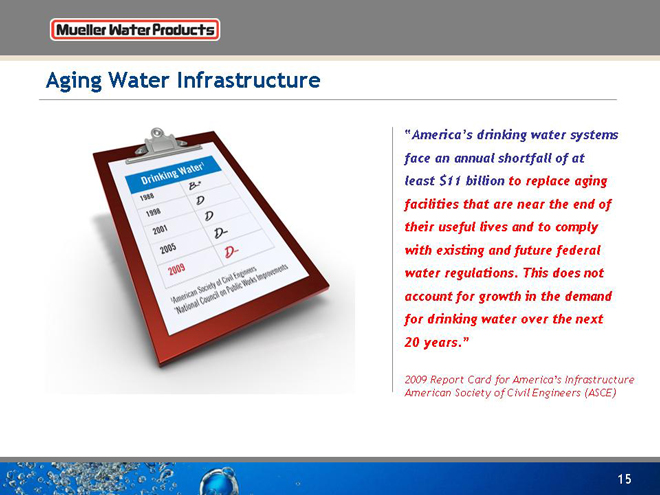
Aging Water Infrastructure
“America’s drinkin g water systems
face an annual shortfall of at
least $11 billion to replace aging
facilities that are near the end of
their useful lives and to comply
with existing and future federal
water regulations. This does not
account for growth in the demand
for drinking water over the next
20 years.”
2009 Report Card for America’s Infrastructure
American Society of Civil Engineers (ASCE)
15
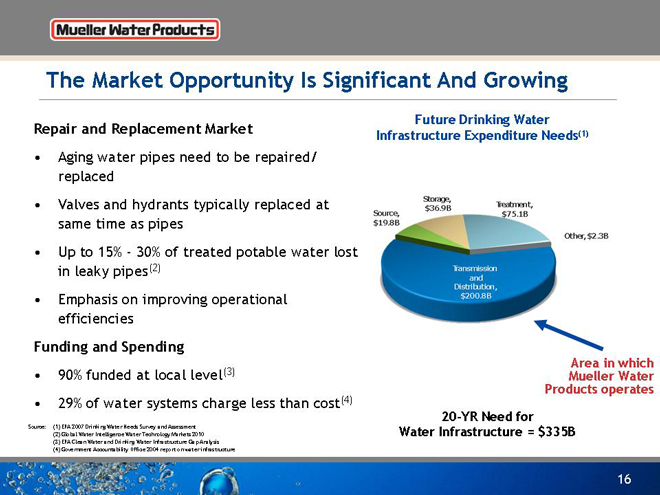
The Market Opportunity Is Significant And Growing
Repair and Replacement Market
Future Drinking Water
Infrastructure Expenditure Needs(1)
Aging water pipes need to be repaired/ replaced
Valves and hydrants typically replaced at same time as pipes
Up to 15%—30% of treated potable water lost in leaky pipes(2)
Emphasis on improving operational efficiencies
[Graphic Appears Here]
Funding and Spending
Area in which
•
90%
funded at local level(3)
Mueller Water
Products operates
•
29%
of water systems charge less than cost(4)
20-YR Need for
Source:
(1) EPA 2007 Drinking Water Needs Survey and Assessment
(2) Global Water Intelligence Water Technology Markets 2010
Water Infrastructure = $335B
(3) EPA Clean Water and Drinking Water Infrastructure Gap Analysis
(4) Government Accountability Office 2004 report on water infrastructure
16
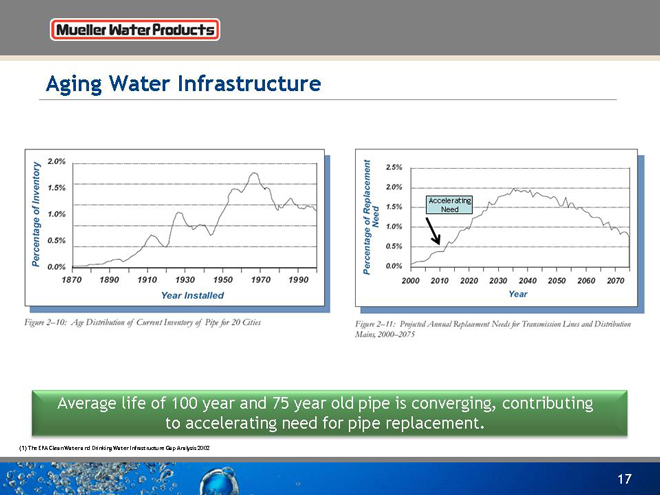
Aging Water Infrastructure
Accelerating Need
Average life of 100 year and 75 year old pipe is converging, contributing to accelerating need for pipe replacement.
(1) | | The EPA Clean Water and Drinking Water Infrastructure Gap Analysis 2002 |
17
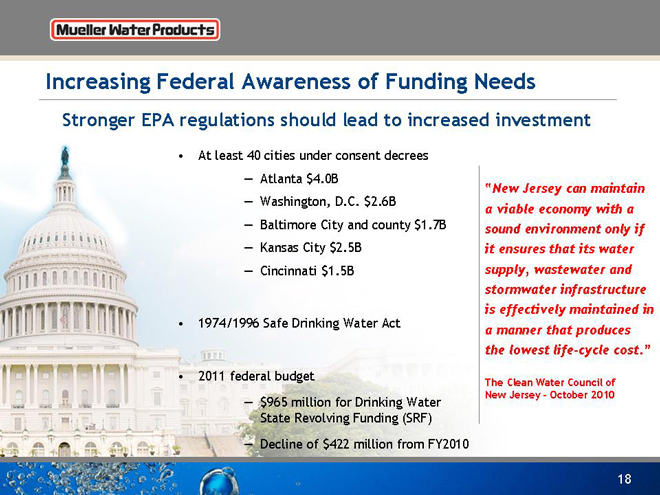
Increasing Federal Awareness of Funding Needs
Stronger EPA regulations should lead to increased investment
• At least 40 cities under consent decrees
Atlanta $4.0B
Washington, D.C. $2.6B
Baltimore City and county $1.7B
Kansas City $2.5B
Cincinnati $1.5B
1974/1996 Safe Drinking Water Act
2011 federal budget
— $965 million for Drinking Water State Revolvin g Funding (SRF)
(1) | | American Water Works Association 2009 State of the Industry Report — Decline of $422 million from FY2010 |
“New Jersey can maintain a viable economy with a sound environment only if it ensures that its water supply, wastewater and stormwater infrastructure is effectively maintained in a manner that produces the lowest life-cycle cost.”
The Clean Water Council of New Jersey—October 2010
18
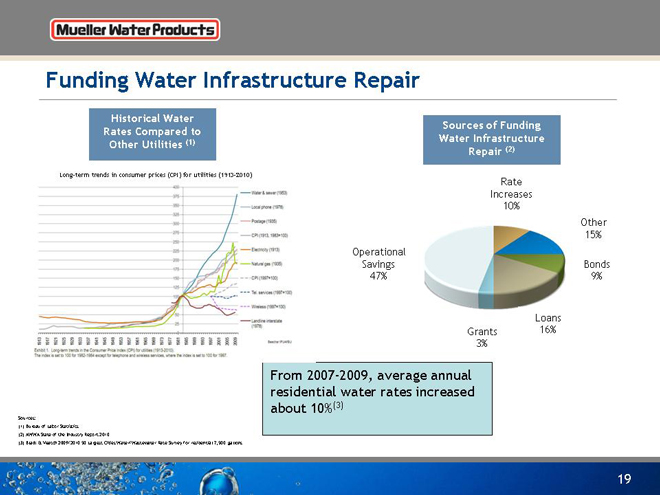
Funding Water Infrastructure Repair
Historical Water
Sources of Funding Rates Compared to (1) Water Infrastructure Other Utilities (2) Repair
Long-term trends in consumer prices (CPI) for utilities (1913-2010)
Rate Increases 10%
Other 15% Operational Savings Bonds 47% 9%
Loans Grants 16% 3%
From 2007-2009, average annual
residential water rates increased
about 10%(3)
Sources:
Bureau of Labor Statistics
AWWA State of the Industry Report 2010
Black & Veatch 2009/2010 50 Largest Cities Water/Wastewater Rate Survey for residential 7,500 gallons
19

Actions & Business Results
20
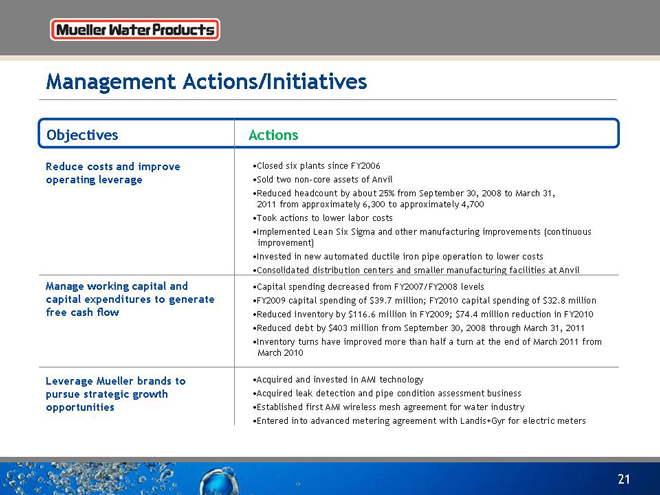
Management Actions/Initiatives
Objectives
Reduce costs and improve operating leverage
Manage working capital and capital expenditures to generate free cash flow
Leverage Mueller brands to pursue strategic growth opportunities Actions
•Closed six plants since FY2006
•Sold two non-core assets of Anvil
•Reduced headcount by about 25% from September 30, 2008 to March 31, 2011 from approximately 6,300 to approximately 4,700 •Took actions to lower labor costs •Implemented Lean Six Sigma and other manufacturing improvements (continuous improvement) •Invested in new automated ductile iron pipe operation to lower costs •Consolidated distribution centers and smaller manufacturing facilities at Anvil •Capital spen 7/FY ding decrease d from FY200 2008 levels •FY2009 capital spending of $39.7 million; FY2010 capital spending of $32.8 million •Reduced inventory by $116.6 million in FY2009; $74.4 million reduction in FY2010 •Reduced debt by $403 million from September 30, 2008 through March 31, 2011 •Inventory turns have improved more than half a turn at the end of March 2011 from March 2010
•Acquired and invested in AMI technology
•Acquired leak detection and pipe condition assessment business •Established first AMI wireless mesh agreement for water industry
•Entered into advanced meterin g agreement with Landis+G yr for electric meters
21
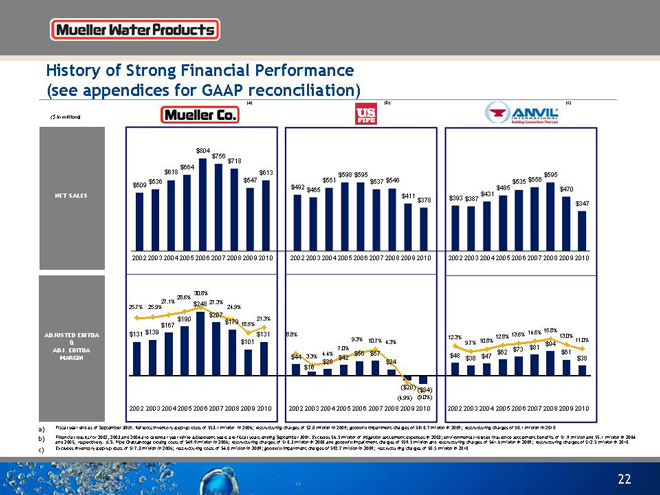
History of Strong Financial Performance
(see appendices for GAAP reconciliation)
($ in millions)
$804 $756 $718 $618 $664 $613 $598 $595 $595 $509 $536 $547 $551 $537 $546 $535 $556
$492 $485 $470 $465
NET SALES $411 $431 $378 $393 $387 $347
2002 2003 2004 2005 2006 2007 2008 2009 2010 2002 2003 2004 2005 2006 2007 2008 2009 2010 2002 2003 2004 2005 2006 2007 2008 2009 2010
30.8% 28.6% 27.1% $248 27.3% 25.7% 25.9% 24.9% $207 $190 21.3% $179 18.5% $167 15.8% ADJUSTED EBITDA $131 $139 $131 8.8% 13.6% 14.6% 12.3% 12.8% 13.0% 9.3% 10.7% 10.8% 11.0% & $101 4.3% 9.7% $81 $94
ADJ. EBITDA 7.0% $73
4.% $564 $57 $62 $61 MARGIN $44 3.3% $42 $48 $38 $47 $38 $16 $26 $24
($20) ($34) (4.9%) (9.0%)
2002 2003 2004 2005 2006 2007 2008 2009 2010 2002 2003 2004 2005 2006 2007 2008 2009 2010 2002 2003 2004 2005 2006 2007 2008 2009 2010
Fiscal year end as of September 30th. Reflects inventory step-up costs of $53.1 million in 2006; restructuring charges of $2.0 million in 2009; goodwill impairment charges of $818.7 million in 2009; restructuring charges of $0.1 million in 2010
Financial results for 2002, 2003 and 2004 are calendar year while subsequent years are fiscal years ending September 30th. Excludes $6.5 million of litigation settlement expenses in 2003; environmental-related insurance settlement benefits of $1.9 million and $5.1 million in 2004 and 2005, respectively. U.S. Pipe Chattanooga closing costs of $49.9 million in 2006; restructuring charges of $18.3 million in 2008 and goodwill impairment charges of $59.5 million and restructuring charges of $41.6 million in 2009; restructuring charges of $12.5 million in 2010
Excludes inventory step-up costs of $17.3 million in 2006; restructuring costs of $4.0 million in 2009; goodwill impairment charges of $92.7 million in 2009; restructuring charges of $0.5 million in 2010
22
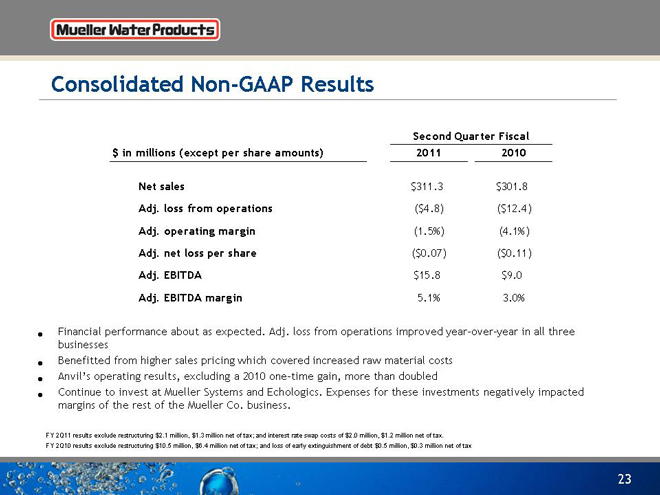
Consolidated Non-GAAP Results
Second Quarter Fiscal
$ in millions (except per share amounts)
2011
2010
Net sales
$311.3
$301.8
Adj. loss from o perations
($4.8)
($12.4)
Adj. operating margin
(1.5%)
(4.1%)
Adj. net loss per share
($0.07)
($0.11)
Adj. EBITDA
$15.8
$9.0
Adj. EBITDA margin
5.1%
3.0%
Financial performance about as expected. Adj. loss from operations improved year-over-year in all three businesses
Benefitted from higher sales pricing which covered increased raw material costs
Anvil’s operating results, excluding a 2010 one-time gain, more than doubled
Continue to invest at Mueller Systems and Echologics. Expenses for these investments negatively impacted margins of the rest of the Mueller Co. business.
FY 2Q11 results exclude restructuring $2.1 million, $1.3 million net of tax; and interest rate swap costs of $2.0 million, $1.2 million net of tax.
FY 2Q10 results exclude restructuring $10.5 million, $6.4 million net of tax; and loss of early extinguishment of debt $0.5 million, $0.3 million net of tax
23

Refinancing Highlights
Recapitalization provides a long-term capital structure
Extended maturities with no significant required principal payments before 2015
Locked in long-term capital at attractive rates
Preserved deleveraging capability
• Expect greater operational flexibilit y
Eliminated financial maintenance covenants with excess availability at the greater of $34 million or 12.5% of facility amount
More than $163 million of excess availability at March 31, 2011
Reduced limitations on business operations including acquisitions, investments, restricted
payments and divestitures
New structure:
$420 million 7.375% Senior Subordinated Notes due
2017
$225 million 8.75 % Senior Unsecured Notes due 2020
$275 million ABL Revolver Credit Facility due 2015
24
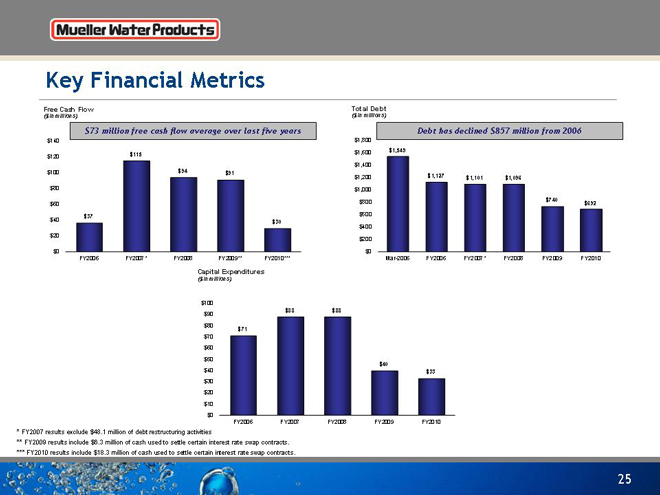
Key Financial Metrics
Free Cash Flow Total Debt
($ in millions) ($ in millions)
$73 million free cash flow average over last five years Debt has declined $857 million from 2006
$140 800 $1, $1,549 $115 $1,600 $120 $94 $1,400 $100 $91 $1,200 $1,127 $1,101 $1,096 $80 $1,000 $800 $740 $60 $692 $40 $37 $600 $30 $400 $20 $200
$0 $0
FY2006 FY2007* FY2008 FY2009** FY2010*** Mar-2006 FY2006 FY2007* FY2008 FY2009 FY2010
Capital Expenditures
($ in millions)
$100 $88 $88 $90 $80 $71 $70 $60 $50 $40 $40 $33 $30 $20 $10 $0 FY2006 FY2007 FY2008 FY2009 FY2010
FY2007 results exclude $48.1 million of debt restructuring activities
FY2009 results include $6.3 million of cash used to settle certain interest rate swap contracts.
FY2010 results include $18.3 million of cash used to settle certain interest rate swap contracts.
25
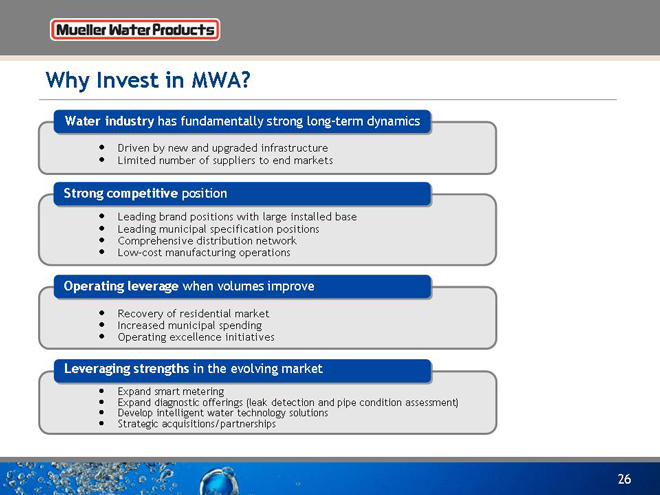
Why Invest in MWA?
Water industry has fundamentally strong long-term dynamics
Driven by new and upgraded infrastructure
Limited number of suppliers to end markets
Strong competitive position
Leading brand positions with large installed base
Leading municipal specification positions
Comprehensive distribution network
Low-cost manufacturing operations
Operating leverage when volumes improve
Recovery of residential market
Increased municipal spending
Operating excellence initiatives
Leveraging strengths in the evolving market
Expand smart metering
Expand diagnostic offerings (leak detection and pipe condition assessment)
Develop intelligent water technology solutions
Strategic acquisitions/partnerships
26

Supplemental Data
27
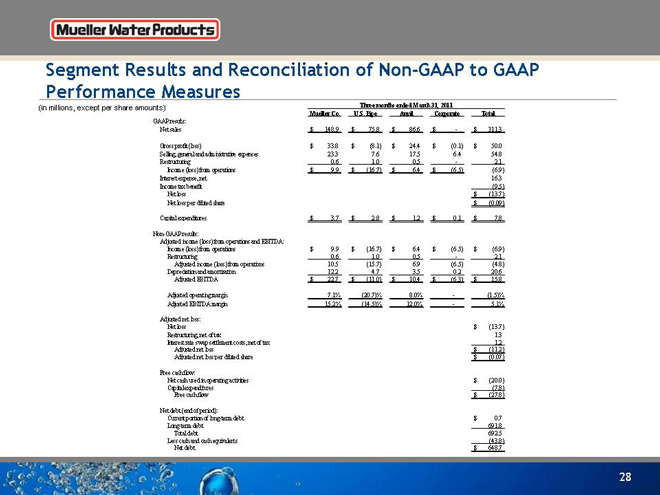
Segment Results and Reconciliation of Non-GAAP to GAAP Performance Measures
(in millions, except per share amounts)
Three months ended March 31, 2011
Mueller Co.
U.S. Pipe
Anvil
Corporate
Total
GAAP results:
Net sales
$148.9
$75.8
$86.6
$—
$311.3
Gross profit (loss)
$33.8
$(8.1)
$24.4
$(0.1)
$50.0
Selling, general and administrative expenses
23.3
7.6
17.5
6.4
54.8
Restructuring
0.6
1.0
0.5
—
2.1
Income (loss) from operations
$9.9
$(16.7)
$6.4
$(6.5)
(6.9)
Interest expense, net
16.3
Income tax benefit
(9.5)
Net loss
$(13.7)
Net loss per diluted share
$(0.09)
Capital expenditures
$3.7
$2.8
$1.2
$0.1
$7.8
Non-GAAP results:
Adjusted income (loss) from operations and EBITDA:
Income (loss) from operations
$9.9
$(16.7)
$6.4
$(6.5)
$(6.9)
Restructuring
0.6
1.0
0.5
—
2.1
Adjusted income (loss) from operations
10.5
(15.7)
6.9
(6.5)
(4.8)
Depreciation and amortization
12.2
4.7
3.5
0.2
20.6
Adjusted EBITDA
$22.7
$(11.0)
$10.4
$(6.3)
$15.8
Adjusted operating margin
7.1%
(20.7)%
8.0%
—
(1.5)%
Adjusted EBITDA margin
15.2%
(14.5)%
12.0%
—
5.1%
Adjusted net loss:
Net loss
$(13.7)
Restructuring, net of tax
1.3
Interest rate swap settlement costs, net of tax
1.2
Adjusted net loss
$(11.2)
Adjusted net loss per diluted share
$(0.07)
Free cash flow:
Net cash used in operating activities
$(20.0)
Capital expenditures
(7.8)
Free cash flow
$(27.8)
Net debt (end of period):
Current portion of long-term debt
$0.7
Long-term debt
691.8
Total debt
692.5
Less cash and cash equivalents
(43.8)
Net debt
$648.7
28
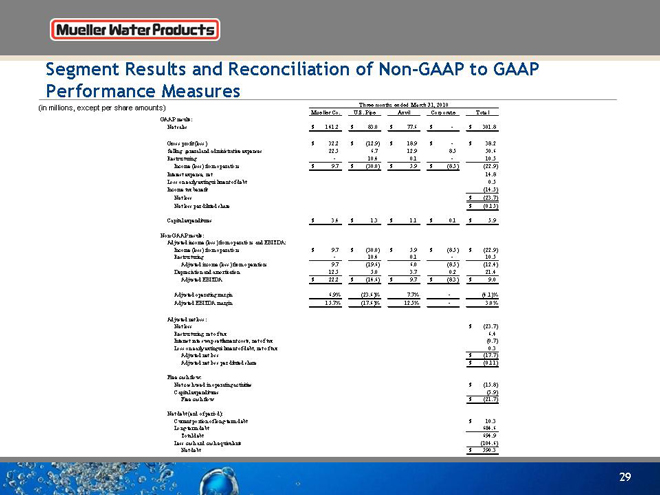
Segment Results and Reconciliation of Non-GAAP to GAAP Performance Measures
except per share amounts) (in millions,
Three months ended March 31, 2010
Mueller Co.
U.S. Pipe
Anvil
Corporate
Total
GAAP results:
Net sales
$141.2
$83.0
$77.6
$—
$301.8
Gross profit (loss)
$32.2
$(12.9)
$18.9
$—
$38.2
Selling, general and administrative expenses
22.5
6.7
12.9
8.5
50.6
Restructuring
—
10.4
0.1
—
10.5
Income (loss) from operations
$9.7
$(30.0)
$5.9
$(8.5)
(22.9)
Interest expense, net
14.8
Loss on early extinguishment of debt
0.5
Income tax benefit
(14.5)
Net loss
$(23.7)
Net loss per diluted share
$(0.15)
Capital expenditures
$3.4
$1.3
$1.1
$0.1
$5.9
Non-GAAP results:
Adjusted income (loss) from operations and EBITDA:
Income (loss) from operations
$9.7
$(30.0)
$5.9
$(8.5)
$(22.9)
Restructuring
—
10.4
0.1
—
10.5
Adjusted income (loss) from operations
9.7
(19.6)
6.0
(8.5)
(12.4)
Depreciation and amortization
12.5
5.0
3.7
0.2
21.4
Adjusted EBITDA
$22.2
$(14.6)
$9.7
$(8.3)
$9.0
Adjusted operating margin
6.9%
(23.6)%
7.7%
—
(4.1)%
Adjusted EBITDA margin
15.7%
(17.6)%
12.5%
—
3.0%
Adjusted net loss:
Net loss
$(23.7)
Restructuring, net of tax
6.4
Interest rate swap settlement costs, net of tax
(0.7)
Loss on early extinguishment of debt, net of tax
0.3
Adjusted net loss
$(17.7)
Adjusted net loss per diluted share
$(0.11)
Free cash flow:
Net cash used in operating activities
$(15.8)
Capital expenditures
(5.9)
Free cash flow
$(21.7)
Net debt (end of period):
Current portion of long-term debt
$10.3
Long-term debt
684.6
Total debt
694.9
Less cash and cash equivalents
(104.6)
Net debt
$590.3
29
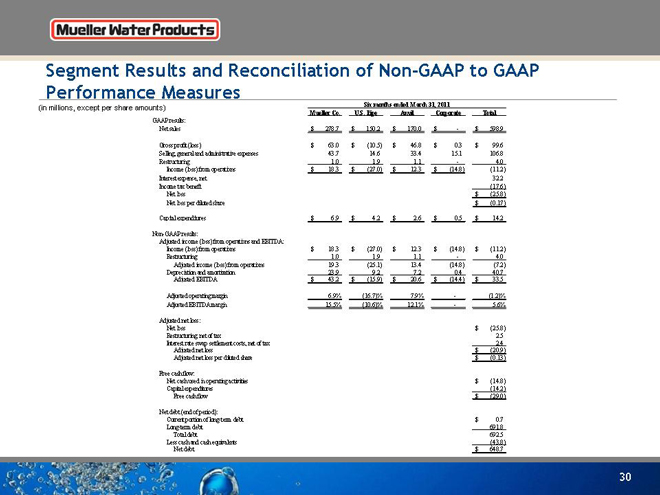
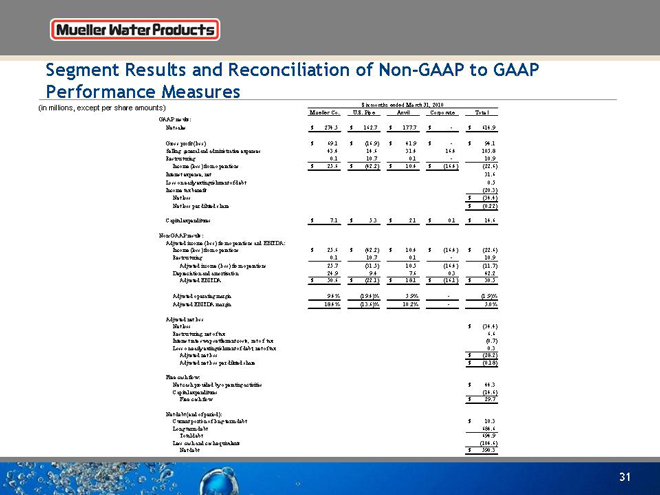
Segment Results and Reconciliation of Non-GAAP to GAAP Performance Measures
(in
millions, except per share amounts)
Six months ended March 31, 2011
Mueller Co.
U.S. Pipe
Anvil
Corporate
Total
GAAP results:
Net sales
$278.7
$150.2
$170.0
$—
$598.9
Gross profit (loss)
$63.0
$(10.5)
$46.8
$0.3
$99.6
Selling, general and administrative expenses
43.7
14.6
33.4
15.1
106.8
Restructuring
1.0
1.9
1.1
—
4.0
Income (loss) from operations
$18.3
$(27.0)
$12.3
$(14.8)
(11.2)
Interest expense, net
32.2
Income tax benefit
(17.6)
Net loss
$(25.8)
Net loss per diluted share
$(0.17)
Capital expenditures
$6.9
$4.2
$2.6
$0.5
$14.2
Non-GAAP results:
Adjusted income (loss) from operations and EBITDA:
Income (loss) from operations
$18.3
$(27.0)
$12.3
$(14.8)
$(11.2)
Restructuring
1.0
1.9
1.1
—
4.0
Adjusted income (loss) from operations
19.3
(25.1)
13.4
(14.8)
(7.2)
Depreciation and amortization
23.9
9.2
7.2
0.4
40.7
Adjusted EBITDA
$43.2
$(15.9)
$20.6
$(14.4)
$33.5
Adjusted operating margin
6.9%
(16.7)%
7.9%
—
(1.2)%
Adjusted EBITDA margin
15.5%
(10.6)%
12.1%
—
5.6%
Adjusted net loss:
Net loss
$(25.8)
Restructuring, net of tax
2.5
Interest rate swap settlement costs, net of tax
2.4
Adjusted net loss
$(20.9)
Adjusted net loss per diluted share
$(0.13)
Free cash flow:
Net cash used in operating activities
$(14.8)
Capital expenditures
(14.2)
Free cash flow
$(29.0)
Net debt (end of period):
Current portion of long-term debt
$0.7
Long-term debt
691.8
Total debt
692.5
Less cash and cash equivalents
(43.8)
Net debt
$648.7
30
Segment Results and Reconciliation of Non-GAAP to GAAP Performance Measures
Six months ended March 31, 2010
(in millions, except per share amounts)
Mueller Co.
U.S. Pipe
Anvil
Corporate
Total
GAAP results:
Net sales
$274.5
$162.7
$177.7
$—
$614.9
Gross profit (loss)
$69.1
$(16.9)
$41.9
$—
$94.1
Selling, general and administrative expenses
43.4
14.6
31.4
16.4
105.8
Restructuring
0.1
10.7
0.1
—
10.9
Income (loss) from operations
$25.6
$(42.2)
$10.4
$(16.4)
(22.6)
Interest expense, net
31.6
Loss on early extinguishment of debt
0.5
Income tax benefit
(20.3)
Net loss
$(34.4)
Net loss per diluted share
$(0.22)
Capital expenditures
$7.1
$5.3
$2.1
$0.1
$14.6
Non-GAAP results:
Adjusted income (loss) from operations and EBITDA:
Income (loss) from operations
$25.6
$(42.2)
$10.4
$(16.4)
$(22.6)
Restructuring
0.1
10.7
0.1
—
10.9
Adjusted income (loss) from operations
25.7
(31.5)
10.5
(16.4)
(11.7)
Depreciation and amortization
24.9
9.4
7.6
0.3
42.2
Adjusted EBITDA
$50.6
$(22.1)
$18.1
$(16.1)
$30.5
Adjusted operating margin
9.4%
(19.4)%
5.9%
—
(1.9)%
Adjusted EBITDA margin
18.4%
(13.6)%
10.2%
—
5.0%
Adjusted net loss
Net loss
$(34.4)
Restructuring, net of tax
6.6
Interest rate swap settlement costs, net of tax
(0.7)
Loss on early extinguishment of debt, net of tax
0.3
Adjusted net loss
$(28.2)
Adjusted net loss per diluted share
$(0.18)
Free cash flow:
Net cash provided by operating activities
$44.3
Capital expenditures
(14.6)
Free cash flow
$29.7
Net debt (end of period):
Current portion of long-term debt
$10.3
Long-term debt
684.6
Total debt
694.9
Less cash and cash equivalents
(104.6)
Net debt
$590.3
31
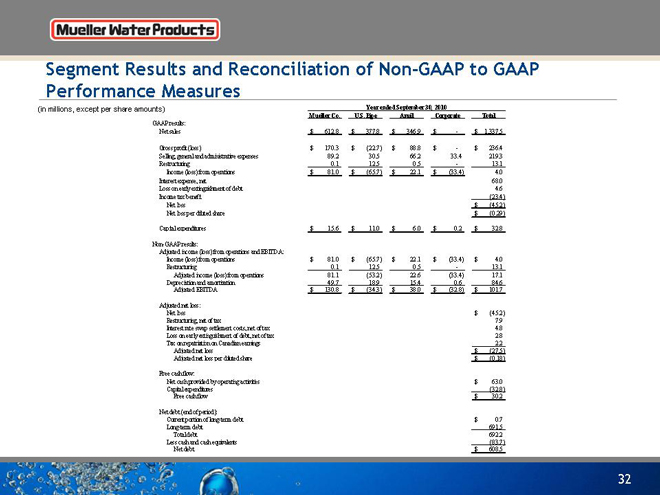
Segment Results and Reconciliation of Non-GAAP to GAAP Performance Measures
(in millions, except per share amounts)
Year ended September 30, 2010
Mueller Co.
U.S. Pipe
Anvil
Corporate
Total
GAAP results:
Net sales
$612.8
$377.8
$346.9
$—
$1,337.5
Gross profit (loss)
$170.3
$(22.7)
$88.8
$—
$236.4
Selling, general and administrative expenses
89.2
30.5
66.2
33.4
219.3
Restructuring
0.1
12.5
0.5
—
13.1
Income (loss) from operations
$81.0
$(65.7)
$22.1
$(33.4)
4.0
Interest expense, net
68.0
Loss on early extinguishment of debt
4.6
Income tax benefit
(23.4)
Net loss
$(45.2)
Net loss per diluted share
$(0.29)
Capital expenditures
$15.6
$11.0
$6.0
$0.2
$32.8
Non-GAAP results:
Adjusted income (loss) from operations and EBITDA:
Income (loss) from operations
$81.0
$(65.7)
$22.1
$(33.4)
$4.0
Restructuring
0.1
12.5
0.5
—
13.1
Adjusted income (loss) from operations
81.1
(53.2)
22.6
(33.4)
17.1
Depreciation and amortizationo
49.7
18.9
15.4
0.6
84.6
Adjusted EBITDA
$130.8
$(34.3)
$38.0
$(32.8)
$101.7
Adjusted net loss:
Net loss
$(45.2)
Restructuring, net of tax
7.9
Interest rate swap settlement costs, net of tax
4.8
Loss on early extinguishment of debt, net of tax
2.8
Tax on repatriation on Canadian earnings
2.2
Adjusted net loss
$(27.5)
Adjusted net loss per diluted share
$(0.18)
Free cash flow:
Net cash provided by operating activities
$63.0
Capital expenditures
(32.8)
Free cash flow
$30.2
Net debt (end of period):
Current portion of long-term debt
$0.7
Long-term debt
691.5
Total debt
692.2
Less cash and cash equivalents
(83.7)
Net debt
$608.5
32

Segment Results and Reconciliation of Non-GAAP to GAAP Performance Measures
(in millions, except per share amounts)
Year ended September 30, 2009
Mueller Co.
U.S. Pipe
Anvil
Corporate
Total
GAAP results:
Net sales
$547.1
$410.9
$469.9
$—
$1,427.9
Gross profit (loss)
$134.3
$(5.7)
$128.2
$0.1
$256.9
Selling, general and administrative expenses
84.2
35.6
84.9
34.4
239.1
Impairment and restructuring
820.7
101.1
96.7
0.2
1,018.7
Loss from operations
$(770.6)
$(142.4)
$(53.4)
$(34.5)
(1,000.9)
Interest expense, net
78.3
Loss on early extinguishment of debt
3.8
Income tax benefit
(86.3)
Net loss
$(996.7)
Net loss per diluted share
$(8.55)
Capital expenditures
$16.2
$11.2
$11.9
$0.4
$39.7
Non-GAAP results:
Adjusted income (loss) from operations and EBITDA:
Loss from operations
$(770.6)
$(142.4)
$(53.4)
$(34.5)
$(1,000.9)
Impairment and restructuring
820.7
101.1
96.7
0.2
1,018.7
Adjusted income (loss) from operations
50.1
(41.3)
43.3
(34.3)
17.8
Depreciation and amortization
50.9
21.1
17.6
0.6
90.2
Adjusted EBITDA
$101.0
$(20.2)
$60.9
$(33.7)
$108.0
Adjusted net loss
Net loss
$(996.7)
Impairment and restructuring, net of tax
954.9
Interest rate swap settlement costs, net of tax
3.8
Loss on early extinguishment of debt, net of tax
2.3
Adjusted net loss
$(35.7)
Adjusted net loss per diluted share
$(0.31)
Free cash flow:
Net cash provided by operating activities
$130.5
Capital expenditures
(39.7)
Free cash flow
$90.8
Net debt (end of period):
Current portion of long-term debt
$11.7
Long-term debt
728.5
Total debt
740.2
Less cash and cash equivalents
(61.5)
Net debt
$678.7
33

Questions
34