1 BB&T Capital Markets Investor Conference August 10, 2011 Exhibit 99.1 |
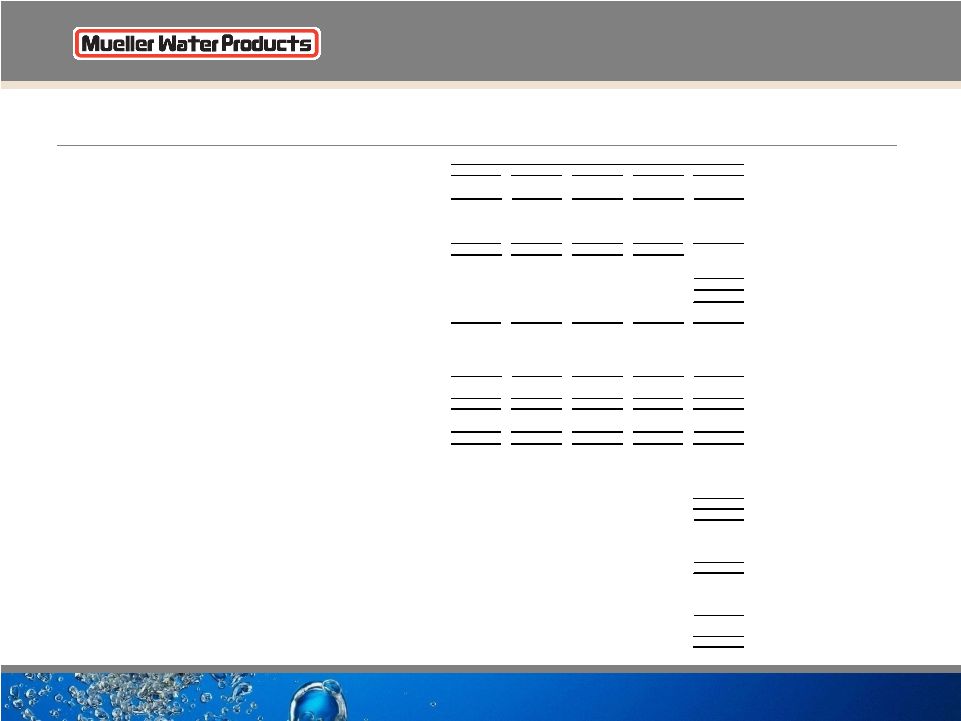
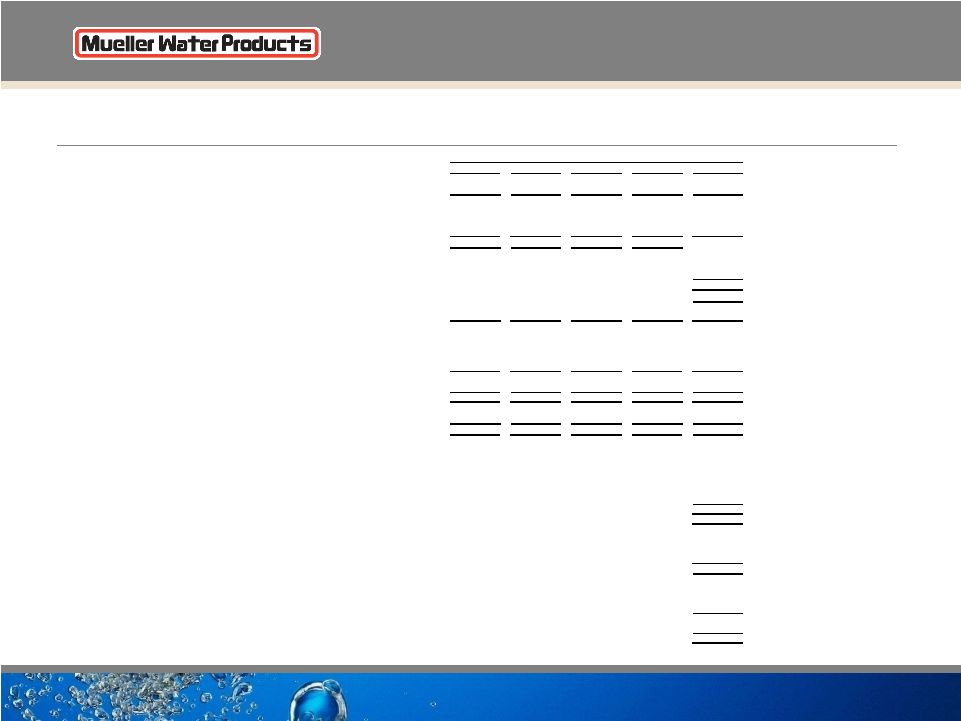
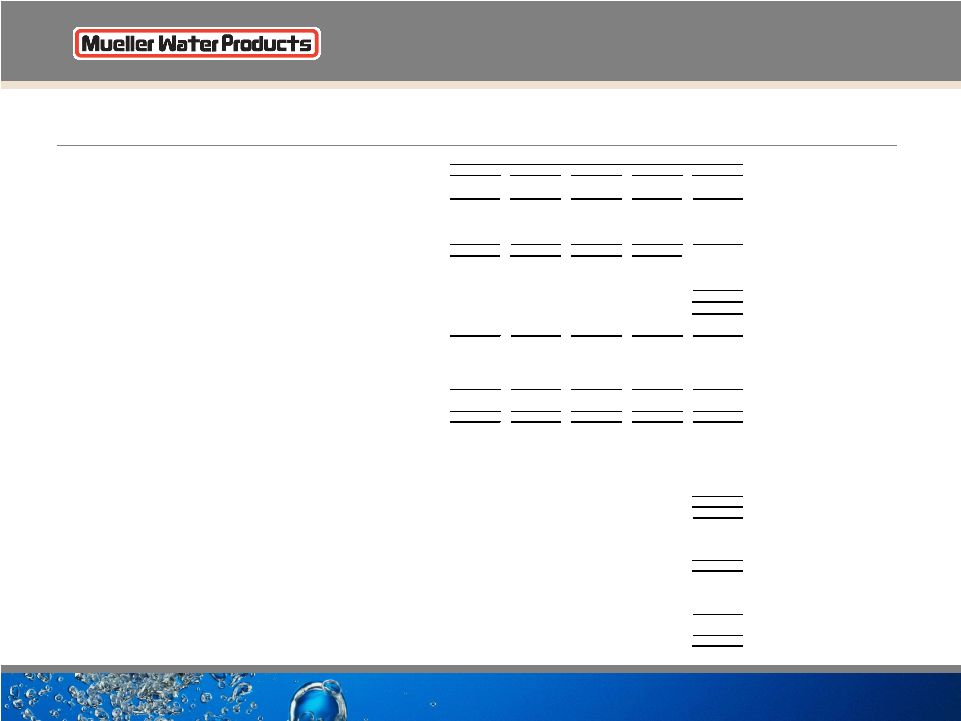
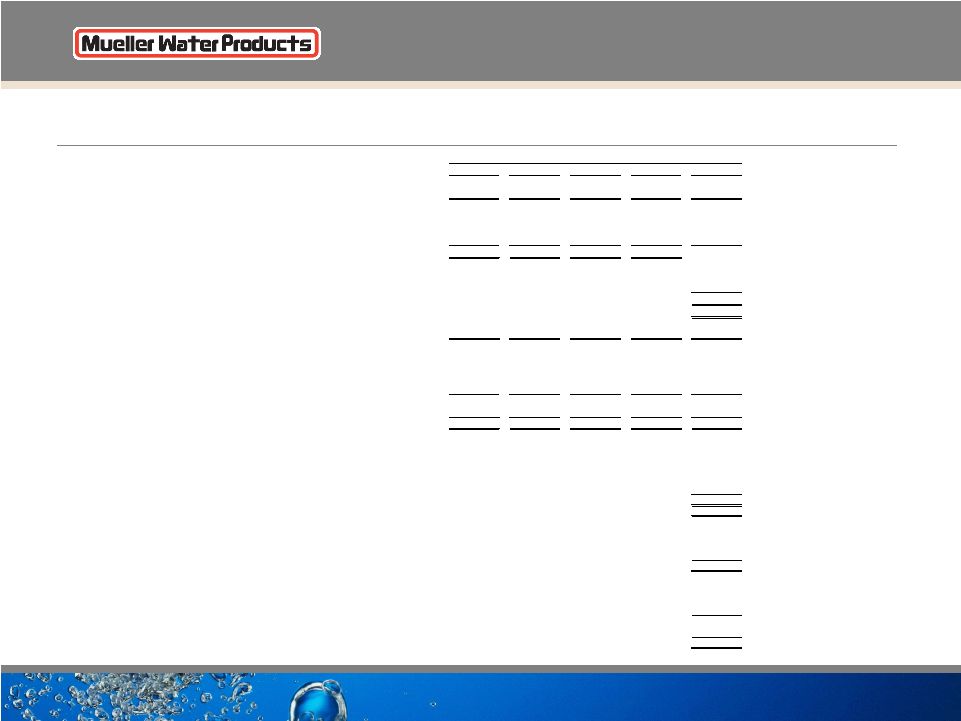
2 Non-GAAP Financial Measures Non-GAAP Financial Measures The Company presents adjusted income (loss) from operations, adjusted operating margin, adjusted EBITDA, adjusted EBITDA margin, adjusted net income (loss), adjusted net income (loss) per share, free cash flow and net debt as non-GAAP measures. Adjusted income (loss) from operations represents income (loss) from operations excluding restructuring. This amount divided by net sales is adjusted operating margin. Adjusted EBITDA represents income (loss) from operations excluding restructuring, depreciation and amortization. This amount divided by net sales is adjusted EBITDA margin. The Company presents adjusted income (loss) from operations, adjusted operating margin, adjusted EBITDA and adjusted EBITDA margin because these are measures management believes are frequently used by securities analysts, investors and interested parties in the evaluation of financial performance. Adjusted net income (loss) and adjusted net income (loss) per share exclude restructuring, certain costs from settled interest rate swap contracts, the income tax effects of these excluded items and a tax adjustment for the repatriation of earnings. These items are excluded because they are not considered indicative of recurring operations. Free cash flow represents cash flow from operating activities less capital expenditures. It is presented as a measurement of cash flow because it is commonly used by the investment community. Net debt represents total debt less cash and cash equivalents. Net debt is commonly used by the investment community as a measure of indebtedness. These non-GAAP measures have limitations as analytical tools, and securities analysts, investors and interested parties should not consider any of these non- GAAP measures in isolation or as a substitute for analysis of the Company's results as reported under accounting principles generally accepted in the United States ("GAAP"). A reconciliation of non-GAAP to GAAP results is included as an attachment to this presentation and has been posted online at www.muellerwaterproducts.com. |
3 Safe Harbor Statement Safe Harbor Statement This presentation contains certain statements that may be deemed “forward-looking statements” within the meaning of the Private Securities Litigation Reform Act of 1995. All statements that address activities, events or developments that we intend, expect, plan, project, believe or anticipate will or may occur in the future are forward-looking statements. Examples of forward-looking statements include, but are not limited to, statements we make regarding spending trends by municipalities on water infrastructure and the market reception of Mueller Systems’ and Echologics’ products and services, and the impact of these factors on our businesses. Forward- looking statements are based on certain assumptions and assessments made by us in light of our experience and perception of historical trends, current conditions and expected future developments. Actual results and the timing of events may differ materially from those contemplated by the forward-looking statements due to a number of factors, including regional, national or global political, economic, business, competitive, market and regulatory conditions and the following: • the spending level for water and wastewater infrastructure; • the demand level of manufacturing and construction activity; • our ability to service our debt obligations; and • the other factors that are described in the section entitled “RISK FACTORS” in Item 1A of our most recently filed Annual Report on Form 10-K and in Part I, Item 1A of our quarterly report on Form 10-Q for the quarter ended March 31, 2011. Undue reliance should not be placed on any forward-looking statements. We do not have any intention or obligation to update forward-looking statements, except as required by law. |
4 Leading North American provider of water infrastructure and flow control products and services Investment Highlights Leading brands in water infrastructure Leveraging brands to expand intelligent water technology offering for diagnostic and data management Low-cost manufacturing processes Increasing investment needed in water infrastructure industry One of the largest installed bases in the U.S. |
5 Our Business • $1.3B LTM net sales (as of June 30, 2011) • Portfolio includes: • Fire hydrants • Valves • Pipe fittings • Ductile iron pipe • Metering systems • Leak detection • Specified in 100 largest U.S. metropolitan markets (1) • More than 75% of FY2010 net sales from products with #1 or #2 position (1) Valves or hydrants (2) Based on management estimates * Residential construction systems driven primarily by new community development FY2010 Primary End Markets (2) Net Sales $1.3B The largest publicly traded water infrastructure company in the United States |
6 Broad Product Portfolio $608 $69 $48 $117 SEGMENT NET SALES PRODUCT PORTFOLIO ADJUSTED OPERATING INCOME (LOSS) (1) $352 ($46) $19 ($27) $352 $31 $15 $45 Iron Gate Valves Butterfly, Ball and Plug Valves Fittings & Couplings Cast Iron Fittings Hangers & Supports Metering Systems Pipe Nipples Hydrants DEPRECIATION AND AMORTIZATION (2) Est. 1857 Est. 1899 Est. 1999 (1850) HISTORICAL ROOTS ADJUSTED EBITDA (1) (2) Note: All statistics are actuals for LTM ended June 30, 2011 (1) Segment operating income (loss) excludes corporate expenses of $30mm. Mueller Co. excludes $1.2 mm of restructuring. U.S. Pipe excludes $4.2 mm of restructuring. Anvil excludes $1.6 mm of restructuring. (2) Segment depreciation and amortization excludes corporate depreciation of $0.6mm. ($ in millions) Ductile Iron Pipe Joint Restraints Restrained Pipe Joint Joint Fittings |
7 Complete Water Transmission Solutions Mueller Water Products manufactures and markets products and services that are used in the transmission, distribution and monitoring of safe, clean drinking water and in water treatment facilities. |
* Company estimates based on internal analysis and information from trade associations and our distributor networks, where available. 8 |
Strategy And Objectives Maintain leadership positions with customers and end users Broaden breadth and depth of products and services Continue to enhance operational and organizational excellence Expand internationally 9 Capitalize on the large, attractive and growing water infrastructure markets worldwide |
Strategic Initiatives Maintain leadership positions with customers and end users Continue to enhance operational and organizational excellence Broaden breadth and depth of products and services Expand internationally • Leveraging the Mueller brand • Developing value-added products and services • Strengthened balance sheet • Implemented Lean Six Sigma • Introduced first wireless mesh agreement for water industry • Enhanced AMI system with remote disconnect meter and customer portal • Export orders • Evaluating opportunities • Leveraging distribution network • Improving customer service levels • Consolidated plants • Automated DIP facility • Acquired leak detection and pipe condition assessment services company 10 |
11 Our End Markets |
Primary End Markets: 2006-2010 Source: Management estimates * Residential construction is driven primarily by new community development Since 2006, our exposure to the residential construction market has declined from roughly 40% to 5%. 12 |
Historical Housing Starts 13 |
Non-Residential Construction Architecture Billings Index Trends Source: IHS Global Insight Data as of July 20, 2011 Non-Residential Construction Actual / Forecast Data as of July 21, 2011 We continue to see signs that the non-residential market has stabilized 14 |
15 Significant Market Opportunities |
16 Opportunity: Aging Water Infrastructure “America’s drinking water systems face an annual shortfall of at least $11 billion to replace aging facilities that are near the end of their useful lives and to comply with existing and future federal water regulations. This does not account for growth in the demand for drinking water over the next 20 years.” 2009 Report Card for America’s Infrastructure American Society of Civil Engineers (ASCE) |
17 The Market Opportunity Is Significant And Growing Repair and Replacement Market • Aging water pipes need to be repaired/ replaced • Valves and hydrants typically replaced at same time as pipes • More than 36 states project water shortages between now and 2013 (1) • Up to 15% - 30% of treated potable water lost in leaky pipes (2) • Emphasis on improving operational efficiencies Funding and Spending • 90% funded at local level (3) • 29% of water systems charge less than cost (4) • 63% of American voters willing to pay more to upgrade water system (5) Source: (1) EPA: WaterSense Statistics and Facts (2) Global Water Intelligence Water Technology Markets 2010 (3) EPA Clean Water and Drinking Water Infrastructure Gap Analysis (4) Government Accountability Office 2004 report on water infrastructure (5) Americans on the U.S. Water Crisis, ITT (6) EPA 2007 Drinking Water Needs Survey and Assessment Future Drinking Water Infrastructure Expenditure Needs (6) Area in which Mueller Water Products operates 20-YR Need for Water Infrastructure = $335B |
Aging Water Infrastructure Average life of 100 year and 75 year old pipe is converging, contributing to accelerating need for pipe replacement. (1) The EPA Clean Water and Drinking Water Infrastructure Gap Analysis 2002 Accelerating Need 18 |
19 Increasing Federal Awareness of Funding Needs • At least 40 cities under consent decrees — Atlanta $4.0B — Washington, D.C. $2.6B — Baltimore City and county $1.7B — Kansas City $2.5B — Cincinnati $1.5B • 1974/1996 Safe Drinking Water Act • 2011 federal budget — $965 million for Drinking Water State Revolving Funding (SRF) — Decline of $422 million from FY2010 Stronger EPA regulations should lead to increased investment “New Jersey can maintain a viable economy with a sound environment only if it ensures that its water supply, wastewater and stormwater infrastructure is effectively maintained in a manner that produces the lowest life-cycle cost.” The Clean Water Council of New Jersey - October 2010 |
20 Funding Water Infrastructure Repair Sources: (1) Bureau of Labor Statistics (2) AWWA State of the Industry Report 2010 (3) Black & Veatch 2009/2010 50 Largest Cities Water/Wastewater Rate Survey for residential 7,500 gallons Sources of Funding Water Infrastructure Repair (2) Historical Water Rates Compared to Other Utilities (1) Long-term trends in consumer prices (CPI) for utilities (1913-2010) Other 15% Bonds 9% Loans 16% Operational Savings 47% Rate Increases 10% Grants 3% From 2007-2009, average annual residential water rates increased about 10% (3) |
21 Opportunities: Smart Metering and Pipe Condition Assessment Smart Metering • Advanced Metering Infrastructure 20% of market - $200 million today* • Forecasted to grow an average of 20% per year through 2015* • Transition from one-way to two-way AMI Systems Pipe Condition Assessment • Constrained municipal budgets • Greater attention on condition assessment • Help prioritize capital spending • Two-way mesh network • Enhanced AMI System • Mi.Hydrant • Mi.Data • 420 Remote Disconnect Meter • Pioneered acoustic, non-invasive leak detection and pipe condition assessment • Proven technology * Proprietary publishing for AWWA; Canada/Mex. Scott Report for AMI/AMR Dec.2010; Management estimates |
22 Actions & Business Results |
23 Management Actions/Initiatives Objectives Actions Reduce costs and improve operating leverage • Closed six plants since FY2006 • Sold two non-core assets of Anvil • Reduced headcount by about 23% from September 30, 2008 to June 30, 2011 from approximately 6,300 to approximately 4,800 • Took actions to lower labor costs • Implemented Lean Six Sigma and other manufacturing improvements (continuous improvement) • Invested in new automated ductile iron pipe operation to lower costs • Consolidated distribution centers and smaller manufacturing facilities at Anvil Manage working capital and capital expenditures to generate free cash flow • Capital spending decreased from FY2007/FY2008 levels • FY2009 capital spending of $39.7 million; FY2010 capital spending of $32.8 million • Reduced inventory by $116.6 million in FY2009; $74.4 million reduction in FY2010 • Reduced debt by $403 million from September 30, 2008 through June 30, 2011 • Inventory turns have improved close to half a turn at the end of June 2011 from June 2010 Leverage Mueller brands to pursue strategic growth opportunities • Acquired and invested in AMI technology • Acquired leak detection and pipe condition assessment business • Established first AMI wireless mesh agreement for water industry • Entered into advanced metering agreement with Landis+Gyr for electric meters |
24 $509 $536 $618 $664 $804 $756 $718 $547 $613 $492 $465 $551 $598 $595 $537 $546 $411 $378 $393 $387 $431 $485 $535 $556 $595 $470 $347 2002 2003 2004 2005 2006 2007 2008 2009 2010 2002 2003 2004 2005 2006 2007 2008 2009 2010 2002 2003 2004 2005 2006 2007 2008 2009 2010 NET SALES ADJUSTED EBITDA & ADJ. EBITDA MARGIN ($ in millions) History of Strong Financial Performance (see appendices for GAAP reconciliation) (a) (c) (b) $131 $139 $167 $190 $248 $207 $179 $101 $131 $44 $26 $42 $56 $57 $24 ($34) $48 $38 $47 $62 $73 $81 $94 $61 $38 25.7% 25.9% 27.1% 28.6% 30.8% 27.3% 24.9% 18.5% 21.3% 8.8% 3.3% 4.4% 7.0% 9.3% 10.7% 4.3% (4.9%) (9.0%) 12.3% 9.7% 10.8% 12.8% 13.6% 14.6% 15.8% 13.0% 11.0% 2002 2003 2004 2005 2006 2007 2008 2009 2010 2002 2003 2004 2005 2006 2007 2008 2009 2010 2002 2003 2004 2005 2006 2007 2008 2009 2010 ($20) $16 c) Excludes inventory step-up costs of $17.3 million in 2006; restructuring costs of $4.0 million in 2009; goodwill impairment charges of $92.7 million in 2009; restructuring charges of $0.5 million in 2010 a) Fiscal year end as of September 30th. Reflects inventory step-up costs of $53.1 million in 2006; restructuring charges of $2.0million in 2009; goodwill impairment charges of $818.7 million in 2009; restructuring charges of $0.1 million in 2010 b) Financial results for 2002, 2003 and 2004 are calendar year while subsequent years are fiscal years ending September 30th. Excludes $6.5 million of litigation settlement expenses in 2003; environmental-related insurance settlement benefits of $1.9 million and $5.1 million in 2004 and 2005, respectively. U.S. Pipe Chattanooga closing costs of $49.9 million in 2006; restructuring charges of $18.3 million in 2008 and goodwill impairment charges of $59.5 million and restructuring charges of $41.6 million in 2009; restructuring charges of $12.5 million in 2010 |
25 Consolidated Non-GAAP Results • Adj. operating income improved year-over-year, although not as much as expected • Higher sales pricing covered increased raw material costs in all three businesses • U.S. Pipe operating performance improved both year-over-year and sequentially • Anvil’s performance was particularly strong with 15.7% increase in net sales and more than doubling of operating income • Market reception of newer water-technology businesses is encouraging. Mueller Systems experienced double digit sales growth year-over-year. Bookings were up in both Mueller Systems and Echologics. $ in millions (except per share amounts) 2011 2010 Net sales $366.7 $375.9 Adj. income from operations $15.6 $13.4 Adj. operating margin 4.3% 3.6% Adj. net income (loss) per share $0.00 ($0.01) Adj. EBITDA $35.9 $34.5 Adj. EBITDA margin 9.8% 9.2% Third Quarter Fiscal FY 3Q11 results exclude restructuring costs of $1.7 million, $1.0 million net of tax; and interest rate swap costs of $2.1 million, $1.3 million net of tax. FY 3Q10 results exclude restructuring costs of $0.9 million, $0.5 million net of tax; and $2.2 million tax expense on the repatriation of Canadian earnings. |
26 Debt Structure • FY 2010 recapitalization provided a long-term capital structure • Extended maturities with no significant required principal payments before 2015 • Locked in long-term capital at attractive rates • Preserved deleveraging capability • Expect greater operational flexibility • Eliminated financial maintenance covenants with excess availability at the greater of $34 million or 12.5% of facility amount • More than $174 million of excess availability at June 30, 2011 • Reduced limitations on business operations including acquisitions, investments, restricted payments and divestitures New structure: •$420 million 7.375% Senior Subordinated Notes due 2017 •$225 million 8.75 % Senior Unsecured Notes due 2020 •$275 million ABL Revolver Credit Facility due 2015 |
27 Key Financial Metrics $37 $115 $94 $91 $30 $0 $20 $40 $60 $80 $100 $120 $140 FY2006 FY2007* FY2008 FY2009** FY2010*** Free Cash Flow ($ in millions) $1,549 $1,127 $1,101 $1,096 $740 $692 $0 $200 $400 $600 $800 $1,000 $1,200 $1,400 $1,600 $1,800 Mar-2006 FY2006 FY2007* FY2008 FY2009 FY2010 Total Debt ($ in millions) $71 $88 $88 $40 $33 $0 $10 $20 $30 $40 $50 $60 $70 $80 $90 $100 FY2006 FY2007 FY2008 FY2009 FY2010 Capital Expenditures ($ in millions) * FY2007 results exclude $48.1 million of debt restructuring activities ** FY2009 results include $6.3 million of cash used to settle certain interest rate swap contracts. *** FY2010 results include $18.3 million of cash used to settle certain interest rate swap contracts. $73 million free cash flow average over last five years Debt has declined $857 million from 2006 |
Why Invest in MWA? Water industry has fundamentally strong long-term dynamics • Driven by new and upgraded infrastructure • Limited number of suppliers to end markets Strong competitive position • Leading brand positions with large installed base • Leading municipal specification positions • Comprehensive distribution network • Low-cost manufacturing operations Operating leverage when volumes improve • Recovery of residential market • Increased municipal spending • Operating excellence initiatives Leveraging strengths in the evolving market • Expand smart metering • Expand diagnostic offerings (leak detection and pipe condition assessment) • Develop intelligent water technology solutions • Strategic acquisitions/partnerships 28 |
29 Supplemental Data |
30 Segment Results and Reconciliation of Non-GAAP to GAAP Performance Measures (in millions, except per share amounts) Three months ended June 30, 2011 Mueller Co. U.S. Pipe Anvil Corporate Total GAAP results: Net sales 165.8 $ 107.1 $ 93.8 $ - $ 366.7 $ Gross profit (loss) 46.7 $ (2.8) $ 26.6 $ (0.2) $ 70.3 $ Selling, general and administrative expenses 23.9 6.6 17.0 7.2 54.7 Restructuring 0.2 1.4 0.1 - 1.7 Income (loss) from operations 22.6 $ (10.8) $ 9.5 $ (7.4) $ 13.9 Interest expense, net 16.8 Income tax benefit (0.2) Net loss (2.7) $ Net loss per diluted share (0.02) $ Capital expenditures 4.1 $ 1.8 $ 1.8 $ - $ 7.7 $ Non-GAAP results: Adjusted income (loss) from operations and EBITDA: Income (loss) from operations 22.6 $ (10.8) $ 9.5 $ (7.4) $ 13.9 $ Restructuring 0.2 1.4 0.1 - 1.7 Adjusted income (loss) from operations 22.8 (9.4) 9.6 (7.4) 15.6 Depreciation and amortization 11.8 4.6 3.7 0.2 20.3 Adjusted EBITDA 34.6 $ (4.8) $ 13.3 $ (7.2) $ 35.9 $ Adjusted operating margin 13.8% -8.8% 10.2% - 4.3% Adjusted EBITDA margin 20.9% -4.5% 14.2% - 9.8% Adjusted net loss: Net loss (2.7) $ Restructuring, net of tax 1.0 Interest rate swap settlement costs, net of tax 1.3 Adjusted net loss (0.4) $ Adjusted net loss per diluted share - $ Free cash flow: Net cash provided by operating activities 12.1 $ Capital expenditures (7.7) Free cash flow 4.4 $ Net debt (end of period): Current portion of long-term debt 0.9 $ Long-term debt 692.1 Total debt 693.0 Less cash and cash equivalents (45.8) Net debt 647.2 $ 30 |
31 Segment Results and Reconciliation of Non-GAAP to GAAP Performance Measures (in millions, except per share amounts) Three months ended June 30, 2010 Mueller Co. U.S. Pipe Anvil Corporate Total GAAP results: Net sales 174.6 $ 120.2 $ 81.1 $ - $ 375.9 $ Gross profit (loss) 52.1 $ (2.7) $ 21.1 $ 0.1 $ 70.6 $ Selling, general and administrative expenses 23.3 7.7 16.6 9.6 57.2 Restructuring - 0.9 - - 0.9 Income (loss) from operations 28.8 $ (11.3) $ 4.5 $ (9.5) $ 12.5 Interest expense, net 15.8 Income tax expense 0.5 Net loss (3.8) $ Net loss per diluted share (0.02) $ Capital expenditures 2.7 $ 2.1 $ 2.0 $ - $ 6.8 $ Non-GAAP results: Adjusted income (loss) from operations and EBITDA: Income (loss) from operations 28.8 $ (11.3) $ 4.5 $ (9.5) $ 12.5 $ Restructuring - 0.9 - - 0.9 Adjusted income (loss) from operations 28.8 (10.4) 4.5 (9.5) 13.4 Depreciation and amortization 12.3 4.6 3.9 0.3 21.1 Adjusted EBITDA 41.1 $ (5.8) $ 8.4 $ (9.2) $ 34.5 $ Adjusted operating margin 16.5% -8.7% 5.5% - 3.6% Adjusted EBITDA margin 23.5% -4.8% 10.4% - 9.2% Adjusted net loss: Net loss (3.8) $ Tax on repatriation on Canadian earnings 2.2 Restructuring, net of tax 0.5 Adjusted net loss (1.1) $ Adjusted net loss per diluted share (0.01) $ Free cash flow: Net cash used in operating activities (8.6) $ Capital expenditures (6.8) Free cash flow (15.4) $ Net debt (end of period): Current portion of long-term debt 10.5 $ Long-term debt 682.2 Total debt 692.7 Less cash and cash equivalents (77.1) Net debt 615.6 $ 31 |
32 Segment Results and Reconciliation of Non-GAAP to GAAP Performance Measures (in millions, except per share amounts) Nine months ended June 30, 2011 Mueller Co. U.S. Pipe Anvil Corporate Total GAAP results: Net sales 444.5 $ 257.3 $ 263.8 $ - $ 965.6 $ Gross profit (loss) 109.7 $ (13.3) $ 73.4 $ 0.1 $ 169.9 $ Selling, general and administrative expenses 67.6 21.2 50.4 22.3 161.5 Restructuring 1.2 3.3 1.2 - 5.7 Income (loss) from operations 40.9 $ (37.8) $ 21.8 $ (22.2) $ 2.7 Interest expense, net 49.0 Income tax benefit (17.8) Net loss (28.5) $ Net loss per diluted share (0.18) $ Capital expenditures 11.0 $ 6.0 $ 4.4 $ 0.5 $ 21.9 $ Non-GAAP results: Adjusted income (loss) from operations and EBITDA: Income (loss) from operations 40.9 $ (37.8) $ 21.8 $ (22.2) $ 2.7 $ Restructuring 1.2 3.3 1.2 - 5.7 Adjusted income (loss) from operations 42.1 (34.5) 23.0 (22.2) 8.4 Depreciation and amortization 35.7 13.8 10.9 0.6 61.0 Adjusted EBITDA 77.8 $ (20.7) $ 33.9 $ (21.6) $ 69.4 $ Adjusted operating margin 9.5% -13.4% 8.7% - 0.9% Adjusted EBITDA margin 17.5% -8.0% 12.9% - 7.2% Adjusted net loss: Net loss (28.5) $ Interest rate swap settlement costs, net of tax 3.7 Restructuring, net of tax 3.5 Adjusted net loss (21.3) $ Adjusted net loss per diluted share (0.14) $ Free cash flow: Net cash used in operating activities (2.7) $ Capital expenditures (21.9) Free cash flow (24.6) $ Net debt (end of period): Current portion of long-term debt 0.9 $ Long-term debt 692.1 Total debt 693.0 Less cash and cash equivalents (45.8) Net debt 647.2 $ 32 |
33 Segment Results and Reconciliation of Non-GAAP to GAAP Performance Measures (in millions, except per share amounts) Nine months ended June 30, 2010 Mueller Co. U.S. Pipe Anvil Corporate Total GAAP results: Net sales 449.1 $ 282.9 $ 258.8 $ - $ 990.8 $ Gross profit (loss) 121.2 $ (19.6) $ 63.0 $ 0.1 $ 164.7 $ Selling, general and administrative expenses 66.7 22.3 48.0 26.0 163.0 Restructuring 0.1 11.6 0.1 - 11.8 Income (loss) from operations 54.4 $ (53.5) $ 14.9 $ (25.9) $ (10.1) Interest expense, net 47.4 Loss on early extinguishment of debt 0.5 Income tax benefit (19.8) Net loss (38.2) $ Net loss per diluted share (0.25) $ Capital expenditures 9.8 $ 7.4 $ 4.1 $ 0.1 $ 21.4 $ Non-GAAP results: Adjusted income (loss) from operations and EBITDA: Income (loss) from operations 54.4 $ (53.5) $ 14.9 $ (25.9) $ (10.1) $ Restructuring 0.1 11.6 0.1 - 11.8 Adjusted income (loss) from operations 54.5 (41.9) 15.0 (25.9) 1.7 Depreciation and amortization 37.2 14.0 11.5 0.6 63.3 Adjusted EBITDA 91.7 $ (27.9) $ 26.5 $ (25.3) $ 65.0 $ Adjusted operating margin 12.1% -14.8% 5.8% - 0.2% Adjusted EBITDA margin 20.4% -9.9% 10.2% - 6.6% Adjusted net loss Net loss (38.2) $ Restructuring, net of tax 7.1 Tax on repatriation on Canadian earnings 2.2 Interest rate swap settlement costs, net of tax (0.7) Loss on early extinguishment of debt, net of tax 0.3 Adjusted net loss (29.3) $ Adjusted net loss per diluted share (0.19) $ Free cash flow: Net cash provided by operating activities 35.7 $ Capital expenditures (21.4) Free cash flow 14.3 $ Net debt (end of period): Current portion of long-term debt 10.5 $ Long-term debt 682.2 Total debt 692.7 Less cash and cash equivalents (77.1) Net debt 615.6 $ 33 |
34 Segment Results and Reconciliation of Non-GAAP to GAAP Performance Measures (in millions, except per share amounts) Year ended September 30, 2010 Mueller Co. U.S. Pipe Anvil Corporate Total GAAP results: Net sales 612.8 $ 377.8 $ 346.9 $ - $ 1,337.5 $ Gross profit (loss) 170.3 $ (22.7) $ 88.8 $ - $ 236.4 $ Selling, general and administrative expenses 89.2 30.5 66.2 33.4 219.3 Restructuring 0.1 12.5 0.5 - 13.1 Income (loss) from operations 81.0 $ (65.7) $ 22.1 $ (33.4) $ 4.0 Interest expense, net 68.0 Loss on early extinguishment of debt 4.6 Income tax benefit (23.4) Net loss (45.2) $ Net loss per diluted share (0.29) $ Capital expenditures 15.6 $ 11.0 $ 6.0 $ 0.2 $ 32.8 $ Non-GAAP results: Adjusted income (loss) from operations and EBITDA: Income (loss) from operations 81.0 $ (65.7) $ 22.1 $ (33.4) $ 4.0 $ Restructuring 0.1 12.5 0.5 - 13.1 Adjusted income (loss) from operations 81.1 (53.2) 22.6 (33.4) 17.1 Depreciation and amortization 49.7 18.9 15.4 0.6 84.6 Adjusted EBITDA 130.8 $ (34.3) $ 38.0 $ (32.8) $ 101.7 $ Adjusted net loss: Net loss (45.2) $ Restructuring, net of tax 7.9 Interest rate swap settlement costs, net of tax 4.8 Loss on early extinguishment of debt, net of tax 2.8 Tax on repatriation on Canadian earnings 2.2 Adjusted net loss (27.5) $ Adjusted net loss per diluted share (0.18) $ Free cash flow: Net cash provided by operating activities 63.0 $ Capital expenditures (32.8) Free cash flow 30.2 $ Net debt (end of period): Current portion of long-term debt 0.7 $ Long-term debt 691.5 Total debt 692.2 Less cash and cash equivalents (83.7) Net debt 608.5 $ |
35 Segment Results and Reconciliation of Non-GAAP to GAAP Performance Measures (in millions, except per share amounts) Year ended September 30, 2009 Mueller Co. U.S. Pipe Anvil Corporate Total GAAP results: Net sales 547.1 $ 410.9 $ 469.9 $ - $ 1,427.9 $ Gross profit (loss) 134.3 $ (5.7) $ 128.2 $ 0.1 $ 256.9 $ Selling, general and administrative expenses 84.2 35.6 84.9 34.4 239.1 Impairment and restructuring 820.7 101.1 96.7 0.2 1,018.7 Loss from operations (770.6) $ (142.4) $ (53.4) $ (34.5) $ (1,000.9) Interest expense, net 78.3 Loss on early extinguishment of debt 3.8 Income tax benefit (86.3) Net loss (996.7) $ Net loss per diluted share (8.55) $ Capital expenditures 16.2 $ 11.2 $ 11.9 $ 0.4 $ 39.7 $ Non-GAAP results: Adjusted income (loss) from operations and EBITDA: Loss from operations (770.6) $ (142.4) $ (53.4) $ (34.5) $ (1,000.9) $ Impairment and restructuring 820.7 101.1 96.7 0.2 1,018.7 Adjusted income (loss) from operations 50.1 (41.3) 43.3 (34.3) 17.8 Depreciation and amortization 50.9 21.1 17.6 0.6 90.2 Adjusted EBITDA 101.0 $ (20.2) $ 60.9 $ (33.7) $ 108.0 $ Adjusted net loss Net loss (996.7) $ Impairment and restructuring, net of tax 954.9 Interest rate swap settlement costs, net of tax 3.8 Loss on early extinguishment of debt, net of tax 2.3 Adjusted net loss (35.7) $ Adjusted net loss per diluted share (0.31) $ Free cash flow: Net cash provided by operating activities 130.5 $ Capital expenditures (39.7) Free cash flow 90.8 $ Net debt (end of period): Current portion of long-term debt 11.7 $ Long-term debt 728.5 Total debt 740.2 Less cash and cash equivalents (61.5) Net debt 678.7 $ |
36 Questions |