
Baird’s 2012 Industrial Conference November 7, 2012
Non-GAAP Financial Measures The Company presents adjusted operating income (loss), adjusted operating margin, adjusted EBITDA, adjusted EBITDA margin, adjusted net income (loss), adjusted net income (loss) per diluted share, free cash flow, net debt and net debt leverage as non-GAAP measures. Adjusted operating income (loss) represents operating income (loss) excluding restructuring. This amount divided by net sales is adjusted operating margin. Adjusted EBITDA represents operating income (loss) excluding restructuring, depreciation and amortization. This amount divided by net sales is adjusted EBITDA margin. The Company presents adjusted operating income (loss), adjusted operating margin, adjusted EBITDA and adjusted EBITDA margin because these are measures management believes are frequently used by securities analysts, investors and other interested parties in the evaluation of financial performance. Adjusted net income (loss) and adjusted net income (loss) per diluted share exclude discontinued operations, restructuring, certain costs from settled interest rate swap contracts, transactions for the early extinguishment of debt and income tax effects of these excluded items. These items are excluded because they are not considered indicative of recurring operations. Free cash flow represents cash flows from operating activities less capital expenditures from continuing operations. It is presented as a measurement of cash flows because management believes it is commonly used by the investment community. Net debt represents total debt less cash and cash equivalents. Net debt leverage represents net debt divided by trailing 12 months adjusted EBITDA. Net debt and net debt leverage are commonly used by the investment community as measures of indebtedness. These non-GAAP measures have limitations as analytical tools, and securities analysts, investors and other interested parties should not consider any of these non-GAAP measures in isolation or as a substitute for analysis of the Company's results as reported under accounting principles generally accepted in the United States ("GAAP"). These non-GAAP measures may not be comparable to similarly titled measures used by other companies. A reconciliation of non-GAAP to GAAP results is included as an attachment to this presentation and has been posted online at www.muellerwaterproducts.com. 2
Forward-Looking Statements This presentation contains certain statements that may be deemed “forward-looking statements” within the meaning of the Private Securities Litigation Reform Act of 1995. All statements that address activities, events or developments that we intend, expect, plan, project, believe or anticipate will or may occur in the future are forward-looking statements. Examples of forward-looking statements include, but are not limited to, statements we make regarding recovery in residential construction and municipal water spending, our long-term targets, our expectation of strong operating leverage when end markets recover and continued growth with our metering systems and leak detection products. Forward-looking statements are based on certain assumptions and assessments made by us in light of our experience and perception of historical trends, current conditions and expected future developments. Actual results and the timing of events may differ materially from those contemplated by the forward- looking statements due to a number of factors, including regional, national or global political, economic, business, competitive, market and regulatory conditions and the following: • the spending level for water and wastewater infrastructure; • the level of manufacturing and construction activity; • our ability to service our debt obligations; and • the other factors that are described in the section entitled “RISK FACTORS” in Item 1A of our most recently filed Annual Report on Form 10-K. Undue reliance should not be placed on any forward-looking statements. We do not have any intention or obligation to update forward-looking statements, except as required by law. 3
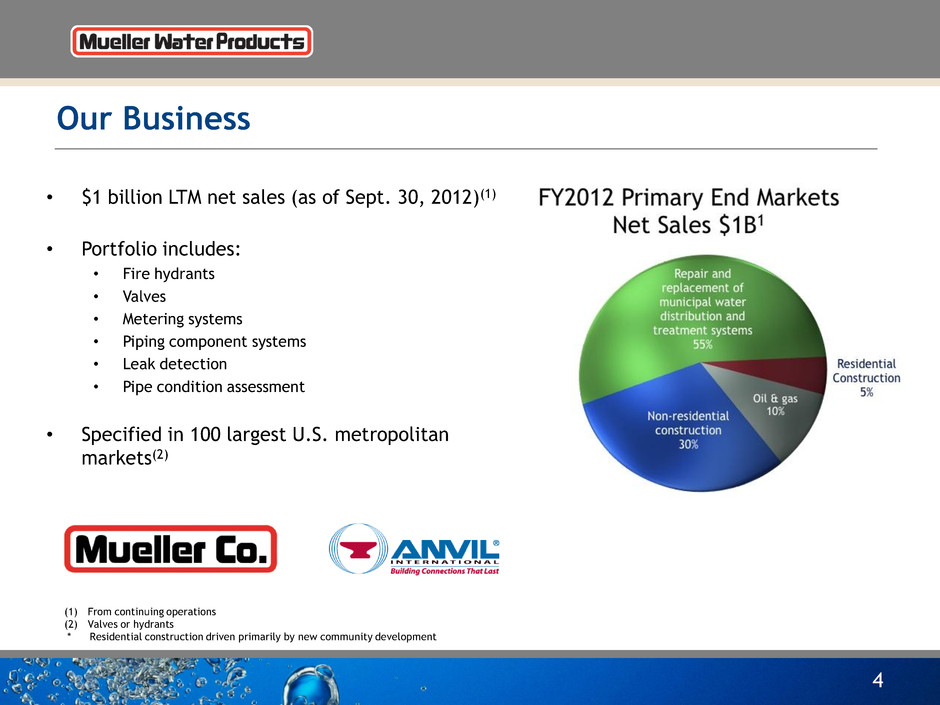
Our Business • $1 billion LTM net sales (as of Sept. 30, 2012)(1) • Portfolio includes: • Fire hydrants • Valves • Metering systems • Piping component systems • Leak detection • Pipe condition assessment • Specified in 100 largest U.S. metropolitan markets(2) 4 (1) From continuing operations (2) Valves or hydrants * Residential construction driven primarily by new community development
5 Investment Highlights Leading North American provider of water infrastructure and flow control products and services Leveraging Mueller brand and relationships to expand intelligent water technology offerings for diagnostic analysis and data management Expected improved results due to strong incremental operating leverage as end markets recover Increasing investment and improved operating efficiencies needed in water infrastructure industry Leading brands in water infrastructure and one of the largest installed bases of valves and hydrants in the U.S.
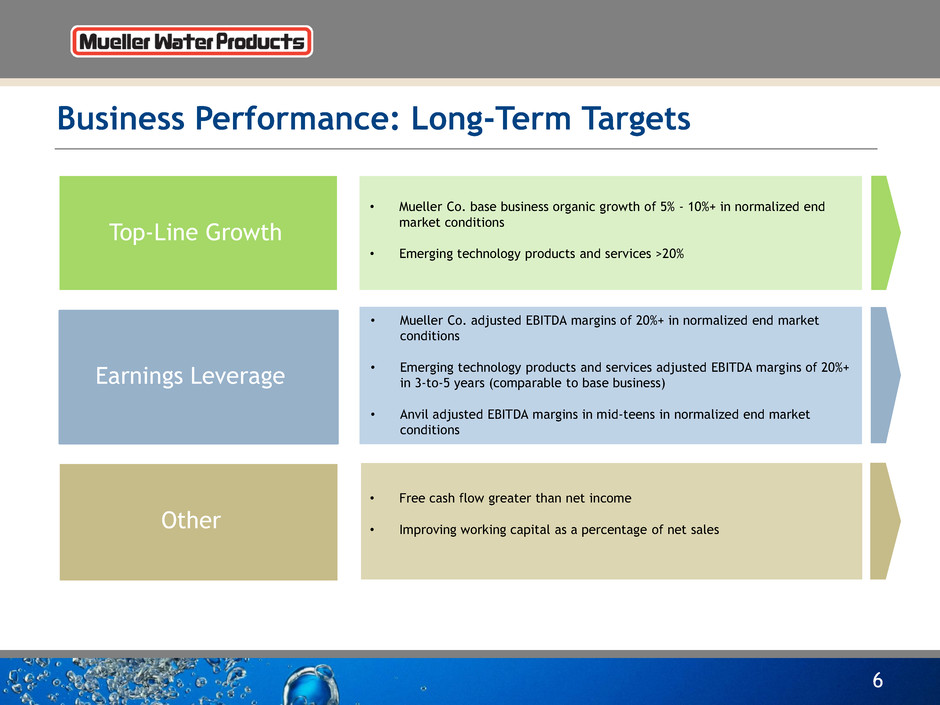
Business Performance: Long-Term Targets 6 Top-Line Growth Other Top-Line Growth • Mueller Co. base business organic growth of 5% - 10%+ in normalized end market conditions • Emerging technology products and services >20% Earnings Leverage • Mueller Co. adjusted EBITDA margins of 20%+ in normalized end market conditions • Emerging technology products and services adjusted EBITDA margins of 20%+ in 3-to-5 years (comparable to base business) • Anvil adjusted EBITDA margins in mid-teens in normalized end market conditions Other • Free cash flow greater than net income • Improving working capital as a percentage of net sales
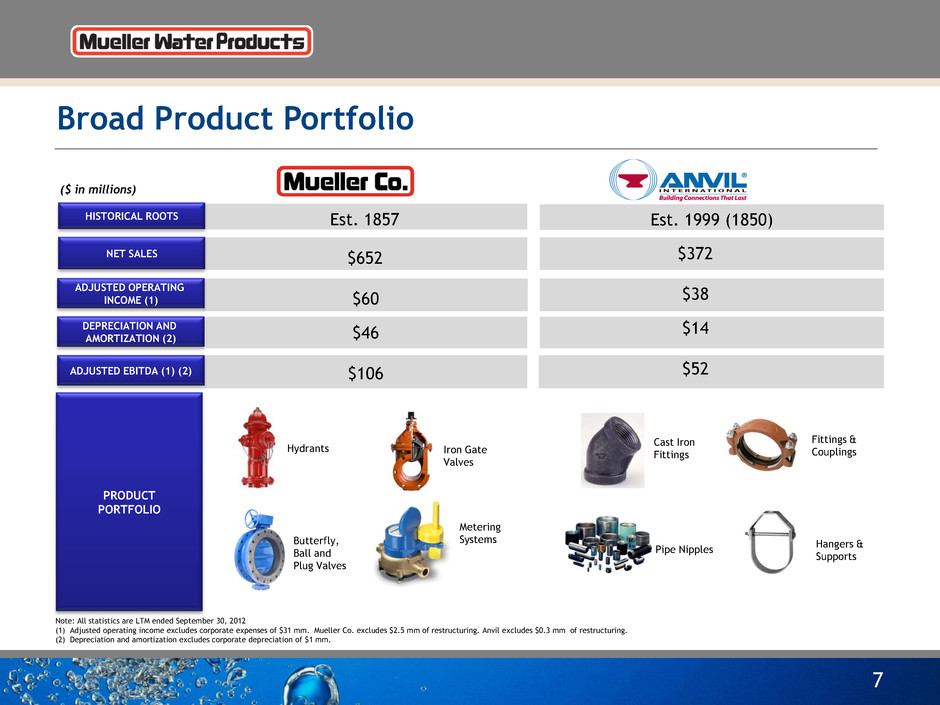
Est. 1857 Broad Product Portfolio 7 Note: All statistics are LTM ended September 30, 2012 (1) Adjusted operating income excludes corporate expenses of $31 mm. Mueller Co. excludes $2.5 mm of restructuring. Anvil excludes $0.3 mm of restructuring. (2) Depreciation and amortization excludes corporate depreciation of $1 mm. $652 $60 $46 $106 NET SALES PRODUCT PORTFOLIO ADJUSTED OPERATING INCOME (1) $372 $38 $14 $52 Iron Gate Valves Butterfly, Ball and Plug Valves Fittings & Couplings Cast Iron Fittings Hangers & Supports Metering Systems Pipe Nipples Hydrants DEPRECIATION AND AMORTIZATION (2) HISTORICAL ROOTS ADJUSTED EBITDA (1) (2) Est. 1999 (1850) ($ in millions)

Water Transmission Solutions 8 Mueller Water Products manufactures and markets products and services that are used in the transmission, distribution and measurement of safe, clean drinking water and in water treatment facilities.
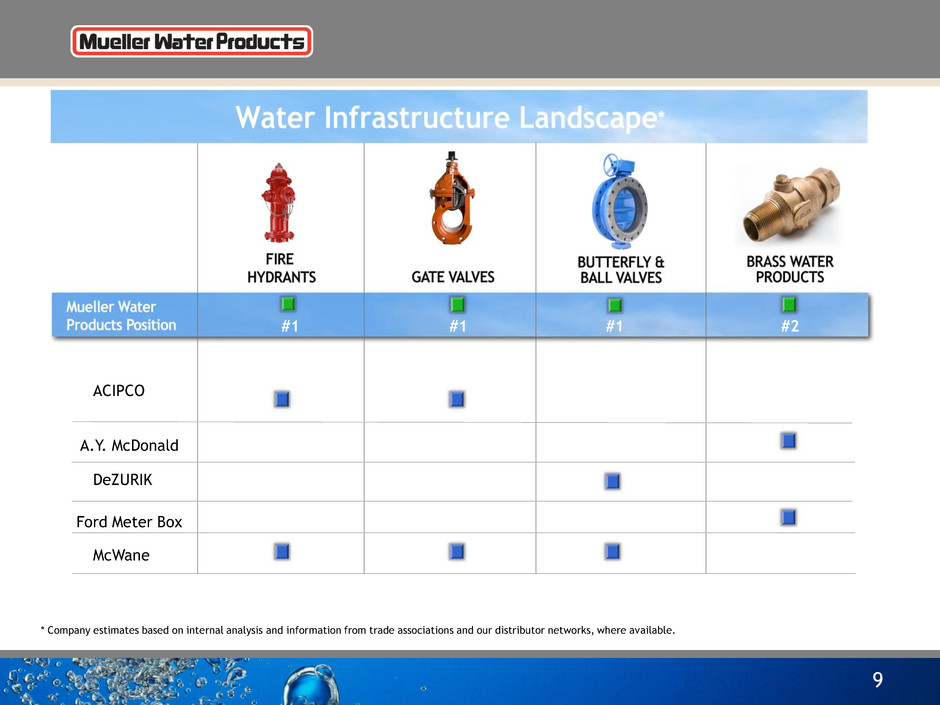
9 #1 #1 #1 #2 ACIPCO A.Y. McDonald DeZURIK Ford Meter Box McWane * Company estimates based on internal analysis and information from trade associations and our distributor networks, where available.
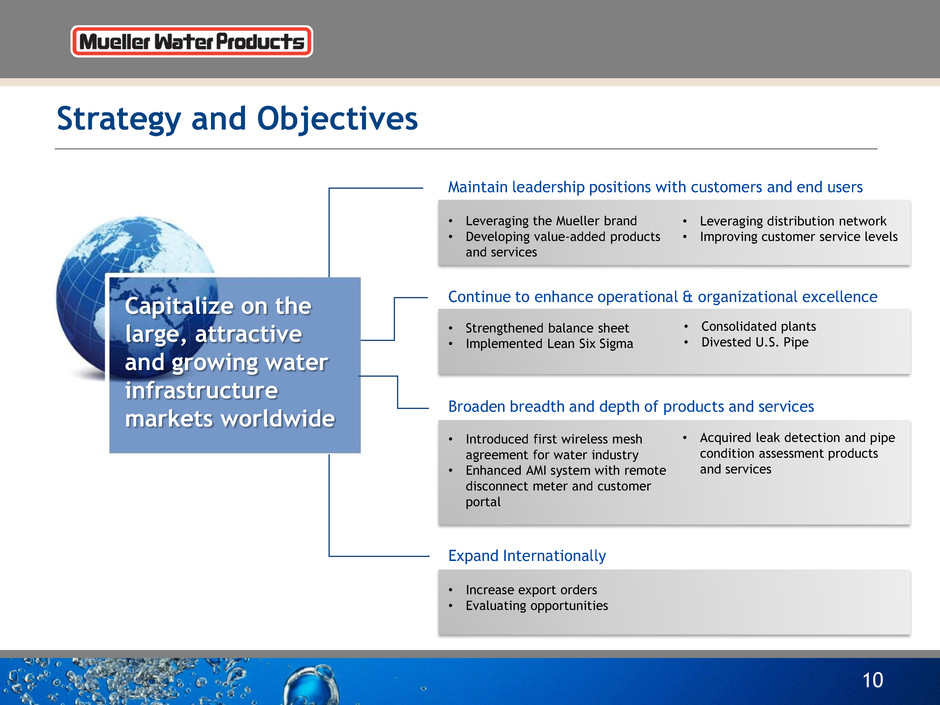
Strategy and Objectives 10 Maintain leadership positions with customers and end users Continue to enhance operational & organizational excellence Broaden breadth and depth of products and services Expand Internationally • Leveraging the Mueller brand • Developing value-added products and services • Leveraging distribution network • Improving customer service levels • Strengthened balance sheet • Implemented Lean Six Sigma • Consolidated plants • Divested U.S. Pipe • Introduced first wireless mesh agreement for water industry • Enhanced AMI system with remote disconnect meter and customer portal • Acquired leak detection and pipe condition assessment products and services • Increase export orders • Evaluating opportunities Capitalize on the large, attractive and growing water infrastructure markets worldwide

11 Our End Markets
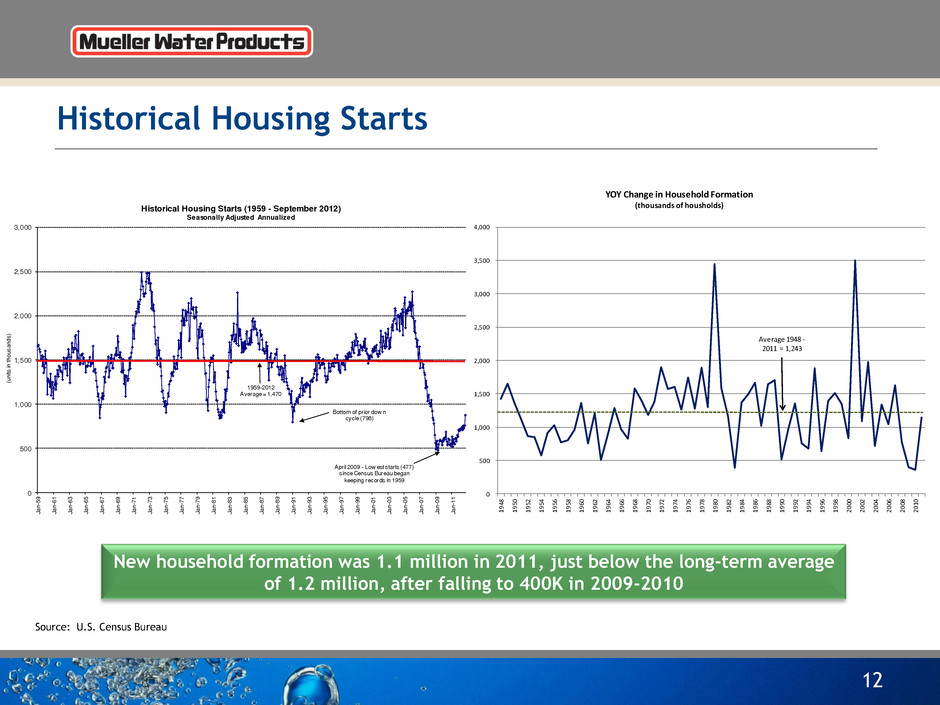
0 500 1,000 1,500 2,000 2,500 3,000 3,500 4,000 19 48 19 50 19 52 19 54 19 56 19 58 19 60 19 62 19 64 19 66 19 68 19 70 19 72 19 74 19 76 19 78 19 80 19 82 19 84 19 86 19 88 19 90 19 92 19 94 19 96 19 98 20 00 20 02 20 04 20 06 20 08 20 10 YOY Change in Household Formation (thousands of housholds) Average 1948 - 2011 = 1,243 Historical Housing Starts 12 New household formation was 1.1 million in 2011, just below the long-term average of 1.2 million, after falling to 400K in 2009-2010 Source: U.S. Census Bureau 0 500 1,000 1,500 2,000 2,500 3,000 Ja n- 59 Ja n- 61 Ja n- 63 Ja n- 65 Ja n- 67 Ja n- 69 Ja n- 71 Ja n- 73 Ja n- 75 Ja n- 77 Ja n- 79 Ja n- 81 Ja n- 83 Ja n- 85 Ja n- 87 Ja n- 89 Ja n- 91 Ja n- 93 Ja n- 95 Ja n- 97 Ja n- 99 Ja n- 01 Ja n- 03 Ja n- 05 Ja n- 07 Ja n- 09 Ja n- 11 (u ni ts in th ou sa nd s) Historical Housing Starts (1959 - September 2012) Seasonally Adjusted Annualized 1959-2012 Average = 1,470 Bottom of prior dow n cycle (798) April 2009 - Low est starts (477) since Census Bureau began keeping records in 1959
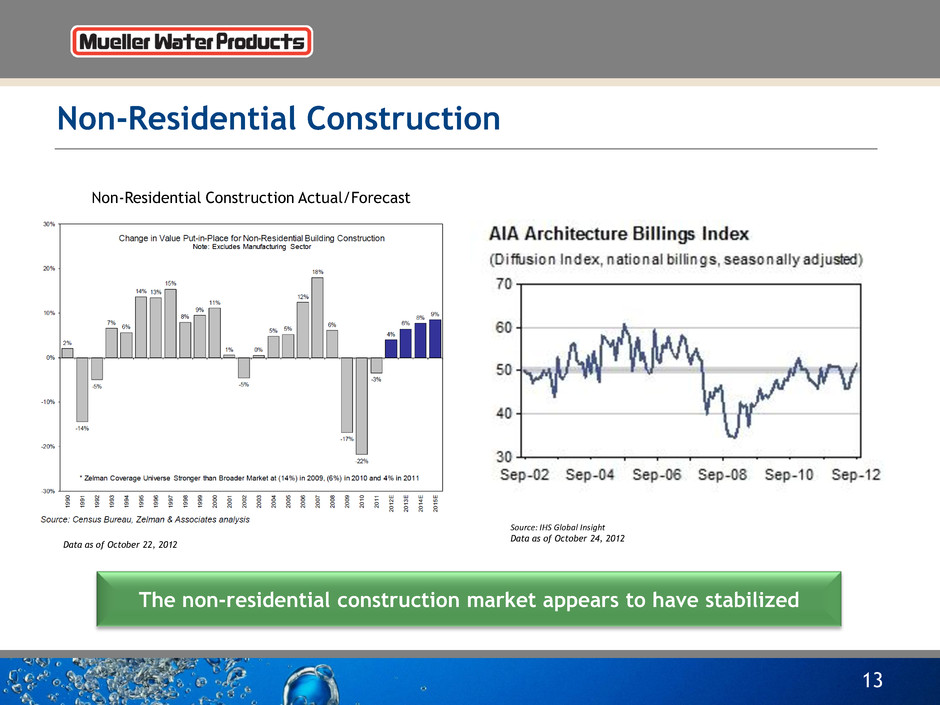
Non-Residential Construction 13 The non-residential construction market appears to have stabilized Non-Residential Construction Actual/Forecast Data as of October 22, 2012 Source: IHS Global Insight Data as of October 24, 2012
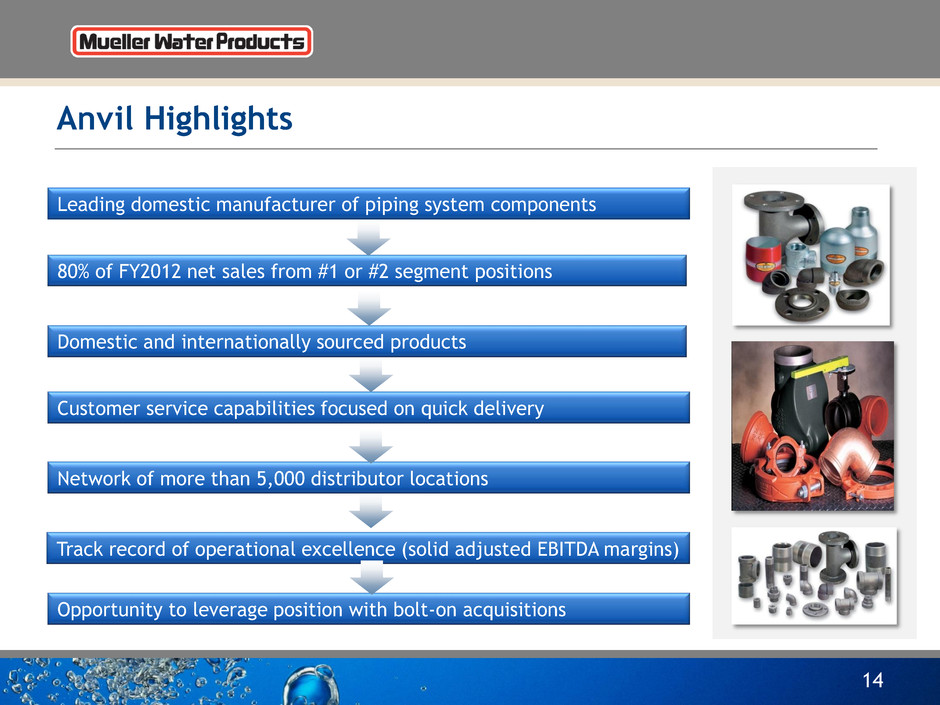
Anvil Highlights 14 Leading domestic manufacturer of piping system components 80% of FY2012 net sales from #1 or #2 segment positions Customer service capabilities focused on quick delivery Network of more than 5,000 distributor locations Track record of operational excellence (solid adjusted EBITDA margins) Opportunity to leverage position with bolt-on acquisitions Domestic and internationally sourced products

Anvil Key Products 15 Percent of Net Sales(1) Market Drivers Products Key Competitors Product Segment Energy (Oil & Gas) Power/High Pressure Mechanical Industrial & Fire Protection 75% 20% 5% Non-Residential Building Construction Oil & Gas Production Power Need Development Mechanical: Grooved, Iron/Steel Fittings, Staple Hangers, Pipe Nipples, Bull Plugs Fire Protection: O-Lets, Grooved, Iron Fittings, Staple Hangers, Pipe Nipples Hammer Union, Swages and Bull Plugs, Forged Steel Fittings, Pipe Nipples, Malleable Iron Engineered Hangers Victaulic, Ward, Erico, Wisconsin, Bonney Forge, Westbrook Victaulic, Ward, Tolco, Wisconsin, Ceirco, Tyco Kemper, C&C, Westbrook, Bonney Forge, Ward, Phoenix Capital Lisega, Piping Tech, Bergen (1) FY2012

16 Significant Market Opportunities

• Valves and hydrants typically replaced at same time as pipes • ASCE graded drinking water infrastructure a D-(1) • At least 36 states projected water shortages between “now and 2013”(2) (3) The Market Opportunity Is Significant And Growing 17 Sources: (1) ASCE: 2009 Report Card for America’s Infrastructure (2) EPA: WaterSense Statistics and Facts (3) The EPA Clean Water and Drinking Water Infrastructure Gap Analysis 2002 (4) EPA 2007 Drinking Water Needs Survey and Assessment Repair and Replacement Market Future Drinking Water Infrastructure Expenditure Needs(4) Transmission and Distribution $200.8B Source $19.8B Storage $36.9B Treatment $75.1B Other $2.3B Area in which Mueller Water Products operates 20-Year Need for Water Infrastructure = $335B Accelerating Need
Funding Water Infrastructure Stronger EPA regulations should lead to increased investment • At least 40 cities under consent decrees — Atlanta — Washington, D.C. — Baltimore City and county — Kansas City — Cincinnati Municipal Bond Market • Jan – Sept 2012 new issuances up 43% over the same period in 2011(1) • Municipal bond rates remain at their lowest points since the 1960s(2) “The brilliant invisibility of our water system has become its most significant vulnerability. That invisibility makes it difficult for people to understand the effort and money required to sustain a system that has been in place for decades, but has in fact been quietly corroding from decades of neglect.” The Big Thirst Charles Fishman 18 Sources: (1) SIFMA – U.S. Municipal Issuance database (2) Bond Buyer GO 20-Year Bond Municipal Bond Index
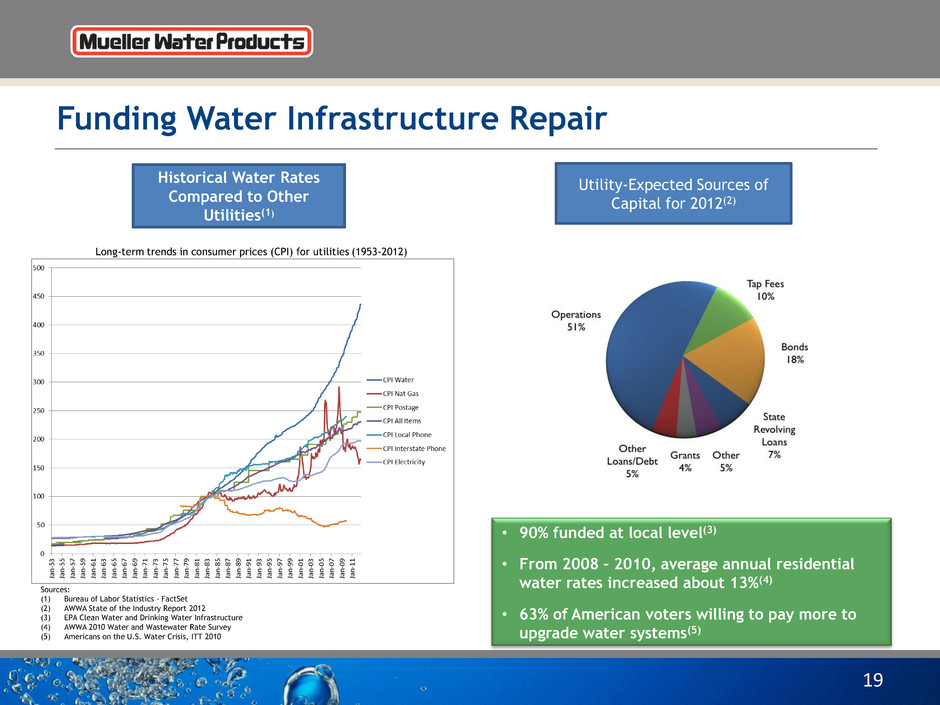
Funding Water Infrastructure Repair 19 Sources: (1) Bureau of Labor Statistics - FactSet (2) AWWA State of the Industry Report 2012 (3) EPA Clean Water and Drinking Water Infrastructure (4) AWWA 2010 Water and Wastewater Rate Survey (5) Americans on the U.S. Water Crisis, ITT 2010 Historical Water Rates Compared to Other Utilities(1) Long-term trends in consumer prices (CPI) for utilities (1953-2012) Utility-Expected Sources of Capital for 2012(2) • 90% funded at local level(3) • From 2008 - 2010, average annual residential water rates increased about 13%(4) • 63% of American voters willing to pay more to upgrade water systems(5)

Significant Growth Opportunities • Investing in Smart Metering and Leak Detection/Condition Assessment Technology • Expect demand for AMI to grow 20%/year through 2015 in water market* • Leak detection and pipe condition assessment technology will help water utilities prioritize capital spending • Leveraging the Mueller brand name and market position • Expect technology products and services to achieve 20%+ adjusted EBITDA margins in 3-to-5 years 20 * North American AMI Deployments & Market Share: Q2 2012; IMS “The World Market for Water Meters – 2011 Edition”; management estimates
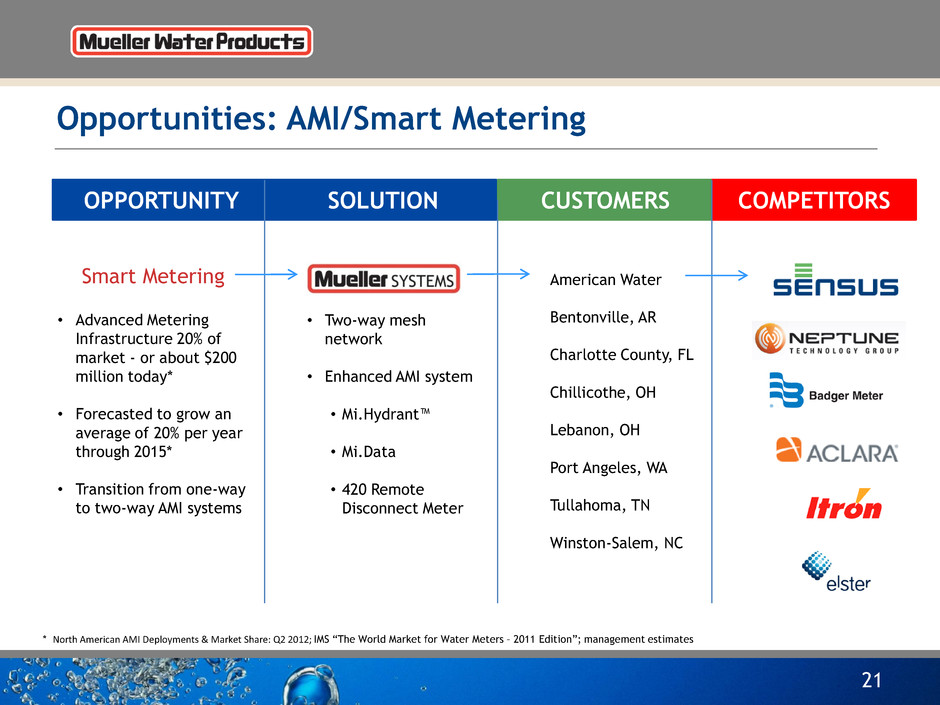
Opportunities: AMI/Smart Metering 21 OPPORTUNITY SOLUTION CUSTOMERS COMPETITORS Smart Metering • Advanced Metering Infrastructure 20% of market - or about $200 million today* • Forecasted to grow an average of 20% per year through 2015* • Transition from one-way to two-way AMI systems • Two-way mesh network • Enhanced AMI system • Mi.Hydrant™ • Mi.Data • 420 Remote Disconnect Meter American Water Bentonville, AR Charlotte County, FL Chillicothe, OH Lebanon, OH Port Angeles, WA Tullahoma, TN Winston-Salem, NC * North American AMI Deployments & Market Share: Q2 2012; IMS “The World Market for Water Meters – 2011 Edition”; management estimates
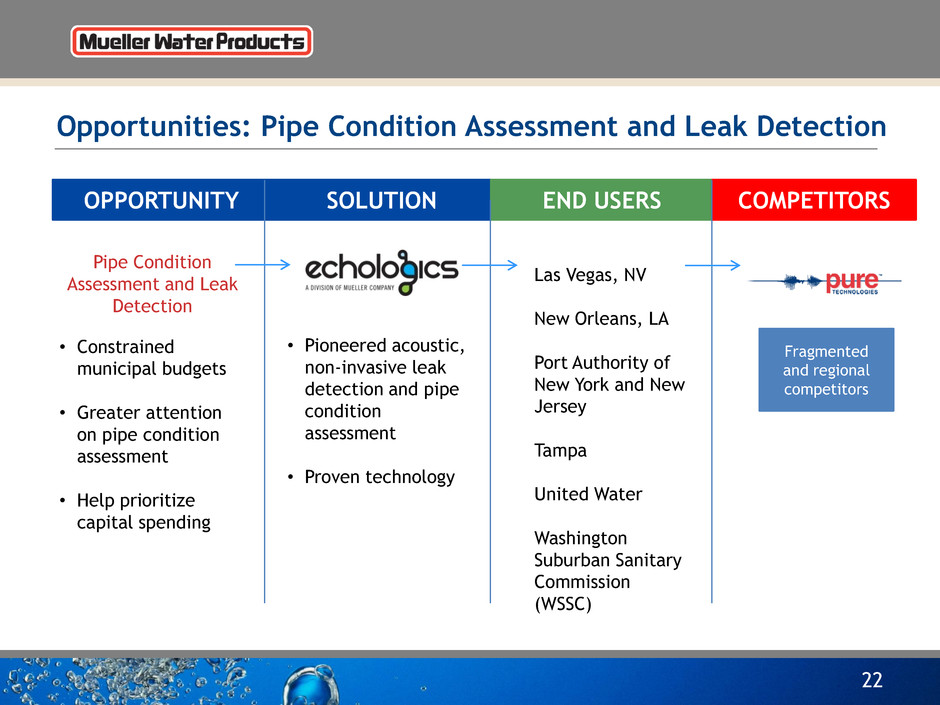
Opportunities: Pipe Condition Assessment and Leak Detection 22 OPPORTUNITY SOLUTION END USERS COMPETITORS Pipe Condition Assessment and Leak Detection • Constrained municipal budgets • Greater attention on pipe condition assessment • Help prioritize capital spending • Pioneered acoustic, non-invasive leak detection and pipe condition assessment • Proven technology Las Vegas, NV New Orleans, LA Port Authority of New York and New Jersey Tampa United Water Washington Suburban Sanitary Commission (WSSC) Fragmented and regional competitors

23 Actions & Business Results

Management Actions / Initiatives 24 Objectives Actions Reduce costs and improve operating leverage Manage working capital and capital expenditures to generate free cash flow Pursue strategic growth opportunities by leveraging the Mueller brand • Closed six plants since FY2006 • Divested two non-core assets of Anvil in FY2010 • Divested U.S. Pipe in FY2012 • Lowered labor costs • Implemented Lean Six Sigma and other manufacturing improvements (continuous improvement) • Consolidated distribution centers and smaller manufacturing facilities at Anvil • Generated increased free cash flow of $45.4 million in FY2012 up from $12.7 million in FY2011 • Reduced debt by $473 million from September 30, 2008 through September 30, 2012 • Inventory turns improved approximately half a turn at September 30, 2012 compared to prior year • Acquired and invested in AMI technology • Established first AMI wireless mesh agreement for water industry • Entered advanced metering agreement with Landis+Gyr for electric meters • Acquired leak detection and pipe condition assessment products and services
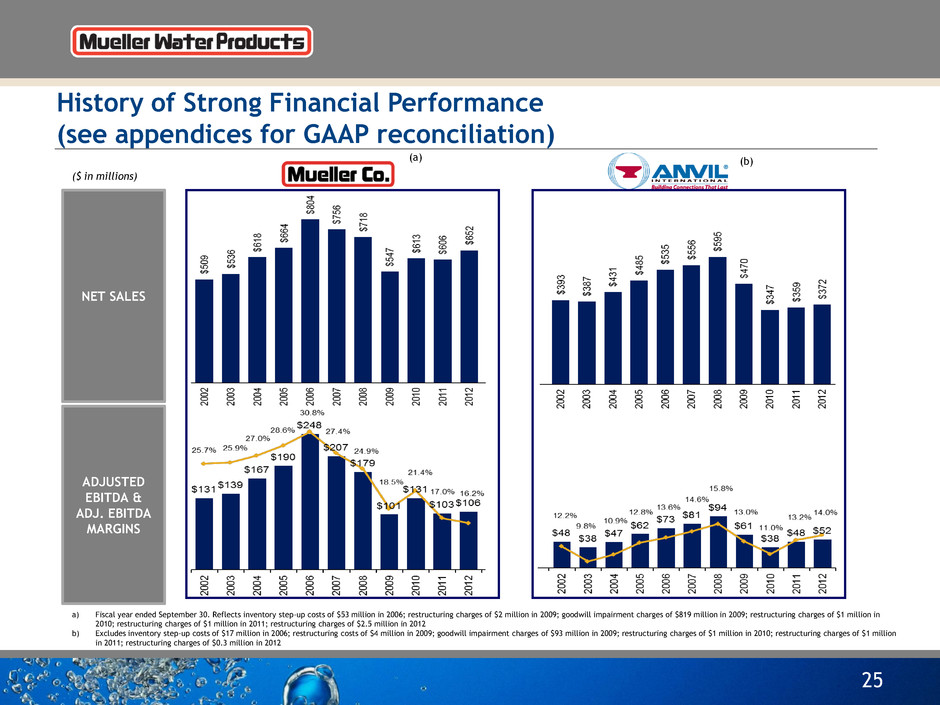
History of Strong Financial Performance (see appendices for GAAP reconciliation) 25 (a) (b) ($ in millions) NET SALES ADJUSTED EBITDA & ADJ. EBITDA MARGINS a) Fiscal year ended September 30. Reflects inventory step-up costs of $53 million in 2006; restructuring charges of $2 million in 2009; goodwill impairment charges of $819 million in 2009; restructuring charges of $1 million in 2010; restructuring charges of $1 million in 2011; restructuring charges of $2.5 million in 2012 b) Excludes inventory step-up costs of $17 million in 2006; restructuring costs of $4 million in 2009; goodwill impairment charges of $93 million in 2009; restructuring charges of $1 million in 2010; restructuring charges of $1 million in 2011; restructuring charges of $0.3 million in 2012

Consolidated Non-GAAP Results • Meaningful improvement in net sales, adjusted operating income and adjusted EBITDA year-over-year • Net sales increased 9.7%; adjusted EBITDA increased 30.0%; adjusted diluted EPS increased $0.06 to $0.03 from a loss of $0.03 last year; free cash flow was $45.4 million for the year • Shipments of valves, hydrants and brass products increased year-over-year reflecting improved municipal spending and demand from residential construction • Sales of metering systems and leak detection products and services increased, demonstrating marketplace traction • Despite lower sales Anvil due to end-market softness operating income was essentially flat • Net debt leverage 4.2x at September 30, 2012 26 Fourth Quarter Fiscal $ in millions (except per share amounts) 2012 2011 Net sales $281.1 $256.3 Adj. operating income $22.7 $13.4 Adj. operating margin 8.1% 5.2% Adj. net income (loss) per diluted share $0.03 ($0.03) Adj. EBITDA $38.1 $29.3 Adj. EBITDA margin 13.6% 11.4% 4Q12 results exclude restructuring costs of $0.8 million, $0.5 million net of tax; interest rate swap costs of $0.7 million, $0.4 million net of tax. Results are for continuing operations. 4Q11 results exclude restructuring costs of $1.2 million, $0.7 million net of tax; and interest rate swap costs of $2.0 million, $1.2 million net of tax. Results are for continuing operations
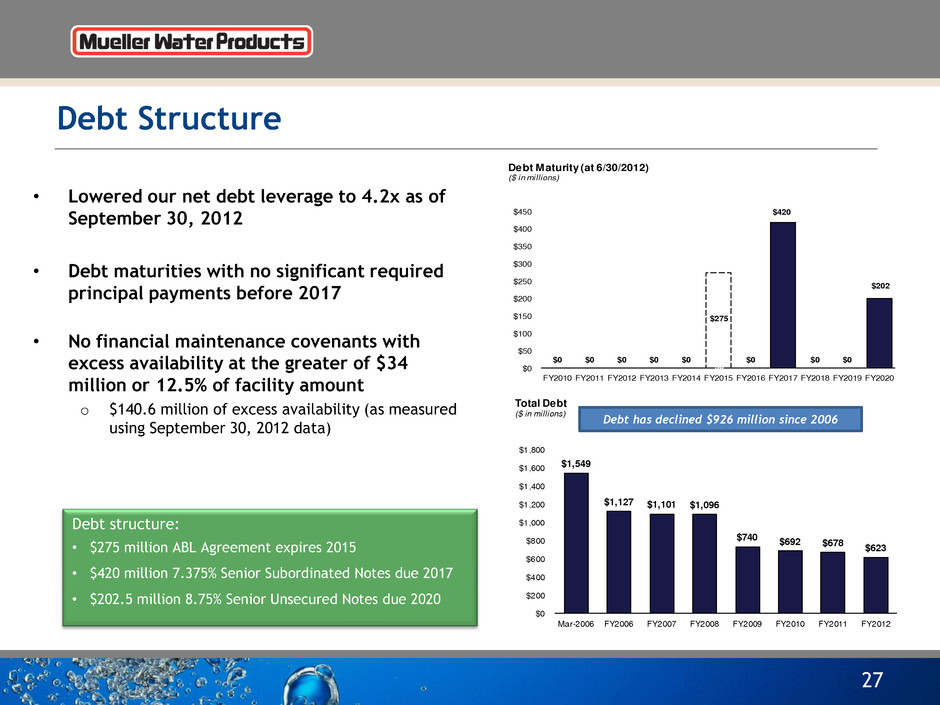
Debt Structure • Lowered our net debt leverage to 4.2x as of September 30, 2012 • Debt maturities with no significant required principal payments before 2017 • No financial maintenance covenants with excess availability at the greater of $34 million or 12.5% of facility amount o $140.6 million of excess availability (as measured using September 30, 2012 data) 27 Debt structure: • $275 million ABL Agreement expires 2015 • $420 million 7.375% Senior Subordinated Notes due 2017 • $202.5 million 8.75% Senior Unsecured Notes due 2020 $0 $0 $0 $0 $0 $0 $0 $420 $0 $0 $202 $275 $0 $50 $100 $150 $200 $250 $300 $350 $400 $450 FY2010 FY2011 FY2012 FY2013 FY2014 FY2015 FY2016 FY2017 FY2018 FY2019 FY2020 Debt Maturity (at 6/30/2012) ($ in millions) $1,549 $1,127 $1,101 $1,096 $740 $692 $678 $623 $0 $200 $400 $600 $800 $1,000 $1,200 $1,400 $1,600 $1,800 Mar-2006 FY2006 FY2007 FY2008 FY2009 FY2010 FY2011 FY2012 Total Debt ($ in millions) Debt has declined $926 million since 2006
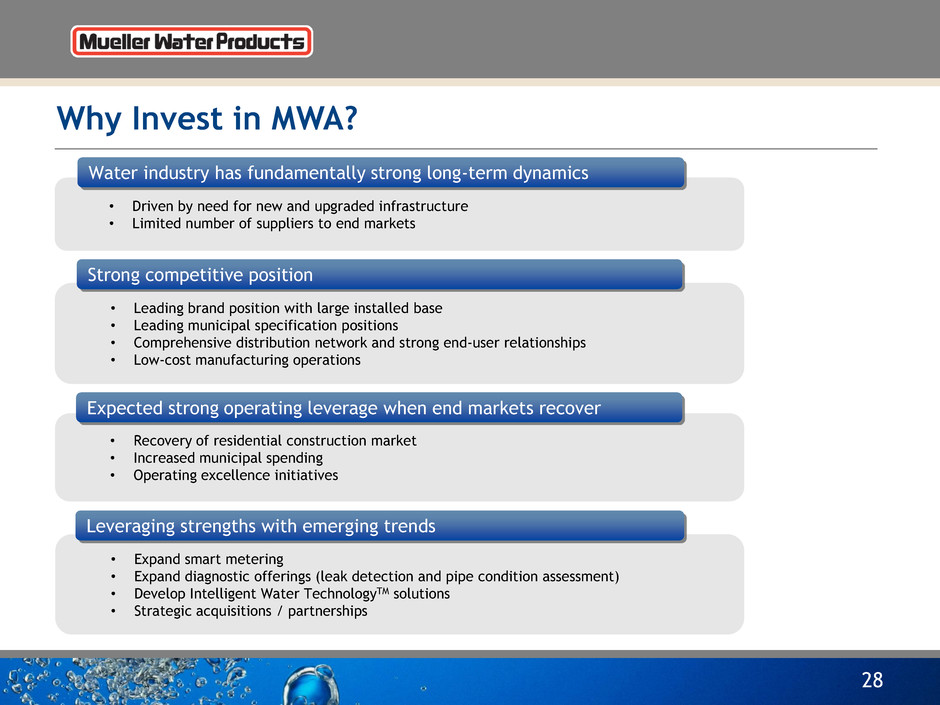
Why Invest in MWA? 28 • Leading brand position with large installed base • Leading municipal specification positions • Comprehensive distribution network and strong end-user relationships • Low-cost manufacturing operations • Recovery of residential construction market • Increased municipal spending • Operating excellence initiatives • Expand smart metering • Expand diagnostic offerings (leak detection and pipe condition assessment) • Develop Intelligent Water TechnologyTM solutions • Strategic acquisitions / partnerships • Driven by need for new and upgraded infrastructure • Limited number of suppliers to end markets Water industry has fundamentally strong long-term dynamics Strong competitive position Expected strong operating leverage when end markets recover Leveraging strengths with emerging trends

29 Supplemental Data
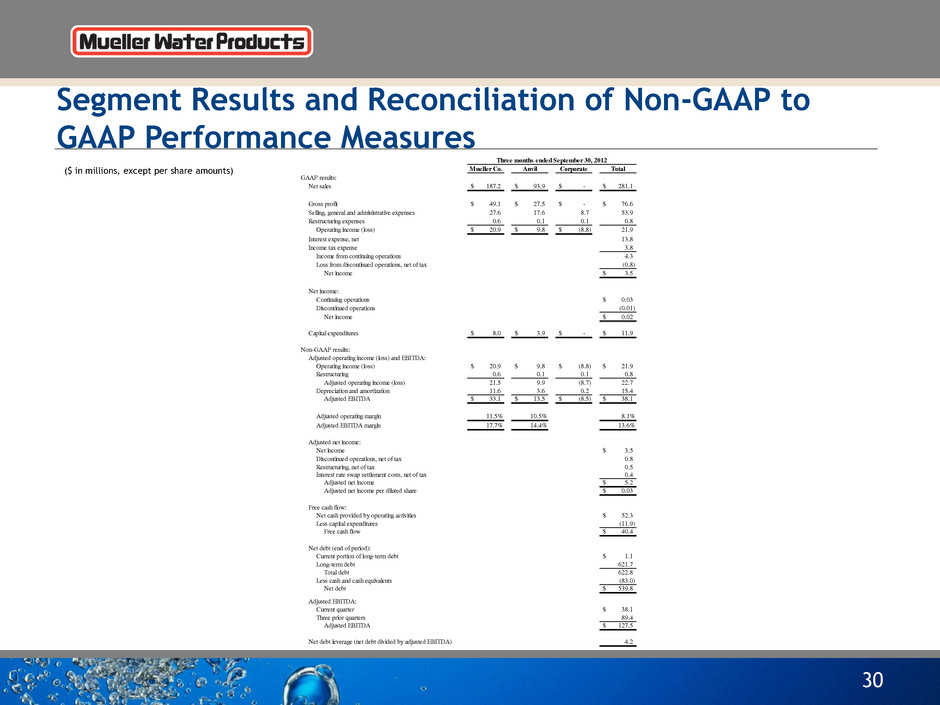
Segment Results and Reconciliation of Non-GAAP to GAAP Performance Measures 30 ($ in millions, except per share amounts) Three months ended September 30, 2012 Mueller Co. Anvil Corporate Total GAAP results: Net sales 187.2$ 93.9$ -$ 281.1$ Gross profit 49.1$ 27.5$ -$ 76.6$ Selling, general and administrative expenses 27.6 17.6 8.7 53.9 Restructuring expenses 0.6 0.1 0.1 0.8 Operating income (loss) 20.9$ 9.8$ (8.8)$ 21.9 Interest expense, net 13.8 Income tax expense 3.8 Income from continuing operations 4.3 Loss from discontinued operations, net of tax (0.8) Net income 3.5$ Net income: Continuing operations 0.03$ Discontinued operations (0.01) Net income 0.02$ Capital expenditures 8.0$ 3.9$ -$ 11.9$ Non-GAAP results: Adjusted operating income (loss) and EBITDA: Operating income (loss) 20.9$ 9.8$ (8.8)$ 21.9$ Restructuring 0.6 0.1 0.1 0.8 Adjusted operating income (loss) 21.5 9.9 (8.7) 22.7 Depreciation and amortization 11.6 3.6 0.2 15.4 Adjusted EBITDA 33.1$ 13.5$ (8.5)$ 38.1$ Adjusted operating margin 11.5% 10.5% 8.1% Adjusted EBITDA margin 17.7% 14.4% 13.6% Adjusted net income: Net income 3.5$ Discontinued operations, net of tax 0.8 Restructuring, net of tax 0.5 Interest rate swap settlement costs, net of tax 0.4 Adjusted net income 5.2$ Adjusted net income per diluted share 0.03$ Free cash flow: Net cash provided by operating activities 52.3$ Less capital expenditures (11.9) Free cash flow 40.4$ Net debt (end of period): Current portion of long-term debt 1.1$ Long-term debt 621.7 Total debt 622.8 Less cash and cash equivalents (83.0) Net debt 539.8$ Adjusted EBITDA: Current quarter 38.1$ Three prior quarters 89.4 Adjusted EBITDA 127.5$ Net debt leverage (net debt divided by adjusted EBITDA) 4.2
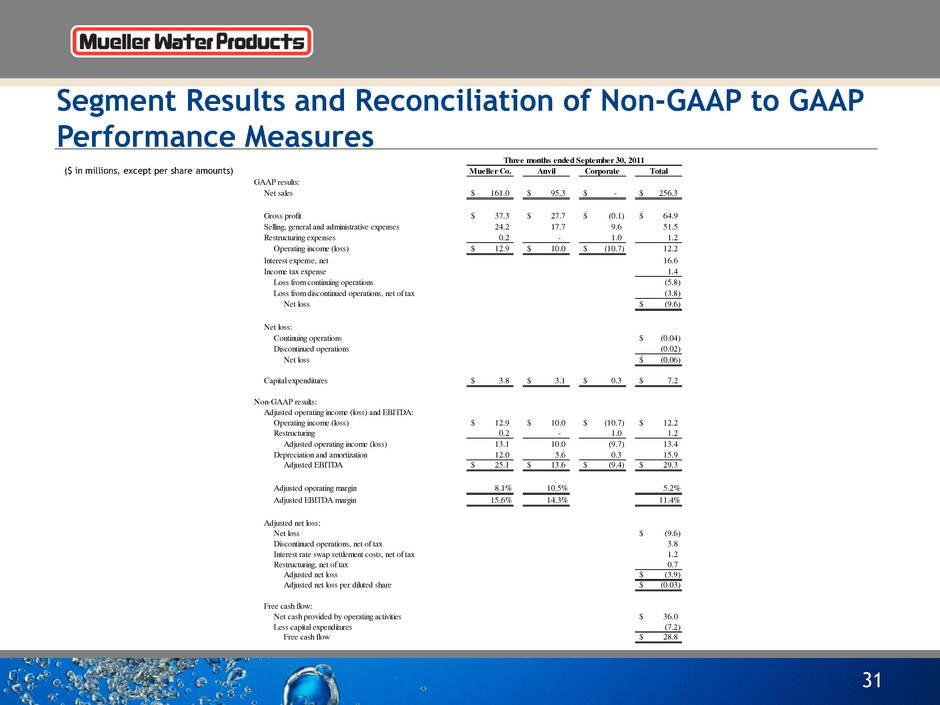
Segment Results and Reconciliation of Non-GAAP to GAAP Performance Measures 31 ($ in millions, except per share amounts) Three months ended September 30, 2011 Mueller Co. Anvil Corporate Total GAAP results: Net sales 161.0$ 95.3$ -$ 256.3$ Gross profit 37.3$ 27.7$ (0.1)$ 64.9$ Selling, general and administrative expenses 24.2 17.7 9.6 51.5 Restructuring expenses 0.2 - 1.0 1.2 Operating income (loss) 12.9$ 10.0$ (10.7)$ 12.2 Interest expense, net 16.6 Income tax expense 1.4 Loss from continuing operations (5.8) Loss from discontinued operations, net of tax (3.8) Net loss (9.6)$ Net loss: Continuing operations (0.04)$ Discontinued operations (0.02) Net loss (0.06)$ Capital expenditures 3.8$ 3.1$ 0.3$ 7.2$ Non-GAAP results: Adjusted operating income (loss) and EBITDA: Operating income (loss) 12.9$ 10.0$ (10.7)$ 12.2$ Restructuring 0.2 - 1.0 1.2 Adjusted operating income (loss) 13.1 10.0 (9.7) 13.4 Depreciation and amortization 12.0 3.6 0.3 15.9 Adjusted EBITDA 25.1$ 13.6$ (9.4)$ 29.3$ Adjusted operating margin 8.1% 10.5% 5.2% Adjusted EBITDA margin 15.6% 14.3% 11.4% Adjusted net loss: Net loss (9.6)$ Discontinued operations, net of tax 3.8 Interest rate swap settlement costs, net of tax 1.2 Restructuring, net of tax 0.7 Adjusted net loss (3.9)$ Adjusted net loss per diluted share (0.03)$ Free cash flow: Net cash provided by operating activities 36.0$ Less capital expenditures (7.2) Free cash flow 28.8$

Segment Results and Reconciliation of Non-GAAP to GAAP Performance Measures 32 ($ in millions, except per share amounts) Year ended September 30, 2012 Mueller Co. Anvil Corporate Total GAAP results: Net sales 652.4$ 371.5$ -$ 1,023.9$ Gross profit 162.8$ 108.3$ -$ 271.1$ Selling, general and administrative expenses 102.6 70.7 30.9 204.2 Restructuring expenses 2.5 0.3 - 2.8 Operating income (loss) 57.7$ 37.3$ (30.9)$ 64.1 Interest expense, net 59.9 Loss on early extinguishment of debt 1.5 Income tax expense 7.9 Loss from continuing operations (5.2) Loss from discontinued operations, net of tax (103.2) Net loss (108.4)$ Net loss per diluted share: Continuing operations (0.03)$ Discontinued operations (0.66) Net loss (0.69)$ Capital expenditures 20.0$ 11.4$ -$ 31.4$ Non-GAAP results: Adjusted operating income (loss) and EBITDA: Operating income (loss) 57.7$ 37.3$ (30.9)$ 64.1$ Restructuring 2.5 0.3 - 2.8 Adjusted operating income (loss) 60.2 37.6 (30.9) 66.9 Depreciation and amortization 45.7 14.3 0.6 60.6 Adjusted EBITDA 105.9$ 51.9$ (30.3)$ 127.5$ Adjusted operating margin 9.2% 10.1% 6.5% Adjusted EBITDA margin 16.2% 14.0% 12.5% Adjusted net income: Net loss (108.4)$ Discontinued operations, net of tax 103.2 Valuation allowance against beginning of the year deferred tax assets 5.9 Interest rate swap settlement costs, net of tax 3.0 Restructuring, net of tax 1.7 Loss on early extinguishment of debt, net of tax 0.9 Adjusted net income 6.3$ Adjusted net income per diluted share 0.04$ Free cash flow: Net cash provided by operating activities 76.8$ Less capital expenditures (31.4) Free cash flow 45.4$ Net debt (end of period): Current portion of long-term debt 1.1$ Long-term debt 621.7 Total debt 622.8 Less cash and cash equivalents (83.0) Net debt 539.8$ Adjusted EBITDA: Current quarter 38.1$ Three prior quarters 89.4 Adjusted EBITDA 127.5$ Net debt leverage (net debt divided by adjusted EBITDA) 4.2
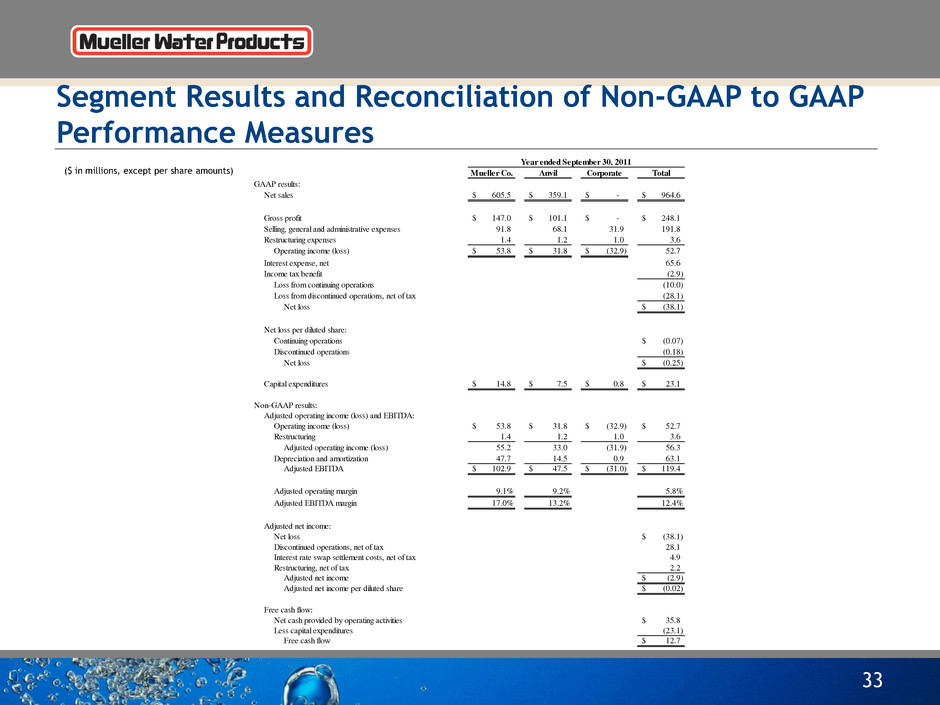
Segment Results and Reconciliation of Non-GAAP to GAAP Performance Measures 33 ($ in millions, except per share amounts) Year ended September 30, 2011 Mueller Co. Anvil Corporate Total GAAP results: Net sales 605.5$ 359.1$ -$ 964.6$ Gross profit 147.0$ 101.1$ -$ 248.1$ Selling, general and administrative expenses 91.8 68.1 31.9 191.8 Restructuring expenses 1.4 1.2 1.0 3.6 Operating income (loss) 53.8$ 31.8$ (32.9)$ 52.7 Interest expense, net 65.6 Income tax benefit (2.9) Loss from continuing operations (10.0) Loss from discontinued operations, net of tax (28.1) Net loss (38.1)$ Net loss per diluted share: Continuing operations (0.07)$ Discontinued operations (0.18) Net loss (0.25)$ Capital expenditures 14.8$ 7.5$ 0.8$ 23.1$ Non-GAAP results: Adjusted operating income (loss) and EBITDA: Operating income (loss) 53.8$ 31.8$ (32.9)$ 52.7$ Restructuring 1.4 1.2 1.0 3.6 Adjusted operating income (loss) 55.2 33.0 (31.9) 56.3 Depreciation and amortization 47.7 14.5 0.9 63.1 Adjusted EBITDA 102.9$ 47.5$ (31.0)$ 119.4$ Adjusted operating margin 9.1% 9.2% 5.8% Adjusted EBITDA margin 17.0% 13.2% 12.4% Adjusted net income: Net loss (38.1)$ Discontinued operations, net of tax 28.1 Interest rate swap settlement costs, net of tax 4.9 Restructuring, net of tax 2.2 Adjusted net income (2.9)$ Adjusted net income per diluted share (0.02)$ Free cash flow: Net cash provided by operating activities 35.8$ Less capital expenditures (23.1) Free cash flow 12.7$

34 Questions


