UNITED STATES
SECURITIES AND EXCHANGE COMMISSION
Washington, D.C. 20549
SCHEDULE 14A
Proxy Statement Pursuant to Section 14(a) of the
Securities Exchange Act of 1934
Filed by the Registrant x Filed by a Party other than the Registrant ¨
Check the appropriate box:
| o | Preliminary Proxy Statement |
| o | Confidential, for Use of the Commission Only (as permitted by Rule 14a-6(e)(2)) |
| x | Definitive Proxy Statement |
| o | Definitive Additional Materials |
| o | Soliciting Material Pursuant to §240.14a-12 |
| Mueller Water Products, Inc. |
| (Name of Registrant as Specified In Its Charter) |
| (Name of Person(s) Filing Proxy Statement, if other than the Registrant) |
| x | No fee required. |
| o | Fee computed on table below per Exchange Act Rules 14a-6(i)(1) and 0-11. |
| (1) | Title of each class of securities to which the transaction applies: | |
| (2) | Aggregate number of securities to which the transaction applies: | |
| (3) | Per unit price or other underlying value of the transaction computed pursuant to Exchange Act Rule 0-11 (set forth the amount on which the filing fee is calculated and state how it was determined): | |
| (4) | Proposed maximum aggregate value of the transaction: | |
| (5) | Total fee paid: | |
| o | Fee paid previously with preliminary materials. |
| o | Check box if any part of the fee is offset as provided by Exchange Act Rule 0-11(a)(2) and identify the filing for which the offsetting fee was paid previously. Identify the previous filing by registration statement number, or the Form or Schedule and the date of its filing. |
| (1) | Amount Previously Paid: | |
| (2) | Form, Schedule or Registration Statement No.: | |
| (3) | Filing Party: | |
| (4) | Date Filed: | |

December 15, 2016
To My Fellow Stockholders:
It is my pleasure to invite you to attend the 2017 Annual Meeting of Stockholders of Mueller Water Products, Inc. The meeting will be held on January 25, 2017 at 10:00 A.M., Eastern Time, in the Peachtree Dunwoody Room on the 3rd Floor of Building 500 at Northpark Town Center, located at 1100 Abernathy Road, N.E. in Atlanta, Georgia. The meeting will begin with voting on the matters described in the attached Notice of Annual Meeting of Stockholders and Proxy Statement, followed by my report on our company’s financial performance and operations.
The Board appreciates and encourages stockholder participation in our affairs. Whether or not you plan to attend the meeting, it is important your shares be represented and voted.
Sincerely,
Gregory E. Hyland
Chairman of the Board, President and Chief Executive Officer
YOUR VOTE IS IMPORTANT TO US. PLEASE REVIEW THE ATTACHED MATERIALS AND SUBMIT YOUR VOTE PROMPTLY. |

______________________________
NOTICE OF ANNUAL MEETING OF STOCKHOLDERS
TO BE HELD ON JANUARY 25, 2017
______________________________
To the Stockholders of Mueller Water Products, Inc.:
NOTICE IS HEREBY GIVEN that the 2017 Annual Meeting of Stockholders of Mueller Water Products, Inc. will be held at 10:00 A.M., Eastern Time, on Wednesday, January 25, 2017 in the Peachtree Dunwoody Room on the 3rd Floor of Building 500 at Northpark Town Center, located at 1100 Abernathy Road, N.E., in Atlanta, Georgia, for the purposes described below.
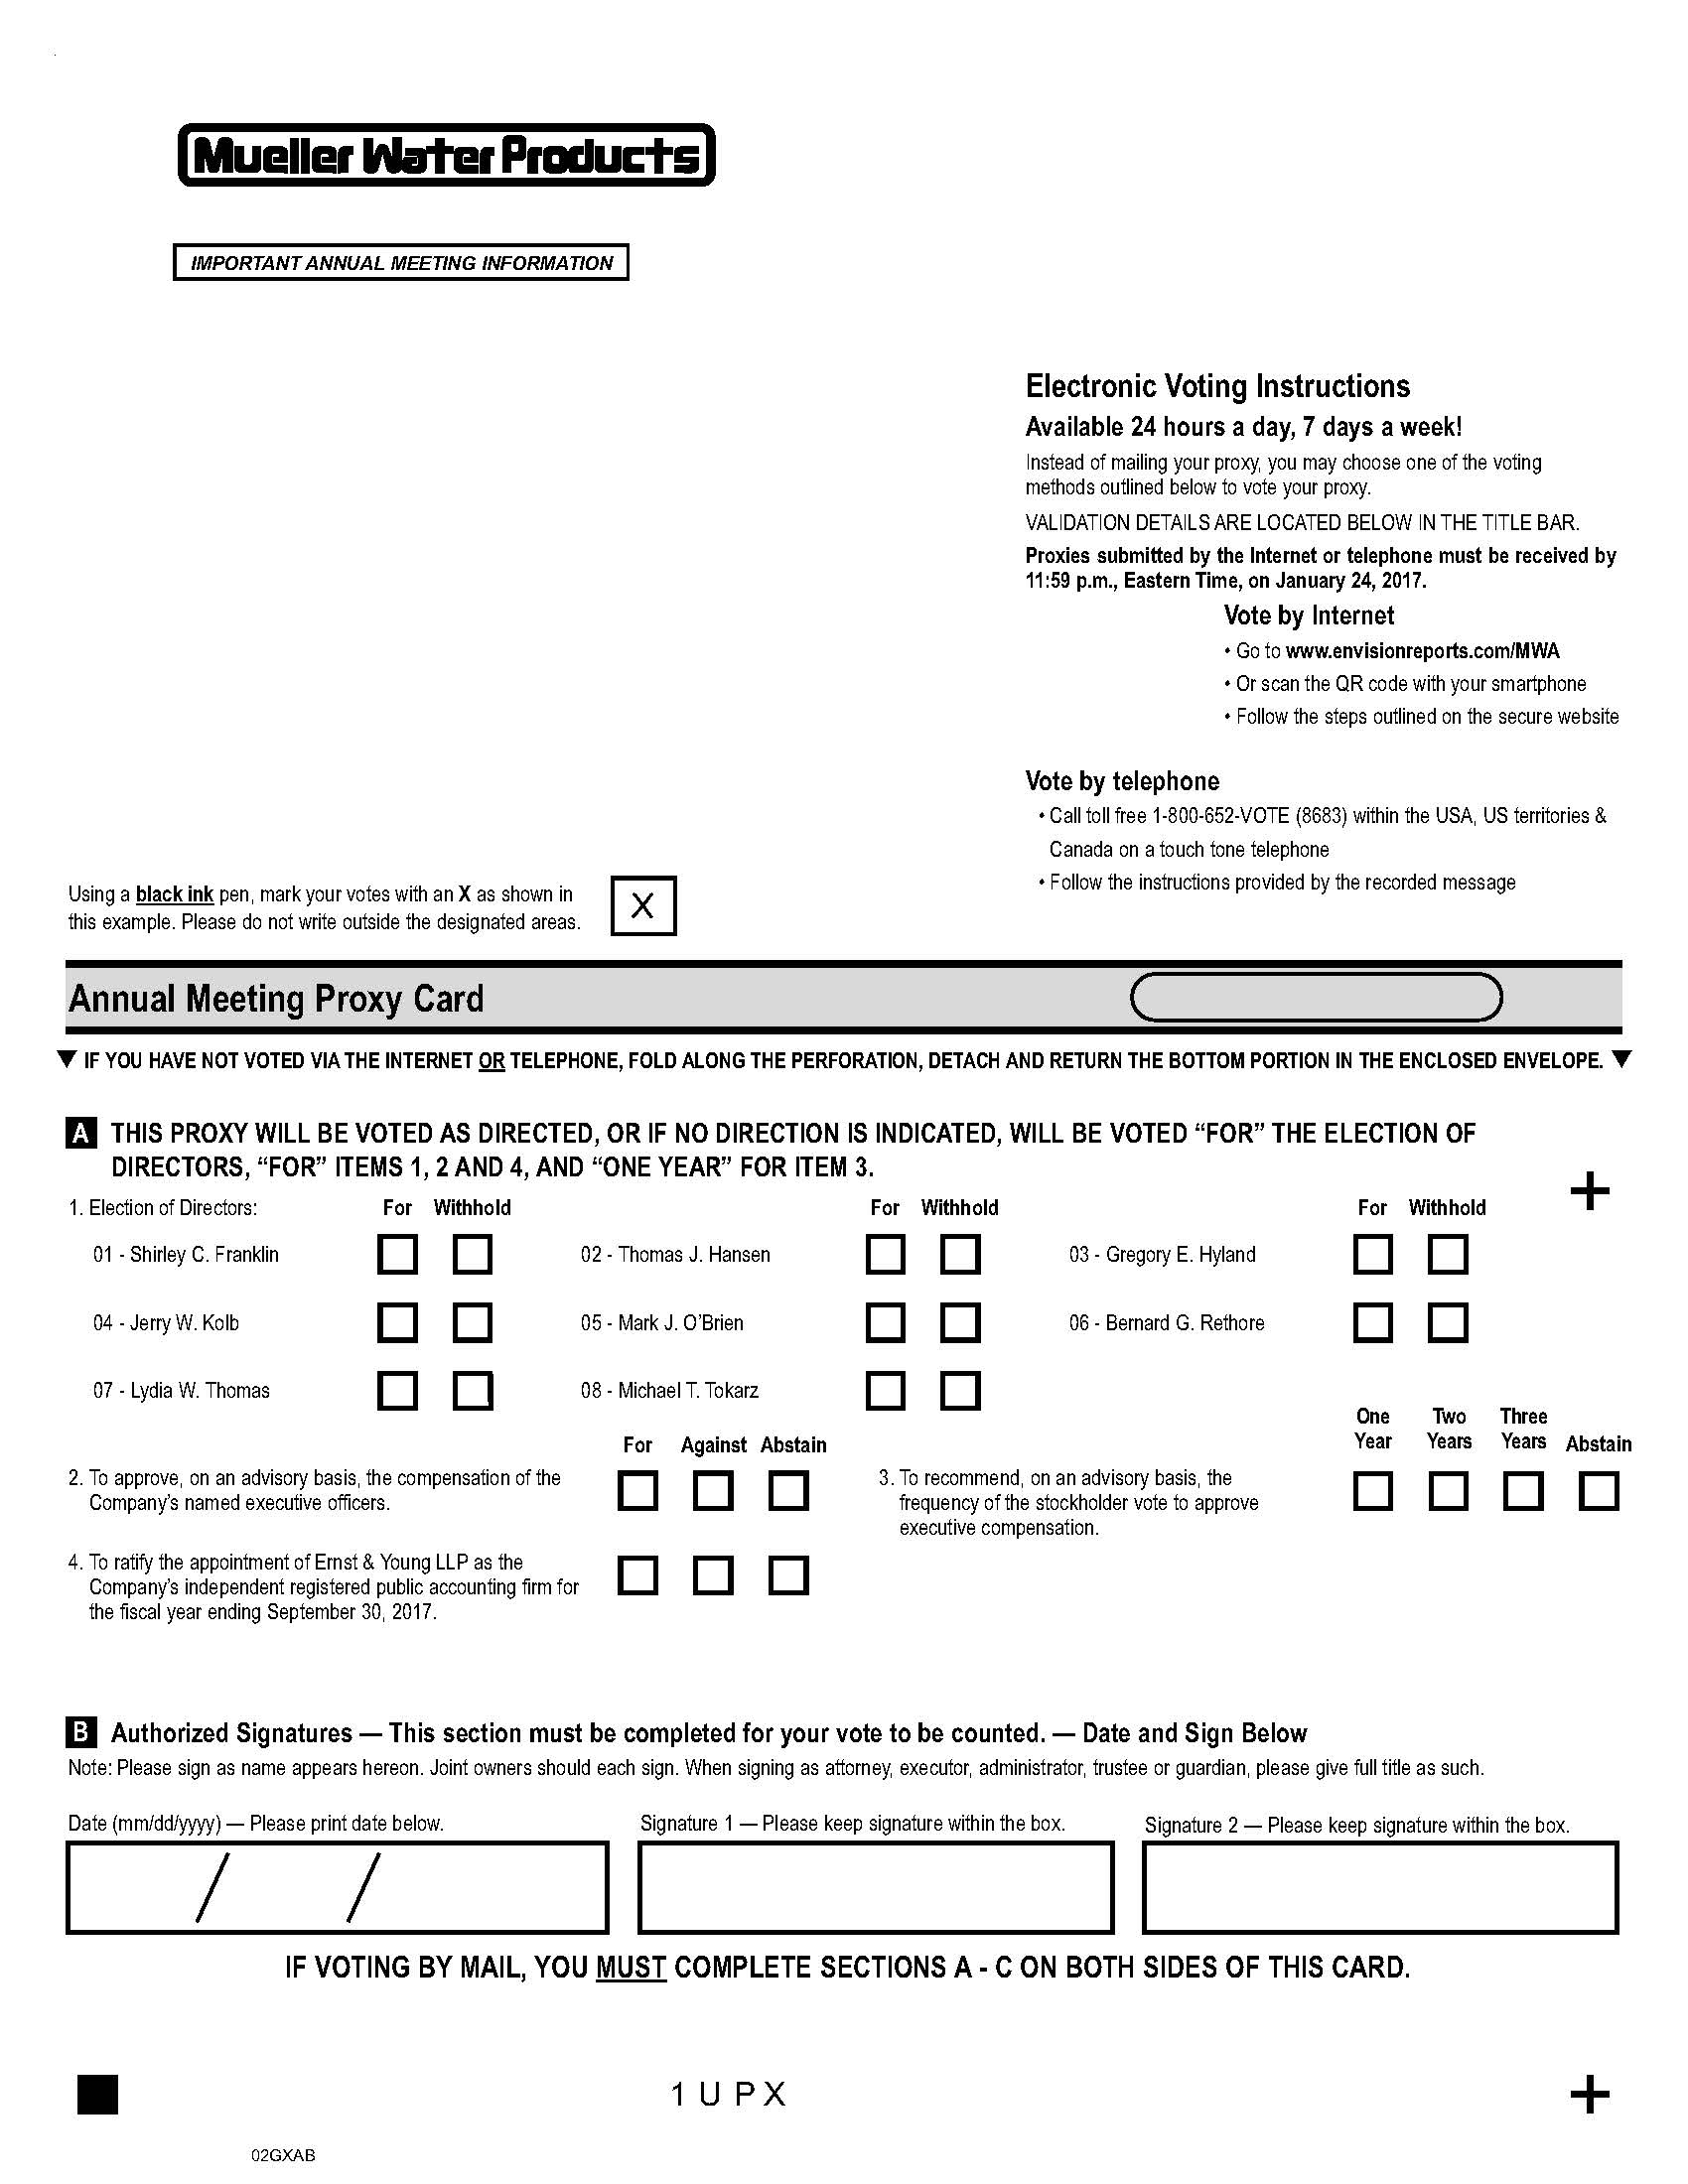
| 1. | Election of eight directors nominated by the board of directors for the coming year; |
| 2. | To consider the compensation of our named executive officers; |
| 3. | To consider whether you prefer to vote on the compensation of our named executive officers annually, every two years or every three years; and |
| 4. | To ratify the appointment of Ernst & Young LLP as our independent registered public accounting firm for the fiscal year ending September 30, 2017. |
We will also transact any other business properly brought before the Annual Meeting.
Only our stockholders at the close of business on December 8, 2016, the record date for voting at the Annual Meeting, are entitled to notice of and to vote at the Annual Meeting and any adjournment or postponement thereof.
This Proxy Statement and our 2016 Annual Report are available at www.proxyvote.com (for beneficial stockholders) and www.edocumentview.com/mwa (for registered stockholders).
We use Securities and Exchange Commission rules allowing issuers to furnish proxy materials to their stockholders over the Internet. A Notice of Internet Availability of Proxy Materials or this Proxy Statement will first be mailed to our stockholders on or about December 15, 2016. Please refer to the Notice of Internet Availability of Proxy Materials, proxy materials email or proxy card you received for information on how to vote your shares and to ensure your shares will be represented and voted at the Annual Meeting.
By Order of the Board of Directors.
Keith L. Belknap
Corporate Secretary
Atlanta, Georgia
December 15, 2016
TABLE OF CONTENTS
| Page | |
| PROXY STATEMENT SUMMARY | |
| Audit Fees and Other Fees | |
| Director Compensation Summary | |
| 2016 Key Accomplishments | |
| Performance and Compensation Highlights | |
| Executive Compensation Program Overview | |
| Other Compensation Practices and Policies | |
| Procedures for Business Matters and Director Nominations for Consideration at Next Year’s Annual Meeting of Stockholders | |
| EXHIBIT A: RECONCILIATION OF NON-GAAP MEASURES TO GAAP RESULTS | |
| Please note attendance at the Annual Meeting will be limited to stockholders of Mueller Water Products, Inc. (or their authorized representatives) as of the record date. You will be required to provide the admission ticket that is detachable from your proxy card or other evidence of ownership, along with photo identification. If your shares are held by a bank or broker, please bring your bank or broker statement evidencing your beneficial ownership of our common stock as of the record date to gain admission to the Annual Meeting. |
| PROXY STATEMENT SUMMARY | |||||
| This summary highlights information contained elsewhere in this Proxy Statement. This summary does not contain all of the information you should consider, and you should read the entire Proxy Statement carefully before voting. Unless the context otherwise requires, the terms “we”, “our”, “us” and the “Company” as used in this Proxy Statement refer to Mueller Water Products, Inc. | |||||
| 2017 ANNUAL MEETING OF STOCKHOLDERS | |||||
| Date and Time: | Wednesday, January 25, 2017; 10:00 A.M., Eastern Time | ||||
| Place: | Peachtree Dunwoody Room, 3rd Floor, Building 500 Northpark Town Center, 1100 Abernathy Road, N.E. Atlanta, Georgia 30328 | ||||
| Record Date: | December 8, 2016 | ||||
| Voting: | Stockholders as of the record date may vote by Internet, telephone, signing and dating the proxy card or in person at the Annual Meeting. | ||||
| VOTING MATTERS | |||||
| Matter | Board of Directors’ recommendations | ||||
• Election of directors | FOR each director nominee | ||||
• Approval of executive compensation | FOR | ||||
• Determination of the frequency of our stockholder vote to approve executive compensation (annually, every two years or every three years) | ANNUALLY | ||||
• Ratification of the appointment of our independent registered public accounting firm | FOR | ||||
| 2016 KEY ACCOMPLISHMENTS | |||||
In fiscal 2016, we improved our operating performance and executed initiatives to return value to our stockholders.
 | Strong Operating Results. Our operating income and net income in fiscal 2016 were $120.6 million and $63.9 million, respectively. Adjusted operating income improved 6.5% in fiscal 2016 to $146.8 million from $137.8 million in fiscal 2015. Adjusted net income improved 13.3% to $75.8 million from $66.9 million. | Adjusted free cash flow improved 66% to $109.9 million from $66.2 million. | ||
 | Increased dividend by 50%. We increased our quarterly dividend per share to $0.03 from $0.02. We paid $16.1 million of dividends in fiscal 2016. | |||
| 2016 Performance Highlights | |||||
The Compensation and Human Resources Committee used several performance elements, including those set forth below, to assess and determine incentive plan compensation earned during fiscal 2016.
| Net Sales | Adjusted Operating Income | Adjusted Net Income | Adjusted Free Cash Flow | Average Investment in Working Capital | Return on Net Assets | ||
| Mueller Co. | Anvil | ||||||
| ($ in millions) | ($ in millions) | ($ in millions) | ($ in millions) | (%) | (%) | (%) | |
| 2016 | 1,138.9 | 146.8 | 75.8 | 109.9 | 20.8 | 29.3 | 25.2 |
| 2015 | 1,164.5 | 137.8 | 66.9 | 66.2 | 23.7 | 27.2 | 24.7 |
See “Compensation Discussion and Analysis — Performance and Compensation Highlights” for more information and Exhibit A for a reconciliation of non-GAAP financial measures to GAAP financial results.
1
| 2016 Compensation Highlights | ||||
We design our executive compensation programs to target total compensation for executives at or about the 50th percentile (plus or minus 15%) of our customized peer group. The principal elements of these compensation programs are base salary, annual performance-based cash bonus, long-term incentive and performance-based equity compensation, as well as broad-based employee benefit plans.
| • | We structure a significant portion of our executives’ overall compensation as incentive compensation. For fiscal 2016, incentive compensation, which includes performance-based compensation, represented approximately 75% of our CEO’s total target compensation, and an average of 63% of the total target compensation of our other named executives. |
| • | We structure performance-based compensation to pay for performance. Performance-based incentive compensation represented 49% of our CEO’s total target compensation for fiscal 2016. We set clear and measurable financial goals for Company and segment performance. In evaluating individual performance, we assess progress toward strategic priorities. |
| • | We paid performance-based compensation for fiscal 2016 that reflects Company, segment and individual performance. Our named executives’ compensation was both positively and negatively affected by Company and segment performance in relation to targets set for fiscal 2016. |
| ◦ | Annual cash bonuses earned by our named executives ranged from 101% to 129% of target (compared with 9% to 63% of target last year). |
| ◦ | Long-term compensation was paid or credited at 102.1% of target for fiscal 2016 because Company performance on the “return on net assets” financial measure was above target levels. |
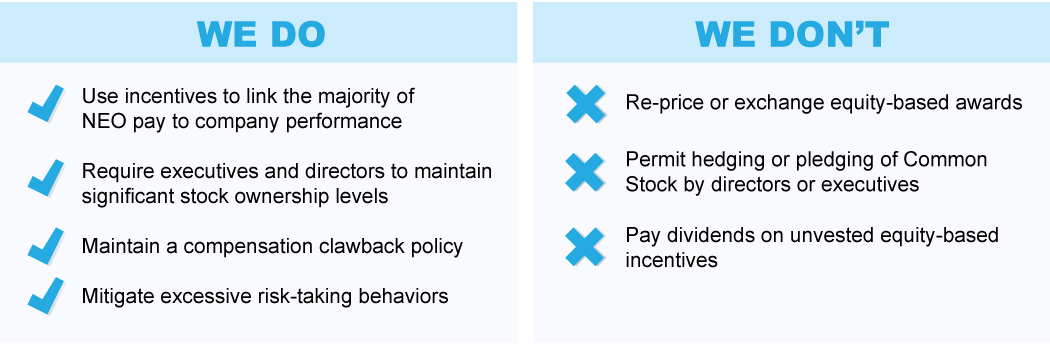
| • | We continue to maintain best practices for executive compensation. |
| ◦ | We design our compensation programs to mitigate risk. |
◦ | Our equity incentive plan prohibits the repricing or exchange of equity-based awards. |
◦ | We prohibit hedging and pledging of our Common Stock by executives or directors. |
◦ | Our executives and directors are subject to stock ownership guidelines. |
| ◦ | We can “clawback” cash- or equity-based compensation paid to executives under certain circumstances. |
See “Compensation Discussion and Analysis — Executive Compensation Program Overview”, “— Other Factors Considered by the Compensation Committee” and “— Other Compensation Practices and Policies” for more information regarding our compensation philosophy, structure and developments.

2
| DIRECTOR NOMINEES | ||||
Each director stands for election annually. All directors are independent, except Mr. Hyland, our Chairman, President and CEO. The Board held 12 meetings in fiscal 2016 and each director attended over 88% of the total number of meetings of the Board and committees of which he or she was a member.
The following table provides summary information about each director nominee. See “Matters to be Voted On — Proposal One” for more information about each nominee.
| Name | Age | Director Since | Independent | Experience | Board Committees(1) | |
 | Shirley C. Franklin | 71 | 2010 |  | Executive Chair of Purpose Built Communities, Inc.; former Mayor of Atlanta | Comp; EHS |
 | Thomas J. Hansen | 67 | 2011 | | Former Vice Chairman of Illinois Tool Works Inc. | Audit; EHS |
 | Gregory E. Hyland | 65 | 2005 | Chairman, President and Chief Executive Officer of Mueller Water Products, Inc. | Exec* | |
 | Jerry W. Kolb | 80 | 2006 | | Retired Vice Chairman of Deloitte & Touche LLP | Audit*; Governance |
 | Mark J. O’Brien(2) | 73 | 2006 | | Former Chairman and Chief Executive Officer of Walter Investment Management Corp. | Exec |
 | Bernard G. Rethore | 75 | 2006 | | Chairman Emeritus of Flowserve Corporation | Audit; Governance*; Exec |
 | Lydia W. Thomas | 72 | 2008 | | Retired President and Chief Executive Officer of Noblis, Inc. | EHS*; Governance |
 | Michael T. Tokarz | 67 | 2006 | | Chairman of Tokarz Group, LLC | Comp*; Governance; Exec |
* Denotes committee chairperson
| (1) | Audit = Audit Committee; Comp = Compensation and Human Resources Committee; EHS = Environment, Health and Safety Committee; Exec = Executive Committee; Governance = Nominating and Corporate Governance Committee |
| (2) | Mr. O’Brien serves as our Lead Director. See “Corporate Governance — Board Operations — Board Leadership Structure” for more information. |
3
MATTERS TO BE VOTED ON
PROPOSAL ONE:
ELECTION OF DIRECTORS
The Nominating and Corporate Governance Committee (the “Governance Committee”) is responsible for identifying qualified candidates to serve on the Board and recommending nominees to be submitted to our stockholders for election at each annual meeting of stockholders. After the Governance Committee completes its evaluation of candidates, it presents its recommendation to the Board for consideration and approval.
In evaluating candidates, the Governance Committee considers a variety of qualifications, experience, attributes and skills, and recognizes that a diversity of knowledge, viewpoints and experience can enhance the Board’s effectiveness. Accordingly, as part of its candidate evaluation, the Governance Committee considers how the candidate’s background, qualifications, experience, attributes and skills may enhance the quality of the Board’s deliberations and decisions.
After many years of distinguished service, it is expected that Joseph B. Leonard will retire from the Board at the 2017 Annual Meeting. We would like to take this opportunity to thank Mr. Leonard for his many years of service to the Board. In connection with Mr. Leonard’s retirement, the Board will follow the recommendation of the Governance Committee and reduce the size of the Board from nine to eight members.
After evaluating each director and the composition of the full Board, the Governance Committee has recommended all of the current Board members (other than Mr. Leonard) for election. If elected, each of the eight individuals nominated for election to the Board will hold office until the 2018 annual meeting of stockholders and until his or her successor is elected and qualified. Each nominee has agreed to serve as a director if elected. However, if for some unforeseen reason a nominee becomes unwilling or unable to serve, proxies will be voted for a substitute nominee selected by the Board. In lieu of designating a substitute nominee, the Board, in its discretion, may reduce the number of directors.
Information about the nominees, including information concerning their qualifications for office, is set forth below:
| Shirley C. Franklin Age: 71 Director since: 2010 Board committees: Compensation, EHS Other public company boards: Delta Air Lines, Inc. Ms. Franklin serves as Executive Chair of the board of directors of Purpose Built Communities, Inc., a national non-profit organization that works to transform struggling neighborhoods into sustainable communities. She also serves as Co-Chair of the Atlanta Regional Commission on Homelessness and as Chair of the board of directors of the National Center for Civil and Human Rights. From 2002 to 2010, Ms. Franklin served as mayor of Atlanta, Georgia. She earned a Bachelor of Science degree in sociology from Howard University and a Master’s degree in sociology from the University of Pennsylvania. The Board considered Ms. Franklin’s record of civic involvement and significant executive management experience, which has spanned three decades. During her service as mayor of Atlanta, Ms. Franklin worked to rebuild the city’s water infrastructure. | |
4
| Thomas J. Hansen Age: 67 Director since: 2011 Board committees: Audit, EHS Other public company boards: Standex International Corporation, Terex Corporation Until 2012, Mr. Hansen served as Vice Chairman of Illinois Tool Works Inc. (“ITW”), a manufacturer of fasteners and components, consumable systems and a variety of specialty products and equipment. He joined ITW in 1980 as a sales and marketing manager of the Shakeproof Industrial Products businesses. From 1998 to 2006, Mr. Hansen served as Executive Vice President of ITW. He earned a Bachelor of Science degree in marketing from Northern Illinois University and a Master of Business Administration degree from Governors State University. The Board considered Mr. Hansen’s experience as a senior executive of a large diversified industrial manufacturing company that faces many of the economic, social and governance issues we face. | |
| Gregory E. Hyland Age: 65 Director since: 2005 Board committees: Executive (Chair) Other public company boards: Ferro Corporation Mr. Hyland serves as the Chairman of the Board and has served as our President and Chief Executive Officer since January 2006. He served as Chairman, President and Chief Executive Officer of Walter Energy, Inc. from September 2005 until December 2006. From June to September 2005, Mr. Hyland served as President, U.S. Fleet Management Solutions of Ryder System, Inc., a transportation and logistics company, and from 2004 to 2005 he served as its Executive Vice President. He earned Bachelor and Master of Business Administration degrees from the University of Pittsburgh. The Board considered Mr. Hyland’s commercial experience and business leadership skills gained from his past and current positions in both management and on the boards of directors of public companies. | |
| Jerry W. Kolb Age: 80 Director since: 2006 Board committees: Audit (Chair), Governance Other public company boards within the last five years: Walter Energy, Inc. From 1986 to 1998, Mr. Kolb served as a Vice Chairman of Deloitte & Touche LLP, a registered public accounting firm. He is a certified public accountant. Mr. Kolb earned a Bachelor of Science degree in accountancy from the University of Illinois and a Master of Business Administration degree from DePaul University. The Board considered Mr. Kolb’s broad perspective in accounting and financial reporting matters and his extensive experience in audit, finance and compensation matters and in executive management based on his 41-year career with Deloitte & Touche. | |
5
| Mark J. O’Brien Age: 73 Director since: 2006 Board committees: Executive and ex officio member of all other standing committees Other public company boards: Walter Investment Management Corp. Mr. O’Brien serves as our Lead Director. He served as Chairman of Walter Investment Management Corp. (formerly Walter Industries’ Homes Business), a mortgage portfolio owner and mortgage originator and servicer, from 2009 through December 2015, and he served as its Chief Executive Officer from 2009 to October 2015. Mr. O'Brien has served as President and Chief Executive Officer of Brier Patch Capital and Management, Inc., a real estate management and investment firm, since 2004. He served in various executive capacities at Pulte Homes, Inc., a home building company, for 21 years, retiring as President and Chief Executive Officer in 2003. Mr. O'Brien earned a Bachelor of Arts degree in history from the University of Miami. The Board considered Mr. O’Brien’s knowledge of capital markets, municipal finance and the homebuilding and real estate sectors of the economy. | |
| Bernard G. Rethore Age: 75 Director since: 2006 Board committees: Audit, Governance (Chair), Executive Other public company boards: Dover Corp. Other public company boards within the last five years: Walter Energy, Inc., Belden, Inc. Mr. Rethore has served as Chairman Emeritus of Flowserve Corporation, a manufacturer of pumps, valves, seals and components, since 2000. From January 2000 to April 2000, he served as Flowserve’s Chairman. Mr. Rethore had previously served as its Chairman, President and Chief Executive Officer. In 2008, Mr. Rethore was honored by the Outstanding Directors Exchange as an Outstanding Director of the Year, and in 2012, he was designated a Board Leadership Fellow by the National Association of Corporate Directors. He earned a Bachelor of Arts degree in Economics (Honors) from Yale University and a Master of Business Administration degree from the Wharton School of the University of Pennsylvania, where he was a Joseph P. Wharton Scholar and Fellow. The Board considered Mr. Rethore’s more than 30 years of experience at senior executive level positions with public manufacturing companies and his service on the boards of multiple public companies, as a member and chair of their audit, compensation, environment, health and safety, and governance committees. His extensive management experience makes him a valuable contributor to the Board on matters involving business strategy, capital allocation and merger and acquisition opportunities. | |
6
| Lydia W. Thomas Age: 72 Director since: 2008 Board committees: Governance, EHS (Chair) Other public company boards: Cabot Corporation, Washington Mutual Investors Fund Dr. Thomas served as President and Chief Executive Officer of Noblis, Inc., a public interest scientific research, technology and strategy company, from 1996 to 2007. She was previously with The MITRE Corporation, Center for Environment, Resources and Space, serving as Senior Vice President and General Manager from 1992 to 1996, Vice President from 1989 to 1992 and Technical Director from 1982 to 1989. In 2013, she was honored by the Outstanding Directors Exchange as an Outstanding Director of the Year. Dr. Thomas earned a Bachelor of Science degree in zoology from Howard University, a Master of Science degree in microbiology from American University and a Doctor of Philosophy degree in cytology from Howard University. The Board considered Dr. Thomas’ extensive experience at senior executive level positions and particular expertise related to information technology and environmental, health and safety matters. | |
| Michael T. Tokarz Age: 67 Director since: 2006 Board committees: Compensation (Chair), Governance, Executive Other public company boards: CNO Financial Group, Inc., MVC Capital, Inc. (Chairman), Walter Investment Management Corp. Other public company boards within the last five years: Walter Energy, Inc., Dakota Growers Pasta Company, IDEX Corporation Since 2002, Mr. Tokarz has served as a member of the Tokarz Group, LLC, an investment company. From 1996 until 2002, Mr. Tokarz served as a member of the limited liability company that serves as the general partner of Kohlberg Kravis Roberts & Co. L.P., a private equity company. In 2007, he was honored by the Outstanding Directors Exchange as an Outstanding Director of the Year. He earned a Bachelor of Arts degree in economics with high distinction and a Master of Business Administration degree in finance from the University of Illinois. The Board considered Mr. Tokarz’s knowledge and experience in banking and finance, his entrepreneurial and business leadership skills, his more than 20 years of board experience with publicly traded companies and his corporate governance training. | |
7
Set forth below is a chart that highlights the skills, qualifications and characteristics of the director nominees.
| Franklin | Hansen | Hyland | Kolb | O’Brien | Rethore | Thomas | Tokarz | |
| Governance | | | | | | | | |
| Financial | | | | | | | | |
| Management | | | | | | | | |
| Government and Regulatory Affairs | | | | | | | ||
| International Business | | | | | | | | |
| Marketing | | | | | ||||
| Mergers and Acquisitions | | | | | | | | |
| Multiple-Part Manufacturing | | | | |||||
| Offshore Sourcing | | |||||||
| Strategic Planning | | | | | | | | |
| Compliance/Risk Management | | | | |||||
| Environment, Health and Safety | | | ||||||
A plurality of the votes cast in respect of the shares of Common Stock present in person or represented by proxy at the Annual Meeting and entitled to vote shall be required to elect these nominees (or a substitute nominee as designated by the Board) to serve as directors.
The Board recommends a vote FOR each nominee for director.
8
PROPOSAL TWO:
ADVISORY VOTE TO APPROVE EXECUTIVE COMPENSATION
We provide our stockholders with the annual opportunity to cast an advisory vote on the compensation of our named executive officers. The vote on this proposal represents an additional means by which we obtain feedback from our stockholders about executive compensation. Our Compensation and Human Resources Committee (the “Compensation Committee”) sets executive compensation.
The overall objective of our executive compensation program is to encourage and reward the creation of sustainable, long-term stockholder value. To meet this objective, the Compensation Committee has designed compensation plans for our executive officers that target total compensation at the 50th percentile (plus or minus 15%) of our customized peer group. A significant portion of our executives’ overall compensation is structured as incentive compensation. For fiscal 2016, incentive compensation represented approximately 75% of our CEO’s total target compensation, and an average of 63% of the total target compensation of the other named executive officers. We believe an emphasis on both short-term and long-term incentive compensation aligns executives’ and stockholders’ interests.
We encourage our stockholders to read the Compensation Discussion and Analysis section of this Proxy Statement, which discusses how our compensation policies and procedures implement our compensation philosophy. The Board and the Compensation Committee believe these policies and procedures are strongly aligned with the long-term interests of our stockholders and are effective in implementing our compensation philosophy and in achieving our strategic goals.
Accordingly, we ask for stockholder approval of the following resolution:
RESOLVED, that the stockholders approve, on an advisory basis, the compensation paid to the named executive officers of Mueller Water Products, Inc., as disclosed in the Compensation Discussion and Analysis, the accompanying compensation tables and the related narrative disclosure in the Company’s proxy statement for the 2017 annual meeting of stockholders.
This vote is advisory and therefore not binding on us, the Board or the Compensation Committee. At last year’s annual meeting of stockholders, approximately 98% of votes cast were in support of the compensation of our named executive officers. The Board and the Compensation Committee value the opinions of our stockholders. The Compensation Committee will consider the result of this year’s vote, as well as other communications from stockholders relating to our compensation practices, and take them into account in future determinations concerning our executive compensation program. See “Compensation Discussion and Analysis — Performance and Compensation Highlights”.
The Board recommends a vote FOR Proposal Two.
9
PROPOSAL THREE:
ADVISORY VOTE ON THE FREQUENCY OF THE ADVISORY VOTE TO APPROVE
EXECUTIVE COMPENSATION
At our 2011 Annual Meeting, we first provided our stockholders with the opportunity to cast an advisory vote on how frequently they would like to vote on our executive compensation, which as described in Proposal Two, is commonly referred to as “Say-on-Pay.” Based on the voting results at our 2011 Annual Meeting, our Board determined to hold Say-on-Pay votes annually. SEC rules require us to ask our stockholders, at least every six years, how often they would like for us to hold Say-on-Pay votes. Accordingly, we are requesting your advisory vote this year to determine the frequency of future Say-on-Pay votes.
By voting on this Proposal Three, stockholders may indicate whether they would prefer that we continue to hold an advisory vote on our executive compensation annually, or whether they prefer such vote to be held every two or three years.
The Board believes that an annual vote is the most effective means for ensuring that our executive compensation policies and procedures are strongly aligned with the interests of our stockholders and are effective in implementing our compensation philosophy and in achieving our strategic goals. The Board’s belief is further based on the premise that this recommendation can be modified in future years if it becomes apparent that a vote once every year is not meaningful or a less frequent vote is recommended by best corporate governance practices.
Accordingly, we ask for stockholder approval of the following resolution:
RESOLVED, that the stockholders approve, on an advisory basis, an annual advisory vote on executive compensation.
This vote is advisory and therefore not binding on us, the Board or the Compensation Committee. The Compensation Committee will consider the result of this year’s vote, as well as other communications from stockholders relating to our compensation practices, and take them into account in future determinations concerning our executive compensation programs.
The Board recommends voting on executive compensation ANNUALLY.
10
PROPOSAL FOUR:
RATIFICATION OF THE APPOINTMENT OF THE
INDEPENDENT REGISTERED PUBLIC ACCOUNTING FIRM
The Audit Committee has authority to retain and terminate the services of our independent registered public accounting firm. The Audit Committee has appointed Ernst & Young LLP as the independent registered public accounting firm to audit our consolidated financial statements and internal controls over financial reporting for the fiscal year ending September 30, 2017, subject to negotiation of definitive fee arrangements. Although stockholder ratification of Ernst & Young’s appointment is not required, the Board believes submitting the appointment to our stockholders for ratification is a matter of good corporate governance. See below for a description of the fees Ernst & Young billed us for fiscal 2016 and fiscal 2015.
A representative of Ernst & Young is expected to be present at the Annual Meeting. The representative will have an opportunity to make a statement and will be available to respond to stockholder questions.
The Board recommends a vote FOR Proposal Four.
FEES AND SERVICES OF THE INDEPENDENT REGISTERED
PUBLIC ACCOUNTING FIRM
The Audit Committee appointed Ernst & Young as the independent registered public accounting firm to audit our consolidated financial statements and internal control over financial reporting for fiscal 2016.
Audit Fees and Other Fees
The following table shows the approximate fees for audit and other services provided by Ernst & Young for fiscal years 2016 and 2015 (in millions).
| 2016 | 2015 | ||||||
Audit fees(1) | $ | 2.5 | $ | 2.5 | |||
Audit-related fees(2) | 0.1 | 0.8 | |||||
| Tax fees | 0.1 | 0.3 | |||||
| All other fees | — | — | |||||
| Total fees | $ | 2.7 | $ | 3.6 | |||
| (1) | Reflects fees for professional services performed by Ernst & Young for annual audits (including out-of-pocket expenses) and quarterly limited reviews of our consolidated financial statements. |
| (2) | Reflects fees for professional services performed by Ernst & Young for audits of a subsidiary’s financial statements for fiscal 2012 through fiscal 2015. |
Pre-Approval of Services Performed by the Independent Registered Public Accounting Firm
The Audit Committee has adopted procedures for pre-approving all audit and non-audit services provided by the independent registered public accounting firm. For both types of pre-approval, the Audit Committee considers whether the services are consistent with the Securities and Exchange Commission’s (“SEC”) rules on auditor independence and whether the independent registered public accounting firm is able to provide the most effective service. Non-audit fees to be incurred by the independent registered public accounting firm for services permitted by the Sarbanes-Oxley Act of 2002 to be performed by such firm must be approved in advance by the Audit Committee Chairman (for individual projects in amounts up to $100,000) or the Audit Committee. The Audit Committee periodically monitors the services rendered and actual fees paid to the independent registered public accounting firm to ensure the services are within the parameters approved by the Audit Committee.
11
REPORT OF THE AUDIT COMMITTEE
Committee Composition and Skills
The Audit Committee is comprised of four independent directors meeting the requirements of applicable SEC and NYSE rules. The Board has determined all Audit Committee members are “financially literate” for purposes of the NYSE Manual and qualify as audit committee “financial experts” within the meaning of the rules and regulations of the SEC. See “Matters to be Voted On — Proposal One” for a description of the business background of each member. No member of the Audit Committee serves on the audit committee of more than three public companies.
Meetings
The Audit Committee met 13 times during fiscal 2016, including eight times by teleconference. Meetings include periodic executive sessions with the independent registered public accounting firm, our internal auditors and our management.
Responsibilities of the Audit Committee, Management and the Independent Auditor
The Audit Committee’s key responsibilities are set forth in its charter, which was approved by the Board and is available on our website. See “Corporate Governance — Board Operations — Board Committee Information” for more information concerning the Audit Committee and its responsibilities. For the audit of our consolidated financial statements for fiscal 2016 and our internal control over financial reporting:
| • | Management was primarily responsible for preparing our financial statements and establishing and maintaining effective internal control over financial reporting. The Audit Committee was responsible for monitoring and overseeing our financial reporting and audit functions, as well as our internal controls over financial reporting and disclosure. |
| • | Ernst & Young, our independent registered public accounting firm for fiscal 2016, was responsible for performing an independent audit of our consolidated financial statements and expressing an opinion on the conformity of those financial statements with accounting principles generally accepted in the United States and was also responsible for performing an independent audit of, and expressing an opinion on, our internal controls over financial reporting. |
| • | The Audit Committee reviewed and discussed with management and Ernst & Young the audited consolidated financial statements for the year ended September 30, 2016, our quarterly consolidated financial statements and operating results for each quarter in the fiscal year and the related significant accounting and disclosure issues, and the effectiveness of our internal controls over financial reporting. |
| • | The Audit Committee reviewed management’s report contained in our annual report on Form 10-K for the year ended September 30, 2016 (“Annual Report”), as well as Ernst & Young’s Reports of Independent Registered Public Accounting Firm included in the Annual Report related to its audits of the consolidated financial statements and internal control over financial reporting. |
| • | The Audit Committee discussed with Ernst & Young matters required to be discussed by Statement on Auditing Standards No. 16, as amended, “Communication with Audit Committees.” In addition, Ernst & Young provided the Audit Committee with the written disclosures and the letter required by the applicable requirements of the Public Company Accounting Oversight Board regarding the independent accountant’s communications with the Audit Committee concerning independence and the Audit Committee has discussed with Ernst & Young the firm’s independence. |
Audited Consolidated Financial Statements
Based on the foregoing discussions with and reports of management and our independent registered public accounting firm and the Audit Committee’s review of the representations of management, the Audit Committee recommended to the Board the inclusion of our consolidated financial statements in the Annual Report.
| Audit Committee |
| Jerry W. Kolb, Chair |
| Thomas J. Hansen |
| Joseph B. Leonard |
| Bernard G. Rethore |
12
CORPORATE GOVERNANCE
Overview
Our Board is committed to establishing and maintaining corporate governance practices that reflect high standards of ethics and integrity.
Our corporate governance structure and processes are based on our key governance documents, including our Corporate Governance Guidelines (the “Guidelines”). The Guidelines govern the operation of the Board and its committees and guide the Board and its committees in the execution of their respective responsibilities. The Governance Committee reviews the Guidelines at least annually and the Board updates the Guidelines periodically in response to changing regulatory requirements, evolving practices and otherwise as circumstances warrant.
In July 2016, a group of leading executives and institutional investors published a statement of “Commonsense Principles of Corporate Governance.” These Commonsense Principles set forth a number of recommendations and guidelines about the roles and responsibilities of boards, public companies and stockholders, and are intended to provide guidance on corporate governance that “works in the real world.”
Because we believe an important aspect of achieving a strong and effective corporate governance structure is to encourage an open dialog with our stockholders, we have reviewed our policies and procedures in light of the suggestions set forth in the Commonsense Principles. Accordingly, we would like to take this opportunity to highlight for you the key areas of our corporate governance practices that we believe best align with the Commonsense Principles.
| Board Composition and Leadership: | | Our Board is led by a joint Chairman and CEO along with a strong, designated independent Lead Director |
| Each of our directors, other than our Chairman, is independent | |
| Our directors have complementary and diverse skills sets, backgrounds and experiences and are continually educated on our industry | |
| Our Board size (eight directors following Mr. Leonard’s retirement) promotes an open dialogue among directors | |
| Board Committee Structure: | | We have a well-developed committee structure with clearly understood responsibilities |
| Director Effectiveness: | | We believe our directors are strong, experienced and knowledgeable |
| Our Board and committees conduct regular director evaluations, led by our Governance Committee, to assess director effectiveness | |
| Director Responsibilities: | | Each of our directors has input into the setting of the Board agenda |
| Each of our directors has unfettered access to management and the authority to retain independent advisors | |
| Our Board frequently meets in executive sessions without the CEO or other members of management | |
| Our Board focuses on significant risks and seeks the proper calibration of risk and reward while focusing on the longer-term interests of our stockholders | |
| Director Compensation: | | We pay a substantial portion of non-employee director compensation in equity awards |
| To encourage longer-term company performance, our equity awards contain vesting periods | |
| Public Reporting: | | We provide our stockholders with transparent quarterly financial results |
| Our non-GAAP measures are used to explain and clarify results for stockholders, rather than to obscure GAAP results | |
13
Our Code of Business Conduct and Ethics (the “Ethics Code”) applies to all of our employees and directors. We also make available an ethics hotline that employees and others may use to anonymously report suspected violations of the Ethics Code. We will disclose promptly any amendments to, or waivers from, provisions of the Ethics Code on our website at www.muellerwaterproducts.com, as may be required under applicable rules.
The table below lists some of the Board policies and other materials relating to our corporate governance that are available on our website. We will also provide copies of any of these policies and materials without charge upon written request to our Corporate Secretary at Mueller Water Products, Inc., 1200 Abernathy Road, N.E., Suite 1200, Atlanta, Georgia 30328. The information on our website is not a part of this Proxy Statement.
| Corporate Governance Policies and Materials | |
• Corporate Governance Guidelines • Code of Business Conduct and Ethics • Board Committee Composition and Committee Charters | • Certificate of Incorporation • Bylaws • Stock Ownership Guidelines |
Board Composition
Board Size
The Board is currently comprised of nine directors and, following Mr. Leonard’s retirement as discussed above, will be comprised of eight directors. In connection with Mr. Leonard’s retirement, the Board will follow the recommendation of the Governance Committee and reduce the size of the Board from nine to eight members.
Director Independence
The Governance Committee and the Board annually assess the outside affiliations of each director to determine if these affiliations could cause a potential conflict of interest or interfere with the director’s independence. The Guidelines set forth the categorical standards of independence for the Board. To be considered “independent” for purposes of the director qualification standards:
| • | The director must meet bright-line independence standards under the NYSE Listed Company Manual (the “NYSE Manual”); and |
| • | The Board must affirmatively determine the director otherwise has no material relationship with us directly or as an officer, stockholder or partner of an organization that has a relationship with us. See the Guidelines on our website for more detail. |
Each of our directors, other than our Chairman, is independent pursuant to our director qualification standards and each member of the Audit Committee, the Compensation Committee and the Governance Committee is independent in accordance with the NYSE Manual and our director independence standards.
| • | No member of those committees receives compensation from us other than directors’ fees and no member is an affiliated person of ours (other than by virtue of his or her directorship). |
| • | All members of the Audit Committee meet the additional standards for audit committee members of publicly traded companies required by the Sarbanes-Oxley Act of 2002. |
| • | All members of the Compensation Committee qualify as “non-employee directors” as defined in Rule 16b-3 under the Exchange Act and meet the independence requirements of the NYSE Manual and additional standards applicable to “outside directors” under Section 162(m) of the Code. |
Director Nomination Process
In discharging its responsibility related to director nominations, the Governance Committee receives input from the Chairman of the Board, other directors and, if applicable, an independent professional search firm. It also considers and evaluates candidates recommended by stockholders, as described below. The Governance Committee utilizes the same criteria to evaluate all candidates, regardless who recommends the candidate.
14
The Governance Committee decides whether to further evaluate each candidate and may select an independent professional search firm to assist in the discharge of its duties. The evaluation includes a reference check, interaction, interviews and discussions about the candidate’s qualifications, availability and commitment. The Chair of the Governance Committee interviews each qualified candidate and selects certain candidates to be interviewed by other members of the Governance Committee. The Governance Committee reviews the results of all interviews and makes a recommendation to the full Board with respect to nominating a candidate for election to the Board. The Board expects all candidates recommended to the full Board to have received the approval of all members of the Governance Committee.
The Governance Committee uses a skills matrix of key experience and competencies to evaluate candidates. The Governance Committee carefully reviews all directors and director candidates in light of these factors based on the context of the current and anticipated composition of the Board, our current and anticipated operating requirements and the long-term interests of our stockholders. In reviewing a candidate, the Governance Committee considers the candidate’s integrity and independence, as defined in the Guidelines and in the NYSE Manual.
Qualifications Required of All Directors
| Key Characteristics Required of All Directors | ||
| • Personal ethics and integrity | • Collaborative skills | • Commitment |
| • Independence | • Interpersonal skills | • Business acumen |
| • Leadership | ||
The Governance Committee does not expect or intend each director to have the same background, skills and experience; instead, it expects directors to have diverse backgrounds, skills and experiences. Although the Board does not have a formal policy regarding diversity, diversity is one among many criteria considered by the Board when evaluating candidates. Diversity criteria may include gender, race, ethnic background, geographic origin or personal, educational and professional experience. The Governance Committee believes the backgrounds and qualifications of the directors, considered as a group, should provide an appropriate mix of experience, knowledge and abilities that will enhance the Board’s oversight role.
Competencies to be Represented on the Board
Listed below are key competencies that are necessary for the Board as a whole. See “Matters to be Voted On — Proposal One” for information concerning each nominee’s relevant experience, qualifications and skills.
15
• General management expertise. Experience serving in management positions is important since these directors bring perspective in analyzing, shaping and overseeing the execution of important operational and policy issues at a senior level. These insights and guidance, and the ability to assess and respond to situations encountered in serving on the Board, may be enhanced if the leadership experience has been developed at businesses or organizations that operate in the manufacturing sector.• Financial expertise. Knowledge of financial markets, financing and funding operations, accounting and financial reporting processes is important since it assists our directors in understanding, advising and overseeing our capital structure, financing and investing activities, financial reporting and internal control of these activities.• Multiple-part manufacturing and operations experience. Experience in manufacturing is useful in understanding our research and development efforts, product engineering, design and manufacturing, operations, products and the market segments in which we compete.• Mergers and acquisitions experience. Since we have a strategy of selectively pursuing potential acquisitions, directors who have a background in M&A transactions can provide useful insight into developing and implementing strategies for growing our businesses through combination with other organizations. Useful experience includes consideration of the “fit” of a proposed combination with our strategy, the valuation of transactions and management’s plans for integration with existing operations.• Compliance/Risk Management. Directors with compliance and risk management experience is increasingly important in light of the potential financial and reputational damage that can occur when companies fail to oversee compliance and properly manage risk. Through its oversight role, the Board strongly conveys to management and employees that compliance and risk management are integral components of our strategy, culture and business operations. | • Environment, Health and Safety. We are committed to responsible environmental stewardship and rigorous health and safety programs. We believe directors with EHS experience can help drive strong environment, health and safety performance not only at the most strategic level but also throughout the entire organization, which is of particular importance to companies such as ours in light of our significant manufacturing operations.• Strategic planning expertise. We operate in competitive markets and our businesses are subject to a wide variety of risks. Directors who have strategic planning experience can assist the Board in adopting policies and procedures that respond to the risks we face.• Corporate governance expertise. Directors who have corporate governance experience can assist the Board in fulfilling its responsibilities related to the oversight of our legal and regulatory compliance.• Offshore sourcing expertise. Directors with knowledge of trends and developments in offshore sourcing are important to us since we periodically evaluate offshore sourcing of certain of our products where doing so will lower costs while maintaining quality.• Marketing expertise. Since we believe many of our products benefit from strong brand recognition, directors who have marketing experience can provide expertise and guidance as we seek to maintain and expand brand and product awareness and a positive reputation.• International business experience. Since we manufacture and sell certain of our products outside the United States, directors with global expertise can provide a useful business and cultural perspective regarding significant aspects of our businesses.• Government and regulatory affairs expertise. The manufacture and marketing of our products is subject to the rules and regulations of various federal, state and local agencies. Directors who have served in government positions or who have worked extensively with governments or regulatory bodies can provide oversight of compliance with rules and regulations and insight into working constructively with governments or regulatory bodies. | ||
16
Director Candidate Recommendations
A stockholder who wishes to submit a director candidate for consideration by the Governance Committee must do so by writing our Corporate Secretary and including the candidate’s biographical data. See “Stockholder Information — Procedures for Business Matters and Director Nominations for Consideration at Next Year’s Annual Meeting of Stockholders”.
Board Operations
Board Leadership Structure
Our governance documents provide the Board with the flexibility to select the appropriate leadership structure for us. The Board does not have a formal policy as to whether the roles of Chairman and Chief Executive Officer should be separate or whether the Chairman should be an employee or a non-employee director.
Under our Bylaws, the Chairman presides over meetings of the Board and of stockholders, while the Chief Executive Officer has general and active management of our property, business and affairs, subject to the supervision and oversight of the Board. Mr. Hyland currently serves as our Chairman and Chief Executive Officer.
As stated in the Commonsense Principles, when the roles of Chairman and Chief Executive Officer are combined, boards should have a “strong designated lead independent director.” Our Board believes in this philosophy and, therefore, has selected Mr. O’Brien to serve as our Lead Director.
| Our Lead Director: |
• Presides at meetings of independent directors and at Board meetings when the Chairman is not present.• Acts as a liaison between the independent directors and management.• Consults with the Chairman on other matters pertinent to our business and the Board. |
The Board believes that Mr. Hyland’s role as Chairman and Chief Executive Officer coupled with a strong designated independent Lead Director in Mr. O’Brien is the most effective leadership structure for us at this time. In particular, it believes having one leader serve as both Chairman and Chief Executive Officer facilitates decisive and effective leadership and this structure, when combined with our other governance policies and procedures, provides appropriate opportunities for oversight, discussion and evaluation of decisions and direction of the Board.
Board Committee Information
The Board has four standing committees: the Audit Committee, the Compensation Committee, the Governance Committee and the Environment, Health and Safety Committee (“EHS Committee”). An additional committee, the Executive Committee, meets only as needed. All standing committee members are independent - they satisfy the NYSE’s and our definitions of an independent director - and the Board has determined all Audit Committee members are “financially literate” under the NYSE Manual and qualify as “audit committee financial experts” within the meaning of the rules and regulations of the SEC.
Each standing committee meets periodically throughout the year, reports its actions and recommendations to the Board, receives reports from management and annually evaluates its performance. Additional information about the committees is provided below. See the committee charters on our website for more detail.
17
Audit Committee
Current Members Kolb (Chair) Hansen Leonard Rethore | • Oversees the integrity of our financial statements, financial reporting activities and accounting policies and procedures. • Selects and oversees the independent registered public accounting firm, approves its services (including both audit and non-audit services) and fees, and evaluates its performance. In its evaluation, the Audit Committee considers the firm’s reputation for independence and integrity, the qualifications and performance of the firm’s personnel and the effectiveness of their communications, the appropriateness of fees and Public Company Accounting Oversight Board reports on the firm and its peers. • Reviews the scope and results of the independent registered public accounting firm’s audits. • Reviews the scope of the internal audit function, internal audit plans, internal audit reports and corrective actions taken in response to internal audit findings. Evaluates the performance of the internal audit function • Oversees our internal accounting systems and related internal controls over financial reporting, as well as our financial risk management profile. • Oversees our legal compliance and ethics programs and the Ethics Code. | ||
| 13 meetings in fiscal 2016 | |||
Compensation and Human Resources Committee
Current Members Tokarz (Chair) Franklin Leonard | • Oversees executive compensation and equity-based plans. • Reviews and recommends the compensation of non-employee directors. • Oversees an annual risk assessment process related to compensation programs. • Manages succession planning across senior positions. | ||
| 5 meetings in fiscal 2016 | |||
Nominating and Corporate Governance Committee
Current Members Rethore (Chair) Kolb Thomas Tokarz | • Establishes criteria for and qualifications of persons suitable for nomination as directors and reports recommendations to Board. • Develops and annually reviews the Guidelines. • Makes recommendations to Board related to committee structure and membership. | ||
| 8 meetings in fiscal 2016 | |||
Environment, Health and Safety Committee
Current Members Thomas (Chair) Franklin Hansen | • Reviews policies and procedures related to complying with laws, regulations and rules pertaining to the environment, health and safety. • Encourages activities and initiatives that demonstrate sound environmental stewardship. | ||
| 4 meetings in fiscal 2016 | |||
Executive Committee
Current Members Hyland (Chair) O’Brien Rethore Tokarz | • Exercises interim powers delegated to it any time when a matter requires expeditious Board action or when it would not be practical for the full Board to meet. | ||
| 5 meetings in fiscal 2016 | |||
18
Director Attendance
As discussed above, the Board held 12 meetings in fiscal 2016 and each director attended over 88% of the total number of meetings of the Board and its committees of which he or she was a member in fiscal 2016. Each current director also attended the 2016 annual meeting of stockholders.
Executive Sessions
Our non-employee directors meet at least quarterly in executive sessions at which employee directors, currently only our Chairman, are not present. Our Lead Director presides at these sessions.
Board and Committee Evaluations
Each year, the Board is required by the Guidelines to conduct an evaluation of its own performance. Additionally, our committee charters require each of our committees to conduct an annual performance evaluation. The Governance Committee is responsible for overseeing the annual self-assessment process on behalf of the Board and its committees. Throughout the self-assessment process, the Governance Committee solicits comments from directors to ensure that the Board and its committees are functioning effectively. The Governance Committee reviews comments from each director to assess directors’ contributions to the Board, evaluate the Board’s contributions to the Company and identify areas for improvement in the Board’s performance. The Governance Committee submits its findings to the Board in an annual report discussing ways in which the Board and its committees can improve their key functions.
Board Risk Oversight
The Board maintains oversight responsibility for our management of risk and charges management with assessing and managing risk. Our internal control environment is designed to identify and manage risks and to facilitate communication with the Board. Our internal audit department, which reports to the Audit Committee, facilitates our enterprise risk assessment and ongoing enterprise risk management processes, in coordination with our legal and compliance functions, and regularly reports on risk-related issues to the Board and its committees to complement our strategic planning process. The Board and Audit Committee receive regular reports and updates from our legal and compliance functions. The Board also considers specific risk topics and receives regular reports from the heads of our principal business and corporate functions that include discussions of the risks and exposures involved in their respective areas of responsibility.
The Board executes its risk oversight function both as a whole and through delegation to committees. In particular:
| Audit Committee | Compensation Committee | ||||
• Oversees risk management related to accounting and financial reporting, the audit process, internal control over financial reporting and disclosure controls and procedures• Oversees the internal audit function• Monitors legal and compliance issues and active matters | • Oversees risk management related to the risks and rewards associated with our compensation policies and practices• Oversees management development and succession planning across senior positions | ||||
| EHS Committee | Governance Committee | ||||
• Oversees risk management related to risks directly related to the environment, health and safety areas | • Oversees risk management related to governance structure and processes and risks arising from related person transactions | ||||
19
Related Person Transactions
The Governance Committee administers a written Related Person Transaction Policy that applies to any transaction or series of transactions in which we are a participant, the amount involved exceeds or may be expected to exceed $120,000 and a related person has a direct or indirect material interest. Under the policy, our General Counsel determines whether a transaction meets the requirements of a related person transaction requiring review by the Governance Committee. Transactions that fall within this definition will be referred to the Governance Committee for approval, ratification or other action. Based on its consideration of all of the relevant facts and circumstances, the Governance Committee will decide whether or not to approve the transaction and will approve only those transactions that are in our best interests. In addition, the Board has delegated to the Chair of the Governance Committee the authority to pre-approve or ratify any transaction with a related person in which the aggregate amount involved is expected to be less than $500,000. We did not engage in any transaction during fiscal 2016, and have no currently proposed transaction, in which the amount involved exceeds $120,000 and a related person had or will have a direct or indirect material interest.
Compensation Committee Interlocks and Insider Participation
During fiscal 2016, none of the members of the Compensation Committee was a former or current officer or employee of Mueller Water Products, Inc. or any of its subsidiaries had any relationships requiring disclosure as a related person transaction. None of our executive officers serves or has served on the board of directors or compensation committee of any other entity that has or has had one or more executive officers who served as a member of the Board or its Compensation Committee during fiscal 2016.
Communicating with the Board
Stockholders and other interested parties may communicate with any of our directors, including our Lead Director and the Chairs of our committees, or our independent directors as a group, on Board-related issues by writing in care of our Corporate Secretary at our principal executive office address: 1200 Abernathy Road, N.E., Suite 1200, Atlanta, Georgia 30328. Stockholders and other interested persons may also communicate with directors by sending an email message to boardofdirectors@muellerwp.com, or with the Audit Committee by sending an email message to auditcommittee@muellerwp.com. These procedures may change from time to time. Please visit our website at www.muellerwaterproducts.com for the most current means of contacting our directors.
20
DIRECTOR COMPENSATION
The Compensation Committee is responsible for reviewing and considering any revisions to director compensation. With the assistance of its independent compensation consultant, the Compensation Committee reviews director compensation and compares it to director compensation paid by other companies in the peer group described under “Compensation Discussion and Analysis — Executive Compensation Program Overview — Peer Group Benchmarking and Total Compensation.”
The Board reviews the Compensation Committee’s recommendations and determines the final structure and amounts of director compensation. The Board has determined compensation for non-employee directors should comprise a mix of cash and equity-based awards. The Board believes the interests of directors are aligned with the interests of other stockholders by linking a significant portion of director compensation to Common Stock performance. Under our stock ownership guidelines, directors are required to hold at least 50% of the Common Stock acquired through equity-based awards until they own Common Stock equal in market value to at least four times their annual retainer. See “Compensation Discussion and Analysis — Other Compensation Practices and Policies — Stock Ownership Guidelines” for more information. As of the date of this Proxy Statement, none of our non-employee directors has sold Common Stock obtained through our equity compensation program.
Annual Retainer
Each non-employee director received an annual retainer of $55,000 for fiscal 2016. Annual retainers are paid quarterly. In addition, the Chairs of the Audit Committee and Compensation Committee each received $15,000, while the Chairs of the Governance Committee and EHS Committee each received $7,500. Our Lead Director received $50,000 for serving in this capacity.
Meeting Fees
Each non-employee director received $1,500 for each Board or committee meeting attended during fiscal 2016, except that our Lead Director, who is an ex officio member of each standing committee of the Board, receives no meeting fees. Meeting fees are paid monthly.
Equity-Based Awards
Our Amended and Restated 2006 Stock Incentive Plan (the “2006 Stock Plan”) provides that, on the date of each annual meeting of stockholders, we will grant equity-based awards with an economic value determined by the Compensation Committee to each non-employee director who is re-elected to the Board and has served as a director for at least six months. In addition, the 2006 Stock Plan provides that each director will receive an initial equity-based grant on the date on which he or she commences service as a director, the economic value and terms of which will be as determined by the Compensation Committee. The number of units equivalent to the economic value of those awards is determined by the Compensation Committee’s compensation consultant. See “Compensation Discussion and Analysis — Other Compensation Practices and Policies — Role of Compensation Consultant in Compensation Decisions”.
On February 26, 2016, each non-employee director received equity-based awards in the form of 10,344 restricted stock units (“RSUs”). The outstanding RSUs vest in equal installments on the first, second and third anniversaries of the grant date.
Under our 2006 Stock Plan, once a participant becomes “retirement-eligible,” all outstanding and unvested equity-based awards automatically vest upon retirement. Each of our directors is ”retirement eligible”. As such, all outstanding equity-based awards granted to directors prior to fiscal 2014 (see the table appearing on page 22) are deemed vested. Commencing in fiscal 2014, all equity-based awards to directors require a director who is or becomes “retirement-eligible” prior to an initial vesting date to remain in continuous service from the grant date through at least the first anniversary thereof to receive accelerated vesting upon retirement from the Board, though the Compensation Committee may waive this minimum service requirement.
Mr. Springer, our former Lead Director, retired from the Board at the 2016 Annual Meeting. At a January 2016 Board meeting, the Board awarded to Mr. Springer an equity-based grant equal to 11,097 shares of common stock in recognition of his many years of service to the Board.
21
Travel Expenses
We reimburse directors for their travel and related expenses in connection with attending Board and committee meetings and related activities.
Director Compensation Summary
The following table shows fiscal 2016 compensation for our non-employee directors.
| Fiscal 2016 Director Compensation Table | ||||||||||||
| Name | Fees Earned or Paid in Cash ($) | Stock Awards ($)(2) | All Other Compensation ($) | Total ($) | ||||||||
Annual Retainer (1) | Meeting Fees | Total | ||||||||||
| Shirley C. Franklin | 55,000 | 37,500 | 92,500 | 89,993 | — | 182,493 | ||||||
| Thomas J. Hansen | 55,000 | 43,500 | 98,500 | 89,993 | — | 188,493 | ||||||
| Jerry W. Kolb | 70,000 | 49,500 | 119,500 | 89,993 | — | 209,493 | ||||||
| Joseph B. Leonard | 55,000 | 42,000 | 97,000 | 89,993 | — | 186,993 | ||||||
| Mark J. O’Brien | 106,250 | 31,500 | 137,750 | 89,993 | — | 227,743 | ||||||
| Bernard G. Rethore | 61,250 | 54,000 | 115,250 | 89,993 | — | 205,243 | ||||||
Neil A. Springer(3) | 16,250 | 15,000 | 31,250 | 89,996 | — | 121,246 | ||||||
| Lydia W. Thomas | 62,500 | 31,500 | 94,000 | 89,993 | — | 183,993 | ||||||
Michael T. Tokarz (4) | 70,000 | 34,500 | 104,500 | 89,993 | 12,703 | 207,196 | ||||||
| (1) | Includes fees earned as chair of a committee or as Lead Director. |
| (2) | Reflects the grant date fair value of the RSUs granted during fiscal 2016 computed in accordance with the stock-based compensation accounting rules described in Note 10 of our fiscal 2016 consolidated financial statements, which are included in the 2016 Annual Report. Since all non-employee directors were retirement-eligible at the grant date, expense is recognized over one year from the date of grant. |
| (3) | Mr. Springer retired from the Board at the 2016 Annual Meeting. In connection with Mr. Springer’s retirement, all of his outstanding stock awards vested and became immediately exercisable. |
| (4) | Mr. Tokarz deferred the receipt of all director compensation fees earned in fiscal 2016 into 10,064 stock equivalent shares of Common Stock. “All Other Compensation” represents amounts accrued on identical terms to dividends paid on Common Stock equal to the accumulated stock equivalent share balance. See “— Deferred Compensation” for more information. |
The following table shows information related to option awards and stock awards made to our non-employee directors that were outstanding at September 30, 2016.
| Option Awards | Stock Awards | ||||||||||
Name(1) | Number of Securities Underlying Unexercised Options (#) | Number of Shares or Units of Stock That Have Not Vested (#) | |||||||||
| Exercisable | Unexercisable | ||||||||||
| Franklin | 65,796 | — | 10,344 | ||||||||
| Hansen | 58,999 | — | 10,344 | ||||||||
| Thomas | 79,724 | — | 10,344 | ||||||||
| Each of Kolb, Leonard, O’Brien, Rethore and Tokarz | 102,025 | — | 10,344 | ||||||||
| (1) | Each director is “retirement-eligible” under the 2006 Stock Plan. Commencing in fiscal 2014, all equity-based awards to directors require a grantee who is or becomes “retirement-eligible” prior to an initial vesting date to remain in continuous service from the grant date through at least the first anniversary thereof to receive accelerated vesting upon retirement. Accordingly, for purposes of this table, any stock options and RSUs outstanding on the date a director became retirement-eligible are deemed vested. |
Deferred Compensation
The Board adopted the Mueller Water Products, Inc. Directors’ Deferred Fee Plan, as amended, under which non-employee directors may elect to defer all or a portion of their directors’ fees. We make deferred payments in January of the year determined by the non-employee director pursuant to an election filed with our Corporate Secretary. The payments may be made in any calendar year not earlier than the year in which the participant has his or her 72nd birthday or the year of the participant’s termination of his or her services as a director, with the
22
payment made in cash in one, five, ten or fifteen annual installments as determined by the participating director in his or her election form. During fiscal 2016, Mr. Tokarz was the only non-employee director who participated in this plan. Mr. Tokarz’s deferred payments are maintained in a stock equivalent account.
23
COMPENSATION DISCUSSION AND ANALYSIS
This Compensation Discussion and Analysis is intended to provide our stockholders with information about our fiscal 2016 compensation program for the following executive officers (collectively, “named executive officers” or “NEOs”):
• | Gregory E. Hyland, Chairman, President and Chief Executive Officer |
• | Evan L. Hart, Senior Vice President and Chief Financial Officer |
• | Keith L. Belknap, Senior Vice President, General Counsel and Chief Compliance Officer; President of Mueller Technologies |
| • | Gregory E. Rogowski, President of Mueller Co. |
| • | Marietta Edmunds Zakas, Senior Vice President, Strategy, Corporate Development and Communications |
| 2016 KEY ACCOMPLISHMENTS | ||||
| In fiscal 2016, we improved our operating performance and executed initiatives to return value to our stockholders. | ||||
| Strong Operating Results. Our operating income and net income in fiscal 2016 were $120.6 million and $63.9 million, respectively. Adjusted operating income improved 6.5% in fiscal 2016 to $146.8 million from $137.8 million in fiscal 2015. Adjusted net income improved 13.3% to $75.8 million from $66.9 million. | Adjusted free cash flow improved 66% to $109.9 million from $66.2 million. | ||
| Increased dividend by 50%. We increased our quarterly dividend per share to $0.03 from $0.02. We paid $16.1 million of dividends in fiscal 2016. | |||
Performance and Compensation Highlights
We design our executive officer compensation programs to target total compensation at or about the 50th percentile for comparable executive positions at our customized peer group. The principal elements of our compensation program for executives are base salary, annual performance-based cash bonus, long-term incentive equity compensation and broad-based benefit programs.
| • | Our performance in fiscal 2016. Despite a 2.2% year-over-year decrease in net sales, which was largely driven by lower sales into the oil & gas markets at our Anvil business unit, we: |
| ◦ | Increased our adjusted operating margin to 12.9% from 11.8% in fiscal 2015, |
| ◦ | Increased our adjusted operating EBITDA margin to 17.5% from 16.8% in fiscal 2015, |
| ◦ | Increased our adjusted operating income 6.5% year-over-year, and |
| ◦ | Increased our adjusted net income 13.3% year-over-year. |
The Compensation Committee used several performance elements (including those set forth below) to assess and determine incentive plan compensation earned during fiscal 2016. See Exhibit A for a reconciliation of non-GAAP financial results to GAAP financial results.
| Net Sales | Adjusted Operating Income(1) | Adjusted Net Income(2) | Adjusted Free Cash Flow(3) | Average Investment in Working Capital(4) | Return on Net Assets(5) | ||
| Mueller Co. | Anvil | ||||||
| ($ in millions) | ($ in millions) | ($ in millions) | ($ in millions) | (%) | (%) | (%) | |
| 2016 | 1,138.9 | 146.8 | 75.8 | 109.9 | 20.8 | 29.3 | 25.2 |
| 2015 | 1,164.5 | 137.8 | 66.9 | 66.2 | 23.7 | 27.2 | 24.7 |
| (1) | Defined for this purpose as operating income adjusted to exclude the loss on the Walter receivable in 2015, certain effects of foreign currency exchange rate changes in 2015, pension settlement expenses, expenses related to exploring potential acquisitions and divestitures, restructuring expenses and other charges. |
24
| (2) | Defined for this purpose as net income calculated using a predetermined income tax rate and to exclude the loss on the Walter receivable in 2015, certain effects of foreign currency exchange rate changes in 2015, restructuring expenses and other charges, expenses related to exploring potential acquisitions and divestitures, results of operations of new or divested businesses, pension settlement expenses and the early extinguishment of debt in 2015. |
| (3) | Defined for this purpose as cash flows from operating activities of continuing operations, adjusted for capital expenditures, restructuring costs, premium paid on the early extinguishment of debt, costs of acquisition and divestiture related activities, certain effects of foreign currency exchange rate changes in 2015, pension settlement expenses and timing of interest payments resulting from refinancing our debt. |
| (4) | Defined for this purpose as the average of adjusted current assets less adjusted current liabilities over the course of a year, which measures exclude cash and cash equivalents, debt and deferred income taxes, as a percent of net sales. |
| (5) | Defined for this purpose as the quotient obtained by dividing income tax-effected adjusted operating income plus amortization by the quarterly average of working capital and fixed assets. Adjusted operating income excludes the loss on the Walter receivable, certain effects of foreign currency exchange rate changes, certain effects from a policy change, pension settlement expenses, restructuring expense and other charges. Income taxes are calculated at a hypothesized rate. Amortization reflects only amortization of assets acquired in business combinations. Working capital excludes cash and debt. Fixed assets is property, plant and equipment plus capitalized software costs reported as part of intangible assets. |
• We structure performance-based compensation to pay for performance. We set clear and measurable financial goals for Company and segment performance. In evaluating individual performance, we assess progress toward strategic priorities. | ||
◦ Performance-based compensation earned by our named executive officers. For fiscal 2016, 49% of our CEO’s total target compensation, and an average of 43% of the total target compensation of our other NEOs, could only be earned by meeting performance goals. | 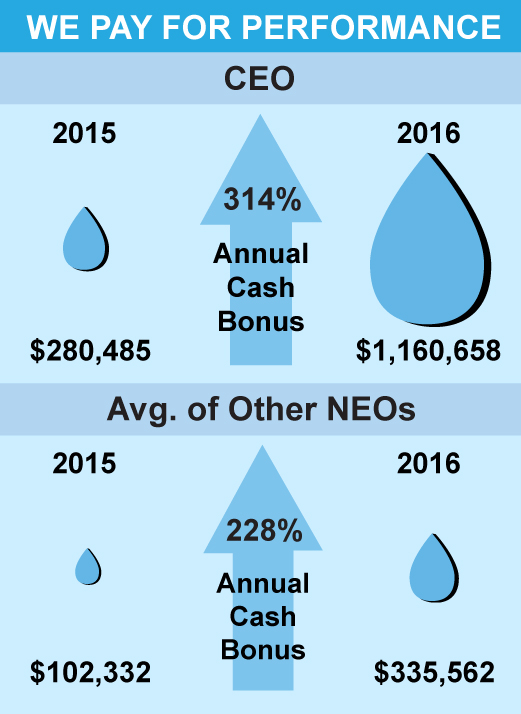 | |
▪ Our NEOs’ compensation was both positively and negatively affected by Company and segment performance in relation to targets set for fiscal 2016.▪ Annual cash bonuses earned by our NEOs ranged from 101% to 129% of target (compared with 9% to 63% of target last year).▪ Long-term compensation was paid or credited at 102.1% of target for fiscal 2016 because Company performance on the “return on net assets” financial measure was above target levels. | ||
| • | We continue to maintain best practices for executive compensation. |
25
| • | We consider stockholder feedback on executive compensation. At our 2016 annual meeting of stockholders, approximately 98% of the votes cast supported the advisory vote on executive compensation. We carefully consider feedback from our stockholders regarding executive compensation. |
| ◦ | Based on strong stockholder support expressed for our executive compensation programs, the Compensation Committee applied a consistent pay-for-performance philosophy in structuring executive compensation for fiscal 2016. |
| ◦ | Stockholders are invited to express their views or concerns on executive compensation directly to the Chair of the Compensation Committee in the manner described under “Corporate Governance — Communicating with the Board.” |
Executive Compensation Program Overview
Guiding Principles
The Compensation Committee has identified the following guiding principles in overseeing the compensation program for our executives:
Competitiveness Compensation programs should be designed to target at or about the 50th percentile, plus or minus 15%, of total compensation for comparable executive positions at a customized peer group. | Pay for Performance Where compensation for an executive is tied to the achievement of financial and strategic goals, actual results that exceed target levels should provide above-target payouts, and results that do not exceed threshold levels should not provide payouts. | ||
Responsibility A significant portion of an executive’s overall compensation should be tied to the achievement of financial performance goals. The portion of an executive’s target total compensation that is incentive based should increase as an executive’s responsibilities increase. | Stockholder Alignment Executives’ interests are more directly aligned with stockholders’ interests when compensation programs: • Emphasize both short- and long-term financial performance • Are significantly impacted by the value of Common Stock • Require meaningful Common Stock ownership. | ||
Peer Group Benchmarking and Total Compensation
Each year, the Compensation Committee, with input from its independent compensation consultant, reviews the prior year peer group. This review focuses on companies that have a primary manufacturing component to their businesses, have similar organizational structures and are publicly traded or otherwise file financial statements with the SEC. The 20-company peer group approved by the Compensation Committee for fiscal 2016 (the “Peer Group”) is listed below and is unchanged from the fiscal 2015 peer group.
| Fiscal 2016 Peer Group | |
| Ametek, Inc. | IDEX Corporation |
| Armstrong World Industries, Inc. | Lennox International Inc. |
| Badger Meter, Inc. | Mueller Industries, Inc. |
| Briggs & Stratton Corporation | Otter Tail Corporation |
| Circor International Inc. | Quanex Building Products Corporation |
| Crane Co. | Roper Technologies, Inc. |
| Curtiss-Wright Corporation | Tennant Co. |
| Donaldson Company, Inc. | Valmont Industries, Inc. |
| EnPro Industries, Inc. | Watts Water Technologies, Inc. |
| Graco Inc. | Worthington Industries, Inc. |
26
Each year, the compensation consultant collects Peer Group compensation data and prepares an executive benchmarking study using a market regression analysis to size-adjust the market data for our net sales size as a whole and for each separate business unit. The Compensation Committee regularly reviews the target total compensation of each executive and compares it to the total compensation for comparable executive positions in the Peer Group. The Compensation Committee targets total compensation at the regressed 50th percentile of the Peer Group, plus or minus 15%, subject to individual adjustments based on experience, length of service, individual performance and other factors deemed appropriate by the Compensation Committee.
Compensation Elements
The following table lists our primary elements of compensation. Each element is targeted at or about the 50th percentile for comparable positions in the Peer Group.
| Pay Element | Salary | Bonus | RSUs | PRSUs |
| Who Receives | All NEOs ----------------------------------------------------------------------------------------------------------------------------------------> | |||
| When Granted | Generally reviewed every 12 months | Annually | Annually | Annually |
| Form of Delivery | Cash ----------------------------------------------------------> | Equity ---------------------------------------------------------> | ||
| Type of Performance | Short-term emphasis -------------------------------------> | Long-term emphasis --------------------------------------> | ||
| Performance Period | Ongoing | 1 year | Generally vest annually over 3 years | Vests at the end of 3-year award cycles |
| How Payout Determined | Predominantly tied to Peer Group data, with an element of Compensation Committee discretion | Predominantly formulaic(based on performance against goals), with an element of Compensation Committee discretion | Completion of required service period through each vesting date | Formulaic (based on performance against goals); Compensation Committee verifies results |
| Most Recent Performance Measures | __ | Mix of 90% financial results / 10% EHS-related operational goals | Value of delivered shares based on stock price on vesting dates | Absolute improvement in return on net assets |
Salary
The Compensation Committee regularly compares the salary of each executive to the regressed 50th percentile of comparable executives in the Peer Group and uses that benchmark as a guide. Salaries for the NEOs are adjusted, as appropriate, annually on February 1. For fiscal 2016, the salaries for the NEOs were within the 50th percentile of the Peer Group, plus or minus 15%. In February 2016, Mr. Hart received an annual salary increase of 3.0%; Mr. Belknap received a salary increase of 2.5%; Mr. Rogowski received a salary increase of 2.5%; and Ms. Zakas received a salary increase of 3.0%. Mr. Hyland did not receive a salary increase. Instead, he received lump sum merit payment equal to 3% of his salary to recognize individual performance while maintaining alignment of base salary level with prior year levels and the baseline level for future compensation actions by the Compensation Committee. Ms. Zakas also received payments of $5,000 per month, beginning in January 2016, for assuming interim human resources responsibilities. See also “— Annual Cash Incentive Awards — Other Cash Awards”.
| Name | Annual Salary Rate at September 30, 2016 ($) | Annual Salary Rate at September 30, 2015 ($) | ||||
| Gregory E. Hyland | 900,000 | 900,000 | ||||
| Evan L. Hart | 405,300 | 393,500 | ||||
| Keith L. Belknap | 430,500 | 420,000 | ||||
| Gregory E. Rogowski | 433,000 | 422,500 | ||||
| Marietta Edmunds Zakas | 341,900 | 331,900 | ||||
27
Annual Cash Incentive Awards
The Compensation Committee targets annual cash incentive compensation for each executive at the regressed 50th percentile of comparable executives in the Peer Group. For fiscal 2016, the total target opportunity for each NEO was within the 50th percentile of the Peer Group, plus or minus 15%. Based on actual achieved performance against performance goals, each NEO may earn between 0% and 200% of his or her target opportunity. For fiscal 2016, each NEO could earn an annual cash incentive award based on achievement against financial performance goals (weighted 90%) and EHS-related operational goals (weighted 10%). For financial performance goals, the Compensation Committee determined numeric goals targeting percentage improvements over the prior year’s results. All financial performance and EHS-related operational goals were set with minimum (or threshold), target and maximum objectives for each goal. The Compensation Committee may decrease, but not increase, the amounts payable to participants.
Fiscal 2016 Financial Performance Goals and Results
The Compensation Committee selected financial performance goals for corporate executives based on consolidated adjusted net income and adjusted free cash flow. The Compensation Committee selected these metrics to encourage focus on delivering net income and managing our balance sheet while optimizing cash flow.
The Compensation Committee selected financial performance goals for segment executives based on the applicable segment’s adjusted operating income (defined as operating income, adjusted to exclude certain effects of results of operations of newly acquired or divested businesses, pension settlement expenses and restructuring expenses) and, in the case of Mueller Co., working capital (defined as the segment’s average of adjusted current assets less adjusted current liabilities over the course of fiscal 2016, which measures exclude cash and cash equivalents, deferred income taxes, and debt) as a percent of the segment’s net sales. The Compensation Committee selected these performance goals to encourage focus on increasing adjusted operating income and managing our balance sheet while optimizing cash flow.
The following table shows the fiscal 2016 financial performance targets and actual results applicable to each NEO.
| Financial Performance | |||||||||||
Results Required to Achieve Bonus ($ in millions, except for percentages) | 2016 Actual Results ($ in millions) | Actual 2016 Payout Factor (% of Target Bonus) unweighted | |||||||||
Weight (% of Target Bonus) | |||||||||||
| Name | Metric | Threshold (0%) | Target (100%) | Maximum (200%) | |||||||
| Gregory E. Hyland | Consolidated Adjusted Net Income | 60 | 51.8 | 74.0 | 96.2 | 75.8 | 108.2 | ||||
| Consolidated Adjusted Free Cash Flow | 30 | 76.0 | 95.0 | 114.0 | 109.9 | 178.4 | |||||
| Evan L. Hart | Consolidated Adjusted Net Income | 60 | 51.8 | 74.0 | 96.2 | 75.8 | 108.2 | ||||
| Consolidated Adjusted Free Cash Flow | 30 | 76.0 | 95.0 | 114.0 | 109.9 | 178.4 | |||||
| Keith L. Belknap | Consolidated Adjusted Net Income | 30 | 51.8 | 74.0 | 96.2 | 75.8 | 108.2 | ||||
| Mueller Systems Adjusted Operating Income (Loss) | 30 | 1.0 | 1.5 | 5.0 | (5.1 | ) | — | ||||
| Consolidated Adjusted Free Cash Flow | 30 | 76.0 | 95.0 | 114.0 | 109.9 | 178.4 | |||||
| Gregory S. Rogowski | Mueller Co. Adjusted Operating Income | 60 | 107.6 | 153.7 | 199.8 | 162.4 | 118.8 | ||||
| Mueller Co. Average Working Capital as a Percent of Net Sales | 30 | 22.1 | % | 21.2 | % | 20.1 | % | 20.8 | % | 136.4 | |
| Marietta Edmunds Zakas | Consolidated Adjusted Net Income | 60 | 51.8 | 74.0 | 96.2 | 75.8 | 108.2 | ||||
| Consolidated Adjusted Free Cash Flow | 30 | 76.0 | 95.0 | 114.0 | 109.9 | 178.4 | |||||
28
Fiscal 2016 Operational / Individual Performance Goals and Results
The Compensation Committee established operational safety and environmental objectives applicable to each NEO that were tied to reductions in total recordable incidence rates and key performance indicators for sustainability and specific activities identified as leading indicators. Messrs. Hyland and Hart and Ms. Zakas were each awarded 105.22% (unweighted) of their target safety and environmental objectives for fiscal 2016. Messrs. Rogowski and Belknap were awarded 87.51% and 152.09% (both unweighted), respectively, of their target safety and environmental objectives for fiscal 2016. The Compensation Committee used adjusted net income to determine the availability of a pool from which to pay the operational safety and environmental objectives portion of the incentive award to Messrs. Hyland, Rogowski and Belknap.
Fiscal 2016 Annual Cash Incentive Awards
Based on performance in fiscal 2016 against financial and individual performance goals, the target and actual annual cash bonuses for each NEO were:
| Name | At Target Performance | At Actual Performance | |||||
| % of Salary | Amount ($) | % of Target | Amount ($) | ||||
| Gregory E. Hyland | 100 | 900,000 | 129.0 | 1,160,658 | |||
| Evan L. Hart | 75 | 301,025 | 129.0 | 388,208 | |||
| Keith L. Belknap | 70 | 298,900 | 101.2 | 302,454 | |||
| Gregory E. Rogowski | 75 | 322,125 | 121.0 | 389,614 | |||
| Marietta Edmunds Zakas | 60 | 203,140 | 129.0 | 261,973 | |||
Other Cash Awards
The Compensation Committee awarded a $100,000 cash bonus to Ms. Zakas in recognition of her interim human resources responsibilities and significant contribution towards strategic initiatives. See also “ — Salary”.
Long-Term Equity-Based Compensation
For fiscal 2016, our long-term incentive program included grants of performance-based restricted stock units (“PRSUs”) and time-vested RSUs. The Compensation Committee targets long-term compensation value for each NEO at the regressed 50th percentile of comparable executives in the Peer Group. For fiscal 2016, target long-term compensation value for each NEO was within the 50th percentile of the Peer Group, plus or minus 15%.
Performance-Based Restricted Stock Units
For fiscal 2016, 50% of target long-term incentive compensation value was awarded in the form of PRSUs. The key terms of the PRSUs are as follows:
| • | Each PRSU award reflects a target number of shares (based on the fair market value of Common Stock on the award date) that may be issued to the award recipient at the end of a three-year award cycle based on the achievement of performance targets. |
| • | PRSUs are divided into three equal tranches and each tranche is earned based on the level of achievement against the applicable annual performance target. |
| • | Each performance period target is established by the Compensation Committee on an annual basis coinciding with our fiscal year. |
| • | At the end of each fiscal year, the Compensation Committee confirms performance against the applicable performance target, and PRSUs representing the level of achievement during that performance period are “banked” for potential payout following the end of the three-year award cycle. |
| • | Earned PRSUs are settled in shares of Company stock. The actual number of shares a participant may receive ranges from zero to two times the target number of shares, depending solely on the level of achievement during each performance period within the award cycle. |
| • | PRSUs do not convey voting rights or earn dividends. |
29
| Timeline for PRSU Grants | |||||
| Grant | Fiscal 2014 | Fiscal 2015 | Fiscal 2016 | Fiscal 2017 | Fiscal 2018 |
| Fiscal 2014 | Performance Period | Performance Period | Performance Period | ||
| Fiscal 2015 | Performance Period | Performance Period | Performance Period | ||
| Fiscal 2016 | Performance Period | Performance Period | Performance Period | ||
Performance Measure and Result for Fiscal 2016
The applicable performance target for the fiscal 2016 performance period for PRSU awards made in fiscal 2014, fiscal 2015 and fiscal 2016 was based on the percentage year-over-year improvement in return on net assets, or “RONA.” For these purposes, the term “RONA” has the meaning described under “— Performance and Compensation Highlights”. The performance necessary to earn a target payout required at least a 1.64% year-over-year improvement in RONA, and the performance necessary to earn a maximum payout required a 10.22% year-over-year improvement in RONA. Actual RONA performance for fiscal 2016 was 25.17%, compared to RONA of 24.72% for fiscal 2015, a 1.8% improvement. Accordingly, the recipients of PRSU awards were each credited with 102.1% of the awards attributable to the fiscal 2016 performance period. See “Executive Compensation — Grants of Plan-Based Awards Table”.
PRSU Awards
Common Stock to be issued related to PRSUs awarded in fiscal 2015 (for the three-year award cycle from fiscal 2015 through fiscal 2017) and fiscal 2016 (for the three-year award cycle from fiscal 2016 through fiscal 2018) will not be issued until the Compensation Committee certifies performance results for fiscal 2017 and fiscal 2018, respectively. PRSUs awarded in fiscal 2014 (for the three-year award cycle from fiscal 2014 through fiscal 2016) were issued in December 2016 to award recipients in the following amounts:
| PRSU Awards | |||||
| Shares Earned | |||||
| Name | Fiscal 2014(1) (#) | Fiscal 2015(1) (#) | Fiscal 2016 (#) | Total Shares Awarded (#) | |
| Gregory E. Hyland | 78,246 | — | 39,944 | 118,190 | |
| Evan L. Hart | 22,026 | — | 11,244 | 33,270 | |
| Keith L. Belknap | 15,648 | — | 7,990 | 23,638 | |
| Gregory E. Rogowski | 21,126 | — | 10,784 | 31,910 | |
| Marietta Edmunds Zakas | 8,802 | — | 4,494 | 13,296 | |
| (1) | See the definitive proxy statements we filed with the SEC on December 17, 2014 and January 15, 2016, respectively, for information concerning target RONA performance and actual RONA performance for the 2014 and 2015 performance periods. |
Time-Based Restricted Stock Units
As described above, a portion of an executive’s long-term incentive award value has historically been awarded in the form of time-based RSUs. For fiscal 2016, 50% of target long-term incentive compensation value was awarded in RSUs. The Compensation Committee approves a dollar value for these awards and its compensation consultant determines the number of RSUs that equals that value, based on the grant date stock price. Typically, one-third of the RSUs granted vest on each anniversary of the grant date. See “Executive Compensation — Grants of Plan-Based Awards Table”.
Timing of Equity Awards
While the Compensation Committee may grant equity-based awards at any of its scheduled meetings or by unanimous written consent, it generally grants awards for executives at its November or December meeting each year, except for awards related to promotions or new hires. Grants approved during scheduled meetings become effective and are priced as of the date of approval or as of a pre-determined future date based on a date of hire. Grants approved by unanimous written consent become effective and are priced as of a pre-determined future date.
30
All stock options have a per-share exercise price equal to the closing stock price on the New York Stock Exchange on the effective date of the grant.
Retirement Benefits
We offer retirement benefits to our NEOs and other employees to provide a competitive source of retirement income. These retirement benefits are provided through the vehicles described below.
Retirement Savings Plan Applicable to Employees Generally
The Mueller Water Products, Inc. Retirement Savings Plan is a 401(k) plan that provides retirement benefits for our non-union employees and those of our participating subsidiaries. Each of our NEOs participated in the plan in fiscal 2016 on the same basis as our other eligible employees.
Deferred Compensation Plan
Mr. Hyland is the only NEO who participates in a deferred compensation plan. He participates in an unfunded deferred compensation plan (the “Retirement Plan”), pursuant to which we credited a bookkeeping account for him, commencing April 16, 2007 and each calendar month thereafter through September 16, 2010, with an amount equal to 10% of his then current monthly base salary. The amounts credited to the plan bear interest at 120% of the long-term Applicable Federal Rate (as defined in the Code) until payment. At September 30, 2016, $644,060 had been accrued and credited to Mr. Hyland’s deferral account. No further accruals will occur to the account, except for interest. Our fiscal 2016 interest accruals to the plan for Mr. Hyland were $17,669.
Upon termination of his employment with us, other than for cause, all deferred compensation under the Retirement Plan will be paid as a lump sum to Mr. Hyland.
Other Benefits
Perquisites
We provide certain perquisites to the NEOs that the Compensation Committee believes are reasonable and consistent with its overall compensation program. In fiscal 2016, the Compensation Committee offered the NEOs limited perquisites, including a car allowance, life insurance, supplemental long-term disability insurance, and reimbursement for certain financial planning and physical examination expenses. See “Executive Compensation — Summary Compensation Table - All Other Compensation”.
Severance Benefits
Each NEO is entitled to severance benefits. See “Executive Compensation — Potential Payments Upon Termination or Change-in-Control”.
Change-in-Control Agreements
Change-in-control agreements are used to create incentives for executives to build stockholder value and to seek the highest value possible for stockholders should we be acquired, despite the risk of losing employment. Our change-in-control agreements for executives provide for vesting of outstanding equity-based awards upon a change-in-control and operate with a “double trigger” for severance payments, meaning severance payments do not occur unless the executive’s employment is involuntarily terminated (other than for cause or for termination for good reason) within 24 months following a change-in-control. The Compensation Committee believes this structure strikes an appropriate balance of incenting executives without providing benefits to executives who continue to enjoy employment with an acquiring company. The Compensation Committee also believes this structure is more attractive to potential acquiring companies that may place significant value on retaining members of our executive team and may perceive this objective to be undermined if executives receive significant severance payments solely upon the closing of such a transaction.
Employee Stock Purchase Plan
Our Employee Stock Purchase Plan (“ESPP”) provides all of our employees an opportunity to purchase Common Stock, subject to certain restrictions, through regular payroll deductions. During fiscal 2016, Messrs. Hart and Belknap were the only NEOs to participate in the ESPP.
31
Health and Welfare Benefits
We generally offer group medical, dental, vision, life and long-term disability insurance in a flexible benefits package to all active U.S. employees, except as otherwise required by collective bargaining agreements. Employees are provided life insurance up to one times their base salaries at no charge, other than related income taxes, to the employee. For an additional charge, employees may obtain coverage of up to four times their base salary up to a maximum life insurance benefit of $1,250,000. NEOs participate on the same basis as other eligible employees.
Other Factors Considered by the Compensation Committee
Risk and Incentive Compensation
The Compensation Committee has conducted an assessment of our compensation policies and practices and does not believe these policies and practices are reasonably likely to have a material adverse effect on us. This assessment included a review of the risk profile of our compensation policies and practices for all employees. To facilitate its review, the Compensation Committee engaged its compensation consultant to review our compensation structure to identify design elements that might encourage excessive risk taking. The compensation consultant discussed its review and conclusions with the Compensation Committee. In conducting its review, the Compensation Committee noted several policies and practices that mitigate risk, including:
| • | Using multiple performance measures in annual incentive awards and capping payout levels; |
| • | Maintaining the ability to reduce annual incentive awards, based on its independent judgment; |
| • | Using multiple long-term incentive vehicles; |
| • | Using overlapping multi-year award cycles in connection with performance shares and capping payout levels; and |
| • | Maintaining stock ownership guidelines, an anti-hedging policy and a clawback policy. |
Tally Sheets
The Compensation Committee regularly reviews “tally sheets” for each executive. The tally sheets contain information concerning prior years’ compensation, proposed compensation for the current year, outstanding equity-based awards (both vested and unvested) and various termination-of-employment scenarios. The tally sheets enable the Compensation Committee to view and evaluate many facets of executive compensation, understand the magnitude of potential payouts as a result of termination-of-employment scenarios and consider changes to our compensation programs, arrangements and plans in light of emerging trends.
Wealth Accumulation Review
The Compensation Committee reviews “wealth accumulation” calculations, such as projections of how much stock an executive is projected to earn or accrue over time through cash and equity-based compensation or through certain benefits.
Other Compensation Practices and Policies
Role of Compensation Consultant in Compensation Decisions
The Compensation Committee has sole authority to select and retain a compensation consultant, including authority to approve fees and retention terms. For fiscal 2016, the Compensation Committee retained Meridian Compensation Partners, LLC as its compensation consultant. The Compensation Committee reviews the performance of its compensation consultant annually.
In fiscal 2016, the compensation consultant’s responsibilities included, but were not limited to:
| • | Providing recommendations regarding the composition of our Peer Group; |
| • | Preparing and analyzing Peer Group compensation and plan design data; |
| • | Reviewing and advising on the performance measures to be used in incentive awards; |
| • | Valuing equity-based awards; and |
32
| • | Reviewing and advising on principal aspects of executive and non-employee director compensation, including base salaries, bonuses and equity-based awards for executives, and cash compensation and equity-based awards for non-employee directors. |
The Compensation Committee considered the independence of its compensation consultant in light of standards under the NYSE Manual. The Compensation Committee requested and received a letter from the compensation consultant addressing its independence, including the factors described below:
| • | Other services provided to us by the consultant; |
| • | Fees paid by us as a percentage of the consultant’s total revenue; |
| • | Policies or procedures maintained by the consultant that are designed to prevent a conflict of interest; |
| • | Any business or personal relationships between the individual consultants involved in the engagement and a member of the Compensation Committee; |
| • | Any Common Stock owned by the individual consultants involved in the engagement; and |
| • | Any business or personal relationships between our executives and the consultant or the individual consultants involved in the engagement. |
The Compensation Committee took into account these considerations, along with other factors relevant to the compensation consultant’s independence from management, and concluded the compensation consultant is independent and the engagement of the compensation consultant and the services rendered by the compensation consultant did not raise any conflict of interest.
Role of Management in Compensation Decisions
The Compensation Committee reviews information provided by its compensation consultant and uses that information as a reference point for the components of compensation. The Compensation Committee and the Chief Executive Officer discuss the financial metrics and operational goals intended to closely align performance targets of the business units and the Company as a whole with our strategic goals. The Chief Executive Officer makes recommendations to the Compensation Committee for executives other than himself with respect to annual salary adjustments, annual incentive adjustments and grants of equity-based awards under our incentive plans. The Compensation Committee makes the final decision with respect to the compensation of these executives, taking into consideration the Chief Executive Officer’s recommendations.
The Compensation Committee annually receives input from the entire Board with respect to the Chief Executive Officer’s performance and recommends his compensation level to the Board. The Board discusses and approves the annual salary of the Chief Executive Officer. The Chair of the Compensation Committee and another Compensation Committee member designated by the Chair meet with the Chief Executive Officer to discuss the Chief Executive Officer’s performance and compensation based on evaluations received from the Board. These discussions are considered by the Compensation Committee in setting all elements of compensation for the Chief Executive Officer.
In fiscal 2016, the Chief Executive Officer was present at all of the Compensation Committee meetings, but was excused from the executive sessions of the Compensation Committee and did not participate in meetings or deliberations during which his compensation was discussed.
Income Tax Consequences of Executive Compensation
Section 162(m) of the Code generally denies a corporate tax deduction for annual compensation exceeding $1 million paid to NEOs (other than the CFO). The limitation does not apply to compensation based on achievement of pre-established performance goals if certain requirements are met. The 2006 Stock Plan, and the PRSUs granted thereunder, as well as the annual cash incentive award, are intended to permit such awards to qualify as performance-based compensation to maximize the tax deductibility of these awards. These awards may not be fully deductible under all circumstances, as a number of additional requirements must be met for the awards to qualify as performance-based compensation. In addition, the Compensation Committee believes stockholder interests are best served by not restricting its discretion and flexibility in structuring compensation programs, even though such programs may result in certain non-deductible compensation expenses, and therefore, it reserves the discretion to award compensation that is not exempt from the deduction limits of Section 162(m).
33
Compensation Recovery (Clawback) Policy
Our employment agreements contain a provision requiring the employee, to the extent required by law, to reimburse us following the publication of a restatement of our financial statements due to material noncompliance with any financial reporting requirement under the securities laws as a result of misconduct for (a) incentive-based or equity-based compensation received and (b) any profits realized from the sale of our securities, in each case during the 12 months prior to discovery of the noncompliance. The Compensation Committee has exclusive authority to interpret and enforce this provision.
The Compensation Committee has adopted a “Clawback Policy” to recover pay that is determined to have been wrongfully earned by managerial or executive employees, including our NEOs. As a result, all RSUs granted after November 30, 2009 include a clause that reduces the number of equity-based awards upon the occurrence of certain events. The Compensation Committee has the exclusive authority to interpret the Clawback Policy, and may offset compensation as necessary to recover amounts due under the Clawback Policy.
Prohibition on Hedging and Pledging
We do not allow directors or employees to hedge the value of our equity securities held directly or indirectly by them. Our policy prohibits the purchase or sale of puts, calls, options or other derivative securities based on our securities, as well as hedging or monetization transactions, purchases of our equity securities on margin and borrowing against any account in which our securities are held. We prohibit pledging of Common Stock by executives or directors.
Stock Ownership Guidelines
The Compensation Committee has adopted stock ownership guidelines to promote a high level of stock retention among executives and non-employee directors. The guidelines require that the total value of the executive’s or non-employee director’s holdings of Common Stock must equal or exceed the specified target value shown below.
| Position/Title | Target Ownership | |
| Chief Executive Officer and President | 6 x base salary | |
| Group Presidents and Executive Vice Presidents | 3 x base salary | |
| Senior Vice Presidents | 2 x base salary | |
| Non-Employee Directors | 4 x annual retainer | |
All NEOs and directors are in compliance with our stock ownership requirements. Our stock ownership guidelines are available on our website. See the Guidelines for more detail.
REPORT OF THE COMPENSATION AND HUMAN RESOURCES COMMITTEE
The Compensation Committee participated in the preparation of the Compensation Discussion and Analysis. Based on its review and discussions with management, the Compensation Committee recommended to the Board that the Compensation Discussion and Analysis be included in this Proxy Statement.
See “Corporate Governance — Board Operations — Board Committee Information” for information concerning the Compensation Committee and its responsibilities.
| Compensation and Human Resources Committee |
| Michael T. Tokarz, Chairman |
| Shirley C. Franklin |
| Joseph B. Leonard |
34
EXECUTIVE COMPENSATION
Summary Compensation Table
The amounts reported in the following table, including base salary, annual and long-term incentive amounts, benefits and perquisites, are described more fully under “Compensation Discussion and Analysis”.
| Name and Principal Position | Fiscal Year | Salary ($) | Bonus(1) ($) | Stock Awards(2) ($) | Non-Equity Incentive Plan Compensation(3) ($) | Change in Pension Value and Nonqualified Deferred Compensation Earnings(4) ($) | All Other Compensation(5) ($) | Total ($) | |||||||||||||
Gregory E. Hyland Chairman, President and Chief Executive Officer | 2016 | 900,000 | 27,000 | 2,020,011 | 1,160,658 | 17,669 | 53,791 | 4,179,129 | |||||||||||||
| 2015 | 900,000 | 27,000 | 2,248,099 | 280,485 | 19,044 | 51,122 | 3,525,750 | ||||||||||||||
| 2014 | 891,667 | — | 2,214,126 | 941,867 | 23,115 | 50,813 | 4,121,588 | ||||||||||||||
Evan L. Hart Senior Vice President and Chief Financial Officer | 2016 | 401,367 | — | 573,278 | 388,208 | — | 31,801 | 1,394,654 | |||||||||||||
| 2015 | 389,673 | — | 652,443 | 96,560 | — | 31,769 | 1,170,445 | ||||||||||||||
| 2014 | 377,713 | — | 655,716 | 319,685 | — | 31,460 | 1,384,574 | ||||||||||||||
Keith L. Belknap Senior Vice President, General Counsel and Chief Compliance Officer; President of Mueller Technologies | 2016 | 427,000 | — | 470,670 | 302,454 | — | 37,198 | 1,237,322 | |||||||||||||
| 2015 | 385,760 | — | 703,181 | 89,218 | — | 38,787 | 1,216,946 | ||||||||||||||
| 2014 | 352,603 | — | 471,888 | 242,979 | — | 40,676 | 1,108,146 | ||||||||||||||
Gregory S. Rogowski President, Mueller Co. | 2016 | 429,500 | — | 552,069 | 389,614 | — | 37,226 | 1,408,409 | |||||||||||||
| 2015 | 418,382 | — | 631,719 | 196,283 | — | 34,005 | 1,280,389 | ||||||||||||||
| 2014 | 406,164 | — | 638,753 | 313,731 | — | 36,601 | 1,395,249 | ||||||||||||||
| Marietta Edmunds Zakas | 2016 | 338,567 | 145,000 | 271,111 | 261,973 | — | 36,612 | 1,053,263 | |||||||||||||
| Senior Vice President, Strategy, Corporate Development and Communications | |||||||||||||||||||||
| (1) | Represents payments made to (a) Mr. Hyland in February 2016 in lieu of a salary increase, and (b) Ms. Zakas in recognition of assuming interim Human Resources responsibilities and contribution towards strategic initiatives. See “Compensation Discussion and Analysis — Compensation Elements — Salary” and “— Annual Cash Incentive Awards”. |
| (2) | The dollar amounts shown for RSU and PRSU awards represent the aggregate grant date fair values calculated in accordance with ASC 718, Stock Compensation, excluding the effect of forfeitures. See “Compensation Discussion and Analysis — Compensation Elements — Long-Term Equity-Based Compensation — Other Equity Awards”. The dollar amounts shown for fiscal 2016 include the aggregate grant date fair values of PRSUs awarded in fiscal 2014, 2015 and 2016 for the fiscal 2016 performance period assuming target performance. Assuming maximum performance, the aggregate values of PRSUs awarded for the fiscal 2016 performance period would have been: $2,040,037 for Mr. Hyland; $576,570 for Mr. Hart; $441,348 for Mr. Belknap; $262,228 for Ms. Zakas; and $554,152 for Mr. Rogowski. The dollar amounts shown for fiscal 2014 include grant-date fair values, assuming target performance, of the transition period PRSU awards that were paid in fiscal 2015. Estimated amounts that may be earned over the entire three-year award cycle of outstanding PRSUs are reflected in “Outstanding Equity Awards at 2016 Fiscal Year-End” below. |
| (3) | Amounts reflect annual non-equity incentive plan compensation awards earned by our NEOs based on Company and segment financial performance and operational / individual performance. The amounts earned for fiscal 2016 were paid in December 2016. See “Compensation Discussion and Analysis — Compensation Elements — Annual Cash Incentive Awards”. |
| (4) | Amounts reflect accruals for deferred compensation for Mr. Hyland under a plan we established for his benefit. See “— Nonqualified Deferred Compensation During Fiscal Year 2016” below. |
| (5) | Amounts reflect the combined value of each NEO’s perquisites and compensation that is not otherwise reflected in the Summary Compensation Table. Amounts for fiscal 2016 are described in “— All Other Compensation” below. |
35
Summary Compensation Table - All Other Compensation
The following table describes the amounts presented in the “All Other Compensation” column in the Summary Compensation Table for fiscal 2016.
| Name | Vehicle Allowance or Use of Leased Vehicle ($) | Financial Planning (1) ($) | Contributions to 401(k) Plans ($) | Life and Long-Term Disability Insurance ($) | Other ($) | Total ($) | |||||||
| Gregory E. Hyland | 24,000 | — | 10,600 | 16,191 | 3,000 | (2) | 53,791 | ||||||
| Evan L. Hart | 18,000 | — | 10,600 | 3,201 | — | 31,801 | |||||||
| Keith L. Belknap | 18,000 | — | 10,600 | 5,598 | 3,000 | (2) | 37,198 | ||||||
| Gregory S. Rogowski | 18,000 | — | 10,600 | 5,462 | 3,164 | (3) | 37,226 | ||||||
| Marietta Edmunds Zakas | 14,400 | 7,500 | 10,600 | 4,112 | — | 36,612 | |||||||
(1) | NEOs are entitled to reimbursement of up to $7,500 of annual financial planning ($10,000 for the CEO). |
| (2) | Represents reimbursement of annual executive physical exam expenses. |
| (3) | Represents the incremental cost to the Company of Mr. Rogowski’s spouse accompanying him on a sales incentive award trip. |
Grants of Plan-Based Awards Table
The following table summarizes the equity awards made to our NEOs during fiscal 2016 on a grant-by-grant basis. Each of the equity-based awards granted during fiscal 2016 and reported in the following table was granted under, and is subject to the terms of, the 2006 Stock Plan.
| Fiscal 2016 Grants of Plan-Based Awards Table | |||||||||||||||||
Estimated Possible Payouts Under Non-Equity Incentive Plan Awards (1) | Estimated Future Issuance of Shares Under Equity Incentive Plans (2) | All Other Stock-Based Awards (#) (3) | Grant Date Fair Value of Stock-Based Awards ($) (4) | ||||||||||||||
| Name | Grant Date | Threshold ($) | Target ($) | Maximum ($) | Threshold (#) | Target (#) | Maximum (#) | ||||||||||
| Gregory E. Hyland | — | 900,000 | 1,800,000 | ||||||||||||||
| 12/1/2015 | (5) | 17,768 | 35,537 | 71,074 | 333,337 | ||||||||||||
| 12/1/2015 | 106,609 | 999,992 | |||||||||||||||
| 12/2/2014 | (5) | 17,041 | 34,083 | 68,166 | 319,699 | ||||||||||||
| 12/3/2013 | (5) | 19,562 | 39,124 | 78,248 | 366,983 | ||||||||||||
| Evan L. Hart | — | 301,025 | 602,050 | ||||||||||||||
| 12/1/2015 | (5) | 5,063 | 10,127 | 20,254 | 94,991 | ||||||||||||
| 12/1/2015 | 30,383 | 284,993 | |||||||||||||||
| 12/2/2014 | (5) | 4,797 | 9,594 | 19,188 | 89,992 | ||||||||||||
| 12/3/2013 | (5) | 5,506 | 11,013 | 22,026 | 103,302 | ||||||||||||
| Keith L. Belknap | — | 298,900 | 597,800 | ||||||||||||||
| 12/1/2015 | (5) | 4,442 | 8,884 | 17,768 | 83,332 | ||||||||||||
| 12/1/2015 | 26,652 | 249,996 | |||||||||||||||
| 12/2/2014 | (5) | 3,408 | 6,816 | 13,632 | 63,934 | ||||||||||||
| 12/3/2013 | (5) | 3,913 | 7,826 | 15,652 | 73,408 | ||||||||||||
| Gregory S. Rogowski | — | 322,125 | 644,250 | ||||||||||||||
| 12/1/2015 | (5) | 4,886 | 9,773 | 19,546 | 91,671 | ||||||||||||
| 12/1/2015 | 29,317 | 274,993 | |||||||||||||||
| 12/2/2014 | (5) | 4,601 | 9,202 | 18,404 | 86,315 | ||||||||||||
| 12/3/2013 | (5) | 5,282 | 10,564 | 21,128 | 99,090 | ||||||||||||
| Marietta Edmunds Zakas | — | 203,140 | 406,280 | ||||||||||||||
| 12/1/2015 | (5) | 2,487 | 4,975 | 9,950 | 46,666 | ||||||||||||
| 12/1/2015 | 14,925 | 139,997 | |||||||||||||||
| 12/2/2014 | (5) | 2,300 | 4,601 | 9,202 | 43,157 | ||||||||||||
| 12/3/2013 | (5) | 2,201 | 4,402 | 8,804 | 41,291 | ||||||||||||
| (1) | Amounts represent the range of possible cash payouts for fiscal 2016 awards under the annual cash incentive plan as described in “Compensation Discussion and Analysis — Compensation Elements — Annual Cash Incentive Awards”. The awards that were earned based on actual performance for fiscal 2016 were paid in December 2016 and are shown in the “Non-Equity Incentive Plan Compensation” column of the Summary Compensation Table. |
| (2) | Represents PRSU awards that may be earned based on the achievement of performance goals in the 2016 performance period. See “Compensation Discussion and Analysis — Compensation Elements — Long-Term Equity-Based Compensation — Performance-Based |
36
Restricted Stock Units”. Estimated amounts that may be earned over the three-year award cycle of PRSUs granted for fiscal 2014, 2015 and 2016 are reflected in “Outstanding Equity Awards at 2016 Fiscal Year-End” below.
| (3) | Represents time-vesting RSUs. Each RSU entitles the grantee to receive one share of Common Stock upon vesting. The RSUs generally vest in equal installments on the first, second and third anniversaries of the grant date. See “Compensation Discussion and Analysis — Compensation Elements — Long-Term Equity-Based Compensation — Time-Based Restricted Stock Units”. |
| (4) | See footnote 2 to the “Summary Compensation Table” for a description of the methods used to determine grant date fair value of equity-based awards. |
| (5) | Represents the range of shares of Common Stock that may vest after the end of the three-year award cycle applicable to a PRSU award solely with respect to the fiscal 2016 performance period, assuming achievement of threshold, target and maximum performance. |
37
Outstanding Equity Awards Table
The following table sets forth information detailing the outstanding unexercised options and unvested RSUs and PRSUs held by each of our NEOs at September 30, 2016.
| Name | Option Awards | Stock Awards | ||||||||||||||||
Grant Date | Number of Securities Underlying Unexercised Options (#) | Option Exercise Price ($) (1) | Option Expiration Date | Number of Units of Stock That Have Not Vested (#) (2) | Market Value of Units of Stock That Have Not Vested ($) (3) | Number of Performance Shares That Have Not Vested (#) | Market Value of Performance Shares That Have Not Vested ($) (3) | |||||||||||
| Exercisable | Unexercisable | |||||||||||||||||
Gregory E. Hyland (7) | 11/29/06 | 88,300 | — | 15.09 | 11/29/16 | — | — | — | — | |||||||||
| 11/29/07 | 226,757 | — | 10.66 | 11/29/17 | — | — | — | — | ||||||||||
| 12/02/08 | 343,155 | — | 5.49 | 12/02/18 | — | — | — | — | ||||||||||
| 12/01/09 | 281,748 | — | 5.05 | 12/01/19 | — | — | — | — | ||||||||||
| 11/30/10 | 281,748 | — | 3.52 | 11/30/20 | — | — | — | — | ||||||||||
| 11/29/11 | 90,931 | — | 2.03 | 11/29/21 | — | — | — | — | ||||||||||
| 12/03/13 | (4) | — | — | — | — | — | — | — | ||||||||||
| 12/02/14 | (5) | — | — | — | — | — | 34,083 | 427,742 | ||||||||||
| 12/01/15 | (6) | — | — | — | 106,609 | 1,337,943 | 71,072 | 891,954 | ||||||||||
| Evan L. Hart | 11/29/06 | 2,384 | — | 15.09 | 11/29/16 | — | — | — | — | |||||||||
| 11/29/07 | 10,459 | — | 10.66 | 11/29/17 | — | — | — | — | ||||||||||
| 07/31/08 | 24,752 | — | 9.10 | 07/31/18 | — | — | — | — | ||||||||||
| 12/02/08 | 66,539 | — | 5.49 | 12/02/18 | — | — | — | — | ||||||||||
| 12/01/09 | 84,615 | — | 5.05 | 12/01/19 | — | — | — | — | ||||||||||
| 11/30/10 | 84,615 | — | 3.52 | 11/30/20 | — | — | — | — | ||||||||||
| 11/29/11 | 71,942 | — | 2.03 | 11/29/21 | — | — | — | — | ||||||||||
| 12/03/13 | (4) | — | — | — | 11,013 | 138,213 | — | — | ||||||||||
| 12/02/14 | (5) | — | — | — | 19,188 | 240,809 | 19,389 | 243,332 | ||||||||||
| 12/01/15 | (6) | — | — | — | 30,383 | 381,307 | 30,596 | 383,980 | ||||||||||
| Keith L. Belknap | 04/02/12 | 22,335 | — | 3.54 | 04/02/22 | — | — | — | — | |||||||||
| 12/03/13 | (4) | — | — | — | 7,825 | 98,204 | — | — | ||||||||||
| 12/02/14 | (5) | — | — | — | 13,632 | 171,082 | 13,775 | 172,876 | ||||||||||
| 07/27/15 | — | — | — | 19,004 | 238,500 | — | — | |||||||||||
| 12/01/15 | (6) | — | — | — | 26,652 | 334,483 | 26,839 | 336,829 | ||||||||||
| Gregory S. Rogowski | 12/01/09 | 85,839 | — | 5.05 | 12/01/19 | — | — | — | — | |||||||||
| 11/30/10 | 85,839 | — | 3.52 | 11/30/20 | — | — | — | — | ||||||||||
| 11/29/11 | 70,684 | — | 2.03 | 11/29/21 | — | — | — | — | ||||||||||
| 12/03/13 | (4) | — | — | — | 10,563 | 132,566 | — | — | ||||||||||
| 12/02/14 | (5) | — | — | — | 18,404 | 230,970 | 18,597 | 233,392 | ||||||||||
| 12/01/15 | (6) | — | — | — | 29,317 | 367,928 | 29,522 | 370,501 | ||||||||||
| Marietta Edmunds Zakas | 11/29/06 | 10,577 | — | 15.09 | 11/29/16 | — | — | — | — | |||||||||
| 11/29/07 | 22,676 | — | 10.66 | 11/29/17 | — | — | — | — | ||||||||||
| 12/02/08 | 38,022 | — | 5.49 | 12/02/18 | — | — | — | — | ||||||||||
| 12/01/09 | 34,965 | — | 5.05 | 12/01/19 | — | — | — | — | ||||||||||
| 11/30/10 | 34,965 | — | 3.52 | 11/30/20 | — | — | — | — | ||||||||||
| 11/29/11 | 25,260 | — | 2.03 | 11/29/21 | — | — | — | — | ||||||||||
| 12/03/13 | (4) | — | — | — | 4,401 | 55,233 | — | — | ||||||||||
| 12/02/14 | (5) | — | — | — | 9,202 | 115,485 | 9,299 | 116,702 | ||||||||||
| 12/01/15 | (6) | — | — | — | 14,925 | 187,309 | 15,029 | 188,614 | ||||||||||
| (1) | Option exercise prices are equal to the closing price of Common Stock on the NYSE on the respective grant dates. |
| (2) | RSUs granted on 12/03/13, 12/02/14, 7/27/15 and 12/01/15 each vest in equal installments on the first, second and third anniversaries of the respective grant dates. |
| (3) | “Market value” is calculated by multiplying the number of RSUs or PRSUs that have not vested by the closing price of Common Stock on the NYSE on September 30, 2016 of $12.55 per share. |
| (4) | Represents PRSUs awarded in fiscal 2014 for a three-year award cycle (fiscal 2014 through fiscal 2016). The performance units shown are based on actual performances for fiscal 2014, 2015 and 2016, which were 200%, 0% and 102.1% of target, respectively. See “Compensation Discussion and Analysis — Compensation Elements — Long-Term Equity-Based Compensation — Performance-Based Restricted Stock Units”. |
| (5) | Represents PRSUs awarded in fiscal 2015 for a three-year award cycle (fiscal 2015 through fiscal 2017). The PRSUs shown are based on actual performance for fiscal 2015 and 2016 and assume target performance for fiscal 2017. Actual performances for fiscal 2015 and 2016 were 0% and 102.1% of target, respectively. See “Compensation Discussion and Analysis — Compensation Elements — Long-Term Equity-Based Compensation — Performance-Based Restricted Stock Units”. |
38
| (6) | Represents PRSUs awarded in fiscal 2016 for a three-year award cycle (fiscal 2016 through fiscal 2018). The PRSUs shown are based on actual performance for fiscal 2016 and assume target performance for fiscal 2017 and 2018. Actual performance for fiscal 2016 was 102.1% of target. See “Compensation Discussion and Analysis — Compensation Elements — Long-Term Equity-Based Compensation — Performance-Based Restricted Stock Units”. |
| (7) | Mr. Hyland is “retirement-eligible” under the terms and for purposes of the 2006 Stock Plan. Accordingly, for purposes of this table, all of his outstanding equity-based awards (other than unearned and outstanding PRSUs) are deemed vested, other than awards granted after December 2013. Beginning in December 2013, all equity-based awards (other than PRSUs) require a grantee who is or becomes retirement-eligible prior to an initial vesting date to remain in continuous service from the grant date through at least the first anniversary thereof to receive accelerated vesting upon retirement. |
Option Exercises and Stock Vested Table
The following table shows stock options exercised and RSUs vested during fiscal 2016.
| Option Awards | Stock Awards | |||||||
| Name | Number of Shares Acquired on Exercise | Value Realized on Exercise(1) ($) | Number of Shares Acquired on Vesting | Value Realized on Vesting(2) ($) | ||||
| Gregory E. Hyland | — | — | 127,617 | 1,183,094 | ||||
| Evan L. Hart | — | — | 37,929 | 351,746 | ||||
| Keith L. Belknap | — | — | 36,821 | 364,070 | ||||
| Gregory S. Rogowski | — | — | 36,986 | 343,035 | ||||
| Marietta Edmunds Zakas | — | — | 15,124 | 140,217 | ||||
| (1) | Calculated by subtracting the exercise price of the option from the closing price of Common Stock on the NYSE on the exercise date, multiplied by the number of options exercised. |
| (2) | Calculated as the closing price of Common Stock on the NYSE on the vesting date multiplied by the number of RSUs that vested. |
Nonqualified Deferred Compensation During Fiscal 2016
Mr. Hyland participates in a deferred compensation plan pursuant to the terms of his employment agreement. None of our other NEOs participate in any executive deferred compensation plan. Mr. Hyland accumulated aggregate earnings from interest in fiscal 2016 of $17,669 and held an aggregate balance on September 30, 2016 of $644,060. These contributions and aggregate earnings are reflected in the “Change in Pension Value and Nonqualified Deferred Compensation Earnings” column of the Summary Compensation Table.
Pension Plan
None of our NEOs participate in a defined benefit pension plan. Each NEO participates in our 401(k) plan, under which we make matching contributions in accordance with the terms of that plan.
Employment, Severance and Change-in-Control Arrangements
At September 30, 2016, we maintained employment agreements with each NEO. Each agreement provides for an annual equity opportunity, which is subject to the discretion of the Compensation Committee in the case of Mr. Hyland and commensurate with their executive-level position in the case of other NEOs. Each agreement also entitles the employee to receive reimbursement for financial planning services and the cost of an annual physical exam. The following table sets forth certain information with respect to these agreements.
| Name | Base Salary Rate(1) ($) | Annual Target Bonus as Percent of Base Salary(2) (%) | Monthly Car Allowance ($) | Annual Vacation | Severance Benefits as Percent of Salary(3) (%) | ||
Gregory E. Hyland(4) | 900,000 | 100 | 2,000 | 4 weeks | 300.0 | ||
| Evan L. Hart | 405,300 | 75 | 1,500 | 4 weeks | 262.5 | ||
| Keith L. Belknap | 430,500 | 70 | 1,500 | 4 weeks | 240.0 | ||
| Gregory S. Rogowski | 433,000 | 75 | 1,500 | 4 weeks | 262.5 | ||
| Marietta Edmunds Zakas | 341,900 | 60 | 1,200 | 4 weeks | 225.0 | ||
| (1) | Salaries are reviewed annually. Amounts shown represent annual salary rates as of September 30, 2016. |
| (2) | Payout can range from zero to up to twice the amount of the target based on the satisfaction of predetermined financial, operational and individual performance objectives. |
| (3) | Paid in monthly installments over 24 months in the case of Mr. Hyland and over 18 months in the case of each other NEO. Also includes a lump sum payment of unpaid salary and other benefits. |
| (4) | Mr. Hyland participates in an unfunded deferred compensation plan. See “— Nonqualified Deferred Compensation During Fiscal 2016“. |
Potential Payments Upon Termination or Change-in-Control
At September 30, 2016, we maintained change-in-control agreements with each NEO. The following table sets forth certain information with respect to these agreements.
Under these agreements, upon a change-in-control (as defined in the agreement) of Mueller Water Products, Inc., all outstanding options and RSUs would immediately vest. The value of PRSUs reflects the pro rata portion of shares earned during the performance period and payout at target for future performance periods within the award cycle. In addition, if the executive’s employment is terminated other than for Cause or for Good Reason (each as defined in the agreement) within 24 months following a change-in-control, the executive would be entitled to a lump-sum severance payment equivalent to base salary and annual incentive bonus (generally calculated as the average of actual annual incentive bonuses over the preceding three years) and continuation of certain benefits, such as group life and medical insurance coverage for a period of 24 months. The agreements for Messrs. Hyland, Hart and Rogowski and Ms. Zakas provide for an additional payment sufficient to eliminate the effect of any applicable excise tax on severance payments in excess of an amount determined under Section 280G of the Code. We would not be able to deduct payments subject to the excise tax for federal and state income tax purposes. The agreements provide that no executive is entitled to receive duplicative severance benefits under any other Company-related plans or programs if benefits are triggered.
The following table sets forth the potential benefits each NEO would be entitled to receive upon termination of employment in the situations outlined below. The NEO would not be entitled to the severance benefits described below if he terminates his employment without Good Reason or is terminated for Cause. The amounts shown are estimates and do not necessarily reflect the actual amounts that would be paid to the NEOs, which would only be known at the time they become eligible for payment. The amounts shown are the amounts that could be payable under existing plans and arrangements if the NEO’s employment had terminated on September 30, 2016, including (other than for Mr. Belknap) an estimated gross-up for certain taxes in the event that any payments made in connection with a change-in-control were subject to the excise tax imposed by Section 4999 of the Code.
39
The termination events pursuant to which the NEOs are entitled to potential payments are as follows:
A - Severance arrangement for termination without cause or for good reason
B - Termination without cause after a change-in-control or, if applicable, sale of segment
C - Death, disability or retirement
| Potential Payments Upon Termination or Change-in-Control Table | ||||||||||||||||||
| Name | Cash Severance ($) | Bonus Earned as of Event Date(1) ($) | Vesting of Unvested Long-Term Awards(2) ($) | Health, Welfare and Other Benefits Continuation ($) | Outplacement(3) ($) | Sec 280G Excise Tax and Related Gross-Up(4) ($) | Total ($) | |||||||||||
| Gregory E. Hyland | A | 3,413,291 | (5) | 1,160,658 | — | 37,114 | (8) | 25,000 | — | 4,636,063 | ||||||||
| B | 4,059,751 | (6) | 1,160,658 | 5,368,842 | 37,114 | (8) | 315,000 | — | 10,941,365 | |||||||||
| C | 644,060 | (7) | — | 4,476,888 | — | — | — | 5,120,948 | ||||||||||
| Evan L. Hart | A | 1,095,089 | (5) | 388,209 | — | 12,250 | (8) | 25,000 | — | 1,520,548 | ||||||||
| B | 1,343,599 | (6) | 388,209 | 1,520,658 | 16,333 | (8) | 141,855 | — | 3,410,654 | |||||||||
| C | — | — | 1,146,041 | — | — | — | 1,146,041 | |||||||||||
| Keith L. Belknap | A | 1,066,315 | (5) | 302,454 | — | 29,174 | (8) | 25,000 | — | 1,422,943 | ||||||||
| B | 1,185,640 | (6) | 302,454 | 1,446,048 | 38,899 | (8) | 150,675 | — | 3,123,716 | |||||||||
| C | — | — | 1,137,519 | — | — | — | 1,137,519 | |||||||||||
| Gregory S. Rogowski | A | 1,169,933 | (5) | 389,614 | — | 7,524 | (8) | 25,000 | — | 1,592,071 | ||||||||
| B | 1,563,744 | (6) | 389,614 | 1,462,942 | 10,032 | (8) | 151,550 | — | 3,577,882 | |||||||||
| C | — | — | 1,102,179 | — | — | — | 1,102,179 | |||||||||||
| Marietta Edmunds Zakas | A | 795,575 | (5) | 261,974 | — | 26,614 | (8) | 25,000 | — | 1,109,163 | ||||||||
| B | 1,004,597 | (6) | 261,974 | 716,066 | 35,485 | (8) | 119,665 | — | 2,137,787 | |||||||||
| C | — | — | 533,451 | — | — | — | 533,451 | |||||||||||
| (1) | Each is entitled to a pro rata share of the current fiscal year bonus in the event of termination without Cause or after a change-in-control. Amounts in this table assume a termination date of September 30, 2016 and represent the actual bonus paid for fiscal 2016 since this amount would not have otherwise been paid at that date. |
| (2) | The value of stock options is calculated as the difference between the closing price of Common Stock on September 30, 2016 and the option exercise prices per share multiplied by the number of in-the-money options. The value of RSUs is the closing price of Common Stock on September 30, 2016 multiplied by the number of RSUs. The value of PRSUs reflects the pro rata portion of shares earned during the performance period and payout at target for future performance periods within the award cycle. The closing price of our common stock on September 30, 2016 on the NYSE was $12.55. Upon termination due to death, disability or retirement, only the equity awards granted beginning November 2007 vest automatically in accordance with their terms. |
| (3) | Services in Case A will be reasonable in our sole discretion. Services in Case B will be provided for up to two years, but will not exceed 35% of the NEO’s base salary at the time of termination. |
| (4) | The estimated gross-up for purposes of Section 280G is calculated by determining if the total amount payable to the executive contingent upon a change-in-control exceeds 2.99 times the average of the annual eligible compensation payable to the executive during the preceding five years. If the total amount payable exceeds the average annual compensation amount, a “gross-up” amount is added to the amounts paid to the executive (other than Mr. Belknap) in order to put the executive in the same after-tax position as if he had not been subject to the excise tax. |
| (5) | Cash severance is equal to a percentage of current annual base salary plus accrued but untaken vacation. The percentage applicable to Mr. Hyland is 300%. The percentage applicable to Messrs. Hart and Rogowski is 262.5%. The percentage applicable to Mr. Belknap is 240%. The percentage applicable to Ms. Zakas is 225%. Cash severance to Mr. Hyland also includes payout under the Retirement Plan. Accrued vacation assumes no vacation has been taken. |
| (6) | Cash severance for Messrs. Hyland, Hart and Rogowski and Ms. Zakas is equal to two times annual base salary plus two times the average bonus over the last three years, plus accrued but untaken vacation. Cash severance to Mr. Hyland also includes payout under the Retirement Plan. Cash severance for Mr. Belknap is equal to two times annual base salary plus one and a half times the average bonus over the last three years, plus accrued but untaken vacation. Accrued vacation assumes no vacation has been taken. |
| (7) | Cash severance to Mr. Hyland includes payout under the Retirement Plan. See “— Nonqualified Deferred Compensation During Fiscal 2016“. |
| (8) | Welfare benefits are continued for up to 24 months for Mr. Hyland and 18 months for other NEOs from the separation date based on the current elections and plan premiums. |
40
BENEFICIAL OWNERSHIP OF COMMON STOCK
The following table lists information as of December 8, 2016 about the number of shares of Common Stock beneficially owned by each incumbent director, each NEO, all of our directors and current executive officers as a group, and each person or group known by us to own more than 5% of our Common Stock. Unless otherwise noted, voting power and investment power in Common Stock are exercisable solely by the named person.
At December 8, 2016, there were 162,065,657 shares of Common Stock outstanding.
Name and Address of Beneficial Owner (1) | Aggregate Number of Shares of Common Stock Beneficially Owned (2) | Percent of Outstanding Common Stock | |||
| Shirley C. Franklin, Director | 122,509 | (3) | * | ||
| Thomas J. Hansen, Director | 100,360 | (3) | * | ||
| Gregory E. Hyland, Chairman, President and Chief Executive Officer | 2,905,470 | (4) | 1.8 | % | |
| Jerry W. Kolb, Director | 200,106 | (3) | * | ||
| Joseph B. Leonard, Director | 211,554 | (3) | * | ||
| Mark J. O’Brien, Director | 182,554 | (3) | * | ||
| Bernard G. Rethore, Director | 208,858 | (3) | * | ||
| Lydia W. Thomas, Director | 154,615 | (3) | * | ||
| Michael T. Tokarz, Director | 515,573 | (3) | * | ||
| Evan L. Hart, Senior Vice President and Chief Financial Officer | 762,699 | * | |||
| Keith L. Belknap, Senior Vice President, General Counsel and Chief Compliance Officer; President of Mueller Technologies companies | 175,648 | * | |||
| Gregory S. Rogowski, President, Mueller Co. | 611,566 | * | |||
Marietta Edmunds Zakas Senior Vice President, Strategy, Corporate Development and Communications | 386,185 | * | |||
| All directors and executive officers as a group (16 individuals) | 7,031,999 | 4.3 | % | ||
Dimensional Fund Advisors LP 6300 Bee Cave Road, Building One, Austin, TX 78746 | 9,188,669 | (5) | 5.7 | % | |
Vanguard Group Inc. PO Box 2600, V26, Valley Forge, PA 19482-2600 | 10,421,634 | (6) | 6.4 | % | |
BlackRock, Inc. 55 East 52nd Street, New York, NY 10055 | 8,956,184 | (7) | 5.5 | % | |
* Less than 1% of outstanding common stock
| (1) | The address of each of our directors and executive officers is c/o Mueller Water Products, Inc., 1200 Abernathy Road, N.E., Suite 1200, Atlanta, Georgia 30328. |
| (2) | Beneficial ownership as reported in the table has been determined in accordance with the rules of the SEC. Under those rules, a person is deemed to be a “beneficial owner” of a security if that person has or shares “voting power,” which includes the power to vote or to direct the voting of such security, or “investment power,” which includes the power to dispose of, or to direct the disposition of, such security. The person is also deemed to be a beneficial owner of any security of which that person has a right to acquire beneficial ownership within 60 days. Under such rules, more than one person may be deemed to be a beneficial owner of the same securities, and a person may be deemed to be a beneficial owner of securities as to which he or she may disclaim any beneficial interest. Except as indicated in other notes to this table, directors and executive officers possessed sole voting and investment power with respect to all shares of Common Stock referred to in the table. See “Executive Compensation — Outstanding Equity Awards at Fiscal Year-End Table” for more information concerning outstanding equity awards to our NEOs and “Director Compensation — Director Compensation Summary” for more information concerning outstanding equity awards to our directors. |
| (3) | Each director is “retirement-eligible” under and for purposes of the 2006 Stock Plan. Accordingly, for purposes of this table, all of their outstanding equity-based awards are deemed vested. Beginning with the equity-based awards granted to directors in January 2014, all such awards to directors require a grantee who is or becomes retirement-eligible prior to an initial vesting date to remain in continuous service from the grant date through at least the first anniversary thereof to receive accelerated vesting upon retirement. The beneficial ownership reported in the table assumes each grantee of an award on February 26, 2016 will remain in continuous service through February 26, 2017. |
| (4) | Includes 180,569 RSUs and no options that are subject to accelerated vesting upon retirement. Also includes 34,798 PRSUs earned with respect to the 2015 and 2016 performance periods under the December 2, 2014 grant and 36,283 PRSUs earned with respect to the 2016 performance period under the December 1, 2015 grant. |
| (5) | As reported on Schedule 13G/A filed with the SEC on February 9, 2016, Dimensional Fund Advisors LP has sole investment discretion with respect to 9,188,669 shares and sole voting power with respect to 8,834,075 shares. |
41
| (6) | As reported on Schedule 13G/A filed with the SEC on February 10, 2016, Vanguard Group, Inc. has sole investment discretion with respect to 10,421,634 shares and sole voting power with respect to 353,167 shares. |
| (7) | As reported on Schedule 13G/A filed with the SEC on January 22, 2016, Blackrock, Inc. has sole investment discretion of 8,956,184 shares and sole voting power with respect to 8,607,348 shares. |
42
QUESTIONS ABOUT VOTING AND THE ANNUAL MEETING
When and where is the Annual Meeting?
Our Annual Meeting will be held on Wednesday, January 25, 2017 at 10:00 A.M., Eastern Time, in the Peachtree Dunwoody Room on the 3rd Floor of Building 500 at Northpark Town Center, located at 1100 Abernathy Road, N.E., in Atlanta, Georgia.
What is the purpose of the Annual Meeting?
At the Annual Meeting, stockholders will vote on matters summarized in this Proxy Statement. This Proxy Statement contains important information for you to consider when deciding how to vote.
Who is entitled to vote?
You may vote at the Annual Meeting, and any adjournment or postponement thereof, if you were a holder of record of our Common Stock at the close of business on December 8, 2016, the record date. On the record date, there were 162,065,657 shares of Common Stock outstanding. Each share of Common Stock represented at the Annual Meeting is entitled to one vote.
Who is soliciting my vote?
The Board is soliciting your proxy to vote your shares at the Annual Meeting. We made our proxy solicitation materials available to you on the Internet or, upon your request, we have delivered printed versions of these materials to you by mail, in connection with our solicitation of proxies.
What is included in the proxy materials?
The proxy materials for the Annual Meeting include the Notice of Internet Availability of Proxy Materials, this Proxy Statement and the Annual Report. If you requested printed versions by mail, these proxy materials also include the proxy card or voting instruction form for the Annual Meeting. These materials were first sent or made available to stockholders on or about December 15, 2016.
What proposals require my vote, what vote is required to approve each proposal, how will abstentions and broker non-votes be treated and how does the Board recommend I vote?
| Voting Item | Voting Standard | Treatment of Abstentions & Broker Non-Votes | Board Recommendation |
| Elect Directors | Plurality of votes cast | Not counted as votes cast and, therefore, no effect | FOR each director |
Approve executive compensation | Majority of votes cast | Not counted as votes cast and, therefore, no effect | FOR |
| Determine the frequency of the shareholder vote to approve executive compensation | Majority of votes cast | Not counted as votes cast and, therefore, no effect | ANNUALLY |
| Ratify Auditor | Majority of votes cast | N/A | FOR |
Will any other business be conducted at the Annual Meeting?
Management is not aware of any items, other than those referred to in this Proxy Statement, that may properly come before the Annual Meeting.
43
How are proxies voted?
Shares represented by all valid proxies received on time will be voted as specified. If a valid proxy form is received and does not indicate specific choices, the shares will be voted in accordance with the Board’s recommendations. The Board has designated Gregory E. Hyland, Evan L. Hart and Keith L. Belknap as proxies for the Annual Meeting.
How may I vote?
If your shares are registered directly in your name with our transfer agent, you are a “registered stockholder.” Registered stockholders may vote by:
| • | Internet at the web address noted in the Notice, proxy materials email or proxy card that you received (we encourage you to vote in this manner); |
| • | Telephone through the number noted in the proxy card that you received (if you received a proxy card); |
| • | Signing and dating your proxy card (if you received a proxy card) and mailing it to the indicated address; or |
| • | Attending the Annual Meeting and voting in person. |
If your shares are held in a bank or brokerage account, you are a “beneficial stockholder” and you should refer to the instructions provided by your bank, brokerage or other nominee regarding how to vote your shares.
If you plan to vote other than by attending the Annual Meeting and voting in person, your vote must be received by 11:59 P.M., Eastern Time on January 24, 2017.
How can I change my vote?
You can revoke a proxy prior to the completion of voting at the Annual Meeting by:
| • | Voting again using the Internet or by telephone prior to the Annual Meeting; |
| • | Delivering a later-dated proxy card; or |
| • | Voting in person at the meeting (if you are a beneficial stockholder). |
What constitutes a quorum for the Annual Meeting?
The holders of a majority of the voting power of the outstanding shares of Common Stock at the close of business on the record date must be present, either in person or represented by proxy, to constitute a quorum necessary to conduct the Annual Meeting. Shares represented by proxies received but marked as abstentions or as withholding voting authority for any or all director nominees, and shares represented by proxies received but reflecting broker non-votes, will be counted as present at the Annual Meeting for purposes of establishing a quorum.
Why did I receive a Notice in the mail instead of a printed set of proxy materials?
We are permitted by SEC rules to furnish proxy materials to stockholders by providing access to those documents on the Internet. Stockholders will not receive printed copies of the proxy materials unless they request them. The Notice provides instructions on how to access and review the Proxy Statement and the Annual Report over the Internet at www.proxyvote.com (for beneficial stockholders) and www.edocumentview.com/mwa (for registered stockholders), and how to submit a proxy over the Internet. If you would like to receive a paper or email copy of the proxy materials, please follow the instructions in the Notice.
What does it mean if I receive more than one Notice, proxy materials email or proxy card?
It means you have multiple accounts holding Common Stock with brokers and/or our transfer agent. You will need to vote separately with respect to each Notice, proxy materials email or proxy card you receive.
44
What do I need to do if I want to attend the Annual Meeting?
Attendance at the Annual Meeting is limited to our stockholders, members of their immediate families or their representatives. To gain admittance to the Annual Meeting, you may be required to show evidence that you were a holder of Common Stock on the record date. We reserve the right to limit the number of representatives who may attend the Annual Meeting.
How are proxies solicited and what is the cost?
We bear all expenses incurred in connection with the solicitation of proxies. We have engaged Alliance Advisors LLC to assist with the solicitation of proxies for an estimated fee of $7,000, plus expenses. We will reimburse brokers, fiduciaries and custodians for their costs in forwarding proxy materials to beneficial holders of Common Stock. Our directors, officers and employees also may solicit proxies in return for no additional compensation.
45
GENERAL INFORMATION
Section 16(a) Beneficial Ownership Reporting Compliance
Section 16(a) of the Exchange Act requires executive officers and directors and persons who beneficially own more than 10% of a company’s common stock (together, “Reporting Persons”) to file initial reports of ownership and reports of changes in ownership with the SEC. Reporting Persons are required by SEC rules to furnish companies with copies of all Section 16(a) forms they file. Based solely on a review of copies of such forms furnished to us and written representations from the executive officers and directors, we believe our Reporting Persons complied with all Section 16 filing requirements during fiscal 2016.
Other Business for Presentation at the Annual Meeting
The Board and management do not intend to bring before the Annual Meeting any matters other than those disclosed in the Notice of Annual Meeting of Stockholders, nor do they know of any business that other persons intend to present at the Annual Meeting. Should any other matter or business requiring a vote of stockholders arise, the persons named in the enclosed proxy intend to exercise the authority conferred by the proxy and vote the shares represented thereby in respect of any such other matter or business in accordance with their best judgment in the interest of Mueller Water Products, Inc.
Other Information
Consolidated financial statements for Mueller Water Products, Inc. are included in the 2016 Annual Report filed with the SEC, 100 F Street, N.E., Washington, D.C. 20549, and the New York Stock Exchange. A copy of the Form 10-K (excluding exhibits) will be furnished, without charge, by writing to the Corporate Secretary, Mueller Water Products, Inc., 1200 Abernathy Road, N.E., Suite 1200, Atlanta, Georgia 30328. The Form 10-K is also available on the SEC’s website at www.sec.gov or on our website at www.muellerwaterproducts.com.
46
STOCKHOLDER INFORMATION
Stockholder Proposals for Inclusion in Next Year’s Proxy Statement
SEC rules permit stockholders to submit proposals for inclusion in our proxy statement if the stockholder and the proposal meet the requirements specified in Rule 14a-8 under the Exchange Act.
| • | When to submit? Any stockholder proposals submitted in accordance with Rule 14a-8 must be received at our principal executive offices no later than September 16, 2017. |
| • | Where to submit? Proposals should be addressed to Corporate Secretary, Mueller Water Products, Inc., 1200 Abernathy Road, N.E., Atlanta, Georgia 30328. |
| • | What to submit? Proposals must conform to and include the information required by Rule 14a-8. |
We encourage stockholders to contact our Corporate Secretary prior to submitting a stockholder proposal or any time they have concerns about us.
Procedures for Business Matters and Director Nominations for Consideration at Next Year’s Annual Meeting of Stockholders
Our Bylaws provide that any stockholder proposal, including director nominations, that is not submitted for inclusion in next year’s proxy statement under Rule 14a-8, but is instead sought to be presented directly at next year’s annual meeting of stockholders must be delivered to our principal executive offices not less than 90 days nor more than 120 days prior to the first anniversary of the date we commenced mailing these proxy materials.
| • | When to submit? Stockholder proposals submitted under these Bylaw provisions must be received no earlier than August 17, 2017 and no later than September 16, 2017. |
| • | Where to submit? Proposals should be addressed to Corporate Secretary, Mueller Water Products, Inc., 1200 Abernathy Road, N.E., Atlanta, Georgia 30328. |
| • | What to submit? Proposals must include the information required by our Bylaws, which are available on our website. If the notice delivered to our Corporate Secretary does not contain all of the information specified in our Bylaws, the proposed business will not be transacted at the annual meeting. |
By Order of the Board of Directors.
Keith L. Belknap
Corporate Secretary
Atlanta, Georgia
December 15, 2016
47
Exhibit A
| Reconciliation of Non-GAAP Performance Measures to GAAP Performance Measures | ||||||||
| Year ended September 30, | ||||||||
| 2016 | 2015 | |||||||
| Net income | $ | 63.9 | $ | 30.9 | ||||
| Income tax reported | 33.1 | 19.8 | ||||||
| Pretax net income | 97.0 | 50.7 | ||||||
| Adjustments: | ||||||||
| Pension settlement | 16.6 | 0.5 | ||||||
| Other charges | 9.6 | 9.2 | ||||||
| Loss on Walter receivable | — | 11.6 | ||||||
| Foreign currency adjustment | — | 6.9 | ||||||
| Loss on early extinguishment of debt | — | 31.3 | ||||||
| Adjusted pretax net income | 123.2 | 110.2 | ||||||
| Tax expense at plan rate | (47.4 | ) | (43.3 | ) | ||||
| Adjusted net income | $ | 75.8 | $ | 66.9 | ||||
| Operating income (loss) | $ | 120.6 | $ | 109.6 | ||||
| Pension settlement | 16.6 | 0.5 | ||||||
| Other charges | 9.6 | 9.2 | ||||||
| Foreign currency adjustment | — | 6.9 | ||||||
| Loss on Walter receivable | — | 11.6 | ||||||
| Adjusted operating income (loss) | 146.8 | 137.8 | ||||||
| Depreciation and amortization | 52.6 | 58.1 | ||||||
| Adjusted EBITDA | $ | 199.4 | $ | 195.9 | ||||
| Adjusted operating margin | 12.9 | % | 11.8 | % | ||||
| Adjusted EBITDA margin | 17.5 | % | 16.8 | % | ||||
| Reconciliation of net debt to total debt (end of period): | ||||||||
| Current portion of long-term debt | $ | 5.9 | 6.1 | |||||
| Long-term debt | 479.2 | 482.9 | ||||||
| Total debt | 485.1 | 489.0 | ||||||
| Less cash and cash equivalents | (195.0 | ) | (113.1 | ) | ||||
| Net debt | $ | 290.1 | $ | 375.9 | ||||
| Reconciliation of free cash flow to net cash provided by operating activities: | ||||||||
| Net cash provided by operating activities | $ | 145.1 | $ | 87.8 | ||||
| Less capital expenditures | (39.4 | ) | (37.5 | ) | ||||
| Free cash flow | 105.7 | 50.3 | ||||||
| Adjustments to free cash flow: | ||||||||
| Other charges | 6.4 | 6.9 | ||||||
| Foreign currency | — | 6.9 | ||||||
| Accrued interest adjustment | — | 7.4 | ||||||
| Pension related | — | 1.4 | ||||||
| Income taxes | (2.2 | ) | (6.7 | ) | ||||
| Adjusted free cash flow | $ | 109.9 | $ | 66.2 | ||||
A-1