UNITED STATES
SECURITIES AND EXCHANGE COMMISSION
Washington, D.C. 20549
FORM 10-Q
(Mark One)
[X] QUARTERLY REPORT PURSUANT TO SECTION 13 OR 15(d) OF THE SECURITIES EXCHANGE ACT OF 1934
For the quarterly period ended: March 31, 2010
[ ] TRANSITION REPORT PURSUANT TO SECTION 13 OR 15(d) OF THE SECURITIES EXCHANGE ACT OF 1934
For the transition period from ____________ to _____________
Commission File Number: 000-53147
CHINA INFORMATION SECURITY TECHNOLOGY, INC.
(Exact Name of Registrant as Specified in Its Charter)
| Nevada | 98-0575209 |
| (State or other jurisdiction of incorporation | (I.R.S. Employer Identification No.) |
| or organization) | |
21st Floor, Everbright Bank Building
Zhuzilin, Futian District
Shenzhen, Guangdong, 518040
People’s Republic of China
(Address of principal executive offices, Zip Code)
(+86) 755-8370-8333
(Registrant’s telephone number, including area code)
______________________________________________________________
(Former name, former address and former fiscal year, if changed since last report)
Indicate by check mark whether the registrant (1) has filed all reports required to be filed by Section 13 or 15(d) of the Securities Exchange Act of 1934 during the preceding 12 months (or for such shorter period that the registrant was required to file such reports), and (2) has been subject to such filing requirements for the past 90 days.
Yes [ X ] No [ ]
Indicate by check mark whether the registrant has submitted electronically and posted on its corporate Web site, if any, every Interactive Data File required to be submitted and posted pursuant to Rule 405 of Regulation S-T (§ 232.405 of this chapter) during the preceding 12 months (or for such shorter period that the registrant was required to submit and post such files).
Yes [ ] No [ ]
Indicate by check mark whether the registrant is a large accelerated filer, an accelerated filer, a non-accelerated filer, or a smaller reporting company. See the definitions of “large accelerated filer,” “accelerated filer” and “smaller reporting company” in Rule 12b-2 of the Exchange Act.
| Large accelerated filer [ ] | Accelerated filer [ X ] |
| Non-accelerated filer [ ] (Do not check if a smaller reporting company) | Smaller reporting company [ ] |
Indicate by check mark whether the registrant is a shell company (as defined in Rule 12b-2 of the Exchange Act).
Yes [ ] No [ X ]
The number of shares outstanding of each of the issuer’s classes of common stock, as of May 7, 2010 is as follows:
| Class of Securities | Shares Outstanding |
| Common Stock, $0.01 par value | 51,805,787 |
| | TABLE OF CONTENTS | |
| | | |
| | | |
| PART I | FINANCIAL INFORMATION | |
| | | |
| ITEM 1. | FINANCIAL STATEMENTS. | 3 - 26 |
| | | |
| ITEM 2. | MANAGEMENT'S DISCUSSION AND ANALYSIS OF FINANCIAL CONDITION AND RESULTS OF OPERATIONS. | 27-35 |
| | | |
| ITEM 3. | QUANTITATIVE AND QUALITATIVE DISCLOSURES ABOUT MARKET RISK. | 36-37 |
| | | |
| ITEM 4. | CONTROLS AND PROCEDURES. | 38 |
| | | |
| PART II | OTHER INFORMATION | |
| | | |
| ITEM 1. | LEGAL PROCEEDINGS. | 39 |
| | | |
| ITEM 1A. | RISK FACTORS. | 39 |
| | | |
| ITEM 2. | UNREGISTERED SALES OF EQUITY SECURITIES AND USE OF PROCEEDS. | 39 |
| | | |
| ITEM 3. | DEFAULTS UPON SENIOR SECURITIES. | 39 |
| | | |
| ITEM 4. | (REMOVED AND RESERVED). | 39 |
| | | |
| ITEM 5. | OTHER INFORMATION. | 39 |
| | | |
| ITEM 6. | EXHIBITS. | 39 |
1
| PART I |
| FINANCIAL INFORMATION |
| ITEM 1. FINANCIAL STATEMENTS. | |
| CHINA INFORMATION SECURITY TECHNOLOGY, INC. |
| INDEX TO CONDENSED CONSOLIDATED FINANCIAL STATEMENTS |
| FOR THE THREE MONTHS ENDED MARCH 31, 2010 AND 2009 |
| Contents | Page(s) |
| | |
| Condensed Consolidated Balance Sheets as of March 31, 2010 (unaudited) and December 31, 2009 | 3 - 4 |
| | |
| Condensed Consolidated Statements of Income for the three months ended March 31, 2010 and 2009 (unaudited) | 5 |
| | |
| Condensed Consolidated Statements of Comprehensive Income for the three months ended March 31, 2010 and 2009 (unaudited) | 6 |
| | |
| Condensed Consolidated Statements of Changes in Equity for the three months ended March 31, 2010 (unaudited) | 7 |
| | |
| Condensed Consolidated Statements of Cash Flows for the three months ended March 31, 2010 and 2009 (unaudited) | 8 - 9 |
| | |
| Notes to the Consolidated Financial Statements (unaudited) | 10 - 26 |
2
CHINA INFORMATION SECURITY TECHNOLOGY, INC.
CONDENSED CONSOLIDATED BALANCE SHEETS
MARCH 31, 2010 AND DECEMBER 31, 2009 |
| | | | | | | | | | |
| | NOTES | | | March 31 | | | December 31 | |
| | | | | 2010 | | | 2009 | |
ASSETS | | | | | (Unaudited) | | | | |
| | | | | | | | | |
CURRENT ASSETS | | | | | | | | | |
Cash and cash equivalents | | | | $ | 11,004,980 | | $ | 13,478,633 | |
Restricted cash
Accounts receivable: | | | | | 6,316,960 | | | 5,859,910 | |
Billed, net of allowance for doubtful accounts of $3,103,000 and $3,123,000, respectively | | | | | 13,667,821 | | | 23,907,035 | |
Unbilled | | | | | 67,705,717 | | | 47,851,638 | |
Bills receivable | | | | | 102,690 | | | - | |
Advances to suppliers | | | | | 3,602,609 | | | 6,924,035 | |
Amount due from related parties, net of allowance for doubtful accounts of $0 and $73,000, respectively | | 6 | | | 138,237 | | | 129,937 | |
Inventories, net of provision of $208,000 and $184,000, respectively | | 7 | | | 16,596,430 | | | 10,936,004 | |
Other receivables and prepaid expenses | | | | | 16,366,468 | | | 15,405,089 | |
Deferred tax assets | | 12 | | | 1,814,416 | | | 1,719,327 | |
TOTAL CURRENT ASSETS | | | | | 137,316,328 | | | 126,211,608 | |
| | | | | | | | | |
Deposit for software purchase | | | | | 4,634,987 | | | 1,426,452 | |
Long-term investments | | 8 | | | 2,862,016 | | | 2,862,016 | |
Property, plant and equipment, net | | 9 | | | 52,777,136 | | | 53,586,514 | |
Land use rights, net | | 10 | | | 2,126,824 | | | 1,907,611 | |
Intangible assets, net | | 10 | | | 13,192,322 | | | 13,556,141 | |
Goodwill | | | | | 50,609,866 | | | 50,609,866 | |
Deferred tax assets | | 12 | | | 380,933 | | | 668,730 | |
TOTAL ASSETS | | | | $ | 263,900,412 | | $ | 250,828,938 | |
| | | | | | | | | |
LIABILITIES AND EQUITY | | | | | | | | | |
| | | | | | | | | |
CURRENT LIABILITIES | | | | | | | | | |
Short-term bank loans | | 11 | | $ | 12,214,242 | | $ | 15,927,780 | |
Accounts payable | | | | | 18,681,672 | | | 20,159,317 | |
Bills payable | | | | | 10,897,636 | | | 12,658,029 | |
Advances from customers | | | | | 3,908,165 | | | 3,950,744 | |
Amount due to related companies | | 6 | | | 583,736 | | | 583,736 | |
Accrued payroll and benefits | | | | | 1,283,047 | | | 3,142,240 | |
Other payables and accrued expenses | | | | | 12,369,519 | | | 14,252,918 | |
Contingent consideration, current portion | | 4 | | | 1,529,226 | | | 1,857,994 | |
Income tax payable | | | | | 2,336,989 | | | 3,290,245 | |
TOTAL CURRENT LIABILITIES | | | | | 63,804,232 | | | 75,823,003 | |
| | | | | | | | | |
Long-term bank loans | | 11 | | | 4,019,580 | | | 1,907,100 | |
Amount due to related parties | | 6 | | | 6,043,037 | | | - | |
Contingent consideration, net of current portion | | 4 | | | 2,169,068 | | | 2,635,397 | |
Deferred tax liabilities | | 12 | | | 2,455,383 | | | 2,564,604 | |
TOTAL LIABILITIES | | | | | 78,491,300 | | | 82,930,104 | |
| | | | | | | | | |
COMMITMENTS AND CONTINGENCIES | | | | | - | | | - | |
| | | | | | | | | |
| (CONTINUED) |
3
CHINA INFORMATION SECURITY TECHNOLOGY, INC.
CONDENSED CONSOLIDATED BALANCE SHEETS
MARCH 31, 2010 AND DECEMBER 31, 2009 (CONTINUED) |
| | | | | | | | | | |
| | | | | | | | | | |
| EQUITY | | | | | | | | | |
Common stock, par $0.01; authorized capital 200,000,000 shares;
shares issued and outstanding 2010: 51,811,787: 2009: 49,905,141shares | | 13 | | $ | 252,615 | | $ | 233,548 | |
Treasury stock, 6,000 shares, at cost | | | | | (11,468 | ) | | (11,468 | ) |
Additional paid-in capital | | | | | 89,357,316 | | | 78,495,062 | |
Reserve | | | | | 8,345,371 | | | 8,345,371 | |
Retained earnings | | | | | 66,743,383 | | | 60,462,275 | |
Accumulated other comprehensive income | | | | | 5,253,568 | | | 5,016,575 | |
Total equity of the Company | | | | | 169,940,785 | | | 152,541,363 | |
Non-controlling interest | | | | | 15,468,327 | | | 15,357,471 | |
Total equity | | | | | 185,409,112 | | | 167,898,834 | |
| | | | | | | | | |
TOTAL LIABILITIES AND EQUITY | | | | | 263,900,412 | | | 250,828,938 | |
The accompanying notes are an integral part of these unaudited condensed consolidated financial statements
4
CHINA INFORMATION SECURITY TECHNOLOGY, INC.
CONDENSED CONSOLIDATED STATEMENTS OF INCOME
THREE MONTHS ENDED MARCH 31, 2010 AND 2009
(Unaudited) |
| | | NOTES | | | Three Months | | | Three Months | |
| | | | | | Ended | | | Ended | |
| | | | | | March 31, | | | March 31, | |
| | | | | | 2010 | | | 2009 | |
| Revenue - Products | | | | $ | 6,347,970 | | $ | 2,821,128 | |
| Revenue - Software | | | | | 15,178,632 | | | 9,011,466 | |
| Revenue - System integration | | | | | 2,783,883 | | | 2,955,457 | |
| Revenue - Others | | | | | 994,622 | | | 192,133 | |
| TOTAL REVENUE | | | | | 25,305,107 | | | 14,980,184 | |
| | | | | | | | | | |
| Cost - Products sold | | | | | 5,240,422 | | | 2,612,791 | |
| Cost - Software sold | | | | | 6,401,411 | | | 2,700,941 | |
| Cost - System integration | | | | | 2,475,810 | | | 2,145,752 | |
| Cost - Others | | | | | 70,011 | | | 37,436 | |
| TOTAL COST | | | | | 14,187,654 | | | 7,496,920 | |
| | | | | | | | | | |
| GROSS PROFIT | | | | | 11,117,453 | | | 7,483,264 | |
| | | | | | | | | | |
| Administrative expenses | | | | | (2,770,031 | ) | | (2,216,347 | ) |
| Research and development expenses | | | | | (569,431 | ) | | (503,852 | ) |
| Selling expenses | | | | | (1,214,562 | ) | | (593,716 | ) |
| INCOME FROM OPERATIONS | | | | | 6,563,429 | | | 4,169,349 | |
| | | | | | | | | | |
| Subsidy income | | | | | 162,782 | | | 197,789 | |
| Other income, net | | | | | 966,799 | | | 181,367 | |
| Interest income | | | | | 18,891 | | | 76,917 | |
| Interest expense | | | | | (148,891 | ) | | (60,210 | ) |
| INCOME BEFORE INCOME TAXES | | | | | 7,563,010 | | | 4,565,212 | |
| | | | | | | | | | |
| Income tax expense | | 12 | | | (1,171,083 | ) | | (588,396 | ) |
| NET INCOME | | | | | 6,391,927 | | | 3,976,816 | |
| | | | | | | | | | |
| Less: Net income attributable to the non-controlling interest | | | | | (110,819 | ) | | (219,823 | ) |
| | | | | | | | | | |
| NET INCOME ATTRIBUTABLE TO THE COMPANY | | 3 | | $ | 6,281,108 | | $ | 3,756,993 | |
| | | | | | | | | | |
| Weighted average number of shares | | | | | | | | | |
| Basic | | 3 | | | 51,213,463 | | | 47,520,030 | |
| Diluted | | 3 | | | 51,213,463 | | | 47,520,030 | |
| | | | | | | | | | |
| Earnings per share - Basic and Diluted | | | | | | | | | |
| Basic - Net income attributable to the Company's common stockholders | | | | $ | 0.12 | | $ | 0.08 | |
| Diluted - Net income attributable to the Company's common stockholders | | | | $ | 0.12 | | $ | 0.08 | |
The accompanying notes are an integral part of these unaudited condensed consolidated financial statements
5
CHINA INFORMATION SECURITY TECHNOLOGY, INC.
CONDENSED CONSOLIDATED STATEMENTS OF COMPREHENSIVE INCOME
THREE MONTHS ENDED MARCH 31, 2010 AND 2009
(Unaudited)
| | | Three Months | | | Three Months | |
| | | Ended | | | Ended | |
| | | March 31, | | | March 31, | |
| | | 2010 | | | 2009 | |
| Net income | $ | 6,391,927 | | $ | 3,976,816 | |
| Other comprehensive income: | | | | | | |
| Foreign currency translation gain | | 237,030 | | | 451,742 | |
| Comprehensive income | | 6,628,957 | | | 4,428,558 | |
| Comprehensive income attributable to the non-controlling interest | | (110,856 | ) | | (219,823 | ) |
| Comprehensive income attributable to the Company | $ | 6,518,101 | | $ | 4,208,735 | |
The accompanying notes are an integral part of these unaudited condensed consolidated financial statements
6
CHINA INFORMATION SECURITY TECHNOLOGY, INC
CONDENSED CONSOLIDATED STATEMENTS OF CHANGES IN EQUITY
THREE MONTHS ENDED MARCH 31, 2010
(Unaudited) |
| | | | | | | | | | | | | | | | | | | | | | | | | | | | | | | |
| | | | | | | | | | | | | | | | | | | | | | | | Accumulated | | | | | | | |
| | | Common stock | | | Treasury stock | | | Additional | | | | | | | | | other | | | Non | | | | |
| | | Par value $0.01 | | | Par value $0.01 | | | Paid-in | | | | | | Retained | | | comprehensive | | | controlling | | | | |
| | | Shares | | | Amount | | | Shares | | | Amount | | | Capital | | | Reserve | | | earnings | | | income | | | interest | | | Total | |
BALANCE AS AT DECEMBER 31,2009 | | 49,905,141 | | $ | 233,548 | | | (6,000 | ) | $ | (11,468) | | $ | 78,495,062 | | $ | 8,345,371 | | $ | 60,462,275 | | $ | 5,016,575 | | $ | 15,357,471 | | $ | 167,898,834 | |
Issuance of common stock in private
( Placements (Note 13 | | 1,652,033 | | | 16,520 | | | - | | | - | | | 9,341,603 | | | - | | | - | | | - | | | - | | | 9,358,123 | |
Common stock issued upon the | | | | | | | | | | | | | | | | | | | | | | | | | | | | | | |
exercise of warrants (Note 13) | | 41,250 | | | 413 | | | - | | | - | | | 253,275 | | | - | | | - | | | - | | | - | | | 253,688 | |
Stock-based compensation (Note 13) | | 213,363 | | | 2,134 | | | - | | | - | | | 1,267,376 | | | - | | | - | | | - | | | - | | | 1,269,510 | |
Net income for the period | | - | | | - | | | - | | | - | | | - | | | - | | | 6,281,108 | | | - | | | 110,819 | | | 6,391,927 | |
Foreign currency translation gain | | - | | | - | | | - | | | - | | | - | | | - | | | - | | | 236,993 | | | 37 | | | 237,030 | |
BALANCE AS AT MARCH 31, 2010 | | 51,811,787 | | | 252,615 | | | (6,000 | ) | | (11,468 | ) | | 89,357,316 | | | 8,345,371 | | | 66,743,383 | | | 5,253,568 | | | 15,468,327 | | | 185,409,112 | |
The accompanying notes are an integral part of these unaudited condensed consolidated financial statements
7
CHINA INFORMATION SECURITY TECHNOLOGY, INC.
CONDENSED CONSOLIDATED STATEMENTS OF CASH FLOWS
THREE MONTHS ENDED MARCH 31, 2010 AND 2009
(Unaudited) |
| | | | | | | |
| | | Three Months | | | Three Months | |
| | | Ended | | | Ended | |
| | | March 31, 2010 | | | March 31, 2009 | |
OPERATING ACTIVITIES | | | | | | |
Net income | $ | 6,391,927 | | $ | 3,976,816 | |
Adjustments to reconcile net income to net cash used in operating activities: | | | | | | |
Depreciation | | 1,524,276 | | | 915,105 | |
Amortization of intangible assets | | 499,657 | | | 428,006 | |
Stock-based compensation | | - | | | 183,600 | |
(Gain)/ loss on disposal of property and equipment | | (5,037 | ) | | 8,329 | |
Change in allowance for accounts receivable | | 438,272 | | | 335,129 | |
Provision for obsolete inventories | | 23,835 | | | - | |
Change in deferred income tax | | 83,458 | | | (18,597 | ) |
Change in fair value of contingent consideration | | (795,097 | ) | | - | |
Changes in operating assets and liabilities, net of effects of business acquisitions: | | | | | | |
Increase in restricted cash | | (456,894 | ) | | - | |
Increase in accounts receivable | | (10,152,521 | ) | | (3,278,151 | ) |
Decrease in advances to suppliers | | 3,484,877 | | | - | |
Increase in other receivables and prepaid expenses | | (1,452,006 | ) | | (1,883,282 | ) |
Increase in inventories | | (5,890,035 | ) | | (5,489,875 | ) |
(Decrease) / increase in accounts payable | | (3,236,934 | ) | | 625,672 | |
(Decrease) / increase in advances from customers | | (41,873 | ) | | 3,783,613 | |
Increase in amount due to related parties | | 844,549 | | | 7,472 | |
Decrease in amount due from related parties | | - | | | 62,663 | |
Decrease in other payables and accrued expenses | | (1,648,862 | ) | | (1,119,926 | ) |
Decrease in income tax payable | | (952,931 | ) | | (26,316 | ) |
Net cash used in operating activities | | (11,341,339 | ) | | (1,489,742 | ) |
| | | | | | |
INVESTING ACTIVITIES | | | | | | |
Proceeds from sales of property and equipment | | 30,797 | | | 21,068 | |
Purchase of land-use-rights | | (384,187 | ) | | - | |
Purchases of property and equipment | | (532,107 | ) | | (231,528 | ) |
Capitalized and purchased software development costs | | (135,962 | ) | | (147,588 | ) |
Deposit for software purchase | | (3,207,441 | ) | | (717,752 | ) |
Net cash used in investing activities | | (4,228,900 | ) | | (1,075,800 | ) |
| | | | | | |
FINANCING ACTIVITIES | | | | | | |
Borrowing of short-term loans | | 8,250,529 | | | - | |
Borrowing of long-term shareholders' loans | | 6,026,550 | | | - | |
Borrowing of long-term loans | | 4,018,210 | | | - | |
Repayment of short-term loans | | (10,872,150 | ) | | - | |
Repayment of long-term loans | | (4,018,210 | ) | | - | |
Issued common stock | | 9,611,811 | | | - | |
Repurchase of common stock | | - | | | (11,468 | ) |
Net cash provided by / (used in) financing activities | | 13,016,740 | | | (11,468 | ) |
| | | | | | |
Effect of exchange rate changes on cash and cash equivalents | | 79,846 | | | 46,153 | |
| | | | | | |
NET DECREASE IN CASH AND CASH EQUIVALENTS | | (2,473,653 | ) | | (2,530,857 | ) |
CASH AND CASH EQUIVALENTS, BEGINNING | | 13,478,633 | | | 9,565,252 | |
CASH AND CASH EQUIVALENTS, ENDING | $ | 11,004,980 | | $ | 7,034,395 | |
8
CHINA INFORMATION SECURITY TECHNOLOGY, INC.
CONDENSED CONSOLIDATED STATEMENTS OF CASH FLOWS
THREE MONTHS ENDED MARCH 31, 2010 AND 2009 (CONTINUED)
(Unaudited) |
| | | | | | | |
| | | Three months | | | Three months | |
| | | Ended | | | Ended | |
| | | March 31, 2010 | | | March 31, 2009 | |
| Supplemental disclosure of cash flow information: | | | | |
| | | | | | | |
| Cash paid during the period | | | | | | |
| Income taxes | $ | 2,041,708 | | $ | 580,677 | |
| Interest paid | $ | 168,478 | | $ | 60,210 | |
| | | | | | | |
| Supplemental disclosure of significant non-cash transactions: | | | | |
On January 12, 2010, the Company granted eligible employees a total of 213,363 shares of the Company's common stock as compensation under the China Information Security Technology, Inc. 2007 Equity Incentive Plan (“The Plan”). The fair value of these shares of approximately $1.2 million, based on the quoted market price, was accrued as of December 31, 2009 as the compensation was for services provided in 2009.
On February 2, 2009, the Company granted eligible employees a total of 60,000 shares of the Company’s common stock as compensation under the Plan. The fair value of these shares of $183,600 based on quoted market price was recognized as stock-based compensation for the three months ended March 31, 2009.
The accompanying notes are an integral part of these unaudited condensed consolidated financial statements.
9
CHINA INFORMATION SECURITY TECHNOLOGY, INC.
NOTES TO THE CONDENSED CONSOLIDATED FINANCIAL STATEMENTS
(UNAUDITED)
1.
ORGANIZATION AND BASIS OF PRESENTATION
China Information Security Technology Inc (the “Company” or “CIST”), together with its subsidiaries, is a total solution provider of digital security, geographic, and hospital information systems in the People's Republic of China (“PRC”). The Company’s total solutions include specialized software, hardware, systems integration, and related services organized into three business segments – Digital Information Security Technology (“DIST”), Geographic Information Systems (“GIS”), and Digital Hospital Information System (“DHIS”). These total solutions are provided through the Company’s wholly-owned PRC subsidiaries, Information Security Technology (China) Co., Ltd (“IST”), Information Security Software (China) Co., Ltd (formerly, Information Security Development Technology Co., Ltd), or “ISS,” Shenzhen Bocom Multimedia Display Technology Co., Ltd (“Bocom”), Shenzhen Zhongtian Technology Development Company Ltd (“Zhongtian”), and Huipu Electronics (Shenzhen) Co., Ltd. ("Huipu"), and through the Company’s variable interest entity (“VIE”), iASPEC Software Co, Ltd (“iASPEC”), and Wuda Geoinformatics Co., Ltd (“Geo”), 57% of which is owned by iASPEC.
The operating results of Bocom, Geo, Zhongtian and Huipu have been included in the Company’s consolidated financial statements since February 1, 2008, April 1, 2008, November 1, 2008, and November 1, 2009 their respective acquisition dates.
The interim condensed consolidated financial statements included herein, presented in accordance with United States generally accepted accounting principles and stated in US dollars, have been prepared by the Company, without audit, pursuant to the rules and regulations of the Securities and Exchange Commission. Certain information and footnote disclosures normally included in financial statements prepared in accordance with generally accepted accounting principles have been condensed or omitted pursuant to such rules and regulations, although the Company believes that the disclosures are adequate to make the information presented not misleading. These statements reflect all adjustments, consisting of normal recurring adjustments, which, in the opinion of management, are necessary for fair presentation of the information contained therein. The condensed consolidated statement of operations for the three months ended March 31, 2010 is not necessarily indicative of the results that may be expected for the entire year ending December 31, 2010. It is suggested that these interim consolidated financial statements be read in conjunction with the financial statements of the Company and related notes thereto included in the Company’s Annual Report on Form 10-K for the year ended December 31, 2009 and notes thereto. The Company follows the same accounting policies in the preparation of interim reports.
2.
SUMMARY OF SIGNIFICANT ACCOUNTING POLICIES
(a) Basis of Consolidation
The consolidated financial statements of the Company have been prepared in accordance with U.S. generally accepted accounting principles. The consolidated financial statements include the accounts of the Company, its subsidiaries and its VIE for which the Company is the primary beneficiary. All significant intercompany accounts and transactions have been eliminated in consolidation.
(b) Foreign Currency Translation
The functional currency of the US and British Virgin Islands (“BVI”) companies is the United States dollars. The functional currency of the Company’s Hong Kong subsidiaries is the Hong Kong dollars.
The functional currency of the Company’s wholly-owned PRC subsidiaries and its VIE is the Chinese Renminbi Yuan, (“RMB”). RMB is not freely convertible into foreign currencies. The Company’s PRC subsidiaries’ and their VIE’s financial statements are maintained in the functional currency. Monetary assets and liabilities denominated in currencies other than the functional currency are translated into the functional currency at rates of exchange prevailing at the balance sheet date. Transactions denominated in currencies other than the functional currency are translated into the functional currency at the exchange rates prevailing at the dates of the transactions. Exchange gains or losses arising from foreign currency transactions are included in the determination of net income for the respective periods.
For financial reporting purposes the financial statements of the Company have been translated into United States dollars. Assets and liabilities are translated at exchange rates at the balance sheet dates and revenue and expenses are translated at average exchange rates, and equity is translated at historical exchange rates. Any resulting translation adjustments are not included in determining net income but are included in foreign exchange adjustment to other comprehensive income, a component of equity.
10
CHINA INFORMATION SECURITY TECHNOLOGY, INC.
NOTES TO THE CONDENSED CONSOLIDATED FINANCIAL STATEMENTS
2.
SUMMARY OF SIGNIFICANT ACCOUNTING POLICIES (CONTINUED)
(c) Revenue Recognition
The Company generates its revenues primarily from three sources, (1) hardware sales, (2) software sales and (3) system integration services. The Company's revenue recognition policies are in accordance with SEC Staff Accounting Bulletin No. 104, "Revenue Recognition" and Financial Accounting Standards Board Accounting Standards Codification (“FASB ASC”) No.605.35 ("FASB ASC 605.35") .
Revenues from hardware products are recognized only when persuasive evidence of an arrangement exists, delivery has occurred and upon receipt of customers' acceptance, the price to the customer is fixed or determinable in accordance with the contract, and collectability is reasonably assured.
Software revenues are generated from fixed-price contracts which include the development of software products, and services to customize such software to meet customers' needs. Generally, when the services are determined to be essential to the functionality of the delivered software, revenue is recognized using the percentage of completion method of accounting in accordance with FASB ASC 605.35. The percentage of completion for each contract is estimated based on the ratio of direct labor hours incurred to total estimated direct labor hours. The Company provides post contract support (PCS), which includes telephone technical support, that is not essential to the functionality of the software. Although vendor-specific objective evidence does not exist for PCS, because (1) the PCS fees are included in the total contract amount, (2) the PCS service period is for less than one year, (3) the estimated cost of providing PCS is not significant, and (4) unspecified upgrades/ enhancements offered are minimal and infrequent; the Company recognizes PCS revenue together with the initial fee after delivery and customer acceptance of the software products.
System integration revenues are generated from fixed-price contracts which provide for software development and hardware integration, which involves more than minor modifications to the functionality of the software and hardware products. Accordingly, system integration revenues are accounted for in accordance with FASB ASC 605.35, using the percentage of completion method of accounting. The percentage of completion for each contract is estimated based on the ratio of costs incurred to total estimated costs. Contract periods are usually less than six months, and typical contract periods for PCS are 12 months.
System integration projects are billed in accordance with contract terms, which typically require partial payment at the signing of the contract, at delivery and customer acceptance dates, with the remainder due within a stated period of time not exceeding 12 months. Occasionally, the Company enters into contracts which allow a percentage of the total contract price to be paid one to three years after completion of the system integration project. Revenues on these extended payments are recognized upon completion of the terms specified in the contract and when collectability is reasonably assured.
No rights of return are allowed except for non-conforming products, which have been insignificant based on historical experiences. If nonconforming products are returned due to software issues, the Company will provide upgrades or additional customization to suit customers' needs. In cases where non-conformity is a result of integrated hardware, the Company returns the hardware to the original vendor for replacement.
Unbilled accounts receivable consist of estimated future billings for work performed but not yet invoiced to the customer. Unbilled accounts receivable are generally invoiced within one year of completion of the work performed. Changes in estimates for revenues, costs and profits are recognized in the period in which they are determinable. When the Company's estimates indicate that the entire contract will be performed at a loss, a provision for the entire loss is recorded in the current accounting period.
Other revenue mainly consists of income derived from maintenance service and royalty income.
(d) Treasury Stock
The Company repurchases its common stock from time to time in the open market and holds such shares as treasury stock. The Company applies the “cost method” and presents the cost to repurchase such shares as a reduction in shareholders’ equity. As of March 31, 2010, the Company has repurchased 6,000 shares of common stock.
11
CHINA INFORMATION SECURITY TECHNOLOGY, INC.
NOTES TO THE CONDENSED CONSOLIDATED FINANCIAL STATEMENTS
2.
SUMMARY OF SIGNIFICANT ACCOUNTING POLICIES (CONTINUED)
(e) Recent Accounting Pronouncements
In February 2010, the FASB issued ASU 2010-09, Amendments to Certain Recognition and Disclosure Requirements, as an amendment to Accounting Standards Codification (“ASC”) Topic 855, Subsequent Events (“ASC 855”). As a result of ASU 2010-09, SEC registrants will not disclose the date through which management evaluated subsequent events in the financial statements. ASU 2010-09 is effective immediately for all financial statements that have not yet been issued or have not yet become available to be issued, or March 31, 2010 for the Company. The adoption of ASU 2010-09 is for disclosure purposes only and did not have any effect on the Company’s financial position or results of operations.
In January 2010, the FASB issued ASU 2010-06, Improving Disclosures about Fair Value Measurements. ASU 2010-06 amends ASC Topic 820, Fair Value Measurement and Disclosure (“ASC 820”) to require a number of additional disclosures regarding fair value measurements. In addition to the new disclosure requirements, ASU 2010-06 also amends ASC 820 to clarify that reporting entities are required to provide fair value measurement disclosures for each class of assets and liabilities. Prior to the issuance of ASU 2010-06, the guidance in ASC 820 required separate fair value disclosures for each major category of assets and liabilities.
ASU 2010-06 also clarifies the requirement for entities to disclose information about both the valuation techniques and inputs used in estimating Level 2 and Level 3 fair value measurements. Except for the requirement to disclose information about purchases, sales, issuance and settlements in the reconciliation of recurring Level 3 measurements on a gross basis, all of the provisions of ASU 2010-06 are effective for interim and annual reporting periods beginning after December 15, 2009, or January 1, 2010 for the Company. The requirement to separately disclose purchases, sales, issuances and settlements of recurring Level 3 measurements does not become effective until fiscal years beginning after December 15, 2010, or January 1, 2011 for the Company. The adoption of ASU 2010-06 is for disclosure purposes only and did not have any effect on the Company’s financial position or results of operations.
In June 2009, the FASB issued guidance now codified within ASC Topic 810, Consolidation (“ASC 810”). ASC 810 requires entities to perform an analysis to determine whether the enterprise’s variable interest or interests give it a controlling financial interest in a variable interest entity. This analysis identifies the primary beneficiary of a variable interest entity as one with the power to direct the activities of a variable interest entity that most significantly impact the entity’s economic performance and obligation to absorb losses of the entity that could potentially be significant to the variable interest. The guidance is effective as of the beginning of the annual reporting period commencing after November 15, 2009, or January 1, 2010 for the Company, with early adoption prohibited. The adoption of the guidance codified within ASC 810 did not have any effect on the Company’s financial position or results of operations.
12
CHINA INFORMATION SECURITY TECHNOLOGY, INC.
NOTES TO THE CONDENSED CONSOLIDATED FINANCIAL STATEMENTS
3.
EARNINGS PER SHARE
Basic earnings per share are computed by dividing income available to common shareholders by the weighted-average number of common shares outstanding during the period. Diluted earnings per share reflects the potential dilution that could occur if securities or other contracts to issue common stock were exercised or converted into common stock, or resulted in the issuance of common stock that shared in the earnings of the entity. For purposes of the computation of net income per share, shares issued in connection with acquisitions that are returnable are considered contingently returnable shares under FASB ASC 260, although classified as issued and outstanding, are not included in the basic weighted average number of shares until all necessary conditions are met that no longer cause the shares to be contingently returnable. These contingently returnable shares are included in the diluted weighted average number of shares as of the beginning of the period in which the conditions were satisfied (or as of the date of the agreement, if later).
| Components of basic and diluted earnings per share were as follows: | | | | | | |
| | | Three Months Ended March 31, | |
| | | 2010 | | | 2009 | |
| | | (Unaudited) | | | (Unaudited) | |
| Net income attributable to the common stockholders | $ | 6,281,108 | | $ | 3,756,993 | |
| Weighted average outstanding shares of common stock | | 51,213,463 | | | 47,520,030 | |
| Dilutive effect of options ,warrants, and contingently issuable shares | | - | | | - | |
| Common stock and common stock equivalents | | 51,213,463 | | | 47,520,030 | |
| | | | | | | |
| Earnings per share: | | | | | | |
| Basic | $ | 0.12 | | $ | 0.08 | |
| Diluted | $ | 0.12 | | $ | 0.08 | |
4.
FAIR VALUE OF FINANCIAL INSTRUMENTS AND FAIR VALUE ACCOUNTING
Financial Instruments
Management has estimated that the carrying amounts of non-related party financial instruments approximate their fair values due to their short-term maturities. The fair value of the amount due from (to) related parties is not practicable to estimate due to the related party nature of the underlying transactions.
Fair Value Accounting
FASB ASC 820.10 establishes a fair value hierarchy that prioritizes the inputs to valuation techniques used to measure fair value. The hierarchy gives the highest priority to unadjusted quoted prices in active markets for identical assets or liabilities (Level 1 measurements) and the lowest priority to unobservable inputs (Level 3 measurements). As required by FASB ASC 820.10, assets are classified in their entirety based on the lowest level of input that is significant to the fair value measurement. The three levels of the fair value hierarchy under FASB ASC 820.10 are described below:
| Level 1 | Unadjusted quoted prices in active markets that are accessible at the measurement date for identical, unrestricted assets or liabilities; |
| Level 2 | Quoted prices in markets that are not active, or inputs that are observable, either directly or indirectly, for substantially the full term of the asset or liability; |
| Level 3 | Prices or valuation techniques that require inputs that are both significant to the fair value measurement and unobservable (supported by little or no market activity). |
At March 31, 2010, the contingent consideration in relation to the purchase of Topwell Treasure Ltd. ("Topwell") and its wholly-owned Chinese subsidiary, Huipu Electronics (Shenzhen) Co., Ltd. ("Huipu") in 2009 was measured at fair value.
13
CHINA INFORMATION SECURITY TECHNOLOGY, INC.
NOTES TO THE CONDENSED CONSOLIDATED FINANCIAL STATEMENTS
4.
FAIR VALUE OF FINANCIAL INSTRUMENTS AND FAIR VALUE ACCOUNTING (CONTINUED)
The fair value estimate of the contingent consideration is based on the weighted probability (level 3 input) of achievement of After Tax Net Income targets (ATNI) in 2010, 2011 and 2012, which could result in the issuance of up to 1,101,930 additional shares of the Company’s common stock. Actual achievement of ATNI below $3.2 million would reduce the liability to zero and achievement of ATNI of $6.8 million or more would increase the liability to $6.8 million. A change in fair value of the acquisition-related contingent consideration could have a material effect on the statement of operations and financial position in the period of the change in estimate. Included in other income in the three months ended March 31, 2010 is a gain of $0.79 million, due to the change in estimate of the fair value of acquisition-related contingent consideration.
5.
VARIABLE INTEREST ENTITY
The Company is the primary beneficiary of iASPEC, pursuant to the Management Service Agreement (“MSA”), and iASPEC qualifies as a variable interest entity of the Company. Accordingly, the assets and liabilities and revenues and expenses of iASPEC have been included in the accompanying consolidated financial statements.
In order to facilitate iASPEC’s expansion and also to provide financing for iASPEC to complete the acquisition of Geo, the Company advanced RMB38 million (approximately $5.4 million) to iASPEC in two installments on November 20, 2007 and May 8, 2008, respectively, to increase iASPEC’s registered capital. In order to comply with PRC laws and regulations, the advance was made to Mr. Lin, iASPEC’s then majority shareholder, who, upon the authority and direction of the Board of Directors, forwarded the funds to iASPEC. The Company has recorded the advance of these funds as an interest-free loan to iASPEC, which was eliminated against additional capital of iASPEC in consolidation. The increase in iASPEC’s registered capital does not affect IST’s exclusive option to purchase iASPEC’s assets and shares under the MSA.
For the three months ended March 31, 2010 and 2009, net income of $110,819 ($134,798 from iASPEC and loss of $23,979 from Geo), $219,823 ($45,000 from iASPEC and $174,823 from Geo), respectively was attributable to non-controlling interest in the consolidated statements of income of the Company.
At March 31, 2010, the consolidation of iASPEC and Geo, resulted in an increase in assets of approximately $47.5 million, an increase in liabilities (consisting primarily of accounts payable and short-term bank loans) of approximately $22.1 million, and an increase in non-controlling interest of approximately $15.5 million, and for the three months ended March 31, 2010 and 2009 the consolidation resulted in an increase in net income attributable to parent company of approximately $2.6 million and $2.7 million respectively.
6.
RELATED PARTY BALANCES AND TRANSACTIONS
(a) Related party balances
As of March 31, 2010 and December 31, 2009, amount due from (to) related parties consists of:
| | | March 31, | | | December 31, | |
| | | 2010 | | | 2009 | |
| | | (Unaudited) | | | | |
| Due from related company | | | | | | |
| - Shenzhen Kewen Information Technology Co., Ltd. | $ | 138,237 | | $ | 129,937 | |
| | | | | | | |
| Due to related companies | | | | | | |
| - Xiamen Yili Geo Information Technology Co., Ltd. | | 7,335 | | | 7,335 | |
| - Wuhan Geo Navigation and Communication Technology Co., Ltd. | | 576,401 | | | 576,401 | |
| | $ | 583,736 | | $ | 583,736 | |
| | | | | | | |
| Due to related parties | | | | | | |
| - Shareholders | $ | 6,043,037 | | $ | - | |
14
CHINA INFORMATION SECURITY TECHNOLOGY, INC.
NOTES TO THE CONDENSED CONSOLIDATED FINANCIAL STATEMENTS
6.
RELATED PARTY BALANCES AND TRANSACTIONS (CONTINUED)
(a) Related party balances (Continued)
Shenzhen Kewen Information Technology Co., Ltd. (“Kewen”) is a private company owned by a member of the senior management of Zhongtian. The balance due from Kewen primarily consists of accounts receivable from sales during the three months ended March 31, 2010.
Due to related companies
Approximately 8% of Xiamen Yili Geo Information Technology Co., Ltd. (“Yili”) is owned by Geo. The balance consists of accounts payable from purchase.
Approximately 9% of Wuhan Geo Navigation and Communication Technology Co., Ltd. (“Geo Navigation”) is owned by Geo. The balance due to Geo Navigation represents advances from Geo Navigation to Geo. These advances are non-interest bearing and due on demand.
Due to related parties
The balance due to shareholders predominantly represents the personal loans of $6 million from Mr. Jianghuai Lin (“Mr. Lin”), the CEO of the Company, to the Company as at March 31, 2010.
On January 14, 2010, Mr. Lin loaned the Company a total of $5 million from the proceeds of the sale of his shares for use for general corporate purposes and working capital. In consideration of the loan from Mr. Lin, the Company's board of directors approved the issuance and delivery of a one-year, non-interest bearing, convertible promissory note (“the Original Note”) to Mr. Lin, in the principal amount of $5 million The note is due and payable on January 14, 2011, and is convertible into shares of the Company's common stock at a conversion price of $5.88 per share (the per share closing price on the trading day prior to the delivery date of the Original Note).
On March 25, 2010, Mr. Lin surrendered the Original Note to the Company and have asked the Company to void and rescind the Original Note, and issue a replacement note (“the New Note”), in the principal amount of $6,000,000, to reflect the principal amount of the Original Note as well as an additional loan of $1,000,000 made to the Company on March 25, 2010.
The New Note has omitted the conversion feature that was contained in the Original Note and it is non-interest bearing. The maturity date of the New Note is March 5, 2012 and the Company may prepay all or any part of the amounts outstanding under this Note at any time before the maturity date without the express written consent of Mr. Lin.
| (b) Revenue - related party | | | | | | |
| | | | | | | |
| Amount earned from Kewen during the three months ended March 31, 2010 and 2009 were as follows: | | | | |
| | | Three Months | | | Three Months | |
| | | Ended March 31, | | | Ended March 31, | |
| | | 2010 | | | 2009 | |
| | | (Unaudited) | | | (Unaudited) | |
| Revenue | $ | 24,892 | | $ | 24,872 | |
| Cost of sales | | (13,465 | ) | | (10,041 | ) |
| Gross profit | | 11,427 | | | 14,831 | |
15
CHINA INFORMATION SECURITY TECHNOLOGY, INC.
NOTES TO THE CONDENSED CONSOLIDATED FINANCIAL STATEMENTS
6.
RELATED PARTY BALANCES AND TRANSACTIONS (CONTINUED)
(c) Guarantees of bank loans
Mr. Lin has provided a personal guarantee for certain of the Company’s loans as follows:
| | | | | | March 31, | | | December 31 |
| Borrower | | Lender | | | 2010 | | | 2009 |
| | | | | | (Unaudited) | | | |
| ISIID | | Hang Seng Bank Limited | | $ | - | | $ | 5,160,000 |
| IASPEC | | Hang Seng Bank Limited | | | - | | | 4,401,000 |
| IASPEC | | Industrial and Commercial Bank of China, Shenzhen | | | - | | | 586,800 |
| IASPEC | | Industrial and Commercial Bank of China, Shenzhen | | | - | | | 733,500 |
| IASPEC | | Industrial and Commercial Bank of China, Shenzhen | | | 1,173,600 | | | 1,173,600 |
| | | | | $ | 1,173,600 | | $ | 12,054,900 |
7.
INVENTORIES
As of March 31, 2010 and December 31, 2009, inventories consist of:
| | | March 31, | | | December 31, | |
| | | 2010 | | | 2009 | |
| | | (Unaudited) | | | | |
| Raw materials | $ | 5,326,623 | | $ | 3,385,758 | |
| Work in Processes | | 990,130 | | | 344,875 | |
| Finished goods | | 3,175,282 | | | 2,034,345 | |
| Installations in process | | 7,104,395 | | | 5,171,026 | |
| Total | $ | 16,596,430 | | $ | 10,936,004 | |
8.
LONG-TERM INVESTMENTS
As of March 31, 2010 and December 31, 2009, long-term investments consist of:
| | | March 31, | | | December 31, | |
| | | 2010 | | | 2009 | |
| | | (Unaudited) | | | | |
| Tianhe Navigation and Communication Technology Co., Ltd. ("Tianhe") | $ | 2,788,666 | | $ | 2,788,666 | |
| Xiamen Yili Geo Information Technology Co., Ltd. ("Yili") | | 73,350 | | | 73,350 | |
| | $ | 2,862,016 | | $ | 2,862,016 | |
Geo holds a 20% ownership interest in Tianhe Navigation and Communication Technology Co., Ltd. (“Tianhe”). Although Geo owns 20% of Tianhe, Geo’s management does not have the ability to exercise significant influence over operating and financial policies of Tianhe due to the following factors:
16
CHINA INFORMATION SECURITY TECHNOLOGY, INC.
NOTES TO THE CONDENSED CONSOLIDATED FINANCIAL STATEMENTS
8.
LONG-TERM INVESTMENTS (CONTINUED)
a. The Company and Geo do not participate in the policy making, operations, or financial processes of Tianhe;
b. There are no intercompany transactions between the Company or Geo and Tianhe;
c. There is no interchange of managerial personnel;
d. The Company and Geo do not nominate or hold a board position at Tianhe; and
e. There is no technological or financial dependence between the Company or Geo and Tianhe.
Long-term investments also include Geo’s investments in Yili. During the year ended December 31, 2009, the Company received dividends of RMB 750,000 (approximately $110,000), in connection with it’s investment in Yili. As at December 31, 2009, management determined that there was an other-than temporary impairment in the value of its investment in Tianhe and recorded an impairment loss of approximately $233,000. As at March 31, 2010, the management reassessed the possible impairment to the investment to Tianhe and determined that no more impairment loss should be made.
9.
PROPERTY AND EQUIPMENT
As of March 31, 2010 and December 31, 2009, property and equipment consist of:
| | | March 31 | | | December 31 | |
| | | 2010 | | | 2009 | |
| | | (Unaudited) | | | | |
| Office building | $ | 7,310,766 | | $ | 6,536,605 | |
| Plant and Machinery | | 18,066,167 | | | 17,844,918 | |
| Electronic equipment, furniture and fixtures | | 11,081,521 | | | 11,405,355 | |
| Motor vehicles | | 1,112,183 | | | 1,098,729 | |
| Purchased software | | 27,036,904 | | | 27,036,904 | |
| Total | | 64,607,541 | | | 63,922,511 | |
| | | | | | | |
| Less: accumulated depreciation | | (11,830,405 | ) | | (10,335,997 | ) |
| | $ | 52,777,136 | | $ | 53,586,514 | |
Depreciation expense for the three months ended March 31, 2010 and 2009 was approximately $1,524,000 and $915,000, respectively.
10.
LAND USE RIGHTS AND INTANGIBLE ASSETS
(a) Land use rights
As of March 31, 2010 and December 31, 2009, land use rights consist of:
| | | March 31 | | | December 31 | |
| | | 2010 | | | 2009 | |
| | | (Unaudited) | | | | |
| Land use rights | $ | 2,145,596 | | $ | 1,914,611 | |
| Less: accumulated amortization | | (18,772 | ) | | (7,000 | ) |
| Land use rights, net | $ | 2,126,824 | | $ | 1,907,611 | |
Amortization expense for the three months ended March 31, 2010 and 2009 was $12,000 and $0, respectively.
17
CHINA INFORMATION SECURITY TECHNOLOGY, INC.
NOTES TO THE CONDENSED CONSOLIDATED FINANCIAL STATEMENTS
10.
LAND USE RIGHTS AND INTANGIBLE ASSETS (CONTINUED)
(a) Land use rights (Continued)
Estimated amortization for the next five years and thereafter is as follows:
| Remainder of 2010 | $ | 35,316 | |
| 2011 | | 47,088 | |
| 2012 | | 47,088 | |
| 2013 | | 47,088 | |
| 2014 | | 47,088 | |
| Thereafter | | 1,903,156 | |
| Total | $ | 2,126,824 | |
(b) Intangible assets
As of March 31, 2010 and December 31, 2009, intangible assets consist of:
| | | March 31 | | | December 31 | |
| | | 2010 | | | 2009 | |
| | | (Unaudited) | | | | |
| Software and software development costs | $ | 5,773,749 | | $ | 5,637,740 | |
| Technology | | 7,191,087 | | | 7,191,087 | |
| Trademarks | | 4,150,143 | | | 4,150,143 | |
| Customer base | | 294,867 | | | 294,867 | |
| Sub-Total | | 17,409,846 | | | 17,273,837 | |
| Less: accumulated amortization | | (4,217,524 | ) | | (3,717,696 | ) |
| | | | | | | |
| Intangible assets, net | $ | 13,192,322 | | $ | 13,556,141 | |
Amortization expense for the three months ended March 31, 2010 and 2009 was approximately $500,000 and $428,000, respectively.
Estimated amortization for the next five years and thereafter is as follows:
| Remainder of 2010 | $ | 1,211,218 | |
| 2011 | | 1,649,742 | |
| 2012 | | 1,563,295 | |
| 2013 | | 1,302,495 | |
| 2014 | | 1,295,090 | |
| Thereafter | | 6,170,482 | |
| Total | $ | 13,192,322 | |
18
CHINA INFORMATION SECURITY TECHNOLOGY, INC.
NOTES TO THE CONDENSED CONSOLIDATED FINANCIAL STATEMENTS |
11.
BANK LOANS
(a) Short-term bank loans
At March 31, 2010 and December 31, 2009, the Company had the following bank borrowings:
| Lender | Terms | LoanPeriod | Interest rateper annum | March 31,2010
(Unaudited) | December 31,2009 |
China Merchants Bank,
Wuhan Donghu Branch | Principal amount of RMB5,000,000 ($733,500). Fixed interest rate; interest is payable monthly and principal is due at maturity. The loan is collateralized by Geo's land and office buildings. | June 25, 2009 to June 24, 2010 | 5.58% | $733,500 | $ 733,500 |
China Merchants Bank,
Wuhan Donghu Branch | Principal amount of RMB3,000,000 ($440,100). Fixed interest rate; interest is payable monthly and principal is due at maturity. The loan is collateralized by Geo's land and office buildings. | October 12, 2009 to October 12, 2010 | 5.58% | 440,100 | 440,100 |
China Merchants Bank,
Wuhan Donghu Branch | Principal amount of RMB4,000,000 ($586,800). Fixed interest rate; interest is payable monthly and principal is due at maturity. The loan is collateralized by Geo's land and office buildings. | December 2, 2009 to December 2, 2010 | 5.58% | 586,800 | 586,800 |
Hang Seng Bank Limited | Principal amount of HKD 40,000,000 ($5,160,000 ).Weighted average interest rate; interest is payable monthly and principal is due at maturity. The loan is guaranteed by Mr. Lin, iASPEC, Bocom, CPSH and the Company and through June 25, 2009 was collateralized by a three-month fixed deposit of RMB40,000,000 ($5,868,000) of IST. | June 18, 2009 to October 31, 2010 | 2.75% p/a over HIBOR | - | 5,160,000 |
Industrial and Commercial Bank of China, Shenzhen Branch | Principal amount of RMB4,000,000 ($586,800). Fixed interest rate; interest is payable monthly and principal is due at maturity. The loan is collateralized by accounts receivable of RMB 4,880,000 ($715,900) and guaranteed by Mr. Lin. | November 5, 2009 to April 1, 2010 | 5.589% | - | 586,800 |
Industrial and Commercial Bank of China, Shenzhen Branch | Principal amount of RMB5,000,000 ($733,500). Fixed interest rate; interest is payable monthly and principal is due at maturity. The loan is collateralized by accounts receivable of RMB 6,912,495 ($1,014,000) and guaranteed by Mr. Lin. | November 10, 2009 to April 29, 2010 | 5.589% | - | 733,500 |
19
CHINA INFORMATION SECURITY TECHNOLOGY, INC.
NOTES TO THE CONDENSED CONSOLIDATED FINANCIAL STATEMENTS |
11.
BANK LOANS (CONTINUED)
(a) Short-term bank loans (continued)
Industrial and Commercial Bank of China, Shenzhen Branch | Principal amount of RMB8,000,000 ($1,173,600). Fixed interest rate; interest is payable monthly and principal is due at maturity. The loan is collateralized by accounts receivable of RMB 9,166,603 ($1,344,700) and guaranteed by Mr. Lin. | December 29, 2009 to May 7, 2010 | 5.589% | 1,173,600 | 1,173,600 |
DBS Bank | Principal amount of RMB660,000 ($96,822). Interest and principal are due at maturity. | January 13, 2010 to May 12, 2010 | 120% of PBOC’s interest rate for Renminbi loan during the period | 96,822 | - |
Hang Seng Bank Limited | Principal amount of RMB 30,000,000 ($4,401,000 ). The loan is guaranteed by Mr. Lin, iASPEC, IST, PST. | September 1, 2009 to October 30, 2010 | 120% of PBOC’s interest rate for Renminbi loan during the period | - | 4,401,000 |
Bank of China, Shenzhen Longgang Branch | Principal amount of RMB30,000,000 ($4,401,000). Fixed interest rate; interest is payable monthly and principal is due at maturity. The loan is guaranteed by IST. | March 17, 2010 to March 16, 2011 | 5.31% | 4,401,000 | - |
Ping An Bank | Principal amount of RMB 32,600,000 ($4,782,420 ). Fixed interest rate; interest is payable monthly and principal is due at maturity. | March 31, 2010 to March 30, 2011 | 5.31% | 4,782,420 | - |
Shenzhen Commercial Bank | Principal amount of RMB 14,400,000 ($2,112,480 ). | December 31, 2009 to December 30, 2010 | 7.128% | - | 2,112,480 |
| | | | $12,214,242 | $15,927,780 |
(b) Long-term bank loans
On October 18, 2006, Huipu obtained a RMB 55,000,000 ($8,069,000) term loan from Shenzhen Commercial Bank to finance the construction of its plant and buildings. The loan has a fixed interest rate at 7.128% per annum and matures on October 17, 2011. Interest on the loan is payable monthly, and principal of RMB 1,200,000 ($176,000) is payable monthly through the maturity date, with any remaining principal also payable on the maturity date.
The total outstanding balance of this loan as of December 31, 2009 is RMB 27,400,000 ($4,020,000), of which RMB 14,400,000 ($2,112,000) is due in one year and classified as current liability
On January 1, 2010, Huipu repaid the outstanding balance and obtained a RMB 27,400,000 ($4,020,000) long term loan from Ping An Bank.
20
CHINA INFORMATION SECURITY TECHNOLOGY, INC.
NOTES TO THE CONDENSED CONSOLIDATED FINANCIAL STATEMENTS
12.
INCOME TAXES
Pre-tax income for the three months ended March 31, 2010 and 2009 was taxable in the following jurisdictions:
| | | Three months ended March 31 | |
| | | 2010 | | | 2009 | |
| | | (Unaudited) | |
| PRC | $ | 7,188,003 | | $ | 4,900,645 | |
| Others | | 375,007 | | | (335,433 | ) |
| | | | | | | |
| Total income before income taxes | $ | 7,563,010 | | $ | 4,565,212 | |
United States
The Company was incorporated in Nevada and is subject to United States of America tax law. It is management's intention to reinvest all the income attributable to the Company earned by its operations outside the United States of America (the “U.S.”). Accordingly, no U.S. corporate income taxes are provided in these condensed consolidated financial statements.
BVI
Under the current laws of the BVI, dividends and capital gains arising from the Company's investments in the BVI are not subject to income taxes.
| PRC | | | | | | |
| | | | | | | |
| The income tax provision consists of the following: | | | | | | |
| | | Three months ended March 31 | |
| | | 2010 | | | 2009 | |
| | | (Unaudited) | |
| Current taxes | $ | 1,087,625 | | $ | 606,993 | |
| Deferred taxes | | 83,458 | | | (18,597 | ) |
| | | | | | | |
| Provision for income taxes | $ | 1,171,083 | | $ | 588,396 | |
| | | Three months ended March 31 | |
| | | 2010 | | | 2009 | |
| | | (Unaudited) | |
| PRC federal statutory tax rate | | 25% | | | 25% | |
| Computed expected income tax expense | $ | 1,890,752 | | $ | 1,141,303 | |
| Tax concession | | (716,025 | ) | | (696,891 | ) |
| Change in valuation allowance | | - | | | 103,059 | |
| Permanent differences | | 100,093 | | | 138,221 | |
| Other differences | | (103,737 | ) | | (97,296 | ) |
| Income taxes | $ | 1,171,083 | | $ | 588,396 | |
21
CHINA INFORMATION SECURITY TECHNOLOGY, INC.
NOTES TO THE CONDENSED CONSOLIDATED FINANCIAL STATEMENTS
12.
INCOME TAXES (CONTINUED)
The significant components of deferred tax assets and deferred tax liabilities were as follows as at March 31, 2010 and December 31, 2009:
| | | March 31, 2010 | | | December 31, 2009 | |
| | | Deferred Tax | | | Deferred Tax | | | Deferred Tax | | | Deferred Tax | |
| | | Assets | | | Liabilities | | | Assets | | | Liabilities | |
| | | (Unaudited) | | | | | | | |
| Fixed assets | $ | 229,167 | | $ | (207,880 | ) | $ | 202,458 | | $ | (212,101 | ) |
| Intangible assets | | 87,697 | | | (2,247,503 | ) | | 91,865 | | | (2,352,503 | ) |
| Inventory valuation | | 953,754 | | | - | | | 953,754 | | | - | |
| Accounts receivable allowance | | 860,662 | | | - | | | 765,573 | | | - | |
| Equity investments | | 35,003 | | | - | | | 35,003 | | | - | |
| Loss carry-forwards | | 1,765,203 | | | - | | | 2,075,541 | | | - | |
| Gross deferred tax assets and liabilities | | 3,931,486 | | | (2,455,383 | ) | | 4,124,194 | | | (2,564,604 | ) |
| | | | | | | | | | | | | |
| Valuation allowance | | (1,736,137 | ) | | - | | | (1,736,137 | ) | | - | |
| | | | | | | | | | | | | |
| Total deferred tax assets and liabilities | $ | 2,195,349 | | $ | (2,455,383 | ) | $ | 2,388,057 | | $ | (2,564,604 | ) |
The breakdown between current and long-term deferred tax assets and liabilities was as follows as at March 31, 2010 and December 31, 2009:
| | | March 31, 2010 | | | December 31, 2009 | |
| | | (Unaudited) | | | | |
| Current deferred tax assets | $ | 1,814,416 | | $ | 1,719,327 | |
| Current deferred tax liabilities | | - | | | - | |
| Long-term deferred tax assets | | 380,933 | | | 668,730 | |
| Long-term deferred tax liabilities | | (2,455,383 | ) | | (2,564,604 | ) |
| | | | | | | |
| Total net deferred tax liabilities | $ | (260,034 | ) | $ | (176,547 | ) |
As at March 31, 2010, Geo and HPC had incurred tax losses of approximately $190,000 and $6,945,000, respectively. The accumulated losses of Geo can be carried forward through approximately 2010. FASB ASC 740 requires that deferred tax assets be reduced by a valuation allowance if it is more likely than not that some portion or all of the deferred tax asset will not be realized. As the management expects that the accumulated losses of HPC may not be utilized to deduct against future taxable profit due to the fact that proper approval from the local tax bureau has not been obtained, the valuation allowance amounting to $1,736,000 existed as at March 31, 2010.
13.
EQUITY
(a) Issuance of new shares
On January 12, 2010, the Company issued 1,652,033 shares of common stock to certain purchasers at $6.15 per share, for the purpose of funding the Company with working capital. The purchasers also received from the Company additional warrants to purchase an aggregate of 813,008 shares of common stock at an exercise price of $6.15. The warrants expired 45 days after the initial issuance date.
On January 21, 2010, the Purchasers exercised the warrants and purchased 41,250 shares of common stock at an exercise price of $6.15.
22
CHINA INFORMATION SECURITY TECHNOLOGY, INC.
NOTES TO THE CONDENSED CONSOLIDATED FINANCIAL STATEMENTS
13.
EQUITY (CONTINUED)
(b) Stock-based compensation
Effective June 13, 2007, the Board of Directors of the Company adopted the China Information Security Technology, Inc. 2007 Equity Incentive Plan (“The Plan”). The Plan provides for grants of stock options, stock appreciation rights, performance units, restricted stock, restricted stock units and performance shares. A total of 8,000,000 shares of the Company’s common stock may be issued pursuant to Awards granted under the Plan.
On November 30, 2007, subject to ratification of the Plan by the stockholders, the Company issued options to certain employees to purchase 490,000 shares of the Company’s common stock, par value $0.01, with an exercise price of $9.48 per share. The options were to vest on December 5, 2008 and expire on December 5, 2011.
On March 3, 2008, the Company's Board of Directors voided and canceled the grant of the stock options, and on March 20, 2008 approved the grant of 400,000 shares of common stock to the employees. The fair value of the Company’s common stock based on quoted market prices on March 20, 2008 was $4.30 per share. Since the cancellation and grant of the replacement award occurred concurrently, they were treated as a modification of the terms of the cancelled award. 100,000 shares of common stock became vested on June 20, 2008 and September 20, 2008, respectively, and the remaining 200,000 shares of common stock were vested on December 20, 2008.
On February 2, 2009, the Company granted eligible employees a total of 60,000 shares of the Company’s common stock as compensation under the Plan.
On January 12, 2010, the Company granted eligible employees a total of 213,363 shares of the Company's common stock as compensation under the Plan. The fair value of these shares of approximately $1.2 million, based on the quoted market price, was accrued as of December 31, 2009 as the compensation was for services provided in 2009.
As of March 31, 2010, there was no unrecognized compensation expenses related to the non-vested options.
14.
CONSOLIDATED SEGMENT DATA
Segment information is consistent with how management reviews the businesses, makes investing and resource allocation decisions and assesses operating performance. Transfers and sales between reportable segments, if any, are recorded at cost.
In connection with the changes in the Company's business portfolio and realignment of management, management conducted a review of its operating business segments during the first quarter of 2009. The review resulted in adding the Digital Hospital Information System Segment and merging the Product Sales Segment into Digital Information Security Technology Segment.
The Company's new segment reporting, which has been used for all periods presented, follows the organizational structure as reflected in its internal management reporting systems, which are the basis for assessing the financial performance of the business segments and for allocating resources to the business segments.
The Company reports financial and operating information in the following three segments:
| (a) | Digital Information Security Technology Segment ("DIST"): includes revenues from information security related projects; |
| | |
| (b) | Geographic Information Systems Segment ("GIS"): includes the Police-Use Geographic Information Systems ("PGIS") and Civil-Use GIS sale; |
(c)
Digital Hospital Information System Segment ("DHIS"): includes revenues from digital information system provided to hospitals or medical institutes.
The Company also provides general corporate services to its segments and these costs are reported as "Corporate and others."
23
CHINA INFORMATION SECURITY TECHNOLOGY, INC.
NOTES TO THE CONDENSED CONSOLIDATED FINANCIAL STATEMENTS
14.
CONSOLIDATED SEGMENT DATA (CONTINUED)
Selected information by segment is presented in the following tables for the three months ended March 31, 2010 and 2009.
| | | Three Months | | | Three Months | |
| | | Ended March 31, | | | Ended March 31, | |
| | | 2010 | | | 2009 | |
| | | (Unaudited) | | | (Unaudited) | |
| Revenues (1) | | | | | | |
| DIST Segment | $ | 12,097,423 | | $ | 7,520,456 | |
| GIS Segment | | 10,637,080 | | | 5,859,666 | |
| DHIS Segment | | 2,570,604 | | | 1,600,062 | |
| | $ | 25,305,107 | | $ | 14,980,184 | |
| | | | | | | |
| (1) Revenues by operating segments exclude intercompany transactions. | | | | | | |
| | | | | | | |
| Income from operations: | | | | | | |
| DIST Segment | $ | 1,667,307 | | $ | 2,615,140 | |
| GIS Segment | | 4,255,852 | | | 1,370,588 | |
| DHIS Segment | | 970,341 | | | 544,717 | |
| Corporate and others (2) | | (330,071 | ) | | (361,096 | ) |
| Income from operations | | 6,563,429 | | | 4,169,349 | |
| | | | | | | |
| Corporate other income (expenses), net | | 1,129,581 | | | 379,156 | |
| Corporate interest income | | 18,891 | | | 76,917 | |
| Corporate interest expense | | (148,891 | ) | | (60,210 | ) |
| Income before income tax | | 7,563,010 | | | 4,565,212 | |
| | | | | | | |
| Income tax expense | | (1,171,083 | ) | | (588,396 | ) |
| Net income | | 6,391,927 | | | 3,976,816 | |
| | | | | | | |
| Net income attributable to the non-controlling interest | | (110,819 | ) | | (219,823 | ) |
| Net income attributable to the Company | $ | 6,281,108 | | $ | 3,756,993 | |
| | | | | | | |
| (2) Includes non-cash compensation, professional fees and consultancy fees for the Company. | | | | | | |
24
CHINA INFORMATION SECURITY TECHNOLOGY, INC.
NOTES TO THE CONDENSED CONSOLIDATED FINANCIAL STATEMENTS
14.
CONSOLIDATED SEGMENT DATA (CONTINUED)
| Total assets by segment as at March 31, 2010 and December 31, 2009 are as follows: | | | | |
| | | | | | | |
| | | March 31, | | | December 31, | |
| | | 2010 | | | 2009 | |
| | | (Unaudited) | | | | |
| Total assets: | | | | | | |
| DIST Segment | $ | 129,655,888 | | $ | 115,003,084 | |
| GIS Segment | | 102,039,253 | | | 98,140,496 | |
| DHIS Segment | | 31,809,100 | | | 30,886,236 | |
| Corporate and others | | 396,171 | | | 6,799,122 | |
| | $ | 263,900,412 | | $ | 250,828,938 | |
15.
COMMITMENTS AND CONTINGENCIES
iASPEC, Bocom, Zhongtian, and HPC lease offices, employee dormitories and factory space in Shenzhen, Guangzhou, Beijing and Dongguan in the PRC, under lease agreements that will expire on various dates through August 2012. Rent expense for the three months ended March 31, 2010 and 2009 was approximately $84,800 and $181,100, respectively.
| Future minimum lease payments under these lease agreements are as follows: | | | |
| | | | |
| Three months ended March 31, 2010 | | | |
| Remainder of 2010 | $ | 189,156 | |
| 2011 | | 185,610 | |
| 2012 | | 56,308 | |
| Total | $ | 431,074 | |
The Company entered into several purchase commitments during the period to purchase operating software and a database. The total contracted price is approximately $1.9 million (RMB13 million). As of March 31, 2010, the Company paid deposits of approximately $0.64 million (RMB4.4 million). The Company will pay the remaining contracted amount 90 days subsequent to final testing of the software.
25
CHINA INFORMATION SECURITY TECHNOLOGY, INC.
NOTES TO THE CONDENSED CONSOLIDATED FINANCIAL STATEMENTS
16.
CONCENTRATIONS
Financial instruments that potentially subject the Company to concentrations of credit risk consist primarily of trade accounts receivable. The Company extends credit to its customers in the normal course of business and generally does not require collateral. As a result, management performs ongoing credit evaluations, and the Company maintains an allowance for potential credit losses based upon its loss history and its aging analysis. The allowance for doubtful accounts ($3,103,000 at March 31, 2010 and $3,123,000 at December 31, 2009) is the Company's best estimate of the amount of probable credit losses in existing accounts receivable.
Management reviews the allowance for doubtful accounts each reporting period based on a detailed analysis of accounts receivable. In the analysis, management primarily considers the age of the customer's receivable and also considers the creditworthiness of the customer, the economic conditions of the customer's industry, and general economic conditions and trends, among other factors. If any of these factors change, the Company may also change its original estimates, which could impact the level of the Company's future allowance for doubtful accounts. If judgments regarding the collectability of accounts receivables were incorrect, adjustments to the allowance may be required, which would reduce profitability. Since the Company's accounts receivables are often concentrated in a relatively few number of customers, a significant change in the liquidity or financial position of any one of these customers could have a material adverse effect on the Company's financial statements.
For the three months ended March 31, 2010, the Company had one customer accounted for approximately 11% of the third party revenue and no other customers accounted for greater than 10% of third party revenue. For the three-month period ended March 31, 2009, the Company had three customers that represented approximately 39.77%, 15.11% and 10.37% of the Company's third party revenue.
At March 31, 2010, accounts receivables were due from 396 customers. Of these, no customers accounted for over 10% of the total accounts receivable. At March 31, 2009, accounts receivables were due from 138 customers. Of these, three customers accounted for 14.7%, 13.2% and 12.4% of total accounts receivable respectively.
26
ITEM 2. MANAGEMENT’S DISCUSSION AND ANALYSIS OF FINANCIAL CONDITION AND RESULTS OF OPERATIONS.
Forward-Looking Statements
This quarterly report contains forward-looking statements relating to us that are based on the beliefs of our management as well as assumptions made by, and information currently available to, our management. When used in this Report, the words “anticipate,” “believe,” “estimate,” “expect,” “intend,” “plan” and similar expressions, as they relate to us or our management, are intended to identify forward-looking statements. These statements reflect management's current view of us concerning future events and are subject to certain risks, uncertainties and assumptions, including among many others: our potential inability to raise additional capital, the possibility that third parties hold proprietary rights that preclude us from marketing our products, the emergence of additional competing technologies, changes in domestic and foreign laws, regulations and taxes, changes in economic conditions, uncertainties related to China's legal system and economic, political and social events in China, a general economic downturn, a downturn in the securities markets, Securities and Exchange Commission regulations which affect trading in the securities of “penny stocks,” and other risks and uncertainties. Should any of these risks or uncertainties materialize, or should underlying assumptions prove incorrect, actual results may vary materially from those described in this Report as anticipated, estimated or expected. We undertake no obligation to publicly release any revisions to the forward-looking statements after the date of this document. You should consider the factors and risks discussed in this report and carefully review the risk factors described in our Annual Report on Form 10-K for our fiscal year ended December 31, 2009 and other documents we file from time to time with the U.S. Securities and Exchange Commission.
Use of Certain Defined Terms
Except as otherwise indicated by the context, references in this report to:
“Bocom” are to Shenzhen Bocom Multimedia Display Technology Co., Ltd, a PRC company,
“China” and “PRC,” are to the People's Republic of China,
“CIST,” “we,” “us,” or “our” and the “Company” are to the combined business of China Information Security Technology, Inc. and its wholly-owned subsidiary, CPSH; along with CPSH's wholly-owned subsidiaries, IST and ISSI, and ISSI's wholly-owned subsidiary, ISS; and ISIID, and its operating PRC subsidiary, Bocom; iASPEC, to whose operations we succeeded on October 9, 2006 and who became our variable interest entity effective July 1, 2007, and its 57% majority owned subsidiary, Geo; and Kwong Tai, and its wholly-owned PRC subsidiary, Zhongtian; and HPC, and its wholly-owned PRC subsidiary, Huipu,
“CPSH” are to China Public Security Holdings Limited, a British Virgin Islands company,
“Geo,” are to Wuda Geoinformatics Co., Ltd., a PRC company,
“Hong Kong,” are to the Hong Kong Special Administrative Region of China,
“HPC” are to HPC Electronics (China) Company Limited (formerly, Topwell Treasure Ltd.("Topwell")), a Hong Kong company,
“Huipu” are to Huipu Electronics (Shenzhen) Co., Ltd. a PRC company.
“iASPEC” are to iASPEC Software Co., Ltd., a PRC company,
“ISIID,” are to Information Security International Investment and Development Limited, a Hong Kong company,
“ISS,” are to Information Security Software (China) Co., Ltd., a PRC company,
“ISSI” are to Information Security Software Investment Limited, a Hong Kong company,
“IST” are to Information Security Technology (China) Co., Ltd., a PRC company,
“Kwong Tai,” are to Kwong Tai International Technology Limited, a Hong Kong company,
“RMB” or “Renminbi,” are to the Renminbi Yuan, China’s national currency and
“Zhongtian,” are to Shenzhen Zhongtian Technology Development Company Ltd. a PRC company.
27
Overview of Our Business
We are a leading provider of integrated solutions for the digital security sector, the Geographic Information Systems, or GIS sector, and the digital hospital information sector. We provide a broad portfolio of fully integrated solutions and services, including First Responder Coordination Platform, Intelligent Recognition System, Residence Card Information Management System, Police-use and Civil-use GIS products, and Digital Hospital Information System, as well as high-end multimedia display systems and technology.
We are headquartered in Shenzhen, China and our common stock is listed on the Nasdaq Global Select Market. We were founded in 1993.
Our customers are mostly public sector entities that use our products and services to improve the service quality and management level and efficiency of public security, traffic control, fire control, medical rescue, border control, and surveying and mapping. Our typical customers include some of the most important governmental departments in China, including the Ministry of Public Security, the public security, fire fighting, traffic and police departments of several provinces, the Shenzhen General Station of Exit and Entry Frontier Inspection, and several provincial personnel, urban planning, civil administration, land resource, and mapping and surveying bureaus. Over the past several years, we have diversified our customer base beyond our local reach.In the future, we expect to continually expand our market and product offerings in the public and other sectors, through active industry consolidation and enhancement of our technical capabilities.
We generate revenues through the sale of our integrated hardware and software products and through the provision of related support services. A significant portion of our operations are conducted through iASPEC, our variable interest entity. iASPEC is a PRC domestic company owned by Jiang Huai Lin, our Chairman and Chief Executive Officer, who is a PRC citizen and resident. iASPEC is able to obtain governmental licenses that are restricted to PRC entities that have no foreign ownership. These licenses allow iASPEC to perform Police-use Geographic Information Systems, or PGIS, services for PRC governmental customers. Under our Amended and Restated Management Services Agreement, or MSA, among our subsidiary, IST, iASPEC and Mr. Lin, IST is entitled to receive 95% of the net received profit of iASPEC during the term of the Agreement, less costs and expenses related to sales and operations, and accrued but uncollected accounts receivable. In fiscal years 2009, 2008 and 2007, 48.6%, 48% and 68% of our revenues, respectively, were generated under this exclusive commercial arrangement with iASPEC. During the quarter ended March 31, 2010, $10.3 million, or 40.7% of our revenue was derived in connection with the MSA.
Where You Can Find Additional Information
We file annual, quarterly and other reports, proxy statements and other information with the SEC. You may obtain and copy any document we file with the SEC at the SEC’s public reference room at 100 F Street, NE, Room 1580, Washington, D.C. 20549. You may obtain information on the operation of the SEC’s public reference facilities by calling the SEC at 1-800-SEC-0330. You can request copies of these documents, upon payment of a duplicating fee, by writing to the SEC at its principal office at 100 F Street, NE, Room 1580, Washington, D.C. 20549-1004. The SEC maintains an Internet website at http://www.sec.gov that contains reports, proxy and information statements, and other information regarding issuers that file electronically with the SEC. Our SEC filings, including exhibits filed therewith, are accessible through the Internet at that website.
You may also request a copy of our SEC filings, at no cost to you, by writing or telephoning us at: China Information Security Technology, Inc., 21st Floor, Everbright Bank Building, Zhuzilin, Futian District, Shenzhen, Guangdong, 518040 People’s Republic of China, attention Corporate Secretary, telephone (+86) 755-8370-8333. We will not send exhibits to the documents, unless the exhibits are specifically requested and you pay our fee for duplication and delivery.
The following chart reflects our corporate organizational structure:
28
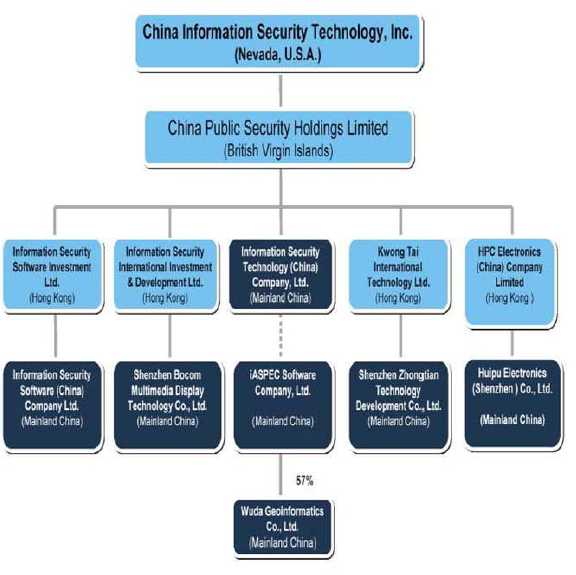
Our corporate headquarters are located at 21st Floor, Everbright Bank Building, Zhuzilin, Futian District, Shenzhen, Guangdong, 518040, People’s Republic of China. Our telephone number is (+86) 755 -8370-8333. We maintain a website at www.chinacpby.comthat contains information about our subsidiary CPSH, but that information is not a part of this report.
29
First Quarter of 2010 Financial Performance Highlights
We continued to experience strong demand for our products and services during the three months ended March 31, 2010, which resulted in growth in our revenue and net income. The following are some financial highlights for the three months ended March 31, 2010:
Revenue: Revenue increased $10.33 million, or 68.92%, to $25.31 million for the three months ended March 31, 2010, from $14.98 million for the three months ended March 31, 2009.
Gross Profit: Gross profit increased $3.64 million, or 48.56%, to $11.12 million for the three months ended March 31, 2010, from $7.48 million for the three months ended March 31, 2009.
Income from operations: Income from operations increased $2.39 million, or 57.42%, to $6.56 million for the three months ended March 31, 2010, from $4.17 million for the three months ended March 31, 2009.
Net income attributable to the Company: Net income attributable to the Company was $6.28 million for the three months ended March 31, 2010, increased $2.52 million, or 67.18%, from $3.76 million for the three months ended March 31, 2009.
Fully diluted net income per share: Fully diluted net income per share was $0.12 for the three months ended March 31, 2010, as compared to $0.08 for the three months ended March 31, 2009.
As at March 31, 2010, the total of our contract backlog is approximately $46.5 million.
Results of Operations
The following tables set forth key components of our results of operations for the periods indicated, both in dollars and as a percentage of sales revenue and key components of our revenue for the periods indicated in dollars. The financial data for the three months ended March 31, 2010 reflects the operating results of the Company and its subsidiaries and our VIE, iASPEC and its subsidiary Geo, while the financial data for the same period in 2009 reflects the operating results of the Company and its subsidiaries and VIE, excluding Huipu, which was not acquired until October 2009.
30
For the Three-Month Periods Ended March 31, 2010 and 2009 (Unaudited)
(All amounts, other than percentages of revenue and numbers of shares, in U.S. Dollars)
| | | 2010 | | | 2009 | | | | | | | |
| | | As reported | | | Percentage | | | As reported | | | Percentage | | | Period-over-period Increase | |
| | | | | | of Revenue | | | | | | of Revenue | | | (Decrease) | |
| | | | | | | | | | | | | | | | | | | |
| Revenue | | 25,305,107 | | | 100.00% | | | 14,980,184 | | | 100.00% | | | 10,324,923 | | | 68.92% | |
| Costs of revenue | | 14,187,654 | | | -56.07% | | | 7,496,920 | | | -50.05% | | | 6,690,734 | | | -89.25% | |
| Gross Profit | | 11,117,453 | | | 43.93% | | | 7,483,264 | | | 49.95% | | | 3,634,189 | | | 48.56% | |
| Administrative expenses | | (2,770,031 | ) | | -10.95% | | | (2,216,347 | ) | | -14.80% | | | (553,684 | ) | | 24.98% | |
| Research and development expenses | | (569,431 | ) | | -2.25% | | | (503,852 | ) | | -3.36% | | | (65,579 | ) | | 13.02% | |
| Selling expenses | | (1,214,562 | ) | | -4.80% | | | (593,716 | ) | | -3.96% | | | (620,846 | ) | | 104.57% | |
| Income from operations | | 6,563,429 | | | 25.94% | | | 4,169,349 | | | 27.83% | | | 2,394,080 | | | 57.42% | |
| Subsidy income | | 162,782 | | | 0.64% | | | 197,789 | | | 1.32% | | | (35,007 | ) | | -17.70% | |
| Other income, net | | 966,799 | | | 3.82% | | | 181,367 | | | 1.21% | | | 785,432 | | | 433.06% | |
| Interest income | | 18,891 | | | 0.07% | | | 76,917 | | | 0.51% | | | (58,026 | ) | | -75.44% | |
| Interest expense | | (148,891 | ) | | -0.59% | | | (60,210 | ) | | -0.40% | | | (88,681 | ) | | 147.29% | |
| Income from continuing operationsbefore Income Taxes | | 7,563,010 | | | 29.89% | | | 4,565,212 | | | 30.48% | | | 2,997,798 | | | 65.67% | |
| Income Tax Expense | | (1,171,083 | ) | | -4.63% | | | (588,396 | ) | | -3.93% | | | (582,687 | ) | | 99.03% | |
| Net Income | | 6,391,927 | | | 25.26% | | | 3,976,816 | | | 26.55% | | | 2,415,111 | | | 60.73% | |
| Less: Net Income Attributable to theNCI | | (110,819 | ) | | -0.44% | | | (219,823 | ) | | -1.47% | | | 109,004 | | | -49.59% | |
| Net Income Attributable to theCompany | | 6,281,108 | | | 24.82% | | | 3,756,993 | | | 25.08% | | | 2,524,115 | | | 67.18% | |
Revenue
Our revenue is generated from our integrated hardware and software products and through the related after-sales services. For the three months ended March 31, 2010, our revenue was $25.31 million, compared to $14.98 million for the three months ended March 31, 2009, an increase of $10.33 million, or 68.92% . During the current quarter, Huipu, which was acquired in October 2009, contributed $4.97 million to revenues. Excluding the impact from Huipu, organic revenue growth was 35.8% . This organic growth rate reflected both our strong business momentum as well as weakness in the same period in the prior year as a result of the global financial crisis.
Software sales increased by 68.44% to $15.18 million for the three months ended March 31, 2010, from $9.01 million for the three months ended March 31, 2009. Software sales constituted 59.98% of our total revenue, roughly in line with 60.16% during the same period in the prior year, reflecting our continued commitment to our core competency in software. Excluding the impact of Huipu, software sales was 74.63% of organic revenues.
Product sales increased by $3.53 million, or 125.02% for the three months ended March 31, 2010, as compared to $2.82 million in the same period of 2009. Product sales constituted 25.09% of total revenue during the current period as compared with 18.83% during the same period in the prior year. Approximately $4.34 million of the product sales for the three months ended March 31, 2010 was contributed by Huipu. Product sales excluding Huipu declined by 28.97% from the same period in the prior year to 9.85% of organic revenues, as we focused on higher value-added product sales with Huipu.
31
Sales of system integration services decreased by 5.81% for the three-month ended March 31, 2010, as compared to the same period of 2009. As a percentage of revenue, it declined from 19.73% during the three months ended March 31, 2009 to 11% during the current quarter. Excluding the impact of Huipu, system integration was 13.69% of organic revenues. Such a decline was due to the timing of certain projects.
Other revenue increased by 417.67%, from $0.19 million in the three months ended March 31, 2009 to $1 million in the same period of 2010. Other revenue mainly derived from maintenance services in the three months period March 31, 2009, while in the same period of 2010, in addition to maintenance services, we also generated $623,000 royalty income from Huipu by licensing other manufacturers to use the HPC trademark. We believe this is an effective way to harvest HPC’s value and monetize its intellectual property, which is the over-riding principle in our business strategy.
Regarding segment breakdown, for the three months ended March 31, 2010, approximately $12.10 million of our revenues were generated by our DIST segment, $10.64 million of our revenues were generated by our GIS segment, and $2.57million was generated by the DHIS segment. This compared with $7.52 million by our DIST segment, $5.86 million by our GIS segment and $1.60 million by our DHIS segment for the three months ended March 31, 2009. The year-over-year growth ratios for the three segments were 60.86%, 81.53% and 60.66% respectively. Excluding the impact of Huipu, the equivalent ratios were 28.46%, 39.95% and 60.66% respectively.
DIST accounted for 47.80% of the total revenue while GIS and DHIS represented 42.04% and 10.16% respectively. Excluding the impact of Huipu, the segment weights were 47.28%, 40.14% and 12.58% respectively. These compared to 50.2%, 39.12% and 10.68% of the total revenue for the three months period ended March 31, 2009. The shifts in segment weights were due to the GIS and DHIS segments outpacing DIST in their growth momentum. This is the direct result of our focus in the last few years on targeting at areas with the highest barriers-to-entry and developing sustainable competitive advantages in the GIS and DHIS segments, in anticipation of accelerating market growth in the coming years. As such anticipation starts to be realized, we believe we have been well positioned to capture the growth opportunities. As such, we will be directing more resources to these two segments going forward.
Cost of Revenue and Gross Profit
| | | | | | | | | 2010 | | | | | | | | | | | | | | | 2009 | | | | | | | |
| | | Revenue | | | % | | | Cost | | | GP | | | GP% | | | Revenue | | | % | | | Cost | | | GP | | | GP% | |
| Products | $ | 6,347,970 | | | 25.09% | | $ | 5,240,422 | | $ | 1,107,548 | | | 17.45% | | $ | 2,821,128 | | | 18.83% | | $ | 2,612,791 | | $ | 208,337 | | | 7.38% | |
| Software | | 15,178,632 | | | 59.98% | | | 6,401,411 | | | 8,777,221 | | | 57.83% | | | 9,011,466 | | | 60.16% | | | 2,700,941 | | | 6,310,525 | | | 70.03% | |
| System | | | | | | | | | | | | | | | | | | | | | | | | | | | | | | |
| integration | | 2,783,883 | | | 11.00% | | | 2,475,810 | | | 308,073 | | | 11.07% | | | 2,955,457 | | | 19.73% | | | 2,145,752 | | | 809,705 | | | 27.40% | |
| Others | | 994,622 | | | 3.93% | | | 70,011 | | | 924,611 | | | 92.96% | | | 192,133 | | | 1.28% | | | 37,436 | | | 154,697 | | | 80.52% | |
| Subtotal | $ | 25,305,107 | | | 100% | | $ | 14,187,654 | | $ | 11,117,453 | | | 43.93% | | $ | 14,980,184 | | | 100% | | $ | 7,496,920 | | $ | 7,483,264 | | | 49.95% | |
As indicated in the table above, our cost of revenues increased $6.69 million, or 89.25%, to $14.19 million, for the three months ended 31, 2010, from $7.50 million for the three months ended March 31, 2009. As a percentage of revenues, our cost of revenue increased to 56.07% during the three months ended March 31, 2010, from 50.05% in the same period of 2009. As a result, gross margin was 43.93% for the three months ended 31, 2010, decrease of 6.02%, from 49.95% in the same period of 2009. With the strategy of capturing royalty income, Huipu yielded a gross margin of 28.86%, which exceeded our original goal. Excluding the impact of Huipu, gross margin of organic business was 47.62% ..
The decrease in gross profit margin for organic business was mainly attributable to the decrease in gross profit margin in software sales and system integration, partially offset by the increase in weight of software business relative to organic revenue total as described in the “Revenue” section..
The decrease of gross profit margin in software sales resulted from outsourcing activities as we chose to focus on the most critical software business activities. For the three-month period, we decided to outsource some non-essential and labor-intensive parts of software projects such as on-site installation for customers in order to stay focused on scalable core activities with the existing work force. Although the near-term impact of this strategy on our profitability was a decline in gross margin from 70.03% in the three months ended March 31, 2009 to 57.83% in the current period, we believe the focus on the highest value-added components in house can accelerate revenue growth in the long run and is accretive to our long-term shareholder value. Also contributing to this decline was the fact that during the three months ended March 31, 2009, we benefited from some projects that yielded higher-than-average profitability.
The gross margin decline of system integration was due to the concurrence of several large projects during the current period, which generally offer lower profit margin than smaller ones.
32
For the three months ended March 31, 2010, approximately $7.86 million of our cost of revenues was attributable to our DIST segment, $5.15 million was attributable to our GIS segment and $1.18 million was attributable to our DHIS segment, compared to $3.69 million to DIST segment, $3.25 million to GIS segment and $0.55 million by DHIS segment, respectively, during the same period of 2009.
Administrative Expenses
Administrative expenses consist primarily of compensation and benefits to our general management, finance and administrative staff, professional advisor fees, audit fees and other expenses incurred in connection with general operations. Our administrative expenses increased by about $0.55 million, or 24.98%, to $2.77 million for the three months ended March 31, 2010, from $2.22 million in the same period of 2009. Some notable changes that resulted in the increase of administrative expenses are: 1) the addition of administrative expenses of Huipu about $0.31 million; 2) the increase of bad debt provision expenses of $0.45 million period-over-period; and 3) the decrease of stock based compensation expenses of $0.18 million.
Research and Development Expenses
Research and development expenses consist primarily of personnel-related expenses, as well as costs associated with new software product development and enhancement. Research and development expenses increased by $0.07 million or 13.02% to $0.57 million for the three months ended March 31, 2010, from $0.5 million in the same period of 2009. As a percentage of sales, research and development expenses accounts for approximately 2% of the total revenue for the three months ended March 31, 2010, compared with 3% of total revenue for same period in 2009. The slight ratio decrease is due to the fact the R&D investments in the previous years are yielding scalable effects in revenue growth.
Selling Expenses
Selling expenses consist primarily of compensation and benefits to our sales and marketing staff, sales and after-sales traveling cost, and other sales related costs. Our selling expenses increased $0.62 million, or 104.57%, to $1.21 million for the three months ended March 31, 2010, from $0.59 million in the corresponding period of 2009. Such an increase outpacing the growth in revenues reflected our heightened efforts in market expansion nationally.
Income from Operations
Income from operations increased $2.39 million, or 57.42%, to $6.56 million for the three months ended March 31, 2010, from $4.17 million in the corresponding period in 2009. Income from operations as a percentage of revenue decreased to 25.94% during the three months ended March 31, 2010, from 27.83% in 2009. The decrease is mainly attributable to the decrease of gross profit margin during the current period, partially offset by operating expense ratio improvements.
Other Income, net
Other income, net of $0.97 million for the three months ended March 31, 2010 primarily due to fair value change for contingent shares paid for HPC acquisition. Approximately $0.8 million gains resulted from the decrease of fair value of the liability to issue the contingent consideration was recorded during the period.
Non-controlling interest
Non-controlling interest of $110,819 for the three months ended March 31, 2010 represents the $134,798 fee retained by iASPEC under the revised MSA, which represents 5% of the net income for the three months ended March 31, 2010, and $23,979 of Geo’s losses retained by the 43% non-controlling interest in Geo. The retained profits by iASPEC during the three months ended March 31, 2009 was $45,000, which was a fixed amount according to the original MSA, and the retained profits by Geo’s 43% shareholders was approximately $175,000.
33
Income Tax Expense
Income tax expense for the three months ended March 31, 2010 was $1.17 million, up from $0.59 million for the same period in 2009. The increase was mainly due to the combined effects of increase in assessable profits during the current period and the increase in tax rate as a result of China’s tax rate unification program.
Our subsidiaries, ISS, Zhongtian and Huipu are all governed by the Income Tax Laws of the PRC and are subject to the PRC’s enterprises income tax, or EIT, at a rate of 22% of assessable profits in 2010, compared to 20% for the same period in 2009, an increase of 2%.
Bocom, and our VIE, iASPEC (inclusive of Geo), as High-Tech Enterprises, are subject to EIT at a rate of 15% of assessable profits. After offsetting accumulated losses from prior years, Geo had no assessable profit subject to EIT for the three months ended March 31, 2010. In addition, as a software company, IST was entitled to a two-year exemption from EIT followed by a 50% tax exemption for the next 3 years. Year 2010 is the fourth year that IST is entitled to the tax holiday and will be subject to a favorable tax rate of 11%.
Net income attributable to the Company
As a result of the factors described above, net income increased $2.52 million, or 67.18%, to $6.28 million during the three months ended March 31, 2010, from $3.76 million for the same period in 2009.
Liquidity and Capital Resources
As of March 31, 2010, we had cash and cash equivalents of $11 million. The following table summarizes the key cash flow metrics from our condensed consolidated statements of cash flows for the three months ended March 31, 2010 and 2009..
| | | Three Months Ended March 31 | |
| | | 2010 | | | 2009 | |
| | | | | | | |
| Net Cash Used in Operating Activities | $ | (11,341,339 | ) | $ | (1,489,742 | ) |
| Net Cash Used in Investing Activities | | (4,228,900 | ) | | (1,075,800 | ) |
| Net Cash provided by / (Used in) Financing Activities | | 13,016,740 | | | (11,468 | ) |
| Effect of Exchange Rate Changes on Cash and cash equivalents | | 79,846 | | | 46,153 | |
| Net Decrease in Cash and Cash Equivalents | | (2,473,653 | ) | | (2,530,857 | ) |
| Cash and Cash Equivalents, Beginning | | 13,478,633 | | | 9,565,252 | |
| Cash and Cash Equivalents, Ending | $ | 11,004,980 | | $ | 7,034,395 | |
Operating Activities
Net cash used by operating activities increased to $11.34 million, or a 661.30% increase, for the three months ended March 31, 2010, as compared to $1.49 million for the same period of 2009.
The net use of cash by operating activities is primarily due to the seasonality factor. The first quarter of the calendar year is typically the slowest season of the year due to the Chinese New Year holiday. During this period, accounts receivable collection is very slow and we also need to prepare for upcoming busier seasons by making payments for inventory.
The increase in net cash used in operating activities during the current period as compared with the same period in the prior year was mainly due to high revenue growth which lead to higher increase in accounts receivable of $10.15 million vs. $3.28 million in the same period of prior year. By using the trailing 12-month period in calculating Days Sales Outstanding (DSO) which eliminates the seasonality factor, our DSO as at March 31, 2010 was 210 days, which declined from 215 days as at December 31, 2009. As at March 31, 2010, accounts receivables were due from 396 customers. Of these, no customers accounted for over 10% of the total accounts receivable. At March 31, 2009, accounts receivables were due from 138 customers. Of these, three customers accounted for 14.7%, 13.2% and 12.4% of total accounts receivable respectively. As at March 31, 2010, provisions were approximately 3.7% of gross accounts receivable outstanding as compared with 4.2% at the end of 2009.
34
Investing Activities
Net cash used by our investing activities increased by $3.15 million, or 293.09% for the three months ended March 31, 2010, as compared to the same period of 2009. The increase was mainly due to an increase in cash used for deposit for software purchase of $2.49 million due to expanding software requirements, and $0.66 million payment for property and plant.
Financing Activities
Net cash provided by our financing activities increased by $13.02 million, or a 113,605% increase, for the three months ended March 31, 2010, as compared to the same period of 2009. The increase was mainly attributable to the net proceeds of $9.61 million raised in issuing of common stock, and a decrease in net borrowing under short-term bank loans of $2.62 million, and increase in borrowings from shareholders' long-term loan of $6.03 million.
Mr. Lin received aggregate gross proceeds of $9.84 million from the sale of his 1,600,000 shares of Common Stock in our registered direct offering to certain purchasers that closed on January 12, 2010. For more details regarding our registered direct offering, see our Current Reports on Form 8-K filed on January 8, 2010 and on January 13, 2010. On January 14, 2010, Mr. Lin loaned the Company a total of $5 million from the proceeds of the sale of his shares for use for general corporate purposes and working capital. In consideration of the loan from Mr. Lin, the Company's board of directors approved the issuance and delivery of a one-year, non-interest bearing, promissory note, or the Original Note, to Mr. Lin, in the principal amount of $5 million. The note was due and payable on January 14, 2011, and was convertible into shares of the Company's common stock at a conversion price of $5.88 per share (the per share closing price on the trading day prior to the delivery date of the Original Note).
On March 25, 2010, Mr. Lin and the Company agreed that Mr. Lin would surrender the Original Note to the Company, and that the Company would void and rescind the Original Note, and issue a replacement note, or the New Note, in the principal amount of $6,000,000, to reflect the principal amount of the Original Note as well as an additional loan of $1,000,000 made to the Company on March 25, 2010. The New Note is non-interest bearing and does not have a conversion feature. The maturity date of the New Note is March 5, 2012 and the Company may prepay all or a portion of the Note at any time before the maturity date without penalty.
| Obligations under Material Contracts | | | | | | | | | | | | | | | |
| | | | | | | | | | | | | | | | |
| The following table sets forth our material contractual obligations as of March 31, 2010: | | | | | | | | | | |
| | | | | | | | | | | | | | | | |
| Payment due by period | |
| | | | | | Less than | | | | | | 3-5 | | | More than 5 | |
| Contractual Obligations | | Total | | | 1 year | | | 1-3 years | | | years | | | years | |
| Operating Lease Obligations | $ | 431,074 | | $ | 189,156 | | $ | 241,918 | | $ | - | | $ | - | |
| Capital Lease Obligations | $ | - | | $ | - | | $ | - | | $ | - | | $ | - | |
| Purchase Obligations | $ | 1,282,305 | | $ | 1,282,305 | | $ | - | | $ | - | | $ | - | |
| Other Long-Term Liabilities Reflected on our Balance Sheet under GAAP | $ | - | | $ | - | | $ | - | | $ | - | | $ | - | |
| | | | | | | | | | | | | | | | |
| Total | $ | 1,713,379 | | $ | 1,471,461 | | $ | 241,918 | | $ | - | | $ | - | |
Critical Accounting Policies
The details of the critical accounting policies relevant to the Company are set out in Item 7, Management's Discussion and Analysis of Results of Operations and Financial Condition in the Company's Annual Report on Form 10-K for the fiscal year ended December 31, 2009.
Recent Accounting Pronouncements
The details of the new pronouncements relevant to the Company are set out in Note 2 (e) to the condensed consolidated financial statements of the Company for the three months ended March 31, 2010. Other new pronouncements issued but not yet effective until after March 31, 2010 are not expected to have a significant effect on the Company’s consolidated financial position or results of operations.
Seasonality of our Sales
The first quarter of the calendar year is typically the slowest season of the year due to the Chinese New Year holiday. During this period, accounts receivable collection is very slow and we also need to prepare for upcoming busier seasons by making payments for inventory.
Inflation
Inflation does not materially affect our business or the results of our operations.
Off-Balance Sheet Arrangements
We do not have any off-balance arrangements.
35
ITEM 3. QUANTITATIVE AND QUALITATIVE DISCLOSURES ABOUT MARKET RISK
Foreign Exchange Risk
Although our reporting currency is the U.S. dollar, the financial records of our operating subsidiaries are maintained in their local currency, the RMB. Approximately 97.44% of our revenues and 100% of our consolidated costs and expenses, and consolidated assets for the three months ended March 31, 2010 are denominated in RMB, which is the functional currency of our operating subsidiaries. As a result, we are exposed to foreign exchange risk as our reported revenues and results of operations may be affected by fluctuations in the exchange rate between U.S. dollars and RMB. If the RMB depreciates against the U.S. dollar, the value of our RMB revenues, earnings and assets as expressed in our U.S. dollar financial statements will decline. Assets and liabilities of our operating subsidiaries are translated into U.S. dollars at the exchange rate at the balance sheet date, their equity accounts are translated at historical exchange rates, and their income and expenses items are translated using the average rate for the period. Any resulting exchange differences are recorded in accumulated other comprehensive income or loss. An average appreciation (depreciation) of the RMB against the U.S. dollar of 5% would increase (decrease) our comprehensive income by $7.7 million based on our outstanding revenues, costs and expenses, assets, and liabilities denominated in RMB as of March 31, 2010. As of March 31, 2010, our accumulated other comprehensive income was $6.39 million. We have not entered into any hedging transactions in an effort to reduce our exposure to foreign exchange risk.
Interest Rate Risk
The Company deposits surplus funds with Chinese banks earning daily interest. The Company does not invest in any instruments for trading purposes. Most of the Company’s outstanding debt instruments carry fixed rates of interest. The Company’s operations generally are not directly sensitive to fluctuations in interest rates. The amount of long-term debt outstanding as of March 31, 2010 and December 31, 2009 was $ 4 million and $2 million, respectively. A hypothetical 1.0% increase in the annual interest rates for all of our credit facilities under which we had outstanding borrowings at March 31, 2010, would decrease net income before provision for income taxes by approximately $8,000 or less than 1% for the period ended March 31, 2010. Management monitors the banks’ prime rates in conjunction with our cash requirements to determine the appropriate level of debt balances relative to other sources of funds. We have not entered into any hedging transactions in an effort to reduce our exposure to interest rate risk.
Inflation Risk
Inflationary factors such as increases in the cost of our product and overhead costs may adversely affect our operating results. Although we do not believe that inflation has had a material impact on our financial position or results of operations to date, a high rate of inflation in the future may have an adverse effect on our ability to maintain current levels of gross margin and selling, general and administrative expenses as a percentage of net revenues if the selling prices of our products do not increase with these increased costs.
36
Risks Related to the Market for Our Stock
Market Volatility
There has been, and will likely continue to be, significant volatility in the market price of securities in general and of technology companies in particular, including ours. These fluctuations can be unrelated to the operating performance of these companies. Factors such as the following could cause the market price of our common stock to fluctuate substantially:
general economic conditions and trends;
stock market price and volume fluctuations of other publicly traded companies and, in particular, those that are in the technology industry;
investor perceptions of the stock market in general and our industry or company in particular;
shortfalls in our actual financial results compared to our guidance or results previously forecasted by stock market analysts
quarterly fluctuations in our financial results or other software companies’ financial results;
acquisitions or strategic alliances or announcements of new products by us or our competitors;
any stock repurchase program;
significant developments relating to our relationships with our customers or suppliers;
litigation involving our Company or any of our officers and directors; and
general conditions in the software industry and conditions in the financial markets.
A decline in the market price of our common stock may adversely impact our ability to attract and retain employees. In addition, stockholders may initiate securities class action lawsuits if the market price of our stock drops significantly, which may cause us to incur substantial costs and could divert the time and attention of our management.
Control Shares
Mr. Jiang Huai Lin, our Chairman, President and Chief Executive Officer, beneficially owns 38.93% of our outstanding voting securities as at March 31, 2010. As a result, he possesses significant influence, giving him the ability, among other things, to elect a majority of our Board of Directors and to authorize or prevent proposed significant corporate transactions. His ownership and control may also have the effect of delaying or preventing a future change in control, impeding a merger, consolidation, takeover or other business combination or discourage a potential acquirer from making a tender offer.
37
ITEM 4. CONTROLS AND PROCEDURES
Disclosure Controls and Procedures
We maintain disclosure controls and procedures (as defined in Rule 13a-15(e) under the Exchange Act). Disclosure controls and procedures refer to controls and other procedures designed to ensure that information required to be disclosed in the reports we file or submit under the Securities Exchange Act is recorded, processed, summarized and reported within the time periods specified in the rules and forms of the SEC and that such information is accumulated and communicated to our management, including our Chief Executive Officer and Chief Financial Officer, as appropriate, to allow timely decisions regarding required disclosure.
As required by Rule 13a-15(e), our management has carried out an evaluation, with the participation and under the supervision of our Chief Executive Officer, Mr. Jiang Huai Lin and our Chief Financial Officer, Ms. Jackie You Kazmerzak, of the effectiveness of the design and operation of our disclosure controls and procedures, as of March 31, 2010. Based upon, and as of the date of this evaluation, Mr. Lin and Ms. Kazmerzak, determined that, as of March 31, 2010, and as of the date of this Report, our disclosure controls and procedures were effective.
Changes in Internal Controls over Financial Reporting
We regularly review our system of internal control over financial reporting and make changes to our processes and systems to improve controls and increase efficiency, while ensuring that we maintain an effective internal control environment. Changes may include such activities as implementing new, more efficient systems, consolidating activities, and migrating processes.
There were no changes in our internal controls over financial reporting during the first quarter of fiscal 2010 that have materially affected, or are reasonably likely to materially affect our internal control over financial reporting.
38
PART II
OTHER INFORMATION
ITEM 1.
LEGAL PROCEEDINGS.
From time to time, we may become involved in various lawsuits and legal proceedings, which arise, in the ordinary course of business. However, litigation is subject to inherent uncertainties, and an adverse result in these, or other matters, may arise from time to time that may harm our business. We are currently not aware of any such legal proceedings or claims that we believe will have a material adverse affect on our business, financial condition or operating results.
ITEM 1A.
RISK FACTORS.
See also the risk factors disclosed in our annual report on Form 10-K for the year ended December 31, 2009.
ITEM 2.
UNREGISTERED SALES OF EQUITY SECURITIES AND USE OF PROCEEDS.
We have not sold any equity securities during the quarter ended March 31, 2010 which sale was not previously disclosed in a current report on Form 8-K filed during that period.
ITEM 3.
DEFAULTS UPON SENIOR SECURITIES.
None.
ITEM 4.
(REMOVED AND RESERVED).
ITEM 5.
OTHER INFORMATION.
Mr. Lin received aggregate gross proceeds of $9.84 million from the sale of his 1,600,000 shares of Common Stock in our registered direct offering to certain purchasers that closed on January 12, 2010. For more details regarding our registered direct offering, see our Current Reports on Form 8-K filed on January 8, 2010 and on January 13, 2010. On January 14, 2010, Mr. Lin loaned the Company a total of $5 million from the proceeds of the sale of his shares for use for general corporate purposes and working capital. In consideration of the loan from Mr. Lin, the Company's board of directors approved the issuance and delivery of a one-year, non-interest bearing, promissory note, or the Original Note, to Mr. Lin, in the principal amount of $5 million. The note was due and payable on January 14, 2011, and was convertible into shares of the Company's common stock at a conversion price of $5.88 per share (the per share closing price on the trading day prior to the delivery date of the Original Note).
On March 25, 2010, Mr. Lin and the Company agreed that Mr. Lin would surrender the Original Note to the Company, and that the Company would void and rescind the Original Note, and issue a replacement note, or the New Note, in the principal amount of $6,000,000, to reflect the principal amount of the Original Note as well as an additional loan of $1,000,000 made to the Company on March 25, 2010. The New Note is non-interest bearing and does not have a conversion feature. The maturity date of the New Note is March 5, 2012 and the Company may prepay all or a portion of the Note at any time before the maturity date without penalty.
We have no other information to include that was required to be but was not disclosed in a report on Form 8-K during the period covered by this Form 10-Q. There have been no material changes to the procedures by which security holders may recommend nominees to our board of directors.
ITEM 6.
EXHIBITS.
The following exhibits are filed as part of this report or incorporated by reference:
39
SIGNATURES
Pursuant to the requirements of the Securities Exchange Act of 1934, the registrant has duly caused this report to be signed on its behalf by the undersigned, thereunto duly authorized.
| | CHINA INFORMATION SECURITY TECHNOLOGY, INC. |
| | |
| | |
| Dated: May 10, 2010 | /s/ Jiang Huai Lin |
| | Jiang Huai Lin |
| | Chairman and Chief Executive Officer |
| | (Principal Executive Officer) |
| | |
| | |
| Dated: May 10, 2010 | /s/ Jackie You Kazmerzak |
| | Jackie You Kazmerzak |
| | Chief Financial Officer |
| | (Principal Financial and Accounting Officer) |
40
EXHIBIT INDEX
41