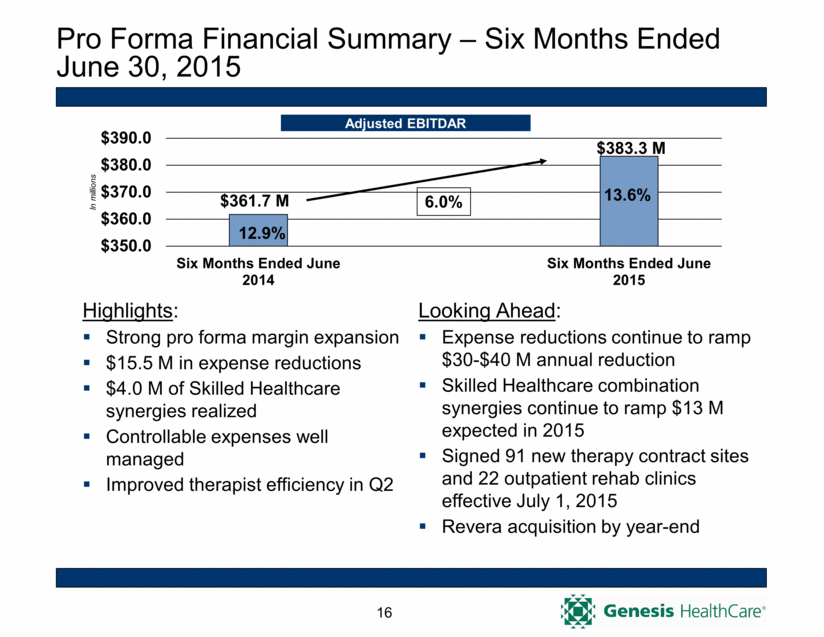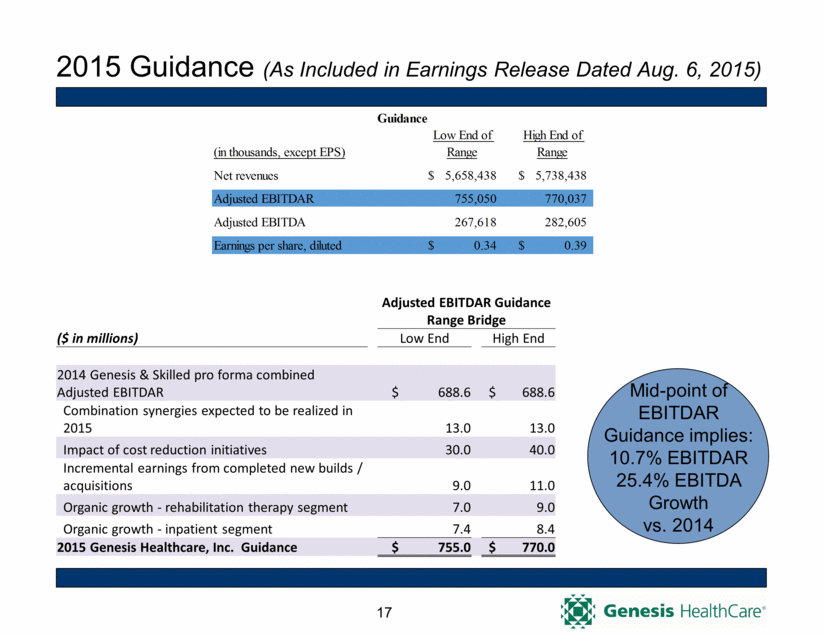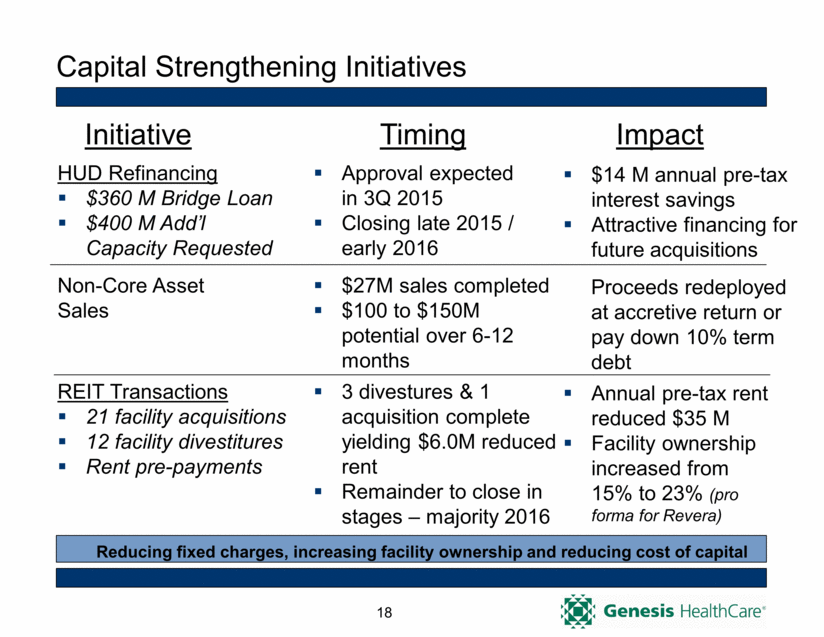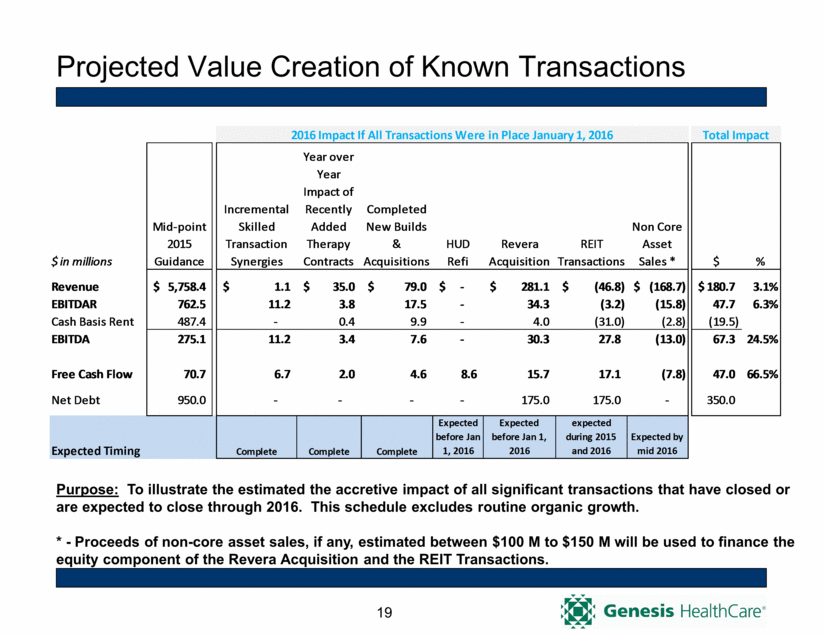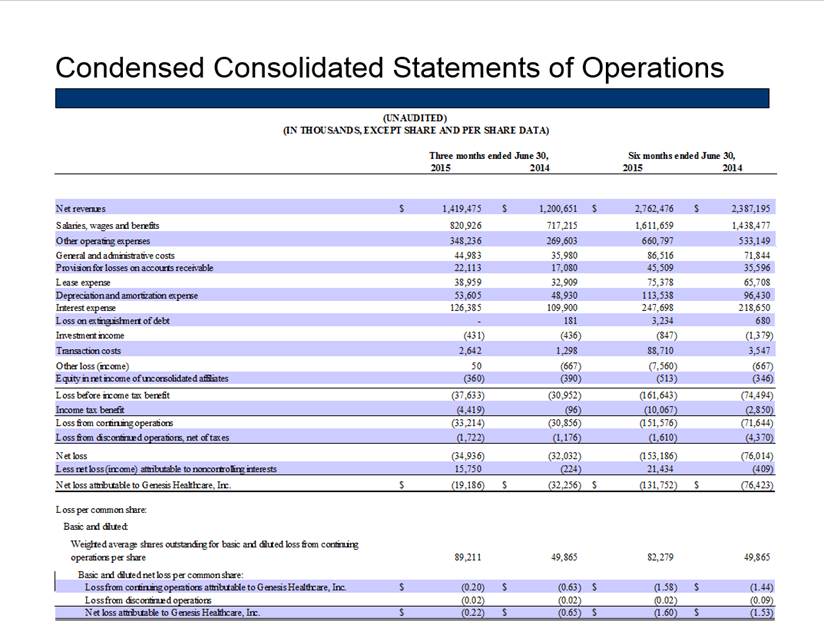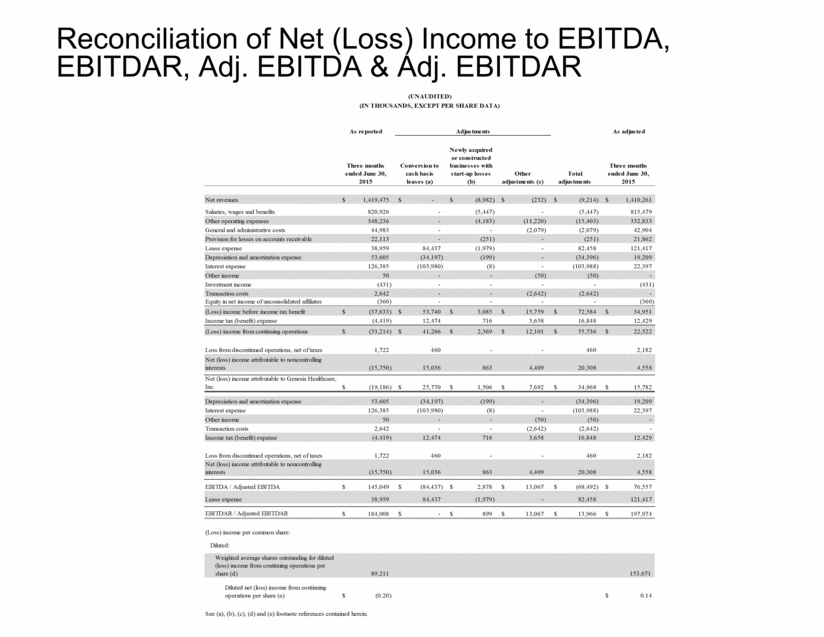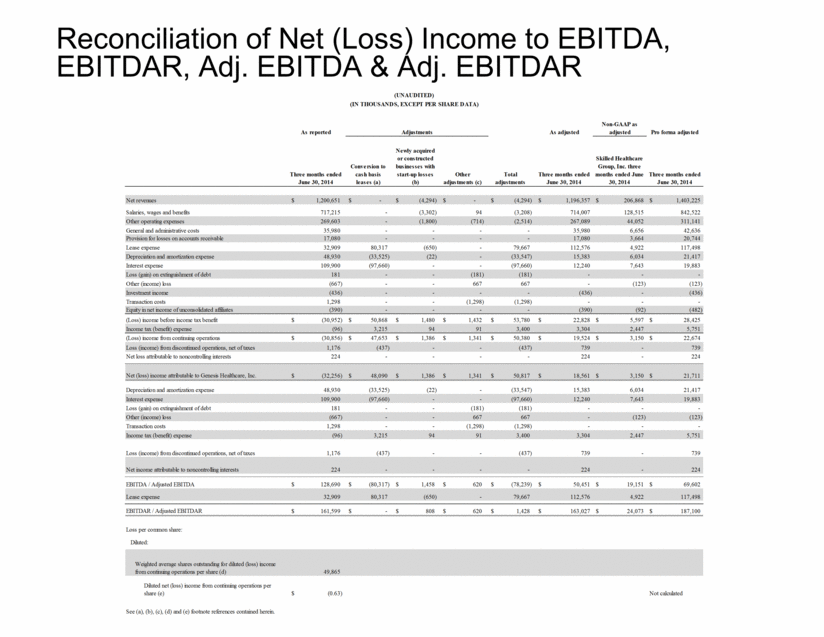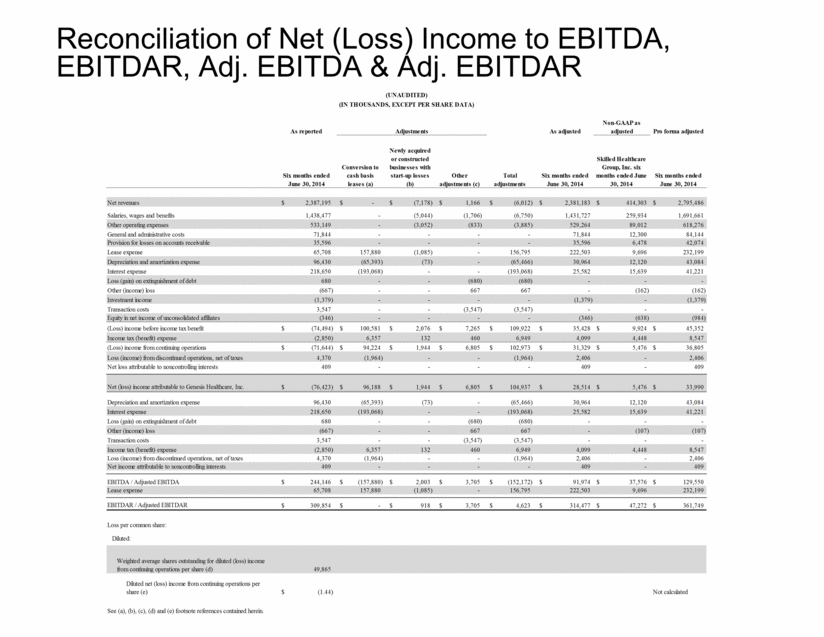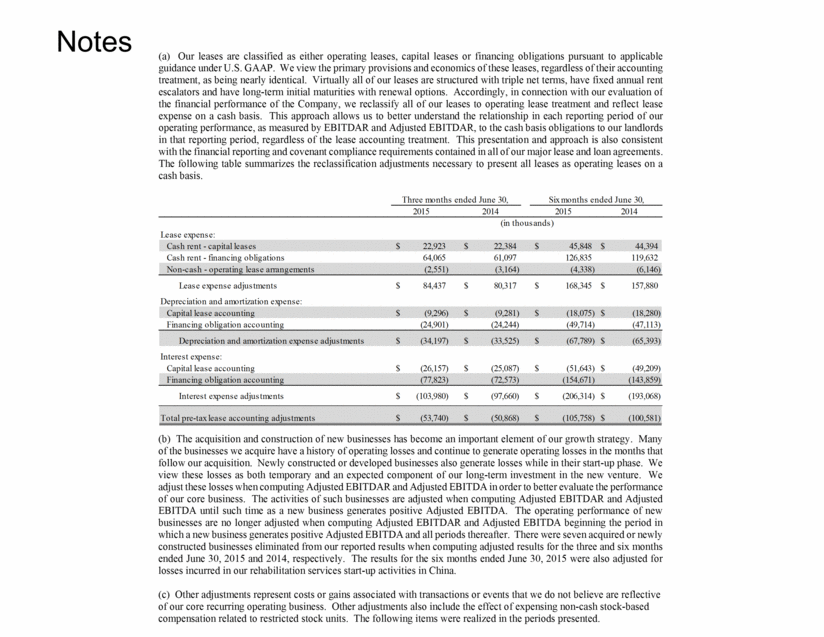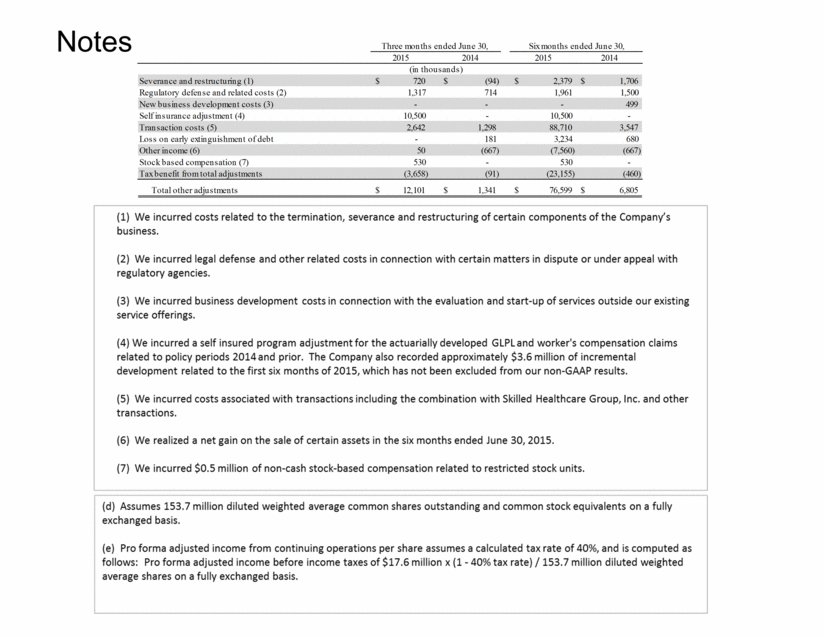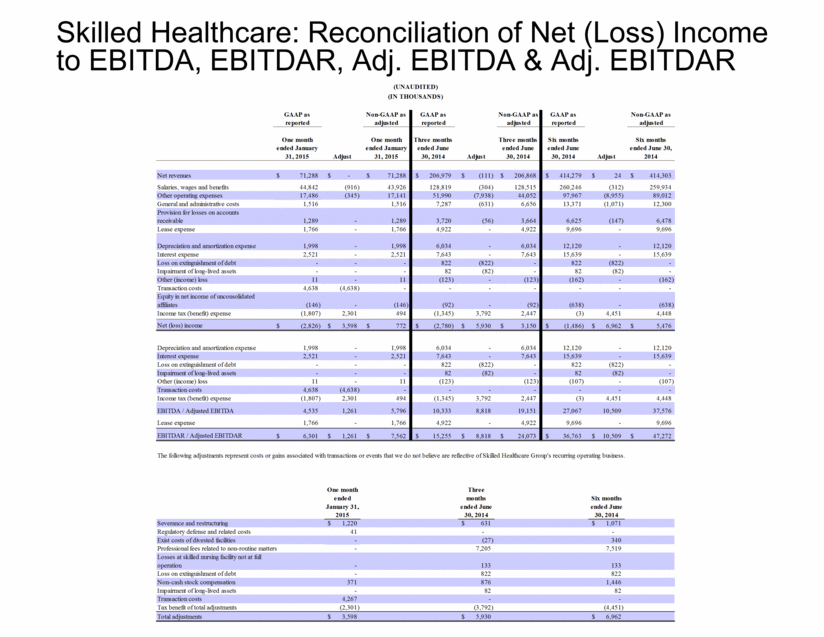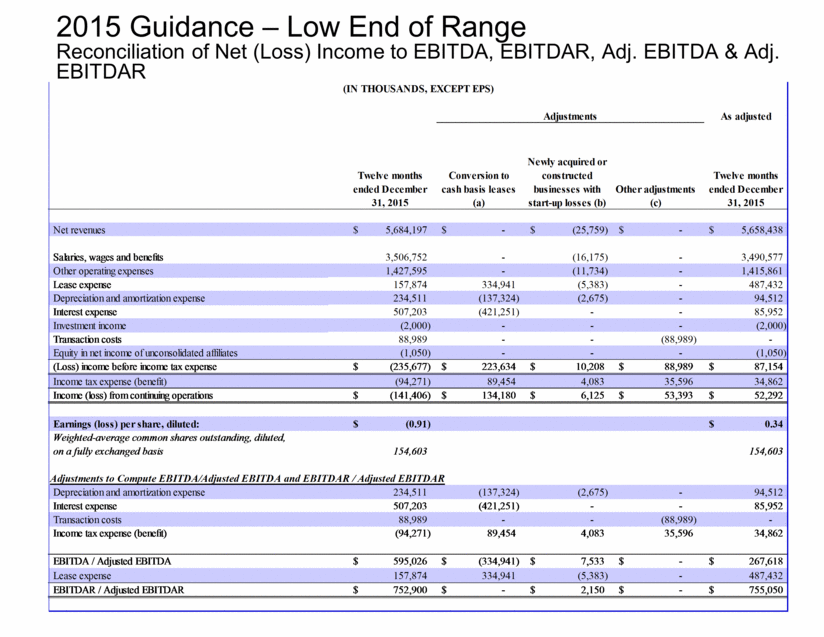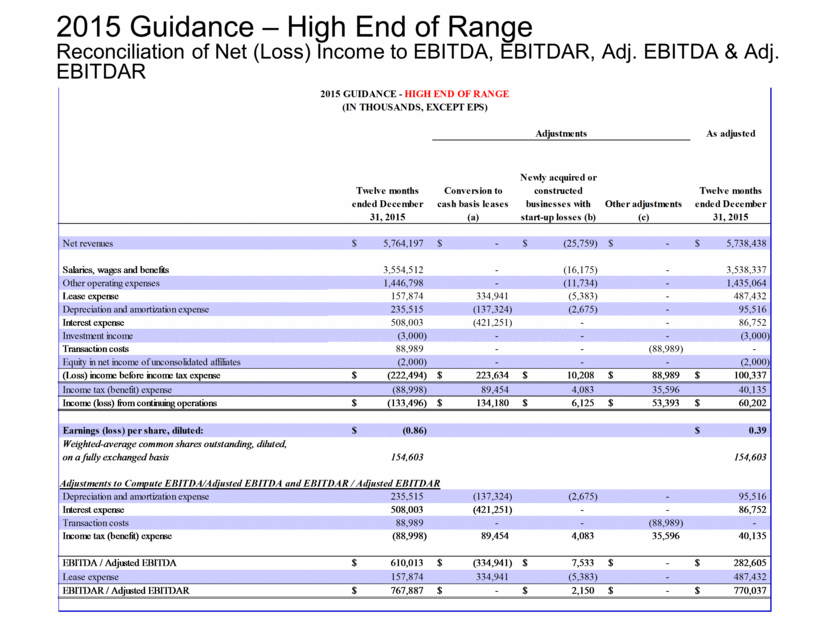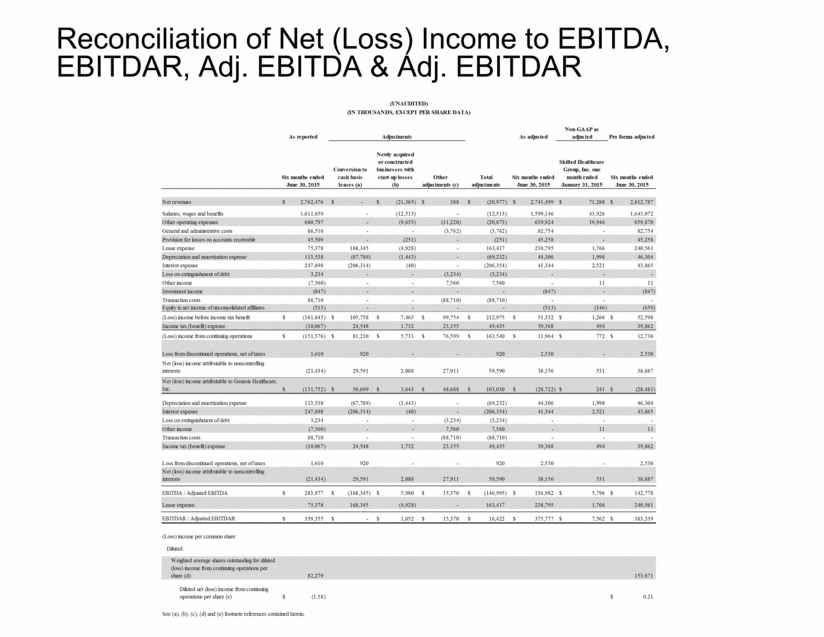
| Reconciliation of Net (Loss) Income to EBITDA, EBITDAR, Adj. EBITDA & Adj. EBITDAR As reported As adjusted Non-GAAP as adjusted Pro forma adjusted Six months ended June 30, 2015 Conversion to cash basis leases (a) Newly acquired or constructed businesses with start-up losses (b) Other adjustments (c) Total adjustments Six months ended June 30, 2015 Skilled Healthcare Group, Inc. one month ended January 31, 2015 Six months ended June 30, 2015 Net revenues 2,762,476 $ - $ (21,365) $ 388 $ (20,977) $ 2,741,499 $ 71,288 $ 2,812,787 $ Salaries, wages and benefits 1,611,659 - (12,513) - (12,513) 1,599,146 43,926 1,643,072 Other operating expenses 660,797 - (9,653) (11,220) (20,873) 639,924 19,946 659,870 General and administrative costs 86,516 - - (3,762) (3,762) 82,754 - 82,754 Provision for losses on accounts receivable 45,509 - (251) - (251) 45,258 - 45,258 Lease expense 75,378 168,345 (4,928) - 163,417 238,795 1,766 240,561 Depreciation and amortization expense 113,538 (67,789) (1,443) - (69,232) 44,306 1,998 46,304 Interest expense 247,698 (206,314) (40) - (206,354) 41,344 2,521 43,865 Loss on extinguishment of debt 3,234 - - (3,234) (3,234) - - - Other income (7,560) - - 7,560 7,560 - 11 11 Investment income (847) - - - - (847) - (847) Transaction costs 88,710 - - (88,710) (88,710) - - - Equity in net income of unconsolidated affiliates (513) - - - - (513) (146) (659) (Loss) income before income tax benefit (161,643) $ 105,758 $ 7,463 $ 99,754 $ 212,975 $ 51,332 $ 1,266 $ 52,598 $ Income tax (benefit) expense (10,067) 24,548 1,732 23,155 49,435 39,368 494 39,862 (Loss) income from continuing operations (151,576) $ 81,210 $ 5,731 $ 76,599 $ 163,540 $ 11,964 $ 772 $ 12,736 $ Loss from discontinued operations, net of taxes 1,610 920 - - 920 2,530 - 2,530 Net (loss) income attributable to noncontrolling interests (21,434) 29,591 2,088 27,911 59,590 38,156 531 38,687 Net (loss) income attributable to Genesis Healthcare, Inc. (131,752) $ 50,699 $ 3,643 $ 48,688 $ 103,030 $ (28,722) $ 241 $ (28,481) $ Depreciation and amortization expense 113,538 (67,789) (1,443) - (69,232) 44,306 1,998 46,304 Interest expense 247,698 (206,314) (40) - (206,354) 41,344 2,521 43,865 Loss on extinguishment of debt 3,234 - - (3,234) (3,234) - - - Other income (7,560) - - 7,560 7,560 - 11 11 Transaction costs 88,710 - - (88,710) (88,710) - - - Income tax (benefit) expense (10,067) 24,548 1,732 23,155 49,435 39,368 494 39,862 Loss from discontinued operations, net of taxes 1,610 920 - - 920 2,530 - 2,530 Net (loss) income attributable to noncontrolling interests (21,434) 29,591 2,088 27,911 59,590 38,156 531 38,687 EBITDA / Adjusted EBITDA 283,977 $ (168,345) $ 5,980 $ 15,370 $ (146,995) $ 136,982 $ 5,796 $ 142,778 $ Lease expense 75,378 168,345 (4,928) - 163,417 238,795 1,766 240,561 EBITDAR / Adjusted EBITDAR 359,355 $ - $ 1,052 $ 15,370 $ 16,422 $ 375,777 $ 7,562 $ 383,339 $ (Loss) income per common share: Diluted: Weighted average shares outstanding for diluted (loss) income from continuing operations per share (d) 82,279 153,671 Diluted net (loss) income from continuing operations per share (e) (1.58) $ 0.21 $ See (a), (b), (c), (d) and (e) footnote references contained herein. (UNAUDITED) (IN THOUSANDS, EXCEPT PER SHARE DATA) Adjustments |
