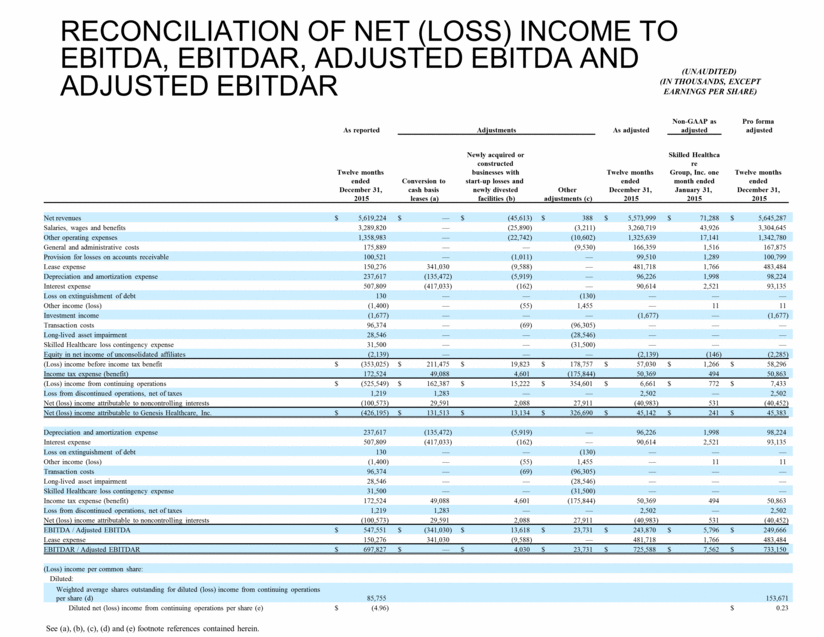
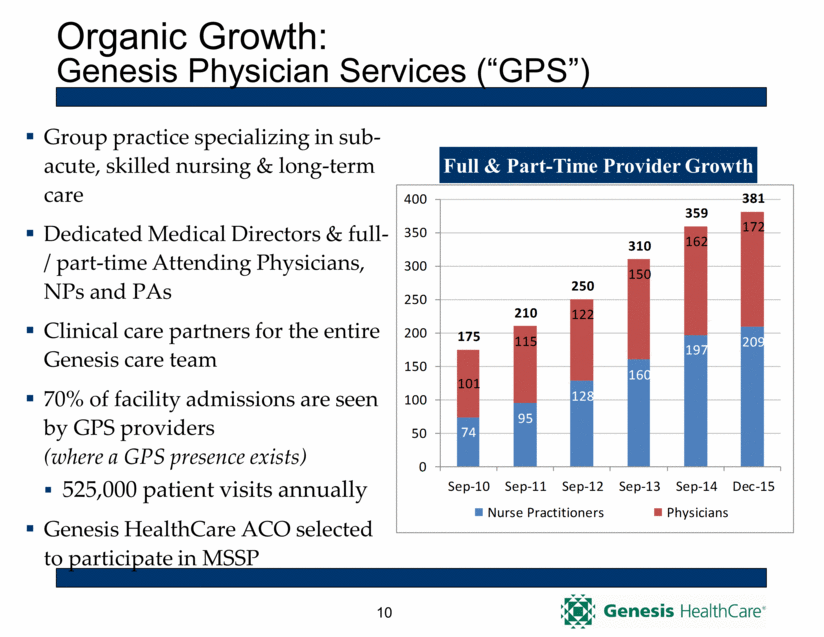
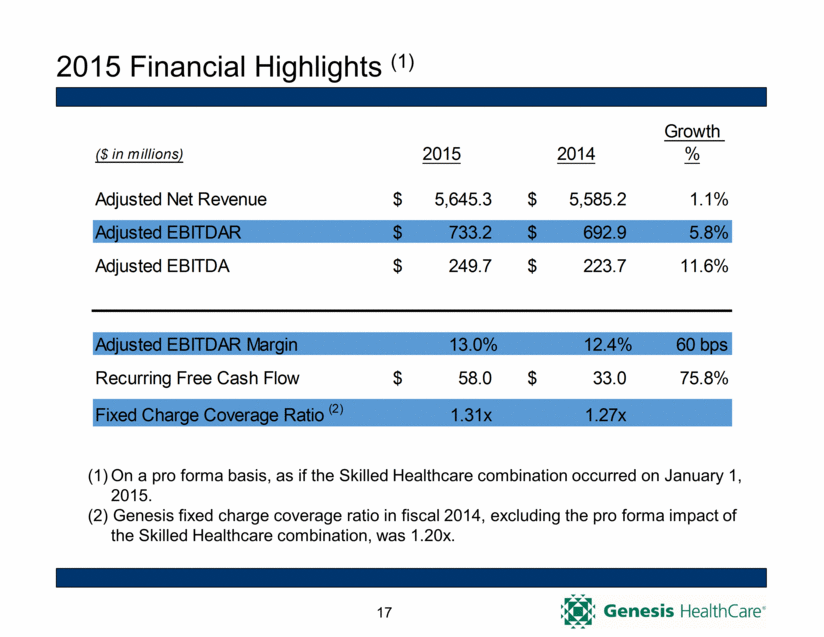
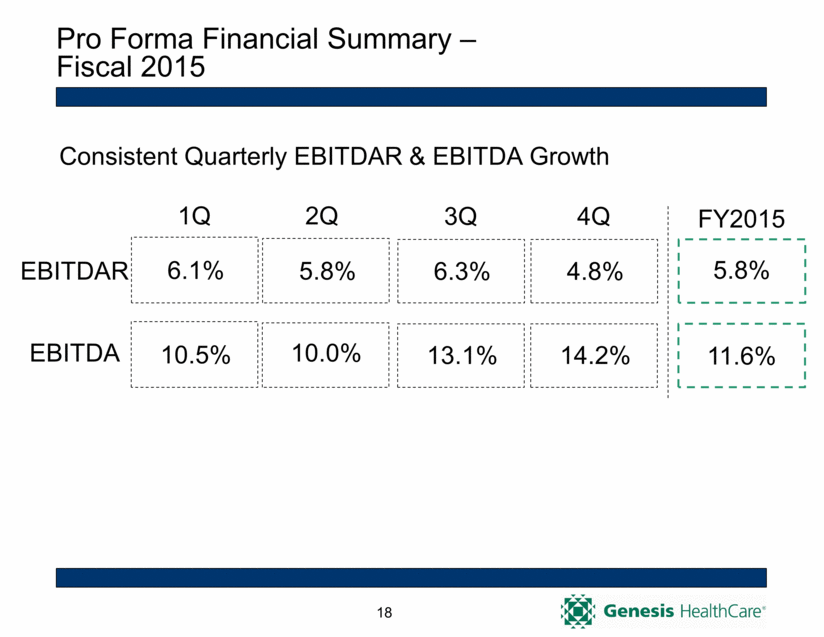
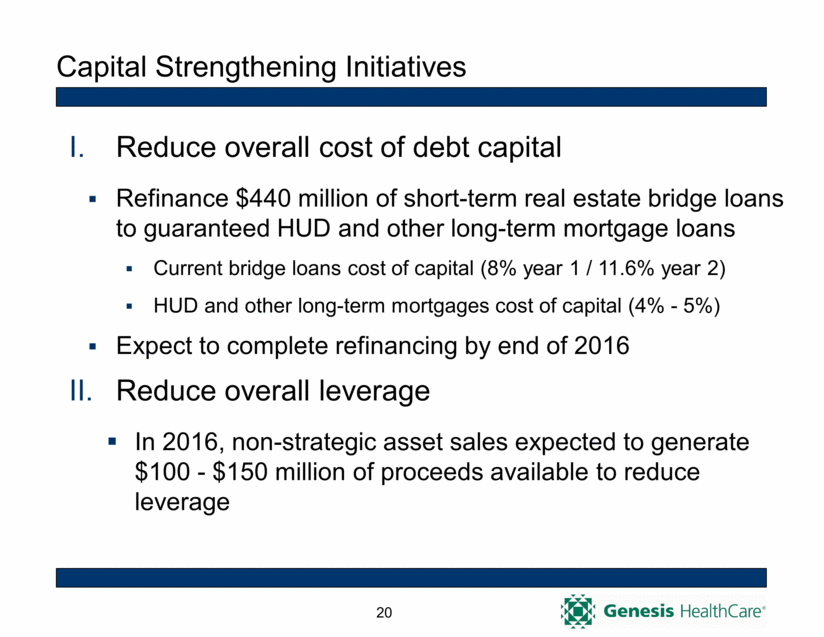
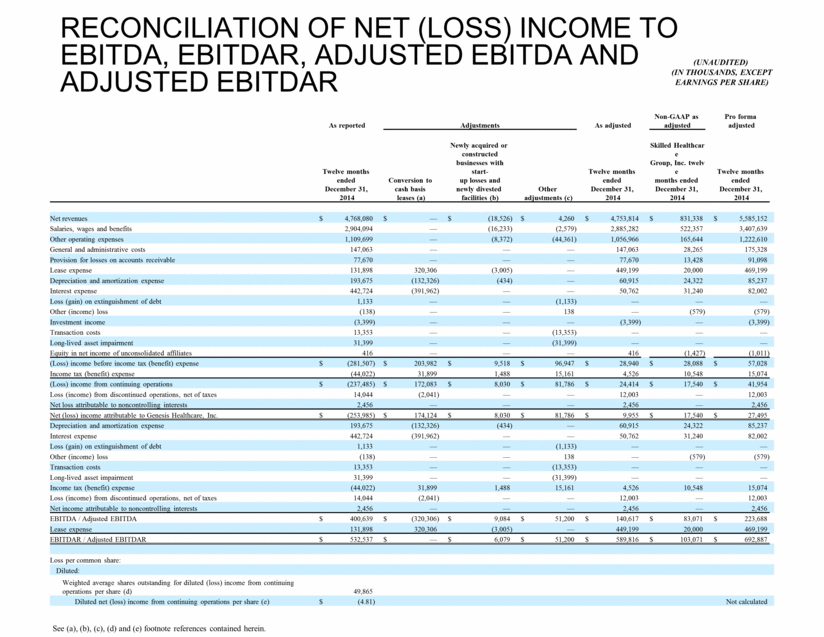
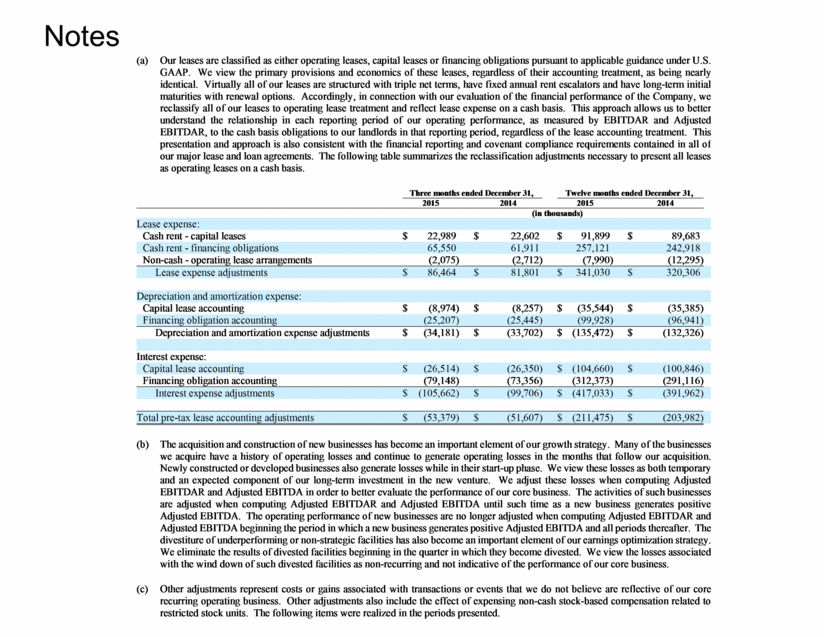
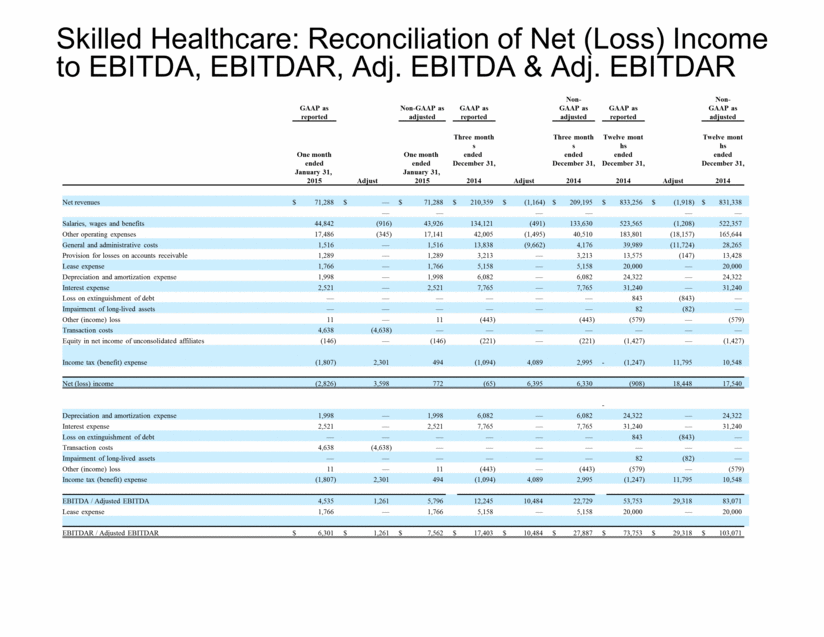
RECONCILIATION OF NET (LOSS) INCOME TO EBITDA, EBITDAR, ADJUSTED EBITDA AND ADJUSTED EBITDAR (UNAUDITED) (IN THOUSANDS, EXCEPT EARNINGS PER SHARE) As reported Adjustments As adjusted Non-GAAP as adjusted Pro forma adjusted Twelve months ended December 31, 2015 Conversion to cash basis leases (a) Newly acquired or constructed businesses with start-up losses and newly divested facilities (b) Other adjustments (c) Twelve months ended December 31, 2015 Skilled Healthcare Group, Inc. one month ended January 31, 2015 Twelve months ended December 31, 2015 Net revenues $ 5,619,224 $ — $ (45,613) $ 388 $ 5,573,999 $ 71,288 $ 5,645,287 Salaries, wages and benefits 3,289,820 — (25,890) (3,211) 3,260,719 43,926 3,304,645 Other operating expenses 1,358,983 — (22,742) (10,602) 1,325,639 17,141 1,342,780 General and administrative costs 175,889 — — (9,530) 166,359 1,516 167,875 Provision for losses on accounts receivable 100,521 — (1,011) — 99,510 1,289 100,799 Lease expense 150,276 341,030 (9,588) — 481,718 1,766 483,484 Depreciation and amortization expense 237,617 (135,472) (5,919) — 96,226 1,998 98,224 Interest expense 507,809 (417,033) (162) — 90,614 2,521 93,135 Loss on extinguishment of debt 130 — — (130) — — — Other income (loss) (1,400) — (55) 1,455 — 11 11 Investment income (1,677) — — — (1,677) — (1,677) Transaction costs 96,374 — (69) (96,305) — — — Long-lived asset impairment 28,546 — — (28,546) — — — Skilled Healthcare loss contingency expense 31,500 — — (31,500) — — — Equity in net income of unconsolidated affiliates (2,139) — — — (2,139) (146) (2,285) (Loss) income before income tax benefit $ (353,025) $ 211,475 $ 19,823 $ 178,757 $ 57,030 $ 1,266 $ 58,296 Income tax expense (benefit) 172,524 49,088 4,601 (175,844) 50,369 494 50,863 (Loss) income from continuing operations $ (525,549) $ 162,387 $ 15,222 $ 354,601 $ 6,661 $ 772 $ 7,433 Loss from discontinued operations, net of taxes 1,219 1,283 — — 2,502 — 2,502 Net (loss) income attributable to noncontrolling interests (100,573) 29,591 2,088 27,911 (40,983) 531 (40,452) Net (loss) income attributable to Genesis Healthcare, Inc. $ (426,195) $ 131,513 $ 13,134 $ 326,690 $ 45,142 $ 241 $ 45,383 Depreciation and amortization expense 237,617 (135,472) (5,919) — 96,226 1,998 98,224 Interest expense 507,809 (417,033) (162) — 90,614 2,521 93,135 Loss on extinguishment of debt 130 — — (130) — — — Other income (loss) (1,400) — (55) 1,455 — 11 11 Transaction costs 96,374 — (69) (96,305) — — — Long-lived asset impairment 28,546 — — (28,546) — — — Skilled Healthcare loss contingency expense 31,500 — — (31,500) — — — Income tax expense (benefit) 172,524 49,088 4,601 (175,844) 50,369 494 50,863 Loss from discontinued operations, net of taxes 1,219 1,283 — — 2,502 — 2,502 Net (loss) income attributable to noncontrolling interests (100,573) 29,591 2,088 27,911 (40,983) 531 (40,452) EBITDA / Adjusted EBITDA $ 547,551 $ (341,030) $ 13,618 $ 23,731 $ 243,870 $ 5,796 $ 249,666 Lease expense 150,276 341,030 (9,588) — 481,718 1,766 483,484 EBITDAR / Adjusted EBITDAR $ 697,827 $ — $ 4,030 $ 23,731 $ 725,588 $ 7,562 $ 733,150 (Loss) income per common share: Diluted: Weighted average shares outstanding for diluted (loss) income from continuing operations per share (d) 85,755 153,671 Diluted net (loss) income from continuing operations per share (e) $ (4.96) $ 0.23 See (a), (b), (c), (d) and (e) footnote references contained herein.