
1
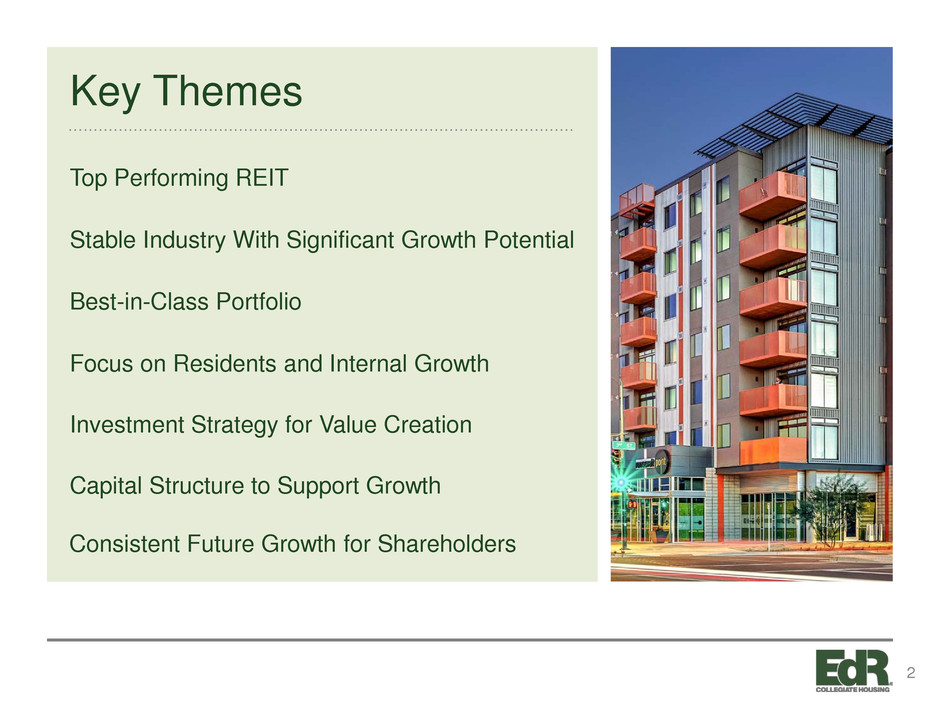
Key Themes Top Performing REIT Stable Industry With Significant Growth Potential Best-in-Class Portfolio Focus on Residents and Internal Growth Investment Strategy for Value Creation Capital Structure to Support Growth Consistent Future Growth for Shareholders 2
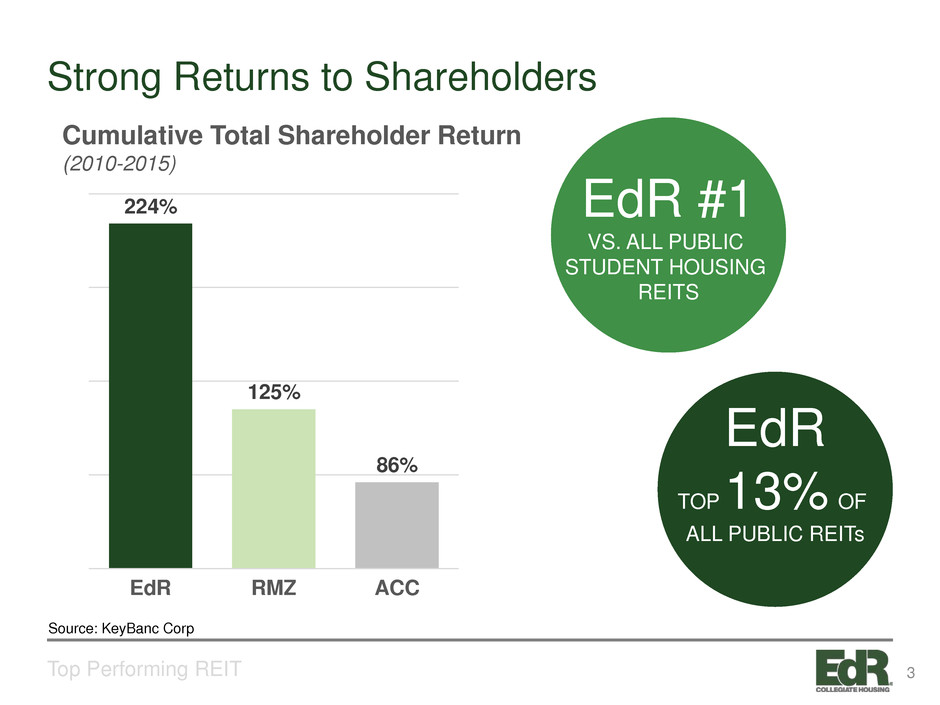
Strong Returns to Shareholders Top Performing REIT EdR #1 VS. ALL PUBLIC STUDENT HOUSING REITS EdR TOP13% OF ALL PUBLIC REITs Cumulative Total Shareholder Return (2010-2015) 224% 125% 86% EdR RMZ ACC Source: KeyBanc Corp 3
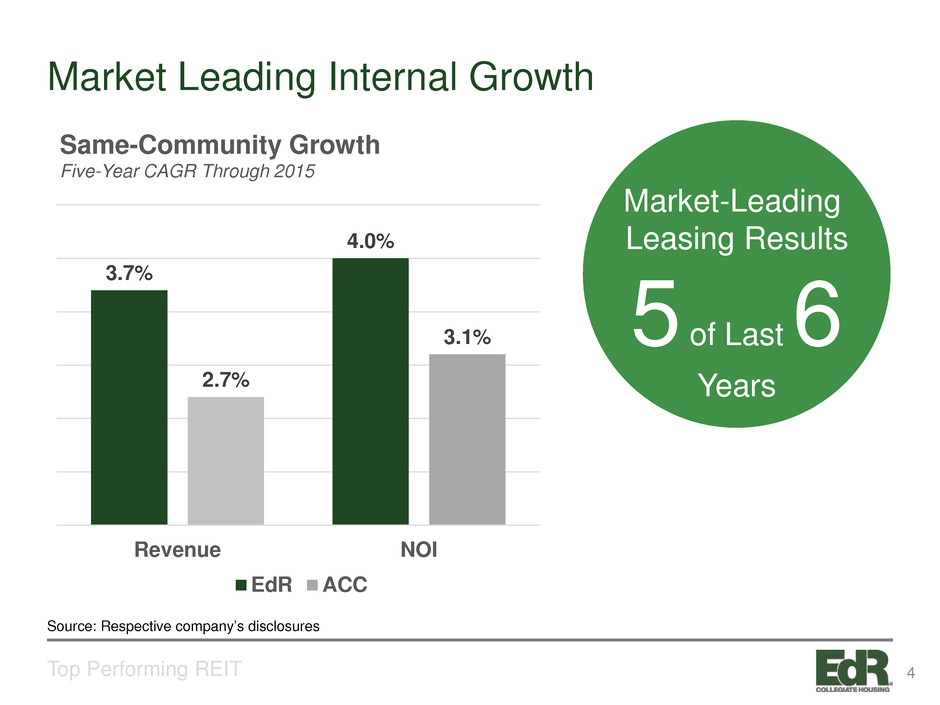
Market Leading Internal Growth Top Performing REIT Same-Community Growth Five-Year CAGR Through 2015 3.7% 4.0% 2.7% 3.1% Revenue NOI EdR ACC Source: Respective company’s disclosures Market-Leading Leasing Results 5 of Last 6 Years 4
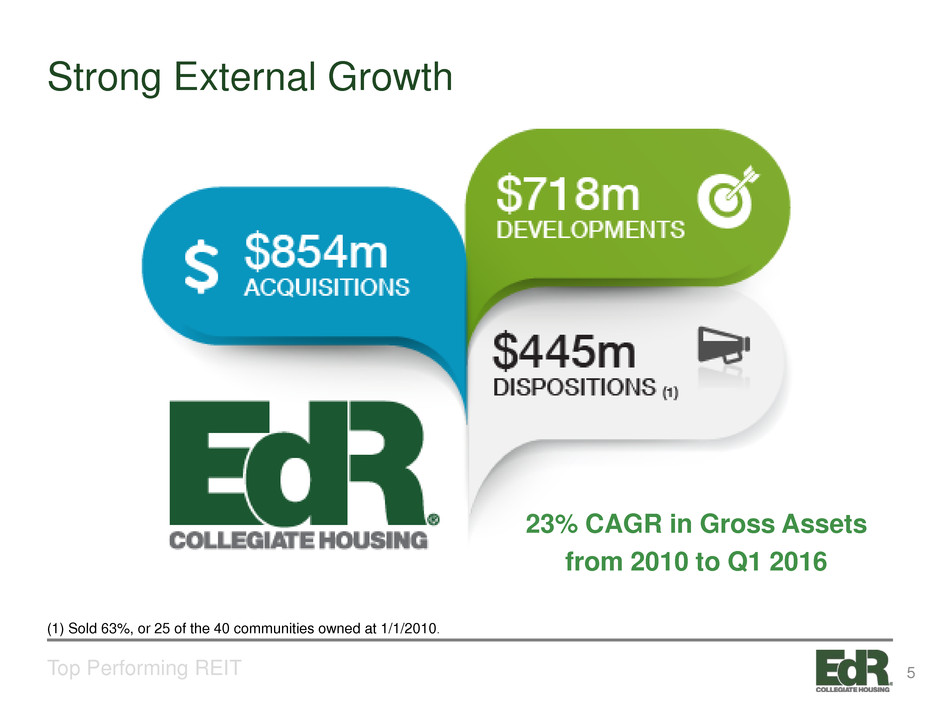
Strong External Growth Top Performing REIT (1) Sold 63%, or 25 of the 40 communities owned at 1/1/2010. 23% CAGR in Gross Assets from 2010 to Q1 2016 5
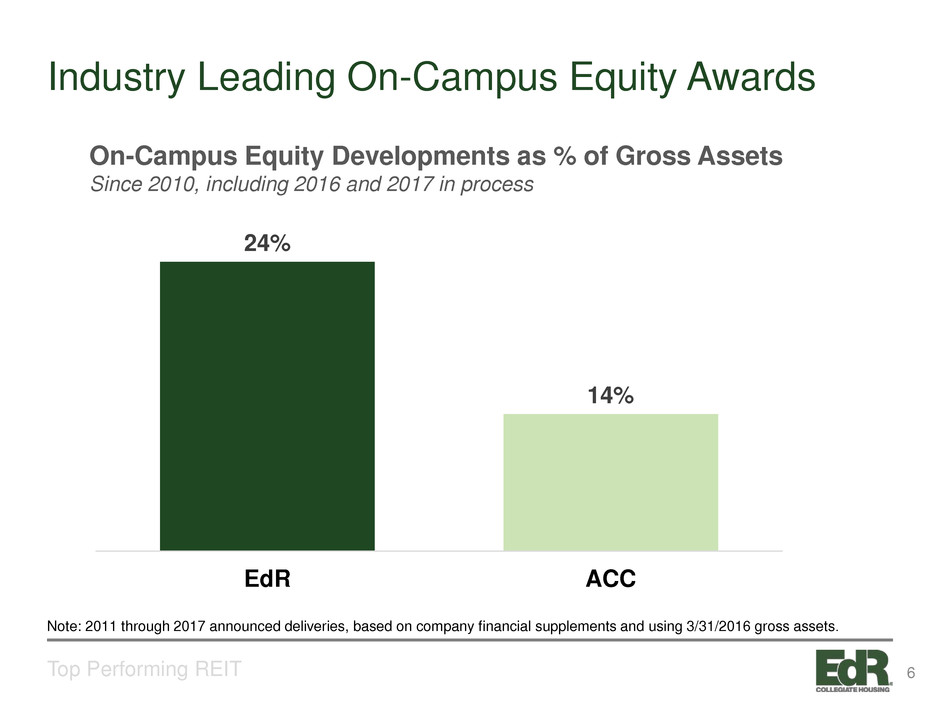
Industry Leading On-Campus Equity Awards Top Performing REIT 24% 14% EdR ACC On-Campus Equity Developments as % of Gross Assets Since 2010, including 2016 and 2017 in process Note: 2011 through 2017 announced deliveries, based on company financial supplements and using 3/31/2016 gross assets. 6
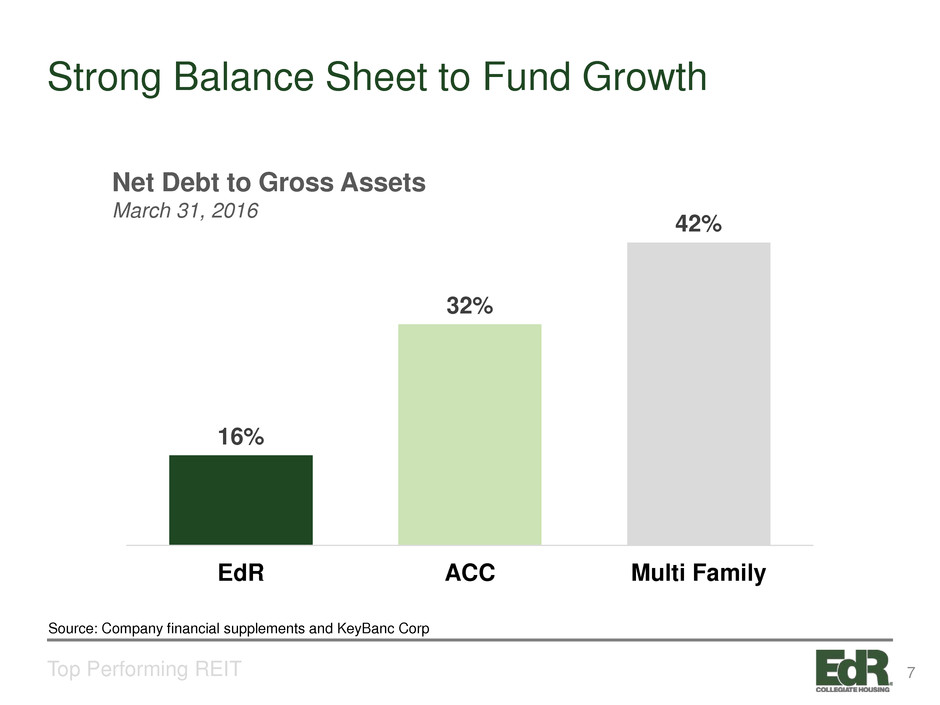
Strong Balance Sheet to Fund Growth Top Performing REIT 16% 32% 42% EdR ACC Multi Family Source: Company financial supplements and KeyBanc Corp Net Debt to Gross Assets March 31, 2016 7

8

2.0% 1.2% 1.5% 1.7% 1.3% 1.3% 1.2% 1.5% 1.5% 1.4% 2014 2015 2016 2017 2018 2019 2020 2021 2022 2023 Stable Demand Stable Industry With Significant Growth Potential Projected Full-Time Enrollment Growth Projected Average % Growth 2014-2023 = 1.4% Sources: National Center for Education Statistics (NCES) report titled “Projections of Education Statistics to 2022, Forty-first edition (Feb. 2014)”, Pew Research - Social & Demographic Trends: The Rising Cost of Not Going to College, February 11, 2014,, Moody’s Investors Service, Special Comment: More US Colleges Face Stagnating Enrollment and Tuition Revenue, According to Moody’s Survey, Jan. 10, 2013. Enrollment Drivers • Higher education earnings gap – Millennials with only a high school diploma earn 62% of what the typical college graduate earns – Earnings gap has stretched to its widest level in nearly a half century • Students seek the highest value education • There is a correlation between university size and enrollment trends, with the highest median enrollment growth experienced at large, program-diversified universities. 9
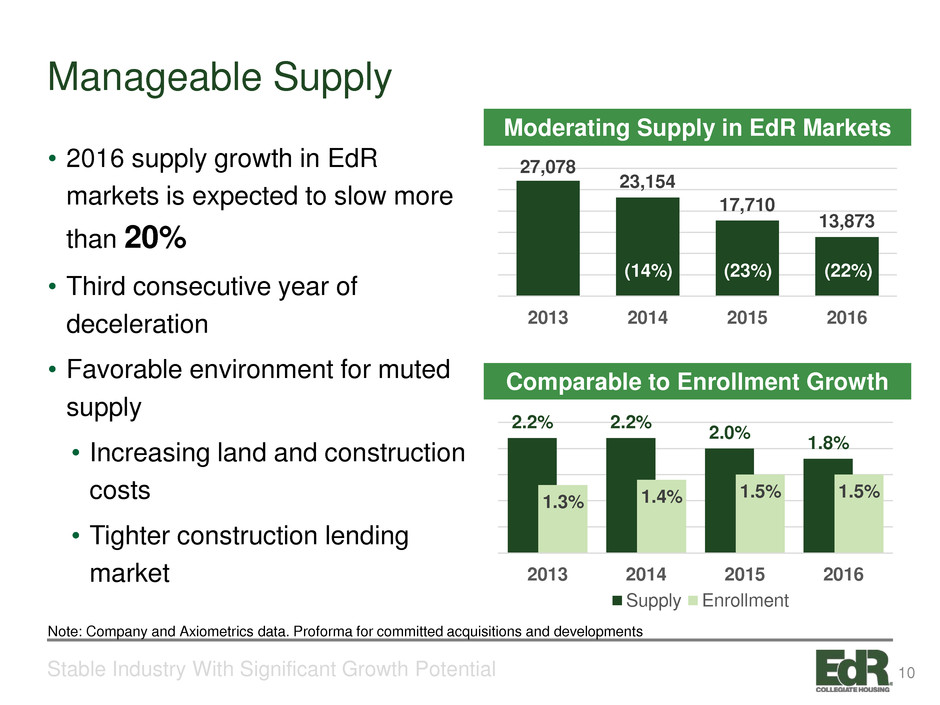
Manageable Supply Stable Industry With Significant Growth Potential Moderating Supply in EdR Markets Comparable to Enrollment Growth Note: Company and Axiometrics data. Proforma for committed acquisitions and developments • 2016 supply growth in EdR markets is expected to slow more than 20% • Third consecutive year of deceleration • Favorable environment for muted supply • Increasing land and construction costs • Tighter construction lending market 27,078 23,154 17,710 13,873 2013 2014 2015 2016 2.2% 2.2% 2.0% 1.8% 1.3% 1.4% 1.5% 1.5% 2013 2014 2015 2016 Supply Enrollment (14%) (23%) (22%) 10

Modernization Stable Industry With Significant Growth Potential Modernization is in full swing with new purpose-built housing supply replacing older duplexes, single-family homes, etc. Other Housing 47%On-Campus Housing 27% Off-Campus Purpose Built 26% Source: Company and Axiometrics data. 11

Consistent and Stable Revenue Growth Stable Industry With Significant Growth Potential Student Housing - 44 consecutive quarters with same store revenue growth. 3.4% Average 3.1% Average -6% -4% -2% 0% 2% 4% 6% 8% 2005 2006 2007 2008 2009 2010 2011 2012 2013 2014 2015 S am e S to re R ev en ue G ro w th , y /y Student Housing Apartment Source: SNL Financial and Goldman Sachs Global Investment Research 12
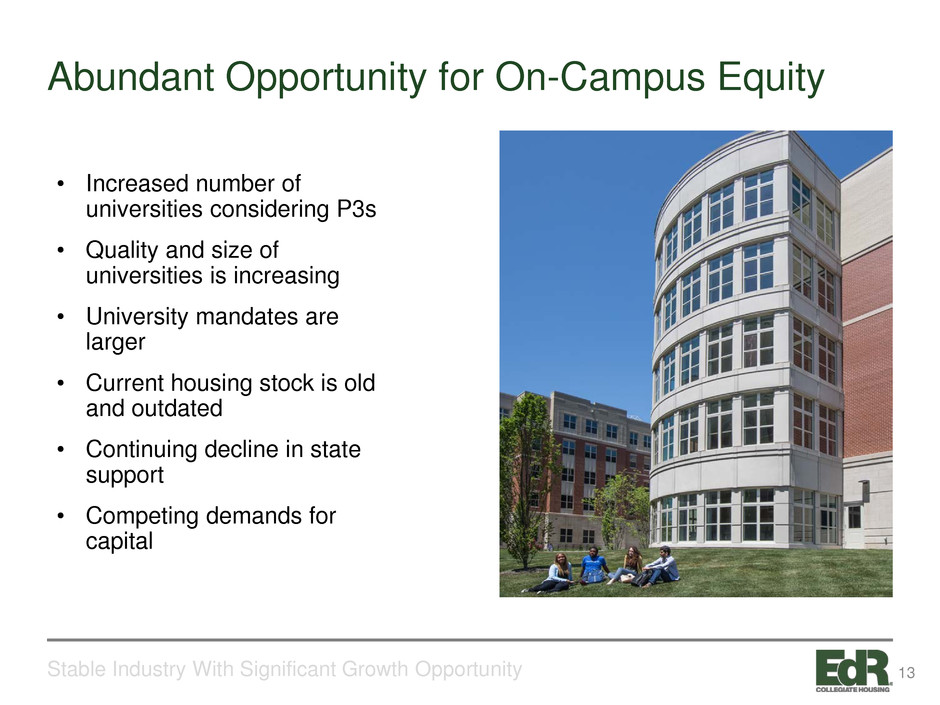
Abundant Opportunity for On-Campus Equity Stable Industry With Significant Growth Opportunity • Increased number of universities considering P3s • Quality and size of universities is increasing • University mandates are larger • Current housing stock is old and outdated • Continuing decline in state support • Competing demands for capital 13

14
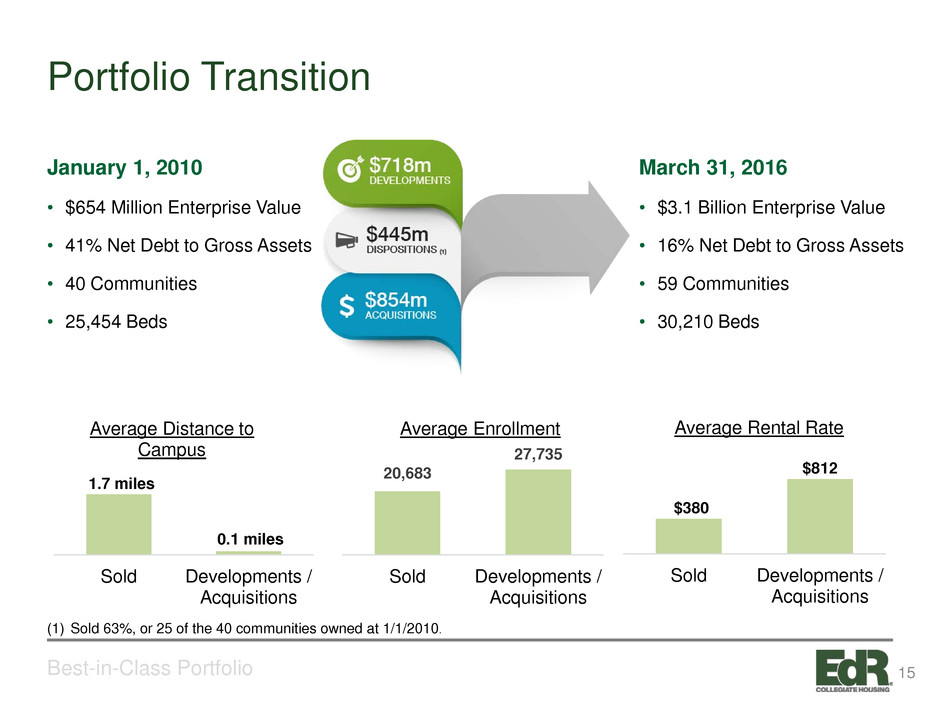
Portfolio Transition Best-in-Class Portfolio January 1, 2010 • $654 Million Enterprise Value • 41% Net Debt to Gross Assets • 40 Communities • 25,454 Beds March 31, 2016 • $3.1 Billion Enterprise Value • 16% Net Debt to Gross Assets • 59 Communities • 30,210 Beds (1) Sold 63%, or 25 of the 40 communities owned at 1/1/2010. 1.7 miles 0.1 miles Sold Developments / Acquisitions Average Distance to Campus 20,683 27,735 Sold Developments / Acquisitions Average Enrollment $380 $812 Sold Developments / Acquisitions Average Rental Rate 15
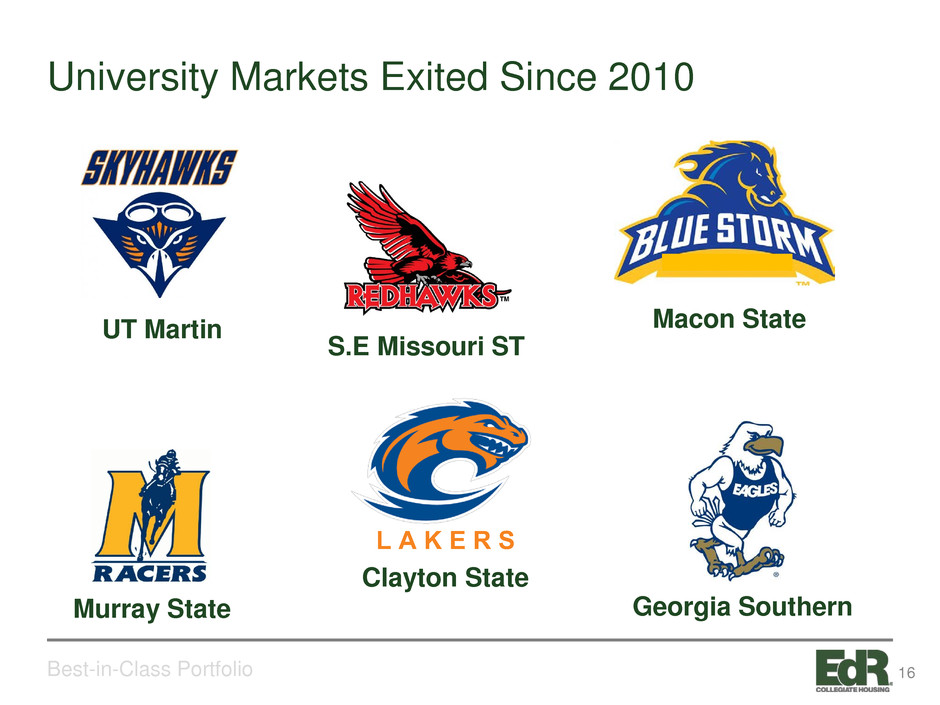
University Markets Exited Since 2010 Best-in-Class Portfolio L A K E R S UT Martin S.E Missouri ST Macon State Georgia Southern Clayton State Murray State 16

New University Markets Since 2010 Best-in-Class Portfolio 17
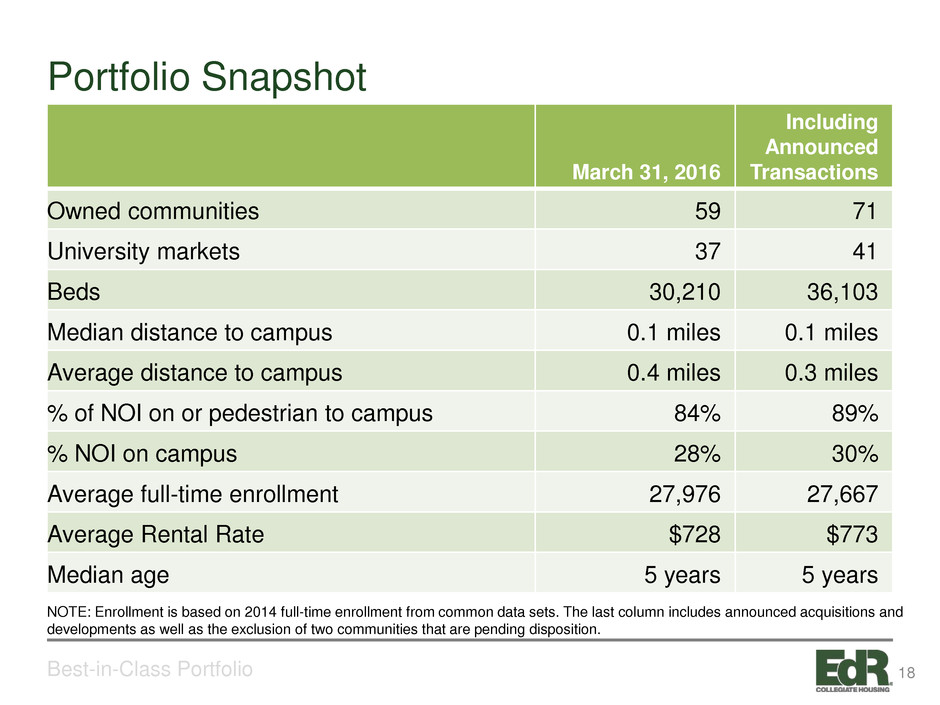
Portfolio Snapshot Best-in-Class Portfolio March 31, 2016 Including Announced Transactions Owned communities 59 71 University markets 37 41 Beds 30,210 36,103 Median distance to campus 0.1 miles 0.1 miles Average distance to campus 0.4 miles 0.3 miles % of NOI on or pedestrian to campus 84% 89% % NOI on campus 28% 30% Average full-time enrollment 27,976 27,667 Average Rental Rate $728 $773 Median age 5 years 5 years NOTE: Enrollment is based on 2014 full-time enrollment from common data sets. The last column includes announced acquisitions and developments as well as the exclusion of two communities that are pending disposition. 18
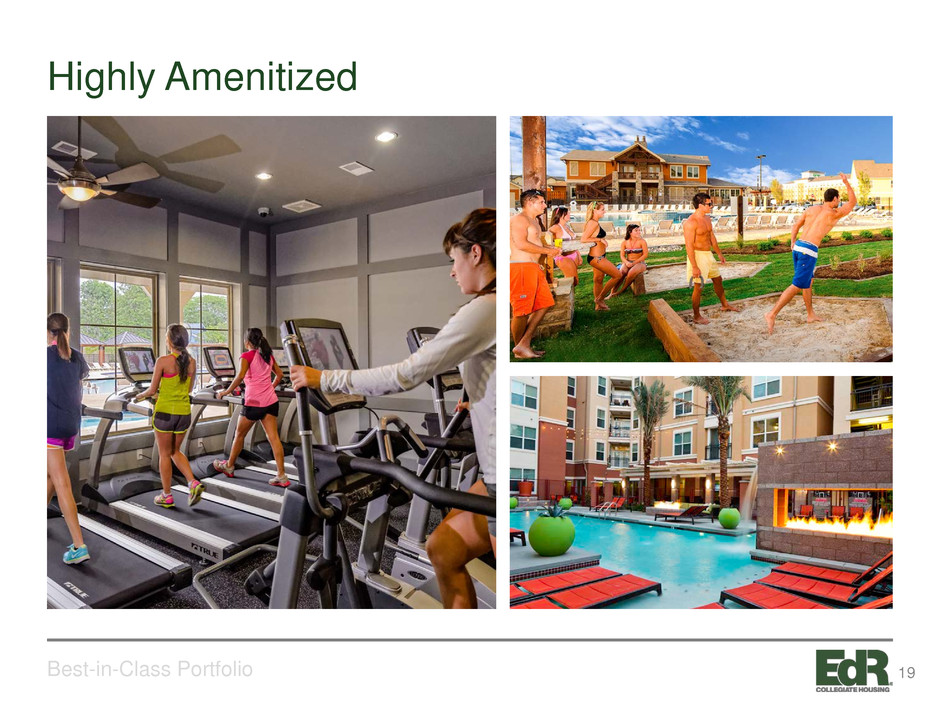
Highly Amenitized Best-in-Class Portfolio 19
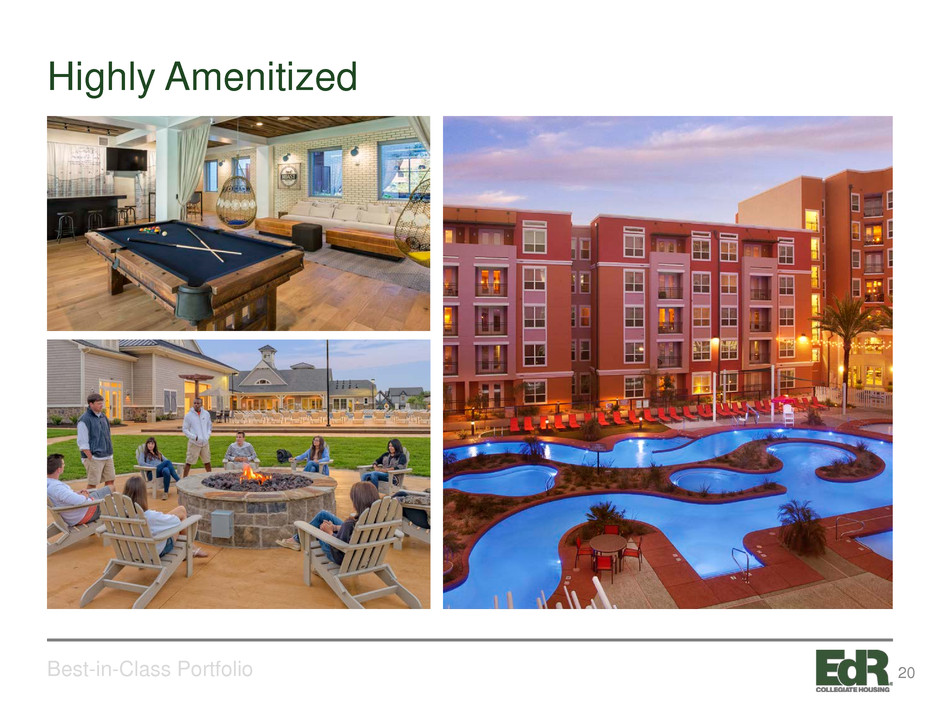
Highly Amenitized Best-in-Class Portfolio 20
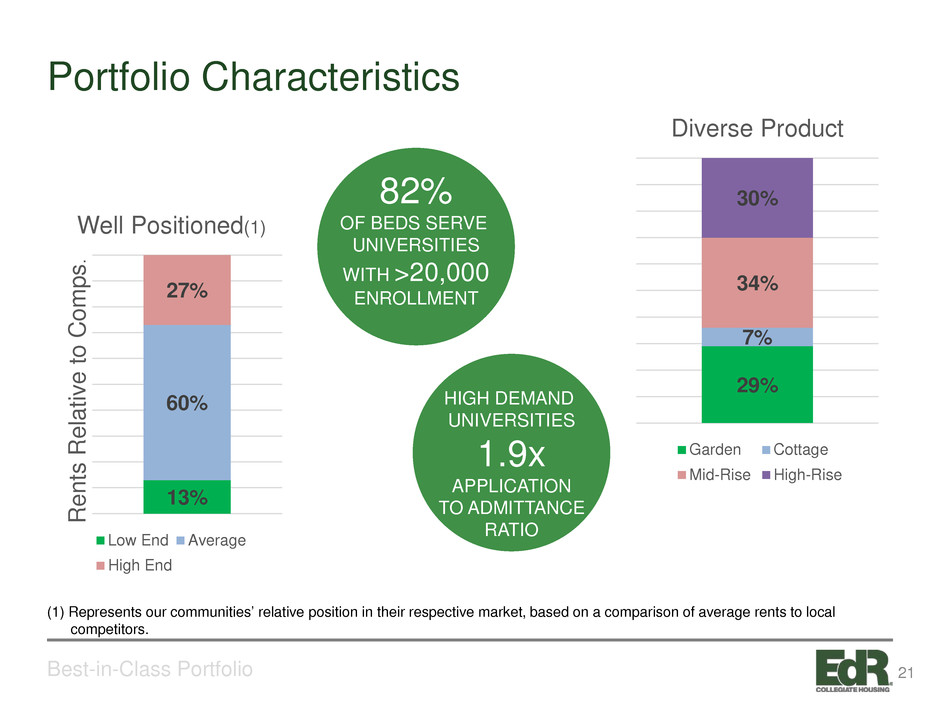
Portfolio Characteristics Best-in-Class Portfolio 13% 60% 27% R en ts R el at iv e to C om ps . Well Positioned(1) Low End Average High End 29% 7% 34% 30% Diverse Product Garden Cottage Mid-Rise High-Rise 82% OF BEDS SERVE UNIVERSITIES WITH >20,000 ENROLLMENT HIGH DEMAND UNIVERSITIES 1.9x APPLICATION TO ADMITTANCE RATIO (1) Represents our communities’ relative position in their respective market, based on a comparison of average rents to local competitors. 21
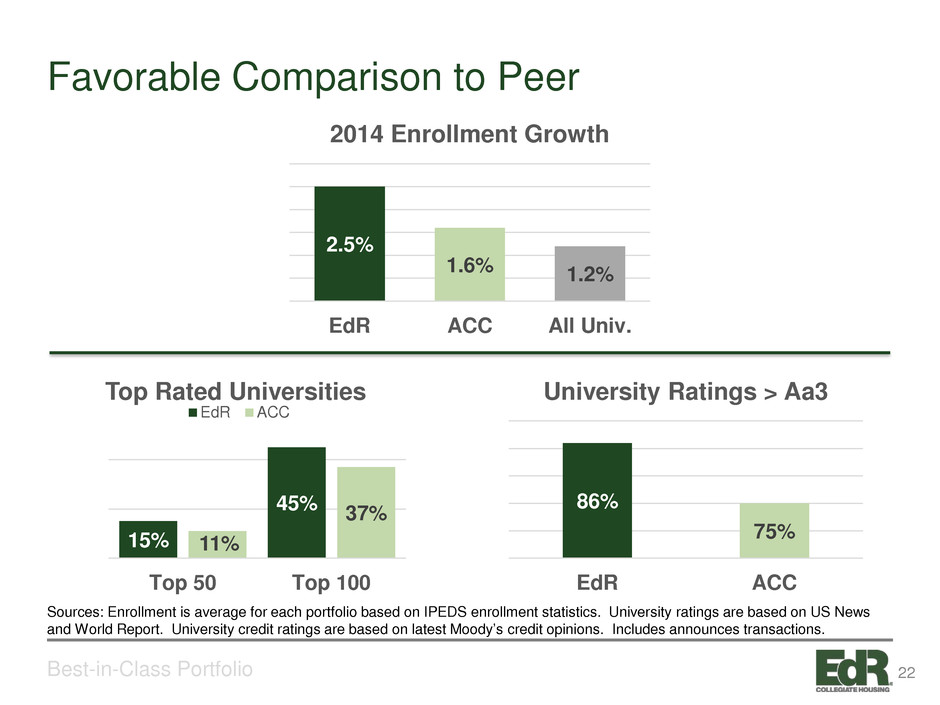
Favorable Comparison to Peer Best-in-Class Portfolio 86% 75% EdR ACC University Ratings > Aa3 15% 45% 11% 37% Top 50 Top 100 Top Rated Universities EdR ACC 2.5% 1.6% 1.2% EdR ACC All Univ. 2014 Enrollment Growth Sources: Enrollment is average for each portfolio based on IPEDS enrollment statistics. University ratings are based on US News and World Report. University credit ratings are based on latest Moody’s credit opinions. Includes announces transactions. 22

Stronger Operating Performance Best-in-Class Portfolio 56% 53% EdR ACC 2015 Same-Community Margins $669 $646 EdR ACC 2015 Same-Community NAR per Occupied Bed Source: Respective company’s disclosures 23
24
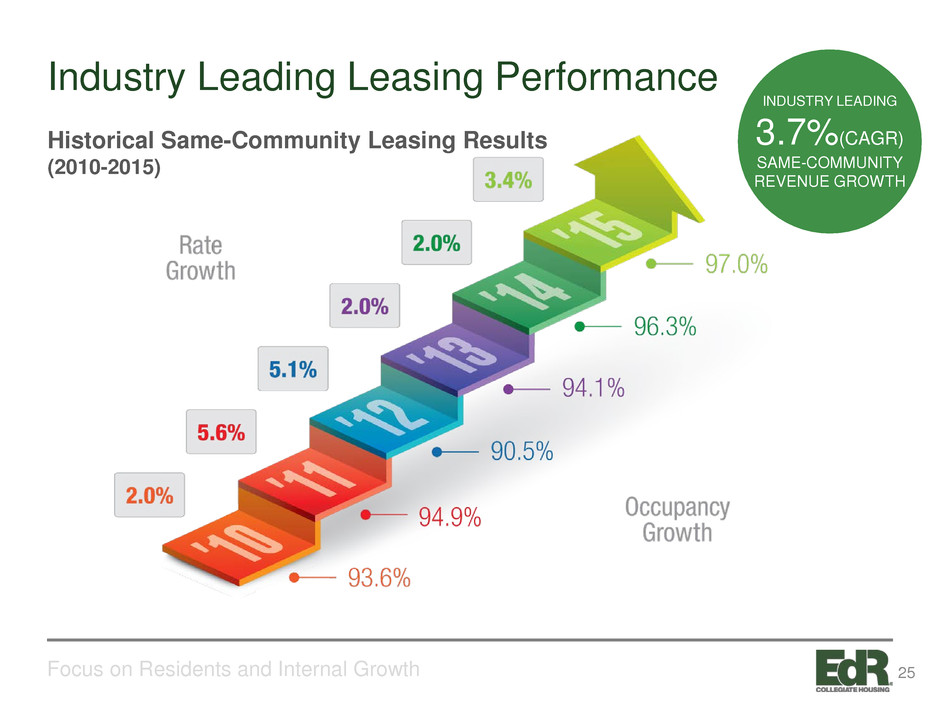
Industry Leading Leasing Performance Focus on Residents and Internal Growth INDUSTRY LEADING 3.7%(CAGR) SAME-COMMUNITY REVENUE GROWTH Historical Same-Community Leasing Results (2010-2015) 25
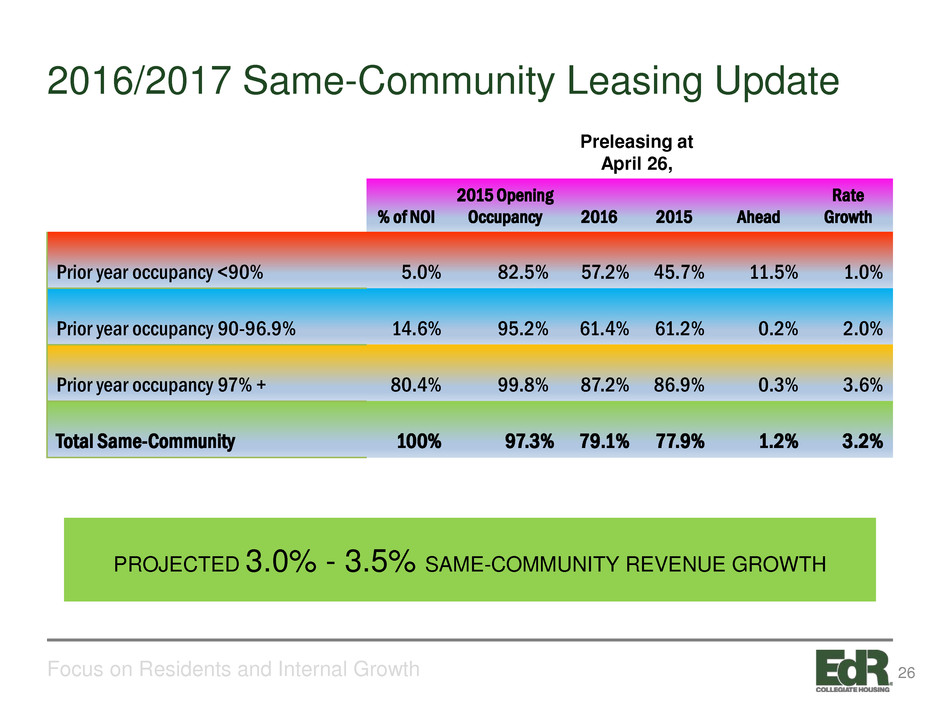
2016/2017 Same-Community Leasing Update Focus on Residents and Internal Growth Preleasing at April 26, % of NOI 2015 Opening Occupancy 2016 2015 Ahead Rate Growth Prior year occupancy <90% 5.0% 82.5% 57.2% 45.7% 11.5% 1.0% Prior year occupancy 90-96.9% 14.6% 95.2% 61.4% 61.2% 0.2% 2.0% Prior year occupancy 97% + 80.4% 99.8% 87.2% 86.9% 0.3% 3.6% Total Same-Community 100% 97.3% 79.1% 77.9% 1.2% 3.2% PROJECTED 3.0% - 3.5% SAME-COMMUNITY REVENUE GROWTH 26
Sales & Marketing Focus on Residents and Internal Growth 27
Sales Initiatives Focus on Residents and Internal Growth 28
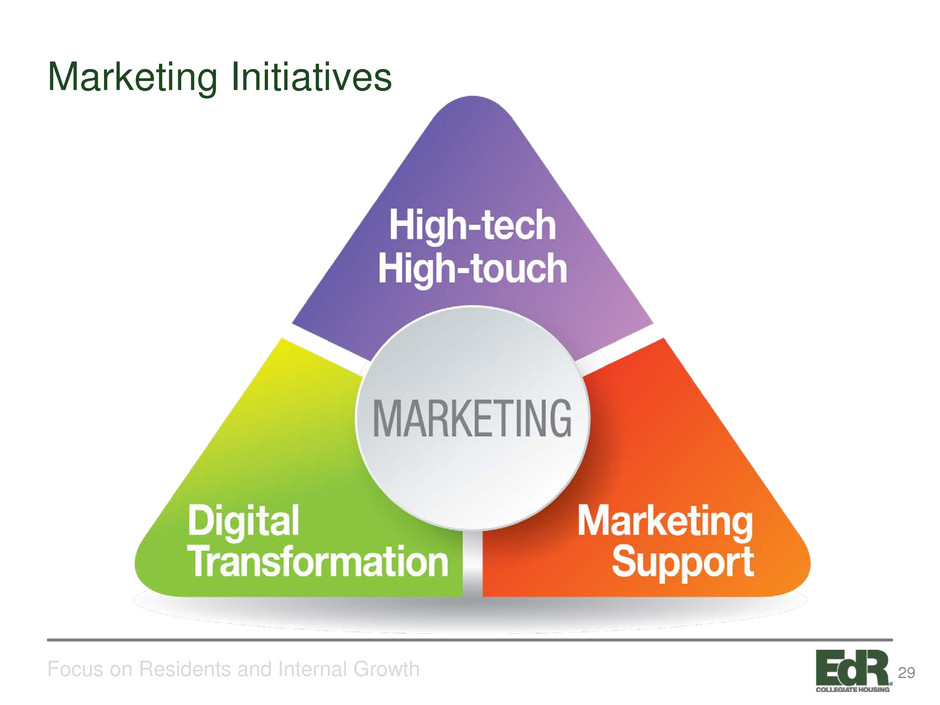
Marketing Initiatives Focus on Residents and Internal Growth 29
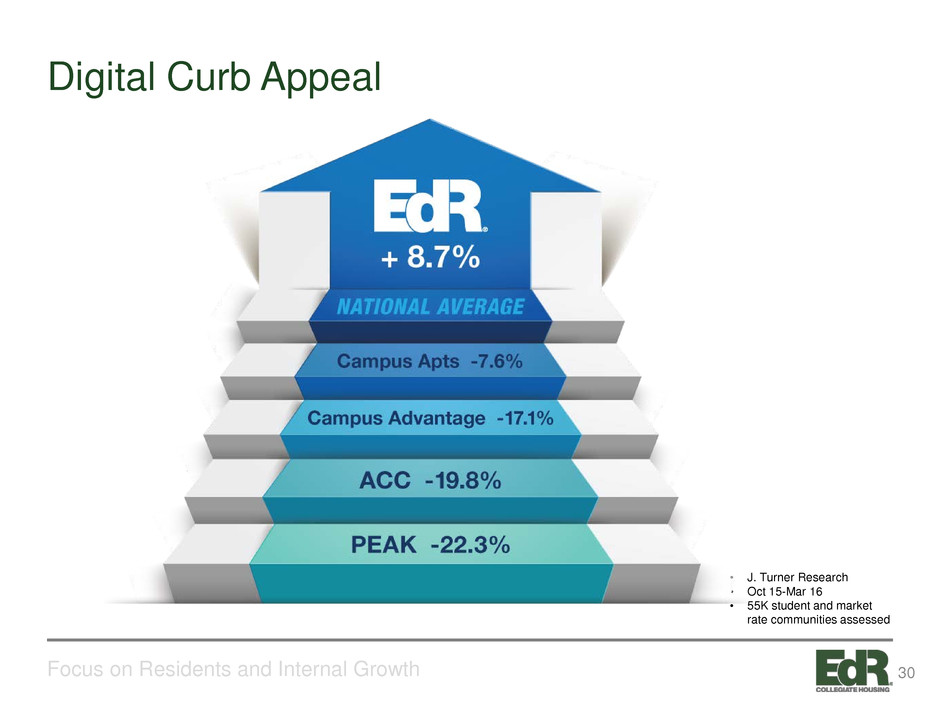
Digital Curb Appeal Focus on Residents and Internal Growth • J. Turner Research • Oct 15-Mar 16 • 55K student and market rate communities assessed 30
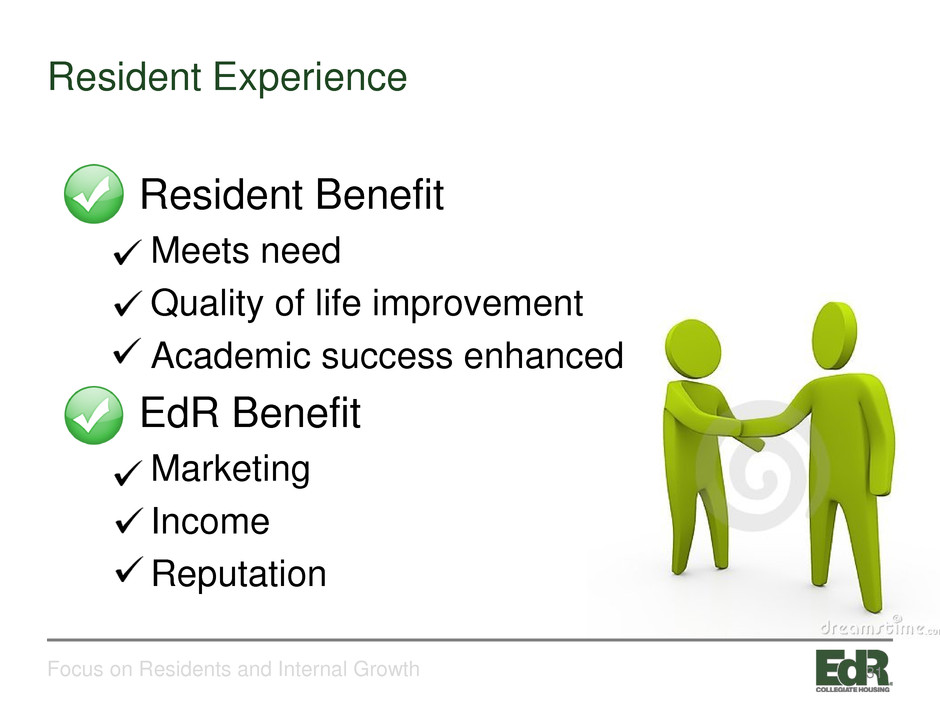
Resident Experience Focus on Residents and Internal Growth • Resident Benefit Meets need Quality of life improvement Academic success enhanced • EdR Benefit Marketing Income Reputation 31

Resident Experience Focus on Residents and Internal Growth 32

33

34

35
36
37
Resident Experience Focus on Residents and Internal Growth 38
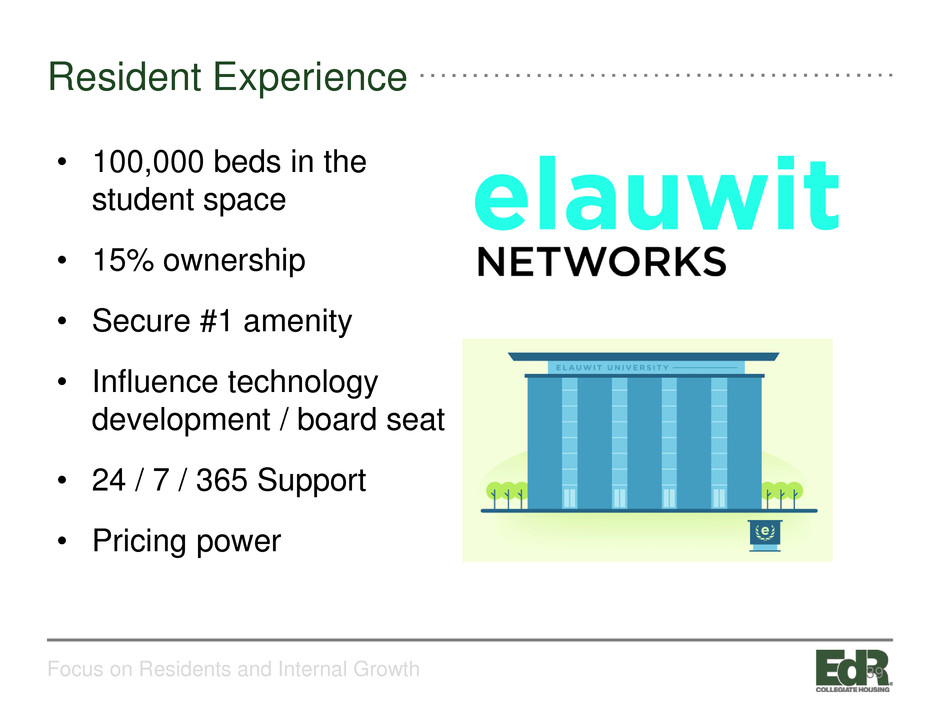
Resident Experience Focus on Residents and Internal Growth • 100,000 beds in the student space • 15% ownership • Secure #1 amenity • Influence technology development / board seat • 24 / 7 / 365 Support • Pricing power 39
Resident Experience Focus on Residents and Internal Growth 40

41

65% of all leases come from friend/word of mouth 42
Sustainable Growth Focus on Residents and Internal Growth • Stable Enrollment Trends – demand • Muted New competition – supply • Solid program in sales and marketing • First class resident experience • A+ team and communities • Strong pre-leasing for the 4th straight year 43

Focus on Residents and Internal Growth 44
45
External Growth Priorities Investment Strategy for Value Creation • Deliver all active developments on time and on budget with operating performance in keeping with our underwriting. • Win more ONE Plan, on-campus, development opportunities • Create a meaningful pipeline of off-campus developments for 2018 and beyond • Disciplined monitoring of the acquisition markets 46
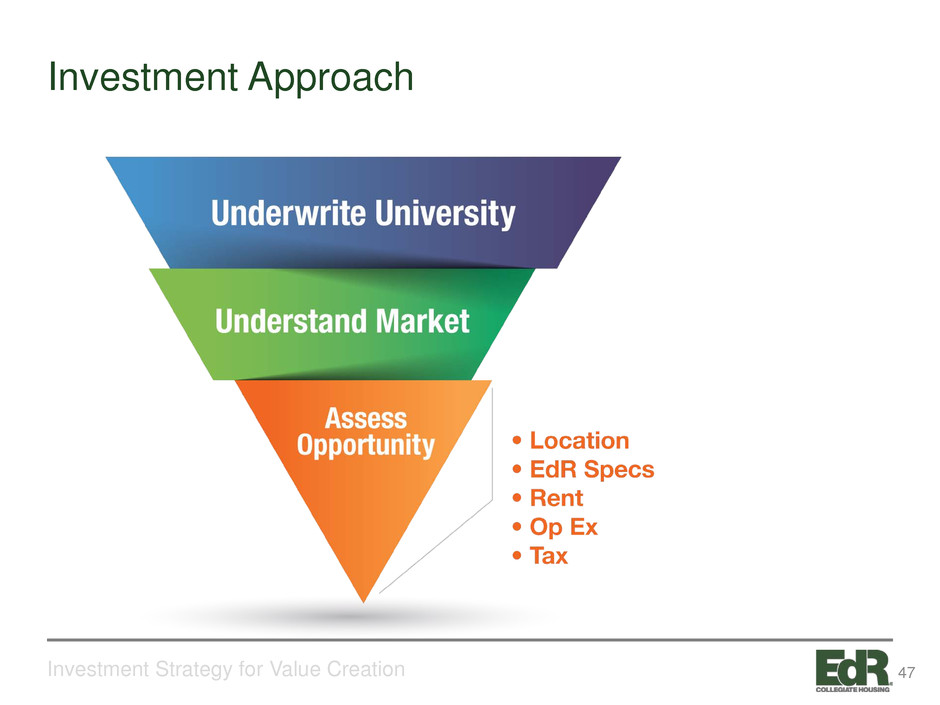
Investment Approach Investment Strategy for Value Creation 47
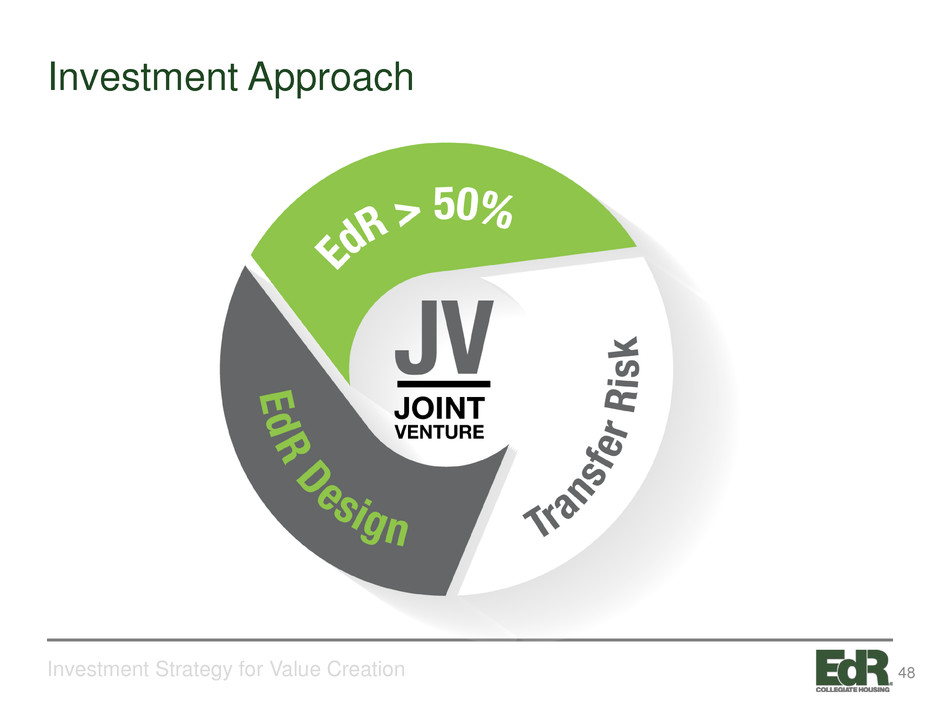
Investment Approach Investment Strategy for Value Creation 48
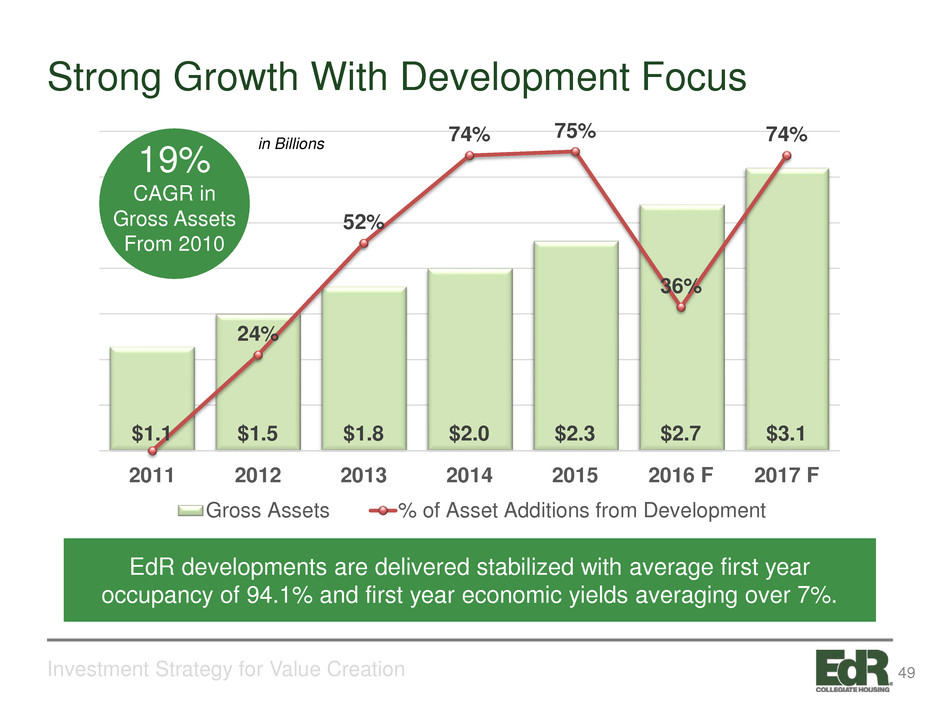
Strong Growth With Development Focus Investment Strategy for Value Creation $1.1 $1.5 $1.8 $2.0 $2.3 $2.7 $3.1 24% 52% 74% 75% 36% 74% 0% 10% 20% 30% 40% 50% 60% 70% 80% $0.0 $0.5 $1.0 $1.5 $2.0 $2.5 $3.0 $3.5 2011 2012 2013 2014 2015 2016 F 2017 F Gross Assets % of Asset Additions from Development EdR developments are delivered stabilized with average first year occupancy of 94.1% and first year economic yields averaging over 7%. 19% CAGR in Gross Assets From 2010 in Billions 49
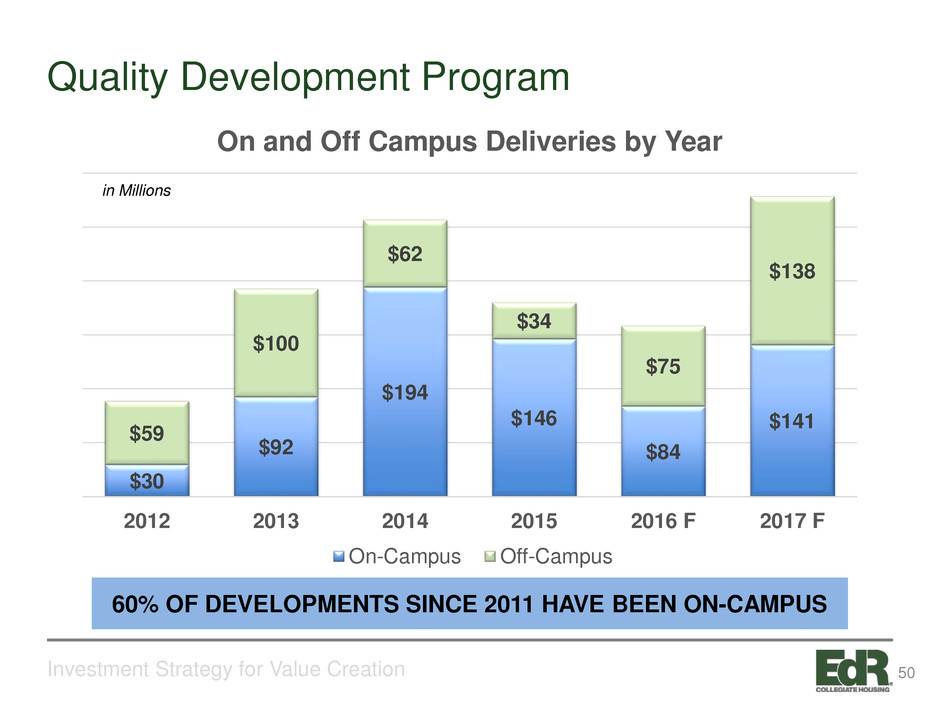
Quality Development Program Investment Strategy for Value Creation $30 $92 $194 $146 $84 $141$59 $100 $62 $34 $75 $138 2012 2013 2014 2015 2016 F 2017 F On and Off Campus Deliveries by Year On-Campus Off-Campus in Millions 60% OF DEVELOPMENTS SINCE 2011 HAVE BEEN ON-CAMPUS 50
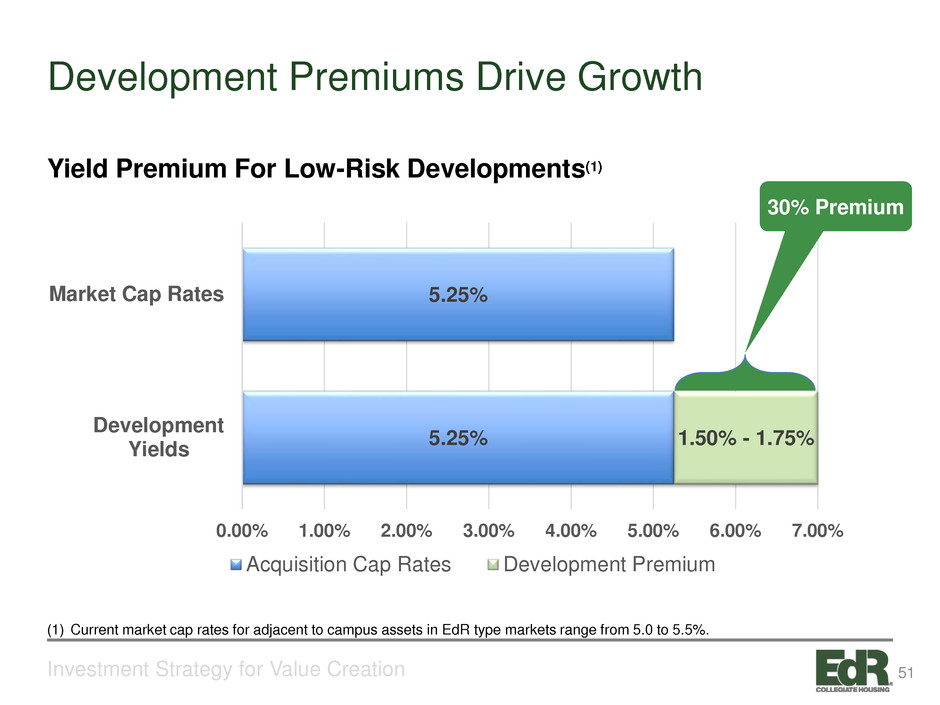
Development Premiums Drive Growth Investment Strategy for Value Creation 5.25% 5.25% 1.50% - 1.75% 0.00% 1.00% 2.00% 3.00% 4.00% 5.00% 6.00% 7.00% Development Yields Market Cap Rates Acquisition Cap Rates Development Premium 30% Premium Yield Premium For Low-Risk Developments(1) (1) Current market cap rates for adjacent to campus assets in EdR type markets range from 5.0 to 5.5%. 51
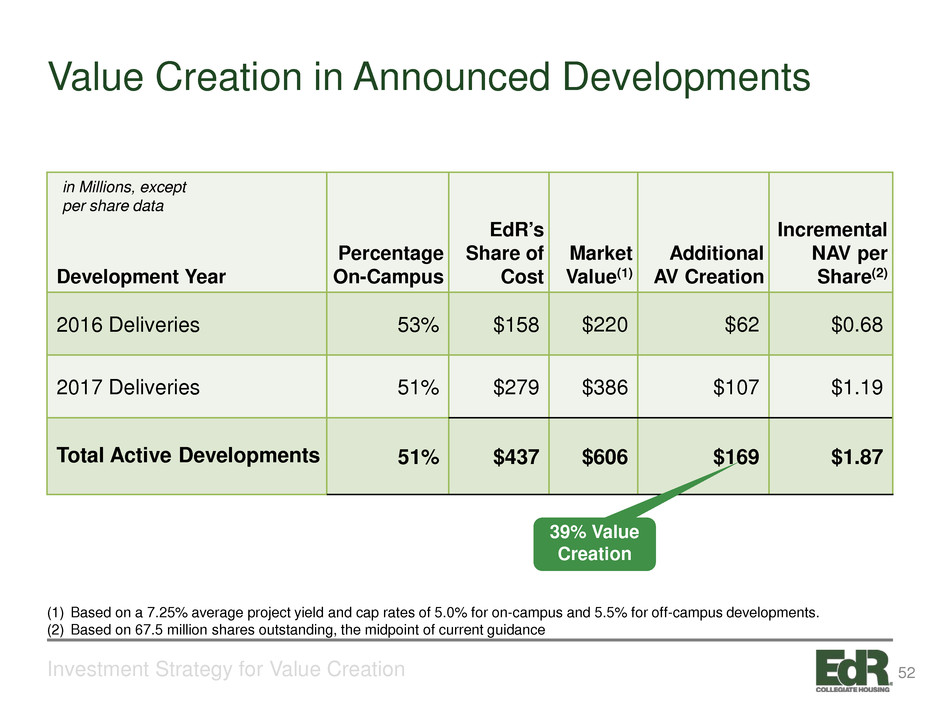
Value Creation in Announced Developments Investment Strategy for Value Creation Development Year Percentage On-Campus EdR’s Share of Cost Market Value(1) Additional AV Creation Incremental NAV per Share(2) 2016 Deliveries 53% $158 $220 $62 $0.68 2017 Deliveries 51% $279 $386 $107 $1.19 Total Active Developments 51% $437 $606 $169 $1.87 (1) Based on a 7.25% average project yield and cap rates of 5.0% for on-campus and 5.5% for off-campus developments. (2) Based on 67.5 million shares outstanding, the midpoint of current guidance 39% Value Creation in Millions, except per share data 52
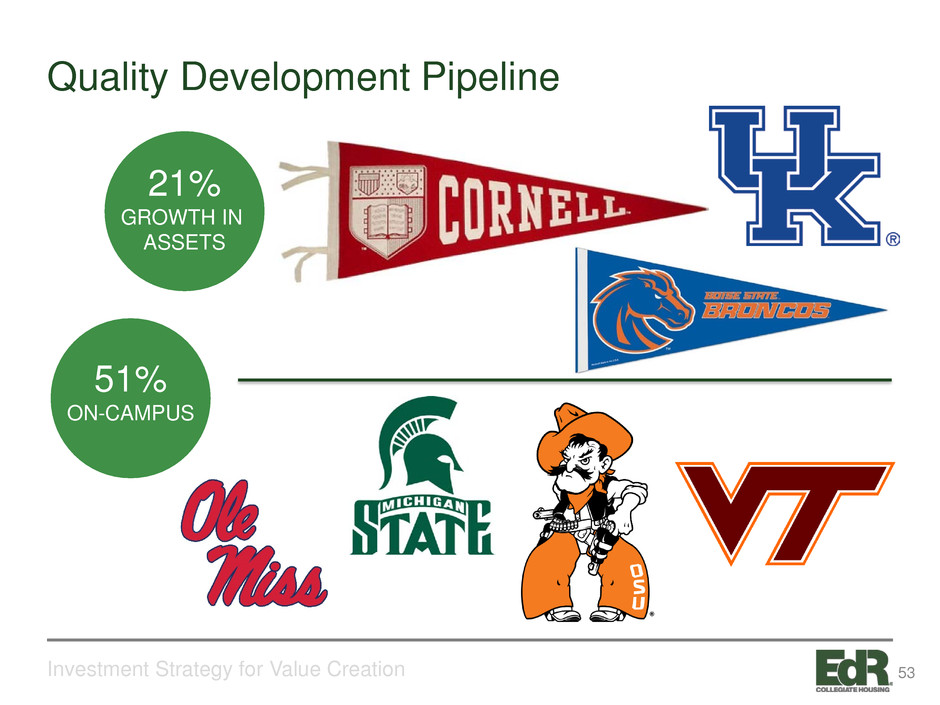
Quality Development Pipeline Investment Strategy for Value Creation 21% GROWTH IN ASSETS 51% ON-CAMPUS 53
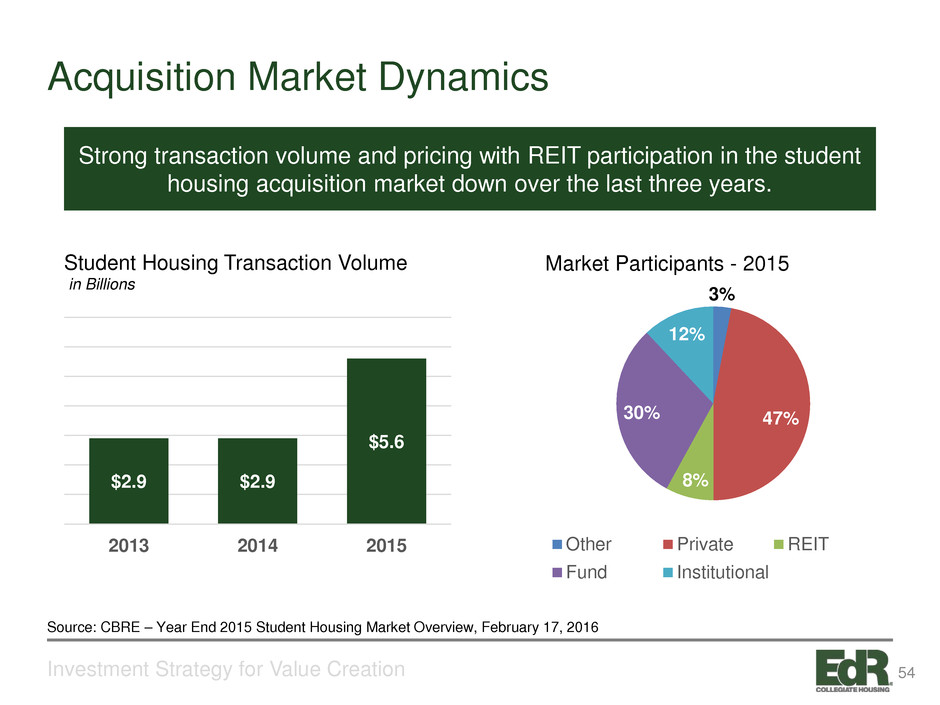
Acquisition Market Dynamics Investment Strategy for Value Creation Strong transaction volume and pricing with REIT participation in the student housing acquisition market down over the last three years. $2.9 $2.9 $5.6 2013 2014 2015 Student Housing Transaction Volume in Billions 3% 47% 8% 30% 12% Other Private REIT Fund Institutional Market Participants - 2015 Source: CBRE – Year End 2015 Student Housing Market Overview, February 17, 2016 54
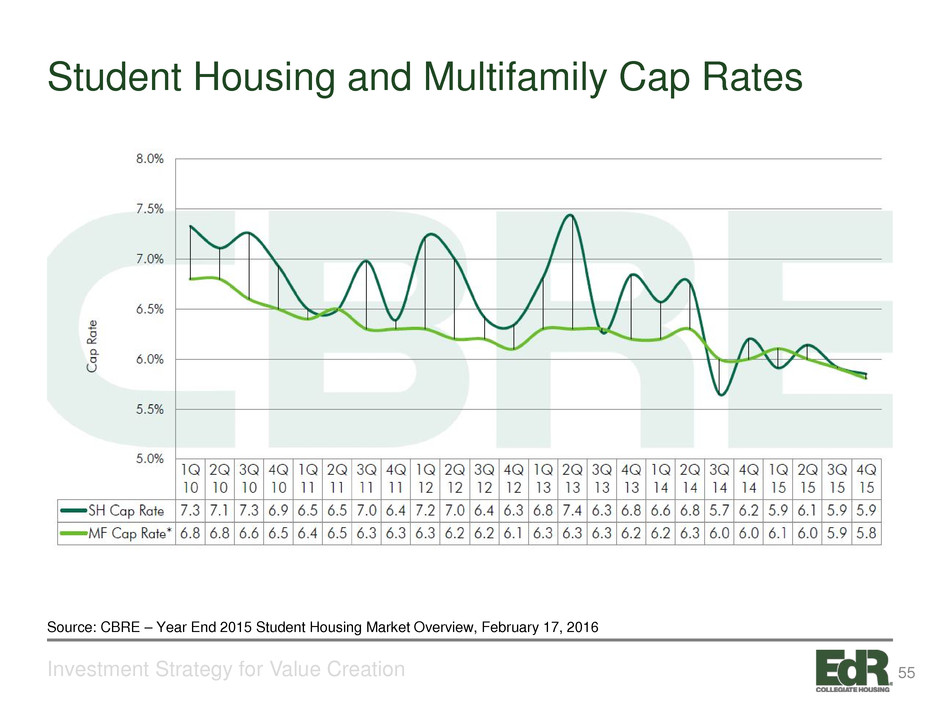
Student Housing and Multifamily Cap Rates Investment Strategy for Value Creation Source: CBRE – Year End 2015 Student Housing Market Overview, February 17, 2016 55
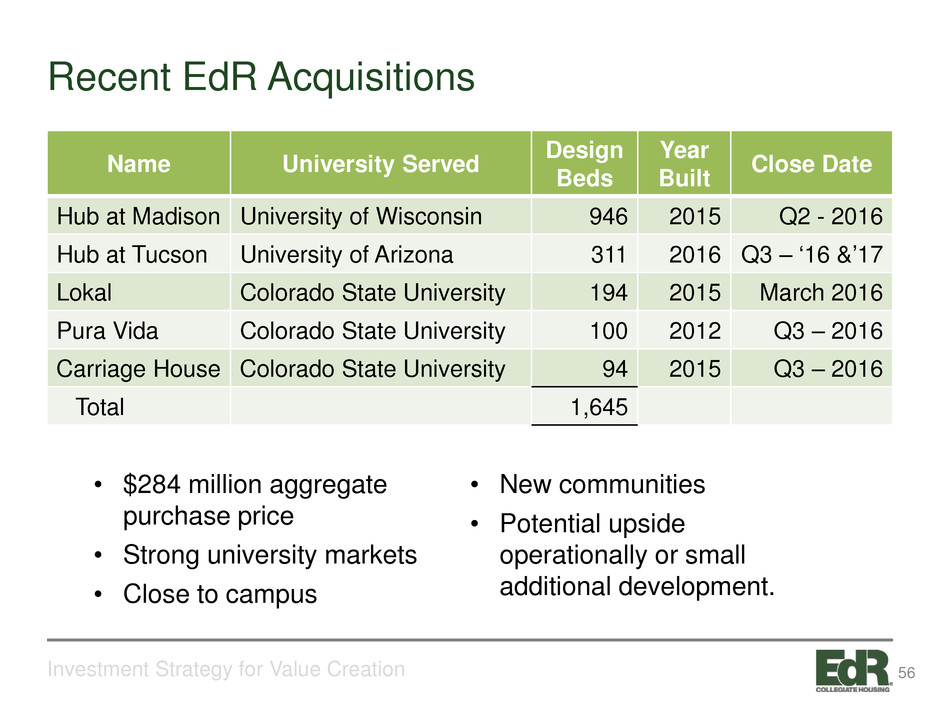
Recent EdR Acquisitions Investment Strategy for Value Creation • $284 million aggregate purchase price • Strong university markets • Close to campus • New communities • Potential upside operationally or small additional development. Name University Served Design Beds Year Built Close Date Hub at Madison University of Wisconsin 946 2015 Q2 - 2016 Hub at Tucson University of Arizona 311 2016 Q3 – ‘16 &’17 Lokal Colorado State University 194 2015 March 2016 Pura Vida Colorado State University 100 2012 Q3 – 2016 Carriage House Colorado State University 94 2015 Q3 – 2016 Total 1,645 56
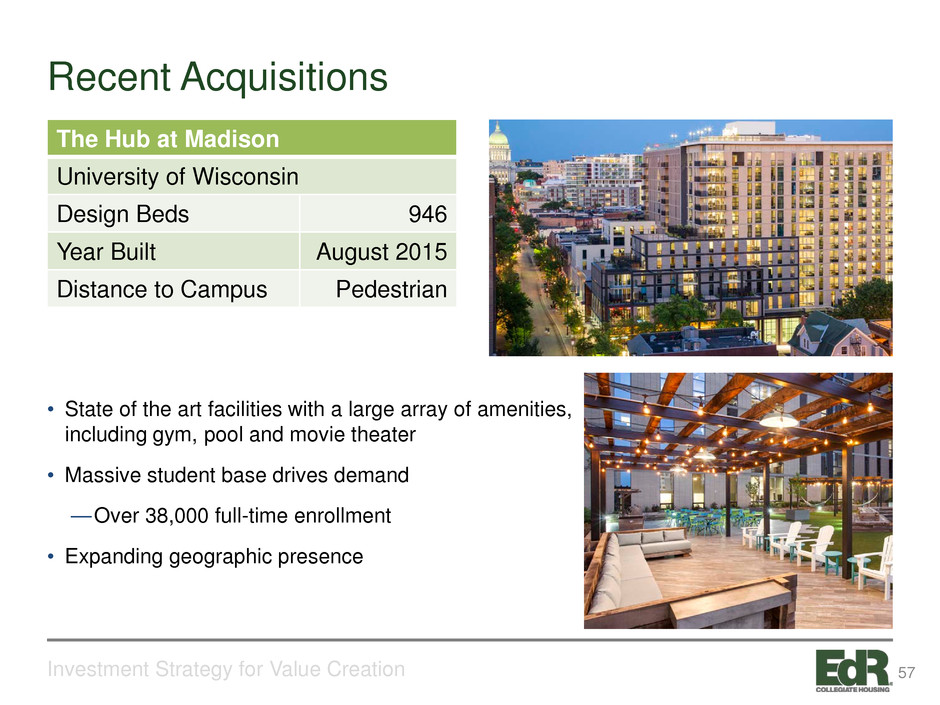
Recent Acquisitions Investment Strategy for Value Creation • State of the art facilities with a large array of amenities, including gym, pool and movie theater • Massive student base drives demand — Over 38,000 full-time enrollment • Expanding geographic presence The Hub at Madison University of Wisconsin Design Beds 946 Year Built August 2015 Distance to Campus Pedestrian 57
Investment Strategy for Value Creation 58
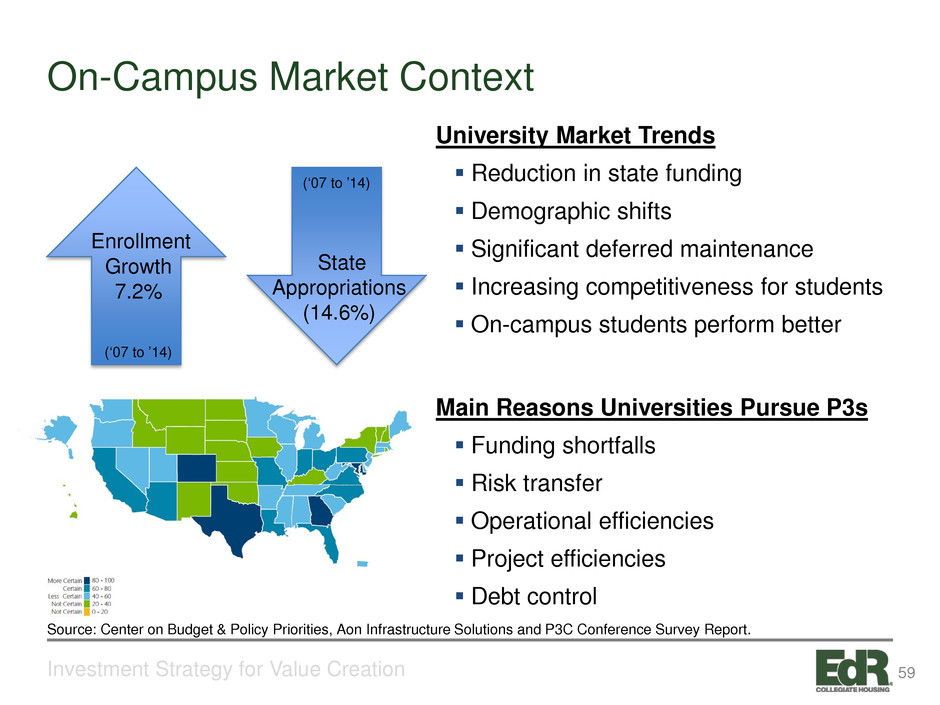
On-Campus Market Context Investment Strategy for Value Creation University Market Trends Reduction in state funding Demographic shifts Significant deferred maintenance Increasing competitiveness for students On-campus students perform better Main Reasons Universities Pursue P3s Funding shortfalls Risk transfer Operational efficiencies Project efficiencies Debt control Enrollment Growth 7.2% State Appropriations (14.6%) Source: Center on Budget & Policy Priorities, Aon Infrastructure Solutions and P3C Conference Survey Report. (‘07 to ’14) (‘07 to ’14) 59
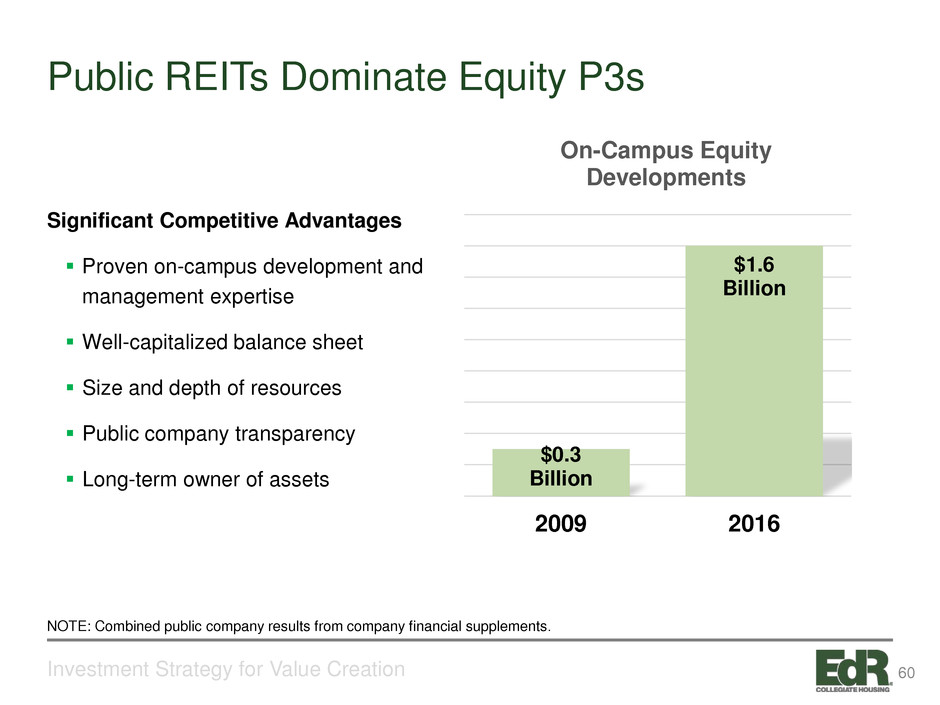
Public REITs Dominate Equity P3s Investment Strategy for Value Creation $0.3 Billion $1.6 Billion 2009 2016 On-Campus Equity Developments NOTE: Combined public company results from company financial supplements. Significant Competitive Advantages Proven on-campus development and management expertise Well-capitalized balance sheet Size and depth of resources Public company transparency Long-term owner of assets 60
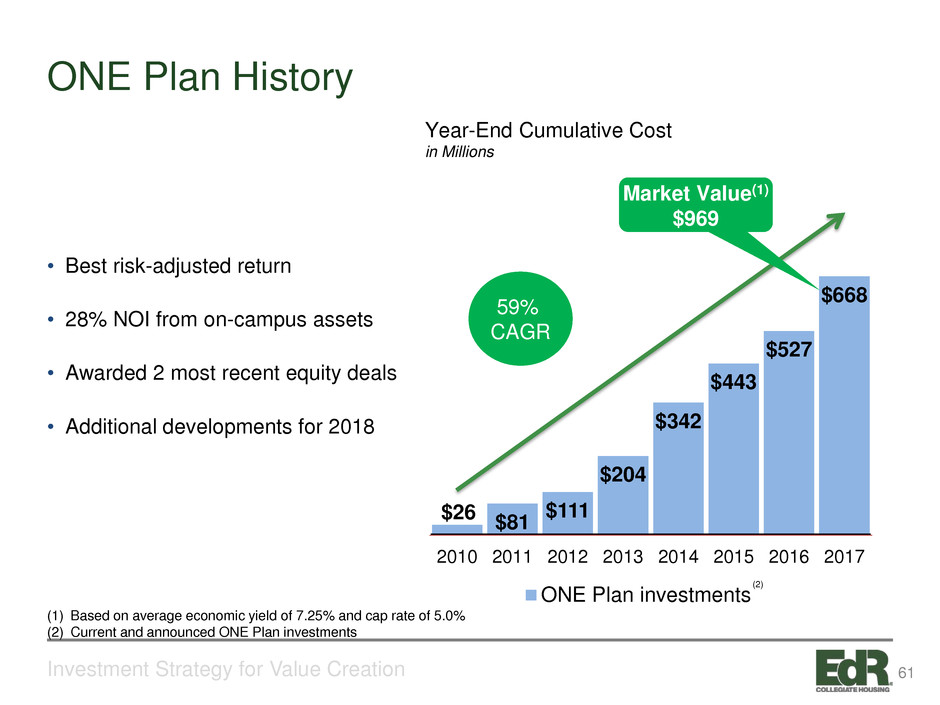
ONE Plan History Investment Strategy for Value Creation • Best risk-adjusted return • 28% NOI from on-campus assets • Awarded 2 most recent equity deals • Additional developments for 2018 $26 $81 $111 $204 $342 $443 $527 $668 2010 2011 2012 2013 2014 2015 2016 2017 ONE Plan investments Market Value(1) $969 Year-End Cumulative Cost in Millions (2) 59% CAGR (1) Based on average economic yield of 7.25% and cap rate of 5.0% (2) Current and announced ONE Plan investments 61
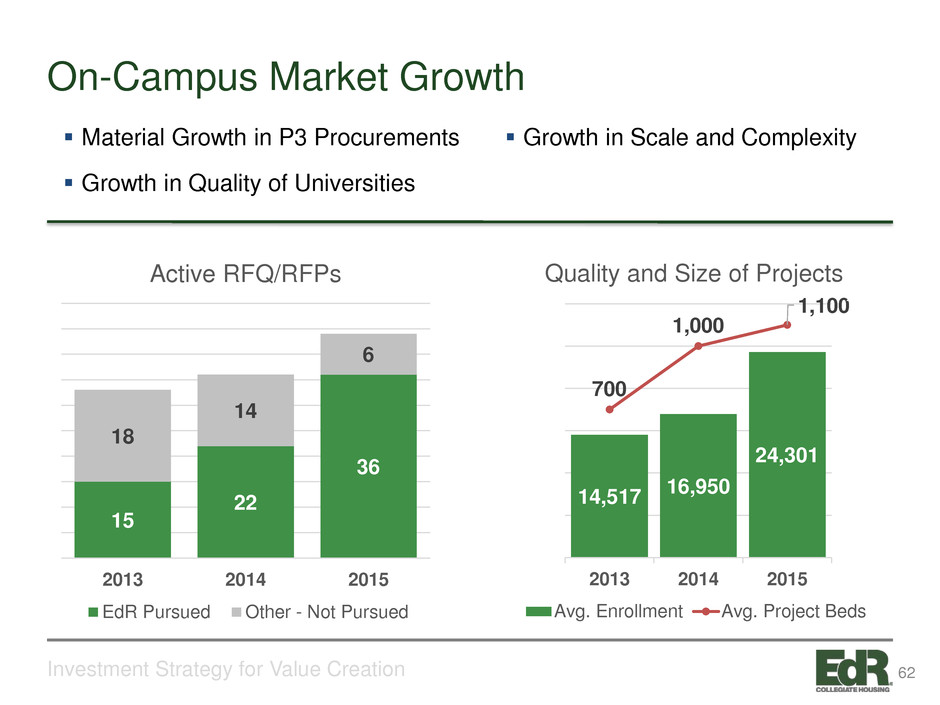
On-Campus Market Growth Investment Strategy for Value Creation Material Growth in P3 Procurements Growth in Quality of Universities Growth in Scale and Complexity 15 22 36 18 14 6 2013 2014 2015 Active RFQ/RFPs EdR Pursued Other - Not Pursued 14,517 16,950 24,301 700 1,000 1,100 0 200 400 600 800 1,000 1,200 0 5,000 10,000 15,000 20,000 25,000 30,000 2013 2014 2015 Quality and Size of Projects Avg. Enrollment Avg. Project Beds 62
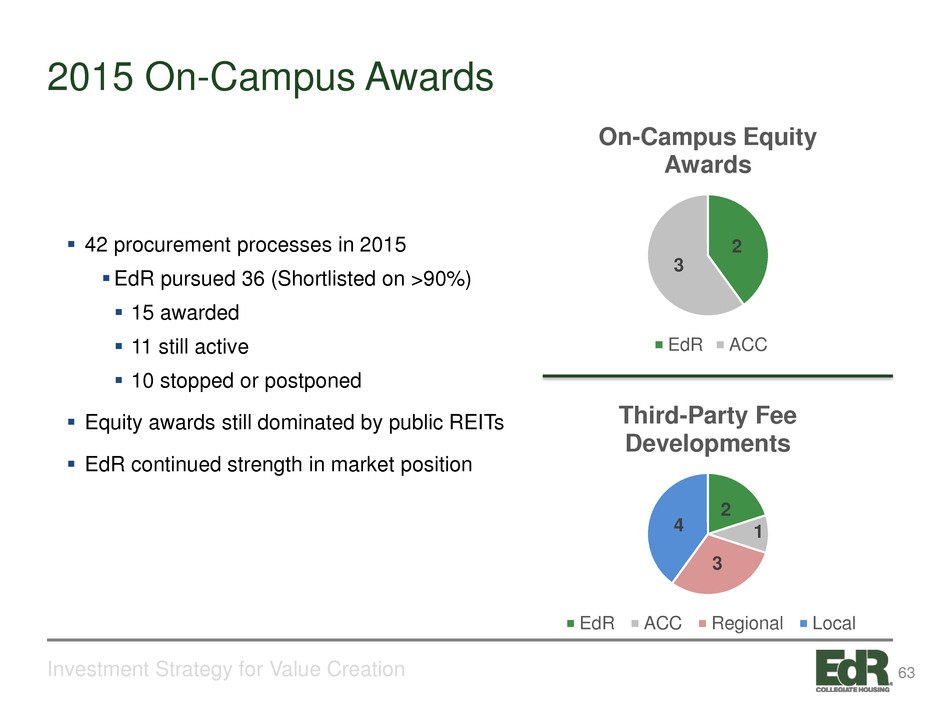
2015 On-Campus Awards Investment Strategy for Value Creation 42 procurement processes in 2015 EdR pursued 36 (Shortlisted on >90%) 15 awarded 11 still active 10 stopped or postponed Equity awards still dominated by public REITs EdR continued strength in market position 2 3 On-Campus Equity Awards EdR ACC 2 1 3 4 Third-Party Fee Developments EdR ACC Regional Local 63
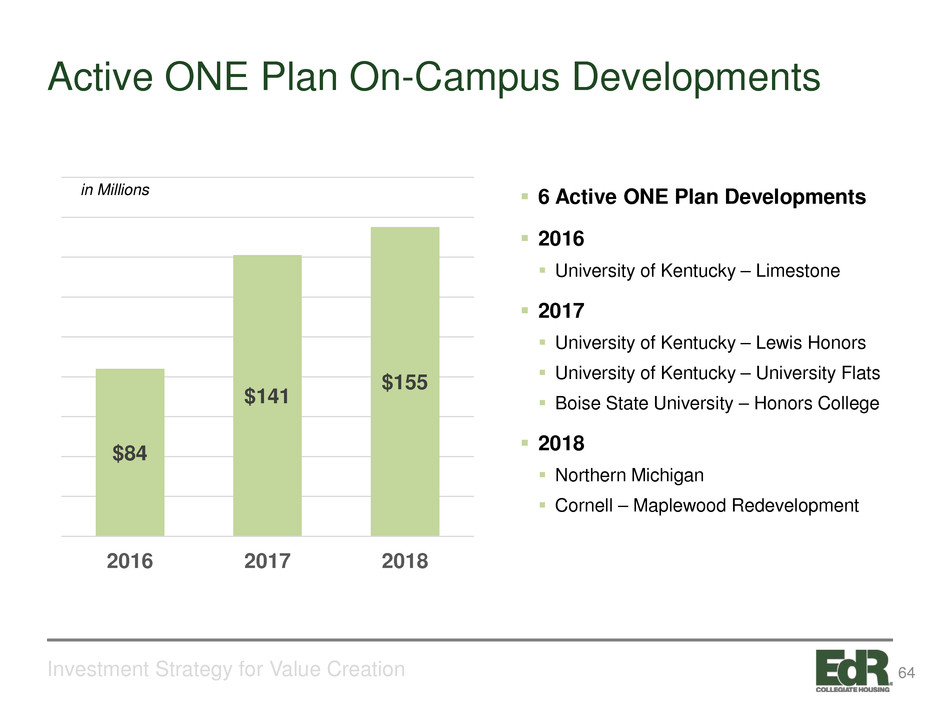
Active ONE Plan On-Campus Developments Investment Strategy for Value Creation $84 $141 $155 2016 2017 2018 6 Active ONE Plan Developments 2016 University of Kentucky – Limestone 2017 University of Kentucky – Lewis Honors University of Kentucky – University Flats Boise State University – Honors College 2018 Northern Michigan Cornell – Maplewood Redevelopment in Millions 64
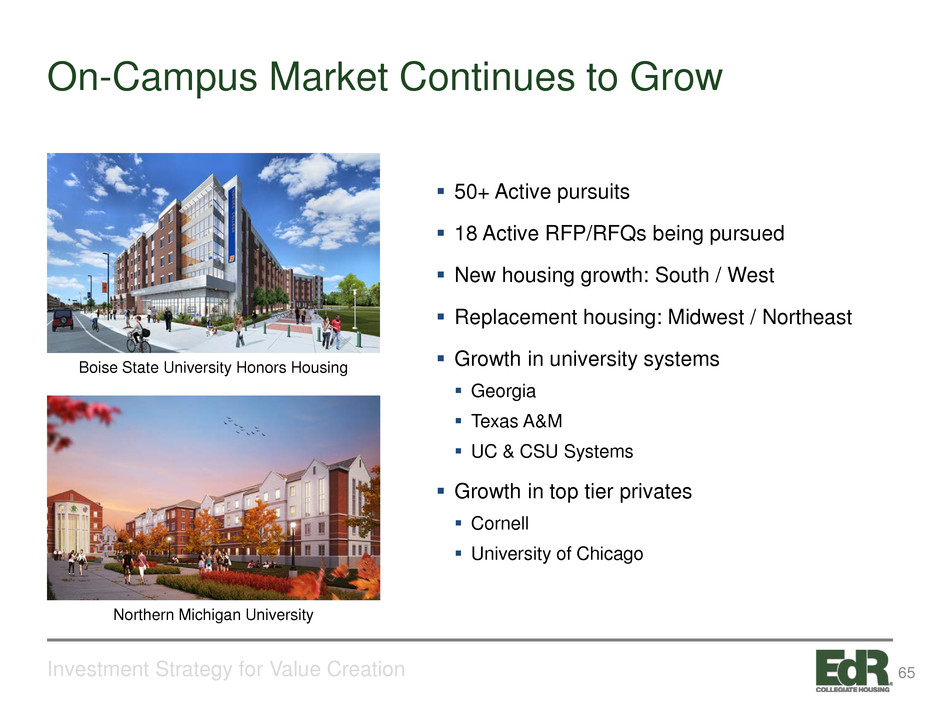
On-Campus Market Continues to Grow Investment Strategy for Value Creation 50+ Active pursuits 18 Active RFP/RFQs being pursued New housing growth: South / West Replacement housing: Midwest / Northeast Growth in university systems Georgia Texas A&M UC & CSU Systems Growth in top tier privates Cornell University of Chicago Boise State University Honors Housing Northern Michigan University 65
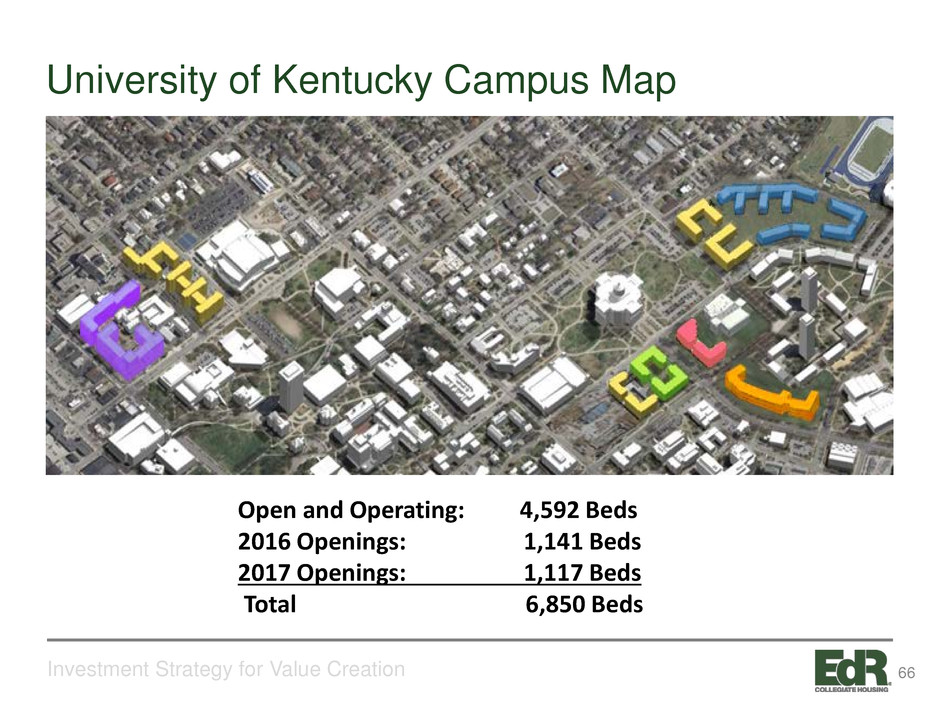
University of Kentucky Campus Map Investment Strategy for Value Creation Open and Operating: 4,592 Beds 2016 Openings: 1,141 Beds 2017 Openings: 1,117 Beds Total 6,850 Beds 66
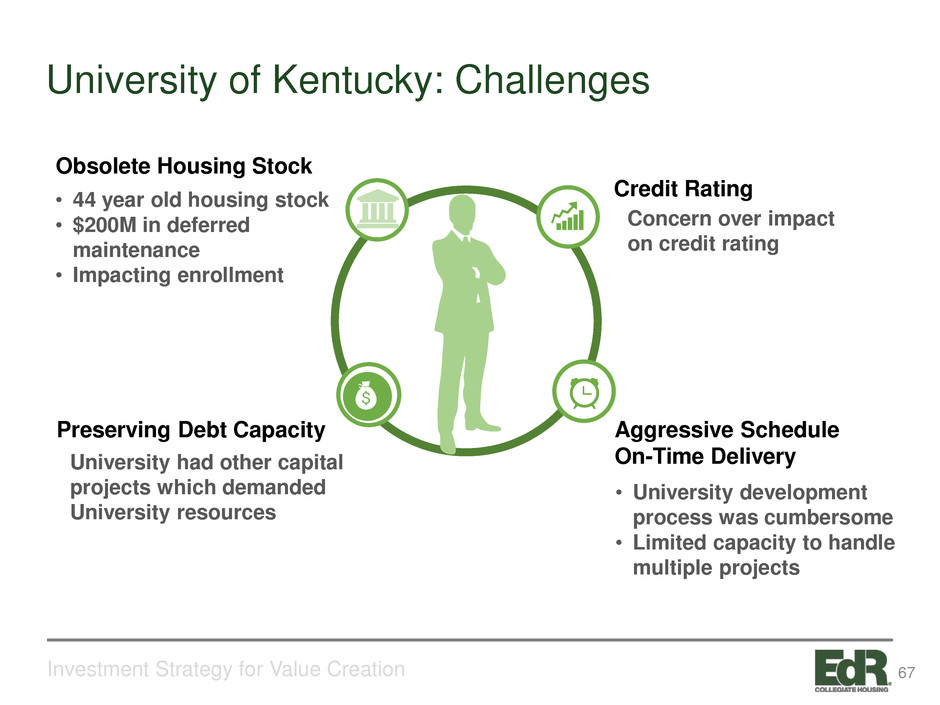
Aggressive Schedule On-Time Delivery • University development process was cumbersome • Limited capacity to handle multiple projects Credit Rating Concern over impact on credit rating Obsolete Housing Stock • 44 year old housing stock • $200M in deferred maintenance • Impacting enrollment Preserving Debt Capacity University had other capital projects which demanded University resources Investment Strategy for Value Creation University of Kentucky: Challenges 67
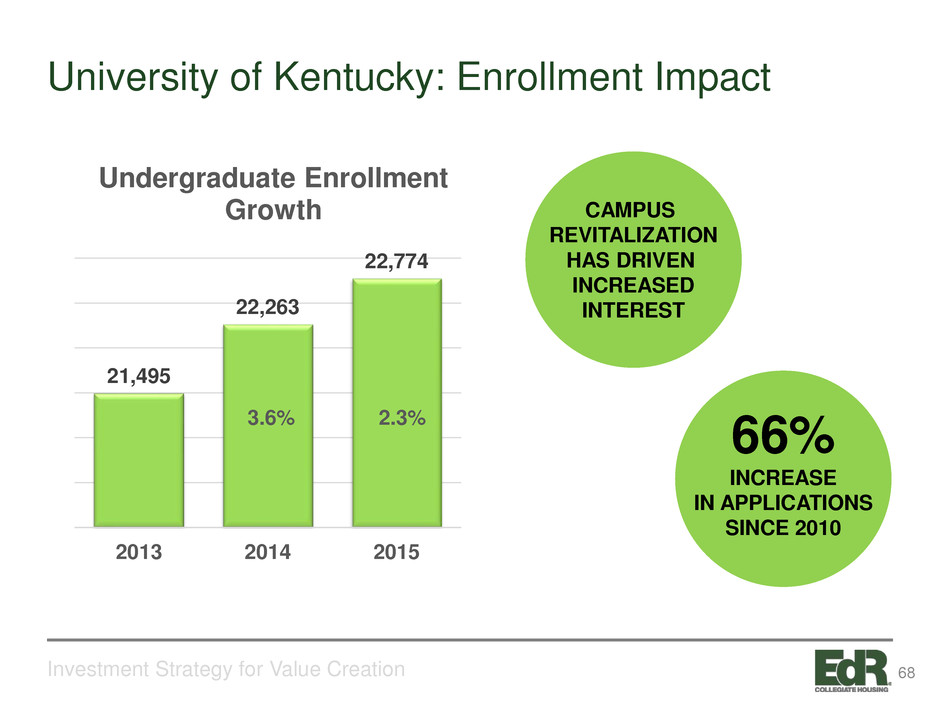
University of Kentucky: Enrollment Impact 3%1% Investment Strategy for Value Creation 21,495 22,263 22,774 2013 2014 2015 Undergraduate Enrollment Growth 66% INCREASE IN APPLICATIONS SINCE 2010 3.6% 2.3% CAMPUS REVITALIZATION HAS DRIVEN INCREASED INTEREST 68
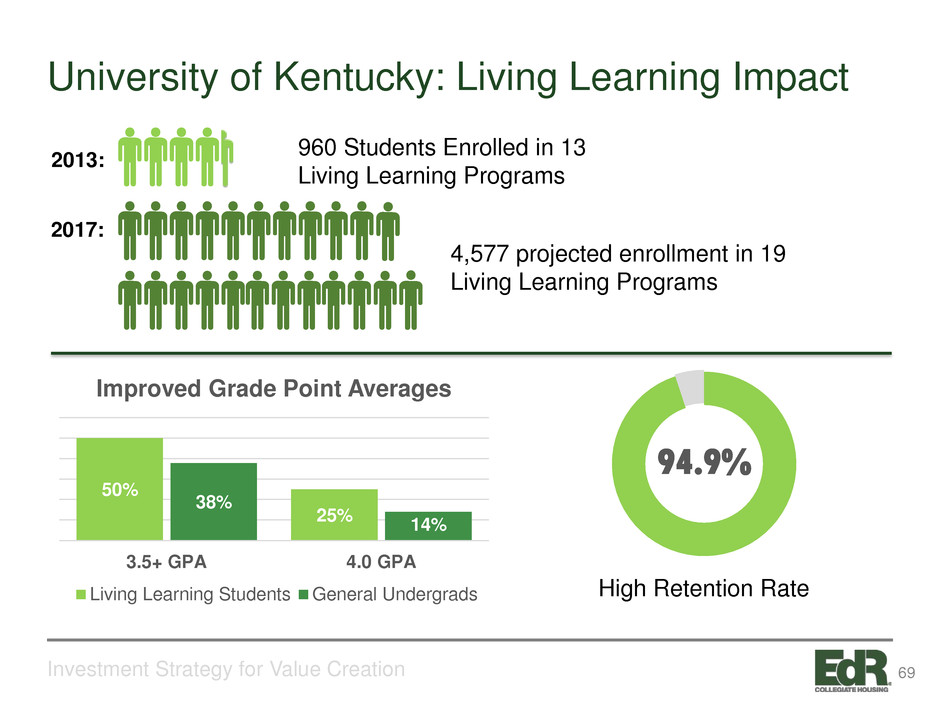
University of Kentucky: Living Learning Impact 17% 4,577 projected enrollment in 19 Living Learning Programs 94.9% High Retention Rate Investment Strategy for Value Creation 2013: 2017: 960 Students Enrolled in 13 Living Learning Programs 50% 25% 38% 14% 3.5+ GPA 4.0 GPA Improved Grade Point Averages Living Learning Students General Undergrads 69

EdR’s Growing Success Story: UK 3% 100% Occupancy On-Time Delivery Project Costs Under Budget Communities Are Outperforming Proforma Returns New Business Generator for EdR Investment Strategy for Value Creation Affordability 70
Investment Strategy for Value Creation Cornell University 71
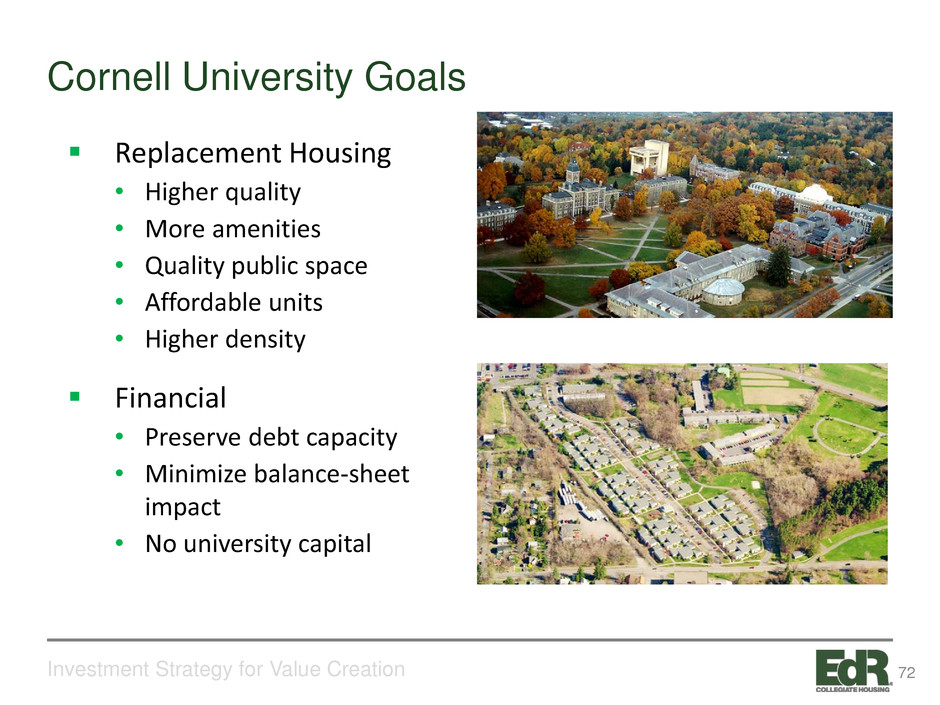
Investment Strategy for Value Creation Cornell University Goals Replacement Housing • Higher quality • More amenities • Quality public space • Affordable units • Higher density Financial • Preserve debt capacity • Minimize balance-sheet impact • No university capital 72
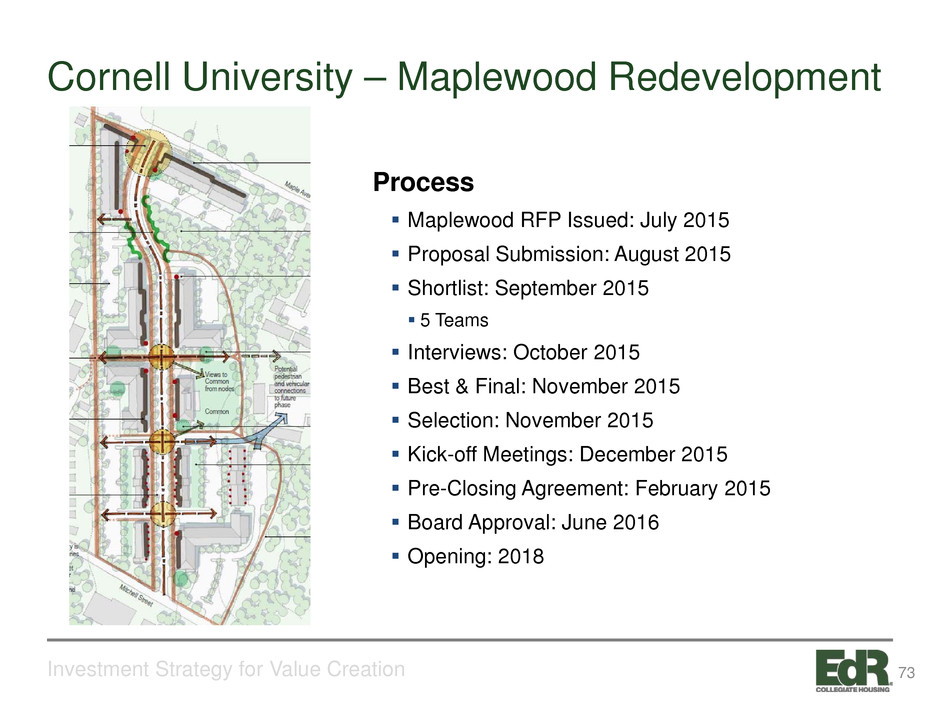
Investment Strategy for Value Creation Cornell University – Maplewood Redevelopment Process Maplewood RFP Issued: July 2015 Proposal Submission: August 2015 Shortlist: September 2015 5 Teams Interviews: October 2015 Best & Final: November 2015 Selection: November 2015 Kick-off Meetings: December 2015 Pre-Closing Agreement: February 2015 Board Approval: June 2016 Opening: 2018 73
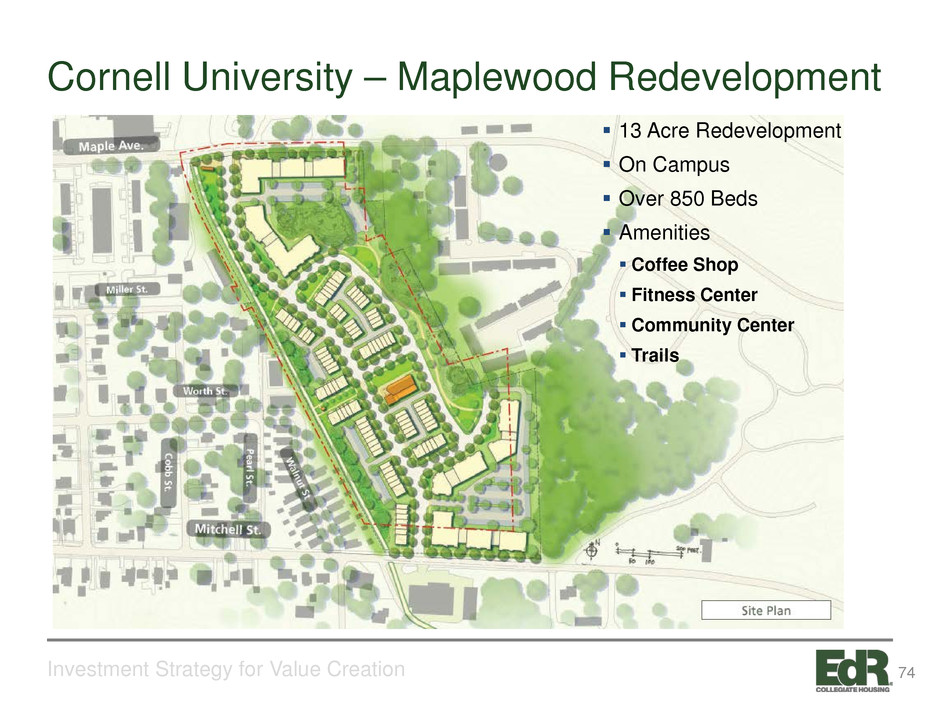
Investment Strategy for Value Creation Cornell University – Maplewood Redevelopment 13 Acre Redevelopment On Campus Over 850 Beds Amenities Coffee Shop Fitness Center Community Center Trails 74
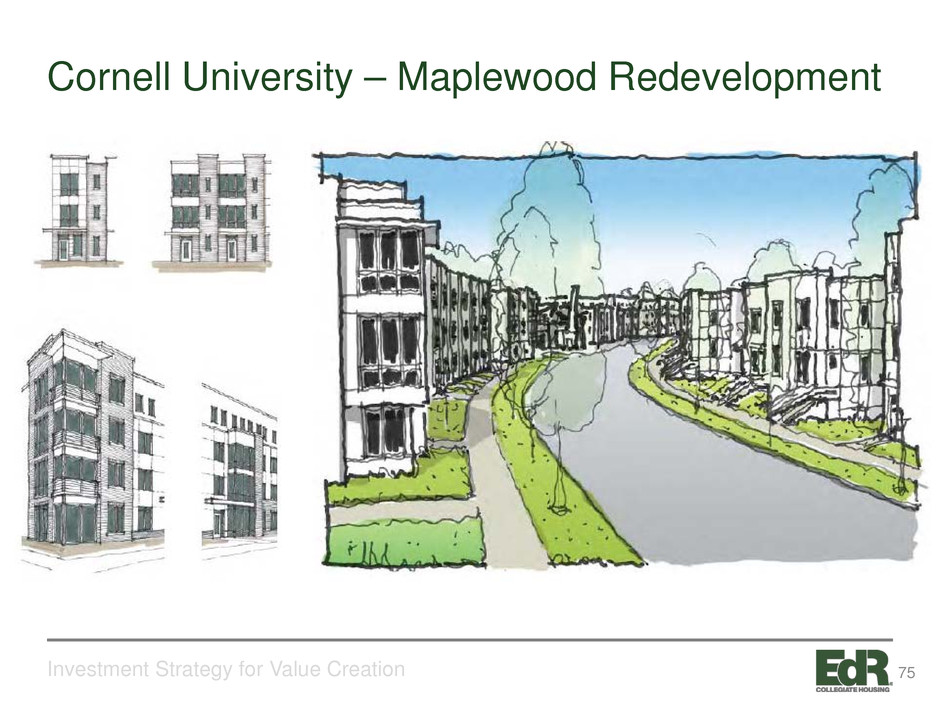
Investment Strategy for Value Creation Cornell University – Maplewood Redevelopment 75
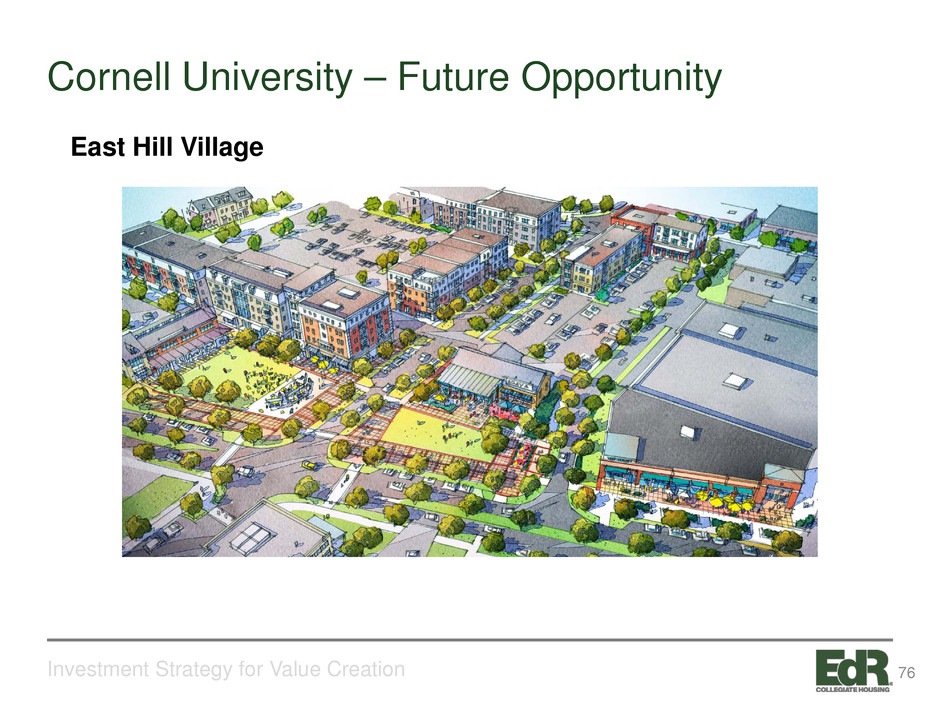
Investment Strategy for Value Creation Cornell University – Future Opportunity East Hill Village 76

77
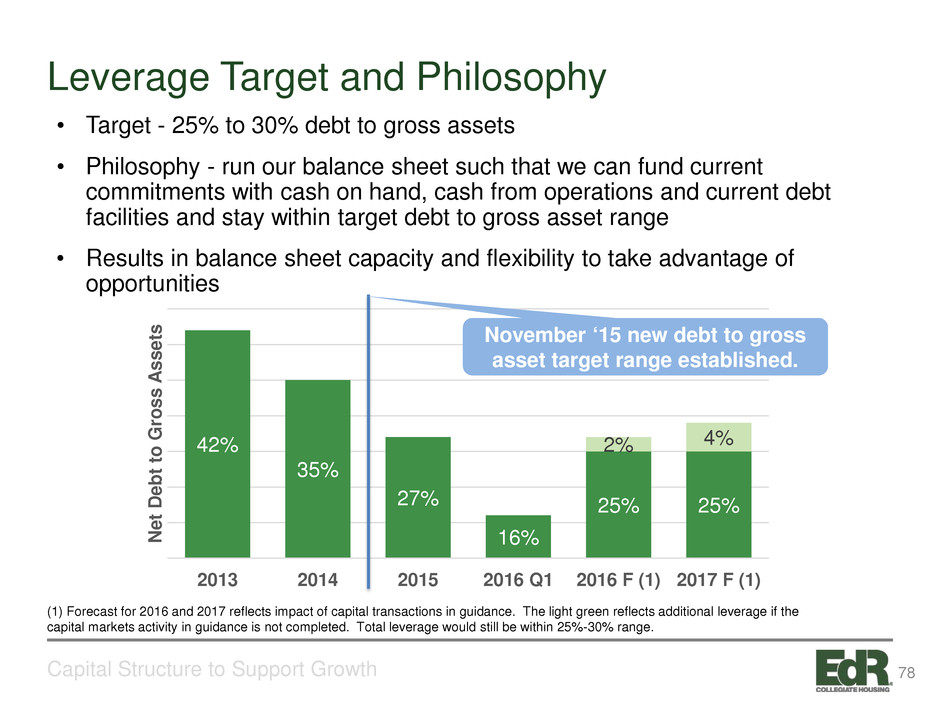
Leverage Target and Philosophy Capital Structure to Support Growth • Target - 25% to 30% debt to gross assets • Philosophy - run our balance sheet such that we can fund current commitments with cash on hand, cash from operations and current debt facilities and stay within target debt to gross asset range • Results in balance sheet capacity and flexibility to take advantage of opportunities 42% 35% 27% 16% 25% 25% 2% 4% 2013 2014 2015 2016 Q1 2016 F (1) 2017 F (1) N et D eb t t o G ro ss A ss et s (1) Forecast for 2016 and 2017 reflects impact of capital transactions in guidance. The light green reflects additional leverage if the capital markets activity in guidance is not completed. Total leverage would still be within 25%-30% range. November ‘15 new debt to gross asset target range established. 78
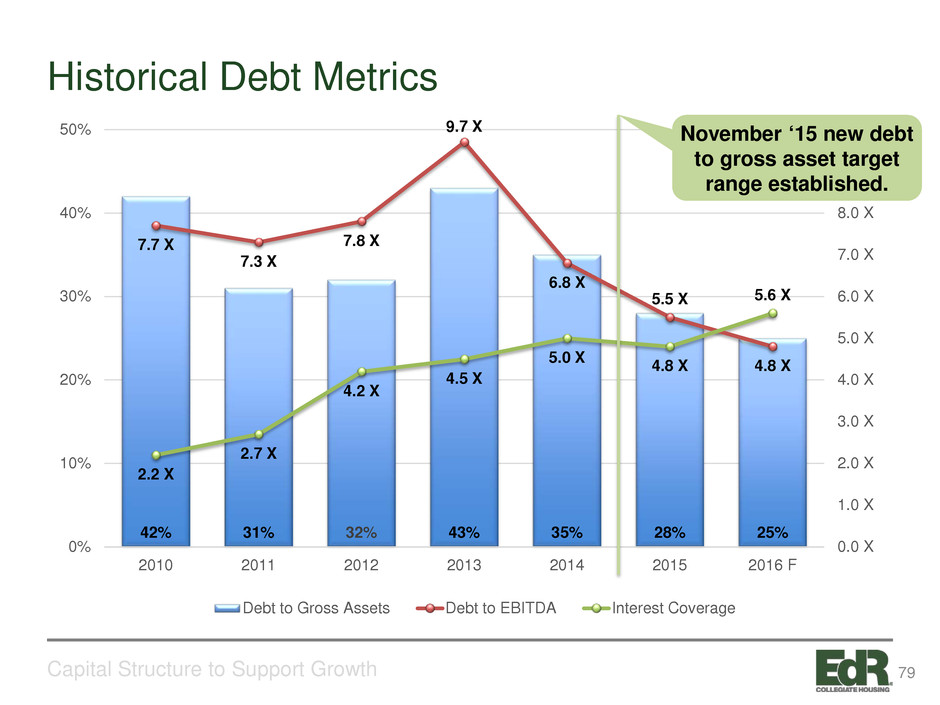
Historical Debt Metrics Capital Structure to Support Growth 42% 31% 32% 43% 35% 28% 25% 7.7 X 7.3 X 7.8 X 9.7 X 6.8 X 5.5 X 4.8 X 2.2 X 2.7 X 4.2 X 4.5 X 5.0 X 4.8 X 5.6 X 0.0 X 1.0 X 2.0 X 3.0 X 4.0 X 5.0 X 6.0 X 7.0 X 8.0 X 9.0 X 10.0 X 0% 10% 20% 30% 40% 50% 2010 2011 2012 2013 2014 2015 2016 F Debt to Gross Assets Debt to EBITDA Interest Coverage November ‘15 new debt to gross asset target range established. 79
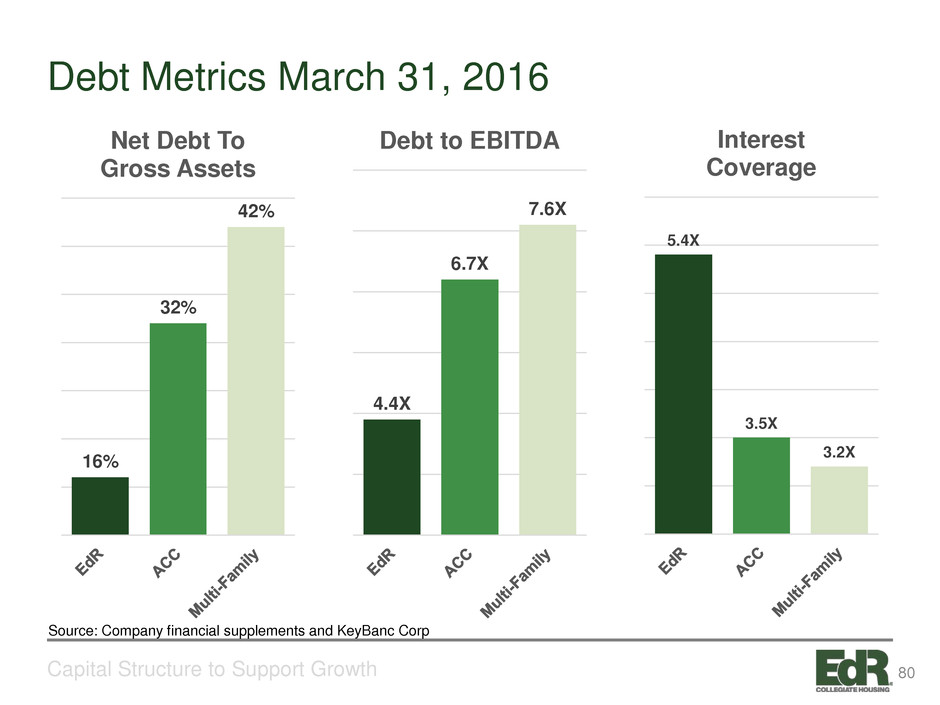
Debt Metrics March 31, 2016 Capital Structure to Support Growth 16% 32% 42% Net Debt To Gross Assets 4.4X 6.7X 7.6X Debt to EBITDA 5.4X 3.5X 3.2X Interest Coverage Source: Company financial supplements and KeyBanc Corp 80
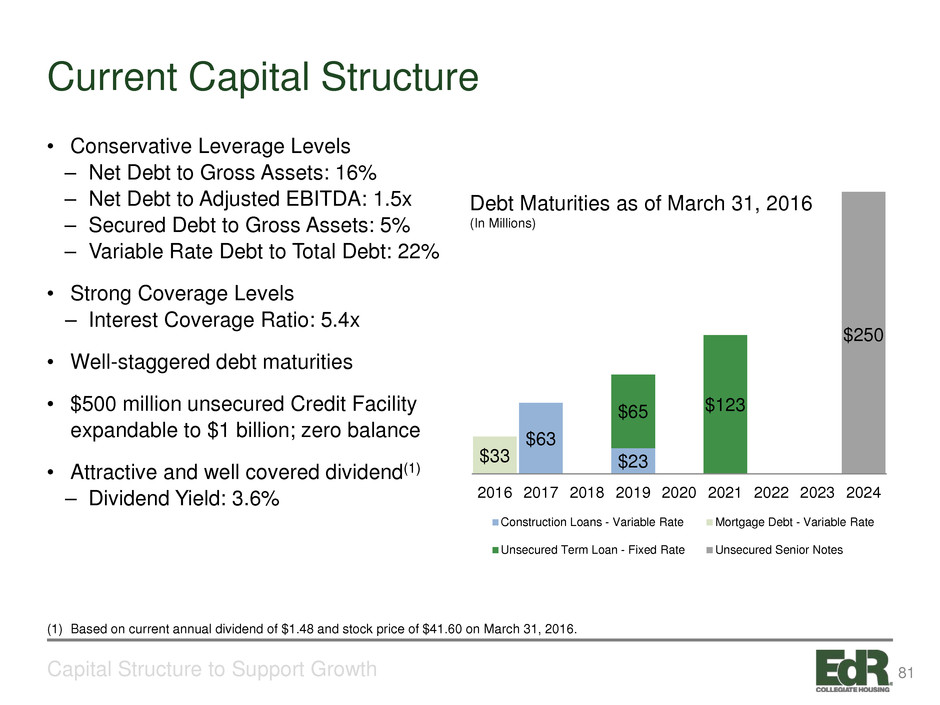
Current Capital Structure Capital Structure to Support Growth • Conservative Leverage Levels – Net Debt to Gross Assets: 16% – Net Debt to Adjusted EBITDA: 1.5x – Secured Debt to Gross Assets: 5% – Variable Rate Debt to Total Debt: 22% • Strong Coverage Levels – Interest Coverage Ratio: 5.4x • Well-staggered debt maturities • $500 million unsecured Credit Facility expandable to $1 billion; zero balance • Attractive and well covered dividend(1) – Dividend Yield: 3.6% $63 $23$33 $65 $123 $250 2016 2017 2018 2019 2020 2021 2022 2023 2024 Construction Loans - Variable Rate Mortgage Debt - Variable Rate Unsecured Term Loan - Fixed Rate Unsecured Senior Notes Debt Maturities as of March 31, 2016 (In Millions) (1) Based on current annual dividend of $1.48 and stock price of $41.60 on March 31, 2016. 81
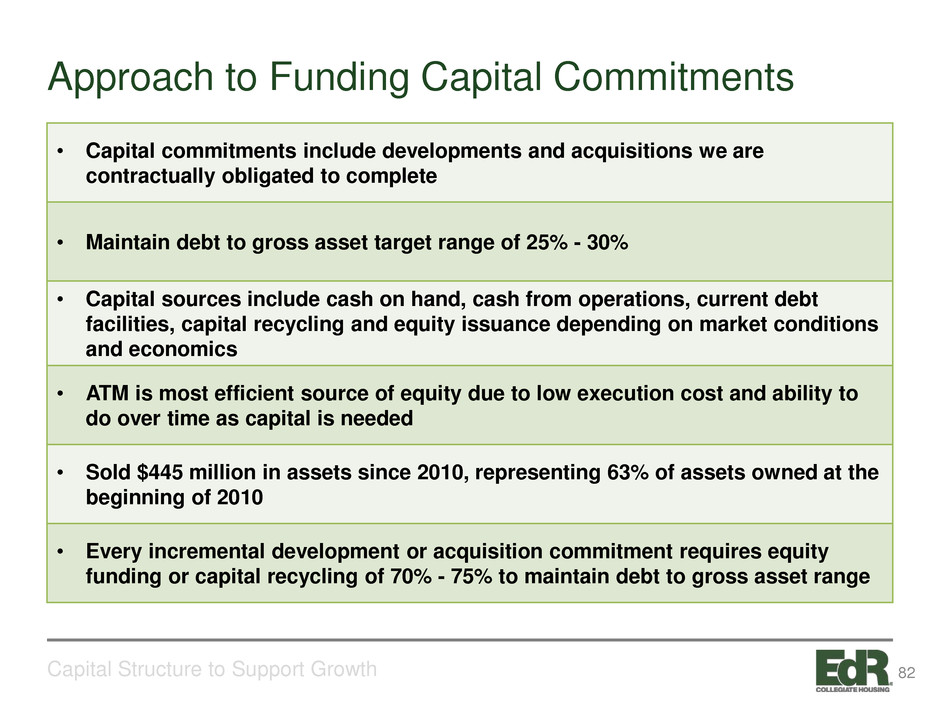
Approach to Funding Capital Commitments Capital Structure to Support Growth • Capital commitments include developments and acquisitions we are contractually obligated to complete • Maintain debt to gross asset target range of 25% - 30% • Capital sources include cash on hand, cash from operations, current debt facilities, capital recycling and equity issuance depending on market conditions and economics • ATM is most efficient source of equity due to low execution cost and ability to do over time as capital is needed • Sold $445 million in assets since 2010, representing 63% of assets owned at the beginning of 2010 • Every incremental development or acquisition commitment requires equity funding or capital recycling of 70% - 75% to maintain debt to gross asset range 82
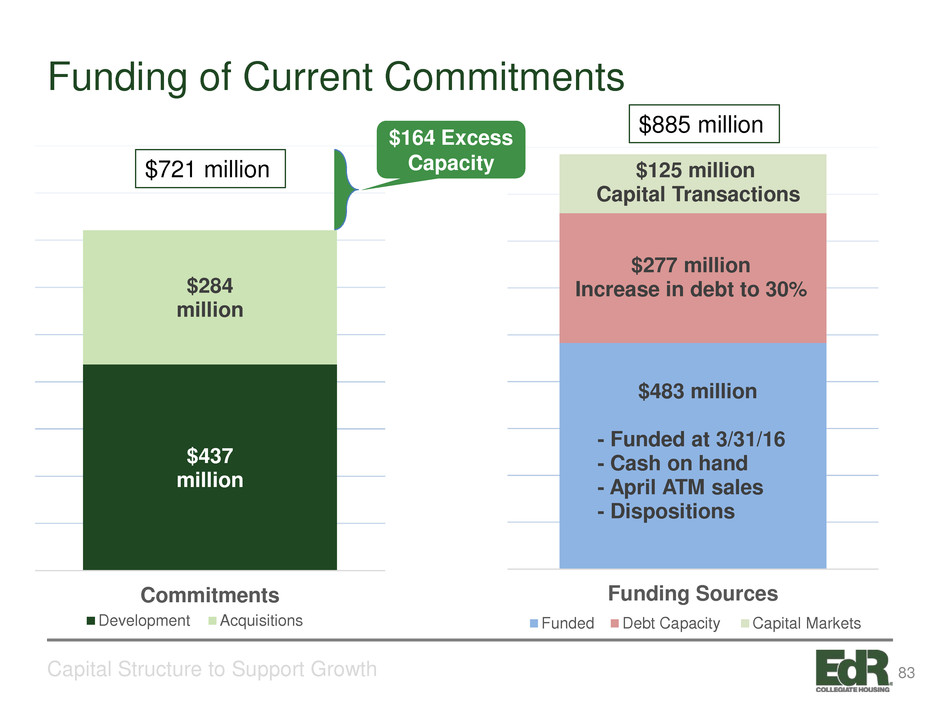
Funding of Current Commitments Capital Structure to Support Growth $483 million - Funded at 3/31/16 - Cash on hand - April ATM sales - Dispositions $277 million Increase in debt to 30% $125 million Capital Transactions Funding Sources Funded Debt Capacity Capital Markets $437 million $284 million Commitments Development Acquisitions $164 Excess Capacity$721 million $885 million 83

84
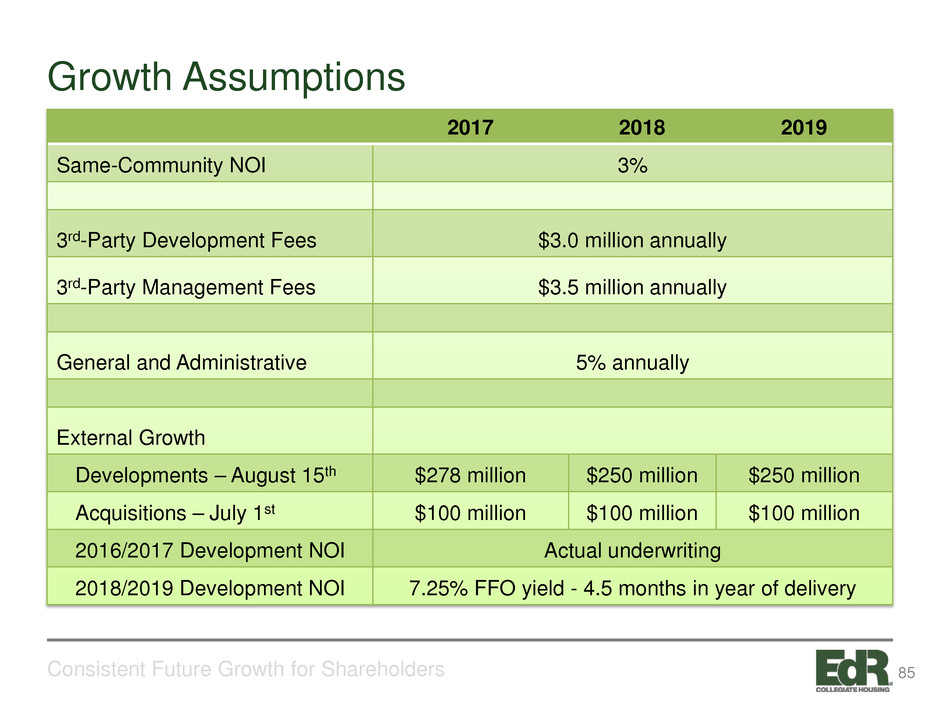
Growth Assumptions Consistent Future Growth for Shareholders 2017 2018 2019 Same-Community NOI 3% 3rd-Party Development Fees $3.0 million annually 3rd-Party Management Fees $3.5 million annually General and Administrative 5% annually External Growth Developments – August 15th $278 million $250 million $250 million Acquisitions – July 1st $100 million $100 million $100 million 2016/2017 Development NOI Actual underwriting 2018/2019 Development NOI 7.25% FFO yield - 4.5 months in year of delivery 85

Capital Structure Assumptions Consistent Future Growth for Shareholders Targets - Assumption Debt to Gross Asset Target 25% Development Spend 65% year prior to delivery – 35% year of delivery(1) Equity Issuance / Capital Recycling – July 1st of each year Debt Assumption Variable interest rates LIBOR Assumptions – 0.75%, 1.00%, 1.20% (‘17,’18,’19) Based on recent Chatham forward yield curve Variable rate debt Variable rate debt <25% of total debt. Termed out $150 million in ‘17, $75 million in ‘18 and $75 million in ’19 into 7- year debt at 4.5%. Dividend Policy Increase quarterly dividend $0.01 each Q3 (1) 2019 incudes $163 million in spend or 63% of 2020 deliveries of $250 million. 86
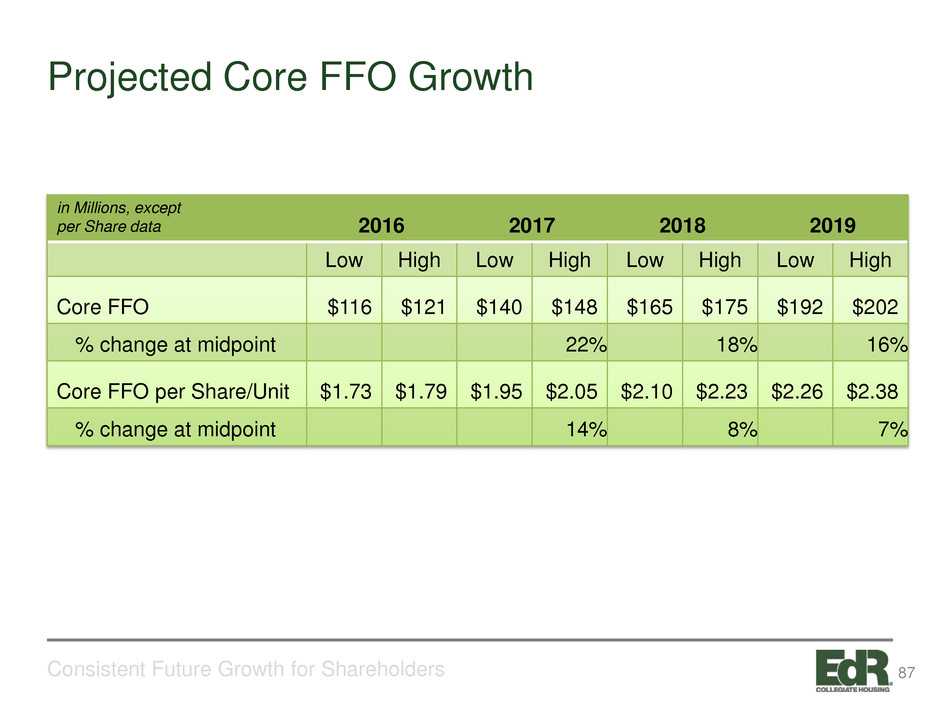
Projected Core FFO Growth Consistent Future Growth for Shareholders 2016 2017 2018 2019 Low High Low High Low High Low High Core FFO $116 $121 $140 $148 $165 $175 $192 $202 % change at midpoint 22% 18% 16% Core FFO per Share/Unit $1.73 $1.79 $1.95 $2.05 $2.10 $2.23 $2.26 $2.38 % change at midpoint 14% 8% 7% in Millions, except per Share data 87
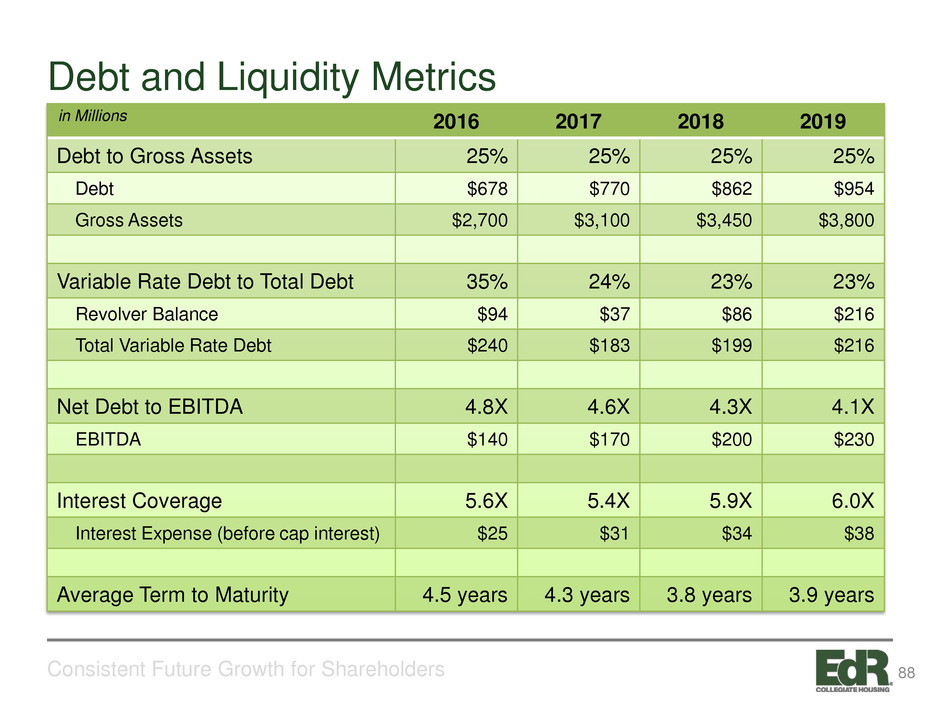
Debt and Liquidity Metrics Consistent Future Growth for Shareholders 2016 2017 2018 2019 Debt to Gross Assets 25% 25% 25% 25% Debt $678 $770 $862 $954 Gross Assets $2,700 $3,100 $3,450 $3,800 Variable Rate Debt to Total Debt 35% 24% 23% 23% Revolver Balance $94 $37 $86 $216 Total Variable Rate Debt $240 $183 $199 $216 Net Debt to EBITDA 4.8X 4.6X 4.3X 4.1X EBITDA $140 $170 $200 $230 Interest Coverage 5.6X 5.4X 5.9X 6.0X Interest Expense (before cap interest) $25 $31 $34 $38 Average Term to Maturity 4.5 years 4.3 years 3.8 years 3.9 years in Millions 88
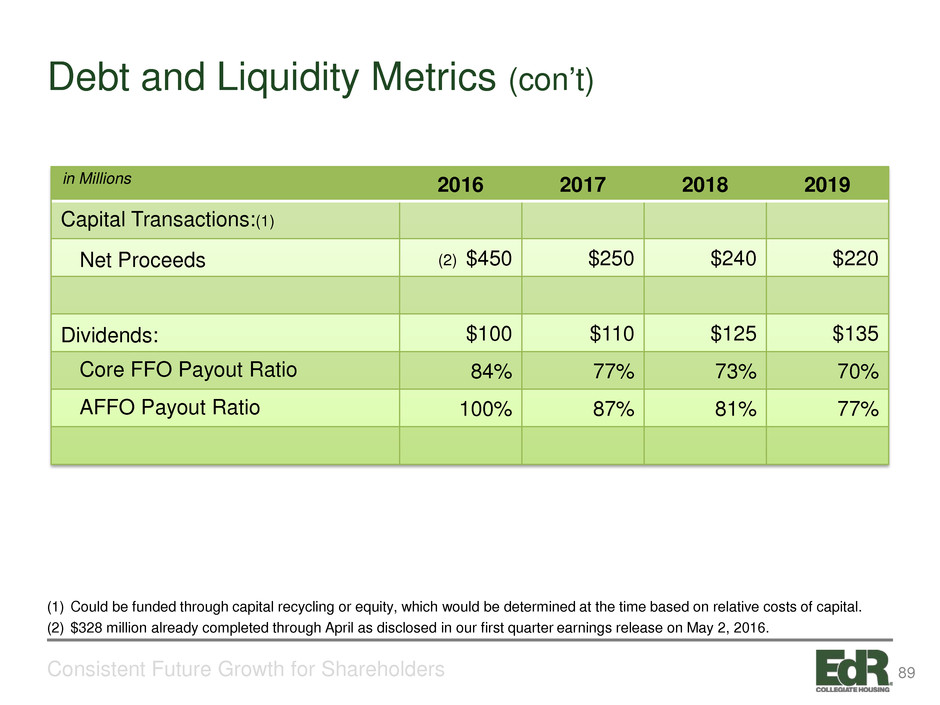
Debt and Liquidity Metrics (con’t) Consistent Future Growth for Shareholders 2016 2017 2018 2019 Capital Transactions:(1) Net Proceeds (2) $450 $250 $240 $220 Dividends: $100 $110 $125 $135 Core FFO Payout Ratio 84% 77% 73% 70% AFFO Payout Ratio 100% 87% 81% 77% (1) Could be funded through capital recycling or equity, which would be determined at the time based on relative costs of capital. (2) $328 million already completed through April as disclosed in our first quarter earnings release on May 2, 2016. in Millions 89
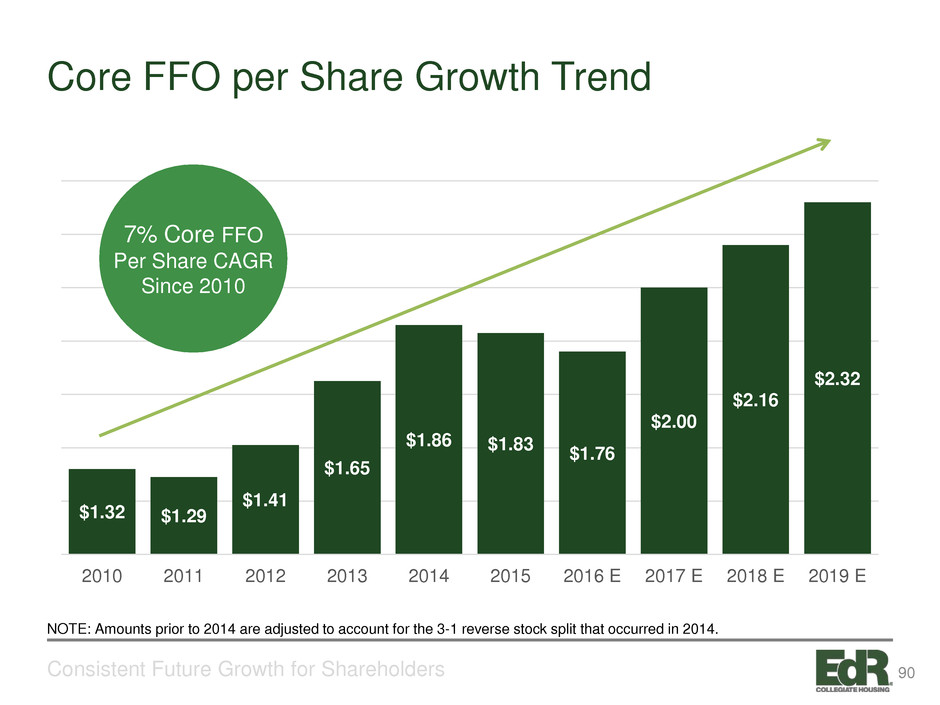
Core FFO per Share Growth Trend Consistent Future Growth for Shareholders $1.32 $1.29 $1.41 $1.65 $1.86 $1.83 $1.76 $2.00 $2.16 $2.32 2010 2011 2012 2013 2014 2015 2016 E 2017 E 2018 E 2019 E 7% Core FFO Per Share CAGR Since 2010 NOTE: Amounts prior to 2014 are adjusted to account for the 3-1 reverse stock split that occurred in 2014. 90

91
Safe Harbor Statement Statements about the Company’s business that are not historical facts are “forward-looking statements,” which relate to expectations, beliefs, projections, future plans and strategies, anticipated events or trends, and similar expressions. In some cases, you can identify forward- looking statements by the use of forward-looking terminology such as “may,” “will,” “should,” “expects,” “intends,” “plans,” “anticipates,” “believes,” “estimates,” “predicts,” “potential,” or the negative of these words and phrases or similar words or phrases which are predictions of or indicate future events or trends and which do not relate solely to historical matters. Forward- looking statements are based on current expectations. You should not rely on our forward-looking statements because the matters that they describe are subject to known and unknown risks and uncertainties that could cause the Company’s business, financial condition, liquidity, results of operations, Core FFO, FFO and prospects to differ materially from those expressed or implied by such statements. Such risks are set forth under the captions “Risk Factors,” “Forward-Looking Statements” and “Management’s Discussion and Analysis of Financial Condition and Results of Operations” (or similar captions) in our most recent Annual Report on Form 10-K and our quarterly reports on Form 10-Q, and as described in our other filings with the Securities and Exchange Commission. Forward-looking statements speak only as of the date on which they are made, and, except as otherwise may be required by law, the Company undertakes no obligation to update publicly or revise any guidance or other forward-looking statement, whether as a result of new information, future developments, or otherwise, except as required by law. 92


