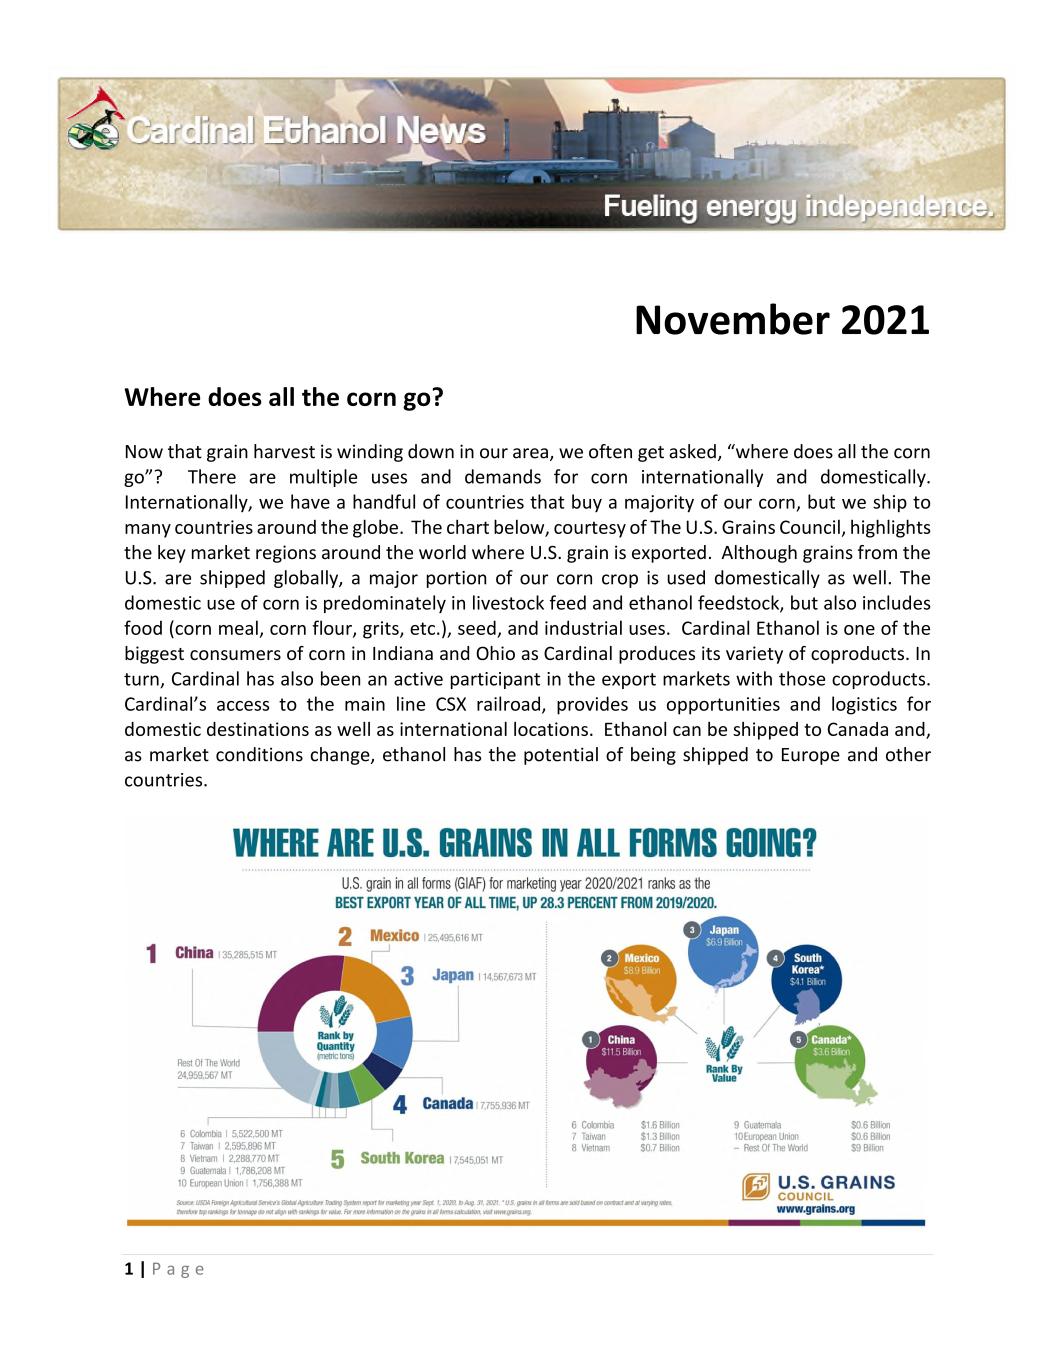
1 | P a g e November 2021 Where does all the corn go? Now that grain harvest is winding down in our area, we often get asked, “where does all the corn go”? There are multiple uses and demands for corn internationally and domestically. Internationally, we have a handful of countries that buy a majority of our corn, but we ship to many countries around the globe. The chart below, courtesy of The U.S. Grains Council, highlights the key market regions around the world where U.S. grain is exported. Although grains from the U.S. are shipped globally, a major portion of our corn crop is used domestically as well. The domestic use of corn is predominately in livestock feed and ethanol feedstock, but also includes food (corn meal, corn flour, grits, etc.), seed, and industrial uses. Cardinal Ethanol is one of the biggest consumers of corn in Indiana and Ohio as Cardinal produces its variety of coproducts. In turn, Cardinal has also been an active participant in the export markets with those coproducts. Cardinal’s access to the main line CSX railroad, provides us opportunities and logistics for domestic destinations as well as international locations. Ethanol can be shipped to Canada and, as market conditions change, ethanol has the potential of being shipped to Europe and other countries.
2 | P a g e As mentioned, ethanol isn’t the only product we deliver internationally. Because of market competitiveness, many of our dried distillers grains end up in destinations inside Mexico, Central America, and Asia. Our ability to access multiple shipping methods makes it possible for Cardinal to have access to these markets. With the CSX railroad, we are able to load barges in St. Louis and containers/vessels in the southeastern U.S. We also have flexibility to ship trucks to Cincinnati for barges for export. We can also easily access the local container markets in Indianapolis and Columbus as well. Outside of the ethanol plant and production of products that we discussed above; we also handle several million bushels of soybeans that are railed to export facilities. They are loaded on vessels and shipped internationally to other countries where they are processed for feed and food uses. Brazil is our biggest competitor with exporting soybeans and, interestingly, their harvest falls opposite of ours so every half year there is production that supplies the world. Distributions On November 16, 2021 the Board voted to make a $650 per unit distribution to members as of that date, to be paid by the beginning of December. Remember to keep us updated with your current contact information so that we can get all information to you efficiently. When you call our office with any investor related questions, you will want to speak with Bill Dartt or Ashleigh Lawrence. Fiscal Year Ended September 30, 2021 Financial Results Below are the condensed income statements and balance sheets from our annual report filed on Form 10-K for the fiscal year ended September 30, 2021. Some of the highlights and key information from the fiscal year include: Net income was approximately $27.1 million or about $1,856 per unit for the fiscal year ended September 30, 2021, compared to a net loss of approximately ($1.1) million or about ($78) per unit for the same period in 2020. We experienced an increase in ethanol gallons sold of 4.2% for the fiscal year ended September 30, 2021 as compared to the same period in 2020 resulting from increased ethanol production rates for the period. The average price per gallon of ethanol sold for the fiscal year ended September 30, 2021 was approximately 53% higher than the average price for the same period in 2020, resulting primarily due increased fuel demand and lower production in some areas due to plants curtailing production in response to poor market conditions. These were coupled with higher corn oil and corn prices during the period, attributing the to favorable price increase.
3 | P a g e We experienced an increase of 3.5% in DDGS sold for the fiscal year ended September 30, 2021 as compared to the same period in 2020 due to increased ethanol production for the period. DDGS prices were up approximately 34% for the fiscal year ended September 30, 2021 compared to the same period in 2020. We experienced an increase in corn oil sold of approximately 14% for the fiscal year ended September 30, 2021 as compared to the same period in 2020 resulting primarily from higher corn oil yields due to improved efficiencies. Corn oil prices were up approximately 68% for the fiscal year ended September 30, 2021 compared to the same period in 2020 due to an increase in soybean oil prices and increased biodiesel production. Our revenues from soybean sales increased for the fiscal year ended September 30, 2021 as compared to the same period in 2020. This increase is primarily a result of an increase in bushels sold of approximately 61%. This increase is primarily due to conducive market conditions for selling soybeans for the fiscal year ended September 30, 2021. We used approximately 5% more bushels of corn to produce our ethanol, distillers’ grain and corn oil in the fiscal year ended September 30, 2021 compared to the same period in 2020 due to higher ethanol production for the period. Corn prices increased approximately 45% for the fiscal year ended September 30, 2021 compared to the same period in 2020, primarily due a smaller crop carry out from 2020’s harvest and concerns that the anticipated planting acres for 2021 will be insufficient to compensate for the smaller 2020 crop. We used approximately 6% more natural gas for the fiscal year ended September 30, 2021 as compared with the same period in 2020 due to increased ethanol production. During the fiscal year ended September 30, 2021, we purchased approximately 59% more bushels of soybeans compared to the same period in 2020 primarily due to a cash price that was conducive to producer selling. More detailed financials and financial footnotes, along with other information, can be found in our quarterly and annual reports filed with the Securities Exchange Commission (SEC). These are available by linking from our website to the SEC website; simply click on “Investors” then “SEC Info”. Please call our office if you need any assistance in obtaining or understanding the reports.
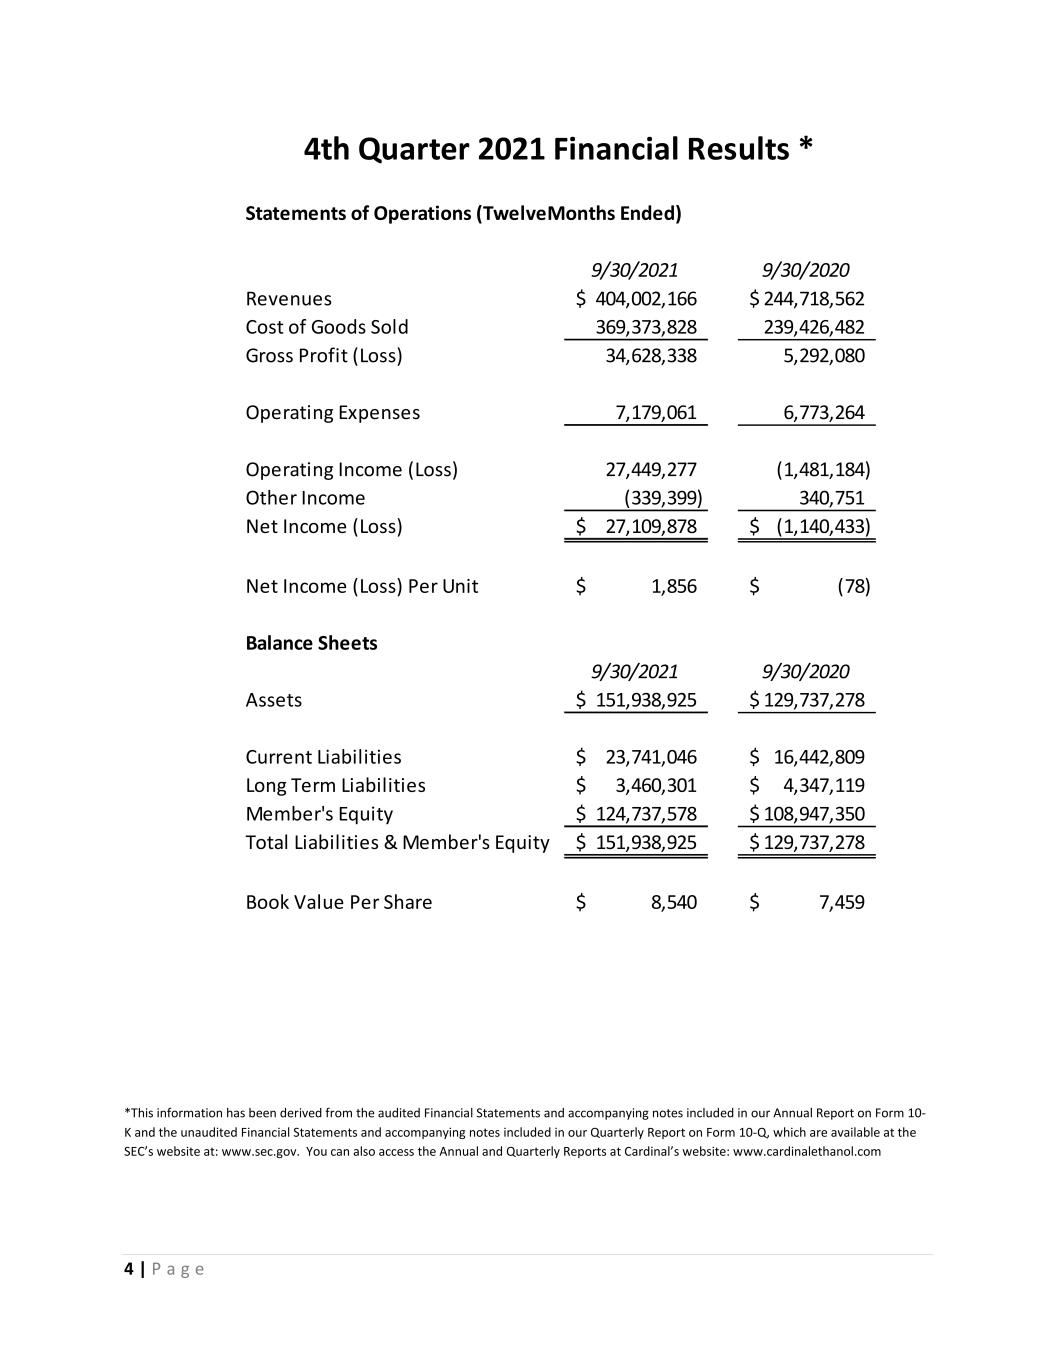
4 | P a g e *This information has been derived from the audited Financial Statements and accompanying notes included in our Annual Report on Form 10- K and the unaudited Financial Statements and accompanying notes included in our Quarterly Report on Form 10-Q, which are available at the SEC’s website at: www.sec.gov. You can also access the Annual and Quarterly Reports at Cardinal’s website: www.cardinalethanol.com Statements of Operations (TwelveMonths Ended) 9/30/2021 9/30/2020 Revenues 404,002,166$ 244,718,562$ Cost of Goods Sold 369,373,828 239,426,482 Gross Profit (Loss) 34,628,338 5,292,080 Operating Expenses 7,179,061 6,773,264 Operating Income (Loss) 27,449,277 (1,481,184) Other Income (339,399) 340,751 Net Income (Loss) 27,109,878$ (1,140,433)$ Net Income (Loss) Per Unit 1,856$ (78)$ Balance Sheets 9/30/2021 9/30/2020 Assets 151,938,925$ 129,737,278$ Current Liabilities 23,741,046$ 16,442,809$ Long Term Liabilities 3,460,301$ 4,347,119$ Member's Equity 124,737,578$ 108,947,350$ Total Liabilities & Member's Equity 151,938,925$ 129,737,278$ Book Value Per Share 8,540$ 7,459$ 4th Quarter 2021 Financial Results *
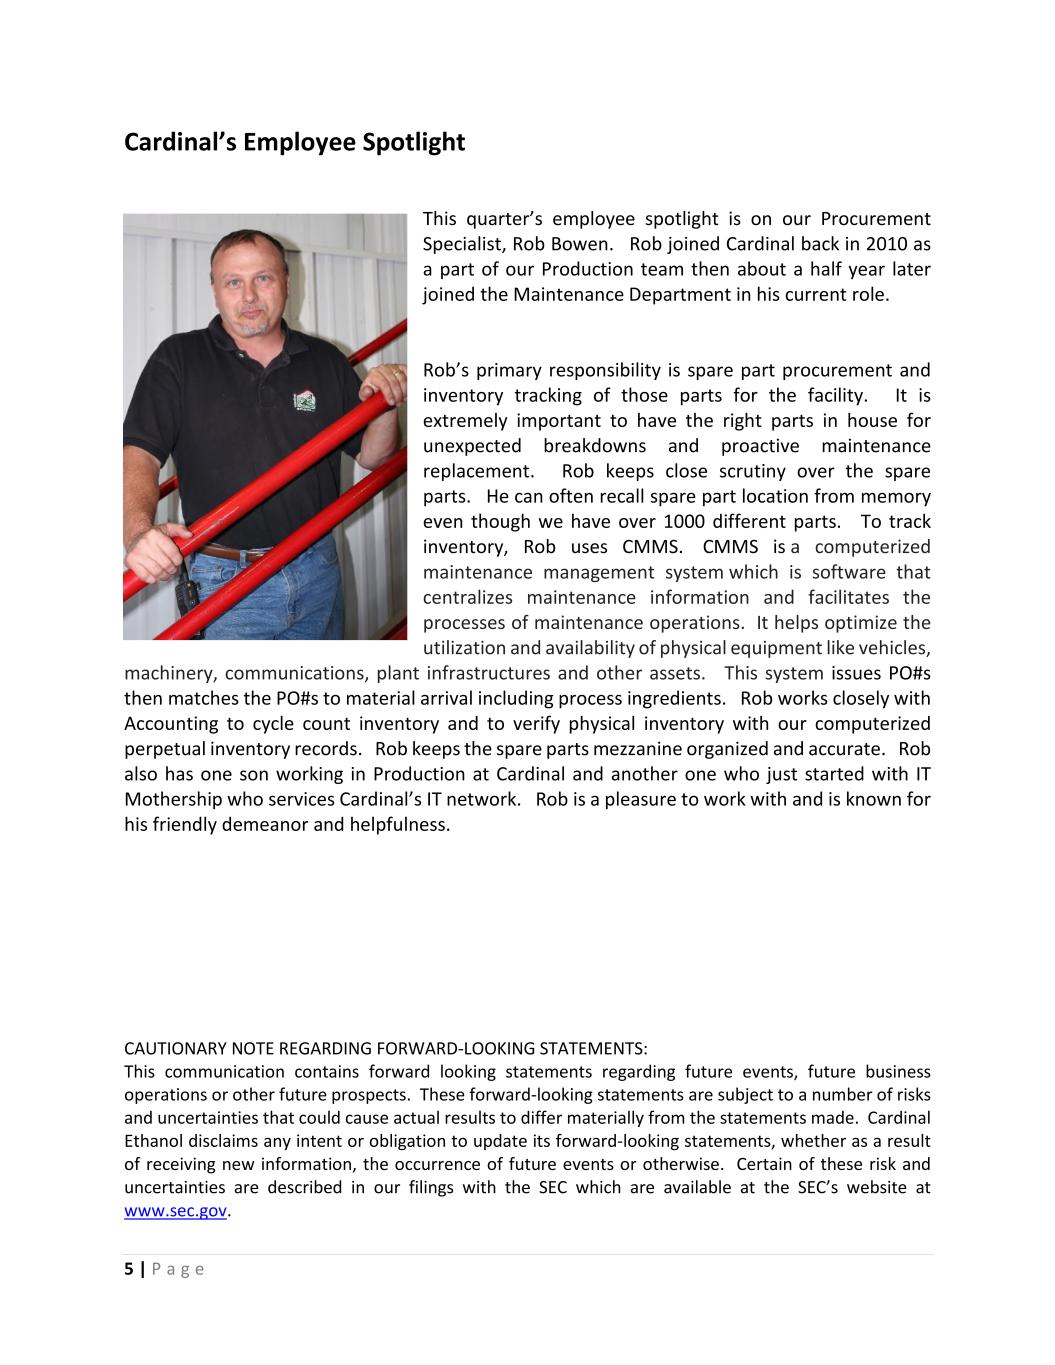
5 | P a g e Cardinal’s Employee Spotlight This quarter’s employee spotlight is on our Procurement Specialist, Rob Bowen. Rob joined Cardinal back in 2010 as a part of our Production team then about a half year later joined the Maintenance Department in his current role. Rob’s primary responsibility is spare part procurement and inventory tracking of those parts for the facility. It is extremely important to have the right parts in house for unexpected breakdowns and proactive maintenance replacement. Rob keeps close scrutiny over the spare parts. He can often recall spare part location from memory even though we have over 1000 different parts. To track inventory, Rob uses CMMS. CMMS is a computerized maintenance management system which is software that centralizes maintenance information and facilitates the processes of maintenance operations. It helps optimize the utilization and availability of physical equipment like vehicles, machinery, communications, plant infrastructures and other assets. This system issues PO#s then matches the PO#s to material arrival including process ingredients. Rob works closely with Accounting to cycle count inventory and to verify physical inventory with our computerized perpetual inventory records. Rob keeps the spare parts mezzanine organized and accurate. Rob also has one son working in Production at Cardinal and another one who just started with IT Mothership who services Cardinal’s IT network. Rob is a pleasure to work with and is known for his friendly demeanor and helpfulness. CAUTIONARY NOTE REGARDING FORWARD-LOOKING STATEMENTS: This communication contains forward looking statements regarding future events, future business operations or other future prospects. These forward-looking statements are subject to a number of risks and uncertainties that could cause actual results to differ materially from the statements made. Cardinal Ethanol disclaims any intent or obligation to update its forward-looking statements, whether as a result of receiving new information, the occurrence of future events or otherwise. Certain of these risk and uncertainties are described in our filings with the SEC which are available at the SEC’s website at www.sec.gov.


