Table of Contents
Index to Financial Statements
As filed with the Securities and Exchange Commission on February 10, 2006
Registration No. 333-
UNITED STATES SECURITIES AND EXCHANGE COMMISSION
WASHINGTON, D.C. 20549
FORM S-1
REGISTRATION STATEMENT UNDER THE SECURITIES ACT OF 1933
Windsor Energy Resources, Inc.
(Exact name of registrant as specified in its charter)
| Delaware | 1311 | 56-2547532 | ||
(State or other jurisdiction of incorporation or organization) | (Primary Standard Industrial Classification Code Number) | (I.R.S. Employer Identification Number) |
14313 N. May Avenue
Suite 100
Oklahoma City, Oklahoma 73134
(405) 463-0510
(Address, including zip code, and telephone number, including area code, of registrant’s principal executive offices)
Michael P. Cross
Chief Executive Officer
Windsor Energy Resources, Inc.
14313 N. May Avenue
Suite 100
Oklahoma City, Oklahoma 73134
(405) 463-0510
(Name, address, including zip code, and telephone number, including area code, of agent for service)
Copies to:
Seth R. Molay, P.C. Brett A. Schrader Akin Gump Strauss Hauer & Feld LLP 1700 Pacific Avenue, Suite 4100 Dallas, TX 75201 (214) 969-4780 | Robert G. Reedy Porter & Hedges, L.L.P. 1000 Main Street, 36th Floor Houston, TX 77002 (713) 226-6674 |
Approximate date of commencement of proposed sale to the public: As soon as practicable after this Registration Statement is declared effective.
If any securities being registered on this form are to be offered on a delayed or continuous basis pursuant to Rule 415 under the Securities Act of 1933, as amended (the “Securities Act”), check the following box. ¨
If this form is filed to register additional securities for an offering pursuant to Rule 462(b) under the Securities Act, check the following box and list the Securities Act registration statement number of the earlier effective registration statement for the same offering. ¨
If this form is a post-effective amendment filed pursuant to Rule 462(c) under the Securities Act, check the following box and list the Securities Act registration statement number of the earlier effective registration statement for the same offering. ¨
If this form is a post-effective amendment filed pursuant to Rule 462(d) under the Securities Act, check the following box and list the Securities Act registration statement number of the earlier effective registration statement for the same offering. ¨
CALCULATION OF REGISTRATION FEE
Title of Each Class of Securities to be Registered | Proposed Maximum Aggregate Offering Price(2) | Amount of Registration Fee | ||||
Common Stock, par value $0.01 per share (1) | $ | 175,000,000 | $ | 18,725 | ||
| (1) | Includes shares of common stock that may be sold to cover the exercise of an over-allotment option granted to the underwriter. |
| (2) | Estimated solely for the purpose of calculating the registration fee in accordance with Rule 457(o) under the Securities Act. |
The Registrant hereby amends this Registration Statement on such date or dates as may be necessary to delay its effective date until the Registrant shall file a further amendment which specifically states that this Registration Statement shall thereafter become effective in accordance with Section 8(a) of the Securities Act or until this Registration Statement shall become effective on such date as the Commission, acting pursuant to said Section 8(a), may determine.
Table of Contents
Index to Financial Statements
The information in this preliminary prospectus is not complete and may be changed. These securities may not be sold until the registration statement filed with the Securities and Exchange Commission is effective. This preliminary prospectus is not an offer to sell nor does it seek an offer to buy these securities in any jurisdiction where the offer or sale is not permitted.
SUBJECT TO COMPLETION. DATED FEBRUARY 10, 2006.
PROSPECTUS
Shares

Common Stock
We are offering shares of our common stock.
Prior to this offering, there has been no public market for our common stock. We expect the initial public offering price per share of our common stock to be between $ and $ . We intend to list our common stock on The Nasdaq National Market under the symbol “WERI.”
Investing in our common stock involves risks. See “Risk Factors” beginning on page 13.
Public Offering Price | Underwriting Discount | Proceeds to Windsor Energy (Before Expenses) | ||||
Per Share | $ | $ | $ | |||
Total | $ | $ | $ |
We have granted the underwriter a 30-day option to purchase up to shares of our common stock to cover any over-allotments.
Delivery of the shares will be made on or about , 2006.
Neither the Securities and Exchange Commission nor any state securities commission has approved or disapproved these securities or determined if this prospectus is truthful or complete. Any representation to the contrary is a criminal offense.
Johnson Rice & Company L.L.C.
The date of this prospectus is , 2006.
Table of Contents
Index to Financial Statements
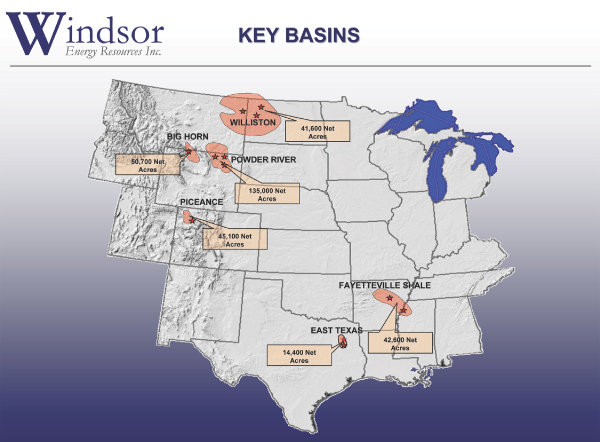
Table of Contents
Index to Financial Statements
| Page | ||
| 1 | ||
| 13 | ||
| 26 | ||
| 27 | ||
| 27 | ||
| 28 | ||
| 29 | ||
| 30 | ||
Management’s Discussion and Analysis of Financial Condition and Results of Operations | 32 | |
| 44 | ||
| 62 | ||
| 68 | ||
| 69 | ||
| 70 | ||
| 73 | ||
| 75 | ||
| 77 | ||
| 77 | ||
| 77 | ||
| F-1 | ||
| A-1 | ||
| B-1 |
You should rely only on the information contained in this prospectus. We have not, and the underwriter has not, authorized anyone to provide you with additional information or information different from that contained in this prospectus. If anyone provides you with different or inconsistent information, you should not rely on it. We are not, and the underwriter is not, making an offer to sell these securities in any jurisdiction where an offer to sell is not permitted. You should assume that the information appearing in this prospectus is accurate only as of the date on the front cover of this prospectus, regardless of the time of delivery of this prospectus or of any sale of our common stock. Our business, financial condition, results of operations and prospects may have changed since that date.
Except as otherwise indicated or required by the context, references in this prospectus to “we,” “us,” “our” or the “Company” refer to the combined business of Windsor Energy Resources, Inc. and its predecessors. The term “you” refers to a prospective investor. Unless the context otherwise requires, the information in the prospectus (other than in the historical financial statements) assumes that the underwriter will not exercise its over-allotment option.
i
Table of Contents
Index to Financial Statements
This summary contains basic information about us and the offering. Because it is a summary, it does not contain all the information that you should consider before investing in our common stock. You should read and carefully consider this entire prospectus before making an investment decision, especially the information presented under the heading “Risk Factors” and our combined financial statements and the accompanying notes included elsewhere in this prospectus, as well as the other documents to which we refer you. We have provided definitions for some of the oil and natural gas industry terms used in this prospectus in the “Glossary of Oil and Natural Gas Terms” in Appendix A. Natural gas equivalents and crude oil equivalents are determined using the ratio of six Mcf of natural gas to one Bbl of crude oil, condensate or natural gas liquids. The oil and natural gas assets and operations described in this prospectus are currently owned and/or operated by certain of our affiliates. Prior to the completion of this offering, these assets and operations will be transferred to us. The descriptions contained in this prospectus give effect to that transfer.
WINDSOR ENERGY RESOURCES, INC.
Overview
We are a rapidly growing independent energy company focused on the exploration, exploitation and development of both conventional and unconventional onshore oil and natural gas reserves. Our unconventional oil and natural gas projects include coalbed methane (CBM) gas development, basin-centered tight gas sand plays and shale plays. We have active unconventional resource development projects located in the Powder River and Piceance Basins in the Rocky Mountains and in the Cotton Valley and Travis Peak trends in East Texas and active conventional exploration and development projects located in the Big Horn Basin in the Rocky Mountains. We also have unconventional prospects in the Williston Basin in Montana and North Dakota and in the Fayetteville Shale trend in Arkansas and Mississippi that are in the exploration and development planning stage. Our management and technical teams have an extensive track record in the exploration and production business as well as significant operating experience in our core project areas. Our strategy is to maximize stockholder value by leveraging our significant undeveloped acreage position and the experience of our management and technical teams in finding and developing oil and natural gas reserves to profitably grow our reserves and production.
We commenced operations in 2003 when we acquired approximately 5,700 acres in the Powder River Basin. Since that time, we have continued to acquire leasehold interests, predominately undeveloped acreage, in several areas. As of December 31, 2005, we held leasehold interests in approximately 518,700 gross (365,900 net) acres. The following table sets forth our approximate acreage position as of December 31, 2005:
Basin / Trend | Location | Gross Acres | Net Acres | |||
Powder River | Wyoming | 182,300 | 135,000 | |||
Piceance | Colorado | 69,500 | 45,100 | |||
Cotton Valley / Travis Peak | East Texas | 45,900 | 14,400 | |||
Big Horn | Wyoming | 53,100 | 50,700 | |||
Williston | Montana / North Dakota | 83,300 | 41,600 | |||
Fayetteville Shale | Arkansas / Mississippi | 46,600 | 42,600 | |||
Other | Various | 38,000 | 36,500 | |||
Total | 518,700 | 365,900 | ||||
At December 31, 2005, our acreage contained 573 gross producing wells and we had identified approximately 1,290 potential drilling locations. We operate approximately 96% of our current wells and expect to operate all future wells on our acreage. From our inception through December 31, 2005, we drilled 228 gross wells on our acreage, of which 224 were completed as producing wells or are in the process of being completed or are dewatering. During this same period, our capital expenditures aggregated approximately $159 million, of
1
Table of Contents
Index to Financial Statements
which approximately $96 million was used for leasehold interest and property acquisitions and approximately $63 million was spent on drilling activities and infrastructure projects. Of the 228 gross wells we drilled, 222 were CBM wells in the Powder River Basin, three were in the Big Horn Basin, two were in the Piceance Basin and one was in the East Texas Basin. Approximately 34% of the CBM wells are currently producing natural gas in commercial quantities with the remainder in various stages of dewatering or awaiting additional infrastructure.
As of December 31, 2005, our estimated net proved reserves were approximately 48.5 Bcfe, of which 89% were natural gas. Our average net daily production in December 2005 was approximately 9.0 MMcfe/day.
Our Strategy
The principal elements of our strategy to maximize stockholder value are:
| • | Generate growth through drilling. We expect to generate long-term reserve and production growth predominantly through our drilling activities. We anticipate the majority of our future capital expenditures will be directed toward the drilling of wells, although we expect to continue to acquire additional leasehold interests. |
| • | Focus on lower risk development projects, with selective expenditures on higher risk exploration projects. We manage our inventory of properties as a portfolio, and seek to manage risk and return to maximize stockholder value. The majority of our acreage position is located in relatively low-risk, unconventional development areas that can provide what we believe are strong returns to our stockholders with limited risk. |
| • | Manage costs by maximizing operational control. We seek to exert control over our exploration, exploitation and development activities. As the operator of our projects, we have greater control over the amount and timing of the expenditures associated with those activities. |
| • | Pursue complementary leasehold interest and property acquisitions. We intend to use our experience and regional expertise to supplement our drilling strategy with complementary leasehold interest and property acquisitions. |
Our Strengths
We believe that our strengths will help us successfully execute our strategy. These strengths include:
| • | Inventory of growth opportunities. We have established an asset base of approximately 365,900 net leasehold acres, of which approximately 90% were undeveloped as of December 31, 2005. As of that date, we had identified approximately 1,290 potential drilling locations on our acreage. |
| • | Substantial acreage position in unconventional, development-based oil and natural gas plays. We have a significant acreage position in relatively low-risk, unconventional oil and natural gas development plays. This includes approximately 135,000 net acres of CBM leasehold interests in the Powder River Basin on which we have identified approximately 910 potential drilling locations, and approximately 177,700 net acres in other unconventional plays, including the Piceance Basin, Cotton Valley and Travis Peak trends, Williston Basin and Fayetteville Shale trend, on which we have identified approximately 370 potential drilling locations. |
| • | Experienced management and technical teams. Our four executive officers average 23 years of experience in the oil and natural gas industry. We have four full time geologists,five petroleum engineers andfive land professionals. |
2
Table of Contents
Index to Financial Statements
| • | Operational control. We operate approximately 96% of the wells in which we have an interest and expect our leasehold ownership positions to allow us to be the operator of future wells drilled on our acreage. This will afford us a significant degree of control over costs and other operational matters. |
| • | Financial flexibility. As of December 31, 2005, as adjusted for this offering and our intended use of the net proceeds of this offering, we would have had $ million in cash and no outstanding debt. We seek to maintain a conservative financial position and believe that our operating cash flow and proceeds from this offering will provide us with the financial flexibility to pursue our planned exploration and development activities through 2006. |
Our Properties
Summary of Exploration, Exploitation and Development Areas
The following table summarizes information regarding our key exploration, exploitation and development areas:
Basin/Trend | Project Area | Approximate Net Acres | Anticipated Average Working Interest(1) | Identified Drilling Locations (2) | Estimated Capital Expenditures (2) | ||||||||||||
| Total | 2006 | 2005 | 2006 | ||||||||||||||
| (millions) | (millions) | ||||||||||||||||
Powder River | Gas Draw/Harris | 14,700 | 80 | % | 95 | 95 | $ | 4.8 | $ | 6.4 | |||||||
Jepson | 17,100 | 100 | % | 248 | 64 | 10.6 | 11.7 | ||||||||||
Beaver Creek(3) | 87,000 | 75 | % | 575 | 1 | 13.7 | 3.5 | ||||||||||
Piceance | Castle Springs | 8,600 | 100 | % | 100 | 18 | 6.2 | 27.9 | |||||||||
East Texas | Overton | 6,800 | 39 | % | 85 | 8 | — | 5.9 | |||||||||
Weeping Mary | 7,600 | 100 | % | 75 | 9 | 0.9 | 14.0 | ||||||||||
Big Horn | Bennett Creek | 9,000 | 88 | % | 4 | 4 | 12.6 | 17.0 | |||||||||
Clark 3-D | 14,500 | 95 | % | — | — | — | 3.0 | ||||||||||
Bison Ranch | 5,600 | 95 | % | 1 | 1 | — | 3.9 | ||||||||||
Heart Mountain | 19,300 | 95 | % | — | — | — | — | ||||||||||
Williston | Bakken Shale | 41,600 | 33 | % | 60 | 3 | — | 6.9 | |||||||||
Fayetteville Shale | Fayetteville Shale | 42,600 | 100 | % | 50 | — | — | — | |||||||||
Total | 274,400 | 1,293 | 203 | $ | 48.8 | $ | 100.2 | ||||||||||
| (1) | Anticipated average working interest is based on the terms of our leases and anticipated unit size. |
| (2) | For each project area, identified drilling locations represent total gross locations specifically identified by management as of December 31, 2005 to be included in our future multi-year drilling activities on existing acreage. Of the total identified drilling locations shown in the table, 66 are classified as proved undeveloped locations, or PUDs. Of the 203 identified drilling locations that are included in our 2006 drilling program, 64 are classified as PUDs. During the year ended December 31, 2005, we drilled a total of 153 gross wells, including 28 PUDs. Our estimated capital expenditure amounts are based on our current drilling and infrastructure plans for the properties indicated. These plans and our actual future drilling activities are subject to change based on a variety of factors, including, but not limited to, the success of our drilling activities, prevailing and anticipated prices for oil and natural gas, the availability of necessary equipment and infrastructure, the availability of capital, the receipt and timing of required regulatory permits and approvals, seasonal conditions and drilling and acquisition costs. Significant additional capital expenditures will be required to more fully develop these areas. For a more complete description of our proposed activities, see “Business.” |
| (3) | We have 90 gross (68 net) CBM wells in the Beaver Creek project area and we are in the process of installing the infrastructure in that area to commence the dewatering process for these wells. We have identified approximately 575 additional drilling locations in the Beaver Creek project area that may be pursued depending upon the success of our pilot programs. |
3
Table of Contents
Index to Financial Statements
Active Project Areas
The following is a summary of our activities in each of the four basins in which we have development projects.
Powder River Basin. Our Powder River Basin properties are located in northeastern Wyoming. Nearly all of our development operations in this basin are focused on CBM plays in three project areas. CBM development typically results in higher drilling success and lower drilling costs when compared to conventional exploration and development activity. CBM production is generally characterized by an initial dewatering phase followed by increasing and then stabilized production prior to a natural decline. We currently have 471 gross CBM wells in this basin, of which 243 are producing, 106 are in the dewatering phase and 122 are shut-in awaiting the installation of infrastructure. Our CBM wells target multiple coal seams in the Ft. Union formation at depths ranging from 300 to 3,500 feet. As of December 31, 2005, we operated all of the wells in each of our Powder River Basin project areas. Key statistics for our position in this basin include:
| • | 135,000 total net acres, including 104,000 net undeveloped acres, at December 31, 2005; |
| • | 5.3 MMcfe/day of estimated average net production for December 2005, compared to 3.5 MMcfe/day for December 2004; |
| • | 12.5 Bcfe of estimated net proved reserves at December 31, 2005; |
| • | $29.8 million of estimated capital expenditures for drilling and related well work and infrastructure during the year ended December 31, 2005, which included a 149 gross well drilling program and 50 recompletions, and $1.4 million for leasehold interest and property acquisitions during the year; and |
| • | estimated capital expenditures in this basin for 2006 of approximately $21.6 million, substantially all of which has been budgeted to drill 160 additional wells. |
Piceance Basin. Our Piceance Basin properties are located in northwestern Colorado. Our development, exploitation and exploration activities are primarily directed towards basin-centered tight gas sand plays. We have four project areas, one of which, Castle Springs, is currently active, while the other three areas are under evaluation. Basin-centered tight gas sand plays typically are characterized by high drilling success and high density drilling. Our Castle Springs wells primarily target the Mesaverde sands at depths ranging from 6,000 to 9,500 feet. All of our Castle Springs wells are fracture stimulated after drilling to improve production rates and recoverability. As of December 31, 2005, we operated all of the wells in our Castle Springs project area. Key statistics for our position in this basin include:
| • | 45,100 total net acres, including 44,200 net undeveloped acres, at December 31, 2005; |
| • | 1.2 MMcfe/day of estimated average net production for December 2005 following the commencement of production in this basin in November 2005; |
| • | 17.0 Bcfe of estimated net proved reserves at December 31, 2005; |
| • | $6.2 million of estimated capital expenditures for drilling and related well work and infrastructure during the year ended December 31, 2005, which included a two gross well drilling program and two recompletions, and $40,000 for leasehold interest and property acquisitions during the year; and |
| • | estimated capital expenditures in this basin for 2006 of approximately $27.9 million, substantially all of which has been budgeted to drill 18 additional wells. |
4
Table of Contents
Index to Financial Statements
East Texas Basin. Our East Texas Basin properties are located adjacent to the Overton Fields in Smith and Cherokee counties in East Texas. Our two project areas focus on tight gas sand plays, targeting production from the Cotton Valley and Travis Peak intervals. The Cotton Valley and Travis Peak formations are found on our acreage at depths ranging from 9,000 to 14,000 feet. Like the Piceance Basin, this play is characterized by relatively high drilling success and high density drilling. At year end 2005, we were in the process of drilling one well and completing another well. All of our wells in this basin have been fracture stimulated after drilling to improve overall production rates, and we intend to fracture stimulate all future wells that we drill in this basin. As of December 31, 2005, we operated all of the wells in each of our East Texas project areas. Key statistics for our position in this basin include:
| • | 14,400 total net acres, including 14,200 net undeveloped acres, at December 31, 2005; |
| • | 0.6 MMcfe/day of estimated average net production for December 2005 following the acquisition of our interest in these project areas in June 2005; |
| • | 0.8 Bcfe of estimated net proved reserves at December 31, 2005; |
| • | $0.9 million of estimated capital expenditures for drilling and related well work and infrastructure, and $5.3 million for leasehold interest and property acquisitions, during the year ended December 31, 2005; and |
| • | estimated capital expenditures in this basin for 2006 of approximately $19.9 million, substantially all of which has been budgeted to complete two wells that we commenced drilling at the end of 2005 and drill 17 additional wells. |
Big Horn Basin. Our Big Horn Basin properties are located in northwest Wyoming. We are pursuing both conventional stratigraphic and structural gas plays, as well as unconventional basin-centered tight gas plays, in this basin. We have three shut-in wells in the Bennett Creek project area that tested at a combined rate of 8.6 MMcfe/day. We are in the process of constructing a 25-mile pipeline, with an estimated total cost upon completion of $5 million, that will provide the transportation required to begin initial production from those wells. We believe the pipeline will be completed in the second quarter of 2006. As of December 31, 2005, we operated all of the wells in each of our Big Horn Basin project areas. Key statistics for our position in this basin include:
| • | 50,700 total net acres, including 47,800 net undeveloped acres, at December 31, 2005; |
| • | 0.7 MMcfe/day of estimated average net production for December 2005, compared to 1.4 MMcfe/day for December 2004; |
| • | 15.5 Bcfe of estimated net proved reserves at December 31, 2005; |
| • | $13.2 million of estimated capital expenditures for drilling and related well work and infrastructure during the year ended December 31, 2005, which included a two gross well drilling program, four recompletions and construction of approximately five miles of pipeline; and |
| • | estimated capital expenditures in this basin for 2006 of approximately $23.9 million in 2006, of which approximately $18.4 million has been budgeted to drill five additional wells. |
Future Project Areas
The following is a summary of two new project areas that we are currently evaluating for future exploration and development potential.
Williston Basin. Our Williston Basin properties are located in western North Dakota and eastern Montana. The Williston Basin is predominantly an oil producing region and represents our only oil-focused project area.
5
Table of Contents
Index to Financial Statements
Our planned activities in this basin include both development and exploration drilling programs situated in several areas, including the Bakken Shale. We anticipate using horizontal drilling technology in this basin to increase production and reserve recoveries while limiting the number of vertical wells we must drill. We may use 3-D seismic surveys to better define our exploration and development projects. Key statistics for our position in this basin include:
| • | 41,600 total net acres at December 31, 2005, all of which was undeveloped; |
| • | 0.7 Bcfe of estimated net proved reserves at December 31, 2005; |
| • | $10.3 million of capital expenditures for the year ended December 31, 2005 for leasehold interest and property acquisitions; and |
| • | estimated capital expenditures in this basin for 2006 of approximately $6.9 million, all of which has been budgeted to drill three wells. |
Fayetteville Shale Trend. Our properties in the Fayetteville Shale trend extend from eastern Arkansas to Mississippi. Our operations in the area involve exploration and development drilling activities. We currently own approximately 42,600 net acres, all of which are undeveloped. We spent approximately $6.0 million for leasehold interest and property acquisitions during 2005.
Risk Factors
Investing in our common stock involves risks that include the speculative nature of oil and natural gas exploration, competition, volatile oil and natural gas prices and other material factors. You should read carefully the section of this prospectus entitled “Risk Factors” beginning on page 13 for an explanation of these risks before investing in our common stock. In particular, the following considerations may offset our competitive strengths or have a negative effect on our strategy as well as activities on our properties, which could cause a decrease in the price of our common stock and a loss of all or part of your investment:
| • | Limited operating history. We are a relatively new company. As such, we have made significant expenditures to acquire and develop our property base and increase production. This has resulted in significant losses in certain periods since our inception. We can give you no assurance that we will not incur further losses in the future. |
| • | Risks relating to the development of oil and natural gas reserves. Approximately 90% of our net leasehold acreage is undeveloped, or acreage on which wells have not been drilled or completed to a point that would permit the production of commercial quantities of oil and natural gas regardless of whether such acreage contains proved reserves. Our oil and natural gas reserves and future production and, therefore, our future cash flow and income are highly dependent on our ability to successfully develop our undeveloped leasehold acreage, which will require substantial amounts of capital. If we are unsuccessful in our drilling efforts or unable to secure other financing, we will not be able to develop our acreage. |
| • | Risks relating to oil and natural gas reserve estimates. Reserve estimates are based on many assumptions and our properties may not produce the reserves we originally forecast. Our reserves will decline unless we are successful in finding or acquiring new reserves. |
| • | Access to equipment and personnel. Shortages of drilling rigs, equipment, supplies or personnel could delay, restrict or increase the cost of our exploration, exploitation and development operations, which in turn could impair our financial condition and results of operations. |
6
Table of Contents
Index to Financial Statements
| • | Concentration and competition. Our presence in the Rocky Mountain and East Texas regions may make us disproportionately exposed to impacts of weather, government regulation and transportation constraints unique to those geographic locations. In addition, competition with other companies in the Rocky Mountain and East Texas regions is significant and may hinder our ability to pursue leasehold interest and property acquisitions as well as our ability to operate in certain of our core areas. |
| • | Risks related to rapid growth. We have grown rapidly through acquisitions and may make additional acquisitions in the future. Acquired leasehold interests and other properties may not produce as projected and we may be unable to determine reserve potential, identify liabilities associated with the leasehold interests and other properties or obtain indemnification or similar protections from sellers against them. |
For a discussion of other considerations that could negatively affect us, see “Risk Factors” and “Cautionary Note Regarding Forward-Looking Statements.”
Our Equity Sponsor
We were formed by affiliates of Wexford Capital LLC, or Wexford, in July 2003. Wexford is a Greenwich, Connecticut based SEC registered investment advisor with approximately $4.0 billion under management as of September 30, 2005. Wexford has made private equity investments in many different sectors with particular expertise in the energy and natural resources sector. Immediately prior to this offering, Wexford beneficially owned all of our outstanding common stock through Windsor Energy Holdings, L.L.C., or Windsor Holdings. Upon completion of the offering, Wexford will beneficially own approximately % of our common stock (approximately % if the over-allotment option is exercised in full).
Our Offices
Our principal executive offices are located at 14313 N. May Avenue, Suite 100, Oklahoma City, Oklahoma, and our telephone number at that address is (405) 463-0510. Our website address iswww.windsorenergy.com. Information contained on our website does not constitute part of this prospectus.
7
Table of Contents
Index to Financial Statements
The Offering
Common stock offered by us | shares |
Common stock to be outstanding immediately after completion of this offering | shares |
Use of proceeds | We intend to use the proceeds of this offering to fund exploration and development activities and for other general corporate purposes, including acquisitions and the repayment of approximately $4.5 million of outstanding indebtedness. See “Use of Proceeds.” |
Dividend policy | We currently anticipate that we will retain all future earnings, if any, to finance the growth and development of our business. We do not intend to pay cash dividends in the foreseeable future. |
Nasdaq National Market symbol | WERI |
Except as otherwise indicated, all information contained in this prospectus:
| • | assumes the underwriter does not exercise its over-allotment option; |
| • | excludes shares of our common stock issuable upon the exercise of options to be outstanding upon completion of this offering, at an exercise price per share equal to the offering price set forth on the cover of this prospectus; and |
| • | excludes an additional shares of common stock reserved for issuance under our equity incentive plan. |
8
Table of Contents
Index to Financial Statements
Summary Financial Data
The following table sets forth our summary historical financial data as of and for each of the periods indicated. The data as of and for the periods ended December 31, 2004 and 2003 is derived from our historical audited combined financial statements for the periods indicated. The data as of and for the periods ended September 30, 2005 and 2004 is derived from our historical unaudited combined financial statements for the interim periods indicated. The interim unaudited information was prepared on a basis consistent with that used in preparing our audited combined financial statements and includes all adjustments, consisting of normal and recurring items, that we consider necessary for a fair presentation of the financial position and results of operations for the unaudited periods. Operating results for the nine months ended September 30, 2005 are not necessarily indicative of results that may be expected for the entire year 2005. You should review this information together with “Management’s Discussion and Analysis of Financial Condition and Results of Operations” and combined historical financial statements and related notes included elsewhere in this prospectus.
| Period from Inception (July 8, 2003) to December 31, 2003 | Year Ended 2004 | Nine Months Ended September 30, | ||||||||||||||
| 2004 | 2005 | |||||||||||||||
| (unaudited) | ||||||||||||||||
| (in thousands, except per share amounts) | ||||||||||||||||
Statement of Operations Data: | ||||||||||||||||
Operating revenues | $ | 2,158 | $ | 9,046 | $ | 6,239 | $ | 11,629 | ||||||||
Other income | — | 84 | 100 | 6 | ||||||||||||
Expenses: | ||||||||||||||||
Lease operating expense | 350 | 2,868 | 1,704 | 6,218 | ||||||||||||
Production taxes | 114 | 540 | 326 | 1,138 | ||||||||||||
Gathering and transportation | 144 | 414 | 354 | 405 | ||||||||||||
Depreciation, depletion and amortization | 586 | 4,025 | 2,881 | 5,007 | ||||||||||||
General and administrative | 34 | 530 | 235 | 1,786 | ||||||||||||
Accretion expense | 13 | 37 | 28 | 145 | ||||||||||||
Total expenses | 1,241 | 8,414 | 5,528 | 14,699 | ||||||||||||
Income (loss) from operations | 917 | 716 | 811 | (3,064 | ) | |||||||||||
Other income (expense): | ||||||||||||||||
Interest expense | (100 | ) | (402 | ) | (286 | ) | (333 | ) | ||||||||
Interest income | — | 9 | 7 | 13 | ||||||||||||
Total other income (expense) | (100 | ) | (393 | ) | (279 | ) | (320 | ) | ||||||||
Net income (loss) | $ | 817 | $ | 323 | $ | 532 | $ | (3,384 | ) | |||||||
Pro Forma C Corporation Data (unaudited):(1)(2) | ||||||||||||||||
Historical net income (loss) before income taxes | $ | 817 | $ | 323 | $ | 532 | $ | (3,384 | ) | |||||||
Pro forma provision (benefit) for income taxes | 328 | 122 | 201 | (1,277 | ) | |||||||||||
Pro forma net income (loss) | $ | 489 | $ | 201 | $ | 331 | $ | (2,107 | ) | |||||||
Pro forma income (loss) per common share—basic and diluted | $ | $ | $ | $ | ||||||||||||
Weighted average pro forma shares outstanding—basic and diluted | ||||||||||||||||
Selected Cash Flow and Other Financial Data: | ||||||||||||||||
Net income (loss) | $ | 817 | $ | 323 | $ | 532 | $ | (3,384 | ) | |||||||
Depreciation, depletion and amortization | 586 | 4,025 | 2,881 | 5,007 | ||||||||||||
Other non-cash items | 14 | 40 | 30 | 148 | ||||||||||||
Change in current assets and liabilities | (1,193 | ) | (251 | ) | 224 | 900 | ||||||||||
Net cash provided by operating activities | $ | 224 | $ | 4,137 | $ | 3,667 | $ | 2,671 | ||||||||
Capital expenditures | $ | 35,053 | $ | 54,382 | $ | 37,914 | $ | 43,392 | ||||||||
9
Table of Contents
Index to Financial Statements
| As of December 31, | As of 2005 | ||||||||
| 2003 | 2004 | ||||||||
| (unaudited) | |||||||||
| (in thousands) | |||||||||
Balance sheet data: | |||||||||
Cash and cash equivalents | $ | 664 | $ | 2,010 | $ | 5,834 | |||
Other current assets | 1,542 | 2,283 | 3,580 | ||||||
Oil and gas properties, net—using full cost method of accounting | 35,063 | 90,019 | 130,807 | ||||||
Other assets | 79 | 496 | 1,909 | ||||||
Total assets | $ | 37,348 | $ | 94,808 | $ | 142,130 | |||
Current liabilities | $ | 2,147 | $ | 5,832 | $ | 11,579 | |||
Long-term debt, net of current maturities | 6,450 | 5,906 | 3,517 | ||||||
Asset retirement obligations, net of current obligation | 601 | 3,109 | 3,523 | ||||||
Members’ equity | 28,150 | 79,961 | 123,511 | ||||||
Total liabilities and members’ equity | $ | 37,348 | $ | 94,808 | $ | 142,130 | |||
| (1) | Windsor Energy Resources, Inc. was formed as a Delaware corporation in December 2005. The combined financial statements and other financial information included in this prospectus pertain to the assets, liabilities, revenues and expenses of certain limited liability companies and limited partnerships and certain oil and natural gas properties owned by companies which, in each case, are affiliated with Windsor Energy Resources, Inc. through our equity sponsor, Wexford. These affiliates were treated as partnerships for federal income tax purposes. As a result, essentially all of our taxable earnings and losses were passed through to Wexford, and we did not pay federal income taxes at the entity level. Prior to the completion of this offering, the oil and natural gas assets and operations currently owned and/or operated by these affiliates will be transferred to Windsor Energy Resources, Inc., which will be taxed as a C corporation. For comparative purposes, we have included a pro forma provision (benefit) for income taxes assuming we had been taxed as a C corporation in all periods prior to the transfer. |
| (2) | Unaudited pro forma basic and diluted income (loss) per share will be presented for all periods on the basis of shares to be issued to Windsor Holdings in connection with the transfer of the oil and natural gas assets and operations to us upon determination of the number of those shares. |
10
Table of Contents
Index to Financial Statements
Summary Operating and Reserve Data
The following estimates of net proved oil and natural gas reserves are based on the reserve report prepared by DeGolyer and MacNaughton, our independent petroleum engineers, and have been made in accordance with the rules and regulations of the SEC. A copy of the reserve report is attached to this prospectus as Appendix B. You should refer to “Risk Factors,” “Management’s Discussion and Analysis of Financial Condition and Results of Operations,” “Business—Oil and Gas Data—Proved Reserves,” “Business—Oil and Gas Data—Production and Price History” and the reserve report included in this prospectus in evaluating the material presented below.
| Period from Inception through (July 8, 2003) December 31, 2003(2) | Year Ended December 31, 2004 | Nine Months September 30, | |||||||
Production Data: | |||||||||
Natural gas (MMcf)(1) | 466.1 | 1,590.5 | 1,986.3 | ||||||
Oil (MBbls) | 9.3 | 28.3 | 18.2 | ||||||
Combined volumes (MMcfe) | 522.0 | 1,760.5 | 2,095.3 | ||||||
Daily combined volumes (MMcfe/day) | 3.0 | 4.8 | 7.7 | ||||||
Average Prices: | |||||||||
Natural gas (per Mcf) | $ | 4.06 | $ | 5.01 | $ | 5.41 | |||
Oil (per Bbl) | 28.49 | 37.80 | 48.71 | ||||||
Combined (per Mcfe) | 4.13 | 5.14 | 5.55 | ||||||
| As of December 31, | |||||||||
| 2004 | 2005 | ||||||||
| Estimated Net Proved Reserves: | |||||||||
Natural gas (Bcf) | 40.8 | 43.0 | |||||||
Oil (MMBbls) | 1.0 | 0.9 | |||||||
Total (Bcfe) | 46.6 | 48.5 | |||||||
PV-10 (in millions)(3) | $ | 96.4 | $ | 135.2 | |||||
Standardized measure (in millions)(4) | $ | 77.3 | $ | ||||||
| (1) | Production of natural gas liquids is included in natural gas revenues and production. |
| (2) | Production data for 2003 covers only a partial year as we acquired our initial properties in the Powder River Basin on July 8, 2003. |
| (3) | The present values of future net revenues before income taxes (PV-10) were determined using the prices for natural gas and oil at December 31, 2004 and 2005, which were $5.85 per MMcf of natural gas and $40.60 per barrel of oil in 2004 and $8.54 per MMcf of natural gas and $57.31 per barrel of oil in 2005. |
The present value of future net cash flows (PV-10 value) is a non-GAAP measure because it excludes income tax effects. Management believes that the presentation of the non-GAAP financial measure of PV-10 provides useful information to investors because it is widely used by professional analysts and sophisticated investors in evaluating oil and gas companies. Because many factors that are unique to each individual company impact the amount of future income taxes estimated to be paid, the use of a pre-tax measure is valuable when evaluating acquisition candidates. PV-10 is not a measure of financial or operating performance under GAAP. PV-10 should not be considered as an alternative to the standardized measure as defined under GAAP. We have included a reconciliation to the most directly comparable GAAP
11
Table of Contents
Index to Financial Statements
measure—standardized measure of discounted future net cash flows. The following table reconciles the standardized measure of future net cash flows to the PV-10 value:
| December 31, | ||||||
| 2004 | 2005 | |||||
Standardized measure of discounted future net cash flows | $ | 77.3 | $ | |||
Add: Present value of future income tax discounted at 10% | 19.1 | |||||
PV-10 value | $ | 96.4 | $ | |||
| (4) | The standardized measure represents the present value of estimated future cash inflows from proved oil and natural gas reserves, less future development, production, and income tax expenses, discounted at 10% per annum to reflect timing of future cash flows and using the same pricing assumptions as were used to calculate PV-10. Standardized measure differs from PV-10 because standardized measure includes the effect of future income taxes. |
12
Table of Contents
Index to Financial Statements
An investment in our common stock involves a high degree of risk. You should carefully consider the following risks and all of the other information contained in this prospectus before deciding to invest in our common stock. The risks described below are not the only ones facing our company. Additional risks not presently known to us or which we currently consider immaterial also may adversely affect our company.
Risks Related to the Oil and Natural Gas Industry and Our Business
Our business is difficult to evaluate because we have a limited operating history.
In considering whether to invest in our common stock, you should consider that there is only limited historical financial and operating information available on which to base your evaluation of our performance. We acquired our first oil and natural gas properties in 2003 and, as a result, we have a limited operating history.
Our oil and natural gas reserves and future production, and, therefore, our future cash flow and income, are highly dependent on our successfully developing our undeveloped leasehold acreage.
Approximately 90% of our net leasehold acreage is undeveloped, or acreage on which wells have not been drilled or completed to a point that would permit the production of commercial quantities of oil and natural gas regardless of whether such acreage contains proved reserves. In addition, many of our oil and gas leases require us to drill wells that are commercially productive, and if we are unsuccessful in drilling such wells, we could lose our rights under such leases. We intend to use cash flow from operations and the proceeds of this offering to develop our leasehold acreage by funding our exploration, exploitation and development activities. Our future oil and natural gas reserves and production, and, therefore, our future cash flow and income are highly dependent on successfully developing our undeveloped leasehold acreage.
Our development and exploration operations require substantial capital and we may be unable to obtain needed capital or financing on satisfactory terms, which could lead to a loss of properties and a decline in our oil and natural gas reserves.
The oil and natural gas industry is capital intensive. We make and expect to continue to make substantial capital expenditures in our business and operations for the exploration for and development, production and acquisition of oil and natural gas reserves. To date, we have financed capital expenditures primarily with funding from our equity sponsor, bank debt and cash generated by operations. In the near term, we intend to finance our capital expenditures with cash flow from operations and the proceeds from this offering. Our cash flow from operations and access to capital are subject to a number of variables, including:
| • | our proved reserves; |
| • | the level of oil and natural gas we are able to produce from existing wells; |
| • | the prices at which oil and natural gas are sold; and |
| • | our ability to acquire, locate and produce new reserves. |
We may, from time to time, need to seek additional financing, including a revolving credit facility. If our revenues decrease or our ability to obtain future financing is impaired as a result of lower oil and natural gas prices, operating difficulties, declines in reserves or for any other reason, we may have limited ability to obtain the capital necessary to sustain our operations at current levels. There can be no assurance as to the availability or terms of any additional financing.
Even if additional capital is needed, we may not be able to obtain debt or equity financing on terms favorable to us, or at all. If cash generated by operations is not sufficient to meet our capital requirements, the
13
Table of Contents
Index to Financial Statements
failure to obtain additional financing could result in a curtailment of our operations relating to exploration and development of our prospects, which in turn could lead to a possible loss of properties and a decline in our oil and natural gas reserves.
Our project areas, which are in various stages of development, may not yield oil or natural gas in commercially viable quantities.
Our project areas are in various stages of development, ranging from project areas with current drilling or production activity to project areas that consist of recently acquired leasehold acreage or that have limited drilling or production history. From inception through December 31, 2005, we participated in drilling a total of 228 gross wells, of which 79 gross wells were completed as producing wells, two gross wells were in the process of being drilled or completed, 57 gross wells were dewatering, 86 wells were shut in awaiting infrastructure to begin dewatering and four gross wells were identified as dry holes. If the wells in the process of being completed or dewatering do not produce sufficient revenues to return a profit or if we drill additional dry holes, our business may be materially affected. The cost of drilling, completing and operating any wells is often uncertain and new wells may not be productive.
Our identified drilling locations comprise an estimation of part of our future drilling plans over several years, making them susceptible to uncertainties that could materially alter the occurrence or timing of their drilling.
We have specifically identified drilling locations to be included in our future multi-year drilling activities on our existing acreage. As of December 31, 2005, we had identified approximately 1,290 gross drilling locations. These identified drilling locations represent a significant part of our growth strategy. Our ability to drill and develop these locations depends on a number of uncertainties, including the availability of capital, construction of infrastructure, seasonal conditions, regulatory approvals, oil and natural gas prices, costs and drilling results. For example, 575 of these potential drilling locations are located in our Beaver Creek project area in the Power River Basin. All of our existing wells in this project area are currently shut in awaiting power and infrastructure, which will account for most of our 2006 capital expenditures in this project area with only one of the 575 potential drilling locations projected to be drilled in 2006. Because of these uncertainties, we do not know if the numerous potential drilling locations we have identified will ever be drilled or if we will be able to produce oil or natural gas from these or any other potential drilling locations. As such, our actual drilling activities may materially differ from those presently identified, which could adversely affect our business.
Oil and natural gas prices are volatile and a decline in oil and natural gas prices can significantly affect our financial results and impede our growth.
Our revenue, profitability and cash flow depend upon the prices and demand for oil and natural gas. The markets for these commodities are very volatile and even relatively modest drops in prices can significantly affect our financial results and impede our growth. Changes in oil and natural gas prices have a significant impact on the value of our reserves and on our cash flow. Prices for oil and natural gas may fluctuate widely in response to relatively minor changes in the supply of and demand for oil and natural gas, market uncertainty and a variety of additional factors that are beyond our control, such as:
| • | the domestic and foreign supply of oil and natural gas; |
| • | the price of foreign imports; |
| • | overall domestic and global economic conditions; |
| • | political and economic conditions in oil producing countries, including the Middle East and South America; |
| • | the ability of members of the Organization of Petroleum Exporting Countries to agree to and maintain oil price and production controls; |
14
Table of Contents
Index to Financial Statements
| • | the level of consumer product demand; |
| • | weather conditions; |
| • | technological advances affecting energy consumption; |
| • | domestic and foreign governmental regulations; |
| • | proximity and capacity of oil and gas pipelines and other transportation facilities; and |
| • | the price and availability of alternative fuels. |
Lower oil and natural gas prices may not only decrease our revenues on a per unit basis, but also may reduce the amount of oil and natural gas that we can produce economically. This may result in our having to make substantial downward adjustments to our estimated proved reserves. If this occurs or if our production estimates change or our exploration or development results deteriorate, full cost accounting rules may require us to write down, as a non-cash charge to earnings, the carrying value of our oil and natural gas properties. Additionally, we currently do not hedge our oil and natural gas production. By not hedging our production, we may be more adversely affected by declines in oil and natural gas prices than our competitors who engage in hedging arrangements. Further, should we elect to hedge in the future, such hedges may result in us receiving lower than current prevailing market prices and place additional financial strains on us due to having to post margin calls on our hedges.
Our method of accounting for investments in oil and natural gas properties may result in impairment of asset value.
We follow the full cost method of accounting for oil and natural gas properties. Accordingly, all costs associated with the acquisition, exploration and development of oil and natural gas properties, including costs of undeveloped leasehold, geological and geophysical expenses, dry holes, leasehold equipment and legal due diligence costs directly related to acquisition, exploration and development activities, are capitalized. Capitalized costs of oil and natural gas properties also include estimated asset retirement costs recorded based on the fair value of the asset retirement obligation when incurred. The capitalized costs plus future development and dismantlement costs are depleted and charged to operations using the equivalent unit-of-production method based on proved oil and natural gas reserves as determined by our independent petroleum engineers. To the extent that such capitalized costs, net of depletion and amortization, exceed the present value of estimated future net revenues, discounted at 10%, from proved oil and natural gas reserves, after income tax effects, such excess costs are charged to operations. Once incurred, a write down of oil and natural gas properties is not reversible at a later date, even if oil or natural gas prices increase. See “Management’s Discussion and Analysis of Financial Condition and Results of Operations—Critical Accounting Policies and Estimates—Oil and Gas Properties” and “—Ceiling Test” for a more detailed description of our method of accounting.
Our estimated reserves are based on many assumptions that may turn out to be inaccurate. Any material inaccuracies in these reserve estimates or underlying assumptions will materially affect the quantities and present value of our reserves.
No one can measure underground accumulations of oil and natural gas in an exact way. Oil and natural gas reserve engineering requires subjective estimates of underground accumulations of oil and natural gas and assumptions concerning future oil and natural gas prices, production levels, and operating and development costs. As a result, estimated quantities of proved reserves and projections of future production rates and the timing of development expenditures may be incorrect. Our estimates of proved reserves and related valuations are based on reports prepared by independent petroleum engineers. The independent petroleum engineers conducted a well-by-well review of all our properties using information provided by us. Over time, we may make
15
Table of Contents
Index to Financial Statements
material changes to reserve estimates taking into account the results of actual drilling, testing, and production. Also, certain assumptions regarding future oil and natural gas prices, production levels, and operating and development costs may prove incorrect. Any significant variance from these assumptions to actual figures could greatly affect our estimates of reserves, the economically recoverable quantities of oil and natural gas attributable to any particular group of properties, the classifications of reserves based on risk of recovery, and estimates of the future net cash flows.A substantial portion of our reserve estimates are made without the benefit of a lengthy production history, which are less reliable than estimates based on a lengthy production history. Numerous changes over time to the assumptions on which our reserve estimates are based, as described above, often result in the actual quantities of oil and natural gas we ultimately recover being different from our reserve estimates.
The present value of future net cash flows from our proved reserves is not necessarily the same as the current market value of our estimated oil and natural gas reserves. We base the estimated discounted future net cash flows from our proved reserves on prices and costs in effect on the day of estimate. However, actual future net cash flows from our oil and natural gas properties also will be affected by factors such as:
| • | actual prices we receive for oil and natural gas; |
| • | the amount and timing of actual production; |
| • | supply of and demand for oil and natural gas; and |
| • | changes in governmental regulations or taxation. |
The timing of both our production and our incurrence of costs in connection with the development and production of oil and natural gas properties will affect the timing of actual future net cash flows from proved reserves, and thus their actual present value. In addition, the 10% discount factor we use when calculating discounted future net cash flows may not be the most appropriate discount factor based on interest rates in effect from time to time and risks associated with us or the oil and natural gas industry in general. For example, if natural gas prices decline by $0.10 per Mcf and oil prices remain constant, then the PV-10 of our proved reserves as of December 31, 2005 would decrease from $135.2 million to $133.3 million. PV-10 is a non-GAAP measure because it excludes income tax effects. We have provided a reconciliation of PV-10 to the standardized measure of discounted future net cash flows “Prospectus Summary—Summary Operating and Reserve Data.”
Many of our producing properties are located in the Rocky Mountain and East Texas regions, making us vulnerable to risks associated with operating in these areas.
Our operations are focused on the Rocky Mountain and East Texas regions, which means our producing properties are geographically concentrated in those areas. As a result, we may be disproportionately exposed to the impact of delays or interruptions of production from these regions caused by significant governmental regulation, lack of infrastructure, transportation capacity constraints, curtailment of production or interruption of transportation of natural gas produced from the wells in this basin. For example, we are currently constructing a 25-mile pipeline that will provide the transportation required to begin initial production from our wells in our Bennett Creek project area in the Big Horn Basin. We estimate the total cost of the pipeline upon its completion will be $5 million.
Shortage of rigs, equipment, supplies or personnel may restrict our operations.
The oil and natural gas industry is cyclical, and at the present time, there is a shortage of drilling rigs, equipment, supplies and personnel. The costs and delivery times of rigs, equipment and supplies has increased as drilling activities have increased. In addition, demand for, and wage rates of, qualified drilling rig crews have risen with increases in the number of active rigs in service. Shortages of drilling rigs, equipment, supplies or personnel could delay or restrict our exploration and development operations, which in turn could impair our financial condition and results of operations.
16
Table of Contents
Index to Financial Statements
Seasonal weather conditions and lease stipulations adversely affect our ability to conduct drilling activities in some of the areas where we operate.
Oil and natural gas operations in the Rocky Mountains are adversely affected by seasonal weather conditions and lease stipulations designed to protect various wildlife. In certain areas, drilling and other oil and natural gas activities can only be conducted during the spring, summer and fall months. Many of our leases with the Department of the Interior’s Bureau of Land Management restrict our operations in those areas from December to April due to wildlife migration. This limits our ability to operate in those areas and can intensify competition during those months for drilling rigs, oilfield equipment, services, supplies and qualified personnel, which may lead to periodic shortages. These constraints and the resulting shortages or high costs could delay our operations and materially increase our operating and capital costs.
Market conditions or operational impediments may hinder our access to oil and natural gas markets or delay our production.
Market conditions or the unavailability of satisfactory oil and natural gas transportation arrangements may hinder our access to oil and natural gas markets or delay our production. The availability of a ready market for our oil and natural gas production depends on a number of factors, including the demand for and supply of oil and natural gas and the proximity of reserves to pipelines and terminal facilities. Our ability to market our production depends in substantial part on the availability and capacity of gathering systems, pipelines and processing facilities owned and operated by third parties. Our failure to obtain such services on acceptable terms could materially harm our business. We may be required to shut in wells for a lack of a market or because of inadequacy or unavailability of natural gas pipeline, gathering system capacity or processing facilities. If that were to occur, then we would be unable to realize revenue from those wells until production arrangements were made to deliver the production to market.
We are subject to complex federal, state, local and other laws and regulations that could adversely affect the cost, manner or feasibility of doing business.
Our exploration, development, production and marketing operations are regulated extensively at the federal, state and local levels. Under these laws and regulations, we could be held liable for personal injuries, property damage, site clean-up and restoration obligations or costs and other damages and liabilities. Failure to comply with these laws and regulations may also result in the suspension or termination of our operations and subject us to administrative, civil and criminal penalties, including the assessment of natural resource damages. Environmental and other governmental laws and regulations also increase the costs to plan, design, drill, install, operate and abandon oil and natural gas wells and remediate impacted areas. These laws and regulations commonly impose strict liability and could impose liability upon us, regardless of fault. Moreover, public interest in environmental protection is intense, and environmental organizations have opposed, with some success, certain drilling projects. For example, the Clark Resource Council is opposing the approval by the Department of the Interior’s Bureau of Land Management, or BLM, of our operations in our Bennett Creek and Clark project areas.
Our coalbed methane exploration and production activities result in the discharge of large volumes of produced water into adjacent ponds, creekbeds and below ground disposal systems. The ratio of methane gas to produced water varies over the life of the well. The environmental soundness of discharging produced water pursuant to water discharge permits has come under increased scrutiny. Moratoriums on the issuance of additional water discharge permits, issuance of stricter permits, modifications to existing permits or requirements for more costly methods of handling these produced waters, may adversely affect future well operation and development. Compliance with more stringent laws or regulations, changed interpretations of these laws and regulations, or more vigorous enforcement policies of the regulatory agencies, or difficulties in negotiating required surface use agreements with land owners, or receiving other governmental approvals, could delay or otherwise adversely affect our CBM exploration and production activities and/or require us to make material expenditures for the installation and operation of systems and equipment for pollution control and/or remediation, all of which could have a material adverse effect on our financial condition or results of operations.
17
Table of Contents
Index to Financial Statements
For example, approximately 15% of our acreage in the Castle Springs project area is subject to a drilling moratorium put in place by the Colorado Oil and Gas Conservation Commission upon the discovery in March 2004 of a gas seep caused by a faulty well drilled by another operator.
In August 2004, the Tenth Circuit Court of Appeals inPennaco Energy, Inc. v. United States Department of the Interior, upheld a decision by the Interior Board of Land Appeals that the BLM failed to fully comply with the National Environmental Policy Act, or NEPA, in granting certain federal leases in the Powder River Basin to Pennaco Energy, Inc. for CBM development. Other recent decisions in the federal district court in Montana have also held that BLM failed to comply with NEPA when considering CBM development in the Powder River Basin. While these recent decisions have not had a material impact on our current operations or planned exploration and development activities, future litigation and/or agency responses to such litigation could materially impact our ability to obtain or maintain required regulatory approvals to conduct operations in the Powder River Basin or elsewhere.
Part of the regulatory environment in which we operate includes, in some cases, federal requirements for performing or preparing environmental assessments, environmental impact studies and/or plans of development before commencing exploration and production activities. In addition, our activities are subject to the regulation by oil and natural gas-producing states of conservation practices and protection of correlative rights. These regulations affect our operations and limit the quantity of oil and natural gas we may produce and sell. A major risk inherent in our drilling plans is the need to obtain drilling permits from state and local authorities. Delays in obtaining regulatory approvals, drilling permits, the failure to obtain a drilling permit for a well or the receipt of a permit with unreasonable conditions or costs could have a material adverse effect on our ability to explore on or develop our properties. The permitting and approval process has been more difficult in recent years than in the past due to increased activism from environmental and other groups and has extended the time it takes us to receive permits. Because of our relatively small size and concentrated property base, we can be disproportionately disadvantaged by delays in obtaining or failing to obtain drilling approvals compared to companies with larger or more dispersed property bases. As a result, we are less able to shift drilling activities to areas where permitting may be easier and we have fewer properties over which to spread the costs related to complying with these regulations and the costs or foregone opportunities resulting from delays. Additionally, the oil and natural gas regulatory environment could change in ways that might substantially increase the financial and managerial costs to comply with the requirements of these laws and regulations and, consequently, adversely affect our profitability. See “Business—Operations—Environmental Matters and Regulation” and “Business—Operations—Other Regulation of the Oil and Gas Industry” for a description of the laws and regulations that affect us.
We rely on a few key employees whose absence or loss could adversely affect our business.
Many key responsibilities within our business have been assigned to a small number of employees. The loss of their services could adversely affect our business. In particular, the loss of the services of our Chief Executive Officer, Michael P. Cross, could disrupt our operations. We do not have an employment contract with any of our executives and they are not restricted from competing with us if they cease to be employed by us. Additionally, as a practical matter, any employment agreement we may enter into will not assure the retention of our employees. In addition, we do not maintain “key person” life insurance policies on any of our employees. As a result, we are not insured against any losses resulting from the death of our key employees.
Our use of 2-D and 3-D seismic data is subject to interpretation and may not accurately identify the presence of oil and natural gas, which could adversely affect the results of our drilling operations.
Even when properly used and interpreted, 2-D and 3-D seismic data and visualization techniques are only tools used to assist geoscientists in identifying subsurface structures and hydrocarbon indicators and do not enable the interpreter to know whether hydrocarbons are, in fact, present in those structures. In addition, the use of 3-D seismic and other advanced technologies requires greater predrilling expenditures than traditional drilling strategies, and we could incur losses as a result of such expenditures. As a result, our drilling activities may not be successful or economical.
18
Table of Contents
Index to Financial Statements
Our interpretation of seismic data delineates for us those portions of an area that we believe are desirable for drilling. Therefore, we may chose not to acquire option or lease rights prior to acquiring seismic data and, in many cases, we may identify hydrocarbon indicators before seeking option or lease rights in the location. If we are not able to lease those locations on acceptable terms, it would result in our having made substantial expenditures to acquire and analyze 3-D data without having an opportunity to attempt to benefit from those expenditures.
Drilling for and producing oil and natural gas are high-risk activities with many uncertainties that could adversely affect our business, financial condition or results of operations.
Our drilling activities are subject to many risks, including the risk that we will not discover commercially productive reservoirs. In addition, our drilling and producing operations may be curtailed, delayed or canceled as a result of other factors, including:
| • | unusual or unexpected geological formations; |
| • | pressures; |
| • | fires; |
| • | blowouts; |
| • | loss of drilling fluid circulation; |
| • | title problems; |
| • | facility or equipment malfunctions; |
| • | unexpected operational events; |
| • | shortages or delivery delays of equipment and services; |
| • | compliance with environmental and other governmental requirements; and |
| • | adverse weather conditions. |
Any of these risks can cause substantial losses, including personal injury or loss of life, damage to or destruction of property, natural resources and equipment, pollution, environmental contamination or loss of wells and other regulatory penalties.
Additionally, the coal beds in the Powder River Basin from which we produce methane gas frequently contain water, which may hamper our ability to produce gas in commercial quantities. The amount of CBM that can be commercially produced depends upon the coal quality, the original gas content of the coal seam, the thickness of the seam, the reservoir pressure, the rate at which gas is released from the coal, and the existence of any natural fractures through which the gas can flow to the well bore. However, coal beds frequently contain water that must be removed in order for the gas to flow to the well bore. The average life of a CBM well in this basin is only five to 15 years. Our ability to remove and dispose of sufficient quantities of water from the coal seam will determine whether or not we can produce coal bed methane in commercial quantities.
Losses and liabilities from uninsured or underinsured drilling and operating activities could have a material adverse effect on our financial condition and operations.
We ordinarily maintain insurance against various losses and liabilities arising from our operations; however, insurance against all operational risks is not available to us. Additionally, we may elect not to obtain insurance if we believe that the cost of available insurance is excessive relative to the perceived risks presented. Thus, losses could occur for uninsurable or uninsured risks or in amounts in excess of existing insurance coverage. The occurrence of an event that is not fully covered by insurance could have a material adverse impact on our business activities, financial condition and results of operations.
19
Table of Contents
Index to Financial Statements
We may be unable to successfully acquire additional leasehold interests or other oil and natural gas properties.
Acquisitions of leasehold interests or other oil and natural gas properties have been an important element of our business, and we will continue to pursue acquisitions in the future. In the last several years, we have pursued and consummated leasehold or other property acquisitions that have provided us opportunities to expand our acreage position, and, to a lesser extent, grow our production and reserves. Although we regularly engage in discussions and submit proposals regarding leasehold interests or other properties, suitable acquisitions may not be available in the future on reasonable terms.
If we do identify appropriate leasehold interests or other properties, we may be unable to successfully negotiate the terms of an acquisition, finance the acquisition or, if the acquisition occurs, successfully develop the acquired leasehold interests or other properties. Negotiations of potential acquisitions may require a disproportionate amount of management’s attention and our resources. Even if we complete additional acquisitions, continued acquisition financing may not be available or available on reasonable terms and any new leasehold interests or other properties may not provide production or reserves comparable to our existing leasehold interests and other properties.
The success of any acquisition will depend on a number of factors, including the ability to identify drilling locations, estimate accurately the recoverable volumes of reserves, rates of future production and future net revenues attainable from the reserves and to assess possible environmental or other liabilities. However, even a detailed review of records and properties may not necessarily reveal existing or potential problems, nor will it permit a buyer to become sufficiently familiar with the properties to assess fully their deficiencies and potential. Inspections may not always be performed on every well, and environmental problems, such as ground water contamination, are not necessarily observable even when an inspection is undertaken. Even when problems are identified, we often assume certain environmental and other risks and liabilities in connection with acquired properties.
Unless we replace our oil and natural gas reserves, our reserves and production will decline, which would adversely affect our business, financial condition and results of operations.
We face the challenge of natural production declines. As initial reservoir pressures are depleted, oil and gas production from a given well naturally decreases. Thus, an oil and gas exploration and production company depletes part of its asset base with each unit of oil or natural gas it produces. Because total estimated proved reserves include our proved undeveloped reserves at December 31, 2005, production will decline even if those proved undeveloped reserves are developed and the wells produce as expected. The rate of decline will change if production from our existing wells declines in a different manner than we have estimated and can change under other circumstances. Thus, our future oil and natural gas reserves and production and, therefore, our cash flow and income are highly dependent on our success in efficiently developing and exploiting our current reserves and economically finding or acquiring additional recoverable reserves. Our future growth will depend on our ability to continue to add reserves in excess of production. Our ability to add reserves through drilling is dependent on our capital resources and can be limited by many factors, including our ability to timely obtain drilling permits and regulatory approvals. Thus, we may not be able to develop, find or acquire additional reserves to replace our current and future production at acceptable costs.
Competition in the oil and natural gas industry is intense, which may adversely affect our ability to succeed.
The oil and natural gas industry is intensely competitive, and we compete with other companies that have greater resources. Many of these companies not only explore for and produce oil and natural gas, but also carry on refining operations and market petroleum and other products on a regional, national or worldwide basis. These companies may be able to pay more for productive oil and natural gas properties and exploratory prospects or define, evaluate, bid for and purchase a greater number of properties and prospects than our financial or human
20
Table of Contents
Index to Financial Statements
resources permit. In addition, these companies may have a greater ability to continue exploration activities during periods of low oil and natural gas market prices. Our larger competitors may be able to absorb the burden of present and future federal, state, local and other laws and regulations more easily than we can, which would adversely affect our competitive position. Our ability to acquire additional properties and to discover reserves in the future will be dependent upon our ability to evaluate and select suitable properties and to consummate transactions in a highly competitive environment. In addition, because we have fewer financial and human resources than many companies in our industry, we may be at a disadvantage in bidding for exploratory prospects and producing oil and natural gas properties.
Certain of our leases in the Powder River Basin are in areas that have been partially depleted or drained by offset wells and our leases in our other project areas may also be subject to depletion or drainage from offset wells.
The Powder River Basin represents a significant part of our drilling program and production in 2006. Our development operations are conducted in three project areas in this basin. In the Powder River Basin, nearly all of our operations are in CBM plays, and our key project areas are located in areas that have been the most active drilling areas in the Rocky Mountain region. As a result, many of our leases are located in areas that have already been partially depleted or drained by earlier offset drilling. This may inhibit our ability to find economically recoverable quantities of natural gas in these areas. Additionally, our leases in our other project areas may be subject to depletion or drainage from offset wells.
We will be subject to the requirements of Section 404 of the Sarbanes-Oxley Act. If we are unable to timely comply with Section 404 or if the costs related to compliance are significant, our profitability, stock price and results of operations and financial condition could be materially adversely affected.
We will be required to comply with the provisions of Section 404 of the Sarbanes-Oxley Act of 2002 as of December 31, 2007. Section 404 requires that we document and test our internal control over financial reporting and issue management’s assessment of our internal control over financial reporting. This section also requires that our independent registered public accounting firm opine on those internal controls and management’s assessment of those controls. We are currently evaluating our existing controls against the standards adopted by the Committee of Sponsoring Organizations of the Treadway Commission, or COSO. During the course of our ongoing evaluation and integration of the internal control over financial reporting, we may identify areas requiring improvement, and we may have to design enhanced processes and controls to address issues identified through this review. For example, we anticipate the need to hire additional administrative and accounting personnel to conduct our financial reporting.
We believe that the out-of-pocket costs, the diversion of management’s attention from running the day-to-day operations and operational changes caused by the need to comply with the requirements of Section 404 of the Sarbanes-Oxley Act could be significant. If the time and costs associated with such compliance exceed our current expectations, our results of operations could be adversely affected.
We cannot be certain at this time that we will be able to successfully complete the procedures, certification and attestation requirements of Section 404 or that we or our auditors will not identify material weaknesses in internal control over financial reporting. If we fail to comply with the requirements of Section 404 or if we or our auditors identify and report such material weakness, the accuracy and timeliness of the filing of our annual and quarterly reports may be materially adversely affected and could cause investors to lose confidence in our reported financial information, which could have a negative effect on the trading price of our common stock. In addition, a material weakness in the effectiveness of our internal control over financial reporting could result in an increased chance of fraud and the loss of customers, reduce our ability to obtain financing and require additional expenditures to comply with these requirements, each of which could have a material adverse effect on our business, results of operations and financial condition.
21
Table of Contents
Index to Financial Statements
Risks Related to this Offering and Our Common Stock
Our largest stockholder controls a significant percentage of our common stock, and its interests may conflict with those of our other stockholders.
Upon completion of this offering, Wexford will beneficially own approximately % of our common stock, or % if the underwriter exercises its over-allotment option in full. See “Principal Stockholders.” As a result, Wexford will continue to be able to exercise significant influence, and in most cases control over matters requiring stockholder approval, including the election of directors, changes to our charter documents and significant corporate transactions. This concentration of ownership makes it unlikely that any other holder or group of holders of our common stock will be able to affect the way we are managed or the direction of our business. The interests of Wexford with respect to matters potentially or actually involving or affecting us, such as future acquisitions, financings and other corporate opportunities and attempts to acquire us, may conflict with the interests of our other stockholders. Wexford’s continued concentrated ownership will make it impossible for another company to acquire us and for you to receive any related takeover premium for your shares unless Wexford approves the acquisition.
Since we are a “controlled company” for purposes of The Nasdaq National Market’s corporate governance requirements, our stockholders will not have, and may never have, the protections that these corporate governance requirements are intended to provide.
Since we are a “controlled company” for purposes of The Nasdaq National Market’s corporate governance requirements, we are not required to comply with the provisions requiring that a majority of our directors be independent, the compensation of our executives be determined by independent directors or nominees for election to our board of directors be selected by independent directors. As a result, our stockholders will not have, and may never have, the protections that these rules are intended to provide.
We rely upon Gulfport Energy Corporation to provide us with administrative services and office space. Gulfport is an affiliate of ours and conflicts of interest may arise. Further, the unexpected loss of these services could negatively impact our operations.
Historically, we have outsourced management and administrative services to Gulfport Energy Corporation and reimbursed Gulfport for its dedicated employee time and related general and administrative costs based on the proportionate amount of time its employees spent performing services for us. In 2003, 2004 and the first nine months of 2005, we paid Gulfport $0, $363,000 and $1,620,000, respectively, under this arrangement. Upon the closing of this offering, Gulfport will no longer provide us with management services. Gulfport will, however, continue to provide us with administrative services, including certain accounting, business resources, legal and technical support, and office space pursuant to an administrative services agreement under terms to be negotiated. These terms will be arrived at through negotiations between us and Gulfport. One of our directors, Mike Liddell, is a director of Gulfport. This may create conflicts of interest because Mr. Liddell has responsibilities to Gulfport and its stockholders, including Wexford and its affiliates, which are Gulfport’s largest stockholders. His duties as a director of Gulfport may conflict with his duties as director of our company regarding business dealings between Gulfport and us and other matters. The resolution of these conflicts may not always be in our or our stockholders’ best interests. Further, an unanticipated loss of the services provided by Gulfport could negatively impact our business. See “Related Party Transactions—Administrative Services Agreement” for further discussion of the administrative services agreement.
We will incur increased costs as a result of being a public company.
As a public company, we will incur significant legal, accounting and other expenses that we did not incur as a private company. We will incur costs associated with our public company reporting requirements. We also anticipate that we will incur costs associated with corporate governance requirements, including requirements
22
Table of Contents
Index to Financial Statements
under the Sarbanes-Oxley Act of 2002, as well as new rules implemented by the SEC and the NASD. We expect these rules and regulations to increase our legal and financial compliance costs and to make some activities more time-consuming and costly. We also expect these new rules and regulations may make it more difficult and more expensive for us to obtain director and officer liability insurance and we may be required to accept reduced policy limits and coverage or incur substantially higher costs to obtain the same or similar coverage. As a result, it may be more difficult for us to attract and retain qualified individuals to serve on our board of directors or as executive officers. We are currently evaluating these new rules, and we cannot predict or estimate the amount of additional costs we may incur or the timing of such costs.
There has been no public market for our common stock and if the price of our common stock fluctuates significantly, your investment could lose value.
Prior to this offering, there has been no public market for our common stock. Although we intend to apply to have our common stock listed on The Nasdaq National Market, we cannot assure you that an active public market will develop for our common stock or that our common stock will trade in the public market subsequent to this offering at or above the initial public offering price. If an active public market for our common stock does not develop, the trading price and liquidity of our common stock will be materially and adversely affected. If there is a thin trading market or “float” for our stock, the market price for our common stock may fluctuate significantly more than the stock market as a whole. Without a large float, our common stock is less liquid than the stock of companies with broader public ownership and, as a result, the trading prices of our common stock may be more volatile. In addition, in the absence of an active public trading market, investors may be unable to liquidate their investment in us. The initial offering price, which will be negotiated between us and the underwriter, may not be indicative of the trading price for our common stock after this offering. In addition, the stock market is subject to significant price and volume fluctuations, and the price of our common stock could fluctuate widely in response to several factors, including:
| • | our quarterly operating results; |
| • | changes in our earnings estimates; |
| • | additions or departures of key personnel; |
| • | changes in the business, earnings estimates or market perceptions of our competitors; |
| • | changes in general market or economic conditions; and |
| • | announcements of legislative or regulatory change. |
The stock market has experienced extreme price and volume fluctuations in recent years that have significantly affected the quoted prices of the securities of many companies, including companies in our industry. The changes often appear to occur without regard to specific operating performance. The price of our common stock could fluctuate based upon factors that have little or nothing to do with our company and these fluctuations could materially reduce our stock price.
Future sales of our common stock may cause our stock price to decline.
Sales of substantial amounts of our common stock in the public market after this offering, or the perception that these sales may occur, could cause the market price of our common stock to decline. See “Shares Eligible for Future Sale.” In addition, the sale of these shares could impair our ability to raise capital through the sale of additional common or preferred stock.
After this offering, we will have shares of common stock outstanding, excluding stock options. Of these shares, all shares sold in this offering, other than shares, if any, purchased by our affiliates, will be freely tradable.
23
Table of Contents
Index to Financial Statements
Windsor Holdings and our officers and directors would be subject to agreements that limit their ability to sell our common stock held by them. These holders cannot sell or otherwise dispose of any shares of our common stock, subject to limited exceptions, for a period of at least 180 days after the date of this prospectus, which period may be extended under limited circumstances, without the prior written approval of Johnson Rice & Company L.L.C., which could, in its sole discretion, elect to permit resale of shares by existing stockholders, prior to the lapse of the 180-day period.
Purchasers in this offering will experience immediate dilution and will experience further dilution with the future exercise of stock options.
If you purchase common stock in this offering, you will pay more for your shares than the amount paid by stockholders who purchased their shares from us prior to this offering. As a result, you will experience immediate and substantial dilution of approximately $ per share, representing the difference between our net tangible book value per share as of after giving effect to this offering and an initial public offering price of $ (which is the midpoint of the range set forth on the cover of the prospectus). Additionally, you will experience further dilution as holders of certain of our stock options exercise those options. Immediately after this offering, we anticipate having options to purchase shares outstanding, of which currently are exercisable. See “Dilution” for a description of dilution.
We may issue preferred stock whose terms could adversely affect the voting power or value of our common stock.
Our certificate of incorporation authorizes us to issue, without the approval of our stockholders, one or more classes or series of preferred stock having such designations, preferences, limitations and relative rights, including preferences over our common stock respecting dividends and distributions, as our board of directors may determine. The terms of one or more classes or series of preferred stock could adversely impact the voting power or value of our common stock. For example, we might grant holders of preferred stock the right to elect some number of our directors in all events or on the happening of specified events or the right to veto specified transactions. Similarly, the repurchase or redemption rights or liquidation preferences we might assign to holders of preferred stock could affect the residual value of the common stock.
Provisions in our certificate of incorporation and bylaws and Delaware law make it more difficult to effect a change in control of the company, which could adversely affect the price of our common stock.
The existence of some provisions in our certificate of incorporation and bylaws and Delaware corporate law could delay or prevent a change in control of our company, even if that change would be beneficial to our stockholders. Our certificate of incorporation and bylaws contain provisions that may make acquiring control of our company difficult, including:
| • | provisions regulating the ability of our stockholders to nominate directors for election or to bring matters for action at annual meetings of our stockholders; |
| • | limitations on the ability of our stockholders to call a special meeting and act by written consent; |
| • | the authorization given to our board of directors to issue and set the terms of preferred stock; and |
| • | limitations on the ability of our stockholders from removing our directors without cause. |
These provisions also could discourage proxy contests and make it more difficult for you and other stockholders to elect directors and take other corporate actions. As a result, these provisions could make it more difficult for a third party to acquire us, even if doing so would benefit our stockholders, which may limit the price that investors are willing to pay in the future for shares of our common stock.
24
Table of Contents
Index to Financial Statements
We do not intend to pay cash dividends on our common stock in the foreseeable future, and therefore only appreciation of the price of our common stock will provide a return to our stockholders.
We currently anticipate that we will retain all future earnings, if any, to finance the growth and development of our business. We do not intend to pay cash dividends in the foreseeable future. Any payment of cash dividends will depend upon our financial condition, capital requirements, earnings and other factors deemed relevant by our board of directors. In addition, the terms of our credit facilities prohibit us from paying dividends and making other distributions. As a result, only appreciation of the price of our common stock, which may not occur, will provide a return to our stockholders.
25
Table of Contents
Index to Financial Statements
CAUTIONARY NOTE REGARDING FORWARD-LOOKING STATEMENTS
This prospectus contains forward-looking statements. These forward-looking statements are subject to a number of risks and uncertainties, many of which are beyond our control, which may include statements about our:
| • | business strategy; |
| • | exploration and development drilling prospects, inventories, projects and programs; |
| • | oil and natural gas reserves; |
| • | identified drilling locations; |
| • | ability to obtain permits and governmental approvals; |
| • | technology; |
| • | financial strategy; |
| • | realized oil and natural gas prices; |
| • | production; |
| • | lease operating expenses, general and administrative costs and finding and development costs; |
| • | future operating results; and |
| • | plans, objectives, expectations and intentions. |
All of these types of statements, other than statements of historical fact included in this prospectus, are forward-looking statements. These forward-looking statements may be found in the “Prospectus Summary,” “Risk Factors,” “Management’s Discussion and Analysis of Financial Condition and Results of Operations,” “Business” and other sections of the prospectus. In some cases, you can identify forward-looking statements by terminology such as “may,” “will,” “could,” “should,” “expect,” “plan,” “project,” “intend,” “anticipate,” “believe,” “estimate,” “predict,” “potential,” “pursue,” “target,” “seek,” “objective” or “continue,” the negative of such terms or other comparable terminology.
The forward-looking statements contained in this prospectus are largely based on our expectations, which reflect estimates and assumptions made by our management. These estimates and assumptions reflect our best judgment based on currently known market conditions and other factors. Although we believe such estimates and assumptions to be reasonable, they are inherently uncertain and involve a number of risks and uncertainties that are beyond our control. In addition, management’s assumptions about future events may prove to be inaccurate. Management cautions all readers that the forward-looking statements contained in this prospectus are not guarantees of future performance, and we cannot assure any reader that such statements will be realized or the forward-looking events and circumstances will occur. Actual results may differ materially from those anticipated or implied in the forward-looking statements due to the many factors including those listed in the “Risk Factors” section and elsewhere in this prospectus. All forward-looking statements speak only as of the date of this prospectus. We do not intend to publicly update or revise any forward-looking statements as a result of new information, future events or otherwise. These cautionary statements qualify all forward-looking statements attributable to us or persons acting on our behalf.
26
Table of Contents
Index to Financial Statements
Our net proceeds from the sale of the shares of common stock in this offering, assuming a public offering price of $ per share (which is the midpoint of the range set forth on the cover of this prospectus), are estimated to be $ million, after deducting underwriting discounts and commissions and estimated offering expenses. The net proceeds would be $ million if the underwriter’s over-allotment option is exercised in full. We will use the net proceeds of this offering to fund exploration and development activities and for general corporate purposes, which may include leasehold interest and property acquisitions, working capital and repayment of approximately $4.5 million of outstanding debt under two bank loans.
If the underwriter’s over-allotment option is exercised, the additional proceeds will be used for these same general corporate purposes.
At February 8, 2006, our outstanding borrowings under our two bank loans were $2.7 million and $1.8 million, respectively. These loans bear interest at a rate equal to the London Interbank Offered Rate, or LIBOR, plus 2.875%, or 7.44% at February 8, 2006. These loans mature on October 1, 2008 and June 1, 2009, respectively.
Pending these uses, we may invest the net proceeds from this offering temporarily in short-term, investment-grade, interest bearing securities or guaranteed obligations of the United States government.
We have never declared or paid any cash dividends on our capital stock. We currently intend to retain all available funds and any future earnings for use in the operation and expansion of our business and do not anticipate declaring or paying any cash dividends in the foreseeable future. Any future determination as to the declaration and payment of dividends will be at the discretion of our board of directors and will depend on then existing conditions, including our financial condition, results of operations, contractual restrictions, capital requirements, business prospects and other factors that our board of directors considers relevant.
27
Table of Contents
Index to Financial Statements
The following table sets forth, as of September 30, 2005, a summary of:
| • | our actual capitalization; and |
| • | our capitalization as adjusted to give effect to the sale of shares of our common stock in this offering at an assumed initial public offering price of $ per share (which is the midpoint of the range set forth on the cover of this prospectus), our receipt of an estimated $ million of net proceeds after deducting the underwriting discounts and commissions and the estimated offering expenses and the use of a portion of those proceeds to repay outstanding borrowings as described under the caption “Use of Proceeds.” |
You should read the following table in conjunction with “Management’s Discussion and Analysis of Financial Condition and Results of Operations” and our combined financial statements and related notes appearing elsewhere in this prospectus.
| As of September 30, 2005 | ||||||
| Actual (1) | As Adjusted for Offering | |||||
| (in thousands) | ||||||
Cash and cash equivalents | $ | 5,834 | $ | |||
Long term debt (including current maturities) | $ | 5,894 | $ | — | ||
Member’s equity | 123,511 | — | ||||
Stockholder’s equity: | ||||||
Common stock, par value $0.01; 0 shares authorized and 0 shares issued and outstanding actual; 100,000,000 shares authorized and shares issued and outstanding as adjusted for the offering | — | |||||
Additional paid-in capital | — | |||||
Total stockholder’s equity | — | |||||
Total capitalization | $ | 129,405 | $ | |||
| (1) | Windsor Energy Resources, Inc. was formed as a Delaware corporation in December 2005. The data in this table has been derived from the combined financial statements and other financial information included in this prospectus which pertain to the assets, liabilities, revenues and expenses of certain limited liability companies and limited partnerships and certain oil and natural gas properties owned by companies which, in each case, are affiliated with Windsor Energy Resources, Inc. through our equity sponsor, Wexford. These assets, liabilities and operations will be transferred to Windsor Energy Resources, Inc. prior to the completion of this offering. |
The data in the table above excludes shares of common stock issuable upon exercise of options to be outstanding upon completion of this offering at an exercise price per share equal to the offering price set forth on the cover of this prospectus.
28
Table of Contents
Index to Financial Statements
Our reported net tangible book value as of September 30, 2005 was $ million, or $ per share of common stock, based upon shares outstanding as of that date after giving pro forma effect to the transfer. Net tangible book value per share is determined by dividing such number of outstanding shares of common stock into our net tangible book value, which is our total tangible assets less total liabilities. Assuming the sale by us of shares of common stock offered in this offering at an estimated initial public offering price of $ per share (which is the midpoint of the range set forth on the cover of this prospectus) and after deducting the underwriting discounts and commissions and estimated offering expenses payable by us, our net tangible book value as of September 30, 2005 would have been approximately $ million, or $ per share after giving pro forma effect to the transfer. This represents an immediate increase in net tangible book value of $ per share to our existing stockholders and an immediate dilution of $ per share to new investors purchasing shares at the initial public offering price.
The following table illustrates the per share dilution:
Assumed initial public offering price per share | $ | |||||
Net tangible book value per share as of September 30, 2005 | $ | |||||
Increase per share attributable to new investors | $ | |||||
As adjusted net tangible book value per share after the offering | $ | |||||
Dilution per share to new investors | $ | |||||
The following table sets forth, as of September 30, 2005, after giving pro forma effect to the transfer, the number of shares of common stock purchased from us by our existing stockholders and by the new investors at the assumed initial public offering price of $ per share, together with the total consideration paid and average price per share paid by each of these groups, before deducting underwriting discounts and commissions and estimated offering expenses.
| Shares Purchased | Total Consideration | Average Price | ||||||||||||
| Number | Percent | Amount | Percent | Per Share | ||||||||||
Existing stockholders | % | $ | % | $ | ||||||||||
New investors | % | % | ||||||||||||
Total | 100.00 | % | $ | 100.00 | % | $ | ||||||||
If the underwriter’s over-allotment option is exercised in full, the number of shares held by new investors will be increased to , or approximately % of the total number of shares of common stock.
The data in the table above excludes shares of common stock issuable upon exercise of options to be outstanding upon completion of this offering at an exercise price per share equal to the offering price set forth on the cover of this prospectus.
29
Table of Contents
Index to Financial Statements
SELECTED HISTORICAL FINANCIAL DATA
The following table sets forth our selected historical financial data as of and for each of the periods indicated. The data as of and for the periods ended December 31, 2004 and 2003 is derived from our historical audited combined financial statements for the periods indicated. The data as of and for the periods ended September 30, 2005 and 2004 is derived from our historical unaudited combined financial statements for the interim periods indicated. The interim unaudited information was prepared on a basis consistent with that used in preparing our audited combined financial statements and includes all adjustments, consisting of normal and recurring items, that we consider necessary for a fair presentation of the financial position and results of operations for the unaudited periods. Operating results for the nine months ended September 30, 2005 are not necessarily indicative of results that may be expected for the entire year 2005. You should review this information together with “Management’s Discussion and Analysis of Financial Condition and Results of Operations” and combined historical financial statements and related notes included elsewhere in this prospectus.
Period from to December 31, | Year Ended December 31, | Nine Months Ended September 30, | ||||||||||||||
| 2003 | 2004 | 2004 | 2005 | |||||||||||||
| (unaudited) | ||||||||||||||||
| (in thousands, except per share data) | ||||||||||||||||
Statement of Operations Data: | ||||||||||||||||
Operating revenues | $ | 2,158 | $ | 9,046 | $ | 6,239 | $ | 11,629 | ||||||||
Other income | — | 84 | 100 | 6 | ||||||||||||
Expenses: | ||||||||||||||||
Lease operating expense | 350 | 2,868 | 1,704 | 6,218 | ||||||||||||
Production taxes | 114 | 540 | 326 | 1,138 | ||||||||||||
Gathering and transportation | 144 | 414 | 354 | 405 | ||||||||||||
Depreciation, depletion and amortization | 586 | 4,025 | 2,881 | 5,007 | ||||||||||||
General and administrative | 34 | 530 | 235 | 1,786 | ||||||||||||
Accretion expense | 13 | 37 | 28 | 145 | ||||||||||||
Total expenses | 1,241 | 8,414 | 5,528 | 14,699 | ||||||||||||
Income (loss) from operations | 917 | 716 | 811 | (3,064 | ) | |||||||||||
Other income (expense): | ||||||||||||||||
Interest expense | (100 | ) | (402 | ) | (286 | ) | (333 | ) | ||||||||
Interest income | — | 9 | 7 | 13 | ||||||||||||
Total other income (expense) | (100 | ) | (393 | ) | (279 | ) | (320 | ) | ||||||||
Net income (loss) | $ | 817 | $ | 323 | $ | 532 | $ | (3,384 | ) | |||||||
Pro Forma C Corporation Data (unaudited):(1)(2) | ||||||||||||||||
Historical net income (loss) before income taxes | $ | 817 | $ | 323 | $ | 532 | $ | (3,384 | ) | |||||||
Pro forma provision (benefit) for income taxes | 328 | 122 | 201 | (1,277 | ) | |||||||||||
Pro forma net income (loss) | $ | 489 | $ | 201 | $ | 331 | $ | (2,107 | ) | |||||||
Pro forma income (loss) per common share—basic and diluted | $ | $ | $ | $ | ||||||||||||
Weighted average pro forma shares outstanding—basic and diluted | ||||||||||||||||
Selected Cash Flow and Other Financial Data: | ||||||||||||||||
Net income (loss) | $ | 817 | $ | 323 | $ | 532 | $ | (3,384 | ) | |||||||
Depreciation, depletion and amortization | 586 | 4,025 | 2,881 | 5,007 | ||||||||||||
Other non-cash items | 14 | 40 | 30 | 148 | ||||||||||||
Change in current assets and liabilities | (1,193 | ) | (251 | ) | 224 | 900 | ||||||||||
Net cash provided by operating activities | $ | 224 | $ | 4,137 | $ | 3,667 | $ | 2,671 | ||||||||
Capital expenditures | $ | 35,053 | $ | 54,382 | $ | 37,914 | $ | 43,392 | ||||||||
30
Table of Contents
Index to Financial Statements
| As of December 31, | As of September 30, | ||||||||
| 2003 | 2004 | 2005 | |||||||
| (unaudited) | |||||||||
| (in thousands) | |||||||||
| Balance sheet data: | |||||||||
Cash and cash equivalents | $ | 664 | $ | 2,010 | $ | 5,834 | |||
Other current assets | 1,542 | 2,283 | 3,580 | ||||||
Oil and gas properties, net—using full cost method of accounting | 35,063 | 90,019 | 130,807 | ||||||
Other assets | 79 | 496 | 1,909 | ||||||
Total assets | $ | 37,348 | $ | 94,808 | $ | 142,130 | |||
Current liabilities | $ | 2,147 | $ | 5,832 | $ | 11,579 | |||
Long-term debt, net of current maturities | 6,450 | 5,906 | 3,517 | ||||||
Asset retirement obligations, net of current obligation | 601 | 3,109 | 3,523 | ||||||
Members’ equity | 28,150 | 79,961 | 123,511 | ||||||
Total liabilities and members’ equity | $ | 37,348 | $ | 94,808 | $ | 142,130 | |||
| (1) | Windsor Energy Resources, Inc. was formed as a Delaware corporation in December 2005. The combined financial statements and other financial information included in this prospectus pertain to the assets, liabilities, revenues and expenses of certain limited liability companies and limited partnerships and certain oil and natural gas properties owned by companies which, in each case, are affiliated with Windsor Energy Resources, Inc. through our equity sponsor, Wexford. These affiliates were treated as partnerships for federal income tax purposes. As a result, essentially all of our taxable earnings and losses were passed through to Wexford, and we did not pay federal income taxes at the entity level. Prior to the completion of this offering, the oil and natural gas assets and operations currently owned and/or operated by these affiliates will be transferred to Windsor Energy Resources, Inc., which will be taxed as a C corporation. For comparative purposes, we have included a pro forma provision (benefit) for income taxes assuming we had been taxed as a C corporation in all periods prior to the transfer. |
| (2) | Unaudited pro forma basic and diluted income (loss) per share will be presented for all periods on the basis of shares to be issued to Windsor Holdings in connection with the transfer of the oil and natural gas assets and operations to us upon determination of the number of those shares. |
31
Table of Contents
Index to Financial Statements
MANAGEMENT’S DISCUSSION AND ANALYSIS OF
FINANCIAL CONDITION AND RESULTS OF OPERATIONS
The following discussion and analysis should be read in conjunction with the “Selected Historical Financial Data” and the combined financial statements and related notes included elsewhere in this prospectus. This discussion contains forward-looking statements reflecting our current expectations and estimates and assumptions concerning events and financial trends that may affect our future operating results or financial position. Actual results and the timing of events may differ materially from those contained in these forward-looking statements due to a number of factors, including those discussed in the sections entitled “Risk Factors” and “Cautionary Note Regarding Forward-Looking Statements” appearing elsewhere in this prospectus.
Overview
We are a rapidly growing independent energy company focused on the exploration, exploitation and development of both conventional and unconventional onshore oil and natural gas reserves in the Rocky Mountain and Midcontinent regions. We intend to increase stockholder value by profitably growing reserves and production, primarily through drilling operations. We seek high quality exploration and development projects with potential for providing long-term drilling inventories that generate high returns. Substantially all of our revenues are generated through the sale of oil and natural gas at market prices production under either short-term contracts or longer term processing, gathering and transportation contracts. Approximately 92.5% of our September 2005 production was natural gas.
Windsor Energy Resources, Inc. was formed as a Delaware corporation in December 2005. The combined financial statements and other financial information included in this prospectus pertain to the assets, liabilities, revenues and expenses of certain limited liability companies and limited partnerships, and certain oil and natural gas properties owned by companies which, in each case, are affiliated with Windsor Energy Resources, Inc. through our equity sponsor, Wexford. Prior to the completion of this offering, those oil and natural gas assets and operations as currently owned and/or operated by these affiliates will be transferred to Windsor Energy Resources, Inc.
We commenced operations in July 2003 when we acquired approximately 5,700 acres in the Powder River Basin. Since that time, we have continued to acquire leasehold interests, predominately undeveloped acreage, in several areas. As of December 31, 2005, we held leasehold interests in approximately 518,700 gross (365,900 net) acres. Our acquisitions were financed with capital contributions from our equity sponsor.
Since we began operations, we have increased our drilling activity, evaluated potential acquisitions and added to our acreage portfolio. Our operating results reflect this growth. Our activities in 2004 and 2005 included development drilling and exploration in the Powder River, Piceance, East Texas and Big Horn Basins. Our activities are now focused on evaluating and developing our asset base in those areas and in the Williston Basin and Fayetteville Shale trend.
Because of our rapid growth through acquisitions and development of our properties, our historical results of operations and period-to-period comparisons of these results and certain financial data may not be meaningful or indicative of future results.
As of December 31, 2005, we had 48.5 Bcfe of estimated net proved reserves with a PV-10 of $135.2 million and a standardized measure of $ million, which were determined using a price of $8.54 per MMcf of natural gas and $57.31 per barrel of oil, while at December 31, 2004, we had 46.6 Bcfe of estimated net proved reserves with a PV-10 of $96.4 million and a standardized measure of $77.3 million, which was determined using a price of $5.85 per MMcf of natural gas and $40.60 per barrel of oil. Substantial portions of our reserves are located in Colorado, Texas and Wyoming.
32
Table of Contents
Index to Financial Statements
The average sales prices received for natural gas in all areas rose sharply in 2004 and 2005. The following table depicts the prices for near month delivery contracts for crude oil and natural gas as traded on the NYMEX on the dates indicated:
| At December 31, | At September 30, 2005 | |||||||||||
| 2003 | 2004 | 2005 | ||||||||||
Crude oil (Bbl) | $ | 32.52 | $ | 43.45 | $ | 61.04 | $ | 66.24 | ||||
Natural gas (MMbtu) | $ | 6.19 | $ | 6.15 | $ | 11.23 | $ | 13.92 | ||||
On January 27, 2006, the closing prices for near month delivery contracts for crude oil and natural gas as traded on the NYMEX were $67.76 per barrel and $8.40 per MMbtu, respectively.
Higher oil and natural gas prices have led to higher demand for drilling rigs, operating personnel and field supplies and services, and have caused increases in the costs of those goods and services. To date, the higher sales prices have more than offset the higher field costs. Given the inherent volatility of oil and natural gas prices that are influenced by many factors beyond our control, we plan our activities and budget based on conservative sales price assumptions, which generally are lower than the average sales prices received in 2004 and the first nine months of 2005. We focus our efforts on increasing natural gas reserves and production while controlling costs at a level that is appropriate for long-term operations. Our future earnings and cash flows are dependent on our ability to manage our overall cost structure to a level that allows for profitable production.
Like all oil and gas exploration and production companies, we face the challenge of natural production declines. As initial reservoir pressures are depleted, oil and gas production from a given well naturally decreases. Thus, an oil and gas exploration and production company depletes part of its asset base with each unit of oil or natural gas it produces. We attempt to overcome this natural decline by drilling to find additional reserves and acquiring more reserves than we produce. Our future growth will depend on our ability to continue to add reserves in excess of production. We will maintain our focus on managing costs associated with drilling and the development and production of reserves. Our ability to add reserves through drilling is dependent on our capital resources and can be limited by many factors, including our ability to timely obtain drilling permits and regulatory approvals. The permitting and approval process has been more difficult in recent years than in the past due to increased activism from environmental and other groups and has extended the time it takes us to receive permits. Because of our relatively small size and concentrated property base, we can be disproportionately disadvantaged by delays in obtaining or failing to obtain drilling approvals compared to companies with larger or more dispersed property bases. As a result, we are less able to shift drilling activities to areas where permitting may be easier and we have fewer properties over which to spread the costs related to complying with these regulations and the costs or foregone opportunities resulting from delays.
Critical Accounting Policies and Estimates
The discussion and analysis of our financial condition and results of operations are based upon our combined financial statements, which have been prepared in accordance with accounting principles generally accepted in the United States. The preparation of these financial statements requires us to make estimates and assumptions that affect the reported amounts of assets, liabilities, revenues and expenses, and related disclosure of contingent assets and liabilities. Certain accounting policies involve judgments and uncertainties to such an extent that there is reasonable likelihood that materially different amounts could have been reported under different conditions, or if different assumptions had been used. We evaluate our estimates and assumptions on a regular basis. We base our estimates on historical experience and various other assumptions that are believed to be reasonable under the circumstances, the results of which form the basis for making judgments about the carrying values of assets and liabilities that are not readily apparent from other sources. Actual results may differ from these estimates and assumptions used in preparation of our financial statements. Below, we have provided expanded discussion of our more significant accounting policies, estimates and judgments. We believe these accounting policies reflect our more significant estimates and assumptions used in preparation of our financial statements. See Note 2 of the notes to our combined financial statements appearing elsewhere in this prospectus for a discussion of additional accounting policies and estimates made by management.
33
Table of Contents
Index to Financial Statements
Oil and Gas Properties
We follow the full cost method of accounting for oil and natural gas properties. Accordingly, all costs associated with the acquisition, exploration and development of oil and natural gas properties, including costs of undeveloped leasehold, geological and geophysical expenses, dry holes, leasehold equipment and legal due diligence costs directly related to acquisition, exploration and development activities, are capitalized. Capitalized costs of oil and gas properties also include estimated asset retirement costs recorded based on the fair value of the asset retirement obligation when incurred. Proceeds received from disposals are credited against accumulated cost except when the sale represents a significant disposal of reserves, in which case a gain or loss is recognized.
The sum of net capitalized costs and estimated future development and dismantlement costs is depleted on the equivalent unit-of-production method, based on proved oil and natural gas reserves as determined by independent petroleum engineers. Oil and natural gas are converted to equivalent units based upon the relative energy content, which is six thousand cubic feet of natural gas to one barrel of oil.
Ceiling Test
Companies that use the full cost method of accounting for oil and gas properties are required to perform a ceiling test each quarter. The test determines a limit, or ceiling, on the book value of the oil and gas properties. Net capitalized costs are limited to the lower of unamortized cost net of deferred income taxes or the cost center ceiling. The cost center ceiling is defined as the sum of (a) estimated future net revenues, discounted at 10% per annum, from proved reserves, based on unescalated year-end prices and costs, adjusted for any contract provisions or financial derivatives, if any, that hedge our oil and natural gas revenue, and excluding the estimated abandonment costs for properties with asset retirement obligations recorded on the balance sheet, (b) the cost of properties not being amortized, if any, and (c) the lower of cost or market value of unproved properties included in the cost being amortized, less income tax effects related to differences between the book and tax basis of the oil and natural gas properties. If the net book value reduced by the related net deferred income tax liability exceeds the ceiling, an impairment or noncash writedown is required. A ceiling test impairment can give us a significant loss for a particular period; however, future depletion expense would be reduced.
The ceiling test is affected by a decrease in net cash flow from reserves due to higher operating or capital costs or reduction in market prices for natural gas and crude oil. These changes can reduce the amount of economically producible reserves. At December 31, 2004, capitalized costs, inclusive of future development costs and net of accumulated depletion, was $2.29 per Mcfe.
Asset Retirement Obligations
We have significant obligations to remove equipment and restore land at the end of oil and gas production operations. Our removal and restoration obligations are primarily associated with plugging and abandoning wells and associated production facilities.
The FASB issued SFAS No. 143,Accounting for Asset Retirement Obligations (“SFAS 143”), which is effective for fiscal years beginning after June 15, 2002. This statement, which we adopted at our inception in 2003, establishes accounting and reporting standards for the legal obligations associated with the retirement of tangible long-lived assets that result from the acquisition, construction or development and the normal operation of long-lived assets. It requires that the fair value of the liability for asset retirement obligations be recognized in the period in which it is incurred. Upon initial recognition of the asset retirement liability, an asset retirement cost is capitalized by increasing the carrying amount of the long-lived asset by the same amount as the liability. In periods subsequent to initial measurement, the asset retirement cost is allocated to expense using a systematic method over the asset’s useful life. Changes in the liability for the asset retirement obligation are recognized for (a) the passage of time and (b) revisions to either the timing or the amount of the original estimate of undiscounted cash flows.
34
Table of Contents
Index to Financial Statements
The fair value of the liability associated with these retirement obligations is determined using significant assumptions, including current estimates of the plugging and abandonment or retirement, annual inflations of these costs, the productive life of the asset and our risk adjusted cost to settle such obligations discounted using our risk-adjusted interest rate. Changes in any of these assumptions can result in significant revisions to the estimated asset retirement obligation. Revisions to the asset retirement obligation are recorded with an offsetting change to the carrying amount of the related long-lived asset, resulting in prospective changes to depreciation, depletion and amortization expense and accretion of discount. Because of the subjectivity of assumptions and the relatively long life of most of our oil and natural gas assets, the costs to ultimately retire these assets may vary significantly from previous estimates.
Oil and Gas Reserve Quantities
Our estimate of proved reserves is based on the quantities of oil and natural gas that engineering and geological analysis demonstrate, with reasonable certainty, to be recoverable from established reservoirs in the future under current operating and economic parameters. DeGolyer and MacNaughton has prepared a reserve report of our reserve estimates on a well-by-well basis for all our properties.
Reserves and their relation to estimated future net cash flows impact our depletion and impairment calculations. As a result, adjustments to depletion and impairment are made concurrently with changes to reserve estimates. DeGolyer and MacNaughton has prepared our reserve estimates, and the projected cash flows derived from these reserve estimates, in accordance with SEC guidelines. The accuracy of our reserve estimates is a function of many factors including the following:
| • | the quality and quantity of available data; |
| • | the interpretation of that data; |
| • | the accuracy of various mandated economic assumptions; and |
| • | the judgments of the individuals preparing the estimates. |
Our proved reserve estimates are a function of many assumptions, all of which could deviate significantly from actual results. As such, reserve estimates may materially vary from the ultimate quantities of oil, natural gas, and natural gas liquids eventually recovered.
Revenue Recognition
Oil, natural gas and related liquids revenues are recognized when delivery has occurred and title to the products has transferred to the purchaser. We follow the “sales method” of accounting for our natural gas revenues, so that we recognize sales revenue on all natural gas sold to our purchasers, regardless of whether the sales are proportionate to our ownership in the property. A liability is recognized only to the extent that we have an overproduced imbalance on a specific property greater than the expected remaining proved reserves. No receivables are recorded for those wells on which we have taken less than our ownership share of production.
Income Taxes
The Windsor entities are classified as partnerships for income tax purposes; accordingly, income taxes on net earnings are payable by the members of those limited liability companies and by partners of those limited partnerships and are not reflected in our financial statements. However, because Windsor Energy Resources, Inc. will be a taxable entity, unaudited pro forma adjustments are reflected on our statements of operations to provide for income taxes in accordance with Statement of Financial Accounting Standards No. 109.
Upon transfer of the oil and natural gas assets and operations to Windsor Energy Resources, Inc., deferred tax liabilities and assets will be recognized for temporary differences between the historical cost bases and tax bases of these assets and liabilities. Based on preliminary estimates of these temporary differences, and assuming the transfer had taken place on December 31, 2005, net deferred tax liabilities of approximately $18 million would be recognized with a corresponding charge to earnings.
35
Table of Contents
Index to Financial Statements
Results of Operations
The following table sets forth selected operating data for the periods indicated.
Period from 2003 | Year Ended 2004 | Increase (Decrease) | Nine Months Ended September 30, | Increase (Decrease) | ||||||||||||||||||||||||||
| �� | Amount | Percent | 2004 | 2005 | Amount | Percent | ||||||||||||||||||||||||
| (unaudited) | ||||||||||||||||||||||||||||||
Operating Results (in thousands): | ||||||||||||||||||||||||||||||
Revenues | ||||||||||||||||||||||||||||||
Oil and gas production | $ | 2,158 | $ | 9,046 | $ | 6,888 | 319.2 | % | $ | 6,239 | $ | 11,629 | $ | 5,390 | 86.4 | % | ||||||||||||||
Other income | — | 84 | 84 | N/A | 100 | 6 | (94 | ) | (94.0 | )% | ||||||||||||||||||||
Operating expenses | ||||||||||||||||||||||||||||||
Lease operating expense | 350 | 2,868 | 2,518 | 719.4 | % | 1,704 | 6,218 | 4,514 | 264.9 | % | ||||||||||||||||||||
Gathering and transportation expense | 144 | 414 | 270 | 187.5 | % | 354 | 405 | 51 | 14.4 | % | ||||||||||||||||||||
Production tax expense | 114 | 540 | 426 | 373.7 | % | 326 | 1,138 | 812 | 249.1 | % | ||||||||||||||||||||
Depreciation, depletion and amortization | 586 | 4,025 | 3,439 | 586.9 | % | 2,881 | 5,007 | 2,126 | 73.8 | % | ||||||||||||||||||||
General and administrative | 34 | 530 | 496 | 1,458.8 | % | 235 | 1,786 | 1,551 | 660.0 | % | ||||||||||||||||||||
Accretion | 13 | 37 | 24 | 184.6 | % | 28 | 145 | 117 | 417.9 | % | ||||||||||||||||||||
Total operating expenses | 1,241 | 8,414 | 7,173 | 578 | % | 5,528 | 14,699 | 9,171 | 165.9 | % | ||||||||||||||||||||
Income (loss) from operations | 917 | 716 | (201 | ) | (21.9 | )% | 811 | (3,064 | ) | (3,875 | ) | (477.8 | )% | |||||||||||||||||
Net interest income (expense) | (100 | ) | (393 | ) | (293 | ) | 293.0 | % | (279 | ) | (320 | ) | (41 | ) | 14.7 | % | ||||||||||||||
Net income (loss) | $ | 817 | $ | 323 | $ | (494 | ) | (60.5 | )% | $ | 532 | $ | (3,384 | ) | $ | (3,916 | ) | (736.1 | )% | |||||||||||
Production Data: | ||||||||||||||||||||||||||||||
Natural gas (MMcf) | 466 | 1,591 | 1,125 | 241.2 | % | 1,127 | 1,986 | 859 | 76.2 | % | ||||||||||||||||||||
Oil (MBbls) | 9 | 28 | 19 | 211.1 | % | 22 | 18 | (4 | ) | (18.2 | )% | |||||||||||||||||||
Combined volumes (MMcfe) | 522 | 1,761 | 1,239 | 237.3 | % | 1,260 | 2,095 | 835 | 66.2 | % | ||||||||||||||||||||
Daily combined volumes (MMcfe/d) | 3 | 5 | 2 | 66.7 | % | 5 | 8 | 3 | 60.0 | % | ||||||||||||||||||||
Average Prices: | ||||||||||||||||||||||||||||||
Natural gas (per Mcf)(1) | $ | 4.06 | $ | 5.01 | $ | 0.95 | 23.4 | % | $ | 4.82 | $ | 5.41 | $ | 0.59 | 12.2 | % | ||||||||||||||
Oil (per Bbl) | 28.49 | 37.80 | 9.31 | 32.7 | % | 36.06 | 48.72 | 12.66 | 35.1 | % | ||||||||||||||||||||
Combined (per Mcfe) | 4.13 | 5.14 | 1.01 | 24.5 | % | 4.95 | 5.55 | 0.60 | 12.1 | % | ||||||||||||||||||||
Average Costs (per Mcfe): | ||||||||||||||||||||||||||||||
Lease operating expense | $ | 0.67 | $ | 1.63 | $ | 0.96 | 143.3 | % | $ | 1.35 | $ | 2.97 | $ | 1.62 | 120.0 | % | ||||||||||||||
Gathering and transportation expense | 0.28 | 0.24 | (0.04 | ) | (14.8 | )% | 0.28 | 0.19 | (0.09 | ) | (32.1 | )% | ||||||||||||||||||
Production tax expense | 0.22 | 0.31 | 0.09 | 40.9 | % | 0.26 | 0.54 | 0.28 | 107.7 | % | ||||||||||||||||||||
Depreciation, depletion and amortization | 1.12 | 2.29 | 1.16 | 103.6 | % | 2.29 | 2.39 | 0.10 | 4.4 | % | ||||||||||||||||||||
General and administrative | 0.07 | 0.30 | 0.23 | 328.6 | % | 0.19 | 0.85 | 0.66 | 347.4 | % | ||||||||||||||||||||
| (1) | Includes natural gas liquids. |
Nine Months Ended September 30, 2005 Compared to the Nine Months Ended September 30, 2004
The following financial information with respect to the nine months ended September 30, 2004 and 2005 is unaudited. In the opinion of management, this information contains all adjustments, consisting only of normal recurring accruals, necessary for a fair presentation of the results for such periods. The results of operations for interim periods are not necessarily indicative of the results of operations for the full fiscal year.
36
Table of Contents
Index to Financial Statements
Production Revenues. Oil and natural gas production revenues increased from $6.2 million in the nine months ended September 30, 2004 to $11.6 million in the nine months ended September 30, 2005 due to both an increase in production and increases in oil and natural gas prices. Price increases added approximately $1.3 million of production revenues while the increase in production volumes from the acquisition and development of properties added approximately $4.1 million in production revenues. Significant decreases in product prices would significantly reduce our revenues from existing properties. See “—Quantitative and Qualitative Disclosure about Market Risk.”
Combined production volumes for the nine months ended September 30, 2005 increased 66.2% from total production in the nine months ended September 30, 2004. Additional information concerning production is set forth in the following table.
| Nine Months Ended September 30, | ||||||||
| 2004 | 2005 | |||||||
| Oil | Natural Gas (1) | Oil | Natural Gas (1) | |||||
| (MBbls) | (MMcf) | (MBbls) | (MMcf) | |||||
Powder River Basin | 18 | 656.7 | 17.3 | 1,397.1 | ||||
Piceance Basin | — | — | — | — | ||||
Cotton Valley/Trans Peak Trends | — | — | — | — | ||||
Big Horn Basin | 3.4 | 99.4 | 0.2 | 276.2 | ||||
Williston Basin | — | — | — | — | ||||
Fayetteville Shale Trend | — | — | — | — | ||||
Other | 0.8 | 371.2 | 0.7 | 313.0 | ||||
Total | 22.2 | 1,127.3 | 18.2 | 1,986.3 | ||||
| (1) | Includes natural gas liquids |
Gas production in the Big Horn Basin from our Skull Creek project area commenced in January 2004, but was shut in during early June 2004 for the installation of a processing plant. Production was restored in November 2004 to our Skull Creek project area and has continued to the present date. The loss of production for several months during 2004, however, resulted in lower overall production during the nine months ended September 30, 2004 as compared to the same period in 2005. Test oil was sold in the Big Horn Basin from our Bennett Creek project area during the first nine months of 2004. Production from our Bennett Creek project area will commence upon completion of the Bennett Creek pipeline.
The increase in gas production in the Powder River Basin is due to development in our Gas Draw field that occurred throughout 2004 and the first nine months of 2005, as well as the acquisition of additional gas producing properties in that area in early 2005.
Production in our other areas during the nine months ended September 30, 2005 was lower than production during the same period in 2004 due to natural production declines in these mature, developed producing properties.
Hedging Activities. We did not participate in any hedging activity in either the 2004 or 2005 periods and do not currently have any financial derivative or “hedge” positions on any of our future oil and natural gas sales. All oil and natural gas sales are made at market prices under either short-term contracts or longer term processing, gathering and transportation contracts. We may evaluate the benefits of various hedging strategies and may choose to hedge our production in the future.
Lease Operating Expense. Our lease operating expense increased $1.62, or 120%, from $1.35 per Mcfe in the first nine months of 2004 to $2.97 per Mcfe in the first nine months of 2005. On a per Mcfe basis, the increase in lease operating expenses was primarily due to the acquisition, in the second half of 2004, of two large
37
Table of Contents
Index to Financial Statements
CBM projects which were still in the start-up or dewatering phase during the nine month period ended September 30, 2005 and, as such, were incurring costs to operate, but were not yet producing commercial quantities of oil and natural gas. As these projects begin to produce commercial quantities, it is anticipated that our operating cost per Mcfe produced will begin to decrease.
Production Tax Expense. Production taxes as a percentage of oil and natural gas sales were 5.2% in the nine months ended September 30, 2004 and 9.8% in the nine months ended September 30, 2005. Production taxes are primarily based on the value of our production at the wellhead and vary across the different areas in which we operate. A larger percentage of our overall sales were from properties located in states with higher production tax rates in the nine month period ended September 30, 2005 than during the same period in 2004. Total production taxes increased from $330,000 in the nine months ended September 30, 2004 to $1.1 million in the nine months ended September 30, 2005 as a result of these higher rates and higher production revenues, primarily due to higher prices and volumes produced in the nine months ended September 30, 2005 compared to the nine months ended September 30, 2004.
Depreciation, Depletion and Amortization. Depreciation, depletion and amortization expense increased $2.1 million to $5.0 million in the nine months ended September 30, 2005 from $2.9 million in the nine months ended September 30, 2004. The increase was due to the 66.2% increase in production.
General and Administrative Expense. General and administrative expense increased $1.6 million from $230,000 in the nine months ended September 30, 2004 to $1.9 million in the nine months ended September 30, 2005. This increase was primarily due to the increased personnel associated with our acquisitions, capital program and production levels. As our capital expenditure program increases our production levels, we expect that general and administrative expense per unit of production will decrease.
Interest Expense. Interest expense increased $50,000 to $330,000 in the nine months ended September 30, 2005 from $280,000 in the nine months ended September 30, 2004. The increase was due to higher debt levels in the nine months ended September 30, 2005.
Net Income (Loss). We generated a net loss of $3.4 million in the nine months ended September 30, 2005 compared to net income of $530,000 in the nine months ended September 30, 2004. The primary reason for the decrease was an increase in lease operating expense per Mcfe and depreciation, depletion and amortization per Mcfe due to the addition of two large CBM projects in the second half of 2004, both of which were still in the dewatering phase during the nine months ended September 30, 2005 and were not producing commercial quantities of natural gas.
Year Ended December 31, 2004 Compared to the Period From July 8, 2003 (Inception) through December 31, 2003
Production Revenues. Production revenues increased $6.9 million from $2.2 million in 2003 to $9.0 million in 2004 due to increases in both production and oil and natural gas prices. Price increases added approximately $1.8 million of production revenues, production from properties acquired in 2004 added approximately $1.6 million of revenues and inclusion of an entire year’s production revenues from properties acquired during mid to late 2003 added approximately $3.5 million of production revenues. Significant decreases in product prices would significantly reduce our revenues from existing properties. See “—Quantitative and Qualitative Disclosure about Market Risk.”
38
Table of Contents
Index to Financial Statements
Production volumes in 2004 increased 237.3% from 2003 levels with increases in all producing basins. Additional information concerning production is set forth in the following table.
| Period from Inception (July 8, 2003) to December 31, 2003 | Year Ended December 31, 2004 | |||||||
| Oil | Natural Gas (1) | Oil | Natural Gas (1) | |||||
| (MBbls) | (MMcf) | (MBbls) | (MMcf) | |||||
Powder River Basin | 9.2 | 373.5 | 23.5 | 929.7 | ||||
Piceance Basin | — | — | — | — | ||||
East Texas Basin | — | — | — | — | ||||
Big Horn Basin | — | — | 3.9 | 173.5 | ||||
Williston Basin | — | — | — | — | ||||
Fayetteville Shale Trend | — | — | — | — | ||||
Other | 0.1 | 92.6 | 0.9 | 487.3 | ||||
Total | 9.3 | 466.1 | 28.3 | 1,590.5 | ||||
| (1) | Includes natural gas liquids. |
The production increases in the Big Horn Basin and our other areas are due to the inclusion of an entire twelve months of production for the year ended December 31, 2004, compared to only a partial year of production for the period from inception to December 31, 2003. The increase in the Powder River Basin is due to the inclusion of an entire twelve months of production for the year ended December 31, 2004, as well as added production from two acquisitions which occurred during 2004, and the additional subsequent development of those properties which took place in the second half of 2004.
Hedging Activities. We did not participate in any hedging activity in either the 2003 or 2004 periods and do not currently have any financial derivative or “hedge” positions on any of our future oil and natural gas sales. All oil and natural gas sales are made at market prices under either short-term contracts or longer term processing, gathering and transportation contracts. We may evaluate the benefits of various hedging strategies and may choose to hedge our production in the future.
Lease Operating Expense. Our lease operating expense increased $0.96 from $0.67 per Mcfe in 2003 to $1.63 per Mcfe in 2004. On a per Mcfe basis, the increase in lease operating expense was primarily due to the 2004 acquisition of two large CBM projects in the Powder River Basin which were still in the start-up or dewatering phase and, as such, were incurring costs to operate, but were not yet producing commercial quantities of natural gas. Additional non-producing and primarily undeveloped projects in the Piceance and East Texas Basins were also acquired during 2004, which incurred operating costs, but had not yet begun to generate revenue by December 31, 2004. As these projects begin to produce commercial quantities of natural gas, it is anticipated that our operating cost per Mcfe will begin to decrease.
Production Tax Expense. Production taxes as a percentage of oil and natural gas sales were 5.3% in 2003 and 5.97% in 2004. Production taxes are primarily based on the value of our production at the wellhead and vary across the different areas in which we operate. Production tax expense increased as a result of higher production revenues, primarily due to increased production and higher prices in 2004 as compared to the period from inception to December 31, 2003.
Depreciation, Depletion and Amortization. Depreciation, depletion and amortization expense increased $3.4 million to $4.0 million in 2004 from $590,000 in 2003. Of the increase, $1.3 million is due to the 237.3% increase in production and $2.1 million is due to an increased depletion rate for the 2004 production. During 2003, the weighted average depletion rate was $1.12 per Mcfe. In 2004, the weighted average depletion rate was $2.29 per Mcfe. The higher per Mcfe depletion rate in 2004 was due mainly to the addition of several acquired properties that were either developed and non-producing or undeveloped. The capitalized costs associated with these properties is included in the full cost pool for purposes of calculating depletion for the year ended
39
Table of Contents
Index to Financial Statements
December 31, 2004, however due to the non-producing nature of these properties, no significant reserve values had been assigned to them as of December 31, 2004. Future depletion rates will be adjusted to reflect changes in proved reserve values as infrastructure is added and as these properties continue to be developed.
General and Administrative Expense. General and administrative expense increased $500,000 from $30,000 in 2003 to $530,000 in 2004. This increase was primarily due to increased personnel required for our capital program and production levels. At our stage of activity compared to our production level, a significant portion of our general and administrative expense consists of the personnel and related costs to prudently manage our capital expenditure program. As our capital expenditure program increases our production levels, we expect that general and administrative expense per unit of production will decrease.
Interest Expense. Interest expense increased $300,000 to $400,000 in 2004 from $100,000 in 2003. The increase was due to average higher debt levels in 2004 as compared to 2003. The weighted average level of debt outstanding during 2004 was $9.0 million as compared to $1.8 million during 2003.
Net Income. Our net income decreased $500,000 from $820,000 in 2003 to $320,000 in 2004. The primary reasons for the decrease were the increases in lease operating expense per Mcfe and depreciation, depletion and amortization per Mcfe, which were caused by additions in 2004 of start-up phase properties that had not yet begun to produce commercial quantities of natural gas by December 31, 2004.
Liquidity and Capital Resources
Operating Activities
Net cash provided by operating activities was $2.7 million for the nine months ended September 30, 2005 as compared to $3.7 million for the same period in 2004, and $4.1 million for the year ended December 31, 2004 as
compared to $200,000 for the period from inception to December 31, 2003. The change for the period ended September 30, 2005 as compared to the same period in 2004 was primarily attributable to a net loss generated for the first nine months of 2005 as a result of increases in operating expenses due to the acquisition of two large CBM projects during the second half of 2004 which were incurring operating costs, but not producing commercial quantities of natural gas. The increase in net cash provided by operating activities for the year ended December 31, 2004 as compared to the period from inception to December 31, 2003 was primarily a result of the inclusion of an entire year of net revenue during 2004 as compared to only a partial year during the period from inception to December 31, 2003, as well as an increase in accounts payable for the year ended December 31, 2004 as a result of the development of acquired properties.
Our operating cash flow is sensitive to many variables, the most significant of which is the volatility of prices for the oil and natural gas produced. Prices for these commodities are determined primarily by prevailing market conditions. Regional and worldwide economic activity, weather and other substantially variable factors influence market conditions for these products. These factors are beyond our control and are difficult to predict.
Investing Activities
Purchases of oil and natural gas properties accounted for the majority of our cash outlays for investing activities during the nine-month periods ended September 30, 2004 and 2005, as well as for the period from inception to December 31, 2003 and the year ended December 31, 2004. We used cash for investing activities of $43.4 million for the nine months ended September 30, 2005 as compared to $37.9 million for the same period in 2004, and $54.4 for the year ended December 31, 2004 as compared to $35.1 million for the period from inception to December 31, 2003.
Our 2003 capital expenditures were mainly for three major purchases of conventional oil and natural gas properties. Two of these projects were mature, producing fields at the time of acquisition. These fields are
40
Table of Contents
Index to Financial Statements
located in Wyoming and Texas and were purchased for $10.8 million and $7.1 million, respectively. The third acquisition involved the purchase of partially developed but predominantly non-producing properties located in Wyoming for $17.2 million.
Capital expenditures in 2004 were focused in four major areas. Expenditures to acquire existing CBM projects totaled $28.3 million for the entire year. Approximately $20.1 million of these expenditures occurred during the nine months ended September 30, 2004. These projects, which are located in Wyoming, were still in the dewatering, or start-up phase, when they were acquired. We spent approximately $6.2 million by September 30, 2004 and $11.0 million during 2004 for the further upgrade and development of these properties. Expenditures to acquire non-producing conventional oil and natural gas projects located in Colorado during the nine month period ended September 30, 2004 and the year ended December 31, 2004 totaled $7.3 million. Additionally, we spent a total of $700,000 for the nine month period ended September 30, 2004 and $1.0 million for the year ended December 31, 2004 to acquire purely undeveloped acreage positions in East Texas. Finally, expenditures to further develop projects acquired during 2003 totaled $6.0 million through September 30, 2004 and $8.8 million through December 31, 2004.
Our capital expenditures for the first nine months of 2005 were mainly for the further development of properties acquired during 2003 and 2004. A total of $24.9 million was spent during the nine-month period ended September 30, 2005 for the further development of our Wyoming CBM projects purchased throughout 2004, while $16.2 million was spent in the further development of the conventional oil and gas properties in Wyoming and Colorado which were purchased during 2003 and 2004. Additionally, $400,000 in costs were incurred to begin development on East Texas acreage purchased during 2004. We spent $1.9 million during the first nine months of 2005 for the purchase of undeveloped acreage in the Williston Basin areas of North Dakota and Montana.
Financing Activities
Our cash flows provided by financing were $44.5 million for the nine months ended September 30, 2005 as compared to $35.1 million for the same period in 2004, and $51.6 million for the year ended December 31, 2004 as compared to $35.5 million for the period from inception to December 31, 2003. The majority of our cash provided by financing was generated by capital contributions from entities controlled by Wexford, our equity sponsor. Capital contributions for the nine month period ended September 30, 2005 totaled $47.4 million as compared to $38.3 million for the same period in 2004. These contributions total $56.5 million for the year ended December 31, 2004 and $35.9 million for the period from inception to December 31, 2003. We have two outstanding bank loans secured by liens on certain producing properties. The first loan, in the original principal amount of $8.6 million, was entered into on September 19, 2003 and matures on October 1, 2008. The second loan, in the original principal amount $4.0 million, was entered into on May 21, 2004 and matures on June 1, 2009. Both loans bear interest at LIBOR plus a margin of 2.875%. Proceeds from these loans were used to fund returns of capital to our owners. At February 8, 2006, our aggregate outstanding borrowings under these loans were $4.5 million and bore interest at 7.44%. We intend to repay these loans in full with a portion of the net proceed from this offering.
Capital Requirements and Sources of Liquidity
We currently anticipate our capital budget for drilling and infrastructure will be approximately $100 million for 2006. We intend to allocate these expenditures as described under the captions “Prospectus Summary–Our Properties” and “Business–Our Properties.” However, the amount and timing of these capital expenditures is largely discretionary and within our control. Depending upon the success of our drilling activities, prevailing and anticipated prices for oil and natural gas and other factors, we could choose to defer a portion of these planned 2006 capital expenditures until later periods. We routinely monitor and adjust our capital expenditures in response to changes in oil and natural gas prices, drilling and acquisition costs, industry conditions and internally generated cash flow. Matters outside our control that could affect the timing of our capital expenditures include obtaining required permits and approvals in a timely manner and the availability of rigs and crews.
41
Table of Contents
Index to Financial Statements
Based upon current oil and natural gas price expectations for 2006, we anticipate that the proceeds of this offering and our operating cash flow will exceed our planned capital expenditures and other cash requirements for 2006. However, future cash flows are subject to a number of variables, including the level of oil and natural gas production and prices. There can be no assurance that operations and other capital resources will provide cash in sufficient amounts to maintain planned levels of capital expenditures. Further, in the event we make one or more acquisitions and the amount of capital required is greater than the amount we have available for acquisitions at that time, we could be required to reduce the expected level of capital expenditures and/or seek additional capital. If we seek additional capital for that or other reasons, we may do so through traditional reserve base borrowings, joint venture partnerships, production payment financings, asset sales, offerings of debt and equity securities or other means. We cannot assure you that needed capital will be available on acceptable terms or at all. If we are unable to obtain funds when needed or on acceptable terms, we may not be able to complete acquisitions that may be favorable to us or finance the capital expenditures necessary to replace our reserves.
Contractual and Commercial Commitments
The following table summarizes our contractual obligations and commercial commitments at September 30, 2005.
| Payments Due By Year (1) | |||||||||||||||||||||
| 2005 | 2006 | 2007 | 2008 | 2009 | After 2009 | Total | |||||||||||||||
| (in thousands) | |||||||||||||||||||||
Office leases | $ | 25 | $ | 31 | $ | 22 | $ | 4 | $ | — | $ | — | $ | 82 | |||||||
Long term debt | 487 | 2,520 | 2,520 | 366 | — | — | 5,893 | ||||||||||||||
Drilling services | — | 7,665 | 8,395 | — | — | — | 16,060 | ||||||||||||||
Total | $ | 512 | $ | 10,216 | $ | 10,937 | $ | 370 | $ | — | $ | — | $ | 22,035 | |||||||
| (1) | This table does not include the liability for dismantlement, abandonment and restoration costs of oil and gas properties. Effective with the adoption of SFAS No. 143,Accounting for Asset Retirement Obligations, we recorded a separate liability for the fair value of this asset retirement obligation. See Note 6 of the Notes to Combined Financial Statements for further discussion. |
Quantitative and Qualitative Disclosure about Market Risk
Our major market risk exposure is in the pricing applicable to our oil and natural gas production. Realized pricing is primarily driven by the prevailing worldwide price for crude oil and spot market prices applicable to our natural gas production. Pricing for oil and natural gas production has been volatile and unpredictable for several years, and we expect this volatility to continue in the future. The prices we receive for production depend on many factors outside of our control.
We are subject to market risk exposure related to changes in interest rates on our long-term notes payable. The terms of our notes payable agreement provide for interest on borrowings at a floating rate equal to LIBOR plus 2.875% (6.5913% at September 30, 2005). An increase or decrease of 1% in the interest rate would have a corresponding decrease or increase in our net income (loss) of approximately $60,000 annually, based on the $5.9 million outstanding in the aggregate under these notes as of September 30, 2005. We intend to repay these notes in full with a portion of the proceeds from this offering.
Recent Accounting Pronouncements
On December 16, 2004, the Financial Accounting Standards Board (FASB) issued Statement of Financial Accounting Standard (SFAS) No. 123(R),Share Based Payment, which revised SFAS No. 123,Accounting for Stock-Based Compensation. SFAS No. 123(R) requires entities to measure the fair value of equity share-based payments (stock compensation) at grant date, and recognize the fair value over the period during which an
42
Table of Contents
Index to Financial Statements
employee is required to provide services in exchange for the equity instrument as a component of the income statement. SFAS No. 123(R) is effective for annual periods beginning after June 15, 2005. Prior to this offering, we have not had any stock option plans and, therefore the adoption of SFAS No. 123(R) currently would have no impact on our financial position or results of operations. The adoption could have a future impact, however, as we intend to implement an equity incentive plan in 2006 in connection with this offering.
43
Table of Contents
Index to Financial Statements
General
We are a rapidly growing independent energy company focused on the exploration, exploitation and development of both conventional and unconventional onshore oil and natural gas reserves. Our unconventional oil and natural gas projects include CBM gas development, basin-centered tight gas sand plays and shale plays. We have active unconventional resource development projects located in the Powder River and Piceance Basins in the Rocky Mountains and in the Cotton Valley and Travis Peak trends in East Texas and active conventional exploration and development projects located in the Big Horn Basin in the Rocky Mountains. We also have unconventional prospects in the Williston Basin in Montana and North Dakota and in the Fayetteville Shale trend in Arkansas and Mississippi that are in the exploration and development planning stage. Our management and technical teams have an extensive track record in the exploration and production business as well as significant operating experience in our core project areas. Our strategy is to maximize stockholder value by leveraging our significant undeveloped acreage position and the experience of our management and technical teams in finding and developing oil and natural gas reserves to profitably grow our reserves and production.
We commenced operations in 2003 when we acquired approximately 5,700 acres in the Powder River Basin. Since that time, we have continued to acquire leasehold interests, predominately undeveloped acreage, in several areas. As of December 31, 2005, we held leasehold interests in approximately 518,700 gross (365,900 net) acres. The following table sets forth our approximate acreage position as of December 31, 2005:
Basin / Trend | Location | Gross Acres | Net Acres | |||
Powder River | Wyoming | 182,300 | 135,000 | |||
Piceance | Colorado | 69,500 | 45,100 | |||
Cotton Valley / Travis Peak | East Texas | 45,900 | 14,400 | |||
Big Horn | Wyoming | 53,100 | 50,700 | |||
Williston | Montana / North Dakota | 83,300 | 41,600 | |||
Fayetteville Shale | Arkansas / Mississippi | 46,600 | 42,600 | |||
Other | Various | 38,000 | 36,500 | |||
Total | 518,700 | 365,900 | ||||
At December 31, 2005, our acreage contained 573 gross producing wells and we had identified approximately 1,290 potential drilling locations. We operate approximately 96% of our current wells and expect to operate all future wells on our acreage. From our inception through December 31, 2005, we drilled 228 gross wells on our acreage, of which 224 were completed as producing wells or are in the process of being completed or are dewatering. During this same period, our capital expenditures aggregated approximately $159 million, of which approximately $96 million was used for leasehold interest and property acquisitions and approximately $63 million was spent on drilling activities and infrastructure projects. Of the 228 gross wells we drilled, 222 were CBM wells in the Powder River Basin, three were in the Big Horn Basin, two were in the Piceance Basin and one was in the East Texas Basin. Approximately 34% of these CBM wells are currently producing natural gas in commercial quantities with the remainder in various stages of dewatering or awaiting additional infrastructure.
As of December 31, 2005, our estimated net proved reserves wereapproximately 48.5 Bcfe, of which89% were natural gas. Our average net daily production in December 2005 was approximately 9.0 MMcfe/day.
44
Table of Contents
Index to Financial Statements
Our Strategy
The principal elements of our strategy to maximize stockholder value are:
| • | Generate growth through drilling. We expect to generate long-term reserve and production growth predominantly through our drilling activities. We believe the experience and expertise of our management and technical teams enable us to identify, evaluate and develop new oil and natural gas reservoirs. We anticipate the majority of our future capital expenditures will be directed toward the drilling of wells, although we expect to continue to acquire additional leasehold interests. From our inception through December 31, 2005, we drilled 228 gross wells. We plan to drill a total of 203 gross wells in 2006. |
| • | Focus on lower risk development projects, with selective expenditures on higher risk exploration projects. We manage our inventory of properties as a portfolio, and seek to manage risk and return to maximize stockholder value. The majority of our acreage position is located in relatively low-risk, unconventional development areas that can provide what we believe are strong returns to our stockholders with limited risk. |
| • | Manage costs by maximizing operational control. We seek to exert control over our exploration, exploitation and development activities. As the operator of our projects, we have greater control over the amount and timing of the expenditures associated with those activities. As we manage our growth, we are actively focusing on reducing lease operating expenses, general and administrative costs and finding and development costs. As of December 31, 2005, we operated 96% of our completed wells and owned an average working interest of approximately 81% in these wells. |
| • | Pursue complementary leasehold interest and property acquisitions. We intend to use our experience and regional expertise to supplement our drilling strategy with complementary leasehold interest and property acquisitions. |
Competitive Strengths
We believe that our strengths will help us successfully execute our strategy. These strengths include:
| • | Inventory of growth opportunities. We have established an asset base of approximately 365,900 net leasehold acres, of which approximately 90% were undeveloped as of December 31, 2005. As of that date, we had identified approximately 1,290 potential drilling locations on our acreage. From our inception through December 31, 2005, we drilled 228 gross wells. We plan to drill a total of 203 gross wells in 2006. In addition, we currently have two exploration projects. |
| • | Substantial acreage position in unconventional, development-based oil and natural gas plays. We have a significant acreage position in relatively low-risk, unconventional oil and natural gas development plays. This includes approximately 135,000 net acres of CBM leasehold interests in the Powder River Basin on which we have identified approximately 910 potential drilling locations, and approximately 177,700 net acres in other unconventional plays, including the Piceance Basin, Cotton Valley and Travis Peak trends, Williston Basin and Fayetteville Shale trend, on which we have identified approximately 370 potential drilling locations. |
| • | Experienced management and technical teams. Ourfour executive officers average23 years of experience in the oil and natural gas industry. Upon the closing of this offering, we will have four full time geologists, five petroleum engineers andfive land professionals. |
| • | Operational control. We operate approximately 96% of the wells in which we have an interest and expect our leasehold ownership positions to allow us to be the operator of future wells drilled on our acreage. This will afford us a significant degree of control over costs and other operational matters. |
45
Table of Contents
Index to Financial Statements
| • | Financial flexibility. As of December 31, 2005, as adjusted for this offering and our intended use of the net proceeds of this offering, we would have had $ million in cash and no outstanding debt. We seek to maintain a conservative financial position and believe that our operating cash flow and proceeds from this offering will provide us with the financial flexibility to pursue our planned exploration and development activities through 2006. |
Our Properties
Review of Exploration, Exploitation and Development Areas
The following table summarizes information regarding our key exploration, exploitation and development areas:
Basin/Trend | Project Area | Approximate Net Acres | Anticipated Average Working Interest(1) | Identified Drilling Locations (2) | Estimated Capital Expenditures(2) | ||||||||||||
| Total | 2006 | 2005 | 2006 | ||||||||||||||
| (millions) | (millions) | ||||||||||||||||
Powder River | Gas Draw/Harris | 14,700 | 80 | % | 95 | 95 | $ | 4.8 | $ | 6.4 | |||||||
| Jepson | 17,100 | 100 | % | 248 | 64 | 10.6 | 11.7 | ||||||||||
| Beaver Creek (3) | 87,000 | 75 | % | 575 | 1 | 13.7 | 3.5 | ||||||||||
Piceance | Castle Springs | 8,600 | 100 | % | 100 | 18 | 6.2 | 27.9 | |||||||||
East Texas | Overton | 6,800 | 39 | % | 85 | 8 | — | 5.9 | |||||||||
| Weeping Mary | 7,600 | 100 | % | 75 | 9 | 0.9 | 14.0 | ||||||||||
Big Horn | Bennett Creek | 9,000 | 88 | % | 4 | 4 | 12.6 | 17.0 | |||||||||
| Clark 3-D | 14,500 | 95 | % | — | — | — | 3.0 | ||||||||||
| Bison Ranch | 5,600 | 95 | % | 1 | 1 | — | 3.9 | ||||||||||
| Heart Mountain | 19,300 | 95 | % | — | — | — | — | ||||||||||
Williston | Bakken Shale | 41,600 | 33 | % | 60 | 3 | — | 6.9 | |||||||||
Fayetteville Shale | Fayetteville Shale | 42,600 | 100 | % | 50 | — | — | — | |||||||||
| Total | 274,400 | 1,293 | 203 | $ | 48.8 | $ | 100.2 | ||||||||||
| (1) | Anticipated average working interest is based on the terms of our leases and anticipated unit size. |
| (2) | For each project area, identified drilling locations represent total gross locations specifically identified by management as of December 31, 2005 to be included in our future multi-year drilling activities on existing acreage. Of the total identified drilling locations shown in the table, 66 are classified as proved undeveloped locations, or PUDs. Of the 203 identified drilling locations that are included in our 2006 drilling program, 64 are classified as PUDs. During the year ended December 31, 2005, we drilled a total of 153 gross wells, including 28 PUDs or offset locations. Our estimated capital expenditure amounts are based on our current drilling and infrastructure plans for the properties indicated. These plans and our actual future drilling activities are subject to change based on a variety of factors, including, but not limited to, the success of our drilling activities, prevailing and anticipated prices for oil and natural gas, the availability of necessary equipment and infrastructure, the availability of capital, the receipt and timing of required regulatory permits and approvals, seasonal conditions and drilling and acquisition costs. Significant additional capital expenditures will be required to more fully develop these areas. For a more complete description of our proposed activities, see “Business.” |
| (3) | We have 90 gross (68 net) CBM wells in the Beaver Creek project area and we are in the process of installing the infrastructure in that area to commence the dewatering process for these wells. We have |
| identified approximately 575 additional drilling locations in the Beaver Creek project area that may be pursued depending upon the success of our pilot programs. |
46
Table of Contents
Index to Financial Statements
Powder River Basin
Our Powder River Basin properties are located in northeastern Wyoming. Our development operations in this basin are focused on CBM plays in the Gas Draw/Harris, Jepson and Beaver Creek project areas. Initially, CBM wells typically produce water in a process called dewatering. This process lowers pressure, allowing the gas to flow to the wellbore. As the coal seam pressure declines, the wells begin producing methane gas at an increasing rate. As the wells mature, the production peaks, stabilizes and then begins declining. The average life of a CBM well in the Powder River Basin ranges from five to 15 years. While these wells generally produce at much lower rates with fewer reserves attributed to them when compared to conventional natural gas wells in the Rocky Mountains, they also typically have higher drilling success rates and lower costs. We have a 160 gross well drilling program in this basin planned for 2006.
Because of the many environmental and regulatory issues presented by drilling CBM wells on federal lands in the Powder River Basin, we have formed a dedicated team of both in-house and outside consultants, which include geologists, environmentalists, hydrologists, surveyors and engineers, to manage our regulatory and permitting matters in this basin. This team takes a proactive approach intended to achieve more efficient processing of federal permits and resource management plans and, ultimately, reduce the likelihood of substantial permitting delays in the Powder River Basin.
Approximately 45% of our gross acreage in the Powder River Basin is leased to us by the federal government and subject to federal authority and, therefore, subject to the National Environmental Policy Act, or NEPA, and certain state regulations, which require governmental agencies to evaluate the potential environmental impacts of their actions. The NEPA process imposes obligations on the federal government that may result in legal challenges and potentially lengthy delays in obtaining project permits or approvals. We have submitted two Environmental Assessments and two federal Plans of Development, or PODs, to the Department of the Interior’s Bureau of Land Management, or BLM, involving 64 wells in our Gas Draw project area and 100 wells in our Jepson project area. We awaiting approval of these Environmental Assessments and PODs.
In August 2004, the Tenth Circuit Court of Appeals in Pennaco Energy, Inc. v. United States Department of the Interior, upheld a decision by the Interior Board of Land Appeals that BLM failed to fully comply with NEPA in granting certain federal leases in the Powder River Basin to Pennaco Energy, Inc. for CBM development. Other recent decisions in the federal district court in Montana have also held that BLM failed to comply with NEPA when considering CBM development in the Powder River Basin. While these recent decisions have not had a material direct impact on our current operations or planned exploration and development activities, future litigation and/or agency responses to such litigation could materially impact our ability to obtain or maintain required regulatory approvals to conduct operations in the Powder River Basin or elsewhere.
Gas Draw/Harris. We acquired our initial acreage in Gas Draw/Harris in January 2004 and, as of December 31, 2005, held leasehold interests in approximately 14,700 net acres with 95 identified drilling locations. Our activity in the Gas Draw/Harris areas is focused on production from multiple coal seams within the Ft. Union coal formation, including the Canyon, Wall and Pawnee. Our wells in this project area are typically drilled to depths ranging from 300 to 1,000 feet. At December 31, 2005, we had 130 active wellbores in the project area, 107 of which were drilled by us and 23 of which were drilled prior to our acquisition of the acreage. As of that date, 98 of the wells were producing and 32 were shut in awaiting additional infrastructure. We averaged 3.0 MMcfe/day of net production from this project area for December 2005. We spent approximately $4.8 million in 2005 to drill 54 gross (44 net) wells and for related well infrastructure. Our 2006 capital expenditure plan contemplates drilling 95 gross wells at an estimated cost (including related infrastructure) of $6.4 million net to our interest. As of December 31, 2005, we operated all of the wells in this project area and had an average working interest of 84%. We expect to be the operator of all the wells included in our 2006 drilling program in this area. Under the terms of the purchase agreement from which we acquired our Gas Draw wells and leasehold interests, we expect to have an initial average effective working interest of 67.5% for all the
47
Table of Contents
Index to Financial Statements
wells in our Gas Draw project area, subject to a reduction to 52.5% when the total amount of our investments in those wells are paid out by our total net revenues from those wells.
Jepson. We acquired our initial acreage in Jepson in August 2004 and, as of December 31, 2005, held interests in approximately 17,100 net acres with 248 identified drilling locations. Our activity in the Jepson area is focused on production from Big George coal seams within the Ft. Union coal formation. Our wells in this project area typically are drilled to depths ranging from 1,000 to 1,500 feet. At December 31, 2005, we had 106 active wellbores in the project area, 57 of which were drilled by us and 49 of which were drilled prior to our acquisition of the acreage. Substantially all of the wells are in the dewatering phase. We averaged 0.1 MMcfe/day of net production from this project area for December 2005. We spent approximately $10.6 million in 2005 to drill 37 gross (37 net) wells and for related well infrastructure. Our 2006 capital expenditure plan contemplates drilling 64 gross wells at an expected cost (including related infrastructure) of $11.7 million net to our interest. As of December 31, 2005, we operated all of the wells in this project area and had a working interest of 100%.
Beaver Creek. We acquired our initial acreage in Beaver Creek in December 2004 and, as of December 31, 2005, held interests in approximately 87,000 net acres with 575 identified drilling locations. Our activity in the Beaver Creek area is focused on production from multiple coal seams within the Ft. Union coal formation, including the Oedekoven, Wall and Pawnee. Our wells in this project area typically are drilled to depths ranging from 1,500 to 3,500 feet. At December 31, 2005, we had 90 active wellbores in the project area, 56 of which were drilled by us and 34 of which were drilled prior to our acquisition of the acreage. All of the wells at Beaver Creek are currently shut in awaiting power and infrastructure, which are required prior to the commencement of production. In 2005, we spent approximately $13.7 million to drill 56 gross (42 net) wells and for related well infrastructure. Our 2006 capital expenditure plan for this project area contemplates spending approximately $3.5 million, most of which will be for power, infrastructure and one well. We anticipate that dewatering of the wells in Beaver Creek will commence in mid-2006. As of December 31, 2005, we operated all of the wells in the project area and had an average working interest of 75%.
Piceance Basin
Our Piceance Basin properties are located in northwestern Colorado and represent an important part of our development and exploration activities and expected production growth in 2006. Our project area is located approximately 45 miles northwest of Aspen and targets production from the Mesaverde formation. The Mesaverde is a thick, tight sandstone appearing at depths ranging from 7,000 to 9,000 feet. Wells drilled into the Mesaverde require high pressure fracture stimulation to achieve production. As of December 31, 2005, we held interests in approximately 69,500 gross (45,100 net) leasehold acres, predominantly on federal lands. Approximately 15% of our Castle Springs acreage is subject to a drilling moratorium put in place by the Colorado Oil and Gas Conservation Commission, or COGCC, upon the discovery in March 2004 of a gas seep caused by a faulty well drilled by another operator. The owner of the well has asked the COGCC to lift the moratorium, which the COGCC will consider at its hearings scheduled for February 13 and 14, 2006. We have an 18 gross well drilling program planned for the Piceance Basin in 2006 and already have one drilling rig under contract in the basin for 2006. We plan to add one additional drilling rig and one completion rig when they become available.
All of our acreage in the Piceance Basin is leased to us by the federal government and is subject to federal authority, NEPA and certain state regulations, which require governmental agencies to evaluate the potential environmental impacts of their actions. We have submitted one Environmental Assessment and POD to the BLM involving 120 wells in our Castle Springs project area and are awaiting their approval.
Castle Springs. We acquired our initial acreage in Castle Springs in August 2004 and, as of December 31, 2005, held leasehold interests in approximately 8,600 net acres with 100 identified drilling locations. Our activity in the Castle Springs area is focused on production from the Mesaverde sands and is adjacent to the Mamm
48
Table of Contents
Index to Financial Statements
Creek and Gibson Gulch development areas. Our wells typically are drilled to depths ranging from 7,000 to 9,500 feet. We have five active wellbores in the project area, two of which were drilled by us and three of which were drilled prior to our acquisition of the acreage. We averaged 1.2 MMcfe/day of net production from this project area for December 2005. We spent approximately $6.2 million in 2005 to drill two gross (two net) wells, recomplete two additional wells and install infrastructure. Our 2006 capital expenditure plan for this project area contemplates drilling 18 wells at an expected cost (including related infrastructure) of $27.9 million. As of December 31, 2005, we operated all of the wells in this project area and had a 100% working interest.
East Texas Basin
Our East Texas Basin properties are located in Smith and Cherokee counties in proximity to the Overton Field. Our two project areas focus on tight gas sand plays, targeting production from the Cotton Valley and Travis Peak intervals. The Cotton Valley and Travis Peak formations are found at depths ranging from 9,000 to 14,000 feet on our acreage. As of December 31, 2005, we held interests in approximately 45,900 gross (14,400 net) leasehold acres. We intend to target depths of approximately 12,000 feet, but there are also deeper and shallower targets including the Bossier, Rodessa and Petit formations. The Cotton Valley and Travis Peak intervals are tight sands characterized by low porosity and permeability. These thick, higher pressured intervals require high pressure, massive fracture stimulations. All of the wells we have drilled have been fracture stimulated after drilling to improve overall production rates. We have a 17 gross well drilling program planned for 2006 with one drilling rig under contract in the basin during 2006 and 2007. We plan to add an additional rig when it becomes available.
Overton. We acquired our initial acreage in Overton in the fourth quarter of 2005 and, as of December 31, 2005, held leasehold interests in 6,800 net acres with 85 identified drilling locations. Our activity in the Overton area is focused on production from the Cotton Valley and Travis Peak intervals and will target depths ranging from 10,500 to 12,500 feet. At December 31, 2005, we had 11 active wellbores in the project area, all of which were drilled prior to our acquisition of the acreage. We averaged 0.6 MMcfe/day of net production from this project area for December 2005. We spent approximately $4.7 million to acquire the acreage and the wells. Our 2006 capital expenditure plan contemplates drilling eight wells at an expected cost (including related infrastructure) of $5.9 million net to our interest. As of December 31, 2005, we operated all of the wells in this project area and had an average working interest of 39%.
Weeping Mary. We acquired our initial acreage in Weeping Mary in June 2004 and, as of December 31, 2005, held leasehold interests in approximately 7,600 net acres with 75 identified drilling locations. Our activity in the Weeping Mary area is focused on production from the Travis Peak interval and will target depths ranging from 9,000 to 12,500 feet. We started drilling two wells in the project area prior to the end of 2005. One of the wells is currently being completed while the other well is still being drilled. Our 2006 capital expenditure plan contemplates drilling nine wells at an expected cost (including related infrastructure) of $14.0 million net to our interest. As of December 31, 2005, we operated all of the wells in this project area and had an average working interest of 100%.
Big Horn Basin
Our Big Horn Basin properties are located in northwest Wyoming. We are pursuing both conventional stratigraphic and structural gas plays, as well as an unconventional basin-centered tight gas play, in this basin. Our primary zones of interest are the Frontier, Mowry and Dakota formations. Our initial activities have been focused in the Bennett Creek project area. We have three additional projects in the basin, the Clark 3-D, Bison Ranch and Heart Mountain project areas. We have a five well drilling program planned for 2006.
Approximately 75% of our gross acreage in the Big Horn Basin is leased to us by the federal government and is subject to federal authority, NEPA and certain state regulations, which require governmental agencies to evaluate the potential environmental impacts of their actions. We have submitted two Environmental
49
Table of Contents
Index to Financial Statements
Assessments and PODs to the BLM involving a pipeline in our Bennett Creek project area and a seismic survey in our Clark 3-D project area. We are awaiting approval of these Environmental Assessments and PODs.
Bennett Creek. We acquired our initial acreage in Bennett Creek in December 2003 and, as of December 31, 2005, held leasehold interests in approximately 9,000 net acres with four identified drilling locations. Our activity in the Bennett Creek area is generally characterized as 3-D seismic driven exploitation, focused on production from the Frontier, Dakota and Mowry formations at depths ranging from 8,000 to 12,000 feet. At December 31, 2005, we had three active wellbores in the project area, all of which were drilled prior to our acquisition of the acreage. These wells are currently shut in, but tested at a combined rate of 5.0 MMcf of natural gas and 600 Bbls of oil per day. Initial production from these wells is expected in May 2006 upon the completion of a 25 mile pipeline. We have already completed approximately five miles of the pipeline and are awaiting approval from the BLM to lay the remaining 20 miles. In 2005, we spent approximately $12.6 million to drill two gross (1.95 net) wells and add related well infrastructure. Both wells were deemed incapable of producing natural gas in commercial quantities. Our 2006 capital expenditure plan contemplates drilling four wells at an expected cost (including related infrastructure) of $17.0 million net to our interest. As of December 31, 2005, we operated all of the wells in this project area and had an average working interest of 95%.
Clark 3-D. We acquired our initial acreage in the Clark 3-D project area in December 2003 and, as of December 31, 2005, held leasehold interests in approximately 14,500 net acres. During 2006, we intend to shoot and process a 3-D seismic survey that will include this acreage. We have no current production in the area. Future activity in the area will be determined after we receive and analyze our 3-D seismic data.
Bison Ranch. We acquired our initial acreage in the Bison Ranch project area in December 2004 and, as of December 31, 2005, held leasehold interests in approximately 5,600 net acres with one identified drilling location. Our activity in the Bison Ranch area is generally characterized as 3-D seismic driven exploration and will target production from the Frontier and Mowry formations. We intend to drill one exploration well at Bison Ranch in 2006 at an expected cost of $3.9 million based on our working interest of 95% in this project area.
Heart Mountain. We acquired our initial acreage in Heart Mountain in December 2003 and, as of December 31, 2005, held leasehold interests in approximately 19,300 net acres. Heart Mountain is a basin-centered tight gas sand play, targeting production from the Mesaverde formation. We are evaluating the area for exploration and development potential.
Williston Basin
Our acreage in the Williston Basin is located in western North Dakota and eastern Montana and represents a new focus area for our development activities and expected production growth in 2006. It is predominantly an oil basin and produces from 11 major geologic horizons that range in depth from approximately 1,000 to over 14,000 feet. Our activities in this basin will include both exploration and development drilling programs located in several areas, including the Bakken Shale. We anticipate using horizontal drilling technology in this basin to increase production and reserve recoveries while limiting the number of vertical wells we must drill. We may use 3-D seismic surveys to better define our exploration and development projects. Our acreage position is wide-spread and each well will be assigned a production unit, which will determine our interest in each well. We expect to operate and own at least a 50% working interest in each well.
Bakken Shale. We acquired our initial acreage in the Bakken Shale project area in January 2005 and, as of December 31, 2005, held interests in approximately 41,600 net acres with 60 identified drilling locations. All of our acreage is currently undeveloped. Wells in the Bakken Shale project area typically are drilled to vertical depths ranging from 9,000 to 12,000 feet and then laterally extended up to 5,000 feet. In 2005, we spent approximately $10.3 million to assemble our current acreage position. Our 2006 capital expenditure plan contemplates drilling three wells at an expected cost (including related infrastructure) of $6.9 million net to our interest. We plan to operate all the wells that will be drilled in 2006 and maintain a majority working interest.
50
Table of Contents
Index to Financial Statements
Fayetteville Shale
Our acreage in the Fayetteville Shale extends from eastern Arkansas to Mississippi. The Fayetteville Shale play is analogous to the Barnett Shale play in north central Texas and is an increasingly active area, with a focus on horizontal drilling. Our operations in this area will involve exploration and development drilling activities. We acquired our initial acreage in the Fayetteville Shale play in the fourth quarter of 2005 and, as of December 31, 2005, held interests in approximately 42,600 gross and net undeveloped leasehold acres. In 2005, we spent approximately $6.0 million to acquire our leasehold interests and other properties in this play. We expect to begin drilling during 2007 and intend to operate each well. The wells in our area are typically drilled 6,000 feet vertically and then continued horizontally for at least 2,500 feet.
Oil and Gas Data
Proved Reserves
The following table presents our estimated net proved oil and natural gas reserves and the present value of our reserves at December 31, 2005, based on a reserve report prepared by DeGolyer and MacNaughton, our independent petroleum engineers, and have been made in accordance with the rules and regulations of the SEC. All our proved reserves included in the reserve report are located in North America. DeGolyer and MacNaughton prepares all our reserve estimates. A copy of the reserve report prepared by our independent petroleum engineers is attached as Appendix B. Our estimates of net proved reserves have not been filed with or included in reports to any federal authority or agency other than the SEC in connection with this offering. The PV-10 and standardized measure shown in the table are not intended to represent the current market value of our estimated oil and natural gas reserves.
| As of December 31, | ||||||||
| 2004 | 2005 | |||||||
Estimated Net Proved Reserves: | ||||||||
Natural gas (Bcf) | 40.8 | 43.0 | ||||||
Oil (MMBbls) | 1.0 | 0.9 | ||||||
Total (Bcfe) | 46.6 | 48.5 | ||||||
Percent proved developed producing | 29.8 | % | 35.6 | % | ||||
PV-10 (in millions)(1) | $ | 96.4 | $ | 135.2 | ||||
Standardized measure (in millions)(2) | $ | 77.3 | $ | |||||
| (1) | Represents present value, discounted at 10% per annum, of estimated future net cash flows before income tax of our estimated proven reserves. In accordance with SEC requirements, our reserves and the future net revenues were determined using the weighted average price for natural gas and oil that we realized at December 31, 2005, which were $8.54 per MMcf of gas and $57.31 per barrel of oil. These prices were adjusted by lease for quality, transportation fees and regional price differences. PV-10 is a non-GAAP measure because it excludes income tax effects. We have provided a reconciliation of PV-10 to the standardized measure of discounted future net cash flows “Prospectus Summary—Operating Reserve Data.” |
| (2) | The present value of estimated future cash inflows from proved oil and natural gas reserves, less future development and production costs and future income tax expenses, discounted at 10% per annum to reflect timing of future cash flows and using the same pricing assumptions as were used to calculate PV-10. Standardized measure differs from PV-10 because standardized measure includes the effect of future income taxes. |
Proved developed reserves are proved reserves that are expected to be recovered from existing wells with existing equipment and operating methods. Proved undeveloped reserves are proved reserves that are expected to be recovered from new wells drilled to known reservoirs on undrilled acreage for which the existence and
51
Table of Contents
Index to Financial Statements
recoverability of such reserves can be estimated with reasonable certainty, or from existing wells on which a relatively major expenditure is required to establish production.
The data in the above table represents estimates only. Oil and natural gas reserve engineering is inherently a subjective process of estimating underground accumulations of oil and natural gas that cannot be measured exactly. The accuracy of any reserve estimate is a function of the quality of available data and engineering and geological interpretation and judgment. Accordingly, reserve estimates may vary from the quantities of oil and natural gas that are ultimately recovered. See “Risk Factors.”
Future prices received for production and costs may vary, perhaps significantly, from the prices and costs assumed for purposes of these estimates. The PV-10 shown should not be construed as the current market value of the reserves. The 10% discount factor used to calculate present value, which is required by Financial Accounting Standard Board pronouncements, is not necessarily the most appropriate discount rate. The present value, no matter what discount rate is used, is materially affected by assumptions as to timing of future production, which may prove to be inaccurate.
Production and Price History
The following table sets forth information regarding net production of oil, natural gas and natural gas liquids, and certain price and cost information for each of the periods indicated:
Period from Inception through | Year Ended December 31, 2004 | Nine Months Ended 2005 | |||||||
Production Data: | |||||||||
Natural gas (MMcf)(1) | 466.1 | 1,590.5 | 1,986.3 | ||||||
Oil (MBbls) | 9.3 | 28.3 | 18.2 | ||||||
Combined volumes (MMcfe) | 522.0 | 1,760.5 | 2,095.3 | ||||||
Daily combined volumes (MMcfe/day) | 3.0 | 4.8 | 7.7 | ||||||
Average Prices: | |||||||||
Natural gas (per Mcf)(1) | $ | 4.06 | $ | 5.01 | $ | 5.41 | |||
Oil (per Bbl) | 28.49 | 37.80 | 48.71 | ||||||
Combined (per Mcfe) | 4.13 | 5.14 | 5.55 | ||||||
Average Costs (per Mcfe): | |||||||||
Lease operating expense | $ | 0.67 | $ | 1.63 | $ | 2.97 | |||
Gathering and transportation expense | 0.28 | 0.24 | 0.19 | ||||||
Production tax expense | 0.22 | 0.31 | 0.54 | ||||||
Depreciation, depletion and amortization | 1.12 | 2.29 | 2.39 | ||||||
General and administrative (excluding non-cash stock based compensation) | 0.07 | 0.30 | 0.85 | ||||||
Total | $ | 2.36 | $ | 4.77 | $ | 6.94 | |||
| (1) | Production of natural gas liquids is included in natural gas revenues and production. |
| (2) | Production data for 2003 covers only a partial year as we acquired our initial properties in the Powder River Basin on July 8, 2003. |
Productive Wells
The following table sets forth information at December 31, 2005, relating to the productive wells in which we owned a working interest as of that date. Productive wells consist of producing wells and wells capable of
52
Table of Contents
Index to Financial Statements
production, including natural gas wells awaiting pipeline connections to commence deliveries and oil wells awaiting connection to production facilities. Gross wells are the total number of producing wells in which we have an interest, and net wells are the sum of our fractional working interests owned in gross wells.
| Gas | Oil | |||||||
Basin | Gross Wells | Net Wells | Gross Wells | Net Wells | ||||
Powder River | 526 | 433.4 | 10 | 6.8 | ||||
Piceance | 5 | 5 | — | — | ||||
East Texas | 11 | 3.9 | — | — | ||||
Big Horn | 6 | 5.7 | — | — | ||||
Williston | — | — | — | — | ||||
Fayetteville Shale | — | — | — | — | ||||
Other | 15 | 9.5 | — | — | ||||
Total | 563 | 457.5 | 10 | 6.8 | ||||
Developed and Undeveloped Acreage
The following table sets forth information as of December 31, 2005 relating to our leasehold acreage.
| Developed Acreage (1) | Undeveloped Acreage (2) | |||||||
Basin | Gross (3) | Net (4) | Gross (3) | Net (4) | ||||
Powder River | 41,700 | 30,900 | 140,600 | 104,100 | ||||
Piceance | 1,200 | 900 | 68,300 | 44,200 | ||||
East Texas | 800 | 200 | 45,100 | 14,200 | ||||
Big Horn | 3,000 | 2,900 | 50,100 | 47,800 | ||||
Williston | — | — | 83,300 | 41,600 | ||||
Fayetteville Shale | — | — | 46,600 | 42,600 | ||||
Other | 2,600 | 2,600 | 35,400 | 34,100 | ||||
Total | 49,300 | 37,500 | 469,400 | 328,600 | ||||
| (1) | Developed acres are acres spaced or assigned to productive wells. |
| (2) | Undeveloped acres are acres on which wells have not been drilled or completed to a point that would permit the production of commercial quantities of oil or natural gas, regardless of whether such acreage contains proved reserves. |
| (3) | A gross acre is an acre in which a working interest is owned. The number of gross acres is the total number of acres in which a working interest is owned. |
| (4) | A net acre is deemed to exist when the sum of the fractional ownership working interests in gross acres equals one. The number of net acres is the sum of the fractional working interests owned in gross acres expressed as whole numbers and fractions thereof. |
Many of the leases comprising the undeveloped acreage set forth in the table above will expire at the end of their respective primary terms unless production from the leasehold acreage has been established prior to such date, in which event the lease will remain in effect until the cessation of production. We have generally been able to obtain extensions of the primary terms of our federal leases for the period that we have been unable to obtain
53
Table of Contents
Index to Financial Statements
drilling permits due to a pending EA, EIS or related legal challenges. The following table sets forth the expiration periods of the gross and net acres subject to leases summarized in the table of undeveloped acreage, unless such leases are currently held by production from a portion of the lease that has been developed.
Undeveloped Acres Expiring | ||||
Twelve Months Ending: | Gross | Net | ||
December 31, 2006 | 43,200 | 23,100 | ||
December 31, 2007 | 60,200 | 24,900 | ||
December 31, 2008 | 29,100 | 31,900 | ||
December 31, 2009 | 84,200 | 54,300 | ||
December 31, 2010 and later | 179,200 | 152,300 | ||
Lease Held by Production or Held by Units | 73,500 | 42,100 | ||
Total | 469,400 | 328,600 | ||
Drilling Results
The following table sets forth information with respect to wells completed during the periods indicated. The information should not be considered indicative of future performance, nor should it be assumed that there is necessarily any correlation between the number of productive wells drilled, quantities of reserves found or economic value. Productive wells are those that produce commercial quantities of hydrocarbons, whether or not they produce a reasonable rate of return.
| Year Ended December 31, | ||||||||
| 2004 | 2005 | |||||||
| Gross | Net | Gross | Net | |||||
Development: | ||||||||
Productive | 53 | 36 | 25 | 17 | ||||
Dry | 1 | 1 | — | — | ||||
Exploratory: | ||||||||
Productive | 1 | 1 | — | — | ||||
Dry | — | — | 3 | 3 | ||||
Total: | ||||||||
Productive | 54 | 37 | 25 | 17 | ||||
Dry | 1 | 1 | 3 | 3 | ||||
As of December 31, 2005, we had 145 gross (130 net) wells in the process of drilling, completing or dewatering or shut in awaiting infrastructure that are not reflected in the above table. From inception through December 31, 2005, we drilled 228 gross wells, of which 79 had been completed as producing, 59 were in process of completing or dewatering, 86 were shut in awaiting infrastructure to begin dewatering and two were dry holes. Also during that time, we recompleted 60 gross wells, which are not included in the totals above.
Operations
General
In general, we serve as operator of wells in which we have a greater than 50% interest. In addition, we seek to be operator of wells in which we have lesser interests. As operator, we design and manage the development of a well and supervise operation and maintenance activities on a day-to-day basis. We do not own drilling rigs or other oil field services equipment used for drilling or maintaining wells on properties we operate. Independent contractors engaged by us provide all the equipment and personnel associated with these activities. We employ
54
Table of Contents
Index to Financial Statements
petroleum engineers, geologists and land professionals who work to improve production rates, increase reserves and lower the cost of operating our oil and natural gas properties.
Marketing and Customers
We market the majority of the oil and natural gas production from properties we operate for both our account and the account of the other working interest owners in these properties. We sell the majority of our production to a variety of purchasers at market prices under either short-term contracts or longer term processing, gathering and transportation contracts. We normally sell production to a relatively small number of customers, as is customary in the exploration, development and production business. However, based on the current demand for oil and natural gas, and the availability of other purchasers, we believe that the loss of any one or all of our major purchasers would not have a material adverse effect on our financial condition and results of operations. For a list of our purchasers that accounted for 10% or more of our oil and natural gas revenues during the last two calendar years, see “Notes to Combined Financial Statements—Note 2—Accounts Receivable.”
Competition
The oil and natural gas industry is intensely competitive, and we compete with other companies that have greater resources. Many of these companies not only explore for and produce oil and natural gas, but also carry on midstream and refining operations and market petroleum and other products on a regional, national or worldwide basis. These companies may be able to pay more for productive oil and natural gas properties and exploratory prospects or to define, evaluate, bid for and purchase a greater number of properties and prospects than our financial or human resources permit. In addition, these companies may have a greater ability to continue exploration activities during periods of low oil and natural gas market prices. Our larger or integrated competitors may be able to absorb the burden of existing, and any changes to, federal, state, local and Native American tribal laws and regulations more easily than we can, which would adversely affect our competitive position. Our ability to acquire additional properties and to discover reserves in the future will be dependent upon our ability to evaluate and select suitable properties and to consummate transactions in a highly competitive environment. In addition, because we have fewer financial and human resources than many companies in our industry, we may be at a disadvantage in bidding for exploratory prospects and producing oil and natural gas properties.
Title to Properties
As is customary in the oil and gas industry, we initially conduct only a cursory review of the title to our properties. At such time as we determine to conduct drilling operations on those properties, we conduct a thorough title examination and perform curative work with respect to significant defects prior to commencement of drilling operations. To the extent title opinions or other investigations reflect title defects on those properties, we are typically responsible for curing any title defects at our expense. We generally will not commence drilling operations on a property until we have cured any material title defects on such property. We have obtained title opinions on substantially all of our producing properties and believe that we have satisfactory title to our producing properties in accordance with standards generally accepted in the oil and gas industry. Prior to completing an acquisition of producing oil and natural gas leases, we perform title reviews on the most significant leases and, depending on the materiality of properties, we may obtain a title opinion, obtain an updated title review or opinion or review previously obtained title opinions. Our oil and natural gas properties are subject to customary royalty and other interests, liens for current taxes and other burdens which we believe do not materially interfere with the use of or affect our carrying value of the properties.
Seasonal Nature of Business
The demand for natural gas has historically been seasonal; however, seasonal anomalies such as mild winters or hot summers sometimes lessen this fluctuation. In addition, natural gas storage facilities can also lessen seasonal demand fluctuations. Pipeline capacity can be affected by the demand for and availability of natural gas.
55
Table of Contents
Index to Financial Statements
Seasonal weather conditions and lease stipulations can limit our drilling and producing activities, and other oil and natural gas operations, in certain areas of the Rocky Mountain region. Many of our leases with the BLM restrict our operations in those areas from December to April due to wildlife migration and other considerations. These seasonal anomalies and restrictions can pose challenges for meeting our well drilling objectives and can increase competition for equipment, supplies and personnel during the spring and summer months, which could lead to shortages and increase costs or delay our operations.
Environmental Matters and Regulation
General.Our operations are subject to stringent federal, state and local laws and regulations governing the discharge of materials into the environment or otherwise relating to environmental protection. Our operations are subject to the same environmental laws and regulations as other companies in the oil and gas exploration and production industry. These laws and regulations may:
| • | require the acquisition of various permits and other authorizations before drilling commences and while operating; |
| • | require the installation of expensive pollution control equipment; |
| • | restrict the types, quantities and concentration of various substances that can be released into the environment in connection with drilling and production activities; |
| • | limit or prohibit drilling activities on lands lying within coastal zones, wetlands, wildlife habitat and other protected areas; |
| • | require remedial measures to prevent or remediate pollution from our operations, such as pit closure and plugging of abandoned wells; |
| • | impose substantial liabilities for pollution resulting from our operations and, under the strict liability provisions of many environmental laws, possibly related to operations by former owners or operators; and |
| • | with respect to operations affecting federal lands or leases, require preparation of a Resource Management Plan, an Environmental Assessment, or EA, and/or an Environmental Impact Statement, or EIS. |
These laws, rules and regulations may also restrict the rate of oil and natural gas production below the rate that would otherwise be possible. The regulatory burden on the oil and natural gas industry increases the cost of doing business in the industry and consequently affects profitability. Additionally, Congress and the federal and state agencies frequently revise the environmental laws and regulations, and any changes that result in more stringent and costly waste handling, water disposal and clean-up requirements for the oil and natural gas industry could have a significant impact on our operating costs. The permitting and approval process has been more difficult in recent years than in the past due to increased activism from environmental and other groups and has extended the time it takes us to receive permits. We believe that we substantially comply with all current applicable environmental laws and regulations and that our continued compliance with existing requirements will not have a material adverse impact on our financial condition and results of operations. However, we cannot predict the passage of or quantify the potential impact of more stringent future laws and regulations at this time. For the year ended December 31, 2005, we did not incur any material capital expenditures to remediate or retrofit pollution control equipment at any of our facilities. As of February 10, 2006, we are not aware of any environmental issues or claims that will require material capital expenditures during 2006 or that will otherwise have a material impact on our financial position or results of operations.
56
Table of Contents
Index to Financial Statements
Several of the environmental laws and regulations which could have a material impact on the oil and natural gas exploration and production industry are as follows:
National Environmental Policy Act. Oil and natural gas exploration and production activities on federal lands are typically subject to the National Environmental Policy Act, or NEPA. NEPA requires federal agencies, including the BLM, to evaluate major agency actions having the potential to significantly impact the environment. In the course of such evaluations, an agency may have an Environmental Assessment, or EA, prepared that assesses the potential direct, indirect and cumulative environmental impacts of a proposed federal action. If impacts are considered likely to be significant, the agency may prepare a more detailed Environmental Impact Statement, or EIS. Both EAs and EISs may be made available for public review and comment. All of our current exploration and production activities, as well as proposed exploration and development plans, on federal lands require governmental authorizations that are subject to the requirements of NEPA. This process has the potential to delay the development of oil and natural gas projects. In certain states, including Montana, state “little NEPA” statutes impose similar environmental review requirements on projects subject to state action.
In August 2004, the Tenth Circuit Court of Appeals inPennaco Energy, Inc. v. United States Department of the Interior, upheld a decision by the Interior Board of Land Appeals that the BLM failed to comply fully with NEPA in granting certain federal leases in the Powder River Basin to Pennaco Energy, Inc. for CBM development. Other recent decisions in the federal district court in Montana have also held that BLM failed to comply with NEPA when considering CBM development in the Powder River Basin. While these recent decisions have not had a material impact on our current operations or planned exploration and development activities, future litigation and/or agency responses to such litigation could materially impact our ability to obtain or maintain regulatory approvals to conduct operations in the Powder River Basin or elsewhere.
Waste Handling. The Resource Conservation and Recovery Act, or RCRA, and comparable state statutes, affect oil and natural gas exploration and production activities by imposing regulations on the generation, transportation, treatment, storage, disposal and cleanup of “hazardous wastes” and on the disposal of non-hazardous wastes. With federal approval, the individual states administer some or all of the provisions of RCRA, sometimes in conjunction with their own, more stringent requirements. Although wastes associated with the exploration, development and production of crude oil and natural gas are exempt from regulation as hazardous wastes under RCRA, such wastes may constitute “solid wastes” that are subject to the less stringent requirements of non-hazardous waste provisions. However, there is no guarantee that the Environmental Protection Agency, or EPA, or the states, or local governments will not adopt more stringent requirements for the handling of non-hazardous wastes or categorize some non-hazardous wastes as hazardous for future regulation. Indeed, legislation has been proposed from time to time to re-categorize certain oil and natural gas exploration and production wastes as “hazardous wastes.”
Administrative, civil and criminal penalties can be imposed for failure to comply with waste handling requirements. We believe that we are in substantial compliance with the requirements of RCRA and related state and local laws and regulations, and that we hold all necessary and up-to-date permits, registrations and other authorizations to the extent that our operations require them under such laws and regulations. Although we do not believe that the current costs of managing our wastes as they are presently classified to be significant, any legislative or regulatory reclassification of oil and natural gas exploration and production wastes could increase our costs to manage and dispose of such wastes.
Comprehensive Environmental Response, Compensation and Liability Act. The Comprehensive Environmental Response, Compensation and Liability Act, also known as CERCLA or the “Superfund” law, generally imposes joint and several liability, without regard to fault or legality of conduct, on classes of persons who are considered to be responsible for the release of a “hazardous substance” into the environment. These persons include the current owner or operator of a contaminated facility, a former owner or operator of the facility at the time of contamination and those persons that disposed or arranged for the disposal of the hazardous substance. Under CERCLA, such persons may be subject to strict joint and several liability for the costs of
57
Table of Contents
Index to Financial Statements
cleaning up the hazardous substances that have been released into the environment, for damages to natural resources and for the costs of certain health studies. In addition, it is not uncommon for neighboring landowners and other third parties to file claims for personal injury and property damage allegedly caused by the hazardous substances released into the environment. In the course of our operations, we use materials, that, if released, would be subject to CERCLA. Therefore, governmental agencies or third parties may seek to hold us responsible under CERCLA for all or part of the costs to clean up sites at which such “hazardous substances” have been deposited.
Water Discharges. The Federal Water Pollution Control Act, also known as the Clean Water Act, and analogous state laws impose restrictions and strict controls regarding the discharge of pollutants, including produced waters and other oil and gas wastes, into waters of the United States. Some states restrict discharges into groundwaters and other state waters not regulated by the Clean Water Act. The discharge of pollutants into regulated waters is prohibited, except in accordance with the terms of a permit issued by EPA or the state. Our CBM exploration and production activities result in the discharge of large volumes of produced water into adjacent ponds, creekbeds and below ground disposal systems. The environmental soundness of discharging produced water pursuant to water discharge permits has come under increased scrutiny. Moratoria on the issuance of additional water discharge permits, issuance of stricter permits, modifications to existing permits or requirements for more costly methods of handling these produced waters, may adversely affect future well operation and development. Compliance with more stringent laws or regulations, changed interpretations of these laws and regulations, or more vigorous enforcement policies of the regulatory agencies, or difficulties in receiving other governmental approvals, could delay or otherwise adversely affect our CBM exploration and production activities and/or require us to make material expenditures for the installation and operation of systems and equipment for pollution control and/or remediation, all of which could have a material adverse effect on our financial condition or results of operations. For example, approximately 15% of our acreage in the Castle Springs project area in the Piceance Basin is subject to a drilling moratorium put in place by the Colorado Oil and Gas Conservation Commission upon the discovery in March 2004 of a gas seep caused by a faulty well drilled by another operator. These prescriptions also prohibit the discharge of dredge and fill material in regulated waters, including wetlands, unless authorized by a permit issued by the U.S. Army Corps of Engineers. Federal and state regulatory agencies can impose administrative, civil and criminal penalties for non-compliance with discharge permits or other requirements of the federal Clean Water Act and analogous state laws and regulations. We believe that we maintain all required discharge permits necessary to conduct our operations, and we believe we are substantial compliance with the terms thereof. Obtaining permits has the potential to delay the development of oil and natural gas projects.
Air Emissions. The federal Clean Air Act, and associated state laws and regulations, regulate emissions of various air pollutants through the issuance of permits and the imposition of other requirements. In addition, EPA has developed, and continues to develop, stringent regulations governing emissions of toxic air pollutants at specified sources. Some of our new facilities will be required to obtain permits before work can begin, permits may be required for our facilities’ operations, and existing facilities may be required to incur capital costs to remain in compliance. These regulations may increase the costs of compliance for some facilities we own or operate, and federal and state regulatory agencies can impose administrative, civil and criminal penalties for non-compliance with air permits or other requirements of the federal Clean Air Act and associated state laws and regulations. We believe that we are in substantial compliance with all air emissions regulations and that we hold all necessary and valid construction and operating permits for our operations. Obtaining permits has the potential to delay the development of oil and natural gas projects.
Other Laws and Regulation. The Kyoto Protocol to the United Nations Framework Convention on Climate Change went into effect in February 2005 and requires all industrialized nations that ratified the Protocol to reduce or limit greenhouse gas emissions to a specified level by 2012. The United States has not ratified the Protocol, and the U.S. Congress has resisted recent proposed legislation directed at reducing greenhouse gas emissions. However, there is increasing public pressure from environmental groups and some states for the
58
Table of Contents
Index to Financial Statements
United States to develop a national program for regulating greenhouse gas emissions, and several states have already adopted regulations or announced initiatives focused on decreasing or stabilizing greenhouse gas emissions associated with industrial activity, primarily carbon dioxide emissions from power plants. The oil and natural gas exploration and production industry is a direct source of certain greenhouse gas emissions, namely carbon dioxide and methane, and future restrictions on the combustion of fossil fuels or the venting of natural gas could impact our future operations. Our operations are not adversely impacted by current state and local climate change initiatives and, at this time, it is not possible to accurately estimate how potential future laws or regulations addressing greenhouse gas emissions would impact our business.
Legislation continues to be introduced in Congress, and development of regulations continues in the Department of Homeland Security and other agencies, concerning the security of industrial facilities, including oil and natural gas facilities. Our operations may be subject to such laws and regulations. Presently, it is not possible to accurately estimate the costs we could incur to comply with any such facility security laws or regulations, but such expenditures could be substantial.
Other Regulation of the Oil and Natural Gas Industry
The oil and natural gas industry is extensively regulated by numerous federal, state and local authorities, including Native American tribes. Legislation affecting the oil and natural gas industry is under constant review for amendment or expansion, frequently increasing the regulatory burden. Also, numerous departments and agencies, both federal and state, and Native American tribes are authorized by statute to issue rules and regulations binding on the oil and natural gas industry and its individual members, some of which carry substantial penalties for failure to comply. Although the regulatory burden on the oil and natural gas industry increases our cost of doing business and, consequently, affects our profitability, these burdens generally do not affect us any differently or to any greater or lesser extent than they affect other companies in the industry with similar types, quantities and locations of production.
Drilling and Production. Our operations are subject to various types of regulation at federal, state and local levels. These types of regulation include requiring permits for the drilling of wells, drilling bonds and reports concerning operations. Most states, and some counties and municipalities, in which we operate also regulate one or more of the following:
| • | the location of wells; |
| • | the method of drilling and casing wells; |
| • | the rates of production or “allowables;” |
| • | the surface use and restoration of properties upon which wells are drilled and other third parties; |
| • | the plugging and abandoning of wells; and |
| • | notice to, and consultation with, surface owners and other third parties. |
State laws regulate the size and shape of drilling and spacing units or proration units governing the pooling of oil and natural gas properties. Some states allow forced pooling or integration of tracts to facilitate exploration while other states rely on voluntary pooling of lands and leases. In some instances, forced pooling or unitization may be implemented by third parties and may reduce our interest in the unitized properties. In addition, state conservation laws establish maximum rates of production from oil and natural gas wells, generally prohibit the venting or flaring of natural gas and impose requirements regarding the ratability of production. These laws and regulations may limit the amount of oil and natural gas we can produce from our wells or limit the number of wells or the locations at which we can drill. Moreover, each state generally imposes a production or severance tax with respect to the production and sale of oil, natural gas and natural gas liquids within its jurisdiction.
59
Table of Contents
Index to Financial Statements
Natural Gas Sales Transportation. Historically, federal legislation and regulatory controls have affected the price of the natural gas we produce and the manner in which we market our production. The Federal Energy Regulatory Commission, or FERC, has jurisdiction over the transportation and sale for resale of natural gas in interstate commerce by natural gas companies under the Natural Gas Act of 1938 and the Natural Gas Policy Act of 1978. Since 1978, various federal laws have been enacted which have resulted in the complete removal of all price and non-price controls for sales of domestic natural gas sold in “first sales”, which include all of our sales of our own production.
FERC also regulates interstate natural gas transportation rates and service conditions, which affects the marketing of natural gas that we produce, as well as the revenues we receive for sales of our natural gas. Commencing in 1985, FERC promulgated a series of orders, regulations and rule makings that significantly fostered competition in the business of transporting and marketing gas. Today, interstate pipeline companies are required to provide nondiscriminatory transportation services to producers, marketers and other shippers, regardless of whether such shippers are affiliated with an interstate pipeline company. FERC’s initiatives have led to the development of a competitive, unregulated, open access market for gas purchases and sales that permits all purchasers of gas to buy gas directly from third-party sellers other than pipelines. However, the natural gas industry historically has been very heavily regulated; therefore, we cannot guarantee that the less stringent regulatory approach recently pursued by FERC and Congress will continue indefinitely into the future nor can we determine what effect, if any, future regulatory changes might have on our natural gas related activities.
Under FERC’s current regulatory regime, transmission services must be provided on an open-access, non-discriminatory basis at cost-based rates or at market-based rates if the transportation market at issue is sufficiently competitive. Gathering service, which occurs upstream of jurisdictional transmission services, is regulated by state agencies. Although its policy is still in flux, FERC recently has reclassified certain jurisdictional transmission facilities as non-jurisdictional gathering facilities, which has the tendency to increase our costs of getting gas to point-of-sale locations.
Operations on Native American Reservations. Native American tribes are subject to various federal statutes and oversight by the Bureau of Indian Affairs. However, each Native American tribe is a sovereign nation and has the right to enforce certain other laws and regulations entirely independent from federal, state and local statutes and regulations, as long as they do not supersede or conflict with such federal statutes. These tribal laws and regulations include various fees, taxes, requirements to employ Native American tribal members, and numerous other conditions that apply to lessees, operators, and contractors conducting operations within the boundaries of a Native American reservation. Further, lessees and operators within a Native American reservation are subject to the Native American tribal court system, unless there is a specific waiver of sovereign immunity by the Native American tribe allowing resolution of disputes between the Native American tribe and those lessees or operators to occur in federal or state court.
If we acquire leasehold interests within a Native American reservation, we will be subject to various laws and regulations pertaining to Native American tribal surface ownership, Native American oil and natural gas leases, fees, taxes and other burdens, obligations and issues unique to oil and natural gas ownership and operations within Native American reservations. One or more of these requirements may increase our costs of doing business on Native American tribal lands and have an impact on the economic viability of any well or project on those lands.
Employees
We have approximately 36 full time employees, including four geologists, five petroleum engineers and five land professionals, all of whom are salaried administrative or supervisory employees. Of these 36 full time employees, four work in our Gillette, Wyoming office and one works in our Sheridan, Wyoming office. None of our employees are represented by labor unions or covered by any collective bargaining agreements. From time to time, we also hire independent contractors and consultants to assist our full time employees.
60
Table of Contents
Index to Financial Statements
Historically, certain personnel of Gulfport Energy Corporation have provided management and administrative services to us. Following the closing of this offering, Gulfport will continue to provide administrative services to us, including accounting, human resources, legal and technical support. We reimbursed Gulfport for its dedicated employee time and related general and administrative costs based upon the pro rata share of time its employees spent performing services for us. Effective upon the closing of the offering, we will enter into an administrative services agreement with Gulfport with respect to the continuation of certain of those services. See “Related Party Transactions—Administrative Services Agreement” for additional information regarding the administrative services agreement.
Facilities
Our corporate headquarters is located at 14313 N. May Avenue, Oklahoma City, Oklahoma in an office building owned by our affiliate, Gulfport. For more information regarding this lease arrangement, see “Related Party Transaction—Administrative Services Agreement.” We also have field offices in Gillette, Wyoming, Sheridan, Wyoming and Silt, Colorado. We believe that our facilities are adequate for our current operations.
Legal Proceedings
Due to the nature of our business, we are, from time to time, involved in routine litigation or subject to disputes or claims related to our business activities, including workers’ compensation claims and employment related disputes. In the opinion of our management, none of the pending litigation, disputes or claims against us, if decided adversely, will have a material adverse effect on our financial condition or results of operations.
61
Table of Contents
Index to Financial Statements
Executive Officers and Directors
Set forth below is the name, age, position and a brief account of the business experience of each of our executive officers and directors as of February 10, 2006.
Name | Age | Position | ||
Executive Officers and Directors: | ||||
Michael P. Cross | 54 | Chief Executive Officer, President and Director | ||
Lisa Klein | 36 | Chief Financial Officer, Treasurer and Secretary | ||
Jeffery D. Dahlberg | 48 | Executive Vice President | ||
Larry Patrick | 52 | Vice President and Land Manager | ||
Mike Liddell | 54 | Chairman of the Board and Director | ||
Gregory L. Cook | 58 | Director Nominee* | ||
Zane L. Fleming | 54 | Director Nominee* |
| * | Mr. Cook and Mr. Fleming have each consented to serve as a director of our company and are expected to join our board prior to the closing of this offering. |
Michael P. Cross has served as Chief Executive Officer and President of our company since December 2005 and as a director since February 2006. From July 2003 to December 2005, Mr. Cross was self-employed and provided oil and natural gas consulting services to various companies, including certain of our affiliates. He served as President and Manager of Twister Gas Services, L.L.C., an oil and gas exploration, production and marketing company, from its inception in 1996 until June 2003 and served as President of its predecessor, Twister Transmission Company, from 1990 to 1996. Mr. Cross served as a director of Canaan Energy Corporation from October 2000 to November 2001. He currently serves as a director of Warren Equipment Company, the Oklahoma Energy Resources Board, and as Secretary and Member of the Executive Committee of the Oklahoma Independent Petroleum Association. Mr. Cross received a Bachelor of Science degree in Business Administration from Oklahoma State University.
Lisa Klein has served as Chief Financial Officer, Treasurer and Secretary of our company since December 2005. From July 2001 to May 2003, she served as the Controller of Gulfport Energy Corporation. From October 2003 to December 2005, Ms. Klein continued to be employed by Gulfport but also provided services to us. See “Related Party Transactions—Administrative Services Agreement.” Ms. Klein served as audit senior and then audit manager with Hogan & Slovacek PC in Oklahoma City from 1997 to 2001 and an audit staff and then senior auditor with Arthur Andersen LP in Oklahoma City from 1993 to 1997. Ms. Klein received a Bachelor of Accountancy degree with distinction from the University of Oklahoma.
Jeffery D. Dahlberg has served as an Executive Vice President of our company since December 2005. From June 2003 to December 2005, he was employed by Gulfport as its Engineering and Marketing Manager but also provided services to us. See “Related Party Transactions—Administrative Services Agreement.” Mr. Dahlberg was Senior Vice President of Twister Gas Services, LLC from 1996 until June 2003 and of Twister Transmission Company from 1991 to 1996. He has been a member of the Society of Petroleum Engineers since 1980 and received a Bachelor of Science degree in Petroleum Engineering from Louisiana Tech University.
Larry Patrick has served as Vice President and Land Manager of our company since December 2005. He previously served as Senior Landman for Gulfport Energy Corporation from July 2003 until December 2005 in which capacity he also provided services to us. Prior to joining Gulfport, he was a partner and Land Manager for Martino-Patrick, LLC from 1996 to July 2003 and DSM Exploration, Inc. from 1986 to 1996. Mr. Patrick was employed as a landman for Core Petroleum, Ltd. from 1983 to 1986, and from 1980 to 1983 he owned and operated Petroleum Research Company. He is a member of the American Association of Petroleum Landmen, the Oklahoma City Association of Petroleum Landmen and the Wyoming Association of Petroleum Landmen.
62
Table of Contents
Index to Financial Statements
Mike Liddell has served as the Chairman of the Board and a director of our company since December 2005. Mr. Liddell has served as the Chairman of the Board and a director of Bronco Drilling Company since May 2005. He has served as a director of Gulfport Energy Corporation since July 1997 and as its Chairman of the Board since July 1998. He also served as Gulfport Energy Corporation’s Chief Executive Officer from April 1998 to December 2005 and as its President from July 2000 to December 2005. He received a Bachelor of Science degree in Education from Oklahoma State University.
Gregory L. Cook has agreed to serve as a director of our company and is expected to join our board prior to the closing of this offering. Since 1998, Mr. Cook has served as the Operations & Exploration Team Manager for The GHK Company, a privately held natural gas exploration and production company. Mr. Cook received a Bachelor of Science and Master of Science degrees in geology from Oklahoma State University. He is a member of the American Association of Petroleum Geologists, the Oklahoma City Geological Society, the Oklahoma Independent Petroleum Association and the Society of Petroleum Engineers.
Zane L. Fleming has agreed to serve as a director of our company and is expected to join our board prior to the closing of this offering. Mr. Fleming has served as owner and Manager of Eagle Drilling Fluids, LLC since October of 1983. From August 1979 to September 1983, he served as President and partner of Falcon Mud Company, Inc. He is a member of the Oklahoma Independent Petroleum Association, American Petroleum Institute and the International Association of Drilling Contractors. Mr. Fleming received a Bachelor of Business Administration in Petroleum Land Management from the University of Oklahoma.
Our Board of Directors and Committees
Upon completion of this offering, our board of directors will consist of five directors. Our certificate of incorporation provides that the terms of office of the directors are one-year from the time of their election until the next annual meeting of stockholders or until their successors are duly elected and qualified.
Our bylaws provide that the authorized number of directors may be changed by an amendment to the bylaws adopted by our board of directors or by the stockholders. In addition, our certificate of incorporation and our bylaws provide that, in general, vacancies on the board may be filled by a majority of directors in office, although less than a quorum.
Our board of directors will establish an audit committee in connection with this offering whose functions include the following:
| • | assist the board of directors in its oversight responsibilities regarding (1) the integrity of our financial statements, (2) our compliance with legal and regulatory requirements, (3) the independent accountant’s qualifications and independence and (4) our accounting and financial reporting processes of and the audits of our financial statements; |
| • | prepare the report required by the SEC for inclusion in our annual proxy or information statement; |
| • | appoint, retain, compensate, evaluate and terminate our independent accountants; |
| • | approve audit and non-audit services to be performed by the independent accountants; and |
| • | perform such other functions as the board of directors may from time to time assign to the audit committee. |
The specific functions and responsibilities of the audit committee will be set forth in the audit committee charter. Upon completion of this offering, our audit committee will include at least one director who satisfies the independence requirements of current SEC rules and The Nasdaq National Market listing standards. Within one
63
Table of Contents
Index to Financial Statements
year after completion of the offering, we expect that our audit committee will be composed of three members that will satisfy the independence requirements of current SEC rules and The Nasdaq National Market listing standards. We also expect that one of the members of the audit committee will qualify as an audit committee financial expert as defined under these rules and listing standards, and the other members of our audit committee will satisfy the financial literacy standards for audit committee members under these rules and listing standards.
Pursuant to our bylaws, our board of directors may, from time to time, establish other committees to facilitate the management of our business and operations. Because we are considered to be controlled by Wexford under The Nasdaq National Market rules, we are eligible for exemptions from provisions of these rules requiring a majority of independent directors, nominating and corporate governance and compensation committees composed entirely of independent directors and written charters addressing specified matters. We have elected to take advantage of these exemptions. In the event that we cease to be a controlled company within the meaning of these rules, we will be required to comply with these provisions after the specified transition periods.
Director Compensation
To date, none of our directors has received compensation for services rendered as a board member. Members of our board of directors who are also officers or employees of our company will not receive compensation for their services as directors. It is anticipated that after the completion of this offering, we will pay our non-employee directors a monthly retainer of $1,000 and a per meeting attendance fee of $500 and reimburse all ordinary and necessary expenses incurred in the conduct of our business.
In connection with this offering, we intend to implement an equity incentive plan. Under the plan, certain non-employee directors will be granted a nonqualified stock option to purchase 20,000 shares of our common stock at an exercise price equal to the initial public offering price. Options granted to eligible non-employee directors under the plan will vest in 36 equal monthly installments beginning on the date of grant and will be exercisable for a period of ten years beginning on the date of its grant.
Compensation Committee Interlocks and Insider Participation
We do not currently have a compensation committee. None of our executive officers serves, or has served during the past year, as a member of the board of directors or compensation committee of any other company that has one or more executive officers serving as a member of our board of directors or compensation committee.
Executive Compensation
From our inception in July 2003 through the closing of this offering, the services of our executive offices have been provided by our affiliate Gulfport Energy Corporation. We did not pay these individuals directly, but instead reimbursed Gulfport for the portion of the time these executives committed to our company. See “Related Party Transactions – Administrative Services Agreement.”
Upon the closing of this offering, our executive officers will be employed by us and their initial annual compensation will be: Michael Cross – $ ; Lisa Klein – $ ; Jeffery Dahlberg – $ ; and Larry Patrick – $ .
Equity Incentive Plan
General. In connection with this offering, we intend to implement an equity incentive plan and approve the forms of agreement to be used by participants under the plan. The purpose of the plan will be to enable our company, and any of its affiliates, to attract and retain the services of the types of employees, consultants and directors who will contribute to our long range success and to provide incentives which are linked directly to increases in share value which will inure to the benefit of our stockholders. The plan provides a means by which eligible recipients of awards may be given an opportunity to benefit from increases in value of our common stock
64
Table of Contents
Index to Financial Statements
through the granting of incentive stock options, nonstatutory stock options, restricted awards, performance awards and stock appreciation rights.
Eligible award recipients are employees, consultants and directors of our company and its affiliates. Incentive stock options may be granted only to our employees. Awards other than incentive stock options may be granted to employees, consultants and directors. The shares that may be issued pursuant to awards consist of our authorized but unissued common stock, and the maximum aggregate amount of such common stock which may be issued upon exercise of all awards under the plan, including incentive stock options, may not exceed shares, subject to adjustment to reflect certain corporate transactions or changes in our capital structure.
We anticipate granting to employees and certain non-employee directors to purchase a total of shares of our common stock under the plan upon completion of this offering.
Share Reserve. The aggregate number of shares of common stock initially authorized for issuance under the Equity Incentive Plan is shares. However, (i) shares covered by an award that expires or otherwise terminates without having been exercised in full and (ii) shares that are forfeited to, or repurchased by, us pursuant to a forfeiture or repurchase provision under the Equity Incentive Plan may return to the Equity Incentive Plan and be available for issuance in connection with a future award.
Administration. Our board of directors (or such committee as may be appointed by our board of directors from time to time) administers the Equity Incentive Plan. Among other responsibilities, the board selects participants from among the eligible individuals, determines the number of ordinary shares that will be subject to each award and determines the terms and conditions of each award, including methods of payment, vesting schedules and limitations and restrictions on awards. Our board of directors may amend, suspend, or terminate the Equity Incentive Plan at any time. Amendments will not be effective without stockholder approval if stockholder approval is required by applicable law or stock exchange requirements.
Stock Options. Incentive and nonstatutory stock options are granted pursuant to incentive and nonstatutory stock option agreements. Employees, directors and consultants may be granted nonstatutory stock options, but only employees may be granted incentive stock options. The plan administrator determines the exercise price of a stock option, provided that the exercise price of a stock option generally cannot be less than 100% (and in the case of an incentive stock option granted to a 10% stockholder, 110%) of the fair market value of our common stock on the date of grant, except when assuming or substituting options in limited situations such as an acquisition. Generally, options granted under the Equity Incentive Plan vest ratably over a five-year period and have a term of ten years (five years in the case of an incentive stock option granted to a 10% stockholder), unless specified otherwise by the plan administrator.
Acceptable consideration for the purchase of common stock issued upon the exercise of a stock option will be determined by the plan administrator and may include (i) cash or check, (ii) a broker-assisted cashless exercise, (iii) the tender of common stock previously owned by the optionee and (iv) other legal consideration approved by the plan administrator.
Unless the plan administrator provides otherwise, options generally are not transferable except by will, the laws of descent and distribution, or pursuant to a domestic relations order. An optionee may designate a beneficiary, however, who may exercise the option following the optionee’s death.
Restricted Awards. Restricted awards are awards of either actual shares of common stock, or of hypothetical share units having a value equal to the fair market value of an identical number of shares of common stock, and which may provide that such restricted awards may not be sold, transferred, or otherwise disposed of for such period as the plan administrator determines. The purchase price and vesting schedule, if applicable, of restricted awards are determined by the plan administrator.
Performance Awards. Performance awards entitle the recipient to acquire shares of common stock, or hypothetical share units having a value equal to the fair market value of an identical number of shares of
65
Table of Contents
Index to Financial Statements
common stock that will be settled in the form of shares of common stock upon the attainment of specified performance goals. Performance awards may be granted independent of or in connection with the granting of any other award under the Equity Incentive Plan. Performance goals will be established by the plan administrator based on one or more business criteria that apply to the plan participant, a business unit, or our company and our affiliates. Performance goals will be objective and meet the requirements of Section 162(m) of the Code. No payout will be made on a performance award granted to a named executive officer unless all applicable performance goals and service requirements are achieved. Performance awards may not be sold, assigned, transferred, pledged or otherwise encumbered and terminate upon the termination of the participant’s service to us or our affiliates.
Stock Appreciation Rights. Stock appreciation rights may be granted independent of or in tandem with the granting of any option under the Equity Incentive Plan. Stock appreciation rights are granted pursuant to stock appreciation rights agreements. The exercise price of a stock appreciation right granted independent of an option is determined by the plan administrator, but may be no less than 100% of the fair market value of our common stock on the date of grant. The exercise price of a stock appreciation right granted in tandem with an option is the same as the exercise price of the related option. Upon the exercise of a stock appreciation right, we will pay the participant an amount equal to the product of (i) the excess of the per share fair market value of our common stock on the date of exercise over the strike price, multiplied by (ii) the number of shares of common stock with respect to which the stock appreciation right is exercised. Payment will be made in cash, delivery of stock, or a combination of cash and stock as deemed appropriate by the plan administrator.
Non-qualified deferred compensation awards. In the event any award under the Equity Incentive Plan is granted with an exercise price less than 100% of the fair market value of our common stock on the date of grant, it will be deemed a non-qualified deferred compensation award under Section 409A of the Code. Generally, a non-qualified deferred compensation award may not be exercised or distributed prior to (i) a specified time or fixed schedule set forth in the award agreement, (ii) the participant’s separation from service, (iii) the death or disability of the participant, (iii) an unforeseeable emergency, or (iv) a change-in-control event. A non-qualified deferred compensation award may be exercisable no later than the later of (a) two and one-half months following the end of our taxable year in which the award first becomes exercisable or distributable or (b) two and one-half months following the end of the award recipient’s taxable year in which the award first becomes exercisable or distributable.
Adjustments in capitalization. In the event that there is a specified type of change in our common stock without the receipt of consideration by us, such as pursuant to a merger, consolidation, reorganization, recapitalization, reincorporation, stock dividend, dividend in property other than cash, stock split, liquidating dividend, combination of shares, exchange of shares, change in corporate structure or other transaction, appropriate adjustments will be made to the various limits under, and the share terms of, the Equity Incentive Plan including (i) the number and class of shares reserved under the Equity Incentive Plan, (ii) the maximum number of stock options and stock appreciation rights that can be granted to any one person in a calendar year and (iii) the number and class of shares and exercise price, strike price, or purchase price, if applicable, of all outstanding stock awards.
Corporate Transactions. In the event of significant corporate transaction (other than a transaction resulting in Wexford Capital LLC or an entity controlled by, or under common control with Wexford Capital LLC maintaining direct or indirect control over the Company), such as a dissolution or liquidation of the Company, or any corporate separation or division, including, but not limited to, a split-up, a split-off or a spin-off, or a sale in one or a series of related transactions, of all or substantially all of the assets of the Company or a merger, consolidation, or reverse merger in which we are not the surviving entity, then all outstanding stock awards under the Equity Incentive Plan may be assumed, continued, or substituted for by any surviving or acquiring entity (or its parent company), or may be cancelled either with or without consideration for the vested portion of the awards. In the event an award would be cancelled without consideration paid to the extent vested, the award recipient may exercise the award in full or in part for a period of 10 days.
66
Table of Contents
Index to Financial Statements
Limitations on Liability and Indemnification of Officers and Directors
Certificate of Incorporation and Bylaws
Our certificate of incorporation provides that no director shall be personally liable to us or any of our stockholders for monetary damages resulting from breaches of their fiduciary duty as directors, except to the extent such limitation on or exemption from liability is not permitted under the Delaware General Corporation Law, or DGCL. The effect of this provision of our certificate of incorporation is to eliminate our rights and those of our stockholders (through stockholders’ derivative suits on our behalf) to recover monetary damages against a director for breach of the fiduciary duty of care as a director, including breaches resulting from negligent or grossly negligent behavior, except, as restricted by the DGCL:
| • | for any breach of the director’s duty of loyalty to the company or its stockholders; |
| • | for acts or omissions not in good faith or that involve intentional misconduct or a knowing violation of law; |
| • | in respect of certain unlawful dividend payments or stock redemptions or repurchases; and |
| • | for any transaction from which the director derives an improper personal benefit. |
This provision does not limit or eliminate our rights or the rights of any stockholder to seek non-monetary relief, such as an injunction or rescission, in the event of a breach of a director’s duty of care.
Our certificate of incorporation also provides that we will, to the fullest extent permitted by Delaware law, indemnify our directors and officers against losses that they may incur in investigations and legal proceedings resulting from their service.
Our bylaws include provisions relating to advancement of expenses and indemnification rights consistent with those provided in our certificate of incorporation. In addition, our bylaws provide:
| • | for a right of indemnitee to bring a suit in the event a claim for indemnification or advancement of expenses is not paid in full by us within a specified period of time; and |
| • | permit us to purchase and maintain insurance, at our expense, to protect us and any of our directors, officers and employees against any loss, whether or not we would have the power to indemnify that person against that loss under Delaware law. |
Liability Insurance
We intend to provide liability insurance for our directors and officers, including coverage for public securities matters. At present, there is no pending litigation or proceeding involving any of our directors, officers or employees for which indemnification from us is sought. We are not aware of any threatened litigation that may result in claims for indemnification from us.
67
Table of Contents
Index to Financial Statements
Administrative Services Agreement
Historically, we have outsourced management and administrative services to Gulfport Energy Corporation and reimbursed Gulfport for its dedicated employee time and related general and administrative costs based on the proportionate amount of time its employees spent performing services for us. In 2003, 2004 and the first nine months of 2005, we paid Gulfport $0, $363,000 and $1,620,000, respectively, under this arrangement. Upon the closing of this offering, Gulfport will no longer provide us with management services. Gulfport will, however, continue to provide us with administrative services, including certain accounting, business resources, legal and technical support, and office space pursuant to an administrative services agreement on terms to be negotiated. These terms will be arrived at through negotiations between us and Gulfport. Although we believe the fees will be reasonable, it is possible that unrelated third parties could provide comparable services at a lower cost. One of our directors, Mike Liddell, is also a director of Gulfport. Wexford and its affiliates, our principal stockholders, are also the largest stockholders of Gulfport.
Operating Services
Prior to the completion of this offering, our affiliate Windsor Energy Group LLC operated the majority of the oil and natural gas properties in which we have working and revenue interests. As operator, Windsor Energy was responsible for the daily operations, monthly operations billings and monthly revenues disbursements related to these properties. Monthly overhead and supervision charges billed to us by Windsor Energy for operations totaled $134,000, $533,000 and $1,018,000 during 2003, 2004 and the nine months ended September 30, 2005, respectively.
Drillings Services Contract
On January 26, 2006, we entered into a term contract with our affiliate, Bronco Drilling Company, Inc., in which Bronco agreed to provide us a drilling rig for a period of two years. Under the terms of this contract, we agreed to pay Bronco a day work rate of $21,000 for the first twelve months of the contract term and a day work rate of $23,000 for the subsequent twelve months of the contract term.
68
Table of Contents
Index to Financial Statements
The following table sets forth certain information with respect to the beneficial ownership of our common stock by:
| • | each stockholder known by us to be the beneficial owner of more than five percent of the outstanding shares of our common stock; |
| • | each of our directors and nominees for director; |
| • | each of our named executive officers; and |
| • | all of our directors and executive officers as a group. |
Except as otherwise indicated, we believe that each of the stockholders named in this table has sole voting and investment power with respect to the shares indicated as beneficially owned.
Percentage of Shares Beneficially Owned(1) | ||||||
Name of Beneficial Owner | Number of Shares | Prior to Offering | After Offering | |||
5% Stockholder: | ||||||
Windsor Energy Holdings, L.L.C.(2) | 100% | |||||
Executive Officers and Directors: | ||||||
Michael P. Cross | ||||||
Lisa Klein | ||||||
Jeffery D. Dahlberg | ||||||
Larry Patrick | ||||||
Mike Liddell | ||||||
Gregory L. Cook(3) | ||||||
Zane L. Flemming(3) | ||||||
All executive officers and directors as a group ( persons) | ||||||
| (1) | Percentage of beneficial ownership is based upon shares of common stock outstanding as of , 2006, and shares of common stock outstanding after the offering. The table assumes no exercise of the underwriter’s over-allotment option. For purposes of this table, a person or group of persons is deemed to have “beneficial ownership” of any shares which such person has the right to acquire within 60 days. For purposes of computing the percentage of outstanding shares held by each person or group of persons named above, any security which such person or group of persons has the right to acquire within 60 days is deemed to be outstanding for the purpose of computing the percentage ownership for such person or persons, but is not deemed to be outstanding for the purpose of computing the percentage ownership of any other person. As a result, the denominator used in calculating the beneficial ownership among our stockholders may differ. |
| (2) | Wexford Capital LLC is the sole Manager of Windsor Energy Holdings, L.L.C. Its address is Wexford Plaza, 411 West Putnam Avenue, Greenwich, Connecticut 06830. |
| (3) | Messrs. Cook and Flemming have each consented to serve as a director of our company and are expected to join our board prior to the closing of this offering. |
69
Table of Contents
Index to Financial Statements
We will amend and restate our certificate of incorporation and bylaws in connection with this offering. The following description of our common stock, certificate of incorporation and our bylaws are summaries thereof and are qualified by reference to our certificate of incorporation and our bylaws as so amended and restated, copies of which will be filed with the SEC as exhibits to the registration statement of which this prospectus is a part.
Our authorized capital stock consists of 100,000,000 shares of common stock, par value $0.01 per share, and 1,000,000 shares of preferred stock, par value $0.01 per share. We intend to apply to have our shares of common stock quoted on The Nasdaq National Market.
Common Stock
Holders of shares of common stock are entitled to one vote per share on all matters submitted to a vote of stockholders. Shares of common stock do not have cumulative voting rights, which means that the holders of more than 50% of the shares voting for the election of the board of directors can elect all the directors to be elected at that time, and, in such event, the holders of the remaining shares will be unable to elect any directors to be elected at that time. Our certificate of incorporation denies stockholders any preemptive rights to acquire or subscribe for any stock, obligation, warrant or other securities of ours. Holders of shares of our common stock have no redemption or conversion rights nor are they entitled to the benefits of any sinking fund provisions.
In the event of our liquidation, dissolution or winding up, holders of shares of common stock shall be entitled to receive, pro rata, all the remaining assets of our company available for distribution to our stockholders after payment of our debts and after there shall have been paid to or set aside for the holders of capital stock ranking senior to common stock in respect of rights upon liquidation, dissolution or winding up the full preferential amounts to which they are respectively entitled.
Holders of record of shares of common stock are entitled to receive dividends when and if declared by the board of directors out of any assets legally available for such dividends, subject to both the rights of all outstanding shares of capital stock ranking senior to the common stock in respect of dividends and to any dividend restrictions contained in debt agreements. All outstanding shares of common stock and any shares sold and issued in this offering will be fully paid and nonassessable by us.
Preferred Stock
Our board of directors is authorized to issue up to 1,000,000 shares of preferred stock in one or more series. The board of directors may fix for each series:
| • | the distinctive serial designation and number of shares of the series; |
| • | the voting powers and the right, if any, to elect a director or directors; |
| • | the terms of office of any directors the holders of preferred shares are entitled to elect; |
| • | the dividend rights, if any; |
| • | the terms of redemption, and the amount of and provisions regarding any sinking fund for the purchase or redemption thereof; |
| • | the liquidation preferences and the amounts payable on dissolution or liquidation; |
| • | the terms and conditions under which shares of the series may or shall be converted into any other series or class of stock or debt of the corporation; and |
| • | any other terms or provisions which the board of directors is legally authorized to fix or alter. |
70
Table of Contents
Index to Financial Statements
We do not need stockholder approval to issue or fix the terms of the preferred stock. The actual effect of the authorization of the preferred stock upon your rights as holders of common stock is unknown until our board of directors determines the specific rights of owners of any series of preferred stock. Depending upon the rights granted to any series of preferred stock, your voting power, liquidation preference or other rights could be adversely affected. Preferred stock may be issued in acquisitions or for other corporate purposes. Issuance in connection with a stockholder rights plan or other takeover defense could have the effect of making it more difficult for a third party to acquire, or of discouraging a third party from acquiring, control of our company. We have no present plans to issue any shares of preferred stock.
Anti-takeover Effects of Provisions of Our Certificate of Incorporation and Our Bylaws
Some provisions of our certificate of incorporation and our bylaws contain provisions that could make it more difficult to acquire us by means of a merger, tender offer, proxy contest or otherwise, or to remove our incumbent officers and directors. These provisions, summarized below, are expected to discourage coercive takeover practices and inadequate takeover bids. These provisions are also designed to encourage persons seeking to acquire control of us to first negotiate with our board of directors. We believe that the benefits of increased protection of our potential ability to negotiate with the proponent of an unfriendly or unsolicited proposal to acquire or restructure us outweigh the disadvantages of discouraging such proposals because negotiation of such proposals could result in an improvement of their terms.
Undesignated preferred stock. The ability to authorize and issue undesignated preferred stock may enable our board of directors to render more difficult or discourage an attempt to change control of us by means of a merger, tender offer, proxy contest or otherwise. For example, if in the due exercise of its fiduciary obligations, the board of directors were to determine that a takeover proposal is not in our best interest, the board of directors could cause shares of preferred stock to be issued without stockholder approval in one or more private offerings or other transactions that might dilute the voting or other rights of the proposed acquirer or insurgent stockholder or stockholder group.
Stockholder meetings. Our certificate of incorporation and bylaws provide that a special meeting of stockholders may be called only by the Chairman of the Board, the Chief Executive Officer or by a resolution adopted by a majority of our board of directors.
Requirements for advance notification of stockholder nominations and proposals. Our bylaws establish advance notice procedures with respect to stockholder proposals and the nomination of candidates for election as directors, other than nominations made by or at the direction of the board of directors.
Stockholder action by written consent. Our bylaws provide that, except as may otherwise be provided with respect to the rights of the holders of preferred stock, no action that is required or permitted to be taken by our stockholders at any annual or special meeting may be effected by written consent of stockholders in lieu of a meeting of stockholders, unless the action to be effected by written consent of stockholders and the taking of such action by such written consent have expressly been approved in advance by our board. This provision, which may not be amended except by the affirmative vote of at least 66 2/3% of the voting power of all then outstanding shares of capital stock entitled to vote generally in the election of directors, voting together as a single class, makes it difficult for stockholders to initiate or effect an action by written consent that is opposed by our board.
Amendment of the bylaws. Under Delaware law, the power to adopt, amend or repeal bylaws is conferred upon the stockholders. A corporation may, however, in its certificate of incorporation also confer upon the board of directors the power to adopt, amend or repeal its bylaws. Our charter and bylaws grant our board the power to adopt, amend and repeal our bylaws at any regular or special meeting of the board on the affirmative vote of a majority of the directors then in office. Our stockholders may adopt, amend or repeal our bylaws but only at any regular or special meeting of stockholders by an affirmative vote of holders of at least 66 2/3% of the voting power of all then outstanding shares of capital stock entitled to vote generally in the election of directors, voting together as a single class.
71
Table of Contents
Index to Financial Statements
Removal of Director. Our certificate of incorporation and bylaws provide that members of our board of directors may only be removed for cause and only by the affirmative vote of holders of at least 66 2/3% of the voting power of all then outstanding shares of capital stock entitled to vote generally in the election of directors, voting together as a single class.
Amendment of the Certificate of Incorporation. Our certificate of incorporation provides that, in addition to any other vote that may be required by law or any preferred stock designation, the affirmative vote of the holders of at least 66 2/3% of the voting power of all then outstanding shares of capital stock entitled to vote generally in the election of directors, voting together as a single class, is required to amend, alter or repeal, or adopt any provision as part of our certificate of incorporation inconsistent with the provisions of our certificate of incorporation dealing with distributions on our common stock, our board of directors, our bylaws, meetings of our stockholders or amendment of our certificate of incorporation.
The provisions of our certificate of incorporation and bylaws could have the effect of discouraging others from attempting hostile takeovers and, as a consequence, they may also inhibit temporary fluctuations in the market price of our common stock that often result from actual or rumored hostile takeover attempts. These provisions may also have the effect of preventing changes in our management. It is possible that these provisions could make it more difficult to accomplish transactions which stockholders may otherwise deem to be in their best interests.
Transfer Agent and Registrar
will be the transfer agent and registrar for our common stock.
72
Table of Contents
Index to Financial Statements
SHARES ELIGIBLE FOR FUTURE SALE
Prior to this offering, there has been no market for our common stock. Future sales in the public markets of substantial amounts of common stock, including shares issued upon exercise of outstanding options, could adversely affect prevailing market prices from time to time for our common stock and impair our ability to raise capital through future sales of equity securities.
Upon completion of this offering, we will have outstanding an aggregate of shares of common stock, assuming no exercise of the underwriter’s over-allotment option and no exercise of outstanding options. All of the shares sold in this offering will be freely tradable without restriction or further registration under the Securities Act, except for shares, if any, which may be acquired by our “affiliates” as that term is defined in Rule 144 under the Securities Act. Persons who may be deemed to be affiliates generally include individuals or entities that control, are controlled by, or are under common control with, us and may include our directors and officers as well as our significant stockholders, if any.
Lock-up Agreements
In connection with this offering, we, our executive officers, directors and Windsor Holdings have agreed to enter into lock-up agreements in favor of the underwriter that prohibit us and these other individuals or entities, directly or indirectly, from selling or otherwise disposing of any shares or securities convertible into shares for a period of 180 days from the date of this prospectus, without the prior written consent of Johnson Rice & Company L.L.C., subject to limited exceptions. Immediately following this offering, persons subject to lock-up agreements will own shares, representing approximately % of the then outstanding shares, or approximately % if the underwriter’s over-allotment option is exercised in full
Rule 144
In general, under Rule 144 as currently in effect, beginning 90 days after the date of this prospectus, a person who has beneficially owned shares of our common stock for at least one year is entitled to sell within any three-month period a number of shares that does not exceed the greater of:
| • | 1% of the number of shares of our common stock then outstanding, which will equal approximately shares immediately after this offering; and |
| • | the average weekly trading volume of our common stock on The Nasdaq National Market during the four calendar weeks preceding the filing of a notice on Form 144 with respect to such sale. |
Sales under Rule 144 are also subject to manner of sale provisions and notice requirements and to the availability of current public information about us. Under Rule 144(k), a person who has not been one of our affiliates at any time during the 90 days preceding a sale, and who has beneficially owned the shares proposed to be sold for at least two years, is entitled to sell those shares without complying with the manner of sale, public information, volume limitation or notice provisions of Rule 144.
Registration Rights
We have entered into a registration rights agreement with Windsor Holdings. Under the registration rights agreement, Windsor Holdings has three demand registration rights, as well as “piggyback” registration rights. The demand rights enable Windsor Holdings to require us to register its shares of our common stock with the SEC at any time, subject to the 180-day lock-up agreement it has entered into in connection with our initial public offering. The piggyback rights will allow Windsor Holdings to register the shares of our common stock that it owns along with any shares that we register with the SEC. These registration rights are subject to customary conditions and limitations, including the right of the underwriters of an offering to limit the number of shares.
73
Table of Contents
Index to Financial Statements
Stock Options
An aggregate of shares of our common stock have be reserved for issuance pursuant to our 2006 Equity Incentive Plan, of which options to purchase shares will be outstanding immediately after this offering. We intend to file a registration statement on Form S-8 with respect to the issuance of all shares issuable under the plan. Accordingly, shares issued pursuant to this plan will be freely tradable, except for any shares held by our affiliates, as such term is defined by the SEC.
74
Table of Contents
Index to Financial Statements
We and the underwriter named below will enter into an underwriting agreement with respect to the shares being offered. Subject to the terms and conditions of the underwriting agreement, the underwriter named below has agreed to purchase from us the number of shares of our common stock set forth opposite its name on the table below at the public offering price, less the underwriting discounts and commissions set forth on the cover page of this prospectus as follows:
Name | Number of Shares | |
Johnson Rice & Company L.L.C. | ||
Total | ||
The underwriting agreement provides that the underwriter’s obligations to purchase shares of our common stock depend on the satisfaction of the conditions contained in the underwriting agreement. The conditions contained in the underwriting agreement include the condition that the representations and warranties made by us to the underwriter are true, that there has been no material adverse change to our condition or in the financial markets and that we deliver to the underwriter customary closing documents. The underwriter is obligated to purchase all of the shares of common stock (other than those covered by the over-allotment option described below) if it purchases any of the shares.
The underwriter proposes to offer the shares of common stock to the public at the public offering price set forth on the cover of this prospectus. The underwriter may offer the common stock to securities dealers at the price to the public less a concession not in excess of $ per share. Security dealers may reallow a concession not in excess of $ per share to other dealers. After the shares of common stock are released for sale to the public, the underwriter may vary the offering price and other selling terms from time to time.
We have granted the underwriter an option, exercisable for 30 days from the date of the underwriting agreement, to purchase up to additional shares at the public offering price per share less the underwriting discounts and commissions shown on the cover page of this prospectus. The underwriter may exercise this option solely to cover over-allotments, if any, made in connection with this offering.
The following table summarizes the compensation to be paid to the underwriter by us and the proceeds, before expenses, payable to us.
| Total | ||||||
| Per Share | Without Over- Allotment | With Over- Allotment | ||||
Public offering price by us | ||||||
Underwriting fees to be paid by us | ||||||
Proceeds, before expenses, to us | ||||||
We estimate our expenses associated with the offering, excluding underwriting discounts and commissions, will be approximately $ .
75
Table of Contents
Index to Financial Statements
We have agreed to indemnify the underwriter against certain liabilities, including liabilities under the federal securities laws, or to contribute to payments that may be required to be made in respect of these liabilities.
We, Windsor Holdings, and our officers and directors have agreed that, for a period of 180 days from the date of this prospectus, we and they will not, without the prior written consent of Johnson Rice & Company L.L.C., directly or indirectly, offer, pledge, sell, contract to sell, sell any option or contract to purchase, purchase any option or contract to sell, grant any option, right or warrant to purchase, or otherwise transfer or dispose of any share of common stock or any securities convertible into or exercisable or exchangeable for common stock, or file any registration statement under the Securities Act of 1933 with respect to any of the foregoing or enter into any swap or any other agreement or transaction that transfers, in whole or in part, directly or indirectly, the economic consequence of ownership of the common stock, except for the sale to the underwriter in this offering, the issuance by us of any securities or options to purchase common stock under employee benefit plans existing as of the date of this prospectus, the issuance by us of securities in exchange for or upon conversion of our outstanding securities described herein, or certain transfers in the case of officers and directors in the form of bona fide gifts, intra family transfers and transfers related to estate planning matters. Notwithstanding the foregoing, if (1) during the last 17 days of such 180-day restricted period we issue an earnings release or (2) prior to the expiration of such 180-day restricted period we announce that we will release earnings results during the 16-day period beginning on the last day of the 180-day restricted period, the foregoing restrictions shall continue to apply until the expiration of the 18-day period beginning on the issuance of the earnings release. The underwriter has advised us that they do not have any present intent to release the lock-up agreements prior to the expiration of the applicable restricted period.
The underwriter may engage in over-allotment, stabilizing transactions, syndicate covering transactions, penalty bids and passive market making in accordance with Regulation M under the Securities Exchange Act of 1934. Over-allotment involves syndicate sales in excess of the offering size, which creates a syndicate short position. Covered short sales are sales made in an amount not greater than the number of shares available for purchase by the underwriter under the over-allotment option. The underwriter may close out a covered short sale by exercising its over-allotment option or purchasing shares in the open market. Naked short sales are sales made in an amount in excess of the number of shares available under the over-allotment option. The underwriter must close out any naked short sale by purchasing shares in the open market. Stabilizing transactions permit bids to purchase the underlying security so long as the stabilizing bids do not exceed a specified maximum. Syndicate covering transactions involve purchases of the shares of common stock in the open market after the distribution has been completed in order to cover syndicate short positions. Penalty bids permit the representatives to reclaim a selling concession from a syndicate member when the shares of common stock originally sold by such syndicate member is purchased in a syndicate covering transaction to cover syndicate short positions. Penalty bids may have the effect of deterring syndicate members from selling to people who have a history of quickly selling their shares. In passive market making, market makers in the shares of common stock who are underwriters or prospective underwriters may, subject to certain limitations, make bids for or purchases of the shares of common stock until the time, if any, at which a stabilizing bid is made. These stabilizing transactions, syndicate covering transactions and penalty bids may cause the price of the shares of common stock to be higher than it would otherwise be in the absence of these transactions. The underwriter is not required to engage in these activities, and may end any of these activities at any time.
76
Table of Contents
Index to Financial Statements
The validity of the shares of common stock that are offered hereby by us and the selling stockholder will be passed upon by Akin Gump Strauss Hauer & Feld LLP. Certain legal matters will be passed upon for the underwriter by Porter & Hedges, L.L.P.
The financial statements included in this prospectus and elsewhere in the registration statement have been audited by Grant Thornton LLP, independent registered public accounting firm, as indicated in their reports with respect thereto, and are included herein in reliance upon the authority of said firm as experts in accounting and auditing.
Information referenced or incorporated by reference in this prospectus regarding our estimated quantities of oil and gas reserves and the discounted present value of future net cash flows therefrom is based upon estimates of such reserves and present values prepared by DeGolyer and MacNaughton, independent petroleum engineers.
WHERE YOU CAN FIND MORE INFORMATION
We have filed with the SEC a registration statement on Form S-1 under the Securities Act covering the securities offered by this prospectus. This prospectus, which constitutes a part of that registration statement, does not contain all of the information that you can find in that registration statement and its exhibits. Certain items are omitted from this prospectus in accordance with the rules and regulations of the SEC. For further information about us and the common stock offered by this prospectus, reference is made to the registration statement and the exhibits filed with the registration statement. Statements contained in this prospectus and any prospectus supplement as to the contents of any contract or other document referred to are not necessarily complete and in each instance such statement is qualified by reference to each such contract or document filed as part of the registration statement. When we complete this offering, we will be required to file annual, quarterly and current reports, proxy statements and other information with the SEC. You may read any materials we file with the SEC free of charge at the SEC’s Public Reference Room at 100 F Street, N.E., Washington, D.C. 20549. Copies of all or any part of these documents may be obtained from such office upon the payment of the fees prescribed by the SEC. The public may obtain information on the operation of the public reference room by calling the SEC at 1-800-SEC-0330. The SEC maintains an Internet site that contains reports, proxy and information statements and other information regarding registrants that file electronically with the SEC. The address of the site iswww.sec.gov.The registration statement, including all exhibits thereto and amendments thereof, has been filed electronically with the SEC.
77
Table of Contents
Index to Financial Statements
WINDSOR ENERGY RESOURCES
Financial Statements | ||
| F-2 | ||
Combined Balance Sheets as of September 30, 2005 (unaudited) and December 31, 2004 and 2003 | F-3 | |
| F-4 | ||
| F-5 | ||
| F-6 | ||
WINDSOR ENERGY RESOURCES, INC. | ||
Financial Statements | ||
| F-19 | ||
| F-20 | ||
| F-21 | ||
ACQUIRED BUSINESS FINANCIAL STATEMENTS | ||
Amos Draw Acquisition Properties | ||
| F-22 | ||
| F-23 | ||
Notes to Statement of Revenues and Direct Operating Expenses | F-24 | |
Motex Acquisition Properties | ||
| F-26 | ||
| F-27 | ||
Notes to Statement of Revenues and Direct Operating Expenses | F-28 | |
F-1
Table of Contents
Index to Financial Statements
Report of Independent Registered Public Accounting Firm
Members and Owners
Windsor Energy Resources
We have audited the accompanying combined balance sheets of Windsor Energy Resources, (“Windsor”, as defined in Note 1 to combined financial statements) as of December 31, 2004 and 2003, and the related combined statements of operations and members’ equity and cash flows for the year ended December 31, 2004 and the period from inception (July 8, 2003) through December 31, 2003. These financials statements are the responsibility of Windsor’s management. Our responsibility is to express an opinion on these financial statements based on our audits.
We conducted our audits in accordance with the standards of the Public Company Accounting Oversight Board (United States). Those standards require that we plan and perform the audit to obtain reasonable assurance about whether the financial statements are free of material misstatement. Windsor is not required to have, nor were we engaged to perform an audit of its internal control over financial reporting. Our audits included consideration of internal control over financial reporting as a basis for designing audit procedures that are appropriate in the circumstances, but not for the purpose of expressing an opinion on the effectiveness of Windsor’s internal control over financial reporting. Accordingly, we express no such opinion. An audit also includes examining, on a test basis, evidence supporting the amounts and disclosures in the financial statements, assessing the accounting principles used and significant estimates made by management, as well as evaluating the overall financial statement presentation. We believe that our audits provide a reasonable basis for our opinion.
In our opinion, the combined financial statements referred to above present fairly, in all material respects, the financial position of Windsor Energy Resources as of December 31, 2004 and 2003, and the results of its operations and its cash flows for the year ended December 31, 2004 and the period from inception (July 8, 2003) through December 31, 2003, in conformity with accounting principles generally accepted in the United States of America.
/s/ Grant Thornton LLP
Oklahoma City, Oklahoma
February 9, 2006
F-2
Table of Contents
Index to Financial Statements
WINDSOR ENERGY RESOURCES
| September 30, 2005 | December 31, | ||||||||
| 2004 | 2003 | ||||||||
| (Unaudited) | |||||||||
ASSETS | |||||||||
Current assets | |||||||||
Cash and cash equivalents | $ | 5,834,000 | $ | 2,010,000 | $ | 664,000 | |||
Accounts receivable – related party | 2,349,000 | 782,000 | 633,000 | ||||||
Accounts receivable | 1,129,000 | 1,501,000 | 909,000 | ||||||
Deposits and other current assets | 102,000 | — | — | ||||||
Total current assets | 9,414,000 | 4,293,000 | 2,206,000 | ||||||
Oil and gas properties, net – using full cost method of accounting | 130,807,000 | 90,019,000 | 35,063,000 | ||||||
Furniture, fixtures and equipment, net | 218,000 | 41,000 | 9,000 | ||||||
Total property and equipment | 131,025,000 | 90,060,000 | 35,072,000 | ||||||
Prepaid drilling costs | — | 378,000 | — | ||||||
Deposits on oil & gas property acquisitions | 745,000 | — | — | ||||||
Other assets | 946,000 | 77,000 | 70,000 | ||||||
| $ | 142,130,000 | $ | 94,808,000 | $ | 37,348,000 | ||||
LIABILITIES AND MEMBERS’ EQUITY | |||||||||
Current liabilities | |||||||||
Accounts payable – related party | $ | 7,638,000 | $ | 3,427,000 | $ | 363,000 | |||
Accounts payable and accrued liabilities | 174,000 | 28,000 | 64,000 | ||||||
Asset retirement obligation – current | 1,390,000 | — | — | ||||||
Current maturities of long-term debt | 2,377,000 | 2,377,000 | 1,720,000 | ||||||
Total current liabilities | 11,579,000 | 5,832,000 | 2,147,000 | ||||||
Long-term debt, net of current maturities | 3,517,000 | 5,906,000 | 6,450,000 | ||||||
Asset retirement obligations, net of current obligation | 3,523,000 | 3,109,000 | 601,000 | ||||||
Commitments and contingencies (Note 9) | |||||||||
Members’ equity | 123,511,000 | 79,961,000 | 28,150,000 | ||||||
| $ | 142,130,000 | $ | 94,808,000 | $ | 37,348,000 | ||||
The accompanying notes are an integral part of these combined financial statements.
F-3
Table of Contents
Index to Financial Statements
WINDSOR ENERGY RESOURCES
COMBINED STATEMENTS OF OPERATIONS AND MEMBERS’ EQUITY
| Nine Months Ended September 30, | Year Ended December 31, | From Inception December 31, | ||||||||||||||
| 2005 | 2004 | 2004 | 2003 | |||||||||||||
| (Unaudited) | ||||||||||||||||
REVENUES | ||||||||||||||||
Gas sales | $ | 9,568,000 | $ | 4,431,000 | $ | 6,552,000 | $ | 1,298,000 | ||||||||
Liquids sales | 1,176,000 | 1,007,000 | 1,423,000 | 595,000 | ||||||||||||
Oil sales | 885,000 | 801,000 | 1,071,000 | 265,000 | ||||||||||||
Other income | 6,000 | 100,000 | 84,000 | — | ||||||||||||
| 11,635,000 | 6,339,000 | 9,130,000 | 2,158,000 | |||||||||||||
EXPENSES | ||||||||||||||||
Lease operating expense | 6,218,000 | 1,704,000 | 2,868,000 | 350,000 | ||||||||||||
Production taxes | 1,138,000 | 326,000 | 540,000 | 114,000 | ||||||||||||
Gathering and transportation | 405,000 | 354,000 | 414,000 | 144,000 | ||||||||||||
Depreciation, depletion, and amortization | 5,007,000 | 2,881,000 | 4,025,000 | 586,000 | ||||||||||||
General and administrative | 1,786,000 | 235,000 | 530,000 | 34,000 | ||||||||||||
Accretion expense | 145,000 | 28,000 | 37,000 | 13,000 | ||||||||||||
| 14,699,000 | 5,528,000 | 8,414,000 | 1,241,000 | |||||||||||||
INCOME (LOSS) FROM OPERATIONS | (3,064,000 | ) | 811,000 | 716,000 | 917,000 | |||||||||||
OTHER INCOME (EXPENSE) | ||||||||||||||||
Interest expense | (333,000 | ) | (286,000 | ) | (402,000 | ) | (100,000 | ) | ||||||||
Interest income | 13,000 | 7,000 | 9,000 | — | ||||||||||||
| (320,000 | ) | (279,000 | ) | (393,000 | ) | (100,000 | ) | |||||||||
NET INCOME (LOSS) | (3,384,000 | ) | 532,000 | 323,000 | 817,000 | |||||||||||
Members’ equity at beginning of period | 79,961,000 | 28,150,000 | 28,150,000 | — | ||||||||||||
Capital contributions | 47,434,000 | 38,323,000 | 56,488,000 | 35,933,000 | ||||||||||||
Returns of capital | (500,000 | ) | (5,000,000 | ) | (5,000,000 | ) | (8,600,000 | ) | ||||||||
Members’ equity at end of period | $ | 123,511,000 | $ | 62,005,000 | $ | 79,961,000 | $ | 28,150,000 | ||||||||
PRO FORMA INFORMATION (unaudited) | ||||||||||||||||
Historical net income (loss) before income taxes | $ | (3,384,000 | ) | $ | 532,000 | $ | 323,000 | $ | 817,000 | |||||||
Pro forma provision (benefit) for income taxes | $ | (1,277,000 | ) | $ | 201,000 | $ | 122,000 | $ | 328,000 | |||||||
Pro forma income (loss) | $ | (2,107,000 | ) | $ | 331,000 | $ | 201,000 | $ | 489,000 | |||||||
Pro forma income (loss) per common share Basic and Diluted | ||||||||||||||||
Weighted average pro forma common shares outstanding – Basic and Diluted | ||||||||||||||||
The accompanying notes are an integral part of these combined financial statements.
F-4
Table of Contents
Index to Financial Statements
WINDSOR ENERGY RESOURCES
COMBINED STATEMENTS OF CASH FLOWS
| Nine Months Ended September 30, | Year Ended December 31, | From Inception December 31, | ||||||||||||||
| 2005 | 2004 | 2004 | 2003 | |||||||||||||
| (Unaudited) | ||||||||||||||||
CASH FLOWS FROM OPERATING ACTIVITIES | ||||||||||||||||
Net income (loss) | $ | (3,384,000 | ) | $ | 532,000 | $ | 323,000 | $ | 817,000 | |||||||
Adjustments to reconcile net income (loss) to net cash provided by operating activities: | ||||||||||||||||
Accretion expense | 145,000 | 28,000 | 37,000 | 13,000 | ||||||||||||
Depletion, depreciation and amortization | 5,007,000 | 2,881,000 | 4,025,000 | 586,000 | ||||||||||||
Amortization of deferred loan costs | 3,000 | 2,000 | 3,000 | 1,000 | ||||||||||||
Changes in operating assets and liabilities: | ||||||||||||||||
(Increase) Decrease in accounts receivable – related party | (1,567,000 | ) | (298,000 | ) | (149,000 | ) | (633,000 | ) | ||||||||
(Increase) Decrease in accounts receivable | 372,000 | 259,000 | (592,000 | ) | (909,000 | ) | ||||||||||
(Increase) Decrease in deposits and other current assets | (102,000 | ) | (8,000 | ) | — | — | ||||||||||
(Increase) Decrease in other assets | (872,000 | ) | — | — | (61,000 | ) | ||||||||||
Increase (Decrease) in accounts payable – related party | 2,923,000 | 151,000 | 526,000 | 346,000 | ||||||||||||
Increase (Decrease) in accounts payable and accrued liabilities | 146,000 | 120,000 | (36,000 | ) | 64,000 | |||||||||||
Net cash provided by operating activities | 2,671,000 | 3,667,000 | 4,137,000 | 224,000 | ||||||||||||
CASH FLOWS FROM INVESTING ACTIVITIES | ||||||||||||||||
Additions to other property and equipment | (210,000 | ) | — | (37,000 | ) | (10,000 | ) | |||||||||
(Increase) Decrease in prepaid drilling costs | 378,000 | — | (378,000 | ) | — | |||||||||||
(Increase) Decrease in deposits for purchases of oil and gas properties | (745,000 | ) | — | — | — | |||||||||||
Additions to oil and gas properties | (42,815,000 | ) | (37,914,000 | ) | (53,967,000 | ) | (35,043,000 | ) | ||||||||
Net cash used in investing activities | (43,392,000 | ) | (37,914,000 | ) | (54,382,000 | ) | (35,053,000 | ) | ||||||||
CASH FLOWS FROM FINANCING ACTIVITIES | ||||||||||||||||
Debt issuance costs | — | (10,000 | ) | (10,000 | ) | (10,000 | ) | |||||||||
Borrowings on note payable | — | 4,000,000 | 4,000,000 | 8,600,000 | ||||||||||||
Principal payments on borrowings | (2,389,000 | ) | (2,257,000 | ) | (3,887,000 | ) | (430,000 | ) | ||||||||
Returns of capital | (500,000 | ) | (5,000,000 | ) | (5,000,000 | ) | (8,600,000 | ) | ||||||||
Capital contributions | 47,434,000 | 38,323,000 | 56,488,000 | 35,933,000 | ||||||||||||
Net cash provided by financing activities | 44,545,000 | 35,056,000 | 51,591,000 | 35,493,000 | ||||||||||||
Net increase in cash and cash equivalents | 3,824,000 | 809,000 | 1,346,000 | 664,000 | ||||||||||||
Cash and cash equivalents at beginning of period | 2,010,000 | 664,000 | 664,000 | — | ||||||||||||
Cash and cash equivalents at end of period | $ | 5,834,000 | $ | 1,473,000 | $ | 2,010,000 | $ | 664,000 | ||||||||
SUPPLEMENTAL DISCLOSURE OF CASH FLOW INFORMATION: | ||||||||||||||||
Interest payments | $ | 330,000 | $ | 284,000 | $ | 399,000 | $ | 99,000 | ||||||||
SUPPLEMENTAL DISCLOSURE OF NON-CASH, INVESTING AND FINANCING TRANSACTIONS: | ||||||||||||||||
Asset retirement obligations capitalized | $ | 1,659,000 | $ | 1,866,000 | $ | 2,471,000 | $ | 588,000 | ||||||||
The accompanying notes are an integral part of these combined financial statements.
F-5
Table of Contents
Index to Financial Statements
WINDSOR ENERGY RESOURCES
NOTES TO COMBINED FINANCIAL STATEMENTS
(Information as of September 30, 2005 and for the nine months ended
September 30, 2004 and 2005 is unaudited)
1. NATURE OF OPERATIONS
Windsor Energy Resources (“Windsor”) includes a group of commonly controlled independent oil and gas companies and certain oil and gas properties (See Note 2—Principles of Combination). Windsor is headquartered in Oklahoma City, Oklahoma. Since its inception (July 8, 2003) Windsor has engaged in the acquisition, development, exploration, production and sale of natural gas, crude oil and natural gas liquids. Substantial portions of Windsor’s reserves are located in Colorado, Texas and Wyoming. Windsor has field offices in Gillette, Wyoming, Sheridan, Wyoming and Silt, Colorado.
Windsor’s results of operations are largely dependent on the difference between the prices received for its natural gas and crude oil products and the cost to find, develop, produce and market such resources. Natural gas and crude oil prices are subject to fluctuations in response to changes in supply, market uncertainty and a variety of factors beyond Windsor’s control. These factors include worldwide political instability, quantity of natural gas in storage, foreign supply of crude oil and natural gas, the price of foreign imports, the level of consumer demand and the price of available alternative fuels.
2. SIGNIFICANT ACCOUNTING POLICIES
Principles of Combination
The combined financial statements include assets, liabilities, revenues and expenses of certain limited liability companies, limited partnerships and certain oil and gas properties that are expected to be transferred to a newly formed entity prior to or concurrent with a planned initial public offering (“IPO”) transaction (See Note 12). The combined financial statements are comprised of the financial activities of Coastal Energy LP, Northranch Energy LLC, and Windsor Wyoming LLC for 2003 and subsequent. Windsor Beaver Creek LLC, Windsor Castle Springs LLC, Windsor Gas Draw LLC, Windsor Jepson LLC, and Windsor Weeping Mary LP, were formed in 2004 and are included in the combined financial statements from formation. Windsor Bakken LLC was formed in 2005 and the Marquiss Properties were acquired by Gulfport Energy Corporation in 2005, and are included in the combined financial statements from formation or acquisition. These entities and properties are collectively referred to as the “LLCs”. The combined financial statements reflect the historical results of the operations and historical basis of assets and liabilities of the LLCs. Significant intercompany accounts and transactions among the combined businesses have been eliminated.
Basis of Presentation—Interim Statements
The accompanying combined financial statements as of September 30, 2005 and for the nine month periods ended September 30, 2005 and 2004 have been prepared pursuant to the rules and regulations of the Securities and Exchange Commission (“SEC”) and, in the opinion of management, include all adjustments, consisting only of adjustments that are normal and recurring in nature, necessary to a fair statement of the results for the interim periods presented. Certain information and footnote disclosures normally included in financial statements prepared in accordance with accounting principles generally accepted in the United States have been condensed or omitted with respect to the interim periods presented pursuant to such rules and regulations.
Use of Estimates
The preparation of financial statements in conformity with accounting principles generally accepted in the United States of America requires management to make estimates and assumptions that affect the reported amounts of certain assets and liabilities and disclosure of contingent assets and liabilities at the date of the financial
F-6
Table of Contents
Index to Financial Statements
WINDSOR ENERGY RESOURCES
NOTES TO COMBINED FINANCIAL STATEMENTS – (CONTINUED)
(Information as of September 30, 2005 and for the nine months ended
September 30, 2004 and 2005 is unaudited)
2. SIGNIFICANT ACCOUNTING POLICIES – (CONTINUED)
statements and the reported amounts of revenues and expenses during each reporting period. Management believes its estimates and assumptions are reasonable; however, such estimates and assumptions are subject to a number of risks and uncertainties, which may cause actual results to differ materially from Windsor’s estimates. Significant estimates underlying these financial statements include the estimated quantities of proved natural gas and crude oil reserves used to compute depletion of natural gas and crude oil properties and the related present value of estimated future net cash flows therefrom (see Note 13—Supplemental Information (Unaudited)).
Cash and Cash Equivalents
Windsor considers all highly liquid investments with a remaining maturity of three months of less when purchased to be cash equivalents.
Accounts Receivable and Major Purchasers
Windsor’s customers are natural gas and crude oil purchasers. Purchasers are evaluated as to creditworthiness prior to the commencement of sales, unless sales of production from the related properties have already been contracted at the time those properties are purchased. Accounts receivable consist primarily of receivables for oil and gas production delivered to purchasers. Those purchasers remit payment for production to the operator of the respective producing properties and the operator, in turn, pays Windsor. As discussed in Note 8, the majority of Windsor’s properties are operated by an affiliate. Most payments are received 1 to 2 months after the production date. No allowance for doubtful accounts is deemed necessary.
During the year ended December 31, 2004, four purchasers accounted for a total of 63% of Windsor’s total combined natural gas and crude oil sales. During the period from inception (July 8, 2003) to December 31, 2003, four purchasers accounted for a total of 98% of Windsor’s combined natural gas and crude oil sales. The following table presents a breakdown, by percentage, of sales to those purchasers:
| Year Ended December 31, 2004 | Period from (July 8, 2003) to | |||||
Purchaser #1 | 13 | % | 0 | % | ||
Purchaser #2 | 19 | % | 21 | % | ||
Purchaser #3 | 19 | % | 43 | % | ||
Purchaser #4 | 12 | % | 23 | % | ||
Purchaser #5 | 0 | % | 11 | % | ||
| 63 | % | 98 | % | |||
Oil and Gas Properties
Windsor follows the full cost method of accounting for oil and gas properties. Accordingly, all costs associated with the acquisition, exploration and development of oil and gas properties, including costs of undeveloped leasehold, geological and geophysical expenses, dry holes, leasehold equipment and directly related legal due diligence costs, are capitalized. Capitalized costs of oil and gas properties also include estimated asset retirement costs recorded based on the fair value of the asset retirement obligation when incurred. Proceeds received from disposals are credited against accumulated cost except when the sale represents a significant disposal of reserves, in which case a gain or loss is recognized.
F-7
Table of Contents
Index to Financial Statements
WINDSOR ENERGY RESOURCES
NOTES TO COMBINED FINANCIAL STATEMENTS – (CONTINUED)
(Information as of September 30, 2005 and for the nine months ended
September 30, 2004 and 2005 is unaudited)
2. SIGNIFICANT ACCOUNTING POLICIES – (CONTINUED)
The sum of net capitalized costs and estimated future development and dismantlement costs is depleted on the equivalent unit-of-production method, based on proved oil and gas reserves as determined by independent petroleum engineers. Natural gas and crude oil are converted to equivalent units based upon the relative energy content, which is six thousand cubic feet of natural gas to one barrel of crude oil.
Net capitalized costs are limited to the lower of unamortized cost, net of deferred income taxes, or the cost center ceiling. The cost center ceiling is defined as the sum of (i) estimated future net revenues, discounted at 10% per annum, from proved reserves, based on unescalated year-end prices and costs, adjusted for any contract provisions or financial derivatives, if any, that hedge Windsor’s oil and gas revenue, and excluding the estimated abandonment costs for properties with asset retirement obligations recorded on the balance sheet (ii) the cost of properties not being amortized, if any, (iii) the lower of cost or market value of unproved properties included in the cost being amortized less (iv) income tax effects related to differences between the book and tax basis of the natural gas and crude oil properties.
Furniture, Fixtures and Equipment
Office and field equipment is recorded at cost. Costs of improvements that substantially extend the useful lives of the assets are capitalized. Leasehold improvements are amortized over the life of the lease. Maintenance and repairs are expensed when incurred. Depreciation of other property and equipment is computed using the straight line method over their estimated useful lives, all of which are currently estimated to be three years. Upon retirements or disposition of assets, the costs and related accumulated depreciation are removed from the accounts with the resulting gains or losses, if any, reflected in results of operations.
Revenue Recognition
Oil, gas and related liquids revenues are recognized when delivery has occurred and title to the products has transferred to the purchaser. Windsor follows the “sales method” of accounting for its natural gas revenues, so that Windsor recognizes sales revenue on all natural gas sold to its purchasers, regardless of whether the sales are proportionate to Windsor’s ownership in the property. A liability is recognized only to the extent that Windsor has an overproduced imbalance on a specific property greater than the expected remaining proved reserves. No receivables are recorded for those wells on which Windsor has taken less than its ownership share of production.
Environmental Compliance and Remediation
Environmental compliance costs, including ongoing maintenance and monitoring, are expensed as incurred.
Income Taxes
The LLCs are classified as partnerships for income tax purposes; accordingly, income taxes on net earnings are payable by the members or partners and are not reflected in the financial statements. However, because the anticipated successor entity, WERI (See Note 12) will be a taxable entity, unaudited pro forma adjustments are reflected on the statement of operations to provide for income taxes in accordance with Statement of Financial Accounting Standards No. 109. For unaudited pro forma income tax calculations, deferred tax assets and liabilities were recognized for the future tax consequences attributable to differences between the financial statement carrying amounts of existing assets and liabilities and their respective tax bases. Deferred tax assets and liabilities were measured using enacted tax rates expected to apply to taxable income in the years in which the Company expects to recover or settle those temporary differences. A statutory Federal tax rate of 34% and
F-8
Table of Contents
Index to Financial Statements
WINDSOR ENERGY RESOURCES
NOTES TO COMBINED FINANCIAL STATEMENTS – (CONTINUED)
(Information as of September 30, 2005 and for the nine months ended
September 30, 2004 and 2005 is unaudited)
2. SIGNIFICANT ACCOUNTING POLICIES – (CONTINUED)
effective state tax rate of 3.7% (net of Federal income tax effects) were used for the pro forma enacted tax rate for all periods. The pro forma tax effects are based upon currently available information and assume Windsor had been a taxable entity in all periods presented. Management believes that these assumptions provide a reasonable basis for presenting the pro forma tax effects.
Pro Forma Income (loss) per share (unaudited)
Pro forma basic and diluted income (loss) per share will be presented for all periods on the basis of shares to be issued to Windsor’s founders, once the number of shares has been determined.
Recently Issued Accounting Standards
In December 2004, the Financial Accounting Standards Boards (FASB) issued Statement of Financial Accounting Standard (SFAS) No. 123(R),Share Based Payment, which revised SFAS No. 123,Accounting for Stock-Based Compensation. SFAS No. 123(R) requires entities to measure the fair value of equity share-based payments (stock compensation) at grant date, and recognize the fair value over the period during which an employee is required to provide services in exchange for the equity instrument as a component of the income statement. SFAS No. 123(R) is effective for annual periods beginning after June 15, 2005. Windsor has not had any stock option plans and, therefore the adoption of SFAS No. 123(R) currently would have no impact on its financial position or results of operations. The adoption could have a future impact, however, as Windsor intends to implement an equity incentive plan in 2006 in connection with the planned initial public offering.
3. ACQUISITIONS
The following acquisitions were made as a part of Windsor’s overall strategy to generate long-term reserve and production growth.
On July 8, 2003, one of the LLCs purchased interests in 55 wells located in the Amos Draw field in Campbell County, Wyoming from Gulf Exploration, LLC at a cost of $11,210,000 after normal price adjustments.
On October 29, 2003, one of the LLCs purchased interests in 14 wells located in East Texas from Cambridge Producers, Ltd. at a cost of $7,067,000 after normal price adjustments.
The results of operations for the above noted acquisitions have been included in Windsor’s result of operations from the respective dates of acquisition. The following unaudited pro forma information presents the financial information of Windsor as if both the acquisitions had occurred at inception, July 8, 2003:
Period from Inception (July 8, 2003) through December 31, 2003 | ||||||
| As Reported | Pro Forma | |||||
Revenues | $ | 2,158,000 | $ | 3,175,000 | ||
Net Income | $ | 817,000 | $ | 1,402,000 | ||
Pro Forma, Tax Effected, Net Income | $ | 489,000 | $ | 853,000 | ||
Pro Forma Net Income per Common Share—Basic and Diluted | $ | 0.05 | $ | 0.09 | ||
F-9
Table of Contents
Index to Financial Statements
WINDSOR ENERGY RESOURCES
NOTES TO COMBINED FINANCIAL STATEMENTS – (CONTINUED)
(Information as of September 30, 2005 and for the nine months ended
September 30, 2004 and 2005 is unaudited)
3. ACQUISITIONS – (CONTINUED)
The pro forma information reflects Windsor’s historical data and historical data from the acquired business for the period indicated. The pro forma data may not be indicative of the results Windsor would have achieved had it completed both acquisitions on July 8, 2003, or that it may achieve in the future. The pro forma financial information should be read on conjunction with the historical financial statements.
On December 23, 2003, one of the LLCs purchased predominantly non-producing and undeveloped oil and gas properties located in Wyoming from Cohort Energy Company. The LLC paid $17,173,000 in cash for these properties after normal price adjustments.
On January 14, 2004, one of the LLCs purchased certain pipeline assets and predominantly non-producing oil and gas properties located in Wyoming from Willmac Resources, LLC for a total cash purchase price of $4,676,000 after normal price adjustments.
On August 3, 2004, one of the LLCs purchased predominantly non-producing oil and gas properties located in Wyoming, Colorado, Kansas and Nebraska from KLT Gas, Inc., KLT Gas Operating Company, and Forest City, LLC, jointly as sellers. Total cash purchase price of these properties was $14,282,000 after normal price adjustments.
On August 24, 2004, one of the LLCs purchased predominantly non-producing and undeveloped oil and gas properties located in Colorado from KLT Gas, Inc. for a cash purchase price of $7,273,000 after normal price adjustments.
On October 29, 2004, one of the LLCs purchased predominantly non-producing and undeveloped oil and gas properties located in Wyoming from J.M. Huber Corporation for a total cash purchase price of $874,000 after normal price adjustments.
On December 13, 2004, one of the LLCs purchased predominantly non-producing and undeveloped oil and gas properties located in Wyoming from J.M. Huber Corporation for a total cash purchase price of $7,123,000 after normal price adjustments.
4. PROPERTIES AND EQUIPMENT
Property and equipment includes the following:
| As of December 31, | ||||||||||||
September 30, (Unaudited) | 2004 | 2003 | ||||||||||
Oil and gas properties | 140,196,000 | $ | 94,624,000 | $ | 35,648,000 | |||||||
Accumulated depletion | (9,389,000 | ) | (4,605,000 | ) | (585,000 | ) | ||||||
Oil and gas properties, net | 130,807,000 | 90,019,000 | 35,063,000 | |||||||||
Furniture, fixtures and equipment | 257,000 | 47,000 | 10,000 | |||||||||
Accumulated depreciation | (39,000 | ) | (6,000 | ) | (1,000 | ) | ||||||
Furniture, fixtures and equipment, net | 218,000 | 41,000 | 9,000 | |||||||||
Property and equipment, net of accumulated depreciation and depletion | $ | 131,025,000 | $ | 90,060,000 | $ | 35,072,000 | ||||||
F-10
Table of Contents
Index to Financial Statements
WINDSOR ENERGY RESOURCES
NOTES TO COMBINED FINANCIAL STATEMENTS – (CONTINUED)
(Information as of September 30, 2005 and for the nine months ended
September 30, 2004 and 2005 is unaudited)
5. OTHER ASSETS
Other assets consist of:
As of (Unaudited) | As of December 31, | ||||||||
| 2004 | 2003 | ||||||||
Debt acquisition costs, net of accumulated amortization | $ | 14,000 | $ | 16,000 | $ | 9,000 | |||
Funds on deposit securing letter of credit | 932,000 | 61,000 | 61,000 | ||||||
| $ | 946,000 | $ | 77,000 | $ | 70,000 | ||||
Costs related to the acquisition of debt are deferred and amortized on a straight-line basis over the term of the debt.
Windsor has funds on deposit which secure letters of credit for performance bonds with various governmental agencies. These funds are restricted and not available for use.
6. ASSET RETIREMENT OBLIGATIONS
The FASB issued SFAS No. 143, Accounting for Asset Retirement Obligations, which is effective for fiscal years beginning after June 15, 2002. This statement, adopted by Windsor at its inception in 2003, establishes accounting and reporting standards for the legal obligations associated with the retirement of tangible long-lived assets that result from the acquisition, construction or development and the normal operation of long-lived assets. It requires that the fair value of the liability for asset retirement obligations be recognized in the period in which it is incurred. Upon initial recognition of the asset retirement liability, an asset retirement cost is capitalized by increasing the carrying amount of the long-lived asset by the same amount as the liability. In periods subsequent to initial measurement, the asset retirement cost is allocated to expense using a systematic method over the asset’s useful life. Changes in the liability for the asset retirement obligation are recognized for (a) the passage of time and (b) revisions to either the timing or the amount of the original estimate of undiscounted cash flows.
The following table provides a reconciliation of the changes in the estimated asset retirement obligation for the periods ended December 31, 2004 and 2003, as well as the nine months ended September 30, 2005:
Nine Months (Unaudited) | Period Ended December 31, | |||||||||
| 2004 | 2003 | |||||||||
Beginning asset retirement obligation | $ | 3,109,000 | $ | 601,000 | $ | — | ||||
Additional liability incurred | 1,659,000 | 2,471,000 | 588,000 | |||||||
Accretion expense | 145,000 | 37,000 | 13,000 | |||||||
Asset retirement costs incurred | — | — | — | |||||||
Ending asset retirement obligation | 4,913,000 | 3,109,000 | 601,000 | |||||||
Less: current portion | (1,390,000 | ) | — | — | ||||||
Asset retirement obligation, long-term | $ | 3,523,000 | $ | 3,109,000 | $ | 601,000 | ||||
F-11
Table of Contents
Index to Financial Statements
WINDSOR ENERGY RESOURCES
NOTES TO COMBINED FINANCIAL STATEMENTS – (CONTINUED)
(Information as of September 30, 2005 and for the nine months ended
September 30, 2004 and 2005 is unaudited)
7. LONG-TERM DEBT
Long-term debt consists of:
| September 30, | December 31, | |||||||||||
| 2005 | 2004 | 2003 | ||||||||||
| (unaudited) | ||||||||||||
| Term note payable to a bank issued in the original amount of $8,600,000; payable in monthly principal payments of $143,334 plus accrued interest through maturity on October 1, 2008; any remaining outstanding principal due at maturity; bears interest at LIBOR plus 2.875%, adjusted monthly (effective rates of 6.7% and 5.2% at September 30, 2005 and December 31, 2004, respectively); collateralized by certain oil and gas properties located in Wyoming | $ | 3,860,000 | $ | 5,650,000 | $ | 8,170,000 | ||||||
| Term note payable to a bank issued in the original amount of $4,000,000; payable in monthly principal payments of $66,667 plus accrued interest through maturity on June 1, 2009; any remaining outstanding principal due at maturity; bears interest at LIBOR plus 2.875%, adjusted monthly (effective rates of 6.7% and 5.2% at September 30, 2005 and December 31, 2004, respectively); collateralized by certain oil and gas properties located in Texas. | $ | 2,034,000 | 2,633,000 | — | ||||||||
| Total long-term debt | $ | 5,894,000 | $ | 8,283,000 | $ | 8,170,000 | ||||||
| Less: current maturities | (2,377,000 | ) | (2,377,000 | ) | (1,720,000 | ) | ||||||
| Long-term debt, net of current maturities | $ | 3,517,000 | $ | 5,906,000 | $ | 6,450,000 | ||||||
Under the terms of both note payable agreements, the outstanding balance of the related note payable shall at no time exceed 75% of the present value of future net cash flows related to the underlying mortgaged properties discounted at a rate of 10%. Windsor was in compliance with this requirement with respect to both loans at the end of all periods presented.
Maturities of long-term debt are as follows:
Year ending December 31: | |||
2005 | $ | 2,377,000 | |
2006 | 2,520,000 | ||
2007 | 2,520,000 | ||
2008 | 866,000 | ||
| $ | 8,283,000 | ||
8. TRANSACTIONS WITH AFFILIATES
An entity under common management provided office space and certain administrative services to the LLCs beginning in 2004. The LLCs reimbursed the entity approximately $363,000 in consideration for those services during the year ended December 31, 2004 and $1,620,000 for the nine months ended September 30, 2005. The administrative reimbursement amount is determined by the affiliate’s management based on estimates of time devoted to Windsor. At December 31, 2004, approximately $196,000 was owed to the entity and included in accounts payable.
An entity under common management operates the majority of the oil and gas properties in which the LLCs have working and revenue interests. As operator of these properties, this entity is responsible for the daily operations, monthly operations billings and monthly revenues disbursements related to the properties in which Windsor
F-12
Table of Contents
Index to Financial Statements
WINDSOR ENERGY RESOURCES
NOTES TO COMBINED FINANCIAL STATEMENTS – (CONTINUED)
(Information as of September 30, 2005 and for the nine months ended
September 30, 2004 and 2005 is unaudited)
8. TRANSACTIONS WITH AFFILIATES – CONTINUED
holds an interest. Monthly overhead and supervision charges billed to the LLCs by the entity for operations totaled $1,018,000, $533,000 and $134,000 during the nine months ended September 30, 2005, the year ended December 31, 2004 and the period from inception (July 8, 2003) to December 31, 2003, respectively. Accounts receivable-related party includes, primarily, amounts due from this operator for monthly revenue disbursements, and accounts payable-related party includes, primarily, amounts due to this operator for monthly joint interest billings.
9. COMMITMENTS AND CONTINGENCIES
Windsor is subject to various possible contingencies, which arise primarily from interpretation of federal and state laws and regulations affecting the natural gas and crude oil industry. Such contingencies include differing interpretations as to the prices at which natural gas and crude oil sales may be made, the prices at which royalty owners may be paid for production from their leases, environmental issues and other matters. Although management believes it has complied with the various laws and regulations, administrative rulings and interpretations thereof, adjustments could be required as new interpretations and regulations are issued. In addition, production rates, marketing and environmental matters are subject to regulation by various federal and state agencies.
The LLCs have been named as defendants in various litigation matters. The ultimate resolution of these matters is not expected to have a material adverse effect on Windsor’s financial condition or results of operations.
10. FAIR VALUE OF FINANCIAL INSTRUMENTS
| Cash | and equivalents, accounts receivable and accounts payable |
The carrying amounts of cash and cash equivalents, accounts receivable, and accounts payable approximate their fair values.
Long-term debt and notes payable
The carrying amounts of long-term debt approximate fair value, due to the fact that their variable rates approximate market rates.
11. SUBSEQUENT EVENTS
Office Leases
During February and November, 2005, Windsor entered into agreements to lease office space for its Gillette, Wyoming and its Sheridan, Wyoming field offices, respectively. The lease on the Gillette office space will terminate February 29, 2008, while the lease on the Sheridan office space will terminate July 16, 2006. Future minimum lease payments for these leases are as follows:
Year ending December 31 | |||
2005 | $ | 25,000 | |
2006 | 31,000 | ||
2007 | 22,000 | ||
2008 | 4,000 | ||
| $ | 82,000 | ||
F-13
Table of Contents
Index to Financial Statements
WINDSOR ENERGY RESOURCES
NOTES TO COMBINED FINANCIAL STATEMENTS – (CONTINUED)
(Information as of September 30, 2005 and for the nine months ended
September 30, 2004 and 2005 is unaudited)
11. SUBSEQUENT EVENTS – (CONTINUED)
Acquisitions
Fayetteville Shale Properties
During October of 2005, one of the LLCs signed an agreement to purchase a total of 26,056 undeveloped net acres in the Fayetteville Shale prospect area of Mississippi at a cost of $1,303,000. The LLC paid a deposit equal to 5% of the total purchase price, or $65,000, at the time the agreement was signed. Under the terms of the agreement, the LLC is to make periodic pro rata payments to the Seller as title to the subject acreage is approved by the LLC. As of December 31, 2005, a total of $1,274,000 had been paid to the seller under the terms of this contract.
During December of 2005, one of the LLCs signed an agreement to purchase a total of 14,449 undeveloped net acres in the Fayetteville Shale prospect area of Arkansas at a cost of $4,335,000. Under the terms of the agreement, the LLC is to pay a refundable deposit in the amount of $2,167,000 by December 29, 2005, with the remaining balance due at closing on or before February 15, 2006. As of December 31, 2005, the LLC had paid the refundable deposit of $2,167,000.
Additional Powder River Basin Properties
During January of 2005, Gulfport Energy Corporation (“Gulfport”), a publicly-traded corporation with controlling interest in common with the LLCs, acquired a package of 115 active coal bed methane wells in Campbell County, Wyoming (Marquiss Properties) for a total purchase price of $376,000. Gulfport intends to contribute these properties to Windsor at its planned IPO. As such, the income and expense related to these properties from the point of acquisition through September 30, 2005, have been included in the accompanying combined statements of operations for the nine months ended September 30, 2005.
Williston Basin Properties
During the nine months ended September 30, 2005, Windsor Bakken LLC (“Windsor Bakken”), an entity with controlling interests in common with the LLCs, acquired leases on 5,232 undeveloped acres in the Willston Basin areas of North Dakota and Montana at a total cost of $2,331,000. Windsor Bakken intends to contribute these properties to Windsor at its planned IPO. As such, the value of this acreage acquisition has been included in the accompanying combined balance sheets as of September 30, 2005.
During September of 2005, Windsor Bakken agreed to purchase an additional 29,811 net undeveloped acres located in the Williston Basin area from various parties at a total cost of $7,450,000. Windsor Bakken also intends to contribute these properties to Windsor at its planned IPO. Down payments equal to 10% of the total purchase price, or $745,000, were paid at the time the agreements were signed and are included as “Deposits on oil & gas property acquisitions” in the accompanying combined balance sheets as of September 30, 2005. As of December 31, 2005, $6,125,000 of the total purchase price has been paid. The remaining balance of $1,328,000 due to the selling parties is expected to be paid in early 2006.
East Texas Basin Properties
During October of 2005, Windsor Overton LP (“Windsor Overton”), an entity with controlling interests in common with the LLCs, purchased a package of properties in the East Texas Basin area at a cost of $5,500,000.
F-14
Table of Contents
Index to Financial Statements
WINDSOR ENERGY RESOURCES
NOTES TO COMBINED FINANCIAL STATEMENTS – (CONTINUED)
(Information as of September 30, 2005 and for the nine months ended
September 30, 2004 and 2005 is unaudited)
11. SUBSEQUENT EVENTS – (CONTINUED)
Included in this package were interests in ten producing wells and two producing units, a gathering system, and approximately 13,220 net undeveloped acres. Windsor Overton intends to contribute these properties to Windsor at its planned IPO.
Field Office—Silt, Colorado
During December of 2005, one of the LLCs purchased a building to be used as its Colorado field office. Total purchase price of the property was $220,000. The LLC intends to contribute this property to Windsor at its planned IPO.
Property Conveyance
During May of 2005, one of the LLCs sold its interest in certain developed non-producing properties located in the Piceance Basin area of Colorado to North Finn, LLC (“North Finn”). There was no sales price in connection with this transaction, however, the LLC retained 10% ownership in the properties to be “carried” with respect to costs for a period of one year. Also under the terms of the agreement, within one year, North Finn shall make every effort to bring all wells back to production, lay a gathering system for the purpose of purchasing gas to operate wells as needed, and drill at least two new wells in the field. If, after a period of one year, North Finn has not performed its stated obligations under the agreement, North Finn shall pay the LLC liquid damages in the amount of $200,000. Also after a period of one year, the LLC may elect to begin paying its 10% proportionate share of working interests and costs going forward or assign its title and interest in the underlying assets to North Finn.
12. WINDSOR ENERGY RESOURCES, INC.
Windsor Energy Resources, Inc. (“WERI”) was formed as a Delaware corporation on December 1, 2005. In conjunction with a planned initial public offering of common stock by WERI in 2006, it is anticipated that all assets and liabilities included in the accompanying combined financial statements and as described above in footnote 11 will be contributed to WERI.
Upon such planned contribution, Windsor Energy Resources, Inc. will recognize deferred tax liabilities and assets for temporary differences between the historical cost bases and tax bases of these assets and liabilities. Based on preliminary estimates of these temporary differences as of December 31, 2005, net deferred tax liabilities of approximately $18 million would be recognized with a corresponding charge to earnings.
13. SUPPLEMENTAL INFORMATION (UNAUDITED)
The following information about Windsor’s oil and gas producing activities is presented in accordance with the financial Accounting Standards Board Statement No. 69, Disclosure About Oil & Gas Producing Activities.
Proved oil and gas reserves estimates as of December 31, 2004 were prepared by DeGolyer and MacNaughton, independent petroleum engineers, as well as Pinnacle Energy Services, LLC, independent petroleum engineers. Proved oil and gas reserves estimates as of December 31, 2003 were prepared by DeGolyer and MacNaughton, independent petroleum engineers. The reserve reports were prepared in accordance with guidelines established
F-15
Table of Contents
Index to Financial Statements
WINDSOR ENERGY RESOURCES
NOTES TO COMBINED FINANCIAL STATEMENTS – (CONTINUED)
(Information as of September 30, 2005 and for the nine months ended
September 30, 2004 and 2005 is unaudited)
13. SUPPLEMENTAL INFORMATION (UNAUDITED) – (CONTINUED)
by the Securities and Exchange Commission and, accordingly, were based on existing economic and operating conditions. Natural gas and crude oil prices in effect as of the date of the reserve reports were used without any escalation except in those instances where the sale of production was covered by contract, in which case the applicable contract prices, including fixed and determinable escalations, were used for the duration of the contract, and thereafter the year-end price was used (See “Standardized Measure of Discounted Future Net Cash Flows and Changes Therein Relating to Proved Oil and Natural Gas Reserves” below for a discussion of the effect of the different prices on reserve quantities and values.) Operating costs, production and ad valorem taxes and future development costs were based on current costs with no escalation.
There are numerous uncertainties inherent in estimating quantities of proved reserves and in projecting the future rates of production and timing of development expenditures. The following reserve data represents estimates only and should not be construed as being exact. Moreover, the present values should not be construed as the current market value of Windsor’s natural gas and crude oil reserves or the costs that would be incurred to obtain equivalent reserves.
Windsor’s oil and gas reserves are attributable solely to properties within the United States. The changes in proved reserves for the year ended December 31, 2004 and the period from inception (July 8, 2003) to December 31, 2003 were as follows:
| Year Ended December 31, 2004 | Inception (July 8, 2003) to December 31, 2003 | |||||||||||
| Oil | Gas | Oil | Gas | |||||||||
| (Bbls) | (Mcf) | (Bbls) | (Mcf) | |||||||||
Proven Reserves | ||||||||||||
Beginning of the period | 836,000 | 36,659,000 | — | — | ||||||||
Revisions of prior reserve estimates | (50,000 | ) | (1,382,000 | ) | — | — | ||||||
Purchases in oil and gas reserves in place | 199,000 | 3,713,000 | 845,000 | 37,125,000 | ||||||||
Extensions and discoveries | — | 3,425,000 | — | — | ||||||||
Current production | (28,000 | ) | (1,591,000 | ) | (9,000 | ) | (466,000 | ) | ||||
End of period | 957,000 | 40,824,000 | 836,000 | 36,659,000 | ||||||||
Proven developed reserves, beginning | 524,000 | 25,396,000 | — | — | ||||||||
Proven developed reserves, ending | 665,000 | 27,588,000 | 524,000 | 25,396,000 | ||||||||
The capitalized costs relating to oil and gas producing activities and the related accumulated depletion, depreciation and amortization as of December 31, 2004 and 2003 were as follows:
| 2004 | 2003 | |||||||
Proven properties | $ | 64,423,000 | $ | 18,645,000 | ||||
Unproved properties | 30,201,000 | 17,003,000 | ||||||
Accumulated depreciation, depletion amortization and impairment reserve | (4,605,000 | ) | (585,000 | ) | ||||
Oil and gas properties, net | $ | 90,019,000 | $ | 35,063,000 | ||||
F-16
Table of Contents
Index to Financial Statements
WINDSOR ENERGY RESOURCES
NOTES TO COMBINED FINANCIAL STATEMENTS – (CONTINUED)
(Information as of September 30, 2005 and for the nine months ended
September 30, 2004 and 2005 is unaudited)
13. SUPPLEMENTAL INFORMATION (UNAUDITED) – (CONTINUED)
Costs incurred in oil and gas property acquisition, exploration and development activities during the year ended December 31, 2004 and the period from inception to December 31, 2003 were as follows:
| 2004 | 2003 | |||||
Acquisition costs | $ | 38,524,000 | $ | 35,043,000 | ||
Development costs | 17,040,000 | 17,000 | ||||
Exploration costs | 941,000 | — | ||||
Capitalized asset retirement obligation | 2,471,000 | 588,000 | ||||
Total | $ | 58,976,000 | $ | 35,648,000 | ||
The Standardized Measure of Discounted Future Net Cash Flows and Changes Therein Relating to Proved Oil and Natural Gas Reserves (“Standardized Measure”) does not purport to present the fair market value of Windsor’s natural gas and crude oil properties. An estimate of such value should consider, among other factors, anticipated future prices of natural gas and crude oil, the probability of recoveries in excess of existing proved reserves, the value of probable reserves and acreage prospects, and perhaps different discount rates. It should be noted that estimates of reserve quantities, especially from new discoveries, are inherently imprecise and subject to substantial revision.
Under the Standardized Measure, future cash inflows were estimated by applying year-end prices, adjusted for contracts with price floors but excluding hedges, to the estimated future production of the year-end reserves. These prices have varied widely and have a significant impact on both the quantities and value of the proved reserves as reduced prices cause wells to reach the end of their economic life much sooner and also make certain proved undeveloped locations uneconomical, both of which reduce reserves. The year-end calculations were made using weighted average prices of $40.60 and $32.39 per Bbl for oil and $5.85 and $6.47 per Mcf for gas for 2004 and 2003, respectively.
Future cash inflows were reduced by estimated future production and development costs based on year-end costs to determine pre-tax cash inflows. Future income taxes were computed by applying the statutory tax rate to the excess of pre-tax cash inflows over the tax basis in the associated proved natural gas and crude oil properties expected as a result of the planned IPO. Future net cash inflows after income taxes were discounted using a 10% annual discount rate to arrive at the Standardized Measure.
The standardized measure of discounted cash flows related to proved oil and gas reserves at December 31, 2004 and 2003 were as follows:
| 2004 | 2003 | |||||||
Future cash flows | $ | 277,796,000 | $ | 264,196,000 | ||||
Future development costs | (21,660,000 | ) | (12,949,000 | ) | ||||
Future production costs | (36,449,000 | ) | (30,644,000 | ) | ||||
Future production taxes | (33,620,000 | ) | (32,113,000 | ) | ||||
Future net income taxes | (36,754,000 | ) | (61,851,000 | ) | ||||
Future net cash flows | 149,313,000 | 126,639,000 | ||||||
10% discount to reflect timing of cash flows | (71,964,000 | ) | (63,901,000 | ) | ||||
Standardized measure of discounted future net cash flows | $ | 77,349,000 | $ | 62,738,000 | ||||
F-17
Table of Contents
Index to Financial Statements
WINDSOR ENERGY RESOURCES
NOTES TO COMBINED FINANCIAL STATEMENTS – (CONTINUED)
(Information as of September 30, 2005 and for the nine months ended
September 30, 2004 and 2005 is unaudited)
13. SUPPLEMENTAL INFORMATION (UNAUDITED) – (CONTINUED)
The primary changes in the standardized measure of discounted future net cash flows for the year ended December 31, 2004 and the period from inception to December 31, 2003 were as follows:
| Year Ended December 31, 2004 | Inception to December 31, 2003 | |||||||
Sales and transfers of oil and gas produced, net of production costs | $ | (5,224,000 | ) | $ | (1,550,000 | ) | ||
Net changes in prices and production costs | (7,857,000 | ) | — | |||||
Extensions, discoveries and improved recovery, net of future production and development costs | 2,011,000 | — | ||||||
Previously estimated development costs incurred | 4,119,000 | — | ||||||
Changes in estimated future development costs | (16,950,000 | ) | — | |||||
Acquisition of oil and gas reserves in place, less related production costs | 20,972,000 | 94,929,000 | ||||||
Revisions of previous quantity estimates, less related production costs | (3,928,000 | ) | — | |||||
Accretion of discount | 9,338,000 | — | ||||||
Net changes in income taxes | 11,602,000 | (30,641,000 | ) | |||||
Other | 528,000 | — | ||||||
Total change in standardized measure of discounted future net cash flows | $ | 14,611,000 | $ | 62,738,000 | ||||
F-18
Table of Contents
Index to Financial Statements
Report of Independent Registered Public Accounting Firm
Board of Directors and Stockholder
Windsor Energy Resources, Inc.
We have audited the accompanying balance sheet of Windsor Energy Resources, Inc. as of January 9, 2006. This financial statement is the responsibility of the Company’s management. Our responsibility is to express an opinion on this financial statement based on our audit.
We conducted our audit in accordance with the standards of the Public Company Accounting Oversight Board (United States). Those standards require that we plan and perform the audit to obtain reasonable assurance about whether the balance sheet is free of material misstatement. The Company is not required to have, nor were we engaged to perform an audit of its internal control over financial reporting. Our audit included consideration of internal control over financial reporting as a basis for designing audit procedures that are appropriate in the circumstances, but not for the purpose of expressing an opinion on the effectiveness of the Company’s internal control over financial reporting. Accordingly, we express no such opinion. An audit also includes examining, on a test basis, evidence supporting the amounts and disclosures in the balance sheet, assessing the accounting principles used and significant estimates made by management, as well as evaluating the overall balance sheet presentation. We believe that our audit of the balance sheet provides a reasonable basis for our opinion.
In our opinion, the balance sheet referred to above presents fairly, in all material respects, the financial position of Windsor Energy Resources, Inc. as of January 9, 2006, in conformity with accounting principles generally accepted in the United States of America.
/S/ GRANT THORNTON LLP
Oklahoma City, Oklahoma
February 9, 2006
F-19
Table of Contents
Index to Financial Statements
WINDSOR ENERGY RESOURCES, INC.
JANUARY 9, 2006
| ASSETS | |||
Cash | $ | 100 | |
Total Assets | $ | 100 | |
| STOCKHOLDER’S EQUITY | |||
Stockholder’s Equity | |||
Common stock $0.01 par value; 10,000,000 shares authorized; 100 shares issued and outstanding | $ | 1 | |
Additional paid-in capital | 99 | ||
Total Stockholder’s Equity | $ | 100 | |
The accompanying note is an integral part of this balance sheet.
F-20
Table of Contents
Index to Financial Statements
WINDSOR ENERGY RESOURCES, INC.
January 9, 2006
Windsor Energy Resources, Inc. (the “Corporation”) is a Delaware corporation formed on December 1, 2005 and capitalized on January 9, 2006. The Corporation has been formed and capitalized; however, there have been no other transactions involving the Corporation.
The Corporation intends to offer common stock pursuant to an initial public offering. In connection with this offering, Coastal Energy LP, Northranch Energy, LLC, Windsor Bakken LLC, Windsor Beaver Creek LLC, Windsor Castle Springs LLC, Windsor Gas Draw LLC, Windsor Jepson LLC, Windsor Overton LP, Windsor Weeping Mary LP, Windsor Wyoming LLC, and Gulfport Energy Corporation intend to contribute certain proved developed and undeveloped and unproved oil and gas properties to the Corporation in exchange for common stock.
F-21
Table of Contents
Index to Financial Statements
Report of Independent Registered Public Accounting Firm
Board of Directors
Windsor Energy Resources, Inc.
We have audited the accompanying statement of revenues and direct operating expenses of the properties (the “Amos Draw Acquisition Properties”) acquired by Northranch Energy LLC (Northranch) from the sellers, as described in Note 1 to the statement, for the period from January 1, 2003 to July 8, 2003. This statement is the responsibility of Northranch’s management. Our responsibility is to express an opinion on this statement based on our audit.
We conducted our audit in accordance with the standards of the Public Company Accounting Oversight Board (United States). Those standards require that we plan and perform the audit to obtain reasonable assurance about whether the statement is free of material misstatement. Northranch is not required to have, nor were we engaged to perform an audit of its internal control over financial reporting. Our audit included consideration of internal control over financial reporting as a basis for designing audit procedures that are appropriate in the circumstances, but not for the purpose of expressing an opinion on the effectiveness of Northranch’s internal control over financial reporting. Accordingly, we express no such opinion. An audit also includes examining, on a test basis, evidence supporting the amounts and disclosures in the statement, assessing the accounting principles used and significant estimates made by management, as well as evaluating the overall presentation of the statement. We believe that our audit provides a reasonable basis for our opinion.
The accompanying statement was prepared for the purpose of complying with the rules and regulations of the Securities and Exchange Commission (for inclusion in the registration statement on Form S-1 of Windsor Energy Resources, Inc.) as described in Note 1 to the statement and is not intended to be a complete presentation of the Amos Draw Acquisition Properties’ revenues and expenses.
In our opinion, the statement referred to above presents fairly, in all material respects, the revenues and direct operating expenses described in Note 1 of the Amos Draw Acquisition Properties for the period from January 1, 2003 to July 8, 2003, in conformity with accounting principles generally accepted in the United States of America.
/s/ Grant Thornton LLP
Oklahoma City, Oklahoma
February 9, 2006
F-22
Table of Contents
Index to Financial Statements
AMOS DRAW ACQUISITION PROPERTIES
POWDER RIVER BASIN
STATEMENT OF REVENUES AND DIRECT OPERATING EXPENSES
FOR THE PERIOD FROM JANUARY 1, 2003 TO JULY 8, 2003
REVENUES – Oil and gas production | $ | 1,869,645 | |
DIRECT OPERATING EXPENSES: | |||
Lease operating expenses | 304,680 | ||
Production taxes and other deductions | 241,129 | ||
Total direct operating expenses | 545,809 | ||
Revenues in excess of direct operating expenses | $ | 1,323,836 | |
See accompanying notes to the Statement of Revenues and Direct Operating Expenses.
F-23
Table of Contents
Index to Financial Statements
AMOS DRAW ACQUISITION PROPERTIES
POWDER RIVER BASIN
NOTES TO STATEMENT OF REVENUES AND DIRECT OPERATING EXPENSES
FOR THE PERIOD FROM JANUARY 1, 2003 TO JULY 8, 2003
| 1. | BASIS OF PRESENTATION |
On July 8, 2003, Northranch Energy LLC, (“Northranch”) purchased interests in 36 operated and 19 non-operated wells located in the Amos Draw Field in Campbell County, Wyoming from Gulf Exploration, Inc., Garrett and Company Resources, LLC, Coastal Oils, Inc., Gulf Production Corp., Garrett Holdings, Inc., Michael P. Cross, Inc. and Michael P. Cross (collectively, the “Sellers”) for $11,000,000. Northranch intends to contribute these properties to Windsor Energy Resources, Inc. (“the Company”) upon consummation of the Company’s initial public offering, and in exchange for common stock of the Company or other consideration yet to be determined. The properties are referred to herein as the “Amos Draw Acquisition Properties”.
The accompanying statement of revenues and direct operating expenses was derived from the historical accounting records of the Sellers and prior operators and reflects the revenues and direct operating expenses of the Amos Draw Acquisition Properties. Such amounts may not be representative of future operations. The statement does not include depreciation, depletion and amortization, general and administrative expenses, income taxes or interest expense as such costs were not allocated to the Amos Draw Acquisition properties by the Sellers and it is not practical to do so, and these costs will not be comparable to the expenses expected to be incurred by the Company on a prospective basis.
The Sellers used the sales method to account for its natural gas revenues, where revenue is recognized on all natural gas sold to its purchasers, regardless of whether sales are proportionate to its ownership in the property. Under this approach, a liability would have been recognized only to the extent that the Sellers had an overproduced imbalance on a specific property greater than the expected remaining proved reserves. No receivables would have been recorded for those wells on which the Sellers had taken less than its ownership share of production. Direct operating expenses include, leases and well repairs, production taxes, maintenance, utilities and other direct operating expenses.
The process of preparing financial statements in conformity with accounting principles generally accepted in the United States of America requires the use of estimates and assumptions regarding certain types of revenues and expenses. Such estimates primarily relate to unsettled transactions and events as of the date of the financial statement. Accordingly, upon settlement, actual results may differ from estimated amounts.
Historical financial statements reflecting financial position, results of operations and cash flows required by accounting principles generally accepted in the United States of America are not presented as such information is not readily available on an individual property basis and not meaningful to the Amos Draw Acquisition Properties. Accordingly, the historical statement of revenue and direct operation expenses is presented in lieu of the financial statements required under Rule 3-05 of the Securities and Exchange Commission Regulation S-X.
F-24
Table of Contents
Index to Financial Statements
AMOS DRAW ACQUISITION PROPERTIES
POWDER RIVER BASIN
NOTES TO STATEMENT OF REVENUES AND DIRECT OPERATING EXPENSES
FOR THE PERIOD FROM JANUARY 1, 2003 TO JULY 8, 2003 (Continued)
| 2. | SUPPLEMENTAL DISCLOSURE OF OIL AND GAS PRODUCING ACTIVITIES (UNAUDITED) |
Reserves Quantities –The following table summarizes the estimated quantities of proved oil and gas reserves of the Amos Draw Acquisition Properties. These amounts were derived from reserve estimates prepared by Pinnacle Energy Services LLC, as of May 1, 2003, adjusted only for May and June 2003 production. Estimates of proved reserves are inherently imprecise and are continually subject to revision based on production history, results of additional exploration and development, price changes and other factors. The oil and gas reserves stated below are attributable to properties within the United States.
| Oil (Bbls) | Gas (Mcf) | |||||
Proved Developed Reserves – January 1, 2003 | 162,051 | 7,398,192 | ||||
Revisions of prior reserve estimates | 10,383 | 457,095 | ||||
Production | (8,603 | ) | (330,971 | ) | ||
Proved Developed Reserves – July 8, 2003 | 163,831 | 7,524,316 | ||||
Standardized Measure of Discounted Future Net Cash Flows– The standardized measure of discounted future net cash flows related to proved oil and gas reserves and the changes in standardized measure of discounted future net cash flows relating to proved oil and gas reserves were prepared in accordance with the provisions of Statement of Financial Accounting Standards No. 69. Future cash inflows were computed by applying prices at period end to estimated future production, less estimated future expenditures (based on period end costs) to be incurred in developing and producing the proved reserves, less estimated future income tax expense. Future income tax expenses are not included because they may not be comparable to those expected to be incurred by the Company. Future net cash flows are discounted at a rate of 10% annually to derive the standard measure of discounted future net cash flows. This calculation procedure does not necessarily result in an estimate of the fair market value or the present value of the Amos Draw Acquisition Properties.
| July 8, 2003 | ||||
Future cash flows | $ | 36,818,658 | ||
Future production costs | (15,908,865 | ) | ||
Future net cash flows | 20,909,793 | |||
10% annual discount for estimated timing of cash flows | (9,550,231 | ) | ||
Standardized measure of discounted future net cash flows | $ | 11,359,562 | ||
The changes in standardized measure of discounted future net cash flows relating to proved oil and gas reserves are as follows:
January 1, 2003 | $ | 9,402,043 | ||
Sale of oil and gas produced, net of production costs | (1,323,836 | ) | ||
Net changes in prices and production costs | 2,322,674 | |||
Revisions of previous quantity estimates, less related production costs | 710,013 | |||
Accretion of discount | 470,102 | |||
Other | (221,434 | ) | ||
July 8, 2003 | $ | 11,359,562 | ||
Average wellhead prices in effect at May 1, 2003 inclusive of adjustments for quality and location used in determining future net revenues related to the standardized measure calculation were $31.20 per barrel of oil and $4.30 per mcf of gas.
F-25
Table of Contents
Index to Financial Statements
Report of Independent Registered Public Accounting Firm
Board of Directors
Windsor Energy Resources, Inc.
We have audited the accompanying statement of revenues and direct operating expenses of the properties (the “Motex Acquisition Properties”) acquired by Coastal Energy LLC (Coastal) from Cambridge Producers, Ltd. for the period from January 1, 2003 to October 31, 2003. This statement is the responsibility of the Coastal’s management. Our responsibility is to express an opinion on this statement based on our audit.
We conducted our audit in accordance with the standards of the Public Company Accounting Oversight Board (United States). Those standards require that we plan and perform the audit to obtain reasonable assurance about whether the statement is free of material misstatement. Coastal is not required to have, nor were we engaged to perform an audit of its internal control over financial reporting. Our audit included consideration of internal control over financial reporting as a basis for designing audit procedures that are appropriate in the circumstances, but not for the purpose of expressing an opinion on the effectiveness of Coastal’s internal control over financial reporting. Accordingly, we express no such opinion. An audit also includes examining, on a test basis, evidence supporting the amounts and disclosures in the statement, assessing the accounting principles used and significant estimates made by management, as well as evaluating the overall presentation of the statement. We believe that our audit provides a reasonable basis for our opinion.
The accompanying statement was prepared for the purpose of complying with the rules and regulations of the Securities and Exchange Commission (for inclusion in the registration statement on Form S-1 of Windsor Energy Resources, Inc.) as described in Note 1 to the statement and is not intended to be a complete presentation of the Motex Acquisition Properties’ revenues and expenses.
In our opinion, the statement referred to above presents fairly, in all material respects, the revenues and direct operating expenses described in Note 1 of the Motex Acquisition Properties for the period from January 1, 2003 to October 31, 2003, in conformity with accounting principles generally accepted in the United States of America.
/s/ Grant Thornton LLP
Oklahoma City, Oklahoma
February 9, 2006
F-26
Table of Contents
Index to Financial Statements
EAST TEXAS AREA
STATEMENT OF REVENUES AND DIRECT OPERATING EXPENSES
FOR THE PERIOD FROM JANUARY 1, 2003 TO OCTOBER 31, 2003
REVENUES – Oil and gas production | $ | 2,888,446 | |
DIRECT OPERATING EXPENSES: | |||
Lease operating expenses | 411,123 | ||
Production taxes and other deductions | 268,494 | ||
Total direct operating expenses | 679,617 | ||
Revenues in excess of direct operating expenses | $ | 2,208,829 | |
See accompanying notes to the Statement of Revenues and Direct Operating Expenses.
F-27
Table of Contents
Index to Financial Statements
EAST TEXAS AREA
NOTES TO STATEMENT OF REVENUES AND DIRECT OPERATING EXPENSES
FOR THE PERIOD FROM JANUARY 1, 2003 TO OCTOBER 31, 2003 (Continued)
| 1. | BASIS OF PRESENTATION |
On November 1, 2003, Coastal Energy LLC, (“Coastal”) purchased interests in 9 operated and 5 non-operated wells located in East Texas from Cambridge Producers, Ltd. (“Cambridge”) for approximately $7,000,000. Coastal intends to contribute these properties to Windsor Energy Resources, Inc. (the “Company”) upon consummation of the Company’s initial public offering, and in exchange for common stock of the Company or other consideration yet to be determined. The properties are referred to herein as the “Motex Acquisition Properties”.
The accompanying statement of revenues and direct operating expenses was derived from the historical accounting records of Cambridge and prior operators and reflects the revenues and direct operating expenses of the Motex Acquisition Properties. Such amounts may not be representative of future operations. The statement does not include depreciation, depletion and amortization, general and administrative expenses, income taxes or interest expense as such costs were not allocated to the Motex Acquisition Properties by Cambridge and it is not practical to do so, and these costs will not be comparable to the expenses expected to be incurred by the Company on a prospective basis.
Cambridge used the sales method to account for its natural gas revenues, where revenue is recognized on all natural gas sold to its purchasers, regardless of whether sales are proportionate to its ownership in the property. Under this approach, a liability would have been recognized only to the extent that Cambridge had an overproduced imbalance on a specific property greater than the expected remaining proved reserves. No receivables would have been recorded for those wells on which Cambridge had taken less than its ownership share of production. Direct operating expenses include, lease and well repairs, production taxes, maintenance, utilities and other direct operating expenses.
The process of preparing financial statements in conformity with accounting principles generally accepted in the United States of America requires the use of estimates and assumptions regarding certain types of revenues and expenses. Such estimates primarily relate to unsettled transactions and events as of the date of the financial statement. Accordingly, upon settlement, actual results may differ from estimated amounts.
Historical financial statements reflecting financial position, results of operations and cash flows required by accounting principles generally accepted in the United States of America are not presented as such information is not readily available on an individual property basis and not meaningful to the Motex Acquisition Properties. Accordingly, the historical statement of revenue and direct operation expenses is presented in lieu of the financial statements required under Rule 3-05 of the Securities and Exchange Commission Regulation S-X.
F-28
Table of Contents
Index to Financial Statements
MOTEX ACQUISITION PROPERTIES
EAST TEXAS AREA
NOTES TO STATEMENT OF REVENUES AND DIRECT OPERATING EXPENSES
FOR THE PERIOD FROM JANUARY 1, 2003 TO OCTOBER 31, 2003 (Continued)
| 2. | SUPPLEMENTAL DISCLOSURE OF OIL AND GAS PRODUCING ACTIVITIES (UNAUDITED) |
Reserves Quantities –The following table summarizes the estimated quantities of proved oil and gas reserves of the Motex Acquisition Properties. These amounts were derived from reserve estimates prepared by Pinnacle Energy Services LLC, as of November 1, 2003. Estimates of proved reserves are inherently imprecise and are continually subject to revision based on production history, results of additional exploration and development, price changes and other factors. The oil and gas reserves stated below are attributable to properties within the United States.
| Oil (Bbls) | Gas (Mcf) | |||||
Proved Developed Reserves – January 1, 2003 | 12,251 | 3,528,446 | ||||
Revisions of prior reserve estimates | 338 | (28,018 | ) | |||
Production | (1,757 | ) | (519,753 | ) | ||
Proved Developed Reserves – October 31, 2003 | 10,832 | 2,980,675 | ||||
Standardized Measure of Discounted Future Net Cash Flows –The standardized measure of discounted future net cash flows related to proved oil and gas reserves and the changes in standardized measure of discounted future net cash flows relating to proved oil and gas reserves were prepared in accordance with the provisions of Statement of Financial Accounting Standards No. 69. Future cash inflows were computed by applying prices at period end to estimated future production, less estimated future expenditures (based on period end costs) to be incurred in developing and producing the proved reserves, less estimated future income tax expense. Future income tax expenses are not included because they may not be comparable to those expected to be incurred by the Company. Future net cash flows are discounted at a rate of 10% annually to derive the standard measure of discounted future net cash flows. This calculation procedure does not necessarily result in an estimate of the fair market value or the present value of the Motex Acquisition Properties.
| October 31, 2003 | ||||
Future cash flows | $ | 13,757,490 | ||
Future production costs | (4,500,083 | ) | ||
Future net cash flows | 9,257,407 | |||
10% annual discount for estimated timing of cash flows | (2,827,779 | ) | ||
Standardized measure of discounted future net cash flows | $ | 6,429,628 | ||
The changes in standardized measure of discounted future net cash flows relating to proved oil and gas reserves are as follows:
January 1, 2003 | $ | 7,901,245 | ||
Sale of oil and gas produced, net of production costs | (2,208,829 | ) | ||
Net changes in prices and production costs | 397,442 | |||
Revisions of previous quantity estimates, less related production costs | (53,433 | ) | ||
Accretion of discount | 658,437 | |||
Other | (265,234 | ) | ||
October 31, 2003 | $ | 6,429,628 | ||
F-29
Table of Contents
Index to Financial Statements
MOTEX ACQUISITION PROPERTIES
EAST TEXAS AREA
NOTES TO STATEMENT OF REVENUES AND DIRECT OPERATING EXPENSES
FOR THE PERIOD FROM JANUARY 1, 2003 TO OCTOBER 31, 2003 (Continued)
Average wellhead prices in effect at October 31, 2003 inclusive of adjustments for quality and location used in determining future net revenues related to the standardized measure calculation were $31.80 per barrel of oil and $4.50 per mcf of gas.
F-30
Table of Contents
Index to Financial Statements
Appendix A
GLOSSARY OF OIL AND NATURAL GAS TERMS
The following is a description of the meanings of some of the oil and natural gas industry terms used in this prospectus.
3-D seismic.Geophysical data that depict the subsurface strata in three dimensions. 3-D seismic typically provides a more detailed and accurate interpretation of the subsurface strata than 2-D, or two-dimensional, seismic.
Basin-centered gas.A regional abnormally-pressured, gas-saturated accumulation in low-permeability reservoirs lacking a down-dip water contact.
Bbl.Stock tank barrel, or 42 U.S. gallons liquid volume, used in this prospectus in reference to crude oil or other liquid hydrocarbons.
Bbl/day.Bbl per day.
Bcf.Billion cubic feet of natural gas.
Bcfe.Billion cubic feet equivalent, determined using the ratio of six Mcf of natural gas to one Bbl of crude oil, condensate or natural gas liquids.
Boe.Barrels of oil equivalent, with six thousand cubic feet of natural gas being equivalent to one barrel of oil.
Btu or British thermal unit.The quantity of heat required to raise the temperature of one pound of water by one degree Fahrenheit.
Coalbed methane (CBM).Natural gas formed as a byproduct of the coal formation process, which is trapped in coal seams and produced by non-traditional means.
Completion.The process of treating a drilled well followed by the installation of permanent equipment for the production of natural gas or oil, or in the case of a dry hole, the reporting of abandonment to the appropriate agency.
Condensate.Liquid hydrocarbons associated with the production of a primarily natural gas reserve.
Developed acreage.The number of acres that are allocated or assignable to productive wells or wells capable of production.
Development well.A well drilled within the proved area of a natural gas or oil reservoir to the depth of a stratigraphic horizon known to be productive.
Down-dip.The occurrence of a formation at a lower elevation than a nearby area.
Dry hole.A well found to be incapable of producing hydrocarbons in sufficient quantities such that proceeds from the sale of such production exceed production expenses and taxes.
Environmental Assessment (EA).A study that can be required pursuant to federal law to assess the potential direct, indirect and cumulative impacts of a project.
A-1
Table of Contents
Index to Financial Statements
Environmental Impact Statement (EIS).A more detailed study that can be required pursuant to federal law to assess the potential direct, indirect and cumulative impacts of a project that may be made available to the public for review and comment.
Exploratory well.A well drilled to find and produce natural gas or oil reserves not classified as proved, to find a new reservoir in a field previously found to be productive of natural gas or oil in another reservoir or to extend a known reservoir.
Field.An area consisting of either a single reservoir or multiple reservoirs, all grouped on or related to the same individual geological structural feature and/or stratigraphic condition.
Finding and Development Costs.Capital costs incurred in the acquisition, exploitation and exploration of proved oil and natural gas reserves divided by proved reserve additions and revisions to proved reserves.
Fracturing. The process of creating and preserving a fracture or system of fractures in a reservoir rock typically by injecting a fluid under pressure through a wellbore and into the targeted formation.
Gross acres or gross wells.The total acres or wells, as the case may be, in which a working interest is owned.
Identified drilling locations.Total gross locations specifically identified by management to be included in the Company’s multi-year drilling activities on existing acreage. The Company’s actual drilling activities may change depending on the availability of capital, regulatory approvals, seasonal restrictions, oil and natural gas prices, costs, drilling results and other factors.
MBbls.Thousand barrels of crude oil or other liquid hydrocarbons.
Mcf.Thousand cubic feet of natural gas.
Mcf/day.Mcf per day.
Mcfe.Thousand cubic feet equivalent, determined using the ratio of six Mcf of natural gas to one Bbl of crude oil, condensate or natural gas liquids.
MMBbls.Million barrels of crude oil or other liquid hydrocarbons.
MMboe.Million barrels of oil equivalent.
MMBtu.Million British Thermal Units.
MMcf.Million cubic feet of natural gas.
MMcf/day.MMcf per day.
MMcfe.Million cubic feet equivalent, determined using the ratio of six Mcf of natural gas to one Bbl of crude oil, condensate or natural gas liquids.
MMcfe/day.MMcfe per day.
Net acres or net wells.The sum of the fractional working interest owned in gross acres or gross wells, as the case may be.
A-2
Table of Contents
Index to Financial Statements
Net revenue interest.An owner’s interest in the revenues of a well after deducting proceeds allocated to royalty and overriding interests.
PDNP.Proved developed non-producing.
PDP.Proved developed producing.
Play. A set of discovered or prospective oil and/or natural gas accumulations sharing similar geologic, geographic and temporal properties, such as source rock, reservoir structure, timing, trapping mechanism and hydrocarbon type.
Plugging and abandonment.Refers to the sealing off of fluids in the strata penetrated by a well so that the fluids from one stratum will not escape into another or to the surface. Regulations of all states require plugging of abandoned wells.
PUD.Proved undeveloped.
Present value of future net revenues (PV-10).The present value of estimated future revenues to be generated from the production of proved reserves, before income taxes, of proved reserves calculated in accordance with Financial Accounting Standards Board guidelines, net of estimated production and future development costs, using prices and costs as of the date of estimation without future escalation, without giving effect to hedging activities, non-property related expenses such as general and administrative expenses, debt service and depreciation, depletion and amortization, and discounted using an annual discount rate of 10%.
Productive well.A well that is found to be capable of producing hydrocarbons in sufficient quantities such that proceeds from the sale of the production exceed production expenses and taxes.
Prospect.A specific geographic area which, based on supporting geological, geophysical or other data and also preliminary economic analysis using reasonably anticipated prices and costs, is deemed to have potential for the discovery of commercial hydrocarbons.
Proved developed reserves (PDP).Reserves that can be expected to be recovered through existing wells with existing equipment and operating methods.
Proved reserves.The estimated quantities of oil, natural gas and natural gas liquids which geological and engineering data demonstrate with reasonable certainty to be commercially recoverable in future years from known reservoirs under existing economic and operating conditions.
Proved undeveloped reserves (PUD).Proved reserves that are expected to be recovered from new wells on undrilled acreage or from existing wells where a relatively major expenditure is required for recompletion.
PV-10.Present value of future net revenues.
Recompletion.The process of re-entering an existing wellbore that is either producing or not producing and completing new reservoirs in an attempt to establish or increase existing production.
Reservoir.A porous and permeable underground formation containing a natural accumulation of producible natural gas and/or oil that is confined by impermeable rock or water barriers and is separate from other reservoirs.
Standardized Measure.The present value of estimated future cash inflows from proved oil and natural gas reserves, less future development and production costs and future income tax expenses, discounted at 10% per annum to reflect timing of future cash flows and using the same pricing assumptions as were used to calculate PV-10. Standardized Measure differs from PV-10 because Standardized Measure includes the effect of future income taxes.
A-3
Table of Contents
Index to Financial Statements
Stratigraphic play.An oil or natural gas formation contained within an area created by permeability and porosity changes characteristic of the alternating rock layer that result from the sedimentation process.
Structural play.An oil or natural gas formation contained within an area created by earth movements that deform or rupture (such as folding or faulting) rock strata.
Tight gas sands.A formation with low permeability that produces natural gas with very low flow rates for long periods of time.
Undeveloped acreage.Lease acreage on which wells have not been drilled or completed to a point that would permit the production of commercial quantities of oil and natural gas regardless of whether such acreage contains proved reserves.
Working interest.The operating interest that gives the owner the right to drill, produce and conduct operating activities on the property and receive a share of production and requires the owner to pay a share of the costs of drilling and production operations.
A-4
Table of Contents
Index to Financial Statements
DeGolyer and MacNaughton
5001 Spring Valley Road
Suite 800 East
Dallas, Texas 75244
APPRAISAL REPORT
as of
DECEMBER 31, 2005
on
CERTAIN PROPERTIES
owned by
VARIOUS WEXFORD CAPITAL LLC ENTITIES
and
GULFPORT ENERGY CORPORATION
prepared for
WINDSOR ENERGY RESOURCES, INC.
FOREWORD
Scope of Investigation
This report is an appraisal, as of December 31, 2005, of the extent and value of the proved crude oil, condensate, and natural gas reserves of certain properties owned by Various Wexford Capital LLC Entities (Wexford) and Gulfport Energy Corporation (Gulfport). The following companies are collectively referred to in this report as the Various Wexford Capital LLC Entities: Coastal Energy, L.P., Northranch Energy, LLC, Windsor Castle Springs LLC, Windsor Gas Draw LLC, Windsor Jepson LLC, Windsor Overton, LLC, Windsor Wyoming LLC, and Windsor Bakken LLC. The properties appraised, which consist of working and royalty interests located in the states of Colorado, North Dakota, Texas, and Wyoming are listed in detail in Appendix A bound with this report. This report was prepared at the request of Windsor Energy Resources, Inc. (Windsor).
Reserves estimated in this report are expressed as gross and net reserves. Gross reserves are defined as the total estimated petroleum remaining to be produced after December 31, 2005. Net reserves are defined as that portion of the gross reserves attributable to the interests owned by Wexford and Gulfport after deducting royalties and interests owned by others.
This report also presents values for proved reserves using initial prices and costs provided by Windsor. Future prices were estimated using guidelines established by the United States Securities and Exchange Commission (SEC) and the Financial Accounting Standards Board (FASB). A detailed explanation of the future price and cost assumptions is included in the Valuation of Reserves section of this report.
Values shown herein are expressed in terms of future gross revenue, future net revenue, and present worth. Future gross revenue is that revenue which will accrue to the appraised interests from the production and sale of the estimated net reserves. Future net revenue is calculated by deducting estimated production taxes, ad valorem taxes, operating expenses, and capital costs from the future gross revenue. Operating expenses include field operating expenses, compression charges, and the estimated expenses of direct supervision, but do not include that portion of general administrative costs sometimes allocated to production. Future income tax expenses were not taken into account in the preparation of these estimates. Present worth is defined as future net revenue discounted at a specified arbitrary discount rate compounded monthly over the expected period of realization. In this report, present worth values using a discount rate of 10 percent are reported in detail and values using discount rates of 5, 8, 12, 15, 20, 25, and 30 percent are reported as totals.
B-1
Table of Contents
Index to Financial Statements
Estimates of oil, condensate, and gas reserves and future net revenue should be regarded only as estimates that may change as further production history and additional information become available. Not only are such reserves and revenue estimates based on that information which is currently available, but such estimates are also subject to the uncertainties inherent in the application of judgmental factors in interpreting such information.
Authority
This report was prepared at the request of Mr. Michael Patrick Cross, Chief Executive Officer, Windsor.
Source of Information
Data used in the preparation of this report were obtained from Windsor, from reports filed with the appropriate regulatory agencies, and from other public sources. Additionally, this information includes data supplied by Petroleum Information/Dwights LLC; Copyright 2006 Petroleum Information/Dwights LLC. In the preparation of this report we have relied, without independent verification, upon information furnished by Windsor with respect to property interests being appraised, production from such properties, current costs of operation and development, current prices for production, agreements relating to current and future operations and sale of production, and various other information and data that were accepted as represented. It was not considered necessary to make a field examination of the physical condition and operation of the properties.
B-2
Table of Contents
Index to Financial Statements
CLASSIFICATION OF RESERVES
Petroleum reserves included in this report are classified as proved and are judged to be economically producible in future years from known reservoirs under existing economic and operating conditions and assuming continuation of current regulatory practices using conventional production methods and equipment. In the analyses of production-decline curves, reserves were estimated only to the limit of economic rates of production under existing economic and operating conditions using prices and costs as of the date the estimate is made, including consideration of changes in existing prices provided only by contractual arrangements but not including escalations based upon future conditions. Proved reserves classifications used in this report are in accordance with the reserves definitions of Rules 4–10(a) (1)–(13) of Regulation S–X of the SEC of the United States. The petroleum reserves are classified as follows:
Proved oil and gas reserves – Proved oil and gas reserves are the estimated quantities of crude oil, natural gas, and natural gas liquids which geological and engineering data demonstrate with reasonable certainty to be recoverable in future years from known reservoirs under existing economic and operating conditions, i.e., prices and costs as of the date the estimate is made. Prices include consideration of changes in existing prices provided only by contractual arrangements, but not on escalations based upon future conditions.
| (i) | Reservoirs are considered proved if economic producibility is supported by either actual production or conclusive formation test. The area of a reservoir considered proved includes (A) that portion delineated by drilling and defined by gas-oil and/or oil-water contacts, if any; and (B) the immediately adjoining portions not yet drilled, but which can be reasonably judged as economically productive on the basis of available geological and engineering data. In the absence of information on fluid contacts, the lowest known structural occurrence of hydrocarbons controls the lower proved limit of the reservoir. |
| (ii) | Reserves which can be produced economically through application of improved recovery techniques (such as fluid injection) are included in the “proved” classification when successful testing by a pilot project, or the operation of an installed program in the reservoir, provides support for the engineering analysis on which the project or program was based. |
| (iii) | Estimates of proved reserves do not include the following: (A) oil that may become available from known reservoirs but is classified separately as “indicated additional reserves”; (B) crude oil, natural gas, and natural gas liquids, the recovery of which is subject to reasonable doubt because of uncertainty as to geology, reservoir characteristics, or economic factors; (C) crude oil, natural gas, and natural gas liquids, that may occur in undrilled prospects; and (D) crude oil, natural gas, and natural gas liquids, that may be recovered from oil shales, coal, gilsonite, and other such sources. |
Proved developed oil and gas reserves – Proved developed oil and gas reserves are reserves that can be expected to be recovered through existing wells with existing equipment and operating methods. Additional oil and gas expected to be obtained through the application of fluid injection or other improved recovery techniques for supplementing the natural forces and mechanisms of primary recovery should be included as “proved developed reserves” only after testing by a pilot project or after the operation of an installed program has confirmed through production response that increased recovery will be achieved.
Proved undeveloped reserves – Proved undeveloped oil and gas reserves are reserves that are expected to be recovered from new wells on undrilled acreage, or from existing wells where a relatively major expenditure is required for recompletion. Reserves on undrilled acreage shall be limited to those drilling units offsetting productive units that are reasonably certain of production when drilled. Proved reserves for other undrilled units can be claimed only where it can be demonstrated with certainty that there is continuity of production from the existing productive formation. Under no circumstances should estimates for proved undeveloped reserves be attributable to any acreage for which an application of fluid injection or other improved recovery technique is contemplated, unless such techniques have been proved effective by actual tests in the area and in the same reservoir.
B-3
Table of Contents
Index to Financial Statements
ESTIMATION OF RESERVES
Estimates of reserves were prepared by the use of standard geological and engineering methods generally accepted by the petroleum industry. The method or combination of methods used in the analysis of each reservoir was tempered by experience with similar reservoirs, stage of development, quality and completeness of basic data, and production history.
When applicable, the volumetric method was used to estimate the original oil in place (OOIP) and original gas in place (OGIP). Structure maps were prepared to delineate each reservoir, and isopach maps were constructed to estimate reservoir volume. Electrical logs, radioactivity logs, core analyses, and other available data were used to prepare these maps as well as to estimate representative values for porosity and water saturation. When adequate data were available and when circumstances justified, material-balance and other engineering methods were used to estimate OOIP or OGIP.
Estimates of ultimate recovery were obtained after applying recovery factors to OOIP or OGIP. These recovery factors were based on consideration of the type of energy inherent in the reservoirs, analyses of the petroleum, the structural positions of the properties, and the production histories. When applicable, material-balance and other engineering methods were used to estimate recovery factors. An analysis of reservoir performance, including production rate, reservoir pressure, and gas-oil ratio behavior, was used in the estimation of reserves.
For depletion-type reservoirs or those whose performance disclosed a reliable decline in producing-rate trends or other diagnostic characteristics, reserves were estimated by the application of appropriate decline curves or other performance relationships. In the analyses of production-decline curves, reserves were estimated only to the limits of economic production based on current economic conditions.
In certain cases, when the previously named methods could not be used, reserves were estimated by analogy with similar wells or reservoirs for which more complete data were available.
Gas volumes estimated herein are expressed as wet gas and sales gas. Wet gas is defined as the total gas to be produced before reductions for volume loss due to fuel and flare consumption and reduction for plant processing. Sales gas is defined as the total gas to be produced from the reservoirs, measured at the point of delivery, after reduction for fuel usage, flare, and shrinkage resulting from field separation and plant processing. Gross gas volumes are reported as wet gas. Net gas volumes are reported as sales gas. All gas volumes are expressed at a temperature base of 60 degrees Fahrenheit (°F) and at the legal pressure base of the state in which the reserves are located. Condensate reserves estimated herein are those to be recovered by normal lease separation.
In the preparation of this study, as of December 31, 2005, gross production estimated to December 31, 2005, was deducted from gross ultimate recovery to arrive at the estimates of gross reserves. In some fields this required that the production rates be estimated for up to 2 months, since production data from certain properties were available only through October 2005. Data available from wells drilled through December 31, 2005, were used in this report.
B-4
Table of Contents
Index to Financial Statements
The proved reserves, as of December 31, 2005, of the properties appraised are estimated as follows, expressed in thousands of barrels (Mbbl) or millions of cubic feet (MMcf):
| Gross Proved Reserves | ||||
| Oil and Condensate (Mbbl) | Wet Gas (MMcf) | |||
Proved Developed Producing | 489 | 29,518 | ||
Proved Developed Nonproducing | 348 | 13,502 | ||
Proved Undeveloped | 993 | 25,117 | ||
Total Proved | 1,830 | 68,137 | ||
| Net proved Reserves | ||||
| Oil and Condensate (Mbbl) | Sales Gas (MMcf) | |||
Proved Developed Producing | 258 | 15,734 | ||
Proved Developed Nonproducing | 261 | 10,031 | ||
Proved Undeveloped | 392 | 17,252 | ||
Total Proved | 911 | 43,017 | ||
B-5
Table of Contents
Index to Financial Statements
VALUATION OF RESERVES
Revenue values in this report were estimated using the initial prices and costs provided by Windsor. Future prices were estimated using guidelines established by the SEC and the FASB. The following assumptions were used for estimating future prices and costs:
Oil and Condensate Prices
Oil and condensate prices for each property were provided by Windsor and were held constant for the lives of the properties. The prices are based on a NYMEX price of $61.04 per barrel and were adjusted to reflect the actual price received for each property. The weighted average price over the lives of the properties was $57.31 per barrel.
Natural Gas Prices
Gas prices for each property were provided by Windsor and were held constant for the lives of the properties. The prices are based on a Henry Hub price of $9.44 per million British thermal units and were adjusted to reflect the actual price received for each property. The weighted average price over the lives of the properties was $8.54 per thousand cubic feet.
Operating Expenses and Capital Costs
Estimates of operating expenses and capital costs based on current costs were used for the lives of the properties with no increases in the future based on inflation. In certain cases, future costs, either higher or lower than current costs, may have been used because of anticipated changes in operating conditions. Future capital costs were estimated using expected 2006 values and were not adjusted for inflation.
Abandonment costs, net of salvage, were provided by Windsor for certain properties.
The estimated future revenue to be derived from the production and sale of the net proved reserves, as of December 31, 2005, of the properties appraised is summarized as follows, expressed in thousands of dollars (M$):
| Developed Producing | Developed Nonproducing | Undeveloped | Total Proved | |||||
Future Gross Revenue, M$ | 153,915 | 100,195 | 165,308 | 419,418 | ||||
Production and Ad Valorem Taxes, M$ | 17,497 | 12,624 | 14,978 | 45,099 | ||||
Operating Expenses, M$ | 32,496 | 7,121 | 24,409 | 64,026 | ||||
Capital Costs, M$ | 290 | 3,431 | 38,748 | 42,469 | ||||
Future Net Revenue (1), M$ | 103,632 | 77,019 | 87,173 | 267,824 | ||||
Present Worth at 10 Percent (1), M$ | 60,413 | 36,290 | 38,485 | 135,188 |
| (1) | Future income tax expenses were not taken into account in the preparation of these estimates. |
The development of production and the resulting timing of capital expenditures were based on a development plan provided by Windsor.
Appendix A bound with this report includes (i) summary projections of proved reserves and revenue sorted by reserves classification, (ii) summary projections of proved reserves and revenue sorted by field and reserves classification, (iii) tabulation of reserves and revenue sorted by field, reserves classification, and lease, and (iv) tabulation of reserves and revenue sorted by company, field, reserves classification, and lease. The separately bound Appendix B contains projections of proved reserves and revenue sorted by field and reserves classification, and lease.
B-6
Table of Contents
Index to Financial Statements
In our opinion, the information relating to estimated proved reserves, estimated future net revenue from proved reserves, and present worth of estimated future net revenue from proved reserves of crude oil, condensate, and natural gas contained in this report has been prepared in accordance with Paragraphs 10–13, 15, and 30(a)–(b) of Statement of Financial Accounting Standards No. 69 (November 1982) of the FASB and Rules 4–10(a) (1)–(13) of Regulation S–X and Rule 302(b) of Regulation S–K of the SEC; provided, however, that (i) certain estimated data have not been provided with respect to changes in reserves information and (ii) future income tax expenses have not been taken into account in estimating the future net revenue and present worth values set forth herein.
To the extent that the above-enumerated rules, regulations, and statements require determinations of an accounting or legal nature or information beyond the scope of our report, we are necessarily unable to express an opinion as to whether the above-described information is in accordance therewith or sufficient therefore.
B-7
Table of Contents
Index to Financial Statements
SUMMARY AND CONCLUSIONS
Wexford and Gulfport own interests in certain properties located in the states of Colorado, North Dakota, Texas, and Wyoming. The estimated net proved reserves of the properties appraised, as of December 31, 2005, are summarized and expressed in thousands of barrels (Mbbl) or millions of cubic feet (MMcf) as follows:
| Net Proved Reserves | ||||
| Oil and Condensate (Mbbl) | Sales Gas (MMcf) | |||
Developed Producing | 258 | 15,734 | ||
Developed Nonproducing | 261 | 10,031 | ||
Total Developed | 519 | 25,765 | ||
Undeveloped | 392 | 17,252 | ||
Total Proved | 911 | 43,017 | ||
Estimated revenue and costs attributable to the Wexford and Gulfport interests in the proved reserves, as of December 31, 2005, of the properties appraised under the aforementioned assumptions concerning future prices and costs are summarized as follows, expressed in thousands of dollars (M$):
| Developed Producing | Developed Nonproducing | Undeveloped | Total Proved | |||||
Future Gross Revenue, M$ | 153,915 | 100,195 | 165,308 | 419,418 | ||||
Production and Ad Valorem Taxes, M$ | 17,497 | 12,624 | 14,978 | 45,099 | ||||
Operating Expenses, M$ | 32,496 | 7,121 | 24,409 | 64,026 | ||||
Capital Costs, M$ | 290 | 3,431 | 38,748 | 42,469 | ||||
Future Net Revenue(1), M$ | 103,632 | 77,019 | 87,173 | 267,824 | ||||
Present Worth at 10 Percent(1), M$ | 60,413 | 36,290 | 38,485 | 135,188 |
| (1) | Future income tax expenses were not taken into account in the preparation of these estimates. |
All gas volumes shown herein are expressed at a temperature base of 60°F and at the legal pressure base of the state in which the reserves are located.
Submitted,
/s/ DeGOLYER and MacNAUGHTON
DeGOLYER and MacNAUGHTON
SIGNED: February 8, 2006
/s/ James Terracio, P.E. |
James Terracio, P.E. Senior Vice President DeGolyer and MacNaughton |
B-8
Table of Contents
Index to Financial Statements
Through and including , 2006 (the 25th day after the date of this prospectus), all dealers effecting transactions in these securities, whether or not participating in this offering, may be required to deliver a prospectus. This is in addition to a dealer’s obligation to deliver a prospectus when acting as an underwriter and with respect to an unsold allotment or subscription.
Shares
Common Stock
PROSPECTUS
Johnson Rice & Company L.L.C.
, 2006
Table of Contents
Index to Financial Statements
PART II
INFORMATION NOT REQUIRED IN PROSPECTUS
Item 13. Other Expenses of Issuance and Distribution.
The following table sets forth the fees and expenses in connection with the issuance and distribution of the securities being registered hereunder. Except for the SEC registration fee and NASD filing fee, all amounts are estimates.
SEC registration fee | $ | 18,725 | |
NASD filing fee | * | ||
Nasdaq listing fee | * | ||
Accounting fees and expenses | * | ||
Legal fees and expenses | * | ||
Blue Sky fees and expenses (including counsel fees) | * | ||
Printing and Engraving expenses | * | ||
Transfer Agent and Registrar fees and expenses | * | ||
Miscellaneous expenses | * | ||
Total | $ | * | |
| * | To be completed by amendment. |
Item 14. Indemnification of Directors and Officers.
Limitation of Liability
Section 102(b)(7) of the Delaware General Corporation Law (the “DGCL”) permits a corporation, in its certificate of incorporation, to limit or eliminate, subject to certain statutory limitations, the liability of directors to the corporation or its stockholders for monetary damages for breaches of fiduciary duty, except for liability:
| • | for any breach of the director’s duty of loyalty to the company or its stockholders; |
| • | for acts or omissions not in good faith or that involve intentional misconduct or a knowing violation of law; |
| • | in respect of certain unlawful dividend payments or stock redemptions or repurchases; and |
| • | for any transaction from which the director derives an improper personal benefit. |
In accordance with Section 102(b)(7) of the DGCL, Section 9.1 of our Certificate of Incorporation provides that that no director shall be personally liable to us or any of our stockholders for monetary damages resulting from breaches of their fiduciary duty as directors, except to the extent such limitation on or exemption from liability is not permitted under the DGCL. The effect of this provision of our certificate of incorporation is to eliminate our rights and those of our stockholders (through stockholders’ derivative suits on our behalf) to recover monetary damages against a director for breach of the fiduciary duty of care as a director, including breaches resulting from negligent or grossly negligent behavior, except, as restricted by Section 102(b)(7) of the DGCL. However, this provision does not limit or eliminate our rights or the rights of any stockholder to seek non-monetary relief, such as an injunction or rescission, in the event of a breach of a director’s duty of care.
If the DGCL is amended to authorize corporate action further eliminating or limiting the liability of directors, then, in accordance with our certificate of incorporation, the liability of our directors to us or our stockholders will be eliminated or limited to the fullest extent authorized by the DGCL, as so amended. Any repeal or amendment of provisions of our certificate of incorporation limiting or eliminating the liability of directors, whether by our stockholders or by changes in law, or the adoption of any other provisions inconsistent therewith, will (unless otherwise required by law) be prospective only, except to the extent such amendment or change in law permits us to further limit or eliminate the liability of directors on a retroactive basis.
II-1
Table of Contents
Index to Financial Statements
Indemnification
Section 145 of the DGCL permits a corporation, under specified circumstances, to indemnify its directors, officers, employees or agents against expenses (including attorneys’ fees), judgments, fines and amounts paid in settlements actually and reasonably incurred by them in connection with any action, suit or proceeding brought by third parties by reason of the fact that they were or are directors, officers, employees or agents of the corporation, if such directors, officers, employees or agents acted in good faith and in a manner they reasonably believed to be in or not opposed to the best interests of the corporation and, with respect to any criminal action or proceeding, had no reason to believe their conduct was unlawful. In a derivative action,i.e., one by or in the right of the corporation, indemnification may be made only for expenses actually and reasonably incurred by directors, officers, employees or agents in connection with the defense or settlement of an action or suit, and only with respect to a matter as to which they shall have acted in good faith and in a manner they reasonably believed to be in or not opposed to the best interests of the corporation, except that no indemnification shall be made if such person shall have been adjudged liable to the corporation, unless and only to the extent that the court in which the action or suit was brought shall determine upon application that the defendant directors, officers, employees or agents are fairly and reasonably entitled to indemnity for such expenses despite such adjudication of liability
Our certificate of incorporation provides that we will, to the fullest extent authorized or permitted by applicable law, indemnify our current and former directors and officers, as well as those persons who, while directors or officers of our corporation, are or were serving as directors, officers, employees or agents of another entity, trust or other enterprise, including service with respect to an employee benefit plan, in connection with any threatened, pending or completed proceeding, whether civil, criminal, administrative or investigative, against all expense, liability and loss (including, without limitation, attorney’s fees, judgments, fines, ERISA excise taxes and penalties and amounts paid in settlement) reasonably incurred or suffered by any such person in connection with any such proceeding. Notwithstanding the foregoing, a person eligible for indemnification pursuant to our certificate of incorporation will be indemnified by us in connection with a proceeding initiated by such person only if such proceeding was authorized by our board of directors, except for proceedings to enforce rights to indemnification.
The right to indemnification conferred by our certificate of incorporation is a contract right that includes the right to be paid by us the expenses incurred in defending or otherwise participating in any proceeding referenced above in advance of its final disposition, provided, however, that if the DGCL requires, an advancement of expenses incurred by our officer or director (solely in the capacity as an officer or director of our corporation) will be made only upon delivery to us of an undertaking, by or on behalf of such officer or director, to repay all amounts so advanced if it is ultimately determined that such person is not entitled to be indemnified for such expenses under our certificate of incorporation or otherwise.
The rights to indemnification and advancement of expenses will not be deemed exclusive of any other rights which any person covered by our certificate of incorporation may have or hereafter acquire under law, our certificate of incorporation, our bylaws, an agreement, vote of stockholders or disinterested directors, or otherwise.
Any repeal or amendment of provisions of our certificate of incorporation affecting indemnification rights, whether by our stockholders or by changes in law, or the adoption of any other provisions inconsistent therewith, will (unless otherwise required by law) be prospective only, except to the extent such amendment or change in law permits us to provide broader indemnification rights on a retroactive basis, and will not in any way diminish or adversely affect any right or protection existing at the time of such repeal or amendment or adoption of such inconsistent provision with respect to any act or omission occurring prior to such repeal or amendment or adoption of such inconsistent provision. Our certificate of incorporation also permits us, to the extent and in the manner authorized or permitted by law, to indemnify and to advance expenses to persons other that those specifically covered by our certificate of incorporation.
II-2
Table of Contents
Index to Financial Statements
Our bylaws include the provisions relating to advancement of expenses and indemnification rights consistent with those set forth in our certificate of incorporation. In addition, our bylaws provide for a right of indemnitee to bring a suit in the event a claim for indemnification or advancement of expenses is not paid in full by us within a specified period of time. Our bylaws also permit us to purchase and maintain insurance, at our expense, to protect us and/or any director, officer, employee or agent of our corporation or another entity, trust or other enterprise against any expense, liability or loss, whether or not we would have the power to indemnify such person against such expense, liability or loss under the DGCL.
Any repeal or amendment of provisions of our bylaws affecting indemnification rights, whether by our board of directors, stockholders or by changes in applicable law, or the adoption of any other provisions inconsistent therewith, will (unless otherwise required by law) be prospective only, except to the extent such amendment or change in law permits us to provide broader indemnification rights on a retroactive basis, and will not in any way diminish or adversely affect any right or protection existing thereunder with respect to any act or omission occurring prior to such repeal or amendment or adoption of such inconsistent provision.
Under the Underwriting Agreement, the underwriter is obligated, under certain circumstances, to indemnify directors and officers of the registrant against certain liabilities, including liabilities under the Securities Act of 1933, as amended (the “Securities Act”). Reference is made to the form of Underwriting Agreement filed as Exhibit 1.1 hereto.
Item 15. Recent Sales of Unregistered Securities.
On , 2006, we issued shares of our common stock to Windsor Energy Holdings, L.L.C. in exchange for the oil and natural gas assets and operations described in the prospectus contained in this Registration Statement and valued at an aggregate amount of $ million, in a transaction exempt from registration pursuant to Section 4(2) of the Securities Act. No underwriters, brokers or finders will be involved in the above transaction.
Item 16. Exhibits and Financial Statement Schedules.
(A) Exhibits:
Exhibit Number | Number Description | |
| 1.1** | Form of Underwriting Agreement. | |
| 3.1** | Certificate of Incorporation of the Company. | |
| 3.2** | Bylaws of the Company. | |
| 4.1** | Specimen Certificate for Shares of Common Stock. | |
| 4.2** | Registration Rights Agreement by and between the Company and Windsor Energy Holdings, L.L.C. | |
| 5.1** | Opinion of Akin Gump Strauss Hauer & Feld LLP. | |
| 10.1** | Loan Agreement dated May 21, 2004 between Americrest Bank, as lender, and Coastal Energy LLC. | |
| 10.2** | Loan Agreement dated September 19, 2003 between Americrest Bank, as lender, and Northranch Energy LLC. | |
| 10.3** | 2006 Equity Incentive Plan. | |
| 10.4** | Form of Stock Option Agreement. | |
| 10.5** | Form of Restricted Stock Agreement. | |
| 10.6** | Form of Administrative Services Agreement by and between the Company and Gulfport Energy Corporation. | |
| 10.7** | Form of Director and Officer Indemnification Agreement. | |
| 21.1** | List of Significant Subsidiaries of the Company. |
II-3
Table of Contents
Index to Financial Statements
Exhibit Number | Number Description | |
| 23.1* | Consent of Grant Thornton LLP. | |
| 23.2* | Consent of DeGolyer and MacNaughton. | |
| 23.3** | Consent of Akin Gump Strauss Hauer & Feld LLP (included in Exhibit 5.1). | |
| 24.1* | Power of Attorney (included on signature page). | |
| 99.1* | Consent of Gregory L. Cook to being named as a director. | |
| 99.2* | Consent of Zane L. Fleming to being named as a director. |
| * | Filed herewith. |
| ** | To be filed by amendment. |
(B) Financial Statement Schedules.
Item 17. Undertakings.
The undersigned Registrant hereby undertakes to provide to the underwriter at the closing specified in the underwriting agreements, certificates in such denominations and registered in such names as required by the underwriter to permit prompt delivery to each purchaser.
Insofar as indemnification by the Registrant for liabilities arising under the Securities Act may be permitted to directors, officers and controlling persons of the Registrant pursuant to the foregoing provisions, or otherwise, the Registrant has been advised that in the opinion of the Securities and Exchange Commission such indemnification is against public policy as expressed in the Securities Act and is, therefore, unenforceable. In the event that a claim for indemnification against such liabilities (other than the payment by the Registrant of expenses incurred or paid by a director, officer, or controlling person of the Registrant in the successful defense of any action, suit or proceeding) is asserted by such director, officer, or controlling person in connection with the securities being registered hereunder, the Registrant will, unless in the opinion of its counsel the matter has been settled by controlling precedent, submit to a court of appropriate jurisdiction the question whether such indemnification by it is against public policy as expressed in the Securities Act and will be governed by the final adjudication of such issue.
The Registrant hereby undertakes that:
(1) For purposes of determining any liability under the Securities Act, the information omitted from the form of prospectus filed as part of this Registration Statement in reliance upon Rule 430A and contained in a form of prospectus filed by the Registrant pursuant to Rule 424(b)(1) or (4) or 497(h) under the Securities Act shall be deemed to be part of this Registration Statement as of the time it was declared effective.
(2) For the purpose of determining any liability under the Securities Act, each post-effective amendment that contains a form of prospectus shall be deemed to be a new registration statement relating to the securities offered therein, and the offering of such securities at that time shall be deemed to be the initialbona fide offering thereof.
II-4
Table of Contents
Index to Financial Statements
SIGNATURES AND POWER OF ATTORNEY
Pursuant to the requirements of the Securities Act of 1933, the Registrant has duly caused this Registration Statement to be signed on its behalf by the undersigned, thereunto duly authorized, in the City of Oklahoma City, State of Oklahoma, on February 10, 2006.
WINDSOR ENERGY RESOURCES, INC. | ||
By: | /s/ Michael P. Cross | |
Michael P. Cross | ||
Chief Executive Officer and President | ||
KNOW ALL MEN BY THESE PRESENT, that each person whose signature appears below constitutes and appoints Mike Liddell, Michael P. Cross and Lisa Klein, and each of them, his or her true and lawful attorney-in-fact and agents, with full power of substitution and resubstitution, from such person and in each person’s name, place and stead, in any and all capacities, to sign any and all amendments (including post-effective amendments) to the Registration Statement, and to file the same, with all exhibits thereto and other documents in connection therewith, with the Securities and Exchange Commission and to sign and file any other registration statement for the same offering that is to be effective upon filing pursuant to Rule 462(b) under the Securities Act of 1933, as amended, granting unto said attorneys-in-fact and agents, full power and authority to do and perform each and every act and thing requisite and necessary to be done as fully to all said attorneys-in-fact and agents, or any of them, may lawfully do or cause to be done by virtue thereof.
Pursuant to the requirements of the Securities Act of 1933, this Amendment has been signed by the following persons in the capacities indicated on February 10, 2006.
Signature | Title | |
/s/ Michael P. Cross Michael P. Cross | Chief Executive Officer, President and Director (Principal Executive Officer) | |
/s/ Lisa Klein Lisa Klein | Chief Financial Officer (Principal Financial and Accounting Officer) | |
/s/ Mike Liddell Mike Liddell | Chairman of the Board and Director | |
II-5