UNITED STATES
SECURITIES AND EXCHANGE COMMISSION
Washington, D.C. 20549
FORM N-CSR
CERTIFIED SHAREHOLDER REPORT OF REGISTERED
MANAGEMENT INVESTMENT COMPANIES
Investment Company Act file number 811-21852
Columbia Funds Series Trust II
(Exact name of registrant as specified in charter)
225 Franklin Street
Boston, Massachusetts 02110
(Address of principal executive offices) (Zip code)
Christopher O. Petersen, Esq.
c/o Columbia Management Investment Advisers, LLC
225 Franklin Street
Boston, Massachusetts 02110
Ryan C. Larrenaga, Esq.
c/o Columbia Management Investment Advisers, LLC
225 Franklin Street
Boston, MA 02110
(Name and address of agent for service)
Registrant’s telephone number, including area code: (800) 345-6611
Date of fiscal year end: February 28
Date of reporting period: August 31, 2018
Form N-CSR is to be used by management investment companies to file reports with the Commission not later than 10 days after the transmission to stockholders of any report that is required to be transmitted to stockholders under Rule 30e-1 under the Investment Company Act of 1940 (17 CFR 270.30e-1). The Commission may use the information provided on Form N-CSR in its regulatory, disclosure review, inspection, and policymaking roles.
A registrant is required to disclose the information specified by Form N-CSR, and the Commission will make this information public. A registrant is not required to respond to the collection of information contained in Form N-CSR unless the Form displays a currently valid Office of Management and Budget (“OMB”) control number. Please direct comments concerning the accuracy of the information collection burden estimate and any suggestions for reducing the burden to Secretary, Securities and Exchange Commission, 450 Fifth Street, NW, Washington, DC 20549-0609. The OMB has reviewed this collection of information under the clearance requirements of 44 U.S.C. § 3507.
Item 1. Reports to Stockholders.

SemiAnnual Report
August 31, 2018
Columbia Global Equity Value Fund
Not FDIC Insured • No bank guarantee • May lose value
Dear Shareholders,
Volatility exists in financial markets and this is not a comfortable fact of life. How investors deal with this reality, including how they react to short term spikes in volatility as well as to longer periods of increased or decreased volatility, may have a significant impact on their overall investing success.
Too often, investors change their investment strategy based on something that’s happening at a moment in time rather than thinking about how that change in strategy might affect their ability to achieve their longer-term financial goals. Emotion replaces logic and reasoning. Investors may sell in reaction to a market drop (fear or panic), locking in low returns which means they won’t be invested when the market returns, or they invest more at a market peak (greed or conviction), essentially when it is expensive to do so. In both cases, selling and buying at the exact wrong time.
We believe the best outcomes come from a consistent approach to investing. Here are five areas where advisors can help us overcome the tendency to react emotionally as we struggle to make the right choices with our investments:
Long-term focus
The further away long-term goals, aspirations and objectives are, the easier it is to stray away from the goals and priorities that we set out. Advisors help us stay focused on what we want to accomplish.
Discipline through up-and-down markets
Advisors help set rules to prevent us from making rash decisions that we may regret later. Knowing ahead of time what you should do in case of certain situations will help you get through volatile markets and not make emotional decisions.
Tax-awareness
Taxes are one of the biggest drags on investment returns and are critical attributes of investing. Yet few of us take the necessary steps to ease the corrosive effect of taxes. Advisors have tools and knowledge that may help us to manage portfolios more tax-efficiently and keep more of what we earn.
Emotional objectivity
Our emotions are very hard to manage and making investment decisions in an emotional state can lead to exceedingly bad outcomes. An objective advisor can help prevent some of the reactionary mistakes emotions often lead us to.
Education and guidance
The role of the advisor is to teach and guide us toward achieving our financial goals. In terms of working through emotions, guidance is by far the most important component.
By understanding our own behaviors and biases, we can prepare for future challenges. Your success is our priority. Talk to your advisor about how working with Columbia Threadneedle Investments may help you stay the course and position your portfolio for consistent, sustainable outcomes, regardless of market conditions.
Sincerely,
Christopher O. Petersen
President, Columbia Funds
Columbia Funds are distributed by Columbia Management Investment Distributors, Inc., member FINRA, and managed by Columbia Management Investment Advisers, LLC.
© 2018 Columbia Management Investment Advisers, LLC. All rights reserved.
Columbia Global Equity Value Fund | Semiannual Report 2018
Columbia Global Equity Value Fund | Semiannual Report 2018
Fund at a Glance
(Unaudited)
Investment objective
Columbia Global Equity Value Fund (the Fund) seeks to provide shareholders with growth of capital and income.
Portfolio management
Fred Copper, CFA
Co-Portfolio Manager
Managed Fund since 2016
Melda Mergen, CFA, CAIA
Co-Portfolio Manager
Managed Fund since 2016
Peter Santoro, CFA
Co-Portfolio Manager
Managed Fund since 2016
Peter Schroeder, CFA
Co-Portfolio Manager
Managed Fund since 2016
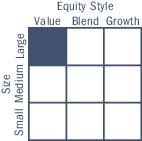
Morningstar style boxTM
The Morningstar Style Box is based on a fund’s portfolio holdings. For equity funds, the vertical axis shows the market capitalization of the stocks owned, and the horizontal axis shows investment style (value, blend, or growth). Information shown is based on the most recent data provided by Morningstar.
© 2018 Morningstar, Inc. All rights reserved. The Morningstar information contained herein: (1) is proprietary to Morningstar and/or its content providers; (2) may not be copied or distributed; and (3) is not warranted to be accurate, complete or timely. Neither Morningstar nor its content providers are responsible for any damages or losses arising from any use of this information.
| Average annual total returns (%) (for the period ended August 31, 2018) |
| | | Inception | 6 Months
cumulative | 1 Year | 5 Years | 10 Years |
| Class A | Excluding sales charges | 03/20/95 | 1.97 | 10.26 | 8.31 | 6.66 |
| | Including sales charges | | -3.92 | 3.93 | 7.03 | 6.03 |
| Advisor Class | 12/11/06 | 2.09 | 10.48 | 8.58 | 6.82 |
| Class C | Excluding sales charges | 06/26/00 | 1.53 | 9.39 | 7.48 | 5.85 |
| | Including sales charges | | 0.55 | 8.39 | 7.48 | 5.85 |
| Institutional Class* | 09/27/10 | 2.10 | 10.52 | 8.57 | 6.88 |
| Institutional 2 Class | 12/11/06 | 2.14 | 10.63 | 8.68 | 7.06 |
| Institutional 3 Class* | 02/28/13 | 2.15 | 10.62 | 8.76 | 6.90 |
| Class R | 12/11/06 | 1.85 | 10.01 | 8.04 | 6.39 |
| Class T | Excluding sales charges | 12/01/06 | 1.96 | 10.28 | 8.29 | 6.64 |
| | Including sales charges | | -0.61 | 7.55 | 7.74 | 6.37 |
| MSCI World Value Index (Net) | | 0.63 | 7.29 | 7.88 | 5.81 |
| MSCI World Index (Net) | | 3.89 | 13.10 | 10.23 | 7.13 |
Returns for Class A shares are shown with and without the maximum initial sales charge of 5.75%. Returns for Class C shares are shown with and without the 1.00% contingent deferred sales charge for the first year only. Returns for Class T shares are shown with and without the maximum initial sales charge of 2.50% per transaction. The Fund’s other share classes are not subject to sales charges and have limited eligibility. Please see the Fund’s prospectus for details. Performance for different share classes will vary based on differences in sales charges and fees associated with each share class. All results shown assume reinvestment of distributions during the period. Returns do not reflect the deduction of taxes that a shareholder may pay on Fund distributions or on the redemption of Fund shares. Performance results reflect the effect of any fee waivers or reimbursements of Fund expenses by Columbia Management Investment Advisers, LLC and/or any of its affiliates. Absent these fee waivers or expense reimbursement arrangements, performance results would have been lower.
The performance information shown represents past performance and is not a guarantee of future results. The investment return and principal value of your investment will fluctuate so that your shares, when redeemed, may be worth more or less than their original cost. Current performance may be lower or higher than the performance information shown. You may obtain performance information current to the most recent month-end by contacting your financial intermediary, visiting columbiathreadneedleus.com/investor/ or calling 800.345.6611.
| * | The returns shown for periods prior to the share class inception date (including returns for the Life of the Fund, if shown, which are since Fund inception) include the returns of the Fund’s oldest share class. Since the oldest share class of the Fund, Class B, are no longer available, Class A shares of the Fund were used. These returns are adjusted to reflect any higher class-related operating expenses of the newer share classes, as applicable. Please visit columbiathreadneedleus.com/investor/investment-products/mutual-funds/appended-performance for more information. |
The Fund’s performance prior to September 2014 reflects returns achieved pursuant to different principal investment strategies. If the Fund’s current strategies had been in place for the prior periods, results shown may have been different.
The MSCI World Value Index (Net) captures large and mid-cap securities exhibiting overall value style characteristics across 23 Developed Markets countries. The value investment style characteristics for index construction are defined using three variables: book value to price, 12-month forward earnings to price and dividend yield. With 819 constituents, the index targets 50% coverage of the free float-adjusted market capitalization of the MSCI World Index.
The MSCI World Index (Net) is a free float-adjusted market capitalization weighted index that is designed to measure the equity market performance of developed markets.
Indices are not available for investment, are not professionally managed and do not reflect sales charges, fees, brokerage commissions, taxes (except the MSCI World Value Index (Net) and the MSCI World Index (Net), which reflect reinvested dividends net of withholding taxes) or other expenses of investing. Securities in the Fund may not match those in an index.
| 2 | Columbia Global Equity Value Fund | Semiannual Report 2018 |
Fund at a Glance (continued)
(Unaudited)
| Top 10 holdings (%) (at August 31, 2018) |
| JPMorgan Chase & Co. (United States) | 4.0 |
| Pfizer, Inc. (United States) | 3.3 |
| Johnson & Johnson (United States) | 2.9 |
| Bank of America Corp. (United States) | 2.7 |
| Microsoft Corp. (United States) | 2.7 |
| Cisco Systems, Inc. (United States) | 2.3 |
| Morgan Stanley (United States) | 2.1 |
| Walmart, Inc. (United States) | 2.1 |
| Berkshire Hathaway, Inc., Class B (United States) | 2.0 |
| DowDuPont, Inc. (United States) | 1.9 |
Percentages indicated are based upon total investments (excluding Money Market Funds and derivatives, if any).
For further detail about these holdings, please refer to the section entitled “Portfolio of Investments.”
Fund holdings are as of the date given, are subject to change at any time, and are not recommendations to buy or sell any security.
| Equity sector breakdown (%) (at August 31, 2018) |
| Consumer Discretionary | 9.7 |
| Consumer Staples | 6.9 |
| Energy | 10.2 |
| Financials | 22.3 |
| Health Care | 11.3 |
| Industrials | 10.1 |
| Information Technology | 13.3 |
| Materials | 5.8 |
| Real Estate | 2.9 |
| Telecommunication Services | 3.1 |
| Utilities | 4.4 |
| Total | 100.0 |
Percentages indicated are based upon total equity investments. The Fund’s portfolio composition is subject to change.
| Country breakdown (%) (at August 31, 2018) |
| Brazil | 0.9 |
| Canada | 2.6 |
| China | 0.5 |
| Finland | 1.3 |
| France | 3.8 |
| Israel | 0.6 |
| Japan | 8.4 |
| Netherlands | 2.7 |
| Norway | 0.9 |
| Russian Federation | 0.5 |
| South Korea | 2.1 |
| Spain | 4.0 |
| Sweden | 0.4 |
| United Kingdom | 8.6 |
| United States(a) | 62.7 |
| Total | 100.0 |
| (a) | Includes investments in Money Market Funds. |
Country breakdown is based primarily on issuer’s place of organization/incorporation. Percentages indicated are based upon total investments and exclude investments in derivatives, if any. The Fund’s portfolio composition is subject to change.
The Fund may use place of organization/incorporation or other factors in determining whether an issuer is domestic (U.S.) or foreign for purposes of its investment policies. At August 31, 2018, the Fund invested at least 40% of its net assets in foreign companies in accordance with its principal investment strategy.
Columbia Global Equity Value Fund | Semiannual Report 2018
| 3 |
Understanding Your Fund’s Expenses
(Unaudited)
As an investor, you incur two types of costs. There are shareholder transaction costs, which generally include sales charges on purchases and may include redemption fees. There are also ongoing costs, which generally include management fees, distribution and/or service fees, and other fund expenses. The following information is intended to help you understand your ongoing costs (in dollars) of investing in the Fund and to help you compare these costs with the ongoing costs of investing in other mutual funds.
Analyzing your Fund’s expenses
To illustrate these ongoing costs, we have provided examples and calculated the expenses paid by investors in each share class of the Fund during the period. The actual and hypothetical information in the table is based on an initial investment of $1,000 at the beginning of the period indicated and held for the entire period. Expense information is calculated two ways and each method provides you with different information. The amount listed in the “Actual” column is calculated using the Fund’s actual operating expenses and total return for the period. You may use the Actual information, together with the amount invested, to estimate the expenses that you paid over the period. Simply divide your account value by $1,000 (for example, an $8,600 account value divided by $1,000 = 8.6), then multiply the results by the expenses paid during the period under the “Actual” column. The amount listed in the “Hypothetical” column assumes a 5% annual rate of return before expenses (which is not the Fund’s actual return) and then applies the Fund’s actual expense ratio for the period to the hypothetical return. You should not use the hypothetical account values and expenses to estimate either your actual account balance at the end of the period or the expenses you paid during the period. See “Compare with other funds” below for details on how to use the hypothetical data.
Compare with other funds
Since all mutual funds are required to include the same hypothetical calculations about expenses in shareholder reports, you can use this information to compare the ongoing cost of investing in the Fund with other funds. To do so, compare the hypothetical example with the 5% hypothetical examples that appear in the shareholder reports of other funds. As you compare hypothetical examples of other funds, it is important to note that hypothetical examples are meant to highlight the ongoing costs of investing in a fund only and do not reflect any transaction costs, such as sales charges, or redemption or exchange fees. Therefore, the hypothetical calculations are useful in comparing ongoing costs only, and will not help you determine the relative total costs of owning different funds. If transaction costs were included in these calculations, your costs would be higher.
| March 1, 2018 — August 31, 2018 |
| | Account value at the
beginning of the
period ($) | Account value at the
end of the
period ($) | Expenses paid during
the period ($) | Fund’s annualized
expense ratio (%) |
| | Actual | Hypothetical | Actual | Hypothetical | Actual | Hypothetical | Actual |
| Class A | 1,000.00 | 1,000.00 | 1,019.70 | 1,019.41 | 5.85 | 5.85 | 1.15 |
| Advisor Class | 1,000.00 | 1,000.00 | 1,020.90 | 1,020.62 | 4.64 | 4.63 | 0.91 |
| Class C | 1,000.00 | 1,000.00 | 1,015.30 | 1,015.68 | 9.60 | 9.60 | 1.89 |
| Institutional Class | 1,000.00 | 1,000.00 | 1,021.00 | 1,020.67 | 4.58 | 4.58 | 0.90 |
| Institutional 2 Class | 1,000.00 | 1,000.00 | 1,021.40 | 1,021.07 | 4.18 | 4.18 | 0.82 |
| Institutional 3 Class | 1,000.00 | 1,000.00 | 1,021.50 | 1,021.27 | 3.97 | 3.97 | 0.78 |
| Class R | 1,000.00 | 1,000.00 | 1,018.50 | 1,018.15 | 7.12 | 7.12 | 1.40 |
| Class T | 1,000.00 | 1,000.00 | 1,019.60 | 1,019.46 | 5.80 | 5.80 | 1.14 |
Expenses paid during the period are equal to the annualized expense ratio for each class as indicated above, multiplied by the average account value over the period and then multiplied by the number of days in the Fund’s most recent fiscal half year and divided by 365.
Expenses do not include fees and expenses incurred indirectly by the Fund from its investment in underlying funds, including affiliated and non-affiliated pooled investment vehicles, such as mutual funds and exchange-traded funds.
| 4 | Columbia Global Equity Value Fund | Semiannual Report 2018 |
Portfolio of Investments
August 31, 2018 (Unaudited)
(Percentages represent value of investments compared to net assets)
Investments in securities
| Common Stocks 99.4% |
| Issuer | Shares | Value ($) |
| Brazil 0.9% |
| Pagseguro Digital Ltd., Class A(a) | 255,358 | 7,377,292 |
| Canada 2.6% |
| Suncor Energy, Inc. | 366,077 | 15,075,051 |
| Yamana Gold, Inc. | 2,222,888 | 6,179,628 |
| Total | 21,254,679 |
| China 0.5% |
| Tencent Holdings Ltd. | 100,800 | 4,333,107 |
| Finland 1.3% |
| UPM-Kymmene OYJ | 269,902 | 10,401,186 |
| France 3.8% |
| Aperam SA | 103,816 | 4,665,931 |
| AXA SA | 519,056 | 13,101,237 |
| BNP Paribas SA | 169,999 | 9,980,766 |
| Casino Guichard Perrachon SA | 99,598 | 3,157,264 |
| Total | 30,905,198 |
| Israel 0.6% |
| Bezeq Israeli Telecommunication Corp., Ltd. (The) | 3,883,188 | 4,640,525 |
| Japan 8.4% |
| Hitachi Capital Corp. | 191,800 | 5,336,030 |
| Hoya Corp. | 125,900 | 7,356,335 |
| ITOCHU Corp. | 759,300 | 13,267,896 |
| Nippon Telegraph & Telephone Corp. | 271,400 | 12,074,856 |
| ORIX Corp. | 614,201 | 9,877,406 |
| Starts Corp., Inc. | 180,300 | 4,096,110 |
| Subaru Corp. | 235,700 | 7,001,014 |
| Sumitomo Mitsui Financial Group, Inc. | 232,900 | 9,156,105 |
| Total | 68,165,752 |
| Netherlands 2.7% |
| ING Groep NV | 559,279 | 7,588,950 |
| Koninklijke Ahold Delhaize NV | 296,265 | 7,207,926 |
| Signify NV | 256,842 | 7,226,655 |
| Total | 22,023,531 |
| Common Stocks (continued) |
| Issuer | Shares | Value ($) |
| Norway 0.9% |
| BW LPG Ltd.(a) | 1,558,361 | 6,089,503 |
| Kongsberg Automotive ASA(a) | 1,316,762 | 1,532,479 |
| Total | 7,621,982 |
| Russian Federation 0.5% |
| Sberbank of Russia PJSC, ADR | 354,174 | 3,844,559 |
| South Korea 2.1% |
| Hyundai Home Shopping Network Corp. | 67,447 | 6,875,682 |
| Youngone Corp. | 328,139 | 10,214,437 |
| Total | 17,090,119 |
| Spain 4.0% |
| ACS Actividades de Construccion y Servicios SA | 355,132 | 14,790,434 |
| Endesa SA | 470,010 | 10,523,931 |
| Tecnicas Reunidas SA | 206,533 | 6,988,222 |
| Total | 32,302,587 |
| Sweden 0.4% |
| Hemfosa Fastigheter AB | 242,945 | 3,304,742 |
| United Kingdom 8.6% |
| BP PLC, ADR | 219,503 | 9,412,289 |
| BT Group PLC | 2,933,758 | 8,266,844 |
| Inchcape PLC | 766,365 | 6,875,394 |
| John Wood Group PLC | 1,060,553 | 9,880,420 |
| Legal & General Group PLC | 3,155,557 | 10,403,470 |
| Nightstar Therapeutics PLC, ADR(a) | 90,995 | 1,956,393 |
| Royal Dutch Shell PLC, Class A | 465,746 | 15,104,470 |
| Shire PLC | 131,738 | 7,683,067 |
| Total | 69,582,347 |
| United States 62.1% |
| Aflac, Inc. | 182,538 | 8,440,557 |
| Alexion Pharmaceuticals, Inc.(a) | 13,090 | 1,600,122 |
| Alphabet, Inc., Class C(a) | 6,774 | 8,252,019 |
| Ameren Corp. | 152,014 | 9,611,845 |
| American Electric Power Co., Inc. | 213,582 | 15,320,237 |
| American Tower Corp. | 61,743 | 9,207,116 |
| Apple, Inc. | 51,276 | 11,671,956 |
| Applied Materials, Inc. | 172,498 | 7,420,864 |
The accompanying Notes to Financial Statements are an integral part of this statement.
Columbia Global Equity Value Fund | Semiannual Report 2018
| 5 |
Portfolio of Investments (continued)
August 31, 2018 (Unaudited)
| Common Stocks (continued) |
| Issuer | Shares | Value ($) |
| Bank of America Corp. | 701,785 | 21,706,210 |
| Berkshire Hathaway, Inc., Class B(a) | 78,148 | 16,311,051 |
| Biogen, Inc.(a) | 6,490 | 2,294,150 |
| BioMarin Pharmaceutical, Inc.(a) | 23,570 | 2,356,529 |
| BlackRock, Inc. | 31,036 | 14,868,106 |
| Booz Allen Hamilton Holdings Corp. | 172,997 | 8,850,527 |
| Broadcom, Inc. | 49,702 | 10,886,229 |
| Cisco Systems, Inc. | 393,848 | 18,814,119 |
| Comcast Corp., Class A | 209,216 | 7,738,900 |
| DISH Network Corp., Class A(a) | 145,688 | 5,150,071 |
| DowDuPont, Inc. | 220,579 | 15,469,205 |
| Eastman Chemical Co. | 105,358 | 10,222,887 |
| EOG Resources, Inc. | 102,447 | 12,112,309 |
| Equity LifeStyle Properties, Inc. | 115,490 | 11,188,671 |
| General Motors Co. | 278,890 | 10,053,984 |
| Home Depot, Inc. (The) | 51,516 | 10,342,867 |
| Honeywell International, Inc. | 59,358 | 9,441,483 |
| Humana, Inc. | 34,788 | 11,593,449 |
| Johnson & Johnson | 173,295 | 23,341,104 |
| JPMorgan Chase & Co. | 282,099 | 32,322,903 |
| L3 Technologies, Inc. | 53,510 | 11,436,157 |
| MasterCard, Inc., Class A | 38,962 | 8,398,649 |
| Microsoft Corp. | 192,022 | 21,569,831 |
| Morgan Stanley | 346,640 | 16,926,431 |
| Norfolk Southern Corp. | 82,537 | 14,348,232 |
| Patterson-UTI Energy, Inc. | 466,300 | 7,987,719 |
| Common Stocks (continued) |
| Issuer | Shares | Value ($) |
| PepsiCo, Inc. | 103,122 | 11,550,695 |
| Pfizer, Inc. | 636,811 | 26,440,392 |
| Philip Morris International, Inc. | 128,194 | 9,985,031 |
| Quotient Ltd.(a) | 516,177 | 3,948,754 |
| Royal Caribbean Cruises Ltd. | 69,997 | 8,580,232 |
| TESARO, Inc.(a) | 14,724 | 477,794 |
| Textron, Inc. | 154,648 | 10,675,351 |
| Tyson Foods, Inc., Class A | 112,500 | 7,066,125 |
| Vertex Pharmaceuticals, Inc.(a) | 13,462 | 2,482,393 |
| Walmart, Inc. | 173,616 | 16,642,830 |
| Total | 505,106,086 |
Total Common Stocks
(Cost $655,657,319) | 807,953,692 |
| Options Purchased Calls 0.0% |
| | | | | | Value ($) |
| (Cost $167,576) | 149,760 |
| Money Market Funds 0.4% |
| | Shares | Value ($) |
| Columbia Short-Term Cash Fund, 2.058%(b),(c) | 3,406,405 | 3,406,064 |
Total Money Market Funds
(Cost $3,406,064) | 3,406,064 |
Total Investments in Securities
(Cost $659,230,959) | 811,509,516 |
| Other Assets & Liabilities, Net | | 1,826,365 |
| Net Assets | $813,335,881 |
At August 31, 2018, securities and/or cash totaling $70,000 were pledged as collateral.
Investments in derivatives
| Forward foreign currency exchange contracts |
Currency to
be sold | Currency to
be purchased | Counterparty | Settlement
date | Unrealized
appreciation ($) | Unrealized
depreciation ($) |
| 8,964,000 EUR | 10,475,187 USD | JPMorgan | 09/12/2018 | 64,807 | — |
| 5,547,000 GBP | 7,259,353 USD | JPMorgan | 09/12/2018 | 65,899 | — |
| 12,767,153,000 KRW | 11,300,466 USD | JPMorgan | 09/12/2018 | — | (164,897) |
| 39,525,000 NOK | 4,847,997 USD | JPMorgan | 09/12/2018 | 133,555 | — |
| 21,112,000 SEK | 2,390,012 USD | JPMorgan | 09/12/2018 | 80,216 | — |
| 19,423,869 USD | 26,255,000 AUD | JPMorgan | 09/12/2018 | — | (549,333) |
| 4,047,706 USD | 5,327,000 CAD | JPMorgan | 09/12/2018 | 34,834 | — |
The accompanying Notes to Financial Statements are an integral part of this statement.
| 6 | Columbia Global Equity Value Fund | Semiannual Report 2018 |
Portfolio of Investments (continued)
August 31, 2018 (Unaudited)
| Forward foreign currency exchange contracts (continued) |
Currency to
be sold | Currency to
be purchased | Counterparty | Settlement
date | Unrealized
appreciation ($) | Unrealized
depreciation ($) |
| 6,447,580 USD | 6,415,000 CHF | JPMorgan | 09/12/2018 | 174,917 | — |
| 4,030,624 USD | 5,499,000 SGD | JPMorgan | 09/12/2018 | — | (23,831) |
| Total | | | | 554,228 | (738,061) |
| Call option contracts purchased |
| Description | Counterparty | Trading
currency | Notional
amount | Number of
contracts | Exercise
price/Rate | Expiration
date | Cost ($) | Value ($) |
| CBOE Volatility Index | JPMorgan | USD | 1,203,696 | 936 | 13.00 | 09/19/2018 | 167,576 | 149,760 |
Notes to Portfolio of Investments
| (a) | Non-income producing investment. |
| (b) | The rate shown is the seven-day current annualized yield at August 31, 2018. |
| (c) | As defined in the Investment Company Act of 1940, an affiliated company is one in which the Fund owns 5% or more of the company’s outstanding voting securities, or a company which is under common ownership or control with the Fund. Holdings and transactions in these affiliated companies during the period ended August 31, 2018 are as follows: |
| Issuer | Beginning
shares | Shares
purchased | Shares
sold | Ending
shares | Realized gain
(loss) —
affiliated
issuers ($) | Net change in
unrealized
appreciation
(depreciation) —
affiliated
issuers ($) | Dividends —
affiliated
issuers ($) | Value —
affiliated
issuers
at end of
period ($) |
| Columbia Short-Term Cash Fund, 2.058% |
| | 3,067,919 | 42,939,431 | (42,600,945) | 3,406,405 | (307) | — | 76,820 | 3,406,064 |
Abbreviation Legend
| ADR | American Depositary Receipt |
Currency Legend
| AUD | Australian Dollar |
| CAD | Canada Dollar |
| CHF | Swiss Franc |
| EUR | Euro |
| GBP | British Pound |
| KRW | South Korean Won |
| NOK | Norwegian Krone |
| SEK | Swedish Krona |
| SGD | Singapore Dollar |
| USD | US Dollar |
Fair value measurements
The Fund categorizes its fair value measurements according to a three-level hierarchy that maximizes the use of observable inputs and minimizes the use of unobservable inputs by prioritizing that the most observable input be used when available. Observable inputs are those that market participants would use in pricing an investment based on market data obtained from sources independent of the reporting entity. Unobservable inputs are those that reflect the Fund’s assumptions about the information market participants would use in pricing an investment. An investment’s level within the fair value hierarchy is based on the lowest level of any input that is deemed significant to the asset’s or liability’s fair value measurement. The input levels are not necessarily an indication of the risk or liquidity associated with investments at that level. For example, certain U.S. government securities are generally high quality and liquid, however, they are reflected as Level 2 because the inputs used to determine fair value may not always be quoted prices in an active market.
Fair value inputs are summarized in the three broad levels listed below:
| ■ | Level 1 — Valuations based on quoted prices for investments in active markets that the Fund has the ability to access at the measurement date. Valuation adjustments are not applied to Level 1 investments. |
| ■ | Level 2 — Valuations based on other significant observable inputs (including quoted prices for similar securities, interest rates, prepayment speeds, credit risks, etc.). |
The accompanying Notes to Financial Statements are an integral part of this statement.
Columbia Global Equity Value Fund | Semiannual Report 2018
| 7 |
Portfolio of Investments (continued)
August 31, 2018 (Unaudited)
Fair value measurements (continued)
| ■ | Level 3 — Valuations based on significant unobservable inputs (including the Fund’s own assumptions and judgment in determining the fair value of investments). |
Inputs that are used in determining fair value of an investment may include price information, credit data, volatility statistics, and other factors. These inputs can be either observable or unobservable. The availability of observable inputs can vary between investments, and is affected by various factors such as the type of investment, and the volume and level of activity for that investment or similar investments in the marketplace. The inputs will be considered by the Investment Manager, along with any other relevant factors in the calculation of an investment’s fair value. The Fund uses prices and inputs that are current as of the measurement date, which may include periods of market dislocations. During these periods, the availability of prices and inputs may be reduced for many investments. This condition could cause an investment to be reclassified between the various levels within the hierarchy.
Foreign equity securities actively traded in markets where there is a significant delay in the local close relative to the New York Stock Exchange are classified as Level 2. The values of these securities may include an adjustment to reflect the impact of significant market movements following the close of local trading, as described in Note 2 to the financial statements – Security valuation.
Certain investments that have been measured at fair value using the net asset value (NAV) per share (or its equivalent) are not categorized in the fair value hierarchy. The fair value amounts presented in the table are intended to reconcile the fair value hierarchy to the amounts presented in the Portfolio of Investments. The Columbia Short-Term Cash Fund seeks to provide shareholders with maximum current income consistent with liquidity and stability of principal. Columbia Short-Term Cash Fund prices its shares with a floating NAV and no longer seeks to maintain a stable NAV.
Investments falling into the Level 3 category are primarily supported by quoted prices from brokers and dealers participating in the market for those investments. However, these may be classified as Level 3 investments due to lack of market transparency and corroboration to support these quoted prices. Additionally, valuation models may be used as the pricing source for any remaining investments classified as Level 3. These models may rely on one or more significant unobservable inputs and/or significant assumptions by the Investment Manager. Inputs used in valuations may include, but are not limited to, financial statement analysis, capital account balances, discount rates and estimated cash flows, and comparable company data.
Under the direction of the Fund’s Board of Trustees (the Board), the Investment Manager’s Valuation Committee (the Committee) is responsible for overseeing the valuation procedures approved by the Board. The Committee consists of voting and non-voting members from various groups within the Investment Manager’s organization, including operations and accounting, trading and investments, compliance, risk management and legal.
The Committee meets at least monthly to review and approve valuation matters, which may include a description of specific valuation determinations, data regarding pricing information received from approved pricing vendors and brokers and the results of Board-approved valuation control policies and procedures (the Policies). The Policies address, among other things, instances when market quotations are or are not readily available, including recommendations of third party pricing vendors and a determination of appropriate pricing methodologies; events that require specific valuation determinations and assessment of fair value techniques; securities with a potential for stale pricing, including those that are illiquid, restricted, or in default; and the effectiveness of third party pricing vendors, including periodic reviews of vendors. The Committee meets more frequently, as needed, to discuss additional valuation matters, which may include the need to review back-testing results, review time-sensitive information or approve related valuation actions. The Committee reports to the Board, with members of the Committee meeting with the Board at each of its regularly scheduled meetings to discuss valuation matters and actions during the period, similar to those described earlier.
For investments categorized as Level 3, the Committee monitors information similar to that described above, which may include: (i) data specific to the issuer or comparable issuers, (ii) general market or specific sector news and (iii) quoted prices and specific or similar security transactions. The Committee considers this data and any changes from prior periods in order to assess the reasonableness of observable and unobservable inputs, any assumptions or internal models used to value those securities and changes in fair value. This data is also used to corroborate, when available, information received from approved pricing vendors and brokers. Various factors impact the frequency of monitoring this information (which may occur as often as daily). However, the Committee may determine that changes to inputs, assumptions and models are not required as a result of the monitoring procedures performed.
The following table is a summary of the inputs used to value the Fund’s investments at August 31, 2018:
| | Level 1
quoted prices
in active
markets for
identical
assets ($) | Level 2
other
significant
observable
inputs ($) | Level 3
significant
unobservable
inputs ($) | Investments
measured at
net asset
value ($) | Total ($) |
| Investments in Securities | | | | | |
| Common Stocks | | | | | |
| Brazil | 7,377,292 | — | — | — | 7,377,292 |
| Canada | 21,254,679 | — | — | — | 21,254,679 |
| China | — | 4,333,107 | — | — | 4,333,107 |
| Finland | — | 10,401,186 | — | — | 10,401,186 |
| France | — | 30,905,198 | — | — | 30,905,198 |
| Israel | — | 4,640,525 | — | — | 4,640,525 |
| Japan | — | 68,165,752 | — | — | 68,165,752 |
| Netherlands | — | 22,023,531 | — | — | 22,023,531 |
| Norway | — | 7,621,982 | — | — | 7,621,982 |
| Russian Federation | — | 3,844,559 | — | — | 3,844,559 |
| South Korea | — | 17,090,119 | — | — | 17,090,119 |
| Spain | — | 32,302,587 | — | — | 32,302,587 |
| Sweden | — | 3,304,742 | — | — | 3,304,742 |
The accompanying Notes to Financial Statements are an integral part of this statement.
| 8 | Columbia Global Equity Value Fund | Semiannual Report 2018 |
Portfolio of Investments (continued)
August 31, 2018 (Unaudited)
Fair value measurements (continued)
| | Level 1
quoted prices
in active
markets for
identical
assets ($) | Level 2
other
significant
observable
inputs ($) | Level 3
significant
unobservable
inputs ($) | Investments
measured at
net asset
value ($) | Total ($) |
| United Kingdom | 11,368,682 | 58,213,665 | — | — | 69,582,347 |
| United States | 505,106,086 | — | — | — | 505,106,086 |
| Total Common Stocks | 545,106,739 | 262,846,953 | — | — | 807,953,692 |
| Options Purchased Calls | 149,760 | — | — | — | 149,760 |
| Money Market Funds | — | — | — | 3,406,064 | 3,406,064 |
| Total Investments in Securities | 545,256,499 | 262,846,953 | — | 3,406,064 | 811,509,516 |
| Investments in Derivatives | | | | | |
| Asset | | | | | |
| Forward Foreign Currency Exchange Contracts | — | 554,228 | — | — | 554,228 |
| Liability | | | | | |
| Forward Foreign Currency Exchange Contracts | — | (738,061) | — | — | (738,061) |
| Total | 545,256,499 | 262,663,120 | — | 3,406,064 | 811,325,683 |
See the Portfolio of Investments for all investment classifications not indicated in the table.
The Fund’s assets assigned to the Level 2 input category are generally valued using the market approach, in which a security’s value is determined through reference to prices and information from market transactions for similar or identical assets. These assets include certain foreign securities for which a third party statistical pricing service may be employed for purposes of fair market valuation. The model utilized by such third party statistical pricing service takes into account a security’s correlation to available market data including, but not limited to, intraday index, ADR, and exchange-traded fund movements.
Forward foreign currency exchange contracts are valued at unrealized appreciation (depreciation).
There were no transfers of financial assets between levels during the period.
The accompanying Notes to Financial Statements are an integral part of this statement.
Columbia Global Equity Value Fund | Semiannual Report 2018
| 9 |
Statement of Assets and Liabilities
August 31, 2018 (Unaudited)
| Assets | |
| Investments in securities, at value | |
| Unaffiliated issuers (cost $655,657,319) | $807,953,692 |
| Affiliated issuers (cost $3,406,064) | 3,406,064 |
| Options purchased (cost $167,576) | 149,760 |
| Cash collateral held at broker for: | |
| Forward foreign currency exchange contracts | 70,000 |
| Unrealized appreciation on forward foreign currency exchange contracts | 554,228 |
| Receivable for: | |
| Investments sold | 32,951 |
| Capital shares sold | 19,471 |
| Dividends | 2,323,812 |
| Foreign tax reclaims | 602,846 |
| Prepaid expenses | 5,176 |
| Other assets | 15,898 |
| Total assets | 815,133,898 |
| Liabilities | |
| Due to custodian | 1,919 |
| Unrealized depreciation on forward foreign currency exchange contracts | 738,061 |
| Payable for: | |
| Capital shares purchased | 687,939 |
| Management services fees | 15,676 |
| Distribution and/or service fees | 4,972 |
| Transfer agent fees | 68,081 |
| Compensation of board members | 202,029 |
| Compensation of chief compliance officer | 91 |
| Other expenses | 79,249 |
| Total liabilities | 1,798,017 |
| Net assets applicable to outstanding capital stock | $813,335,881 |
| Represented by | |
| Paid in capital | 629,866,855 |
| Undistributed net investment income | 438,731 |
| Accumulated net realized gain | 30,900,932 |
| Unrealized appreciation (depreciation) on: | |
| Investments - unaffiliated issuers | 152,296,373 |
| Foreign currency translations | 34,639 |
| Forward foreign currency exchange contracts | (183,833) |
| Options purchased | (17,816) |
| Total - representing net assets applicable to outstanding capital stock | $813,335,881 |
The accompanying Notes to Financial Statements are an integral part of this statement.
| 10 | Columbia Global Equity Value Fund | Semiannual Report 2018 |
Statement of Assets and Liabilities (continued)
August 31, 2018 (Unaudited)
| Class A | |
| Net assets | $695,187,134 |
| Shares outstanding | 49,791,232 |
| Net asset value per share | $13.96 |
| Maximum sales charge | 5.75% |
| Maximum offering price per share (calculated by dividing the net asset value per share by 1.0 minus the maximum sales charge for Class A shares) | $14.81 |
| Advisor Class | |
| Net assets | $1,741,795 |
| Shares outstanding | 124,219 |
| Net asset value per share | $14.02 |
| Class C | |
| Net assets | $6,375,308 |
| Shares outstanding | 462,170 |
| Net asset value per share | $13.79 |
| Institutional Class | |
| Net assets | $107,892,295 |
| Shares outstanding | 7,716,772 |
| Net asset value per share | $13.98 |
| Institutional 2 Class | |
| Net assets | $569,581 |
| Shares outstanding | 40,829 |
| Net asset value per share | $13.95 |
| Institutional 3 Class | |
| Net assets | $429,539 |
| Shares outstanding | 31,573 |
| Net asset value per share | $13.60 |
| Class R | |
| Net assets | $1,132,672 |
| Shares outstanding | 81,303 |
| Net asset value per share | $13.93 |
| Class T | |
| Net assets | $7,557 |
| Shares outstanding | 537 |
| Net asset value per share(a) | $14.06 |
| Maximum sales charge | 2.50% |
| Maximum offering price per share (calculated by dividing the net asset value per share by 1.0 minus the maximum sales charge per transaction for Class T shares) | $14.42 |
| (a) | Net asset value per share rounds to this amount due to fractional shares outstanding. |
The accompanying Notes to Financial Statements are an integral part of this statement.
Columbia Global Equity Value Fund | Semiannual Report 2018
| 11 |
Statement of Operations
Six Months Ended August 31, 2018 (Unaudited)
| Net investment income | |
| Income: | |
| Dividends — unaffiliated issuers | $14,118,626 |
| Dividends — affiliated issuers | 76,820 |
| Foreign taxes withheld | (912,455) |
| Total income | 13,282,991 |
| Expenses: | |
| Management services fees | 2,889,691 |
| Distribution and/or service fees | |
| Class A | 872,178 |
| Class C | 78,723 |
| Class R | 2,848 |
| Class T | 10 |
| Transfer agent fees | |
| Class A | 496,728 |
| Advisor Class | 1,016 |
| Class C | 11,181 |
| Institutional Class | 76,917 |
| Institutional 2 Class | 136 |
| Institutional 3 Class | 42 |
| Class K | 5 |
| Class R | 811 |
| Class T | 6 |
| Plan administration fees | |
| Class K | 24 |
| Compensation of board members | 13,009 |
| Custodian fees | 47,991 |
| Printing and postage fees | 56,210 |
| Registration fees | 65,128 |
| Audit fees | 19,824 |
| Legal fees | 7,901 |
| Interest on collateral | 983 |
| Compensation of chief compliance officer | 84 |
| Other | 22,201 |
| Total expenses | 4,663,647 |
| Expense reduction | (8,429) |
| Total net expenses | 4,655,218 |
| Net investment income | 8,627,773 |
| Realized and unrealized gain (loss) — net | |
| Net realized gain (loss) on: | |
| Investments — unaffiliated issuers | 34,158,706 |
| Investments — affiliated issuers | (307) |
| Foreign currency translations | (61,189) |
| Forward foreign currency exchange contracts | (337,668) |
| Options purchased | (458,234) |
| Net realized gain | 33,301,308 |
| Net change in unrealized appreciation (depreciation) on: | |
| Investments — unaffiliated issuers | (25,710,041) |
| Foreign currency translations | (25,941) |
| Forward foreign currency exchange contracts | (244,751) |
| Options purchased | (17,816) |
| Net change in unrealized appreciation (depreciation) | (25,998,549) |
| Net realized and unrealized gain | 7,302,759 |
| Net increase in net assets resulting from operations | $15,930,532 |
The accompanying Notes to Financial Statements are an integral part of this statement.
| 12 | Columbia Global Equity Value Fund | Semiannual Report 2018 |
Statement of Changes in Net Assets
| | Six Months Ended
August 31, 2018
(Unaudited) | Year Ended
February 28, 2018 |
| Operations | | |
| Net investment income | $8,627,773 | $11,758,331 |
| Net realized gain | 33,301,308 | 66,294,868 |
| Net change in unrealized appreciation (depreciation) | (25,998,549) | 56,110,209 |
| Net increase in net assets resulting from operations | 15,930,532 | 134,163,408 |
| Distributions to shareholders | | |
| Net investment income | | |
| Class A | (5,016,280) | (12,363,063) |
| Advisor Class | (11,911) | (8,504) |
| Class B | — | (3,573) |
| Class C | (66,881) | (205,437) |
| Class I | — | (13) |
| Institutional Class | (912,924) | (2,102,510) |
| Institutional 2 Class | (3,634) | (7,506) |
| Institutional 3 Class | (3,743) | (4,994) |
| Class K | — | (6,751) |
| Class R | (6,770) | (13,958) |
| Class T | (61) | (140) |
| Net realized gains | | |
| Class A | (19,766,501) | — |
| Advisor Class | (43,987) | — |
| Class C | (550,696) | — |
| Institutional Class | (3,086,668) | — |
| Institutional 2 Class | (11,772) | — |
| Institutional 3 Class | (12,353) | — |
| Class R | (32,216) | — |
| Class T | (239) | — |
| Total distributions to shareholders | (29,526,636) | (14,716,449) |
| Decrease in net assets from capital stock activity | (14,536,980) | (81,439,576) |
| Total increase (decrease) in net assets | (28,133,084) | 38,007,383 |
| Net assets at beginning of period | 841,468,965 | 803,461,582 |
| Net assets at end of period | $813,335,881 | $841,468,965 |
| Undistributed (excess of distributions over) net investment income | $438,731 | $(2,166,838) |
The accompanying Notes to Financial Statements are an integral part of this statement.
Columbia Global Equity Value Fund | Semiannual Report 2018
| 13 |
Statement of Changes in Net Assets (continued)
| | Six Months Ended | Year Ended |
| | August 31, 2018 (Unaudited) | February 28, 2018 |
| | Shares | Dollars ($) | Shares | Dollars ($) |
| Capital stock activity |
| Class A | | | | |
| Subscriptions | 1,211,383 | 16,549,935 | 832,226 | 10,999,203 |
| Distributions reinvested | 1,678,211 | 23,004,911 | 854,531 | 11,437,806 |
| Redemptions | (3,121,753) | (43,481,680) | (7,670,211) | (101,887,176) |
| Net decrease | (232,159) | (3,926,834) | (5,983,454) | (79,450,167) |
| Advisor Class | | | | |
| Subscriptions | 83,755 | 1,183,313 | 41,335 | 563,670 |
| Distributions reinvested | 4,056 | 55,796 | 619 | 8,452 |
| Redemptions | (11,852) | (164,088) | (9,188) | (129,355) |
| Net increase | 75,959 | 1,075,021 | 32,766 | 442,767 |
| Class B | | | | |
| Subscriptions | — | — | 104 | 1,309 |
| Distributions reinvested | — | — | 280 | 3,519 |
| Redemptions | — | — | (167,770) | (2,179,305) |
| Net decrease | — | — | (167,386) | (2,174,477) |
| Class C | | | | |
| Subscriptions | 19,316 | 267,808 | 100,746 | 1,331,489 |
| Distributions reinvested | 43,945 | 594,932 | 14,372 | 192,089 |
| Redemptions | (1,005,732) | (13,568,179) | (439,318) | (5,699,415) |
| Net decrease | (942,471) | (12,705,439) | (324,200) | (4,175,837) |
| Class I | | | | |
| Redemptions | — | — | (213) | (2,535) |
| Net decrease | — | — | (213) | (2,535) |
| Institutional Class | | | | |
| Subscriptions | 368,548 | 5,135,263 | 1,596,406 | 20,428,379 |
| Distributions reinvested | 238,858 | 3,278,380 | 126,673 | 1,694,852 |
| Redemptions | (517,631) | (7,222,255) | (1,416,692) | (18,797,777) |
| Net increase | 89,775 | 1,191,388 | 306,387 | 3,325,454 |
| Institutional 2 Class | | | | |
| Subscriptions | 13,732 | 187,149 | 17,549 | 232,208 |
| Distributions reinvested | 1,117 | 15,301 | 557 | 7,451 |
| Redemptions | (3,021) | (41,888) | (13,573) | (179,298) |
| Net increase | 11,828 | 160,562 | 4,533 | 60,361 |
| Institutional 3 Class | | | | |
| Subscriptions | 15,424 | 207,278 | 43,784 | 591,625 |
| Distributions reinvested | 1,198 | 15,993 | 369 | 4,939 |
| Redemptions | (11,140) | (151,870) | (19,084) | (263,917) |
| Net increase | 5,482 | 71,401 | 25,069 | 332,647 |
| Class K | | | | |
| Subscriptions | — | — | 3,545 | 47,273 |
| Distributions reinvested | — | — | 499 | 6,703 |
| Redemptions | (27,969) | (404,295) | (2,617) | (34,778) |
| Net increase (decrease) | (27,969) | (404,295) | 1,427 | 19,198 |
| Class R | | | | |
| Subscriptions | 3,960 | 55,513 | 15,537 | 226,120 |
| Distributions reinvested | 2,599 | 35,526 | 937 | 12,550 |
| Redemptions | (6,396) | (89,152) | (4,203) | (55,437) |
| Net increase | 163 | 1,887 | 12,271 | 183,233 |
The accompanying Notes to Financial Statements are an integral part of this statement.
| 14 | Columbia Global Equity Value Fund | Semiannual Report 2018 |
Statement of Changes in Net Assets (continued)
| | Six Months Ended | Year Ended |
| | August 31, 2018 (Unaudited) | February 28, 2018 |
| | Shares | Dollars ($) | Shares | Dollars ($) |
| Class T | | | | |
| Distributions reinvested | 15 | 203 | 7 | 95 |
| Redemptions | (64) | (874) | (23) | (315) |
| Net decrease | (49) | (671) | (16) | (220) |
| Total net decrease | (1,019,441) | (14,536,980) | (6,092,816) | (81,439,576) |
The accompanying Notes to Financial Statements are an integral part of this statement.
Columbia Global Equity Value Fund | Semiannual Report 2018
| 15 |
The following table is intended to help you understand the Fund’s financial performance. Certain information reflects financial results for a single share of a class held for the periods shown. Per share net investment income (loss) amounts are calculated based on average shares outstanding during the period. Total return assumes reinvestment of all dividends and distributions, if any. Total return does not reflect payment of sales charges, if any. Total return and portfolio turnover are not annualized for periods of less than one year. The portfolio turnover rate is calculated without regard to purchase and sales transactions of short-term instruments and certain derivatives, if any. If such transactions were included, the Fund’s portfolio turnover rate may be higher.
| | Net asset value,
beginning of
period | Net
investment
income | Net
realized
and
unrealized
gain (loss) | Total from
investment
operations | Distributions
from net
investment
income | Distributions
from net
realized
gains | Total
distributions to
shareholders |
| Class A |
| Six Months Ended 8/31/2018 (Unaudited) | $14.20 | 0.15 | 0.12 | 0.27 | (0.10) | (0.41) | (0.51) |
| Year Ended 2/28/2018 | $12.29 | 0.19 | 1.96 | 2.15 | (0.24) | — | (0.24) |
| Year Ended 2/28/2017 | $10.48 | 0.24 | 1.84 | 2.08 | (0.27) | — | (0.27) |
| Year Ended 2/29/2016 | $13.00 | 0.18 | (2.17) | (1.99) | (0.26) | (0.27) | (0.53) |
| Year Ended 2/28/2015 | $13.78 | 0.22 | 0.97 | 1.19 | (0.16) | (1.81) | (1.97) |
| Year Ended 2/28/2014 | $11.82 | 0.14 | 2.45 | 2.59 | (0.14) | (0.49) | (0.63) |
| Advisor Class |
| Six Months Ended 8/31/2018 (Unaudited) | $14.26 | 0.16 | 0.13 | 0.29 | (0.12) | (0.41) | (0.53) |
| Year Ended 2/28/2018 | $12.35 | 0.19 | 1.99 | 2.18 | (0.27) | — | (0.27) |
| Year Ended 2/28/2017 | $10.52 | 0.26 | 1.87 | 2.13 | (0.30) | — | (0.30) |
| Year Ended 2/29/2016 | $13.05 | 0.19 | (2.15) | (1.96) | (0.30) | (0.27) | (0.57) |
| Year Ended 2/28/2015 | $13.82 | 0.26 | 0.97 | 1.23 | (0.19) | (1.81) | (2.00) |
| Year Ended 2/28/2014 | $11.86 | 0.19 | 2.43 | 2.62 | (0.17) | (0.49) | (0.66) |
| Class C |
| Six Months Ended 8/31/2018 (Unaudited) | $14.04 | 0.10 | 0.11 | 0.21 | (0.05) | (0.41) | (0.46) |
| Year Ended 2/28/2018 | $12.16 | 0.09 | 1.93 | 2.02 | (0.14) | — | (0.14) |
| Year Ended 2/28/2017 | $10.36 | 0.15 | 1.84 | 1.99 | (0.19) | — | (0.19) |
| Year Ended 2/29/2016 | $12.86 | 0.09 | (2.15) | (2.06) | (0.17) | (0.27) | (0.44) |
| Year Ended 2/28/2015 | $13.65 | 0.12 | 0.96 | 1.08 | (0.06) | (1.81) | (1.87) |
| Year Ended 2/28/2014 | $11.72 | 0.05 | 2.41 | 2.46 | (0.04) | (0.49) | (0.53) |
| Institutional Class |
| Six Months Ended 8/31/2018 (Unaudited) | $14.22 | 0.16 | 0.13 | 0.29 | (0.12) | (0.41) | (0.53) |
| Year Ended 2/28/2018 | $12.31 | 0.22 | 1.96 | 2.18 | (0.27) | — | (0.27) |
| Year Ended 2/28/2017 | $10.49 | 0.27 | 1.85 | 2.12 | (0.30) | — | (0.30) |
| Year Ended 2/29/2016 | $13.02 | 0.21 | (2.17) | (1.96) | (0.30) | (0.27) | (0.57) |
| Year Ended 2/28/2015 | $13.79 | 0.26 | 0.97 | 1.23 | (0.19) | (1.81) | (2.00) |
| Year Ended 2/28/2014 | $11.84 | 0.19 | 2.42 | 2.61 | (0.17) | (0.49) | (0.66) |
| Institutional 2 Class |
| Six Months Ended 8/31/2018 (Unaudited) | $14.19 | 0.17 | 0.12 | 0.29 | (0.12) | (0.41) | (0.53) |
| Year Ended 2/28/2018 | $12.29 | 0.22 | 1.96 | 2.18 | (0.28) | — | (0.28) |
| Year Ended 2/28/2017 | $10.47 | 0.27 | 1.86 | 2.13 | (0.31) | — | (0.31) |
| Year Ended 2/29/2016 | $13.00 | 0.20 | (2.15) | (1.95) | (0.31) | (0.27) | (0.58) |
| Year Ended 2/28/2015 | $13.78 | 0.30 | 0.94 | 1.24 | (0.21) | (1.81) | (2.02) |
| Year Ended 2/28/2014 | $11.83 | 0.17 | 2.46 | 2.63 | (0.19) | (0.49) | (0.68) |
The accompanying Notes to Financial Statements are an integral part of this statement.
| 16 | Columbia Global Equity Value Fund | Semiannual Report 2018 |
Financial Highlights (continued)
| | Net
asset
value,
end of
period | Total
return | Total gross
expense
ratio to
average
net assets(a) | Total net
expense
ratio to
average
net assets(a),(b) | Net investment
income
ratio to
average
net assets | Portfolio
turnover | Net
assets,
end of
period
(000’s) |
| Class A |
| Six Months Ended 8/31/2018 (Unaudited) | $13.96 | 1.97% | 1.15% (c),(d) | 1.15% (c),(d),(e) | 2.07% (c) | 12% | $695,187 |
| Year Ended 2/28/2018 | $14.20 | 17.59% | 1.15% | 1.15% (e) | 1.40% | 32% | $710,292 |
| Year Ended 2/28/2017 | $12.29 | 20.08% | 1.19% | 1.19% (e) | 2.07% | 36% | $688,572 |
| Year Ended 2/29/2016 | $10.48 | (15.81%) (f) | 1.18% | 1.18% (e) | 1.48% | 143% | $672,100 |
| Year Ended 2/28/2015 | $13.00 | 9.06% | 1.17% | 1.17% (e) | 1.66% | 61% | $894,934 |
| Year Ended 2/28/2014 | $13.78 | 22.21% | 1.19% | 1.18% (e) | 1.06% | 61% | $925,249 |
| Advisor Class |
| Six Months Ended 8/31/2018 (Unaudited) | $14.02 | 2.09% | 0.91% (c),(d) | 0.91% (c),(d),(e) | 2.26% (c) | 12% | $1,742 |
| Year Ended 2/28/2018 | $14.26 | 17.79% | 0.90% | 0.90% (e) | 1.36% | 32% | $688 |
| Year Ended 2/28/2017 | $12.35 | 20.49% | 0.94% | 0.94% (e) | 2.21% | 36% | $191 |
| Year Ended 2/29/2016 | $10.52 | (15.61%) (f) | 0.93% | 0.93% (e) | 1.56% | 143% | $105 |
| Year Ended 2/28/2015 | $13.05 | 9.38% | 0.92% | 0.92% (e) | 1.93% | 61% | $203 |
| Year Ended 2/28/2014 | $13.82 | 22.45% | 0.94% | 0.93% (e) | 1.42% | 61% | $105 |
| Class C |
| Six Months Ended 8/31/2018 (Unaudited) | $13.79 | 1.53% | 1.89% (c),(d) | 1.89% (c),(d),(e) | 1.46% (c) | 12% | $6,375 |
| Year Ended 2/28/2018 | $14.04 | 16.67% | 1.90% | 1.90% (e) | 0.68% | 32% | $19,715 |
| Year Ended 2/28/2017 | $12.16 | 19.32% | 1.94% | 1.94% (e) | 1.33% | 36% | $21,017 |
| Year Ended 2/29/2016 | $10.36 | (16.47%) (f) | 1.93% | 1.93% (e) | 0.71% | 143% | $21,304 |
| Year Ended 2/28/2015 | $12.86 | 8.25% | 1.92% | 1.92% (e) | 0.90% | 61% | $29,304 |
| Year Ended 2/28/2014 | $13.65 | 21.23% | 1.93% | 1.93% (e) | 0.39% | 61% | $31,265 |
| Institutional Class |
| Six Months Ended 8/31/2018 (Unaudited) | $13.98 | 2.10% | 0.90% (c),(d) | 0.90% (c),(d),(e) | 2.32% (c) | 12% | $107,892 |
| Year Ended 2/28/2018 | $14.22 | 17.84% | 0.90% | 0.90% (e) | 1.64% | 32% | $108,444 |
| Year Ended 2/28/2017 | $12.31 | 20.45% | 0.94% | 0.94% (e) | 2.31% | 36% | $90,114 |
| Year Ended 2/29/2016 | $10.49 | (15.65%) (f) | 0.93% | 0.93% (e) | 1.72% | 143% | $84,630 |
| Year Ended 2/28/2015 | $13.02 | 9.41% | 0.92% | 0.92% (e) | 1.91% | 61% | $111,869 |
| Year Ended 2/28/2014 | $13.79 | 22.40% | 0.93% | 0.93% (e) | 1.41% | 61% | $115,642 |
| Institutional 2 Class |
| Six Months Ended 8/31/2018 (Unaudited) | $13.95 | 2.14% | 0.82% (c),(d) | 0.82% (c),(d) | 2.38% (c) | 12% | $570 |
| Year Ended 2/28/2018 | $14.19 | 17.90% | 0.83% | 0.83% | 1.65% | 32% | $411 |
| Year Ended 2/28/2017 | $12.29 | 20.64% | 0.82% | 0.82% | 2.37% | 36% | $301 |
| Year Ended 2/29/2016 | $10.47 | (15.55%) (f) | 0.79% | 0.79% | 1.75% | 143% | $190 |
| Year Ended 2/28/2015 | $13.00 | 9.48% | 0.79% | 0.79% | 2.23% | 61% | $25 |
| Year Ended 2/28/2014 | $13.78 | 22.59% | 0.78% | 0.78% | 1.32% | 61% | $22 |
The accompanying Notes to Financial Statements are an integral part of this statement.
Columbia Global Equity Value Fund | Semiannual Report 2018
| 17 |
Financial Highlights (continued)
| | Net asset value,
beginning of
period | Net
investment
income | Net
realized
and
unrealized
gain (loss) | Total from
investment
operations | Distributions
from net
investment
income | Distributions
from net
realized
gains | Total
distributions to
shareholders |
| Institutional 3 Class |
| Six Months Ended 8/31/2018 (Unaudited) | $13.85 | 0.17 | 0.12 | 0.29 | (0.13) | (0.41) | (0.54) |
| Year Ended 2/28/2018 | $12.00 | 0.17 | 1.97 | 2.14 | (0.29) | — | (0.29) |
| Year Ended 2/28/2017 | $10.24 | 0.26 | 1.82 | 2.08 | (0.32) | — | (0.32) |
| Year Ended 2/29/2016 | $12.71 | 0.23 | (2.11) | (1.88) | (0.32) | (0.27) | (0.59) |
| Year Ended 2/28/2015 | $13.52 | 0.27 | 0.95 | 1.22 | (0.22) | (1.81) | (2.03) |
| Year Ended 2/28/2014 | $11.61 | 0.19 | 2.41 | 2.60 | (0.20) | (0.49) | (0.69) |
| Class R |
| Six Months Ended 8/31/2018 (Unaudited) | $14.17 | 0.13 | 0.12 | 0.25 | (0.08) | (0.41) | (0.49) |
| Year Ended 2/28/2018 | $12.27 | 0.15 | 1.95 | 2.10 | (0.20) | — | (0.20) |
| Year Ended 2/28/2017 | $10.46 | 0.21 | 1.84 | 2.05 | (0.24) | — | (0.24) |
| Year Ended 2/29/2016 | $12.98 | 0.15 | (2.17) | (2.02) | (0.23) | (0.27) | (0.50) |
| Year Ended 2/28/2015 | $13.76 | 0.19 | 0.97 | 1.16 | (0.13) | (1.81) | (1.94) |
| Year Ended 2/28/2014 | $11.82 | 0.12 | 2.43 | 2.55 | (0.12) | (0.49) | (0.61) |
| Class T |
| Six Months Ended 8/31/2018 (Unaudited) | $14.30 | 0.15 | 0.12 | 0.27 | (0.10) | (0.41) | (0.51) |
| Year Ended 2/28/2018 | $12.38 | 0.19 | 1.97 | 2.16 | (0.24) | — | (0.24) |
| Year Ended 2/28/2017 | $10.55 | 0.24 | 1.86 | 2.10 | (0.27) | — | (0.27) |
| Year Ended 2/29/2016 | $13.09 | 0.18 | (2.18) | (2.00) | (0.27) | (0.27) | (0.54) |
| Year Ended 2/28/2015 | $13.86 | 0.22 | 0.98 | 1.20 | (0.16) | (1.81) | (1.97) |
| Year Ended 2/28/2014 | $11.89 | 0.14 | 2.46 | 2.60 | (0.14) | (0.49) | (0.63) |
| Notes to Financial Highlights |
| (a) | In addition to the fees and expenses that the Fund bears directly, the Fund indirectly bears a pro rata share of the fees and expenses of any other funds in which it invests. Such indirect expenses are not included in the Fund’s reported expense ratios. |
| (b) | Total net expenses include the impact of certain fee waivers/expense reimbursements made by the Investment Manager and certain of its affiliates, if applicable. |
| (c) | Annualized. |
| (d) | Ratios include interest on collateral expense which is less than 0.01%. |
| (e) | The benefits derived from expense reductions had an impact of less than 0.01%. |
| (f) | The Fund received proceeds from regulatory settlements. Had the Fund not received these proceeds, the total return would have been lower by 0.05%. |
The accompanying Notes to Financial Statements are an integral part of this statement.
| 18 | Columbia Global Equity Value Fund | Semiannual Report 2018 |
Financial Highlights (continued)
| | Net
asset
value,
end of
period | Total
return | Total gross
expense
ratio to
average
net assets(a) | Total net
expense
ratio to
average
net assets(a),(b) | Net investment
income
ratio to
average
net assets | Portfolio
turnover | Net
assets,
end of
period
(000’s) |
| Institutional 3 Class |
| Six Months Ended 8/31/2018 (Unaudited) | $13.60 | 2.15% | 0.78% (c),(d) | 0.78% (c),(d) | 2.46% (c) | 12% | $430 |
| Year Ended 2/28/2018 | $13.85 | 17.96% | 0.78% | 0.78% | 1.26% | 32% | $361 |
| Year Ended 2/28/2017 | $12.00 | 20.61% | 0.77% | 0.77% | 2.29% | 36% | $12 |
| Year Ended 2/29/2016 | $10.24 | (15.38%) (f) | 0.71% | 0.71% | 1.95% | 143% | $2 |
| Year Ended 2/28/2015 | $12.71 | 9.50% | 0.72% | 0.72% | 2.01% | 61% | $2 |
| Year Ended 2/28/2014 | $13.52 | 22.76% | 0.72% | 0.72% | 1.46% | 61% | $6 |
| Class R |
| Six Months Ended 8/31/2018 (Unaudited) | $13.93 | 1.85% | 1.40% (c),(d) | 1.40% (c),(d),(e) | 1.83% (c) | 12% | $1,133 |
| Year Ended 2/28/2018 | $14.17 | 17.25% | 1.40% | 1.40% (e) | 1.13% | 32% | $1,150 |
| Year Ended 2/28/2017 | $12.27 | 19.82% | 1.44% | 1.44% (e) | 1.82% | 36% | $845 |
| Year Ended 2/29/2016 | $10.46 | (16.04%) (f) | 1.43% | 1.43% (e) | 1.25% | 143% | $830 |
| Year Ended 2/28/2015 | $12.98 | 8.80% | 1.42% | 1.42% (e) | 1.46% | 61% | $1,115 |
| Year Ended 2/28/2014 | $13.76 | 21.88% | 1.43% | 1.43% (e) | 0.87% | 61% | $992 |
| Class T |
| Six Months Ended 8/31/2018 (Unaudited) | $14.06 | 1.96% | 1.14% (c),(d) | 1.14% (c),(d),(e) | 2.10% (c) | 12% | $8 |
| Year Ended 2/28/2018 | $14.30 | 17.56% | 1.14% | 1.14% (e) | 1.39% | 32% | $8 |
| Year Ended 2/28/2017 | $12.38 | 20.14% | 1.19% | 1.19% (e) | 2.05% | 36% | $7 |
| Year Ended 2/29/2016 | $10.55 | (15.84%) (f) | 1.17% | 1.17% (e) | 1.49% | 143% | $11 |
| Year Ended 2/28/2015 | $13.09 | 9.08% | 1.16% | 1.16% (e) | 1.65% | 61% | $14 |
| Year Ended 2/28/2014 | $13.86 | 22.16% | 1.19% | 1.18% (e) | 1.08% | 61% | $19 |
The accompanying Notes to Financial Statements are an integral part of this statement.
Columbia Global Equity Value Fund | Semiannual Report 2018
| 19 |
Notes to Financial Statements
August 31, 2018 (Unaudited)
Note 1. Organization
Columbia Global Equity Value Fund (the Fund), a series of Columbia Funds Series Trust II (the Trust), is a diversified fund. The Trust is registered under the Investment Company Act of 1940, as amended (the 1940 Act), as an open-end management investment company organized as a Massachusetts business trust.
Fund shares
The Trust may issue an unlimited number of shares (without par value). Although all share classes generally have identical voting, dividend and liquidation rights, each share class votes separately when required by the Trust’s organizational documents or by law. Different share classes pay different distribution amounts to the extent the expenses of such share classes differ, and distributions in liquidation will be proportional to the net asset value of each share class. Each share class has its own expense and sales charge structure. The Fund offers each of the share classes identified below.
Class A shares are subject to a maximum front-end sales charge of 5.75% based on the initial investment amount. Class A shares purchased without an initial sales charge in accounts aggregating $1 million to $50 million at the time of purchase are subject to a contingent deferred sales charge (CDSC) if the shares are sold within 18 months after purchase, charged as follows: 1.00% CDSC if redeemed within 12 months after purchase, and 0.50% CDSC if redeemed more than 12, but less than 18, months after purchase.
Advisor Class shares are not subject to sales charges and are generally available only to omnibus retirement plans and certain investors as described in the Fund’s prospectus.
Class C shares are subject to a 1.00% CDSC on shares redeemed within 12 months after purchase. Effective July 1, 2018, Class C shares will automatically convert to Class A shares of the same Fund in the month of or the month following the 10-year anniversary of the Class C shares purchase date.
Institutional Class shares are not subject to sales charges and are generally available only to eligible investors, which are subject to different investment minimums as described in the Fund’s prospectus.
Institutional 2 Class shares are not subject to sales charges and are generally available only to investors purchasing through authorized investment professionals and omnibus retirement plans as described in the Fund’s prospectus.
Institutional 3 Class shares are not subject to sales charges and are available to institutional and certain other investors as described in the Fund’s prospectus.
The Fund no longer accepts investments by existing investors in Class K shares. When available, Class K shares were not subject to sales charges and were made available only to existing investors in Class K shares. On March 9, 2018, Class K shares were redeemed or exchanged for Advisor Class shares of the Fund in a tax free transaction that had no impact on fees and expenses paid by the shareholders.
Class R shares are not subject to sales charges and are generally available only to certain retirement plans and other investors as described in the Fund’s prospectus.
Class T shares are subject to a maximum front-end sales charge of 2.50% per transaction and must be purchased through financial intermediaries that, by written agreement with Columbia Management Investment Distributors, Inc., are specifically authorized to sell Class T shares.
Note 2. Summary of significant accounting policies
Basis of preparation
The Fund is an investment company that applies the accounting and reporting guidance in the Financial Accounting Standards Board (FASB) Accounting Standards Codification Topic 946, Financial Services - Investment Companies (ASC 946). The financial statements are prepared in accordance with U.S. generally accepted accounting principles (GAAP), which
| 20 | Columbia Global Equity Value Fund | Semiannual Report 2018 |
Notes to Financial Statements (continued)
August 31, 2018 (Unaudited)
requires management to make certain estimates and assumptions that affect the reported amounts of assets and liabilities, the disclosure of contingent assets and liabilities at the date of the financial statements and the reported amounts of income and expenses during the reporting period. Actual results could differ from those estimates.
The following is a summary of significant accounting policies followed by the Fund in the preparation of its financial statements.
Security valuation
All equity securities are valued at the close of business of the New York Stock Exchange. Equity securities are valued at the last quoted sales price on the principal exchange or market on which they trade, except for securities traded on the NASDAQ Stock Market, which are valued at the NASDAQ official close price. Unlisted securities or listed securities for which there were no sales during the day are valued at the mean of the latest quoted bid and ask prices on such exchanges or markets.
Foreign equity securities are valued based on the closing price on the foreign exchange in which such securities are primarily traded. If any foreign equity security closing prices are not readily available, the securities are valued at the mean of the latest quoted bid and ask prices on such exchanges or markets. Foreign currency exchange rates are generally determined at 4:00 p.m. Eastern (U.S.) time. Many securities markets and exchanges outside the U.S. close prior to the close of the New York Stock Exchange; therefore, the closing prices for securities in such markets or on such exchanges may not fully reflect events that occur after such close but before the close of the New York Stock Exchange. In those situations, foreign securities will be fair valued pursuant to a policy adopted by the Board of Trustees, including, if available, utilizing a third party pricing service to determine these fair values. The third party pricing service takes into account multiple factors, including, but not limited to, movements in the U.S. securities markets, certain depositary receipts, futures contracts and foreign exchange rates that have occurred subsequent to the close of the foreign exchange or market, to determine a good faith estimate that reasonably reflects the current market conditions as of the close of the New York Stock Exchange. The fair value of a security is likely to be different from the quoted or published price, if available.
Investments in open-end investment companies, including money market funds, are valued at their latest net asset value.
Forward foreign currency exchange contracts are marked-to-market based upon foreign currency exchange rates provided by a pricing service.
Option contracts are valued at the mean of the latest quoted bid and ask prices on their primary exchanges. Option contracts, including over-the-counter option contracts, with no readily available market quotations are valued using quotes obtained from independent brokers as of the close of the New York Stock Exchange.
Investments for which market quotations are not readily available, or that have quotations which management believes are not reflective of market value or reliable, are valued at fair value as determined in good faith under procedures approved by and under the general supervision of the Board of Trustees. If a security or class of securities (such as foreign securities) is valued at fair value, such value is likely to be different from the quoted or published price for the security.
The determination of fair value often requires significant judgment. To determine fair value, management may use assumptions including but not limited to future cash flows and estimated risk premiums. Multiple inputs from various sources may be used to determine fair value.
GAAP requires disclosure regarding the inputs and valuation techniques used to measure fair value and any changes in valuation inputs or techniques. In addition, investments shall be disclosed by major category. This information is disclosed following the Fund’s Portfolio of Investments.
Foreign currency transactions and translations
The values of all assets and liabilities denominated in foreign currencies are generally translated into U.S. dollars at exchange rates determined at the close of regular trading on the New York Stock Exchange. Net realized and unrealized gains (losses) on foreign currency transactions and translations include gains (losses) arising from the fluctuation in exchange
Columbia Global Equity Value Fund | Semiannual Report 2018
| 21 |
Notes to Financial Statements (continued)
August 31, 2018 (Unaudited)
rates between trade and settlement dates on securities transactions, gains (losses) arising from the disposition of foreign currency and currency gains (losses) between the accrual and payment dates on dividends, interest income and foreign withholding taxes.
For financial statement purposes, the Fund does not distinguish that portion of gains (losses) on investments which is due to changes in foreign exchange rates from that which is due to changes in market prices of the investments. Such fluctuations are included with the net realized and unrealized gains (losses) on investments in the Statement of Operations.
Derivative instruments
The Fund invests in certain derivative instruments, as detailed below, to meet its investment objectives. Derivatives are instruments whose values depend on, or are derived from, in whole or in part, the value of one or more securities, currencies, commodities, indices, or other assets or instruments. Derivatives may be used to increase investment flexibility (including to maintain cash reserves while maintaining desired exposure to certain assets), for risk management (hedging) purposes, to facilitate trading, to reduce transaction costs and to pursue higher investment returns. The Fund may also use derivative instruments to mitigate certain investment risks, such as foreign currency exchange rate risk, interest rate risk and credit risk. Derivatives may involve various risks, including the potential inability of the counterparty to fulfill its obligations under the terms of the contract, the potential for an illiquid secondary market (making it difficult for the Fund to sell or terminate, including at favorable prices) and the potential for market movements which may expose the Fund to gains or losses in excess of the amount shown in the Statement of Assets and Liabilities. The notional amounts of derivative instruments, if applicable, are not recorded in the financial statements.
A derivative instrument may suffer a marked-to-market loss if the value of the contract decreases due to an unfavorable change in the market rates or values of the underlying instrument. Losses can also occur if the counterparty does not perform its obligations under the contract. The Fund’s risk of loss from counterparty credit risk on over-the-counter derivatives is generally limited to the aggregate unrealized gain netted against any collateral held by the Fund and the amount of any variation margin held by the counterparty, plus any replacement costs or related amounts. With exchange-traded or centrally cleared derivatives, there is reduced counterparty credit risk to the Fund since the clearinghouse or central counterparty (CCP) provides some protection in the case of clearing member default. The clearinghouse or CCP stands between the buyer and the seller of the contract; therefore, additional counterparty credit risk is failure of the clearinghouse or CCP. However, credit risk still exists in exchange-traded or centrally cleared derivatives with respect to initial and variation margin that is held in a broker’s customer account. While brokers are required to segregate customer margin from their own assets, in the event that a broker becomes insolvent or goes into bankruptcy and at that time there is a shortfall in the aggregate amount of margin held by the broker for all its clients, U.S. bankruptcy laws will typically allocate that shortfall on a pro-rata basis across all the broker’s customers (including the Fund), potentially resulting in losses to the Fund.
In order to better define its contractual rights and to secure rights that will help the Fund mitigate its counterparty risk, the Fund may enter into an International Swaps and Derivatives Association, Inc. Master Agreement (ISDA Master Agreement) or similar agreement with its derivatives contract counterparties. An ISDA Master Agreement is an agreement between the Fund and a counterparty that governs over-the-counter derivatives and typically contains, among other things, collateral posting terms and netting provisions in the event of a default and/or termination event. Under an ISDA Master Agreement, the Fund may, under certain circumstances, offset with the counterparty certain derivative instrument’s payables and/or receivables with collateral held and/or posted and create one single net payment. The provisions of the ISDA Master Agreement typically permit a single net payment in the event of default (close-out netting), including the bankruptcy or insolvency of the counterparty. Note, however, that bankruptcy or insolvency laws of a particular jurisdiction may impose restrictions on or prohibitions against the right of offset or netting in bankruptcy, insolvency or other events.
Collateral (margin) requirements differ by type of derivative. Margin requirements are established by the clearinghouse or CCP for exchange-traded and centrally cleared derivatives. Brokers can ask for margin in excess of the minimum in certain circumstances. Collateral terms are contract specific for over-the-counter derivatives. For over-the-counter derivatives traded under an ISDA Master Agreement, the collateral requirements are typically calculated by netting the marked-to-market amount for each transaction under such agreement and comparing that amount to the value of any variation margin currently pledged by the Fund and/or the counterparty. Generally, the amount of collateral due from or to a party has to exceed a minimum transfer amount threshold (e.g., $250,000) before a transfer has to be made. To the extent amounts due to the Fund from its counterparties are not fully collateralized, contractually or otherwise, the Fund bears the risk of loss from counterparty
| 22 | Columbia Global Equity Value Fund | Semiannual Report 2018 |
Notes to Financial Statements (continued)
August 31, 2018 (Unaudited)
nonperformance. The Fund may also pay interest expense on cash collateral received from the broker. Any interest expense paid by the Fund is shown on the Statement of Operations. The Fund attempts to mitigate counterparty risk by only entering into agreements with counterparties that it believes have the financial resources to honor their obligations and by monitoring the financial stability of those counterparties.
Certain ISDA Master Agreements allow counterparties of over-the-counter derivatives transactions to terminate derivatives contracts prior to maturity in the event the Fund’s net asset value declines by a stated percentage over a specified time period or if the Fund fails to meet certain terms of the ISDA Master Agreement, which would cause the Fund to accelerate payment of any net liability owed to the counterparty. The Fund also has termination rights if the counterparty fails to meet certain terms of the ISDA Master Agreement. In determining whether to exercise such termination rights, the Fund would consider, in addition to counterparty credit risk, whether termination would result in a net liability owed from the counterparty.
For financial reporting purposes, the Fund does not offset derivative assets and derivative liabilities that are subject to netting arrangements in the Statement of Assets and Liabilities.
Forward foreign currency exchange contracts
Forward foreign currency exchange contracts are over-the-counter agreements between two parties to buy and sell a currency at a set price on a future date. The Fund utilized forward foreign currency exchange contracts to hedge the currency exposure associated with some or all of the Fund’s securities, to shift investment exposure from one currency to another, to shift U.S. dollar exposure to achieve a representative weighted mix of major currencies in its benchmark and to recover an underweight country exposure in its portfolio. These instruments may be used for other purposes in future periods.
The values of forward foreign currency exchange contracts fluctuate daily with changes in foreign currency exchange rates. Changes in the value of these contracts are recorded as unrealized appreciation or depreciation until the contract is exercised or has expired. The Fund will realize a gain or loss when the forward foreign currency exchange contract is closed or expires.
The use of forward foreign currency exchange contracts does not eliminate fluctuations in the prices of the Fund’s portfolio securities. The risks of forward foreign currency exchange contracts include movement in the values of the foreign currencies relative to the U.S. dollar (or other foreign currencies) and the possibility that counterparties will not complete their contractual obligations, which may be in excess of the amount reflected, if any, in the Statement of Assets and Liabilities.
Options contracts
Options are contracts which entitle the holder to purchase or sell securities or other identified assets at a specified price, or in the case of index option contracts, to receive or pay the difference between the index value and the strike price of the index option contract. Option contracts can be either exchange-traded or over-the-counter. The Fund purchased option contracts to decrease the Fund’s exposure to equity market risk and to increase return on investments. These instruments may be used for other purposes in future periods. Completion of transactions for option contracts traded in the over-the-counter market depends upon the performance of the other party. Cash collateral may be collected or posted by the Fund to secure certain over-the-counter option contract trades. Cash collateral held or posted by the Fund for such option contract trades must be returned to the broker or the Fund upon closure, exercise or expiration of the contract.
Options contracts purchased are recorded as investments. When the Fund writes an options contract, the premium received is recorded as an asset and an amount equivalent to the premium is recorded as a liability in the Statement of Assets and Liabilities and is subsequently adjusted to reflect the current fair value of the option written. Changes in the fair value of the written option are recorded as unrealized appreciation or depreciation until the contract is exercised or has expired. The Fund will realize a gain or loss when the option contract is closed or expires. When option contracts are exercised, the proceeds on sales for a written call or purchased put option contract, or the purchase cost for a written put or purchased call option contract, is adjusted by the amount of premium received or paid.
For over-the-counter options purchased, the Fund bears the risk of loss of the amount of the premiums paid plus the positive change in market values net of any collateral held by the Fund should the counterparty fail to perform under the contracts. Option contracts written by the Fund do not typically give rise to significant counterparty credit risk, as options written generally obligate the Fund and not the counterparty to perform. The risk in writing a call option contract is that the Fund
Columbia Global Equity Value Fund | Semiannual Report 2018
| 23 |
Notes to Financial Statements (continued)
August 31, 2018 (Unaudited)
gives up the opportunity for profit if the market price of the security increases above the strike price and the option contract is exercised. The risk in writing a put option contract is that the Fund may incur a loss if the market price of the security decreases below the strike price and the option contract is exercised. Exercise of a written option could result in the Fund purchasing or selling a security or foreign currency when it otherwise would not, or at a price different from the current market value. In purchasing and writing options, the Fund bears the risk of an unfavorable change in the value of the underlying instrument or the risk that the Fund may not be able to enter into a closing transaction due to an illiquid market.
Effects of derivative transactions in the financial statements
The following tables are intended to provide additional information about the effect of derivatives on the financial statements of the Fund, including: the fair value of derivatives by risk category and the location of those fair values in the Statement of Assets and Liabilities; and the impact of derivative transactions over the period in the Statement of Operations, including realized and unrealized gains (losses). The derivative instrument schedules following the Portfolio of Investments present additional information regarding derivative instruments outstanding at the end of the period, if any.
The following table is a summary of the fair value of derivative instruments (not considered to be hedging instruments for accounting disclosure purposes) at August 31, 2018:
| | Asset derivatives | |
Risk exposure
category | Statement
of assets and liabilities
location | Fair value ($) |
| Equity risk | Investments, at value — Options Purchased | 149,760 |
| Foreign exchange risk | Unrealized appreciation on forward foreign currency exchange contracts | 554,228 |
| Total | | 703,988 |
| | Liability derivatives | |
Risk exposure
category | Statement
of assets and liabilities
location | Fair value ($) |
| Foreign exchange risk | Unrealized depreciation on forward foreign currency exchange contracts | 738,061 |
The following table indicates the effect of derivative instruments (not considered to be hedging instruments for accounting disclosure purposes) in the Statement of Operations for the six months ended August 31, 2018:
| Amount of realized gain (loss) on derivatives recognized in income |
| Risk exposure category | Forward
foreign
currency
exchange
contracts
($) | Options
contracts
purchased
($) | Total
($) |
| Equity risk | — | (458,234) | (458,234) |
| Foreign exchange risk | (337,668) | — | (337,668) |
| Total | (337,668) | (458,234) | (795,902) |
| |
| Change in unrealized appreciation (depreciation) on derivatives recognized in income |
| Risk exposure category | Forward
foreign
currency
exchange
contracts
($) | Options
contracts
purchased
($) | Total
($) |
| Equity risk | — | (17,816) | (17,816) |
| Foreign exchange risk | (244,751) | — | (244,751) |
| Total | (244,751) | (17,816) | (262,567) |
| 24 | Columbia Global Equity Value Fund | Semiannual Report 2018 |
Notes to Financial Statements (continued)
August 31, 2018 (Unaudited)
The following table is a summary of the average outstanding volume by derivative instrument for the six months ended August 31, 2018:
| Derivative instrument | Average
value ($)* |
| Options contracts — purchased | 74,880 |
| Derivative instrument | Average unrealized
appreciation ($)* | Average unrealized
depreciation ($)* |
| Forward foreign currency exchange contracts | 335,009 | (421,811) |
| * | Based on the ending quarterly outstanding amounts for the six months ended August 31, 2018. |
Offsetting of assets and liabilities
The following table presents the Fund’s gross and net amount of assets and liabilities available for offset under netting arrangements as well as any related collateral received or pledged by the Fund as of August 31, 2018:
| | JPMorgan ($) |
| Assets | |
| Forward foreign currency exchange contracts | 554,228 |
| Options purchased calls | 149,760 |
| Total assets | 703,988 |
| Liabilities | |
| Forward foreign currency exchange contracts | 738,061 |
| Total financial and derivative net assets | (34,073) |
| Total collateral received (pledged) (a) | (34,073) |
| Net amount (b) | - |
| (a) | In some instances, the actual collateral received and/or pledged may be more than the amount shown due to overcollateralization. |
| (b) | Represents the net amount due from/(to) counterparties in the event of default. |
Security transactions
Security transactions are accounted for on the trade date. Cost is determined and gains (losses) are based upon the specific identification method for both financial statement and federal income tax purposes.
Income recognition
Corporate actions and dividend income are generally recorded net of any non-reclaimable tax withholdings, on the ex-dividend date or upon receipt of ex-dividend notification in the case of certain foreign securities.
The Fund may receive distributions from holdings in equity securities, business development companies (BDCs), exchange-traded funds (ETFs), limited partnerships (LPs), other regulated investment companies (RICs), and real estate investment trusts (REITs), which report information on the tax character of their distributions annually. These distributions are allocated to dividend income, capital gain and return of capital based on actual information reported. Return of capital is recorded as a reduction of the cost basis of securities held. If the Fund no longer owns the applicable securities, return of capital is recorded as a realized gain. With respect to REITs, to the extent actual information has not yet been reported, estimates for return of capital are made by the Fund’s management. Management’s estimates are subsequently adjusted when the actual character of the distributions is disclosed by the REITs, which could result in a proportionate change in return of capital to shareholders.
Awards from class action litigation are recorded as a reduction of cost basis if the Fund still owns the applicable securities on the payment date. If the Fund no longer owns the applicable securities, the proceeds are recorded as realized gains.
Columbia Global Equity Value Fund | Semiannual Report 2018
| 25 |
Notes to Financial Statements (continued)
August 31, 2018 (Unaudited)
Expenses
General expenses of the Trust are allocated to the Fund and other funds of the Trust based upon relative net assets or other expense allocation methodologies determined by the nature of the expense. Expenses directly attributable to the Fund are charged to the Fund. Expenses directly attributable to a specific class of shares are charged to that share class.
Determination of class net asset value
All income, expenses (other than class-specific expenses, which are charged to that share class, as shown in the Statement of Operations) and realized and unrealized gains (losses) are allocated to each class of the Fund on a daily basis, based on the relative net assets of each class, for purposes of determining the net asset value of each class.
Federal income tax status
The Fund intends to qualify each year as a regulated investment company under Subchapter M of the Internal Revenue Code, as amended, and will distribute substantially all of its investment company taxable income and net capital gain, if any, for its tax year, and as such will not be subject to federal income taxes. In addition, the Fund intends to distribute in each calendar year substantially all of its ordinary income, capital gain net income and certain other amounts, if any, such that the Fund should not be subject to federal excise tax. Therefore, no federal income or excise tax provision is recorded.
Foreign taxes
The Fund may be subject to foreign taxes on income, gains on investments or currency repatriation, a portion of which may be recoverable. The Fund will accrue such taxes and recoveries, as applicable, based upon its current interpretation of tax rules and regulations that exist in the markets in which it invests.
Realized gains in certain countries may be subject to foreign taxes at the Fund level, based on statutory rates. The Fund accrues for such foreign taxes on realized and unrealized gains at the appropriate rate for each jurisdiction, as applicable. The amount, if any, is disclosed as a liability on the Statement of Assets and Liabilities.
Distributions to shareholders
Distributions from net investment income, if any, are declared and paid each calendar quarter. Net realized capital gains, if any, are distributed at least annually. Income distributions and capital gain distributions are determined in accordance with federal income tax regulations, which may differ from GAAP.
Guarantees and indemnifications
Under the Trust’s organizational documents and, in some cases, by contract, its officers and trustees are indemnified against certain liabilities arising out of the performance of their duties to the Trust or its funds. In addition, certain of the Fund’s contracts with its service providers contain general indemnification clauses. The Fund’s maximum exposure under these arrangements is unknown since the amount of any future claims that may be made against the Fund cannot be determined, and the Fund has no historical basis for predicting the likelihood of any such claims.
Recent accounting pronouncement
Accounting Standards Update 2017-08 Premium Amortization on Purchased Callable Debt Securities
In March 2017, the Financial Accounting Standards Board issued Accounting Standards Update (ASU) No. 2017-08 Premium Amortization on Purchased Callable Debt Securities. ASU No. 2017-08 updates the accounting standards to shorten the amortization period for certain purchased callable debt securities, held at a premium, to be amortized to the earliest call date. The update applies to securities with explicit, noncontingent call features that are callable at fixed prices and on preset dates. The standard is effective for annual periods beginning after December 15, 2018 and interim periods within those fiscal years. At this time, management is evaluating the implication of this guidance and the impact it will have on the financial statement amounts and footnote disclosures, if any.
| 26 | Columbia Global Equity Value Fund | Semiannual Report 2018 |
Notes to Financial Statements (continued)
August 31, 2018 (Unaudited)
Note 3. Fees and other transactions with affiliates
Management services fees
The Fund has entered into a Management Agreement with Columbia Management Investment Advisers, LLC (the Investment Manager), a wholly-owned subsidiary of Ameriprise Financial, Inc. (Ameriprise Financial). Under the Management Agreement, the Investment Manager provides the Fund with investment research and advice, as well as administrative and accounting services. The management services fee is an annual fee that is equal to a percentage of the Fund’s daily net assets that declines from 0.72% to 0.52% as the Fund’s net assets increase. The annualized effective management services fee rate for the six months ended August 31, 2018 was 0.70% of the Fund’s average daily net assets.
Compensation of board members
Members of the Board of Trustees who are not officers or employees of the Investment Manager or Ameriprise Financial are compensated for their services to the Fund as disclosed in the Statement of Operations. Under a Deferred Compensation Plan (the Plan), these members of the Board of Trustees may elect to defer payment of up to 100% of their compensation. Deferred amounts are treated as though equivalent dollar amounts had been invested in shares of certain funds managed by the Investment Manager. The Fund’s liability for these amounts is adjusted for market value changes and remains in the Fund until distributed in accordance with the Plan. All amounts payable under the Plan constitute a general unsecured obligation of the Fund.
Compensation of Chief Compliance Officer
The Board of Trustees has appointed a Chief Compliance Officer to the Fund in accordance with federal securities regulations. As disclosed in the Statement of Operations, a portion of the Chief Compliance Officer’s total compensation is allocated to the Fund, along with other allocations to affiliated funds governed by the Board of Trustees, based on relative net assets.
Transfer agency fees
Under a Transfer and Dividend Disbursing Agent Agreement, Columbia Management Investment Services Corp. (the Transfer Agent), an affiliate of the Investment Manager and a wholly-owned subsidiary of Ameriprise Financial, is responsible for providing transfer agency services to the Fund. The Transfer Agent has contracted with DST Asset Manager Solutions, Inc. (DST) to serve as sub-transfer agent. The Transfer Agent pays the fees of DST for services as sub-transfer agent and DST is not entitled to reimbursement for such fees from the Fund (with the exception of out-of-pocket fees).
The Fund pays the Transfer Agent a monthly transfer agency fee based on the number or the average value of accounts, depending on the type of account. In addition, the Fund pays the Transfer Agent a fee for shareholder services based on the number of accounts or on a percentage of the average aggregate value of the Fund’s shares maintained in omnibus accounts up to the lesser of the amount charged by the financial intermediary or a cap established by the Board of Trustees from time to time.
The Transfer Agent also receives compensation from the Fund for various shareholder services and reimbursements for certain out-of-pocket fees. Total transfer agency fees for Class K, Institutional 2 Class and Institutional 3 Class shares are subject to an annual limitation of not more than 0.07%, 0.07% and 0.02%, respectively, of the average daily net assets attributable to each share class.
Columbia Global Equity Value Fund | Semiannual Report 2018
| 27 |
Notes to Financial Statements (continued)
August 31, 2018 (Unaudited)
For the six months ended August 31, 2018, the Fund’s annualized effective transfer agency fee rates as a percentage of average daily net assets of each class were as follows:
| | Effective rate (%) |
| Class A | 0.14 |
| Advisor Class | 0.14 |
| Class C | 0.14 |
| Institutional Class | 0.14 |
| Institutional 2 Class | 0.06 |
| Institutional 3 Class | 0.02 |
| Class K | 0.00 (a) |
| Class R | 0.14 |
| Class T | 0.14 |
An annual minimum account balance fee of $20 may apply to certain accounts with a value below the applicable share class’s initial minimum investment requirements to reduce the impact of small accounts on transfer agency fees. These minimum account balance fees are remitted to the Fund and recorded as part of expense reductions in the Statement of Operations. For the six months ended August 31, 2018, these minimum account balance fees reduced total expenses of the Fund by $8,429.
Plan administration fees
Under a Plan Administration Services Agreement with the Transfer Agent, the Fund paid an annual fee at a rate of 0.25% of the Fund’s average daily net assets attributable to Class K shares for the provision of various administrative, recordkeeping, communication and educational services. As a result of all Class K shares of the Fund being redeemed or exchanged for Advisor Class shares, March 9, 2018 was the last day the Fund paid a plan administration fee for Class K shares.
Distribution and service fees
The Fund has entered into an agreement with Columbia Management Investment Distributors, Inc. (the Distributor), an affiliate of the Investment Manager and a wholly-owned subsidiary of Ameriprise Financial, for distribution and shareholder services. Under a Plan and Agreement of Distribution, the Fund pays a fee at the maximum annual rates of up to 0.25%, 1.00%, 0.50% and 0.25% of the Fund’s average daily net assets attributable to Class A, Class C, Class R and Class T shares, respectively. For Class C shares, of the 1.00% fee, up to 0.75% can be reimbursed for distribution expenses and up to an additional 0.25% can be reimbursed for shareholder servicing expenses. For Class R shares, of the 0.50% fee, up to 0.25% can be reimbursed for shareholder servicing expenses. For Class T shares, of the 0.25% fee, up to 0.25% can be reimbursed for distribution and/or shareholder servicing expenses.
The amount of distribution and shareholder services expenses incurred by the Distributor and not yet reimbursed (unreimbursed expense) was approximately $56,000 for Class C shares. This amount is based on the most recent information available as of June 30, 2018, and may be recovered from future payments under the distribution plan or CDSCs. To the extent the unreimbursed expense has been fully recovered, the distribution and/or shareholder services fee is reduced.
Sales charges
Sales charges, including front-end charges and CDSCs, received by the Distributor for distributing Fund shares for the six months ended August 31, 2018, if any, are listed below:
| | Amount ($) |
| Class A | 55,084 |
| Class C | 81 |
| 28 | Columbia Global Equity Value Fund | Semiannual Report 2018 |
Notes to Financial Statements (continued)
August 31, 2018 (Unaudited)
Expenses waived/reimbursed by the Investment Manager and its affiliates
The Investment Manager and certain of its affiliates have contractually agreed to waive fees and/or reimburse expenses (excluding certain fees and expenses described below) for the period(s) disclosed below, unless sooner terminated at the sole discretion of the Board of Trustees, so that the Fund’s net operating expenses, after giving effect to fees waived/expenses reimbursed and any balance credits and/or overdraft charges from the Fund’s custodian, do not exceed the following annual rate(s) as a percentage of the class’ average daily net assets:
| | July 1, 2018
through
June 30, 2019 | Prior to
July 1, 2018 |
| Class A | 1.20% | 1.20% |
| Advisor Class | 0.95 | 0.95 |
| Class C | 1.95 | 1.95 |
| Institutional Class | 0.95 | 0.95 |
| Institutional 2 Class | 0.88 | 0.905 |
| Institutional 3 Class | 0.83 | 0.855 |
| Class R | 1.45 | 1.45 |
| Class T | 1.20 | 1.20 |
Under the agreement governing these fee waivers and/or expense reimbursement arrangements, the following fees and expenses are excluded from the waiver/reimbursement commitment, and therefore will be paid by the Fund, if applicable: taxes (including foreign transaction taxes), expenses associated with investments in affiliated and non-affiliated pooled investment vehicles (including mutual funds and exchange-traded funds), transaction costs and brokerage commissions, costs related to any securities lending program, dividend expenses associated with securities sold short, inverse floater program fees and expenses, transaction charges and interest on borrowed money, interest, infrequent and/or unusual expenses and any other expenses the exclusion of which is specifically approved by the Board of Trustees. This agreement may be modified or amended only with approval from the Investment Manager, certain of its affiliates and the Fund. Any fees waived and/or expenses reimbursed under the expense reimbursement arrangements described above are not recoverable by the Investment Manager or its affiliates in future periods.
Note 4. Federal tax information
The timing and character of income and capital gain distributions are determined in accordance with income tax regulations, which may differ from GAAP because of temporary or permanent book to tax differences.
At August 31, 2018, the approximate cost of all investments for federal income tax purposes and the aggregate gross approximate unrealized appreciation and depreciation based on that cost was:
Federal
tax cost ($) | Gross unrealized
appreciation ($) | Gross unrealized
(depreciation) ($) | Net unrealized
appreciation ($) |
| 659,231,000 | 179,288,000 | (27,192,000) | 152,096,000 |
Tax cost of investments and unrealized appreciation/(depreciation) may also include timing differences that do not constitute adjustments to tax basis.
Management of the Fund has concluded that there are no significant uncertain tax positions in the Fund that would require recognition in the financial statements. However, management’s conclusion may be subject to review and adjustment at a later date based on factors including, but not limited to, new tax laws, regulations, and administrative interpretations (including relevant court decisions). Generally, the Fund’s federal tax returns for the prior three fiscal years remain subject to examination by the Internal Revenue Service.
Columbia Global Equity Value Fund | Semiannual Report 2018
| 29 |
Notes to Financial Statements (continued)
August 31, 2018 (Unaudited)
Note 5. Portfolio information
The cost of purchases and proceeds from sales of securities, excluding short-term investments and derivatives, if any, aggregated to $99,151,766 and $133,771,773, respectively, for the six months ended August 31, 2018. The amount of purchase and sale activity impacts the portfolio turnover rate reported in the Financial Highlights.
Note 6. Affiliated money market fund
The Fund invests in Columbia Short-Term Cash Fund, an affiliated money market fund established for the exclusive use by the Fund and other affiliated funds (the Affiliated MMF). The income earned by the Fund from such investments is included as Dividends - affiliated issuers in the Statement of Operations. As an investing fund, the Fund indirectly bears its proportionate share of the expenses of the Affiliated MMF. The Affiliated MMF prices its shares with a floating net asset value. In addition, the Board of Trustees of the Affiliated MMF may impose a fee on redemptions (sometimes referred to as a liquidity fee) or temporarily suspend redemptions (sometimes referred to as imposing a redemption gate) in the event its liquidity falls below regulatory limits.
Note 7. Interfund lending
Pursuant to an exemptive order granted by the Securities and Exchange Commission, the Fund participates in a program (the Interfund Program) allowing each participating Columbia Fund (each, a Participating Fund) to lend money directly to and, except for closed-end funds and money market funds, borrow money directly from other Participating Funds for temporary purposes. The amounts eligible for borrowing and lending under the Interfund Program are subject to certain restrictions.
Interfund loans are subject to the risk that the borrowing fund could be unable to repay the loan when due, and a delay in repayment to the lending fund could result in lost opportunities and/or additional lending costs. The exemptive order is subject to conditions intended to mitigate conflicts of interest arising from the Investment Manager’s relationship with each Participating Fund.
The Fund did not borrow or lend money under the Interfund Program during the six months ended August 31, 2018.
Note 8. Line of credit
The Fund has access to a revolving credit facility with a syndicate of banks led by Citibank, N.A., HSBC Bank USA, N.A. and JPMorgan Chase Bank, N.A. whereby the Fund may borrow for the temporary funding of shareholder redemptions or for other temporary or emergency purposes. The credit facility, which is a collective agreement between the Fund and certain other funds managed by the Investment Manager, severally and not jointly, permits collective borrowings up to $1 billion. Interest is charged to each participating fund based on its borrowings at a rate equal to the higher of (i) the overnight federal funds rate plus 1.00% or (ii) the one-month LIBOR rate plus 1.00%. Each borrowing under the credit facility matures no later than 60 days after the date of borrowing. The Fund also pays a commitment fee equal to its pro rata share of the amount of the credit facility at a rate of 0.15% per annum. The commitment fee is included in other expenses in the Statement of Operations. This agreement expires annually in December unless extended or renewed.
The Fund had no borrowings during the six months ended August 31, 2018.
Note 9. Significant risks
Financial sector risk
The Fund may be more susceptible to the particular risks that may affect companies in the financial services sector than if it were invested in a wider variety of companies in unrelated sectors. Companies in the financial services sector are subject to certain risks, including the risk of regulatory change, decreased liquidity in credit markets and unstable interest rates. Such companies may have concentrated portfolios, such as a high level of loans to real estate developers, which makes them vulnerable to economic conditions that affect that industry. Performance of such companies may be affected by competitive pressures and exposure to investments or agreements that, under certain circumstances, may lead to losses (e.g., subprime
| 30 | Columbia Global Equity Value Fund | Semiannual Report 2018 |
Notes to Financial Statements (continued)
August 31, 2018 (Unaudited)
loans). Companies in the financial services sector are subject to extensive governmental regulation that may limit the amount and types of loans and other financial commitments they can make, and interest rates and fees that they may charge. In addition, profitability of such companies is largely dependent upon the availability and the cost of capital.
Foreign securities and emerging market countries risk
Investing in foreign securities may include certain risks and considerations not typically associated with investing in U.S. securities, such as fluctuating currency values and changing local and regional economic, political and social conditions, which may result in greater market volatility. In addition, certain foreign securities may not be as liquid as U.S. securities. Investing in emerging markets may accentuate these risks. These countries are also more likely to experience high levels of inflation, deflation or currency devaluation which could hurt their economies and securities markets. To the extent that the Fund concentrates its investment exposure to any one or a few specific countries, the Fund will be particularly susceptible to the various conditions, events or other factors impacting those countries and may, therefore, have a greater risk than that of a fund which is more geographically diversified.
Shareholder concentration risk
At August 31, 2018, affiliated shareholders of record owned 42.8% of the outstanding shares of the Fund in one or more accounts. Subscription and redemption activity by concentrated accounts may have a significant effect on the operations of the Fund. In the case of a large redemption, the Fund may be forced to sell investments at inopportune times, including its liquid positions, which may result in Fund losses and the Fund holding a higher percentage of less liquid positions. Large redemptions could result in decreased economies of scale and increased operating expenses for non-redeeming Fund shareholders.
Note 10. Subsequent events
Management has evaluated the events and transactions that have occurred through the date the financial statements were issued and noted no items requiring adjustment of the financial statements or additional disclosure.
Note 11. Information regarding pending and settled legal proceedings
Ameriprise Financial and certain of its affiliates have historically been involved in a number of legal, arbitration and regulatory proceedings, including routine litigation, class actions, and governmental actions, concerning matters arising in connection with the conduct of their business activities. Ameriprise Financial believes that the Fund is not currently the subject of, and that neither Ameriprise Financial nor any of its affiliates are the subject of, any pending legal, arbitration or regulatory proceedings that are likely to have a material adverse effect on the Fund or the ability of Ameriprise Financial or its affiliates to perform under their contracts with the Fund. Ameriprise Financial is required to make quarterly (10-Q), annual (10-K) and, as necessary, 8-K filings with the Securities and Exchange Commission (SEC) on legal and regulatory matters that relate to Ameriprise Financial and its affiliates. Copies of these filings may be obtained by accessing the SEC website at www.sec.gov.
There can be no assurance that these matters, or the adverse publicity associated with them, will not result in increased Fund redemptions, reduced sale of Fund shares or other adverse consequences to the Fund. Further, although we believe proceedings are not likely to have a material adverse effect on the Fund or the ability of Ameriprise Financial or its affiliates to perform under their contracts with the Fund, these proceedings are subject to uncertainties and, as such, we are unable to estimate the possible loss or range of loss that may result. An adverse outcome in one or more of these proceedings could result in adverse judgments, settlements, fines, penalties or other relief that could have a material adverse effect on the consolidated financial condition or results of operations of Ameriprise Financial.
Columbia Global Equity Value Fund | Semiannual Report 2018
| 31 |
Approval of Management Agreement
Columbia Management Investment Advisers, LLC (Columbia Threadneedle or the Investment Manager, and together with its domestic and global affiliates, Columbia Threadneedle Investments), a wholly-owned subsidiary of Ameriprise Financial, Inc. (Ameriprise Financial), serves as the investment manager to Columbia Global Equity Value Fund (the Fund). Under a management agreement (the Management Agreement), Columbia Threadneedle provides investment advice and other services to the Fund and other funds distributed by Columbia Management Investment Distributors, Inc. (collectively, the Funds).
On an annual basis, the Fund’s Board of Trustees (the Board), including the independent Board members (the Independent Trustees), considers renewal of the Management Agreement. Columbia Threadneedle prepared detailed reports for the Board and its Contracts Committee in November 2017 and February, March, April and June 2018, including reports providing the results of analyses performed by an independent organization, Broadridge Financial Solutions, Inc. (Broadridge), and a comprehensive response to items of information requested by independent legal counsel to the Independent Trustees (Independent Legal Counsel) in a letter to the Investment Manager, to assist the Board in making this determination. Many of the materials presented at these meetings were first supplied in draft form to designated independent Board representatives, i.e., Independent Legal Counsel, Fund Counsel, the Chair of the Board (who is an Independent Trustee) and the Chair of the Contracts Committee (who is an Independent Trustee), and the final materials were revised to include information reflective of discussion and subsequent requests made by the Contracts Committee. In addition, throughout the year, the Board (or its committees) regularly meets with portfolio management teams and senior management personnel and reviews information prepared by Columbia Threadneedle addressing the services Columbia Threadneedle provides and Fund performance. The Board also accords appropriate weight to the work, deliberations and conclusions of the various committees, such as the Contracts Committee, the Investment Review Committee, the Audit Committee and the Compliance Committee in determining whether to continue the Management Agreement.
The Board, at its June 18-20, 2018 in-person Board meeting (the June Meeting), considered the renewal of the Management Agreement for an additional one-year term. At the June Meeting, Independent Legal Counsel reviewed with the Independent Trustees various factors relevant to the Board’s consideration of management agreements and the Board’s legal responsibilities related to such consideration. Following an analysis and discussion of the factors identified below, the Board, including all of the Independent Trustees, approved the renewal of the Management Agreement.
Nature, extent and quality of services provided by Columbia Threadneedle
The Board analyzed various reports and presentations it had received detailing the services performed by Columbia Threadneedle, as well as its history, reputation, expertise, resources and capabilities, and the qualifications of its personnel.
The Board specifically considered the many developments during recent years concerning the services provided by Columbia Threadneedle, including, in particular, the organization and depth of the equity and credit research departments and the various technological enhancements that have been made or are anticipated. The Board further observed the enhancements to the investment risk management department’s processes, systems and oversight, as well as planned 2018 initiatives in this regard. The Board also took into account the broad scope of services provided by Columbia Threadneedle to each Fund, including, among other services, investment, risk and compliance oversight. The Board also took into account the information it received concerning Columbia Threadneedle’s ability to attract and retain key portfolio management personnel and that it has sufficient resources to provide competitive and adequate compensation to investment personnel.
In connection with the Board’s evaluation of the overall package of services provided by Columbia Threadneedle, the Board also considered the nature, quality and range of administrative services provided to the Fund by Columbia Threadneedle, as well as the achievements in 2017 in the performance of administrative services, and noted the various enhancements anticipated for 2018. In evaluating the quality of services provided under the Management Agreement, the Board also took into account the organization and strength of the Fund’s and its service providers’ compliance programs. In addition, the Board reviewed the financial condition of Columbia Threadneedle and its affiliates and each entity’s ability to carry out its responsibilities under the Management Agreement and the Fund’s other service agreements with affiliates of Ameriprise Financial, observing the financial strength of Ameriprise Financial, with its strong cash position and solid balance sheet.
| 32 | Columbia Global Equity Value Fund | Semiannual Report 2018 |
Approval of Management Agreement (continued)
The Board also discussed the acceptability of the terms of the Management Agreement (including the relatively broad scope of services required to be performed by Columbia Threadneedle), noting that no material changes are proposed from the form of agreement previously approved. They also noted the wide array of legal and compliance services provided to the Funds under the Management Agreement. It was also observed that the services being performed under the Management Agreement were of a reasonably high quality.
Based on the foregoing, and based on other information received (both oral and written, including the information on investment performance referenced below) and other considerations, the Board concluded that Columbia Threadneedle and its affiliates are in a position to continue to provide a high quality and level of services to the Fund.
Investment performance
For purposes of evaluating the nature, extent and quality of services provided under the Management Agreement, the Board carefully reviewed the investment performance of the Fund. In this regard, the Board considered detailed reports providing the results of analyses performed by an independent organization showing, for various periods, including since manager inception, the performance of the Fund, the performance of a benchmark index, the percentage ranking of the Fund among its comparison group, the product score of the Fund (taking into account performance relative to peers and benchmarks) and the net assets of the Fund. The Board observed that the Fund’s investment performance met expectations.
Comparative fees, costs of services provided and the profits realized by Columbia Threadneedle and its affiliates from their relationships with the Fund
The Board reviewed comparative fees and the costs of services provided under the Management Agreement. The Board members considered detailed comparative information set forth in an annual report on fees and expenses, including, among other things, data (based on analyses conducted by an independent organization) showing a comparison of the Fund’s expenses with median expenses paid by funds in its comparative peer universe, as well as data showing the Fund’s contribution to Columbia Threadneedle’s profitability.
The Board considered the reports of its independent fee consultant, JDL Consultants, LLC (JDL), which assisted in the Board’s analysis of the Funds’ performance and expenses, the reasonableness of the Funds’ fee rates, and JDL’s conclusion that the management fees being charged to the Fund are reasonable. The Board accorded particular weight to the notion that the level of fees should generally reflect a rational pricing model applied consistently across the various product lines in the Fund family, while assuring that the overall fees for each Fund (with certain defined exceptions) are generally in line with the "pricing philosophy" currently in effect (i.e., that Fund total expense ratios, in general, approximate or are lower than median expense ratios of funds in an agreed upon Lipper or customized comparison universe). The Board took into account that the Fund’s total expense ratio (after considering proposed expense caps/waivers) was below the peer universe’s median expense ratio shown in the reports. Based on its review, the Board concluded that the Fund’s management fee was fair and reasonable in light of the extent and quality of services that the Fund receives.
The Board also considered the profitability of Columbia Threadneedle and its affiliates in connection with Columbia Threadneedle providing management services to the Fund. In this regard, the Independent Trustees referred to their detailed analysis of the Profitability Report, discussing the profitability to Columbia Threadneedle and Ameriprise Financial from managing, operating and distributing the Funds. The Board considered that in 2017 the Board had concluded that 2016 profitability was reasonable and that Columbia Threadneedle generated 2017 profitability that only increased slightly from 2016 levels. It also took into account the indirect economic benefits flowing to Columbia Threadneedle or its affiliates in connection with managing or distributing the Funds, such as the enhanced ability to offer various other financial products to Ameriprise Financial customers, soft dollar benefits and overall reputational advantages. The Board noted that the fees paid by the Fund should permit the Investment Manager to offer competitive compensation to its personnel, make necessary investments in its business and earn an appropriate profit. The Board concluded that profitability levels were reasonable.
Columbia Global Equity Value Fund | Semiannual Report 2018
| 33 |
Approval of Management Agreement (continued)
Economies of scale to be realized
The Board also considered the economies of scale that might be realized by Columbia Threadneedle as the Fund grows and took note of the extent to which Fund shareholders might also benefit from such growth. In this regard, the Board took into account that management fees decline as Fund assets exceed various breakpoints, all of which have not been surpassed. The Board concluded that the breakpoints in the management fee rate schedule satisfactorily provides for the sharing of economies of scale, as they allow for adequate opportunity for shareholders to realize benefits (fee breaks) as Fund assets grow.
Based on the foregoing, the Board, including all of the Independent Trustees, concluded that the management fees were fair and reasonable in light of the extent and quality of services provided. In reaching this conclusion, no single factor was determinative. On June 20, 2018, the Board, including all of the Independent Trustees, approved the renewal of the Management Agreement.
| 34 | Columbia Global Equity Value Fund | Semiannual Report 2018 |
The Fund mails one shareholder report to each shareholder address. If you would like more than one report, please call shareholder services at 800.345.6611 and additional reports will be sent to you.
Proxy voting policies and procedures
The policy of the Board of Trustees is to vote the proxies of the companies in which the Fund holds investments consistent with the procedures as stated in the Statement of Additional Information (SAI). You may obtain a copy of the SAI without charge by calling 800.345.6611; contacting your financial intermediary; visiting columbiathreadneedleus.com/investor/; or searching the website of the Securities and Exchange Commission (SEC) at sec.gov. Information regarding how the Fund voted proxies relating to portfolio securities is filed with the SEC by August 31st for the most recent 12-month period ending June 30th of that year, and is available without charge by visiting columbiathreadneedleus.com/investor/, or searching the website of the SEC at sec.gov.
Quarterly schedule of investments
The Fund files a complete schedule of portfolio holdings with the SEC for the first and third quarters of each fiscal year on Form N-Q or Form N-PORT. The Fund’s Form N-Q or Form N-PORT is available on the SEC’s website at sec.gov and may be reviewed and copied at the SEC’s Public Reference Room in Washington, D.C. Information on the operation of the Public Reference Room may be obtained by calling 800.SEC.0330. The Fund’s complete schedule of portfolio holdings, as filed on Form N-Q or Form N-PORT, can also be obtained without charge, upon request, by calling 800.345.6611.
Additional Fund information
For more information about the Fund, please visit columbiathreadneedleus.com/investor/ or call 800.345.6611. Customer Service Representatives are available to answer your questions Monday through Friday from 8 a.m. to 7 p.m. Eastern time.
Fund investment manager
Columbia Management Investment Advisers, LLC
225 Franklin Street
Boston, MA 02110
Fund distributor
Columbia Management Investment Distributors, Inc.
225 Franklin Street
Boston, MA 02110
Fund transfer agent
Columbia Management Investment Services Corp.
Through October 31, 2018:
P.O. Box 8081
Boston, MA 02266-8081
Effective November 1, 2018:
P.O. Box 219104
Kansas City, MO 64121-9104
Columbia Global Equity Value Fund | Semiannual Report 2018
| 35 |
[THIS PAGE INTENTIONALLY LEFT BLANK]
[THIS PAGE INTENTIONALLY LEFT BLANK]
Columbia Global Equity Value Fund
Through October 31, 2018:
P.O. Box 8081
Boston, MA 02266-8081
Effective November 1, 2018:
P.O. Box 219104
Kansas City, MO 64121-9104
Please read and consider the investment objectives, risks, charges and expenses for any fund carefully before investing. For a prospectus and summary prospectus, which contains this and other important information about the Fund, go to
columbiathreadneedleus.com/investor/. The Fund is distributed by Columbia Management Investment Distributors, Inc., member FINRA, and managed by Columbia Management Investment Advisers, LLC.
Columbia Threadneedle Investments (Columbia Threadneedle) is the global brand name of the Columbia and Threadneedle group of companies. All rights reserved.
© 2018 Columbia Management Investment Advisers, LLC.
columbiathreadneedleus .com/investor/

SemiAnnual Report
August 31, 2018
Columbia Overseas Core Fund
Not FDIC Insured • No bank guarantee • May lose value
Dear Shareholders,
Volatility exists in financial markets and this is not a comfortable fact of life. How investors deal with this reality, including how they react to short term spikes in volatility as well as to longer periods of increased or decreased volatility, may have a significant impact on their overall investing success.
Too often, investors change their investment strategy based on something that’s happening at a moment in time rather than thinking about how that change in strategy might affect their ability to achieve their longer-term financial goals. Emotion replaces logic and reasoning. Investors may sell in reaction to a market drop (fear or panic), locking in low returns which means they won’t be invested when the market returns, or they invest more at a market peak (greed or conviction), essentially when it is expensive to do so. In both cases, selling and buying at the exact wrong time.
We believe the best outcomes come from a consistent approach to investing. Here are five areas where advisors can help us overcome the tendency to react emotionally as we struggle to make the right choices with our investments:
Long-term focus
The further away long-term goals, aspirations and objectives are, the easier it is to stray away from the goals and priorities that we set out. Advisors help us stay focused on what we want to accomplish.
Discipline through up-and-down markets
Advisors help set rules to prevent us from making rash decisions that we may regret later. Knowing ahead of time what you should do in case of certain situations will help you get through volatile markets and not make emotional decisions.
Tax-awareness
Taxes are one of the biggest drags on investment returns and are critical attributes of investing. Yet few of us take the necessary steps to ease the corrosive effect of taxes. Advisors have tools and knowledge that may help us to manage portfolios more tax-efficiently and keep more of what we earn.
Emotional objectivity
Our emotions are very hard to manage and making investment decisions in an emotional state can lead to exceedingly bad outcomes. An objective advisor can help prevent some of the reactionary mistakes emotions often lead us to.
Education and guidance
The role of the advisor is to teach and guide us toward achieving our financial goals. In terms of working through emotions, guidance is by far the most important component.
By understanding our own behaviors and biases, we can prepare for future challenges. Your success is our priority. Talk to your advisor about how working with Columbia Threadneedle Investments may help you stay the course and position your portfolio for consistent, sustainable outcomes, regardless of market conditions.
Sincerely,
Christopher O. Petersen
President, Columbia Funds
Columbia Funds are distributed by Columbia Management Investment Distributors, Inc., member FINRA, and managed by Columbia Management Investment Advisers, LLC.
© 2018 Columbia Management Investment Advisers, LLC. All rights reserved.
Columbia Overseas Core Fund | Semiannual Report 2018
Columbia Overseas Core Fund | Semiannual Report 2018
Fund at a Glance
(Unaudited)
Investment objective
Columbia Overseas Core Fund (the Fund) seeks to provide shareholders with long-term capital appreciation.
Portfolio management
Fred Copper, CFA
Co-Portfolio Manager
Managed Fund since March 2018
Daisuke Nomoto, CMA (SAAJ)
Co-Portfolio Manager
Managed Fund since March 2018
Morningstar style boxTM
The Morningstar Style Box is based on a fund’s portfolio holdings. For equity funds, the vertical axis shows the market capitalization of the stocks owned, and the horizontal axis shows investment style (value, blend, or growth). Information shown is based on the most recent data provided by Morningstar.
© 2018 Morningstar, Inc. All rights reserved. The Morningstar information contained herein: (1) is proprietary to Morningstar and/or its content providers; (2) may not be copied or distributed; and (3) is not warranted to be accurate, complete or timely. Neither Morningstar nor its content providers are responsible for any damages or losses arising from any use of this information.
| Top 10 holdings (%) (at August 31, 2018) |
| Royal Dutch Shell PLC, Class B (United Kingdom) | 3.9 |
| Sony Corp. (Japan) | 2.6 |
| Roche Holding AG, Genusschein Shares (Switzerland) | 2.5 |
| Shire PLC (United Kingdom) | 2.3 |
| Sanofi (France) | 2.2 |
| DCC PLC (United Kingdom) | 2.1 |
| UPM-Kymmene OYJ (Finland) | 2.1 |
| ITOCHU Corp. (Japan) | 2.1 |
| Cott Corp. (Canada) | 2.0 |
| British American Tobacco PLC (United Kingdom) | 2.0 |
Percentages indicated are based upon total investments (excluding Money Market Funds and derivatives, if any).
For further detail about these holdings, please refer to the section entitled “Portfolio of Investments.”
Fund holdings are as of the date given, are subject to change at any time, and are not recommendations to buy or sell any security.
| Equity sector breakdown (%) (at August 31, 2018) |
| Consumer Discretionary | 13.2 |
| Consumer Staples | 10.1 |
| Energy | 6.8 |
| Financials | 16.7 |
| Health Care | 17.1 |
| Industrials | 14.7 |
| Information Technology | 10.3 |
| Materials | 4.6 |
| Real Estate | 2.0 |
| Telecommunication Services | 3.0 |
| Utilities | 1.5 |
| Total | 100.0 |
Percentages indicated are based upon total equity investments. The Fund’s portfolio composition is subject to change.
| 2 | Columbia Overseas Core Fund | Semiannual Report 2018 |
Fund at a Glance (continued)
(Unaudited)
| Country breakdown (%) (at August 31, 2018) |
| Argentina | 0.4 |
| Australia | 0.8 |
| Brazil | 1.4 |
| Canada | 4.5 |
| China | 1.9 |
| Finland | 2.1 |
| France | 7.6 |
| Germany | 2.1 |
| Hong Kong | 1.5 |
| Ireland | 0.7 |
| Israel | 2.7 |
| Italy | 1.2 |
| Japan | 25.0 |
| Netherlands | 8.2 |
| Norway | 0.7 |
| Russian Federation | 0.6 |
| South Korea | 3.0 |
| Spain | 4.2 |
| Sweden | 1.7 |
| Switzerland | 3.9 |
| United Kingdom | 19.2 |
| United States(a) | 6.6 |
| Total | 100.0 |
| (a) | Includes investments in Money Market Funds. |
Country breakdown is based primarily on issuer’s place of organization/incorporation. Percentages indicated are based upon total investments and exclude investments in derivatives, if any. The Fund’s portfolio composition is subject to change.
Columbia Overseas Core Fund | Semiannual Report 2018
| 3 |
Understanding Your Fund’s Expenses
(Unaudited)
As an investor, you incur two types of costs. There are shareholder transaction costs, which generally include sales charges on purchases and may include redemption fees. There are also ongoing costs, which generally include management fees, distribution and/or service fees, and other fund expenses. The following information is intended to help you understand your ongoing costs (in dollars) of investing in the Fund and to help you compare these costs with the ongoing costs of investing in other mutual funds.
Analyzing your Fund’s expenses
To illustrate these ongoing costs, we have provided examples and calculated the expenses paid by investors in each share class of the Fund during the period. The actual and hypothetical information in the table is based on an initial investment of $1,000 at the beginning of the period indicated and held for the entire period. Expense information is calculated two ways and each method provides you with different information. The amount listed in the “Actual” column is calculated using the Fund’s actual operating expenses and total return for the period. You may use the Actual information, together with the amount invested, to estimate the expenses that you paid over the period. Simply divide your account value by $1,000 (for example, an $8,600 account value divided by $1,000 = 8.6), then multiply the results by the expenses paid during the period under the “Actual” column. The amount listed in the “Hypothetical” column assumes a 5% annual rate of return before expenses (which is not the Fund’s actual return) and then applies the Fund’s actual expense ratio for the period to the hypothetical return. You should not use the hypothetical account values and expenses to estimate either your actual account balance at the end of the period or the expenses you paid during the period. See “Compare with other funds” below for details on how to use the hypothetical data.
Compare with other funds
Since all mutual funds are required to include the same hypothetical calculations about expenses in shareholder reports, you can use this information to compare the ongoing cost of investing in the Fund with other funds. To do so, compare the hypothetical example with the 5% hypothetical examples that appear in the shareholder reports of other funds. As you compare hypothetical examples of other funds, it is important to note that hypothetical examples are meant to highlight the ongoing costs of investing in a fund only and do not reflect any transaction costs, such as sales charges, or redemption or exchange fees. Therefore, the hypothetical calculations are useful in comparing ongoing costs only, and will not help you determine the relative total costs of owning different funds. If transaction costs were included in these calculations, your costs would be higher.
| March 1, 2018 — August 31, 2018 |
| | Account value at the
beginning of the
period ($) | Account value at the
end of the
period ($) | Expenses paid during
the period ($) | Fund’s annualized
expense ratio (%) |
| | Actual | Hypothetical | Actual | Hypothetical | Actual | Hypothetical | Actual |
| Class A | 1,000.00 | 1,000.00 | 961.00 (a) | 1,018.75 | 6.15 (a) | 6.51 | 1.28 (a) |
| Advisor Class | 1,000.00 | 1,000.00 | 962.00 (a) | 1,020.01 | 4.96 (a) | 5.24 | 1.03 (a) |
| Class C | 1,000.00 | 1,000.00 | 958.00 (a) | 1,014.97 | 9.75 (a) | 10.31 | 2.03 (a) |
| Institutional Class | 1,000.00 | 1,000.00 | 962.00 (a) | 1,020.01 | 4.96 (a) | 5.24 | 1.03 (a) |
| Institutional 2 Class | 1,000.00 | 1,000.00 | 963.00 (a) | 1,020.52 | 4.48 (a) | 4.74 | 0.93 (a) |
| Institutional 3 Class | 1,000.00 | 1,000.00 | 963.00 (a) | 1,020.82 | 4.19 (a) | 4.43 | 0.87 (a) |
| Class R | 1,000.00 | 1,000.00 | 960.00 (a) | 1,017.49 | 7.35 (a) | 7.78 | 1.53 (a) |
| (a) | Based on operations from March 5, 2018 (commencement of operations) through the stated period end. |
Expenses paid during the period are equal to the annualized expense ratio for each class as indicated above, multiplied by the average account value over the period and then multiplied by the number of days in the Fund’s most recent fiscal half year and divided by 365.
Expenses do not include fees and expenses incurred indirectly by the Fund from its investment in underlying funds, including affiliated and non-affiliated pooled investment vehicles, such as mutual funds and exchange-traded funds.
Had Columbia Management Investment Advisers, LLC and/or certain of its affiliates not waived/reimbursed certain fees and expenses, account value at the end of the period would have been reduced.
| 4 | Columbia Overseas Core Fund | Semiannual Report 2018 |
Portfolio of Investments
August 31, 2018 (Unaudited)
(Percentages represent value of investments compared to net assets)
Investments in securities
| Common Stocks 99.0% |
| Issuer | Shares | Value ($) |
| Argentina 0.4% |
| Banco Macro SA, ADR | 12,262 | 535,114 |
| Australia 0.8% |
| Fortescue Metals Group Ltd. | 404,297 | 1,114,049 |
| Brazil 1.4% |
| Pagseguro Digital Ltd., Class A(a) | 67,294 | 1,944,124 |
| Canada 4.5% |
| Cott Corp. | 181,862 | 2,837,047 |
| Stars Group, Inc. (The)(a) | 77,025 | 2,187,392 |
| Yamana Gold, Inc. | 478,538 | 1,330,336 |
| Yamana Gold, Inc. | 35,858 | 99,468 |
| Total | 6,454,243 |
| China 1.9% |
| Alibaba Group Holding Ltd., ADR(a) | 3,859 | 675,364 |
| BeiGene Ltd., ADR(a) | 1,682 | 298,605 |
| Tencent Holdings Ltd. | 40,900 | 1,758,175 |
| Total | 2,732,144 |
| Finland 2.0% |
| UPM-Kymmene OYJ | 75,904 | 2,925,105 |
| France 7.5% |
| BNP Paribas SA | 31,508 | 1,849,858 |
| Capgemini SE | 21,089 | 2,711,055 |
| DBV Technologies SA, ADR(a) | 18,336 | 407,793 |
| Sanofi | 36,972 | 3,162,424 |
| VINCI SA | 27,648 | 2,649,550 |
| Total | 10,780,680 |
| Germany 2.0% |
| Bayer AG, Registered Shares | 19,827 | 1,849,881 |
| Duerr AG | 23,322 | 1,074,719 |
| Total | 2,924,600 |
| Hong Kong 1.5% |
| WH Group Ltd. | 2,739,500 | 2,068,952 |
| Ireland 0.7% |
| ICON PLC(a) | 6,766 | 1,008,269 |
| Common Stocks (continued) |
| Issuer | Shares | Value ($) |
| Israel 2.7% |
| Bank Hapoalim BM | 353,479 | 2,648,396 |
| Bezeq Israeli Telecommunication Corp., Ltd. (The) | 969,378 | 1,158,435 |
| Total | 3,806,831 |
| Italy 1.2% |
| Recordati SpA | 50,394 | 1,764,789 |
| Japan 24.8% |
| Amano Corp. | 74,400 | 1,555,573 |
| BayCurrent Consulting, Inc. | 63,200 | 1,724,990 |
| CYBERDYNE, Inc.(a) | 30,400 | 239,104 |
| Digital Arts, Inc. | 34,700 | 1,580,878 |
| Hitachi Capital Corp. | 74,100 | 2,061,522 |
| Hoya Corp. | 27,700 | 1,618,511 |
| Invincible Investment Corp. | 3,195 | 1,383,961 |
| ITOCHU Corp. | 166,900 | 2,916,386 |
| Koito Manufacturing Co., Ltd. | 29,500 | 1,823,535 |
| Matsumotokiyoshi Holdings Co., Ltd. | 55,000 | 2,078,101 |
| Mitsubishi UFJ Financial Group, Inc. | 325,500 | 1,967,545 |
| Nihon M&A Center, Inc. | 102,800 | 2,687,236 |
| ORIX Corp. | 144,200 | 2,318,984 |
| Round One Corp. | 19,000 | 249,799 |
| Shionogi & Co., Ltd. | 27,300 | 1,586,618 |
| SoftBank Group Corp. | 15,900 | 1,472,139 |
| Sony Corp. | 63,700 | 3,622,150 |
| Subaru Corp. | 63,400 | 1,883,175 |
| Takeda Pharmaceutical Co., Ltd. | 20,200 | 841,556 |
| Takuma Co., Ltd. | 150,300 | 1,851,673 |
| Total | 35,463,436 |
| Netherlands 8.2% |
| ABN AMRO Group NV | 81,027 | 2,194,235 |
| ASR Nederland NV | 50,743 | 2,420,787 |
| ING Groep NV | 145,633 | 1,976,119 |
| Koninklijke Ahold Delhaize NV | 101,261 | 2,463,611 |
| Signify NV | 92,868 | 2,612,988 |
| Total | 11,667,740 |
The accompanying Notes to Financial Statements are an integral part of this statement.
Columbia Overseas Core Fund | Semiannual Report 2018
| 5 |
Portfolio of Investments (continued)
August 31, 2018 (Unaudited)
| Common Stocks (continued) |
| Issuer | Shares | Value ($) |
| Norway 0.7% |
| BW LPG Ltd.(a) | 270,508 | 1,057,046 |
| Russian Federation 0.6% |
| Sberbank of Russia PJSC, ADR | 72,605 | 788,127 |
| South Korea 3.0% |
| Hyundai Home Shopping Network Corp. | 12,607 | 1,285,183 |
| Samsung Electronics Co., Ltd. | 42,515 | 1,848,155 |
| Youngone Corp. | 35,808 | 1,114,645 |
| Total | 4,247,983 |
| Spain 4.2% |
| ACS Actividades de Construccion y Servicios SA | 54,577 | 2,273,007 |
| Endesa SA | 93,557 | 2,094,823 |
| Tecnicas Reunidas SA | 46,867 | 1,585,785 |
| Total | 5,953,615 |
| Sweden 1.7% |
| Granges AB | 84,892 | 994,181 |
| Hemfosa Fastigheter AB | 106,115 | 1,443,465 |
| Total | 2,437,646 |
| Switzerland 3.9% |
| Nestlé SA, Registered Shares | 24,472 | 2,054,714 |
| Roche Holding AG, Genusschein Shares | 14,305 | 3,553,927 |
| Total | 5,608,641 |
| United Kingdom 19.1% |
| British American Tobacco PLC | 57,841 | 2,790,678 |
| BT Group PLC | 570,124 | 1,606,515 |
| Crest Nicholson Holdings PLC | 177,886 | 882,353 |
| DCC PLC | 33,171 | 2,990,966 |
| Greene King PLC | 181,534 | 1,145,447 |
| GW Pharmaceuticals PLC, ADR(a) | 2,858 | 419,497 |
| John Wood Group PLC | 162,862 | 1,517,270 |
| Just Group PLC | 876,310 | 1,032,708 |
| Legal & General Group PLC | 601,769 | 1,983,956 |
| Royal Dutch Shell PLC, Class B | 165,571 | 5,453,299 |
| Common Stocks (continued) |
| Issuer | Shares | Value ($) |
| Shire PLC | 55,454 | 3,234,122 |
| TP ICAP PLC | 519,818 | 1,920,667 |
| WPP PLC | 142,324 | 2,359,037 |
| Total | 27,336,515 |
| United States 6.2% |
| ACADIA Pharmaceuticals, Inc.(a) | 22,052 | 313,579 |
| Aerie Pharmaceuticals, Inc.(a) | 4,956 | 304,051 |
| Alexion Pharmaceuticals, Inc.(a) | 5,368 | 656,184 |
| BioMarin Pharmaceutical, Inc.(a) | 4,214 | 421,316 |
| Broadcom, Inc. | 11,353 | 2,486,647 |
| Insmed, Inc.(a) | 17,663 | 352,024 |
| Liberty Global PLC, Class C(a) | 82,338 | 2,131,731 |
| Puma Biotechnology, Inc.(a) | 7,217 | 317,187 |
| Quotient Ltd.(a) | 55,352 | 423,443 |
| Sage Therapeutics, Inc.(a) | 1,415 | 232,428 |
| Spark Therapeutics, Inc.(a) | 4,808 | 296,221 |
| TESARO, Inc.(a) | 8,843 | 286,955 |
| Vertex Pharmaceuticals, Inc.(a) | 3,468 | 639,499 |
| Total | 8,861,265 |
Total Common Stocks
(Cost $151,398,846) | 141,480,914 |
| Options Purchased Calls 0.0% |
| | | | | | Value ($) |
| (Cost $29,541) | 26,400 |
| Money Market Funds 0.4% |
| | Shares | Value ($) |
| Columbia Short-Term Cash Fund, 2.058%(b),(c) | 543,538 | 543,483 |
Total Money Market Funds
(Cost $543,483) | 543,483 |
Total Investments in Securities
(Cost $151,971,870) | 142,050,797 |
| Other Assets & Liabilities, Net | | 852,688 |
| Net Assets | $142,903,485 |
The accompanying Notes to Financial Statements are an integral part of this statement.
| 6 | Columbia Overseas Core Fund | Semiannual Report 2018 |
Portfolio of Investments (continued)
August 31, 2018 (Unaudited)
Investments in derivatives
| Forward foreign currency exchange contracts |
Currency to
be sold | Currency to
be purchased | Counterparty | Settlement
date | Unrealized
appreciation ($) | Unrealized
depreciation ($) |
| 4,335,000 CAD | 3,293,948 USD | Morgan Stanley | 09/12/2018 | — | (28,337) |
| 889,000 GBP | 1,163,932 USD | Morgan Stanley | 09/12/2018 | 11,060 | — |
| 989,000 GBP | 1,272,952 USD | Morgan Stanley | 09/12/2018 | — | (9,602) |
| 10,015,000 ILS | 2,761,768 USD | Morgan Stanley | 09/12/2018 | — | (17,669) |
| 48,996,000 JPY | 435,516 USD | Morgan Stanley | 09/12/2018 | — | (5,669) |
| 3,617,327,000 KRW | 3,200,891 USD | Morgan Stanley | 09/12/2018 | — | (47,599) |
| 7,005,847 USD | 9,468,000 AUD | Morgan Stanley | 09/12/2018 | — | (199,367) |
| 1,307,748 USD | 1,301,000 CHF | Morgan Stanley | 09/12/2018 | 35,334 | — |
| 726,606 USD | 4,632,000 DKK | Morgan Stanley | 09/12/2018 | — | (4,958) |
| 578,554 USD | 495,000 EUR | Morgan Stanley | 09/12/2018 | — | (3,683) |
| 868,168 USD | 7,764,000 SEK | Morgan Stanley | 09/12/2018 | — | (18,734) |
| 1,744,071 USD | 2,379,000 SGD | Morgan Stanley | 09/12/2018 | — | (10,636) |
| Total | | | | 46,394 | (346,254) |
| Call option contracts purchased |
| Description | Counterparty | Trading
currency | Notional
amount | Number of
contracts | Exercise
price/Rate | Expiration
date | Cost ($) | Value ($) |
| CBOE Volatility Index | JPMorgan | USD | 212,190 | 165 | 13.00 | 09/19/2018 | 29,541 | 26,400 |
Notes to Portfolio of Investments
| (a) | Non-income producing investment. |
| (b) | The rate shown is the seven-day current annualized yield at August 31, 2018. |
| (c) | As defined in the Investment Company Act of 1940, an affiliated company is one in which the Fund owns 5% or more of the company’s outstanding voting securities, or a company which is under common ownership or control with the Fund. Holdings and transactions in these affiliated companies during the period ended August 31, 2018 are as follows: |
| Issuer | Beginning
shares | Shares
purchased | Shares
sold | Ending
shares | Realized gain
(loss) —
affiliated
issuers ($) | Net change in
unrealized
appreciation
(depreciation) —
affiliated
issuers ($) | Dividends —
affiliated
issuers ($) | Value —
affiliated
issuers
at end of
period ($) |
| Columbia Short-Term Cash Fund, 2.058% |
| | — | 28,584,069 | (28,040,531) | 543,538 | 211 | — | 10,448 | 543,483 |
Abbreviation Legend
| ADR | American Depositary Receipt |
Currency Legend
| AUD | Australian Dollar |
| CAD | Canada Dollar |
| CHF | Swiss Franc |
| DKK | Danish Krone |
| EUR | Euro |
| GBP | British Pound |
| ILS | New Israeli Sheqel |
| JPY | Japanese Yen |
| KRW | South Korean Won |
| SEK | Swedish Krona |
| SGD | Singapore Dollar |
The accompanying Notes to Financial Statements are an integral part of this statement.
Columbia Overseas Core Fund | Semiannual Report 2018
| 7 |
Portfolio of Investments (continued)
August 31, 2018 (Unaudited)
Currency Legend (continued)
Fair value measurements
The Fund categorizes its fair value measurements according to a three-level hierarchy that maximizes the use of observable inputs and minimizes the use of unobservable inputs by prioritizing that the most observable input be used when available. Observable inputs are those that market participants would use in pricing an investment based on market data obtained from sources independent of the reporting entity. Unobservable inputs are those that reflect the Fund’s assumptions about the information market participants would use in pricing an investment. An investment’s level within the fair value hierarchy is based on the lowest level of any input that is deemed significant to the asset’s or liability’s fair value measurement. The input levels are not necessarily an indication of the risk or liquidity associated with investments at that level. For example, certain U.S. government securities are generally high quality and liquid, however, they are reflected as Level 2 because the inputs used to determine fair value may not always be quoted prices in an active market.
Fair value inputs are summarized in the three broad levels listed below:
| ■ | Level 1 — Valuations based on quoted prices for investments in active markets that the Fund has the ability to access at the measurement date. Valuation adjustments are not applied to Level 1 investments. |
| ■ | Level 2 — Valuations based on other significant observable inputs (including quoted prices for similar securities, interest rates, prepayment speeds, credit risks, etc.). |
| ■ | Level 3 — Valuations based on significant unobservable inputs (including the Fund’s own assumptions and judgment in determining the fair value of investments). |
Inputs that are used in determining fair value of an investment may include price information, credit data, volatility statistics, and other factors. These inputs can be either observable or unobservable. The availability of observable inputs can vary between investments, and is affected by various factors such as the type of investment, and the volume and level of activity for that investment or similar investments in the marketplace. The inputs will be considered by the Investment Manager, along with any other relevant factors in the calculation of an investment’s fair value. The Fund uses prices and inputs that are current as of the measurement date, which may include periods of market dislocations. During these periods, the availability of prices and inputs may be reduced for many investments. This condition could cause an investment to be reclassified between the various levels within the hierarchy.
Foreign equity securities actively traded in markets where there is a significant delay in the local close relative to the New York Stock Exchange are classified as Level 2. The values of these securities may include an adjustment to reflect the impact of significant market movements following the close of local trading, as described in Note 2 to the financial statements – Security valuation.
Certain investments that have been measured at fair value using the net asset value (NAV) per share (or its equivalent) are not categorized in the fair value hierarchy. The fair value amounts presented in the table are intended to reconcile the fair value hierarchy to the amounts presented in the Portfolio of Investments. The Columbia Short-Term Cash Fund seeks to provide shareholders with maximum current income consistent with liquidity and stability of principal. Columbia Short-Term Cash Fund prices its shares with a floating NAV and no longer seeks to maintain a stable NAV.
Investments falling into the Level 3 category are primarily supported by quoted prices from brokers and dealers participating in the market for those investments. However, these may be classified as Level 3 investments due to lack of market transparency and corroboration to support these quoted prices. Additionally, valuation models may be used as the pricing source for any remaining investments classified as Level 3. These models may rely on one or more significant unobservable inputs and/or significant assumptions by the Investment Manager. Inputs used in valuations may include, but are not limited to, financial statement analysis, capital account balances, discount rates and estimated cash flows, and comparable company data.
Under the direction of the Fund’s Board of Trustees (the Board), the Investment Manager’s Valuation Committee (the Committee) is responsible for overseeing the valuation procedures approved by the Board. The Committee consists of voting and non-voting members from various groups within the Investment Manager’s organization, including operations and accounting, trading and investments, compliance, risk management and legal.
The Committee meets at least monthly to review and approve valuation matters, which may include a description of specific valuation determinations, data regarding pricing information received from approved pricing vendors and brokers and the results of Board-approved valuation control policies and procedures (the Policies). The Policies address, among other things, instances when market quotations are or are not readily available, including recommendations of third party pricing vendors and a determination of appropriate pricing methodologies; events that require specific valuation determinations and assessment of fair value techniques; securities with a potential for stale pricing, including those that are illiquid, restricted, or in default; and the effectiveness of third party pricing vendors, including periodic reviews of vendors. The Committee meets more frequently, as needed, to discuss additional valuation matters, which may include the need to review back-testing results, review time-sensitive information or approve related valuation actions. The Committee reports to the Board, with members of the Committee meeting with the Board at each of its regularly scheduled meetings to discuss valuation matters and actions during the period, similar to those described earlier.
For investments categorized as Level 3, the Committee monitors information similar to that described above, which may include: (i) data specific to the issuer or comparable issuers, (ii) general market or specific sector news and (iii) quoted prices and specific or similar security transactions. The Committee considers this data and any changes from prior periods in order to assess the reasonableness of observable and unobservable inputs, any assumptions or internal models used to value those securities and changes in fair value. This data is also used to corroborate, when available, information received from approved pricing vendors and brokers. Various factors impact the frequency of monitoring this information (which may occur as often as daily). However, the Committee may determine that changes to inputs, assumptions and models are not required as a result of the monitoring procedures performed.
The accompanying Notes to Financial Statements are an integral part of this statement.
| 8 | Columbia Overseas Core Fund | Semiannual Report 2018 |
Portfolio of Investments (continued)
August 31, 2018 (Unaudited)
Fair value measurements (continued)
The following table is a summary of the inputs used to value the Fund’s investments at August 31, 2018:
| | Level 1
quoted prices
in active
markets for
identical
assets ($) | Level 2
other
significant
observable
inputs ($) | Level 3
significant
unobservable
inputs ($) | Investments
measured at
net asset
value ($) | Total ($) |
| Investments in Securities | | | | | |
| Common Stocks | | | | | |
| Argentina | 535,114 | — | — | — | 535,114 |
| Australia | — | 1,114,049 | — | — | 1,114,049 |
| Brazil | 1,944,124 | — | — | — | 1,944,124 |
| Canada | 6,454,243 | — | — | — | 6,454,243 |
| China | 973,969 | 1,758,175 | — | — | 2,732,144 |
| Finland | — | 2,925,105 | — | — | 2,925,105 |
| France | 407,793 | 10,372,887 | — | — | 10,780,680 |
| Germany | — | 2,924,600 | — | — | 2,924,600 |
| Hong Kong | — | 2,068,952 | — | — | 2,068,952 |
| Ireland | 1,008,269 | — | — | — | 1,008,269 |
| Israel | — | 3,806,831 | — | — | 3,806,831 |
| Italy | — | 1,764,789 | — | — | 1,764,789 |
| Japan | — | 35,463,436 | — | — | 35,463,436 |
| Netherlands | — | 11,667,740 | — | — | 11,667,740 |
| Norway | — | 1,057,046 | — | — | 1,057,046 |
| Russian Federation | — | 788,127 | — | — | 788,127 |
| South Korea | — | 4,247,983 | — | — | 4,247,983 |
| Spain | — | 5,953,615 | — | — | 5,953,615 |
| Sweden | — | 2,437,646 | — | — | 2,437,646 |
| Switzerland | — | 5,608,641 | — | — | 5,608,641 |
| United Kingdom | 419,497 | 26,917,018 | — | — | 27,336,515 |
| United States | 8,861,265 | — | — | — | 8,861,265 |
| Total Common Stocks | 20,604,274 | 120,876,640 | — | — | 141,480,914 |
| Options Purchased Calls | 26,400 | — | — | — | 26,400 |
| Money Market Funds | — | — | — | 543,483 | 543,483 |
| Total Investments in Securities | 20,630,674 | 120,876,640 | — | 543,483 | 142,050,797 |
| Investments in Derivatives | | | | | |
| Asset | | | | | |
| Forward Foreign Currency Exchange Contracts | — | 46,394 | — | — | 46,394 |
| Liability | | | | | |
| Forward Foreign Currency Exchange Contracts | — | (346,254) | — | — | (346,254) |
| Total | 20,630,674 | 120,576,780 | — | 543,483 | 141,750,937 |
See the Portfolio of Investments for all investment classifications not indicated in the table.
The Fund’s assets assigned to the Level 2 input category are generally valued using the market approach, in which a security’s value is determined through reference to prices and information from market transactions for similar or identical assets. These assets include certain foreign securities for which a third party statistical pricing service may be employed for purposes of fair market valuation. The model utilized by such third party statistical pricing service takes into account a security’s correlation to available market data including, but not limited to, intraday index, ADR, and exchange-traded fund movements.
Forward foreign currency exchange contracts are valued at unrealized appreciation (depreciation).
There were no transfers of financial assets between levels during the period.
The accompanying Notes to Financial Statements are an integral part of this statement.
Columbia Overseas Core Fund | Semiannual Report 2018
| 9 |
Statement of Assets and Liabilities
August 31, 2018 (Unaudited)
| Assets | |
| Investments in securities, at value | |
| Unaffiliated issuers (cost $151,398,846) | $141,480,914 |
| Affiliated issuers (cost $543,483) | 543,483 |
| Options purchased (cost $29,541) | 26,400 |
| Foreign currency (cost $104,221) | 104,221 |
| Unrealized appreciation on forward foreign currency exchange contracts | 46,394 |
| Receivable for: | |
| Investments sold | 838,830 |
| Dividends | 367,006 |
| Foreign tax reclaims | 102,233 |
| Expense reimbursement due from Investment Manager | 1,494 |
| Prepaid expenses | 3,048 |
| Other assets | 152,408 |
| Total assets | 143,666,431 |
| Liabilities | |
| Unrealized depreciation on forward foreign currency exchange contracts | 346,254 |
| Payable for: | |
| Investments purchased | 354,968 |
| Management services fees | 3,422 |
| Distribution and/or service fees | 1 |
| Transfer agent fees | 154 |
| Compensation of board members | 3,209 |
| Compensation of chief compliance officer | 14 |
| Other expenses | 54,924 |
| Total liabilities | 762,946 |
| Net assets applicable to outstanding capital stock | $142,903,485 |
| Represented by | |
| Paid in capital | 150,160,599 |
| Undistributed net investment income | 2,108,089 |
| Accumulated net realized gain | 855,402 |
| Unrealized appreciation (depreciation) on: | |
| Investments - unaffiliated issuers | (9,917,932) |
| Foreign currency translations | 328 |
| Forward foreign currency exchange contracts | (299,860) |
| Options purchased | (3,141) |
| Total - representing net assets applicable to outstanding capital stock | $142,903,485 |
The accompanying Notes to Financial Statements are an integral part of this statement.
| 10 | Columbia Overseas Core Fund | Semiannual Report 2018 |
Statement of Assets and Liabilities (continued)
August 31, 2018 (Unaudited)
| Class A | |
| Net assets | $20,187 |
| Shares outstanding | 2,100 |
| Net asset value per share | $9.61 |
| Maximum sales charge | 5.75% |
| Maximum offering price per share (calculated by dividing the net asset value per share by 1.0 minus the maximum sales charge for Class A shares) | $10.20 |
| Advisor Class | |
| Net assets | $20,211 |
| Shares outstanding | 2,100 |
| Net asset value per share | $9.62 |
| Class C | |
| Net assets | $24,863 |
| Shares outstanding | 2,596 |
| Net asset value per share | $9.58 |
| Institutional Class | |
| Net assets | $20,211 |
| Shares outstanding | 2,100 |
| Net asset value per share | $9.62 |
| Institutional 2 Class | |
| Net assets | $28,562 |
| Shares outstanding | 2,966 |
| Net asset value per share | $9.63 |
| Institutional 3 Class | |
| Net assets | $142,769,290 |
| Shares outstanding | 14,822,436 |
| Net asset value per share | $9.63 |
| Class R | |
| Net assets | $20,161 |
| Shares outstanding | 2,100 |
| Net asset value per share | $9.60 |
The accompanying Notes to Financial Statements are an integral part of this statement.
Columbia Overseas Core Fund | Semiannual Report 2018
| 11 |
Statement of Operations
For the period from March 5, 2018 (commencement of operations) through August 31, 2018 (Unaudited)
| Net investment income | |
| Income: | |
| Dividends — unaffiliated issuers | $2,960,917 |
| Dividends — affiliated issuers | 10,448 |
| Foreign taxes withheld | (281,961) |
| Total income | 2,689,404 |
| Expenses: | |
| Management services fees | 582,360 |
| Distribution and/or service fees | |
| Class A | 26 |
| Class C | 112 |
| Class R | 51 |
| Transfer agent fees | |
| Class A | 38 |
| Advisor Class | 38 |
| Class C | 43 |
| Institutional Class | 38 |
| Institutional 2 Class | 8 |
| Institutional 3 Class | 5,363 |
| Class R | 38 |
| Compensation of board members | 6,415 |
| Custodian fees | 50,261 |
| Printing and postage fees | 10,462 |
| Registration fees | 5,859 |
| Audit fees | 23,048 |
| Legal fees | 4,524 |
| Offering costs | 123,268 |
| Compensation of chief compliance officer | 14 |
| Other | 9,357 |
| Total expenses | 821,323 |
| Fees waived or expenses reimbursed by Investment Manager and its affiliates | (240,008) |
| Total net expenses | 581,315 |
| Net investment income | 2,108,089 |
| Realized and unrealized gain (loss) — net | |
| Net realized gain (loss) on: | |
| Investments — unaffiliated issuers | 1,257,577 |
| Investments — affiliated issuers | 211 |
| Foreign currency translations | (9,348) |
| Forward foreign currency exchange contracts | (292,156) |
| Options purchased | (100,882) |
| Net realized gain | 855,402 |
| Net change in unrealized appreciation (depreciation) on: | |
| Investments — unaffiliated issuers | (9,917,932) |
| Foreign currency translations | 328 |
| Forward foreign currency exchange contracts | (299,860) |
| Options purchased | (3,141) |
| Net change in unrealized appreciation (depreciation) | (10,220,605) |
| Net realized and unrealized loss | (9,365,203) |
| Net decrease in net assets resulting from operations | $(7,257,114) |
The accompanying Notes to Financial Statements are an integral part of this statement.
| 12 | Columbia Overseas Core Fund | Semiannual Report 2018 |
Statement of Changes in Net Assets
| | Six Months Ended
August 31, 2018
(Unaudited)(a) |
| Operations | |
| Net investment income | $2,108,089 |
| Net realized gain | 855,402 |
| Net change in unrealized appreciation (depreciation) | (10,220,605) |
| Net decrease in net assets resulting from operations | (7,257,114) |
| Increase in net assets from capital stock activity | 150,013,599 |
| Total increase in net assets | 142,756,485 |
| Net assets at beginning of period | 147,000 |
| Net assets at end of period | $142,903,485 |
| Undistributed net investment income | $2,108,089 |
| (a) | Based on operations from March 5, 2018 (fund commencement of operations) through the stated period end. |
The accompanying Notes to Financial Statements are an integral part of this statement.
Columbia Overseas Core Fund | Semiannual Report 2018
| 13 |
Statement of Changes in Net Assets (continued)
| | Six Months Ended |
| | August 31, 2018
(Unaudited)(a) |
| | Shares | Dollars ($) |
| Capital stock activity |
| Class C | | |
| Subscriptions | 496 | 5,000 |
| Net increase | 496 | 5,000 |
| Institutional 2 Class | | |
| Subscriptions | 866 | 8,599 |
| Net increase | 866 | 8,599 |
| Institutional 3 Class | | |
| Subscriptions | 14,820,336 | 150,000,000 |
| Net increase | 14,820,336 | 150,000,000 |
| Total net increase | 14,821,698 | 150,013,599 |
| (a) | Based on operations from March 5, 2018 (fund commencement of operations) through the stated period end. |
The accompanying Notes to Financial Statements are an integral part of this statement.
| 14 | Columbia Overseas Core Fund | Semiannual Report 2018 |
[THIS PAGE INTENTIONALLY LEFT BLANK]
Columbia Overseas Core Fund | Semiannual Report 2018
| 15 |
The following table is intended to help you understand the Fund’s financial performance. Certain information reflects financial results for a single share of a class held for the periods shown. Per share net investment income (loss) amounts are calculated based on average shares outstanding during the period. Total return assumes reinvestment of all dividends and distributions, if any. Total return does not reflect payment of sales charges, if any. Total return and portfolio turnover are not annualized for periods of less than one year. The portfolio turnover rate is calculated without regard to purchase and sales transactions of short-term instruments and certain derivatives, if any. If such transactions were included, the Fund’s portfolio turnover rate may be higher.
| | Net asset value,
beginning of
period | Net
investment
income | Net
realized
and
unrealized
gain (loss) | Total from
investment
operations |
| Class A |
| Six Months Ended 8/31/2018 (Unaudited)(c) | $10.00 | 0.13 | (0.52) | (0.39) |
| Advisor Class |
| Six Months Ended 8/31/2018 (Unaudited)(c) | $10.00 | 0.14 | (0.52) | (0.38) |
| Class C |
| Six Months Ended 8/31/2018 (Unaudited)(c) | $10.00 | 0.09 | (0.51) | (0.42) |
| Institutional Class |
| Six Months Ended 8/31/2018 (Unaudited)(c) | $10.00 | 0.14 | (0.52) | (0.38) |
| Institutional 2 Class |
| Six Months Ended 8/31/2018 (Unaudited)(c) | $10.00 | 0.14 | (0.51) | (0.37) |
| Institutional 3 Class |
| Six Months Ended 8/31/2018 (Unaudited)(c) | $10.00 | 0.15 | (0.52) | (0.37) |
| Class R |
| Six Months Ended 8/31/2018 (Unaudited)(c) | $10.00 | 0.12 | (0.52) | (0.40) |
| Notes to Financial Highlights |
| (a) | In addition to the fees and expenses that the Fund bears directly, the Fund indirectly bears a pro rata share of the fees and expenses of any other funds in which it invests. Such indirect expenses are not included in the Fund’s reported expense ratios. |
| (b) | Total net expenses include the impact of certain fee waivers/expense reimbursements made by the Investment Manager and certain of its affiliates, if applicable. |
| (c) | The Fund commenced operations on March 5, 2018. Per share data and total return reflect activity from that date. |
| (d) | Annualized. |
The accompanying Notes to Financial Statements are an integral part of this statement.
| 16 | Columbia Overseas Core Fund | Semiannual Report 2018 |
Financial Highlights (continued)
| | Net
asset
value,
end of
period | Total
return | Total gross
expense
ratio to
average
net assets(a) | Total net
expense
ratio to
average
net assets(a),(b) | Net investment
income
ratio to
average
net assets | Portfolio
turnover | Net
assets,
end of
period
(000’s) |
| Class A |
| Six Months Ended 8/31/2018 (Unaudited)(c) | $9.61 | (3.90%) | 1.84% (d) | 1.28% (d) | 2.69% (d) | 43% | $20 |
| Advisor Class |
| Six Months Ended 8/31/2018 (Unaudited)(c) | $9.62 | (3.80%) | 1.59% (d) | 1.03% (d) | 2.94% (d) | 43% | $20 |
| Class C |
| Six Months Ended 8/31/2018 (Unaudited)(c) | $9.58 | (4.20%) | 2.59% (d) | 2.03% (d) | 1.79% (d) | 43% | $25 |
| Institutional Class |
| Six Months Ended 8/31/2018 (Unaudited)(c) | $9.62 | (3.80%) | 1.59% (d) | 1.03% (d) | 2.94% (d) | 43% | $20 |
| Institutional 2 Class |
| Six Months Ended 8/31/2018 (Unaudited)(c) | $9.63 | (3.70%) | 1.29% (d) | 0.93% (d) | 2.94% (d) | 43% | $29 |
| Institutional 3 Class |
| Six Months Ended 8/31/2018 (Unaudited)(c) | $9.63 | (3.70%) | 1.23% (d) | 0.87% (d) | 3.15% (d) | 43% | $142,769 |
| Class R |
| Six Months Ended 8/31/2018 (Unaudited)(c) | $9.60 | (4.00%) | 2.09% (d) | 1.53% (d) | 2.44% (d) | 43% | $20 |
The accompanying Notes to Financial Statements are an integral part of this statement.
Columbia Overseas Core Fund | Semiannual Report 2018
| 17 |
Notes to Financial Statements
August 31, 2018 (Unaudited)
Note 1. Organization
Columbia Overseas Core Fund (the Fund), a series of Columbia Funds Series Trust II (the Trust), is a diversified fund. The Trust is registered under the Investment Company Act of 1940, as amended (the 1940 Act), as an open-end management investment company organized as a Massachusetts business trust.
On March 2, 2018, Columbia Management Investment Advisers, LLC (the Investment Manager), a wholly-owned subsidiary of Ameriprise Financial, Inc. (Ameriprise Financial), invested $147,000 in the Fund (2,100 shares for Class A, 2,100 shares for Advisor Class, 2,100 shares for Class C, 2,100 shares for Institutional Class, 2,100 shares for Institutional 2 Class, 2,100 shares for Institutional 3 Class and 2,100 shares for Class R), which represented the initial capital for each class at $10 per share. Shares of the Fund were first offered to the public on March 5, 2018.
These financial statements cover the period from March 5, 2018 (commencement of operations) through August 31, 2018. All references to the six months ended August 31, 2018 refer to the period from March 5, 2018 through August 31, 2018.
Fund shares
The Trust may issue an unlimited number of shares (without par value). Although all share classes generally have identical voting, dividend and liquidation rights, each share class votes separately when required by the Trust’s organizational documents or by law. Different share classes pay different distribution amounts to the extent the expenses of such share classes differ, and distributions in liquidation will be proportional to the net asset value of each share class. Each share class has its own expense and sales charge structure. The Fund offers each of the share classes identified below.
Class A shares are subject to a maximum front-end sales charge of 5.75% based on the initial investment amount. Class A shares purchased without an initial sales charge in accounts aggregating $1 million to $50 million at the time of purchase are subject to a contingent deferred sales charge (CDSC) if the shares are sold within 18 months after purchase, charged as follows: 1.00% CDSC if redeemed within 12 months after purchase, and 0.50% CDSC if redeemed more than 12, but less than 18, months after purchase.
Advisor Class shares are not subject to sales charges and are generally available only to omnibus retirement plans and certain investors as described in the Fund’s prospectus.
Class C shares are subject to a 1.00% CDSC on shares redeemed within 12 months after purchase. Effective July 1, 2018, Class C shares will automatically convert to Class A shares of the same Fund in the month of or the month following the 10-year anniversary of the Class C shares purchase date.
Institutional Class shares are not subject to sales charges and are generally available only to eligible investors, which are subject to different investment minimums as described in the Fund’s prospectus.
Institutional 2 Class shares are not subject to sales charges and are generally available only to investors purchasing through authorized investment professionals and omnibus retirement plans as described in the Fund’s prospectus.
Institutional 3 Class shares are not subject to sales charges and are available to institutional and certain other investors as described in the Fund’s prospectus.
Class R shares are not subject to sales charges and are generally available only to certain retirement plans and other investors as described in the Fund’s prospectus.
Note 2. Summary of significant accounting policies
Basis of preparation
The Fund is an investment company that applies the accounting and reporting guidance in the Financial Accounting Standards Board (FASB) Accounting Standards Codification Topic 946, Financial Services - Investment Companies (ASC 946). The financial statements are prepared in accordance with U.S. generally accepted accounting principles (GAAP), which
| 18 | Columbia Overseas Core Fund | Semiannual Report 2018 |
Notes to Financial Statements (continued)
August 31, 2018 (Unaudited)
requires management to make certain estimates and assumptions that affect the reported amounts of assets and liabilities, the disclosure of contingent assets and liabilities at the date of the financial statements and the reported amounts of income and expenses during the reporting period. Actual results could differ from those estimates.
The following is a summary of significant accounting policies followed by the Fund in the preparation of its financial statements.
Security valuation
All equity securities and exchange-traded funds are valued at the close of business of the New York Stock Exchange. Equity securities and exchange-traded funds are valued at the last quoted sales price on the principal exchange or market on which they trade, except for securities traded on the NASDAQ Stock Market, which are valued at the NASDAQ official close price. Unlisted securities or listed securities for which there were no sales during the day are valued at the mean of the latest quoted bid and ask prices on such exchanges or markets.
Foreign equity securities are valued based on the closing price on the foreign exchange in which such securities are primarily traded. If any foreign equity security closing prices are not readily available, the securities are valued at the mean of the latest quoted bid and ask prices on such exchanges or markets. Foreign currency exchange rates are generally determined at 4:00 p.m. Eastern (U.S.) time. Many securities markets and exchanges outside the U.S. close prior to the close of the New York Stock Exchange; therefore, the closing prices for securities in such markets or on such exchanges may not fully reflect events that occur after such close but before the close of the New York Stock Exchange. In those situations, foreign securities will be fair valued pursuant to a policy adopted by the Board of Trustees, including, if available, utilizing a third party pricing service to determine these fair values. The third party pricing service takes into account multiple factors, including, but not limited to, movements in the U.S. securities markets, certain depositary receipts, futures contracts and foreign exchange rates that have occurred subsequent to the close of the foreign exchange or market, to determine a good faith estimate that reasonably reflects the current market conditions as of the close of the New York Stock Exchange. The fair value of a security is likely to be different from the quoted or published price, if available.
Investments in open-end investment companies, including money market funds, are valued at their latest net asset value.
Forward foreign currency exchange contracts are marked-to-market based upon foreign currency exchange rates provided by a pricing service.
Option contracts are valued at the mean of the latest quoted bid and ask prices on their primary exchanges. Option contracts, including over-the-counter option contracts, with no readily available market quotations are valued using quotes obtained from independent brokers as of the close of the New York Stock Exchange.
Investments for which market quotations are not readily available, or that have quotations which management believes are not reflective of market value or reliable, are valued at fair value as determined in good faith under procedures approved by and under the general supervision of the Board of Trustees. If a security or class of securities (such as foreign securities) is valued at fair value, such value is likely to be different from the quoted or published price for the security.
The determination of fair value often requires significant judgment. To determine fair value, management may use assumptions including but not limited to future cash flows and estimated risk premiums. Multiple inputs from various sources may be used to determine fair value.
GAAP requires disclosure regarding the inputs and valuation techniques used to measure fair value and any changes in valuation inputs or techniques. In addition, investments shall be disclosed by major category. This information is disclosed following the Fund’s Portfolio of Investments.
Foreign currency transactions and translations
The values of all assets and liabilities denominated in foreign currencies are generally translated into U.S. dollars at exchange rates determined at the close of regular trading on the New York Stock Exchange. Net realized and unrealized gains (losses) on foreign currency transactions and translations include gains (losses) arising from the fluctuation in exchange
Columbia Overseas Core Fund | Semiannual Report 2018
| 19 |
Notes to Financial Statements (continued)
August 31, 2018 (Unaudited)
rates between trade and settlement dates on securities transactions, gains (losses) arising from the disposition of foreign currency and currency gains (losses) between the accrual and payment dates on dividends, interest income and foreign withholding taxes.
For financial statement purposes, the Fund does not distinguish that portion of gains (losses) on investments which is due to changes in foreign exchange rates from that which is due to changes in market prices of the investments. Such fluctuations are included with the net realized and unrealized gains (losses) on investments in the Statement of Operations.
Derivative instruments
The Fund invests in certain derivative instruments, as detailed below, to meet its investment objectives. Derivatives are instruments whose values depend on, or are derived from, in whole or in part, the value of one or more securities, currencies, commodities, indices, or other assets or instruments. Derivatives may be used to increase investment flexibility (including to maintain cash reserves while maintaining desired exposure to certain assets), for risk management (hedging) purposes, to facilitate trading, to reduce transaction costs and to pursue higher investment returns. The Fund may also use derivative instruments to mitigate certain investment risks, such as foreign currency exchange rate risk, interest rate risk and credit risk. Derivatives may involve various risks, including the potential inability of the counterparty to fulfill its obligations under the terms of the contract, the potential for an illiquid secondary market (making it difficult for the Fund to sell or terminate, including at favorable prices) and the potential for market movements which may expose the Fund to gains or losses in excess of the amount shown in the Statement of Assets and Liabilities. The notional amounts of derivative instruments, if applicable, are not recorded in the financial statements.
A derivative instrument may suffer a marked-to-market loss if the value of the contract decreases due to an unfavorable change in the market rates or values of the underlying instrument. Losses can also occur if the counterparty does not perform its obligations under the contract. The Fund’s risk of loss from counterparty credit risk on over-the-counter derivatives is generally limited to the aggregate unrealized gain netted against any collateral held by the Fund and the amount of any variation margin held by the counterparty, plus any replacement costs or related amounts. With exchange-traded or centrally cleared derivatives, there is reduced counterparty credit risk to the Fund since the clearinghouse or central counterparty (CCP) provides some protection in the case of clearing member default. The clearinghouse or CCP stands between the buyer and the seller of the contract; therefore, additional counterparty credit risk is failure of the clearinghouse or CCP. However, credit risk still exists in exchange-traded or centrally cleared derivatives with respect to initial and variation margin that is held in a broker’s customer account. While brokers are required to segregate customer margin from their own assets, in the event that a broker becomes insolvent or goes into bankruptcy and at that time there is a shortfall in the aggregate amount of margin held by the broker for all its clients, U.S. bankruptcy laws will typically allocate that shortfall on a pro-rata basis across all the broker’s customers (including the Fund), potentially resulting in losses to the Fund.
In order to better define its contractual rights and to secure rights that will help the Fund mitigate its counterparty risk, the Fund may enter into an International Swaps and Derivatives Association, Inc. Master Agreement (ISDA Master Agreement) or similar agreement with its derivatives contract counterparties. An ISDA Master Agreement is an agreement between the Fund and a counterparty that governs over-the-counter derivatives and typically contains, among other things, collateral posting terms and netting provisions in the event of a default and/or termination event. Under an ISDA Master Agreement, the Fund may, under certain circumstances, offset with the counterparty certain derivative instrument’s payables and/or receivables with collateral held and/or posted and create one single net payment. The provisions of the ISDA Master Agreement typically permit a single net payment in the event of default (close-out netting), including the bankruptcy or insolvency of the counterparty. Note, however, that bankruptcy or insolvency laws of a particular jurisdiction may impose restrictions on or prohibitions against the right of offset or netting in bankruptcy, insolvency or other events.
Collateral (margin) requirements differ by type of derivative. Margin requirements are established by the clearinghouse or CCP for exchange-traded and centrally cleared derivatives. Brokers can ask for margin in excess of the minimum in certain circumstances. Collateral terms are contract specific for over-the-counter derivatives. For over-the-counter derivatives traded under an ISDA Master Agreement, the collateral requirements are typically calculated by netting the marked-to-market amount for each transaction under such agreement and comparing that amount to the value of any variation margin currently pledged by the Fund and/or the counterparty. Generally, the amount of collateral due from or to a party has to exceed a minimum transfer amount threshold (e.g., $250,000) before a transfer has to be made. To the extent amounts due to the Fund from its counterparties are not fully collateralized, contractually or otherwise, the Fund bears the risk of loss from counterparty
| 20 | Columbia Overseas Core Fund | Semiannual Report 2018 |
Notes to Financial Statements (continued)
August 31, 2018 (Unaudited)
nonperformance. The Fund may also pay interest expense on cash collateral received from the broker. Any interest expense paid by the Fund is shown on the Statement of Operations. The Fund attempts to mitigate counterparty risk by only entering into agreements with counterparties that it believes have the financial resources to honor their obligations and by monitoring the financial stability of those counterparties.
Certain ISDA Master Agreements allow counterparties of over-the-counter derivatives transactions to terminate derivatives contracts prior to maturity in the event the Fund’s net asset value declines by a stated percentage over a specified time period or if the Fund fails to meet certain terms of the ISDA Master Agreement, which would cause the Fund to accelerate payment of any net liability owed to the counterparty. The Fund also has termination rights if the counterparty fails to meet certain terms of the ISDA Master Agreement. In determining whether to exercise such termination rights, the Fund would consider, in addition to counterparty credit risk, whether termination would result in a net liability owed from the counterparty.
For financial reporting purposes, the Fund does not offset derivative assets and derivative liabilities that are subject to netting arrangements in the Statement of Assets and Liabilities.
Forward foreign currency exchange contracts
Forward foreign currency exchange contracts are over-the-counter agreements between two parties to buy and sell a currency at a set price on a future date. The Fund utilized forward foreign currency exchange contracts to hedge the currency exposure associated with some or all of the Fund’s securities, to shift investment exposure from one currency to another and to shift U.S. dollar exposure to achieve a representative weighted mix of major currencies in its benchmark, and/or to recover an underweight country exposure in its portfolio. These instruments may be used for other purposes in future periods.
The values of forward foreign currency exchange contracts fluctuate daily with changes in foreign currency exchange rates. Changes in the value of these contracts are recorded as unrealized appreciation or depreciation until the contract is exercised or has expired. The Fund will realize a gain or loss when the forward foreign currency exchange contract is closed or expires.
The use of forward foreign currency exchange contracts does not eliminate fluctuations in the prices of the Fund’s portfolio securities. The risks of forward foreign currency exchange contracts include movement in the values of the foreign currencies relative to the U.S. dollar (or other foreign currencies) and the possibility that counterparties will not complete their contractual obligations, which may be in excess of the amount reflected, if any, in the Statement of Assets and Liabilities.
Options contracts
Options are contracts which entitle the holder to purchase or sell securities or other identified assets at a specified price, or in the case of index option contracts, to receive or pay the difference between the index value and the strike price of the index option contract. Option contracts can be either exchange-traded or over-the-counter. The Fund purchased option contracts to decrease the Fund’s exposure to equity market risk and to increase return on investments. These instruments may be used for other purposes in future periods. Completion of transactions for option contracts traded in the over-the-counter market depends upon the performance of the other party. Cash collateral may be collected or posted by the Fund to secure certain over-the-counter option contract trades. Cash collateral held or posted by the Fund for such option contract trades must be returned to the broker or the Fund upon closure, exercise or expiration of the contract.
Options contracts purchased are recorded as investments. When the Fund writes an options contract, the premium received is recorded as an asset and an amount equivalent to the premium is recorded as a liability in the Statement of Assets and Liabilities and is subsequently adjusted to reflect the current fair value of the option written. Changes in the fair value of the written option are recorded as unrealized appreciation or depreciation until the contract is exercised or has expired. The Fund will realize a gain or loss when the option contract is closed or expires. When option contracts are exercised, the proceeds on sales for a written call or purchased put option contract, or the purchase cost for a written put or purchased call option contract, is adjusted by the amount of premium received or paid.
For over-the-counter options purchased, the Fund bears the risk of loss of the amount of the premiums paid plus the positive change in market values net of any collateral held by the Fund should the counterparty fail to perform under the contracts. Option contracts written by the Fund do not typically give rise to significant counterparty credit risk, as options written generally obligate the Fund and not the counterparty to perform. The risk in writing a call option contract is that the Fund
Columbia Overseas Core Fund | Semiannual Report 2018
| 21 |
Notes to Financial Statements (continued)
August 31, 2018 (Unaudited)
gives up the opportunity for profit if the market price of the security increases above the strike price and the option contract is exercised. The risk in writing a put option contract is that the Fund may incur a loss if the market price of the security decreases below the strike price and the option contract is exercised. Exercise of a written option could result in the Fund purchasing or selling a security or foreign currency when it otherwise would not, or at a price different from the current market value. In purchasing and writing options, the Fund bears the risk of an unfavorable change in the value of the underlying instrument or the risk that the Fund may not be able to enter into a closing transaction due to an illiquid market.
Effects of derivative transactions in the financial statements
The following tables are intended to provide additional information about the effect of derivatives on the financial statements of the Fund, including: the fair value of derivatives by risk category and the location of those fair values in the Statement of Assets and Liabilities; and the impact of derivative transactions over the period in the Statement of Operations, including realized and unrealized gains (losses). The derivative instrument schedules following the Portfolio of Investments present additional information regarding derivative instruments outstanding at the end of the period, if any.
The following table is a summary of the fair value of derivative instruments (not considered to be hedging instruments for accounting disclosure purposes) at August 31, 2018:
| | Asset derivatives | |
Risk exposure
category | Statement
of assets and liabilities
location | Fair value ($) |
| Equity risk | Investments, at value — Options Purchased | 26,400 |
| Foreign exchange risk | Unrealized appreciation on forward foreign currency exchange contracts | 46,394 |
| Total | | 72,794 |
| | Liability derivatives | |
Risk exposure
category | Statement
of assets and liabilities
location | Fair value ($) |
| Foreign exchange risk | Unrealized depreciation on forward foreign currency exchange contracts | 346,254 |
The following table indicates the effect of derivative instruments (not considered to be hedging instruments for accounting disclosure purposes) in the Statement of Operations for the six months ended August 31, 2018:
| Amount of realized gain (loss) on derivatives recognized in income |
| Risk exposure category | Forward
foreign
currency
exchange
contracts
($) | Options
contracts
purchased
($) | Total
($) |
| Equity risk | — | (100,882) | (100,882) |
| Foreign exchange risk | (292,156) | — | (292,156) |
| Total | (292,156) | (100,882) | (393,038) |
| |
| Change in unrealized appreciation (depreciation) on derivatives recognized in income |
| Risk exposure category | Forward
foreign
currency
exchange
contracts
($) | Options
contracts
purchased
($) | Total
($) |
| Equity risk | — | (3,141) | (3,141) |
| Foreign exchange risk | (299,860) | — | (299,860) |
| Total | (299,860) | (3,141) | (303,001) |
| 22 | Columbia Overseas Core Fund | Semiannual Report 2018 |
Notes to Financial Statements (continued)
August 31, 2018 (Unaudited)
The following table is a summary of the average outstanding volume by derivative instrument for the six months ended August 31, 2018:
| Derivative instrument | Average
value ($)* |
| Options contracts — purchased | 13,200 |
| Derivative instrument | Average unrealized
appreciation ($)* | Average unrealized
depreciation ($)* |
| Forward foreign currency exchange contracts | 41,958 | (189,890) |
| * | Based on the ending quarterly outstanding amounts for the six months ended August 31, 2018. |
Offsetting of assets and liabilities
The following table presents the Fund’s gross and net amount of assets and liabilities available for offset under netting arrangements as well as any related collateral received or pledged by the Fund as of August 31, 2018:
| | JPMorgan ($) | Morgan
Stanley ($) | Total ($) |
| Assets | | | |
| Forward foreign currency exchange contracts | - | 46,394 | 46,394 |
| Options purchased calls | 26,400 | - | 26,400 |
| Total assets | 26,400 | 46,394 | 72,794 |
| Liabilities | | | |
| Forward foreign currency exchange contracts | - | 346,254 | 346,254 |
| Total liabilities | - | 346,254 | 346,254 |
| Total financial and derivative net assets | 26,400 | (299,860) | (273,460) |
| Total collateral received (pledged) (a) | - | - | - |
| Net amount (b) | 26,400 | (299,860) | (273,460) |
| (a) | In some instances, the actual collateral received and/or pledged may be more than the amount shown due to overcollateralization. |
| (b) | Represents the net amount due from/(to) counterparties in the event of default. |
Security transactions
Security transactions are accounted for on the trade date. Cost is determined and gains (losses) are based upon the specific identification method for both financial statement and federal income tax purposes.
Income recognition
Corporate actions and dividend income are generally recorded net of any non-reclaimable tax withholdings, on the ex-dividend date or upon receipt of ex-dividend notification in the case of certain foreign securities.
The Fund may receive distributions from holdings in equity securities, business development companies (BDCs), exchange-traded funds (ETFs), limited partnerships (LPs), other regulated investment companies (RICs), and real estate investment trusts (REITs), which report information on the tax character of their distributions annually. These distributions are allocated to dividend income, capital gain and return of capital based on actual information reported. Return of capital is recorded as a reduction of the cost basis of securities held. If the Fund no longer owns the applicable securities, return of capital is recorded as a realized gain. With respect to REITs, to the extent actual information has not yet been reported, estimates for return of capital are made by the Fund’s management. Management’s estimates are subsequently adjusted when the actual character of the distributions is disclosed by the REITs, which could result in a proportionate change in return of capital to shareholders.
Awards from class action litigation are recorded as a reduction of cost basis if the Fund still owns the applicable securities on the payment date. If the Fund no longer owns the applicable securities, the proceeds are recorded as realized gains.
Columbia Overseas Core Fund | Semiannual Report 2018
| 23 |
Notes to Financial Statements (continued)
August 31, 2018 (Unaudited)
Expenses
General expenses of the Trust are allocated to the Fund and other funds of the Trust based upon relative net assets or other expense allocation methodologies determined by the nature of the expense. Expenses directly attributable to the Fund are charged to the Fund. Expenses directly attributable to a specific class of shares are charged to that share class.
Determination of class net asset value
All income, expenses (other than class-specific expenses, which are charged to that share class, as shown in the Statement of Operations) and realized and unrealized gains (losses) are allocated to each class of the Fund on a daily basis, based on the relative net assets of each class, for purposes of determining the net asset value of each class.
Federal income tax status
The Fund intends to qualify each year as a regulated investment company under Subchapter M of the Internal Revenue Code, as amended, and will distribute substantially all of its investment company taxable income and net capital gain, if any, for its tax year, and as such will not be subject to federal income taxes. In addition, the Fund intends to distribute in each calendar year substantially all of its ordinary income, capital gain net income and certain other amounts, if any, such that the Fund should not be subject to federal excise tax. Therefore, no federal income or excise tax provision is recorded.
Foreign taxes
The Fund may be subject to foreign taxes on income, gains on investments or currency repatriation, a portion of which may be recoverable. The Fund will accrue such taxes and recoveries, as applicable, based upon its current interpretation of tax rules and regulations that exist in the markets in which it invests.
Realized gains in certain countries may be subject to foreign taxes at the Fund level, based on statutory rates. The Fund accrues for such foreign taxes on realized and unrealized gains at the appropriate rate for each jurisdiction, as applicable. The amount, if any, is disclosed as a liability on the Statement of Assets and Liabilities.
Distributions to shareholders
Distributions from net investment income, if any, are declared and paid semi-annually. Net realized capital gains, if any, are distributed at least annually. Income distributions and capital gain distributions are determined in accordance with federal income tax regulations, which may differ from GAAP.
Guarantees and indemnifications
Under the Trust’s organizational documents and, in some cases, by contract, its officers and trustees are indemnified against certain liabilities arising out of the performance of their duties to the Trust or its funds. In addition, certain of the Fund’s contracts with its service providers contain general indemnification clauses. The Fund’s maximum exposure under these arrangements is unknown since the amount of any future claims that may be made against the Fund cannot be determined, and the Fund has no historical basis for predicting the likelihood of any such claims.
Recent accounting pronouncement
Accounting Standards Update 2017-08 Premium Amortization on Purchased Callable Debt Securities
In March 2017, the Financial Accounting Standards Board issued Accounting Standards Update (ASU) No. 2017-08 Premium Amortization on Purchased Callable Debt Securities. ASU No. 2017-08 updates the accounting standards to shorten the amortization period for certain purchased callable debt securities, held at a premium, to be amortized to the earliest call date. The update applies to securities with explicit, noncontingent call features that are callable at fixed prices and on preset dates. The standard is effective for annual periods beginning after December 15, 2018 and interim periods within those fiscal years. At this time, management is evaluating the implication of this guidance and the impact it will have on the financial statement amounts and footnote disclosures, if any.
| 24 | Columbia Overseas Core Fund | Semiannual Report 2018 |
Notes to Financial Statements (continued)
August 31, 2018 (Unaudited)
Note 3. Fees and other transactions with affiliates
Management services fees
The Fund has entered into a Management Agreement with Columbia Management Investment Advisers, LLC (the Investment Manager), a wholly-owned subsidiary of Ameriprise Financial, Inc. (Ameriprise Financial). Under the Management Agreement, the Investment Manager provides the Fund with investment research and advice, as well as administrative and accounting services. The management services fee is an annual fee that is equal to a percentage of the Fund’s daily net assets that declines from 0.87% to 0.67% as the Fund’s net assets increase. The annualized effective management services fee rate for the six months ended August 31, 2018 was 0.87% of the Fund’s average daily net assets.
Offering costs
Offering costs were incurred prior to the shares of the Fund being offered. Offering costs include, among other things, state registration filing fees and printing costs. The Fund amortizes offering costs over a period of 12 months from the commencement of operations.
Compensation of board members
Members of the Board of Trustees who are not officers or employees of the Investment Manager or Ameriprise Financial are compensated for their services to the Fund as disclosed in the Statement of Operations. Under a Deferred Compensation Plan (the Plan), these members of the Board of Trustees may elect to defer payment of up to 100% of their compensation. Deferred amounts are treated as though equivalent dollar amounts had been invested in shares of certain funds managed by the Investment Manager. The Fund’s liability for these amounts is adjusted for market value changes and remains in the Fund until distributed in accordance with the Plan. All amounts payable under the Plan constitute a general unsecured obligation of the Fund.
Compensation of Chief Compliance Officer
The Board of Trustees has appointed a Chief Compliance Officer to the Fund in accordance with federal securities regulations. As disclosed in the Statement of Operations, a portion of the Chief Compliance Officer’s total compensation is allocated to the Fund, along with other allocations to affiliated funds governed by the Board of Trustees, based on relative net assets.
Transactions with affiliates
For the six months ended August 31, 2018, the Fund engaged in purchase and/or sale transactions with affiliates and/or accounts that have a common investment manager (or affiliated investment managers), common directors/trustees, and/or common officers. Those purchase and sale transactions complied with provisions of Rule 17a-7 under the 1940 Act and were $0 and $14,086,096, respectively. The sale transactions resulted in a net realized loss of $86,421.
Transfer agency fees
Under a Transfer and Dividend Disbursing Agent Agreement, Columbia Management Investment Services Corp. (the Transfer Agent), an affiliate of the Investment Manager and a wholly-owned subsidiary of Ameriprise Financial, is responsible for providing transfer agency services to the Fund. The Transfer Agent has contracted with DST Asset Manager Solutions, Inc. (DST) to serve as sub-transfer agent. The Transfer Agent pays the fees of DST for services as sub-transfer agent and DST is not entitled to reimbursement for such fees from the Fund (with the exception of out-of-pocket fees).
The Fund pays the Transfer Agent a monthly transfer agency fee based on the number or the average value of accounts, depending on the type of account. In addition, the Fund pays the Transfer Agent a fee for shareholder services based on the number of accounts or on a percentage of the average aggregate value of the Fund’s shares maintained in omnibus accounts up to the lesser of the amount charged by the financial intermediary or a cap established by the Board of Trustees from time to time.
Columbia Overseas Core Fund | Semiannual Report 2018
| 25 |
Notes to Financial Statements (continued)
August 31, 2018 (Unaudited)
The Transfer Agent also receives compensation from the Fund for various shareholder services and reimbursements for certain out-of-pocket fees. Total transfer agency fees for Institutional 2 Class and Institutional 3 Class shares are subject to an annual limitation of not more than 0.07% and 0.02%, respectively, of the average daily net assets attributable to each share class.
For the six months ended August 31, 2018, the Fund’s annualized effective transfer agency fee rates as a percentage of average daily net assets of each class were as follows:
| | Effective rate (%) |
| Class A | 0.37 |
| Advisor Class | 0.37 |
| Class C | 0.37 |
| Institutional Class | 0.37 |
| Institutional 2 Class | 0.07 |
| Institutional 3 Class | 0.01 |
| Class R | 0.37 |
An annual minimum account balance fee of $20 may apply to certain accounts with a value below the applicable share class’s initial minimum investment requirements to reduce the impact of small accounts on transfer agency fees. These minimum account balance fees are remitted to the Fund and recorded as part of expense reductions in the Statement of Operations. For the six months ended August 31, 2018, no minimum account balance fees were charged by the Fund.
Distribution and service fees
The Fund has entered into an agreement with Columbia Management Investment Distributors, Inc. (the Distributor), an affiliate of the Investment Manager and a wholly-owned subsidiary of Ameriprise Financial, for distribution and shareholder services. Under a Plan and Agreement of Distribution, the Fund pays a fee at the maximum annual rates of up to 0.25%, 1.00% and 0.50% of the Fund’s average daily net assets attributable to Class A, Class C and Class R shares, respectively. For Class C shares, of the 1.00% fee, up to 0.75% can be reimbursed for distribution expenses and up to an additional 0.25% can be reimbursed for shareholder servicing expenses. For Class R shares, of the 0.50% fee, up to 0.25% can be reimbursed for shareholder servicing expenses.
Sales charges
For the six months ended August 31, 2018, there were no sales charges, including front-end charges and CDSCs, received by the Distributor for distributing Fund shares.
Expenses waived/reimbursed by the Investment Manager and its affiliates
The Investment Manager and certain of its affiliates have contractually agreed to waive fees and/or reimburse expenses (excluding certain fees and expenses described below) for the period(s) disclosed below, unless sooner terminated at the sole discretion of the Board of Trustees, so that the Fund’s net operating expenses, after giving effect to fees waived/expenses reimbursed and any balance credits and/or overdraft charges from the Fund’s custodian, do not exceed the following annual rate(s) as a percentage of the class’ average daily net assets:
| | Fee rate(s) contractual
through
June 30, 2019 |
| Class A | 1.28% |
| Advisor Class | 1.03 |
| Class C | 2.03 |
| Institutional Class | 1.03 |
| Institutional 2 Class | 0.93 |
| Institutional 3 Class | 0.87 |
| Class R | 1.53 |
| 26 | Columbia Overseas Core Fund | Semiannual Report 2018 |
Notes to Financial Statements (continued)
August 31, 2018 (Unaudited)
Under the agreement governing these fee waivers and/or expense reimbursement arrangements, the following fees and expenses are excluded from the waiver/reimbursement commitment, and therefore will be paid by the Fund, if applicable: taxes (including foreign transaction taxes), expenses associated with investments in affiliated and non-affiliated pooled investment vehicles (including mutual funds and exchange-traded funds), transaction costs and brokerage commissions, costs related to any securities lending program, dividend expenses associated with securities sold short, inverse floater program fees and expenses, transaction charges and interest on borrowed money, interest, infrequent and/or unusual expenses and any other expenses the exclusion of which is specifically approved by the Board of Trustees. This agreement may be modified or amended only with approval from the Investment Manager, certain of its affiliates and the Fund. Any fees waived and/or expenses reimbursed under the expense reimbursement arrangements described above are not recoverable by the Investment Manager or its affiliates in future periods.
Note 4. Federal tax information
The timing and character of income and capital gain distributions are determined in accordance with income tax regulations, which may differ from GAAP because of temporary or permanent book to tax differences.
At August 31, 2018, the approximate cost of all investments for federal income tax purposes and the aggregate gross approximate unrealized appreciation and depreciation based on that cost was:
Federal
tax cost ($) | Gross unrealized
appreciation ($) | Gross unrealized
(depreciation) ($) | Net unrealized
(depreciation) ($) |
| 151,972,000 | 4,940,000 | (15,161,000) | (10,221,000) |
Tax cost of investments and unrealized appreciation/(depreciation) may also include timing differences that do not constitute adjustments to tax basis.
Management of the Fund has concluded that there are no significant uncertain tax positions in the Fund that would require recognition in the financial statements. However, management’s conclusion may be subject to review and adjustment at a later date based on factors including, but not limited to, new tax laws, regulations, and administrative interpretations (including relevant court decisions). Generally, the Fund’s federal tax returns for the prior three fiscal years remain subject to examination by the Internal Revenue Service.
Note 5. Portfolio information
The cost of purchases and proceeds from sales of securities, excluding short-term investments and derivatives, if any, aggregated to $213,211,833 and $63,070,564, respectively, for the six months ended August 31, 2018. The amount of purchase and sale activity impacts the portfolio turnover rate reported in the Financial Highlights.
Note 6. Affiliated money market fund
The Fund invests in Columbia Short-Term Cash Fund, an affiliated money market fund established for the exclusive use by the Fund and other affiliated funds (the Affiliated MMF). The income earned by the Fund from such investments is included as Dividends - affiliated issuers in the Statement of Operations. As an investing fund, the Fund indirectly bears its proportionate share of the expenses of the Affiliated MMF. The Affiliated MMF prices its shares with a floating net asset value. In addition, the Board of Trustees of the Affiliated MMF may impose a fee on redemptions (sometimes referred to as a liquidity fee) or temporarily suspend redemptions (sometimes referred to as imposing a redemption gate) in the event its liquidity falls below regulatory limits.
Note 7. Interfund lending
Pursuant to an exemptive order granted by the Securities and Exchange Commission, the Fund participates in a program (the Interfund Program) allowing each participating Columbia Fund (each, a Participating Fund) to lend money directly to and, except for closed-end funds and money market funds, borrow money directly from other Participating Funds for temporary purposes. The amounts eligible for borrowing and lending under the Interfund Program are subject to certain restrictions.
Columbia Overseas Core Fund | Semiannual Report 2018
| 27 |
Notes to Financial Statements (continued)
August 31, 2018 (Unaudited)
Interfund loans are subject to the risk that the borrowing fund could be unable to repay the loan when due, and a delay in repayment to the lending fund could result in lost opportunities and/or additional lending costs. The exemptive order is subject to conditions intended to mitigate conflicts of interest arising from the Investment Manager’s relationship with each Participating Fund.
The Fund did not borrow or lend money under the Interfund Program during the six months ended August 31, 2018.
Note 8. Line of credit
The Fund has access to a revolving credit facility with a syndicate of banks led by Citibank, N.A., HSBC Bank USA, N.A. and JPMorgan Chase Bank, N.A. whereby the Fund may borrow for the temporary funding of shareholder redemptions or for other temporary or emergency purposes. The credit facility, which is a collective agreement between the Fund and certain other funds managed by the Investment Manager, severally and not jointly, permits collective borrowings up to $1 billion. Interest is charged to each participating fund based on its borrowings at a rate equal to the higher of (i) the overnight federal funds rate plus 1.00% or (ii) the one-month LIBOR rate plus 1.00%. Each borrowing under the credit facility matures no later than 60 days after the date of borrowing. The Fund also pays a commitment fee equal to its pro rata share of the amount of the credit facility at a rate of 0.15% per annum. The commitment fee is included in other expenses in the Statement of Operations. This agreement expires annually in December unless extended or renewed.
The Fund had no borrowings during the six months ended August 31, 2018.
Note 9. Significant risks
Foreign securities and emerging market countries risk
Investing in foreign securities may include certain risks and considerations not typically associated with investing in U.S. securities, such as fluctuating currency values and changing local and regional economic, political and social conditions, which may result in greater market volatility. In addition, certain foreign securities may not be as liquid as U.S. securities. Investing in emerging markets may accentuate these risks. These countries are also more likely to experience high levels of inflation, deflation or currency devaluation which could hurt their economies and securities markets. To the extent that the Fund concentrates its investment exposure to any one or a few specific countries, the Fund will be particularly susceptible to the various conditions, events or other factors impacting those countries and may, therefore, have a greater risk than that of a fund which is more geographically diversified.
Shareholder concentration risk
At August 31, 2018, affiliated shareholders of record owned 100.0% of the outstanding shares of the Fund in one or more accounts. Subscription and redemption activity by concentrated accounts may have a significant effect on the operations of the Fund. In the case of a large redemption, the Fund may be forced to sell investments at inopportune times, including its liquid positions, which may result in Fund losses and the Fund holding a higher percentage of less liquid positions. Large redemptions could result in decreased economies of scale and increased operating expenses for non-redeeming Fund shareholders.
Note 10. Subsequent events
Management has evaluated the events and transactions that have occurred through the date the financial statements were issued and noted no items requiring adjustment of the financial statements or additional disclosure.
Note 11. Information regarding pending and settled legal proceedings
Ameriprise Financial and certain of its affiliates have historically been involved in a number of legal, arbitration and regulatory proceedings, including routine litigation, class actions, and governmental actions, concerning matters arising in connection with the conduct of their business activities. Ameriprise Financial believes that the Fund is not currently the subject of, and that neither Ameriprise Financial nor any of its affiliates are the subject of, any pending legal, arbitration or regulatory proceedings that are likely to have a material adverse effect on the Fund or the ability of Ameriprise Financial or its affiliates
| 28 | Columbia Overseas Core Fund | Semiannual Report 2018 |
Notes to Financial Statements (continued)
August 31, 2018 (Unaudited)
to perform under their contracts with the Fund. Ameriprise Financial is required to make quarterly (10-Q), annual (10-K) and, as necessary, 8-K filings with the Securities and Exchange Commission (SEC) on legal and regulatory matters that relate to Ameriprise Financial and its affiliates. Copies of these filings may be obtained by accessing the SEC website at www.sec.gov.
There can be no assurance that these matters, or the adverse publicity associated with them, will not result in increased Fund redemptions, reduced sale of Fund shares or other adverse consequences to the Fund. Further, although we believe proceedings are not likely to have a material adverse effect on the Fund or the ability of Ameriprise Financial or its affiliates to perform under their contracts with the Fund, these proceedings are subject to uncertainties and, as such, we are unable to estimate the possible loss or range of loss that may result. An adverse outcome in one or more of these proceedings could result in adverse judgments, settlements, fines, penalties or other relief that could have a material adverse effect on the consolidated financial condition or results of operations of Ameriprise Financial.
Columbia Overseas Core Fund | Semiannual Report 2018
| 29 |
February 2018 Board Consideration and Approval of the Management Agreement
Columbia Management Investment Advisers, LLC (Columbia Threadneedle or the Investment Manager, and together with its domestic and global affiliates, Columbia Threadneedle Investments), a wholly-owned subsidiary of Ameriprise Financial, Inc., serves as the investment manager to Columbia Overseas Core Fund (the Fund). Under a management agreement (the Management Agreement), Columbia Threadneedle provides investment advice and other services to the Fund and other funds distributed by Columbia Management Investment Distributors, Inc. (collectively, the Funds).
At the January 31 – February 2, 2018 in-person meeting of the Fund’s Board of Trustees (the Board), the Board, including the independent Board members (the Independent Trustees), considered approval of the Management Agreement.
At this meeting, independent legal counsel to the Independent Trustees reviewed with the Board various factors relevant to the Board’s consideration of the Management Agreement and the Board’s legal responsibilities related to such consideration. The Board took into account the variety of written materials and oral presentations it received at the meeting and at the November 13-15, 2017 meeting in connection with its evaluation of the services proposed to be provided by Columbia Threadneedle for the Fund. The Board accorded appropriate weight to the work, deliberations and conclusions of the various committees, such as the Contracts Committee, the Investment Review Committee and the Compliance Committee in determining whether to approve the Management Agreement. The Board also took into account all of the information considered at the June 19-21, 2017 meeting (the June 2017 Meeting) concerning the proposed 15(c) renewal of the other Funds’ management agreements. Following an analysis and discussion of the factors identified below, the Board, including all of the Independent Trustees, approved the Management Agreement for the Fund.
Nature, extent and quality of services proposed to be provided by Columbia Threadneedle
The Board analyzed various reports and presentations they had received detailing the services to be performed by Columbia Threadneedle, as well as its history, reputation, expertise, resources and relative capabilities, and the qualifications of its personnel, including the firm’s experience managing Columbia Overseas Value Fund (the Overseas Value Fund) as the investment process of the Fund is expected to be very similar to that of the Overseas Value Fund, and the Fund will be managed by the same portfolio managers who currently manage the Overseas Value Fund.
The Board also discussed the compliance program of Columbia Threadneedle and observed that the program had previously been reviewed by the Fund’s Chief Compliance Officer and the Independent Trustees. The Board also recalled its review of the financial condition of Columbia Threadneedle and observed its ability to carry out its responsibilities under the Management Agreement.
In connection with the Independent Trustees’ evaluation of the overall package of services to be provided by Columbia Threadneedle to the Fund, they considered the oversight of the shareholder services to be provided by Columbia Threadneedle affiliates (which were considered at the June 2017 Meeting with respect to the 15(c) renewals as well as the ongoing oversight of the shareholder services providers).
The Board also discussed the acceptability of the terms of the Management Agreement, including the relatively broad scope of services required to be performed.
Investment performance
The Board noted that a review of investment performance is a key factor in evaluating the nature, extent and quality of services provided under investment management agreements. It was noted that since the Fund has not yet commenced operations, it does not have its own track record as of yet. They observed though the historical positive performance of the Overseas Value Fund as the proposed investment process of the Fund is expected to be very similar to that of the Overseas Value Fund (though the Fund will have a somewhat different investment strategy as it will be a “core” fund and not a “value” fund) and the Fund will be managed by the same portfolio managers who currently manage the Overseas Value Fund. They also noted the Overseas Value Fund’s outperformance versus the applicable peer universe and its benchmark for the one-, three- and five-year periods.
Based on the foregoing, and based on other information received (both oral and written) and other considerations, the Board concluded that Columbia Threadneedle is in a position to provide a high quality and level of service to the Fund.
| 30 | Columbia Overseas Core Fund | Semiannual Report 2018 |
February 2018 Board Consideration and Approval of the Management Agreement (continued)
Comparative fees, costs of services provided and profitability
The Board reviewed comparative fees and the costs of services to be provided under the Management Agreement. In considering the proposed level of fees under the Management Agreement, the Board accorded particular weight to the notion that the proposed level of fees should reflect a rational pricing model applied consistently across the various product lines in the fund family, while assuring that the overall fees for the Fund are generally in line with the “pricing philosophy” currently in effect (i.e., that the total expense ratio of the Fund is at or below the median expense ratio of funds in the same comparison group). The Board noted the proposed expense cap, which was lower than the median total expense ratio for the expected peer universe of the Fund. They also observed that the proposed management fee schedule is identical to the Overseas Value Fund management fee schedule and that the expected effective management fee rate falls well within the range of contractual management fee rates for the peer universe.
The Board also considered the expected profitability of Columbia Threadneedle in connection with the Fund. They noted that the fees to be paid by the Fund should permit Columbia Threadneedle to offer competitive compensation to its personnel, make necessary investments in its business and earn an appropriate profit. They recalled their review at the June 2017 Meeting of Columbia Threadneedle’s profitability from other Funds and the full Board’s conclusion that the profitability levels were reasonable.
Economies of scale to be realized
The Board considered the economies of scale that may be realized by Columbia Threadneedle and its affiliates as the Fund grows and took note of the extent to which shareholders might also benefit from such growth. The Board considered that the Management Agreement provides for lower fees as assets increase at pre-established breakpoints, and concluded that the Management Agreement satisfactorily provides for sharing of these economies of scale.
Based on all of the foregoing, the Board, including all of the Independent Trustees, concluded that the proposed investment management fees were fair and reasonable in light of the extent and quality of services to be provided. In reaching this conclusion, no single factor was determinative. On February 2, 2018, the Board, including all of the Independent Trustees, approved the Management Agreement.
Columbia Overseas Core Fund | Semiannual Report 2018
| 31 |
The Fund mails one shareholder report to each shareholder address. If you would like more than one report, please call shareholder services at 800.345.6611 and additional reports will be sent to you.
Proxy voting policies and procedures
The policy of the Board of Trustees is to vote the proxies of the companies in which the Fund holds investments consistent with the procedures as stated in the Statement of Additional Information (SAI). You may obtain a copy of the SAI without charge by calling 800.345.6611; contacting your financial intermediary; visiting columbiathreadneedleus.com/investor/; or searching the website of the Securities and Exchange Commission (SEC) at sec.gov. Information regarding how the Fund voted proxies relating to portfolio securities is filed with the SEC by August 31st for the most recent 12-month period ending June 30th of that year, and is available without charge by visiting columbiathreadneedleus.com/investor/, or searching the website of the SEC at sec.gov.
Quarterly schedule of investments
The Fund files a complete schedule of portfolio holdings with the SEC for the first and third quarters of each fiscal year on Form N-Q or Form N-PORT. The Fund’s Form N-Q or Form N-PORT is available on the SEC’s website at sec.gov and may be reviewed and copied at the SEC’s Public Reference Room in Washington, D.C. Information on the operation of the Public Reference Room may be obtained by calling 800.SEC.0330. The Fund’s complete schedule of portfolio holdings, as filed on Form N-Q or Form N-PORT, can also be obtained without charge, upon request, by calling 800.345.6611.
Additional Fund information
For more information about the Fund, please visit columbiathreadneedleus.com/investor/ or call 800.345.6611. Customer Service Representatives are available to answer your questions Monday through Friday from 8 a.m. to 7 p.m. Eastern time.
Fund investment manager
Columbia Management Investment Advisers, LLC
225 Franklin Street
Boston, MA 02110
Fund distributor
Columbia Management Investment Distributors, Inc.
225 Franklin Street
Boston, MA 02110
Fund transfer agent
Columbia Management Investment Services Corp.
Through October 31, 2018:
P.O. Box 8081
Boston, MA 02266-8081
Effective November 1, 2018:
P.O. Box 219104
Kansas City, MO 64121-9104
| 32 | Columbia Overseas Core Fund | Semiannual Report 2018 |
[THIS PAGE INTENTIONALLY LEFT BLANK]
Columbia Overseas Core Fund
Through October 31, 2018:
P.O. Box 8081
Boston, MA 02266-8081
Effective November 1, 2018:
P.O. Box 219104
Kansas City, MO 64121-9104
Please read and consider the investment objectives, risks, charges and expenses for any fund carefully before investing. For a prospectus and summary prospectus, which contains this and other important information about the Fund, go to
columbiathreadneedleus.com/investor/. The Fund is distributed by Columbia Management Investment Distributors, Inc., member FINRA, and managed by Columbia Management Investment Advisers, LLC.
Columbia Threadneedle Investments (Columbia Threadneedle) is the global brand name of the Columbia and Threadneedle group of companies. All rights reserved.
© 2018 Columbia Management Investment Advisers, LLC.
columbiathreadneedleus .com/investor/
Item 2. Code of Ethics.
Not applicable for semiannual reports.
Item 3. Audit Committee Financial Expert.
Not applicable for semiannual reports.
Item 4. Principal Accountant Fees and Services.
Not applicable for semiannual reports.
Item 5. Audit Committee of Listed Registrants.
Not applicable.
Item 6. Investments
| | (a) | The registrant’s “Schedule I – Investments in securities of unaffiliated issuers” (as set forth in 17 CFR 210.12-12) is included in Item 1 of this Form N-CSR. |
Item 7. Disclosure of Proxy Voting Policies and Procedures for Closed-End Management Investment Companies.
Not applicable.
Item 8. Portfolio Managers of Closed-End Management Investment Companies.
Not applicable.
Item 9. Purchases of Equity Securities by Closed-End Management Investment Company and Affiliated Purchasers.
Not applicable.
Item 10. Submission of Matters to a Vote of Security Holders.
There were no material changes to the procedures by which shareholders may recommend nominees to the registrant’s board of directors.
Item 11. Controls and Procedures.
| | (a) | The registrant’s principal executive officer and principal financial officers, based on their evaluation of the registrant’s disclosure controls and procedures as of a |
| | date within 90 days of the filing of this report, have concluded that such controls and procedures are adequately designed to ensure that material information required to be disclosed by the registrant in Form N-CSR is accumulated and communicated to the registrant’s management, including the principal executive officer and principal financial officer, or persons performing similar functions, as appropriate to allow timely decisions regarding required disclosure. |
| | (b) | There was no change in the registrant’s internal control over financial reporting that occurred during the registrant’s second fiscal quarter of the period covered by this report that has materially affected, or is reasonably likely to materially affect, the registrant’s internal control over financial reporting. |
Item 12. Disclosure of Securities Lending Activities for Closed-End Management Investment Companies
Not applicable.
Item 13. Exhibits.
(a)(1) Code of ethics required to be disclosed under Item 2 of Form N-CSR: Not applicable for semiannual reports.
(a)(2) Certifications pursuant to Rule 30a-2(a) under the Investment Company Act of 1940 (17 CFR 270.30a-2(a)) attached hereto as Exhibit 99.CERT.
(a)(3) Not applicable.
(b) Certification pursuant to Rule 30a-2(b) under the Investment Company Act of 1940 (17 CFR 270.30a-2(b)) attached hereto as Exhibit 99.906CERT.
SIGNATURES
Pursuant to the requirements of the Securities Exchange Act of 1934 and the Investment Company Act of 1940, the registrant has duly caused this report to be signed on its behalf by the undersigned, thereunto duly authorized.
(registrant) Columbia Funds Series Trust II
By (Signature and Title) /s/ Christopher O. Petersen
Christopher O. Petersen, President and Principal Executive Officer
Date October 22, 2018
Pursuant to the requirements of the Securities Exchange Act of 1934 and the Investment Company Act of 1940, this report has been signed below by the following persons on behalf of the registrant and in the capacities and on the dates indicated.
By (Signature and Title) /s/ Christopher O. Petersen
Christopher O. Petersen, President and Principal Executive Officer
Date October 22, 2018
By (Signature and Title) /s/ Michael G. Clarke
Michael G. Clarke, Treasurer and Chief Financial Officer
Date October 22, 2018