UNITED STATES
SECURITIES AND EXCHANGE COMMISSION
Washington, D.C. 20549
FORM N-CSR
CERTIFIED SHAREHOLDER REPORT OF REGISTERED MANAGEMENT INVESTMENT COMPANIES
Investment Company Act file number 811-21852
Columbia Funds Series Trust II
(Exact name of registrant as specified in charter)
290 Congress Street
Boston, MA 02210
(Address of principal executive offices) (Zip code)
Daniel J. Beckman
c/o Columbia Management Investment Advisers, LLC
290 Congress Street
Boston, MA 02210
Ryan C. Larrenaga, Esq.
c/o Columbia Management Investment Advisers, LLC
290 Congress Street
Boston, MA 02210
(Name and address of agent for service)
Registrant's telephone number, including area code: (800) 345-6611
Date of fiscal year end: May 31
Date of reporting period: November 30, 2022
Form N-CSR is to be used by management investment companies to file reports with the Commission not later than 10 days after the transmission to stockholders of any report that is required to be transmitted to stockholders under Rule 30e-1 under the Investment Company Act of 1940 (17 CFR 270.30e-1). The Commission may use the information provided on Form N-CSR in its regulatory, disclosure review, inspection, and policymaking roles.
A registrant is required to disclose the information specified by Form N-CSR, and the Commission will make this information public. A registrant is not required to respond to the collection of information contained in Form N-CSR unless the Form displays a currently valid Office of Management and Budget ("OMB") control number. Please direct comments concerning the accuracy of the information collection burden estimate and any suggestions for reducing the burden to Secretary, Securities and Exchange Commission, 100 F Street, NE, Washington, DC 20549. The OMB has reviewed this collection of information under the clearance requirements of 44 U.S.C. § 3507.
Item 1. Reports to Stockholders.

Semiannual Report
November 30, 2022 (Unaudited)
Multi-Manager Value Strategies Fund
Not FDIC or NCUA Insured • No Financial Institution Guarantee • May Lose Value
If you elect to receive the shareholder report for Multi-Manager Value Strategies Fund (the Fund) in paper, mailed to you, the Fund mails one shareholder report to each shareholder address, unless such shareholder elects to receive shareholder reports from the Fund electronically via e-mail or by having a paper notice mailed to you (Postcard Notice) that your Fund’s shareholder report is available at the Columbia funds’ website (columbiathreadneedleus.com/investor/). If you would like more than one report in paper to be mailed to you, or would like to elect to receive reports via e-mail or access them through Postcard Notice, please call shareholder services at 800.345.6611 and additional reports will be sent to you.
Proxy voting policies and procedures
The policy of the Board of Trustees is to vote the proxies of the companies in which the Fund holds investments consistent with the procedures as stated in the Statement of Additional Information (SAI). You may obtain a copy of the SAI without charge by calling 800.345.6611; contacting your financial intermediary; visiting columbiathreadneedleus.com/investor/; or searching the website of the Securities and Exchange Commission (SEC) at sec.gov. Information regarding how the Fund voted proxies relating to portfolio securities is filed with the SEC by August 31st for the most recent 12-month period ending June 30th of that year, and is available without charge by visiting columbiathreadneedleus.com/investor/, or searching the website of the SEC at sec.gov.
Quarterly schedule of investments
The Fund files a complete schedule of portfolio holdings with the SEC for the first and third quarters of each fiscal year on Form N-PORT. The Fund’s Form N-PORT filings are available on the SEC’s website at sec.gov. The Fund’s complete schedule of portfolio holdings, as filed on Form N-PORT, is available on columbiathreadneedleus.com/investor/ or can also be obtained without charge, upon request, by calling 800.345.6611.
Additional Fund information
For more information about the Fund, please visit columbiathreadneedleus.com/investor/ or call 800.345.6611. Customer Service Representatives are available to answer your questions Monday through Friday from 8 a.m. to 7 p.m. Eastern time.
Fund investment manager
Columbia Management Investment Advisers, LLC (the Investment Manager)
290 Congress Street
Boston, MA 02210
Fund distributor
Columbia Management Investment Distributors, Inc.
290 Congress Street
Boston, MA 02210
Fund transfer agent
Columbia Management Investment Services Corp.
P.O. Box 219104
Kansas City, MO 64121-9104
Multi-Manager Value Strategies Fund | Semiannual Report 2022
Fund at a Glance
(Unaudited)
Investment objective
The Fund seeks to provide shareholders with growth of capital and income.
Portfolio management
Columbia Management Investment Advisers, LLC
Scott Davis*
Michael Barclay, CFA
Tara Gately, CFA
* Mr. Davis has announced that he plans to retire from the Investment Manager effective June 30, 2023.
Diamond Hill Capital Management, Inc.
Charles Bath, CFA
Austin Hawley, CFA
Dimensional Fund Advisors LP
Jed Fogdall
Joel Schneider
John Hertzer, CFA
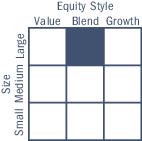
Morningstar style boxTM
The Morningstar Style Box is based on a fund’s portfolio holdings. For equity funds, the vertical axis shows the market capitalization of the stocks owned, and the horizontal axis shows investment style (value, blend, or growth). Information shown is based on the most recent data provided by Morningstar.
© 2023 Morningstar, Inc. All rights reserved. The Morningstar information contained herein: (1) is proprietary to Morningstar and/or its content providers; (2) may not be copied or distributed; and (3) is not warranted to be accurate, complete or timely. Neither Morningstar nor its content providers are responsible for any damages or losses arising from any use of this information.
| Average annual total returns (%) (for the period ended November 30, 2022) |
| | | Inception | 6 Months
cumulative | 1 Year | 5 Years | 10 Years |
| Institutional Class* | 01/03/17 | 1.01 | 1.97 | 8.72 | 11.24 |
| Institutional 3 Class* | 12/18/19 | 1.05 | 2.06 | 8.78 | 11.27 |
| Russell 1000 Value Index | | 0.90 | 2.42 | 7.86 | 10.97 |
All results shown assume reinvestment of distributions during the period. Returns do not reflect the deduction of taxes that a shareholder may pay on Fund distributions or on the redemption of Fund shares. Performance results reflect the effect of any fee waivers or reimbursements of Fund expenses by Columbia Management Investment Advisers, LLC and/or any of its affiliates. Absent these fee waivers or expense reimbursement arrangements, performance results would have been lower.
The performance information shown represents past performance and is not a guarantee of future results. The investment return and principal value of your investment will fluctuate so that your shares, when redeemed, may be worth more or less than their original cost. Current performance may be lower or higher than the performance information shown. You may obtain performance information current to the most recent month-end by contacting your financial intermediary, visiting columbiathreadneedleus.com/investor/ or calling 800.345.6611.
| * | The returns shown for periods prior to the share class inception date (including returns for the Life of the Fund, if shown, which are since Fund inception) include the returns of the Fund’s oldest share class. Returns shown for periods prior to the inception date of each class include the returns of the Fund’s Class A shares for the period prior to January 3, 2017, and for Institutional 3 Class shares, include the returns of the Fund’s Institutional Class shares for the period from January 3, 2017 through the inception date of the class. Class A shares were offered prior to the Fund’s Institutional Class shares but have since been merged into the Fund’s Institutional Class shares. These returns are adjusted to reflect any higher class-related operating expenses of the newer share classes, as applicable. Please visit columbiathreadneedleus.com/investor/investment-products/mutual-funds/appended-performance for more information. |
The Fund’s performance prior to October 1, 2016 reflects returns achieved pursuant to a different investment objective, principal investment strategies and/or management teams. If the Fund’s current investment objective, strategies and/or management teams had been in place for the prior periods, results shown may have been different.
The Russell 1000 Value Index, an unmanaged index, measures the performance of those stocks in the Russell 1000 Index with lower price-to-book ratios and lower forecasted growth values.
Indices are not available for investment, are not professionally managed and do not reflect sales charges, fees, brokerage commissions, taxes or other expenses of investing. Securities in the Fund may not match those in an index.
Multi-Manager Value Strategies Fund | Semiannual Report 2022
| 3 |
Fund at a Glance (continued)
(Unaudited)
| Portfolio breakdown (%) (at November 30, 2022) |
| Common Stocks | 98.6 |
| Money Market Funds | 1.4 |
| Total | 100.0 |
Percentages indicated are based upon total investments excluding investments in derivatives, if any. The Fund’s portfolio composition is subject to change.
| Equity sector breakdown (%) (at November 30, 2022) |
| Communication Services | 6.6 |
| Consumer Discretionary | 8.5 |
| Consumer Staples | 5.3 |
| Energy | 10.3 |
| Financials | 20.4 |
| Health Care | 16.3 |
| Industrials | 12.9 |
| Information Technology | 10.6 |
| Materials | 5.9 |
| Real Estate | 1.2 |
| Utilities | 2.0 |
| Total | 100.0 |
Percentages indicated are based upon total equity investments. The Fund’s portfolio composition is subject to change.
| 4 | Multi-Manager Value Strategies Fund | Semiannual Report 2022 |
Understanding Your Fund’s Expenses
(Unaudited)
As an investor, you incur two types of costs. There are shareholder transaction costs, which may include redemption fees. There are also ongoing fund costs, which generally include management fees, distribution and/or service fees, and other fund expenses. The following information is intended to help you understand your ongoing costs (in dollars) of investing in the Fund and to help you compare these costs with the ongoing costs of investing in other mutual funds.
Analyzing your Fund’s expenses
To illustrate these ongoing costs, we have provided examples and calculated the expenses paid by investors in each share class of the Fund during the period. The actual and hypothetical information in the table is based on an initial investment of $1,000 at the beginning of the period indicated and held for the entire period. Expense information is calculated two ways and each method provides you with different information. The amount listed in the “Actual” column is calculated using the Fund’s actual operating expenses and total return for the period. You may use the Actual information, together with the amount invested, to estimate the expenses that you paid over the period. Simply divide your account value by $1,000 (for example, an $8,600 account value divided by $1,000 = 8.6), then multiply the results by the expenses paid during the period under the “Actual” column. The amount listed in the “Hypothetical” column assumes a 5% annual rate of return before expenses (which is not the Fund’s actual return) and then applies the Fund’s actual expense ratio for the period to the hypothetical return. You should not use the hypothetical account values and expenses to estimate either your actual account balance at the end of the period or the expenses you paid during the period. See “Compare with other funds” below for details on how to use the hypothetical data.
Compare with other funds
Since all mutual funds are required to include the same hypothetical calculations about expenses in shareholder reports, you can use this information to compare the ongoing cost of investing in the Fund with other funds. To do so, compare the hypothetical example with the 5% hypothetical examples that appear in the shareholder reports of other funds. As you compare hypothetical examples of other funds, it is important to note that hypothetical examples are meant to highlight the ongoing costs of investing in a fund only and do not reflect any transaction costs, such as redemption or exchange fees. Therefore, the hypothetical calculations are useful in comparing ongoing costs only, and will not help you determine the relative total costs of owning different funds. If transaction costs were included in these calculations, your costs would be higher.
| June 1, 2022 — November 30, 2022 |
| | Account value at the
beginning of the
period ($) | Account value at the
end of the
period ($) | Expenses paid during
the period ($) | Fund’s annualized
expense ratio (%) |
| | Actual | Hypothetical | Actual | Hypothetical | Actual | Hypothetical | Actual |
| Institutional Class | 1,000.00 | 1,000.00 | 1,010.10 | 1,021.46 | 3.63 | 3.65 | 0.72 |
| Institutional 3 Class | 1,000.00 | 1,000.00 | 1,010.50 | 1,022.06 | 3.02 | 3.04 | 0.60 |
Expenses paid during the period are equal to the annualized expense ratio for each class as indicated above, multiplied by the average account value over the period and then multiplied by the number of days in the Fund’s most recent fiscal half year and divided by 365.
Expenses do not include fees and expenses incurred indirectly by the Fund from its investment in underlying funds, including affiliated and non-affiliated pooled investment vehicles, such as mutual funds and exchange-traded funds.
The Fund is offered only through certain wrap fee programs sponsored and/or managed by Ameriprise Financial, Inc. or its affiliates. Participants in wrap fee programs pay other fees that are not included in the above table. Please refer to the wrap program documents for information about the fees charged.
Multi-Manager Value Strategies Fund | Semiannual Report 2022
| 5 |
Portfolio of Investments
November 30, 2022 (Unaudited)
(Percentages represent value of investments compared to net assets)
Investments in securities
| Common Stocks 98.5% |
| Issuer | Shares | Value ($) |
| Communication Services 6.5% |
| Diversified Telecommunication Services 1.9% |
| AT&T, Inc. | 1,342,853 | 25,890,206 |
| Lumen Technologies, Inc. | 379,310 | 2,074,826 |
| Verizon Communications, Inc. | 1,462,320 | 57,001,233 |
| Total | | 84,966,265 |
| Entertainment 1.4% |
| Activision Blizzard, Inc. | 72,433 | 5,356,420 |
| Electronic Arts, Inc. | 48,532 | 6,347,015 |
| Liberty Media Group LLC, Class A(a) | 2,700 | 148,419 |
| Liberty Media Group LLC, Class C(a) | 21,151 | 1,288,942 |
| Madison Square Garden Entertainment Corp.(a) | 476 | 22,905 |
| Take-Two Interactive Software, Inc.(a) | 118,677 | 12,542,972 |
| Walt Disney Co. (The)(a) | 334,189 | 32,707,078 |
| Warner Bros Discovery, Inc.(a) | 393,838 | 4,489,753 |
| Total | | 62,903,504 |
| Interactive Media & Services 1.1% |
| Alphabet, Inc., Class A(a) | 347,033 | 35,046,863 |
| Meta Platforms, Inc., Class A(a) | 138,120 | 16,311,972 |
| Total | | 51,358,835 |
| Media 1.7% |
| Charter Communications, Inc., Class A(a) | 46 | 17,999 |
| Comcast Corp., Class A | 1,546,654 | 56,669,403 |
| DISH Network Corp., Class A(a) | 70,159 | 1,126,052 |
| Fox Corp., Class A | 85,360 | 2,769,932 |
| Fox Corp., Class B | 67,862 | 2,071,148 |
| Interpublic Group of Companies, Inc. (The) | 128,172 | 4,403,990 |
| Liberty Broadband Corp., Class A(a) | 2,117 | 190,953 |
| Liberty Broadband Corp., Class C(a) | 18,699 | 1,698,991 |
| Liberty SiriusXM Group, Class A(a) | 13,066 | 572,552 |
| Liberty SiriusXM Group, Class C(a) | 29,602 | 1,297,456 |
| News Corp., Class A | 41,973 | 803,783 |
| News Corp., Class B | 22,496 | 437,547 |
| Omnicom Group, Inc. | 86 | 6,859 |
| Paramount Global, Class A | 5,695 | 130,302 |
| Paramount Global, Class B | 175,738 | 3,528,819 |
| Total | | 75,725,786 |
| Common Stocks (continued) |
| Issuer | Shares | Value ($) |
| Wireless Telecommunication Services 0.4% |
| T-Mobile US, Inc.(a) | 106,744 | 16,167,446 |
| Total Communication Services | 291,121,836 |
| Consumer Discretionary 8.4% |
| Auto Components 0.6% |
| Aptiv PLC(a) | 20,808 | 2,219,589 |
| Autoliv, Inc. | 16,890 | 1,493,076 |
| BorgWarner, Inc. | 498,305 | 21,182,946 |
| Gentex Corp. | 35,624 | 1,029,534 |
| Lear Corp. | 18,300 | 2,639,592 |
| Total | | 28,564,737 |
| Automobiles 1.2% |
| Ford Motor Co. | 603,184 | 8,384,257 |
| General Motors Co. | 1,117,205 | 45,313,835 |
| Total | | 53,698,092 |
| Distributors 0.1% |
| LKQ Corp. | 105,221 | 5,716,657 |
| Hotels, Restaurants & Leisure 1.1% |
| Aramark | 45,023 | 1,872,957 |
| Booking Holdings, Inc.(a) | 10,130 | 21,064,829 |
| Caesars Entertainment, Inc.(a) | 5,016 | 254,863 |
| Carnival Corp.(a) | 130,288 | 1,293,760 |
| Hyatt Hotels Corp., Class A(a) | 5,864 | 588,276 |
| McDonald’s Corp. | 71,048 | 19,381,184 |
| MGM Resorts International | 82,729 | 3,049,391 |
| Norwegian Cruise Line Holdings Ltd.(a) | 6,188 | 101,731 |
| Royal Caribbean Cruises Ltd.(a) | 31,724 | 1,901,219 |
| Total | | 49,508,210 |
| Household Durables 1.6% |
| D.R. Horton, Inc. | 126,147 | 10,848,642 |
| Garmin Ltd. | 40,144 | 3,732,991 |
| Lennar Corp., Class A | 89,215 | 7,835,753 |
| Lennar Corp., Class B | 6,679 | 484,962 |
| Mohawk Industries, Inc.(a) | 20,238 | 2,050,717 |
| Newell Brands, Inc. | 9,534 | 123,656 |
| NVR, Inc.(a) | 8,350 | 38,735,733 |
The accompanying Notes to Financial Statements are an integral part of this statement.
| 6 | Multi-Manager Value Strategies Fund | Semiannual Report 2022 |
Portfolio of Investments (continued)
November 30, 2022 (Unaudited)
| Common Stocks (continued) |
| Issuer | Shares | Value ($) |
| PulteGroup, Inc. | 82,663 | 3,701,649 |
| Toll Brothers, Inc. | 1,937 | 92,802 |
| Whirlpool Corp. | 20,193 | 2,958,880 |
| Total | | 70,565,785 |
| Internet & Direct Marketing Retail 0.8% |
| Amazon.com, Inc.(a) | 290,857 | 28,079,335 |
| eBay, Inc. | 120,797 | 5,489,015 |
| Total | | 33,568,350 |
| Leisure Products 0.0% |
| Hasbro, Inc. | 3,197 | 200,836 |
| Multiline Retail 0.4% |
| Dollar Tree, Inc.(a) | 44,357 | 6,666,414 |
| Target Corp. | 76,787 | 12,828,804 |
| Total | | 19,495,218 |
| Specialty Retail 2.0% |
| Advance Auto Parts, Inc. | 16,588 | 2,504,622 |
| CarMax, Inc.(a) | 365,627 | 25,359,889 |
| Dick’s Sporting Goods, Inc. | 1,132 | 135,364 |
| Home Depot, Inc. (The) | 179,296 | 58,090,111 |
| Lithia Motors, Inc., Class A | 3,312 | 792,595 |
| Penske Automotive Group, Inc. | 2,522 | 318,907 |
| Total | | 87,201,488 |
| Textiles, Apparel & Luxury Goods 0.6% |
| Capri Holdings Ltd.(a) | 1,813 | 103,975 |
| NIKE, Inc., Class B | 44,549 | 4,886,580 |
| Ralph Lauren Corp. | 6,915 | 782,225 |
| Tapestry, Inc. | 23,496 | 887,444 |
| VF Corp. | 532,026 | 17,461,093 |
| Total | | 24,121,317 |
| Total Consumer Discretionary | 372,640,690 |
| Consumer Staples 5.2% |
| Beverages 2.1% |
| Coca-Cola Co. (The) | 291,349 | 18,532,710 |
| Constellation Brands, Inc., Class A | 16,464 | 4,237,010 |
| Keurig Dr. Pepper, Inc. | 46,824 | 1,810,684 |
| Molson Coors Beverage Co., Class B | 30,867 | 1,701,080 |
| PepsiCo, Inc. | 348,666 | 64,681,030 |
| Total | | 90,962,514 |
| Common Stocks (continued) |
| Issuer | Shares | Value ($) |
| Food & Staples Retailing 0.7% |
| Casey��s General Stores, Inc. | 223 | 54,193 |
| Kroger Co. (The) | 243,827 | 11,993,850 |
| Performance Food Group, Inc.(a) | 2,340 | 142,693 |
| U.S. Foods Holding Corp.(a) | 40,272 | 1,473,150 |
| Walgreens Boots Alliance, Inc. | 135,390 | 5,618,685 |
| Walmart, Inc. | 85,852 | 13,085,562 |
| Total | | 32,368,133 |
| Food Products 1.4% |
| Archer-Daniels-Midland Co. | 72,502 | 7,068,945 |
| Bunge Ltd. | 49,798 | 5,220,822 |
| Campbell Soup Co. | 2,535 | 136,053 |
| ConAgra Foods, Inc. | 78,696 | 2,988,874 |
| Darling Ingredients, Inc.(a) | 26,581 | 1,909,313 |
| General Mills, Inc. | 125,849 | 10,734,920 |
| Hormel Foods Corp. | 15,575 | 732,025 |
| Ingredion, Inc. | 349 | 34,192 |
| JM Smucker Co. (The) | 29,856 | 4,598,123 |
| Kraft Heinz Co. (The) | 55,028 | 2,165,352 |
| McCormick & Co., Inc. | 2,137 | 182,030 |
| Mondelez International, Inc., Class A | 318,214 | 21,514,449 |
| Pilgrim’s Pride Corp.(a) | 284 | 7,429 |
| Post Holdings, Inc.(a) | 6,582 | 616,141 |
| Tyson Foods, Inc., Class A | 93,436 | 6,192,938 |
| Total | | 64,101,606 |
| Household Products 0.6% |
| Procter & Gamble Co. (The) | 189,696 | 28,295,055 |
| Personal Products 0.0% |
| BellRing Brands, Inc.(a) | 8,344 | 207,849 |
| Tobacco 0.4% |
| Philip Morris International, Inc. | 157,574 | 15,705,401 |
| Total Consumer Staples | 231,640,558 |
| Energy 10.1% |
| Energy Equipment & Services 0.3% |
| Baker Hughes Co. | 150,571 | 4,369,571 |
| Schlumberger Ltd. | 208,482 | 10,747,247 |
| TechnipFMC PLC(a) | 48,738 | 604,351 |
| Total | | 15,721,169 |
The accompanying Notes to Financial Statements are an integral part of this statement.
Multi-Manager Value Strategies Fund | Semiannual Report 2022
| 7 |
Portfolio of Investments (continued)
November 30, 2022 (Unaudited)
| Common Stocks (continued) |
| Issuer | Shares | Value ($) |
| Oil, Gas & Consumable Fuels 9.8% |
| Chevron Corp. | 498,044 | 91,296,446 |
| ConocoPhillips Co. | 794,580 | 98,138,576 |
| Coterra Energy, Inc. | 71,228 | 1,987,973 |
| Devon Energy Corp. | 37,754 | 2,586,904 |
| Diamondback Energy, Inc. | 36,642 | 5,423,749 |
| EOG Resources, Inc. | 265,976 | 37,749,974 |
| Exxon Mobil Corp. | 1,014,997 | 113,009,766 |
| Hess Corp. | 47,079 | 6,775,139 |
| Kinder Morgan, Inc. | 245,204 | 4,688,300 |
| Marathon Oil Corp. | 145,822 | 4,466,528 |
| Marathon Petroleum Corp. | 81,850 | 9,970,149 |
| Occidental Petroleum Corp. | 149,855 | 10,413,424 |
| ONEOK, Inc. | 40,357 | 2,700,690 |
| Ovintiv, Inc. | 42,416 | 2,365,116 |
| Phillips 66 | 43,453 | 4,712,043 |
| Pioneer Natural Resources Co. | 31,667 | 7,473,095 |
| Targa Resources Corp. | 33,811 | 2,515,200 |
| Valero Energy Corp. | 158,338 | 21,157,124 |
| Williams Companies, Inc. (The) | 218,287 | 7,574,559 |
| Total | | 435,004,755 |
| Total Energy | 450,725,924 |
| Financials 20.1% |
| Banks 9.4% |
| Bank of America Corp. | 2,718,867 | 102,909,116 |
| Citigroup, Inc. | 207,948 | 10,066,763 |
| Citizens Financial Group, Inc. | 55,445 | 2,349,759 |
| Comerica, Inc. | 20,737 | 1,487,672 |
| East West Bancorp, Inc. | 6,247 | 438,602 |
| Fifth Third Bancorp | 149,775 | 5,445,819 |
| First Citizens BancShares Inc., Class A | 78 | 63,684 |
| First Horizon Corp. | 7,895 | 196,191 |
| First Republic Bank | 124,941 | 15,943,721 |
| Huntington Bancshares, Inc. | 228,535 | 3,537,722 |
| JPMorgan Chase & Co. | 807,731 | 111,612,270 |
| KeyCorp | 246,562 | 4,637,831 |
| M&T Bank Corp. | 11,504 | 1,955,910 |
| PNC Financial Services Group, Inc. (The) | 138,337 | 23,276,584 |
| Prosperity Bancshares, Inc. | 622 | 47,004 |
| Common Stocks (continued) |
| Issuer | Shares | Value ($) |
| Regions Financial Corp. | 250,269 | 5,808,743 |
| Truist Financial Corp. | 963,778 | 45,114,448 |
| U.S. Bancorp | 470,901 | 21,374,196 |
| Wells Fargo & Co. | 1,259,824 | 60,408,561 |
| Zions Bancorp | 31,400 | 1,627,148 |
| Total | | 418,301,744 |
| Capital Markets 3.8% |
| Bank of New York Mellon Corp. (The) | 163,162 | 7,489,136 |
| BlackRock, Inc. | 19,382 | 13,877,512 |
| CME Group, Inc. | 75,874 | 13,391,761 |
| Franklin Resources, Inc. | 95,259 | 2,553,894 |
| Goldman Sachs Group, Inc. (The) | 54,766 | 21,147,891 |
| Invesco Ltd. | 14,455 | 276,235 |
| Jefferies Financial Group, Inc. | 13,256 | 503,595 |
| KKR & Co., Inc., Class A | 725,071 | 37,645,686 |
| Morgan Stanley | 296,566 | 27,601,398 |
| Nasdaq, Inc. | 413,985 | 28,341,413 |
| Northern Trust Corp. | 121,773 | 11,338,284 |
| State Street Corp. | 57,672 | 4,594,728 |
| Total | | 168,761,533 |
| Consumer Finance 0.4% |
| Ally Financial, Inc. | 104,256 | 2,815,955 |
| Capital One Financial Corp. | 95,448 | 9,854,052 |
| Synchrony Financial | 125,547 | 4,718,056 |
| Total | | 17,388,063 |
| Diversified Financial Services 1.5% |
| Apollo Global Management, Inc. | 5,640 | 391,360 |
| Berkshire Hathaway, Inc., Class B(a) | 211,136 | 67,267,929 |
| Equitable Holdings, Inc. | 219 | 6,951 |
| Total | | 67,666,240 |
| Insurance 5.0% |
| Aflac, Inc. | 101,557 | 7,304,995 |
| Allstate Corp. (The) | 29,677 | 3,973,750 |
| American Financial Group, Inc. | 1,763 | 250,734 |
| American International Group, Inc. | 1,160,002 | 73,207,726 |
| Arch Capital Group Ltd.(a) | 51,657 | 3,094,771 |
| Assurant, Inc. | 6,544 | 839,072 |
| Axis Capital Holdings Ltd. | 98 | 5,641 |
The accompanying Notes to Financial Statements are an integral part of this statement.
| 8 | Multi-Manager Value Strategies Fund | Semiannual Report 2022 |
Portfolio of Investments (continued)
November 30, 2022 (Unaudited)
| Common Stocks (continued) |
| Issuer | Shares | Value ($) |
| Chubb Ltd. | 121,914 | 26,771,095 |
| CNA Financial Corp. | 3,492 | 148,689 |
| Everest Re Group Ltd. | 4,525 | 1,529,179 |
| Fidelity National Financial, Inc. | 76,310 | 3,079,872 |
| Globe Life, Inc. | 23,935 | 2,871,243 |
| Hartford Financial Services Group, Inc. (The) | 341,126 | 26,051,793 |
| Lincoln National Corp. | 3,447 | 134,226 |
| Loews Corp. | 38,397 | 2,232,786 |
| Markel Corp.(a) | 666 | 882,343 |
| Marsh & McLennan Companies, Inc. | 313,563 | 54,302,840 |
| MetLife, Inc. | 55,862 | 4,284,615 |
| Old Republic International Corp. | 28,849 | 706,801 |
| Principal Financial Group, Inc. | 54,334 | 4,872,673 |
| Prudential Financial, Inc. | 38,409 | 4,149,324 |
| Travelers Companies, Inc. (The) | 22,184 | 4,210,745 |
| Total | | 224,904,913 |
| Total Financials | 897,022,493 |
| Health Care 16.1% |
| Biotechnology 2.1% |
| AbbVie, Inc. | 309,453 | 49,877,634 |
| Biogen, Inc.(a) | 37,445 | 11,427,091 |
| Gilead Sciences, Inc. | 152,967 | 13,435,092 |
| Moderna, Inc.(a) | 40,066 | 7,048,010 |
| Regeneron Pharmaceuticals, Inc.(a) | 10,678 | 8,026,652 |
| United Therapeutics Corp.(a) | 4,719 | 1,320,801 |
| Vertex Pharmaceuticals, Inc.(a) | 11,059 | 3,499,068 |
| Total | | 94,634,348 |
| Health Care Equipment & Supplies 4.2% |
| Abbott Laboratories | 558,403 | 60,072,995 |
| Baxter International, Inc. | 53,175 | 3,005,983 |
| Becton Dickinson and Co. | 192,924 | 48,103,670 |
| Boston Scientific Corp.(a) | 3,150 | 142,600 |
| Cooper Companies, Inc. (The) | 1,711 | 541,275 |
| Dentsply Sirona, Inc. | 19,280 | 583,413 |
| Hologic, Inc.(a) | 21,641 | 1,648,179 |
| Medtronic PLC | 558,094 | 44,111,750 |
| STERIS PLC | 12,626 | 2,345,153 |
| Stryker Corp. | 101,363 | 23,707,792 |
| Teleflex, Inc. | 2,321 | 543,392 |
| Common Stocks (continued) |
| Issuer | Shares | Value ($) |
| Zimmer Biomet Holdings, Inc. | 31,778 | 3,816,538 |
| Zimvie, Inc.(a) | 3,177 | 28,402 |
| Total | | 188,651,142 |
| Health Care Providers & Services 4.6% |
| Centene Corp.(a) | 45,816 | 3,988,283 |
| Cigna Corp. | 86,820 | 28,554,230 |
| CVS Health Corp. | 175,297 | 17,859,259 |
| Elevance Health, Inc. | 66,644 | 35,515,921 |
| HCA Healthcare, Inc. | 116,445 | 27,972,418 |
| Henry Schein, Inc.(a) | 38,024 | 3,076,902 |
| Humana, Inc. | 69,688 | 38,321,431 |
| Laboratory Corp. of America Holdings | 34,080 | 8,203,056 |
| McKesson Corp. | 5,309 | 2,026,339 |
| Quest Diagnostics, Inc. | 44,222 | 6,714,226 |
| UnitedHealth Group, Inc. | 48,278 | 26,444,757 |
| Universal Health Services, Inc., Class B | 26,871 | 3,516,070 |
| Total | | 202,192,892 |
| Life Sciences Tools & Services 0.8% |
| Bio-Rad Laboratories, Inc., Class A(a) | 2,854 | 1,183,582 |
| Danaher Corp. | 56,699 | 15,502,074 |
| PerkinElmer, Inc. | 16,674 | 2,329,858 |
| Thermo Fisher Scientific, Inc. | 29,539 | 16,548,338 |
| Total | | 35,563,852 |
| Pharmaceuticals 4.4% |
| Bristol-Myers Squibb Co. | 290,916 | 23,354,736 |
| Catalent, Inc.(a) | 6,266 | 314,114 |
| Elanco Animal Health, Inc.(a) | 16,317 | 210,000 |
| Eli Lilly & Co. | 31,436 | 11,665,271 |
| Jazz Pharmaceuticals PLC(a) | 13,557 | 2,127,229 |
| Johnson & Johnson | 229,726 | 40,891,228 |
| Merck & Co., Inc. | 280,722 | 30,913,107 |
| Perrigo Co. PLC | 1,120 | 36,098 |
| Pfizer, Inc. | 1,682,023 | 84,319,813 |
| Viatris, Inc. | 203,802 | 2,247,936 |
| Total | | 196,079,532 |
| Total Health Care | 717,121,766 |
The accompanying Notes to Financial Statements are an integral part of this statement.
Multi-Manager Value Strategies Fund | Semiannual Report 2022
| 9 |
Portfolio of Investments (continued)
November 30, 2022 (Unaudited)
| Common Stocks (continued) |
| Issuer | Shares | Value ($) |
| Industrials 12.7% |
| Aerospace & Defense 2.0% |
| General Dynamics Corp. | 31,557 | 7,964,671 |
| Howmet Aerospace, Inc. | 91,958 | 3,464,058 |
| Huntington Ingalls Industries, Inc. | 1,364 | 316,393 |
| L3Harris Technologies, Inc. | 102,460 | 23,266,617 |
| Lockheed Martin Corp. | 30,827 | 14,956,952 |
| Northrop Grumman Corp. | 45,701 | 24,371,886 |
| Raytheon Technologies Corp. | 105,550 | 10,419,896 |
| Textron, Inc. | 63,628 | 4,541,767 |
| Total | | 89,302,240 |
| Air Freight & Logistics 0.7% |
| FedEx Corp. | 44,772 | 8,158,354 |
| GXO Logistics, Inc.(a) | 6,109 | 286,268 |
| United Parcel Service, Inc., Class B | 124,985 | 23,713,404 |
| Total | | 32,158,026 |
| Airlines 0.1% |
| JetBlue Airways Corp.(a) | 3,151 | 25,082 |
| Southwest Airlines Co.(a) | 87,417 | 3,488,813 |
| United Airlines Holdings, Inc.(a) | 43,849 | 1,936,810 |
| Total | | 5,450,705 |
| Building Products 1.1% |
| Builders FirstSource, Inc.(a) | 47,462 | 3,034,246 |
| Carlisle Companies, Inc. | 7,875 | 2,071,991 |
| Carrier Global Corp. | 398,367 | 17,655,625 |
| Fortune Brands Home & Security, Inc. | 29,167 | 1,905,772 |
| Johnson Controls International PLC | 104,802 | 6,963,045 |
| Owens Corning | 26,387 | 2,344,221 |
| Trane Technologies PLC | 74,797 | 13,345,281 |
| Total | | 47,320,181 |
| Commercial Services & Supplies 1.1% |
| Republic Services, Inc. | 97,052 | 13,518,373 |
| Waste Management, Inc. | 210,306 | 35,272,522 |
| Total | | 48,790,895 |
| Common Stocks (continued) |
| Issuer | Shares | Value ($) |
| Construction & Engineering 0.3% |
| AECOM | 28,741 | 2,442,985 |
| Arcosa, Inc. | 165 | 10,081 |
| Jacobs Solutions, Inc. | 18,570 | 2,349,848 |
| Quanta Services, Inc. | 46,726 | 7,003,293 |
| Total | | 11,806,207 |
| Electrical Equipment 0.6% |
| Acuity Brands, Inc. | 34 | 6,402 |
| AMETEK, Inc. | 11,624 | 1,655,490 |
| Eaton Corp. PLC | 131,563 | 21,503,972 |
| Emerson Electric Co. | 62 | 5,938 |
| Hubbell, Inc. | 1,885 | 478,903 |
| Sensata Technologies Holding | 40,917 | 1,845,357 |
| Total | | 25,496,062 |
| Industrial Conglomerates 1.1% |
| General Electric Co. | 72,136 | 6,201,532 |
| Honeywell International, Inc. | 200,894 | 44,106,278 |
| Total | | 50,307,810 |
| Machinery 3.9% |
| AGCO Corp. | 21,789 | 2,891,836 |
| Caterpillar, Inc. | 139,994 | 33,095,982 |
| Cummins, Inc. | 79,302 | 19,917,490 |
| Deere & Co. | 77,974 | 34,386,534 |
| Dover Corp. | 13,860 | 1,967,427 |
| Fortive Corp. | 44,622 | 3,014,216 |
| Ingersoll Rand, Inc. | 48,131 | 2,597,630 |
| Middleby Corp. (The)(a) | 3,903 | 562,774 |
| Oshkosh Corp. | 883 | 81,298 |
| Otis Worldwide Corp. | 54,838 | 4,282,299 |
| PACCAR, Inc. | 95,587 | 10,123,619 |
| Parker-Hannifin Corp. | 155,914 | 46,608,931 |
| Pentair PLC | 48,154 | 2,204,009 |
| Snap-On, Inc. | 18,739 | 4,508,603 |
| Stanley Black & Decker, Inc. | 43,730 | 3,573,616 |
| Westinghouse Air Brake Technologies Corp. | 23,456 | 2,371,167 |
| Total | | 172,187,431 |
The accompanying Notes to Financial Statements are an integral part of this statement.
| 10 | Multi-Manager Value Strategies Fund | Semiannual Report 2022 |
Portfolio of Investments (continued)
November 30, 2022 (Unaudited)
| Common Stocks (continued) |
| Issuer | Shares | Value ($) |
| Professional Services 0.2% |
| Booz Allen Hamilton Holding Corp. | 50,680 | 5,392,352 |
| Leidos Holdings, Inc. | 44,926 | 4,911,759 |
| Total | | 10,304,111 |
| Road & Rail 1.5% |
| AMERCO | 5,483 | 347,074 |
| AMERCO(a) | 49,347 | 3,117,250 |
| CSX Corp. | 206 | 6,734 |
| Knight-Swift Transportation Holdings, Inc. | 7,886 | 437,121 |
| Norfolk Southern Corp. | 40,737 | 10,449,041 |
| Union Pacific Corp. | 235,050 | 51,106,921 |
| Total | | 65,464,141 |
| Trading Companies & Distributors 0.1% |
| United Rentals, Inc.(a) | 18,295 | 6,458,684 |
| Total Industrials | 565,046,493 |
| Information Technology 10.4% |
| Communications Equipment 0.7% |
| Ciena Corp.(a) | 4,225 | 189,956 |
| Cisco Systems, Inc. | 562,820 | 27,983,410 |
| F5, Inc.(a) | 668 | 103,279 |
| Juniper Networks, Inc. | 44,440 | 1,477,186 |
| Total | | 29,753,831 |
| Electronic Equipment, Instruments & Components 0.5% |
| Arrow Electronics, Inc.(a) | 16,208 | 1,762,458 |
| Avnet, Inc. | 268 | 12,105 |
| Corning, Inc. | 270,893 | 9,245,578 |
| Flex Ltd.(a) | 81,764 | 1,797,173 |
| IPG Photonics Corp.(a) | 223 | 20,300 |
| Jabil, Inc. | 18,328 | 1,323,098 |
| TD SYNNEX Corp. | 5,786 | 591,908 |
| TE Connectivity Ltd. | 65,407 | 8,249,131 |
| Teledyne Technologies, Inc.(a) | 3,076 | 1,292,228 |
| Total | | 24,293,979 |
| IT Services 2.7% |
| Accenture PLC, Class A | 51,505 | 15,499,400 |
| Akamai Technologies, Inc.(a) | 15,026 | 1,425,366 |
| Amdocs Ltd. | 39,912 | 3,546,580 |
| Automatic Data Processing, Inc. | 55,067 | 14,545,398 |
| Common Stocks (continued) |
| Issuer | Shares | Value ($) |
| Cognizant Technology Solutions Corp., Class A | 112,676 | 7,009,574 |
| Concentrix Corp. | 5,603 | 685,695 |
| DXC Technology Co.(a) | 12,300 | 364,941 |
| Fidelity National Information Services, Inc. | 43,404 | 3,150,262 |
| Fiserv, Inc.(a) | 51,275 | 5,351,059 |
| Global Payments, Inc. | 17,120 | 1,776,714 |
| International Business Machines Corp. | 114,190 | 17,002,891 |
| Kyndryl Holdings, Inc.(a) | 3,420 | 40,048 |
| SS&C Technologies Holdings, Inc. | 502,242 | 27,000,530 |
| Twilio, Inc., Class A(a) | 1,217 | 59,657 |
| Visa, Inc., Class A | 109,199 | 23,696,183 |
| Total | | 121,154,298 |
| Semiconductors & Semiconductor Equipment 4.7% |
| Advanced Micro Devices, Inc.(a) | 29,358 | 2,279,062 |
| Analog Devices, Inc. | 136,263 | 23,424,972 |
| Broadcom, Inc. | 44,489 | 24,514,774 |
| Intel Corp. | 792,079 | 23,817,815 |
| KLA Corp. | 49,413 | 19,426,721 |
| Lam Research Corp. | 31,676 | 14,963,109 |
| Marvell Technology, Inc. | 61,411 | 2,856,840 |
| Microchip Technology, Inc. | 188,761 | 14,947,984 |
| Micron Technology, Inc. | 208,863 | 12,040,952 |
| ON Semiconductor Corp.(a) | 57,355 | 4,313,096 |
| Qorvo, Inc.(a) | 35,816 | 3,554,738 |
| Skyworks Solutions, Inc. | 34,750 | 3,322,795 |
| Texas Instruments, Inc. | 335,812 | 60,600,633 |
| Total | | 210,063,491 |
| Software 1.5% |
| Black Knight, Inc.(a) | 2,911 | 180,453 |
| Dolby Laboratories, Inc., Class A | 659 | 49,339 |
| Microsoft Corp. | 234,487 | 59,827,013 |
| Roper Technologies, Inc. | 1,397 | 613,129 |
| Salesforce, Inc.(a) | 48,890 | 7,834,623 |
| Total | | 68,504,557 |
The accompanying Notes to Financial Statements are an integral part of this statement.
Multi-Manager Value Strategies Fund | Semiannual Report 2022
| 11 |
Portfolio of Investments (continued)
November 30, 2022 (Unaudited)
| Common Stocks (continued) |
| Issuer | Shares | Value ($) |
| Technology Hardware, Storage & Peripherals 0.3% |
| Hewlett Packard Enterprise Co. | 372,558 | 6,251,523 |
| HP, Inc. | 37,320 | 1,121,093 |
| Western Digital Corp.(a) | 100,588 | 3,696,609 |
| Xerox Holdings Corp. | 1,999 | 32,604 |
| Total | | 11,101,829 |
| Total Information Technology | 464,871,985 |
| Materials 5.9% |
| Chemicals 3.0% |
| Air Products & Chemicals, Inc. | 22,983 | 7,128,407 |
| Albemarle Corp. | 10,319 | 2,868,579 |
| Celanese Corp., Class A | 8,111 | 870,310 |
| CF Industries Holdings, Inc. | 37,289 | 4,034,297 |
| Corteva, Inc. | 69,209 | 4,648,076 |
| Dow, Inc. | 196,442 | 10,012,649 |
| DuPont de Nemours, Inc. | 47,436 | 3,344,712 |
| Eastman Chemical Co. | 46,835 | 4,056,848 |
| International Flavors & Fragrances, Inc. | 24,739 | 2,617,881 |
| Linde PLC | 154,491 | 51,983,132 |
| LyondellBasell Industries NV, Class A | 104,868 | 8,914,829 |
| Mosaic Co. (The) | 82,785 | 4,246,870 |
| Olin Corp. | 4,107 | 234,017 |
| PPG Industries, Inc. | 69,575 | 9,407,931 |
| Sherwin-Williams Co. (The) | 70,977 | 17,686,049 |
| Westlake Corp. | 19,870 | 2,139,006 |
| Total | | 134,193,593 |
| Construction Materials 0.6% |
| Martin Marietta Materials, Inc. | 55,619 | 20,383,251 |
| Vulcan Materials Co. | 21,438 | 3,930,229 |
| Total | | 24,313,480 |
| Containers & Packaging 0.5% |
| Amcor PLC | 67,703 | 836,132 |
| Avery Dennison Corp. | 40,988 | 7,924,210 |
| International Paper Co. | 119,659 | 4,441,742 |
| Packaging Corp. of America | 47,681 | 6,479,371 |
| Sonoco Products Co. | 212 | 13,010 |
| WestRock Co. | 41,589 | 1,577,055 |
| Total | | 21,271,520 |
| Common Stocks (continued) |
| Issuer | Shares | Value ($) |
| Metals & Mining 1.8% |
| Alcoa Corp. | 31,915 | 1,599,899 |
| Arconic Corp.(a) | 1,340 | 31,932 |
| Cleveland-Cliffs, Inc.(a) | 67,129 | 1,039,157 |
| Freeport-McMoRan, Inc. | 1,129,144 | 44,939,931 |
| Newmont Corp. | 128,988 | 6,123,060 |
| Nucor Corp. | 100,960 | 15,138,952 |
| Reliance Steel & Aluminum Co. | 20,889 | 4,413,637 |
| Royal Gold, Inc. | 389 | 43,697 |
| Steel Dynamics, Inc. | 71,770 | 7,459,056 |
| Total | | 80,789,321 |
| Paper & Forest Products 0.0% |
| Sylvamo Corp. | 134 | 7,248 |
| Total Materials | 260,575,162 |
| Real Estate 1.2% |
| Equity Real Estate Investment Trusts (REITS) 1.0% |
| AvalonBay Communities, Inc. | 35,165 | 6,150,359 |
| Crown Castle, Inc. | 47,704 | 6,746,777 |
| SBA Communications Corp. | 46,351 | 13,872,854 |
| Weyerhaeuser Co. | 560,437 | 18,331,894 |
| Total | | 45,101,884 |
| Real Estate Management & Development 0.2% |
| CBRE Group, Inc., Class A(a) | 84,036 | 6,689,265 |
| Howard Hughes Corporation(a) | 259 | 19,306 |
| Jones Lang LaSalle, Inc.(a) | 13,410 | 2,255,160 |
| Zillow Group, Inc., Class C(a) | 10,447 | 396,777 |
| Total | | 9,360,508 |
| Total Real Estate | 54,462,392 |
| Utilities 1.9% |
| Electric Utilities 1.0% |
| American Electric Power Co., Inc. | 86,626 | 8,385,397 |
| Entergy Corp. | 63,801 | 7,418,142 |
| Eversource Energy | 75,766 | 6,277,971 |
| NextEra Energy, Inc. | 143,425 | 12,148,097 |
| NRG Energy, Inc. | 42,608 | 1,808,710 |
| Xcel Energy, Inc. | 111,337 | 7,818,084 |
| Total | | 43,856,401 |
The accompanying Notes to Financial Statements are an integral part of this statement.
| 12 | Multi-Manager Value Strategies Fund | Semiannual Report 2022 |
Portfolio of Investments (continued)
November 30, 2022 (Unaudited)
| Common Stocks (continued) |
| Issuer | Shares | Value ($) |
| Independent Power and Renewable Electricity Producers 0.0% |
| Vistra Corp. | 63,624 | 1,547,972 |
| Multi-Utilities 0.9% |
| Ameren Corp. | 84,254 | 7,525,567 |
| CMS Energy Corp. | 92,223 | 5,632,059 |
| Dominion Energy, Inc. | 241,095 | 14,733,315 |
| DTE Energy Co. | 40,608 | 4,710,934 |
| WEC Energy Group, Inc. | 86,068 | 8,532,782 |
| Total | | 41,134,657 |
| Total Utilities | 86,539,030 |
Total Common Stocks
(Cost $3,484,644,953) | 4,391,768,329 |
|
| Money Market Funds 1.4% |
| | Shares | Value ($) |
| Columbia Short-Term Cash Fund, 3.989%(b),(c) | 62,993,719 | 62,968,522 |
Total Money Market Funds
(Cost $62,968,046) | 62,968,522 |
Total Investments in Securities
(Cost: $3,547,612,999) | 4,454,736,851 |
| Other Assets & Liabilities, Net | | 4,097,374 |
| Net Assets | 4,458,834,225 |
Notes to Portfolio of Investments
| (a) | Non-income producing investment. |
| (b) | The rate shown is the seven-day current annualized yield at November 30, 2022. |
| (c) | As defined in the Investment Company Act of 1940, as amended, an affiliated company is one in which the Fund owns 5% or more of the company’s outstanding voting securities, or a company which is under common ownership or control with the Fund. The value of the holdings and transactions in these affiliated companies during the period ended November 30, 2022 are as follows: |
| Affiliated issuers | Beginning
of period($) | Purchases($) | Sales($) | Net change in
unrealized
appreciation
(depreciation)($) | End of
period($) | Realized gain
(loss)($) | Dividends($) | End of
period shares |
| Columbia Short-Term Cash Fund, 3.989% |
| | 41,578,354 | 261,468,626 | (240,078,934) | 476 | 62,968,522 | 3,052 | 917,334 | 62,993,719 |
Fair value measurements
The Fund categorizes its fair value measurements according to a three-level hierarchy that maximizes the use of observable inputs and minimizes the use of unobservable inputs by prioritizing that the most observable input be used when available. Observable inputs are those that market participants would use in pricing an investment based on market data obtained from sources independent of the reporting entity. Unobservable inputs are those that reflect the Fund’s assumptions about the information market participants would use in pricing an investment. An investment’s level within the fair value hierarchy is based on the lowest level of any input that is deemed significant to the asset’s or liability’s fair value measurement. The input levels are not necessarily an indication of the risk or liquidity associated with investments at that level. For example, certain U.S. government securities are generally high quality and liquid, however, they are reflected as Level 2 because the inputs used to determine fair value may not always be quoted prices in an active market.
Fair value inputs are summarized in the three broad levels listed below:
| ■ | Level 1 — Valuations based on quoted prices for investments in active markets that the Fund has the ability to access at the measurement date. Valuation adjustments are not applied to Level 1 investments. |
| ■ | Level 2 — Valuations based on other significant observable inputs (including quoted prices for similar securities, interest rates, prepayment speeds, credit risks, etc.). |
| ■ | Level 3 — Valuations based on significant unobservable inputs (including the Fund’s own assumptions and judgment in determining the fair value of investments). |
Inputs that are used in determining fair value of an investment may include price information, credit data, volatility statistics, and other factors. These inputs can be either observable or unobservable. The availability of observable inputs can vary between investments, and is affected by various factors such as the type of investment, and the volume and level of activity for that investment or similar investments in the marketplace. The inputs will be considered by the Investment Manager, along with any other relevant factors in the calculation of an investment’s fair value. The Fund uses prices and inputs that are current as of the measurement date, which may include periods of market dislocations. During these periods, the availability of prices and inputs may be reduced for many investments. This condition could cause an investment to be reclassified between the various levels within the hierarchy.
Investments falling into the Level 3 category are primarily supported by quoted prices from brokers and dealers participating in the market for those investments. However, these may be classified as Level 3 investments due to lack of market transparency and corroboration to support these quoted prices. Additionally, valuation models may be used as the pricing source for any remaining investments classified as Level 3. These models may rely on one or more significant unobservable inputs and/or significant assumptions by the Investment Manager. Inputs used in valuations may include, but are not limited to, financial statement analysis, capital account balances, discount rates and estimated cash flows, and comparable company data.
The accompanying Notes to Financial Statements are an integral part of this statement.
Multi-Manager Value Strategies Fund | Semiannual Report 2022
| 13 |
Portfolio of Investments (continued)
November 30, 2022 (Unaudited)
Fair value measurements (continued)
The Fund’s Board of Trustees (the Board) has designated the Investment Manager, through its Valuation Committee (the Committee), as valuation designee, responsible for determining the fair value of the assets of the Fund for which market quotations are not readily available using valuation procedures approved by the Board. The Committee consists of voting and non-voting members from various groups within the Investment Manager’s organization, including operations and accounting, trading and investments, compliance, risk management and legal.
The Committee meets at least monthly to review and approve valuation matters, which may include a description of specific valuation determinations, data regarding pricing information received from approved pricing vendors and brokers and the results of Board-approved valuation policies and procedures (the Policies). The Policies address, among other things, instances when market quotations are or are not readily available, including recommendations of third party pricing vendors and a determination of appropriate pricing methodologies; events that require specific valuation determinations and assessment of fair value techniques; securities with a potential for stale pricing, including those that are illiquid, restricted, or in default; and the effectiveness of third party pricing vendors, including periodic reviews of vendors. The Committee meets more frequently, as needed, to discuss additional valuation matters, which may include the need to review back-testing results, review time-sensitive information or approve related valuation actions. Representatives of Columbia Management Investment Advisers, LLC report to the Board at each of its regularly scheduled meetings to discuss valuation matters and actions during the period, similar to those described earlier.
The following table is a summary of the inputs used to value the Fund’s investments at November 30, 2022:
| | Level 1 ($) | Level 2 ($) | Level 3 ($) | Total ($) |
| Investments in Securities | | | | |
| Common Stocks | | | | |
| Communication Services | 291,121,836 | — | — | 291,121,836 |
| Consumer Discretionary | 372,640,690 | — | — | 372,640,690 |
| Consumer Staples | 231,640,558 | — | — | 231,640,558 |
| Energy | 450,725,924 | — | — | 450,725,924 |
| Financials | 897,022,493 | — | — | 897,022,493 |
| Health Care | 717,121,766 | — | — | 717,121,766 |
| Industrials | 565,046,493 | — | — | 565,046,493 |
| Information Technology | 464,871,985 | — | — | 464,871,985 |
| Materials | 260,575,162 | — | — | 260,575,162 |
| Real Estate | 54,462,392 | — | — | 54,462,392 |
| Utilities | 86,539,030 | — | — | 86,539,030 |
| Total Common Stocks | 4,391,768,329 | — | — | 4,391,768,329 |
| Money Market Funds | 62,968,522 | — | — | 62,968,522 |
| Total Investments in Securities | 4,454,736,851 | — | — | 4,454,736,851 |
See the Portfolio of Investments for all investment classifications not indicated in the table.
The accompanying Notes to Financial Statements are an integral part of this statement.
| 14 | Multi-Manager Value Strategies Fund | Semiannual Report 2022 |
Statement of Assets and Liabilities
November 30, 2022 (Unaudited)
| Assets | |
| Investments in securities, at value | |
| Unaffiliated issuers (cost $3,484,644,953) | $4,391,768,329 |
| Affiliated issuers (cost $62,968,046) | 62,968,522 |
| Receivable for: | |
| Investments sold | 1,109,212 |
| Capital shares sold | 3,973,060 |
| Dividends | 9,736,948 |
| Foreign tax reclaims | 139,858 |
| Prepaid expenses | 33,767 |
| Total assets | 4,469,729,696 |
| Liabilities | |
| Due to custodian | 27,424 |
| Payable for: | |
| Investments purchased | 3,247,923 |
| Capital shares purchased | 6,985,356 |
| Management services fees | 71,563 |
| Transfer agent fees | 317,817 |
| Compensation of board members | 154,913 |
| Compensation of chief compliance officer | 407 |
| Other expenses | 90,068 |
| Total liabilities | 10,895,471 |
| Net assets applicable to outstanding capital stock | $4,458,834,225 |
| Represented by | |
| Paid in capital | 3,111,149,091 |
| Total distributable earnings (loss) | 1,347,685,134 |
| Total - representing net assets applicable to outstanding capital stock | $4,458,834,225 |
| Institutional Class | |
| Net assets | $4,458,831,361 |
| Shares outstanding | 269,507,056 |
| Net asset value per share | $16.54 |
| Institutional 3 Class | |
| Net assets | $2,864 |
| Shares outstanding | 173 |
| Net asset value per share(a) | $16.57 |
| (a) | Net asset value per share rounds to this amount due to fractional shares outstanding. |
The accompanying Notes to Financial Statements are an integral part of this statement.
Multi-Manager Value Strategies Fund | Semiannual Report 2022
| 15 |
Statement of Operations
Six Months Ended November 30, 2022 (Unaudited)
| Net investment income | |
| Income: | |
| Dividends — unaffiliated issuers | $52,138,481 |
| Dividends — affiliated issuers | 917,334 |
| European Union tax reclaim | 133,633 |
| Foreign taxes withheld | (50) |
| Total income | 53,189,398 |
| Expenses: | |
| Management services fees | 12,936,787 |
| Transfer agent fees | |
| Institutional Class | 2,212,041 |
| Compensation of board members | 31,398 |
| Custodian fees | 18,614 |
| Printing and postage fees | 143,558 |
| Registration fees | 62,123 |
| Audit fees | 15,279 |
| Legal fees | 34,357 |
| Compensation of chief compliance officer | 407 |
| Other | 33,108 |
| Total expenses | 15,487,672 |
| Net investment income | 37,701,726 |
| Realized and unrealized gain (loss) — net | |
| Net realized gain (loss) on: | |
| Investments — unaffiliated issuers | 90,864,556 |
| Investments — affiliated issuers | 3,052 |
| Foreign currency translations | 1,074 |
| Futures contracts | 40,405 |
| Net realized gain | 90,909,087 |
| Net change in unrealized appreciation (depreciation) on: | |
| Investments — unaffiliated issuers | (91,420,278) |
| Investments — affiliated issuers | 476 |
| Foreign currency translations | (3,513) |
| Net change in unrealized appreciation (depreciation) | (91,423,315) |
| Net realized and unrealized loss | (514,228) |
| Net increase in net assets resulting from operations | $37,187,498 |
The accompanying Notes to Financial Statements are an integral part of this statement.
| 16 | Multi-Manager Value Strategies Fund | Semiannual Report 2022 |
Statement of Changes in Net Assets
| | Six Months Ended
November 30, 2022
(Unaudited) | Year Ended
May 31, 2022 |
| Operations | | |
| Net investment income | $37,701,726 | $68,222,560 |
| Net realized gain | 90,909,087 | 476,060,691 |
| Net change in unrealized appreciation (depreciation) | (91,423,315) | (497,624,233) |
| Net increase in net assets resulting from operations | 37,187,498 | 46,659,018 |
| Distributions to shareholders | | |
| Net investment income and net realized gains | | |
| Institutional Class | (36,661,115) | (408,044,013) |
| Institutional 3 Class | (24) | (244) |
| Total distributions to shareholders | (36,661,139) | (408,044,257) |
| Decrease in net assets from capital stock activity | (130,890,056) | (105,137,297) |
| Total decrease in net assets | (130,363,697) | (466,522,536) |
| Net assets at beginning of period | 4,589,197,922 | 5,055,720,458 |
| Net assets at end of period | $4,458,834,225 | $4,589,197,922 |
| | Six Months Ended | Year Ended |
| | November 30, 2022 (Unaudited) | May 31, 2022 |
| | Shares | Dollars ($) | Shares | Dollars ($) |
| Capital stock activity |
| Institutional Class | | | | |
| Subscriptions | 21,804,787 | 340,678,383 | 54,031,716 | 935,240,677 |
| Distributions reinvested | 2,465,126 | 36,661,115 | 23,954,125 | 408,044,013 |
| Redemptions | (32,618,498) | (508,229,554) | (86,176,500) | (1,448,421,987) |
| Net decrease | (8,348,585) | (130,890,056) | (8,190,659) | (105,137,297) |
| Total net decrease | (8,348,585) | (130,890,056) | (8,190,659) | (105,137,297) |
The accompanying Notes to Financial Statements are an integral part of this statement.
Multi-Manager Value Strategies Fund | Semiannual Report 2022
| 17 |
The following table is intended to help you understand the Fund’s financial performance. Certain information reflects financial results for a single share of a class held for the periods shown. Per share net investment income (loss) amounts are calculated based on average shares outstanding during the period. Total return assumes reinvestment of all dividends and distributions, if any. Total return does not reflect payment of sales charges, if any. Total return and portfolio turnover are not annualized for periods of less than one year. The portfolio turnover rate is calculated without regard to purchase and sales transactions of short-term instruments and certain derivatives, if any. If such transactions were included, the Fund’s portfolio turnover rate may be higher.
| | Net asset value,
beginning of
period | Net
investment
income | Net
realized
and
unrealized
gain (loss) | Total from
investment
operations | Distributions
from net
investment
income | Distributions
from net
realized
gains | Total
distributions to
shareholders |
| Institutional Class |
| Six Months Ended 11/30/2022 (Unaudited) | $16.52 | 0.13 | 0.02(c) | 0.15 | (0.13) | — | (0.13) |
| Year Ended 5/31/2022 | $17.67 | 0.23 | 0.02(c) | 0.25 | (0.22) | (1.18) | (1.40) |
| Year Ended 5/31/2021 | $12.48 | 0.21 | 5.34 | 5.55 | (0.21) | (0.15) | (0.36) |
| Year Ended 5/31/2020 | $12.83 | 0.24 | (0.06)(c) | 0.18 | (0.23) | (0.30) | (0.53) |
| Year Ended 5/31/2019 | $13.64 | 0.21 | (0.02)(c) | 0.19 | (0.20) | (0.80) | (1.00) |
| Year Ended 5/31/2018 | $12.97 | 0.20 | 1.15 | 1.35 | (0.20) | (0.48) | (0.68) |
| Institutional 3 Class |
| Six Months Ended 11/30/2022 (Unaudited) | $16.55 | 0.14 | 0.02(c) | 0.16 | (0.14) | — | (0.14) |
| Year Ended 5/31/2022 | $17.69 | 0.24 | 0.03(c) | 0.27 | (0.23) | (1.18) | (1.41) |
| Year Ended 5/31/2021 | $12.50 | 0.22 | 5.34 | 5.56 | (0.22) | (0.15) | (0.37) |
| Year Ended 5/31/2020(g) | $14.47 | 0.11 | (2.02)(c) | (1.91) | (0.06) | — | (0.06) |
| Notes to Financial Highlights |
| (a) | In addition to the fees and expenses that the Fund bears directly, the Fund indirectly bears a pro rata share of the fees and expenses of any other funds in which it invests. Such indirect expenses are not included in the Fund’s reported expense ratios. |
| (b) | Total net expenses include the impact of certain fee waivers/expense reimbursements made by the Investment Manager and certain of its affiliates, if applicable. |
| (c) | Calculation of the net gain (loss) per share (both realized and unrealized) does not correlate to the aggregate realized and unrealized gain (loss) presented in the Statement of Operations due to the timing of subscriptions and redemptions of Fund shares in relation to fluctuations in the market value of the portfolio. |
| (d) | Annualized. |
| (e) | Ratios include interfund lending expense which is less than 0.01%. |
| (f) | Ratios include line of credit interest expense which is less than 0.01%. |
| (g) | Institutional 3 Class shares commenced operations on December 18, 2019. Per share data and total return reflect activity from that date. |
The accompanying Notes to Financial Statements are an integral part of this statement.
| 18 | Multi-Manager Value Strategies Fund | Semiannual Report 2022 |
Financial Highlights (continued)
| | Net
asset
value,
end of
period | Total
return | Total gross
expense
ratio to
average
net assets(a) | Total net
expense
ratio to
average
net assets(a),(b) | Net investment
income
ratio to
average
net assets | Portfolio
turnover | Net
assets,
end of
period
(000’s) |
| Institutional Class |
| Six Months Ended 11/30/2022 (Unaudited) | $16.54 | 1.01% | 0.72%(d) | 0.72%(d) | 1.74%(d) | 9% | $4,458,831 |
| Year Ended 5/31/2022 | $16.52 | 1.22% | 0.69%(e) | 0.69%(e) | 1.31% | 22% | $4,589,195 |
| Year Ended 5/31/2021 | $17.67 | 45.16% | 0.71%(e) | 0.71%(e) | 1.41% | 29% | $5,055,717 |
| Year Ended 5/31/2020 | $12.48 | 1.07% | 0.76% | 0.74% | 1.78% | 19% | $3,589,152 |
| Year Ended 5/31/2019 | $12.83 | 1.62% | 0.77% | 0.77% | 1.59% | 20% | $2,849,432 |
| Year Ended 5/31/2018 | $13.64 | 10.41% | 0.78%(f) | 0.78%(f) | 1.46% | 21% | $3,137,590 |
| Institutional 3 Class |
| Six Months Ended 11/30/2022 (Unaudited) | $16.57 | 1.05% | 0.60%(d) | 0.60%(d) | 1.84%(d) | 9% | $3 |
| Year Ended 5/31/2022 | $16.55 | 1.35% | 0.62%(e) | 0.62%(e) | 1.37% | 22% | $3 |
| Year Ended 5/31/2021 | $17.69 | 45.20% | 0.63%(e) | 0.63%(e) | 1.49% | 29% | $3 |
| Year Ended 5/31/2020(g) | $12.50 | (13.14%) | 0.66%(d) | 0.64%(d) | 1.84%(d) | 19% | $2 |
The accompanying Notes to Financial Statements are an integral part of this statement.
Multi-Manager Value Strategies Fund | Semiannual Report 2022
| 19 |
Notes to Financial Statements
November 30, 2022 (Unaudited)
Note 1. Organization
Multi-Manager Value Strategies Fund (the Fund), a series of Columbia Funds Series Trust II (the Trust), is a diversified fund. The Trust is registered under the Investment Company Act of 1940, as amended (the 1940 Act), as an open-end management investment company organized as a Massachusetts business trust.
Fund shares
The Trust may issue an unlimited number of shares (without par value). The Fund is offered only through certain wrap fee programs sponsored and/or managed by Ameriprise Financial, Inc. (Ameriprise Financial) or its affiliates. The Fund offers each of the share classes listed in the Statement of Assets and Liabilities which are not subject to any front-end sales charge or contingent deferred sales charge.
Note 2. Summary of significant accounting policies
Basis of preparation
The Fund is an investment company that applies the accounting and reporting guidance in the Financial Accounting Standards Board (FASB) Accounting Standards Codification Topic 946, Financial Services - Investment Companies (ASC 946). The financial statements are prepared in accordance with U.S. generally accepted accounting principles (GAAP), which requires management to make certain estimates and assumptions that affect the reported amounts of assets and liabilities, the disclosure of contingent assets and liabilities at the date of the financial statements and the reported amounts of income and expenses during the reporting period. Actual results could differ from those estimates.
The following is a summary of significant accounting policies followed by the Fund in the preparation of its financial statements.
Security valuation
Equity securities listed on an exchange are valued at the closing price or last trade price on their primary exchange at the close of business of the New York Stock Exchange. Securities with a closing price not readily available or not listed on any exchange are valued at the mean between the closing bid and ask prices. Listed preferred stocks convertible into common stocks are valued using an evaluated price from a pricing service.
Foreign equity securities are valued based on the closing price or last trade price on their primary exchange at the close of business of the New York Stock Exchange. If any foreign equity security closing prices are not readily available, the securities are valued at the mean of the latest quoted bid and ask prices on such exchanges or markets. Foreign currency exchange rates are determined at the scheduled closing time of the New York Stock Exchange. Many securities markets and exchanges outside the U.S. close prior to the close of the New York Stock Exchange; therefore, the closing prices for securities in such markets or on such exchanges may not fully reflect events that occur after such close but before the close of the New York Stock Exchange. In those situations, foreign securities will be fair valued pursuant to a policy approved by the Board of Trustees. Under the policy, the Fund may utilize a third-party pricing service to determine these fair values. The third-party pricing service takes into account multiple factors, including, but not limited to, movements in the U.S. securities markets, certain depositary receipts, futures contracts and foreign exchange rates that have occurred subsequent to the close of the foreign exchange or market, to determine a good faith estimate that reasonably reflects the current market conditions as of the close of the New York Stock Exchange. The fair value of a security is likely to be different from the quoted or published price, if available.
Investments in open-end investment companies (other than exchange-traded funds (ETFs)), are valued at the latest net asset value reported by those companies as of the valuation time.
Investments for which market quotations are not readily available, or that have quotations which management believes are not reflective of market value or reliable, are valued at fair value as determined in good faith under procedures approved by the Board of Trustees. If a security or class of securities (such as foreign securities) is valued at fair value, such value is likely to be different from the quoted or published price for the security, if available.
| 20 | Multi-Manager Value Strategies Fund | Semiannual Report 2022 |
Notes to Financial Statements (continued)
November 30, 2022 (Unaudited)
The determination of fair value often requires significant judgment. To determine fair value, management may use assumptions including but not limited to future cash flows and estimated risk premiums. Multiple inputs from various sources may be used to determine fair value.
GAAP requires disclosure regarding the inputs and valuation techniques used to measure fair value and any changes in valuation inputs or techniques. In addition, investments shall be disclosed by major category. This information is disclosed following the Fund’s Portfolio of Investments.
Foreign currency transactions and translations
The values of all assets and liabilities denominated in foreign currencies are generally translated into U.S. dollars at exchange rates determined at the close of regular trading on the New York Stock Exchange. Net realized and unrealized gains (losses) on foreign currency transactions and translations include gains (losses) arising from the fluctuation in exchange rates between trade and settlement dates on securities transactions, gains (losses) arising from the disposition of foreign currency and currency gains (losses) between the accrual and payment dates on dividends, interest income and foreign withholding taxes.
For financial statement purposes, the Fund does not distinguish that portion of gains (losses) on investments which is due to changes in foreign exchange rates from that which is due to changes in market prices of the investments. Such fluctuations are included with the net realized and unrealized gains (losses) on investments in the Statement of Operations.
Derivative instruments
The Fund invests in certain derivative instruments, as detailed below, in seeking to meet its investment objectives. Derivatives are instruments whose values depend on, or are derived from, in whole or in part, the value of one or more securities, currencies, commodities, indices, or other assets or instruments. Derivatives may be used to increase investment flexibility (including to maintain cash reserves while maintaining desired exposure to certain assets), for risk management (hedging) purposes, to facilitate trading, to reduce transaction costs and to pursue higher investment returns. The Fund may also use derivative instruments to mitigate certain investment risks, such as foreign currency exchange rate risk, interest rate risk and credit risk. Derivatives may involve various risks, including the potential inability of the counterparty to fulfill its obligations under the terms of the contract, the potential for an illiquid secondary market (making it difficult for the Fund to sell or terminate, including at favorable prices) and the potential for market movements which may expose the Fund to gains or losses in excess of the amount shown in the Statement of Assets and Liabilities. The notional amounts of derivative instruments, if applicable, are not recorded in the financial statements.
A derivative instrument may suffer a marked-to-market loss if the value of the contract decreases due to an unfavorable change in the market rates or values of the underlying instrument. Losses can also occur if the counterparty does not perform its obligations under the contract. The Fund’s risk of loss from counterparty credit risk on over-the-counter derivatives is generally limited to the aggregate unrealized gain netted against any collateral held by the Fund and the amount of any variation margin held by the counterparty, plus any replacement costs or related amounts. With exchange-traded or centrally cleared derivatives, there is reduced counterparty credit risk to the Fund since the clearinghouse or central counterparty (CCP) provides some protection in the case of clearing member default. The clearinghouse or CCP stands between the buyer and the seller of the contract; therefore, failure of the clearinghouse or CCP may pose additional counterparty credit risk. However, credit risk still exists in exchange-traded or centrally cleared derivatives with respect to initial and variation margin that is held in a broker’s customer account. While clearing brokers are required to segregate customer margin from their own assets, in the event that a clearing broker becomes insolvent or goes into bankruptcy and at that time there is a shortfall in the aggregate amount of margin held by the clearing broker for all its clients and such shortfall is remedied by the CCP or otherwise, U.S. bankruptcy laws will typically allocate that shortfall on a pro-rata basis across all the clearing broker’s customers (including the Fund), potentially resulting in losses to the Fund.
In order to better define its contractual rights and to secure rights that will help the Fund mitigate its counterparty risk, the Fund may enter into an International Swaps and Derivatives Association, Inc. Master Agreement (ISDA Master Agreement) or similar agreement with its derivatives counterparties. An ISDA Master Agreement is an agreement between the Fund and a counterparty that governs over-the-counter derivatives and foreign exchange forward contracts and contains, among other things, collateral posting terms and netting provisions in the event of a default and/or termination event. Under an ISDA
Multi-Manager Value Strategies Fund | Semiannual Report 2022
| 21 |
Notes to Financial Statements (continued)
November 30, 2022 (Unaudited)
Master Agreement, the Fund may, under certain circumstances, offset with the counterparty certain derivative instruments’ payables and/or receivables with collateral held and/or posted and create one single net payment. The provisions of the ISDA Master Agreement typically permit a single net payment in the event of default (close-out netting), including the bankruptcy or insolvency of the counterparty. Note, however, that bankruptcy or insolvency laws of a particular jurisdiction may impose restrictions on or prohibitions against the right of offset or netting in bankruptcy, insolvency or other events.
Collateral (margin) requirements differ by type of derivative. Margin requirements are established by the clearinghouse or CCP for exchange-traded and centrally cleared derivatives. Brokers can ask for margin in excess of the minimum in certain circumstances. Collateral terms for most over-the-counter derivatives are subject to regulatory requirements to exchange variation margin with trading counterparties and may have contract specific margin terms as well. For over-the-counter derivatives traded under an ISDA Master Agreement, the collateral requirements are typically calculated by netting the marked-to-market amount for each transaction under such agreement and comparing that amount to the value of any variation margin currently pledged by the Fund and/or the counterparty. Generally, the amount of collateral due from or to a party has to exceed a minimum transfer amount threshold (e.g., $250,000) before a transfer has to be made. To the extent amounts due to the Fund from its counterparties are not fully collateralized, contractually or otherwise, the Fund bears the risk of loss from counterparty nonperformance. The Fund may also pay interest expense on cash collateral received from the broker. Any interest expense paid by the Fund is shown in the Statement of Operations. The Fund attempts to mitigate counterparty risk by only entering into agreements with counterparties that it believes have the financial resources to honor their obligations and by monitoring the financial stability of those counterparties.
Certain ISDA Master Agreements allow counterparties of over-the-counter derivatives transactions to terminate derivatives contracts prior to maturity in the event the Fund’s net asset value declines by a stated percentage over a specified time period or if the Fund fails to meet certain terms of the ISDA Master Agreement, which would cause the Fund to accelerate payment of any net liability owed to the counterparty. The Fund also has termination rights if the counterparty fails to meet certain terms of the ISDA Master Agreement. In determining whether to exercise such termination rights, the Fund would consider, in addition to counterparty credit risk, whether termination would result in a net liability owed from the counterparty.
For financial reporting purposes, the Fund does not offset derivative assets and derivative liabilities that are subject to netting arrangements in the Statement of Assets and Liabilities.
Futures contracts
Futures contracts are exchange-traded and represent commitments for the future purchase or sale of an asset at a specified price on a specified date. The Fund bought and sold futures contracts to maintain appropriate equity market exposure while keeping sufficient cash to accommodate daily redemptions. These instruments may be used for other purposes in future periods. Upon entering into futures contracts, the Fund bears risks that it may not achieve the anticipated benefits of the futures contracts and may realize a loss. Additional risks include counterparty credit risk, the possibility of an illiquid market, and that a change in the value of the contract or option may not correlate with changes in the value of the underlying asset.
Upon entering into a futures contract, the Fund deposits cash or securities with the broker, known as a futures commission merchant (FCM), in an amount sufficient to meet the initial margin requirement. The initial margin deposit must be maintained at an established level over the life of the contract. Cash deposited as initial margin is recorded in the Statement of Assets and Liabilities as margin deposits. Securities deposited as initial margin are designated in the Portfolio of Investments. Subsequent payments (variation margin) are made or received by the Fund each day. The variation margin payments are equal to the daily change in the contract value and are recorded as variation margin receivable or payable and are offset in unrealized gains or losses. The Fund generally expects to earn interest income on its margin deposits. The Fund recognizes a realized gain or loss when the contract is closed or expires. Futures contracts involve, to varying degrees, risk of loss in excess of the variation margin disclosed in the Statement of Assets and Liabilities.
| 22 | Multi-Manager Value Strategies Fund | Semiannual Report 2022 |
Notes to Financial Statements (continued)
November 30, 2022 (Unaudited)
Effects of derivative transactions in the financial statements
The following tables are intended to provide additional information about the effect of derivatives on the financial statements of the Fund, including: the fair value of derivatives by risk category and the location of those fair values in the Statement of Assets and Liabilities; and the impact of derivative transactions over the period in the Statement of Operations, including realized and unrealized gains (losses). The derivative instrument schedules following the Portfolio of Investments present additional information regarding derivative instruments outstanding at the end of the period, if any.
The following table indicates the effect of derivative instruments (not considered to be hedging instruments for accounting disclosure purposes) in the Statement of Operations for the six months ended November 30, 2022:
| Amount of realized gain (loss) on derivatives recognized in income |
| Risk exposure category | Futures
contracts
($) |
| Equity risk | 40,405 |
The following table is a summary of the average outstanding volume by derivative instrument for the six months ended November 30, 2022:
| Derivative instrument | Average notional
amounts ($)* |
| Futures contracts — long | 671,222 |
| * | Based on the ending daily outstanding amounts for the six months ended November 30, 2022. |
Security transactions
Security transactions are accounted for on the trade date. Cost is determined and gains (losses) are based upon the specific identification method for both financial statement and federal income tax purposes.
Income recognition
Corporate actions and dividend income are generally recorded net of any non-reclaimable tax withholdings, on the ex-dividend date or upon receipt of an ex-dividend notification in the case of certain foreign securities.
The Fund may receive distributions from holdings in equity securities, business development companies (BDCs), exchange-traded funds (ETFs), limited partnerships (LPs), other regulated investment companies (RICs), and real estate investment trusts (REITs), which report information as to the tax character of their distributions annually. These distributions are allocated to dividend income, capital gain and return of capital based on actual information reported. Return of capital is recorded as a reduction of the cost basis of securities held. If the Fund no longer owns the applicable securities, return of capital is recorded as a realized gain. With respect to REITs, to the extent actual information has not yet been reported, estimates for return of capital are made by Columbia Management Investment Advisers, LLC (the Investment Manager), a wholly-owned subsidiary of Ameriprise Financial, Inc. (Ameriprise Financial). The Investment Manager’s estimates are subsequently adjusted when the actual character of the distributions is disclosed by the REITs, which could result in a proportionate change in return of capital to shareholders.
Awards from class action litigation are recorded as a reduction of cost basis if the Fund still owns the applicable securities on the payment date. If the Fund no longer owns the applicable securities on the payment date, the proceeds are recorded as realized gains.
Expenses
General expenses of the Trust are allocated to the Fund and other funds of the Trust based upon relative net assets or other expense allocation methodologies determined by the nature of the expense. Expenses directly attributable to the Fund are charged to the Fund. Expenses directly attributable to a specific class of shares are charged to that share class.
Multi-Manager Value Strategies Fund | Semiannual Report 2022
| 23 |
Notes to Financial Statements (continued)
November 30, 2022 (Unaudited)
Determination of class net asset value
All income, expenses (other than class-specific expenses, which are charged to that share class, as shown in the Statement of Operations) and realized and unrealized gains (losses) are allocated to each class of the Fund on a daily basis, based on the relative net assets of each class, for purposes of determining the net asset value of each class.
Federal income tax status
The Fund intends to qualify each year as a regulated investment company under Subchapter M of the Internal Revenue Code, as amended, and will distribute substantially all of its investment company taxable income and net capital gain, if any, for its tax year, and as such will not be subject to federal income taxes. In addition, the Fund intends to distribute in each calendar year substantially all of its ordinary income, capital gain net income and certain other amounts, if any, such that the Fund should not be subject to federal excise tax. Therefore, no federal income or excise tax provision is recorded.
Foreign taxes
The Fund may be subject to foreign taxes on income, gains on investments or currency repatriation, a portion of which may be recoverable. The Fund will accrue such taxes and recoveries, as applicable, based upon its current interpretation of tax rules and regulations that exist in the markets in which it invests.
Realized gains in certain countries may be subject to foreign taxes at the Fund level, based on statutory rates. The Fund accrues for such foreign taxes on realized and unrealized gains at the appropriate rate for each jurisdiction, as applicable. The amount, if any, is disclosed as a liability in the Statement of Assets and Liabilities.
The Fund may file withholding tax reclaims in certain European Union countries to recover a portion of foreign taxes previously withheld on dividends earned, which may be reclaimable based upon certain provisions in the Treaty on the Functioning of the European Union (EU) and subsequent rulings by the European Court of Justice. The Fund may record a reclaim receivable when the amount is known, the Fund has received notice of a pending refund, and there are no significant uncertainties on collectability. Income received from EU reclaims is included in the Statement of Operations.
Distributions to shareholders
Distributions from net investment income, if any, are declared and paid each calendar quarter. Net realized capital gains, if any, are distributed at least annually. Income distributions and capital gain distributions are determined in accordance with federal income tax regulations, which may differ from GAAP.
Guarantees and indemnifications
Under the Trust’s organizational documents and, in some cases, by contract, its officers and trustees are indemnified against certain liabilities arising out of the performance of their duties to the Trust or its funds. In addition, certain of the Fund’s contracts with its service providers contain general indemnification clauses. The Fund’s maximum exposure under these arrangements is unknown since the amount of any future claims that may be made against the Fund cannot be determined, and the Fund has no historical basis for predicting the likelihood of any such claims.
Recent accounting pronouncement
Tailored Shareholder Reports
In October 2022, the Securities and Exchange Commission (SEC) adopted a final rule relating to Tailored Shareholder Reports for Mutual Funds and Exchange-Traded Funds (ETFs); Fee Information in Investment Company Advertisements. The rule and form amendments will require mutual funds and ETFs to transmit concise and visually engaging shareholder reports that highlight key information. The amendments will require that funds tag information in a structured data format. The rule amendments will require that certain more in-depth information be made available online and available for delivery free of charge to investors on request. The amendments will become effective January 24, 2023. There is an 18-month transition period after the effective date of the amendment.
| 24 | Multi-Manager Value Strategies Fund | Semiannual Report 2022 |
Notes to Financial Statements (continued)
November 30, 2022 (Unaudited)
Note 3. Fees and other transactions with affiliates
Management services fees
The Fund has entered into a Management Agreement with Columbia Management Investment Advisers, LLC (the Investment Manager), a wholly-owned subsidiary of Ameriprise Financial, Inc. (Ameriprise Financial). Under the Management Agreement, the Investment Manager provides the Fund with investment research and advice, as well as administrative and accounting services. The Investment Manager is responsible for the ultimate oversight of investments made by the Fund. The Fund’s subadvisers (see Subadvisory agreements below) have the primary responsibility for the day-to-day portfolio management of their portion of the Fund. The management services fee is an annual fee that is equal to a percentage of the Fund’s daily net assets that declines from 0.72% to 0.52% as the Fund’s net assets increase. The annualized effective management services fee rate for the six months ended November 30, 2022 was 0.60% of the Fund’s average daily net assets.
Subadvisory agreements
The Investment Manager has entered into Subadvisory Agreements with Diamond Hill Capital Management, Inc. and Dimensional Fund Advisors LP, each of which subadvises a portion of the assets of the Fund. New investments in the Fund, net of redemptions, are allocated in accordance with the Investment Manager’s determination. Each subadviser’s proportionate share of investments in the Fund will vary due to market fluctuations. The Investment Manager compensates each subadviser to manage the investment of the Fund’s assets.
Compensation of board members
Members of the Board of Trustees who are not officers or employees of the Investment Manager or Ameriprise Financial are compensated for their services to the Fund as disclosed in the Statement of Operations. Under a Deferred Compensation Plan (the Deferred Plan), these members of the Board of Trustees may elect to defer payment of up to 100% of their compensation. Deferred amounts are treated as though equivalent dollar amounts had been invested in shares of certain funds managed by the Investment Manager. The Fund’s liability for these amounts is adjusted for market value changes and remains in the Fund until distributed in accordance with the Deferred Plan. All amounts payable under the Deferred Plan constitute a general unsecured obligation of the Fund. The expense for the Deferred Plan, which includes Trustees’ fees deferred during the current period as well as any gains or losses on the Trustees’ deferred compensation balances as a result of market fluctuations, is included in "Compensation of board members" in the Statement of Operations.
Compensation of Chief Compliance Officer
The Board of Trustees has appointed a Chief Compliance Officer for the Fund in accordance with federal securities regulations. As disclosed in the Statement of Operations, a portion of the Chief Compliance Officer’s total compensation is allocated to the Fund, along with other allocations to affiliated registered investment companies managed by the Investment Manager and its affiliates, based on relative net assets.
Transfer agency fees
Under a Transfer and Dividend Disbursing Agent Agreement, Columbia Management Investment Services Corp. (the Transfer Agent), an affiliate of the Investment Manager and a wholly-owned subsidiary of Ameriprise Financial, is responsible for providing transfer agency services to the Fund. The Transfer Agent has contracted with SS&C GIDS, Inc. (SS&C GIDS) to serve as sub-transfer agent. Prior to January 1, 2023, SS&C GIDS was known as DST Asset Manager Solutions, Inc. The Transfer Agent pays the fees of SS&C GIDS for services as sub-transfer agent and SS&C GIDS is not entitled to reimbursement for such fees from the Fund (with the exception of out-of-pocket fees).
The Fund pays the Transfer Agent a monthly transfer agency fee based on the number or the average value of accounts, depending on the type of account. In addition, the Fund pays the Transfer Agent a fee for shareholder services based on the number of accounts or on a percentage of the average aggregate value of the Fund’s shares maintained in omnibus accounts up to the lesser of the amount charged by the financial intermediary or a cap established by the Board of Trustees from time to time.
Multi-Manager Value Strategies Fund | Semiannual Report 2022
| 25 |
Notes to Financial Statements (continued)
November 30, 2022 (Unaudited)
The Transfer Agent also receives compensation from the Fund for various shareholder services and reimbursements for certain out-of-pocket fees. Total transfer agency fees for Institutional 3 Class shares are subject to an annual limitation of not more than 0.02% of the average daily net assets attributable to Institutional 3 Class shares.
For the six months ended November 30, 2022, the Fund’s annualized effective transfer agency fee rates as a percentage of average daily net assets of each class were as follows:
| | Effective rate (%) |
| Institutional Class | 0.10 |
| Institutional 3 Class | 0.02 |
Distribution and service fees
The Fund has an agreement with Columbia Management Investment Distributors, Inc. (the Distributor), an affiliate of the Investment Manager and a wholly-owned subsidiary of Ameriprise Financial, for distribution and shareholder services. The Fund does not pay the Distributor a fee for the distribution services it provides to the Fund.
Expenses waived/reimbursed by the Investment Manager and its affiliates
The Investment Manager and certain of its affiliates have contractually agreed to waive fees and/or reimburse expenses (excluding certain fees and expenses described below) for the period(s) disclosed below, unless sooner terminated at the sole discretion of the Board of Trustees, so that the Fund’s net operating expenses, after giving effect to fees waived/expenses reimbursed and any balance credits and/or overdraft charges from the Fund’s custodian, do not exceed the following annual rate(s) as a percentage of the classes’ average daily net assets:
| | October 1, 2022
through
September 30, 2023 | Prior to
October 1, 2022 |
| Institutional Class | 0.74% | 0.74% |
| Institutional 3 Class | 0.67 | 0.68 |
Under the agreement governing these fee waivers and/or expense reimbursement arrangements, the following fees and expenses are excluded from the waiver/reimbursement commitment, and therefore will be paid by the Fund, if applicable: taxes (including foreign transaction taxes), expenses associated with investments in affiliated and non-affiliated pooled investment vehicles (including mutual funds and exchange-traded funds), transaction costs and brokerage commissions, costs related to any securities lending program, dividend expenses associated with securities sold short, inverse floater program fees and expenses, transaction charges and interest on borrowed money, interest, costs associated with shareholder meetings, infrequent and/or unusual expenses and any other expenses the exclusion of which is specifically approved by the Board of Trustees. This agreement may be modified or amended only with approval from the Investment Manager, certain of its affiliates and the Fund. Any fees waived and/or expenses reimbursed under the expense reimbursement arrangements described above are not recoverable by the Investment Manager or its affiliates in future periods.
Note 4. Federal tax information
The timing and character of income and capital gain distributions are determined in accordance with income tax regulations, which may differ from GAAP because of temporary or permanent book to tax differences.
At November 30, 2022, the approximate cost of all investments for federal income tax purposes and the aggregate gross approximate unrealized appreciation and depreciation based on that cost was:
Federal
tax cost ($) | Gross unrealized
appreciation ($) | Gross unrealized
(depreciation) ($) | Net unrealized
appreciation ($) |
| 3,547,613,000 | 1,089,051,000 | (181,927,000) | 907,124,000 |
Tax cost of investments and unrealized appreciation/(depreciation) may also include timing differences that do not constitute adjustments to tax basis.
| 26 | Multi-Manager Value Strategies Fund | Semiannual Report 2022 |
Notes to Financial Statements (continued)
November 30, 2022 (Unaudited)
Management of the Fund has concluded that there are no significant uncertain tax positions in the Fund that would require recognition in the financial statements. However, management’s conclusion may be subject to review and adjustment at a later date based on factors including, but not limited to, new tax laws, regulations, and administrative interpretations (including relevant court decisions). Generally, the Fund’s federal tax returns for the prior three fiscal years remain subject to examination by the Internal Revenue Service.
Note 5. Portfolio information
The cost of purchases and proceeds from sales of securities, excluding short-term investments and derivatives, if any, aggregated to $368,134,005 and $514,460,981, respectively, for the six months ended November 30, 2022. The amount of purchase and sale activity impacts the portfolio turnover rate reported in the Financial Highlights.
Note 6. Affiliated money market fund
The Fund invests in Columbia Short-Term Cash Fund, an affiliated money market fund established for the exclusive use by the Fund and other affiliated funds (the Affiliated MMF). The income earned by the Fund from such investments is included as Dividends - affiliated issuers in the Statement of Operations. As an investing fund, the Fund indirectly bears its proportionate share of the expenses of the Affiliated MMF. The Affiliated MMF prices its shares with a floating net asset value. In addition, the Board of Trustees of the Affiliated MMF may impose a fee on redemptions (sometimes referred to as a liquidity fee) or temporarily suspend redemptions (sometimes referred to as imposing a redemption gate) in the event its liquidity falls below regulatory limits.
Note 7. Interfund lending
Pursuant to an exemptive order granted by the Securities and Exchange Commission, the Fund participates in a program (the Interfund Program) allowing each participating Columbia Fund (each, a Participating Fund) to lend money directly to and, except for closed-end funds and money market funds, borrow money directly from other Participating Funds for temporary purposes. The amounts eligible for borrowing and lending under the Interfund Program are subject to certain restrictions.
Interfund loans are subject to the risk that the borrowing fund could be unable to repay the loan when due, and a delay in repayment to the lending fund could result in lost opportunities and/or additional lending costs. The exemptive order is subject to conditions intended to mitigate conflicts of interest arising from the Investment Manager’s relationship with each Participating Fund.
The Fund did not borrow or lend money under the Interfund Program during the six months ended November 30, 2022.
Note 8. Line of credit
The Fund has access to a revolving credit facility with a syndicate of banks led by JPMorgan Chase Bank, N.A., Citibank, N.A. and Wells Fargo Bank, N.A. whereby the Fund may borrow for the temporary funding of shareholder redemptions or for other temporary or emergency purposes. Pursuant to an October 27, 2022 amendment and restatement, the credit facility, which is an agreement between the Fund and certain other funds managed by the Investment Manager or an affiliated investment manager, severally and not jointly, permits aggregate borrowings up to $950 million. Interest is currently charged to each participating fund based on its borrowings at a rate equal to the higher of (i) the federal funds effective rate, (ii) the secured overnight financing rate plus 0.10% and (iii) the overnight bank funding rate, plus in each case, 1.00%. Each borrowing under the credit facility matures no later than 60 days after the date of borrowing. The Fund also pays a commitment fee equal to its pro rata share of the unused amount of the credit facility at a rate of 0.15% per annum. The commitment fee is included in other expenses in the Statement of Operations. This agreement expires annually in October unless extended or renewed. Prior to the October 27, 2022 amendment and restatement, the Fund had access to a revolving credit facility with a syndicate of banks led by JPMorgan Chase Bank, N.A., Citibank, N.A. and Wells Fargo Bank, N.A. which permitted collective borrowings up to $950 million. Interest was charged to each participating fund based on its borrowings at a rate equal to the higher of (i) the federal funds effective rate, (ii) the secured overnight financing rate plus 0.11448% and (iii) the overnight bank funding rate, plus in each case, 1.00%.
The Fund had no borrowings during the six months ended November 30, 2022.
Multi-Manager Value Strategies Fund | Semiannual Report 2022
| 27 |
Notes to Financial Statements (continued)
November 30, 2022 (Unaudited)
Note 9. Significant risks
Financial sector risk
The Fund is more susceptible to the particular risks that may affect companies in the financial services sector than if it were invested in a wider variety of companies in unrelated sectors. Companies in the financial services sector are subject to certain risks, including the risk of regulatory change, decreased liquidity in credit markets and unstable interest rates. Such companies may have concentrated portfolios, such as a high level of loans to one or more industries or sectors, which makes them vulnerable to economic conditions that affect such industries or sectors. Performance of such companies may be affected by competitive pressures and exposure to investments, agreements and counterparties, including credit products that, under certain circumstances, may lead to losses (e.g., subprime loans). Companies in the financial services sector are subject to extensive governmental regulation that may limit the amount and types of loans and other financial commitments they can make, and interest rates and fees that they may charge. In addition, profitability of such companies is largely dependent upon the availability and the cost of capital.
Market risk
The Fund may incur losses due to declines in the value of one or more securities in which it invests. These declines may be due to factors affecting a particular issuer, or the result of, among other things, political, regulatory, market, economic or social developments affecting the relevant market(s) more generally. In addition, turbulence in financial markets and reduced liquidity in equity, credit and/or fixed income markets may negatively affect many issuers, which could adversely affect the Fund’s ability to price or value hard-to-value assets in thinly traded and closed markets and could cause significant redemptions and operational challenges. Global economies and financial markets are increasingly interconnected, and conditions and events in one country, region or financial market may adversely impact issuers in a different country, region or financial market. These risks may be magnified if certain events or developments adversely interrupt the global supply chain; in these and other circumstances, such risks might affect companies worldwide. As a result, local, regional or global events such as terrorism, war, natural disasters, disease/virus outbreaks and epidemics or other public health issues, recessions, depressions or other events – or the potential for such events – could have a significant negative impact on global economic and market conditions.
The large-scale invasion of Ukraine by Russia in February 2022 has resulted in sanctions and market disruptions, including declines in regional and global stock markets, unusual volatility in global commodity markets and significant devaluations of Russian currency. The extent and duration of the military action are impossible to predict but could be significant. Market disruption caused by the Russian military action, and any counter-measures or responses thereto (including international sanctions, a downgrade in the country’s credit rating, purchasing and financing restrictions, boycotts, tariffs, changes in consumer or purchaser preferences, cyberattacks and espionage) could have severe adverse impacts on regional and/or global securities and commodities markets, including markets for oil and natural gas. These impacts may include reduced market liquidity, distress in credit markets, further disruption of global supply chains, increased risk of inflation, and limited access to investments in certain international markets and/or issuers. These developments and other related events could negatively impact Fund performance.
The pandemic caused by coronavirus disease 2019 and its variants (COVID-19) has resulted in, and may continue to result in, significant global economic and societal disruption and market volatility due to disruptions in market access, resource availability, facilities operations, imposition of tariffs, export controls and supply chain disruption, among others. Such disruptions may be caused, or exacerbated by, quarantines and travel restrictions, workforce displacement and loss in human and other resources. The uncertainty surrounding the magnitude, duration, reach, costs and effects of the global pandemic, as well as actions that have been or could be taken by governmental authorities or other third parties, present unknowns that are yet to unfold. The impacts, as well as the uncertainty over impacts to come, of COVID-19 – and any other infectious illness outbreaks, epidemics and pandemics that may arise in the future – could negatively affect global economies and markets in ways that cannot necessarily be foreseen. In addition, the impact of infectious illness outbreaks and epidemics in emerging market countries may be greater due to generally less established healthcare systems, governments and financial markets. Public health crises caused by the COVID-19 outbreak may exacerbate other pre-existing
| 28 | Multi-Manager Value Strategies Fund | Semiannual Report 2022 |
Notes to Financial Statements (continued)
November 30, 2022 (Unaudited)
political, social and economic risks in certain countries or globally. The disruptions caused by COVID-19 could prevent the Fund from executing advantageous investment decisions in a timely manner and negatively impact the Fund’s ability to achieve its investment objective. Any such events could have a significant adverse impact on the value and risk profile of the Fund.
Shareholder concentration risk
At November 30, 2022, affiliated shareholders of record owned 100.0% of the outstanding shares of the Fund in one or more accounts. Subscription and redemption activity by concentrated accounts may have a significant effect on the operations of the Fund. In the case of a large redemption, the Fund may be forced to sell investments at inopportune times, including its liquid positions, which may result in Fund losses and the Fund holding a higher percentage of less liquid positions. Large redemptions could result in decreased economies of scale and increased operating expenses for non-redeeming Fund shareholders.
Note 10. Subsequent events
Management has evaluated the events and transactions that have occurred through the date the financial statements were issued and noted no items requiring adjustment of the financial statements or additional disclosure.
Note 11. Information regarding pending and settled legal proceedings
Ameriprise Financial and certain of its affiliates are involved in the normal course of business in legal proceedings which include regulatory inquiries, arbitration and litigation, including class actions concerning matters arising in connection with the conduct of its activities as a diversified financial services firm. Ameriprise Financial believes that the Fund is not currently the subject of, and that neither Ameriprise Financial nor any of its affiliates are the subject of, any pending legal, arbitration or regulatory proceedings that are likely to have a material adverse effect on the Fund or the ability of Ameriprise Financial or its affiliates to perform under their contracts with the Fund. Ameriprise Financial is required to make quarterly (10-Q), annual (10-K) and, as necessary, 8-K filings with the Securities and Exchange Commission (SEC) on legal and regulatory matters that relate to Ameriprise Financial and its affiliates. Copies of these filings may be obtained by accessing the SEC website at www.sec.gov.
There can be no assurance that these matters, or the adverse publicity associated with them, will not result in increased Fund redemptions, reduced sale of Fund shares or other adverse consequences to the Fund. Further, although we believe proceedings are not likely to have a material adverse effect on the Fund or the ability of Ameriprise Financial or its affiliates to perform under their contracts with the Fund, these proceedings are subject to uncertainties and, as such, we are unable to estimate the possible loss or range of loss that may result. An adverse outcome in one or more of these proceedings could result in adverse judgments, settlements, fines, penalties or other relief that could have a material adverse effect on the consolidated financial condition or results of operations of Ameriprise Financial or one or more of its affiliates that provides services to the Fund.
Multi-Manager Value Strategies Fund | Semiannual Report 2022
| 29 |
Approval of Management and SubadvisoryAgreements
(Unaudited)
Columbia Management Investment Advisers, LLC (the Investment Manager, and together with its domestic and global affiliates, Columbia Threadneedle Investments), a wholly-owned subsidiary of Ameriprise Financial, Inc. (Ameriprise Financial), serves as the investment manager to Multi-Manager Value Strategies Fund (the Fund). Under a management agreement (the Management Agreement), the Investment Manager provides investment advice and other services to the Fund and other funds distributed by Columbia Management Investment Distributors, Inc. (collectively, the Funds). In addition, under the subadvisory agreements (the Subadvisory Agreements) between the Investment Manager and each of Diamond Hill Capital Management, Inc. and Dimensional Fund Advisors LP (collectively, the Subadvisers), the Subadvisers provide portfolio management and related services for the Fund.
On an annual basis, the Fund’s Board of Trustees (the Board), including the independent Board members (the Independent Trustees), considers renewal of the Management Agreement and the Subadvisory Agreements (together, the Advisory Agreements). The Investment Manager prepared detailed reports for the Board and its Contracts Committee (including its Contracts Subcommittee) in November 2021 and March, April and June 2022, including reports providing the results of analyses performed by an independent third-party data provider, Broadridge Financial Solutions, Inc. (Broadridge), and comprehensive responses to written requests for information by independent legal counsels to the Independent Trustees (Independent Legal Counsel) to the Investment Manager, to assist the Board in making this determination. In addition, throughout the year, the Board (or its committees or subcommittees) regularly meets with portfolio management teams and senior management personnel and reviews information prepared by the Investment Manager addressing the services the Investment Manager provides and Fund performance. The Board also accords appropriate weight to the work, deliberations and conclusions of the various committees, such as the Contracts Committee, the Investment Review Committee, the Audit Committee and the Compliance Committee in determining whether to continue the Advisory Agreements.
The Board, at its June 23, 2022 Board meeting (the June Meeting), considered the renewal of each of the Advisory Agreements for additional one-year terms. At the June Meeting, Independent Legal Counsel reviewed with the Independent Trustees various factors relevant to the Board’s consideration of advisory and subadvisory agreements and the Board’s legal responsibilities related to such consideration. The Independent Trustees considered all information that they, their legal counsel or the Investment Manager believed reasonably necessary to evaluate and to approve the continuation of each of the Advisory Agreements. Among other things, the information and factors considered included the following:
| • | Information on the investment performance of the Fund relative to the performance of a group of mutual funds determined to be comparable to the Fund by Broadridge, as well as performance relative to benchmarks; |
| • | Information on the Fund’s management fees and total expenses, including information comparing the Fund’s expenses to those of a group of comparable mutual funds, as determined by Broadridge; |
| • | The Investment Manager’s agreement to contractually limit or cap total operating expenses for the Fund so that total operating expenses (excluding certain fees and expenses, such as transaction costs and certain other investment related expenses, interest, taxes, acquired fund fees and expenses and infrequent and/or unusual expenses) would not exceed a specified annual rate, as a percentage of the Fund’s net assets; |
| • | Terms of the Advisory Agreements; |
| • | Subadvisory fees payable by the Investment Manager under the Subadvisory Agreements; |
| • | Descriptions of other agreements and arrangements with affiliates of the Investment Manager relating to the operations of the Fund, including agreements with respect to the provision of transfer agency and shareholder services to the Fund; |
| • | Descriptions of various services performed by the Investment Manager and the Subadvisers under the Advisory Agreements, including portfolio management and portfolio trading practices; |
| • | Information regarding any recently negotiated management fees of similarly-managed portfolios of other institutional clients of the Investment Manager; |
| 30 | Multi-Manager Value Strategies Fund | Semiannual Report 2022 |
Approval of Management and Subadvisory
Agreements (continued)
(Unaudited)
| • | Information regarding the resources of the Investment Manager and Subadvisers, including information regarding senior management, portfolio managers and other personnel; |
| • | Information regarding the capabilities of the Investment Manager and the Subadvisers with respect to compliance monitoring services; |
| • | The profitability to the Investment Manager and its affiliates from their relationships with the Fund; and |
| • | Report provided by the Board’s independent fee consultant, JDL Consultants, LLC (JDL). |
Following an analysis and discussion of the foregoing, and the factors identified below, the Board, including all of the Independent Trustees, approved the renewal of each of the Advisory Agreements.
Nature, extent and quality of services provided by the Investment Manager and the Subadvisers
The Board analyzed various reports and presentations it had received detailing the services performed by the Investment Manager and the Subadvisers, as well as their history, expertise, resources and relative capabilities, and the qualifications of their personnel.
The Board specifically considered the many developments during recent years concerning the services provided by the Investment Manager, including, in particular, detailed information regarding the process employed for selecting and overseeing affiliated and unaffiliated Subadvisers. With respect to the Investment Manager, the Board also noted the organization and depth of the equity and credit research departments. The Board further observed the enhancements to the investment risk management department’s processes, systems and oversight, over the past several years, as well as planned 2022 initiatives in this regard. The Board also took into account the broad scope of services provided by the Investment Manager to each subadvised Fund, including, among other services, investment, risk and compliance oversight. The Board also took into account the information it received concerning the Investment Manager’s ability to attract and retain key portfolio management personnel and that it has sufficient resources to provide competitive and adequate compensation to investment personnel. The Board also observed that the Investment Manager has been able to effectively manage, operate and distribute the Funds through the COVID-19 pandemic period with no disruptions in services provided. The Board also considered added personnel and resources obtained by Columbia Threadneedle through Ameriprise Financial’s acquisition of BMO Financial Group’s Europe, Middle East, and Africa (EMEA) asset management business.
In connection with the Board’s evaluation of the overall package of services provided by the Investment Manager, the Board also considered the nature, quality and range of administrative services provided to the Fund by the Investment Manager, as well as the achievements in 2021 in the performance of administrative services, and noted the various enhancements anticipated for 2022. In evaluating the quality of services provided under the Advisory Agreements, the Board also took into account the organization and strength of the Fund’s and its service providers’ compliance programs. The Board also reviewed the financial condition of the Investment Manager and its affiliates and each entity’s ability to carry out its responsibilities under the Management Agreement and the Fund’s other service agreements.
In addition, the Board discussed the acceptability of the terms of the Management Agreement (including the relatively broad scope of services required to be performed by the Investment Manager in addition to monitoring each Subadviser), noting that no changes were proposed from the forms of agreements previously approved. The Board also noted the wide array of legal and compliance services provided to the Fund under the Management Agreement.
The Board considered each Subadviser’s organizational strength and resources, portfolio management team depth and capabilities and investment process. The Board also considered each Subadviser’s capability and wherewithal to carry out its responsibilities under the applicable Subadvisory Agreement. In addition, the Board discussed the acceptability of the terms of the Subadvisory Agreements, including the scope of services required to be performed. The Board noted that the terms of the Subadvisory Agreements are generally consistent with the terms of other subadvisory agreements for subadvisers who manage other funds managed by the Investment Manager. It was observed that no changes were recommended to the
Multi-Manager Value Strategies Fund | Semiannual Report 2022
| 31 |
Approval of Management and Subadvisory
Agreements (continued)
(Unaudited)
Subadvisory Agreements. The Board took into account the Investment Manager’s representation that each Subadviser was in a position to provide quality services to the Fund. In this regard, the Board further observed the various services provided by the Investment Manager’s subadvisory oversight team and their significant resources added in recent years.
After reviewing these and related factors (including investment performance as discussed below), the Board concluded, within the context of their overall conclusions, that the nature, extent and quality of the services provided to the Fund under the Advisory Agreements supported the continuation of the Management Agreement and the Subadvisory Agreements.
Investment performance
In this connection, the Board carefully reviewed the investment performance of the Fund, including detailed reports providing the results of analyses performed by each of the Investment Manager, Broadridge and JDL collectively showing, for various periods (including since manager inception): (i) the performance of the Fund, (ii) the performance of a benchmark index, (iii) the percentage ranking of the Fund among its comparison group, (iv) the Fund’s performance relative to peers and benchmarks and (v) the net assets of the Fund. The Board observed that the Fund’s performance for certain periods ranked above median based on information provided by Broadridge.
Additionally, the Board reviewed the performance of each of the Subadvisers and the Investment Manager’s process for monitoring such Subadvisers’ performance. The Board considered, in particular, management’s rationale for recommending the continued retention of each Subadviser and management’s representations that the Investment Manager’s profitability is not the key factor driving their recommendation to select, renew or terminate the Subadvisers.
The Board also reviewed a description of the third-party data provider’s methodology for identifying the Fund’s peer groups for purposes of performance and expense comparisons.
The Board also considered the Investment Manager’s and Subadvisers’ performance and reputation generally and the Investment Manager’s evaluation of each Subadviser’s contribution to the Fund’s broader investment mandate. After reviewing these and related factors, the Board concluded, within the context of their overall conclusions, that the performance of the Fund, the Investment Manager and the Subadvisers, in light of other considerations, supported the continuation of the Management Agreement and the Subadvisory Agreements.
Comparative fees, costs of services provided and the profits realized by the Investment Manager and its affiliates from their relationships with the Fund
The Board reviewed comparative fees and the costs of services provided under each of the Advisory Agreements. The Board members considered detailed comparative information set forth in an annual report on fees and expenses, including, among other things, data (based on analyses conducted by Broadridge and JDL) showing a comparison of the Fund’s expenses with median expenses paid by funds in its comparative peer universe, as well as data showing the Fund’s contribution to the Investment Manager’s profitability.
The Board considered the reports of JDL, which assisted in the Board’s analysis of the Funds’ performance and expenses and the reasonableness of the Funds’ fee rates. The Board accorded particular weight to the notion that a primary objective of the level of fees is to achieve a rational pricing model applied consistently across the various product lines in the Fund family, while assuring that the overall fees for each Fund (with certain exceptions) are generally in line with the current "pricing philosophy" such that Fund total expense ratios, in general, approximate or are lower than the median expense ratios of funds in the same Lipper comparison universe. The Board took into account that the Fund’s total expense ratio (after considering proposed expense caps/waivers) approximated the peer universe’s median expense ratio.
Additionally, the Board reviewed the level of subadvisory fees paid to each Subadviser, noting that the fees are paid by the Investment Manager and do not impact the fees paid by the Fund. The Board also reviewed advisory fee rates charged by other comparable mutual funds employing each Subadviser to provide comparable subadvisory services. After reviewing
| 32 | Multi-Manager Value Strategies Fund | Semiannual Report 2022 |
Approval of Management and Subadvisory
Agreements (continued)
(Unaudited)
these and related factors, the Board concluded, within the context of their overall conclusions, that the levels of management fees, subadvisory fees and expenses of the Fund, in light of other considerations, supported the continuation of each of the Management Agreement and the Subadvisory Agreements.
The Board also considered the profitability of the Investment Manager and its affiliates in connection with the Investment Manager providing management services to the Fund. Because the Subadvisory Agreements were negotiated at arms-length by the Investment Manager, which is responsible for payments to the Subadvisers thereunder, the Board did not consider the profitability to each Subadviser from its relationship with the Fund. With respect to the profitability of the Investment Manager and its affiliates, the Independent Trustees referred to information discussing the profitability to the Investment Manager and Ameriprise Financial from managing, operating and distributing the Funds. The Board considered that in 2021 the Board had considered 2020 profitability and that the 2022 information showed that the profitability generated by the Investment Manager in 2021 increased from 2020 levels, due to a variety of factors, including the increased assets under management of the Funds. It also took into account the indirect economic benefits flowing to the Investment Manager or its affiliates in connection with managing or distributing the Funds, such as the enhanced ability to offer various other financial products to Ameriprise Financial customers, soft dollar benefits and overall reputational advantages. The Board noted that the fees paid by the Fund should permit the Investment Manager to offer competitive compensation to its personnel, make necessary investments in its business and earn an appropriate profit. After reviewing these and related factors, the Board concluded, within the context of their overall conclusions, that the costs of services provided and the profitability to the Investment Manager and its affiliates from their relationships with the Fund supported the continuation of the Management Agreement and the Subadvisory Agreements.
Economies of scale
The Board considered the potential existence of economies of scale in the provision by the Investment Manager of services to the Fund, to groups of related funds and to the Investment Manager as a whole, and whether those economies of scale were shared with the Fund through breakpoints in investment management fees or other means, such as expense limitation arrangements and additional investments by the Investment Manager in investment, trading, compliance and other resources. The Board considered the economies of scale that might be realized as the Fund’s net asset level grows and took note of the extent to which Fund shareholders might also benefit from such growth. In this regard, the Board took into account that management fees decline as Fund assets exceed various breakpoints, all of which have not been surpassed. The Board observed that the Management Agreement provided for breakpoints in the management fee rate schedule that allow opportunities for shareholders to realize lower fees as Fund assets grow and that there are additional opportunities through other means for sharing economies of scale with shareholders.
Conclusion
The Board reviewed all of the above considerations in reaching its decision to approve the continuation of the Management Agreement and the Subadvisory Agreements. In reaching its conclusions, no single factor was determinative.
On June 23, 2022, the Board, including all of the Independent Trustees, determined that fees payable under each of the Advisory Agreements were fair and reasonable in light of the extent and quality of services provided and approved the renewal of each of the Advisory Agreements.
Multi-Manager Value Strategies Fund | Semiannual Report 2022
| 33 |
[THIS PAGE INTENTIONALLY LEFT BLANK]
[THIS PAGE INTENTIONALLY LEFT BLANK]
Multi-Manager Value Strategies Fund
P.O. Box 219104
Kansas City, MO 64121-9104
Please read and consider the investment objectives, risks, charges and expenses for any fund carefully before investing. For a prospectus and summary prospectus, which contains this and other important information about the Fund, go to
columbiathreadneedleus.com/investor/. The Fund is distributed by Columbia Management Investment Distributors, Inc., member FINRA, and managed by Columbia Management Investment Advisers, LLC.
Columbia Threadneedle Investments (Columbia Threadneedle) is the global brand name of the Columbia and Threadneedle group of companies. All rights reserved.
© 2023 Columbia Management Investment Advisers, LLC.
columbiathreadneedleus.com/investor/

Semiannual Report
November 30, 2022 (Unaudited)
Columbia Large Cap Value Fund
Not FDIC or NCUA Insured • No Financial Institution Guarantee • May Lose Value
If you elect to receive the shareholder report for Columbia Large Cap Value Fund (the Fund) in paper, mailed to you, the Fund mails one shareholder report to each shareholder address, unless such shareholder elects to receive shareholder reports from the Fund electronically via e-mail or by having a paper notice mailed to you (Postcard Notice) that your Fund’s shareholder report is available at the Columbia funds’ website (columbiathreadneedleus.com/investor/). If you would like more than one report in paper to be mailed to you, or would like to elect to receive reports via e-mail or access them through Postcard Notice, please call shareholder services at 800.345.6611 and additional reports will be sent to you.
Proxy voting policies and procedures
The policy of the Board of Trustees is to vote the proxies of the companies in which the Fund holds investments consistent with the procedures as stated in the Statement of Additional Information (SAI). You may obtain a copy of the SAI without charge by calling 800.345.6611; contacting your financial intermediary; visiting columbiathreadneedleus.com/investor/; or searching the website of the Securities and Exchange Commission (SEC) at sec.gov. Information regarding how the Fund voted proxies relating to portfolio securities is filed with the SEC by August 31st for the most recent 12-month period ending June 30th of that year, and is available without charge by visiting columbiathreadneedleus.com/investor/, or searching the website of the SEC at sec.gov.
Quarterly schedule of investments
The Fund files a complete schedule of portfolio holdings with the SEC for the first and third quarters of each fiscal year on Form N-PORT. The Fund’s Form N-PORT filings are available on the SEC’s website at sec.gov. The Fund’s complete schedule of portfolio holdings, as filed on Form N-PORT, is available on columbiathreadneedleus.com/investor/ or can also be obtained without charge, upon request, by calling 800.345.6611.
Additional Fund information
For more information about the Fund, please visit columbiathreadneedleus.com/investor/ or call 800.345.6611. Customer Service Representatives are available to answer your questions Monday through Friday from 8 a.m. to 7 p.m. Eastern time.
Fund investment manager
Columbia Management Investment Advisers, LLC (the Investment Manager)
290 Congress Street
Boston, MA 02210
Fund distributor
Columbia Management Investment Distributors, Inc.
290 Congress Street
Boston, MA 02210
Fund transfer agent
Columbia Management Investment Services Corp.
P.O. Box 219104
Kansas City, MO 64121-9104
Columbia Large Cap Value Fund | Semiannual Report 2022
Fund at a Glance
(Unaudited)
Investment objective
The Fund seeks to provide shareholders with a high level of current income and, as a secondary objective, steady growth of capital.
Portfolio management
Hugh Mullin, CFA
Portfolio Manager
Managed Fund since 2013
Morningstar style boxTM
The Morningstar Style Box is based on a fund’s portfolio holdings. For equity funds, the vertical axis shows the market capitalization of the stocks owned, and the horizontal axis shows investment style (value, blend, or growth). Information shown is based on the most recent data provided by Morningstar.
© 2023 Morningstar, Inc. All rights reserved. The Morningstar information contained herein: (1) is proprietary to Morningstar and/or its content providers; (2) may not be copied or distributed; and (3) is not warranted to be accurate, complete or timely. Neither Morningstar nor its content providers are responsible for any damages or losses arising from any use of this information.
| Average annual total returns (%) (for the period ended November 30, 2022) |
| | | Inception | 6 Months
cumulative | 1 Year | 5 Years | 10 Years |
| Class A | Excluding sales charges | 10/15/90 | 1.56 | 5.93 | 8.58 | 11.14 |
| | Including sales charges | | -4.28 | -0.17 | 7.30 | 10.49 |
| Advisor Class | 12/11/06 | 1.69 | 6.21 | 8.85 | 11.42 |
| Class C | Excluding sales charges | 06/26/00 | 1.21 | 5.18 | 7.77 | 10.31 |
| | Including sales charges | | 0.21 | 4.19 | 7.77 | 10.31 |
| Institutional Class | 09/27/10 | 1.70 | 6.23 | 8.85 | 11.42 |
| Institutional 2 Class | 12/11/06 | 1.71 | 6.25 | 8.91 | 11.50 |
| Institutional 3 Class | 11/08/12 | 1.78 | 6.34 | 8.94 | 11.55 |
| Class R | 12/11/06 | 1.43 | 5.71 | 8.31 | 10.87 |
| Russell 1000 Value Index | | 0.90 | 2.42 | 7.86 | 10.97 |
Returns for Class A shares are shown with and without the maximum initial sales charge of 5.75%. Returns for Class C shares are shown with and without the 1.00% contingent deferred sales charge for the first year only. The Fund’s other share classes are not subject to sales charges and have limited eligibility. Please see the Fund’s prospectus for details. Performance for different share classes will vary based on differences in sales charges and fees associated with each share class. All results shown assume reinvestment of distributions during the period. Returns do not reflect the deduction of taxes that a shareholder may pay on Fund distributions or on the redemption of Fund shares. Performance results reflect the effect of any fee waivers or reimbursements of Fund expenses by Columbia Management Investment Advisers, LLC and/or any of its affiliates. Absent these fee waivers or expense reimbursement arrangements, performance results would have been lower.
The performance information shown represents past performance and is not a guarantee of future results. The investment return and principal value of your investment will fluctuate so that your shares, when redeemed, may be worth more or less than their original cost. Current performance may be lower or higher than the performance information shown. You may obtain performance information current to the most recent month-end by contacting your financial intermediary, visiting columbiathreadneedleus.com/investor/ or calling 800.345.6611.
The Russell 1000 Value Index, an unmanaged index, measures the performance of those stocks in the Russell 1000 Index with lower price-to-book ratios and lower forecasted growth values.
Indices are not available for investment, are not professionally managed and do not reflect sales charges, fees, brokerage commissions, taxes or other expenses of investing. Securities in the Fund may not match those in an index.
Columbia Large Cap Value Fund | Semiannual Report 2022
| 3 |
Fund at a Glance (continued)
(Unaudited)
| Portfolio breakdown (%) (at November 30, 2022) |
| Common Stocks | 98.4 |
| Convertible Bonds | 0.8 |
| Money Market Funds | 0.8 |
| Total | 100.0 |
Percentages indicated are based upon total investments excluding investments in derivatives, if any. The Fund’s portfolio composition is subject to change.
| Equity sector breakdown (%) (at November 30, 2022) |
| Communication Services | 4.9 |
| Consumer Discretionary | 7.0 |
| Consumer Staples | 8.1 |
| Energy | 9.3 |
| Financials | 20.3 |
| Health Care | 18.2 |
| Industrials | 9.9 |
| Information Technology | 8.8 |
| Materials | 5.6 |
| Real Estate | 3.8 |
| Utilities | 4.1 |
| Total | 100.0 |
Percentages indicated are based upon total equity investments. The Fund’s portfolio composition is subject to change.
| 4 | Columbia Large Cap Value Fund | Semiannual Report 2022 |
Understanding Your Fund’s Expenses
(Unaudited)
As an investor, you incur two types of costs. There are shareholder transaction costs, which generally include sales charges on purchases and may include redemption fees. There are also ongoing fund costs, which generally include management fees, distribution and/or service fees, and other fund expenses. The following information is intended to help you understand your ongoing costs (in dollars) of investing in the Fund and to help you compare these costs with the ongoing costs of investing in other mutual funds.
Analyzing your Fund’s expenses
To illustrate these ongoing costs, we have provided examples and calculated the expenses paid by investors in each share class of the Fund during the period. The actual and hypothetical information in the table is based on an initial investment of $1,000 at the beginning of the period indicated and held for the entire period. Expense information is calculated two ways and each method provides you with different information. The amount listed in the “Actual” column is calculated using the Fund’s actual operating expenses and total return for the period. You may use the Actual information, together with the amount invested, to estimate the expenses that you paid over the period. Simply divide your account value by $1,000 (for example, an $8,600 account value divided by $1,000 = 8.6), then multiply the results by the expenses paid during the period under the “Actual” column. The amount listed in the “Hypothetical” column assumes a 5% annual rate of return before expenses (which is not the Fund’s actual return) and then applies the Fund’s actual expense ratio for the period to the hypothetical return. You should not use the hypothetical account values and expenses to estimate either your actual account balance at the end of the period or the expenses you paid during the period. See “Compare with other funds” below for details on how to use the hypothetical data.
Compare with other funds
Since all mutual funds are required to include the same hypothetical calculations about expenses in shareholder reports, you can use this information to compare the ongoing cost of investing in the Fund with other funds. To do so, compare the hypothetical example with the 5% hypothetical examples that appear in the shareholder reports of other funds. As you compare hypothetical examples of other funds, it is important to note that hypothetical examples are meant to highlight the ongoing costs of investing in a fund only and do not reflect any transaction costs, such as sales charges, or redemption or exchange fees. Therefore, the hypothetical calculations are useful in comparing ongoing costs only, and will not help you determine the relative total costs of owning different funds. If transaction costs were included in these calculations, your costs would be higher.
| June 1, 2022 — November 30, 2022 |
| | Account value at the
beginning of the
period ($) | Account value at the
end of the
period ($) | Expenses paid during
the period ($) | Fund’s annualized
expense ratio (%) |
| | Actual | Hypothetical | Actual | Hypothetical | Actual | Hypothetical | Actual |
| Class A | 1,000.00 | 1,000.00 | 1,015.60 | 1,020.10 | 5.00 | 5.01 | 0.99 |
| Advisor Class | 1,000.00 | 1,000.00 | 1,016.90 | 1,021.36 | 3.74 | 3.75 | 0.74 |
| Class C | 1,000.00 | 1,000.00 | 1,012.10 | 1,016.34 | 8.78 | 8.80 | 1.74 |
| Institutional Class | 1,000.00 | 1,000.00 | 1,017.00 | 1,021.36 | 3.74 | 3.75 | 0.74 |
| Institutional 2 Class | 1,000.00 | 1,000.00 | 1,017.10 | 1,021.56 | 3.54 | 3.55 | 0.70 |
| Institutional 3 Class | 1,000.00 | 1,000.00 | 1,017.80 | 1,021.76 | 3.34 | 3.35 | 0.66 |
| Class R | 1,000.00 | 1,000.00 | 1,014.30 | 1,018.85 | 6.26 | 6.28 | 1.24 |
Expenses paid during the period are equal to the annualized expense ratio for each class as indicated above, multiplied by the average account value over the period and then multiplied by the number of days in the Fund’s most recent fiscal half year and divided by 365.
Expenses do not include fees and expenses incurred indirectly by the Fund from its investment in underlying funds, including affiliated and non-affiliated pooled investment vehicles, such as mutual funds and exchange-traded funds.
Columbia Large Cap Value Fund | Semiannual Report 2022
| 5 |
Portfolio of Investments
November 30, 2022 (Unaudited)
(Percentages represent value of investments compared to net assets)
Investments in securities
| Common Stocks 98.4% |
| Issuer | Shares | Value ($) |
| Communication Services 4.9% |
| Diversified Telecommunication Services 1.0% |
| AT&T, Inc. | 1,331,800 | 25,677,104 |
| Media 2.2% |
| Comcast Corp., Class A | 1,457,300 | 53,395,472 |
| Wireless Telecommunication Services 1.7% |
| T-Mobile US, Inc.(a) | 276,600 | 41,893,836 |
| Total Communication Services | 120,966,412 |
| Consumer Discretionary 6.9% |
| Hotels, Restaurants & Leisure 2.9% |
| Darden Restaurants, Inc. | 275,300 | 40,466,347 |
| Las Vegas Sands Corp.(a) | 681,600 | 31,926,144 |
| Total | | 72,392,491 |
| Household Durables 1.1% |
| Toll Brothers, Inc. | 541,600 | 25,948,056 |
| Specialty Retail 1.9% |
| Gap, Inc. (The) | 1,823,580 | 26,514,853 |
| Home Depot, Inc. (The) | 63,150 | 20,459,969 |
| Total | | 46,974,822 |
| Textiles, Apparel & Luxury Goods 1.0% |
| Levi Strauss & Co., Class A | 1,494,416 | 24,702,696 |
| Total Consumer Discretionary | 170,018,065 |
| Consumer Staples 8.0% |
| Beverages 1.7% |
| Coca-Cola Co. (The) | 673,600 | 42,847,696 |
| Food & Staples Retailing 2.2% |
| Walmart, Inc. | 359,413 | 54,781,729 |
| Household Products 2.1% |
| Procter & Gamble Co. (The) | 341,600 | 50,953,056 |
| Tobacco 2.0% |
| Philip Morris International, Inc. | 492,500 | 49,087,475 |
| Total Consumer Staples | 197,669,956 |
| Common Stocks (continued) |
| Issuer | Shares | Value ($) |
| Energy 9.2% |
| Oil, Gas & Consumable Fuels 9.2% |
| Chevron Corp. | 261,200 | 47,880,572 |
| ConocoPhillips Co. | 536,600 | 66,275,466 |
| EOG Resources, Inc. | 405,529 | 57,556,731 |
| Valero Energy Corp. | 422,700 | 56,481,174 |
| Total | | 228,193,943 |
| Total Energy | 228,193,943 |
| Financials 20.0% |
| Banks 9.4% |
| Bank of America Corp. | 1,934,943 | 73,237,593 |
| JPMorgan Chase & Co. | 584,400 | 80,752,392 |
| PNC Financial Services Group, Inc. (The) | 288,201 | 48,492,700 |
| Truist Financial Corp. | 676,500 | 31,666,965 |
| Total | | 234,149,650 |
| Capital Markets 4.8% |
| Bank of New York Mellon Corp. (The) | 803,600 | 36,885,240 |
| Intercontinental Exchange, Inc. | 286,600 | 31,041,646 |
| Morgan Stanley | 553,200 | 51,486,324 |
| Total | | 119,413,210 |
| Diversified Financial Services 2.5% |
| Berkshire Hathaway, Inc., Class B(a) | 194,238 | 61,884,227 |
| Insurance 3.3% |
| Chubb Ltd. | 222,500 | 48,858,775 |
| Marsh & McLennan Companies, Inc. | 182,500 | 31,605,350 |
| Total | | 80,464,125 |
| Total Financials | 495,911,212 |
| Health Care 17.9% |
| Biotechnology 2.9% |
| BioMarin Pharmaceutical, Inc.(a) | 122,300 | 12,349,854 |
| Vertex Pharmaceuticals, Inc.(a) | 185,400 | 58,660,560 |
| Total | | 71,010,414 |
| Health Care Equipment & Supplies 2.4% |
| Baxter International, Inc. | 475,000 | 26,851,750 |
| Becton Dickinson and Co. | 125,800 | 31,366,972 |
| Total | | 58,218,722 |
The accompanying Notes to Financial Statements are an integral part of this statement.
| 6 | Columbia Large Cap Value Fund | Semiannual Report 2022 |
Portfolio of Investments (continued)
November 30, 2022 (Unaudited)
| Common Stocks (continued) |
| Issuer | Shares | Value ($) |
| Health Care Providers & Services 5.7% |
| Cigna Corp. | 188,200 | 61,897,098 |
| CVS Health Corp. | 407,366 | 41,502,448 |
| Elevance Health, Inc. | 73,000 | 38,903,160 |
| Total | | 142,302,706 |
| Pharmaceuticals 6.9% |
| Bristol-Myers Squibb Co. | 577,000 | 46,321,560 |
| Johnson & Johnson | 458,800 | 81,666,400 |
| Merck & Co., Inc. | 395,600 | 43,563,472 |
| Total | | 171,551,432 |
| Total Health Care | 443,083,274 |
| Industrials 9.7% |
| Aerospace & Defense 1.8% |
| Northrop Grumman Corp. | 81,200 | 43,303,148 |
| Air Freight & Logistics 1.1% |
| FedEx Corp. | 153,345 | 27,942,526 |
| Airlines 1.0% |
| Alaska Air Group, Inc.(a) | 529,800 | 25,133,712 |
| Building Products 1.4% |
| Trane Technologies PLC | 199,800 | 35,648,316 |
| Machinery 3.4% |
| AGCO Corp. | 245,200 | 32,542,944 |
| Ingersoll Rand, Inc. | 417,463 | 22,530,478 |
| Stanley Black & Decker, Inc. | 352,300 | 28,789,956 |
| Total | | 83,863,378 |
| Road & Rail 1.0% |
| Norfolk Southern Corp. | 100,700 | 25,829,550 |
| Total Industrials | 241,720,630 |
| Information Technology 8.6% |
| Communications Equipment 2.2% |
| Cisco Systems, Inc. | 1,079,600 | 53,677,712 |
| IT Services 1.0% |
| MasterCard, Inc., Class A | 70,100 | 24,983,640 |
| Common Stocks (continued) |
| Issuer | Shares | Value ($) |
| Semiconductors & Semiconductor Equipment 3.8% |
| Broadcom, Inc. | 45,637 | 25,147,356 |
| GlobalFoundries, Inc.(a) | 618,700 | 39,813,345 |
| Lam Research Corp. | 61,400 | 29,004,132 |
| Total | | 93,964,833 |
| Software 0.9% |
| Microsoft Corp. | 91,200 | 23,268,768 |
| Technology Hardware, Storage & Peripherals 0.7% |
| Western Digital Corp.(a) | 497,900 | 18,297,825 |
| Total Information Technology | 214,192,778 |
| Materials 5.5% |
| Chemicals 4.1% |
| Eastman Chemical Co. | 332,000 | 28,757,840 |
| FMC Corp. | 243,800 | 31,850,032 |
| Linde PLC | 119,100 | 40,074,768 |
| Total | | 100,682,640 |
| Metals & Mining 1.4% |
| Freeport-McMoRan, Inc. | 899,662 | 35,806,548 |
| Total Materials | 136,489,188 |
| Real Estate 3.7% |
| Equity Real Estate Investment Trusts (REITS) 3.7% |
| American Tower Corp. | 151,416 | 33,500,790 |
| Prologis, Inc. | 286,363 | 33,730,698 |
| Welltower, Inc. | 357,686 | 25,406,436 |
| Total | | 92,637,924 |
| Total Real Estate | 92,637,924 |
| Utilities 4.0% |
| Electric Utilities 1.3% |
| Xcel Energy, Inc. | 475,608 | 33,397,194 |
| Multi-Utilities 2.7% |
| Ameren Corp. | 372,281 | 33,252,139 |
| DTE Energy Co. | 280,700 | 32,564,007 |
| Total | | 65,816,146 |
| Total Utilities | 99,213,340 |
Total Common Stocks
(Cost $1,561,883,692) | 2,440,096,722 |
The accompanying Notes to Financial Statements are an integral part of this statement.
Columbia Large Cap Value Fund | Semiannual Report 2022
| 7 |
Portfolio of Investments (continued)
November 30, 2022 (Unaudited)
| Convertible Bonds 0.8% |
| Issuer | Coupon
Rate | | Principal
Amount ($) | Value ($) |
| Cable and Satellite 0.8% |
| DISH Network Corp.(b) |
| 12/15/2025 | 0.000% | | 27,961,000 | 18,898,840 |
Total Convertible Bonds
(Cost $27,668,213) | 18,898,840 |
| Money Market Funds 0.8% |
| | Shares | Value ($) |
| Columbia Short-Term Cash Fund, 3.989%(c),(d) | 20,097,308 | 20,089,269 |
Total Money Market Funds
(Cost $20,085,450) | 20,089,269 |
Total Investments in Securities
(Cost: $1,609,637,355) | 2,479,084,831 |
| Other Assets & Liabilities, Net | | 395,858 |
| Net Assets | 2,479,480,689 |
Notes to Portfolio of Investments
| (a) | Non-income producing investment. |
| (b) | Zero coupon bond. |
| (c) | The rate shown is the seven-day current annualized yield at November 30, 2022. |
| (d) | As defined in the Investment Company Act of 1940, as amended, an affiliated company is one in which the Fund owns 5% or more of the company’s outstanding voting securities, or a company which is under common ownership or control with the Fund. The value of the holdings and transactions in these affiliated companies during the period ended November 30, 2022 are as follows: |
| Affiliated issuers | Beginning
of period($) | Purchases($) | Sales($) | Net change in
unrealized
appreciation
(depreciation)($) | End of
period($) | Realized gain
(loss)($) | Dividends($) | End of
period shares |
| Columbia Short-Term Cash Fund, 3.989% |
| | 38,639,026 | 117,367,451 | (135,921,027) | 3,819 | 20,089,269 | (6,089) | 274,292 | 20,097,308 |
Fair value measurements
The Fund categorizes its fair value measurements according to a three-level hierarchy that maximizes the use of observable inputs and minimizes the use of unobservable inputs by prioritizing that the most observable input be used when available. Observable inputs are those that market participants would use in pricing an investment based on market data obtained from sources independent of the reporting entity. Unobservable inputs are those that reflect the Fund’s assumptions about the information market participants would use in pricing an investment. An investment’s level within the fair value hierarchy is based on the lowest level of any input that is deemed significant to the asset’s or liability’s fair value measurement. The input levels are not necessarily an indication of the risk or liquidity associated with investments at that level. For example, certain U.S. government securities are generally high quality and liquid, however, they are reflected as Level 2 because the inputs used to determine fair value may not always be quoted prices in an active market.
Fair value inputs are summarized in the three broad levels listed below:
| ■ | Level 1 — Valuations based on quoted prices for investments in active markets that the Fund has the ability to access at the measurement date. Valuation adjustments are not applied to Level 1 investments. |
| ■ | Level 2 — Valuations based on other significant observable inputs (including quoted prices for similar securities, interest rates, prepayment speeds, credit risks, etc.). |
| ■ | Level 3 — Valuations based on significant unobservable inputs (including the Fund’s own assumptions and judgment in determining the fair value of investments). |
Inputs that are used in determining fair value of an investment may include price information, credit data, volatility statistics, and other factors. These inputs can be either observable or unobservable. The availability of observable inputs can vary between investments, and is affected by various factors such as the type of investment, and the volume and level of activity for that investment or similar investments in the marketplace. The inputs will be considered by the Investment Manager, along with any other relevant factors in the calculation of an investment’s fair value. The Fund uses prices and inputs that are current as of the measurement date, which may include periods of market dislocations. During these periods, the availability of prices and inputs may be reduced for many investments. This condition could cause an investment to be reclassified between the various levels within the hierarchy.
The accompanying Notes to Financial Statements are an integral part of this statement.
| 8 | Columbia Large Cap Value Fund | Semiannual Report 2022 |
Portfolio of Investments (continued)
November 30, 2022 (Unaudited)
Fair value measurements (continued)
Investments falling into the Level 3 category are primarily supported by quoted prices from brokers and dealers participating in the market for those investments. However, these may be classified as Level 3 investments due to lack of market transparency and corroboration to support these quoted prices. Additionally, valuation models may be used as the pricing source for any remaining investments classified as Level 3. These models may rely on one or more significant unobservable inputs and/or significant assumptions by the Investment Manager. Inputs used in valuations may include, but are not limited to, financial statement analysis, capital account balances, discount rates and estimated cash flows, and comparable company data.
The Fund’s Board of Trustees (the Board) has designated the Investment Manager, through its Valuation Committee (the Committee), as valuation designee, responsible for determining the fair value of the assets of the Fund for which market quotations are not readily available using valuation procedures approved by the Board. The Committee consists of voting and non-voting members from various groups within the Investment Manager’s organization, including operations and accounting, trading and investments, compliance, risk management and legal.
The Committee meets at least monthly to review and approve valuation matters, which may include a description of specific valuation determinations, data regarding pricing information received from approved pricing vendors and brokers and the results of Board-approved valuation policies and procedures (the Policies). The Policies address, among other things, instances when market quotations are or are not readily available, including recommendations of third party pricing vendors and a determination of appropriate pricing methodologies; events that require specific valuation determinations and assessment of fair value techniques; securities with a potential for stale pricing, including those that are illiquid, restricted, or in default; and the effectiveness of third party pricing vendors, including periodic reviews of vendors. The Committee meets more frequently, as needed, to discuss additional valuation matters, which may include the need to review back-testing results, review time-sensitive information or approve related valuation actions. Representatives of Columbia Management Investment Advisers, LLC report to the Board at each of its regularly scheduled meetings to discuss valuation matters and actions during the period, similar to those described earlier.
The following table is a summary of the inputs used to value the Fund’s investments at November 30, 2022:
| | Level 1 ($) | Level 2 ($) | Level 3 ($) | Total ($) |
| Investments in Securities | | | | |
| Common Stocks | | | | |
| Communication Services | 120,966,412 | — | — | 120,966,412 |
| Consumer Discretionary | 170,018,065 | — | — | 170,018,065 |
| Consumer Staples | 197,669,956 | — | — | 197,669,956 |
| Energy | 228,193,943 | — | — | 228,193,943 |
| Financials | 495,911,212 | — | — | 495,911,212 |
| Health Care | 443,083,274 | — | — | 443,083,274 |
| Industrials | 241,720,630 | — | — | 241,720,630 |
| Information Technology | 214,192,778 | — | — | 214,192,778 |
| Materials | 136,489,188 | — | — | 136,489,188 |
| Real Estate | 92,637,924 | — | — | 92,637,924 |
| Utilities | 99,213,340 | — | — | 99,213,340 |
| Total Common Stocks | 2,440,096,722 | — | — | 2,440,096,722 |
| Convertible Bonds | — | 18,898,840 | — | 18,898,840 |
| Money Market Funds | 20,089,269 | — | — | 20,089,269 |
| Total Investments in Securities | 2,460,185,991 | 18,898,840 | — | 2,479,084,831 |
See the Portfolio of Investments for all investment classifications not indicated in the table.
The Fund’s assets assigned to the Level 2 input category are generally valued using the market approach, in which a security’s value is determined through reference to prices and information from market transactions for similar or identical assets.
The accompanying Notes to Financial Statements are an integral part of this statement.
Columbia Large Cap Value Fund | Semiannual Report 2022
| 9 |
Statement of Assets and Liabilities
November 30, 2022 (Unaudited)
| Assets | |
| Investments in securities, at value | |
| Unaffiliated issuers (cost $1,589,551,905) | $2,458,995,562 |
| Affiliated issuers (cost $20,085,450) | 20,089,269 |
| Receivable for: | |
| Capital shares sold | 553,892 |
| Dividends | 2,989,665 |
| Prepaid expenses | 21,918 |
| Other assets | 17,926 |
| Total assets | 2,482,668,232 |
| Liabilities | |
| Payable for: | |
| Capital shares purchased | 2,641,514 |
| Management services fees | 42,161 |
| Distribution and/or service fees | 11,639 |
| Transfer agent fees | 146,359 |
| Compensation of board members | 289,205 |
| Compensation of chief compliance officer | 224 |
| Other expenses | 56,441 |
| Total liabilities | 3,187,543 |
| Net assets applicable to outstanding capital stock | $2,479,480,689 |
| Represented by | |
| Paid in capital | 1,450,475,999 |
| Total distributable earnings (loss) | 1,029,004,690 |
| Total - representing net assets applicable to outstanding capital stock | $2,479,480,689 |
| Class A | |
| Net assets | $1,677,897,992 |
| Shares outstanding | 100,521,220 |
| Net asset value per share | $16.69 |
| Maximum sales charge | 5.75% |
| Maximum offering price per share (calculated by dividing the net asset value per share by 1.0 minus the maximum sales charge for Class A shares) | $17.71 |
| Advisor Class | |
| Net assets | $43,045,135 |
| Shares outstanding | 2,580,783 |
| Net asset value per share | $16.68 |
| Class C | |
| Net assets | $11,423,186 |
| Shares outstanding | 686,539 |
| Net asset value per share | $16.64 |
| Institutional Class | |
| Net assets | $222,669,838 |
| Shares outstanding | 13,365,762 |
| Net asset value per share | $16.66 |
| Institutional 2 Class | |
| Net assets | $32,858,115 |
| Shares outstanding | 1,968,963 |
| Net asset value per share | $16.69 |
| Institutional 3 Class | |
| Net assets | $488,330,209 |
| Shares outstanding | 28,869,637 |
| Net asset value per share | $16.92 |
| Class R | |
| Net assets | $3,256,214 |
| Shares outstanding | 196,662 |
| Net asset value per share | $16.56 |
The accompanying Notes to Financial Statements are an integral part of this statement.
| 10 | Columbia Large Cap Value Fund | Semiannual Report 2022 |
Statement of Operations
Six Months Ended November 30, 2022 (Unaudited)
| Net investment income | |
| Income: | |
| Dividends — unaffiliated issuers | $29,921,253 |
| Dividends — affiliated issuers | 274,292 |
| Interest | 47,879 |
| Total income | 30,243,424 |
| Expenses: | |
| Management services fees | 7,562,089 |
| Distribution and/or service fees | |
| Class A | 1,985,397 |
| Class C | 54,587 |
| Class R | 7,785 |
| Transfer agent fees | |
| Class A | 675,578 |
| Advisor Class | 16,983 |
| Class C | 4,643 |
| Institutional Class | 91,200 |
| Institutional 2 Class | 7,315 |
| Institutional 3 Class | 15,879 |
| Class R | 1,325 |
| Compensation of board members | 6,423 |
| Custodian fees | 6,581 |
| Printing and postage fees | 56,491 |
| Registration fees | 77,346 |
| Audit fees | 15,059 |
| Legal fees | 21,696 |
| Compensation of chief compliance officer | 224 |
| Other | 22,343 |
| Total expenses | 10,628,944 |
| Expense reduction | (120) |
| Total net expenses | 10,628,824 |
| Net investment income | 19,614,600 |
| Realized and unrealized gain (loss) — net | |
| Net realized gain (loss) on: | |
| Investments — unaffiliated issuers | (10,423,426) |
| Investments — affiliated issuers | (6,089) |
| Net realized loss | (10,429,515) |
| Net change in unrealized appreciation (depreciation) on: | |
| Investments — unaffiliated issuers | 16,994,621 |
| Investments — affiliated issuers | 3,819 |
| Net change in unrealized appreciation (depreciation) | 16,998,440 |
| Net realized and unrealized gain | 6,568,925 |
| Net increase in net assets resulting from operations | $26,183,525 |
The accompanying Notes to Financial Statements are an integral part of this statement.
Columbia Large Cap Value Fund | Semiannual Report 2022
| 11 |
Statement of Changes in Net Assets
| | Six Months Ended
November 30, 2022
(Unaudited) | Year Ended
May 31, 2022 |
| Operations | | |
| Net investment income | $19,614,600 | $33,361,363 |
| Net realized gain (loss) | (10,429,515) | 256,699,425 |
| Net change in unrealized appreciation (depreciation) | 16,998,440 | (243,833,224) |
| Net increase in net assets resulting from operations | 26,183,525 | 46,227,564 |
| Distributions to shareholders | | |
| Net investment income and net realized gains | | |
| Class A | (11,711,991) | (113,587,179) |
| Advisor Class | (345,903) | (2,780,127) |
| Class C | (38,365) | (717,638) |
| Institutional Class | (1,873,141) | (15,102,047) |
| Institutional 2 Class | (265,136) | (2,079,822) |
| Institutional 3 Class | (4,680,310) | (42,237,274) |
| Class R | (19,069) | (187,147) |
| Total distributions to shareholders | (18,933,915) | (176,691,234) |
| Decrease in net assets from capital stock activity | (165,907,532) | (41,502,157) |
| Total decrease in net assets | (158,657,922) | (171,965,827) |
| Net assets at beginning of period | 2,638,138,611 | 2,810,104,438 |
| Net assets at end of period | $2,479,480,689 | $2,638,138,611 |
The accompanying Notes to Financial Statements are an integral part of this statement.
| 12 | Columbia Large Cap Value Fund | Semiannual Report 2022 |
Statement of Changes in Net Assets (continued)
| | Six Months Ended | Year Ended |
| | November 30, 2022 (Unaudited) | May 31, 2022 |
| | Shares | Dollars ($) | Shares | Dollars ($) |
| Capital stock activity |
| Class A | | | | |
| Subscriptions | 1,187,218 | 18,291,190 | 2,963,699 | 50,087,908 |
| Distributions reinvested | 778,705 | 11,628,506 | 6,817,584 | 112,802,091 |
| Redemptions | (5,358,012) | (82,635,015) | (12,222,236) | (207,037,967) |
| Net decrease | (3,392,089) | (52,715,319) | (2,440,953) | (44,147,968) |
| Advisor Class | | | | |
| Subscriptions | 405,424 | 6,222,984 | 421,130 | 7,144,146 |
| Distributions reinvested | 23,044 | 343,658 | 166,836 | 2,757,667 |
| Redemptions | (369,079) | (5,734,058) | (535,180) | (9,083,558) |
| Net increase | 59,389 | 832,584 | 52,786 | 818,255 |
| Class C | | | | |
| Subscriptions | 86,875 | 1,333,360 | 156,071 | 2,632,408 |
| Distributions reinvested | 2,576 | 38,365 | 43,390 | 716,183 |
| Redemptions | (132,618) | (2,031,579) | (240,502) | (4,048,461) |
| Net decrease | (43,167) | (659,854) | (41,041) | (699,870) |
| Institutional Class | | | | |
| Subscriptions | 1,132,614 | 17,540,461 | 2,868,888 | 48,516,464 |
| Distributions reinvested | 125,309 | 1,867,140 | 911,766 | 15,052,963 |
| Redemptions | (2,007,272) | (30,829,150) | (2,596,972) | (43,925,831) |
| Net increase (decrease) | (749,349) | (11,421,549) | 1,183,682 | 19,643,596 |
| Institutional 2 Class | | | | |
| Subscriptions | 150,482 | 2,327,090 | 506,749 | 8,655,079 |
| Distributions reinvested | 17,758 | 265,011 | 125,751 | 2,079,822 |
| Redemptions | (114,900) | (1,764,951) | (345,494) | (5,836,984) |
| Net increase | 53,340 | 827,150 | 287,006 | 4,897,917 |
| Institutional 3 Class | | | | |
| Subscriptions | 151,349 | 2,367,604 | 2,910,332 | 50,994,692 |
| Distributions reinvested | 309,339 | 4,679,964 | 2,520,100 | 42,233,098 |
| Redemptions | (7,055,623) | (109,760,895) | (6,769,335) | (115,518,413) |
| Net decrease | (6,594,935) | (102,713,327) | (1,338,903) | (22,290,623) |
| Class R | | | | |
| Subscriptions | 11,288 | 174,715 | 49,538 | 830,890 |
| Distributions reinvested | 1,287 | 19,069 | 11,402 | 187,147 |
| Redemptions | (16,250) | (251,001) | (43,781) | (741,501) |
| Net increase (decrease) | (3,675) | (57,217) | 17,159 | 276,536 |
| Total net decrease | (10,670,486) | (165,907,532) | (2,280,264) | (41,502,157) |
The accompanying Notes to Financial Statements are an integral part of this statement.
Columbia Large Cap Value Fund | Semiannual Report 2022
| 13 |
The following table is intended to help you understand the Fund’s financial performance. Certain information reflects financial results for a single share of a class held for the periods shown. Per share net investment income (loss) amounts are calculated based on average shares outstanding during the period. Total return assumes reinvestment of all dividends and distributions, if any. Total return does not reflect payment of sales charges, if any. Total return and portfolio turnover are not annualized for periods of less than one year. The portfolio turnover rate is calculated without regard to purchase and sales transactions of short-term instruments and certain derivatives, if any. If such transactions were included, the Fund’s portfolio turnover rate may be higher.
| | Net asset value,
beginning of
period | Net
investment
income | Net
realized
and
unrealized
gain (loss) | Total from
investment
operations | Distributions
from net
investment
income | Distributions
from net
realized
gains | Total
distributions to
shareholders |
| Class A |
| Six Months Ended 11/30/2022 (Unaudited) | $16.56 | 0.12 | 0.12 | 0.24 | (0.11) | — | (0.11) |
| Year Ended 5/31/2022 | $17.39 | 0.19 | 0.09 | 0.28 | (0.19) | (0.92) | (1.11) |
| Year Ended 5/31/2021 | $12.02 | 0.18 | 5.38 | 5.56 | (0.19) | — | (0.19) |
| Year Ended 5/31/2020 | $12.66 | 0.22 | (0.05) | 0.17 | (0.21) | (0.60) | (0.81) |
| Year Ended 5/31/2019 | $14.04 | 0.20 | (0.16) | 0.04 | (0.19) | (1.23) | (1.42) |
| Year Ended 5/31/2018 | $13.92 | 0.17 | 0.94 | 1.11 | (0.16) | (0.83) | (0.99) |
| Advisor Class |
| Six Months Ended 11/30/2022 (Unaudited) | $16.55 | 0.14 | 0.12 | 0.26 | (0.13) | — | (0.13) |
| Year Ended 5/31/2022 | $17.38 | 0.23 | 0.09 | 0.32 | (0.23) | (0.92) | (1.15) |
| Year Ended 5/31/2021 | $12.02 | 0.21 | 5.37 | 5.58 | (0.22) | — | (0.22) |
| Year Ended 5/31/2020 | $12.66 | 0.25 | (0.05) | 0.20 | (0.24) | (0.60) | (0.84) |
| Year Ended 5/31/2019 | $14.03 | 0.24 | (0.15) | 0.09 | (0.23) | (1.23) | (1.46) |
| Year Ended 5/31/2018 | $13.91 | 0.21 | 0.94 | 1.15 | (0.20) | (0.83) | (1.03) |
| Class C |
| Six Months Ended 11/30/2022 (Unaudited) | $16.50 | 0.06 | 0.13 | 0.19 | (0.05) | — | (0.05) |
| Year Ended 5/31/2022 | $17.33 | 0.06 | 0.09 | 0.15 | (0.06) | (0.92) | (0.98) |
| Year Ended 5/31/2021 | $11.99 | 0.07 | 5.36 | 5.43 | (0.09) | — | (0.09) |
| Year Ended 5/31/2020 | $12.62 | 0.12 | (0.05) | 0.07 | (0.10) | (0.60) | (0.70) |
| Year Ended 5/31/2019 | $13.99 | 0.10 | (0.15) | (0.05) | (0.09) | (1.23) | (1.32) |
| Year Ended 5/31/2018 | $13.88 | 0.06 | 0.93 | 0.99 | (0.05) | (0.83) | (0.88) |
| Institutional Class |
| Six Months Ended 11/30/2022 (Unaudited) | $16.53 | 0.14 | 0.12 | 0.26 | (0.13) | — | (0.13) |
| Year Ended 5/31/2022 | $17.36 | 0.23 | 0.09 | 0.32 | (0.23) | (0.92) | (1.15) |
| Year Ended 5/31/2021 | $12.00 | 0.21 | 5.37 | 5.58 | (0.22) | — | (0.22) |
| Year Ended 5/31/2020 | $12.65 | 0.25 | (0.06) | 0.19 | (0.24) | (0.60) | (0.84) |
| Year Ended 5/31/2019 | $14.02 | 0.24 | (0.15) | 0.09 | (0.23) | (1.23) | (1.46) |
| Year Ended 5/31/2018 | $13.90 | 0.20 | 0.95 | 1.15 | (0.20) | (0.83) | (1.03) |
| Institutional 2 Class |
| Six Months Ended 11/30/2022 (Unaudited) | $16.56 | 0.14 | 0.13 | 0.27 | (0.14) | — | (0.14) |
| Year Ended 5/31/2022 | $17.39 | 0.24 | 0.09 | 0.33 | (0.24) | (0.92) | (1.16) |
| Year Ended 5/31/2021 | $12.03 | 0.22 | 5.37 | 5.59 | (0.23) | — | (0.23) |
| Year Ended 5/31/2020 | $12.67 | 0.25 | (0.04) | 0.21 | (0.25) | (0.60) | (0.85) |
| Year Ended 5/31/2019 | $14.04 | 0.25 | (0.15) | 0.10 | (0.24) | (1.23) | (1.47) |
| Year Ended 5/31/2018 | $13.93 | 0.21 | 0.93 | 1.14 | (0.20) | (0.83) | (1.03) |
The accompanying Notes to Financial Statements are an integral part of this statement.
| 14 | Columbia Large Cap Value Fund | Semiannual Report 2022 |
Financial Highlights (continued)
| | Net
asset
value,
end of
period | Total
return | Total gross
expense
ratio to
average
net assets(a) | Total net
expense
ratio to
average
net assets(a),(b) | Net investment
income
ratio to
average
net assets | Portfolio
turnover | Net
assets,
end of
period
(000’s) |
| Class A |
| Six Months Ended 11/30/2022 (Unaudited) | $16.69 | 1.56% | 0.99%(c) | 0.99%(c),(d) | 1.54%(c) | 5% | $1,677,898 |
| Year Ended 5/31/2022 | $16.56 | 1.64% | 0.97% | 0.97%(d) | 1.11% | 21% | $1,720,873 |
| Year Ended 5/31/2021 | $17.39 | 46.70% | 1.01% | 1.01%(d) | 1.25% | 27% | $1,849,691 |
| Year Ended 5/31/2020 | $12.02 | 0.73% | 1.02% | 1.02%(d) | 1.64% | 15% | $1,429,986 |
| Year Ended 5/31/2019 | $12.66 | 0.62% | 1.02% | 1.02%(d) | 1.49% | 23% | $1,621,964 |
| Year Ended 5/31/2018 | $14.04 | 7.82% | 1.01% | 1.01%(d) | 1.17% | 21% | $1,836,324 |
| Advisor Class |
| Six Months Ended 11/30/2022 (Unaudited) | $16.68 | 1.69% | 0.74%(c) | 0.74%(c),(d) | 1.79%(c) | 5% | $43,045 |
| Year Ended 5/31/2022 | $16.55 | 1.91% | 0.72% | 0.72%(d) | 1.36% | 21% | $41,728 |
| Year Ended 5/31/2021 | $17.38 | 46.97% | 0.76% | 0.76%(d) | 1.50% | 27% | $42,909 |
| Year Ended 5/31/2020 | $12.02 | 1.01% | 0.77% | 0.77%(d) | 1.89% | 15% | $30,446 |
| Year Ended 5/31/2019 | $12.66 | 0.95% | 0.77% | 0.77%(d) | 1.74% | 23% | $33,903 |
| Year Ended 5/31/2018 | $14.03 | 8.10% | 0.77% | 0.77%(d) | 1.50% | 21% | $42,087 |
| Class C |
| Six Months Ended 11/30/2022 (Unaudited) | $16.64 | 1.21% | 1.74%(c) | 1.74%(c),(d) | 0.80%(c) | 5% | $11,423 |
| Year Ended 5/31/2022 | $16.50 | 0.86% | 1.72% | 1.72%(d) | 0.36% | 21% | $12,043 |
| Year Ended 5/31/2021 | $17.33 | 45.52% | 1.76% | 1.76%(d) | 0.52% | 27% | $13,359 |
| Year Ended 5/31/2020 | $11.99 | (0.03%) | 1.77% | 1.77%(d) | 0.89% | 15% | $18,031 |
| Year Ended 5/31/2019 | $12.62 | (0.06%) | 1.76% | 1.76%(d) | 0.74% | 23% | $23,646 |
| Year Ended 5/31/2018 | $13.99 | 6.96% | 1.76% | 1.76%(d) | 0.41% | 21% | $57,445 |
| Institutional Class |
| Six Months Ended 11/30/2022 (Unaudited) | $16.66 | 1.70% | 0.74%(c) | 0.74%(c),(d) | 1.79%(c) | 5% | $222,670 |
| Year Ended 5/31/2022 | $16.53 | 1.91% | 0.72% | 0.72%(d) | 1.36% | 21% | $233,329 |
| Year Ended 5/31/2021 | $17.36 | 47.04% | 0.76% | 0.76%(d) | 1.49% | 27% | $224,531 |
| Year Ended 5/31/2020 | $12.00 | 0.93% | 0.77% | 0.77%(d) | 1.89% | 15% | $134,233 |
| Year Ended 5/31/2019 | $12.65 | 0.96% | 0.77% | 0.77%(d) | 1.74% | 23% | $159,448 |
| Year Ended 5/31/2018 | $14.02 | 8.10% | 0.76% | 0.76%(d) | 1.42% | 21% | $193,314 |
| Institutional 2 Class |
| Six Months Ended 11/30/2022 (Unaudited) | $16.69 | 1.71% | 0.70%(c) | 0.70%(c) | 1.82%(c) | 5% | $32,858 |
| Year Ended 5/31/2022 | $16.56 | 1.95% | 0.68% | 0.68% | 1.39% | 21% | $31,720 |
| Year Ended 5/31/2021 | $17.39 | 47.01% | 0.71% | 0.71% | 1.54% | 27% | $28,324 |
| Year Ended 5/31/2020 | $12.03 | 1.08% | 0.71% | 0.71% | 1.95% | 15% | $18,546 |
| Year Ended 5/31/2019 | $12.67 | 1.02% | 0.70% | 0.70% | 1.82% | 23% | $16,474 |
| Year Ended 5/31/2018 | $14.04 | 8.08% | 0.71% | 0.71% | 1.47% | 21% | $39,230 |
The accompanying Notes to Financial Statements are an integral part of this statement.
Columbia Large Cap Value Fund | Semiannual Report 2022
| 15 |
Financial Highlights (continued)
| | Net asset value,
beginning of
period | Net
investment
income | Net
realized
and
unrealized
gain (loss) | Total from
investment
operations | Distributions
from net
investment
income | Distributions
from net
realized
gains | Total
distributions to
shareholders |
| Institutional 3 Class |
| Six Months Ended 11/30/2022 (Unaudited) | $16.78 | 0.15 | 0.13 | 0.28 | (0.14) | — | (0.14) |
| Year Ended 5/31/2022 | $17.61 | 0.25 | 0.08 | 0.33 | (0.24) | (0.92) | (1.16) |
| Year Ended 5/31/2021 | $12.17 | 0.24 | 5.43 | 5.67 | (0.23) | — | (0.23) |
| Year Ended 5/31/2020 | $12.82 | 0.26 | (0.06) | 0.20 | (0.25) | (0.60) | (0.85) |
| Year Ended 5/31/2019 | $14.19 | 0.25 | (0.15) | 0.10 | (0.24) | (1.23) | (1.47) |
| Year Ended 5/31/2018 | $14.06 | 0.23 | 0.94 | 1.17 | (0.21) | (0.83) | (1.04) |
| Class R |
| Six Months Ended 11/30/2022 (Unaudited) | $16.43 | 0.10 | 0.12 | 0.22 | (0.09) | — | (0.09) |
| Year Ended 5/31/2022 | $17.26 | 0.15 | 0.08 | 0.23 | (0.14) | (0.92) | (1.06) |
| Year Ended 5/31/2021 | $11.93 | 0.14 | 5.35 | 5.49 | (0.16) | — | (0.16) |
| Year Ended 5/31/2020 | $12.57 | 0.18 | (0.05) | 0.13 | (0.17) | (0.60) | (0.77) |
| Year Ended 5/31/2019 | $13.95 | 0.17 | (0.16) | 0.01 | (0.16) | (1.23) | (1.39) |
| Year Ended 5/31/2018 | $13.83 | 0.13 | 0.94 | 1.07 | (0.12) | (0.83) | (0.95) |
| Notes to Financial Highlights |
| (a) | In addition to the fees and expenses that the Fund bears directly, the Fund indirectly bears a pro rata share of the fees and expenses of any other funds in which it invests. Such indirect expenses are not included in the Fund’s reported expense ratios. |
| (b) | Total net expenses include the impact of certain fee waivers/expense reimbursements made by the Investment Manager and certain of its affiliates, if applicable. |
| (c) | Annualized. |
| (d) | The benefits derived from expense reductions had an impact of less than 0.01%. |
The accompanying Notes to Financial Statements are an integral part of this statement.
| 16 | Columbia Large Cap Value Fund | Semiannual Report 2022 |
Financial Highlights (continued)
| | Net
asset
value,
end of
period | Total
return | Total gross
expense
ratio to
average
net assets(a) | Total net
expense
ratio to
average
net assets(a),(b) | Net investment
income
ratio to
average
net assets | Portfolio
turnover | Net
assets,
end of
period
(000’s) |
| Institutional 3 Class |
| Six Months Ended 11/30/2022 (Unaudited) | $16.92 | 1.78% | 0.66%(c) | 0.66%(c) | 1.89%(c) | 5% | $488,330 |
| Year Ended 5/31/2022 | $16.78 | 1.96% | 0.64% | 0.64% | 1.43% | 21% | $595,155 |
| Year Ended 5/31/2021 | $17.61 | 47.16% | 0.66% | 0.66% | 1.54% | 27% | $648,129 |
| Year Ended 5/31/2020 | $12.17 | 1.01% | 0.69% | 0.69% | 1.97% | 15% | $3,344 |
| Year Ended 5/31/2019 | $12.82 | 1.03% | 0.69% | 0.69% | 1.82% | 23% | $2,746 |
| Year Ended 5/31/2018 | $14.19 | 8.18% | 0.69% | 0.68% | 1.56% | 21% | $3,281 |
| Class R |
| Six Months Ended 11/30/2022 (Unaudited) | $16.56 | 1.43% | 1.24%(c) | 1.24%(c),(d) | 1.29%(c) | 5% | $3,256 |
| Year Ended 5/31/2022 | $16.43 | 1.39% | 1.22% | 1.22%(d) | 0.86% | 21% | $3,291 |
| Year Ended 5/31/2021 | $17.26 | 46.37% | 1.26% | 1.26%(d) | 1.00% | 27% | $3,161 |
| Year Ended 5/31/2020 | $11.93 | 0.45% | 1.27% | 1.27%(d) | 1.38% | 15% | $2,371 |
| Year Ended 5/31/2019 | $12.57 | 0.37% | 1.27% | 1.27%(d) | 1.24% | 23% | $3,574 |
| Year Ended 5/31/2018 | $13.95 | 7.61% | 1.26% | 1.26%(d) | 0.91% | 21% | $4,510 |
The accompanying Notes to Financial Statements are an integral part of this statement.
Columbia Large Cap Value Fund | Semiannual Report 2022
| 17 |
Notes to Financial Statements
November 30, 2022 (Unaudited)
Note 1. Organization
Columbia Large Cap Value Fund (the Fund), a series of Columbia Funds Series Trust II (the Trust), is a diversified fund. The Trust is registered under the Investment Company Act of 1940, as amended (the 1940 Act), as an open-end management investment company organized as a Massachusetts business trust.
Fund shares
The Trust may issue an unlimited number of shares (without par value). The Fund offers each of the share classes listed in the Statement of Assets and Liabilities. Although all share classes generally have identical voting, dividend and liquidation rights, each share class votes separately when required by the Trust’s organizational documents or by law. Each share class has its own expense and sales charge structure. Different share classes may have different minimum initial investment amounts and pay different net investment income distribution amounts to the extent the expenses of distributing such share classes vary. Distributions to shareholders in a liquidation will be proportional to the net asset value of each share class.
As described in the Fund’s prospectus, Class A and Class C shares are offered to the general public for investment. Class C shares automatically convert to Class A shares after 8 years. Advisor Class, Institutional Class, Institutional 2 Class, Institutional 3 Class and Class R shares are available for purchase through authorized investment professionals to omnibus retirement plans or to institutional investors and to certain other investors as also described in the Fund’s prospectus.
Note 2. Summary of significant accounting policies
Basis of preparation
The Fund is an investment company that applies the accounting and reporting guidance in the Financial Accounting Standards Board (FASB) Accounting Standards Codification Topic 946, Financial Services - Investment Companies (ASC 946). The financial statements are prepared in accordance with U.S. generally accepted accounting principles (GAAP), which requires management to make certain estimates and assumptions that affect the reported amounts of assets and liabilities, the disclosure of contingent assets and liabilities at the date of the financial statements and the reported amounts of income and expenses during the reporting period. Actual results could differ from those estimates.
The following is a summary of significant accounting policies followed by the Fund in the preparation of its financial statements.
Security valuation
Equity securities listed on an exchange are valued at the closing price or last trade price on their primary exchange at the close of business of the New York Stock Exchange. Securities with a closing price not readily available or not listed on any exchange are valued at the mean between the closing bid and ask prices. Listed preferred stocks convertible into common stocks are valued using an evaluated price from a pricing service.
Debt securities generally are valued based on prices obtained from pricing services, which are intended to reflect market transactions for normal, institutional-size trading units of similar securities. The services may use various pricing techniques that take into account, as applicable, factors such as yield, quality, coupon rate, maturity, type of issue, trading characteristics and other data, as well as approved independent broker-dealer quotes. Debt securities for which quotations are not readily available or not believed to be reflective of market value may also be valued based upon a bid quote from an approved independent broker-dealer. Debt securities maturing in 60 days or less are valued primarily at amortized market value, unless this method results in a valuation that management believes does not approximate fair value.
Foreign equity securities are valued based on the closing price or last trade price on their primary exchange at the close of business of the New York Stock Exchange. If any foreign equity security closing prices are not readily available, the securities are valued at the mean of the latest quoted bid and ask prices on such exchanges or markets. Foreign currency exchange rates are determined at the scheduled closing time of the New York Stock Exchange. Many securities markets and exchanges outside the U.S. close prior to the close of the New York Stock Exchange; therefore, the closing prices for securities in such markets or on such exchanges may not fully reflect events that occur after such close but before the close of the New York Stock Exchange. In those situations, foreign securities will be fair valued pursuant to a policy approved by the Board of Trustees. Under the policy, the Fund may utilize a third-party pricing service to determine these fair values. The
| 18 | Columbia Large Cap Value Fund | Semiannual Report 2022 |
Notes to Financial Statements (continued)
November 30, 2022 (Unaudited)
third-party pricing service takes into account multiple factors, including, but not limited to, movements in the U.S. securities markets, certain depositary receipts, futures contracts and foreign exchange rates that have occurred subsequent to the close of the foreign exchange or market, to determine a good faith estimate that reasonably reflects the current market conditions as of the close of the New York Stock Exchange. The fair value of a security is likely to be different from the quoted or published price, if available.
Investments in open-end investment companies (other than exchange-traded funds (ETFs)), are valued at the latest net asset value reported by those companies as of the valuation time.
Investments for which market quotations are not readily available, or that have quotations which management believes are not reflective of market value or reliable, are valued at fair value as determined in good faith under procedures approved by the Board of Trustees. If a security or class of securities (such as foreign securities) is valued at fair value, such value is likely to be different from the quoted or published price for the security, if available.
The determination of fair value often requires significant judgment. To determine fair value, management may use assumptions including but not limited to future cash flows and estimated risk premiums. Multiple inputs from various sources may be used to determine fair value.
GAAP requires disclosure regarding the inputs and valuation techniques used to measure fair value and any changes in valuation inputs or techniques. In addition, investments shall be disclosed by major category. This information is disclosed following the Fund’s Portfolio of Investments.
Security transactions
Security transactions are accounted for on the trade date. Cost is determined and gains (losses) are based upon the specific identification method for both financial statement and federal income tax purposes.
Income recognition
Interest income is recorded on an accrual basis. Market premiums and discounts, including original issue discounts, are amortized and accreted, respectively, over the expected life of the security on all debt securities, unless otherwise noted. For convertible securities, premiums attributable to the conversion feature are not amortized.
The Fund may place a debt security on non-accrual status and reduce related interest income when it becomes probable that the interest will not be collected and the amount of uncollectible interest can be reasonably estimated. The Fund may also adjust accrual rates when it becomes probable the full interest will not be collected and a partial payment will be received. A defaulted debt security is removed from non-accrual status when the issuer resumes interest payments or when collectability of interest is reasonably assured.
Corporate actions and dividend income are generally recorded net of any non-reclaimable tax withholdings, on the ex-dividend date or upon receipt of an ex-dividend notification in the case of certain foreign securities.
The Fund may receive distributions from holdings in equity securities, business development companies (BDCs), exchange-traded funds (ETFs), limited partnerships (LPs), other regulated investment companies (RICs), and real estate investment trusts (REITs), which report information as to the tax character of their distributions annually. These distributions are allocated to dividend income, capital gain and return of capital based on actual information reported. Return of capital is recorded as a reduction of the cost basis of securities held. If the Fund no longer owns the applicable securities, return of capital is recorded as a realized gain. With respect to REITs, to the extent actual information has not yet been reported, estimates for return of capital are made by Columbia Management Investment Advisers, LLC (the Investment Manager), a wholly-owned subsidiary of Ameriprise Financial, Inc. (Ameriprise Financial). The Investment Manager’s estimates are subsequently adjusted when the actual character of the distributions is disclosed by the REITs, which could result in a proportionate change in return of capital to shareholders.
Awards from class action litigation are recorded as a reduction of cost basis if the Fund still owns the applicable securities on the payment date. If the Fund no longer owns the applicable securities on the payment date, the proceeds are recorded as realized gains.
Columbia Large Cap Value Fund | Semiannual Report 2022
| 19 |
Notes to Financial Statements (continued)
November 30, 2022 (Unaudited)
Expenses
General expenses of the Trust are allocated to the Fund and other funds of the Trust based upon relative net assets or other expense allocation methodologies determined by the nature of the expense. Expenses directly attributable to the Fund are charged to the Fund. Expenses directly attributable to a specific class of shares are charged to that share class.
Determination of class net asset value
All income, expenses (other than class-specific expenses, which are charged to that share class, as shown in the Statement of Operations) and realized and unrealized gains (losses) are allocated to each class of the Fund on a daily basis, based on the relative net assets of each class, for purposes of determining the net asset value of each class.
Federal income tax status
The Fund intends to qualify each year as a regulated investment company under Subchapter M of the Internal Revenue Code, as amended, and will distribute substantially all of its investment company taxable income and net capital gain, if any, for its tax year, and as such will not be subject to federal income taxes. In addition, the Fund intends to distribute in each calendar year substantially all of its ordinary income, capital gain net income and certain other amounts, if any, such that the Fund should not be subject to federal excise tax. Therefore, no federal income or excise tax provision is recorded.
Distributions to shareholders
Distributions from net investment income, if any, are declared and paid each calendar quarter. Net realized capital gains, if any, are distributed at least annually. Income distributions and capital gain distributions are determined in accordance with federal income tax regulations, which may differ from GAAP.
Guarantees and indemnifications
Under the Trust’s organizational documents and, in some cases, by contract, its officers and trustees are indemnified against certain liabilities arising out of the performance of their duties to the Trust or its funds. In addition, certain of the Fund’s contracts with its service providers contain general indemnification clauses. The Fund’s maximum exposure under these arrangements is unknown since the amount of any future claims that may be made against the Fund cannot be determined, and the Fund has no historical basis for predicting the likelihood of any such claims.
Recent accounting pronouncement
Tailored Shareholder Reports
In October 2022, the Securities and Exchange Commission (SEC) adopted a final rule relating to Tailored Shareholder Reports for Mutual Funds and Exchange-Traded Funds (ETFs); Fee Information in Investment Company Advertisements. The rule and form amendments will require mutual funds and ETFs to transmit concise and visually engaging shareholder reports that highlight key information. The amendments will require that funds tag information in a structured data format. The rule amendments will require that certain more in-depth information be made available online and available for delivery free of charge to investors on request. The amendments will become effective January 24, 2023. There is an 18-month transition period after the effective date of the amendment.
Note 3. Fees and other transactions with affiliates
Management services fees
The Fund has entered into a Management Agreement with Columbia Management Investment Advisers, LLC (the Investment Manager), a wholly-owned subsidiary of Ameriprise Financial, Inc. (Ameriprise Financial). Under the Management Agreement, the Investment Manager provides the Fund with investment research and advice, as well as administrative and accounting services. The management services fee is an annual fee that is equal to a percentage of the Fund’s daily net assets that declines from 0.72% to 0.52% as the Fund’s net assets increase. The annualized effective management services fee rate for the six months ended November 30, 2022 was 0.63% of the Fund’s average daily net assets.
| 20 | Columbia Large Cap Value Fund | Semiannual Report 2022 |
Notes to Financial Statements (continued)
November 30, 2022 (Unaudited)
Compensation of board members
Members of the Board of Trustees who are not officers or employees of the Investment Manager or Ameriprise Financial are compensated for their services to the Fund as disclosed in the Statement of Operations. Under a Deferred Compensation Plan (the Deferred Plan), these members of the Board of Trustees may elect to defer payment of up to 100% of their compensation. Deferred amounts are treated as though equivalent dollar amounts had been invested in shares of certain funds managed by the Investment Manager. The Fund’s liability for these amounts is adjusted for market value changes and remains in the Fund until distributed in accordance with the Deferred Plan. All amounts payable under the Deferred Plan constitute a general unsecured obligation of the Fund. The expense for the Deferred Plan, which includes Trustees’ fees deferred during the current period as well as any gains or losses on the Trustees’ deferred compensation balances as a result of market fluctuations, is included in "Compensation of board members" in the Statement of Operations.
Compensation of Chief Compliance Officer
The Board of Trustees has appointed a Chief Compliance Officer for the Fund in accordance with federal securities regulations. As disclosed in the Statement of Operations, a portion of the Chief Compliance Officer’s total compensation is allocated to the Fund, along with other allocations to affiliated registered investment companies managed by the Investment Manager and its affiliates, based on relative net assets.
Transfer agency fees
Under a Transfer and Dividend Disbursing Agent Agreement, Columbia Management Investment Services Corp. (the Transfer Agent), an affiliate of the Investment Manager and a wholly-owned subsidiary of Ameriprise Financial, is responsible for providing transfer agency services to the Fund. The Transfer Agent has contracted with SS&C GIDS, Inc. (SS&C GIDS) to serve as sub-transfer agent. Prior to January 1, 2023, SS&C GIDS was known as DST Asset Manager Solutions, Inc. The Transfer Agent pays the fees of SS&C GIDS for services as sub-transfer agent and SS&C GIDS is not entitled to reimbursement for such fees from the Fund (with the exception of out-of-pocket fees).
The Fund pays the Transfer Agent a monthly transfer agency fee based on the number or the average value of accounts, depending on the type of account. In addition, the Fund pays the Transfer Agent a fee for shareholder services based on the number of accounts or on a percentage of the average aggregate value of the Fund’s shares maintained in omnibus accounts up to the lesser of the amount charged by the financial intermediary or a cap established by the Board of Trustees from time to time.
The Transfer Agent also receives compensation from the Fund for various shareholder services and reimbursements for certain out-of-pocket fees. Total transfer agency fees for Institutional 2 Class and Institutional 3 Class shares are subject to an annual limitation of not more than 0.07% and 0.02%, respectively, of the average daily net assets attributable to each share class.
For the six months ended November 30, 2022, the Fund’s annualized effective transfer agency fee rates as a percentage of average daily net assets of each class were as follows:
| | Effective rate (%) |
| Class A | 0.09 |
| Advisor Class | 0.09 |
| Class C | 0.09 |
| Institutional Class | 0.09 |
| Institutional 2 Class | 0.05 |
| Institutional 3 Class | 0.01 |
| Class R | 0.09 |
An annual minimum account balance fee of $20 may apply to certain accounts with a value below the applicable share class’s initial minimum investment requirements to reduce the impact of small accounts on transfer agency fees. These minimum account balance fees are remitted to the Fund and recorded as part of expense reductions in the Statement of Operations. For the six months ended November 30, 2022, these minimum account balance fees reduced total expenses of the Fund by $120.
Columbia Large Cap Value Fund | Semiannual Report 2022
| 21 |
Notes to Financial Statements (continued)
November 30, 2022 (Unaudited)
Distribution and service fees
The Fund has entered into an agreement with Columbia Management Investment Distributors, Inc. (the Distributor), an affiliate of the Investment Manager and a wholly-owned subsidiary of Ameriprise Financial, for distribution and shareholder services. Under a Plan and Agreement of Distribution, the Fund pays a fee at the maximum annual rates of up to 0.25%, 1.00% and 0.50% of the Fund’s average daily net assets attributable to Class A, Class C and Class R shares, respectively. For Class C shares, of the 1.00% fee, up to 0.75% can be reimbursed for distribution expenses and up to an additional 0.25% can be reimbursed for shareholder servicing expenses. For Class R shares, of the 0.50% fee, up to 0.25% can be reimbursed for shareholder servicing expenses.
The amount of distribution and shareholder services expenses incurred by the Distributor and not yet reimbursed (unreimbursed expense) was approximately $587,000 for Class C shares. This amount is based on the most recent information available as of September 30, 2022, and may be recovered from future payments under the distribution plan or contingent deferred sales charges (CDSCs). To the extent the unreimbursed expense has been fully recovered, the distribution and/or shareholder services fee is reduced.
Sales charges
Sales charges, including front-end charges and CDSCs, received by the Distributor for distributing Fund shares for the six months ended November 30, 2022, if any, are listed below:
| | Front End (%) | CDSC (%) | Amount ($) |
| Class A | 5.75 | 0.50 - 1.00(a) | 126,404 |
| Class C | — | 1.00(b) | 603 |
| (a) | This charge is imposed on certain investments of between $1 million and $50 million redeemed within 18 months after purchase, as follows: 1.00% if redeemed within 12 months after purchase, and 0.50% if redeemed more than 12, but less than 18, months after purchase, with certain limited exceptions. |
| (b) | This charge applies to redemptions within 12 months after purchase, with certain limited exceptions. |
The Fund’s other share classes are not subject to sales charges.
Expenses waived/reimbursed by the Investment Manager and its affiliates
The Investment Manager and certain of its affiliates have contractually agreed to waive fees and/or reimburse expenses (excluding certain fees and expenses described below) for the period(s) disclosed below, unless sooner terminated at the sole discretion of the Board of Trustees, so that the Fund’s net operating expenses, after giving effect to fees waived/expenses reimbursed and any balance credits and/or overdraft charges from the Fund’s custodian, do not exceed the following annual rate(s) as a percentage of the classes’ average daily net assets:
| | October 1, 2022
through
September 30, 2023 | Prior to
October 1, 2022 |
| Class A | 1.08% | 1.08% |
| Advisor Class | 0.83 | 0.83 |
| Class C | 1.83 | 1.83 |
| Institutional Class | 0.83 | 0.83 |
| Institutional 2 Class | 0.80 | 0.79 |
| Institutional 3 Class | 0.76 | 0.76 |
| Class R | 1.33 | 1.33 |
Under the agreement governing these fee waivers and/or expense reimbursement arrangements, the following fees and expenses are excluded from the waiver/reimbursement commitment, and therefore will be paid by the Fund, if applicable: taxes (including foreign transaction taxes), expenses associated with investments in affiliated and non-affiliated pooled investment vehicles (including mutual funds and exchange-traded funds), transaction costs and brokerage commissions, costs related to any securities lending program, dividend expenses associated with securities sold short, inverse floater program fees and expenses, transaction charges and interest on borrowed money, interest, costs associated with shareholder meetings, infrequent and/or unusual expenses and any other expenses the exclusion of which is
| 22 | Columbia Large Cap Value Fund | Semiannual Report 2022 |
Notes to Financial Statements (continued)
November 30, 2022 (Unaudited)
specifically approved by the Board of Trustees. This agreement may be modified or amended only with approval from the Investment Manager, certain of its affiliates and the Fund. Any fees waived and/or expenses reimbursed under the expense reimbursement arrangements described above are not recoverable by the Investment Manager or its affiliates in future periods.
Note 4. Federal tax information
The timing and character of income and capital gain distributions are determined in accordance with income tax regulations, which may differ from GAAP because of temporary or permanent book to tax differences.
At November 30, 2022, the approximate cost of all investments for federal income tax purposes and the aggregate gross approximate unrealized appreciation and depreciation based on that cost was:
Federal
tax cost ($) | Gross unrealized
appreciation ($) | Gross unrealized
(depreciation) ($) | Net unrealized
appreciation ($) |
| 1,609,637,000 | 934,515,000 | (65,067,000) | 869,448,000 |
Tax cost of investments and unrealized appreciation/(depreciation) may also include timing differences that do not constitute adjustments to tax basis.
Management of the Fund has concluded that there are no significant uncertain tax positions in the Fund that would require recognition in the financial statements. However, management’s conclusion may be subject to review and adjustment at a later date based on factors including, but not limited to, new tax laws, regulations, and administrative interpretations (including relevant court decisions). Generally, the Fund’s federal tax returns for the prior three fiscal years remain subject to examination by the Internal Revenue Service.
Note 5. Portfolio information
The cost of purchases and proceeds from sales of securities, excluding short-term investments and derivatives, if any, aggregated to $110,131,699 and $257,957,407, respectively, for the six months ended November 30, 2022. The amount of purchase and sale activity impacts the portfolio turnover rate reported in the Financial Highlights.
Note 6. Affiliated money market fund
The Fund invests in Columbia Short-Term Cash Fund, an affiliated money market fund established for the exclusive use by the Fund and other affiliated funds (the Affiliated MMF). The income earned by the Fund from such investments is included as Dividends - affiliated issuers in the Statement of Operations. As an investing fund, the Fund indirectly bears its proportionate share of the expenses of the Affiliated MMF. The Affiliated MMF prices its shares with a floating net asset value. In addition, the Board of Trustees of the Affiliated MMF may impose a fee on redemptions (sometimes referred to as a liquidity fee) or temporarily suspend redemptions (sometimes referred to as imposing a redemption gate) in the event its liquidity falls below regulatory limits.
Note 7. Interfund lending
Pursuant to an exemptive order granted by the Securities and Exchange Commission, the Fund participates in a program (the Interfund Program) allowing each participating Columbia Fund (each, a Participating Fund) to lend money directly to and, except for closed-end funds and money market funds, borrow money directly from other Participating Funds for temporary purposes. The amounts eligible for borrowing and lending under the Interfund Program are subject to certain restrictions.
Interfund loans are subject to the risk that the borrowing fund could be unable to repay the loan when due, and a delay in repayment to the lending fund could result in lost opportunities and/or additional lending costs. The exemptive order is subject to conditions intended to mitigate conflicts of interest arising from the Investment Manager’s relationship with each Participating Fund.
The Fund did not borrow or lend money under the Interfund Program during the six months ended November 30, 2022.
Columbia Large Cap Value Fund | Semiannual Report 2022
| 23 |
Notes to Financial Statements (continued)
November 30, 2022 (Unaudited)
Note 8. Line of credit
The Fund has access to a revolving credit facility with a syndicate of banks led by JPMorgan Chase Bank, N.A., Citibank, N.A. and Wells Fargo Bank, N.A. whereby the Fund may borrow for the temporary funding of shareholder redemptions or for other temporary or emergency purposes. Pursuant to an October 27, 2022 amendment and restatement, the credit facility, which is an agreement between the Fund and certain other funds managed by the Investment Manager or an affiliated investment manager, severally and not jointly, permits aggregate borrowings up to $950 million. Interest is currently charged to each participating fund based on its borrowings at a rate equal to the higher of (i) the federal funds effective rate, (ii) the secured overnight financing rate plus 0.10% and (iii) the overnight bank funding rate, plus in each case, 1.00%. Each borrowing under the credit facility matures no later than 60 days after the date of borrowing. The Fund also pays a commitment fee equal to its pro rata share of the unused amount of the credit facility at a rate of 0.15% per annum. The commitment fee is included in other expenses in the Statement of Operations. This agreement expires annually in October unless extended or renewed. Prior to the October 27, 2022 amendment and restatement, the Fund had access to a revolving credit facility with a syndicate of banks led by JPMorgan Chase Bank, N.A., Citibank, N.A. and Wells Fargo Bank, N.A. which permitted collective borrowings up to $950 million. Interest was charged to each participating fund based on its borrowings at a rate equal to the higher of (i) the federal funds effective rate, (ii) the secured overnight financing rate plus 0.11448% and (iii) the overnight bank funding rate, plus in each case, 1.00%.
The Fund had no borrowings during the six months ended November 30, 2022.
Note 9. Significant risks
Financial sector risk
The Fund is more susceptible to the particular risks that may affect companies in the financial services sector than if it were invested in a wider variety of companies in unrelated sectors. Companies in the financial services sector are subject to certain risks, including the risk of regulatory change, decreased liquidity in credit markets and unstable interest rates. Such companies may have concentrated portfolios, such as a high level of loans to one or more industries or sectors, which makes them vulnerable to economic conditions that affect such industries or sectors. Performance of such companies may be affected by competitive pressures and exposure to investments, agreements and counterparties, including credit products that, under certain circumstances, may lead to losses (e.g., subprime loans). Companies in the financial services sector are subject to extensive governmental regulation that may limit the amount and types of loans and other financial commitments they can make, and interest rates and fees that they may charge. In addition, profitability of such companies is largely dependent upon the availability and the cost of capital.
Market risk
The Fund may incur losses due to declines in the value of one or more securities in which it invests. These declines may be due to factors affecting a particular issuer, or the result of, among other things, political, regulatory, market, economic or social developments affecting the relevant market(s) more generally. In addition, turbulence in financial markets and reduced liquidity in equity, credit and/or fixed income markets may negatively affect many issuers, which could adversely affect the Fund’s ability to price or value hard-to-value assets in thinly traded and closed markets and could cause significant redemptions and operational challenges. Global economies and financial markets are increasingly interconnected, and conditions and events in one country, region or financial market may adversely impact issuers in a different country, region or financial market. These risks may be magnified if certain events or developments adversely interrupt the global supply chain; in these and other circumstances, such risks might affect companies worldwide. As a result, local, regional or global events such as terrorism, war, natural disasters, disease/virus outbreaks and epidemics or other public health issues, recessions, depressions or other events – or the potential for such events – could have a significant negative impact on global economic and market conditions.
The large-scale invasion of Ukraine by Russia in February 2022 has resulted in sanctions and market disruptions, including declines in regional and global stock markets, unusual volatility in global commodity markets and significant devaluations of Russian currency. The extent and duration of the military action are impossible to predict but could be significant. Market disruption caused by the Russian military action, and any counter-measures or responses thereto (including international sanctions, a downgrade in the country’s credit rating, purchasing and financing restrictions, boycotts, tariffs, changes in
| 24 | Columbia Large Cap Value Fund | Semiannual Report 2022 |
Notes to Financial Statements (continued)
November 30, 2022 (Unaudited)
consumer or purchaser preferences, cyberattacks and espionage) could have severe adverse impacts on regional and/or global securities and commodities markets, including markets for oil and natural gas. These impacts may include reduced market liquidity, distress in credit markets, further disruption of global supply chains, increased risk of inflation, and limited access to investments in certain international markets and/or issuers. These developments and other related events could negatively impact Fund performance.
The pandemic caused by coronavirus disease 2019 and its variants (COVID-19) has resulted in, and may continue to result in, significant global economic and societal disruption and market volatility due to disruptions in market access, resource availability, facilities operations, imposition of tariffs, export controls and supply chain disruption, among others. Such disruptions may be caused, or exacerbated by, quarantines and travel restrictions, workforce displacement and loss in human and other resources. The uncertainty surrounding the magnitude, duration, reach, costs and effects of the global pandemic, as well as actions that have been or could be taken by governmental authorities or other third parties, present unknowns that are yet to unfold. The impacts, as well as the uncertainty over impacts to come, of COVID-19 – and any other infectious illness outbreaks, epidemics and pandemics that may arise in the future – could negatively affect global economies and markets in ways that cannot necessarily be foreseen. In addition, the impact of infectious illness outbreaks and epidemics in emerging market countries may be greater due to generally less established healthcare systems, governments and financial markets. Public health crises caused by the COVID-19 outbreak may exacerbate other pre-existing political, social and economic risks in certain countries or globally. The disruptions caused by COVID-19 could prevent the Fund from executing advantageous investment decisions in a timely manner and negatively impact the Fund’s ability to achieve its investment objective. Any such events could have a significant adverse impact on the value and risk profile of the Fund.
Shareholder concentration risk
At November 30, 2022, affiliated shareholders of record owned 85.8% of the outstanding shares of the Fund in one or more accounts. Subscription and redemption activity by concentrated accounts may have a significant effect on the operations of the Fund. In the case of a large redemption, the Fund may be forced to sell investments at inopportune times, including its liquid positions, which may result in Fund losses and the Fund holding a higher percentage of less liquid positions. Large redemptions could result in decreased economies of scale and increased operating expenses for non-redeeming Fund shareholders.
Note 10. Subsequent events
Management has evaluated the events and transactions that have occurred through the date the financial statements were issued and noted no items requiring adjustment of the financial statements or additional disclosure.
Note 11. Information regarding pending and settled legal proceedings
Ameriprise Financial and certain of its affiliates are involved in the normal course of business in legal proceedings which include regulatory inquiries, arbitration and litigation, including class actions concerning matters arising in connection with the conduct of its activities as a diversified financial services firm. Ameriprise Financial believes that the Fund is not currently the subject of, and that neither Ameriprise Financial nor any of its affiliates are the subject of, any pending legal, arbitration or regulatory proceedings that are likely to have a material adverse effect on the Fund or the ability of Ameriprise Financial or its affiliates to perform under their contracts with the Fund. Ameriprise Financial is required to make quarterly (10-Q), annual (10-K) and, as necessary, 8-K filings with the Securities and Exchange Commission (SEC) on legal and regulatory matters that relate to Ameriprise Financial and its affiliates. Copies of these filings may be obtained by accessing the SEC website at www.sec.gov.
There can be no assurance that these matters, or the adverse publicity associated with them, will not result in increased Fund redemptions, reduced sale of Fund shares or other adverse consequences to the Fund. Further, although we believe proceedings are not likely to have a material adverse effect on the Fund or the ability of Ameriprise Financial or its affiliates to perform under their contracts with the Fund, these proceedings are subject to uncertainties and, as such, we are unable to estimate the possible loss or range of loss that may result. An adverse outcome in one or more of these proceedings could
Columbia Large Cap Value Fund | Semiannual Report 2022
| 25 |
Notes to Financial Statements (continued)
November 30, 2022 (Unaudited)
result in adverse judgments, settlements, fines, penalties or other relief that could have a material adverse effect on the consolidated financial condition or results of operations of Ameriprise Financial or one or more of its affiliates that provides services to the Fund.
| 26 | Columbia Large Cap Value Fund | Semiannual Report 2022 |
Approval of Management Agreement
(Unaudited)
Columbia Management Investment Advisers, LLC (the Investment Manager, and together with its domestic and global affiliates, Columbia Threadneedle Investments), a wholly-owned subsidiary of Ameriprise Financial, Inc. (Ameriprise Financial), serves as the investment manager to Columbia Large Cap Value Fund (the Fund). Under a management agreement (the Management Agreement), the Investment Manager provides investment advice and other services to the Fund and other funds distributed by Columbia Management Investment Distributors, Inc. (collectively, the Funds).
On an annual basis, the Fund’s Board of Trustees (the Board), including the independent Board members (the Independent Trustees), considers renewal of the Management Agreement. The Investment Manager prepared detailed reports for the Board and its Contracts Committee (including its Contracts Subcommittee) in November 2021 and March, April and June 2022, including reports providing the results of analyses performed by an independent third-party data provider, Broadridge Financial Solutions, Inc. (Broadridge), and comprehensive responses to written requests for information by independent legal counsels to the Independent Trustees (Independent Legal Counsel) to the Investment Manager, to assist the Board in making this determination. In addition, throughout the year, the Board (or its committees or subcommittees) regularly meets with portfolio management teams and senior management personnel and reviews information prepared by the Investment Manager addressing the services the Investment Manager provides and Fund performance. The Board also accords appropriate weight to the work, deliberations and conclusions of the various committees, such as the Contracts Committee, the Investment Review Committee, the Audit Committee and the Compliance Committee in determining whether to continue the Management Agreement.
The Board, at its June 23, 2022 Board meeting (the June Meeting), considered the renewal of the Management Agreement for an additional one-year term. At the June Meeting, Independent Legal Counsel reviewed with the Independent Trustees various factors relevant to the Board’s consideration of advisory agreements and the Board’s legal responsibilities related to such consideration. The Independent Trustees considered all information that they, their legal counsel or the Investment Manager believed reasonably necessary to evaluate and to approve the continuation of the Management Agreement. Among other things, the information and factors considered included the following:
| • | Information on the investment performance of the Fund relative to the performance of a group of mutual funds determined to be comparable to the Fund by Broadridge, as well as performance relative to benchmarks; |
| • | Information on the Fund’s management fees and total expenses, including information comparing the Fund’s expenses to those of a group of comparable mutual funds, as determined by Broadridge; |
| • | The Investment Manager’s agreement to contractually limit or cap total operating expenses for the Fund so that total operating expenses (excluding certain fees and expenses, such as transaction costs and certain other investment related expenses, interest, taxes, acquired fund fees and expenses and infrequent and/or unusual expenses) would not exceed a specified annual rate, as a percentage of the Fund’s net assets; |
| • | Terms of the Management Agreement; |
| • | Descriptions of other agreements and arrangements with affiliates of the Investment Manager relating to the operations of the Fund, including agreements with respect to the provision of transfer agency and shareholder services to the Fund; |
| • | Descriptions of various services performed by the Investment Manager under the Management Agreement, including portfolio management and portfolio trading practices; |
| • | Information regarding any recently negotiated management fees of similarly-managed portfolios of other institutional clients of the Investment Manager; |
| • | Information regarding the resources of the Investment Manager, including information regarding senior management, portfolio managers and other personnel; |
| • | Information regarding the capabilities of the Investment Manager with respect to compliance monitoring services; |
| • | The profitability to the Investment Manager and its affiliates from their relationships with the Fund; and |
| • | Report provided by the Board’s independent fee consultant, JDL Consultants, LLC (JDL). |
Columbia Large Cap Value Fund | Semiannual Report 2022
| 27 |
Approval of Management Agreement (continued)
(Unaudited)
Following an analysis and discussion of the foregoing, and the factors identified below, the Board, including all of the Independent Trustees, approved the renewal of the Management Agreement.
Nature, extent and quality of services provided by the Investment Manager
The Board analyzed various reports and presentations it had received detailing the services performed by the Investment Manager, as well as its history, expertise, resources and relative capabilities, and the qualifications of its personnel.
The Board specifically considered the many developments during recent years concerning the services provided by the Investment Manager. Among other things, the Board noted the organization and depth of the equity and credit research departments. The Board further observed the enhancements to the investment risk management department’s processes, systems and oversight, over the past several years, as well as planned 2022 initiatives in this regard. The Board also took into account the broad scope of services provided by the Investment Manager to the Fund, including, among other services, investment, risk and compliance oversight. The Board also took into account the information it received concerning the Investment Manager’s ability to attract and retain key portfolio management personnel and that it has sufficient resources to provide competitive and adequate compensation to investment personnel. The Board also observed that the Investment Manager has been able to effectively manage, operate and distribute the Funds through the COVID-19 pandemic period with no disruptions in services provided. The Board also considered added personnel and resources obtained by Columbia Threadneedle through Ameriprise Financial’s acquisition of BMO Financial Group’s Europe, Middle East, and Africa (EMEA) asset management business.
In connection with the Board’s evaluation of the overall package of services provided by the Investment Manager, the Board also considered the nature, quality and range of administrative services provided to the Fund by the Investment Manager, as well as the achievements in 2021 in the performance of administrative services, and noted the various enhancements anticipated for 2022. In evaluating the quality of services provided under the Management Agreement, the Board also took into account the organization and strength of the Fund’s and its service providers’ compliance programs. The Board also reviewed the financial condition of the Investment Manager and its affiliates and each entity’s ability to carry out its responsibilities under the Management Agreement and the Fund’s other service agreements.
In addition, the Board discussed the acceptability of the terms of the Management Agreement, noting that no changes were proposed from the form of agreement previously approved. The Board also noted the wide array of legal and compliance services provided to the Fund under the Management Agreement.
After reviewing these and related factors (including investment performance as discussed below), the Board concluded, within the context of their overall conclusions, that the nature, extent and quality of the services provided to the Fund under the Management Agreement supported the continuation of the Management Agreement.
Investment performance
In this connection, the Board carefully reviewed the investment performance of the Fund, including detailed reports providing the results of analyses performed by each of the Investment Manager, Broadridge and JDL collectively showing, for various periods (including since manager inception): (i) the performance of the Fund, (ii) the performance of a benchmark index, (iii) the percentage ranking of the Fund among its comparison group, (iv) the Fund’s performance relative to peers and benchmarks and (v) the net assets of the Fund. The Board observed that the Fund’s performance for certain periods ranked above median based on information provided by Broadridge.
The Board also reviewed a description of the third-party data provider’s methodology for identifying the Fund’s peer groups for purposes of performance and expense comparisons.
The Board also considered the Investment Manager’s performance and reputation generally. After reviewing these and related factors, the Board concluded, within the context of their overall conclusions, that the performance of the Fund and the Investment Manager, in light of other considerations, supported the continuation of the Management Agreement.
| 28 | Columbia Large Cap Value Fund | Semiannual Report 2022 |
Approval of Management Agreement (continued)
(Unaudited)
Comparative fees, costs of services provided and the profits realized by the Investment Manager and its affiliates from their relationships with the Fund
The Board reviewed comparative fees and the costs of services provided under the Management Agreement. The Board members considered detailed comparative information set forth in an annual report on fees and expenses, including, among other things, data (based on analyses conducted by Broadridge and JDL) showing a comparison of the Fund’s expenses with median expenses paid by funds in its comparative peer universe, as well as data showing the Fund’s contribution to the Investment Manager’s profitability. The Board reviewed the fees charged to comparable institutional or other accounts/vehicles managed by the Investment Manager and discussed differences in how the products are managed and operated, thus explaining many of the differences in fees.
The Board considered the reports of JDL, which assisted in the Board’s analysis of the Funds’ performance and expenses and the reasonableness of the Funds’ fee rates. The Board accorded particular weight to the notion that a primary objective of the level of fees is to achieve a rational pricing model applied consistently across the various product lines in the Fund family, while assuring that the overall fees for each Fund (with certain exceptions) are generally in line with the current "pricing philosophy" such that Fund total expense ratios, in general, approximate or are lower than the median expense ratios of funds in the same Lipper comparison universe. The Board took into account that the Fund’s total expense ratio (after considering proposed expense caps/waivers) approximated the peer universe’s median expense ratio.
After reviewing these and related factors, the Board concluded, within the context of their overall conclusions, that the levels of management fees and expenses of the Fund, in light of other considerations, supported the continuation of the Management Agreement.
The Board also considered the profitability of the Investment Manager and its affiliates in connection with the Investment Manager providing management services to the Fund. With respect to the profitability of the Investment Manager and its affiliates, the Independent Trustees referred to information discussing the profitability to the Investment Manager and Ameriprise Financial from managing, operating and distributing the Funds. The Board considered that in 2021 the Board had considered 2020 profitability and that the 2022 information showed that the profitability generated by the Investment Manager in 2021 increased from 2020 levels, due to a variety of factors, including the increased assets under management of the Funds. It also took into account the indirect economic benefits flowing to the Investment Manager or its affiliates in connection with managing or distributing the Funds, such as the enhanced ability to offer various other financial products to Ameriprise Financial customers, soft dollar benefits and overall reputational advantages. The Board noted that the fees paid by the Fund should permit the Investment Manager to offer competitive compensation to its personnel, make necessary investments in its business and earn an appropriate profit. After reviewing these and related factors, the Board concluded, within the context of their overall conclusions, that the costs of services provided and the profitability to the Investment Manager and its affiliates from their relationships with the Fund supported the continuation of the Management Agreement.
Economies of scale
The Board considered the potential existence of economies of scale in the provision by the Investment Manager of services to the Fund, to groups of related funds and to the Investment Manager as a whole, and whether those economies of scale were shared with the Fund through breakpoints in investment management fees or other means, such as expense limitation arrangements and additional investments by the Investment Manager in investment, trading, compliance and other resources. The Board considered the economies of scale that might be realized as the Fund’s net asset level grows and took note of the extent to which Fund shareholders might also benefit from such growth. In this regard, the Board took into account that management fees decline as Fund assets exceed various breakpoints, all of which have not been surpassed. The Board observed that the Management Agreement provided for breakpoints in the management fee rate schedule that allow opportunities for shareholders to realize lower fees as Fund assets grow and that there are additional opportunities through other means for sharing economies of scale with shareholders.
Conclusion
The Board reviewed all of the above considerations in reaching its decision to approve the continuation of the Management Agreement. In reaching its conclusions, no single factor was determinative.
Columbia Large Cap Value Fund | Semiannual Report 2022
| 29 |
Approval of Management Agreement (continued)
(Unaudited)
On June 23, 2022, the Board, including all of the Independent Trustees, determined that fees payable under the Management Agreement were fair and reasonable in light of the extent and quality of services provided and approved the renewal of the Management Agreement.
| 30 | Columbia Large Cap Value Fund | Semiannual Report 2022 |
[THIS PAGE INTENTIONALLY LEFT BLANK]
Columbia Large Cap Value Fund
P.O. Box 219104
Kansas City, MO 64121-9104
Please read and consider the investment objectives, risks, charges and expenses for any fund carefully before investing. For a prospectus and summary prospectus, which contains this and other important information about the Fund, go to
columbiathreadneedleus.com/investor/. The Fund is distributed by Columbia Management Investment Distributors, Inc., member FINRA, and managed by Columbia Management Investment Advisers, LLC.
Columbia Threadneedle Investments (Columbia Threadneedle) is the global brand name of the Columbia and Threadneedle group of companies. All rights reserved.
© 2023 Columbia Management Investment Advisers, LLC.
columbiathreadneedleus.com/investor/

Semiannual Report
November 30, 2022 (Unaudited)
Columbia Seligman Technology and Information Fund
Not FDIC or NCUA Insured • No Financial Institution Guarantee • May Lose Value
If you elect to receive the shareholder report for Columbia Seligman Technology and Information Fund (the Fund) in paper, mailed to you, the Fund mails one shareholder report to each shareholder address, unless such shareholder elects to receive shareholder reports from the Fund electronically via e-mail or by having a paper notice mailed to you (Postcard Notice) that your Fund’s shareholder report is available at the Columbia funds’ website (columbiathreadneedleus.com/investor/). If you would like more than one report in paper to be mailed to you, or would like to elect to receive reports via e-mail or access them through Postcard Notice, please call shareholder services at 800.345.6611 and additional reports will be sent to you.
Proxy voting policies and procedures
The policy of the Board of Trustees is to vote the proxies of the companies in which the Fund holds investments consistent with the procedures as stated in the Statement of Additional Information (SAI). You may obtain a copy of the SAI without charge by calling 800.345.6611; contacting your financial intermediary; visiting columbiathreadneedleus.com/investor/; or searching the website of the Securities and Exchange Commission (SEC) at sec.gov. Information regarding how the Fund voted proxies relating to portfolio securities is filed with the SEC by August 31st for the most recent 12-month period ending June 30th of that year, and is available without charge by visiting columbiathreadneedleus.com/investor/, or searching the website of the SEC at sec.gov.
Quarterly schedule of investments
The Fund files a complete schedule of portfolio holdings with the SEC for the first and third quarters of each fiscal year on Form N-PORT. The Fund’s Form N-PORT filings are available on the SEC’s website at sec.gov. The Fund’s complete schedule of portfolio holdings, as filed on Form N-PORT, is available on columbiathreadneedleus.com/investor/ or can also be obtained without charge, upon request, by calling 800.345.6611.
Additional Fund information
For more information about the Fund, please visit columbiathreadneedleus.com/investor/ or call 800.345.6611. Customer Service Representatives are available to answer your questions Monday through Friday from 8 a.m. to 7 p.m. Eastern time.
Fund investment manager
Columbia Management Investment Advisers, LLC (the Investment Manager)
290 Congress Street
Boston, MA 02210
Fund distributor
Columbia Management Investment Distributors, Inc.
290 Congress Street
Boston, MA 02210
Fund transfer agent
Columbia Management Investment Services Corp.
P.O. Box 219104
Kansas City, MO 64121-9104
Columbia Seligman Technology and Information Fund | Semiannual Report 2022
Fund at a Glance
(Unaudited)
Investment objective
The Fund seeks to provide shareholders with capital gain.
Portfolio management
Paul Wick
Lead Portfolio Manager
Managed Fund since 1990
Shekhar Pramanick
Technology Team Member
Managed Fund since 2013
Sanjay Devgan
Technology Team Member
Managed Fund since 2013
Jeetil Patel
Technology Team Member
Managed Fund since 2015
Vimal Patel
Technology Team Member
Managed Fund since 2018
Israel Hernandez
Technology Team Member
Managed Fund since 2021
Morningstar style boxTM
The Morningstar Style Box is based on a fund’s portfolio holdings. For equity funds, the vertical axis shows the market capitalization of the stocks owned, and the horizontal axis shows investment style (value, blend, or growth). Information shown is based on the most recent data provided by Morningstar.
© 2023 Morningstar, Inc. All rights reserved. The Morningstar information contained herein: (1) is proprietary to Morningstar and/or its content providers; (2) may not be copied or distributed; and (3) is not warranted to be accurate, complete or timely. Neither Morningstar nor its content providers are responsible for any damages or losses arising from any use of this information.
| Average annual total returns (%) (for the period ended November 30, 2022) |
| | | Inception | 6 Months
cumulative | 1 Year | 5 Years | 10 Years |
| Class A | Excluding sales charges | 06/23/83 | -7.46 | -20.86 | 15.86 | 19.00 |
| | Including sales charges | | -12.78 | -25.41 | 14.50 | 18.30 |
| Advisor Class | 08/03/09 | -7.35 | -20.67 | 16.15 | 19.30 |
| Class C | Excluding sales charges | 05/27/99 | -7.80 | -21.44 | 15.00 | 18.12 |
| | Including sales charges | | -8.72 | -22.09 | 15.00 | 18.12 |
| Institutional Class | 09/27/10 | -7.34 | -20.67 | 16.15 | 19.30 |
| Institutional 2 Class | 11/30/01 | -7.33 | -20.63 | 16.20 | 19.40 |
| Institutional 3 Class* | 03/01/17 | -7.30 | -20.60 | 16.26 | 19.24 |
| Class R | 04/30/03 | -7.58 | -21.06 | 15.57 | 18.71 |
| S&P North American Technology Sector Index | | -6.72 | -28.73 | 13.64 | 17.78 |
Returns for Class A shares are shown with and without the maximum initial sales charge of 5.75%. Returns for Class C shares are shown with and without the 1.00% contingent deferred sales charge for the first year only. The Fund’s other share classes are not subject to sales charges and have limited eligibility. Please see the Fund’s prospectus for details. Performance for different share classes will vary based on differences in sales charges and fees associated with each share class. All results shown assume reinvestment of distributions during the period. Returns do not reflect the deduction of taxes that a shareholder may pay on Fund distributions or on the redemption of Fund shares. Performance results reflect the effect of any fee waivers or reimbursements of Fund expenses by Columbia Management Investment Advisers, LLC and/or any of its affiliates. Absent these fee waivers or expense reimbursement arrangements, performance results would have been lower.
The performance information shown represents past performance and is not a guarantee of future results. The investment return and principal value of your investment will fluctuate so that your shares, when redeemed, may be worth more or less than their original cost. Current performance may be lower or higher than the performance information shown. You may obtain performance information current to the most recent month-end by contacting your financial intermediary, visiting columbiathreadneedleus.com/investor/ or calling 800.345.6611.
| * | The returns shown for periods prior to the share class inception date (including returns for the Life of the Fund, if shown, which are since Fund inception) include the returns of the Fund’s oldest share class. These returns are adjusted to reflect any higher class-related operating expenses of the newer share classes, as applicable. Please visit columbiathreadneedleus.com/investor/investment-products/mutual-funds/appended-performance for more information. |
The S&P North American Technology Sector Index is an unmanaged modified capitalization-weighted index based on a universe of technology-related stocks.
Indices are not available for investment, are not professionally managed and do not reflect sales charges, fees, brokerage commissions, taxes or other expenses of investing. Securities in the Fund may not match those in an index.
Columbia Seligman Technology and Information Fund | Semiannual Report 2022
| 3 |
Fund at a Glance (continued)
(Unaudited)
| Portfolio breakdown (%) (at November 30, 2022) |
| Common Stocks | 97.8 |
| Convertible Bonds | 0.0(a) |
| Exchange-Traded Equity Funds | 0.1 |
| Money Market Funds | 2.1 |
| Preferred Stocks | 0.0(a) |
| Total | 100.0 |
Percentages indicated are based upon total investments excluding investments in derivatives, if any. The Fund’s portfolio composition is subject to change.
| Equity sector breakdown (%) (at November 30, 2022) |
| Communication Services | 10.3 |
| Consumer Discretionary | 2.2 |
| Financials | 0.0(a) |
| Health Care | 0.4 |
| Industrials | 2.8 |
| Information Technology | 84.3 |
| Total | 100.0 |
Percentages indicated are based upon total equity investments. The Fund’s portfolio composition is subject to change.
| Equity sub-industry breakdown (%) (at November 30, 2022) |
| Information Technology | |
| Application Software | 7.6 |
| Communications Equipment | 3.7 |
| Data Processing & Outsourced Services | 5.1 |
| Electronic Equipment & Instruments | 2.1 |
| Internet Services & Infrastructure | 2.6 |
| IT Consulting & Other Services | 0.8 |
| Semiconductor Equipment | 13.6 |
| Semiconductors | 23.7 |
| Systems Software | 14.8 |
| Technology Hardware, Storage & Peripherals | 10.3 |
| Total | 84.3 |
Percentages indicated are based upon total equity investments. The Fund’s portfolio composition is subject to change.
| 4 | Columbia Seligman Technology and Information Fund | Semiannual Report 2022 |
Understanding Your Fund’s Expenses
(Unaudited)
As an investor, you incur two types of costs. There are shareholder transaction costs, which generally include sales charges on purchases and may include redemption fees. There are also ongoing fund costs, which generally include management fees, distribution and/or service fees, and other fund expenses. The following information is intended to help you understand your ongoing costs (in dollars) of investing in the Fund and to help you compare these costs with the ongoing costs of investing in other mutual funds.
Analyzing your Fund’s expenses
To illustrate these ongoing costs, we have provided examples and calculated the expenses paid by investors in each share class of the Fund during the period. The actual and hypothetical information in the table is based on an initial investment of $1,000 at the beginning of the period indicated and held for the entire period. Expense information is calculated two ways and each method provides you with different information. The amount listed in the “Actual” column is calculated using the Fund’s actual operating expenses and total return for the period. You may use the Actual information, together with the amount invested, to estimate the expenses that you paid over the period. Simply divide your account value by $1,000 (for example, an $8,600 account value divided by $1,000 = 8.6), then multiply the results by the expenses paid during the period under the “Actual” column. The amount listed in the “Hypothetical” column assumes a 5% annual rate of return before expenses (which is not the Fund’s actual return) and then applies the Fund’s actual expense ratio for the period to the hypothetical return. You should not use the hypothetical account values and expenses to estimate either your actual account balance at the end of the period or the expenses you paid during the period. See “Compare with other funds” below for details on how to use the hypothetical data.
Compare with other funds
Since all mutual funds are required to include the same hypothetical calculations about expenses in shareholder reports, you can use this information to compare the ongoing cost of investing in the Fund with other funds. To do so, compare the hypothetical example with the 5% hypothetical examples that appear in the shareholder reports of other funds. As you compare hypothetical examples of other funds, it is important to note that hypothetical examples are meant to highlight the ongoing costs of investing in a fund only and do not reflect any transaction costs, such as sales charges, or redemption or exchange fees. Therefore, the hypothetical calculations are useful in comparing ongoing costs only, and will not help you determine the relative total costs of owning different funds. If transaction costs were included in these calculations, your costs would be higher.
| June 1, 2022 — November 30, 2022 |
| | Account value at the
beginning of the
period ($) | Account value at the
end of the
period ($) | Expenses paid during
the period ($) | Fund’s annualized
expense ratio (%) |
| | Actual | Hypothetical | Actual | Hypothetical | Actual | Hypothetical | Actual |
| Class A | 1,000.00 | 1,000.00 | 925.40 | 1,019.05 | 5.79 | 6.07 | 1.20 |
| Advisor Class | 1,000.00 | 1,000.00 | 926.50 | 1,020.31 | 4.59 | 4.81 | 0.95 |
| Class C | 1,000.00 | 1,000.00 | 922.00 | 1,015.29 | 9.40 | 9.85 | 1.95 |
| Institutional Class | 1,000.00 | 1,000.00 | 926.60 | 1,020.31 | 4.59 | 4.81 | 0.95 |
| Institutional 2 Class | 1,000.00 | 1,000.00 | 926.70 | 1,020.51 | 4.40 | 4.61 | 0.91 |
| Institutional 3 Class | 1,000.00 | 1,000.00 | 927.00 | 1,020.76 | 4.15 | 4.36 | 0.86 |
| Class R | 1,000.00 | 1,000.00 | 924.20 | 1,017.80 | 6.99 | 7.33 | 1.45 |
Expenses paid during the period are equal to the annualized expense ratio for each class as indicated above, multiplied by the average account value over the period and then multiplied by the number of days in the Fund’s most recent fiscal half year and divided by 365.
Expenses do not include fees and expenses incurred indirectly by the Fund from its investment in underlying funds, including affiliated and non-affiliated pooled investment vehicles, such as mutual funds and exchange-traded funds.
Had Columbia Management Investment Advisers, LLC and/or certain of its affiliates not waived/reimbursed certain fees and expenses, account value at the end of the period would have been reduced.
Columbia Seligman Technology and Information Fund | Semiannual Report 2022
| 5 |
Portfolio of Investments
November 30, 2022 (Unaudited)
(Percentages represent value of investments compared to net assets)
Investments in securities
| Common Stocks 97.7% |
| Issuer | Shares | Value ($) |
| Communication Services 10.0% |
| Broadcasting 1.5% |
| Fox Corp., Class A | 4,056,480 | 131,632,776 |
| Total Broadcasting | 131,632,776 |
| Cable & Satellite 0.4% |
| Comcast Corp., Class A(a) | 1,013,525 | 37,135,556 |
| Total Cable & Satellite | 37,135,556 |
| Interactive Home Entertainment 1.4% |
| Activision Blizzard, Inc. | 1,615,181 | 119,442,635 |
| Total Interactive Home Entertainment | 119,442,635 |
| Interactive Media & Services 5.9% |
| Alphabet, Inc., Class A(b) | 2,984,080 | 301,362,239 |
| Alphabet, Inc., Class C(b) | 1,843,360 | 187,008,872 |
| Match Group, Inc.(b) | 443,700 | 22,433,472 |
| Total Interactive Media & Services | 510,804,583 |
| Movies & Entertainment 0.3% |
| Warner Bros Discovery, Inc.(b) | 2,579,606 | 29,407,508 |
| Total Movies & Entertainment | 29,407,508 |
| Wireless Telecommunication Services 0.5% |
| T-Mobile US, Inc.(b) | 276,700 | 41,908,982 |
| Total Wireless Telecommunication Services | 41,908,982 |
| Total Communication Services | 870,332,040 |
| Consumer Discretionary 2.1% |
| Internet & Direct Marketing Retail 2.1% |
| eBay, Inc. | 4,056,324 | 184,319,363 |
| Total Internet & Direct Marketing Retail | 184,319,363 |
| Total Consumer Discretionary | 184,319,363 |
| Financials 0.0% |
| Consumer Finance 0.0% |
| CommonBond, Class A(b),(c),(d),(e) | 1,505,550 | 1 |
| Total Consumer Finance | 1 |
| Total Financials | 1 |
| Health Care 0.4% |
| Common Stocks (continued) |
| Issuer | Shares | Value ($) |
| Biotechnology 0.4% |
| Apnimed, Inc.(b),(c),(d),(e) | 1,127,586 | 12,517,332 |
| Apnimed, Inc.(b),(c),(d),(e) | 675,613 | 7,499,980 |
| Apnimed, Inc.(b),(c),(d),(e) | 360,327 | 3,999,990 |
| Eiger BioPharmaceuticals, Inc.(b),(f) | 2,319,150 | 10,528,941 |
| Total Biotechnology | 34,546,243 |
| Total Health Care | 34,546,243 |
| Industrials 2.8% |
| Heavy Electrical Equipment 2.6% |
| Bloom Energy Corp., Class A(b),(f) | 10,356,848 | 220,497,294 |
| Total Heavy Electrical Equipment | 220,497,294 |
| Human Resource & Employment Services 0.2% |
| HireRight Holdings Corp.(b) | 1,576,392 | 19,972,887 |
| Total Human Resource & Employment Services | 19,972,887 |
| Total Industrials | 240,470,181 |
| Information Technology 82.4% |
| Application Software 7.5% |
| Cerence, Inc.(b) | 1,641,024 | 33,657,402 |
| Dropbox, Inc., Class A(b) | 9,084,509 | 214,031,032 |
| Intapp, Inc.(b) | 425,646 | 9,836,679 |
| Salesforce, Inc.(b) | 395,651 | 63,403,073 |
| Samsara, Inc., Class A(b) | 877,056 | 8,358,344 |
| Splunk, Inc.(b) | 135,700 | 10,541,176 |
| Synopsys, Inc.(b) | 906,940 | 307,942,407 |
| Total Application Software | 647,770,113 |
| Communications Equipment 3.6% |
| Arista Networks, Inc.(b) | 545,028 | 75,922,400 |
| F5, Inc.(a),(b) | 806,400 | 124,677,504 |
| Lumentum Holdings, Inc.(b) | 1,669,070 | 91,698,706 |
| Telefonaktiebolaget LM Ericsson, ADR | 3,749,299 | 23,883,035 |
| Total Communications Equipment | 316,181,645 |
| Data Processing & Outsourced Services 5.0% |
| Fidelity National Information Services, Inc. | 994,600 | 72,188,068 |
| Fiserv, Inc.(b) | 965,544 | 100,764,172 |
| Visa, Inc., Class A | 1,192,425 | 258,756,225 |
| Total Data Processing & Outsourced Services | 431,708,465 |
The accompanying Notes to Financial Statements are an integral part of this statement.
| 6 | Columbia Seligman Technology and Information Fund | Semiannual Report 2022 |
Portfolio of Investments (continued)
November 30, 2022 (Unaudited)
| Common Stocks (continued) |
| Issuer | Shares | Value ($) |
| Electronic Equipment & Instruments 2.1% |
| Advanced Energy Industries, Inc. | 1,749,739 | 162,095,821 |
| National Instruments Corp. | 435,600 | 17,868,312 |
| Total Electronic Equipment & Instruments | 179,964,133 |
| Internet Services & Infrastructure 2.5% |
| GoDaddy, Inc., Class A(b) | 2,800,930 | 221,637,591 |
| Total Internet Services & Infrastructure | 221,637,591 |
| IT Consulting & Other Services 0.7% |
| DXC Technology Co.(b) | 1,576,100 | 46,762,887 |
| Thoughtworks Holding, Inc.(b) | 1,818,563 | 16,585,294 |
| Total IT Consulting & Other Services | 63,348,181 |
| Semiconductor Equipment 13.3% |
| Applied Materials, Inc. | 2,754,831 | 301,929,477 |
| Lam Research Corp. | 1,146,668 | 541,663,030 |
| Teradyne, Inc. | 3,340,922 | 312,209,161 |
| Total Semiconductor Equipment | 1,155,801,668 |
| Semiconductors 23.1% |
| Analog Devices, Inc. | 1,608,402 | 276,500,388 |
| Broadcom, Inc. | 714,576 | 393,752,813 |
| GlobalFoundries, Inc.(b) | 1,746,152 | 112,364,881 |
| indie Semiconductor, Inc., Class A(b) | 2,000,000 | 16,420,000 |
| Marvell Technology, Inc. | 4,109,453 | 191,171,754 |
| mCube, Inc.(b),(c),(d),(e) | 6,015,834 | 22,860,168 |
| Microchip Technology, Inc. | 1,953,650 | 154,709,543 |
| Micron Technology, Inc.(a) | 1,504,794 | 86,751,374 |
| NXP Semiconductors NV | 695,300 | 122,261,552 |
| ON Semiconductor Corp.(b) | 139,600 | 10,497,920 |
| Qorvo, Inc.(b) | 1,229,750 | 122,052,688 |
| QUALCOMM, Inc. | 65,000 | 8,221,850 |
| Rambus, Inc.(b) | 1,975,200 | 75,808,176 |
| Renesas Electronics Corp.(b) | 10,607,800 | 104,038,195 |
| Skyworks Solutions, Inc. | 168,300 | 16,092,846 |
| SMART Global Holdings, Inc.(b),(f) | 2,963,996 | 50,121,172 |
| Synaptics, Inc.(b),(f) | 2,180,645 | 231,082,951 |
| Transphorm, Inc.(b),(f) | 2,987,500 | 17,178,125 |
| Total Semiconductors | 2,011,886,396 |
| Common Stocks (continued) |
| Issuer | Shares | Value ($) |
| Systems Software 14.5% |
| Adeia, Inc.(f) | 7,076,541 | 78,195,778 |
| Fortinet, Inc.(b) | 2,968,515 | 157,806,257 |
| Gen Digital, Inc. | 7,341,108 | 168,551,840 |
| Microsoft Corp. | 1,235,575 | 315,244,606 |
| Oracle Corp. | 2,644,800 | 219,597,744 |
| Palo Alto Networks, Inc.(b) | 1,038,210 | 176,391,879 |
| Tenable Holdings, Inc.(b) | 660,894 | 25,232,933 |
| VMware, Inc., Class A(b) | 695,969 | 84,553,274 |
| Xperi, Inc.(b),(f) | 2,830,616 | 30,315,897 |
| Total Systems Software | 1,255,890,208 |
| Technology Hardware, Storage & Peripherals 10.1% |
| Apple, Inc.(a) | 3,293,200 | 487,492,396 |
| Dell Technologies, Inc. | 2,035,936 | 91,189,573 |
| NetApp, Inc. | 2,717,706 | 183,744,103 |
| Western Digital Corp.(b) | 3,052,392 | 112,175,406 |
| Total Technology Hardware, Storage & Peripherals | 874,601,478 |
| Total Information Technology | 7,158,789,878 |
Total Common Stocks
(Cost: $4,916,522,256) | 8,488,457,706 |
| Convertible Bonds 0.0% |
| Issuer | Coupon
Rate | Principal
Amount | Value ($) |
| Technology 0.0% |
| Movella, Inc.(c),(d),(e) |
| 09/01/2023 | 6.000% | 3,000,000 | 2,775,000 |
Total Convertible Bonds
(Cost: $3,000,000) | 2,775,000 |
| Exchange-Traded Equity Funds 0.1% |
| Issuer | Shares | Value ($) |
| Financials 0.1% |
| Diversified Capital Markets 0.1% |
| Columbia Seligman Semiconductor and Technology ETF(b),(f) | 540,600 | 9,322,485 |
| Total Diversified Capital Markets | 9,322,485 |
| Total Financials | 9,322,485 |
Total Exchange-Traded Equity Funds
(Cost: $8,811,780) | 9,322,485 |
The accompanying Notes to Financial Statements are an integral part of this statement.
Columbia Seligman Technology and Information Fund | Semiannual Report 2022
| 7 |
Portfolio of Investments (continued)
November 30, 2022 (Unaudited)
| Preferred Stocks 0.0% |
| Issuer | | Shares | Value ($) |
| Financials 0.0% |
| Consumer Finance 0.0% |
| CommonBond LLC(c),(d),(e) | 1.000% | 686,561 | 1 |
| Total Financials | 1 |
Total Preferred Stocks
(Cost: $295,734) | 1 |
| Money Market Funds 2.1% |
| | Shares | Value ($) |
| Columbia Short-Term Cash Fund, 3.989%(f),(g) | 181,805,016 | 181,732,294 |
Total Money Market Funds
(Cost: $181,720,300) | 181,732,294 |
Total Investments in Securities
(Cost $5,110,350,070) | 8,682,287,486 |
| Other Assets & Liabilities, Net | | 8,589,806 |
| Net Assets | $8,690,877,292 |
At November 30, 2022, securities and/or cash totaling $94,866,914 were pledged as collateral.
Investments in derivatives
| Call option contracts written |
| Description | Counterparty | Trading
currency | Notional
amount | Number of
contracts | Exercise
price/Rate | Expiration
date | Premium
received ($) | Value ($) |
| Apple, Inc. | Morgan Stanley | USD | (15,276,696) | (1,032) | 165.00 | 2/17/2023 | (401,600) | (306,504) |
| Comcast Corp | Morgan Stanley | USD | (37,134,640) | (10,135) | 45.00 | 1/19/2024 | (979,550) | (2,097,945) |
| F5, Inc. | Morgan Stanley | USD | (1,051,348) | (68) | 195.00 | 1/20/2023 | (40,422) | (16,320) |
| Micron Technology, Inc. | Morgan Stanley | USD | (41,404,230) | (7,182) | 70.00 | 6/16/2023 | (2,103,134) | (2,370,060) |
| Total | | | | | | | (3,524,706) | (4,790,829) |
Notes to Portfolio of Investments
| (a) | This security or a portion of this security has been pledged as collateral in connection with derivative contracts. |
| (b) | Non-income producing investment. |
| (c) | Represents fair value as determined in good faith under procedures approved by the Board of Trustees. At November 30, 2022, the total value of these securities amounted to $49,652,472, which represents 0.57% of total net assets. |
| (d) | Denotes a restricted security, which is subject to legal or contractual restrictions on resale under federal securities laws. Disposal of a restricted investment may involve time-consuming negotiations and expenses, and prompt sale at an acceptable price may be difficult to achieve. Private placement securities are generally considered to be restricted, although certain of those securities may be traded between qualified institutional investors under the provisions of Section 4(a)(2) and Rule 144A. The Fund will not incur any registration costs upon such a trade. These securities are valued at fair value determined in good faith under consistently applied procedures established by the Fund’s Board of Trustees. At November 30, 2022, the total market value of these securities amounted to $49,652,472, which represents 0.57% of total net assets. Additional information on these securities is as follows: |
| Security | Acquisition
Dates | Shares | Cost ($) | Value ($) |
| Apnimed, Inc. | 04/28/2022 | 360,327 | 4,002,965 | 3,999,990 |
| Apnimed, Inc. | 04/28/2022 | 675,613 | 5,999,993 | 7,499,980 |
| Apnimed, Inc. | 03/12/2021 | 1,127,586 | 9,999,997 | 12,517,332 |
| CommonBond LLC | 10/15/2020—12/31/2021 | 686,561 | 295,734 | 1 |
| CommonBond, Class A | 03/19/2018—12/31/2021 | 1,505,550 | 10,292,674 | 1 |
The accompanying Notes to Financial Statements are an integral part of this statement.
| 8 | Columbia Seligman Technology and Information Fund | Semiannual Report 2022 |
Portfolio of Investments (continued)
November 30, 2022 (Unaudited)
Notes to Portfolio of Investments (continued)
| Security | Acquisition
Dates | Shares | Cost ($) | Value ($) |
| mCube, Inc. | 09/08/2020 | 6,015,834 | 25,000,001 | 22,860,168 |
| Movella, Inc. | 03/08/2022 | 3,000,000 | 3,000,000 | 2,775,000 |
| | | | 58,591,364 | 49,652,472 |
| (e) | Valuation based on significant unobservable inputs. |
| (f) | As defined in the Investment Company Act of 1940, as amended, an affiliated company is one in which the Fund owns 5% or more of the company’s outstanding voting securities, or a company which is under common ownership or control with the Fund. The value of the holdings and transactions in these affiliated companies during the period ended November 30, 2022 are as follows: |
| Affiliated issuers | Beginning
of period($) | Purchases($) | Sales($) | Net change in
unrealized
appreciation
(depreciation)($) | End of
period($) | Realized gain
(loss)($) | Dividends($) | End of
period shares |
| Adeia, Inc. |
| | — | 90,406,308* | — | (12,210,530) | 78,195,778 | — | 353,827 | 7,076,541 |
| Bloom Energy Corp., Class A |
| | 177,998,785 | 4,385,633 | — | 38,112,876 | 220,497,294 | — | — | 10,356,848 |
| Columbia Seligman Semiconductor and Technology ETF |
| | — | 8,811,780 | — | 510,705 | 9,322,485 | — | — | 540,600 |
| Columbia Short-Term Cash Fund, 3.989% |
| | 4,554,197 | 640,499,192 | (463,333,089) | 11,994 | 181,732,294 | 5,523 | 1,640,884 | 181,805,016 |
| Eiger BioPharmaceuticals, Inc. |
| | 16,094,901 | — | — | (5,565,960) | 10,528,941 | — | — | 2,319,150 |
| SMART Global Holdings, Inc. |
| | 70,486,576 | 1,698,058 | — | (22,063,462) | 50,121,172 | — | — | 2,963,996 |
| Synaptics, Inc. |
| | 307,422,319 | 10,905,659 | — | (87,245,027) | 231,082,951 | — | — | 2,180,645 |
| Transphorm, Inc. |
| | 17,954,875 | — | — | (776,750) | 17,178,125 | — | — | 2,987,500 |
| Xperi Holding Corp. |
| | 116,479,865 | — | (185,733,819)* | 69,253,954 | — | — | 353,827 | — |
| Xperi, Inc. |
| | — | 95,327,511* | (10) | (65,011,604) | 30,315,897 | (4) | — | 2,830,616 |
| Total | 710,991,518 | | | (84,983,804) | 828,974,937 | 5,519 | 2,348,538 | |
| * | Includes the effects of a corporate action. |
| (g) | The rate shown is the seven-day current annualized yield at November 30, 2022. |
Abbreviation Legend
| ADR | American Depositary Receipt |
Currency Legend
Fair value measurements
The Fund categorizes its fair value measurements according to a three-level hierarchy that maximizes the use of observable inputs and minimizes the use of unobservable inputs by prioritizing that the most observable input be used when available. Observable inputs are those that market participants would use in pricing an investment based on market data obtained from sources independent of the reporting entity. Unobservable inputs are those that reflect the Fund’s assumptions about the information market participants would use in
The accompanying Notes to Financial Statements are an integral part of this statement.
Columbia Seligman Technology and Information Fund | Semiannual Report 2022
| 9 |
Portfolio of Investments (continued)
November 30, 2022 (Unaudited)
Fair value measurements (continued)
pricing an investment. An investment’s level within the fair value hierarchy is based on the lowest level of any input that is deemed significant to the asset’s or liability’s fair value measurement. The input levels are not necessarily an indication of the risk or liquidity associated with investments at that level. For example, certain U.S. government securities are generally high quality and liquid, however, they are reflected as Level 2 because the inputs used to determine fair value may not always be quoted prices in an active market.
Fair value inputs are summarized in the three broad levels listed below:
| ■ | Level 1 — Valuations based on quoted prices for investments in active markets that the Fund has the ability to access at the measurement date. Valuation adjustments are not applied to Level 1 investments. |
| ■ | Level 2 — Valuations based on other significant observable inputs (including quoted prices for similar securities, interest rates, prepayment speeds, credit risks, etc.). |
| ■ | Level 3 — Valuations based on significant unobservable inputs (including the Fund’s own assumptions and judgment in determining the fair value of investments). |
Inputs that are used in determining fair value of an investment may include price information, credit data, volatility statistics, and other factors. These inputs can be either observable or unobservable. The availability of observable inputs can vary between investments, and is affected by various factors such as the type of investment, and the volume and level of activity for that investment or similar investments in the marketplace. The inputs will be considered by the Investment Manager, along with any other relevant factors in the calculation of an investment’s fair value. The Fund uses prices and inputs that are current as of the measurement date, which may include periods of market dislocations. During these periods, the availability of prices and inputs may be reduced for many investments. This condition could cause an investment to be reclassified between the various levels within the hierarchy.
Foreign equity securities actively traded in markets where there is a significant delay in the local close relative to the New York Stock Exchange are classified as Level 2. The values of these securities may include an adjustment to reflect the impact of market movements following the close of local trading, as described in Note 2 to the financial statements – Security valuation.
Investments falling into the Level 3 category are primarily supported by quoted prices from brokers and dealers participating in the market for those investments. However, these may be classified as Level 3 investments due to lack of market transparency and corroboration to support these quoted prices. Additionally, valuation models may be used as the pricing source for any remaining investments classified as Level 3. These models may rely on one or more significant unobservable inputs and/or significant assumptions by the Investment Manager. Inputs used in valuations may include, but are not limited to, financial statement analysis, capital account balances, discount rates and estimated cash flows, and comparable company data.
The Fund’s Board of Trustees (the Board) has designated the Investment Manager, through its Valuation Committee (the Committee), as valuation designee, responsible for determining the fair value of the assets of the Fund for which market quotations are not readily available using valuation procedures approved by the Board. The Committee consists of voting and non-voting members from various groups within the Investment Manager’s organization, including operations and accounting, trading and investments, compliance, risk management and legal.
The Committee meets at least monthly to review and approve valuation matters, which may include a description of specific valuation determinations, data regarding pricing information received from approved pricing vendors and brokers and the results of Board-approved valuation policies and procedures (the Policies). The Policies address, among other things, instances when market quotations are or are not readily available, including recommendations of third party pricing vendors and a determination of appropriate pricing methodologies; events that require specific valuation determinations and assessment of fair value techniques; securities with a potential for stale pricing, including those that are illiquid, restricted, or in default; and the effectiveness of third party pricing vendors, including periodic reviews of vendors. The Committee meets more frequently, as needed, to discuss additional valuation matters, which may include the need to review back-testing results, review time-sensitive information or approve related valuation actions. Representatives of Columbia Management Investment Advisers, LLC report to the Board at each of its regularly scheduled meetings to discuss valuation matters and actions during the period, similar to those described earlier.
The following table is a summary of the inputs used to value the Fund’s investments at November 30, 2022:
| | Level 1 ($) | Level 2 ($) | Level 3 ($) | Total ($) |
| Investments in Securities | | | | |
| Common Stocks | | | | |
| Communication Services | 870,332,040 | — | — | 870,332,040 |
| Consumer Discretionary | 184,319,363 | — | — | 184,319,363 |
| Financials | — | — | 1 | 1 |
| Health Care | 10,528,941 | — | 24,017,302 | 34,546,243 |
| Industrials | 240,470,181 | — | — | 240,470,181 |
| Information Technology | 7,031,891,515 | 104,038,195 | 22,860,168 | 7,158,789,878 |
| Total Common Stocks | 8,337,542,040 | 104,038,195 | 46,877,471 | 8,488,457,706 |
| Convertible Bonds | — | — | 2,775,000 | 2,775,000 |
| Exchange-Traded Equity Funds | 9,322,485 | — | — | 9,322,485 |
| Preferred Stocks | | | | |
| Financials | — | — | 1 | 1 |
| Total Preferred Stocks | — | — | 1 | 1 |
| Money Market Funds | 181,732,294 | — | — | 181,732,294 |
| Total Investments in Securities | 8,528,596,819 | 104,038,195 | 49,652,472 | 8,682,287,486 |
| Investments in Derivatives | | | | |
| Liability | | | | |
| Options Contracts Written | (4,790,829) | — | — | (4,790,829) |
| Total | 8,523,805,990 | 104,038,195 | 49,652,472 | 8,677,496,657 |
See the Portfolio of Investments for all investment classifications not indicated in the table.
The accompanying Notes to Financial Statements are an integral part of this statement.
| 10 | Columbia Seligman Technology and Information Fund | Semiannual Report 2022 |
Portfolio of Investments (continued)
November 30, 2022 (Unaudited)
Fair value measurements (continued)
The Fund’s assets assigned to the Level 2 input category are generally valued using the market approach, in which a security’s value is determined through reference to prices and information from market transactions for similar or identical assets. These assets include certain foreign securities for which a third party statistical pricing service may be employed for purposes of fair market valuation. The model utilized by such third party statistical pricing service takes into account a security’s correlation to available market data including, but not limited to, intraday index, ADR, and exchange-traded fund movements.
The Fund does not hold any significant investments (greater than one percent of net assets) categorized as Level 3.
The accompanying Notes to Financial Statements are an integral part of this statement.
Columbia Seligman Technology and Information Fund | Semiannual Report 2022
| 11 |
Statement of Assets and Liabilities
November 30, 2022 (Unaudited)
| Assets | |
| Investments in securities, at value | |
| Unaffiliated issuers (cost $4,396,360,399) | $7,853,312,549 |
| Affiliated issuers (cost $713,989,671) | 828,974,937 |
| Receivable for: | |
| Investments sold | 11,986,861 |
| Capital shares sold | 4,561,283 |
| Dividends | 5,981,122 |
| Interest | 131,500 |
| Foreign tax reclaims | 129,528 |
| Expense reimbursement due from Investment Manager | 182 |
| Prepaid expenses | 65,618 |
| Other assets | 129 |
| Total assets | 8,705,143,709 |
| Liabilities | |
| Option contracts written, at value (premiums received $3,524,706) | 4,790,829 |
| Due to custodian | 12,035 |
| Payable for: | |
| Capital shares purchased | 8,087,355 |
| Management services fees | 192,021 |
| Distribution and/or service fees | 46,608 |
| Transfer agent fees | 682,481 |
| Compensation of board members | 336,174 |
| Compensation of chief compliance officer | 818 |
| Other expenses | 118,096 |
| Total liabilities | 14,266,417 |
| Net assets applicable to outstanding capital stock | $8,690,877,292 |
| Represented by | |
| Paid in capital | 4,398,346,933 |
| Total distributable earnings (loss) | 4,292,530,359 |
| Total - representing net assets applicable to outstanding capital stock | $8,690,877,292 |
The accompanying Notes to Financial Statements are an integral part of this statement.
| 12 | Columbia Seligman Technology and Information Fund | Semiannual Report 2022 |
Statement of Assets and Liabilities (continued)
November 30, 2022 (Unaudited)
| Class A | |
| Net assets | $5,736,845,964 |
| Shares outstanding | 59,039,429 |
| Net asset value per share | $97.17 |
| Maximum sales charge | 5.75% |
| Maximum offering price per share (calculated by dividing the net asset value per share by 1.0 minus the maximum sales charge for Class A shares) | $103.10 |
| Advisor Class | |
| Net assets | $303,741,068 |
| Shares outstanding | 3,262,735 |
| Net asset value per share | $93.09 |
| Class C | |
| Net assets | $305,477,410 |
| Shares outstanding | 6,062,734 |
| Net asset value per share | $50.39 |
| Institutional Class | |
| Net assets | $1,802,720,609 |
| Shares outstanding | 16,211,451 |
| Net asset value per share | $111.20 |
| Institutional 2 Class | |
| Net assets | $343,118,172 |
| Shares outstanding | 3,063,788 |
| Net asset value per share | $111.99 |
| Institutional 3 Class | |
| Net assets | $134,179,127 |
| Shares outstanding | 1,211,392 |
| Net asset value per share | $110.76 |
| Class R | |
| Net assets | $64,794,942 |
| Shares outstanding | 723,852 |
| Net asset value per share | $89.51 |
The accompanying Notes to Financial Statements are an integral part of this statement.
Columbia Seligman Technology and Information Fund | Semiannual Report 2022
| 13 |
Statement of Operations
Six Months Ended November 30, 2022 (Unaudited)
| Net investment income | |
| Income: | |
| Dividends — unaffiliated issuers | $36,261,241 |
| Dividends — affiliated issuers | 2,348,538 |
| Interest | 90,000 |
| Interfund lending | 712 |
| Foreign taxes withheld | (413,029) |
| Total income | 38,287,462 |
| Expenses: | |
| Management services fees | 36,006,120 |
| Distribution and/or service fees | |
| Class A | 7,117,476 |
| Class C | 1,567,256 |
| Class R | 164,127 |
| Transfer agent fees | |
| Class A | 2,665,566 |
| Advisor Class | 140,837 |
| Class C | 146,709 |
| Institutional Class | 825,473 |
| Institutional 2 Class | 92,651 |
| Institutional 3 Class | 4,268 |
| Class R | 30,730 |
| Compensation of board members | 52,192 |
| Custodian fees | 28,507 |
| Printing and postage fees | 123,756 |
| Registration fees | 119,059 |
| Audit fees | 15,237 |
| Legal fees | 62,892 |
| Compensation of chief compliance officer | 818 |
| Other | 234,304 |
| Total expenses | 49,397,978 |
| Fees waived or expenses reimbursed by Investment Manager and its affiliates | (27,739) |
| Expense reduction | (4,852) |
| Total net expenses | 49,365,387 |
| Net investment loss | (11,077,925) |
| Realized and unrealized gain (loss) — net | |
| Net realized gain (loss) on: | |
| Investments — unaffiliated issuers | 65,583,669 |
| Investments — affiliated issuers | 5,519 |
| Foreign currency translations | 15,441 |
| Options contracts written | 768,501 |
| Net realized gain | 66,373,130 |
| Net change in unrealized appreciation (depreciation) on: | |
| Investments — unaffiliated issuers | (689,624,163) |
| Investments — affiliated issuers | (84,983,804) |
| Foreign currency translations | (4,102) |
| Options contracts written | (1,333,697) |
| Net change in unrealized appreciation (depreciation) | (775,945,766) |
| Net realized and unrealized loss | (709,572,636) |
| Net decrease in net assets resulting from operations | $(720,650,561) |
The accompanying Notes to Financial Statements are an integral part of this statement.
| 14 | Columbia Seligman Technology and Information Fund | Semiannual Report 2022 |
Statement of Changes in Net Assets
| | Six Months Ended
November 30, 2022
(Unaudited) | Year Ended
May 31, 2022 |
| Operations | | |
| Net investment loss | $(11,077,925) | $(37,890,200) |
| Net realized gain | 66,373,130 | 1,086,869,313 |
| Net change in unrealized appreciation (depreciation) | (775,945,766) | (1,347,230,669) |
| Net decrease in net assets resulting from operations | (720,650,561) | (298,251,556) |
| Distributions to shareholders | | |
| Net investment income and net realized gains | | |
| Class A | — | (866,441,965) |
| Advisor Class | — | (43,557,391) |
| Class C | — | (83,396,546) |
| Institutional Class | — | (230,885,422) |
| Institutional 2 Class | — | (37,204,174) |
| Institutional 3 Class | — | (14,971,365) |
| Class R | — | (11,285,269) |
| Total distributions to shareholders | — | (1,287,742,132) |
| Increase (decrease) in net assets from capital stock activity | (136,136,034) | 763,941,568 |
| Total decrease in net assets | (856,786,595) | (822,052,120) |
| Net assets at beginning of period | 9,547,663,887 | 10,369,716,007 |
| Net assets at end of period | $8,690,877,292 | $9,547,663,887 |
The accompanying Notes to Financial Statements are an integral part of this statement.
Columbia Seligman Technology and Information Fund | Semiannual Report 2022
| 15 |
Statement of Changes in Net Assets (continued)
| | Six Months Ended | Year Ended |
| | November 30, 2022 (Unaudited) | May 31, 2022 |
| | Shares | Dollars ($) | Shares | Dollars ($) |
| Capital stock activity |
| Class A | | | | |
| Subscriptions | 964,676 | 91,906,458 | 2,724,048 | 333,312,923 |
| Distributions reinvested | — | — | 6,190,765 | 789,879,698 |
| Redemptions | (2,620,353) | (246,522,922) | (6,441,394) | (777,124,975) |
| Net increase (decrease) | (1,655,677) | (154,616,464) | 2,473,419 | 346,067,646 |
| Advisor Class | | | | |
| Subscriptions | 397,083 | 36,377,052 | 1,049,902 | 122,233,718 |
| Distributions reinvested | — | — | 302,755 | 36,917,944 |
| Redemptions | (432,775) | (38,600,872) | (774,015) | (88,067,650) |
| Net increase (decrease) | (35,692) | (2,223,820) | 578,642 | 71,084,012 |
| Class C | | | | |
| Subscriptions | 303,562 | 15,019,000 | 699,676 | 46,253,388 |
| Distributions reinvested | — | — | 1,201,664 | 80,090,877 |
| Redemptions | (811,428) | (39,285,334) | (1,346,988) | (86,867,002) |
| Net increase (decrease) | (507,866) | (24,266,334) | 554,352 | 39,477,263 |
| Institutional Class | | | | |
| Subscriptions | 1,866,971 | 201,094,890 | 2,802,246 | 388,214,158 |
| Distributions reinvested | — | — | 1,358,568 | 197,875,363 |
| Redemptions | (1,671,887) | (177,992,524) | (2,938,574) | (400,842,921) |
| Net increase | 195,084 | 23,102,366 | 1,222,240 | 185,246,600 |
| Institutional 2 Class | | | | |
| Subscriptions | 553,957 | 61,055,238 | 940,648 | 130,422,369 |
| Distributions reinvested | — | — | 252,690 | 37,054,467 |
| Redemptions | (399,885) | (42,735,200) | (609,010) | (82,835,539) |
| Net increase | 154,072 | 18,320,038 | 584,328 | 84,641,297 |
| Institutional 3 Class | | | | |
| Subscriptions | 194,820 | 20,727,321 | 479,084 | 67,810,180 |
| Distributions reinvested | — | — | 92,198 | 13,365,074 |
| Redemptions | (119,863) | (13,254,488) | (278,716) | (37,504,702) |
| Net increase | 74,957 | 7,472,833 | 292,566 | 43,670,552 |
| Class R | | | | |
| Subscriptions | 38,889 | 3,415,734 | 141,187 | 16,209,102 |
| Distributions reinvested | — | — | 94,447 | 11,127,750 |
| Redemptions | (83,443) | (7,340,387) | (293,092) | (33,582,654) |
| Net decrease | (44,554) | (3,924,653) | (57,458) | (6,245,802) |
| Total net increase (decrease) | (1,819,676) | (136,136,034) | 5,648,089 | 763,941,568 |
The accompanying Notes to Financial Statements are an integral part of this statement.
| 16 | Columbia Seligman Technology and Information Fund | Semiannual Report 2022 |
[THIS PAGE INTENTIONALLY LEFT BLANK]
Columbia Seligman Technology and Information Fund | Semiannual Report 2022
| 17 |
The following table is intended to help you understand the Fund’s financial performance. Certain information reflects financial results for a single share of a class held for the periods shown. Per share net investment income (loss) amounts are calculated based on average shares outstanding during the period. Total return assumes reinvestment of all dividends and distributions, if any. Total return does not reflect payment of sales charges, if any. Total return and portfolio turnover are not annualized for periods of less than one year. The portfolio turnover rate is calculated without regard to purchase and sales transactions of short-term instruments and certain derivatives, if any. If such transactions were included, the Fund’s portfolio turnover rate may be higher.
| | Net asset value,
beginning of
period | Net
investment
income
(loss) | Net
realized
and
unrealized
gain (loss) | Total from
investment
operations | Distributions
from net
investment
income | Distributions
from net
realized
gains | Total
distributions to
shareholders |
| Class A |
| Six Months Ended 11/30/2022 (Unaudited) | $105.00 | (0.14) | (7.69) | (7.83) | — | — | — |
| Year Ended 5/31/2022 | $121.58 | (0.48) | (0.88) | (1.36) | — | (15.22) | (15.22) |
| Year Ended 5/31/2021 | $79.11 | (0.19) | 53.51 | 53.32 | (0.44) | (10.41) | (10.85) |
| Year Ended 5/31/2020 | $67.52 | 0.41(f) | 20.34 | 20.75 | — | (9.16) | (9.16) |
| Year Ended 5/31/2019 | $76.76 | (0.03) | (2.02) | (2.05) | — | (7.19) | (7.19) |
| Year Ended 5/31/2018 | $72.96 | (0.29) | 11.98 | 11.69 | — | (7.89) | (7.89) |
| Advisor Class |
| Six Months Ended 11/30/2022 (Unaudited) | $100.47 | (0.02) | (7.36) | (7.38) | — | — | — |
| Year Ended 5/31/2022 | $116.88 | (0.17) | (0.72) | (0.89) | — | (15.52) | (15.52) |
| Year Ended 5/31/2021 | $76.31 | 0.06 | 51.57 | 51.63 | (0.52) | (10.54) | (11.06) |
| Year Ended 5/31/2020 | $65.38 | 0.58(f) | 19.69 | 20.27 | — | (9.34) | (9.34) |
| Year Ended 5/31/2019 | $74.50 | 0.14 | (2.00) | (1.86) | — | (7.26) | (7.26) |
| Year Ended 5/31/2018 | $71.01 | (0.10) | 11.65 | 11.55 | — | (8.06) | (8.06) |
| Class C |
| Six Months Ended 11/30/2022 (Unaudited) | $54.65 | (0.26) | (4.00) | (4.26) | — | — | — |
| Year Ended 5/31/2022 | $69.20 | (0.76) | 0.51(h) | (0.25) | — | (14.30) | (14.30) |
| Year Ended 5/31/2021 | $48.21 | (0.57) | 31.78 | 31.21 | (0.20) | (10.02) | (10.22) |
| Year Ended 5/31/2020 | $43.98 | (0.10)(f) | 13.09 | 12.99 | — | (8.76) | (8.76) |
| Year Ended 5/31/2019 | $52.96 | (0.37) | (1.65) | (2.02) | — | (6.96) | (6.96) |
| Year Ended 5/31/2018 | $52.49 | (0.60) | 8.45 | 7.85 | — | (7.38) | (7.38) |
| Institutional Class |
| Six Months Ended 11/30/2022 (Unaudited) | $120.01 | (0.03) | (8.78) | (8.81) | — | — | — |
| Year Ended 5/31/2022 | $137.04 | (0.20) | (1.31) | (1.51) | — | (15.52) | (15.52) |
| Year Ended 5/31/2021 | $88.14 | 0.07 | 59.89 | 59.96 | (0.52) | (10.54) | (11.06) |
| Year Ended 5/31/2020 | $74.36 | 0.67(f) | 22.45 | 23.12 | — | (9.34) | (9.34) |
| Year Ended 5/31/2019 | $83.59 | 0.16 | (2.13) | (1.97) | — | (7.26) | (7.26) |
| Year Ended 5/31/2018 | $78.77 | (0.11) | 12.99 | 12.88 | — | (8.06) | (8.06) |
| Institutional 2 Class |
| Six Months Ended 11/30/2022 (Unaudited) | $120.85 | (0.01) | (8.85) | (8.86) | — | — | — |
| Year Ended 5/31/2022 | $137.89 | (0.16) | (1.31) | (1.47) | — | (15.57) | (15.57) |
| Year Ended 5/31/2021 | $88.63 | 0.11 | 60.24 | 60.35 | (0.53) | (10.56) | (11.09) |
| Year Ended 5/31/2020 | $74.73 | 0.71(f) | 22.57 | 23.28 | — | (9.38) | (9.38) |
| Year Ended 5/31/2019 | $83.94 | 0.20 | (2.13) | (1.93) | — | (7.28) | (7.28) |
| Year Ended 5/31/2018 | $79.07 | (0.07) | 13.04 | 12.97 | — | (8.10) | (8.10) |
The accompanying Notes to Financial Statements are an integral part of this statement.
| 18 | Columbia Seligman Technology and Information Fund | Semiannual Report 2022 |
Financial Highlights (continued)
| | Net
asset
value,
end of
period | Total
return | Total gross
expense
ratio to
average
net assets(a) | Total net
expense
ratio to
average
net assets(a),(b) | Net investment
income (loss)
ratio to
average
net assets | Portfolio
turnover | Net
assets,
end of
period
(000’s) |
| Class A |
| Six Months Ended 11/30/2022 (Unaudited) | $97.17 | (7.46%) | 1.20%(c) | 1.20%(c),(d) | (0.30%)(c) | 5% | $5,736,846 |
| Year Ended 5/31/2022 | $105.00 | (3.34%) | 1.17%(e) | 1.17%(d),(e) | (0.39%) | 16% | $6,373,137 |
| Year Ended 5/31/2021 | $121.58 | 70.10% | 1.20%(e) | 1.20%(d),(e) | (0.19%) | 32% | $7,078,794 |
| Year Ended 5/31/2020 | $79.11 | 31.36% | 1.23%(e),(g) | 1.23%(d),(e),(g) | 0.54% | 37% | $4,506,828 |
| Year Ended 5/31/2019 | $67.52 | (1.50%) | 1.25%(e) | 1.24%(d),(e) | (0.05%) | 37% | $3,759,214 |
| Year Ended 5/31/2018 | $76.76 | 16.85% | 1.24% | 1.24%(d) | (0.39%) | 39% | $3,767,260 |
| Advisor Class |
| Six Months Ended 11/30/2022 (Unaudited) | $93.09 | (7.35%) | 0.95%(c) | 0.95%(c),(d) | (0.05%)(c) | 5% | $303,741 |
| Year Ended 5/31/2022 | $100.47 | (3.10%) | 0.93%(e) | 0.93%(d),(e) | (0.14%) | 16% | $331,400 |
| Year Ended 5/31/2021 | $116.88 | 70.53% | 0.95%(e) | 0.95%(d),(e) | 0.06% | 32% | $317,883 |
| Year Ended 5/31/2020 | $76.31 | 31.69% | 0.98%(e),(g) | 0.98%(d),(e),(g) | 0.79% | 37% | $190,471 |
| Year Ended 5/31/2019 | $65.38 | (1.26%) | 0.99%(e) | 0.99%(d),(e) | 0.21% | 37% | $143,228 |
| Year Ended 5/31/2018 | $74.50 | 17.15% | 0.99% | 0.99%(d) | (0.14%) | 39% | $154,144 |
| Class C |
| Six Months Ended 11/30/2022 (Unaudited) | $50.39 | (7.80%) | 1.95%(c) | 1.95%(c),(d) | (1.05%)(c) | 5% | $305,477 |
| Year Ended 5/31/2022 | $54.65 | (4.08%) | 1.92%(e) | 1.92%(d),(e) | (1.14%) | 16% | $359,106 |
| Year Ended 5/31/2021 | $69.20 | 68.85% | 1.94%(e) | 1.94%(d),(e) | (0.96%) | 32% | $416,301 |
| Year Ended 5/31/2020 | $48.21 | 30.39% | 1.98%(e),(g) | 1.98%(d),(e),(g) | (0.22%) | 37% | $339,268 |
| Year Ended 5/31/2019 | $43.98 | (2.23%) | 1.99%(e) | 1.99%(d),(e) | (0.75%) | 37% | $344,977 |
| Year Ended 5/31/2018 | $52.96 | 15.98% | 1.99% | 1.99%(d) | (1.14%) | 39% | $957,190 |
| Institutional Class |
| Six Months Ended 11/30/2022 (Unaudited) | $111.20 | (7.34%) | 0.95%(c) | 0.95%(c),(d) | (0.05%)(c) | 5% | $1,802,721 |
| Year Ended 5/31/2022 | $120.01 | (3.09%) | 0.92%(e) | 0.92%(d),(e) | (0.14%) | 16% | $1,922,182 |
| Year Ended 5/31/2021 | $137.04 | 70.53% | 0.95%(e) | 0.95%(d),(e) | 0.06% | 32% | $2,027,453 |
| Year Ended 5/31/2020 | $88.14 | 31.70% | 0.98%(e),(g) | 0.98%(d),(e),(g) | 0.80% | 37% | $1,292,741 |
| Year Ended 5/31/2019 | $74.36 | (1.25%) | 0.99%(e) | 0.99%(d),(e) | 0.21% | 37% | $1,030,165 |
| Year Ended 5/31/2018 | $83.59 | 17.14% | 0.99% | 0.99%(d) | (0.14%) | 39% | $1,205,243 |
| Institutional 2 Class |
| Six Months Ended 11/30/2022 (Unaudited) | $111.99 | (7.33%) | 0.91%(c) | 0.91%(c) | (0.02%)(c) | 5% | $343,118 |
| Year Ended 5/31/2022 | $120.85 | (3.05%) | 0.89%(e) | 0.89%(e) | (0.11%) | 16% | $351,625 |
| Year Ended 5/31/2021 | $137.89 | 70.60% | 0.91%(e) | 0.91%(e) | 0.09% | 32% | $320,652 |
| Year Ended 5/31/2020 | $88.63 | 31.76% | 0.94%(e),(g) | 0.94%(e),(g) | 0.83% | 37% | $223,964 |
| Year Ended 5/31/2019 | $74.73 | (1.20%) | 0.95%(e) | 0.95%(e) | 0.25% | 37% | $178,417 |
| Year Ended 5/31/2018 | $83.94 | 17.20% | 0.94% | 0.94% | (0.09%) | 39% | $173,624 |
The accompanying Notes to Financial Statements are an integral part of this statement.
Columbia Seligman Technology and Information Fund | Semiannual Report 2022
| 19 |
Financial Highlights (continued)
| | Net asset value,
beginning of
period | Net
investment
income
(loss) | Net
realized
and
unrealized
gain (loss) | Total from
investment
operations | Distributions
from net
investment
income | Distributions
from net
realized
gains | Total
distributions to
shareholders |
| Institutional 3 Class |
| Six Months Ended 11/30/2022 (Unaudited) | $119.49 | 0.02 | (8.75) | (8.73) | — | — | — |
| Year Ended 5/31/2022 | $136.48 | (0.09) | (1.27) | (1.36) | — | (15.63) | (15.63) |
| Year Ended 5/31/2021 | $87.79 | 0.19 | 59.63 | 59.82 | (0.54) | (10.59) | (11.13) |
| Year Ended 5/31/2020 | $74.09 | 0.78(f) | 22.33 | 23.11 | — | (9.41) | (9.41) |
| Year Ended 5/31/2019 | $83.26 | 0.24 | (2.12) | (1.88) | — | (7.29) | (7.29) |
| Year Ended 5/31/2018 | $78.48 | (0.00)(i) | 12.90 | 12.90 | — | (8.12) | (8.12) |
| Class R |
| Six Months Ended 11/30/2022 (Unaudited) | $96.85 | (0.24) | (7.10) | (7.34) | — | — | — |
| Year Ended 5/31/2022 | $113.17 | (0.73) | (0.67) | (1.40) | — | (14.92) | (14.92) |
| Year Ended 5/31/2021 | $74.19 | (0.42) | 50.04 | 49.62 | (0.36) | (10.28) | (10.64) |
| Year Ended 5/31/2020 | $63.78 | 0.19(f) | 19.20 | 19.39 | — | (8.98) | (8.98) |
| Year Ended 5/31/2019 | $73.05 | (0.20) | (1.96) | (2.16) | — | (7.11) | (7.11) |
| Year Ended 5/31/2018 | $69.79 | (0.46) | 11.44 | 10.98 | — | (7.72) | (7.72) |
| Notes to Financial Highlights |
| (a) | In addition to the fees and expenses that the Fund bears directly, the Fund indirectly bears a pro rata share of the fees and expenses of any other funds in which it invests. Such indirect expenses are not included in the Fund’s reported expense ratios. |
| (b) | Total net expenses include the impact of certain fee waivers/expense reimbursements made by the Investment Manager and certain of its affiliates, if applicable. |
| (c) | Annualized. |
| (d) | The benefits derived from expense reductions had an impact of less than 0.01%. |
| (e) | Ratios include interfund lending expense which is less than 0.01%. |
| (f) | Net investment income per share includes special dividends. The per share effect of these dividends amounted to: |
| Year Ended | Class A | Advisor
Class | Class C | Institutional
Class | Institutional 2
Class | Institutional 3
Class | Class R |
| 05/31/2020 | $0.52 | $0.50 | $0.32 | $0.58 | $0.58 | $0.58 | $0.49 |
| (g) | Ratios include line of credit interest expense which is less than 0.01%. |
| (h) | Calculation of the net gain (loss) per share (both realized and unrealized) does not correlate to the aggregate realized and unrealized gain (loss) presented in the Statement of Operations due to the timing of subscriptions and redemptions of Fund shares in relation to fluctuations in the market value of the portfolio. |
| (i) | Rounds to zero. |
The accompanying Notes to Financial Statements are an integral part of this statement.
| 20 | Columbia Seligman Technology and Information Fund | Semiannual Report 2022 |
Financial Highlights (continued)
| | Net
asset
value,
end of
period | Total
return | Total gross
expense
ratio to
average
net assets(a) | Total net
expense
ratio to
average
net assets(a),(b) | Net investment
income (loss)
ratio to
average
net assets | Portfolio
turnover | Net
assets,
end of
period
(000’s) |
| Institutional 3 Class |
| Six Months Ended 11/30/2022 (Unaudited) | $110.76 | (7.30%) | 0.86%(c) | 0.86%(c) | 0.03%(c) | 5% | $134,179 |
| Year Ended 5/31/2022 | $119.49 | (3.01%) | 0.84%(e) | 0.84%(e) | (0.07%) | 16% | $135,794 |
| Year Ended 5/31/2021 | $136.48 | 70.67% | 0.86%(e) | 0.86%(e) | 0.17% | 32% | $115,173 |
| Year Ended 5/31/2020 | $87.79 | 31.81% | 0.89%(e),(g) | 0.89%(e),(g) | 0.93% | 37% | $49,333 |
| Year Ended 5/31/2019 | $74.09 | (1.14%) | 0.90%(e) | 0.90%(e) | 0.31% | 37% | $32,058 |
| Year Ended 5/31/2018 | $83.26 | 17.25% | 0.90% | 0.90% | (0.00%)(i) | 39% | $20,050 |
| Class R |
| Six Months Ended 11/30/2022 (Unaudited) | $89.51 | (7.58%) | 1.45%(c) | 1.45%(c),(d) | (0.56%)(c) | 5% | $64,795 |
| Year Ended 5/31/2022 | $96.85 | (3.59%) | 1.42%(e) | 1.42%(d),(e) | (0.64%) | 16% | $74,421 |
| Year Ended 5/31/2021 | $113.17 | 69.70% | 1.44%(e) | 1.44%(d),(e) | (0.44%) | 32% | $93,459 |
| Year Ended 5/31/2020 | $74.19 | 31.03% | 1.48%(e),(g) | 1.48%(d),(e),(g) | 0.27% | 37% | $64,178 |
| Year Ended 5/31/2019 | $63.78 | (1.75%) | 1.49%(e) | 1.49%(d),(e) | (0.29%) | 37% | $64,874 |
| Year Ended 5/31/2018 | $73.05 | 16.57% | 1.49% | 1.49%(d) | (0.64%) | 39% | $76,007 |
The accompanying Notes to Financial Statements are an integral part of this statement.
Columbia Seligman Technology and Information Fund | Semiannual Report 2022
| 21 |
Notes to Financial Statements
November 30, 2022 (Unaudited)
Note 1. Organization
Columbia Seligman Technology and Information Fund (the Fund), a series of Columbia Funds Series Trust II (the Trust), is a non-diversified fund. The Trust is registered under the Investment Company Act of 1940, as amended (the 1940 Act), as an open-end management investment company organized as a Massachusetts business trust.
Fund shares
The Trust may issue an unlimited number of shares (without par value). The Fund offers each of the share classes listed in the Statement of Assets and Liabilities. Although all share classes generally have identical voting, dividend and liquidation rights, each share class votes separately when required by the Trust’s organizational documents or by law. Each share class has its own expense and sales charge structure. Different share classes may have different minimum initial investment amounts and pay different net investment income distribution amounts to the extent the expenses of distributing such share classes vary. Distributions to shareholders in a liquidation will be proportional to the net asset value of each share class.
As described in the Fund’s prospectus, Class A and Class C shares are offered to the general public for investment. Class C shares automatically convert to Class A shares after 8 years. Advisor Class, Institutional Class, Institutional 2 Class, Institutional 3 Class and Class R shares are available for purchase through authorized investment professionals to omnibus retirement plans or to institutional investors and to certain other investors as also described in the Fund’s prospectus.
Note 2. Summary of significant accounting policies
Basis of preparation
The Fund is an investment company that applies the accounting and reporting guidance in the Financial Accounting Standards Board (FASB) Accounting Standards Codification Topic 946, Financial Services - Investment Companies (ASC 946). The financial statements are prepared in accordance with U.S. generally accepted accounting principles (GAAP), which requires management to make certain estimates and assumptions that affect the reported amounts of assets and liabilities, the disclosure of contingent assets and liabilities at the date of the financial statements and the reported amounts of income and expenses during the reporting period. Actual results could differ from those estimates.
The following is a summary of significant accounting policies followed by the Fund in the preparation of its financial statements.
Security valuation
Equity securities listed on an exchange are valued at the closing price or last trade price on their primary exchange at the close of business of the New York Stock Exchange. Securities with a closing price not readily available or not listed on any exchange are valued at the mean between the closing bid and ask prices. Listed preferred stocks convertible into common stocks are valued using an evaluated price from a pricing service.
Debt securities generally are valued based on prices obtained from pricing services, which are intended to reflect market transactions for normal, institutional-size trading units of similar securities. The services may use various pricing techniques that take into account, as applicable, factors such as yield, quality, coupon rate, maturity, type of issue, trading characteristics and other data, as well as approved independent broker-dealer quotes. Debt securities for which quotations are not readily available or not believed to be reflective of market value may also be valued based upon a bid quote from an approved independent broker-dealer. Debt securities maturing in 60 days or less are valued primarily at amortized market value, unless this method results in a valuation that management believes does not approximate fair value.
Foreign equity securities are valued based on the closing price or last trade price on their primary exchange at the close of business of the New York Stock Exchange. If any foreign equity security closing prices are not readily available, the securities are valued at the mean of the latest quoted bid and ask prices on such exchanges or markets. Foreign currency exchange rates are determined at the scheduled closing time of the New York Stock Exchange. Many securities markets and exchanges outside the U.S. close prior to the close of the New York Stock Exchange; therefore, the closing prices for securities in such markets or on such exchanges may not fully reflect events that occur after such close but before the close of the New York Stock Exchange. In those situations, foreign securities will be fair valued pursuant to a policy approved by the Board of Trustees. Under the policy, the Fund may utilize a third-party pricing service to determine these fair values. The
| 22 | Columbia Seligman Technology and Information Fund | Semiannual Report 2022 |
Notes to Financial Statements (continued)
November 30, 2022 (Unaudited)
third-party pricing service takes into account multiple factors, including, but not limited to, movements in the U.S. securities markets, certain depositary receipts, futures contracts and foreign exchange rates that have occurred subsequent to the close of the foreign exchange or market, to determine a good faith estimate that reasonably reflects the current market conditions as of the close of the New York Stock Exchange. The fair value of a security is likely to be different from the quoted or published price, if available.
Investments in open-end investment companies (other than exchange-traded funds (ETFs)), are valued at the latest net asset value reported by those companies as of the valuation time.
Option contracts are valued at the mean of the latest quoted bid and ask prices on their primary exchanges. Option contracts, including over-the-counter option contracts, with no readily available market quotations are valued using mid-market evaluations from independent third-party vendors.
Investments for which market quotations are not readily available, or that have quotations which management believes are not reflective of market value or reliable, are valued at fair value as determined in good faith under procedures approved by the Board of Trustees. If a security or class of securities (such as foreign securities) is valued at fair value, such value is likely to be different from the quoted or published price for the security, if available.
The determination of fair value often requires significant judgment. To determine fair value, management may use assumptions including but not limited to future cash flows and estimated risk premiums. Multiple inputs from various sources may be used to determine fair value.
GAAP requires disclosure regarding the inputs and valuation techniques used to measure fair value and any changes in valuation inputs or techniques. In addition, investments shall be disclosed by major category. This information is disclosed following the Fund’s Portfolio of Investments.
Foreign currency transactions and translations
The values of all assets and liabilities denominated in foreign currencies are generally translated into U.S. dollars at exchange rates determined at the close of regular trading on the New York Stock Exchange. Net realized and unrealized gains (losses) on foreign currency transactions and translations include gains (losses) arising from the fluctuation in exchange rates between trade and settlement dates on securities transactions, gains (losses) arising from the disposition of foreign currency and currency gains (losses) between the accrual and payment dates on dividends, interest income and foreign withholding taxes.
For financial statement purposes, the Fund does not distinguish that portion of gains (losses) on investments which is due to changes in foreign exchange rates from that which is due to changes in market prices of the investments. Such fluctuations are included with the net realized and unrealized gains (losses) on investments in the Statement of Operations.
Derivative instruments
The Fund invests in certain derivative instruments, as detailed below, in seeking to meet its investment objectives. Derivatives are instruments whose values depend on, or are derived from, in whole or in part, the value of one or more securities, currencies, commodities, indices, or other assets or instruments. Derivatives may be used to increase investment flexibility (including to maintain cash reserves while maintaining desired exposure to certain assets), for risk management (hedging) purposes, to facilitate trading, to reduce transaction costs and to pursue higher investment returns. The Fund may also use derivative instruments to mitigate certain investment risks, such as foreign currency exchange rate risk, interest rate risk and credit risk. Derivatives may involve various risks, including the potential inability of the counterparty to fulfill its obligations under the terms of the contract, the potential for an illiquid secondary market (making it difficult for the Fund to sell or terminate, including at favorable prices) and the potential for market movements which may expose the Fund to gains or losses in excess of the amount shown in the Statement of Assets and Liabilities. The notional amounts of derivative instruments, if applicable, are not recorded in the financial statements.
A derivative instrument may suffer a marked-to-market loss if the value of the contract decreases due to an unfavorable change in the market rates or values of the underlying instrument. Losses can also occur if the counterparty does not perform its obligations under the contract. The Fund’s risk of loss from counterparty credit risk on over-the-counter derivatives
Columbia Seligman Technology and Information Fund | Semiannual Report 2022
| 23 |
Notes to Financial Statements (continued)
November 30, 2022 (Unaudited)
is generally limited to the aggregate unrealized gain netted against any collateral held by the Fund and the amount of any variation margin held by the counterparty, plus any replacement costs or related amounts. With exchange-traded or centrally cleared derivatives, there is reduced counterparty credit risk to the Fund since the clearinghouse or central counterparty (CCP) provides some protection in the case of clearing member default. The clearinghouse or CCP stands between the buyer and the seller of the contract; therefore, failure of the clearinghouse or CCP may pose additional counterparty credit risk. However, credit risk still exists in exchange-traded or centrally cleared derivatives with respect to initial and variation margin that is held in a broker’s customer account. While clearing brokers are required to segregate customer margin from their own assets, in the event that a clearing broker becomes insolvent or goes into bankruptcy and at that time there is a shortfall in the aggregate amount of margin held by the clearing broker for all its clients and such shortfall is remedied by the CCP or otherwise, U.S. bankruptcy laws will typically allocate that shortfall on a pro-rata basis across all the clearing broker’s customers (including the Fund), potentially resulting in losses to the Fund.
In order to better define its contractual rights and to secure rights that will help the Fund mitigate its counterparty risk, the Fund may enter into an International Swaps and Derivatives Association, Inc. Master Agreement (ISDA Master Agreement) or similar agreement with its derivatives counterparties. An ISDA Master Agreement is an agreement between the Fund and a counterparty that governs over-the-counter derivatives and foreign exchange forward contracts and contains, among other things, collateral posting terms and netting provisions in the event of a default and/or termination event. Under an ISDA Master Agreement, the Fund may, under certain circumstances, offset with the counterparty certain derivative instruments’ payables and/or receivables with collateral held and/or posted and create one single net payment. The provisions of the ISDA Master Agreement typically permit a single net payment in the event of default (close-out netting), including the bankruptcy or insolvency of the counterparty. Note, however, that bankruptcy or insolvency laws of a particular jurisdiction may impose restrictions on or prohibitions against the right of offset or netting in bankruptcy, insolvency or other events.
Collateral (margin) requirements differ by type of derivative. Margin requirements are established by the clearinghouse or CCP for exchange-traded and centrally cleared derivatives. Brokers can ask for margin in excess of the minimum in certain circumstances. Collateral terms for most over-the-counter derivatives are subject to regulatory requirements to exchange variation margin with trading counterparties and may have contract specific margin terms as well. For over-the-counter derivatives traded under an ISDA Master Agreement, the collateral requirements are typically calculated by netting the marked-to-market amount for each transaction under such agreement and comparing that amount to the value of any variation margin currently pledged by the Fund and/or the counterparty. Generally, the amount of collateral due from or to a party has to exceed a minimum transfer amount threshold (e.g., $250,000) before a transfer has to be made. To the extent amounts due to the Fund from its counterparties are not fully collateralized, contractually or otherwise, the Fund bears the risk of loss from counterparty nonperformance. The Fund may also pay interest expense on cash collateral received from the broker. Any interest expense paid by the Fund is shown in the Statement of Operations. The Fund attempts to mitigate counterparty risk by only entering into agreements with counterparties that it believes have the financial resources to honor their obligations and by monitoring the financial stability of those counterparties.
Certain ISDA Master Agreements allow counterparties of over-the-counter derivatives transactions to terminate derivatives contracts prior to maturity in the event the Fund’s net asset value declines by a stated percentage over a specified time period or if the Fund fails to meet certain terms of the ISDA Master Agreement, which would cause the Fund to accelerate payment of any net liability owed to the counterparty. The Fund also has termination rights if the counterparty fails to meet certain terms of the ISDA Master Agreement. In determining whether to exercise such termination rights, the Fund would consider, in addition to counterparty credit risk, whether termination would result in a net liability owed from the counterparty.
For financial reporting purposes, the Fund does not offset derivative assets and derivative liabilities that are subject to netting arrangements in the Statement of Assets and Liabilities.
Options contracts
Options are contracts which entitle the holder to purchase or sell securities or other identified assets at a specified price, or in the case of index option contracts, to receive or pay the difference between the index value and the strike price of the index option contract. Option contracts can be either exchange-traded or over-the-counter. The Fund has written option contracts to decrease the Fund’s exposure to equity market risk and to protect gains. These instruments may be used for other purposes in future periods. Completion of transactions for option contracts traded in the over-the-counter market
| 24 | Columbia Seligman Technology and Information Fund | Semiannual Report 2022 |
Notes to Financial Statements (continued)
November 30, 2022 (Unaudited)
depends upon the performance of the other party. Collateral may be collected or posted by the Fund to secure over-the-counter option contract trades. Collateral held or posted by the Fund for such option contract trades must be returned to the broker or the Fund upon closure, exercise or expiration of the contract.
Options contracts purchased are recorded as investments. When the Fund writes an options contract, the premium received is recorded as an asset and an amount equivalent to the premium is recorded as a liability in the Statement of Assets and Liabilities and is subsequently adjusted to reflect the current fair value of the option written. Changes in the fair value of the written option are recorded as unrealized appreciation or depreciation until the contract is exercised or has expired. The Fund realizes a gain or loss when the option contract is closed or expires. When option contracts are exercised, the proceeds on sales for a written call or purchased put option contract, or the purchase cost for a written put or purchased call option contract, is adjusted by the amount of premium received or paid.
For over-the-counter options purchased, the Fund bears the risk of loss of the amount of the premiums paid plus the positive change in market values net of any collateral held by the Fund should the counterparty fail to perform under the contracts. Option contracts written by the Fund do not typically give rise to significant counterparty credit risk, as options written generally obligate the Fund and not the counterparty to perform. The risk in writing a call option contract is that the Fund gives up the opportunity for profit if the market price of the security increases above the strike price and the option contract is exercised. The risk in writing a put option contract is that the Fund may incur a loss if the market price of the security decreases below the strike price and the option contract is exercised. Exercise of a written option could result in the Fund purchasing or selling a security or foreign currency when it otherwise would not, or at a price different from the current market value. In purchasing and writing options, the Fund bears the risk of an unfavorable change in the value of the underlying instrument or the risk that the Fund may not be able to enter into a closing transaction due to an illiquid market.
Effects of derivative transactions in the financial statements
The following tables are intended to provide additional information about the effect of derivatives on the financial statements of the Fund, including: the fair value of derivatives by risk category and the location of those fair values in the Statement of Assets and Liabilities; and the impact of derivative transactions over the period in the Statement of Operations, including realized and unrealized gains (losses). The derivative instrument schedules following the Portfolio of Investments present additional information regarding derivative instruments outstanding at the end of the period, if any.
The following table is a summary of the fair value of derivative instruments (not considered to be hedging instruments for accounting disclosure purposes) at November 30, 2022:
| | Liability derivatives | |
Risk exposure
category | Statement
of assets and liabilities
location | Fair value ($) |
| Equity risk | Options contracts written, at value | 4,790,829 |
The following table indicates the effect of derivative instruments (not considered to be hedging instruments for accounting disclosure purposes) in the Statement of Operations for the six months ended November 30, 2022:
| Amount of realized gain (loss) on derivatives recognized in income |
| Risk exposure category | Options contracts written ($) |
| Equity risk | 768,501 |
| |
| Change in unrealized appreciation (depreciation) on derivatives recognized in income |
| Risk exposure category | Options contracts written ($) |
| Equity risk | (1,333,697) |
Columbia Seligman Technology and Information Fund | Semiannual Report 2022
| 25 |
Notes to Financial Statements (continued)
November 30, 2022 (Unaudited)
The following table is a summary of the average outstanding volume by derivative instrument for the six months ended November 30, 2022:
| Derivative instrument | Average
value ($)* |
| Options contracts — written | (2,552,393) |
| * | Based on the ending quarterly outstanding amounts for the six months ended November 30, 2022. |
Offsetting of assets and liabilities
The following table presents the Fund’s gross and net amount of assets and liabilities available for offset under netting arrangements as well as any related collateral received or pledged by the Fund as of November 30, 2022:
| | Morgan
Stanley ($) |
| Liabilities | |
| Options contracts written | 4,790,829 |
| Total financial and derivative net assets | (4,790,829) |
| Total collateral received (pledged) (a) | (4,790,829) |
| Net amount (b) | - |
| (a) | In some instances, the actual collateral received and/or pledged may be more than the amount shown due to overcollateralization. |
| (b) | Represents the net amount due from/(to) counterparties in the event of default. |
Security transactions
Security transactions are accounted for on the trade date. Cost is determined and gains (losses) are based upon the specific identification method for both financial statement and federal income tax purposes.
Income recognition
Interest income is recorded on an accrual basis. Market premiums and discounts, including original issue discounts, are amortized and accreted, respectively, over the expected life of the security on all debt securities, unless otherwise noted.
The Fund may place a debt security on non-accrual status and reduce related interest income when it becomes probable that the interest will not be collected and the amount of uncollectible interest can be reasonably estimated. The Fund may also adjust accrual rates when it becomes probable the full interest will not be collected and a partial payment will be received. A defaulted debt security is removed from non-accrual status when the issuer resumes interest payments or when collectability of interest is reasonably assured.
Corporate actions and dividend income are generally recorded net of any non-reclaimable tax withholdings, on the ex-dividend date or upon receipt of an ex-dividend notification in the case of certain foreign securities.
The Fund may receive distributions from holdings in equity securities, business development companies (BDCs), exchange-traded funds (ETFs), limited partnerships (LPs), other regulated investment companies (RICs), and real estate investment trusts (REITs), which report information as to the tax character of their distributions annually. These distributions are allocated to dividend income, capital gain and return of capital based on actual information reported. Return of capital is recorded as a reduction of the cost basis of securities held. If the Fund no longer owns the applicable securities, return of capital is recorded as a realized gain. With respect to REITs, to the extent actual information has not yet been reported, estimates for return of capital are made by Columbia Management Investment Advisers, LLC (the Investment Manager), a wholly-owned subsidiary of Ameriprise Financial, Inc. (Ameriprise Financial). The Investment Manager’s estimates are subsequently adjusted when the actual character of the distributions is disclosed by the REITs, which could result in a proportionate change in return of capital to shareholders.
Awards from class action litigation are recorded as a reduction of cost basis if the Fund still owns the applicable securities on the payment date. If the Fund no longer owns the applicable securities on the payment date, the proceeds are recorded as realized gains.
| 26 | Columbia Seligman Technology and Information Fund | Semiannual Report 2022 |
Notes to Financial Statements (continued)
November 30, 2022 (Unaudited)
Expenses
General expenses of the Trust are allocated to the Fund and other funds of the Trust based upon relative net assets or other expense allocation methodologies determined by the nature of the expense. Expenses directly attributable to the Fund are charged to the Fund. Expenses directly attributable to a specific class of shares are charged to that share class.
Determination of class net asset value
All income, expenses (other than class-specific expenses, which are charged to that share class, as shown in the Statement of Operations) and realized and unrealized gains (losses) are allocated to each class of the Fund on a daily basis, based on the relative net assets of each class, for purposes of determining the net asset value of each class.
Federal income tax status
The Fund intends to qualify each year as a regulated investment company under Subchapter M of the Internal Revenue Code, as amended, and will distribute substantially all of its investment company taxable income and net capital gain, if any, for its tax year, and as such will not be subject to federal income taxes. In addition, the Fund intends to distribute in each calendar year substantially all of its ordinary income, capital gain net income and certain other amounts, if any, such that the Fund should not be subject to federal excise tax. Therefore, no federal income or excise tax provision is recorded.
Foreign taxes
The Fund may be subject to foreign taxes on income, gains on investments or currency repatriation, a portion of which may be recoverable. The Fund will accrue such taxes and recoveries, as applicable, based upon its current interpretation of tax rules and regulations that exist in the markets in which it invests.
Realized gains in certain countries may be subject to foreign taxes at the Fund level, based on statutory rates. The Fund accrues for such foreign taxes on realized and unrealized gains at the appropriate rate for each jurisdiction, as applicable. The amount, if any, is disclosed as a liability in the Statement of Assets and Liabilities.
Distributions to shareholders
Distributions from net investment income, if any, are declared and paid annually. Net realized capital gains, if any, are distributed at least annually. Income distributions and capital gain distributions are determined in accordance with federal income tax regulations, which may differ from GAAP.
Guarantees and indemnifications
Under the Trust’s organizational documents and, in some cases, by contract, its officers and trustees are indemnified against certain liabilities arising out of the performance of their duties to the Trust or its funds. In addition, certain of the Fund’s contracts with its service providers contain general indemnification clauses. The Fund’s maximum exposure under these arrangements is unknown since the amount of any future claims that may be made against the Fund cannot be determined, and the Fund has no historical basis for predicting the likelihood of any such claims.
Recent accounting pronouncement
Tailored Shareholder Reports
In October 2022, the Securities and Exchange Commission (SEC) adopted a final rule relating to Tailored Shareholder Reports for Mutual Funds and Exchange-Traded Funds (ETFs); Fee Information in Investment Company Advertisements. The rule and form amendments will require mutual funds and ETFs to transmit concise and visually engaging shareholder reports that highlight key information. The amendments will require that funds tag information in a structured data format. The rule amendments will require that certain more in-depth information be made available online and available for delivery free of charge to investors on request. The amendments will become effective January 24, 2023. There is an 18-month transition period after the effective date of the amendment.
Columbia Seligman Technology and Information Fund | Semiannual Report 2022
| 27 |
Notes to Financial Statements (continued)
November 30, 2022 (Unaudited)
Note 3. Fees and other transactions with affiliates
Management services fees
The Fund has entered into a Management Agreement with Columbia Management Investment Advisers, LLC (the Investment Manager), a wholly-owned subsidiary of Ameriprise Financial, Inc. (Ameriprise Financial). Under the Management Agreement, the Investment Manager provides the Fund with investment research and advice, as well as administrative and accounting services. Effective July 1, 2022, the management services fee is an annual fee that is equal to a percentage of the Fund’s daily net assets that declines from 0.915% to 0.705% as the Fund’s net assets increase. Prior to July 1, 2022, the management services fee was equal to a percentage of the Fund’s daily net assets that declined from 0.915% to 0.755% as the Fund’s net assets increased. The annualized effective management services fee rate for the six months ended November 30, 2022 was 0.838% of the Fund’s average daily net assets.
To the extent the Fund invests a portion of its assets in affiliated mutual funds, exchange-traded funds and closed-end funds that pay a management services fee or, where applicable, an advisory fee to the Investment Manager, the Investment Manager has contractually agreed to waive net management services fees (management services fees, less reimbursements/waivers) or, where applicable, the net investment advisory services fees, (investment advisory services fees, less reimbursements/waivers) charged to such affiliated fund(s). The Investment Manager, in its discretion, may revise or discontinue this arrangement at any time.
Compensation of board members
Members of the Board of Trustees who are not officers or employees of the Investment Manager or Ameriprise Financial are compensated for their services to the Fund as disclosed in the Statement of Operations. Under a Deferred Compensation Plan (the Deferred Plan), these members of the Board of Trustees may elect to defer payment of up to 100% of their compensation. Deferred amounts are treated as though equivalent dollar amounts had been invested in shares of certain funds managed by the Investment Manager. The Fund’s liability for these amounts is adjusted for market value changes and remains in the Fund until distributed in accordance with the Deferred Plan. All amounts payable under the Deferred Plan constitute a general unsecured obligation of the Fund. The expense for the Deferred Plan, which includes Trustees’ fees deferred during the current period as well as any gains or losses on the Trustees’ deferred compensation balances as a result of market fluctuations, is included in "Compensation of board members" in the Statement of Operations.
Compensation of Chief Compliance Officer
The Board of Trustees has appointed a Chief Compliance Officer for the Fund in accordance with federal securities regulations. As disclosed in the Statement of Operations, a portion of the Chief Compliance Officer’s total compensation is allocated to the Fund, along with other allocations to affiliated registered investment companies managed by the Investment Manager and its affiliates, based on relative net assets.
Transfer agency fees
Under a Transfer and Dividend Disbursing Agent Agreement, Columbia Management Investment Services Corp. (the Transfer Agent), an affiliate of the Investment Manager and a wholly-owned subsidiary of Ameriprise Financial, is responsible for providing transfer agency services to the Fund. The Transfer Agent has contracted with SS&C GIDS, Inc. (SS&C GIDS) to serve as sub-transfer agent. Prior to January 1, 2023, SS&C GIDS was known as DST Asset Manager Solutions, Inc. The Transfer Agent pays the fees of SS&C GIDS for services as sub-transfer agent and SS&C GIDS is not entitled to reimbursement for such fees from the Fund (with the exception of out-of-pocket fees).
The Fund pays the Transfer Agent a monthly transfer agency fee based on the number or the average value of accounts, depending on the type of account. In addition, the Fund pays the Transfer Agent a fee for shareholder services based on the number of accounts or on a percentage of the average aggregate value of the Fund’s shares maintained in omnibus accounts up to the lesser of the amount charged by the financial intermediary or a cap established by the Board of Trustees from time to time.
| 28 | Columbia Seligman Technology and Information Fund | Semiannual Report 2022 |
Notes to Financial Statements (continued)
November 30, 2022 (Unaudited)
The Transfer Agent also receives compensation from the Fund for various shareholder services and reimbursements for certain out-of-pocket fees. Total transfer agency fees for Institutional 2 Class and Institutional 3 Class shares are subject to an annual limitation of not more than 0.07% and 0.02%, respectively, of the average daily net assets attributable to each share class.
For the six months ended November 30, 2022, the Fund’s annualized effective transfer agency fee rates as a percentage of average daily net assets of each class were as follows:
| | Effective rate (%) |
| Class A | 0.09 |
| Advisor Class | 0.09 |
| Class C | 0.09 |
| Institutional Class | 0.09 |
| Institutional 2 Class | 0.06 |
| Institutional 3 Class | 0.01 |
| Class R | 0.09 |
An annual minimum account balance fee of $20 may apply to certain accounts with a value below the applicable share class’s initial minimum investment requirements to reduce the impact of small accounts on transfer agency fees. These minimum account balance fees are remitted to the Fund and recorded as part of expense reductions in the Statement of Operations. For the six months ended November 30, 2022, these minimum account balance fees reduced total expenses of the Fund by $4,852.
Distribution and service fees
The Fund has entered into an agreement with Columbia Management Investment Distributors, Inc. (the Distributor), an affiliate of the Investment Manager and a wholly-owned subsidiary of Ameriprise Financial, for distribution and shareholder services. Under a Plan and Agreement of Distribution, the Fund pays a fee at the maximum annual rates of up to 0.25%, 1.00% and 0.50% of the Fund’s average daily net assets attributable to Class A, Class C and Class R shares, respectively. For Class C shares, of the 1.00% fee, up to 0.75% can be reimbursed for distribution expenses and up to an additional 0.25% can be reimbursed for shareholder servicing expenses. For Class R shares, of the 0.50% fee, up to 0.25% can be reimbursed for shareholder servicing expenses.
The amount of distribution and shareholder services expenses incurred by the Distributor and not yet reimbursed (unreimbursed expense) was approximately $14,489,000 for Class C shares. This amount is based on the most recent information available as of September 30, 2022, and may be recovered from future payments under the distribution plan or contingent deferred sales charges (CDSCs). To the extent the unreimbursed expense has been fully recovered, the distribution and/or shareholder services fee is reduced.
Sales charges
Sales charges, including front-end charges and CDSCs, received by the Distributor for distributing Fund shares for the six months ended November 30, 2022, if any, are listed below:
| | Front End (%) | CDSC (%) | Amount ($) |
| Class A | 5.75 | 0.50 - 1.00(a) | 811,064 |
| Class C | — | 1.00(b) | 8,574 |
| (a) | This charge is imposed on certain investments of between $1 million and $50 million redeemed within 18 months after purchase, as follows: 1.00% if redeemed within 12 months after purchase, and 0.50% if redeemed more than 12, but less than 18, months after purchase, with certain limited exceptions. |
| (b) | This charge applies to redemptions within 12 months after purchase, with certain limited exceptions. |
The Fund’s other share classes are not subject to sales charges.
Columbia Seligman Technology and Information Fund | Semiannual Report 2022
| 29 |
Notes to Financial Statements (continued)
November 30, 2022 (Unaudited)
Expenses waived/reimbursed by the Investment Manager and its affiliates
The Investment Manager and certain of its affiliates have contractually agreed to waive fees and/or reimburse expenses (excluding certain fees and expenses described below) for the period(s) disclosed below, unless sooner terminated at the sole discretion of the Board of Trustees, so that the Fund’s net operating expenses, after giving effect to fees waived/expenses reimbursed and any balance credits and/or overdraft charges from the Fund’s custodian, do not exceed the following annual rate(s) as a percentage of the classes’ average daily net assets:
| | October 1, 2022
through
September 30, 2023 | Prior to
October 1, 2022 |
| Class A | 1.33% | 1.34% |
| Advisor Class | 1.08 | 1.09 |
| Class C | 2.08 | 2.09 |
| Institutional Class | 1.08 | 1.09 |
| Institutional 2 Class | 1.05 | 1.06 |
| Institutional 3 Class | 1.00 | 1.01 |
| Class R | 1.58 | 1.59 |
Under the agreement governing these fee waivers and/or expense reimbursement arrangements, the following fees and expenses are excluded from the waiver/reimbursement commitment, and therefore will be paid by the Fund, if applicable: taxes (including foreign transaction taxes), expenses associated with investments in affiliated and non-affiliated pooled investment vehicles (including mutual funds and exchange-traded funds), transaction costs and brokerage commissions, costs related to any securities lending program, dividend expenses associated with securities sold short, inverse floater program fees and expenses, transaction charges and interest on borrowed money, interest, costs associated with shareholder meetings, infrequent and/or unusual expenses and any other expenses the exclusion of which is specifically approved by the Board of Trustees. This agreement may be modified or amended only with approval from the Investment Manager, certain of its affiliates and the Fund. Any fees waived and/or expenses reimbursed under the expense reimbursement arrangements described above are not recoverable by the Investment Manager or its affiliates in future periods.
Note 4. Federal tax information
The timing and character of income and capital gain distributions are determined in accordance with income tax regulations, which may differ from GAAP because of temporary or permanent book to tax differences.
At November 30, 2022, the approximate cost of all investments for federal income tax purposes and the aggregate gross approximate unrealized appreciation and depreciation based on that cost was:
Federal
tax cost ($) | Gross unrealized
appreciation ($) | Gross unrealized
(depreciation) ($) | Net unrealized
appreciation ($) |
| 5,106,825,000 | 4,034,485,000 | (463,813,000) | 3,570,672,000 |
Tax cost of investments and unrealized appreciation/(depreciation) may also include timing differences that do not constitute adjustments to tax basis.
Under current tax rules, regulated investment companies can elect to treat certain late-year ordinary losses incurred and post-October capital losses (capital losses realized after October 31) as arising on the first day of the following taxable year. The Fund will elect to treat the following late-year ordinary losses and post-October capital losses at May 31, 2022 as arising on June 1, 2022.
Late year
ordinary losses ($) | Post-October
capital losses ($) |
| 5,923,225 | — |
| 30 | Columbia Seligman Technology and Information Fund | Semiannual Report 2022 |
Notes to Financial Statements (continued)
November 30, 2022 (Unaudited)
Management of the Fund has concluded that there are no significant uncertain tax positions in the Fund that would require recognition in the financial statements. However, management’s conclusion may be subject to review and adjustment at a later date based on factors including, but not limited to, new tax laws, regulations, and administrative interpretations (including relevant court decisions). Generally, the Fund’s federal tax returns for the prior three fiscal years remain subject to examination by the Internal Revenue Service.
Note 5. Portfolio information
The cost of purchases and proceeds from sales of securities, excluding short-term investments and derivatives, if any, aggregated to $433,700,154 and $767,672,199, respectively, for the six months ended November 30, 2022. The amount of purchase and sale activity impacts the portfolio turnover rate reported in the Financial Highlights.
Note 6. Affiliated money market fund
The Fund invests in Columbia Short-Term Cash Fund, an affiliated money market fund established for the exclusive use by the Fund and other affiliated funds (the Affiliated MMF). The income earned by the Fund from such investments is included as Dividends - affiliated issuers in the Statement of Operations. As an investing fund, the Fund indirectly bears its proportionate share of the expenses of the Affiliated MMF. The Affiliated MMF prices its shares with a floating net asset value. In addition, the Board of Trustees of the Affiliated MMF may impose a fee on redemptions (sometimes referred to as a liquidity fee) or temporarily suspend redemptions (sometimes referred to as imposing a redemption gate) in the event its liquidity falls below regulatory limits.
Note 7. Interfund lending
Pursuant to an exemptive order granted by the Securities and Exchange Commission, the Fund participates in a program (the Interfund Program) allowing each participating Columbia Fund (each, a Participating Fund) to lend money directly to and, except for closed-end funds and money market funds, borrow money directly from other Participating Funds for temporary purposes. The amounts eligible for borrowing and lending under the Interfund Program are subject to certain restrictions.
Interfund loans are subject to the risk that the borrowing fund could be unable to repay the loan when due, and a delay in repayment to the lending fund could result in lost opportunities and/or additional lending costs. The exemptive order is subject to conditions intended to mitigate conflicts of interest arising from the Investment Manager’s relationship with each Participating Fund.
The Fund’s activity in the Interfund Program during the six months ended November 30, 2022 was as follows:
| Borrower or lender | Average loan
balance ($) | Weighted average
interest rate (%) | Number of days
with outstanding loans |
| Lender | 3,000,000 | 2.85 | 3 |
Interest income earned by the Fund is recorded as Interfund lending in the Statement of Operations. The Fund had no outstanding interfund loans at November 30, 2022.
Note 8. Line of credit
The Fund has access to a revolving credit facility with a syndicate of banks led by JPMorgan Chase Bank, N.A., Citibank, N.A. and Wells Fargo Bank, N.A. whereby the Fund may borrow for the temporary funding of shareholder redemptions or for other temporary or emergency purposes. Pursuant to an October 27, 2022 amendment and restatement, the credit facility, which is an agreement between the Fund and certain other funds managed by the Investment Manager or an affiliated investment manager, severally and not jointly, permits aggregate borrowings up to $950 million. Interest is currently charged to each participating fund based on its borrowings at a rate equal to the higher of (i) the federal funds effective rate, (ii) the secured overnight financing rate plus 0.10% and (iii) the overnight bank funding rate, plus in each case, 1.00%. Each borrowing under the credit facility matures no later than 60 days after the date of borrowing. The Fund also pays a commitment fee equal to its pro rata share of the unused amount of the credit facility at a rate of 0.15% per annum. The commitment fee is included in other expenses in the Statement of Operations. This agreement expires annually in October unless extended or renewed. Prior to the October 27, 2022 amendment and restatement, the Fund had access to a revolving credit facility with a syndicate
Columbia Seligman Technology and Information Fund | Semiannual Report 2022
| 31 |
Notes to Financial Statements (continued)
November 30, 2022 (Unaudited)
of banks led by JPMorgan Chase Bank, N.A., Citibank, N.A. and Wells Fargo Bank, N.A. which permitted collective borrowings up to $950 million. Interest was charged to each participating fund based on its borrowings at a rate equal to the higher of (i) the federal funds effective rate, (ii) the secured overnight financing rate plus 0.11448% and (iii) the overnight bank funding rate, plus in each case, 1.00%.
The Fund had no borrowings during the six months ended November 30, 2022.
Note 9. Significant risks
Information technology sector risk
The Fund is more susceptible to the particular risks that may affect companies in the information technology sector than if it were invested in a wider variety of companies in unrelated sectors. Companies in the information technology sector are subject to certain risks, including the risk that new services, equipment or technologies will not be accepted by consumers and businesses or will become rapidly obsolete. Performance of such companies may be affected by factors including obtaining and protecting patents (or the failure to do so) and significant competitive pressures, including aggressive pricing of their products or services, new market entrants, competition for market share and short product cycles due to an accelerated rate of technological developments. Such competitive pressures may lead to limited earnings and/or falling profit margins. As a result, the value of their securities may fall or fail to rise. In addition, many information technology sector companies have limited operating histories and prices of these companies’ securities historically have been more volatile than other securities, especially over the short term. Some companies in the information technology sector are facing increased government and regulatory scrutiny and may be subject to adverse government or regulatory action, which could negatively impact the value of their securities.
Market risk
The Fund may incur losses due to declines in the value of one or more securities in which it invests. These declines may be due to factors affecting a particular issuer, or the result of, among other things, political, regulatory, market, economic or social developments affecting the relevant market(s) more generally. In addition, turbulence in financial markets and reduced liquidity in equity, credit and/or fixed income markets may negatively affect many issuers, which could adversely affect the Fund’s ability to price or value hard-to-value assets in thinly traded and closed markets and could cause significant redemptions and operational challenges. Global economies and financial markets are increasingly interconnected, and conditions and events in one country, region or financial market may adversely impact issuers in a different country, region or financial market. These risks may be magnified if certain events or developments adversely interrupt the global supply chain; in these and other circumstances, such risks might affect companies worldwide. As a result, local, regional or global events such as terrorism, war, natural disasters, disease/virus outbreaks and epidemics or other public health issues, recessions, depressions or other events – or the potential for such events – could have a significant negative impact on global economic and market conditions.
The large-scale invasion of Ukraine by Russia in February 2022 has resulted in sanctions and market disruptions, including declines in regional and global stock markets, unusual volatility in global commodity markets and significant devaluations of Russian currency. The extent and duration of the military action are impossible to predict but could be significant. Market disruption caused by the Russian military action, and any counter-measures or responses thereto (including international sanctions, a downgrade in the country’s credit rating, purchasing and financing restrictions, boycotts, tariffs, changes in consumer or purchaser preferences, cyberattacks and espionage) could have severe adverse impacts on regional and/or global securities and commodities markets, including markets for oil and natural gas. These impacts may include reduced market liquidity, distress in credit markets, further disruption of global supply chains, increased risk of inflation, and limited access to investments in certain international markets and/or issuers. These developments and other related events could negatively impact Fund performance.
The pandemic caused by coronavirus disease 2019 and its variants (COVID-19) has resulted in, and may continue to result in, significant global economic and societal disruption and market volatility due to disruptions in market access, resource availability, facilities operations, imposition of tariffs, export controls and supply chain disruption, among others. Such disruptions may be caused, or exacerbated by, quarantines and travel restrictions, workforce displacement and loss in human and other resources. The uncertainty surrounding the magnitude, duration, reach, costs and effects of the global
| 32 | Columbia Seligman Technology and Information Fund | Semiannual Report 2022 |
Notes to Financial Statements (continued)
November 30, 2022 (Unaudited)
pandemic, as well as actions that have been or could be taken by governmental authorities or other third parties, present unknowns that are yet to unfold. The impacts, as well as the uncertainty over impacts to come, of COVID-19 – and any other infectious illness outbreaks, epidemics and pandemics that may arise in the future – could negatively affect global economies and markets in ways that cannot necessarily be foreseen. In addition, the impact of infectious illness outbreaks and epidemics in emerging market countries may be greater due to generally less established healthcare systems, governments and financial markets. Public health crises caused by the COVID-19 outbreak may exacerbate other pre-existing political, social and economic risks in certain countries or globally. The disruptions caused by COVID-19 could prevent the Fund from executing advantageous investment decisions in a timely manner and negatively impact the Fund’s ability to achieve its investment objective. Any such events could have a significant adverse impact on the value and risk profile of the Fund.
Non-diversification risk
A non-diversified fund is permitted to invest a greater percentage of its total assets in fewer issuers than a diversified fund. This increases the risk that a change in the value of any one investment held by the Fund could affect the overall value of the Fund more than it would affect that of a diversified fund holding a greater number of investments. Accordingly, the Fund’s value will likely be more volatile than the value of a more diversified fund.
Note 10. Subsequent events
Management has evaluated the events and transactions that have occurred through the date the financial statements were issued and noted no items requiring adjustment of the financial statements or additional disclosure.
Note 11. Information regarding pending and settled legal proceedings
Ameriprise Financial and certain of its affiliates are involved in the normal course of business in legal proceedings which include regulatory inquiries, arbitration and litigation, including class actions concerning matters arising in connection with the conduct of its activities as a diversified financial services firm. Ameriprise Financial believes that the Fund is not currently the subject of, and that neither Ameriprise Financial nor any of its affiliates are the subject of, any pending legal, arbitration or regulatory proceedings that are likely to have a material adverse effect on the Fund or the ability of Ameriprise Financial or its affiliates to perform under their contracts with the Fund. Ameriprise Financial is required to make quarterly (10-Q), annual (10-K) and, as necessary, 8-K filings with the Securities and Exchange Commission (SEC) on legal and regulatory matters that relate to Ameriprise Financial and its affiliates. Copies of these filings may be obtained by accessing the SEC website at www.sec.gov.
There can be no assurance that these matters, or the adverse publicity associated with them, will not result in increased Fund redemptions, reduced sale of Fund shares or other adverse consequences to the Fund. Further, although we believe proceedings are not likely to have a material adverse effect on the Fund or the ability of Ameriprise Financial or its affiliates to perform under their contracts with the Fund, these proceedings are subject to uncertainties and, as such, we are unable to estimate the possible loss or range of loss that may result. An adverse outcome in one or more of these proceedings could result in adverse judgments, settlements, fines, penalties or other relief that could have a material adverse effect on the consolidated financial condition or results of operations of Ameriprise Financial or one or more of its affiliates that provides services to the Fund.
Columbia Seligman Technology and Information Fund | Semiannual Report 2022
| 33 |
Approval of Management Agreement
(Unaudited)
Columbia Management Investment Advisers, LLC (the Investment Manager, and together with its domestic and global affiliates, Columbia Threadneedle Investments), a wholly-owned subsidiary of Ameriprise Financial, Inc. (Ameriprise Financial), serves as the investment manager to Columbia Seligman Technology and Information Fund (the Fund). Under a management agreement (the Management Agreement), the Investment Manager provides investment advice and other services to the Fund and other funds distributed by Columbia Management Investment Distributors, Inc. (collectively, the Funds).
On an annual basis, the Fund’s Board of Trustees (the Board), including the independent Board members (the Independent Trustees), considers renewal of the Management Agreement. The Investment Manager prepared detailed reports for the Board and its Contracts Committee (including its Contracts Subcommittee) in November 2021 and March, April and June 2022, including reports providing the results of analyses performed by an independent third-party data provider, Broadridge Financial Solutions, Inc. (Broadridge), and comprehensive responses to written requests for information by independent legal counsels to the Independent Trustees (Independent Legal Counsel) to the Investment Manager, to assist the Board in making this determination. In addition, throughout the year, the Board (or its committees or subcommittees) regularly meets with portfolio management teams and senior management personnel and reviews information prepared by the Investment Manager addressing the services the Investment Manager provides and Fund performance. The Board also accords appropriate weight to the work, deliberations and conclusions of the various committees, such as the Contracts Committee, the Investment Review Committee, the Audit Committee and the Compliance Committee in determining whether to continue the Management Agreement.
The Board, at its June 23, 2022 Board meeting (the June Meeting), considered the renewal of the Management Agreement for an additional one-year term. At the June Meeting, Independent Legal Counsel reviewed with the Independent Trustees various factors relevant to the Board’s consideration of advisory agreements and the Board’s legal responsibilities related to such consideration. The Independent Trustees considered all information that they, their legal counsel or the Investment Manager believed reasonably necessary to evaluate and to approve the continuation of the Management Agreement. Among other things, the information and factors considered included the following:
| • | Information on the investment performance of the Fund relative to the performance of a group of mutual funds determined to be comparable to the Fund by Broadridge, as well as performance relative to benchmarks; |
| • | Information on the Fund’s management fees and total expenses, including information comparing the Fund’s expenses to those of a group of comparable mutual funds, as determined by Broadridge; |
| • | The Investment Manager’s agreement to contractually limit or cap total operating expenses for the Fund so that total operating expenses (excluding certain fees and expenses, such as transaction costs and certain other investment related expenses, interest, taxes, acquired fund fees and expenses and infrequent and/or unusual expenses) would not exceed a specified annual rate, as a percentage of the Fund’s net assets; |
| • | Terms of the Management Agreement; |
| • | Descriptions of other agreements and arrangements with affiliates of the Investment Manager relating to the operations of the Fund, including agreements with respect to the provision of transfer agency and shareholder services to the Fund; |
| • | Descriptions of various services performed by the Investment Manager under the Management Agreement, including portfolio management and portfolio trading practices; |
| • | Information regarding any recently negotiated management fees of similarly-managed portfolios of other institutional clients of the Investment Manager; |
| • | Information regarding the resources of the Investment Manager, including information regarding senior management, portfolio managers and other personnel; |
| • | Information regarding the capabilities of the Investment Manager with respect to compliance monitoring services; |
| • | The profitability to the Investment Manager and its affiliates from their relationships with the Fund; and |
| • | Report provided by the Board’s independent fee consultant, JDL Consultants, LLC (JDL). |
| 34 | Columbia Seligman Technology and Information Fund | Semiannual Report 2022 |
Approval of Management Agreement (continued)
(Unaudited)
Following an analysis and discussion of the foregoing, and the factors identified below, the Board, including all of the Independent Trustees, approved the renewal of the Management Agreement.
Nature, extent and quality of services provided by the Investment Manager
The Board analyzed various reports and presentations it had received detailing the services performed by the Investment Manager, as well as its history, expertise, resources and relative capabilities, and the qualifications of its personnel.
The Board specifically considered the many developments during recent years concerning the services provided by the Investment Manager. Among other things, the Board noted the organization and depth of the equity and credit research departments. The Board further observed the enhancements to the investment risk management department’s processes, systems and oversight, over the past several years, as well as planned 2022 initiatives in this regard. The Board also took into account the broad scope of services provided by the Investment Manager to the Fund, including, among other services, investment, risk and compliance oversight. The Board also took into account the information it received concerning the Investment Manager’s ability to attract and retain key portfolio management personnel and that it has sufficient resources to provide competitive and adequate compensation to investment personnel. The Board also observed that the Investment Manager has been able to effectively manage, operate and distribute the Funds through the COVID-19 pandemic period with no disruptions in services provided. The Board also considered added personnel and resources obtained by Columbia Threadneedle through Ameriprise Financial’s acquisition of BMO Financial Group’s Europe, Middle East, and Africa (EMEA) asset management business.
In connection with the Board’s evaluation of the overall package of services provided by the Investment Manager, the Board also considered the nature, quality and range of administrative services provided to the Fund by the Investment Manager, as well as the achievements in 2021 in the performance of administrative services, and noted the various enhancements anticipated for 2022. In evaluating the quality of services provided under the Management Agreement, the Board also took into account the organization and strength of the Fund’s and its service providers’ compliance programs. The Board also reviewed the financial condition of the Investment Manager and its affiliates and each entity’s ability to carry out its responsibilities under the Management Agreement and the Fund’s other service agreements.
In addition, the Board discussed the acceptability of the terms of the Management Agreement, noting that no changes were proposed from the form of agreement previously approved. The Board also noted the wide array of legal and compliance services provided to the Fund under the Management Agreement.
After reviewing these and related factors (including investment performance as discussed below), the Board concluded, within the context of their overall conclusions, that the nature, extent and quality of the services provided to the Fund under the Management Agreement supported the continuation of the Management Agreement.
Investment performance
In this connection, the Board carefully reviewed the investment performance of the Fund, including detailed reports providing the results of analyses performed by each of the Investment Manager, Broadridge and JDL collectively showing, for various periods (including since manager inception): (i) the performance of the Fund, (ii) the performance of a benchmark index, (iii) the percentage ranking of the Fund among its comparison group, (iv) the Fund’s performance relative to peers and benchmarks and (v) the net assets of the Fund. The Board observed that the Fund’s performance for certain periods ranked above median based on information provided by Broadridge.
The Board also reviewed a description of the third-party data provider’s methodology for identifying the Fund’s peer groups for purposes of performance and expense comparisons.
The Board also considered the Investment Manager’s performance and reputation generally. After reviewing these and related factors, the Board concluded, within the context of their overall conclusions, that the performance of the Fund and the Investment Manager, in light of other considerations, supported the continuation of the Management Agreement.
Columbia Seligman Technology and Information Fund | Semiannual Report 2022
| 35 |
Approval of Management Agreement (continued)
(Unaudited)
Comparative fees, costs of services provided and the profits realized by the Investment Manager and its affiliates from their relationships with the Fund
The Board reviewed comparative fees and the costs of services provided under the Management Agreement. The Board members considered detailed comparative information set forth in an annual report on fees and expenses, including, among other things, data (based on analyses conducted by Broadridge and JDL) showing a comparison of the Fund’s expenses with median expenses paid by funds in its comparative peer universe, as well as data showing the Fund’s contribution to the Investment Manager’s profitability.
The Board considered the reports of JDL, which assisted in the Board’s analysis of the Funds’ performance and expenses and the reasonableness of the Funds’ fee rates. The Board accorded particular weight to the notion that a primary objective of the level of fees is to achieve a rational pricing model applied consistently across the various product lines in the Fund family, while assuring that the overall fees for each Fund (with certain exceptions) are generally in line with the current "pricing philosophy" such that Fund total expense ratios, in general, approximate or are lower than the median expense ratios of funds in the same Lipper comparison universe. The Board took into account that the Fund’s total expense ratio (after considering proposed expense caps/waivers) approximated the peer universe’s median expense ratio. The Board also considered the benefits of the proposed additional breakpoints to the Fund’s current fee rate schedule (the Proposed Additional Breakpoints).
After reviewing these and related factors, the Board concluded, within the context of their overall conclusions, that the levels of management fees and expenses of the Fund, in light of other considerations, supported the continuation of the Management Agreement.
The Board also considered the profitability of the Investment Manager and its affiliates in connection with the Investment Manager providing management services to the Fund. With respect to the profitability of the Investment Manager and its affiliates, the Independent Trustees referred to information discussing the profitability to the Investment Manager and Ameriprise Financial from managing, operating and distributing the Funds. The Board considered that in 2021 the Board had considered 2020 profitability and that the 2022 information showed that the profitability generated by the Investment Manager in 2021 increased from 2020 levels, due to a variety of factors, including the increased assets under management of the Funds. It also took into account the indirect economic benefits flowing to the Investment Manager or its affiliates in connection with managing or distributing the Funds, such as the enhanced ability to offer various other financial products to Ameriprise Financial customers, soft dollar benefits and overall reputational advantages. The Board noted that the fees paid by the Fund should permit the Investment Manager to offer competitive compensation to its personnel, make necessary investments in its business and earn an appropriate profit. After reviewing these and related factors, the Board concluded, within the context of their overall conclusions, that the costs of services provided and the profitability to the Investment Manager and its affiliates from their relationships with the Fund supported the continuation of the Management Agreement.
Economies of scale
The Board considered the potential existence of economies of scale in the provision by the Investment Manager of services to the Fund, to groups of related funds and to the Investment Manager as a whole, and whether those economies of scale were shared with the Fund through breakpoints in investment management fees or other means, such as expense limitation arrangements and additional investments by the Investment Manager in investment, trading, compliance and other resources. The Board considered the economies of scale that might be realized as the Fund’s net asset level grows and took note of the extent to which Fund shareholders might also benefit from such growth. In this regard, the Board took into account that management fees decline as Fund assets exceed various breakpoints. The Board observed that the Management Agreement provided for breakpoints in the management fee rate schedule that allow opportunities for shareholders to realize lower fees as Fund assets grow and that there are additional opportunities through other means for sharing economies of scale with shareholders. In this regard, the Board noted the Proposed Additional Breakpoints.
Conclusion
The Board reviewed all of the above considerations in reaching its decision to approve the continuation of the Management Agreement. In reaching its conclusions, no single factor was determinative.
| 36 | Columbia Seligman Technology and Information Fund | Semiannual Report 2022 |
Approval of Management Agreement (continued)
(Unaudited)
On June 23, 2022, the Board, including all of the Independent Trustees, determined that fees payable under the Management Agreement were fair and reasonable in light of the extent and quality of services provided and approved the renewal of the Management Agreement.
Columbia Seligman Technology and Information Fund | Semiannual Report 2022
| 37 |
[THIS PAGE INTENTIONALLY LEFT BLANK]
[THIS PAGE INTENTIONALLY LEFT BLANK]
Columbia Seligman Technology and Information Fund
P.O. Box 219104
Kansas City, MO 64121-9104
Please read and consider the investment objectives, risks, charges and expenses for any fund carefully before investing. For a prospectus and summary prospectus, which contains this and other important information about the Fund, go to
columbiathreadneedleus.com/investor/. The Fund is distributed by Columbia Management Investment Distributors, Inc., member FINRA, and managed by Columbia Management Investment Advisers, LLC.
Columbia Threadneedle Investments (Columbia Threadneedle) is the global brand name of the Columbia and Threadneedle group of companies. All rights reserved.
© 2023 Columbia Management Investment Advisers, LLC.
columbiathreadneedleus.com/investor/

Semiannual Report
November 30, 2022 (Unaudited)
Columbia Dividend Opportunity Fund
Not FDIC or NCUA Insured • No Financial Institution Guarantee • May Lose Value
If you elect to receive the shareholder report for Columbia Dividend Opportunity Fund (the Fund) in paper, mailed to you, the Fund mails one shareholder report to each shareholder address, unless such shareholder elects to receive shareholder reports from the Fund electronically via e-mail or by having a paper notice mailed to you (Postcard Notice) that your Fund’s shareholder report is available at the Columbia funds’ website (columbiathreadneedleus.com/investor/). If you would like more than one report in paper to be mailed to you, or would like to elect to receive reports via e-mail or access them through Postcard Notice, please call shareholder services at 800.345.6611 and additional reports will be sent to you.
Proxy voting policies and procedures
The policy of the Board of Trustees is to vote the proxies of the companies in which the Fund holds investments consistent with the procedures as stated in the Statement of Additional Information (SAI). You may obtain a copy of the SAI without charge by calling 800.345.6611; contacting your financial intermediary; visiting columbiathreadneedleus.com/investor/; or searching the website of the Securities and Exchange Commission (SEC) at sec.gov. Information regarding how the Fund voted proxies relating to portfolio securities is filed with the SEC by August 31st for the most recent 12-month period ending June 30th of that year, and is available without charge by visiting columbiathreadneedleus.com/investor/, or searching the website of the SEC at sec.gov.
Quarterly schedule of investments
The Fund files a complete schedule of portfolio holdings with the SEC for the first and third quarters of each fiscal year on Form N-PORT. The Fund’s Form N-PORT filings are available on the SEC’s website at sec.gov. The Fund’s complete schedule of portfolio holdings, as filed on Form N-PORT, is available on columbiathreadneedleus.com/investor/ or can also be obtained without charge, upon request, by calling 800.345.6611.
Additional Fund information
For more information about the Fund, please visit columbiathreadneedleus.com/investor/ or call 800.345.6611. Customer Service Representatives are available to answer your questions Monday through Friday from 8 a.m. to 7 p.m. Eastern time.
Fund investment manager
Columbia Management Investment Advisers, LLC (the Investment Manager)
290 Congress Street
Boston, MA 02210
Fund distributor
Columbia Management Investment Distributors, Inc.
290 Congress Street
Boston, MA 02210
Fund transfer agent
Columbia Management Investment Services Corp.
P.O. Box 219104
Kansas City, MO 64121-9104
Columbia Dividend Opportunity Fund | Semiannual Report 2022
Fund at a Glance
(Unaudited)
Investment objective
The Fund seeks to provide shareholders with a high level of current income. The Fund’s secondary objective is growth of income and capital.
Portfolio management
David King, CFA
Lead Portfolio Manager
Managed Fund since 2018
Yan Jin
Portfolio Manager
Managed Fund since 2018
Grace Lee, CAIA
Portfolio Manager
Managed Fund since 2020
Morningstar style boxTM
The Morningstar Style Box is based on a fund’s portfolio holdings. For equity funds, the vertical axis shows the market capitalization of the stocks owned, and the horizontal axis shows investment style (value, blend, or growth). Information shown is based on the most recent data provided by Morningstar.
© 2023 Morningstar, Inc. All rights reserved. The Morningstar information contained herein: (1) is proprietary to Morningstar and/or its content providers; (2) may not be copied or distributed; and (3) is not warranted to be accurate, complete or timely. Neither Morningstar nor its content providers are responsible for any damages or losses arising from any use of this information.
| Average annual total returns (%) (for the period ended November 30, 2022) |
| | | Inception | 6 Months
cumulative | 1 Year | 5 Years | 10 Years |
| Class A | Excluding sales charges | 08/01/88 | 0.90 | 9.28 | 9.04 | 10.33 |
| | Including sales charges | | -4.91 | 3.01 | 7.76 | 9.68 |
| Advisor Class | 11/08/12 | 1.01 | 9.52 | 9.31 | 10.60 |
| Class C | Excluding sales charges | 06/26/00 | 0.51 | 8.44 | 8.23 | 9.49 |
| | Including sales charges | | -0.49 | 7.48 | 8.23 | 9.49 |
| Institutional Class | 09/27/10 | 1.00 | 9.54 | 9.32 | 10.59 |
| Institutional 2 Class | 08/01/08 | 1.05 | 9.59 | 9.38 | 10.68 |
| Institutional 3 Class | 11/08/12 | 1.08 | 9.63 | 9.41 | 10.73 |
| Class R | 08/01/08 | 0.76 | 8.97 | 8.76 | 10.04 |
| MSCI USA High Dividend Yield Index (Net) | | 1.72 | 5.86 | 7.35 | 10.72 |
| Russell 1000 Value Index | | 0.90 | 2.42 | 7.86 | 10.97 |
Returns for Class A shares are shown with and without the maximum initial sales charge of 5.75%. Returns for Class C shares are shown with and without the 1.00% contingent deferred sales charge for the first year only. The Fund’s other share classes are not subject to sales charges and have limited eligibility. Please see the Fund’s prospectus for details. Performance for different share classes will vary based on differences in sales charges and fees associated with each share class. All results shown assume reinvestment of distributions during the period. Returns do not reflect the deduction of taxes that a shareholder may pay on Fund distributions or on the redemption of Fund shares. Performance results reflect the effect of any fee waivers or reimbursements of Fund expenses by Columbia Management Investment Advisers, LLC and/or any of its affiliates. Absent these fee waivers or expense reimbursement arrangements, performance results would have been lower.
The performance information shown represents past performance and is not a guarantee of future results. The investment return and principal value of your investment will fluctuate so that your shares, when redeemed, may be worth more or less than their original cost. Current performance may be lower or higher than the performance information shown. You may obtain performance information current to the most recent month-end by contacting your financial intermediary, visiting columbiathreadneedleus.com/investor/ or calling 800.345.6611.
The MSCI USA High Dividend Yield Index (Net) is composed of those securities in the MSCI USA Index that have higher-than-average dividend yield (e.g. 30% higher than that of the MSCI USA Index), a track record of consistent dividend payments and the capacity to sustain future dividend payments. The MSCI USA Index is a free float adjusted market capitalization index that is designed to measure large- and mid-cap U.S. equity market performance.
The Russell 1000 Value Index, an unmanaged index, measures the performance of those stocks in the Russell 1000 Index with lower price-to-book ratios and lower forecasted growth values.
Indices are not available for investment, are not professionally managed and do not reflect sales charges, fees, brokerage commissions, taxes (except the MSCI USA High Dividend Yield Index (Net), which reflects reinvested dividends net of withholding taxes) or other expenses of investing. Securities in the Fund may not match those in an index.
Columbia Dividend Opportunity Fund | Semiannual Report 2022
| 3 |
Fund at a Glance (continued)
(Unaudited)
| Portfolio breakdown (%) (at November 30, 2022) |
| Common Stocks | 95.8 |
| Convertible Preferred Stocks | 3.7 |
| Money Market Funds | 0.5 |
| Total | 100.0 |
Percentages indicated are based upon total investments excluding investments in derivatives, if any. The Fund’s portfolio composition is subject to change.
| Equity sector breakdown (%) (at November 30, 2022) |
| Communication Services | 4.0 |
| Consumer Discretionary | 5.3 |
| Consumer Staples | 13.4 |
| Energy | 11.8 |
| Financials | 19.4 |
| Health Care | 14.6 |
| Industrials | 7.6 |
| Information Technology | 9.3 |
| Materials | 1.9 |
| Real Estate | 6.2 |
| Utilities | 6.5 |
| Total | 100.0 |
Percentages indicated are based upon total equity investments. The Fund’s portfolio composition is subject to change.
| 4 | Columbia Dividend Opportunity Fund | Semiannual Report 2022 |
Understanding Your Fund’s Expenses
(Unaudited)
As an investor, you incur two types of costs. There are shareholder transaction costs, which generally include sales charges on purchases and may include redemption fees. There are also ongoing fund costs, which generally include management fees, distribution and/or service fees, and other fund expenses. The following information is intended to help you understand your ongoing costs (in dollars) of investing in the Fund and to help you compare these costs with the ongoing costs of investing in other mutual funds.
Analyzing your Fund’s expenses
To illustrate these ongoing costs, we have provided examples and calculated the expenses paid by investors in each share class of the Fund during the period. The actual and hypothetical information in the table is based on an initial investment of $1,000 at the beginning of the period indicated and held for the entire period. Expense information is calculated two ways and each method provides you with different information. The amount listed in the “Actual” column is calculated using the Fund’s actual operating expenses and total return for the period. You may use the Actual information, together with the amount invested, to estimate the expenses that you paid over the period. Simply divide your account value by $1,000 (for example, an $8,600 account value divided by $1,000 = 8.6), then multiply the results by the expenses paid during the period under the “Actual” column. The amount listed in the “Hypothetical” column assumes a 5% annual rate of return before expenses (which is not the Fund’s actual return) and then applies the Fund’s actual expense ratio for the period to the hypothetical return. You should not use the hypothetical account values and expenses to estimate either your actual account balance at the end of the period or the expenses you paid during the period. See “Compare with other funds” below for details on how to use the hypothetical data.
Compare with other funds
Since all mutual funds are required to include the same hypothetical calculations about expenses in shareholder reports, you can use this information to compare the ongoing cost of investing in the Fund with other funds. To do so, compare the hypothetical example with the 5% hypothetical examples that appear in the shareholder reports of other funds. As you compare hypothetical examples of other funds, it is important to note that hypothetical examples are meant to highlight the ongoing costs of investing in a fund only and do not reflect any transaction costs, such as sales charges, or redemption or exchange fees. Therefore, the hypothetical calculations are useful in comparing ongoing costs only, and will not help you determine the relative total costs of owning different funds. If transaction costs were included in these calculations, your costs would be higher.
| June 1, 2022 — November 30, 2022 |
| | Account value at the
beginning of the
period ($) | Account value at the
end of the
period ($) | Expenses paid during
the period ($) | Fund’s annualized
expense ratio (%) |
| | Actual | Hypothetical | Actual | Hypothetical | Actual | Hypothetical | Actual |
| Class A | 1,000.00 | 1,000.00 | 1,009.00 | 1,020.10 | 4.99 | 5.01 | 0.99 |
| Advisor Class | 1,000.00 | 1,000.00 | 1,010.10 | 1,021.36 | 3.73 | 3.75 | 0.74 |
| Class C | 1,000.00 | 1,000.00 | 1,005.10 | 1,016.34 | 8.75 | 8.80 | 1.74 |
| Institutional Class | 1,000.00 | 1,000.00 | 1,010.00 | 1,021.36 | 3.73 | 3.75 | 0.74 |
| Institutional 2 Class | 1,000.00 | 1,000.00 | 1,010.50 | 1,021.56 | 3.53 | 3.55 | 0.70 |
| Institutional 3 Class | 1,000.00 | 1,000.00 | 1,010.80 | 1,021.81 | 3.28 | 3.29 | 0.65 |
| Class R | 1,000.00 | 1,000.00 | 1,007.60 | 1,018.85 | 6.24 | 6.28 | 1.24 |
Expenses paid during the period are equal to the annualized expense ratio for each class as indicated above, multiplied by the average account value over the period and then multiplied by the number of days in the Fund’s most recent fiscal half year and divided by 365.
Expenses do not include fees and expenses incurred indirectly by the Fund from its investment in underlying funds, including affiliated and non-affiliated pooled investment vehicles, such as mutual funds and exchange-traded funds.
Had Columbia Management Investment Advisers, LLC and/or certain of its affiliates not waived/reimbursed certain fees and expenses, account value at the end of the period would have been reduced.
Columbia Dividend Opportunity Fund | Semiannual Report 2022
| 5 |
Portfolio of Investments
November 30, 2022 (Unaudited)
(Percentages represent value of investments compared to net assets)
Investments in securities
| Common Stocks 96.2% |
| Issuer | Shares | Value ($) |
| Communication Services 4.0% |
| Diversified Telecommunication Services 2.7% |
| AT&T, Inc. | 1,975,000 | 38,078,000 |
| Verizon Communications, Inc. | 825,000 | 32,158,500 |
| Total | | 70,236,500 |
| Media 1.3% |
| Comcast Corp., Class A | 900,000 | 32,976,000 |
| Total Communication Services | 103,212,500 |
| Consumer Discretionary 4.8% |
| Hotels, Restaurants & Leisure 1.0% |
| Darden Restaurants, Inc. | 90,000 | 13,229,100 |
| McDonald’s Corp. | 47,500 | 12,957,525 |
| Total | | 26,186,625 |
| Multiline Retail 1.0% |
| Target Corp. | 145,000 | 24,225,150 |
| Specialty Retail 2.3% |
| Home Depot, Inc. (The) | 185,000 | 59,938,150 |
| Textiles, Apparel & Luxury Goods 0.5% |
| Tapestry, Inc. | 350,000 | 13,219,500 |
| Total Consumer Discretionary | 123,569,425 |
| Consumer Staples 13.4% |
| Beverages 5.5% |
| Coca-Cola Co. (The) | 1,125,000 | 71,561,250 |
| PepsiCo, Inc. | 385,000 | 71,421,350 |
| Total | | 142,982,600 |
| Food Products 2.6% |
| Bunge Ltd. | 130,000 | 13,629,200 |
| ConAgra Foods, Inc. | 335,000 | 12,723,300 |
| JM Smucker Co. (The) | 90,000 | 13,860,900 |
| Kraft Heinz Co. (The) | 665,000 | 26,167,750 |
| Total | | 66,381,150 |
| Household Products 3.0% |
| Procter & Gamble Co. (The) | 525,000 | 78,309,000 |
| Common Stocks (continued) |
| Issuer | Shares | Value ($) |
| Tobacco 2.3% |
| Altria Group, Inc. | 412,500 | 19,214,250 |
| Philip Morris International, Inc. | 400,000 | 39,868,000 |
| Total | | 59,082,250 |
| Total Consumer Staples | 346,755,000 |
| Energy 11.7% |
| Oil, Gas & Consumable Fuels 11.7% |
| Chesapeake Energy Corp. | 125,000 | 12,937,500 |
| Chevron Corp. | 345,000 | 63,241,950 |
| ConocoPhillips Co. | 100,000 | 12,351,000 |
| Devon Energy Corp. | 175,000 | 11,991,000 |
| EOG Resources, Inc. | 185,000 | 26,257,050 |
| Exxon Mobil Corp. | 1,150,000 | 128,041,000 |
| Valero Energy Corp. | 225,000 | 30,064,500 |
| Williams Companies, Inc. (The) | 550,000 | 19,085,000 |
| Total | | 303,969,000 |
| Total Energy | 303,969,000 |
| Financials 19.4% |
| Banks 11.5% |
| Bank of America Corp. | 2,100,000 | 79,485,000 |
| Citizens Financial Group, Inc. | 450,000 | 19,071,000 |
| JPMorgan Chase & Co. | 575,000 | 79,453,500 |
| M&T Bank Corp. | 150,000 | 25,503,000 |
| PNC Financial Services Group, Inc. (The) | 225,000 | 37,858,500 |
| Wells Fargo & Co. | 1,175,000 | 56,341,250 |
| Total | | 297,712,250 |
| Capital Markets 5.2% |
| Ares Capital Corp. | 675,000 | 13,263,750 |
| BlackRock, Inc. | 37,500 | 26,850,000 |
| Blackstone, Inc. | 185,000 | 16,933,050 |
| Morgan Stanley | 515,000 | 47,931,050 |
| State Street Corp. | 365,000 | 29,079,550 |
| Total | | 134,057,400 |
The accompanying Notes to Financial Statements are an integral part of this statement.
| 6 | Columbia Dividend Opportunity Fund | Semiannual Report 2022 |
Portfolio of Investments (continued)
November 30, 2022 (Unaudited)
| Common Stocks (continued) |
| Issuer | Shares | Value ($) |
| Insurance 2.2% |
| MetLife, Inc. | 400,000 | 30,680,000 |
| Progressive Corp. (The) | 105,000 | 13,875,750 |
| Prudential Financial, Inc. | 120,000 | 12,963,600 |
| Total | | 57,519,350 |
| Mortgage Real Estate Investment Trusts (REITS) 0.5% |
| Starwood Property Trust, Inc. | 550,000 | 11,775,500 |
| Total Financials | 501,064,500 |
| Health Care 13.3% |
| Biotechnology 3.1% |
| AbbVie, Inc. | 425,000 | 68,501,500 |
| Amgen, Inc. | 45,000 | 12,888,000 |
| Total | | 81,389,500 |
| Health Care Equipment & Supplies 0.5% |
| Medtronic PLC | 175,000 | 13,832,000 |
| Pharmaceuticals 9.7% |
| Bristol-Myers Squibb Co. | 485,000 | 38,935,800 |
| Johnson & Johnson | 435,000 | 77,430,000 |
| Merck & Co., Inc. | 635,000 | 69,926,200 |
| Pfizer, Inc. | 1,275,000 | 63,915,750 |
| Total | | 250,207,750 |
| Total Health Care | 345,429,250 |
| Industrials 7.5% |
| Aerospace & Defense 1.8% |
| Huntington Ingalls Industries, Inc. | 55,000 | 12,757,800 |
| Raytheon Technologies Corp. | 335,000 | 33,071,200 |
| Total | | 45,829,000 |
| Air Freight & Logistics 2.3% |
| CH Robinson Worldwide, Inc. | 110,000 | 11,024,200 |
| United Parcel Service, Inc., Class B | 260,000 | 49,329,800 |
| Total | | 60,354,000 |
| Electrical Equipment 0.7% |
| Eaton Corp. PLC | 115,000 | 18,796,750 |
| Common Stocks (continued) |
| Issuer | Shares | Value ($) |
| Machinery 2.2% |
| AGCO Corp. | 100,000 | 13,272,000 |
| Caterpillar, Inc. | 100,000 | 23,641,000 |
| Stanley Black & Decker, Inc. | 240,000 | 19,612,800 |
| Total | | 56,525,800 |
| Road & Rail 0.5% |
| Union Pacific Corp. | 55,000 | 11,958,650 |
| Total Industrials | 193,464,200 |
| Information Technology 9.3% |
| Communications Equipment 2.4% |
| Cisco Systems, Inc. | 1,000,000 | 49,720,000 |
| Juniper Networks, Inc. | 410,000 | 13,628,400 |
| Total | | 63,348,400 |
| Electronic Equipment, Instruments & Components 0.5% |
| Corning, Inc. | 375,000 | 12,798,750 |
| IT Services 1.6% |
| International Business Machines Corp. | 275,000 | 40,947,500 |
| Semiconductors & Semiconductor Equipment 4.3% |
| Broadcom, Inc. | 95,000 | 52,347,850 |
| Intel Corp. | 450,000 | 13,531,500 |
| QUALCOMM, Inc. | 110,000 | 13,913,900 |
| Texas Instruments, Inc. | 175,000 | 31,580,500 |
| Total | | 111,373,750 |
| Technology Hardware, Storage & Peripherals 0.5% |
| HP, Inc. | 425,000 | 12,767,000 |
| Total Information Technology | 241,235,400 |
| Materials 1.9% |
| Chemicals 1.4% |
| Dow, Inc. | 500,000 | 25,485,000 |
| Nutrien Ltd. | 135,000 | 10,854,000 |
| Total | | 36,339,000 |
| Metals & Mining 0.5% |
| Newmont Corp. | 275,000 | 13,054,250 |
| Total Materials | 49,393,250 |
The accompanying Notes to Financial Statements are an integral part of this statement.
Columbia Dividend Opportunity Fund | Semiannual Report 2022
| 7 |
Portfolio of Investments (continued)
November 30, 2022 (Unaudited)
| Common Stocks (continued) |
| Issuer | Shares | Value ($) |
| Real Estate 6.2% |
| Equity Real Estate Investment Trusts (REITS) 6.2% |
| Alexandria Real Estate Equities, Inc. | 82,500 | 12,837,825 |
| AvalonBay Communities, Inc. | 95,000 | 16,615,500 |
| Crown Castle, Inc. | 140,000 | 19,800,200 |
| Kimco Realty Corp. | 850,000 | 19,482,000 |
| Life Storage, Inc. | 160,000 | 17,198,400 |
| Prologis, Inc. | 165,000 | 19,435,350 |
| Simon Property Group, Inc. | 200,000 | 23,888,000 |
| VICI Properties, Inc. | 550,000 | 18,810,000 |
| Welltower, Inc. | 185,000 | 13,140,550 |
| Total | | 161,207,825 |
| Total Real Estate | 161,207,825 |
| Utilities 4.7% |
| Electric Utilities 3.7% |
| American Electric Power Co., Inc. | 275,000 | 26,620,000 |
| Duke Energy Corp. | 260,000 | 25,981,800 |
| Entergy Corp. | 210,000 | 24,416,700 |
| FirstEnergy Corp. | 465,000 | 19,176,600 |
| Total | | 96,195,100 |
| Multi-Utilities 1.0% |
| DTE Energy Co. | 228,600 | 26,519,886 |
| Total Utilities | 122,714,986 |
Total Common Stocks
(Cost $1,928,483,641) | 2,492,015,336 |
| Convertible Preferred Stocks 3.7% |
| Issuer | | Shares | Value ($) |
| Consumer Discretionary 0.5% |
| Auto Components 0.5% |
| Aptiv PLC | 5.500% | 115,000 | 13,859,800 |
| Total Consumer Discretionary | 13,859,800 |
| Convertible Preferred Stocks (continued) |
| Issuer | | Shares | Value ($) |
| Health Care 1.3% |
| Health Care Equipment & Supplies 1.3% |
| Becton Dickinson and Co. | 6.000% | 260,000 | 12,914,200 |
| Boston Scientific Corp. | 5.500% | 175,000 | 19,764,500 |
| Total | | | 32,678,700 |
| Total Health Care | 32,678,700 |
| Industrials 0.1% |
| Professional Services 0.1% |
| Clarivate PLC | 5.250% | 82,500 | 3,526,050 |
| Total Industrials | 3,526,050 |
| Utilities 1.8% |
| Electric Utilities 0.8% |
| NextEra Energy, Inc. | 6.219% | 225,000 | 11,353,500 |
| NextEra Energy, Inc. | 6.926% | 160,000 | 7,886,400 |
| Total | | | 19,239,900 |
| Multi-Utilities 1.0% |
| NiSource, Inc. | 7.750% | 250,000 | 26,955,000 |
| Total Utilities | 46,194,900 |
Total Convertible Preferred Stocks
(Cost $95,003,448) | 96,259,450 |
| Money Market Funds 0.5% |
| | Shares | Value ($) |
| Columbia Short-Term Cash Fund, 3.989%(a),(b) | 12,120,560 | 12,115,712 |
Total Money Market Funds
(Cost $12,115,156) | 12,115,712 |
Total Investments in Securities
(Cost: $2,035,602,245) | 2,600,390,498 |
| Other Assets & Liabilities, Net | | (10,414,885) |
| Net Assets | 2,589,975,613 |
The accompanying Notes to Financial Statements are an integral part of this statement.
| 8 | Columbia Dividend Opportunity Fund | Semiannual Report 2022 |
Portfolio of Investments (continued)
November 30, 2022 (Unaudited)
Notes to Portfolio of Investments
| (a) | The rate shown is the seven-day current annualized yield at November 30, 2022. |
| (b) | As defined in the Investment Company Act of 1940, as amended, an affiliated company is one in which the Fund owns 5% or more of the company’s outstanding voting securities, or a company which is under common ownership or control with the Fund. The value of the holdings and transactions in these affiliated companies during the period ended November 30, 2022 are as follows: |
| Affiliated issuers | Beginning
of period($) | Purchases($) | Sales($) | Net change in
unrealized
appreciation
(depreciation)($) | End of
period($) | Realized gain
(loss)($) | Dividends($) | End of
period shares |
| Columbia Short-Term Cash Fund, 3.989% |
| | 3,121,726 | 309,988,266 | (300,994,836) | 556 | 12,115,712 | 2,282 | 350,530 | 12,120,560 |
Fair value measurements
The Fund categorizes its fair value measurements according to a three-level hierarchy that maximizes the use of observable inputs and minimizes the use of unobservable inputs by prioritizing that the most observable input be used when available. Observable inputs are those that market participants would use in pricing an investment based on market data obtained from sources independent of the reporting entity. Unobservable inputs are those that reflect the Fund’s assumptions about the information market participants would use in pricing an investment. An investment’s level within the fair value hierarchy is based on the lowest level of any input that is deemed significant to the asset’s or liability’s fair value measurement. The input levels are not necessarily an indication of the risk or liquidity associated with investments at that level. For example, certain U.S. government securities are generally high quality and liquid, however, they are reflected as Level 2 because the inputs used to determine fair value may not always be quoted prices in an active market.
Fair value inputs are summarized in the three broad levels listed below:
| ■ | Level 1 — Valuations based on quoted prices for investments in active markets that the Fund has the ability to access at the measurement date. Valuation adjustments are not applied to Level 1 investments. |
| ■ | Level 2 — Valuations based on other significant observable inputs (including quoted prices for similar securities, interest rates, prepayment speeds, credit risks, etc.). |
| ■ | Level 3 — Valuations based on significant unobservable inputs (including the Fund’s own assumptions and judgment in determining the fair value of investments). |
Inputs that are used in determining fair value of an investment may include price information, credit data, volatility statistics, and other factors. These inputs can be either observable or unobservable. The availability of observable inputs can vary between investments, and is affected by various factors such as the type of investment, and the volume and level of activity for that investment or similar investments in the marketplace. The inputs will be considered by the Investment Manager, along with any other relevant factors in the calculation of an investment’s fair value. The Fund uses prices and inputs that are current as of the measurement date, which may include periods of market dislocations. During these periods, the availability of prices and inputs may be reduced for many investments. This condition could cause an investment to be reclassified between the various levels within the hierarchy.
Foreign equity securities actively traded in markets where there is a significant delay in the local close relative to the New York Stock Exchange are classified as Level 2. The values of these securities may include an adjustment to reflect the impact of market movements following the close of local trading, as described in Note 2 to the financial statements – Security valuation.
Investments falling into the Level 3 category are primarily supported by quoted prices from brokers and dealers participating in the market for those investments. However, these may be classified as Level 3 investments due to lack of market transparency and corroboration to support these quoted prices. Additionally, valuation models may be used as the pricing source for any remaining investments classified as Level 3. These models may rely on one or more significant unobservable inputs and/or significant assumptions by the Investment Manager. Inputs used in valuations may include, but are not limited to, financial statement analysis, capital account balances, discount rates and estimated cash flows, and comparable company data.
The Fund’s Board of Trustees (the Board) has designated the Investment Manager, through its Valuation Committee (the Committee), as valuation designee, responsible for determining the fair value of the assets of the Fund for which market quotations are not readily available using valuation procedures approved by the Board. The Committee consists of voting and non-voting members from various groups within the Investment Manager’s organization, including operations and accounting, trading and investments, compliance, risk management and legal.
The Committee meets at least monthly to review and approve valuation matters, which may include a description of specific valuation determinations, data regarding pricing information received from approved pricing vendors and brokers and the results of Board-approved valuation policies and procedures (the Policies). The Policies address, among other things, instances when market quotations are or are not readily available, including recommendations of third party pricing vendors and a determination of appropriate pricing methodologies; events that require specific valuation determinations and assessment of fair value techniques; securities with a potential for stale pricing, including those that are illiquid, restricted, or in default; and the effectiveness of third party pricing vendors, including periodic reviews of vendors. The Committee meets more frequently, as needed, to discuss additional valuation matters, which may include the need to review back-testing results, review time-sensitive information or approve related valuation actions. Representatives of Columbia Management Investment Advisers, LLC report to the Board at each of its regularly scheduled meetings to discuss valuation matters and actions during the period, similar to those described earlier.
The following table is a summary of the inputs used to value the Fund’s investments at November 30, 2022:
| | Level 1 ($) | Level 2 ($) | Level 3 ($) | Total ($) |
| Investments in Securities | | | | |
| Common Stocks | | | | |
| Communication Services | 103,212,500 | — | — | 103,212,500 |
| Consumer Discretionary | 123,569,425 | — | — | 123,569,425 |
| Consumer Staples | 346,755,000 | — | — | 346,755,000 |
| Energy | 303,969,000 | — | — | 303,969,000 |
| Financials | 501,064,500 | — | — | 501,064,500 |
The accompanying Notes to Financial Statements are an integral part of this statement.
Columbia Dividend Opportunity Fund | Semiannual Report 2022
| 9 |
Portfolio of Investments (continued)
November 30, 2022 (Unaudited)
Fair value measurements (continued)
| | Level 1 ($) | Level 2 ($) | Level 3 ($) | Total ($) |
| Health Care | 345,429,250 | — | — | 345,429,250 |
| Industrials | 193,464,200 | — | — | 193,464,200 |
| Information Technology | 241,235,400 | — | — | 241,235,400 |
| Materials | 49,393,250 | — | — | 49,393,250 |
| Real Estate | 161,207,825 | — | — | 161,207,825 |
| Utilities | 122,714,986 | — | — | 122,714,986 |
| Total Common Stocks | 2,492,015,336 | — | — | 2,492,015,336 |
| Convertible Preferred Stocks | | | | |
| Consumer Discretionary | — | 13,859,800 | — | 13,859,800 |
| Health Care | — | 32,678,700 | — | 32,678,700 |
| Industrials | — | 3,526,050 | — | 3,526,050 |
| Utilities | — | 46,194,900 | — | 46,194,900 |
| Total Convertible Preferred Stocks | — | 96,259,450 | — | 96,259,450 |
| Money Market Funds | 12,115,712 | — | — | 12,115,712 |
| Total Investments in Securities | 2,504,131,048 | 96,259,450 | — | 2,600,390,498 |
See the Portfolio of Investments for all investment classifications not indicated in the table.
The Fund’s assets assigned to the Level 2 input category are generally valued using the market approach, in which a security’s value is determined through reference to prices and information from market transactions for similar or identical assets. These assets include certain foreign securities for which a third party statistical pricing service may be employed for purposes of fair market valuation. The model utilized by such third party statistical pricing service takes into account a security’s correlation to available market data including, but not limited to, intraday index, ADR, and exchange-traded fund movements.
The accompanying Notes to Financial Statements are an integral part of this statement.
| 10 | Columbia Dividend Opportunity Fund | Semiannual Report 2022 |
Statement of Assets and Liabilities
November 30, 2022 (Unaudited)
| Assets | |
| Investments in securities, at value | |
| Unaffiliated issuers (cost $2,023,487,089) | $2,588,274,786 |
| Affiliated issuers (cost $12,115,156) | 12,115,712 |
| Receivable for: | |
| Investments sold | 30,853,275 |
| Capital shares sold | 1,433,290 |
| Dividends | 11,684,851 |
| Foreign tax reclaims | 1,462,809 |
| Prepaid expenses | 20,851 |
| Other assets | 16,500 |
| Total assets | 2,645,862,074 |
| Liabilities | |
| Due to custodian | 25,312 |
| Payable for: | |
| Investments purchased | 52,612,474 |
| Capital shares purchased | 2,685,658 |
| Management services fees | 43,812 |
| Distribution and/or service fees | 12,285 |
| Transfer agent fees | 187,041 |
| Compensation of board members | 268,688 |
| Compensation of chief compliance officer | 220 |
| Other expenses | 50,971 |
| Total liabilities | 55,886,461 |
| Net assets applicable to outstanding capital stock | $2,589,975,613 |
| Represented by | |
| Paid in capital | 1,913,960,595 |
| Total distributable earnings (loss) | 676,015,018 |
| Total - representing net assets applicable to outstanding capital stock | $2,589,975,613 |
The accompanying Notes to Financial Statements are an integral part of this statement.
Columbia Dividend Opportunity Fund | Semiannual Report 2022
| 11 |
Statement of Assets and Liabilities (continued)
November 30, 2022 (Unaudited)
| Class A | |
| Net assets | $1,364,826,440 |
| Shares outstanding | 35,853,226 |
| Net asset value per share | $38.07 |
| Maximum sales charge | 5.75% |
| Maximum offering price per share (calculated by dividing the net asset value per share by 1.0 minus the maximum sales charge for Class A shares) | $40.39 |
| Advisor Class | |
| Net assets | $107,462,973 |
| Shares outstanding | 2,746,744 |
| Net asset value per share | $39.12 |
| Class C | |
| Net assets | $95,558,838 |
| Shares outstanding | 2,593,247 |
| Net asset value per share | $36.85 |
| Institutional Class | |
| Net assets | $656,177,952 |
| Shares outstanding | 17,121,447 |
| Net asset value per share | $38.32 |
| Institutional 2 Class | |
| Net assets | $117,406,926 |
| Shares outstanding | 3,053,376 |
| Net asset value per share | $38.45 |
| Institutional 3 Class | |
| Net assets | $207,466,163 |
| Shares outstanding | 5,282,256 |
| Net asset value per share | $39.28 |
| Class R | |
| Net assets | $41,076,321 |
| Shares outstanding | 1,079,708 |
| Net asset value per share | $38.04 |
The accompanying Notes to Financial Statements are an integral part of this statement.
| 12 | Columbia Dividend Opportunity Fund | Semiannual Report 2022 |
Statement of Operations
Six Months Ended November 30, 2022 (Unaudited)
| Net investment income | |
| Income: | |
| Dividends — unaffiliated issuers | $49,253,642 |
| Dividends — affiliated issuers | 350,530 |
| Interfund lending | 700 |
| European Union tax reclaim | 294,365 |
| Foreign taxes withheld | (41,280) |
| Total income | 49,857,957 |
| Expenses: | |
| Management services fees | 7,580,221 |
| Distribution and/or service fees | |
| Class A | 1,620,584 |
| Class C | 450,381 |
| Class R | 97,225 |
| Transfer agent fees | |
| Class A | 601,150 |
| Advisor Class | 49,147 |
| Class C | 41,768 |
| Institutional Class | 275,662 |
| Institutional 2 Class | 32,019 |
| Institutional 3 Class | 5,591 |
| Class R | 18,034 |
| Compensation of board members | 7,910 |
| Custodian fees | 8,424 |
| Printing and postage fees | 53,885 |
| Registration fees | 76,045 |
| Audit fees | 16,014 |
| Legal fees | 21,362 |
| Compensation of chief compliance officer | 220 |
| Other | 22,145 |
| Total expenses | 10,977,787 |
| Fees waived by transfer agent | |
| Institutional 2 Class | (6,292) |
| Institutional 3 Class | (3,340) |
| Expense reduction | (120) |
| Total net expenses | 10,968,035 |
| Net investment income | 38,889,922 |
| Realized and unrealized gain (loss) — net | |
| Net realized gain (loss) on: | |
| Investments — unaffiliated issuers | (15,253,335) |
| Investments — affiliated issuers | 2,282 |
| Foreign currency translations | (1,667) |
| Net realized loss | (15,252,720) |
| Net change in unrealized appreciation (depreciation) on: | |
| Investments — unaffiliated issuers | 4,476,249 |
| Investments — affiliated issuers | 556 |
| Foreign currency translations | (45,191) |
| Net change in unrealized appreciation (depreciation) | 4,431,614 |
| Net realized and unrealized loss | (10,821,106) |
| Net increase in net assets resulting from operations | $28,068,816 |
The accompanying Notes to Financial Statements are an integral part of this statement.
Columbia Dividend Opportunity Fund | Semiannual Report 2022
| 13 |
Statement of Changes in Net Assets
| | Six Months Ended
November 30, 2022
(Unaudited) | Year Ended
May 31, 2022 |
| Operations | | |
| Net investment income | $38,889,922 | $67,399,988 |
| Net realized gain (loss) | (15,252,720) | 203,391,886 |
| Net change in unrealized appreciation (depreciation) | 4,431,614 | (55,878,231) |
| Net increase in net assets resulting from operations | 28,068,816 | 214,913,643 |
| Distributions to shareholders | | |
| Net investment income and net realized gains | | |
| Class A | (18,147,644) | (164,397,027) |
| Advisor Class | (1,613,199) | (12,767,220) |
| Class C | (932,502) | (11,089,843) |
| Institutional Class | (8,912,523) | (69,373,878) |
| Institutional 2 Class | (1,738,665) | (16,037,196) |
| Institutional 3 Class | (2,158,931) | (18,019,787) |
| Class R | (491,932) | (4,652,665) |
| Total distributions to shareholders | (33,995,396) | (296,337,616) |
| Increase in net assets from capital stock activity | 89,558,283 | 107,105,162 |
| Total increase in net assets | 83,631,703 | 25,681,189 |
| Net assets at beginning of period | 2,506,343,910 | 2,480,662,721 |
| Net assets at end of period | $2,589,975,613 | $2,506,343,910 |
The accompanying Notes to Financial Statements are an integral part of this statement.
| 14 | Columbia Dividend Opportunity Fund | Semiannual Report 2022 |
Statement of Changes in Net Assets (continued)
| | Six Months Ended | Year Ended |
| | November 30, 2022 (Unaudited) | May 31, 2022 |
| | Shares | Dollars ($) | Shares | Dollars ($) |
| Capital stock activity |
| Class A | | | | |
| Subscriptions | 1,541,320 | 54,935,367 | 2,227,538 | 85,824,916 |
| Distributions reinvested | 513,305 | 17,727,638 | 4,319,885 | 160,563,998 |
| Redemptions | (2,548,372) | (90,538,224) | (4,740,677) | (184,402,807) |
| Net increase (decrease) | (493,747) | (17,875,219) | 1,806,746 | 61,986,107 |
| Advisor Class | | | | |
| Subscriptions | 332,948 | 12,340,009 | 660,642 | 26,112,531 |
| Distributions reinvested | 45,279 | 1,606,236 | 333,065 | 12,711,577 |
| Redemptions | (521,997) | (18,789,541) | (774,394) | (31,055,700) |
| Net increase (decrease) | (143,770) | (4,843,296) | 219,313 | 7,768,408 |
| Class C | | | | |
| Subscriptions | 409,350 | 14,184,436 | 605,451 | 22,724,414 |
| Distributions reinvested | 27,481 | 919,841 | 301,735 | 10,863,141 |
| Redemptions | (397,038) | (13,615,277) | (1,050,865) | (39,545,239) |
| Net increase (decrease) | 39,793 | 1,489,000 | (143,679) | (5,957,684) |
| Institutional Class | | | | |
| Subscriptions | 2,927,497 | 105,594,363 | 3,536,655 | 137,420,967 |
| Distributions reinvested | 240,734 | 8,365,322 | 1,733,429 | 64,857,694 |
| Redemptions | (1,546,803) | (55,421,303) | (4,048,659) | (159,221,847) |
| Net increase | 1,621,428 | 58,538,382 | 1,221,425 | 43,056,814 |
| Institutional 2 Class | | | | |
| Subscriptions | 385,830 | 13,678,193 | 581,309 | 22,838,793 |
| Distributions reinvested | 42,827 | 1,493,502 | 365,385 | 13,710,246 |
| Redemptions | (560,910) | (20,167,388) | (1,115,634) | (43,565,011) |
| Net decrease | (132,253) | (4,995,693) | (168,940) | (7,015,972) |
| Institutional 3 Class | | | | |
| Subscriptions | 2,341,481 | 84,051,173 | 996,555 | 39,704,663 |
| Distributions reinvested | 55,764 | 1,984,510 | 438,620 | 16,801,049 |
| Redemptions | (818,522) | (29,958,041) | (1,280,795) | (50,753,698) |
| Net increase | 1,578,723 | 56,077,642 | 154,380 | 5,752,014 |
| Class R | | | | |
| Subscriptions | 121,351 | 4,340,222 | 109,885 | 4,223,855 |
| Distributions reinvested | 14,195 | 490,159 | 124,613 | 4,628,174 |
| Redemptions | (103,899) | (3,662,914) | (189,210) | (7,336,554) |
| Net increase | 31,647 | 1,167,467 | 45,288 | 1,515,475 |
| Total net increase | 2,501,821 | 89,558,283 | 3,134,533 | 107,105,162 |
The accompanying Notes to Financial Statements are an integral part of this statement.
Columbia Dividend Opportunity Fund | Semiannual Report 2022
| 15 |
The following table is intended to help you understand the Fund’s financial performance. Certain information reflects financial results for a single share of a class held for the periods shown. Per share net investment income (loss) amounts are calculated based on average shares outstanding during the period. Total return assumes reinvestment of all dividends and distributions, if any. Total return does not reflect payment of sales charges, if any. Total return and portfolio turnover are not annualized for periods of less than one year. The portfolio turnover rate is calculated without regard to purchase and sales transactions of short-term instruments and certain derivatives, if any. If such transactions were included, the Fund’s portfolio turnover rate may be higher.
| | Net asset value,
beginning of
period | Net
investment
income | Net
realized
and
unrealized
gain (loss) | Total from
investment
operations | Distributions
from net
investment
income | Distributions
from net
realized
gains | Total
distributions to
shareholders |
| Class A(c) |
| Six Months Ended 11/30/2022 (Unaudited) | $38.28 | 0.57 | (0.28) | 0.29 | (0.50) | — | (0.50) |
| Year Ended 5/31/2022 | $39.82 | 1.04 | 2.32 | 3.36 | (1.05) | (3.85) | (4.90) |
| Year Ended 5/31/2021 | $30.78 | 1.01 | 9.43 | 10.44 | (1.12) | (0.28) | (1.40) |
| Year Ended 5/31/2020 | $35.23 | 1.20 | (1.17) | 0.03 | (1.12) | (3.36) | (4.48) |
| Year Ended 5/31/2019 | $38.24 | 1.08 | 0.15 | 1.23 | (1.24) | (3.00) | (4.24) |
| Year Ended 5/31/2018 | $39.68 | 1.40 | 1.72 | 3.12 | (1.44) | (3.12) | (4.56) |
| Advisor Class(c) |
| Six Months Ended 11/30/2022 (Unaudited) | $39.33 | 0.63 | (0.29) | 0.34 | (0.55) | — | (0.55) |
| Year Ended 5/31/2022 | $40.78 | 1.17 | 2.38 | 3.55 | (1.15) | (3.85) | (5.00) |
| Year Ended 5/31/2021 | $31.49 | 1.12 | 9.65 | 10.77 | (1.20) | (0.28) | (1.48) |
| Year Ended 5/31/2020 | $35.96 | 1.32 | (1.23) | 0.09 | (1.20) | (3.36) | (4.56) |
| Year Ended 5/31/2019 | $38.94 | 1.20 | 0.14 | 1.34 | (1.32) | (3.00) | (4.32) |
| Year Ended 5/31/2018 | $40.32 | 1.52 | 1.74 | 3.26 | (1.52) | (3.12) | (4.64) |
| Class C(c) |
| Six Months Ended 11/30/2022 (Unaudited) | $37.06 | 0.42 | (0.27) | 0.15 | (0.36) | — | (0.36) |
| Year Ended 5/31/2022 | $38.69 | 0.72 | 2.25 | 2.97 | (0.75) | (3.85) | (4.60) |
| Year Ended 5/31/2021 | $29.93 | 0.74 | 9.18 | 9.92 | (0.88) | (0.28) | (1.16) |
| Year Ended 5/31/2020 | $34.34 | 0.92 | (1.13) | (0.21) | (0.84) | (3.36) | (4.20) |
| Year Ended 5/31/2019 | $37.37 | 0.80 | 0.13 | 0.93 | (0.96) | (3.00) | (3.96) |
| Year Ended 5/31/2018 | $38.86 | 1.08 | 1.67 | 2.75 | (1.12) | (3.12) | (4.24) |
| Institutional Class(c) |
| Six Months Ended 11/30/2022 (Unaudited) | $38.54 | 0.62 | (0.29) | 0.33 | (0.55) | — | (0.55) |
| Year Ended 5/31/2022 | $40.06 | 1.15 | 2.33 | 3.48 | (1.15) | (3.85) | (5.00) |
| Year Ended 5/31/2021 | $30.95 | 1.10 | 9.49 | 10.59 | (1.20) | (0.28) | (1.48) |
| Year Ended 5/31/2020 | $35.42 | 1.28 | (1.19) | 0.09 | (1.20) | (3.36) | (4.56) |
| Year Ended 5/31/2019 | $38.42 | 1.20 | 0.12 | 1.32 | (1.32) | (3.00) | (4.32) |
| Year Ended 5/31/2018 | $39.84 | 1.52 | 1.70 | 3.22 | (1.52) | (3.12) | (4.64) |
| Institutional 2 Class(c) |
| Six Months Ended 11/30/2022 (Unaudited) | $38.66 | 0.62 | (0.27) | 0.35 | (0.56) | — | (0.56) |
| Year Ended 5/31/2022 | $40.18 | 1.17 | 2.33 | 3.50 | (1.17) | (3.85) | (5.02) |
| Year Ended 5/31/2021 | $31.04 | 1.12 | 9.52 | 10.64 | (1.22) | (0.28) | (1.50) |
| Year Ended 5/31/2020 | $35.50 | 1.32 | (1.18) | 0.14 | (1.24) | (3.36) | (4.60) |
| Year Ended 5/31/2019 | $38.49 | 1.20 | 0.17 | 1.37 | (1.36) | (3.00) | (4.36) |
| Year Ended 5/31/2018 | $39.91 | 1.52 | 1.74 | 3.26 | (1.56) | (3.12) | (4.68) |
The accompanying Notes to Financial Statements are an integral part of this statement.
| 16 | Columbia Dividend Opportunity Fund | Semiannual Report 2022 |
Financial Highlights (continued)
| | Net
asset
value,
end of
period | Total
return | Total gross
expense
ratio to
average
net assets(a) | Total net
expense
ratio to
average
net assets(a),(b) | Net investment
income
ratio to
average
net assets | Portfolio
turnover | Net
assets,
end of
period
(000’s) |
| Class A(c) |
| Six Months Ended 11/30/2022 (Unaudited) | $38.07 | 0.90% | 0.99%(d) | 0.99%(d),(e) | 3.16%(d) | 25% | $1,364,826 |
| Year Ended 5/31/2022 | $38.28 | 9.04% | 0.99%(f) | 0.99%(e),(f) | 2.64% | 41% | $1,391,270 |
| Year Ended 5/31/2021 | $39.82 | 34.85% | 1.01% | 1.01%(e) | 2.98% | 51% | $1,375,445 |
| Year Ended 5/31/2020 | $30.78 | (0.90%) | 1.00% | 1.00%(e) | 3.44% | 47% | $1,179,625 |
| Year Ended 5/31/2019 | $35.23 | 3.47% | 0.99% | 0.99%(e) | 2.92% | 66% | $1,424,224 |
| Year Ended 5/31/2018 | $38.24 | 7.96% | 0.98%(g) | 0.98%(e),(g) | 3.54% | 65% | $1,612,108 |
| Advisor Class(c) |
| Six Months Ended 11/30/2022 (Unaudited) | $39.12 | 1.01% | 0.74%(d) | 0.74%(d),(e) | 3.40%(d) | 25% | $107,463 |
| Year Ended 5/31/2022 | $39.33 | 9.32% | 0.74%(f) | 0.74%(e),(f) | 2.89% | 41% | $113,675 |
| Year Ended 5/31/2021 | $40.78 | 35.31% | 0.76% | 0.76%(e) | 3.23% | 51% | $108,945 |
| Year Ended 5/31/2020 | $31.49 | (0.74%) | 0.75% | 0.75%(e) | 3.72% | 47% | $79,477 |
| Year Ended 5/31/2019 | $35.96 | 3.77% | 0.74% | 0.74%(e) | 3.18% | 66% | $82,497 |
| Year Ended 5/31/2018 | $38.94 | 8.20% | 0.73%(g) | 0.73%(e),(g) | 3.76% | 65% | $114,441 |
| Class C(c) |
| Six Months Ended 11/30/2022 (Unaudited) | $36.85 | 0.51% | 1.74%(d) | 1.74%(d),(e) | 2.42%(d) | 25% | $95,559 |
| Year Ended 5/31/2022 | $37.06 | 8.21% | 1.74%(f) | 1.74%(e),(f) | 1.89% | 41% | $94,620 |
| Year Ended 5/31/2021 | $38.69 | 34.05% | 1.76% | 1.76%(e) | 2.26% | 51% | $104,339 |
| Year Ended 5/31/2020 | $29.93 | (1.67%) | 1.75% | 1.75%(e) | 2.68% | 47% | $163,439 |
| Year Ended 5/31/2019 | $34.34 | 2.64% | 1.74% | 1.74%(e) | 2.18% | 66% | $219,222 |
| Year Ended 5/31/2018 | $37.37 | 7.08% | 1.73%(g) | 1.73%(e),(g) | 2.80% | 65% | $312,766 |
| Institutional Class(c) |
| Six Months Ended 11/30/2022 (Unaudited) | $38.32 | 1.00% | 0.74%(d) | 0.74%(d),(e) | 3.43%(d) | 25% | $656,178 |
| Year Ended 5/31/2022 | $38.54 | 9.32% | 0.74%(f) | 0.74%(e),(f) | 2.89% | 41% | $597,311 |
| Year Ended 5/31/2021 | $40.06 | 35.26% | 0.76% | 0.76%(e) | 3.23% | 51% | $572,007 |
| Year Ended 5/31/2020 | $30.95 | (0.63%) | 0.75% | 0.75%(e) | 3.68% | 47% | $510,928 |
| Year Ended 5/31/2019 | $35.42 | 3.71% | 0.74% | 0.74%(e) | 3.18% | 66% | $647,702 |
| Year Ended 5/31/2018 | $38.42 | 8.19% | 0.73%(g) | 0.73%(e),(g) | 3.83% | 65% | $815,788 |
| Institutional 2 Class(c) |
| Six Months Ended 11/30/2022 (Unaudited) | $38.45 | 1.05% | 0.71%(d) | 0.70%(d) | 3.45%(d) | 25% | $117,407 |
| Year Ended 5/31/2022 | $38.66 | 9.35% | 0.70%(f) | 0.69%(f) | 2.94% | 41% | $123,165 |
| Year Ended 5/31/2021 | $40.18 | 35.37% | 0.72% | 0.71% | 3.29% | 51% | $134,775 |
| Year Ended 5/31/2020 | $31.04 | (0.69%) | 0.71% | 0.70% | 3.76% | 47% | $112,602 |
| Year Ended 5/31/2019 | $35.50 | 3.87% | 0.70% | 0.69% | 3.22% | 66% | $116,907 |
| Year Ended 5/31/2018 | $38.49 | 8.24% | 0.69%(g) | 0.68%(g) | 3.86% | 65% | $160,493 |
The accompanying Notes to Financial Statements are an integral part of this statement.
Columbia Dividend Opportunity Fund | Semiannual Report 2022
| 17 |
Financial Highlights (continued)
| | Net asset value,
beginning of
period | Net
investment
income | Net
realized
and
unrealized
gain (loss) | Total from
investment
operations | Distributions
from net
investment
income | Distributions
from net
realized
gains | Total
distributions to
shareholders |
| Institutional 3 Class(c) |
| Six Months Ended 11/30/2022 (Unaudited) | $39.48 | 0.66 | (0.30) | 0.36 | (0.56) | — | (0.56) |
| Year Ended 5/31/2022 | $40.92 | 1.21 | 2.39 | 3.60 | (1.19) | (3.85) | (5.04) |
| Year Ended 5/31/2021 | $31.59 | 1.16 | 9.68 | 10.84 | (1.23) | (0.28) | (1.51) |
| Year Ended 5/31/2020 | $36.06 | 1.36 | (1.23) | 0.13 | (1.24) | (3.36) | (4.60) |
| Year Ended 5/31/2019 | $39.03 | 1.24 | 0.15 | 1.39 | (1.36) | (3.00) | (4.36) |
| Year Ended 5/31/2018 | $40.41 | 1.56 | 1.74 | 3.30 | (1.56) | (3.12) | (4.68) |
| Class R(c) |
| Six Months Ended 11/30/2022 (Unaudited) | $38.25 | 0.52 | (0.28) | 0.24 | (0.45) | — | (0.45) |
| Year Ended 5/31/2022 | $39.79 | 0.94 | 2.32 | 3.26 | (0.95) | (3.85) | (4.80) |
| Year Ended 5/31/2021 | $30.76 | 0.92 | 9.43 | 10.35 | (1.04) | (0.28) | (1.32) |
| Year Ended 5/31/2020 | $35.20 | 1.12 | (1.16) | (0.04) | (1.04) | (3.36) | (4.40) |
| Year Ended 5/31/2019 | $38.20 | 1.00 | 0.12 | 1.12 | (1.12) | (3.00) | (4.12) |
| Year Ended 5/31/2018 | $39.65 | 1.28 | 1.71 | 2.99 | (1.32) | (3.12) | (4.44) |
| Notes to Financial Highlights |
| (a) | In addition to the fees and expenses that the Fund bears directly, the Fund indirectly bears a pro rata share of the fees and expenses of any other funds in which it invests. Such indirect expenses are not included in the Fund’s reported expense ratios. |
| (b) | Total net expenses include the impact of certain fee waivers/expense reimbursements made by the Investment Manager and certain of its affiliates, if applicable. |
| (c) | Per share amounts have been adjusted on a retroactive basis to reflect a 4 to 1 reverse stock split completed after the close of business on September 11, 2020. |
| (d) | Annualized. |
| (e) | The benefits derived from expense reductions had an impact of less than 0.01%. |
| (f) | Ratios include interfund lending expense which is less than 0.01%. |
| (g) | Ratios include line of credit interest expense which is less than 0.01%. |
The accompanying Notes to Financial Statements are an integral part of this statement.
| 18 | Columbia Dividend Opportunity Fund | Semiannual Report 2022 |
Financial Highlights (continued)
| | Net
asset
value,
end of
period | Total
return | Total gross
expense
ratio to
average
net assets(a) | Total net
expense
ratio to
average
net assets(a),(b) | Net investment
income
ratio to
average
net assets | Portfolio
turnover | Net
assets,
end of
period
(000’s) |
| Institutional 3 Class(c) |
| Six Months Ended 11/30/2022 (Unaudited) | $39.28 | 1.08% | 0.66%(d) | 0.65%(d) | 3.57%(d) | 25% | $207,466 |
| Year Ended 5/31/2022 | $39.48 | 9.42% | 0.65%(f) | 0.65%(f) | 2.97% | 41% | $146,214 |
| Year Ended 5/31/2021 | $40.92 | 35.36% | 0.67% | 0.66% | 3.33% | 51% | $145,247 |
| Year Ended 5/31/2020 | $31.59 | (0.63%) | 0.66% | 0.65% | 3.83% | 47% | $112,370 |
| Year Ended 5/31/2019 | $36.06 | 3.87% | 0.65% | 0.64% | 3.28% | 66% | $112,951 |
| Year Ended 5/31/2018 | $39.03 | 8.40% | 0.64%(g) | 0.63%(g) | 3.86% | 65% | $132,205 |
| Class R(c) |
| Six Months Ended 11/30/2022 (Unaudited) | $38.04 | 0.76% | 1.24%(d) | 1.24%(d),(e) | 2.91%(d) | 25% | $41,076 |
| Year Ended 5/31/2022 | $38.25 | 8.76% | 1.24%(f) | 1.24%(e),(f) | 2.39% | 41% | $40,089 |
| Year Ended 5/31/2021 | $39.79 | 34.60% | 1.26% | 1.26%(e) | 2.73% | 51% | $39,905 |
| Year Ended 5/31/2020 | $30.76 | (1.19%) | 1.25% | 1.25%(e) | 3.21% | 47% | $33,516 |
| Year Ended 5/31/2019 | $35.20 | 3.21% | 1.24% | 1.24%(e) | 2.67% | 66% | $38,093 |
| Year Ended 5/31/2018 | $38.20 | 7.69% | 1.23%(g) | 1.23%(e),(g) | 3.28% | 65% | $43,418 |
The accompanying Notes to Financial Statements are an integral part of this statement.
Columbia Dividend Opportunity Fund | Semiannual Report 2022
| 19 |
Notes to Financial Statements
November 30, 2022 (Unaudited)
Note 1. Organization
Columbia Dividend Opportunity Fund (the Fund), a series of Columbia Funds Series Trust II (the Trust), is a diversified fund. The Trust is registered under the Investment Company Act of 1940, as amended (the 1940 Act), as an open-end management investment company organized as a Massachusetts business trust.
Fund shares
The Trust may issue an unlimited number of shares (without par value). The Fund offers each of the share classes listed in the Statement of Assets and Liabilities. Although all share classes generally have identical voting, dividend and liquidation rights, each share class votes separately when required by the Trust’s organizational documents or by law. Each share class has its own expense and sales charge structure. Different share classes may have different minimum initial investment amounts and pay different net investment income distribution amounts to the extent the expenses of distributing such share classes vary. Distributions to shareholders in a liquidation will be proportional to the net asset value of each share class.
As described in the Fund’s prospectus, Class A and Class C shares are offered to the general public for investment. Class C shares automatically convert to Class A shares after 8 years. Advisor Class, Institutional Class, Institutional 2 Class, Institutional 3 Class and Class R shares are available for purchase through authorized investment professionals to omnibus retirement plans or to institutional investors and to certain other investors as also described in the Fund’s prospectus.
Note 2. Summary of significant accounting policies
Basis of preparation
The Fund is an investment company that applies the accounting and reporting guidance in the Financial Accounting Standards Board (FASB) Accounting Standards Codification Topic 946, Financial Services - Investment Companies (ASC 946). The financial statements are prepared in accordance with U.S. generally accepted accounting principles (GAAP), which requires management to make certain estimates and assumptions that affect the reported amounts of assets and liabilities, the disclosure of contingent assets and liabilities at the date of the financial statements and the reported amounts of income and expenses during the reporting period. Actual results could differ from those estimates.
The following is a summary of significant accounting policies followed by the Fund in the preparation of its financial statements.
Security valuation
Equity securities listed on an exchange are valued at the closing price or last trade price on their primary exchange at the close of business of the New York Stock Exchange. Securities with a closing price not readily available or not listed on any exchange are valued at the mean between the closing bid and ask prices. Listed preferred stocks convertible into common stocks are valued using an evaluated price from a pricing service.
Foreign equity securities are valued based on the closing price or last trade price on their primary exchange at the close of business of the New York Stock Exchange. If any foreign equity security closing prices are not readily available, the securities are valued at the mean of the latest quoted bid and ask prices on such exchanges or markets. Foreign currency exchange rates are determined at the scheduled closing time of the New York Stock Exchange. Many securities markets and exchanges outside the U.S. close prior to the close of the New York Stock Exchange; therefore, the closing prices for securities in such markets or on such exchanges may not fully reflect events that occur after such close but before the close of the New York Stock Exchange. In those situations, foreign securities will be fair valued pursuant to a policy approved by the Board of Trustees. Under the policy, the Fund may utilize a third-party pricing service to determine these fair values. The third-party pricing service takes into account multiple factors, including, but not limited to, movements in the U.S. securities markets, certain depositary receipts, futures contracts and foreign exchange rates that have occurred subsequent to the close of the foreign exchange or market, to determine a good faith estimate that reasonably reflects the current market conditions as of the close of the New York Stock Exchange. The fair value of a security is likely to be different from the quoted or published price, if available.
Investments in open-end investment companies (other than exchange-traded funds (ETFs)), are valued at the latest net asset value reported by those companies as of the valuation time.
| 20 | Columbia Dividend Opportunity Fund | Semiannual Report 2022 |
Notes to Financial Statements (continued)
November 30, 2022 (Unaudited)
Investments for which market quotations are not readily available, or that have quotations which management believes are not reflective of market value or reliable, are valued at fair value as determined in good faith under procedures approved by the Board of Trustees. If a security or class of securities (such as foreign securities) is valued at fair value, such value is likely to be different from the quoted or published price for the security, if available.
The determination of fair value often requires significant judgment. To determine fair value, management may use assumptions including but not limited to future cash flows and estimated risk premiums. Multiple inputs from various sources may be used to determine fair value.
GAAP requires disclosure regarding the inputs and valuation techniques used to measure fair value and any changes in valuation inputs or techniques. In addition, investments shall be disclosed by major category. This information is disclosed following the Fund’s Portfolio of Investments.
Foreign currency transactions and translations
The values of all assets and liabilities denominated in foreign currencies are generally translated into U.S. dollars at exchange rates determined at the close of regular trading on the New York Stock Exchange. Net realized and unrealized gains (losses) on foreign currency transactions and translations include gains (losses) arising from the fluctuation in exchange rates between trade and settlement dates on securities transactions, gains (losses) arising from the disposition of foreign currency and currency gains (losses) between the accrual and payment dates on dividends, interest income and foreign withholding taxes.
For financial statement purposes, the Fund does not distinguish that portion of gains (losses) on investments which is due to changes in foreign exchange rates from that which is due to changes in market prices of the investments. Such fluctuations are included with the net realized and unrealized gains (losses) on investments in the Statement of Operations.
Security transactions
Security transactions are accounted for on the trade date. Cost is determined and gains (losses) are based upon the specific identification method for both financial statement and federal income tax purposes.
Income recognition
Corporate actions and dividend income are generally recorded net of any non-reclaimable tax withholdings, on the ex-dividend date or upon receipt of an ex-dividend notification in the case of certain foreign securities.
The Fund may receive distributions from holdings in equity securities, business development companies (BDCs), exchange-traded funds (ETFs), limited partnerships (LPs), other regulated investment companies (RICs), and real estate investment trusts (REITs), which report information as to the tax character of their distributions annually. These distributions are allocated to dividend income, capital gain and return of capital based on actual information reported. Return of capital is recorded as a reduction of the cost basis of securities held. If the Fund no longer owns the applicable securities, return of capital is recorded as a realized gain. With respect to REITs, to the extent actual information has not yet been reported, estimates for return of capital are made by Columbia Management Investment Advisers, LLC (the Investment Manager), a wholly-owned subsidiary of Ameriprise Financial, Inc. (Ameriprise Financial). The Investment Manager’s estimates are subsequently adjusted when the actual character of the distributions is disclosed by the REITs, which could result in a proportionate change in return of capital to shareholders.
Awards from class action litigation are recorded as a reduction of cost basis if the Fund still owns the applicable securities on the payment date. If the Fund no longer owns the applicable securities on the payment date, the proceeds are recorded as realized gains.
Expenses
General expenses of the Trust are allocated to the Fund and other funds of the Trust based upon relative net assets or other expense allocation methodologies determined by the nature of the expense. Expenses directly attributable to the Fund are charged to the Fund. Expenses directly attributable to a specific class of shares are charged to that share class.
Columbia Dividend Opportunity Fund | Semiannual Report 2022
| 21 |
Notes to Financial Statements (continued)
November 30, 2022 (Unaudited)
Determination of class net asset value
All income, expenses (other than class-specific expenses, which are charged to that share class, as shown in the Statement of Operations) and realized and unrealized gains (losses) are allocated to each class of the Fund on a daily basis, based on the relative net assets of each class, for purposes of determining the net asset value of each class.
Federal income tax status
The Fund intends to qualify each year as a regulated investment company under Subchapter M of the Internal Revenue Code, as amended, and will distribute substantially all of its investment company taxable income and net capital gain, if any, for its tax year, and as such will not be subject to federal income taxes. In addition, the Fund intends to distribute in each calendar year substantially all of its ordinary income, capital gain net income and certain other amounts, if any, such that the Fund should not be subject to federal excise tax. Therefore, no federal income or excise tax provision is recorded.
Foreign taxes
The Fund may be subject to foreign taxes on income, gains on investments or currency repatriation, a portion of which may be recoverable. The Fund will accrue such taxes and recoveries, as applicable, based upon its current interpretation of tax rules and regulations that exist in the markets in which it invests.
Realized gains in certain countries may be subject to foreign taxes at the Fund level, based on statutory rates. The Fund accrues for such foreign taxes on realized and unrealized gains at the appropriate rate for each jurisdiction, as applicable. The amount, if any, is disclosed as a liability in the Statement of Assets and Liabilities.
The Fund may file withholding tax reclaims in certain European Union countries to recover a portion of foreign taxes previously withheld on dividends earned, which may be reclaimable based upon certain provisions in the Treaty on the Functioning of the European Union (EU) and subsequent rulings by the European Court of Justice. The Fund may record a reclaim receivable when the amount is known, the Fund has received notice of a pending refund, and there are no significant uncertainties on collectability. Income received from EU reclaims is included in the Statement of Operations.
Distributions to shareholders
Distributions from net investment income, if any, are declared and paid each calendar quarter. Net realized capital gains, if any, are distributed at least annually. Income distributions and capital gain distributions are determined in accordance with federal income tax regulations, which may differ from GAAP.
Guarantees and indemnifications
Under the Trust’s organizational documents and, in some cases, by contract, its officers and trustees are indemnified against certain liabilities arising out of the performance of their duties to the Trust or its funds. In addition, certain of the Fund’s contracts with its service providers contain general indemnification clauses. The Fund’s maximum exposure under these arrangements is unknown since the amount of any future claims that may be made against the Fund cannot be determined, and the Fund has no historical basis for predicting the likelihood of any such claims.
Recent accounting pronouncement
Tailored Shareholder Reports
In October 2022, the Securities and Exchange Commission (SEC) adopted a final rule relating to Tailored Shareholder Reports for Mutual Funds and Exchange-Traded Funds (ETFs); Fee Information in Investment Company Advertisements. The rule and form amendments will require mutual funds and ETFs to transmit concise and visually engaging shareholder reports that highlight key information. The amendments will require that funds tag information in a structured data format. The rule amendments will require that certain more in-depth information be made available online and available for delivery free of charge to investors on request. The amendments will become effective January 24, 2023. There is an 18-month transition period after the effective date of the amendment.
| 22 | Columbia Dividend Opportunity Fund | Semiannual Report 2022 |
Notes to Financial Statements (continued)
November 30, 2022 (Unaudited)
Note 3. Fees and other transactions with affiliates
Management services fees
The Fund has entered into a Management Agreement with Columbia Management Investment Advisers, LLC (the Investment Manager), a wholly-owned subsidiary of Ameriprise Financial, Inc. (Ameriprise Financial). Under the Management Agreement, the Investment Manager provides the Fund with investment research and advice, as well as administrative and accounting services. The management services fee is an annual fee that is equal to a percentage of the Fund’s daily net assets that declines from 0.72% to 0.52% as the Fund’s net assets increase. The annualized effective management services fee rate for the six months ended November 30, 2022 was 0.63% of the Fund’s average daily net assets.
Compensation of board members
Members of the Board of Trustees who are not officers or employees of the Investment Manager or Ameriprise Financial are compensated for their services to the Fund as disclosed in the Statement of Operations. Under a Deferred Compensation Plan (the Deferred Plan), these members of the Board of Trustees may elect to defer payment of up to 100% of their compensation. Deferred amounts are treated as though equivalent dollar amounts had been invested in shares of certain funds managed by the Investment Manager. The Fund’s liability for these amounts is adjusted for market value changes and remains in the Fund until distributed in accordance with the Deferred Plan. All amounts payable under the Deferred Plan constitute a general unsecured obligation of the Fund. The expense for the Deferred Plan, which includes Trustees’ fees deferred during the current period as well as any gains or losses on the Trustees’ deferred compensation balances as a result of market fluctuations, is included in "Compensation of board members" in the Statement of Operations.
Compensation of Chief Compliance Officer
The Board of Trustees has appointed a Chief Compliance Officer for the Fund in accordance with federal securities regulations. As disclosed in the Statement of Operations, a portion of the Chief Compliance Officer’s total compensation is allocated to the Fund, along with other allocations to affiliated registered investment companies managed by the Investment Manager and its affiliates, based on relative net assets.
Transfer agency fees
Under a Transfer and Dividend Disbursing Agent Agreement, Columbia Management Investment Services Corp. (the Transfer Agent), an affiliate of the Investment Manager and a wholly-owned subsidiary of Ameriprise Financial, is responsible for providing transfer agency services to the Fund. The Transfer Agent has contracted with SS&C GIDS, Inc. (SS&C GIDS) to serve as sub-transfer agent. Prior to January 1, 2023, SS&C GIDS was known as DST Asset Manager Solutions, Inc. The Transfer Agent pays the fees of SS&C GIDS for services as sub-transfer agent and SS&C GIDS is not entitled to reimbursement for such fees from the Fund (with the exception of out-of-pocket fees).
The Fund pays the Transfer Agent a monthly transfer agency fee based on the number or the average value of accounts, depending on the type of account. In addition, the Fund pays the Transfer Agent a fee for shareholder services based on the number of accounts or on a percentage of the average aggregate value of the Fund’s shares maintained in omnibus accounts up to the lesser of the amount charged by the financial intermediary or a cap established by the Board of Trustees from time to time.
The Transfer Agent also receives compensation from the Fund for various shareholder services and reimbursements for certain out-of-pocket fees. Total transfer agency fees for Institutional 2 Class and Institutional 3 Class shares are subject to an annual limitation of not more than 0.07% and 0.02%, respectively, of the average daily net assets attributable to each share class. In addition, prior to October 1, 2022, Institutional 2 Class shares were subject to a contractual transfer agency fee annual limitation of not more than 0.04% and Institutional 3 Class shares were subject to a contractual transfer agency fee annual limitation of not more than 0.00% of the average daily net assets attributable to each share class.
Columbia Dividend Opportunity Fund | Semiannual Report 2022
| 23 |
Notes to Financial Statements (continued)
November 30, 2022 (Unaudited)
For the six months ended November 30, 2022, the Fund’s annualized effective transfer agency fee rates as a percentage of average daily net assets of each class were as follows:
| | Effective rate (%) |
| Class A | 0.09 |
| Advisor Class | 0.09 |
| Class C | 0.09 |
| Institutional Class | 0.09 |
| Institutional 2 Class | 0.05 |
| Institutional 3 Class | 0.00 |
| Class R | 0.09 |
An annual minimum account balance fee of $20 may apply to certain accounts with a value below the applicable share class’s initial minimum investment requirements to reduce the impact of small accounts on transfer agency fees. These minimum account balance fees are remitted to the Fund and recorded as part of expense reductions in the Statement of Operations. For the six months ended November 30, 2022, these minimum account balance fees reduced total expenses of the Fund by $120.
Distribution and service fees
The Fund has entered into an agreement with Columbia Management Investment Distributors, Inc. (the Distributor), an affiliate of the Investment Manager and a wholly-owned subsidiary of Ameriprise Financial, for distribution and shareholder services. Under a Plan and Agreement of Distribution, the Fund pays a fee at the maximum annual rates of up to 0.25%, 1.00% and 0.50% of the Fund’s average daily net assets attributable to Class A, Class C and Class R shares, respectively. For Class C shares, of the 1.00% fee, up to 0.75% can be reimbursed for distribution expenses and up to an additional 0.25% can be reimbursed for shareholder servicing expenses. For Class R shares, of the 0.50% fee, up to 0.25% can be reimbursed for shareholder servicing expenses.
The amount of distribution and shareholder services expenses incurred by the Distributor and not yet reimbursed (unreimbursed expense) was approximately $834,000 for Class C shares. This amount is based on the most recent information available as of September 30, 2022, and may be recovered from future payments under the distribution plan or contingent deferred sales charges (CDSCs). To the extent the unreimbursed expense has been fully recovered, the distribution and/or shareholder services fee is reduced.
Sales charges
Sales charges, including front-end charges and CDSCs, received by the Distributor for distributing Fund shares for the six months ended November 30, 2022, if any, are listed below:
| | Front End (%) | CDSC (%) | Amount ($) |
| Class A | 5.75 | 0.50 - 1.00(a) | 462,133 |
| Class C | — | 1.00(b) | 3,137 |
| (a) | This charge is imposed on certain investments of between $1 million and $50 million redeemed within 18 months after purchase, as follows: 1.00% if redeemed within 12 months after purchase, and 0.50% if redeemed more than 12, but less than 18, months after purchase, with certain limited exceptions. |
| (b) | This charge applies to redemptions within 12 months after purchase, with certain limited exceptions. |
The Fund’s other share classes are not subject to sales charges.
| 24 | Columbia Dividend Opportunity Fund | Semiannual Report 2022 |
Notes to Financial Statements (continued)
November 30, 2022 (Unaudited)
Expenses waived/reimbursed by the Investment Manager and its affiliates
The Investment Manager and certain of its affiliates have contractually agreed to waive fees and/or reimburse expenses (excluding certain fees and expenses described below) for the period(s) disclosed below, unless sooner terminated at the sole discretion of the Board of Trustees, so that the Fund’s net operating expenses, after giving effect to fees waived/expenses reimbursed and any balance credits and/or overdraft charges from the Fund’s custodian, do not exceed the following annual rate(s) as a percentage of the classes’ average daily net assets:
| | October 1, 2022
through
September 30, 2023 | Prior to
October 1, 2022 |
| Class A | 1.06% | 1.06% |
| Advisor Class | 0.81 | 0.81 |
| Class C | 1.81 | 1.81 |
| Institutional Class | 0.81 | 0.81 |
| Institutional 2 Class | 0.78 | 0.76 |
| Institutional 3 Class | 0.73 | 0.72 |
| Class R | 1.31 | 1.31 |
Under the agreement governing these fee waivers and/or expense reimbursement arrangements, the following fees and expenses are excluded from the waiver/reimbursement commitment, and therefore will be paid by the Fund, if applicable: taxes (including foreign transaction taxes), expenses associated with investments in affiliated and non-affiliated pooled investment vehicles (including mutual funds and exchange-traded funds), transaction costs and brokerage commissions, costs related to any securities lending program, dividend expenses associated with securities sold short, inverse floater program fees and expenses, transaction charges and interest on borrowed money, interest, costs associated with shareholder meetings, infrequent and/or unusual expenses and any other expenses the exclusion of which is specifically approved by the Board of Trustees. This agreement may be modified or amended only with approval from the Investment Manager, certain of its affiliates and the Fund. Reflected in the contractual cap commitment, prior to October 1, 2022, is the Transfer Agent’s contractual agreement to limit total transfer agency fees to an annual rate of not more than 0.04% for Institutional 2 Class and 0.00% for Institutional 3 Class of the average daily net assets attributable to each share class. Any fees waived and/or expenses reimbursed under the expense reimbursement arrangements described above are not recoverable by the Investment Manager or its affiliates in future periods.
Note 4. Federal tax information
The timing and character of income and capital gain distributions are determined in accordance with income tax regulations, which may differ from GAAP because of temporary or permanent book to tax differences.
At November 30, 2022, the approximate cost of all investments for federal income tax purposes and the aggregate gross approximate unrealized appreciation and depreciation based on that cost was:
Federal
tax cost ($) | Gross unrealized
appreciation ($) | Gross unrealized
(depreciation) ($) | Net unrealized
appreciation ($) |
| 2,035,602,000 | 596,078,000 | (31,290,000) | 564,788,000 |
Tax cost of investments and unrealized appreciation/(depreciation) may also include timing differences that do not constitute adjustments to tax basis.
Management of the Fund has concluded that there are no significant uncertain tax positions in the Fund that would require recognition in the financial statements. However, management’s conclusion may be subject to review and adjustment at a later date based on factors including, but not limited to, new tax laws, regulations, and administrative interpretations (including relevant court decisions). Generally, the Fund’s federal tax returns for the prior three fiscal years remain subject to examination by the Internal Revenue Service.
Columbia Dividend Opportunity Fund | Semiannual Report 2022
| 25 |
Notes to Financial Statements (continued)
November 30, 2022 (Unaudited)
Note 5. Portfolio information
The cost of purchases and proceeds from sales of securities, excluding short-term investments and derivatives, if any, aggregated to $705,108,298 and $596,714,023, respectively, for the six months ended November 30, 2022. The amount of purchase and sale activity impacts the portfolio turnover rate reported in the Financial Highlights.
Note 6. Affiliated money market fund
The Fund invests in Columbia Short-Term Cash Fund, an affiliated money market fund established for the exclusive use by the Fund and other affiliated funds (the Affiliated MMF). The income earned by the Fund from such investments is included as Dividends - affiliated issuers in the Statement of Operations. As an investing fund, the Fund indirectly bears its proportionate share of the expenses of the Affiliated MMF. The Affiliated MMF prices its shares with a floating net asset value. In addition, the Board of Trustees of the Affiliated MMF may impose a fee on redemptions (sometimes referred to as a liquidity fee) or temporarily suspend redemptions (sometimes referred to as imposing a redemption gate) in the event its liquidity falls below regulatory limits.
Note 7. Interfund lending
Pursuant to an exemptive order granted by the Securities and Exchange Commission, the Fund participates in a program (the Interfund Program) allowing each participating Columbia Fund (each, a Participating Fund) to lend money directly to and, except for closed-end funds and money market funds, borrow money directly from other Participating Funds for temporary purposes. The amounts eligible for borrowing and lending under the Interfund Program are subject to certain restrictions.
Interfund loans are subject to the risk that the borrowing fund could be unable to repay the loan when due, and a delay in repayment to the lending fund could result in lost opportunities and/or additional lending costs. The exemptive order is subject to conditions intended to mitigate conflicts of interest arising from the Investment Manager’s relationship with each Participating Fund.
The Fund’s activity in the Interfund Program during the six months ended November 30, 2022 was as follows:
| Borrower or lender | Average loan
balance ($) | Weighted average
interest rate (%) | Number of days
with outstanding loans |
| Lender | 3,500,000 | 3.60 | 2 |
Interest income earned by the Fund is recorded as Interfund lending in the Statement of Operations. The Fund had no outstanding interfund loans at November 30, 2022.
Note 8. Line of credit
The Fund has access to a revolving credit facility with a syndicate of banks led by JPMorgan Chase Bank, N.A., Citibank, N.A. and Wells Fargo Bank, N.A. whereby the Fund may borrow for the temporary funding of shareholder redemptions or for other temporary or emergency purposes. Pursuant to an October 27, 2022 amendment and restatement, the credit facility, which is an agreement between the Fund and certain other funds managed by the Investment Manager or an affiliated investment manager, severally and not jointly, permits aggregate borrowings up to $950 million. Interest is currently charged to each participating fund based on its borrowings at a rate equal to the higher of (i) the federal funds effective rate, (ii) the secured overnight financing rate plus 0.10% and (iii) the overnight bank funding rate, plus in each case, 1.00%. Each borrowing under the credit facility matures no later than 60 days after the date of borrowing. The Fund also pays a commitment fee equal to its pro rata share of the unused amount of the credit facility at a rate of 0.15% per annum. The commitment fee is included in other expenses in the Statement of Operations. This agreement expires annually in October unless extended or renewed. Prior to the October 27, 2022 amendment and restatement, the Fund had access to a revolving credit facility with a syndicate of banks led by JPMorgan Chase Bank, N.A., Citibank, N.A. and Wells Fargo Bank, N.A. which permitted collective borrowings up to $950 million. Interest was charged to each participating fund based on its borrowings at a rate equal to the higher of (i) the federal funds effective rate, (ii) the secured overnight financing rate plus 0.11448% and (iii) the overnight bank funding rate, plus in each case, 1.00%.
The Fund had no borrowings during the six months ended November 30, 2022.
| 26 | Columbia Dividend Opportunity Fund | Semiannual Report 2022 |
Notes to Financial Statements (continued)
November 30, 2022 (Unaudited)
Note 9. Significant risks
Market risk
The Fund may incur losses due to declines in the value of one or more securities in which it invests. These declines may be due to factors affecting a particular issuer, or the result of, among other things, political, regulatory, market, economic or social developments affecting the relevant market(s) more generally. In addition, turbulence in financial markets and reduced liquidity in equity, credit and/or fixed income markets may negatively affect many issuers, which could adversely affect the Fund’s ability to price or value hard-to-value assets in thinly traded and closed markets and could cause significant redemptions and operational challenges. Global economies and financial markets are increasingly interconnected, and conditions and events in one country, region or financial market may adversely impact issuers in a different country, region or financial market. These risks may be magnified if certain events or developments adversely interrupt the global supply chain; in these and other circumstances, such risks might affect companies worldwide. As a result, local, regional or global events such as terrorism, war, natural disasters, disease/virus outbreaks and epidemics or other public health issues, recessions, depressions or other events – or the potential for such events – could have a significant negative impact on global economic and market conditions.
The large-scale invasion of Ukraine by Russia in February 2022 has resulted in sanctions and market disruptions, including declines in regional and global stock markets, unusual volatility in global commodity markets and significant devaluations of Russian currency. The extent and duration of the military action are impossible to predict but could be significant. Market disruption caused by the Russian military action, and any counter-measures or responses thereto (including international sanctions, a downgrade in the country’s credit rating, purchasing and financing restrictions, boycotts, tariffs, changes in consumer or purchaser preferences, cyberattacks and espionage) could have severe adverse impacts on regional and/or global securities and commodities markets, including markets for oil and natural gas. These impacts may include reduced market liquidity, distress in credit markets, further disruption of global supply chains, increased risk of inflation, and limited access to investments in certain international markets and/or issuers. These developments and other related events could negatively impact Fund performance.
The pandemic caused by coronavirus disease 2019 and its variants (COVID-19) has resulted in, and may continue to result in, significant global economic and societal disruption and market volatility due to disruptions in market access, resource availability, facilities operations, imposition of tariffs, export controls and supply chain disruption, among others. Such disruptions may be caused, or exacerbated by, quarantines and travel restrictions, workforce displacement and loss in human and other resources. The uncertainty surrounding the magnitude, duration, reach, costs and effects of the global pandemic, as well as actions that have been or could be taken by governmental authorities or other third parties, present unknowns that are yet to unfold. The impacts, as well as the uncertainty over impacts to come, of COVID-19 – and any other infectious illness outbreaks, epidemics and pandemics that may arise in the future – could negatively affect global economies and markets in ways that cannot necessarily be foreseen. In addition, the impact of infectious illness outbreaks and epidemics in emerging market countries may be greater due to generally less established healthcare systems, governments and financial markets. Public health crises caused by the COVID-19 outbreak may exacerbate other pre-existing political, social and economic risks in certain countries or globally. The disruptions caused by COVID-19 could prevent the Fund from executing advantageous investment decisions in a timely manner and negatively impact the Fund’s ability to achieve its investment objective. Any such events could have a significant adverse impact on the value and risk profile of the Fund.
Shareholder concentration risk
At November 30, 2022, affiliated shareholders of record owned 54.8% of the outstanding shares of the Fund in one or more accounts. Subscription and redemption activity by concentrated accounts may have a significant effect on the operations of the Fund. In the case of a large redemption, the Fund may be forced to sell investments at inopportune times, including its liquid positions, which may result in Fund losses and the Fund holding a higher percentage of less liquid positions. Large redemptions could result in decreased economies of scale and increased operating expenses for non-redeeming Fund shareholders.
Columbia Dividend Opportunity Fund | Semiannual Report 2022
| 27 |
Notes to Financial Statements (continued)
November 30, 2022 (Unaudited)
Note 10. Subsequent events
Management has evaluated the events and transactions that have occurred through the date the financial statements were issued and noted no items requiring adjustment of the financial statements or additional disclosure.
Note 11. Information regarding pending and settled legal proceedings
Ameriprise Financial and certain of its affiliates are involved in the normal course of business in legal proceedings which include regulatory inquiries, arbitration and litigation, including class actions concerning matters arising in connection with the conduct of its activities as a diversified financial services firm. Ameriprise Financial believes that the Fund is not currently the subject of, and that neither Ameriprise Financial nor any of its affiliates are the subject of, any pending legal, arbitration or regulatory proceedings that are likely to have a material adverse effect on the Fund or the ability of Ameriprise Financial or its affiliates to perform under their contracts with the Fund. Ameriprise Financial is required to make quarterly (10-Q), annual (10-K) and, as necessary, 8-K filings with the Securities and Exchange Commission (SEC) on legal and regulatory matters that relate to Ameriprise Financial and its affiliates. Copies of these filings may be obtained by accessing the SEC website at www.sec.gov.
There can be no assurance that these matters, or the adverse publicity associated with them, will not result in increased Fund redemptions, reduced sale of Fund shares or other adverse consequences to the Fund. Further, although we believe proceedings are not likely to have a material adverse effect on the Fund or the ability of Ameriprise Financial or its affiliates to perform under their contracts with the Fund, these proceedings are subject to uncertainties and, as such, we are unable to estimate the possible loss or range of loss that may result. An adverse outcome in one or more of these proceedings could result in adverse judgments, settlements, fines, penalties or other relief that could have a material adverse effect on the consolidated financial condition or results of operations of Ameriprise Financial or one or more of its affiliates that provides services to the Fund.
| 28 | Columbia Dividend Opportunity Fund | Semiannual Report 2022 |
Approval of Management Agreement
(Unaudited)
Columbia Management Investment Advisers, LLC (the Investment Manager, and together with its domestic and global affiliates, Columbia Threadneedle Investments), a wholly-owned subsidiary of Ameriprise Financial, Inc. (Ameriprise Financial), serves as the investment manager to Columbia Dividend Opportunity Fund (the Fund). Under a management agreement (the Management Agreement), the Investment Manager provides investment advice and other services to the Fund and other funds distributed by Columbia Management Investment Distributors, Inc. (collectively, the Funds).
On an annual basis, the Fund’s Board of Trustees (the Board), including the independent Board members (the Independent Trustees), considers renewal of the Management Agreement. The Investment Manager prepared detailed reports for the Board and its Contracts Committee (including its Contracts Subcommittee) in November 2021 and March, April and June 2022, including reports providing the results of analyses performed by an independent third-party data provider, Broadridge Financial Solutions, Inc. (Broadridge), and comprehensive responses to written requests for information by independent legal counsels to the Independent Trustees (Independent Legal Counsel) to the Investment Manager, to assist the Board in making this determination. In addition, throughout the year, the Board (or its committees or subcommittees) regularly meets with portfolio management teams and senior management personnel and reviews information prepared by the Investment Manager addressing the services the Investment Manager provides and Fund performance. The Board also accords appropriate weight to the work, deliberations and conclusions of the various committees, such as the Contracts Committee, the Investment Review Committee, the Audit Committee and the Compliance Committee in determining whether to continue the Management Agreement.
The Board, at its June 23, 2022 Board meeting (the June Meeting), considered the renewal of the Management Agreement for an additional one-year term. At the June Meeting, Independent Legal Counsel reviewed with the Independent Trustees various factors relevant to the Board’s consideration of advisory agreements and the Board’s legal responsibilities related to such consideration. The Independent Trustees considered all information that they, their legal counsel or the Investment Manager believed reasonably necessary to evaluate and to approve the continuation of the Management Agreement. Among other things, the information and factors considered included the following:
| • | Information on the investment performance of the Fund relative to the performance of a group of mutual funds determined to be comparable to the Fund by Broadridge, as well as performance relative to benchmarks; |
| • | Information on the Fund’s management fees and total expenses, including information comparing the Fund’s expenses to those of a group of comparable mutual funds, as determined by Broadridge; |
| • | The Investment Manager’s agreement to contractually limit or cap total operating expenses for the Fund so that total operating expenses (excluding certain fees and expenses, such as transaction costs and certain other investment related expenses, interest, taxes, acquired fund fees and expenses and infrequent and/or unusual expenses) would not exceed a specified annual rate, as a percentage of the Fund’s net assets; |
| • | Terms of the Management Agreement; |
| • | Descriptions of other agreements and arrangements with affiliates of the Investment Manager relating to the operations of the Fund, including agreements with respect to the provision of transfer agency and shareholder services to the Fund; |
| • | Descriptions of various services performed by the Investment Manager under the Management Agreement, including portfolio management and portfolio trading practices; |
| • | Information regarding any recently negotiated management fees of similarly-managed portfolios of other institutional clients of the Investment Manager; |
| • | Information regarding the resources of the Investment Manager, including information regarding senior management, portfolio managers and other personnel; |
| • | Information regarding the capabilities of the Investment Manager with respect to compliance monitoring services; |
| • | The profitability to the Investment Manager and its affiliates from their relationships with the Fund; and |
| • | Report provided by the Board’s independent fee consultant, JDL Consultants, LLC (JDL). |
Columbia Dividend Opportunity Fund | Semiannual Report 2022
| 29 |
Approval of Management Agreement (continued)
(Unaudited)
Following an analysis and discussion of the foregoing, and the factors identified below, the Board, including all of the Independent Trustees, approved the renewal of the Management Agreement.
Nature, extent and quality of services provided by the Investment Manager
The Board analyzed various reports and presentations it had received detailing the services performed by the Investment Manager, as well as its history, expertise, resources and relative capabilities, and the qualifications of its personnel.
The Board specifically considered the many developments during recent years concerning the services provided by the Investment Manager. Among other things, the Board noted the organization and depth of the equity and credit research departments. The Board further observed the enhancements to the investment risk management department’s processes, systems and oversight, over the past several years, as well as planned 2022 initiatives in this regard. The Board also took into account the broad scope of services provided by the Investment Manager to the Fund, including, among other services, investment, risk and compliance oversight. The Board also took into account the information it received concerning the Investment Manager’s ability to attract and retain key portfolio management personnel and that it has sufficient resources to provide competitive and adequate compensation to investment personnel. The Board also observed that the Investment Manager has been able to effectively manage, operate and distribute the Funds through the COVID-19 pandemic period with no disruptions in services provided. The Board also considered added personnel and resources obtained by Columbia Threadneedle through Ameriprise Financial’s acquisition of BMO Financial Group’s Europe, Middle East, and Africa (EMEA) asset management business.
In connection with the Board’s evaluation of the overall package of services provided by the Investment Manager, the Board also considered the nature, quality and range of administrative services provided to the Fund by the Investment Manager, as well as the achievements in 2021 in the performance of administrative services, and noted the various enhancements anticipated for 2022. In evaluating the quality of services provided under the Management Agreement, the Board also took into account the organization and strength of the Fund’s and its service providers’ compliance programs. The Board also reviewed the financial condition of the Investment Manager and its affiliates and each entity’s ability to carry out its responsibilities under the Management Agreement and the Fund’s other service agreements.
In addition, the Board discussed the acceptability of the terms of the Management Agreement, noting that no changes were proposed from the form of agreement previously approved. The Board also noted the wide array of legal and compliance services provided to the Fund under the Management Agreement.
After reviewing these and related factors (including investment performance as discussed below), the Board concluded, within the context of their overall conclusions, that the nature, extent and quality of the services provided to the Fund under the Management Agreement supported the continuation of the Management Agreement.
Investment performance
In this connection, the Board carefully reviewed the investment performance of the Fund, including detailed reports providing the results of analyses performed by each of the Investment Manager, Broadridge and JDL collectively showing, for various periods (including since manager inception): (i) the performance of the Fund, (ii) the performance of a benchmark index, (iii) the percentage ranking of the Fund among its comparison group, (iv) the Fund’s performance relative to peers and benchmarks and (v) the net assets of the Fund. The Board observed that the Fund’s performance for certain periods ranked above median based on information provided by Broadridge.
The Board also reviewed a description of the third-party data provider’s methodology for identifying the Fund’s peer groups for purposes of performance and expense comparisons.
The Board also considered the Investment Manager’s performance and reputation generally. After reviewing these and related factors, the Board concluded, within the context of their overall conclusions, that the performance of the Fund and the Investment Manager, in light of other considerations, supported the continuation of the Management Agreement.
| 30 | Columbia Dividend Opportunity Fund | Semiannual Report 2022 |
Approval of Management Agreement (continued)
(Unaudited)
Comparative fees, costs of services provided and the profits realized by the Investment Manager and its affiliates from their relationships with the Fund
The Board reviewed comparative fees and the costs of services provided under the Management Agreement. The Board members considered detailed comparative information set forth in an annual report on fees and expenses, including, among other things, data (based on analyses conducted by Broadridge and JDL) showing a comparison of the Fund’s expenses with median expenses paid by funds in its comparative peer universe, as well as data showing the Fund’s contribution to the Investment Manager’s profitability. The Board reviewed the fees charged to comparable institutional or other accounts/vehicles managed by the Investment Manager and discussed differences in how the products are managed and operated, thus explaining many of the differences in fees.
The Board considered the reports of JDL, which assisted in the Board’s analysis of the Funds’ performance and expenses and the reasonableness of the Funds’ fee rates. The Board accorded particular weight to the notion that a primary objective of the level of fees is to achieve a rational pricing model applied consistently across the various product lines in the Fund family, while assuring that the overall fees for each Fund (with certain exceptions) are generally in line with the current "pricing philosophy" such that Fund total expense ratios, in general, approximate or are lower than the median expense ratios of funds in the same Lipper comparison universe. The Board took into account that the Fund’s total expense ratio (after considering proposed expense caps/waivers) approximated the peer universe’s median expense ratio.
After reviewing these and related factors, the Board concluded, within the context of their overall conclusions, that the levels of management fees and expenses of the Fund, in light of other considerations, supported the continuation of the Management Agreement.
The Board also considered the profitability of the Investment Manager and its affiliates in connection with the Investment Manager providing management services to the Fund. With respect to the profitability of the Investment Manager and its affiliates, the Independent Trustees referred to information discussing the profitability to the Investment Manager and Ameriprise Financial from managing, operating and distributing the Funds. The Board considered that in 2021 the Board had considered 2020 profitability and that the 2022 information showed that the profitability generated by the Investment Manager in 2021 increased from 2020 levels, due to a variety of factors, including the increased assets under management of the Funds. It also took into account the indirect economic benefits flowing to the Investment Manager or its affiliates in connection with managing or distributing the Funds, such as the enhanced ability to offer various other financial products to Ameriprise Financial customers, soft dollar benefits and overall reputational advantages. The Board noted that the fees paid by the Fund should permit the Investment Manager to offer competitive compensation to its personnel, make necessary investments in its business and earn an appropriate profit. After reviewing these and related factors, the Board concluded, within the context of their overall conclusions, that the costs of services provided and the profitability to the Investment Manager and its affiliates from their relationships with the Fund supported the continuation of the Management Agreement.
Economies of scale
The Board considered the potential existence of economies of scale in the provision by the Investment Manager of services to the Fund, to groups of related funds and to the Investment Manager as a whole, and whether those economies of scale were shared with the Fund through breakpoints in investment management fees or other means, such as expense limitation arrangements and additional investments by the Investment Manager in investment, trading, compliance and other resources. The Board considered the economies of scale that might be realized as the Fund’s net asset level grows and took note of the extent to which Fund shareholders might also benefit from such growth. In this regard, the Board took into account that management fees decline as Fund assets exceed various breakpoints, all of which have not been surpassed. The Board observed that the Management Agreement provided for breakpoints in the management fee rate schedule that allow opportunities for shareholders to realize lower fees as Fund assets grow and that there are additional opportunities through other means for sharing economies of scale with shareholders.
Conclusion
The Board reviewed all of the above considerations in reaching its decision to approve the continuation of the Management Agreement. In reaching its conclusions, no single factor was determinative.
Columbia Dividend Opportunity Fund | Semiannual Report 2022
| 31 |
Approval of Management Agreement (continued)
(Unaudited)
On June 23, 2022, the Board, including all of the Independent Trustees, determined that fees payable under the Management Agreement were fair and reasonable in light of the extent and quality of services provided and approved the renewal of the Management Agreement.
| 32 | Columbia Dividend Opportunity Fund | Semiannual Report 2022 |
[THIS PAGE INTENTIONALLY LEFT BLANK]
[THIS PAGE INTENTIONALLY LEFT BLANK]
[THIS PAGE INTENTIONALLY LEFT BLANK]
Columbia Dividend Opportunity Fund
P.O. Box 219104
Kansas City, MO 64121-9104
Please read and consider the investment objectives, risks, charges and expenses for any fund carefully before investing. For a prospectus and summary prospectus, which contains this and other important information about the Fund, go to
columbiathreadneedleus.com/investor/. The Fund is distributed by Columbia Management Investment Distributors, Inc., member FINRA, and managed by Columbia Management Investment Advisers, LLC.
Columbia Threadneedle Investments (Columbia Threadneedle) is the global brand name of the Columbia and Threadneedle group of companies. All rights reserved.
© 2023 Columbia Management Investment Advisers, LLC.
columbiathreadneedleus.com/investor/

Semiannual Report
November 30, 2022 (Unaudited)
Columbia High Yield Bond Fund
Not FDIC or NCUA Insured • No Financial Institution Guarantee • May Lose Value
If you elect to receive the shareholder report for Columbia High Yield Bond Fund (the Fund) in paper, mailed to you, the Fund mails one shareholder report to each shareholder address, unless such shareholder elects to receive shareholder reports from the Fund electronically via e-mail or by having a paper notice mailed to you (Postcard Notice) that your Fund’s shareholder report is available at the Columbia funds’ website (columbiathreadneedleus.com/investor/). If you would like more than one report in paper to be mailed to you, or would like to elect to receive reports via e-mail or access them through Postcard Notice, please call shareholder services at 800.345.6611 and additional reports will be sent to you.
Proxy voting policies and procedures
The policy of the Board of Trustees is to vote the proxies of the companies in which the Fund holds investments consistent with the procedures as stated in the Statement of Additional Information (SAI). You may obtain a copy of the SAI without charge by calling 800.345.6611; contacting your financial intermediary; visiting columbiathreadneedleus.com/investor/; or searching the website of the Securities and Exchange Commission (SEC) at sec.gov. Information regarding how the Fund voted proxies relating to portfolio securities is filed with the SEC by August 31st for the most recent 12-month period ending June 30th of that year, and is available without charge by visiting columbiathreadneedleus.com/investor/, or searching the website of the SEC at sec.gov.
Quarterly schedule of investments
The Fund files a complete schedule of portfolio holdings with the SEC for the first and third quarters of each fiscal year on Form N-PORT. The Fund’s Form N-PORT filings are available on the SEC’s website at sec.gov. The Fund’s complete schedule of portfolio holdings, as filed on Form N-PORT, is available on columbiathreadneedleus.com/investor/ or can also be obtained without charge, upon request, by calling 800.345.6611.
Additional Fund information
For more information about the Fund, please visit columbiathreadneedleus.com/investor/ or call 800.345.6611. Customer Service Representatives are available to answer your questions Monday through Friday from 8 a.m. to 7 p.m. Eastern time.
Fund investment manager
Columbia Management Investment Advisers, LLC (the Investment Manager)
290 Congress Street
Boston, MA 02210
Fund distributor
Columbia Management Investment Distributors, Inc.
290 Congress Street
Boston, MA 02210
Fund transfer agent
Columbia Management Investment Services Corp.
P.O. Box 219104
Kansas City, MO 64121-9104
Columbia High Yield Bond Fund | Semiannual Report 2022
Fund at a Glance
(Unaudited)
Investment objective
The Fund seeks to provide shareholders with high current income as its primary objective and, as its secondary objective, capital growth.
Portfolio management
Brian Lavin, CFA
Lead Portfolio Manager
Managed Fund since 2010
Daniel DeYoung
Portfolio Manager
Managed Fund since 2019
| Average annual total returns (%) (for the period ended November 30, 2022) |
| | | Inception | 6 Months
cumulative | 1 Year | 5 Years | 10 Years |
| Class A | Excluding sales charges | 12/08/83 | -2.73 | -8.19 | 2.05 | 3.67 |
| | Including sales charges | | -7.38 | -12.53 | 1.05 | 3.16 |
| Advisor Class | 12/11/06 | -2.58 | -7.97 | 2.29 | 3.92 |
| Class C | Excluding sales charges | 06/26/00 | -3.13 | -8.95 | 1.29 | 2.92 |
| | Including sales charges | | -4.07 | -9.82 | 1.29 | 2.92 |
| Institutional Class | 09/27/10 | -2.61 | -8.05 | 2.36 | 3.92 |
| Institutional 2 Class | 12/11/06 | -2.59 | -7.94 | 2.37 | 3.98 |
| Institutional 3 Class | 11/08/12 | -2.56 | -7.87 | 2.46 | 4.09 |
| Class R | 12/11/06 | -2.83 | -8.46 | 1.79 | 3.41 |
| ICE BofA U.S. Cash Pay High Yield Constrained Index | | -2.94 | -8.70 | 2.33 | 4.17 |
Returns for Class A shares are shown with and without the maximum initial sales charge of 4.75%. Returns for Class C shares are shown with and without the 1.00% contingent deferred sales charge for the first year only. The Fund’s other share classes are not subject to sales charges and have limited eligibility. Please see the Fund’s prospectus for details. Performance for different share classes will vary based on differences in sales charges and fees associated with each share class. All results shown assume reinvestment of distributions during the period. Returns do not reflect the deduction of taxes that a shareholder may pay on Fund distributions or on the redemption of Fund shares. Performance results reflect the effect of any fee waivers or reimbursements of Fund expenses by Columbia Management Investment Advisers, LLC and/or any of its affiliates. Absent these fee waivers or expense reimbursement arrangements, performance results would have been lower.
The performance information shown represents past performance and is not a guarantee of future results. The investment return and principal value of your investment will fluctuate so that your shares, when redeemed, may be worth more or less than their original cost. Current performance may be lower or higher than the performance information shown. You may obtain performance information current to the most recent month-end by contacting your financial intermediary, visiting columbiathreadneedleus.com/investor/ or calling 800.345.6611.
The ICE BofA U.S. Cash Pay High Yield Constrained Index tracks the performance of U.S. dollar-denominated below investment grade corporate debt, currently in a coupon paying period that is publicly issued in the U.S. domestic market.
Indices are not available for investment, are not professionally managed and do not reflect sales charges, fees, brokerage commissions, taxes or other expenses of investing. Securities in the Fund may not match those in an index.
Columbia High Yield Bond Fund | Semiannual Report 2022
| 3 |
Fund at a Glance (continued)
(Unaudited)
| Portfolio breakdown (%) (at November 30, 2022) |
| Convertible Bonds | 0.9 |
| Corporate Bonds & Notes | 92.4 |
| Foreign Government Obligations | 0.5 |
| Money Market Funds | 3.2 |
| Senior Loans | 3.0 |
| Total | 100.0 |
Percentages indicated are based upon total investments excluding investments in derivatives, if any. The Fund’s portfolio composition is subject to change.
| Quality breakdown (%) (at November 30, 2022) |
| BBB rating | 1.8 |
| BB rating | 43.9 |
| B rating | 42.2 |
| CCC rating | 12.0 |
| Not rated | 0.1 |
| Total | 100.0 |
Percentages indicated are based upon total fixed income investments.
Bond ratings apply to the underlying holdings of the Fund and not the Fund itself and are divided into categories ranging from highest to lowest credit quality, determined by using the average rating of Moody’s, S&P and Fitch. When ratings are available from only two rating agencies, the average of the two rating is used. When a rating is available from only one rating agency, that rating is used. When a bond is not rated by any rating agency, it is designated as “Not rated.” Credit quality ratings assigned by a rating agency are subjective opinions, not statements of fact, and are subject to change, including daily. The ratings assigned by credit rating agencies are but one of the considerations that the Investment Manager and/or Fund’s subadviser incorporates into its credit analysis process, along with such other issuer-specific factors as cash flows, capital structure and leverage ratios, ability to de-leverage (repay) through free cash flow, quality of management, market positioning and access to capital, as well as such security-specific factors as the terms of the security (e.g., interest rate and time to maturity) and the amount and type of any collateral.
| 4 | Columbia High Yield Bond Fund | Semiannual Report 2022 |
Understanding Your Fund’s Expenses
(Unaudited)
As an investor, you incur two types of costs. There are shareholder transaction costs, which generally include sales charges on purchases and may include redemption fees. There are also ongoing fund costs, which generally include management fees, distribution and/or service fees, and other fund expenses. The following information is intended to help you understand your ongoing costs (in dollars) of investing in the Fund and to help you compare these costs with the ongoing costs of investing in other mutual funds.
Analyzing your Fund’s expenses
To illustrate these ongoing costs, we have provided examples and calculated the expenses paid by investors in each share class of the Fund during the period. The actual and hypothetical information in the table is based on an initial investment of $1,000 at the beginning of the period indicated and held for the entire period. Expense information is calculated two ways and each method provides you with different information. The amount listed in the “Actual” column is calculated using the Fund’s actual operating expenses and total return for the period. You may use the Actual information, together with the amount invested, to estimate the expenses that you paid over the period. Simply divide your account value by $1,000 (for example, an $8,600 account value divided by $1,000 = 8.6), then multiply the results by the expenses paid during the period under the “Actual” column. The amount listed in the “Hypothetical” column assumes a 5% annual rate of return before expenses (which is not the Fund’s actual return) and then applies the Fund’s actual expense ratio for the period to the hypothetical return. You should not use the hypothetical account values and expenses to estimate either your actual account balance at the end of the period or the expenses you paid during the period. See “Compare with other funds” below for details on how to use the hypothetical data.
Compare with other funds
Since all mutual funds are required to include the same hypothetical calculations about expenses in shareholder reports, you can use this information to compare the ongoing cost of investing in the Fund with other funds. To do so, compare the hypothetical example with the 5% hypothetical examples that appear in the shareholder reports of other funds. As you compare hypothetical examples of other funds, it is important to note that hypothetical examples are meant to highlight the ongoing costs of investing in a fund only and do not reflect any transaction costs, such as sales charges, or redemption or exchange fees. Therefore, the hypothetical calculations are useful in comparing ongoing costs only, and will not help you determine the relative total costs of owning different funds. If transaction costs were included in these calculations, your costs would be higher.
| June 1, 2022 — November 30, 2022 |
| | Account value at the
beginning of the
period ($) | Account value at the
end of the
period ($) | Expenses paid during
the period ($) | Fund’s annualized
expense ratio (%) |
| | Actual | Hypothetical | Actual | Hypothetical | Actual | Hypothetical | Actual |
| Class A | 1,000.00 | 1,000.00 | 972.70 | 1,020.05 | 4.95 | 5.06 | 1.00 |
| Advisor Class | 1,000.00 | 1,000.00 | 974.20 | 1,021.31 | 3.71 | 3.80 | 0.75 |
| Class C | 1,000.00 | 1,000.00 | 968.70 | 1,016.29 | 8.64 | 8.85 | 1.75 |
| Institutional Class | 1,000.00 | 1,000.00 | 973.90 | 1,021.31 | 3.71 | 3.80 | 0.75 |
| Institutional 2 Class | 1,000.00 | 1,000.00 | 974.10 | 1,021.66 | 3.37 | 3.45 | 0.68 |
| Institutional 3 Class | 1,000.00 | 1,000.00 | 974.40 | 1,021.91 | 3.12 | 3.19 | 0.63 |
| Class R | 1,000.00 | 1,000.00 | 971.70 | 1,018.80 | 6.18 | 6.33 | 1.25 |
Expenses paid during the period are equal to the annualized expense ratio for each class as indicated above, multiplied by the average account value over the period and then multiplied by the number of days in the Fund’s most recent fiscal half year and divided by 365.
Expenses do not include fees and expenses incurred indirectly by the Fund from its investment in underlying funds, including affiliated and non-affiliated pooled investment vehicles, such as mutual funds and exchange-traded funds.
Had Columbia Management Investment Advisers, LLC and/or certain of its affiliates not waived/reimbursed certain fees and expenses, account value at the end of the period would have been reduced.
Columbia High Yield Bond Fund | Semiannual Report 2022
| 5 |
Portfolio of Investments
November 30, 2022 (Unaudited)
(Percentages represent value of investments compared to net assets)
Investments in securities
| Convertible Bonds 0.9% |
| Issuer | Coupon
Rate | | Principal
Amount ($) | Value ($) |
| Cable and Satellite 0.9% |
| DISH Network Corp. |
| Subordinated |
| 08/15/2026 | 3.375% | | 19,098,000 | 12,365,955 |
Total Convertible Bonds
(Cost $16,909,534) | 12,365,955 |
|
| Corporate Bonds & Notes 91.1% |
| | | | |
| Aerospace & Defense 2.0% |
| Bombardier, Inc.(a) |
| 04/15/2027 | 7.875% | | 3,633,000 | 3,575,148 |
| Spirit AeroSystems, Inc.(a) |
| 11/30/2029 | 9.375% | | 1,529,000 | 1,609,096 |
| TransDigm UK Holdings PLC |
| 05/15/2026 | 6.875% | | 1,017,000 | 1,002,432 |
| TransDigm, Inc.(a) |
| 03/15/2026 | 6.250% | | 13,968,000 | 13,886,625 |
| TransDigm, Inc. |
| 06/15/2026 | 6.375% | | 5,628,000 | 5,525,228 |
| 11/15/2027 | 5.500% | | 1,244,000 | 1,172,434 |
| Total | 26,770,963 |
| Airlines 2.4% |
| Air Canada(a) |
| 08/15/2026 | 3.875% | | 3,955,000 | 3,618,723 |
| American Airlines, Inc./AAdvantage Loyalty IP Ltd.(a) |
| 04/20/2026 | 5.500% | | 14,097,486 | 13,701,968 |
| 04/20/2029 | 5.750% | | 296,305 | 276,689 |
| Hawaiian Brand Intellectual Property Ltd./Miles Loyalty Ltd.(a) |
| 01/20/2026 | 5.750% | | 5,251,529 | 4,976,296 |
| Mileage Plus Holdings LLC/Intellectual Property Assets Ltd.(a) |
| 06/20/2027 | 6.500% | | 6,655,019 | 6,592,301 |
| Spirit Loyalty Cayman Ltd.(a) |
| 09/20/2025 | 8.000% | | 3,255,000 | 3,292,360 |
| Total | 32,458,337 |
| Automotive 3.8% |
| American Axle & Manufacturing, Inc. |
| 03/15/2026 | 6.250% | | 1,716,000 | 1,635,268 |
| 04/01/2027 | 6.500% | | 203,000 | 190,957 |
| Clarios Global LP(a) |
| 05/15/2025 | 6.750% | | 2,270,000 | 2,270,000 |
| Ford Motor Co. |
| 02/12/2032 | 3.250% | | 3,108,000 | 2,463,226 |
| 01/15/2043 | 4.750% | | 4,357,000 | 3,231,965 |
| Corporate Bonds & Notes (continued) |
| Issuer | Coupon
Rate | | Principal
Amount ($) | Value ($) |
| Ford Motor Credit Co. LLC |
| 03/18/2024 | 5.584% | | 4,661,000 | 4,620,228 |
| 11/01/2024 | 4.063% | | 1,261,000 | 1,218,846 |
| 06/16/2025 | 5.125% | | 1,781,000 | 1,724,262 |
| 11/13/2025 | 3.375% | | 4,360,000 | 4,025,270 |
| 01/08/2026 | 4.389% | | 2,745,000 | 2,609,819 |
| 05/28/2027 | 4.950% | | 1,375,000 | 1,301,158 |
| 08/17/2027 | 4.125% | | 5,119,000 | 4,662,401 |
| 11/04/2027 | 7.350% | | 2,400,000 | 2,491,668 |
| 02/16/2028 | 2.900% | | 2,325,000 | 1,955,538 |
| 11/13/2030 | 4.000% | | 3,180,000 | 2,690,691 |
| Goodyear Tire & Rubber Co. (The) |
| 07/15/2029 | 5.000% | | 1,512,000 | 1,307,576 |
| IAA Spinco, Inc.(a) |
| 06/15/2027 | 5.500% | | 3,971,000 | 3,902,209 |
| KAR Auction Services, Inc.(a) |
| 06/01/2025 | 5.125% | | 5,162,000 | 5,051,054 |
| Panther BF Aggregator 2 LP/Finance Co., Inc.(a) |
| 05/15/2027 | 8.500% | | 4,347,000 | 4,261,650 |
| Total | 51,613,786 |
| Brokerage/Asset Managers/Exchanges 1.8% |
| AG Issuer LLC(a) |
| 03/01/2028 | 6.250% | | 117,000 | 109,290 |
| AG TTMT Escrow Issuer LLC(a) |
| 09/30/2027 | 8.625% | | 5,036,000 | 5,090,077 |
| Hightower Holding LLC(a) |
| 04/15/2029 | 6.750% | | 4,062,000 | 3,371,633 |
| NFP Corp(a) |
| 10/01/2030 | 7.500% | | 3,974,000 | 3,821,921 |
| NFP Corp.(a) |
| 08/15/2028 | 4.875% | | 4,122,000 | 3,591,600 |
| 08/15/2028 | 6.875% | | 10,440,000 | 8,831,513 |
| Total | 24,816,034 |
| Building Materials 1.3% |
| American Builders & Contractors Supply Co., Inc.(a) |
| 01/15/2028 | 4.000% | | 6,043,000 | 5,468,307 |
| Beacon Roofing Supply, Inc.(a) |
| 11/15/2026 | 4.500% | | 2,198,000 | 2,040,907 |
| Interface, Inc.(a) |
| 12/01/2028 | 5.500% | | 551,000 | 448,173 |
| SRS Distribution, Inc.(a) |
| 07/01/2028 | 4.625% | | 5,453,000 | 4,863,907 |
| 12/01/2029 | 6.000% | | 3,708,000 | 3,054,862 |
The accompanying Notes to Financial Statements are an integral part of this statement.
| 6 | Columbia High Yield Bond Fund | Semiannual Report 2022 |
Portfolio of Investments (continued)
November 30, 2022 (Unaudited)
| Corporate Bonds & Notes (continued) |
| Issuer | Coupon
Rate | | Principal
Amount ($) | Value ($) |
| White Cap Buyer LLC(a) |
| 10/15/2028 | 6.875% | | 1,687,000 | 1,460,193 |
| Total | 17,336,349 |
| Cable and Satellite 6.5% |
| CCO Holdings LLC/Capital Corp.(a) |
| 06/01/2029 | 5.375% | | 6,200,000 | 5,625,346 |
| 03/01/2030 | 4.750% | | 11,138,000 | 9,592,423 |
| 08/15/2030 | 4.500% | | 4,484,000 | 3,777,671 |
| 02/01/2032 | 4.750% | | 4,106,000 | 3,431,560 |
| CSC Holdings LLC(a) |
| 01/15/2030 | 5.750% | | 2,571,000 | 1,751,172 |
| 12/01/2030 | 4.125% | | 1,315,000 | 1,006,504 |
| 02/15/2031 | 3.375% | | 17,826,000 | 12,851,342 |
| DISH DBS Corp. |
| 06/01/2029 | 5.125% | | 9,530,000 | 6,268,167 |
| DISH Network Corp.(a) |
| 11/15/2027 | 11.750% | | 2,641,000 | 2,714,348 |
| Radiate Holdco LLC/Finance, Inc.(a) |
| 09/15/2026 | 4.500% | | 5,652,000 | 4,631,825 |
| 09/15/2028 | 6.500% | | 6,960,000 | 3,831,227 |
| Sirius XM Radio, Inc.(a) |
| 09/01/2026 | 3.125% | | 3,338,000 | 3,019,356 |
| 07/01/2030 | 4.125% | | 6,167,000 | 5,203,831 |
| Videotron Ltd.(a) |
| 06/15/2029 | 3.625% | | 3,504,000 | 2,981,509 |
| Virgin Media Finance PLC(a) |
| 07/15/2030 | 5.000% | | 7,349,000 | 6,015,534 |
| VZ Secured Financing BV(a) |
| 01/15/2032 | 5.000% | | 7,667,000 | 6,340,362 |
| Ziggo Bond Co. BV(a) |
| 02/28/2030 | 5.125% | | 3,470,000 | 2,815,559 |
| Ziggo BV(a) |
| 01/15/2030 | 4.875% | | 7,741,000 | 6,578,833 |
| Total | 88,436,569 |
| Chemicals 3.6% |
| Avient Corp.(a) |
| 08/01/2030 | 7.125% | | 2,706,000 | 2,654,727 |
| Axalta Coating Systems LLC(a) |
| 02/15/2029 | 3.375% | | 2,346,000 | 1,921,493 |
| Axalta Coating Systems LLC/Dutch Holding B BV(a) |
| 06/15/2027 | 4.750% | | 2,767,000 | 2,535,293 |
| Cheever Escrow Issuer LLC(a) |
| 10/01/2027 | 7.125% | | 3,594,000 | 3,379,521 |
| Element Solutions, Inc.(a) |
| 09/01/2028 | 3.875% | | 5,917,000 | 5,062,399 |
| Corporate Bonds & Notes (continued) |
| Issuer | Coupon
Rate | | Principal
Amount ($) | Value ($) |
| HB Fuller Co. |
| 10/15/2028 | 4.250% | | 3,105,000 | 2,765,924 |
| Herens Holdco Sarl(a) |
| 05/15/2028 | 4.750% | | 4,046,000 | 3,267,611 |
| Illuminate Buyer LLC/Holdings IV, Inc.(a) |
| 07/01/2028 | 9.000% | | 1,609,000 | 1,334,563 |
| INEOS Quattro Finance 2 Plc(a) |
| 01/15/2026 | 3.375% | | 814,000 | 722,617 |
| Ingevity Corp.(a) |
| 11/01/2028 | 3.875% | | 3,545,000 | 3,022,747 |
| Innophos Holdings, Inc.(a) |
| 02/15/2028 | 9.375% | | 3,244,000 | 3,182,265 |
| Iris Holdings, Inc.(a),(b) |
| 02/15/2026 | 8.750% | | 2,366,000 | 2,010,549 |
| Olympus Water US Holding Corp.(a) |
| 10/01/2028 | 4.250% | | 4,186,000 | 3,391,605 |
| SPCM SA(a) |
| 03/15/2027 | 3.125% | | 1,661,000 | 1,424,778 |
| Unifrax Escrow Issuer Corp.(a) |
| 09/30/2028 | 5.250% | | 1,671,000 | 1,380,439 |
| 09/30/2029 | 7.500% | | 939,000 | 627,791 |
| WR Grace Holdings LLC(a) |
| 06/15/2027 | 4.875% | | 5,928,000 | 5,311,064 |
| 08/15/2029 | 5.625% | | 6,296,000 | 5,188,465 |
| Total | 49,183,851 |
| Construction Machinery 1.1% |
| H&E Equipment Services, Inc.(a) |
| 12/15/2028 | 3.875% | | 10,696,000 | 9,248,824 |
| Herc Holdings, Inc.(a) |
| 07/15/2027 | 5.500% | | 2,032,000 | 1,900,568 |
| Ritchie Bros. Auctioneers, Inc.(a) |
| 01/15/2025 | 5.375% | | 3,498,000 | 3,450,612 |
| Total | 14,600,004 |
| Consumer Cyclical Services 2.9% |
| APX Group, Inc.(a) |
| 02/15/2027 | 6.750% | | 2,620,000 | 2,597,782 |
| Arches Buyer, Inc.(a) |
| 06/01/2028 | 4.250% | | 5,763,000 | 4,740,528 |
| 12/01/2028 | 6.125% | | 2,860,000 | 2,307,545 |
| Match Group, Inc.(a) |
| 12/15/2027 | 5.000% | | 1,031,000 | 967,311 |
| 06/01/2028 | 4.625% | | 2,144,000 | 1,934,946 |
| 02/15/2029 | 5.625% | | 1,076,000 | 996,349 |
| Staples, Inc.(a) |
| 04/15/2026 | 7.500% | | 2,462,000 | 2,195,905 |
The accompanying Notes to Financial Statements are an integral part of this statement.
Columbia High Yield Bond Fund | Semiannual Report 2022
| 7 |
Portfolio of Investments (continued)
November 30, 2022 (Unaudited)
| Corporate Bonds & Notes (continued) |
| Issuer | Coupon
Rate | | Principal
Amount ($) | Value ($) |
| Uber Technologies, Inc.(a) |
| 05/15/2025 | 7.500% | | 10,010,000 | 10,076,875 |
| 08/15/2029 | 4.500% | | 15,143,000 | 13,191,243 |
| Total | 39,008,484 |
| Consumer Products 1.3% |
| CD&R Smokey Buyer, Inc.(a) |
| 07/15/2025 | 6.750% | | 4,844,000 | 4,329,363 |
| Mattel, Inc.(a) |
| 12/15/2027 | 5.875% | | 2,735,000 | 2,672,848 |
| Newell Brands, Inc. |
| 09/15/2027 | 6.375% | | 1,112,000 | 1,093,769 |
| 09/15/2029 | 6.625% | | 1,572,000 | 1,550,997 |
| Prestige Brands, Inc.(a) |
| 01/15/2028 | 5.125% | | 1,428,000 | 1,353,925 |
| Scotts Miracle-Gro Co. (The) |
| 04/01/2031 | 4.000% | | 1,865,000 | 1,430,564 |
| Spectrum Brands, Inc. |
| 07/15/2025 | 5.750% | | 2,076,000 | 2,050,647 |
| Spectrum Brands, Inc.(a) |
| 10/01/2029 | 5.000% | | 1,901,000 | 1,627,881 |
| 07/15/2030 | 5.500% | | 240,000 | 205,945 |
| Tempur Sealy International, Inc.(a) |
| 10/15/2031 | 3.875% | | 1,032,000 | 802,213 |
| Total | 17,118,152 |
| Diversified Manufacturing 1.2% |
| Madison IAQ LLC(a) |
| 06/30/2028 | 4.125% | | 3,229,000 | 2,792,330 |
| 06/30/2029 | 5.875% | | 2,861,000 | 2,099,302 |
| Resideo Funding, Inc.(a) |
| 09/01/2029 | 4.000% | | 3,127,000 | 2,475,980 |
| Vertical Holdco GmbH(a) |
| 07/15/2028 | 7.625% | | 566,000 | 470,060 |
| Vertical US Newco, Inc.(a) |
| 07/15/2027 | 5.250% | | 1,123,000 | 1,013,509 |
| WESCO Distribution, Inc.(a) |
| 06/15/2025 | 7.125% | | 3,201,000 | 3,241,115 |
| 06/15/2028 | 7.250% | | 4,147,000 | 4,203,354 |
| Total | 16,295,650 |
| Electric 5.2% |
| Atlantica Sustainable Infrastructure PLC(a) |
| 06/15/2028 | 4.125% | | 2,597,000 | 2,299,668 |
| Clearway Energy Operating LLC(a) |
| 03/15/2028 | 4.750% | | 4,159,000 | 3,880,697 |
| 02/15/2031 | 3.750% | | 10,800,000 | 9,116,765 |
| 01/15/2032 | 3.750% | | 5,451,000 | 4,381,030 |
| Corporate Bonds & Notes (continued) |
| Issuer | Coupon
Rate | | Principal
Amount ($) | Value ($) |
| FirstEnergy Corp. |
| 11/15/2031 | 7.375% | | 1,042,000 | 1,172,472 |
| FirstEnergy Corp.(c) |
| 07/15/2047 | 5.100% | | 1,563,000 | 1,379,722 |
| Leeward Renewable Energy Operations LLC(a) |
| 07/01/2029 | 4.250% | | 5,183,000 | 4,324,478 |
| NextEra Energy Operating Partners LP(a) |
| 09/15/2027 | 4.500% | | 14,495,000 | 13,640,183 |
| NRG Energy, Inc.(a) |
| 06/15/2029 | 5.250% | | 9,490,000 | 8,749,266 |
| 02/15/2031 | 3.625% | | 2,553,000 | 2,055,795 |
| Pattern Energy Operations LP/Inc.(a) |
| 08/15/2028 | 4.500% | | 2,180,000 | 1,976,771 |
| PG&E Corp. |
| 07/01/2028 | 5.000% | | 1,985,000 | 1,811,888 |
| TerraForm Power Operating LLC(a) |
| 01/31/2028 | 5.000% | | 5,584,000 | 5,209,803 |
| 01/15/2030 | 4.750% | | 3,725,000 | 3,361,266 |
| Vistra Operations Co. LLC(a) |
| 09/01/2026 | 5.500% | | 1,147,000 | 1,109,736 |
| 02/15/2027 | 5.625% | | 2,638,000 | 2,551,227 |
| 07/31/2027 | 5.000% | | 1,538,000 | 1,440,430 |
| 05/01/2029 | 4.375% | | 2,730,000 | 2,441,917 |
| Total | 70,903,114 |
| Environmental 1.1% |
| GFL Environmental, Inc.(a) |
| 06/01/2025 | 4.250% | | 2,474,000 | 2,370,360 |
| 08/01/2025 | 3.750% | | 2,894,000 | 2,730,073 |
| 12/15/2026 | 5.125% | | 3,627,000 | 3,491,263 |
| Waste Pro USA, Inc.(a) |
| 02/15/2026 | 5.500% | | 7,108,000 | 6,561,304 |
| Total | 15,153,000 |
| Finance Companies 1.7% |
| Navient Corp. |
| 06/25/2025 | 6.750% | | 4,810,000 | 4,677,989 |
| OneMain Finance Corp. |
| 09/15/2030 | 4.000% | | 228,000 | 172,204 |
| Provident Funding Associates LP/Finance Corp.(a) |
| 06/15/2025 | 6.375% | | 5,305,000 | 4,685,481 |
| Quicken Loans LLC/Co-Issuer, Inc.(a) |
| 03/01/2029 | 3.625% | | 2,146,000 | 1,727,062 |
| 03/01/2031 | 3.875% | | 4,163,000 | 3,219,436 |
| Rocket Mortgage LLC/Co-Issuer, Inc.(a) |
| 10/15/2033 | 4.000% | | 10,010,000 | 7,357,298 |
The accompanying Notes to Financial Statements are an integral part of this statement.
| 8 | Columbia High Yield Bond Fund | Semiannual Report 2022 |
Portfolio of Investments (continued)
November 30, 2022 (Unaudited)
| Corporate Bonds & Notes (continued) |
| Issuer | Coupon
Rate | | Principal
Amount ($) | Value ($) |
| Springleaf Finance Corp. |
| 03/15/2024 | 6.125% | | 1,490,000 | 1,453,526 |
| Total | 23,292,996 |
| Food and Beverage 2.2% |
| Darling Ingredients, Inc.(a) |
| 04/15/2027 | 5.250% | | 3,562,000 | 3,474,655 |
| 06/15/2030 | 6.000% | | 2,566,000 | 2,513,864 |
| FAGE International SA/USA Dairy Industry, Inc.(a) |
| 08/15/2026 | 5.625% | | 11,764,000 | 10,782,695 |
| Pilgrim’s Pride Corp.(a) |
| 04/15/2031 | 4.250% | | 2,118,000 | 1,840,620 |
| 03/01/2032 | 3.500% | | 868,000 | 701,949 |
| Post Holdings, Inc.(a) |
| 03/01/2027 | 5.750% | | 2,444,000 | 2,383,374 |
| 01/15/2028 | 5.625% | | 1,020,000 | 972,960 |
| 04/15/2030 | 4.625% | | 2,626,000 | 2,305,314 |
| Primo Water Holdings, Inc.(a) |
| 04/30/2029 | 4.375% | | 2,749,000 | 2,369,718 |
| Simmons Foods, Inc./Prepared Foods, Inc./Pet Food, Inc./Feed(a) |
| 03/01/2029 | 4.625% | | 3,502,000 | 2,896,900 |
| Total | 30,242,049 |
| Gaming 3.3% |
| Boyd Gaming Corp. |
| 12/01/2027 | 4.750% | | 1,892,000 | 1,764,390 |
| Boyd Gaming Corp.(a) |
| 06/15/2031 | 4.750% | | 857,000 | 751,961 |
| Colt Merger Sub, Inc.(a) |
| 07/01/2025 | 5.750% | | 5,798,000 | 5,733,034 |
| 07/01/2025 | 6.250% | | 5,031,000 | 4,963,992 |
| 07/01/2027 | 8.125% | | 9,083,000 | 9,118,795 |
| International Game Technology PLC(a) |
| 02/15/2025 | 6.500% | | 1,151,000 | 1,158,062 |
| 04/15/2026 | 4.125% | | 1,892,000 | 1,780,563 |
| Midwest Gaming Borrower LLC(a) |
| 05/01/2029 | 4.875% | | 5,237,000 | 4,522,441 |
| Penn National Gaming, Inc.(a) |
| 07/01/2029 | 4.125% | | 2,071,000 | 1,706,611 |
| Scientific Games Holdings LP/US FinCo, Inc.(a) |
| 03/01/2030 | 6.625% | | 4,558,000 | 3,857,214 |
| Scientific Games International, Inc.(a) |
| 05/15/2028 | 7.000% | | 2,215,000 | 2,194,418 |
| VICI Properties LP/Note Co., Inc.(a) |
| 06/15/2025 | 4.625% | | 3,784,000 | 3,645,149 |
| Wynn Las Vegas LLC/Capital Corp.(a) |
| 03/01/2025 | 5.500% | | 1,427,000 | 1,372,059 |
| Corporate Bonds & Notes (continued) |
| Issuer | Coupon
Rate | | Principal
Amount ($) | Value ($) |
| Wynn Resorts Finance LLC/Capital Corp.(a) |
| 04/15/2025 | 7.750% | | 1,430,000 | 1,431,616 |
| Total | 44,000,305 |
| Health Care 6.0% |
| 180 Medical, Inc.(a) |
| 10/15/2029 | 3.875% | | 1,050,000 | 897,698 |
| Acadia Healthcare Co., Inc.(a) |
| 07/01/2028 | 5.500% | | 601,000 | 566,281 |
| 04/15/2029 | 5.000% | | 829,000 | 764,468 |
| AdaptHealth LLC(a) |
| 08/01/2029 | 4.625% | | 925,000 | 778,026 |
| 03/01/2030 | 5.125% | | 5,420,000 | 4,639,495 |
| Avantor Funding, Inc.(a) |
| 07/15/2028 | 4.625% | | 3,369,000 | 3,099,142 |
| 11/01/2029 | 3.875% | | 7,225,000 | 6,195,921 |
| Catalent Pharma Solutions, Inc.(a) |
| 04/01/2030 | 3.500% | | 2,930,000 | 2,417,297 |
| Charles River Laboratories International, Inc.(a) |
| 05/01/2028 | 4.250% | | 1,072,000 | 976,598 |
| 03/15/2029 | 3.750% | | 1,397,000 | 1,223,114 |
| 03/15/2031 | 4.000% | | 1,596,000 | 1,378,937 |
| CHS/Community Health Systems, Inc.(a) |
| 04/15/2029 | 6.875% | | 4,444,000 | 2,376,182 |
| 05/15/2030 | 5.250% | | 7,800,000 | 5,958,266 |
| 02/15/2031 | 4.750% | | 922,000 | 677,103 |
| Indigo Merger Sub, Inc.(a) |
| 07/15/2026 | 2.875% | | 1,595,000 | 1,443,511 |
| Mozart Debt Merger Sub, Inc.(a) |
| 10/01/2029 | 5.250% | | 2,525,000 | 2,058,368 |
| Owens & Minor, Inc.(a) |
| 03/31/2029 | 4.500% | | 1,685,000 | 1,379,102 |
| 04/01/2030 | 6.625% | | 2,245,000 | 1,993,478 |
| RP Escrow Issuer LLC(a) |
| 12/15/2025 | 5.250% | | 9,424,000 | 7,894,421 |
| Select Medical Corp.(a) |
| 08/15/2026 | 6.250% | | 5,661,000 | 5,478,183 |
| Surgery Center Holdings, Inc.(a) |
| 07/01/2025 | 6.750% | | 454,000 | 447,417 |
| 04/15/2027 | 10.000% | | 2,922,000 | 2,939,180 |
| Teleflex, Inc. |
| 11/15/2027 | 4.625% | | 3,130,000 | 2,958,081 |
| Teleflex, Inc.(a) |
| 06/01/2028 | 4.250% | | 946,000 | 878,372 |
| Tenet Healthcare Corp.(a) |
| 02/01/2027 | 6.250% | | 3,553,000 | 3,422,207 |
| 11/01/2027 | 5.125% | | 7,256,000 | 6,798,608 |
| 10/01/2028 | 6.125% | | 4,440,000 | 3,916,460 |
| 01/15/2030 | 4.375% | | 1,776,000 | 1,546,773 |
The accompanying Notes to Financial Statements are an integral part of this statement.
Columbia High Yield Bond Fund | Semiannual Report 2022
| 9 |
Portfolio of Investments (continued)
November 30, 2022 (Unaudited)
| Corporate Bonds & Notes (continued) |
| Issuer | Coupon
Rate | | Principal
Amount ($) | Value ($) |
| 06/15/2030 | 6.125% | | 2,352,000 | 2,229,516 |
| US Acute Care Solutions LLC(a) |
| 03/01/2026 | 6.375% | | 4,101,000 | 3,720,824 |
| Total | 81,053,029 |
| Home Construction 0.5% |
| Meritage Homes Corp.(a) |
| 04/15/2029 | 3.875% | | 1,930,000 | 1,635,516 |
| Shea Homes LP/Funding Corp. |
| 02/15/2028 | 4.750% | | 1,843,000 | 1,591,313 |
| 04/01/2029 | 4.750% | | 513,000 | 425,736 |
| Taylor Morrison Communities, Inc./Holdings II(a) |
| 03/01/2024 | 5.625% | | 2,745,000 | 2,721,079 |
| Total | 6,373,644 |
| Independent Energy 5.7% |
| Apache Corp. |
| 09/01/2040 | 5.100% | | 1,016,000 | 835,336 |
| 02/01/2042 | 5.250% | | 755,000 | 616,071 |
| 04/15/2043 | 4.750% | | 2,937,000 | 2,239,418 |
| Callon Petroleum Co. |
| 07/01/2026 | 6.375% | | 3,915,000 | 3,758,504 |
| Callon Petroleum Co.(a) |
| 08/01/2028 | 8.000% | | 1,453,000 | 1,434,052 |
| 06/15/2030 | 7.500% | | 1,504,000 | 1,414,600 |
| CNX Resources Corp.(a) |
| 01/15/2029 | 6.000% | | 2,593,000 | 2,439,032 |
| Colgate Energy Partners III LLC(a) |
| 07/01/2029 | 5.875% | | 4,943,000 | 4,546,864 |
| Comstock Resources, Inc.(a) |
| 03/01/2029 | 6.750% | | 1,886,000 | 1,825,168 |
| CrownRock LP/Finance, Inc.(a) |
| 05/01/2029 | 5.000% | | 1,378,000 | 1,269,314 |
| Hilcorp Energy I LP/Finance Co.(a) |
| 11/01/2028 | 6.250% | | 8,929,000 | 8,540,026 |
| 02/01/2029 | 5.750% | | 2,250,000 | 2,064,649 |
| 04/15/2030 | 6.000% | | 1,444,000 | 1,332,835 |
| Matador Resources Co. |
| 09/15/2026 | 5.875% | | 5,949,000 | 5,825,740 |
| Occidental Petroleum Corp. |
| 09/01/2030 | 6.625% | | 6,530,000 | 6,814,699 |
| 01/01/2031 | 6.125% | | 6,027,000 | 6,117,706 |
| 05/01/2031 | 7.500% | | 1,490,000 | 1,618,494 |
| 09/15/2036 | 6.450% | | 7,823,000 | 7,876,410 |
| 03/15/2046 | 6.600% | | 1,129,000 | 1,146,706 |
| SM Energy Co. |
| 07/15/2028 | 6.500% | | 6,017,000 | 5,866,994 |
| Corporate Bonds & Notes (continued) |
| Issuer | Coupon
Rate | | Principal
Amount ($) | Value ($) |
| Southwestern Energy Co. |
| 02/01/2032 | 4.750% | | 10,396,000 | 9,146,855 |
| Total | 76,729,473 |
| Leisure 2.9% |
| Carnival Corp.(a) |
| 03/01/2026 | 7.625% | | 1,763,000 | 1,483,162 |
| 03/01/2027 | 5.750% | | 5,805,000 | 4,316,375 |
| Carnival Holdings Bermuda Ltd.(a) |
| 05/01/2028 | 10.375% | | 2,405,000 | 2,491,247 |
| Cedar Fair LP/Canada’s Wonderland Co./Magnum Management Corp./Millennium Operations LLC(a) |
| 05/01/2025 | 5.500% | | 4,476,000 | 4,460,907 |
| Cinemark USA, Inc.(a) |
| 03/15/2026 | 5.875% | | 7,484,000 | 6,547,825 |
| Live Nation Entertainment, Inc.(a) |
| 10/15/2027 | 4.750% | | 1,629,000 | 1,449,914 |
| NCL Corp., Ltd.(a) |
| 02/15/2027 | 5.875% | | 2,178,000 | 1,937,952 |
| Royal Caribbean Cruises Ltd.(a) |
| 06/01/2025 | 11.500% | | 2,619,000 | 2,807,441 |
| 07/01/2026 | 4.250% | | 5,787,000 | 4,796,597 |
| 08/31/2026 | 5.500% | | 7,959,000 | 6,902,372 |
| 07/15/2027 | 5.375% | | 1,748,000 | 1,450,785 |
| Total | 38,644,577 |
| Lodging 0.2% |
| Hilton Domestic Operating Co., Inc.(a) |
| 05/01/2025 | 5.375% | | 1,328,000 | 1,318,694 |
| 05/01/2028 | 5.750% | | 1,440,000 | 1,411,005 |
| Total | 2,729,699 |
| Media and Entertainment 2.7% |
| Clear Channel International BV(a) |
| 08/01/2025 | 6.625% | | 4,173,000 | 3,968,609 |
| Clear Channel Outdoor Holdings, Inc.(a) |
| 04/15/2028 | 7.750% | | 6,659,000 | 4,996,089 |
| 06/01/2029 | 7.500% | | 1,861,000 | 1,381,561 |
| Clear Channel Worldwide Holdings, Inc.(a) |
| 08/15/2027 | 5.125% | | 4,457,000 | 3,874,309 |
| iHeartCommunications, Inc. |
| 05/01/2026 | 6.375% | | 756,788 | 718,334 |
| iHeartCommunications, Inc.(a) |
| 08/15/2027 | 5.250% | | 3,902,000 | 3,477,453 |
| Outfront Media Capital LLC/Corp.(a) |
| 08/15/2027 | 5.000% | | 1,896,000 | 1,733,967 |
| 01/15/2029 | 4.250% | | 1,468,000 | 1,237,630 |
| 03/15/2030 | 4.625% | | 4,828,000 | 4,074,705 |
The accompanying Notes to Financial Statements are an integral part of this statement.
| 10 | Columbia High Yield Bond Fund | Semiannual Report 2022 |
Portfolio of Investments (continued)
November 30, 2022 (Unaudited)
| Corporate Bonds & Notes (continued) |
| Issuer | Coupon
Rate | | Principal
Amount ($) | Value ($) |
| Playtika Holding Corp.(a) |
| 03/15/2029 | 4.250% | | 5,803,000 | 4,704,305 |
| Roblox Corp.(a) |
| 05/01/2030 | 3.875% | | 4,511,000 | 3,690,893 |
| Univision Communications, Inc.(a) |
| 06/30/2030 | 7.375% | | 2,936,000 | 2,929,829 |
| Total | 36,787,684 |
| Metals and Mining 3.4% |
| Allegheny Technologies, Inc. |
| 10/01/2029 | 4.875% | | 1,139,000 | 974,645 |
| 10/01/2031 | 5.125% | | 4,832,000 | 4,126,384 |
| Constellium SE(a) |
| 06/15/2028 | 5.625% | | 2,534,000 | 2,324,590 |
| 04/15/2029 | 3.750% | | 14,087,000 | 11,554,593 |
| Hudbay Minerals, Inc.(a) |
| 04/01/2026 | 4.500% | | 5,530,000 | 5,078,670 |
| 04/01/2029 | 6.125% | | 13,088,000 | 11,770,139 |
| Kaiser Aluminum Corp.(a) |
| 06/01/2031 | 4.500% | | 5,121,000 | 4,321,354 |
| Novelis Corp.(a) |
| 11/15/2026 | 3.250% | | 2,802,000 | 2,516,691 |
| 01/30/2030 | 4.750% | | 2,560,000 | 2,310,864 |
| 08/15/2031 | 3.875% | | 1,421,000 | 1,169,614 |
| Total | 46,147,544 |
| Midstream 5.0% |
| Cheniere Energy Partners LP |
| 03/01/2031 | 4.000% | | 725,000 | 633,404 |
| 01/31/2032 | 3.250% | | 6,837,000 | 5,563,414 |
| CNX Midstream Partners LP(a) |
| 04/15/2030 | 4.750% | | 3,589,000 | 3,003,094 |
| DCP Midstream Operating LP |
| 04/01/2044 | 5.600% | | 3,189,000 | 3,001,221 |
| Delek Logistics Partners LP/Finance Corp. |
| 05/15/2025 | 6.750% | | 4,005,000 | 3,915,246 |
| EQM Midstream Partners LP(a) |
| 07/01/2025 | 6.000% | | 4,666,000 | 4,587,503 |
| 06/01/2027 | 7.500% | | 1,178,000 | 1,189,089 |
| 07/01/2027 | 6.500% | | 2,315,000 | 2,284,723 |
| 01/15/2029 | 4.500% | | 2,593,000 | 2,277,712 |
| EQM Midstream Partners LP |
| 07/15/2028 | 5.500% | | 1,860,000 | 1,724,516 |
| 07/15/2048 | 6.500% | | 5,911,000 | 4,612,941 |
| Holly Energy Partners LP/Finance Corp.(a) |
| 04/15/2027 | 6.375% | | 1,769,000 | 1,732,773 |
| 02/01/2028 | 5.000% | | 4,181,000 | 3,808,475 |
| Corporate Bonds & Notes (continued) |
| Issuer | Coupon
Rate | | Principal
Amount ($) | Value ($) |
| NuStar Logistics LP |
| 10/01/2025 | 5.750% | | 2,046,000 | 1,997,860 |
| 06/01/2026 | 6.000% | | 2,535,000 | 2,457,984 |
| 04/28/2027 | 5.625% | | 6,524,000 | 6,195,048 |
| TransMontaigne Partners LP/TLP Finance Corp. |
| 02/15/2026 | 6.125% | | 5,843,000 | 5,068,808 |
| Venture Global Calcasieu Pass LLC(a) |
| 08/15/2029 | 3.875% | | 4,898,000 | 4,272,358 |
| 08/15/2031 | 4.125% | | 7,668,000 | 6,615,450 |
| 11/01/2033 | 3.875% | | 4,167,000 | 3,391,263 |
| Total | 68,332,882 |
| Oil Field Services 0.9% |
| Nabors Industries Ltd.(a) |
| 01/15/2028 | 7.500% | | 1,604,000 | 1,466,129 |
| Nabors Industries, Inc.(a) |
| 05/15/2027 | 7.375% | | 1,330,000 | 1,297,908 |
| Transocean Sentry Ltd.(a) |
| 05/15/2023 | 5.375% | | 9,173,467 | 9,085,038 |
| Total | 11,849,075 |
| Other REIT 1.5% |
| Blackstone Mortgage Trust, Inc.(a) |
| 01/15/2027 | 3.750% | | 4,756,000 | 4,186,421 |
| Ladder Capital Finance Holdings LLLP/Corp.(a) |
| 02/01/2027 | 4.250% | | 8,519,000 | 7,434,989 |
| 06/15/2029 | 4.750% | | 1,676,000 | 1,380,996 |
| Park Intermediate Holdings LLC/Domestic Property/Finance Co-Issuer(a) |
| 10/01/2028 | 5.875% | | 1,957,000 | 1,812,313 |
| Park Intermediate Holdings LLC/PK Domestic Property LLC/Finance Co-Issuer(a) |
| 05/15/2029 | 4.875% | | 1,286,000 | 1,099,547 |
| RLJ Lodging Trust LP(a) |
| 07/01/2026 | 3.750% | | 1,903,000 | 1,737,865 |
| Service Properties Trust |
| 03/15/2024 | 4.650% | | 1,517,000 | 1,467,197 |
| 10/01/2024 | 4.350% | | 704,000 | 656,852 |
| Total | 19,776,180 |
| Packaging 1.7% |
| Ardagh Metal Packaging Finance USA LLC/PLC(a) |
| 06/15/2027 | 6.000% | | 1,311,000 | 1,280,103 |
| 09/01/2029 | 4.000% | | 7,374,000 | 5,946,683 |
| Ardagh Packaging Finance PLC/Holdings USA, Inc.(a) |
| 04/30/2025 | 5.250% | | 2,283,000 | 2,203,463 |
| 08/15/2026 | 4.125% | | 2,762,000 | 2,432,219 |
| BWAY Holding Co.(a) |
| 04/15/2024 | 5.500% | | 2,428,000 | 2,393,754 |
| Canpack SA/US LLC(a) |
| 11/15/2029 | 3.875% | | 6,176,000 | 4,865,544 |
The accompanying Notes to Financial Statements are an integral part of this statement.
Columbia High Yield Bond Fund | Semiannual Report 2022
| 11 |
Portfolio of Investments (continued)
November 30, 2022 (Unaudited)
| Corporate Bonds & Notes (continued) |
| Issuer | Coupon
Rate | | Principal
Amount ($) | Value ($) |
| Trivium Packaging Finance BV(a) |
| 08/15/2026 | 5.500% | | 3,440,000 | 3,229,391 |
| Total | 22,351,157 |
| Pharmaceuticals 1.7% |
| 1375209 BC Ltd.(a) |
| 01/30/2028 | 9.000% | | 240,000 | 235,710 |
| Bausch Health Companies, Inc.(a) |
| 02/01/2027 | 6.125% | | 3,105,000 | 2,063,302 |
| 06/01/2028 | 4.875% | | 4,466,000 | 2,736,194 |
| 09/30/2028 | 11.000% | | 428,000 | 329,905 |
| 10/15/2030 | 14.000% | | 85,000 | 47,805 |
| Endo Dac/Finance LLC/Finco, Inc.(a),(d) |
| 06/30/2028 | 0.000% | | 1,684,000 | 78,805 |
| Grifols Escrow Issuer SA(a) |
| 10/15/2028 | 4.750% | | 2,601,000 | 2,175,803 |
| Jazz Securities DAC(a) |
| 01/15/2029 | 4.375% | | 1,990,000 | 1,789,867 |
| Organon Finance 1 LLC(a) |
| 04/30/2028 | 4.125% | | 8,273,000 | 7,444,618 |
| 04/30/2031 | 5.125% | | 6,662,000 | 5,910,860 |
| Total | 22,812,869 |
| Property & Casualty 3.0% |
| Alliant Holdings Intermediate LLC/Co-Issuer(a) |
| 10/15/2027 | 4.250% | | 2,588,000 | 2,330,707 |
| 10/15/2027 | 6.750% | | 6,770,000 | 6,241,215 |
| 11/01/2029 | 5.875% | | 2,548,000 | 2,177,902 |
| AssuredPartners, Inc.(a) |
| 08/15/2025 | 7.000% | | 3,791,000 | 3,651,505 |
| 01/15/2029 | 5.625% | | 3,448,000 | 2,929,458 |
| BroadStreet Partners, Inc.(a) |
| 04/15/2029 | 5.875% | | 6,070,000 | 5,154,573 |
| GTCR AP Finance, Inc.(a) |
| 05/15/2027 | 8.000% | | 1,239,000 | 1,201,953 |
| HUB International Ltd.(a) |
| 05/01/2026 | 7.000% | | 7,070,000 | 6,989,748 |
| 12/01/2029 | 5.625% | | 4,780,000 | 4,205,179 |
| MGIC Investment Corp. |
| 08/15/2028 | 5.250% | | 460,000 | 421,048 |
| Radian Group, Inc. |
| 03/15/2025 | 6.625% | | 179,000 | 177,446 |
| 03/15/2027 | 4.875% | | 1,061,000 | 959,835 |
| USI, Inc.(a) |
| 05/01/2025 | 6.875% | | 4,898,000 | 4,817,629 |
| Total | 41,258,198 |
| Corporate Bonds & Notes (continued) |
| Issuer | Coupon
Rate | | Principal
Amount ($) | Value ($) |
| Restaurants 0.9% |
| 1011778 BC ULC/New Red Finance, Inc.(a) |
| 04/15/2025 | 5.750% | | 2,265,000 | 2,262,481 |
| Fertitta Entertainment LLC/Finance Co., Inc.(a) |
| 01/15/2029 | 4.625% | | 1,120,000 | 988,624 |
| 01/15/2030 | 6.750% | | 2,566,000 | 2,159,280 |
| IRB Holding Corp.(a) |
| 06/15/2025 | 7.000% | | 2,830,000 | 2,837,951 |
| Yum! Brands, Inc. |
| 04/01/2032 | 5.375% | | 3,550,000 | 3,285,161 |
| Total | 11,533,497 |
| Retailers 1.7% |
| Asbury Automotive Group, Inc.(a) |
| 11/15/2029 | 4.625% | | 1,088,000 | 949,225 |
| 02/15/2032 | 5.000% | | 1,087,000 | 919,233 |
| Group 1 Automotive, Inc.(a) |
| 08/15/2028 | 4.000% | | 2,345,000 | 2,002,519 |
| L Brands, Inc.(a) |
| 07/01/2025 | 9.375% | | 745,000 | 787,239 |
| 10/01/2030 | 6.625% | | 3,925,000 | 3,679,245 |
| L Brands, Inc. |
| 06/15/2029 | 7.500% | | 735,000 | 737,328 |
| LCM Investments Holdings II LLC(a) |
| 05/01/2029 | 4.875% | | 4,393,000 | 3,700,280 |
| Lithia Motors, Inc.(a) |
| 01/15/2031 | 4.375% | | 1,665,000 | 1,408,848 |
| Penske Automotive Group, Inc. |
| 09/01/2025 | 3.500% | | 859,000 | 816,970 |
| PetSmart, Inc./Finance Corp.(a) |
| 02/15/2028 | 4.750% | | 7,727,000 | 7,058,267 |
| Wolverine World Wide, Inc.(a) |
| 08/15/2029 | 4.000% | | 1,783,000 | 1,347,342 |
| Total | 23,406,496 |
| Supermarkets 0.2% |
| Albertsons Companies LLC/Safeway, Inc./New Albertsons LP/Albertsons LLC(a) |
| 03/15/2026 | 7.500% | | 1,874,000 | 1,921,107 |
| SEG Holding LLC/Finance Corp.(a) |
| 10/15/2028 | 5.625% | | 759,000 | 720,291 |
| Total | 2,641,398 |
| Technology 7.3% |
| Black Knight InfoServ LLC(a) |
| 09/01/2028 | 3.625% | | 7,212,000 | 6,484,445 |
| Boxer Parent Co., Inc.(a) |
| 10/02/2025 | 7.125% | | 897,000 | 875,476 |
| 03/01/2026 | 9.125% | | 546,000 | 522,070 |
The accompanying Notes to Financial Statements are an integral part of this statement.
| 12 | Columbia High Yield Bond Fund | Semiannual Report 2022 |
Portfolio of Investments (continued)
November 30, 2022 (Unaudited)
| Corporate Bonds & Notes (continued) |
| Issuer | Coupon
Rate | | Principal
Amount ($) | Value ($) |
| Camelot Finance SA(a) |
| 11/01/2026 | 4.500% | | 2,158,000 | 2,046,897 |
| Clarivate Science Holdings Corp.(a) |
| 07/01/2028 | 3.875% | | 4,129,000 | 3,704,223 |
| 07/01/2029 | 4.875% | | 5,282,000 | 4,524,038 |
| Condor Merger Sub, Inc.(a) |
| 02/15/2030 | 7.375% | | 2,596,000 | 2,147,204 |
| Entegris Escrow Corp.(a) |
| 04/15/2029 | 4.750% | | 3,522,000 | 3,186,244 |
| 06/15/2030 | 5.950% | | 4,088,000 | 3,848,633 |
| Gartner, Inc.(a) |
| 07/01/2028 | 4.500% | | 1,500,000 | 1,411,550 |
| 06/15/2029 | 3.625% | | 1,678,000 | 1,470,899 |
| HealthEquity, Inc.(a) |
| 10/01/2029 | 4.500% | | 4,486,000 | 3,929,964 |
| Helios Software Holdings, Inc.(a) |
| 05/01/2028 | 4.625% | | 4,210,000 | 3,218,380 |
| ION Trading Technologies Sarl(a) |
| 05/15/2028 | 5.750% | | 4,281,000 | 3,482,689 |
| Iron Mountain, Inc.(a) |
| 09/15/2027 | 4.875% | | 3,207,000 | 3,016,954 |
| Logan Merger Sub, Inc.(a) |
| 09/01/2027 | 5.500% | | 8,896,000 | 5,204,332 |
| Minerva Merger Sub, Inc.(a) |
| 02/15/2030 | 6.500% | | 6,639,000 | 4,962,301 |
| NCR Corp.(a) |
| 10/01/2028 | 5.000% | | 3,605,000 | 3,135,957 |
| 04/15/2029 | 5.125% | | 7,628,000 | 6,562,859 |
| 10/01/2030 | 5.250% | | 232,000 | 196,027 |
| Neptune Bidco US, Inc.(a) |
| 04/15/2029 | 9.290% | | 2,196,000 | 2,114,600 |
| Picard Midco, Inc.(a) |
| 03/31/2029 | 6.500% | | 2,464,000 | 2,155,006 |
| PTC, Inc.(a) |
| 02/15/2025 | 3.625% | | 723,000 | 687,865 |
| 02/15/2028 | 4.000% | | 1,043,000 | 951,755 |
| Sabre GLBL, Inc.(a),(e) |
| 12/15/2027 | 11.250% | | 495,000 | 507,586 |
| Sensata Technologies BV(a) |
| 09/01/2030 | 5.875% | | 2,567,000 | 2,450,066 |
| Shift4 Payments LLC/Finance Sub, Inc.(a) |
| 11/01/2026 | 4.625% | | 6,350,000 | 6,001,328 |
| Switch Ltd.(a) |
| 09/15/2028 | 3.750% | | 1,314,000 | 1,338,638 |
| 06/15/2029 | 4.125% | | 3,706,000 | 3,782,455 |
| Synaptics, Inc.(a) |
| 06/15/2029 | 4.000% | | 3,175,000 | 2,697,776 |
| Corporate Bonds & Notes (continued) |
| Issuer | Coupon
Rate | | Principal
Amount ($) | Value ($) |
| Tempo Acquisition LLC/Finance Corp.(a) |
| 06/01/2025 | 5.750% | | 1,447,000 | 1,436,710 |
| Verscend Escrow Corp.(a) |
| 08/15/2026 | 9.750% | | 4,487,000 | 4,492,369 |
| ZoomInfo Technologies LLC/Finance Corp.(a) |
| 02/01/2029 | 3.875% | | 8,250,000 | 6,977,054 |
| Total | 99,524,350 |
| Wireless 2.6% |
| Altice France Holding SA(a) |
| 02/15/2028 | 6.000% | | 4,642,000 | 3,141,223 |
| Altice France SA(a) |
| 07/15/2029 | 5.125% | | 10,389,000 | 8,062,851 |
| 10/15/2029 | 5.500% | | 1,785,000 | 1,409,700 |
| Sprint Capital Corp. |
| 11/15/2028 | 6.875% | | 9,886,000 | 10,473,726 |
| 03/15/2032 | 8.750% | | 2,390,000 | 2,857,575 |
| Vmed O2 UK Financing I PLC(a) |
| 01/31/2031 | 4.250% | | 5,525,000 | 4,434,431 |
| 07/15/2031 | 4.750% | | 6,483,000 | 5,312,321 |
| Total | 35,691,827 |
| Wirelines 1.8% |
| Front Range BidCo, Inc.(a) |
| 03/01/2027 | 4.000% | | 5,033,000 | 3,606,550 |
| Frontier Communications Holdings LLC(a) |
| 10/15/2027 | 5.875% | | 2,525,000 | 2,402,238 |
| 05/15/2030 | 8.750% | | 3,053,000 | 3,157,431 |
| Iliad Holding SAS(a) |
| 10/15/2026 | 6.500% | | 9,821,000 | 9,361,447 |
| 10/15/2028 | 7.000% | | 6,316,000 | 5,963,175 |
| Total | 24,490,841 |
Total Corporate Bonds & Notes
(Cost $1,374,754,235) | 1,233,364,063 |
|
| Foreign Government Obligations(f) 0.5% |
| | | | |
| Canada 0.5% |
| NOVA Chemicals Corp.(a) |
| 06/01/2027 | 5.250% | | 6,476,000 | 5,833,396 |
| 05/15/2029 | 4.250% | | 1,218,000 | 1,024,225 |
| Total | 6,857,621 |
Total Foreign Government Obligations
(Cost $7,615,421) | 6,857,621 |
|
The accompanying Notes to Financial Statements are an integral part of this statement.
Columbia High Yield Bond Fund | Semiannual Report 2022
| 13 |
Portfolio of Investments (continued)
November 30, 2022 (Unaudited)
| Senior Loans 2.9% |
| Borrower | Coupon
Rate | | Principal
Amount ($) | Value ($) |
| Consumer Cyclical Services 0.6% |
| 8th Avenue Food & Provisions, Inc.(g),(h) |
| 1st Lien Term Loan |
1-month USD LIBOR + 3.500%
10/01/2025 | 7.821% | | 5,846,263 | 4,925,477 |
| 2nd Lien Term Loan |
1-month USD LIBOR + 7.750%
10/01/2026 | 11.821% | | 3,441,442 | 2,710,135 |
| Total | 7,635,612 |
| Health Care 0.2% |
| Surgery Center Holdings, Inc.(g),(h) |
| Term Loan |
1-month USD LIBOR + 3.750%
Floor 0.750%
08/31/2026 | 7.630% | | 2,930,632 | 2,872,020 |
| Media and Entertainment 0.9% |
| Cengage Learning, Inc.(g),(h) |
| Tranche B 1st Lien Term Loan |
1-month USD LIBOR + 4.750%
Floor 1.000%
07/14/2026 | 7.814% | | 13,552,539 | 12,420,903 |
| Technology 1.2% |
| Applied Systems, Inc.(g),(h) |
| 1st Lien Term Loan |
3-month USD LIBOR + 3.000%
Floor 1.000%
09/19/2024 | 6.674% | | 1,747,800 | 1,740,844 |
| Ascend Learning LLC(g),(h) |
| 1st Lien Term Loan |
1-month USD LIBOR + 3.500%
Floor 0.500%
12/11/2028 | 7.571% | | 3,147,218 | 2,973,239 |
| 2nd Lien Term Loan |
1-month USD LIBOR + 5.750%
Floor 0.500%
12/10/2029 | 9.821% | | 1,886,000 | 1,598,385 |
| Senior Loans (continued) |
| Borrower | Coupon
Rate | | Principal
Amount ($) | Value ($) |
| DCert Buyer, Inc.(g),(h) |
| 2nd Lien Term Loan |
1-month USD LIBOR + 7.000%
02/19/2029 | 11.696% | | 2,702,000 | 2,447,012 |
| Epicore Software Corp.(g),(h) |
| 2nd Lien Term Loan |
1-month USD LIBOR + 7.750%
Floor 1.000%
07/31/2028 | 11.821% | | 1,039,000 | 1,024,714 |
| UKG, Inc.(g),(h) |
| 1st Lien Term Loan |
3-month USD LIBOR + 3.750%
05/04/2026 | 7.821% | | 1,835,240 | 1,785,542 |
1-month USD LIBOR + 3.250%
Floor 0.500%
05/04/2026 | 6.998% | | 1,888,577 | 1,821,683 |
| 2nd Lien Term Loan |
1-month USD LIBOR + 5.250%
Floor 0.500%
05/03/2027 | 8.998% | | 3,669,000 | 3,357,135 |
| Total | 16,748,554 |
Total Senior Loans
(Cost $42,784,155) | 39,677,089 |
| Money Market Funds 3.2% |
| | Shares | Value ($) |
| Columbia Short-Term Cash Fund, 3.989%(i),(j) | 42,822,161 | 42,805,032 |
Total Money Market Funds
(Cost $42,813,603) | 42,805,032 |
Total Investments in Securities
(Cost: $1,484,876,948) | 1,335,069,760 |
| Other Assets & Liabilities, Net | | 19,364,774 |
| Net Assets | 1,354,434,534 |
Notes to Portfolio of Investments
| (a) | Represents privately placed and other securities and instruments exempt from Securities and Exchange Commission registration (collectively, private placements), such as Section 4(a)(2) and Rule 144A eligible securities, which are often sold only to qualified institutional buyers. At November 30, 2022, the total value of these securities amounted to $1,049,119,452, which represents 77.46% of total net assets. |
| (b) | Payment-in-kind security. Interest can be paid by issuing additional par of the security or in cash. |
| (c) | Represents a variable rate security with a step coupon where the rate adjusts according to a schedule for a series of periods, typically lower for an initial period and then increasing to a higher coupon rate thereafter. The interest rate shown was the current rate as of November 30, 2022. |
| (d) | Represents a security in default. |
| (e) | Represents a security purchased on a when-issued basis. |
| (f) | Principal and interest may not be guaranteed by a governmental entity. |
The accompanying Notes to Financial Statements are an integral part of this statement.
| 14 | Columbia High Yield Bond Fund | Semiannual Report 2022 |
Portfolio of Investments (continued)
November 30, 2022 (Unaudited)
Notes to Portfolio of Investments (continued)
| (g) | The stated interest rate represents the weighted average interest rate at November 30, 2022 of contracts within the senior loan facility. Interest rates on contracts are primarily determined either weekly, monthly or quarterly by reference to the indicated base lending rate and spread and the reset period. These base lending rates are primarily the LIBOR and other short-term rates. Base lending rates may be subject to a floor or minimum rate. The interest rate for senior loans purchased on a when-issued or delayed delivery basis will be determined upon settlement, therefore no interest rate is disclosed. Senior loans often require prepayments from excess cash flows or permit the borrowers to repay at their election. The degree to which borrowers repay cannot be predicted with accuracy. As a result, remaining maturities of senior loans may be less than the stated maturities. Generally, the Fund is contractually obligated to receive approval from the agent bank and/or borrower prior to the disposition of a senior loan. |
| (h) | Variable rate security. The interest rate shown was the current rate as of November 30, 2022. |
| (i) | The rate shown is the seven-day current annualized yield at November 30, 2022. |
| (j) | As defined in the Investment Company Act of 1940, as amended, an affiliated company is one in which the Fund owns 5% or more of the company’s outstanding voting securities, or a company which is under common ownership or control with the Fund. The value of the holdings and transactions in these affiliated companies during the period ended November 30, 2022 are as follows: |
| Affiliated issuers | Beginning
of period($) | Purchases($) | Sales($) | Net change in
unrealized
appreciation
(depreciation)($) | End of
period($) | Realized gain
(loss)($) | Dividends($) | End of
period shares |
| Columbia Short-Term Cash Fund, 3.989% |
| | 58,145,865 | 203,506,290 | (218,847,123) | — | 42,805,032 | (5,657) | 471,229 | 42,822,161 |
Abbreviation Legend
| LIBOR | London Interbank Offered Rate |
Fair value measurements
The Fund categorizes its fair value measurements according to a three-level hierarchy that maximizes the use of observable inputs and minimizes the use of unobservable inputs by prioritizing that the most observable input be used when available. Observable inputs are those that market participants would use in pricing an investment based on market data obtained from sources independent of the reporting entity. Unobservable inputs are those that reflect the Fund’s assumptions about the information market participants would use in pricing an investment. An investment’s level within the fair value hierarchy is based on the lowest level of any input that is deemed significant to the asset’s or liability’s fair value measurement. The input levels are not necessarily an indication of the risk or liquidity associated with investments at that level. For example, certain U.S. government securities are generally high quality and liquid, however, they are reflected as Level 2 because the inputs used to determine fair value may not always be quoted prices in an active market.
Fair value inputs are summarized in the three broad levels listed below:
| ■ | Level 1 — Valuations based on quoted prices for investments in active markets that the Fund has the ability to access at the measurement date. Valuation adjustments are not applied to Level 1 investments. |
| ■ | Level 2 — Valuations based on other significant observable inputs (including quoted prices for similar securities, interest rates, prepayment speeds, credit risks, etc.). |
| ■ | Level 3 — Valuations based on significant unobservable inputs (including the Fund’s own assumptions and judgment in determining the fair value of investments). |
Inputs that are used in determining fair value of an investment may include price information, credit data, volatility statistics, and other factors. These inputs can be either observable or unobservable. The availability of observable inputs can vary between investments, and is affected by various factors such as the type of investment, and the volume and level of activity for that investment or similar investments in the marketplace. The inputs will be considered by the Investment Manager, along with any other relevant factors in the calculation of an investment’s fair value. The Fund uses prices and inputs that are current as of the measurement date, which may include periods of market dislocations. During these periods, the availability of prices and inputs may be reduced for many investments. This condition could cause an investment to be reclassified between the various levels within the hierarchy.
Investments falling into the Level 3 category are primarily supported by quoted prices from brokers and dealers participating in the market for those investments. However, these may be classified as Level 3 investments due to lack of market transparency and corroboration to support these quoted prices. Additionally, valuation models may be used as the pricing source for any remaining investments classified as Level 3. These models may rely on one or more significant unobservable inputs and/or significant assumptions by the Investment Manager. Inputs used in valuations may include, but are not limited to, financial statement analysis, capital account balances, discount rates and estimated cash flows, and comparable company data.
The Fund’s Board of Trustees (the Board) has designated the Investment Manager, through its Valuation Committee (the Committee), as valuation designee, responsible for determining the fair value of the assets of the Fund for which market quotations are not readily available using valuation procedures approved by the Board. The Committee consists of voting and non-voting members from various groups within the Investment Manager’s organization, including operations and accounting, trading and investments, compliance, risk management and legal.
The Committee meets at least monthly to review and approve valuation matters, which may include a description of specific valuation determinations, data regarding pricing information received from approved pricing vendors and brokers and the results of Board-approved valuation policies and procedures (the Policies). The Policies address, among other things, instances when market quotations are or are not readily available, including recommendations of third party pricing vendors and a determination of appropriate pricing methodologies; events that require specific valuation determinations and assessment of fair value techniques; securities with a potential for stale pricing, including those that are illiquid, restricted, or in default; and the effectiveness of third party pricing vendors, including periodic reviews of vendors. The Committee meets more frequently, as needed, to discuss additional valuation matters, which may include the need to review back-testing results, review time-sensitive information or approve related valuation actions. Representatives of Columbia Management Investment Advisers, LLC report to the Board at each of its regularly scheduled meetings to discuss valuation matters and actions during the period, similar to those described earlier.
The accompanying Notes to Financial Statements are an integral part of this statement.
Columbia High Yield Bond Fund | Semiannual Report 2022
| 15 |
Portfolio of Investments (continued)
November 30, 2022 (Unaudited)
Fair value measurements (continued)
The following table is a summary of the inputs used to value the Fund’s investments at November 30, 2022:
| | Level 1 ($) | Level 2 ($) | Level 3 ($) | Total ($) |
| Investments in Securities | | | | |
| Convertible Bonds | — | 12,365,955 | — | 12,365,955 |
| Corporate Bonds & Notes | — | 1,233,364,063 | — | 1,233,364,063 |
| Foreign Government Obligations | — | 6,857,621 | — | 6,857,621 |
| Senior Loans | — | 39,677,089 | — | 39,677,089 |
| Money Market Funds | 42,805,032 | — | — | 42,805,032 |
| Total Investments in Securities | 42,805,032 | 1,292,264,728 | — | 1,335,069,760 |
See the Portfolio of Investments for all investment classifications not indicated in the table.
The Fund’s assets assigned to the Level 2 input category are generally valued using the market approach, in which a security’s value is determined through reference to prices and information from market transactions for similar or identical assets.
The accompanying Notes to Financial Statements are an integral part of this statement.
| 16 | Columbia High Yield Bond Fund | Semiannual Report 2022 |
Statement of Assets and Liabilities
November 30, 2022 (Unaudited)
| Assets | |
| Investments in securities, at value | |
| Unaffiliated issuers (cost $1,442,063,345) | $1,292,264,728 |
| Affiliated issuers (cost $42,813,603) | 42,805,032 |
| Cash | 94,049 |
| Receivable for: | |
| Investments sold | 3,470,070 |
| Capital shares sold | 7,277,694 |
| Dividends | 138,145 |
| Interest | 19,777,463 |
| Foreign tax reclaims | 12,731 |
| Expense reimbursement due from Investment Manager | 1,714 |
| Prepaid expenses | 16,398 |
| Trustees’ deferred compensation plan | 515 |
| Other assets | 21,704 |
| Total assets | 1,365,880,243 |
| Liabilities | |
| Payable for: | |
| Investments purchased | 1,898,983 |
| Investments purchased on a delayed delivery basis | 485,763 |
| Capital shares purchased | 2,099,811 |
| Distributions to shareholders | 6,613,611 |
| Management services fees | 23,314 |
| Distribution and/or service fees | 3,782 |
| Transfer agent fees | 89,497 |
| Compensation of board members | 173,386 |
| Compensation of chief compliance officer | 134 |
| Other expenses | 56,913 |
| Trustees’ deferred compensation plan | 515 |
| Total liabilities | 11,445,709 |
| Net assets applicable to outstanding capital stock | $1,354,434,534 |
| Represented by | |
| Paid in capital | 1,553,879,470 |
| Total distributable earnings (loss) | (199,444,936) |
| Total - representing net assets applicable to outstanding capital stock | $1,354,434,534 |
The accompanying Notes to Financial Statements are an integral part of this statement.
Columbia High Yield Bond Fund | Semiannual Report 2022
| 17 |
Statement of Assets and Liabilities (continued)
November 30, 2022 (Unaudited)
| Class A | |
| Net assets | $481,600,542 |
| Shares outstanding | 46,419,004 |
| Net asset value per share | $10.38 |
| Maximum sales charge | 4.75% |
| Maximum offering price per share (calculated by dividing the net asset value per share by 1.0 minus the maximum sales charge for Class A shares) | $10.90 |
| Advisor Class | |
| Net assets | $91,509,541 |
| Shares outstanding | 8,769,331 |
| Net asset value per share | $10.44 |
| Class C | |
| Net assets | $11,759,017 |
| Shares outstanding | 1,140,389 |
| Net asset value per share | $10.31 |
| Institutional Class | |
| Net assets | $142,280,218 |
| Shares outstanding | 13,724,393 |
| Net asset value per share | $10.37 |
| Institutional 2 Class | |
| Net assets | $36,856,882 |
| Shares outstanding | 3,564,757 |
| Net asset value per share | $10.34 |
| Institutional 3 Class | |
| Net assets | $577,222,559 |
| Shares outstanding | 55,733,193 |
| Net asset value per share | $10.36 |
| Class R | |
| Net assets | $13,205,775 |
| Shares outstanding | 1,268,991 |
| Net asset value per share | $10.41 |
The accompanying Notes to Financial Statements are an integral part of this statement.
| 18 | Columbia High Yield Bond Fund | Semiannual Report 2022 |
Statement of Operations
Six Months Ended November 30, 2022 (Unaudited)
| Net investment income | |
| Income: | |
| Dividends — unaffiliated issuers | $143,507 |
| Dividends — affiliated issuers | 471,229 |
| Interest | 41,171,012 |
| Interfund lending | 1,658 |
| Total income | 41,787,406 |
| Expenses: | |
| Management services fees | 4,443,737 |
| Distribution and/or service fees | |
| Class A | 618,292 |
| Class C | 64,111 |
| Class R | 33,639 |
| Transfer agent fees | |
| Class A | 337,159 |
| Advisor Class | 62,453 |
| Class C | 8,732 |
| Institutional Class | 102,681 |
| Institutional 2 Class | 11,383 |
| Institutional 3 Class | 19,646 |
| Class R | 9,172 |
| Compensation of board members | 7,304 |
| Custodian fees | 11,520 |
| Printing and postage fees | 39,052 |
| Registration fees | 65,462 |
| Audit fees | 20,165 |
| Legal fees | 15,306 |
| Compensation of chief compliance officer | 133 |
| Other | 16,095 |
| Total expenses | 5,886,042 |
| Fees waived or expenses reimbursed by Investment Manager and its affiliates | (260,114) |
| Fees waived by transfer agent | |
| Institutional 3 Class | (13,204) |
| Expense reduction | (1,520) |
| Total net expenses | 5,611,204 |
| Net investment income | 36,176,202 |
| Realized and unrealized gain (loss) — net | |
| Net realized gain (loss) on: | |
| Investments — unaffiliated issuers | (44,763,389) |
| Investments — affiliated issuers | (5,657) |
| Net realized loss | (44,769,046) |
| Net change in unrealized appreciation (depreciation) on: | |
| Investments — unaffiliated issuers | (35,833,631) |
| Net change in unrealized appreciation (depreciation) | (35,833,631) |
| Net realized and unrealized loss | (80,602,677) |
| Net decrease in net assets resulting from operations | $(44,426,475) |
The accompanying Notes to Financial Statements are an integral part of this statement.
Columbia High Yield Bond Fund | Semiannual Report 2022
| 19 |
Statement of Changes in Net Assets
| | Six Months Ended
November 30, 2022
(Unaudited) | Year Ended
May 31, 2022 |
| Operations | | |
| Net investment income | $36,176,202 | $74,484,263 |
| Net realized gain (loss) | (44,769,046) | 18,622,436 |
| Net change in unrealized appreciation (depreciation) | (35,833,631) | (170,625,643) |
| Net decrease in net assets resulting from operations | (44,426,475) | (77,518,944) |
| Distributions to shareholders | | |
| Net investment income and net realized gains | | |
| Class A | (12,651,169) | (26,900,181) |
| Advisor Class | (2,458,597) | (4,891,897) |
| Class C | (279,060) | (630,748) |
| Institutional Class | (4,032,048) | (9,121,949) |
| Institutional 2 Class | (1,043,163) | (3,075,117) |
| Institutional 3 Class | (16,525,134) | (36,819,268) |
| Class R | (327,129) | (665,906) |
| Total distributions to shareholders | (37,316,300) | (82,105,066) |
| Decrease in net assets from capital stock activity | (105,502,096) | (115,305,465) |
| Total decrease in net assets | (187,244,871) | (274,929,475) |
| Net assets at beginning of period | 1,541,679,405 | 1,816,608,880 |
| Net assets at end of period | $1,354,434,534 | $1,541,679,405 |
The accompanying Notes to Financial Statements are an integral part of this statement.
| 20 | Columbia High Yield Bond Fund | Semiannual Report 2022 |
Statement of Changes in Net Assets (continued)
| | Six Months Ended | Year Ended |
| | November 30, 2022 (Unaudited) | May 31, 2022 |
| | Shares | Dollars ($) | Shares | Dollars ($) |
| Capital stock activity |
| Class A | | | | |
| Subscriptions | 4,785,237 | 49,444,329 | 10,827,069 | 128,054,269 |
| Distributions reinvested | 1,183,327 | 12,205,348 | 2,204,155 | 25,955,268 |
| Redemptions | (8,041,170) | (83,164,026) | (16,690,545) | (196,638,272) |
| Net decrease | (2,072,606) | (21,514,349) | (3,659,321) | (42,628,735) |
| Advisor Class | | | | |
| Subscriptions | 756,482 | 7,875,834 | 1,828,617 | 21,812,220 |
| Distributions reinvested | 233,824 | 2,426,490 | 408,710 | 4,833,407 |
| Redemptions | (1,020,293) | (10,625,848) | (1,869,692) | (22,072,873) |
| Net increase (decrease) | (29,987) | (323,524) | 367,635 | 4,572,754 |
| Class C | | | | |
| Subscriptions | 78,895 | 813,564 | 198,211 | 2,338,402 |
| Distributions reinvested | 26,289 | 269,473 | 52,647 | 616,414 |
| Redemptions | (273,314) | (2,810,375) | (445,364) | (5,183,343) |
| Net decrease | (168,130) | (1,727,338) | (194,506) | (2,228,527) |
| Institutional Class | | | | |
| Subscriptions | 1,517,253 | 15,768,491 | 5,608,078 | 65,644,478 |
| Distributions reinvested | 367,013 | 3,782,832 | 733,909 | 8,626,894 |
| Redemptions | (4,382,036) | (45,221,981) | (6,061,963) | (70,700,133) |
| Net increase (decrease) | (2,497,770) | (25,670,658) | 280,024 | 3,571,239 |
| Institutional 2 Class | | | | |
| Subscriptions | 1,365,389 | 14,325,969 | 1,833,656 | 21,408,900 |
| Distributions reinvested | 101,234 | 1,040,199 | 256,601 | 3,030,537 |
| Redemptions | (1,303,991) | (13,184,770) | (5,554,423) | (64,914,775) |
| Net increase (decrease) | 162,632 | 2,181,398 | (3,464,166) | (40,475,338) |
| Institutional 3 Class | | | | |
| Subscriptions | 1,253,576 | 13,210,851 | 5,482,439 | 63,837,305 |
| Distributions reinvested | 1,551,099 | 15,973,482 | 3,022,342 | 35,510,537 |
| Redemptions | (8,443,720) | (87,128,930) | (12,051,510) | (137,909,489) |
| Net decrease | (5,639,045) | (57,944,597) | (3,546,729) | (38,561,647) |
| Class R | | | | |
| Subscriptions | 87,317 | 904,395 | 568,721 | 6,746,419 |
| Distributions reinvested | 31,445 | 325,397 | 55,393 | 653,095 |
| Redemptions | (165,782) | (1,732,820) | (592,042) | (6,954,725) |
| Net increase (decrease) | (47,020) | (503,028) | 32,072 | 444,789 |
| Total net decrease | (10,291,926) | (105,502,096) | (10,184,991) | (115,305,465) |
The accompanying Notes to Financial Statements are an integral part of this statement.
Columbia High Yield Bond Fund | Semiannual Report 2022
| 21 |
The following table is intended to help you understand the Fund’s financial performance. Certain information reflects financial results for a single share of a class held for the periods shown. Per share net investment income (loss) amounts are calculated based on average shares outstanding during the period. Total return assumes reinvestment of all dividends and distributions, if any. Total return does not reflect payment of sales charges, if any. Total return and portfolio turnover are not annualized for periods of less than one year. The portfolio turnover rate is calculated without regard to purchase and sales transactions of short-term instruments and certain derivatives, if any. If such transactions were included, the Fund’s portfolio turnover rate may be higher.
| | Net asset value,
beginning of
period | Net
investment
income | Net
realized
and
unrealized
gain (loss) | Total from
investment
operations | Distributions
from net
investment
income | Distributions
from net
realized
gains | Total
distributions to
shareholders |
| Class A(c) |
| Six Months Ended 11/30/2022 (Unaudited) | $10.95 | 0.26 | (0.56) | (0.30) | (0.27) | — | (0.27) |
| Year Ended 5/31/2022 | $12.03 | 0.48 | (1.03) | (0.55) | (0.49) | (0.04) | (0.53) |
| Year Ended 5/31/2021 | $11.19 | 0.52 | 0.85 | 1.37 | (0.53) | — | (0.53) |
| Year Ended 5/31/2020 | $11.44 | 0.56 | (0.25) | 0.31 | (0.56) | — | (0.56) |
| Year Ended 5/31/2019 | $11.39 | 0.56 | 0.05 | 0.61 | (0.56) | — | (0.56) |
| Year Ended 5/31/2018 | $11.92 | 0.56 | (0.57) | (0.01) | (0.52) | — | (0.52) |
| Advisor Class(c) |
| Six Months Ended 11/30/2022 (Unaudited) | $11.01 | 0.27 | (0.56) | (0.29) | (0.28) | — | (0.28) |
| Year Ended 5/31/2022 | $12.10 | 0.51 | (1.04) | (0.53) | (0.52) | (0.04) | (0.56) |
| Year Ended 5/31/2021 | $11.26 | 0.55 | 0.85 | 1.40 | (0.56) | — | (0.56) |
| Year Ended 5/31/2020 | $11.50 | 0.60 | (0.24) | 0.36 | (0.60) | — | (0.60) |
| Year Ended 5/31/2019 | $11.46 | 0.60 | 0.04 | 0.64 | (0.60) | — | (0.60) |
| Year Ended 5/31/2018 | $11.99 | 0.56 | (0.53) | 0.03 | (0.56) | — | (0.56) |
| Class C(c) |
| Six Months Ended 11/30/2022 (Unaudited) | $10.88 | 0.22 | (0.56) | (0.34) | (0.23) | — | (0.23) |
| Year Ended 5/31/2022 | $11.96 | 0.39 | (1.03) | (0.64) | (0.40) | (0.04) | (0.44) |
| Year Ended 5/31/2021 | $11.13 | 0.43 | 0.84 | 1.27 | (0.44) | — | (0.44) |
| Year Ended 5/31/2020 | $11.36 | 0.48 | (0.23) | 0.25 | (0.48) | — | (0.48) |
| Year Ended 5/31/2019 | $11.32 | 0.48 | 0.04 | 0.52 | (0.48) | — | (0.48) |
| Year Ended 5/31/2018 | $11.84 | 0.44 | (0.52) | (0.08) | (0.44) | — | (0.44) |
| Institutional Class(c) |
| Six Months Ended 11/30/2022 (Unaudited) | $10.94 | 0.27 | (0.56) | (0.29) | (0.28) | — | (0.28) |
| Year Ended 5/31/2022 | $12.02 | 0.51 | (1.03) | (0.52) | (0.52) | (0.04) | (0.56) |
| Year Ended 5/31/2021 | $11.19 | 0.54 | 0.85 | 1.39 | (0.56) | — | (0.56) |
| Year Ended 5/31/2020 | $11.43 | 0.60 | (0.24) | 0.36 | (0.60) | — | (0.60) |
| Year Ended 5/31/2019 | $11.38 | 0.60 | 0.05 | 0.65 | (0.60) | — | (0.60) |
| Year Ended 5/31/2018 | $11.91 | 0.56 | (0.53) | 0.03 | (0.56) | — | (0.56) |
| Institutional 2 Class(c) |
| Six Months Ended 11/30/2022 (Unaudited) | $10.91 | 0.27 | (0.56) | (0.29) | (0.28) | — | (0.28) |
| Year Ended 5/31/2022 | $11.99 | 0.52 | (1.03) | (0.51) | (0.53) | (0.04) | (0.57) |
| Year Ended 5/31/2021 | $11.16 | 0.55 | 0.85 | 1.40 | (0.57) | — | (0.57) |
| Year Ended 5/31/2020 | $11.39 | 0.60 | (0.23) | 0.37 | (0.60) | — | (0.60) |
| Year Ended 5/31/2019 | $11.35 | 0.60 | 0.04 | 0.64 | (0.60) | — | (0.60) |
| Year Ended 5/31/2018 | $11.88 | 0.56 | (0.53) | 0.03 | (0.56) | — | (0.56) |
The accompanying Notes to Financial Statements are an integral part of this statement.
| 22 | Columbia High Yield Bond Fund | Semiannual Report 2022 |
Financial Highlights (continued)
| | Net
asset
value,
end of
period | Total
return | Total gross
expense
ratio to
average
net assets(a) | Total net
expense
ratio to
average
net assets(a),(b) | Net investment
income
ratio to
average
net assets | Portfolio
turnover | Net
assets,
end of
period
(000’s) |
| Class A(c) |
| Six Months Ended 11/30/2022 (Unaudited) | $10.38 | (2.73%) | 1.04%(d) | 1.00%(d),(e) | 4.95%(d) | 18% | $481,601 |
| Year Ended 5/31/2022 | $10.95 | (4.78%) | 1.02% | 1.00%(e) | 4.03% | 47% | $530,844 |
| Year Ended 5/31/2021 | $12.03 | 12.35% | 1.03% | 1.01%(e) | 4.39% | 58% | $627,451 |
| Year Ended 5/31/2020 | $11.19 | 2.82% | 1.04% | 1.03%(e) | 4.86% | 59% | $617,031 |
| Year Ended 5/31/2019 | $11.44 | 5.47% | 1.04% | 1.04%(e) | 4.93% | 41% | $692,138 |
| Year Ended 5/31/2018 | $11.39 | 0.10% | 1.03% | 1.03%(e) | 4.60% | 49% | $778,978 |
| Advisor Class(c) |
| Six Months Ended 11/30/2022 (Unaudited) | $10.44 | (2.58%) | 0.79%(d) | 0.75%(d),(e) | 5.20%(d) | 18% | $91,510 |
| Year Ended 5/31/2022 | $11.01 | (4.58%) | 0.77% | 0.75%(e) | 4.29% | 47% | $96,886 |
| Year Ended 5/31/2021 | $12.10 | 12.89% | 0.78% | 0.76%(e) | 4.63% | 58% | $102,028 |
| Year Ended 5/31/2020 | $11.26 | 3.08% | 0.79% | 0.78%(e) | 5.11% | 59% | $98,512 |
| Year Ended 5/31/2019 | $11.50 | 5.36% | 0.79% | 0.79%(e) | 5.17% | 41% | $88,582 |
| Year Ended 5/31/2018 | $11.46 | 0.37% | 0.78% | 0.78%(e) | 4.89% | 49% | $112,377 |
| Class C(c) |
| Six Months Ended 11/30/2022 (Unaudited) | $10.31 | (3.13%) | 1.79%(d) | 1.75%(d),(e) | 4.19%(d) | 18% | $11,759 |
| Year Ended 5/31/2022 | $10.88 | (5.54%) | 1.77% | 1.75%(e) | 3.28% | 47% | $14,237 |
| Year Ended 5/31/2021 | $11.96 | 11.66% | 1.78% | 1.76%(e) | 3.65% | 58% | $17,974 |
| Year Ended 5/31/2020 | $11.13 | 2.03% | 1.79% | 1.78%(e) | 4.12% | 59% | $26,532 |
| Year Ended 5/31/2019 | $11.36 | 4.68% | 1.79% | 1.79%(e) | 4.17% | 41% | $34,097 |
| Year Ended 5/31/2018 | $11.32 | (0.68%) | 1.78% | 1.78%(e) | 3.85% | 49% | $65,568 |
| Institutional Class(c) |
| Six Months Ended 11/30/2022 (Unaudited) | $10.37 | (2.61%) | 0.79%(d) | 0.75%(d),(e) | 5.19%(d) | 18% | $142,280 |
| Year Ended 5/31/2022 | $10.94 | (4.55%) | 0.77% | 0.75%(e) | 4.28% | 47% | $177,452 |
| Year Ended 5/31/2021 | $12.02 | 12.54% | 0.78% | 0.76%(e) | 4.63% | 58% | $191,648 |
| Year Ended 5/31/2020 | $11.19 | 3.07% | 0.79% | 0.78%(e) | 5.11% | 59% | $171,521 |
| Year Ended 5/31/2019 | $11.43 | 5.73% | 0.79% | 0.79%(e) | 5.17% | 41% | $174,135 |
| Year Ended 5/31/2018 | $11.38 | 0.35% | 0.78% | 0.78%(e) | 4.84% | 49% | $242,148 |
| Institutional 2 Class(c) |
| Six Months Ended 11/30/2022 (Unaudited) | $10.34 | (2.59%) | 0.72%(d) | 0.68%(d) | 5.27%(d) | 18% | $36,857 |
| Year Ended 5/31/2022 | $10.91 | (4.51%) | 0.70% | 0.68% | 4.30% | 47% | $37,114 |
| Year Ended 5/31/2021 | $11.99 | 12.74% | 0.71% | 0.69% | 4.70% | 58% | $82,319 |
| Year Ended 5/31/2020 | $11.16 | 3.14% | 0.72% | 0.71% | 5.15% | 59% | $95,933 |
| Year Ended 5/31/2019 | $11.39 | 5.82% | 0.71% | 0.71% | 5.23% | 41% | $77,805 |
| Year Ended 5/31/2018 | $11.35 | 0.40% | 0.71% | 0.71% | 4.92% | 49% | $136,612 |
The accompanying Notes to Financial Statements are an integral part of this statement.
Columbia High Yield Bond Fund | Semiannual Report 2022
| 23 |
Financial Highlights (continued)
| | Net asset value,
beginning of
period | Net
investment
income | Net
realized
and
unrealized
gain (loss) | Total from
investment
operations | Distributions
from net
investment
income | Distributions
from net
realized
gains | Total
distributions to
shareholders |
| Institutional 3 Class(c) |
| Six Months Ended 11/30/2022 (Unaudited) | $10.93 | 0.28 | (0.56) | (0.28) | (0.29) | — | (0.29) |
| Year Ended 5/31/2022 | $12.01 | 0.52 | (1.03) | (0.51) | (0.53) | (0.04) | (0.57) |
| Year Ended 5/31/2021 | $11.17 | 0.55 | 0.86 | 1.41 | (0.57) | — | (0.57) |
| Year Ended 5/31/2020 | $11.41 | 0.60 | (0.24) | 0.36 | (0.60) | — | (0.60) |
| Year Ended 5/31/2019 | $11.37 | 0.60 | 0.04 | 0.64 | (0.60) | — | (0.60) |
| Year Ended 5/31/2018 | $11.90 | 0.60 | (0.53) | 0.07 | (0.60) | — | (0.60) |
| Class R(c) |
| Six Months Ended 11/30/2022 (Unaudited) | $10.98 | 0.25 | (0.57) | (0.32) | (0.25) | — | (0.25) |
| Year Ended 5/31/2022 | $12.07 | 0.45 | (1.04) | (0.59) | (0.46) | (0.04) | (0.50) |
| Year Ended 5/31/2021 | $11.23 | 0.49 | 0.85 | 1.34 | (0.50) | — | (0.50) |
| Year Ended 5/31/2020 | $11.47 | 0.52 | (0.24) | 0.28 | (0.52) | — | (0.52) |
| Year Ended 5/31/2019 | $11.43 | 0.52 | 0.04 | 0.56 | (0.52) | — | (0.52) |
| Year Ended 5/31/2018 | $11.96 | 0.52 | (0.53) | (0.01) | (0.52) | — | (0.52) |
| Notes to Financial Highlights |
| (a) | In addition to the fees and expenses that the Fund bears directly, the Fund indirectly bears a pro rata share of the fees and expenses of any other funds in which it invests. Such indirect expenses are not included in the Fund’s reported expense ratios. |
| (b) | Total net expenses include the impact of certain fee waivers/expense reimbursements made by the Investment Manager and certain of its affiliates, if applicable. |
| (c) | Per share amounts have been adjusted on a retroactive basis to reflect a 4 to 1 reverse stock split completed after the close of business on September 11, 2020. |
| (d) | Annualized. |
| (e) | The benefits derived from expense reductions had an impact of less than 0.01%. |
The accompanying Notes to Financial Statements are an integral part of this statement.
| 24 | Columbia High Yield Bond Fund | Semiannual Report 2022 |
Financial Highlights (continued)
| | Net
asset
value,
end of
period | Total
return | Total gross
expense
ratio to
average
net assets(a) | Total net
expense
ratio to
average
net assets(a),(b) | Net investment
income
ratio to
average
net assets | Portfolio
turnover | Net
assets,
end of
period
(000’s) |
| Institutional 3 Class(c) |
| Six Months Ended 11/30/2022 (Unaudited) | $10.36 | (2.56%) | 0.66%(d) | 0.63%(d) | 5.31%(d) | 18% | $577,223 |
| Year Ended 5/31/2022 | $10.93 | (4.44%) | 0.65% | 0.63% | 4.40% | 47% | $670,696 |
| Year Ended 5/31/2021 | $12.01 | 12.99% | 0.67% | 0.64% | 4.70% | 58% | $779,695 |
| Year Ended 5/31/2020 | $11.17 | 3.19% | 0.66% | 0.66% | 5.23% | 59% | $323,763 |
| Year Ended 5/31/2019 | $11.41 | 5.87% | 0.66% | 0.66% | 5.29% | 41% | $385,410 |
| Year Ended 5/31/2018 | $11.37 | 0.45% | 0.66% | 0.66% | 4.99% | 49% | $475,135 |
| Class R(c) |
| Six Months Ended 11/30/2022 (Unaudited) | $10.41 | (2.83%) | 1.29%(d) | 1.25%(d),(e) | 4.70%(d) | 18% | $13,206 |
| Year Ended 5/31/2022 | $10.98 | (5.07%) | 1.27% | 1.25%(e) | 3.79% | 47% | $14,451 |
| Year Ended 5/31/2021 | $12.07 | 12.05% | 1.28% | 1.26%(e) | 4.13% | 58% | $15,494 |
| Year Ended 5/31/2020 | $11.23 | 2.57% | 1.29% | 1.28%(e) | 4.61% | 59% | $13,930 |
| Year Ended 5/31/2019 | $11.47 | 5.21% | 1.29% | 1.29%(e) | 4.68% | 41% | $19,019 |
| Year Ended 5/31/2018 | $11.43 | (0.14%) | 1.28% | 1.28%(e) | 4.36% | 49% | $22,450 |
The accompanying Notes to Financial Statements are an integral part of this statement.
Columbia High Yield Bond Fund | Semiannual Report 2022
| 25 |
Notes to Financial Statements
November 30, 2022 (Unaudited)
Note 1. Organization
Columbia High Yield Bond Fund (the Fund), a series of Columbia Funds Series Trust II (the Trust), is a diversified fund. The Trust is registered under the Investment Company Act of 1940, as amended (the 1940 Act), as an open-end management investment company organized as a Massachusetts business trust.
Fund shares
The Trust may issue an unlimited number of shares (without par value). The Fund offers each of the share classes listed in the Statement of Assets and Liabilities. Although all share classes generally have identical voting, dividend and liquidation rights, each share class votes separately when required by the Trust’s organizational documents or by law. Each share class has its own expense and sales charge structure. Different share classes may have different minimum initial investment amounts and pay different net investment income distribution amounts to the extent the expenses of distributing such share classes vary. Distributions to shareholders in a liquidation will be proportional to the net asset value of each share class.
As described in the Fund’s prospectus, Class A and Class C shares are offered to the general public for investment. Class C shares automatically convert to Class A shares after 8 years. Advisor Class, Institutional Class, Institutional 2 Class, Institutional 3 Class and Class R shares are available for purchase through authorized investment professionals to omnibus retirement plans or to institutional investors and to certain other investors as also described in the Fund’s prospectus.
Note 2. Summary of significant accounting policies
Basis of preparation
The Fund is an investment company that applies the accounting and reporting guidance in the Financial Accounting Standards Board (FASB) Accounting Standards Codification Topic 946, Financial Services - Investment Companies (ASC 946). The financial statements are prepared in accordance with U.S. generally accepted accounting principles (GAAP), which requires management to make certain estimates and assumptions that affect the reported amounts of assets and liabilities, the disclosure of contingent assets and liabilities at the date of the financial statements and the reported amounts of income and expenses during the reporting period. Actual results could differ from those estimates.
The following is a summary of significant accounting policies followed by the Fund in the preparation of its financial statements.
Security valuation
Debt securities generally are valued based on prices obtained from pricing services, which are intended to reflect market transactions for normal, institutional-size trading units of similar securities. The services may use various pricing techniques that take into account, as applicable, factors such as yield, quality, coupon rate, maturity, type of issue, trading characteristics and other data, as well as approved independent broker-dealer quotes. Debt securities for which quotations are not readily available or not believed to be reflective of market value may also be valued based upon a bid quote from an approved independent broker-dealer. Debt securities maturing in 60 days or less are valued primarily at amortized market value, unless this method results in a valuation that management believes does not approximate fair value.
Senior loan securities for which reliable market quotations are readily available are generally valued by pricing services at the average of the bids received.
Investments in open-end investment companies (other than exchange-traded funds (ETFs)), are valued at the latest net asset value reported by those companies as of the valuation time.
Investments for which market quotations are not readily available, or that have quotations which management believes are not reflective of market value or reliable, are valued at fair value as determined in good faith under procedures approved by the Board of Trustees. If a security or class of securities (such as foreign securities) is valued at fair value, such value is likely to be different from the quoted or published price for the security, if available.
| 26 | Columbia High Yield Bond Fund | Semiannual Report 2022 |
Notes to Financial Statements (continued)
November 30, 2022 (Unaudited)
The determination of fair value often requires significant judgment. To determine fair value, management may use assumptions including but not limited to future cash flows and estimated risk premiums. Multiple inputs from various sources may be used to determine fair value.
GAAP requires disclosure regarding the inputs and valuation techniques used to measure fair value and any changes in valuation inputs or techniques. In addition, investments shall be disclosed by major category. This information is disclosed following the Fund’s Portfolio of Investments.
Investments in senior loans
The Fund may invest in senior loan assignments. When the Fund purchases an assignment of a senior loan, the Fund typically has direct rights against the borrower; provided, however, that the Fund’s rights may be more limited than the lender from which it acquired the assignment and the Fund may be able to enforce its rights only through an administrative agent. Although certain senior loan assignments are secured by collateral, the Fund could experience delays or limitations in realizing such collateral or have its interest subordinated to other indebtedness of the obligor. In the event that the administrator or collateral agent of a loan becomes insolvent or enters into receivership or bankruptcy, the Fund may incur costs and delays in realizing payment or may suffer a loss of principal and/or interest. The risk of loss is greater for unsecured or subordinated loans. In addition, senior loan assignments are vulnerable to market, economic or other conditions or events that may reduce the demand for senior loan assignments and certain senior loan assignments which were liquid when purchased, may become illiquid.
The Fund may enter into senior loan assignments where all or a portion of the loan may be unfunded. The Fund is obligated to fund these commitments at the borrower’s discretion. These commitments, if any, are generally traded and priced in the same manner as other senior loan securities and are disclosed as unfunded senior loan commitments in the Fund’s Portfolio of Investments with a corresponding payable for investments purchased. The Fund designates cash or liquid securities to cover these commitments.
Delayed delivery securities
The Fund may trade securities on other than normal settlement terms, including securities purchased or sold on a “when-issued” or "forward commitment" basis. This may increase risk to the Fund since the other party to the transaction may fail to deliver, which could cause the Fund to subsequently invest at less advantageous prices. The Fund designates cash or liquid securities in an amount equal to the delayed delivery commitment.
Security transactions
Security transactions are accounted for on the trade date. Cost is determined and gains (losses) are based upon the specific identification method for both financial statement and federal income tax purposes.
The trade date for senior loans purchased in the primary market is the date on which the loan is allocated. The trade date for senior loans purchased in the secondary market is the date on which the transaction is entered into.
Income recognition
Interest income is recorded on an accrual basis. Market premiums and discounts, including original issue discounts, are amortized and accreted, respectively, over the expected life of the security on all debt securities, unless otherwise noted. For convertible securities, premiums attributable to the conversion feature are not amortized.
The Fund may place a debt security on non-accrual status and reduce related interest income when it becomes probable that the interest will not be collected and the amount of uncollectible interest can be reasonably estimated. The Fund may also adjust accrual rates when it becomes probable the full interest will not be collected and a partial payment will be received. A defaulted debt security is removed from non-accrual status when the issuer resumes interest payments or when collectability of interest is reasonably assured.
Corporate actions and dividend income are recorded on the ex-dividend date.
Columbia High Yield Bond Fund | Semiannual Report 2022
| 27 |
Notes to Financial Statements (continued)
November 30, 2022 (Unaudited)
The Fund may receive distributions from holdings in equity securities, business development companies (BDCs), exchange-traded funds (ETFs), limited partnerships (LPs), other regulated investment companies (RICs), and real estate investment trusts (REITs), which report information as to the tax character of their distributions annually. These distributions are allocated to dividend income, capital gain and return of capital based on actual information reported. Return of capital is recorded as a reduction of the cost basis of securities held. If the Fund no longer owns the applicable securities, return of capital is recorded as a realized gain. With respect to REITs, to the extent actual information has not yet been reported, estimates for return of capital are made by Columbia Management Investment Advisers, LLC (the Investment Manager), a wholly-owned subsidiary of Ameriprise Financial, Inc. (Ameriprise Financial). The Investment Manager’s estimates are subsequently adjusted when the actual character of the distributions is disclosed by the REITs, which could result in a proportionate change in return of capital to shareholders.
Awards from class action litigation are recorded as a reduction of cost basis if the Fund still owns the applicable securities on the payment date. If the Fund no longer owns the applicable securities on the payment date, the proceeds are recorded as realized gains.
The value of additional securities received as an income payment through a payment in kind, if any, is recorded as interest income and increases the cost basis of such securities.
The Fund may receive other income from senior loans, including amendment fees, consent fees and commitment fees. These fees are recorded as income when received by the Fund. These amounts are included in Interest Income in the Statement of Operations.
Expenses
General expenses of the Trust are allocated to the Fund and other funds of the Trust based upon relative net assets or other expense allocation methodologies determined by the nature of the expense. Expenses directly attributable to the Fund are charged to the Fund. Expenses directly attributable to a specific class of shares are charged to that share class.
Determination of class net asset value
All income, expenses (other than class-specific expenses, which are charged to that share class, as shown in the Statement of Operations) and realized and unrealized gains (losses) are allocated to each class of the Fund on a daily basis, based on the relative net assets of each class, for purposes of determining the net asset value of each class.
Federal income tax status
The Fund intends to qualify each year as a regulated investment company under Subchapter M of the Internal Revenue Code, as amended, and will distribute substantially all of its investment company taxable income and net capital gain, if any, for its tax year, and as such will not be subject to federal income taxes. In addition, the Fund intends to distribute in each calendar year substantially all of its ordinary income, capital gain net income and certain other amounts, if any, such that the Fund should not be subject to federal excise tax. Therefore, no federal income or excise tax provision is recorded.
Foreign taxes
The Fund may be subject to foreign taxes on income, gains on investments or currency repatriation, a portion of which may be recoverable. The Fund will accrue such taxes and recoveries, as applicable, based upon its current interpretation of tax rules and regulations that exist in the markets in which it invests.
Realized gains in certain countries may be subject to foreign taxes at the Fund level, based on statutory rates. The Fund accrues for such foreign taxes on realized and unrealized gains at the appropriate rate for each jurisdiction, as applicable. The amount, if any, is disclosed as a liability in the Statement of Assets and Liabilities.
Distributions to shareholders
Distributions from net investment income, if any, are declared daily and paid monthly. Net realized capital gains, if any, are distributed at least annually. Income distributions and capital gain distributions are determined in accordance with federal income tax regulations, which may differ from GAAP.
| 28 | Columbia High Yield Bond Fund | Semiannual Report 2022 |
Notes to Financial Statements (continued)
November 30, 2022 (Unaudited)
Guarantees and indemnifications
Under the Trust’s organizational documents and, in some cases, by contract, its officers and trustees are indemnified against certain liabilities arising out of the performance of their duties to the Trust or its funds. In addition, certain of the Fund’s contracts with its service providers contain general indemnification clauses. The Fund’s maximum exposure under these arrangements is unknown since the amount of any future claims that may be made against the Fund cannot be determined, and the Fund has no historical basis for predicting the likelihood of any such claims.
Recent accounting pronouncement
Tailored Shareholder Reports
In October 2022, the Securities and Exchange Commission (SEC) adopted a final rule relating to Tailored Shareholder Reports for Mutual Funds and Exchange-Traded Funds (ETFs); Fee Information in Investment Company Advertisements. The rule and form amendments will require mutual funds and ETFs to transmit concise and visually engaging shareholder reports that highlight key information. The amendments will require that funds tag information in a structured data format. The rule amendments will require that certain more in-depth information be made available online and available for delivery free of charge to investors on request. The amendments will become effective January 24, 2023. There is an 18-month transition period after the effective date of the amendment.
Note 3. Fees and other transactions with affiliates
Management services fees
The Fund has entered into a Management Agreement with Columbia Management Investment Advisers, LLC (the Investment Manager), a wholly-owned subsidiary of Ameriprise Financial, Inc. (Ameriprise Financial). Under the Management Agreement, the Investment Manager provides the Fund with investment research and advice, as well as administrative and accounting services. The management services fee is an annual fee that is equal to a percentage of the Fund’s daily net assets that declines from 0.66% to 0.40% as the Fund’s net assets increase. The annualized effective management services fee rate for the six months ended November 30, 2022 was 0.63% of the Fund’s average daily net assets.
Compensation of board members
Members of the Board of Trustees who are not officers or employees of the Investment Manager or Ameriprise Financial are compensated for their services to the Fund as disclosed in the Statement of Operations. Under a Deferred Compensation Plan (the Deferred Plan), these members of the Board of Trustees may elect to defer payment of up to 100% of their compensation. Deferred amounts are treated as though equivalent dollar amounts had been invested in shares of certain funds managed by the Investment Manager. The Fund’s liability for these amounts is adjusted for market value changes and remains in the Fund until distributed in accordance with the Deferred Plan. All amounts payable under the Deferred Plan constitute a general unsecured obligation of the Fund. The expense for the Deferred Plan, which includes Trustees’ fees deferred during the current period as well as any gains or losses on the Trustees’ deferred compensation balances as a result of market fluctuations, is included in "Compensation of board members" in the Statement of Operations.
Compensation of Chief Compliance Officer
The Board of Trustees has appointed a Chief Compliance Officer for the Fund in accordance with federal securities regulations. As disclosed in the Statement of Operations, a portion of the Chief Compliance Officer’s total compensation is allocated to the Fund, along with other allocations to affiliated registered investment companies managed by the Investment Manager and its affiliates, based on relative net assets.
Transfer agency fees
Under a Transfer and Dividend Disbursing Agent Agreement, Columbia Management Investment Services Corp. (the Transfer Agent), an affiliate of the Investment Manager and a wholly-owned subsidiary of Ameriprise Financial, is responsible for providing transfer agency services to the Fund. The Transfer Agent has contracted with SS&C GIDS, Inc. (SS&C GIDS) to
Columbia High Yield Bond Fund | Semiannual Report 2022
| 29 |
Notes to Financial Statements (continued)
November 30, 2022 (Unaudited)
serve as sub-transfer agent. Prior to January 1, 2023, SS&C GIDS was known as DST Asset Manager Solutions, Inc. The Transfer Agent pays the fees of SS&C GIDS for services as sub-transfer agent and SS&C GIDS is not entitled to reimbursement for such fees from the Fund (with the exception of out-of-pocket fees).
The Fund pays the Transfer Agent a monthly transfer agency fee based on the number or the average value of accounts, depending on the type of account. In addition, the Fund pays the Transfer Agent a fee for shareholder services based on the number of accounts or on a percentage of the average aggregate value of the Fund’s shares maintained in omnibus accounts up to the lesser of the amount charged by the financial intermediary or a cap established by the Board of Trustees from time to time.
The Transfer Agent also receives compensation from the Fund for various shareholder services and reimbursements for certain out-of-pocket fees. Total transfer agency fees for Institutional 2 Class and Institutional 3 Class shares are subject to an annual limitation of not more than 0.07% and 0.02%, respectively, of the average daily net assets attributable to each share class. In addition, prior to October 1, 2022, Institutional 3 Class shares were subject to a contractual transfer agency fee annual limitation of not more than 0.00% of the average daily net assets attributable to that share class.
For the six months ended November 30, 2022, the Fund’s annualized effective transfer agency fee rates as a percentage of average daily net assets of each class were as follows:
| | Effective rate (%) |
| Class A | 0.14 |
| Advisor Class | 0.14 |
| Class C | 0.14 |
| Institutional Class | 0.14 |
| Institutional 2 Class | 0.06 |
| Institutional 3 Class | 0.00 |
| Class R | 0.14 |
An annual minimum account balance fee of $20 may apply to certain accounts with a value below the applicable share class’s initial minimum investment requirements to reduce the impact of small accounts on transfer agency fees. These minimum account balance fees are remitted to the Fund and recorded as part of expense reductions in the Statement of Operations. For the six months ended November 30, 2022, these minimum account balance fees reduced total expenses of the Fund by $1,520.
Distribution and service fees
The Fund has entered into an agreement with Columbia Management Investment Distributors, Inc. (the Distributor), an affiliate of the Investment Manager and a wholly-owned subsidiary of Ameriprise Financial, for distribution and shareholder services. Under a Plan and Agreement of Distribution, the Fund pays a fee at the maximum annual rates of up to 0.25%, 1.00% and 0.50% of the Fund’s average daily net assets attributable to Class A, Class C and Class R shares, respectively. For Class C shares, of the 1.00% fee, up to 0.75% can be reimbursed for distribution expenses and up to an additional 0.25% can be reimbursed for shareholder servicing expenses. For Class R shares, of the 0.50% fee, up to 0.25% can be reimbursed for shareholder servicing expenses.
The amount of distribution and shareholder services expenses incurred by the Distributor and not yet reimbursed (unreimbursed expense) was approximately $6,285,000 for Class C shares. This amount is based on the most recent information available as of September 30, 2022, and may be recovered from future payments under the distribution plan or contingent deferred sales charges (CDSCs). To the extent the unreimbursed expense has been fully recovered, the distribution and/or shareholder services fee is reduced.
| 30 | Columbia High Yield Bond Fund | Semiannual Report 2022 |
Notes to Financial Statements (continued)
November 30, 2022 (Unaudited)
Sales charges
Sales charges, including front-end charges and CDSCs, received by the Distributor for distributing Fund shares for the six months ended November 30, 2022, if any, are listed below:
| | Front End (%) | CDSC (%) | Amount ($) |
| Class A | 4.75 | 0.50 - 1.00(a) | 46,447 |
| Class C | — | 1.00(b) | 1,746 |
| (a) | This charge is imposed on certain investments of between $1 million and $50 million redeemed within 18 months after purchase, as follows: 1.00% if redeemed within 12 months after purchase, and 0.50% if redeemed more than 12, but less than 18, months after purchase, with certain limited exceptions. |
| (b) | This charge applies to redemptions within 12 months after purchase, with certain limited exceptions. |
The Fund’s other share classes are not subject to sales charges.
Expenses waived/reimbursed by the Investment Manager and its affiliates
The Investment Manager and certain of its affiliates have contractually agreed to waive fees and/or reimburse expenses (excluding certain fees and expenses described below) for the period(s) disclosed below, unless sooner terminated at the sole discretion of the Board of Trustees, so that the Fund’s net operating expenses, after giving effect to fees waived/expenses reimbursed and any balance credits and/or overdraft charges from the Fund’s custodian, do not exceed the following annual rate(s) as a percentage of the classes’ average daily net assets:
| | Fee rate(s) contractual
through
September 30, 2023 |
| Class A | 1.00% |
| Advisor Class | 0.75 |
| Class C | 1.75 |
| Institutional Class | 0.75 |
| Institutional 2 Class | 0.68 |
| Institutional 3 Class | 0.63 |
| Class R | 1.25 |
Under the agreement governing these fee waivers and/or expense reimbursement arrangements, the following fees and expenses are excluded from the waiver/reimbursement commitment, and therefore will be paid by the Fund, if applicable: taxes (including foreign transaction taxes), expenses associated with investments in affiliated and non-affiliated pooled investment vehicles (including mutual funds and exchange-traded funds), transaction costs and brokerage commissions, costs related to any securities lending program, dividend expenses associated with securities sold short, inverse floater program fees and expenses, transaction charges and interest on borrowed money, interest, costs associated with shareholder meetings, infrequent and/or unusual expenses and any other expenses the exclusion of which is specifically approved by the Board of Trustees. This agreement may be modified or amended only with approval from the Investment Manager, certain of its affiliates and the Fund. Reflected in the contractual cap commitment, prior to October 1, 2022, is the Transfer Agent’s contractual agreement to limit total transfer agency fees to an annual rate of not more than 0.00% for Institutional 3 Class of the average daily net assets attributable to that share class. Any fees waived and/or expenses reimbursed under the expense reimbursement arrangements described above are not recoverable by the Investment Manager or its affiliates in future periods.
Note 4. Federal tax information
The timing and character of income and capital gain distributions are determined in accordance with income tax regulations, which may differ from GAAP because of temporary or permanent book to tax differences.
Columbia High Yield Bond Fund | Semiannual Report 2022
| 31 |
Notes to Financial Statements (continued)
November 30, 2022 (Unaudited)
At November 30, 2022, the approximate cost of all investments for federal income tax purposes and the aggregate gross approximate unrealized appreciation and depreciation based on that cost was:
Federal
tax cost ($) | Gross unrealized
appreciation ($) | Gross unrealized
(depreciation) ($) | Net unrealized
(depreciation) ($) |
| 1,484,877,000 | 2,353,000 | (152,160,000) | (149,807,000) |
Tax cost of investments and unrealized appreciation/(depreciation) may also include timing differences that do not constitute adjustments to tax basis.
The following capital loss carryforwards, determined at May 31, 2022, may be available to reduce future net realized gains on investments, if any, to the extent permitted by the Internal Revenue Code.
No expiration
short-term ($) | No expiration
long-term ($) | Total ($) |
| (2,476,724) | — | (2,476,724) |
Management of the Fund has concluded that there are no significant uncertain tax positions in the Fund that would require recognition in the financial statements. However, management’s conclusion may be subject to review and adjustment at a later date based on factors including, but not limited to, new tax laws, regulations, and administrative interpretations (including relevant court decisions). Generally, the Fund’s federal tax returns for the prior three fiscal years remain subject to examination by the Internal Revenue Service.
Note 5. Portfolio information
The cost of purchases and proceeds from sales of securities, excluding short-term investments and derivatives, if any, aggregated to $242,726,576 and $331,335,501, respectively, for the six months ended November 30, 2022. The amount of purchase and sale activity impacts the portfolio turnover rate reported in the Financial Highlights.
Note 6. Affiliated money market fund
The Fund invests in Columbia Short-Term Cash Fund, an affiliated money market fund established for the exclusive use by the Fund and other affiliated funds (the Affiliated MMF). The income earned by the Fund from such investments is included as Dividends - affiliated issuers in the Statement of Operations. As an investing fund, the Fund indirectly bears its proportionate share of the expenses of the Affiliated MMF. The Affiliated MMF prices its shares with a floating net asset value. In addition, the Board of Trustees of the Affiliated MMF may impose a fee on redemptions (sometimes referred to as a liquidity fee) or temporarily suspend redemptions (sometimes referred to as imposing a redemption gate) in the event its liquidity falls below regulatory limits.
Note 7. Interfund lending
Pursuant to an exemptive order granted by the Securities and Exchange Commission, the Fund participates in a program (the Interfund Program) allowing each participating Columbia Fund (each, a Participating Fund) to lend money directly to and, except for closed-end funds and money market funds, borrow money directly from other Participating Funds for temporary purposes. The amounts eligible for borrowing and lending under the Interfund Program are subject to certain restrictions.
Interfund loans are subject to the risk that the borrowing fund could be unable to repay the loan when due, and a delay in repayment to the lending fund could result in lost opportunities and/or additional lending costs. The exemptive order is subject to conditions intended to mitigate conflicts of interest arising from the Investment Manager’s relationship with each Participating Fund.
The Fund’s activity in the Interfund Program during the six months ended November 30, 2022 was as follows:
| Borrower or lender | Average loan
balance ($) | Weighted average
interest rate (%) | Number of days
with outstanding loans |
| Lender | 2,042,857 | 4.13 | 7 |
| 32 | Columbia High Yield Bond Fund | Semiannual Report 2022 |
Notes to Financial Statements (continued)
November 30, 2022 (Unaudited)
Interest income earned by the Fund is recorded as Interfund lending in the Statement of Operations. The Fund had no outstanding interfund loans at November 30, 2022.
Note 8. Line of credit
The Fund has access to a revolving credit facility with a syndicate of banks led by JPMorgan Chase Bank, N.A., Citibank, N.A. and Wells Fargo Bank, N.A. whereby the Fund may borrow for the temporary funding of shareholder redemptions or for other temporary or emergency purposes. Pursuant to an October 27, 2022 amendment and restatement, the credit facility, which is an agreement between the Fund and certain other funds managed by the Investment Manager or an affiliated investment manager, severally and not jointly, permits aggregate borrowings up to $950 million. Interest is currently charged to each participating fund based on its borrowings at a rate equal to the higher of (i) the federal funds effective rate, (ii) the secured overnight financing rate plus 0.10% and (iii) the overnight bank funding rate, plus in each case, 1.00%. Each borrowing under the credit facility matures no later than 60 days after the date of borrowing. The Fund also pays a commitment fee equal to its pro rata share of the unused amount of the credit facility at a rate of 0.15% per annum. The commitment fee is included in other expenses in the Statement of Operations. This agreement expires annually in October unless extended or renewed. Prior to the October 27, 2022 amendment and restatement, the Fund had access to a revolving credit facility with a syndicate of banks led by JPMorgan Chase Bank, N.A., Citibank, N.A. and Wells Fargo Bank, N.A. which permitted collective borrowings up to $950 million. Interest was charged to each participating fund based on its borrowings at a rate equal to the higher of (i) the federal funds effective rate, (ii) the secured overnight financing rate plus 0.11448% and (iii) the overnight bank funding rate, plus in each case, 1.00%.
The Fund had no borrowings during the six months ended November 30, 2022.
Note 9. Significant risks
Credit risk
Credit risk is the risk that the value of debt instruments in the Fund’s portfolio may decline because the issuer defaults or otherwise becomes unable or unwilling, or is perceived to be unable or unwilling, to honor its financial obligations, such as making payments to the Fund when due. Credit rating agencies assign credit ratings to certain debt instruments to indicate their credit risk. Lower-rated or unrated debt instruments held by the Fund may present increased credit risk as compared to higher-rated debt instruments.
High-yield investments risk
Securities and other debt instruments held by the Fund that are rated below investment grade (commonly called "high-yield" or "junk" bonds) and unrated debt instruments of comparable quality expose the Fund to a greater risk of loss of principal and income than a fund that invests solely or primarily in investment grade debt instruments. In addition, these investments have greater price fluctuations, are less liquid and are more likely to experience a default than higher-rated debt instruments. High-yield debt instruments are considered to be predominantly speculative with respect to the issuer’s capacity to pay interest and repay principal.
Interest rate risk
Interest rate risk is the risk of losses attributable to changes in interest rates. In general, if prevailing interest rates rise, the values of debt instruments tend to fall, and if interest rates fall, the values of debt instruments tend to rise. Actions by governments and central banking authorities can result in increases or decreases in interest rates. Higher periods of inflation could lead such authorities to raise interest rates. Increasing interest rates may negatively affect the value of debt securities held by the Fund, resulting in a negative impact on the Fund’s performance and net asset value per share. In general, the longer the maturity or duration of a debt security, the greater its sensitivity to changes in interest rates. The Fund is subject to the risk that the income generated by its investments may not keep pace with inflation.
Liquidity risk
Liquidity risk is the risk associated with a lack of marketability of investments which may make it difficult to sell the investment at a desirable time or price. Changing regulatory, market or other conditions or environments (for example, the interest rate or credit environments) may adversely affect the liquidity of the Fund’s investments. The Fund may have to
Columbia High Yield Bond Fund | Semiannual Report 2022
| 33 |
Notes to Financial Statements (continued)
November 30, 2022 (Unaudited)
accept a lower selling price for the holding, sell other investments, or forego another, more appealing investment opportunity. Generally, the less liquid the market at the time the Fund sells a portfolio investment, the greater the risk of loss or decline of value to the Fund. A less liquid market can lead to an increase in Fund redemptions, which may negatively impact Fund performance and net asset value per share, including, for example, if the Fund is forced to sell securities in a down market.
Market risk
The Fund may incur losses due to declines in the value of one or more securities in which it invests. These declines may be due to factors affecting a particular issuer, or the result of, among other things, political, regulatory, market, economic or social developments affecting the relevant market(s) more generally. In addition, turbulence in financial markets and reduced liquidity in equity, credit and/or fixed income markets may negatively affect many issuers, which could adversely affect the Fund’s ability to price or value hard-to-value assets in thinly traded and closed markets and could cause significant redemptions and operational challenges. Global economies and financial markets are increasingly interconnected, and conditions and events in one country, region or financial market may adversely impact issuers in a different country, region or financial market. These risks may be magnified if certain events or developments adversely interrupt the global supply chain; in these and other circumstances, such risks might affect companies worldwide. As a result, local, regional or global events such as terrorism, war, natural disasters, disease/virus outbreaks and epidemics or other public health issues, recessions, depressions or other events – or the potential for such events – could have a significant negative impact on global economic and market conditions.
The large-scale invasion of Ukraine by Russia in February 2022 has resulted in sanctions and market disruptions, including declines in regional and global stock markets, unusual volatility in global commodity markets and significant devaluations of Russian currency. The extent and duration of the military action are impossible to predict but could be significant. Market disruption caused by the Russian military action, and any counter-measures or responses thereto (including international sanctions, a downgrade in the country’s credit rating, purchasing and financing restrictions, boycotts, tariffs, changes in consumer or purchaser preferences, cyberattacks and espionage) could have severe adverse impacts on regional and/or global securities and commodities markets, including markets for oil and natural gas. These impacts may include reduced market liquidity, distress in credit markets, further disruption of global supply chains, increased risk of inflation, and limited access to investments in certain international markets and/or issuers. These developments and other related events could negatively impact Fund performance.
The pandemic caused by coronavirus disease 2019 and its variants (COVID-19) has resulted in, and may continue to result in, significant global economic and societal disruption and market volatility due to disruptions in market access, resource availability, facilities operations, imposition of tariffs, export controls and supply chain disruption, among others. Such disruptions may be caused, or exacerbated by, quarantines and travel restrictions, workforce displacement and loss in human and other resources. The uncertainty surrounding the magnitude, duration, reach, costs and effects of the global pandemic, as well as actions that have been or could be taken by governmental authorities or other third parties, present unknowns that are yet to unfold. The impacts, as well as the uncertainty over impacts to come, of COVID-19 – and any other infectious illness outbreaks, epidemics and pandemics that may arise in the future – could negatively affect global economies and markets in ways that cannot necessarily be foreseen. In addition, the impact of infectious illness outbreaks and epidemics in emerging market countries may be greater due to generally less established healthcare systems, governments and financial markets. Public health crises caused by the COVID-19 outbreak may exacerbate other pre-existing political, social and economic risks in certain countries or globally. The disruptions caused by COVID-19 could prevent the Fund from executing advantageous investment decisions in a timely manner and negatively impact the Fund’s ability to achieve its investment objective. Any such events could have a significant adverse impact on the value and risk profile of the Fund.
Shareholder concentration risk
At November 30, 2022, affiliated shareholders of record owned 66.6% of the outstanding shares of the Fund in one or more accounts. Subscription and redemption activity by concentrated accounts may have a significant effect on the operations of the Fund. In the case of a large redemption, the Fund may be forced to sell investments at inopportune times, including its liquid positions, which may result in Fund losses and the Fund holding a higher percentage of less liquid positions. Large redemptions could result in decreased economies of scale and increased operating expenses for non-redeeming Fund shareholders.
| 34 | Columbia High Yield Bond Fund | Semiannual Report 2022 |
Notes to Financial Statements (continued)
November 30, 2022 (Unaudited)
Note 10. Subsequent events
Management has evaluated the events and transactions that have occurred through the date the financial statements were issued and noted no items requiring adjustment of the financial statements or additional disclosure.
Note 11. Information regarding pending and settled legal proceedings
Ameriprise Financial and certain of its affiliates are involved in the normal course of business in legal proceedings which include regulatory inquiries, arbitration and litigation, including class actions concerning matters arising in connection with the conduct of its activities as a diversified financial services firm. Ameriprise Financial believes that the Fund is not currently the subject of, and that neither Ameriprise Financial nor any of its affiliates are the subject of, any pending legal, arbitration or regulatory proceedings that are likely to have a material adverse effect on the Fund or the ability of Ameriprise Financial or its affiliates to perform under their contracts with the Fund. Ameriprise Financial is required to make quarterly (10-Q), annual (10-K) and, as necessary, 8-K filings with the Securities and Exchange Commission (SEC) on legal and regulatory matters that relate to Ameriprise Financial and its affiliates. Copies of these filings may be obtained by accessing the SEC website at www.sec.gov.
There can be no assurance that these matters, or the adverse publicity associated with them, will not result in increased Fund redemptions, reduced sale of Fund shares or other adverse consequences to the Fund. Further, although we believe proceedings are not likely to have a material adverse effect on the Fund or the ability of Ameriprise Financial or its affiliates to perform under their contracts with the Fund, these proceedings are subject to uncertainties and, as such, we are unable to estimate the possible loss or range of loss that may result. An adverse outcome in one or more of these proceedings could result in adverse judgments, settlements, fines, penalties or other relief that could have a material adverse effect on the consolidated financial condition or results of operations of Ameriprise Financial or one or more of its affiliates that provides services to the Fund.
Columbia High Yield Bond Fund | Semiannual Report 2022
| 35 |
Approval of Management Agreement
(Unaudited)
Columbia Management Investment Advisers, LLC (the Investment Manager, and together with its domestic and global affiliates, Columbia Threadneedle Investments), a wholly-owned subsidiary of Ameriprise Financial, Inc. (Ameriprise Financial), serves as the investment manager to Columbia High Yield Bond Fund (the Fund). Under a management agreement (the Management Agreement), the Investment Manager provides investment advice and other services to the Fund and other funds distributed by Columbia Management Investment Distributors, Inc. (collectively, the Funds).
On an annual basis, the Fund’s Board of Trustees (the Board), including the independent Board members (the Independent Trustees), considers renewal of the Management Agreement. The Investment Manager prepared detailed reports for the Board and its Contracts Committee (including its Contracts Subcommittee) in November 2021 and March, April and June 2022, including reports providing the results of analyses performed by an independent third-party data provider, Broadridge Financial Solutions, Inc. (Broadridge), and comprehensive responses to written requests for information by independent legal counsels to the Independent Trustees (Independent Legal Counsel) to the Investment Manager, to assist the Board in making this determination. In addition, throughout the year, the Board (or its committees or subcommittees) regularly meets with portfolio management teams and senior management personnel and reviews information prepared by the Investment Manager addressing the services the Investment Manager provides and Fund performance. The Board also accords appropriate weight to the work, deliberations and conclusions of the various committees, such as the Contracts Committee, the Investment Review Committee, the Audit Committee and the Compliance Committee in determining whether to continue the Management Agreement.
The Board, at its June 23, 2022 Board meeting (the June Meeting), considered the renewal of the Management Agreement for an additional one-year term. At the June Meeting, Independent Legal Counsel reviewed with the Independent Trustees various factors relevant to the Board’s consideration of advisory agreements and the Board’s legal responsibilities related to such consideration. The Independent Trustees considered all information that they, their legal counsel or the Investment Manager believed reasonably necessary to evaluate and to approve the continuation of the Management Agreement. Among other things, the information and factors considered included the following:
| • | Information on the investment performance of the Fund relative to the performance of a group of mutual funds determined to be comparable to the Fund by Broadridge, as well as performance relative to benchmarks; |
| • | Information on the Fund’s management fees and total expenses, including information comparing the Fund’s expenses to those of a group of comparable mutual funds, as determined by Broadridge; |
| • | The Investment Manager’s agreement to contractually limit or cap total operating expenses for the Fund so that total operating expenses (excluding certain fees and expenses, such as transaction costs and certain other investment related expenses, interest, taxes, acquired fund fees and expenses and infrequent and/or unusual expenses) would not exceed a specified annual rate, as a percentage of the Fund’s net assets; |
| • | Terms of the Management Agreement; |
| • | Descriptions of other agreements and arrangements with affiliates of the Investment Manager relating to the operations of the Fund, including agreements with respect to the provision of transfer agency and shareholder services to the Fund; |
| • | Descriptions of various services performed by the Investment Manager under the Management Agreement, including portfolio management and portfolio trading practices; |
| • | Information regarding any recently negotiated management fees of similarly-managed portfolios of other institutional clients of the Investment Manager; |
| • | Information regarding the resources of the Investment Manager, including information regarding senior management, portfolio managers and other personnel; |
| • | Information regarding the capabilities of the Investment Manager with respect to compliance monitoring services; |
| • | The profitability to the Investment Manager and its affiliates from their relationships with the Fund; and |
| • | Report provided by the Board’s independent fee consultant, JDL Consultants, LLC (JDL). |
| 36 | Columbia High Yield Bond Fund | Semiannual Report 2022 |
Approval of Management Agreement (continued)
(Unaudited)
Following an analysis and discussion of the foregoing, and the factors identified below, the Board, including all of the Independent Trustees, approved the renewal of the Management Agreement.
Nature, extent and quality of services provided by the Investment Manager
The Board analyzed various reports and presentations it had received detailing the services performed by the Investment Manager, as well as its history, expertise, resources and relative capabilities, and the qualifications of its personnel.
The Board specifically considered the many developments during recent years concerning the services provided by the Investment Manager. Among other things, the Board noted the organization and depth of the equity and credit research departments. The Board further observed the enhancements to the investment risk management department’s processes, systems and oversight, over the past several years, as well as planned 2022 initiatives in this regard. The Board also took into account the broad scope of services provided by the Investment Manager to the Fund, including, among other services, investment, risk and compliance oversight. The Board also took into account the information it received concerning the Investment Manager’s ability to attract and retain key portfolio management personnel and that it has sufficient resources to provide competitive and adequate compensation to investment personnel. The Board also observed that the Investment Manager has been able to effectively manage, operate and distribute the Funds through the COVID-19 pandemic period with no disruptions in services provided. The Board also considered added personnel and resources obtained by Columbia Threadneedle through Ameriprise Financial’s acquisition of BMO Financial Group’s Europe, Middle East, and Africa (EMEA) asset management business.
In connection with the Board’s evaluation of the overall package of services provided by the Investment Manager, the Board also considered the nature, quality and range of administrative services provided to the Fund by the Investment Manager, as well as the achievements in 2021 in the performance of administrative services, and noted the various enhancements anticipated for 2022. In evaluating the quality of services provided under the Management Agreement, the Board also took into account the organization and strength of the Fund’s and its service providers’ compliance programs. The Board also reviewed the financial condition of the Investment Manager and its affiliates and each entity’s ability to carry out its responsibilities under the Management Agreement and the Fund’s other service agreements.
In addition, the Board discussed the acceptability of the terms of the Management Agreement, noting that no changes were proposed from the form of agreement previously approved. The Board also noted the wide array of legal and compliance services provided to the Fund under the Management Agreement.
After reviewing these and related factors (including investment performance as discussed below), the Board concluded, within the context of their overall conclusions, that the nature, extent and quality of the services provided to the Fund under the Management Agreement supported the continuation of the Management Agreement.
Investment performance
In this connection, the Board carefully reviewed the investment performance of the Fund, including detailed reports providing the results of analyses performed by each of the Investment Manager, Broadridge and JDL collectively showing, for various periods (including since manager inception): (i) the performance of the Fund, (ii) the performance of a benchmark index, (iii) the percentage ranking of the Fund among its comparison group, (iv) the Fund’s performance relative to peers and benchmarks and (v) the net assets of the Fund. The Board observed that the Fund’s performance for certain periods ranked above median based on information provided by Broadridge.
The Board also reviewed a description of the third-party data provider’s methodology for identifying the Fund’s peer groups for purposes of performance and expense comparisons.
The Board also considered the Investment Manager’s performance and reputation generally. After reviewing these and related factors, the Board concluded, within the context of their overall conclusions, that the performance of the Fund and the Investment Manager, in light of other considerations, supported the continuation of the Management Agreement.
Columbia High Yield Bond Fund | Semiannual Report 2022
| 37 |
Approval of Management Agreement (continued)
(Unaudited)
Comparative fees, costs of services provided and the profits realized by the Investment Manager and its affiliates from their relationships with the Fund
The Board reviewed comparative fees and the costs of services provided under the Management Agreement. The Board members considered detailed comparative information set forth in an annual report on fees and expenses, including, among other things, data (based on analyses conducted by Broadridge and JDL) showing a comparison of the Fund’s expenses with median expenses paid by funds in its comparative peer universe, as well as data showing the Fund’s contribution to the Investment Manager’s profitability. The Board reviewed the fees charged to comparable institutional or other accounts/vehicles managed by the Investment Manager and discussed differences in how the products are managed and operated, thus explaining many of the differences in fees.
The Board considered the reports of JDL, which assisted in the Board’s analysis of the Funds’ performance and expenses and the reasonableness of the Funds’ fee rates. The Board accorded particular weight to the notion that a primary objective of the level of fees is to achieve a rational pricing model applied consistently across the various product lines in the Fund family, while assuring that the overall fees for each Fund (with certain exceptions) are generally in line with the current "pricing philosophy" such that Fund total expense ratios, in general, approximate or are lower than the median expense ratios of funds in the same Lipper comparison universe. The Board took into account that the Fund’s total expense ratio (after considering proposed expense caps/waivers) approximated the peer universe’s median expense ratio.
After reviewing these and related factors, the Board concluded, within the context of their overall conclusions, that the levels of management fees and expenses of the Fund, in light of other considerations, supported the continuation of the Management Agreement.
The Board also considered the profitability of the Investment Manager and its affiliates in connection with the Investment Manager providing management services to the Fund. With respect to the profitability of the Investment Manager and its affiliates, the Independent Trustees referred to information discussing the profitability to the Investment Manager and Ameriprise Financial from managing, operating and distributing the Funds. The Board considered that in 2021 the Board had considered 2020 profitability and that the 2022 information showed that the profitability generated by the Investment Manager in 2021 increased from 2020 levels, due to a variety of factors, including the increased assets under management of the Funds. It also took into account the indirect economic benefits flowing to the Investment Manager or its affiliates in connection with managing or distributing the Funds, such as the enhanced ability to offer various other financial products to Ameriprise Financial customers, soft dollar benefits and overall reputational advantages. The Board noted that the fees paid by the Fund should permit the Investment Manager to offer competitive compensation to its personnel, make necessary investments in its business and earn an appropriate profit. After reviewing these and related factors, the Board concluded, within the context of their overall conclusions, that the costs of services provided and the profitability to the Investment Manager and its affiliates from their relationships with the Fund supported the continuation of the Management Agreement.
Economies of scale
The Board considered the potential existence of economies of scale in the provision by the Investment Manager of services to the Fund, to groups of related funds and to the Investment Manager as a whole, and whether those economies of scale were shared with the Fund through breakpoints in investment management fees or other means, such as expense limitation arrangements and additional investments by the Investment Manager in investment, trading, compliance and other resources. The Board considered the economies of scale that might be realized as the Fund’s net asset level grows and took note of the extent to which Fund shareholders might also benefit from such growth. In this regard, the Board took into account that management fees decline as Fund assets exceed various breakpoints, all of which have not been surpassed. The Board observed that the Management Agreement provided for breakpoints in the management fee rate schedule that allow opportunities for shareholders to realize lower fees as Fund assets grow and that there are additional opportunities through other means for sharing economies of scale with shareholders.
Conclusion
The Board reviewed all of the above considerations in reaching its decision to approve the continuation of the Management Agreement. In reaching its conclusions, no single factor was determinative.
| 38 | Columbia High Yield Bond Fund | Semiannual Report 2022 |
Approval of Management Agreement (continued)
(Unaudited)
On June 23, 2022, the Board, including all of the Independent Trustees, determined that fees payable under the Management Agreement were fair and reasonable in light of the extent and quality of services provided and approved the renewal of the Management Agreement.
Columbia High Yield Bond Fund | Semiannual Report 2022
| 39 |
Columbia High Yield Bond Fund
P.O. Box 219104
Kansas City, MO 64121-9104
Please read and consider the investment objectives, risks, charges and expenses for any fund carefully before investing. For a prospectus and summary prospectus, which contains this and other important information about the Fund, go to
columbiathreadneedleus.com/investor/. The Fund is distributed by Columbia Management Investment Distributors, Inc., member FINRA, and managed by Columbia Management Investment Advisers, LLC.
Columbia Threadneedle Investments (Columbia Threadneedle) is the global brand name of the Columbia and Threadneedle group of companies. All rights reserved.
© 2023 Columbia Management Investment Advisers, LLC.
columbiathreadneedleus.com/investor/

Semiannual Report
November 30, 2022 (Unaudited)
Columbia Quality Income Fund
Not FDIC or NCUA Insured • No Financial Institution Guarantee • May Lose Value
If you elect to receive the shareholder report for Columbia Quality Income Fund (the Fund) in paper, mailed to you, the Fund mails one shareholder report to each shareholder address, unless such shareholder elects to receive shareholder reports from the Fund electronically via e-mail or by having a paper notice mailed to you (Postcard Notice) that your Fund’s shareholder report is available at the Columbia funds’ website (columbiathreadneedleus.com/investor/). If you would like more than one report in paper to be mailed to you, or would like to elect to receive reports via e-mail or access them through Postcard Notice, please call shareholder services at 800.345.6611 and additional reports will be sent to you.
Proxy voting policies and procedures
The policy of the Board of Trustees is to vote the proxies of the companies in which the Fund holds investments consistent with the procedures as stated in the Statement of Additional Information (SAI). You may obtain a copy of the SAI without charge by calling 800.345.6611; contacting your financial intermediary; visiting columbiathreadneedleus.com/investor/; or searching the website of the Securities and Exchange Commission (SEC) at sec.gov. Information regarding how the Fund voted proxies relating to portfolio securities is filed with the SEC by August 31st for the most recent 12-month period ending June 30th of that year, and is available without charge by visiting columbiathreadneedleus.com/investor/, or searching the website of the SEC at sec.gov.
Quarterly schedule of investments
The Fund files a complete schedule of portfolio holdings with the SEC for the first and third quarters of each fiscal year on Form N-PORT. The Fund’s Form N-PORT filings are available on the SEC’s website at sec.gov. The Fund’s complete schedule of portfolio holdings, as filed on Form N-PORT, is available on columbiathreadneedleus.com/investor/ or can also be obtained without charge, upon request, by calling 800.345.6611.
Additional Fund information
For more information about the Fund, please visit columbiathreadneedleus.com/investor/ or call 800.345.6611. Customer Service Representatives are available to answer your questions Monday through Friday from 8 a.m. to 7 p.m. Eastern time.
Fund investment manager
Columbia Management Investment Advisers, LLC (the Investment Manager)
290 Congress Street
Boston, MA 02210
Fund distributor
Columbia Management Investment Distributors, Inc.
290 Congress Street
Boston, MA 02210
Fund transfer agent
Columbia Management Investment Services Corp.
P.O. Box 219104
Kansas City, MO 64121-9104
Columbia Quality Income Fund | Semiannual Report 2022
Fund at a Glance
(Unaudited)
Investment objective
The Fund seeks to provide shareholders with current income as its primary objective and, as its secondary objective, preservation of capital.
Portfolio management
Jason Callan
Co-Portfolio Manager
Managed Fund since 2009
Tom Heuer, CFA
Co-Portfolio Manager
Managed Fund since 2010
Ryan Osborn, CFA
Co-Portfolio Manager
Managed Fund since 2019
| Average annual total returns (%) (for the period ended November 30, 2022) |
| | | Inception | 6 Months
cumulative | 1 Year | 5 Years | 10 Years |
| Class A | Excluding sales charges | 02/14/02 | -8.46 | -16.85 | -0.89 | 0.55 |
| | Including sales charges | | -11.21 | -19.34 | -1.50 | 0.25 |
| Advisor Class | 11/08/12 | -8.35 | -16.64 | -0.61 | 0.80 |
| Class C | Excluding sales charges | 02/14/02 | -8.78 | -17.48 | -1.60 | -0.20 |
| | Including sales charges | | -9.69 | -18.29 | -1.60 | -0.20 |
| Institutional Class | 09/27/10 | -8.35 | -16.65 | -0.61 | 0.80 |
| Institutional 2 Class | 11/08/12 | -8.30 | -16.56 | -0.52 | 0.89 |
| Institutional 3 Class* | 10/01/14 | -8.27 | -16.51 | -0.47 | 0.88 |
| Class R* | 03/01/16 | -8.58 | -17.03 | -1.11 | 0.28 |
| Bloomberg U.S. Mortgage-Backed Securities Index | | -4.45 | -11.50 | -0.38 | 0.80 |
Returns for Class A shares are shown with and without the maximum initial sales charge of 3.00%. Returns for Class C shares are shown with and without the 1.00% contingent deferred sales charge for the first year only. The Fund’s other share classes are not subject to sales charges and have limited eligibility. Please see the Fund’s prospectus for details. Performance for different share classes will vary based on differences in sales charges and fees associated with each share class. All results shown assume reinvestment of distributions during the period. Returns do not reflect the deduction of taxes that a shareholder may pay on Fund distributions or on the redemption of Fund shares. Performance results reflect the effect of any fee waivers or reimbursements of Fund expenses by Columbia Management Investment Advisers, LLC and/or any of its affiliates. Absent these fee waivers or expense reimbursement arrangements, performance results would have been lower.
The performance information shown represents past performance and is not a guarantee of future results. The investment return and principal value of your investment will fluctuate so that your shares, when redeemed, may be worth more or less than their original cost. Current performance may be lower or higher than the performance information shown. You may obtain performance information current to the most recent month-end by contacting your financial intermediary, visiting columbiathreadneedleus.com/investor/ or calling 800.345.6611.
| * | The returns shown for periods prior to the share class inception date (including returns for the Life of the Fund, if shown, which are since Fund inception) include the returns of the Fund’s oldest share class. Since the Fund launched more than one share class at its inception, Class A shares were used. These returns are adjusted to reflect any higher class-related operating expenses of the newer share classes, as applicable. Please visit columbiathreadneedleus.com/investor/investment-products/mutual-funds/appended-performance for more information. |
The Bloomberg U.S. Mortgage-Backed Securities Index is composed of all mortgage-backed pass-through securities of Ginnie Mae (GNMA), Fannie Mae (FNMA), and Freddie Mac (FHLMC).
Indices are not available for investment, are not professionally managed and do not reflect sales charges, fees, brokerage commissions, taxes or other expenses of investing. Securities in the Fund may not match those in an index.
Columbia Quality Income Fund | Semiannual Report 2022
| 3 |
Fund at a Glance (continued)
(Unaudited)
| Portfolio breakdown (%) (at November 30, 2022) |
| Asset-Backed Securities — Non-Agency | 8.8 |
| Commercial Mortgage-Backed Securities - Agency | 2.3 |
| Commercial Mortgage-Backed Securities - Non-Agency | 7.1 |
| Money Market Funds | 6.2 |
| Options Purchased Calls | 1.0 |
| Residential Mortgage-Backed Securities - Agency | 60.5 |
| Residential Mortgage-Backed Securities - Non-Agency | 14.1 |
| Total | 100.0 |
Percentages indicated are based upon total investments including options purchased and excluding all other investments in derivatives, if any. The Fund’s portfolio composition is subject to change.
| Quality breakdown (%) (at November 30, 2022) |
| AAA rating | 68.4 |
| AA rating | 4.2 |
| A rating | 6.1 |
| BBB rating | 9.9 |
| BB rating | 2.6 |
| B rating | 2.9 |
| CCC rating | 0.1 |
| Not rated | 5.8 |
| Total | 100.0 |
Percentages indicated are based upon total fixed income investments.
Bond ratings apply to the underlying holdings of the Fund and not the Fund itself and are divided into categories ranging from highest to lowest credit quality, determined by using the middle rating of Moody’s, S&P and Fitch, after dropping the highest and lowest available ratings. When ratings are available from only two rating agencies, the lower rating is used. When a rating is available from only one rating agency, that rating is used. If a security is not rated but has a rating by Kroll and/or DBRS, the same methodology is applied to those bonds that would otherwise be not rated. When a bond is not rated by any rating agency, it is designated as “Not rated.” Credit quality ratings assigned by a rating agency are subjective opinions, not statements of fact, and are subject to change, including daily. The ratings assigned by credit rating agencies are but one of the considerations that the Investment Manager and/or Fund’s subadviser incorporates into its credit analysis process, along with such other issuer-specific factors as cash flows, capital structure and leverage ratios, ability to de-leverage (repay) through free cash flow, quality of management, market positioning and access to capital, as well as such security-specific factors as the terms of the security (e.g., interest rate and time to maturity) and the amount and type of any collateral.
| 4 | Columbia Quality Income Fund | Semiannual Report 2022 |
Understanding Your Fund’s Expenses
(Unaudited)
As an investor, you incur two types of costs. There are shareholder transaction costs, which generally include sales charges on purchases and may include redemption fees. There are also ongoing fund costs, which generally include management fees, distribution and/or service fees, and other fund expenses. The following information is intended to help you understand your ongoing costs (in dollars) of investing in the Fund and to help you compare these costs with the ongoing costs of investing in other mutual funds.
Analyzing your Fund’s expenses
To illustrate these ongoing costs, we have provided examples and calculated the expenses paid by investors in each share class of the Fund during the period. The actual and hypothetical information in the table is based on an initial investment of $1,000 at the beginning of the period indicated and held for the entire period. Expense information is calculated two ways and each method provides you with different information. The amount listed in the “Actual” column is calculated using the Fund’s actual operating expenses and total return for the period. You may use the Actual information, together with the amount invested, to estimate the expenses that you paid over the period. Simply divide your account value by $1,000 (for example, an $8,600 account value divided by $1,000 = 8.6), then multiply the results by the expenses paid during the period under the “Actual” column. The amount listed in the “Hypothetical” column assumes a 5% annual rate of return before expenses (which is not the Fund’s actual return) and then applies the Fund’s actual expense ratio for the period to the hypothetical return. You should not use the hypothetical account values and expenses to estimate either your actual account balance at the end of the period or the expenses you paid during the period. See “Compare with other funds” below for details on how to use the hypothetical data.
Compare with other funds
Since all mutual funds are required to include the same hypothetical calculations about expenses in shareholder reports, you can use this information to compare the ongoing cost of investing in the Fund with other funds. To do so, compare the hypothetical example with the 5% hypothetical examples that appear in the shareholder reports of other funds. As you compare hypothetical examples of other funds, it is important to note that hypothetical examples are meant to highlight the ongoing costs of investing in a fund only and do not reflect any transaction costs, such as sales charges, or redemption or exchange fees. Therefore, the hypothetical calculations are useful in comparing ongoing costs only, and will not help you determine the relative total costs of owning different funds. If transaction costs were included in these calculations, your costs would be higher.
| June 1, 2022 — November 30, 2022 |
| | Account value at the
beginning of the
period ($) | Account value at the
end of the
period ($) | Expenses paid during
the period ($) | Fund’s annualized
expense ratio (%) |
| | Actual | Hypothetical | Actual | Hypothetical | Actual | Hypothetical | Actual |
| Class A | 1,000.00 | 1,000.00 | 915.40 | 1,020.46 | 4.42 | 4.66 | 0.92 |
| Advisor Class | 1,000.00 | 1,000.00 | 916.50 | 1,021.71 | 3.22 | 3.40 | 0.67 |
| Class C | 1,000.00 | 1,000.00 | 912.20 | 1,016.70 | 8.01 | 8.44 | 1.67 |
| Institutional Class | 1,000.00 | 1,000.00 | 916.50 | 1,021.71 | 3.22 | 3.40 | 0.67 |
| Institutional 2 Class | 1,000.00 | 1,000.00 | 917.00 | 1,022.16 | 2.79 | 2.94 | 0.58 |
| Institutional 3 Class | 1,000.00 | 1,000.00 | 917.30 | 1,022.41 | 2.55 | 2.69 | 0.53 |
| Class R | 1,000.00 | 1,000.00 | 914.20 | 1,019.20 | 5.61 | 5.92 | 1.17 |
Expenses paid during the period are equal to the annualized expense ratio for each class as indicated above, multiplied by the average account value over the period and then multiplied by the number of days in the Fund’s most recent fiscal half year and divided by 365.
Expenses do not include fees and expenses incurred indirectly by the Fund from its investment in underlying funds, including affiliated and non-affiliated pooled investment vehicles, such as mutual funds and exchange-traded funds.
Had Columbia Management Investment Advisers, LLC and/or certain of its affiliates not waived/reimbursed certain fees and expenses, account value at the end of the period would have been reduced.
Columbia Quality Income Fund | Semiannual Report 2022
| 5 |
Portfolio of Investments
November 30, 2022 (Unaudited)
(Percentages represent value of investments compared to net assets)
Investments in securities
| Asset-Backed Securities — Non-Agency 11.6% |
| Issuer | Coupon
Rate | | Principal
Amount ($) | Value ($) |
| Apidos CLO XXVIII(a),(b) |
| Series 2017-28A Class B |
3-month USD LIBOR + 1.700%
Floor 1.700%
01/20/2031 | 5.943% | | 8,000,000 | 7,554,288 |
| Carlyle Global Market Strategies CLO Ltd.(a),(b) |
| Series 2013-3A Class BR |
3-month USD LIBOR + 1.700%
Floor 1.700%
10/15/2030 | 5.779% | | 6,750,000 | 6,243,838 |
| Series 2013-4A Class BRR |
3-month USD LIBOR + 1.420%
Floor 1.420%
01/15/2031 | 5.499% | | 14,725,000 | 14,001,428 |
| Consumer Underlying Bond Securitization(a) |
| Series 2018-1 Class B |
| 02/17/2026 | 6.170% | | 2,125,964 | 2,125,042 |
| LendingPoint Asset Securitization Trust(a) |
| Subordinated Series 2021-A Class B |
| 12/15/2028 | 1.460% | | 8,750,000 | 8,579,507 |
| Madison Park Funding XVIII Ltd.(a),(b) |
| Series 2015-18A Class CRR |
3-month USD LIBOR + 1.900%
Floor 1.900%
10/21/2030 | 4.632% | | 17,075,000 | 16,017,716 |
| OZLM Funding IV Ltd.(a),(b) |
| Series 2013-4A Class D2R |
3-month USD LIBOR + 7.250%
Floor 7.250%
10/22/2030 | 11.575% | | 2,750,000 | 2,317,285 |
| OZLM XI Ltd.(a),(b) |
| Series 2015-11A Class A2R |
3-month USD LIBOR + 1.750%
10/30/2030 | 6.165% | | 7,000,000 | 6,710,522 |
| Pagaya AI Debt Selection Trust(a) |
| Series 2021-1 Class A |
| 11/15/2027 | 1.180% | | 1,492,423 | 1,464,561 |
| Series 2021-1 Class B |
| 11/15/2027 | 2.130% | | 8,846,353 | 7,962,971 |
| Series 2021-2 Class NOTE |
| 01/25/2029 | 3.000% | | 4,745,868 | 4,410,674 |
| Series 2021-5 Class A |
| 08/15/2029 | 1.530% | | 5,290,323 | 5,086,692 |
| Subordinated Series 2021-3 Class B |
| 05/15/2029 | 1.740% | | 4,549,752 | 4,130,084 |
| Pagaya AI Debt Trust(a) |
| Subordinated Series 2022-1 Class B |
| 10/15/2029 | 3.344% | | 9,998,678 | 8,811,543 |
| Asset-Backed Securities — Non-Agency (continued) |
| Issuer | Coupon
Rate | | Principal
Amount ($) | Value ($) |
| PAGAYA AI Debt Trust(a) |
| Subordinated Series 2022-3 Class B |
| 03/15/2030 | 8.050% | | 5,000,000 | 4,857,165 |
| Palmer Square Loan Funding Ltd.(a),(b) |
| Series 2020-4A Class D |
3-month USD LIBOR + 7.050%
Floor 7.050%
11/25/2028 | 11.807% | | 3,000,000 | 2,830,692 |
| Series 2021-4A Class B |
3-month USD LIBOR + 1.750%
Floor 1.750%
10/15/2029 | 5.829% | | 12,000,000 | 11,290,680 |
| Redding Ridge Asset Management Ltd.(a),(b) |
| Series 2018-4A Class D |
3-month USD LIBOR + 5.850%
04/15/2030 | 9.929% | | 7,000,000 | 5,875,359 |
| Research-Driven Pagaya Motor Asset Trust IV(a) |
| Series 2021-2A Class A |
| 03/25/2030 | 2.650% | | 5,707,952 | 5,014,719 |
| RR 1 LLC(a),(b) |
| Series 2017-1A Class A2B |
3-month USD LIBOR + 1.600%
Floor 1.600%
07/15/2035 | 5.679% | | 7,800,000 | 7,453,969 |
| RR 3 Ltd.(a),(b) |
| Series 2014-14A Class A2R2 |
3-month USD LIBOR + 1.400%
Floor 1.400%
01/15/2030 | 5.479% | | 6,500,000 | 6,279,624 |
| Sound Point IV-R CLO Ltd.(a),(b) |
| Series 2013-3RA Class B |
3-month USD LIBOR + 1.750%
Floor 1.750%
04/18/2031 | 5.944% | | 10,000,000 | 9,393,270 |
| Theorem Funding Trust(a) |
| Subordinated Series 2021-1A Class B |
| 12/15/2027 | 1.840% | | 4,000,000 | 3,702,670 |
| Subordinated Series 2022-1A Class B |
| 02/15/2028 | 3.100% | | 5,670,000 | 5,329,512 |
| Upstart Pass-Through Trust(a) |
| Series 2021-ST1 Class A |
| 02/20/2027 | 2.750% | | 2,164,040 | 2,054,791 |
| Series 2021-ST8 Class A |
| 10/20/2029 | 1.750% | | 5,480,559 | 5,081,583 |
| Series 2021-ST9 Class A |
| 11/20/2029 | 1.700% | | 4,205,690 | 3,957,190 |
The accompanying Notes to Financial Statements are an integral part of this statement.
| 6 | Columbia Quality Income Fund | Semiannual Report 2022 |
Portfolio of Investments (continued)
November 30, 2022 (Unaudited)
| Asset-Backed Securities — Non-Agency (continued) |
| Issuer | Coupon
Rate | | Principal
Amount ($) | Value ($) |
| Upstart Securitization Trust(a) |
| Subordinated Series 2021-2 Class B |
| 06/20/2031 | 1.750% | | 4,000,000 | 3,793,244 |
Total Asset-Backed Securities — Non-Agency
(Cost $184,565,930) | 172,330,619 |
|
| Commercial Mortgage-Backed Securities - Agency 3.0% |
| | | | |
| Federal National Mortgage Association(c) |
| Series 2017-M15 Class ATS2 |
| 11/25/2027 | 3.212% | | 13,446,469 | 12,722,180 |
| Federal National Mortgage Association |
| Series 2017-T1 Class A |
| 06/25/2027 | 2.898% | | 17,890,988 | 16,835,189 |
| FRESB Mortgage Trust(c) |
| Series 2018-SB45 Class A10F (FHLMC) |
| 11/25/2027 | 3.160% | | 7,618,867 | 7,195,584 |
| Government National Mortgage Association(c),(d) |
| Series 2019-102 Class IB |
| 03/16/2060 | 0.834% | | 13,047,223 | 768,270 |
| Series 2019-109 Class IO |
| 04/16/2060 | 0.804% | | 24,517,611 | 1,413,269 |
| Series 2019-118 Class IO |
| 06/16/2061 | 0.811% | | 19,793,612 | 989,146 |
| Series 2019-131 Class IO |
| 07/16/2061 | 0.802% | | 25,485,224 | 1,440,219 |
| Series 2019-134 Class IO |
| 08/16/2061 | 0.652% | | 17,470,017 | 795,399 |
| Series 2019-139 Class IO |
| 11/16/2061 | 0.651% | | 19,914,679 | 921,225 |
| Series 2020-19 Class IO |
| 12/16/2061 | 0.699% | | 19,572,726 | 1,063,316 |
| Series 2020-3 Class IO |
| 02/16/2062 | 0.624% | | 19,508,243 | 946,524 |
Total Commercial Mortgage-Backed Securities - Agency
(Cost $62,252,975) | 45,090,321 |
|
| Commercial Mortgage-Backed Securities - Non-Agency 9.3% |
| | | | |
| BBCMS Trust(a),(b) |
| Subordinated Series 2018-BXH Class E |
1-month USD LIBOR + 2.250%
Floor 2.250%
10/15/2037 | 6.125% | | 4,490,000 | 4,174,456 |
| BHMS Mortgage Trust(a),(b) |
| Series 2018-ATLS Class A |
1-month USD LIBOR + 1.250%
Floor 1.250%
07/15/2035 | 5.126% | | 10,000,000 | 9,624,971 |
| Commercial Mortgage-Backed Securities - Non-Agency (continued) |
| Issuer | Coupon
Rate | | Principal
Amount ($) | Value ($) |
| Braemar Hotels & Resorts Trust(a),(b) |
| Subordinated Series 2018-PRME Class D |
1-month USD LIBOR + 1.800%
Floor 1.925%
06/15/2035 | 5.676% | | 6,500,000 | 6,214,574 |
| BX Trust(a),(b) |
| Series 2018-GW Class D |
1-month USD LIBOR + 1.770%
Floor 1.770%
05/15/2037 | 5.645% | | 3,830,000 | 3,647,679 |
| Series 2018-GW Class E |
1-month USD LIBOR + 1.970%
Floor 1.970%
05/15/2035 | 5.845% | | 7,000,000 | 6,658,807 |
| BX Trust(a) |
| Series 2019-OC11 Class E |
| 12/09/2041 | 4.076% | | 2,450,000 | 1,905,017 |
| Credit Suisse Mortgage Capital Certificates OA LLC(a) |
| Subordinated Series 2014-USA Class E |
| 09/15/2037 | 4.373% | | 10,400,000 | 6,862,789 |
| Subordinated Series 2014-USA Class F |
| 09/15/2037 | 4.373% | | 4,050,000 | 2,121,567 |
| Extended Stay America Trust(a),(b) |
| Series 2021-ESH Class D |
1-month USD LIBOR + 2.250%
Floor 2.250%
07/15/2038 | 6.125% | | 5,857,154 | 5,549,289 |
| Hilton USA Trust(a),(c) |
| Series 2016-HHV Class D |
| 11/05/2038 | 4.333% | | 8,395,000 | 7,306,437 |
| Series 2016-HHV Class F |
| 11/05/2038 | 4.333% | | 15,500,000 | 13,123,555 |
| Hilton USA Trust(a) |
| Subordinated Series 2016-SFP Class D |
| 11/05/2035 | 4.927% | | 5,000,000 | 4,565,884 |
| Subordinated Series 2016-SFP Class F |
| 11/05/2035 | 6.155% | | 8,700,000 | 8,022,899 |
| Home Partners of America Trust(a) |
| Subordinated Series 2021-2 Class B |
| 12/17/2026 | 2.302% | | 19,469,027 | 16,627,453 |
| JPMorgan Chase Commercial Mortgage Securities Trust(a),(b) |
| Subordinated Series 2021-HTL5 Class D |
1-month USD LIBOR + 2.515%
Floor 2.515%
11/15/2038 | 6.390% | | 6,990,000 | 6,395,038 |
| Morgan Stanley Capital I Trust(a),(c) |
| Series 2019-MEAD Class D |
| 11/10/2036 | 3.283% | | 5,500,000 | 4,767,230 |
The accompanying Notes to Financial Statements are an integral part of this statement.
Columbia Quality Income Fund | Semiannual Report 2022
| 7 |
Portfolio of Investments (continued)
November 30, 2022 (Unaudited)
| Commercial Mortgage-Backed Securities - Non-Agency (continued) |
| Issuer | Coupon
Rate | | Principal
Amount ($) | Value ($) |
| Progress Residential Trust(a) |
| Series 2019-SFR4 Class E |
| 10/17/2036 | 3.435% | | 11,000,000 | 10,396,683 |
| Series 2020-SFR1 Class E |
| 04/17/2037 | 3.032% | | 8,000,000 | 7,202,858 |
| Subordinated Series 2019-SFR3 Class E |
| 09/17/2036 | 3.369% | | 5,000,000 | 4,677,319 |
| Subordinated Series 2019-SFR3 Class F |
| 09/17/2036 | 3.867% | | 2,604,000 | 2,438,545 |
| Wells Fargo Commercial Mortgage Trust(a),(b) |
| Series 2021-FCMT Class D |
1-month USD LIBOR + 3.500%
Floor 3.500%
05/15/2031 | 7.375% | | 6,225,000 | 5,887,696 |
Total Commercial Mortgage-Backed Securities - Non-Agency
(Cost $150,529,846) | 138,170,746 |
|
| Residential Mortgage-Backed Securities - Agency 79.2% |
| | | | |
| Federal Home Loan Mortgage Corp. |
10/01/2024-
06/01/2039 | 5.000% | | 2,446,008 | 2,519,880 |
| 06/01/2030 | 5.500% | | 1,578,069 | 1,597,981 |
| 05/01/2036 | 2.000% | | 6,458,988 | 5,828,924 |
| 08/01/2041 | 4.500% | | 1,888,509 | 1,895,352 |
03/01/2042-
11/01/2046 | 3.500% | | 35,412,910 | 33,340,947 |
11/01/2043-
08/01/2052 | 3.000% | | 55,875,466 | 49,980,528 |
08/01/2044-
07/01/2052 | 4.000% | | 41,723,708 | 40,151,486 |
| 02/01/2051 | 2.500% | | 23,709,459 | 20,575,646 |
| Federal Home Loan Mortgage Corp.(b),(d) |
| CMO Series 264 Class S1 |
-1.0 x 1-month USD LIBOR + 5.950%
Cap 5.950%
07/15/2042 | 2.077% | | 3,474,127 | 363,901 |
| CMO Series 318 Class S1 |
-1.0 x 1-month USD LIBOR + 5.950%
Cap 5.950%
11/15/2043 | 2.077% | | 5,057,698 | 538,617 |
| CMO Series 4286 Class NS |
-1.0 x 1-month USD LIBOR + 5.900%
Cap 5.900%
12/15/2043 | 2.027% | | 2,148,469 | 284,240 |
| CMO Series 4594 Class SA |
-1.0 x 1-month USD LIBOR + 5.950%
Cap 5.950%
06/15/2046 | 2.077% | | 4,469,734 | 530,059 |
| Residential Mortgage-Backed Securities - Agency (continued) |
| Issuer | Coupon
Rate | | Principal
Amount ($) | Value ($) |
| CMO Series 4935 Class JS |
-1.0 x 1-month USD LIBOR + 6.050%
Cap 6.050%
12/25/2049 | 2.034% | | 7,953,746 | 990,007 |
| CMO Series 4965 Class KS |
1-month USD LIBOR + 5.850%
Cap 5.850%
04/25/2050 | 1.834% | | 5,855,025 | 586,898 |
| CMO Series 4987 Class KS |
-1.0 x 1-month USD LIBOR + 6.080%
Cap 6.080%
06/25/2050 | 2.064% | | 12,734,166 | 1,872,366 |
| CMO Series 4993 Class MS |
-1.0 x 1-month USD LIBOR + 6.050%
Cap 6.050%
07/25/2050 | 2.034% | | 16,185,798 | 2,459,604 |
| CMO STRIPS Series 309 Class S4 |
-1.0 x 1-month USD LIBOR + 5.970%
Cap 5.970%
08/15/2043 | 2.097% | | 4,772,604 | 489,274 |
| CMO STRIPS Series 326 Class S1 |
-1.0 x 1-month USD LIBOR + 6.000%
Cap 6.000%
03/15/2044 | 2.127% | | 1,718,853 | 176,801 |
| Federal Home Loan Mortgage Corp.(d) |
| CMO Series 304 Class C69 |
| 12/15/2042 | 4.000% | | 1,384,955 | 269,608 |
| CMO Series 4122 Class JI |
| 12/15/2040 | 4.000% | | 90,268 | 724 |
| CMO Series 4139 Class CI |
| 05/15/2042 | 3.500% | | 2,108,941 | 203,787 |
| CMO Series 4147 Class CI |
| 01/15/2041 | 3.500% | | 1,203,860 | 59,660 |
| CMO Series 4148 Class BI |
| 02/15/2041 | 4.000% | | 27,491 | 80 |
| CMO Series 4177 Class IY |
| 03/15/2043 | 4.000% | | 3,819,623 | 626,152 |
| CMO Series 4215 Class IL |
| 07/15/2041 | 3.500% | | 373,286 | 17,848 |
| Federal Home Loan Mortgage Corp.(c),(d) |
| CMO Series 4068 Class GI |
| 09/15/2036 | 0.000% | | 2,933,218 | 152,232 |
| CMO Series 4107 Class KS |
| 06/15/2038 | 0.000% | | 2,712,487 | 84,546 |
The accompanying Notes to Financial Statements are an integral part of this statement.
| 8 | Columbia Quality Income Fund | Semiannual Report 2022 |
Portfolio of Investments (continued)
November 30, 2022 (Unaudited)
| Residential Mortgage-Backed Securities - Agency (continued) |
| Issuer | Coupon
Rate | | Principal
Amount ($) | Value ($) |
| CMO Series 4620 Class AS |
| 11/15/2042 | 0.000% | | 4,275,784 | 193,179 |
| Federal Home Loan Mortgage Corp. REMICS(b),(d) |
| CMO Series 4983 Class SY |
-1.0 x 1-month USD LIBOR + 6.100%
Cap 6.100%
05/25/2050 | 2.084% | | 14,628,119 | 1,677,050 |
| Federal Home Loan Mortgage Corp. REMICS(d) |
| CMO Series 5105 Class ID |
| 05/25/2051 | 3.000% | | 21,362,508 | 4,068,996 |
| Federal National Mortgage Association |
| 07/01/2023 | 6.000% | | 9,377 | 9,348 |
11/01/2034-
07/01/2048 | 3.500% | | 52,762,871 | 49,909,941 |
02/01/2035-
12/01/2040 | 5.000% | | 10,499,766 | 10,784,945 |
03/01/2036-
08/01/2041 | 4.500% | | 8,781,061 | 8,783,909 |
06/01/2036-
05/01/2051 | 2.000% | | 136,107,862 | 113,777,458 |
| 09/01/2036 | 6.500% | | 1,410,999 | 1,482,477 |
04/01/2037-
05/01/2051 | 2.500% | | 64,184,448 | 57,072,427 |
02/01/2041-
08/01/2052 | 4.000% | | 49,249,848 | 47,221,761 |
11/01/2046-
08/01/2050 | 3.000% | | 84,699,582 | 76,255,300 |
| CMO Series 2017-72 Class B |
| 09/25/2047 | 3.000% | | 5,296,421 | 4,833,560 |
| Federal National Mortgage Association(b),(d) |
| CMO Series 2005-74 Class NI |
-1.0 x 1-month USD LIBOR + 6.080%
Cap 6.080%
05/25/2035 | 2.064% | | 5,703,900 | 162,148 |
| CMO Series 2007-54 Class DI |
-1.0 x 1-month USD LIBOR + 6.100%
Cap 6.100%
06/25/2037 | 2.084% | | 4,804,197 | 493,622 |
| CMO Series 2013-97 Class SB |
-1.0 x 1-month USD LIBOR + 6.100%
Cap 6.100%
06/25/2032 | 2.514% | | 1,217,528 | 23,033 |
| CMO Series 2014-93 Class ES |
-1.0 x 1-month USD LIBOR + 6.150%
Cap 6.150%
01/25/2045 | 2.134% | | 7,562,703 | 901,584 |
| Residential Mortgage-Backed Securities - Agency (continued) |
| Issuer | Coupon
Rate | | Principal
Amount ($) | Value ($) |
| CMO Series 2016-101 Class SK |
-1.0 x 1-month USD LIBOR + 5.950%
Cap 5.950%
01/25/2047 | 1.934% | | 15,362,623 | 1,857,851 |
| CMO Series 2016-37 Class SA |
-1.0 x 1-month USD LIBOR + 5.850%
Cap 5.850%
06/25/2046 | 1.834% | | 9,767,377 | 1,189,863 |
| CMO Series 2016-42 Class SB |
-1.0 x 1-month USD LIBOR + 6.000%
Cap 6.000%
07/25/2046 | 1.984% | | 13,770,552 | 1,697,463 |
| CMO Series 2017-3 Class SA |
-1.0 x 1-month USD LIBOR + 6.000%
Cap 6.000%
02/25/2047 | 1.984% | | 11,375,823 | 1,308,725 |
| CMO Series 2017-51 Class SC |
-1.0 x 1-month USD LIBOR + 6.150%
Cap 6.150%
07/25/2047 | 2.134% | | 9,424,072 | 1,105,357 |
| CMO Series 2017-72 Class S |
-1.0 x 1-month USD LIBOR + 3.950%
Cap 2.750%
09/25/2047 | 0.364% | | 29,791,358 | 1,275,857 |
| CMO Series 2017-90 Class SP |
-1.0 x 1-month USD LIBOR + 6.150%
Cap 6.150%
11/25/2047 | 2.134% | | 6,998,080 | 798,034 |
| CMO Series 2019-33 Class SB |
-1.0 x 1-month USD LIBOR + 6.050%
Cap 6.050%
07/25/2049 | 2.034% | | 19,605,251 | 2,232,564 |
| CMO Series 2019-57 Class AS |
-1.0 x 1-month USD LIBOR + 6.050%
Cap 6.050%
10/25/2049 | 2.034% | | 11,892,224 | 1,264,897 |
| CMO Series 2019-77 Class SP |
-1.0 x 1-month USD LIBOR + 5.950%
Cap 5.950%
01/25/2050 | 1.934% | | 15,820,444 | 1,884,028 |
The accompanying Notes to Financial Statements are an integral part of this statement.
Columbia Quality Income Fund | Semiannual Report 2022
| 9 |
Portfolio of Investments (continued)
November 30, 2022 (Unaudited)
| Residential Mortgage-Backed Securities - Agency (continued) |
| Issuer | Coupon
Rate | | Principal
Amount ($) | Value ($) |
| CMO Series 2020-40 Class LS |
-1.0 x 1-month USD LIBOR + 6.080%
Cap 6.080%
06/25/2050 | 2.064% | | 17,425,689 | 2,684,542 |
| Federal National Mortgage Association(c),(d) |
| CMO Series 2006-5 Class N1 |
| 08/25/2034 | 0.000% | | 3,008,403 | 30 |
| Federal National Mortgage Association(d) |
| CMO Series 2012-129 Class IC |
| 01/25/2041 | 3.500% | | 1,497,905 | 72,256 |
| CMO Series 2012-133 Class EI |
| 07/25/2031 | 3.500% | | 417,207 | 9,249 |
| CMO Series 2012-134 Class AI |
| 07/25/2040 | 3.500% | | 719,849 | 14,354 |
| CMO Series 2012-144 Class HI |
| 07/25/2042 | 3.500% | | 1,952,124 | 208,737 |
| CMO Series 2013-1 Class AI |
| 02/25/2043 | 3.500% | | 1,747,334 | 243,706 |
| CMO Series 2013-16 |
| 01/25/2040 | 3.500% | | 1,508,972 | 52,072 |
| CMO Series 2013-6 Class MI |
| 02/25/2040 | 3.500% | | 50,254 | 24 |
| CMO Series 2020-55 Class MI |
| 08/25/2050 | 2.500% | | 20,254,662 | 3,186,905 |
| CMO Series 417 Class C4 |
| 02/25/2043 | 3.500% | | 6,872,714 | 1,356,524 |
| Federal National Mortgage Association REMICS(d) |
| CMO Series 2021-13 Class IO |
| 03/25/2051 | 3.000% | | 15,547,637 | 2,848,517 |
| CMO Series 2021-54 Class LI |
| 04/25/2049 | 2.500% | | 22,161,157 | 2,958,060 |
| Government National Mortgage Association |
12/15/2031-
02/15/2032 | 6.500% | | 140,670 | 145,326 |
01/15/2039-
08/20/2040 | 5.000% | | 4,815,932 | 4,951,464 |
04/20/2051-
05/20/2051 | 2.500% | | 79,500,211 | 68,334,525 |
| Government National Mortgage Association(e) |
| 04/20/2048 | 4.500% | | 7,598,346 | 7,551,517 |
| Government National Mortgage Association(d) |
| CMO Series 2012-121 Class PI |
| 09/16/2042 | 4.500% | | 3,062,366 | 479,447 |
| CMO Series 2012-129 Class AI |
| 08/20/2037 | 3.000% | | 795,224 | 10,866 |
| CMO Series 2014-131 Class EI |
| 09/16/2039 | 4.000% | | 5,333,262 | 495,493 |
| Residential Mortgage-Backed Securities - Agency (continued) |
| Issuer | Coupon
Rate | | Principal
Amount ($) | Value ($) |
| CMO Series 2015-175 Class AI |
| 10/16/2038 | 3.500% | | 12,170,952 | 1,220,168 |
| CMO Series 2020-129 Class YI |
| 09/20/2050 | 2.500% | | 25,206,047 | 3,273,252 |
| CMO Series 2020-138 Class IN |
| 09/20/2050 | 2.500% | | 13,509,724 | 2,002,487 |
| CMO Series 2020-138 Class JI |
| 09/20/2050 | 2.500% | | 30,112,434 | 3,993,586 |
| CMO Series 2020-142 Class GI |
| 09/20/2050 | 3.000% | | 9,233,066 | 1,300,040 |
| CMO Series 2020-175 Class KI |
| 11/20/2050 | 2.500% | | 21,344,593 | 2,984,450 |
| CMO Series 2020-191 Class TI |
| 12/20/2050 | 2.500% | | 10,425,403 | 1,300,794 |
| CMO Series 2020-191 Class UC |
| 12/20/2050 | 4.000% | | 18,869,122 | 2,967,413 |
| CMO Series 2021-1 Class IB |
| 01/20/2051 | 2.500% | | 21,798,950 | 2,849,692 |
| CMO Series 2021-111 Class AI |
| 06/20/2051 | 2.500% | | 20,047,731 | 2,614,140 |
| CMO Series 2021-119 Class LI |
| 07/20/2051 | 3.000% | | 22,554,109 | 3,526,351 |
| CMO Series 2021-122 Class HI |
| 11/20/2050 | 2.500% | | 18,870,065 | 2,676,413 |
| CMO Series 2021-142 Class IX |
| 08/20/2051 | 2.500% | | 25,281,505 | 3,649,512 |
| CMO Series 2021-146 Class IK |
| 08/20/2051 | 3.500% | | 23,296,692 | 3,958,949 |
| CMO Series 2021-158 Class VI |
| 09/20/2051 | 3.000% | | 18,865,345 | 3,065,007 |
| CMO Series 2021-159 Class IP |
| 09/20/2051 | 3.000% | | 14,660,499 | 2,171,092 |
| CMO Series 2021-175 Class IJ |
| 10/20/2051 | 3.000% | | 25,260,545 | 3,929,945 |
| CMO Series 2021-27 Class IN |
| 02/20/2051 | 2.500% | | 13,169,737 | 1,691,489 |
| CMO Series 2021-67 Class GI |
| 04/20/2051 | 3.000% | | 21,774,567 | 3,270,601 |
| CMO Series 2021-8 Class BI |
| 01/20/2051 | 2.500% | | 19,357,968 | 3,041,894 |
| CMO Series 2021-8 Class IO |
| 01/20/2051 | 3.000% | | 39,628,620 | 6,074,120 |
The accompanying Notes to Financial Statements are an integral part of this statement.
| 10 | Columbia Quality Income Fund | Semiannual Report 2022 |
Portfolio of Investments (continued)
November 30, 2022 (Unaudited)
| Residential Mortgage-Backed Securities - Agency (continued) |
| Issuer | Coupon
Rate | | Principal
Amount ($) | Value ($) |
| Government National Mortgage Association(b),(d) |
| CMO Series 2014-131 Class BS |
-1.0 x 1-month USD LIBOR + 6.200%
Cap 6.200%
09/16/2044 | 2.313% | | 10,244,436 | 1,496,481 |
| CMO Series 2017-170 Class QS |
-1.0 x 1-month USD LIBOR + 6.200%
Cap 6.200%
11/20/2047 | 2.261% | | 6,914,456 | 673,930 |
| CMO Series 2018-1 Class SA |
-1.0 x 1-month USD LIBOR + 6.200%
Cap 6.200%
01/20/2048 | 2.261% | | 8,463,064 | 838,952 |
| CMO Series 2018-105 Class SA |
-1.0 x 1-month USD LIBOR + 6.200%
Cap 6.200%
08/20/2048 | 2.261% | | 6,357,616 | 549,842 |
| CMO Series 2018-139 Class KS |
-1.0 x 1-month USD LIBOR + 6.150%
Cap 6.150%
10/20/2048 | 2.211% | | 4,008,409 | 372,147 |
| CMO Series 2018-147 Class SA |
1-month USD LIBOR + 6.200%
Cap 6.200%
10/20/2048 | 2.261% | | 10,719,925 | 1,029,169 |
| CMO Series 2018-155 Class LS |
-1.0 x 1-month USD LIBOR + 6.150%
Cap 6.150%
11/20/2048 | 2.211% | | 8,358,822 | 831,607 |
| CMO Series 2018-21 Class WS |
-1.0 x 1-month USD LIBOR + 6.200%
Cap 6.200%
02/20/2048 | 2.261% | | 7,679,701 | 895,025 |
| CMO Series 2018-40 Class SC |
-1.0 x 1-month USD LIBOR + 6.200%
Cap 6.200%
03/20/2048 | 2.261% | | 4,945,307 | 449,669 |
| CMO Series 2018-63 Class HS |
-1.0 x 1-month USD LIBOR + 6.200%
Cap 6.200%
04/20/2048 | 2.261% | | 5,476,776 | 511,721 |
| Residential Mortgage-Backed Securities - Agency (continued) |
| Issuer | Coupon
Rate | | Principal
Amount ($) | Value ($) |
| CMO Series 2018-94 Class SA |
-1.0 x 1-month USD LIBOR + 6.200%
Cap 6.200%
05/20/2048 | 2.261% | | 7,518,215 | 876,865 |
| CMO Series 2018-97 Class MS |
-1.0 x 1-month USD LIBOR + 6.200%
Cap 6.200%
07/20/2048 | 2.261% | | 6,459,468 | 581,123 |
| CMO Series 2019-117 Class SA |
-1.0 x 1-month USD LIBOR + 6.100%
Cap 6.100%
09/20/2049 | 2.161% | | 14,543,149 | 1,621,075 |
| CMO Series 2019-119 Class GS |
-1.0 x 1-month USD LIBOR + 6.100%
Cap 6.100%
09/20/2049 | 2.161% | | 8,206,928 | 690,555 |
| CMO Series 2019-120 Class SA |
-1.0 x 1-month USD LIBOR + 3.400%
Cap 3.400%
09/20/2049 | 0.000% | | 19,398,072 | 518,483 |
| CMO Series 2019-21 Class SH |
-1.0 x 1-month USD LIBOR + 6.050%
Cap 6.050%
02/20/2049 | 2.111% | | 7,297,601 | 589,244 |
| CMO Series 2019-23 Class SQ |
-1.0 x 1-month USD LIBOR + 6.050%
Cap 6.050%
02/20/2049 | 2.111% | | 7,147,760 | 943,659 |
| CMO Series 2019-43 Class SE |
-1.0 x 1-month USD LIBOR + 6.100%
Cap 6.100%
04/20/2049 | 2.161% | | 13,697,270 | 1,354,450 |
| CMO Series 2019-52 Class AS |
-1.0 x 1-month USD LIBOR + 6.050%
Cap 6.050%
04/16/2049 | 2.163% | | 16,093,158 | 2,893,854 |
| CMO Series 2019-92 Class SD |
-1.0 x 1-month USD LIBOR + 6.100%
Cap 6.100%
07/20/2049 | 2.161% | | 17,879,943 | 2,031,047 |
The accompanying Notes to Financial Statements are an integral part of this statement.
Columbia Quality Income Fund | Semiannual Report 2022
| 11 |
Portfolio of Investments (continued)
November 30, 2022 (Unaudited)
| Residential Mortgage-Backed Securities - Agency (continued) |
| Issuer | Coupon
Rate | | Principal
Amount ($) | Value ($) |
| CMO Series 2020-104 Class SA |
-1.0 x 1-month USD LIBOR + 6.200%
07/20/2050 | 2.261% | | 13,332,596 | 1,558,514 |
| CMO Series 2020-125 Class AS |
-1.0 x 1-month USD LIBOR + 6.250%
Cap 6.250%
08/20/2050 | 2.311% | | 20,426,446 | 2,343,800 |
| CMO Series 2020-125 Class SD |
-1.0 x 1-month USD LIBOR + 6.250%
Cap 6.250%
08/20/2050 | 2.311% | | 14,395,373 | 1,689,889 |
| CMO Series 2021-161 Class SM |
-1.0 x 1-month USD LIBOR + 6.300%
Cap 6.300%
09/20/2051 | 2.361% | | 22,361,976 | 2,803,373 |
| CMO Series 2021-193 Class ES |
30-day Average SOFR + 1.700%
11/20/2051 | 0.000% | | 163,728,004 | 931,514 |
| CMO Series 2021-46 Class SE |
-1.0 x 1-month USD LIBOR + 6.300%
Cap 6.300%
03/20/2051 | 2.361% | | 25,562,625 | 2,783,675 |
| Government National Mortgage Association TBA(f) |
| 12/20/2052 | 3.000% | | 47,000,000 | 42,444,518 |
| 12/20/2052 | 4.000% | | 30,000,000 | 28,634,765 |
| 12/20/2052 | 5.500% | | 31,000,000 | 31,367,659 |
| Uniform Mortgage-Backed Security TBA(f) |
12/15/2037-
12/13/2052 | 3.000% | | 67,000,000 | 61,311,232 |
| 12/13/2052 | 2.000% | | 25,000,000 | 20,590,820 |
| 12/13/2052 | 3.500% | | 87,500,000 | 80,089,844 |
| 12/13/2052 | 4.500% | | 115,000,000 | 111,927,344 |
| 12/13/2052 | 5.000% | | 57,000,000 | 56,715,000 |
Total Residential Mortgage-Backed Securities - Agency
(Cost $1,287,834,218) | 1,179,968,379 |
|
| Residential Mortgage-Backed Securities - Non-Agency 18.5% |
| | | | |
| Ajax Mortgage Loan Trust(a),(c) |
| CMO Series 2021-B Class A |
| 06/25/2066 | 2.239% | | 5,446,863 | 4,982,679 |
| Bellemeade Re Ltd.(a),(b) |
| CMO Series 2019-1A Class M1B |
1-month USD LIBOR + 1.750%
Floor 1.750%
03/25/2029 | 5.794% | | 321,806 | 321,240 |
| Residential Mortgage-Backed Securities - Non-Agency (continued) |
| Issuer | Coupon
Rate | | Principal
Amount ($) | Value ($) |
| CMO Series 2019-3A Class M1C |
1-month USD LIBOR + 1.950%
Floor 1.950%
07/25/2029 | 5.994% | | 6,299,000 | 6,230,205 |
| CMO Series 2019-4A Class M1C |
1-month USD LIBOR + 2.500%
Floor 2.500%
10/25/2029 | 6.544% | | 4,587,081 | 4,575,921 |
| BVRT Financing Trust(a),(b),(g) |
| CMO Series 2021-3F Class M2 |
30-day Average SOFR + 2.900%
Floor 2.900%
07/12/2033 | 4.187% | | 10,000,000 | 10,000,000 |
| BVRT Financing Trust(a),(b),(g),(h) |
| CMO Series 2021-CRT1 Class M3 |
1-month USD LIBOR + 2.750%
Floor 3.000%
01/10/2033 | 3.000% | | 9,412,224 | 8,949,614 |
| CHNGE Mortgage Trust(a),(c) |
| CMO Series 2022-2 Class A1 |
| 03/25/2067 | 3.757% | | 7,907,558 | 7,294,637 |
| CIM Trust(a),(c) |
| CMO Series 2021-NR1 Class A1 |
| 07/25/2055 | 2.569% | | 4,088,358 | 3,835,492 |
| CMO Series 2021-NR4 Class A1 |
| 10/25/2061 | 2.816% | | 3,539,022 | 3,240,082 |
| Citigroup Mortgage Loan Trust, Inc.(a),(c) |
| CMO Series 2009-11 Class 1A2 |
| 02/25/2037 | 2.448% | | 292,024 | 274,517 |
| CMO Series 2014-A Class B2 |
| 01/25/2035 | 5.480% | | 813,550 | 761,107 |
| Citigroup Mortgage Loan Trust, Inc.(a) |
| CMO Series 2015-RP2 Class B2 |
| 01/25/2053 | 4.250% | | 3,238,113 | 3,035,438 |
| Connecticut Avenue Securities Trust(a),(b) |
| CMO Series 2019-HRP1 Class M2 |
1-month USD LIBOR + 2.150%
11/25/2039 | 6.166% | | 2,815,486 | 2,711,346 |
| CMO Series 2020-R01 Class 1M2 |
1-month USD LIBOR + 2.050%
01/25/2040 | 6.066% | | 2,567,664 | 2,522,730 |
| CMO Series 2022-R02 Class 2M2 |
30-day Average SOFR + 3.000%
01/25/2042 | 6.521% | | 10,000,000 | 9,260,134 |
| Subordinated CMO Series 2019-R01 Class 2B1 |
1-month USD LIBOR + 4.350%
07/25/2031 | 8.366% | | 11,290,000 | 10,980,969 |
| Subordinated CMO Series 2022-R01 Class 1B2 |
30-day Average SOFR + 6.000%
12/25/2041 | 9.521% | | 7,000,000 | 5,938,852 |
The accompanying Notes to Financial Statements are an integral part of this statement.
| 12 | Columbia Quality Income Fund | Semiannual Report 2022 |
Portfolio of Investments (continued)
November 30, 2022 (Unaudited)
| Residential Mortgage-Backed Securities - Non-Agency (continued) |
| Issuer | Coupon
Rate | | Principal
Amount ($) | Value ($) |
| CSMC Trust(a),(c) |
| CMO Series 2021-JR2 Class A1 |
| 11/25/2061 | 2.215% | | 3,305,025 | 3,104,577 |
| CMO Series 2022-NQM1 Class A3 |
| 11/25/2066 | 2.675% | | 5,543,169 | 4,309,814 |
| Freddie Mac STACR REMIC Trust(a),(b) |
| Subordinated CMO Series 2021-DNA5 Class B2 |
30-day Average SOFR + 5.500%
01/25/2034 | 9.021% | | 7,000,000 | 5,350,673 |
| Freddie Mac Structured Agency Credit Risk Debt Notes(a),(b) |
| CMO Series 2020-HQA5 Class M2 |
30-day Average SOFR + 2.600%
11/25/2050 | 6.121% | | 7,429,412 | 7,343,444 |
| Subordinated CMO Series 2022-DNA2 Class B1 |
30-day Average SOFR + 4.750%
02/25/2042 | 8.271% | | 7,500,000 | 6,707,788 |
| GCAT LLC(a),(c) |
| CMO Series 2021-CM1 Class A1 |
| 04/25/2065 | 1.469% | | 2,520,967 | 2,380,739 |
| Glebe Funding Trust (The)(a),(g) |
| CMO Series 2021-1 Class PT |
| 10/27/2023 | 3.000% | | 6,664,658 | 5,998,192 |
| Imperial Fund Mortgage Trust(a),(c) |
| CMO Series 2021-NQM4 Class A3 |
| 01/25/2057 | 2.450% | | 8,448,631 | 6,387,766 |
| Legacy Mortgage Asset Trust(a),(c) |
| CMO Series 2021-GS1 Class A1 |
| 10/25/2066 | 1.892% | | 4,435,197 | 3,827,789 |
| Loan Revolving Advance Investment Trust(a),(b),(g),(h) |
| CMO Series 2021-2 Class A1X |
1-month USD LIBOR + 2.750%
Floor 2.750%
06/30/2023 | 6.623% | | 4,096,951 | 4,096,951 |
| Mortgage Acquisition Trust I LLC(a),(g) |
| CMO Series 2021-1 Class PT |
| 11/29/2023 | 3.500% | | 4,986,390 | 4,261,805 |
| New Residential Mortgage Loan Trust(a),(c),(d) |
| CMO Series 2014-1A Class AIO |
| 01/25/2054 | 2.290% | | 9,480,662 | 482,151 |
| New Residential Mortgage Loan Trust(a),(c) |
| CMO Series 2022-NQM2 Class A2 |
| 03/27/2062 | 3.699% | | 4,420,000 | 3,220,154 |
| NRZ Excess Spread-Collateralized Notes(a) |
| CMO Series 2021-GNT1 Class A |
| 11/25/2026 | 3.474% | | 5,435,692 | 4,786,619 |
| OBX Trust(a),(c) |
| CMO Series 2022-NQM3 Class A2 |
| 01/25/2062 | 3.833% | | 5,264,000 | 3,908,520 |
| Residential Mortgage-Backed Securities - Non-Agency (continued) |
| Issuer | Coupon
Rate | | Principal
Amount ($) | Value ($) |
| PMT Credit Risk Transfer Trust(a),(b) |
| Series 2019-2R Class A |
1-month USD LIBOR + 2.750%
Floor 2.750%
05/27/2023 | 6.805% | | 1,980,159 | 1,873,626 |
| PNMAC GMSR Issuer Trust(a),(b),(d) |
| CMO Series 2018-GT1 Class A |
1-month USD LIBOR + 2.850%
Floor 2.850%
02/25/2023 | 6.894% | | 26,500,000 | 25,707,146 |
| PNMAC GMSR Issuer Trust(a),(b) |
| CMO Series 2018-GT2 Class A |
1-month USD LIBOR + 2.650%
08/25/2025 | 6.694% | | 26,500,000 | 25,291,854 |
| Point Securitization Trust(a),(c) |
| CMO Series 2021-1 Class A1 |
| 02/25/2052 | 3.228% | | 7,481,693 | 7,145,622 |
| Preston Ridge Partners Mortgage Trust(a),(c) |
| CMO Series 2021-1 Class A1 |
| 01/25/2026 | 2.115% | | 8,535,151 | 7,779,464 |
| CMO Series 2021-3 Class A1 |
| 04/25/2026 | 1.867% | | 5,767,893 | 5,069,910 |
| Pretium Mortgage Credit Partners(a),(c) |
| CMO Series 2022-NPL1 Class A1 |
| 01/25/2052 | 2.981% | | 4,116,756 | 3,704,971 |
| Radnor Re Ltd.(a),(b) |
| CMO Series 2020-1 Class M1B |
1-month USD LIBOR + 1.450%
Floor 1.450%
01/25/2030 | 5.494% | | 7,400,000 | 7,163,082 |
| Subordinated CMO Series 2021-2 Class M1A |
30-day Average SOFR + 1.850%
Floor 1.850%
11/25/2031 | 4.847% | | 2,261,167 | 2,236,830 |
| Saluda Grade Alternative Mortgage Trust(a) |
| CMO Series 2020-FIG1 Class A1 |
| 09/25/2050 | 3.568% | | 2,218,157 | 2,172,277 |
| SG Residential Mortgage Trust(a),(c) |
| CMO Series 2019-3 Class M1 |
| 09/25/2059 | 3.526% | | 4,224,000 | 3,985,665 |
| Stanwich Mortgage Loan Co. LLC(a),(c) |
| CMO Series 2021-NPB1 Class A1 |
| 10/16/2026 | 2.735% | | 7,214,268 | 6,241,189 |
| Stonnington Mortgage Trust(a),(c),(g),(h) |
| CMO Series 2020-1 Class A |
| 07/28/2024 | 3.500% | | 1,530,955 | 1,530,955 |
| Toorak Mortgage Corp., Ltd.(a),(c),(g),(h) |
| CMO Series 2020-1 Class M1 |
| 03/25/2023 | 5.000% | | 7,000,000 | 6,895,000 |
The accompanying Notes to Financial Statements are an integral part of this statement.
Columbia Quality Income Fund | Semiannual Report 2022
| 13 |
Portfolio of Investments (continued)
November 30, 2022 (Unaudited)
| Residential Mortgage-Backed Securities - Non-Agency (continued) |
| Issuer | Coupon
Rate | | Principal
Amount ($) | Value ($) |
| Triangle Re Ltd.(a),(b) |
| CMO Series 2021-2 Class M1B |
1-month USD LIBOR + 2.600%
Floor 2.600%
10/25/2033 | 6.644% | | 10,000,000 | 9,874,927 |
| Vendee Mortgage Trust(c),(d) |
| CMO Series 1998-1 Class 2IO |
| 03/15/2028 | 0.000% | | 438,255 | 0 |
| CMO Series 1998-3 Class IO |
| 03/15/2029 | 0.000% | | 500,790 | 0 |
| Verus Securitization Trust(a),(c) |
| CMO Series 2020-1 Class M1 |
| 01/25/2060 | 3.021% | | 6,700,000 | 4,883,697 |
| Visio Trust(a) |
| CMO Series 2021-1R Class A3 |
| 05/25/2056 | 1.688% | | 2,864,525 | 2,576,840 |
Total Residential Mortgage-Backed Securities - Non-Agency
(Cost $293,426,337) | 275,215,000 |
| Options Purchased Calls 1.3% |
| | | | | Value ($) |
| (Cost $29,346,995) | 19,749,423 |
| Money Market Funds 8.0% |
| | Shares | Value ($) |
| Columbia Short-Term Cash Fund, 3.989%(i),(j) | 120,096,969 | 120,048,930 |
Total Money Market Funds
(Cost $120,048,930) | 120,048,930 |
Total Investments in Securities
(Cost: $2,128,005,231) | 1,950,573,418 |
| Other Assets & Liabilities, Net | | (460,232,025) |
| Net Assets | 1,490,341,393 |
At November 30, 2022, securities and/or cash totaling $6,242,653 were pledged as collateral.
Investments in derivatives
| Long futures contracts |
| Description | Number of
contracts | Expiration
date | Trading
currency | Notional
amount | Value/Unrealized
appreciation ($) | Value/Unrealized
depreciation ($) |
| U.S. Treasury 5-Year Note | 1,072 | 03/2023 | USD | 116,387,376 | 701,301 | — |
| U.S. Treasury Ultra Bond | 185 | 03/2023 | USD | 25,212,031 | — | (211,934) |
| Total | | | | | 701,301 | (211,934) |
| Short futures contracts |
| Description | Number of
contracts | Expiration
date | Trading
currency | Notional
amount | Value/Unrealized
appreciation ($) | Value/Unrealized
depreciation ($) |
| U.S. Long Bond | (17) | 03/2023 | USD | (2,159,000) | — | (28,459) |
| U.S. Treasury 10-Year Note | (433) | 03/2023 | USD | (49,145,500) | — | (389,954) |
| Total | | | | | — | (418,413) |
| Call option contracts purchased |
| Description | Counterparty | Trading
currency | Notional
amount | Number of
contracts | Exercise
price/Rate | Expiration
date | Cost ($) | Value ($) |
| 10-Year OTC interest rate swap with Citi to receive exercise rate and pay SOFR | Citi | USD | 45,560,000 | 45,560,000 | 2.25 | 04/27/2023 | 1,093,440 | 127,540 |
| 10-Year OTC interest rate swap with Citi to receive exercise rate and pay SOFR | Citi | USD | 91,220,000 | 91,220,000 | 2.50 | 05/12/2023 | 2,727,478 | 539,384 |
| 10-Year OTC interest rate swap with Citi to receive exercise rate and pay SOFR | Citi | USD | 90,000,000 | 90,000,000 | 2.75 | 06/26/2023 | 2,922,750 | 1,151,244 |
| 10-Year OTC interest rate swap with Citi to receive exercise rate and pay SOFR | Citi | USD | 33,990,000 | 33,990,000 | 2.75 | 07/11/2023 | 1,189,650 | 466,734 |
| 10-Year OTC interest rate swap with Citi to receive exercise rate and pay SOFR | Citi | USD | 150,000,000 | 150,000,000 | 2.00 | 08/03/2023 | 2,527,500 | 625,035 |
The accompanying Notes to Financial Statements are an integral part of this statement.
| 14 | Columbia Quality Income Fund | Semiannual Report 2022 |
Portfolio of Investments (continued)
November 30, 2022 (Unaudited)
| Call option contracts purchased (continued) |
| Description | Counterparty | Trading
currency | Notional
amount | Number of
contracts | Exercise
price/Rate | Expiration
date | Cost ($) | Value ($) |
| 10-Year OTC interest rate swap with Citi to receive exercise rate and pay SOFR | Citi | USD | 50,000,000 | 50,000,000 | 3.50 | 10/27/2023 | 1,900,000 | 2,503,815 |
| 10-Year OTC interest rate swap with Citi to receive exercise rate and pay SOFR | Citi | USD | 40,000,000 | 40,000,000 | 3.50 | 10/27/2023 | 1,420,000 | 2,003,052 |
| 10-Year OTC interest rate swap with Citi to receive exercise rate and pay SOFR | Citi | USD | 68,970,000 | 68,970,000 | 3.30 | 11/14/2023 | 2,207,040 | 2,863,372 |
| 10-Year OTC interest rate swap with Citi to receive exercise rate and pay SOFR | Citi | USD | 75,000,000 | 75,000,000 | 3.00 | 11/30/2023 | 2,306,250 | 2,306,250 |
| 10-Year OTC interest rate swap with JPMorgan to receive exercise rate and pay SOFR | JPMorgan | USD | 130,000,000 | 130,000,000 | 2.25 | 05/26/2023 | 2,600,000 | 519,428 |
| 10-Year OTC interest rate swap with Morgan Stanley to receive exercise rate and pay SOFR | Morgan Stanley | USD | 75,000,000 | 75,000,000 | 2.25 | 04/27/2023 | 1,788,750 | 209,955 |
| 10-Year OTC interest rate swap with Morgan Stanley to receive exercise rate and pay SOFR | Morgan Stanley | USD | 91,220,000 | 91,220,000 | 2.50 | 05/12/2023 | 2,814,137 | 539,384 |
| 10-Year OTC interest rate swap with Morgan Stanley to receive exercise rate and pay SOFR | Morgan Stanley | USD | 100,000,000 | 100,000,000 | 3.65 | 11/10/2023 | 3,850,000 | 5,894,230 |
| Total | | | | | | | 29,346,995 | 19,749,423 |
| Put option contracts written |
| Description | Counterparty | Trading
currency | Notional
amount | Number of
contracts | Exercise
price/Rate | Expiration
date | Premium
received ($) | Value ($) |
| 10-Year OTC interest rate swap with Citi to receive exercise rate and pay SOFR | Citi | USD | (110,000,000) | (110,000,000) | 3.60 | 01/05/2023 | (1,760,000) | (701,657) |
| 10-Year OTC interest rate swap with Morgan Stanley to receive exercise rate and pay SOFR | Morgan Stanley | USD | (70,750,000) | (70,750,000) | 3.75 | 12/29/2022 | (1,061,250) | (212,462) |
| 10-Year OTC interest rate swap with Morgan Stanley to receive exercise rate and pay SOFR | Morgan Stanley | USD | (58,500,000) | (58,500,000) | 3.90 | 01/27/2023 | (1,096,876) | (231,017) |
| Total | | | | | | | (3,918,126) | (1,145,136) |
| Credit default swap contracts - sell protection |
Reference
entity | Counterparty | Maturity
date | Receive
fixed
rate
(%) | Payment
frequency | Implied
credit
spread
(%)* | Notional
currency | Notional
amount | Value
($) | Periodic
payments
receivable
(payable)
($) | Upfront
payments
($) | Upfront
receipts
($) | Unrealized
appreciation
($) | Unrealized
depreciation
($) |
| Markit CMBX North America Index, Series 10 BBB- | Citi | 11/17/2059 | 3.000 | Monthly | 8.821 | USD | 10,000,000 | (1,767,188) | 5,000 | — | (1,199,752) | — | (562,436) |
| Markit CMBX North America Index, Series 10 BBB- | JPMorgan | 11/17/2059 | 3.000 | Monthly | 8.821 | USD | 10,000,000 | (1,767,188) | 5,000 | — | (1,696,100) | — | (66,088) |
| Markit CMBX North America Index, Series 10 BBB- | Morgan Stanley | 11/17/2059 | 3.000 | Monthly | 8.821 | USD | 20,000,000 | (3,534,376) | 10,000 | — | (3,709,984) | 185,608 | — |
| Markit CMBX North America Index, Series 10 BBB- | Morgan Stanley | 11/17/2059 | 3.000 | Monthly | 8.821 | USD | 5,000,000 | (883,594) | 2,500 | — | (807,641) | — | (73,453) |
| Markit CMBX North America Index, Series 10 BBB- | Morgan Stanley | 11/17/2059 | 3.000 | Monthly | 8.821 | USD | 10,000,000 | (1,767,188) | 5,000 | — | (1,560,909) | — | (201,279) |
| Markit CMBX North America Index, Series 7 BBB- | Morgan Stanley | 01/17/2047 | 3.000 | Monthly | 30.695 | USD | 5,000,000 | (1,045,312) | 2,500 | — | (268,192) | — | (774,620) |
| Total | | | | | | | | (10,764,846) | 30,000 | — | (9,242,578) | 185,608 | (1,677,876) |
The accompanying Notes to Financial Statements are an integral part of this statement.
Columbia Quality Income Fund | Semiannual Report 2022
| 15 |
Portfolio of Investments (continued)
November 30, 2022 (Unaudited)
| * | Implied credit spreads, represented in absolute terms, utilized in determining the market value of credit default swap agreements on corporate or sovereign issues as of period end serve as an indicator of the current status of the payment/performance risk and represent the likelihood or risk of default for the credit derivative. The implied credit spread of a particular referenced entity reflects the cost of buying/selling protection and may include upfront payments required to be made to enter into the agreement. Wider credit spreads represent a deterioration of the referenced entity’s credit soundness and a greater likelihood or risk of default or other credit event occurring as defined under the terms of the agreement. |
Notes to Portfolio of Investments
| (a) | Represents privately placed and other securities and instruments exempt from Securities and Exchange Commission registration (collectively, private placements), such as Section 4(a)(2) and Rule 144A eligible securities, which are often sold only to qualified institutional buyers. At November 30, 2022, the total value of these securities amounted to $585,716,365, which represents 39.30% of total net assets. |
| (b) | Variable rate security. The interest rate shown was the current rate as of November 30, 2022. |
| (c) | Variable or floating rate security, the interest rate of which adjusts periodically based on changes in current interest rates and prepayments on the underlying pool of assets. The interest rate shown was the current rate as of November 30, 2022. |
| (d) | Represents interest only securities which have the right to receive the monthly interest payments on an underlying pool of mortgage loans. |
| (e) | This security or a portion of this security has been pledged as collateral in connection with derivative contracts. |
| (f) | Represents a security purchased on a when-issued basis. |
| (g) | Valuation based on significant unobservable inputs. |
| (h) | Represents fair value as determined in good faith under procedures approved by the Board of Trustees. At November 30, 2022, the total value of these securities amounted to $21,472,520, which represents 1.44% of total net assets. |
| (i) | The rate shown is the seven-day current annualized yield at November 30, 2022. |
| (j) | As defined in the Investment Company Act of 1940, as amended, an affiliated company is one in which the Fund owns 5% or more of the company’s outstanding voting securities, or a company which is under common ownership or control with the Fund. The value of the holdings and transactions in these affiliated companies during the period ended November 30, 2022 are as follows: |
| Affiliated issuers | Beginning
of period($) | Purchases($) | Sales($) | Net change in
unrealized
appreciation
(depreciation)($) | End of
period($) | Realized gain
(loss)($) | Dividends($) | End of
period shares |
| Columbia Short-Term Cash Fund, 3.989% |
| | 50,324,422 | 538,798,109 | (469,073,601) | — | 120,048,930 | 21,655 | 1,010,135 | 120,096,969 |
Abbreviation Legend
| CMO | Collateralized Mortgage Obligation |
| FHLMC | Federal Home Loan Mortgage Corporation |
| LIBOR | London Interbank Offered Rate |
| SOFR | Secured Overnight Financing Rate |
| STRIPS | Separate Trading of Registered Interest and Principal Securities |
| TBA | To Be Announced |
Currency Legend
Fair value measurements
The Fund categorizes its fair value measurements according to a three-level hierarchy that maximizes the use of observable inputs and minimizes the use of unobservable inputs by prioritizing that the most observable input be used when available. Observable inputs are those that market participants would use in pricing an investment based on market data obtained from sources independent of the reporting entity. Unobservable inputs are those that reflect the Fund’s assumptions about the information market participants would use in pricing an investment. An investment’s level within the fair value hierarchy is based on the lowest level of any input that is deemed significant to the asset’s or liability’s fair value measurement. The input levels are not necessarily an indication of the risk or liquidity associated with investments at that level. For example, certain U.S. government securities are generally high quality and liquid, however, they are reflected as Level 2 because the inputs used to determine fair value may not always be quoted prices in an active market.
Fair value inputs are summarized in the three broad levels listed below:
| ■ | Level 1 — Valuations based on quoted prices for investments in active markets that the Fund has the ability to access at the measurement date. Valuation adjustments are not applied to Level 1 investments. |
| ■ | Level 2 — Valuations based on other significant observable inputs (including quoted prices for similar securities, interest rates, prepayment speeds, credit risks, etc.). |
| ■ | Level 3 — Valuations based on significant unobservable inputs (including the Fund’s own assumptions and judgment in determining the fair value of investments). |
The accompanying Notes to Financial Statements are an integral part of this statement.
| 16 | Columbia Quality Income Fund | Semiannual Report 2022 |
Portfolio of Investments (continued)
November 30, 2022 (Unaudited)
Fair value measurements (continued)
Inputs that are used in determining fair value of an investment may include price information, credit data, volatility statistics, and other factors. These inputs can be either observable or unobservable. The availability of observable inputs can vary between investments, and is affected by various factors such as the type of investment, and the volume and level of activity for that investment or similar investments in the marketplace. The inputs will be considered by the Investment Manager, along with any other relevant factors in the calculation of an investment’s fair value. The Fund uses prices and inputs that are current as of the measurement date, which may include periods of market dislocations. During these periods, the availability of prices and inputs may be reduced for many investments. This condition could cause an investment to be reclassified between the various levels within the hierarchy.
Investments falling into the Level 3 category are primarily supported by quoted prices from brokers and dealers participating in the market for those investments. However, these may be classified as Level 3 investments due to lack of market transparency and corroboration to support these quoted prices. Additionally, valuation models may be used as the pricing source for any remaining investments classified as Level 3. These models may rely on one or more significant unobservable inputs and/or significant assumptions by the Investment Manager. Inputs used in valuations may include, but are not limited to, financial statement analysis, capital account balances, discount rates and estimated cash flows, and comparable company data.
The Fund’s Board of Trustees (the Board) has designated the Investment Manager, through its Valuation Committee (the Committee), as valuation designee, responsible for determining the fair value of the assets of the Fund for which market quotations are not readily available using valuation procedures approved by the Board. The Committee consists of voting and non-voting members from various groups within the Investment Manager’s organization, including operations and accounting, trading and investments, compliance, risk management and legal.
The Committee meets at least monthly to review and approve valuation matters, which may include a description of specific valuation determinations, data regarding pricing information received from approved pricing vendors and brokers and the results of Board-approved valuation policies and procedures (the Policies). The Policies address, among other things, instances when market quotations are or are not readily available, including recommendations of third party pricing vendors and a determination of appropriate pricing methodologies; events that require specific valuation determinations and assessment of fair value techniques; securities with a potential for stale pricing, including those that are illiquid, restricted, or in default; and the effectiveness of third party pricing vendors, including periodic reviews of vendors. The Committee meets more frequently, as needed, to discuss additional valuation matters, which may include the need to review back-testing results, review time-sensitive information or approve related valuation actions. Representatives of Columbia Management Investment Advisers, LLC report to the Board at each of its regularly scheduled meetings to discuss valuation matters and actions during the period, similar to those described earlier.
The following table is a summary of the inputs used to value the Fund’s investments at November 30, 2022:
| | Level 1 ($) | Level 2 ($) | Level 3 ($) | Total ($) |
| Investments in Securities | | | | |
| Asset-Backed Securities — Non-Agency | — | 172,330,619 | — | 172,330,619 |
| Commercial Mortgage-Backed Securities - Agency | — | 45,090,321 | — | 45,090,321 |
| Commercial Mortgage-Backed Securities - Non-Agency | — | 138,170,746 | — | 138,170,746 |
| Residential Mortgage-Backed Securities - Agency | — | 1,179,968,379 | — | 1,179,968,379 |
| Residential Mortgage-Backed Securities - Non-Agency | — | 233,482,483 | 41,732,517 | 275,215,000 |
| Options Purchased Calls | — | 19,749,423 | — | 19,749,423 |
| Money Market Funds | 120,048,930 | — | — | 120,048,930 |
| Total Investments in Securities | 120,048,930 | 1,788,791,971 | 41,732,517 | 1,950,573,418 |
| Investments in Derivatives | | | | |
| Asset | | | | |
| Futures Contracts | 701,301 | — | — | 701,301 |
| Swap Contracts | — | 185,608 | — | 185,608 |
| Liability | | | | |
| Futures Contracts | (630,347) | — | — | (630,347) |
| Options Contracts Written | — | (1,145,136) | — | (1,145,136) |
| Swap Contracts | — | (1,677,876) | — | (1,677,876) |
| Total | 120,119,884 | 1,786,154,567 | 41,732,517 | 1,948,006,968 |
See the Portfolio of Investments for all investment classifications not indicated in the table.
The Fund’s assets assigned to the Level 2 input category are generally valued using the market approach, in which a security’s value is determined through reference to prices and information from market transactions for similar or identical assets.
Futures contracts and swap contracts are valued at unrealized appreciation (depreciation).
The accompanying Notes to Financial Statements are an integral part of this statement.
Columbia Quality Income Fund | Semiannual Report 2022
| 17 |
Portfolio of Investments (continued)
November 30, 2022 (Unaudited)
Fair value measurements (continued)
The following table is a reconciliation of Level 3 assets for which significant observable and unobservable inputs were used to determine fair value:
| | Balance
as of
05/31/2022
($) | Increase
(decrease)
in accrued
discounts/
premiums
($) | Realized
gain (loss)
($) | Change
in unrealized
appreciation
(depreciation)(a)
($) | Purchases
($) | Sales
($) | Transfers
into
Level 3
($) | Transfers
out of
Level 3
($) | Balance
as of
11/30/2022
($) |
| Asset-Backed Securities — Non-Agency | 2,468,000 | (1,047,926) | 2,013,203 | (1,608,277) | — | (1,825,000) | — | — | — |
| Residential Mortgage-Backed Securities — Non-Agency | 68,153,339 | 28,710 | 42,322 | (1,343,462) | — | (25,148,392) | — | — | 41,732,517 |
| Total | 70,621,339 | (1,019,216) | 2,055,525 | (2,951,739) | — | (26,973,392) | — | — | 41,732,517 |
(a) Change in unrealized appreciation (depreciation) relating to securities held at November 30, 2022 was $(1,369,451) which is comprised of Residential Mortgage-Backed Securities — Non-Agency of $(1,369,451).
The Fund’s assets assigned to the Level 3 category are valued utilizing the valuation technique deemed the most appropriate in the circumstances. Certain residential mortgage backed securities classified as Level 3 are valued using the market approach and utilize single market quotations from broker dealers which may have included, but not limited to, the distressed nature of the security and observable transactions for similar assets in the market. Significant increases (decreases) to any of these inputs would have resulted in a significantly higher (lower) fair value measurement.
The accompanying Notes to Financial Statements are an integral part of this statement.
| 18 | Columbia Quality Income Fund | Semiannual Report 2022 |
Statement of Assets and Liabilities
November 30, 2022 (Unaudited)
| Assets | |
| Investments in securities, at value | |
| Unaffiliated issuers (cost $1,978,609,306) | $1,810,775,065 |
| Affiliated issuers (cost $120,048,930) | 120,048,930 |
| Options purchased (cost $29,346,995) | 19,749,423 |
| Cash collateral held at broker for: | |
| Swap contracts | 3,542,000 |
| Other(a) | 980,000 |
| Unrealized appreciation on swap contracts | 185,608 |
| Receivable for: | |
| Investments sold | 1,904 |
| Investments sold on a delayed delivery basis | 61,911,250 |
| Capital shares sold | 4,932,994 |
| Dividends | 376,037 |
| Interest | 5,775,430 |
| Variation margin for futures contracts | 1,369,966 |
| Expense reimbursement due from Investment Manager | 573 |
| Prepaid expenses | 17,657 |
| Other assets | 9,030 |
| Total assets | 2,029,675,867 |
| Liabilities | |
| Option contracts written, at value (premiums received $3,918,126) | 1,145,136 |
| Due to custodian | 49,823 |
| Unrealized depreciation on swap contracts | 1,677,876 |
| Upfront receipts on swap contracts | 9,242,578 |
| Payable for: | |
| Investments purchased | 38,003,673 |
| Investments purchased on a delayed delivery basis | 480,729,545 |
| Capital shares purchased | 2,558,380 |
| Distributions to shareholders | 4,790,588 |
| Variation margin for futures contracts | 802,547 |
| Management services fees | 19,932 |
| Distribution and/or service fees | 2,116 |
| Transfer agent fees | 72,477 |
| Compensation of board members | 175,741 |
| Compensation of chief compliance officer | 150 |
| Other expenses | 63,912 |
| Total liabilities | 539,334,474 |
| Net assets applicable to outstanding capital stock | $1,490,341,393 |
| Represented by | |
| Paid in capital | 1,882,319,851 |
| Total distributable earnings (loss) | (391,978,458) |
| Total - representing net assets applicable to outstanding capital stock | $1,490,341,393 |
The accompanying Notes to Financial Statements are an integral part of this statement.
Columbia Quality Income Fund | Semiannual Report 2022
| 19 |
Statement of Assets and Liabilities (continued)
November 30, 2022 (Unaudited)
| Class A | |
| Net assets | $273,251,061 |
| Shares outstanding | 15,103,218 |
| Net asset value per share | $18.09 |
| Maximum sales charge | 3.00% |
| Maximum offering price per share (calculated by dividing the net asset value per share by 1.0 minus the maximum sales charge for Class A shares) | $18.65 |
| Advisor Class | |
| Net assets | $24,737,061 |
| Shares outstanding | 1,368,047 |
| Net asset value per share | $18.08 |
| Class C | |
| Net assets | $8,398,494 |
| Shares outstanding | 463,436 |
| Net asset value per share | $18.12 |
| Institutional Class | |
| Net assets | $264,428,358 |
| Shares outstanding | 14,624,995 |
| Net asset value per share | $18.08 |
| Institutional 2 Class | |
| Net assets | $21,243,229 |
| Shares outstanding | 1,174,883 |
| Net asset value per share | $18.08 |
| Institutional 3 Class | |
| Net assets | $896,085,870 |
| Shares outstanding | 49,758,676 |
| Net asset value per share | $18.01 |
| Class R | |
| Net assets | $2,197,320 |
| Shares outstanding | 121,546 |
| Net asset value per share | $18.08 |
| (a) | Includes collateral related to options contracts written and swap contracts. |
The accompanying Notes to Financial Statements are an integral part of this statement.
| 20 | Columbia Quality Income Fund | Semiannual Report 2022 |
Statement of Operations
Six Months Ended November 30, 2022 (Unaudited)
| Net investment income | |
| Income: | |
| Dividends — affiliated issuers | $1,010,135 |
| Interest | 28,645,914 |
| Interfund lending | 2,359 |
| Total income | 29,658,408 |
| Expenses: | |
| Management services fees | 3,815,658 |
| Distribution and/or service fees | |
| Class A | 370,223 |
| Class C | 52,585 |
| Class R | 6,208 |
| Transfer agent fees | |
| Class A | 229,428 |
| Advisor Class | 22,504 |
| Class C | 8,125 |
| Institutional Class | 215,101 |
| Institutional 2 Class | 6,372 |
| Institutional 3 Class | 28,496 |
| Class R | 1,922 |
| Compensation of board members | 9,076 |
| Custodian fees | 17,682 |
| Printing and postage fees | 33,690 |
| Registration fees | 66,646 |
| Audit fees | 25,270 |
| Legal fees | 16,423 |
| Interest on collateral | 78,804 |
| Compensation of chief compliance officer | 150 |
| Other | 17,943 |
| Total expenses | 5,022,306 |
| Fees waived or expenses reimbursed by Investment Manager and its affiliates | (39,423) |
| Fees waived by transfer agent | |
| Institutional 2 Class | (573) |
| Expense reduction | (3,838) |
| Total net expenses | 4,978,472 |
| Net investment income | 24,679,936 |
| Realized and unrealized gain (loss) — net | |
| Net realized gain (loss) on: | |
| Investments — unaffiliated issuers | (49,844,949) |
| Investments — affiliated issuers | 21,655 |
| Futures contracts | (46,636,730) |
| Options purchased | 10,152,348 |
| Options contracts written | (16,653,045) |
| Swap contracts | 1,235,188 |
| Net realized loss | (101,725,533) |
| Net change in unrealized appreciation (depreciation) on: | |
| Investments — unaffiliated issuers | (51,864,355) |
| Futures contracts | (297,722) |
| Options purchased | (19,569,370) |
| Options contracts written | 15,744,750 |
| Swap contracts | (3,401,531) |
| Net change in unrealized appreciation (depreciation) | (59,388,228) |
| Net realized and unrealized loss | (161,113,761) |
| Net decrease in net assets resulting from operations | $(136,433,825) |
The accompanying Notes to Financial Statements are an integral part of this statement.
Columbia Quality Income Fund | Semiannual Report 2022
| 21 |
Statement of Changes in Net Assets
| | Six Months Ended
November 30, 2022
(Unaudited) | Year Ended
May 31, 2022 |
| Operations | | |
| Net investment income | $24,679,936 | $50,609,909 |
| Net realized loss | (101,725,533) | (97,561,435) |
| Net change in unrealized appreciation (depreciation) | (59,388,228) | (180,617,511) |
| Net decrease in net assets resulting from operations | (136,433,825) | (227,569,037) |
| Distributions to shareholders | | |
| Net investment income and net realized gains | | |
| Class A | (4,206,038) | (6,748,034) |
| Advisor Class | (445,170) | (1,139,219) |
| Class C | (107,831) | (167,123) |
| Institutional Class | (4,270,084) | (9,277,490) |
| Institutional 2 Class | (351,254) | (732,645) |
| Institutional 3 Class | (14,820,557) | (25,074,485) |
| Class R | (31,958) | (68,666) |
| Total distributions to shareholders | (24,232,892) | (43,207,662) |
| Decrease in net assets from capital stock activity | (67,171,100) | (284,593,108) |
| Total decrease in net assets | (227,837,817) | (555,369,807) |
| Net assets at beginning of period | 1,718,179,210 | 2,273,549,017 |
| Net assets at end of period | $1,490,341,393 | $1,718,179,210 |
The accompanying Notes to Financial Statements are an integral part of this statement.
| 22 | Columbia Quality Income Fund | Semiannual Report 2022 |
Statement of Changes in Net Assets (continued)
| | Six Months Ended | Year Ended |
| | November 30, 2022 (Unaudited) | May 31, 2022 |
| | Shares | Dollars ($) | Shares | Dollars ($) |
| Capital stock activity |
| Class A | | | | |
| Subscriptions | 572,204 | 10,841,708 | 1,984,813 | 43,861,129 |
| Distributions reinvested | 173,004 | 3,212,829 | 237,245 | 5,181,270 |
| Redemptions | (1,793,216) | (33,464,398) | (4,849,505) | (106,035,059) |
| Net decrease | (1,048,008) | (19,409,861) | (2,627,447) | (56,992,660) |
| Advisor Class | | | | |
| Subscriptions | 102,365 | 1,942,390 | 1,072,876 | 24,027,547 |
| Distributions reinvested | 22,204 | 412,918 | 48,850 | 1,069,711 |
| Redemptions | (437,959) | (8,187,632) | (2,179,374) | (46,789,753) |
| Net decrease | (313,390) | (5,832,324) | (1,057,648) | (21,692,495) |
| Class C | | | | |
| Subscriptions | 17,102 | 298,253 | 193,529 | 4,361,303 |
| Distributions reinvested | 5,077 | 94,392 | 6,913 | 151,525 |
| Redemptions | (201,114) | (3,754,673) | (337,886) | (7,365,751) |
| Net decrease | (178,935) | (3,362,028) | (137,444) | (2,852,923) |
| Institutional Class | | | | |
| Subscriptions | 3,772,567 | 68,438,673 | 4,371,659 | 97,210,740 |
| Distributions reinvested | 204,433 | 3,792,253 | 323,956 | 7,078,900 |
| Redemptions | (5,932,510) | (112,563,641) | (10,864,871) | (234,639,662) |
| Net decrease | (1,955,510) | (40,332,715) | (6,169,256) | (130,350,022) |
| Institutional 2 Class | | | | |
| Subscriptions | 259,472 | 4,999,802 | 520,816 | 11,500,378 |
| Distributions reinvested | 18,944 | 351,052 | 33,348 | 731,318 |
| Redemptions | (336,625) | (6,322,448) | (1,119,144) | (24,603,407) |
| Net decrease | (58,209) | (971,594) | (564,980) | (12,371,711) |
| Institutional 3 Class | | | | |
| Subscriptions | 8,819,697 | 162,049,847 | 7,256,559 | 159,522,579 |
| Distributions reinvested | 766,770 | 14,186,134 | 1,097,694 | 23,824,955 |
| Redemptions | (9,330,525) | (173,130,938) | (11,505,626) | (241,592,634) |
| Net increase (decrease) | 255,942 | 3,105,043 | (3,151,373) | (58,245,100) |
| Class R | | | | |
| Subscriptions | 2,362 | 43,290 | 14,878 | 331,816 |
| Distributions reinvested | 1,722 | 31,958 | 3,134 | 68,664 |
| Redemptions | (23,708) | (442,869) | (116,899) | (2,488,677) |
| Net decrease | (19,624) | (367,621) | (98,887) | (2,088,197) |
| Total net decrease | (3,317,734) | (67,171,100) | (13,807,035) | (284,593,108) |
The accompanying Notes to Financial Statements are an integral part of this statement.
Columbia Quality Income Fund | Semiannual Report 2022
| 23 |
The following table is intended to help you understand the Fund’s financial performance. Certain information reflects financial results for a single share of a class held for the periods shown. Per share net investment income (loss) amounts are calculated based on average shares outstanding during the period. Total return assumes reinvestment of all dividends and distributions, if any. Total return does not reflect payment of sales charges, if any. Total return and portfolio turnover are not annualized for periods of less than one year. The portfolio turnover rate is calculated without regard to purchase and sales transactions of short-term instruments and certain derivatives, if any. If such transactions were included, the Fund’s portfolio turnover rate may be higher.
| | Net asset value,
beginning of
period | Net
investment
income | Net
realized
and
unrealized
gain (loss) | Total from
investment
operations | Distributions
from net
investment
income | Distributions
from net
realized
gains | Total
distributions to
shareholders |
| Class A(c) |
| Six Months Ended 11/30/2022 (Unaudited) | $20.05 | 0.27 | (1.96) | (1.69) | (0.27) | — | (0.27) |
| Year Ended 5/31/2022 | $22.86 | 0.46 | (2.89) | (2.43) | (0.38) | — | (0.38) |
| Year Ended 5/31/2021 | $22.20 | 0.61 | 1.00 | 1.61 | (0.68) | (0.27) | (0.95) |
| Year Ended 5/31/2020 | $22.10 | 0.56 | 0.06 | 0.62 | (0.52) | — | (0.52) |
| Year Ended 5/31/2019 | $21.35 | 0.64 | 0.63 | 1.27 | (0.52) | — | (0.52) |
| Year Ended 5/31/2018 | $21.94 | 0.56 | (0.55) | 0.01 | (0.60) | — | (0.60) |
| Advisor Class(c) |
| Six Months Ended 11/30/2022 (Unaudited) | $20.04 | 0.30 | (1.97) | (1.67) | (0.29) | — | (0.29) |
| Year Ended 5/31/2022 | $22.84 | 0.51 | (2.87) | (2.36) | (0.44) | — | (0.44) |
| Year Ended 5/31/2021 | $22.19 | 0.67 | 0.99 | 1.66 | (0.74) | (0.27) | (1.01) |
| Year Ended 5/31/2020 | $22.09 | 0.64 | 0.06 | 0.70 | (0.60) | — | (0.60) |
| Year Ended 5/31/2019 | $21.34 | 0.68 | 0.67 | 1.35 | (0.60) | — | (0.60) |
| Year Ended 5/31/2018 | $21.92 | 0.60 | (0.50) | 0.10 | (0.68) | — | (0.68) |
| Class C(c) |
| Six Months Ended 11/30/2022 (Unaudited) | $20.08 | 0.20 | (1.96) | (1.76) | (0.20) | — | (0.20) |
| Year Ended 5/31/2022 | $22.90 | 0.29 | (2.89) | (2.60) | (0.22) | — | (0.22) |
| Year Ended 5/31/2021 | $22.24 | 0.44 | 1.00 | 1.44 | (0.51) | (0.27) | (0.78) |
| Year Ended 5/31/2020 | $22.14 | 0.40 | 0.06 | 0.46 | (0.36) | — | (0.36) |
| Year Ended 5/31/2019 | $21.39 | 0.48 | 0.63 | 1.11 | (0.36) | — | (0.36) |
| Year Ended 5/31/2018 | $21.97 | 0.40 | (0.54) | (0.14) | (0.44) | — | (0.44) |
| Institutional Class(c) |
| Six Months Ended 11/30/2022 (Unaudited) | $20.04 | 0.30 | (1.97) | (1.67) | (0.29) | — | (0.29) |
| Year Ended 5/31/2022 | $22.84 | 0.51 | (2.87) | (2.36) | (0.44) | — | (0.44) |
| Year Ended 5/31/2021 | $22.19 | 0.66 | 1.00 | 1.66 | (0.74) | (0.27) | (1.01) |
| Year Ended 5/31/2020 | $22.09 | 0.64 | 0.06 | 0.70 | (0.60) | — | (0.60) |
| Year Ended 5/31/2019 | $21.34 | 0.68 | 0.67 | 1.35 | (0.60) | — | (0.60) |
| Year Ended 5/31/2018 | $21.92 | 0.60 | (0.50) | 0.10 | (0.68) | — | (0.68) |
| Institutional 2 Class(c) |
| Six Months Ended 11/30/2022 (Unaudited) | $20.04 | 0.31 | (1.97) | (1.66) | (0.30) | — | (0.30) |
| Year Ended 5/31/2022 | $22.84 | 0.53 | (2.88) | (2.35) | (0.45) | — | (0.45) |
| Year Ended 5/31/2021 | $22.19 | 0.68 | 1.00 | 1.68 | (0.76) | (0.27) | (1.03) |
| Year Ended 5/31/2020 | $22.09 | 0.64 | 0.06 | 0.70 | (0.60) | — | (0.60) |
| Year Ended 5/31/2019 | $21.35 | 0.72 | 0.62 | 1.34 | (0.60) | — | (0.60) |
| Year Ended 5/31/2018 | $21.93 | 0.64 | (0.54) | 0.10 | (0.68) | — | (0.68) |
The accompanying Notes to Financial Statements are an integral part of this statement.
| 24 | Columbia Quality Income Fund | Semiannual Report 2022 |
Financial Highlights (continued)
| | Net
asset
value,
end of
period | Total
return | Total gross
expense
ratio to
average
net assets(a) | Total net
expense
ratio to
average
net assets(a),(b) | Net investment
income
ratio to
average
net assets | Portfolio
turnover | Net
assets,
end of
period
(000’s) |
| Class A(c) |
| Six Months Ended 11/30/2022 (Unaudited) | $18.09 | (8.46%) | 0.93%(d),(e) | 0.92%(d),(e),(f) | 2.90%(d) | 158% | $273,251 |
| Year Ended 5/31/2022 | $20.05 | (10.74%) | 0.89%(e) | 0.89%(e),(f) | 2.06% | 207% | $323,845 |
| Year Ended 5/31/2021 | $22.86 | 7.36% | 0.91%(e) | 0.90%(e),(f) | 2.69% | 319% | $429,196 |
| Year Ended 5/31/2020 | $22.20 | 2.81% | 0.92%(e) | 0.90%(e),(f) | 2.61% | 326% | $421,105 |
| Year Ended 5/31/2019 | $22.10 | 6.12% | 0.93%(e) | 0.92%(e),(f) | 2.96% | 302% | $453,821 |
| Year Ended 5/31/2018 | $21.35 | 0.22% | 0.93% | 0.91%(f) | 2.58% | 311% | $494,616 |
| Advisor Class(c) |
| Six Months Ended 11/30/2022 (Unaudited) | $18.08 | (8.35%) | 0.68%(d),(e) | 0.67%(d),(e),(f) | 3.14%(d) | 158% | $24,737 |
| Year Ended 5/31/2022 | $20.04 | (10.49%) | 0.64%(e) | 0.64%(e),(f) | 2.30% | 207% | $33,695 |
| Year Ended 5/31/2021 | $22.84 | 7.53% | 0.66%(e) | 0.65%(e),(f) | 2.94% | 319% | $62,560 |
| Year Ended 5/31/2020 | $22.19 | 3.25% | 0.67%(e) | 0.65%(e),(f) | 2.87% | 326% | $99,749 |
| Year Ended 5/31/2019 | $22.09 | 6.21% | 0.68%(e) | 0.67%(e),(f) | 3.22% | 302% | $90,690 |
| Year Ended 5/31/2018 | $21.34 | 0.48% | 0.67% | 0.67%(f) | 2.83% | 311% | $85,695 |
| Class C(c) |
| Six Months Ended 11/30/2022 (Unaudited) | $18.12 | (8.78%) | 1.68%(d),(e) | 1.67%(d),(e),(f) | 2.13%(d) | 158% | $8,398 |
| Year Ended 5/31/2022 | $20.08 | (11.44%) | 1.64%(e) | 1.64%(e),(f) | 1.31% | 207% | $12,902 |
| Year Ended 5/31/2021 | $22.90 | 6.54% | 1.66%(e) | 1.65%(e),(f) | 1.94% | 319% | $17,854 |
| Year Ended 5/31/2020 | $22.24 | 2.23% | 1.67%(e) | 1.66%(e),(f) | 1.86% | 326% | $21,452 |
| Year Ended 5/31/2019 | $22.14 | 5.14% | 1.68%(e) | 1.67%(e),(f) | 2.20% | 302% | $22,792 |
| Year Ended 5/31/2018 | $21.39 | (0.53%) | 1.67% | 1.66%(f) | 1.84% | 311% | $29,850 |
| Institutional Class(c) |
| Six Months Ended 11/30/2022 (Unaudited) | $18.08 | (8.35%) | 0.68%(d),(e) | 0.67%(d),(e),(f) | 3.14%(d) | 158% | $264,428 |
| Year Ended 5/31/2022 | $20.04 | (10.49%) | 0.64%(e) | 0.64%(e),(f) | 2.30% | 207% | $332,225 |
| Year Ended 5/31/2021 | $22.84 | 7.53% | 0.66%(e) | 0.65%(e),(f) | 2.93% | 319% | $519,577 |
| Year Ended 5/31/2020 | $22.19 | 3.25% | 0.67%(e) | 0.65%(e),(f) | 2.86% | 326% | $522,050 |
| Year Ended 5/31/2019 | $22.09 | 6.41% | 0.68%(e) | 0.67%(e),(f) | 3.23% | 302% | $603,089 |
| Year Ended 5/31/2018 | $21.34 | 0.29% | 0.67% | 0.66%(f) | 2.83% | 311% | $534,970 |
| Institutional 2 Class(c) |
| Six Months Ended 11/30/2022 (Unaudited) | $18.08 | (8.30%) | 0.58%(d),(e) | 0.58%(d),(e) | 3.25%(d) | 158% | $21,243 |
| Year Ended 5/31/2022 | $20.04 | (10.41%) | 0.56%(e) | 0.56%(e) | 2.37% | 207% | $24,711 |
| Year Ended 5/31/2021 | $22.84 | 7.62% | 0.57%(e) | 0.56%(e) | 2.99% | 319% | $41,073 |
| Year Ended 5/31/2020 | $22.19 | 3.35% | 0.58%(e) | 0.56%(e) | 2.96% | 326% | $30,795 |
| Year Ended 5/31/2019 | $22.09 | 6.32% | 0.58%(e) | 0.56%(e) | 3.34% | 302% | $37,589 |
| Year Ended 5/31/2018 | $21.35 | 0.58% | 0.57% | 0.57% | 2.91% | 311% | $34,203 |
The accompanying Notes to Financial Statements are an integral part of this statement.
Columbia Quality Income Fund | Semiannual Report 2022
| 25 |
Financial Highlights (continued)
| | Net asset value,
beginning of
period | Net
investment
income | Net
realized
and
unrealized
gain (loss) | Total from
investment
operations | Distributions
from net
investment
income | Distributions
from net
realized
gains | Total
distributions to
shareholders |
| Institutional 3 Class(c) |
| Six Months Ended 11/30/2022 (Unaudited) | $19.96 | 0.31 | (1.96) | (1.65) | (0.30) | — | (0.30) |
| Year Ended 5/31/2022 | $22.75 | 0.54 | (2.87) | (2.33) | (0.46) | — | (0.46) |
| Year Ended 5/31/2021 | $22.10 | 0.69 | 0.99 | 1.68 | (0.76) | (0.27) | (1.03) |
| Year Ended 5/31/2020 | $22.00 | 0.68 | 0.06 | 0.74 | (0.64) | — | (0.64) |
| Year Ended 5/31/2019 | $21.25 | 0.72 | 0.63 | 1.35 | (0.60) | — | (0.60) |
| Year Ended 5/31/2018 | $21.83 | 0.64 | (0.54) | 0.10 | (0.68) | — | (0.68) |
| Class R(c) |
| Six Months Ended 11/30/2022 (Unaudited) | $20.04 | 0.25 | (1.96) | (1.71) | (0.25) | — | (0.25) |
| Year Ended 5/31/2022 | $22.84 | 0.40 | (2.87) | (2.47) | (0.33) | — | (0.33) |
| Year Ended 5/31/2021 | $22.18 | 0.54 | 1.01 | 1.55 | (0.62) | (0.27) | (0.89) |
| Year Ended 5/31/2020 | $22.08 | 0.52 | 0.06 | 0.58 | (0.48) | — | (0.48) |
| Year Ended 5/31/2019 | $21.33 | 0.60 | 0.63 | 1.23 | (0.48) | — | (0.48) |
| Year Ended 5/31/2018 | $21.92 | 0.52 | (0.55) | (0.03) | (0.56) | — | (0.56) |
| Notes to Financial Highlights |
| (a) | In addition to the fees and expenses that the Fund bears directly, the Fund indirectly bears a pro rata share of the fees and expenses of any other funds in which it invests. Such indirect expenses are not included in the Fund’s reported expense ratios. |
| (b) | Total net expenses include the impact of certain fee waivers/expense reimbursements made by the Investment Manager and certain of its affiliates, if applicable. |
| (c) | Per share amounts have been adjusted on a retroactive basis to reflect a 4 to 1 reverse stock split completed after the close of business on September 11, 2020. |
| (d) | Annualized. |
| (e) | Ratios include interest on collateral expense. For the periods indicated below, if interest on collateral expense had been excluded, expenses would have been lower by: |
| Class | 11/30/2022 | 5/31/2022 | 5/31/2021 | 5/31/2020 | 5/31/2019 |
| Class A | 0.01% | less than 0.01% | less than 0.01% | 0.01% | less than 0.01% |
| Advisor Class | 0.01% | less than 0.01% | less than 0.01% | 0.01% | less than 0.01% |
| Class C | 0.01% | less than 0.01% | less than 0.01% | 0.01% | less than 0.01% |
| Institutional Class | 0.01% | less than 0.01% | less than 0.01% | 0.01% | less than 0.01% |
| Institutional 2 Class | 0.01% | less than 0.01% | less than 0.01% | 0.01% | less than 0.01% |
| Institutional 3 Class | 0.01% | less than 0.01% | less than 0.01% | 0.01% | less than 0.01% |
| Class R | 0.01% | less than 0.01% | less than 0.01% | 0.01% | less than 0.01% |
| (f) | The benefits derived from expense reductions had an impact of less than 0.01%. |
The accompanying Notes to Financial Statements are an integral part of this statement.
| 26 | Columbia Quality Income Fund | Semiannual Report 2022 |
Financial Highlights (continued)
| | Net
asset
value,
end of
period | Total
return | Total gross
expense
ratio to
average
net assets(a) | Total net
expense
ratio to
average
net assets(a),(b) | Net investment
income
ratio to
average
net assets | Portfolio
turnover | Net
assets,
end of
period
(000’s) |
| Institutional 3 Class(c) |
| Six Months Ended 11/30/2022 (Unaudited) | $18.01 | (8.27%) | 0.53%(d),(e) | 0.53%(d),(e) | 3.29%(d) | 158% | $896,086 |
| Year Ended 5/31/2022 | $19.96 | (10.38%) | 0.51%(e) | 0.51%(e) | 2.45% | 207% | $987,973 |
| Year Ended 5/31/2021 | $22.75 | 7.64% | 0.52%(e) | 0.52%(e) | 3.05% | 319% | $1,197,807 |
| Year Ended 5/31/2020 | $22.10 | 3.40% | 0.53%(e) | 0.51%(e) | 3.01% | 326% | $729,991 |
| Year Ended 5/31/2019 | $22.00 | 6.58% | 0.52%(e) | 0.51%(e) | 3.37% | 302% | $692,552 |
| Year Ended 5/31/2018 | $21.25 | 0.43% | 0.52% | 0.52% | 2.98% | 311% | $765,037 |
| Class R(c) |
| Six Months Ended 11/30/2022 (Unaudited) | $18.08 | (8.58%) | 1.18%(d),(e) | 1.17%(d),(e),(f) | 2.64%(d) | 158% | $2,197 |
| Year Ended 5/31/2022 | $20.04 | (10.94%) | 1.14%(e) | 1.14%(e),(f) | 1.79% | 207% | $2,828 |
| Year Ended 5/31/2021 | $22.84 | 7.00% | 1.16%(e) | 1.15%(e),(f) | 2.40% | 319% | $5,482 |
| Year Ended 5/31/2020 | $22.18 | 2.74% | 1.17%(e) | 1.15%(e),(f) | 2.36% | 326% | $2,711 |
| Year Ended 5/31/2019 | $22.08 | 5.87% | 1.19%(e) | 1.17%(e),(f) | 2.76% | 302% | $1,454 |
| Year Ended 5/31/2018 | $21.33 | (0.21%) | 1.17% | 1.16%(f) | 2.34% | 311% | $735 |
The accompanying Notes to Financial Statements are an integral part of this statement.
Columbia Quality Income Fund | Semiannual Report 2022
| 27 |
Notes to Financial Statements
November 30, 2022 (Unaudited)
Note 1. Organization
Columbia Quality Income Fund (the Fund), a series of Columbia Funds Series Trust II (the Trust), is a diversified fund. The Trust is registered under the Investment Company Act of 1940, as amended (the 1940 Act), as an open-end management investment company organized as a Massachusetts business trust.
Fund shares
The Trust may issue an unlimited number of shares (without par value). The Fund offers each of the share classes listed in the Statement of Assets and Liabilities. Although all share classes generally have identical voting, dividend and liquidation rights, each share class votes separately when required by the Trust’s organizational documents or by law. Each share class has its own expense and sales charge structure. Different share classes may have different minimum initial investment amounts and pay different net investment income distribution amounts to the extent the expenses of distributing such share classes vary. Distributions to shareholders in a liquidation will be proportional to the net asset value of each share class.
As described in the Fund’s prospectus, Class A and Class C shares are offered to the general public for investment. Class C shares automatically convert to Class A shares after 8 years. Advisor Class, Institutional Class, Institutional 2 Class, Institutional 3 Class and Class R shares are available for purchase through authorized investment professionals to omnibus retirement plans or to institutional investors and to certain other investors as also described in the Fund’s prospectus.
Note 2. Summary of significant accounting policies
Basis of preparation
The Fund is an investment company that applies the accounting and reporting guidance in the Financial Accounting Standards Board (FASB) Accounting Standards Codification Topic 946, Financial Services - Investment Companies (ASC 946). The financial statements are prepared in accordance with U.S. generally accepted accounting principles (GAAP), which requires management to make certain estimates and assumptions that affect the reported amounts of assets and liabilities, the disclosure of contingent assets and liabilities at the date of the financial statements and the reported amounts of income and expenses during the reporting period. Actual results could differ from those estimates.
The following is a summary of significant accounting policies followed by the Fund in the preparation of its financial statements.
Security valuation
Asset- and mortgage-backed securities are generally valued by pricing services, which utilize pricing models that incorporate the securities’ cash flow and loan performance data. These models also take into account available market data, including trades, market quotations, and benchmark yield curves for identical or similar securities. Factors used to identify similar securities may include, but are not limited to, issuer, collateral type, vintage, prepayment speeds, collateral performance, credit ratings, credit enhancement and expected life. Asset-backed securities for which quotations are readily available may also be valued based upon an over-the-counter or exchange bid quote from an approved independent broker-dealer. Debt securities maturing in 60 days or less are valued primarily at amortized market value, unless this method results in a valuation that management believes does not approximate fair value.
Investments in open-end investment companies (other than exchange-traded funds (ETFs)), are valued at the latest net asset value reported by those companies as of the valuation time.
Futures and options on futures contracts are valued based upon the settlement price at the close of regular trading on their principal exchanges or, in the absence of a settlement price, at the mean of the latest quoted bid and ask prices.
Option contracts are valued at the mean of the latest quoted bid and ask prices on their primary exchanges. Option contracts, including over-the-counter option contracts, with no readily available market quotations are valued using mid-market evaluations from independent third-party vendors.
Swap transactions are valued through an independent pricing service or broker, or if neither is available, through an internal model based upon observable inputs.
| 28 | Columbia Quality Income Fund | Semiannual Report 2022 |
Notes to Financial Statements (continued)
November 30, 2022 (Unaudited)
Investments for which market quotations are not readily available, or that have quotations which management believes are not reflective of market value or reliable, are valued at fair value as determined in good faith under procedures approved by the Board of Trustees. If a security or class of securities (such as foreign securities) is valued at fair value, such value is likely to be different from the quoted or published price for the security, if available.
The determination of fair value often requires significant judgment. To determine fair value, management may use assumptions including but not limited to future cash flows and estimated risk premiums. Multiple inputs from various sources may be used to determine fair value.
GAAP requires disclosure regarding the inputs and valuation techniques used to measure fair value and any changes in valuation inputs or techniques. In addition, investments shall be disclosed by major category. This information is disclosed following the Fund’s Portfolio of Investments.
Derivative instruments
The Fund invests in certain derivative instruments, as detailed below, in seeking to meet its investment objectives. Derivatives are instruments whose values depend on, or are derived from, in whole or in part, the value of one or more securities, currencies, commodities, indices, or other assets or instruments. Derivatives may be used to increase investment flexibility (including to maintain cash reserves while maintaining desired exposure to certain assets), for risk management (hedging) purposes, to facilitate trading, to reduce transaction costs and to pursue higher investment returns. The Fund may also use derivative instruments to mitigate certain investment risks, such as foreign currency exchange rate risk, interest rate risk and credit risk. Derivatives may involve various risks, including the potential inability of the counterparty to fulfill its obligations under the terms of the contract, the potential for an illiquid secondary market (making it difficult for the Fund to sell or terminate, including at favorable prices) and the potential for market movements which may expose the Fund to gains or losses in excess of the amount shown in the Statement of Assets and Liabilities. The notional amounts of derivative instruments, if applicable, are not recorded in the financial statements.
A derivative instrument may suffer a marked-to-market loss if the value of the contract decreases due to an unfavorable change in the market rates or values of the underlying instrument. Losses can also occur if the counterparty does not perform its obligations under the contract. The Fund’s risk of loss from counterparty credit risk on over-the-counter derivatives is generally limited to the aggregate unrealized gain netted against any collateral held by the Fund and the amount of any variation margin held by the counterparty, plus any replacement costs or related amounts. With exchange-traded or centrally cleared derivatives, there is reduced counterparty credit risk to the Fund since the clearinghouse or central counterparty (CCP) provides some protection in the case of clearing member default. The clearinghouse or CCP stands between the buyer and the seller of the contract; therefore, failure of the clearinghouse or CCP may pose additional counterparty credit risk. However, credit risk still exists in exchange-traded or centrally cleared derivatives with respect to initial and variation margin that is held in a broker’s customer account. While clearing brokers are required to segregate customer margin from their own assets, in the event that a clearing broker becomes insolvent or goes into bankruptcy and at that time there is a shortfall in the aggregate amount of margin held by the clearing broker for all its clients and such shortfall is remedied by the CCP or otherwise, U.S. bankruptcy laws will typically allocate that shortfall on a pro-rata basis across all the clearing broker’s customers (including the Fund), potentially resulting in losses to the Fund.
In order to better define its contractual rights and to secure rights that will help the Fund mitigate its counterparty risk, the Fund may enter into an International Swaps and Derivatives Association, Inc. Master Agreement (ISDA Master Agreement) or similar agreement with its derivatives counterparties. An ISDA Master Agreement is an agreement between the Fund and a counterparty that governs over-the-counter derivatives and foreign exchange forward contracts and contains, among other things, collateral posting terms and netting provisions in the event of a default and/or termination event. Under an ISDA Master Agreement, the Fund may, under certain circumstances, offset with the counterparty certain derivative instruments’ payables and/or receivables with collateral held and/or posted and create one single net payment. The provisions of the ISDA Master Agreement typically permit a single net payment in the event of default (close-out netting), including the bankruptcy or insolvency of the counterparty. Note, however, that bankruptcy or insolvency laws of a particular jurisdiction may impose restrictions on or prohibitions against the right of offset or netting in bankruptcy, insolvency or other events.
Columbia Quality Income Fund | Semiannual Report 2022
| 29 |
Notes to Financial Statements (continued)
November 30, 2022 (Unaudited)
Collateral (margin) requirements differ by type of derivative. Margin requirements are established by the clearinghouse or CCP for exchange-traded and centrally cleared derivatives. Brokers can ask for margin in excess of the minimum in certain circumstances. Collateral terms for most over-the-counter derivatives are subject to regulatory requirements to exchange variation margin with trading counterparties and may have contract specific margin terms as well. For over-the-counter derivatives traded under an ISDA Master Agreement, the collateral requirements are typically calculated by netting the marked-to-market amount for each transaction under such agreement and comparing that amount to the value of any variation margin currently pledged by the Fund and/or the counterparty. Generally, the amount of collateral due from or to a party has to exceed a minimum transfer amount threshold (e.g., $250,000) before a transfer has to be made. To the extent amounts due to the Fund from its counterparties are not fully collateralized, contractually or otherwise, the Fund bears the risk of loss from counterparty nonperformance. The Fund may also pay interest expense on cash collateral received from the broker. Any interest expense paid by the Fund is shown in the Statement of Operations. The Fund attempts to mitigate counterparty risk by only entering into agreements with counterparties that it believes have the financial resources to honor their obligations and by monitoring the financial stability of those counterparties.
Certain ISDA Master Agreements allow counterparties of over-the-counter derivatives transactions to terminate derivatives contracts prior to maturity in the event the Fund’s net asset value declines by a stated percentage over a specified time period or if the Fund fails to meet certain terms of the ISDA Master Agreement, which would cause the Fund to accelerate payment of any net liability owed to the counterparty. The Fund also has termination rights if the counterparty fails to meet certain terms of the ISDA Master Agreement. In determining whether to exercise such termination rights, the Fund would consider, in addition to counterparty credit risk, whether termination would result in a net liability owed from the counterparty.
For financial reporting purposes, the Fund does not offset derivative assets and derivative liabilities that are subject to netting arrangements in the Statement of Assets and Liabilities.
Futures contracts
Futures contracts are exchange-traded and represent commitments for the future purchase or sale of an asset at a specified price on a specified date. The Fund bought and sold futures contracts to manage the duration and yield curve exposure of the Fund versus the benchmark and to manage exposure to movements in interest rates. These instruments may be used for other purposes in future periods. Upon entering into futures contracts, the Fund bears risks that it may not achieve the anticipated benefits of the futures contracts and may realize a loss. Additional risks include counterparty credit risk, the possibility of an illiquid market, and that a change in the value of the contract or option may not correlate with changes in the value of the underlying asset.
Upon entering into a futures contract, the Fund deposits cash or securities with the broker, known as a futures commission merchant (FCM), in an amount sufficient to meet the initial margin requirement. The initial margin deposit must be maintained at an established level over the life of the contract. Cash deposited as initial margin is recorded in the Statement of Assets and Liabilities as margin deposits. Securities deposited as initial margin are designated in the Portfolio of Investments. Subsequent payments (variation margin) are made or received by the Fund each day. The variation margin payments are equal to the daily change in the contract value and are recorded as variation margin receivable or payable and are offset in unrealized gains or losses. The Fund generally expects to earn interest income on its margin deposits. The Fund recognizes a realized gain or loss when the contract is closed or expires. Futures contracts involve, to varying degrees, risk of loss in excess of the variation margin disclosed in the Statement of Assets and Liabilities.
Options contracts
Options are contracts which entitle the holder to purchase or sell securities or other identified assets at a specified price, or in the case of index option contracts, to receive or pay the difference between the index value and the strike price of the index option contract. Option contracts can be either exchange-traded or over-the-counter. The Fund purchased and has written option contracts to manage exposure to fluctuations in interest rates and to hedge the fair value of the Fund’s investments. These instruments may be used for other purposes in future periods. Completion of transactions for option contracts traded in the over-the-counter market depends upon the performance of the other party. Collateral may be collected or posted by the Fund to secure over-the-counter option contract trades. Collateral held or posted by the Fund for such option contract trades must be returned to the broker or the Fund upon closure, exercise or expiration of the contract.
| 30 | Columbia Quality Income Fund | Semiannual Report 2022 |
Notes to Financial Statements (continued)
November 30, 2022 (Unaudited)
Options contracts purchased are recorded as investments. When the Fund writes an options contract, the premium received is recorded as an asset and an amount equivalent to the premium is recorded as a liability in the Statement of Assets and Liabilities and is subsequently adjusted to reflect the current fair value of the option written. Changes in the fair value of the written option are recorded as unrealized appreciation or depreciation until the contract is exercised or has expired. The Fund realizes a gain or loss when the option contract is closed or expires. When option contracts are exercised, the proceeds on sales for a written call or purchased put option contract, or the purchase cost for a written put or purchased call option contract, is adjusted by the amount of premium received or paid.
For over-the-counter options purchased, the Fund bears the risk of loss of the amount of the premiums paid plus the positive change in market values net of any collateral held by the Fund should the counterparty fail to perform under the contracts. Option contracts written by the Fund do not typically give rise to significant counterparty credit risk, as options written generally obligate the Fund and not the counterparty to perform. The risk in writing a call option contract is that the Fund gives up the opportunity for profit if the market price of the security increases above the strike price and the option contract is exercised. The risk in writing a put option contract is that the Fund may incur a loss if the market price of the security decreases below the strike price and the option contract is exercised. Exercise of a written option could result in the Fund purchasing or selling a security or foreign currency when it otherwise would not, or at a price different from the current market value. In purchasing and writing options, the Fund bears the risk of an unfavorable change in the value of the underlying instrument or the risk that the Fund may not be able to enter into a closing transaction due to an illiquid market.
Swap contracts
Swap contracts are negotiated in the over-the-counter market and are entered into bilaterally or centrally cleared (centrally cleared swap contract). In a centrally cleared swap contract, immediately following execution of the swap contract with a broker, the swap contract is novated to a central counterparty (the CCP) and the CCP becomes the Fund’s counterparty to the centrally cleared swap contract. The Fund is required to deposit initial margin with the futures commission merchant (FCM), which pledges it through to the CCP in the form of cash or securities in an amount that varies depending on the size and risk profile of the particular swap contract. Securities deposited as initial margin are designated in the Portfolio of Investments and cash deposited is recorded in the Statement of Assets and Liabilities as margin deposits. For a bilateral swap contract, the Fund has credit exposure to the broker, but exchanges daily variation margin with the broker based on the mark-to-market value of the swap contract to minimize that exposure. For centrally cleared swap contracts, the Fund has minimal credit exposure to the FCM because the CCP stands between the Fund and the relevant buyer/seller on the other side of the contract. Swap contracts are marked-to-market daily and changes in value are recorded as unrealized appreciation (depreciation). The daily change in valuation of swap contracts, if any, is recorded as a receivable or payable for variation margin in the Statement of Assets and Liabilities.
Entering into these contracts involves, to varying degrees, elements of interest, liquidity and counterparty credit risk in excess of the amounts recognized in the Statement of Assets and Liabilities. Such risks involve the possibility that there may be unfavorable changes in interest rates, market conditions or other conditions, that it may be difficult to initiate a swap transaction or liquidate a position at an advantageous time or price which may result in significant losses, and that the bilateral counterparty, FCM, or CCP, as applicable, may not fulfill its obligation under the contract.
Credit default swap contracts
The Fund entered into credit default swap contracts to increase or decrease its credit exposure to an index and to manage credit risk exposure. These instruments may be used for other purposes in future periods. Credit default swap contracts are transactions in which one party pays fixed periodic payments to a counterparty in consideration for an agreement from the counterparty to make a specific payment should a specified credit event(s) take place. Although specified credit events are contract specific, credit events are typically bankruptcy, failure to pay, restructuring, obligation acceleration, obligation default, or repudiation/moratorium.
As the purchaser of a credit default swap contract, the Fund purchases protection by paying a periodic interest rate on the notional amount to the counterparty. The interest amount is accrued daily as a component of unrealized appreciation (depreciation) and is recorded as a realized loss upon payment. If a credit event as specified in the contract occurs, the Fund may have the option either to deliver the reference obligation to the seller in exchange for a cash payment of its par amount,
Columbia Quality Income Fund | Semiannual Report 2022
| 31 |
Notes to Financial Statements (continued)
November 30, 2022 (Unaudited)
or to receive a net cash settlement equal to the par amount less an agreed-upon value of the reference obligation as of the date of the credit event. The difference between the value of the obligation or cash delivered and the notional amount received will be recorded as a realized gain (loss).
As the seller of a credit default swap contract, the Fund sells protection to a buyer and will generally receive a periodic interest rate on a notional amount. The interest amount is accrued daily as a component of unrealized appreciation (depreciation) and is recorded as a realized gain upon receipt of the payment. If a credit event as specified in the contract with the counterparty occurs, the Fund may either be required to accept the reference obligation from the buyer in exchange for a cash payment of its notional amount, or to pay the buyer a net cash settlement equal to the notional amount less an agreed-upon value of the reference obligation (recovery value) as of the date of the credit event. The difference between the value of the obligation or cash received and the notional amount paid will be recorded as a realized gain (loss). The maximum potential amount of undiscounted future payments the Fund could be required to make as the seller of protection under a credit default swap contract is equal to the notional amount of the reference obligation. These potential amounts may be partially offset by any recovery values of the respective reference obligations or upfront receipts upon entering into the agreement. The notional amounts and market values of all credit default swap contracts in which the Fund is the seller of protection, if any, are disclosed in the Credit Default Swap Contracts Outstanding schedule following the Portfolio of Investments.
As a protection seller, the Fund bears the risk of loss from the credit events specified in the contract with the counterparty. For credit default swap contracts on credit indices, quoted market prices and resulting market values serve as an indicator of the current status of the payment/performance risk. Increasing market values, in absolute terms when compared to the notional amount of the swap, represent a deterioration of the reference entity’s credit soundness and a greater likelihood or risk of default or other credit event occurring as defined under the terms of the contract.
Any upfront payment or receipt by the Fund upon entering into a credit default swap contract is recorded as an asset or liability, respectively, and amortized daily as a component of realized gain (loss) in the Statement of Operations. Credit default swap contracts are valued daily, and the change in value is recorded as unrealized appreciation (depreciation) until the termination of the swap, at which time a realized gain (loss) is recorded.
Credit default swap contracts can involve greater risks than if a fund had invested in the reference obligation directly since, in addition to general market risks, credit default swaps are subject to counterparty credit risk, leverage risk, hedging risk, correlation risk and liquidity risk.
Effects of derivative transactions in the financial statements
The following tables are intended to provide additional information about the effect of derivatives on the financial statements of the Fund, including: the fair value of derivatives by risk category and the location of those fair values in the Statement of Assets and Liabilities; and the impact of derivative transactions over the period in the Statement of Operations, including realized and unrealized gains (losses). The derivative instrument schedules following the Portfolio of Investments present additional information regarding derivative instruments outstanding at the end of the period, if any.
The following table is a summary of the fair value of derivative instruments (not considered to be hedging instruments for accounting disclosure purposes) at November 30, 2022:
| | Asset derivatives | |
Risk exposure
category | Statement
of assets and liabilities
location | Fair value ($) |
| Credit risk | Component of total distributable earnings (loss) — unrealized appreciation on swap contracts | 185,608* |
| Interest rate risk | Component of total distributable earnings (loss) — unrealized appreciation on futures contracts | 701,301* |
| Interest rate risk | Investments, at value — Options purchased | 19,749,423 |
| Total | | 20,636,332 |
| 32 | Columbia Quality Income Fund | Semiannual Report 2022 |
Notes to Financial Statements (continued)
November 30, 2022 (Unaudited)
| | Liability derivatives | |
Risk exposure
category | Statement
of assets and liabilities
location | Fair value ($) |
| Credit risk | Component of total distributable earnings (loss) — unrealized depreciation on swap contracts | 1,677,876* |
| Credit risk | Upfront receipts on swap contracts | 9,242,578 |
| Interest rate risk | Component of total distributable earnings (loss) — unrealized depreciation on futures contracts | 630,347* |
| Interest rate risk | Options contracts written, at value | 1,145,136 |
| Total | | 12,695,937 |
| * | Includes cumulative appreciation (depreciation) as reported in the tables following the Portfolio of Investments. Only the current day’s variation margin is reported in receivables or payables in the Statement of Assets and Liabilities. |
The following table indicates the effect of derivative instruments (not considered to be hedging instruments for accounting disclosure purposes) in the Statement of Operations for the six months ended November 30, 2022:
| Amount of realized gain (loss) on derivatives recognized in income |
| Risk exposure category | | Futures
contracts
($) | Options
contracts
written
($) | Options
contracts
purchased
($) | Swap
contracts
($) | Total
($) |
| Credit risk | | — | — | — | 1,235,188 | 1,235,188 |
| Interest rate risk | | (46,636,730) | (16,653,045) | 10,152,348 | — | (53,137,427) |
| Total | | (46,636,730) | (16,653,045) | 10,152,348 | 1,235,188 | (51,902,239) |
| |
| Change in unrealized appreciation (depreciation) on derivatives recognized in income |
| Risk exposure category | | Futures
contracts
($) | Options
contracts
written
($) | Options
contracts
purchased
($) | Swap
contracts
($) | Total
($) |
| Credit risk | | — | — | — | (3,401,531) | (3,401,531) |
| Interest rate risk | | (297,722) | 15,744,750 | (19,569,370) | — | (4,122,342) |
| Total | | (297,722) | 15,744,750 | (19,569,370) | (3,401,531) | (7,523,873) |
The following table is a summary of the average outstanding volume by derivative instrument for the six months ended November 30, 2022:
| Derivative instrument | Average notional
amounts ($)* |
| Futures contracts — long | 269,315,134 |
| Futures contracts — short | 110,761,094 |
| Credit default swap contracts — sell protection | 73,000,000 |
| Derivative instrument | Average
value ($)* |
| Options contracts — purchased | 18,882,065 |
| Options contracts — written | (1,652,568) |
| * | Based on the ending quarterly outstanding amounts for the six months ended November 30, 2022. |
Asset- and mortgage-backed securities
The Fund may invest in asset-backed and mortgage-backed securities. The maturity dates shown represent the original maturity of the underlying obligation. Actual maturity may vary based upon prepayment activity on these obligations. All, or a portion, of the obligation may be prepaid at any time because the underlying asset may be prepaid. As a result, decreasing market interest rates could result in an increased level of prepayment. An increased prepayment rate will have the effect of shortening the maturity of the security. Unless otherwise noted, the coupon rates presented are fixed rates.
Columbia Quality Income Fund | Semiannual Report 2022
| 33 |
Notes to Financial Statements (continued)
November 30, 2022 (Unaudited)
Delayed delivery securities
The Fund may trade securities on other than normal settlement terms, including securities purchased or sold on a “when-issued” or "forward commitment" basis. This may increase risk to the Fund since the other party to the transaction may fail to deliver, which could cause the Fund to subsequently invest at less advantageous prices. The Fund designates cash or liquid securities in an amount equal to the delayed delivery commitment.
To be announced securities
The Fund may trade securities on a To Be Announced (TBA) basis. As with other delayed-delivery transactions, a seller agrees to issue a TBA security at a future date. However, the seller does not specify the particular securities to be delivered. Instead, the Fund agrees to accept any security that meets specified terms.
In some cases, Master Securities Forward Transaction Agreements (MSFTAs) may be used to govern transactions of certain forward-settling agency mortgage-backed securities, such as delayed-delivery and TBAs, between the Fund and counterparty. The MSFTA maintains provisions for, among other things, initiation and confirmation, payment and transfer, events of default, termination, and maintenance of collateral relating to such transactions.
Mortgage dollar roll transactions
The Fund may enter into mortgage “dollar rolls” in which the Fund sells securities for delivery in the current month and simultaneously contracts with the same counterparty to repurchase similar but not identical securities (same type, coupon and maturity) on a specified future date. During the roll period, the Fund loses the right to receive principal and interest paid on the securities sold. However, the Fund may benefit because it receives negotiated amounts in the form of reductions of the purchase price for the future purchase plus the interest earned on the cash proceeds of the securities sold until the settlement date of the forward purchase. The Fund records the incremental difference between the forward purchase and sale of each forward roll as a realized gain or loss. Unless any realized gains exceed the income, capital appreciation, and gain or loss due to mortgage prepayments that would have been realized on the securities sold as part of the mortgage dollar roll, the use of this technique may diminish the investment performance of the Fund compared to what the performance would have been without the use of mortgage dollar rolls. All cash proceeds will be invested in instruments that are permissible investments for the Fund. The Fund identifies cash or liquid securities in an amount equal to the forward purchase price.
For financial reporting and tax purposes, the Fund treats “to be announced” mortgage dollar rolls as two separate transactions, one involving the purchase of a security and a separate transaction involving a sale. These transactions may increase the Fund’s portfolio turnover rate. The Fund does not currently enter into mortgage dollar rolls that are accounted for as financing transactions.
Mortgage dollar rolls involve the risk that the market value of the securities the Fund is obligated to repurchase may decline below the repurchase price, or that the counterparty may default on its obligations.
Interest only and principal only securities
The Fund may invest in Interest Only (IO) or Principal Only (PO) securities. IOs are stripped securities entitled to receive all of the security’s interest, but none of its principal. IOs are particularly sensitive to changes in interest rates and therefore subject to greater fluctuations in price than typical interest bearing debt securities. IOs are also subject to credit risk because the Fund may not receive all or part of the interest payments if the issuer, obligor, guarantor or counterparty defaults on its obligation. Payments received for IOs are included in interest income in the Statement of Operations. Because no principal will be received at the maturity of an IO, adjustments are made to the cost of the security on a monthly basis until maturity. These adjustments are included in interest income in the Statement of Operations. POs are stripped securities entitled to receive the principal from the underlying obligation, but not the interest. POs are particularly sensitive to changes in interest rates and therefore are subject to fluctuations in price. POs are also subject to credit risk because the Fund may not receive all or part of its principal if the issuer, obligor, guarantor or counterparty defaults on its obligation. The Fund may also invest in IO or PO stripped mortgage-backed securities. Payments received for POs are treated as reductions to the cost and par value of the securities.
| 34 | Columbia Quality Income Fund | Semiannual Report 2022 |
Notes to Financial Statements (continued)
November 30, 2022 (Unaudited)
Offsetting of assets and liabilities
The following table presents the Fund’s gross and net amount of assets and liabilities available for offset under netting arrangements as well as any related collateral received or pledged by the Fund as of November 30, 2022:
| | Citi ($) (a) | Citi ($) (a) | JPMorgan ($) (a) | JPMorgan ($) (a) | Morgan Stanley ($) | Total ($) |
| Assets | | | | | | |
| Options purchased calls | 12,586,426 | - | 519,428 | - | 6,643,569 | 19,749,423 |
| OTC credit default swap contracts (b) | - | - | - | - | 185,608 | 185,608 |
| Total assets | 12,586,426 | - | 519,428 | - | 6,829,177 | 19,935,031 |
| Liabilities | | | | | | |
| Options contracts written | 701,657 | - | - | - | 443,479 | 1,145,136 |
| OTC credit default swap contracts (b) | - | 1,762,188 | - | 1,762,188 | 7,396,078 | 10,920,454 |
| Total liabilities | 701,657 | 1,762,188 | - | 1,762,188 | 7,839,557 | 12,065,590 |
| Total financial and derivative net assets | 11,884,769 | (1,762,188) | 519,428 | (1,762,188) | (1,010,380) | 7,869,441 |
| Total collateral received (pledged) (c) | 5,279,000 | (1,762,188) | 430,000 | (1,762,188) | (980,000) | 1,204,624 |
| Net amount (d) | 6,605,769 | - | 89,428 | - | (30,380) | 6,664,817 |
| (a) | Exposure can only be netted across transactions governed under the same master agreement with the same legal entity. |
| (b) | Over-the-Counter (OTC) swap contracts are presented at market value plus periodic payments receivable (payable), which is comprised of unrealized appreciation, unrealized depreciation, upfront payments and upfront receipts. |
| (c) | In some instances, the actual collateral received and/or pledged may be more than the amount shown due to overcollateralization. |
| (d) | Represents the net amount due from/(to) counterparties in the event of default. |
Security transactions
Security transactions are accounted for on the trade date. Cost is determined and gains (losses) are based upon the specific identification method for both financial statement and federal income tax purposes.
Income recognition
Interest income is recorded on an accrual basis. Market premiums and discounts, including original issue discounts, are amortized and accreted, respectively, over the expected life of the security on all debt securities, unless otherwise noted. The Fund classifies gains and losses realized on prepayments received on mortgage-backed securities as adjustments to interest income.
The Fund may place a debt security on non-accrual status and reduce related interest income when it becomes probable that the interest will not be collected and the amount of uncollectible interest can be reasonably estimated. The Fund may also adjust accrual rates when it becomes probable the full interest will not be collected and a partial payment will be received. A defaulted debt security is removed from non-accrual status when the issuer resumes interest payments or when collectability of interest is reasonably assured.
Dividend income is recorded on the ex-dividend date.
Expenses
General expenses of the Trust are allocated to the Fund and other funds of the Trust based upon relative net assets or other expense allocation methodologies determined by the nature of the expense. Expenses directly attributable to the Fund are charged to the Fund. Expenses directly attributable to a specific class of shares are charged to that share class.
Determination of class net asset value
All income, expenses (other than class-specific expenses, which are charged to that share class, as shown in the Statement of Operations) and realized and unrealized gains (losses) are allocated to each class of the Fund on a daily basis, based on the relative net assets of each class, for purposes of determining the net asset value of each class.
Columbia Quality Income Fund | Semiannual Report 2022
| 35 |
Notes to Financial Statements (continued)
November 30, 2022 (Unaudited)
Federal income tax status
The Fund intends to qualify each year as a regulated investment company under Subchapter M of the Internal Revenue Code, as amended, and will distribute substantially all of its investment company taxable income and net capital gain, if any, for its tax year, and as such will not be subject to federal income taxes. In addition, the Fund intends to distribute in each calendar year substantially all of its ordinary income, capital gain net income and certain other amounts, if any, such that the Fund should not be subject to federal excise tax. Therefore, no federal income or excise tax provision is recorded.
Distributions to shareholders
Distributions from net investment income, if any, are declared daily and paid monthly. Net realized capital gains, if any, are distributed at least annually. Income distributions and capital gain distributions are determined in accordance with federal income tax regulations, which may differ from GAAP.
Guarantees and indemnifications
Under the Trust’s organizational documents and, in some cases, by contract, its officers and trustees are indemnified against certain liabilities arising out of the performance of their duties to the Trust or its funds. In addition, certain of the Fund’s contracts with its service providers contain general indemnification clauses. The Fund’s maximum exposure under these arrangements is unknown since the amount of any future claims that may be made against the Fund cannot be determined, and the Fund has no historical basis for predicting the likelihood of any such claims.
Recent accounting pronouncement
Tailored Shareholder Reports
In October 2022, the Securities and Exchange Commission (SEC) adopted a final rule relating to Tailored Shareholder Reports for Mutual Funds and Exchange-Traded Funds (ETFs); Fee Information in Investment Company Advertisements. The rule and form amendments will require mutual funds and ETFs to transmit concise and visually engaging shareholder reports that highlight key information. The amendments will require that funds tag information in a structured data format. The rule amendments will require that certain more in-depth information be made available online and available for delivery free of charge to investors on request. The amendments will become effective January 24, 2023. There is an 18-month transition period after the effective date of the amendment.
Note 3. Fees and other transactions with affiliates
Management services fees
The Fund has entered into a Management Agreement with Columbia Management Investment Advisers, LLC (the Investment Manager), a wholly-owned subsidiary of Ameriprise Financial, Inc. (Ameriprise Financial). Under the Management Agreement, the Investment Manager provides the Fund with investment research and advice, as well as administrative and accounting services. The management services fee is an annual fee that is equal to a percentage of the Fund’s daily net assets that declines from 0.50% to 0.34% as the Fund’s net assets increase. The annualized effective management services fee rate for the six months ended November 30, 2022 was 0.49% of the Fund’s average daily net assets.
Compensation of board members
Members of the Board of Trustees who are not officers or employees of the Investment Manager or Ameriprise Financial are compensated for their services to the Fund as disclosed in the Statement of Operations. Under a Deferred Compensation Plan (the Deferred Plan), these members of the Board of Trustees may elect to defer payment of up to 100% of their compensation. Deferred amounts are treated as though equivalent dollar amounts had been invested in shares of certain funds managed by the Investment Manager. The Fund’s liability for these amounts is adjusted for market value changes and remains in the Fund until distributed in accordance with the Deferred Plan. All amounts payable under the Deferred Plan constitute a general unsecured obligation of the Fund. The expense for the Deferred Plan, which includes Trustees’ fees deferred during the current period as well as any gains or losses on the Trustees’ deferred compensation balances as a result of market fluctuations, is included in "Compensation of board members" in the Statement of Operations.
| 36 | Columbia Quality Income Fund | Semiannual Report 2022 |
Notes to Financial Statements (continued)
November 30, 2022 (Unaudited)
Compensation of Chief Compliance Officer
The Board of Trustees has appointed a Chief Compliance Officer for the Fund in accordance with federal securities regulations. As disclosed in the Statement of Operations, a portion of the Chief Compliance Officer’s total compensation is allocated to the Fund, along with other allocations to affiliated registered investment companies managed by the Investment Manager and its affiliates, based on relative net assets.
Transfer agency fees
Under a Transfer and Dividend Disbursing Agent Agreement, Columbia Management Investment Services Corp. (the Transfer Agent), an affiliate of the Investment Manager and a wholly-owned subsidiary of Ameriprise Financial, is responsible for providing transfer agency services to the Fund. The Transfer Agent has contracted with SS&C GIDS, Inc. (SS&C GIDS) to serve as sub-transfer agent. Prior to January 1, 2023, SS&C GIDS was known as DST Asset Manager Solutions, Inc. The Transfer Agent pays the fees of SS&C GIDS for services as sub-transfer agent and SS&C GIDS is not entitled to reimbursement for such fees from the Fund (with the exception of out-of-pocket fees).
The Fund pays the Transfer Agent a monthly transfer agency fee based on the number or the average value of accounts, depending on the type of account. In addition, the Fund pays the Transfer Agent a fee for shareholder services based on the number of accounts or on a percentage of the average aggregate value of the Fund’s shares maintained in omnibus accounts up to the lesser of the amount charged by the financial intermediary or a cap established by the Board of Trustees from time to time.
The Transfer Agent also receives compensation from the Fund for various shareholder services and reimbursements for certain out-of-pocket fees. Total transfer agency fees for Institutional 2 Class and Institutional 3 Class shares are subject to an annual limitation of not more than 0.07% and 0.02%, respectively, of the average daily net assets attributable to each share class. In addition, prior to October 1, 2022, Institutional 2 Class shares were subject to a contractual transfer agency fee annual limitation of not more than 0.05% of the average daily net assets attributable to that share class.
For the six months ended November 30, 2022, the Fund’s annualized effective transfer agency fee rates as a percentage of average daily net assets of each class were as follows:
| | Effective rate (%) |
| Class A | 0.15 |
| Advisor Class | 0.15 |
| Class C | 0.15 |
| Institutional Class | 0.15 |
| Institutional 2 Class | 0.05 |
| Institutional 3 Class | 0.01 |
| Class R | 0.15 |
An annual minimum account balance fee of $20 may apply to certain accounts with a value below the applicable share class’s initial minimum investment requirements to reduce the impact of small accounts on transfer agency fees. These minimum account balance fees are remitted to the Fund and recorded as part of expense reductions in the Statement of Operations. For the six months ended November 30, 2022, these minimum account balance fees reduced total expenses of the Fund by $3,838.
Distribution and service fees
The Fund has entered into an agreement with Columbia Management Investment Distributors, Inc. (the Distributor), an affiliate of the Investment Manager and a wholly-owned subsidiary of Ameriprise Financial, for distribution and shareholder services. Under a Plan and Agreement of Distribution, the Fund pays a fee at the maximum annual rates of up to 0.25%, 1.00% and 0.50% of the Fund’s average daily net assets attributable to Class A, Class C and Class R shares, respectively. For Class C shares, of the 1.00% fee, up to 0.75% can be reimbursed for distribution expenses and up to an additional 0.25% can be reimbursed for shareholder servicing expenses. For Class R shares, of the 0.50% fee, up to 0.25% can be reimbursed for shareholder servicing expenses.
Columbia Quality Income Fund | Semiannual Report 2022
| 37 |
Notes to Financial Statements (continued)
November 30, 2022 (Unaudited)
The amount of distribution and shareholder services expenses incurred by the Distributor and not yet reimbursed (unreimbursed expense) was approximately $395,000 for Class C shares. This amount is based on the most recent information available as of September 30, 2022, and may be recovered from future payments under the distribution plan or contingent deferred sales charges (CDSCs). To the extent the unreimbursed expense has been fully recovered, the distribution and/or shareholder services fee is reduced.
Sales charges
Sales charges, including front-end charges and CDSCs, received by the Distributor for distributing Fund shares for the six months ended November 30, 2022, if any, are listed below:
| | Front End (%) | CDSC (%) | Amount ($) |
| Class A | 3.00 | 0.50 - 1.00(a) | 8,182 |
| Class C | — | 1.00(b) | 2,124 |
| (a) | This charge is imposed on certain investments of between $1 million and $50 million redeemed within 18 months after purchase, as follows: 1.00% if redeemed within 12 months after purchase, and 0.50% if redeemed more than 12, but less than 18, months after purchase, with certain limited exceptions. |
| (b) | This charge applies to redemptions within 12 months after purchase, with certain limited exceptions. |
The Fund’s other share classes are not subject to sales charges.
Expenses waived/reimbursed by the Investment Manager and its affiliates
The Investment Manager and certain of its affiliates have contractually agreed to waive fees and/or reimburse expenses (excluding certain fees and expenses described below) for the period(s) disclosed below, unless sooner terminated at the sole discretion of the Board of Trustees, so that the Fund’s net operating expenses, after giving effect to fees waived/expenses reimbursed and any balance credits and/or overdraft charges from the Fund’s custodian, do not exceed the following annual rate(s) as a percentage of the classes’ average daily net assets:
| | October 1, 2022
through
September 30, 2023 | Prior to
October 1, 2022 |
| Class A | 0.91% | 0.91% |
| Advisor Class | 0.66 | 0.66 |
| Class C | 1.66 | 1.66 |
| Institutional Class | 0.66 | 0.66 |
| Institutional 2 Class | 0.57 | 0.57 |
| Institutional 3 Class | 0.52 | 0.53 |
| Class R | 1.16 | 1.16 |
Under the agreement governing these fee waivers and/or expense reimbursement arrangements, the following fees and expenses are excluded from the waiver/reimbursement commitment, and therefore will be paid by the Fund, if applicable: taxes (including foreign transaction taxes), expenses associated with investments in affiliated and non-affiliated pooled investment vehicles (including mutual funds and exchange-traded funds), transaction costs and brokerage commissions, costs related to any securities lending program, dividend expenses associated with securities sold short, inverse floater program fees and expenses, transaction charges and interest on borrowed money, interest, costs associated with shareholder meetings, infrequent and/or unusual expenses and any other expenses the exclusion of which is specifically approved by the Board of Trustees. This agreement may be modified or amended only with approval from the Investment Manager, certain of its affiliates and the Fund. Reflected in the contractual cap commitment, prior to October 1, 2022, is the Transfer Agent’s contractual agreement to limit total transfer agency fees to an annual rate of not more than 0.05% for Institutional 2 Class of the average daily net assets attributable to that share class. Any fees waived and/or expenses reimbursed under the expense reimbursement arrangements described above are not recoverable by the Investment Manager or its affiliates in future periods.
| 38 | Columbia Quality Income Fund | Semiannual Report 2022 |
Notes to Financial Statements (continued)
November 30, 2022 (Unaudited)
Note 4. Federal tax information
The timing and character of income and capital gain distributions are determined in accordance with income tax regulations, which may differ from GAAP because of temporary or permanent book to tax differences.
At November 30, 2022, the approximate cost of all investments for federal income tax purposes and the aggregate gross approximate unrealized appreciation and depreciation based on that cost was:
Federal
tax cost ($) | Gross unrealized
appreciation ($) | Gross unrealized
(depreciation) ($) | Net unrealized
(depreciation) ($) |
| 2,114,845,000 | 28,013,000 | (204,094,000) | (176,081,000) |
Tax cost of investments and unrealized appreciation/(depreciation) may also include timing differences that do not constitute adjustments to tax basis.
The following capital loss carryforwards, determined at May 31, 2022, may be available to reduce future net realized gains on investments, if any, to the extent permitted by the Internal Revenue Code.
No expiration
short-term ($) | No expiration
long-term ($) | Total ($) |
| (61,613,303) | (51,503,386) | (113,116,689) |
Management of the Fund has concluded that there are no significant uncertain tax positions in the Fund that would require recognition in the financial statements. However, management’s conclusion may be subject to review and adjustment at a later date based on factors including, but not limited to, new tax laws, regulations, and administrative interpretations (including relevant court decisions). Generally, the Fund’s federal tax returns for the prior three fiscal years remain subject to examination by the Internal Revenue Service.
Note 5. Portfolio information
The cost of purchases and proceeds from sales of securities, excluding short-term investments and derivatives, if any, aggregated to $2,935,432,958 and $3,059,908,953, respectively, for the six months ended November 30, 2022, of which $2,895,805,699 and $2,866,737,583, respectively, were U.S. government securities. The amount of purchase and sale activity impacts the portfolio turnover rate reported in the Financial Highlights.
Note 6. Affiliated money market fund
The Fund invests in Columbia Short-Term Cash Fund, an affiliated money market fund established for the exclusive use by the Fund and other affiliated funds (the Affiliated MMF). The income earned by the Fund from such investments is included as Dividends - affiliated issuers in the Statement of Operations. As an investing fund, the Fund indirectly bears its proportionate share of the expenses of the Affiliated MMF. The Affiliated MMF prices its shares with a floating net asset value. In addition, the Board of Trustees of the Affiliated MMF may impose a fee on redemptions (sometimes referred to as a liquidity fee) or temporarily suspend redemptions (sometimes referred to as imposing a redemption gate) in the event its liquidity falls below regulatory limits.
Note 7. Interfund lending
Pursuant to an exemptive order granted by the Securities and Exchange Commission, the Fund participates in a program (the Interfund Program) allowing each participating Columbia Fund (each, a Participating Fund) to lend money directly to and, except for closed-end funds and money market funds, borrow money directly from other Participating Funds for temporary purposes. The amounts eligible for borrowing and lending under the Interfund Program are subject to certain restrictions.
Interfund loans are subject to the risk that the borrowing fund could be unable to repay the loan when due, and a delay in repayment to the lending fund could result in lost opportunities and/or additional lending costs. The exemptive order is subject to conditions intended to mitigate conflicts of interest arising from the Investment Manager’s relationship with each Participating Fund.
Columbia Quality Income Fund | Semiannual Report 2022
| 39 |
Notes to Financial Statements (continued)
November 30, 2022 (Unaudited)
The Fund’s activity in the Interfund Program during the six months ended November 30, 2022 was as follows:
| Borrower or lender | Average loan
balance ($) | Weighted average
interest rate (%) | Number of days
with outstanding loans |
| Lender | 11,850,000 | 3.59 | 2 |
Interest income earned by the Fund is recorded as Interfund lending in the Statement of Operations. The Fund had no outstanding interfund loans at November 30, 2022.
Note 8. Line of credit
The Fund has access to a revolving credit facility with a syndicate of banks led by JPMorgan Chase Bank, N.A., Citibank, N.A. and Wells Fargo Bank, N.A. whereby the Fund may borrow for the temporary funding of shareholder redemptions or for other temporary or emergency purposes. Pursuant to an October 27, 2022 amendment and restatement, the credit facility, which is an agreement between the Fund and certain other funds managed by the Investment Manager or an affiliated investment manager, severally and not jointly, permits aggregate borrowings up to $950 million. Interest is currently charged to each participating fund based on its borrowings at a rate equal to the higher of (i) the federal funds effective rate, (ii) the secured overnight financing rate plus 0.10% and (iii) the overnight bank funding rate, plus in each case, 1.00%. Each borrowing under the credit facility matures no later than 60 days after the date of borrowing. The Fund also pays a commitment fee equal to its pro rata share of the unused amount of the credit facility at a rate of 0.15% per annum. The commitment fee is included in other expenses in the Statement of Operations. This agreement expires annually in October unless extended or renewed. Prior to the October 27, 2022 amendment and restatement, the Fund had access to a revolving credit facility with a syndicate of banks led by JPMorgan Chase Bank, N.A., Citibank, N.A. and Wells Fargo Bank, N.A. which permitted collective borrowings up to $950 million. Interest was charged to each participating fund based on its borrowings at a rate equal to the higher of (i) the federal funds effective rate, (ii) the secured overnight financing rate plus 0.11448% and (iii) the overnight bank funding rate, plus in each case, 1.00%.
The Fund had no borrowings during the six months ended November 30, 2022.
Note 9. Significant risks
Credit risk
Credit risk is the risk that the value of debt instruments in the Fund’s portfolio may decline because the issuer defaults or otherwise becomes unable or unwilling, or is perceived to be unable or unwilling, to honor its financial obligations, such as making payments to the Fund when due. Credit rating agencies assign credit ratings to certain debt instruments to indicate their credit risk. Lower-rated or unrated debt instruments held by the Fund may present increased credit risk as compared to higher-rated debt instruments.
Derivatives risk
Losses involving derivative instruments may be substantial, because a relatively small movement in the underlying reference (which is generally the price, rate or other economic indicator associated with a security(ies), commodity, currency, index or other instrument or asset) may result in a substantial loss for the Fund. In addition to the potential for increased losses, the use of derivative instruments may lead to increased volatility within the Fund. Derivatives will typically increase the Fund’s exposure to principal risks to which it is otherwise exposed, and may expose the Fund to additional risks, including correlation risk, counterparty risk, hedging risk, leverage risk, liquidity risk and pricing risk.
Interest rate risk
Interest rate risk is the risk of losses attributable to changes in interest rates. In general, if prevailing interest rates rise, the values of debt instruments tend to fall, and if interest rates fall, the values of debt instruments tend to rise. Actions by governments and central banking authorities can result in increases or decreases in interest rates. Higher periods of inflation could lead such authorities to raise interest rates. Increasing interest rates may negatively affect the value of debt securities held by the Fund, resulting in a negative impact on the Fund’s performance and net asset value per share. In general, the longer the maturity or duration of a debt security, the greater its sensitivity to changes in interest rates. The Fund is subject to the risk that the income generated by its investments may not keep pace with inflation.
| 40 | Columbia Quality Income Fund | Semiannual Report 2022 |
Notes to Financial Statements (continued)
November 30, 2022 (Unaudited)
LIBOR replacement risk
The elimination of London Inter-Bank Offered Rate (LIBOR), among other "inter-bank offered" reference rates, may adversely affect the interest rates on, and value of, certain Fund investments for which the value is tied to LIBOR. The U.K. Financial Conduct Authority and the ICE Benchmark Administration have announced that a majority of U.S. dollar LIBOR settings will cease publication after June 30, 2023. A subset of non-U.S. dollar LIBOR settings is continuing to be published on a “synthetic” basis and it is possible that a subset of U.S. dollar LIBOR settings will also be published after June 30, 2023 on a “synthetic” basis. Any such publications are, or would be considered, non-representative of the underlying market. Markets are slowly developing in response to the elimination of LIBOR. Uncertainty related to the liquidity impact of the change in rates, and how to appropriately adjust these rates at the time of transition, poses risks for the Fund. These risks are likely to persist until new reference rates and fallbacks for both legacy and new instruments and contracts are commercially accepted and market practices become more settled. Alternatives to LIBOR have been established or are in development in most major currencies, including the Secured Overnight Financing Rate (SOFR), which the U.S. Federal Reserve is promoting as the alternative reference rate to U.S. dollar LIBOR.
Liquidity risk
Liquidity risk is the risk associated with a lack of marketability of investments which may make it difficult to sell the investment at a desirable time or price. Changing regulatory, market or other conditions or environments (for example, the interest rate or credit environments) may adversely affect the liquidity of the Fund’s investments. The Fund may have to accept a lower selling price for the holding, sell other investments, or forego another, more appealing investment opportunity. Generally, the less liquid the market at the time the Fund sells a portfolio investment, the greater the risk of loss or decline of value to the Fund. A less liquid market can lead to an increase in Fund redemptions, which may negatively impact Fund performance and net asset value per share, including, for example, if the Fund is forced to sell securities in a down market.
Market risk
The Fund may incur losses due to declines in the value of one or more securities in which it invests. These declines may be due to factors affecting a particular issuer, or the result of, among other things, political, regulatory, market, economic or social developments affecting the relevant market(s) more generally. In addition, turbulence in financial markets and reduced liquidity in equity, credit and/or fixed income markets may negatively affect many issuers, which could adversely affect the Fund’s ability to price or value hard-to-value assets in thinly traded and closed markets and could cause significant redemptions and operational challenges. Global economies and financial markets are increasingly interconnected, and conditions and events in one country, region or financial market may adversely impact issuers in a different country, region or financial market. These risks may be magnified if certain events or developments adversely interrupt the global supply chain; in these and other circumstances, such risks might affect companies worldwide. As a result, local, regional or global events such as terrorism, war, natural disasters, disease/virus outbreaks and epidemics or other public health issues, recessions, depressions or other events – or the potential for such events – could have a significant negative impact on global economic and market conditions.
The large-scale invasion of Ukraine by Russia in February 2022 has resulted in sanctions and market disruptions, including declines in regional and global stock markets, unusual volatility in global commodity markets and significant devaluations of Russian currency. The extent and duration of the military action are impossible to predict but could be significant. Market disruption caused by the Russian military action, and any counter-measures or responses thereto (including international sanctions, a downgrade in the country’s credit rating, purchasing and financing restrictions, boycotts, tariffs, changes in consumer or purchaser preferences, cyberattacks and espionage) could have severe adverse impacts on regional and/or global securities and commodities markets, including markets for oil and natural gas. These impacts may include reduced market liquidity, distress in credit markets, further disruption of global supply chains, increased risk of inflation, and limited access to investments in certain international markets and/or issuers. These developments and other related events could negatively impact Fund performance.
The pandemic caused by coronavirus disease 2019 and its variants (COVID-19) has resulted in, and may continue to result in, significant global economic and societal disruption and market volatility due to disruptions in market access, resource availability, facilities operations, imposition of tariffs, export controls and supply chain disruption, among others. Such disruptions may be caused, or exacerbated by, quarantines and travel restrictions, workforce displacement and loss in
Columbia Quality Income Fund | Semiannual Report 2022
| 41 |
Notes to Financial Statements (continued)
November 30, 2022 (Unaudited)
human and other resources. The uncertainty surrounding the magnitude, duration, reach, costs and effects of the global pandemic, as well as actions that have been or could be taken by governmental authorities or other third parties, present unknowns that are yet to unfold. The impacts, as well as the uncertainty over impacts to come, of COVID-19 – and any other infectious illness outbreaks, epidemics and pandemics that may arise in the future – could negatively affect global economies and markets in ways that cannot necessarily be foreseen. In addition, the impact of infectious illness outbreaks and epidemics in emerging market countries may be greater due to generally less established healthcare systems, governments and financial markets. Public health crises caused by the COVID-19 outbreak may exacerbate other pre-existing political, social and economic risks in certain countries or globally. The disruptions caused by COVID-19 could prevent the Fund from executing advantageous investment decisions in a timely manner and negatively impact the Fund’s ability to achieve its investment objective. Any such events could have a significant adverse impact on the value and risk profile of the Fund.
Mortgage- and other asset-backed securities risk
The value of any mortgage-backed and other asset-backed securities including collateralized debt obligations, if any, held by the Fund may be affected by, among other things, changes or perceived changes in: interest rates; factors concerning the interests in and structure of the issuer or the originator of the mortgages or other assets; the creditworthiness of the entities that provide any supporting letters of credit, surety bonds or other credit enhancements; or the market’s assessment of the quality of underlying assets. Payment of principal and interest on some mortgage-backed securities (but not the market value of the securities themselves) may be guaranteed by the full faith and credit of a particular U.S. Government agency, authority, enterprise or instrumentality, and some, but not all, are also insured or guaranteed by the U.S. Government. Mortgage-backed securities issued by non-governmental issuers (such as commercial banks, savings and loan institutions, private mortgage insurance companies, mortgage bankers and other secondary market issuers) may entail greater risk than obligations guaranteed by the U.S. Government. Mortgage- and other asset-backed securities are subject to liquidity risk and prepayment risk. A decline or flattening of housing values may cause delinquencies in mortgages (especially sub-prime or non-prime mortgages) underlying mortgage-backed securities and thereby adversely affect the ability of the mortgage-backed securities issuer to make principal and/or interest payments to mortgage-backed securities holders, including the Fund. Rising or high interest rates tend to extend the duration of mortgage- and other asset-backed securities, making their prices more volatile and more sensitive to changes in interest rates.
Shareholder concentration risk
At November 30, 2022, affiliated shareholders of record owned 70.0% of the outstanding shares of the Fund in one or more accounts. Subscription and redemption activity by concentrated accounts may have a significant effect on the operations of the Fund. In the case of a large redemption, the Fund may be forced to sell investments at inopportune times, including its liquid positions, which may result in Fund losses and the Fund holding a higher percentage of less liquid positions. Large redemptions could result in decreased economies of scale and increased operating expenses for non-redeeming Fund shareholders.
Note 10. Subsequent events
Management has evaluated the events and transactions that have occurred through the date the financial statements were issued and noted no items requiring adjustment of the financial statements or additional disclosure.
Note 11. Information regarding pending and settled legal proceedings
Ameriprise Financial and certain of its affiliates are involved in the normal course of business in legal proceedings which include regulatory inquiries, arbitration and litigation, including class actions concerning matters arising in connection with the conduct of its activities as a diversified financial services firm. Ameriprise Financial believes that the Fund is not currently the subject of, and that neither Ameriprise Financial nor any of its affiliates are the subject of, any pending legal, arbitration or regulatory proceedings that are likely to have a material adverse effect on the Fund or the ability of Ameriprise Financial or its affiliates to perform under their contracts with the Fund. Ameriprise Financial is required to make quarterly (10-Q), annual (10-K) and, as necessary, 8-K filings with the Securities and Exchange Commission (SEC) on legal and regulatory matters that relate to Ameriprise Financial and its affiliates. Copies of these filings may be obtained by accessing the SEC website at www.sec.gov.
| 42 | Columbia Quality Income Fund | Semiannual Report 2022 |
Notes to Financial Statements (continued)
November 30, 2022 (Unaudited)
There can be no assurance that these matters, or the adverse publicity associated with them, will not result in increased Fund redemptions, reduced sale of Fund shares or other adverse consequences to the Fund. Further, although we believe proceedings are not likely to have a material adverse effect on the Fund or the ability of Ameriprise Financial or its affiliates to perform under their contracts with the Fund, these proceedings are subject to uncertainties and, as such, we are unable to estimate the possible loss or range of loss that may result. An adverse outcome in one or more of these proceedings could result in adverse judgments, settlements, fines, penalties or other relief that could have a material adverse effect on the consolidated financial condition or results of operations of Ameriprise Financial or one or more of its affiliates that provides services to the Fund.
Columbia Quality Income Fund | Semiannual Report 2022
| 43 |
Approval of Management Agreement
(Unaudited)
Columbia Management Investment Advisers, LLC (the Investment Manager, and together with its domestic and global affiliates, Columbia Threadneedle Investments), a wholly-owned subsidiary of Ameriprise Financial, Inc. (Ameriprise Financial), serves as the investment manager to Columbia Quality Income Fund (the Fund). Under a management agreement (the Management Agreement), the Investment Manager provides investment advice and other services to the Fund and other funds distributed by Columbia Management Investment Distributors, Inc. (collectively, the Funds).
On an annual basis, the Fund’s Board of Trustees (the Board), including the independent Board members (the Independent Trustees), considers renewal of the Management Agreement. The Investment Manager prepared detailed reports for the Board and its Contracts Committee (including its Contracts Subcommittee) in November 2021 and March, April and June 2022, including reports providing the results of analyses performed by an independent third-party data provider, Broadridge Financial Solutions, Inc. (Broadridge), and comprehensive responses to written requests for information by independent legal counsels to the Independent Trustees (Independent Legal Counsel) to the Investment Manager, to assist the Board in making this determination. In addition, throughout the year, the Board (or its committees or subcommittees) regularly meets with portfolio management teams and senior management personnel and reviews information prepared by the Investment Manager addressing the services the Investment Manager provides and Fund performance. The Board also accords appropriate weight to the work, deliberations and conclusions of the various committees, such as the Contracts Committee, the Investment Review Committee, the Audit Committee and the Compliance Committee in determining whether to continue the Management Agreement.
The Board, at its June 23, 2022 Board meeting (the June Meeting), considered the renewal of the Management Agreement for an additional one-year term. At the June Meeting, Independent Legal Counsel reviewed with the Independent Trustees various factors relevant to the Board’s consideration of advisory agreements and the Board’s legal responsibilities related to such consideration. The Independent Trustees considered all information that they, their legal counsel or the Investment Manager believed reasonably necessary to evaluate and to approve the continuation of the Management Agreement. Among other things, the information and factors considered included the following:
| • | Information on the investment performance of the Fund relative to the performance of a group of mutual funds determined to be comparable to the Fund by Broadridge, as well as performance relative to benchmarks; |
| • | Information on the Fund’s management fees and total expenses, including information comparing the Fund’s expenses to those of a group of comparable mutual funds, as determined by Broadridge; |
| • | The Investment Manager’s agreement to contractually limit or cap total operating expenses for the Fund so that total operating expenses (excluding certain fees and expenses, such as transaction costs and certain other investment related expenses, interest, taxes, acquired fund fees and expenses and infrequent and/or unusual expenses) would not exceed a specified annual rate, as a percentage of the Fund’s net assets; |
| • | Terms of the Management Agreement; |
| • | Descriptions of other agreements and arrangements with affiliates of the Investment Manager relating to the operations of the Fund, including agreements with respect to the provision of transfer agency and shareholder services to the Fund; |
| • | Descriptions of various services performed by the Investment Manager under the Management Agreement, including portfolio management and portfolio trading practices; |
| • | Information regarding any recently negotiated management fees of similarly-managed portfolios of other institutional clients of the Investment Manager; |
| • | Information regarding the resources of the Investment Manager, including information regarding senior management, portfolio managers and other personnel; |
| • | Information regarding the capabilities of the Investment Manager with respect to compliance monitoring services; |
| • | The profitability to the Investment Manager and its affiliates from their relationships with the Fund; and |
| • | Report provided by the Board’s independent fee consultant, JDL Consultants, LLC (JDL). |
| 44 | Columbia Quality Income Fund | Semiannual Report 2022 |
Approval of Management Agreement (continued)
(Unaudited)
Following an analysis and discussion of the foregoing, and the factors identified below, the Board, including all of the Independent Trustees, approved the renewal of the Management Agreement.
Nature, extent and quality of services provided by the Investment Manager
The Board analyzed various reports and presentations it had received detailing the services performed by the Investment Manager, as well as its history, expertise, resources and relative capabilities, and the qualifications of its personnel.
The Board specifically considered the many developments during recent years concerning the services provided by the Investment Manager. Among other things, the Board noted the organization and depth of the equity and credit research departments. The Board further observed the enhancements to the investment risk management department’s processes, systems and oversight, over the past several years, as well as planned 2022 initiatives in this regard. The Board also took into account the broad scope of services provided by the Investment Manager to the Fund, including, among other services, investment, risk and compliance oversight. The Board also took into account the information it received concerning the Investment Manager’s ability to attract and retain key portfolio management personnel and that it has sufficient resources to provide competitive and adequate compensation to investment personnel. The Board also observed that the Investment Manager has been able to effectively manage, operate and distribute the Funds through the COVID-19 pandemic period with no disruptions in services provided. The Board also considered added personnel and resources obtained by Columbia Threadneedle through Ameriprise Financial’s acquisition of BMO Financial Group’s Europe, Middle East, and Africa (EMEA) asset management business.
In connection with the Board’s evaluation of the overall package of services provided by the Investment Manager, the Board also considered the nature, quality and range of administrative services provided to the Fund by the Investment Manager, as well as the achievements in 2021 in the performance of administrative services, and noted the various enhancements anticipated for 2022. In evaluating the quality of services provided under the Management Agreement, the Board also took into account the organization and strength of the Fund’s and its service providers’ compliance programs. The Board also reviewed the financial condition of the Investment Manager and its affiliates and each entity’s ability to carry out its responsibilities under the Management Agreement and the Fund’s other service agreements.
In addition, the Board discussed the acceptability of the terms of the Management Agreement, noting that no changes were proposed from the form of agreement previously approved. The Board also noted the wide array of legal and compliance services provided to the Fund under the Management Agreement.
After reviewing these and related factors (including investment performance as discussed below), the Board concluded, within the context of their overall conclusions, that the nature, extent and quality of the services provided to the Fund under the Management Agreement supported the continuation of the Management Agreement.
Investment performance
In this connection, the Board carefully reviewed the investment performance of the Fund, including detailed reports providing the results of analyses performed by each of the Investment Manager, Broadridge and JDL collectively showing, for various periods (including since manager inception): (i) the performance of the Fund, (ii) the performance of a benchmark index, (iii) the percentage ranking of the Fund among its comparison group, (iv) the Fund’s performance relative to peers and benchmarks and (v) the net assets of the Fund. The Board observed that the Fund’s performance for certain periods ranked above median based on information provided by Broadridge.
The Board also reviewed a description of the third-party data provider’s methodology for identifying the Fund’s peer groups for purposes of performance and expense comparisons.
The Board also considered the Investment Manager’s performance and reputation generally. After reviewing these and related factors, the Board concluded, within the context of their overall conclusions, that the performance of the Fund and the Investment Manager, in light of other considerations, supported the continuation of the Management Agreement.
Columbia Quality Income Fund | Semiannual Report 2022
| 45 |
Approval of Management Agreement (continued)
(Unaudited)
Comparative fees, costs of services provided and the profits realized by the Investment Manager and its affiliates from their relationships with the Fund
The Board reviewed comparative fees and the costs of services provided under the Management Agreement. The Board members considered detailed comparative information set forth in an annual report on fees and expenses, including, among other things, data (based on analyses conducted by Broadridge and JDL) showing a comparison of the Fund’s expenses with median expenses paid by funds in its comparative peer universe, as well as data showing the Fund’s contribution to the Investment Manager’s profitability.
The Board considered the reports of JDL, which assisted in the Board’s analysis of the Funds’ performance and expenses and the reasonableness of the Funds’ fee rates. The Board accorded particular weight to the notion that a primary objective of the level of fees is to achieve a rational pricing model applied consistently across the various product lines in the Fund family, while assuring that the overall fees for each Fund (with certain exceptions) are generally in line with the current "pricing philosophy" such that Fund total expense ratios, in general, approximate or are lower than the median expense ratios of funds in the same Lipper comparison universe. The Board took into account that the Fund’s total expense ratio (after considering proposed expense caps/waivers) approximated the peer universe’s median expense ratio.
After reviewing these and related factors, the Board concluded, within the context of their overall conclusions, that the levels of management fees and expenses of the Fund, in light of other considerations, supported the continuation of the Management Agreement.
The Board also considered the profitability of the Investment Manager and its affiliates in connection with the Investment Manager providing management services to the Fund. With respect to the profitability of the Investment Manager and its affiliates, the Independent Trustees referred to information discussing the profitability to the Investment Manager and Ameriprise Financial from managing, operating and distributing the Funds. The Board considered that in 2021 the Board had considered 2020 profitability and that the 2022 information showed that the profitability generated by the Investment Manager in 2021 increased from 2020 levels, due to a variety of factors, including the increased assets under management of the Funds. It also took into account the indirect economic benefits flowing to the Investment Manager or its affiliates in connection with managing or distributing the Funds, such as the enhanced ability to offer various other financial products to Ameriprise Financial customers, soft dollar benefits and overall reputational advantages. The Board noted that the fees paid by the Fund should permit the Investment Manager to offer competitive compensation to its personnel, make necessary investments in its business and earn an appropriate profit. After reviewing these and related factors, the Board concluded, within the context of their overall conclusions, that the costs of services provided and the profitability to the Investment Manager and its affiliates from their relationships with the Fund supported the continuation of the Management Agreement.
Economies of scale
The Board considered the potential existence of economies of scale in the provision by the Investment Manager of services to the Fund, to groups of related funds and to the Investment Manager as a whole, and whether those economies of scale were shared with the Fund through breakpoints in investment management fees or other means, such as expense limitation arrangements and additional investments by the Investment Manager in investment, trading, compliance and other resources. The Board considered the economies of scale that might be realized as the Fund’s net asset level grows and took note of the extent to which Fund shareholders might also benefit from such growth. In this regard, the Board took into account that management fees decline as Fund assets exceed various breakpoints, all of which have not been surpassed. The Board observed that the Management Agreement provided for breakpoints in the management fee rate schedule that allow opportunities for shareholders to realize lower fees as Fund assets grow and that there are additional opportunities through other means for sharing economies of scale with shareholders.
Conclusion
The Board reviewed all of the above considerations in reaching its decision to approve the continuation of the Management Agreement. In reaching its conclusions, no single factor was determinative.
| 46 | Columbia Quality Income Fund | Semiannual Report 2022 |
Approval of Management Agreement (continued)
(Unaudited)
On June 23, 2022, the Board, including all of the Independent Trustees, determined that fees payable under the Management Agreement were fair and reasonable in light of the extent and quality of services provided and approved the renewal of the Management Agreement.
Columbia Quality Income Fund | Semiannual Report 2022
| 47 |
Columbia Quality Income Fund
P.O. Box 219104
Kansas City, MO 64121-9104
Please read and consider the investment objectives, risks, charges and expenses for any fund carefully before investing. For a prospectus and summary prospectus, which contains this and other important information about the Fund, go to
columbiathreadneedleus.com/investor/. The Fund is distributed by Columbia Management Investment Distributors, Inc., member FINRA, and managed by Columbia Management Investment Advisers, LLC.
Columbia Threadneedle Investments (Columbia Threadneedle) is the global brand name of the Columbia and Threadneedle group of companies. All rights reserved.
© 2023 Columbia Management Investment Advisers, LLC.
columbiathreadneedleus.com/investor/

Semiannual Report
November 30, 2022 (Unaudited)
Columbia Select Large Cap Value Fund
Not FDIC or NCUA Insured • No Financial Institution Guarantee • May Lose Value
If you elect to receive the shareholder report for Columbia Select Large Cap Value Fund (the Fund) in paper, mailed to you, the Fund mails one shareholder report to each shareholder address, unless such shareholder elects to receive shareholder reports from the Fund electronically via e-mail or by having a paper notice mailed to you (Postcard Notice) that your Fund’s shareholder report is available at the Columbia funds’ website (columbiathreadneedleus.com/investor/). If you would like more than one report in paper to be mailed to you, or would like to elect to receive reports via e-mail or access them through Postcard Notice, please call shareholder services at 800.345.6611 and additional reports will be sent to you.
Proxy voting policies and procedures
The policy of the Board of Trustees is to vote the proxies of the companies in which the Fund holds investments consistent with the procedures as stated in the Statement of Additional Information (SAI). You may obtain a copy of the SAI without charge by calling 800.345.6611; contacting your financial intermediary; visiting columbiathreadneedleus.com/investor/; or searching the website of the Securities and Exchange Commission (SEC) at sec.gov. Information regarding how the Fund voted proxies relating to portfolio securities is filed with the SEC by August 31st for the most recent 12-month period ending June 30th of that year, and is available without charge by visiting columbiathreadneedleus.com/investor/, or searching the website of the SEC at sec.gov.
Quarterly schedule of investments
The Fund files a complete schedule of portfolio holdings with the SEC for the first and third quarters of each fiscal year on Form N-PORT. The Fund’s Form N-PORT filings are available on the SEC’s website at sec.gov. The Fund’s complete schedule of portfolio holdings, as filed on Form N-PORT, is available on columbiathreadneedleus.com/investor/ or can also be obtained without charge, upon request, by calling 800.345.6611.
Additional Fund information
For more information about the Fund, please visit columbiathreadneedleus.com/investor/ or call 800.345.6611. Customer Service Representatives are available to answer your questions Monday through Friday from 8 a.m. to 7 p.m. Eastern time.
Fund investment manager
Columbia Management Investment Advisers, LLC (the Investment Manager)
290 Congress Street
Boston, MA 02210
Fund distributor
Columbia Management Investment Distributors, Inc.
290 Congress Street
Boston, MA 02210
Fund transfer agent
Columbia Management Investment Services Corp.
P.O. Box 219104
Kansas City, MO 64121-9104
Columbia Select Large Cap Value Fund | Semiannual Report 2022
Fund at a Glance
(Unaudited)
Investment objective
The Fund seeks to provide shareholders with long-term capital appreciation.
Portfolio management
Richard Rosen
Lead Portfolio Manager
Managed Fund since 1997
Richard Taft
Portfolio Manager
Managed Fund since 2016
Morningstar style boxTM
The Morningstar Style Box is based on a fund’s portfolio holdings. For equity funds, the vertical axis shows the market capitalization of the stocks owned, and the horizontal axis shows investment style (value, blend, or growth). Information shown is based on the most recent data provided by Morningstar.
© 2023 Morningstar, Inc. All rights reserved. The Morningstar information contained herein: (1) is proprietary to Morningstar and/or its content providers; (2) may not be copied or distributed; and (3) is not warranted to be accurate, complete or timely. Neither Morningstar nor its content providers are responsible for any damages or losses arising from any use of this information.
| Average annual total returns (%) (for the period ended November 30, 2022) |
| | | Inception | 6 Months
cumulative | 1 Year | 5 Years | 10 Years |
| Class A | Excluding sales charges | 04/25/97 | 3.48 | 9.31 | 9.40 | 12.61 |
| | Including sales charges | | -2.48 | 3.03 | 8.11 | 11.94 |
| Advisor Class | 11/08/12 | 3.61 | 9.54 | 9.67 | 12.89 |
| Class C | Excluding sales charges | 05/27/99 | 3.12 | 8.49 | 8.58 | 11.77 |
| | Including sales charges | | 2.12 | 7.49 | 8.58 | 11.77 |
| Institutional Class | 09/27/10 | 3.63 | 9.56 | 9.67 | 12.89 |
| Institutional 2 Class | 11/30/01 | 3.67 | 9.62 | 9.73 | 12.97 |
| Institutional 3 Class* | 10/01/14 | 3.69 | 9.68 | 9.78 | 12.95 |
| Class R | 04/30/03 | 3.36 | 9.00 | 9.13 | 12.33 |
| Russell 1000 Value Index | | 0.90 | 2.42 | 7.86 | 10.97 |
| S&P 500 Index | | -0.40 | -9.21 | 10.98 | 13.34 |
Returns for Class A shares are shown with and without the maximum initial sales charge of 5.75%. Returns for Class C shares are shown with and without the 1.00% contingent deferred sales charge for the first year only. The Fund’s other share classes are not subject to sales charges and have limited eligibility. Please see the Fund’s prospectus for details. Performance for different share classes will vary based on differences in sales charges and fees associated with each share class. All results shown assume reinvestment of distributions during the period. Returns do not reflect the deduction of taxes that a shareholder may pay on Fund distributions or on the redemption of Fund shares. Performance results reflect the effect of any fee waivers or reimbursements of Fund expenses by Columbia Management Investment Advisers, LLC and/or any of its affiliates. Absent these fee waivers or expense reimbursement arrangements, performance results would have been lower.
The performance information shown represents past performance and is not a guarantee of future results. The investment return and principal value of your investment will fluctuate so that your shares, when redeemed, may be worth more or less than their original cost. Current performance may be lower or higher than the performance information shown. You may obtain performance information current to the most recent month-end by contacting your financial intermediary, visiting columbiathreadneedleus.com/investor/ or calling 800.345.6611.
| * | The returns shown for periods prior to the share class inception date (including returns for the Life of the Fund, if shown, which are since Fund inception) include the returns of the Fund’s oldest share class. These returns are adjusted to reflect any higher class-related operating expenses of the newer share classes, as applicable. Please visit columbiathreadneedleus.com/investor/investment-products/mutual-funds/appended-performance for more information. |
The Russell 1000 Value Index, an unmanaged index, measures the performance of those stocks in the Russell 1000 Index with lower price-to-book ratios and lower forecasted growth values.
The S&P 500 Index, an unmanaged index, measures the performance of 500 widely held, large-capitalization U.S. stocks and is frequently used as a general measure of market performance.
Indices are not available for investment, are not professionally managed and do not reflect sales charges, fees, brokerage commissions, taxes or other expenses of investing. Securities in the Fund may not match those in an index.
Columbia Select Large Cap Value Fund | Semiannual Report 2022
| 3 |
Fund at a Glance (continued)
(Unaudited)
| Portfolio breakdown (%) (at November 30, 2022) |
| Common Stocks | 96.1 |
| Money Market Funds | 3.8 |
| Preferred Stocks | 0.1 |
| Total | 100.0 |
Percentages indicated are based upon total investments excluding investments in derivatives, if any. The Fund’s portfolio composition is subject to change.
| Equity sector breakdown (%) (at November 30, 2022) |
| Communication Services | 3.4 |
| Consumer Discretionary | 3.6 |
| Consumer Staples | 3.2 |
| Energy | 11.2 |
| Financials | 17.9 |
| Health Care | 15.3 |
| Industrials | 9.7 |
| Information Technology | 13.9 |
| Materials | 11.3 |
| Utilities | 10.5 |
| Total | 100.0 |
Percentages indicated are based upon total equity investments. The Fund’s portfolio composition is subject to change.
| 4 | Columbia Select Large Cap Value Fund | Semiannual Report 2022 |
Understanding Your Fund’s Expenses
(Unaudited)
As an investor, you incur two types of costs. There are shareholder transaction costs, which generally include sales charges on purchases and may include redemption fees. There are also ongoing fund costs, which generally include management fees, distribution and/or service fees, and other fund expenses. The following information is intended to help you understand your ongoing costs (in dollars) of investing in the Fund and to help you compare these costs with the ongoing costs of investing in other mutual funds.
Analyzing your Fund’s expenses
To illustrate these ongoing costs, we have provided examples and calculated the expenses paid by investors in each share class of the Fund during the period. The actual and hypothetical information in the table is based on an initial investment of $1,000 at the beginning of the period indicated and held for the entire period. Expense information is calculated two ways and each method provides you with different information. The amount listed in the “Actual” column is calculated using the Fund’s actual operating expenses and total return for the period. You may use the Actual information, together with the amount invested, to estimate the expenses that you paid over the period. Simply divide your account value by $1,000 (for example, an $8,600 account value divided by $1,000 = 8.6), then multiply the results by the expenses paid during the period under the “Actual” column. The amount listed in the “Hypothetical” column assumes a 5% annual rate of return before expenses (which is not the Fund’s actual return) and then applies the Fund’s actual expense ratio for the period to the hypothetical return. You should not use the hypothetical account values and expenses to estimate either your actual account balance at the end of the period or the expenses you paid during the period. See “Compare with other funds” below for details on how to use the hypothetical data.
Compare with other funds
Since all mutual funds are required to include the same hypothetical calculations about expenses in shareholder reports, you can use this information to compare the ongoing cost of investing in the Fund with other funds. To do so, compare the hypothetical example with the 5% hypothetical examples that appear in the shareholder reports of other funds. As you compare hypothetical examples of other funds, it is important to note that hypothetical examples are meant to highlight the ongoing costs of investing in a fund only and do not reflect any transaction costs, such as sales charges, or redemption or exchange fees. Therefore, the hypothetical calculations are useful in comparing ongoing costs only, and will not help you determine the relative total costs of owning different funds. If transaction costs were included in these calculations, your costs would be higher.
| June 1, 2022 — November 30, 2022 |
| | Account value at the
beginning of the
period ($) | Account value at the
end of the
period ($) | Expenses paid during
the period ($) | Fund’s annualized
expense ratio (%) |
| | Actual | Hypothetical | Actual | Hypothetical | Actual | Hypothetical | Actual |
| Class A | 1,000.00 | 1,000.00 | 1,034.80 | 1,021.06 | 4.08 | 4.05 | 0.80 |
| Advisor Class | 1,000.00 | 1,000.00 | 1,036.10 | 1,022.31 | 2.81 | 2.79 | 0.55 |
| Class C | 1,000.00 | 1,000.00 | 1,031.20 | 1,017.30 | 7.89 | 7.84 | 1.55 |
| Institutional Class | 1,000.00 | 1,000.00 | 1,036.30 | 1,022.31 | 2.81 | 2.79 | 0.55 |
| Institutional 2 Class | 1,000.00 | 1,000.00 | 1,036.70 | 1,022.66 | 2.45 | 2.43 | 0.48 |
| Institutional 3 Class | 1,000.00 | 1,000.00 | 1,036.90 | 1,022.91 | 2.20 | 2.18 | 0.43 |
| Class R | 1,000.00 | 1,000.00 | 1,033.60 | 1,019.80 | 5.35 | 5.32 | 1.05 |
Expenses paid during the period are equal to the annualized expense ratio for each class as indicated above, multiplied by the average account value over the period and then multiplied by the number of days in the Fund’s most recent fiscal half year and divided by 365.
Expenses do not include fees and expenses incurred indirectly by the Fund from its investment in underlying funds, including affiliated and non-affiliated pooled investment vehicles, such as mutual funds and exchange-traded funds.
Had Columbia Management Investment Advisers, LLC and/or certain of its affiliates not waived/reimbursed certain fees and expenses, account value at the end of the period would have been reduced.
Columbia Select Large Cap Value Fund | Semiannual Report 2022
| 5 |
Portfolio of Investments
November 30, 2022 (Unaudited)
(Percentages represent value of investments compared to net assets)
Investments in securities
| Common Stocks 96.0% |
| Issuer | Shares | Value ($) |
| Communication Services 3.2% |
| Diversified Telecommunication Services 3.2% |
| Verizon Communications, Inc. | 2,015,602 | 78,568,166 |
| Total Communication Services | 78,568,166 |
| Consumer Discretionary 3.3% |
| Internet & Direct Marketing Retail 0.3% |
| Qurate Retail, Inc.(a) | 3,046,206 | 7,158,584 |
| Specialty Retail 3.0% |
| Lowe’s Companies, Inc. | 351,326 | 74,674,341 |
| Total Consumer Discretionary | 81,832,925 |
| Consumer Staples 3.1% |
| Tobacco 3.1% |
| Philip Morris International, Inc. | 760,966 | 75,845,481 |
| Total Consumer Staples | 75,845,481 |
| Energy 10.7% |
| Energy Equipment & Services 2.4% |
| TechnipFMC PLC(a) | 4,662,911 | 57,820,096 |
| Oil, Gas & Consumable Fuels 8.3% |
| Chevron Corp. | 280,927 | 51,496,728 |
| Marathon Petroleum Corp. | 669,170 | 81,511,598 |
| Williams Companies, Inc. (The) | 2,053,057 | 71,241,078 |
| Total | | 204,249,404 |
| Total Energy | 262,069,500 |
| Financials 17.2% |
| Banks 10.1% |
| Bank of America Corp. | 1,648,132 | 62,381,796 |
| Citigroup, Inc. | 886,540 | 42,917,401 |
| JPMorgan Chase & Co. | 392,792 | 54,275,999 |
| Wells Fargo & Co. | 1,814,443 | 87,002,542 |
| Total | | 246,577,738 |
| Capital Markets 2.0% |
| Morgan Stanley | 521,271 | 48,514,692 |
| Common Stocks (continued) |
| Issuer | Shares | Value ($) |
| Insurance 5.1% |
| American International Group, Inc. | 940,610 | 59,361,897 |
| MetLife, Inc. | 869,018 | 66,653,681 |
| Total | | 126,015,578 |
| Total Financials | 421,108,008 |
| Health Care 14.7% |
| Health Care Equipment & Supplies 2.0% |
| Baxter International, Inc. | 875,631 | 49,499,420 |
| Health Care Providers & Services 9.8% |
| Centene Corp.(a) | 755,794 | 65,791,868 |
| Cigna Corp. | 302,761 | 99,575,065 |
| Humana, Inc. | 135,973 | 74,771,553 |
| Total | | 240,138,486 |
| Pharmaceuticals 2.9% |
| Bristol-Myers Squibb Co. | 879,649 | 70,618,222 |
| Total Health Care | 360,256,128 |
| Industrials 9.4% |
| Aerospace & Defense 2.7% |
| Raytheon Technologies Corp. | 682,662 | 67,392,393 |
| Airlines 2.6% |
| Southwest Airlines Co.(a) | 1,572,450 | 62,756,479 |
| Machinery 1.6% |
| Caterpillar, Inc. | 162,069 | 38,314,732 |
| Road & Rail 2.5% |
| CSX Corp. | 1,164,294 | 38,060,771 |
| Union Pacific Corp. | 101,409 | 22,049,359 |
| Total | | 60,110,130 |
| Total Industrials | 228,573,734 |
| Information Technology 13.4% |
| Communications Equipment 3.0% |
| Cisco Systems, Inc. | 1,455,418 | 72,363,383 |
| Electronic Equipment, Instruments & Components 2.8% |
| Corning, Inc. | 1,996,727 | 68,148,293 |
The accompanying Notes to Financial Statements are an integral part of this statement.
| 6 | Columbia Select Large Cap Value Fund | Semiannual Report 2022 |
Portfolio of Investments (continued)
November 30, 2022 (Unaudited)
| Common Stocks (continued) |
| Issuer | Shares | Value ($) |
| Semiconductors & Semiconductor Equipment 5.7% |
| Applied Materials, Inc. | 668,962 | 73,318,235 |
| QUALCOMM, Inc. | 524,450 | 66,337,681 |
| Total | | 139,655,916 |
| Software 1.9% |
| Teradata Corp.(a) | 1,361,235 | 46,486,175 |
| Total Information Technology | 326,653,767 |
| Materials 10.9% |
| Chemicals 4.0% |
| FMC Corp. | 757,215 | 98,922,568 |
| Metals & Mining 6.9% |
| Barrick Gold Corp. | 4,367,588 | 71,279,036 |
| Freeport-McMoRan, Inc. | 2,416,913 | 96,193,137 |
| Total | | 167,472,173 |
| Total Materials | 266,394,741 |
| Utilities 10.1% |
| Electric Utilities 7.2% |
| FirstEnergy Corp. | 1,935,905 | 79,836,722 |
| PG&E Corp.(a) | 6,025,560 | 94,601,292 |
| Total | | 174,438,014 |
| Independent Power and Renewable Electricity Producers 2.9% |
| AES Corp. (The) | 2,465,613 | 71,305,528 |
| Total Utilities | 245,743,542 |
Total Common Stocks
(Cost $1,622,803,832) | 2,347,045,992 |
| Preferred Stocks 0.1% |
| Issuer | | Shares | Value ($) |
| Consumer Discretionary 0.1% |
| Internet & Direct Marketing Retail 0.1% |
| Qurate Retail, Inc. | 8.000% | 61,780 | 2,654,687 |
| Total Consumer Discretionary | 2,654,687 |
Total Preferred Stocks
(Cost $11,983,372) | 2,654,687 |
| Money Market Funds 3.8% |
| | Shares | Value ($) |
| Columbia Short-Term Cash Fund, 3.989%(b),(c) | 93,677,393 | 93,639,922 |
Total Money Market Funds
(Cost $93,622,367) | 93,639,922 |
Total Investments in Securities
(Cost: $1,728,409,571) | 2,443,340,601 |
| Other Assets & Liabilities, Net | | 1,613,724 |
| Net Assets | 2,444,954,325 |
Notes to Portfolio of Investments
| (a) | Non-income producing investment. |
| (b) | The rate shown is the seven-day current annualized yield at November 30, 2022. |
| (c) | As defined in the Investment Company Act of 1940, as amended, an affiliated company is one in which the Fund owns 5% or more of the company’s outstanding voting securities, or a company which is under common ownership or control with the Fund. The value of the holdings and transactions in these affiliated companies during the period ended November 30, 2022 are as follows: |
| Affiliated issuers | Beginning
of period($) | Purchases($) | Sales($) | Net change in
unrealized
appreciation
(depreciation)($) | End of
period($) | Realized gain
(loss)($) | Dividends($) | End of
period shares |
| Columbia Short-Term Cash Fund, 3.989% |
| | 68,145,830 | 177,668,870 | (152,192,333) | 17,555 | 93,639,922 | (15,499) | 1,031,528 | 93,677,393 |
The accompanying Notes to Financial Statements are an integral part of this statement.
Columbia Select Large Cap Value Fund | Semiannual Report 2022
| 7 |
Portfolio of Investments (continued)
November 30, 2022 (Unaudited)
Fair value measurements
The Fund categorizes its fair value measurements according to a three-level hierarchy that maximizes the use of observable inputs and minimizes the use of unobservable inputs by prioritizing that the most observable input be used when available. Observable inputs are those that market participants would use in pricing an investment based on market data obtained from sources independent of the reporting entity. Unobservable inputs are those that reflect the Fund’s assumptions about the information market participants would use in pricing an investment. An investment’s level within the fair value hierarchy is based on the lowest level of any input that is deemed significant to the asset’s or liability’s fair value measurement. The input levels are not necessarily an indication of the risk or liquidity associated with investments at that level. For example, certain U.S. government securities are generally high quality and liquid, however, they are reflected as Level 2 because the inputs used to determine fair value may not always be quoted prices in an active market.
Fair value inputs are summarized in the three broad levels listed below:
| ■ | Level 1 — Valuations based on quoted prices for investments in active markets that the Fund has the ability to access at the measurement date. Valuation adjustments are not applied to Level 1 investments. |
| ■ | Level 2 — Valuations based on other significant observable inputs (including quoted prices for similar securities, interest rates, prepayment speeds, credit risks, etc.). |
| ■ | Level 3 — Valuations based on significant unobservable inputs (including the Fund’s own assumptions and judgment in determining the fair value of investments). |
Inputs that are used in determining fair value of an investment may include price information, credit data, volatility statistics, and other factors. These inputs can be either observable or unobservable. The availability of observable inputs can vary between investments, and is affected by various factors such as the type of investment, and the volume and level of activity for that investment or similar investments in the marketplace. The inputs will be considered by the Investment Manager, along with any other relevant factors in the calculation of an investment’s fair value. The Fund uses prices and inputs that are current as of the measurement date, which may include periods of market dislocations. During these periods, the availability of prices and inputs may be reduced for many investments. This condition could cause an investment to be reclassified between the various levels within the hierarchy.
Investments falling into the Level 3 category are primarily supported by quoted prices from brokers and dealers participating in the market for those investments. However, these may be classified as Level 3 investments due to lack of market transparency and corroboration to support these quoted prices. Additionally, valuation models may be used as the pricing source for any remaining investments classified as Level 3. These models may rely on one or more significant unobservable inputs and/or significant assumptions by the Investment Manager. Inputs used in valuations may include, but are not limited to, financial statement analysis, capital account balances, discount rates and estimated cash flows, and comparable company data.
The Fund’s Board of Trustees (the Board) has designated the Investment Manager, through its Valuation Committee (the Committee), as valuation designee, responsible for determining the fair value of the assets of the Fund for which market quotations are not readily available using valuation procedures approved by the Board. The Committee consists of voting and non-voting members from various groups within the Investment Manager’s organization, including operations and accounting, trading and investments, compliance, risk management and legal.
The Committee meets at least monthly to review and approve valuation matters, which may include a description of specific valuation determinations, data regarding pricing information received from approved pricing vendors and brokers and the results of Board-approved valuation policies and procedures (the Policies). The Policies address, among other things, instances when market quotations are or are not readily available, including recommendations of third party pricing vendors and a determination of appropriate pricing methodologies; events that require specific valuation determinations and assessment of fair value techniques; securities with a potential for stale pricing, including those that are illiquid, restricted, or in default; and the effectiveness of third party pricing vendors, including periodic reviews of vendors. The Committee meets more frequently, as needed, to discuss additional valuation matters, which may include the need to review back-testing results, review time-sensitive information or approve related valuation actions. Representatives of Columbia Management Investment Advisers, LLC report to the Board at each of its regularly scheduled meetings to discuss valuation matters and actions during the period, similar to those described earlier.
The following table is a summary of the inputs used to value the Fund’s investments at November 30, 2022:
| | Level 1 ($) | Level 2 ($) | Level 3 ($) | Total ($) |
| Investments in Securities | | | | |
| Common Stocks | | | | |
| Communication Services | 78,568,166 | — | — | 78,568,166 |
| Consumer Discretionary | 81,832,925 | — | — | 81,832,925 |
| Consumer Staples | 75,845,481 | — | — | 75,845,481 |
| Energy | 262,069,500 | — | — | 262,069,500 |
| Financials | 421,108,008 | — | — | 421,108,008 |
| Health Care | 360,256,128 | — | — | 360,256,128 |
| Industrials | 228,573,734 | — | — | 228,573,734 |
| Information Technology | 326,653,767 | — | — | 326,653,767 |
| Materials | 266,394,741 | — | — | 266,394,741 |
| Utilities | 245,743,542 | — | — | 245,743,542 |
| Total Common Stocks | 2,347,045,992 | — | — | 2,347,045,992 |
| Preferred Stocks | | | | |
| Consumer Discretionary | 2,654,687 | — | — | 2,654,687 |
| Total Preferred Stocks | 2,654,687 | — | — | 2,654,687 |
| Money Market Funds | 93,639,922 | — | — | 93,639,922 |
| Total Investments in Securities | 2,443,340,601 | — | — | 2,443,340,601 |
See the Portfolio of Investments for all investment classifications not indicated in the table.
The accompanying Notes to Financial Statements are an integral part of this statement.
| 8 | Columbia Select Large Cap Value Fund | Semiannual Report 2022 |
Statement of Assets and Liabilities
November 30, 2022 (Unaudited)
| Assets | |
| Investments in securities, at value | |
| Unaffiliated issuers (cost $1,634,787,204) | $2,349,700,679 |
| Affiliated issuers (cost $93,622,367) | 93,639,922 |
| Receivable for: | |
| Capital shares sold | 2,709,251 |
| Dividends | 4,809,251 |
| Foreign tax reclaims | 21,116 |
| Expense reimbursement due from Investment Manager | 18,324 |
| Prepaid expenses | 16,253 |
| Other assets | 19,808 |
| Total assets | 2,450,934,604 |
| Liabilities | |
| Payable for: | |
| Investments purchased | 2,321,824 |
| Capital shares purchased | 3,199,266 |
| Management services fees | 43,743 |
| Distribution and/or service fees | 4,408 |
| Transfer agent fees | 280,972 |
| Compensation of board members | 90,238 |
| Compensation of chief compliance officer | 199 |
| Other expenses | 39,629 |
| Total liabilities | 5,980,279 |
| Net assets applicable to outstanding capital stock | $2,444,954,325 |
| Represented by | |
| Paid in capital | 1,720,430,601 |
| Total distributable earnings (loss) | 724,523,724 |
| Total - representing net assets applicable to outstanding capital stock | $2,444,954,325 |
The accompanying Notes to Financial Statements are an integral part of this statement.
Columbia Select Large Cap Value Fund | Semiannual Report 2022
| 9 |
Statement of Assets and Liabilities (continued)
November 30, 2022 (Unaudited)
| Class A | |
| Net assets | $354,107,987 |
| Shares outstanding | 11,242,791 |
| Net asset value per share | $31.50 |
| Maximum sales charge | 5.75% |
| Maximum offering price per share (calculated by dividing the net asset value per share by 1.0 minus the maximum sales charge for Class A shares) | $33.42 |
| Advisor Class | |
| Net assets | $308,688,229 |
| Shares outstanding | 9,181,406 |
| Net asset value per share | $33.62 |
| Class C | |
| Net assets | $56,464,563 |
| Shares outstanding | 2,009,633 |
| Net asset value per share | $28.10 |
| Institutional Class | |
| Net assets | $1,369,175,406 |
| Shares outstanding | 41,392,106 |
| Net asset value per share | $33.08 |
| Institutional 2 Class | |
| Net assets | $182,879,373 |
| Shares outstanding | 5,525,041 |
| Net asset value per share | $33.10 |
| Institutional 3 Class | |
| Net assets | $133,549,406 |
| Shares outstanding | 3,955,781 |
| Net asset value per share | $33.76 |
| Class R | |
| Net assets | $40,089,361 |
| Shares outstanding | 1,301,132 |
| Net asset value per share | $30.81 |
The accompanying Notes to Financial Statements are an integral part of this statement.
| 10 | Columbia Select Large Cap Value Fund | Semiannual Report 2022 |
Statement of Operations
Six Months Ended November 30, 2022 (Unaudited)
| Net investment income | |
| Income: | |
| Dividends — unaffiliated issuers | $27,048,124 |
| Dividends — affiliated issuers | 1,031,528 |
| Interfund lending | 363 |
| Foreign taxes withheld | (195,878) |
| Total income | 27,884,137 |
| Expenses: | |
| Management services fees | 7,353,024 |
| Distribution and/or service fees | |
| Class A | 407,160 |
| Class C | 258,204 |
| Class R | 90,226 |
| Transfer agent fees | |
| Class A | 227,667 |
| Advisor Class | 182,098 |
| Class C | 36,083 |
| Institutional Class | 863,747 |
| Institutional 2 Class | 43,450 |
| Institutional 3 Class | 4,083 |
| Class R | 25,225 |
| Compensation of board members | 17,480 |
| Custodian fees | 6,534 |
| Printing and postage fees | 53,861 |
| Registration fees | 96,590 |
| Audit fees | 15,060 |
| Legal fees | 19,957 |
| Compensation of chief compliance officer | 199 |
| Other | 17,390 |
| Total expenses | 9,718,038 |
| Fees waived or expenses reimbursed by Investment Manager and its affiliates | (3,074,752) |
| Fees waived by transfer agent | |
| Institutional 2 Class | (3,250) |
| Institutional 3 Class | (2,637) |
| Expense reduction | (440) |
| Total net expenses | 6,636,959 |
| Net investment income | 21,247,178 |
| Realized and unrealized gain (loss) — net | |
| Net realized gain (loss) on: | |
| Investments — unaffiliated issuers | (1,548,037) |
| Investments — affiliated issuers | (15,499) |
| Net realized loss | (1,563,536) |
| Net change in unrealized appreciation (depreciation) on: | |
| Investments — unaffiliated issuers | 68,919,600 |
| Investments — affiliated issuers | 17,555 |
| Net change in unrealized appreciation (depreciation) | 68,937,155 |
| Net realized and unrealized gain | 67,373,619 |
| Net increase in net assets resulting from operations | $88,620,797 |
The accompanying Notes to Financial Statements are an integral part of this statement.
Columbia Select Large Cap Value Fund | Semiannual Report 2022
| 11 |
Statement of Changes in Net Assets
| | Six Months Ended
November 30, 2022
(Unaudited) | Year Ended
May 31, 2022 |
| Operations | | |
| Net investment income | $21,247,178 | $33,584,637 |
| Net realized gain (loss) | (1,563,536) | 38,600,950 |
| Net change in unrealized appreciation (depreciation) | 68,937,155 | (38,442,095) |
| Net increase in net assets resulting from operations | 88,620,797 | 33,743,492 |
| Distributions to shareholders | | |
| Net investment income and net realized gains | | |
| Class A | — | (18,325,995) |
| Advisor Class | — | (13,300,264) |
| Class C | — | (2,497,797) |
| Institutional Class | — | (62,299,783) |
| Institutional 2 Class | — | (7,212,872) |
| Institutional 3 Class | — | (9,507,787) |
| Class R | — | (1,705,831) |
| Total distributions to shareholders | — | (114,850,329) |
| Increase in net assets from capital stock activity | 59,047,814 | 649,934,837 |
| Total increase in net assets | 147,668,611 | 568,828,000 |
| Net assets at beginning of period | 2,297,285,714 | 1,728,457,714 |
| Net assets at end of period | $2,444,954,325 | $2,297,285,714 |
The accompanying Notes to Financial Statements are an integral part of this statement.
| 12 | Columbia Select Large Cap Value Fund | Semiannual Report 2022 |
Statement of Changes in Net Assets (continued)
| | Six Months Ended | Year Ended |
| | November 30, 2022 (Unaudited) | May 31, 2022 |
| | Shares | Dollars ($) | Shares | Dollars ($) |
| Capital stock activity |
| Class A | | | | |
| Subscriptions | 1,431,125 | 41,102,014 | 4,354,921 | 134,050,372 |
| Distributions reinvested | — | — | 390,889 | 11,679,757 |
| Redemptions | (1,417,264) | (41,179,278) | (2,161,879) | (66,685,107) |
| Net increase (decrease) | 13,861 | (77,264) | 2,583,931 | 79,045,022 |
| Advisor Class | | | | |
| Subscriptions | 3,011,390 | 89,648,118 | 3,219,450 | 105,349,538 |
| Distributions reinvested | — | — | 398,853 | 12,687,523 |
| Redemptions | (1,181,241) | (36,301,659) | (2,242,707) | (73,676,416) |
| Net increase | 1,830,149 | 53,346,459 | 1,375,596 | 44,360,645 |
| Class C | | | | |
| Subscriptions | 255,815 | 6,511,665 | 878,514 | 24,361,547 |
| Distributions reinvested | — | — | 73,467 | 1,971,851 |
| Redemptions | (321,315) | (8,168,444) | (314,442) | (8,677,966) |
| Net increase (decrease) | (65,500) | (1,656,779) | 637,539 | 17,655,432 |
| Institutional Class | | | | |
| Subscriptions | 6,609,841 | 198,047,622 | 24,485,149 | 788,186,172 |
| Distributions reinvested | — | — | 1,499,157 | 46,923,619 |
| Redemptions | (6,598,998) | (197,123,688) | (12,153,756) | (389,305,336) |
| Net increase | 10,843 | 923,934 | 13,830,550 | 445,804,455 |
| Institutional 2 Class | | | | |
| Subscriptions | 1,584,498 | 48,124,591 | 3,082,044 | 100,264,921 |
| Distributions reinvested | — | — | 230,277 | 7,207,675 |
| Redemptions | (1,609,832) | (47,040,483) | (1,796,410) | (58,036,116) |
| Net increase (decrease) | (25,334) | 1,084,108 | 1,515,911 | 49,436,480 |
| Institutional 3 Class | | | | |
| Subscriptions | 888,293 | 27,071,332 | 3,000,498 | 99,180,752 |
| Distributions reinvested | — | — | 203,825 | 6,504,042 |
| Redemptions | (710,475) | (21,496,580) | (3,322,737) | (107,238,483) |
| Net increase (decrease) | 177,818 | 5,574,752 | (118,414) | (1,553,689) |
| Class R | | | | |
| Subscriptions | 170,698 | 4,782,974 | 736,352 | 22,388,901 |
| Distributions reinvested | — | — | 56,698 | 1,661,253 |
| Redemptions | (181,391) | (4,930,370) | (294,132) | (8,863,662) |
| Net increase (decrease) | (10,693) | (147,396) | 498,918 | 15,186,492 |
| Total net increase | 1,931,144 | 59,047,814 | 20,324,031 | 649,934,837 |
The accompanying Notes to Financial Statements are an integral part of this statement.
Columbia Select Large Cap Value Fund | Semiannual Report 2022
| 13 |
The following table is intended to help you understand the Fund’s financial performance. Certain information reflects financial results for a single share of a class held for the periods shown. Per share net investment income (loss) amounts are calculated based on average shares outstanding during the period. Total return assumes reinvestment of all dividends and distributions, if any. Total return does not reflect payment of sales charges, if any. Total return and portfolio turnover are not annualized for periods of less than one year. The portfolio turnover rate is calculated without regard to purchase and sales transactions of short-term instruments and certain derivatives, if any. If such transactions were included, the Fund’s portfolio turnover rate may be higher.
| | Net asset value,
beginning of
period | Net
investment
income | Net
realized
and
unrealized
gain (loss) | Total from
investment
operations | Distributions
from net
investment
income | Distributions
from net
realized
gains | Total
distributions to
shareholders |
| Class A |
| Six Months Ended 11/30/2022 (Unaudited) | $30.44 | 0.25 | 0.81 | 1.06 | — | — | — |
| Year Ended 5/31/2022 | $31.85 | 0.45 | (0.05) | 0.40 | (0.56) | (1.25) | (1.81) |
| Year Ended 5/31/2021 | $21.50 | 0.71(e) | 11.57 | 12.28 | (0.60) | (1.33) | (1.93) |
| Year Ended 5/31/2020 | $23.28 | 0.41 | (0.38) | 0.03 | (0.46) | (1.35) | (1.81) |
| Year Ended 5/31/2019 | $25.66 | 0.41 | (1.73) | (1.32) | (0.36) | (0.70) | (1.06) |
| Year Ended 5/31/2018 | $23.93 | 0.27 | 2.71 | 2.98 | (0.24) | (1.01) | (1.25) |
| Advisor Class |
| Six Months Ended 11/30/2022 (Unaudited) | $32.45 | 0.31 | 0.86 | 1.17 | — | — | — |
| Year Ended 5/31/2022 | $33.83 | 0.57 | (0.07) | 0.50 | (0.63) | (1.25) | (1.88) |
| Year Ended 5/31/2021 | $22.74 | 0.82(e) | 12.25 | 13.07 | (0.65) | (1.33) | (1.98) |
| Year Ended 5/31/2020 | $24.52 | 0.49 | (0.40) | 0.09 | (0.52) | (1.35) | (1.87) |
| Year Ended 5/31/2019 | $26.98 | 0.50 | (1.83) | (1.33) | (0.43) | (0.70) | (1.13) |
| Year Ended 5/31/2018 | $25.10 | 0.36 | 2.83 | 3.19 | (0.30) | (1.01) | (1.31) |
| Class C |
| Six Months Ended 11/30/2022 (Unaudited) | $27.25 | 0.13 | 0.72 | 0.85 | — | — | — |
| Year Ended 5/31/2022 | $28.68 | 0.19 | (0.05) | 0.14 | (0.32) | (1.25) | (1.57) |
| Year Ended 5/31/2021 | $19.52 | 0.46(e) | 10.45 | 10.91 | (0.42) | (1.33) | (1.75) |
| Year Ended 5/31/2020 | $21.26 | 0.21 | (0.34) | (0.13) | (0.26) | (1.35) | (1.61) |
| Year Ended 5/31/2019 | $23.49 | 0.20 | (1.57) | (1.37) | (0.16) | (0.70) | (0.86) |
| Year Ended 5/31/2018 | $22.00 | 0.07 | 2.48 | 2.55 | (0.05) | (1.01) | (1.06) |
| Institutional Class |
| Six Months Ended 11/30/2022 (Unaudited) | $31.92 | 0.30 | 0.86 | 1.16 | — | — | — |
| Year Ended 5/31/2022 | $33.31 | 0.55 | (0.06) | 0.49 | (0.63) | (1.25) | (1.88) |
| Year Ended 5/31/2021 | $22.41 | 0.84(e) | 12.04 | 12.88 | (0.65) | (1.33) | (1.98) |
| Year Ended 5/31/2020 | $24.19 | 0.49 | (0.40) | 0.09 | (0.52) | (1.35) | (1.87) |
| Year Ended 5/31/2019 | $26.63 | 0.49 | (1.80) | (1.31) | (0.43) | (0.70) | (1.13) |
| Year Ended 5/31/2018 | $24.79 | 0.36 | 2.79 | 3.15 | (0.30) | (1.01) | (1.31) |
| Institutional 2 Class |
| Six Months Ended 11/30/2022 (Unaudited) | $31.93 | 0.31 | 0.86 | 1.17 | — | — | — |
| Year Ended 5/31/2022 | $33.32 | 0.56 | (0.05) | 0.51 | (0.65) | (1.25) | (1.90) |
| Year Ended 5/31/2021 | $22.42 | 0.91(e) | 11.99 | 12.90 | (0.67) | (1.33) | (2.00) |
| Year Ended 5/31/2020 | $24.20 | 0.50 | (0.40) | 0.10 | (0.53) | (1.35) | (1.88) |
| Year Ended 5/31/2019 | $26.64 | 0.50 | (1.79) | (1.29) | (0.45) | (0.70) | (1.15) |
| Year Ended 5/31/2018 | $24.81 | 0.39 | 2.77 | 3.16 | (0.32) | (1.01) | (1.33) |
The accompanying Notes to Financial Statements are an integral part of this statement.
| 14 | Columbia Select Large Cap Value Fund | Semiannual Report 2022 |
Financial Highlights (continued)
| | Net
asset
value,
end of
period | Total
return | Total gross
expense
ratio to
average
net assets(a) | Total net
expense
ratio to
average
net assets(a),(b) | Net investment
income
ratio to
average
net assets | Portfolio
turnover | Net
assets,
end of
period
(000’s) |
| Class A |
| Six Months Ended 11/30/2022 (Unaudited) | $31.50 | 3.48% | 1.08%(c) | 0.80%(c),(d) | 1.75%(c) | 2% | $354,108 |
| Year Ended 5/31/2022 | $30.44 | 1.35% | 1.08% | 0.79%(d) | 1.46% | 8% | $341,762 |
| Year Ended 5/31/2021 | $31.85 | 59.28% | 1.12% | 0.79%(d) | 2.74% | 29% | $275,301 |
| Year Ended 5/31/2020 | $21.50 | (0.98%) | 1.14%(f) | 0.80%(d),(f) | 1.70% | 18% | $187,746 |
| Year Ended 5/31/2019 | $23.28 | (5.09%) | 1.13% | 0.80%(d) | 1.64% | 21% | $218,458 |
| Year Ended 5/31/2018 | $25.66 | 12.39% | 1.15% | 1.03%(d) | 1.07% | 9% | $225,532 |
| Advisor Class |
| Six Months Ended 11/30/2022 (Unaudited) | $33.62 | 3.61% | 0.84%(c) | 0.55%(c),(d) | 2.02%(c) | 2% | $308,688 |
| Year Ended 5/31/2022 | $32.45 | 1.60% | 0.83% | 0.54%(d) | 1.71% | 8% | $238,530 |
| Year Ended 5/31/2021 | $33.83 | 59.64% | 0.87% | 0.54%(d) | 2.99% | 29% | $202,134 |
| Year Ended 5/31/2020 | $22.74 | (0.70%) | 0.89%(f) | 0.55%(d),(f) | 1.96% | 18% | $133,966 |
| Year Ended 5/31/2019 | $24.52 | (4.87%) | 0.88% | 0.55%(d) | 1.89% | 21% | $148,935 |
| Year Ended 5/31/2018 | $26.98 | 12.67% | 0.90% | 0.77%(d) | 1.35% | 9% | $154,976 |
| Class C |
| Six Months Ended 11/30/2022 (Unaudited) | $28.10 | 3.12% | 1.83%(c) | 1.55%(c),(d) | 1.00%(c) | 2% | $56,465 |
| Year Ended 5/31/2022 | $27.25 | 0.59% | 1.83% | 1.54%(d) | 0.70% | 8% | $56,553 |
| Year Ended 5/31/2021 | $28.68 | 58.03% | 1.87% | 1.54%(d) | 1.97% | 29% | $41,236 |
| Year Ended 5/31/2020 | $19.52 | (1.68%) | 1.89%(f) | 1.55%(d),(f) | 0.94% | 18% | $32,781 |
| Year Ended 5/31/2019 | $21.26 | (5.80%) | 1.88% | 1.55%(d) | 0.87% | 21% | $48,824 |
| Year Ended 5/31/2018 | $23.49 | 11.53% | 1.90% | 1.78%(d) | 0.32% | 9% | $70,325 |
| Institutional Class |
| Six Months Ended 11/30/2022 (Unaudited) | $33.08 | 3.63% | 0.83%(c) | 0.55%(c),(d) | 2.00%(c) | 2% | $1,369,175 |
| Year Ended 5/31/2022 | $31.92 | 1.59% | 0.83% | 0.54%(d) | 1.70% | 8% | $1,321,063 |
| Year Ended 5/31/2021 | $33.31 | 59.67% | 0.87% | 0.54%(d) | 3.06% | 29% | $917,729 |
| Year Ended 5/31/2020 | $22.41 | (0.71%) | 0.89%(f) | 0.55%(d),(f) | 1.97% | 18% | $441,521 |
| Year Ended 5/31/2019 | $24.19 | (4.86%) | 0.88% | 0.55%(d) | 1.89% | 21% | $428,080 |
| Year Ended 5/31/2018 | $26.63 | 12.66% | 0.90% | 0.77%(d) | 1.35% | 9% | $397,901 |
| Institutional 2 Class |
| Six Months Ended 11/30/2022 (Unaudited) | $33.10 | 3.67% | 0.75%(c) | 0.48%(c) | 2.07%(c) | 2% | $182,879 |
| Year Ended 5/31/2022 | $31.93 | 1.65% | 0.75% | 0.49% | 1.73% | 8% | $177,246 |
| Year Ended 5/31/2021 | $33.32 | 59.74% | 0.81% | 0.48% | 3.23% | 29% | $134,430 |
| Year Ended 5/31/2020 | $22.42 | (0.66%) | 0.82%(f) | 0.50%(f) | 1.98% | 18% | $28,742 |
| Year Ended 5/31/2019 | $24.20 | (4.80%) | 0.82% | 0.51% | 1.92% | 21% | $39,688 |
| Year Ended 5/31/2018 | $26.64 | 12.69% | 0.84% | 0.69% | 1.48% | 9% | $54,500 |
The accompanying Notes to Financial Statements are an integral part of this statement.
Columbia Select Large Cap Value Fund | Semiannual Report 2022
| 15 |
Financial Highlights (continued)
| | Net asset value,
beginning of
period | Net
investment
income | Net
realized
and
unrealized
gain (loss) | Total from
investment
operations | Distributions
from net
investment
income | Distributions
from net
realized
gains | Total
distributions to
shareholders |
| Institutional 3 Class |
| Six Months Ended 11/30/2022 (Unaudited) | $32.56 | 0.32 | 0.88 | 1.20 | — | — | — |
| Year Ended 5/31/2022 | $33.94 | 0.60 | (0.06) | 0.54 | (0.67) | (1.25) | (1.92) |
| Year Ended 5/31/2021 | $22.81 | 0.88(e) | 12.26 | 13.14 | (0.68) | (1.33) | (2.01) |
| Year Ended 5/31/2020 | $24.59 | 0.52 | (0.40) | 0.12 | (0.55) | (1.35) | (1.90) |
| Year Ended 5/31/2019 | $27.05 | 0.53 | (1.83) | (1.30) | (0.46) | (0.70) | (1.16) |
| Year Ended 5/31/2018 | $25.16 | 0.39 | 2.84 | 3.23 | (0.33) | (1.01) | (1.34) |
| Class R |
| Six Months Ended 11/30/2022 (Unaudited) | $29.81 | 0.21 | 0.79 | 1.00 | — | — | — |
| Year Ended 5/31/2022 | $31.24 | 0.37 | (0.05) | 0.32 | (0.50) | (1.25) | (1.75) |
| Year Ended 5/31/2021 | $21.12 | 0.67(e) | 11.33 | 12.00 | (0.55) | (1.33) | (1.88) |
| Year Ended 5/31/2020 | $22.90 | 0.34 | (0.38) | (0.04) | (0.39) | (1.35) | (1.74) |
| Year Ended 5/31/2019 | $25.25 | 0.34 | (1.69) | (1.35) | (0.30) | (0.70) | (1.00) |
| Year Ended 5/31/2018 | $23.57 | 0.20 | 2.67 | 2.87 | (0.18) | (1.01) | (1.19) |
| Notes to Financial Highlights |
| (a) | In addition to the fees and expenses that the Fund bears directly, the Fund indirectly bears a pro rata share of the fees and expenses of any other funds in which it invests. Such indirect expenses are not included in the Fund’s reported expense ratios. |
| (b) | Total net expenses include the impact of certain fee waivers/expense reimbursements made by the Investment Manager and certain of its affiliates, if applicable. |
| (c) | Annualized. |
| (d) | The benefits derived from expense reductions had an impact of less than 0.01%. |
| (e) | Net investment income per share includes special dividends. The per share effect of these dividends amounted to: |
| Year Ended | Class A | Advisor
Class | Class C | Institutional
Class | Institutional 2
Class | Institutional 3
Class | Class R |
| 05/31/2021 | $0.19 | $0.21 | $0.17 | $0.19 | $0.17 | $0.25 | $0.19 |
| (f) | Ratios include interfund lending expense which is less than 0.01%. |
The accompanying Notes to Financial Statements are an integral part of this statement.
| 16 | Columbia Select Large Cap Value Fund | Semiannual Report 2022 |
Financial Highlights (continued)
| | Net
asset
value,
end of
period | Total
return | Total gross
expense
ratio to
average
net assets(a) | Total net
expense
ratio to
average
net assets(a),(b) | Net investment
income
ratio to
average
net assets | Portfolio
turnover | Net
assets,
end of
period
(000’s) |
| Institutional 3 Class |
| Six Months Ended 11/30/2022 (Unaudited) | $33.76 | 3.69% | 0.70%(c) | 0.43%(c) | 2.12%(c) | 2% | $133,549 |
| Year Ended 5/31/2022 | $32.56 | 1.70% | 0.70% | 0.44% | 1.81% | 8% | $123,025 |
| Year Ended 5/31/2021 | $33.94 | 59.79% | 0.76% | 0.43% | 3.22% | 29% | $132,235 |
| Year Ended 5/31/2020 | $22.81 | (0.60%) | 0.77%(f) | 0.45%(f) | 2.06% | 18% | $87,839 |
| Year Ended 5/31/2019 | $24.59 | (4.76%) | 0.77% | 0.46% | 1.98% | 21% | $149,956 |
| Year Ended 5/31/2018 | $27.05 | 12.80% | 0.79% | 0.66% | 1.44% | 9% | $145,244 |
| Class R |
| Six Months Ended 11/30/2022 (Unaudited) | $30.81 | 3.36% | 1.33%(c) | 1.05%(c),(d) | 1.51%(c) | 2% | $40,089 |
| Year Ended 5/31/2022 | $29.81 | 1.11% | 1.31% | 1.02%(d) | 1.23% | 8% | $39,107 |
| Year Ended 5/31/2021 | $31.24 | 58.97% | 1.32% | 0.99%(d) | 2.62% | 29% | $25,393 |
| Year Ended 5/31/2020 | $21.12 | (1.24%) | 1.39%(f) | 1.05%(d),(f) | 1.43% | 18% | $15,554 |
| Year Ended 5/31/2019 | $22.90 | (5.32%) | 1.38% | 1.05%(d) | 1.39% | 21% | $24,725 |
| Year Ended 5/31/2018 | $25.25 | 12.10% | 1.40% | 1.28%(d) | 0.82% | 9% | $24,222 |
The accompanying Notes to Financial Statements are an integral part of this statement.
Columbia Select Large Cap Value Fund | Semiannual Report 2022
| 17 |
Notes to Financial Statements
November 30, 2022 (Unaudited)
Note 1. Organization
Columbia Select Large Cap Value Fund (the Fund), a series of Columbia Funds Series Trust II (the Trust), is a diversified fund. The Trust is registered under the Investment Company Act of 1940, as amended (the 1940 Act), as an open-end management investment company organized as a Massachusetts business trust.
Fund shares
The Trust may issue an unlimited number of shares (without par value). The Fund offers each of the share classes listed in the Statement of Assets and Liabilities. Although all share classes generally have identical voting, dividend and liquidation rights, each share class votes separately when required by the Trust’s organizational documents or by law. Each share class has its own expense and sales charge structure. Different share classes may have different minimum initial investment amounts and pay different net investment income distribution amounts to the extent the expenses of distributing such share classes vary. Distributions to shareholders in a liquidation will be proportional to the net asset value of each share class.
As described in the Fund’s prospectus, Class A and Class C shares are offered to the general public for investment. Class C shares automatically convert to Class A shares after 8 years. Advisor Class, Institutional Class, Institutional 2 Class, Institutional 3 Class and Class R shares are available for purchase through authorized investment professionals to omnibus retirement plans or to institutional investors and to certain other investors as also described in the Fund’s prospectus.
Note 2. Summary of significant accounting policies
Basis of preparation
The Fund is an investment company that applies the accounting and reporting guidance in the Financial Accounting Standards Board (FASB) Accounting Standards Codification Topic 946, Financial Services - Investment Companies (ASC 946). The financial statements are prepared in accordance with U.S. generally accepted accounting principles (GAAP), which requires management to make certain estimates and assumptions that affect the reported amounts of assets and liabilities, the disclosure of contingent assets and liabilities at the date of the financial statements and the reported amounts of income and expenses during the reporting period. Actual results could differ from those estimates.
The following is a summary of significant accounting policies followed by the Fund in the preparation of its financial statements.
Security valuation
Equity securities listed on an exchange are valued at the closing price or last trade price on their primary exchange at the close of business of the New York Stock Exchange. Securities with a closing price not readily available or not listed on any exchange are valued at the mean between the closing bid and ask prices. Listed preferred stocks convertible into common stocks are valued using an evaluated price from a pricing service.
Foreign equity securities are valued based on the closing price or last trade price on their primary exchange at the close of business of the New York Stock Exchange. If any foreign equity security closing prices are not readily available, the securities are valued at the mean of the latest quoted bid and ask prices on such exchanges or markets. Foreign currency exchange rates are determined at the scheduled closing time of the New York Stock Exchange. Many securities markets and exchanges outside the U.S. close prior to the close of the New York Stock Exchange; therefore, the closing prices for securities in such markets or on such exchanges may not fully reflect events that occur after such close but before the close of the New York Stock Exchange. In those situations, foreign securities will be fair valued pursuant to a policy approved by the Board of Trustees. Under the policy, the Fund may utilize a third-party pricing service to determine these fair values. The third-party pricing service takes into account multiple factors, including, but not limited to, movements in the U.S. securities markets, certain depositary receipts, futures contracts and foreign exchange rates that have occurred subsequent to the close of the foreign exchange or market, to determine a good faith estimate that reasonably reflects the current market conditions as of the close of the New York Stock Exchange. The fair value of a security is likely to be different from the quoted or published price, if available.
Investments in open-end investment companies (other than exchange-traded funds (ETFs)), are valued at the latest net asset value reported by those companies as of the valuation time.
| 18 | Columbia Select Large Cap Value Fund | Semiannual Report 2022 |
Notes to Financial Statements (continued)
November 30, 2022 (Unaudited)
Investments for which market quotations are not readily available, or that have quotations which management believes are not reflective of market value or reliable, are valued at fair value as determined in good faith under procedures approved by the Board of Trustees. If a security or class of securities (such as foreign securities) is valued at fair value, such value is likely to be different from the quoted or published price for the security, if available.
The determination of fair value often requires significant judgment. To determine fair value, management may use assumptions including but not limited to future cash flows and estimated risk premiums. Multiple inputs from various sources may be used to determine fair value.
GAAP requires disclosure regarding the inputs and valuation techniques used to measure fair value and any changes in valuation inputs or techniques. In addition, investments shall be disclosed by major category. This information is disclosed following the Fund’s Portfolio of Investments.
Security transactions
Security transactions are accounted for on the trade date. Cost is determined and gains (losses) are based upon the specific identification method for both financial statement and federal income tax purposes.
Income recognition
Corporate actions and dividend income are generally recorded net of any non-reclaimable tax withholdings, on the ex-dividend date or upon receipt of an ex-dividend notification in the case of certain foreign securities.
The Fund may receive distributions from holdings in equity securities, business development companies (BDCs), exchange-traded funds (ETFs), limited partnerships (LPs), other regulated investment companies (RICs), and real estate investment trusts (REITs), which report information as to the tax character of their distributions annually. These distributions are allocated to dividend income, capital gain and return of capital based on actual information reported. Return of capital is recorded as a reduction of the cost basis of securities held. If the Fund no longer owns the applicable securities, return of capital is recorded as a realized gain. With respect to REITs, to the extent actual information has not yet been reported, estimates for return of capital are made by Columbia Management Investment Advisers, LLC (the Investment Manager), a wholly-owned subsidiary of Ameriprise Financial, Inc. (Ameriprise Financial). The Investment Manager’s estimates are subsequently adjusted when the actual character of the distributions is disclosed by the REITs, which could result in a proportionate change in return of capital to shareholders.
Awards from class action litigation are recorded as a reduction of cost basis if the Fund still owns the applicable securities on the payment date. If the Fund no longer owns the applicable securities on the payment date, the proceeds are recorded as realized gains.
Expenses
General expenses of the Trust are allocated to the Fund and other funds of the Trust based upon relative net assets or other expense allocation methodologies determined by the nature of the expense. Expenses directly attributable to the Fund are charged to the Fund. Expenses directly attributable to a specific class of shares are charged to that share class.
Determination of class net asset value
All income, expenses (other than class-specific expenses, which are charged to that share class, as shown in the Statement of Operations) and realized and unrealized gains (losses) are allocated to each class of the Fund on a daily basis, based on the relative net assets of each class, for purposes of determining the net asset value of each class.
Federal income tax status
The Fund intends to qualify each year as a regulated investment company under Subchapter M of the Internal Revenue Code, as amended, and will distribute substantially all of its investment company taxable income and net capital gain, if any, for its tax year, and as such will not be subject to federal income taxes. In addition, the Fund intends to distribute in each calendar year substantially all of its ordinary income, capital gain net income and certain other amounts, if any, such that the Fund should not be subject to federal excise tax. Therefore, no federal income or excise tax provision is recorded.
Columbia Select Large Cap Value Fund | Semiannual Report 2022
| 19 |
Notes to Financial Statements (continued)
November 30, 2022 (Unaudited)
Foreign taxes
The Fund may be subject to foreign taxes on income, gains on investments or currency repatriation, a portion of which may be recoverable. The Fund will accrue such taxes and recoveries, as applicable, based upon its current interpretation of tax rules and regulations that exist in the markets in which it invests.
Realized gains in certain countries may be subject to foreign taxes at the Fund level, based on statutory rates. The Fund accrues for such foreign taxes on realized and unrealized gains at the appropriate rate for each jurisdiction, as applicable. The amount, if any, is disclosed as a liability in the Statement of Assets and Liabilities.
Distributions to shareholders
Distributions from net investment income, if any, are declared and paid annually. Net realized capital gains, if any, are distributed at least annually. Income distributions and capital gain distributions are determined in accordance with federal income tax regulations, which may differ from GAAP.
Guarantees and indemnifications
Under the Trust’s organizational documents and, in some cases, by contract, its officers and trustees are indemnified against certain liabilities arising out of the performance of their duties to the Trust or its funds. In addition, certain of the Fund’s contracts with its service providers contain general indemnification clauses. The Fund’s maximum exposure under these arrangements is unknown since the amount of any future claims that may be made against the Fund cannot be determined, and the Fund has no historical basis for predicting the likelihood of any such claims.
Recent accounting pronouncement
Tailored Shareholder Reports
In October 2022, the Securities and Exchange Commission (SEC) adopted a final rule relating to Tailored Shareholder Reports for Mutual Funds and Exchange-Traded Funds (ETFs); Fee Information in Investment Company Advertisements. The rule and form amendments will require mutual funds and ETFs to transmit concise and visually engaging shareholder reports that highlight key information. The amendments will require that funds tag information in a structured data format. The rule amendments will require that certain more in-depth information be made available online and available for delivery free of charge to investors on request. The amendments will become effective January 24, 2023. There is an 18-month transition period after the effective date of the amendment.
Note 3. Fees and other transactions with affiliates
Management services fees
The Fund has entered into a Management Agreement with Columbia Management Investment Advisers, LLC (the Investment Manager), a wholly-owned subsidiary of Ameriprise Financial, Inc. (Ameriprise Financial). Under the Management Agreement, the Investment Manager provides the Fund with investment research and advice, as well as administrative and accounting services. The management services fee is an annual fee that is equal to a percentage of the Fund’s daily net assets that declines from 0.77% to 0.57% as the Fund’s net assets increase. The annualized effective management services fee rate for the six months ended November 30, 2022 was 0.67% of the Fund’s average daily net assets.
Compensation of board members
Members of the Board of Trustees who are not officers or employees of the Investment Manager or Ameriprise Financial are compensated for their services to the Fund as disclosed in the Statement of Operations. Under a Deferred Compensation Plan (the Deferred Plan), these members of the Board of Trustees may elect to defer payment of up to 100% of their compensation. Deferred amounts are treated as though equivalent dollar amounts had been invested in shares of certain funds managed by the Investment Manager. The Fund’s liability for these amounts is adjusted for market value changes and remains in the Fund until distributed in accordance with the Deferred Plan. All amounts payable under the Deferred Plan constitute a general unsecured obligation of the Fund. The expense for the Deferred Plan, which includes Trustees’ fees deferred during the current period as well as any gains or losses on the Trustees’ deferred compensation balances as a result of market fluctuations, is included in "Compensation of board members" in the Statement of Operations.
| 20 | Columbia Select Large Cap Value Fund | Semiannual Report 2022 |
Notes to Financial Statements (continued)
November 30, 2022 (Unaudited)
Compensation of Chief Compliance Officer
The Board of Trustees has appointed a Chief Compliance Officer for the Fund in accordance with federal securities regulations. As disclosed in the Statement of Operations, a portion of the Chief Compliance Officer’s total compensation is allocated to the Fund, along with other allocations to affiliated registered investment companies managed by the Investment Manager and its affiliates, based on relative net assets.
Transfer agency fees
Under a Transfer and Dividend Disbursing Agent Agreement, Columbia Management Investment Services Corp. (the Transfer Agent), an affiliate of the Investment Manager and a wholly-owned subsidiary of Ameriprise Financial, is responsible for providing transfer agency services to the Fund. The Transfer Agent has contracted with SS&C GIDS, Inc. (SS&C GIDS) to serve as sub-transfer agent. Prior to January 1, 2023, SS&C GIDS was known as DST Asset Manager Solutions, Inc. The Transfer Agent pays the fees of SS&C GIDS for services as sub-transfer agent and SS&C GIDS is not entitled to reimbursement for such fees from the Fund (with the exception of out-of-pocket fees).
The Fund pays the Transfer Agent a monthly transfer agency fee based on the number or the average value of accounts, depending on the type of account. In addition, the Fund pays the Transfer Agent a fee for shareholder services based on the number of accounts or on a percentage of the average aggregate value of the Fund’s shares maintained in omnibus accounts up to the lesser of the amount charged by the financial intermediary or a cap established by the Board of Trustees from time to time.
The Transfer Agent also receives compensation from the Fund for various shareholder services and reimbursements for certain out-of-pocket fees. Total transfer agency fees for Institutional 2 Class and Institutional 3 Class shares are subject to an annual limitation of not more than 0.07% and 0.02%, respectively, of the average daily net assets attributable to each share class. In addition, prior to October 1, 2022, Institutional 2 Class shares were subject to a contractual transfer agency fee annual limitation of not more than 0.05% and Institutional 3 Class shares were subject to a contractual transfer agency fee annual limitation of not more than 0.00% of the average daily net assets attributable to each share class.
For the six months ended November 30, 2022, the Fund’s annualized effective transfer agency fee rates as a percentage of average daily net assets of each class were as follows:
| | Effective rate (%) |
| Class A | 0.14 |
| Advisor Class | 0.14 |
| Class C | 0.14 |
| Institutional Class | 0.14 |
| Institutional 2 Class | 0.05 |
| Institutional 3 Class | 0.00 |
| Class R | 0.14 |
An annual minimum account balance fee of $20 may apply to certain accounts with a value below the applicable share class’s initial minimum investment requirements to reduce the impact of small accounts on transfer agency fees. These minimum account balance fees are remitted to the Fund and recorded as part of expense reductions in the Statement of Operations. For the six months ended November 30, 2022, these minimum account balance fees reduced total expenses of the Fund by $440.
Distribution and service fees
The Fund has entered into an agreement with Columbia Management Investment Distributors, Inc. (the Distributor), an affiliate of the Investment Manager and a wholly-owned subsidiary of Ameriprise Financial, for distribution and shareholder services. Under a Plan and Agreement of Distribution, the Fund pays a fee at the maximum annual rates of up to 0.25%, 1.00% and 0.50% of the Fund’s average daily net assets attributable to Class A, Class C and Class R shares, respectively. For Class C shares, of the 1.00% fee, up to 0.75% can be reimbursed for distribution expenses and up to an additional 0.25% can be reimbursed for shareholder servicing expenses. For Class R shares, of the 0.50% fee, up to 0.25% can be reimbursed for shareholder servicing expenses.
Columbia Select Large Cap Value Fund | Semiannual Report 2022
| 21 |
Notes to Financial Statements (continued)
November 30, 2022 (Unaudited)
The amount of distribution and shareholder services expenses incurred by the Distributor and not yet reimbursed (unreimbursed expense) was approximately $2,696,000 for Class C shares. This amount is based on the most recent information available as of September 30, 2022, and may be recovered from future payments under the distribution plan or contingent deferred sales charges (CDSCs). To the extent the unreimbursed expense has been fully recovered, the distribution and/or shareholder services fee is reduced.
Sales charges
Sales charges, including front-end charges and CDSCs, received by the Distributor for distributing Fund shares for the six months ended November 30, 2022, if any, are listed below:
| | Front End (%) | CDSC (%) | Amount ($) |
| Class A | 5.75 | 0.50 - 1.00(a) | 176,409 |
| Class C | — | 1.00(b) | 10,241 |
| (a) | This charge is imposed on certain investments of between $1 million and $50 million redeemed within 18 months after purchase, as follows: 1.00% if redeemed within 12 months after purchase, and 0.50% if redeemed more than 12, but less than 18, months after purchase, with certain limited exceptions. |
| (b) | This charge applies to redemptions within 12 months after purchase, with certain limited exceptions. |
The Fund’s other share classes are not subject to sales charges.
Expenses waived/reimbursed by the Investment Manager and its affiliates
The Investment Manager and certain of its affiliates have contractually agreed to waive fees and/or reimburse expenses (excluding certain fees and expenses described below) for the period(s) disclosed below, unless sooner terminated at the sole discretion of the Board of Trustees, so that the Fund’s net operating expenses, after giving effect to fees waived/expenses reimbursed and any balance credits and/or overdraft charges from the Fund’s custodian, do not exceed the following annual rate(s) as a percentage of the classes’ average daily net assets:
| | October 1, 2022
through
September 30, 2023 | Prior to
October 1, 2022 |
| Class A | 0.80% | 0.80% |
| Advisor Class | 0.55 | 0.55 |
| Class C | 1.55 | 1.55 |
| Institutional Class | 0.55 | 0.55 |
| Institutional 2 Class | 0.47 | 0.49 |
| Institutional 3 Class | 0.42 | 0.44 |
| Class R | 1.05 | 1.05 |
Under the agreement governing these fee waivers and/or expense reimbursement arrangements, the following fees and expenses are excluded from the waiver/reimbursement commitment, and therefore will be paid by the Fund, if applicable: taxes (including foreign transaction taxes), expenses associated with investments in affiliated and non-affiliated pooled investment vehicles (including mutual funds and exchange-traded funds), transaction costs and brokerage commissions, costs related to any securities lending program, dividend expenses associated with securities sold short, inverse floater program fees and expenses, transaction charges and interest on borrowed money, interest, costs associated with shareholder meetings, infrequent and/or unusual expenses and any other expenses the exclusion of which is specifically approved by the Board of Trustees. This agreement may be modified or amended only with approval from the Investment Manager, certain of its affiliates and the Fund. Reflected in the contractual cap commitment, prior to October 1, 2022, is the Transfer Agent’s contractual agreement to limit total transfer agency fees to an annual rate of not more than 0.05% for Institutional 2 Class and 0.00% for Institutional 3 Class of the average daily net assets attributable to each share class. Any fees waived and/or expenses reimbursed under the expense reimbursement arrangements described above are not recoverable by the Investment Manager or its affiliates in future periods.
| 22 | Columbia Select Large Cap Value Fund | Semiannual Report 2022 |
Notes to Financial Statements (continued)
November 30, 2022 (Unaudited)
Note 4. Federal tax information
The timing and character of income and capital gain distributions are determined in accordance with income tax regulations, which may differ from GAAP because of temporary or permanent book to tax differences.
At November 30, 2022, the approximate cost of all investments for federal income tax purposes and the aggregate gross approximate unrealized appreciation and depreciation based on that cost was:
Federal
tax cost ($) | Gross unrealized
appreciation ($) | Gross unrealized
(depreciation) ($) | Net unrealized
appreciation ($) |
| 1,728,410,000 | 785,764,000 | (70,833,000) | 714,931,000 |
Tax cost of investments and unrealized appreciation/(depreciation) may also include timing differences that do not constitute adjustments to tax basis.
Management of the Fund has concluded that there are no significant uncertain tax positions in the Fund that would require recognition in the financial statements. However, management’s conclusion may be subject to review and adjustment at a later date based on factors including, but not limited to, new tax laws, regulations, and administrative interpretations (including relevant court decisions). Generally, the Fund’s federal tax returns for the prior three fiscal years remain subject to examination by the Internal Revenue Service.
Note 5. Portfolio information
The cost of purchases and proceeds from sales of securities, excluding short-term investments and derivatives, if any, aggregated to $90,502,954 and $33,273,427, respectively, for the six months ended November 30, 2022. The amount of purchase and sale activity impacts the portfolio turnover rate reported in the Financial Highlights.
Note 6. Affiliated money market fund
The Fund invests in Columbia Short-Term Cash Fund, an affiliated money market fund established for the exclusive use by the Fund and other affiliated funds (the Affiliated MMF). The income earned by the Fund from such investments is included as Dividends - affiliated issuers in the Statement of Operations. As an investing fund, the Fund indirectly bears its proportionate share of the expenses of the Affiliated MMF. The Affiliated MMF prices its shares with a floating net asset value. In addition, the Board of Trustees of the Affiliated MMF may impose a fee on redemptions (sometimes referred to as a liquidity fee) or temporarily suspend redemptions (sometimes referred to as imposing a redemption gate) in the event its liquidity falls below regulatory limits.
Note 7. Interfund lending
Pursuant to an exemptive order granted by the Securities and Exchange Commission, the Fund participates in a program (the Interfund Program) allowing each participating Columbia Fund (each, a Participating Fund) to lend money directly to and, except for closed-end funds and money market funds, borrow money directly from other Participating Funds for temporary purposes. The amounts eligible for borrowing and lending under the Interfund Program are subject to certain restrictions.
Interfund loans are subject to the risk that the borrowing fund could be unable to repay the loan when due, and a delay in repayment to the lending fund could result in lost opportunities and/or additional lending costs. The exemptive order is subject to conditions intended to mitigate conflicts of interest arising from the Investment Manager’s relationship with each Participating Fund.
The Fund’s activity in the Interfund Program during the six months ended November 30, 2022 was as follows:
| Borrower or lender | Average loan
balance ($) | Weighted average
interest rate (%) | Number of days
with outstanding loans |
| Lender | 1,866,667 | 3.33 | 3 |
Interest income earned by the Fund is recorded as Interfund lending in the Statement of Operations. The Fund had no outstanding interfund loans at November 30, 2022.
Columbia Select Large Cap Value Fund | Semiannual Report 2022
| 23 |
Notes to Financial Statements (continued)
November 30, 2022 (Unaudited)
Note 8. Line of credit
The Fund has access to a revolving credit facility with a syndicate of banks led by JPMorgan Chase Bank, N.A., Citibank, N.A. and Wells Fargo Bank, N.A. whereby the Fund may borrow for the temporary funding of shareholder redemptions or for other temporary or emergency purposes. Pursuant to an October 27, 2022 amendment and restatement, the credit facility, which is an agreement between the Fund and certain other funds managed by the Investment Manager or an affiliated investment manager, severally and not jointly, permits aggregate borrowings up to $950 million. Interest is currently charged to each participating fund based on its borrowings at a rate equal to the higher of (i) the federal funds effective rate, (ii) the secured overnight financing rate plus 0.10% and (iii) the overnight bank funding rate, plus in each case, 1.00%. Each borrowing under the credit facility matures no later than 60 days after the date of borrowing. The Fund also pays a commitment fee equal to its pro rata share of the unused amount of the credit facility at a rate of 0.15% per annum. The commitment fee is included in other expenses in the Statement of Operations. This agreement expires annually in October unless extended or renewed. Prior to the October 27, 2022 amendment and restatement, the Fund had access to a revolving credit facility with a syndicate of banks led by JPMorgan Chase Bank, N.A., Citibank, N.A. and Wells Fargo Bank, N.A. which permitted collective borrowings up to $950 million. Interest was charged to each participating fund based on its borrowings at a rate equal to the higher of (i) the federal funds effective rate, (ii) the secured overnight financing rate plus 0.11448% and (iii) the overnight bank funding rate, plus in each case, 1.00%.
The Fund had no borrowings during the six months ended November 30, 2022.
Note 9. Significant risks
Market risk
The Fund may incur losses due to declines in the value of one or more securities in which it invests. These declines may be due to factors affecting a particular issuer, or the result of, among other things, political, regulatory, market, economic or social developments affecting the relevant market(s) more generally. In addition, turbulence in financial markets and reduced liquidity in equity, credit and/or fixed income markets may negatively affect many issuers, which could adversely affect the Fund’s ability to price or value hard-to-value assets in thinly traded and closed markets and could cause significant redemptions and operational challenges. Global economies and financial markets are increasingly interconnected, and conditions and events in one country, region or financial market may adversely impact issuers in a different country, region or financial market. These risks may be magnified if certain events or developments adversely interrupt the global supply chain; in these and other circumstances, such risks might affect companies worldwide. As a result, local, regional or global events such as terrorism, war, natural disasters, disease/virus outbreaks and epidemics or other public health issues, recessions, depressions or other events – or the potential for such events – could have a significant negative impact on global economic and market conditions.
The large-scale invasion of Ukraine by Russia in February 2022 has resulted in sanctions and market disruptions, including declines in regional and global stock markets, unusual volatility in global commodity markets and significant devaluations of Russian currency. The extent and duration of the military action are impossible to predict but could be significant. Market disruption caused by the Russian military action, and any counter-measures or responses thereto (including international sanctions, a downgrade in the country’s credit rating, purchasing and financing restrictions, boycotts, tariffs, changes in consumer or purchaser preferences, cyberattacks and espionage) could have severe adverse impacts on regional and/or global securities and commodities markets, including markets for oil and natural gas. These impacts may include reduced market liquidity, distress in credit markets, further disruption of global supply chains, increased risk of inflation, and limited access to investments in certain international markets and/or issuers. These developments and other related events could negatively impact Fund performance.
The pandemic caused by coronavirus disease 2019 and its variants (COVID-19) has resulted in, and may continue to result in, significant global economic and societal disruption and market volatility due to disruptions in market access, resource availability, facilities operations, imposition of tariffs, export controls and supply chain disruption, among others. Such disruptions may be caused, or exacerbated by, quarantines and travel restrictions, workforce displacement and loss in human and other resources. The uncertainty surrounding the magnitude, duration, reach, costs and effects of the global pandemic, as well as actions that have been or could be taken by governmental authorities or other third parties, present unknowns that are yet to unfold. The impacts, as well as the uncertainty over impacts to come, of COVID-19 – and any other
| 24 | Columbia Select Large Cap Value Fund | Semiannual Report 2022 |
Notes to Financial Statements (continued)
November 30, 2022 (Unaudited)
infectious illness outbreaks, epidemics and pandemics that may arise in the future – could negatively affect global economies and markets in ways that cannot necessarily be foreseen. In addition, the impact of infectious illness outbreaks and epidemics in emerging market countries may be greater due to generally less established healthcare systems, governments and financial markets. Public health crises caused by the COVID-19 outbreak may exacerbate other pre-existing political, social and economic risks in certain countries or globally. The disruptions caused by COVID-19 could prevent the Fund from executing advantageous investment decisions in a timely manner and negatively impact the Fund’s ability to achieve its investment objective. Any such events could have a significant adverse impact on the value and risk profile of the Fund.
Shareholder concentration risk
At November 30, 2022, three unaffiliated shareholders of record owned 46.3% of the outstanding shares of the Fund in one or more accounts. The Fund has no knowledge about whether any portion of those shares was owned beneficially. Subscription and redemption activity by concentrated accounts may have a significant effect on the operations of the Fund. In the case of a large redemption, the Fund may be forced to sell investments at inopportune times, including its liquid positions, which may result in Fund losses and the Fund holding a higher percentage of less liquid positions. Large redemptions could result in decreased economies of scale and increased operating expenses for non-redeeming Fund shareholders.
Note 10. Subsequent events
Management has evaluated the events and transactions that have occurred through the date the financial statements were issued and noted no items requiring adjustment of the financial statements or additional disclosure.
Note 11. Information regarding pending and settled legal proceedings
Ameriprise Financial and certain of its affiliates are involved in the normal course of business in legal proceedings which include regulatory inquiries, arbitration and litigation, including class actions concerning matters arising in connection with the conduct of its activities as a diversified financial services firm. Ameriprise Financial believes that the Fund is not currently the subject of, and that neither Ameriprise Financial nor any of its affiliates are the subject of, any pending legal, arbitration or regulatory proceedings that are likely to have a material adverse effect on the Fund or the ability of Ameriprise Financial or its affiliates to perform under their contracts with the Fund. Ameriprise Financial is required to make quarterly (10-Q), annual (10-K) and, as necessary, 8-K filings with the Securities and Exchange Commission (SEC) on legal and regulatory matters that relate to Ameriprise Financial and its affiliates. Copies of these filings may be obtained by accessing the SEC website at www.sec.gov.
There can be no assurance that these matters, or the adverse publicity associated with them, will not result in increased Fund redemptions, reduced sale of Fund shares or other adverse consequences to the Fund. Further, although we believe proceedings are not likely to have a material adverse effect on the Fund or the ability of Ameriprise Financial or its affiliates to perform under their contracts with the Fund, these proceedings are subject to uncertainties and, as such, we are unable to estimate the possible loss or range of loss that may result. An adverse outcome in one or more of these proceedings could result in adverse judgments, settlements, fines, penalties or other relief that could have a material adverse effect on the consolidated financial condition or results of operations of Ameriprise Financial or one or more of its affiliates that provides services to the Fund.
Columbia Select Large Cap Value Fund | Semiannual Report 2022
| 25 |
Approval of Management Agreement
(Unaudited)
Columbia Management Investment Advisers, LLC (the Investment Manager, and together with its domestic and global affiliates, Columbia Threadneedle Investments), a wholly-owned subsidiary of Ameriprise Financial, Inc. (Ameriprise Financial), serves as the investment manager to Columbia Select Large Cap Value Fund (the Fund). Under a management agreement (the Management Agreement), the Investment Manager provides investment advice and other services to the Fund and other funds distributed by Columbia Management Investment Distributors, Inc. (collectively, the Funds).
On an annual basis, the Fund’s Board of Trustees (the Board), including the independent Board members (the Independent Trustees), considers renewal of the Management Agreement. The Investment Manager prepared detailed reports for the Board and its Contracts Committee (including its Contracts Subcommittee) in November 2021 and March, April and June 2022, including reports providing the results of analyses performed by an independent third-party data provider, Broadridge Financial Solutions, Inc. (Broadridge), and comprehensive responses to written requests for information by independent legal counsels to the Independent Trustees (Independent Legal Counsel) to the Investment Manager, to assist the Board in making this determination. In addition, throughout the year, the Board (or its committees or subcommittees) regularly meets with portfolio management teams and senior management personnel and reviews information prepared by the Investment Manager addressing the services the Investment Manager provides and Fund performance. The Board also accords appropriate weight to the work, deliberations and conclusions of the various committees, such as the Contracts Committee, the Investment Review Committee, the Audit Committee and the Compliance Committee in determining whether to continue the Management Agreement.
The Board, at its June 23, 2022 Board meeting (the June Meeting), considered the renewal of the Management Agreement for an additional one-year term. At the June Meeting, Independent Legal Counsel reviewed with the Independent Trustees various factors relevant to the Board’s consideration of advisory agreements and the Board’s legal responsibilities related to such consideration. The Independent Trustees considered all information that they, their legal counsel or the Investment Manager believed reasonably necessary to evaluate and to approve the continuation of the Management Agreement. Among other things, the information and factors considered included the following:
| • | Information on the investment performance of the Fund relative to the performance of a group of mutual funds determined to be comparable to the Fund by Broadridge, as well as performance relative to benchmarks; |
| • | Information on the Fund’s management fees and total expenses, including information comparing the Fund’s expenses to those of a group of comparable mutual funds, as determined by Broadridge; |
| • | The Investment Manager’s agreement to contractually limit or cap total operating expenses for the Fund so that total operating expenses (excluding certain fees and expenses, such as transaction costs and certain other investment related expenses, interest, taxes, acquired fund fees and expenses and infrequent and/or unusual expenses) would not exceed a specified annual rate, as a percentage of the Fund’s net assets; |
| • | Terms of the Management Agreement; |
| • | Descriptions of other agreements and arrangements with affiliates of the Investment Manager relating to the operations of the Fund, including agreements with respect to the provision of transfer agency and shareholder services to the Fund; |
| • | Descriptions of various services performed by the Investment Manager under the Management Agreement, including portfolio management and portfolio trading practices; |
| • | Information regarding any recently negotiated management fees of similarly-managed portfolios of other institutional clients of the Investment Manager; |
| • | Information regarding the resources of the Investment Manager, including information regarding senior management, portfolio managers and other personnel; |
| • | Information regarding the capabilities of the Investment Manager with respect to compliance monitoring services; |
| • | The profitability to the Investment Manager and its affiliates from their relationships with the Fund; and |
| • | Report provided by the Board’s independent fee consultant, JDL Consultants, LLC (JDL). |
| 26 | Columbia Select Large Cap Value Fund | Semiannual Report 2022 |
Approval of Management Agreement (continued)
(Unaudited)
Following an analysis and discussion of the foregoing, and the factors identified below, the Board, including all of the Independent Trustees, approved the renewal of the Management Agreement.
Nature, extent and quality of services provided by the Investment Manager
The Board analyzed various reports and presentations it had received detailing the services performed by the Investment Manager, as well as its history, expertise, resources and relative capabilities, and the qualifications of its personnel.
The Board specifically considered the many developments during recent years concerning the services provided by the Investment Manager. Among other things, the Board noted the organization and depth of the equity and credit research departments. The Board further observed the enhancements to the investment risk management department’s processes, systems and oversight, over the past several years, as well as planned 2022 initiatives in this regard. The Board also took into account the broad scope of services provided by the Investment Manager to the Fund, including, among other services, investment, risk and compliance oversight. The Board also took into account the information it received concerning the Investment Manager’s ability to attract and retain key portfolio management personnel and that it has sufficient resources to provide competitive and adequate compensation to investment personnel. The Board also observed that the Investment Manager has been able to effectively manage, operate and distribute the Funds through the COVID-19 pandemic period with no disruptions in services provided. The Board also considered added personnel and resources obtained by Columbia Threadneedle through Ameriprise Financial’s acquisition of BMO Financial Group’s Europe, Middle East, and Africa (EMEA) asset management business.
In connection with the Board’s evaluation of the overall package of services provided by the Investment Manager, the Board also considered the nature, quality and range of administrative services provided to the Fund by the Investment Manager, as well as the achievements in 2021 in the performance of administrative services, and noted the various enhancements anticipated for 2022. In evaluating the quality of services provided under the Management Agreement, the Board also took into account the organization and strength of the Fund’s and its service providers’ compliance programs. The Board also reviewed the financial condition of the Investment Manager and its affiliates and each entity’s ability to carry out its responsibilities under the Management Agreement and the Fund’s other service agreements.
In addition, the Board discussed the acceptability of the terms of the Management Agreement, noting that no changes were proposed from the form of agreement previously approved. The Board also noted the wide array of legal and compliance services provided to the Fund under the Management Agreement.
After reviewing these and related factors (including investment performance as discussed below), the Board concluded, within the context of their overall conclusions, that the nature, extent and quality of the services provided to the Fund under the Management Agreement supported the continuation of the Management Agreement.
Investment performance
In this connection, the Board carefully reviewed the investment performance of the Fund, including detailed reports providing the results of analyses performed by each of the Investment Manager, Broadridge and JDL collectively showing, for various periods (including since manager inception): (i) the performance of the Fund, (ii) the performance of a benchmark index, (iii) the percentage ranking of the Fund among its comparison group, (iv) the Fund’s performance relative to peers and benchmarks and (v) the net assets of the Fund. The Board observed that the Fund’s performance for certain periods ranked above median based on information provided by Broadridge.
The Board also reviewed a description of the third-party data provider’s methodology for identifying the Fund’s peer groups for purposes of performance and expense comparisons.
The Board also considered the Investment Manager’s performance and reputation generally. After reviewing these and related factors, the Board concluded, within the context of their overall conclusions, that the performance of the Fund and the Investment Manager, in light of other considerations, supported the continuation of the Management Agreement.
Columbia Select Large Cap Value Fund | Semiannual Report 2022
| 27 |
Approval of Management Agreement (continued)
(Unaudited)
Comparative fees, costs of services provided and the profits realized by the Investment Manager and its affiliates from their relationships with the Fund
The Board reviewed comparative fees and the costs of services provided under the Management Agreement. The Board members considered detailed comparative information set forth in an annual report on fees and expenses, including, among other things, data (based on analyses conducted by Broadridge and JDL) showing a comparison of the Fund’s expenses with median expenses paid by funds in its comparative peer universe, as well as data showing the Fund’s contribution to the Investment Manager’s profitability. The Board reviewed the fees charged to comparable institutional or other accounts/vehicles managed by the Investment Manager, including accounts subadvised by the Investment Manager, and discussed differences in how the products are managed and operated, thus explaining many of the differences in fees.
The Board considered the reports of JDL, which assisted in the Board’s analysis of the Funds’ performance and expenses and the reasonableness of the Funds’ fee rates. The Board accorded particular weight to the notion that a primary objective of the level of fees is to achieve a rational pricing model applied consistently across the various product lines in the Fund family, while assuring that the overall fees for each Fund (with certain exceptions) are generally in line with the current "pricing philosophy" such that Fund total expense ratios, in general, approximate or are lower than the median expense ratios of funds in the same Lipper comparison universe. The Board took into account that the Fund’s total expense ratio (after considering proposed expense caps/waivers) was below the peer universe’s median expense ratio shown in the reports.
After reviewing these and related factors, the Board concluded, within the context of their overall conclusions, that the levels of management fees and expenses of the Fund, in light of other considerations, supported the continuation of the Management Agreement.
The Board also considered the profitability of the Investment Manager and its affiliates in connection with the Investment Manager providing management services to the Fund. With respect to the profitability of the Investment Manager and its affiliates, the Independent Trustees referred to information discussing the profitability to the Investment Manager and Ameriprise Financial from managing, operating and distributing the Funds. The Board considered that in 2021 the Board had considered 2020 profitability and that the 2022 information showed that the profitability generated by the Investment Manager in 2021 increased from 2020 levels, due to a variety of factors, including the increased assets under management of the Funds. It also took into account the indirect economic benefits flowing to the Investment Manager or its affiliates in connection with managing or distributing the Funds, such as the enhanced ability to offer various other financial products to Ameriprise Financial customers, soft dollar benefits and overall reputational advantages. The Board noted that the fees paid by the Fund should permit the Investment Manager to offer competitive compensation to its personnel, make necessary investments in its business and earn an appropriate profit. After reviewing these and related factors, the Board concluded, within the context of their overall conclusions, that the costs of services provided and the profitability to the Investment Manager and its affiliates from their relationships with the Fund supported the continuation of the Management Agreement.
Economies of scale
The Board considered the potential existence of economies of scale in the provision by the Investment Manager of services to the Fund, to groups of related funds and to the Investment Manager as a whole, and whether those economies of scale were shared with the Fund through breakpoints in investment management fees or other means, such as expense limitation arrangements and additional investments by the Investment Manager in investment, trading, compliance and other resources. The Board considered the economies of scale that might be realized as the Fund’s net asset level grows and took note of the extent to which Fund shareholders might also benefit from such growth. In this regard, the Board took into account that management fees decline as Fund assets exceed various breakpoints, all of which have not been surpassed. The Board observed that the Management Agreement provided for breakpoints in the management fee rate schedule that allow opportunities for shareholders to realize lower fees as Fund assets grow and that there are additional opportunities through other means for sharing economies of scale with shareholders.
Conclusion
The Board reviewed all of the above considerations in reaching its decision to approve the continuation of the Management Agreement. In reaching its conclusions, no single factor was determinative.
| 28 | Columbia Select Large Cap Value Fund | Semiannual Report 2022 |
Approval of Management Agreement (continued)
(Unaudited)
On June 23, 2022, the Board, including all of the Independent Trustees, determined that fees payable under the Management Agreement were fair and reasonable in light of the extent and quality of services provided and approved the renewal of the Management Agreement.
Columbia Select Large Cap Value Fund | Semiannual Report 2022
| 29 |
[THIS PAGE INTENTIONALLY LEFT BLANK]
[THIS PAGE INTENTIONALLY LEFT BLANK]
Columbia Select Large Cap Value Fund
P.O. Box 219104
Kansas City, MO 64121-9104
Please read and consider the investment objectives, risks, charges and expenses for any fund carefully before investing. For a prospectus and summary prospectus, which contains this and other important information about the Fund, go to
columbiathreadneedleus.com/investor/. The Fund is distributed by Columbia Management Investment Distributors, Inc., member FINRA, and managed by Columbia Management Investment Advisers, LLC.
Columbia Threadneedle Investments (Columbia Threadneedle) is the global brand name of the Columbia and Threadneedle group of companies. All rights reserved.
© 2023 Columbia Management Investment Advisers, LLC.
columbiathreadneedleus.com/investor/

Semiannual Report
November 30, 2022 (Unaudited)
Columbia Select Small Cap Value Fund
Not FDIC or NCUA Insured • No Financial Institution Guarantee • May Lose Value
If you elect to receive the shareholder report for Columbia Select Small Cap Value Fund (the Fund) in paper, mailed to you, the Fund mails one shareholder report to each shareholder address, unless such shareholder elects to receive shareholder reports from the Fund electronically via e-mail or by having a paper notice mailed to you (Postcard Notice) that your Fund’s shareholder report is available at the Columbia funds’ website (columbiathreadneedleus.com/investor/). If you would like more than one report in paper to be mailed to you, or would like to elect to receive reports via e-mail or access them through Postcard Notice, please call shareholder services at 800.345.6611 and additional reports will be sent to you.
Proxy voting policies and procedures
The policy of the Board of Trustees is to vote the proxies of the companies in which the Fund holds investments consistent with the procedures as stated in the Statement of Additional Information (SAI). You may obtain a copy of the SAI without charge by calling 800.345.6611; contacting your financial intermediary; visiting columbiathreadneedleus.com/investor/; or searching the website of the Securities and Exchange Commission (SEC) at sec.gov. Information regarding how the Fund voted proxies relating to portfolio securities is filed with the SEC by August 31st for the most recent 12-month period ending June 30th of that year, and is available without charge by visiting columbiathreadneedleus.com/investor/, or searching the website of the SEC at sec.gov.
Quarterly schedule of investments
The Fund files a complete schedule of portfolio holdings with the SEC for the first and third quarters of each fiscal year on Form N-PORT. The Fund’s Form N-PORT filings are available on the SEC’s website at sec.gov. The Fund’s complete schedule of portfolio holdings, as filed on Form N-PORT, is available on columbiathreadneedleus.com/investor/ or can also be obtained without charge, upon request, by calling 800.345.6611.
Additional Fund information
For more information about the Fund, please visit columbiathreadneedleus.com/investor/ or call 800.345.6611. Customer Service Representatives are available to answer your questions Monday through Friday from 8 a.m. to 7 p.m. Eastern time.
Fund investment manager
Columbia Management Investment Advisers, LLC (the Investment Manager)
290 Congress Street
Boston, MA 02210
Fund distributor
Columbia Management Investment Distributors, Inc.
290 Congress Street
Boston, MA 02210
Fund transfer agent
Columbia Management Investment Services Corp.
P.O. Box 219104
Kansas City, MO 64121-9104
Columbia Select Small Cap Value Fund | Semiannual Report 2022
Fund at a Glance
(Unaudited)
Investment objective
The Fund seeks to provide shareholders with long-term capital appreciation.
Portfolio management
Kari Montanus
Lead Portfolio Manager
Managed Fund since 2014
Jonas Patrikson, CFA
Portfolio Manager
Managed Fund since 2018
Morningstar style boxTM
The Morningstar Style Box is based on a fund’s portfolio holdings. For equity funds, the vertical axis shows the market capitalization of the stocks owned, and the horizontal axis shows investment style (value, blend, or growth). Information shown is based on the most recent data provided by Morningstar.
© 2023 Morningstar, Inc. All rights reserved. The Morningstar information contained herein: (1) is proprietary to Morningstar and/or its content providers; (2) may not be copied or distributed; and (3) is not warranted to be accurate, complete or timely. Neither Morningstar nor its content providers are responsible for any damages or losses arising from any use of this information.
| Average annual total returns (%) (for the period ended November 30, 2022) |
| | | Inception | 6 Months
cumulative | 1 Year | 5 Years | 10 Years |
| Class A | Excluding sales charges | 04/25/97 | 0.92 | -4.03 | 5.67 | 10.07 |
| | Including sales charges | | -4.89 | -9.54 | 4.43 | 9.43 |
| Advisor Class | 11/08/12 | 1.07 | -3.75 | 5.94 | 10.35 |
| Class C | Excluding sales charges | 05/27/99 | 0.64 | -4.66 | 4.89 | 9.26 |
| | Including sales charges | | -0.36 | -5.52 | 4.89 | 9.26 |
| Institutional Class | 09/27/10 | 1.13 | -3.73 | 5.95 | 10.36 |
| Institutional 2 Class | 11/30/01 | 1.11 | -3.71 | 6.02 | 10.46 |
| Institutional 3 Class* | 10/01/14 | 1.15 | -3.64 | 6.07 | 10.42 |
| Class R | 04/30/03 | 0.90 | -4.13 | 5.51 | 9.85 |
| Russell 2000 Value Index | | -0.25 | -4.75 | 5.35 | 9.67 |
Returns for Class A shares are shown with and without the maximum initial sales charge of 5.75%. Returns for Class C shares are shown with and without the 1.00% contingent deferred sales charge for the first year only. The Fund’s other share classes are not subject to sales charges and have limited eligibility. Please see the Fund’s prospectus for details. Performance for different share classes will vary based on differences in sales charges and fees associated with each share class. All results shown assume reinvestment of distributions during the period. Returns do not reflect the deduction of taxes that a shareholder may pay on Fund distributions or on the redemption of Fund shares. Performance results reflect the effect of any fee waivers or reimbursements of Fund expenses by Columbia Management Investment Advisers, LLC and/or any of its affiliates. Absent these fee waivers or expense reimbursement arrangements, performance results would have been lower.
The performance information shown represents past performance and is not a guarantee of future results. The investment return and principal value of your investment will fluctuate so that your shares, when redeemed, may be worth more or less than their original cost. Current performance may be lower or higher than the performance information shown. You may obtain performance information current to the most recent month-end by contacting your financial intermediary, visiting columbiathreadneedleus.com/investor/ or calling 800.345.6611.
| * | The returns shown for periods prior to the share class inception date (including returns for the Life of the Fund, if shown, which are since Fund inception) include the returns of the Fund’s oldest share class. These returns are adjusted to reflect any higher class-related operating expenses of the newer share classes, as applicable. Please visit columbiathreadneedleus.com/investor/investment-products/mutual-funds/appended-performance for more information. |
The Russell 2000 Value Index, an unmanaged index, measures the performance of those stocks in the Russell 2000 Index with lower price-to-book ratios and lower forecasted growth values.
Indices are not available for investment, are not professionally managed and do not reflect sales charges, fees, brokerage commissions, taxes or other expenses of investing. Securities in the Fund may not match those in an index.
Columbia Select Small Cap Value Fund | Semiannual Report 2022
| 3 |
Fund at a Glance (continued)
(Unaudited)
| Portfolio breakdown (%) (at November 30, 2022) |
| Common Stocks | 98.4 |
| Money Market Funds | 1.6 |
| Rights | 0.0(a) |
| Total | 100.0 |
Percentages indicated are based upon total investments excluding investments in derivatives, if any. The Fund’s portfolio composition is subject to change.
| Equity sector breakdown (%) (at November 30, 2022) |
| Communication Services | 1.8 |
| Consumer Discretionary | 10.1 |
| Consumer Staples | 1.6 |
| Energy | 5.2 |
| Financials | 27.4 |
| Health Care | 5.8 |
| Industrials | 17.8 |
| Information Technology | 9.9 |
| Materials | 8.9 |
| Real Estate | 9.5 |
| Utilities | 2.0 |
| Total | 100.0 |
Percentages indicated are based upon total equity investments. The Fund’s portfolio composition is subject to change.
| 4 | Columbia Select Small Cap Value Fund | Semiannual Report 2022 |
Understanding Your Fund’s Expenses
(Unaudited)
As an investor, you incur two types of costs. There are shareholder transaction costs, which generally include sales charges on purchases and may include redemption fees. There are also ongoing fund costs, which generally include management fees, distribution and/or service fees, and other fund expenses. The following information is intended to help you understand your ongoing costs (in dollars) of investing in the Fund and to help you compare these costs with the ongoing costs of investing in other mutual funds.
Analyzing your Fund’s expenses
To illustrate these ongoing costs, we have provided examples and calculated the expenses paid by investors in each share class of the Fund during the period. The actual and hypothetical information in the table is based on an initial investment of $1,000 at the beginning of the period indicated and held for the entire period. Expense information is calculated two ways and each method provides you with different information. The amount listed in the “Actual” column is calculated using the Fund’s actual operating expenses and total return for the period. You may use the Actual information, together with the amount invested, to estimate the expenses that you paid over the period. Simply divide your account value by $1,000 (for example, an $8,600 account value divided by $1,000 = 8.6), then multiply the results by the expenses paid during the period under the “Actual” column. The amount listed in the “Hypothetical” column assumes a 5% annual rate of return before expenses (which is not the Fund’s actual return) and then applies the Fund’s actual expense ratio for the period to the hypothetical return. You should not use the hypothetical account values and expenses to estimate either your actual account balance at the end of the period or the expenses you paid during the period. See “Compare with other funds” below for details on how to use the hypothetical data.
Compare with other funds
Since all mutual funds are required to include the same hypothetical calculations about expenses in shareholder reports, you can use this information to compare the ongoing cost of investing in the Fund with other funds. To do so, compare the hypothetical example with the 5% hypothetical examples that appear in the shareholder reports of other funds. As you compare hypothetical examples of other funds, it is important to note that hypothetical examples are meant to highlight the ongoing costs of investing in a fund only and do not reflect any transaction costs, such as sales charges, or redemption or exchange fees. Therefore, the hypothetical calculations are useful in comparing ongoing costs only, and will not help you determine the relative total costs of owning different funds. If transaction costs were included in these calculations, your costs would be higher.
| June 1, 2022 — November 30, 2022 |
| | Account value at the
beginning of the
period ($) | Account value at the
end of the
period ($) | Expenses paid during
the period ($) | Fund’s annualized
expense ratio (%) |
| | Actual | Hypothetical | Actual | Hypothetical | Actual | Hypothetical | Actual |
| Class A | 1,000.00 | 1,000.00 | 1,009.20 | 1,018.65 | 6.45 | 6.48 | 1.28 |
| Advisor Class | 1,000.00 | 1,000.00 | 1,010.70 | 1,019.90 | 5.19 | 5.22 | 1.03 |
| Class C | 1,000.00 | 1,000.00 | 1,006.40 | 1,014.89 | 10.21 | 10.25 | 2.03 |
| Institutional Class | 1,000.00 | 1,000.00 | 1,011.30 | 1,019.90 | 5.19 | 5.22 | 1.03 |
| Institutional 2 Class | 1,000.00 | 1,000.00 | 1,011.10 | 1,020.21 | 4.89 | 4.91 | 0.97 |
| Institutional 3 Class | 1,000.00 | 1,000.00 | 1,011.50 | 1,020.51 | 4.59 | 4.61 | 0.91 |
| Class R | 1,000.00 | 1,000.00 | 1,009.00 | 1,017.50 | 7.60 | 7.64 | 1.51 |
Expenses paid during the period are equal to the annualized expense ratio for each class as indicated above, multiplied by the average account value over the period and then multiplied by the number of days in the Fund’s most recent fiscal half year and divided by 365.
Expenses do not include fees and expenses incurred indirectly by the Fund from its investment in underlying funds, including affiliated and non-affiliated pooled investment vehicles, such as mutual funds and exchange-traded funds.
Had Columbia Management Investment Advisers, LLC and/or certain of its affiliates not waived/reimbursed certain fees and expenses, account value at the end of the period would have been reduced.
Columbia Select Small Cap Value Fund | Semiannual Report 2022
| 5 |
Portfolio of Investments
November 30, 2022 (Unaudited)
(Percentages represent value of investments compared to net assets)
Investments in securities
| Common Stocks 98.4% |
| Issuer | Shares | Value ($) |
| Communication Services 1.8% |
| Media 0.9% |
| iHeartMedia, Inc., Class A(a) | 530,000 | 4,261,200 |
| Wireless Telecommunication Services 0.9% |
| Telephone and Data Systems, Inc. | 452,104 | 4,765,176 |
| Total Communication Services | 9,026,376 |
| Consumer Discretionary 10.0% |
| Auto Components 2.9% |
| Visteon Corp.(a) | 100,000 | 14,680,000 |
| Hotels, Restaurants & Leisure 4.2% |
| Penn Entertainment, Inc.(a) | 44,535 | 1,567,187 |
| Six Flags Entertainment Corp.(a) | 321,170 | 7,736,985 |
| Texas Roadhouse, Inc. | 118,470 | 11,766,440 |
| Total | | 21,070,612 |
| Household Durables 1.2% |
| KB Home | 196,665 | 6,173,314 |
| Textiles, Apparel & Luxury Goods 1.7% |
| Kontoor Brands, Inc. | 195,977 | 8,515,201 |
| Total Consumer Discretionary | 50,439,127 |
| Consumer Staples 1.5% |
| Food Products 1.5% |
| Nomad Foods Ltd.(a) | 443,422 | 7,755,451 |
| Total Consumer Staples | 7,755,451 |
| Energy 5.1% |
| Energy Equipment & Services 2.7% |
| Patterson-UTI Energy, Inc. | 764,515 | 13,723,044 |
| Oil, Gas & Consumable Fuels 2.4% |
| Devon Energy Corp. | 179,397 | 12,292,283 |
| Total Energy | 26,015,327 |
| Financials 26.9% |
| Banks 13.9% |
| First Hawaiian, Inc. | 388,838 | 10,323,649 |
| Huntington Bancshares, Inc. | 631,825 | 9,780,651 |
| OceanFirst Financial Corp. | 450,000 | 10,512,000 |
| Pacific Premier Bancorp, Inc. | 428,623 | 15,837,620 |
| Common Stocks (continued) |
| Issuer | Shares | Value ($) |
| Popular, Inc. | 161,254 | 11,774,767 |
| Stock Yards Bancorp, Inc. | 162,322 | 12,015,074 |
| Total | | 70,243,761 |
| Consumer Finance 0.5% |
| PROG Holdings, Inc.(a) | 126,098 | 2,482,870 |
| Insurance 6.3% |
| CNO Financial Group, Inc. | 400,308 | 9,399,232 |
| Hanover Insurance Group, Inc. (The) | 92,753 | 13,662,517 |
| Lincoln National Corp. | 224,254 | 8,732,451 |
| Total | | 31,794,200 |
| Mortgage Real Estate Investment Trusts (REITS) 0.9% |
| Ladder Capital Corp., Class A | 416,221 | 4,620,053 |
| Thrifts & Mortgage Finance 5.3% |
| Axos Financial, Inc.(a) | 371,820 | 14,913,700 |
| Radian Group, Inc. | 621,310 | 12,159,037 |
| Total | | 27,072,737 |
| Total Financials | 136,213,621 |
| Health Care 5.7% |
| Biotechnology —% |
| OmniAb, Inc.(a),(b),(c),(d) | 9,220 | 0 |
| OmniAb, Inc.(a),(b),(c),(d) | 9,220 | 0 |
| Total | | 0 |
| Health Care Equipment & Supplies 3.0% |
| CONMED Corp. | 101,129 | 8,378,538 |
| LivaNova PLC(a) | 120,000 | 6,644,400 |
| Total | | 15,022,938 |
| Health Care Providers & Services 1.2% |
| Tenet Healthcare Corp.(a) | 128,000 | 5,911,040 |
| Life Sciences Tools & Services 1.2% |
| OmniAb, Inc.(a) | 119,150 | 421,791 |
| Syneos Health, Inc.(a) | 157,418 | 5,553,707 |
| Total | | 5,975,498 |
| Pharmaceuticals 0.3% |
| Ligand Pharmaceuticals, Inc.(a) | 24,316 | 1,772,636 |
| Total Health Care | 28,682,112 |
The accompanying Notes to Financial Statements are an integral part of this statement.
| 6 | Columbia Select Small Cap Value Fund | Semiannual Report 2022 |
Portfolio of Investments (continued)
November 30, 2022 (Unaudited)
| Common Stocks (continued) |
| Issuer | Shares | Value ($) |
| Industrials 17.6% |
| Aerospace & Defense 2.6% |
| Curtiss-Wright Corp. | 72,696 | 12,841,748 |
| Airlines 1.0% |
| American Airlines Group, Inc.(a) | 532 | 7,677 |
| Spirit Airlines, Inc.(a) | 235,938 | 5,122,214 |
| Total | | 5,129,891 |
| Building Products 1.6% |
| Zurn Elkay Water Solutions Corp. | 322,458 | 7,806,708 |
| Commercial Services & Supplies 1.9% |
| Waste Connections, Inc. | 66,511 | 9,610,839 |
| Construction & Engineering 1.1% |
| Primoris Services Corp. | 250,004 | 5,337,585 |
| Electrical Equipment 2.8% |
| Bloom Energy Corp., Class A(a) | 226,774 | 4,828,019 |
| Regal Rexnord Corp. | 71,895 | 9,426,153 |
| Total | | 14,254,172 |
| Machinery 1.9% |
| ITT, Inc. | 116,032 | 9,807,025 |
| Professional Services 1.9% |
| CACI International, Inc., Class A(a) | 31,046 | 9,695,666 |
| Road & Rail 2.8% |
| Knight-Swift Transportation Holdings, Inc. | 257,999 | 14,300,885 |
| Total Industrials | 88,784,519 |
| Information Technology 9.7% |
| Communications Equipment 5.2% |
| Extreme Networks, Inc.(a) | 907,538 | 19,031,072 |
| Viavi Solutions, Inc.(a) | 648,628 | 7,348,955 |
| Total | | 26,380,027 |
| IT Services 0.8% |
| EPAM Systems, Inc.(a) | 10,306 | 3,798,585 |
| Semiconductors & Semiconductor Equipment 3.7% |
| Kulicke & Soffa Industries, Inc. | 163,457 | 7,837,763 |
| MACOM Technology Solutions Holdings, Inc.(a) | 161,679 | 11,105,731 |
| Total | | 18,943,494 |
| Total Information Technology | 49,122,106 |
| Common Stocks (continued) |
| Issuer | Shares | Value ($) |
| Materials 8.8% |
| Chemicals 1.6% |
| Minerals Technologies, Inc. | 135,521 | 8,170,561 |
| Construction Materials 2.1% |
| Summit Materials, Inc., Class A(a) | 356,276 | 10,791,600 |
| Containers & Packaging 2.7% |
| O-I Glass, Inc.(a) | 815,491 | 13,382,207 |
| Metals & Mining 2.4% |
| ATI, Inc.(a) | 392,586 | 11,977,799 |
| Total Materials | 44,322,167 |
| Real Estate 9.3% |
| Equity Real Estate Investment Trusts (REITS) 9.3% |
| Apple Hospitality REIT, Inc. | 700,000 | 11,942,000 |
| First Industrial Realty Trust, Inc. | 187,555 | 9,480,905 |
| Gaming and Leisure Properties, Inc. | 184,629 | 9,713,332 |
| Outfront Media, Inc. | 490,000 | 8,962,100 |
| Physicians Realty Trust | 474,453 | 7,083,583 |
| Total | | 47,181,920 |
| Total Real Estate | 47,181,920 |
| Utilities 2.0% |
| Electric Utilities 2.0% |
| Portland General Electric Co. | 205,233 | 10,103,621 |
| Total Utilities | 10,103,621 |
Total Common Stocks
(Cost $348,549,422) | 497,646,347 |
|
| Rights —% |
| | |
| Industrials —% |
| Airlines —% |
| American Airlines Escrow(a),(b),(d) | 52,560 | 0 |
| Total Industrials | 0 |
Total Rights
(Cost $—) | 0 |
|
The accompanying Notes to Financial Statements are an integral part of this statement.
Columbia Select Small Cap Value Fund | Semiannual Report 2022
| 7 |
Portfolio of Investments (continued)
November 30, 2022 (Unaudited)
| Money Market Funds 1.6% |
| | Shares | Value ($) |
| Columbia Short-Term Cash Fund, 3.989%(e),(f) | 8,016,636 | 8,013,429 |
Total Money Market Funds
(Cost $8,013,186) | 8,013,429 |
Total Investments in Securities
(Cost: $356,562,608) | 505,659,776 |
| Other Assets & Liabilities, Net | | (234,981) |
| Net Assets | 505,424,795 |
Notes to Portfolio of Investments
| (a) | Non-income producing investment. |
| (b) | Represents fair value as determined in good faith under procedures approved by the Board of Trustees. At November 30, 2022, the total value of these securities amounted to $0, which represents less than 0.01% of total net assets. |
| (c) | Denotes a restricted security, which is subject to legal or contractual restrictions on resale under federal securities laws. Disposal of a restricted investment may involve time-consuming negotiations and expenses, and prompt sale at an acceptable price may be difficult to achieve. Private placement securities are generally considered to be restricted, although certain of those securities may be traded between qualified institutional investors under the provisions of Section 4(a)(2) and Rule 144A. The Fund will not incur any registration costs upon such a trade. These securities are valued at fair value determined in good faith under consistently applied procedures established by the Fund’s Board of Trustees. At November 30, 2022, the total market value of these securities amounted to $0, which represents less than 0.01% of total net assets. Additional information on these securities is as follows: |
| Security | Acquisition
Dates | Shares | Cost ($) | Value ($) |
| OmniAb, Inc. | 02/13/2015-02/27/2015 | 9,220 | — | — |
| OmniAb, Inc. | 02/13/2015-02/27/2015 | 9,220 | — | — |
| | | | — | — |
| (d) | Valuation based on significant unobservable inputs. |
| (e) | The rate shown is the seven-day current annualized yield at November 30, 2022. |
| (f) | As defined in the Investment Company Act of 1940, as amended, an affiliated company is one in which the Fund owns 5% or more of the company’s outstanding voting securities, or a company which is under common ownership or control with the Fund. The value of the holdings and transactions in these affiliated companies during the period ended November 30, 2022 are as follows: |
| Affiliated issuers | Beginning
of period($) | Purchases($) | Sales($) | Net change in
unrealized
appreciation
(depreciation)($) | End of
period($) | Realized gain
(loss)($) | Dividends($) | End of
period shares |
| Columbia Short-Term Cash Fund, 3.989% |
| | 7,014,016 | 29,993,285 | (28,994,115) | 243 | 8,013,429 | 187 | 59,867 | 8,016,636 |
Fair value measurements
The Fund categorizes its fair value measurements according to a three-level hierarchy that maximizes the use of observable inputs and minimizes the use of unobservable inputs by prioritizing that the most observable input be used when available. Observable inputs are those that market participants would use in pricing an investment based on market data obtained from sources independent of the reporting entity. Unobservable inputs are those that reflect the Fund’s assumptions about the information market participants would use in pricing an investment. An investment’s level within the fair value hierarchy is based on the lowest level of any input that is deemed significant to the asset’s or liability’s fair value measurement. The input levels are not necessarily an indication of the risk or liquidity associated with investments at that level. For example, certain U.S. government securities are generally high quality and liquid, however, they are reflected as Level 2 because the inputs used to determine fair value may not always be quoted prices in an active market.
Fair value inputs are summarized in the three broad levels listed below:
| ■ | Level 1 — Valuations based on quoted prices for investments in active markets that the Fund has the ability to access at the measurement date. Valuation adjustments are not applied to Level 1 investments. |
| ■ | Level 2 — Valuations based on other significant observable inputs (including quoted prices for similar securities, interest rates, prepayment speeds, credit risks, etc.). |
| ■ | Level 3 — Valuations based on significant unobservable inputs (including the Fund’s own assumptions and judgment in determining the fair value of investments). |
The accompanying Notes to Financial Statements are an integral part of this statement.
| 8 | Columbia Select Small Cap Value Fund | Semiannual Report 2022 |
Portfolio of Investments (continued)
November 30, 2022 (Unaudited)
Fair value measurements (continued)
Inputs that are used in determining fair value of an investment may include price information, credit data, volatility statistics, and other factors. These inputs can be either observable or unobservable. The availability of observable inputs can vary between investments, and is affected by various factors such as the type of investment, and the volume and level of activity for that investment or similar investments in the marketplace. The inputs will be considered by the Investment Manager, along with any other relevant factors in the calculation of an investment’s fair value. The Fund uses prices and inputs that are current as of the measurement date, which may include periods of market dislocations. During these periods, the availability of prices and inputs may be reduced for many investments. This condition could cause an investment to be reclassified between the various levels within the hierarchy.
Investments falling into the Level 3 category are primarily supported by quoted prices from brokers and dealers participating in the market for those investments. However, these may be classified as Level 3 investments due to lack of market transparency and corroboration to support these quoted prices. Additionally, valuation models may be used as the pricing source for any remaining investments classified as Level 3. These models may rely on one or more significant unobservable inputs and/or significant assumptions by the Investment Manager. Inputs used in valuations may include, but are not limited to, financial statement analysis, capital account balances, discount rates and estimated cash flows, and comparable company data.
The Fund’s Board of Trustees (the Board) has designated the Investment Manager, through its Valuation Committee (the Committee), as valuation designee, responsible for determining the fair value of the assets of the Fund for which market quotations are not readily available using valuation procedures approved by the Board. The Committee consists of voting and non-voting members from various groups within the Investment Manager’s organization, including operations and accounting, trading and investments, compliance, risk management and legal.
The Committee meets at least monthly to review and approve valuation matters, which may include a description of specific valuation determinations, data regarding pricing information received from approved pricing vendors and brokers and the results of Board-approved valuation policies and procedures (the Policies). The Policies address, among other things, instances when market quotations are or are not readily available, including recommendations of third party pricing vendors and a determination of appropriate pricing methodologies; events that require specific valuation determinations and assessment of fair value techniques; securities with a potential for stale pricing, including those that are illiquid, restricted, or in default; and the effectiveness of third party pricing vendors, including periodic reviews of vendors. The Committee meets more frequently, as needed, to discuss additional valuation matters, which may include the need to review back-testing results, review time-sensitive information or approve related valuation actions. Representatives of Columbia Management Investment Advisers, LLC report to the Board at each of its regularly scheduled meetings to discuss valuation matters and actions during the period, similar to those described earlier.
The following table is a summary of the inputs used to value the Fund’s investments at November 30, 2022:
| | Level 1 ($) | Level 2 ($) | Level 3 ($) | Total ($) |
| Investments in Securities | | | | |
| Common Stocks | | | | |
| Communication Services | 9,026,376 | — | — | 9,026,376 |
| Consumer Discretionary | 50,439,127 | — | — | 50,439,127 |
| Consumer Staples | 7,755,451 | — | — | 7,755,451 |
| Energy | 26,015,327 | — | — | 26,015,327 |
| Financials | 136,213,621 | — | — | 136,213,621 |
| Health Care | 28,682,112 | — | 0* | 28,682,112 |
| Industrials | 88,784,519 | — | — | 88,784,519 |
| Information Technology | 49,122,106 | — | — | 49,122,106 |
| Materials | 44,322,167 | — | — | 44,322,167 |
| Real Estate | 47,181,920 | — | — | 47,181,920 |
| Utilities | 10,103,621 | — | — | 10,103,621 |
| Total Common Stocks | 497,646,347 | — | 0* | 497,646,347 |
| Rights | | | | |
| Industrials | — | — | 0* | 0* |
| Total Rights | — | — | 0* | 0* |
| Money Market Funds | 8,013,429 | — | — | 8,013,429 |
| Total Investments in Securities | 505,659,776 | — | 0* | 505,659,776 |
See the Portfolio of Investments for all investment classifications not indicated in the table.
The Fund does not hold any significant investments (greater than one percent of net assets) categorized as Level 3.
The accompanying Notes to Financial Statements are an integral part of this statement.
Columbia Select Small Cap Value Fund | Semiannual Report 2022
| 9 |
Statement of Assets and Liabilities
November 30, 2022 (Unaudited)
| Assets | |
| Investments in securities, at value | |
| Unaffiliated issuers (cost $348,549,422) | $497,646,347 |
| Affiliated issuers (cost $8,013,186) | 8,013,429 |
| Receivable for: | |
| Capital shares sold | 98,004 |
| Dividends | 383,357 |
| Foreign tax reclaims | 1,696 |
| Expense reimbursement due from Investment Manager | 473 |
| Prepaid expenses | 9,317 |
| Other assets | 892 |
| Total assets | 506,153,515 |
| Liabilities | |
| Payable for: | |
| Capital shares purchased | 537,257 |
| Management services fees | 11,755 |
| Distribution and/or service fees | 2,416 |
| Transfer agent fees | 40,894 |
| Compensation of board members | 102,807 |
| Compensation of chief compliance officer | 46 |
| Other expenses | 33,545 |
| Total liabilities | 728,720 |
| Net assets applicable to outstanding capital stock | $505,424,795 |
| Represented by | |
| Paid in capital | 333,641,052 |
| Total distributable earnings (loss) | 171,783,743 |
| Total - representing net assets applicable to outstanding capital stock | $505,424,795 |
The accompanying Notes to Financial Statements are an integral part of this statement.
| 10 | Columbia Select Small Cap Value Fund | Semiannual Report 2022 |
Statement of Assets and Liabilities (continued)
November 30, 2022 (Unaudited)
| Class A | |
| Net assets | $343,945,470 |
| Shares outstanding | 17,499,145 |
| Net asset value per share | $19.65 |
| Maximum sales charge | 5.75% |
| Maximum offering price per share (calculated by dividing the net asset value per share by 1.0 minus the maximum sales charge for Class A shares) | $20.85 |
| Advisor Class | |
| Net assets | $3,741,922 |
| Shares outstanding | 158,200 |
| Net asset value per share | $23.65 |
| Class C | |
| Net assets | $3,526,400 |
| Shares outstanding | 280,841 |
| Net asset value per share | $12.56 |
| Institutional Class | |
| Net assets | $50,370,176 |
| Shares outstanding | 2,169,721 |
| Net asset value per share | $23.22 |
| Institutional 2 Class | |
| Net assets | $4,770,669 |
| Shares outstanding | 202,059 |
| Net asset value per share | $23.61 |
| Institutional 3 Class | |
| Net assets | $97,268,541 |
| Shares outstanding | 3,960,743 |
| Net asset value per share | $24.56 |
| Class R | |
| Net assets | $1,801,617 |
| Shares outstanding | 100,115 |
| Net asset value per share | $18.00 |
The accompanying Notes to Financial Statements are an integral part of this statement.
Columbia Select Small Cap Value Fund | Semiannual Report 2022
| 11 |
Statement of Operations
Six Months Ended November 30, 2022 (Unaudited)
| Net investment income | |
| Income: | |
| Dividends — unaffiliated issuers | $5,714,814 |
| Dividends — affiliated issuers | 59,867 |
| Foreign taxes withheld | (22,922) |
| Total income | 5,751,759 |
| Expenses: | |
| Management services fees | 2,128,636 |
| Distribution and/or service fees | |
| Class A | 416,890 |
| Class C | 17,861 |
| Class R | 4,585 |
| Transfer agent fees | |
| Class A | 217,861 |
| Advisor Class | 2,206 |
| Class C | 2,333 |
| Institutional Class | 30,392 |
| Institutional 2 Class | 989 |
| Institutional 3 Class | 3,161 |
| Class R | 1,248 |
| Compensation of board members | 5,453 |
| Custodian fees | 2,378 |
| Printing and postage fees | 25,920 |
| Registration fees | 73,506 |
| Audit fees | 15,059 |
| Legal fees | 9,203 |
| Compensation of chief compliance officer | 46 |
| Other | 8,896 |
| Total expenses | 2,966,623 |
| Fees waived or expenses reimbursed by Investment Manager and its affiliates | (63,062) |
| Expense reduction | (500) |
| Total net expenses | 2,903,061 |
| Net investment income | 2,848,698 |
| Realized and unrealized gain (loss) — net | |
| Net realized gain (loss) on: | |
| Investments — unaffiliated issuers | 19,241,217 |
| Investments — affiliated issuers | 187 |
| Net realized gain | 19,241,404 |
| Net change in unrealized appreciation (depreciation) on: | |
| Investments — unaffiliated issuers | (18,183,704) |
| Investments — affiliated issuers | 243 |
| Net change in unrealized appreciation (depreciation) | (18,183,461) |
| Net realized and unrealized gain | 1,057,943 |
| Net increase in net assets resulting from operations | $3,906,641 |
The accompanying Notes to Financial Statements are an integral part of this statement.
| 12 | Columbia Select Small Cap Value Fund | Semiannual Report 2022 |
Statement of Changes in Net Assets
| | Six Months Ended
November 30, 2022
(Unaudited) | Year Ended
May 31, 2022 |
| Operations | | |
| Net investment income | $2,848,698 | $1,208,520 |
| Net realized gain | 19,241,404 | 13,916,690 |
| Net change in unrealized appreciation (depreciation) | (18,183,461) | (63,613,565) |
| Net increase (decrease) in net assets resulting from operations | 3,906,641 | (48,488,355) |
| Distributions to shareholders | | |
| Net investment income and net realized gains | | |
| Class A | — | (25,903,890) |
| Advisor Class | — | (200,508) |
| Class C | — | (451,603) |
| Institutional Class | — | (2,351,228) |
| Institutional 2 Class | — | (189,237) |
| Institutional 3 Class | — | (6,407,644) |
| Class R | — | (216,248) |
| Total distributions to shareholders | — | (35,720,358) |
| Increase (decrease) in net assets from capital stock activity | (23,324,107) | 8,016,141 |
| Total decrease in net assets | (19,417,466) | (76,192,572) |
| Net assets at beginning of period | 524,842,261 | 601,034,833 |
| Net assets at end of period | $505,424,795 | $524,842,261 |
The accompanying Notes to Financial Statements are an integral part of this statement.
Columbia Select Small Cap Value Fund | Semiannual Report 2022
| 13 |
Statement of Changes in Net Assets (continued)
| | Six Months Ended | Year Ended |
| | November 30, 2022 (Unaudited) | May 31, 2022 |
| | Shares | Dollars ($) | Shares | Dollars ($) |
| Capital stock activity |
| Class A | | | | |
| Subscriptions | 170,493 | 3,131,707 | 507,534 | 10,965,300 |
| Distributions reinvested | — | — | 1,178,095 | 25,423,289 |
| Redemptions | (991,996) | (18,315,515) | (1,910,302) | (40,878,780) |
| Net decrease | (821,503) | (15,183,808) | (224,673) | (4,490,191) |
| Advisor Class | | | | |
| Subscriptions | 18,683 | 431,285 | 49,707 | 1,274,991 |
| Distributions reinvested | — | — | 7,565 | 195,996 |
| Redemptions | (7,068) | (156,088) | (65,444) | (1,694,723) |
| Net increase (decrease) | 11,615 | 275,197 | (8,172) | (223,736) |
| Class C | | | | |
| Subscriptions | 15,174 | 179,573 | 78,662 | 1,121,908 |
| Distributions reinvested | — | — | 32,495 | 451,353 |
| Redemptions | (50,861) | (597,981) | (122,722) | (1,718,346) |
| Net decrease | (35,687) | (418,408) | (11,565) | (145,085) |
| Institutional Class | | | | |
| Subscriptions | 483,994 | 10,657,030 | 1,067,433 | 26,463,504 |
| Distributions reinvested | — | — | 91,784 | 2,334,077 |
| Redemptions | (462,718) | (10,073,725) | (707,649) | (17,698,937) |
| Net increase | 21,276 | 583,305 | 451,568 | 11,098,644 |
| Institutional 2 Class | | | | |
| Subscriptions | 104,429 | 2,234,186 | 63,596 | 1,652,752 |
| Distributions reinvested | — | — | 7,314 | 189,068 |
| Redemptions | (19,239) | (419,664) | (112,688) | (2,872,408) |
| Net increase (decrease) | 85,190 | 1,814,522 | (41,778) | (1,030,588) |
| Institutional 3 Class | | | | |
| Subscriptions | 22,476 | 518,504 | 447,140 | 12,070,432 |
| Distributions reinvested | — | — | 217,810 | 5,852,565 |
| Redemptions | (441,950) | (10,351,487) | (537,418) | (14,359,466) |
| Net increase (decrease) | (419,474) | (9,832,983) | 127,532 | 3,563,531 |
| Class R | | | | |
| Subscriptions | 5,778 | 97,359 | 34,423 | 686,829 |
| Distributions reinvested | — | — | 8,864 | 175,508 |
| Redemptions | (39,515) | (659,291) | (81,587) | (1,618,771) |
| Net decrease | (33,737) | (561,932) | (38,300) | (756,434) |
| Total net increase (decrease) | (1,192,320) | (23,324,107) | 254,612 | 8,016,141 |
The accompanying Notes to Financial Statements are an integral part of this statement.
| 14 | Columbia Select Small Cap Value Fund | Semiannual Report 2022 |
[THIS PAGE INTENTIONALLY LEFT BLANK]
Columbia Select Small Cap Value Fund | Semiannual Report 2022
| 15 |
The following table is intended to help you understand the Fund’s financial performance. Certain information reflects financial results for a single share of a class held for the periods shown. Per share net investment income (loss) amounts are calculated based on average shares outstanding during the period. Total return assumes reinvestment of all dividends and distributions, if any. Total return does not reflect payment of sales charges, if any. Total return and portfolio turnover are not annualized for periods of less than one year. The portfolio turnover rate is calculated without regard to purchase and sales transactions of short-term instruments and certain derivatives, if any. If such transactions were included, the Fund’s portfolio turnover rate may be higher.
| | Net asset value,
beginning of
period | Net
investment
income
(loss) | Net
realized
and
unrealized
gain (loss) | Total from
investment
operations | Distributions
from net
investment
income | Distributions
from net
realized
gains | Total
distributions to
shareholders |
| Class A |
| Six Months Ended 11/30/2022 (Unaudited) | $19.47 | 0.10 | 0.08 | 0.18 | — | — | — |
| Year Ended 5/31/2022 | $22.67 | 0.03 | (1.78) | (1.75) | (0.01) | (1.44) | (1.45) |
| Year Ended 5/31/2021 | $13.83 | 0.01 | 9.98 | 9.99 | (0.01) | (1.14) | (1.15) |
| Year Ended 5/31/2020 | $15.83 | 0.01 | (1.99) | (1.98) | (0.02) | (0.00)(e) | (0.02) |
| Year Ended 5/31/2019 | $18.40 | 0.01 | (1.47) | (1.46) | (0.02) | (1.09) | (1.11) |
| Year Ended 5/31/2018 | $18.85 | 0.08(f) | 1.91 | 1.99 | — | (2.44) | (2.44) |
| Advisor Class |
| Six Months Ended 11/30/2022 (Unaudited) | $23.40 | 0.15 | 0.10 | 0.25 | — | — | — |
| Year Ended 5/31/2022 | $26.94 | 0.10 | (2.14) | (2.04) | (0.06) | (1.44) | (1.50) |
| Year Ended 5/31/2021 | $16.27 | 0.07 | 11.79 | 11.86 | (0.05) | (1.14) | (1.19) |
| Year Ended 5/31/2020 | $18.62 | 0.06 | (2.34) | (2.28) | (0.07) | (0.00)(e) | (0.07) |
| Year Ended 5/31/2019 | $21.38 | 0.05 | (1.69) | (1.64) | (0.03) | (1.09) | (1.12) |
| Year Ended 5/31/2018 | $21.49 | 0.17(f) | 2.16 | 2.33 | — | (2.44) | (2.44) |
| Class C |
| Six Months Ended 11/30/2022 (Unaudited) | $12.48 | 0.02 | 0.06 | 0.08 | — | — | — |
| Year Ended 5/31/2022 | $15.15 | (0.09) | (1.14) | (1.23) | — | (1.44) | (1.44) |
| Year Ended 5/31/2021 | $9.59 | (0.08) | 6.78 | 6.70 | — | (1.14) | (1.14) |
| Year Ended 5/31/2020 | $11.05 | (0.07) | (1.39) | (1.46) | — | (0.00)(e) | (0.00)(e) |
| Year Ended 5/31/2019 | $13.29 | (0.09) | (1.06) | (1.15) | — | (1.09) | (1.09) |
| Year Ended 5/31/2018 | $14.35 | (0.05)(f) | 1.43 | 1.38 | — | (2.44) | (2.44) |
| Institutional Class |
| Six Months Ended 11/30/2022 (Unaudited) | $22.96 | 0.14 | 0.12 | 0.26 | — | — | — |
| Year Ended 5/31/2022 | $26.47 | 0.09 | (2.10) | (2.01) | (0.06) | (1.44) | (1.50) |
| Year Ended 5/31/2021 | $16.00 | 0.07 | 11.59 | 11.66 | (0.05) | (1.14) | (1.19) |
| Year Ended 5/31/2020 | $18.31 | 0.06 | (2.30) | (2.24) | (0.07) | (0.00)(e) | (0.07) |
| Year Ended 5/31/2019 | $21.05 | 0.05 | (1.67) | (1.62) | (0.03) | (1.09) | (1.12) |
| Year Ended 5/31/2018 | $21.19 | 0.15(f) | 2.15 | 2.30 | — | (2.44) | (2.44) |
| Institutional 2 Class |
| Six Months Ended 11/30/2022 (Unaudited) | $23.35 | 0.15 | 0.11 | 0.26 | — | — | — |
| Year Ended 5/31/2022 | $26.89 | 0.12 | (2.15) | (2.03) | (0.07) | (1.44) | (1.51) |
| Year Ended 5/31/2021 | $16.24 | 0.08 | 11.77 | 11.85 | (0.06) | (1.14) | (1.20) |
| Year Ended 5/31/2020 | $18.58 | 0.07 | (2.33) | (2.26) | (0.08) | (0.00)(e) | (0.08) |
| Year Ended 5/31/2019 | $21.33 | 0.08 | (1.70) | (1.62) | (0.04) | (1.09) | (1.13) |
| Year Ended 5/31/2018 | $21.43 | 0.17(f) | 2.17 | 2.34 | — | (2.44) | (2.44) |
The accompanying Notes to Financial Statements are an integral part of this statement.
| 16 | Columbia Select Small Cap Value Fund | Semiannual Report 2022 |
Financial Highlights (continued)
| | Net
asset
value,
end of
period | Total
return | Total gross
expense
ratio to
average
net assets(a) | Total net
expense
ratio to
average
net assets(a),(b) | Net investment
income (loss)
ratio to
average
net assets | Portfolio
turnover | Net
assets,
end of
period
(000’s) |
| Class A |
| Six Months Ended 11/30/2022 (Unaudited) | $19.65 | 0.92% | 1.31%(c) | 1.28%(c),(d) | 1.07%(c) | 3% | $343,945 |
| Year Ended 5/31/2022 | $19.47 | (8.35%) | 1.28% | 1.26%(d) | 0.12% | 7% | $356,657 |
| Year Ended 5/31/2021 | $22.67 | 74.66% | 1.32% | 1.28%(d) | 0.08% | 30% | $420,471 |
| Year Ended 5/31/2020 | $13.83 | (12.52%) | 1.31% | 1.31%(d) | 0.07% | 17% | $281,259 |
| Year Ended 5/31/2019 | $15.83 | (7.80%) | 1.30% | 1.30%(d) | 0.08% | 17% | $379,113 |
| Year Ended 5/31/2018 | $18.40 | 10.88% | 1.29% | 1.29%(d) | 0.42% | 20% | $459,420 |
| Advisor Class |
| Six Months Ended 11/30/2022 (Unaudited) | $23.65 | 1.07% | 1.06%(c) | 1.03%(c),(d) | 1.32%(c) | 3% | $3,742 |
| Year Ended 5/31/2022 | $23.40 | (8.13%) | 1.03% | 1.01%(d) | 0.37% | 7% | $3,430 |
| Year Ended 5/31/2021 | $26.94 | 75.04% | 1.07% | 1.03%(d) | 0.33% | 30% | $4,169 |
| Year Ended 5/31/2020 | $16.27 | (12.32%) | 1.06% | 1.06%(d) | 0.33% | 17% | $2,898 |
| Year Ended 5/31/2019 | $18.62 | (7.50%) | 1.04% | 1.04%(d) | 0.26% | 17% | $3,219 |
| Year Ended 5/31/2018 | $21.38 | 11.14% | 1.04% | 1.04%(d) | 0.78% | 20% | $5,519 |
| Class C |
| Six Months Ended 11/30/2022 (Unaudited) | $12.56 | 0.64% | 2.06%(c) | 2.03%(c),(d) | 0.33%(c) | 3% | $3,526 |
| Year Ended 5/31/2022 | $12.48 | (9.08%) | 2.03% | 2.01%(d) | (0.62%) | 7% | $3,951 |
| Year Ended 5/31/2021 | $15.15 | 73.36% | 2.07% | 2.03%(d) | (0.66%) | 30% | $4,971 |
| Year Ended 5/31/2020 | $9.59 | (13.18%) | 2.06% | 2.06%(d) | (0.67%) | 17% | $5,402 |
| Year Ended 5/31/2019 | $11.05 | (8.46%) | 2.04% | 2.04%(d) | (0.68%) | 17% | $9,187 |
| Year Ended 5/31/2018 | $13.29 | 9.98% | 2.04% | 2.04%(d) | (0.34%) | 20% | $30,308 |
| Institutional Class |
| Six Months Ended 11/30/2022 (Unaudited) | $23.22 | 1.13% | 1.06%(c) | 1.03%(c),(d) | 1.31%(c) | 3% | $50,370 |
| Year Ended 5/31/2022 | $22.96 | (8.15%) | 1.03% | 1.01%(d) | 0.37% | 7% | $49,338 |
| Year Ended 5/31/2021 | $26.47 | 75.06% | 1.07% | 1.02%(d) | 0.33% | 30% | $44,918 |
| Year Ended 5/31/2020 | $16.00 | (12.31%) | 1.06% | 1.06%(d) | 0.32% | 17% | $29,670 |
| Year Ended 5/31/2019 | $18.31 | (7.53%) | 1.04% | 1.04%(d) | 0.25% | 17% | $73,967 |
| Year Ended 5/31/2018 | $21.05 | 11.15% | 1.04% | 1.04%(d) | 0.71% | 20% | $127,825 |
| Institutional 2 Class |
| Six Months Ended 11/30/2022 (Unaudited) | $23.61 | 1.11% | 0.99%(c) | 0.97%(c) | 1.30%(c) | 3% | $4,771 |
| Year Ended 5/31/2022 | $23.35 | (8.10%) | 0.97% | 0.95% | 0.46% | 7% | $2,729 |
| Year Ended 5/31/2021 | $26.89 | 75.16% | 0.99% | 0.96% | 0.39% | 30% | $4,265 |
| Year Ended 5/31/2020 | $16.24 | (12.24%) | 0.98% | 0.98% | 0.36% | 17% | $2,841 |
| Year Ended 5/31/2019 | $18.58 | (7.44%) | 0.97% | 0.97% | 0.40% | 17% | $9,678 |
| Year Ended 5/31/2018 | $21.33 | 11.22% | 0.96% | 0.96% | 0.78% | 20% | $11,770 |
The accompanying Notes to Financial Statements are an integral part of this statement.
Columbia Select Small Cap Value Fund | Semiannual Report 2022
| 17 |
Financial Highlights (continued)
| | Net asset value,
beginning of
period | Net
investment
income
(loss) | Net
realized
and
unrealized
gain (loss) | Total from
investment
operations | Distributions
from net
investment
income | Distributions
from net
realized
gains | Total
distributions to
shareholders |
| Institutional 3 Class |
| Six Months Ended 11/30/2022 (Unaudited) | $24.28 | 0.17 | 0.11 | 0.28 | — | — | — |
| Year Ended 5/31/2022 | $27.90 | 0.13 | (2.23) | (2.10) | (0.08) | (1.44) | (1.52) |
| Year Ended 5/31/2021 | $16.81 | 0.10 | 12.20 | 12.30 | (0.07) | (1.14) | (1.21) |
| Year Ended 5/31/2020 | $19.23 | 0.09 | (2.42) | (2.33) | (0.09) | (0.00)(e) | (0.09) |
| Year Ended 5/31/2019 | $22.03 | 0.10 | (1.77) | (1.67) | (0.04) | (1.09) | (1.13) |
| Year Ended 5/31/2018 | $22.05 | 0.18(f) | 2.24 | 2.42 | — | (2.44) | (2.44) |
| Class R |
| Six Months Ended 11/30/2022 (Unaudited) | $17.84 | 0.07 | 0.09 | 0.16 | — | — | — |
| Year Ended 5/31/2022 | $20.94 | 0.00(e) | (1.64) | (1.64) | (0.02) | (1.44) | (1.46) |
| Year Ended 5/31/2021 | $12.83 | 0.02 | 9.23 | 9.25 | — | (1.14) | (1.14) |
| Year Ended 5/31/2020 | $14.71 | (0.03) | (1.85) | (1.88) | — | (0.00)(e) | (0.00)(e) |
| Year Ended 5/31/2019 | $17.20 | (0.03) | (1.37) | (1.40) | — | (1.09) | (1.09) |
| Year Ended 5/31/2018 | $17.81 | 0.04(f) | 1.79 | 1.83 | — | (2.44) | (2.44) |
| Notes to Financial Highlights |
| (a) | In addition to the fees and expenses that the Fund bears directly, the Fund indirectly bears a pro rata share of the fees and expenses of any other funds in which it invests. Such indirect expenses are not included in the Fund’s reported expense ratios. |
| (b) | Total net expenses include the impact of certain fee waivers/expense reimbursements made by the Investment Manager and certain of its affiliates, if applicable. |
| (c) | Annualized. |
| (d) | The benefits derived from expense reductions had an impact of less than 0.01%. |
| (e) | Rounds to zero. |
| (f) | Net investment income per share includes special dividends. The per share effect of these dividends amounted to: |
| Year Ended | Class A | Advisor
Class | Class C | Institutional
Class | Institutional 2
Class | Institutional 3
Class | Class R |
| 05/31/2018 | $0.22 | $0.28 | $0.16 | $0.26 | $0.26 | $0.26 | $0.22 |
The accompanying Notes to Financial Statements are an integral part of this statement.
| 18 | Columbia Select Small Cap Value Fund | Semiannual Report 2022 |
Financial Highlights (continued)
| | Net
asset
value,
end of
period | Total
return | Total gross
expense
ratio to
average
net assets(a) | Total net
expense
ratio to
average
net assets(a),(b) | Net investment
income (loss)
ratio to
average
net assets | Portfolio
turnover | Net
assets,
end of
period
(000’s) |
| Institutional 3 Class |
| Six Months Ended 11/30/2022 (Unaudited) | $24.56 | 1.15% | 0.93%(c) | 0.91%(c) | 1.44%(c) | 3% | $97,269 |
| Year Ended 5/31/2022 | $24.28 | (8.05%) | 0.92% | 0.90% | 0.48% | 7% | $106,349 |
| Year Ended 5/31/2021 | $27.90 | 75.30% | 0.94% | 0.89% | 0.44% | 30% | $118,636 |
| Year Ended 5/31/2020 | $16.81 | (12.20%) | 0.93% | 0.93% | 0.46% | 17% | $11,355 |
| Year Ended 5/31/2019 | $19.23 | (7.41%) | 0.92% | 0.92% | 0.47% | 17% | $13,299 |
| Year Ended 5/31/2018 | $22.03 | 11.27% | 0.91% | 0.91% | 0.79% | 20% | $15,117 |
| Class R |
| Six Months Ended 11/30/2022 (Unaudited) | $18.00 | 0.90% | 1.54%(c) | 1.51%(c),(d) | 0.87%(c) | 3% | $1,802 |
| Year Ended 5/31/2022 | $17.84 | (8.52%) | 1.39% | 1.38%(d) | 0.02% | 7% | $2,388 |
| Year Ended 5/31/2021 | $20.94 | 74.76% | 1.26% | 1.22%(d) | 0.12% | 30% | $3,604 |
| Year Ended 5/31/2020 | $12.83 | (12.76%) | 1.56% | 1.56%(d) | (0.19%) | 17% | $2,579 |
| Year Ended 5/31/2019 | $14.71 | (7.97%) | 1.54% | 1.54%(d) | (0.21%) | 17% | $5,720 |
| Year Ended 5/31/2018 | $17.20 | 10.60% | 1.54% | 1.54%(d) | 0.23% | 20% | $9,018 |
The accompanying Notes to Financial Statements are an integral part of this statement.
Columbia Select Small Cap Value Fund | Semiannual Report 2022
| 19 |
Notes to Financial Statements
November 30, 2022 (Unaudited)
Note 1. Organization
Columbia Select Small Cap Value Fund (the Fund), a series of Columbia Funds Series Trust II (the Trust), is a diversified fund. The Trust is registered under the Investment Company Act of 1940, as amended (the 1940 Act), as an open-end management investment company organized as a Massachusetts business trust.
Fund shares
The Trust may issue an unlimited number of shares (without par value). The Fund offers each of the share classes listed in the Statement of Assets and Liabilities. Although all share classes generally have identical voting, dividend and liquidation rights, each share class votes separately when required by the Trust’s organizational documents or by law. Each share class has its own expense and sales charge structure. Different share classes may have different minimum initial investment amounts and pay different net investment income distribution amounts to the extent the expenses of distributing such share classes vary. Distributions to shareholders in a liquidation will be proportional to the net asset value of each share class.
As described in the Fund’s prospectus, Class A and Class C shares are offered to the general public for investment. Class C shares automatically convert to Class A shares after 8 years. Advisor Class, Institutional Class, Institutional 2 Class, Institutional 3 Class and Class R shares are available for purchase through authorized investment professionals to omnibus retirement plans or to institutional investors and to certain other investors as also described in the Fund’s prospectus.
Note 2. Summary of significant accounting policies
Basis of preparation
The Fund is an investment company that applies the accounting and reporting guidance in the Financial Accounting Standards Board (FASB) Accounting Standards Codification Topic 946, Financial Services - Investment Companies (ASC 946). The financial statements are prepared in accordance with U.S. generally accepted accounting principles (GAAP), which requires management to make certain estimates and assumptions that affect the reported amounts of assets and liabilities, the disclosure of contingent assets and liabilities at the date of the financial statements and the reported amounts of income and expenses during the reporting period. Actual results could differ from those estimates.
The following is a summary of significant accounting policies followed by the Fund in the preparation of its financial statements.
Security valuation
Equity securities listed on an exchange are valued at the closing price or last trade price on their primary exchange at the close of business of the New York Stock Exchange. Securities with a closing price not readily available or not listed on any exchange are valued at the mean between the closing bid and ask prices. Listed preferred stocks convertible into common stocks are valued using an evaluated price from a pricing service.
Foreign equity securities are valued based on the closing price or last trade price on their primary exchange at the close of business of the New York Stock Exchange. If any foreign equity security closing prices are not readily available, the securities are valued at the mean of the latest quoted bid and ask prices on such exchanges or markets. Foreign currency exchange rates are determined at the scheduled closing time of the New York Stock Exchange. Many securities markets and exchanges outside the U.S. close prior to the close of the New York Stock Exchange; therefore, the closing prices for securities in such markets or on such exchanges may not fully reflect events that occur after such close but before the close of the New York Stock Exchange. In those situations, foreign securities will be fair valued pursuant to a policy approved by the Board of Trustees. Under the policy, the Fund may utilize a third-party pricing service to determine these fair values. The third-party pricing service takes into account multiple factors, including, but not limited to, movements in the U.S. securities markets, certain depositary receipts, futures contracts and foreign exchange rates that have occurred subsequent to the close of the foreign exchange or market, to determine a good faith estimate that reasonably reflects the current market conditions as of the close of the New York Stock Exchange. The fair value of a security is likely to be different from the quoted or published price, if available.
Investments in open-end investment companies (other than exchange-traded funds (ETFs)), are valued at the latest net asset value reported by those companies as of the valuation time.
| 20 | Columbia Select Small Cap Value Fund | Semiannual Report 2022 |
Notes to Financial Statements (continued)
November 30, 2022 (Unaudited)
Investments for which market quotations are not readily available, or that have quotations which management believes are not reflective of market value or reliable, are valued at fair value as determined in good faith under procedures approved by the Board of Trustees. If a security or class of securities (such as foreign securities) is valued at fair value, such value is likely to be different from the quoted or published price for the security, if available.
The determination of fair value often requires significant judgment. To determine fair value, management may use assumptions including but not limited to future cash flows and estimated risk premiums. Multiple inputs from various sources may be used to determine fair value.
GAAP requires disclosure regarding the inputs and valuation techniques used to measure fair value and any changes in valuation inputs or techniques. In addition, investments shall be disclosed by major category. This information is disclosed following the Fund’s Portfolio of Investments.
Security transactions
Security transactions are accounted for on the trade date. Cost is determined and gains (losses) are based upon the specific identification method for both financial statement and federal income tax purposes.
Income recognition
Corporate actions and dividend income are generally recorded net of any non-reclaimable tax withholdings, on the ex-dividend date or upon receipt of an ex-dividend notification in the case of certain foreign securities.
The Fund may receive distributions from holdings in equity securities, business development companies (BDCs), exchange-traded funds (ETFs), limited partnerships (LPs), other regulated investment companies (RICs), and real estate investment trusts (REITs), which report information as to the tax character of their distributions annually. These distributions are allocated to dividend income, capital gain and return of capital based on actual information reported. Return of capital is recorded as a reduction of the cost basis of securities held. If the Fund no longer owns the applicable securities, return of capital is recorded as a realized gain. With respect to REITs, to the extent actual information has not yet been reported, estimates for return of capital are made by Columbia Management Investment Advisers, LLC (the Investment Manager), a wholly-owned subsidiary of Ameriprise Financial, Inc. (Ameriprise Financial). The Investment Manager’s estimates are subsequently adjusted when the actual character of the distributions is disclosed by the REITs, which could result in a proportionate change in return of capital to shareholders.
Awards from class action litigation are recorded as a reduction of cost basis if the Fund still owns the applicable securities on the payment date. If the Fund no longer owns the applicable securities on the payment date, the proceeds are recorded as realized gains.
Expenses
General expenses of the Trust are allocated to the Fund and other funds of the Trust based upon relative net assets or other expense allocation methodologies determined by the nature of the expense. Expenses directly attributable to the Fund are charged to the Fund. Expenses directly attributable to a specific class of shares are charged to that share class.
Determination of class net asset value
All income, expenses (other than class-specific expenses, which are charged to that share class, as shown in the Statement of Operations) and realized and unrealized gains (losses) are allocated to each class of the Fund on a daily basis, based on the relative net assets of each class, for purposes of determining the net asset value of each class.
Federal income tax status
The Fund intends to qualify each year as a regulated investment company under Subchapter M of the Internal Revenue Code, as amended, and will distribute substantially all of its investment company taxable income and net capital gain, if any, for its tax year, and as such will not be subject to federal income taxes. In addition, the Fund intends to distribute in each calendar year substantially all of its ordinary income, capital gain net income and certain other amounts, if any, such that the Fund should not be subject to federal excise tax. Therefore, no federal income or excise tax provision is recorded.
Columbia Select Small Cap Value Fund | Semiannual Report 2022
| 21 |
Notes to Financial Statements (continued)
November 30, 2022 (Unaudited)
Foreign taxes
The Fund may be subject to foreign taxes on income, gains on investments or currency repatriation, a portion of which may be recoverable. The Fund will accrue such taxes and recoveries, as applicable, based upon its current interpretation of tax rules and regulations that exist in the markets in which it invests.
Realized gains in certain countries may be subject to foreign taxes at the Fund level, based on statutory rates. The Fund accrues for such foreign taxes on realized and unrealized gains at the appropriate rate for each jurisdiction, as applicable. The amount, if any, is disclosed as a liability in the Statement of Assets and Liabilities.
Distributions to shareholders
Distributions from net investment income, if any, are declared and paid annually. Net realized capital gains, if any, are distributed at least annually. Income distributions and capital gain distributions are determined in accordance with federal income tax regulations, which may differ from GAAP.
Guarantees and indemnifications
Under the Trust’s organizational documents and, in some cases, by contract, its officers and trustees are indemnified against certain liabilities arising out of the performance of their duties to the Trust or its funds. In addition, certain of the Fund’s contracts with its service providers contain general indemnification clauses. The Fund’s maximum exposure under these arrangements is unknown since the amount of any future claims that may be made against the Fund cannot be determined, and the Fund has no historical basis for predicting the likelihood of any such claims.
Recent accounting pronouncement
Tailored Shareholder Reports
In October 2022, the Securities and Exchange Commission (SEC) adopted a final rule relating to Tailored Shareholder Reports for Mutual Funds and Exchange-Traded Funds (ETFs); Fee Information in Investment Company Advertisements. The rule and form amendments will require mutual funds and ETFs to transmit concise and visually engaging shareholder reports that highlight key information. The amendments will require that funds tag information in a structured data format. The rule amendments will require that certain more in-depth information be made available online and available for delivery free of charge to investors on request. The amendments will become effective January 24, 2023. There is an 18-month transition period after the effective date of the amendment.
Note 3. Fees and other transactions with affiliates
Management services fees
The Fund has entered into a Management Agreement with Columbia Management Investment Advisers, LLC (the Investment Manager), a wholly-owned subsidiary of Ameriprise Financial, Inc. (Ameriprise Financial). Under the Management Agreement, the Investment Manager provides the Fund with investment research and advice, as well as administrative and accounting services. The management services fee is an annual fee that is equal to a percentage of the Fund’s daily net assets that declines from 0.87% to 0.75% as the Fund’s net assets increase. The annualized effective management services fee rate for the six months ended November 30, 2022 was 0.87% of the Fund’s average daily net assets.
Compensation of board members
Members of the Board of Trustees who are not officers or employees of the Investment Manager or Ameriprise Financial are compensated for their services to the Fund as disclosed in the Statement of Operations. Under a Deferred Compensation Plan (the Deferred Plan), these members of the Board of Trustees may elect to defer payment of up to 100% of their compensation. Deferred amounts are treated as though equivalent dollar amounts had been invested in shares of certain funds managed by the Investment Manager. The Fund’s liability for these amounts is adjusted for market value changes and remains in the Fund until distributed in accordance with the Deferred Plan. All amounts payable under the Deferred Plan constitute a general unsecured obligation of the Fund. The expense for the Deferred Plan, which includes Trustees’ fees deferred during the current period as well as any gains or losses on the Trustees’ deferred compensation balances as a result of market fluctuations, is included in "Compensation of board members" in the Statement of Operations.
| 22 | Columbia Select Small Cap Value Fund | Semiannual Report 2022 |
Notes to Financial Statements (continued)
November 30, 2022 (Unaudited)
Compensation of Chief Compliance Officer
The Board of Trustees has appointed a Chief Compliance Officer for the Fund in accordance with federal securities regulations. As disclosed in the Statement of Operations, a portion of the Chief Compliance Officer’s total compensation is allocated to the Fund, along with other allocations to affiliated registered investment companies managed by the Investment Manager and its affiliates, based on relative net assets.
Transfer agency fees
Under a Transfer and Dividend Disbursing Agent Agreement, Columbia Management Investment Services Corp. (the Transfer Agent), an affiliate of the Investment Manager and a wholly-owned subsidiary of Ameriprise Financial, is responsible for providing transfer agency services to the Fund. The Transfer Agent has contracted with SS&C GIDS, Inc. (SS&C GIDS) to serve as sub-transfer agent. Prior to January 1, 2023, SS&C GIDS was known as DST Asset Manager Solutions, Inc. The Transfer Agent pays the fees of SS&C GIDS for services as sub-transfer agent and SS&C GIDS is not entitled to reimbursement for such fees from the Fund (with the exception of out-of-pocket fees).
The Fund pays the Transfer Agent a monthly transfer agency fee based on the number or the average value of accounts, depending on the type of account. In addition, the Fund pays the Transfer Agent a fee for shareholder services based on the number of accounts or on a percentage of the average aggregate value of the Fund’s shares maintained in omnibus accounts up to the lesser of the amount charged by the financial intermediary or a cap established by the Board of Trustees from time to time.
The Transfer Agent also receives compensation from the Fund for various shareholder services and reimbursements for certain out-of-pocket fees. Total transfer agency fees for Institutional 2 Class and Institutional 3 Class shares are subject to an annual limitation of not more than 0.07% and 0.02%, respectively, of the average daily net assets attributable to each share class.
For the six months ended November 30, 2022, the Fund’s annualized effective transfer agency fee rates as a percentage of average daily net assets of each class were as follows:
| | Effective rate (%) |
| Class A | 0.13 |
| Advisor Class | 0.13 |
| Class C | 0.13 |
| Institutional Class | 0.13 |
| Institutional 2 Class | 0.06 |
| Institutional 3 Class | 0.01 |
| Class R | 0.13 |
An annual minimum account balance fee of $20 may apply to certain accounts with a value below the applicable share class’s initial minimum investment requirements to reduce the impact of small accounts on transfer agency fees. These minimum account balance fees are remitted to the Fund and recorded as part of expense reductions in the Statement of Operations. For the six months ended November 30, 2022, these minimum account balance fees reduced total expenses of the Fund by $500.
Distribution and service fees
The Fund has entered into an agreement with Columbia Management Investment Distributors, Inc. (the Distributor), an affiliate of the Investment Manager and a wholly-owned subsidiary of Ameriprise Financial, for distribution and shareholder services. Under a Plan and Agreement of Distribution, the Fund pays a fee at the maximum annual rates of up to 0.25%, 1.00% and 0.50% of the Fund’s average daily net assets attributable to Class A, Class C and Class R shares, respectively. For Class C shares, of the 1.00% fee, up to 0.75% can be reimbursed for distribution expenses and up to an additional 0.25% can be reimbursed for shareholder servicing expenses. For Class R shares, of the 0.50% fee, up to 0.25% can be reimbursed for shareholder servicing expenses.
Columbia Select Small Cap Value Fund | Semiannual Report 2022
| 23 |
Notes to Financial Statements (continued)
November 30, 2022 (Unaudited)
The amount of distribution and shareholder services expenses incurred by the Distributor and not yet reimbursed (unreimbursed expense) was approximately $2,118,000 for Class C shares. This amount is based on the most recent information available as of September 30, 2022, and may be recovered from future payments under the distribution plan or contingent deferred sales charges (CDSCs). To the extent the unreimbursed expense has been fully recovered, the distribution and/or shareholder services fee is reduced. For Class R shares, the Fund currently pays the distribution fees up to the point where the Distributor’s expenses are fully recovered.
Sales charges
Sales charges, including front-end charges and CDSCs, received by the Distributor for distributing Fund shares for the six months ended November 30, 2022, if any, are listed below:
| | Front End (%) | CDSC (%) | Amount ($) |
| Class A | 5.75 | 0.50 - 1.00(a) | 26,426 |
| Class C | — | 1.00(b) | 141 |
| (a) | This charge is imposed on certain investments of between $1 million and $50 million redeemed within 18 months after purchase, as follows: 1.00% if redeemed within 12 months after purchase, and 0.50% if redeemed more than 12, but less than 18, months after purchase, with certain limited exceptions. |
| (b) | This charge applies to redemptions within 12 months after purchase, with certain limited exceptions. |
The Fund’s other share classes are not subject to sales charges.
Expenses waived/reimbursed by the Investment Manager and its affiliates
The Investment Manager and certain of its affiliates have contractually agreed to waive fees and/or reimburse expenses (excluding certain fees and expenses described below) for the period(s) disclosed below, unless sooner terminated at the sole discretion of the Board of Trustees, so that the Fund’s net operating expenses, after giving effect to fees waived/expenses reimbursed and any balance credits and/or overdraft charges from the Fund’s custodian, do not exceed the following annual rate(s) as a percentage of the classes’ average daily net assets:
| | October 1, 2022
through
September 30, 2023 | Prior to
October 1, 2022 |
| Class A | 1.28% | 1.28% |
| Advisor Class | 1.03 | 1.03 |
| Class C | 2.03 | 2.03 |
| Institutional Class | 1.03 | 1.03 |
| Institutional 2 Class | 0.96 | 0.97 |
| Institutional 3 Class | 0.91 | 0.92 |
| Class R | 1.53 | 1.53 |
Under the agreement governing these fee waivers and/or expense reimbursement arrangements, the following fees and expenses are excluded from the waiver/reimbursement commitment, and therefore will be paid by the Fund, if applicable: taxes (including foreign transaction taxes), expenses associated with investments in affiliated and non-affiliated pooled investment vehicles (including mutual funds and exchange-traded funds), transaction costs and brokerage commissions, costs related to any securities lending program, dividend expenses associated with securities sold short, inverse floater program fees and expenses, transaction charges and interest on borrowed money, interest, costs associated with shareholder meetings, infrequent and/or unusual expenses and any other expenses the exclusion of which is specifically approved by the Board of Trustees. This agreement may be modified or amended only with approval from the Investment Manager, certain of its affiliates and the Fund. Any fees waived and/or expenses reimbursed under the expense reimbursement arrangements described above are not recoverable by the Investment Manager or its affiliates in future periods.
Note 4. Federal tax information
The timing and character of income and capital gain distributions are determined in accordance with income tax regulations, which may differ from GAAP because of temporary or permanent book to tax differences.
| 24 | Columbia Select Small Cap Value Fund | Semiannual Report 2022 |
Notes to Financial Statements (continued)
November 30, 2022 (Unaudited)
At November 30, 2022, the approximate cost of all investments for federal income tax purposes and the aggregate gross approximate unrealized appreciation and depreciation based on that cost was:
Federal
tax cost ($) | Gross unrealized
appreciation ($) | Gross unrealized
(depreciation) ($) | Net unrealized
appreciation ($) |
| 356,563,000 | 182,197,000 | (33,100,000) | 149,097,000 |
Tax cost of investments and unrealized appreciation/(depreciation) may also include timing differences that do not constitute adjustments to tax basis.
Under current tax rules, regulated investment companies can elect to treat certain late-year ordinary losses incurred and post-October capital losses (capital losses realized after October 31) as arising on the first day of the following taxable year. The Fund will elect to treat the following late-year ordinary losses and post-October capital losses at May 31, 2022 as arising on June 1, 2022.
Late year
ordinary losses ($) | Post-October
capital losses ($) |
| — | 513,446 |
Management of the Fund has concluded that there are no significant uncertain tax positions in the Fund that would require recognition in the financial statements. However, management’s conclusion may be subject to review and adjustment at a later date based on factors including, but not limited to, new tax laws, regulations, and administrative interpretations (including relevant court decisions). Generally, the Fund’s federal tax returns for the prior three fiscal years remain subject to examination by the Internal Revenue Service.
Note 5. Portfolio information
The cost of purchases and proceeds from sales of securities, excluding short-term investments and derivatives, if any, aggregated to $15,671,048 and $36,764,539, respectively, for the six months ended November 30, 2022. The amount of purchase and sale activity impacts the portfolio turnover rate reported in the Financial Highlights.
Note 6. Affiliated money market fund
The Fund invests in Columbia Short-Term Cash Fund, an affiliated money market fund established for the exclusive use by the Fund and other affiliated funds (the Affiliated MMF). The income earned by the Fund from such investments is included as Dividends - affiliated issuers in the Statement of Operations. As an investing fund, the Fund indirectly bears its proportionate share of the expenses of the Affiliated MMF. The Affiliated MMF prices its shares with a floating net asset value. In addition, the Board of Trustees of the Affiliated MMF may impose a fee on redemptions (sometimes referred to as a liquidity fee) or temporarily suspend redemptions (sometimes referred to as imposing a redemption gate) in the event its liquidity falls below regulatory limits.
Note 7. Interfund lending
Pursuant to an exemptive order granted by the Securities and Exchange Commission, the Fund participates in a program (the Interfund Program) allowing each participating Columbia Fund (each, a Participating Fund) to lend money directly to and, except for closed-end funds and money market funds, borrow money directly from other Participating Funds for temporary purposes. The amounts eligible for borrowing and lending under the Interfund Program are subject to certain restrictions.
Interfund loans are subject to the risk that the borrowing fund could be unable to repay the loan when due, and a delay in repayment to the lending fund could result in lost opportunities and/or additional lending costs. The exemptive order is subject to conditions intended to mitigate conflicts of interest arising from the Investment Manager’s relationship with each Participating Fund.
The Fund did not borrow or lend money under the Interfund Program during the six months ended November 30, 2022.
Columbia Select Small Cap Value Fund | Semiannual Report 2022
| 25 |
Notes to Financial Statements (continued)
November 30, 2022 (Unaudited)
Note 8. Line of credit
The Fund has access to a revolving credit facility with a syndicate of banks led by JPMorgan Chase Bank, N.A., Citibank, N.A. and Wells Fargo Bank, N.A. whereby the Fund may borrow for the temporary funding of shareholder redemptions or for other temporary or emergency purposes. Pursuant to an October 27, 2022 amendment and restatement, the credit facility, which is an agreement between the Fund and certain other funds managed by the Investment Manager or an affiliated investment manager, severally and not jointly, permits aggregate borrowings up to $950 million. Interest is currently charged to each participating fund based on its borrowings at a rate equal to the higher of (i) the federal funds effective rate, (ii) the secured overnight financing rate plus 0.10% and (iii) the overnight bank funding rate, plus in each case, 1.00%. Each borrowing under the credit facility matures no later than 60 days after the date of borrowing. The Fund also pays a commitment fee equal to its pro rata share of the unused amount of the credit facility at a rate of 0.15% per annum. The commitment fee is included in other expenses in the Statement of Operations. This agreement expires annually in October unless extended or renewed. Prior to the October 27, 2022 amendment and restatement, the Fund had access to a revolving credit facility with a syndicate of banks led by JPMorgan Chase Bank, N.A., Citibank, N.A. and Wells Fargo Bank, N.A. which permitted collective borrowings up to $950 million. Interest was charged to each participating fund based on its borrowings at a rate equal to the higher of (i) the federal funds effective rate, (ii) the secured overnight financing rate plus 0.11448% and (iii) the overnight bank funding rate, plus in each case, 1.00%.
The Fund had no borrowings during the six months ended November 30, 2022.
Note 9. Significant risks
Financial sector risk
The Fund is more susceptible to the particular risks that may affect companies in the financial services sector than if it were invested in a wider variety of companies in unrelated sectors. Companies in the financial services sector are subject to certain risks, including the risk of regulatory change, decreased liquidity in credit markets and unstable interest rates. Such companies may have concentrated portfolios, such as a high level of loans to one or more industries or sectors, which makes them vulnerable to economic conditions that affect such industries or sectors. Performance of such companies may be affected by competitive pressures and exposure to investments, agreements and counterparties, including credit products that, under certain circumstances, may lead to losses (e.g., subprime loans). Companies in the financial services sector are subject to extensive governmental regulation that may limit the amount and types of loans and other financial commitments they can make, and interest rates and fees that they may charge. In addition, profitability of such companies is largely dependent upon the availability and the cost of capital.
Market risk
The Fund may incur losses due to declines in the value of one or more securities in which it invests. These declines may be due to factors affecting a particular issuer, or the result of, among other things, political, regulatory, market, economic or social developments affecting the relevant market(s) more generally. In addition, turbulence in financial markets and reduced liquidity in equity, credit and/or fixed income markets may negatively affect many issuers, which could adversely affect the Fund’s ability to price or value hard-to-value assets in thinly traded and closed markets and could cause significant redemptions and operational challenges. Global economies and financial markets are increasingly interconnected, and conditions and events in one country, region or financial market may adversely impact issuers in a different country, region or financial market. These risks may be magnified if certain events or developments adversely interrupt the global supply chain; in these and other circumstances, such risks might affect companies worldwide. As a result, local, regional or global events such as terrorism, war, natural disasters, disease/virus outbreaks and epidemics or other public health issues, recessions, depressions or other events – or the potential for such events – could have a significant negative impact on global economic and market conditions.
The large-scale invasion of Ukraine by Russia in February 2022 has resulted in sanctions and market disruptions, including declines in regional and global stock markets, unusual volatility in global commodity markets and significant devaluations of Russian currency. The extent and duration of the military action are impossible to predict but could be significant. Market disruption caused by the Russian military action, and any counter-measures or responses thereto (including international sanctions, a downgrade in the country’s credit rating, purchasing and financing restrictions, boycotts, tariffs, changes in
| 26 | Columbia Select Small Cap Value Fund | Semiannual Report 2022 |
Notes to Financial Statements (continued)
November 30, 2022 (Unaudited)
consumer or purchaser preferences, cyberattacks and espionage) could have severe adverse impacts on regional and/or global securities and commodities markets, including markets for oil and natural gas. These impacts may include reduced market liquidity, distress in credit markets, further disruption of global supply chains, increased risk of inflation, and limited access to investments in certain international markets and/or issuers. These developments and other related events could negatively impact Fund performance.
The pandemic caused by coronavirus disease 2019 and its variants (COVID-19) has resulted in, and may continue to result in, significant global economic and societal disruption and market volatility due to disruptions in market access, resource availability, facilities operations, imposition of tariffs, export controls and supply chain disruption, among others. Such disruptions may be caused, or exacerbated by, quarantines and travel restrictions, workforce displacement and loss in human and other resources. The uncertainty surrounding the magnitude, duration, reach, costs and effects of the global pandemic, as well as actions that have been or could be taken by governmental authorities or other third parties, present unknowns that are yet to unfold. The impacts, as well as the uncertainty over impacts to come, of COVID-19 – and any other infectious illness outbreaks, epidemics and pandemics that may arise in the future – could negatively affect global economies and markets in ways that cannot necessarily be foreseen. In addition, the impact of infectious illness outbreaks and epidemics in emerging market countries may be greater due to generally less established healthcare systems, governments and financial markets. Public health crises caused by the COVID-19 outbreak may exacerbate other pre-existing political, social and economic risks in certain countries or globally. The disruptions caused by COVID-19 could prevent the Fund from executing advantageous investment decisions in a timely manner and negatively impact the Fund’s ability to achieve its investment objective. Any such events could have a significant adverse impact on the value and risk profile of the Fund.
Shareholder concentration risk
At November 30, 2022, affiliated shareholders of record owned 73.3% of the outstanding shares of the Fund in one or more accounts. Subscription and redemption activity by concentrated accounts may have a significant effect on the operations of the Fund. In the case of a large redemption, the Fund may be forced to sell investments at inopportune times, including its liquid positions, which may result in Fund losses and the Fund holding a higher percentage of less liquid positions. Large redemptions could result in decreased economies of scale and increased operating expenses for non-redeeming Fund shareholders.
Small- and mid-cap company risk
Investments in small- and mid-capitalization companies (small- and mid-cap companies) often involve greater risks than investments in larger, more established companies (larger companies) because small- and mid-cap companies tend to have less predictable earnings and may lack the management experience, financial resources, product diversification and competitive strengths of larger companies. Securities of small- and mid-cap companies may be less liquid and more volatile than the securities of larger companies.
Note 10. Subsequent events
Management has evaluated the events and transactions that have occurred through the date the financial statements were issued and noted no items requiring adjustment of the financial statements or additional disclosure.
Note 11. Information regarding pending and settled legal proceedings
Ameriprise Financial and certain of its affiliates are involved in the normal course of business in legal proceedings which include regulatory inquiries, arbitration and litigation, including class actions concerning matters arising in connection with the conduct of its activities as a diversified financial services firm. Ameriprise Financial believes that the Fund is not currently the subject of, and that neither Ameriprise Financial nor any of its affiliates are the subject of, any pending legal, arbitration or regulatory proceedings that are likely to have a material adverse effect on the Fund or the ability of Ameriprise Financial or its affiliates to perform under their contracts with the Fund. Ameriprise Financial is required to make quarterly (10-Q), annual (10-K) and, as necessary, 8-K filings with the Securities and Exchange Commission (SEC) on legal and regulatory matters that relate to Ameriprise Financial and its affiliates. Copies of these filings may be obtained by accessing the SEC website at www.sec.gov.
Columbia Select Small Cap Value Fund | Semiannual Report 2022
| 27 |
Notes to Financial Statements (continued)
November 30, 2022 (Unaudited)
There can be no assurance that these matters, or the adverse publicity associated with them, will not result in increased Fund redemptions, reduced sale of Fund shares or other adverse consequences to the Fund. Further, although we believe proceedings are not likely to have a material adverse effect on the Fund or the ability of Ameriprise Financial or its affiliates to perform under their contracts with the Fund, these proceedings are subject to uncertainties and, as such, we are unable to estimate the possible loss or range of loss that may result. An adverse outcome in one or more of these proceedings could result in adverse judgments, settlements, fines, penalties or other relief that could have a material adverse effect on the consolidated financial condition or results of operations of Ameriprise Financial or one or more of its affiliates that provides services to the Fund.
| 28 | Columbia Select Small Cap Value Fund | Semiannual Report 2022 |
Approval of Management Agreement
(Unaudited)
Columbia Management Investment Advisers, LLC (the Investment Manager, and together with its domestic and global affiliates, Columbia Threadneedle Investments), a wholly-owned subsidiary of Ameriprise Financial, Inc. (Ameriprise Financial), serves as the investment manager to Columbia Select Small Cap Value Fund (the Fund). Under a management agreement (the Management Agreement), the Investment Manager provides investment advice and other services to the Fund and other funds distributed by Columbia Management Investment Distributors, Inc. (collectively, the Funds).
On an annual basis, the Fund’s Board of Trustees (the Board), including the independent Board members (the Independent Trustees), considers renewal of the Management Agreement. The Investment Manager prepared detailed reports for the Board and its Contracts Committee (including its Contracts Subcommittee) in November 2021 and March, April and June 2022, including reports providing the results of analyses performed by an independent third-party data provider, Broadridge Financial Solutions, Inc. (Broadridge), and comprehensive responses to written requests for information by independent legal counsels to the Independent Trustees (Independent Legal Counsel) to the Investment Manager, to assist the Board in making this determination. In addition, throughout the year, the Board (or its committees or subcommittees) regularly meets with portfolio management teams and senior management personnel and reviews information prepared by the Investment Manager addressing the services the Investment Manager provides and Fund performance. The Board also accords appropriate weight to the work, deliberations and conclusions of the various committees, such as the Contracts Committee, the Investment Review Committee, the Audit Committee and the Compliance Committee in determining whether to continue the Management Agreement.
The Board, at its June 23, 2022 Board meeting (the June Meeting), considered the renewal of the Management Agreement for an additional one-year term. At the June Meeting, Independent Legal Counsel reviewed with the Independent Trustees various factors relevant to the Board’s consideration of advisory agreements and the Board’s legal responsibilities related to such consideration. The Independent Trustees considered all information that they, their legal counsel or the Investment Manager believed reasonably necessary to evaluate and to approve the continuation of the Management Agreement. Among other things, the information and factors considered included the following:
| • | Information on the investment performance of the Fund relative to the performance of a group of mutual funds determined to be comparable to the Fund by Broadridge, as well as performance relative to benchmarks; |
| • | Information on the Fund’s management fees and total expenses, including information comparing the Fund’s expenses to those of a group of comparable mutual funds, as determined by Broadridge; |
| • | The Investment Manager’s agreement to contractually limit or cap total operating expenses for the Fund so that total operating expenses (excluding certain fees and expenses, such as transaction costs and certain other investment related expenses, interest, taxes, acquired fund fees and expenses and infrequent and/or unusual expenses) would not exceed a specified annual rate, as a percentage of the Fund’s net assets; |
| • | Terms of the Management Agreement; |
| • | Descriptions of other agreements and arrangements with affiliates of the Investment Manager relating to the operations of the Fund, including agreements with respect to the provision of transfer agency and shareholder services to the Fund; |
| • | Descriptions of various services performed by the Investment Manager under the Management Agreement, including portfolio management and portfolio trading practices; |
| • | Information regarding any recently negotiated management fees of similarly-managed portfolios of other institutional clients of the Investment Manager; |
| • | Information regarding the resources of the Investment Manager, including information regarding senior management, portfolio managers and other personnel; |
| • | Information regarding the capabilities of the Investment Manager with respect to compliance monitoring services; |
| • | The profitability to the Investment Manager and its affiliates from their relationships with the Fund; and |
| • | Report provided by the Board’s independent fee consultant, JDL Consultants, LLC (JDL). |
Columbia Select Small Cap Value Fund | Semiannual Report 2022
| 29 |
Approval of Management Agreement (continued)
(Unaudited)
Following an analysis and discussion of the foregoing, and the factors identified below, the Board, including all of the Independent Trustees, approved the renewal of the Management Agreement.
Nature, extent and quality of services provided by the Investment Manager
The Board analyzed various reports and presentations it had received detailing the services performed by the Investment Manager, as well as its history, expertise, resources and relative capabilities, and the qualifications of its personnel.
The Board specifically considered the many developments during recent years concerning the services provided by the Investment Manager. Among other things, the Board noted the organization and depth of the equity and credit research departments. The Board further observed the enhancements to the investment risk management department’s processes, systems and oversight, over the past several years, as well as planned 2022 initiatives in this regard. The Board also took into account the broad scope of services provided by the Investment Manager to the Fund, including, among other services, investment, risk and compliance oversight. The Board also took into account the information it received concerning the Investment Manager’s ability to attract and retain key portfolio management personnel and that it has sufficient resources to provide competitive and adequate compensation to investment personnel. The Board also observed that the Investment Manager has been able to effectively manage, operate and distribute the Funds through the COVID-19 pandemic period with no disruptions in services provided. The Board also considered added personnel and resources obtained by Columbia Threadneedle through Ameriprise Financial’s acquisition of BMO Financial Group’s Europe, Middle East, and Africa (EMEA) asset management business.
In connection with the Board’s evaluation of the overall package of services provided by the Investment Manager, the Board also considered the nature, quality and range of administrative services provided to the Fund by the Investment Manager, as well as the achievements in 2021 in the performance of administrative services, and noted the various enhancements anticipated for 2022. In evaluating the quality of services provided under the Management Agreement, the Board also took into account the organization and strength of the Fund’s and its service providers’ compliance programs. The Board also reviewed the financial condition of the Investment Manager and its affiliates and each entity’s ability to carry out its responsibilities under the Management Agreement and the Fund’s other service agreements.
In addition, the Board discussed the acceptability of the terms of the Management Agreement, noting that no changes were proposed from the form of agreement previously approved. The Board also noted the wide array of legal and compliance services provided to the Fund under the Management Agreement.
After reviewing these and related factors (including investment performance as discussed below), the Board concluded, within the context of their overall conclusions, that the nature, extent and quality of the services provided to the Fund under the Management Agreement supported the continuation of the Management Agreement.
Investment performance
In this connection, the Board carefully reviewed the investment performance of the Fund, including detailed reports providing the results of analyses performed by each of the Investment Manager, Broadridge and JDL collectively showing, for various periods (including since manager inception): (i) the performance of the Fund, (ii) the performance of a benchmark index, (iii) the percentage ranking of the Fund among its comparison group, (iv) the Fund’s performance relative to peers and benchmarks and (v) the net assets of the Fund. The Board observed that the Fund’s performance for certain periods ranked above median based on information provided by Broadridge.
The Board also reviewed a description of the third-party data provider’s methodology for identifying the Fund’s peer groups for purposes of performance and expense comparisons.
The Board also considered the Investment Manager’s performance and reputation generally. After reviewing these and related factors, the Board concluded, within the context of their overall conclusions, that the performance of the Fund and the Investment Manager, in light of other considerations, supported the continuation of the Management Agreement.
| 30 | Columbia Select Small Cap Value Fund | Semiannual Report 2022 |
Approval of Management Agreement (continued)
(Unaudited)
Comparative fees, costs of services provided and the profits realized by the Investment Manager and its affiliates from their relationships with the Fund
The Board reviewed comparative fees and the costs of services provided under the Management Agreement. The Board members considered detailed comparative information set forth in an annual report on fees and expenses, including, among other things, data (based on analyses conducted by Broadridge and JDL) showing a comparison of the Fund’s expenses with median expenses paid by funds in its comparative peer universe, as well as data showing the Fund’s contribution to the Investment Manager’s profitability. The Board reviewed the fees charged to comparable institutional or other accounts/vehicles managed by the Investment Manager and discussed differences in how the products are managed and operated, thus explaining many of the differences in fees.
The Board considered the reports of JDL, which assisted in the Board’s analysis of the Funds’ performance and expenses and the reasonableness of the Funds’ fee rates. The Board accorded particular weight to the notion that a primary objective of the level of fees is to achieve a rational pricing model applied consistently across the various product lines in the Fund family, while assuring that the overall fees for each Fund (with certain exceptions) are generally in line with the current "pricing philosophy" such that Fund total expense ratios, in general, approximate or are lower than the median expense ratios of funds in the same Lipper comparison universe. The Board took into account that the Fund’s total expense ratio (after considering proposed expense caps/waivers) approximated the peer universe’s median expense ratio.
After reviewing these and related factors, the Board concluded, within the context of their overall conclusions, that the levels of management fees and expenses of the Fund, in light of other considerations, supported the continuation of the Management Agreement.
The Board also considered the profitability of the Investment Manager and its affiliates in connection with the Investment Manager providing management services to the Fund. With respect to the profitability of the Investment Manager and its affiliates, the Independent Trustees referred to information discussing the profitability to the Investment Manager and Ameriprise Financial from managing, operating and distributing the Funds. The Board considered that in 2021 the Board had considered 2020 profitability and that the 2022 information showed that the profitability generated by the Investment Manager in 2021 increased from 2020 levels, due to a variety of factors, including the increased assets under management of the Funds. It also took into account the indirect economic benefits flowing to the Investment Manager or its affiliates in connection with managing or distributing the Funds, such as the enhanced ability to offer various other financial products to Ameriprise Financial customers, soft dollar benefits and overall reputational advantages. The Board noted that the fees paid by the Fund should permit the Investment Manager to offer competitive compensation to its personnel, make necessary investments in its business and earn an appropriate profit. After reviewing these and related factors, the Board concluded, within the context of their overall conclusions, that the costs of services provided and the profitability to the Investment Manager and its affiliates from their relationships with the Fund supported the continuation of the Management Agreement.
Economies of scale
The Board considered the potential existence of economies of scale in the provision by the Investment Manager of services to the Fund, to groups of related funds and to the Investment Manager as a whole, and whether those economies of scale were shared with the Fund through breakpoints in investment management fees or other means, such as expense limitation arrangements and additional investments by the Investment Manager in investment, trading, compliance and other resources. The Board considered the economies of scale that might be realized as the Fund’s net asset level grows and took note of the extent to which Fund shareholders might also benefit from such growth. In this regard, the Board took into account that management fees decline as Fund assets exceed various breakpoints, all of which have not been surpassed. The Board observed that the Management Agreement provided for breakpoints in the management fee rate schedule that allow opportunities for shareholders to realize lower fees as Fund assets grow and that there are additional opportunities through other means for sharing economies of scale with shareholders.
Conclusion
The Board reviewed all of the above considerations in reaching its decision to approve the continuation of the Management Agreement. In reaching its conclusions, no single factor was determinative.
Columbia Select Small Cap Value Fund | Semiannual Report 2022
| 31 |
Approval of Management Agreement (continued)
(Unaudited)
On June 23, 2022, the Board, including all of the Independent Trustees, determined that fees payable under the Management Agreement were fair and reasonable in light of the extent and quality of services provided and approved the renewal of the Management Agreement.
| 32 | Columbia Select Small Cap Value Fund | Semiannual Report 2022 |
[THIS PAGE INTENTIONALLY LEFT BLANK]
[THIS PAGE INTENTIONALLY LEFT BLANK]
[THIS PAGE INTENTIONALLY LEFT BLANK]
Columbia Select Small Cap Value Fund
P.O. Box 219104
Kansas City, MO 64121-9104
Please read and consider the investment objectives, risks, charges and expenses for any fund carefully before investing. For a prospectus and summary prospectus, which contains this and other important information about the Fund, go to
columbiathreadneedleus.com/investor/. The Fund is distributed by Columbia Management Investment Distributors, Inc., member FINRA, and managed by Columbia Management Investment Advisers, LLC.
Columbia Threadneedle Investments (Columbia Threadneedle) is the global brand name of the Columbia and Threadneedle group of companies. All rights reserved.
© 2023 Columbia Management Investment Advisers, LLC.
columbiathreadneedleus.com/investor/

Semiannual Report
November 30, 2022 (Unaudited)
Columbia Flexible Capital Income Fund
Not FDIC or NCUA Insured • No Financial Institution Guarantee • May Lose Value
If you elect to receive the shareholder report for Columbia Flexible Capital Income Fund (the Fund) in paper, mailed to you, the Fund mails one shareholder report to each shareholder address, unless such shareholder elects to receive shareholder reports from the Fund electronically via e-mail or by having a paper notice mailed to you (Postcard Notice) that your Fund’s shareholder report is available at the Columbia funds’ website (columbiathreadneedleus.com/investor/). If you would like more than one report in paper to be mailed to you, or would like to elect to receive reports via e-mail or access them through Postcard Notice, please call shareholder services at 800.345.6611 and additional reports will be sent to you.
Proxy voting policies and procedures
The policy of the Board of Trustees is to vote the proxies of the companies in which the Fund holds investments consistent with the procedures as stated in the Statement of Additional Information (SAI). You may obtain a copy of the SAI without charge by calling 800.345.6611; contacting your financial intermediary; visiting columbiathreadneedleus.com/investor/; or searching the website of the Securities and Exchange Commission (SEC) at sec.gov. Information regarding how the Fund voted proxies relating to portfolio securities is filed with the SEC by August 31st for the most recent 12-month period ending June 30th of that year, and is available without charge by visiting columbiathreadneedleus.com/investor/, or searching the website of the SEC at sec.gov.
Quarterly schedule of investments
The Fund files a complete schedule of portfolio holdings with the SEC for the first and third quarters of each fiscal year on Form N-PORT. The Fund’s Form N-PORT filings are available on the SEC’s website at sec.gov. The Fund’s complete schedule of portfolio holdings, as filed on Form N-PORT, is available on columbiathreadneedleus.com/investor/ or can also be obtained without charge, upon request, by calling 800.345.6611.
Additional Fund information
For more information about the Fund, please visit columbiathreadneedleus.com/investor/ or call 800.345.6611. Customer Service Representatives are available to answer your questions Monday through Friday from 8 a.m. to 7 p.m. Eastern time.
Fund investment manager
Columbia Management Investment Advisers, LLC (the Investment Manager)
290 Congress Street
Boston, MA 02210
Fund distributor
Columbia Management Investment Distributors, Inc.
290 Congress Street
Boston, MA 02210
Fund transfer agent
Columbia Management Investment Services Corp.
P.O. Box 219104
Kansas City, MO 64121-9104
Columbia Flexible Capital Income Fund | Semiannual Report 2022
Fund at a Glance
(Unaudited)
Investment objective
The Fund seeks to provide shareholders current income, with long-term capital appreciation.
Portfolio management
David King, CFA
Co-Portfolio Manager
Managed Fund since 2011
Yan Jin
Co-Portfolio Manager
Managed Fund since 2011
Grace Lee, CAIA
Co-Portfolio Manager
Managed Fund since 2020
| Average annual total returns (%) (for the period ended November 30, 2022) |
| | | Inception | 6 Months
cumulative | 1 Year | 5 Years | 10 Years |
| Class A | Excluding sales charges | 07/28/11 | -3.79 | -4.22 | 6.40 | 7.78 |
| | Including sales charges | | -9.33 | -9.73 | 5.14 | 7.15 |
| Advisor Class | 11/08/12 | -3.76 | -4.00 | 6.64 | 8.04 |
| Class C | Excluding sales charges | 07/28/11 | -4.20 | -4.94 | 5.59 | 6.97 |
| | Including sales charges | | -5.14 | -5.81 | 5.59 | 6.97 |
| Institutional Class | 07/28/11 | -3.73 | -4.04 | 6.65 | 8.05 |
| Institutional 2 Class | 11/08/12 | -3.75 | -3.98 | 6.68 | 8.09 |
| Institutional 3 Class* | 03/01/17 | -3.64 | -3.92 | 6.73 | 7.99 |
| Class R | 07/28/11 | -3.99 | -4.48 | 6.12 | 7.50 |
| Blended Benchmark | | -1.36 | -9.72 | 6.42 | 8.15 |
| Bloomberg U.S. Aggregate Bond Index | | -4.06 | -12.84 | 0.21 | 1.09 |
Returns for Class A shares are shown with and without the maximum initial sales charge of 5.75%. Returns for Class C shares are shown with and without the 1.00% contingent deferred sales charge for the first year only. The Fund’s other share classes are not subject to sales charges and have limited eligibility. Please see the Fund’s prospectus for details. Performance for different share classes will vary based on differences in sales charges and fees associated with each share class. All results shown assume reinvestment of distributions during the period. Returns do not reflect the deduction of taxes that a shareholder may pay on Fund distributions or on the redemption of Fund shares. Performance results reflect the effect of any fee waivers or reimbursements of Fund expenses by Columbia Management Investment Advisers, LLC and/or any of its affiliates. Absent these fee waivers or expense reimbursement arrangements, performance results would have been lower.
The performance information shown represents past performance and is not a guarantee of future results. The investment return and principal value of your investment will fluctuate so that your shares, when redeemed, may be worth more or less than their original cost. Current performance may be lower or higher than the performance information shown. You may obtain performance information current to the most recent month-end by contacting your financial intermediary, visiting columbiathreadneedleus.com/investor/ or calling 800.345.6611.
| * | The returns shown for periods prior to the share class inception date (including returns for the Life of the Fund, if shown, which are since Fund inception) include the returns of the Fund’s oldest share class. Since the Fund launched more than one share class at its inception, Class A shares were used. These returns are adjusted to reflect any higher class-related operating expenses of the newer share classes, as applicable. Please visit columbiathreadneedleus.com/investor/investment-products/mutual-funds/appended-performance for more information. |
The Blended Benchmark, established by the Investment Manager, is composed of one-third each of the Russell 1000 Value Index, the Bloomberg U.S. Corporate Investment Grade & High Yield Index and the Bloomberg U.S. Convertible Composite Index. The Russell 1000 Value Index measures the performance of those stocks in the Russell 1000 Index with lower price-to-book ratios and lower forecasted growth values. The Bloomberg U.S. Corporate Investment Grade & High Yield Index measures the performance of investment grade and non-investment grade, fixed-rate and taxable corporate bonds. It includes USD-denominated securities publicly issued by U.S. and non U.S. industrial, utility, and financial issuers that meet specified maturity, liquidity, and quality requirements. The Bloomberg U.S. Convertible Composite Index measures the performance of all four major classes of USD equity-linked securities including: convertible cash coupon bonds, zero-coupon bonds, preferred convertibles with fixed par amounts and mandatory equity-linked securities.
The Bloomberg U.S. Aggregate Bond Index measures the investment-grade, U.S. dollar denominated, fixed-rate taxable bond market, including Treasuries, government-related and corporate securities, mortgage-backed securities (agency fixed-rate and hybrid adjustable-rate mortgage passthroughs), asset-backed securities, and commercial mortgage-backed securities.
Indices are not available for investment, are not professionally managed and do not reflect sales charges, fees, brokerage commissions, taxes or other expenses of investing. Securities in the Fund may not match those in an index.
Columbia Flexible Capital Income Fund | Semiannual Report 2022
| 3 |
Fund at a Glance (continued)
(Unaudited)
| Portfolio breakdown (%) (at November 30, 2022) |
| Common Stocks | 47.4 |
| Convertible Bonds | 10.3 |
| Convertible Preferred Stocks | 8.2 |
| Corporate Bonds & Notes | 32.6 |
| Money Market Funds | 0.9 |
| Preferred Debt | 0.6 |
| Warrants | 0.0(a) |
| Total | 100.0 |
Percentages indicated are based upon total investments excluding investments in derivatives, if any. The Fund’s portfolio composition is subject to change.
| 4 | Columbia Flexible Capital Income Fund | Semiannual Report 2022 |
Understanding Your Fund’s Expenses
(Unaudited)
As an investor, you incur two types of costs. There are shareholder transaction costs, which generally include sales charges on purchases and may include redemption fees. There are also ongoing fund costs, which generally include management fees, distribution and/or service fees, and other fund expenses. The following information is intended to help you understand your ongoing costs (in dollars) of investing in the Fund and to help you compare these costs with the ongoing costs of investing in other mutual funds.
Analyzing your Fund’s expenses
To illustrate these ongoing costs, we have provided examples and calculated the expenses paid by investors in each share class of the Fund during the period. The actual and hypothetical information in the table is based on an initial investment of $1,000 at the beginning of the period indicated and held for the entire period. Expense information is calculated two ways and each method provides you with different information. The amount listed in the “Actual” column is calculated using the Fund’s actual operating expenses and total return for the period. You may use the Actual information, together with the amount invested, to estimate the expenses that you paid over the period. Simply divide your account value by $1,000 (for example, an $8,600 account value divided by $1,000 = 8.6), then multiply the results by the expenses paid during the period under the “Actual” column. The amount listed in the “Hypothetical” column assumes a 5% annual rate of return before expenses (which is not the Fund’s actual return) and then applies the Fund’s actual expense ratio for the period to the hypothetical return. You should not use the hypothetical account values and expenses to estimate either your actual account balance at the end of the period or the expenses you paid during the period. See “Compare with other funds” below for details on how to use the hypothetical data.
Compare with other funds
Since all mutual funds are required to include the same hypothetical calculations about expenses in shareholder reports, you can use this information to compare the ongoing cost of investing in the Fund with other funds. To do so, compare the hypothetical example with the 5% hypothetical examples that appear in the shareholder reports of other funds. As you compare hypothetical examples of other funds, it is important to note that hypothetical examples are meant to highlight the ongoing costs of investing in a fund only and do not reflect any transaction costs, such as sales charges, or redemption or exchange fees. Therefore, the hypothetical calculations are useful in comparing ongoing costs only, and will not help you determine the relative total costs of owning different funds. If transaction costs were included in these calculations, your costs would be higher.
| June 1, 2022 — November 30, 2022 |
| | Account value at the
beginning of the
period ($) | Account value at the
end of the
period ($) | Expenses paid during
the period ($) | Fund’s annualized
expense ratio (%) |
| | Actual | Hypothetical | Actual | Hypothetical | Actual | Hypothetical | Actual |
| Class A | 1,000.00 | 1,000.00 | 962.10 | 1,020.10 | 4.87 | 5.01 | 0.99 |
| Advisor Class | 1,000.00 | 1,000.00 | 962.40 | 1,021.36 | 3.64 | 3.75 | 0.74 |
| Class C | 1,000.00 | 1,000.00 | 958.00 | 1,016.34 | 8.54 | 8.80 | 1.74 |
| Institutional Class | 1,000.00 | 1,000.00 | 962.70 | 1,021.36 | 3.64 | 3.75 | 0.74 |
| Institutional 2 Class | 1,000.00 | 1,000.00 | 962.50 | 1,021.51 | 3.49 | 3.60 | 0.71 |
| Institutional 3 Class | 1,000.00 | 1,000.00 | 963.60 | 1,021.71 | 3.30 | 3.40 | 0.67 |
| Class R | 1,000.00 | 1,000.00 | 960.10 | 1,018.85 | 6.09 | 6.28 | 1.24 |
Expenses paid during the period are equal to the annualized expense ratio for each class as indicated above, multiplied by the average account value over the period and then multiplied by the number of days in the Fund’s most recent fiscal half year and divided by 365.
Expenses do not include fees and expenses incurred indirectly by the Fund from its investment in underlying funds, including affiliated and non-affiliated pooled investment vehicles, such as mutual funds and exchange-traded funds.
Columbia Flexible Capital Income Fund | Semiannual Report 2022
| 5 |
Portfolio of Investments
November 30, 2022 (Unaudited)
(Percentages represent value of investments compared to net assets)
Investments in securities
| Common Stocks 46.7% |
| Issuer | Shares | Value ($) |
| Communication Services 2.4% |
| Diversified Telecommunication Services 1.9% |
| AT&T, Inc. | 825,000 | 15,906,000 |
| Verizon Communications, Inc. | 275,000 | 10,719,500 |
| Total | | 26,625,500 |
| Media 0.5% |
| Comcast Corp., Class A | 210,000 | 7,694,400 |
| Total Communication Services | 34,319,900 |
| Consumer Discretionary 1.8% |
| Hotels, Restaurants & Leisure 0.5% |
| Darden Restaurants, Inc. | 55,000 | 8,084,450 |
| Household Durables 0.5% |
| Newell Brands, Inc. | 550,000 | 7,133,500 |
| Specialty Retail 0.8% |
| Home Depot, Inc. (The) | 35,000 | 11,339,650 |
| Total Consumer Discretionary | 26,557,600 |
| Consumer Staples 2.5% |
| Food Products 1.4% |
| Bunge Ltd. | 75,000 | 7,863,000 |
| Kraft Heinz Co. (The) | 300,000 | 11,805,000 |
| Total | | 19,668,000 |
| Tobacco 1.1% |
| Philip Morris International, Inc. | 160,000 | 15,947,200 |
| Total Consumer Staples | 35,615,200 |
| Energy 5.6% |
| Oil, Gas & Consumable Fuels 5.6% |
| Chesapeake Energy Corp. | 70,000 | 7,245,000 |
| Chevron Corp. | 80,000 | 14,664,800 |
| Devon Energy Corp. | 120,000 | 8,222,400 |
| Enviva, Inc. | 110,000 | 6,242,500 |
| EOG Resources, Inc. | 110,000 | 15,612,300 |
| Exxon Mobil Corp. | 200,000 | 22,268,000 |
| Valero Energy Corp. | 50,000 | 6,681,000 |
| Total | | 80,936,000 |
| Total Energy | 80,936,000 |
| Common Stocks (continued) |
| Issuer | Shares | Value ($) |
| Financials 10.3% |
| Banks 3.8% |
| Citizens Financial Group, Inc. | 175,000 | 7,416,500 |
| JPMorgan Chase & Co. | 125,000 | 17,272,500 |
| M&T Bank Corp. | 87,500 | 14,876,750 |
| PNC Financial Services Group, Inc. (The) | 90,000 | 15,143,400 |
| Total | | 54,709,150 |
| Capital Markets 3.7% |
| Ares Capital Corp. | 750,000 | 14,737,500 |
| BlackRock, Inc. | 11,500 | 8,234,000 |
| Blackstone Secured Lending Fund | 300,000 | 7,182,000 |
| Blackstone, Inc. | 77,500 | 7,093,575 |
| Morgan Stanley | 180,000 | 16,752,600 |
| Total | | 53,999,675 |
| Insurance 1.1% |
| MetLife, Inc. | 200,000 | 15,340,000 |
| Mortgage Real Estate Investment Trusts (REITS) 1.7% |
| Blackstone Mortgage Trust, Inc. | 400,000 | 10,108,000 |
| Starwood Property Trust, Inc. | 700,000 | 14,987,000 |
| Total | | 25,095,000 |
| Total Financials | 149,143,825 |
| Health Care 5.6% |
| Biotechnology 1.6% |
| AbbVie, Inc. | 95,000 | 15,312,100 |
| Amgen, Inc. | 25,000 | 7,160,000 |
| Total | | 22,472,100 |
| Pharmaceuticals 4.0% |
| Amryt Pharma PLC, ADR(a) | 172,608 | 1,228,969 |
| Bristol-Myers Squibb Co. | 150,000 | 12,042,000 |
| Johnson & Johnson | 60,000 | 10,680,000 |
| Merck & Co., Inc. | 175,000 | 19,271,000 |
| Pfizer, Inc. | 300,000 | 15,039,000 |
| Total | | 58,260,969 |
| Total Health Care | 80,733,069 |
The accompanying Notes to Financial Statements are an integral part of this statement.
| 6 | Columbia Flexible Capital Income Fund | Semiannual Report 2022 |
Portfolio of Investments (continued)
November 30, 2022 (Unaudited)
| Common Stocks (continued) |
| Issuer | Shares | Value ($) |
| Industrials 3.2% |
| Aerospace & Defense 1.0% |
| Raytheon Technologies Corp. | 150,000 | 14,808,000 |
| Air Freight & Logistics 1.1% |
| United Parcel Service, Inc., Class B | 85,000 | 16,127,050 |
| Machinery 1.1% |
| AGCO Corp. | 60,000 | 7,963,200 |
| Stanley Black & Decker, Inc. | 92,500 | 7,559,100 |
| Total | | 15,522,300 |
| Total Industrials | 46,457,350 |
| Information Technology 7.8% |
| Communications Equipment 1.8% |
| Cisco Systems, Inc. | 350,000 | 17,402,000 |
| Juniper Networks, Inc. | 235,000 | 7,811,400 |
| Total | | 25,213,400 |
| Electronic Equipment, Instruments & Components 1.0% |
| Corning, Inc. | 435,000 | 14,846,550 |
| IT Services 1.2% |
| International Business Machines Corp. | 115,000 | 17,123,500 |
| Semiconductors & Semiconductor Equipment 3.3% |
| Broadcom, Inc. | 29,000 | 15,979,870 |
| Intel Corp. | 260,000 | 7,818,200 |
| QUALCOMM, Inc. | 62,500 | 7,905,625 |
| Texas Instruments, Inc. | 85,000 | 15,339,100 |
| Total | | 47,042,795 |
| Technology Hardware, Storage & Peripherals 0.5% |
| HP, Inc. | 250,000 | 7,510,000 |
| Total Information Technology | 111,736,245 |
| Materials 2.0% |
| Chemicals 1.5% |
| Dow, Inc. | 285,000 | 14,526,450 |
| Nutrien Ltd. | 85,000 | 6,834,000 |
| Total | | 21,360,450 |
| Metals & Mining 0.5% |
| Newmont Corp. | 160,000 | 7,595,200 |
| Total Materials | 28,955,650 |
| Common Stocks (continued) |
| Issuer | Shares | Value ($) |
| Real Estate 3.4% |
| Equity Real Estate Investment Trusts (REITS) 3.4% |
| Crown Castle, Inc. | 45,000 | 6,364,350 |
| Life Storage, Inc. | 65,000 | 6,986,850 |
| Medical Properties Trust, Inc. | 600,000 | 7,872,000 |
| Simon Property Group, Inc. | 72,500 | 8,659,400 |
| VICI Properties, Inc. | 325,000 | 11,115,000 |
| Welltower, Inc. | 110,000 | 7,813,300 |
| Total | | 48,810,900 |
| Total Real Estate | 48,810,900 |
| Utilities 2.1% |
| Electric Utilities 1.5% |
| Duke Energy Corp. | 70,000 | 6,995,100 |
| Entergy Corp. | 65,000 | 7,557,550 |
| FirstEnergy Corp. | 185,000 | 7,629,400 |
| Total | | 22,182,050 |
| Multi-Utilities 0.6% |
| DTE Energy Co. | 68,580 | 7,955,966 |
| Total Utilities | 30,138,016 |
Total Common Stocks
(Cost $578,173,642) | 673,403,755 |
| Convertible Bonds 10.2% |
| Issuer | Coupon
Rate | | Principal
Amount ($) | Value ($) |
| Airlines 0.5% |
| American Airlines Group, Inc. |
| 07/01/2025 | 6.500% | | 6,500,000 | 7,348,250 |
| Automotive 0.2% |
| Lucid Group, Inc.(b) |
| 12/15/2026 | 1.250% | | 5,500,000 | 3,059,375 |
| Cable and Satellite 0.9% |
| DISH Network Corp. |
| Subordinated |
| 08/15/2026 | 3.375% | | 20,000,000 | 12,950,000 |
| Diversified Manufacturing 0.5% |
| Greenbrier Companies, Inc. (The) |
| 04/15/2028 | 2.875% | | 8,500,000 | 7,943,250 |
| Food and Beverage 0.8% |
| Post Holdings, Inc.(b) |
| 08/15/2027 | 2.500% | | 10,200,000 | 10,873,200 |
The accompanying Notes to Financial Statements are an integral part of this statement.
Columbia Flexible Capital Income Fund | Semiannual Report 2022
| 7 |
Portfolio of Investments (continued)
November 30, 2022 (Unaudited)
| Convertible Bonds (continued) |
| Issuer | Coupon
Rate | | Principal
Amount ($) | Value ($) |
| Health Care 0.7% |
| CONMED Corp.(b) |
| 06/15/2027 | 2.250% | | 7,500,000 | 6,648,750 |
| Invacare Corp. |
| 11/15/2024 | 5.000% | | 4,500,000 | 3,797,652 |
| Total | 10,446,402 |
| Independent Energy 0.0% |
| Chesapeake Energy Escrow |
| 09/15/2026 | 5.500% | | 10,500,000 | 236,250 |
| Leisure 1.1% |
| NCL Corp Ltd. |
| 08/01/2025 | 5.375% | | 6,200,000 | 7,306,700 |
| Royal Caribbean Cruises Ltd.(b) |
| 08/15/2025 | 6.000% | | 5,700,000 | 8,105,302 |
| Total | 15,412,002 |
| Media and Entertainment 0.3% |
| fuboTV, Inc. |
| 02/15/2026 | 3.250% | | 9,000,000 | 4,189,500 |
| Other Financial Institutions 0.6% |
| RWT Holdings, Inc. |
| 10/01/2025 | 5.750% | | 10,050,000 | 8,316,375 |
| Other REIT 1.1% |
| PennyMac Corp. |
| 03/15/2026 | 5.500% | | 16,500,000 | 13,963,125 |
| Redwood Trust, Inc.(b) |
| 06/15/2027 | 7.750% | | 2,000,000 | 1,776,250 |
| Total | 15,739,375 |
| Pharmaceuticals 1.5% |
| Aegerion Pharmaceuticals, Inc.(b) |
| 04/01/2025 | 5.000% | | 1,012,542 | 965,762 |
| BridgeBio Pharma, Inc. |
| 02/01/2029 | 2.250% | | 15,500,000 | 6,219,375 |
| Clovis Oncology, Inc. |
| 05/01/2025 | 0.000% | | 11,700,000 | 877,500 |
| Cytokinetics, Inc.(b) |
| 07/01/2027 | 3.500% | | 5,700,000 | 6,298,500 |
| Tilray, Inc. |
| 10/01/2023 | 5.000% | | 7,000,000 | 6,784,962 |
| Total | 21,146,099 |
| Retailers 0.9% |
| Farfetch Ltd. |
| 05/01/2027 | 3.750% | | 7,500,000 | 7,160,242 |
| Convertible Bonds (continued) |
| Issuer | Coupon
Rate | | Principal
Amount ($) | Value ($) |
| Wayfair, Inc.(b) |
| 09/15/2027 | 3.250% | | 7,700,000 | 6,190,800 |
| Total | 13,351,042 |
| Technology 1.1% |
| 2U, Inc. |
| 05/01/2025 | 2.250% | | 9,500,000 | 6,369,750 |
| Infinera Corp.(b) |
| 08/01/2028 | 3.750% | | 7,400,000 | 9,115,805 |
| Total | 15,485,555 |
Total Convertible Bonds
(Cost $173,031,583) | 146,496,675 |
| Convertible Preferred Stocks 8.1% |
| Issuer | | Shares | Value ($) |
| Consumer Discretionary 0.5% |
| Auto Components 0.5% |
| Aptiv PLC | 5.500% | 65,000 | 7,833,800 |
| Total Consumer Discretionary | 7,833,800 |
| Financials 1.3% |
| Banks 1.0% |
| Bank of America Corp. | 7.250% | 11,500 | 14,007,000 |
| Capital Markets 0.3% |
| AMG Capital Trust II | 5.150% | 87,500 | 4,481,750 |
| Total Financials | 18,488,750 |
| Health Care 1.5% |
| Health Care Equipment & Supplies 1.5% |
| Becton Dickinson and Co. | 6.000% | 225,000 | 11,175,750 |
| Boston Scientific Corp. | 5.500% | 100,000 | 11,294,000 |
| Total | | | 22,469,750 |
| Total Health Care | 22,469,750 |
| Industrials 0.5% |
| Professional Services 0.5% |
| Clarivate PLC | 5.250% | 155,000 | 6,624,700 |
| Total Industrials | 6,624,700 |
| Information Technology 0.7% |
| Electronic Equipment, Instruments & Components 0.7% |
| Coherent Corp. | 6.000% | 57,500 | 9,597,031 |
| Total Information Technology | 9,597,031 |
The accompanying Notes to Financial Statements are an integral part of this statement.
| 8 | Columbia Flexible Capital Income Fund | Semiannual Report 2022 |
Portfolio of Investments (continued)
November 30, 2022 (Unaudited)
| Convertible Preferred Stocks (continued) |
| Issuer | | Shares | Value ($) |
| Utilities 3.6% |
| Electric Utilities 1.0% |
| NextEra Energy, Inc. | 6.926% | 300,000 | 14,787,000 |
| Gas Utilities 1.5% |
| Spire, Inc. | 7.500% | 215,000 | 11,051,547 |
| UGI Corp. | 7.250% | 120,000 | 10,486,800 |
| Total | | | 21,538,347 |
| Multi-Utilities 1.1% |
| NiSource, Inc. | 7.750% | 145,000 | 15,633,900 |
| Total Utilities | 51,959,247 |
Total Convertible Preferred Stocks
(Cost $125,120,695) | 116,973,278 |
| Corporate Bonds & Notes 32.1% |
| Issuer | Coupon
Rate | | Principal
Amount ($) | Value ($) |
| Aerospace & Defense 2.1% |
| Bombardier, Inc.(b) |
| 06/15/2026 | 7.125% | | 15,500,000 | 15,223,165 |
| Rolls-Royce PLC(b) |
| 10/15/2027 | 5.750% | | 8,133,000 | 7,783,231 |
| Spirit AeroSystems, Inc.(b) |
| 04/15/2025 | 7.500% | | 7,200,000 | 7,121,386 |
| Total | 30,127,782 |
| Cable and Satellite 0.2% |
| Telesat Canada/LLC(b) |
| 10/15/2027 | 6.500% | | 7,114,000 | 2,189,843 |
| Chemicals 0.9% |
| Innophos Holdings, Inc.(b) |
| 02/15/2028 | 9.375% | | 7,000,000 | 6,866,787 |
| Olympus Water US Holding Corp.(b) |
| 10/01/2029 | 6.250% | | 9,000,000 | 6,475,804 |
| Total | 13,342,591 |
| Construction Machinery 0.3% |
| PECF USS Intermediate Holding III Corp.(b) |
| 11/15/2029 | 8.000% | | 8,350,000 | 4,947,745 |
| Consumer Cyclical Services 1.0% |
| Staples, Inc.(b) |
| 04/15/2026 | 7.500% | | 7,500,000 | 6,689,393 |
| Corporate Bonds & Notes (continued) |
| Issuer | Coupon
Rate | | Principal
Amount ($) | Value ($) |
| Uber Technologies, Inc.(b) |
| 09/15/2027 | 7.500% | | 2,600,000 | 2,611,681 |
| 01/15/2028 | 6.250% | | 4,695,000 | 4,575,515 |
| Total | 13,876,589 |
| Consumer Products 1.2% |
| Mattel, Inc. |
| 10/01/2040 | 6.200% | | 2,770,000 | 2,367,924 |
| 11/01/2041 | 5.450% | | 1,100,000 | 874,339 |
| Newell Brands, Inc. |
| 09/15/2027 | 6.375% | | 3,664,000 | 3,603,931 |
| 09/15/2029 | 6.625% | | 3,750,000 | 3,699,896 |
| SWF Escrow Issuer Corp.(b) |
| 10/01/2029 | 6.500% | | 10,500,000 | 6,136,911 |
| Total | 16,683,001 |
| Electric 0.5% |
| Pacific Gas and Electric Co. |
| 06/15/2027 | 5.450% | | 7,000,000 | 6,834,767 |
| Finance Companies 0.5% |
| Curo Group Holdings Corp.(b) |
| 08/01/2028 | 7.500% | | 9,000,000 | 3,689,533 |
| Fortress Transportation and Infrastructure Investors LLC(b) |
| 08/01/2027 | 9.750% | | 3,240,000 | 3,268,966 |
| Total | 6,958,499 |
| Food and Beverage 1.4% |
| Triton Water Holdings, Inc.(b) |
| 04/01/2029 | 6.250% | | 13,929,000 | 10,847,837 |
| United Natural Foods, Inc.(b) |
| 10/15/2028 | 6.750% | | 10,320,000 | 10,012,083 |
| Total | 20,859,920 |
| Gaming 1.2% |
| Colt Merger Sub, Inc.(b) |
| 07/01/2027 | 8.125% | | 7,299,000 | 7,327,764 |
| Scientific Games Holdings LP/US FinCo, Inc.(b) |
| 03/01/2030 | 6.625% | | 12,500,000 | 10,578,142 |
| Total | 17,905,906 |
| Health Care 2.1% |
| Quotient Ltd.(b),(c),(d) |
| 10/15/2025 | 12.000% | | 1,219,166 | 1,219,167 |
| 10/15/2025 | 12.000% | | 522,500 | 522,500 |
| Surgery Center Holdings, Inc.(b) |
| 07/01/2025 | 6.750% | | 15,000,000 | 14,782,486 |
The accompanying Notes to Financial Statements are an integral part of this statement.
Columbia Flexible Capital Income Fund | Semiannual Report 2022
| 9 |
Portfolio of Investments (continued)
November 30, 2022 (Unaudited)
| Corporate Bonds & Notes (continued) |
| Issuer | Coupon
Rate | | Principal
Amount ($) | Value ($) |
| Tenet Healthcare Corp.(b) |
| 10/01/2028 | 6.125% | | 15,521,000 | 13,690,849 |
| Total | 30,215,002 |
| Independent Energy 3.5% |
| Hilcorp Energy I LP/Finance Co.(b) |
| 04/15/2030 | 6.000% | | 16,000,000 | 14,768,258 |
| Oasis Petroleum, Inc.(b) |
| 06/01/2026 | 6.375% | | 7,500,000 | 7,334,194 |
| Occidental Petroleum Corp. |
| 07/15/2044 | 4.500% | | 9,800,000 | 7,887,410 |
| 04/15/2046 | 4.400% | | 10,600,000 | 8,416,500 |
| Southwestern Energy Co. |
| 02/01/2029 | 5.375% | | 12,220,000 | 11,538,208 |
| Total | 49,944,570 |
| Leisure 2.6% |
| Carnival Corp.(b) |
| 05/01/2029 | 6.000% | | 16,500,000 | 11,692,972 |
| 06/01/2030 | 10.500% | | 4,000,000 | 3,425,590 |
| Cedar Fair LP/Canada’s Wonderland Co./Magnum Management Corp./Millennium Operations LLC |
| 10/01/2028 | 6.500% | | 7,300,000 | 7,016,050 |
| NCL Corp., Ltd.(b) |
| 02/15/2029 | 7.750% | | 9,500,000 | 7,606,438 |
| Royal Caribbean Cruises Ltd.(b) |
| 08/15/2027 | 11.625% | | 7,243,000 | 7,380,417 |
| Total | 37,121,467 |
| Media and Entertainment 2.7% |
| Clear Channel Outdoor Holdings, Inc.(b) |
| 04/15/2028 | 7.750% | | 18,000,000 | 13,504,971 |
| Deluxe Corp.(b) |
| 06/01/2029 | 8.000% | | 8,000,000 | 6,620,997 |
| Lions Gate Capital Holdings LLC(b) |
| 04/15/2029 | 5.500% | | 17,500,000 | 11,375,000 |
| Mav Acquisition Corp.(b) |
| 08/01/2029 | 8.000% | | 9,000,000 | 7,628,508 |
| Total | 39,129,476 |
| Metals and Mining 0.3% |
| CONSOL Energy, Inc.(b) |
| 11/15/2025 | 11.000% | | 4,630,000 | 4,748,388 |
| Oil Field Services 0.5% |
| Nabors Industries Ltd.(b) |
| 01/15/2026 | 7.250% | | 4,568,000 | 4,388,419 |
| 01/15/2028 | 7.500% | | 3,231,000 | 2,953,281 |
| Total | 7,341,700 |
| Corporate Bonds & Notes (continued) |
| Issuer | Coupon
Rate | | Principal
Amount ($) | Value ($) |
| Other Financial Institutions 0.3% |
| WeWork Companies, Inc.(b) |
| 05/01/2025 | 7.875% | | 9,300,000 | 4,750,918 |
| Packaging 1.5% |
| ARD Finance SA(b),(e) |
| 06/30/2027 | 6.500% | | 8,754,310 | 6,480,888 |
| BWAY Holding Co.(b) |
| 04/15/2025 | 7.250% | | 16,000,000 | 14,524,205 |
| Total | 21,005,093 |
| Paper 0.5% |
| Sylvamo Corp.(b) |
| 09/01/2029 | 7.000% | | 7,800,000 | 7,541,798 |
| Pharmaceuticals 0.8% |
| 1375209 BC Ltd.(b) |
| 01/30/2028 | 9.000% | | 1,957,000 | 1,922,015 |
| Bausch Health Companies, Inc.(b) |
| 09/30/2028 | 11.000% | | 3,477,000 | 2,680,096 |
| 10/15/2030 | 14.000% | | 695,000 | 390,879 |
| Organon Finance 1 LLC(b) |
| 04/30/2031 | 5.125% | | 7,523,000 | 6,674,783 |
| Total | 11,667,773 |
| Restaurants 1.0% |
| Fertitta Entertainment LLC/Finance Co., Inc.(b) |
| 01/15/2030 | 6.750% | | 17,500,000 | 14,726,192 |
| Retailers 1.3% |
| Academy Ltd.(b) |
| 11/15/2027 | 6.000% | | 7,833,000 | 7,477,347 |
| L Brands, Inc.(b) |
| 10/01/2030 | 6.625% | | 7,500,000 | 7,030,404 |
| Magic MergeCo, Inc.(b) |
| 05/01/2029 | 7.875% | | 6,500,000 | 3,842,555 |
| Total | 18,350,306 |
| Supermarkets 0.4% |
| Safeway, Inc. |
| 02/01/2031 | 7.250% | | 6,088,000 | 6,087,535 |
| Technology 5.1% |
| Avaya, Inc.(b) |
| 09/15/2028 | 6.125% | | 8,500,000 | 3,749,085 |
| Consensus Cloud Solutions, Inc.(b) |
| 10/15/2026 | 6.000% | | 8,000,000 | 7,422,601 |
| Diebold Nixdorf, Inc.(b) |
| 07/15/2025 | 9.375% | | 2,700,000 | 1,909,210 |
The accompanying Notes to Financial Statements are an integral part of this statement.
| 10 | Columbia Flexible Capital Income Fund | Semiannual Report 2022 |
Portfolio of Investments (continued)
November 30, 2022 (Unaudited)
| Corporate Bonds & Notes (continued) |
| Issuer | Coupon
Rate | | Principal
Amount ($) | Value ($) |
| Diebold, Inc. |
| 04/15/2024 | 8.500% | | 13,000,000 | 7,112,525 |
| Minerva Merger Sub, Inc.(b) |
| 02/15/2030 | 6.500% | | 13,000,000 | 9,716,812 |
| Neptune Bidco US, Inc.(b) |
| 04/15/2029 | 9.290% | | 7,772,000 | 7,483,913 |
| NortonLifeLock, Inc.(b) |
| 09/30/2027 | 6.750% | | 10,000,000 | 10,042,748 |
| 09/30/2030 | 7.125% | | 5,000,000 | 5,040,044 |
| Picard Midco, Inc.(b) |
| 03/31/2029 | 6.500% | | 8,000,000 | 6,996,773 |
| Rocket Software, Inc.(b) |
| 02/15/2029 | 6.500% | | 14,125,000 | 11,135,254 |
| Sabre GLBL, Inc.(b) |
| 04/15/2025 | 9.250% | | 2,200,000 | 2,193,115 |
| 09/01/2025 | 7.375% | | 1,077,000 | 1,026,054 |
| Total | 73,828,134 |
| Wirelines 0.2% |
| Front Range BidCo, Inc.(b) |
| 03/01/2028 | 6.125% | | 6,500,000 | 3,528,808 |
Total Corporate Bonds & Notes
(Cost $551,518,045) | 463,713,803 |
| Preferred Debt 0.6% |
| Issuer | Coupon
Rate | | Shares | Value ($) |
| Banking 0.6% |
| Citigroup Capital XIII(f) |
| 10/30/2040 | 10.785% | | 285,000 | 8,139,600 |
Total Preferred Debt
(Cost $7,605,226) | 8,139,600 |
| Warrants 0.0% |
| Issuer | Shares | Value ($) |
| Health Care 0.0% |
| Health Care Equipment & Supplies 0.0% |
| Quotient Ltd.(a) | 24,163 | 18 |
| Quotient Ltd.(a) | 111,309 | 529 |
| Total | | 547 |
| Total Health Care | 547 |
Total Warrants
(Cost $—) | 547 |
|
| Money Market Funds 0.9% |
| | Shares | Value ($) |
| Columbia Short-Term Cash Fund, 3.989%(g),(h) | 13,418,587 | 13,413,219 |
Total Money Market Funds
(Cost $13,411,317) | 13,413,219 |
Total Investments in Securities
(Cost: $1,448,860,508) | 1,422,140,877 |
| Other Assets & Liabilities, Net | | 19,796,649 |
| Net Assets | 1,441,937,526 |
Notes to Portfolio of Investments
| (a) | Non-income producing investment. |
| (b) | Represents privately placed and other securities and instruments exempt from Securities and Exchange Commission registration (collectively, private placements), such as Section 4(a)(2) and Rule 144A eligible securities, which are often sold only to qualified institutional buyers. At November 30, 2022, the total value of these securities amounted to $451,308,462, which represents 31.30% of total net assets. |
| (c) | Represents fair value as determined in good faith under procedures approved by the Board of Trustees. At November 30, 2022, the total value of these securities amounted to $1,741,667, which represents 0.12% of total net assets. |
| (d) | Valuation based on significant unobservable inputs. |
| (e) | Payment-in-kind security. Interest can be paid by issuing additional par of the security or in cash. |
| (f) | Represents a variable rate security with a step coupon where the rate adjusts according to a schedule for a series of periods, typically lower for an initial period and then increasing to a higher coupon rate thereafter. The interest rate shown was the current rate as of November 30, 2022. |
| (g) | The rate shown is the seven-day current annualized yield at November 30, 2022. |
The accompanying Notes to Financial Statements are an integral part of this statement.
Columbia Flexible Capital Income Fund | Semiannual Report 2022
| 11 |
Portfolio of Investments (continued)
November 30, 2022 (Unaudited)
Notes to Portfolio of Investments (continued)
| (h) | As defined in the Investment Company Act of 1940, as amended, an affiliated company is one in which the Fund owns 5% or more of the company’s outstanding voting securities, or a company which is under common ownership or control with the Fund. The value of the holdings and transactions in these affiliated companies during the period ended November 30, 2022 are as follows: |
| Affiliated issuers | Beginning
of period($) | Purchases($) | Sales($) | Net change in
unrealized
appreciation
(depreciation)($) | End of
period($) | Realized gain
(loss)($) | Dividends($) | End of
period shares |
| Columbia Short-Term Cash Fund, 3.989% |
| | 20,206,575 | 204,691,402 | (211,486,660) | 1,902 | 13,413,219 | (4,819) | 267,857 | 13,418,587 |
Abbreviation Legend
| ADR | American Depositary Receipt |
Fair value measurements
The Fund categorizes its fair value measurements according to a three-level hierarchy that maximizes the use of observable inputs and minimizes the use of unobservable inputs by prioritizing that the most observable input be used when available. Observable inputs are those that market participants would use in pricing an investment based on market data obtained from sources independent of the reporting entity. Unobservable inputs are those that reflect the Fund’s assumptions about the information market participants would use in pricing an investment. An investment’s level within the fair value hierarchy is based on the lowest level of any input that is deemed significant to the asset’s or liability’s fair value measurement. The input levels are not necessarily an indication of the risk or liquidity associated with investments at that level. For example, certain U.S. government securities are generally high quality and liquid, however, they are reflected as Level 2 because the inputs used to determine fair value may not always be quoted prices in an active market.
Fair value inputs are summarized in the three broad levels listed below:
| ■ | Level 1 — Valuations based on quoted prices for investments in active markets that the Fund has the ability to access at the measurement date. Valuation adjustments are not applied to Level 1 investments. |
| ■ | Level 2 — Valuations based on other significant observable inputs (including quoted prices for similar securities, interest rates, prepayment speeds, credit risks, etc.). |
| ■ | Level 3 — Valuations based on significant unobservable inputs (including the Fund’s own assumptions and judgment in determining the fair value of investments). |
Inputs that are used in determining fair value of an investment may include price information, credit data, volatility statistics, and other factors. These inputs can be either observable or unobservable. The availability of observable inputs can vary between investments, and is affected by various factors such as the type of investment, and the volume and level of activity for that investment or similar investments in the marketplace. The inputs will be considered by the Investment Manager, along with any other relevant factors in the calculation of an investment’s fair value. The Fund uses prices and inputs that are current as of the measurement date, which may include periods of market dislocations. During these periods, the availability of prices and inputs may be reduced for many investments. This condition could cause an investment to be reclassified between the various levels within the hierarchy.
Investments falling into the Level 3 category are primarily supported by quoted prices from brokers and dealers participating in the market for those investments. However, these may be classified as Level 3 investments due to lack of market transparency and corroboration to support these quoted prices. Additionally, valuation models may be used as the pricing source for any remaining investments classified as Level 3. These models may rely on one or more significant unobservable inputs and/or significant assumptions by the Investment Manager. Inputs used in valuations may include, but are not limited to, financial statement analysis, capital account balances, discount rates and estimated cash flows, and comparable company data.
The Fund’s Board of Trustees (the Board) has designated the Investment Manager, through its Valuation Committee (the Committee), as valuation designee, responsible for determining the fair value of the assets of the Fund for which market quotations are not readily available using valuation procedures approved by the Board. The Committee consists of voting and non-voting members from various groups within the Investment Manager’s organization, including operations and accounting, trading and investments, compliance, risk management and legal.
The Committee meets at least monthly to review and approve valuation matters, which may include a description of specific valuation determinations, data regarding pricing information received from approved pricing vendors and brokers and the results of Board-approved valuation policies and procedures (the Policies). The Policies address, among other things, instances when market quotations are or are not readily available, including recommendations of third party pricing vendors and a determination of appropriate pricing methodologies; events that require specific valuation determinations and assessment of fair value techniques; securities with a potential for stale pricing, including those that are illiquid, restricted, or in default; and the effectiveness of third party pricing vendors, including periodic reviews of vendors. The Committee meets more frequently, as needed, to discuss additional valuation matters, which may include the need to review back-testing results, review time-sensitive information or approve related valuation actions. Representatives of Columbia Management Investment Advisers, LLC report to the Board at each of its regularly scheduled meetings to discuss valuation matters and actions during the period, similar to those described earlier.
The following table is a summary of the inputs used to value the Fund’s investments at November 30, 2022:
| | Level 1 ($) | Level 2 ($) | Level 3 ($) | Total ($) |
| Investments in Securities | | | | |
| Common Stocks | | | | |
| Communication Services | 34,319,900 | — | — | 34,319,900 |
| Consumer Discretionary | 26,557,600 | — | — | 26,557,600 |
| Consumer Staples | 35,615,200 | — | — | 35,615,200 |
| Energy | 80,936,000 | — | — | 80,936,000 |
| Financials | 149,143,825 | — | — | 149,143,825 |
The accompanying Notes to Financial Statements are an integral part of this statement.
| 12 | Columbia Flexible Capital Income Fund | Semiannual Report 2022 |
Portfolio of Investments (continued)
November 30, 2022 (Unaudited)
Fair value measurements (continued)
| | Level 1 ($) | Level 2 ($) | Level 3 ($) | Total ($) |
| Health Care | 80,733,069 | — | — | 80,733,069 |
| Industrials | 46,457,350 | — | — | 46,457,350 |
| Information Technology | 111,736,245 | — | — | 111,736,245 |
| Materials | 28,955,650 | — | — | 28,955,650 |
| Real Estate | 48,810,900 | — | — | 48,810,900 |
| Utilities | 30,138,016 | — | — | 30,138,016 |
| Total Common Stocks | 673,403,755 | — | — | 673,403,755 |
| Convertible Bonds | — | 146,496,675 | — | 146,496,675 |
| Convertible Preferred Stocks | | | | |
| Consumer Discretionary | — | 7,833,800 | — | 7,833,800 |
| Financials | — | 18,488,750 | — | 18,488,750 |
| Health Care | — | 22,469,750 | — | 22,469,750 |
| Industrials | — | 6,624,700 | — | 6,624,700 |
| Information Technology | — | 9,597,031 | — | 9,597,031 |
| Utilities | — | 51,959,247 | — | 51,959,247 |
| Total Convertible Preferred Stocks | — | 116,973,278 | — | 116,973,278 |
| Corporate Bonds & Notes | — | 461,972,136 | 1,741,667 | 463,713,803 |
| Preferred Debt | 8,139,600 | — | — | 8,139,600 |
| Warrants | | | | |
| Health Care | — | 547 | — | 547 |
| Total Warrants | — | 547 | — | 547 |
| Money Market Funds | 13,413,219 | — | — | 13,413,219 |
| Total Investments in Securities | 694,956,574 | 725,442,636 | 1,741,667 | 1,422,140,877 |
See the Portfolio of Investments for all investment classifications not indicated in the table.
The Fund’s assets assigned to the Level 2 input category are generally valued using the market approach, in which a security’s value is determined through reference to prices and information from market transactions for similar or identical assets.
The Fund does not hold any significant investments (greater than one percent of net assets) categorized as Level 3.
The accompanying Notes to Financial Statements are an integral part of this statement.
Columbia Flexible Capital Income Fund | Semiannual Report 2022
| 13 |
Statement of Assets and Liabilities
November 30, 2022 (Unaudited)
| Assets | |
| Investments in securities, at value | |
| Unaffiliated issuers (cost $1,435,449,191) | $1,408,727,658 |
| Affiliated issuers (cost $13,411,317) | 13,413,219 |
| Receivable for: | |
| Investments sold | 20,485,688 |
| Capital shares sold | 2,507,237 |
| Dividends | 4,732,755 |
| Interest | 10,613,485 |
| Foreign tax reclaims | 19,920 |
| Prepaid expenses | 13,821 |
| Other assets | 35,670 |
| Total assets | 1,460,549,453 |
| Liabilities | |
| Payable for: | |
| Investments purchased | 16,885,394 |
| Capital shares purchased | 1,497,773 |
| Management services fees | 24,583 |
| Distribution and/or service fees | 8,382 |
| Transfer agent fees | 91,906 |
| Compensation of board members | 70,018 |
| Compensation of chief compliance officer | 131 |
| Other expenses | 33,740 |
| Total liabilities | 18,611,927 |
| Net assets applicable to outstanding capital stock | $1,441,937,526 |
| Represented by | |
| Paid in capital | 1,453,575,542 |
| Total distributable earnings (loss) | (11,638,016) |
| Total - representing net assets applicable to outstanding capital stock | $1,441,937,526 |
The accompanying Notes to Financial Statements are an integral part of this statement.
| 14 | Columbia Flexible Capital Income Fund | Semiannual Report 2022 |
Statement of Assets and Liabilities (continued)
November 30, 2022 (Unaudited)
| Class A | |
| Net assets | $370,073,174 |
| Shares outstanding | 27,077,507 |
| Net asset value per share | $13.67 |
| Maximum sales charge | 5.75% |
| Maximum offering price per share (calculated by dividing the net asset value per share by 1.0 minus the maximum sales charge for Class A shares) | $14.50 |
| Advisor Class | |
| Net assets | $54,832,612 |
| Shares outstanding | 3,972,515 |
| Net asset value per share | $13.80 |
| Class C | |
| Net assets | $217,377,569 |
| Shares outstanding | 16,017,820 |
| Net asset value per share | $13.57 |
| Institutional Class | |
| Net assets | $720,357,364 |
| Shares outstanding | 52,721,900 |
| Net asset value per share | $13.66 |
| Institutional 2 Class | |
| Net assets | $54,987,047 |
| Shares outstanding | 3,980,411 |
| Net asset value per share | $13.81 |
| Institutional 3 Class | |
| Net assets | $23,351,710 |
| Shares outstanding | 1,717,109 |
| Net asset value per share | $13.60 |
| Class R | |
| Net assets | $958,050 |
| Shares outstanding | 70,179 |
| Net asset value per share | $13.65 |
The accompanying Notes to Financial Statements are an integral part of this statement.
Columbia Flexible Capital Income Fund | Semiannual Report 2022
| 15 |
Statement of Operations
Six Months Ended November 30, 2022 (Unaudited)
| Net investment income | |
| Income: | |
| Dividends — unaffiliated issuers | $20,394,536 |
| Dividends — affiliated issuers | 267,857 |
| Interest | 22,623,570 |
| Foreign taxes withheld | (18,720) |
| Total income | 43,267,243 |
| Expenses: | |
| Management services fees | 4,465,953 |
| Distribution and/or service fees | |
| Class A | 445,629 |
| Class C | 1,114,802 |
| Class R | 2,578 |
| Transfer agent fees | |
| Class A | 143,451 |
| Advisor Class | 21,757 |
| Class C | 89,683 |
| Institutional Class | 282,311 |
| Institutional 2 Class | 15,778 |
| Institutional 3 Class | 875 |
| Class R | 415 |
| Compensation of board members | 13,745 |
| Custodian fees | 4,517 |
| Printing and postage fees | 37,626 |
| Registration fees | 84,997 |
| Audit fees | 15,060 |
| Legal fees | 15,212 |
| Compensation of chief compliance officer | 131 |
| Other | 18,079 |
| Total expenses | 6,772,599 |
| Expense reduction | (60) |
| Total net expenses | 6,772,539 |
| Net investment income | 36,494,704 |
| Realized and unrealized gain (loss) — net | |
| Net realized gain (loss) on: | |
| Investments — unaffiliated issuers | (32,367,757) |
| Investments — affiliated issuers | (4,819) |
| Net realized loss | (32,372,576) |
| Net change in unrealized appreciation (depreciation) on: | |
| Investments — unaffiliated issuers | (63,085,760) |
| Investments — affiliated issuers | 1,902 |
| Net change in unrealized appreciation (depreciation) | (63,083,858) |
| Net realized and unrealized loss | (95,456,434) |
| Net decrease in net assets resulting from operations | $(58,961,730) |
The accompanying Notes to Financial Statements are an integral part of this statement.
| 16 | Columbia Flexible Capital Income Fund | Semiannual Report 2022 |
Statement of Changes in Net Assets
| | Six Months Ended
November 30, 2022
(Unaudited) | Year Ended
May 31, 2022 |
| Operations | | |
| Net investment income | $36,494,704 | $58,163,026 |
| Net realized gain (loss) | (32,372,576) | 57,932,135 |
| Net change in unrealized appreciation (depreciation) | (63,083,858) | (129,244,474) |
| Net decrease in net assets resulting from operations | (58,961,730) | (13,149,313) |
| Distributions to shareholders | | |
| Net investment income and net realized gains | | |
| Class A | (8,513,447) | (28,924,537) |
| Advisor Class | (1,363,073) | (4,896,894) |
| Class C | (4,525,731) | (18,629,219) |
| Institutional Class | (17,688,496) | (53,681,002) |
| Institutional 2 Class | (1,428,949) | (5,504,814) |
| Institutional 3 Class | (568,068) | (1,764,705) |
| Class R | (23,366) | (87,902) |
| Total distributions to shareholders | (34,111,130) | (113,489,073) |
| Increase in net assets from capital stock activity | 30,929,106 | 353,304,182 |
| Total increase (decrease) in net assets | (62,143,754) | 226,665,796 |
| Net assets at beginning of period | 1,504,081,280 | 1,277,415,484 |
| Net assets at end of period | $1,441,937,526 | $1,504,081,280 |
The accompanying Notes to Financial Statements are an integral part of this statement.
Columbia Flexible Capital Income Fund | Semiannual Report 2022
| 17 |
Statement of Changes in Net Assets (continued)
| | Six Months Ended | Year Ended |
| | November 30, 2022 (Unaudited) | May 31, 2022 |
| | Shares | Dollars ($) | Shares | Dollars ($) |
| Capital stock activity |
| Class A | | | | |
| Subscriptions | 3,489,994 | 47,052,049 | 7,695,132 | 118,865,323 |
| Distributions reinvested | 631,999 | 8,360,160 | 1,867,061 | 28,276,585 |
| Redemptions | (2,554,780) | (34,043,299) | (4,675,421) | (71,774,812) |
| Net increase | 1,567,213 | 21,368,910 | 4,886,772 | 75,367,096 |
| Advisor Class | | | | |
| Subscriptions | 667,821 | 9,080,182 | 2,364,105 | 37,097,040 |
| Distributions reinvested | 101,764 | 1,358,541 | 320,200 | 4,893,480 |
| Redemptions | (1,164,713) | (15,732,223) | (1,805,017) | (28,295,014) |
| Net increase (decrease) | (395,128) | (5,293,500) | 879,288 | 13,695,506 |
| Class C | | | | |
| Subscriptions | 945,434 | 12,734,685 | 3,699,449 | 57,160,500 |
| Distributions reinvested | 343,134 | 4,511,940 | 1,234,165 | 18,571,698 |
| Redemptions | (2,246,733) | (29,966,177) | (3,319,328) | (50,590,070) |
| Net increase (decrease) | (958,165) | (12,719,552) | 1,614,286 | 25,142,128 |
| Institutional Class | | | | |
| Subscriptions | 8,653,557 | 116,315,284 | 20,077,936 | 308,144,991 |
| Distributions reinvested | 1,329,318 | 17,571,490 | 3,523,851 | 53,340,988 |
| Redemptions | (7,688,247) | (102,376,706) | (9,254,572) | (141,972,179) |
| Net increase | 2,294,628 | 31,510,068 | 14,347,215 | 219,513,800 |
| Institutional 2 Class | | | | |
| Subscriptions | 485,516 | 6,617,164 | 2,903,364 | 44,953,976 |
| Distributions reinvested | 106,320 | 1,420,588 | 358,447 | 5,481,177 |
| Redemptions | (996,367) | (13,597,736) | (2,490,769) | (37,822,086) |
| Net increase (decrease) | (404,531) | (5,559,984) | 771,042 | 12,613,067 |
| Institutional 3 Class | | | | |
| Subscriptions | 312,987 | 4,197,183 | 614,850 | 9,462,948 |
| Distributions reinvested | 43,201 | 567,998 | 117,126 | 1,764,444 |
| Redemptions | (226,654) | (3,047,161) | (273,612) | (4,140,660) |
| Net increase | 129,534 | 1,718,020 | 458,364 | 7,086,732 |
| Class R | | | | |
| Subscriptions | 5,609 | 73,360 | 23,577 | 358,476 |
| Distributions reinvested | 1,763 | 23,302 | 5,784 | 87,647 |
| Redemptions | (14,312) | (191,518) | (35,885) | (560,270) |
| Net decrease | (6,940) | (94,856) | (6,524) | (114,147) |
| Total net increase | 2,226,611 | 30,929,106 | 22,950,443 | 353,304,182 |
The accompanying Notes to Financial Statements are an integral part of this statement.
| 18 | Columbia Flexible Capital Income Fund | Semiannual Report 2022 |
[THIS PAGE INTENTIONALLY LEFT BLANK]
Columbia Flexible Capital Income Fund | Semiannual Report 2022
| 19 |
The following table is intended to help you understand the Fund’s financial performance. Certain information reflects financial results for a single share of a class held for the periods shown. Per share net investment income (loss) amounts are calculated based on average shares outstanding during the period. Total return assumes reinvestment of all dividends and distributions, if any. Total return does not reflect payment of sales charges, if any. Total return and portfolio turnover are not annualized for periods of less than one year. The portfolio turnover rate is calculated without regard to purchase and sales transactions of short-term instruments and certain derivatives, if any. If such transactions were included, the Fund’s portfolio turnover rate may be higher.
| | Net asset value,
beginning of
period | Net
investment
income | Net
realized
and
unrealized
gain (loss) | Total from
investment
operations | Distributions
from net
investment
income | Distributions
from net
realized
gains | Total
distributions to
shareholders |
| Class A |
| Six Months Ended 11/30/2022 (Unaudited) | $14.56 | 0.35 | (0.91) | (0.56) | (0.33) | — | (0.33) |
| Year Ended 5/31/2022 | $15.90 | 0.63 | (0.71) | (0.08) | (0.63) | (0.63) | (1.26) |
| Year Ended 5/31/2021 | $12.06 | 0.58 | 3.90 | 4.48 | (0.64) | — | (0.64) |
| Year Ended 5/31/2020 | $12.56 | 0.62 | (0.53) | 0.09 | (0.59) | — | (0.59) |
| Year Ended 5/31/2019 | $12.98 | 0.55 | (0.44) | 0.11 | (0.53) | — | (0.53) |
| Year Ended 5/31/2018 | $12.49 | 0.52 | 0.52 | 1.04 | (0.55) | — | (0.55) |
| Advisor Class |
| Six Months Ended 11/30/2022 (Unaudited) | $14.71 | 0.37 | (0.94) | (0.57) | (0.34) | — | (0.34) |
| Year Ended 5/31/2022 | $16.04 | 0.68 | (0.71) | (0.03) | (0.67) | (0.63) | (1.30) |
| Year Ended 5/31/2021 | $12.16 | 0.63 | 3.93 | 4.56 | (0.68) | — | (0.68) |
| Year Ended 5/31/2020 | $12.66 | 0.66 | (0.54) | 0.12 | (0.62) | — | (0.62) |
| Year Ended 5/31/2019 | $13.08 | 0.58 | (0.44) | 0.14 | (0.56) | — | (0.56) |
| Year Ended 5/31/2018 | $12.59 | 0.56 | 0.51 | 1.07 | (0.58) | — | (0.58) |
| Class C |
| Six Months Ended 11/30/2022 (Unaudited) | $14.46 | 0.29 | (0.91) | (0.62) | (0.27) | — | (0.27) |
| Year Ended 5/31/2022 | $15.80 | 0.51 | (0.71) | (0.20) | (0.51) | (0.63) | (1.14) |
| Year Ended 5/31/2021 | $11.99 | 0.47 | 3.89 | 4.36 | (0.55) | — | (0.55) |
| Year Ended 5/31/2020 | $12.48 | 0.53 | (0.53) | 0.00(e) | (0.49) | — | (0.49) |
| Year Ended 5/31/2019 | $12.90 | 0.45 | (0.44) | 0.01 | (0.43) | — | (0.43) |
| Year Ended 5/31/2018 | $12.42 | 0.42 | 0.52 | 0.94 | (0.46) | — | (0.46) |
| Institutional Class |
| Six Months Ended 11/30/2022 (Unaudited) | $14.56 | 0.36 | (0.92) | (0.56) | (0.34) | — | (0.34) |
| Year Ended 5/31/2022 | $15.90 | 0.67 | (0.71) | (0.04) | (0.67) | (0.63) | (1.30) |
| Year Ended 5/31/2021 | $12.06 | 0.61 | 3.91 | 4.52 | (0.68) | — | (0.68) |
| Year Ended 5/31/2020 | $12.56 | 0.66 | (0.54) | 0.12 | (0.62) | — | (0.62) |
| Year Ended 5/31/2019 | $12.98 | 0.58 | (0.44) | 0.14 | (0.56) | — | (0.56) |
| Year Ended 5/31/2018 | $12.49 | 0.56 | 0.51 | 1.07 | (0.58) | — | (0.58) |
| Institutional 2 Class |
| Six Months Ended 11/30/2022 (Unaudited) | $14.72 | 0.37 | (0.94) | (0.57) | (0.34) | — | (0.34) |
| Year Ended 5/31/2022 | $16.06 | 0.68 | (0.72) | (0.04) | (0.67) | (0.63) | (1.30) |
| Year Ended 5/31/2021 | $12.17 | 0.62 | 3.95 | 4.57 | (0.68) | — | (0.68) |
| Year Ended 5/31/2020 | $12.67 | 0.67 | (0.55) | 0.12 | (0.62) | — | (0.62) |
| Year Ended 5/31/2019 | $13.09 | 0.59 | (0.45) | 0.14 | (0.56) | — | (0.56) |
| Year Ended 5/31/2018 | $12.60 | 0.57 | 0.51 | 1.08 | (0.59) | — | (0.59) |
The accompanying Notes to Financial Statements are an integral part of this statement.
| 20 | Columbia Flexible Capital Income Fund | Semiannual Report 2022 |
Financial Highlights (continued)
| | Net
asset
value,
end of
period | Total
return | Total gross
expense
ratio to
average
net assets(a) | Total net
expense
ratio to
average
net assets(a),(b) | Net investment
income
ratio to
average
net assets | Portfolio
turnover | Net
assets,
end of
period
(000’s) |
| Class A |
| Six Months Ended 11/30/2022 (Unaudited) | $13.67 | (3.79%) | 0.99%(c) | 0.99%(c),(d) | 5.13%(c) | 21% | $370,073 |
| Year Ended 5/31/2022 | $14.56 | (0.65%) | 0.98% | 0.98% | 4.06% | 38% | $371,502 |
| Year Ended 5/31/2021 | $15.90 | 38.27% | 1.00% | 1.00% | 4.13% | 58% | $327,938 |
| Year Ended 5/31/2020 | $12.06 | 0.80% | 1.01% | 1.01% | 4.95% | 59% | $218,974 |
| Year Ended 5/31/2019 | $12.56 | 0.82% | 1.02% | 1.02% | 4.31% | 32% | $212,999 |
| Year Ended 5/31/2018 | $12.98 | 8.48% | 1.04% | 1.04%(d) | 4.06% | 50% | $156,011 |
| Advisor Class |
| Six Months Ended 11/30/2022 (Unaudited) | $13.80 | (3.76%) | 0.74%(c) | 0.74%(c),(d) | 5.37%(c) | 21% | $54,833 |
| Year Ended 5/31/2022 | $14.71 | (0.32%) | 0.73% | 0.73% | 4.32% | 38% | $64,229 |
| Year Ended 5/31/2021 | $16.04 | 38.61% | 0.75% | 0.75% | 4.42% | 58% | $55,969 |
| Year Ended 5/31/2020 | $12.16 | 1.06% | 0.76% | 0.76% | 5.21% | 59% | $19,454 |
| Year Ended 5/31/2019 | $12.66 | 1.07% | 0.77% | 0.77% | 4.54% | 32% | $24,065 |
| Year Ended 5/31/2018 | $13.08 | 8.68% | 0.79% | 0.79%(d) | 4.30% | 50% | $21,291 |
| Class C |
| Six Months Ended 11/30/2022 (Unaudited) | $13.57 | (4.20%) | 1.74%(c) | 1.74%(c),(d) | 4.36%(c) | 21% | $217,378 |
| Year Ended 5/31/2022 | $14.46 | (1.41%) | 1.73% | 1.73% | 3.30% | 38% | $245,459 |
| Year Ended 5/31/2021 | $15.80 | 37.25% | 1.75% | 1.75% | 3.40% | 58% | $242,640 |
| Year Ended 5/31/2020 | $11.99 | 0.06% | 1.76% | 1.76% | 4.20% | 59% | $209,401 |
| Year Ended 5/31/2019 | $12.48 | 0.07% | 1.77% | 1.77% | 3.56% | 32% | $213,342 |
| Year Ended 5/31/2018 | $12.90 | 7.64% | 1.79% | 1.79%(d) | 3.32% | 50% | $168,061 |
| Institutional Class |
| Six Months Ended 11/30/2022 (Unaudited) | $13.66 | (3.73%) | 0.74%(c) | 0.74%(c),(d) | 5.38%(c) | 21% | $720,357 |
| Year Ended 5/31/2022 | $14.56 | (0.40%) | 0.73% | 0.73% | 4.33% | 38% | $734,226 |
| Year Ended 5/31/2021 | $15.90 | 38.60% | 0.75% | 0.75% | 4.39% | 58% | $573,637 |
| Year Ended 5/31/2020 | $12.06 | 1.07% | 0.76% | 0.76% | 5.22% | 59% | $426,343 |
| Year Ended 5/31/2019 | $12.56 | 1.08% | 0.77% | 0.77% | 4.56% | 32% | $406,033 |
| Year Ended 5/31/2018 | $12.98 | 8.75% | 0.79% | 0.79%(d) | 4.32% | 50% | $306,954 |
| Institutional 2 Class |
| Six Months Ended 11/30/2022 (Unaudited) | $13.81 | (3.75%) | 0.71%(c) | 0.71%(c) | 5.37%(c) | 21% | $54,987 |
| Year Ended 5/31/2022 | $14.72 | (0.37%) | 0.71% | 0.71% | 4.33% | 38% | $64,534 |
| Year Ended 5/31/2021 | $16.06 | 38.70% | 0.73% | 0.73% | 4.41% | 58% | $58,024 |
| Year Ended 5/31/2020 | $12.17 | 1.10% | 0.73% | 0.73% | 5.25% | 59% | $29,105 |
| Year Ended 5/31/2019 | $12.67 | 1.10% | 0.74% | 0.73% | 4.59% | 32% | $18,828 |
| Year Ended 5/31/2018 | $13.09 | 8.71% | 0.77% | 0.76% | 4.37% | 50% | $19,095 |
The accompanying Notes to Financial Statements are an integral part of this statement.
Columbia Flexible Capital Income Fund | Semiannual Report 2022
| 21 |
Financial Highlights (continued)
| | Net asset value,
beginning of
period | Net
investment
income | Net
realized
and
unrealized
gain (loss) | Total from
investment
operations | Distributions
from net
investment
income | Distributions
from net
realized
gains | Total
distributions to
shareholders |
| Institutional 3 Class |
| Six Months Ended 11/30/2022 (Unaudited) | $14.49 | 0.37 | (0.91) | (0.54) | (0.35) | — | (0.35) |
| Year Ended 5/31/2022 | $15.83 | 0.68 | (0.71) | (0.03) | (0.68) | (0.63) | (1.31) |
| Year Ended 5/31/2021 | $12.01 | 0.62 | 3.89 | 4.51 | (0.69) | — | (0.69) |
| Year Ended 5/31/2020 | $12.51 | 0.67 | (0.54) | 0.13 | (0.63) | — | (0.63) |
| Year Ended 5/31/2019 | $12.93 | 0.59 | (0.44) | 0.15 | (0.57) | — | (0.57) |
| Year Ended 5/31/2018 | $12.44 | 0.58 | 0.50 | 1.08 | (0.59) | — | (0.59) |
| Class R |
| Six Months Ended 11/30/2022 (Unaudited) | $14.55 | 0.33 | (0.92) | (0.59) | (0.31) | — | (0.31) |
| Year Ended 5/31/2022 | $15.88 | 0.59 | (0.70) | (0.11) | (0.59) | (0.63) | (1.22) |
| Year Ended 5/31/2021 | $12.05 | 0.54 | 3.90 | 4.44 | (0.61) | — | (0.61) |
| Year Ended 5/31/2020 | $12.55 | 0.59 | (0.54) | 0.05 | (0.55) | — | (0.55) |
| Year Ended 5/31/2019 | $12.97 | 0.52 | (0.45) | 0.07 | (0.49) | — | (0.49) |
| Year Ended 5/31/2018 | $12.48 | 0.49 | 0.52 | 1.01 | (0.52) | — | (0.52) |
| Notes to Financial Highlights |
| (a) | In addition to the fees and expenses that the Fund bears directly, the Fund indirectly bears a pro rata share of the fees and expenses of any other funds in which it invests. Such indirect expenses are not included in the Fund’s reported expense ratios. |
| (b) | Total net expenses include the impact of certain fee waivers/expense reimbursements made by the Investment Manager and certain of its affiliates, if applicable. |
| (c) | Annualized. |
| (d) | The benefits derived from expense reductions had an impact of less than 0.01%. |
| (e) | Rounds to zero. |
The accompanying Notes to Financial Statements are an integral part of this statement.
| 22 | Columbia Flexible Capital Income Fund | Semiannual Report 2022 |
Financial Highlights (continued)
| | Net
asset
value,
end of
period | Total
return | Total gross
expense
ratio to
average
net assets(a) | Total net
expense
ratio to
average
net assets(a),(b) | Net investment
income
ratio to
average
net assets | Portfolio
turnover | Net
assets,
end of
period
(000’s) |
| Institutional 3 Class |
| Six Months Ended 11/30/2022 (Unaudited) | $13.60 | (3.64%) | 0.67%(c) | 0.67%(c) | 5.46%(c) | 21% | $23,352 |
| Year Ended 5/31/2022 | $14.49 | (0.33%) | 0.66% | 0.66% | 4.40% | 38% | $23,010 |
| Year Ended 5/31/2021 | $15.83 | 38.70% | 0.68% | 0.68% | 4.47% | 58% | $17,878 |
| Year Ended 5/31/2020 | $12.01 | 1.16% | 0.68% | 0.68% | 5.36% | 59% | $14,621 |
| Year Ended 5/31/2019 | $12.51 | 1.16% | 0.70% | 0.69% | 4.66% | 32% | $9,267 |
| Year Ended 5/31/2018 | $12.93 | 8.82% | 0.72% | 0.71% | 4.50% | 50% | $5,009 |
| Class R |
| Six Months Ended 11/30/2022 (Unaudited) | $13.65 | (3.99%) | 1.24%(c) | 1.24%(c),(d) | 4.84%(c) | 21% | $958 |
| Year Ended 5/31/2022 | $14.55 | (0.84%) | 1.23% | 1.23% | 3.78% | 38% | $1,122 |
| Year Ended 5/31/2021 | $15.88 | 37.88% | 1.25% | 1.25% | 3.88% | 58% | $1,329 |
| Year Ended 5/31/2020 | $12.05 | 0.52% | 1.26% | 1.26% | 4.68% | 59% | $912 |
| Year Ended 5/31/2019 | $12.55 | 0.57% | 1.27% | 1.27% | 4.08% | 32% | $1,402 |
| Year Ended 5/31/2018 | $12.97 | 8.22% | 1.29% | 1.29%(d) | 3.81% | 50% | $832 |
The accompanying Notes to Financial Statements are an integral part of this statement.
Columbia Flexible Capital Income Fund | Semiannual Report 2022
| 23 |
Notes to Financial Statements
November 30, 2022 (Unaudited)
Note 1. Organization
Columbia Flexible Capital Income Fund (the Fund), a series of Columbia Funds Series Trust II (the Trust), is a diversified fund. The Trust is registered under the Investment Company Act of 1940, as amended (the 1940 Act), as an open-end management investment company organized as a Massachusetts business trust.
Fund shares
The Trust may issue an unlimited number of shares (without par value). The Fund offers each of the share classes listed in the Statement of Assets and Liabilities. Although all share classes generally have identical voting, dividend and liquidation rights, each share class votes separately when required by the Trust’s organizational documents or by law. Each share class has its own expense and sales charge structure. Different share classes may have different minimum initial investment amounts and pay different net investment income distribution amounts to the extent the expenses of distributing such share classes vary. Distributions to shareholders in a liquidation will be proportional to the net asset value of each share class.
As described in the Fund’s prospectus, Class A and Class C shares are offered to the general public for investment. Class C shares automatically convert to Class A shares after 8 years. Advisor Class, Institutional Class, Institutional 2 Class, Institutional 3 Class and Class R shares are available for purchase through authorized investment professionals to omnibus retirement plans or to institutional investors and to certain other investors as also described in the Fund’s prospectus.
Note 2. Summary of significant accounting policies
Basis of preparation
The Fund is an investment company that applies the accounting and reporting guidance in the Financial Accounting Standards Board (FASB) Accounting Standards Codification Topic 946, Financial Services - Investment Companies (ASC 946). The financial statements are prepared in accordance with U.S. generally accepted accounting principles (GAAP), which requires management to make certain estimates and assumptions that affect the reported amounts of assets and liabilities, the disclosure of contingent assets and liabilities at the date of the financial statements and the reported amounts of income and expenses during the reporting period. Actual results could differ from those estimates.
The following is a summary of significant accounting policies followed by the Fund in the preparation of its financial statements.
Security valuation
Equity securities listed on an exchange are valued at the closing price or last trade price on their primary exchange at the close of business of the New York Stock Exchange. Securities with a closing price not readily available or not listed on any exchange are valued at the mean between the closing bid and ask prices. Listed preferred stocks convertible into common stocks are valued using an evaluated price from a pricing service.
Debt securities generally are valued based on prices obtained from pricing services, which are intended to reflect market transactions for normal, institutional-size trading units of similar securities. The services may use various pricing techniques that take into account, as applicable, factors such as yield, quality, coupon rate, maturity, type of issue, trading characteristics and other data, as well as approved independent broker-dealer quotes. Debt securities for which quotations are not readily available or not believed to be reflective of market value may also be valued based upon a bid quote from an approved independent broker-dealer. Debt securities maturing in 60 days or less are valued primarily at amortized market value, unless this method results in a valuation that management believes does not approximate fair value.
Foreign equity securities are valued based on the closing price or last trade price on their primary exchange at the close of business of the New York Stock Exchange. If any foreign equity security closing prices are not readily available, the securities are valued at the mean of the latest quoted bid and ask prices on such exchanges or markets. Foreign currency exchange rates are determined at the scheduled closing time of the New York Stock Exchange. Many securities markets and exchanges outside the U.S. close prior to the close of the New York Stock Exchange; therefore, the closing prices for securities in such markets or on such exchanges may not fully reflect events that occur after such close but before the close of the New York Stock Exchange. In those situations, foreign securities will be fair valued pursuant to a policy approved by the Board of Trustees. Under the policy, the Fund may utilize a third-party pricing service to determine these fair values. The
| 24 | Columbia Flexible Capital Income Fund | Semiannual Report 2022 |
Notes to Financial Statements (continued)
November 30, 2022 (Unaudited)
third-party pricing service takes into account multiple factors, including, but not limited to, movements in the U.S. securities markets, certain depositary receipts, futures contracts and foreign exchange rates that have occurred subsequent to the close of the foreign exchange or market, to determine a good faith estimate that reasonably reflects the current market conditions as of the close of the New York Stock Exchange. The fair value of a security is likely to be different from the quoted or published price, if available.
Investments in open-end investment companies (other than exchange-traded funds (ETFs)), are valued at the latest net asset value reported by those companies as of the valuation time.
Investments for which market quotations are not readily available, or that have quotations which management believes are not reflective of market value or reliable, are valued at fair value as determined in good faith under procedures approved by the Board of Trustees. If a security or class of securities (such as foreign securities) is valued at fair value, such value is likely to be different from the quoted or published price for the security, if available.
The determination of fair value often requires significant judgment. To determine fair value, management may use assumptions including but not limited to future cash flows and estimated risk premiums. Multiple inputs from various sources may be used to determine fair value.
GAAP requires disclosure regarding the inputs and valuation techniques used to measure fair value and any changes in valuation inputs or techniques. In addition, investments shall be disclosed by major category. This information is disclosed following the Fund’s Portfolio of Investments.
Security transactions
Security transactions are accounted for on the trade date. Cost is determined and gains (losses) are based upon the specific identification method for both financial statement and federal income tax purposes.
Income recognition
Interest income is recorded on an accrual basis. Market premiums and discounts, including original issue discounts, are amortized and accreted, respectively, over the expected life of the security on all debt securities, unless otherwise noted. For convertible securities, premiums attributable to the conversion feature are not amortized.
The Fund may place a debt security on non-accrual status and reduce related interest income when it becomes probable that the interest will not be collected and the amount of uncollectible interest can be reasonably estimated. The Fund may also adjust accrual rates when it becomes probable the full interest will not be collected and a partial payment will be received. A defaulted debt security is removed from non-accrual status when the issuer resumes interest payments or when collectability of interest is reasonably assured.
Corporate actions and dividend income are generally recorded net of any non-reclaimable tax withholdings, on the ex-dividend date or upon receipt of an ex-dividend notification in the case of certain foreign securities.
The Fund may receive distributions from holdings in equity securities, business development companies (BDCs), exchange-traded funds (ETFs), limited partnerships (LPs), other regulated investment companies (RICs), and real estate investment trusts (REITs), which report information as to the tax character of their distributions annually. These distributions are allocated to dividend income, capital gain and return of capital based on actual information reported. Return of capital is recorded as a reduction of the cost basis of securities held. If the Fund no longer owns the applicable securities, return of capital is recorded as a realized gain. With respect to REITs, to the extent actual information has not yet been reported, estimates for return of capital are made by Columbia Management Investment Advisers, LLC (the Investment Manager), a wholly-owned subsidiary of Ameriprise Financial, Inc. (Ameriprise Financial). The Investment Manager’s estimates are subsequently adjusted when the actual character of the distributions is disclosed by the REITs, which could result in a proportionate change in return of capital to shareholders.
Awards from class action litigation are recorded as a reduction of cost basis if the Fund still owns the applicable securities on the payment date. If the Fund no longer owns the applicable securities on the payment date, the proceeds are recorded as realized gains.
Columbia Flexible Capital Income Fund | Semiannual Report 2022
| 25 |
Notes to Financial Statements (continued)
November 30, 2022 (Unaudited)
The value of additional securities received as an income payment through a payment in kind, if any, is recorded as interest income and increases the cost basis of such securities.
Expenses
General expenses of the Trust are allocated to the Fund and other funds of the Trust based upon relative net assets or other expense allocation methodologies determined by the nature of the expense. Expenses directly attributable to the Fund are charged to the Fund. Expenses directly attributable to a specific class of shares are charged to that share class.
Determination of class net asset value
All income, expenses (other than class-specific expenses, which are charged to that share class, as shown in the Statement of Operations) and realized and unrealized gains (losses) are allocated to each class of the Fund on a daily basis, based on the relative net assets of each class, for purposes of determining the net asset value of each class.
Federal income tax status
The Fund intends to qualify each year as a regulated investment company under Subchapter M of the Internal Revenue Code, as amended, and will distribute substantially all of its investment company taxable income and net capital gain, if any, for its tax year, and as such will not be subject to federal income taxes. In addition, the Fund intends to distribute in each calendar year substantially all of its ordinary income, capital gain net income and certain other amounts, if any, such that the Fund should not be subject to federal excise tax. Therefore, no federal income or excise tax provision is recorded.
Foreign taxes
The Fund may be subject to foreign taxes on income, gains on investments or currency repatriation, a portion of which may be recoverable. The Fund will accrue such taxes and recoveries, as applicable, based upon its current interpretation of tax rules and regulations that exist in the markets in which it invests.
Realized gains in certain countries may be subject to foreign taxes at the Fund level, based on statutory rates. The Fund accrues for such foreign taxes on realized and unrealized gains at the appropriate rate for each jurisdiction, as applicable. The amount, if any, is disclosed as a liability in the Statement of Assets and Liabilities.
Distributions to shareholders
Distributions from net investment income, if any, are declared and paid each calendar quarter. Net realized capital gains, if any, are distributed at least annually. Income distributions and capital gain distributions are determined in accordance with federal income tax regulations, which may differ from GAAP.
Guarantees and indemnifications
Under the Trust’s organizational documents and, in some cases, by contract, its officers and trustees are indemnified against certain liabilities arising out of the performance of their duties to the Trust or its funds. In addition, certain of the Fund’s contracts with its service providers contain general indemnification clauses. The Fund’s maximum exposure under these arrangements is unknown since the amount of any future claims that may be made against the Fund cannot be determined, and the Fund has no historical basis for predicting the likelihood of any such claims.
Recent accounting pronouncement
Tailored Shareholder Reports
In October 2022, the Securities and Exchange Commission (SEC) adopted a final rule relating to Tailored Shareholder Reports for Mutual Funds and Exchange-Traded Funds (ETFs); Fee Information in Investment Company Advertisements. The rule and form amendments will require mutual funds and ETFs to transmit concise and visually engaging shareholder reports that highlight key information. The amendments will require that funds tag information in a structured data format. The rule amendments will require that certain more in-depth information be made available online and available for delivery free of charge to investors on request. The amendments will become effective January 24, 2023. There is an 18-month transition period after the effective date of the amendment.
| 26 | Columbia Flexible Capital Income Fund | Semiannual Report 2022 |
Notes to Financial Statements (continued)
November 30, 2022 (Unaudited)
Note 3. Fees and other transactions with affiliates
Management services fees
The Fund has entered into a Management Agreement with Columbia Management Investment Advisers, LLC (the Investment Manager), a wholly-owned subsidiary of Ameriprise Financial, Inc. (Ameriprise Financial). Under the Management Agreement, the Investment Manager provides the Fund with investment research and advice, as well as administrative and accounting services. The management services fee is an annual fee that is equal to a percentage of the Fund’s daily net assets that declines from 0.65% to 0.54% as the Fund’s net assets increase. The annualized effective management services fee rate for the six months ended November 30, 2022 was 0.63% of the Fund’s average daily net assets.
Compensation of board members
Members of the Board of Trustees who are not officers or employees of the Investment Manager or Ameriprise Financial are compensated for their services to the Fund as disclosed in the Statement of Operations. Under a Deferred Compensation Plan (the Deferred Plan), these members of the Board of Trustees may elect to defer payment of up to 100% of their compensation. Deferred amounts are treated as though equivalent dollar amounts had been invested in shares of certain funds managed by the Investment Manager. The Fund’s liability for these amounts is adjusted for market value changes and remains in the Fund until distributed in accordance with the Deferred Plan. All amounts payable under the Deferred Plan constitute a general unsecured obligation of the Fund. The expense for the Deferred Plan, which includes Trustees’ fees deferred during the current period as well as any gains or losses on the Trustees’ deferred compensation balances as a result of market fluctuations, is included in "Compensation of board members" in the Statement of Operations.
Compensation of Chief Compliance Officer
The Board of Trustees has appointed a Chief Compliance Officer for the Fund in accordance with federal securities regulations. As disclosed in the Statement of Operations, a portion of the Chief Compliance Officer’s total compensation is allocated to the Fund, along with other allocations to affiliated registered investment companies managed by the Investment Manager and its affiliates, based on relative net assets.
Transfer agency fees
Under a Transfer and Dividend Disbursing Agent Agreement, Columbia Management Investment Services Corp. (the Transfer Agent), an affiliate of the Investment Manager and a wholly-owned subsidiary of Ameriprise Financial, is responsible for providing transfer agency services to the Fund. The Transfer Agent has contracted with SS&C GIDS, Inc. (SS&C GIDS) to serve as sub-transfer agent. Prior to January 1, 2023, SS&C GIDS was known as DST Asset Manager Solutions, Inc. The Transfer Agent pays the fees of SS&C GIDS for services as sub-transfer agent and SS&C GIDS is not entitled to reimbursement for such fees from the Fund (with the exception of out-of-pocket fees).
The Fund pays the Transfer Agent a monthly transfer agency fee based on the number or the average value of accounts, depending on the type of account. In addition, the Fund pays the Transfer Agent a fee for shareholder services based on the number of accounts or on a percentage of the average aggregate value of the Fund’s shares maintained in omnibus accounts up to the lesser of the amount charged by the financial intermediary or a cap established by the Board of Trustees from time to time.
The Transfer Agent also receives compensation from the Fund for various shareholder services and reimbursements for certain out-of-pocket fees. Total transfer agency fees for Institutional 2 Class and Institutional 3 Class shares are subject to an annual limitation of not more than 0.07% and 0.02%, respectively, of the average daily net assets attributable to each share class.
Columbia Flexible Capital Income Fund | Semiannual Report 2022
| 27 |
Notes to Financial Statements (continued)
November 30, 2022 (Unaudited)
For the six months ended November 30, 2022, the Fund’s annualized effective transfer agency fee rates as a percentage of average daily net assets of each class were as follows:
| | Effective rate (%) |
| Class A | 0.08 |
| Advisor Class | 0.08 |
| Class C | 0.08 |
| Institutional Class | 0.08 |
| Institutional 2 Class | 0.06 |
| Institutional 3 Class | 0.01 |
| Class R | 0.08 |
An annual minimum account balance fee of $20 may apply to certain accounts with a value below the applicable share class’s initial minimum investment requirements to reduce the impact of small accounts on transfer agency fees. These minimum account balance fees are remitted to the Fund and recorded as part of expense reductions in the Statement of Operations. For the six months ended November 30, 2022, these minimum account balance fees reduced total expenses of the Fund by $60.
Distribution and service fees
The Fund has entered into an agreement with Columbia Management Investment Distributors, Inc. (the Distributor), an affiliate of the Investment Manager and a wholly-owned subsidiary of Ameriprise Financial, for distribution and shareholder services. Under a Plan and Agreement of Distribution, the Fund pays a fee at the maximum annual rates of up to 0.25%, 1.00% and 0.50% of the Fund’s average daily net assets attributable to Class A, Class C and Class R shares, respectively. For Class C shares, of the 1.00% fee, up to 0.75% can be reimbursed for distribution expenses and up to an additional 0.25% can be reimbursed for shareholder servicing expenses. For Class R shares, of the 0.50% fee, up to 0.25% can be reimbursed for shareholder servicing expenses.
The amount of distribution and shareholder services expenses incurred by the Distributor and not yet reimbursed (unreimbursed expense) was approximately $1,157,000 for Class C shares. This amount is based on the most recent information available as of September 30, 2022, and may be recovered from future payments under the distribution plan or contingent deferred sales charges (CDSCs). To the extent the unreimbursed expense has been fully recovered, the distribution and/or shareholder services fee is reduced.
Sales charges
Sales charges, including front-end charges and CDSCs, received by the Distributor for distributing Fund shares for the six months ended November 30, 2022, if any, are listed below:
| | Front End (%) | CDSC (%) | Amount ($) |
| Class A | 5.75 | 0.50 - 1.00(a) | 323,385 |
| Class C | — | 1.00(b) | 9,958 |
| (a) | This charge is imposed on certain investments of between $1 million and $50 million redeemed within 18 months after purchase, as follows: 1.00% if redeemed within 12 months after purchase, and 0.50% if redeemed more than 12, but less than 18, months after purchase, with certain limited exceptions. |
| (b) | This charge applies to redemptions within 12 months after purchase, with certain limited exceptions. |
The Fund’s other share classes are not subject to sales charges.
| 28 | Columbia Flexible Capital Income Fund | Semiannual Report 2022 |
Notes to Financial Statements (continued)
November 30, 2022 (Unaudited)
Expenses waived/reimbursed by the Investment Manager and its affiliates
The Investment Manager and certain of its affiliates have contractually agreed to waive fees and/or reimburse expenses (excluding certain fees and expenses described below) for the period(s) disclosed below, unless sooner terminated at the sole discretion of the Board of Trustees, so that the Fund’s net operating expenses, after giving effect to fees waived/expenses reimbursed and any balance credits and/or overdraft charges from the Fund’s custodian, do not exceed the following annual rate(s) as a percentage of the classes’ average daily net assets:
| | October 1, 2022
through
September 30, 2023 | Prior to
October 1, 2022 |
| Class A | 1.15% | 1.20% |
| Advisor Class | 0.90 | 0.95 |
| Class C | 1.90 | 1.95 |
| Institutional Class | 0.90 | 0.95 |
| Institutional 2 Class | 0.88 | 0.94 |
| Institutional 3 Class | 0.83 | 0.89 |
| Class R | 1.40 | 1.45 |
Under the agreement governing these fee waivers and/or expense reimbursement arrangements, the following fees and expenses are excluded from the waiver/reimbursement commitment, and therefore will be paid by the Fund, if applicable: taxes (including foreign transaction taxes), expenses associated with investments in affiliated and non-affiliated pooled investment vehicles (including mutual funds and exchange-traded funds), transaction costs and brokerage commissions, costs related to any securities lending program, dividend expenses associated with securities sold short, inverse floater program fees and expenses, transaction charges and interest on borrowed money, interest, costs associated with shareholder meetings, infrequent and/or unusual expenses and any other expenses the exclusion of which is specifically approved by the Board of Trustees. This agreement may be modified or amended only with approval from the Investment Manager, certain of its affiliates and the Fund. Any fees waived and/or expenses reimbursed under the expense reimbursement arrangements described above are not recoverable by the Investment Manager or its affiliates in future periods.
Note 4. Federal tax information
The timing and character of income and capital gain distributions are determined in accordance with income tax regulations, which may differ from GAAP because of temporary or permanent book to tax differences.
At November 30, 2022, the approximate cost of all investments for federal income tax purposes and the aggregate gross approximate unrealized appreciation and depreciation based on that cost was:
Federal
tax cost ($) | Gross unrealized
appreciation ($) | Gross unrealized
(depreciation) ($) | Net unrealized
(depreciation) ($) |
| 1,448,861,000 | 126,607,000 | (153,327,000) | (26,720,000) |
Tax cost of investments and unrealized appreciation/(depreciation) may also include timing differences that do not constitute adjustments to tax basis.
Management of the Fund has concluded that there are no significant uncertain tax positions in the Fund that would require recognition in the financial statements. However, management’s conclusion may be subject to review and adjustment at a later date based on factors including, but not limited to, new tax laws, regulations, and administrative interpretations (including relevant court decisions). Generally, the Fund’s federal tax returns for the prior three fiscal years remain subject to examination by the Internal Revenue Service.
Columbia Flexible Capital Income Fund | Semiannual Report 2022
| 29 |
Notes to Financial Statements (continued)
November 30, 2022 (Unaudited)
Note 5. Portfolio information
The cost of purchases and proceeds from sales of securities, excluding short-term investments and derivatives, if any, aggregated to $330,237,609 and $288,964,011, respectively, for the six months ended November 30, 2022. The amount of purchase and sale activity impacts the portfolio turnover rate reported in the Financial Highlights.
Note 6. Affiliated money market fund
The Fund invests in Columbia Short-Term Cash Fund, an affiliated money market fund established for the exclusive use by the Fund and other affiliated funds (the Affiliated MMF). The income earned by the Fund from such investments is included as Dividends - affiliated issuers in the Statement of Operations. As an investing fund, the Fund indirectly bears its proportionate share of the expenses of the Affiliated MMF. The Affiliated MMF prices its shares with a floating net asset value. In addition, the Board of Trustees of the Affiliated MMF may impose a fee on redemptions (sometimes referred to as a liquidity fee) or temporarily suspend redemptions (sometimes referred to as imposing a redemption gate) in the event its liquidity falls below regulatory limits.
Note 7. Interfund lending
Pursuant to an exemptive order granted by the Securities and Exchange Commission, the Fund participates in a program (the Interfund Program) allowing each participating Columbia Fund (each, a Participating Fund) to lend money directly to and, except for closed-end funds and money market funds, borrow money directly from other Participating Funds for temporary purposes. The amounts eligible for borrowing and lending under the Interfund Program are subject to certain restrictions.
Interfund loans are subject to the risk that the borrowing fund could be unable to repay the loan when due, and a delay in repayment to the lending fund could result in lost opportunities and/or additional lending costs. The exemptive order is subject to conditions intended to mitigate conflicts of interest arising from the Investment Manager’s relationship with each Participating Fund.
The Fund did not borrow or lend money under the Interfund Program during the six months ended November 30, 2022.
Note 8. Line of credit
The Fund has access to a revolving credit facility with a syndicate of banks led by JPMorgan Chase Bank, N.A., Citibank, N.A. and Wells Fargo Bank, N.A. whereby the Fund may borrow for the temporary funding of shareholder redemptions or for other temporary or emergency purposes. Pursuant to an October 27, 2022 amendment and restatement, the credit facility, which is an agreement between the Fund and certain other funds managed by the Investment Manager or an affiliated investment manager, severally and not jointly, permits aggregate borrowings up to $950 million. Interest is currently charged to each participating fund based on its borrowings at a rate equal to the higher of (i) the federal funds effective rate, (ii) the secured overnight financing rate plus 0.10% and (iii) the overnight bank funding rate, plus in each case, 1.00%. Each borrowing under the credit facility matures no later than 60 days after the date of borrowing. The Fund also pays a commitment fee equal to its pro rata share of the unused amount of the credit facility at a rate of 0.15% per annum. The commitment fee is included in other expenses in the Statement of Operations. This agreement expires annually in October unless extended or renewed. Prior to the October 27, 2022 amendment and restatement, the Fund had access to a revolving credit facility with a syndicate of banks led by JPMorgan Chase Bank, N.A., Citibank, N.A. and Wells Fargo Bank, N.A. which permitted collective borrowings up to $950 million. Interest was charged to each participating fund based on its borrowings at a rate equal to the higher of (i) the federal funds effective rate, (ii) the secured overnight financing rate plus 0.11448% and (iii) the overnight bank funding rate, plus in each case, 1.00%.
The Fund had no borrowings during the six months ended November 30, 2022.
| 30 | Columbia Flexible Capital Income Fund | Semiannual Report 2022 |
Notes to Financial Statements (continued)
November 30, 2022 (Unaudited)
Note 9. Significant risks
Credit risk
Credit risk is the risk that the value of debt instruments in the Fund’s portfolio may decline because the issuer defaults or otherwise becomes unable or unwilling, or is perceived to be unable or unwilling, to honor its financial obligations, such as making payments to the Fund when due. Credit rating agencies assign credit ratings to certain debt instruments to indicate their credit risk. Lower-rated or unrated debt instruments held by the Fund may present increased credit risk as compared to higher-rated debt instruments.
Interest rate risk
Interest rate risk is the risk of losses attributable to changes in interest rates. In general, if prevailing interest rates rise, the values of debt instruments tend to fall, and if interest rates fall, the values of debt instruments tend to rise. Actions by governments and central banking authorities can result in increases or decreases in interest rates. Higher periods of inflation could lead such authorities to raise interest rates. Increasing interest rates may negatively affect the value of debt securities held by the Fund, resulting in a negative impact on the Fund’s performance and net asset value per share. In general, the longer the maturity or duration of a debt security, the greater its sensitivity to changes in interest rates. The Fund is subject to the risk that the income generated by its investments may not keep pace with inflation.
Liquidity risk
Liquidity risk is the risk associated with a lack of marketability of investments which may make it difficult to sell the investment at a desirable time or price. Changing regulatory, market or other conditions or environments (for example, the interest rate or credit environments) may adversely affect the liquidity of the Fund’s investments. The Fund may have to accept a lower selling price for the holding, sell other investments, or forego another, more appealing investment opportunity. Generally, the less liquid the market at the time the Fund sells a portfolio investment, the greater the risk of loss or decline of value to the Fund. A less liquid market can lead to an increase in Fund redemptions, which may negatively impact Fund performance and net asset value per share, including, for example, if the Fund is forced to sell securities in a down market.
Market risk
The Fund may incur losses due to declines in the value of one or more securities in which it invests. These declines may be due to factors affecting a particular issuer, or the result of, among other things, political, regulatory, market, economic or social developments affecting the relevant market(s) more generally. In addition, turbulence in financial markets and reduced liquidity in equity, credit and/or fixed income markets may negatively affect many issuers, which could adversely affect the Fund’s ability to price or value hard-to-value assets in thinly traded and closed markets and could cause significant redemptions and operational challenges. Global economies and financial markets are increasingly interconnected, and conditions and events in one country, region or financial market may adversely impact issuers in a different country, region or financial market. These risks may be magnified if certain events or developments adversely interrupt the global supply chain; in these and other circumstances, such risks might affect companies worldwide. As a result, local, regional or global events such as terrorism, war, natural disasters, disease/virus outbreaks and epidemics or other public health issues, recessions, depressions or other events – or the potential for such events – could have a significant negative impact on global economic and market conditions.
The large-scale invasion of Ukraine by Russia in February 2022 has resulted in sanctions and market disruptions, including declines in regional and global stock markets, unusual volatility in global commodity markets and significant devaluations of Russian currency. The extent and duration of the military action are impossible to predict but could be significant. Market disruption caused by the Russian military action, and any counter-measures or responses thereto (including international sanctions, a downgrade in the country’s credit rating, purchasing and financing restrictions, boycotts, tariffs, changes in consumer or purchaser preferences, cyberattacks and espionage) could have severe adverse impacts on regional and/or global securities and commodities markets, including markets for oil and natural gas. These impacts may include reduced market liquidity, distress in credit markets, further disruption of global supply chains, increased risk of inflation, and limited access to investments in certain international markets and/or issuers. These developments and other related events could negatively impact Fund performance.
Columbia Flexible Capital Income Fund | Semiannual Report 2022
| 31 |
Notes to Financial Statements (continued)
November 30, 2022 (Unaudited)
The pandemic caused by coronavirus disease 2019 and its variants (COVID-19) has resulted in, and may continue to result in, significant global economic and societal disruption and market volatility due to disruptions in market access, resource availability, facilities operations, imposition of tariffs, export controls and supply chain disruption, among others. Such disruptions may be caused, or exacerbated by, quarantines and travel restrictions, workforce displacement and loss in human and other resources. The uncertainty surrounding the magnitude, duration, reach, costs and effects of the global pandemic, as well as actions that have been or could be taken by governmental authorities or other third parties, present unknowns that are yet to unfold. The impacts, as well as the uncertainty over impacts to come, of COVID-19 – and any other infectious illness outbreaks, epidemics and pandemics that may arise in the future – could negatively affect global economies and markets in ways that cannot necessarily be foreseen. In addition, the impact of infectious illness outbreaks and epidemics in emerging market countries may be greater due to generally less established healthcare systems, governments and financial markets. Public health crises caused by the COVID-19 outbreak may exacerbate other pre-existing political, social and economic risks in certain countries or globally. The disruptions caused by COVID-19 could prevent the Fund from executing advantageous investment decisions in a timely manner and negatively impact the Fund’s ability to achieve its investment objective. Any such events could have a significant adverse impact on the value and risk profile of the Fund.
Shareholder concentration risk
At November 30, 2022, one unaffiliated shareholder of record owned 10.6% of the outstanding shares of the Fund in one or more accounts. The Fund has no knowledge about whether any portion of those shares was owned beneficially. Affiliated shareholders of record owned 34.3% of the outstanding shares of the Fund in one or more accounts. Subscription and redemption activity by concentrated accounts may have a significant effect on the operations of the Fund. In the case of a large redemption, the Fund may be forced to sell investments at inopportune times, including its liquid positions, which may result in Fund losses and the Fund holding a higher percentage of less liquid positions. Large redemptions could result in decreased economies of scale and increased operating expenses for non-redeeming Fund shareholders.
Note 10. Subsequent events
Management has evaluated the events and transactions that have occurred through the date the financial statements were issued and noted no items requiring adjustment of the financial statements or additional disclosure.
Note 11. Information regarding pending and settled legal proceedings
Ameriprise Financial and certain of its affiliates are involved in the normal course of business in legal proceedings which include regulatory inquiries, arbitration and litigation, including class actions concerning matters arising in connection with the conduct of its activities as a diversified financial services firm. Ameriprise Financial believes that the Fund is not currently the subject of, and that neither Ameriprise Financial nor any of its affiliates are the subject of, any pending legal, arbitration or regulatory proceedings that are likely to have a material adverse effect on the Fund or the ability of Ameriprise Financial or its affiliates to perform under their contracts with the Fund. Ameriprise Financial is required to make quarterly (10-Q), annual (10-K) and, as necessary, 8-K filings with the Securities and Exchange Commission (SEC) on legal and regulatory matters that relate to Ameriprise Financial and its affiliates. Copies of these filings may be obtained by accessing the SEC website at www.sec.gov.
There can be no assurance that these matters, or the adverse publicity associated with them, will not result in increased Fund redemptions, reduced sale of Fund shares or other adverse consequences to the Fund. Further, although we believe proceedings are not likely to have a material adverse effect on the Fund or the ability of Ameriprise Financial or its affiliates to perform under their contracts with the Fund, these proceedings are subject to uncertainties and, as such, we are unable to estimate the possible loss or range of loss that may result. An adverse outcome in one or more of these proceedings could result in adverse judgments, settlements, fines, penalties or other relief that could have a material adverse effect on the consolidated financial condition or results of operations of Ameriprise Financial or one or more of its affiliates that provides services to the Fund.
| 32 | Columbia Flexible Capital Income Fund | Semiannual Report 2022 |
Approval of Management Agreement
(Unaudited)
Columbia Management Investment Advisers, LLC (the Investment Manager, and together with its domestic and global affiliates, Columbia Threadneedle Investments), a wholly-owned subsidiary of Ameriprise Financial, Inc. (Ameriprise Financial), serves as the investment manager to Columbia Flexible Capital Income Fund (the Fund). Under a management agreement (the Management Agreement), the Investment Manager provides investment advice and other services to the Fund and other funds distributed by Columbia Management Investment Distributors, Inc. (collectively, the Funds).
On an annual basis, the Fund’s Board of Trustees (the Board), including the independent Board members (the Independent Trustees), considers renewal of the Management Agreement. The Investment Manager prepared detailed reports for the Board and its Contracts Committee (including its Contracts Subcommittee) in November 2021 and March, April and June 2022, including reports providing the results of analyses performed by an independent third-party data provider, Broadridge Financial Solutions, Inc. (Broadridge), and comprehensive responses to written requests for information by independent legal counsels to the Independent Trustees (Independent Legal Counsel) to the Investment Manager, to assist the Board in making this determination. In addition, throughout the year, the Board (or its committees or subcommittees) regularly meets with portfolio management teams and senior management personnel and reviews information prepared by the Investment Manager addressing the services the Investment Manager provides and Fund performance. The Board also accords appropriate weight to the work, deliberations and conclusions of the various committees, such as the Contracts Committee, the Investment Review Committee, the Audit Committee and the Compliance Committee in determining whether to continue the Management Agreement.
The Board, at its June 23, 2022 Board meeting (the June Meeting), considered the renewal of the Management Agreement for an additional one-year term. At the June Meeting, Independent Legal Counsel reviewed with the Independent Trustees various factors relevant to the Board’s consideration of advisory agreements and the Board’s legal responsibilities related to such consideration. The Independent Trustees considered all information that they, their legal counsel or the Investment Manager believed reasonably necessary to evaluate and to approve the continuation of the Management Agreement. Among other things, the information and factors considered included the following:
| • | Information on the investment performance of the Fund relative to the performance of a group of mutual funds determined to be comparable to the Fund by Broadridge, as well as performance relative to benchmarks; |
| • | Information on the Fund’s management fees and total expenses, including information comparing the Fund’s expenses to those of a group of comparable mutual funds, as determined by Broadridge; |
| • | The Investment Manager’s agreement to contractually limit or cap total operating expenses for the Fund so that total operating expenses (excluding certain fees and expenses, such as transaction costs and certain other investment related expenses, interest, taxes, acquired fund fees and expenses and infrequent and/or unusual expenses) would not exceed a specified annual rate, as a percentage of the Fund’s net assets; |
| • | Terms of the Management Agreement; |
| • | Descriptions of other agreements and arrangements with affiliates of the Investment Manager relating to the operations of the Fund, including agreements with respect to the provision of transfer agency and shareholder services to the Fund; |
| • | Descriptions of various services performed by the Investment Manager under the Management Agreement, including portfolio management and portfolio trading practices; |
| • | Information regarding any recently negotiated management fees of similarly-managed portfolios of other institutional clients of the Investment Manager; |
| • | Information regarding the resources of the Investment Manager, including information regarding senior management, portfolio managers and other personnel; |
| • | Information regarding the capabilities of the Investment Manager with respect to compliance monitoring services; |
| • | The profitability to the Investment Manager and its affiliates from their relationships with the Fund; and |
| • | Report provided by the Board’s independent fee consultant, JDL Consultants, LLC (JDL). |
Columbia Flexible Capital Income Fund | Semiannual Report 2022
| 33 |
Approval of Management Agreement (continued)
(Unaudited)
Following an analysis and discussion of the foregoing, and the factors identified below, the Board, including all of the Independent Trustees, approved the renewal of the Management Agreement.
Nature, extent and quality of services provided by the Investment Manager
The Board analyzed various reports and presentations it had received detailing the services performed by the Investment Manager, as well as its history, expertise, resources and relative capabilities, and the qualifications of its personnel.
The Board specifically considered the many developments during recent years concerning the services provided by the Investment Manager. Among other things, the Board noted the organization and depth of the equity and credit research departments. The Board further observed the enhancements to the investment risk management department’s processes, systems and oversight, over the past several years, as well as planned 2022 initiatives in this regard. The Board also took into account the broad scope of services provided by the Investment Manager to the Fund, including, among other services, investment, risk and compliance oversight. The Board also took into account the information it received concerning the Investment Manager’s ability to attract and retain key portfolio management personnel and that it has sufficient resources to provide competitive and adequate compensation to investment personnel. The Board also observed that the Investment Manager has been able to effectively manage, operate and distribute the Funds through the COVID-19 pandemic period with no disruptions in services provided. The Board also considered added personnel and resources obtained by Columbia Threadneedle through Ameriprise Financial’s acquisition of BMO Financial Group’s Europe, Middle East, and Africa (EMEA) asset management business.
In connection with the Board’s evaluation of the overall package of services provided by the Investment Manager, the Board also considered the nature, quality and range of administrative services provided to the Fund by the Investment Manager, as well as the achievements in 2021 in the performance of administrative services, and noted the various enhancements anticipated for 2022. In evaluating the quality of services provided under the Management Agreement, the Board also took into account the organization and strength of the Fund’s and its service providers’ compliance programs. The Board also reviewed the financial condition of the Investment Manager and its affiliates and each entity’s ability to carry out its responsibilities under the Management Agreement and the Fund’s other service agreements.
In addition, the Board discussed the acceptability of the terms of the Management Agreement, noting that no changes were proposed from the form of agreement previously approved. The Board also noted the wide array of legal and compliance services provided to the Fund under the Management Agreement.
After reviewing these and related factors (including investment performance as discussed below), the Board concluded, within the context of their overall conclusions, that the nature, extent and quality of the services provided to the Fund under the Management Agreement supported the continuation of the Management Agreement.
Investment performance
In this connection, the Board carefully reviewed the investment performance of the Fund, including detailed reports providing the results of analyses performed by each of the Investment Manager, Broadridge and JDL collectively showing, for various periods (including since manager inception): (i) the performance of the Fund, (ii) the performance of a benchmark index, (iii) the percentage ranking of the Fund among its comparison group, (iv) the Fund’s performance relative to peers and benchmarks and (v) the net assets of the Fund. The Board observed that the Fund’s performance for certain periods ranked above median based on information provided by Broadridge.
The Board also reviewed a description of the third-party data provider’s methodology for identifying the Fund’s peer groups for purposes of performance and expense comparisons.
The Board also considered the Investment Manager’s performance and reputation generally. After reviewing these and related factors, the Board concluded, within the context of their overall conclusions, that the performance of the Fund and the Investment Manager, in light of other considerations, supported the continuation of the Management Agreement.
| 34 | Columbia Flexible Capital Income Fund | Semiannual Report 2022 |
Approval of Management Agreement (continued)
(Unaudited)
Comparative fees, costs of services provided and the profits realized by the Investment Manager and its affiliates from their relationships with the Fund
The Board reviewed comparative fees and the costs of services provided under the Management Agreement. The Board members considered detailed comparative information set forth in an annual report on fees and expenses, including, among other things, data (based on analyses conducted by Broadridge and JDL) showing a comparison of the Fund’s expenses with median expenses paid by funds in its comparative peer universe, as well as data showing the Fund’s contribution to the Investment Manager’s profitability.
The Board considered the reports of JDL, which assisted in the Board’s analysis of the Funds’ performance and expenses and the reasonableness of the Funds’ fee rates. The Board accorded particular weight to the notion that a primary objective of the level of fees is to achieve a rational pricing model applied consistently across the various product lines in the Fund family, while assuring that the overall fees for each Fund (with certain exceptions) are generally in line with the current “pricing philosophy” such that Fund total expense ratios, in general, approximate or are lower than the median expense ratios of funds in the same Lipper comparison universe. The Board took into account that the Fund’s total expense ratio (after considering proposed expense caps/waivers) approximated the peer universe’s median expense ratio.
After reviewing these and related factors, the Board concluded, within the context of their overall conclusions, that the levels of management fees and expenses of the Fund, in light of other considerations, supported the continuation of the Management Agreement.
The Board also considered the profitability of the Investment Manager and its affiliates in connection with the Investment Manager providing management services to the Fund. With respect to the profitability of the Investment Manager and its affiliates, the Independent Trustees referred to information discussing the profitability to the Investment Manager and Ameriprise Financial from managing, operating and distributing the Funds. The Board considered that in 2021 the Board had considered 2020 profitability and that the 2022 information showed that the profitability generated by the Investment Manager in 2021 increased from 2020 levels, due to a variety of factors, including the increased assets under management of the Funds. It also took into account the indirect economic benefits flowing to the Investment Manager or its affiliates in connection with managing or distributing the Funds, such as the enhanced ability to offer various other financial products to Ameriprise Financial customers, soft dollar benefits and overall reputational advantages. The Board noted that the fees paid by the Fund should permit the Investment Manager to offer competitive compensation to its personnel, make necessary investments in its business and earn an appropriate profit. After reviewing these and related factors, the Board concluded, within the context of their overall conclusions, that the costs of services provided and the profitability to the Investment Manager and its affiliates from their relationships with the Fund supported the continuation of the Management Agreement.
Economies of scale
The Board considered the potential existence of economies of scale in the provision by the Investment Manager of services to the Fund, to groups of related funds and to the Investment Manager as a whole, and whether those economies of scale were shared with the Fund through breakpoints in investment management fees or other means, such as expense limitation arrangements and additional investments by the Investment Manager in investment, trading, compliance and other resources. The Board considered the economies of scale that might be realized as the Fund’s net asset level grows and took note of the extent to which Fund shareholders might also benefit from such growth. In this regard, the Board took into account that management fees decline as Fund assets exceed various breakpoints, all of which have not been surpassed.The Board observed that the Management Agreement provided for breakpoints in the management fee rate schedule that allow opportunities for shareholders to realize lower fees as Fund assets grow and that there are additional opportunities through other means for sharing economies of scale with shareholders.
Conclusion
The Board reviewed all of the above considerations in reaching its decision to approve the continuation of the Management Agreement. In reaching its conclusions, no single factor was determinative.
Columbia Flexible Capital Income Fund | Semiannual Report 2022
| 35 |
Approval of Management Agreement (continued)
(Unaudited)
On June 23, 2022, the Board, including all of the Independent Trustees, determined that fees payable under the Management Agreement were fair and reasonable in light of the extent and quality of services provided and approved the renewal of the Management Agreement.
| 36 | Columbia Flexible Capital Income Fund | Semiannual Report 2022 |
[THIS PAGE INTENTIONALLY LEFT BLANK]
[THIS PAGE INTENTIONALLY LEFT BLANK]
[THIS PAGE INTENTIONALLY LEFT BLANK]
Columbia Flexible Capital Income Fund
P.O. Box 219104
Kansas City, MO 64121-9104
Please read and consider the investment objectives, risks, charges and expenses for any fund carefully before investing. For a prospectus and summary prospectus, which contains this and other important information about the Fund, go to
columbiathreadneedleus.com/investor/. The Fund is distributed by Columbia Management Investment Distributors, Inc., member FINRA, and managed by Columbia Management Investment Advisers, LLC.
Columbia Threadneedle Investments (Columbia Threadneedle) is the global brand name of the Columbia and Threadneedle group of companies. All rights reserved.
© 2023 Columbia Management Investment Advisers, LLC.
columbiathreadneedleus.com/investor/

Semiannual Report
November 30, 2022 (Unaudited)
Columbia Mortgage Opportunities Fund
Not FDIC or NCUA Insured • No Financial Institution Guarantee • May Lose Value
If you elect to receive the shareholder report for Columbia Mortgage Opportunities Fund (the Fund) in paper, mailed to you, the Fund mails one shareholder report to each shareholder address, unless such shareholder elects to receive shareholder reports from the Fund electronically via e-mail or by having a paper notice mailed to you (Postcard Notice) that your Fund’s shareholder report is available at the Columbia funds’ website (columbiathreadneedleus.com/investor/). If you would like more than one report in paper to be mailed to you, or would like to elect to receive reports via e-mail or access them through Postcard Notice, please call shareholder services at 800.345.6611 and additional reports will be sent to you.
Proxy voting policies and procedures
The policy of the Board of Trustees is to vote the proxies of the companies in which the Fund holds investments consistent with the procedures as stated in the Statement of Additional Information (SAI). You may obtain a copy of the SAI without charge by calling 800.345.6611; contacting your financial intermediary; visiting columbiathreadneedleus.com/investor/; or searching the website of the Securities and Exchange Commission (SEC) at sec.gov. Information regarding how the Fund voted proxies relating to portfolio securities is filed with the SEC by August 31st for the most recent 12-month period ending June 30th of that year, and is available without charge by visiting columbiathreadneedleus.com/investor/, or searching the website of the SEC at sec.gov.
Quarterly schedule of investments
The Fund files a complete schedule of portfolio holdings with the SEC for the first and third quarters of each fiscal year on Form N-PORT. The Fund’s Form N-PORT filings are available on the SEC’s website at sec.gov. The Fund’s complete schedule of portfolio holdings, as filed on Form N-PORT, is available on columbiathreadneedleus.com/investor/ or can also be obtained without charge, upon request, by calling 800.345.6611.
Additional Fund information
For more information about the Fund, please visit columbiathreadneedleus.com/investor/ or call 800.345.6611. Customer Service Representatives are available to answer your questions Monday through Friday from 8 a.m. to 7 p.m. Eastern time.
Fund investment manager
Columbia Management Investment Advisers, LLC (the Investment Manager)
290 Congress Street
Boston, MA 02210
Fund distributor
Columbia Management Investment Distributors, Inc.
290 Congress Street
Boston, MA 02210
Fund transfer agent
Columbia Management Investment Services Corp.
P.O. Box 219104
Kansas City, MO 64121-9104
Columbia Mortgage Opportunities Fund | Semiannual Report 2022
Fund at a Glance
(Unaudited)
Investment objective
The Fund seeks total return, consisting of long-term capital appreciation and current income.
Portfolio management
Jason Callan
Co-Portfolio Manager
Managed Fund since 2014
Tom Heuer, CFA
Co-Portfolio Manager
Managed Fund since 2014
Ryan Osborn, CFA
Co-Portfolio Manager
Managed Fund since 2019
| Average annual total returns (%) (for the period ended November 30, 2022) |
| | | Inception | 6 Months
cumulative | 1 Year | 5 Years | Life |
| Class A | Excluding sales charges | 04/30/14 | -11.84 | -17.82 | 1.45 | 2.69 |
| | Including sales charges | | -14.52 | -20.31 | 0.84 | 2.32 |
| Advisor Class | 04/30/14 | -11.74 | -17.55 | 1.71 | 2.93 |
| Class C | Excluding sales charges | 04/30/14 | -12.19 | -18.46 | 0.67 | 1.91 |
| | Including sales charges | | -13.05 | -19.24 | 0.67 | 1.91 |
| Institutional Class | 04/30/14 | -11.74 | -17.63 | 1.69 | 2.93 |
| Institutional 2 Class | 04/30/14 | -11.72 | -17.59 | 1.75 | 3.00 |
| Institutional 3 Class* | 03/01/17 | -11.69 | -17.45 | 1.81 | 2.93 |
| FTSE One-Month U.S. Treasury Bill Index | | 1.08 | 1.14 | 1.15 | 0.78 |
Returns for Class A shares are shown with and without the maximum initial sales charge of 3.00%. Returns for Class C shares are shown with and without the 1.00% contingent deferred sales charge for the first year only. The Fund’s other share classes are not subject to sales charges and have limited eligibility. Please see the Fund’s prospectus for details. Performance for different share classes will vary based on differences in sales charges and fees associated with each share class. All results shown assume reinvestment of distributions during the period. Returns do not reflect the deduction of taxes that a shareholder may pay on Fund distributions or on the redemption of Fund shares. Performance results reflect the effect of any fee waivers or reimbursements of Fund expenses by Columbia Management Investment Advisers, LLC and/or any of its affiliates. Absent these fee waivers or expense reimbursement arrangements, performance results would have been lower.
The performance information shown represents past performance and is not a guarantee of future results. The investment return and principal value of your investment will fluctuate so that your shares, when redeemed, may be worth more or less than their original cost. Current performance may be lower or higher than the performance information shown. You may obtain performance information current to the most recent month-end by contacting your financial intermediary, visiting columbiathreadneedleus.com/investor/ or calling 800.345.6611.
| * | The returns shown for periods prior to the share class inception date (including returns for the Life of the Fund, which are since Fund inception) include the returns of the Fund’s oldest share class. Since the Fund launched more than one share class at its inception, Class A shares were used. These returns are adjusted to reflect any higher class-related operating expenses of the newer share classes, as applicable. Please visit columbiathreadneedleus.com/investor/investment-products/mutual-funds/appended-performance for more information. |
The FTSE One-Month U.S. Treasury Bill Index is an unmanaged index that measures the rate of return for 30-day U.S. Treasury Bills.
Indices are not available for investment, are not professionally managed and do not reflect sales charges, fees, brokerage commissions, taxes or other expenses of investing. Securities in the Fund may not match those in an index.
Columbia Mortgage Opportunities Fund | Semiannual Report 2022
| 3 |
Fund at a Glance (continued)
(Unaudited)
| Portfolio breakdown (%) (at November 30, 2022) |
| Asset-Backed Securities — Non-Agency | 6.4 |
| Commercial Mortgage-Backed Securities - Agency | 0.1 |
| Commercial Mortgage-Backed Securities - Non-Agency | 3.5 |
| Money Market Funds | 3.5 |
| Options Purchased Calls | 1.3 |
| Residential Mortgage-Backed Securities - Agency | 53.8 |
| Residential Mortgage-Backed Securities - Non-Agency | 31.4 |
| Total | 100.0 |
Percentages indicated are based upon total investments including options purchased and excluding all other investments in derivatives, if any. The Fund’s portfolio composition is subject to change.
| Quality breakdown (%) (at November 30, 2022) |
| AAA rating | 56.7 |
| AA rating | 0.1 |
| A rating | 1.1 |
| BBB rating | 4.2 |
| BB rating | 10.7 |
| B rating | 6.7 |
| CCC rating | 0.5 |
| Not rated | 20.0 |
| Total | 100.0 |
Percentages indicated are based upon total fixed income investments.
Bond ratings apply to the underlying holdings of the Fund and not the Fund itself and are divided into categories ranging from highest to lowest credit quality, determined by using the middle rating of Moody’s, S&P and Fitch, after dropping the highest and lowest available ratings. When ratings are available from only two rating agencies, the lower rating is used. When a rating is available from only one rating agency, that rating is used. If a security is not rated but has a rating by Kroll and/or DBRS, the same methodology is applied to those bonds that would otherwise be not rated. When a bond is not rated by any rating agency, it is designated as “Not rated.” Credit quality ratings assigned by a rating agency are subjective opinions, not statements of fact, and are subject to change, including daily. The ratings assigned by credit rating agencies are but one of the considerations that the Investment Manager and/or Fund’s subadviser incorporates into its credit analysis process, along with such other issuer-specific factors as cash flows, capital structure and leverage ratios, ability to de-leverage (repay) through free cash flow, quality of management, market positioning and access to capital, as well as such security-specific factors as the terms of the security (e.g., interest rate and time to maturity) and the amount and type of any collateral.
| 4 | Columbia Mortgage Opportunities Fund | Semiannual Report 2022 |
Understanding Your Fund’s Expenses
(Unaudited)
As an investor, you incur two types of costs. There are shareholder transaction costs, which generally include sales charges on purchases and may include redemption fees. There are also ongoing fund costs, which generally include management fees, distribution and/or service fees, and other fund expenses. The following information is intended to help you understand your ongoing costs (in dollars) of investing in the Fund and to help you compare these costs with the ongoing costs of investing in other mutual funds.
Analyzing your Fund’s expenses
To illustrate these ongoing costs, we have provided examples and calculated the expenses paid by investors in each share class of the Fund during the period. The actual and hypothetical information in the table is based on an initial investment of $1,000 at the beginning of the period indicated and held for the entire period. Expense information is calculated two ways and each method provides you with different information. The amount listed in the “Actual” column is calculated using the Fund’s actual operating expenses and total return for the period. You may use the Actual information, together with the amount invested, to estimate the expenses that you paid over the period. Simply divide your account value by $1,000 (for example, an $8,600 account value divided by $1,000 = 8.6), then multiply the results by the expenses paid during the period under the “Actual” column. The amount listed in the “Hypothetical” column assumes a 5% annual rate of return before expenses (which is not the Fund’s actual return) and then applies the Fund’s actual expense ratio for the period to the hypothetical return. You should not use the hypothetical account values and expenses to estimate either your actual account balance at the end of the period or the expenses you paid during the period. See “Compare with other funds” below for details on how to use the hypothetical data.
Compare with other funds
Since all mutual funds are required to include the same hypothetical calculations about expenses in shareholder reports, you can use this information to compare the ongoing cost of investing in the Fund with other funds. To do so, compare the hypothetical example with the 5% hypothetical examples that appear in the shareholder reports of other funds. As you compare hypothetical examples of other funds, it is important to note that hypothetical examples are meant to highlight the ongoing costs of investing in a fund only and do not reflect any transaction costs, such as sales charges, or redemption or exchange fees. Therefore, the hypothetical calculations are useful in comparing ongoing costs only, and will not help you determine the relative total costs of owning different funds. If transaction costs were included in these calculations, your costs would be higher.
| June 1, 2022 — November 30, 2022 |
| | Account value at the
beginning of the
period ($) | Account value at the
end of the
period ($) | Expenses paid during
the period ($) | Fund’s annualized
expense ratio (%) |
| | Actual | Hypothetical | Actual | Hypothetical | Actual | Hypothetical | Actual |
| Class A | 1,000.00 | 1,000.00 | 881.60 | 1,020.00 | 4.76 | 5.11 | 1.01 |
| Advisor Class | 1,000.00 | 1,000.00 | 882.60 | 1,021.26 | 3.59 | 3.85 | 0.76 |
| Class C | 1,000.00 | 1,000.00 | 878.10 | 1,016.24 | 8.29 | 8.90 | 1.76 |
| Institutional Class | 1,000.00 | 1,000.00 | 882.60 | 1,021.26 | 3.59 | 3.85 | 0.76 |
| Institutional 2 Class | 1,000.00 | 1,000.00 | 882.80 | 1,021.46 | 3.40 | 3.65 | 0.72 |
| Institutional 3 Class | 1,000.00 | 1,000.00 | 883.10 | 1,021.71 | 3.16 | 3.40 | 0.67 |
Expenses paid during the period are equal to the annualized expense ratio for each class as indicated above, multiplied by the average account value over the period and then multiplied by the number of days in the Fund’s most recent fiscal half year and divided by 365.
Expenses do not include fees and expenses incurred indirectly by the Fund from its investment in underlying funds, including affiliated and non-affiliated pooled investment vehicles, such as mutual funds and exchange-traded funds.
Had Columbia Management Investment Advisers, LLC and/or certain of its affiliates not waived/reimbursed certain fees and expenses, account value at the end of the period would have been reduced.
Columbia Mortgage Opportunities Fund | Semiannual Report 2022
| 5 |
Portfolio of Investments
November 30, 2022 (Unaudited)
(Percentages represent value of investments compared to net assets)
Investments in securities
| Asset-Backed Securities — Non-Agency 11.1% |
| Issuer | Coupon
Rate | | Principal
Amount ($) | Value ($) |
| American Credit Acceptance Receivables Trust(a) |
| Series 2020-4 Class F |
| 08/13/2027 | 5.220% | | 3,620,000 | 3,503,654 |
| Series 2021-2 Class F |
| 01/13/2028 | 3.730% | | 4,000,000 | 3,732,983 |
| Subordinated Series 2021-1 Class F |
| 11/15/2027 | 4.010% | | 900,000 | 859,709 |
| Subordinated Series 2021-2 Class E |
| 07/13/2027 | 2.540% | | 6,000,000 | 5,532,770 |
| ARES CLO(a),(b) |
| Series 2021-60A Class E |
3-month USD LIBOR + 6.250%
Floor 6.250%
07/18/2034 | 10.444% | | 15,000,000 | 12,433,350 |
| Ares LVIII CLO Ltd.(a),(b) |
| Series 2020-58A Class ER |
3-month Term SOFR + 6.700%
Floor 6.700%
01/15/2035 | 10.564% | | 6,000,000 | 4,878,072 |
| ARES XLIV CLO Ltd.(a),(b) |
| Series 2017-44A Class DR |
3-month USD LIBOR + 6.870%
Floor 6.870%
04/15/2034 | 10.949% | | 25,975,000 | 22,167,195 |
| Avant Loans Funding Trust(a) |
| Subordinated Series 2021-REV1 Class C |
| 07/15/2030 | 2.300% | | 3,375,000 | 3,055,625 |
| Bain Capital Credit CLO Ltd.(a),(b) |
| Series 2020-4A Class E |
3-month USD LIBOR + 7.950%
Floor 7.950%
10/20/2033 | 12.193% | | 8,100,000 | 7,722,240 |
| Carlyle Global Market Strategies(a),(b) |
| Series 2021-5A Class E |
3-month USD LIBOR + 6.250%
Floor 6.250%
07/20/2034 | 10.493% | | 14,125,000 | 12,379,404 |
| Carlyle Global Market Strategies CLO Ltd.(a),(b) |
| Series 2013-3A Class BR |
3-month USD LIBOR + 1.700%
Floor 1.700%
10/15/2030 | 5.779% | | 11,000,000 | 10,175,143 |
| Series 2015-4A Class CR |
3-month USD LIBOR + 3.700%
07/20/2032 | 7.943% | | 7,500,000 | 6,797,610 |
| Series 2016-3A Class ERR |
3-month USD LIBOR + 7.000%
Floor 7.000%
07/20/2034 | 11.243% | | 10,000,000 | 8,138,730 |
| Asset-Backed Securities — Non-Agency (continued) |
| Issuer | Coupon
Rate | | Principal
Amount ($) | Value ($) |
| Carvana Auto Receivables Trust(a) |
| Subordinated Series 2021-N1 Class E |
| 01/10/2028 | 2.880% | | 11,180,000 | 10,091,453 |
| Consumer Loan Underlying Bond Credit Trust(a),(c),(d) |
| Subordinated Series 2018-P1 Class CERT |
| 07/15/2025 | 0.000% | | 850,000 | 5,015,000 |
| Subordinated Series 2018-P2 Class CERT |
| 10/15/2025 | 0.000% | | 850,000 | 7,267,500 |
| Dryden CLO Ltd.(a),(b) |
| Series 2018-57A Class B |
3-month USD LIBOR + 1.350%
Floor 1.350%
05/15/2031 | 5.956% | | 1,250,000 | 1,195,310 |
| LendingClub Receivables Trust(a),(c),(d) |
| Series 2020-2 Class R |
| 02/15/2046 | 0.000% | | 865,000 | 1,946,250 |
| LendingPoint Asset Securitization Trust(a),(d),(e) |
| Subordinated Series 2021-1 Class C |
| 04/15/2027 | 4.935% | | 14,564,000 | 14,090,670 |
| Subordinated Series 2021-1 Class D |
| 04/15/2027 | 7.226% | | 15,712,000 | 14,258,640 |
| LendingPoint Asset Securitization Trust(a) |
| Subordinated Series 2021-A Class C |
| 12/15/2028 | 2.750% | | 12,000,000 | 11,332,684 |
| LP LMS Asset Securitization Trust(a),(d),(e) |
| Subordinated Series 2021-2A Class B |
| 01/15/2029 | 2.330% | | 6,882,000 | 6,249,716 |
| Madison Park Funding XLVII Ltd.(a),(b) |
| Series 2020-47A Class E |
3-month USD LIBOR + 7.460%
Floor 7.460%
01/19/2034 | 10.198% | | 5,200,000 | 4,978,563 |
| Madison Park Funding XXII Ltd.(a),(b) |
| Series 2016-22A Class DR |
3-month USD LIBOR + 3.500%
Floor 3.500%
01/15/2033 | 7.579% | | 3,700,000 | 3,389,759 |
| Marlette Funding Trust(a) |
| Series 2021-1A Class D |
| 06/16/2031 | 2.470% | | 1,000,000 | 901,636 |
| Octagon 54 Ltd.(a),(b) |
| Series 2021-1A Class E |
3-month USD LIBOR + 6.250%
Floor 6.250%
07/15/2034 | 10.329% | | 12,500,000 | 10,347,175 |
The accompanying Notes to Financial Statements are an integral part of this statement.
| 6 | Columbia Mortgage Opportunities Fund | Semiannual Report 2022 |
Portfolio of Investments (continued)
November 30, 2022 (Unaudited)
| Asset-Backed Securities — Non-Agency (continued) |
| Issuer | Coupon
Rate | | Principal
Amount ($) | Value ($) |
| Octagon Investment Partners 47 Ltd.(a),(b) |
| Series 2020-1A Class ER |
3-month USD LIBOR + 6.250%
Floor 6.250%
07/20/2034 | 10.493% | | 15,250,000 | 13,361,440 |
| OZLM Funding IV Ltd.(a),(b) |
| Series 2013-4A Class D2R |
3-month USD LIBOR + 7.250%
Floor 7.250%
10/22/2030 | 11.575% | | 2,000,000 | 1,685,298 |
| OZLM XVII Ltd.(a),(b) |
| Series 2017-17A Class D |
3-month USD LIBOR + 5.990%
Floor 5.990%
07/20/2030 | 10.233% | | 3,750,000 | 3,132,004 |
| Pagaya AI Debt Selection Trust(a),(d) |
| Series 2020-2 Class NOTE |
| 12/15/2027 | 7.500% | | 1,007,374 | 987,226 |
| Pagaya AI Debt Selection Trust(a),(c),(d) |
| Series 2020-3 Class CERT |
| 05/17/2027 | 0.000% | | 23,803,550 | 3,092,272 |
| Series 2021-1 Class CERT |
| 11/15/2027 | 0.000% | | 1,901,904 | 18,815 |
| Subordinated Series 2021-3 Class |
| 05/15/2029 | 0.000% | | 12,925,852 | 1,375,349 |
| Subordinated Series 2021-5 Class |
| 08/15/2029 | 0.000% | | 12,321,273 | 3,195,818 |
| Pagaya AI Debt Selection Trust(a) |
| Series 2021-2 Class NOTE |
| 01/25/2029 | 3.000% | | 15,613,907 | 14,511,119 |
| PAGAYA AI Debt Trust(a) |
| Subordinated Series 2022-3 Class B |
| 03/15/2030 | 8.050% | | 11,500,000 | 11,171,479 |
| Palmer Square Loan Funding Ltd.(a),(b) |
| Series 2020-4A Class D |
3-month USD LIBOR + 7.050%
Floor 7.050%
11/25/2028 | 11.807% | | 7,000,000 | 6,604,948 |
| Prosper Pass-Through Trust(a),(d) |
| Series 2019-ST2 Class A |
| 11/15/2025 | 3.750% | | 563,082 | 563,082 |
| Redding Ridge Asset Management Ltd.(a),(b) |
| Series 2018-4A Class D |
3-month USD LIBOR + 5.850%
04/15/2030 | 9.929% | | 5,000,000 | 4,196,685 |
| Research-Driven Pagaya Motor Asset Trust IV(a) |
| Series 2021-2A Class A |
| 03/25/2030 | 2.650% | | 11,648,883 | 10,234,120 |
| Asset-Backed Securities — Non-Agency (continued) |
| Issuer | Coupon
Rate | | Principal
Amount ($) | Value ($) |
| RR 16 Ltd.(a),(b) |
| Series 2021-16A Class D |
3-month USD LIBOR + 6.250%
Floor 6.250%
07/15/2036 | 10.329% | | 14,000,000 | 12,346,096 |
| SoFi Consumer Loan Program LLC(a),(c),(d) |
| Series 2016-2 Class R |
| 10/27/2025 | 0.000% | | 379,888 | 949,720 |
| Upstart Pass-Through Trust(a) |
| Series 2021-ST1 Class A |
| 02/20/2027 | 2.750% | | 2,350,071 | 2,231,432 |
| Series 2021-ST7 Class A |
| 09/20/2029 | 1.850% | | 3,311,060 | 3,076,701 |
| US Auto Funding(a) |
| Subordinated Series 2021-1A Class D |
| 03/15/2027 | 4.360% | | 2,375,000 | 2,147,912 |
Total Asset-Backed Securities — Non-Agency
(Cost $368,143,077) | 287,322,357 |
|
| Commercial Mortgage-Backed Securities - Agency 0.1% |
| | | | |
| Government National Mortgage Association(f),(g) |
| Series 2017-30 Class IO |
| 08/16/2058 | 0.576% | | 31,439,263 | 881,909 |
| Series 2019-102 Class IB |
| 03/16/2060 | 0.834% | | 12,597,318 | 741,778 |
| Series 2020-19 Class IO |
| 12/16/2061 | 0.699% | | 19,321,794 | 1,049,683 |
| Series 2020-3 Class IO |
| 02/16/2062 | 0.624% | | 18,507,821 | 897,985 |
Total Commercial Mortgage-Backed Securities - Agency
(Cost $12,343,681) | 3,571,355 |
|
| Commercial Mortgage-Backed Securities - Non-Agency 6.2% |
| | | | |
| BAMLL Commercial Mortgage Securities Trust(a),(f) |
| Subordinated Series 2013-WBRK Class E |
| 03/10/2037 | 3.652% | | 4,500,000 | 3,742,807 |
| BFLD Trust(a),(b) |
| Series 2019-DPLO Class F |
1-month USD LIBOR + 2.540%
Floor 2.540%
10/15/2034 | 6.413% | | 1,165,000 | 1,088,736 |
| Series 2019-DPLO Class G |
1-month USD LIBOR + 3.190%
Floor 3.190%
10/15/2034 | 7.063% | | 6,853,000 | 6,401,037 |
| BHMS Mortgage Trust(a),(b) |
| Series 2018-ATLS Class A |
1-month USD LIBOR + 1.250%
Floor 1.250%
07/15/2035 | 5.126% | | 10,500,000 | 10,106,220 |
The accompanying Notes to Financial Statements are an integral part of this statement.
Columbia Mortgage Opportunities Fund | Semiannual Report 2022
| 7 |
Portfolio of Investments (continued)
November 30, 2022 (Unaudited)
| Commercial Mortgage-Backed Securities - Non-Agency (continued) |
| Issuer | Coupon
Rate | | Principal
Amount ($) | Value ($) |
| Braemar Hotels & Resorts Trust(a),(b) |
| Series 2018-PRME Class E |
1-month USD LIBOR + 2.400%
Floor 2.400%
06/15/2035 | 6.276% | | 11,000,000 | 10,161,308 |
| BX Commercial Mortgage Trust(a),(b) |
| Subordinated Series 2021-MFM1 Class G |
1-month USD LIBOR + 3.900%
Floor 3.900%
01/15/2034 | 7.775% | | 650,000 | 588,332 |
| BXP Trust(a),(f) |
| Subordinated Series 2021-601L Class E |
| 01/15/2044 | 2.868% | | 21,000,000 | 12,782,383 |
| CLNY Trust(a),(b) |
| Subordinated Series 2019-IKPR Class E |
1-month USD LIBOR + 2.721%
Floor 2.721%
11/15/2038 | 6.596% | | 12,575,000 | 11,536,206 |
| COMM Mortgage Trust(a),(f) |
| Subordinated Series 2020-CBM Class F |
| 02/10/2037 | 3.754% | | 17,650,000 | 15,194,753 |
| Credit Suisse Mortgage Capital Certificates OA LLC(a) |
| Subordinated Series 2014-USA Class E |
| 09/15/2037 | 4.373% | | 24,275,000 | 16,018,674 |
| Subordinated Series 2014-USA Class F |
| 09/15/2037 | 4.373% | | 18,400,000 | 9,638,724 |
| CSMC Trust(a),(f) |
| Subordinated Series 2019-UVIL Class E |
| 12/15/2041 | 3.393% | | 5,200,000 | 3,791,914 |
| Hilton USA Trust(a) |
| Subordinated Series 2016-SFP Class F |
| 11/05/2035 | 6.155% | | 27,400,000 | 25,267,521 |
| Home Partners of America Trust(a) |
| Series 2019-2 Class F |
| 10/19/2039 | 3.866% | | 2,774,834 | 2,298,521 |
| Morgan Stanley Capital I Trust(a),(f) |
| Series 2019-MEAD Class E |
| 11/10/2036 | 3.283% | | 5,500,000 | 4,714,406 |
| Progress Residential Trust(a) |
| Series 2020-SFR1 Class F |
| 04/17/2037 | 3.431% | | 5,975,000 | 5,376,426 |
| Wells Fargo Commercial Mortgage Trust(a),(b) |
| Series 2021-FCMT Class E |
1-month USD LIBOR + 4.500%
Floor 4.500%
05/15/2031 | 8.375% | | 21,600,000 | 20,491,754 |
Total Commercial Mortgage-Backed Securities - Non-Agency
(Cost $184,434,476) | 159,199,722 |
|
| Residential Mortgage-Backed Securities - Agency 94.1% |
| Issuer | Coupon
Rate | | Principal
Amount ($) | Value ($) |
| Fannie Mae REMICS(b),(g) |
| CMO Series 2017-81 Class SM |
-1.0 x 1-month USD LIBOR + 6.200%
Cap 6.200%
10/25/2047 | 2.184% | | 31,363,319 | 3,658,610 |
| Federal Home Loan Mortgage Corp. |
| 03/01/2052 | 2.500% | | 115,796,220 | 99,763,988 |
| 05/01/2052 | 3.000% | | 48,442,049 | 43,129,442 |
| Federal Home Loan Mortgage Corp.(b),(g) |
| CMO Series 2013-101 Class HS |
-1.0 x 1-month USD LIBOR + 6.500%
Cap 6.500%
10/25/2043 | 2.484% | | 11,860,051 | 1,450,504 |
| CMO Series 3922 Class SH |
-1.0 x 1-month USD LIBOR + 5.900%
Cap 5.900%
09/15/2041 | 2.027% | | 2,836,943 | 231,894 |
| CMO Series 4097 Class ST |
-1.0 x 1-month USD LIBOR + 6.050%
Cap 6.050%
08/15/2042 | 2.177% | | 889,873 | 140,863 |
| CMO Series 4286 Class NS |
-1.0 x 1-month USD LIBOR + 5.900%
Cap 5.900%
12/15/2043 | 2.027% | | 1,074,234 | 142,120 |
| CMO Series 4704 Class SK |
-1.0 x 1-month USD LIBOR + 6.150%
Cap 6.150%
07/15/2047 | 2.277% | | 9,946,933 | 1,133,657 |
| CMO Series 4826 Class KS |
-1.0 x 1-month USD LIBOR + 6.200%
Cap 6.200%
09/15/2048 | 2.327% | | 9,839,714 | 1,171,570 |
| CMO Series 4926 Class ST |
-1.0 x 1-month USD LIBOR + 6.080%
Cap 6.080%
01/15/2040 | 2.207% | | 8,274,994 | 705,684 |
| CMO Series 4987 Class KS |
-1.0 x 1-month USD LIBOR + 6.080%
Cap 6.080%
06/25/2050 | 2.064% | | 10,278,292 | 1,511,267 |
The accompanying Notes to Financial Statements are an integral part of this statement.
| 8 | Columbia Mortgage Opportunities Fund | Semiannual Report 2022 |
Portfolio of Investments (continued)
November 30, 2022 (Unaudited)
| Residential Mortgage-Backed Securities - Agency (continued) |
| Issuer | Coupon
Rate | | Principal
Amount ($) | Value ($) |
| CMO Series 4993 Class MS |
-1.0 x 1-month USD LIBOR + 6.050%
Cap 6.050%
07/25/2050 | 2.034% | | 19,292,507 | 2,931,701 |
| CMO STRIPS Series 309 Class S4 |
-1.0 x 1-month USD LIBOR + 5.970%
Cap 5.970%
08/15/2043 | 2.097% | | 2,075,045 | 212,728 |
| Federal Home Loan Mortgage Corp.(g) |
| CMO Series 4215 Class IL |
| 07/15/2041 | 3.500% | | 319,146 | 15,260 |
| CMO Series 5040 Class IH |
| 11/25/2050 | 3.500% | | 13,330,671 | 2,587,145 |
| CMO Series 5083 Class NI |
| 12/25/2040 | 4.500% | | 11,710,609 | 2,521,538 |
| CMO STRIPS Series 304 Class C67 |
| 12/15/2042 | 4.500% | | 1,801,833 | 242,023 |
| Federal Home Loan Mortgage Corp.(f),(g) |
| CMO Series 4620 Class AS |
| 11/15/2042 | 0.000% | | 1,425,261 | 64,393 |
| Federal Home Loan Mortgage Corp. REMICS(b),(g) |
| CMO Series 4606 Class SL |
-1.0 x 1-month USD LIBOR + 6.000%
Cap 6.000%
12/15/2044 | 2.127% | | 51,632,999 | 5,141,975 |
| CMO Series 5119 Class QS |
-1.0 x 30-day Average SOFR + 6.300%
Cap 6.300%
06/25/2051 | 3.303% | | 41,194,050 | 9,262,593 |
| Federal Home Loan Mortgage Corp. REMICS(g) |
| CMO Series 5105 Class ID |
| 05/25/2051 | 3.000% | | 40,111,264 | 7,640,141 |
| CMO Series 5105 Class JI |
| 03/25/2045 | 3.000% | | 26,883,463 | 3,026,801 |
| Federal National Mortgage Association |
| 08/01/2051 | 3.000% | | 33,159,074 | 29,577,631 |
| 08/01/2052 | 4.000% | | 43,530,490 | 41,558,148 |
| Federal National Mortgage Association(g) |
| CMO Series 2012-152 Class EI |
| 07/25/2031 | 3.000% | | 2,166,268 | 55,707 |
| Federal National Mortgage Association(b),(g) |
| CMO Series 2013-101 Class CS |
-1.0 x 1-month USD LIBOR + 5.900%
Cap 5.900%
10/25/2043 | 1.884% | | 2,245,317 | 239,518 |
| Residential Mortgage-Backed Securities - Agency (continued) |
| Issuer | Coupon
Rate | | Principal
Amount ($) | Value ($) |
| CMO Series 2013-97 Class SB |
-1.0 x 1-month USD LIBOR + 6.100%
Cap 6.100%
06/25/2032 | 2.514% | | 334,381 | 6,326 |
| CMO Series 2014-93 Class ES |
-1.0 x 1-month USD LIBOR + 6.150%
Cap 6.150%
01/25/2045 | 2.134% | | 1,260,450 | 150,264 |
| CMO Series 2015-27 Class AS |
-1.0 x 1-month USD LIBOR + 5.650%
Cap 5.650%
05/25/2045 | 1.634% | | 9,932,001 | 1,134,066 |
| CMO Series 2016-31 Class VS |
-1.0 x 1-month USD LIBOR + 6.000%
Cap 6.000%
06/25/2046 | 1.984% | | 1,391,773 | 140,045 |
| CMO Series 2017-50 Class SB |
-1.0 x 1-month USD LIBOR + 6.100%
Cap 6.100%
07/25/2047 | 2.084% | | 8,569,242 | 1,098,333 |
| CMO Series 2017-72 Class S |
-1.0 x 1-month USD LIBOR + 3.950%
Cap 2.750%
09/25/2047 | 0.364% | | 21,191,539 | 907,557 |
| CMO Series 2017-90 Class SP |
-1.0 x 1-month USD LIBOR + 6.150%
Cap 6.150%
11/25/2047 | 2.134% | | 8,917,806 | 1,016,953 |
| CMO Series 2020-38 Class SE |
1-month USD LIBOR + 6.050%
06/25/2050 | 2.034% | | 7,141,542 | 808,698 |
| CMO Series 2020-38 Class WS |
-1.0 x 1-month USD LIBOR + 5.000%
Cap 5.000%
06/25/2050 | 0.984% | | 23,163,642 | 2,121,018 |
| Freddie Mac STACR REMIC Trust(a),(b) |
| Subordinated CMO Series 2021-HQA2 Class B2 |
30-day Average SOFR + 5.450%
12/25/2033 | 8.971% | | 14,350,000 | 10,790,389 |
| Government National Mortgage Association(g) |
| CMO Series 2014-184 Class CI |
| 11/16/2041 | 3.500% | | 5,696,368 | 716,225 |
The accompanying Notes to Financial Statements are an integral part of this statement.
Columbia Mortgage Opportunities Fund | Semiannual Report 2022
| 9 |
Portfolio of Investments (continued)
November 30, 2022 (Unaudited)
| Residential Mortgage-Backed Securities - Agency (continued) |
| Issuer | Coupon
Rate | | Principal
Amount ($) | Value ($) |
| CMO Series 2018-78 Class GI |
| 04/20/2048 | 4.000% | | 8,652,897 | 1,083,780 |
| CMO Series 2020-104 Class IY |
| 07/20/2050 | 3.000% | | 14,728,710 | 2,178,110 |
| CMO Series 2020-129 Class GI |
| 09/20/2050 | 3.000% | | 18,361,005 | 2,781,454 |
| CMO Series 2020-129 Class YI |
| 09/20/2050 | 2.500% | | 22,648,912 | 2,941,183 |
| CMO Series 2020-160 Class DI |
| 10/20/2050 | 2.500% | | 19,859,096 | 2,449,812 |
| CMO Series 2020-160 Class HI |
| 10/20/2050 | 2.500% | | 15,984,196 | 2,169,326 |
| CMO Series 2020-160 Class ID |
| 10/20/2050 | 2.500% | | 15,509,770 | 1,914,407 |
| CMO Series 2020-162 Class EI |
| 10/20/2050 | 2.500% | | 15,345,394 | 1,891,969 |
| CMO Series 2020-164 Class CI |
| 11/20/2050 | 3.000% | | 20,182,548 | 3,046,709 |
| CMO Series 2020-191 Class UC |
| 12/20/2050 | 4.000% | | 23,153,951 | 3,641,257 |
| CMO Series 2020-191 Class UM |
| 12/20/2050 | 3.500% | | 30,690,875 | 5,643,871 |
| CMO Series 2020-85 Class MI |
| 06/20/2050 | 3.500% | | 13,460,330 | 3,051,505 |
| CMO Series 2021-158 Class VI |
| 09/20/2051 | 3.000% | | 36,621,080 | 5,949,739 |
| CMO Series 2021-160 Class CI |
| 09/20/2051 | 2.500% | | 73,576,611 | 9,852,666 |
| CMO Series 2021-175 Class IJ |
| 10/20/2051 | 3.000% | | 8,455,519 | 1,315,479 |
| CMO Series 2021-24 Class MI |
| 02/20/2051 | 3.000% | | 19,175,955 | 2,871,908 |
| CMO Series 2021-24 Class PI |
| 01/20/2051 | 2.500% | | 22,054,653 | 2,589,726 |
| CMO Series 2021-29 Class HI |
| 02/20/2051 | 3.500% | | 23,502,388 | 3,929,449 |
| CMO Series 2021-44 Class CI |
| 03/20/2051 | 3.000% | | 28,721,934 | 4,336,575 |
| CMO Series 2021-44 Class MI |
| 03/20/2051 | 3.000% | | 18,242,324 | 2,614,213 |
| CMO Series 2021-49 Class WI |
| 05/20/2048 | 2.500% | | 20,119,804 | 1,964,914 |
| CMO Series 2021-58 Class IA |
| 04/20/2051 | 3.500% | | 15,901,846 | 2,348,407 |
| CMO Series 2021-7 Class IT |
| 01/16/2051 | 3.000% | | 31,184,049 | 6,343,964 |
| Residential Mortgage-Backed Securities - Agency (continued) |
| Issuer | Coupon
Rate | | Principal
Amount ($) | Value ($) |
| Government National Mortgage Association(b),(g) |
| CMO Series 2014-6 Class SJ |
-1.0 x 1-month USD LIBOR + 6.100%
Cap 6.100%
01/20/2044 | 2.161% | | 10,345,503 | 1,432,058 |
| CMO Series 2017-163 Class SD |
-1.0 x 1-month USD LIBOR + 6.200%
Cap 6.200%
11/20/2047 | 2.261% | | 11,532,442 | 1,362,356 |
| CMO Series 2018-124 Class SG |
-1.0 x 1-month USD LIBOR + 6.200%
Cap 6.200%
09/20/2048 | 2.261% | | 10,384,495 | 1,222,837 |
| CMO Series 2018-155 Class LS |
-1.0 x 1-month USD LIBOR + 6.150%
Cap 6.150%
11/20/2048 | 2.211% | | 9,085,677 | 903,920 |
| CMO Series 2018-40 Class SC |
-1.0 x 1-month USD LIBOR + 6.200%
Cap 6.200%
03/20/2048 | 2.261% | | 7,064,723 | 642,384 |
| CMO Series 2018-63 Class HS |
-1.0 x 1-month USD LIBOR + 6.200%
Cap 6.200%
04/20/2048 | 2.261% | | 9,176,570 | 857,411 |
| CMO Series 2018-63 Class SH |
-1.0 x 1-month USD LIBOR + 6.200%
Cap 6.200%
04/20/2048 | 2.261% | | 8,725,196 | 764,144 |
| CMO Series 2018-78 Class SB |
-1.0 x 1-month USD LIBOR + 6.200%
Cap 6.200%
06/20/2048 | 2.261% | | 7,894,863 | 914,348 |
| CMO Series 2018-94 Class SA |
-1.0 x 1-month USD LIBOR + 6.200%
Cap 6.200%
05/20/2048 | 2.261% | | 7,163,525 | 835,497 |
| CMO Series 2019-103 Class SA |
-1.0 x 1-month USD LIBOR + 6.050%
Cap 6.050%
08/20/2049 | 2.111% | | 16,568,563 | 1,856,903 |
The accompanying Notes to Financial Statements are an integral part of this statement.
| 10 | Columbia Mortgage Opportunities Fund | Semiannual Report 2022 |
Portfolio of Investments (continued)
November 30, 2022 (Unaudited)
| Residential Mortgage-Backed Securities - Agency (continued) |
| Issuer | Coupon
Rate | | Principal
Amount ($) | Value ($) |
| CMO Series 2019-120 Class SA |
-1.0 x 1-month USD LIBOR + 3.400%
Cap 3.400%
09/20/2049 | 0.000% | | 21,707,366 | 580,207 |
| CMO Series 2019-128 Class YS |
1-month USD LIBOR + 2.850%
Cap 2.850%
10/20/2049 | 0.000% | | 40,658,918 | 591,734 |
| CMO Series 2019-43 Class NS |
-1.0 x 1-month USD LIBOR + 3.270%
Cap 3.270%
04/20/2049 | 0.000% | | 16,972,689 | 381,986 |
| CMO Series 2020-104 Class SA |
-1.0 x 1-month USD LIBOR + 6.200%
07/20/2050 | 2.261% | | 11,846,302 | 1,384,773 |
| CMO Series 2020-133 Class DS |
-1.0 x 1-month USD LIBOR + 6.300%
Cap 6.300%
09/20/2050 | 2.361% | | 72,779,027 | 8,543,988 |
| CMO Series 2020-148 Class SA |
-1.0 x 1-month USD LIBOR + 6.300%
10/20/2050 | 2.361% | | 22,123,493 | 2,610,220 |
| CMO Series 2020-175 Class NS |
-1.0 x 1-month USD LIBOR + 6.300%
Cap 6.300%
11/20/2050 | 2.361% | | 27,098,391 | 3,353,350 |
| CMO Series 2020-187 Class SE |
-1.0 x 1-month USD LIBOR + 6.300%
Cap 6.300%
12/20/2050 | 2.361% | | 20,736,448 | 2,587,776 |
| CMO Series 2020-62 Class SK |
-1.0 x 1-month USD LIBOR + 6.150%
Cap 6.150%
05/20/2050 | 2.211% | | 10,922,894 | 1,401,999 |
| CMO Series 2020-78 Class SD |
-1.0 x 1-month USD LIBOR + 6.150%
Cap 6.150%
06/20/2050 | 2.211% | | 28,900,423 | 3,147,554 |
| CMO Series 2021-117 Class HS |
1-month USD LIBOR + 6.300%
Cap 6.300%
07/20/2051 | 2.361% | | 31,135,757 | 3,770,733 |
| Residential Mortgage-Backed Securities - Agency (continued) |
| Issuer | Coupon
Rate | | Principal
Amount ($) | Value ($) |
| CMO Series 2021-122 Class SB |
-1.0 x 30-day Average SOFR + 2.600%
Cap 2.600%
07/20/2051 | 0.000% | | 68,545,469 | 679,279 |
| CMO Series 2021-122 Class SG |
1-month USD LIBOR + 6.300%
Cap 6.300%
07/20/2051 | 2.361% | | 71,413,446 | 8,158,979 |
| CMO Series 2021-142 Class SL |
-1.0 x 1-month USD LIBOR + 6.300%
Cap 6.300%
08/20/2051 | 2.361% | | 70,776,588 | 9,059,262 |
| CMO Series 2021-155 Class SM |
-1.0 x 1-month USD LIBOR + 6.300%
Cap 6.300%
07/20/2051 | 2.361% | | 35,750,843 | 4,361,170 |
| CMO Series 2021-156 Class SA |
-1.0 x 1-month USD LIBOR + 6.300%
Cap 6.300%
09/20/2051 | 2.361% | | 54,247,008 | 7,305,737 |
| CMO Series 2021-160 Class S |
-1.0 x 30-day Average SOFR + 2.650%
Cap 2.650%
09/20/2051 | 0.000% | | 87,914,807 | 818,575 |
| CMO Series 2021-161 Class SL |
-1.0 x 1-month USD LIBOR + 6.300%
Cap 6.300%
09/20/2051 | 2.361% | | 43,453,743 | 6,016,475 |
| CMO Series 2021-193 Class ES |
30-day Average SOFR + 1.700%
11/20/2051 | 0.000% | | 311,992,807 | 1,775,052 |
| CMO Series 2021-42 Class SD |
-1.0 x 1-month USD LIBOR + 6.300%
Cap 6.300%
11/20/2050 | 2.361% | | 44,533,619 | 6,122,152 |
| CMO Series 2021-96 Class US |
-1.0 x 30-day Average SOFR + 3.250%
Cap 3.250%
06/20/2051 | 0.000% | | 52,060,537 | 845,244 |
The accompanying Notes to Financial Statements are an integral part of this statement.
Columbia Mortgage Opportunities Fund | Semiannual Report 2022
| 11 |
Portfolio of Investments (continued)
November 30, 2022 (Unaudited)
| Residential Mortgage-Backed Securities - Agency (continued) |
| Issuer | Coupon
Rate | | Principal
Amount ($) | Value ($) |
| CMO Series 2021-97 Class CS |
-1.0 x 1-month USD LIBOR + 6.300%
Cap 6.300%
06/20/2051 | 2.361% | | 52,154,654 | 6,295,098 |
| CMO Series 2022-83 Class AS |
-1.0 x 1-month USD LIBOR + 6.150%
Cap 6.150%
06/20/2050 | 2.211% | | 28,888,506 | 3,549,005 |
| Government National Mortgage Association TBA(h) |
| 12/20/2052 | 4.000% | | 152,000,000 | 145,082,811 |
| 12/20/2052 | 5.500% | | 258,000,000 | 261,059,875 |
| Uniform Mortgage-Backed Security TBA(h) |
| 12/13/2052 | 4.000% | | 542,500,000 | 512,980,367 |
| 12/13/2052 | 4.500% | | 775,000,000 | 754,292,969 |
| 12/13/2052 | 5.000% | | 306,000,000 | 304,470,000 |
Total Residential Mortgage-Backed Securities - Agency
(Cost $2,479,570,053) | 2,425,935,426 |
|
| Residential Mortgage-Backed Securities - Non-Agency 55.0% |
| | | | |
| 510 Asset Backed Trust(a),(f) |
| CMO Series 2021-NPL2 Class A1 |
| 06/25/2061 | 2.116% | | 3,351,648 | 3,103,493 |
| Ajax Mortgage Loan Trust(a),(f) |
| CMO Series 2021-B Class A |
| 06/25/2066 | 2.239% | | 10,493,382 | 9,599,131 |
| CMO Series 2021-C Class A |
| 01/25/2061 | 2.115% | | 6,305,633 | 5,912,151 |
| AlphaFlow Transitional Mortgage Trust(a) |
| CMO Series 2021-WL1 Class A1 |
| 01/25/2026 | 3.280% | | 4,429,559 | 4,314,989 |
| Angel Oak Mortgage Trust(a),(f) |
| CMO Series 2021-5 Class A3 |
| 07/25/2066 | 1.311% | | 5,491,635 | 4,244,899 |
| Angel Oak Mortgage Trust I LLC(a),(f) |
| Subordinated CMO Series 2019-2 Class B2 |
| 03/25/2049 | 6.286% | | 4,800,000 | 4,625,027 |
| Bellemeade Re Ltd.(a),(b) |
| CMO Series 2017-1 Class M2 |
1-month USD LIBOR + 3.350%
10/25/2027 | 7.394% | | 481,566 | 481,567 |
| CMO Series 2019-1A Class M1B |
1-month USD LIBOR + 1.750%
Floor 1.750%
03/25/2029 | 5.794% | | 193,083 | 192,744 |
| CMO Series 2019-4A Class M1C |
1-month USD LIBOR + 2.500%
Floor 2.500%
10/25/2029 | 6.544% | | 1,376,124 | 1,372,776 |
| Residential Mortgage-Backed Securities - Non-Agency (continued) |
| Issuer | Coupon
Rate | | Principal
Amount ($) | Value ($) |
| CMO Series 2020-2A Class M1C |
1-month USD LIBOR + 4.000%
Floor 4.000%
08/26/2030 | 8.044% | | 237,562 | 237,540 |
| CMO Series 2021-1A Class M2 |
30-day Average SOFR + 4.850%
Floor 4.850%
03/25/2031 | 6.364% | | 18,000,000 | 16,655,434 |
| CMO Series 2021-2A Class M1C |
30-day Average SOFR + 1.850%
Floor 1.850%
06/25/2031 | 4.131% | | 9,465,000 | 8,390,170 |
| CMO Series 2021-2A Class M2 |
30-day Average SOFR + 2.900%
Floor 2.900%
06/25/2031 | 5.181% | | 15,250,000 | 12,862,204 |
| Subordinated CMO Series 2019-4A Class B1 |
1-month USD LIBOR + 3.850%
Floor 3.850%
10/25/2029 | 7.894% | | 17,089,000 | 16,049,835 |
| Subordinated CMO Series 2020-4A Class B1 |
1-month USD LIBOR + 5.000%
Floor 5.000%
06/25/2030 | 9.044% | | 4,000,000 | 3,921,178 |
| Subordinated CMO Series 2021-1A Class B1 |
30-day Average SOFR + 6.750%
Floor 6.750%
03/25/2031 | 8.264% | | 3,750,000 | 3,537,003 |
| Subordinated CMO Series 2021-2A Class B1 |
30-day Average SOFR + 4.150%
Floor 4.150%
06/25/2031 | 6.431% | | 2,800,000 | 2,241,922 |
| BRAVO Residential Funding Trust(a),(f) |
| CMO Series 2020-NQM1 Class B1 |
| 05/25/2060 | 5.086% | | 2,200,000 | 1,962,968 |
| CMO Series 2020-NQM1 Class B2 |
| 05/25/2060 | 5.667% | | 2,800,000 | 2,580,536 |
| CMO Series 2021-B Class A1 |
| 04/01/2069 | 2.115% | | 7,716,294 | 7,203,050 |
| Subordinated CMO Series 2021-NQM2 Class B1 |
| 03/25/2060 | 3.044% | | 2,950,000 | 2,332,616 |
| Subordinated CMO Series 2021-NQM2 Class B2 |
| 03/25/2060 | 4.099% | | 4,100,000 | 3,206,732 |
The accompanying Notes to Financial Statements are an integral part of this statement.
| 12 | Columbia Mortgage Opportunities Fund | Semiannual Report 2022 |
Portfolio of Investments (continued)
November 30, 2022 (Unaudited)
| Residential Mortgage-Backed Securities - Non-Agency (continued) |
| Issuer | Coupon
Rate | | Principal
Amount ($) | Value ($) |
| BRAVO Residential Funding Trust(a),(b) |
| CMO Series 2021-HE2 Class B1 |
30-day Average SOFR + 2.400%
11/25/2069 | 5.187% | | 6,000,000 | 5,872,891 |
| Subordinated CMO Series 2021-HE1 Class B1 |
30-day Average SOFR + 2.500%
01/25/2070 | 6.047% | | 6,708,000 | 6,612,142 |
| Subordinated CMO Series 2021-HE1 Class B2 |
30-day Average SOFR + 3.000%
01/25/2070 | 6.547% | | 4,129,000 | 3,986,843 |
| Subordinated CMO Series 2021-HE2 Class B2 |
30-day Average SOFR + 3.400%
11/25/2069 | 5.187% | | 6,570,000 | 6,418,215 |
| BVRT Financing Trust(a),(b),(d) |
| CMO Series 2021-2F Class M2 |
30-day Average SOFR + 2.500%
Floor 2.500%
01/10/2032 | 3.761% | | 7,513,324 | 7,521,243 |
| CMO Series 2021-3F Class M2 |
30-day Average SOFR + 2.900%
Floor 2.900%
07/12/2033 | 4.187% | | 40,000,000 | 40,000,000 |
| CMO Series 2021-CRT3 Class B1 |
30-day Average SOFR + 4.300%
Floor 4.300%
01/10/2031 | 4.338% | | 15,200,000 | 15,200,000 |
| CMO Series 2021-CRT3 Class M3 |
30-day Average SOFR + 3.150%
Floor 3.150%
01/10/2031 | 3.188% | | 808,796 | 808,797 |
| CMO Series 2021-CRT3 Class M4 |
30-day Average SOFR + 3.800%
Floor 3.800%
01/10/2031 | 3.838% | | 3,400,000 | 3,400,000 |
| BVRT Financing Trust(a),(b),(d),(e) |
| CMO Series 2021-CRT1 Class M4 |
1-month USD LIBOR + 3.500%
Floor 3.500%
07/10/2032 | 3.589% | | 16,250,000 | 15,472,844 |
| CIM Trust(a),(f) |
| CMO Series 2021-NR1 Class A1 |
| 07/25/2055 | 2.569% | | 13,798,209 | 12,944,785 |
| Residential Mortgage-Backed Securities - Non-Agency (continued) |
| Issuer | Coupon
Rate | | Principal
Amount ($) | Value ($) |
| CMO Series 2021-NR2 Class A1 |
| 07/25/2059 | 2.568% | | 24,741,224 | 22,534,972 |
| CMO Series 2021-NR4 Class A1 |
| 10/25/2061 | 2.816% | | 7,078,043 | 6,480,163 |
| COLT Mortgage Loan Trust(a),(f) |
| CMO Series 2020-2 Class M1 |
| 03/25/2065 | 5.250% | | 1,463,000 | 1,290,002 |
| CMO Series 2021-3 Class A3 |
| 09/27/2066 | 1.419% | | 8,087,439 | 6,067,347 |
| Subordinated CMO Series 2020-2 Class B1 |
| 03/25/2065 | 5.250% | | 3,716,000 | 3,213,696 |
| Subordinated CMO Series 2021-4 Class B1 |
| 10/25/2066 | 3.764% | | 5,969,000 | 3,844,552 |
| Subordinated Series 2021-3 Class B1 |
| 09/27/2066 | 3.059% | | 2,502,000 | 1,265,513 |
| Connecticut Avenue Securities Trust(a),(b) |
| CMO Series 2019-HRP1 Class M2 |
1-month USD LIBOR + 2.150%
11/25/2039 | 6.166% | | 9,937,008 | 9,569,455 |
| Subordinated CMO Series 2021-R03 Class 1B2 |
30-day Average SOFR + 5.500%
Floor 5.500%
12/25/2041 | 9.021% | | 16,909,000 | 14,297,914 |
| Subordinated CMO Series 2022-R01 Class 1B2 |
30-day Average SOFR + 6.000%
12/25/2041 | 9.521% | | 49,550,000 | 42,038,587 |
| Subordinated CMO Series 2022-R02 Class 2B2 |
30-day Average SOFR + 7.650%
01/25/2042 | 11.171% | | 37,400,000 | 32,659,157 |
| Subordinated CMO Series 2022-R03 Class 1B1 |
30-day Average SOFR + 6.250%
03/25/2042 | 9.771% | | 2,550,000 | 2,574,231 |
| Subordinated CMO Series 2022-R04 Class 1B1 |
30-day Average SOFR + 5.250%
03/25/2042 | 8.771% | | 13,850,000 | 13,450,353 |
| Subordinated CMO Series 2022-R04 Class 1B2 |
30-day Average SOFR + 9.500%
03/25/2042 | 13.021% | | 13,800,000 | 13,161,484 |
| Subordinated CMO Series 2022-R07 Class 1B2 |
30-day Average SOFR + 12.000%
06/25/2042 | 15.521% | | 7,300,000 | 7,541,799 |
The accompanying Notes to Financial Statements are an integral part of this statement.
Columbia Mortgage Opportunities Fund | Semiannual Report 2022
| 13 |
Portfolio of Investments (continued)
November 30, 2022 (Unaudited)
| Residential Mortgage-Backed Securities - Non-Agency (continued) |
| Issuer | Coupon
Rate | | Principal
Amount ($) | Value ($) |
| Credit Suisse Mortgage Trust(a),(f) |
| CMO Series 2022-JR1 Class A1 |
| 10/25/2066 | 4.267% | | 28,483,718 | 26,932,039 |
| CSMC Trust(a),(f) |
| CMO Series 2021-JR2 Class A1 |
| 11/25/2061 | 2.215% | | 6,221,851 | 5,844,499 |
| Eagle Re Ltd.(a),(b) |
| CMO Series 2019-1 Class M2 |
1-month USD LIBOR + 3.300%
04/25/2029 | 7.344% | | 21,000,000 | 20,011,742 |
| CMO Series 2021-1 Class M2 |
30-day Average SOFR + 4.450%
Floor 4.450%
10/25/2033 | 7.447% | | 17,000,000 | 16,185,950 |
| Fannie Mae Connecticut Avenue Securities(a),(b) |
| Subordinated CMO Series 2021-R02 Class 2B2 |
30-day Average SOFR + 6.200%
11/25/2041 | 9.721% | | 15,900,000 | 13,157,398 |
| FMC GMSR Issuer Trust(a),(f) |
| CMO Series 2020-GT1 Class A |
| 01/25/2026 | 4.450% | | 9,050,000 | 7,893,910 |
| Freddie Mac STACR(a),(b) |
| Subordinated CMO Series 2019-HQA3 Class B1 |
1-month USD LIBOR + 3.000%
09/25/2049 | 7.016% | | 19,309,209 | 18,223,137 |
| Freddie Mac STACR REMIC Trust(a),(b) |
| CMO Series 2020-HQA3 Class M2 |
1-month USD LIBOR + 3.600%
07/25/2050 | 7.616% | | 3,726 | 3,726 |
| CMO Series 2022-HQA1 Class M2 |
30-day Average SOFR + 5.250%
03/25/2042 | 8.771% | | 11,650,000 | 10,930,699 |
| Subordinated CMO Series 2020-DNA4 Class B1 |
1-month USD LIBOR + 6.000%
08/25/2050 | 10.016% | | 11,147,239 | 11,777,257 |
| Subordinated CMO Series 2020-DNA5 Class B1 |
30-day Average SOFR + 4.800%
10/25/2050 | 7.797% | | 11,200,000 | 11,149,724 |
| Subordinated CMO Series 2020-DNA6 Class B2 |
30-day Average SOFR + 5.650%
12/25/2050 | 9.171% | | 15,500,000 | 12,712,251 |
| Subordinated CMO Series 2020-HQA1 Class B1 |
1-month USD LIBOR + 2.350%
01/25/2050 | 6.366% | | 28,457,336 | 25,966,542 |
| Residential Mortgage-Backed Securities - Non-Agency (continued) |
| Issuer | Coupon
Rate | | Principal
Amount ($) | Value ($) |
| Subordinated CMO Series 2020-HQA3 Class B1 |
1-month USD LIBOR + 5.750%
07/25/2050 | 9.766% | | 8,000,000 | 8,183,113 |
| Subordinated CMO Series 2020-HQA4 Class B1 |
1-month USD LIBOR + 5.250%
09/25/2050 | 9.266% | | 16,600,000 | 16,916,059 |
| Subordinated CMO Series 2021-DNA1 Class B2 |
30-day Average SOFR + 4.750%
01/25/2051 | 8.271% | | 18,450,000 | 13,859,503 |
| Subordinated CMO Series 2021-DNA5 Class B2 |
30-day Average SOFR + 5.500%
01/25/2034 | 9.021% | | 46,650,000 | 35,658,411 |
| Subordinated CMO Series 2021-DNA6 Class B2 |
30-day Average SOFR + 7.500%
10/25/2041 | 11.047% | | 12,600,000 | 10,588,256 |
| Subordinated CMO Series 2022-DNA1 Class B2 |
30-day Average SOFR + 7.100%
01/25/2042 | 10.621% | | 23,350,000 | 18,449,659 |
| Subordinated CMO Series 2022-HQA1 Class B2 |
30-day Average SOFR + 11.000%
03/25/2042 | 14.521% | | 3,560,000 | 3,123,476 |
| Freddie Mac STACR Trust(a),(b) |
| Subordinated CMO Series 2019-HQA2 Class B1 |
1-month USD LIBOR + 4.100%
04/25/2049 | 8.116% | | 20,000,000 | 20,144,880 |
| Freddie Mac Structured Agency Credit Risk Debt Notes(a),(b) |
| Subordinated CMO Series 2020-DNA3 Class B1 |
1-month USD LIBOR + 5.100%
06/25/2050 | 9.116% | | 8,473,515 | 8,722,446 |
| Subordinated CMO Series 2020-HQA5 Class B1 |
30-day Average SOFR + 4.000%
11/25/2050 | 7.521% | | 6,750,000 | 6,188,023 |
| Subordinated CMO Series 2020-HQA5 Class B2 |
30-day Average SOFR + 7.400%
11/25/2050 | 10.921% | | 14,200,000 | 13,368,199 |
| Subordinated CMO Series 2021-DNA7 Class B2 |
30-day Average SOFR + 7.800%
11/25/2041 | 10.797% | | 46,278,740 | 38,690,318 |
| GCAT Trust(a),(f) |
| CMO Series 2019-NQM3 Class M1 |
| 11/25/2059 | 3.450% | | 5,650,000 | 4,545,497 |
The accompanying Notes to Financial Statements are an integral part of this statement.
| 14 | Columbia Mortgage Opportunities Fund | Semiannual Report 2022 |
Portfolio of Investments (continued)
November 30, 2022 (Unaudited)
| Residential Mortgage-Backed Securities - Non-Agency (continued) |
| Issuer | Coupon
Rate | | Principal
Amount ($) | Value ($) |
| Genworth Mortgage Insurance Corp.(a),(b) |
| CMO Series 2021-3 Class M1B |
30-day Average SOFR + 2.900%
Floor 2.900%
02/25/2034 | 5.897% | | 29,500,000 | 27,118,875 |
| Subordinated CMO Series 2021-3 Class B1 |
30-day Average SOFR + 4.950%
Floor 4.950%
02/25/2034 | 7.947% | | 7,500,000 | 5,925,805 |
| Glebe Funding Trust (The)(a),(d) |
| CMO Series 2021-1 Class PT |
| 10/27/2023 | 3.000% | | 27,769,407 | 24,992,466 |
| Homeward Opportunities Fund I Trust(a),(f) |
| Subordinated CMO Series 2020-2 Class B1 |
| 05/25/2065 | 5.450% | | 3,750,000 | 3,340,156 |
| Homeward Opportunities Fund Trust(a),(f) |
| CMO Series 2020-BPL1 Class A2 |
| 08/25/2025 | 5.438% | | 7,825,282 | 7,803,614 |
| Imperial Fund Mortgage Trust(a),(f) |
| Subordinated CMO Series 2021-NQM3 Class B1 |
| 11/25/2056 | 4.184% | | 7,384,000 | 4,651,893 |
| Loan Revolving Advance Investment Trust(a),(b),(d),(e) |
| CMO Series 2021-2 Class A1X |
1-month USD LIBOR + 2.750%
Floor 2.750%
06/30/2023 | 6.623% | | 11,072,840 | 11,072,840 |
| MFA Trust(a),(f) |
| CMO Series 2020-NQM3 Class M1 |
| 01/26/2065 | 2.654% | | 3,500,000 | 2,736,382 |
| Subordinated CMO Series 2020-NQM3 Class B1 |
| 01/26/2065 | 3.661% | | 6,250,000 | 4,986,234 |
| Mortgage Acquisition Trust I LLC(a),(d) |
| CMO Series 2021-1 Class PT |
| 11/29/2023 | 3.500% | | 18,698,961 | 15,981,768 |
| Mortgage Insurance-Linked Notes(a),(b) |
| CMO Series 2020-1 Class M1C |
1-month USD LIBOR + 1.750%
Floor 1.750%
01/25/2030 | 5.794% | | 3,050,000 | 2,896,522 |
| New Residential Mortgage Loan Trust(a),(f),(g) |
| CMO Series 2014-1A Class AIO |
| 01/25/2054 | 2.290% | | 4,501,204 | 228,915 |
| New York Mortgage Trust(a),(f) |
| CMO Series 2021-BPL1 Class A1 |
| 05/25/2026 | 2.239% | | 12,080,000 | 11,208,054 |
| CMO Series 2021-BPL1 Class A2 |
| 05/25/2026 | 2.981% | | 5,000,000 | 4,630,815 |
| Residential Mortgage-Backed Securities - Non-Agency (continued) |
| Issuer | Coupon
Rate | | Principal
Amount ($) | Value ($) |
| NRZ Excess Spread-Collateralized Notes(a) |
| Series 2020-PLS1 Class A |
| 12/25/2025 | 3.844% | | 3,677,320 | 3,346,910 |
| Oaktown Re VI Ltd.(a),(b) |
| CMO Series 2021-1A Class B1 |
30-day Average SOFR + 5.500%
Floor 5.500%
10/25/2033 | 9.021% | | 2,373,000 | 2,140,861 |
| CMO Series 2021-1A Class M2 |
30-day Average SOFR + 3.950%
Floor 3.950%
10/25/2033 | 7.471% | | 6,500,000 | 5,867,452 |
| OSAT Trust(a),(f) |
| CMO Series 2021-RPL1 Class A2 |
| 05/25/2065 | 3.967% | | 5,000,000 | 4,518,215 |
| PMT Credit Risk Transfer Trust(a),(b) |
| Series 2019-2R Class A |
1-month USD LIBOR + 2.750%
Floor 2.750%
05/27/2023 | 6.805% | | 7,366,670 | 6,970,343 |
| PNMAC GMSR Issuer Trust(a),(b) |
| CMO Series 2018-FT1 Class A |
1-month USD LIBOR + 2.350%
04/25/2023 | 6.366% | | 9,500,000 | 8,951,823 |
| CMO Series 2018-GT1 Class A |
1-month USD LIBOR + 2.850%
Floor 2.850%
02/25/2023 | 6.894% | | 19,379,000 | 18,799,200 |
| CMO Series 2018-GT2 Class A |
1-month USD LIBOR + 2.650%
08/25/2025 | 6.694% | | 47,570,000 | 45,401,265 |
| Point Securitization Trust(a),(f) |
| CMO Series 2021-1 Class A1 |
| 02/25/2052 | 3.228% | | 14,045,821 | 13,414,894 |
| Preston Ridge Partners Mortgage(a),(f) |
| CMO Series 2021-2 Class A2 |
| 03/25/2026 | 3.770% | | 18,598,000 | 15,299,064 |
| CMO Series 2021-3 Class A2 |
| 04/25/2026 | 3.720% | | 7,000,000 | 5,828,105 |
| CMO Series 2021-4 Class A2 |
| 04/25/2026 | 3.474% | | 5,350,000 | 4,468,065 |
| Preston Ridge Partners Mortgage LLC(a),(f) |
| CMO Series 2020-4 Class A1 |
| 10/25/2025 | 2.610% | | 6,951,839 | 6,558,223 |
| CMO Series 2020-6 Class A2 |
| 11/25/2025 | 4.703% | | 2,300,000 | 2,055,241 |
The accompanying Notes to Financial Statements are an integral part of this statement.
Columbia Mortgage Opportunities Fund | Semiannual Report 2022
| 15 |
Portfolio of Investments (continued)
November 30, 2022 (Unaudited)
| Residential Mortgage-Backed Securities - Non-Agency (continued) |
| Issuer | Coupon
Rate | | Principal
Amount ($) | Value ($) |
| Preston Ridge Partners Mortgage Trust(a),(f) |
| CMO Series 2021-1 Class A1 |
| 01/25/2026 | 2.115% | | 7,112,626 | 6,482,886 |
| CMO Series 2021-1 Class A2 |
| 01/25/2026 | 3.720% | | 28,254,000 | 23,724,432 |
| CMO Series 2021-2 Class A1 |
| 03/25/2026 | 2.115% | | 6,353,714 | 5,769,243 |
| CMO Series 2021-5 Class A2 |
| 06/25/2026 | 3.721% | | 16,300,000 | 12,866,483 |
| CMO Series 2021-8 Class A1 |
| 09/25/2026 | 1.743% | | 15,812,213 | 13,826,896 |
| Pretium Mortgage Credit Partners(a),(f) |
| CMO Series 2022-NPL1 Class A1 |
| 01/25/2052 | 2.981% | | 20,583,781 | 18,524,855 |
| Pretium Mortgage Credit Partners I LLC(a),(f) |
| CMO Series 2021-NPL1 Class A1 |
| 09/27/2060 | 2.240% | | 6,539,513 | 5,905,112 |
| Pretium Mortgage Credit Partners LLC(a),(f) |
| CMO Series 2021-NPL6 Class A2 |
| 07/25/2051 | 5.071% | | 5,600,000 | 4,904,186 |
| CMO Series 2021-RN2 Class A1 |
| 07/25/2051 | 1.744% | | 6,446,364 | 5,828,256 |
| Radnor Re Ltd.(a),(b) |
| Subordinated CMO Series 2021-1 Class B1 |
30-day Average SOFR + 4.000%
Floor 4.000%
12/27/2033 | 7.547% | | 4,750,000 | 3,742,613 |
| Radnor RE Ltd.(a),(b) |
| CMO Series 2021-1 Class M1C |
30-day Average SOFR + 2.700%
Floor 2.700%
12/27/2033 | 6.247% | | 20,500,000 | 19,441,835 |
| Residential Mortgage Loan Trust(a),(f) |
| CMO Series 2019-3 Class M1 |
| 09/25/2059 | 3.257% | | 6,378,000 | 5,708,540 |
| Subordinated CMO Series 2020-1 Class B1 |
| 01/26/2060 | 3.946% | | 3,938,000 | 2,963,808 |
| Saluda Grade Alternative Mortgage Trust(a) |
| CMO Series 2020-FIG1 Class A3 |
| 09/25/2050 | 5.086% | | 3,800,689 | 3,731,916 |
| Stanwich Mortgage Loan Co. LLC(a),(f) |
| CMO Series 2021-NPB1 Class A1 |
| 10/16/2026 | 2.735% | | 25,424,733 | 21,995,379 |
| Starwood Mortgage Residential Trust(a),(f) |
| CMO Series 2020-3 Class B1 |
| 04/25/2065 | 4.750% | | 4,750,000 | 3,669,956 |
| Residential Mortgage-Backed Securities - Non-Agency (continued) |
| Issuer | Coupon
Rate | | Principal
Amount ($) | Value ($) |
| CMO Series 2021-3 Class A1 |
| 06/25/2056 | 1.127% | | 5,178,587 | 4,142,758 |
| Starwood Mortgage Residential Trust(a) |
| Subordinated CMO Series 2020-INV1 Class B1 |
| 11/25/2055 | 3.257% | | 3,200,000 | 2,385,628 |
| Subordinated CMO Series 2020-INV1 Class B2 |
| 11/25/2055 | 4.261% | | 1,400,000 | 1,091,635 |
| Stonnington Mortgage Trust(a),(d),(e),(f) |
| CMO Series 2020-1 Class A |
| 07/28/2024 | 3.500% | | 2,503,418 | 2,503,418 |
| Toorak Mortgage Corp., Ltd.(a),(d),(e),(f) |
| CMO Series 2020-1 Class M1 |
| 03/25/2023 | 5.000% | | 19,600,000 | 19,306,000 |
| Toorak Mortgage Corp., Ltd.(a),(f) |
| CMO Series 2021-1 Class A1 |
| 06/25/2024 | 2.240% | | 21,000,000 | 20,014,237 |
| Triangle Re Ltd.(a),(b) |
| CMO Series 2021-2 Class M1C |
1-month USD LIBOR + 4.500%
Floor 4.500%
10/25/2033 | 8.544% | | 5,000,000 | 4,922,335 |
| CMO Series 2021-2 Class M2 |
1-month USD LIBOR + 5.500%
Floor 5.500%
10/25/2033 | 9.544% | | 10,000,000 | 9,553,647 |
| Subordinated CMO Series 2021-1 Class B1 |
1-month USD LIBOR + 4.500%
Floor 4.500%
08/25/2033 | 8.544% | | 22,926,000 | 21,549,468 |
| Subordinated CMO Series 2021-2 Class B1 |
1-month USD LIBOR + 7.500%
Floor 7.500%
10/25/2033 | 11.544% | | 7,100,000 | 6,425,687 |
| VCAT Asset Securitization LLC(a),(f) |
| CMO Series 2021-NPL3 Class A2 |
| 05/25/2051 | 3.967% | | 3,980,000 | 3,225,506 |
| CMO Series 2021-NPL6 Class A1 |
| 09/25/2051 | 1.917% | | 13,161,452 | 11,816,315 |
| VCAT LLC(a),(f) |
| CMO Series 2021-NPL2 Class A2 |
| 03/27/2051 | 4.212% | | 5,500,000 | 4,517,170 |
| Vericrest Opportunity Loan Transferee(a),(f) |
| CMO Series 2021-NPL4 Class A1 |
| 03/27/2051 | 2.240% | | 9,333,412 | 8,636,125 |
| Vericrest Opportunity Loan Transferee XCIV LLC(a),(f) |
| CMO Series 2021-NPL3 Class A1 |
| 02/27/2051 | 2.240% | | 11,987,291 | 10,996,206 |
| Vericrest Opportunity Loan Transferee XCVI LLC(a),(f) |
| CMO Series 2021-NPL5 Class A1 |
| 03/27/2051 | 2.116% | | 20,831,088 | 18,536,354 |
The accompanying Notes to Financial Statements are an integral part of this statement.
| 16 | Columbia Mortgage Opportunities Fund | Semiannual Report 2022 |
Portfolio of Investments (continued)
November 30, 2022 (Unaudited)
| Residential Mortgage-Backed Securities - Non-Agency (continued) |
| Issuer | Coupon
Rate | | Principal
Amount ($) | Value ($) |
| Vericrest Opportunity Loan Transferee XCVII LLC(a),(f) |
| CMO Series 2021-NPL6 Class A1 |
| 04/25/2051 | 2.240% | | 17,468,671 | 15,580,526 |
| Verus Securitization Trust(a),(f) |
| CMO Series 2020-NPL1 Class A2 |
| 08/25/2050 | 5.682% | | 6,615,571 | 6,549,998 |
| Subordinated CMO Series 2019-4 Class B1 |
| 11/25/2059 | 3.860% | | 4,150,000 | 3,256,558 |
| Subordinated CMO Series 2020-1 Class B1 |
| 01/25/2060 | 3.624% | | 6,000,000 | 4,157,960 |
| Subordinated CMO Series 2020-4 Class B1 |
| 05/25/2065 | 5.046% | | 2,450,000 | 1,908,531 |
| Subordinated CMO Series 2020-4 Class B2 |
| 05/25/2065 | 5.600% | | 2,000,000 | 1,450,734 |
| Subordinated Series 2021-5 Class B1 |
| 09/25/2066 | 3.037% | | 3,800,000 | 2,360,175 |
| Subordinated Series 2021-5 Class B2 |
| 09/25/2066 | 3.941% | | 3,500,000 | 2,146,240 |
| Verus Securitization Trust(a) |
| Subordinated CMO Series 2020-INV1 Class B1 |
| 03/25/2060 | 5.750% | | 1,050,000 | 959,201 |
| Subordinated CMO Series 2020-INV1 Class B2 |
| 03/25/2060 | 6.000% | | 3,150,000 | 2,902,283 |
| Visio Trust(a),(f) |
| CMO Series 2019-2 Class M1 |
| 11/25/2054 | 3.260% | | 1,400,000 | 1,125,751 |
| Residential Mortgage-Backed Securities - Non-Agency (continued) |
| Issuer | Coupon
Rate | | Principal
Amount ($) | Value ($) |
| Subordinated CMO Series 2019-2 Class B1 |
| 11/25/2054 | 3.910% | | 1,200,000 | 965,436 |
| Vista Point Securitization Trust(a),(f) |
| Subordinated CMO Series 2020-1 Class B1 |
| 03/25/2065 | 5.353% | | 2,000,000 | 1,772,669 |
Total Residential Mortgage-Backed Securities - Non-Agency
(Cost $1,571,992,744) | 1,417,520,611 |
| Options Purchased Calls 2.4% |
| | | | | Value ($) |
| (Cost $84,862,035) | 60,621,875 |
| Money Market Funds 6.1% |
| | Shares | Value ($) |
| Columbia Short-Term Cash Fund, 3.989%(i),(j) | 156,627,035 | 156,564,384 |
Total Money Market Funds
(Cost $156,546,713) | 156,564,384 |
Total Investments in Securities
(Cost: $4,857,892,779) | 4,510,735,730 |
| Other Assets & Liabilities, Net | | (1,933,632,836) |
| Net Assets | 2,577,102,894 |
At November 30, 2022, securities and/or cash totaling $68,285,658 were pledged as collateral.
Investments in derivatives
| Long futures contracts |
| Description | Number of
contracts | Expiration
date | Trading
currency | Notional
amount | Value/Unrealized
appreciation ($) | Value/Unrealized
depreciation ($) |
| U.S. Treasury Ultra Bond | 1,306 | 03/2023 | USD | 177,983,313 | — | (1,496,821) |
| Short futures contracts |
| Description | Number of
contracts | Expiration
date | Trading
currency | Notional
amount | Value/Unrealized
appreciation ($) | Value/Unrealized
depreciation ($) |
| U.S. Treasury 10-Year Note | (10,299) | 03/2023 | USD | (1,168,936,500) | — | (6,523,905) |
| U.S. Treasury 5-Year Note | (4,588) | 03/2023 | USD | (498,120,596) | — | (3,021,423) |
| Total | | | | | — | (9,545,328) |
The accompanying Notes to Financial Statements are an integral part of this statement.
Columbia Mortgage Opportunities Fund | Semiannual Report 2022
| 17 |
Portfolio of Investments (continued)
November 30, 2022 (Unaudited)
| Call option contracts purchased |
| Description | Counterparty | Trading
currency | Notional
amount | Number of
contracts | Exercise
price/Rate | Expiration
date | Cost ($) | Value ($) |
| 10-Year OTC interest rate swap with Citi to receive exercise rate and pay SOFR | Citi | USD | 107,600,000 | 107,600,000 | 2.25 | 04/27/2023 | 2,582,400 | 301,215 |
| 10-Year OTC interest rate swap with Citi to receive exercise rate and pay SOFR | Citi | USD | 212,740,000 | 212,740,000 | 2.50 | 05/12/2023 | 6,360,926 | 1,257,932 |
| 10-Year OTC interest rate swap with Citi to receive exercise rate and pay SOFR | Citi | USD | 202,000,000 | 202,000,000 | 2.75 | 06/26/2023 | 6,559,950 | 2,583,903 |
| 10-Year OTC interest rate swap with Citi to receive exercise rate and pay SOFR | Citi | USD | 74,220,000 | 74,220,000 | 2.75 | 07/11/2023 | 2,597,700 | 1,019,152 |
| 10-Year OTC interest rate swap with Citi to receive exercise rate and pay SOFR | Citi | USD | 325,000,000 | 325,000,000 | 2.00 | 08/03/2023 | 5,476,250 | 1,354,243 |
| 10-Year OTC interest rate swap with Citi to receive exercise rate and pay SOFR | Citi | USD | 190,000,000 | 190,000,000 | 3.50 | 10/27/2023 | 6,745,000 | 9,514,497 |
| 10-Year OTC interest rate swap with Citi to receive exercise rate and pay SOFR | Citi | USD | 150,000,000 | 150,000,000 | 3.50 | 10/27/2023 | 5,700,000 | 7,511,445 |
| 10-Year OTC interest rate swap with Citi to receive exercise rate and pay SOFR | Citi | USD | 120,290,000 | 120,290,000 | 3.30 | 11/14/2023 | 3,849,280 | 4,993,984 |
| 10-Year OTC interest rate swap with Citi to receive exercise rate and pay SOFR | Citi | USD | 400,000,000 | 400,000,000 | 3.00 | 11/30/2023 | 12,300,000 | 12,300,000 |
| 10-Year OTC interest rate swap with JPMorgan to receive exercise rate and pay SOFR | JPMorgan | USD | 300,000,000 | 300,000,000 | 2.25 | 05/26/2023 | 6,000,000 | 1,198,680 |
| 10-Year OTC interest rate swap with Morgan Stanley to receive exercise rate and pay SOFR | Morgan Stanley | USD | 400,000,000 | 400,000,000 | 2.25 | 04/27/2023 | 9,540,000 | 1,119,760 |
| 10-Year OTC interest rate swap with Morgan Stanley to receive exercise rate and pay SOFR | Morgan Stanley | USD | 212,740,000 | 212,740,000 | 2.50 | 05/12/2023 | 6,563,029 | 1,257,932 |
| 10-Year OTC interest rate swap with Morgan Stanley to receive exercise rate and pay SOFR | Morgan Stanley | USD | 275,000,000 | 275,000,000 | 3.65 | 11/10/2023 | 10,587,500 | 16,209,132 |
| Total | | | | | | | 84,862,035 | 60,621,875 |
| Put option contracts written |
| Description | Counterparty | Trading
currency | Notional
amount | Number of
contracts | Exercise
price/Rate | Expiration
date | Premium
received ($) | Value ($) |
| 10-Year OTC interest rate swap with Citi to receive exercise rate and pay SOFR | Citi | USD | (321,000,000) | (321,000,000) | 3.60 | 01/05/2023 | (5,136,000) | (2,047,563) |
| 10-Year OTC interest rate swap with Morgan Stanley to receive exercise rate and pay SOFR | Morgan Stanley | USD | (149,220,000) | (149,220,000) | 3.75 | 12/29/2022 | (2,238,300) | (448,108) |
| 10-Year OTC interest rate swap with Morgan Stanley to receive exercise rate and pay SOFR | Morgan Stanley | USD | (175,000,000) | (175,000,000) | 3.90 | 01/27/2023 | (3,281,250) | (691,075) |
| Total | | | | | | | (10,655,550) | (3,186,746) |
| Credit default swap contracts - buy protection |
Reference
entity | Counterparty | Maturity
date | Pay
fixed
rate
(%) | Payment
frequency | Notional
currency | Notional
amount | Value
($) | Periodic
payments
receivable
(payable)
($) | Upfront
payments
($) | Upfront
receipts
($) | Unrealized
appreciation
($) | Unrealized
depreciation
($) |
| Markit CMBX North America Index, Series 11 BBB- | Citi | 11/18/2054 | 3.000 | Monthly | USD | 10,000,000 | 1,435,379 | (5,000) | 329,005 | — | 1,101,374 | — |
| Markit CMBX North America Index, Series 11 BBB- | Goldman Sachs International | 11/18/2054 | 3.000 | Monthly | USD | 10,000,000 | 1,435,380 | (5,000) | 1,540,992 | — | — | (110,612) |
| Total | | | | | | | 2,870,759 | (10,000) | 1,869,997 | — | 1,101,374 | (110,612) |
The accompanying Notes to Financial Statements are an integral part of this statement.
| 18 | Columbia Mortgage Opportunities Fund | Semiannual Report 2022 |
Portfolio of Investments (continued)
November 30, 2022 (Unaudited)
| Cleared credit default swap contracts - buy protection |
Reference
entity | Counterparty | Maturity
date | Pay
fixed
rate
(%) | Payment
frequency | Notional
currency | Notional
amount | Value
($) | Upfront
payments
($) | Upfront
receipts
($) | Unrealized
appreciation
($) | Unrealized
depreciation
($) |
| Markit CDX North America High Yield Index, Series 39 | Morgan Stanley | 12/20/2027 | 5.000 | Quarterly | USD | 189,500,000 | (12,394,891) | — | — | — | (12,394,891) |
| Credit default swap contracts - sell protection |
Reference
entity | Counterparty | Maturity
date | Receive
fixed
rate
(%) | Payment
frequency | Implied
credit
spread
(%)* | Notional
currency | Notional
amount | Value
($) | Periodic
payments
receivable
(payable)
($) | Upfront
payments
($) | Upfront
receipts
($) | Unrealized
appreciation
($) | Unrealized
depreciation
($) |
| Markit CMBX North America Index, Series 10 BBB- | Citi | 11/17/2059 | 3.000 | Monthly | 8.821 | USD | 10,000,000 | (1,767,187) | 5,000 | — | (2,162,838) | 400,651 | — |
| Markit CMBX North America Index, Series 10 BBB- | Citi | 11/17/2059 | 3.000 | Monthly | 8.821 | USD | 40,000,000 | (7,068,752) | 20,000 | — | (4,799,009) | — | (2,249,743) |
| Markit CMBX North America Index, Series 10 BBB- | Goldman Sachs International | 11/17/2059 | 3.000 | Monthly | 8.821 | USD | 10,125,000 | (1,789,277) | 5,062 | — | (1,143,627) | — | (640,588) |
| Markit CMBX North America Index, Series 10 BBB- | JPMorgan | 11/17/2059 | 3.000 | Monthly | 8.821 | USD | 10,000,000 | (1,767,188) | 5,000 | — | (1,696,100) | — | (66,088) |
| Markit CMBX North America Index, Series 10 BBB- | Morgan Stanley | 11/17/2059 | 3.000 | Monthly | 8.821 | USD | 8,800,000 | (1,555,125) | 4,400 | — | (2,020,788) | 470,063 | — |
| Markit CMBX North America Index, Series 10 BBB- | Morgan Stanley | 11/17/2059 | 3.000 | Monthly | 8.821 | USD | 20,000,000 | (3,534,376) | 10,000 | — | (3,919,639) | 395,263 | — |
| Markit CMBX North America Index, Series 10 BBB- | Morgan Stanley | 11/17/2059 | 3.000 | Monthly | 8.821 | USD | 26,500,000 | (4,683,048) | 13,250 | — | (4,915,729) | 245,931 | — |
| Markit CMBX North America Index, Series 10 BBB- | Morgan Stanley | 11/17/2059 | 3.000 | Monthly | 8.821 | USD | 10,000,000 | (1,767,188) | 5,000 | — | (1,901,873) | 139,685 | — |
| Markit CMBX North America Index, Series 10 BBB- | Morgan Stanley | 11/17/2059 | 3.000 | Monthly | 8.821 | USD | 5,000,000 | (883,594) | 2,500 | — | (807,641) | — | (73,453) |
| Markit CMBX North America Index, Series 10 BBB- | Morgan Stanley | 11/17/2059 | 3.000 | Monthly | 8.821 | USD | 13,000,000 | (2,297,345) | 6,500 | — | (2,029,182) | — | (261,663) |
| Markit CMBX North America Index, Series 10 BBB- | Morgan Stanley | 11/17/2059 | 3.000 | Monthly | 8.821 | USD | 45,000,000 | (7,952,346) | 22,500 | — | (5,105,646) | — | (2,824,200) |
| Markit CMBX North America Index, Series 12 BBB- | Morgan Stanley | 08/17/2061 | 3.000 | Monthly | 7.200 | USD | 22,000,000 | (3,877,500) | 11,000 | — | (3,137,480) | — | (729,020) |
| Markit CMBX North America Index, Series 7 BBB- | Morgan Stanley | 01/17/2047 | 3.000 | Monthly | 30.695 | USD | 2,550,000 | (533,109) | 1,275 | — | (208,343) | — | (323,491) |
| Markit CMBX North America Index, Series 7 BBB- | Morgan Stanley | 01/17/2047 | 3.000 | Monthly | 30.695 | USD | 5,000,000 | (1,045,313) | 2,500 | — | (268,192) | — | (774,621) |
| Total | | | | | | | | (40,521,348) | 113,987 | — | (34,116,087) | 1,651,593 | (7,942,867) |
The accompanying Notes to Financial Statements are an integral part of this statement.
Columbia Mortgage Opportunities Fund | Semiannual Report 2022
| 19 |
Portfolio of Investments (continued)
November 30, 2022 (Unaudited)
| * | Implied credit spreads, represented in absolute terms, utilized in determining the market value of credit default swap agreements on corporate or sovereign issues as of period end serve as an indicator of the current status of the payment/performance risk and represent the likelihood or risk of default for the credit derivative. The implied credit spread of a particular referenced entity reflects the cost of buying/selling protection and may include upfront payments required to be made to enter into the agreement. Wider credit spreads represent a deterioration of the referenced entity’s credit soundness and a greater likelihood or risk of default or other credit event occurring as defined under the terms of the agreement. |
Notes to Portfolio of Investments
| (a) | Represents privately placed and other securities and instruments exempt from Securities and Exchange Commission registration (collectively, private placements), such as Section 4(a)(2) and Rule 144A eligible securities, which are often sold only to qualified institutional buyers. At November 30, 2022, the total value of these securities amounted to $1,874,833,079, which represents 72.75% of total net assets. |
| (b) | Variable rate security. The interest rate shown was the current rate as of November 30, 2022. |
| (c) | Security represents a pool of loans that generate cash payments generally over fixed periods of time. Such securities entitle the security holders to receive distributions (i.e. principal and interest, net of fees and expenses) that are tied to the payments made by the borrower on the underlying loans. Due to the structure of the security the cash payments received are not known until the time of payment. The interest rate shown is the stated coupon rate as of November 30, 2022 and is not reflective of the cash flow payments. |
| (d) | Valuation based on significant unobservable inputs. |
| (e) | Represents fair value as determined in good faith under procedures approved by the Board of Trustees. At November 30, 2022, the total value of these securities amounted to $82,954,128, which represents 3.22% of total net assets. |
| (f) | Variable or floating rate security, the interest rate of which adjusts periodically based on changes in current interest rates and prepayments on the underlying pool of assets. The interest rate shown was the current rate as of November 30, 2022. |
| (g) | Represents interest only securities which have the right to receive the monthly interest payments on an underlying pool of mortgage loans. |
| (h) | Represents a security purchased on a when-issued basis. |
| (i) | The rate shown is the seven-day current annualized yield at November 30, 2022. |
| (j) | As defined in the Investment Company Act of 1940, as amended, an affiliated company is one in which the Fund owns 5% or more of the company’s outstanding voting securities, or a company which is under common ownership or control with the Fund. The value of the holdings and transactions in these affiliated companies during the period ended November 30, 2022 are as follows: |
| Affiliated issuers | Beginning
of period($) | Purchases($) | Sales($) | Net change in
unrealized
appreciation
(depreciation)($) | End of
period($) | Realized gain
(loss)($) | Dividends($) | End of
period shares |
| Columbia Short-Term Cash Fund, 3.989% |
| | 218,546,293 | 1,208,293,860 | (1,270,293,099) | 17,330 | 156,564,384 | (9,660) | 2,121,332 | 156,627,035 |
Abbreviation Legend
| CMO | Collateralized Mortgage Obligation |
| LIBOR | London Interbank Offered Rate |
| SOFR | Secured Overnight Financing Rate |
| STRIPS | Separate Trading of Registered Interest and Principal Securities |
| TBA | To Be Announced |
Currency Legend
Fair value measurements
The Fund categorizes its fair value measurements according to a three-level hierarchy that maximizes the use of observable inputs and minimizes the use of unobservable inputs by prioritizing that the most observable input be used when available. Observable inputs are those that market participants would use in pricing an investment based on market data obtained from sources independent of the reporting entity. Unobservable inputs are those that reflect the Fund’s assumptions about the information market participants would use in pricing an investment. An investment’s level within the fair value hierarchy is based on the lowest level of any input that is deemed significant to the asset’s or liability’s fair value measurement. The input levels are not necessarily an indication of the risk or liquidity associated with investments at that level. For example, certain U.S. government securities are generally high quality and liquid, however, they are reflected as Level 2 because the inputs used to determine fair value may not always be quoted prices in an active market.
Fair value inputs are summarized in the three broad levels listed below:
| ■ | Level 1 — Valuations based on quoted prices for investments in active markets that the Fund has the ability to access at the measurement date. Valuation adjustments are not applied to Level 1 investments. |
| ■ | Level 2 — Valuations based on other significant observable inputs (including quoted prices for similar securities, interest rates, prepayment speeds, credit risks, etc.). |
The accompanying Notes to Financial Statements are an integral part of this statement.
| 20 | Columbia Mortgage Opportunities Fund | Semiannual Report 2022 |
Portfolio of Investments (continued)
November 30, 2022 (Unaudited)
Fair value measurements (continued)
| ■ | Level 3 — Valuations based on significant unobservable inputs (including the Fund’s own assumptions and judgment in determining the fair value of investments). |
Inputs that are used in determining fair value of an investment may include price information, credit data, volatility statistics, and other factors. These inputs can be either observable or unobservable. The availability of observable inputs can vary between investments, and is affected by various factors such as the type of investment, and the volume and level of activity for that investment or similar investments in the marketplace. The inputs will be considered by the Investment Manager, along with any other relevant factors in the calculation of an investment’s fair value. The Fund uses prices and inputs that are current as of the measurement date, which may include periods of market dislocations. During these periods, the availability of prices and inputs may be reduced for many investments. This condition could cause an investment to be reclassified between the various levels within the hierarchy.
Investments falling into the Level 3 category are primarily supported by quoted prices from brokers and dealers participating in the market for those investments. However, these may be classified as Level 3 investments due to lack of market transparency and corroboration to support these quoted prices. Additionally, valuation models may be used as the pricing source for any remaining investments classified as Level 3. These models may rely on one or more significant unobservable inputs and/or significant assumptions by the Investment Manager. Inputs used in valuations may include, but are not limited to, financial statement analysis, capital account balances, discount rates and estimated cash flows, and comparable company data.
The Fund’s Board of Trustees (the Board) has designated the Investment Manager, through its Valuation Committee (the Committee), as valuation designee, responsible for determining the fair value of the assets of the Fund for which market quotations are not readily available using valuation procedures approved by the Board. The Committee consists of voting and non-voting members from various groups within the Investment Manager’s organization, including operations and accounting, trading and investments, compliance, risk management and legal.
The Committee meets at least monthly to review and approve valuation matters, which may include a description of specific valuation determinations, data regarding pricing information received from approved pricing vendors and brokers and the results of Board-approved valuation policies and procedures (the Policies). The Policies address, among other things, instances when market quotations are or are not readily available, including recommendations of third party pricing vendors and a determination of appropriate pricing methodologies; events that require specific valuation determinations and assessment of fair value techniques; securities with a potential for stale pricing, including those that are illiquid, restricted, or in default; and the effectiveness of third party pricing vendors, including periodic reviews of vendors. The Committee meets more frequently, as needed, to discuss additional valuation matters, which may include the need to review back-testing results, review time-sensitive information or approve related valuation actions. Representatives of Columbia Management Investment Advisers, LLC report to the Board at each of its regularly scheduled meetings to discuss valuation matters and actions during the period, similar to those described earlier.
The following table is a summary of the inputs used to value the Fund’s investments at November 30, 2022:
| | Level 1 ($) | Level 2 ($) | Level 3 ($) | Total ($) |
| Investments in Securities | | | | |
| Asset-Backed Securities — Non-Agency | — | 228,312,299 | 59,010,058 | 287,322,357 |
| Commercial Mortgage-Backed Securities - Agency | — | 3,571,355 | — | 3,571,355 |
| Commercial Mortgage-Backed Securities - Non-Agency | — | 159,199,722 | — | 159,199,722 |
| Residential Mortgage-Backed Securities - Agency | — | 2,425,935,426 | — | 2,425,935,426 |
| Residential Mortgage-Backed Securities - Non-Agency | — | 1,261,261,235 | 156,259,376 | 1,417,520,611 |
| Options Purchased Calls | — | 60,621,875 | — | 60,621,875 |
| Money Market Funds | 156,564,384 | — | — | 156,564,384 |
| Total Investments in Securities | 156,564,384 | 4,138,901,912 | 215,269,434 | 4,510,735,730 |
| Investments in Derivatives | | | | |
| Asset | | | | |
| Swap Contracts | — | 2,752,967 | — | 2,752,967 |
| Liability | | | | |
| Futures Contracts | (11,042,149) | — | — | (11,042,149) |
| Options Contracts Written | — | (3,186,746) | — | (3,186,746) |
| Swap Contracts | — | (20,448,370) | — | (20,448,370) |
| Total | 145,522,235 | 4,118,019,763 | 215,269,434 | 4,478,811,432 |
See the Portfolio of Investments for all investment classifications not indicated in the table.
The Fund’s assets assigned to the Level 2 input category are generally valued using the market approach, in which a security’s value is determined through reference to prices and information from market transactions for similar or identical assets.
Futures contracts and swap contracts are valued at unrealized appreciation (depreciation).
The accompanying Notes to Financial Statements are an integral part of this statement.
Columbia Mortgage Opportunities Fund | Semiannual Report 2022
| 21 |
Portfolio of Investments (continued)
November 30, 2022 (Unaudited)
Fair value measurements (continued)
The following table is a reconciliation of Level 3 assets for which significant observable and unobservable inputs were used to determine fair value:
| | Balance
as of
05/31/2022
($) | Increase
(decrease)
in accrued
discounts/
premiums
($) | Realized
gain (loss)
($) | Change
in unrealized
appreciation
(depreciation)(a)
($) | Purchases
($) | Sales
($) | Transfers
into
Level 3
($) | Transfers
out of
Level 3
($) | Balance
as of
11/30/2022
($) |
| Asset-Backed Securities — Non-Agency | 154,202,529 | (43,043,670) | (53,576,891) | 32,433,827 | — | (31,005,737) | — | — | 59,010,058 |
| Residential Mortgage-Backed Securities — Non-Agency | 232,604,003 | (18,118) | 152,319 | (5,212,306) | — | (71,266,522) | — | — | 156,259,376 |
| Total | 386,806,532 | (43,061,788) | (53,424,572) | 27,221,521 | — | (102,272,259) | — | — | 215,269,434 |
(a) Change in unrealized appreciation (depreciation) relating to securities held at November 30, 2022 was $10,391,689, which is comprised of Asset-Backed Securities - Non-Agency of $15,718,261 and Residential Mortgage-Backed Securities - Non-Agency of $(5,326,572).
The Fund’s assets assigned to the Level 3 category are valued utilizing the valuation technique deemed the most appropriate in the circumstances. Certain residential mortgage backed securities and asset backed securities classified as Level 3 are valued using the market approach and utilize single market quotations from broker dealers which may have included, but not limited to, the distressed nature of the security and observable transactions for similar assets in the market. Significant increases (decreases) to any of these inputs would have resulted in a significantly higher (lower) fair value measurement.
The accompanying Notes to Financial Statements are an integral part of this statement.
| 22 | Columbia Mortgage Opportunities Fund | Semiannual Report 2022 |
Statement of Assets and Liabilities
November 30, 2022 (Unaudited)
| Assets | |
| Investments in securities, at value | |
| Unaffiliated issuers (cost $4,616,484,031) | $4,293,549,471 |
| Affiliated issuers (cost $156,546,713) | 156,564,384 |
| Options purchased (cost $84,862,035) | 60,621,875 |
| Cash | 117,709 |
| Cash collateral held at broker for: | |
| Swap contracts | 13,828,000 |
| Other(a) | 10,524,000 |
| Margin deposits on: | |
| Futures contracts | 31,506,145 |
| Swap contracts | 12,427,513 |
| Unrealized appreciation on swap contracts | 2,752,967 |
| Upfront payments on swap contracts | 1,869,997 |
| Receivable for: | |
| Investments sold | 10,417 |
| Investments sold on a delayed delivery basis | 325,474,870 |
| Capital shares sold | 12,498,121 |
| Dividends | 399,412 |
| Interest | 24,460,563 |
| Variation margin for futures contracts | 1,855,237 |
| Expense reimbursement due from Investment Manager | 1,574 |
| Prepaid expenses | 24,052 |
| Other assets | 80 |
| Total assets | 4,948,486,387 |
| Liabilities | |
| Option contracts written, at value (premiums received $10,655,550) | 3,186,746 |
| Unrealized depreciation on swap contracts | 8,053,479 |
| Upfront receipts on swap contracts | 34,116,087 |
| Payable for: | |
| Investments purchased | 40,735,871 |
| Investments purchased on a delayed delivery basis | 2,265,431,739 |
| Capital shares purchased | 8,406,616 |
| Dividends and interest on securities sold short | 341,667 |
| Variation margin for futures contracts | 8,880,297 |
| Variation margin for swap contracts | 1,733,783 |
| Management services fees | 44,318 |
| Distribution and/or service fees | 3,972 |
| Transfer agent fees | 190,494 |
| Compensation of board members | 79,918 |
| Compensation of chief compliance officer | 327 |
| Other expenses | 178,179 |
| Total liabilities | 2,371,383,493 |
| Net assets applicable to outstanding capital stock | $2,577,102,894 |
| Represented by | |
| Paid in capital | 3,511,909,131 |
| Total distributable earnings (loss) | (934,806,237) |
| Total - representing net assets applicable to outstanding capital stock | $2,577,102,894 |
The accompanying Notes to Financial Statements are an integral part of this statement.
Columbia Mortgage Opportunities Fund | Semiannual Report 2022
| 23 |
Statement of Assets and Liabilities (continued)
November 30, 2022 (Unaudited)
| Class A | |
| Net assets | $347,125,912 |
| Shares outstanding | 42,391,617 |
| Net asset value per share | $8.19 |
| Maximum sales charge | 3.00% |
| Maximum offering price per share (calculated by dividing the net asset value per share by 1.0 minus the maximum sales charge for Class A shares) | $8.44 |
| Advisor Class | |
| Net assets | $177,017,069 |
| Shares outstanding | 21,648,319 |
| Net asset value per share | $8.18 |
| Class C | |
| Net assets | $58,203,024 |
| Shares outstanding | 7,110,992 |
| Net asset value per share | $8.18 |
| Institutional Class | |
| Net assets | $1,337,286,230 |
| Shares outstanding | 163,411,756 |
| Net asset value per share | $8.18 |
| Institutional 2 Class | |
| Net assets | $410,645,107 |
| Shares outstanding | 50,200,554 |
| Net asset value per share | $8.18 |
| Institutional 3 Class | |
| Net assets | $246,825,552 |
| Shares outstanding | 30,149,869 |
| Net asset value per share | $8.19 |
| (a) | Includes collateral related to options written and swap contracts. |
The accompanying Notes to Financial Statements are an integral part of this statement.
| 24 | Columbia Mortgage Opportunities Fund | Semiannual Report 2022 |
Statement of Operations
Six Months Ended November 30, 2022 (Unaudited)
| Net investment income | |
| Income: | |
| Dividends — unaffiliated issuers | $6,315,381 |
| Dividends — affiliated issuers | 2,121,332 |
| Interest | 119,098,524 |
| Interfund lending | 378 |
| Total income | 127,535,615 |
| Expenses: | |
| Management services fees | 10,162,908 |
| Distribution and/or service fees | |
| Class A | 488,746 |
| Class C | 335,134 |
| Transfer agent fees | |
| Class A | 199,428 |
| Advisor Class | 128,016 |
| Class C | 34,150 |
| Institutional Class | 887,301 |
| Institutional 2 Class | 137,505 |
| Institutional 3 Class | 8,684 |
| Compensation of board members | 28,439 |
| Custodian fees | 26,027 |
| Printing and postage fees | 109,202 |
| Registration fees | 182,945 |
| Audit fees | 25,270 |
| Legal fees | 28,971 |
| Interest on collateral | 102,376 |
| Compensation of chief compliance officer | 327 |
| Other | 27,888 |
| Total expenses | 12,913,317 |
| Fees waived or expenses reimbursed by Investment Manager and its affiliates | (96,398) |
| Expense reduction | (20) |
| Total net expenses | 12,816,899 |
| Net investment income | 114,718,716 |
| Realized and unrealized gain (loss) — net | |
| Net realized gain (loss) on: | |
| Investments — unaffiliated issuers | (177,761,585) |
| Investments — affiliated issuers | (9,660) |
| Futures contracts | (186,021,009) |
| Options purchased | (5,959,150) |
| Options contracts written | (54,280,791) |
| Swap contracts | (31,023,343) |
| Net realized loss | (455,055,538) |
| Net change in unrealized appreciation (depreciation) on: | |
| Investments — unaffiliated issuers | (117,275,962) |
| Investments — affiliated issuers | 17,330 |
| Forward sale commitments | 7,447,265 |
| Futures contracts | (9,253,161) |
| Options purchased | (17,753,940) |
| Options contracts written | 53,626,603 |
| Swap contracts | (433,113) |
| Net change in unrealized appreciation (depreciation) | (83,624,978) |
| Net realized and unrealized loss | (538,680,516) |
| Net decrease in net assets resulting from operations | $(423,961,800) |
The accompanying Notes to Financial Statements are an integral part of this statement.
Columbia Mortgage Opportunities Fund | Semiannual Report 2022
| 25 |
Statement of Changes in Net Assets
| | Six Months Ended
November 30, 2022
(Unaudited) | Year Ended
May 31, 2022 |
| Operations | | |
| Net investment income | $114,718,716 | $201,714,621 |
| Net realized loss | (455,055,538) | (159,961,741) |
| Net change in unrealized appreciation (depreciation) | (83,624,978) | (391,101,621) |
| Net decrease in net assets resulting from operations | (423,961,800) | (349,348,741) |
| Distributions to shareholders | | |
| Net investment income and net realized gains | | |
| Class A | (12,217,039) | (15,264,078) |
| Advisor Class | (7,771,483) | (18,693,751) |
| Class C | (1,804,317) | (3,049,711) |
| Institutional Class | (54,721,344) | (111,364,858) |
| Institutional 2 Class | (15,722,323) | (31,642,312) |
| Institutional 3 Class | (8,910,065) | (18,896,928) |
| Total distributions to shareholders | (101,146,571) | (198,911,638) |
| Increase (decrease) in net assets from capital stock activity | (806,884,226) | 476,133,368 |
| Total decrease in net assets | (1,331,992,597) | (72,127,011) |
| Net assets at beginning of period | 3,909,095,491 | 3,981,222,502 |
| Net assets at end of period | $2,577,102,894 | $3,909,095,491 |
The accompanying Notes to Financial Statements are an integral part of this statement.
| 26 | Columbia Mortgage Opportunities Fund | Semiannual Report 2022 |
Statement of Changes in Net Assets (continued)
| | Six Months Ended | Year Ended |
| | November 30, 2022 (Unaudited) | May 31, 2022 |
| | Shares | Dollars ($) | Shares | Dollars ($) |
| Capital stock activity |
| Class A | | | | |
| Subscriptions | 12,548,345 | 114,411,595 | 38,999,287 | 406,944,552 |
| Distributions reinvested | 1,412,688 | 12,211,331 | 1,480,236 | 15,255,621 |
| Redemptions | (14,315,754) | (124,174,143) | (15,320,599) | (157,908,941) |
| Net increase (decrease) | (354,721) | 2,448,783 | 25,158,924 | 264,291,232 |
| Advisor Class | | | | |
| Subscriptions | 3,744,558 | 33,628,026 | 22,674,673 | 237,290,697 |
| Distributions reinvested | 891,956 | 7,760,432 | 1,802,248 | 18,671,922 |
| Redemptions | (17,003,040) | (148,947,860) | (29,584,615) | (304,569,303) |
| Net decrease | (12,366,526) | (107,559,402) | (5,107,694) | (48,606,684) |
| Class C | | | | |
| Subscriptions | 429,058 | 3,764,449 | 2,816,093 | 29,802,151 |
| Distributions reinvested | 207,816 | 1,797,791 | 292,117 | 3,022,837 |
| Redemptions | (1,489,906) | (13,074,652) | (1,762,205) | (18,009,594) |
| Net increase (decrease) | (853,032) | (7,512,412) | 1,346,005 | 14,815,394 |
| Institutional Class | | | | |
| Subscriptions | 42,836,095 | 373,446,857 | 167,893,736 | 1,751,722,439 |
| Distributions reinvested | 6,222,519 | 54,022,276 | 10,682,012 | 110,463,436 |
| Redemptions | (110,045,872) | (955,349,630) | (138,750,909) | (1,410,271,854) |
| Net increase (decrease) | (60,987,258) | (527,880,497) | 39,824,839 | 451,914,021 |
| Institutional 2 Class | | | | |
| Subscriptions | 12,473,961 | 111,608,539 | 39,473,192 | 410,487,335 |
| Distributions reinvested | 1,809,602 | 15,700,772 | 3,061,126 | 31,617,889 |
| Redemptions | (31,403,891) | (280,476,675) | (48,368,850) | (502,357,562) |
| Net decrease | (17,120,328) | (153,167,364) | (5,834,532) | (60,252,338) |
| Institutional 3 Class | | | | |
| Subscriptions | 9,565,091 | 84,363,753 | 13,714,243 | 145,223,510 |
| Distributions reinvested | 1,011,795 | 8,800,328 | 1,803,629 | 18,771,991 |
| Redemptions | (11,923,169) | (106,377,415) | (29,443,098) | (310,023,758) |
| Net decrease | (1,346,283) | (13,213,334) | (13,925,226) | (146,028,257) |
| Total net increase (decrease) | (93,028,148) | (806,884,226) | 41,462,316 | 476,133,368 |
The accompanying Notes to Financial Statements are an integral part of this statement.
Columbia Mortgage Opportunities Fund | Semiannual Report 2022
| 27 |
The following table is intended to help you understand the Fund’s financial performance. Certain information reflects financial results for a single share of a class held for the periods shown. Per share net investment income (loss) amounts are calculated based on average shares outstanding during the period. Total return assumes reinvestment of all dividends and distributions, if any. Total return does not reflect payment of sales charges, if any. Total return and portfolio turnover are not annualized for periods of less than one year. The portfolio turnover rate is calculated without regard to purchase and sales transactions of short-term instruments and certain derivatives, if any. If such transactions were included, the Fund’s portfolio turnover rate may be higher.
| | Net asset value,
beginning of
period | Net
investment
income | Net
realized
and
unrealized
gain (loss) | Total from
investment
operations | Distributions
from net
investment
income | Distributions
from net
realized
gains | Total
distributions to
shareholders |
| Class A |
| Six Months Ended 11/30/2022 (Unaudited) | $9.59 | 0.31 | (1.43) | (1.12) | (0.28) | — | (0.28) |
| Year Ended 5/31/2022 | $10.87 | 0.48 | (1.30) | (0.82) | (0.40) | (0.06) | (0.46) |
| Year Ended 5/31/2021 | $9.35 | 0.47 | 1.66 | 2.13 | (0.43) | (0.18) | (0.61) |
| Year Ended 5/31/2020 | $10.19 | 0.40 | (0.85) | (0.45) | (0.31) | (0.08) | (0.39) |
| Year Ended 5/31/2019 | $9.93 | 0.44 | 0.25 | 0.69 | (0.40) | (0.03) | (0.43) |
| Year Ended 5/31/2018 | $10.12 | 0.49 | 0.04 | 0.53 | (0.38) | (0.34) | (0.72) |
| Advisor Class |
| Six Months Ended 11/30/2022 (Unaudited) | $9.58 | 0.32 | (1.43) | (1.11) | (0.29) | — | (0.29) |
| Year Ended 5/31/2022 | $10.86 | 0.49 | (1.28) | (0.79) | (0.43) | (0.06) | (0.49) |
| Year Ended 5/31/2021 | $9.35 | 0.50 | 1.65 | 2.15 | (0.46) | (0.18) | (0.64) |
| Year Ended 5/31/2020 | $10.18 | 0.42 | (0.83) | (0.41) | (0.34) | (0.08) | (0.42) |
| Year Ended 5/31/2019 | $9.92 | 0.47 | 0.24 | 0.71 | (0.42) | (0.03) | (0.45) |
| Year Ended 5/31/2018 | $10.11 | 0.54 | 0.01 | 0.55 | (0.40) | (0.34) | (0.74) |
| Class C |
| Six Months Ended 11/30/2022 (Unaudited) | $9.58 | 0.27 | (1.43) | (1.16) | (0.24) | — | (0.24) |
| Year Ended 5/31/2022 | $10.87 | 0.39 | (1.30) | (0.91) | (0.32) | (0.06) | (0.38) |
| Year Ended 5/31/2021 | $9.35 | 0.40 | 1.65 | 2.05 | (0.35) | (0.18) | (0.53) |
| Year Ended 5/31/2020 | $10.19 | 0.32 | (0.84) | (0.52) | (0.24) | (0.08) | (0.32) |
| Year Ended 5/31/2019 | $9.93 | 0.37 | 0.24 | 0.61 | (0.32) | (0.03) | (0.35) |
| Year Ended 5/31/2018 | $10.12 | 0.44 | 0.01 | 0.45 | (0.30) | (0.34) | (0.64) |
| Institutional Class |
| Six Months Ended 11/30/2022 (Unaudited) | $9.58 | 0.32 | (1.43) | (1.11) | (0.29) | — | (0.29) |
| Year Ended 5/31/2022 | $10.86 | 0.49 | (1.28) | (0.79) | (0.43) | (0.06) | (0.49) |
| Year Ended 5/31/2021 | $9.35 | 0.50 | 1.65 | 2.15 | (0.46) | (0.18) | (0.64) |
| Year Ended 5/31/2020 | $10.19 | 0.42 | (0.84) | (0.42) | (0.34) | (0.08) | (0.42) |
| Year Ended 5/31/2019 | $9.93 | 0.47 | 0.24 | 0.71 | (0.42) | (0.03) | (0.45) |
| Year Ended 5/31/2018 | $10.12 | 0.53 | 0.02 | 0.55 | (0.40) | (0.34) | (0.74) |
| Institutional 2 Class |
| Six Months Ended 11/30/2022 (Unaudited) | $9.58 | 0.32 | (1.43) | (1.11) | (0.29) | — | (0.29) |
| Year Ended 5/31/2022 | $10.86 | 0.50 | (1.29) | (0.79) | (0.43) | (0.06) | (0.49) |
| Year Ended 5/31/2021 | $9.35 | 0.50 | 1.65 | 2.15 | (0.46) | (0.18) | (0.64) |
| Year Ended 5/31/2020 | $10.18 | 0.42 | (0.83) | (0.41) | (0.34) | (0.08) | (0.42) |
| Year Ended 5/31/2019 | $9.92 | 0.47 | 0.25 | 0.72 | (0.43) | (0.03) | (0.46) |
| Year Ended 5/31/2018 | $10.11 | 0.52 | 0.03 | 0.55 | (0.40) | (0.34) | (0.74) |
The accompanying Notes to Financial Statements are an integral part of this statement.
| 28 | Columbia Mortgage Opportunities Fund | Semiannual Report 2022 |
Financial Highlights (continued)
| | Net
asset
value,
end of
period | Total
return | Total gross
expense
ratio to
average
net assets(a) | Total net
expense
ratio to
average
net assets(a),(b) | Net investment
income
ratio to
average
net assets | Portfolio
turnover | Net
assets,
end of
period
(000’s) |
| Class A |
| Six Months Ended 11/30/2022 (Unaudited) | $8.19 | (11.84%) | 1.02%(c),(d) | 1.01%(c),(d),(e) | 6.94%(c) | 301% | $347,126 |
| Year Ended 5/31/2022 | $9.59 | (7.79%) | 0.99%(d) | 0.99%(d),(e) | 4.58% | 340% | $409,868 |
| Year Ended 5/31/2021 | $10.87 | 23.28% | 1.01%(d) | 1.00%(d),(e) | 4.56% | 496% | $191,161 |
| Year Ended 5/31/2020 | $9.35 | (4.54%) | 1.04%(d),(f) | 1.01%(d),(f) | 3.97% | 819% | $92,796 |
| Year Ended 5/31/2019 | $10.19 | 7.12% | 1.08%(d) | 1.01%(d) | 4.41% | 528% | $123,926 |
| Year Ended 5/31/2018 | $9.93 | 5.53% | 1.12% | 1.00% | 5.12% | 716% | $70,299 |
| Advisor Class |
| Six Months Ended 11/30/2022 (Unaudited) | $8.18 | (11.74%) | 0.76%(c),(d) | 0.76%(c),(d),(e) | 7.12%(c) | 301% | $177,017 |
| Year Ended 5/31/2022 | $9.58 | (7.56%) | 0.74%(d) | 0.74%(d),(e) | 4.65% | 340% | $325,742 |
| Year Ended 5/31/2021 | $10.86 | 23.48% | 0.76%(d) | 0.75%(d),(e) | 4.79% | 496% | $424,803 |
| Year Ended 5/31/2020 | $9.35 | (4.20%) | 0.78%(d),(f) | 0.76%(d),(f) | 4.20% | 819% | $146,447 |
| Year Ended 5/31/2019 | $10.18 | 7.39% | 0.84%(d) | 0.76%(d) | 4.69% | 528% | $196,808 |
| Year Ended 5/31/2018 | $9.92 | 5.79% | 0.86% | 0.75% | 5.52% | 716% | $29,201 |
| Class C |
| Six Months Ended 11/30/2022 (Unaudited) | $8.18 | (12.19%) | 1.76%(c),(d) | 1.76%(c),(d),(e) | 6.16%(c) | 301% | $58,203 |
| Year Ended 5/31/2022 | $9.58 | (8.57%) | 1.74%(d) | 1.74%(d),(e) | 3.70% | 340% | $76,327 |
| Year Ended 5/31/2021 | $10.87 | 22.37% | 1.76%(d) | 1.75%(d),(e) | 3.82% | 496% | $71,915 |
| Year Ended 5/31/2020 | $9.35 | (5.26%) | 1.79%(d),(f) | 1.76%(d),(f) | 3.26% | 819% | $40,482 |
| Year Ended 5/31/2019 | $10.19 | 6.32% | 1.84%(d) | 1.76%(d) | 3.69% | 528% | $32,543 |
| Year Ended 5/31/2018 | $9.93 | 4.74% | 1.85% | 1.75% | 4.44% | 716% | $5,842 |
| Institutional Class |
| Six Months Ended 11/30/2022 (Unaudited) | $8.18 | (11.74%) | 0.76%(c),(d) | 0.76%(c),(d),(e) | 7.13%(c) | 301% | $1,337,286 |
| Year Ended 5/31/2022 | $9.58 | (7.56%) | 0.74%(d) | 0.74%(d),(e) | 4.72% | 340% | $2,150,404 |
| Year Ended 5/31/2021 | $10.86 | 23.48% | 0.76%(d) | 0.75%(d),(e) | 4.80% | 496% | $2,005,278 |
| Year Ended 5/31/2020 | $9.35 | (4.29%) | 0.78%(d),(f) | 0.76%(d),(f) | 4.23% | 819% | $752,376 |
| Year Ended 5/31/2019 | $10.19 | 7.38% | 0.84%(d) | 0.76%(d) | 4.71% | 528% | $694,646 |
| Year Ended 5/31/2018 | $9.93 | 5.80% | 0.85% | 0.75% | 5.44% | 716% | $64,054 |
| Institutional 2 Class |
| Six Months Ended 11/30/2022 (Unaudited) | $8.18 | (11.72%) | 0.72%(c),(d) | 0.72%(c),(d) | 7.17%(c) | 301% | $410,645 |
| Year Ended 5/31/2022 | $9.58 | (7.52%) | 0.70%(d) | 0.70%(d) | 4.76% | 340% | $644,830 |
| Year Ended 5/31/2021 | $10.86 | 23.53% | 0.72%(d) | 0.71%(d) | 4.82% | 496% | $794,473 |
| Year Ended 5/31/2020 | $9.35 | (4.15%) | 0.74%(d),(f) | 0.71%(d),(f) | 4.26% | 819% | $203,390 |
| Year Ended 5/31/2019 | $10.18 | 7.45% | 0.77%(d) | 0.70%(d) | 4.70% | 528% | $150,092 |
| Year Ended 5/31/2018 | $9.92 | 5.84% | 0.83% | 0.71% | 5.44% | 716% | $47,960 |
The accompanying Notes to Financial Statements are an integral part of this statement.
Columbia Mortgage Opportunities Fund | Semiannual Report 2022
| 29 |
Financial Highlights (continued)
| | Net asset value,
beginning of
period | Net
investment
income | Net
realized
and
unrealized
gain (loss) | Total from
investment
operations | Distributions
from net
investment
income | Distributions
from net
realized
gains | Total
distributions to
shareholders |
| Institutional 3 Class |
| Six Months Ended 11/30/2022 (Unaudited) | $9.59 | 0.32 | (1.43) | (1.11) | (0.29) | — | (0.29) |
| Year Ended 5/31/2022 | $10.87 | 0.49 | (1.27) | (0.78) | (0.44) | (0.06) | (0.50) |
| Year Ended 5/31/2021 | $9.35 | 0.51 | 1.66 | 2.17 | (0.47) | (0.18) | (0.65) |
| Year Ended 5/31/2020 | $10.19 | 0.43 | (0.84) | (0.41) | (0.35) | (0.08) | (0.43) |
| Year Ended 5/31/2019 | $9.93 | 0.47 | 0.25 | 0.72 | (0.43) | (0.03) | (0.46) |
| Year Ended 5/31/2018 | $10.12 | 0.55 | 0.01 | 0.56 | (0.41) | (0.34) | (0.75) |
| Notes to Financial Highlights |
| (a) | In addition to the fees and expenses that the Fund bears directly, the Fund indirectly bears a pro rata share of the fees and expenses of any other funds in which it invests. Such indirect expenses are not included in the Fund’s reported expense ratios. |
| (b) | Total net expenses include the impact of certain fee waivers/expense reimbursements made by the Investment Manager and certain of its affiliates, if applicable. |
| (c) | Annualized. |
| (d) | Ratios include interest on collateral expense. For the periods indicated below, if interest on collateral expense had been excluded, expenses would have been lower by: |
| Class | 11/30/2022 | 5/31/2022 | 5/31/2021 | 5/31/2020 | 5/31/2019 |
| Class A | 0.01% | less than 0.01% | less than 0.01% | 0.01% | 0.01% |
| Advisor Class | 0.01% | less than 0.01% | less than 0.01% | 0.01% | 0.01% |
| Class C | 0.01% | less than 0.01% | less than 0.01% | 0.01% | 0.01% |
| Institutional Class | 0.01% | less than 0.01% | less than 0.01% | 0.01% | 0.01% |
| Institutional 2 Class | 0.01% | less than 0.01% | less than 0.01% | 0.01% | 0.01% |
| Institutional 3 Class | 0.01% | less than 0.01% | less than 0.01% | 0.01% | 0.01% |
| (e) | The benefits derived from expense reductions had an impact of less than 0.01%. |
| (f) | Ratios include interfund lending expense which is less than 0.01%. |
The accompanying Notes to Financial Statements are an integral part of this statement.
| 30 | Columbia Mortgage Opportunities Fund | Semiannual Report 2022 |
Financial Highlights (continued)
| | Net
asset
value,
end of
period | Total
return | Total gross
expense
ratio to
average
net assets(a) | Total net
expense
ratio to
average
net assets(a),(b) | Net investment
income
ratio to
average
net assets | Portfolio
turnover | Net
assets,
end of
period
(000’s) |
| Institutional 3 Class |
| Six Months Ended 11/30/2022 (Unaudited) | $8.19 | (11.69%) | 0.67%(c),(d) | 0.67%(c),(d) | 7.26%(c) | 301% | $246,826 |
| Year Ended 5/31/2022 | $9.59 | (7.47%) | 0.65%(d) | 0.65%(d) | 4.65% | 340% | $301,924 |
| Year Ended 5/31/2021 | $10.87 | 23.71% | 0.67%(d) | 0.66%(d) | 4.92% | 496% | $493,593 |
| Year Ended 5/31/2020 | $9.35 | (4.20%) | 0.69%(d),(f) | 0.66%(d),(f) | 4.36% | 819% | $215,799 |
| Year Ended 5/31/2019 | $10.19 | 7.49% | 0.72%(d) | 0.65%(d) | 4.71% | 528% | $205,730 |
| Year Ended 5/31/2018 | $9.93 | 5.90% | 0.75% | 0.65% | 5.55% | 716% | $189,672 |
The accompanying Notes to Financial Statements are an integral part of this statement.
Columbia Mortgage Opportunities Fund | Semiannual Report 2022
| 31 |
Notes to Financial Statements
November 30, 2022 (Unaudited)
Note 1. Organization
Columbia Mortgage Opportunities Fund (the Fund), a series of Columbia Funds Series Trust II (the Trust), is a diversified fund. The Trust is registered under the Investment Company Act of 1940, as amended (the 1940 Act), as an open-end management investment company organized as a Massachusetts business trust.
Fund shares
The Trust may issue an unlimited number of shares (without par value). The Fund offers each of the share classes listed in the Statement of Assets and Liabilities. Although all share classes generally have identical voting, dividend and liquidation rights, each share class votes separately when required by the Trust’s organizational documents or by law. Each share class has its own expense and sales charge structure. Different share classes may have different minimum initial investment amounts and pay different net investment income distribution amounts to the extent the expenses of distributing such share classes vary. Distributions to shareholders in a liquidation will be proportional to the net asset value of each share class.
As described in the Fund’s prospectus, Class A and Class C shares are offered to the general public for investment. Class C shares automatically convert to Class A shares after 8 years. Advisor Class, Institutional Class, Institutional 2 Class and Institutional 3 Class shares are available for purchase through authorized investment professionals to omnibus retirement plans or to institutional investors and to certain other investors as also described in the Fund’s prospectus.
Note 2. Summary of significant accounting policies
Basis of preparation
The Fund is an investment company that applies the accounting and reporting guidance in the Financial Accounting Standards Board (FASB) Accounting Standards Codification Topic 946, Financial Services - Investment Companies (ASC 946). The financial statements are prepared in accordance with U.S. generally accepted accounting principles (GAAP), which requires management to make certain estimates and assumptions that affect the reported amounts of assets and liabilities, the disclosure of contingent assets and liabilities at the date of the financial statements and the reported amounts of income and expenses during the reporting period. Actual results could differ from those estimates.
The following is a summary of significant accounting policies followed by the Fund in the preparation of its financial statements.
Security valuation
Asset- and mortgage-backed securities are generally valued by pricing services, which utilize pricing models that incorporate the securities’ cash flow and loan performance data. These models also take into account available market data, including trades, market quotations, and benchmark yield curves for identical or similar securities. Factors used to identify similar securities may include, but are not limited to, issuer, collateral type, vintage, prepayment speeds, collateral performance, credit ratings, credit enhancement and expected life. Asset-backed securities for which quotations are readily available may also be valued based upon an over-the-counter or exchange bid quote from an approved independent broker-dealer. Debt securities maturing in 60 days or less are valued primarily at amortized market value, unless this method results in a valuation that management believes does not approximate fair value.
Investments in open-end investment companies (other than exchange-traded funds (ETFs)), are valued at the latest net asset value reported by those companies as of the valuation time.
Futures and options on futures contracts are valued based upon the settlement price at the close of regular trading on their principal exchanges or, in the absence of a settlement price, at the mean of the latest quoted bid and ask prices.
Option contracts are valued at the mean of the latest quoted bid and ask prices on their primary exchanges. Option contracts, including over-the-counter option contracts, with no readily available market quotations are valued using mid-market evaluations from independent third-party vendors.
Swap transactions are valued through an independent pricing service or broker, or if neither is available, through an internal model based upon observable inputs.
| 32 | Columbia Mortgage Opportunities Fund | Semiannual Report 2022 |
Notes to Financial Statements (continued)
November 30, 2022 (Unaudited)
Investments for which market quotations are not readily available, or that have quotations which management believes are not reflective of market value or reliable, are valued at fair value as determined in good faith under procedures approved by the Board of Trustees. If a security or class of securities (such as foreign securities) is valued at fair value, such value is likely to be different from the quoted or published price for the security, if available.
The determination of fair value often requires significant judgment. To determine fair value, management may use assumptions including but not limited to future cash flows and estimated risk premiums. Multiple inputs from various sources may be used to determine fair value.
GAAP requires disclosure regarding the inputs and valuation techniques used to measure fair value and any changes in valuation inputs or techniques. In addition, investments shall be disclosed by major category. This information is disclosed following the Fund’s Portfolio of Investments.
Derivative instruments
The Fund invests in certain derivative instruments, as detailed below, in seeking to meet its investment objectives. Derivatives are instruments whose values depend on, or are derived from, in whole or in part, the value of one or more securities, currencies, commodities, indices, or other assets or instruments. Derivatives may be used to increase investment flexibility (including to maintain cash reserves while maintaining desired exposure to certain assets), for risk management (hedging) purposes, to facilitate trading, to reduce transaction costs and to pursue higher investment returns. The Fund may also use derivative instruments to mitigate certain investment risks, such as foreign currency exchange rate risk, interest rate risk and credit risk. Derivatives may involve various risks, including the potential inability of the counterparty to fulfill its obligations under the terms of the contract, the potential for an illiquid secondary market (making it difficult for the Fund to sell or terminate, including at favorable prices) and the potential for market movements which may expose the Fund to gains or losses in excess of the amount shown in the Statement of Assets and Liabilities. The notional amounts of derivative instruments, if applicable, are not recorded in the financial statements.
A derivative instrument may suffer a marked-to-market loss if the value of the contract decreases due to an unfavorable change in the market rates or values of the underlying instrument. Losses can also occur if the counterparty does not perform its obligations under the contract. The Fund’s risk of loss from counterparty credit risk on over-the-counter derivatives is generally limited to the aggregate unrealized gain netted against any collateral held by the Fund and the amount of any variation margin held by the counterparty, plus any replacement costs or related amounts. With exchange-traded or centrally cleared derivatives, there is reduced counterparty credit risk to the Fund since the clearinghouse or central counterparty (CCP) provides some protection in the case of clearing member default. The clearinghouse or CCP stands between the buyer and the seller of the contract; therefore, failure of the clearinghouse or CCP may pose additional counterparty credit risk. However, credit risk still exists in exchange-traded or centrally cleared derivatives with respect to initial and variation margin that is held in a broker’s customer account. While clearing brokers are required to segregate customer margin from their own assets, in the event that a clearing broker becomes insolvent or goes into bankruptcy and at that time there is a shortfall in the aggregate amount of margin held by the clearing broker for all its clients and such shortfall is remedied by the CCP or otherwise, U.S. bankruptcy laws will typically allocate that shortfall on a pro-rata basis across all the clearing broker’s customers (including the Fund), potentially resulting in losses to the Fund.
In order to better define its contractual rights and to secure rights that will help the Fund mitigate its counterparty risk, the Fund may enter into an International Swaps and Derivatives Association, Inc. Master Agreement (ISDA Master Agreement) or similar agreement with its derivatives counterparties. An ISDA Master Agreement is an agreement between the Fund and a counterparty that governs over-the-counter derivatives and foreign exchange forward contracts and contains, among other things, collateral posting terms and netting provisions in the event of a default and/or termination event. Under an ISDA Master Agreement, the Fund may, under certain circumstances, offset with the counterparty certain derivative instruments’ payables and/or receivables with collateral held and/or posted and create one single net payment. The provisions of the ISDA Master Agreement typically permit a single net payment in the event of default (close-out netting), including the bankruptcy or insolvency of the counterparty. Note, however, that bankruptcy or insolvency laws of a particular jurisdiction may impose restrictions on or prohibitions against the right of offset or netting in bankruptcy, insolvency or other events.
Columbia Mortgage Opportunities Fund | Semiannual Report 2022
| 33 |
Notes to Financial Statements (continued)
November 30, 2022 (Unaudited)
Collateral (margin) requirements differ by type of derivative. Margin requirements are established by the clearinghouse or CCP for exchange-traded and centrally cleared derivatives. Brokers can ask for margin in excess of the minimum in certain circumstances. Collateral terms for most over-the-counter derivatives are subject to regulatory requirements to exchange variation margin with trading counterparties and may have contract specific margin terms as well. For over-the-counter derivatives traded under an ISDA Master Agreement, the collateral requirements are typically calculated by netting the marked-to-market amount for each transaction under such agreement and comparing that amount to the value of any variation margin currently pledged by the Fund and/or the counterparty. Generally, the amount of collateral due from or to a party has to exceed a minimum transfer amount threshold (e.g., $250,000) before a transfer has to be made. To the extent amounts due to the Fund from its counterparties are not fully collateralized, contractually or otherwise, the Fund bears the risk of loss from counterparty nonperformance. The Fund may also pay interest expense on cash collateral received from the broker. Any interest expense paid by the Fund is shown in the Statement of Operations. The Fund attempts to mitigate counterparty risk by only entering into agreements with counterparties that it believes have the financial resources to honor their obligations and by monitoring the financial stability of those counterparties.
Certain ISDA Master Agreements allow counterparties of over-the-counter derivatives transactions to terminate derivatives contracts prior to maturity in the event the Fund’s net asset value declines by a stated percentage over a specified time period or if the Fund fails to meet certain terms of the ISDA Master Agreement, which would cause the Fund to accelerate payment of any net liability owed to the counterparty. The Fund also has termination rights if the counterparty fails to meet certain terms of the ISDA Master Agreement. In determining whether to exercise such termination rights, the Fund would consider, in addition to counterparty credit risk, whether termination would result in a net liability owed from the counterparty.
For financial reporting purposes, the Fund does not offset derivative assets and derivative liabilities that are subject to netting arrangements in the Statement of Assets and Liabilities.
Futures contracts
Futures contracts are exchange-traded and represent commitments for the future purchase or sale of an asset at a specified price on a specified date. The Fund bought and sold futures contracts to manage the duration and yield curve exposure of the Fund versus the benchmark and to manage exposure to movements in interest rates. These instruments may be used for other purposes in future periods. Upon entering into futures contracts, the Fund bears risks that it may not achieve the anticipated benefits of the futures contracts and may realize a loss. Additional risks include counterparty credit risk, the possibility of an illiquid market, and that a change in the value of the contract or option may not correlate with changes in the value of the underlying asset.
Upon entering into a futures contract, the Fund deposits cash or securities with the broker, known as a futures commission merchant (FCM), in an amount sufficient to meet the initial margin requirement. The initial margin deposit must be maintained at an established level over the life of the contract. Cash deposited as initial margin is recorded in the Statement of Assets and Liabilities as margin deposits. Securities deposited as initial margin are designated in the Portfolio of Investments. Subsequent payments (variation margin) are made or received by the Fund each day. The variation margin payments are equal to the daily change in the contract value and are recorded as variation margin receivable or payable and are offset in unrealized gains or losses. The Fund generally expects to earn interest income on its margin deposits. The Fund recognizes a realized gain or loss when the contract is closed or expires. Futures contracts involve, to varying degrees, risk of loss in excess of the variation margin disclosed in the Statement of Assets and Liabilities.
Options contracts
Options are contracts which entitle the holder to purchase or sell securities or other identified assets at a specified price, or in the case of index option contracts, to receive or pay the difference between the index value and the strike price of the index option contract. Option contracts can be either exchange-traded or over-the-counter. The Fund purchased and has written option contracts to manage exposure to fluctuations in interest rates and to hedge the fair value of the Fund’s investments. These instruments may be used for other purposes in future periods. Completion of transactions for option contracts traded in the over-the-counter market depends upon the performance of the other party. Collateral may be collected or posted by the Fund to secure over-the-counter option contract trades. Collateral held or posted by the Fund for such option contract trades must be returned to the broker or the Fund upon closure, exercise or expiration of the contract.
| 34 | Columbia Mortgage Opportunities Fund | Semiannual Report 2022 |
Notes to Financial Statements (continued)
November 30, 2022 (Unaudited)
Options contracts purchased are recorded as investments. When the Fund writes an options contract, the premium received is recorded as an asset and an amount equivalent to the premium is recorded as a liability in the Statement of Assets and Liabilities and is subsequently adjusted to reflect the current fair value of the option written. Changes in the fair value of the written option are recorded as unrealized appreciation or depreciation until the contract is exercised or has expired. The Fund realizes a gain or loss when the option contract is closed or expires. When option contracts are exercised, the proceeds on sales for a written call or purchased put option contract, or the purchase cost for a written put or purchased call option contract, is adjusted by the amount of premium received or paid.
For over-the-counter options purchased, the Fund bears the risk of loss of the amount of the premiums paid plus the positive change in market values net of any collateral held by the Fund should the counterparty fail to perform under the contracts. Option contracts written by the Fund do not typically give rise to significant counterparty credit risk, as options written generally obligate the Fund and not the counterparty to perform. The risk in writing a call option contract is that the Fund gives up the opportunity for profit if the market price of the security increases above the strike price and the option contract is exercised. The risk in writing a put option contract is that the Fund may incur a loss if the market price of the security decreases below the strike price and the option contract is exercised. Exercise of a written option could result in the Fund purchasing or selling a security or foreign currency when it otherwise would not, or at a price different from the current market value. In purchasing and writing options, the Fund bears the risk of an unfavorable change in the value of the underlying instrument or the risk that the Fund may not be able to enter into a closing transaction due to an illiquid market.
Interest rate swaption contracts
Interest rate swaption contracts entered into by the Fund typically represent an option that gives the purchaser the right, but not the obligation, to enter into an interest rate swap contract on a future date. Each interest rate swaption contract will specify if the buyer is entitled to receive the fixed or floating rate if the interest rate is exercised. Changes in the value of a purchased interest rate swaption contracts are reported as unrealized appreciation or depreciation on options in the Statement of Assets and Liabilities. Gain or loss is recognized in the Statement of Operations when the interest rate swaption contract is closed or expires.
When the Fund writes an interest rate swaption contract, the premium received is recorded as an asset and an amount equivalent to the premium is recorded as a liability in the Statement of Assets and Liabilities and is subsequently adjusted to reflect the current fair value of the interest rate swaption contract written. Premiums received from writing interest rate swaption contracts that expire unexercised are recorded by the Fund on the expiration date as realized gains from options written in the Statement of Operations. The difference between the premium and the amount paid on effecting a closing purchase transaction, including brokerage commissions, is also recorded as realized gain, or if the premium is less than the amount paid for the closing purchase, as realized loss. These amounts are reflected as net realized gain (loss) on options written in the Statement of Operations.
Swap contracts
Swap contracts are negotiated in the over-the-counter market and are entered into bilaterally or centrally cleared (centrally cleared swap contract). In a centrally cleared swap contract, immediately following execution of the swap contract with a broker, the swap contract is novated to a central counterparty (the CCP) and the CCP becomes the Fund’s counterparty to the centrally cleared swap contract. The Fund is required to deposit initial margin with the futures commission merchant (FCM), which pledges it through to the CCP in the form of cash or securities in an amount that varies depending on the size and risk profile of the particular swap contract. Securities deposited as initial margin are designated in the Portfolio of Investments and cash deposited is recorded in the Statement of Assets and Liabilities as margin deposits. For a bilateral swap contract, the Fund has credit exposure to the broker, but exchanges daily variation margin with the broker based on the mark-to-market value of the swap contract to minimize that exposure. For centrally cleared swap contracts, the Fund has minimal credit exposure to the FCM because the CCP stands between the Fund and the relevant buyer/seller on the other side of the contract. Swap contracts are marked-to-market daily and changes in value are recorded as unrealized appreciation (depreciation). The daily change in valuation of swap contracts, if any, is recorded as a receivable or payable for variation margin in the Statement of Assets and Liabilities.
Columbia Mortgage Opportunities Fund | Semiannual Report 2022
| 35 |
Notes to Financial Statements (continued)
November 30, 2022 (Unaudited)
Entering into these contracts involves, to varying degrees, elements of interest, liquidity and counterparty credit risk in excess of the amounts recognized in the Statement of Assets and Liabilities. Such risks involve the possibility that there may be unfavorable changes in interest rates, market conditions or other conditions, that it may be difficult to initiate a swap transaction or liquidate a position at an advantageous time or price which may result in significant losses, and that the bilateral counterparty, FCM, or CCP, as applicable, may not fulfill its obligation under the contract.
Credit default swap contracts
The Fund entered into credit default swap contracts to increase or decrease its credit exposure to an index and to manage credit exposure. These instruments may be used for other purposes in future periods. Credit default swap contracts are transactions in which one party pays fixed periodic payments to a counterparty in consideration for an agreement from the counterparty to make a specific payment should a specified credit event(s) take place. Although specified credit events are contract specific, credit events are typically bankruptcy, failure to pay, restructuring, obligation acceleration, obligation default, or repudiation/moratorium.
As the purchaser of a credit default swap contract, the Fund purchases protection by paying a periodic interest rate on the notional amount to the counterparty. The interest amount is accrued daily as a component of unrealized appreciation (depreciation) and is recorded as a realized loss upon payment. If a credit event as specified in the contract occurs, the Fund may have the option either to deliver the reference obligation to the seller in exchange for a cash payment of its par amount, or to receive a net cash settlement equal to the par amount less an agreed-upon value of the reference obligation as of the date of the credit event. The difference between the value of the obligation or cash delivered and the notional amount received will be recorded as a realized gain (loss).
As the seller of a credit default swap contract, the Fund sells protection to a buyer and will generally receive a periodic interest rate on a notional amount. The interest amount is accrued daily as a component of unrealized appreciation (depreciation) and is recorded as a realized gain upon receipt of the payment. If a credit event as specified in the contract with the counterparty occurs, the Fund may either be required to accept the reference obligation from the buyer in exchange for a cash payment of its notional amount, or to pay the buyer a net cash settlement equal to the notional amount less an agreed-upon value of the reference obligation (recovery value) as of the date of the credit event. The difference between the value of the obligation or cash received and the notional amount paid will be recorded as a realized gain (loss). The maximum potential amount of undiscounted future payments the Fund could be required to make as the seller of protection under a credit default swap contract is equal to the notional amount of the reference obligation. These potential amounts may be partially offset by any recovery values of the respective reference obligations or upfront receipts upon entering into the agreement. The notional amounts and market values of all credit default swap contracts in which the Fund is the seller of protection, if any, are disclosed in the Credit Default Swap Contracts Outstanding schedule following the Portfolio of Investments.
As a protection seller, the Fund bears the risk of loss from the credit events specified in the contract with the counterparty. For credit default swap contracts on credit indices, quoted market prices and resulting market values serve as an indicator of the current status of the payment/performance risk. Increasing market values, in absolute terms when compared to the notional amount of the swap, represent a deterioration of the reference entity’s credit soundness and a greater likelihood or risk of default or other credit event occurring as defined under the terms of the contract.
Any upfront payment or receipt by the Fund upon entering into a credit default swap contract is recorded as an asset or liability, respectively, and amortized daily as a component of realized gain (loss) in the Statement of Operations. Credit default swap contracts are valued daily, and the change in value is recorded as unrealized appreciation (depreciation) until the termination of the swap, at which time a realized gain (loss) is recorded.
Credit default swap contracts can involve greater risks than if a fund had invested in the reference obligation directly since, in addition to general market risks, credit default swaps are subject to counterparty credit risk, leverage risk, hedging risk, correlation risk and liquidity risk.
| 36 | Columbia Mortgage Opportunities Fund | Semiannual Report 2022 |
Notes to Financial Statements (continued)
November 30, 2022 (Unaudited)
Effects of derivative transactions in the financial statements
The following tables are intended to provide additional information about the effect of derivatives on the financial statements of the Fund, including: the fair value of derivatives by risk category and the location of those fair values in the Statement of Assets and Liabilities; and the impact of derivative transactions over the period in the Statement of Operations, including realized and unrealized gains (losses). The derivative instrument schedules following the Portfolio of Investments present additional information regarding derivative instruments outstanding at the end of the period, if any.
The following table is a summary of the fair value of derivative instruments (not considered to be hedging instruments for accounting disclosure purposes) at November 30, 2022:
| | Asset derivatives | |
Risk exposure
category | Statement
of assets and liabilities
location | Fair value ($) |
| Credit risk | Component of total distributable earnings (loss) — unrealized appreciation on swap contracts | 2,752,967* |
| Credit risk | Upfront payments on swap contracts | 1,869,997 |
| Interest rate risk | Investments, at value — Options purchased | 60,621,875 |
| Total | | 65,244,839 |
| | Liability derivatives | |
Risk exposure
category | Statement
of assets and liabilities
location | Fair value ($) |
| Credit risk | Component of total distributable earnings (loss) — unrealized depreciation on swap contracts | 20,448,370* |
| Credit risk | Upfront receipts on swap contracts | 34,116,087 |
| Interest rate risk | Component of total distributable earnings (loss) — unrealized depreciation on futures contracts | 11,042,149* |
| Interest rate risk | Options contracts written, at value | 3,186,746 |
| Total | | 68,793,352 |
| * | Includes cumulative appreciation (depreciation) as reported in the tables following the Portfolio of Investments. Only the current day’s variation margin is reported in receivables or payables in the Statement of Assets and Liabilities. |
The following table indicates the effect of derivative instruments (not considered to be hedging instruments for accounting disclosure purposes) in the Statement of Operations for the six months ended November 30, 2022:
| Amount of realized gain (loss) on derivatives recognized in income |
| Risk exposure category | Futures
contracts
($) | Options
contracts
written
($) | Options
contracts
purchased
($) | Swap
contracts
($) | Total
($) |
| Credit risk | — | — | — | (31,023,343) | (31,023,343) |
| Interest rate risk | (186,021,009) | (54,280,791) | (5,959,150) | — | (246,260,950) |
| Total | (186,021,009) | (54,280,791) | (5,959,150) | (31,023,343) | (277,284,293) |
| |
| Change in unrealized appreciation (depreciation) on derivatives recognized in income |
| Risk exposure category | Futures
contracts
($) | Options
contracts
written
($) | Options
contracts
purchased
($) | Swap
contracts
($) | Total
($) |
| Credit risk | — | — | — | (433,113) | (433,113) |
| Interest rate risk | (9,253,161) | 53,626,603 | (17,753,940) | — | 26,619,502 |
| Total | (9,253,161) | 53,626,603 | (17,753,940) | (433,113) | 26,186,389 |
Columbia Mortgage Opportunities Fund | Semiannual Report 2022
| 37 |
Notes to Financial Statements (continued)
November 30, 2022 (Unaudited)
The following table is a summary of the average outstanding volume by derivative instrument for the six months ended November 30, 2022:
| Derivative instrument | Average notional
amounts ($)* |
| Futures contracts — long | 1,054,994,781 |
| Futures contracts — short | 2,145,891,206 |
| Credit default swap contracts — buy protection | 374,575,000 |
| Credit default swap contracts — sell protection | 328,037,500 |
| Derivative instrument | Average
value ($)* |
| Options contracts — purchased | 51,706,461 |
| Options contracts — written | (4,761,373) |
| * | Based on the ending quarterly outstanding amounts for the six months ended November 30, 2022. |
Asset- and mortgage-backed securities
The Fund may invest in asset-backed and mortgage-backed securities. The maturity dates shown represent the original maturity of the underlying obligation. Actual maturity may vary based upon prepayment activity on these obligations. All, or a portion, of the obligation may be prepaid at any time because the underlying asset may be prepaid. As a result, decreasing market interest rates could result in an increased level of prepayment. An increased prepayment rate will have the effect of shortening the maturity of the security. Unless otherwise noted, the coupon rates presented are fixed rates.
Delayed delivery securities
The Fund may trade securities on other than normal settlement terms, including securities purchased or sold on a “when-issued” or "forward commitment" basis. This may increase risk to the Fund since the other party to the transaction may fail to deliver, which could cause the Fund to subsequently invest at less advantageous prices. The Fund designates cash or liquid securities in an amount equal to the delayed delivery commitment.
To be announced securities
The Fund may trade securities on a To Be Announced (TBA) basis. As with other delayed-delivery transactions, a seller agrees to issue a TBA security at a future date. However, the seller does not specify the particular securities to be delivered. Instead, the Fund agrees to accept any security that meets specified terms.
In some cases, Master Securities Forward Transaction Agreements (MSFTAs) may be used to govern transactions of certain forward-settling agency mortgage-backed securities, such as delayed-delivery and TBAs, between the Fund and counterparty. The MSFTA maintains provisions for, among other things, initiation and confirmation, payment and transfer, events of default, termination, and maintenance of collateral relating to such transactions.
Mortgage dollar roll transactions
The Fund may enter into mortgage “dollar rolls” in which the Fund sells securities for delivery in the current month and simultaneously contracts with the same counterparty to repurchase similar but not identical securities (same type, coupon and maturity) on a specified future date. During the roll period, the Fund loses the right to receive principal and interest paid on the securities sold. However, the Fund may benefit because it receives negotiated amounts in the form of reductions of the purchase price for the future purchase plus the interest earned on the cash proceeds of the securities sold until the settlement date of the forward purchase. The Fund records the incremental difference between the forward purchase and sale of each forward roll as a realized gain or loss. Unless any realized gains exceed the income, capital appreciation, and gain or loss due to mortgage prepayments that would have been realized on the securities sold as part of the mortgage dollar roll, the use of this technique may diminish the investment performance of the Fund compared to what the performance would have been without the use of mortgage dollar rolls. All cash proceeds will be invested in instruments that are permissible investments for the Fund. The Fund identifies cash or liquid securities in an amount equal to the forward purchase price.
| 38 | Columbia Mortgage Opportunities Fund | Semiannual Report 2022 |
Notes to Financial Statements (continued)
November 30, 2022 (Unaudited)
For financial reporting and tax purposes, the Fund treats “to be announced” mortgage dollar rolls as two separate transactions, one involving the purchase of a security and a separate transaction involving a sale. These transactions may increase the Fund’s portfolio turnover rate. The Fund does not currently enter into mortgage dollar rolls that are accounted for as financing transactions.
Mortgage dollar rolls involve the risk that the market value of the securities the Fund is obligated to repurchase may decline below the repurchase price, or that the counterparty may default on its obligations.
Interest only and principal only securities
The Fund may invest in Interest Only (IO) or Principal Only (PO) securities. IOs are stripped securities entitled to receive all of the security’s interest, but none of its principal. IOs are particularly sensitive to changes in interest rates and therefore subject to greater fluctuations in price than typical interest bearing debt securities. IOs are also subject to credit risk because the Fund may not receive all or part of the interest payments if the issuer, obligor, guarantor or counterparty defaults on its obligation. Payments received for IOs are included in interest income in the Statement of Operations. Because no principal will be received at the maturity of an IO, adjustments are made to the cost of the security on a monthly basis until maturity. These adjustments are included in interest income in the Statement of Operations. POs are stripped securities entitled to receive the principal from the underlying obligation, but not the interest. POs are particularly sensitive to changes in interest rates and therefore are subject to fluctuations in price. POs are also subject to credit risk because the Fund may not receive all or part of its principal if the issuer, obligor, guarantor or counterparty defaults on its obligation. The Fund may also invest in IO or PO stripped mortgage-backed securities. Payments received for POs are treated as reductions to the cost and par value of the securities.
Offsetting of assets and liabilities
The following table presents the Fund’s gross and net amount of assets and liabilities available for offset under netting arrangements as well as any related collateral received or pledged by the Fund as of November 30, 2022:
| | Citi ($) (a) | Citi ($) (a) | Goldman
Sachs
International ($) | JPMorgan ($) (a) | JPMorgan ($) (a) | Morgan
Stanley ($) (a) | Morgan
Stanley ($) (a) | Total ($) | |
| Assets | | | | | | | | | |
| Options purchased calls | 40,836,371 | - | - | 1,198,680 | - | 18,586,824 | - | 60,621,875 | |
| OTC credit default swap contracts (b) | - | 1,831,030 | 1,540,992 | - | - | 1,250,942 | - | 4,622,964 | |
| Total assets | 40,836,371 | 1,831,030 | 1,540,992 | 1,198,680 | - | 19,837,766 | - | 65,244,839 | |
| Liabilities | | | | | | | | | |
| Centrally cleared credit default swap contracts (c) | - | - | - | - | - | - | 1,733,783 | 1,733,783 | |
| Options contracts written | 2,047,563 | - | - | - | - | 1,139,183 | - | 3,186,746 | |
| OTC credit default swap contracts (b) | - | 9,211,590 | 1,894,827 | - | 1,762,188 | 29,300,961 | - | 42,169,566 | |
| Total liabilities | 2,047,563 | 9,211,590 | 1,894,827 | - | 1,762,188 | 30,440,144 | 1,733,783 | 47,090,095 | |
| Total financial and derivative net assets | 38,788,808 | (7,380,560) | (353,835) | 1,198,680 | (1,762,188) | (10,602,378) | (1,733,783) | 18,154,744 | |
| Total collateral received (pledged) (d) | 13,796,000 | (7,380,560) | (310,000) | 1,198,680 | (1,762,188) | (10,524,000) | (1,733,783) | (6,715,851) | |
| Net amount (e) | 24,992,808 | - | (43,835) | - | - | (78,378) | - | 24,870,595 | |
| (a) | Exposure can only be netted across transactions governed under the same master agreement with the same legal entity. |
| (b) | Over-the-Counter (OTC) swap contracts are presented at market value plus periodic payments receivable (payable), which is comprised of unrealized appreciation, unrealized depreciation, upfront payments and upfront receipts. |
| (c) | Centrally cleared swaps are included within payable/receivable for variation margin in the Statement of Assets and Liabilities. |
| (d) | In some instances, the actual collateral received and/or pledged may be more than the amount shown due to overcollateralization. |
| (e) | Represents the net amount due from/(to) counterparties in the event of default. |
Columbia Mortgage Opportunities Fund | Semiannual Report 2022
| 39 |
Notes to Financial Statements (continued)
November 30, 2022 (Unaudited)
Security transactions
Security transactions are accounted for on the trade date. Cost is determined and gains (losses) are based upon the specific identification method for both financial statement and federal income tax purposes.
Income recognition
Interest income is recorded on an accrual basis. Market premiums and discounts, including original issue discounts, are amortized and accreted, respectively, over the expected life of the security on all debt securities, unless otherwise noted. The Fund classifies gains and losses realized on prepayments received on mortgage-backed securities as adjustments to interest income.
The Fund may place a debt security on non-accrual status and reduce related interest income when it becomes probable that the interest will not be collected and the amount of uncollectible interest can be reasonably estimated. The Fund may also adjust accrual rates when it becomes probable the full interest will not be collected and a partial payment will be received. A defaulted debt security is removed from non-accrual status when the issuer resumes interest payments or when collectability of interest is reasonably assured.
Dividend income is recorded on the ex-dividend date.
Expenses
General expenses of the Trust are allocated to the Fund and other funds of the Trust based upon relative net assets or other expense allocation methodologies determined by the nature of the expense. Expenses directly attributable to the Fund are charged to the Fund. Expenses directly attributable to a specific class of shares are charged to that share class.
Determination of class net asset value
All income, expenses (other than class-specific expenses, which are charged to that share class, as shown in the Statement of Operations) and realized and unrealized gains (losses) are allocated to each class of the Fund on a daily basis, based on the relative net assets of each class, for purposes of determining the net asset value of each class.
Federal income tax status
The Fund intends to qualify each year as a regulated investment company under Subchapter M of the Internal Revenue Code, as amended, and will distribute substantially all of its investment company taxable income and net capital gain, if any, for its tax year, and as such will not be subject to federal income taxes. In addition, the Fund intends to distribute in each calendar year substantially all of its ordinary income, capital gain net income and certain other amounts, if any, such that the Fund should not be subject to federal excise tax. Therefore, no federal income or excise tax provision is recorded.
Distributions to shareholders
Distributions from net investment income, if any, are declared and paid monthly. Net realized capital gains, if any, are distributed at least annually. Income distributions and capital gain distributions are determined in accordance with federal income tax regulations, which may differ from GAAP.
Guarantees and indemnifications
Under the Trust’s organizational documents and, in some cases, by contract, its officers and trustees are indemnified against certain liabilities arising out of the performance of their duties to the Trust or its funds. In addition, certain of the Fund’s contracts with its service providers contain general indemnification clauses. The Fund’s maximum exposure under these arrangements is unknown since the amount of any future claims that may be made against the Fund cannot be determined, and the Fund has no historical basis for predicting the likelihood of any such claims.
Recent accounting pronouncement
Tailored Shareholder Reports
| 40 | Columbia Mortgage Opportunities Fund | Semiannual Report 2022 |
Notes to Financial Statements (continued)
November 30, 2022 (Unaudited)
In October 2022, the Securities and Exchange Commission (SEC) adopted a final rule relating to Tailored Shareholder Reports for Mutual Funds and Exchange-Traded Funds (ETFs); Fee Information in Investment Company Advertisements. The rule and form amendments will require mutual funds and ETFs to transmit concise and visually engaging shareholder reports that highlight key information. The amendments will require that funds tag information in a structured data format. The rule amendments will require that certain more in-depth information be made available online and available for delivery free of charge to investors on request. The amendments will become effective January 24, 2023. There is an 18-month transition period after the effective date of the amendment.
Note 3. Fees and other transactions with affiliates
Management services fees
The Fund has entered into a Management Agreement with Columbia Management Investment Advisers, LLC (the Investment Manager), a wholly-owned subsidiary of Ameriprise Financial, Inc. (Ameriprise Financial). Under the Management Agreement, the Investment Manager provides the Fund with investment research and advice, as well as administrative and accounting services. The management services fee is an annual fee that is equal to a percentage of the Fund’s daily net assets that declines from 0.65% to 0.535% as the Fund’s net assets increase. The annualized effective management services fee rate for the six months ended November 30, 2022 was 0.629% of the Fund’s average daily net assets.
Compensation of board members
Members of the Board of Trustees who are not officers or employees of the Investment Manager or Ameriprise Financial are compensated for their services to the Fund as disclosed in the Statement of Operations. Under a Deferred Compensation Plan (the Deferred Plan), these members of the Board of Trustees may elect to defer payment of up to 100% of their compensation. Deferred amounts are treated as though equivalent dollar amounts had been invested in shares of certain funds managed by the Investment Manager. The Fund’s liability for these amounts is adjusted for market value changes and remains in the Fund until distributed in accordance with the Deferred Plan. All amounts payable under the Deferred Plan constitute a general unsecured obligation of the Fund. The expense for the Deferred Plan, which includes Trustees’ fees deferred during the current period as well as any gains or losses on the Trustees’ deferred compensation balances as a result of market fluctuations, is included in "Compensation of board members" in the Statement of Operations.
Compensation of Chief Compliance Officer
The Board of Trustees has appointed a Chief Compliance Officer for the Fund in accordance with federal securities regulations. As disclosed in the Statement of Operations, a portion of the Chief Compliance Officer’s total compensation is allocated to the Fund, along with other allocations to affiliated registered investment companies managed by the Investment Manager and its affiliates, based on relative net assets.
Transfer agency fees
Under a Transfer and Dividend Disbursing Agent Agreement, Columbia Management Investment Services Corp. (the Transfer Agent), an affiliate of the Investment Manager and a wholly-owned subsidiary of Ameriprise Financial, is responsible for providing transfer agency services to the Fund. The Transfer Agent has contracted with SS&C GIDS, Inc. (SS&C GIDS) to serve as sub-transfer agent. Prior to January 1, 2023, SS&C GIDS was known as DST Asset Manager Solutions, Inc. The Transfer Agent pays the fees of SS&C GIDS for services as sub-transfer agent and SS&C GIDS is not entitled to reimbursement for such fees from the Fund (with the exception of out-of-pocket fees).
The Fund pays the Transfer Agent a monthly transfer agency fee based on the number or the average value of accounts, depending on the type of account. In addition, the Fund pays the Transfer Agent a fee for shareholder services based on the number of accounts or on a percentage of the average aggregate value of the Fund’s shares maintained in omnibus accounts up to the lesser of the amount charged by the financial intermediary or a cap established by the Board of Trustees from time to time.
Columbia Mortgage Opportunities Fund | Semiannual Report 2022
| 41 |
Notes to Financial Statements (continued)
November 30, 2022 (Unaudited)
The Transfer Agent also receives compensation from the Fund for various shareholder services and reimbursements for certain out-of-pocket fees. Total transfer agency fees for Institutional 2 Class and Institutional 3 Class shares are subject to an annual limitation of not more than 0.07% and 0.02%, respectively, of the average daily net assets attributable to each share class.
For the six months ended November 30, 2022, the Fund’s annualized effective transfer agency fee rates as a percentage of average daily net assets of each class were as follows:
| | Effective rate (%) |
| Class A | 0.10 |
| Advisor Class | 0.10 |
| Class C | 0.10 |
| Institutional Class | 0.10 |
| Institutional 2 Class | 0.06 |
| Institutional 3 Class | 0.01 |
An annual minimum account balance fee of $20 may apply to certain accounts with a value below the applicable share class’s initial minimum investment requirements to reduce the impact of small accounts on transfer agency fees. These minimum account balance fees are remitted to the Fund and recorded as part of expense reductions in the Statement of Operations. For the six months ended November 30, 2022, these minimum account balance fees reduced total expenses of the Fund by $20.
Distribution and service fees
The Fund has entered into an agreement with Columbia Management Investment Distributors, Inc. (the Distributor), an affiliate of the Investment Manager and a wholly-owned subsidiary of Ameriprise Financial, for distribution and shareholder services. Under a Plan and Agreement of Distribution, the Fund pays a fee at the maximum annual rates of up to 0.25% and 1.00% of the Fund’s average daily net assets attributable to Class A and Class C shares, respectively. For Class C shares, of the 1.00% fee, up to 0.75% can be reimbursed for distribution expenses and up to an additional 0.25% can be reimbursed for shareholder servicing expenses.
The amount of distribution and shareholder services expenses incurred by the Distributor and not yet reimbursed (unreimbursed expense) was approximately $293,000 for Class C shares. This amount is based on the most recent information available as of September 30, 2022, and may be recovered from future payments under the distribution plan or contingent deferred sales charges (CDSCs). To the extent the unreimbursed expense has been fully recovered, the distribution and/or shareholder services fee is reduced.
Sales charges
Sales charges, including front-end charges and CDSCs, received by the Distributor for distributing Fund shares for the six months ended November 30, 2022, if any, are listed below:
| | Front End (%) | CDSC (%) | Amount ($) |
| Class A | 3.00 | 0.50 - 1.00(a) | 81,037 |
| Class C | — | 1.00(b) | 8,743 |
| (a) | This charge is imposed on certain investments of between $1 million and $50 million redeemed within 18 months after purchase, as follows: 1.00% if redeemed within 12 months after purchase, and 0.50% if redeemed more than 12, but less than 18, months after purchase, with certain limited exceptions. |
| (b) | This charge applies to redemptions within 12 months after purchase, with certain limited exceptions. |
The Fund’s other share classes are not subject to sales charges.
| 42 | Columbia Mortgage Opportunities Fund | Semiannual Report 2022 |
Notes to Financial Statements (continued)
November 30, 2022 (Unaudited)
Expenses waived/reimbursed by the Investment Manager and its affiliates
The Investment Manager and certain of its affiliates have contractually agreed to waive fees and/or reimburse expenses (excluding certain fees and expenses described below) for the period(s) disclosed below, unless sooner terminated at the sole discretion of the Board of Trustees, so that the Fund’s net operating expenses, after giving effect to fees waived/expenses reimbursed and any balance credits and/or overdraft charges from the Fund’s custodian, do not exceed the following annual rate(s) as a percentage of the classes’ average daily net assets:
| | Fee rate(s) contractual
through
September 30, 2023 |
| Class A | 1.00% |
| Advisor Class | 0.75 |
| Class C | 1.75 |
| Institutional Class | 0.75 |
| Institutional 2 Class | 0.71 |
| Institutional 3 Class | 0.66 |
Under the agreement governing these fee waivers and/or expense reimbursement arrangements, the following fees and expenses are excluded from the waiver/reimbursement commitment, and therefore will be paid by the Fund, if applicable: taxes (including foreign transaction taxes), expenses associated with investments in affiliated and non-affiliated pooled investment vehicles (including mutual funds and exchange-traded funds), transaction costs and brokerage commissions, costs related to any securities lending program, dividend expenses associated with securities sold short, inverse floater program fees and expenses, transaction charges and interest on borrowed money, interest, costs associated with shareholder meetings, infrequent and/or unusual expenses and any other expenses the exclusion of which is specifically approved by the Board of Trustees. This agreement may be modified or amended only with approval from the Investment Manager, certain of its affiliates and the Fund. Any fees waived and/or expenses reimbursed under the expense reimbursement arrangements described above are not recoverable by the Investment Manager or its affiliates in future periods.
Note 4. Federal tax information
The timing and character of income and capital gain distributions are determined in accordance with income tax regulations, which may differ from GAAP because of temporary or permanent book to tax differences.
At November 30, 2022, the approximate cost of all investments for federal income tax purposes and the aggregate gross approximate unrealized appreciation and depreciation based on that cost was:
Federal
tax cost ($) | Gross unrealized
appreciation ($) | Gross unrealized
(depreciation) ($) | Net unrealized
(depreciation) ($) |
| 4,814,991,000 | 126,197,000 | (494,623,000) | (368,426,000) |
Tax cost of investments and unrealized appreciation/(depreciation) may also include timing differences that do not constitute adjustments to tax basis.
Management of the Fund has concluded that there are no significant uncertain tax positions in the Fund that would require recognition in the financial statements. However, management’s conclusion may be subject to review and adjustment at a later date based on factors including, but not limited to, new tax laws, regulations, and administrative interpretations (including relevant court decisions). Generally, the Fund’s federal tax returns for the prior three fiscal years remain subject to examination by the Internal Revenue Service.
Columbia Mortgage Opportunities Fund | Semiannual Report 2022
| 43 |
Notes to Financial Statements (continued)
November 30, 2022 (Unaudited)
Note 5. Portfolio information
The cost of purchases and proceeds from sales of securities, excluding short-term investments and derivatives, if any, aggregated to $13,788,326,366 and $13,471,980,047, respectively, for the six months ended November 30, 2022, of which $13,710,618,001 and $12,386,781,067, respectively, were U.S. government securities. The amount of purchase and sale activity impacts the portfolio turnover rate reported in the Financial Highlights.
Note 6. Affiliated money market fund
The Fund invests in Columbia Short-Term Cash Fund, an affiliated money market fund established for the exclusive use by the Fund and other affiliated funds (the Affiliated MMF). The income earned by the Fund from such investments is included as Dividends - affiliated issuers in the Statement of Operations. As an investing fund, the Fund indirectly bears its proportionate share of the expenses of the Affiliated MMF. The Affiliated MMF prices its shares with a floating net asset value. In addition, the Board of Trustees of the Affiliated MMF may impose a fee on redemptions (sometimes referred to as a liquidity fee) or temporarily suspend redemptions (sometimes referred to as imposing a redemption gate) in the event its liquidity falls below regulatory limits.
Note 7. Interfund lending
Pursuant to an exemptive order granted by the Securities and Exchange Commission, the Fund participates in a program (the Interfund Program) allowing each participating Columbia Fund (each, a Participating Fund) to lend money directly to and, except for closed-end funds and money market funds, borrow money directly from other Participating Funds for temporary purposes. The amounts eligible for borrowing and lending under the Interfund Program are subject to certain restrictions.
Interfund loans are subject to the risk that the borrowing fund could be unable to repay the loan when due, and a delay in repayment to the lending fund could result in lost opportunities and/or additional lending costs. The exemptive order is subject to conditions intended to mitigate conflicts of interest arising from the Investment Manager’s relationship with each Participating Fund.
The Fund’s activity in the Interfund Program during the six months ended November 30, 2022 was as follows:
| Borrower or lender | Average loan
balance ($) | Weighted average
interest rate (%) | Number of days
with outstanding loans |
| Lender | 1,950,000 | 3.23 | 2 |
Interest income earned by the Fund is recorded as Interfund lending in the Statement of Operations. The Fund had no outstanding interfund loans at November 30, 2022.
Note 8. Line of credit
The Fund has access to a revolving credit facility with a syndicate of banks led by JPMorgan Chase Bank, N.A., Citibank, N.A. and Wells Fargo Bank, N.A. whereby the Fund may borrow for the temporary funding of shareholder redemptions or for other temporary or emergency purposes. Pursuant to an October 27, 2022 amendment and restatement, the credit facility, which is an agreement between the Fund and certain other funds managed by the Investment Manager or an affiliated investment manager, severally and not jointly, permits aggregate borrowings up to $950 million. Interest is currently charged to each participating fund based on its borrowings at a rate equal to the higher of (i) the federal funds effective rate, (ii) the secured overnight financing rate plus 0.10% and (iii) the overnight bank funding rate, plus in each case, 1.00%. Each borrowing under the credit facility matures no later than 60 days after the date of borrowing. The Fund also pays a commitment fee equal to its pro rata share of the unused amount of the credit facility at a rate of 0.15% per annum. The commitment fee is included in other expenses in the Statement of Operations. This agreement expires annually in October unless extended or renewed. Prior to the October 27, 2022 amendment and restatement, the Fund had access to a revolving credit facility with a syndicate of banks led by JPMorgan Chase Bank, N.A., Citibank, N.A. and Wells Fargo Bank, N.A. which permitted collective borrowings up to $950 million. Interest was charged to each participating fund based on its borrowings at a rate equal to the higher of (i) the federal funds effective rate, (ii) the secured overnight financing rate plus 0.11448% and (iii) the overnight bank funding rate, plus in each case, 1.00%.
| 44 | Columbia Mortgage Opportunities Fund | Semiannual Report 2022 |
Notes to Financial Statements (continued)
November 30, 2022 (Unaudited)
The Fund had no borrowings during the six months ended November 30, 2022.
Note 9. Significant risks
Credit risk
Credit risk is the risk that the value of debt instruments in the Fund’s portfolio may decline because the issuer defaults or otherwise becomes unable or unwilling, or is perceived to be unable or unwilling, to honor its financial obligations, such as making payments to the Fund when due. Credit rating agencies assign credit ratings to certain debt instruments to indicate their credit risk. Lower-rated or unrated debt instruments held by the Fund may present increased credit risk as compared to higher-rated debt instruments.
Derivatives risk
Losses involving derivative instruments may be substantial, because a relatively small movement in the underlying reference (which is generally the price, rate or other economic indicator associated with a security(ies), commodity, currency, index or other instrument or asset) may result in a substantial loss for the Fund. In addition to the potential for increased losses, the use of derivative instruments may lead to increased volatility within the Fund. Derivatives will typically increase the Fund’s exposure to principal risks to which it is otherwise exposed, and may expose the Fund to additional risks, including correlation risk, counterparty risk, hedging risk, leverage risk, liquidity risk and pricing risk.
High-yield investments risk
Securities and other debt instruments held by the Fund that are rated below investment grade (commonly called "high-yield" or "junk" bonds) and unrated debt instruments of comparable quality expose the Fund to a greater risk of loss of principal and income than a fund that invests solely or primarily in investment grade debt instruments. In addition, these investments have greater price fluctuations, are less liquid and are more likely to experience a default than higher-rated debt instruments. High-yield debt instruments are considered to be predominantly speculative with respect to the issuer’s capacity to pay interest and repay principal.
Interest rate risk
Interest rate risk is the risk of losses attributable to changes in interest rates. In general, if prevailing interest rates rise, the values of debt instruments tend to fall, and if interest rates fall, the values of debt instruments tend to rise. Actions by governments and central banking authorities can result in increases or decreases in interest rates. Higher periods of inflation could lead such authorities to raise interest rates. Increasing interest rates may negatively affect the value of debt securities held by the Fund, resulting in a negative impact on the Fund’s performance and net asset value per share. In general, the longer the maturity or duration of a debt security, the greater its sensitivity to changes in interest rates. The Fund is subject to the risk that the income generated by its investments may not keep pace with inflation.
Leverage risk
Leverage occurs when the Fund increases its assets available for investment using borrowings, short sales, derivatives, or similar instruments or techniques. The use of leverage may produce volatility and may exaggerate changes in the Fund’s NAV and in the return on the Fund’s portfolio, which may increase the risk that the Fund will lose more than it has invested. Because short sales involve borrowing securities and then selling them, the Fund’s short sales effectively leverage the Fund’s assets. The Fund’s assets that are used as collateral to secure the Fund’s obligations to return the securities sold short may decrease in value while the short positions are outstanding, which may force the Fund to use its other assets to increase the collateral. Leverage can create an interest expense that may lower the Fund’s overall returns. Leverage presents the opportunity for increased net income and capital gains, but may also exaggerate the Fund’s volatility and risk of loss. There can be no guarantee that a leveraging strategy will be successful.
LIBOR replacement risk
The elimination of London Inter-Bank Offered Rate (LIBOR), among other "inter-bank offered" reference rates, may adversely affect the interest rates on, and value of, certain Fund investments for which the value is tied to LIBOR. The U.K. Financial Conduct Authority and the ICE Benchmark Administration have announced that a majority of U.S. dollar LIBOR settings will
Columbia Mortgage Opportunities Fund | Semiannual Report 2022
| 45 |
Notes to Financial Statements (continued)
November 30, 2022 (Unaudited)
cease publication after June 30, 2023. A subset of non-U.S. dollar LIBOR settings is continuing to be published on a “synthetic” basis and it is possible that a subset of U.S. dollar LIBOR settings will also be published after June 30, 2023 on a “synthetic” basis. Any such publications are, or would be considered, non-representative of the underlying market. Markets are slowly developing in response to the elimination of LIBOR. Uncertainty related to the liquidity impact of the change in rates, and how to appropriately adjust these rates at the time of transition, poses risks for the Fund. These risks are likely to persist until new reference rates and fallbacks for both legacy and new instruments and contracts are commercially accepted and market practices become more settled. Alternatives to LIBOR have been established or are in development in most major currencies, including the Secured Overnight Financing Rate (SOFR), which the U.S. Federal Reserve is promoting as the alternative reference rate to U.S. dollar LIBOR.
Liquidity risk
Liquidity risk is the risk associated with a lack of marketability of investments which may make it difficult to sell the investment at a desirable time or price. Changing regulatory, market or other conditions or environments (for example, the interest rate or credit environments) may adversely affect the liquidity of the Fund’s investments. The Fund may have to accept a lower selling price for the holding, sell other investments, or forego another, more appealing investment opportunity. Generally, the less liquid the market at the time the Fund sells a portfolio investment, the greater the risk of loss or decline of value to the Fund. A less liquid market can lead to an increase in Fund redemptions, which may negatively impact Fund performance and net asset value per share, including, for example, if the Fund is forced to sell securities in a down market.
Market risk
The Fund may incur losses due to declines in the value of one or more securities in which it invests. These declines may be due to factors affecting a particular issuer, or the result of, among other things, political, regulatory, market, economic or social developments affecting the relevant market(s) more generally. In addition, turbulence in financial markets and reduced liquidity in equity, credit and/or fixed income markets may negatively affect many issuers, which could adversely affect the Fund’s ability to price or value hard-to-value assets in thinly traded and closed markets and could cause significant redemptions and operational challenges. Global economies and financial markets are increasingly interconnected, and conditions and events in one country, region or financial market may adversely impact issuers in a different country, region or financial market. These risks may be magnified if certain events or developments adversely interrupt the global supply chain; in these and other circumstances, such risks might affect companies worldwide. As a result, local, regional or global events such as terrorism, war, natural disasters, disease/virus outbreaks and epidemics or other public health issues, recessions, depressions or other events – or the potential for such events – could have a significant negative impact on global economic and market conditions.
The large-scale invasion of Ukraine by Russia in February 2022 has resulted in sanctions and market disruptions, including declines in regional and global stock markets, unusual volatility in global commodity markets and significant devaluations of Russian currency. The extent and duration of the military action are impossible to predict but could be significant. Market disruption caused by the Russian military action, and any counter-measures or responses thereto (including international sanctions, a downgrade in the country’s credit rating, purchasing and financing restrictions, boycotts, tariffs, changes in consumer or purchaser preferences, cyberattacks and espionage) could have severe adverse impacts on regional and/or global securities and commodities markets, including markets for oil and natural gas. These impacts may include reduced market liquidity, distress in credit markets, further disruption of global supply chains, increased risk of inflation, and limited access to investments in certain international markets and/or issuers. These developments and other related events could negatively impact Fund performance.
The pandemic caused by coronavirus disease 2019 and its variants (COVID-19) has resulted in, and may continue to result in, significant global economic and societal disruption and market volatility due to disruptions in market access, resource availability, facilities operations, imposition of tariffs, export controls and supply chain disruption, among others. Such disruptions may be caused, or exacerbated by, quarantines and travel restrictions, workforce displacement and loss in human and other resources. The uncertainty surrounding the magnitude, duration, reach, costs and effects of the global pandemic, as well as actions that have been or could be taken by governmental authorities or other third parties, present unknowns that are yet to unfold. The impacts, as well as the uncertainty over impacts to come, of COVID-19 – and any other infectious illness outbreaks, epidemics and pandemics that may arise in the future – could negatively affect global economies and markets in ways that cannot necessarily be foreseen. In addition, the impact of infectious illness outbreaks
| 46 | Columbia Mortgage Opportunities Fund | Semiannual Report 2022 |
Notes to Financial Statements (continued)
November 30, 2022 (Unaudited)
and epidemics in emerging market countries may be greater due to generally less established healthcare systems, governments and financial markets. Public health crises caused by the COVID-19 outbreak may exacerbate other pre-existing political, social and economic risks in certain countries or globally. The disruptions caused by COVID-19 could prevent the Fund from executing advantageous investment decisions in a timely manner and negatively impact the Fund’s ability to achieve its investment objective. Any such events could have a significant adverse impact on the value and risk profile of the Fund.
Mortgage- and other asset-backed securities risk
The value of any mortgage-backed and other asset-backed securities including collateralized debt obligations, if any, held by the Fund may be affected by, among other things, changes or perceived changes in: interest rates; factors concerning the interests in and structure of the issuer or the originator of the mortgages or other assets; the creditworthiness of the entities that provide any supporting letters of credit, surety bonds or other credit enhancements; or the market’s assessment of the quality of underlying assets. Payment of principal and interest on some mortgage-backed securities (but not the market value of the securities themselves) may be guaranteed by the full faith and credit of a particular U.S. Government agency, authority, enterprise or instrumentality, and some, but not all, are also insured or guaranteed by the U.S. Government. Mortgage-backed securities issued by non-governmental issuers (such as commercial banks, savings and loan institutions, private mortgage insurance companies, mortgage bankers and other secondary market issuers) may entail greater risk than obligations guaranteed by the U.S. Government. Mortgage- and other asset-backed securities are subject to liquidity risk and prepayment risk. A decline or flattening of housing values may cause delinquencies in mortgages (especially sub-prime or non-prime mortgages) underlying mortgage-backed securities and thereby adversely affect the ability of the mortgage-backed securities issuer to make principal and/or interest payments to mortgage-backed securities holders, including the Fund. Rising or high interest rates tend to extend the duration of mortgage- and other asset-backed securities, making their prices more volatile and more sensitive to changes in interest rates.
Shareholder concentration risk
At November 30, 2022, three unaffiliated shareholders of record owned 40.5% of the outstanding shares of the Fund in one or more accounts. The Fund has no knowledge about whether any portion of those shares was owned beneficially. Affiliated shareholders of record owned 18.4% of the outstanding shares of the Fund in one or more accounts. Subscription and redemption activity by concentrated accounts may have a significant effect on the operations of the Fund. In the case of a large redemption, the Fund may be forced to sell investments at inopportune times, including its liquid positions, which may result in Fund losses and the Fund holding a higher percentage of less liquid positions. Large redemptions could result in decreased economies of scale and increased operating expenses for non-redeeming Fund shareholders.
Note 10. Subsequent events
Management has evaluated the events and transactions that have occurred through the date the financial statements were issued and noted no items requiring adjustment of the financial statements or additional disclosure.
Note 11. Information regarding pending and settled legal proceedings
Ameriprise Financial and certain of its affiliates are involved in the normal course of business in legal proceedings which include regulatory inquiries, arbitration and litigation, including class actions concerning matters arising in connection with the conduct of its activities as a diversified financial services firm. Ameriprise Financial believes that the Fund is not currently the subject of, and that neither Ameriprise Financial nor any of its affiliates are the subject of, any pending legal, arbitration or regulatory proceedings that are likely to have a material adverse effect on the Fund or the ability of Ameriprise Financial or its affiliates to perform under their contracts with the Fund. Ameriprise Financial is required to make quarterly (10-Q), annual (10-K) and, as necessary, 8-K filings with the Securities and Exchange Commission (SEC) on legal and regulatory matters that relate to Ameriprise Financial and its affiliates. Copies of these filings may be obtained by accessing the SEC website at www.sec.gov.
There can be no assurance that these matters, or the adverse publicity associated with them, will not result in increased Fund redemptions, reduced sale of Fund shares or other adverse consequences to the Fund. Further, although we believe proceedings are not likely to have a material adverse effect on the Fund or the ability of Ameriprise Financial or its affiliates to perform under their contracts with the Fund, these proceedings are subject to uncertainties and, as such, we are unable to
Columbia Mortgage Opportunities Fund | Semiannual Report 2022
| 47 |
Notes to Financial Statements (continued)
November 30, 2022 (Unaudited)
estimate the possible loss or range of loss that may result. An adverse outcome in one or more of these proceedings could result in adverse judgments, settlements, fines, penalties or other relief that could have a material adverse effect on the consolidated financial condition or results of operations of Ameriprise Financial or one or more of its affiliates that provides services to the Fund.
| 48 | Columbia Mortgage Opportunities Fund | Semiannual Report 2022 |
Approval of Management Agreement
(Unaudited)
Columbia Management Investment Advisers, LLC (the Investment Manager, and together with its domestic and global affiliates, Columbia Threadneedle Investments), a wholly-owned subsidiary of Ameriprise Financial, Inc. (Ameriprise Financial), serves as the investment manager to Columbia Mortgage Opportunities Fund (the Fund). Under a management agreement (the Management Agreement), the Investment Manager provides investment advice and other services to the Fund and other funds distributed by Columbia Management Investment Distributors, Inc. (collectively, the Funds).
On an annual basis, the Fund’s Board of Trustees (the Board), including the independent Board members (the Independent Trustees), considers renewal of the Management Agreement. The Investment Manager prepared detailed reports for the Board and its Contracts Committee (including its Contracts Subcommittee) in November 2021 and March, April and June 2022, including reports providing the results of analyses performed by an independent third-party data provider, Broadridge Financial Solutions, Inc. (Broadridge), and comprehensive responses to written requests for information by independent legal counsels to the Independent Trustees (Independent Legal Counsel) to the Investment Manager, to assist the Board in making this determination. In addition, throughout the year, the Board (or its committees or subcommittees) regularly meets with portfolio management teams and senior management personnel and reviews information prepared by the Investment Manager addressing the services the Investment Manager provides and Fund performance. The Board also accords appropriate weight to the work, deliberations and conclusions of the various committees, such as the Contracts Committee, the Investment Review Committee, the Audit Committee and the Compliance Committee in determining whether to continue the Management Agreement.
The Board, at its June 23, 2022 Board meeting (the June Meeting), considered the renewal of the Management Agreement for an additional one-year term. At the June Meeting, Independent Legal Counsel reviewed with the Independent Trustees various factors relevant to the Board’s consideration of advisory agreements and the Board’s legal responsibilities related to such consideration. The Independent Trustees considered all information that they, their legal counsel or the Investment Manager believed reasonably necessary to evaluate and to approve the continuation of the Management Agreement. Among other things, the information and factors considered included the following:
| • | Information on the investment performance of the Fund relative to the performance of a group of mutual funds determined to be comparable to the Fund by Broadridge, as well as performance relative to benchmarks; |
| • | Information on the Fund’s management fees and total expenses, including information comparing the Fund’s expenses to those of a group of comparable mutual funds, as determined by Broadridge; |
| • | The Investment Manager’s agreement to contractually limit or cap total operating expenses for the Fund so that total operating expenses (excluding certain fees and expenses, such as transaction costs and certain other investment related expenses, interest, taxes, acquired fund fees and expenses and infrequent and/or unusual expenses) would not exceed a specified annual rate, as a percentage of the Fund’s net assets; |
| • | Terms of the Management Agreement; |
| • | Descriptions of other agreements and arrangements with affiliates of the Investment Manager relating to the operations of the Fund, including agreements with respect to the provision of transfer agency and shareholder services to the Fund; |
| • | Descriptions of various services performed by the Investment Manager under the Management Agreement, including portfolio management and portfolio trading practices; |
| • | Information regarding any recently negotiated management fees of similarly-managed portfolios of other institutional clients of the Investment Manager; |
| • | Information regarding the resources of the Investment Manager, including information regarding senior management, portfolio managers and other personnel; |
| • | Information regarding the capabilities of the Investment Manager with respect to compliance monitoring services; |
| • | The profitability to the Investment Manager and its affiliates from their relationships with the Fund; and |
| • | Report provided by the Board’s independent fee consultant, JDL Consultants, LLC (JDL). |
Columbia Mortgage Opportunities Fund | Semiannual Report 2022
| 49 |
Approval of Management Agreement (continued)
(Unaudited)
Following an analysis and discussion of the foregoing, and the factors identified below, the Board, including all of the Independent Trustees, approved the renewal of the Management Agreement.
Nature, extent and quality of services provided by the Investment Manager
The Board analyzed various reports and presentations it had received detailing the services performed by the Investment Manager, as well as its history, expertise, resources and relative capabilities, and the qualifications of its personnel.
The Board specifically considered the many developments during recent years concerning the services provided by the Investment Manager. Among other things, the Board noted the organization and depth of the equity and credit research departments. The Board further observed the enhancements to the investment risk management department’s processes, systems and oversight, over the past several years, as well as planned 2022 initiatives in this regard. The Board also took into account the broad scope of services provided by the Investment Manager to the Fund, including, among other services, investment, risk and compliance oversight. The Board also took into account the information it received concerning the Investment Manager’s ability to attract and retain key portfolio management personnel and that it has sufficient resources to provide competitive and adequate compensation to investment personnel. The Board also observed that the Investment Manager has been able to effectively manage, operate and distribute the Funds through the COVID-19 pandemic period with no disruptions in services provided. The Board also considered added personnel and resources obtained by Columbia Threadneedle through Ameriprise Financial’s acquisition of BMO Financial Group’s Europe, Middle East, and Africa (EMEA) asset management business.
In connection with the Board’s evaluation of the overall package of services provided by the Investment Manager, the Board also considered the nature, quality and range of administrative services provided to the Fund by the Investment Manager, as well as the achievements in 2021 in the performance of administrative services, and noted the various enhancements anticipated for 2022. In evaluating the quality of services provided under the Management Agreement, the Board also took into account the organization and strength of the Fund’s and its service providers’ compliance programs. The Board also reviewed the financial condition of the Investment Manager and its affiliates and each entity’s ability to carry out its responsibilities under the Management Agreement and the Fund’s other service agreements.
In addition, the Board discussed the acceptability of the terms of the Management Agreement, noting that no changes were proposed from the form of agreement previously approved. The Board also noted the wide array of legal and compliance services provided to the Fund under the Management Agreement.
After reviewing these and related factors (including investment performance as discussed below), the Board concluded, within the context of their overall conclusions, that the nature, extent and quality of the services provided to the Fund under the Management Agreement supported the continuation of the Management Agreement.
Investment performance
In this connection, the Board carefully reviewed the investment performance of the Fund, including detailed reports providing the results of analyses performed by each of the Investment Manager, Broadridge and JDL collectively showing, for various periods (including since manager inception): (i) the performance of the Fund, (ii) the performance of a benchmark index, (iii) the percentage ranking of the Fund among its comparison group, (iv) the Fund’s performance relative to peers and benchmarks and (v) the net assets of the Fund. The Board observed that the Fund’s performance for certain periods ranked above median based on information provided by Broadridge.
The Board also reviewed a description of the third-party data provider’s methodology for identifying the Fund’s peer groups for purposes of performance and expense comparisons.
The Board also considered the Investment Manager’s performance and reputation generally. After reviewing these and related factors, the Board concluded, within the context of their overall conclusions, that the performance of the Fund and the Investment Manager, in light of other considerations, supported the continuation of the Management Agreement.
| 50 | Columbia Mortgage Opportunities Fund | Semiannual Report 2022 |
Approval of Management Agreement (continued)
(Unaudited)
Comparative fees, costs of services provided and the profits realized by the Investment Manager and its affiliates from their relationships with the Fund
The Board reviewed comparative fees and the costs of services provided under the Management Agreement. The Board members considered detailed comparative information set forth in an annual report on fees and expenses, including, among other things, data (based on analyses conducted by Broadridge and JDL) showing a comparison of the Fund’s expenses with median expenses paid by funds in its comparative peer universe, as well as data showing the Fund’s contribution to the Investment Manager’s profitability.
The Board considered the reports of JDL, which assisted in the Board’s analysis of the Funds’ performance and expenses and the reasonableness of the Funds’ fee rates. The Board accorded particular weight to the notion that a primary objective of the level of fees is to achieve a rational pricing model applied consistently across the various product lines in the Fund family, while assuring that the overall fees for each Fund (with certain exceptions) are generally in line with the current "pricing philosophy" such that Fund total expense ratios, in general, approximate or are lower than the median expense ratios of funds in the same Lipper comparison universe. The Board took into account that the Fund’s total expense ratio (after considering proposed expense caps/waivers) approximated the peer universe’s median expense ratio.
After reviewing these and related factors, the Board concluded, within the context of their overall conclusions, that the levels of management fees and expenses of the Fund, in light of other considerations, supported the continuation of the Management Agreement.
The Board also considered the profitability of the Investment Manager and its affiliates in connection with the Investment Manager providing management services to the Fund. With respect to the profitability of the Investment Manager and its affiliates, the Independent Trustees referred to information discussing the profitability to the Investment Manager and Ameriprise Financial from managing, operating and distributing the Funds. The Board considered that in 2021 the Board had considered 2020 profitability and that the 2022 information showed that the profitability generated by the Investment Manager in 2021 increased from 2020 levels, due to a variety of factors, including the increased assets under management of the Funds. It also took into account the indirect economic benefits flowing to the Investment Manager or its affiliates in connection with managing or distributing the Funds, such as the enhanced ability to offer various other financial products to Ameriprise Financial customers, soft dollar benefits and overall reputational advantages. The Board noted that the fees paid by the Fund should permit the Investment Manager to offer competitive compensation to its personnel, make necessary investments in its business and earn an appropriate profit. After reviewing these and related factors, the Board concluded, within the context of their overall conclusions, that the costs of services provided and the profitability to the Investment Manager and its affiliates from their relationships with the Fund supported the continuation of the Management Agreement.
Economies of scale
The Board considered the potential existence of economies of scale in the provision by the Investment Manager of services to the Fund, to groups of related funds and to the Investment Manager as a whole, and whether those economies of scale were shared with the Fund through breakpoints in investment management fees or other means, such as expense limitation arrangements and additional investments by the Investment Manager in investment, trading, compliance and other resources. The Board considered the economies of scale that might be realized as the Fund’s net asset level grows and took note of the extent to which Fund shareholders might also benefit from such growth. In this regard, the Board took into account that management fees decline as Fund assets exceed various breakpoints, all of which have not been surpassed.The Board observed that the Management Agreement provided for breakpoints in the management fee rate schedule that allow opportunities for shareholders to realize lower fees as Fund assets grow and that there are additional opportunities through other means for sharing economies of scale with shareholders.
Conclusion
The Board reviewed all of the above considerations in reaching its decision to approve the continuation of the Management Agreement. In reaching its conclusions, no single factor was determinative.
Columbia Mortgage Opportunities Fund | Semiannual Report 2022
| 51 |
Approval of Management Agreement (continued)
(Unaudited)
On June 23, 2022, the Board, including all of the Independent Trustees, determined that fees payable under the Management Agreement were fair and reasonable in light of the extent and quality of services provided and approved the renewal of the Management Agreement.
| 52 | Columbia Mortgage Opportunities Fund | Semiannual Report 2022 |
[THIS PAGE INTENTIONALLY LEFT BLANK]
[THIS PAGE INTENTIONALLY LEFT BLANK]
[THIS PAGE INTENTIONALLY LEFT BLANK]
Columbia Mortgage Opportunities Fund
P.O. Box 219104
Kansas City, MO 64121-9104
Please read and consider the investment objectives, risks, charges and expenses for any fund carefully before investing. For a prospectus and summary prospectus, which contains this and other important information about the Fund, go to
columbiathreadneedleus.com/investor/. The Fund is distributed by Columbia Management Investment Distributors, Inc., member FINRA, and managed by Columbia Management Investment Advisers, LLC.
Columbia Threadneedle Investments (Columbia Threadneedle) is the global brand name of the Columbia and Threadneedle group of companies. All rights reserved.
© 2023 Columbia Management Investment Advisers, LLC.
columbiathreadneedleus.com/investor/

Semiannual Report
November 30, 2022 (Unaudited)
Columbia Commodity Strategy Fund
Not FDIC or NCUA Insured • No Financial Institution Guarantee • May Lose Value
If you elect to receive the shareholder report for Columbia Commodity Strategy Fund (the Fund) in paper, mailed to you, the Fund mails one shareholder report to each shareholder address, unless such shareholder elects to receive shareholder reports from the Fund electronically via e-mail or by having a paper notice mailed to you (Postcard Notice) that your Fund’s shareholder report is available at the Columbia funds’ website (columbiathreadneedleus.com/investor/). If you would like more than one report in paper to be mailed to you, or would like to elect to receive reports via e-mail or access them through Postcard Notice, please call shareholder services at 800.345.6611 and additional reports will be sent to you.
Proxy voting policies and procedures
The policy of the Board of Trustees is to vote the proxies of the companies in which the Fund holds investments consistent with the procedures as stated in the Statement of Additional Information (SAI). You may obtain a copy of the SAI without charge by calling 800.345.6611; contacting your financial intermediary; visiting columbiathreadneedleus.com/investor/; or searching the website of the Securities and Exchange Commission (SEC) at sec.gov. Information regarding how the Fund voted proxies relating to portfolio securities is filed with the SEC by August 31st for the most recent 12-month period ending June 30th of that year, and is available without charge by visiting columbiathreadneedleus.com/investor/, or searching the website of the SEC at sec.gov.
Quarterly schedule of investments
The Fund files a complete schedule of portfolio holdings with the SEC for the first and third quarters of each fiscal year on Form N-PORT. The Fund’s Form N-PORT filings are available on the SEC’s website at sec.gov. The Fund’s complete schedule of portfolio holdings, as filed on Form N-PORT, is available on columbiathreadneedleus.com/investor/ or can also be obtained without charge, upon request, by calling 800.345.6611.
Additional Fund information
For more information about the Fund, please visit columbiathreadneedleus.com/investor/ or call 800.345.6611. Customer Service Representatives are available to answer your questions Monday through Friday from 8 a.m. to 7 p.m. Eastern time.
You may obtain the current net asset value (NAV) of Fund shares at no cost by calling 800.345.6611 or by sending an e-mail to serviceinquiries@columbiathreadneedle.com.
Fund investment manager
Columbia Management Investment Advisers, LLC (the Investment Manager)
290 Congress Street
Boston, MA 02210
Fund distributor
Columbia Management Investment Distributors, Inc.
290 Congress Street
Boston, MA 02210
Fund transfer agent
Columbia Management Investment Services Corp.
P.O. Box 219104
Kansas City, MO 64121-9104
Columbia Commodity Strategy Fund | Semiannual Report 2022
Fund at a Glance
(Unaudited)
Investment objective
The Fund seeks to provide shareholders with total return.
Portfolio management
Marc Khalamayzer, CFA
Commodity Strategies Co-Portfolio Manager
Managed Fund since 2019
Matthew Ferrelli, CFA
Commodity Strategies Co-Portfolio Manager
Managed Fund since 2019
Ronald Stahl, CFA
Cash/Liquidity Strategies Co-Portfolio Manager
Managed Fund since 2021
Gregory Liechty
Cash/Liquidity Strategies Co-Portfolio Manager
Managed Fund since 2021
John D. Dempsey, CFA
Cash/Liquidity Strategies Co-Portfolio Manager
Managed Fund since 2021
| Average annual total returns (%) (for the period ended November 30, 2022) |
| | | Inception | 6 Months
cumulative | 1 Year | 5 Years | 10 Years |
| Class A | Excluding sales charges | 06/18/12 | -10.09 | 26.10 | 8.35 | -1.48 |
| | Including sales charges | | -15.28 | 18.82 | 7.09 | -2.07 |
| Advisor Class* | 03/19/13 | -10.00 | 26.39 | 8.60 | -1.25 |
| Class C | Excluding sales charges | 06/18/12 | -10.45 | 25.10 | 7.53 | -2.22 |
| | Including sales charges | | -11.35 | 24.22 | 7.53 | -2.22 |
| Institutional Class | 06/18/12 | -9.97 | 26.45 | 8.63 | -1.24 |
| Institutional 2 Class* | 01/08/14 | -9.95 | 26.57 | 8.72 | -1.19 |
| Institutional 3 Class* | 10/01/14 | -9.94 | 26.58 | 8.85 | -1.13 |
| Class R | 06/18/12 | -10.18 | 25.80 | 8.08 | -1.71 |
| Bloomberg Commodity Index Total Return | | -10.34 | 23.20 | 7.60 | -1.30 |
Returns for Class A shares are shown with and without the maximum initial sales charge of 5.75%. Returns for Class C shares are shown with and without the 1.00% contingent deferred sales charge for the first year only. The Fund’s other share classes are not subject to sales charges and have limited eligibility. Please see the Fund’s prospectus for details. Performance for different share classes will vary based on differences in sales charges and fees associated with each share class. All results shown assume reinvestment of distributions during the period. Returns do not reflect the deduction of taxes that a shareholder may pay on Fund distributions or on the redemption of Fund shares. Performance results reflect the effect of any fee waivers or reimbursements of Fund expenses by Columbia Management Investment Advisers, LLC and/or any of its affiliates. Absent these fee waivers or expense reimbursement arrangements, performance results would have been lower.
The performance information shown represents past performance and is not a guarantee of future results. The investment return and principal value of your investment will fluctuate so that your shares, when redeemed, may be worth more or less than their original cost. Current performance may be lower or higher than the performance information shown. You may obtain performance information current to the most recent month-end by contacting your financial intermediary, visiting columbiathreadneedleus.com/investor/ or calling 800.345.6611.
| * | The returns shown for periods prior to the share class inception date (including returns for the Life of the Fund, if shown, which are since Fund inception) include the returns of the Fund’s Class T shares for the period from July 28, 2011 through June 17, 2012, and of the Fund’s Class A shares for the period from June 18, 2012 through the inception date of such class (in each case, without applicable sales charges and adjusted to reflect the higher class-related operating expenses of such share class, where applicable). Class T shares were offered prior to the Fund’s Class A shares but have since been merged into the Fund’s Class A shares. Share classes with expenses that are higher than Class T and/or Class A shares will have performance that is lower than Class T and/or Class A shares (without sales charges). Please visit columbiathreadneedleus.com/investor/investment-products/mutual-funds/appended-performance for more information. |
The Bloomberg Commodity Index Total Return is a total return index based on the Bloomberg Commodity Index, which is a broadly diversified index composed of futures contracts on physical commodities that allows investors to track commodity futures through a single, simple measure.
Indices are not available for investment, are not professionally managed and do not reflect sales charges, fees, brokerage commissions, taxes or other expenses of investing. Securities in the Fund may not match those in an index.
Columbia Commodity Strategy Fund | Semiannual Report 2022
| 3 |
Fund at a Glance (continued)
(Unaudited)
| Portfolio breakdown (%) (at November 30, 2022) |
| Asset-Backed Securities — Non-Agency | 26.1 |
| Commercial Mortgage-Backed Securities - Non-Agency | 1.5 |
| Corporate Bonds & Notes | 36.6 |
| Foreign Government Obligations | 0.7 |
| Money Market Funds | 28.2 |
| Residential Mortgage-Backed Securities - Non-Agency | 5.4 |
| U.S. Government & Agency Obligations | 0.7 |
| U.S. Treasury Obligations | 0.8 |
| Total | 100.0 |
Percentages indicated are based upon total investments excluding investments in derivatives, if any. The Fund’s portfolio composition is subject to change.
At period end, the Fund held an investment in an Affiliated Money Market Fund, which has been segregated to cover obligations relating to the Fund’s investments in open commodities contracts which provide exposure to the commodities market. For a description of the Fund’s investment in derivatives, see Investments in derivatives following the Consolidated Portfolio of Investments and Note 2 of the Notes to Consolidated Financial Statements.
Commodities market exposure (%)
(at November 30, 2022) |
| Commodities contracts(a) | Long | Short | Net |
| Agriculture | 29.3 | — | 29.3 |
| Energy | 37.0 | — | 37.0 |
| Industrial Metals | 11.5 | — | 11.5 |
| Livestock | 5.7 | — | 5.7 |
| Precious Metals | 16.5 | — | 16.5 |
Total notional market value of
commodities contracts | 100.0 | — | 100.0 |
(a) Reflects notional market value of commodities contracts. The notional exposure of a financial instrument is the nominal or face amount that is used to calculate payments made on that instrument and/or changes in value for the instrument. The notional exposure is a hypothetical underlying quantity upon which payment obligations are computed. Notional exposures provide a gauge for how the Fund may behave given changes in individual markets. Notional amounts for each commodities contract are shown in the Consolidated Portfolio of Investments. For a description of the Fund’s investments in derivatives, see Investments in derivatives following the Consolidated Portfolio of Investments and Note 2 of the Notes to Consolidated Financial Statements.
| 4 | Columbia Commodity Strategy Fund | Semiannual Report 2022 |
Understanding Your Fund’s Expenses
(Unaudited)
As an investor, you incur two types of costs. There are shareholder transaction costs, which generally include sales charges on purchases and may include redemption fees. There are also ongoing fund costs, which generally include management fees, distribution and/or service fees, and other fund expenses. The following information is intended to help you understand your ongoing costs (in dollars) of investing in the Fund and to help you compare these costs with the ongoing costs of investing in other mutual funds.
Analyzing your Fund’s expenses
To illustrate these ongoing costs, we have provided examples and calculated the expenses paid by investors in each share class of the Fund during the period. The actual and hypothetical information in the table is based on an initial investment of $1,000 at the beginning of the period indicated and held for the entire period. Expense information is calculated two ways and each method provides you with different information. The amount listed in the “Actual” column is calculated using the Fund’s actual operating expenses and total return for the period. You may use the Actual information, together with the amount invested, to estimate the expenses that you paid over the period. Simply divide your account value by $1,000 (for example, an $8,600 account value divided by $1,000 = 8.6), then multiply the results by the expenses paid during the period under the “Actual” column. The amount listed in the “Hypothetical” column assumes a 5% annual rate of return before expenses (which is not the Fund’s actual return) and then applies the Fund’s actual expense ratio for the period to the hypothetical return. You should not use the hypothetical account values and expenses to estimate either your actual account balance at the end of the period or the expenses you paid during the period. See “Compare with other funds” below for details on how to use the hypothetical data.
Compare with other funds
Since all mutual funds are required to include the same hypothetical calculations about expenses in shareholder reports, you can use this information to compare the ongoing cost of investing in the Fund with other funds. To do so, compare the hypothetical example with the 5% hypothetical examples that appear in the shareholder reports of other funds. As you compare hypothetical examples of other funds, it is important to note that hypothetical examples are meant to highlight the ongoing costs of investing in a fund only and do not reflect any transaction costs, such as sales charges, or redemption or exchange fees. Therefore, the hypothetical calculations are useful in comparing ongoing costs only, and will not help you determine the relative total costs of owning different funds. If transaction costs were included in these calculations, your costs would be higher.
| June 1, 2022 — November 30, 2022 |
| | Account value at the
beginning of the
period ($) | Account value at the
end of the
period ($) | Expenses paid during
the period ($) | Fund’s annualized
expense ratio (%) |
| | Actual | Hypothetical | Actual | Hypothetical | Actual | Hypothetical | Actual |
| Class A | 1,000.00 | 1,000.00 | 899.10 | 1,019.45 | 5.33 | 5.67 | 1.12 |
| Advisor Class | 1,000.00 | 1,000.00 | 900.00 | 1,020.76 | 4.10 | 4.36 | 0.86 |
| Class C | 1,000.00 | 1,000.00 | 895.50 | 1,015.69 | 8.89 | 9.45 | 1.87 |
| Institutional Class | 1,000.00 | 1,000.00 | 900.30 | 1,020.81 | 4.05 | 4.31 | 0.85 |
| Institutional 2 Class | 1,000.00 | 1,000.00 | 900.50 | 1,021.16 | 3.72 | 3.95 | 0.78 |
| Institutional 3 Class | 1,000.00 | 1,000.00 | 900.60 | 1,021.46 | 3.43 | 3.65 | 0.72 |
| Class R | 1,000.00 | 1,000.00 | 898.20 | 1,018.20 | 6.52 | 6.93 | 1.37 |
Expenses paid during the period are equal to the annualized expense ratio for each class as indicated above, multiplied by the average account value over the period and then multiplied by the number of days in the Fund’s most recent fiscal half year and divided by 365.
Expenses do not include fees and expenses incurred indirectly by the Fund from its investment in underlying funds, including affiliated and non-affiliated pooled investment vehicles, such as mutual funds and exchange-traded funds.
Columbia Commodity Strategy Fund | Semiannual Report 2022
| 5 |
Consolidated Portfolio of Investments
November 30, 2022 (Unaudited)
(Percentages represent value of investments compared to net assets)
Investments in securities
| Asset-Backed Securities — Non-Agency 20.7% |
| Issuer | Coupon
Rate | | Principal
Amount ($) | Value ($) |
| ACC Trust(a) |
| Series 2022-1 Class A |
| 09/20/2024 | 1.190% | | 142,278 | 141,454 |
| AmeriCredit Automobile Receivables Trust |
| Series 2021-2 Class A2 |
| 11/18/2024 | 0.260% | | 43,485 | 43,414 |
| Amur Equipment Finance Receivables IX LLC(a) |
| Series 2021-1A Class A2 |
| 11/20/2026 | 0.750% | | 343,049 | 330,047 |
| Avis Budget Rental Car Funding AESOP LLC(a) |
| Series 2017-2A Class A |
| 03/20/2024 | 2.970% | | 150,000 | 149,193 |
| BMW Vehicle Lease Trust |
| Series 2021-1 Class A4 |
| 07/25/2024 | 0.370% | | 625,000 | 607,927 |
| Subordinated Series 2022-1 Class A3 |
| 03/25/2025 | 1.100% | | 250,000 | 240,919 |
| Carmax Auto Owner Trust |
| Series 2019-2 Class A4 |
| 12/16/2024 | 2.770% | | 1,000,000 | 992,591 |
| Series 2019-4 Class A3 |
| 11/15/2024 | 2.020% | | 793,643 | 784,820 |
| CarMax Auto Owner Trust |
| Series 2022-1 Class A2 |
| 02/18/2025 | 0.910% | | 1,628,806 | 1,605,582 |
| Dell Equipment Finance Trust(a) |
| Subordinated Series 2020-1 Class B |
| 04/24/2023 | 2.980% | | 1,284,860 | 1,283,817 |
| DLLST LLC(a) |
| Series 2022-1A Class A1 |
| 05/22/2023 | 1.560% | | 519,452 | 518,175 |
| Drive Auto Receivables Trust |
| Subordinated Series 2020-2 Class C |
| 08/17/2026 | 2.280% | | 241,504 | 239,314 |
| DT Auto Owner Trust(a) |
| Series 2022-1A Class A |
| 04/15/2026 | 1.580% | | 1,662,315 | 1,625,605 |
| Series 2022-3A Class A |
| 10/15/2026 | 6.050% | | 1,800,000 | 1,798,204 |
| FHF Trust(a) |
| Series 2021-1A Class A |
| 03/15/2027 | 1.270% | | 494,385 | 472,057 |
| Series 2021-2A Class A |
| 12/15/2026 | 0.830% | | 650,253 | 622,016 |
| Ford Credit Auto Lease Trust |
| Series 2021-B Class A3 |
| 10/15/2024 | 0.370% | | 277,000 | 268,944 |
| Asset-Backed Securities — Non-Agency (continued) |
| Issuer | Coupon
Rate | | Principal
Amount ($) | Value ($) |
| Ford Credit Auto Owner Trust(a) |
| Series 2019-1 Class A |
| 07/15/2030 | 3.520% | | 825,000 | 805,709 |
| Ford Credit Auto Owner Trust |
| Series 2020-B Class A4 |
| 11/15/2025 | 0.790% | | 450,000 | 429,041 |
| Ford Credit Floorplan Master Owner Trust A |
| Series 2020-1 Class A1 |
| 09/15/2025 | 0.700% | | 955,000 | 919,992 |
| FREED ABS Trust(a) |
| Series 2022-4FP Class A |
| 12/18/2029 | 6.490% | | 425,000 | 425,345 |
| GLS Auto Receivables Issuer Trust(a) |
| Subordinated Series 2020-3A Class C |
| 05/15/2025 | 1.920% | | 1,935,220 | 1,916,967 |
| GM Financial Automobile Leasing Trust |
| Series 2020-3 Class A4 |
| 10/21/2024 | 0.510% | | 178,150 | 177,291 |
| Subordinated Series 2021-1 Class C |
| 02/20/2025 | 0.700% | | 530,000 | 512,495 |
| GM Financial Consumer Automobile Receivables Trust |
| Series 2020-1 Class A4 |
| 03/17/2025 | 1.900% | | 300,000 | 292,664 |
| Harley-Davidson Motorcycle Trust |
| Series 2021-B Class A2 |
| 12/16/2024 | 0.240% | | 11,997 | 11,977 |
| JPMorgan Chase Bank NA(a) |
| Subordinated Series 2021-2 Class C |
| 12/26/2028 | 0.969% | | 2,062,171 | 1,960,675 |
| Lendbuzz Securitization Trust(a) |
| Series 2021-1A Class A |
| 06/15/2026 | 1.460% | | 239,814 | 228,230 |
| LendingPoint Asset Securitization Trust(a) |
| Series 2020-REV1 Class A |
| 10/15/2028 | 2.731% | | 2,636,760 | 2,595,752 |
| Series 2021-A Class A |
| 12/15/2028 | 1.000% | | 90,113 | 89,953 |
| Series 2021-B Class A |
| 02/15/2029 | 1.110% | | 362,615 | 359,260 |
| Series 2022-A Class A |
| 06/15/2029 | 1.680% | | 451,052 | 447,657 |
| LL ABS Trust(a) |
| Series 2021-1A Class A |
| 05/15/2029 | 1.070% | | 182,911 | 177,805 |
| Marlin Receivables LLC(a) |
| Series 2022-1A Class A1 |
| 07/20/2023 | 3.372% | | 929,752 | 925,726 |
The accompanying Notes to Consolidated Financial Statements are an integral part of this statement.
| 6 | Columbia Commodity Strategy Fund | Semiannual Report 2022 |
Consolidated Portfolio of Investments (continued)
November 30, 2022 (Unaudited)
| Asset-Backed Securities — Non-Agency (continued) |
| Issuer | Coupon
Rate | | Principal
Amount ($) | Value ($) |
| Mercedes-Benz Auto Receivables Trust |
| Series 2020-1 Class A4 |
| 10/15/2026 | 0.770% | | 250,000 | 237,197 |
| Nissan Auto Lease Trust |
| Series 2021-A Class A3 |
| 08/15/2024 | 0.520% | | 1,050,000 | 1,019,750 |
| Oportun Issuance Trust(a) |
| Series 2022-3 Class A |
| 01/08/2030 | 7.451% | | 600,000 | 599,673 |
| Pagaya AI Debt Selection Trust(a) |
| Series 2021-1 Class A |
| 11/15/2027 | 1.180% | | 781,059 | 766,478 |
| Series 2021-5 Class A |
| 08/15/2029 | 1.530% | | 259,062 | 249,091 |
| Santander Drive Auto Receivables Trust |
| Series 2022-2 Class A2 |
| 10/15/2026 | 2.120% | | 493,987 | 491,548 |
| Series 2022-4 Class A2 |
| 07/15/2025 | 4.050% | | 875,000 | 870,035 |
| Subordinated Series 2019-2 Class D |
| 07/15/2025 | 3.220% | | 306,467 | 304,142 |
| Subordinated Series 2020-4 Class C |
| 01/15/2026 | 1.010% | | 507,231 | 501,066 |
| Santander Retail Auto Lease Trust(a) |
| Series 2021-A Class A3 |
| 07/22/2024 | 0.510% | | 440,000 | 426,603 |
| Series 2021-B Class A2 |
| 01/22/2024 | 0.310% | | 201,901 | 200,308 |
| SCF Equipment Leasing LLC(a) |
| Series 2021-1A Class A2 |
| 08/20/2026 | 0.420% | | 64,930 | 64,758 |
| Theorem Funding Trust(a) |
| Series 2021-1A Class A |
| 12/15/2027 | 1.210% | | 226,111 | 221,938 |
| United Auto Credit Securitization Trust(a) |
| Series 2022-1 Class A |
| 07/10/2024 | 1.110% | | 188,489 | 187,839 |
| Upstart Pass-Through Trust(a) |
| Series 2021-ST6 Class A |
| 08/20/2027 | 1.850% | | 232,720 | 216,340 |
| Upstart Securitization Trust(a) |
| Series 2021-3 Class A |
| 07/20/2031 | 0.830% | | 835,668 | 808,090 |
| US Auto Funding(a) |
| Series 2021-1A Class A |
| 07/15/2024 | 0.790% | | 23,665 | 23,632 |
| Verizon Owner Trust |
| Series 2020-A Class A1A |
| 07/22/2024 | 1.850% | | 528,378 | 524,772 |
| Asset-Backed Securities — Non-Agency (continued) |
| Issuer | Coupon
Rate | | Principal
Amount ($) | Value ($) |
| Volkswagen Auto Lease Trust |
| Series 2020-A Class A3 |
| 01/22/2024 | 0.390% | | 415,724 | 412,947 |
| Westlake Automobile Receivables Trust(a) |
| Series 2022-1A Class A2A |
| 12/16/2024 | 1.970% | | 216,427 | 213,789 |
| Subordinated Series 2021-2A Class B |
| 07/15/2026 | 0.620% | | 2,081,000 | 2,007,576 |
| World Omni Auto Receivables Trust |
| Series 2018-D Class A4 |
| 12/16/2024 | 3.440% | | 775,340 | 774,958 |
| World Omni Automobile Lease Securitization Trust |
| Series 2022-A Class A2 |
| 10/15/2024 | 2.630% | | 1,716,971 | 1,693,294 |
| World Omni Select Auto Trust |
| Series 2021-A Class A3 |
| 03/15/2027 | 0.530% | | 1,267,000 | 1,216,024 |
Total Asset-Backed Securities — Non-Agency
(Cost $38,423,005) | 38,032,466 |
|
| Commercial Mortgage-Backed Securities - Non-Agency 1.2% |
| | | | |
| Citigroup Commercial Mortgage Trust |
| Series 2013-GC11 Class AAB |
| 04/10/2046 | 2.690% | | 6 | 7 |
| COMM Mortgage Trust |
| Series 2013-CR6 Class A4 |
| 03/10/2046 | 3.101% | | 514,439 | 512,876 |
| GS Mortgage Securities Corp. Trust(a),(b) |
| Series 2022-SHIP Class A |
1-month Term SOFR + 0.731%
Floor 0.731%
08/15/2036 | 4.525% | | 800,000 | 784,028 |
| GS Mortgage Securities Trust(c) |
| Series 2013-GC13 Class A5 |
| 07/10/2046 | 4.181% | | 635,000 | 628,461 |
| UBS-Barclays Commercial Mortgage Trust |
| Series 2013-C5 Class A4 |
| 03/10/2046 | 3.185% | | 75,029 | 74,787 |
| WF-RBS Commercial Mortgage Trust |
| Series 2013-C18 Class ASB |
| 12/15/2046 | 3.676% | | 215,969 | 213,401 |
Total Commercial Mortgage-Backed Securities - Non-Agency
(Cost $2,218,782) | 2,213,560 |
|
| Corporate Bonds & Notes 29.1% |
| | | | |
| Aerospace & Defense 1.0% |
| BAE Systems Holdings, Inc.(a) |
| 10/07/2024 | 3.800% | | 223,000 | 217,848 |
The accompanying Notes to Consolidated Financial Statements are an integral part of this statement.
Columbia Commodity Strategy Fund | Semiannual Report 2022
| 7 |
Consolidated Portfolio of Investments (continued)
November 30, 2022 (Unaudited)
| Corporate Bonds & Notes (continued) |
| Issuer | Coupon
Rate | | Principal
Amount ($) | Value ($) |
| Boeing Co. (The) |
| 02/01/2024 | 1.950% | | 550,000 | 528,661 |
| L3Harris Technologies, Inc. |
| 06/15/2023 | 3.850% | | 525,000 | 521,427 |
| Raytheon Technologies Corp. |
| 03/15/2024 | 3.200% | | 550,000 | 539,462 |
| Total | 1,807,398 |
| Automotive 0.6% |
| Daimler Trucks Finance North America LLC(a),(b) |
SOFR + 1.000%
04/05/2024 | 4.810% | | 525,000 | 521,833 |
| Toyota Motor Credit Corp. |
| 06/14/2024 | 0.500% | | 625,000 | 584,194 |
| Total | 1,106,027 |
| Banking 9.9% |
| American Express Co.(b) |
3-month USD LIBOR + 0.750%
08/03/2023 | 5.210% | | 700,000 | 701,588 |
| Bank of America Corp.(b) |
3-month USD LIBOR + 0.430%
05/28/2024 | 4.963% | | 1,000,000 | 991,250 |
| Bank of Montreal |
| 09/14/2024 | 4.250% | | 600,000 | 592,268 |
| Bank of New York Mellon Corp. (The)(b) |
SOFR + 0.260%
04/26/2024 | 4.070% | | 27,000 | 26,774 |
| Bank of Nova Scotia (The)(b) |
SOFR + 0.380%
07/31/2024 | 4.190% | | 600,000 | 592,405 |
| BBVA USA |
| 08/27/2024 | 2.500% | | 725,000 | 697,433 |
| Canadian Imperial Bank of Commerce(b) |
3-month USD LIBOR + 0.660%
09/13/2023 | 3.905% | | 650,000 | 650,287 |
| Citigroup, Inc.(b) |
3-month USD LIBOR + 1.100%
05/17/2024 | 5.750% | | 1,000,000 | 993,766 |
| Commonwealth Bank of Australia(a),(b) |
3-month USD LIBOR + 0.820%
06/04/2024 | 3.978% | | 575,000 | 575,707 |
| Cooperatieve Rabobank UA(b) |
3-month USD LIBOR + 0.480%
01/10/2023 | 4.389% | | 550,000 | 549,918 |
| Credit Suisse AG |
| 08/09/2024 | 4.750% | | 550,000 | 518,840 |
| Discover Bank |
| 02/06/2023 | 3.350% | | 475,000 | 473,344 |
| Corporate Bonds & Notes (continued) |
| Issuer | Coupon
Rate | | Principal
Amount ($) | Value ($) |
| DNB Bank ASA(a) |
| 12/02/2022 | 2.150% | | 525,000 | 524,930 |
| Goldman Sachs Group, Inc. (The)(b) |
3-month USD LIBOR + 1.600%
11/29/2023 | 6.334% | | 1,000,000 | 1,005,067 |
| HSBC Holdings PLC(d) |
| 08/17/2024 | 0.732% | | 625,000 | 598,360 |
| JPMorgan Chase & Co.(d) |
| 06/14/2025 | 3.845% | | 1,025,000 | 1,006,779 |
| Morgan Stanley(b) |
3-month USD LIBOR + 1.220%
05/08/2024 | 5.770% | | 1,000,000 | 1,000,857 |
| National Australia Bank Ltd. |
| 11/22/2024 | 5.132% | | 535,000 | 537,233 |
| Royal Bank of Canada(b) |
3-month USD LIBOR + 0.660%
10/05/2023 | 4.408% | | 575,000 | 573,976 |
| Skandinaviska Enskilda Banken AB(a),(b) |
3-month USD LIBOR + 0.320%
09/01/2023 | 5.081% | | 525,000 | 523,206 |
| State Street Corp.(d) |
| 12/03/2024 | 3.776% | | 525,000 | 518,629 |
| Svenska Handelsbanken AB(a) |
| 06/30/2023 | 0.625% | | 600,000 | 584,441 |
| Toronto-Dominion Bank (The)(b) |
SOFR + 0.910%
03/08/2024 | 4.720% | | 600,000 | 598,165 |
| Truist Bank(b) |
SOFR + 0.200%
01/17/2024 | 4.010% | | 600,000 | 599,956 |
| UBS Group AG(a),(d) |
| 08/05/2025 | 4.490% | | 650,000 | 636,304 |
| US Bancorp |
| 07/30/2024 | 2.400% | | 625,000 | 603,425 |
| Wells Fargo & Co.(d) |
| 05/19/2025 | 0.805% | | 925,000 | 862,170 |
| Westpac Banking Corp.(b) |
3-month USD LIBOR + 0.770%
02/26/2024 | 5.506% | | 525,000 | 525,784 |
| Total | 18,062,862 |
| Cable and Satellite 0.5% |
| Charter Communications Operating LLC/Capital(b) |
3-month USD LIBOR + 1.650%
02/01/2024 | 6.090% | | 475,000 | 477,496 |
The accompanying Notes to Consolidated Financial Statements are an integral part of this statement.
| 8 | Columbia Commodity Strategy Fund | Semiannual Report 2022 |
Consolidated Portfolio of Investments (continued)
November 30, 2022 (Unaudited)
| Corporate Bonds & Notes (continued) |
| Issuer | Coupon
Rate | | Principal
Amount ($) | Value ($) |
| Comcast Corp.(b) |
3-month USD LIBOR + 0.630%
04/15/2024 | 4.709% | | 525,000 | 525,791 |
| Total | 1,003,287 |
| Chemicals 0.3% |
| DuPont de Nemours, Inc.(b) |
3-month USD LIBOR + 1.110%
11/15/2023 | 5.716% | | 525,000 | 524,677 |
| Construction Machinery 0.6% |
| Caterpillar Financial Services Corp. |
| 01/17/2025 | 4.900% | | 535,000 | 536,742 |
| John Deere Capital Corp.(b) |
3-month USD LIBOR + 0.550%
06/07/2023 | 3.695% | | 550,000 | 550,003 |
| Total | 1,086,745 |
| Diversified Manufacturing 0.3% |
| Siemens Financieringsmaatschappij NV(a) |
| 03/11/2023 | 0.400% | | 600,000 | 592,415 |
| Electric 2.4% |
| American Electric Power Co., Inc. |
| 12/15/2022 | 2.950% | | 525,000 | 524,588 |
| CenterPoint Energy, Inc.(b) |
SOFR + 0.650%
05/13/2024 | 4.460% | | 325,000 | 320,019 |
| Consumers Energy Co. |
| 08/15/2023 | 3.375% | | 425,000 | 419,992 |
| DTE Energy Co. |
| 11/01/2024 | 4.220% | | 600,000 | 589,655 |
| Duke Energy Corp.(b) |
SOFR + 0.250%
06/10/2023 | 4.060% | | 525,000 | 522,368 |
| Eversource Energy(b) |
SOFR + 0.250%
08/15/2023 | 4.060% | | 475,000 | 472,292 |
| Mississippi Power Co.(b) |
SOFR + 0.300%
06/28/2024 | 4.110% | | 450,000 | 439,770 |
| NextEra Energy Capital Holdings, Inc.(b) |
SOFR + 1.020%
03/21/2024 | 4.830% | | 425,000 | 422,512 |
| PPL Electric Utilities Corp.(b) |
SOFR + 0.330%
06/24/2024 | 4.140% | | 500,000 | 493,233 |
| Public Service Enterprise Group, Inc. |
| 11/08/2023 | 0.841% | | 300,000 | 287,615 |
| Total | 4,492,044 |
| Corporate Bonds & Notes (continued) |
| Issuer | Coupon
Rate | | Principal
Amount ($) | Value ($) |
| Food and Beverage 1.0% |
| Campbell Soup Co. |
| 03/15/2023 | 3.650% | | 265,000 | 263,833 |
| ConAgra Foods, Inc. |
| 01/25/2023 | 3.200% | | 525,000 | 523,577 |
| Mondelez International, Inc. |
| 03/17/2024 | 2.125% | | 550,000 | 530,281 |
| Tyson Foods, Inc. |
| 09/28/2023 | 3.900% | | 500,000 | 495,290 |
| Total | 1,812,981 |
| Health Care 1.4% |
| Becton Dickinson and Co. |
| 06/06/2024 | 3.363% | | 550,000 | 537,232 |
| Cigna Corp.(b) |
3-month USD LIBOR + 0.890%
07/15/2023 | 4.969% | | 475,000 | 475,964 |
| CVS Health Corp. |
| 08/15/2024 | 2.625% | | 500,000 | 483,361 |
| GE Healthcare Holding LLC(a) |
| 11/15/2024 | 5.550% | | 536,000 | 538,464 |
| Thermo Fisher Scientific, Inc.(b) |
SOFR + 0.350%
04/18/2023 | 4.160% | | 525,000 | 524,309 |
| Total | 2,559,330 |
| Healthcare Insurance 0.5% |
| UnitedHealth Group, Inc. |
| 10/15/2024 | 5.000% | | 393,000 | 396,169 |
| Wellpoint, Inc. |
| 08/15/2024 | 3.500% | | 500,000 | 488,942 |
| Total | 885,111 |
| Independent Energy 0.2% |
| Pioneer Natural Resources Co. |
| 05/15/2023 | 0.550% | | 425,000 | 416,656 |
| Integrated Energy 0.7% |
| Chevron USA, Inc.(b) |
3-month USD LIBOR + 0.200%
08/11/2023 | 4.850% | | 575,000 | 574,476 |
| Shell International Finance BV(b) |
3-month USD LIBOR + 0.400%
11/13/2023 | 5.050% | | 650,000 | 650,260 |
| Total | 1,224,736 |
| Life Insurance 1.2% |
| Five Corners Funding Trust(a) |
| 11/15/2023 | 4.419% | | 550,000 | 545,181 |
The accompanying Notes to Consolidated Financial Statements are an integral part of this statement.
Columbia Commodity Strategy Fund | Semiannual Report 2022
| 9 |
Consolidated Portfolio of Investments (continued)
November 30, 2022 (Unaudited)
| Corporate Bonds & Notes (continued) |
| Issuer | Coupon
Rate | | Principal
Amount ($) | Value ($) |
| Metropolitan Life Global Funding I(a) |
| 09/27/2024 | 0.700% | | 600,000 | 554,136 |
| New York Life Global Funding(a),(b) |
SOFR + 0.220%
02/02/2023 | 4.030% | | 475,000 | 474,956 |
| Principal Life Global Funding II(a) |
| 01/08/2024 | 0.500% | | 625,000 | 594,363 |
| Total | 2,168,636 |
| Media and Entertainment 0.5% |
| Magallanes, Inc.(a),(b) |
SOFR + 1.780%
03/15/2024 | 5.590% | | 475,000 | 473,369 |
| Walt Disney Co. (The) |
| 09/15/2024 | 3.700% | | 525,000 | 515,334 |
| Total | 988,703 |
| Midstream 1.6% |
| Enable Midstream Partners LP |
| 05/15/2024 | 3.900% | | 250,000 | 243,740 |
| Enbridge, Inc. |
| 02/16/2024 | 2.150% | | 375,000 | 361,932 |
| Enterprise Products Operating LLC |
| 02/15/2024 | 3.900% | | 500,000 | 492,186 |
| Kinder Morgan Energy Partners LP |
| 02/01/2024 | 4.150% | | 325,000 | 320,763 |
| 05/01/2024 | 4.300% | | 250,000 | 246,781 |
| Plains All American Pipeline LP/Finance Corp. |
| 11/01/2024 | 3.600% | | 500,000 | 482,013 |
| Southern Natural Gas Co. LLC(a) |
| 04/28/2023 | 0.625% | | 275,000 | 268,620 |
| Williams Companies, Inc. (The) |
| 06/24/2024 | 4.550% | | 525,000 | 519,687 |
| Total | 2,935,722 |
| Pharmaceuticals 1.4% |
| AbbVie, Inc. |
| 03/15/2025 | 3.800% | | 550,000 | 538,527 |
| Amgen, Inc. |
| 05/22/2024 | 3.625% | | 525,000 | 516,826 |
| Astrazeneca Finance LLC |
| 05/28/2024 | 0.700% | | 575,000 | 541,107 |
| Bristol-Myers Squibb Co. |
| 11/13/2023 | 0.537% | | 550,000 | 527,979 |
| Roche Holdings, Inc.(a),(b) |
SOFR + 0.330%
09/11/2023 | 4.140% | | 525,000 | 524,071 |
| Total | 2,648,510 |
| Corporate Bonds & Notes (continued) |
| Issuer | Coupon
Rate | | Principal
Amount ($) | Value ($) |
| Property & Casualty 0.6% |
| Chubb INA Holdings, Inc. |
| 05/15/2024 | 3.350% | | 550,000 | 539,677 |
| Loews Corp. |
| 05/15/2023 | 2.625% | | 525,000 | 518,945 |
| Total | 1,058,622 |
| Railroads 0.5% |
| CSX Corp. |
| 08/01/2024 | 3.400% | | 400,000 | 391,075 |
| Union Pacific Corp. |
| 01/15/2023 | 2.950% | | 475,000 | 473,775 |
| Total | 864,850 |
| Retailers 0.3% |
| Lowe’s Companies, Inc. |
| 09/15/2024 | 3.125% | | 550,000 | 534,580 |
| Technology 2.1% |
| Broadcom Corp./Cayman Finance Ltd. |
| 01/15/2024 | 3.625% | | 550,000 | 540,681 |
| Fidelity National Information Services, Inc. |
| 03/01/2024 | 0.600% | | 342,000 | 323,547 |
| International Business Machines Corp. |
| 02/12/2024 | 3.625% | | 425,000 | 419,109 |
| Microchip Technology, Inc. |
| 02/15/2024 | 0.972% | | 450,000 | 426,167 |
| NXP BV/Funding LLC |
| 03/01/2024 | 4.875% | | 525,000 | 520,287 |
| Oracle Corp. |
| 09/15/2023 | 2.400% | | 500,000 | 489,902 |
| QUALCOMM, Inc.(b) |
3-month USD LIBOR + 0.730%
01/30/2023 | 5.145% | | 600,000 | 600,225 |
| RELX Capital, Inc. |
| 03/16/2023 | 3.500% | | 475,000 | 472,810 |
| Total | 3,792,728 |
| Transportation Services 0.3% |
| ERAC USA Finance LLC(a) |
| 11/01/2023 | 2.700% | | 550,000 | 536,707 |
| Wireless 0.5% |
| American Tower Corp. |
| 05/15/2024 | 3.375% | | 540,000 | 526,099 |
| T-Mobile USA, Inc. |
| 04/15/2025 | 3.500% | | 350,000 | 339,019 |
| Total | 865,118 |
The accompanying Notes to Consolidated Financial Statements are an integral part of this statement.
| 10 | Columbia Commodity Strategy Fund | Semiannual Report 2022 |
Consolidated Portfolio of Investments (continued)
November 30, 2022 (Unaudited)
| Corporate Bonds & Notes (continued) |
| Issuer | Coupon
Rate | | Principal
Amount ($) | Value ($) |
| Wirelines 0.7% |
| AT&T, Inc.(b) |
3-month USD LIBOR + 1.180%
06/12/2024 | 4.416% | | 700,000 | 703,141 |
| Verizon Communications, Inc.(b) |
SOFR + 0.500%
03/22/2024 | 4.310% | | 700,000 | 694,799 |
| Total | 1,397,940 |
Total Corporate Bonds & Notes
(Cost $54,059,239) | 53,366,385 |
|
| Foreign Government Obligations(e) 0.6% |
| | | | |
| Canada 0.6% |
| Province of Ontario |
| 01/24/2023 | 1.750% | | 550,000 | 547,745 |
| Province of Quebec |
| 02/13/2023 | 2.625% | | 525,000 | 522,681 |
| Total | 1,070,426 |
Total Foreign Government Obligations
(Cost $1,077,076) | 1,070,426 |
|
| Residential Mortgage-Backed Securities - Non-Agency 4.3% |
| | | | |
| Bellemeade Re Ltd.(a),(b) |
| CMO Series 2020-3A Class M1B |
1-month USD LIBOR + 2.850%
Floor 2.850%
10/25/2030 | 6.894% | | 72,087 | 72,083 |
| CMO Series 2021-3A Class M1A |
30-day Average SOFR + 1.000%
Floor 1.000%
09/25/2031 | 4.521% | | 1,197,477 | 1,172,129 |
| CFMT LLC(a),(c) |
| CMO Series 2021-EBO1 Class A |
| 11/25/2050 | 0.985% | | 436,428 | 409,317 |
| Connecticut Avenue Securities Trust(a),(b) |
| CMO Series 2022-R02 Class 2M1 |
30-day Average SOFR + 1.200%
01/25/2042 | 4.721% | | 2,103,952 | 2,061,244 |
| CMO Series 2022-R05 Class 2M1 |
30-day Average SOFR + 1.900%
04/25/2042 | 5.421% | | 658,548 | 650,696 |
| Residential Mortgage-Backed Securities - Non-Agency (continued) |
| Issuer | Coupon
Rate | | Principal
Amount ($) | Value ($) |
| Pretium Mortgage Credit Partners LLC(a),(c) |
| CMO Series 2021-RN2 Class A1 |
| 07/25/2051 | 1.744% | | 566,022 | 511,749 |
| Towd Point Mortgage Trust(a),(c) |
| CMO Series 2021-SJ2 Class A1A |
| 12/25/2061 | 2.250% | | 961,302 | 874,732 |
| VCAT LLC(a),(c) |
| CMO Series 2021-NPL4 Class A1 |
| 08/25/2051 | 1.868% | | 1,477,373 | 1,367,637 |
| CMO Series 2021-NPL5 Class A1 |
| 08/25/2051 | 1.868% | | 813,295 | 739,204 |
Total Residential Mortgage-Backed Securities - Non-Agency
(Cost $8,289,736) | 7,858,791 |
|
| U.S. Government & Agency Obligations 0.6% |
| | | | |
| Federal Farm Credit Banks Funding Corp.(b) |
SOFR + 0.040%
02/09/2024 | 3.850% | | 1,050,000 | 1,050,041 |
Total U.S. Government & Agency Obligations
(Cost $1,050,000) | 1,050,041 |
|
| U.S. Treasury Obligations 0.6% |
| | | | |
| U.S. Treasury |
| 12/31/2022 | 0.125% | | 1,075,000 | 1,071,436 |
Total U.S. Treasury Obligations
(Cost $1,072,591) | 1,071,436 |
| Money Market Funds 22.5% |
| | Shares | Value ($) |
| Columbia Short-Term Cash Fund, 3.989%(f),(g) | 41,173,453 | 41,156,983 |
Total Money Market Funds
(Cost $41,156,818) | 41,156,983 |
Total Investments in Securities
(Cost: $147,347,247) | 145,820,088 |
| Other Assets & Liabilities, Net | | 37,285,463 |
| Net Assets | 183,105,551 |
At November 30, 2022, securities and/or cash totaling $17,516,555 were pledged as collateral.
The accompanying Notes to Consolidated Financial Statements are an integral part of this statement.
Columbia Commodity Strategy Fund | Semiannual Report 2022
| 11 |
Consolidated Portfolio of Investments (continued)
November 30, 2022 (Unaudited)
Investments in derivatives
| Long futures contracts |
| Description | Number of
contracts | Expiration
date | Trading
currency | Notional
amount | Value/Unrealized
appreciation ($) | Value/Unrealized
depreciation ($) |
| Brent Crude | 41 | 01/2023 | USD | 3,566,590 | 5,804 | — |
| Brent Crude | 2 | 01/2023 | USD | 173,980 | — | (6,646) |
| Brent Crude | 1 | 03/2023 | USD | 86,580 | 961 | — |
| Brent Crude | 27 | 03/2023 | USD | 2,337,660 | — | (120,393) |
| Brent Crude | 41 | 05/2023 | USD | 3,515,750 | 11,346 | — |
| Brent Crude | 15 | 05/2023 | USD | 1,286,250 | — | (1,732) |
| Brent Crude | 28 | 07/2023 | USD | 2,376,080 | — | (19,986) |
| Cocoa | 6 | 03/2023 | USD | 149,880 | 9,064 | — |
| Coffee | 5 | 03/2023 | USD | 318,563 | 7,104 | — |
| Coffee | 14 | 05/2023 | USD | 893,288 | — | (153,804) |
| Coffee | 9 | 07/2023 | USD | 573,750 | 26,998 | — |
| Coffee | 18 | 07/2023 | USD | 1,147,500 | — | (44,118) |
| Copper | 5 | 03/2023 | USD | 467,250 | — | (12,847) |
| Copper | 28 | 07/2023 | USD | 2,613,450 | 140,671 | — |
| Copper | 15 | 07/2023 | USD | 1,400,063 | — | (34,533) |
| Corn | 96 | 03/2023 | USD | 3,201,600 | 15,435 | — |
| Corn | 30 | 03/2023 | USD | 1,000,500 | — | (2,992) |
| Corn | 83 | 05/2023 | USD | 2,760,788 | — | (65,045) |
| Corn | 22 | 05/2023 | USD | 2,054,800 | 87,221 | — |
| Corn | 168 | 07/2023 | USD | 5,541,900 | — | (122,082) |
| Cotton | 63 | 03/2023 | USD | 2,665,215 | 125,725 | — |
| Cotton | 16 | 03/2023 | USD | 676,880 | — | (13,774) |
| Cotton | 1 | 05/2023 | USD | 42,015 | 1,126 | — |
| Cotton | 10 | 05/2023 | USD | 420,150 | — | (52,070) |
| Cotton | 16 | 07/2023 | USD | 666,240 | 4,171 | — |
| Cotton | 7 | 07/2023 | USD | 291,480 | — | (4,548) |
| Feeder Cattle | 3 | 01/2023 | USD | 270,713 | 2,137 | — |
| Gas Oil | 39 | 01/2023 | USD | 3,644,550 | 19,541 | — |
| Gas Oil | 5 | 01/2023 | USD | 467,250 | — | (22,168) |
| Gas Oil | 12 | 03/2023 | USD | 1,082,400 | — | (64,547) |
| Gas Oil | 13 | 05/2023 | USD | 1,122,550 | — | (51,671) |
| Gas Oil | 27 | 07/2023 | USD | 2,276,100 | — | (109,755) |
| Gold 100 oz. | 29 | 02/2023 | USD | 5,103,710 | 65,521 | — |
| Gold 100 oz. | 1 | 02/2023 | USD | 175,990 | — | (3,183) |
| Gold 100 oz. | 28 | 04/2023 | USD | 4,970,280 | — | (128,513) |
| Gold 100 oz. | 56 | 06/2023 | USD | 10,026,800 | 233,442 | — |
| Gold 100 oz. | 21 | 08/2023 | USD | 3,794,280 | 61,359 | — |
| Gold 100 oz. | 7 | 08/2023 | USD | 1,264,760 | — | (16,952) |
| Lead | 14 | 01/2023 | USD | 766,325 | 70,716 | — |
| Lean Hogs | 50 | 02/2023 | USD | 1,707,000 | — | (59,126) |
| Lean Hogs | 17 | 04/2023 | USD | 616,420 | — | (22,475) |
| Lean Hogs | 22 | 06/2023 | USD | 905,300 | 38,868 | — |
| Lean Hogs | 8 | 06/2023 | USD | 329,200 | — | (3,075) |
| Lean Hogs | 15 | 07/2023 | USD | 623,250 | — | (13,484) |
| Live Cattle | 25 | 02/2023 | USD | 1,556,750 | 33,692 | — |
| Live Cattle | 20 | 04/2023 | USD | 1,274,200 | 8,387 | — |
| Live Cattle | 1 | 04/2023 | USD | 63,710 | — | (334) |
| Live Cattle | 44 | 06/2023 | USD | 2,738,120 | 29,124 | — |
| Live Cattle | 22 | 08/2023 | USD | 1,371,920 | 16,028 | — |
| Natural Gas | 115 | 12/2022 | USD | 7,969,500 | — | (165,912) |
| Natural Gas | 125 | 02/2023 | USD | 7,722,500 | — | (223,941) |
| Natural Gas | 100 | 04/2023 | USD | 5,181,000 | 216,163 | — |
| Natural Gas | 145 | 06/2023 | USD | 7,735,750 | 349,364 | — |
| Nickel | 2 | 01/2023 | USD | 323,034 | 53,278 | — |
| Nickel | 7 | 03/2023 | USD | 1,135,344 | 189,313 | — |
The accompanying Notes to Consolidated Financial Statements are an integral part of this statement.
| 12 | Columbia Commodity Strategy Fund | Semiannual Report 2022 |
Consolidated Portfolio of Investments (continued)
November 30, 2022 (Unaudited)
| Long futures contracts (continued) |
| Description | Number of
contracts | Expiration
date | Trading
currency | Notional
amount | Value/Unrealized
appreciation ($) | Value/Unrealized
depreciation ($) |
| Nickel | 7 | 05/2023 | USD | 1,139,712 | 113,624 | — |
| Nickel | 14 | 07/2023 | USD | 2,288,916 | 241,625 | — |
| NY Harbor ULSD | 7 | 02/2023 | USD | 944,475 | — | (2,499) |
| NY Harbor ULSD Heat Oil | 12 | 12/2022 | USD | 1,695,204 | — | (54,586) |
| NY Harbor ULSD Heat Oil | 7 | 04/2023 | USD | 898,052 | — | (15,720) |
| NY Harbor ULSD Heat Oil | 14 | 06/2023 | USD | 1,749,359 | — | (29,926) |
| Primary Aluminum | 12 | 01/2023 | USD | 739,350 | 36,853 | — |
| Primary Aluminum | 19 | 03/2023 | USD | 1,178,000 | 52,938 | — |
| Primary Aluminum | 19 | 05/2023 | USD | 1,185,363 | 81,557 | — |
| Primary Aluminum | 37 | 07/2023 | USD | 2,321,288 | 132,537 | — |
| RBOB Gasoline | 1 | 12/2022 | USD | 100,157 | 802 | — |
| RBOB Gasoline | 21 | 12/2022 | USD | 2,103,305 | — | (18,442) |
| RBOB Gasoline | 7 | 02/2023 | USD | 704,512 | — | (14,728) |
| RBOB Gasoline | 7 | 04/2023 | USD | 759,049 | 10,074 | — |
| RBOB Gasoline | 14 | 06/2023 | USD | 1,496,284 | — | (25,778) |
| Silver | 15 | 03/2023 | USD | 1,633,575 | 14,498 | — |
| Silver | 19 | 05/2023 | USD | 2,083,445 | 184,125 | — |
| Silver | 37 | 07/2023 | USD | 4,088,315 | 161,034 | — |
| Soybean | 15 | 01/2023 | USD | 1,102,125 | 24,465 | — |
| Soybean | 28 | 03/2023 | USD | 2,065,700 | 119,469 | — |
| Soybean | 20 | 05/2023 | USD | 1,482,750 | 26,453 | — |
| Soybean | 8 | 05/2023 | USD | 593,100 | — | (18) |
| Soybean | 55 | 07/2023 | USD | 4,086,500 | 133,202 | — |
| Soybean Meal | 33 | 01/2023 | USD | 1,378,740 | 49,894 | — |
| Soybean Meal | 29 | 03/2023 | USD | 1,206,400 | 54,596 | — |
| Soybean Meal | 29 | 05/2023 | USD | 1,198,570 | 8,613 | — |
| Soybean Meal | 58 | 07/2023 | USD | 2,389,020 | 79,326 | — |
| Soybean Oil | 36 | 01/2023 | USD | 1,552,608 | 150,733 | — |
| Soybean Oil | 31 | 03/2023 | USD | 1,307,208 | 192,998 | — |
| Soybean Oil | 32 | 05/2023 | USD | 1,320,576 | 100,362 | — |
| Soybean Oil | 57 | 07/2023 | USD | 2,308,158 | 96,904 | — |
| Soybean Oil | 7 | 07/2023 | USD | 283,458 | — | (5,872) |
| Sugar #11 | 71 | 02/2023 | USD | 1,560,978 | 76,408 | — |
| Sugar #11 | 60 | 04/2023 | USD | 1,247,232 | 56,910 | — |
| Sugar #11 | 4 | 04/2023 | USD | 83,149 | — | (1,678) |
| Sugar #11 | 113 | 06/2023 | USD | 2,269,221 | 69,805 | — |
| Sugar #11 | 20 | 06/2023 | USD | 401,632 | — | (1,798) |
| Wheat | 20 | 03/2023 | USD | 899,750 | — | (32,825) |
| Wheat | 21 | 03/2023 | USD | 835,275 | — | (41,134) |
| Wheat | 20 | 05/2023 | USD | 893,000 | — | (38,733) |
| Wheat | 33 | 05/2023 | USD | 1,329,900 | — | (115,501) |
| Wheat | 40 | 07/2023 | USD | 1,767,500 | — | (116,596) |
| Wheat | 67 | 07/2023 | USD | 2,709,313 | — | (222,655) |
| WTI Crude | 31 | 12/2022 | USD | 2,497,050 | — | (142,691) |
| WTI Crude | 33 | 02/2023 | USD | 2,664,750 | — | (36,680) |
| WTI Crude | 21 | 04/2023 | USD | 1,692,390 | 13,183 | — |
| WTI Crude | 12 | 04/2023 | USD | 967,080 | — | (2,463) |
| WTI Crude | 66 | 06/2023 | USD | 5,283,300 | — | (43,605) |
| Zinc | 51 | 01/2023 | USD | 3,881,100 | 235,456 | — |
| Zinc | 12 | 03/2023 | USD | 910,950 | 59,059 | — |
| Zinc | 12 | 05/2023 | USD | 908,400 | — | (2,328) |
| Zinc | 23 | 07/2023 | USD | 1,734,200 | 109,810 | — |
| Total | | | | | 4,509,872 | (2,505,962) |
The accompanying Notes to Consolidated Financial Statements are an integral part of this statement.
Columbia Commodity Strategy Fund | Semiannual Report 2022
| 13 |
Consolidated Portfolio of Investments (continued)
November 30, 2022 (Unaudited)
| Short futures contracts |
| Description | Number of
contracts | Expiration
date | Trading
currency | Notional
amount | Value/Unrealized
appreciation ($) | Value/Unrealized
depreciation ($) |
| U.S. Treasury 2-Year Note | (72) | 03/2023 | USD | (14,785,875) | — | (23,804) |
Notes to Consolidated Portfolio of Investments
| (a) | Represents privately placed and other securities and instruments exempt from Securities and Exchange Commission registration (collectively, private placements), such as Section 4(a)(2) and Rule 144A eligible securities, which are often sold only to qualified institutional buyers. At November 30, 2022, the total value of these securities amounted to $40,189,132, which represents 21.95% of total net assets. |
| (b) | Variable rate security. The interest rate shown was the current rate as of November 30, 2022. |
| (c) | Variable or floating rate security, the interest rate of which adjusts periodically based on changes in current interest rates and prepayments on the underlying pool of assets. The interest rate shown was the current rate as of November 30, 2022. |
| (d) | Represents a variable rate security with a step coupon where the rate adjusts according to a schedule for a series of periods, typically lower for an initial period and then increasing to a higher coupon rate thereafter. The interest rate shown was the current rate as of November 30, 2022. |
| (e) | Principal and interest may not be guaranteed by a governmental entity. |
| (f) | The rate shown is the seven-day current annualized yield at November 30, 2022. |
| (g) | As defined in the Investment Company Act of 1940, as amended, an affiliated company is one in which the Fund owns 5% or more of the company’s outstanding voting securities, or a company which is under common ownership or control with the Fund. The value of the holdings and transactions in these affiliated companies during the period ended November 30, 2022 are as follows: |
| Affiliated issuers | Beginning
of period($) | Purchases($) | Sales($) | Net change in
unrealized
appreciation
(depreciation)($) | End of
period($) | Realized gain
(loss)($) | Dividends($) | End of
period shares |
| Columbia Short-Term Cash Fund, 3.989% |
| | 230,547,183 | 201,681,017 | (391,072,617) | 1,400 | 41,156,983 | (33,211) | 1,183,968 | 41,173,453 |
Abbreviation Legend
| CMO | Collateralized Mortgage Obligation |
| LIBOR | London Interbank Offered Rate |
| SOFR | Secured Overnight Financing Rate |
Currency Legend
Fair value measurements
The Fund categorizes its fair value measurements according to a three-level hierarchy that maximizes the use of observable inputs and minimizes the use of unobservable inputs by prioritizing that the most observable input be used when available. Observable inputs are those that market participants would use in pricing an investment based on market data obtained from sources independent of the reporting entity. Unobservable inputs are those that reflect the Fund’s assumptions about the information market participants would use in pricing an investment. An investment’s level within the fair value hierarchy is based on the lowest level of any input that is deemed significant to the asset’s or liability’s fair value measurement. The input levels are not necessarily an indication of the risk or liquidity associated with investments at that level. For example, certain U.S. government securities are generally high quality and liquid, however, they are reflected as Level 2 because the inputs used to determine fair value may not always be quoted prices in an active market.
Fair value inputs are summarized in the three broad levels listed below:
| ■ | Level 1 — Valuations based on quoted prices for investments in active markets that the Fund has the ability to access at the measurement date. Valuation adjustments are not applied to Level 1 investments. |
| ■ | Level 2 — Valuations based on other significant observable inputs (including quoted prices for similar securities, interest rates, prepayment speeds, credit risks, etc.). |
| ■ | Level 3 — Valuations based on significant unobservable inputs (including the Fund’s own assumptions and judgment in determining the fair value of investments). |
Inputs that are used in determining fair value of an investment may include price information, credit data, volatility statistics, and other factors. These inputs can be either observable or unobservable. The availability of observable inputs can vary between investments, and is affected by various factors such as the type of investment, and the volume and level of activity for that investment or similar investments in the marketplace. The inputs will be considered by the Investment Manager, along with any other relevant factors in the calculation of an investment’s fair value. The Fund uses prices and inputs that are current as of the measurement date, which may include periods of market dislocations. During these periods, the availability of prices and inputs may be reduced for many investments. This condition could cause an investment to be reclassified between the various levels within the hierarchy.
The accompanying Notes to Consolidated Financial Statements are an integral part of this statement.
| 14 | Columbia Commodity Strategy Fund | Semiannual Report 2022 |
Consolidated Portfolio of Investments (continued)
November 30, 2022 (Unaudited)
Fair value measurements (continued)
Investments falling into the Level 3 category are primarily supported by quoted prices from brokers and dealers participating in the market for those investments. However, these may be classified as Level 3 investments due to lack of market transparency and corroboration to support these quoted prices. Additionally, valuation models may be used as the pricing source for any remaining investments classified as Level 3. These models may rely on one or more significant unobservable inputs and/or significant assumptions by the Investment Manager. Inputs used in valuations may include, but are not limited to, financial statement analysis, capital account balances, discount rates and estimated cash flows, and comparable company data.
The Fund’s Board of Trustees (the Board) has designated the Investment Manager, through its Valuation Committee (the Committee), as valuation designee, responsible for determining the fair value of the assets of the Fund for which market quotations are not readily available using valuation procedures approved by the Board. The Committee consists of voting and non-voting members from various groups within the Investment Manager’s organization, including operations and accounting, trading and investments, compliance, risk management and legal.
The Committee meets at least monthly to review and approve valuation matters, which may include a description of specific valuation determinations, data regarding pricing information received from approved pricing vendors and brokers and the results of Board-approved valuation policies and procedures (the Policies). The Policies address, among other things, instances when market quotations are or are not readily available, including recommendations of third party pricing vendors and a determination of appropriate pricing methodologies; events that require specific valuation determinations and assessment of fair value techniques; securities with a potential for stale pricing, including those that are illiquid, restricted, or in default; and the effectiveness of third party pricing vendors, including periodic reviews of vendors. The Committee meets more frequently, as needed, to discuss additional valuation matters, which may include the need to review back-testing results, review time-sensitive information or approve related valuation actions. Representatives of Columbia Management Investment Advisers, LLC report to the Board at each of its regularly scheduled meetings to discuss valuation matters and actions during the period, similar to those described earlier.
The following table is a summary of the inputs used to value the Fund’s investments at November 30, 2022:
| | Level 1 ($) | Level 2 ($) | Level 3 ($) | Total ($) |
| Investments in Securities | | | | |
| Asset-Backed Securities — Non-Agency | — | 38,032,466 | — | 38,032,466 |
| Commercial Mortgage-Backed Securities - Non-Agency | — | 2,213,560 | — | 2,213,560 |
| Corporate Bonds & Notes | — | 53,366,385 | — | 53,366,385 |
| Foreign Government Obligations | — | 1,070,426 | — | 1,070,426 |
| Residential Mortgage-Backed Securities - Non-Agency | — | 7,858,791 | — | 7,858,791 |
| U.S. Government & Agency Obligations | — | 1,050,041 | — | 1,050,041 |
| U.S. Treasury Obligations | — | 1,071,436 | — | 1,071,436 |
| Money Market Funds | 41,156,983 | — | — | 41,156,983 |
| Total Investments in Securities | 41,156,983 | 104,663,105 | — | 145,820,088 |
| Investments in Derivatives | | | | |
| Asset | | | | |
| Futures Contracts | 4,509,872 | — | — | 4,509,872 |
| Liability | | | | |
| Futures Contracts | (2,529,766) | — | — | (2,529,766) |
| Total | 43,137,089 | 104,663,105 | — | 147,800,194 |
See the Consolidated Portfolio of Investments for all investment classifications not indicated in the table.
The Fund’s assets assigned to the Level 2 input category are generally valued using the market approach, in which a security’s value is determined through reference to prices and information from market transactions for similar or identical assets.
Derivative instruments are valued at unrealized appreciation (depreciation).
The accompanying Notes to Consolidated Financial Statements are an integral part of this statement.
Columbia Commodity Strategy Fund | Semiannual Report 2022
| 15 |
Consolidated Statement of Assets and Liabilities
November 30, 2022 (Unaudited)
| Assets | |
| Investments in securities, at value | |
| Unaffiliated issuers (cost $106,190,429) | $104,663,105 |
| Affiliated issuers (cost $41,156,818) | 41,156,983 |
| Cash | 20,347,177 |
| Margin deposits on: | |
| Futures contracts | 17,516,555 |
| Receivable for: | |
| Capital shares sold | 497,936 |
| Dividends | 157,149 |
| Interest | 388,716 |
| Foreign tax reclaims | 5,753 |
| Variation margin for futures contracts | 3,110,899 |
| Prepaid expenses | 8,603 |
| Other assets | 1,352 |
| Total assets | 187,854,228 |
| Liabilities | |
| Foreign currency (cost $23) | 23 |
| Payable for: | |
| Investments purchased | 485,584 |
| Capital shares purchased | 3,205,018 |
| Variation margin for futures contracts | 958,439 |
| Management services fees | 3,331 |
| Distribution and/or service fees | 396 |
| Transfer agent fees | 15,389 |
| Compensation of board members | 50,063 |
| Compensation of chief compliance officer | 19 |
| Other expenses | 30,415 |
| Total liabilities | 4,748,677 |
| Net assets applicable to outstanding capital stock | $183,105,551 |
| Represented by | |
| Paid in capital | 238,761,523 |
| Total distributable earnings (loss) | (55,655,972) |
| Total - representing net assets applicable to outstanding capital stock | $183,105,551 |
The accompanying Notes to Consolidated Financial Statements are an integral part of this statement.
| 16 | Columbia Commodity Strategy Fund | Semiannual Report 2022 |
Consolidated Statement of Assets and Liabilities (continued)
November 30, 2022 (Unaudited)
| Class A | |
| Net assets | $27,615,309 |
| Shares outstanding | 1,402,610 |
| Net asset value per share | $19.69 |
| Maximum sales charge | 5.75% |
| Maximum offering price per share (calculated by dividing the net asset value per share by 1.0 minus the maximum sales charge for Class A shares) | $20.89 |
| Advisor Class | |
| Net assets | $13,285,287 |
| Shares outstanding | 649,842 |
| Net asset value per share | $20.44 |
| Class C | |
| Net assets | $4,922,282 |
| Shares outstanding | 273,538 |
| Net asset value per share | $17.99 |
| Institutional Class | |
| Net assets | $28,132,923 |
| Shares outstanding | 1,390,965 |
| Net asset value per share | $20.23 |
| Institutional 2 Class | |
| Net assets | $12,471,014 |
| Shares outstanding | 604,333 |
| Net asset value per share | $20.64 |
| Institutional 3 Class | |
| Net assets | $94,025,302 |
| Shares outstanding | 4,508,931 |
| Net asset value per share | $20.85 |
| Class R | |
| Net assets | $2,653,434 |
| Shares outstanding | 138,656 |
| Net asset value per share | $19.14 |
The accompanying Notes to Consolidated Financial Statements are an integral part of this statement.
Columbia Commodity Strategy Fund | Semiannual Report 2022
| 17 |
Consolidated Statement of Operations
Six Months Ended November 30, 2022 (Unaudited)
| Net investment income | |
| Income: | |
| Dividends — affiliated issuers | $1,183,968 |
| Interest | 1,704,617 |
| Interfund lending | 288 |
| Total income | 2,888,873 |
| Expenses: | |
| Management services fees | 1,034,497 |
| Distribution and/or service fees | |
| Class A | 36,305 |
| Class C | 29,012 |
| Class R | 6,163 |
| Transfer agent fees | |
| Class A | 19,912 |
| Advisor Class | 15,437 |
| Class C | 3,981 |
| Institutional Class | 43,083 |
| Institutional 2 Class | 4,103 |
| Institutional 3 Class | 6,032 |
| Class R | 1,689 |
| Compensation of board members | 8,116 |
| Custodian fees | 8,117 |
| Printing and postage fees | 13,491 |
| Registration fees | 70,599 |
| Audit fees | 20,165 |
| Legal fees | 8,601 |
| Compensation of chief compliance officer | 19 |
| Other | 9,323 |
| Total expenses | 1,338,645 |
| Expense reduction | (20) |
| Total net expenses | 1,338,625 |
| Net investment income | 1,550,248 |
| Realized and unrealized gain (loss) — net | |
| Net realized gain (loss) on: | |
| Investments — unaffiliated issuers | (1,169,768) |
| Investments — affiliated issuers | (33,211) |
| Futures contracts | (32,363,849) |
| Swap contracts | 445,812 |
| Net realized loss | (33,121,016) |
| Net change in unrealized appreciation (depreciation) on: | |
| Investments — unaffiliated issuers | 375,286 |
| Investments — affiliated issuers | 1,400 |
| Futures contracts | (21,967,477) |
| Swap contracts | 24,955 |
| Net change in unrealized appreciation (depreciation) | (21,565,836) |
| Net realized and unrealized loss | (54,686,852) |
| Net decrease in net assets resulting from operations | $(53,136,604) |
The accompanying Notes to Consolidated Financial Statements are an integral part of this statement.
| 18 | Columbia Commodity Strategy Fund | Semiannual Report 2022 |
Consolidated Statement of Changes in Net Assets
| | Six Months Ended
November 30, 2022
(Unaudited) | Year Ended
May 31, 2022 |
| Operations | | |
| Net investment income (loss) | $1,550,248 | $(1,447,231) |
| Net realized gain (loss) | (33,121,016) | 194,142,110 |
| Net change in unrealized appreciation (depreciation) | (21,565,836) | (7,499,396) |
| Net increase (decrease) in net assets resulting from operations | (53,136,604) | 185,195,483 |
| Distributions to shareholders | | |
| Net investment income and net realized gains | | |
| Class A | — | (1,367,093) |
| Advisor Class | — | (907,105) |
| Class C | — | (526,987) |
| Institutional Class | — | (3,725,492) |
| Institutional 2 Class | — | (2,514,889) |
| Institutional 3 Class | — | (123,791,658) |
| Class R | — | (244,620) |
| Total distributions to shareholders | — | (133,077,844) |
| Decrease in net assets from capital stock activity | (197,517,403) | (45,107,803) |
| Total increase (decrease) in net assets | (250,654,007) | 7,009,836 |
| Net assets at beginning of period | 433,759,558 | 426,749,722 |
| Net assets at end of period | $183,105,551 | $433,759,558 |
The accompanying Notes to Consolidated Financial Statements are an integral part of this statement.
Columbia Commodity Strategy Fund | Semiannual Report 2022
| 19 |
Consolidated Statement of Changes in Net Assets (continued)
| | Six Months Ended | Year Ended |
| | November 30, 2022 (Unaudited) | May 31, 2022 |
| | Shares | Dollars ($) | Shares | Dollars ($) |
| Capital stock activity |
| Class A | | | | |
| Subscriptions | 728,124 | 15,042,773 | 1,912,684 | 37,475,133 |
| Distributions reinvested | — | — | 86,880 | 1,356,192 |
| Redemptions | (800,530) | (15,827,288) | (656,974) | (13,269,279) |
| Net increase (decrease) | (72,406) | (784,515) | 1,342,590 | 25,562,046 |
| Advisor Class | | | | |
| Subscriptions | 635,760 | 13,503,828 | 1,152,473 | 25,273,477 |
| Distributions reinvested | — | — | 53,518 | 865,391 |
| Redemptions | (1,202,902) | (23,747,347) | (155,727) | (3,403,112) |
| Net increase (decrease) | (567,142) | (10,243,519) | 1,050,264 | 22,735,756 |
| Class C | | | | |
| Subscriptions | 99,858 | 1,882,059 | 239,505 | 4,580,503 |
| Distributions reinvested | — | — | 36,641 | 526,525 |
| Redemptions | (111,879) | (1,987,739) | (26,158) | (499,293) |
| Net increase (decrease) | (12,021) | (105,680) | 249,988 | 4,607,735 |
| Institutional Class | | | | |
| Subscriptions | 975,461 | 20,184,571 | 4,641,966 | 91,175,164 |
| Distributions reinvested | — | — | 232,754 | 3,724,071 |
| Redemptions | (3,895,250) | (77,773,880) | (629,517) | (13,227,370) |
| Net increase (decrease) | (2,919,789) | (57,589,309) | 4,245,203 | 81,671,865 |
| Institutional 2 Class | | | | |
| Subscriptions | 86,033 | 1,817,301 | 456,720 | 9,921,132 |
| Distributions reinvested | — | — | 154,164 | 2,514,419 |
| Redemptions | (242,362) | (4,935,162) | (754,802) | (15,768,236) |
| Net decrease | (156,329) | (3,117,861) | (143,918) | (3,332,685) |
| Institutional 3 Class | | | | |
| Subscriptions | 1,139,666 | 23,101,834 | 33,008,655 | 694,995,472 |
| Distributions reinvested | — | — | 7,516,160 | 123,791,160 |
| Redemptions | (7,487,886) | (149,203,796) | (48,212,582) | (996,632,284) |
| Net decrease | (6,348,220) | (126,101,962) | (7,687,767) | (177,845,652) |
| Class R | | | | |
| Subscriptions | 52,659 | 1,008,175 | 81,715 | 1,583,080 |
| Distributions reinvested | — | — | 16,054 | 244,173 |
| Redemptions | (29,698) | (582,732) | (16,937) | (334,121) |
| Net increase | 22,961 | 425,443 | 80,832 | 1,493,132 |
| Total net decrease | (10,052,946) | (197,517,403) | (862,808) | (45,107,803) |
The accompanying Notes to Consolidated Financial Statements are an integral part of this statement.
| 20 | Columbia Commodity Strategy Fund | Semiannual Report 2022 |
[THIS PAGE INTENTIONALLY LEFT BLANK]
Columbia Commodity Strategy Fund | Semiannual Report 2022
| 21 |
Consolidated Financial Highlights
The following table is intended to help you understand the Fund’s financial performance. Certain information reflects financial results for a single share of a class held for the periods shown. Per share net investment income (loss) amounts are calculated based on average shares outstanding during the period. Total return assumes reinvestment of all dividends and distributions, if any. Total return does not reflect payment of sales charges, if any. Total return and portfolio turnover are not annualized for periods of less than one year. The portfolio turnover rate is calculated without regard to purchase and sales transactions of short-term instruments and certain derivatives, if any. If such transactions were included, the Fund’s portfolio turnover rate may be higher.
| | Net asset value,
beginning of
period | Net
investment
income
(loss) | Net
realized
and
unrealized
gain (loss) | Total from
investment
operations | Distributions
from net
investment
income | Total
distributions to
shareholders |
| Class A(c) |
| Six Months Ended 11/30/2022 (Unaudited) | $21.90 | 0.08 | (2.29) | (2.21) | — | — |
| Year Ended 5/31/2022 | $20.69 | (0.12) | 7.43 | 7.31 | (6.10) | (6.10) |
| Year Ended 5/31/2021 | $13.99 | (0.18) | 6.90 | 6.72 | (0.02) | (0.02) |
| Year Ended 5/31/2020 | $16.67 | 0.12 | (2.64) | (2.52) | (0.16) | (0.16) |
| Year Ended 5/31/2019 | $23.03 | 0.24 | (3.60) | (3.36) | (3.00) | (3.00) |
| Year Ended 5/31/2018 | $20.95 | 0.04 | 2.04 | 2.08 | — | — |
| Advisor Class(c) |
| Six Months Ended 11/30/2022 (Unaudited) | $22.71 | 0.10 | (2.37) | (2.27) | — | — |
| Year Ended 5/31/2022 | $21.22 | (0.08) | 7.70 | 7.62 | (6.13) | (6.13) |
| Year Ended 5/31/2021 | $14.32 | (0.11) | 7.03 | 6.92 | (0.02) | (0.02) |
| Year Ended 5/31/2020 | $17.05 | 0.16 | (2.69) | (2.53) | (0.20) | (0.20) |
| Year Ended 5/31/2019 | $23.49 | 0.28 | (3.64) | (3.36) | (3.08) | (3.08) |
| Year Ended 5/31/2018 | $21.32 | 0.12 | 2.09 | 2.21 | (0.04) | (0.04) |
| Class C(c) |
| Six Months Ended 11/30/2022 (Unaudited) | $20.09 | 0.00(g) | (2.10) | (2.10) | — | — |
| Year Ended 5/31/2022 | $19.53 | (0.26) | 6.86 | 6.60 | (6.04) | (6.04) |
| Year Ended 5/31/2021 | $13.30 | (0.30) | 6.54 | 6.24 | (0.01) | (0.01) |
| Year Ended 5/31/2020 | $15.84 | (0.00)(g) | (2.54) | (2.54) | (0.00)(g) | (0.00)(g) |
| Year Ended 5/31/2019 | $22.03 | 0.08 | (3.43) | (3.35) | (2.84) | (2.84) |
| Year Ended 5/31/2018 | $20.17 | (0.12) | 1.98 | 1.86 | — | — |
| Institutional Class(c) |
| Six Months Ended 11/30/2022 (Unaudited) | $22.47 | 0.09 | (2.33) | (2.24) | — | — |
| Year Ended 5/31/2022 | $21.05 | (0.05) | 7.59 | 7.54 | (6.12) | (6.12) |
| Year Ended 5/31/2021 | $14.20 | (0.15) | 7.02 | 6.87 | (0.02) | (0.02) |
| Year Ended 5/31/2020 | $16.91 | 0.20 | (2.71) | (2.51) | (0.20) | (0.20) |
| Year Ended 5/31/2019 | $23.32 | 0.28 | (3.61) | (3.33) | (3.08) | (3.08) |
| Year Ended 5/31/2018 | $21.18 | 0.12 | 2.06 | 2.18 | (0.04) | (0.04) |
| Institutional 2 Class(c) |
| Six Months Ended 11/30/2022 (Unaudited) | $22.92 | 0.11 | (2.39) | (2.28) | — | — |
| Year Ended 5/31/2022 | $21.34 | (0.07) | 7.78 | 7.71 | (6.13) | (6.13) |
| Year Ended 5/31/2021 | $14.40 | (0.12) | 7.08 | 6.96 | (0.02) | (0.02) |
| Year Ended 5/31/2020 | $17.14 | 0.24 | (2.78) | (2.54) | (0.20) | (0.20) |
| Year Ended 5/31/2019 | $23.59 | 0.32 | (3.69) | (3.37) | (3.08) | (3.08) |
| Year Ended 5/31/2018 | $21.41 | 0.12 | 2.10 | 2.22 | (0.04) | (0.04) |
The accompanying Notes to Consolidated Financial Statements are an integral part of this statement.
| 22 | Columbia Commodity Strategy Fund | Semiannual Report 2022 |
Consolidated Financial Highlights (continued)
| | Net
asset
value,
end of
period | Total
return | Total gross
expense
ratio to
average
net assets(a) | Total net
expense
ratio to
average
net assets(a),(b) | Net investment
income (loss)
ratio to
average
net assets | Portfolio
turnover | Net
assets,
end of
period
(000’s) |
| Class A(c) |
| Six Months Ended 11/30/2022 (Unaudited) | $19.69 | (10.09%) | 1.12%(d) | 1.12%(d),(e) | 0.78%(d) | 59% | $27,615 |
| Year Ended 5/31/2022 | $21.90 | 47.23% | 1.12%(f) | 1.12%(f) | (0.57%) | 329% | $32,304 |
| Year Ended 5/31/2021 | $20.69 | 47.95% | 1.14%(f) | 1.14%(e),(f) | (1.03%) | 0% | $2,739 |
| Year Ended 5/31/2020 | $13.99 | (15.35%) | 1.14% | 1.14%(e) | 0.63% | 0% | $1,283 |
| Year Ended 5/31/2019 | $16.67 | (14.76%) | 1.11% | 1.11%(e) | 1.18% | 0% | $1,775 |
| Year Ended 5/31/2018 | $23.03 | 9.92% | 1.08% | 1.08%(e) | 0.22% | 0% | $2,148 |
| Advisor Class(c) |
| Six Months Ended 11/30/2022 (Unaudited) | $20.44 | (10.00%) | 0.86%(d) | 0.86%(d),(e) | 0.97%(d) | 59% | $13,285 |
| Year Ended 5/31/2022 | $22.71 | 47.57% | 0.89%(f) | 0.89%(f) | (0.36%) | 329% | $27,641 |
| Year Ended 5/31/2021 | $21.22 | 48.38% | 0.85%(f) | 0.85%(e),(f) | (0.71%) | 0% | $3,537 |
| Year Ended 5/31/2020 | $14.32 | (15.05%) | 0.89% | 0.89%(e) | 0.86% | 0% | $20,335 |
| Year Ended 5/31/2019 | $17.05 | (14.62%) | 0.86% | 0.86%(e) | 1.44% | 0% | $23,533 |
| Year Ended 5/31/2018 | $23.49 | 10.24% | 0.83% | 0.83%(e) | 0.48% | 0% | $21,601 |
| Class C(c) |
| Six Months Ended 11/30/2022 (Unaudited) | $17.99 | (10.45%) | 1.87%(d) | 1.87%(d),(e) | 0.05%(d) | 59% | $4,922 |
| Year Ended 5/31/2022 | $20.09 | 46.14% | 1.88%(f) | 1.88%(f) | (1.36%) | 329% | $5,738 |
| Year Ended 5/31/2021 | $19.53 | 47.13% | 1.87%(f) | 1.87%(e),(f) | (1.78%) | 0% | $695 |
| Year Ended 5/31/2020 | $13.30 | (16.08%) | 1.89% | 1.89%(e) | (0.11%) | 0% | $76 |
| Year Ended 5/31/2019 | $15.84 | (15.53%) | 1.86% | 1.86%(e) | 0.41% | 0% | $124 |
| Year Ended 5/31/2018 | $22.03 | 9.33% | 1.82% | 1.82%(e) | (0.57%) | 0% | $224 |
| Institutional Class(c) |
| Six Months Ended 11/30/2022 (Unaudited) | $20.23 | (9.97%) | 0.85%(d) | 0.85%(d),(e) | 0.87%(d) | 59% | $28,133 |
| Year Ended 5/31/2022 | $22.47 | 47.60% | 0.86%(f) | 0.86%(f) | (0.26%) | 329% | $96,858 |
| Year Ended 5/31/2021 | $21.05 | 48.45% | 0.90%(f) | 0.90%(e),(f) | (0.82%) | 0% | $1,380 |
| Year Ended 5/31/2020 | $14.20 | (15.15%) | 0.86% | 0.86%(e) | 1.07% | 0% | $66 |
| Year Ended 5/31/2019 | $16.91 | (14.51%) | 0.84% | 0.84%(e) | 1.35% | 0% | $771 |
| Year Ended 5/31/2018 | $23.32 | 10.32% | 0.83% | 0.83%(e) | 0.52% | 0% | $4,485 |
| Institutional 2 Class(c) |
| Six Months Ended 11/30/2022 (Unaudited) | $20.64 | (9.95%) | 0.78%(d) | 0.78%(d) | 1.07%(d) | 59% | $12,471 |
| Year Ended 5/31/2022 | $22.92 | 47.79% | 0.77%(f) | 0.77%(f) | (0.34%) | 329% | $17,431 |
| Year Ended 5/31/2021 | $21.34 | 48.41% | 0.77%(f) | 0.77%(f) | (0.68%) | 0% | $19,305 |
| Year Ended 5/31/2020 | $14.40 | (14.90%) | 0.76% | 0.76% | 1.32% | 0% | $57 |
| Year Ended 5/31/2019 | $17.14 | (14.64%) | 0.78% | 0.78% | 1.52% | 0% | $1,404 |
| Year Ended 5/31/2018 | $23.59 | 10.43% | 0.75% | 0.75% | 0.56% | 0% | $1,331 |
The accompanying Notes to Consolidated Financial Statements are an integral part of this statement.
Columbia Commodity Strategy Fund | Semiannual Report 2022
| 23 |
Consolidated Financial Highlights (continued)
| | Net asset value,
beginning of
period | Net
investment
income
(loss) | Net
realized
and
unrealized
gain (loss) | Total from
investment
operations | Distributions
from net
investment
income | Total
distributions to
shareholders |
| Institutional 3 Class(c) |
| Six Months Ended 11/30/2022 (Unaudited) | $23.15 | 0.11 | (2.41) | (2.30) | — | — |
| Year Ended 5/31/2022 | $21.48 | (0.07) | 7.88 | 7.81 | (6.14) | (6.14) |
| Year Ended 5/31/2021 | $14.48 | (0.11) | 7.14 | 7.03 | (0.03) | (0.03) |
| Year Ended 5/31/2020 | $17.20 | 0.20 | (2.72) | (2.52) | (0.20) | (0.20) |
| Year Ended 5/31/2019 | $23.66 | 0.32 | (3.66) | (3.34) | (3.12) | (3.12) |
| Year Ended 5/31/2018 | $21.46 | 0.16 | 2.08 | 2.24 | (0.04) | (0.04) |
| Class R(c) |
| Six Months Ended 11/30/2022 (Unaudited) | $21.31 | 0.06 | (2.23) | (2.17) | — | — |
| Year Ended 5/31/2022 | $20.32 | (0.18) | 7.25 | 7.07 | (6.08) | (6.08) |
| Year Ended 5/31/2021 | $13.77 | (0.21) | 6.77 | 6.56 | (0.01) | (0.01) |
| Year Ended 5/31/2020 | $16.40 | 0.04 | (2.55) | (2.51) | (0.12) | (0.12) |
| Year Ended 5/31/2019 | $22.70 | 0.20 | (3.54) | (3.34) | (2.96) | (2.96) |
| Year Ended 5/31/2018 | $20.69 | 0.00(g) | 2.01 | 2.01 | — | — |
| Notes to Consolidated Financial Highlights |
| (a) | In addition to the fees and expenses that the Fund bears directly, the Fund indirectly bears a pro rata share of the fees and expenses of any other funds in which it invests. Such indirect expenses are not included in the Fund’s reported expense ratios. |
| (b) | Total net expenses include the impact of certain fee waivers/expense reimbursements made by the Investment Manager and certain of its affiliates, if applicable. |
| (c) | Per share amounts have been adjusted on a retroactive basis to reflect a 4 to 1 reverse stock split completed after the close of business on September 11, 2020. |
| (d) | Annualized. |
| (e) | The benefits derived from expense reductions had an impact of less than 0.01%. |
| (f) | Ratios include interest on collateral expense. For the periods indicated below, if interest on collateral expense had been excluded, expenses would have been lower by: |
| Class | 5/31/2022 | 5/31/2021 |
| Class A | 0.01% | 0.02% |
| Advisor Class | 0.01% | less than 0.01% |
| Class C | 0.01% | 0.05% |
| Institutional Class | 0.01% | 0.02% |
| Institutional 2 Class | 0.01% | 0.02% |
| Institutional 3 Class | 0.01% | 0.01% |
| Class R | 0.01% | 0.01% |
The accompanying Notes to Consolidated Financial Statements are an integral part of this statement.
| 24 | Columbia Commodity Strategy Fund | Semiannual Report 2022 |
Consolidated Financial Highlights (continued)
| | Net
asset
value,
end of
period | Total
return | Total gross
expense
ratio to
average
net assets(a) | Total net
expense
ratio to
average
net assets(a),(b) | Net investment
income (loss)
ratio to
average
net assets | Portfolio
turnover | Net
assets,
end of
period
(000’s) |
| Institutional 3 Class(c) |
| Six Months Ended 11/30/2022 (Unaudited) | $20.85 | (9.94%) | 0.72%(d) | 0.72%(d) | 1.01%(d) | 59% | $94,025 |
| Year Ended 5/31/2022 | $23.15 | 47.94% | 0.70%(f) | 0.70%(f) | (0.32%) | 329% | $251,323 |
| Year Ended 5/31/2021 | $21.48 | 48.57% | 0.71%(f) | 0.71%(f) | (0.61%) | 0% | $398,386 |
| Year Ended 5/31/2020 | $14.48 | (14.77%) | 0.70% | 0.70% | 1.20% | 0% | $159,442 |
| Year Ended 5/31/2019 | $17.20 | (14.34%) | 0.70% | 0.70% | 1.56% | 0% | $320,251 |
| Year Ended 5/31/2018 | $23.66 | 10.44% | 0.69% | 0.69% | 0.64% | 0% | $581,920 |
| Class R(c) |
| Six Months Ended 11/30/2022 (Unaudited) | $19.14 | (10.18%) | 1.37%(d) | 1.37%(d),(e) | 0.58%(d) | 59% | $2,653 |
| Year Ended 5/31/2022 | $21.31 | 46.82% | 1.37%(f) | 1.37%(f) | (0.89%) | 329% | $2,466 |
| Year Ended 5/31/2021 | $20.32 | 47.81% | 1.38%(f) | 1.38%(e),(f) | (1.27%) | 0% | $708 |
| Year Ended 5/31/2020 | $13.77 | (15.59%) | 1.39% | 1.39%(e) | 0.38% | 0% | $416 |
| Year Ended 5/31/2019 | $16.40 | (15.08%) | 1.36% | 1.36%(e) | 0.97% | 0% | $590 |
| Year Ended 5/31/2018 | $22.70 | 9.86% | 1.34% | 1.34%(e) | 0.07% | 0% | $391 |
The accompanying Notes to Consolidated Financial Statements are an integral part of this statement.
Columbia Commodity Strategy Fund | Semiannual Report 2022
| 25 |
Notes to Consolidated Financial Statements
November 30, 2022 (Unaudited)
Note 1. Organization
Columbia Commodity Strategy Fund (the Fund), a series of Columbia Funds Series Trust II (the Trust), is a diversified fund. The Trust is registered under the Investment Company Act of 1940, as amended (the 1940 Act), as an open-end management investment company organized as a Massachusetts business trust.
Basis for consolidation
CCFS Offshore Fund, Ltd. (the Subsidiary) is a Cayman Islands exempted company and wholly-owned subsidiary of the Fund. The Subsidiary acts as an investment vehicle in order to effect certain investment strategies consistent with the Fund’s investment objective and policies as stated in its current prospectus and statement of additional information. In accordance with the Memorandum and Articles of Association of the Subsidiary (the Articles), the Fund owns the sole issued share of the Subsidiary and retains all rights associated with such share, including the right to receive notice of, attend and vote at general meetings of the Subsidiary, rights in a winding-up or repayment of capital and the right to participate in the profits or assets of the Subsidiary. The consolidated financial statements (financial statements) include the accounts of the consolidated Fund and the respective Subsidiary. Subsequent references to the Fund within the Notes to Consolidated Financial Statements collectively refer to the Fund and the Subsidiary. All intercompany transactions and balances have been eliminated in the consolidation process.
At November 30, 2022, the Subsidiary financial statement information is as follows:
| | CCSF Offshore Fund, Ltd. |
| % of consolidated fund net assets | 21.82% |
| Net assets | $39,945,575 |
| Net investment income (loss) | 38,718 |
| Net realized gain (loss) | (32,477,616) |
| Net change in unrealized appreciation (depreciation) | (21,943,673) |
The financial statements present the portfolio holdings, financial position and results of operations of the Fund and the Subsidiary on a consolidated basis.
Fund shares
The Trust may issue an unlimited number of shares (without par value). The Fund offers each of the share classes listed in the Consolidated Statement of Assets and Liabilities. Although all share classes generally have identical voting, dividend and liquidation rights, each share class votes separately when required by the Trust’s organizational documents or by law. Each share class has its own expense and sales charge structure. Different share classes may have different minimum initial investment amounts and pay different net investment income distribution amounts to the extent the expenses of distributing such share classes vary. Distributions to shareholders in a liquidation will be proportional to the net asset value of each share class.
As described in the Fund’s prospectus, Class A and Class C shares are offered to the general public for investment. Class C shares automatically convert to Class A shares after 8 years. Advisor Class, Institutional Class, Institutional 2 Class, Institutional 3 Class and Class R shares are available for purchase through authorized investment professionals to omnibus retirement plans or to institutional investors and to certain other investors as also described in the Fund’s prospectus.
Note 2. Summary of significant accounting policies
Basis of preparation
The Fund is an investment company that applies the accounting and reporting guidance in the Financial Accounting Standards Board (FASB) Accounting Standards Codification Topic 946, Financial Services - Investment Companies (ASC 946). The financial statements are prepared in accordance with U.S. generally accepted accounting principles (GAAP), which requires management to make certain estimates and assumptions that affect the reported amounts of assets and liabilities, the disclosure of contingent assets and liabilities at the date of the financial statements and the reported amounts of income and expenses during the reporting period. Actual results could differ from those estimates.
| 26 | Columbia Commodity Strategy Fund | Semiannual Report 2022 |
Notes to Consolidated Financial Statements (continued)
November 30, 2022 (Unaudited)
The following is a summary of significant accounting policies followed by the Fund in the preparation of its financial statements.
Security valuation
Debt securities generally are valued based on prices obtained from pricing services, which are intended to reflect market transactions for normal, institutional-size trading units of similar securities. The services may use various pricing techniques that take into account, as applicable, factors such as yield, quality, coupon rate, maturity, type of issue, trading characteristics and other data, as well as approved independent broker-dealer quotes. Debt securities for which quotations are not readily available or not believed to be reflective of market value may also be valued based upon a bid quote from an approved independent broker-dealer. Debt securities maturing in 60 days or less are valued primarily at amortized market value, unless this method results in a valuation that management believes does not approximate fair value.
Asset- and mortgage-backed securities are generally valued by pricing services, which utilize pricing models that incorporate the securities’ cash flow and loan performance data. These models also take into account available market data, including trades, market quotations, and benchmark yield curves for identical or similar securities. Factors used to identify similar securities may include, but are not limited to, issuer, collateral type, vintage, prepayment speeds, collateral performance, credit ratings, credit enhancement and expected life. Asset-backed securities for which quotations are readily available may also be valued based upon an over-the-counter or exchange bid quote from an approved independent broker-dealer. Debt securities maturing in 60 days or less are valued primarily at amortized market value, unless this method results in a valuation that management believes does not approximate fair value.
Investments in open-end investment companies (other than exchange-traded funds (ETFs)), are valued at the latest net asset value reported by those companies as of the valuation time.
Futures and options on futures contracts are valued based upon the settlement price at the close of regular trading on their principal exchanges or, in the absence of a settlement price, at the mean of the latest quoted bid and ask prices.
Investments for which market quotations are not readily available, or that have quotations which management believes are not reflective of market value or reliable, are valued at fair value as determined in good faith under procedures approved by the Board of Trustees. If a security or class of securities (such as foreign securities) is valued at fair value, such value is likely to be different from the quoted or published price for the security, if available.
The determination of fair value often requires significant judgment. To determine fair value, management may use assumptions including but not limited to future cash flows and estimated risk premiums. Multiple inputs from various sources may be used to determine fair value.
GAAP requires disclosure regarding the inputs and valuation techniques used to measure fair value and any changes in valuation inputs or techniques. In addition, investments shall be disclosed by major category. This information is disclosed following the Fund’s Consolidated Portfolio of Investments.
Derivative instruments
The Fund invests in certain derivative instruments, as detailed below, in seeking to meet its investment objectives. Derivatives are instruments whose values depend on, or are derived from, in whole or in part, the value of one or more securities, currencies, commodities, indices, or other assets or instruments. Derivatives may be used to increase investment flexibility (including to maintain cash reserves while maintaining desired exposure to certain assets), for risk management (hedging) purposes, to facilitate trading, to reduce transaction costs and to pursue higher investment returns. The Fund may also use derivative instruments to mitigate certain investment risks, such as foreign currency exchange rate risk, interest rate risk and credit risk. Derivatives may involve various risks, including the potential inability of the counterparty to fulfill its obligations under the terms of the contract, the potential for an illiquid secondary market (making it difficult for the Fund to sell or terminate, including at favorable prices) and the potential for market movements which may expose the Fund to gains or losses in excess of the amount shown in the Consolidated Statement of Assets and Liabilities. The notional amounts of derivative instruments, if applicable, are not recorded in the financial statements.
Columbia Commodity Strategy Fund | Semiannual Report 2022
| 27 |
Notes to Consolidated Financial Statements (continued)
November 30, 2022 (Unaudited)
A derivative instrument may suffer a marked-to-market loss if the value of the contract decreases due to an unfavorable change in the market rates or values of the underlying instrument. Losses can also occur if the counterparty does not perform its obligations under the contract. The Fund’s risk of loss from counterparty credit risk on over-the-counter derivatives is generally limited to the aggregate unrealized gain netted against any collateral held by the Fund and the amount of any variation margin held by the counterparty, plus any replacement costs or related amounts. With exchange-traded or centrally cleared derivatives, there is reduced counterparty credit risk to the Fund since the clearinghouse or central counterparty (CCP) provides some protection in the case of clearing member default. The clearinghouse or CCP stands between the buyer and the seller of the contract; therefore, failure of the clearinghouse or CCP may pose additional counterparty credit risk. However, credit risk still exists in exchange-traded or centrally cleared derivatives with respect to initial and variation margin that is held in a broker’s customer account. While clearing brokers are required to segregate customer margin from their own assets, in the event that a clearing broker becomes insolvent or goes into bankruptcy and at that time there is a shortfall in the aggregate amount of margin held by the clearing broker for all its clients and such shortfall is remedied by the CCP or otherwise, U.S. bankruptcy laws will typically allocate that shortfall on a pro-rata basis across all the clearing broker’s customers (including the Fund), potentially resulting in losses to the Fund.
In order to better define its contractual rights and to secure rights that will help the Fund mitigate its counterparty risk, the Fund may enter into an International Swaps and Derivatives Association, Inc. Master Agreement (ISDA Master Agreement) or similar agreement with its derivatives counterparties. An ISDA Master Agreement is an agreement between the Fund and a counterparty that governs over-the-counter derivatives and foreign exchange forward contracts and contains, among other things, collateral posting terms and netting provisions in the event of a default and/or termination event. Under an ISDA Master Agreement, the Fund may, under certain circumstances, offset with the counterparty certain derivative instruments’ payables and/or receivables with collateral held and/or posted and create one single net payment. The provisions of the ISDA Master Agreement typically permit a single net payment in the event of default (close-out netting), including the bankruptcy or insolvency of the counterparty. Note, however, that bankruptcy or insolvency laws of a particular jurisdiction may impose restrictions on or prohibitions against the right of offset or netting in bankruptcy, insolvency or other events.
Collateral (margin) requirements differ by type of derivative. Margin requirements are established by the clearinghouse or CCP for exchange-traded and centrally cleared derivatives. Brokers can ask for margin in excess of the minimum in certain circumstances. Collateral terms for most over-the-counter derivatives are subject to regulatory requirements to exchange variation margin with trading counterparties and may have contract specific margin terms as well. For over-the-counter derivatives traded under an ISDA Master Agreement, the collateral requirements are typically calculated by netting the marked-to-market amount for each transaction under such agreement and comparing that amount to the value of any variation margin currently pledged by the Fund and/or the counterparty. Generally, the amount of collateral due from or to a party has to exceed a minimum transfer amount threshold (e.g., $250,000) before a transfer has to be made. To the extent amounts due to the Fund from its counterparties are not fully collateralized, contractually or otherwise, the Fund bears the risk of loss from counterparty nonperformance. The Fund may also pay interest expense on cash collateral received from the broker. Any interest expense paid by the Fund is shown in the Consolidated Statement of Operations. The Fund attempts to mitigate counterparty risk by only entering into agreements with counterparties that it believes have the financial resources to honor their obligations and by monitoring the financial stability of those counterparties.
Certain ISDA Master Agreements allow counterparties of over-the-counter derivatives transactions to terminate derivatives contracts prior to maturity in the event the Fund’s net asset value declines by a stated percentage over a specified time period or if the Fund fails to meet certain terms of the ISDA Master Agreement, which would cause the Fund to accelerate payment of any net liability owed to the counterparty. The Fund also has termination rights if the counterparty fails to meet certain terms of the ISDA Master Agreement. In determining whether to exercise such termination rights, the Fund would consider, in addition to counterparty credit risk, whether termination would result in a net liability owed from the counterparty.
For financial reporting purposes, the Fund does not offset derivative assets and derivative liabilities that are subject to netting arrangements in the Consolidated Statement of Assets and Liabilities.
Futures contracts
Futures contracts are exchange-traded and represent commitments for the future purchase or sale of an asset at a specified price on a specified date. The Fund bought and sold futures contracts to manage the duration and yield curve exposure of the Fund versus the benchmark and to manage exposure to the commodities market. These instruments may be used for other
| 28 | Columbia Commodity Strategy Fund | Semiannual Report 2022 |
Notes to Consolidated Financial Statements (continued)
November 30, 2022 (Unaudited)
purposes in future periods. Upon entering into futures contracts, the Fund bears risks that it may not achieve the anticipated benefits of the futures contracts and may realize a loss. Additional risks include counterparty credit risk, the possibility of an illiquid market, and that a change in the value of the contract or option may not correlate with changes in the value of the underlying asset.
Upon entering into a futures contract, the Fund deposits cash or securities with the broker, known as a futures commission merchant (FCM), in an amount sufficient to meet the initial margin requirement. The initial margin deposit must be maintained at an established level over the life of the contract. Cash deposited as initial margin is recorded in the Consolidated Statement of Assets and Liabilities as margin deposits. Securities deposited as initial margin are designated in the Consolidated Portfolio of Investments. Subsequent payments (variation margin) are made or received by the Fund each day. The variation margin payments are equal to the daily change in the contract value and are recorded as variation margin receivable or payable and are offset in unrealized gains or losses. The Fund generally expects to earn interest income on its margin deposits. The Fund recognizes a realized gain or loss when the contract is closed or expires. Futures contracts involve, to varying degrees, risk of loss in excess of the variation margin disclosed in the Consolidated Statement of Assets and Liabilities.
Swap contracts
Swap contracts are negotiated in the over-the-counter market and are entered into bilaterally or centrally cleared (centrally cleared swap contract). In a centrally cleared swap contract, immediately following execution of the swap contract with a broker, the swap contract is novated to a central counterparty (the CCP) and the CCP becomes the Fund’s counterparty to the centrally cleared swap contract. The Fund is required to deposit initial margin with the futures commission merchant (FCM), which pledges it through to the CCP in the form of cash or securities in an amount that varies depending on the size and risk profile of the particular swap contract. Securities deposited as initial margin are designated in the Consolidated Portfolio of Investments and cash deposited is recorded in the Consolidated Statement of Assets and Liabilities as margin deposits. For a bilateral swap contract, the Fund has credit exposure to the broker, but exchanges daily variation margin with the broker based on the mark-to-market value of the swap contract to minimize that exposure. For centrally cleared swap contracts, the Fund has minimal credit exposure to the FCM because the CCP stands between the Fund and the relevant buyer/seller on the other side of the contract. Swap contracts are marked-to-market daily and changes in value are recorded as unrealized appreciation (depreciation). The daily change in valuation of swap contracts, if any, is recorded as a receivable or payable for variation margin in the Consolidated Statement of Assets and Liabilities.
Entering into these contracts involves, to varying degrees, elements of interest, liquidity and counterparty credit risk in excess of the amounts recognized in the Consolidated Statement of Assets and Liabilities. Such risks involve the possibility that there may be unfavorable changes in interest rates, market conditions or other conditions, that it may be difficult to initiate a swap transaction or liquidate a position at an advantageous time or price which may result in significant losses, and that the bilateral counterparty, FCM, or CCP, as applicable, may not fulfill its obligation under the contract.
Interest rate and inflation rate swap contracts
The Fund entered into interest rate swap transactions and/or inflation rate swap contracts to manage interest rate and market risk exposure to produce incremental earnings. These instruments may be used for other purposes in future periods. An interest rate swap or inflation rate swap, as applicable, is an agreement between two parties where there are two flows and payments are made between the two counterparties and the payments are dependent upon changes in an interest rate, inflation rate or inflation index calculated on a nominal amount. Interest rate swaps are agreements between two parties that involve the exchange of one type of interest rate for another type of interest rate cash flow on specified dates in the future, based on a predetermined, specified notional amount. Certain interest rate swaps are considered forward-starting, whereby the accrual for the exchange of cash flows does not begin until a specified date in the future. The net cash flow for a standard interest rate swap transaction is generally the difference between a floating market interest rate versus a fixed interest rate.
Interest rate swaps are valued daily and unrealized appreciation (depreciation) is recorded. Certain interest rate swaps may accrue periodic interest on a daily basis as a component of unrealized appreciation (depreciation); the Fund will realize a gain or loss upon the payment or receipt of accrued interest. The Fund will realize a gain or a loss when the interest rate swap is terminated.
Columbia Commodity Strategy Fund | Semiannual Report 2022
| 29 |
Notes to Consolidated Financial Statements (continued)
November 30, 2022 (Unaudited)
Effects of derivative transactions in the financial statements
The following tables are intended to provide additional information about the effect of derivatives on the financial statements of the Fund, including: the fair value of derivatives by risk category and the location of those fair values in the Consolidated Statement of Assets and Liabilities; and the impact of derivative transactions over the period in the Consolidated Statement of Operations, including realized and unrealized gains (losses). The derivative instrument schedules following the Consolidated Portfolio of Investments present additional information regarding derivative instruments outstanding at the end of the period, if any.
The following table is a summary of the fair value of derivative instruments (not considered to be hedging instruments for accounting disclosure purposes) at November 30, 2022:
| | Asset derivatives | |
Risk exposure
category | Consolidated statement
of assets and liabilities
location | Fair value ($) |
| Commodity-related investment risk | Component of total distributable earnings (loss) — unrealized appreciation on futures contracts | 4,509,872* |
| | Liability derivatives | |
Risk exposure
category | Consolidated statement
of assets and liabilities
location | Fair value ($) |
| Interest rate risk | Component of total distributable earnings (loss) — unrealized depreciation on futures contracts | 23,804* |
| Commodity-related investment risk | Component of total distributable earnings (loss) — unrealized depreciation on futures contracts | 2,505,962* |
| Total | | 2,529,766 |
| * | Includes cumulative appreciation (depreciation) as reported in the tables following the Consolidated Portfolio of Investments. Only the current day’s variation margin is reported in receivables or payables in the Consolidated Statement of Assets and Liabilities. |
The following table indicates the effect of derivative instruments (not considered to be hedging instruments for accounting disclosure purposes) in the Consolidated Statement of Operations for the six months ended November 30, 2022:
| Amount of realized gain (loss) on derivatives recognized in income |
| Risk exposure category | Futures
contracts
($) | Swap
contracts
($) | Total
($) |
| Commodity-related investment risk | (32,477,616) | — | (32,477,616) |
| Interest rate risk | 113,767 | 445,812 | 559,579 |
| Total | (32,363,849) | 445,812 | (31,918,037) |
| |
| Change in unrealized appreciation (depreciation) on derivatives recognized in income |
| Risk exposure category | Futures
contracts
($) | Swap
contracts
($) | Total
($) |
| Commodity-related investment risk | (21,943,673) | — | (21,943,673) |
| Interest rate risk | (23,804) | 24,955 | 1,151 |
| Total | (21,967,477) | 24,955 | (21,942,522) |
The following table is a summary of the average outstanding volume by derivative instrument for the six months ended November 30, 2022:
| Derivative instrument | Average notional
amounts ($)* |
| Futures contracts — long | 309,350,223 |
| Futures contracts — short | 8,851,235 |
| 30 | Columbia Commodity Strategy Fund | Semiannual Report 2022 |
Notes to Consolidated Financial Statements (continued)
November 30, 2022 (Unaudited)
| Derivative instrument | Average unrealized
appreciation ($)** | Average unrealized
depreciation ($)** |
| Interest rate swap contracts | 203,661 | (3,726) |
| * | Based on the ending quarterly outstanding amounts for the six months ended November 30, 2022. |
| ** | Based on the ending daily outstanding amounts for the six months ended November 30, 2022. |
Asset- and mortgage-backed securities
The Fund may invest in asset-backed and mortgage-backed securities. The maturity dates shown represent the original maturity of the underlying obligation. Actual maturity may vary based upon prepayment activity on these obligations. All, or a portion, of the obligation may be prepaid at any time because the underlying asset may be prepaid. As a result, decreasing market interest rates could result in an increased level of prepayment. An increased prepayment rate will have the effect of shortening the maturity of the security. Unless otherwise noted, the coupon rates presented are fixed rates.
Security transactions
Security transactions are accounted for on the trade date. Cost is determined and gains (losses) are based upon the specific identification method for both financial statement and federal income tax purposes.
Income recognition
Interest income is recorded on an accrual basis. Market premiums and discounts, including original issue discounts, are amortized and accreted, respectively, over the expected life of the security on all debt securities, unless otherwise noted. The Fund classifies gains and losses realized on prepayments received on mortgage-backed securities as adjustments to interest income.
The Fund may place a debt security on non-accrual status and reduce related interest income when it becomes probable that the interest will not be collected and the amount of uncollectible interest can be reasonably estimated. The Fund may also adjust accrual rates when it becomes probable the full interest will not be collected and a partial payment will be received. A defaulted debt security is removed from non-accrual status when the issuer resumes interest payments or when collectability of interest is reasonably assured.
Dividend income is recorded on the ex-dividend date.
Expenses
General expenses of the Trust are allocated to the Fund and other funds of the Trust based upon relative net assets or other expense allocation methodologies determined by the nature of the expense. Expenses directly attributable to the Fund are charged to the Fund. Expenses directly attributable to a specific class of shares are charged to that share class.
Determination of class net asset value
All income, expenses (other than class-specific expenses, which are charged to that share class, as shown in the Consolidated Statement of Operations) and realized and unrealized gains (losses) are allocated to each class of the Fund on a daily basis, based on the relative net assets of each class, for purposes of determining the net asset value of each class.
Federal income tax status
The Fund intends to qualify each year as a regulated investment company under Subchapter M of the Internal Revenue Code, as amended, and will distribute substantially all of its investment company taxable income and net capital gain, if any, for its tax year, and as such will not be subject to federal income taxes. In addition, the Fund intends to distribute in each calendar year substantially all of its ordinary income, capital gain net income and certain other amounts, if any, such that the Fund should not be subject to federal excise tax. Therefore, no federal income or excise tax provision is recorded.
Columbia Commodity Strategy Fund | Semiannual Report 2022
| 31 |
Notes to Consolidated Financial Statements (continued)
November 30, 2022 (Unaudited)
Foreign taxes
The Fund may be subject to foreign taxes on income, gains on investments or currency repatriation, a portion of which may be recoverable. The Fund will accrue such taxes and recoveries, as applicable, based upon its current interpretation of tax rules and regulations that exist in the markets in which it invests.
Realized gains in certain countries may be subject to foreign taxes at the Fund level, based on statutory rates. The Fund accrues for such foreign taxes on realized and unrealized gains at the appropriate rate for each jurisdiction, as applicable. The amount, if any, is disclosed as a liability in the Consolidated Statement of Assets and Liabilities.
Distributions to shareholders
Distributions from net investment income, if any, are declared and paid annually. Net realized capital gains, if any, are distributed at least annually. Income distributions and capital gain distributions are determined in accordance with federal income tax regulations, which may differ from GAAP.
In order to avoid federal excise tax in 2022, the Fund declared a special ordinary income distribution to shareholders of record on December 2, 2022, which was paid on December 5, 2022.
Guarantees and indemnifications
Under the Trust’s organizational documents and, in some cases, by contract, its officers and trustees are indemnified against certain liabilities arising out of the performance of their duties to the Trust or its funds. In addition, certain of the Fund’s contracts with its service providers contain general indemnification clauses. The Fund’s maximum exposure under these arrangements is unknown since the amount of any future claims that may be made against the Fund cannot be determined, and the Fund has no historical basis for predicting the likelihood of any such claims.
Recent accounting pronouncement
Tailored Shareholder Reports
In October 2022, the Securities and Exchange Commission (SEC) adopted a final rule relating to Tailored Shareholder Reports for Mutual Funds and Exchange-Traded Funds (ETFs); Fee Information in Investment Company Advertisements. The rule and form amendments will require mutual funds and ETFs to transmit concise and visually engaging shareholder reports that highlight key information. The amendments will require that funds tag information in a structured data format. The rule amendments will require that certain more in-depth information be made available online and available for delivery free of charge to investors on request. The amendments will become effective January 24, 2023. There is an 18-month transition period after the effective date of the amendment.
Note 3. Fees and other transactions with affiliates
Management services fees
The Fund has entered into a Management Agreement with Columbia Management Investment Advisers, LLC (the Investment Manager), a wholly-owned subsidiary of Ameriprise Financial, Inc. (Ameriprise Financial). Under the Management Agreement, the Investment Manager provides the Fund with investment research and advice, as well as administrative and accounting services. The management services fee is an annual fee that is equal to a percentage of the Fund’s daily net assets that declines from 0.63% to 0.49% as the Fund’s net assets increase. The annualized effective management services fee rate for the six months ended November 30, 2022 was 0.63% of the Fund’s average daily net assets.
Subadvisory agreement
The Fund’s Board of Trustees has approved a Subadvisory Agreement between the Investment Manager and Threadneedle International Limited (Threadneedle), an affiliate of the Investment Manager and an indirect wholly-owned subsidiary of Ameriprise Financial. As of November 30, 2022, Threadneedle is not providing services to the Fund pursuant to the Subadvisory Agreement.
| 32 | Columbia Commodity Strategy Fund | Semiannual Report 2022 |
Notes to Consolidated Financial Statements (continued)
November 30, 2022 (Unaudited)
Compensation of board members
Members of the Board of Trustees who are not officers or employees of the Investment Manager or Ameriprise Financial are compensated for their services to the Fund as disclosed in the Consolidated Statement of Operations. Under a Deferred Compensation Plan (the Deferred Plan), these members of the Board of Trustees may elect to defer payment of up to 100% of their compensation. Deferred amounts are treated as though equivalent dollar amounts had been invested in shares of certain funds managed by the Investment Manager. The Fund’s liability for these amounts is adjusted for market value changes and remains in the Fund until distributed in accordance with the Deferred Plan. All amounts payable under the Deferred Plan constitute a general unsecured obligation of the Fund. The expense for the Deferred Plan, which includes Trustees’ fees deferred during the current period as well as any gains or losses on the Trustees’ deferred compensation balances as a result of market fluctuations, is included in "Compensation of board members" in the Consolidated Statement of Operations.
Compensation of Chief Compliance Officer
The Board of Trustees has appointed a Chief Compliance Officer for the Fund in accordance with federal securities regulations. As disclosed in the Consolidated Statement of Operations, a portion of the Chief Compliance Officer’s total compensation is allocated to the Fund, along with other allocations to affiliated registered investment companies managed by the Investment Manager and its affiliates, based on relative net assets.
Transfer agency fees
Under a Transfer and Dividend Disbursing Agent Agreement, Columbia Management Investment Services Corp. (the Transfer Agent), an affiliate of the Investment Manager and a wholly-owned subsidiary of Ameriprise Financial, is responsible for providing transfer agency services to the Fund. The Transfer Agent has contracted with SS&C GIDS, Inc. (SS&C GIDS) to serve as sub-transfer agent. Prior to January 1, 2023, SS&C GIDS was known as DST Asset Manager Solutions, Inc. The Transfer Agent pays the fees of SS&C GIDS for services as sub-transfer agent and SS&C GIDS is not entitled to reimbursement for such fees from the Fund (with the exception of out-of-pocket fees).
The Fund pays the Transfer Agent a monthly transfer agency fee based on the number or the average value of accounts, depending on the type of account. In addition, the Fund pays the Transfer Agent a fee for shareholder services based on the number of accounts or on a percentage of the average aggregate value of the Fund’s shares maintained in omnibus accounts up to the lesser of the amount charged by the financial intermediary or a cap established by the Board of Trustees from time to time.
The Transfer Agent also receives compensation from the Fund for various shareholder services and reimbursements for certain out-of-pocket fees. Total transfer agency fees for Institutional 2 Class and Institutional 3 Class shares are subject to an annual limitation of not more than 0.07% and 0.02%, respectively, of the average daily net assets attributable to each share class.
For the six months ended November 30, 2022, the Fund’s annualized effective transfer agency fee rates as a percentage of average daily net assets of each class were as follows:
| | Effective rate (%) |
| Class A | 0.14 |
| Advisor Class | 0.14 |
| Class C | 0.14 |
| Institutional Class | 0.14 |
| Institutional 2 Class | 0.06 |
| Institutional 3 Class | 0.01 |
| Class R | 0.14 |
Columbia Commodity Strategy Fund | Semiannual Report 2022
| 33 |
Notes to Consolidated Financial Statements (continued)
November 30, 2022 (Unaudited)
An annual minimum account balance fee of $20 may apply to certain accounts with a value below the applicable share class’s initial minimum investment requirements to reduce the impact of small accounts on transfer agency fees. These minimum account balance fees are remitted to the Fund and recorded as part of expense reductions in the Consolidated Statement of Operations. For the six months ended November 30, 2022, these minimum account balance fees reduced total expenses of the Fund by $20.
Distribution and service fees
The Fund has entered into an agreement with Columbia Management Investment Distributors, Inc. (the Distributor), an affiliate of the Investment Manager and a wholly-owned subsidiary of Ameriprise Financial, for distribution and shareholder services. Under a Plan and Agreement of Distribution, the Fund pays a fee at the maximum annual rates of up to 0.25%, 1.00% and 0.50% of the Fund’s average daily net assets attributable to Class A, Class C and Class R shares, respectively. For Class C shares, of the 1.00% fee, up to 0.75% can be reimbursed for distribution expenses and up to an additional 0.25% can be reimbursed for shareholder servicing expenses. For Class R shares, of the 0.50% fee, up to 0.25% can be reimbursed for shareholder servicing expenses.
The amount of distribution and shareholder services expenses incurred by the Distributor and not yet reimbursed (unreimbursed expense) was approximately $61,000 for Class C shares. This amount is based on the most recent information available as of September 30, 2022, and may be recovered from future payments under the distribution plan or contingent deferred sales charges (CDSCs). To the extent the unreimbursed expense has been fully recovered, the distribution and/or shareholder services fee is reduced.
Sales charges
Sales charges, including front-end charges and CDSCs, received by the Distributor for distributing Fund shares for the six months ended November 30, 2022, if any, are listed below:
| | Front End (%) | CDSC (%) | Amount ($) |
| Class A | 5.75 | 0.50 - 1.00(a) | 112,171 |
| Class C | — | 1.00(b) | 1,487 |
| (a) | This charge is imposed on certain investments of between $1 million and $50 million redeemed within 18 months after purchase, as follows: 1.00% if redeemed within 12 months after purchase, and 0.50% if redeemed more than 12, but less than 18, months after purchase, with certain limited exceptions. |
| (b) | This charge applies to redemptions within 12 months after purchase, with certain limited exceptions. |
The Fund’s other share classes are not subject to sales charges.
Expenses waived/reimbursed by the Investment Manager and its affiliates
The Investment Manager and certain of its affiliates have contractually agreed to waive fees and/or reimburse expenses (excluding certain fees and expenses described below) for the period(s) disclosed below, unless sooner terminated at the sole discretion of the Board of Trustees, so that the Fund’s net operating expenses, after giving effect to fees waived/expenses reimbursed and any balance credits and/or overdraft charges from the Fund’s custodian, do not exceed the following annual rate(s) as a percentage of the classes’ average daily net assets:
| | October 1, 2022
through
September 30, 2023 | Prior to
October 1, 2022 |
| Class A | 1.20% | 1.29% |
| Advisor Class | 0.95 | 1.04 |
| Class C | 1.95 | 2.04 |
| Institutional Class | 0.95 | 1.04 |
| Institutional 2 Class | 0.87 | 0.91 |
| Institutional 3 Class | 0.82 | 0.87 |
| Class R | 1.45 | 1.54 |
| 34 | Columbia Commodity Strategy Fund | Semiannual Report 2022 |
Notes to Consolidated Financial Statements (continued)
November 30, 2022 (Unaudited)
Under the agreement governing these fee waivers and/or expense reimbursement arrangements, the following fees and expenses are excluded from the waiver/reimbursement commitment, and therefore will be paid by the Fund, if applicable: taxes (including foreign transaction taxes), expenses associated with investments in affiliated and non-affiliated pooled investment vehicles (including mutual funds and exchange-traded funds), transaction costs and brokerage commissions, costs related to any securities lending program, dividend expenses associated with securities sold short, inverse floater program fees and expenses, transaction charges and interest on borrowed money, interest, costs associated with shareholder meetings, infrequent and/or unusual expenses and any other expenses the exclusion of which is specifically approved by the Board of Trustees. This agreement may be modified or amended only with approval from the Investment Manager, certain of its affiliates and the Fund. Any fees waived and/or expenses reimbursed under the expense reimbursement arrangements described above are not recoverable by the Investment Manager or its affiliates in future periods.
Note 4. Federal tax information
The timing and character of income and capital gain distributions are determined in accordance with income tax regulations, which may differ from GAAP because of temporary or permanent book to tax differences.
At November 30, 2022, the approximate cost of all investments for federal income tax purposes and the aggregate gross approximate unrealized appreciation and depreciation based on that cost was:
Federal
tax cost ($) | Gross unrealized
appreciation ($) | Gross unrealized
(depreciation) ($) | Net unrealized
appreciation ($) |
| 147,347,000 | 4,550,000 | (4,097,000) | 453,000 |
Tax cost of investments and unrealized appreciation/(depreciation) may also include timing differences that do not constitute adjustments to tax basis.
The following capital loss carryforwards, determined at May 31, 2022, may be available to reduce future net realized gains on investments, if any, to the extent permitted by the Internal Revenue Code.
No expiration
short-term ($) | No expiration
long-term ($) | Total ($) |
| (944,216) | — | (944,216) |
Management of the Fund has concluded that there are no significant uncertain tax positions in the Fund that would require recognition in the financial statements. However, management’s conclusion may be subject to review and adjustment at a later date based on factors including, but not limited to, new tax laws, regulations, and administrative interpretations (including relevant court decisions). Generally, the Fund’s federal tax returns for the prior three fiscal years remain subject to examination by the Internal Revenue Service.
Note 5. Portfolio information
The cost of purchases and proceeds from sales of securities, excluding short-term investments and derivatives, if any, aggregated to $83,888,767 and $143,872,918, respectively, for the six months ended November 30, 2022, of which $1,679,082 and $3,017,280, respectively, were U.S. government securities. The amount of purchase and sale activity impacts the portfolio turnover rate reported in the Consolidated Financial Highlights.
Note 6. Affiliated money market fund
The Fund invests significantly in Columbia Short-Term Cash Fund, an affiliated money market fund established for the exclusive use by the Fund and other affiliated funds (the Affiliated MMF). The income earned by the Fund from such investments is included as Dividends - affiliated issuers in the Consolidated Statement of Operations. As an investing fund, the Fund indirectly bears its proportionate share of the expenses of the Affiliated MMF. The Affiliated MMF prices its shares with a floating net asset value. In addition, the Board of Trustees of the Affiliated MMF may impose a fee on redemptions (sometimes referred to as a liquidity fee) or temporarily suspend redemptions (sometimes referred to as imposing a redemption gate) in the event its liquidity falls below regulatory limits.
Columbia Commodity Strategy Fund | Semiannual Report 2022
| 35 |
Notes to Consolidated Financial Statements (continued)
November 30, 2022 (Unaudited)
Note 7. Interfund lending
Pursuant to an exemptive order granted by the Securities and Exchange Commission, the Fund participates in a program (the Interfund Program) allowing each participating Columbia Fund (each, a Participating Fund) to lend money directly to and, except for closed-end funds and money market funds, borrow money directly from other Participating Funds for temporary purposes. The amounts eligible for borrowing and lending under the Interfund Program are subject to certain restrictions.
Interfund loans are subject to the risk that the borrowing fund could be unable to repay the loan when due, and a delay in repayment to the lending fund could result in lost opportunities and/or additional lending costs. The exemptive order is subject to conditions intended to mitigate conflicts of interest arising from the Investment Manager’s relationship with each Participating Fund.
The Fund’s activity in the Interfund Program during the six months ended November 30, 2022 was as follows:
| Borrower or lender | Average loan
balance ($) | Weighted average
interest rate (%) | Number of days
with outstanding loans |
| Lender | 2,900,000 | 3.58 | 1 |
Interest income earned by the Fund is recorded as Interfund lending in the Consolidated Statement of Operations. The Fund had no outstanding interfund loans at November 30, 2022.
Note 8. Line of credit
The Fund has access to a revolving credit facility with a syndicate of banks led by JPMorgan Chase Bank, N.A., Citibank, N.A. and Wells Fargo Bank, N.A. whereby the Fund may borrow for the temporary funding of shareholder redemptions or for other temporary or emergency purposes. Pursuant to an October 27, 2022 amendment and restatement, the credit facility, which is an agreement between the Fund and certain other funds managed by the Investment Manager or an affiliated investment manager, severally and not jointly, permits aggregate borrowings up to $950 million. Interest is currently charged to each participating fund based on its borrowings at a rate equal to the higher of (i) the federal funds effective rate, (ii) the secured overnight financing rate plus 0.10% and (iii) the overnight bank funding rate, plus in each case, 1.00%. Each borrowing under the credit facility matures no later than 60 days after the date of borrowing. The Fund also pays a commitment fee equal to its pro rata share of the unused amount of the credit facility at a rate of 0.15% per annum. The commitment fee is included in other expenses in the Consolidated Statement of Operations. This agreement expires annually in October unless extended or renewed. Prior to the October 27, 2022 amendment and restatement, the Fund had access to a revolving credit facility with a syndicate of banks led by JPMorgan Chase Bank, N.A., Citibank, N.A. and Wells Fargo Bank, N.A. which permitted collective borrowings up to $950 million. Interest was charged to each participating fund based on its borrowings at a rate equal to the higher of (i) the federal funds effective rate, (ii) the secured overnight financing rate plus 0.11448% and (iii) the overnight bank funding rate, plus in each case, 1.00%.
The Fund had no borrowings during the six months ended November 30, 2022.
Note 9. Significant risks
Commodity-related investment risk
The value of commodities investments will generally be affected by overall market movements and factors specific to a particular industry or commodity, which may include demand for the commodity, weather, embargoes, tariffs, and economic health, political, international, regulatory and other developments. Exposure to commodities and commodities markets may subject the value of the Fund’s investments (and therefore the Fund) to greater volatility than other types of investments. Commodities investments may also subject the Fund to counterparty risk and liquidity risk. The Fund may make commodity-related investments through one or more wholly-owned subsidiaries organized outside the U.S. that are generally not subject to U.S. laws (including securities laws) and their protections.
| 36 | Columbia Commodity Strategy Fund | Semiannual Report 2022 |
Notes to Consolidated Financial Statements (continued)
November 30, 2022 (Unaudited)
Credit risk
Credit risk is the risk that the value of debt instruments in the Fund’s portfolio may decline because the issuer defaults or otherwise becomes unable or unwilling, or is perceived to be unable or unwilling, to honor its financial obligations, such as making payments to the Fund when due. Credit rating agencies assign credit ratings to certain debt instruments to indicate their credit risk. Lower-rated or unrated debt instruments held by the Fund may present increased credit risk as compared to higher-rated debt instruments.
Derivatives risk
Losses involving derivative instruments may be substantial, because a relatively small movement in the underlying reference (which is generally the price, rate or other economic indicator associated with a security(ies), commodity, currency, index or other instrument or asset) may result in a substantial loss for the Fund. In addition to the potential for increased losses, the use of derivative instruments may lead to increased volatility within the Fund. Derivatives will typically increase the Fund’s exposure to principal risks to which it is otherwise exposed, and may expose the Fund to additional risks, including correlation risk, counterparty risk, hedging risk, leverage risk, liquidity risk and pricing risk.
Interest rate risk
Interest rate risk is the risk of losses attributable to changes in interest rates. In general, if prevailing interest rates rise, the values of debt instruments tend to fall, and if interest rates fall, the values of debt instruments tend to rise. Actions by governments and central banking authorities can result in increases or decreases in interest rates. Higher periods of inflation could lead such authorities to raise interest rates. Increasing interest rates may negatively affect the value of debt securities held by the Fund, resulting in a negative impact on the Fund’s performance and net asset value per share. In general, the longer the maturity or duration of a debt security, the greater its sensitivity to changes in interest rates. The Fund is subject to the risk that the income generated by its investments may not keep pace with inflation.
Leverage risk
Leverage occurs when the Fund increases its assets available for investment using borrowings, short sales, derivatives, or similar instruments or techniques. The use of leverage may produce volatility and may exaggerate changes in the Fund’s NAV and in the return on the Fund’s portfolio, which may increase the risk that the Fund will lose more than it has invested. Because short sales involve borrowing securities and then selling them, the Fund’s short sales effectively leverage the Fund’s assets. The Fund’s assets that are used as collateral to secure the Fund’s obligations to return the securities sold short may decrease in value while the short positions are outstanding, which may force the Fund to use its other assets to increase the collateral. Leverage can create an interest expense that may lower the Fund’s overall returns. Leverage presents the opportunity for increased net income and capital gains, but may also exaggerate the Fund’s volatility and risk of loss. There can be no guarantee that a leveraging strategy will be successful.
Liquidity risk
Liquidity risk is the risk associated with a lack of marketability of investments which may make it difficult to sell the investment at a desirable time or price. Changing regulatory, market or other conditions or environments (for example, the interest rate or credit environments) may adversely affect the liquidity of the Fund’s investments. The Fund may have to accept a lower selling price for the holding, sell other investments, or forego another, more appealing investment opportunity. Generally, the less liquid the market at the time the Fund sells a portfolio investment, the greater the risk of loss or decline of value to the Fund. A less liquid market can lead to an increase in Fund redemptions, which may negatively impact Fund performance and net asset value per share, including, for example, if the Fund is forced to sell securities in a down market.
Market risk
The Fund may incur losses due to declines in the value of one or more securities in which it invests. These declines may be due to factors affecting a particular issuer, or the result of, among other things, political, regulatory, market, economic or social developments affecting the relevant market(s) more generally. In addition, turbulence in financial markets and reduced liquidity in equity, credit and/or fixed income markets may negatively affect many issuers, which could adversely affect the Fund’s ability to price or value hard-to-value assets in thinly traded and closed markets and could cause significant redemptions and operational challenges. Global economies and financial markets are increasingly interconnected, and
Columbia Commodity Strategy Fund | Semiannual Report 2022
| 37 |
Notes to Consolidated Financial Statements (continued)
November 30, 2022 (Unaudited)
conditions and events in one country, region or financial market may adversely impact issuers in a different country, region or financial market. These risks may be magnified if certain events or developments adversely interrupt the global supply chain; in these and other circumstances, such risks might affect companies worldwide. As a result, local, regional or global events such as terrorism, war, natural disasters, disease/virus outbreaks and epidemics or other public health issues, recessions, depressions or other events – or the potential for such events – could have a significant negative impact on global economic and market conditions.
The large-scale invasion of Ukraine by Russia in February 2022 has resulted in sanctions and market disruptions, including declines in regional and global stock markets, unusual volatility in global commodity markets and significant devaluations of Russian currency. The extent and duration of the military action are impossible to predict but could be significant. Market disruption caused by the Russian military action, and any counter-measures or responses thereto (including international sanctions, a downgrade in the country’s credit rating, purchasing and financing restrictions, boycotts, tariffs, changes in consumer or purchaser preferences, cyberattacks and espionage) could have severe adverse impacts on regional and/or global securities and commodities markets, including markets for oil and natural gas. These impacts may include reduced market liquidity, distress in credit markets, further disruption of global supply chains, increased risk of inflation, and limited access to investments in certain international markets and/or issuers. These developments and other related events could negatively impact Fund performance.
The pandemic caused by coronavirus disease 2019 and its variants (COVID-19) has resulted in, and may continue to result in, significant global economic and societal disruption and market volatility due to disruptions in market access, resource availability, facilities operations, imposition of tariffs, export controls and supply chain disruption, among others. Such disruptions may be caused, or exacerbated by, quarantines and travel restrictions, workforce displacement and loss in human and other resources. The uncertainty surrounding the magnitude, duration, reach, costs and effects of the global pandemic, as well as actions that have been or could be taken by governmental authorities or other third parties, present unknowns that are yet to unfold. The impacts, as well as the uncertainty over impacts to come, of COVID-19 – and any other infectious illness outbreaks, epidemics and pandemics that may arise in the future – could negatively affect global economies and markets in ways that cannot necessarily be foreseen. In addition, the impact of infectious illness outbreaks and epidemics in emerging market countries may be greater due to generally less established healthcare systems, governments and financial markets. Public health crises caused by the COVID-19 outbreak may exacerbate other pre-existing political, social and economic risks in certain countries or globally. The disruptions caused by COVID-19 could prevent the Fund from executing advantageous investment decisions in a timely manner and negatively impact the Fund’s ability to achieve its investment objective. Any such events could have a significant adverse impact on the value and risk profile of the Fund.
Money market fund investment risk
An investment in a money market fund is not a bank deposit and is not insured or guaranteed by any bank, the FDIC or any other government agency. Certain money market funds float their net asset value while others seek to preserve the value of investments at a stable net asset value (typically, $1.00 per share). An investment in a money market fund, even an investment in a fund seeking to maintain a stable net asset value per share, is not guaranteed and it is possible for the Fund to lose money by investing in these and other types of money market funds. If the liquidity of a money market fund’s portfolio deteriorates below certain levels, the money market fund may suspend redemptions (i.e., impose a redemption gate) and thereby prevent the Fund from selling its investment in the money market fund or impose a fee of up to 2% on amounts the Fund redeems from the money market fund (i.e., impose a liquidity fee). These measures may result in an investment loss or prohibit the Fund from redeeming shares when the Investment Manager would otherwise redeem shares. In addition to the fees and expenses that the Fund directly bears, the Fund indirectly bears the fees and expenses of any money market funds in which it invests, including affiliated money market funds. By investing in a money market fund, the Fund will be exposed to the investment risks of the money market fund in direct proportion to such investment. To the extent the Fund invests in instruments such as derivatives, the Fund may hold investments, which may be significant, in money market fund shares to cover its obligations resulting from the Fund’s investments in such instruments. Money market funds and the securities they invest in are subject to comprehensive regulations. The enactment of new legislation or regulations, as well as changes in interpretation and enforcement of current laws, may affect the manner of operation, performance and/or yield of money market funds.
| 38 | Columbia Commodity Strategy Fund | Semiannual Report 2022 |
Notes to Consolidated Financial Statements (continued)
November 30, 2022 (Unaudited)
Mortgage- and other asset-backed securities risk
The value of any mortgage-backed and other asset-backed securities including collateralized debt obligations, if any, held by the Fund may be affected by, among other things, changes or perceived changes in: interest rates; factors concerning the interests in and structure of the issuer or the originator of the mortgages or other assets; the creditworthiness of the entities that provide any supporting letters of credit, surety bonds or other credit enhancements; or the market’s assessment of the quality of underlying assets. Payment of principal and interest on some mortgage-backed securities (but not the market value of the securities themselves) may be guaranteed by the full faith and credit of a particular U.S. Government agency, authority, enterprise or instrumentality, and some, but not all, are also insured or guaranteed by the U.S. Government. Mortgage-backed securities issued by non-governmental issuers (such as commercial banks, savings and loan institutions, private mortgage insurance companies, mortgage bankers and other secondary market issuers) may entail greater risk than obligations guaranteed by the U.S. Government. Mortgage- and other asset-backed securities are subject to liquidity risk and prepayment risk. A decline or flattening of housing values may cause delinquencies in mortgages (especially sub-prime or non-prime mortgages) underlying mortgage-backed securities and thereby adversely affect the ability of the mortgage-backed securities issuer to make principal and/or interest payments to mortgage-backed securities holders, including the Fund. Rising or high interest rates tend to extend the duration of mortgage- and other asset-backed securities, making their prices more volatile and more sensitive to changes in interest rates.
Shareholder concentration risk
At November 30, 2022, one unaffiliated shareholder of record owned 11.1% of the outstanding shares of the Fund in one or more accounts. The Fund has no knowledge about whether any portion of those shares was owned beneficially. Affiliated shareholders of record owned 52.6% of the outstanding shares of the Fund in one or more accounts. Subscription and redemption activity by concentrated accounts may have a significant effect on the operations of the Fund. In the case of a large redemption, the Fund may be forced to sell investments at inopportune times, including its liquid positions, which may result in Fund losses and the Fund holding a higher percentage of less liquid positions. Large redemptions could result in decreased economies of scale and increased operating expenses for non-redeeming Fund shareholders.
Note 10. Subsequent events
Management has evaluated the events and transactions that have occurred through the date the financial statements were issued. As described in Note 2 above, subsequent to its fiscal period end, the Fund made a special income distribution.
Note 11. Information regarding pending and settled legal proceedings
Ameriprise Financial and certain of its affiliates are involved in the normal course of business in legal proceedings which include regulatory inquiries, arbitration and litigation, including class actions concerning matters arising in connection with the conduct of its activities as a diversified financial services firm. Ameriprise Financial believes that the Fund is not currently the subject of, and that neither Ameriprise Financial nor any of its affiliates are the subject of, any pending legal, arbitration or regulatory proceedings that are likely to have a material adverse effect on the Fund or the ability of Ameriprise Financial or its affiliates to perform under their contracts with the Fund. Ameriprise Financial is required to make quarterly (10-Q), annual (10-K) and, as necessary, 8-K filings with the Securities and Exchange Commission (SEC) on legal and regulatory matters that relate to Ameriprise Financial and its affiliates. Copies of these filings may be obtained by accessing the SEC website at www.sec.gov.
There can be no assurance that these matters, or the adverse publicity associated with them, will not result in increased Fund redemptions, reduced sale of Fund shares or other adverse consequences to the Fund. Further, although we believe proceedings are not likely to have a material adverse effect on the Fund or the ability of Ameriprise Financial or its affiliates to perform under their contracts with the Fund, these proceedings are subject to uncertainties and, as such, we are unable to estimate the possible loss or range of loss that may result. An adverse outcome in one or more of these proceedings could result in adverse judgments, settlements, fines, penalties or other relief that could have a material adverse effect on the consolidated financial condition or results of operations of Ameriprise Financial or one or more of its affiliates that provides services to the Fund.
Columbia Commodity Strategy Fund | Semiannual Report 2022
| 39 |
Approval of Management and SubadvisoryAgreements
(Unaudited)
Columbia Management Investment Advisers, LLC (the Investment Manager, and together with its domestic and global affiliates, Columbia Threadneedle Investments), a wholly-owned subsidiary of Ameriprise Financial, Inc. (Ameriprise Financial), serves as the investment manager to Columbia Commodity Strategy Fund (the Fund). Under a management agreement (the Management Agreement), the Investment Manager provides investment advice and other services to the Fund and other funds distributed by Columbia Management Investment Distributors, Inc. (collectively, the Funds). In addition, under a Subadvisory Agreement (the Subadvisory Agreement) between the Investment Manager and Threadneedle International Limited (the Subadviser), an affiliate of the Investment Manager, the Investment Manager has retained the Subadviser to perform portfolio management and related services for the Fund. Although the Subadviser is not currently providing such services, the Investment Manager may in the future reallocate Fund assets to be managed by the Subadviser.
On an annual basis, the Fund’s Board of Trustees (the Board), including the independent Board members (the Independent Trustees), considers renewal of the Management Agreement and the Subadvisory Agreement (together, the Advisory Agreements). The Investment Manager prepared detailed reports for the Board and its Contracts Committee (including its Contracts Subcommittee) in November 2021 and March, April and June 2022, including reports providing the results of analyses performed by an independent third-party data provider, Broadridge Financial Solutions, Inc. (Broadridge), and comprehensive responses to written requests for information by independent legal counsels to the Independent Trustees (Independent Legal Counsel) to the Investment Manager, to assist the Board in making this determination. In addition, throughout the year, the Board (or its committees or subcommittees) regularly meets with portfolio management teams and senior management personnel and reviews information prepared by the Investment Manager addressing the services the Investment Manager provides and Fund performance. The Board also accords appropriate weight to the work, deliberations and conclusions of the various committees, such as the Contracts Committee, the Investment Review Committee, the Audit Committee and the Compliance Committee in determining whether to continue the Advisory Agreements.
The Board, at its June 23, 2022 Board meeting (the June Meeting), considered the renewal of each of the Advisory Agreements for additional one-year terms. At the June Meeting, Independent Legal Counsel reviewed with the Independent Trustees various factors relevant to the Board’s consideration of advisory and subadvisory agreements and the Board’s legal responsibilities related to such consideration. The Independent Trustees considered all information that they, their legal counsel or the Investment Manager believed reasonably necessary to evaluate and to approve the continuation of each of the Advisory Agreements. Among other things, the information and factors considered included the following:
| • | Information on the investment performance of the Fund relative to the performance of a group of mutual funds determined to be comparable to the Fund by Broadridge, as well as performance relative to benchmarks; |
| • | Information on the Fund’s management fees and total expenses, including information comparing the Fund’s expenses to those of a group of comparable mutual funds, as determined by Broadridge; |
| • | The Investment Manager’s agreement to contractually limit or cap total operating expenses for the Fund so that total operating expenses (excluding certain fees and expenses, such as transaction costs and certain other investment related expenses, interest, taxes, acquired fund fees and expenses and infrequent and/or unusual expenses) would not exceed a specified annual rate, as a percentage of the Fund’s net assets; |
| • | Terms of the Advisory Agreements; |
| • | Subadvisory fees payable by the Investment Manager under the Subadvisory Agreement; |
| • | Descriptions of other agreements and arrangements with affiliates of the Investment Manager relating to the operations of the Fund, including agreements with respect to the provision of transfer agency and shareholder services to the Fund; |
| • | Descriptions of various services performed by the Investment Manager and the Subadviser under the Advisory Agreements, including portfolio management and portfolio trading practices; |
| • | Information regarding any recently negotiated management fees of similarly-managed portfolios of other institutional clients of the Investment Manager; |
| 40 | Columbia Commodity Strategy Fund | Semiannual Report 2022 |
Approval of Management and Subadvisory
Agreements (continued)
(Unaudited)
| • | Information regarding the resources of the Investment Manager and the Subadviser, including information regarding senior management, portfolio managers and other personnel; |
| • | Information regarding the capabilities of the Investment Manager and the Subadviser with respect to compliance monitoring services; |
| • | The profitability to the Investment Manager and its affiliates from their relationships with the Fund; and |
| • | Report provided by the Board’s independent fee consultant, JDL Consultants, LLC (JDL). |
Following an analysis and discussion of the foregoing, and the factors identified below, the Board, including all of the Independent Trustees, approved the renewal of the Management Agreement and the Subadvisory Agreement.
Nature, extent and quality of services provided by the Investment Manager and the Subadviser
The Board analyzed various reports and presentations it had received detailing the services performed by the Investment Manager and the Subadviser, as well as their history, expertise, resources and relative capabilities, and the qualifications of their personnel.
The Board specifically considered the many developments during recent years concerning the services provided by the Investment Manager, including, in particular, detailed information regarding the process employed for selecting and overseeing affiliated and unaffiliated Subadvisers. With respect to the Investment Manager, the Board also noted the organization and depth of the equity and credit research departments. The Board further observed the enhancements to the investment risk management department’s processes, systems and oversight, over the past several years, as well as planned 2022 initiatives in this regard. The Board also took into account the broad scope of services provided by the Investment Manager to each subadvised Fund, including, among other services, investment, risk and compliance oversight. The Board also took into account the information it received concerning the Investment Manager’s ability to attract and retain key portfolio management personnel and that it has sufficient resources to provide competitive and adequate compensation to investment personnel. The Board also observed that the Investment Manager has been able to effectively manage, operate and distribute the Funds through the COVID-19 pandemic period with no disruptions in services provided. The Board also considered added personnel and resources obtained by Columbia Threadneedle through Ameriprise Financial’s acquisition of BMO Financial Group’s Europe, Middle East, and Africa (EMEA) asset management business.
In connection with the Board’s evaluation of the overall package of services provided by the Investment Manager, the Board also considered the nature, quality and range of administrative services provided to the Fund by the Investment Manager, as well as the achievements in 2021 in the performance of administrative services, and noted the various enhancements anticipated for 2022. In evaluating the quality of services provided under the Advisory Agreements, the Board also took into account the organization and strength of the Fund’s and its service providers’ compliance programs. The Board also reviewed the financial condition of the Investment Manager and its affiliates and each entity’s ability to carry out its responsibilities under the Management Agreement and the Fund’s other service agreements.
In addition, the Board discussed the acceptability of the terms of the Management Agreement (including the relatively broad scope of services required to be performed by the Investment Manager in addition to monitoring the Subadviser), noting that no changes were proposed from the forms of agreements previously approved. The Board also noted the wide array of legal and compliance services provided to the Fund under the Management Agreement.
The Board considered the Subadviser’s organizational strength and resources, portfolio management team depth and capabilities and investment process. The Board also considered the Subadviser’s capability and wherewithal to carry out its responsibilities under the Subadvisory Agreement. In addition, the Board discussed the acceptability of the terms of the Subadvisory Agreement, including the scope of services required to be performed. The Board noted that the terms of the Subadvisory Agreement are generally consistent with the terms of other subadvisory agreements for subadvisers who manage other funds managed by the Investment Manager. It was observed that no changes were recommended to the
Columbia Commodity Strategy Fund | Semiannual Report 2022
| 41 |
Approval of Management and Subadvisory
Agreements (continued)
(Unaudited)
Subadvisory Agreement. The Board took into account the Investment Manager’s representation that the Subadviser was in a position to provide quality services to the Fund. In this regard, the Board further observed the various services provided by the Investment Manager’s subadvisory oversight team and their significant resources added in recent years.
After reviewing these and related factors (including investment performance as discussed below), the Board concluded, within the context of their overall conclusions, that the nature, extent and quality of the services provided to the Fund under the Advisory Agreements supported the continuation of the Management Agreement and the Subadvisory Agreement.
Investment performance
In this connection, the Board carefully reviewed the investment performance of the Fund, including detailed reports providing the results of analyses performed by each of the Investment Manager, Broadridge and JDL collectively showing, for various periods (including since manager inception): (i) the performance of the Fund, (ii) the performance of a benchmark index, (iii) the percentage ranking of the Fund among its comparison group, (iv) the Fund’s performance relative to peers and benchmarks and (v) the net assets of the Fund. The Board observed that the Fund’s performance for certain periods ranked above median based on information provided by Broadridge.
The Board also considered management’s rationale for recommending the continued retention of the Subadviser.
The Board also reviewed a description of the third-party data provider’s methodology for identifying the Fund’s peer groups for purposes of performance and expense comparisons.
The Board also considered the Investment Manager’s and Subadviser’s performance and reputation generally. After reviewing these and related factors, the Board concluded, within the context of their overall conclusions, that the performance of the Fund and the Investment Manager, in light of other considerations, supported the continuation of the Management Agreement and the Subadvisory Agreement.
Comparative fees, costs of services provided and the profits realized by the Investment Manager and its affiliates from their relationships with the Fund
The Board reviewed comparative fees and the costs of services provided under each of the Advisory Agreements. The Board members considered detailed comparative information set forth in an annual report on fees and expenses, including, among other things, data (based on analyses conducted by Broadridge and JDL) showing a comparison of the Fund’s expenses with median expenses paid by funds in its comparative peer universe, as well as data showing the Fund’s contribution to the Investment Manager’s profitability.
The Board considered the reports of JDL, which assisted in the Board’s analysis of the Funds’ performance and expenses and the reasonableness of the Funds’ fee rates. The Board accorded particular weight to the notion that a primary objective of the level of fees is to achieve a rational pricing model applied consistently across the various product lines in the Fund family, while assuring that the overall fees for each Fund (with certain exceptions) are generally in line with the current "pricing philosophy" such that Fund total expense ratios, in general, approximate or are lower than the median expense ratios of funds in the same Lipper comparison universe. The Board took into account that the Fund’s total expense ratio (after considering proposed expense caps/waivers) approximated the peer universe’s median expense ratio.
Additionally, the Board reviewed the level of subadvisory fees to be paid under the Subadvisory Agreement, noting that the fees would be paid by the Investment Manager and do not impact the fees paid by the Fund. After reviewing these and related factors, the Board concluded, within the context of their overall conclusions, that the levels of management fees, subadvisory fees and expenses of the Fund, in light of other considerations, supported the continuation of each of the Management Agreement and the Subadvisory Agreement.
The Board also considered the profitability of the Investment Manager and its affiliates in connection with the Investment Manager providing management services to the Fund. The Independent Trustees referred to information discussing the profitability to the Investment Manager and Ameriprise Financial from managing, operating and distributing the Funds. The
| 42 | Columbia Commodity Strategy Fund | Semiannual Report 2022 |
Approval of Management and Subadvisory
Agreements (continued)
(Unaudited)
Board considered that in 2021 the Board had considered 2020 profitability and that the 2022 information showed that the profitability generated by the Investment Manager in 2021 increased from 2020 levels, due to a variety of factors, including the increased assets under management of the Funds. It also took into account the indirect economic benefits flowing to the Investment Manager or its affiliates in connection with managing or distributing the Funds, such as the enhanced ability to offer various other financial products to Ameriprise Financial customers, soft dollar benefits and overall reputational advantages. The Board noted that the fees paid by the Fund should permit the Investment Manager to offer competitive compensation to its personnel, make necessary investments in its business and earn an appropriate profit. After reviewing these and related factors, the Board concluded, within the context of their overall conclusions, that the costs of services provided and the profitability to the Investment Manager and its affiliates from their relationships with the Fund supported the continuation of the Management Agreement and the Subadvisory Agreement.
Economies of scale
The Board considered the potential existence of economies of scale in the provision by the Investment Manager of services to the Fund, to groups of related funds and to the Investment Manager as a whole, and whether those economies of scale were shared with the Fund through breakpoints in investment management fees or other means, such as expense limitation arrangements and additional investments by the Investment Manager in investment, trading, compliance and other resources. The Board considered the economies of scale that might be realized as the Fund’s net asset level grows and took note of the extent to which Fund shareholders might also benefit from such growth. In this regard, the Board took into account that management fees decline as Fund assets exceed various breakpoints, all of which have not been surpassed. The Board observed that the Management Agreement provided for breakpoints in the management fee rate schedule that allow opportunities for shareholders to realize lower fees as Fund assets grow and that there are additional opportunities through other means for sharing economies of scale with shareholders.
Conclusion
The Board reviewed all of the above considerations in reaching its decision to approve the continuation of the Management Agreement and the Subadvisory Agreement. In reaching its conclusions, no single factor was determinative.
On June 23, 2022, the Board, including all of the Independent Trustees, determined that fees payable under each of the Advisory Agreements were fair and reasonable in light of the extent and quality of services provided and approved the renewal of each of the Advisory Agreements.
Columbia Commodity Strategy Fund | Semiannual Report 2022
| 43 |
Columbia Commodity Strategy Fund
P.O. Box 219104
Kansas City, MO 64121-9104
Please read and consider the investment objectives, risks, charges and expenses for any fund carefully before investing. For a prospectus and summary prospectus, which contains this and other important information about the Fund, go to
columbiathreadneedleus.com/investor/. The Fund is distributed by Columbia Management Investment Distributors, Inc., member FINRA, and managed by Columbia Management Investment Advisers, LLC.
Columbia Threadneedle Investments (Columbia Threadneedle) is the global brand name of the Columbia and Threadneedle group of companies. All rights reserved.
© 2023 Columbia Management Investment Advisers, LLC.
columbiathreadneedleus.com/investor/
Item 2. Code of Ethics.
Not applicable for semiannual reports.
Item 3. Audit Committee Financial Expert.
Not applicable for semiannual reports.
Item 4. Principal Accountant Fees and Services.
Not applicable for semiannual reports.
Item 5. Audit Committee of Listed Registrants.
Not applicable.
Item 6. Investments
(a) | The registrant’s “Schedule I – Investments in securities of unaffiliated issuers” (as set forth in 17 CFR 210.12-12) is included in Item 1 of this Form N-CSR. |
Item 7. Disclosure of Proxy Voting Policies and Procedures for Closed-End Management Investment Companies.
Not applicable.
Item 8. Portfolio Managers of Closed-End Management Investment Companies.
Not applicable.
Item 9. Purchases of Equity Securities by Closed-End Management Investment Company and Affiliated Purchasers.
Not applicable.
Item 10. Submission of Matters to a Vote of Security Holders.
There were no material changes to the procedures by which shareholders may recommend nominees to the registrant's board of directors.
Item 11. Controls and Procedures.
(a) | The registrant’s principal executive officer and principal financial officer, based on their evaluation of the registrant’s disclosure controls and procedures as of a date within 90 days of the filing of this report, have concluded that such controls and procedures are adequately designed to ensure that information required to be disclosed by the registrant in Form N-CSR is accumulated and communicated to the registrant’s management, including the principal executive officer and principal financial officer, or persons performing similar functions, as appropriate to allow timely decisions regarding required disclosure. |
(b) | There was no change in the registrant’s internal control over financial reporting that occurred during the period covered by this report that has materially affected, or is reasonably likely to materially affect, the registrant’s internal control over financial reporting. |
Item 12. Disclosure of Securities Lending Activities for Closed-End Management Investment Companies
Not applicable.
Item 13. Exhibits.
(a)(1) Code of ethics required to be disclosed under Item 2 of Form N-CSR: Not applicable for semiannual reports.
(a)(2) Certifications pursuant to Rule 30a-2(a) under the Investment Company Act of 1940 (17 CFR 270.30a-2(a)) attached hereto as Exhibit 99.CERT.
(b) Certification pursuant to Rule 30a-2(b) under the Investment Company Act of 1940 (17 CFR 270.30a-2(b)) attached hereto as Exhibit 99.906CERT.
SIGNATURES
Pursuant to the requirements of the Securities Exchange Act of 1934 and the Investment Company Act of 1940, the registrant has duly caused this report to be signed on its behalf by the undersigned, thereunto duly authorized.
(registrant) | Columbia Funds Series Trust II |
| |
By (Signature and Title) | /s/ Daniel J. Beckman |
| Daniel J. Beckman, President and Principal Executive Officer |
| |
Date | January 20, 2023 |
| |
| |
Pursuant to the requirements of the Securities Exchange Act of 1934 and the Investment Company Act of 1940, this report has been signed below by the following persons on behalf of the registrant and in the capacities and on the dates indicated.
By (Signature and Title) | /s/ Daniel J. Beckman |
| Daniel J. Beckman, President and Principal Executive Officer |
| |
Date | January 20, 2023 |
By (Signature and Title) | /s/ Michael G. Clarke |
| Michael G. Clarke, Chief Financial Officer, |
| Principal Financial Officer and Senior Vice President |
| |
Date | January 20, 2023 |
By (Signature and Title) | /s/ Joseph Beranek |
| Joseph Beranek, Treasurer, Chief Accounting |
| Officer and Principal Financial Officer |
| |
Date | January 20, 2023 |