UNITED STATES
SECURITIES AND EXCHANGE COMMISSION
Washington, D.C. 20549
FORM N-CSR
CERTIFIED SHAREHOLDER REPORT OF REGISTERED MANAGEMENT INVESTMENT COMPANIES
Investment Company Act file number 811-21852
Columbia Funds Series Trust II
(Exact name of registrant as specified in charter)
290 Congress Street
Boston, MA 02210
(Address of principal executive offices) (Zip code)
Daniel J. Beckman
c/o Columbia Management Investment Advisers, LLC
290 Congress Street
Boston, MA 02210
Ryan C. Larrenaga, Esq.
c/o Columbia Management Investment Advisers, LLC
290 Congress Street
Boston, MA 02210
(Name and address of agent for service)
Registrant's telephone number, including area code: (800) 345-6611
Date of fiscal year end: February 29
Date of reporting period: August 31, 2023
Form N-CSR is to be used by management investment companies to file reports with the Commission not later than 10 days after the transmission to stockholders of any report that is required to be transmitted to stockholders under Rule 30e-1 under the Investment Company Act of 1940 (17 CFR 270.30e-1). The Commission may use the information provided on Form N-CSR in its regulatory, disclosure review, inspection, and policymaking roles.
A registrant is required to disclose the information specified by Form N-CSR, and the Commission will make this information public. A registrant is not required to respond to the collection of information contained in Form N-CSR unless the Form displays a currently valid Office of Management and Budget ("OMB") control number. Please direct comments concerning the accuracy of the information collection burden estimate and any suggestions for reducing the burden to Secretary, Securities and Exchange Commission, 100 F Street, NE, Washington, DC 20549. The OMB has reviewed this collection of information under the clearance requirements of 44 U.S.C. § 3507.
Item 1. Reports to Stockholders.

Semiannual Report
August 31, 2023 (Unaudited)
Columbia Global Value Fund
Not FDIC or NCUA Insured • No Financial Institution Guarantee • May Lose Value
If you elect to receive the shareholder report for Columbia Global Value Fund (the Fund) in paper, mailed to you, the Fund mails one shareholder report to each shareholder address, unless such shareholder elects to receive shareholder reports from the Fund electronically via e-mail or by having a paper notice mailed to you (Postcard Notice) that your Fund’s shareholder report is available at the Columbia funds’ website (columbiathreadneedleus.com/investor/). If you would like more than one report in paper to be mailed to you, or would like to elect to receive reports via e-mail or access them through Postcard Notice, please call shareholder services at 800.345.6611 and additional reports will be sent to you.
Proxy voting policies and procedures
The policy of the Board of Trustees is to vote the proxies of the companies in which the Fund holds investments consistent with the procedures as stated in the Statement of Additional Information (SAI). You may obtain a copy of the SAI without charge by calling 800.345.6611; contacting your financial intermediary; visiting columbiathreadneedleus.com/investor/; or searching the website of the Securities and Exchange Commission (SEC) at sec.gov. Information regarding how the Fund voted proxies relating to portfolio securities is filed with the SEC by August 31st for the most recent 12-month period ending June 30th of that year, and is available without charge by visiting columbiathreadneedleus.com/investor/, or searching the website of the SEC at sec.gov.
Quarterly schedule of investments
The Fund files a complete schedule of portfolio holdings with the SEC for the first and third quarters of each fiscal year on Form N-PORT. The Fund’s Form N-PORT filings are available on the SEC’s website at sec.gov. The Fund’s complete schedule of portfolio holdings, as filed on Form N-PORT, is available on columbiathreadneedleus.com/investor/ or can also be obtained without charge, upon request, by calling 800.345.6611.
Additional Fund information
For more information about the Fund, please visit columbiathreadneedleus.com/investor/ or call 800.345.6611. Customer Service Representatives are available to answer your questions Monday through Friday from 8 a.m. to 7 p.m. Eastern time.
Fund investment manager
Columbia Management Investment Advisers, LLC (the Investment Manager)
290 Congress Street
Boston, MA 02210
Fund distributor
Columbia Management Investment Distributors, Inc.
290 Congress Street
Boston, MA 02210
Fund transfer agent
Columbia Management Investment Services Corp.
P.O. Box 219104
Kansas City, MO 64121-9104
Columbia Global Value Fund | Semiannual Report 2023
Fund at a Glance
(Unaudited)
Investment objective
The Fund seeks to provide shareholders with growth of capital and income.
Portfolio management
Fred Copper, CFA
Co-Portfolio Manager
Managed Fund since 2016
Melda Mergen, CFA, CAIA
Co-Portfolio Manager
Managed Fund since 2016
Peter Schroeder, CFA
Co-Portfolio Manager
Managed Fund since 2016
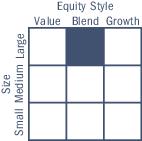
Morningstar style boxTM
The Morningstar Style Box is based on a fund’s portfolio holdings. For equity funds, the vertical axis shows the market capitalization of the stocks owned, and the horizontal axis shows investment style (value, blend, or growth). Information shown is based on the most recent data provided by Morningstar.
© 2023 Morningstar, Inc. All rights reserved. The Morningstar information contained herein: (1) is proprietary to Morningstar and/or its content providers; (2) may not be copied or distributed; and (3) is not warranted to be accurate, complete or timely. Neither Morningstar nor its content providers are responsible for any damages or losses arising from any use of this information.
| Average annual total returns (%) (for the period ended August 31, 2023) |
| | | Inception | 6 Months
cumulative | 1 Year | 5 Years | 10 Years |
| Class A | Excluding sales charges | 03/20/95 | 3.98 | 11.09 | 6.18 | 7.24 |
| | Including sales charges | | -2.02 | 4.71 | 4.94 | 6.61 |
| Advisor Class | 12/11/06 | 4.08 | 11.29 | 6.44 | 7.51 |
| Class C | Excluding sales charges | 06/26/00 | 3.57 | 10.28 | 5.39 | 6.43 |
| | Including sales charges | | 2.57 | 9.28 | 5.39 | 6.43 |
| Institutional Class | 09/27/10 | 4.10 | 11.34 | 6.44 | 7.50 |
| Institutional 2 Class | 12/11/06 | 4.07 | 11.37 | 6.52 | 7.59 |
| Institutional 3 Class | 02/28/13 | 4.16 | 11.49 | 6.59 | 7.67 |
| Class R | 12/11/06 | 3.86 | 10.76 | 5.92 | 6.97 |
| MSCI World Value Index (Net) | | 3.33 | 10.24 | 5.23 | 6.54 |
| MSCI World Index (Net) | | 11.11 | 15.60 | 8.33 | 9.28 |
Returns for Class A shares are shown with and without the maximum initial sales charge of 5.75%. Returns for Class C shares are shown with and without the 1.00% contingent deferred sales charge for the first year only. The Fund’s other share classes are not subject to sales charges and have limited eligibility. Please see the Fund’s prospectus for details. Performance for different share classes will vary based on differences in sales charges and fees associated with each share class. All results shown assume reinvestment of distributions during the period. Returns do not reflect the deduction of taxes that a shareholder may pay on Fund distributions or on the redemption of Fund shares. Performance results reflect the effect of any fee waivers or reimbursements of Fund expenses by Columbia Management Investment Advisers, LLC and/or any of its affiliates. Absent these fee waivers or expense reimbursement arrangements, performance results would have been lower.
The performance information shown represents past performance and is not a guarantee of future results. The investment return and principal value of your investment will fluctuate so that your shares, when redeemed, may be worth more or less than their original cost. Current performance may be lower or higher than the performance information shown. You may obtain performance information current to the most recent month-end by contacting your financial intermediary, visiting columbiathreadneedleus.com/investor/ or calling 800.345.6611.
The Fund’s performance prior to September 2014 reflects returns achieved pursuant to different principal investment strategies. If the Fund’s current strategies had been in place for the prior periods, results shown may have been different.
The MSCI World Value Index (Net) captures large- and mid-cap securities exhibiting overall value style characteristics across 23 developed market countries. The value investment style characteristics for index construction are defined using three variables: book value to price, 12-month forward earnings to price and dividend yield. With 819 constituents, the index targets 50% coverage of the free float-adjusted market capitalization of the MSCI World Index.
The MSCI World Index (Net) is a free float-adjusted market capitalization weighted index that is designed to measure the equity market performance of developed markets.
Indices are not available for investment, are not professionally managed and do not reflect sales charges, fees, brokerage commissions, taxes (except the MSCI World Value Index (Net) and the MSCI World Index (Net), which reflect reinvested dividends net of withholding taxes) or other expenses of investing. Securities in the Fund may not match those in an index.
Columbia Global Value Fund | Semiannual Report 2023
| 3 |
Fund at a Glance (continued)
(Unaudited)
| Equity sector breakdown (%) (at August 31, 2023) |
| Communication Services | 4.9 |
| Consumer Discretionary | 4.4 |
| Consumer Staples | 11.7 |
| Energy | 10.8 |
| Financials | 19.8 |
| Health Care | 14.6 |
| Industrials | 11.4 |
| Information Technology | 11.7 |
| Materials | 3.1 |
| Real Estate | 3.9 |
| Utilities | 3.7 |
| Total | 100.0 |
Percentages indicated are based upon total equity investments. The Fund’s portfolio composition is subject to change.
| Country breakdown (%) (at August 31, 2023) |
| Australia | 1.6 |
| Canada | 1.5 |
| Finland | 0.9 |
| France | 4.1 |
| Hong Kong | 0.8 |
| Japan | 7.0 |
| Netherlands | 4.0 |
| Russian Federation | 0.0(a) |
| Singapore | 1.8 |
| South Korea | 1.5 |
| United Kingdom | 5.8 |
| United States(b) | 71.0 |
| Total | 100.0 |
| (a) | Rounds to zero. |
| (b) | Includes investments in Money Market Funds and Exchange-Traded Funds. |
Country breakdown is based primarily on issuer’s place of organization/incorporation. Percentages indicated are based upon total investments excluding investments in derivatives, if any. The Fund’s portfolio composition is subject to change.
The Fund may use place of organization/incorporation or other factors in determining whether an issuer is domestic (U.S.) or foreign for purposes of its investment policies. At August 31, 2023, the Fund invested at least 40% of its net assets in foreign companies in accordance with its principal investment strategy.
| 4 | Columbia Global Value Fund | Semiannual Report 2023 |
Understanding Your Fund’s Expenses
(Unaudited)
As an investor, you incur two types of costs. There are shareholder transaction costs, which generally include sales charges on purchases and may include redemption fees. There are also ongoing fund costs, which generally include management fees, distribution and/or service fees, and other fund expenses. The following information is intended to help you understand your ongoing costs (in dollars) of investing in the Fund and to help you compare these costs with the ongoing costs of investing in other mutual funds.
Analyzing your Fund’s expenses
To illustrate these ongoing costs, we have provided examples and calculated the expenses paid by investors in each share class of the Fund during the period. The actual and hypothetical information in the table is based on an initial investment of $1,000 at the beginning of the period indicated and held for the entire period. Expense information is calculated two ways and each method provides you with different information. The amount listed in the “Actual” column is calculated using the Fund’s actual operating expenses and total return for the period. You may use the Actual information, together with the amount invested, to estimate the expenses that you paid over the period. Simply divide your account value by $1,000 (for example, an $8,600 account value divided by $1,000 = 8.6), then multiply the results by the expenses paid during the period under the “Actual” column. The amount listed in the “Hypothetical” column assumes a 5% annual rate of return before expenses (which is not the Fund’s actual return) and then applies the Fund’s actual expense ratio for the period to the hypothetical return. You should not use the hypothetical account values and expenses to estimate either your actual account balance at the end of the period or the expenses you paid during the period. See “Compare with other funds” below for details on how to use the hypothetical data.
Compare with other funds
Since all mutual funds are required to include the same hypothetical calculations about expenses in shareholder reports, you can use this information to compare the ongoing cost of investing in the Fund with other funds. To do so, compare the hypothetical example with the 5% hypothetical examples that appear in the shareholder reports of other funds. As you compare hypothetical examples of other funds, it is important to note that hypothetical examples are meant to highlight the ongoing costs of investing in a fund only and do not reflect any transaction costs, such as sales charges, or redemption or exchange fees. Therefore, the hypothetical calculations are useful in comparing ongoing costs only, and will not help you determine the relative total costs of owning different funds. If transaction costs were included in these calculations, your costs would be higher.
| March 1, 2023 — August 31, 2023 |
| | Account value at the
beginning of the
period ($) | Account value at the
end of the
period ($) | Expenses paid during
the period ($) | Fund’s annualized
expense ratio (%) |
| | Actual | Hypothetical | Actual | Hypothetical | Actual | Hypothetical | Actual |
| Class A | 1,000.00 | 1,000.00 | 1,039.80 | 1,019.46 | 5.79 | 5.74 | 1.13 |
| Advisor Class | 1,000.00 | 1,000.00 | 1,040.80 | 1,020.71 | 4.51 | 4.47 | 0.88 |
| Class C | 1,000.00 | 1,000.00 | 1,035.70 | 1,015.63 | 9.67 | 9.58 | 1.89 |
| Institutional Class | 1,000.00 | 1,000.00 | 1,041.00 | 1,020.71 | 4.51 | 4.47 | 0.88 |
| Institutional 2 Class | 1,000.00 | 1,000.00 | 1,040.70 | 1,021.01 | 4.21 | 4.17 | 0.82 |
| Institutional 3 Class | 1,000.00 | 1,000.00 | 1,041.60 | 1,021.27 | 3.95 | 3.91 | 0.77 |
| Class R | 1,000.00 | 1,000.00 | 1,038.60 | 1,018.15 | 7.12 | 7.05 | 1.39 |
Expenses paid during the period are equal to the annualized expense ratio for each class as indicated above, multiplied by the average account value over the period and then multiplied by the number of days in the Fund’s most recent fiscal half year and divided by 366.
Expenses do not include fees and expenses incurred indirectly by the Fund from its investment in underlying funds, including affiliated and non-affiliated pooled investment vehicles, such as mutual funds and exchange-traded funds.
Columbia Global Value Fund | Semiannual Report 2023
| 5 |
Portfolio of Investments
August 31, 2023 (Unaudited)
(Percentages represent value of investments compared to net assets)
Investments in securities
| Common Stocks 98.6% |
| Issuer | Shares | Value ($) |
| Australia 1.6% |
| Northern Star Resources Ltd. | 1,626,532 | 12,462,726 |
| Canada 1.5% |
| Cameco Corp. | 317,076 | 11,731,812 |
| Finland 0.9% |
| UPM-Kymmene OYJ | 219,534 | 7,513,009 |
| France 4.1% |
| AXA SA | 522,704 | 15,704,580 |
| BNP Paribas SA | 260,950 | 16,875,024 |
| Total | 32,579,604 |
| Hong Kong 0.8% |
| WH Group Ltd. | 12,771,593 | 6,577,310 |
| Japan 7.0% |
| Daiwabo Holdings Co., Ltd. | 584,100 | 11,839,681 |
| ITOCHU Corp. | 355,900 | 13,356,694 |
| ORIX Corp. | 809,201 | 15,087,293 |
| Takeda Pharmaceutical Co., Ltd. | 510,428 | 15,774,813 |
| Total | 56,058,481 |
| Netherlands 4.0% |
| ING Groep NV | 1,047,186 | 14,837,583 |
| Shell PLC | 571,099 | 17,461,509 |
| Total | 32,299,092 |
| Russian Federation —% |
| Lukoil PJSC(a),(b),(c),(d) | 48,225 | — |
| Singapore 1.8% |
| BW LPG Ltd. | 376,920 | 4,566,525 |
| Venture Corp., Ltd. | 989,900 | 9,594,662 |
| Total | 14,161,187 |
| South Korea 1.5% |
| Hyundai Home Shopping Network Corp. | 77,381 | 2,552,812 |
| Youngone Corp. | 242,344 | 9,835,693 |
| Total | 12,388,505 |
| Common Stocks (continued) |
| Issuer | Shares | Value ($) |
| United Kingdom 5.7% |
| BP PLC, ADR | 270,401 | 10,053,509 |
| BT Group PLC | 3,420,543 | 5,003,958 |
| DCC PLC | 123,958 | 6,782,626 |
| Just Group PLC | 6,205,213 | 5,927,016 |
| TP Icap Group PLC | 4,361,487 | 9,127,518 |
| Vodafone Group PLC | 9,793,118 | 9,078,753 |
| Total | 45,973,380 |
| United States 69.7% |
| Ameren Corp. | 207,352 | 16,436,793 |
| AT&T, Inc. | 754,685 | 11,161,791 |
| Bank of America Corp. | 606,888 | 17,399,479 |
| Baxter International, Inc. | 176,734 | 7,175,400 |
| Boston Scientific Corp.(e) | 230,092 | 12,411,162 |
| Broadcom, Inc. | 25,427 | 23,466,324 |
| Chubb Ltd. | 67,047 | 13,467,731 |
| Cisco Systems, Inc. | 352,265 | 20,202,398 |
| Coca-Cola Co. (The) | 279,244 | 16,707,169 |
| Comcast Corp., Class A | 295,353 | 13,810,706 |
| Delta Air Lines, Inc. | 208,906 | 8,957,889 |
| Diversified Energy Co. PLC | 2,892,610 | 3,354,720 |
| DTE Energy Co. | 122,211 | 12,634,173 |
| Eaton Corp. PLC | 70,723 | 16,292,458 |
| Elevance Health, Inc. | 22,171 | 9,799,804 |
| Eli Lilly & Co. | 21,784 | 12,072,693 |
| EOG Resources, Inc. | 110,317 | 14,188,973 |
| Equinix, Inc. | 12,136 | 9,482,828 |
| Exxon Mobil Corp. | 214,911 | 23,895,954 |
| Global Payments, Inc. | 94,854 | 12,017,053 |
| Hilton Worldwide Holdings, Inc. | 79,607 | 11,833,581 |
| Honeywell International, Inc. | 70,158 | 13,185,495 |
| Jazz Pharmaceuticals PLC(e) | 71,328 | 10,225,582 |
| Laboratory Corp. of America Holdings | 48,155 | 10,021,055 |
| Las Vegas Sands Corp. | 189,790 | 10,411,879 |
| MasTec, Inc.(e) | 85,291 | 8,485,602 |
| MasterCard, Inc., Class A | 32,325 | 13,338,588 |
| Merck & Co., Inc. | 172,640 | 18,814,307 |
The accompanying Notes to Financial Statements are an integral part of this statement.
| 6 | Columbia Global Value Fund | Semiannual Report 2023 |
Portfolio of Investments (continued)
August 31, 2023 (Unaudited)
| Common Stocks (continued) |
| Issuer | Shares | Value ($) |
| Mondelez International, Inc., Class A | 164,278 | 11,706,450 |
| Morgan Stanley | 153,123 | 13,038,423 |
| MP Materials Corp.(e) | 203,263 | 4,256,327 |
| Parker-Hannifin Corp. | 31,494 | 13,129,849 |
| Primo Water Corp. | 1,063,941 | 16,235,740 |
| Procter & Gamble Co. (The) | 133,335 | 20,578,924 |
| Prologis, Inc. | 96,416 | 11,974,867 |
| QUALCOMM, Inc. | 127,270 | 14,576,233 |
| Realty Income Corp. | 168,128 | 9,421,893 |
| Republic Services, Inc. | 69,953 | 10,082,326 |
| S&P Global, Inc. | 23,117 | 9,035,511 |
| TE Connectivity Ltd. | 95,583 | 12,654,233 |
| Vertex Pharmaceuticals, Inc.(e) | 13,869 | 4,831,127 |
| Walmart, Inc. | 125,592 | 20,422,515 |
| Zoetis, Inc. | 74,714 | 14,233,764 |
| Total | 557,429,769 |
Total Common Stocks
(Cost $708,205,965) | 789,174,875 |
|
| Exchange-Traded Equity Funds 0.4% |
| | Shares | Value ($) |
| United States 0.4% |
| iShares Russell 1000 Value ETF | 18,105 | 2,878,333 |
Total Exchange-Traded Equity Funds
(Cost $2,755,038) | 2,878,333 |
|
| Money Market Funds 0.8% |
| | |
| Columbia Short-Term Cash Fund, 5.476%(f),(g) | 6,288,309 | 6,286,423 |
Total Money Market Funds
(Cost $6,285,376) | 6,286,423 |
Total Investments in Securities
(Cost $717,246,379) | 798,339,631 |
| Other Assets & Liabilities, Net | | 1,926,152 |
| Net Assets | $800,265,783 |
Investments in derivatives
| Forward foreign currency exchange contracts |
Currency to
be sold | Currency to
be purchased | Counterparty | Settlement
date | Unrealized
appreciation ($) | Unrealized
depreciation ($) |
| 4,884,000 AUD | 3,202,759 USD | Morgan Stanley | 09/21/2023 | 36,296 | — |
| 4,884,000 AUD | 3,161,853 USD | Morgan Stanley | 09/21/2023 | — | (4,610) |
| 3,195,000 CAD | 2,362,028 USD | Morgan Stanley | 09/21/2023 | — | (3,116) |
| 2,834,000 CHF | 3,324,643 USD | Morgan Stanley | 09/21/2023 | 110,824 | — |
| 1,446,000 EUR | 1,573,287 USD | Morgan Stanley | 09/21/2023 | 4,106 | — |
| 2,537,000 GBP | 3,256,545 USD | Morgan Stanley | 09/21/2023 | 42,430 | — |
| 2,196,191,000 JPY | 15,606,564 USD | Morgan Stanley | 09/21/2023 | 473,179 | — |
| 21,000,924,000 KRW | 16,471,287 USD | Morgan Stanley | 09/21/2023 | 590,745 | — |
| 73,529,000 NOK | 7,206,465 USD | Morgan Stanley | 09/21/2023 | 286,946 | — |
| 29,456,000 SGD | 22,187,932 USD | Morgan Stanley | 09/21/2023 | 376,321 | — |
| 3,315,513 USD | 4,884,000 AUD | Morgan Stanley | 09/21/2023 | — | (149,050) |
| 28,986,765 USD | 38,140,000 CAD | Morgan Stanley | 09/21/2023 | — | (753,093) |
| 7,247,614 USD | 6,593,000 EUR | Morgan Stanley | 09/21/2023 | — | (92,974) |
| 3,255,599 USD | 33,400,000 NOK | Morgan Stanley | 09/21/2023 | — | (112,459) |
| 13,289,554 USD | 21,272,000 NZD | Morgan Stanley | 09/21/2023 | — | (604,607) |
| 13,197,356 USD | 137,329,000 SEK | Morgan Stanley | 09/21/2023 | — | (644,275) |
| 7,095,004 USD | 9,588,000 SGD | Morgan Stanley | 09/21/2023 | 4,728 | — |
| 4,091,023 USD | 5,477,000 SGD | Morgan Stanley | 09/21/2023 | — | (35,408) |
| Total | | | | 1,925,575 | (2,399,592) |
The accompanying Notes to Financial Statements are an integral part of this statement.
Columbia Global Value Fund | Semiannual Report 2023
| 7 |
Portfolio of Investments (continued)
August 31, 2023 (Unaudited)
Notes to Portfolio of Investments
| (a) | Represents fair value as determined in good faith under procedures approved by the Board of Trustees. At August 31, 2023, the total value of these securities amounted to $0, which represents less than 0.01% of total net assets. |
| (b) | Denotes a restricted security, which is subject to legal or contractual restrictions on resale under federal securities laws. Disposal of a restricted investment may involve time-consuming negotiations and expenses, and prompt sale at an acceptable price may be difficult to achieve. Private placement securities are generally considered to be restricted, although certain of those securities may be traded between qualified institutional investors under the provisions of Section 4(a)(2) and Rule 144A. The Fund will not incur any registration costs upon such a trade. These securities are valued at fair value determined in good faith under consistently applied procedures approved by the Fund’s Board of Trustees. At August 31, 2023, the total market value of these securities amounted to $0, which represents less than 0.01% of total net assets. Additional information on these securities is as follows: |
| Security | Acquisition
Dates | Shares | Cost ($) | Value ($) |
| Lukoil PJSC | 01/27/2022 | 48,225 | 4,239,605 | — |
| (c) | As a result of sanctions and restricted cross-border payments, certain income and/or principal has not been recognized by the Fund. The Fund will continue to monitor the net realizable value and record the income when it is considered collectible. |
| (d) | Valuation based on significant unobservable inputs. |
| (e) | Non-income producing investment. |
| (f) | The rate shown is the seven-day current annualized yield at August 31, 2023. |
| (g) | As defined in the Investment Company Act of 1940, as amended, an affiliated company is one in which the Fund owns 5% or more of the company’s outstanding voting securities, or a company which is under common ownership or control with the Fund. The value of the holdings and transactions in these affiliated companies during the period ended August 31, 2023 are as follows: |
| Affiliated issuers | Beginning
of period($) | Purchases($) | Sales($) | Net change in
unrealized
appreciation
(depreciation)($) | End of
period($) | Realized gain
(loss)($) | Dividends($) | End of
period shares |
| Columbia Short-Term Cash Fund, 5.476% |
| | 4,890,862 | 44,183,964 | (42,789,099) | 696 | 6,286,423 | 286 | 167,901 | 6,288,309 |
Abbreviation Legend
| ADR | American Depositary Receipt |
Currency Legend
| AUD | Australian Dollar |
| CAD | Canada Dollar |
| CHF | Swiss Franc |
| EUR | Euro |
| GBP | British Pound |
| JPY | Japanese Yen |
| KRW | South Korean Won |
| NOK | Norwegian Krone |
| NZD | New Zealand Dollar |
| SEK | Swedish Krona |
| SGD | Singapore Dollar |
| USD | US Dollar |
Fair value measurements
The Fund categorizes its fair value measurements according to a three-level hierarchy that maximizes the use of observable inputs and minimizes the use of unobservable inputs by prioritizing that the most observable input be used when available. Observable inputs are those that market participants would use in pricing an investment based on market data obtained from sources independent of the reporting entity. Unobservable inputs are those that reflect the Fund’s assumptions about the information market participants would use in pricing an investment. An investment’s level within the fair value hierarchy is based on the lowest level of any input that is deemed significant to the asset’s or liability’s fair value measurement. The input levels are not necessarily an indication of the risk or liquidity associated with investments at that level. For example, certain U.S. government securities are generally high quality and liquid, however, they are reflected as Level 2 because the inputs used to determine fair value may not always be quoted prices in an active market.
Fair value inputs are summarized in the three broad levels listed below:
The accompanying Notes to Financial Statements are an integral part of this statement.
| 8 | Columbia Global Value Fund | Semiannual Report 2023 |
Portfolio of Investments (continued)
August 31, 2023 (Unaudited)
Fair value measurements (continued)
| ■ | Level 1 — Valuations based on quoted prices for investments in active markets that the Fund has the ability to access at the measurement date. Valuation adjustments are not applied to Level 1 investments. |
| ■ | Level 2 — Valuations based on other significant observable inputs (including quoted prices for similar securities, interest rates, prepayment speeds, credit risks, etc.). |
| ■ | Level 3 — Valuations based on significant unobservable inputs (including the Fund’s own assumptions and judgment in determining the fair value of investments). |
Inputs that are used in determining fair value of an investment may include price information, credit data, volatility statistics, and other factors. These inputs can be either observable or unobservable. The availability of observable inputs can vary between investments, and is affected by various factors such as the type of investment, and the volume and level of activity for that investment or similar investments in the marketplace. The inputs will be considered by the Investment Manager, along with any other relevant factors in the calculation of an investment’s fair value. The Fund uses prices and inputs that are current as of the measurement date, which may include periods of market dislocations. During these periods, the availability of prices and inputs may be reduced for many investments. This condition could cause an investment to be reclassified between the various levels within the hierarchy.
Foreign equity securities actively traded in markets where there is a significant delay in the local close relative to the New York Stock Exchange are classified as Level 2. The values of these securities may include an adjustment to reflect the impact of market movements following the close of local trading, as described in Note 2 to the financial statements – Security valuation.
Investments falling into the Level 3 category are primarily supported by quoted prices from brokers and dealers participating in the market for those investments. However, these may be classified as Level 3 investments due to lack of market transparency and corroboration to support these quoted prices. Additionally, valuation models may be used as the pricing source for any remaining investments classified as Level 3. These models may rely on one or more significant unobservable inputs and/or significant assumptions by the Investment Manager. Inputs used in valuations may include, but are not limited to, financial statement analysis, capital account balances, discount rates and estimated cash flows, and comparable company data.
The Fund’s Board of Trustees (the Board) has designated the Investment Manager, through its Valuation Committee (the Committee), as valuation designee, responsible for determining the fair value of the assets of the Fund for which market quotations are not readily available using valuation procedures approved by the Board. The Committee consists of voting and non-voting members from various groups within the Investment Manager’s organization, including operations and accounting, trading and investments, compliance, risk management and legal.
The Committee meets at least monthly to review and approve valuation matters, which may include a description of specific valuation determinations, data regarding pricing information received from approved pricing vendors and brokers and the results of Board-approved valuation policies and procedures (the Policies). The Policies address, among other things, instances when market quotations are or are not readily available, including recommendations of third party pricing vendors and a determination of appropriate pricing methodologies; events that require specific valuation determinations and assessment of fair value techniques; securities with a potential for stale pricing, including those that are illiquid, restricted, or in default; and the effectiveness of third party pricing vendors, including periodic reviews of vendors. The Committee meets more frequently, as needed, to discuss additional valuation matters, which may include the need to review back-testing results, review time-sensitive information or approve related valuation actions. Representatives of Columbia Management Investment Advisers, LLC report to the Board at each of its regularly scheduled meetings to discuss valuation matters and actions during the period, similar to those described earlier.
The following table is a summary of the inputs used to value the Fund’s investments at August 31, 2023:
| | Level 1 ($) | Level 2 ($) | Level 3 ($) | Total ($) |
| Investments in Securities | | | | |
| Common Stocks | | | | |
| Australia | — | 12,462,726 | — | 12,462,726 |
| Canada | 11,731,812 | — | — | 11,731,812 |
| Finland | — | 7,513,009 | — | 7,513,009 |
| France | — | 32,579,604 | — | 32,579,604 |
| Hong Kong | — | 6,577,310 | — | 6,577,310 |
| Japan | — | 56,058,481 | — | 56,058,481 |
| Netherlands | — | 32,299,092 | — | 32,299,092 |
| Russian Federation | — | — | 0* | 0* |
| Singapore | — | 14,161,187 | — | 14,161,187 |
| South Korea | — | 12,388,505 | — | 12,388,505 |
| United Kingdom | 10,053,509 | 35,919,871 | — | 45,973,380 |
| United States | 554,075,049 | 3,354,720 | — | 557,429,769 |
| Total Common Stocks | 575,860,370 | 213,314,505 | 0* | 789,174,875 |
| Exchange-Traded Equity Funds | 2,878,333 | — | — | 2,878,333 |
| Money Market Funds | 6,286,423 | — | — | 6,286,423 |
| Total Investments in Securities | 585,025,126 | 213,314,505 | 0* | 798,339,631 |
| Investments in Derivatives | | | | |
| Asset | | | | |
| Forward Foreign Currency Exchange Contracts | — | 1,925,575 | — | 1,925,575 |
| Liability | | | | |
| Forward Foreign Currency Exchange Contracts | — | (2,399,592) | — | (2,399,592) |
| Total | 585,025,126 | 212,840,488 | 0* | 797,865,614 |
See the Portfolio of Investments for all investment classifications not indicated in the table.
The accompanying Notes to Financial Statements are an integral part of this statement.
Columbia Global Value Fund | Semiannual Report 2023
| 9 |
Portfolio of Investments (continued)
August 31, 2023 (Unaudited)
Fair value measurements (continued)
The Fund’s assets assigned to the Level 2 input category are generally valued using the market approach, in which a security’s value is determined through reference to prices and information from market transactions for similar or identical assets. These assets include certain foreign securities for which a third party statistical pricing service may be employed for purposes of fair market valuation. The model utilized by such third party statistical pricing service takes into account a security’s correlation to available market data including, but not limited to, intraday index, ADR, and exchange-traded fund movements.
Derivative instruments are valued at unrealized appreciation (depreciation).
The Fund does not hold any significant investments (greater than one percent of net assets) categorized as Level 3.
The accompanying Notes to Financial Statements are an integral part of this statement.
| 10 | Columbia Global Value Fund | Semiannual Report 2023 |
Statement of Assets and Liabilities
August 31, 2023 (Unaudited)
| Assets | |
| Investments in securities, at value | |
| Unaffiliated issuers (cost $710,961,003) | $792,053,208 |
| Affiliated issuers (cost $6,285,376) | 6,286,423 |
| Unrealized appreciation on forward foreign currency exchange contracts | 1,925,575 |
| Receivable for: | |
| Investments sold | 804,561 |
| Capital shares sold | 168,947 |
| Dividends | 2,017,120 |
| Foreign tax reclaims | 302,230 |
| Trustees’ fees | 80,101 |
| Prepaid expenses | 11,888 |
| Other assets | 13,775 |
| Total assets | 803,663,828 |
| Liabilities | |
| Foreign currency (cost $15,679) | 15,685 |
| Unrealized depreciation on forward foreign currency exchange contracts | 2,399,592 |
| Payable for: | |
| Capital shares redeemed | 516,698 |
| Management services fees | 15,418 |
| Distribution and/or service fees | 4,604 |
| Transfer agent fees | 75,799 |
| Trustees’ fees | 352,291 |
| Compensation of chief compliance officer | 77 |
| Other expenses | 17,881 |
| Total liabilities | 3,398,045 |
| Net assets applicable to outstanding capital stock | $800,265,783 |
| Represented by | |
| Paid in capital | 756,561,301 |
| Total distributable earnings (loss) | 43,704,482 |
| Total - representing net assets applicable to outstanding capital stock | $800,265,783 |
The accompanying Notes to Financial Statements are an integral part of this statement.
Columbia Global Value Fund | Semiannual Report 2023
| 11 |
Statement of Assets and Liabilities (continued)
August 31, 2023 (Unaudited)
| Class A | |
| Net assets | $625,922,594 |
| Shares outstanding | 52,795,751 |
| Net asset value per share | $11.86 |
| Maximum sales charge | 5.75% |
| Maximum offering price per share (calculated by dividing the net asset value per share by 1.0 minus the maximum sales charge for Class A shares) | $12.58 |
| Advisor Class | |
| Net assets | $6,006,148 |
| Shares outstanding | 502,837 |
| Net asset value per share | $11.94 |
| Class C | |
| Net assets | $8,086,170 |
| Shares outstanding | 696,156 |
| Net asset value per share | $11.62 |
| Institutional Class | |
| Net assets | $130,251,629 |
| Shares outstanding | 10,954,743 |
| Net asset value per share | $11.89 |
| Institutional 2 Class | |
| Net assets | $8,408,330 |
| Shares outstanding | 709,495 |
| Net asset value per share | $11.85 |
| Institutional 3 Class | |
| Net assets | $15,676,250 |
| Shares outstanding | 1,378,007 |
| Net asset value per share | $11.38 |
| Class R | |
| Net assets | $5,914,662 |
| Shares outstanding | 500,865 |
| Net asset value per share | $11.81 |
The accompanying Notes to Financial Statements are an integral part of this statement.
| 12 | Columbia Global Value Fund | Semiannual Report 2023 |
Statement of Operations
Six Months Ended August 31, 2023 (Unaudited)
| Net investment income | |
| Income: | |
| Dividends — unaffiliated issuers | $15,309,683 |
| Dividends — affiliated issuers | 167,901 |
| Foreign taxes withheld | (714,636) |
| Total income | 14,762,948 |
| Expenses: | |
| Management services fees | 2,837,797 |
| Distribution and/or service fees | |
| Class A | 790,020 |
| Class C | 41,305 |
| Class R | 15,258 |
| Transfer agent fees | |
| Class A | 398,979 |
| Advisor Class | 3,716 |
| Class C | 5,216 |
| Institutional Class | 84,529 |
| Institutional 2 Class | 2,596 |
| Institutional 3 Class | 642 |
| Class R | 3,854 |
| Trustees’ fees | 30,806 |
| Custodian fees | 24,999 |
| Printing and postage fees | 42,412 |
| Registration fees | 56,329 |
| Accounting services fees | 34,085 |
| Legal fees | 9,994 |
| Interest on collateral | 2,903 |
| Compensation of chief compliance officer | 77 |
| Other | 18,373 |
| Total expenses | 4,403,890 |
| Net investment income | 10,359,058 |
| Realized and unrealized gain (loss) — net | |
| Net realized gain (loss) on: | |
| Investments — unaffiliated issuers | 14,817,682 |
| Investments — affiliated issuers | 286 |
| Foreign currency translations | (49,534) |
| Forward foreign currency exchange contracts | 2,411,564 |
| Option contracts written | 53,821 |
| Net realized gain | 17,233,819 |
| Net change in unrealized appreciation (depreciation) on: | |
| Investments — unaffiliated issuers | 5,209,544 |
| Investments — affiliated issuers | 696 |
| Foreign currency translations | 32,066 |
| Forward foreign currency exchange contracts | (1,549,239) |
| Net change in unrealized appreciation (depreciation) | 3,693,067 |
| Net realized and unrealized gain | 20,926,886 |
| Net increase in net assets resulting from operations | $31,285,944 |
The accompanying Notes to Financial Statements are an integral part of this statement.
Columbia Global Value Fund | Semiannual Report 2023
| 13 |
Statement of Changes in Net Assets
| | Six Months Ended
August 31, 2023
(Unaudited) | Year Ended
February 28, 2023 |
| Operations | | |
| Net investment income | $10,359,058 | $14,593,970 |
| Net realized gain | 17,233,819 | 26,341,714 |
| Net change in unrealized appreciation (depreciation) | 3,693,067 | (61,005,676) |
| Net increase (decrease) in net assets resulting from operations | 31,285,944 | (20,069,992) |
| Distributions to shareholders | | |
| Net investment income and net realized gains | | |
| Class A | (19,652,054) | (47,053,581) |
| Advisor Class | (186,869) | (508,198) |
| Class C | (230,458) | (656,180) |
| Institutional Class | (4,281,361) | (10,693,987) |
| Institutional 2 Class | (273,363) | (4,318,013) |
| Institutional 3 Class | (515,372) | (712,368) |
| Class R | (182,615) | (437,067) |
| Total distributions to shareholders | (25,322,092) | (64,379,394) |
| Decrease in net assets from capital stock activity | (19,330,314) | (76,626,875) |
| Total decrease in net assets | (13,366,462) | (161,076,261) |
| Net assets at beginning of period | 813,632,245 | 974,708,506 |
| Net assets at end of period | $800,265,783 | $813,632,245 |
The accompanying Notes to Financial Statements are an integral part of this statement.
| 14 | Columbia Global Value Fund | Semiannual Report 2023 |
Statement of Changes in Net Assets (continued)
| | Six Months Ended | Year Ended |
| | August 31, 2023 (Unaudited) | February 28, 2023 |
| | Shares | Dollars ($) | Shares | Dollars ($) |
| Capital stock activity |
| Class A | | | | |
| Shares sold | 355,210 | 4,177,241 | 1,057,347 | 12,178,834 |
| Distributions reinvested | 1,563,225 | 18,342,333 | 4,045,837 | 43,975,633 |
| Shares redeemed | (2,982,656) | (35,109,212) | (6,294,521) | (73,402,862) |
| Net decrease | (1,064,221) | (12,589,638) | (1,191,337) | (17,248,395) |
| Advisor Class | | | | |
| Shares sold | 52,102 | 617,130 | 132,358 | 1,571,155 |
| Distributions reinvested | 13,159 | 155,340 | 38,995 | 427,022 |
| Shares redeemed | (60,498) | (717,499) | (248,167) | (2,879,175) |
| Net increase (decrease) | 4,763 | 54,971 | (76,814) | (880,998) |
| Class C | | | | |
| Shares sold | 8,369 | 96,641 | 45,688 | 516,066 |
| Distributions reinvested | 19,857 | 229,123 | 61,736 | 654,781 |
| Shares redeemed | (71,179) | (816,196) | (280,309) | (3,185,575) |
| Net decrease | (42,953) | (490,432) | (172,885) | (2,014,728) |
| Institutional Class | | | | |
| Shares sold | 451,445 | 5,339,607 | 1,003,017 | 11,724,293 |
| Distributions reinvested | 330,237 | 3,881,565 | 889,213 | 9,706,409 |
| Shares redeemed | (1,402,229) | (16,574,983) | (2,362,528) | (27,347,764) |
| Net decrease | (620,547) | (7,353,811) | (470,298) | (5,917,062) |
| Institutional 2 Class | | | | |
| Shares sold | 67,177 | 793,570 | 415,453 | 5,015,187 |
| Distributions reinvested | 23,340 | 273,285 | 396,061 | 4,282,197 |
| Shares redeemed | (145,107) | (1,712,843) | (5,646,478) | (64,232,463) |
| Net decrease | (54,590) | (645,988) | (4,834,964) | (54,935,079) |
| Institutional 3 Class | | | | |
| Shares sold | 302,473 | 3,417,490 | 681,678 | 7,597,930 |
| Distributions reinvested | 45,353 | 510,360 | 67,545 | 708,542 |
| Shares redeemed | (150,281) | (1,698,073) | (328,683) | (3,766,597) |
| Net increase | 197,545 | 2,229,777 | 420,540 | 4,539,875 |
| Class R | | | | |
| Shares sold | 58,207 | 682,283 | 167,223 | 1,940,562 |
| Distributions reinvested | 15,607 | 182,615 | 40,371 | 437,064 |
| Shares redeemed | (119,458) | (1,400,091) | (215,393) | (2,548,114) |
| Net decrease | (45,644) | (535,193) | (7,799) | (170,488) |
| Total net decrease | (1,625,647) | (19,330,314) | (6,333,557) | (76,626,875) |
The accompanying Notes to Financial Statements are an integral part of this statement.
Columbia Global Value Fund | Semiannual Report 2023
| 15 |
The following table is intended to help you understand the Fund’s financial performance. Certain information reflects financial results for a single share of a class held for the periods shown. Per share net investment income (loss) amounts are calculated based on average shares outstanding during the period. Total return assumes reinvestment of all dividends and distributions, if any. Total return does not reflect payment of sales charges, if any. Total return and portfolio turnover are not annualized for periods of less than one year. The ratios of expenses and net investment income are annualized for periods of less than one year. The portfolio turnover rate is calculated without regard to purchase and sales transactions of short-term instruments and certain derivatives, if any. If such transactions were included, the Fund’s portfolio turnover rate may be higher.
| | Net asset value,
beginning of
period | Net
investment
income | Net
realized
and
unrealized
gain (loss) | Total from
investment
operations | Distributions
from net
investment
income | Distributions
from net
realized
gains | Total
distributions to
shareholders |
| Class A |
| Six Months Ended 8/31/2023 (Unaudited) | $11.77 | 0.15 | 0.31 | 0.46 | (0.11) | (0.26) | (0.37) |
| Year Ended 2/28/2023 | $12.91 | 0.19 | (0.46) | (0.27) | (0.18) | (0.69) | (0.87) |
| Year Ended 2/28/2022 | $12.87 | 0.21 | 1.35 | 1.56 | (0.33) | (1.19) | (1.52) |
| Year Ended 2/28/2021 | $11.89 | 0.19 | 1.89 | 2.08 | (0.20) | (0.90) | (1.10) |
| Year Ended 2/29/2020 | $13.00 | 0.29 | (0.18) | 0.11 | (0.27) | (0.95) | (1.22) |
| Year Ended 2/28/2019 | $14.20 | 0.22 | (0.22) | 0.00(e) | (0.17) | (1.03) | (1.20) |
| Advisor Class |
| Six Months Ended 8/31/2023 (Unaudited) | $11.85 | 0.16 | 0.32 | 0.48 | (0.13) | (0.26) | (0.39) |
| Year Ended 2/28/2023 | $13.00 | 0.23 | (0.48) | (0.25) | (0.21) | (0.69) | (0.90) |
| Year Ended 2/28/2022 | $12.95 | 0.24 | 1.37 | 1.61 | (0.37) | (1.19) | (1.56) |
| Year Ended 2/28/2021 | $11.96 | 0.20 | 1.92 | 2.12 | (0.23) | (0.90) | (1.13) |
| Year Ended 2/29/2020 | $13.07 | 0.32 | (0.18) | 0.14 | (0.30) | (0.95) | (1.25) |
| Year Ended 2/28/2019 | $14.26 | 0.24 | (0.20) | 0.04 | (0.20) | (1.03) | (1.23) |
| Class C |
| Six Months Ended 8/31/2023 (Unaudited) | $11.54 | 0.10 | 0.31 | 0.41 | (0.07) | (0.26) | (0.33) |
| Year Ended 2/28/2023 | $12.67 | 0.11 | (0.46) | (0.35) | (0.09) | (0.69) | (0.78) |
| Year Ended 2/28/2022 | $12.66 | 0.11 | 1.32 | 1.43 | (0.23) | (1.19) | (1.42) |
| Year Ended 2/28/2021 | $11.70 | 0.06 | 1.91 | 1.97 | (0.11) | (0.90) | (1.01) |
| Year Ended 2/29/2020 | $12.81 | 0.19 | (0.18) | 0.01 | (0.17) | (0.95) | (1.12) |
| Year Ended 2/28/2019 | $14.04 | 0.16 | (0.27) | (0.11) | (0.09) | (1.03) | (1.12) |
| Institutional Class |
| Six Months Ended 8/31/2023 (Unaudited) | $11.80 | 0.16 | 0.32 | 0.48 | (0.13) | (0.26) | (0.39) |
| Year Ended 2/28/2023 | $12.95 | 0.22 | (0.47) | (0.25) | (0.21) | (0.69) | (0.90) |
| Year Ended 2/28/2022 | $12.90 | 0.24 | 1.37 | 1.61 | (0.37) | (1.19) | (1.56) |
| Year Ended 2/28/2021 | $11.92 | 0.21 | 1.90 | 2.11 | (0.23) | (0.90) | (1.13) |
| Year Ended 2/29/2020 | $13.03 | 0.32 | (0.18) | 0.14 | (0.30) | (0.95) | (1.25) |
| Year Ended 2/28/2019 | $14.22 | 0.25 | (0.21) | 0.04 | (0.20) | (1.03) | (1.23) |
| Institutional 2 Class |
| Six Months Ended 8/31/2023 (Unaudited) | $11.77 | 0.17 | 0.30 | 0.47 | (0.13) | (0.26) | (0.39) |
| Year Ended 2/28/2023 | $12.91 | 0.27 | (0.50) | (0.23) | (0.22) | (0.69) | (0.91) |
| Year Ended 2/28/2022 | $12.87 | 0.25 | 1.36 | 1.61 | (0.38) | (1.19) | (1.57) |
| Year Ended 2/28/2021 | $11.89 | 0.19 | 1.93 | 2.12 | (0.24) | (0.90) | (1.14) |
| Year Ended 2/29/2020 | $13.00 | 0.32 | (0.17) | 0.15 | (0.31) | (0.95) | (1.26) |
| Year Ended 2/28/2019 | $14.19 | 0.25 | (0.21) | 0.04 | (0.20) | (1.03) | (1.23) |
The accompanying Notes to Financial Statements are an integral part of this statement.
| 16 | Columbia Global Value Fund | Semiannual Report 2023 |
Financial Highlights (continued)
| | Net
asset
value,
end of
period | Total
return | Total gross
expense
ratio to
average
net assets(a) | Total net
expense
ratio to
average
net assets(a),(b) | Net investment
income
ratio to
average
net assets | Portfolio
turnover | Net
assets,
end of
period
(000’s) |
| Class A |
| Six Months Ended 8/31/2023 (Unaudited) | $11.86 | 3.98% | 1.13%(c) | 1.13%(c) | 2.52% | 35% | $625,923 |
| Year Ended 2/28/2023 | $11.77 | (1.40%) | 1.13%(c) | 1.13%(c),(d) | 1.65% | 52% | $633,847 |
| Year Ended 2/28/2022 | $12.91 | 12.13% | 1.11%(c) | 1.11%(c),(d) | 1.52% | 48% | $710,822 |
| Year Ended 2/28/2021 | $12.87 | 18.84% | 1.15%(c) | 1.15%(c),(d) | 1.61% | 70% | $696,568 |
| Year Ended 2/29/2020 | $11.89 | 0.36% | 1.13%(c) | 1.13%(c),(d) | 2.20% | 37% | $570,739 |
| Year Ended 2/28/2019 | $13.00 | 0.40% | 1.15%(c) | 1.15%(c),(d) | 1.62% | 33% | $645,363 |
| Advisor Class |
| Six Months Ended 8/31/2023 (Unaudited) | $11.94 | 4.08% | 0.88%(c) | 0.88%(c) | 2.77% | 35% | $6,006 |
| Year Ended 2/28/2023 | $11.85 | (1.21%) | 0.88%(c) | 0.87%(c),(d) | 1.93% | 52% | $5,904 |
| Year Ended 2/28/2022 | $13.00 | 12.44% | 0.83%(c) | 0.83%(c),(d) | 1.77% | 48% | $7,474 |
| Year Ended 2/28/2021 | $12.95 | 19.14% | 0.90%(c) | 0.90%(c),(d) | 1.72% | 70% | $4,937 |
| Year Ended 2/29/2020 | $11.96 | 0.61% | 0.88%(c) | 0.88%(c),(d) | 2.44% | 37% | $2,349 |
| Year Ended 2/28/2019 | $13.07 | 0.66% | 0.90%(c) | 0.90%(c),(d) | 1.77% | 33% | $1,856 |
| Class C |
| Six Months Ended 8/31/2023 (Unaudited) | $11.62 | 3.57% | 1.89%(c) | 1.89%(c) | 1.77% | 35% | $8,086 |
| Year Ended 2/28/2023 | $11.54 | (2.13%) | 1.88%(c) | 1.87%(c),(d) | 0.92% | 52% | $8,527 |
| Year Ended 2/28/2022 | $12.67 | 11.24% | 1.85%(c) | 1.85%(c),(d) | 0.82% | 48% | $11,556 |
| Year Ended 2/28/2021 | $12.66 | 18.01% | 1.90%(c) | 1.90%(c),(d) | 0.54% | 70% | $14,480 |
| Year Ended 2/29/2020 | $11.70 | (0.39%) | 1.89%(c) | 1.89%(c),(d) | 1.46% | 37% | $3,696 |
| Year Ended 2/28/2019 | $12.81 | (0.39%) | 1.89%(c) | 1.89%(c),(d) | 1.17% | 33% | $5,573 |
| Institutional Class |
| Six Months Ended 8/31/2023 (Unaudited) | $11.89 | 4.10% | 0.88%(c) | 0.88%(c) | 2.78% | 35% | $130,252 |
| Year Ended 2/28/2023 | $11.80 | (1.22%) | 0.88%(c) | 0.88%(c),(d) | 1.91% | 52% | $136,608 |
| Year Ended 2/28/2022 | $12.95 | 12.47% | 0.85%(c) | 0.85%(c),(d) | 1.77% | 48% | $155,962 |
| Year Ended 2/28/2021 | $12.90 | 19.11% | 0.90%(c) | 0.90%(c),(d) | 1.78% | 70% | $148,950 |
| Year Ended 2/29/2020 | $11.92 | 0.61% | 0.88%(c) | 0.88%(c),(d) | 2.45% | 37% | $88,301 |
| Year Ended 2/28/2019 | $13.03 | 0.66% | 0.90%(c) | 0.90%(c),(d) | 1.87% | 33% | $99,972 |
| Institutional 2 Class |
| Six Months Ended 8/31/2023 (Unaudited) | $11.85 | 4.07% | 0.82%(c) | 0.82%(c) | 2.85% | 35% | $8,408 |
| Year Ended 2/28/2023 | $11.77 | (1.06%) | 0.78%(c) | 0.78%(c) | 2.26% | 52% | $8,990 |
| Year Ended 2/28/2022 | $12.91 | 12.48% | 0.79%(c) | 0.79%(c) | 1.81% | 48% | $72,299 |
| Year Ended 2/28/2021 | $12.87 | 19.26% | 0.84%(c) | 0.84%(c) | 1.55% | 70% | $63,366 |
| Year Ended 2/29/2020 | $11.89 | 0.68% | 0.81%(c) | 0.81%(c) | 2.48% | 37% | $1,008 |
| Year Ended 2/28/2019 | $13.00 | 0.72% | 0.83%(c) | 0.83%(c) | 1.86% | 33% | $626 |
The accompanying Notes to Financial Statements are an integral part of this statement.
Columbia Global Value Fund | Semiannual Report 2023
| 17 |
Financial Highlights (continued)
| | Net asset value,
beginning of
period | Net
investment
income | Net
realized
and
unrealized
gain (loss) | Total from
investment
operations | Distributions
from net
investment
income | Distributions
from net
realized
gains | Total
distributions to
shareholders |
| Institutional 3 Class |
| Six Months Ended 8/31/2023 (Unaudited) | $11.31 | 0.16 | 0.30 | 0.46 | (0.13) | (0.26) | (0.39) |
| Year Ended 2/28/2023 | $12.45 | 0.22 | (0.44) | (0.22) | (0.23) | (0.69) | (0.92) |
| Year Ended 2/28/2022 | $12.46 | 0.25 | 1.32 | 1.57 | (0.39) | (1.19) | (1.58) |
| Year Ended 2/28/2021 | $11.55 | 0.19 | 1.87 | 2.06 | (0.25) | (0.90) | (1.15) |
| Year Ended 2/29/2020 | $12.66 | 0.32 | (0.16) | 0.16 | (0.32) | (0.95) | (1.27) |
| Year Ended 2/28/2019 | $13.85 | 0.25 | (0.20) | 0.05 | (0.21) | (1.03) | (1.24) |
| Class R |
| Six Months Ended 8/31/2023 (Unaudited) | $11.72 | 0.13 | 0.32 | 0.45 | (0.10) | (0.26) | (0.36) |
| Year Ended 2/28/2023 | $12.87 | 0.16 | (0.47) | (0.31) | (0.15) | (0.69) | (0.84) |
| Year Ended 2/28/2022 | $12.83 | 0.18 | 1.35 | 1.53 | (0.30) | (1.19) | (1.49) |
| Year Ended 2/28/2021 | $11.85 | 0.13 | 1.92 | 2.05 | (0.17) | (0.90) | (1.07) |
| Year Ended 2/29/2020 | $12.96 | 0.26 | (0.18) | 0.08 | (0.24) | (0.95) | (1.19) |
| Year Ended 2/28/2019 | $14.17 | 0.18 | (0.22) | (0.04) | (0.14) | (1.03) | (1.17) |
| Notes to Financial Highlights |
| (a) | In addition to the fees and expenses that the Fund bears directly, the Fund indirectly bears a pro rata share of the fees and expenses of any other funds in which it invests. Such indirect expenses are not included in the Fund’s reported expense ratios. |
| (b) | Total net expenses include the impact of certain fee waivers/expense reimbursements made by the Investment Manager and certain of its affiliates, if applicable. |
| (c) | Ratios include interest on collateral expense which is less than 0.01%. |
| (d) | The benefits derived from expense reductions had an impact of less than 0.01%. |
| (e) | Rounds to zero. |
The accompanying Notes to Financial Statements are an integral part of this statement.
| 18 | Columbia Global Value Fund | Semiannual Report 2023 |
Financial Highlights (continued)
| | Net
asset
value,
end of
period | Total
return | Total gross
expense
ratio to
average
net assets(a) | Total net
expense
ratio to
average
net assets(a),(b) | Net investment
income
ratio to
average
net assets | Portfolio
turnover | Net
assets,
end of
period
(000’s) |
| Institutional 3 Class |
| Six Months Ended 8/31/2023 (Unaudited) | $11.38 | 4.16% | 0.77%(c) | 0.77%(c) | 2.87% | 35% | $15,676 |
| Year Ended 2/28/2023 | $11.31 | (1.05%) | 0.76%(c) | 0.76%(c) | 1.94% | 52% | $13,349 |
| Year Ended 2/28/2022 | $12.45 | 12.59% | 0.70%(c) | 0.70%(c) | 1.90% | 48% | $9,462 |
| Year Ended 2/28/2021 | $12.46 | 19.29% | 0.78%(c) | 0.78%(c) | 1.65% | 70% | $8,071 |
| Year Ended 2/29/2020 | $11.55 | 0.75% | 0.77%(c) | 0.77%(c) | 2.56% | 37% | $809 |
| Year Ended 2/28/2019 | $12.66 | 0.78% | 0.78%(c) | 0.78%(c) | 1.96% | 33% | $578 |
| Class R |
| Six Months Ended 8/31/2023 (Unaudited) | $11.81 | 3.86% | 1.39%(c) | 1.39%(c) | 2.29% | 35% | $5,915 |
| Year Ended 2/28/2023 | $11.72 | (1.74%) | 1.38%(c) | 1.38%(c),(d) | 1.39% | 52% | $6,407 |
| Year Ended 2/28/2022 | $12.87 | 11.92% | 1.32%(c) | 1.32%(c),(d) | 1.34% | 48% | $7,132 |
| Year Ended 2/28/2021 | $12.83 | 18.59% | 1.40%(c) | 1.40%(c),(d) | 1.08% | 70% | $7,825 |
| Year Ended 2/29/2020 | $11.85 | 0.11% | 1.38%(c) | 1.38%(c),(d) | 1.96% | 37% | $784 |
| Year Ended 2/28/2019 | $12.96 | 0.14% | 1.40%(c) | 1.40%(c),(d) | 1.37% | 33% | $1,187 |
The accompanying Notes to Financial Statements are an integral part of this statement.
Columbia Global Value Fund | Semiannual Report 2023
| 19 |
Notes to Financial Statements
August 31, 2023 (Unaudited)
Note 1. Organization
Columbia Global Value Fund (the Fund), a series of Columbia Funds Series Trust II (the Trust), is a diversified fund. The Trust is registered under the Investment Company Act of 1940, as amended (the 1940 Act), as an open-end management investment company organized as a Massachusetts business trust.
Fund shares
The Trust may issue an unlimited number of shares (without par value). The Fund offers each of the share classes listed in the Statement of Assets and Liabilities. Although all share classes generally have identical voting, dividend and liquidation rights, each share class votes separately when required by the Trust’s organizational documents or by law. Each share class has its own expense and sales charge structure. Different share classes may have different minimum initial investment amounts and pay different net investment income distribution amounts to the extent the expenses of distributing such share classes vary. Distributions to shareholders in a liquidation will be proportional to the net asset value of each share class.
As described in the Fund’s prospectus, Class A and Class C shares are offered to the general public for investment. Class C shares automatically convert to Class A shares after 8 years. Advisor Class, Institutional Class, Institutional 2 Class, Institutional 3 Class and Class R shares are available for purchase through authorized investment professionals to omnibus retirement plans or to institutional investors and to certain other investors as also described in the Fund’s prospectus.
Note 2. Summary of significant accounting policies
Basis of preparation
The Fund is an investment company that applies the accounting and reporting guidance in the Financial Accounting Standards Board (FASB) Accounting Standards Codification Topic 946, Financial Services - Investment Companies (ASC 946). The financial statements are prepared in accordance with U.S. generally accepted accounting principles (GAAP), which requires management to make certain estimates and assumptions that affect the reported amounts of assets and liabilities, the disclosure of contingent assets and liabilities at the date of the financial statements and the reported amounts of income and expenses during the reporting period. Actual results could differ from those estimates.
The following is a summary of significant accounting policies followed by the Fund in the preparation of its financial statements.
Security valuation
Equity securities listed on an exchange are valued at the closing price or last trade price on their primary exchange at the close of business of the New York Stock Exchange. Securities with a closing price not readily available or not listed on any exchange are valued at the mean between the closing bid and ask prices. Listed preferred stocks convertible into common stocks are valued using an evaluated price from a pricing service.
Foreign equity securities are valued based on the closing price or last trade price on their primary exchange at the close of business of the New York Stock Exchange. If any foreign equity security closing prices are not readily available, the securities are valued at the mean of the latest quoted bid and ask prices on such exchanges or markets. Foreign currency exchange rates are determined at the scheduled closing time of the New York Stock Exchange. Many securities markets and exchanges outside the U.S. close prior to the close of the New York Stock Exchange; therefore, the closing prices for securities in such markets or on such exchanges may not fully reflect events that occur after such close but before the close of the New York Stock Exchange. In those situations, foreign securities will be fair valued pursuant to a policy approved by the Board of Trustees. Under the policy, the Fund may utilize a third-party pricing service to determine these fair values. The third-party pricing service takes into account multiple factors, including, but not limited to, movements in the U.S. securities markets, certain depositary receipts, futures contracts and foreign exchange rates that have occurred subsequent to the close of the foreign exchange or market, to determine a good faith estimate that reasonably reflects the current market conditions as of the close of the New York Stock Exchange. The fair value of a security is likely to be different from the quoted or published price, if available.
Investments in open-end investment companies (other than exchange-traded funds (ETFs)), are valued at the latest net asset value reported by those companies as of the valuation time.
| 20 | Columbia Global Value Fund | Semiannual Report 2023 |
Notes to Financial Statements (continued)
August 31, 2023 (Unaudited)
Forward foreign currency exchange contracts are marked-to-market based upon foreign currency exchange rates provided by a pricing service.
Investments for which market quotations are not readily available, or that have quotations which management believes are not reflective of market value or reliable, are valued at fair value as determined in good faith under procedures approved by the Board of Trustees. If a security or class of securities (such as foreign securities) is valued at fair value, such value is likely to be different from the quoted or published price for the security, if available.
The determination of fair value often requires significant judgment. To determine fair value, management may use assumptions including but not limited to future cash flows and estimated risk premiums. Multiple inputs from various sources may be used to determine fair value.
GAAP requires disclosure regarding the inputs and valuation techniques used to measure fair value and any changes in valuation inputs or techniques. In addition, investments shall be disclosed by major category. This information is disclosed following the Fund’s Portfolio of Investments.
Foreign currency transactions and translations
The values of all assets and liabilities denominated in foreign currencies are generally translated into U.S. dollars at exchange rates determined at the close of regular trading on the New York Stock Exchange. Net realized and unrealized gains (losses) on foreign currency transactions and translations include gains (losses) arising from the fluctuation in exchange rates between trade and settlement dates on securities transactions, gains (losses) arising from the disposition of foreign currency and currency gains (losses) between the accrual and payment dates on dividends, interest income and foreign withholding taxes.
For financial statement purposes, the Fund does not distinguish that portion of gains (losses) on investments which is due to changes in foreign exchange rates from that which is due to changes in market prices of the investments. Such fluctuations are included with the net realized and unrealized gains (losses) on investments in the Statement of Operations.
Derivative instruments
The Fund invests in certain derivative instruments, as detailed below, in seeking to meet its investment objectives. Derivatives are instruments whose values depend on, or are derived from, in whole or in part, the value of one or more securities, currencies, commodities, indices, or other assets or instruments. Derivatives may be used to increase investment flexibility (including to maintain cash reserves while maintaining desired exposure to certain assets), for risk management (hedging) purposes, to facilitate trading, to reduce transaction costs and to pursue higher investment returns. The Fund may also use derivative instruments to mitigate certain investment risks, such as foreign currency exchange rate risk, interest rate risk and credit risk. Derivatives may involve various risks, including the potential inability of the counterparty to fulfill its obligations under the terms of the contract, the potential for an illiquid secondary market (making it difficult for the Fund to sell or terminate, including at favorable prices) and the potential for market movements which may expose the Fund to gains or losses in excess of the amount shown in the Statement of Assets and Liabilities. The notional amounts of derivative instruments, if applicable, are not recorded in the financial statements.
A derivative instrument may suffer a marked-to-market loss if the value of the contract decreases due to an unfavorable change in the market rates or values of the underlying instrument. Losses can also occur if the counterparty does not perform its obligations under the contract. The Fund’s risk of loss from counterparty credit risk on over-the-counter derivatives is generally limited to the aggregate unrealized gain netted against any collateral held by the Fund and the amount of any variation margin held by the counterparty, plus any replacement costs or related amounts. With exchange-traded or centrally cleared derivatives, there is reduced counterparty credit risk to the Fund since the clearinghouse or central counterparty (CCP) provides some protection in the case of clearing member default. The clearinghouse or CCP stands between the buyer and the seller of the contract; therefore, failure of the clearinghouse or CCP may pose additional counterparty credit risk. However, credit risk still exists in exchange-traded or centrally cleared derivatives with respect to initial and variation margin that is held in a broker’s customer account. While clearing brokers are required to segregate customer margin from their own assets, in the event that a clearing broker becomes insolvent or goes into bankruptcy and at that time there is a shortfall in
Columbia Global Value Fund | Semiannual Report 2023
| 21 |
Notes to Financial Statements (continued)
August 31, 2023 (Unaudited)
the aggregate amount of margin held by the clearing broker for all its clients and such shortfall is remedied by the CCP or otherwise, U.S. bankruptcy laws will typically allocate that shortfall on a pro-rata basis across all the clearing broker’s customers (including the Fund), potentially resulting in losses to the Fund.
In order to better define its contractual rights and to secure rights that will help the Fund mitigate its counterparty risk, the Fund may enter into an International Swaps and Derivatives Association, Inc. Master Agreement (ISDA Master Agreement) or similar agreement with its derivatives counterparties. An ISDA Master Agreement is an agreement between the Fund and a counterparty that governs over-the-counter derivatives and foreign exchange forward contracts and contains, among other things, collateral posting terms and netting provisions in the event of a default and/or termination event. Under an ISDA Master Agreement, the Fund may, under certain circumstances, offset with the counterparty certain derivative instruments’ payables and/or receivables with collateral held and/or posted and create one single net payment. The provisions of the ISDA Master Agreement typically permit a single net payment in the event of default (close-out netting), including the bankruptcy or insolvency of the counterparty. Note, however, that bankruptcy or insolvency laws of a particular jurisdiction may impose restrictions on or prohibitions against the right of offset or netting in bankruptcy, insolvency or other events.
Collateral (margin) requirements differ by type of derivative. Margin requirements are established by the clearinghouse or CCP for exchange-traded and centrally cleared derivatives. Brokers can ask for margin in excess of the minimum in certain circumstances. Collateral terms for most over-the-counter derivatives are subject to regulatory requirements to exchange variation margin with trading counterparties and may have contract specific margin terms as well. For over-the-counter derivatives traded under an ISDA Master Agreement, the collateral requirements are typically calculated by netting the marked-to-market amount for each transaction under such agreement and comparing that amount to the value of any variation margin currently pledged by the Fund and/or the counterparty. Generally, the amount of collateral due from or to a party has to exceed a minimum transfer amount threshold (e.g., $250,000) before a transfer has to be made. To the extent amounts due to the Fund from its counterparties are not fully collateralized, contractually or otherwise, the Fund bears the risk of loss from counterparty nonperformance. The Fund may also pay interest expense on cash collateral received from the broker or receive interest income on cash collateral pledged to the broker. The Fund attempts to mitigate counterparty risk by only entering into agreements with counterparties that it believes have the financial resources to honor their obligations and by monitoring the financial stability of those counterparties.
Certain ISDA Master Agreements allow counterparties of over-the-counter derivatives transactions to terminate derivatives contracts prior to maturity in the event the Fund’s net asset value declines by a stated percentage over a specified time period or if the Fund fails to meet certain terms of the ISDA Master Agreement, which would cause the Fund to accelerate payment of any net liability owed to the counterparty. The Fund also has termination rights if the counterparty fails to meet certain terms of the ISDA Master Agreement. In determining whether to exercise such termination rights, the Fund would consider, in addition to counterparty credit risk, whether termination would result in a net liability owed from the counterparty.
For financial reporting purposes, the Fund does not offset derivative assets and derivative liabilities that are subject to netting arrangements in the Statement of Assets and Liabilities.
Forward foreign currency exchange contracts
Forward foreign currency exchange contracts are over-the-counter agreements between two parties to buy and sell a currency at a set price on a future date. The Fund utilized forward foreign currency exchange contracts to hedge the currency exposure associated with some or all of the Fund’s securities, to shift investment exposure from one currency to another and to shift U.S. dollar exposure to achieve a representative weighted mix of major currencies in its benchmark. These instruments may be used for other purposes in future periods.
The values of forward foreign currency exchange contracts fluctuate daily with changes in foreign currency exchange rates. Changes in the value of these contracts are recorded as unrealized appreciation or depreciation until the contract is exercised or has expired. The Fund will realize a gain or loss when the forward foreign currency exchange contract is closed or expires. Non-deliverable forward foreign currency exchange contracts are settled with the counterparty in U.S. dollars without delivery of foreign currency.
| 22 | Columbia Global Value Fund | Semiannual Report 2023 |
Notes to Financial Statements (continued)
August 31, 2023 (Unaudited)
The use of forward foreign currency exchange contracts does not eliminate fluctuations in the prices of the Fund’s portfolio securities. The risks of forward foreign currency exchange contracts include movement in the values of the foreign currencies relative to the U.S. dollar (or other foreign currencies) and the possibility that counterparties will not complete their contractual obligations, which may be in excess of the amount reflected, if any, in the Statement of Assets and Liabilities.
Options contracts
Options are contracts which entitle the holder to purchase or sell securities or other identified assets at a specified price, or in the case of index option contracts, to receive or pay the difference between the index value and the strike price of the index option contract. Option contracts can be either exchange-traded or over-the-counter. The Fund has written option contracts to decrease the Fund’s exposure to equity risk and to facilitate buying and selling of securities for investments. These instruments may be used for other purposes in future periods. Completion of transactions for option contracts traded in the over-the-counter market depends upon the performance of the other party. Collateral may be collected or posted by the Fund to secure over-the-counter option contract trades. Collateral held or posted by the Fund for such option contract trades must be returned to the broker or the Fund upon closure, exercise or expiration of the contract.
Options contracts purchased are recorded as investments. When the Fund writes an options contract, the premium received is recorded as an asset and an amount equivalent to the premium is recorded as a liability in the Statement of Assets and Liabilities and is subsequently adjusted to reflect the current fair value of the option written. Changes in the fair value of the written option are recorded as unrealized appreciation or depreciation until the contract is exercised or has expired. The Fund realizes a gain or loss when the option contract is closed or expires. When option contracts are exercised, the proceeds on sales for a written call or purchased put option contract, or the purchase cost for a written put or purchased call option contract, is adjusted by the amount of premium received or paid.
For over-the-counter options purchased, the Fund bears the risk of loss of the amount of the premiums paid plus the positive change in market values net of any collateral held by the Fund should the counterparty fail to perform under the contracts. Option contracts written by the Fund do not typically give rise to significant counterparty credit risk, as options written generally obligate the Fund and not the counterparty to perform. The risk in writing a call option contract is that the Fund gives up the opportunity for profit if the market price of the security increases above the strike price and the option contract is exercised. The risk in writing a put option contract is that the Fund may incur a loss if the market price of the security decreases below the strike price and the option contract is exercised. Exercise of a written option could result in the Fund purchasing or selling a security or foreign currency when it otherwise would not, or at a price different from the current market value. In purchasing and writing options, the Fund bears the risk of an unfavorable change in the value of the underlying instrument or the risk that the Fund may not be able to enter into a closing transaction due to an illiquid market.
Effects of derivative transactions in the financial statements
The following tables are intended to provide additional information about the effect of derivatives on the financial statements of the Fund, including: the fair value of derivatives by risk category and the location of those fair values in the Statement of Assets and Liabilities; and the impact of derivative transactions over the period in the Statement of Operations, including realized and unrealized gains (losses). The derivative instrument schedules following the Portfolio of Investments present additional information regarding derivative instruments outstanding at the end of the period, if any.
The following table is a summary of the fair value of derivative instruments (not considered to be hedging instruments for accounting disclosure purposes) at August 31, 2023:
| | Asset derivatives | |
Risk exposure
category | Statement
of assets and liabilities
location | Fair value ($) |
| Foreign exchange risk | Unrealized appreciation on forward foreign currency exchange contracts | 1,925,575 |
Columbia Global Value Fund | Semiannual Report 2023
| 23 |
Notes to Financial Statements (continued)
August 31, 2023 (Unaudited)
| | Liability derivatives | |
Risk exposure
category | Statement
of assets and liabilities
location | Fair value ($) |
| Foreign exchange risk | Unrealized depreciation on forward foreign currency exchange contracts | 2,399,592 |
The following table indicates the effect of derivative instruments (not considered to be hedging instruments for accounting disclosure purposes) in the Statement of Operations for the six months ended August 31, 2023:
| Amount of realized gain (loss) on derivatives recognized in income |
| Risk exposure category | Forward
foreign
currency
exchange
contracts
($) | Option
contracts
written
($) | Total
($) |
| Equity risk | — | 53,821 | 53,821 |
| Foreign exchange risk | 2,411,564 | — | 2,411,564 |
| Total | 2,411,564 | 53,821 | 2,465,385 |
| Change in unrealized appreciation (depreciation) on derivatives recognized in income |
| Risk exposure category | Forward
foreign
currency
exchange
contracts
($) |
| Foreign exchange risk | (1,549,239) |
The following table is a summary of the average daily outstanding volume by derivative instrument for the six months ended August 31, 2023:
| Derivative instrument | Average
value ($) |
| Option contracts written | (953) |
| Derivative instrument | Average unrealized
appreciation ($) | Average unrealized
depreciation ($) |
| Forward foreign currency exchange contracts | 1,603,004 | (1,466,772) |
Offsetting of assets and liabilities
The following table presents the Fund’s gross and net amount of assets and liabilities available for offset under netting arrangements as well as any related collateral received or pledged by the Fund as of August 31, 2023:
| | Morgan
Stanley ($) |
| Assets | |
| Forward foreign currency exchange contracts | 1,925,575 |
| Liabilities | |
| Forward foreign currency exchange contracts | 2,399,592 |
| Total liabilities | 2,399,592 |
| Total financial and derivative net assets | (474,017) |
| Total collateral received (pledged) (a) | - |
| Net amount (b) | (474,017) |
| (a) | In some instances, the actual collateral received and/or pledged may be more than the amount shown due to overcollateralization. |
| (b) | Represents the net amount due from/(to) counterparties in the event of default. |
| 24 | Columbia Global Value Fund | Semiannual Report 2023 |
Notes to Financial Statements (continued)
August 31, 2023 (Unaudited)
Security transactions
Security transactions are accounted for on the trade date. Cost is determined and gains (losses) are based upon the specific identification method for both financial statement and federal income tax purposes.
Income recognition
Corporate actions and dividend income are generally recorded net of any non-reclaimable tax withholdings, on the ex-dividend date or upon receipt of an ex-dividend notification in the case of certain foreign securities.
The Fund may receive distributions from holdings in equity securities, business development companies (BDCs), exchange-traded funds (ETFs), limited partnerships (LPs), other regulated investment companies (RICs), and real estate investment trusts (REITs), which report information as to the tax character of their distributions annually. These distributions are allocated to dividend income, capital gain and return of capital based on actual information reported. Return of capital is recorded as a reduction of the cost basis of securities held. If the Fund no longer owns the applicable securities, return of capital is recorded as a realized gain. With respect to REITs, to the extent actual information has not yet been reported, estimates for return of capital are made by Columbia Management Investment Advisers, LLC (the Investment Manager), a wholly-owned subsidiary of Ameriprise Financial, Inc. (Ameriprise Financial). The Investment Manager’s estimates are subsequently adjusted when the actual character of the distributions is disclosed by the REITs, which could result in a proportionate change in return of capital to shareholders.
Awards from class action litigation are recorded as a reduction of cost basis if the Fund still owns the applicable securities on the payment date. If the Fund no longer owns the applicable securities on the payment date, the proceeds are recorded as realized gains.
Expenses
General expenses of the Trust are allocated to the Fund and other funds of the Trust based upon relative net assets or other expense allocation methodologies determined by the nature of the expense. Expenses directly attributable to the Fund are charged to the Fund. Expenses directly attributable to a specific class of shares are charged to that share class.
Determination of class net asset value
All income, expenses (other than class-specific expenses, which are charged to that share class, as shown in the Statement of Operations) and realized and unrealized gains (losses) are allocated to each class of the Fund on a daily basis, based on the relative net assets of each class, for purposes of determining the net asset value of each class.
Federal income tax status
The Fund intends to qualify each year as a regulated investment company under Subchapter M of the Internal Revenue Code, as amended, and will distribute substantially all of its investment company taxable income and net capital gain, if any, for its tax year, and as such will not be subject to federal income taxes. In addition, the Fund intends to distribute in each calendar year substantially all of its ordinary income, capital gain net income and certain other amounts, if any, such that the Fund should not be subject to federal excise tax. Therefore, no federal income or excise tax provision is recorded.
Foreign taxes
The Fund may be subject to foreign taxes on income, gains on investments or currency repatriation, a portion of which may be recoverable. The Fund will accrue such taxes and recoveries, as applicable, based upon its current interpretation of tax rules and regulations that exist in the markets in which it invests.
Realized gains in certain countries may be subject to foreign taxes at the Fund level, based on statutory rates. The Fund accrues for such foreign taxes on realized and unrealized gains at the appropriate rate for each jurisdiction, as applicable. The amount, if any, is disclosed as a liability in the Statement of Assets and Liabilities.
Columbia Global Value Fund | Semiannual Report 2023
| 25 |
Notes to Financial Statements (continued)
August 31, 2023 (Unaudited)
Distributions to shareholders
Distributions from net investment income, if any, are declared and paid each calendar quarter. Net realized capital gains, if any, are distributed at least annually. Income distributions and capital gain distributions are determined in accordance with federal income tax regulations, which may differ from GAAP.
Guarantees and indemnifications
Under the Trust’s organizational documents and, in some cases, by contract, its officers and trustees are indemnified against certain liabilities arising out of the performance of their duties to the Trust or its funds. In addition, certain of the Fund’s contracts with its service providers contain general indemnification clauses. The Fund’s maximum exposure under these arrangements is unknown since the amount of any future claims that may be made against the Fund cannot be determined, and the Fund has no historical basis for predicting the likelihood of any such claims.
Recent accounting pronouncements and regulatory updates
Tailored Shareholder Reports
In October 2022, the Securities and Exchange Commission (SEC) adopted a final rule relating to Tailored Shareholder Reports for Mutual Funds and Exchange-Traded Funds; Fee Information in Investment Company Advertisements. The rule and form amendments will, among other things, require the Fund to transmit concise and visually engaging shareholder reports that highlight key information. The amendments will require that funds tag information in a structured data format and that certain more in-depth information be made available online and available for delivery free of charge to investors on request. The amendments became effective January 24, 2023. There is an 18-month transition period after the effective date of the amendments.
Note 3. Fees and other transactions with affiliates
Management services fees
The Fund has entered into a Management Agreement with Columbia Management Investment Advisers, LLC (the Investment Manager), a wholly-owned subsidiary of Ameriprise Financial, Inc. (Ameriprise Financial). Under the Management Agreement, the Investment Manager provides the Fund with investment research and advice, as well as administrative and accounting services. The management services fee is an annual fee that is equal to a percentage of the Fund’s daily net assets that declines from 0.72% to 0.52% as the Fund’s net assets increase. The annualized effective management services fee rate for the six months ended August 31, 2023 was 0.70% of the Fund’s average daily net assets.
Compensation of board members
Members of the Board of Trustees who are not officers or employees of the Investment Manager or Ameriprise Financial are compensated for their services to the Fund as disclosed in the Statement of Operations. Under a Deferred Compensation Plan (the Deferred Plan), these members of the Board of Trustees may elect to defer payment of up to 100% of their compensation. Deferred amounts are treated as though equivalent dollar amounts had been invested in shares of certain funds managed by the Investment Manager. The Fund’s liability for these amounts is adjusted for market value changes and remains in the Fund until distributed in accordance with the Deferred Plan. All amounts payable under the Deferred Plan constitute a general unsecured obligation of the Fund. The expense for the Deferred Plan, which includes Trustees’ fees deferred during the current period as well as any gains or losses on the Trustees’ deferred compensation balances as a result of market fluctuations, is included in "Trustees’ fees" in the Statement of Operations.
Compensation of Chief Compliance Officer
The Board of Trustees has appointed a Chief Compliance Officer for the Fund in accordance with federal securities regulations. As disclosed in the Statement of Operations, a portion of the Chief Compliance Officer’s total compensation is allocated to the Fund, along with other allocations to affiliated registered investment companies managed by the Investment Manager and its affiliates, based on relative net assets.
| 26 | Columbia Global Value Fund | Semiannual Report 2023 |
Notes to Financial Statements (continued)
August 31, 2023 (Unaudited)
Transfer agency fees
Under a Transfer and Dividend Disbursing Agent Agreement, Columbia Management Investment Services Corp. (the Transfer Agent), an affiliate of the Investment Manager and a wholly-owned subsidiary of Ameriprise Financial, is responsible for providing transfer agency services to the Fund. The Transfer Agent has contracted with SS&C GIDS, Inc. (SS&C GIDS) to serve as sub-transfer agent. The Transfer Agent pays the fees of SS&C GIDS for services as sub-transfer agent and SS&C GIDS is not entitled to reimbursement for such fees from the Fund (with the exception of out-of-pocket fees).
The Fund pays the Transfer Agent a monthly transfer agency fee based on the number or the average value of accounts, depending on the type of account. In addition, the Fund pays the Transfer Agent a fee for shareholder services based on the number of accounts or on a percentage of the average aggregate value of the Fund’s shares maintained in omnibus accounts up to the lesser of the amount charged by the financial intermediary or a cap established by the Board of Trustees from time to time.
The Transfer Agent also receives compensation from the Fund for various shareholder services and reimbursements for certain out-of-pocket fees. Total transfer agency fees for Institutional 2 Class and Institutional 3 Class shares are subject to an annual limitation of not more than 0.07% and 0.02%, respectively, of the average daily net assets attributable to each share class.
For the six months ended August 31, 2023, the Fund’s annualized effective transfer agency fee rates as a percentage of average daily net assets of each class were as follows:
| | Effective rate (%) |
| Class A | 0.13 |
| Advisor Class | 0.13 |
| Class C | 0.13 |
| Institutional Class | 0.13 |
| Institutional 2 Class | 0.06 |
| Institutional 3 Class | 0.01 |
| Class R | 0.13 |
An annual minimum account balance fee of $20 may apply to certain accounts with a value below the applicable share class’s initial minimum investment requirements to reduce the impact of small accounts on transfer agency fees. These minimum account balance fees are remitted to the Fund and recorded as part of expense reductions in the Statement of Operations. For the six months ended August 31, 2023, no minimum account balance fees were charged by the Fund.
Distribution and service fees
The Fund has entered into an agreement with Columbia Management Investment Distributors, Inc. (the Distributor), an affiliate of the Investment Manager and a wholly-owned subsidiary of Ameriprise Financial, for distribution and shareholder services. Under a Plan and Agreement of Distribution, the Fund pays a fee at the maximum annual rates of up to 0.25%, 1.00% and 0.50% of the Fund’s average daily net assets attributable to Class A, Class C and Class R shares, respectively. For Class C shares, of the 1.00% fee, up to 0.75% can be reimbursed for distribution expenses and up to an additional 0.25% can be reimbursed for shareholder servicing expenses. For Class R shares, of the 0.50% fee, up to 0.25% can be reimbursed for shareholder servicing expenses.
The amount of distribution and shareholder services expenses incurred by the Distributor and not yet reimbursed (unreimbursed expense) was approximately $809,000 for Class C shares. This amount is based on the most recent information available as of June 30, 2023, and may be recovered from future payments under the distribution plan or contingent deferred sales charges (CDSCs). To the extent the unreimbursed expense has been fully recovered, the distribution and/or shareholder services fee is reduced.
Columbia Global Value Fund | Semiannual Report 2023
| 27 |
Notes to Financial Statements (continued)
August 31, 2023 (Unaudited)
Sales charges
Sales charges, including front-end charges and CDSCs, received by the Distributor for distributing Fund shares for the six months ended August 31, 2023, if any, are listed below:
| | Front End (%) | CDSC (%) | Amount ($) |
| Class A | 5.75 | 0.50 - 1.00(a) | 29,999 |
| Class C | — | 1.00(b) | 45 |
| (a) | This charge is imposed on certain investments of between $1 million and $50 million redeemed within 18 months after purchase, as follows: 1.00% if redeemed within 12 months after purchase, and 0.50% if redeemed more than 12, but less than 18, months after purchase, with certain limited exceptions. |
| (b) | This charge applies to redemptions within 12 months after purchase, with certain limited exceptions. |
The Fund’s other share classes are not subject to sales charges.
Expenses waived/reimbursed by the Investment Manager and its affiliates
The Investment Manager and certain of its affiliates have contractually agreed to waive fees and/or reimburse expenses (excluding certain fees and expenses described below) for the period(s) disclosed below, unless sooner terminated at the sole discretion of the Board of Trustees, so that the Fund’s net operating expenses, after giving effect to fees waived/expenses reimbursed and any balance credits and/or overdraft charges from the Fund’s custodian, do not exceed the following annual rate(s) as a percentage of the classes’ average daily net assets:
| | July 1, 2023
through
June 30, 2024 | Prior to
July 1, 2023 |
| Class A | 1.17% | 1.15% |
| Advisor Class | 0.92 | 0.90 |
| Class C | 1.92 | 1.90 |
| Institutional Class | 0.92 | 0.90 |
| Institutional 2 Class | 0.85 | 0.84 |
| Institutional 3 Class | 0.80 | 0.79 |
| Class R | 1.42 | 1.40 |
Under the agreement governing these fee waivers and/or expense reimbursement arrangements, the following fees and expenses are excluded from the waiver/reimbursement commitment, and therefore will be paid by the Fund, if applicable: taxes (including foreign transaction taxes), expenses associated with investments in affiliated and non-affiliated pooled investment vehicles (including mutual funds and exchange-traded funds), transaction costs and brokerage commissions, costs related to any securities lending program, dividend expenses associated with securities sold short, inverse floater program fees and expenses, transaction charges and interest on borrowed money, interest, costs associated with shareholder meetings, infrequent and/or unusual expenses and any other expenses the exclusion of which is specifically approved by the Board of Trustees. This agreement may be modified or amended only with approval from the Investment Manager, certain of its affiliates and the Fund. Any fees waived and/or expenses reimbursed under the expense reimbursement arrangements described above are not recoverable by the Investment Manager or its affiliates in future periods.
Note 4. Federal tax information
The timing and character of income and capital gain distributions are determined in accordance with income tax regulations, which may differ from GAAP because of temporary or permanent book to tax differences.
At August 31, 2023, the approximate cost of all investments for federal income tax purposes and the aggregate gross approximate unrealized appreciation and depreciation based on that cost was:
Federal
tax cost ($) | Gross unrealized
appreciation ($) | Gross unrealized
(depreciation) ($) | Net unrealized
appreciation ($) |
| 717,246,000 | 129,803,000 | (49,183,000) | 80,620,000 |
| 28 | Columbia Global Value Fund | Semiannual Report 2023 |
Notes to Financial Statements (continued)
August 31, 2023 (Unaudited)
Tax cost of investments and unrealized appreciation/(depreciation) may also include timing differences that do not constitute adjustments to tax basis.
The following capital loss carryforwards, determined at February 28, 2023, may be available to reduce future net realized gains on investments, if any, to the extent permitted by the Internal Revenue Code.
No expiration
short-term ($) | No expiration
long-term ($) | Total ($) |
| (6,433,790) | (45,453,991) | (51,887,781) |
Management of the Fund has concluded that there are no significant uncertain tax positions in the Fund that would require recognition in the financial statements. However, management’s conclusion may be subject to review and adjustment at a later date based on factors including, but not limited to, new tax laws, regulations, and administrative interpretations (including relevant court decisions). Generally, the Fund’s federal tax returns for the prior three fiscal years remain subject to examination by the Internal Revenue Service.
Note 5. Portfolio information
The cost of purchases and proceeds from sales of securities, excluding short-term investments and derivatives, if any, aggregated to $276,104,592 and $308,612,318, respectively, for the six months ended August 31, 2023. The amount of purchase and sale activity impacts the portfolio turnover rate reported in the Financial Highlights.
Note 6. Affiliated money market fund
The Fund invests in Columbia Short-Term Cash Fund, an affiliated money market fund established for the exclusive use by the Fund and other affiliated funds (the Affiliated MMF). The income earned by the Fund from such investments is included as Dividends - affiliated issuers in the Statement of Operations. As an investing fund, the Fund indirectly bears its proportionate share of the expenses of the Affiliated MMF. The Affiliated MMF prices its shares with a floating net asset value. The Securities and Exchange Commission has adopted amendments to money market fund rules requiring institutional prime money market funds like the Affiliated MMF to be subject, by October 2, 2024, to a liquidity fee if daily net redemptions exceed 5% of net assets and, by April 2, 2024, to a discretionary liquidity fee up to 2% if the imposition of such a fee is determined to be in the best interest of the Affiliated MMF.
Note 7. Interfund lending
Pursuant to an exemptive order granted by the Securities and Exchange Commission, the Fund participates in a program (the Interfund Program) allowing each participating Columbia Fund (each, a Participating Fund) to lend money directly to and, except for closed-end funds and money market funds, borrow money directly from other Participating Funds for temporary purposes. The amounts eligible for borrowing and lending under the Interfund Program are subject to certain restrictions.
Interfund loans are subject to the risk that the borrowing fund could be unable to repay the loan when due, and a delay in repayment to the lending fund could result in lost opportunities and/or additional lending costs. The exemptive order is subject to conditions intended to mitigate conflicts of interest arising from the Investment Manager’s relationship with each Participating Fund.
The Fund did not borrow or lend money under the Interfund Program during the six months ended August 31, 2023.
Note 8. Line of credit
The Fund has access to a revolving credit facility with a syndicate of banks led by JPMorgan Chase Bank, N.A., Citibank, N.A. and Wells Fargo Bank, N.A. whereby the Fund may borrow for the temporary funding of shareholder redemptions or for other temporary or emergency purposes. Pursuant to an October 27, 2022 amendment and restatement, the credit facility, which is an agreement between the Fund and certain other funds managed by the Investment Manager or an affiliated investment manager, severally and not jointly, permits aggregate borrowings up to $950 million. Interest is currently charged to each participating fund based on its borrowings at a rate equal to the higher of (i) the federal funds effective rate, (ii) the secured overnight financing rate plus 0.10% and (iii) the overnight bank funding rate plus, in each case, 1.00%. Each borrowing under
Columbia Global Value Fund | Semiannual Report 2023
| 29 |
Notes to Financial Statements (continued)
August 31, 2023 (Unaudited)
the credit facility matures no later than 60 days after the date of borrowing. The Fund also pays a commitment fee equal to its pro rata share of the unused amount of the credit facility at a rate of 0.15% per annum. The commitment fee is included in other expenses in the Statement of Operations. This agreement expires annually in October unless extended or renewed. Prior to the October 27, 2022 amendment and restatement, the Fund had access to a revolving credit facility with a syndicate of banks led by JPMorgan Chase Bank, N.A., Citibank, N.A. and Wells Fargo Bank, N.A. which permitted collective borrowings up to $950 million. Interest was charged to each participating fund based on its borrowings at a rate equal to the higher of (i) the federal funds effective rate, (ii) the secured overnight financing rate plus 0.11448% and (iii) the overnight bank funding rate plus, in each case, 1.00%.
The Fund had no borrowings during the six months ended August 31, 2023.
Note 9. Significant risks
Derivatives risk
Losses involving derivative instruments may be substantial, because a relatively small movement in the underlying reference (which is generally the price, rate or other economic indicator associated with a security(ies), commodity, currency, index or other instrument or asset) may result in a substantial loss for the Fund. In addition to the potential for increased losses, the use of derivative instruments may lead to increased volatility within the Fund. Derivatives will typically increase the Fund’s exposure to principal risks to which it is otherwise exposed, and may expose the Fund to additional risks, including correlation risk, counterparty risk, hedging risk, leverage risk, liquidity risk and pricing risk.
Foreign securities and emerging market countries risk
Investing in foreign securities may involve heightened risks relative to investments in U.S. securities. Investing in foreign securities subjects the Fund to the risks associated with the issuer’s country of organization and places of business operations, including risks associated with political, regulatory, economic, social, diplomatic and other conditions or events occurring in the country or region, which may result in significant market volatility. In addition, certain foreign securities may be more volatile and less liquid than U.S. securities. Investing in emerging markets may increase these risks and expose the Fund to elevated risks associated with increased inflation, deflation or currency devaluation. To the extent that the Fund concentrates its investment exposure to any one or a few specific countries, the Fund will be particularly susceptible to the risks associated with the conditions, events or other factors impacting those countries or regions and may, therefore, have a greater risk than that of a fund that is more geographically diversified. The financial information and disclosure made available by issuers of emerging market securities may be considerably less reliable than publicly available information about other foreign securities. The Public Company Accounting Oversight Board, which regulates auditors of U.S. public companies, is unable to inspect audit work papers in certain foreign countries. Investors in foreign countries often have limited rights and few practical remedies to pursue shareholder claims, including class actions or fraud claims, and the ability of the U.S. Securities and Exchange Commission, the U.S. Department of Justice and other authorities to bring and enforce actions against foreign issuers or foreign persons is limited.
Market risk
The Fund may incur losses due to declines in the value of one or more securities in which it invests. These declines may be due to factors affecting a particular issuer, or the result of, among other things, political, regulatory, market, economic or social developments affecting the relevant market(s) more generally. In addition, turbulence in financial markets and reduced liquidity in equity, credit and/or fixed income markets may negatively affect many issuers, which could adversely affect the Fund’s ability to price or value hard-to-value assets in thinly traded and closed markets and could cause significant redemptions and operational challenges. Global economies and financial markets are increasingly interconnected, and conditions and events in one country, region or financial market may adversely impact issuers in a different country, region or financial market. These risks may be magnified if certain events or developments adversely interrupt the global supply chain; in these and other circumstances, such risks might affect companies worldwide. As a result, local, regional or global events such as terrorism, war, natural disasters, disease/virus outbreaks and epidemics or other public health issues, recessions, depressions or other events – or the potential for such events – could have a significant negative impact on global economic and market conditions.
| 30 | Columbia Global Value Fund | Semiannual Report 2023 |
Notes to Financial Statements (continued)
August 31, 2023 (Unaudited)
The large-scale invasion of Ukraine by Russia in February 2022 has resulted in sanctions and market disruptions, including declines in regional and global stock markets, unusual volatility in global commodity markets and significant devaluations of Russian currency. The extent and duration of the military action are impossible to predict but could be significant. Market disruption caused by the Russian military action, and any counter-measures or responses thereto (including international sanctions, a downgrade in the country’s credit rating, purchasing and financing restrictions, boycotts, tariffs, changes in consumer or purchaser preferences, cyberattacks and espionage) could have severe adverse impacts on regional and/or global securities and commodities markets, including markets for oil and natural gas. These impacts may include reduced market liquidity, distress in credit markets, further disruption of global supply chains, increased risk of inflation, restricted cross-border payments and limited access to investments and/or assets in certain international markets and/or issuers. These developments and other related events could negatively impact Fund performance.
Shareholder concentration risk
At August 31, 2023, affiliated shareholders of record owned 41.0% of the outstanding shares of the Fund in one or more accounts. Fund shares sold to or redeemed by concentrated accounts may have a significant effect on the operations of the Fund. In the case of a large redemption, the Fund may be forced to sell investments at inopportune times, including its liquid positions, which may result in Fund losses and the Fund holding a higher percentage of less liquid positions. Large redemptions could result in decreased economies of scale and increased operating expenses for non-redeeming Fund shareholders.
Note 10. Subsequent events
Management has evaluated the events and transactions that have occurred through the date the financial statements were issued and noted no items requiring adjustment of the financial statements or additional disclosure.
Note 11. Information regarding pending and settled legal proceedings
Ameriprise Financial and certain of its affiliates are involved in the normal course of business in legal proceedings which include regulatory inquiries, arbitration and litigation, including class actions concerning matters arising in connection with the conduct of their activities as part of a diversified financial services firm. Ameriprise Financial believes that the Fund is not currently the subject of, and that neither Ameriprise Financial nor any of its affiliates are the subject of, any pending legal, arbitration or regulatory proceedings that are likely to have a material adverse effect on the Fund or the ability of Ameriprise Financial or its affiliates to perform under their contracts with the Fund. Ameriprise Financial is required to make quarterly (10-Q), annual (10-K) and, as necessary, 8-K filings with the Securities and Exchange Commission (SEC) on legal and regulatory matters that relate to Ameriprise Financial and its affiliates. Copies of these filings may be obtained by accessing the SEC website at www.sec.gov.
There can be no assurance that these matters, or the adverse publicity associated with them, will not result in increased Fund redemptions, reduced sale of Fund shares or other adverse consequences to the Fund. Further, although we believe proceedings are not likely to have a material adverse effect on the Fund or the ability of Ameriprise Financial or its affiliates to perform under their contracts with the Fund, these proceedings are subject to uncertainties and, as such, we are unable to estimate the possible loss or range of loss that may result. An adverse outcome in one or more of these proceedings could result in adverse judgments, settlements, fines, penalties or other relief that could have a material adverse effect on the consolidated financial condition or results of operations of Ameriprise Financial or one or more of its affiliates that provide services to the Fund.
Columbia Global Value Fund | Semiannual Report 2023
| 31 |
Liquidity Risk Management Program
(Unaudited)
Pursuant to Rule 22e-4 under the 1940 Act, the Fund has adopted a liquidity risk management program (Program). The Program’s principal objectives include assessing, managing and periodically reviewing the Fund’s liquidity risk. Liquidity risk is defined as the risk that the Fund could not meet redemption requests without significant dilution of remaining investors’ interests in the Fund.
The Board has appointed the Investment Manager as the program administrator for the Fund’s Program. The Investment Manager has delegated oversight of the Program to its Liquidity Risk Management Committee (the Committee). At a Board meeting during the fiscal period, the Committee provided the Board with a report addressing the operations of the Program and assessing its adequacy and effectiveness of implementation for the period January 1, 2022 through December 31, 2022, including:
| • | the Fund had sufficient liquidity to both meet redemptions and operate effectively on behalf of shareholders; |
| • | there were no material changes to the Program during the period; |
| • | the implementation of the Program was effective to manage the Fund’s liquidity risk; and |
| • | the Program operated adequately during the period. |
There can be no assurance that the Program will achieve its objectives in the future. Please refer to the Fund’s prospectus for more information regarding the Fund’s exposure to liquidity risk and other principal risks to which an investment in the Fund may be subject.
Approval of Management Agreement
(Unaudited)
Columbia Management Investment Advisers, LLC (the Investment Manager, and together with its domestic and global affiliates, Columbia Threadneedle Investments), a wholly-owned subsidiary of Ameriprise Financial, Inc. (Ameriprise Financial), serves as the investment manager to Columbia Global Value Fund (the Fund). Under a management agreement (the Management Agreement), the Investment Manager provides investment advice and other services to the Fund and other funds distributed by Columbia Management Investment Distributors, Inc. (collectively, the Funds).
On an annual basis, the Fund’s Board of Trustees (the Board), including the independent Board members (the Independent Trustees), considers renewal of the Management Agreement. The Investment Manager prepared detailed reports for the Board and its Contracts Committee (including its Contracts Subcommittee) in February, March, April, May and June 2023, including reports providing the results of analyses performed by a third-party data provider, Broadridge Financial Solutions, Inc. (Broadridge), and comprehensive responses by the Investment Manager to written requests for information by independent legal counsel to the Independent Trustees (Independent Legal Counsel), to assist the Board in making this determination. In addition, throughout the year, the Board (or its committees or subcommittees) regularly meets with portfolio management teams and senior management personnel and reviews information prepared by the Investment Manager addressing the services the Investment Manager provides and Fund performance. The Board also accords appropriate weight to the work, deliberations and conclusions of the various committees (including their subcommittees), such as the Contracts Committee, the Investment Review Committee, the Audit Committee and the Compliance Committee in determining whether to continue the Management Agreement.
The Board, at its June 22, 2023 Board meeting (the June Meeting), considered the renewal of the Management Agreement for an additional one-year term. At the June Meeting, Independent Legal Counsel reviewed with the Independent Trustees various factors relevant to the Board’s consideration of advisory agreements and the Board’s legal responsibilities related to such consideration. The Independent Trustees considered all information that they, their legal counsel or the Investment Manager believed reasonably necessary to evaluate and to approve the continuation of the Management Agreement. Among other things, the information and factors considered included the following:
| 32 | Columbia Global Value Fund | Semiannual Report 2023 |
Approval of Management Agreement (continued)
(Unaudited)
| • | Information on the investment performance of the Fund relative to the performance of a group of mutual funds determined to be comparable to the Fund by Broadridge, as well as performance relative to one or more benchmarks; |
| • | Information on the Fund’s management fees and total expenses, including information comparing the Fund’s expenses to those of a group of comparable mutual funds, as determined by Broadridge; |
| • | The Investment Manager’s agreement to contractually limit or cap total operating expenses for the Fund so that total operating expenses (excluding certain fees and expenses, such as transaction costs and certain other investment related expenses, interest, taxes, acquired fund fees and expenses and infrequent and/or unusual expenses) would not exceed a specified annual rate, as a percentage of the Fund’s net assets; |
| • | Terms of the Management Agreement; |
| • | Descriptions of other agreements and arrangements with affiliates of the Investment Manager relating to the operations of the Fund, including agreements with respect to the provision of transfer agency and shareholder services to the Fund; |
| • | Descriptions of various services performed by the Investment Manager under the Management Agreement, including portfolio management and portfolio trading practices; |
| • | Information regarding any recently negotiated management fees of similarly-managed portfolios of other institutional clients of the Investment Manager; |
| • | Information regarding the resources of the Investment Manager, including information regarding senior management, portfolio managers and other personnel; |
| • | Information regarding the capabilities of the Investment Manager with respect to compliance monitoring services; |
| • | The profitability to the Investment Manager and its affiliates from their relationships with the Fund; and |
| • | Report provided by the Board’s independent fee consultant, JDL Consultants, LLC (JDL). |
Following an analysis and discussion of the foregoing, and the factors identified below, the Board, including all of the Independent Trustees, approved the renewal of the Management Agreement.
Nature, extent and quality of services provided by the Investment Manager
The Board analyzed various reports and presentations it had received detailing the services performed by the Investment Manager, as well as its history, expertise, resources and relative capabilities, and the qualifications of its personnel.
The Board specifically considered the many developments during recent years concerning the services provided by the Investment Manager. Among other things, the Board noted the organization and depth of the equity and credit research departments. The Board further observed the enhancements to the investment risk management department’s processes, systems and oversight over the past several years. The Board also took into account the broad scope of services provided by the Investment Manager to the Fund, including, among other services, investment, risk and compliance oversight. The Board also took into account the information it received concerning the Investment Manager’s ability to attract and retain key portfolio management personnel and that it has sufficient resources to provide competitive and adequate compensation to investment personnel.
In connection with the Board’s evaluation of the overall package of services provided by the Investment Manager, the Board also considered the nature, quality and range of administrative services provided to the Fund by the Investment Manager, as well as the achievements in 2022 in the performance of administrative services, and noted the various enhancements anticipated for 2023. In evaluating the quality of services provided under the Management Agreement, the Board also took into account the organization and strength of the Fund’s and its service providers’ compliance programs. The Board also reviewed the financial condition of the Investment Manager and its affiliates and each entity’s ability to carry out its responsibilities under the Management Agreement and the Fund’s other service agreements.
Columbia Global Value Fund | Semiannual Report 2023
| 33 |
Approval of Management Agreement (continued)
(Unaudited)
In addition, the Board discussed the acceptability of the terms of the Management Agreement, noting that no changes were proposed from the form of agreement previously approved. The Board also noted the wide array of legal and compliance services provided to the Fund under the Management Agreement.
After reviewing these and related factors (including investment performance as discussed below), the Board concluded, within the context of their overall conclusions, that the nature, extent and quality of the services provided to the Fund under the Management Agreement supported the continuation of the Management Agreement.
Investment performance
The Board carefully reviewed the investment performance of the Fund, including detailed reports providing the results of analyses performed by each of the Investment Manager, Broadridge and JDL collectively showing, for various periods (including since manager inception): (i) the performance of the Fund, (ii) the Fund’s performance relative to peers and benchmarks and (iii) the net assets of the Fund. The Board observed that the Fund’s performance for certain periods ranked above median based on information provided by Broadridge.
The Board also reviewed a description of the third-party data provider’s methodology for identifying the Fund’s peer groups for purposes of performance and expense comparisons.
The Board also considered the Investment Manager’s performance and reputation generally. After reviewing these and related factors, the Board concluded, within the context of their overall conclusions, that the performance of the Fund and the Investment Manager, in light of other considerations, supported the continuation of the Management Agreement.
Comparative fees, costs of services provided and the profits realized by the Investment Manager and its affiliates from their relationships with the Fund
The Board reviewed comparative fees and the costs of services provided under the Management Agreement. The Board members considered detailed comparative information set forth in an annual report on fees and expenses, including, among other things, data (based on analyses conducted by Broadridge and JDL) showing a comparison of the Fund’s expenses with median expenses paid by funds in its comparative peer universe, as well as data showing the Fund’s contribution to the Investment Manager’s profitability.
The Board considered the reports of JDL, which assisted in the Board’s analysis of the Funds’ performance and expenses and the reasonableness of the Funds’ fee rates. The Board accorded particular weight to the notion that a primary objective of the level of fees is to achieve a rational pricing model applied consistently across the various product lines in the Fund family, while assuring that the overall fees for each Fund (with certain exceptions) are generally in line with the current “pricing philosophy” such that Fund total expense ratios, in general, approximate or are lower than the median expense ratios of funds in the same Lipper comparison universe. The Board took into account that the Fund’s total expense ratio (after considering proposed expense caps/waivers) approximated the peer universe’s median expense ratio.
After reviewing these and related factors, the Board concluded, within the context of their overall conclusions, that the levels of management fees and expenses of the Fund, in light of other considerations, supported the continuation of the Management Agreement.
The Board also considered the profitability of the Investment Manager and its affiliates in connection with the Investment Manager providing management services to the Fund. With respect to the profitability of the Investment Manager and its affiliates, the Independent Trustees referred to information discussing the profitability to the Investment Manager and Ameriprise Financial from managing, operating and distributing the Funds. The Board considered that the profitability generated by the Investment Manager in 2022 had declined from 2021 levels, due to a variety of factors, including the decreased assets under management of the Funds. It also took into account the indirect economic benefits flowing to the Investment Manager or its affiliates in connection with managing or distributing the Funds, such as the enhanced ability to offer various other financial products to Ameriprise Financial customers, soft dollar benefits and overall reputational advantages. The Board noted that the fees paid by the Fund should permit the Investment Manager to offer competitive compensation to its personnel, make necessary investments in its business and earn an appropriate profit. After reviewing
| 34 | Columbia Global Value Fund | Semiannual Report 2023 |
Approval of Management Agreement (continued)
(Unaudited)
these and related factors, the Board concluded, within the context of their overall conclusions, that the costs of services provided and the profitability to the Investment Manager and its affiliates from their relationships with the Fund supported the continuation of the Management Agreement.
Economies of scale
The Board considered the potential existence of economies of scale in the provision by the Investment Manager of services to the Fund, and whether those economies of scale were shared with the Fund through breakpoints in investment management fees or other means, such as expense limitation arrangements and additional investments by the Investment Manager in investment, trading, compliance and other resources. The Board considered the economies of scale that might be realized as the Fund’s net asset level grows and took note of the extent to which Fund shareholders might also benefit from such growth. In this regard, the Board took into account that management fees decline as Fund assets exceed various breakpoints, all of which have not been surpassed. The Board observed that the Management Agreement provided for breakpoints in the management fee rate schedule that allow opportunities for shareholders to realize lower fees as Fund assets grow and that there are additional opportunities through other means for sharing economies of scale with shareholders.
Conclusion
The Board reviewed all of the above considerations in reaching its decision to approve the continuation of the Management Agreement. In reaching its conclusions, no single factor was determinative.
On June 22, 2023, the Board, including all of the Independent Trustees, determined that fees payable under the Management Agreement were fair and reasonable in light of the extent and quality of services provided and approved the renewal of the Management Agreement.
Columbia Global Value Fund | Semiannual Report 2023
| 35 |
Columbia Global Value Fund
P.O. Box 219104
Kansas City, MO 64121-9104
Please read and consider the investment objectives, risks, charges and expenses for any fund carefully before investing. For a prospectus and summary prospectus, which contains this and other important information about the Fund, go to
columbiathreadneedleus.com/investor/. The Fund is distributed by Columbia Management Investment Distributors, Inc., member FINRA, and managed by Columbia Management Investment Advisers, LLC.
Columbia Threadneedle Investments (Columbia Threadneedle) is the global brand name of the Columbia and Threadneedle group of companies. All rights reserved.
© 2023 Columbia Management Investment Advisers, LLC.
columbiathreadneedleus.com/investor/

Semiannual Report
August 31, 2023 (Unaudited)
Columbia Overseas Core Fund
Not FDIC or NCUA Insured • No Financial Institution Guarantee • May Lose Value
If you elect to receive the shareholder report for Columbia Overseas Core Fund (the Fund) in paper, mailed to you, the Fund mails one shareholder report to each shareholder address, unless such shareholder elects to receive shareholder reports from the Fund electronically via e-mail or by having a paper notice mailed to you (Postcard Notice) that your Fund’s shareholder report is available at the Columbia funds’ website (columbiathreadneedleus.com/investor/). If you would like more than one report in paper to be mailed to you, or would like to elect to receive reports via e-mail or access them through Postcard Notice, please call shareholder services at 800.345.6611 and additional reports will be sent to you.
Proxy voting policies and procedures
The policy of the Board of Trustees is to vote the proxies of the companies in which the Fund holds investments consistent with the procedures as stated in the Statement of Additional Information (SAI). You may obtain a copy of the SAI without charge by calling 800.345.6611; contacting your financial intermediary; visiting columbiathreadneedleus.com/investor/; or searching the website of the Securities and Exchange Commission (SEC) at sec.gov. Information regarding how the Fund voted proxies relating to portfolio securities is filed with the SEC by August 31st for the most recent 12-month period ending June 30th of that year, and is available without charge by visiting columbiathreadneedleus.com/investor/, or searching the website of the SEC at sec.gov.
Quarterly schedule of investments
The Fund files a complete schedule of portfolio holdings with the SEC for the first and third quarters of each fiscal year on Form N-PORT. The Fund’s Form N-PORT filings are available on the SEC’s website at sec.gov. The Fund’s complete schedule of portfolio holdings, as filed on Form N-PORT, is available on columbiathreadneedleus.com/investor/ or can also be obtained without charge, upon request, by calling 800.345.6611.
Additional Fund information
For more information about the Fund, please visit columbiathreadneedleus.com/investor/ or call 800.345.6611. Customer Service Representatives are available to answer your questions Monday through Friday from 8 a.m. to 7 p.m. Eastern time.
Fund investment manager
Columbia Management Investment Advisers, LLC (the Investment Manager)
290 Congress Street
Boston, MA 02210
Fund distributor
Columbia Management Investment Distributors, Inc.
290 Congress Street
Boston, MA 02210
Fund transfer agent
Columbia Management Investment Services Corp.
P.O. Box 219104
Kansas City, MO 64121-9104
Columbia Overseas Core Fund | Semiannual Report 2023
Fund at a Glance
(Unaudited)
Investment objective
The Fund seeks to provide shareholders with long-term capital appreciation.
Portfolio management
Fred Copper, CFA
Co-Portfolio Manager
Managed Fund since 2018
Daisuke Nomoto, CMA (SAAJ)
Co-Portfolio Manager
Managed Fund since 2018
Morningstar style boxTM
The Morningstar Style Box is based on a fund’s portfolio holdings. For equity funds, the vertical axis shows the market capitalization of the stocks owned, and the horizontal axis shows investment style (value, blend, or growth). Information shown is based on the most recent data provided by Morningstar.
© 2023 Morningstar, Inc. All rights reserved. The Morningstar information contained herein: (1) is proprietary to Morningstar and/or its content providers; (2) may not be copied or distributed; and (3) is not warranted to be accurate, complete or timely. Neither Morningstar nor its content providers are responsible for any damages or losses arising from any use of this information.
| Average annual total returns (%) (for the period ended August 31, 2023) |
| | | Inception | 6 Months
cumulative | 1 Year | 5 Years | Life |
| Class A | Excluding sales charges | 03/05/18 | 4.80 | 14.57 | 3.68 | 2.60 |
| | Including sales charges | | -1.21 | 8.02 | 2.45 | 1.50 |
| Advisor Class | 03/05/18 | 5.03 | 14.93 | 3.95 | 2.87 |
| Class C | Excluding sales charges | 03/05/18 | 4.43 | 13.75 | 2.89 | 1.83 |
| | Including sales charges | | 3.43 | 12.75 | 2.89 | 1.83 |
| Institutional Class | 03/05/18 | 4.92 | 14.80 | 3.95 | 2.86 |
| Institutional 2 Class | 03/05/18 | 4.98 | 14.97 | 4.03 | 2.96 |
| Institutional 3 Class | 03/05/18 | 5.02 | 15.03 | 4.09 | 3.01 |
| Class R | 03/05/18 | 4.67 | 14.32 | 3.43 | 2.35 |
| MSCI EAFE Index (Net) | | 4.75 | 17.92 | 4.14 | 3.64 |
Returns for Class A shares are shown with and without the maximum initial sales charge of 5.75%. Returns for Class C shares are shown with and without the 1.00% contingent deferred sales charge for the first year only. The Fund’s other share classes are not subject to sales charges and have limited eligibility. Please see the Fund’s prospectus for details. Performance for different share classes will vary based on differences in sales charges and fees associated with each share class. All results shown assume reinvestment of distributions during the period. Returns do not reflect the deduction of taxes that a shareholder may pay on Fund distributions or on the redemption of Fund shares. Performance results reflect the effect of any fee waivers or reimbursements of Fund expenses by Columbia Management Investment Advisers, LLC and/or any of its affiliates. Absent these fee waivers or expense reimbursement arrangements, performance results would have been lower.
The performance information shown represents past performance and is not a guarantee of future results. The investment return and principal value of your investment will fluctuate so that your shares, when redeemed, may be worth more or less than their original cost. Current performance may be lower or higher than the performance information shown. You may obtain performance information current to the most recent month-end by contacting your financial intermediary, visiting columbiathreadneedleus.com/investor/ or calling 800.345.6611.
The MSCI EAFE Index (Net) is a free float-adjusted market capitalization index that is designed to measure the equity market performance of developed markets, excluding the U.S. and Canada. The index is compiled from a composite of securities markets of Europe, Australasia and the Far East and is widely recognized by investors in foreign markets as the measurement index for portfolios of non-North American securities.
Indices are not available for investment, are not professionally managed and do not reflect sales charges, fees, brokerage commissions, taxes (except the MSCI EAFE Index (Net), which reflects reinvested dividends net of withholding taxes) or other expenses of investing. Securities in the Fund may not match those in an index.
Columbia Overseas Core Fund | Semiannual Report 2023
| 3 |
Fund at a Glance (continued)
(Unaudited)
| Equity sector breakdown (%) (at August 31, 2023) |
| Communication Services | 3.5 |
| Consumer Discretionary | 10.5 |
| Consumer Staples | 13.3 |
| Energy | 10.3 |
| Financials | 17.6 |
| Health Care | 15.1 |
| Industrials | 11.3 |
| Information Technology | 11.9 |
| Materials | 5.7 |
| Utilities | 0.8 |
| Total | 100.0 |
Percentages indicated are based upon total equity investments. The Fund’s portfolio composition is subject to change.
| Country breakdown (%) (at August 31, 2023) |
| Australia | 4.4 |
| Austria | 0.6 |
| Brazil | 0.4 |
| Canada | 4.9 |
| Denmark | 1.8 |
| Finland | 1.6 |
| France | 6.1 |
| Germany | 2.0 |
| Greece | 0.6 |
| Hong Kong | 0.4 |
| Ireland | 2.3 |
| Israel | 3.2 |
| Japan | 22.8 |
| Netherlands | 11.5 |
| Norway | 1.4 |
| Russian Federation | 0.0(a) |
| Singapore | 2.6 |
| South Africa | 0.2 |
| South Korea | 2.4 |
| Sweden | 0.2 |
| Switzerland | 3.6 |
| Taiwan | 3.2 |
| United Kingdom | 13.4 |
| United States(b) | 10.4 |
| Total | 100.0 |
| (a) | Rounds to zero. |
| (b) | Includes investments in Money Market Funds. |
Country breakdown is based primarily on issuer’s place of organization/incorporation. Percentages indicated are based upon total investments, including option contracts purchased and excluding all other investments in derivatives, if any. The Fund’s portfolio composition is subject to change.
| 4 | Columbia Overseas Core Fund | Semiannual Report 2023 |
Understanding Your Fund’s Expenses
(Unaudited)
As an investor, you incur two types of costs. There are shareholder transaction costs, which generally include sales charges on purchases and may include redemption fees. There are also ongoing fund costs, which generally include management fees, distribution and/or service fees, and other fund expenses. The following information is intended to help you understand your ongoing costs (in dollars) of investing in the Fund and to help you compare these costs with the ongoing costs of investing in other mutual funds.
Analyzing your Fund’s expenses
To illustrate these ongoing costs, we have provided examples and calculated the expenses paid by investors in each share class of the Fund during the period. The actual and hypothetical information in the table is based on an initial investment of $1,000 at the beginning of the period indicated and held for the entire period. Expense information is calculated two ways and each method provides you with different information. The amount listed in the “Actual” column is calculated using the Fund’s actual operating expenses and total return for the period. You may use the Actual information, together with the amount invested, to estimate the expenses that you paid over the period. Simply divide your account value by $1,000 (for example, an $8,600 account value divided by $1,000 = 8.6), then multiply the results by the expenses paid during the period under the “Actual” column. The amount listed in the “Hypothetical” column assumes a 5% annual rate of return before expenses (which is not the Fund’s actual return) and then applies the Fund’s actual expense ratio for the period to the hypothetical return. You should not use the hypothetical account values and expenses to estimate either your actual account balance at the end of the period or the expenses you paid during the period. See “Compare with other funds” below for details on how to use the hypothetical data.
Compare with other funds
Since all mutual funds are required to include the same hypothetical calculations about expenses in shareholder reports, you can use this information to compare the ongoing cost of investing in the Fund with other funds. To do so, compare the hypothetical example with the 5% hypothetical examples that appear in the shareholder reports of other funds. As you compare hypothetical examples of other funds, it is important to note that hypothetical examples are meant to highlight the ongoing costs of investing in a fund only and do not reflect any transaction costs, such as sales charges, or redemption or exchange fees. Therefore, the hypothetical calculations are useful in comparing ongoing costs only, and will not help you determine the relative total costs of owning different funds. If transaction costs were included in these calculations, your costs would be higher.
| March 1, 2023 — August 31, 2023 |
| | Account value at the
beginning of the
period ($) | Account value at the
end of the
period ($) | Expenses paid during
the period ($) | Fund’s annualized
expense ratio (%) |
| | Actual | Hypothetical | Actual | Hypothetical | Actual | Hypothetical | Actual |
| Class A | 1,000.00 | 1,000.00 | 1,048.00 | 1,019.00 | 6.28 | 6.19 | 1.22 |
| Advisor Class | 1,000.00 | 1,000.00 | 1,050.30 | 1,020.26 | 5.00 | 4.93 | 0.97 |
| Class C | 1,000.00 | 1,000.00 | 1,044.30 | 1,015.23 | 10.12 | 9.98 | 1.97 |
| Institutional Class | 1,000.00 | 1,000.00 | 1,049.20 | 1,020.26 | 5.00 | 4.93 | 0.97 |
| Institutional 2 Class | 1,000.00 | 1,000.00 | 1,049.80 | 1,020.61 | 4.64 | 4.57 | 0.90 |
| Institutional 3 Class | 1,000.00 | 1,000.00 | 1,050.20 | 1,020.91 | 4.33 | 4.27 | 0.84 |
| Class R | 1,000.00 | 1,000.00 | 1,046.70 | 1,017.75 | 7.56 | 7.46 | 1.47 |
Expenses paid during the period are equal to the annualized expense ratio for each class as indicated above, multiplied by the average account value over the period and then multiplied by the number of days in the Fund’s most recent fiscal half year and divided by 366.
Expenses do not include fees and expenses incurred indirectly by the Fund from its investment in underlying funds, including affiliated and non-affiliated pooled investment vehicles, such as mutual funds and exchange-traded funds.
Had Columbia Management Investment Advisers, LLC and/or certain of its affiliates not waived/reimbursed certain fees and expenses, account value at the end of the period would have been reduced.
Columbia Overseas Core Fund | Semiannual Report 2023
| 5 |
Portfolio of Investments
August 31, 2023 (Unaudited)
(Percentages represent value of investments compared to net assets)
Investments in securities
| Common Stocks 98.8% |
| Issuer | Shares | Value ($) |
| Australia 4.4% |
| Ansell Ltd. | 368,914 | 5,622,211 |
| Northern Star Resources Ltd. | 1,856,473 | 14,224,567 |
| Paladin Energy Ltd.(a) | 9,517,824 | 5,171,024 |
| Santos Ltd. | 2,575,066 | 12,741,522 |
| Total | 37,759,324 |
| Austria 0.6% |
| Kontron AG | 236,577 | 5,149,631 |
| Brazil 0.4% |
| JBS S/A | 890,404 | 3,329,991 |
| Canada 4.9% |
| Alimentation Couche-Tard, Inc. | 106,168 | 5,551,977 |
| Cameco Corp. | 381,634 | 14,120,458 |
| Pan American Silver Corp. | 279,952 | 4,633,206 |
| Vermilion Energy, Inc. | 321,798 | 4,682,161 |
| Whitecap Resources, Inc. | 1,608,319 | 13,152,697 |
| Total | 42,140,499 |
| Denmark 1.8% |
| Novo Nordisk A/S, Class B | 82,527 | 15,222,414 |
| Finland 1.6% |
| UPM-Kymmene OYJ | 410,667 | 14,054,064 |
| France 6.1% |
| AXA SA | 214,486 | 6,444,207 |
| DBV Technologies SA, ADR(a) | 158,287 | 250,093 |
| Eiffage SA | 153,616 | 15,182,337 |
| Sanofi | 201,617 | 21,473,011 |
| TotalEnergies SE | 132,251 | 8,295,958 |
| Worldline SA(a) | 48,128 | 1,566,383 |
| Total | 53,211,989 |
| Germany 2.0% |
| Duerr AG | 163,830 | 4,883,513 |
| E.ON SE | 592,861 | 7,297,920 |
| KION Group AG | 127,328 | 5,083,089 |
| Total | 17,264,522 |
| Greece 0.6% |
| JUMBO SA | 177,151 | 5,478,512 |
| Common Stocks (continued) |
| Issuer | Shares | Value ($) |
| Hong Kong 0.4% |
| WH Group Ltd. | 6,472,402 | 3,333,256 |
| Ireland 2.3% |
| Amarin Corp. PLC, ADR(a) | 107,069 | 112,423 |
| Bank of Ireland Group PLC | 558,658 | 5,562,985 |
| Flutter Entertainment PLC(a) | 78,965 | 14,361,009 |
| Total | 20,036,417 |
| Israel 3.2% |
| Bank Hapoalim BM | 1,124,011 | 9,305,853 |
| Check Point Software Technologies Ltd.(a) | 138,788 | 18,679,477 |
| Total | 27,985,330 |
| Japan 22.8% |
| Amano Corp. | 298,900 | 6,515,359 |
| BayCurrent Consulting, Inc. | 260,100 | 8,940,332 |
| Denso Corp. | 89,700 | 6,122,262 |
| Hitachi Ltd. | 87,200 | 5,795,507 |
| ITOCHU Corp. | 477,000 | 17,901,498 |
| JustSystems Corp. | 104,800 | 2,168,346 |
| Kinden Corp. | 318,600 | 4,378,569 |
| Macnica Fuji Electronics Holdings, Inc. | 211,400 | 9,891,104 |
| MatsukiyoCocokara & Co. | 262,900 | 15,479,676 |
| Mebuki Financial Group, Inc. | 1,870,900 | 5,171,933 |
| Meitec Corp. | 157,500 | 2,757,247 |
| Mitsubishi UFJ Financial Group, Inc. | 1,850,800 | 14,765,091 |
| Nihon M&A Center Holdings, Inc. | 376,000 | 2,088,614 |
| ORIX Corp. | 664,000 | 12,380,067 |
| Otsuka Corp. | 104,200 | 4,643,984 |
| Round One Corp. | 1,852,600 | 7,543,489 |
| Sankyo Co., Ltd. | 59,900 | 2,608,510 |
| Shimamura Co., Ltd. | 79,100 | 8,153,141 |
| Ship Healthcare Holdings, Inc. | 489,900 | 8,312,033 |
| Suntory Beverage & Food Ltd. | 221,400 | 7,123,419 |
| Takeda Pharmaceutical Co., Ltd. | 601,377 | 18,585,598 |
| Takuma Co., Ltd. | 351,400 | 3,889,088 |
| Toppan Printing Co., Ltd. | 531,000 | 12,826,797 |
| USS Co., Ltd. | 479,900 | 8,380,115 |
The accompanying Notes to Financial Statements are an integral part of this statement.
| 6 | Columbia Overseas Core Fund | Semiannual Report 2023 |
Portfolio of Investments (continued)
August 31, 2023 (Unaudited)
| Common Stocks (continued) |
| Issuer | Shares | Value ($) |
| ValueCommerce Co., Ltd. | 130,700 | 1,152,228 |
| Total | 197,574,007 |
| Netherlands 11.5% |
| Adyen NV(a) | 3,292 | 2,748,890 |
| ASR Nederland NV | 370,246 | 16,188,852 |
| Heineken NV | 122,036 | 11,863,173 |
| ING Groep NV | 1,214,438 | 17,207,377 |
| Koninklijke Ahold Delhaize NV | 498,509 | 16,306,226 |
| Prosus NV(a) | 205,162 | 14,150,924 |
| Shell PLC | 683,183 | 20,888,509 |
| Total | 99,353,951 |
| Norway 1.4% |
| SalMar ASA | 128,764 | 6,286,168 |
| Yara International ASA | 167,506 | 6,105,485 |
| Total | 12,391,653 |
| Russian Federation —% |
| Lukoil PJSC(b),(c),(d),(e) | 33,398 | — |
| Singapore 2.6% |
| BW LPG Ltd. | 219,592 | 2,660,438 |
| DBS Group Holdings Ltd. | 411,700 | 10,133,437 |
| Venture Corp., Ltd. | 967,400 | 9,376,580 |
| Total | 22,170,455 |
| South Africa 0.2% |
| Impala Platinum Holdings Ltd. | 346,207 | 1,782,318 |
| South Korea 2.4% |
| Hyundai Home Shopping Network Corp. | 62,773 | 2,070,892 |
| Samsung Electronics Co., Ltd. | 224,403 | 11,349,462 |
| Youngone Corp. | 192,797 | 7,824,794 |
| Total | 21,245,148 |
| Sweden 0.2% |
| Stillfront Group AB(a) | 1,073,652 | 1,763,781 |
| Switzerland 3.6% |
| Landis+Gyr Group AG(a) | 86,686 | 6,406,055 |
| Nestlé SA, Registered Shares | 74,802 | 8,994,149 |
| Novartis AG, Registered Shares | 46,454 | 4,675,213 |
| UBS AG | 425,538 | 11,271,098 |
| Total | 31,346,515 |
| Common Stocks (continued) |
| Issuer | Shares | Value ($) |
| Taiwan 3.2% |
| Fubon Financial Holding Co., Ltd. | 6,066,425 | 12,097,440 |
| Parade Technologies Ltd. | 427,000 | 11,988,246 |
| Taiwan Semiconductor Manufacturing Co., Ltd., ADR | 37,948 | 3,550,795 |
| Total | 27,636,481 |
| United Kingdom 13.4% |
| AstraZeneca PLC, ADR | 406,313 | 27,556,148 |
| British American Tobacco PLC | 529,994 | 17,555,726 |
| Crest Nicholson Holdings PLC | 789,056 | 1,804,235 |
| DCC PLC | 232,382 | 12,715,277 |
| Intermediate Capital Group PLC | 238,579 | 4,077,219 |
| JD Sports Fashion PLC | 6,004,851 | 11,021,901 |
| John Wood Group PLC(a) | 775,838 | 1,566,276 |
| Just Group PLC | 3,294,442 | 3,146,743 |
| Liberty Global PLC, Class C(a) | 665,115 | 13,195,882 |
| TP Icap Group PLC | 4,163,229 | 8,712,612 |
| Vodafone Group PLC | 15,460,896 | 14,333,091 |
| Total | 115,685,110 |
| United States 9.2% |
| ACADIA Pharmaceuticals, Inc.(a) | 25,382 | 685,822 |
| Broadcom, Inc. | 12,882 | 11,888,669 |
| Burford Capital Ltd. | 728,117 | 10,026,171 |
| Energy Fuels, Inc.(a) | 662,884 | 4,726,363 |
| Insmed, Inc.(a) | 88,299 | 1,932,865 |
| Jazz Pharmaceuticals PLC(a) | 91,030 | 13,050,061 |
| Livent Corp.(a) | 383,376 | 8,231,083 |
| Primo Water Corp. | 1,155,586 | 17,634,242 |
| Roche Holding AG, Genusschein Shares | 37,780 | 11,087,992 |
| Sage Therapeutics, Inc.(a) | 30,588 | 611,760 |
| Total | 79,875,028 |
Total Common Stocks
(Cost $805,344,676) | 855,790,396 |
|
| Exchange-Traded Equity Funds 0.6% |
| | Shares | Value ($) |
| United States 0.6% |
| iShares MSCI EAFE ETF | 73,564 | 5,262,033 |
Total Exchange-Traded Equity Funds
(Cost $5,265,261) | 5,262,033 |
The accompanying Notes to Financial Statements are an integral part of this statement.
Columbia Overseas Core Fund | Semiannual Report 2023
| 7 |
Portfolio of Investments (continued)
August 31, 2023 (Unaudited)
| Call Option Contracts Purchased 0.0% |
| | | | | | Value ($) |
| (Cost $263,456) | 87,615 |
| Money Market Funds 0.6% |
| | Shares | Value ($) |
| Columbia Short-Term Cash Fund, 5.476%(f),(g) | 4,843,573 | 4,842,120 |
Total Money Market Funds
(Cost $4,841,350) | 4,842,120 |
Total Investments in Securities
(Cost $815,714,743) | 865,982,164 |
| Other Assets & Liabilities, Net | | (244,261) |
| Net Assets | $865,737,903 |
Investments in derivatives
| Forward foreign currency exchange contracts |
Currency to
be sold | Currency to
be purchased | Counterparty | Settlement
date | Unrealized
appreciation ($) | Unrealized
depreciation ($) |
| 2,695,000 AUD | 1,767,288 USD | Morgan Stanley | 09/21/2023 | 20,028 | — |
| 3,951,000 AUD | 2,557,838 USD | Morgan Stanley | 09/21/2023 | — | (3,727) |
| 36,231,000 CAD | 27,511,849 USD | Morgan Stanley | 09/21/2023 | 691,340 | — |
| 7,031,000 EUR | 7,649,917 USD | Morgan Stanley | 09/21/2023 | 19,965 | — |
| 1,356,000 GBP | 1,730,697 USD | Morgan Stanley | 09/21/2023 | 12,786 | — |
| 1,505,274,000 JPY | 10,575,167 USD | Morgan Stanley | 09/21/2023 | 202,712 | — |
| 502,141,000 JPY | 3,459,416 USD | Morgan Stanley | 09/21/2023 | — | (708) |
| 29,263,472,000 KRW | 22,951,707 USD | Morgan Stanley | 09/21/2023 | 823,167 | — |
| 159,854,000 NOK | 15,840,096 USD | Morgan Stanley | 09/21/2023 | 796,877 | — |
| 21,083,000 SGD | 15,904,496 USD | Morgan Stanley | 09/21/2023 | 292,933 | — |
| 1,428,827,000 TWD | 45,833,491 USD | Morgan Stanley | 09/21/2023 | 948,255 | — |
| 15,991,038 USD | 23,556,000 AUD | Morgan Stanley | 09/21/2023 | — | (718,882) |
| 15,032,278 USD | 12,877,000 CHF | Morgan Stanley | 09/21/2023 | — | (429,475) |
| 11,440,589 USD | 76,841,000 DKK | Morgan Stanley | 09/21/2023 | — | (250,198) |
| 77,874,817 USD | 70,122,000 EUR | Morgan Stanley | 09/21/2023 | — | (1,779,311) |
| 15,071,661 USD | 11,643,000 GBP | Morgan Stanley | 09/21/2023 | — | (321,191) |
| 2,640,251 USD | 27,087,000 NOK | Morgan Stanley | 09/21/2023 | — | (91,203) |
| 15,135,048 USD | 24,226,000 NZD | Morgan Stanley | 09/21/2023 | — | (688,568) |
| 29,398,141 USD | 304,604,000 SEK | Morgan Stanley | 09/21/2023 | — | (1,554,652) |
| 5,103,839 USD | 6,897,000 SGD | Morgan Stanley | 09/21/2023 | 3,259 | — |
| 5,308,545 USD | 7,107,000 SGD | Morgan Stanley | 09/21/2023 | — | (45,946) |
| 5,943,086 USD | 188,901,000 TWD | Morgan Stanley | 09/21/2023 | — | (8,942) |
| Total | | | | 3,811,322 | (5,892,803) |
| Call option contracts purchased |
| Description | Counterparty | Trading
currency | Notional
amount | Number of
contracts | Exercise
price/Rate | Expiration
date | Cost ($) | Value ($) |
| CBOE Volatility Index | Morgan Stanley | USD | 806,058 | 594 | 14.00 | 09/20/2023 | 263,456 | 87,615 |
The accompanying Notes to Financial Statements are an integral part of this statement.
| 8 | Columbia Overseas Core Fund | Semiannual Report 2023 |
Portfolio of Investments (continued)
August 31, 2023 (Unaudited)
Notes to Portfolio of Investments
| (a) | Non-income producing investment. |
| (b) | Represents fair value as determined in good faith under procedures approved by the Board of Trustees. At August 31, 2023, the total value of these securities amounted to $0, which represents less than 0.01% of total net assets. |
| (c) | Denotes a restricted security, which is subject to legal or contractual restrictions on resale under federal securities laws. Disposal of a restricted investment may involve time-consuming negotiations and expenses, and prompt sale at an acceptable price may be difficult to achieve. Private placement securities are generally considered to be restricted, although certain of those securities may be traded between qualified institutional investors under the provisions of Section 4(a)(2) and Rule 144A. The Fund will not incur any registration costs upon such a trade. These securities are valued at fair value determined in good faith under consistently applied procedures approved by the Fund’s Board of Trustees. At August 31, 2023, the total market value of these securities amounted to $0, which represents less than 0.01% of total net assets. Additional information on these securities is as follows: |
| Security | Acquisition
Dates | Shares | Cost ($) | Value ($) |
| Lukoil PJSC | 01/25/2022- 02/02/2022 | 33,398 | 2,752,771 | — |
| (d) | As a result of sanctions and restricted cross-border payments, certain income and/or principal has not been recognized by the Fund. The Fund will continue to monitor the net realizable value and record the income when it is considered collectible. |
| (e) | Valuation based on significant unobservable inputs. |
| (f) | The rate shown is the seven-day current annualized yield at August 31, 2023. |
| (g) | As defined in the Investment Company Act of 1940, as amended, an affiliated company is one in which the Fund owns 5% or more of the company’s outstanding voting securities, or a company which is under common ownership or control with the Fund. The value of the holdings and transactions in these affiliated companies during the period ended August 31, 2023 are as follows: |
| Affiliated issuers | Beginning
of period($) | Purchases($) | Sales($) | Net change in
unrealized
appreciation
(depreciation)($) | End of
period($) | Realized gain
(loss)($) | Dividends($) | End of
period shares |
| Columbia Short-Term Cash Fund, 5.476% |
| | 2,640,181 | 93,254,206 | (91,053,028) | 761 | 4,842,120 | (1,367) | 126,400 | 4,843,573 |
Abbreviation Legend
| ADR | American Depositary Receipt |
Currency Legend
| AUD | Australian Dollar |
| CAD | Canada Dollar |
| CHF | Swiss Franc |
| DKK | Danish Krone |
| EUR | Euro |
| GBP | British Pound |
| JPY | Japanese Yen |
| KRW | South Korean Won |
| NOK | Norwegian Krone |
| NZD | New Zealand Dollar |
| SEK | Swedish Krona |
| SGD | Singapore Dollar |
| TWD | New Taiwan Dollar |
| USD | US Dollar |
Fair value measurements
The Fund categorizes its fair value measurements according to a three-level hierarchy that maximizes the use of observable inputs and minimizes the use of unobservable inputs by prioritizing that the most observable input be used when available. Observable inputs are those that market participants would use in pricing an investment based on market data obtained from sources independent of the reporting entity. Unobservable inputs are those that reflect the Fund’s assumptions about the information market participants would use in
The accompanying Notes to Financial Statements are an integral part of this statement.
Columbia Overseas Core Fund | Semiannual Report 2023
| 9 |
Portfolio of Investments (continued)
August 31, 2023 (Unaudited)
Fair value measurements (continued)
pricing an investment. An investment’s level within the fair value hierarchy is based on the lowest level of any input that is deemed significant to the asset’s or liability’s fair value measurement. The input levels are not necessarily an indication of the risk or liquidity associated with investments at that level. For example, certain U.S. government securities are generally high quality and liquid, however, they are reflected as Level 2 because the inputs used to determine fair value may not always be quoted prices in an active market.
Fair value inputs are summarized in the three broad levels listed below:
| ■ | Level 1 — Valuations based on quoted prices for investments in active markets that the Fund has the ability to access at the measurement date. Valuation adjustments are not applied to Level 1 investments. |
| ■ | Level 2 — Valuations based on other significant observable inputs (including quoted prices for similar securities, interest rates, prepayment speeds, credit risks, etc.). |
| ■ | Level 3 — Valuations based on significant unobservable inputs (including the Fund’s own assumptions and judgment in determining the fair value of investments). |
Inputs that are used in determining fair value of an investment may include price information, credit data, volatility statistics, and other factors. These inputs can be either observable or unobservable. The availability of observable inputs can vary between investments, and is affected by various factors such as the type of investment, and the volume and level of activity for that investment or similar investments in the marketplace. The inputs will be considered by the Investment Manager, along with any other relevant factors in the calculation of an investment’s fair value. The Fund uses prices and inputs that are current as of the measurement date, which may include periods of market dislocations. During these periods, the availability of prices and inputs may be reduced for many investments. This condition could cause an investment to be reclassified between the various levels within the hierarchy.
Foreign equity securities actively traded in markets where there is a significant delay in the local close relative to the New York Stock Exchange are classified as Level 2. The values of these securities may include an adjustment to reflect the impact of market movements following the close of local trading, as described in Note 2 to the financial statements – Security valuation.
Investments falling into the Level 3 category are primarily supported by quoted prices from brokers and dealers participating in the market for those investments. However, these may be classified as Level 3 investments due to lack of market transparency and corroboration to support these quoted prices. Additionally, valuation models may be used as the pricing source for any remaining investments classified as Level 3. These models may rely on one or more significant unobservable inputs and/or significant assumptions by the Investment Manager. Inputs used in valuations may include, but are not limited to, financial statement analysis, capital account balances, discount rates and estimated cash flows, and comparable company data.
The Fund’s Board of Trustees (the Board) has designated the Investment Manager, through its Valuation Committee (the Committee), as valuation designee, responsible for determining the fair value of the assets of the Fund for which market quotations are not readily available using valuation procedures approved by the Board. The Committee consists of voting and non-voting members from various groups within the Investment Manager’s organization, including operations and accounting, trading and investments, compliance, risk management and legal.
The Committee meets at least monthly to review and approve valuation matters, which may include a description of specific valuation determinations, data regarding pricing information received from approved pricing vendors and brokers and the results of Board-approved valuation policies and procedures (the Policies). The Policies address, among other things, instances when market quotations are or are not readily available, including recommendations of third party pricing vendors and a determination of appropriate pricing methodologies; events that require specific valuation determinations and assessment of fair value techniques; securities with a potential for stale pricing, including those that are illiquid, restricted, or in default; and the effectiveness of third party pricing vendors, including periodic reviews of vendors. The Committee meets more frequently, as needed, to discuss additional valuation matters, which may include the need to review back-testing results, review time-sensitive information or approve related valuation actions. Representatives of Columbia Management Investment Advisers, LLC report to the Board at each of its regularly scheduled meetings to discuss valuation matters and actions during the period, similar to those described earlier.
The following table is a summary of the inputs used to value the Fund’s investments at August 31, 2023:
| | Level 1 ($) | Level 2 ($) | Level 3 ($) | Total ($) |
| Investments in Securities | | | | |
| Common Stocks | | | | |
| Australia | — | 37,759,324 | — | 37,759,324 |
| Austria | — | 5,149,631 | — | 5,149,631 |
| Brazil | 3,329,991 | — | — | 3,329,991 |
| Canada | 42,140,499 | — | — | 42,140,499 |
| Denmark | — | 15,222,414 | — | 15,222,414 |
| Finland | — | 14,054,064 | — | 14,054,064 |
| France | 250,093 | 52,961,896 | — | 53,211,989 |
| Germany | — | 17,264,522 | — | 17,264,522 |
| Greece | — | 5,478,512 | — | 5,478,512 |
| Hong Kong | — | 3,333,256 | — | 3,333,256 |
| Ireland | 112,423 | 19,923,994 | — | 20,036,417 |
| Israel | 18,679,477 | 9,305,853 | — | 27,985,330 |
| Japan | — | 197,574,007 | — | 197,574,007 |
| Netherlands | — | 99,353,951 | — | 99,353,951 |
| Norway | — | 12,391,653 | — | 12,391,653 |
| Russian Federation | — | — | 0* | 0* |
| Singapore | — | 22,170,455 | — | 22,170,455 |
| South Africa | — | 1,782,318 | — | 1,782,318 |
| South Korea | — | 21,245,148 | — | 21,245,148 |
| Sweden | — | 1,763,781 | — | 1,763,781 |
| Switzerland | — | 31,346,515 | — | 31,346,515 |
| Taiwan | 3,550,795 | 24,085,686 | — | 27,636,481 |
The accompanying Notes to Financial Statements are an integral part of this statement.
| 10 | Columbia Overseas Core Fund | Semiannual Report 2023 |
Portfolio of Investments (continued)
August 31, 2023 (Unaudited)
Fair value measurements (continued)
| | Level 1 ($) | Level 2 ($) | Level 3 ($) | Total ($) |
| United Kingdom | 40,752,030 | 74,933,080 | — | 115,685,110 |
| United States | 68,787,036 | 11,087,992 | — | 79,875,028 |
| Total Common Stocks | 177,602,344 | 678,188,052 | 0* | 855,790,396 |
| Exchange-Traded Equity Funds | 5,262,033 | — | — | 5,262,033 |
| Call Option Contracts Purchased | 87,615 | — | — | 87,615 |
| Money Market Funds | 4,842,120 | — | — | 4,842,120 |
| Total Investments in Securities | 187,794,112 | 678,188,052 | 0* | 865,982,164 |
| Investments in Derivatives | | | | |
| Asset | | | | |
| Forward Foreign Currency Exchange Contracts | — | 3,811,322 | — | 3,811,322 |
| Liability | | | | |
| Forward Foreign Currency Exchange Contracts | — | (5,892,803) | — | (5,892,803) |
| Total | 187,794,112 | 676,106,571 | 0* | 863,900,683 |
See the Portfolio of Investments for all investment classifications not indicated in the table.
The Fund’s assets assigned to the Level 2 input category are generally valued using the market approach, in which a security’s value is determined through reference to prices and information from market transactions for similar or identical assets. These assets include certain foreign securities for which a third party statistical pricing service may be employed for purposes of fair market valuation. The model utilized by such third party statistical pricing service takes into account a security’s correlation to available market data including, but not limited to, intraday index, ADR, and exchange-traded fund movements.
Forward foreign currency exchange contracts are valued at unrealized appreciation (depreciation).
The Fund does not hold any significant investments (greater than one percent of net assets) categorized as Level 3.
The accompanying Notes to Financial Statements are an integral part of this statement.
Columbia Overseas Core Fund | Semiannual Report 2023
| 11 |
Statement of Assets and Liabilities
August 31, 2023 (Unaudited)
| Assets | |
| Investments in securities, at value | |
| Unaffiliated issuers (cost $810,609,937) | $861,052,429 |
| Affiliated issuers (cost $4,841,350) | 4,842,120 |
| Option contracts purchased (cost $263,456) | 87,615 |
| Unrealized appreciation on forward foreign currency exchange contracts | 3,811,322 |
| Receivable for: | |
| Investments sold | 8,819,767 |
| Capital shares sold | 97,159 |
| Dividends | 1,694,587 |
| Foreign tax reclaims | 1,590,056 |
| Expense reimbursement due from Investment Manager | 1,797 |
| Prepaid expenses | 11,654 |
| Total assets | 882,008,506 |
| Liabilities | |
| Foreign currency (cost $1,189) | 1,194 |
| Unrealized depreciation on forward foreign currency exchange contracts | 5,892,803 |
| Payable for: | |
| Investments purchased | 9,784,612 |
| Capital shares redeemed | 393,447 |
| Foreign capital gains taxes deferred | 881 |
| Management services fees | 20,053 |
| Distribution and/or service fees | 364 |
| Transfer agent fees | 49,949 |
| Trustees’ fees | 90,690 |
| Compensation of chief compliance officer | 83 |
| Other expenses | 36,527 |
| Total liabilities | 16,270,603 |
| Net assets applicable to outstanding capital stock | $865,737,903 |
| Represented by | |
| Paid in capital | 879,528,244 |
| Total distributable earnings (loss) | (13,790,341) |
| Total - representing net assets applicable to outstanding capital stock | $865,737,903 |
The accompanying Notes to Financial Statements are an integral part of this statement.
| 12 | Columbia Overseas Core Fund | Semiannual Report 2023 |
Statement of Assets and Liabilities (continued)
August 31, 2023 (Unaudited)
| Class A | |
| Net assets | $47,624,699 |
| Shares outstanding | 4,925,233 |
| Net asset value per share | $9.67 |
| Maximum sales charge | 5.75% |
| Maximum offering price per share (calculated by dividing the net asset value per share by 1.0 minus the maximum sales charge for Class A shares) | $10.26 |
| Advisor Class | |
| Net assets | $427,390 |
| Shares outstanding | 44,126 |
| Net asset value per share | $9.69 |
| Class C | |
| Net assets | $1,321,660 |
| Shares outstanding | 137,659 |
| Net asset value per share | $9.60 |
| Institutional Class | |
| Net assets | $285,711,470 |
| Shares outstanding | 29,477,649 |
| Net asset value per share | $9.69 |
| Institutional 2 Class | |
| Net assets | $752,360 |
| Shares outstanding | 77,515 |
| Net asset value per share | $9.71 |
| Institutional 3 Class | |
| Net assets | $529,897,283 |
| Shares outstanding | 54,573,475 |
| Net asset value per share | $9.71 |
| Class R | |
| Net assets | $3,041 |
| Shares outstanding | 315 |
| Net asset value per share(a) | $9.66 |
| (a) | Net asset value per share rounds to this amount due to fractional shares outstanding. |
The accompanying Notes to Financial Statements are an integral part of this statement.
Columbia Overseas Core Fund | Semiannual Report 2023
| 13 |
Statement of Operations
Six Months Ended August 31, 2023 (Unaudited)
| Net investment income | |
| Income: | |
| Dividends — unaffiliated issuers | $19,426,957 |
| Dividends — affiliated issuers | 126,400 |
| Foreign taxes withheld | (1,760,296) |
| Total income | 17,793,061 |
| Expenses: | |
| Management services fees | 3,654,486 |
| Distribution and/or service fees | |
| Class A | 60,318 |
| Class C | 7,104 |
| Class R | 7 |
| Transfer agent fees | |
| Class A | 35,292 |
| Advisor Class | 241 |
| Class C | 1,040 |
| Institutional Class | 208,579 |
| Institutional 2 Class | 258 |
| Institutional 3 Class | 14,706 |
| Class R | 2 |
| Trustees’ fees | 20,213 |
| Custodian fees | 78,112 |
| Printing and postage fees | 12,498 |
| Registration fees | 57,744 |
| Accounting services fees | 43,353 |
| Legal fees | 10,307 |
| Interest on collateral | 11,646 |
| Compensation of chief compliance officer | 83 |
| Other | 21,100 |
| Total expenses | 4,237,089 |
| Fees waived or expenses reimbursed by Investment Manager and its affiliates | (311,114) |
| Total net expenses | 3,925,975 |
| Net investment income | 13,867,086 |
| Realized and unrealized gain (loss) — net | |
| Net realized gain (loss) on: | |
| Investments — unaffiliated issuers | 3,102,431 |
| Investments — affiliated issuers | (1,367) |
| Foreign currency translations | (187,674) |
| Forward foreign currency exchange contracts | 5,569,423 |
| Option contracts purchased | (53,123) |
| Option contracts written | 84,930 |
| Net realized gain | 8,514,620 |
| Net change in unrealized appreciation (depreciation) on: | |
| Investments — unaffiliated issuers | 21,905,796 |
| Investments — affiliated issuers | 761 |
| Foreign currency translations | 118,030 |
| Forward foreign currency exchange contracts | (2,356,432) |
| Option contracts purchased | (175,841) |
| Net change in unrealized appreciation (depreciation) | 19,492,314 |
| Net realized and unrealized gain | 28,006,934 |
| Net increase in net assets resulting from operations | $41,874,020 |
The accompanying Notes to Financial Statements are an integral part of this statement.
| 14 | Columbia Overseas Core Fund | Semiannual Report 2023 |
Statement of Changes in Net Assets
| | Six Months Ended
August 31, 2023
(Unaudited) | Year Ended
February 28, 2023 |
| Operations | | |
| Net investment income | $13,867,086 | $19,491,358 |
| Net realized gain (loss) | 8,514,620 | (70,676,248) |
| Net change in unrealized appreciation (depreciation) | 19,492,314 | (30,171,454) |
| Net increase (decrease) in net assets resulting from operations | 41,874,020 | (81,356,344) |
| Distributions to shareholders | | |
| Net investment income and net realized gains | | |
| Class A | (783,896) | (711,103) |
| Advisor Class | (7,852) | (3,199) |
| Class C | (13,123) | (30,685) |
| Institutional Class | (5,353,015) | (4,867,701) |
| Institutional 2 Class | (14,214) | (6,050) |
| Institutional 3 Class | (10,397,133) | (8,588,232) |
| Class R | (43) | (42) |
| Total distributions to shareholders | (16,569,276) | (14,207,012) |
| Decrease in net assets from capital stock activity | (17,877,161) | (46,696,535) |
| Total increase (decrease) in net assets | 7,427,583 | (142,259,891) |
| Net assets at beginning of period | 858,310,320 | 1,000,570,211 |
| Net assets at end of period | $865,737,903 | $858,310,320 |
The accompanying Notes to Financial Statements are an integral part of this statement.
Columbia Overseas Core Fund | Semiannual Report 2023
| 15 |
Statement of Changes in Net Assets (continued)
| | Six Months Ended | Year Ended |
| | August 31, 2023 (Unaudited) | February 28, 2023 |
| | Shares | Dollars ($) | Shares | Dollars ($) |
| Capital stock activity |
| Class A | | | | |
| Shares sold | 151,246 | 1,460,827 | 417,180 | 3,782,989 |
| Distributions reinvested | 80,439 | 770,602 | 81,687 | 697,607 |
| Shares redeemed | (344,098) | (3,302,506) | (908,262) | (8,071,441) |
| Net decrease | (112,413) | (1,071,077) | (409,395) | (3,590,845) |
| Advisor Class | | | | |
| Shares sold | 25,973 | 252,024 | 286 | 2,538 |
| Distributions reinvested | 779 | 7,473 | 341 | 2,921 |
| Shares redeemed | (2,727) | (26,836) | (6,164) | (52,080) |
| Net increase (decrease) | 24,025 | 232,661 | (5,537) | (46,621) |
| Class C | | | | |
| Shares sold | 7,745 | 73,162 | 14,576 | 132,658 |
| Distributions reinvested | 1,359 | 12,934 | 3,401 | 28,907 |
| Shares redeemed | (32,373) | (309,413) | (118,762) | (1,041,494) |
| Net decrease | (23,269) | (223,317) | (100,785) | (879,929) |
| Institutional Class | | | | |
| Shares sold | 2,141,437 | 20,729,713 | 15,681,407 | 153,782,615 |
| Distributions reinvested | 557,396 | 5,351,002 | 568,340 | 4,864,990 |
| Shares redeemed | (3,681,700) | (35,265,110) | (12,654,681) | (112,948,653) |
| Net increase (decrease) | (982,867) | (9,184,395) | 3,595,066 | 45,698,952 |
| Institutional 2 Class | | | | |
| Shares sold | 526 | 5,066 | 70,546 | 639,595 |
| Distributions reinvested | 1,206 | 11,593 | 701 | 6,009 |
| Shares redeemed | (14,377) | (142,502) | (25,357) | (225,576) |
| Net increase (decrease) | (12,645) | (125,843) | 45,890 | 420,028 |
| Institutional 3 Class | | | | |
| Shares sold | 816,436 | 7,938,022 | 892,497 | 8,278,860 |
| Distributions reinvested | 1,081,901 | 10,397,072 | 1,002,123 | 8,588,191 |
| Shares redeemed | (2,652,745) | (25,840,284) | (11,594,370) | (105,165,171) |
| Net decrease | (754,408) | (7,505,190) | (9,699,750) | (88,298,120) |
| Total net decrease | (1,861,577) | (17,877,161) | (6,574,511) | (46,696,535) |
The accompanying Notes to Financial Statements are an integral part of this statement.
| 16 | Columbia Overseas Core Fund | Semiannual Report 2023 |
[THIS PAGE INTENTIONALLY LEFT BLANK]
Columbia Overseas Core Fund | Semiannual Report 2023
| 17 |
The following table is intended to help you understand the Fund’s financial performance. Certain information reflects financial results for a single share of a class held for the periods shown. Per share net investment income (loss) amounts are calculated based on average shares outstanding during the period. Total return assumes reinvestment of all dividends and distributions, if any. Total return does not reflect payment of sales charges, if any. Total return and portfolio turnover are not annualized for periods of less than one year. The ratios of expenses and net investment income are annualized for periods of less than one year. The portfolio turnover rate is calculated without regard to purchase and sales transactions of short-term instruments and certain derivatives, if any. If such transactions were included, the Fund’s portfolio turnover rate may be higher.
| | Net asset value,
beginning of
period | Net
investment
income
(loss) | Net
realized
and
unrealized
gain (loss) | Total from
investment
operations | Distributions
from net
investment
income | Distributions
from net
realized
gains | Total
distributions to
shareholders |
| Class A |
| Six Months Ended 8/31/2023 (Unaudited) | $9.38 | 0.14 | 0.31 | 0.45 | (0.16) | — | (0.16) |
| Year Ended 2/28/2023 | $10.23 | 0.16 | (0.88) | (0.72) | — | (0.13) | (0.13) |
| Year Ended 2/28/2022 | $10.89 | 0.17 | 0.02(f) | 0.19 | (0.27) | (0.58) | (0.85) |
| Year Ended 2/28/2021 | $8.99 | 0.06 | 2.06 | 2.12 | (0.05) | (0.17) | (0.22) |
| Year Ended 2/29/2020 | $9.36 | 0.09 | (0.11) | (0.02) | (0.31) | (0.04) | (0.35) |
| Year Ended 2/28/2019(g) | $10.00 | 0.25 | (0.81) | (0.56) | (0.08) | — | (0.08) |
| Advisor Class |
| Six Months Ended 8/31/2023 (Unaudited) | $9.40 | 0.14 | 0.33 | 0.47 | (0.18) | — | (0.18) |
| Year Ended 2/28/2023 | $10.23 | 0.19 | (0.89) | (0.70) | — | (0.13) | (0.13) |
| Year Ended 2/28/2022 | $10.89 | 0.21 | 0.01(f) | 0.22 | (0.30) | (0.58) | (0.88) |
| Year Ended 2/28/2021 | $8.99 | 0.09 | 2.05 | 2.14 | (0.07) | (0.17) | (0.24) |
| Year Ended 2/29/2020 | $9.37 | 0.19 | (0.19) | 0.00 | (0.34) | (0.04) | (0.38) |
| Year Ended 2/28/2019(g) | $10.00 | 0.28 | (0.81) | (0.53) | (0.10) | — | (0.10) |
| Class C |
| Six Months Ended 8/31/2023 (Unaudited) | $9.28 | 0.10 | 0.31 | 0.41 | (0.09) | — | (0.09) |
| Year Ended 2/28/2023 | $10.20 | 0.10 | (0.89) | (0.79) | — | (0.13) | (0.13) |
| Year Ended 2/28/2022 | $10.86 | 0.09 | 0.02(f) | 0.11 | (0.19) | (0.58) | (0.77) |
| Year Ended 2/28/2021 | $9.00 | (0.01) | 2.04 | 2.03 | — | (0.17) | (0.17) |
| Year Ended 2/29/2020 | $9.36 | 0.06 | (0.15) | (0.09) | (0.23) | (0.04) | (0.27) |
| Year Ended 2/28/2019(g) | $10.00 | 0.18 | (0.80) | (0.62) | (0.02) | — | (0.02) |
| Institutional Class |
| Six Months Ended 8/31/2023 (Unaudited) | $9.41 | 0.15 | 0.31 | 0.46 | (0.18) | — | (0.18) |
| Year Ended 2/28/2023 | $10.24 | 0.19 | (0.89) | (0.70) | — | (0.13) | (0.13) |
| Year Ended 2/28/2022 | $10.89 | 0.19 | 0.04(f) | 0.23 | (0.30) | (0.58) | (0.88) |
| Year Ended 2/28/2021 | $9.00 | 0.13 | 2.00 | 2.13 | (0.07) | (0.17) | (0.24) |
| Year Ended 2/29/2020 | $9.37 | 0.19 | (0.18) | 0.01 | (0.34) | (0.04) | (0.38) |
| Year Ended 2/28/2019(g) | $10.00 | 0.38 | (0.91) | (0.53) | (0.10) | — | (0.10) |
| Institutional 2 Class |
| Six Months Ended 8/31/2023 (Unaudited) | $9.43 | 0.16 | 0.31 | 0.47 | (0.19) | — | (0.19) |
| Year Ended 2/28/2023 | $10.25 | 0.16 | (0.85) | (0.69) | — | (0.13) | (0.13) |
| Year Ended 2/28/2022 | $10.90 | 0.20 | 0.04(f) | 0.24 | (0.31) | (0.58) | (0.89) |
| Year Ended 2/28/2021 | $9.00 | 0.10 | 2.05 | 2.15 | (0.08) | (0.17) | (0.25) |
| Year Ended 2/29/2020 | $9.38 | 0.19 | (0.18) | 0.01 | (0.35) | (0.04) | (0.39) |
| Year Ended 2/28/2019(g) | $10.00 | 0.28 | (0.81) | (0.53) | (0.09) | — | (0.09) |
The accompanying Notes to Financial Statements are an integral part of this statement.
| 18 | Columbia Overseas Core Fund | Semiannual Report 2023 |
Financial Highlights (continued)
| | Net
asset
value,
end of
period | Total
return | Total gross
expense
ratio to
average
net assets(a) | Total net
expense
ratio to
average
net assets(a),(b) | Net investment
income (loss)
ratio to
average
net assets | Portfolio
turnover | Net
assets,
end of
period
(000’s) |
| Class A |
| Six Months Ended 8/31/2023 (Unaudited) | $9.67 | 4.80% | 1.30%(c) | 1.22%(c) | 2.90% | 21% | $47,625 |
| Year Ended 2/28/2023 | $9.38 | (6.89%) | 1.28%(c),(d) | 1.22%(c),(d),(e) | 1.74% | 60% | $47,250 |
| Year Ended 2/28/2022 | $10.23 | 1.38% | 1.27%(c),(d) | 1.22%(c),(d),(e) | 1.47% | 43% | $55,723 |
| Year Ended 2/28/2021 | $10.89 | 23.80% | 1.33%(c),(d) | 1.24%(c),(d),(e) | 0.59% | 39% | $57,243 |
| Year Ended 2/29/2020 | $8.99 | (0.46%) | 1.40% | 1.26% | 0.94% | 48% | $431 |
| Year Ended 2/28/2019(g) | $9.36 | (5.55%) | 1.65%(d) | 1.28%(d) | 2.64% | 71% | $30 |
| Advisor Class |
| Six Months Ended 8/31/2023 (Unaudited) | $9.69 | 5.03% | 1.06%(c) | 0.97%(c) | 2.92% | 21% | $427 |
| Year Ended 2/28/2023 | $9.40 | (6.69%) | 1.03%(c),(d) | 0.97%(c),(d),(e) | 2.05% | 60% | $189 |
| Year Ended 2/28/2022 | $10.23 | 1.64% | 1.02%(c),(d) | 0.97%(c),(d),(e) | 1.83% | 43% | $262 |
| Year Ended 2/28/2021 | $10.89 | 24.07% | 1.08%(c),(d) | 0.99%(c),(d),(e) | 0.91% | 39% | $368 |
| Year Ended 2/29/2020 | $8.99 | (0.30%) | 1.15% | 1.01% | 1.98% | 48% | $19 |
| Year Ended 2/28/2019(g) | $9.37 | (5.22%) | 1.40%(d) | 1.03%(d) | 2.95% | 71% | $20 |
| Class C |
| Six Months Ended 8/31/2023 (Unaudited) | $9.60 | 4.43% | 2.05%(c) | 1.97%(c) | 2.19% | 21% | $1,322 |
| Year Ended 2/28/2023 | $9.28 | (7.60%) | 2.03%(c),(d) | 1.97%(c),(d),(e) | 1.13% | 60% | $1,494 |
| Year Ended 2/28/2022 | $10.20 | 0.60% | 2.02%(c),(d) | 1.97%(c),(d),(e) | 0.82% | 43% | $2,670 |
| Year Ended 2/28/2021 | $10.86 | 22.80% | 2.07%(c),(d) | 1.99%(c),(d),(e) | (0.14%) | 39% | $3,863 |
| Year Ended 2/29/2020 | $9.00 | (1.17%) | 2.15% | 2.01% | 0.63% | 48% | $49 |
| Year Ended 2/28/2019(g) | $9.36 | (6.22%) | 2.40%(d) | 2.03%(d) | 1.89% | 71% | $25 |
| Institutional Class |
| Six Months Ended 8/31/2023 (Unaudited) | $9.69 | 4.92% | 1.05%(c) | 0.97%(c) | 3.13% | 21% | $285,711 |
| Year Ended 2/28/2023 | $9.41 | (6.68%) | 1.03%(c),(d) | 0.97%(c),(d),(e) | 2.05% | 60% | $286,669 |
| Year Ended 2/28/2022 | $10.24 | 1.73% | 1.02%(c),(d) | 0.97%(c),(d),(e) | 1.68% | 43% | $275,013 |
| Year Ended 2/28/2021 | $10.89 | 23.93% | 1.10%(c),(d) | 1.00%(c),(d),(e) | 1.40% | 39% | $215,765 |
| Year Ended 2/29/2020 | $9.00 | (0.19%) | 1.15% | 1.02% | 1.98% | 48% | $131,881 |
| Year Ended 2/28/2019(g) | $9.37 | (5.22%) | 1.37%(d) | 1.03%(d) | 4.47% | 71% | $120,114 |
| Institutional 2 Class |
| Six Months Ended 8/31/2023 (Unaudited) | $9.71 | 4.98% | 0.97%(c) | 0.90%(c) | 3.27% | 21% | $752 |
| Year Ended 2/28/2023 | $9.43 | (6.58%) | 0.97%(c),(d) | 0.90%(c),(d) | 1.78% | 60% | $850 |
| Year Ended 2/28/2022 | $10.25 | 1.81% | 0.95%(c),(d) | 0.90%(c),(d) | 1.77% | 43% | $454 |
| Year Ended 2/28/2021 | $10.90 | 24.16% | 0.99%(c),(d) | 0.90%(c),(d) | 1.02% | 39% | $439 |
| Year Ended 2/29/2020 | $9.00 | (0.18%) | 1.04% | 0.91% | 1.99% | 48% | $47 |
| Year Ended 2/28/2019(g) | $9.38 | (5.17%) | 1.25%(d) | 0.93%(d) | 3.02% | 71% | $29 |
The accompanying Notes to Financial Statements are an integral part of this statement.
Columbia Overseas Core Fund | Semiannual Report 2023
| 19 |
Financial Highlights (continued)
| | Net asset value,
beginning of
period | Net
investment
income
(loss) | Net
realized
and
unrealized
gain (loss) | Total from
investment
operations | Distributions
from net
investment
income | Distributions
from net
realized
gains | Total
distributions to
shareholders |
| Institutional 3 Class |
| Six Months Ended 8/31/2023 (Unaudited) | $9.43 | 0.16 | 0.31 | 0.47 | (0.19) | — | (0.19) |
| Year Ended 2/28/2023 | $10.25 | 0.19 | (0.88) | (0.69) | — | (0.13) | (0.13) |
| Year Ended 2/28/2022 | $10.91 | 0.21 | 0.03(f) | 0.24 | (0.32) | (0.58) | (0.90) |
| Year Ended 2/28/2021 | $9.00 | 0.12 | 2.05 | 2.17 | (0.09) | (0.17) | (0.26) |
| Year Ended 2/29/2020 | $9.38 | 0.21 | (0.19) | 0.02 | (0.36) | (0.04) | (0.40) |
| Year Ended 2/28/2019(g) | $10.00 | 0.29 | (0.81) | (0.52) | (0.10) | — | (0.10) |
| Class R |
| Six Months Ended 8/31/2023 (Unaudited) | $9.36 | 0.13 | 0.31 | 0.44 | (0.14) | — | (0.14) |
| Year Ended 2/28/2023 | $10.23 | 0.13 | (0.87) | (0.74) | — | (0.13) | (0.13) |
| Year Ended 2/28/2022 | $10.88 | 0.15 | 0.02(f) | 0.17 | (0.24) | (0.58) | (0.82) |
| Year Ended 2/28/2021 | $8.99 | 0.20 | 1.88 | 2.08 | (0.02) | (0.17) | (0.19) |
| Year Ended 2/29/2020 | $9.36 | 0.18 | (0.22) | (0.04) | (0.29) | (0.04) | (0.33) |
| Year Ended 2/28/2019(g) | $10.00 | 0.26 | (0.84) | (0.58) | (0.06) | — | (0.06) |
| Notes to Financial Highlights |
| (a) | In addition to the fees and expenses that the Fund bears directly, the Fund indirectly bears a pro rata share of the fees and expenses of any other funds in which it invests. Such indirect expenses are not included in the Fund’s reported expense ratios. |
| (b) | Total net expenses include the impact of certain fee waivers/expense reimbursements made by the Investment Manager and certain of its affiliates, if applicable. |
| (c) | Ratios include interest on collateral expense which is less than 0.01%. |
| (d) | Ratios include interfund lending expense which is less than 0.01%. |
| (e) | The benefits derived from expense reductions had an impact of less than 0.01%. |
| (f) | Calculation of the net gain (loss) per share (both realized and unrealized) does not correlate to the aggregate realized and unrealized gain (loss) presented in the Statement of Operations due to timing of Fund shares sold and redeemed in relation to fluctuations in the market value of the portfolio. |
| (g) | The Fund commenced operations on March 5, 2018. Per share data and total return reflect activity from that date. |
The accompanying Notes to Financial Statements are an integral part of this statement.
| 20 | Columbia Overseas Core Fund | Semiannual Report 2023 |
Financial Highlights (continued)
| | Net
asset
value,
end of
period | Total
return | Total gross
expense
ratio to
average
net assets(a) | Total net
expense
ratio to
average
net assets(a),(b) | Net investment
income (loss)
ratio to
average
net assets | Portfolio
turnover | Net
assets,
end of
period
(000’s) |
| Institutional 3 Class |
| Six Months Ended 8/31/2023 (Unaudited) | $9.71 | 5.02% | 0.91%(c) | 0.84%(c) | 3.28% | 21% | $529,897 |
| Year Ended 2/28/2023 | $9.43 | (6.58%) | 0.90%(c),(d) | 0.85%(c),(d) | 2.13% | 60% | $521,856 |
| Year Ended 2/28/2022 | $10.25 | 1.78% | 0.89%(c),(d) | 0.84%(c),(d) | 1.85% | 43% | $666,445 |
| Year Ended 2/28/2021 | $10.91 | 24.34% | 0.94%(c),(d) | 0.84%(c),(d) | 1.21% | 39% | $555,487 |
| Year Ended 2/29/2020 | $9.00 | (0.11%) | 0.97% | 0.85% | 2.18% | 48% | $119,513 |
| Year Ended 2/28/2019(g) | $9.38 | (5.11%) | 1.19%(d) | 0.87%(d) | 3.14% | 71% | $132,187 |
| Class R |
| Six Months Ended 8/31/2023 (Unaudited) | $9.66 | 4.67% | 1.55%(c) | 1.47%(c) | 2.64% | 21% | $3 |
| Year Ended 2/28/2023 | $9.36 | (7.09%) | 1.50%(c),(d) | 1.47%(c),(d),(e) | 1.46% | 60% | $3 |
| Year Ended 2/28/2022 | $10.23 | 1.18% | 1.51%(c),(d) | 1.47%(c),(d),(e) | 1.24% | 43% | $3 |
| Year Ended 2/28/2021 | $10.88 | 23.43% | 1.59%(c),(d) | 1.48%(c),(d),(e) | 2.33% | 39% | $3 |
| Year Ended 2/29/2020 | $8.99 | (0.73%) | 1.65% | 1.52% | 1.88% | 48% | $19 |
| Year Ended 2/28/2019(g) | $9.36 | (5.77%) | 1.90%(d) | 1.53%(d) | 2.91% | 71% | $64 |
The accompanying Notes to Financial Statements are an integral part of this statement.
Columbia Overseas Core Fund | Semiannual Report 2023
| 21 |
Notes to Financial Statements
August 31, 2023 (Unaudited)
Note 1. Organization
Columbia Overseas Core Fund (the Fund), a series of Columbia Funds Series Trust II (the Trust), is a diversified fund. The Trust is registered under the Investment Company Act of 1940, as amended (the 1940 Act), as an open-end management investment company organized as a Massachusetts business trust.
Fund shares
The Trust may issue an unlimited number of shares (without par value). The Fund offers each of the share classes listed in the Statement of Assets and Liabilities. Although all share classes generally have identical voting, dividend and liquidation rights, each share class votes separately when required by the Trust’s organizational documents or by law. Each share class has its own expense and sales charge structure. Different share classes may have different minimum initial investment amounts and pay different net investment income distribution amounts to the extent the expenses of distributing such share classes vary. Distributions to shareholders in a liquidation will be proportional to the net asset value of each share class.
As described in the Fund’s prospectus, Class A and Class C shares are offered to the general public for investment. Class C shares automatically convert to Class A shares after 8 years. Advisor Class, Institutional Class, Institutional 2 Class, Institutional 3 Class and Class R shares are available for purchase through authorized investment professionals to omnibus retirement plans or to institutional investors and to certain other investors as also described in the Fund’s prospectus.
Note 2. Summary of significant accounting policies
Basis of preparation
The Fund is an investment company that applies the accounting and reporting guidance in the Financial Accounting Standards Board (FASB) Accounting Standards Codification Topic 946, Financial Services - Investment Companies (ASC 946). The financial statements are prepared in accordance with U.S. generally accepted accounting principles (GAAP), which requires management to make certain estimates and assumptions that affect the reported amounts of assets and liabilities, the disclosure of contingent assets and liabilities at the date of the financial statements and the reported amounts of income and expenses during the reporting period. Actual results could differ from those estimates.
The following is a summary of significant accounting policies followed by the Fund in the preparation of its financial statements.
Security valuation
Equity securities listed on an exchange are valued at the closing price or last trade price on their primary exchange at the close of business of the New York Stock Exchange. Securities with a closing price not readily available or not listed on any exchange are valued at the mean between the closing bid and ask prices. Listed preferred stocks convertible into common stocks are valued using an evaluated price from a pricing service.
Foreign equity securities are valued based on the closing price or last trade price on their primary exchange at the close of business of the New York Stock Exchange. If any foreign equity security closing prices are not readily available, the securities are valued at the mean of the latest quoted bid and ask prices on such exchanges or markets. Foreign currency exchange rates are determined at the scheduled closing time of the New York Stock Exchange. Many securities markets and exchanges outside the U.S. close prior to the close of the New York Stock Exchange; therefore, the closing prices for securities in such markets or on such exchanges may not fully reflect events that occur after such close but before the close of the New York Stock Exchange. In those situations, foreign securities will be fair valued pursuant to a policy approved by the Board of Trustees. Under the policy, the Fund may utilize a third-party pricing service to determine these fair values. The third-party pricing service takes into account multiple factors, including, but not limited to, movements in the U.S. securities markets, certain depositary receipts, futures contracts and foreign exchange rates that have occurred subsequent to the close of the foreign exchange or market, to determine a good faith estimate that reasonably reflects the current market conditions as of the close of the New York Stock Exchange. The fair value of a security is likely to be different from the quoted or published price, if available.
Investments in open-end investment companies (other than exchange-traded funds (ETFs)), are valued at the latest net asset value reported by those companies as of the valuation time.
| 22 | Columbia Overseas Core Fund | Semiannual Report 2023 |
Notes to Financial Statements (continued)
August 31, 2023 (Unaudited)
Forward foreign currency exchange contracts are marked-to-market based upon foreign currency exchange rates provided by a pricing service.
Option contracts are valued at the mean of the latest quoted bid and ask prices on their primary exchanges. Option contracts, including over-the-counter option contracts, with no readily available market quotations are valued using mid-market evaluations from independent third-party vendors.
Investments for which market quotations are not readily available, or that have quotations which management believes are not reflective of market value or reliable, are valued at fair value as determined in good faith under procedures approved by the Board of Trustees. If a security or class of securities (such as foreign securities) is valued at fair value, such value is likely to be different from the quoted or published price for the security, if available.
The determination of fair value often requires significant judgment. To determine fair value, management may use assumptions including but not limited to future cash flows and estimated risk premiums. Multiple inputs from various sources may be used to determine fair value.
GAAP requires disclosure regarding the inputs and valuation techniques used to measure fair value and any changes in valuation inputs or techniques. In addition, investments shall be disclosed by major category. This information is disclosed following the Fund’s Portfolio of Investments.
Foreign currency transactions and translations
The values of all assets and liabilities denominated in foreign currencies are generally translated into U.S. dollars at exchange rates determined at the close of regular trading on the New York Stock Exchange. Net realized and unrealized gains (losses) on foreign currency transactions and translations include gains (losses) arising from the fluctuation in exchange rates between trade and settlement dates on securities transactions, gains (losses) arising from the disposition of foreign currency and currency gains (losses) between the accrual and payment dates on dividends, interest income and foreign withholding taxes.
For financial statement purposes, the Fund does not distinguish that portion of gains (losses) on investments which is due to changes in foreign exchange rates from that which is due to changes in market prices of the investments. Such fluctuations are included with the net realized and unrealized gains (losses) on investments in the Statement of Operations.
Derivative instruments
The Fund invests in certain derivative instruments, as detailed below, in seeking to meet its investment objectives. Derivatives are instruments whose values depend on, or are derived from, in whole or in part, the value of one or more securities, currencies, commodities, indices, or other assets or instruments. Derivatives may be used to increase investment flexibility (including to maintain cash reserves while maintaining desired exposure to certain assets), for risk management (hedging) purposes, to facilitate trading, to reduce transaction costs and to pursue higher investment returns. The Fund may also use derivative instruments to mitigate certain investment risks, such as foreign currency exchange rate risk, interest rate risk and credit risk. Derivatives may involve various risks, including the potential inability of the counterparty to fulfill its obligations under the terms of the contract, the potential for an illiquid secondary market (making it difficult for the Fund to sell or terminate, including at favorable prices) and the potential for market movements which may expose the Fund to gains or losses in excess of the amount shown in the Statement of Assets and Liabilities. The notional amounts of derivative instruments, if applicable, are not recorded in the financial statements.
A derivative instrument may suffer a marked-to-market loss if the value of the contract decreases due to an unfavorable change in the market rates or values of the underlying instrument. Losses can also occur if the counterparty does not perform its obligations under the contract. The Fund’s risk of loss from counterparty credit risk on over-the-counter derivatives is generally limited to the aggregate unrealized gain netted against any collateral held by the Fund and the amount of any variation margin held by the counterparty, plus any replacement costs or related amounts. With exchange-traded or centrally cleared derivatives, there is reduced counterparty credit risk to the Fund since the clearinghouse or central counterparty (CCP) provides some protection in the case of clearing member default. The clearinghouse or CCP stands between the buyer and the seller of the contract; therefore, failure of the clearinghouse or CCP may pose additional counterparty credit risk. However, credit risk still exists in exchange-traded or centrally cleared derivatives with respect to initial and variation margin
Columbia Overseas Core Fund | Semiannual Report 2023
| 23 |
Notes to Financial Statements (continued)
August 31, 2023 (Unaudited)
that is held in a broker’s customer account. While clearing brokers are required to segregate customer margin from their own assets, in the event that a clearing broker becomes insolvent or goes into bankruptcy and at that time there is a shortfall in the aggregate amount of margin held by the clearing broker for all its clients and such shortfall is remedied by the CCP or otherwise, U.S. bankruptcy laws will typically allocate that shortfall on a pro-rata basis across all the clearing broker’s customers (including the Fund), potentially resulting in losses to the Fund.
In order to better define its contractual rights and to secure rights that will help the Fund mitigate its counterparty risk, the Fund may enter into an International Swaps and Derivatives Association, Inc. Master Agreement (ISDA Master Agreement) or similar agreement with its derivatives counterparties. An ISDA Master Agreement is an agreement between the Fund and a counterparty that governs over-the-counter derivatives and foreign exchange forward contracts and contains, among other things, collateral posting terms and netting provisions in the event of a default and/or termination event. Under an ISDA Master Agreement, the Fund may, under certain circumstances, offset with the counterparty certain derivative instruments’ payables and/or receivables with collateral held and/or posted and create one single net payment. The provisions of the ISDA Master Agreement typically permit a single net payment in the event of default (close-out netting), including the bankruptcy or insolvency of the counterparty. Note, however, that bankruptcy or insolvency laws of a particular jurisdiction may impose restrictions on or prohibitions against the right of offset or netting in bankruptcy, insolvency or other events.
Collateral (margin) requirements differ by type of derivative. Margin requirements are established by the clearinghouse or CCP for exchange-traded and centrally cleared derivatives. Brokers can ask for margin in excess of the minimum in certain circumstances. Collateral terms for most over-the-counter derivatives are subject to regulatory requirements to exchange variation margin with trading counterparties and may have contract specific margin terms as well. For over-the-counter derivatives traded under an ISDA Master Agreement, the collateral requirements are typically calculated by netting the marked-to-market amount for each transaction under such agreement and comparing that amount to the value of any variation margin currently pledged by the Fund and/or the counterparty. Generally, the amount of collateral due from or to a party has to exceed a minimum transfer amount threshold (e.g., $250,000) before a transfer has to be made. To the extent amounts due to the Fund from its counterparties are not fully collateralized, contractually or otherwise, the Fund bears the risk of loss from counterparty nonperformance. The Fund may also pay interest expense on cash collateral received from the broker or receive interest income on cash collateral pledged to the broker. The Fund attempts to mitigate counterparty risk by only entering into agreements with counterparties that it believes have the financial resources to honor their obligations and by monitoring the financial stability of those counterparties.
Certain ISDA Master Agreements allow counterparties of over-the-counter derivatives transactions to terminate derivatives contracts prior to maturity in the event the Fund’s net asset value declines by a stated percentage over a specified time period or if the Fund fails to meet certain terms of the ISDA Master Agreement, which would cause the Fund to accelerate payment of any net liability owed to the counterparty. The Fund also has termination rights if the counterparty fails to meet certain terms of the ISDA Master Agreement. In determining whether to exercise such termination rights, the Fund would consider, in addition to counterparty credit risk, whether termination would result in a net liability owed from the counterparty.
For financial reporting purposes, the Fund does not offset derivative assets and derivative liabilities that are subject to netting arrangements in the Statement of Assets and Liabilities.
Forward foreign currency exchange contracts
Forward foreign currency exchange contracts are over-the-counter agreements between two parties to buy and sell a currency at a set price on a future date. The Fund utilized forward foreign currency exchange contracts to hedge the currency exposure associated with some or all of the Fund’s securities, to shift investment exposure from one currency to another and to shift U.S. dollar exposure to achieve a representative weighted mix of major currencies in its benchmark. These instruments may be used for other purposes in future periods.
The values of forward foreign currency exchange contracts fluctuate daily with changes in foreign currency exchange rates. Changes in the value of these contracts are recorded as unrealized appreciation or depreciation until the contract is exercised or has expired. The Fund will realize a gain or loss when the forward foreign currency exchange contract is closed or expires. Non-deliverable forward foreign currency exchange contracts are settled with the counterparty in U.S. dollars without delivery of foreign currency.
| 24 | Columbia Overseas Core Fund | Semiannual Report 2023 |
Notes to Financial Statements (continued)
August 31, 2023 (Unaudited)
The use of forward foreign currency exchange contracts does not eliminate fluctuations in the prices of the Fund’s portfolio securities. The risks of forward foreign currency exchange contracts include movement in the values of the foreign currencies relative to the U.S. dollar (or other foreign currencies) and the possibility that counterparties will not complete their contractual obligations, which may be in excess of the amount reflected, if any, in the Statement of Assets and Liabilities.
Options contracts
Options are contracts which entitle the holder to purchase or sell securities or other identified assets at a specified price, or in the case of index option contracts, to receive or pay the difference between the index value and the strike price of the index option contract. Option contracts can be either exchange-traded or over-the-counter. The Fund purchased and has written option contracts to decrease the Fund’s exposure to equity risk and to facilitate buying and selling of securities for investments. These instruments may be used for other purposes in future periods. Completion of transactions for option contracts traded in the over-the-counter market depends upon the performance of the other party. Collateral may be collected or posted by the Fund to secure over-the-counter option contract trades. Collateral held or posted by the Fund for such option contract trades must be returned to the broker or the Fund upon closure, exercise or expiration of the contract.
Options contracts purchased are recorded as investments. When the Fund writes an options contract, the premium received is recorded as an asset and an amount equivalent to the premium is recorded as a liability in the Statement of Assets and Liabilities and is subsequently adjusted to reflect the current fair value of the option written. Changes in the fair value of the written option are recorded as unrealized appreciation or depreciation until the contract is exercised or has expired. The Fund realizes a gain or loss when the option contract is closed or expires. When option contracts are exercised, the proceeds on sales for a written call or purchased put option contract, or the purchase cost for a written put or purchased call option contract, is adjusted by the amount of premium received or paid.
For over-the-counter options purchased, the Fund bears the risk of loss of the amount of the premiums paid plus the positive change in market values net of any collateral held by the Fund should the counterparty fail to perform under the contracts. Option contracts written by the Fund do not typically give rise to significant counterparty credit risk, as options written generally obligate the Fund and not the counterparty to perform. The risk in writing a call option contract is that the Fund gives up the opportunity for profit if the market price of the security increases above the strike price and the option contract is exercised. The risk in writing a put option contract is that the Fund may incur a loss if the market price of the security decreases below the strike price and the option contract is exercised. Exercise of a written option could result in the Fund purchasing or selling a security or foreign currency when it otherwise would not, or at a price different from the current market value. In purchasing and writing options, the Fund bears the risk of an unfavorable change in the value of the underlying instrument or the risk that the Fund may not be able to enter into a closing transaction due to an illiquid market.
Effects of derivative transactions in the financial statements
The following tables are intended to provide additional information about the effect of derivatives on the financial statements of the Fund, including: the fair value of derivatives by risk category and the location of those fair values in the Statement of Assets and Liabilities; and the impact of derivative transactions over the period in the Statement of Operations, including realized and unrealized gains (losses). The derivative instrument schedules following the Portfolio of Investments present additional information regarding derivative instruments outstanding at the end of the period, if any.
The following table is a summary of the fair value of derivative instruments (not considered to be hedging instruments for accounting disclosure purposes) at August 31, 2023:
| | Asset derivatives | |
Risk exposure
category | Statement
of assets and liabilities
location | Fair value ($) |
| Equity risk | Investments, at value — Option contracts purchased | 87,615 |
| Foreign exchange risk | Unrealized appreciation on forward foreign currency exchange contracts | 3,811,322 |
| Total | | 3,898,937 |
Columbia Overseas Core Fund | Semiannual Report 2023
| 25 |
Notes to Financial Statements (continued)
August 31, 2023 (Unaudited)
| | Liability derivatives | |
Risk exposure
category | Statement
of assets and liabilities
location | Fair value ($) |
| Foreign exchange risk | Unrealized depreciation on forward foreign currency exchange contracts | 5,892,803 |
The following table indicates the effect of derivative instruments (not considered to be hedging instruments for accounting disclosure purposes) in the Statement of Operations for the six months ended August 31, 2023:
| Amount of realized gain (loss) on derivatives recognized in income |
| Risk exposure category | Forward
foreign
currency
exchange
contracts
($) | Option
contracts
purchased
($) | Option
contracts
written
($) | Total
($) |
| Equity risk | — | (53,123) | 84,930 | 31,807 |
| Foreign exchange risk | 5,569,423 | — | — | 5,569,423 |
| Total | 5,569,423 | (53,123) | 84,930 | 5,601,230 |
| Change in unrealized appreciation (depreciation) on derivatives recognized in income |
| Risk exposure category | Forward
foreign
currency
exchange
contracts
($) | Option
contracts
purchased
($) | Total
($) |
| Equity risk | — | (175,841) | (175,841) |
| Foreign exchange risk | (2,356,432) | — | (2,356,432) |
| Total | (2,356,432) | (175,841) | (2,532,273) |
The following table is a summary of the average daily outstanding volume by derivative instrument for the six months ended August 31, 2023:
| Derivative instrument | Average
value ($) |
| Option contracts purchased | 134,721 |
| Option contracts written | (1,602) |
| Derivative instrument | Average unrealized
appreciation ($) | Average unrealized
depreciation ($) |
| Forward foreign currency exchange contracts | 3,691,775 | (2,665,802) |
| 26 | Columbia Overseas Core Fund | Semiannual Report 2023 |
Notes to Financial Statements (continued)
August 31, 2023 (Unaudited)
Offsetting of assets and liabilities
The following table presents the Fund’s gross and net amount of assets and liabilities available for offset under netting arrangements as well as any related collateral received or pledged by the Fund as of August 31, 2023:
| | Morgan
Stanley ($) |
| Assets | |
| Forward foreign currency exchange contracts | 3,811,322 |
| Call option contracts purchased | 87,615 |
| Total assets | 3,898,937 |
| Liabilities | |
| Forward foreign currency exchange contracts | 5,892,803 |
| Total liabilities | 5,892,803 |
| Total financial and derivative net assets | (1,993,866) |
| Total collateral received (pledged) (a) | - |
| Net amount (b) | (1,993,866) |
| (a) | In some instances, the actual collateral received and/or pledged may be more than the amount shown due to overcollateralization. |
| (b) | Represents the net amount due from/(to) counterparties in the event of default. |
Security transactions
Security transactions are accounted for on the trade date. Cost is determined and gains (losses) are based upon the specific identification method for both financial statement and federal income tax purposes.
Income recognition
Corporate actions and dividend income are generally recorded net of any non-reclaimable tax withholdings, on the ex-dividend date or upon receipt of an ex-dividend notification in the case of certain foreign securities.
The Fund may receive distributions from holdings in equity securities, business development companies (BDCs), exchange-traded funds (ETFs), limited partnerships (LPs), other regulated investment companies (RICs), and real estate investment trusts (REITs), which report information as to the tax character of their distributions annually. These distributions are allocated to dividend income, capital gain and return of capital based on actual information reported. Return of capital is recorded as a reduction of the cost basis of securities held. If the Fund no longer owns the applicable securities, return of capital is recorded as a realized gain. With respect to REITs, to the extent actual information has not yet been reported, estimates for return of capital are made by Columbia Management Investment Advisers, LLC (the Investment Manager), a wholly-owned subsidiary of Ameriprise Financial, Inc. (Ameriprise Financial). The Investment Manager’s estimates are subsequently adjusted when the actual character of the distributions is disclosed by the REITs, which could result in a proportionate change in return of capital to shareholders.
Awards from class action litigation are recorded as a reduction of cost basis if the Fund still owns the applicable securities on the payment date. If the Fund no longer owns the applicable securities on the payment date, the proceeds are recorded as realized gains.
Expenses
General expenses of the Trust are allocated to the Fund and other funds of the Trust based upon relative net assets or other expense allocation methodologies determined by the nature of the expense. Expenses directly attributable to the Fund are charged to the Fund. Expenses directly attributable to a specific class of shares are charged to that share class.
Determination of class net asset value
All income, expenses (other than class-specific expenses, which are charged to that share class, as shown in the Statement of Operations) and realized and unrealized gains (losses) are allocated to each class of the Fund on a daily basis, based on the relative net assets of each class, for purposes of determining the net asset value of each class.
Columbia Overseas Core Fund | Semiannual Report 2023
| 27 |
Notes to Financial Statements (continued)
August 31, 2023 (Unaudited)
Federal income tax status
The Fund intends to qualify each year as a regulated investment company under Subchapter M of the Internal Revenue Code, as amended, and will distribute substantially all of its investment company taxable income and net capital gain, if any, for its tax year, and as such will not be subject to federal income taxes. In addition, the Fund intends to distribute in each calendar year substantially all of its ordinary income, capital gain net income and certain other amounts, if any, such that the Fund should not be subject to federal excise tax. Therefore, no federal income or excise tax provision is recorded.
Foreign taxes
The Fund may be subject to foreign taxes on income, gains on investments or currency repatriation, a portion of which may be recoverable. The Fund will accrue such taxes and recoveries, as applicable, based upon its current interpretation of tax rules and regulations that exist in the markets in which it invests.
Realized gains in certain countries may be subject to foreign taxes at the Fund level, based on statutory rates. The Fund accrues for such foreign taxes on realized and unrealized gains at the appropriate rate for each jurisdiction, as applicable. The amount, if any, is disclosed as a liability in the Statement of Assets and Liabilities.
Distributions to shareholders
Distributions from net investment income, if any, are declared and paid semi-annually. Net realized capital gains, if any, are distributed at least annually. Income distributions and capital gain distributions are determined in accordance with federal income tax regulations, which may differ from GAAP.
Guarantees and indemnifications
Under the Trust’s organizational documents and, in some cases, by contract, its officers and trustees are indemnified against certain liabilities arising out of the performance of their duties to the Trust or its funds. In addition, certain of the Fund’s contracts with its service providers contain general indemnification clauses. The Fund’s maximum exposure under these arrangements is unknown since the amount of any future claims that may be made against the Fund cannot be determined, and the Fund has no historical basis for predicting the likelihood of any such claims.
Recent accounting pronouncements and regulatory updates
Tailored Shareholder Reports
In October 2022, the Securities and Exchange Commission (SEC) adopted a final rule relating to Tailored Shareholder Reports for Mutual Funds and Exchange-Traded Funds; Fee Information in Investment Company Advertisements. The rule and form amendments will, among other things, require the Fund to transmit concise and visually engaging shareholder reports that highlight key information. The amendments will require that funds tag information in a structured data format and that certain more in-depth information be made available online and available for delivery free of charge to investors on request. The amendments became effective January 24, 2023. There is an 18-month transition period after the effective date of the amendments.
Note 3. Fees and other transactions with affiliates
Management services fees
The Fund has entered into a Management Agreement with Columbia Management Investment Advisers, LLC (the Investment Manager), a wholly-owned subsidiary of Ameriprise Financial, Inc. (Ameriprise Financial). Under the Management Agreement, the Investment Manager provides the Fund with investment research and advice, as well as administrative and accounting services. The management services fee is an annual fee that is equal to a percentage of the Fund’s daily net assets that declines from 0.87% to 0.62% as the Fund’s net assets increase. The annualized effective management services fee rate for the six months ended August 31, 2023 was 0.84% of the Fund’s average daily net assets.
| 28 | Columbia Overseas Core Fund | Semiannual Report 2023 |
Notes to Financial Statements (continued)
August 31, 2023 (Unaudited)
Compensation of board members
Members of the Board of Trustees who are not officers or employees of the Investment Manager or Ameriprise Financial are compensated for their services to the Fund as disclosed in the Statement of Operations. Under a Deferred Compensation Plan (the Deferred Plan), these members of the Board of Trustees may elect to defer payment of up to 100% of their compensation. Deferred amounts are treated as though equivalent dollar amounts had been invested in shares of certain funds managed by the Investment Manager. The Fund’s liability for these amounts is adjusted for market value changes and remains in the Fund until distributed in accordance with the Deferred Plan. All amounts payable under the Deferred Plan constitute a general unsecured obligation of the Fund. The expense for the Deferred Plan, which includes Trustees’ fees deferred during the current period as well as any gains or losses on the Trustees’ deferred compensation balances as a result of market fluctuations, is included in "Trustees’ fees" in the Statement of Operations.
Compensation of Chief Compliance Officer
The Board of Trustees has appointed a Chief Compliance Officer for the Fund in accordance with federal securities regulations. As disclosed in the Statement of Operations, a portion of the Chief Compliance Officer’s total compensation is allocated to the Fund, along with other allocations to affiliated registered investment companies managed by the Investment Manager and its affiliates, based on relative net assets.
Transfer agency fees
Under a Transfer and Dividend Disbursing Agent Agreement, Columbia Management Investment Services Corp. (the Transfer Agent), an affiliate of the Investment Manager and a wholly-owned subsidiary of Ameriprise Financial, is responsible for providing transfer agency services to the Fund. The Transfer Agent has contracted with SS&C GIDS, Inc. (SS&C GIDS) to serve as sub-transfer agent. The Transfer Agent pays the fees of SS&C GIDS for services as sub-transfer agent and SS&C GIDS is not entitled to reimbursement for such fees from the Fund (with the exception of out-of-pocket fees).
The Fund pays the Transfer Agent a monthly transfer agency fee based on the number or the average value of accounts, depending on the type of account. In addition, the Fund pays the Transfer Agent a fee for shareholder services based on the number of accounts or on a percentage of the average aggregate value of the Fund’s shares maintained in omnibus accounts up to the lesser of the amount charged by the financial intermediary or a cap established by the Board of Trustees from time to time.
The Transfer Agent also receives compensation from the Fund for various shareholder services and reimbursements for certain out-of-pocket fees. Total transfer agency fees for Institutional 2 Class and Institutional 3 Class shares are subject to an annual limitation of not more than 0.07% and 0.02%, respectively, of the average daily net assets attributable to each share class.
For the six months ended August 31, 2023, the Fund’s annualized effective transfer agency fee rates as a percentage of average daily net assets of each class were as follows:
| | Effective rate (%) |
| Class A | 0.15 |
| Advisor Class | 0.15 |
| Class C | 0.15 |
| Institutional Class | 0.15 |
| Institutional 2 Class | 0.07 |
| Institutional 3 Class | 0.01 |
| Class R | 0.15 |
An annual minimum account balance fee of $20 may apply to certain accounts with a value below the applicable share class’s initial minimum investment requirements to reduce the impact of small accounts on transfer agency fees. These minimum account balance fees are remitted to the Fund and recorded as part of expense reductions in the Statement of Operations. For the six months ended August 31, 2023, no minimum account balance fees were charged by the Fund.
Columbia Overseas Core Fund | Semiannual Report 2023
| 29 |
Notes to Financial Statements (continued)
August 31, 2023 (Unaudited)
Distribution and service fees
The Fund has entered into an agreement with Columbia Management Investment Distributors, Inc. (the Distributor), an affiliate of the Investment Manager and a wholly-owned subsidiary of Ameriprise Financial, for distribution and shareholder services. Under a Plan and Agreement of Distribution, the Fund pays a fee at the maximum annual rates of up to 0.25%, 1.00% and 0.50% of the Fund’s average daily net assets attributable to Class A, Class C and Class R shares, respectively. For Class C shares, of the 1.00% fee, up to 0.75% can be reimbursed for distribution expenses and up to an additional 0.25% can be reimbursed for shareholder servicing expenses. For Class R shares, of the 0.50% fee, up to 0.25% can be reimbursed for shareholder servicing expenses.
The amount of distribution and shareholder services expenses incurred by the Distributor and not yet reimbursed (unreimbursed expense) was approximately $194,000 for Class C shares. This amount is based on the most recent information available as of June 30, 2023, and may be recovered from future payments under the distribution plan or contingent deferred sales charges (CDSCs). To the extent the unreimbursed expense has been fully recovered, the distribution and/or shareholder services fee is reduced.
Sales charges
Sales charges, including front-end charges and CDSCs, received by the Distributor for distributing Fund shares for the six months ended August 31, 2023, if any, are listed below:
| | Front End (%) | CDSC (%) | Amount ($) |
| Class A | 5.75 | 0.50 - 1.00(a) | 11,515 |
| Class C | — | 1.00(b) | 21 |
| (a) | This charge is imposed on certain investments of between $1 million and $50 million redeemed within 18 months after purchase, as follows: 1.00% if redeemed within 12 months after purchase, and 0.50% if redeemed more than 12, but less than 18, months after purchase, with certain limited exceptions. |
| (b) | This charge applies to redemptions within 12 months after purchase, with certain limited exceptions. |
The Fund’s other share classes are not subject to sales charges.
Expenses waived/reimbursed by the Investment Manager and its affiliates
The Investment Manager and certain of its affiliates have contractually agreed to waive fees and/or reimburse expenses (excluding certain fees and expenses described below) for the period(s) disclosed below, unless sooner terminated at the sole discretion of the Board of Trustees, so that the Fund’s net operating expenses, after giving effect to fees waived/expenses reimbursed and any balance credits and/or overdraft charges from the Fund’s custodian, do not exceed the following annual rate(s) as a percentage of the classes’ average daily net assets:
| | July 1, 2023
through
June 30, 2024 | Prior to
July 1, 2023 |
| Class A | 1.22% | 1.22% |
| Advisor Class | 0.97 | 0.97 |
| Class C | 1.97 | 1.97 |
| Institutional Class | 0.97 | 0.97 |
| Institutional 2 Class | 0.89 | 0.90 |
| Institutional 3 Class | 0.83 | 0.85 |
| Class R | 1.47 | 1.47 |
Under the agreement governing these fee waivers and/or expense reimbursement arrangements, the following fees and expenses are excluded from the waiver/reimbursement commitment, and therefore will be paid by the Fund, if applicable: taxes (including foreign transaction taxes), expenses associated with investments in affiliated and non-affiliated pooled investment vehicles (including mutual funds and exchange-traded funds), transaction costs and brokerage commissions, costs related to any securities lending program, dividend expenses associated with securities sold short, inverse floater program fees and expenses, transaction charges and interest on borrowed money, interest, costs associated with shareholder meetings, infrequent and/or unusual expenses and any other expenses the exclusion of which is
| 30 | Columbia Overseas Core Fund | Semiannual Report 2023 |
Notes to Financial Statements (continued)
August 31, 2023 (Unaudited)
specifically approved by the Board of Trustees. This agreement may be modified or amended only with approval from the Investment Manager, certain of its affiliates and the Fund. Any fees waived and/or expenses reimbursed under the expense reimbursement arrangements described above are not recoverable by the Investment Manager or its affiliates in future periods.
Note 4. Federal tax information
The timing and character of income and capital gain distributions are determined in accordance with income tax regulations, which may differ from GAAP because of temporary or permanent book to tax differences.
At August 31, 2023, the approximate cost of all investments for federal income tax purposes and the aggregate gross approximate unrealized appreciation and depreciation based on that cost was:
Federal
tax cost ($) | Gross unrealized
appreciation ($) | Gross unrealized
(depreciation) ($) | Net unrealized
appreciation ($) |
| 815,715,000 | 139,605,000 | (91,419,000) | 48,186,000 |
Tax cost of investments and unrealized appreciation/(depreciation) may also include timing differences that do not constitute adjustments to tax basis.
The following capital loss carryforwards, determined at February 28, 2023, may be available to reduce future net realized gains on investments, if any, to the extent permitted by the Internal Revenue Code.
No expiration
short-term ($) | No expiration
long-term ($) | Total ($) |
| (31,432,423) | (33,814,896) | (65,247,319) |
Management of the Fund has concluded that there are no significant uncertain tax positions in the Fund that would require recognition in the financial statements. However, management’s conclusion may be subject to review and adjustment at a later date based on factors including, but not limited to, new tax laws, regulations, and administrative interpretations (including relevant court decisions). Generally, the Fund’s federal tax returns for the prior three fiscal years remain subject to examination by the Internal Revenue Service.
Note 5. Portfolio information
The cost of purchases and proceeds from sales of securities, excluding short-term investments and derivatives, if any, aggregated to $176,197,619 and $194,324,512, respectively, for the six months ended August 31, 2023. The amount of purchase and sale activity impacts the portfolio turnover rate reported in the Financial Highlights.
Note 6. Affiliated money market fund
The Fund invests in Columbia Short-Term Cash Fund, an affiliated money market fund established for the exclusive use by the Fund and other affiliated funds (the Affiliated MMF). The income earned by the Fund from such investments is included as Dividends - affiliated issuers in the Statement of Operations. As an investing fund, the Fund indirectly bears its proportionate share of the expenses of the Affiliated MMF. The Affiliated MMF prices its shares with a floating net asset value. The Securities and Exchange Commission has adopted amendments to money market fund rules requiring institutional prime money market funds like the Affiliated MMF to be subject, by October 2, 2024, to a liquidity fee if daily net redemptions exceed 5% of net assets and, by April 2, 2024, to a discretionary liquidity fee up to 2% if the imposition of such a fee is determined to be in the best interest of the Affiliated MMF.
Note 7. Interfund lending
Pursuant to an exemptive order granted by the Securities and Exchange Commission, the Fund participates in a program (the Interfund Program) allowing each participating Columbia Fund (each, a Participating Fund) to lend money directly to and, except for closed-end funds and money market funds, borrow money directly from other Participating Funds for temporary purposes. The amounts eligible for borrowing and lending under the Interfund Program are subject to certain restrictions.
Columbia Overseas Core Fund | Semiannual Report 2023
| 31 |
Notes to Financial Statements (continued)
August 31, 2023 (Unaudited)
Interfund loans are subject to the risk that the borrowing fund could be unable to repay the loan when due, and a delay in repayment to the lending fund could result in lost opportunities and/or additional lending costs. The exemptive order is subject to conditions intended to mitigate conflicts of interest arising from the Investment Manager’s relationship with each Participating Fund.
The Fund did not borrow or lend money under the Interfund Program during the six months ended August 31, 2023.
Note 8. Line of credit
The Fund has access to a revolving credit facility with a syndicate of banks led by JPMorgan Chase Bank, N.A., Citibank, N.A. and Wells Fargo Bank, N.A. whereby the Fund may borrow for the temporary funding of shareholder redemptions or for other temporary or emergency purposes. Pursuant to an October 27, 2022 amendment and restatement, the credit facility, which is an agreement between the Fund and certain other funds managed by the Investment Manager or an affiliated investment manager, severally and not jointly, permits aggregate borrowings up to $950 million. Interest is currently charged to each participating fund based on its borrowings at a rate equal to the higher of (i) the federal funds effective rate, (ii) the secured overnight financing rate plus 0.10% and (iii) the overnight bank funding rate plus, in each case, 1.00%. Each borrowing under the credit facility matures no later than 60 days after the date of borrowing. The Fund also pays a commitment fee equal to its pro rata share of the unused amount of the credit facility at a rate of 0.15% per annum. The commitment fee is included in other expenses in the Statement of Operations. This agreement expires annually in October unless extended or renewed. Prior to the October 27, 2022 amendment and restatement, the Fund had access to a revolving credit facility with a syndicate of banks led by JPMorgan Chase Bank, N.A., Citibank, N.A. and Wells Fargo Bank, N.A. which permitted collective borrowings up to $950 million. Interest was charged to each participating fund based on its borrowings at a rate equal to the higher of (i) the federal funds effective rate, (ii) the secured overnight financing rate plus 0.11448% and (iii) the overnight bank funding rate plus, in each case, 1.00%.
The Fund had no borrowings during the six months ended August 31, 2023.
Note 9. Significant risks
Derivatives risk
Losses involving derivative instruments may be substantial, because a relatively small movement in the underlying reference (which is generally the price, rate or other economic indicator associated with a security(ies), commodity, currency, index or other instrument or asset) may result in a substantial loss for the Fund. In addition to the potential for increased losses, the use of derivative instruments may lead to increased volatility within the Fund. Derivatives will typically increase the Fund’s exposure to principal risks to which it is otherwise exposed, and may expose the Fund to additional risks, including correlation risk, counterparty risk, hedging risk, leverage risk, liquidity risk and pricing risk.
Foreign securities and emerging market countries risk
Investing in foreign securities may involve heightened risks relative to investments in U.S. securities. Investing in foreign securities subjects the Fund to the risks associated with the issuer’s country of organization and places of business operations, including risks associated with political, regulatory, economic, social, diplomatic and other conditions or events occurring in the country or region, which may result in significant market volatility. In addition, certain foreign securities may be more volatile and less liquid than U.S. securities. Investing in emerging markets may increase these risks and expose the Fund to elevated risks associated with increased inflation, deflation or currency devaluation. To the extent that the Fund concentrates its investment exposure to any one or a few specific countries, the Fund will be particularly susceptible to the risks associated with the conditions, events or other factors impacting those countries or regions and may, therefore, have a greater risk than that of a fund that is more geographically diversified. The financial information and disclosure made available by issuers of emerging market securities may be considerably less reliable than publicly available information about other foreign securities. The Public Company Accounting Oversight Board, which regulates auditors of U.S. public companies, is unable to inspect audit work papers in certain foreign countries. Investors in foreign countries often have limited rights and few practical remedies to pursue shareholder claims, including class actions or fraud claims, and the ability of the U.S. Securities and Exchange Commission, the U.S. Department of Justice and other authorities to bring and enforce actions against foreign issuers or foreign persons is limited.
| 32 | Columbia Overseas Core Fund | Semiannual Report 2023 |
Notes to Financial Statements (continued)
August 31, 2023 (Unaudited)
Geographic focus risk
The Fund may be particularly susceptible to risks related to economic, political, regulatory or other events or conditions affecting issuers and countries within the specific geographic regions in which the Fund invests. The Fund’s net asset value may be more volatile than the net asset value of a more geographically diversified fund.
Asia Pacific Region. The Fund is particularly susceptible to economic, political, regulatory or other events or conditions affecting issuers and countries in the Asia Pacific region. Many of the countries in the region are considered underdeveloped or developing, including from a political, economic and/or social perspective, and may have relatively unstable governments and economies based on limited business, industries and/or natural resources or commodities. Events in any one country within the region may impact other countries in the region or the region as a whole. As a result, events in the region will generally have a greater effect on the Fund than if the Fund were more geographically diversified. This could result in increased volatility in the value of the Fund’s investments and losses for the Fund. Also, securities of some companies in the region can be less liquid than U.S. or other foreign securities, potentially making it difficult for the Fund to sell such securities at a desirable time and price.
Europe. The Fund is particularly susceptible to risks related to economic, political, regulatory or other events or conditions, including acts of war or other conflicts in the region, affecting issuers and countries in Europe. Countries in Europe are often closely connected and interdependent, and events in one European country can have an adverse impact on, and potentially spread to, other European countries. In addition, significant private or public debt problems in a single European Union (EU) country can pose economic risks to the EU as a whole. As a result, the Fund’s net asset value may be more volatile than the net asset value of a more geographically diversified fund. If securities of issuers in Europe fall out of favor, it may cause the Fund to underperform other funds that do not focus their investments in this region of the world. Uncertainty caused by the departure of the United Kingdom (UK) from the EU, which occurred in January 2020, could have negative impacts on the UK and EU, as well as other European economies and the broader global economy. These could include negative impacts on currencies and financial markets as well as increased volatility and illiquidity, and potentially lower economic growth in markets in Europe, which could adversely affect the value of your investment in the Fund.
Japan. The Fund is particularly susceptible to the social, political, economic, regulatory and other conditions or events that may affect Japan’s economy. The Japanese economy is heavily dependent upon international trade, including, among other things, the export of finished goods and the import of oil and other commodities and raw materials. Because of its trade dependence, the Japanese economy is particularly exposed to the risks of currency fluctuation, foreign trade policy and regional and global economic disruption, including the risk of increased tariffs, embargoes, and other trade limitations or factors. Strained relationships between Japan and its neighboring countries, including China, South Korea and North Korea, based on historical grievances, territorial disputes, and defense concerns, may also cause uncertainty in Japanese markets. As a result, additional tariffs, other trade barriers, or boycotts may have an adverse impact on the Japanese economy. Japanese government policy has been characterized by economic regulation, intervention, protectionism and large government deficits. The Japanese economy is also challenged by an unstable financial services sector, highly leveraged corporate balance sheets and extensive cross-ownership among major corporations. Structural social and labor market changes, including an aging workforce, population decline and traditional aversion to labor mobility may adversely affect Japan’s economic competitiveness and growth potential. The potential for natural disasters, such as earthquakes, volcanic eruptions, typhoons and tsunamis, could also have significant negative effects on Japan’s economy. As a result of the Fund’s investment in Japanese securities, the Fund’s net asset value may be more volatile than the net asset value of a more geographically diversified fund. If securities of issuers in Japan fall out of favor, it may cause the Fund to underperform other funds that do not focus their investments in Japan.
Market risk
The Fund may incur losses due to declines in the value of one or more securities in which it invests. These declines may be due to factors affecting a particular issuer, or the result of, among other things, political, regulatory, market, economic or social developments affecting the relevant market(s) more generally. In addition, turbulence in financial markets and reduced liquidity in equity, credit and/or fixed income markets may negatively affect many issuers, which could adversely affect the Fund’s ability to price or value hard-to-value assets in thinly traded and closed markets and could cause significant redemptions and operational challenges. Global economies and financial markets are increasingly interconnected, and conditions and events in one country, region or financial market may adversely impact issuers in a different country, region or
Columbia Overseas Core Fund | Semiannual Report 2023
| 33 |
Notes to Financial Statements (continued)
August 31, 2023 (Unaudited)
financial market. These risks may be magnified if certain events or developments adversely interrupt the global supply chain; in these and other circumstances, such risks might affect companies worldwide. As a result, local, regional or global events such as terrorism, war, natural disasters, disease/virus outbreaks and epidemics or other public health issues, recessions, depressions or other events – or the potential for such events – could have a significant negative impact on global economic and market conditions.
The large-scale invasion of Ukraine by Russia in February 2022 has resulted in sanctions and market disruptions, including declines in regional and global stock markets, unusual volatility in global commodity markets and significant devaluations of Russian currency. The extent and duration of the military action are impossible to predict but could be significant. Market disruption caused by the Russian military action, and any counter-measures or responses thereto (including international sanctions, a downgrade in the country’s credit rating, purchasing and financing restrictions, boycotts, tariffs, changes in consumer or purchaser preferences, cyberattacks and espionage) could have severe adverse impacts on regional and/or global securities and commodities markets, including markets for oil and natural gas. These impacts may include reduced market liquidity, distress in credit markets, further disruption of global supply chains, increased risk of inflation, restricted cross-border payments and limited access to investments and/or assets in certain international markets and/or issuers. These developments and other related events could negatively impact Fund performance.
Shareholder concentration risk
At August 31, 2023, affiliated shareholders of record owned 85.6% of the outstanding shares of the Fund in one or more accounts. Fund shares sold to or redeemed by concentrated accounts may have a significant effect on the operations of the Fund. In the case of a large redemption, the Fund may be forced to sell investments at inopportune times, including its liquid positions, which may result in Fund losses and the Fund holding a higher percentage of less liquid positions. Large redemptions could result in decreased economies of scale and increased operating expenses for non-redeeming Fund shareholders.
Note 10. Subsequent events
Management has evaluated the events and transactions that have occurred through the date the financial statements were issued and noted no items requiring adjustment of the financial statements or additional disclosure.
Note 11. Information regarding pending and settled legal proceedings
Ameriprise Financial and certain of its affiliates are involved in the normal course of business in legal proceedings which include regulatory inquiries, arbitration and litigation, including class actions concerning matters arising in connection with the conduct of their activities as part of a diversified financial services firm. Ameriprise Financial believes that the Fund is not currently the subject of, and that neither Ameriprise Financial nor any of its affiliates are the subject of, any pending legal, arbitration or regulatory proceedings that are likely to have a material adverse effect on the Fund or the ability of Ameriprise Financial or its affiliates to perform under their contracts with the Fund. Ameriprise Financial is required to make quarterly (10-Q), annual (10-K) and, as necessary, 8-K filings with the Securities and Exchange Commission (SEC) on legal and regulatory matters that relate to Ameriprise Financial and its affiliates. Copies of these filings may be obtained by accessing the SEC website at www.sec.gov.
There can be no assurance that these matters, or the adverse publicity associated with them, will not result in increased Fund redemptions, reduced sale of Fund shares or other adverse consequences to the Fund. Further, although we believe proceedings are not likely to have a material adverse effect on the Fund or the ability of Ameriprise Financial or its affiliates to perform under their contracts with the Fund, these proceedings are subject to uncertainties and, as such, we are unable to estimate the possible loss or range of loss that may result. An adverse outcome in one or more of these proceedings could result in adverse judgments, settlements, fines, penalties or other relief that could have a material adverse effect on the consolidated financial condition or results of operations of Ameriprise Financial or one or more of its affiliates that provide services to the Fund.
| 34 | Columbia Overseas Core Fund | Semiannual Report 2023 |
Liquidity Risk Management Program
(Unaudited)
Pursuant to Rule 22e-4 under the 1940 Act, the Fund has adopted a liquidity risk management program (Program). The Program’s principal objectives include assessing, managing and periodically reviewing the Fund’s liquidity risk. Liquidity risk is defined as the risk that the Fund could not meet redemption requests without significant dilution of remaining investors’ interests in the Fund.
The Board has appointed the Investment Manager as the program administrator for the Fund’s Program. The Investment Manager has delegated oversight of the Program to its Liquidity Risk Management Committee (the Committee). At a Board meeting during the fiscal period, the Committee provided the Board with a report addressing the operations of the Program and assessing its adequacy and effectiveness of implementation for the period January 1, 2022 through December 31, 2022, including:
| • | the Fund had sufficient liquidity to both meet redemptions and operate effectively on behalf of shareholders; |
| • | there were no material changes to the Program during the period; |
| • | the implementation of the Program was effective to manage the Fund’s liquidity risk; and |
| • | the Program operated adequately during the period. |
There can be no assurance that the Program will achieve its objectives in the future. Please refer to the Fund’s prospectus for more information regarding the Fund’s exposure to liquidity risk and other principal risks to which an investment in the Fund may be subject.
Approval of Management Agreement
(Unaudited)
Columbia Management Investment Advisers, LLC (the Investment Manager, and together with its domestic and global affiliates, Columbia Threadneedle Investments), a wholly-owned subsidiary of Ameriprise Financial, Inc. (Ameriprise Financial), serves as the investment manager to Columbia Overseas Core Fund (the Fund). Under a management agreement (the Management Agreement), the Investment Manager provides investment advice and other services to the Fund and other funds distributed by Columbia Management Investment Distributors, Inc. (collectively, the Funds).
On an annual basis, the Fund’s Board of Trustees (the Board), including the independent Board members (the Independent Trustees), considers renewal of the Management Agreement. The Investment Manager prepared detailed reports for the Board and its Contracts Committee (including its Contracts Subcommittee) in February, March, April, May and June 2023, including reports providing the results of analyses performed by a third-party data provider, Broadridge Financial Solutions, Inc. (Broadridge), and comprehensive responses by the Investment Manager to written requests for information by independent legal counsel to the Independent Trustees (Independent Legal Counsel), to assist the Board in making this determination. In addition, throughout the year, the Board (or its committees or subcommittees) regularly meets with portfolio management teams and senior management personnel and reviews information prepared by the Investment Manager addressing the services the Investment Manager provides and Fund performance. The Board also accords appropriate weight to the work, deliberations and conclusions of the various committees (including their subcommittees), such as the Contracts Committee, the Investment Review Committee, the Audit Committee and the Compliance Committee in determining whether to continue the Management Agreement.
The Board, at its June 22, 2023 Board meeting (the June Meeting), considered the renewal of the Management Agreement for an additional one-year term. At the June Meeting, Independent Legal Counsel reviewed with the Independent Trustees various factors relevant to the Board’s consideration of advisory agreements and the Board’s legal responsibilities related to such consideration. The Independent Trustees considered all information that they, their legal counsel or the Investment Manager believed reasonably necessary to evaluate and to approve the continuation of the Management Agreement. Among other things, the information and factors considered included the following:
Columbia Overseas Core Fund | Semiannual Report 2023
| 35 |
Approval of Management Agreement (continued)
(Unaudited)
| • | Information on the investment performance of the Fund relative to the performance of a group of mutual funds determined to be comparable to the Fund by Broadridge, as well as performance relative to one or more benchmarks; |
| • | Information on the Fund’s management fees and total expenses, including information comparing the Fund’s expenses to those of a group of comparable mutual funds, as determined by Broadridge; |
| • | The Investment Manager’s agreement to contractually limit or cap total operating expenses for the Fund so that total operating expenses (excluding certain fees and expenses, such as transaction costs and certain other investment related expenses, interest, taxes, acquired fund fees and expenses and infrequent and/or unusual expenses) would not exceed a specified annual rate, as a percentage of the Fund’s net assets; |
| • | Terms of the Management Agreement; |
| • | Descriptions of other agreements and arrangements with affiliates of the Investment Manager relating to the operations of the Fund, including agreements with respect to the provision of transfer agency and shareholder services to the Fund; |
| • | Descriptions of various services performed by the Investment Manager under the Management Agreement, including portfolio management and portfolio trading practices; |
| • | Information regarding any recently negotiated management fees of similarly-managed portfolios of other institutional clients of the Investment Manager; |
| • | Information regarding the resources of the Investment Manager, including information regarding senior management, portfolio managers and other personnel; |
| • | Information regarding the capabilities of the Investment Manager with respect to compliance monitoring services; |
| • | The profitability to the Investment Manager and its affiliates from their relationships with the Fund; and |
| • | Report provided by the Board’s independent fee consultant, JDL Consultants, LLC (JDL). |
Following an analysis and discussion of the foregoing, and the factors identified below, the Board, including all of the Independent Trustees, approved the renewal of the Management Agreement.
Nature, extent and quality of services provided by the Investment Manager
The Board analyzed various reports and presentations it had received detailing the services performed by the Investment Manager, as well as its history, expertise, resources and relative capabilities, and the qualifications of its personnel.
The Board specifically considered the many developments during recent years concerning the services provided by the Investment Manager. Among other things, the Board noted the organization and depth of the equity and credit research departments. The Board further observed the enhancements to the investment risk management department’s processes, systems and oversight over the past several years. The Board also took into account the broad scope of services provided by the Investment Manager to the Fund, including, among other services, investment, risk and compliance oversight. The Board also took into account the information it received concerning the Investment Manager’s ability to attract and retain key portfolio management personnel and that it has sufficient resources to provide competitive and adequate compensation to investment personnel.
In connection with the Board’s evaluation of the overall package of services provided by the Investment Manager, the Board also considered the nature, quality and range of administrative services provided to the Fund by the Investment Manager, as well as the achievements in 2022 in the performance of administrative services, and noted the various enhancements anticipated for 2023. In evaluating the quality of services provided under the Management Agreement, the Board also took into account the organization and strength of the Fund’s and its service providers’ compliance programs. The Board also reviewed the financial condition of the Investment Manager and its affiliates and each entity’s ability to carry out its responsibilities under the Management Agreement and the Fund’s other service agreements.
| 36 | Columbia Overseas Core Fund | Semiannual Report 2023 |
Approval of Management Agreement (continued)
(Unaudited)
In addition, the Board discussed the acceptability of the terms of the Management Agreement, noting that no changes were proposed from the form of agreement previously approved. The Board also noted the wide array of legal and compliance services provided to the Fund under the Management Agreement.
After reviewing these and related factors (including investment performance as discussed below), the Board concluded, within the context of their overall conclusions, that the nature, extent and quality of the services provided to the Fund under the Management Agreement supported the continuation of the Management Agreement.
Investment performance
The Board carefully reviewed the investment performance of the Fund, including detailed reports providing the results of analyses performed by each of the Investment Manager, Broadridge and JDL collectively showing, for various periods (including since manager inception): (i) the performance of the Fund, (ii) the Fund’s performance relative to peers and benchmarks and (iii) the net assets of the Fund. The Board observed that the Fund’s performance for certain periods ranked above median based on information provided by Broadridge.
The Board also reviewed a description of the third-party data provider’s methodology for identifying the Fund’s peer groups for purposes of performance and expense comparisons.
The Board also considered the Investment Manager’s performance and reputation generally. After reviewing these and related factors, the Board concluded, within the context of their overall conclusions, that the performance of the Fund and the Investment Manager, in light of other considerations, supported the continuation of the Management Agreement.
Comparative fees, costs of services provided and the profits realized by the Investment Manager and its affiliates from their relationships with the Fund
The Board reviewed comparative fees and the costs of services provided under the Management Agreement. The Board members considered detailed comparative information set forth in an annual report on fees and expenses, including, among other things, data (based on analyses conducted by Broadridge and JDL) showing a comparison of the Fund’s expenses with median expenses paid by funds in its comparative peer universe, as well as data showing the Fund’s contribution to the Investment Manager’s profitability.
The Board considered the reports of JDL, which assisted in the Board’s analysis of the Funds’ performance and expenses and the reasonableness of the Funds’ fee rates. The Board accorded particular weight to the notion that a primary objective of the level of fees is to achieve a rational pricing model applied consistently across the various product lines in the Fund family, while assuring that the overall fees for each Fund (with certain exceptions) are generally in line with the current “pricing philosophy” such that Fund total expense ratios, in general, approximate or are lower than the median expense ratios of funds in the same Lipper comparison universe. The Board took into account that the Fund’s total expense ratio (after considering proposed expense caps/waivers) approximated the peer universe’s median expense ratio.
After reviewing these and related factors, the Board concluded, within the context of their overall conclusions, that the levels of management fees and expenses of the Fund, in light of other considerations, supported the continuation of the Management Agreement.
The Board also considered the profitability of the Investment Manager and its affiliates in connection with the Investment Manager providing management services to the Fund. With respect to the profitability of the Investment Manager and its affiliates, the Independent Trustees referred to information discussing the profitability to the Investment Manager and Ameriprise Financial from managing, operating and distributing the Funds. The Board considered that the profitability generated by the Investment Manager in 2022 had declined from 2021 levels, due to a variety of factors, including the decreased assets under management of the Funds. It also took into account the indirect economic benefits flowing to the Investment Manager or its affiliates in connection with managing or distributing the Funds, such as the enhanced ability to offer various other financial products to Ameriprise Financial customers, soft dollar benefits and overall reputational advantages. The Board noted that the fees paid by the Fund should permit the Investment Manager to offer competitive compensation to its personnel, make necessary investments in its business and earn an appropriate profit. After reviewing
Columbia Overseas Core Fund | Semiannual Report 2023
| 37 |
Approval of Management Agreement (continued)
(Unaudited)
these and related factors, the Board concluded, within the context of their overall conclusions, that the costs of services provided and the profitability to the Investment Manager and its affiliates from their relationships with the Fund supported the continuation of the Management Agreement.
Economies of scale
The Board considered the potential existence of economies of scale in the provision by the Investment Manager of services to the Fund, and whether those economies of scale were shared with the Fund through breakpoints in investment management fees or other means, such as expense limitation arrangements and additional investments by the Investment Manager in investment, trading, compliance and other resources. The Board considered the economies of scale that might be realized as the Fund’s net asset level grows and took note of the extent to which Fund shareholders might also benefit from such growth. In this regard, the Board took into account that management fees decline as Fund assets exceed various breakpoints, all of which have not been surpassed. The Board observed that the Management Agreement provided for breakpoints in the management fee rate schedule that allow opportunities for shareholders to realize lower fees as Fund assets grow and that there are additional opportunities through other means for sharing economies of scale with shareholders.
Conclusion
The Board reviewed all of the above considerations in reaching its decision to approve the continuation of the Management Agreement. In reaching its conclusions, no single factor was determinative.
On June 22, 2023, the Board, including all of the Independent Trustees, determined that fees payable under the Management Agreement were fair and reasonable in light of the extent and quality of services provided and approved the renewal of the Management Agreement.
| 38 | Columbia Overseas Core Fund | Semiannual Report 2023 |
[THIS PAGE INTENTIONALLY LEFT BLANK]
Columbia Overseas Core Fund
P.O. Box 219104
Kansas City, MO 64121-9104
Please read and consider the investment objectives, risks, charges and expenses for any fund carefully before investing. For a prospectus and summary prospectus, which contains this and other important information about the Fund, go to
columbiathreadneedleus.com/investor/. The Fund is distributed by Columbia Management Investment Distributors, Inc., member FINRA, and managed by Columbia Management Investment Advisers, LLC.
Columbia Threadneedle Investments (Columbia Threadneedle) is the global brand name of the Columbia and Threadneedle group of companies. All rights reserved.
© 2023 Columbia Management Investment Advisers, LLC.
columbiathreadneedleus.com/investor/
Item 2. Code of Ethics.
Not applicable for semiannual reports.
Item 3. Audit Committee Financial Expert.
Not applicable for semiannual reports.
Item 4. Principal Accountant Fees and Services.
Not applicable for semiannual reports.
Item 5. Audit Committee of Listed Registrants.
Not applicable.
Item 6. Investments
(a) | The registrant’s “Schedule I – Investments in securities of unaffiliated issuers” (as set forth in 17 CFR 210.12-12) is included in Item 1 of this Form N-CSR. |
Item 7. Disclosure of Proxy Voting Policies and Procedures for Closed-End Management Investment Companies.
Not applicable.
Item 8. Portfolio Managers of Closed-End Management Investment Companies.
Not applicable.
Item 9. Purchases of Equity Securities by Closed-End Management Investment Company and Affiliated Purchasers.
Not applicable.
Item 10. Submission of Matters to a Vote of Security Holders.
There were no material changes to the procedures by which shareholders may recommend nominees to the registrant's board of directors.
Item 11. Controls and Procedures.
(a) | The registrant’s principal executive officer and principal financial officer, based on their evaluation of the registrant’s disclosure controls and procedures as of a date within 90 days of the filing of this report, have concluded that such controls and procedures are adequately designed to ensure that information required to be disclosed by the registrant in Form N-CSR is accumulated and communicated to the registrant’s management, including the principal executive officer and principal financial officer, or persons performing similar functions, as appropriate to allow timely decisions regarding required disclosure. |
(b) | There was no change in the registrant’s internal control over financial reporting that occurred during the period covered by this report that has materially affected, or is reasonably likely to materially affect, the registrant’s internal control over financial reporting. |
Item 12. Disclosure of Securities Lending Activities for Closed-End Management Investment Companies
Not applicable.
Item 13. Exhibits.
(a)(1) Code of ethics required to be disclosed under Item 2 of Form N-CSR: Not applicable for semiannual reports.
(a)(2) Certifications pursuant to Rule 30a-2(a) under the Investment Company Act of 1940 (17 CFR 270.30a-2(a)) attached hereto as Exhibit 99.CERT.
(b) Certification pursuant to Rule 30a-2(b) under the Investment Company Act of 1940 (17 CFR 270.30a-2(b)) attached hereto as Exhibit 99.906CERT.
SIGNATURES
Pursuant to the requirements of the Securities Exchange Act of 1934 and the Investment Company Act of 1940, the registrant has duly caused this report to be signed on its behalf by the undersigned, thereunto duly authorized.
(registrant) | Columbia Funds Series Trust II |
| |
By (Signature and Title) | /s/ Daniel J. Beckman |
| Daniel J. Beckman, President and Principal Executive Officer |
| |
Date | October 23, 2023 |
| |
| |
Pursuant to the requirements of the Securities Exchange Act of 1934 and the Investment Company Act of 1940, this report has been signed below by the following persons on behalf of the registrant and in the capacities and on the dates indicated.
By (Signature and Title) | /s/ Daniel J. Beckman |
| Daniel J. Beckman, President and Principal Executive Officer |
| |
Date | October 23, 2023 |
By (Signature and Title) | /s/ Michael G. Clarke |
| Michael G. Clarke, Chief Financial Officer, |
| Principal Financial Officer and Senior Vice President |
| |
Date | October 23, 2023 |
By (Signature and Title) | /s/ Joseph Beranek |
| Joseph Beranek, Treasurer, Chief Accounting |
| Officer and Principal Financial Officer |
| |
Date | October 23, 2023 |