15-16 JUNE 2006
XII Santander Annual Telecoms Conference
(a)(5)(ii)
1

Disclaimer
SAFE HARBOUR
This presentation does not constitute an offer or invitation to purchase any securities or a solicitation of an offer to buy any securities, pursuant to the proposed offer (the “Offer”) for the shares of Portugal
Telecom, SGPS, S.A. (“PT”), or otherwise. The Offer will be made solely by an offer document containing and setting out the terms and conditions of the Offer (the “Offer Document”) and the letter of
transmittal and form of acceptance (the “Acceptance Forms”), which will contain details of how the Offer may be accepted. In the United States, Sonae, SGPS, S.A. (“Sonae”), and Sonaecom, SGPS, S.A.
(“Sonaecom”), will be filing a Tender Offer Statement containing the Offer Document, the Acceptance Forms and other related documentation with the US Securities and Exchange Commission (the “SEC”)
on Schedule TO (the “Tender Offer Statement”) and PT is expected to file a Solicitation/ Recommendation Statement on Schedule 14D-9 (the “Solicitation/Recommendation Statement”) with the SEC after
the Offer Document is made available to PT shareholders. Free copies of the Tender Offer Statement, the Solicitation/ Recommendation Statement and the other related documents to be filed by Sonae or
Sonaecom and PT in connection with the Offer will be available from the date the Offer Document is made available to PT shareholders on the SEC’s website at http://www.sec.gov. The Offer Document
and the Acceptance Forms will be made available by Sonaecom or its duly designated agent to all PT shareholders at no charge to them. PT shareholders are strongly advised to read the Offer Document
and the Acceptance Forms, and any other relevant documents filed with the SEC, as well as amendments and supplements to those documents because they will contain important information. PT
shareholders in the United States are also advised to read the Tender Offer Statement and the Solicitation/Recommendation Statement because they will contain important information.
Unless otherwise determined by Sonae and/or Sonaecom and permitted by applicable law and regulation, the Offer will not be made, directly or indirectly, in or into, or by use of the mails of, or by any other
means or instrumentality (including, without limitation, telephonically or electronically) of interstate or foreign commerce of, or of any facility of a national securities exchange of Canada, nor will it be made in
or into Australia or Japan and the Offer will not be capable of acceptance by any such use, means, instrumentality or facilities from or within Australia, Canada or Japan. Accordingly, unless otherwise
determined by Sonae and/or Sonaecom and permitted by applicable law and regulation, neither copies of this presentation nor any other documents relating to the Offer are being, or may be, mailed or
otherwise forwarded, distributed or sent in or into Australia, Canada or Japan and persons receiving such documents (including custodians, nominees and trustees) must not distribute or send them in, into
or from such jurisdictions. Notwithstanding the foregoing, Sonae and/or Sonaecom retains the right to permit the Offer to be accepted and any sale of securities pursuant to the Offer to be completed if, in
its sole discretion, it is satisfied that the transaction in question can be undertaken in compliance with applicable law and regulation. The availability of the Offer to persons not resident in Portugal or the
United States may be affected by the laws of the relevant jurisdiction. Persons who are not resident in Portugal or the United States should inform themselves about and observe any applicable
requirements. The Offer will be made by Sonae and/or Sonaecom and (outside the United States) by Banco Santander de Negócios Portugal, S.A., on its or their behalf.
This presentation may contain forward-looking information and statements about Sonae, Sonaecom, PT or their combined businesses after completion of the proposed Offer, based on management’s
current expectations or beliefs. Forward-looking statements are statements that are not historical facts. These forward-looking statements may relate to, among other things: management strategies;
synergies and cost savings; future operations, products and services; integration of the businesses; market position; planned asset disposal and capital expenditures; net debt levels and EBITDA; and
earnings per share growth, dividend policy and timing and benefits of the offer and the combined company. These forward-looking statements are subject to a number of factors and uncertainties that could
cause actual results to differ materially from those described in the forward-looking statements, including, but not limited to, changes in regulation, the telecommunications industry and economic conditions;
the ability to integrate the businesses; obtaining any applicable governmental approvals and complying with any conditions related thereto; costs relating to the offer and the integration; litigation; and the
effects of competition. Forward-looking statements may be identified by words such as “believes,” “expects,” “anticipates,” “projects,” “intends,” “should,” “seeks,” “estimates,” “future” or similar expressions.
Although these statements reflect our current expectations, which we believe are reasonable, investors and PT shareholders are cautioned that forward-looking information and statements are subject to
various risks and uncertainties, many of which are difficult to predict and generally beyond our control, that could cause actual results and developments to differ materially from those expressed in, or
implied or projected by, the forward-looking information and statements. You are cautioned not to put undue reliance on any forward-looking information or statements. We do not undertake any obligation to
update any forward-looking information or statements. Recipients are invited to consult the documentation and public information filed by Sonaecom with the Portuguese Securities Exchange Commission
(“CMVM”).
2

1.
OVERVIEW
2.
BUSINESS UNITS 1Q06 HIGHLIGHTS
3.
PT TENDER OFFER
4.
CONSOLIDATED 1Q06 RESULTS
5.
APPENDIX
INDEX
3

OVERVIEW

OVERVIEW
MISSION STATEMENT
Sonaecom is an entrepreneurial growth company whose ambition is to be the best
Portuguese communication services provider and the company of choice for
exceptional people to work and discover their full potential.
Sonaecom relentlessly pursues the creation of innovative products, services and
solutions that fulfil the needs of its markets and generate superior economic value
5

OVERVIEW
GROUP HIGHLIGHTS
1Q06 RESULTS BETTER THAN EXPECTED BENEFITING FROM OUR GROWTH INVESTMENT STRATEGY
2005
1Q05
€ Millions
Turnover
EBITDA
Margin
Net Profit (1)
CAPEX
EBITDA-CAPEX
(1) Net Profit after Minority Interest
843
157
19%
2
197
44
22%
4.6
35
2.6
1Q06
197
39
20%
0.1
3.0
y.o.y.
0.0%
-11.3%
-2.5pp
-96.8%
14.2%
122
41.4
36.1
-12.9%
Service Revenues
741
180
180
-0.3%
6

POSITIVE OPERATIONAL DEVELOPMENTS AT THE TELECOMS BUSINESSES IN CUSTOMER BASE,
CUSTOMER REVENUES AND LEADING INDICATORS IN 1Q06
1Q05
€ Millions
Customers (EOP) (000)
Data as % Service Revenues
Minutes of Use
ARPU (euros)
Total Services (EOP)
Direct Services (EOP)
62
2,135
9.9%
108.7
22.2
Direct Access as % Customer Rev.
Optimus
Sonaecom Fixed
268,840
11,343
27.3%
62
1Q06
2,383
13.4%
113.7
19.3
309,263
153,790
56.9%
2005
2,353
11.2%
114.4
21.9
93,861
271,463
48.5%
y.o.y.
11.6%
3.5pp
4.6%
-12.9%
29.6pp
15.0%
1,255.8%
Turnover
36.6
44.5
158.4
21.5%
Customer Revenues
92.8
97.2
391.1
4.8%
OVERVIEW
GROUP HIGHLIGHTS
7
OVERVIEW
GROUP 1Q06 RESULTS
EXCELLENT OPERATIONAL PERFORMANCE, COMPARED TO LAST YEAR, DESPITE REGULATORY CONDITIONS
POSITIVE
EFFECTS
(compared to
1Q05)
NEGATIVE
EFFECTS
(compared to
1Q05)
Optimus Customer base growing;
Optimus Data Revenues with higher weight;
Continued growth of Optimus new services, in particular Optimus Home and
Kanguru;
Customer Revenues growth at Optimus;
Sonaecom Fixed significant increase of direct access services;
Customer and Wholesale Revenues increase at Sonaecom Fixed.
Lower Mobile Termination Rates;
Lower Fixed incoming traffic;
Accelerated reduction of indirect access voice and narrowband internet;
Higher Network Costs, due to the 3G/HSDPA deployment;
Higher Servicing Costs associated with ULL double play activation process
(customer services; IT/IS);
Higher Marketing & Sales Costs (advertising; commissions).
8

OVERVIEW
GROUP MILESTONES
Beginning 2005: implementation of growth investment strategy, through
innovation and redefinition of markets and business models;
Success of strategy delivering growth: visible in main operational indicators
and quarterly results.
INVESTMENT
STRATEGY
TRANSFORMATION
OF SONAECOM
FIXED
UMTS/HSDPA
DEPLOYMENT
Sonaecom Fixed Strategy: refocus to a direct access business, through
expansion of ADSL broadband services over ULL;
1Q06 results reflect implemented strategy: direct access business with 75%
of the ULL market growth; leading ADSL Broadband customer net additions
in the market.
UMTS network: 50% population coverage by end 1Q06; expected 80%
population coverage by the end of 2006;
HSDPA network: Optimus - first Operator with commercially available HSDPA
network; increase of UMTS bandwidth up to 1.8 Mbps, more than 40% of
population coverage by end 1Q06.
9

3G NETWORK
RENEGOTIATION
INTEGRATING
NETWORK
Optimus 1Q06: completion of RFP process to improve prices and conditions
of supply of UMTS/HSDPA network elements;
Huawei, Ericsson and Motorola as the main backbone and access network
providers;
Sonaecom 1Q06: extension of strategy of telecom integration in the pursuit
of operating efficiencies and cost synergies;
Full integration of both Optimus and Sonaecom Fixed technical teams, being
managed under an unified organizational team structure.
SALE OF
ENABLER
SSI 2Q06: sale of 100% of Enabler to Wipro;
Consideration includes up-front cash payments (41mn) and “earn-out”
structure over 2 year period;
Terms of transaction imply a minimum 1.4x EV/Sales 2005 multiple;
Expected to generate a capital gain of approximately 23 million euros.
OVERVIEW
GROUP MILESTONES
10

BUSINESS UNITS
1Q06 HIGHLIGHTS

BUSINESS UNITS
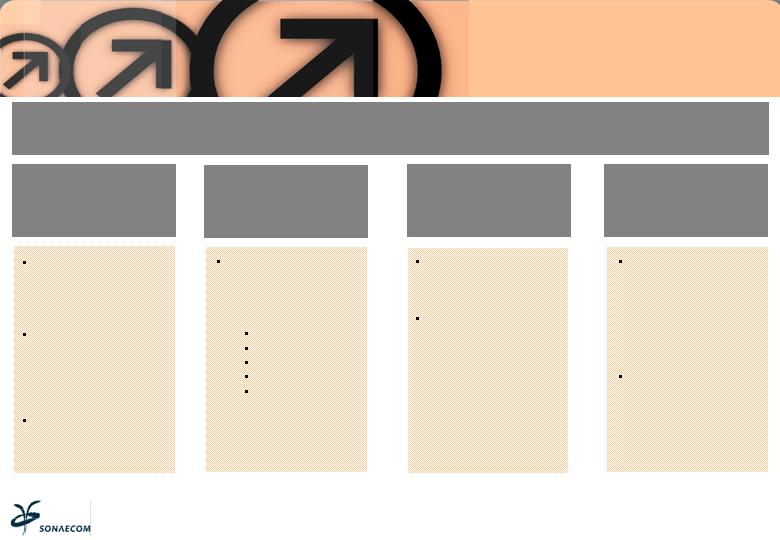
OPTIMUS-STRATEGY
FOUR CORNERSTONES OF STRATEGY AIMED AT INCREASING CUSTOMER BASE, REVENUE PER
CUSTOMER, MARKET SHARE GROWTH AND EXTENSION OF ADDRESSABLE MARKET
MIGRATION TO
3G
SEGMENTATION
INNOVATION AND
LAUNCH OF NEW
DATA SERVICES
FIXED-MOBILE
CONVERGENCE
Decision of leadership
in 3G
Aggressive push to
extend UMTS
network:
(i) +50% population
coverage and
(ii) approximately
45% population
coverage for
HSDPA
Reformulation of all tariff
plans
Launch of revolutionary
tariffs, such as Chat
June 05: Launch of
Rede4, the discount
mobile service with an
“internet” cost structure
May 06: Launch of
Optimus A, a value
proposition offer targeted
to high end residential
customers, with
exclusive tariffs, free
replacement of handsets
and high quality
customer service
Innovative data
services:
Push E-mail
Push-to-talk
Instant
Messaging
September 05: Launch
of Kanguru, a portable
broadband internet
offer over UMTS
technology
April 06:Launch of
Kanguru Xpress, a
broadband internet
offer over HSDPA
March 05: Launch of
Optimus Home,
pioneer world hybrid
product with fixed dial
numbers, fixed
network costs and
GSM access
12
BUSINESS UNITS
OPTIMUS-PERFORMANCE
NEW PRODUCTS AND SERVICES HAVE DELIVERED GROWTH IN 1Q06 COMPARED TO 1Q05
Customers grew 11.6%;
Net Additions of 30.2 thousand;
ARPU decrease explained by MTR’s impact and price cuts in Roaming In;
New products (Home, Kanguru, Rede4) the main drivers of customer
growth.
CUSTOMER
GROWTH
DATA USAGE
GROWTH
Data revenues represented 13.4% of service Revenues;
Approximately 9% of customer base was 3G enabled.
TRAFFIC
GROWTH
Mobile traffic 15.8% higher and MOU increasing 4.6%;
Continued reduction of incoming fixed traffic.
13

SUCCESS OF GROWTH STRATEGY VISIBLE IN 1Q06 RESULTS
2005
1Q05
€ Millions
Turnover
627.4
146.8
1Q06
141.2
2004
659.6
EBITDA
Margin
Net Profit
EBITDA -CAPEX
167.1
26.6%
45.1
43.5
29.6%
11.5
79.9
26.8
44.4
31.4%
15.8
18.1
CAPEX
87.2
16.7
26.3
190.2
28.8%
50.5
103.6
86.6
Service Revenues
567.0
138.6
133.7
602.0
BUSINESS UNITS
OPTIMUS-FINANCIALS
14
BUSINESS UNITS
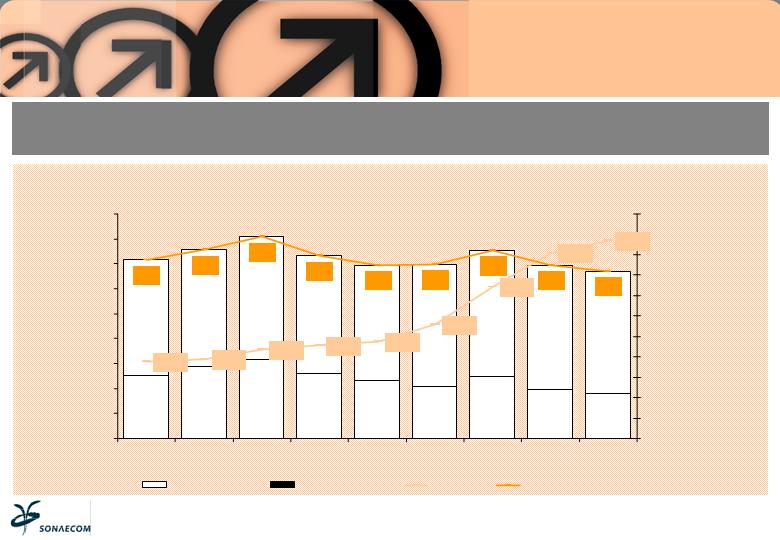
OPTIMUS-SUBSCRIBERS
OPTIMUS CUSTOMER BASE INCREASED SIGNIFICANTLY BY 11.6% IN 1Q06 Y.o.Y, REFLECTING NET
ADDITIONS OF 30 THOUSAND SUBSCRIBERS
Evolution of Subscribers & Service Revenues
2,088.0
2,093.0
2,117.0
2,129.0
2,136.0
2,179.0
2,270.0
2,353.2
2,383.4
142.9
151.1
161.8
146.2
138.6
139.2
150.6
138.6
133.7
0.0
20.0
40.0
60.0
80.0
100.0
120.0
140.0
160.0
180.0
1Q04
2Q04
3Q04
4Q04
1Q05
2Q05
3Q05
4Q05
1Q06
1,900.0
1,950.0
2,000.0
2,050.0
2,100.0
2,150.0
2,200.0
2,250.0
2,300.0
2,350.0
2,400.0
2,450.0
Operator Revenues
Customer Revenues
Subscribers
Service Revenues
Thousand
Million €
15
BUSINESS UNITS
MOBILE SECTOR OVERVIEW
Source: Companies’ Report & Accounts
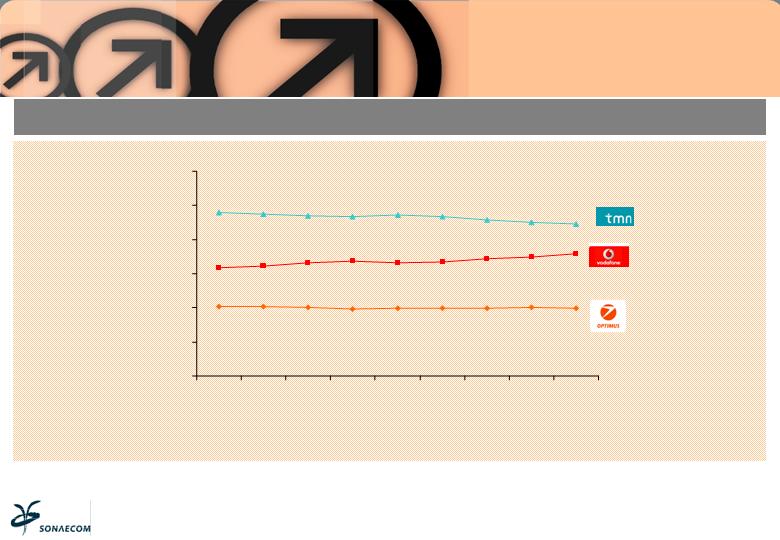
OPTIMUS HAS MANAGED TO SUSTAIN 20% MARKET SHARE
Market Share Evolution – Subscribers EOP
20.3%
20.3%
20.1%
19.7%
19.8%
19.9%
19.9%
20.0%
19.9%
31.7%
32.3%
33.1%
33.6%
33.2%
33.5%
34.3%
35.0%
35.7%
48.0%
47.4%
46.9%
46.7%
47.1%
46.6%
45.7%
45.1%
44.4%
0.0%
10.0%
20.0%
30.0%
40.0%
50.0%
60.0%
1Q04
2Q04
3Q04
4Q04
1Q05
2Q05
3Q05
4Q05
1Q06
16
BUSINESS UNITS
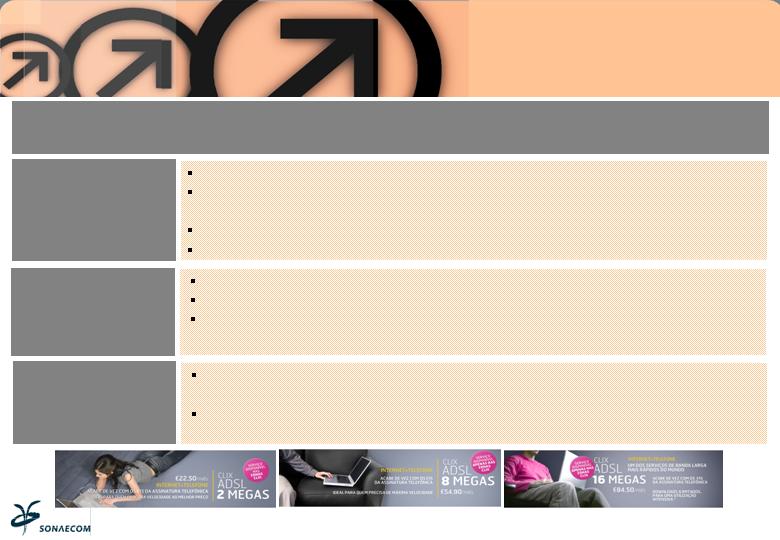
SONAECOM FIXED-STRATEGY
FOUR CORNERSTONES OF OUR STRATEGY IMPLEMENTED DURING 2005, AIMED AT TRANSFORMING
THE BUSINESS TO A DIRECT ACCESS MODEL AND AT GROWING THE WHOLESALE BUSINESS
DIRECT ACCESS
FOCUS ON SME
AND CORPORATE
SEGMENTS
WHOLESALE
GROWTH
INNOVATION ON
BROADBAND
Increase of the local
access capillarity
through local loop
unbundling;
Continuous
investment in superior
technology (VOIP,
Gigabit Ethernet,
ADSL 2+, IP/MPLS);
Increase of direct
access customers
based on direct voice
and ADSL services
Developing Premium
services based on
direct interconnections;
Focus on acquiring
additional international
clients.
November 05:
Commercial pilot test
of Triple Play bundled
offer of voice, internet
and IPTV. Commercial
launch planned for
2H06;
June 06: Launch of the
20Mb ADSL offer for
bundled voice and
internet
Development of new
services and
functionalities for SME
and corporate
segments:
Web conference
File sharing
SME Flat Rates
eFax
Decreasing
Monthly Fees
17
BUSINESS UNITS
SONAECOM FIXED-PERFORMANCE
REAL PROGRESS WAS MADE DURING 1Q06 IN THE TRANSFORMATION OF SONAECOM FIXED TO A
DIRECT ACCESS BUSINESS
Total services reached 309 thousand, increasing 15%;
Acquisition of direct access services more than compensated for
decline of indirect access customers;
Total Direct Services representing almost 50% of Customer base;
Accounted for 57% of Customer Revenues.
CUSTOMER BASE
INCREASED
Traffic increased 35%;
Wholesale traffic growth by 62.1%;
Increase of Direct Voice traffic by 168%, partially compensating for
decrease of indirect voice traffic.
TRAFFIC
GROWTH
Continuing with commercial test of triple play offer, developing
commercial and communication strategy;
All essential content negotiations, including PT’s controlled content,
successfully completed
GROWTH
INITIATIVES IN
PLACE
18

BUSINESS UNITS
SONAECOM FIXED-FINANCIALS
INVESTMENT IN ADSL2+ BROADBAND SERVICES OVER ULL BEGAN TO SHOW TANGIBLE RESULTS,
STIMULATED BY A GOOD PRODUCT MIX, IMPROVED PRICING AND IMPROVED PROCESSES AND SYSTEMS
2005
1Q05
€ Millions
Turnover
EBITDA
Margin
Net Profit
EBITDA-CAPEX
158.4
-14.7
-9.2%
-34.5
36.6
-1.3
-3.5%
-4.3
-41.6
-5.8
1Q06
44.5
-4.5
-10.1%
-8.8
-13.2
CAPEX
26.9
4.5
8.7
2004
150.1
3.7
2.5%
-14.5
26.2
-22.5
19
BUSINESS UNITS
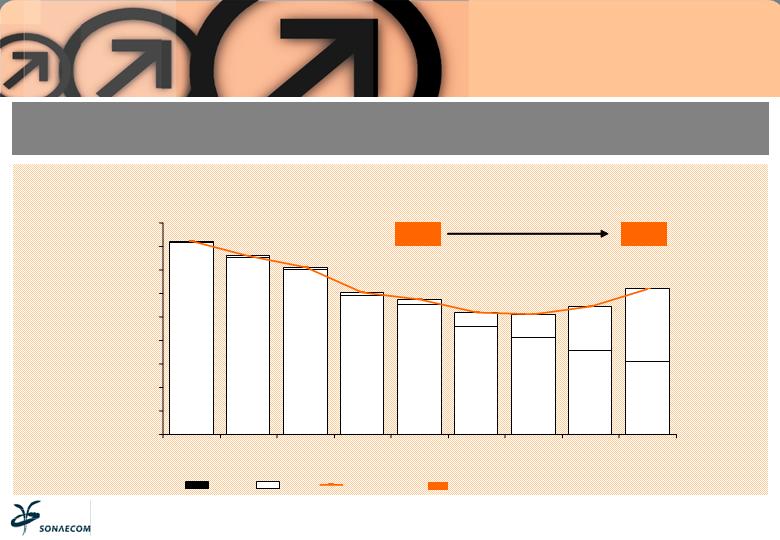
SONAECOM FIXED-SERVICES
SONAECOM FIXED SAW A SIGNIFICANT INCREASE IN ITS DIRECT ACCESS BUSINESS, WHICH NOW
ACCOUNTS FOR APPROXIMATELY 50% OF TOTAL SERVICES
Evolution of number of Total Services - EOP
408,160
376,786
350,571
295,837
275,478
230,538
206,068
177,602
155,473
2,038
3,383
4,186
5,492
11,919
27,895
49,024
93,861
153,790
410,198
380,169
354,757
301,329
287,397
258,433
255,092
271,463
309,263
0
50,000
100,000
150,000
200,000
250,000
300,000
350,000
400,000
450,000
1Q04
2Q04
3Q04
4Q04
1Q05
2Q05
3Q05
4Q05
1Q06
Indirect
Direct
Total Services
27%
57%
Direct Access % Customer Revenues
20
BUSINESS UNITS
PÚBLICO-HIGHLIGHTS
Third daily newspaper in paid circulation;
Pioneer in the development of Associated Products;
Strategic content provider;
Protection against increased sector concentration.
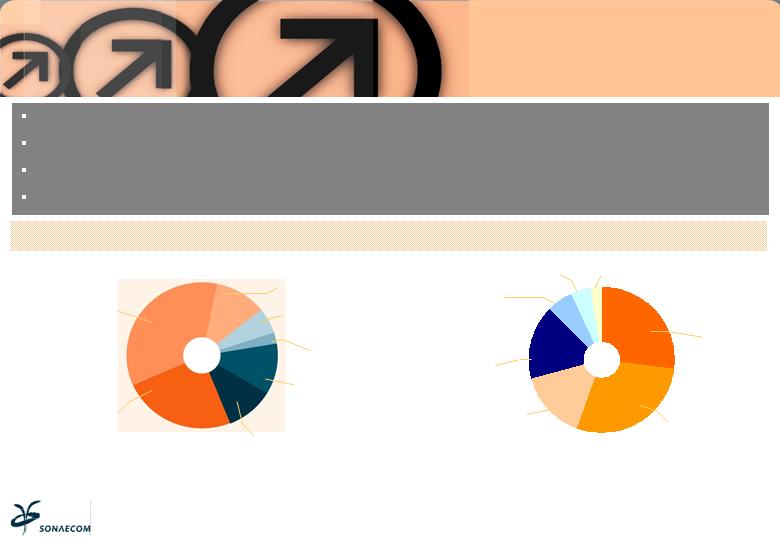
MARKET SHARE OF PAID CIRCULATION JAN/DEC 05
MARKET SHARE OF ADVERTISING 1Q06
SOURCE: APCT latest available data
Jornal de Notícias
26.5%
Correio da Manhã
31.7%
Público
13.6%
Jornal de Negócios
2%
Diário Económico
3.3%
24 Horas
13.6%
Diário de Notícias
9.3%
Jornal de Notícias
26%
Correio da Manhã
26.9%
Público
15.6%
Jornal de Negócios
3.4%
Diário Económico
6.4%
24 Horas
4.5%
Diário de Notícias
16.3%
SOURCE: Marktest/MediaMonitor
21
BUSINESS UNITS
PÚBLICO-PERFORMANCE
PÚBLICO HAD ANOTHER CHALLENGING 1Q06 AND FACED PRESSURE ON ALL 3 OF ITS REVENUE
LINES
REVENUE
PRESSURE
STRATEGY
IMPLEMENTED
Average Paid circulation decreased by 8.1% (average of 44,256 units);
Advertising sales were down 11.6%;
Market share was not impacted by circulation performance, reaching
15.7%;
Associated Products sales were down 22%;
Redesign the newspaper introducing more colour;
Seeking new sales and distribution channels;
Improving POS quality and control;
Step-up Advertising commercial activity by strengthening
relationship with top brands and establishing partnerships.
22

BUSINESS UNITS
PÚBLICO-FINANCIALS
EFFORTS WILL CONTINUE TO TURN-AROUND THE CURRENT PERFORMANCE AND ACHIEVE AN
ACCEPTABLE LEVEL OF PROFITABILITY
2005
1Q05
€ Millions
Turnover
EBITDA
Margin
Net Profit
EBITDA-CAPEX
44.1
-1.7
-3.9%
-3.2
10
-0.4
-4.3%
-0.5
-2.6
-0.5
1Q06
8.7
-1.9
-22%
-2.2
-2.0
CAPEX
0.9
0.1
0.1
2004
55.5
2.1
3.7%
0.0
0.8
1.3
23
BUSINESS UNITS
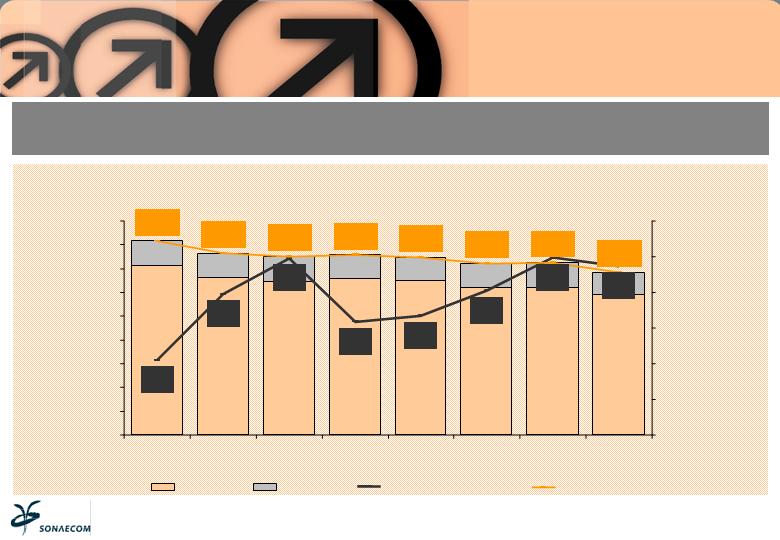
PÚBLICO-MARKET SHARE
PÚBLICO CONTINUED TO SUFFER FROM COMPETITIVE PRESSURES OF TABLOID NEWSPAPERS AND
FREE NEWSPAPERS, AS WELL AS THE REDUCTION OF THE SIZE OF THE PRESS MARKET
Evolution of Daily Market & Público Market Share
12.6%
13.5%
14.0%
13.1%
13.2%
13.5%
14.0%
13.9%
408,489
382,260
374,791
379,271
373,483
359,826
362,107
342,143
0
50,000
100,000
150,000
200,000
250,000
300,000
350,000
400,000
450,000
1Q04
2Q04
3Q04
4Q04
1Q05
2Q05
3Q05
4Q05
11.5%
12.0%
12.5%
13.0%
13.5%
14.0%
14.5%
Others
Público
Público Market Share
Total Market
Circulation
(units)
24
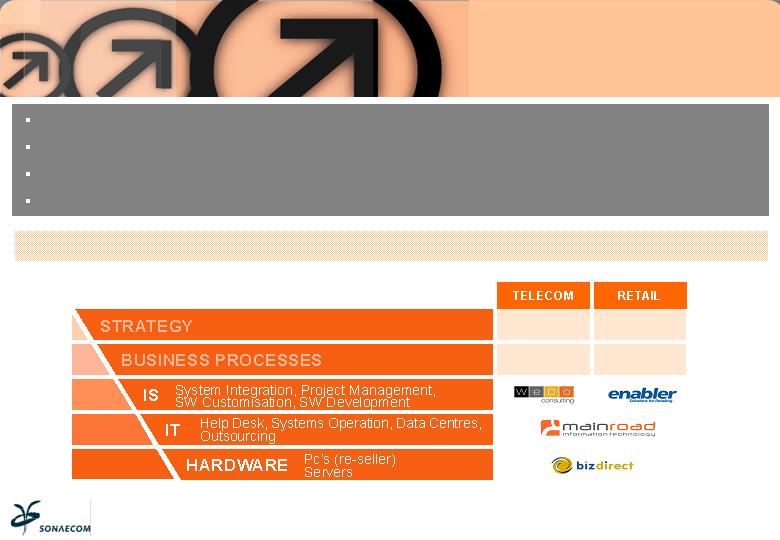
BUSINESS UNITS
SSI-HIGHLIGHTS
Sixth largest IT/IS group in Portugal;
International presence through Enabler (Retail IS) and Wedo (Telco IS);
Major accounts in UK, Germany, Spain, Brazil, Italy and France;
Strong organic growth.
SOFTWARE AND SYSTEMS INTEGRATION UNITS AND TARGET MARKETS
25
BUSINESS UNITS
SSI-PERFORMANCE
SSI CONTINUED TO PROMOTE AND EXPLORE INTERNATIONAL GROWTH OPPORTUNITIES
POSITIVE
QUARTER
SSI had another positive quarter although EBITDA was lower than in 1Q05 :
Turnover increased by 10.4%;
Lower margins due to higher volume of Equipment sales (30% of Turnover)
that generate lower margins;
EBITDA decreased by 35.6%, mainly explained by lower margins of
Equipment sales and weaker contribution from Enabler.
ENABLER WITH
WEAKER
PERFORMANCE
Weaker project base in 1Q06 compared to 1Q05, their best quarter ever;
However, it has acquired new customers during the quarter:
Tesco UK, Tesco Ireland, Tesco Check Republic, Gallery Lafayette, Dubai Duty Free;
…impacting 2Q06 results performance.
WEDO WITH A
GOOD QUARTER
Turnover increased by 10%;
EBITDA grew by 18%.
26

BUSINESS UNITS
SSI-FINANCIALS
SSI HAD A POSITIVE 1Q06, ALTHOUGH EBITDA WAS LOWER THAN IN 1Q05 DUE TO WEAKER
PERFORMANCE AT ENABLER
2004
2005
1Q05
€ Millions
Turnover
EBITDA
Margin
Net Profit
EBITDA-CAPEX
82.0
8.4
10.2%
4.0
86.0
9.5
11.1%
5.2
20.0
3.0
14.8%
1.9
6.2
8.8
2.8
1Q06
22.1
1.9
8.6%
1.1
1.7
CAPEX
2.2
0.7
0.2
0.2
27

PT TENDER OFFER
PT TENDER OFFER
BID RATIONALE
OUR OFFER IS WELL BALANCED AND ADDRESSES OBJECTIVES OF ALL CONSTITUENTS
Maximizes value with all-cash offer
Price of 9.5 euros/share assuming a dividend payment of 0.385 euros/share offers
full and fair value
Offer implies an EV/EBITDA (2005) of 7.5x, a significant premium to comparable
incumbent transactions
COMPETITION
AUTHORITY AND
CONSUMERS
PORTUGUESE
STATE
Transforms overnight the competitive landscape of the wireline and content
markets
Increases overall competition in the main fixed telephony segments (voice,
internet, pay-tv and wholesale)
Concentration in mobile mitigated by remedies likely to be imposed by the CA
Incorporates leading Portuguese shareholder as controlling shareholder in an
important strategic asset, providing a market friendly long term solution for the
existing “golden share”
Incorporates a Portuguese group with a strong track record of long term job
creation;
Over time, Sonaecom/PT will create additional employment opportunities
through the long term growth of the company
PT INVESTORS
EMPLOYEES
Offers a value enhancing transaction through a long-sought for structural change in
the Portuguese telecoms market
SONAECOM
INVESTORS
29

PT TENDER OFFER
STRATEGY
Integration of Sonaecom Group’s businesses with PT;
Merger of Optimus and TMN, earning CAPEX and cost efficiencies;
Sale of one of the Fixed networks (copper or cable);
Launch of Triple Play;
Increase investment in technology and innovation.
Readjust portfolio based on control;
Negotiate with Telefonica;
Reallocate resources towards controlled assets (existing/new).
European mobile partnerships;
Preservation of independence;
Protection of brands;
Technological partnerships.
STRENGTHEN PT’S
COMPETITIVENESS
REORIENT PT’S
INTERNATIONAL STRATEGY
IMPLEMENT CLEAR
INTERNATIONAL
PARTNERSHIP STRATEGY
WE HAVE A CLEAR STRATEGY FOR THE NEW SONAECOM/PT GROUP
Committed majority shareholding with vision and necessary skills for
implementation and execution;
Sonae Group culture and corporate values;
Able to live with “Golden Share” or other mechanism to safeguard
strategic interests of the Portuguese State;
Intention to keep Sonaecom and PT (or merged entity) quoted on
Euronext Lisbon.
ESTABLISH STRONG
SHAREHOLDER LEADERSHIP
Board composition;
Quality and transparency of financial information;
Best practices (reporting, internal controls, managing conflicts, etc.);
Human resources.
ADOPT “BEST PRACTICE” IN
CORPORATE GOVERNANCE
30
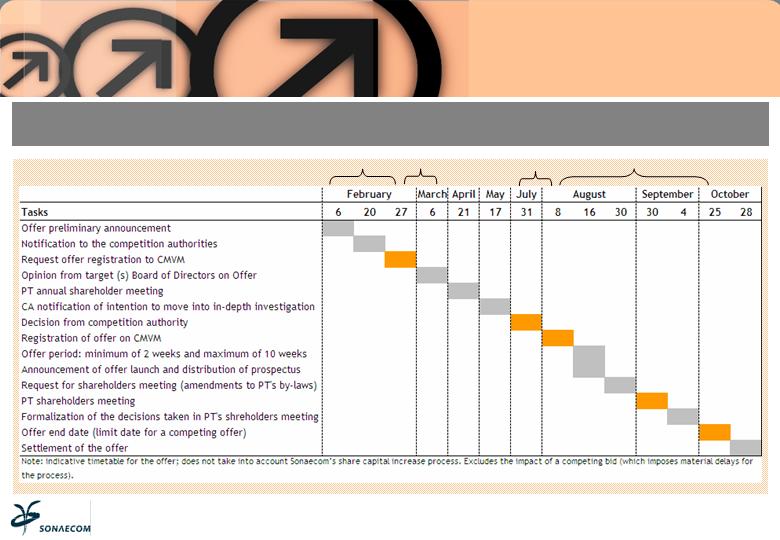
PT TENDER OFFER
TIMETABLE
WHERE ARE WE IN THE BID PROCESS?
20 days
8 days
8 days
2-10 weeks
31
PT TENDER OFFER
STATUS
SONAECOM INFORMED THE MARKET ON TWO ISSUES RELATING THE OFFER
Notification by the Competition Authority of its decision to initiate an
in-depth investigation process;
Sonaecom’s intention to make suggestions during this 2nd phase.
REMEDIES
Acquisition of just over 1% of the share capital of PT;
Average price of 9.38€ per share;
Goal of reaching the minimum threshold required to obtain access to
certain information.
PT SHARES
32

CONSOLIDATED 1Q06
RESULTS

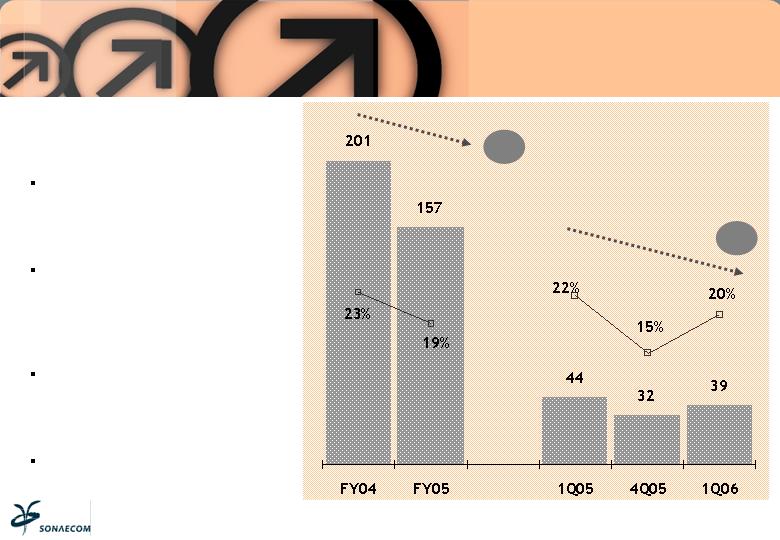
Turnover similar to 1Q05, for the
first time since 2004
Optimus
Higher Customer Revenues
(+4.8%): performance of new
products;
Lower Service Revenues (-3.5%):
MTR cuts, lower Roaming In.
Sonaecom Fixed
Higher Turnover (+21.5%): strong
growth in Operator Revenues
(+30.6%) and in Customer
Revenues (+13.5%);
Positive performance of ULL direct
access business: direct access
revenues increased (+136.5%).
SSI
Turnover up 10.4%.
Público
Lower Turnover by 12.5%.
-4.2%
TURNOVER
(MILLION EUROS)
CONSOLIDATED 1Q06 RESULTS
TURNOVER
34

Total Operating Costs increased 3.2% on
1Q06, due to growth related costs
Outsourcing costs up 24.7%: growth of
Sonaecom Fixed ULL direct access
services requiring more customer
activation support services;
Marketing & Sales up 7.2%: aggressive
sales of Sonaecom Fixed direct
broadband double play offers;
Network costs up 1.6%: extension of
3G network and number of central
offices unbundled (energy and rental).
Non-related growth costs decreased
compared to last year
COGS decreased 9.6%: expected one-
off discount from equipment
suppliers;
Interconnection costs fell 9.6%: MTR’s
reduction;
Leased Lines decreased 2%:
Optimization of fixed network.
+2.1%
+3.2%
TOTAL OPEX
(MILLION EUROS)
CONSOLIDATED 1Q06 RESULTS
TOTAL OPEX
35
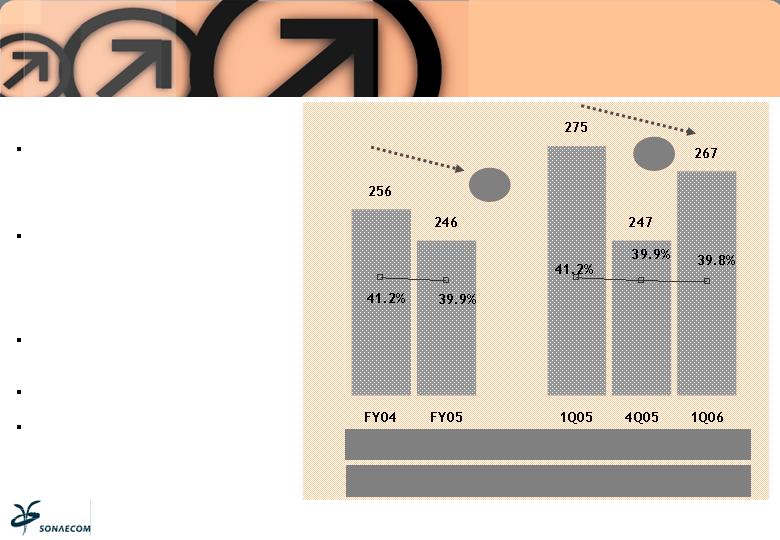
Consolidated EBITDA better than
expected
Optimus
EBITDA up 2%: higher Customer
Revenues and lower Total OPEX
and despite MTR reductions.
Sonaecom Fixed
Negative EBITDA: higher
investment in customer
acquisition and other ULL
servicing related costs.
Público
Negative EBITDA: lower sales of
three revenue lines; lower
margins of Associated Products.
SSI
Lower EBITDA by 35.6%: lower
Service Revenues at Enabler.
-11.3%
-21.8%
EBITDA & EBITDA MARGIN
(MILLION EUROS)
CONSOLIDATED 1Q06 RESULTS
EBITDA & EBITDA MARGIN
36
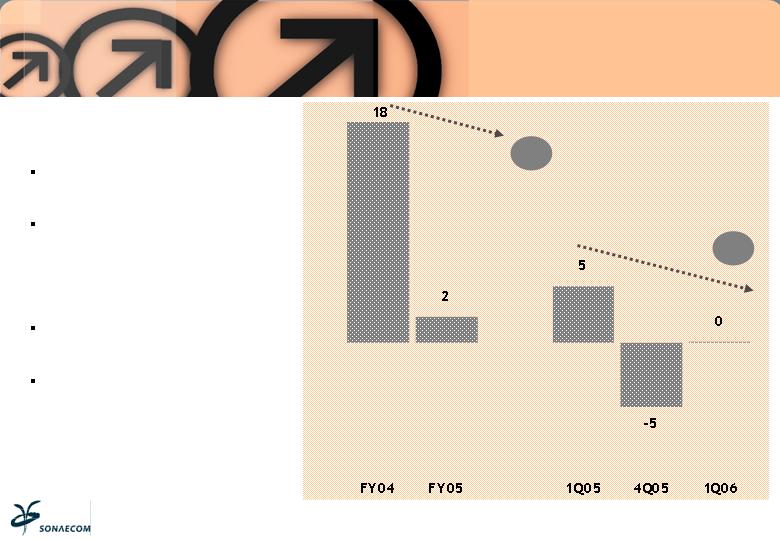
NET PROFIT AFTER MINORITIES
(MILLION EUROS)
Net Results Group share positive 0.1
million euros
Depreciation & Amortization up
2.6%: extension of 3G network;
Net Financial charges increased
0.7 million euros: higher Gross
debt due to 150 million euros
bond issue; increase of Euribor
rates by 25 basis points;
Tax line with benefit of 2.2
million euros;
Minority Interest impact: since
December05, Consolidated Results
include 100% of Sonaecom Fixed
and 69.2% of Optimus (versus
56.7% and 49%) with Roll-up of FT.
-96.8%
-88.8%
CONSOLIDATED 1Q06 RESULTS
NET PROFIT
37
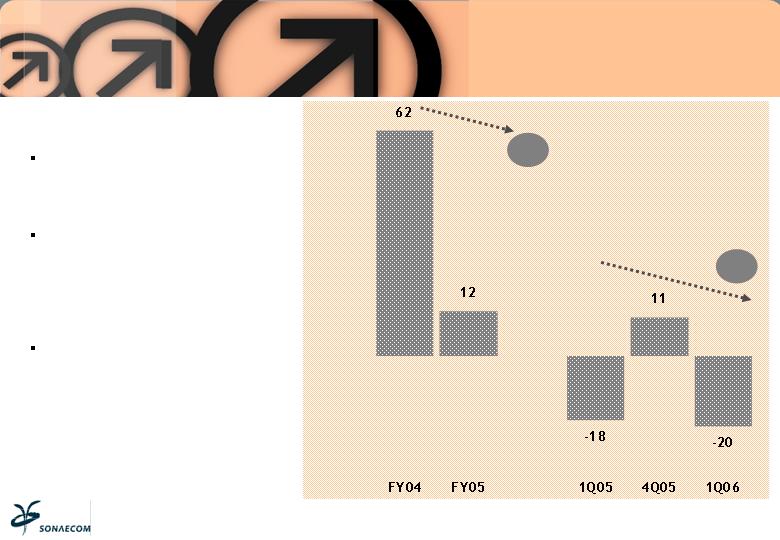
FREE CASH FLOW
(MILLION EUROS)
CAPEX lower by 12.9% vs 1Q05 and
representing 18.3% Turnover
Consistent with strategy of
investment in UMTS/HSDPA (41%
of CAPEX) and in ULL broadband
business (16% of CAPEX);
1Q05 CAPEX includes financial
investment of acquisition of
minority position by 18.8 million
euros.
FCF down 9.6% vs 1Q05
Higher investment in working
capital (+6.6 million euros):
increased stock levels at Optimus;
higher payments to trade creditors
at telecom businesses.
EBITDA – CAPEX 14% up on 1Q05
-80.6%
-9.6%
CONSOLIDATED 1Q06 RESULTS
CAPEX & FCF
38
NET DEBT & DEBT:EQUITY
(MILLION EUROS)
INTEREST
COVER
NET DEBT:
EBITDA
12.9X
12.4X
1.3X
1.6X
16.6X
8.9X
10.0X
1.8X
1.6X
1.4X
Stable Capital Structure
Consolidated Gross Debt stood at
457 million euros (+149 million
euros): 150 million euros bond issue
in June 2005;
Liquidity increased by 156 million
euros (+156 million euros): bond
issue proceeds invested as treasury
application and FCF performance at
Optimus and SSI;
Leverage increased: Net Debt to
annualized EBITDA at 1.8x;
Gearing remained at 40%
Interest cover improved vs 4Q05
-3.9%
-2.8%
CONSOLIDATED 1Q06 RESULTS
CAPITAL STRUCTURE
39
APPENDIX
APPENDIX
GROUP STRUCTURE
L
E
A
D
I
N
G
I
T
&
S
Y
S
T
E
M
S
I
N
T
E
G
R
A
T
O
R
S
T
E
L
C
O
M
O
B
I
L
E
#
3
M
O
B
I
L
E
O
P
E
R
A
T
O
R
T
E
L
C
O
F
I
X
E
D
#2 FIXED OPERATOR
INTERNET AND VOICE
M
E
D
I
A
LEADING REFERENCE
DAILY PAPER
S
O
N
A
E
S
G
P
S
F
R
E
E
F
L
O
A
T
F
R
A
N
C
E
T
E
L
E
C
O
M
2
3
.
7
%
S
O
N
A
E
C
O
M
6
9
.
2
4
%
(
1
)
1
0
0
%
1
0
0
%
1
0
0
%
(2)
S
S
I
(2) Minority Shareholders: EDP – 25.7%; Parpública - 5.04%
(1) 65.2% of voting rights
(3) Software and Systems Integration
(3)
61.79%
14.51%
41
T
O
T
A
L
S
O
N
A
E
C
O
M
G
R
O
U
P
S
O
N
A
E
C
O
M
C
O
R
P
O
R
A
T
E
C
E
N
T
R
E
2
6
S
H
A
R
E
D
S
E
R
V
I
C
E
S
B
a
c
k
O
f
f
i
c
e
C
o
r
p
o
r
a
t
e
S
e
r
v
i
c
e
s
M
i
d
d
l
e
w
a
r
e
T
E
L
E
C
O
M
S
M
O
B
I
L
E
F
I
X
E
D
P
Ú
B
L
I
C
O
3
5
4
S
S
I
1
7
0
2,278 (1)
(1) As at 30 March 2006; including SSI’s subsidiaries
Senior Management
PCG
IR
PR
Legal
IA
645
263
790
APPENDIX
ORGANIZATION
42