
MORGAN STANLEY TMT CONFERENCE
MANAGEMENT PRESENTATION
November 2006
1
SAFE HARBOUR
This presentation is provided for information purposes only and does not constitute, nor must it be interpreted as,
a solicitation or recommendation to acquire or dispose of any investment or to engage in any other transaction.
Any decision to buy or sell securities is the exclusive responsibility of the user. The presentation contains some
statements which constitute forward-looking statements which are based on the beliefs and assumptions of our
management and on information available to management at the time such statements were made.
These statements are not guarantees of future performance and involve risks and uncertainties that are difficult to
predict. Further, certain forward-looking statements are based upon assumptions as to future events that may not
prove to be accurate. Therefore, actual developments and results may differ materially from the information,
opinions or intentions reflected in this presentation.
Forward-looking statements speak only as of the date they are made, and Sonaecom does not undertake any
obligation to publicly update them in light of new information or future developments or to provide reasons why
actual results may differ. Recipients are invited to consult the documentation and public information filed by
Sonaecom with the Portuguese Securities Exchange Commission (CMVM).
2
ÍNDICE
1
OVERVIEW OF SONAECOM’S 3Q06 RESULTS
3
HIGHLIGHTS OF 3Q06 RESULTS – FINANCIAL PERFORMANCE
Top-Line Growth:
Customer growth at Optimus and Sonaecom Fixed;
Customer Revenues up 6.5% vs 3Q05;
Service Revenues up 2.6% vs 3Q05.
Costs kept under control:
OPEX excluding COGS only 1% above 3Q05;
73.7% of Service Revenues compared to 74.9% in 3Q05;
Cost increases were growth led.
Improvement in Profitability:
EBITDA growth of 12.6%;
EBITDA – CAPEX growth of 47.6%;
FCF growth of 8.3%.
4
HIGHLIGHTS OF 3Q06 RESULTS – OTHER DEVELOPMENTS
EDP and Parpública Roll-up:
Share-for-share exchanges;
EDP received 58.3 million Sonaecom shares for 25.72% in Optimus;
Parpública received 11.4 million Sonaecom shares for 5.04% in
Optimus;
Enlarged share capital of 366.2 million shares;
New Market Cap. at €5.1/share of approximately €1.9bn.
Restructuring programme at Público:
Restructuring programme under implementation;
Actions to reduce fixed costs, improve productivity and redesign the
newspaper;
Restructuring costs with an impact of 2 million euros YTD;
Continued implementation during 4Q06 and 1Q07;
Benefits to be seen in 2007 results.
5

TOP LINE PERFORMANCE DRIVEN BY TELCO GROWTH
SERVICE REVENUES
CUSTOMER REVENUES
In € million
Growth in subscriber base at Optimus; strengthened position of Sonaecom
Fixed in the broadband market.
+6.5%
+2.6%
384.0
402.3
125.7
133.8
9M05(R)
9M06
3Q05(R)
3Q06
549.7
557.4
187.0
191.9
9M05(R)
9M06
3Q05(R)
3Q06
6
COSTS KEPT UNDER CONTROL
In € million
COSTS EXCLUDING COGS
Costs reflect investment in growing market share and achieving profitability.
Lower Network Costs (-4.1%):
lower maintenance and interconnection costs;
leased lines costs up 4.8%:
extension of direct access coverage;
higher monthly fees per local loop and
wholesale circuits;
Personnel Costs up 11.9%:
restructuring programme at Público and related
severance costs;
Marketing & Sales costs up 3.8%:
SCF promotion of double play offers.
+1%
416.7
421.7
140.2
141.5
9M05(R)
9M06
3Q05(R)
3Q06
7
EBITDA UP 12.6% YOY DESPITE IMPACT OF MTRs
In € million
EBITDA & EBITDA MARGIN
Optimus EBITDA up 6.5%:
higher Customer Revenues (+2.2%);
lower total OPEX;
Sonaecom Fixed EBITDA break-even:
ULL direct business began to generate positive
contribution to profitability;
Público negative EBITDA:
lower Advertising Sales, lower Associated
Product margins and Severance Costs (1.7
million euros);
SSI EBITDA down 0.6 million:
driven by lower EBITDA at WeDo.
EBITDA growth was driven by the performance of our telco companies.
+12.6%
124.3
151.3
40.7
45.8
18.9%
20.0%
24.2%
21.3%
9M05(R)
9M06
3Q05(R)
3Q06
8
POSITIVE EBITDA - CAPEX
In € million
EBITDA - CAPEX
EBITDA up 12.6%;
CAPEX down 1.8% (13.2% Turnover):
lower investment at SCF (-20.8%), due to less
aggressive expansion of capacity given
investment effort in 3Q05;
EBITDA – CAPEX up 47.6%.
Operational cash flow performance driven by EBITDA growth and lower
CAPEX.
+47.6%
30.9
-47.9
11.9
17.5
9M05(R)
9M06
3Q05(R)
3Q06
9

ÍNDICE
2
OPTIMUS’ PERFORMANCE
10
OPTIMUS - STEADY GROWTH OF CUSTOMERS AND DATA USAGE
CUSTOMERS
DATA % SERVICE REV.
In thousands
Non-SMS data
36.5%
Extracting more value from data and broadening market boundaries through
wireless internet products and fixed-mobile convergent products.
SMS data
63.5%
+9.7%
+2.7pp
2,270.5
2,491.5
3Q05
3Q06
10.5%
13.8%
11.5%
14.1%
9M05
9M06
3Q05
3Q06
11
OPTIMUS - SERVICE REVENUES AND EBITDA POSITIVE
EVOLUTION
SERVICE REVENUES
Customer Revenues
69.2%
Operator Revenues
30.8%
EBITDA & EBITDA MARGIN
Growth achieved in Customer Revenues and EBITDA.
In € million
In € million
+6.5%
-0.7%
428.4
420.0
150.6
149.6
9M05
9M06
3Q05
3Q06
130.7
134.6
44.8
47.7
26.8%
29.4%
29.7%
28.0%
9M05
9M06
3Q05
3Q06
12
ÍNDICE
3
SONAECOM FIXED PERFORMANCE
13
SCF - CONTINUOUS EXPANSION OF DIRECT ADSL SERVICES
TOTAL SERVICES EVOLUTION EOP
Significant increase in direct business, representing 68% of Customer
Revenues.
38%
68%
408,160
376,786
350,571
295,837
275,478
230,538
206,068
177,602
155,473
133,107
117,311
2,038
3,383
4,186
5,492
11,919
27,895
49,024
93,861
153,790
194,240
219,160
410,198
380,169
354,757
301,329
287,397
258,433
255,092
271,463
309,263
327,347
336,471
0
50,000
100,000
150,000
200,000
250,000
300,000
350,000
400,000
450,000
1Q04
2Q04
3Q04
4Q04
1Q05
2Q05
3Q05
4Q05
1Q06
2Q06
3Q06
Indirect
Direct
Total Services
Direct Access % Customer Revenues
14
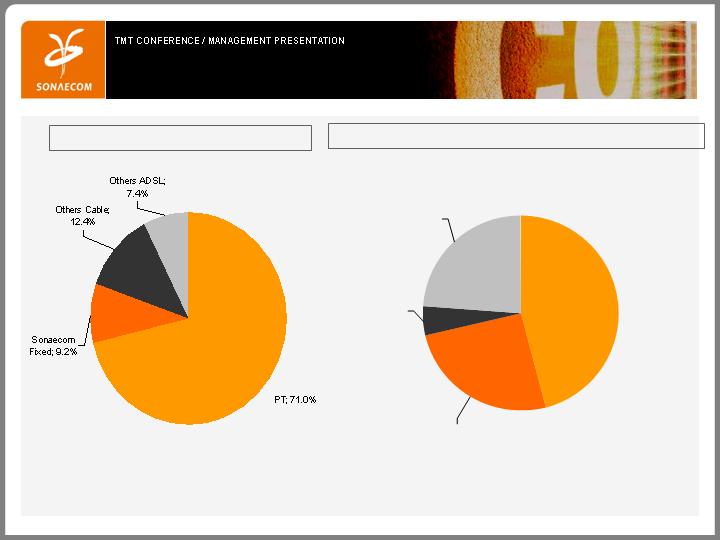
SCF – LEADING THE ALTNETS BROADBAND MARKET
BROADBAND MARKET SHARE 3Q06
BROADBAND MARKET SHARE NET ADDS 3Q06
Sonaecom Fixed is reinforcing its Broadband market share.
Latest available market data (Cable and ADSL)
Latest available market data (Cable and ADSL)
Source: Anacom, Company reports; Sonaecom analysis
Others ADSL;
23,8%
Others Cable;
4,8%
Sonaecom
Fixed; 25,6%
PT; 45,8%
15
SCF - DIRECT SERVICES GENERATING TANGIBLE FINANCIAL
RESULTS
TURNOVER
EBITDA & EBITDA MARGIN
Direct Revenues
30.7%
Operator Revenues
54.4%
Indirect
Revenues
13.3%
Investment in direct access business began to show returns, with the
company achieving positive EBITDA in the quarter.
In € million
In € million
+25.3%
Other
1.6%
117.0
146.2
41.8
52.4
9M05
9M06
3Q05
3Q06
-8.3
-6.4
-4.3
0.6
-10.2%
-7.1%
-4.4%
1.2%
9M05
9M06
3Q05
3Q06
16

ÍNDICE
4
PT TENDER OFFER - CONSIDERATIONS
17
BRIEF OVERVIEW OF SONAECOM’S OFFER FOR PT AND PTM
OFFER PRICE
€9.50 for each ordinary shares (including ADSs) and class A shares
of Portugal Telecom (“PT”):
100% of PT share capital;
Valuing PT at €10.7bn (equity value);
€9.03 for each share of PT Multimedia (“PTM”):
Acquisition of the stake not-owned by PT (~42%);
On announcement, prices assumed a dividend distribution of
€0.385/share for PT and €0.275/share for PTM.
Principal Tender Offer conditions include:
Sonaecom acquiring at least 50.01%;
Amendments to PT articles of association;
Approval from the Portuguese Competition Authority;
Non-opposition by the Portuguese Government;
Offer for PTM subject to the success of the Offer for PT.
PRINCIPAL TENDER
OFFER CONDITIONS
18

INDICATIVE TENDER OFFER TIMETABLE
Timing dependent on ADC’s final decision
Sonaecom to file draft
revised prospectus,
Offer announcement
and draft bank
guarantee / cash
confirmation with CMVM
Comments permitted
prior to AdC sign
-
off
PT Deadline to file
Schedule 14d
-
9 with
SEC with
recommendation to
PT shareholders
1
3
4
8
D Day
15 Dec
27 Sept
6
5
D
-
5
7 Dec
2
D
-
10
[30 Nov]
D+10
26 Dec
7
D+?
D+65/74
9 Feb (8 wks)
23 Feb (10 wks)
D+?
Offer
Period
OFFER
COMMENCES
Announcement
of preliminary
ADC approval
Final ADC
Approval
CMVM
Register final prospectus with CMVM
SEC
File Schedule TO with SEC
Notice sent to PT
shareholders on
EGM to be held re.
conditions of Offer
EGM
Expiration
of the Offer
9
D+69/78
15 Feb (8 wks)
1 Mar (10 wks)
Settlement
of the Offer
EGM
called
1
–
19

PRELIMINARY ADC DECISION MORE AGGRESSIVE THAN
EXPECTED
REMEDIES MORE
AGGRESSIVE
THAN EXPECTED
Combination of remedies will stimulate market competition;
Fixed Networks:
Vertical separation if Sonaecom keeps copper network;
Not enough to separate horizontally.
Content:
Divest all content assets inside PTM;
Cannot bundle content assets with sale of one of fixed
networks.
Mobile:
Rapid creation of a new MNO;
Divestment of more spectrum than expected;
Network effects: MNO protection regarding M-M
interconnection; and on-net/ off-net pricing.
Substantial negative impact on the NPV of combined business plan.
20
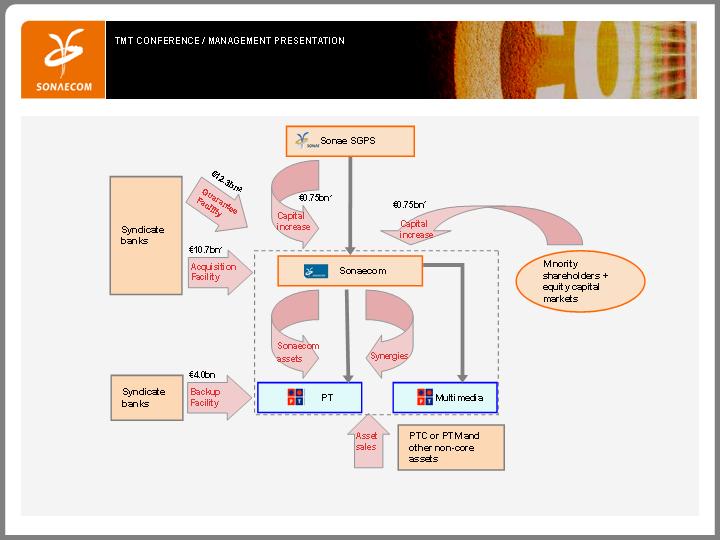
THE OFFER IS FULLY FINANCED THROUGH A SOUND STRUCTURE
Full flexible financing structure; Sonae Group is committing its telecom assets,
related synergies and share of equity recapitalization.
1 Capital increased will be used to amortize part of the acquisition facility
2 Guarantee facility include the full acquisition of PT shares, the acquisition of PTM minorities and the acquisition of outstanding convertible bonds
21

A CAPITAL INCREASE WAS APPROVED BY SONAECOM’S BOARD
CONDITIONED TO THE SUCCESS OF THE OFFER
BOARD APPROVAL
On 26 October 2006, Sonaecom’s Board unanimously approved a
share capital increase of €1.5bn;
The share capital increase is conditional upon the registration,
launch and success of the Tender Offer over PT.
Format: rights issue;
Issue size: €1.5bn (1,500,000,000 new ordinary shares);
Price: nominal value of €1.00 each;
Underwriting: the rights issue will be fully underwritten by Sonae
SGPS and/or the banks leading the offering.
Capital increase to be launched after settlement of the Tender Offer;
Operation could be completed within 10 to 14 weeks.
SUMMARY OF
MAIN TERMS
TIMING
22

PT – UNDERLYING VALUE CONSIDERATIONS
PTC:
Line loss and traffic deterioration – total main lines decreased by 1.2%
yoy in 3Q06 and total traffic fell by 9.6% yoy
Poor broadband growth – only +22K ADSL retail lines net adds in 3Q06
(vs.+47K in 3Q05)
3Q06 retail wireline revenues (excluding ADSL) down 16.0% yoy.
PTM:
Net loss of 28K Pay TV customers (9M06) vs. 36K net additions in 9M05;
Net adds in cable broadband customers of only 1K in 9M06, a decrease of
98.4% in relation to 9M05.
Vivo:
Continue market share loss to GSM operators: now less than 30% vs.
36% a year ago;
GSM migration: estimated CAPEX of €400m; probable customer loss
during migration;
9M06 EBITDA fell 24.7% in relation to 9M05 (in Brazilian Real).
TMN:
Market share under pressure;
Customer Revenues down 0.6% in 9M06 vs 9M05.
23
PT – UNDERLYING VALUE CONSIDERATIONS (CONT’D)
At €9.5 per share Sonaecom is paying a full and fair price for PT.
Dividend per PT ordinary share paid in 2006 higher than what was
previously expected (€0.475 vs. €0.385);
Uncertainty surrounding the fair value of the unfunded pension & healthcare
liability.
24

MORGAN STANLEY TMT CONFERENCE
MANAGEMENT PRESENTATION
November 2006
25