UNITED STATES
SECURITIES AND EXCHANGE COMMISSION
Washington, D.C. 20549
FORM N-CSR
CERTIFIED SHAREHOLDER REPORT OF REGISTERED
MANAGEMENT INVESTMENT COMPANIES
|
| | | | | | |
| Investment Company Act file number | 811-21861 |
| | |
| AMERICAN CENTURY GROWTH FUNDS, INC. |
| (Exact name of registrant as specified in charter) |
| | |
| 4500 MAIN STREET, KANSAS CITY, MISSOURI | 64111 |
| (Address of principal executive offices) | (Zip Code) |
| | |
CHARLES A. ETHERINGTON 4500 MAIN STREET, KANSAS CITY, MISSOURI 64111 |
| (Name and address of agent for service) |
| | |
| Registrant’s telephone number, including area code: | 816-531-5575 |
| | |
| Date of fiscal year end: | 07-31 |
| | |
| Date of reporting period: | 07-31-2018 |
ITEM 1. REPORTS TO STOCKHOLDERS.
|
| |
| | |
| | Annual Report |
| | |
| | July 31, 2018 |
| | |
| | Adaptive Small Cap Fund |
| | Investor Class (ACMNX) |
| | I Class (ACMHX) |
| | Advisor Class (ACMFX) |
| | R Class (ACMEX) |
| | R5 Class (ACMUX) |
| | R6 Class (ACMMX) |
|
| |
| President’s Letter | |
| Performance | |
| Portfolio Commentary | |
| Fund Characteristics | |
| Shareholder Fee Example | |
| Schedule of Investments | |
| Statement of Assets and Liabilities | |
| Statement of Operations | |
| Statement of Changes in Net Assets | |
| Notes to Financial Statements | |
| Financial Highlights | |
| Report of Independent Registered Public Accounting Firm | |
| Management | |
| Approval of Management Agreement | |
| Proxy Voting Results | |
| Additional Information | |
Any opinions expressed in this report reflect those of the author as of the date of the report, and do not necessarily represent the opinions of American Century Investments® or any other person in the American Century Investments organization. Any such opinions are subject to change at any time based upon market or other conditions and American Century Investments disclaims any responsibility to update such opinions. These opinions may not be relied upon as investment advice and, because investment decisions made by American Century Investments funds are based on numerous factors, may not be relied upon as an indication of trading intent on behalf of any American Century Investments fund. Security examples are used for representational purposes only and are not intended as recommendations to purchase or sell securities. Performance information for comparative indices and securities is provided to American Century Investments by third party vendors. To the best of American Century Investments’ knowledge, such information is accurate at the time of printing.
 Jonathan Thomas
Dear Investor:
Thank you for reviewing this annual report for the period ended July 31, 2018. Annual reports help convey important information about fund returns, including market factors that affected performance during the reporting period. For additional, updated investment and market insights, please visit our website, americancentury.com.
Despite Heightened Volatility, Stocks Stayed Strong
Broad U.S. and global stock indices rose significantly in the first half of the 12-month period. A favorable backdrop of robust corporate earnings results, improving global economic growth, relatively low interest rates, and growth-oriented U.S. tax reform drove stock prices higher. For the six months ended January 31, 2018, U.S. stocks (S&P 500 Index) returned 15.43%, while global stocks (MSCI ACWI Index) gained 14.29%. U.S. bonds struggled, as interest rates edged higher and the Federal Reserve (the Fed) continued is rate-normalization efforts.
The global stock rally came to an abrupt halt in early February, stifled by the return of market volatility. Better-than-expected U.S. economic data triggered expectations for rising inflation, higher interest rates, and a more-hawkish Fed. In response, U.S. Treasury yields climbed to their highest levels in several years, and stock prices plunged. However, economic data released in subsequent months were more in line with market expectations. Additionally, corporate earnings generally remained strong, and the Fed stayed on track. This news helped calm the market unrest, but rising interest rates, geopolitical tensions, and global trade war fears provided periodic headwinds.
Overall, U.S. and global stocks held onto double-digit gains for the 12-month period, led by growth stocks. Meanwhile, rising U.S. Treasury yields and inflation took a toll on investment-grade bonds, which declined modestly for the 12 months.
With inflationary pressures mounting, Treasury yields rising, volatility resurfacing, and the implications of U.S. tariff and trade policy still unfolding, investors likely will face new opportunities and challenges in the months ahead. We believe this scenario warrants a disciplined, diversified, and risk-aware approach, using professionally managed portfolios in pursuit of investment goals. We appreciate your continued trust and confidence in us.
Sincerely,
Jonathan Thomas
President and Chief Executive Officer
American Century Investments
|
| | | | | | |
| Total Returns as of July 31, 2018 |
| | | | Average Annual Returns | |
| | Ticker Symbol | 1 year | 5 years | 10 years | Since Inception | Inception Date |
| Investor Class | ACMNX | 12.55% | 10.72% | 7.90% | — | 5/31/06 |
| Russell 2000 Index | — | 18.73% | 11.33% | 10.38% | — | — |
| Russell 3000 Index | — | 16.39% | 12.82% | 10.67% | — | — |
| I Class | ACMHX | 12.85% | 10.96% | 8.11% | — | 5/31/06 |
| Advisor Class | ACMFX | 12.29% | 10.45% | 7.62% | — | 5/31/06 |
| R Class | ACMEX | 12.05% | 10.18% | 7.35% | — | 5/31/06 |
| R5 Class | ACMUX | 12.83% | — | — | 13.35% | 4/10/17 |
| R6 Class | ACMMX | 12.97% | — | — | 14.61% | 12/1/16 |
Average annual returns since inception are presented when ten years of performance history is not available.
Effective May 7, 2018, the fund's investment advisor selected a different benchmark for comparison purposes.
The advisor believes the Russell 2000 Index is more reflective of the fund's strategy.
Data presented reflect past performance. Past performance is no guarantee of future results. Current performance may be higher or lower than the performance shown. Total returns for periods less than one year are not annualized. Investment return and principal value will fluctuate, and redemption value may be more or less than original cost. Data assumes reinvestment of dividends and capital gains, and none of the charts reflect the deduction of taxes that a shareholder would pay on fund distributions or the redemption of fund shares. To obtain performance data current to the most recent month end, please call 1-800-345-2021 or visit americancentury.com. For additional information about the fund, please consult the prospectus.
|
|
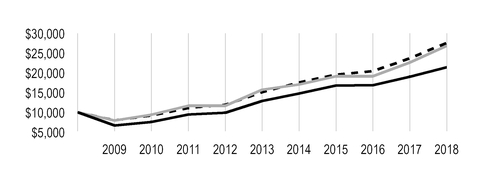
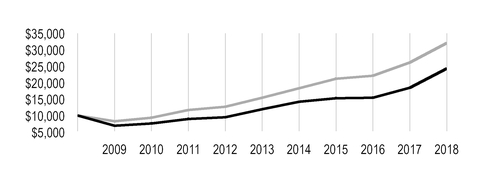
| Growth of $10,000 Over 10 Years |
| $10,000 investment made July 31, 2008 |
| Performance for other share classes will vary due to differences in fee structure. |
|
| |
| Value on July 31, 2018 |
| | Investor Class — $21,399 |
| |
| | Russell 2000 Index — $26,870 |
| |
| | Russell 3000 Index — $27,581 |
| |
|
| | | | | |
| Total Annual Fund Operating Expenses | |
| Investor Class | I Class | Advisor Class | R Class | R5 Class | R6 Class |
| 1.15% | 0.95% | 1.40% | 1.65% | 0.95% | 0.80% |
The total annual fund operating expenses shown is as stated in the fund’s prospectus current as of the date of this report. The prospectus may vary from the expense ratio shown elsewhere in this report because it is based on a different time period, includes acquired fund fees and expenses, and, if applicable, does not include fee waivers or expense reimbursements.
Data presented reflect past performance. Past performance is no guarantee of future results. Current performance may be higher or lower than the performance shown. Total returns for periods less than one year are not annualized. Investment return and principal value will fluctuate, and redemption value may be more or less than original cost. Data assumes reinvestment of dividends and capital gains, and none of the charts reflect the deduction of taxes that a shareholder would pay on fund distributions or the redemption of fund shares. To obtain performance data current to the most recent month end, please call 1-800-345-2021 or visit americancentury.com. For additional information about the fund, please consult the prospectus.
Portfolio Managers: Joe Reiland and Stephen Pool
Effective May 7, 2018, Adaptive All Cap's name changed to Adaptive Small Cap. This change better reflects the fund’s new investment strategy focus. The fund’s benchmark also changed to the Russell 2000 Index from the Russell 3000 Index.
Performance Summary
Adaptive Small Cap returned 12.55%* for the 12 months ended July 31, 2018, lagging the 18.73% return of the portfolio’s benchmark, the Russell 2000 Index.
U.S. stock indices delivered strong returns during the reporting period. Within the small-cap Russell 2000 Index, health care, information technology, and industrials stocks drove the benchmark’s performance. The real estate, utilities, and telecommunication services sectors posted the weakest contributions for the year.
Throughout the year, we continued to use our quantitative process that continually evaluates the market environment and its influence on company characteristics to identify potentially successful stocks. Purchases and sales, as well as individual security and industry allocations, are the result of applying this process as company-specific and market events change. The fund lagged its new benchmark, the Russell 2000 Index. Stock selection in the health care sector was a significant source of underperformance relative to the benchmark. Stock choices in the consumer discretionary and materials sectors also hampered performance. Stock selection among information technology and industrials stocks was beneficial.
Health Care Stocks Were Key Detractors
The fund’s underperformance in the health care sector was driven by stock selection, especially within the biotechnology industry, where MediciNova was a key detractor. MediciNova, which targets novel treatments for a variety of diseases such as amyotrophic lateral sclerosis and multiple sclerosis, suffered a volatile year typical of many biotechnology firms. Its largest decline during the year followed its announcement that a phase 2 study of a treatment for methamphetamine dependence had failed. Pharmaceutical company Prestige Brands Holdings, which owns such household over-the-counter names as Chloraseptic, Efferdent, and Monistat, declined on concerns about its low organic growth rate and high debt load. Sage Therapeutics was another underperformer among biotechnology companies, and health care equipment firm Anika Therapeutics also hampered performance in the health care sector.
Consumer discretionary holdings detracted, particularly among media companies. Advertising firm MDC Partners fell sharply after reporting weak revenues and lowering earnings guidance for the year. The stock was eliminated from the portfolio. Stock selection among specialty retailers was also negative.
Elsewhere, semiconductor maker SMART Global Holdings detracted. The company has partnered with a Brazilian firm, and investor concerns about weakness in Brazil’s currency weighed on the stock price.
*All fund returns referenced in this commentary are for Investor Class shares. Performance for other share classes will vary due to differences in fee structure; when Investor Class performance exceeds that of the fund's benchmark, other share classes may not. See page 3 for returns for all share classes.
Information Technology Holdings Led Contributors
The solid performance of our information technology holdings was led by Fortinet. The cybersecurity firm benefited from reporting strong revenues and earnings and offering improved guidance. Audio equipment maker Plantronics was a significant contributor. The company reported strong revenues across several quarters.
Stock selection in the industrials sector was led by aerospace and defense stocks. Boeing was a standout performer. The airplane manufacturer outperformed as the company continued to see strong free cash flow due to sales of its 737 and 787 planes. Boeing was eliminated.
Other top contributors included Buffalo Wild Wings and Marathon Petroleum. Sports bar and restaurant company Buffalo Wild Wings reported excellent earnings and received a strong buyout offer from the company that owns Arby’s. Marathon benefited from rising gas prices and its purchase of refiner and pipeline owner Andeavor. Both Buffalo Wild Wings and Marathon were eliminated from the portfolio. Medpace Holdings was another solid contributor. Medpace, which conducts feasibility studies and clinical trials for biotechnology, pharmaceutical, and medical device companies, reported strong year-over-year earnings and sales growth.
Outlook
Stocks performed well over the past fiscal year in a strong domestic growth environment, even as political and geopolitical concerns continued. Whatever the backdrop, we continue to employ a disciplined investment approach that uses a quantitative process that combines market conditions and company-specific characteristics to identify opportunities in any given market environment. The quantitative model allows us to uncover investments across the growth, value, and market-capitalization spectrums.
At period-end, the process pointed the portfolio to a significant overweight to health care along with lesser overweights in the consumer staples and information technology sectors. The largest underweights were in utilities, financials, and consumer discretionary.
|
| |
| JULY 31, 2018 |
| Top Ten Holdings | % of net assets |
| Walker & Dunlop, Inc. | 2.1% |
| LeMaitre Vascular, Inc. | 2.1% |
| Northwest Bancshares, Inc. | 2.1% |
| Meridian Bioscience, Inc. | 2.0% |
| PRA Health Sciences, Inc. | 1.9% |
| Orthofix International NV | 1.9% |
| Saia, Inc. | 1.9% |
| Weight Watchers International, Inc. | 1.8% |
| Calavo Growers, Inc. | 1.8% |
| Costamare, Inc. | 1.5% |
| | |
| Top Five Industries | % of net assets |
| Thrifts and Mortgage Finance | 7.4% |
| Equity Real Estate Investment Trusts (REITs) | 6.8% |
| Health Care Equipment and Supplies | 6.6% |
| Life Sciences Tools and Services | 5.2% |
| Software | 5.0% |
| | |
| Types of Investments in Portfolio | % of net assets |
| Common Stocks | 99.9% |
| Other Assets and Liabilities | 0.1% |
Fund shareholders may incur two types of costs: (1) transaction costs, including sales charges (loads) on purchase payments and redemption/exchange fees; and (2) ongoing costs, including management fees; distribution and service (12b-1) fees; and other fund expenses. This example is intended to help you understand your ongoing costs (in dollars) of investing in your fund and to compare these costs with the ongoing cost of investing in other mutual funds.
The example is based on an investment of $1,000 made at the beginning of the period and held for the entire period from February 1, 2018 to July 31, 2018.
Actual Expenses
The table provides information about actual account values and actual expenses for each class. You may use the information, together with the amount you invested, to estimate the expenses that you paid over the period. First, identify the share class you own. Then simply divide your account value by $1,000 (for example, an $8,600 account value divided by $1,000 = 8.6), then multiply the result by the number under the heading “Expenses Paid During Period” to estimate the expenses you paid on your account during this period.
If you hold Investor Class shares of any American Century Investments fund, or I Class shares of the American Century Diversified Bond Fund, in an American Century Investments account (i.e., not a financial intermediary or retirement plan account), American Century Investments may charge you a $12.50 semiannual account maintenance fee if the value of those shares is less than $10,000. We will redeem shares automatically in one of your accounts to pay the $12.50 fee. In determining your total eligible investment amount, we will include your investments in all personal accounts (including American Century Investments Brokerage accounts) registered under your Social Security number. Personal accounts include individual accounts, joint accounts, UGMA/UTMA accounts, personal trusts, Coverdell Education Savings Accounts and IRAs (including traditional, Roth, Rollover, SEP-, SARSEP- and SIMPLE-IRAs), and certain other retirement accounts. If you have only business, business retirement, employer-sponsored or American Century Investments Brokerage accounts, you are currently not subject to this fee. If you are subject to the Account Maintenance Fee, your account value could be reduced by the fee amount.
Hypothetical Example for Comparison Purposes
The table also provides information about hypothetical account values and hypothetical expenses based on the actual expense ratio of each class of your fund and an assumed rate of return of 5% per year before expenses, which is not the actual return of a fund’s share class. The hypothetical account values and expenses may not be used to estimate the actual ending account balance or expenses you paid for the period. You may use this information to compare the ongoing costs of investing in your fund and other funds. To do so, compare this 5% hypothetical example with the 5% hypothetical examples that appear in the shareholder reports of the other funds.
Please note that the expenses shown in the table are meant to highlight your ongoing costs only and do not reflect any transactional costs, such as sales charges (loads) or redemption/exchange fees. Therefore, the table is useful in comparing ongoing costs only, and will not help you determine the relative total costs of owning different funds. In addition, if these transactional costs were included, your costs would have been higher.
|
| | | | |
| | Beginning
Account Value
2/1/18 | Ending
Account Value
7/31/18 | Expenses Paid
During Period(1)
2/1/18 - 7/31/18 | Annualized Expense Ratio(1) |
| Actual |
| Investor Class | $1,000 | $994.50 | $5.74 | 1.16% |
| I Class | $1,000 | $995.90 | $4.75 | 0.96% |
| Advisor Class | $1,000 | $993.50 | $6.97 | 1.41% |
| R Class | $1,000 | $992.00 | $8.20 | 1.66% |
| R5 Class | $1,000 | $995.40 | $4.75 | 0.96% |
| R6 Class | $1,000 | $996.40 | $4.01 | 0.81% |
| Hypothetical |
| Investor Class | $1,000 | $1,019.04 | $5.81 | 1.16% |
| I Class | $1,000 | $1,020.03 | $4.81 | 0.96% |
| Advisor Class | $1,000 | $1,017.80 | $7.05 | 1.41% |
| R Class | $1,000 | $1,016.56 | $8.30 | 1.66% |
| R5 Class | $1,000 | $1,020.03 | $4.81 | 0.96% |
| R6 Class | $1,000 | $1,020.78 | $4.06 | 0.81% |
| |
| (1) | Expenses are equal to the class's annualized expense ratio listed in the table above, multiplied by the average account value over the period, multiplied by 181, the number of days in the most recent fiscal half-year, divided by 365, to reflect the one-half year period. Annualized expense ratio reflects actual expenses, including any applicable fee waivers or expense reimbursements and excluding any acquired fund fees and expenses. |
JULY 31, 2018
|
| | | | | |
| | Shares | Value |
| COMMON STOCKS — 99.9% | | |
| Aerospace and Defense — 2.3% | | |
Aerojet Rocketdyne Holdings, Inc.(1) | 11,005 |
| $ | 370,869 |
|
| Curtiss-Wright Corp. | 6,729 |
| 895,159 |
|
| TransDigm Group, Inc. | 2,097 |
| 787,507 |
|
| | | 2,053,535 |
|
| Airlines — 0.3% | | |
JetBlue Airways Corp.(1) | 13,296 |
| 239,328 |
|
| Banks — 4.7% | | |
| BCB Bancorp, Inc. | 19,619 |
| 292,323 |
|
| CIT Group, Inc. | 10,769 |
| 570,003 |
|
| LCNB Corp. | 12,175 |
| 226,455 |
|
| Macatawa Bank Corp. | 62,149 |
| 762,568 |
|
| Sterling Bancorp | 41,725 |
| 926,295 |
|
Texas Capital Bancshares, Inc.(1) | 13,501 |
| 1,225,891 |
|
| United Security Bancshares | 19,282 |
| 207,282 |
|
| | | 4,210,817 |
|
| Biotechnology — 1.8% | | |
BioSpecifics Technologies Corp.(1) | 9,367 |
| 426,199 |
|
MediciNova, Inc.(1) | 8,539 |
| 80,779 |
|
Mersana Therapeutics, Inc.(1) | 31,574 |
| 372,573 |
|
Sage Therapeutics, Inc.(1) | 4,756 |
| 686,386 |
|
| | | 1,565,937 |
|
| Building Products — 1.0% | | |
| Simpson Manufacturing Co., Inc. | 11,908 |
| 868,808 |
|
| Capital Markets — 2.2% | | |
| Artisan Partners Asset Management, Inc., Class A | 5,627 |
| 193,850 |
|
| Evercore, Inc., Class A | 9,840 |
| 1,111,920 |
|
| Waddell & Reed Financial, Inc., Class A | 30,998 |
| 641,969 |
|
| | | 1,947,739 |
|
| Chemicals — 1.9% | | |
| FutureFuel Corp. | 6,421 |
| 88,353 |
|
| Quaker Chemical Corp. | 636 |
| 112,915 |
|
| Sensient Technologies Corp. | 13,880 |
| 962,717 |
|
| Trinseo SA | 7,365 |
| 550,166 |
|
| | | 1,714,151 |
|
| Communications Equipment — 1.4% | | |
| Plantronics, Inc. | 18,437 |
| 1,265,884 |
|
| Construction and Engineering — 0.9% | | |
AECOM(1) | 14,093 |
| 472,961 |
|
Orion Group Holdings, Inc.(1) | 35,307 |
| 323,765 |
|
| | | 796,726 |
|
| Construction Materials — 0.1% | | |
Summit Materials, Inc., Class A(1) | 1,933 |
| 48,518 |
|
| Consumer Finance — 1.4% | | |
EZCORP, Inc., Class A(1) | 105,194 |
| 1,204,471 |
|
|
| | | | | |
| | Shares | Value |
| Distributors — 0.9% | | |
| Genuine Parts Co. | 7,981 |
| $ | 776,631 |
|
| Diversified Consumer Services — 3.5% | | |
| Carriage Services, Inc. | 27,989 |
| 699,445 |
|
| H&R Block, Inc. | 33,792 |
| 850,207 |
|
Weight Watchers International, Inc.(1) | 17,654 |
| 1,580,562 |
|
| | | 3,130,214 |
|
| Diversified Telecommunication Services — 0.5% | | |
Zayo Group Holdings, Inc.(1) | 11,998 |
| 445,006 |
|
| Electric Utilities — 0.5% | | |
| Avangrid, Inc. | 6,707 |
| 335,752 |
|
| IDACORP, Inc. | 916 |
| 86,324 |
|
| | | 422,076 |
|
| Electrical Equipment — 1.0% | | |
| Allied Motion Technologies, Inc. | 14,188 |
| 650,946 |
|
nVent Electric plc(1) | 9,866 |
| 270,328 |
|
| | | 921,274 |
|
| Electronic Equipment, Instruments and Components — 1.9% | | |
| Badger Meter, Inc. | 1,339 |
| 69,829 |
|
| Daktronics, Inc. | 69,893 |
| 600,381 |
|
Plexus Corp.(1) | 17,141 |
| 1,018,518 |
|
| | | 1,688,728 |
|
| Energy Equipment and Services — 2.0% | | |
Dril-Quip, Inc.(1) | 7,286 |
| 375,593 |
|
Helix Energy Solutions Group, Inc.(1) | 7,923 |
| 79,309 |
|
| Helmerich & Payne, Inc. | 1,129 |
| 69,264 |
|
Mammoth Energy Services, Inc.(1) | 18,154 |
| 675,692 |
|
Pioneer Energy Services Corp.(1) | 11,822 |
| 39,013 |
|
| RPC, Inc. | 8,509 |
| 125,933 |
|
Solaris Oilfield Infrastructure, Inc., Class A(1) | 27,171 |
| 426,313 |
|
| | | 1,791,117 |
|
| Equity Real Estate Investment Trusts (REITs) — 6.8% | | |
| Agree Realty Corp. | 6,626 |
| 352,768 |
|
| Armada Hoffler Properties, Inc. | 42,473 |
| 641,342 |
|
| Ashford Hospitality Trust, Inc. | 101,487 |
| 801,747 |
|
| BRT Apartments Corp. | 4,356 |
| 57,194 |
|
| City Office REIT, Inc. | 24,383 |
| 310,883 |
|
| CubeSmart | 14,263 |
| 433,025 |
|
| Easterly Government Properties, Inc. | 28,172 |
| 533,860 |
|
| Gladstone Commercial Corp. | 19,890 |
| 394,618 |
|
InfraREIT, Inc.(1) | 45,026 |
| 943,295 |
|
| MedEquities Realty Trust, Inc. | 44,844 |
| 502,253 |
|
| Sunstone Hotel Investors, Inc. | 24,775 |
| 403,089 |
|
| VEREIT, Inc. | 83,192 |
| 634,755 |
|
| | | 6,008,829 |
|
| Food Products — 1.8% | | |
| Calavo Growers, Inc. | 16,895 |
| 1,562,787 |
|
| Health Care Equipment and Supplies — 6.6% | | |
Anika Therapeutics, Inc.(1) | 15,039 |
| 602,011 |
|
| LeMaitre Vascular, Inc. | 51,057 |
| 1,838,052 |
|
| Meridian Bioscience, Inc. | 110,741 |
| 1,749,708 |
|
|
| | | | | |
| | Shares | Value |
Orthofix International NV(1) | 27,619 |
| $ | 1,670,673 |
|
| | | 5,860,444 |
|
| Health Care Providers and Services — 2.5% | | |
Addus HomeCare Corp.(1) | 13,377 |
| 884,889 |
|
| Encompass Health Corp. | 11,400 |
| 862,182 |
|
Magellan Health, Inc.(1) | 5,984 |
| 435,336 |
|
| | | 2,182,407 |
|
| Hotels, Restaurants and Leisure — 3.2% | | |
Denny's Corp.(1) | 77,712 |
| 1,130,710 |
|
| International Game Technology plc | 2,016 |
| 50,964 |
|
| Ruth's Hospitality Group, Inc. | 22,925 |
| 663,679 |
|
Scientific Games Corp., Class A(1) | 5,869 |
| 282,005 |
|
| Sonic Corp. | 2,226 |
| 78,244 |
|
| Wingstop, Inc. | 13,813 |
| 681,672 |
|
| | | 2,887,274 |
|
| Household Durables — 0.6% | | |
| Toll Brothers, Inc. | 2,989 |
| 105,392 |
|
TRI Pointe Group, Inc.(1) | 32,977 |
| 467,284 |
|
| | | 572,676 |
|
| Household Products — 1.1% | | |
| WD-40 Co. | 5,935 |
| 950,490 |
|
| Independent Power and Renewable Electricity Producers — 1.3% | |
| Ormat Technologies, Inc. | 21,175 |
| 1,148,744 |
|
| Insurance — 0.9% | | |
| Old Republic International Corp. | 36,924 |
| 786,850 |
|
| Internet and Direct Marketing Retail — 0.6% | | |
Shutterfly, Inc.(1) | 6,404 |
| 526,793 |
|
| Internet Software and Services — 2.7% | | |
Cornerstone OnDemand, Inc.(1) | 18,959 |
| 936,575 |
|
DHI Group, Inc.(1) | 54,472 |
| 114,391 |
|
eGain Corp.(1) | 36,645 |
| 476,385 |
|
QuinStreet, Inc.(1) | 28,224 |
| 374,250 |
|
Yelp, Inc.(1) | 12,552 |
| 462,918 |
|
| | | 2,364,519 |
|
| IT Services — 1.6% | | |
EPAM Systems, Inc.(1) | 7,004 |
| 911,991 |
|
| NIC, Inc. | 12,050 |
| 197,620 |
|
| Western Union Co. (The) | 14,304 |
| 288,368 |
|
| | | 1,397,979 |
|
| Life Sciences Tools and Services — 5.2% | | |
Charles River Laboratories International, Inc.(1) | 7,512 |
| 933,742 |
|
Medpace Holdings, Inc.(1) | 16,290 |
| 999,717 |
|
PRA Health Sciences, Inc.(1) | 15,905 |
| 1,672,252 |
|
Waters Corp.(1) | 5,217 |
| 1,029,157 |
|
| | | 4,634,868 |
|
| Machinery — 0.6% | | |
| EnPro Industries, Inc. | 1,369 |
| 104,578 |
|
| Pentair plc | 9,866 |
| 440,517 |
|
| | | 545,095 |
|
| Marine — 1.5% | | |
| Costamare, Inc. | 186,564 |
| 1,294,754 |
|
|
| | | | | |
| | Shares | Value |
| Media — 0.5% | | |
| Interpublic Group of Cos., Inc. (The) | 19,020 |
| $ | 428,901 |
|
| Metals and Mining — 1.4% | | |
| Compass Minerals International, Inc. | 4,710 |
| 319,573 |
|
| Gold Resource Corp. | 50 |
| 328 |
|
| Kaiser Aluminum Corp. | 7,588 |
| 846,973 |
|
| Reliance Steel & Aluminum Co. | 1,106 |
| 99,761 |
|
| | | 1,266,635 |
|
| Mortgage Real Estate Investment Trusts (REITs) — 0.7% | | |
| Apollo Commercial Real Estate Finance, Inc. | 11,598 |
| 221,406 |
|
| Starwood Property Trust, Inc. | 17,675 |
| 403,697 |
|
| | | 625,103 |
|
| Oil, Gas and Consumable Fuels — 2.7% | | |
Abraxas Petroleum Corp.(1) | 19,797 |
| 51,472 |
|
California Resources Corp.(1) | 12,425 |
| 452,394 |
|
CONSOL Energy, Inc.(1) | 4,920 |
| 204,820 |
|
Denbury Resources, Inc.(1) | 59,313 |
| 267,502 |
|
Dorian LPG Ltd.(1) | 6,492 |
| 55,182 |
|
| Evolution Petroleum Corp. | 7,775 |
| 83,581 |
|
| Hallador Energy Co. | 36,750 |
| 257,617 |
|
Matador Resources Co.(1) | 14,370 |
| 481,395 |
|
| Murphy Oil Corp. | 2,891 |
| 96,155 |
|
| Panhandle Oil and Gas, Inc., Class A | 2,400 |
| 48,960 |
|
Par Pacific Holdings, Inc.(1) | 23,516 |
| 411,765 |
|
| | | 2,410,843 |
|
| Paper and Forest Products — 0.9% | | |
| Neenah, Inc. | 8,951 |
| 785,898 |
|
| Pharmaceuticals — 1.4% | | |
Catalent, Inc.(1) | 8,262 |
| 344,525 |
|
Prestige Brands Holdings, Inc.(1) | 25,076 |
| 895,966 |
|
| | | 1,240,491 |
|
| Professional Services — 4.0% | | |
| CRA International, Inc. | 14,912 |
| 807,037 |
|
| Dun & Bradstreet Corp. (The) | 7,449 |
| 937,755 |
|
Navigant Consulting, Inc.(1) | 48,334 |
| 1,051,748 |
|
| Robert Half International, Inc. | 2,176 |
| 164,854 |
|
| TransUnion | 8,409 |
| 608,811 |
|
| | | 3,570,205 |
|
| Real Estate Management and Development — 0.4% | | |
| HFF, Inc., Class A | 8,401 |
| 378,129 |
|
| Road and Rail — 2.6% | | |
Genesee & Wyoming, Inc., Class A(1) | 7,415 |
| 637,690 |
|
Saia, Inc.(1) | 22,162 |
| 1,669,907 |
|
| | | 2,307,597 |
|
| Semiconductors and Semiconductor Equipment — 2.0% | | |
| Cabot Microelectronics Corp. | 1,879 |
| 226,326 |
|
| Power Integrations, Inc. | 5,448 |
| 389,532 |
|
SMART Global Holdings, Inc.(1) | 29,154 |
| 890,072 |
|
Tower Semiconductor Ltd.(1) | 11,853 |
| 244,764 |
|
| | | 1,750,694 |
|
|
| | | | | |
| | Shares | Value |
| Software — 5.0% | | |
| American Software, Inc., Class A | 47,197 |
| $ | 706,067 |
|
Fortinet, Inc.(1) | 18,520 |
| 1,165,093 |
|
| Progress Software Corp. | 29,178 |
| 1,073,459 |
|
| QAD, Inc., Class A | 19,330 |
| 962,634 |
|
RealPage, Inc.(1) | 9,244 |
| 509,344 |
|
| | | 4,416,597 |
|
| Specialty Retail — 2.9% | | |
Boot Barn Holdings, Inc.(1) | 54,195 |
| 1,267,621 |
|
| Citi Trends, Inc. | 21,204 |
| 602,406 |
|
| Williams-Sonoma, Inc. | 8,847 |
| 517,461 |
|
Zumiez, Inc.(1) | 8,102 |
| 183,510 |
|
| | | 2,570,998 |
|
| Technology Hardware, Storage and Peripherals — 0.5% | | |
Immersion Corp.(1) | 33,202 |
| 466,156 |
|
| Textiles, Apparel and Luxury Goods — 0.3% | | |
Skechers U.S.A., Inc., Class A(1) | 9,942 |
| 275,592 |
|
| Thrifts and Mortgage Finance — 7.4% | | |
Entegra Financial Corp.(1) | 6,771 |
| 197,375 |
|
Essent Group Ltd.(1) | 22,372 |
| 859,085 |
|
NMI Holdings, Inc., Class A(1) | 22,432 |
| 468,829 |
|
| Northwest Bancshares, Inc. | 101,707 |
| 1,832,760 |
|
| Provident Financial Holdings, Inc. | 8,357 |
| 155,022 |
|
| Prudential Bancorp, Inc. | 2,700 |
| 51,165 |
|
| Walker & Dunlop, Inc. | 31,770 |
| 1,882,690 |
|
| Waterstone Financial, Inc. | 65,041 |
| 1,105,697 |
|
| | | 6,552,623 |
|
| Tobacco — 0.6% | | |
| Turning Point Brands, Inc. | 2,328 |
| 77,895 |
|
| Vector Group Ltd. | 24,333 |
| 448,944 |
|
| | | 526,839 |
|
| Trading Companies and Distributors — 1.1% | | |
CAI International, Inc.(1) | 42,149 |
| 967,741 |
|
| Water Utilities — 0.2% | | |
| Global Water Resources, Inc. | 23,428 |
| 222,332 |
|
TOTAL INVESTMENT SECURITIES — 99.9%
(Cost $80,216,781) | | 88,578,843 |
|
| OTHER ASSETS AND LIABILITIES — 0.1% | | 106,504 |
|
| TOTAL NET ASSETS — 100.0% | | $ | 88,685,347 |
|
|
| | |
| NOTES TO SCHEDULE OF INVESTMENTS |
See Notes to Financial Statements.
|
|
| Statement of Assets and Liabilities |
|
| | | |
| JULY 31, 2018 |
| Assets |
| Investment securities, at value (cost of $80,216,781) | $ | 88,578,843 |
|
| Receivable for investments sold | 205,855 |
|
| Receivable for capital shares sold | 49,747 |
|
| Dividends and interest receivable | 45,425 |
|
| | 88,879,870 |
|
| | |
| Liabilities | |
| Disbursements in excess of demand deposit cash | 29,704 |
|
| Payable for capital shares redeemed | 75,817 |
|
| Accrued management fees | 85,415 |
|
| Distribution and service fees payable | 3,587 |
|
| | 194,523 |
|
| | |
| Net Assets | $ | 88,685,347 |
|
| | |
| Net Assets Consist of: | |
| Capital (par value and paid-in surplus) | $ | 75,101,879 |
|
| Undistributed net realized gain | 5,221,406 |
|
| Net unrealized appreciation | 8,362,062 |
|
| | $ | 88,685,347 |
|
|
| | | | | | |
| | Net Assets | Shares Outstanding | Net Asset Value Per Share |
| Investor Class, $0.01 Par Value |
| $63,924,862 |
| 2,968,600 |
| $21.53 |
| I Class, $0.01 Par Value |
| $13,019,349 |
| 599,831 |
| $21.71 |
| Advisor Class, $0.01 Par Value |
| $4,992,103 |
| 234,442 |
| $21.29 |
| R Class, $0.01 Par Value |
| $5,922,243 |
| 281,866 |
| $21.01 |
| R5 Class, $0.01 Par Value |
| $238,355 |
| 10,973 |
| $21.72 |
| R6 Class, $0.01 Par Value |
| $588,435 |
| 26,782 |
| $21.97 |
See Notes to Financial Statements.
|
| | | |
| YEAR ENDED JULY 31, 2018 |
| Investment Income (Loss) |
| Income: | |
| Dividends (net of foreign taxes withheld of $124) | $ | 1,713,225 |
|
| Interest | 4,976 |
|
| | 1,718,201 |
|
| | |
| Expenses: | |
| Management fees | 1,098,544 |
|
| Distribution and service fees: | |
| Advisor Class | 9,955 |
|
| R Class | 26,994 |
|
| Directors' fees and expenses | 2,956 |
|
| Other expenses | 3,555 |
|
| | 1,142,004 |
|
| | |
| Net investment income (loss) | 576,197 |
|
| | |
| Realized and Unrealized Gain (Loss) | |
| Net realized gain (loss) on: | |
| Investment transactions | 12,384,312 |
|
| Forward foreign currency exchange contract transactions | (20,260 | ) |
| Foreign currency translation transactions | (19 | ) |
| | 12,364,033 |
|
| | |
| Change in net unrealized appreciation (depreciation) on: | |
| Investments | (964,990 | ) |
| Forward foreign currency exchange contracts | 35,397 |
|
| | (929,593 | ) |
| | |
| Net realized and unrealized gain (loss) | 11,434,440 |
|
| | |
| Net Increase (Decrease) in Net Assets Resulting from Operations | $ | 12,010,637 |
|
See Notes to Financial Statements.
|
|
| Statement of Changes in Net Assets |
|
| | | | | | |
| YEARS ENDED JULY 31, 2018 AND JULY 31, 2017 |
| Increase (Decrease) in Net Assets | July 31, 2018 | July 31, 2017 |
| Operations |
| Net investment income (loss) | $ | 576,197 |
| $ | 903,091 |
|
| Net realized gain (loss) | 12,364,033 |
| 7,270,630 |
|
| Change in net unrealized appreciation (depreciation) | (929,593 | ) | 3,215,608 |
|
| Net increase (decrease) in net assets resulting from operations | 12,010,637 |
| 11,389,329 |
|
| | | |
| Distributions to Shareholders | | |
| From net investment income: | | |
| Investor Class | (1,147,713 | ) | (707,284 | ) |
| I Class | (228,191 | ) | (112,982 | ) |
| Advisor Class | (39,871 | ) | (61,896 | ) |
| R Class | (54,299 | ) | (17,887 | ) |
| R5 Class | (6,046 | ) | — |
|
| R6 Class | (7,486 | ) | (28 | ) |
| From net realized gains: | | |
| Investor Class | (4,992,235 | ) | — |
|
| I Class | (871,224 | ) | — |
|
| Advisor Class | (209,984 | ) | — |
|
| R Class | (362,355 | ) | — |
|
| R5 Class | (23,885 | ) | — |
|
| R6 Class | (26,179 | ) | — |
|
| Decrease in net assets from distributions | (7,969,468 | ) | (900,077 | ) |
| | | |
| Capital Share Transactions | | |
| Net increase (decrease) in net assets from capital share transactions (Note 5) | (14,551,098 | ) | (672,676 | ) |
| | | |
| Net increase (decrease) in net assets | (10,509,929 | ) | 9,816,576 |
|
| | | |
| Net Assets | | |
| Beginning of period | 99,195,276 |
| 89,378,700 |
|
| End of period | $ | 88,685,347 |
| $ | 99,195,276 |
|
| | | |
| Undistributed net investment income | — |
| $ | 723,007 |
|
See Notes to Financial Statements.
|
|
| Notes to Financial Statements |
JULY 31, 2018
1. Organization
American Century Growth Funds, Inc. (the corporation) is registered under the Investment Company Act of 1940, as amended (the 1940 Act), as an open-end management investment company and is organized as a Maryland corporation. Adaptive Small Cap Fund (formerly Adaptive All Cap Fund) (the fund) is one fund in a series issued by the corporation. The fund’s investment objective is to seek long-term capital growth. The fund offers the Investor Class, I Class, Advisor Class, R Class, R5 Class and R6 Class. Sale of the R5 Class and R6 Class commenced on April 10, 2017 and December 1, 2016, respectively.
2. Significant Accounting Policies
The following is a summary of significant accounting policies consistently followed by the fund in preparation of its financial statements. The fund is an investment company and follows accounting and reporting guidance in accordance with accounting principles generally accepted in the United States of America. This may require management to make certain estimates and assumptions at the date of the financial statements. Actual results could differ from these estimates. Management evaluated the impact of events or transactions occurring through the date the financial statements were issued that would merit recognition or disclosure.
Investment Valuations — The fund determines the fair value of its investments and computes its net asset value per share at the close of regular trading (usually 4 p.m. Eastern time) on the New York Stock Exchange (NYSE) on each day the NYSE is open. The Board of Directors has adopted valuation policies and procedures to guide the investment advisor in the fund’s investment valuation process and to provide methodologies for the oversight of the fund’s pricing function.
Equity securities that are listed or traded on a domestic securities exchange are valued at the last reported sales price or at the official closing price as provided by the exchange. Equity securities traded on foreign securities exchanges are generally valued at the closing price of such securities on the exchange where primarily traded or at the close of the NYSE, if that is earlier. If no last sales price is reported, or if local convention or regulation so provides, the mean of the latest bid and asked prices may be used. Securities traded over-the-counter are valued at the mean of the latest bid and asked prices, the last sales price, or the official closing price. Equity securities initially expressed in local currencies are translated into U.S. dollars at the mean of the appropriate currency exchange rate at the close of the NYSE as provided by an independent pricing service.
Open-end management investment companies are valued at the reported net asset value per share. Repurchase agreements are valued at cost, which approximates fair value. Forward foreign currency exchange contracts are valued at the mean of the appropriate forward exchange rate at the close of the NYSE as provided by an independent pricing service.
If the fund determines that the market price for an investment is not readily available or the valuation methods mentioned above do not reflect an investment’s fair value, such investment is valued as determined in good faith by the Board of Directors or its delegate, in accordance with policies and procedures adopted by the Board of Directors. In its determination of fair value, the fund may review several factors including, but not limited to, market information regarding the specific investment or comparable investments and correlation with other investment types, futures indices or general market indicators. Circumstances that may cause the fund to use these procedures to value an investment include, but are not limited to: an investment has been declared in default or is distressed; trading in a security has been suspended during the trading day or a security is not actively trading on its principal exchange; prices received from a regular pricing source are deemed unreliable; or there is a foreign market holiday and no trading occurred.
The fund monitors for significant events occurring after the close of an investment’s primary exchange but before the fund’s net asset value per share is determined. Significant events may include, but are not limited to: corporate announcements and transactions; governmental action and political unrest that could impact a specific investment or an investment sector; or armed conflicts, natural disasters and similar events that could affect investments in a specific country or region. The fund also monitors for significant fluctuations between domestic and foreign markets, as evidenced by the U.S. market or such other indicators that the Board of Directors, or its delegate, deems appropriate. If significant fluctuations in foreign markets are identified, the
fund may apply a model-derived factor to the closing price of equity securities traded on foreign securities exchanges. The factor is based on observable market data as provided by an independent pricing service.
Security Transactions — Security transactions are accounted for as of the trade date. Net realized gains and losses are determined on the identified cost basis, which is also used for federal income tax purposes.
Investment Income — Dividend income less foreign taxes withheld, if any, is recorded as of the ex-dividend date. Distributions received on securities that represent a return of capital or long-term capital gain are recorded as a reduction of cost of investments and/or as a realized gain. The fund may estimate the components of distributions received that may be considered nontaxable distributions or long-term capital gain distributions for income tax purposes. Interest income is recorded on the accrual basis and includes accretion of discounts and amortization of premiums.
Foreign Currency Translations — All assets and liabilities initially expressed in foreign currencies are translated into U.S. dollars at prevailing exchange rates at period end. The fund may enter into spot foreign currency exchange contracts to facilitate transactions denominated in a foreign currency. Purchases and sales of investment securities, dividend and interest income, spot foreign currency exchange contracts, and expenses are translated at the rates of exchange prevailing on the respective dates of such transactions. Net realized and unrealized foreign currency exchange gains or losses related to investment securities are a component of net realized gain (loss) on investment transactions and change in net unrealized appreciation (depreciation) on investments, respectively.
Repurchase Agreements — The fund may enter into repurchase agreements with institutions that American Century Investment Management, Inc. (ACIM) (the investment advisor) has determined are creditworthy pursuant to criteria adopted by the Board of Directors. The fund requires that the collateral, represented by securities, received in a repurchase transaction be transferred to the custodian in a manner sufficient to enable the fund to obtain those securities in the event of a default under the repurchase agreement. ACIM monitors, on a daily basis, the securities transferred to ensure the value, including accrued interest, of the securities under each repurchase agreement is equal to or greater than amounts owed to the fund under each repurchase agreement.
Joint Trading Account — Pursuant to an Exemptive Order issued by the Securities and Exchange Commission, the fund, along with certain other funds in the American Century Investments family of funds, may transfer uninvested cash balances into a joint trading account. These balances are invested in one or more repurchase agreements that are collateralized by U.S. Treasury or Agency obligations.
Income Tax Status — It is the fund’s policy to distribute substantially all net investment income and net realized gains to shareholders and to otherwise qualify as a regulated investment company under provisions of the Internal Revenue Code. Accordingly, no provision has been made for income taxes. The fund files U.S. federal, state, local and non-U.S. tax returns as applicable. The fund's tax returns are subject to examination by the relevant taxing authority until expiration of the applicable statute of limitations, which is generally three years from the date of filing but can be longer in certain jurisdictions. At this time, management believes there are no uncertain tax positions which, based on their technical merit, would not be sustained upon examination and for which it is reasonably possible that the total amounts of unrecognized tax benefits will significantly change in the next twelve months.
Multiple Class — All shares of the fund represent an equal pro rata interest in the net assets of the class to which such shares belong, and have identical voting, dividend, liquidation and other rights and the same terms and conditions, except for class specific expenses and exclusive rights to vote on matters affecting only individual classes. Income, non-class specific expenses, and realized and unrealized capital gains and losses of the fund are allocated to each class of shares based on their relative net assets.
Distributions to Shareholders — Distributions from net investment income and net realized gains, if any, are generally declared and paid annually. The fund may elect to treat a portion of its payment to a redeeming shareholder, which represents the pro rata share of undistributed net investment income and net realized gains, as a distribution for federal income tax purposes (tax equalization).
Indemnifications — Under the corporation’s organizational documents, its officers and directors are indemnified against certain liabilities arising out of the performance of their duties to the fund. In addition, in the normal course of business, the fund enters into contracts that provide general indemnifications. The maximum exposure under these arrangements is unknown as this would involve future claims that may be made against a fund. The risk of material loss from such claims is considered by management to be remote.
3. Fees and Transactions with Related Parties
Certain officers and directors of the corporation are also officers and/or directors of American Century Companies, Inc. (ACC). The corporation’s investment advisor, ACIM, the corporation's distributor, American Century Investment Services, Inc. (ACIS), and the corporation’s transfer agent, American Century Services, LLC, are wholly owned, directly or indirectly, by ACC.
Management Fees — The corporation has entered into a management agreement with ACIM, under which ACIM provides the fund with investment advisory and management services in exchange for a single, unified management fee (the fee) per class. The agreement provides that all expenses of managing and operating the fund, except distribution and service fees, brokerage expenses, taxes, interest, fees and expenses of the independent directors (including legal counsel fees), and extraordinary expenses, will be paid by ACIM. The fee is computed and accrued daily based on each class’s daily net assets and paid monthly in arrears. The difference in the fee among the classes is a result of their separate arrangements for non-Rule 12b-1 shareholder services. It is not the result of any difference in advisory or custodial fees or other expenses related to the management of the fund’s assets, which do not vary by class. The rate of the fee is determined by applying a fee rate calculation formula. This formula takes into account the fund’s assets as well as certain assets, if any, of other clients of the investment advisor outside the American Century Investments family of funds (such as subadvised funds and separate accounts) that use very similar investment teams and strategies (strategy assets).
The management fee schedule range and the effective annual management fee for each class for the period ended July 31, 2018 are as follows:
|
| | |
| | Management Fee Schedule Range | Effective Annual Management Fee |
| Investor Class | 0.85% to 1.15% | 1.15% |
| I Class | 0.65% to 0.95% | 0.95% |
| Advisor Class | 0.85% to 1.15% | 1.15% |
| R Class | 0.85% to 1.15% | 1.15% |
| R5 Class | 0.65% to 0.95% | 0.95% |
| R6 Class | 0.50% to 0.80% | 0.80% |
Distribution and Service Fees — The Board of Directors has adopted a separate Master Distribution and Individual Shareholder Services Plan for each of the R Class and Advisor Class (collectively the plans), pursuant to Rule 12b-1 of the 1940 Act. The plans provide that the R Class will pay ACIS an annual distribution and service fee of 0.50%. The plans provide that the Advisor Class will pay ACIS an annual distribution and service fee of 0.25%. The fees are computed and accrued daily based on each class’s daily net assets and paid monthly in arrears. The fees are used to pay financial intermediaries for distribution and individual shareholder services. Fees incurred under the plans during the period ended July 31, 2018 are detailed in the Statement of Operations.
Directors' Fees and Expenses — The Board of Directors is responsible for overseeing the investment advisor’s management and operations of the fund. The directors receive detailed information about the fund and its investment advisor regularly throughout the year, and meet at least quarterly with management of the investment advisor to review reports about fund operations. The fund’s officers do not receive compensation from the fund.
Interfund Transactions — The fund may enter into security transactions with other American Century Investments funds and other client accounts of the investment advisor, in accordance with the 1940 Act rules and procedures adopted by the Board of Directors. The rules and procedures require, among other things, that these transactions be effected at the independent current market price of the security. During the period, the interfund purchases and sales were $734,379 and $1,931,978, respectively. The effect of interfund transactions on the Statement of Operations was $507,239 in net realized gain (loss) on investment transactions.
4. Investment Transactions
Purchases and sales of investment securities, excluding short-term investments, for the period ended July 31, 2018 were $99,270,623 and $120,219,046, respectively.
5. Capital Share Transactions
The corporation is authorized to issue 3,000,000,000 shares. Transactions in shares of the fund were as follows:
|
| | | | | | | | | | |
| | Year ended
July 31, 2018 | Year ended July 31, 2017(1) |
| | Shares | Amount | Shares | Amount |
| Investor Class | | | | |
| Sold | 831,015 |
| $ | 17,636,013 |
| 1,535,888 |
| $ | 29,985,032 |
|
| Issued in reinvestment of distributions | 283,162 |
| 5,923,753 |
| 35,661 |
| 689,679 |
|
| Redeemed | (1,911,669 | ) | (40,817,550 | ) | (1,641,743 | ) | (31,984,773 | ) |
| | (797,492 | ) | (17,257,784 | ) | (70,194 | ) | (1,310,062 | ) |
| I Class | | | | |
| Sold | 147,033 |
| 3,163,646 |
| 362,329 |
| 7,132,416 |
|
| Issued in reinvestment of distributions | 51,160 |
| 1,077,429 |
| 5,806 |
| 112,982 |
|
| Redeemed | (216,968 | ) | (4,701,954 | ) | (101,964 | ) | (2,052,327 | ) |
| | (18,775 | ) | (460,879 | ) | 266,171 |
| 5,193,071 |
|
| Advisor Class | | | | |
| Sold | 148,090 |
| 3,122,736 |
| 73,421 |
| 1,405,769 |
|
| Issued in reinvestment of distributions | 12,059 |
| 249,855 |
| 3,230 |
| 61,896 |
|
| Redeemed | (60,799 | ) | (1,310,120 | ) | (421,935 | ) | (8,274,626 | ) |
| | 99,350 |
| 2,062,471 |
| (345,284 | ) | (6,806,961 | ) |
| R Class | | | | |
| Sold | 124,784 |
| 2,613,708 |
| 107,690 |
| 2,029,664 |
|
| Issued in reinvestment of distributions | 20,344 |
| 416,654 |
| 943 |
| 17,887 |
|
| Redeemed | (84,487 | ) | (1,747,219 | ) | (42,002 | ) | (795,196 | ) |
| | 60,641 |
| 1,283,143 |
| 66,631 |
| 1,252,355 |
|
| R5 Class | | | | |
| Sold | 19,827 |
| 433,054 |
| 250 |
| 5,000 |
|
| Issued in reinvestment of distributions | 1,420 |
| 29,931 |
| — |
| — |
|
| Redeemed | (10,524 | ) | (224,948 | ) | — |
| — |
|
| | 10,723 |
| 238,037 |
| 250 |
| 5,000 |
|
| R6 Class | | | | |
| Sold | 10,101 |
| 219,429 |
| 46,666 |
| 993,893 |
|
| Issued in reinvestment of distributions | 1,580 |
| 33,665 |
| 1 |
| 28 |
|
| Redeemed | (31,566 | ) | (669,180 | ) | — |
| — |
|
| | (19,885 | ) | (416,086 | ) | 46,667 |
| 993,921 |
|
| Net increase (decrease) | (665,438 | ) | $ | (14,551,098 | ) | (35,759 | ) | $ | (672,676 | ) |
| |
| (1) | April 10, 2017 (commencement of sale) through July 31, 2017 for the R5 Class and December 1, 2016 (commencement of sale) through July 31, 2017 for the R6 Class. |
6. Fair Value Measurements
The fund’s investments valuation process is based on several considerations and may use multiple inputs to determine the fair value of the investments held by the fund. In conformity with accounting principles generally accepted in the United States of America, the inputs used to determine a valuation are classified into three broad levels.
| |
| • | Level 1 valuation inputs consist of unadjusted quoted prices in an active market for identical investments. |
| |
| • | Level 2 valuation inputs consist of direct or indirect observable market data (including quoted prices for comparable investments, evaluations of subsequent market events, interest rates, prepayment speeds, credit risk, etc.). These inputs also consist of quoted prices for identical investments initially expressed in local currencies that are adjusted through translation into U.S. dollars. |
| |
| • | Level 3 valuation inputs consist of unobservable data (including a fund’s own assumptions). |
The level classification is based on the lowest level input that is significant to the fair valuation measurement. The valuation inputs are not necessarily an indication of the risks associated with investing in these securities or other financial instruments.
As of period end, the fund’s investment securities were classified as Level 1. The Schedule of Investments provides additional information on the fund's portfolio holdings.
7. Derivative Instruments
Foreign Currency Risk — The fund is subject to foreign currency exchange rate risk in the normal course of pursuing its investment objectives. The value of foreign investments held by a fund may be significantly affected by changes in foreign currency exchange rates. The dollar value of a foreign security generally decreases when the value of the dollar rises against the foreign currency in which the security is denominated and tends to increase when the value of the dollar declines against such foreign currency. A fund may enter into forward foreign currency exchange contracts to reduce a fund's exposure to foreign currency exchange rate fluctuations. The net U.S. dollar value of foreign currency underlying all contractual commitments held by a fund and the resulting unrealized appreciation or depreciation are determined daily. Realized gain or loss is recorded upon the termination of the contract. Net realized and unrealized gains or losses occurring during the holding period of forward foreign currency exchange contracts are a component of net realized gain (loss) on forward foreign currency exchange contract transactions and change in net unrealized appreciation (depreciation) on forward foreign currency exchange contracts, respectively. A fund bears the risk of an unfavorable change in the foreign currency exchange rate underlying the forward contract. Additionally, losses, up to the fair value, may arise if the counterparties do not perform under the contract terms. The fund's average U.S. dollar exposure to foreign currency risk derivative instruments held during the period was $875,282.
At period end, the fund did not have any derivative instruments disclosed on the Statement of Assets and Liabilities. For the year ended July 31, 2018, the effect of foreign currency risk derivative instruments on the Statement of Operations was $(20,260) in net realized gain (loss) on forward foreign currency exchange contract transactions and $35,397 in change in net unrealized appreciation (depreciation) on forward foreign currency exchange contracts.
8. Risk Factors
The fund’s investment process may result in high portfolio turnover, which could mean high transaction costs, affecting both performance and capital gains tax liabilities to investors.
The fund invests in common stocks of small companies. Because of this, the fund may be subject to greater risk and market fluctuations than a fund investing in larger, more established companies.
9. Federal Tax Information
The tax character of distributions paid during the years ended July 31, 2018 and July 31, 2017 were as follows:
|
| | | | | | |
| | 2018 | 2017 |
| Distributions Paid From | | |
| Ordinary income | $ | 3,441,980 |
| $ | 900,077 |
|
| Long-term capital gains | $ | 4,527,488 |
| — |
|
The book-basis character of distributions made during the year from net investment income or net realized gains may differ from their ultimate characterization for federal income tax purposes. These differences reflect the differing character of certain income items and net realized gains and losses for financial statement and tax purposes, and may result in reclassification among certain capital accounts on the financial statements.
The reclassifications, which are primarily due to tax equalization, were made to capital $1,262,999, distributions in excess of net investment income $184,402, and undistributed net realized gain $(1,447,401).
As of period end, the federal tax cost of investments and the components of distributable earnings on a tax-basis were as follows:
|
| | | |
| Federal tax cost of investments | $ | 80,231,275 |
|
| Gross tax appreciation of investments | $ | 11,169,294 |
|
| Gross tax depreciation of investments | (2,821,726 | ) |
| Net tax appreciation (depreciation) of investments | $ | 8,347,568 |
|
| Undistributed ordinary income | $ | 641,576 |
|
| Accumulated long-term gains | $ | 4,594,324 |
|
The difference between book-basis and tax-basis unrealized appreciation (depreciation) is attributable primarily to the tax deferral of losses on wash sales and the return of capital dividends received.
|
| | | | | | | | | | | | | | | |
| For a Share Outstanding Throughout the Years Ended July 31 (except as noted) |
| Per-Share Data | Ratios and Supplemental Data |
| | | Income From Investment Operations: | Distributions From: | | | Ratio to Average Net Assets of: | | |
| | Net Asset Value, Beginning of Period | Net Investment Income (Loss)(1) | Net Realized and Unrealized Gain (Loss) | Total From Investment Operations | Net
Investment
Income | Net
Realized
Gains | Total
Distributions | Net Asset Value, End of Period | Total Return(2) | Operating Expenses | Net Investment Income (Loss) | Portfolio Turnover Rate | Net Assets, End of Period (in thousands) |
| Investor Class |
| 2018 | $20.72 | 0.13 | 2.43 | 2.56 | (0.33) | (1.42) | (1.75) | $21.53 | 12.55% | 1.16% | 0.59% | 102% |
| $63,925 |
|
| 2017 | $18.55 | 0.19 | 2.17 | 2.36 | (0.19) | — | (0.19) | $20.72 | 12.85% | 1.15% | 0.97% | 105% |
| $78,040 |
|
| 2016 | $18.54 | 0.18 | (0.12)(3) | 0.06 | (0.05) | — | (0.05) | $18.55 | 0.36% | 1.16% | 1.06% | 126% |
| $71,170 |
|
| 2015 | $16.35 | 0.09 | 2.18 | 2.27 | (0.08) | — | (0.08) | $18.54 | 13.94% | 1.16% | 0.48% | 193% |
| $37,463 |
|
| 2014 | $14.46 | 0.09 | 2.01 | 2.10 | (0.21) | — | (0.21) | $16.35 | 14.60% | 1.15% | 0.54% | 175% |
| $21,232 |
|
| I Class |
| 2018 | $20.88 | 0.17 | 2.45 | 2.62 | (0.37) | (1.42) | (1.79) | $21.71 | 12.85% | 0.96% | 0.79% | 102% |
| $13,019 |
|
| 2017 | $18.69 | 0.21 | 2.21 | 2.42 | (0.23) | — | (0.23) | $20.88 | 13.03% | 0.95% | 1.17% | 105% |
| $12,914 |
|
| 2016 | $18.68 | 0.23 | (0.13)(3) | 0.10 | (0.09) | — | (0.09) | $18.69 | 0.55% | 0.96% | 1.26% | 126% |
| $6,587 |
|
| 2015 | $16.47 | 0.11 | 2.22 | 2.33 | (0.12) | — | (0.12) | $18.68 | 14.19% | 0.96% | 0.68% | 193% |
| $504 |
|
| 2014 | $14.56 | 0.12 | 2.03 | 2.15 | (0.24) | — | (0.24) | $16.47 | 14.86% | 0.95% | 0.74% | 175% |
| $32 |
|
| Advisor Class |
| 2018 | $20.51 | 0.05 | 2.42 | 2.47 | (0.27) | (1.42) | (1.69) | $21.29 | 12.29% | 1.41% | 0.34% | 102% |
| $4,992 |
|
| 2017 | $18.36 | 0.16 | 2.13 | 2.29 | (0.14) | — | (0.14) | $20.51 | 12.53% | 1.40% | 0.72% | 105% |
| $2,770 |
|
| 2016 | $18.35 | 0.14 | (0.12)(3) | 0.02 | (0.01) | — | (0.01) | $18.36 | 0.11% | 1.41% | 0.81% | 126% |
| $8,819 |
|
| 2015 | $16.18 | 0.05 | 2.16 | 2.21 | (0.04) | — | (0.04) | $18.35 | 13.67% | 1.41% | 0.23% | 193% |
| $3,995 |
|
| 2014 | $14.31 | 0.05 | 1.99 | 2.04 | (0.17) | — | (0.17) | $16.18 | 14.32% | 1.40% | 0.29% | 175% |
| $3,221 |
|
| | | | | | | | | | | | | | |
|
| | | | | | | | | | | | | | | |
| For a Share Outstanding Throughout the Years Ended July 31 (except as noted) |
| Per-Share Data | Ratios and Supplemental Data |
| | | Income From Investment Operations: | Distributions From: | | | Ratio to Average Net Assets of: | | |
| | Net Asset Value, Beginning of Period | Net Investment Income (Loss)(1) | Net Realized and Unrealized Gain (Loss) | Total From Investment Operations | Net
Investment
Income | Net
Realized
Gains | Total
Distributions | Net Asset Value, End of Period | Total Return(2) | Operating Expenses | Net Investment Income (Loss) | Portfolio Turnover Rate | Net Assets, End of Period (in thousands) |
| R Class |
| 2018 | $20.25 | 0.01 | 2.38 | 2.39 | (0.21) | (1.42) | (1.63) | $21.01 | 12.05% | 1.66% | 0.09% | 102% |
| $5,922 |
|
| 2017 | $18.13 | 0.07 | 2.14 | 2.21 | (0.09) | — | (0.09) | $20.25 | 12.23% | 1.65% | 0.47% | 105% |
| $4,480 |
|
| 2016 | $18.16 | 0.10 | (0.13)(3) | (0.03) | — | — | — | $18.13 | (0.17)% | 1.66% | 0.56% | 126% |
| $2,803 |
|
| 2015 | $16.01 | (0.01) | 2.16 | 2.15 | — | — | — | $18.16 | 13.43% | 1.66% | (0.02)% | 193% |
| $655 |
|
| 2014 | $14.16 | —(4) | 1.98 | 1.98 | (0.13) | — | (0.13) | $16.01 | 14.03% | 1.65% | 0.04% | 175% |
| $142 |
|
| R5 Class |
| 2018 | $20.88 | 0.17 | 2.45 | 2.62 | (0.36) | (1.42) | (1.78) | $21.72 | 12.83% | 0.96% | 0.79% | 102% |
| $238 |
|
2017(5) | $20.00 | 0.04 | 0.84 | 0.88 | — | — | — | $20.88 | 4.40% | 0.95%(6) | 0.58%(6) | 105%(7) |
| $5 |
|
| R6 Class |
| 2018 | $21.11 | 0.22 | 2.47 | 2.69 | (0.41) | (1.42) | (1.83) | $21.97 | 12.97% | 0.81% | 0.94% | 102% |
| $588 |
|
2017(8) | $19.04 | 0.01 | 2.08 | 2.09 | (0.02) | — | (0.02) | $21.11 | 11.05% | 0.80%(6) | 0.07%(6) | 105%(7) |
| $985 |
|
|
|
| Notes to Financial Highlights |
| |
| (1) | Computed using average shares outstanding throughout the period. |
| |
| (2) | Total returns are calculated based on the net asset value of the last business day. Total returns for periods less than one year are not annualized. |
| |
| (3) | Per-share amount was not in accord with the net realized and unrealized gain (loss) for the period because of the timing of transactions in shares of the fund and the amount and timing of per-share net realized and unrealized gain (loss) on such shares. |
| |
| (4) | Per-share amount was less than $0.005. |
| |
| (5) | April 10, 2017 (commencement of sale) through July 31, 2017. |
| |
| (7) | Portfolio turnover is calculated at the fund level. Percentage indicated was calculated for the year ended July 31, 2017. |
| |
| (8) | December 1, 2016 (commencement of sale) through July 31, 2017. |
See Notes to Financial Statements.
|
|
| Report of Independent Registered Public Accounting Firm |
To the shareholders and the Board of Directors of American Century Growth Funds, Inc.:
Opinion on the Financial Statements and Financial Highlights
We have audited the accompanying statement of assets and liabilities, including the schedule of investments, of Adaptive Small Cap Fund (formerly, Adaptive All Cap Fund), one of the funds constituting the American Century Growth Funds, Inc. (the “Fund”), as of July 31, 2018, the related statement of operations for the year then ended, the statements of changes in net assets for each of the two years in the period then ended, the financial highlights for each of the five years in the period then ended, and the related notes. In our opinion, the financial statements and financial highlights present fairly, in all material respects, the financial position of Adaptive Small Cap Fund of the American Century Growth Funds, Inc. as of July 31, 2018, the results of its operations for the year then ended, the changes in its net assets for each of the two years in the period then ended, and the financial highlights for each of the five years in the period then ended, in conformity with accounting principles generally accepted in the United States of America.
Basis for Opinion
These financial statements and financial highlights are the responsibility of the Fund's management. Our responsibility is to express an opinion on the Fund’s financial statements and financial highlights based on our audits. We are a public accounting firm registered with the Public Company Accounting Oversight Board (United States) (PCAOB) and are required to be independent with respect to the Fund in accordance with the U.S. federal securities laws and the applicable rules and regulations of the Securities and Exchange Commission and the PCAOB.
We conducted our audits in accordance with the standards of the PCAOB. Those standards require that we plan and perform the audit to obtain reasonable assurance about whether the financial statements and financial highlights are free of material misstatement, whether due to error or fraud. The Fund is not required to have, nor were we engaged to perform, an audit of its internal control over financial reporting. As part of our audits we are required to obtain an understanding of internal control over financial reporting but not for the purpose of expressing an opinion on the effectiveness of the Fund’s internal control over financial reporting. Accordingly, we express no such opinion.
Our audits included performing procedures to assess the risks of material misstatement of the financial statements and financial highlights, whether due to error or fraud, and performing procedures that respond to those risks. Such procedures included examining, on a test basis, evidence regarding the amounts and disclosures in the financial statements and financial highlights. Our audits also included evaluating the accounting principles used and significant estimates made by management, as well as evaluating the overall presentation of the financial statements and financial highlights. Our procedures included confirmation of securities owned as of July 31, 2018, by correspondence with the custodian and brokers; when replies were not received from brokers, we performed other auditing procedures. We believe that our audits provide a reasonable basis for our opinion.
DELOITTE & TOUCHE LLP
Kansas City, Missouri
September 19, 2018
We have served as the auditor of one or more American Century investment companies since 1997.
The Board of Directors
The individuals listed below serve as directors of the funds. Each director will continue to serve in this capacity until death, retirement, resignation or removal from office. The board has adopted a mandatory retirement age for directors who are not “interested persons,” as that term is defined in the Investment Company Act (independent directors). Independent directors shall retire by December 31 of the year in which they reach their 75th birthday.
Mr. Thomas is an “interested person” because he currently serves as President and Chief Executive Officer of American Century Companies, Inc. (ACC), the parent company of American Century Investment Management, Inc. (ACIM or the advisor). The other directors (more than three-fourths of the total number) are independent. They are not employees, directors or officers of, and have no financial interest in, ACC or any of its wholly owned, direct or indirect, subsidiaries, including ACIM, American Century Investment Services, Inc. (ACIS) and American Century Services, LLC (ACS), and they do not have any other affiliations, positions or relationships that would cause them to be considered “interested persons” under the Investment Company Act. The directors serve in this capacity for seven (in the case of Jonathan S. Thomas, 16; and Stephen E. Yates, 8) registered investment companies in the American Century Investments family of funds.
The following table presents additional information about the directors. The mailing address for each director is 4500 Main Street, Kansas City, Missouri 64111.
|
| | | | | |
Name
(Year of Birth) | Position(s) Held with Funds | Length of Time Served | Principal Occupation(s) During Past 5 Years | Number of American Century Portfolios Overseen by Director | Other Directorships Held During Past 5 Years |
| Independent Directors |
|
|
| Thomas W. Bunn (1953) | Director | Since 2017 | Retired | 67 | SquareTwo Financial; Barings (formerly Babson Capital Funds Trust) (2013 to 2016) |
Barry Fink
(1955) | Director | Since 2012 (independent since 2016) | Retired; Executive Vice President, ACC (2007 to 2013); President, ACS (2007 to 2013); Chief Operating Officer, ACC (2007 to 2012) | 67 | None |
Andrea C. Hall(1)
(1945) | Director | Since 1997 | Retired | 67 | None |
Jan M. Lewis
(1957) | Director | Since 2011 | Retired; President and Chief Executive Officer, Catholic Charities of Northeast Kansas (human services organization) (2006 to 2013) | 67 | None |
M. Jeannine Strandjord
(1945) | Director | Since 1994 | Self-employed Consultant | 67 | Euronet Worldwide Inc. and MGP Ingredients, Inc. |
|
| | | | | |
Name
(Year of Birth) | Position(s) Held with Funds | Length of Time Served | Principal Occupation(s) During Past 5 Years | Number of American Century Portfolios Overseen by Director | Other Directorships Held During Past 5 Years |
| Independent Directors |
|
|
John R. Whitten
(1946) | Director | Since 2008 | Retired | 67 | Rudolph Technologies, Inc. |
Stephen E. Yates
(1948) | Director and Chairman of the Board | Since 2012 (Chairman since 2018) | Retired | 69 | None |
| Interested Director |
|
|
Jonathan S. Thomas
(1963) | Director and President | Since 2007 | President and Chief Executive Officer, ACC (2007 to present). Also serves as Chief Executive Officer, ACS; Executive Vice President, ACIM; Director, ACC, ACIM and other ACC subsidiaries | 114 | BioMed Valley Discoveries, Inc. |
1) Effective August 31, 2018, Andrea C. Hall retired from the Board of Directors.
The Statement of Additional Information has additional information about the fund's directors and is available without charge, upon request, by calling 1-800-345-2021.
Officers
The following table presents certain information about the executive officers of the funds. Each officer serves as an officer for each of the 16 (in the case of Robert J. Leach, 15) investment companies in the American Century family of funds. No officer is compensated for his or her service as an officer of the funds. The listed officers are interested persons of the funds and are appointed or re-appointed on an annual basis. The mailing address for each officer listed below is 4500 Main Street, Kansas City, Missouri 64111.
|
| | |
Name
(Year of Birth) | Offices with the Funds | Principal Occupation(s) During the Past Five Years |
Jonathan S. Thomas
(1963) | Director and President since 2007 | President and Chief Executive Officer, ACC (2007 to present). Also serves as Chief Executive Officer, ACS; Executive Vice President, ACIM; Director, ACC, ACIM and other ACC subsidiaries |
R. Wes Campbell
(1974) | Chief Financial Officer and Treasurer since 2018
| Investment Operations and Investment Accounting, ACS (2000 to present)
|
Amy D. Shelton
(1964) | Chief Compliance Officer and Vice President since 2014 | Chief Compliance Officer, American Century funds, (2014 to present); Chief Compliance Officer, ACIM (2014 to present); Chief Compliance Officer, ACIS (2009 to present); Vice President, Client Interactions and Marketing, ACIS (2013 to 2014). Also serves as Vice President, ACIS |
Charles A. Etherington
(1957) | General Counsel since 2007 and Senior Vice President since 2006 | Attorney, ACC (1994 to present); Vice President, ACC (2005 to present); General Counsel, ACC (2007 to present). Also serves as General Counsel, ACIM, ACS, ACIS and other ACC subsidiaries; and Senior Vice President, ACIM and ACS |
C. Jean Wade
(1964) | Vice President since 2012 | Senior Vice President, ACS (2017 to present); Vice President, ACS (2000 to 2017)
|
Robert J. Leach
(1966) | Vice President since 2006 | Vice President, ACS (2000 to present) |
David H. Reinmiller
(1963) | Vice President since 2000 | Attorney, ACC (1994 to present). Also serves as Vice President, ACIM and ACS |
Ward D. Stauffer
(1960) | Secretary since 2005 | Attorney, ACC (2003 to present) |
|
|
| Approval of Management Agreement |
At a meeting held on June 28, 2018, the Fund’s Board of Directors (the "Board") unanimously approved the renewal of the management agreement pursuant to which American Century Investment Management, Inc. (the “Advisor”) acts as the investment advisor for the Fund. Under Section 15(c) of the Investment Company Act, contracts for investment advisory services are required to be reviewed, evaluated, and approved by a majority of a fund’s directors (the “Directors”), including a majority of the independent Directors, each year.
Prior to its consideration of the renewal of the management agreement, the Directors requested and reviewed extensive data and information compiled by the Advisor and certain independent providers of evaluation data concerning the Fund and the services provided to the Fund by the Advisor. This review was in addition to the oversight and evaluation undertaken by the Board and its committees on a continual basis and the information received was supplemental to the extensive information that the Board and its committees receive and consider throughout the year. The Directors also conducted a review of the process by which the Board considers the renewal of the management agreements. The Board consulted with industry experts and reviewed industry best practices and recent judicial precedent. The Directors believe that the enhancements resulting from their review resulted in increased dialogue with the Advisor and an improved process for fund shareholders.
In connection with its consideration of the renewal of the management agreement, the Board’s review and evaluation of the services provided by the Advisor included, but was not limited to, the following:
| |
| • | the nature, extent, and quality of investment management, shareholder services, and other services provided and to be provided to the Fund; |
| |
| • | the wide range of other programs and services provided and to be provided to the Fund and its shareholders on a routine and non-routine basis; |
| |
| • | the investment performance of the Fund, including data comparing the Fund's performance to appropriate benchmarks and/or a peer group of other mutual funds with similar investment objectives and strategies; |
| |
| • | the cost of owning the Fund compared to the cost of owning similar funds; |
| |
| • | the compliance policies, procedures, and regulatory experience of the Advisor and the Fund's service providers; |
| |
| • | financial data showing the cost of services provided to the Fund, the profitability of the Fund to the Advisor, and the overall profitability of the Advisor |
| |
| • | strategic plans of the Advisor; |
| |
| • | any economies of scale associated with the Advisor’s management of the Fund and other accounts; |
| |
| • | services provided and charges to the Advisor's other investment management clients; |
| |
| • | acquired fund fees and expenses; |
| |
| • | payments and practices in connection with financial intermediaries holding shares of the Fund and the services provided by intermediaries in connection therewith; and |
| |
| • | any collateral benefits derived by the Advisor from the management of the Fund. |
The Directors held two in-person meetings and one telephonic meeting to review and discuss the information provided. The independent Directors also reviewed responses to supplemental information requests provided by the Directors to the Advisor and held active discussions with the Advisor regarding the renewal of the management agreement. The independent Directors had the benefit of the advice of their independent counsel throughout the process.
Factors Considered
The Directors considered all of the information provided by the Advisor, the independent data providers, and independent counsel in connection with the approval. They determined that the information was sufficient for them to evaluate the management agreement for the Fund. In connection with their review, the Directors did not identify any single factor as being all-important or controlling, and each Director may have attributed different levels of importance to different factors. In deciding to renew the management agreement, the Board based its decision on a number of factors, including without limitation the following:
Nature, Extent and Quality of Services - Generally. Under the management agreement, the Advisor is responsible for providing or arranging for all services necessary for the operation of the Fund. The Board noted that the Advisor provides or arranges at its own expense a wide variety of services including without limitation the following:
| |
| • | portfolio research and security selection |
| |
| • | daily valuation of the Fund’s portfolio |
| |
| • | shareholder servicing and transfer agency, including shareholder confirmations, recordkeeping, and communications |
| |
| • | legal services (except the independent Directors’ counsel) |
| |
| • | regulatory and portfolio compliance |
| |
| • | marketing and distribution (except amounts paid by the Fund under Rule 12b-1 plans) |
The Board noted that many of these services have expanded over time in terms of both quantity and complexity in response to shareholder demands, competition in the industry, changing distribution channels, and the changing regulatory environment.
Investment Management Services. The nature of the investment management services provided to the Fund is quite complex and allows Fund shareholders access to professional money management, instant diversification of their investments within an asset class, the opportunity to easily diversify among asset classes by investing in or exchanging among various American Century Investments funds, and liquidity. In evaluating investment performance, the Board expects the Advisor to manage the Fund in accordance with its investment objectives and approved strategies. Further, the Directors recognize that the Advisor has an obligation to monitor trading activities, and in particular to seek the best execution of fund trades, and to evaluate the use of and payment for research. In providing these services, the Advisor utilizes teams of investment professionals (portfolio managers, analysts, research assistants, and securities traders) who require extensive information technology, research, training, compliance, and other systems to conduct their business. The Board, directly and through its Fund Performance Review Committee, provides oversight of the investment performance process. It regularly reviews investment performance information for the Fund, together with comparative information for appropriate benchmarks and/or peer groups of similarly-managed funds, over different time horizons. The Directors also review detailed performance information provided by the Advisor during the management agreement renewal process. If performance concerns are identified, the Fund receives special reviews until performance improves, during which the Board receives a report from the Advisor regarding the reasons for such results (e.g., market conditions, security selection) and any efforts being undertaken to improve performance. The Fund’s performance was above its benchmark for the five-year period and below its benchmark for the one-, three-, and ten-year periods reviewed by the Board. The Board found the investment management services provided by the Advisor to the Fund to be satisfactory and consistent with the management agreement.
Shareholder and Other Services. Under the management agreement, the Advisor provides the Fund with a comprehensive package of transfer agency, shareholder, and other services. The Board, directly and through various committees of the Board, regularly reviews reports and evaluations of such services at its regular meetings. These reports include, but are not limited to, information regarding the operational efficiency and accuracy of the shareholder and transfer agency services provided, staffing levels, shareholder satisfaction (as measured by external as well as internal sources), technology support, new products and services offered to Fund shareholders, securities trading activities, portfolio valuation services, auditing services, and legal and operational compliance activities. The Board found the services provided by the Advisor to the Fund under the management agreement to be competitive and of high quality.
Costs of Services and Profitability. The Advisor provides detailed information concerning its cost of providing various services to the Fund, its profitability in managing the Fund (pre- and post-distribution), its overall profitability, and its financial condition. The Directors have reviewed with the Advisor the methodology used to prepare this financial information. This information is considered in evaluating the Advisor’s financial condition, its ability to continue to provide services under the management agreement, and the reasonableness of the current management fee. The Board concluded that the Advisor’s profits were reasonable in light of the services provided to the Fund.
Ethics. The Board generally considers the Advisor’s commitment to providing quality services to shareholders and to conducting its business ethically. They noted that the Advisor’s practices generally meet or exceed industry best practices.
Economies of Scale. The Board also reviewed information provided by the Advisor regarding the possible existence of economies of scale in connection with the management of the Fund. The Board concluded that economies of scale are difficult to measure and predict with precision, especially on a fund-by-fund basis. The Board concluded that the Advisor is appropriately sharing economies of scale through its competitive fee structure, offering competitive fees from fund inception, and through reinvestment in its business to provide shareholders additional content and services. The Board also noted that economies of scale are shared with the Fund and its shareholders through management fee breakpoints that serve to reduce the effective management fee as the assets of the Fund grow.
Comparison to Other Funds’ Fees. The management agreement provides that the Fund pays the Advisor a single, all-inclusive (or unified) management fee for providing all services necessary for the management and operation of the Fund, other than brokerage expenses, expenses attributable to short sales, taxes, interest, extraordinary expenses, and the fees and expenses of the Fund’s independent Directors (including their independent legal counsel) and expenses incurred in connection with the provision of shareholder services and distribution services under a plan adopted pursuant to Rule 12b-1 under the 1940 Act. Under the unified fee structure, the Advisor is responsible for providing all investment advisory, custody, audit, administrative, compliance, recordkeeping, marketing and shareholder services, or arranging and supervising third parties to provide such services. By contrast, most other funds are charged a variety of fees, including an investment advisory fee, a transfer agency fee, an administrative fee, distribution charges, and other expenses. Other than their investment advisory fees and any applicable Rule 12b-1 distribution fees, all other components of the total fees charged by these other funds may be increased without shareholder approval. The Board believes the unified fee structure is a benefit to Fund shareholders because it clearly discloses to shareholders the cost of owning Fund shares, and, since the unified fee cannot be increased without a vote of Fund shareholders, it shifts to the Advisor the risk of increased costs of operating the Fund and provides a direct incentive to minimize administrative inefficiencies. Part of the Board’s analysis of fee levels involves reviewing certain evaluative data compiled by an independent provider comparing the Fund’s unified fee to the total expense ratios of its peers. The unified fee charged to shareholders of the Fund was above the median of the total expense ratios of the Fund’s peer expense universe and was within the range of its peer expense group. The Board concluded that the management fee paid by the
Fund to the Advisor under the management agreement is reasonable in light of the services provided to the Fund.
Comparison to Fees and Services Provided to Other Clients of the Advisor. The Directors also requested and received information from the Advisor concerning the nature of the services, fees, costs, and profitability of its advisory services to advisory clients other than the Fund. They observed that these varying types of client accounts require different services and involve different regulatory and entrepreneurial risks than the management of the Fund. The Board analyzed this information and concluded that the fees charged and services provided to the Fund were reasonable by comparison.
Payments to Intermediaries. The Directors also requested and received a description of payments made to intermediaries by the Fund and the Advisor and services provided in response thereto. These payments include various payments made by the Fund or the Advisor to different types of intermediaries and recordkeepers for distribution and service activities provided for the Fund. The Board reviewed such information and received representations from the Advisor that all such payments by the Fund were made pursuant to the Fund's Rule 12b-1 Plan and that all such payments by the Advisor were made from the Advisor’s resources and reasonable profits. The Board found the payments to be reasonable in scope and purpose.
Collateral or “Fall-Out” Benefits Derived by the Advisor. The Board considered the existence of collateral benefits the Advisor may receive as a result of its relationship with the Fund. They concluded that the Advisor’s primary business is managing mutual funds and it generally does not use fund or shareholder information to generate profits in other lines of business, and therefore does not derive any significant collateral benefits from them. The Board noted that additional assets from other clients may offer the Advisor some benefit from increased leverage with service providers and counterparties. Additionally, the Advisor may receive proprietary research from broker-dealers that execute fund portfolio transactions, which the Board concluded is likely to benefit other clients of the Advisor, as well as Fund shareholders. The Board also determined that the Advisor is able to provide investment management services to certain clients other than the Fund, at least in part, due to its existing infrastructure built to serve the fund complex. The Board concluded that appropriate allocation methodologies had been employed to assign resources and the cost of those resources to these other clients and, where expressly provided, these other client assets may be included with the assets of the Fund to determine breakpoints in the management fee schedule.
Existing Relationship. The Board also considered whether there was any reason for not continuing the existing arrangement with the Advisor. In this regard, the Board was mindful of the potential disruptions of the Fund’s operations and various risks, uncertainties, and other effects that could occur as a result of a decision not to continue such relationship. In particular, the Board recognized that most shareholders have invested in the Fund on the strength of the Advisor’s industry standing and reputation and in the expectation that the Advisor will have a continuing role in providing advisory services to the Fund.
Conclusion of the Directors. As a result of this process, the Board, including all of the independent Directors, taking into account all of the factors discussed above and the information provided by the Advisor and others in connection with its review and throughout the year, determined that the management fee is fair and reasonable in light of the services provided and that the investment management agreement between the Fund and the Advisor should be renewed.
A special meeting of shareholders was held on October 18, 2017, to vote on the following proposal. The proposal received the required votes and was adopted. A summary of voting results is listed below.
To elect four directors to the Board of Directors of American Century Growth Funds, Inc.: |
| | | | | | | |
| Affirmative |
| Withhold |
| Thomas W. Bunn | $ | 91,289,412 |
|
| $ | 1,678,991 |
|
| Barry Fink | $ | 91,251,000 |
|
| $ | 1,717,403 |
|
| Jan M. Lewis | $ | 91,297,912 |
|
| $ | 1,670,491 |
|
| Stephen E. Yates | $ | 91,202,473 |
|
| $ | 1,765,930 |
|
The other directors whose term of office continued after the meeting include Jonathan S. Thomas, Andrea C. Hall, James A. Olson, M. Jeannine Strandjord, and John R. Whitten.
Retirement Account Information
As required by law, distributions you receive from certain retirement accounts are subject to federal income tax withholding, unless you elect not to have withholding apply*. Tax will be withheld on the total amount withdrawn even though you may be receiving amounts that are not subject to withholding, such as nondeductible contributions. In such case, excess amounts of withholding could occur. You may adjust your withholding election so that a greater or lesser amount will be withheld.
If you don’t want us to withhold on this amount, you must notify us to not withhold the federal income tax. You may notify us in writing or in certain situations by telephone or through other electronic means. For systematic withdrawals, your withholding election will remain in effect until revoked or changed by filing a new election. You have the right to revoke your election at any time and change your withholding percentage for future distributions.
Remember, even if you elect not to have income tax withheld, you are liable for paying income tax on the taxable portion of your withdrawal. If you elect not to have income tax withheld or you don’t have enough income tax withheld, you may be responsible for payment of estimated tax. You may incur penalties under the estimated tax rules if your withholding and estimated tax payments are not sufficient. You can reduce or defer the income tax on a distribution by directly or indirectly rolling such distribution over to another IRA or eligible plan. You should consult your tax advisor for additional information.
State tax will be withheld if, at the time of your distribution, your address is within one of the mandatory withholding states and you have federal income tax withheld (or as otherwise required by state law). State taxes will be withheld from your distribution in accordance with the respective state rules.
*Some 403(b), 457 and qualified retirement plan distributions may be subject to 20% mandatory withholding, as they are subject to special tax and withholding rules. Your plan administrator or plan sponsor is required to provide you with a special tax notice explaining those rules at the time you request a distribution. If applicable, federal and/or state taxes may be withheld from your distribution amount.
Proxy Voting Policies
A description of the policies that the fund's investment advisor uses in exercising the voting rights associated with the securities purchased and/or held by the fund is available without charge, upon request, by calling 1-800-345-2021. It is also available on the "About Us" page of American Century Investments’ website at americancentury.com and on the Securities and Exchange Commission’s website at sec.gov. Information regarding how the investment advisor voted proxies relating to portfolio securities during the most recent 12-month period ended June 30 is available on the "About Us" page at americancentury.com. It is also available at sec.gov.
Quarterly Portfolio Disclosure
The fund files its complete schedule of portfolio holdings with the Securities and Exchange Commission (SEC) for the first and third quarters of each fiscal year on Form N-Q. The fund’s Forms N-Q are available on the SEC’s website at sec.gov, and may be reviewed and copied at the SEC’s Public Reference Room in Washington, DC. Information on the operation of the Public Reference Room may be obtained by calling 1-800-SEC-0330. The fund also makes its complete schedule of portfolio holdings for the most recent quarter of its fiscal year available on its website at americancentury.com and, upon request, by calling 1-800-345-2021.
Other Tax Information
The following information is provided pursuant to provisions of the Internal Revenue Code.
The fund hereby designates up to the maximum amount allowable as qualified dividend income for the fiscal year ended July 31, 2018.
For corporate taxpayers, the fund hereby designates $1,991,615, or up to the maximum amount allowable, of ordinary income distributions paid during the fiscal year ended July 31, 2018 as qualified for the corporate dividends received deduction.
The fund hereby designates $5,429,051, or up to the maximum amount allowable, as long-term capital gain distributions (20% rate gain distributions) for the fiscal year ended July 31, 2018.
The fund hereby designates $2,684,368 as qualified short-term capital gain distributions for purposes of Internal Revenue Code Section 871 for the fiscal year ended July 31, 2018.
The fund utilized earnings and profits of $1,272,859 distributed to shareholders on redemption of shares as part of the dividends paid deduction (tax equalization).
|
| | |
| |
| | | |
| Contact Us | americancentury.com | |
| Automated Information Line | 1-800-345-8765 | |
| Investor Services Representative | 1-800-345-2021
or 816-531-5575 | |
| Investors Using Advisors | 1-800-378-9878 | |
| Business, Not-For-Profit, Employer-Sponsored Retirement Plans | 1-800-345-3533 | |
| Banks and Trust Companies, Broker-Dealers, Financial Professionals, Insurance Companies | 1-800-345-6488 | |
| Telecommunications Relay Service for the Deaf | 711 | |
| | | |
| American Century Growth Funds, Inc. | |
| | | |
Investment Advisor: American Century Investment Management, Inc. Kansas City, Missouri | |
| | | |
| This report and the statements it contains are submitted for the general information of our shareholders. The report is not authorized for distribution to prospective investors unless preceded or accompanied by an effective prospectus. | |
| | | |
©2018 American Century Proprietary Holdings, Inc. All rights reserved.
CL-ANN-93183 1809 | |
|
| |
| | |
| | Annual Report |
| | |
| | July 31, 2018 |
| | |
| | Focused Dynamic Growth Fund |
| | Investor Class (ACFOX) |
| | I Class (ACFSX) |
| | Advisor Class (ACFDX) |
| | R Class (ACFCX) |
| | R6 Class (ACFNX) |
|
| |
| President’s Letter | |
| Performance | |
| Portfolio Commentary | |
| Fund Characteristics | |
| Shareholder Fee Example | |
| Schedule of Investments | |
| Statement of Assets and Liabilities | |
| Statement of Operations | |
| Statement of Changes in Net Assets | |
| Notes to Financial Statements | |
| Financial Highlights | |
| Report of Independent Registered Public Accounting Firm | |
| Management | |
| Approval of Management Agreement | |
| Proxy Voting Results | |
| Additional Information | |
Any opinions expressed in this report reflect those of the author as of the date of the report, and do not necessarily represent the opinions of American Century Investments® or any other person in the American Century Investments organization. Any such opinions are subject to change at any time based upon market or other conditions and American Century Investments disclaims any responsibility to update such opinions. These opinions may not be relied upon as investment advice and, because investment decisions made by American Century Investments funds are based on numerous factors, may not be relied upon as an indication of trading intent on behalf of any American Century Investments fund. Security examples are used for representational purposes only and are not intended as recommendations to purchase or sell securities. Performance information for comparative indices and securities is provided to American Century Investments by third party vendors. To the best of American Century Investments’ knowledge, such information is accurate at the time of printing.
Jonathan Thomas
Dear Investor:
Thank you for reviewing this annual report for the period ended July 31, 2018. Annual reports help convey important information about fund returns, including market factors that affected performance during the reporting period. For additional, updated investment and market insights, please visit our website, americancentury.com.
Despite Heightened Volatility, Stocks Stayed Strong
Broad U.S. and global stock indices rose significantly in the first half of the 12-month period. A favorable backdrop of robust corporate earnings results, improving global economic growth, relatively low interest rates, and growth-oriented U.S. tax reform drove stock prices higher. For the six months ended January 31, 2018, U.S. stocks (S&P 500 Index) returned 15.43%, while global stocks (MSCI ACWI Index) gained 14.29%. U.S. bonds struggled, as interest rates edged higher and the Federal Reserve (the Fed) continued is rate-normalization efforts.
The global stock rally came to an abrupt halt in early February, stifled by the return of market volatility. Better-than-expected U.S. economic data triggered expectations for rising inflation, higher interest rates, and a more-hawkish Fed. In response, U.S. Treasury yields climbed to their highest levels in several years, and stock prices plunged. However, economic data released in subsequent months were more in line with market expectations. Additionally, corporate earnings generally remained strong, and the Fed stayed on track. This news helped calm the market unrest, but rising interest rates, geopolitical tensions, and global trade war fears provided periodic headwinds.
Overall, U.S. and global stocks held onto double-digit gains for the 12-month period, led by growth stocks. Meanwhile, rising U.S. Treasury yields and inflation took a toll on investment-grade bonds, which declined modestly for the 12 months.
With inflationary pressures mounting, Treasury yields rising, volatility resurfacing, and the implications of U.S. tariff and trade policy still unfolding, investors likely will face new opportunities and challenges in the months ahead. We believe this scenario warrants a disciplined, diversified, and risk-aware approach, using professionally managed portfolios in pursuit of investment goals. We appreciate your continued trust and confidence in us.
Sincerely,
Jonathan Thomas
President and Chief Executive Officer
American Century Investments
|
| | | | | | |
| Total Returns as of July 31, 2018 |
| | | | Average Annual Returns | |
| | Ticker Symbol | 1 year | 5 years | 10 years | Since Inception | Inception Date |
| Investor Class | ACFOX | 31.92% | 15.33% | 9.30% | — | 5/31/06 |
| Russell 1000 Growth Index | — | 22.84% | 15.82% | 12.36% | — | — |
| I Class | ACFSX | 32.14% | 15.54% | 9.52% | — | 5/31/06 |
| Advisor Class | ACFDX | 31.53% | 15.03% | 9.02% | — | 5/31/06 |
| R Class | ACFCX | 31.20% | 14.75% | 8.75% | — | 5/31/06 |
| R6 Class | ACFNX | 32.39% | — | — | 34.23% | 12/1/16 |
Average annual returns since inception are presented when ten years of performance history is not available.
Fund returns would have been lower if a portion of the fees had not been waived. Extraordinary performance is attributable in part to unusually favorable market conditions and may not be repeated or consistently achieved in the future.
Data presented reflect past performance. Past performance is no guarantee of future results. Current performance may be higher or lower than the performance shown. Total returns for periods less than one year are not annualized. Investment return and principal value will fluctuate, and redemption value may be more or less than original cost. Data assumes reinvestment of dividends and capital gains, and none of the charts reflect the deduction of taxes that a shareholder would pay on fund distributions or the redemption of fund shares. To obtain performance data current to the most recent month end, please call 1-800-345-2021 or visit americancentury.com. For additional information about the fund, please consult the prospectus.
|
|
| Growth of $10,000 Over 10 Years |
| $10,000 investment made July 31, 2008 |
| Performance for other share classes will vary due to differences in fee structure. |
|
| |
| Value on July 31, 2018 |
| | Investor Class — $24,340 |
| |
| | Russell 1000 Growth Index — $32,087 |
| |
Ending value of Investor Class would have been lower if a portion of the fees had not been waived.
|
| | | | |
| Total Annual Fund Operating Expenses |
| Investor Class | I Class | Advisor Class | R Class | R6 Class |
| 1.10% | 0.90% | 1.35% | 1.60% | 0.75% |
The total annual fund operating expenses shown is as stated in the fund’s prospectus current as of the date of this report. The prospectus may vary from the expense ratio shown elsewhere in this report because it is based on a different time period, includes acquired fund fees and expenses, and, if applicable, does not include fee waivers or expense reimbursements.
Data presented reflect past performance. Past performance is no guarantee of future results. Current performance may be higher or lower than the performance shown. Total returns for periods less than one year are not annualized. Investment return and principal value will fluctuate, and redemption value may be more or less than original cost. Data assumes reinvestment of dividends and capital gains, and none of the charts reflect the deduction of taxes that a shareholder would pay on fund distributions or the redemption of fund shares. To obtain performance data current to the most recent month end, please call 1-800-345-2021 or visit americancentury.com. For additional information about the fund, please consult the prospectus.
Portfolio Managers: Keith Lee, Michael Li, Henry He, and Prabha Ram
Performance Summary
Focused Dynamic Growth returned 31.92%* for the 12 months ended July 31, 2018, outperforming the 22.84% return of the portfolio’s benchmark, the Russell 1000 Growth Index.
U.S. stock indices delivered strong returns during the reporting period. Within the Russell 1000 Growth Index, total return was largely driven by strong performance in the information technology sector. Consumer discretionary stocks were also key contributors to results in a period when all sectors of the index posted positive total returns.
The fund’s investment strategy features a concentrated portfolio of comparatively early and rapid stage companies with potential to sustain above-average growth rates. Stock selection in the information technology sector was the leading contributor to the fund’s performance relative to the Russell 1000 Growth Index. Stock selection in the consumer discretionary and consumer staples sectors was strong. Stock choices in industrials and health care hindered relative performance.
Information Technology Stocks Led Contributors
Within the information technology sector, stock selection among information technology services companies was particularly beneficial. Positioning among electronic payment processors was a key source of strength relative to the index. Square, which provides electronic payment services for smaller merchants, continued to be a top performer for the fund, benefiting from rising transaction volumes. The company is growing rapidly as its product serves small merchants’ payment needs and is also starting to capture business from larger merchants who are attracted by the ease of use and elegance of the system. Exposure to cloud-based secure-identification firm Okta benefited performance. It offers best-in-class software and service solutions from different providers integrated on a single platform. The company reported bookings and revenue growth well ahead of expectations.
Other notable information technology contributors were software companies focused on helping businesses more effectively utilize data, such as Tableau Software. Tableau reported solid results, which demonstrated that its broadening of product choices and price points is enabling it to move to larger clients and expanding the overall user base of its products. The company also continues to successfully pivot to a subscription model faster than many expected. Tableau is an example of our long-term oriented view that choice and customer satisfaction leads to a more sustainable franchise. The company’s high recurring subscription model also illustrates what we describe as a high-quality/great business.
Stock selection in the consumer staples sector benefited relative results, especially within the beverages industry. Our investment in The Boston Beer Co., brewer of Samuel Adams brand beverages, was helpful. The stock price increased on strong earnings and positive product sales trends. We continue to like the stock, in part because of management’s investment in new, more efficient production capacity to meet rising sales volumes and sustain margins.
Other significant contributors included Netflix, which saw its stock price continue to climb for most of the period as a result of expectations for solid user growth, particularly overseas, powered by
* All fund returns referenced in this commentary are for Investor Class shares. Fund returns would have been lower if a portion of the fees had not been waived. Performance for other share classes will vary due to differences in fee structure; when Investor Class performance exceeds that of the fund’s benchmark, other share classes may not. See page 3 for returns for all share classes.
new streaming content. Although it was a major contributor, the stock gave back some of its gains late in the period on weaker subscriber growth than investors had expected.
Industrials Holdings Were Key Detractors
Security selection in the industrials sector detracted from relative performance, particularly in the machinery industry. Notable individual detractors included food preparation equipment company The Middleby Corp., whose stock slid after revenues and earnings fell short of expectations. In addition, several expected orders that would have increased revenue were delayed.
An overweight allocation to biotechnology companies and stock selection within the industry hurt performance in the health care sector. Regeneron Pharmaceuticals declined as investors remain concerned about competition for its Eylea drug used to treat macular degeneration, a key market for the company. In addition, there are concerns about newly reported side effects associated with Eylea. Other detractors from relative results in this space were Ionis Pharmaceuticals and Celgene.
Elsewhere, Chipotle Mexican Grill continued to struggle with fallout from health-related issues at some of its restaurants. In addition, its CEO and founder left the company amid continued delays in demonstrating results from efforts to improve its operations. We eliminated the stock. Not owning Microsoft detracted. We did not own the stock because the portfolio tends to hold early and rapid stage growth companies, and the stock had been trading above our estimate for its fair value. Nevertheless, the company’s commercial cloud services division performed better than we expected amid fierce competition from Amazon.com and Alphabet (Google), stocks that we own.
Outlook
The fund typically holds a relatively small number of stocks (30 to 45) that we believe can sustain their high growth rates and have potential for long-term capital appreciation in excess of the fund’s benchmark. We are primarily focused on sustainability of earnings growth, so we visit corporate management and evaluate companies’ balance sheets to understand how well positioned a given company is to respond to changing market conditions and opportunities. The fund’s sector allocations are primarily the result of this investment process emphasizing growth and individual security selection.
At the end of the reporting period, the energy and health care sectors represented the largest overweight allocations versus the benchmark. The largest underweight was in consumer staples. The portfolio held no stocks in the real estate, materials, or telecommunication services sectors.
|
| |
| JULY 31, 2018 |
| Top Ten Holdings | % of net assets |
| Alphabet, Inc., Class C | 6.8% |
| NIKE, Inc., Class B | 5.1% |
| Amazon.com, Inc. | 5.1% |
| WABCO Holdings, Inc. | 5.0% |
| Intercontinental Exchange, Inc. | 4.6% |
| Baidu, Inc. ADR | 4.5% |
| Celgene Corp. | 4.4% |
| Tesla, Inc. | 4.2% |
| Visa, Inc., Class A | 4.2% |
| Splunk, Inc. | 3.9% |
| | |
| Top Five Industries | % of net assets |
| Internet Software and Services | 18.6% |
| Biotechnology | 15.3% |
| Machinery | 11.8% |
| IT Services | 9.4% |
| Software | 8.5% |
| | |
| Types of Investments in Portfolio | % of net assets |
| Domestic Common Stocks | 88.1% |
| Foreign Common Stocks* | 10.2% |
| Total Common Stocks | 98.3% |
| Temporary Cash Investments | 2.4% |
| Other Assets and Liabilities | (0.7)% |
*Includes depositary shares, dual listed securities and foreign ordinary shares.
Fund shareholders may incur two types of costs: (1) transaction costs, including sales charges (loads) on purchase payments and redemption/exchange fees; and (2) ongoing costs, including management fees; distribution and service (12b-1) fees; and other fund expenses. This example is intended to help you understand your ongoing costs (in dollars) of investing in your fund and to compare these costs with the ongoing cost of investing in other mutual funds.
The example is based on an investment of $1,000 made at the beginning of the period and held for the entire period from February 1, 2018 to July 31, 2018.
Actual Expenses
The table provides information about actual account values and actual expenses for each class. You may use the information, together with the amount you invested, to estimate the expenses that you paid over the period. First, identify the share class you own. Then simply divide your account value by $1,000 (for example, an $8,600 account value divided by $1,000 = 8.6), then multiply the result by the number under the heading “Expenses Paid During Period” to estimate the expenses you paid on your account during this period.
If you hold Investor Class shares of any American Century Investments fund, or I Class shares of the American Century Diversified Bond Fund, in an American Century Investments account (i.e., not a financial intermediary or retirement plan account), American Century Investments may charge you a $12.50 semiannual account maintenance fee if the value of those shares is less than $10,000. We will redeem shares automatically in one of your accounts to pay the $12.50 fee. In determining your total eligible investment amount, we will include your investments in all personal accounts (including American Century Investments Brokerage accounts) registered under your Social Security number. Personal accounts include individual accounts, joint accounts, UGMA/UTMA accounts, personal trusts, Coverdell Education Savings Accounts and IRAs (including traditional, Roth, Rollover, SEP-, SARSEP- and SIMPLE-IRAs), and certain other retirement accounts. If you have only business, business retirement, employer-sponsored or American Century Investments Brokerage accounts, you are currently not subject to this fee. If you are subject to the Account Maintenance Fee, your account value could be reduced by the fee amount.
Hypothetical Example for Comparison Purposes
The table also provides information about hypothetical account values and hypothetical expenses based on the actual expense ratio of each class of your fund and an assumed rate of return of 5% per year before expenses, which is not the actual return of a fund’s share class. The hypothetical account values and expenses may not be used to estimate the actual ending account balance or expenses you paid for the period. You may use this information to compare the ongoing costs of investing in your fund and other funds. To do so, compare this 5% hypothetical example with the 5% hypothetical examples that appear in the shareholder reports of the other funds.
Please note that the expenses shown in the table are meant to highlight your ongoing costs only and do not reflect any transactional costs, such as sales charges (loads) or redemption/exchange fees. Therefore, the table is useful in comparing ongoing costs only, and will not help you determine the relative total costs of owning different funds. In addition, if these transactional costs were included, your costs would have been higher.
|
| | | | |
| | Beginning
Account Value
2/1/18 | Ending
Account Value
7/31/18 | Expenses Paid
During Period(1)
2/1/18 - 7/31/18 |
Annualized
Expense Ratio(1) |
| Actual |
| Investor Class | $1,000 | $1,096.90 | $5.30 | 1.02% |
| I Class | $1,000 | $1,098.10 | $4.27 | 0.82% |
| Advisor Class | $1,000 | $1,095.20 | $6.60 | 1.27% |
| R Class | $1,000 | $1,093.90 | $7.89 | 1.52% |
| R6 Class | $1,000 | $1,098.40 | $3.49 | 0.67% |
| Hypothetical |
| Investor Class | $1,000 | $1,019.74 | $5.11 | 1.02% |
| I Class | $1,000 | $1,020.73 | $4.11 | 0.82% |
| Advisor Class | $1,000 | $1,018.50 | $6.36 | 1.27% |
| R Class | $1,000 | $1,017.26 | $7.60 | 1.52% |
| R6 Class | $1,000 | $1,021.47 | $3.36 | 0.67% |
| |
| (1) | Expenses are equal to the class's annualized expense ratio listed in the table above, multiplied by the average account value over the period, multiplied by 181, the number of days in the most recent fiscal half-year, divided by 365, to reflect the one-half year period. Annualized expense ratio reflects actual expenses, including any applicable fee waivers or expense reimbursements and excluding any acquired fund fees and expenses. |
JULY 31, 2018
|
| | | | | |
| | Shares | Value |
| COMMON STOCKS — 98.3% | | |
| Automobiles — 4.2% | | |
Tesla, Inc.(1) | 12,014 |
| $ | 3,581,854 |
|
| Beverages — 1.3% | | |
Boston Beer Co., Inc. (The), Class A(1) | 3,805 |
| 1,046,185 |
|
| Biotechnology — 15.3% | | |
Biogen, Inc.(1) | 6,152 |
| 2,057,044 |
|
Blueprint Medicines Corp.(1) | 16,288 |
| 969,787 |
|
Celgene Corp.(1) | 41,755 |
| 3,761,708 |
|
Ionis Pharmaceuticals, Inc.(1) | 38,423 |
| 1,678,317 |
|
Regeneron Pharmaceuticals, Inc.(1) | 5,040 |
| 1,854,770 |
|
Spark Therapeutics, Inc.(1) | 9,779 |
| 750,245 |
|
Vertex Pharmaceuticals, Inc.(1) | 10,697 |
| 1,872,510 |
|
| | | 12,944,381 |
|
| Capital Markets — 4.6% | | |
| Intercontinental Exchange, Inc. | 53,036 |
| 3,919,891 |
|
| Electronic Equipment, Instruments and Components — 3.5% | | |
| Cognex Corp. | 56,524 |
| 2,983,337 |
|
| Energy Equipment and Services — 2.0% | | |
Cactus, Inc., Class A(1) | 51,645 |
| 1,689,824 |
|
| Health Care Equipment and Supplies — 0.7% | | |
Intuitive Surgical, Inc.(1) | 1,172 |
| 595,599 |
|
| Internet and Direct Marketing Retail — 6.8% | | |
Amazon.com, Inc.(1) | 2,420 |
| 4,301,405 |
|
Netflix, Inc.(1) | 4,296 |
| 1,449,685 |
|
| | | 5,751,090 |
|
| Internet Software and Services — 18.6% | | |
Alphabet, Inc., Class C(1) | 4,709 |
| 5,732,077 |
|
Baidu, Inc. ADR(1) | 15,342 |
| 3,792,236 |
|
Facebook, Inc., Class A(1) | 15,333 |
| 2,646,169 |
|
Okta, Inc.(1) | 34,339 |
| 1,704,932 |
|
| Tencent Holdings Ltd. | 40,700 |
| 1,841,833 |
|
| | | 15,717,247 |
|
| IT Services — 9.4% | | |
| MasterCard, Inc., Class A | 13,500 |
| 2,673,000 |
|
Square, Inc., Class A(1) | 27,021 |
| 1,746,908 |
|
| Visa, Inc., Class A | 26,012 |
| 3,556,881 |
|
| | | 7,976,789 |
|
| Machinery — 11.8% | | |
| FANUC Corp. | 15,100 |
| 3,001,023 |
|
Middleby Corp. (The)(1) | 8,117 |
| 831,830 |
|
WABCO Holdings, Inc.(1) | 33,404 |
| 4,198,215 |
|
| Wabtec Corp. | 18,059 |
| 1,992,269 |
|
| | | 10,023,337 |
|
| Oil, Gas and Consumable Fuels — 2.6% | | |
Concho Resources, Inc.(1) | 14,980 |
| 2,184,833 |
|
|
| | | | | |
| | Shares | Value |
| Professional Services — 1.8% | | |
Verisk Analytics, Inc.(1) | 13,910 |
| $ | 1,538,724 |
|
| Software — 8.5% | | |
salesforce.com, Inc.(1) | 12,297 |
| 1,686,534 |
|
Splunk, Inc.(1) | 34,233 |
| 3,289,791 |
|
Tableau Software, Inc., Class A(1) | 21,799 |
| 2,246,823 |
|
| | | 7,223,148 |
|
| Specialty Retail — 2.1% | | |
| Ross Stores, Inc. | 20,059 |
| 1,753,758 |
|
| Textiles, Apparel and Luxury Goods — 5.1% | | |
| NIKE, Inc., Class B | 56,273 |
| 4,327,956 |
|
TOTAL COMMON STOCKS
(Cost $73,743,476) | | 83,257,953 |
|
| TEMPORARY CASH INVESTMENTS — 2.4% | | |
| Repurchase Agreement, BMO Capital Markets Corp., (collateralized by various U.S. Treasury obligations, 1.125% - 4.375%, 1/31/20 - 11/15/47, valued at $1,143,508), in a joint trading account at 1.75%, dated 7/31/18, due 8/1/18 (Delivery value $1,123,147) | | 1,123,092 |
|
| Repurchase Agreement, Fixed Income Clearing Corp., (collateralized by various U.S. Treasury obligations, 3.75%, 11/15/43, valued at $958,191), at 0.90%, dated 7/31/18, due 8/1/18 (Delivery value $936,023) | | 936,000 |
|
| State Street Institutional U.S. Government Money Market Fund, Premier Class | 2,772 |
| 2,772 |
|
TOTAL TEMPORARY CASH INVESTMENTS
(Cost $2,061,864) | | 2,061,864 |
|
TOTAL INVESTMENT SECURITIES — 100.7%
(Cost $75,805,340) | | 85,319,817 |
|
| OTHER ASSETS AND LIABILITIES — (0.7)% | | (587,642 | ) |
| TOTAL NET ASSETS — 100.0% | | $ | 84,732,175 |
|
|
| |
| GEOGRAPHIC DIVERSIFICATION | |
| (as a % of net assets) | |
| United States | 88.1% |
| China | 6.7% |
| Japan | 3.5% |
Cash and Equivalents*
| 1.7% |
*Includes temporary cash investments and other assets and liabilities.
|
| | |
| NOTES TO SCHEDULE OF INVESTMENTS |
| ADR | - | American Depositary Receipt |
See Notes to Financial Statements.
|
|
| Statement of Assets and Liabilities |
|
| | | |
| JULY 31, 2018 |
| Assets |
| Investment securities, at value (cost of $75,805,340) | $ | 85,319,817 |
|
| Receivable for capital shares sold | 468,803 |
|
| Dividends and interest receivable | 2,741 |
|
| | 85,791,361 |
|
| | |
| Liabilities |
| Payable for investments purchased | 598,250 |
|
| Payable for capital shares redeemed | 389,926 |
|
| Accrued management fees | 70,624 |
|
| Distribution and service fees payable | 386 |
|
| | 1,059,186 |
|
| | |
| Net Assets | $ | 84,732,175 |
|
| | |
| Net Assets Consist of: |
| Capital (par value and paid-in surplus) | $ | 75,443,405 |
|
| Accumulated net investment loss | (220,224 | ) |
| Accumulated net realized loss | (5,454 | ) |
| Net unrealized appreciation | 9,514,448 |
|
| | $ | 84,732,175 |
|
|
| | | | | | |
| | Net Assets | Shares Outstanding | Net Asset Value Per Share |
| Investor Class, $0.01 Par Value |
| $82,825,640 |
| 3,127,165 |
| $26.49 |
| I Class, $0.01 Par Value |
| $613,830 |
| 23,045 |
| $26.64 |
| Advisor Class, $0.01 Par Value |
| $639,358 |
| 24,362 |
| $26.24 |
| R Class, $0.01 Par Value |
| $612,554 |
| 23,567 |
| $25.99 |
| R6 Class, $0.01 Par Value |
| $40,793 |
| 1,510 |
| $27.02 |
See Notes to Financial Statements.
|
| | | |
| YEAR ENDED JULY 31, 2018 |
| Investment Income (Loss) |
| Income: | |
| Dividends (net of foreign taxes withheld of $2,997) | $ | 124,359 |
|
| Interest | 16,290 |
|
| | 140,649 |
|
| | |
| Expenses: | |
| Management fees | 453,287 |
|
| Distribution and service fees: | |
| Advisor Class | 1,232 |
|
| R Class | 1,328 |
|
| Directors' fees and expenses | 1,133 |
|
| Other expenses | 621 |
|
| | 457,601 |
|
Fees waived(1) | (33,039 | ) |
| | 424,562 |
|
| | |
| Net investment income (loss) | (283,913 | ) |
| | |
| Realized and Unrealized Gain (Loss) |
| Net realized gain (loss) on: | |
| Investment transactions | 4,791,226 |
|
| Foreign currency translation transactions | (1,706 | ) |
| | 4,789,520 |
|
| | |
| Change in net unrealized appreciation (depreciation) on: | |
| Investments | 6,091,337 |
|
| Translation of assets and liabilities in foreign currencies | (96 | ) |
| | 6,091,241 |
|
| | |
| Net realized and unrealized gain (loss) | 10,880,761 |
|
| | |
| Net Increase (Decrease) in Net Assets Resulting from Operations | $ | 10,596,848 |
|
| |
| (1) | Amount consists of $32,052, $352, $394, $212 and $29 for Investor Class, I Class, Advisor Class, R Class and R6 Class, respectively. |
See Notes to Financial Statements.
|
|
| Statement of Changes in Net Assets |
|
| | | | | | |
| YEARS ENDED JULY 31, 2018 AND JULY 31, 2017 |
| Increase (Decrease) in Net Assets | July 31, 2018 | July 31, 2017 |
| Operations |
| Net investment income (loss) | $ | (283,913 | ) | $ | (87,133 | ) |
| Net realized gain (loss) | 4,789,520 |
| (157,207 | ) |
| Change in net unrealized appreciation (depreciation) | 6,091,241 |
| 2,823,938 |
|
| Net increase (decrease) in net assets resulting from operations | 10,596,848 |
| 2,579,598 |
|
| | | |
| Distributions to Shareholders |
| From net investment income: | | |
| Investor Class | — |
| (110,059 | ) |
| I Class | — |
| (262 | ) |
| Advisor Class | — |
| (3,520 | ) |
| R Class | — |
| (150 | ) |
| R6 Class | — |
| (31 | ) |
| Decrease in net assets from distributions | — |
| (114,022 | ) |
| | | |
| Capital Share Transactions |
| Net increase (decrease) in net assets from capital share transactions (Note 5) | 52,534,832 |
| 9,131,862 |
|
| | | |
| Net increase (decrease) in net assets | 63,131,680 |
| 11,597,438 |
|
| | | |
| Net Assets |
| Beginning of period | 21,600,495 |
| 10,003,057 |
|
| End of period | $ | 84,732,175 |
| $ | 21,600,495 |
|
| | | |
| Accumulated net investment loss | $ | (220,224 | ) | $ | (60,570 | ) |
See Notes to Financial Statements.
|
|
| Notes to Financial Statements |
JULY 31, 2018
1. Organization
American Century Growth Funds, Inc. (the corporation) is registered under the Investment Company Act of 1940, as amended (the 1940 Act), as an open-end management investment company and is organized as a Maryland corporation. Focused Dynamic Growth Fund (the fund) is one fund in a series issued by the corporation. The fund’s investment objective is to seek long-term capital growth. The fund offers the Investor Class, I Class, Advisor Class, R Class and R6 Class. Sale of the R6 Class commenced on December 1, 2016.
2. Significant Accounting Policies
The following is a summary of significant accounting policies consistently followed by the fund in preparation of its financial statements. The fund is an investment company and follows accounting and reporting guidance in accordance with accounting principles generally accepted in the United States of America. This may require management to make certain estimates and assumptions at the date of the financial statements. Actual results could differ from these estimates. Management evaluated the impact of events or transactions occurring through the date the financial statements were issued that would merit recognition or disclosure.
Investment Valuations — The fund determines the fair value of its investments and computes its net asset value per share at the close of regular trading (usually 4 p.m. Eastern time) on the New York Stock Exchange (NYSE) on each day the NYSE is open. The Board of Directors has adopted valuation policies and procedures to guide the investment advisor in the fund’s investment valuation process and to provide methodologies for the oversight of the fund’s pricing function.
Equity securities that are listed or traded on a domestic securities exchange are valued at the last reported sales price or at the official closing price as provided by the exchange. Equity securities traded on foreign securities exchanges are generally valued at the closing price of such securities on the exchange where primarily traded or at the close of the NYSE, if that is earlier. If no last sales price is reported, or if local convention or regulation so provides, the mean of the latest bid and asked prices may be used. Securities traded over-the-counter are valued at the mean of the latest bid and asked prices, the last sales price, or the official closing price. Equity securities initially expressed in local currencies are translated into U.S. dollars at the mean of the appropriate currency exchange rate at the close of the NYSE as provided by an independent pricing service.
Open-end management investment companies are valued at the reported net asset value per share. Repurchase agreements are valued at cost, which approximates fair value.
If the fund determines that the market price for an investment is not readily available or the valuation methods mentioned above do not reflect an investment’s fair value, such investment is valued as determined in good faith by the Board of Directors or its delegate, in accordance with policies and procedures adopted by the Board of Directors. In its determination of fair value, the fund may review several factors including, but not limited to, market information regarding the specific investment or comparable investments and correlation with other investment types, futures indices or general market indicators. Circumstances that may cause the fund to use these procedures to value an investment include, but are not limited to: an investment has been declared in default or is distressed; trading in a security has been suspended during the trading day or a security is not actively trading on its principal exchange; prices received from a regular pricing source are deemed unreliable; or there is a foreign market holiday and no trading occurred.
The fund monitors for significant events occurring after the close of an investment’s primary exchange but before the fund’s net asset value per share is determined. Significant events may include, but are not limited to: corporate announcements and transactions; governmental action and political unrest that could impact a specific investment or an investment sector; or armed conflicts, natural disasters and similar events that could affect investments in a specific country or region. The fund also monitors for significant fluctuations between domestic and foreign markets, as evidenced by the U.S. market or such other indicators that the Board of Directors, or its delegate, deems appropriate. If significant fluctuations in foreign markets are identified, the fund may apply a model-derived factor to the closing price of equity securities traded on foreign securities exchanges. The factor is based on observable market data as provided by an independent pricing service.
Security Transactions — Security transactions are accounted for as of the trade date. Net realized gains and losses are determined on the identified cost basis, which is also used for federal income tax purposes.
Investment Income — Dividend income less foreign taxes withheld, if any, is recorded as of the ex-dividend date. Distributions received on securities that represent a return of capital or long-term capital gain are recorded as a reduction of cost of investments and/or as a realized gain. The fund may estimate the components of distributions received that may be considered nontaxable distributions or long-term capital gain distributions for income tax purposes. Interest income is recorded on the accrual basis and includes accretion of discounts and amortization of premiums.
Foreign Currency Translations — All assets and liabilities initially expressed in foreign currencies are translated into U.S. dollars at prevailing exchange rates at period end. The fund may enter into spot foreign currency exchange contracts to facilitate transactions denominated in a foreign currency. Purchases and sales of investment securities, dividend and interest income, spot foreign currency exchange contracts, and expenses are translated at the rates of exchange prevailing on the respective dates of such transactions. Net realized and unrealized foreign currency exchange gains or losses related to investment securities are a component of net realized gain (loss) on investment transactions and change in net unrealized appreciation (depreciation) on investments, respectively.
Repurchase Agreements — The fund may enter into repurchase agreements with institutions that American Century Investment Management, Inc. (ACIM) (the investment advisor) has determined are creditworthy pursuant to criteria adopted by the Board of Directors. The fund requires that the collateral, represented by securities, received in a repurchase transaction be transferred to the custodian in a manner sufficient to enable the fund to obtain those securities in the event of a default under the repurchase agreement. ACIM monitors, on a daily basis, the securities transferred to ensure the value, including accrued interest, of the securities under each repurchase agreement is equal to or greater than amounts owed to the fund under each repurchase agreement.
Joint Trading Account — Pursuant to an Exemptive Order issued by the Securities and Exchange Commission, the fund, along with certain other funds in the American Century Investments family of funds, may transfer uninvested cash balances into a joint trading account. These balances are invested in one or more repurchase agreements that are collateralized by U.S. Treasury or Agency obligations.
Income Tax Status — It is the fund’s policy to distribute substantially all net investment income and net realized gains to shareholders and to otherwise qualify as a regulated investment company under provisions of the Internal Revenue Code. Accordingly, no provision has been made for income taxes. The fund files U.S. federal, state, local and non-U.S. tax returns as applicable. The fund's tax returns are subject to examination by the relevant taxing authority until expiration of the applicable statute of limitations, which is generally three years from the date of filing but can be longer in certain jurisdictions. At this time, management believes there are no uncertain tax positions which, based on their technical merit, would not be sustained upon examination and for which it is reasonably possible that the total amounts of unrecognized tax benefits will significantly change in the next twelve months.
Multiple Class — All shares of the fund represent an equal pro rata interest in the net assets of the class to which such shares belong, and have identical voting, dividend, liquidation and other rights and the same terms and conditions, except for class specific expenses and exclusive rights to vote on matters affecting only individual classes. Income, non-class specific expenses, and realized and unrealized capital gains and losses of the fund are allocated to each class of shares based on their relative net assets.
Distributions to Shareholders — Distributions from net investment income and net realized gains, if any, are generally declared and paid annually.
Indemnifications — Under the corporation’s organizational documents, its officers and directors are indemnified against certain liabilities arising out of the performance of their duties to the fund. In addition, in the normal course of business, the fund enters into contracts that provide general indemnifications. The maximum exposure under these arrangements is unknown as this would involve future claims that may be made against a fund. The risk of material loss from such claims is considered by management to be remote.
3. Fees and Transactions with Related Parties
Certain officers and directors of the corporation are also officers and/or directors of American Century Companies, Inc. (ACC). The corporation’s investment advisor, ACIM, the corporation's distributor, American Century Investment Services, Inc. (ACIS), and the corporation’s transfer agent, American Century Services, LLC, are wholly owned, directly or indirectly, by ACC.
Management Fees — The corporation has entered into a management agreement with ACIM, under which ACIM provides the fund with investment advisory and management services in exchange for a single, unified management fee (the fee) per class. The agreement provides that all expenses of managing and operating the fund, except distribution and service fees, brokerage expenses, taxes, interest, fees and expenses of the independent directors (including legal counsel fees), and extraordinary expenses, will be paid by ACIM. The fee is computed and accrued daily based on each class's daily net assets and paid monthly in arrears. The difference in the fee among the classes is a result of their separate arrangements for non-Rule 12b-1 shareholder services. It is not the result of any difference in advisory or custodial fees or other expenses related to the management of the fund’s assets, which do not vary by class. The rate of the fee is determined by applying a fee rate calculation formula. This formula takes into account the fund’s assets as well as certain assets, if any, of other clients of the investment advisor outside the American Century Investments family of funds (such as subadvised funds and separate accounts) that use very similar investment teams and strategies (strategy assets). During the period ended July 31, 2018, the investment advisor agreed to waive 0.08% of the fund's management fee. Effective August 1, 2018, the investment advisor terminated the waiver and decreased the management fee schedule range by 0.08%.
The management fee schedule range and the effective annual management fee for each class for the period ended July 31, 2018, are as follows:
|
| | | |
| | | Effective Annual Management Fee |
| | Management Fee Schedule Range* | Before Waiver | After Waiver |
| Investor Class | 0.80% to 1.10% | 1.10% | 1.02% |
| I Class | 0.60% to 0.90% | 0.90% | 0.82% |
| Advisor Class | 0.80% to 1.10% | 1.10% | 1.02% |
| R Class | 0.80% to 1.10% | 1.10% | 1.02% |
| R6 Class | 0.45% to 0.75% | 0.75% | 0.67% |
*Effective August 1, 2018, the management fee schedule range is 0.80% to 1.02% for the Investor Class, Advisor Class and R Class, 0.60% to 0.82% for the I Class and 0.45% to 0.67% for the R6 Class.
Distribution and Service Fees — The Board of Directors has adopted a separate Master Distribution and Individual Shareholder Services Plan for each of the R Class and Advisor Class (collectively the plans), pursuant to Rule 12b-1 of the 1940 Act. The plans provide that the R Class will pay ACIS an annual distribution and service fee of 0.50%. The plans provide that the Advisor Class will pay ACIS an annual distribution and service fee of 0.25%. The fees are computed and accrued daily based on each class’s daily net assets and paid monthly in arrears. The fees are used to pay financial intermediaries for distribution and individual shareholder services. Fees incurred under the plans during the period ended July 31, 2018 are detailed in the Statement of Operations.
Directors' Fees and Expenses — The Board of Directors is responsible for overseeing the investment advisor’s management and operations of the fund. The directors receive detailed information about the fund and its investment advisor regularly throughout the year, and meet at least quarterly with management of the investment advisor to review reports about fund operations. The fund’s officers do not receive compensation from the fund.
4. Investment Transactions
Purchases and sales of investment securities, excluding short-term investments, for the period ended July 31, 2018 were $63,322,936 and $11,942,525, respectively.
5. Capital Share Transactions
The corporation is authorized to issue 3,000,000,000 shares. Transactions in shares of the fund were as follows:
|
| | | | | | | | | | |
| | Year ended July 31, 2018 | Year ended July 31, 2017(1) |
| | Shares | Amount | Shares | Amount |
| Investor Class | | | | |
| Sold | 2,705,202 |
| $ | 66,575,518 |
| 731,261 |
| $ | 13,488,885 |
|
| Issued in reinvestment of distributions | — |
| — |
| 6,349 |
| 106,341 |
|
| Redeemed | (622,525 | ) | (15,000,734 | ) | (231,470 | ) | (4,134,952 | ) |
| | 2,082,677 |
| 51,574,784 |
| 506,140 |
| 9,460,274 |
|
| I Class | | | | |
| Sold | 30,252 |
| 693,132 |
| 5,467 |
| 106,072 |
|
| Issued in reinvestment of distributions | — |
| — |
| 16 |
| 262 |
|
| Redeemed | (13,869 | ) | (323,889 | ) | (761 | ) | (12,883 | ) |
| | 16,383 |
| 369,243 |
| 4,722 |
| 93,451 |
|
| Advisor Class | | | | |
| Sold | 6,185 |
| 145,859 |
| 4,672 |
| 79,756 |
|
| Issued in reinvestment of distributions | — |
| — |
| 211 |
| 3,520 |
|
| Redeemed | (18 | ) | (1,385 | ) | (13,308 | ) | (239,051 | ) |
| | 6,167 |
| 144,474 |
| (8,425 | ) | (155,775 | ) |
| R Class | | | | |
| Sold | 21,376 |
| 511,121 |
| 5,386 |
| 97,928 |
|
| Issued in reinvestment of distributions | — |
| — |
| 9 |
| 150 |
|
| Redeemed | (2,753 | ) | (64,790 | ) | (22,736 | ) | (389,197 | ) |
| | 18,623 |
| 446,331 |
| (17,341 | ) | (291,119 | ) |
| R6 Class | | | | |
| Sold | — |
| — |
| 1,508 |
| 25,000 |
|
| Issued in reinvestment of distributions | — |
| — |
| 2 |
| 31 |
|
| | — |
| — |
| 1,510 |
| 25,031 |
|
| Net increase (decrease) | 2,123,850 |
| $ | 52,534,832 |
| 486,606 |
| $ | 9,131,862 |
|
| |
| (1) | December 1, 2016 (commencement of sale) through July 31, 2017 for the R6 Class. |
6. Fair Value Measurements
The fund’s investments valuation process is based on several considerations and may use multiple inputs to determine the fair value of the investments held by the fund. In conformity with accounting principles generally accepted in the United States of America, the inputs used to determine a valuation are classified into three broad levels.
| |
| • | Level 1 valuation inputs consist of unadjusted quoted prices in an active market for identical investments. |
| |
| • | Level 2 valuation inputs consist of direct or indirect observable market data (including quoted prices for comparable investments, evaluations of subsequent market events, interest rates, prepayment speeds, credit risk, etc.). These inputs also consist of quoted prices for identical investments initially expressed in local currencies that are adjusted through translation into U.S. dollars. |
| |
| • | Level 3 valuation inputs consist of unobservable data (including a fund’s own assumptions). |
The level classification is based on the lowest level input that is significant to the fair valuation measurement. The valuation inputs are not necessarily an indication of the risks associated with investing in these securities or other financial instruments.
The following is a summary of the level classifications as of period end. The Schedule of Investments provides additional information on the fund’s portfolio holdings.
|
| | | | | | | | |
| | Level 1 | Level 2 | Level 3 |
| Assets | | | |
| Investment Securities | | | |
| Common Stocks | | | |
| Internet Software and Services | $ | 13,875,414 |
| $ | 1,841,833 |
| — |
|
| Machinery | 7,022,314 |
| 3,001,023 |
| — |
|
| Other Industries | 57,517,369 |
| — |
| — |
|
| Temporary Cash Investments | 2,772 |
| 2,059,092 |
| — |
|
| | $ | 78,417,869 |
| $ | 6,901,948 |
| — |
|
7. Risk Factors
There are certain risks involved in investing in foreign securities. These risks include those resulting from future adverse political, social and economic developments, fluctuations in currency exchange rates, the possible imposition of exchange controls, and other foreign laws or restrictions.
8. Federal Tax Information
The tax character of distributions paid during the years ended July 31, 2018 and July 31, 2017 were as follows:
|
| | | | | |
| | 2018 | 2017 |
| Distributions Paid From | | |
| Ordinary income | — |
| $ | 114,022 |
|
| Long-term capital gains | — |
| — |
|
The book-basis character of distributions made during the year from net investment income or net realized gains may differ from their ultimate characterization for federal income tax purposes. These differences reflect the differing character of certain income items and net realized gains and losses for financial statement and tax purposes, and may result in reclassification among certain capital accounts on the financial statements.
As of period end, the federal tax cost of investments and the components of distributable earnings on a tax-basis were as follows:
|
| | | |
| Federal tax cost of investments | $ | 75,810,794 |
|
| Gross tax appreciation of investments | $ | 9,993,957 |
|
| Gross tax depreciation of investments | (484,934 | ) |
| Net tax appreciation (depreciation) of investments | 9,509,023 |
|
Net tax appreciation (depreciation) on translation of assets and liabilities in foreign currencies | 558 |
|
| Net tax appreciation (depreciation) | $ | 9,509,581 |
|
| Undistributed ordinary income | — |
|
| Late-year ordinary loss deferral | $ | (220,811 | ) |
The difference between book-basis and tax-basis unrealized appreciation (depreciation) is attributable primarily to the tax deferral of losses on wash sales.
Loss deferrals represent certain qualified losses that the fund has elected to treat as having been incurred in the following fiscal year for federal income tax purposes.
|
| | | | | | | | | | | | | | | |
| For a Share Outstanding Throughout the Years Ended July 31 (except as noted) |
| Per-Share Data | Ratios and Supplemental Data |
| | | Income From Investment Operations: | | Ratio to Average Net Assets of: | | |
| | Net Asset Value, Beginning of Period | Net Investment Income (Loss)(1) | Net Realized and Unrealized Gain (Loss) | Total From Investment Operations | Distributions From Net
Investment
Income | Net Asset Value, End of Period | Total Return(2) | Operating Expenses | Operating Expenses (before expense waiver) | Net Investment Income (Loss) | Net Investment Income (Loss) (before expense waiver) | Portfolio Turnover Rate | Net Assets, End of Period (in thousands) |
| Investor Class |
| 2018 | $20.08 | (0.16) | 6.57 | 6.41 | — | $26.49 | 31.92% | 1.02% | 1.10% | (0.68)% | (0.76)% | 29% |
| $82,826 |
|
| 2017 | $16.99 | (0.12) | 3.40 | 3.28 | (0.19) | $20.08 | 19.52% | 1.02% | 1.10% | (0.65)% | (0.73)% | 21% |
| $20,975 |
|
| 2016 | $17.04 | 0.18 | (0.02) | 0.16 | (0.21) | $16.99 | 1.03% | 1.10% | 1.11% | 1.11% | 1.10% | 250% |
| $9,147 |
|
| 2015 | $16.06 | 0.13 | 1.07 | 1.20 | (0.22) | $17.04 | 7.55% | 1.11% | 1.11% | 0.76% | 0.76% | 216% |
| $12,309 |
|
| 2014 | $13.61 | 0.22 | 2.37 | 2.59 | (0.14) | $16.06 | 19.16% | 1.10% | 1.10% | 1.46% | 1.46% | 228% |
| $14,829 |
|
I Class |
| 2018 | $20.16 | (0.12) | 6.60 | 6.48 | — | $26.64 | 32.14% | 0.82% | 0.90% | (0.48)% | (0.56)% | 29% |
| $614 |
|
| 2017 | $17.05 | (0.09) | 3.42 | 3.33 | (0.22) | $20.16 | 19.80% | 0.82% | 0.90% | (0.45)% | (0.53)% | 21% |
| $134 |
|
| 2016 | $17.10 | 0.20 | (0.01) | 0.19 | (0.24) | $17.05 | 1.23% | 0.90% | 0.91% | 1.31% | 1.30% | 250% |
| $33 |
|
| 2015 | $16.12 | 0.17 | 1.06 | 1.23 | (0.25) | $17.10 | 7.74% | 0.91% | 0.91% | 0.96% | 0.96% | 216% |
| $33 |
|
| 2014 | $13.67 | 0.25 | 2.37 | 2.62 | (0.17) | $16.12 | 19.32% | 0.90% | 0.90% | 1.66% | 1.66% | 228% |
| $18 |
|
| Advisor Class |
| 2018 | $19.95 | (0.21) | 6.50 | 6.29 | — | $26.24 | 31.53% | 1.27% | 1.35% | (0.93)% | (1.01)% | 29% |
| $639 |
|
| 2017 | $16.88 | (0.16) | 3.38 | 3.22 | (0.15) | $19.95 | 19.22% | 1.27% | 1.35% | (0.90)% | (0.98)% | 21% |
| $363 |
|
| 2016 | $16.92 | 0.13 | —(3) | 0.13 | (0.17) | $16.88 | 0.85% | 1.35% | 1.36% | 0.86% | 0.85% | 250% |
| $449 |
|
| 2015 | $15.95 | 0.09 | 1.06 | 1.15 | (0.18) | $16.92 | 7.26% | 1.36% | 1.36% | 0.51% | 0.51% | 216% |
| $602 |
|
| 2014 | $13.53 | 0.16 | 2.37 | 2.53 | (0.11) | $15.95 | 18.75% | 1.35% | 1.35% | 1.21% | 1.21% | 228% |
| $664 |
|
|
| | | | | | | | | | | | | | | |
| For a Share Outstanding Throughout the Years Ended July 31 (except as noted) |
| Per-Share Data | Ratios and Supplemental Data |
| | | Income From Investment Operations: | | Ratio to Average Net Assets of: | | |
| | Net Asset Value, Beginning of Period | Net Investment Income (Loss)(1) | Net Realized and Unrealized Gain (Loss) | Total From Investment Operations | Distributions From Net
Investment
Income | Net Asset Value, End of Period | Total Return(2) | Operating Expenses | Operating Expenses (before expense waiver) | Net Investment Income (Loss) | Net Investment Income (Loss) (before expense waiver) | Portfolio Turnover Rate | Net Assets, End of Period (in thousands) |
| R Class |
| 2018 | $19.81 | (0.28) | 6.46 | 6.18 | — | $25.99 | 31.20% | 1.52% | 1.60% | (1.18)% | (1.26)% | 29% |
| $613 |
|
| 2017 | $16.76 | (0.18) | 3.33 | 3.15 | (0.10) | $19.81 | 18.94% | 1.52% | 1.60% | (1.15)% | (1.23)% | 21% |
| $98 |
|
| 2016 | $16.81 | 0.09 | (0.01) | 0.08 | (0.13) | $16.76 | 0.54% | 1.60% | 1.61% | 0.61% | 0.60% | 250% |
| $374 |
|
| 2015 | $15.84 | 0.04 | 1.07 | 1.11 | (0.14) | $16.81 | 7.04% | 1.61% | 1.61% | 0.26% | 0.26% | 216% |
| $510 |
|
| 2014 | $13.43 | 0.06 | 2.42 | 2.48 | (0.07) | $15.84 | 18.51% | 1.60% | 1.60% | 0.96% | 0.96% | 228% |
| $423 |
|
| R6 Class |
| 2018 | $20.41 | (0.07) | 6.68 | 6.61 | — | $27.02 | 32.39% | 0.67% | 0.75% | (0.33)% | (0.41)% | 29% |
| $41 |
|
2017(4) | $16.58 | (0.04) | 3.89 | 3.85 | (0.02) | $20.41 | 23.25% | 0.67%(5) | 0.75%(5) | (0.34)%(5) | (0.42)%(5) | 21%(6) |
| $31 |
|
|
|
| Notes to Financial Highlights |
| |
| (1) | Computed using average shares outstanding throughout the period. |
| |
| (2) | Total returns are calculated based on the net asset value of the last business day. Total returns for periods less than one year are not annualized. |
| |
| (3) | Per share amount was less than $0.005. |
| |
| (4) | December 1, 2016 (commencement of sale) through July 31, 2017. |
| |
| (6) | Portfolio turnover is calculated at the fund level. Percentage indicated was calculated for the year ended July 31, 2017. |
See Notes to Financial Statements.
|
|
| Report of Independent Registered Public Accounting Firm |
To the shareholders and the Board of Directors of American Century Growth Funds, Inc.:
Opinion on the Financial Statements and Financial Highlights
We have audited the accompanying statement of assets and liabilities, including the schedule of investments, of Focused Dynamic Growth Fund, one of the funds constituting the American Century Growth Funds, Inc. (the “Fund”), as of July 31, 2018, the related statement of operations for the year then ended, the statements of changes in net assets for each of the two years in the period then ended, the financial highlights for each of the five years in the period then ended, and the related notes. In our opinion, the financial statements and financial highlights present fairly, in all material respects, the financial position of Focused Dynamic Growth Fund of the American Century Growth Funds, Inc. as of July 31, 2018, the results of its operations for the year then ended, the changes in its net assets for each of the two years in the period then ended, and the financial highlights for each of the five years in the period then ended, in conformity with accounting principles generally accepted in the United States of America.
Basis for Opinion
These financial statements and financial highlights are the responsibility of the Fund's management. Our responsibility is to express an opinion on the Fund’s financial statements and financial highlights based on our audits. We are a public accounting firm registered with the Public Company Accounting Oversight Board (United States) (PCAOB) and are required to be independent with respect to the Fund in accordance with the U.S. federal securities laws and the applicable rules and regulations of the Securities and Exchange Commission and the PCAOB.
We conducted our audits in accordance with the standards of the PCAOB. Those standards require that we plan and perform the audit to obtain reasonable assurance about whether the financial statements and financial highlights are free of material misstatement, whether due to error or fraud. The Fund is not required to have, nor were we engaged to perform, an audit of its internal control over financial reporting. As part of our audits we are required to obtain an understanding of internal control over financial reporting but not for the purpose of expressing an opinion on the effectiveness of the Fund’s internal control over financial reporting. Accordingly, we express no such opinion.
Our audits included performing procedures to assess the risks of material misstatement of the financial statements and financial highlights, whether due to error or fraud, and performing procedures that respond to those risks. Such procedures included examining, on a test basis, evidence regarding the amounts and disclosures in the financial statements and financial highlights. Our audits also included evaluating the accounting principles used and significant estimates made by management, as well as evaluating the overall presentation of the financial statements and financial highlights. Our procedures included confirmation of securities owned as of July 31, 2018, by correspondence with the custodian and brokers; when replies were not received from brokers, we performed other auditing procedures. We believe that our audits provide a reasonable basis for our opinion.
DELOITTE & TOUCHE LLP
Kansas City, Missouri
September 19, 2018
We have served as the auditor of one or more American Century investment companies since 1997.
The Board of Directors
The individuals listed below serve as directors of the funds. Each director will continue to serve in this capacity until death, retirement, resignation or removal from office. The board has adopted a mandatory retirement age for directors who are not “interested persons,” as that term is defined in the Investment Company Act (independent directors). Independent directors shall retire by December 31 of the year in which they reach their 75th birthday.
Mr. Thomas is an “interested person” because he currently serves as President and Chief Executive Officer of American Century Companies, Inc. (ACC), the parent company of American Century Investment Management, Inc. (ACIM or the advisor). The other directors (more than three-fourths of the total number) are independent. They are not employees, directors or officers of, and have no financial interest in, ACC or any of its wholly owned, direct or indirect, subsidiaries, including ACIM, American Century Investment Services, Inc. (ACIS) and American Century Services, LLC (ACS), and they do not have any other affiliations, positions or relationships that would cause them to be considered “interested persons” under the Investment Company Act. The directors serve in this capacity for seven (in the case of Jonathan S. Thomas, 16; and Stephen E. Yates, 8) registered investment companies in the American Century Investments family of funds.
The following table presents additional information about the directors. The mailing address for each director is 4500 Main Street, Kansas City, Missouri 64111.
|
| | | | | |
Name
(Year of Birth) | Position(s) Held with Funds | Length of Time Served | Principal Occupation(s) During Past 5 Years | Number of American Century Portfolios Overseen by Director | Other Directorships Held During Past 5 Years |
| Independent Directors |
|
|
| Thomas W. Bunn (1953) | Director | Since 2017 | Retired | 67 | SquareTwo Financial; Barings (formerly Babson Capital Funds Trust) (2013 to 2016) |
Barry Fink
(1955) | Director | Since 2012 (independent since 2016) | Retired; Executive Vice President, ACC (2007 to 2013); President, ACS (2007 to 2013); Chief Operating Officer, ACC (2007 to 2012) | 67 | None |
Andrea C. Hall(1)
(1945) | Director | Since 1997 | Retired | 67 | None |
Jan M. Lewis
(1957) | Director | Since 2011 | Retired; President and Chief Executive Officer, Catholic Charities of Northeast Kansas (human services organization) (2006 to 2013) | 67 | None |
M. Jeannine Strandjord
(1945) | Director | Since 1994 | Self-employed Consultant | 67 | Euronet Worldwide Inc. and MGP Ingredients, Inc. |
|
| | | | | |
Name
(Year of Birth) | Position(s) Held with Funds | Length of Time Served | Principal Occupation(s) During Past 5 Years | Number of American Century Portfolios Overseen by Director | Other Directorships Held During Past 5 Years |
| Independent Directors |
|
|
John R. Whitten
(1946) | Director | Since 2008 | Retired | 67 | Rudolph Technologies, Inc. |
Stephen E. Yates
(1948) | Director and Chairman of the Board | Since 2012 (Chairman since 2018) | Retired | 69 | None |
| Interested Director |
|
|
Jonathan S. Thomas
(1963) | Director and President | Since 2007 | President and Chief Executive Officer, ACC (2007 to present). Also serves as Chief Executive Officer, ACS; Executive Vice President, ACIM; Director, ACC, ACIM and other ACC subsidiaries | 114 | BioMed Valley Discoveries, Inc. |
1) Effective August 31, 2018, Andrea C. Hall retired from the Board of Directors.
The Statement of Additional Information has additional information about the fund's directors and is available without charge, upon request, by calling 1-800-345-2021.
Officers
The following table presents certain information about the executive officers of the funds. Each officer serves as an officer for each of the 16 (in the case of Robert J. Leach, 15) investment companies in the American Century family of funds. No officer is compensated for his or her service as an officer of the funds. The listed officers are interested persons of the funds and are appointed or re-appointed on an annual basis. The mailing address for each officer listed below is 4500 Main Street, Kansas City, Missouri 64111.
|
| | |
Name
(Year of Birth) | Offices with the Funds | Principal Occupation(s) During the Past Five Years |
Jonathan S. Thomas
(1963) | Director and President since 2007 | President and Chief Executive Officer, ACC (2007 to present). Also serves as Chief Executive Officer, ACS; Executive Vice President, ACIM; Director, ACC, ACIM and other ACC subsidiaries |
R. Wes Campbell
(1974) | Chief Financial Officer and Treasurer since 2018
| Investment Operations and Investment Accounting, ACS (2000 to present)
|
Amy D. Shelton
(1964) | Chief Compliance Officer and Vice President since 2014 | Chief Compliance Officer, American Century funds, (2014 to present); Chief Compliance Officer, ACIM (2014 to present); Chief Compliance Officer, ACIS (2009 to present); Vice President, Client Interactions and Marketing, ACIS (2013 to 2014). Also serves as Vice President, ACIS |
Charles A. Etherington
(1957) | General Counsel since 2007 and Senior Vice President since 2006 | Attorney, ACC (1994 to present); Vice President, ACC (2005 to present); General Counsel, ACC (2007 to present). Also serves as General Counsel, ACIM, ACS, ACIS and other ACC subsidiaries; and Senior Vice President, ACIM and ACS |
C. Jean Wade
(1964) | Vice President since 2012 | Senior Vice President, ACS (2017 to present); Vice President, ACS (2000 to 2017)
|
Robert J. Leach
(1966) | Vice President since 2006 | Vice President, ACS (2000 to present) |
David H. Reinmiller
(1963) | Vice President since 2000 | Attorney, ACC (1994 to present). Also serves as Vice President, ACIM and ACS |
Ward D. Stauffer
(1960) | Secretary since 2005 | Attorney, ACC (2003 to present) |
|
|
| Approval of Management Agreement |
At a meeting held on June 28, 2018, the Fund’s Board of Directors (the "Board") unanimously approved the renewal of the management agreement pursuant to which American Century Investment Management, Inc. (the “Advisor”) acts as the investment advisor for the Fund. Under Section 15(c) of the Investment Company Act, contracts for investment advisory services are required to be reviewed, evaluated, and approved by a majority of a fund’s directors (the “Directors”), including a majority of the independent Directors, each year.
Prior to its consideration of the renewal of the management agreement, the Directors requested and reviewed extensive data and information compiled by the Advisor and certain independent providers of evaluation data concerning the Fund and the services provided to the Fund by the Advisor. This review was in addition to the oversight and evaluation undertaken by the Board and its committees on a continual basis and the information received was supplemental to the extensive information that the Board and its committees receive and consider throughout the year. The Directors also conducted a review of the process by which the Board considers the renewal of the management agreements. The Board consulted with industry experts and reviewed industry best practices and recent judicial precedent. The Directors believe that the enhancements resulting from their review resulted in increased dialogue with the Advisor and an improved process for fund shareholders.
In connection with its consideration of the renewal of the management agreement, the Board’s review and evaluation of the services provided by the Advisor included, but was not limited to, the following:
| |
| • | the nature, extent, and quality of investment management, shareholder services, and other services provided and to be provided to the Fund; |
| |
| • | the wide range of other programs and services provided and to be provided to the Fund and its shareholders on a routine and non-routine basis; |
| |
| • | the investment performance of the Fund, including data comparing the Fund's performance to appropriate benchmarks and/or a peer group of other mutual funds with similar investment objectives and strategies; |
| |
| • | the cost of owning the Fund compared to the cost of owning similar funds; |
| |
| • | the compliance policies, procedures, and regulatory experience of the Advisor and the Fund's service providers; |
| |
| • | financial data showing the cost of services provided to the Fund, the profitability of the Fund to the Advisor, and the overall profitability of the Advisor |
| |
| • | strategic plans of the Advisor; |
| |
| • | any economies of scale associated with the Advisor’s management of the Fund and other accounts; |
| |
| • | services provided and charges to the Advisor's other investment management clients; |
| |
| • | acquired fund fees and expenses; |
| |
| • | payments and practices in connection with financial intermediaries holding shares of the Fund and the services provided by intermediaries in connection therewith; and |
| |
| • | any collateral benefits derived by the Advisor from the management of the Fund. |
The Directors held two in-person meetings and one telephonic meeting to review and discuss the information provided. The independent Directors also reviewed responses to supplemental information requests provided by the Directors to the Advisor and held active discussions with the Advisor regarding the renewal of the management agreement. The independent Directors had the benefit of the advice of their independent counsel throughout the process.
Factors Considered
The Directors considered all of the information provided by the Advisor, the independent data providers, and independent counsel in connection with the approval. They determined that the information was sufficient for them to evaluate the management agreement for the Fund. In connection with their review, the Directors did not identify any single factor as being all-important or controlling, and each Director may have attributed different levels of importance to different factors. In deciding to renew the management agreement, the Board based its decision on a number of factors, including without limitation the following:
Nature, Extent and Quality of Services - Generally. Under the management agreement, the Advisor is responsible for providing or arranging for all services necessary for the operation of the Fund. The Board noted that the Advisor provides or arranges at its own expense a wide variety of services including without limitation the following:
| |
| • | portfolio research and security selection |
| |
| • | daily valuation of the Fund’s portfolio |
| |
| • | shareholder servicing and transfer agency, including shareholder confirmations, recordkeeping, and communications |
| |
| • | legal services (except the independent Directors’ counsel) |
| |
| • | regulatory and portfolio compliance |
| |
| • | marketing and distribution (except amounts paid by the Fund under Rule 12b-1 plans) |
The Board noted that many of these services have expanded over time in terms of both quantity and complexity in response to shareholder demands, competition in the industry, changing distribution channels, and the changing regulatory environment.
Investment Management Services. The nature of the investment management services provided to the Fund is quite complex and allows Fund shareholders access to professional money management, instant diversification of their investments within an asset class, the opportunity to easily diversify among asset classes by investing in or exchanging among various American Century Investments funds, and liquidity. In evaluating investment performance, the Board expects the Advisor to manage the Fund in accordance with its investment objectives and approved strategies. Further, the Directors recognize that the Advisor has an obligation to monitor trading activities, and in particular to seek the best execution of fund trades, and to evaluate the use of and payment for research. In providing these services, the Advisor utilizes teams of investment professionals (portfolio managers, analysts, research assistants, and securities traders) who require extensive information technology, research, training, compliance, and other systems to conduct their business. The Board, directly and through its Fund Performance Review Committee, provides oversight of the investment performance process. It regularly reviews investment performance information for the Fund, together with comparative information for appropriate benchmarks and/or peer groups of similarly-managed funds, over different time horizons. The Directors also review detailed performance information provided by the Advisor during the management agreement renewal process. If performance concerns are identified, the Fund receives special reviews until performance improves, during which the Board receives a report from the Advisor regarding the reasons for such results (e.g., market conditions, security selection) and any efforts being undertaken to improve performance. The Fund’s performance was above its benchmark for the one- and five-year periods and below its benchmark for the three- and ten-year periods reviewed by the Board. The Board found the investment management services provided by the Advisor to the Fund to be satisfactory and consistent with the management agreement.
Shareholder and Other Services. Under the management agreement, the Advisor provides the Fund with a comprehensive package of transfer agency, shareholder, and other services. The Board, directly and through various committees of the Board, regularly reviews reports and evaluations of such services at its regular meetings. These reports include, but are not limited to, information regarding the operational efficiency and accuracy of the shareholder and transfer agency services provided, staffing levels, shareholder satisfaction (as measured by external as well as internal sources), technology support, new products and services offered to Fund shareholders, securities trading activities, portfolio valuation services, auditing services, and legal and operational compliance activities. The Board found the services provided by the Advisor to the Fund under the management agreement to be competitive and of high quality.
Costs of Services and Profitability. The Advisor provides detailed information concerning its cost of providing various services to the Fund, its profitability in managing the Fund (pre- and post-distribution), its overall profitability, and its financial condition. The Directors have reviewed with the Advisor the methodology used to prepare this financial information. This information is considered in evaluating the Advisor’s financial condition, its ability to continue to provide services under the management agreement, and the reasonableness of the current management fee. The Board concluded that the Advisor’s profits were reasonable in light of the services provided to the Fund.
Ethics. The Board generally considers the Advisor’s commitment to providing quality services to shareholders and to conducting its business ethically. They noted that the Advisor’s practices generally meet or exceed industry best practices.
Economies of Scale. The Board also reviewed information provided by the Advisor regarding the possible existence of economies of scale in connection with the management of the Fund. The Board concluded that economies of scale are difficult to measure and predict with precision, especially on a fund-by-fund basis. The Board concluded that the Advisor is appropriately sharing economies of scale through its competitive fee structure, offering competitive fees from fund inception, and through reinvestment in its business to provide shareholders additional content and services. The Board also noted that economies of scale are shared with the Fund and its shareholders through management fee breakpoints that serve to reduce the effective management fee as the assets of the Fund grow.
Comparison to Other Funds’ Fees. The management agreement provides that the Fund pays the Advisor a single, all-inclusive (or unified) management fee for providing all services necessary for the management and operation of the Fund, other than brokerage expenses, expenses attributable to short sales, taxes, interest, extraordinary expenses, and the fees and expenses of the Fund’s independent Directors (including their independent legal counsel) and expenses incurred in connection with the provision of shareholder services and distribution services under a plan adopted pursuant to Rule 12b-1 under the 1940 Act. Under the unified fee structure, the Advisor is responsible for providing all investment advisory, custody, audit, administrative, compliance, recordkeeping, marketing and shareholder services, or arranging and supervising third parties to provide such services. By contrast, most other funds are charged a variety of fees, including an investment advisory fee, a transfer agency fee, an administrative fee, distribution charges, and other expenses. Other than their investment advisory fees and any applicable Rule 12b-1 distribution fees, all other components of the total fees charged by these other funds may be increased without shareholder approval. The Board believes the unified fee structure is a benefit to Fund shareholders because it clearly discloses to shareholders the cost of owning Fund shares, and, since the unified fee cannot be increased without a vote of Fund shareholders, it shifts to the Advisor the risk of increased costs of operating the Fund and provides a direct incentive to minimize administrative inefficiencies. Part of the Board’s analysis of fee levels involves reviewing certain evaluative data compiled by an independent provider comparing the Fund’s unified fee to the total expense ratios of its peers. The unified fee charged to shareholders of the Fund was above the median of the total expense ratios of the Fund’s peer expense universe and was within the range of its peer expense group. The Board and the Advisor agreed to a permanent change to
the fund's fee schedule that should have the effect of lowering the fund's annual unified management fee by approximately 0.08% (e.g., the Investor Class unified fee will be reduced from 1.10% to 1.02%) beginning August 1, 2018. The Board concluded that the management fee paid by the Fund to the Advisor under the management agreement is reasonable in light of the services provided to the Fund.
Comparison to Fees and Services Provided to Other Clients of the Advisor. The Directors also requested and received information from the Advisor concerning the nature of the services, fees, costs, and profitability of its advisory services to advisory clients other than the Fund. They observed that these varying types of client accounts require different services and involve different regulatory and entrepreneurial risks than the management of the Fund. The Board analyzed this information and concluded that the fees charged and services provided to the Fund were reasonable by comparison.
Payments to Intermediaries. The Directors also requested and received a description of payments made to intermediaries by the Fund and the Advisor and services provided in response thereto. These payments include various payments made by the Fund or the Advisor to different types of intermediaries and recordkeepers for distribution and service activities provided for the Fund. The Board reviewed such information and received representations from the Advisor that all such payments by the Fund were made pursuant to the Fund's Rule 12b-1 Plan and that all such payments by the Advisor were made from the Advisor’s resources and reasonable profits. The Board found the payments to be reasonable in scope and purpose.
Collateral or “Fall-Out” Benefits Derived by the Advisor. The Board considered the existence of collateral benefits the Advisor may receive as a result of its relationship with the Fund. They concluded that the Advisor’s primary business is managing mutual funds and it generally does not use fund or shareholder information to generate profits in other lines of business, and therefore does not derive any significant collateral benefits from them. The Board noted that additional assets from other clients may offer the Advisor some benefit from increased leverage with service providers and counterparties. Additionally, the Advisor may receive proprietary research from broker-dealers that execute fund portfolio transactions, which the Board concluded is likely to benefit other clients of the Advisor, as well as Fund shareholders. The Board also determined that the Advisor is able to provide investment management services to certain clients other than the Fund, at least in part, due to its existing infrastructure built to serve the fund complex. The Board concluded that appropriate allocation methodologies had been employed to assign resources and the cost of those resources to these other clients and, where expressly provided, these other client assets may be included with the assets of the Fund to determine breakpoints in the management fee schedule.
Existing Relationship. The Board also considered whether there was any reason for not continuing the existing arrangement with the Advisor. In this regard, the Board was mindful of the potential disruptions of the Fund’s operations and various risks, uncertainties, and other effects that could occur as a result of a decision not to continue such relationship. In particular, the Board recognized that most shareholders have invested in the Fund on the strength of the Advisor’s industry standing and reputation and in the expectation that the Advisor will have a continuing role in providing advisory services to the Fund.
Conclusion of the Directors. As a result of this process, the Board, including all of the independent Directors, taking into account all of the factors discussed above and the information provided by the Advisor and others in connection with its review and throughout the year, determined that the management fee is fair and reasonable in light of the services provided and that the investment management agreement between the Fund and the Advisor should be renewed.
A special meeting of shareholders was held on October 18, 2017, to vote on the following proposal. The proposal received the required votes and was adopted. A summary of voting results is listed below.
To elect four directors to the Board of Directors of American Century Growth Funds, Inc.:
|
| | | | | | | |
| Affirmative |
| Withhold |
| Thomas W. Bunn | $ | 91,289,412 |
|
| $ | 1,678,991 |
|
| Barry Fink | $ | 91,251,000 |
|
| $ | 1,717,403 |
|
| Jan M. Lewis | $ | 91,297,912 |
|
| $ | 1,670,491 |
|
| Stephen E. Yates | $ | 91,202,473 |
|
| $ | 1,765,930 |
|
The other directors whose term of office continued after the meeting include Jonathan S. Thomas, Andrea C. Hall, James A. Olson, M. Jeannine Strandjord, and John R. Whitten.
Retirement Account Information
As required by law, distributions you receive from certain retirement accounts are subject to federal income tax withholding, unless you elect not to have withholding apply*. Tax will be withheld on the total amount withdrawn even though you may be receiving amounts that are not subject to withholding, such as nondeductible contributions. In such case, excess amounts of withholding could occur. You may adjust your withholding election so that a greater or lesser amount will be withheld.
If you don’t want us to withhold on this amount, you must notify us to not withhold the federal income tax. You may notify us in writing or in certain situations by telephone or through other electronic means. For systematic withdrawals, your withholding election will remain in effect until revoked or changed by filing a new election. You have the right to revoke your election at any time and change your withholding percentage for future distributions.
Remember, even if you elect not to have income tax withheld, you are liable for paying income tax on the taxable portion of your withdrawal. If you elect not to have income tax withheld or you don’t have enough income tax withheld, you may be responsible for payment of estimated tax. You may incur penalties under the estimated tax rules if your withholding and estimated tax payments are not sufficient. You can reduce or defer the income tax on a distribution by directly or indirectly rolling such distribution over to another IRA or eligible plan. You should consult your tax advisor for additional information.
State tax will be withheld if, at the time of your distribution, your address is within one of the mandatory withholding states and you have federal income tax withheld (or as otherwise required by state law). State taxes will be withheld from your distribution in accordance with the respective state rules.
*Some 403(b), 457 and qualified retirement plan distributions may be subject to 20% mandatory withholding, as they are subject to special tax and withholding rules. Your plan administrator or plan sponsor is required to provide you with a special tax notice explaining those rules at the time you request a distribution. If applicable, federal and/or state taxes may be withheld from your distribution amount.
Proxy Voting Policies
A description of the policies that the fund's investment advisor uses in exercising the voting rights associated with the securities purchased and/or held by the fund is available without charge, upon request, by calling 1-800-345-2021. It is also available on the "About Us" page of American Century Investments’ website at americancentury.com and on the Securities and Exchange Commission’s website at sec.gov. Information regarding how the investment advisor voted proxies relating to portfolio securities during the most recent 12-month period ended June 30 is available on the "About Us" page at americancentury.com. It is also available at sec.gov.
Quarterly Portfolio Disclosure
The fund files its complete schedule of portfolio holdings with the Securities and Exchange Commission (SEC) for the first and third quarters of each fiscal year on Form N-Q. The fund’s Forms N-Q are available on the SEC’s website at sec.gov, and may be reviewed and copied at the SEC’s Public Reference Room in Washington, DC. Information on the operation of the Public Reference Room may be obtained by calling 1-800-SEC-0330. The fund also makes its complete schedule of portfolio holdings for the most recent quarter of its fiscal year available on its website at americancentury.com and, upon request, by calling 1-800-345-2021.
|
| | |
| |
| | | |
| Contact Us | americancentury.com | |
| Automated Information Line | 1-800-345-8765 | |
| Investor Services Representative | 1-800-345-2021
or 816-531-5575 | |
| Investors Using Advisors | 1-800-378-9878 | |
| Business, Not-For-Profit, Employer-Sponsored Retirement Plans | 1-800-345-3533 | |
| Banks and Trust Companies, Broker-Dealers, Financial Professionals, Insurance Companies | 1-800-345-6488 | |
| Telecommunications Relay Service for the Deaf | 711 | |
| | | |
| American Century Growth Funds, Inc. | |
| | | |
Investment Advisor: American Century Investment Management, Inc. Kansas City, Missouri | |
| | | |
| This report and the statements it contains are submitted for the general information of our shareholders. The report is not authorized for distribution to prospective investors unless preceded or accompanied by an effective prospectus. | |
| | | |
©2018 American Century Proprietary Holdings, Inc. All rights reserved.
CL-ANN-93182 1809 | |
ITEM 2. CODE OF ETHICS.
| |
| (a) | The registrant has adopted a Code of Ethics for Senior Financial Officers that applies to the registrant’s principal executive officer, principal financial officer, principal accounting officer, and persons performing similar functions. |
| |
| (f) | The registrant’s Code of Ethics for Senior Financial Officers was filed as Exhibit 12 (a)(1) to American Century Asset Allocation Portfolios, Inc.’s Annual Certified Shareholder Report on Form N-CSR, File No. 811-21591, on September 29, 2005, and is incorporated herein by reference. |
ITEM 3. AUDIT COMMITTEE FINANCIAL EXPERT.
| |
| (a)(1) | The registrant’s board has determined that the registrant has at least one audit committee financial expert serving on its audit committee. |
| |
| (a)(2) | John R. Whitten and Jan M. Lewis are the registrant’s designated audit committee financial experts. They are “independent” as defined in Item 3 of Form N-CSR. |
ITEM 4. PRINCIPAL ACCOUNTANT FEES AND SERVICES.
The aggregate fees billed for each of the last two fiscal years for professional services rendered by the principal accountant for the audit of the registrant’s annual financial statements or services that are normally provided by the accountant in connection with statutory and regulatory filings or engagements for those fiscal years were as follows:
FY 2017: $44,836
FY 2018: $36,140
The aggregate fees billed in each of the last two fiscal years for assurance and related services by the principal accountant that are reasonably related to the performance of the audit of the registrant’s financial statements and are not reported under paragraph (a) of this Item were as follows:
For services rendered to the registrant:
FY 2017:$0
FY 2018:$0
Fees required to be approved pursuant to paragraph (c)(7)(ii) of Rule 2-01 of Regulation S-X (relating to certain engagements for non-audit services with the registrant’s investment adviser and its affiliates):
FY 2017:$0
FY 2018:$0
The aggregate fees billed in each of the last two fiscal years for professional services rendered by the principal accountant for tax compliance, tax advice, and tax planning were as follows:
For services rendered to the registrant:
FY 2017: $0
FY 2018: $0
Fees required to be approved pursuant to paragraph (c)(7)(ii) of Rule 2-01 of Regulation S-X (relating to certain engagements for non-audit services with the registrant’s investment adviser and its affiliates):
FY 2017: $0
FY 2018: $0
The aggregate fees billed in each of the last two fiscal years for products and services provided by the principal accountant, other than the services reported in paragraphs (a) through (c) of this Item were as follows:
For services rendered to the registrant:
FY 2017:$0
FY 2018:$0
Fees required to be approved pursuant to paragraph (c)(7)(ii) of Rule 2-01 of Regulation S-X (relating to certain engagements for non-audit services with the registrant’s investment adviser and its affiliates):
FY 2017:$0
FY 2018:$0
| |
| (e)(1) | In accordance with paragraph (c)(7)(i)(A) of Rule 2-01 of Regulation S-X, before the accountant is engaged by the registrant to render audit or non-audit services, the engagement is approved by the registrant’s audit committee. Pursuant to paragraph (c)(7)(ii) of Rule 2-01 of Regulation S-X, the registrant’s audit committee also pre-approves its accountant’s engagements for non-audit services with the registrant’s investment adviser, its parent company, and any entity controlled by, or under common control with the investment adviser that provides ongoing services to the registrant, if the engagement relates directly to the operations and financial reporting of the registrant. |
| |
| (e)(2) | All services described in each of paragraphs (b) through (d) of this Item were pre-approved before the engagement by the registrant’s audit committee pursuant to paragraph (c)(7)(i)(A) of Rule 2-01 of Regulation S-X. Consequently, none of such services were required to be approved by the audit committee pursuant to paragraph (c)(7)(i)(C). |
| |
| (f) | The percentage of hours expended on the principal accountant’s engagement to audit the registrant’s financial statements for the most recent fiscal year that were attributed to work performed by persons other than the principal accountant’s full-time, permanent employees was less than 50%. |
| |
| (g) | The aggregate non-audit fees billed by the registrant’s accountant for services rendered to the registrant, and rendered to the registrant’s investment adviser (not including any sub-adviser whose role is primarily portfolio management and is subcontracted with or overseen by another investment adviser), and any entity controlling, controlled by, or under common control with the adviser that provides ongoing services to the registrant for each of the last two fiscal years of the registrant were as follows: |
FY 2017: $794,350
FY 2018: $160,500
| |
| (h) | The registrant’s investment adviser and accountant have notified the registrant’s audit committee of all non-audit services that were rendered by the registrant’s accountant to the registrant’s investment adviser, its parent company, and any entity controlled by, or under common control with the investment adviser that provides services to the registrant, which services were not required to be pre-approved pursuant to paragraph (c)(7)(ii) of Rule 2-01 of Regulation S-X. The notification provided to the registrant’s audit committee included sufficient details regarding such services to allow the registrant’s audit committee to consider the continuing independence of its principal accountant. |
ITEM 5. AUDIT COMMITTEE OF LISTED REGISTRANTS.
Not applicable.
ITEM 6. INVESTMENTS.
| |
| (a) | The schedule of investments is included as part of the report to stockholders filed under Item 1 of this Form. |
ITEM 7. DISCLOSURE OF PROXY VOTING POLICIES AND PROCEDURES FOR CLOSED-END MANAGEMENT INVESTMENT COMPANIES.
Not applicable.
ITEM 8. PORTFOLIO MANAGERS OF CLOSED-END MANAGEMENT INVESTMENT COMPANIES.
Not applicable.
ITEM 9. PURCHASES OF EQUITY SECURITIES BY CLOSED-END MANAGEMENT INVESTMENT COMPANY AND AFFILIATED PURCHASERS.
Not applicable.
ITEM 10. SUBMISSION OF MATTERS TO A VOTE OF SECURITY HOLDERS.
During the reporting period, there were no material changes to the procedures by which shareholders may recommend nominees to the registrant’s board.
ITEM 11. CONTROLS AND PROCEDURES.
| |
| (a) | The registrant's principal executive officer and principal financial officer have concluded that the registrant's disclosure controls and procedures (as defined in Rule 30a-3(c) under the Investment Company Act of 1940) are effective based on their evaluation of these controls and procedures as of a date within 90 days of the filing date of this report. |
| |
| (b) | There were no changes in the registrant's internal control over financial reporting (as defined in Rule 30a-3(d) under the Investment Company Act of 1940) that occurred during the period covered by this report that have materially affected, or are reasonably likely to materially affect, the registrant's internal control over financial reporting. |
ITEM 12. DISCLOSURE OF SECURITIES LENDING ACTIVITIES FOR CLOSED-END MANAGEMENT INVESTMENT COMPANIES.
Not applicable.
ITEM 13. EXHIBITS.
| |
| (a)(1) | Registrant’s Code of Ethics for Senior Financial Officers, which is the subject of the disclosure required by Item 2 of Form N-CSR, was filed as Exhibit 12(a)(1) to American Century Asset Allocation Portfolios, Inc.’s Certified Shareholder Report on Form N-CSR, File No. 811-21591, on September 29, 2005. |
| |
| (a)(2) | Separate certifications by the registrant’s principal executive officer and principal financial officer, pursuant to Section 302 of the Sarbanes-Oxley Act of 2002 and Rule 30a-2(a) under the Investment Company Act of 1940, are filed and attached hereto as EX-99.CERT. |
| |
| (b) | A certification by the registrant’s chief executive officer and chief financial officer, pursuant to Section 906 of the Sarbanes-Oxley Act of 2002, is furnished and attached hereto as EX-99.906CERT. |
SIGNATURES
Pursuant to the requirements of the Securities Exchange Act of 1934 and the Investment Company Act of 1940, the registrant has duly caused this report to be signed on its behalf by the undersigned, thereunto duly authorized.
|
| | | | |
| Registrant: | American Century Growth Funds, Inc. | |
| | | | |
| | | | |
| By: | /s/ Jonathan S. Thomas | |
| | Name: | Jonathan S. Thomas | |
| | Title: | President | |
| | | | |
| Date: | September 27, 2018 | |
| | | |
Pursuant to the requirements of the Securities Exchange Act of 1934 and the Investment Company Act of 1940, this report has been signed below by the following persons on behalf of the registrant and in the capacities and on the dates indicated.
|
| | | |
| By: | /s/ Jonathan S. Thomas | |
| | Name: | Jonathan S. Thomas | |
| | Title: | President | |
| | | (principal executive officer) | |
| | | | |
| | | | |
| Date: | September 27, 2018 | |
|
| | | |
| By: | /s/ R. Wes Campbell | |
| | Name: | R. Wes Campbell | |
| | Title: | Treasurer and | |
| | | Chief Financial Officer | |
| | | (principal financial officer) | |
| | | | |
| Date: | September 27, 2018 | |