LIBERTY BANCORP, INC.
2007 ANNUAL REPORT
[LIBERTY BANCORP, INC. LETTERHEAD]
Dear Shareholder:
I am pleased to report consolidated net earnings of $1,944,000, or $.42 per share, for the year ended September 30, 2007 compared to $1,463,000, or $.31 per share, for the year ended September 30, 2006. The performance of the Company was aided by a significant loan loss recovery of $506,000 in the fourth quarter of the fiscal year. Total assets increased 15.86% from $287.6 million as of September 30, 2006, to $333.2 million as of September 30, 2007. For the same period, total deposits increased $53.8 million, from $198.5 million to $252.3 million, and total loans increased $32.1 million, from $200.2 million to $232.3 million.
The past year was challenging as numerous events and issues resulted in a difficult operating environment for financial institutions. Our trade area experienced a continued downturn in the housing market which has increased delinquencies and non-performing assets in our residential construction and development loan portfolio. Additionally, rising funding costs from increased competition, a flat yield curve, and volatile credit markets put pressure on our net interest margin. Throughout the year, our team of dedicated professionals worked very hard to minimize the effect of these arduous conditions and continue to build a premier community banking franchise.
We opened our seventh retail bank facility during September, 2007, in Gladstone, Missouri, our third new location in the last two years, and plan to open an additional banking center in North Kansas City, Missouri, in 2008. Although we expect our new banking centers to produce core deposit growth, revenue growth, and long-term shareholder value, these investments are likely to have a negative effect on earnings during the first two to three years of operation.
Our professional, friendly, and knowledgeable employees are focused on consistently delivering a superior experience to our customers. This customer focus, coupled with convenient locations and progressive products has produced a growing company and improving market share. The next year holds many uncertainties and may prove to be as challenging as the last, but we plan to make further strides building a solid banking franchise that will produce long-term shareholder value.
Thank you to our employees, customers, and stockholders for your continued support.
|
| |
| /s/ Brent M. Giles |
| Brent M. Giles |
| President and Chief Executive Officer |
|
Business of the Company
Liberty Bancorp, Inc. (the “Company” or “Liberty Bancorp”) was organized as a Missouri corporation at the direction of BankLiberty, formerly “Liberty Savings Bank, F.S.B.” (the “Bank” or “BankLiberty”), in February 2006 to become the holding company for the Bank upon the completion of the “second-step” mutual-to-stock conversion (the “Conversion”) of Liberty Savings Mutual Holding Company (the “MHC”). The Conversion was completed on July 21, 2006. As part of the Conversion, the MHC merged into the Bank, thereby ceasing to exist, and Liberty Savings Bank, F.S.B. changed its name to “BankLiberty.” A total of 2,807,383 shares of common stock were sold in the stock offering at a price of $10.00 per share. In addition, a total of approximately 1,952,754 shares of common stock were issued to the minority shareholders of the former Liberty Savings Bank, F.S.B. representing an exchange ratio of 3.5004 shares of Company common stock for each share of Liberty Savings Bank, F.S.B. common stock. Fractional shares in the aggregate, or 36 shares, were redeemed for cash. Total shares outstanding after the stock offering and the exchange totaled 4,760,137 shares. Net proceeds of $25.6 million were raised in the stock offering, excluding $1.2 million which was loaned by the Company to a trust for the Employee Stock Ownership Plan (the “ESOP”), enabling it to finance the purchase of 153,263 shares of common stock in the offering and exchange. Direct offering costs totaled approximately $1.3 million. In addition, as part of the Conversion, and dissolution of Liberty Savings Mutual Holding Company, the Bank received $694,000 of cash previously held by the MHC.
The Company has no significant assets, other than all of the outstanding shares of the Bank and the portion of the net proceeds it retained from the Conversion, and no significant liabilities. The Company neither owns nor leases any property, but instead uses the premises, equipment and furniture of the Bank.
Business of the Bank
The Bank is a community-oriented financial institution dedicated to serving the financial service needs of consumers and businesses within its market area which consists of Clay, Clinton, Platte and Jackson Counties in Missouri. We attract deposits from the general public and use these funds to originate loans secured by real estate located in our market area. Our real estate loans include construction loans, commercial real estate loans, and loans secured by single-family or multi-family properties. To a lesser extent, we originate consumer loans and commercial business loans. We currently operate out of our main office in Liberty, Missouri and six full-service branch offices – two in Kansas City, Missouri and one in Plattsburg, Platte City, Independence and Gladstone, Missouri.
The Bank is subject to extensive regulation, examination and supervision by the Office of Thrift Supervision, its primary federal regulator, and the Federal Deposit Insurance Corporation, its deposit insurer. The Bank has been a member of the Federal Home Loan Bank System since its inception and is a member of the Federal Home Loan Bank of Des Moines.
Common Stock
The common stock of Liberty Bancorp, Inc. is traded on the NASDAQ Capital Market under the symbol “LBCP.” The Company completed its initial public offering on July 21, 2006 and commenced trading on July 24, 2006. The following table sets forth the high and low sales prices for the common stock and dividends per share for the fourth quarter of 2006 and year ended September 30, 2007, as reported by NASDAQ. The prices do not necessarily reflect inter-dealer prices without retail markup, markdown or commissions and may not reflect actual transmissions.
| | | For the Year Ended | | For the Year Ended | |
| | | September 30, 2006 | | September 30, 2007 | |
| | | | | | | | | | | | |
| | | 4th Quarter | | 1st Quarter | | 2nd Quarter | | 3rd Quarter | | 4th Quarter | |
| | | | | | | | | | | | |
| High | | | 10.540 | | | 10.730 | | | 11.450 | | | 11.380 | | | 11.000 | |
| Low | | | 10.050 | | | 9.960 | | | 10.500 | | | 10.730 | | | 10.080 | |
| Dividend | | | .025 | | | .025 | | | .025 | | | .025 | | | .025 | |
As of September 30, 2007, the Company had approximately 407 stockholders of record; this does not reflect the number of persons whose shares are in nominee or “street” name accounts through brokers.
Liberty Bancorp is subject to Missouri law, which generally permits Liberty Bancorp to pay dividends on its common stock as long as no dividend is declared or paid at a time when the net assets of the corporation are less than its stated capital or when the payment of such dividends would reduce the net assets of the corporation below its stated capital.
Dividend payments by the Company depend primarily on dividends received by the Company from the Bank. See note 13 to Consolidated Financial Statements for information regarding the dividend restrictions applicable to the Company and the Bank.
On August 6, 2007 the Company announced a stock repurchase program to acquire up to 476,119 shares, or 10%, of the Company’s outstanding common stock. On December 20, 2007, the Company announced a second stock repurchase program to acquire up to 222,048 shares, or 5%, of the Company’s common stock. Subsequent to September 30, 2007, the Company has repurchased 320,230 shares at an average price of $10.57 per share. Repurchased shares will be held in treasury.
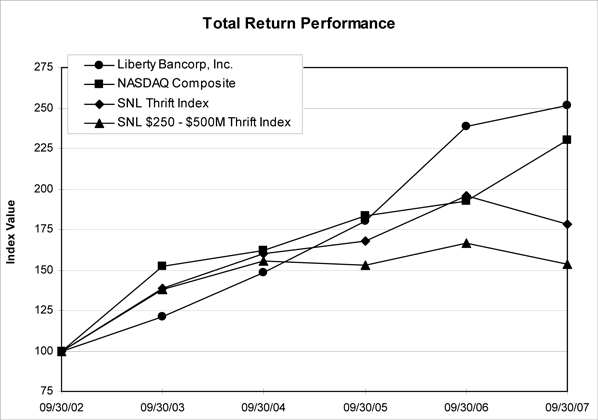
The graph and table which follow show the cumulative total return on the Company’s common stock during the period from September 30, 2002 through September 30, 2007 with (1) the total cumulative return of all companies whose equity securities are traded on the Nasdaq Stock Market, (2) the total cumulative return of thrifts and (3) the cumulative return of thrifts having asset sizes between $250 million and $500 million. The performance of the Company’s common stock also includes the performance of the common stock of the Bank, the predecessor to the Company, prior to its reorganization in 2006. The Bank’s common stock was traded on the OTC Bulletin Board and the Company’s common stock commenced trading on the Nasdaq Capital Market on July 24, 2006. Accordingly, the comparison assumes $100 was invested in the common stock of the Bank on June 30, 2002 in each of the foregoing indices and assumes reinvestment of dividends. The stockholder returns shown on the performance graph are not necessarily indicative of the future performance of the Company’s common stock or of any particular index.
| | | | |
Index | | 09/30/02 | | 09/30/03 | | 09/30/04 | | 09/30/05 | | 09/30/06 | | 09/30/07 | |
| Liberty Bancorp, Inc. | | | 100.00 | | | 121.21 | | | 148.43 | | | 180.12 | | | 238.37 | | | 251.87 | |
| NASDAQ Composite | | | 100.00 | | | 152.46 | | | 161.84 | | | 183.58 | | | 192.69 | | | 230.49 | |
| SNL Thrift Index | | | 100.00 | | | 138.64 | | | 160.15 | | | 168.09 | | | 195.66 | | | 178.57 | |
| SNL $250 - $500M Thrift Index | | | 100.00 | | | 138.10 | | | 155.47 | | | 152.86 | | | 166.34 | | | 153.70 | |
Selected Financial Highlights
The financial data presented below is qualified in its entirety by the more detailed financial data appearing elsewhere in this report. Financial data presented for 2003 through 2005 represents the financial position and results of operations for BankLiberty (formerly Liberty Savings Bank, F.S.B.). Financial data presented for 2006 and 2007 represents this same information for Liberty Bancorp, Inc. and its subsidiary, BankLiberty.
Financial Condition Data:
| | | At September, 30 | |
| | | 2007 | | 2006 | | 2005 | | 2004 | | 2003 | |
| | | (Dollars in Thousands) | |
| Total assets | | $ | 333,186 | | $ | 287,561 | | $ | 237,576 | | $ | 213,482 | | $ | 189,264 | |
| Cash and cash equivalents, federal funds sold, securities and stock in the Federal Home Loan Bank of Des Moines | | | 58,556 | | | 51,239 | | | 34,465 | | | 22,477 | | | 16,877 | |
| Mortgage-backed securities | | | 19,277 | | | 24,217 | | | 27,189 | | | 23,107 | | | 23,961 | |
| Loans receivable, net | | | 232,308 | | | 200,222 | | | 163,843 | | | 159,840 | | | 141,993 | |
| Deposits | | | 252,305 | | | 198,471 | | | 181,617 | | | 152,929 | | | 136,339 | |
| Advances from the Federal Home Loan Bank of Des Moines | | | 26,430 | | | 34,064 | | | 30,497 | | | 37,130 | | | 30,314 | |
| Stockholders’ equity | | | 50,195 | | | 48,982 | | | 21,131 | | | 20,184 | | | 19,465 | |
| Full service offices open | | | 7 | | | 6 | | | 5 | | | 4 | | | 4 | |
Operating Data:
| | | For the Years Ended September 30, | |
| | | 2007 | | 2006 | | 2005 | | 2004 | | 2003 | |
| | | (Dollars in Thousands) | |
| Interest income | | $ | 20,563 | | $ | 16,664 | | $ | 12,816 | | $ | 10,595 | | $ | 10,659 | |
| Interest expense | | | (10,494 | ) | | (7,600 | ) | | (5,175 | ) | | (4,031 | ) | | (5,168 | ) |
| Net interest income | | | 10,069 | | | 9,064 | | | 7,641 | | | 6,564 | | | 5,491 | |
| Provision for loan losses | | | (602 | ) | | (852 | ) | | (430 | ) | | (885 | ) | | (206 | ) |
| Net interest income after provision for loan losses | | | 9,467 | | | 8,212 | | | 7,211 | | | 5,679 | | | 5,285 | |
| Noninterest income | | | 1,477 | | | 1,237 | | | 1,200 | | | 1,118 | | | 1,783 | |
| Noninterest expense | | | (8,046 | ) | | (7,203 | ) | | (6,065 | ) | | (5,267 | ) | | (5,972 | ) |
| Earnings before income taxes | | | 2,898 | | | 2,246 | | | 2,346 | | | 1,530 | | | 1,096 | |
| Income taxes | | | (954 | ) | | (783 | ) | | (841 | ) | | (567 | ) | | (395 | ) |
| Net earnings | | $ | 1,944 | | $ | 1,463 | | $ | 1,505 | | $ | 963 | | $ | 701 | |
Per Share Data: | | | | | | | | | | | | | | | | |
| Basic earnings per share (1) | | $ | 0.42 | | $ | 0.32 | | $ | 0.32 | | $ | 0.21 | | $ | 0.15 | |
| Diluted earnings per share (1) | | | 0.42 | | | 0.31 | | | 0.32 | | | 0.21 | | | 0.15 | |
| Dividends per share (2) | | | 0.10 | | | 0.20 | | | 0.23 | | | 0.23 | | | 0.23 | |
| (1) | Earnings per share are based upon the weighted-average shares outstanding. Weighted-average shares outstanding for periods prior to the July 21, 2006 conversion date have been adjusted by the exchange ratio of 3.5004 to calculate earnings per share. |
| (2) | Dividends per share prior to the July 21, 2006 conversion date have been adjusted by the exchange ratio of 3.5004. Dividends on 800,000 shares owned by Liberty Savings Mutual Holding Company were waived. See note 13 of the notes to consolidated financial statements |
| | | At or For the Years Ended September 30, | |
| | | 2007 | | 2006 | | 2005 | | 2004 | | 2003 | |
Performance Ratios: | | | | | | | | | | | |
| Return on average assets | | | 0.63 | % | | 0.56 | % | | 0.67 | % | | 0.47 | % | | 0.37 | % |
| Return on average equity | | | 3.94 | | | 5.47 | | | 7.28 | | | 4.81 | | | 3.57 | |
| Interest rate spread (1) | | | 2.97 | | | 3.43 | | | 3.41 | | | 3.22 | | | 2.76 | |
| Net interest margin (2) | | | 3.47 | | | 3.66 | | | 3.54 | | | 3.37 | | | 3.03 | |
| Noninterest expense to average assets | | | 2.61 | | | 2.74 | | | 2.69 | | | 2.62 | | | 3.21 | |
| Efficiency ratio (3) | | | 69.68 | | | 69.93 | | | 68.60 | | | 68.56 | | | 82.10 | |
| Average interest-earning assets to average interest-bearing liabilities | | | 113.88 | | | 107.40 | | | 105.48 | | | 106.54 | | | 109.31 | |
| Average equity to average assets | | | 16.00 | | | 10.16 | | | 9.16 | | | 9.74 | | | 10.56 | |
| Dividend payout ratio (4) | | | 23.86 | | | 29.86 | | | 28.26 | | | 43.37 | | | 59.90 | |
Capital Ratios: (5) | | | | | | | | | | | | | | | | |
| Tangible capital | | | 10.84 | | | 12.73 | | | 8.99 | | | 9.42 | | | 10.32 | |
| Core capital | | | 10.84 | | | 12.73 | | | 8.99 | | | 9.42 | | | 10.32 | |
| Tier 1 risk-based capital | | | 13.91 | | | 17.12 | | | 12.31 | | | 12.64 | | | 14.62 | |
| Total risk-based capital | | | 15.08 | | | 18.14 | | | 13.32 | | | 13.89 | | | 15.59 | |
Asset Quality Ratios: | | | | | | | | | | | | | | | | |
| Allowance for loan losses as a percent of gross loans | | | 1.13 | | | 0.93 | | | 0.93 | | | 1.09 | | | 0.80 | |
| Allowance for loan losses as a percent of non-performing loans | | | 87.98 | | | 50.80 | | | 134.50 | | | 55.38 | | | 472.43 | |
| Net charge-offs (recoveries) to average outstanding loans during the year | | | (0.12 | ) | | 0.25 | | | 0.40 | | | 0.09 | | | (0.02 | ) |
| Non-accrual and 90 days or more past due loans as a percent of total loans, net | | | 1.47 | | | 2.11 | | | 0.55 | | | 0.45 | | | ― | |
| Non-performing assets as a percent of total assets | | | 1.53 | | | 2.02 | | | 1.20 | | | 1.97 | | | 0.15 | |
| | (1) | Represents the difference between the weighted average yield on average interest-earning assets and the weighted average cost of interest-bearing liabilities. No tax equivalent adjustments were made. |
| | (2) | Represents net interest income as a percent of average interest-earning assets. No tax equivalent adjustments were made. |
| | (3) | Represents noninterest expense divided by the sum of net interest income and noninterest income. |
| | (4) | Represents dividends paid to shareholders as a percent of net earnings. Does not include dividends waived by Liberty Savings Mutual Holding Company. |
| (5) | Represents capital ratios only for the Company’s subsidiary, BankLiberty. |
Management’s Discussion and Analysis of
Financial Condition and Results of Operations
Forward-Looking Statements
This Annual Report contains “forward-looking statements” within the meaning of the federal securities laws. These statements are not historical fact; rather, they are statements based on Liberty Bancorp, Inc.’s current expectations regarding its business strategies, intended results and future performance. Forward-looking statements are generally identified by use of the words “believe,” “expect,” “intend,” “anticipate,” “estimate,” “project” or similar expressions.
Management’s ability to predict results or the actual effect of future plans or strategies is inherently uncertain. Factors which could have a material adverse effect on the operations of Liberty Bancorp, Inc. and its subsidiary include, but are not limited to, changes in interest rates, national and regional economic conditions, legislative and regulatory changes, monetary and fiscal policies of the U.S. Government, including policies of the U.S. Treasury and the Federal Reserve Board, the quality and composition of the loan or investment portfolios, demand for loan products, deposit flows, competition, demand for financial services in BankLiberty’s market area, changes in real estate market values in BankLiberty’s market area, changes in relevant accounting principles and guidelines and inability or third party service providers to perform.
These risks and uncertainties should be considered in evaluating forward-looking statements and undue reliance should not be placed on such statements. Except as required by applicable law or regulations, Liberty Bancorp, Inc. does not undertake, and specifically disclaims any obligation, to release publicly the result of any revisions that may be made to any forward-looking statements to reflect events or circumstances after the date of the statements or to reflect the occurrence of anticipated or unanticipated events.
Overview
Income. Our primary source of pre-tax income is net interest income. Net interest income is the difference between interest income, which is the income that we earn on our loans and securities, and interest expense, which is the interest that we pay on our deposits and borrowings. Other significant sources of pre-tax income are service charges on deposit accounts, gains on sales of loans and other loan service charges. In addition, we recognize income or losses from the sale of investments in years that we have such sales.
Allowance for Loan Losses. The allowance for loan losses is a valuation allowance for probable losses inherent in the loan portfolio. Provisions for loan losses are charged against the allowance when management believes the uncollectibility of a loan balance is confirmed. Subsequent recoveries, if any, are credited to the allowance. We estimate the allowance balance required using past loan loss experience, the nature and value of the portfolio, information about specific borrower situations, and estimated collateral values, economic conditions and other factors. Allocation of the allowance may be made for specific loans, but the entire allowance is available for any loan that, in our judgment, should be charged off.
Expenses. The noninterest expenses we incur in operating our business consist of compensation and employee benefit expenses, occupancy expense, equipment and data processing expenses, advertising expenses, federal deposit insurance premiums and various other miscellaneous expenses.
Compensation and employee benefits consist primarily of salaries and wages paid to our employees, director and committee fees, payroll taxes, expenses for health insurance and other employee benefits.
Occupancy and equipment expenses, which are the fixed and variable costs of buildings and equipment, consist primarily of depreciation charges, furniture and equipment expenses, rent expense, maintenance, real estate taxes and costs of utilities. Depreciation of premises and equipment is computed using the straight-line method based on the useful lives of the related assets, which range from three to 40 years.
Data processing expenses include fees paid to our third party data processing service and ATM expense.
Advertising expenses include expenses for print, radio and television advertisements, promotions, third-party marketing services and premium items.
Federal deposit insurance premiums are primarily payments we make to the Federal Deposit Insurance Corporation for insurance of our deposit accounts.
Other expenses include correspondent banking charges, operations from foreclosed real estate, professional and regulatory services, expenses for supplies, telephone and postage, contributions and donations, insurance and surety bond premiums and other fees and expenses.
We expect that noninterest expenses will increase as a result of our strategy to expand our branch network. These additional expenses will consist primarily of salaries and employee benefits and occupancy and equipment expenses. Initially, we expect that these expenses will be greater than the additional income that we generate through our new facilities. Over time, we anticipate that we will generate sufficient income to offset the expenses related to our new facilities and new employees, but we cannot provide assurances as to when or if our branch expansion strategy will be accretive to our earnings.
Critical Accounting Policies
Our accounting and reporting policies were prepared in accordance with U.S. generally accepted accounting principles (“US GAAP”) and to general practices within the financial services industry. The preparation of financial statements in conformity with US GAAP requires management to make estimates and assumptions that affect the amounts reported in the consolidated financial statements and accompanying notes. Actual results could differ from those estimates. Management has identified the accounting policies described below as those that, due to the judgments, estimates and assumptions inherent in those policies, are critical to an understanding of our financial statements and management’s discussion and analysis.
Income Recognition. We recognize interest income by methods conforming to US GAAP that include general accounting practices within the financial services industry. Interest income on loans and investment securities is recognized by methods that result in level rates of return on principal amounts outstanding, including yield adjustments resulting from the amortization of loan costs and premiums on investment securities and accretion of loan fees and discounts on investment securities.
In the event management believes collection of all or a portion of contractual interest on a loan has become doubtful, which generally occurs after the loan is 90 days past due, the accrual of interest is discontinued. In addition, previously accrued interest deemed uncollectible that was recognized in income is reversed. Interest received on nonaccrual loans is included in income only if principal recovery is reasonably assured. A non-accrual loan is restored to accrual status when it is brought current or has performed in accordance with contractual terms for a reasonable period of time, and the collectibility of the total contractual principal and interest is no longer doubtful.
Allowance for Loan Losses. Valuation allowances are established for impaired loans for the difference between the loan amount and the fair value of collateral less estimated selling costs. We consider a loan to be impaired when, based on current information and events, it is probable that we will be unable to collect all amounts due according to the contractual terms of the loan agreement on a timely basis. The types of loans for which impairment is measured include nonaccrual income property loans (excluding those loans included in the homogenous portfolio which are collectively reviewed for impairment), large, non-accrual single-family loans and troubled debt restructurings. Such loans are generally placed on non-accrual status at the point deemed uncollectible. Impairment losses are recognized through an increase in the allowance for loan losses. See note 5 of the notes to consolidated financial statements for information regarding impaired loans at September 30, 2007, 2006 and 2005.
Allowances for loan losses are available to absorb losses incurred on loans and represent additions charged to expense, less net charge-offs. The allowances are evaluated on a regular basis by management and are based on management’s periodic review of the collectibility of loans, in light of historical experience, fair value of the underlying collateral, changes in the types and mix of loans originated and prevailing economic conditions.
Operating Strategy
Our mission is to operate and further expand a profitable and diversified community banking franchise. We plan to achieve this by executing our strategy of:
| · | expanding through de novo branching in the Kansas City metropolitan area; and |
| | · | continuing to transform our balance sheet to emphasize assets and liabilities that allow us to increase our net interest margin while reducing our exposure to risk from interest rate fluctuations. |
Expansion Through De Novo Branching. In 2004, the Board of Directors, with the assistance of our Chief Executive Officer hired in September 2003, determined to pursue a strategic plan to enhance long-term shareholder value through franchise growth. The strategic plan calls for expansion through de novo branching in the Kansas City metropolitan area to enable us to take advantage of the opportunities afforded by recent and forecasted economic growth in that market. We believe that the increased asset size to be achieved through the planned expansion will enable us to leverage better efficiencies and technology but still attract customers based on personal service and relationships. Our first new branch was opened in Independence, Missouri in May 2005, a second new branch was opened in Kansas City, Missouri in January 2006, and a third new branch was opened in Gladstone, Missouri in September 2007. We anticipate that over the next three to five years, based on and subject to local market conditions, we will open additional branch offices in suburban Kansas City growth areas that complement our existing branch network.
While we anticipate that this expansion strategy will enhance long-term shareholder value, we cannot assure you when or if our branch expansion strategy will be accretive to our earnings. New branches generally require a significant initial capital investment and take approximately three years or longer to become profitable. New branches require an upfront investment of between $2.0 million and $3.0 million each for land and building expenses. Accordingly, we anticipate that, in the short term, net income will be negatively affected as we incur significant capital expenditures and noninterest expense in opening and operating new branches before the new branches can produce sufficient net interest income to offset the increased expense. In addition, the need to use capital to fund de novo branching may limit our ability to pay or increase dividends on our common stock. There also is implementation risk associated with new branches. Numerous factors will determine whether our branch expansion strategy will be successful, such as our ability to select suitable branch locations, real estate acquisition costs, competition, interest rates, managerial resources, our ability to hire and retain qualified personnel, the effectiveness of our marketing strategy and our ability to attract deposits.
Continued Transformation of Our Balance Sheet. Our strategic plan also calls for us to transform our balance sheet to emphasize assets and liabilities that allow us to increase our net interest margin while reducing our exposure to risk from interest rate fluctuations.
With respect to our assets, our strategy has been, and continues to be, to increase the percentage of assets invested in commercial business, commercial real estate and multi-family loans, which tend to have higher yields than traditional single-family residential mortgage loans and which have shorter terms to maturity or adjustable interest rates. In addition, in recent years we have sought to increase our originations of real estate construction loans, which also have short terms and adjustable interest rates, although in the future we will seek to maintain construction loans approximately at current levels so as not to unduly concentrate credit risk in the real estate construction market. At the same time, we have sought to decrease our reliance on single-family residential mortgage loans. Currently, we sell substantially all new, fixed-rate conforming single-family loans in the secondary market.
Commercial real estate, commercial business and multi-family real estate loans provide us with the opportunity to earn more income because they tend to have higher interest rates than residential mortgage loans. In addition, these loans are beneficial for interest rate risk management because they typically have shorter terms and adjustable interest rates. There are many multi-family and commercial properties and businesses located in our market area, and with the additional capital raised in the offering we intend to pursue the larger lending relationships associated with these opportunities. To facilitate our growth, we have added expertise in our commercial loan department in recent years through the hiring of experienced personnel, including a new chief lending officer.
As a result of these efforts, our commercial real estate loans have increased from $16.2 million, or 12.18% of total loans, at September 30, 2001 to $57.2 million, or 21.44% of total loans, at September 30, 2007. In addition, commercial business loans have increased from $2.7 million, or 2.04% of total loans, at September 30, 2001 to $18.0 million, or 6.72% of total loans, at September 30, 2007, and multi-family real estate loans have increased from $3.4 million, or 2.56% of total loans, at September 30, 2001 to $12.2 million, or 4.57% of total loans, at September 30, 2007. The percentage of our total loan portfolio comprised of residential mortgage loans has decreased in recent years, amounting to 36.28%, 28.71%, 20.71%, 18.48% and 15.64% at September 30, 2003, 2004, 2005, 2006 and 2007, respectively.
With respect to liabilities, our strategy is to emphasize transaction and money market accounts, as well as shorter-term certificates of deposit. We value these types of deposits because they represent longer-term customer relationships and a lower cost of funding compared to longer-term certificates of deposit. We aggressively seek transaction and money market deposits through competitive products and pricing and targeted advertising. In addition, we offer business checking accounts for our commercial customers. We also hope to increase core deposits through our de novo branching strategy.
Balance Sheet Analysis
Loans. Our primary lending activity is the origination of loans secured by real estate. We originate construction loans, single-family residential loans and multi-family and commercial real estate loans. To a lesser extent, we also originate commercial business and consumer loans.
The largest segment of our loan portfolio is real estate construction loans. At September 30, 2007, these loans totaled $125.8 million and represented 47.12% of total loans, compared to $99.8 million, or 43.25% of total loans, at September 30, 2006. Through the implementation of our strategic plan, the size of our real estate construction loan portfolio rose $26.0 million over this period due primarily to increased emphasis on development and commercial construction lending which have higher yields as compared to single-family construction loans. During the year ended September 30, 2007, the largest growth in our construction loan portfolio resulted from increases in commercial real estate construction loans. This was the result of our successful efforts to increase this type of lending. Commercial real estate construction loans increased by $25.8 million, or 102.67%, from $25.2 million at September 30, 2006 to $51.0 million at September 30, 2007. Development loans increased by $12.4 million, or 51.95%, from $24.0 million at September 30, 2006 to $36.4 million at September 30, 2007. Single-family – spec loans decreased by $8.5 million, or 22.33%, from $37.8 million at September 30, 2006 to $29.3 million at September 30, 2007. Single-family – custom construction loans decreased by $5.2 million, or 42.07%, from $12.3 million at September 30, 2006 to $7.1 million at September 30, 2007. Decreases in single-family spec and custom construction loans reflect loan portfolio adjustments to current market conditions.
Single-family residential loans totaled $41.7 million and represented 15.64% of total loans at September 30, 2007, compared to $42.6 million, or 18.48% of total loans, at September 30, 2006. The Bank has pursued the strategy of selling substantially all new, fixed-rate residential loans we originate because of the relatively low yields that have been attainable on residential loans over the last several years and to decrease the interest rate risk resulting from the retention of longer-term fixed-rate loans.
Commercial real estate loans increased by $3.9 million, or 7.27%, to $57.2 million and represented 21.44% of total loans at September 30, 2007, compared to $53.3 million, or 23.13% of total loans, at September 30, 2006. These increases were due to our strategic decision to emphasize lending on income producing property projects. Currently, the Bank offers a variety of commercial real estate products to owner occupants and investors. Our primary commercial real estate lending focus areas are retail, office and industrial uses.
Multi-family loans totaled $12.2 million and represented 4.57% of total loans at September 30, 2007, compared to $10.4 million, or 4.52% of total loans, at September 30, 2006.
We also originate a variety of consumer loans and home equity loans, as well as loans secured by deposit accounts, automobile loans and other miscellaneous loans. Consumer loans totaled $12.0 million and represented 4.51% of total loans at September 30, 2007, compared to $13.2 million, or 5.73% of total loans, at September 30, 2006. The decrease in consumer loans was due primarily to a decrease in home equity loans.
Commercial business loans increased from $11.3 million or 4.89% of total loans at September 30, 2006 to $18.0 million, or 6.72% of total loans at September 30, 2007. The increase was due primarily to the addition of two loans totaling $6.5 million.
Set forth below is selected data relating to the composition of our loan portfolio at the dates indicated.
| | | At September 30, | |
| | | 2007 | | 2006 | |
| | Amount | | % | | Amount | | % | |
| | | (Dollars in thousands) | |
Type of Loan: | | | | | | | | | |
| Real estate loans: | | | | | | | | | |
| Single-family 1-4 units | | $ | 41,749 | | | 15.64 | % | $ | 42,623 | | | 18.48 | % |
| Multi-family 5 or more units | | | 12,198 | | | 4.57 | | | 10,416 | | | 4.52 | |
| Real estate construction loans | | | 125,797 | | | 47.12 | | | 99,759 | | | 43.25 | |
| Commercial real estate loans | | | 57,241 | | | 21.44 | | | 53,360 | | | 23.13 | |
| Total real estate loans | | | 236,985 | | | 88.77 | | | 206,158 | | | 89.38 | |
| Consumer loans: | | | | | | | | | | | | | |
| Loans secured by deposit accounts | | | 228 | | | 0.09 | | | 211 | | | 0.09 | |
| Automobile loans | | | 477 | | | 0.18 | | | 608 | | | 0.26 | |
| Home equity loans | | | 10,713 | | | 4.01 | | | 11,662 | | | 5.06 | |
| Other | | | 620 | | | 0.23 | | | 738 | | | 0.32 | |
| Total consumer loans | | | 12,038 | | | 4.51 | | | 13,219 | | | 5.73 | |
| Commercial business loans | | | 17,951 | | | 6.72 | | | 11,270 | | | 4.89 | |
| Total gross loans | | | 266,974 | | | 100.00 | % | | 230,647 | | | 100.00 | % |
| Loans in process | | | (31,316 | ) | | | | | (27,962 | ) | | | |
| Deferred loan fees, net | | | (339 | ) | | | | | (314 | ) | | | |
| Unearned discounts, net | | | ¾ | | | | | | (5 | ) | | | |
| Allowance for loan losses | | | (3,011 | ) | | | | | (2,144 | ) | | | |
| Total | | $ | 232,308 | | | | | $ | 200,222 | | | | |
| | | At September 30, | |
| | | 2005 | | 2004 | | 2003 | |
| | | Amount | | % | | Amount | | % | | Amount | | % | |
| | | (Dollars in thousands) | |
Type of Loan: | | | | | | | | | | | | | |
| Real estate loans: | | | | | | | | | | | | | |
| Single-family 1-4 units | | $ | 39,435 | | | 20.71 | % | $ | 53,098 | | | 28.71 | % | $ | 59,123 | | | 36.28 | % |
| Multi-family 5 or more units | | | 15,603 | | | 8.20 | | | 12,877 | | | 6.96 | | | 11,027 | | | 6.77 | |
| Real estate construction loans | | | 79,979 | | | 42.01 | | | 71,875 | | | 38.86 | | | 54,423 | | | 33.40 | |
| Commercial real estate loans | | | 37,568 | | | 19.74 | | | 30,294 | | | 16.38 | | | 23,671 | | | 14.53 | |
| Total real estate loans | | | 172,585 | | | 90.66 | | | 168,144 | | | 90.91 | | | 148,244 | | | 90.98 | |
| | | | | | | | | | | | | | | | | | | | |
| Consumer loans: | | | | | | | | | | | | | | | | | | | |
| Loans secured by deposit accounts | | | 128 | | | 0.07 | | | 167 | | | 0.09 | | | 166 | | | 0.10 | |
| Automobile loans | | | 867 | | | 0.46 | | | 1,097 | | | 0.59 | | | 1,316 | | | 0.81 | |
| Home equity loans | | | 10,266 | | | 5.39 | | | 9,764 | | | 5.28 | | | 8,126 | | | 4.99 | |
| Other | | | 1,129 | | | 0.59 | | | 1,037 | | | 0.56 | | | 638 | | | 0.39 | |
| Total consumer loans | | | 12,390 | | | 6.51 | | | 12,065 | | | 6.52 | | | 10,246 | | | 6.29 | |
| Commercial business loans | | | 5,397 | | | 2.83 | | | 4,754 | | | 2.57 | | | 4,457 | | | 2.73 | |
| | | | | | | | | | | | | | | | | | | | |
| Total gross loans | | | 190,372 | | | 100.00 | % | | 184,963 | | | 100.00 | % | | 162,947 | | | 100.00 | % |
| | | | | | | | | | | | | | | | | | | | |
| Loans in process | | | (24,444 | ) | | | | | (22,549 | ) | | | | | (19,066 | ) | | | |
| Deferred loan fees, net | | | (316 | ) | | | | | (368 | ) | | | | | (389 | ) | | | |
| Unearned discounts, net | | | (7 | ) | | | | | (182 | ) | | | | | (202 | ) | | | |
| Allowance for loan losses | | | (1,762 | ) | | | | | (2,024 | ) | | | | | (1,297 | ) | | | |
| Total | | $ | 163,843 | | | | | $ | 159,840 | | | | | $ | 141,993 | | | | |
The following table sets forth certain information at September 30, 2007, regarding the dollar amount of loan principal repayments coming due during the years indicated. The table below does not include any estimate of prepayments, which significantly shorten the average life of all loans and may cause our actual repayment experience to differ from that shown below. Demand loans having no stated schedule of repayments and no stated maturity are reported as due in one year or less.
| | | Due during the Year Ended September 30, | | Due after 3 through 5 years after | | Due after 5 through 10 years after | | Due after 10 through 15 years after | | Due after 15 years after | | | |
| | | 2008 | | 2009 | | 2010 | | 9/30/07 | | 9/30/07 | | 9/30/07 | | 9/30/07 | | Total | |
| | | (Dollars in thousands) | |
| Single-family mortgage loans | | $ | 1,156 | | $ | 1,244 | | $ | 1,339 | | $ | 2,992 | | $ | 9,721 | | $ | 14,037 | | $ | 11,260 | | $ | 41,749 | |
| Multi-family mortgage loans | | | 338 | | | 364 | | | 391 | | | 874 | | | 2,840 | | | 4,101 | | | 3,290 | | | 12,198 | |
| Real estate construction loans | | | 99,610 | | | 26,187 | | | | | | — | | | | | | | | | | | | 125,797 | |
| Commercial real estate loans | | | 1,517 | | | 1,639 | | | 1,772 | | | 3,984 | | | 13,143 | | | 19,382 | | | 15,804 | | | 57,241 | |
| Loans secured by deposit accounts | | | 228 | | | | | | | | | | | | | | | | | | | | | 228 | |
| Other consumer loans | | | 2,609 | | | 2,826 | | | 3,060 | | | 3,315 | | | | | | | | | | | | 11,810 | |
| Commercial business loans | | | 2,430 | | | 2,631 | | | 2,849 | | | 6,425 | | | 3,616 | | | | | | | | | 17,951 | |
| Total gross loans | | $ | 107,888 | | $ | 34,891 | | $ | 9,411 | | $ | 17,590 | | $ | 29,320 | | $ | 37,520 | | $ | 30,354 | | $ | 266,974 | |
The following table sets forth the dollar amount of all loans at September 30, 2007, that are due after September 30, 2008 which have either fixed interest rates or adjustable interest rates.
| | | Fixed Rates | | Adjustable Rates | | Total | |
| | | (Dollars in thousands) | |
| | | | | | | | |
| Single-family mortgage loans | | $ | 25,072 | | $ | 15,521 | | $ | 40,593 | |
| Multi-family mortgage loans | | | 6,353 | | | 5,507 | | | 11,860 | |
| Real estate construction loans | | | 7,556 | | | 18,631 | | | 26,187 | |
| Commercial real estate loans | | | 50,850 | | | 4,874 | | | 55,724 | |
| Loans secured by deposit accounts | | | ¾ | | | ¾ | | | ¾ | |
| Other consumer loans | | | 1,096 | | | 8,105 | | | 9,201 | |
| Commercial business loans | | | 11,892 | | | 3,629 | | | 15,521 | |
| Total gross loans | | $ | 102,819 | | $ | 56,267 | | $ | 159,086 | |
The following table shows our loan origination, sale and other activity during the years indicated.
| | | For the Years Ended September 30, | |
| | | 2007 | | 2006 | | 2005 | |
| | | (Dollars in thousands) | |
| Total net loans at the beginning of year | | $ | 200,222 | | $ | 163,843 | | $ | 159,840 | |
| Loans originated for portfolio: | | | | | | | | | | |
| Single and multi-family mortgage loans | | | 25,703 | | | 17,437 | | | 12,378 | |
| Real estate construction loans | | | 64,541 | | | 74,792 | | | 68,648 | |
| Commercial real estate loans | | | 27,002 | | | 33,167 | | | 19,172 | |
| Commercial business loans | | | 16,657 | | | 9,179 | | | 2,919 | |
| Loans secured by deposit accounts | | | 212 | | | 295 | | | 197 | |
| Home equity loans | | | 3,460 | | | 4,277 | | | 2,602 | |
| Automobile and other consumer loans | | | 1,036 | | | 1,028 | | | 1,984 | |
| Total loans originated | | $ | 138,611 | | $ | 140,175 | | $ | 107,900 | |
| | | | | | | | | | | |
| Deduct: | | | | | | | | | | |
| Principal loan repayment and other, net | | | 106,790 | | | 103,326 | | | 103,205 | |
| Loan charge-offs, net of (recoveries) | | | (265 | ) | | 470 | | | 692 | |
| Total net loans at end of year | | $ | 232,308 | | $ | 200,222 | | $ | 163,843 | |
| Loans originated for sale | | $ | 20,354 | | $ | 17,656 | | $ | 21,140 | |
| Loans sold in secondary market | | $ | 20,094 | | $ | 19,281 | | $ | 20,132 | |
Loans Held for Sale. Loans held for sale increased $260,000 to $719,000 at September 30, 2007.
Securities. Our securities portfolio consists primarily of government agency securities, municipal securities and mortgage-backed securities. Although municipal securities generally have greater credit risk than government agency securities, they generally have higher yields than government securities of similar duration. Securities available for sale increased from $35.9 million at September 30, 2006 to $48.0 million at September 30, 2007 due to purchases of intermediate-term agencies and intermediate and long-term municipal securities, partially offset by maturities and calls. Mortgage-backed securities available for sale decreased from $24.2 million at September 30, 2006 to $19.3 million at September 30, 2007 due to principal repayments.
The following table sets forth the Bank’s mortgage-backed securities purchases and sales for the years indicated.
| | | Years Ended September 30, | |
| | | 2007 | | 2006 | | 2005 | |
| | | (In thousands) | |
| Mortgage-backed securities: | | | | | | | |
| Purchased | | | ¾ | | $ | 3,452 | | $ | 13,755 | |
| Sold | | | ¾ | | | ¾ | | | 1,874 | |
The following table sets forth the carrying values and fair values of our securities and mortgage-backed securities portfolio at the dates indicated.
| | | At September 30, | |
| | | 2007 | | 2006 | | 2005 | |
| | | Amortized Cost | | Fair Value | | Amortized Cost | | Fair Value | | Amortized Cost | | Fair Value | |
| | | (Dollars in thousands) | |
| Securities available for sale: | | | | | | | | | | | | | |
| Federal agency obligations | | $ | 34,555 | | $ | 34,848 | | $ | 29,711 | | $ | 29,543 | | $ | 16,577 | | $ | 16,450 | |
| State and municipal obligations | | | 12,839 | | | 12,741 | | | 6,435 | | | 6,340 | | | 5,882 | | | 5,864 | |
| Mortgage-backed securities | | | 19,621 | | | 19,277 | | | 24,863 | | | 24,217 | | | 27,583 | | | 27,189 | |
| Equity securities | | | 395 | | | 394 | | | ¾ | | | ¾ | | | ¾ | | | ¾ | |
| Total securities available for sale | | $ | 67,410 | | $ | 67,260 | | $ | 61,009 | | $ | 60,100 | | $ | 50,042 | | $ | 49,503 | |
| | | | | | | | | | | | | | | | | | | | |
| Weighted-average rate on securities (1) | | | 4.72 | % | | | | | 4.44 | % | | | | | 3.94 | % | | | |
| Weighted-average rate on mortgage - backed securities | | | 4.31 | % | | | | | 4.29 | % | | | | | 4.16 | % | | | |
(1) Weighted-average yields are not presented on a tax-equivalent basis.
At September 30, 2007, we had no investments in a single company or entity (other than U.S. Government- sponsored entity securities) that had an aggregate book value in excess of 10% of our equity.
The following table sets forth the maturities and weighted-average yields of debt securities at September 30, 2007. Weighted-average yields are not presented on a tax-equivalent basis.
| | | One Year or Less | | More than One Year to Five Years | | More than Five Years to Ten Years | | More than Ten Years | | Total | |
| | | Carrying Value | | Weighted -Average Yield | | Carrying Value | | Weighted -Average Yield | | Carrying Value | | Weighted -Average Yield | | Carrying Value | | Weighted -Average Yield | | Carrying Value | | Weighted -Average Yield | |
| | | (Dollars in thousands) | |
| Securities available-for sale: | | | | | | | | | | | | | | | | | | | | | |
| State and municipal obligations | | $ | | | | | % | $ | 2,512 | | | 4.29 | % | $ | 4,119 | | | 4.22 | % | $ | 6,110 | | | 5.26 | % | $ | 12,741 | | | 4.73 | % |
| Federal agency obligations | | | 4,287 | | | 4.23 | | | 27,048 | | | 4.77 | | | 3,513 | | | 5.41 | | | | | | | | | 34,848 | | | 4.77 | |
| Mortgage-backed securities | | | 1,244 | | | 4.44 | | | 9,723 | | | 4.23 | | | 829 | | | 5.00 | | | 6,907 | | | 4.39 | | | 18,703 | | | 4.34 | |
| Collateralized mortgage obligations | | | | | | | | | | | | | | | | | | | | | 574 | | | 3.36 | | | 574 | | | 3.36 | |
| Total securities available for sale | | $ | 5,531 | | | 3.99 | | $ | 39,283 | | | 4.60 | | $ | 8,461 | | | 4.78 | | $ | 13,591 | | | 4.74 | | $ | 66,866 | | | 4.60 | |
Premises and Equipment. Premises and equipment, net, increased from $6.7 million at September 30, 2006 to $8.7 million at September 30, 2007 due to the opening of a new branch in Gladstone, Missouri in September 2007.
Other Assets. Bank-owned life insurance represents the purchase of two policies of $3.0 million in June 2007 and $5.0 million in July 2007, respectively, and change in cash surrender value of $101,000. Accrued interest receivable increased due to higher securities and loan balances and timing of interest receipts.
Deposits. Our primary source of funds is our deposit accounts, which are comprised of noninterest-bearing NOW accounts, interest-bearing NOW accounts, money market accounts, statement accounts and certificates of deposit. These deposits are provided primarily by individuals within our market areas. Deposits increased $53.8 million, or 27.1%, to $252.3 million at September 30, 2007 from $198.5 million at September 30, 2006. The increase in deposits for the year ended September 30, 2007 consisted of an increase in money market accounts and certificate of deposit accounts less than twelve months, which were attracted primarily through special promotions, brokered deposits and to a lesser extent, an increase in noninterest-bearing checking accounts, partially offset by a decrease in interest bearing checking accounts and certificate of deposit accounts greater than twelve months. The amount of brokered deposits in the future will be contingent upon current market rates as compared to retail deposits and FHLB advances.
The following table sets forth average balances and average rates of our deposit products for the years indicated. For purposes of this table, average balances have been calculated using month-end balances. Management does not believe that the use of month-end balances instead of daily average balances has caused any material differences in the information presented.
| | | Years Ended September 30, | |
| | | 2007 | | 2006 | | 2005 | |
| | | Average Balance | | Average Rate | | Average Balance | | Average Rate | | Average Balance | | Average Rate | |
| | | (Dollars in thousands) | |
| | | | | | | | | | | | | | |
| Noninterest-bearing NOW accounts | | $ | 12,458 | | | — | | $ | 11,633 | | | — | | $ | 9,933 | | | — | |
| Interest-bearing NOW accounts | | | 24,331 | | | 1.88 | % | | 25,224 | | | 1.83 | % | | 18,146 | | | 1.15 | % |
| Money market accounts | | | 38,052 | | | 4.47 | | | 21,290 | | | 2.38 | | | 25,315 | | | 1.77 | |
| Statement accounts | | | 7,336 | | | 0.31 | | | 9,059 | | | 0.34 | | | 9,024 | | | 0.31 | |
| Certificates of deposit | | | 143,665 | | | 4.80 | | | 126,275 | | | 3.97 | | | 106,218 | | | 3.10 | |
| Total | | $ | 225,842 | | | 4.02 | | $ | 193,481 | | | 3.10 | | $ | 168,636 | | | 2.36 | |
The following table sets forth the balances of our deposit products at the dates indicated.
| | | At September 30, | |
| | | 2007 | | 2006 | | 2005 | |
| | | Amount | | Percent | | Amount | | Percent | | Amount | | Percent | |
| Noninterest-bearing NOW accounts | | $ | 13,617 | | | 5.4 | % | $ | 11,896 | | | 6.0 | % | $ | 11,590 | | | 6.4 | % |
| Interest-bearing NOW accounts | | | 21,368 | | | 8.5 | | | 25,234 | | | 12.7 | | | 22,020 | | | 12.1 | |
| Money market accounts | | | 68,482 | | | 27.1 | | | 13,617 | | | 6.9 | | | 26,237 | | | 14.4 | |
| Statement accounts | | | 7,200 | | | 2.9 | | | 7,702 | | | 3.9 | | | 8,880 | | | 4.9 | |
| Certificates of deposit | | | 141,638 | | | 56.1 | | | 140,022 | | | 70.5 | | | 112,890 | | | 62.2 | |
| Total | | $ | 252,305 | | | 100.0 | % | $ | 198,471 | | | 100.0 | % | $ | 181,617 | | | 100.0 | % |
The following table indicates the amount of jumbo certificates of deposit by time remaining until maturity as of September 30, 2007. Jumbo certificates of deposit require minimum deposits of $100,000.
Maturity Period | | Certificates of
Deposit | |
| | | (In thousands) | |
| Three months or less | | $ | 29,144 | |
| Over three through six months | | | 10,304 | |
| Over six through 12 months | | | 5,337 | |
| Over 12 months | | | 2,948 | |
| Total | | $ | 47,733 | |
The following table sets forth time deposits classified by rates at the dates indicated.
| | | At September 30, | |
| | | 2007 | | 2006 | | 2005 | |
| | | | | | | | |
| 0.00 - 0.99% | | $ | — | | $ | — | | $ | 47 | |
| 1.00 - 1.99 | | | — | | | 5 | | | 653 | |
| 2.00 - 2.99 | | | 300 | | | 2,254 | | | 27,956 | |
| 3.00 - 3.99 | | | 9,249 | | | 33,373 | | | 61,079 | |
| 4.00 - 4.99 | | | 60,152 | | | 44,344 | | | 20,224 | |
| 5.00 - 5.99 | | | 71,937 | | | 60,046 | | | 2,542 | |
| 6.00 - 6.99 | | | — | | | — | | | 389 | |
| | | $ | 141,638 | | $ | 140,022 | | $ | 112,890 | |
The following table sets forth the amount and maturities of time deposits at September 30, 2007.
| | | Amount Due | | | |
| | | One Year or Less | | 1-2 Years | | 2-3 Years | | 3-4 Years | | 4-5 Years | | Total | | Percent of
Total Certificate Accounts | |
| | | (In thousands) | |
| 2.00 - 2.99 | | $ | 300 | | $ | ¾ | | $ | ¾ | | $ | ¾ | | $ | ¾ | | $ | 300 | | | .2 | % |
| 3.00 - 3.99 | | | 5,770 | | | 2,305 | | | 1,051 | | | 41 | | | 82 | | | 9,249 | | | 6.5 | |
| 4.00 - 4.99 | | | 51,415 | | | 3,580 | | | 2,693 | | | 870 | | | 1,594 | | | 60,152 | | | 42.5 | |
| 5.00 - 5.99 | | | 69,149 | | | 1,610 | | | 170 | | | 992 | | | 16 | | | 71,937 | | | 50.8 | |
| | | $ | 126,634 | | $ | 7,495 | | $ | 3,914 | | $ | 1,903 | | $ | 1,692 | | $ | 141,638 | | | 100.0 | % |
The following table sets forth deposit activity for the years indicated.
| | | Years Ended September 30, | |
| | | 2007 | | 2006 | | 2005 | |
| | | (In thousands) | |
| | | | | | | | |
| Net deposits (withdrawals) before interest credited | | $ | 45,803 | | $ | 11,629 | | $ | 25,459 | |
| Interest credited | | | 8,032 | | | 5,225 | | | 3,229 | |
| Net increase (decrease) in deposits | | $ | 53,835 | | $ | 16,854 | | $ | 28,688 | |
Borrowings. We utilize borrowings from the Federal Home Loan Bank of Des Moines and securities sold under agreement to repurchase to supplement our supply of funds for loans and investments and to meet deposit withdrawal requirements.
The following table sets forth certain information regarding short-term borrowings by the Bank at the end of and during the years indicated:
| | | At September 30, | |
| | | 2007 | | 2006 | | 2005 | |
| | | (Dollars in thousands) | |
| Outstanding advances from Federal Home Loan Bank | | $ | 22,056 | | $ | 23,833 | | $ | 9,633 | |
| Weighted-average rate paid on advances from Federal Home Loan Bank | | | 4.90 | % | | 4.19 | % | | 3.17 | % |
| Outstanding securities sold under agreement to repurchase | | $ | 681 | | $ | 3,384 | | $ | 1,157 | |
| Weighted-average rate paid on securities sold under agreement to repurchase | | | 3.41 | % | | 3.44 | % | | 2.05 | % |
| | | Years Ended September 30, | |
| | | 2007 | | 2006 | | 2005 | |
| | | (Dollars in thousands) | |
| Maximum outstanding advances from Federal Home Loan Bank at any month end | | $ | 26,083 | | $ | 35,633 | | $ | 17,133 | |
| Weighted-average rate paid on advances from Federal Home Loan Bank (1) | | | 4.84 | % | | 3.97 | % | | 2.44 | % |
| Average advances from Federal Home Loan Bank outstanding | | $ | 19,904 | | $ | 22,167 | | $ | 10,967 | |
| Maximum outstanding securities sold under agreement to repurchase at any month end | | $ | 5,164 | | $ | 4,400 | | $ | 1,798 | |
| Weighted-average rate paid on securities sold under agreement to repurchase (2) | | | 3.39 | % | | 3.18 | % | | 1.76 | % |
| Average securities sold under agreement to repurchase | | $ | 1,573 | | $ | 2,224 | | $ | 1,073 | |
| (1) | The weighted-average rate paid is based on the weighted-average balances determined on a monthly basis. |
| (2) | The weighted-average rate paid is based on the weighted-average balances determined on a daily basis. |
Federal Home Loan Bank of Des Moines borrowings decreased $7.7 million, or 22.4%, to $26.4 million at September 30, 2007 from $34.1 million at September 30, 2006. The advances outstanding as of September 30, 2007 mature in 2007 through 2012.
Securities sold under agreement to repurchase decreased by $2.2 million for the year ended September 30, 2007 due to lower balances from existing customers. Accrued interest on deposits increased due to higher money market and certificate balances, and rate and timing of payments. Other liabilities increased as a result of the timing of payroll payments and higher accrued bonuses and other accrual items.
Results of Operations for the Years Ended September 30, 2007, 2006 and 2005
Overview.
| | | Years Ended September 30, | | % Change | | % Change | |
| | | 2007 | | 2006 | | 2005 | | 2007/2006 | | 2006/2005 | |
| | | (Dollars in thousands) | | | | | |
| | | | | | | | | | | | |
| Net earnings | | $ | 1,944 | | $ | 1,463 | | $ | 1,505 | | | 32.9 | % | | (2.8 | )% |
| Return on assets (1) | | | 0.63 | % | | 0.56 | % | | 0.67 | % | | 12.5 | | | (16.4 | ) |
| Return on stockholders’ equity (2) | | | 3.94 | | | 5.47 | | | 7.28 | | | (28.0 | ) | | (24.9 | ) |
| Stockholders’ equity-to-assets ratio (3) | | | 16.00 | | | 10.16 | | | 9.16 | | | 57.5 | | | 10.9 | |
| Dividend payout ratio (4) | | | 23.86 | | | 29.86 | | | 28.26 | | | (20.1 | ) | | 5.7 | |
| (1) | Net earnings divided by average assets. |
| (2) | Net earnings divided by average stockholders’ equity. |
| (3) | Average stockholders’ equity divided by average total assets. |
| (4) | Represents dividends paid to shareholders as a percent of net earnings. Does not include dividends waived by Liberty Savings Mutual Holding Company. |
2007 vs. 2006. Net earnings increased $481,000, or 32.9%, for the year ended September 30, 2007 compared to the year ended September 30, 2006. The increase in net earnings was due primarily to a $3.9 million or 23.4% increase in interest income, partially offset by a $2.9 million or 38.1% increase in interest expense and a $843,000 or 11.7% increase in noninterest expense. Net interest income increased primarily as a result of an increase in loans receivable, partially offset by a smaller interest rate spread. Noninterest income in 2007 increased primarily due to an increase in the cash surrender value of bank-owned life insurance, deposit account service charges and gains on sale of loans. Noninterest expense increased primarily due to an increase in compensation, occupancy, net expenses from operations from foreclosed real estate and other noninterest expenses, partially offset by a decrease in advertising expenses.
2006 vs. 2005. Net earnings decreased $42,000, or 2.8%, for the year ended September 30, 2006 compared to the year ended September 30, 2005. The decrease in net earnings was due primarily to a $3.8 million or 30.0% increase in interest income, being more than offset by a $2.4 million or 46.8% increase in interest expense, $422,000 or 98.1% increase in provisions for loan losses and a $1.1 million or 18.8% increase in noninterest expense. Net interest income increased primarily as a result of an increase in loans receivable. Noninterest income in 2006 was positively affected by a higher amount of deposit account service charges, loan service charges and gains on sale of loans, partially offset by a decrease in gains on sale of mortgage-backed securities. Noninterest expense increased as a result of increased expenses attributable to new branches.
Net Earnings.
2007 vs. 2006. Net earnings increased by $481,000 from $1.5 million for 2006 to $1.9 million for 2007. The increase was due to higher net interest income and noninterest income, and lower provisions for loan losses, partially offset by higher noninterest expense and income taxes.
2006 vs. 2005. Net earnings remained substantially the same at $1.5 million for both 2005 and 2006, with only a slight decrease of $42,000. The slight decrease in net earnings was due to higher net interest income, being more than offset by higher provisions for loan losses and noninterest expense.
Net Interest Income.
2007 vs. 2006. Net interest income increased by $1.0 million, or 11.1%, from $9.1 million for 2006 to $10.1 million for 2007 as a result of an increase in net earning assets, partially offset by a lower interest rate spread. The increase in net earning assets is due to an increase of $42.6 million, or 17.2%, in interest-earning assets, partially offset by an increase of $24.3 million, or 10.5%, in average interest-bearing liabilities. The interest rate spread decreased from 3.43% for 2006 to 2.97% for 2007.
Interest on loans receivable increased as a result of a higher weighted-average balance and, to a lesser extent a higher average yield. The weighted-average yield on loans increased from 7.59% for 2006 to 7.91% for 2007.
Interest on mortgage-backed securities decreased due to a lower average balance, partially offset by a higher average yield.
Interest on securities increased as a result of a higher average balance and yield, reflecting higher market interest rates. Interest on other interest-earning assets also increased as a result of a higher average balance and yield.
Interest on deposits increased as a result of a higher weighted-average rate and, to a lesser extent a higher weighted-average balance. During 2007, the Bank’s promotion of attractive money market and short-term certificate of deposit rates resulted in increased balances. Higher weighted-average rates resulted from higher market interest rates.
Interest on advances from the Federal Home Loan Bank of Des Moines decreased primarily due to a lower average balance, partially offset by a higher average rate.
2006 vs. 2005. Net interest income increased by $1.4 million, or 18.6%, from $7.7 million for 2005 to $9.1 million for 2006 as a result of higher interest rates on loans, deposits and advances and to a lesser extent, higher loan, investment, deposit and advance balances.
Interest on loans receivable increased as a result of a higher average balance and yield. The weighted-average yield on loans increased from 6.57% for 2005 to 7.59% for 2006.
Interest on mortgage-backed securities increased due to a higher yield, reflecting higher market interest rates and a higher weighted-average balance.
Interest on securities increased as a result of a higher weighted-average balance and yield, reflecting higher market interest rates. Interest on other interest-earning assets increased as a result of a higher weighted-average yield.
Interest on deposits increased as a result of a higher weighted-average balance and, to a greater extent, a higher weighted-average rate. During 2006, the Bank’s promotion of attractive certificates of deposit rates resulted in increased balances, particularly in short-term certificates.
Interest on advances from the Federal Home Loan Bank of Des Moines increased primarily due to a higher average rate.
Average Balances and Yields. The following table presents information regarding average balances of assets and liabilities, the total dollar amounts of interest income and dividends from average interest-earnings assets, the total dollar amounts of interest expense on average interest-bearing liabilities, and the resulting average yields and costs. The yields and costs for the years indicated are derived by dividing income or expense by the average balances of assets or liabilities, respectively, for the years presented. For purposes of this table, average balances have been calculated using month-end balances and, to a lesser extent, daily balances, and nonaccrual loans are included in average balances only. Management does not believe that the use of month-end balances instead of daily average balances has caused any material differences in the information presented. No tax equivalent adjustments were made. Nonaccruing loans have been included in the table as loans carrying a zero yield.
| | | Years Ended September 30, | |
| | | 2007 | | 2006 | | 2005 | |
| | | Average Balance | | Interest | | Average Yield/ Cost | | Average Balance | | Interest | | Average Yield/ Cost | | Average Balance | | Interest | | Average Yield/ Cost | |
| | | (Dollars in thousands) | |
| Interest-earning assets: | | | | | | | | | | | | | | | | | | | | | | | | | | | | |
| Loans receivable | | $ | 217,841 | | $ | 17,233 | | | 7.91 | % | $ | 187,818 | | $ | 14,253 | | | 7.59 | % | $ | 172,869 | | $ | 11,354 | | | 6.57 | % |
| Mortgage-backed securities | | | 22,229 | | | 933 | | | 4.20 | | | 25,216 | | | 995 | | | 3.95 | | | 21,656 | | | 808 | | | 3.73 | |
| Securities | | | 43,988 | | | 2,076 | | | 4.72 | | | 29,117 | | | 1,170 | | | 4.02 | | | 14,371 | | | 463 | | | 3.22 | |
| Other interest-earning assets | | | 6,484 | | | 321 | | | 4.95 | | | 5,768 | | | 246 | | | 4.27 | | | 6,942 | | | 191 | | | 2.75 | |
| Total interest-earning assets | | | 290,542 | | | 20,563 | | | 7.08 | | | 247,919 | | | 16,664 | | | 6.72 | | | 215,838 | | | 12,816 | | | 5.94 | |
| | | | | | | | | | | | | | | | | | | | | | | | | | | | | |
| Interest-bearing liabilities: | | | | | | | | | | | | | | | | | | | | | | | | | | | | |
| Deposits | | | 225,842 | | | 9,084 | | | 4.02 | | | 193,481 | | | 6,007 | | | 3.10 | | | 168,636 | | | 3,979 | | | 2.36 | |
| Federal Home Loan Bank advances | | | 27,189 | | | 1,333 | | | 4.90 | | | 34,807 | | | 1,497 | | | 4.30 | | | 34,525 | | | 1,142 | | | 3.31 | |
| Securities sold under agreement to repurchase | | | 2,097 | | | 77 | | | 3.69 | | | 2,224 | | | 71 | | | 3.18 | | | 1,058 | | | 30 | | | 2.81 | |
| ESOP note payable | | | — | | | — | | | — | | | 327 | | | 25 | | | 7.66 | | | 415 | | | 25 | | | 5.93 | |
| Total interest-bearing liabilities | | $ | 255,128 | | | 10,494 | | | 4.11 | | $ | 230,839 | | | 7,600 | | | 3.29 | | $ | 204,634 | | | 5,176 | | | 2.53 | |
| | | | | | | | | | | | | | | | | | | | | | | | | | | | | |
| Net interest income before provision for loan losses | | | | | $ | 10,069 | | | | | | | | $ | 9,064 | | | | | | | | $ | 7,640 | | | | |
| Net interest-earning assets | | $ | 35,414 | | | | | | | | $ | 17,080 | | | | | | | | $ | 11,204 | | | | | | | |
| Interest rate spread | | | | | | | | | 2.97 | % | | | | | | | | 3.43 | % | | | | | | | | 3.41 | % |
| Net yield on average interest-earning assets | | | | | | | | | 3.47 | % | | | | | | | | 3.66 | % | | | | | | | | 3.54 | % |
| Ratio of average interest-earning assets to average interest-bearing liabilities | | | 113.88 | % | | | | | | | | 107.40 | % | | | | | | | | 105.48 | % | | | | | | |
Rate/Volume Analysis. The following table sets forth the effects of changing rates and volumes on our net interest income. The rate column shows the effects attributable to changes in rate (changes in rate multiplied by prior volume). The volume column shows the effects attributable to changes in volume (changes in volume multiplied by prior rate). The rate/volume column shows the effects attributable to changes in both rate and volume (changes in rate multiplied by changes in volume). The total column represents the sum of the prior columns.
| | | Year Ended September 30, 2007 vs. 2006 | | Year Ended September 30, 2006 vs. 2005 | |
| | | Increase (Decrease) due to: | | Increase (Decrease) due to: | |
| | | Volume | | Rate | | Rate/ Volume | | Total | | Volume | | Rate | | Rate/ Volume | | Total | |
| | | (Dollars in thousands) | |
| Interest income: | | | | | | | | | | | | | | | | | | | | | | | | | |
| Loans receivable | | $ | 2,279 | | $ | 605 | | $ | 96 | | $ | 2,980 | | $ | 982 | | $ | 1,764 | | $ | 153 | | $ | 2,899 | |
| Mortgage-backed securities | | | (118 | ) | | 63 | | | (7 | ) | | (62 | ) | | 132 | | | 47 | | | 8 | | | 187 | |
| Securities | | | 598 | | | 204 | | | 104 | | | 906 | | | 474 | | | 115 | | | 118 | | | 707 | |
| Other interest-earning assets | | | 31 | | | 39 | | | 5 | | | 75 | | | (32 | ) | | 105 | | | (18 | ) | | 55 | |
| Total interest-earning assets | | $ | 2,790 | | $ | 911 | | $ | 198 | | $ | 3,899 | | $ | 1,556 | | $ | 2,031 | | $ | 261 | | $ | 3,848 | |
| | | | | | | | | | | | | | | | | | | | | | | | | | |
| Interest expense: | | | | | | | | | | | | | | | | | | | | | | | | | |
| Deposits | | | 1,003 | | | 1,777 | | | 297 | | | 3,077 | | | 586 | | | 1,258 | | | 184 | | | 2,028 | |
| Federal Home Loan Bank advances | | | (328 | ) | | 209 | | | (45 | ) | | (164 | ) | | 9 | | | 342 | | | 4 | | | 355 | |
| Securities sold under agreement to repurchase | | | (4 | ) | | 11 | | | (1 | ) | | 6 | | | 33 | | | 4 | | | 4 | | | 41 | |
| ESOP note payable | | | (25 | ) | | (25 | ) | | 25 | | | (25 | ) | | (5 | ) | | 7 | | | (2 | ) | | — | |
| Total interest-bearing liabilities | | | 646 | | | 1,972 | | | 276 | | | 2,894 | | | 623 | | | 1,611 | | | 190 | | | 2,424 | |
| Change in net interest income | | $ | 2,144 | | $ | (1,061 | ) | $ | (78 | ) | $ | 1,005 | | $ | 933 | | $ | 420 | | $ | 71 | | $ | 1,424 | |
Provision for Loan Losses.
2007 vs. 2006. Provision for loan losses decreased from $852,000 for 2006 to $602,000 for 2007. At September 30, 2007, the allowance for loan losses was $3.0 million, or 1.1% of the gross loan portfolio, compared to $2.1 million or 0.9% of the loan portfolio at September 30, 2006. At September 30, 2007, loans secured by non-construction single-family properties totaled 15.6% of total loans and 7.0% of the allowance for loan losses was allocated to these loans. All other loans totaled 84.4% of the portfolio and 93.0% of the allowance for loan losses.
During the year ended September 30, 2007, we recorded a provision for loan losses of $602,000, a decrease of 29.3% from the provision for loan losses of $852,000 recorded for the year ended September 30, 2006. The decreased provision is the result of an increase in recoveries of previously charged off loans.
Non-accrual loans amounted to $3.4 million and $1.5 million at September 30, 2007 and 2006, respectively. Other impaired loans, single family specs decreased by $2.7 million due to the foreclosure of such properties, primarily in November 2006. There were net recoveries of $265,000 during 2007 compared to net charge-offs of $470,000 during 2006. Recoveries in 2007 included $506,000 which were related to previously charged-off loans secured by 1-4 family investment properties.
2006 vs. 2005. Provision for loan losses increased from $430,000 for 2005 to $852,000 for 2006. At September 30, 2006, the allowance for loan losses was $2.1 million, or 0.9% of the gross loan portfolio, compared to $1.8 million or 0.9% of the loan portfolio at September 30, 2005. At September 30, 2006, loans secured by non-construction single-family properties totaled 18.5% of total loans and 9.3% of the allowance for loan losses was allocated to these loans. All other loans totaled 81.5% of the portfolio and 90.7% of the allowance for loan losses.
During the year ended September 30, 2006, we recorded a provision for loan losses of $852,000, an increase of 98.1% from the provision for loan losses of $430,000 recorded for the year ended September 30, 2005. The increased provision is the result of the growth of the loan portfolio and the increase in classified assets.
Non-accrual loans amounted to $1.5 million and $907,000 at September 30, 2006 and 2005, respectively. Net loan charge-offs amounted to $470,000 during 2006 compared to $692,000 during 2005. The majority of the net loan charge-offs in 2006 were due to loans that were identified as classified assets as of September 30, 2005.
Noninterest Income. The following table shows the components of noninterest income and the percentage changes for the years ended September 30, 2007 and 2006.
| | | Years Ended September 30, | | % Change | | % Change | |
| | | 2007 | | 2006 | | 2005 | | 2007/2006 | | 2006/2005 | |
| | | (Dollars in thousands) | | | | | |
| | | | | | | | | | | | |
| Loan service charges | | $ | 90 | | $ | 69 | | $ | 53 | | | 30.3 | % | | 29.0 | % |
| Gain on sale of mortgage-backed securities available for sale | | | — | | | — | | | 10 | | | — | | | (100.0 | ) |
| Gain on sale of loans | | | 247 | | | 203 | | | 194 | | | 21.8 | | | 4.7 | |
| Change in cash surrender value of BOLI | | | 101 | | | — | | | — | | | 100.0 | | | — | |
| Deposit account service charges | | | 1,039 | | | 965 | | | 943 | | | 7.7 | | | 2.4 | |
| Total | | $ | 1,477 | | $ | 1,237 | | $ | 1,200 | | | 19.4 | | | 3.1 | |
2007 vs. 2006. Noninterest income increased from $1.2 million for 2006 to $1.5 million for 2007 due to an increase in the cash surrender value of bank-owned life insurance, deposit account service charges, gains on sale of loans and loan service charges.
The Bank recognized gains on sale of loans of $247,000 and $203,000 for the years ended September 30, 2007 and 2006, respectively. During 2007 and 2006, we sold loans to secondary market investors totaling $20.1 million and $19.3 million, respectively.
2006 vs. 2005. Noninterest income remained substantially the same at $1.2 million for both 2005 and 2006, with only a slight $37,000 increase due to a higher amount of deposit account service charges, loan service charges and gains on sale of loans, partially offset by a decrease in gains on sale of mortgage-backed securities.
The Bank recognized gains on sale of loans of $203,000 and $194,000 for the years ended September 30, 2006 and 2005, respectively. During 2006 and 2005, we sold loans to secondary market investors totaling $19.3 million and $20.1 million, respectively.
Noninterest Expense. The following table shows the components of noninterest expense and the percentage changes for the years ended September 30, 2007 and 2006.
| | | Years Ended September 30, | | % Change | | % Change | |
| | | 2007 | | 2006 | | 2005 | | 2007/2006 | | 2006/2005 | |
| | | (Dollars in thousands) | | | | | |
| Compensation and benefits | | $ | 4,445 | | $ | 3,975 | | $ | 3,302 | | | 11.8 | % | | 20.4 | % |
| Occupancy expense | | | 625 | | | 508 | | | 433 | | | 22.8 | | | 17.4 | |
| Equipment and data processing expense | | | 798 | | | 740 | | | 770 | | | 7.9 | | | (4.0 | ) |
| Operations from foreclosed real estate, net | | | 356 | | | 139 | | | (22 | ) | | 156.4 | | | 736.4 | |
| Federal deposit insurance premiums | | | 41 | | | 24 | | | 23 | | | 72.5 | | | 5.6 | |
| Professional and regulatory services | | | 408 | | | 347 | | | 305 | | | 17.6 | | | 13.6 | |
| Advertising | | | 255 | | | 414 | | | 315 | | | (38.4 | ) | | 31.6 | |
| Correspondent banking charges | | | 260 | | | 260 | | | 216 | | | 0.2 | | | 20.7 | |
| Supplies | | | 138 | | | 182 | | | 141 | | | (24.6 | ) | | 29.7 | |
| Other | | | 720 | | | 614 | | | 582 | | | 17.3 | | | 5.4 | |
| Total noninterest expense | | $ | 8,046 | | $ | 7,203 | | $ | 6,065 | | | 11.7 | % | | 18.8 | % |
| | | | | | | | | | | | | | | | | |
| Efficiency ratio (1) | | | 69.7 | % | | 69.9 | % | | 68.6 | % | | | | | | |
(1) Computed as noninterest expense divided by the sum of net interest income and noninterest income.
2007 vs. 2006. Noninterest expense increased from $7.2 million for 2006 to $8.0 million for 2007. Compensation and benefit expense increased due to the costs associated with the additional staff for the new branches and higher ESOP and stock-based compensation plan expenses.
On October 1, 2006, the Company adopted Statement of Financial Accounting Standards (“SFAS”) No. 123 (revised 2004) (SFAS No. 123(R)), “Share-Based Payment”, using the modified prospective method. Under this method compensation expense is recognized based on the fair value of unvested stock awards at the implementation of SFAS No. 123(R) and new awards granted thereafter, which includes restricted stock and stock awards at the grant date and is recognized on a straight-line basis over the requisite service period. The fair value of stock options is estimated at the date of grant using the Black-Scholes pricing model and related assumptions. Prior to October 1, 2006, the Company applied the intrinsic value method of accounting for stock-based compensation expense under APB No. 25 and adopted the disclosure requirements. Under the intrinsic value method, no compensation expense was recognized in the financial statements since the exercise price of the Company’s stock was equal to the market price of the stock at the grant date.
During 2007, the Company recognized stock option expense and restricted stock award expense of $68,000 and $163,000, respectively. During both 2006 and 2005, the Company recognized stock option expense and restricted stock award expense of $0 and $28,000, respectively. At September 30, 2007, total unrecognized stock option expense was approximately $219,000 and is expected to be recognized over the weighted-average period of 3.40 years. At September 30, 2007, total unrecognized restricted stock award expense was $1.1 million and is expected to be recognized over the next 4.4 years.
Operations for foreclosed real estate, net increased from a loss of $139,000 to $356,000 for the years ended September 30, 2006 and 2007, respectively. The Bank recognized net losses for 2006 and 2007 on sale of foreclosed real estate of $89,000, and $288,000, respectively. Occupancy expense increased due to the opening of the new branches. There were also modest increases in professional and regulatory services, equipment and data processing expense and a small decrease in supplies expense. Advertising expense decreased due to lower direct mail costs. Other noninterest expense increased from $614,000 for 2006 to $720,000 for 2007 due primarily to higher stock administration and data line expense.
2006 vs. 2005. Noninterest expense increased from $6.1 million for 2005 to $7.2 million for 2006. Compensation and benefit expense increased due to the costs associated with the additional staff for the new branches and higher ESOP expenses. Occupancy, advertising and supplies expense also increased because of the new branches. Operations for foreclosed real estate, net increased from a gain of $22,000 to a loss of $139,000 for the years ended September 30, 2005 and 2006, respectively. In 2005, the Bank recognized net gains on sale of foreclosed real estate of $77,000, in contrast to net losses on sale of foreclosed real estate of $89,000 recognized in 2006. There were also modest increases in professional and regulatory services, correspondent banking charges and a decrease in equipment and data processing expense. Other noninterest expense increased from $582,000 for 2005 to $614,000 for 2006 due primarily to costs involving new data lines.
Income Taxes.
2007 vs. 2006. Income tax expense for the year ended September 30, 2007 was $954,000 compared to $783,000 for the year ended September 30, 2006. Income taxes increased due to an increase in earnings, partially offset by additional purchases of tax-exempt municipal securities. The effective tax rate for 2007 was 32.9% compared to 34.9% for 2006.
2006 vs. 2005. Income tax expense for the year ended September 30, 2006 was $783,000 compared to $841,000 for the year ended September 30, 2005. Income taxes decreased due to additional purchases of tax-exempt municipal securities. The effective tax rate for 2006 was 34.9% compared to 35.9% for 2005.
Stockholders’ Equity.
2007 vs. 2006. Stockholders’ equity increased by $1.2 million from $49.0 million at September 30, 2006 to $50.2 million at September 30, 2007 primarily due to an increase in net earnings of $1.9 million, the amortization of ESOP and stock-based compensation expenses of $563,000 and a decrease in unrealized losses on investments and mortgage-backed securities, net of taxes of $478,000, partially offset by the payment of dividends of $464,000 and the purchase of common stock used to fund restricted stock awards of $1.4 million.
Risk Management
Overview. Managing risk is an essential part of successfully managing a financial institution. Our most prominent risk exposures are credit risk, interest rate risk and market risk. Credit risk is the risk of not collecting the interest and/or the principal balance of a loan or investment when it is due. Interest rate risk is the potential reduction of net interest income as a result of changes in interest rates. Market risk arises from fluctuations in interest rates that may result in changes in the values of financial instruments, such as available for sale securities, that are accounted for on a mark-to-market basis. Other risks that we face are operational risks, liquidity risks and reputation risk. Operational risks include risks related to fraud, regulatory compliance, processing errors, technology and disaster recovery. Liquidity risk is the possible inability to fund obligations to depositors, lenders or borrowers. Reputation risk is the risk that negative publicity or press, whether true or not, could cause a decline in our customer base or revenue.
Credit Risk Management. Our strategy for credit risk management focuses on having well-defined credit policies and uniform underwriting criteria and providing prompt attention to potential problem loans.
When a borrower fails to make a required loan payment, we take a number of steps to attempt to have the borrower cure the delinquency and restore the loan to current status. When the loan becomes 15 days past due, a 5% penalty is assessed, and a written notification of the late payment is sent. If payment is not received by the 30th day of delinquency, the borrower is contacted by telephone, payment is requested and efforts are made to formulate an affirmative plan to cure the delinquency. After a loan becomes past due 60 days, we generally provide a final notice that we will initiate legal proceedings in 30 days, after which foreclosure procedures commence to obtain the real property securing the loan. Generally, when a loan becomes 90 days past due, the loan is placed on non-accrual status. We may consider loan workout arrangements with certain borrowers under certain circumstances.
Management reports to the Board of Directors monthly regarding the amount of loans delinquent more than 30 days, all loans in foreclosure and all foreclosed and repossessed property that we own.
Real estate acquired by the Bank as a result of foreclosure is classified as foreclosed real estate until such time as it is sold. When such property is acquired, a new appraisal is obtained and it is recorded at the lower of its unpaid principal or fair value, less estimated selling costs. Any required write-down of the loan to its fair value upon foreclosure is charged against the allowance for losses.
Analysis of Non-Performing and Classified Assets. We consider repossessed assets and loans that are 90 days or more past due to be non-performing assets. Loans are generally placed on nonaccrual status when they become 90 days delinquent, at which time the accrual of interest ceases and the allowance for any uncollectible accrued interest is established and charged against operations. Typically, payments received on a nonaccrual loan are applied to the outstanding principal and interest as determined at the time of collection of the loan.
Real estate that we acquire as a result of foreclosure or deed-in-lieu of foreclosure is classified as foreclosed assets until it is sold. When property is acquired, it is initially recorded at the lower of its cost, or market, less estimated selling expenses. Holding costs and declines in fair value after acquisition of the property result in charges against income.
The following table sets forth information with respect to our nonperforming assets at the dates indicated.
| | | At September 30, | |
| | | 2007 | | 2006 | | 2005 | | 2004 | | 2003 | |
| | | (Dollars in thousands) | |
| Loans accounted for on a non-accrual basis: (1) | | | | | | | | | | | | | | | | |
| Single and multi-family loans | | $ | 104 | | $ | 828 | | $ | 351 | | $ | 723 | | $ | ― | |
| Real estate construction spec loans | | | 1,932 | | | 304 | | | 556 | | | ― | | | ― | |
| Land development loans | | | 1,386 | | | ― | | | ― | | | ― | | | ― | |
| Consumer | | | ― | | | 349 | | | ― | | | ― | | | ― | |
| Total non-accrual loans | | | 3,422 | | | 1,481 | | | 907 | | | 723 | | | ― | |
| | | | | | | | | | | | | | | | | |
Accruing loans which are contractually past due 90 days or more – single-family loans (1) | | | ― | | | 58 | | | ― | | | ― | | | ― | |
| Total non-accrual and 90 days or more past due loans | | | 3,422 | | | 1,539 | | | 907 | | | 723 | | | ― | |
| Other impaired loans - single family 1-4 units, investment property | | | ― | | | ― | | | 403 | | | 2,933 | | | ― | |
| Other impaired loans - single family, spec | | | ― | | | 2,682 | | | ― | | | ― | | | ― | |
| Troubled debt restructuring (2) | | | ― | | | ― | | | ― | | | ― | | | 274 | |
| | | | | | | | | | | | | | | | | |
| Foreclosed real estate held for sale | | | 1,676 | | | 1,580 | | | 1,530 | | | 547 | | | ― | |
| Total nonperforming assets | | | 5,098 | | | 5,801 | | | 2,840 | | | 4,203 | | | 274 | |
| Allowance for losses on impaired loans | | | 370 | | | 258 | | | 199 | | | 655 | | $ | ― | |
| Impaired loans with no related allowance for loan losses | | $ | ― | | $ | 58 | | $ | 116 | | $ | ― | | $ | ― | |
| Non-accrual and 90 days or more past due loans as a percentage of total loans, net | | | 1.47 | % | | 2.11 | % | | 0.55 | % | | 0.45 | % | | ― | % |
| Non-accrual and 90 days or more past due loans as a percentage of total assets | | | 1.03 | % | | 1.47 | % | | 0.38 | % | | 0.34 | % | | ― | % |
| Nonperforming assets as a percentage of total assets | | | 1.53 | % | | 2.02 | % | | 1.20 | % | | 1.97 | % | | 0.15 | % |
(1) Interest on delinquent loans is accrued to income to the extent considered collectible.
(2) As defined in Statement of Financial Accounting Standards No. 15.
Non-performing assets totaled $5.1 million, or 1.53% of total assets, at September 30, 2007, which was a decrease of $703,000 or 12.1%, from $5.8 million, or 2.02% of total assets, at September 30, 2006. Non-performing assets at September 30, 2007 consisted of $3.4 million in non-accrual loans, and $1.7 million in foreclosed real estate. At September 30, 2007, non-accrual loans consisted of $1.9 million in real estate construction loans, $104,000 in single-family loans and one land development loan totaling $1.4 million.
Interest income that would have been recorded for the year ended September 30, 2007 had nonaccrual loans been current according to their original terms amounted to $70,389. There was no interest income recognized on such loans during the period the loans were classified as nonaccrual in 2007.
Foreclosed real estate owned by the Bank at September 30, 2007 totaled $1.7 million compared to $1.6 million at September 30, 2006. Foreclosed real estate at September 30, 2007 included five 1-4 family properties, five 1-4 family construction properties and one lot.
Classified Assets. Federal regulations require us to review and classify our assets on a regular basis. In addition, the Office of Thrift Supervision has the authority to identify problem assets and, if appropriate, require them to be classified. There are three classifications for problem assets: substandard, doubtful and loss. “Substandard assets” must have one or more defined weaknesses and are characterized by the distinct possibility that we will sustain some loss if the deficiencies are not corrected. “Doubtful assets” have the weaknesses of substandard assets with the additional characteristic that the weaknesses make collection or liquidation in full on the basis of currently existing facts, conditions and values questionable, and there is a high possibility of loss. An asset classified as “loss” is considered uncollectible and of such little value that continuance as an asset of the institution is not warranted. The regulations also provide for a “special mention” category, described as assets that do not currently expose us to a sufficient degree of risk to warrant classification but do possess credit deficiencies or potential weaknesses deserving our close attention. When we classify an asset as special mention, substandard or doubtful we establish an allowance for loan losses. If we classify an asset as loss, we allocate an amount equal to 100% of the portion of the asset classified loss.
The following table shows the aggregate amounts of our classified assets at the dates indicated.
| | | At September 30, | |
| | | 2007 | | 2006 | | 2005 | |
| | | (In thousands) | |
| Special mention assets | | $ | 1,386 | | $ | 2,986 | | $ | 1,729 | |
| Substandard assets (1) | | | 5,435 | | | 3,149 | | | 2,854 | |
| Doubtful assets | | | 105 | | | 196 | | | ― | |
| Loss assets | | | ― | | | ― | | | ― | |
| Total classified assets | | $ | 6,926 | | $ | 6,331 | | $ | 4,583 | |
| | (1) | Includes foreclosed real estate of $1,675,871, $1,579,848 and $1,529,586 at September 30, 2007, 2006 and 2005, respectively. |
The increase in our substandard assets at September 30, 2007 compared to September 30, 2006 was due to classification of several spec construction loans. Substandard assets increased from $3.1 million at September 30, 2006 to $5.4 million at September 30, 2007. Our substandard loans at September 30, 2007 consisted primarily of eighteen loans to four individuals totaling $3.8 million secured by spec homes and residential lots. During November 2007, the Bank foreclosed on five of these properties totaling $908,000.
Special mention assets at September 30, 2007 consisted of one loan totaling $1.4 million secured by land for the development of multi-family lots.
Delinquencies. The following table provides information about delinquencies in our loan portfolio at the dates indicated.
| | | At September 30, | |
| | | 2007 | | 2006 | | 2005 | |
| | | 30-59 Days Past Due | | 60-89 Days Past Due | | 30-59 Days Past Due | | 60-89 Days Past Due | | 30-59 Days Past Due | | 60-89 Days Past Due | |
| | | (In thousands) | |
Real estate – mortgage loans | | $ | 155 | | $ | 31 | | $ | 1,533 | | $ | 746 | | $ | ― | | $ | 559 | |
| Construction loans | | | ¾ | | | 2,233 | | | 635 | | | 323 | | | ― | | | 345 | |
| Commercial loans | | | 906 | | | 95 | | | ¾ | | | ¾ | | | ― | | | ― | |
| Consumer loans | | | 97 | | | 10 | | | 83 | | | ¾ | | | 69 | | | 43 | |
| Total | | $ | 1,158 | | $ | 2,369 | | $ | 2,251 | | $ | 1,069 | | $ | 69 | | $ | 947 | |
Analysis and Determination of the Allowance for Loan Losses. The allowance for loan losses is a valuation allowance for probable losses inherent in the loan portfolio. We evaluate the need to establish allowances against losses on loans on a monthly basis. When additional allowances are necessary, a provision for loan losses is charged to earnings.
We establish an allowance on certain identified problem loans based on such factors as (1) the strength of the customer’s personal or business cash flows; (2) the availability of other sources of repayment; (3) the amount due or past due; (4) the type and value of collateral; (5) the strength of our collateral position; (6) the estimated cost to sell the collateral; and (7) the borrower’s effort to cure the delinquency.
In addition, we establish an allowance for loans that are not delinquent to recognize the losses associated with lending activities. This valuation allowance is determined by segregating the loans by loan category and assigning percentages to each category. The percentages are adjusted for significant factors that, in management’s judgment, affect the collectibility of the portfolio as of the evaluation date. These significant factors may include changes in existing general economic and business conditions affecting our primary lending areas and the national economy, staff lending experience, recent loss experience in particular segments of the portfolio, classified asset trends, delinquency trends and risk rating trends. The applied loss factors are reevaluated quarterly to ensure their relevance in the current economic environment.
We identify loans that may need to be charged off as a loss by reviewing all delinquent loans, classified loans and other loans that management may have concerns about collectibility. For individually reviewed loans, the borrower’s inability to make payments under the terms of the loan or a shortfall in collateral value would result in our allocating a portion of the allowance to the loan that was impaired.
The Office of Thrift Supervision, as an integral part of its examination process, periodically reviews our allowance for loan losses. The Office of Thrift Supervision may require us to make additional provisions for loan losses based on judgments different from ours.
At September 30, 2007, our allowance for loan losses represented 1.1% of total gross loans and 87.98% of non-performing loans. The allowance for loan losses increased $867,000 from September 30, 2006 to September 30, 2007 due to a provision for loan losses of $602,000 and recoveries totaling $532,000, partially offset by charge-offs of loans totaling $267,000. There was no material change in the loss factors used to calculate the allowance from September 30, 2006 to September 30, 2007.
At September 30, 2006, our allowance for loan losses represented 0.9% of total gross loans and 50.80% of non-performing loans. The allowance for loan losses increased $382,000 from September 30, 2005 to September 30, 2006 due to a provision for loan losses of $852,000, partially offset by net charge-offs of loans totaling $470,000. There was no material change in the loss factors used to calculate the allowance from September 30, 2005 to September 30, 2006.
The following table sets forth the breakdown of the allowance for loan losses by loan category at the dates indicated. Management believes that the allowance can be allocated by category only on an approximate basis. The allocation of the allowance to each category is not necessarily indicative of future losses and does not restrict the use of the allowance to absorb losses in any category.
| | | At September 30, | |
| | | 2007 | | 2006 | |
| | | Amount | | Percent of Loans in Each Category to Total Gross Loans | | Amount | | Percent of Loans in Each Category to Total Gross Loans | |
| | | (Dollars in thousands) | |
Real estate – mortgage: | | | | | | | | | | | | | |
| Single-family 1-4 units | | $ | 210 | | | 15.64 | % | $ | 200 | | | 18.48 | % |
| Multi-family 5 or more units | | | 75 | | | 4.57 | | | 61 | | | 4.52 | |
| Real estate construction loans | | | 1,941 | | | 47.12 | | | 787 | | | 43.25 | |
| Commercial real estate loans | | | 562 | | | 21.44 | | | 781 | | | 23.13 | |
| Commercial business loans | | | 211 | | | 6.72 | | | 126 | | | 4.89 | |
| Consumer loans | | | 12 | | | 4.51 | | | 189 | | | 5.73 | |
| Total allowance for loan losses | | $ | 3,011 | | | 100.00 | % | $ | 2,144 | | | 100.00 | % |
| | | At September 30, | |
| | | 2005 | | 2004 | | 2003 | |
| | | Amount | | Percent of Loans in Each Category to Total Gross Loans | | Amount | | Percent of Loans in Each Category to Total Gross Loans | | Amount | | Percent of Loans in Each Category to Total Gross Loans | |
| | | (Dollars in thousands) | |
| Real estate – mortgage: | | | | | | | | | | | | | | | | | | | |
| Single-family 1-4 units | | $ | 268 | | | 20.71 | % | $ | 593 | | | 28.71 | % | $ | 159 | | | 36.28 | % |
| Multi-family 5 or more units | | | 102 | | | 8.20 | | | 277 | | | 6.96 | | | 111 | | | 6.77 | |
| Real estate construction loans | | | 565 | | | 42.01 | | | 579 | | | 38.86 | | | 512 | | | 33.40 | |
| Commercial real estate loans | | | 672 | | | 19.74 | | | 423 | | | 16.38 | | | 287 | | | 14.53 | |
| Commercial business loans | | | 65 | | | 2.83 | | | 54 | | | 2.57 | | | 127 | | | 2.73 | |
| Consumer loans | | | 90 | | | 6.51 | | | 98 | | | 6.52 | | | 101 | | | 6.29 | |
| Total allowance for loan losses | | $ | 1,762 | | | 100.00 | % | $ | 2,024 | | | 100.00 | % | $ | 1,297 | | | 100.00 | % |
Although we believe that we use the best information available to establish the allowance for loan losses, future adjustments to the allowance for loan losses may be necessary and our results of operations could be adversely affected if circumstances differ substantially from the assumptions used in making the determinations. Furthermore, while we believe we have established our allowance for loan losses in conformity with U.S. generally accepted accounting principles, there can be no assurance that regulators, in reviewing our loan portfolio, will not request us to increase our allowance for loan losses. In addition, because future events affecting borrowers and collateral cannot be predicted with certainty, there can be no assurance that increases will not be necessary should the quality of any loans deteriorate as a result of the factors discussed above. Any material increase in the allowance for loan losses may adversely affect our financial condition and results of operations.
Analysis of Loan Loss Experience. The following table sets forth an analysis of the Bank’s allowance for loan losses for the years indicated. Where specific loan loss allowances have been established, any difference between the loss allowance and the amount of loss realized has been charged or credited to income.
| | | Years Ended September 30, | |
| | | 2007 | | 2006 | | 2005 | | 2004 | | 2003 | |
| | | | | | | | | | | | |
| Balance at beginning of year | | $ | 2,144 | | $ | 1,762 | | $ | 2,024 | | $ | 1,297 | | $ | 1,067 | |
| | | | | | | | | | | | | | | | | |
| Loans charged-off: | | | | | | | | | | | | | | | | |
| Single-family 1-4 units | | | (82 | ) | | (261 | ) | | (482 | ) | | (132 | ) | | (2 | ) |
| Multi-family 5 or more units | | | ― | | | (113 | ) | | ― | | | ― | | | ― | |
| Real estate construction loans | | | (140 | ) | | (78 | ) | | (197 | ) | | ― | | | ― | |
| Commercial business loans | | | (35 | ) | | ― | | | ― | | | ― | | | ― | |
| Consumer loans | | | (10 | ) | | (20 | ) | | (16 | ) | | (33 | ) | | (14 | ) |
| Total charge-offs | | | (267 | ) | | (472 | ) | | (695 | ) | | (165 | ) | | (16 | ) |
| | | | | | | | | | | | | | | | | |
| Recoveries: | | | | | | | | | | | | | | | | |
| Single-family 1-4 units | | | 511 | | | ― | | | 1 | | | 6 | | | ― | |
| Multi-family 5 or more units | | | 18 | | | ― | | | ― | | | 1 | | | ― | |
| Real estate construction | | | ― | | | 1 | | | ― | | | ― | | | 40 | |
| Consumer loans | | | 3 | | | 1 | | | 2 | | | ― | | | ― | |
| Total recoveries | | | 532 | | | 2 | | | 3 | | | 7 | | | 40 | |
| Net loans charged-off | | | 265 | | | (470 | ) | | (692 | ) | | (158 | ) | | 24 | |
| Provision for loan losses | | | 602 | | | 852 | | | 430 | | | 885 | | | 206 | |
| Balance at end of year | | $ | 3,011 | | $ | 2,144 | | $ | 1,762 | | $ | 2,024 | | $ | 1,297 | |
| Ratio of allowance for losses to gross loans receivable | | | 1.13 | % | | 0.93 | % | | 0.93 | % | | 1.09 | % | | 0.80 | % |
| Ratio of net loan charge-offs (recoveries) to average loans outstanding during the year | | | (0.12 | )% | | 0.25 | % | | 0.40 | % | | 0.09 | % | | (0.02 | )% |
Interest Rate Risk Management. We manage the interest rate sensitivity of our interest-bearing liabilities and interest-earning assets in an effort to minimize the adverse effects of changes in the interest rate environment. Deposit accounts typically react more quickly to changes in market interest rates than mortgage loans because of the shorter maturities of deposits. As a result, sharp increases in interest rates may adversely affect our earnings while decreases in interest rates may beneficially affect our earnings. To reduce the potential volatility of our earnings, we have sought to provide a better match between the interest rate sensitivity of our assets and liabilities. In particular, the strategies utilized by the Bank are intended to stabilize net interest income for the long term by protecting its interest rate spread against increases in interest rates. Such strategies include the origination for portfolio of one-year, adjustable-rate mortgage loans secured by one- to four-family residential real estate and the origination of other loans with greater interest rate sensitivities than long-term, fixed-rate residential mortgage loans. Asset/liability management in the form of structuring the maturity or repricing of cash instruments provides greater flexibility to adjust exposure to interest rates. During periods of high interest rates, management believes it is prudent to offer competitive rates on short-term deposits and less competitive rates for long-term liabilities. This posture allows the Bank to benefit quickly from declines in interest rates. Likewise, offering more competitive rates on long-term deposits during the low interest rate periods allows the Bank to extend the repricing and/or maturity of its liabilities thus reducing its exposure to rising interest rates. We currently do not participate in hedging programs, interest rate swaps or other activities involving the use of derivative financial instruments.
We have an Asset/Liability Management (“ALCO”) Committee, which includes members of management, to communicate, coordinate and control all aspects involving asset/liability management. The committee establishes and monitors the volume, maturities, pricing and mix of assets and funding sources with the objective of managing assets and funding sources to provide results that are consistent with liquidity, growth, risk limits and profitability goals.
Net Portfolio Value Simulation Analysis. We use an interest rate sensitivity analysis prepared by the OTS to review our level of interest rate risk. This analysis measures interest rate risk by computing changes in net portfolio value of our cash flows from assets, liabilities and off-balance sheet items in the event of a range of assumed changes in market interest rates. Net portfolio value represents the market value of portfolio equity and is equal to the market value of assets minus the market value of liabilities, with adjustments made for off-balance sheet items. This analysis assesses the risk of loss in market risk sensitive instruments in the event of a sudden and sustained 50 to 300 basis point increase or 50 to 200 basis point decrease in market interest rates with no effect given to any steps that we might take to counter the effect of that interest rate movement. We measure interest rate risk by modeling the changes in net portfolio value over a variety of interest rate scenarios. The following table, which is based on information that we provide to the OTS, presents the change in our net portfolio value at September 30, 2007 that would occur in the event of an immediate change in interest rates based on OTS assumptions, with no effect given to any steps that we might take to counteract that change.
Change | | Estimated Net Portfolio Value | | NPV as % of PV of Assets | |
(In Basis Points) in Interest Rates | | $ Amount | | $ Change | | % Change | | NPV Ratio | | BP Change | |
| | | (Dollars in thousands) | | | | | |
| | | | | | | | | | | | |
| +300 | | $ | 39,835 | | | (9,198 | ) | | (19 | )% | | 11.87 | % | | (236 | ) |
| +200 | | | 42,833 | | | (6,200 | ) | | (13 | ) | | 12.66 | | | (157 | ) |
| +100 | | | 45,927 | | | (3,106 | ) | | (6 | ) | | 13.45 | | | (78 | ) |
| +50 | | | 47,516 | | | (1,517 | ) | | (3 | ) | | 13.85 | | | (38 | ) |
| 0 | | | 49,033 | | | ¾ | | | ¾ | | | 14.23 | | | ¾ | |
| (50) | | | 50,244 | | | 1,211 | | | 2 | | | 14.52 | | | 29 | |
| (100) | | | 51,465 | | | 2,432 | | | 5 | | | 14.82 | | | 59 | |
| (200) | | | 53,680 | | | 4,647 | | | 9 | | | 15.34 | | | 111 | |
The OTS uses certain assumptions in assessing the interest rate risk of savings associations. These assumptions relate to interest rates, loan prepayment rates, deposit decay rates and the market values of certain assets under differing interest rate scenarios, among others. As with any method of measuring interest rate risk, certain shortcomings are inherent in the method of analysis presented in the foregoing table. For example, although certain assets and liabilities may have similar maturities or periods to repricing, they may react in different degrees to changes in market interest rates. Also, the interest rates on certain types of assets and liabilities may fluctuate in advance of changes in market interest rates, while interest rates on other types may lag behind changes in market rates. Additionally, certain assets, such as adjustable-rate mortgage loans, have features which restrict changes in interest rates on a short-term basis and over the life of the asset. Further, in the event of a change in interest rates, expected rates of prepayments on loans and early withdrawals from certificates could deviate significantly from those assumed in calculating the table.
Liquidity Management. Liquidity is the ability to meet current and future financial obligations of a short-term nature. Our primary sources of funds consist of deposit inflows, loan repayments, maturities and sales of securities and borrowings from the Federal Home Loan Bank of Des Moines. While maturities and scheduled amortization of loans and securities are predictable sources of funds, deposit flows and loan prepayments are greatly influenced by general interest rates, economic conditions and competition.
We regularly adjust our investments in liquid assets based upon our assessment of expected loan demand, expected deposit flows, yields available on interest-earning deposits and securities and the objectives of our asset/liability management policy.
Our most liquid assets are cash and cash equivalents. The levels of these assets depend on our operating, financing, lending and investing activities during any given period. At September 30, 2007, cash and cash equivalents amounted to $9.0 million. Securities classified as available for sale, which provide additional sources of liquidity, totaled $48.0 million at September 30, 2007. In addition, at September 30, 2007, we had the ability to borrow an additional amount of approximately $37.9 million from the Federal Home Loan Bank of Des Moines, in the form of available overnight lines of credit. On that date, we had 2.0 million in overnight advances outstanding.
At September 30, 2007, we had $78.1 million in loan commitments outstanding, which included $31.3 million in undisbursed loans and $13.2 million in unused lines of credit. Certificates of deposit due within one year of September 30, 2007 totaled $126.6 million, or 89.4% of certificates of deposit. We believe the large percentage of certificates of deposit that mature within one year reflects customers’ hesitancy to invest their funds for long periods in the current interest rate environment. If these maturing deposits do not remain with us, we will be required to seek other sources of funds, including other certificates of deposit and borrowings. Depending on market conditions, we may be required to pay higher rates on such deposits or other borrowings than we currently pay on the certificates of deposit due on or before September 30, 2008. We believe, however, based on past experience, that a significant portion of our certificates of deposit will remain with us. We have the ability to attract and retain deposits by adjusting the interest rates offered.
The following table presents certain of our contractual obligations as of September 30, 2007.
| | | Payments due by period | |
| | | Total | | Less than One Year | | One to Three Years | | Three to Five Years | | More Than 5 Years | |
| | | (In thousands) | |
| | | | | | | | | | | | |
| Federal Home Loan Bank advances | | $ | 26,430 | | $ | 22,055 | | $ | 200 | | $ | 4,175 | | $ | ¾ | |
| Securities sold under agreement to repurchase | | | 1,221 | | | 681 | | | 540 | | | ¾ | | | ¾ | |
| Operating lease obligations | | | 1,392 | | | 92 | | | 183 | | | 193 | | | 924 | |
| Total | | $ | 29,043 | | $ | 22,828 | | $ | 923 | | $ | 4,368 | | $ | 924 | |
Our primary investing activities are the origination and purchase of loans and the purchase of securities. Our primary financing activities consist of activity in deposit accounts and Federal Home Loan Bank advances. Deposit flows are affected by the overall level of interest rates, the interest rates and products offered by us and our local competitors and other factors. We generally manage the pricing of our deposits to be competitive and to increase core deposit relationships. We offer promotional rates on certain deposit products to attract deposits.
The following table presents our primary investing and financing activities during the years indicated.
| | | Years Ended September 30, | |
| | | 2007 | | 2006 | | 2005 | |
| | | | |
| Investing activities: | | | | | | | | | | |
| Net change in loans receivable | | $ | (35,402 | ) | $ | (40,028 | ) | $ | (5,727 | ) |
| Purchases of securities (1) | | | (16,946 | ) | | (22,529 | ) | | (28,613 | ) |
| Proceeds from calls, maturities and principal repayments of securities (1) | | | 10,579 | | | 11,486 | | | 12,950 | |
| Proceeds from sales of securities (1) | | | — | | | — | | | 1,884 | |
| Financing activities: | | | | | | | | | | |
| Increase (decrease) in deposits | | | 53,835 | | | 16,854 | | | 28,688 | |
| Increase (decrease) in Federal Home Loan Bank borrowings | | | (7,633 | ) | | 3,567 | | | (6,633 | ) |
(1) Includes mortgaged-backed securities.
Capital Management. We are subject to various regulatory capital requirements administered by the OTS, including a risk-based capital measure. The risk-based capital guidelines include both a definition of capital and a framework for calculating risk-weighted assets by assigning balance sheet assets and off-balance sheet items to broad risk categories. At September 30, 2007, the Bank exceeded all of its regulatory capital requirements. The Bank is considered “well capitalized” under regulatory guidelines
Off-Balance Sheet Arrangements. In the normal course of operations, we engage in a variety of financial transactions that, in accordance with U.S. generally accepted accounting principles, are not recorded in our consolidated financial statements. These transactions involve, to varying degrees, elements of credit, interest rate and liquidity risk. Such transactions are used primarily to manage customers’ requests for funding and take the form of loan commitments and lines of credit. For information about our loan commitments and unused lines of credit, see note 14 of the notes to consolidated financial statements. We currently have no plans to engage in hedging activities in the future.
For the year ended September 30, 2007, we engaged in no off-balance sheet transactions reasonably likely to have a material effect on our financial condition, results of operations or cash flows.
Impact of Recent Accounting Pronouncements
The impact of recent accounting pronouncements is discussed in note 1 of the notes to consolidated financial statements included herewith.
MICHAEL TROKEY & COMPANY, P.C.
CERTIFIED PUBLIC ACCOUNTANTS
10411 CLAYTON ROAD
ST. LOUIS, MISSOURI 63131
Report of Independent Registered Public Accounting Firm
Audit Committee, Board of Directors and Stockholders
Liberty Bancorp, Inc.
Liberty, Missouri
We have audited the accompanying consolidated balance sheets of Liberty Bancorp, Inc. and subsidiary (“the Company”) as of September 30, 2007 and 2006 and the related consolidated statements of earnings, comprehensive earnings, stockholders' equity, and cash flows for each of the three years in the period ended September 30, 2007. These financial statements are the responsibility of the Company’s management. Our responsibility is to express an opinion on these financial statements based on our audits.
We conducted our audits in accordance with standards of the Public Company Accounting Oversight Board (United States). Those standards require that we plan and perform the audit to obtain reasonable assurance about whether the financial statements are free of material misstatement. An audit includes examining, on a test basis, evidence supporting the amounts and disclosures in the financial statements. An audit also includes assessing the accounting principles used and significant estimates made by management, as well as evaluating the overall financial statement presentation. We believe that our audits provide a reasonable basis for our opinion.
In our opinion, the consolidated financial statements referred to above present fairly, in all material respects, the financial position of Liberty Bancorp, Inc. and subsidiary as of September 30, 2007 and 2006, and the results of their operations and their cash flows for each of the three years in the period ended September 30, 2007 in conformity with U.S. generally accepted accounting principles.
/s/ Michael Trokey & Company, P.C.
St. Louis, Missouri
December 20, 2007
Consolidated Balance Sheets
September 30, 2007 and 2006
| | | 2007 | | 2006 | |
Assets | | | | | | | |
| Cash and cash equivalents | | $ | 6,502,289 | | | 6,943,701 | |
| Federal funds sold | | | 2,540,000 | | | 6,460,000 | |
| Total cash and cash equivalents | | | 9,042,289 | | | 13,403,701 | |
| Securities available for sale, at market value (amortized cost of $47,789,202 and $36,146,235, respectively) | | | 47,982,519 | | | 35,882,630 | |
| Stock in Federal Home Loan Bank of Des Moines | | | 1,531,200 | | | 1,952,900 | |
| Mortgage-backed securities: | | | | | | | |
| Available for sale, at market value (amortized cost of $19,620,825 and $24,863,446, respectively) | | | 19,276,996 | | | 24,217,321 | |
| Loans receivable, net of allowance for loan losses of $3,010,904 and $2,144,121, respectively | | | 232,307,925 | | | 200,222,378 | |
| Loans held for sale | | | 719,086 | | | 459,201 | |
| Premises and equipment, net | | | 8,744,846 | | | 6,700,189 | |
| Bank-owned life insurance (BOLI) | | | 8,101,192 | | | | |
| Foreclosed real estate, net | | | 1,675,871 | | | 1,579,848 | |
| Accrued interest receivable | | | 2,055,814 | | | 1,486,355 | |
| Other assets | | | 214,823 | | | 182,242 | |
| Deferred tax asset | | | 1,533,426 | | | 1,474,600 | |
| Total assets | | $ | 333,185,987 | | | 287,561,365 | |
| | | | | | | | |
Liabilities and Stockholders' Equity | | | | | | | |
| Deposits | | $ | 252,305,482 | | | 198,470,979 | |
| Accrued interest payable on deposits | | | 601,285 | | | 316,366 | |
| Advances from FHLB | | | 26,430,394 | | | 34,063,738 | |
| Securities sold under agreement to repurchase | | | 1,221,184 | | | 3,383,997 | |
| Advances from borrowers for taxes and insurance | | | 905,606 | | | 843,512 | |
| Other liabilities | | | 1,439,195 | | | 1,340,470 | |
| Accrued income taxes | | | 88,308 | | | 160,727 | |
| Total liabilities | | | 282,991,454 | | | 238,579,789 | |
| Commitments and contingencies | | | | | | | |
| Stockholders' equity: | | | | | | | |
| Preferred stock, $0.01 par value; 1,000,000 shares authorized; shares issued and outstanding - none | | | | | | | |
| Common stock, $0.01 par value; 20,000,000 shares authorized; 4,761,187 and 4,760,137 shares issued and outstanding | | | 47,612 | | | 47,601 | |
| Additional paid-in capital | | | 31,923,289 | | | 33,001,965 | |
| Common stock acquired by ESOP | | | (701,309 | ) | | (933,192 | ) |
| Common stock acquired by Incentive Plan | | | | | | (18,676 | ) |
| Accumulated other comprehensive earnings, net | | | (12,619 | ) | | (573,130 | ) |
| Retained earnings - substantially restricted | | | 18,937,560 | | | 17,457,008 | |
| Total stockholders' equity | | | 50,194,533 | | | 48,981,576 | |
| Total liabilities and stockholders' equity | | $ | 333,185,987 | | | 287,561,365 | |
See accompanying notes to consolidated financial statements.
LIBERTY BANCORP, INC.
Consolidated Statements of Earnings
Years Ended September 30, 2007, 2006 and 2005
| | | 2007 | | 2006 | | 2005 | |
| Interest income: | | | | | | | |
| Loans receivable | | $ | 17,233,026 | | | 14,252,869 | | | 11,354,201 | |
| Mortgage-backed securities | | | 933,469 | | | 995,097 | | | 808,336 | |
| Securities - taxable | | | 1,714,706 | | | 944,316 | | | 373,563 | |
| Securities - non-taxable | | | 361,092 | | | 225,101 | | | 89,103 | |
| Other interest-earning assets | | | 320,881 | | | 246,458 | | | 190,615 | |
| Total interest income | | | 20,563,174 | | | 16,663,841 | | | 12,815,818 | |
| Interest expense: | | | | | | | | | | |
| Deposits | | | 9,084,278 | | | 6,006,960 | | | 3,978,568 | |
| Securities sold under agreement to repurchase | | | 77,323 | | | 70,787 | | | 29,776 | |
| ESOP note payable | | | | | | 25,068 | | | 24,612 | |
| Advances from FHLB | | | 1,332,527 | | | 1,496,864 | | | 1,142,249 | |
| Total interest expense | | | 10,494,128 | | | 7,599,679 | | | 5,175,205 | |
| Net interest income | | | 10,069,046 | | | 9,064,162 | | | 7,640,613 | |
| Provision for loan losses | | | 602,089 | | | 852,000 | | | 430,000 | |
| Net interest income after provision for loan losses | | | 9,466,957 | | | 8,212,162 | | | 7,210,613 | |
| Noninterest income: | | | | | | | | | | |
| Loan service charges | | | 89,507 | | | 68,700 | | | 53,251 | |
| Gain on sale of MBSs available for sale | | | | | | | | | 9,711 | |
| Gain on sale of loans | | | 247,339 | | | 202,992 | | | 193,812 | |
| Change in cash surrender value of BOLI | | | 101,192 | | | | | | | |
| Deposit account service charges | | | 1,039,412 | | | 965,234 | | | 942,892 | |
| Total noninterest income | | | 1,477,450 | | | 1,236,926 | | | 1,199,666 | |
| Noninterest expense: | | | | | | | | | | |
| Compensation and benefits | | | 4,445,083 | | | 3,974,833 | | | 3,302,387 | |
| Occupancy expense | | | 624,759 | | | 508,583 | | | 433,148 | |
| Equipment and data processing expense | | | 798,133 | | | 739,676 | | | 770,155 | |
| Operations from foreclosed real estate, net | | | 356,348 | | | 138,980 | | | (21,837 | ) |
| Federal deposit insurance premiums | | | 41,048 | | | 23,794 | | | 22,529 | |
| Professional and regulatory services | | | 407,760 | | | 346,821 | | | 305,327 | |
| Advertising | | | 254,930 | | | 413,923 | | | 314,449 | |
| Correspondent banking charges | | | 260,576 | | | 260,175 | | | 215,562 | |
| Supplies | | | 137,693 | | | 182,662 | | | 140,802 | |
| Other | | | 719,683 | | | 613,706 | | | 582,095 | |
| Total noninterest expense | | | 8,046,013 | | | 7,203,153 | | | 6,064,617 | |
| Earnings before income taxes | | | 2,898,394 | | | 2,245,935 | | | 2,345,662 | |
| Income taxes: | | | | | | | | | | |
| Current | | | 1,338,000 | | | 926,000 | | | 675,000 | |
| Deferred | | | (384,000 | ) | | (143,000 | ) | | 166,000 | |
| Total income taxes | | | 954,000 | | | 783,000 | | | 841,000 | |
| Net earnings | | $ | 1,944,394 | | | 1,462,935 | | | 1,504,662 | |
| | | | | | | | | | | |
| Basic earnings per share | | $ | 0.42 | | | 0.32 | | | 0.32 | |
| Diluted earnings per share | | $ | 0.42 | | | 0.31 | | | 0.32 | |
See accompanying notes to consolidated financial statements.
LIBERTY BANCORP, INC.
Consolidated Statements of Comprehensive Earnings
Years Ended September 30, 2007, 2006 and 2005
| | | 2007 | | 2006 | | 2005 | |
| | | | | | | | |
| Net earnings | | $ | 1,944,394 | | | 1,462,935 | | | 1,504,662 | |
| Other comprehensive earnings: | | | | | | | | | | |
| Unrealized gain (loss) on securities and MBSs available for sale, net: | | | | | | | | | | |
| Reclassification adjustment for gains included in earnings, net of tax of $0, $0 and $3,399, respectively | | | - | | | - | | | (6,312 | ) |
| Unrealized gains (losses) arising during the year, net of tax of $280,911, $137,114, and $178,222, respectively. | | | 478,307 | | | (233,465 | ) | | (303,460 | ) |
| Adjustment to initially apply SFAS Statement No. 158, net of tax of $44,264 | | | 82,204 | | | - | | | - | |
| Comprehensive earnings | | $ | 2,504,905 | | | 1,229,470 | | | 1,194,890 | |
See accompanying notes to consolidated financial statements.
LIBERTY BANCORP, INC.
Consolidated Statements of Stockholders’ Equity
Years Ended September 30, 2007, 2006 and 2005
| | | | | | | Common | | Common | | | | Accumulated | | | |
| | | | | Additional | | Stock | | Stock | | | | Other | | Total | |
| | | Common | | Paid-In | | Acquired | | Acquired by | | Retained | | Comprehensive | | Stockholders' | |
| | | Stock | | Capital | | by ESOP | | Incentive Plan | | Earnings | | Earnings, Net | | Equity | |
| | | | | | | | | | | | | | | | |
| Balance at September 30, 2004 | | $ | 1,354,576 | | | 3,987,154 | | | (404,878 | ) | | (74,668 | ) | | 15,351,468 | | | (29,893 | ) | | 20,183,759 | |
| | | | | | | | | | | | | | | | | | | | | | | |
| Shares acquired by ESOP | | | - | | | - | | | (53,847 | ) | | - | | | - | | | - | | | (53,847 | ) |
| Shares issued under stock-based incentive plan | | | 3,200 | | | 71,075 | | | - | | | - | | | - | | | - | | | 74,275 | |
| Amortization of ESOP award | | | - | | | 48,759 | | | 80,045 | | | - | | | - | | | - | | | 128,804 | |
| Amortization of stock awards | | | - | | | - | | | - | | | 27,996 | | | - | | | - | | | 27,996 | |
| Unrealized loss on securities available for sale, net | | | - | | | - | | | - | | | - | | | - | | | (309,772 | ) | | (309,772 | ) |
| Cash dividends of $.23 per share | | | - | | | - | | | - | | | - | | | (425,181 | ) | | - | | | (425,181 | ) |
| Net earnings | | | - | | | - | | | - | | | - | | | 1,504,662 | | | - | | | 1,504,662 | |
| | | | | | | | | | | | | | | | | | | | | | | |
| Balance at September 30, 2005 | | | 1,357,776 | | | 4,106,988 | | | (378,680 | ) | | (46,672 | ) | | 16,430,949 | | | (339,665 | ) | | 21,130,696 | |
| | | | | | | | | | | | | | | | | | | | | | | |
| Refinance of ESOP | | | - | | | - | | | 412,316 | | | - | | | - | | | - | | | 412,316 | |
| Shares acquired by ESOP | | | - | | | - | | | (33,714 | ) | | - | | | - | | | - | | | (33,714 | ) |
| Shares issued under stock-based incentive plan | | | 100 | | | 2,300 | | | - | | | - | | | - | | | - | | | 2,400 | |
| Amortization of ESOP award | | | - | | | 72,065 | | | 234,882 | | | - | | | - | | | - | | | 306,947 | |
| Amortization of stock awards | | | - | | | - | | | - | | | 27,996 | | | - | | | - | | | 27,996 | |
| Unrealized loss on securities available for sale, net | | | - | | | - | | | - | | | - | | | - | | | (233,465 | ) | | (233,465 | ) |
| Issuance and exchange of common stock | | | (1,310,275 | ) | | 28,820,612 | | | (1,167,996 | ) | | - | | | - | | | - | | | 26,342,341 | |
| Cash dividends of $.20 per share | | | - | | | - | | | - | | | - | | | (436,876 | ) | | - | | | (436,876 | ) |
| Net earnings | | | - | | | - | | | - | | | - | | | 1,462,935 | | | - | | | 1,462,935 | |
| | | | | | | | | | | | | | | | | | | | | | | |
| Balance at September 30, 2006 | | $ | 47,601 | | | 33,001,965 | | | (933,192 | ) | | (18,676 | ) | | 17,457,008 | | | (573,130 | ) | | 48,981,576 | |
| | | | | | | | | | | | | | | | | | | | | | | |
| Shares issued under stock-based incentive plan | | | 11 | | | 8,684 | | | - | | | - | | | - | | | - | | | 8,695 | |
| Amortization of ESOP award | | | - | | | 100,852 | | | 231,883 | | | - | | | - | | | - | | | 332,735 | |
| Reclass to apply SFAS No. 123(R) | | | - | | | (18,676 | ) | | - | | | 18,676 | | | - | | | - | | | - | |
| Amortization of stock awards | | | - | | | 162,519 | | | - | | | - | | | - | | | - | | | 162,519 | |
| Amortization of stock option grants | | | - | | | 67,553 | | | - | | | - | | | - | | | - | | | 67,553 | |
| Unrealized gain on securities available for sale, net | | | - | | | - | | | - | | | - | | | - | | | 478,307 | | | 478,307 | |
| Unrealized gain to initally apply SFAS No. 158, net | | | - | | | - | | | - | | | - | | | - | | | 82,204 | | | 82,204 | |
| Repurchase of common stock for incentive stock award plan | | | - | | | (1,399,608 | ) | | - | | | - | | | - | | | - | | | (1,399,608 | ) |
| Cash dividends of $.10 per share | | | - | | | - | | | - | | | - | | | (463,842 | ) | | - | | | (463,842 | ) |
| Net earnings | | | - | | | - | | | - | | | - | | | 1,944,394 | | | - | | | 1,944,394 | |
| | | | | | | | | | | | | | | | | | | | | | | |
| Balance at September 30, 2007 | | $ | 47,612 | | | 31,923,289 | | | (701,309 | ) | | - | | | 18,937,560 | | | (12,619 | ) | | 50,194,533 | |
See accompanying notes to consolidated financial statements.
LIBERTY BANCORP, INC.
Consolidated Statements of Cash Flows
Years Ended September 30, 2007, 2006 and 2005
| | | 2007 | | 2006 | | 2005 | |
| Cash flows from operating activities: | | | | | | | |
| Net earnings | | $ | 1,944,394 | | | 1,462,935 | | | 1,504,662 | |
| Adjustments to reconcile net earnings to net cash provided by (used for) operating activities: | | | | | | | | | | |
| Depreciation expense | | | 463,259 | | | 444,591 | | | 405,246 | |
| ESOP expense | | | 332,735 | | | 306,947 | | | 128,804 | |
| Incentive Plan expense | | | 230,072 | | | 27,996 | | | 27,996 | |
| Amortization of premiums on investments, net | | | (32,714 | ) | | 75,149 | | | 174,551 | |
| Amortization of unearned discount on loans and deferred loan fees, net | | | (294,752 | ) | | (441,229 | ) | | (428,290 | ) |
| Provision for loan losses | | | 602,089 | | | 852,000 | | | 430,000 | |
| Loans held for sale - originated | | | (20,353,682 | ) | | (17,655,681 | ) | | (21,139,599 | ) |
| Loans held for sale - proceeds from sale | | | 20,341,136 | | | 19,484,202 | | | 20,325,568 | |
| Gain on sale of loans | | | (247,339 | ) | | (202,992 | ) | | (193,812 | ) |
| Increase in cash surrender value of bank-owned life insurance | | | (101,192 | ) | | - | | | - | |
| Gain on sale of MBSs available for sale | | | - | | | - | | | (9,711 | ) |
| Loss (gain) on foreclosed real estate, net | | | 288,045 | | | 89,170 | | | (77,417 | ) |
| Decrease (increase) in: | | | | | | | | | | |
| Accrued interest receivable | | | (569,459 | ) | | (398,965 | ) | | (242,428 | ) |
| Other assets | | | (32,581 | ) | | 68,822 | | | (84,398 | ) |
| Deferred tax assets | | | (384,000 | ) | | (143,000 | ) | | 166,000 | |
| Increase (decrease) in: | | | | | | | | | | |
| Accrued interest on deposits and other liabilities | | | 510,112 | | | 232,568 | | | 276,375 | |
| Accrued income taxes | | | (72,419 | ) | | 160,727 | | | (19,869 | ) |
| Net cash provided by (used for) operating activities | | | 2,623,704 | | | 4,363,240 | | | 1,243,678 | |
| Cash flows from investing activities: | | | | | | | | | | |
| Net change in loans receivable | | | (35,401,657 | ) | | (40,028,140 | ) | | (5,726,621 | ) |
| Mortgage-backed securities: | | | | | | | | | | |
| Available for sale - purchased | | | - | | | (3,451,940 | ) | | (13,754,551 | ) |
| Available for sale - principal collections | | | 5,228,574 | | | 6,121,149 | | | 7,306,606 | |
| Available for sale - proceeds | | | - | | | - | | | 1,883,700 | |
| Held to maturity - principal collections | | | - | | | - | | | 68,785 | |
| Securities available for sale: | | | | | | | | | | |
| Purchase | | | (16,946,207 | ) | | (19,076,689 | ) | | (14,858,794 | ) |
| Proceeds from maturity or call | | | 5,350,000 | | | 5,365,000 | | | 5,575,000 | |
| Purchase of stock in FHLB of Des Moines | | | (1,300,100 | ) | | (1,599,700 | ) | | (642,000 | ) |
| Redemption of stock in FHLB of Des Moines | | | 1,721,800 | | | 1,326,000 | | | 855,300 | |
| Proceeds from the sale of foreclosed real estate, net | | | 2,624,705 | | | 3,098,369 | | | 817,034 | |
| Purchase of premises and equipment | | | (2,507,916 | ) | | (1,212,591 | ) | | (2,094,112 | ) |
| Purchase of bank-owned life insurance policy | | | (8,000,000 | ) | | - | | | - | |
| Net cash provided by (used for) investing activities | | $ | (49,230,801 | ) | | (49,458,542 | ) | | (20,569,653 | ) |
(Continued)
LIBERTY BANCORP, INC.
Consolidated Statements of Cash Flows
Years Ended September 30, 2007, 2006 and 2005
(Continued)
| | | 2007 | | 2006 | | 2005 | |
| | | | | | | | |
| Cash flows from financing activities: | | | | | | | |
| Net increase (decrease) in deposits | | $ | 53,834,503 | | | 16,854,325 | | | 28,687,793 | |
| Increase (decrease) in advances from borrowers for taxes and insurance | | | 62,094 | | | (30,127 | ) | | (98,272 | ) |
| Proceeds from advances from the FHLB | | | 276,100,000 | | | 377,950,000 | | | 35,750,000 | |
| Repayment of advances from the FHLB | | | (283,733,344 | ) | | (374,383,344 | ) | | (42,383,344 | ) |
| Securities sold under agreement to repurchase: | | | | | | | | | | |
| Proceeds | | | 51,974,878 | | | 55,243,591 | | | 32,101,202 | |
| Repayments | | | (54,137,691 | ) | | (53,514,345 | ) | | (31,140,405 | ) |
| Repayment of ESOP note payable | | | - | | | - | | | (80,439 | ) |
| Proceeds from exercise of stock options | | | 8,695 | | | 2,400 | | | 74,275 | |
| Issuance and exchange of common stock | | | - | | | 26,342,341 | | | - | |
| Repurchase of common stock for stock award plan | | | (1,399,608 | ) | | - | | | - | |
| Cash dividends | | | (463,842 | ) | | (436,876 | ) | | (425,181 | ) |
| Net cash provided by (used for) financing activities | | | 42,245,685 | | | 48,027,965 | | | 22,485,629 | |
| Net increase (decrease) in cash and cash equivalents | | | (4,361,412 | ) | | 2,932,663 | | | 3,159,654 | |
| Cash and cash equivalents at beginning of year | | | 13,403,701 | | | 10,471,038 | | | 7,311,384 | |
| Cash and cash equivalents at end of year | | $ | 9,042,289 | | | 13,403,701 | | | 10,471,038 | |
| | | | | | | | | | | |
| Supplemental disclosures of cash flow information: | | | | | | | | | | |
| Cash paid (received) during the year for: | | | | | | | | | | |
| Interest on deposits | | $ | 8,799,195 | | | 5,913,587 | | | 3,863,868 | |
| Interest on ESOP note payable | | | - | | | 25,068 | | | 24,612 | |
| Interest on advances from FHLB of Des Moines | | | 1,329,586 | | | 1,482,973 | | | 1,142,249 | |
| Interest on securities sold under agreement to repurchase | | | 77,487 | | | 70,517 | | | 29,776 | |
| Federal income taxes | | | 1,285,000 | | | 685,000 | | | 650,000 | |
| State income taxes | | | 126,889 | | | 44,631 | | | 80,511 | |
| Real estate acquired in settlement of loans | | | 5,383,483 | | | 3,237,801 | | | 1,721,750 | |
| Loans originated to finance the sale of foreclosed real estate | | | 2,374,710 | | | - | | | - | |
| Transfer of securities and MBSs held to maturity to available for sale | | | - | | | - | | | 1,308,092 | |
See accompanying notes to consolidated financial statements.
LIBERTY BANCORP, INC.
Notes to Consolidated Financial Statements
September 30, 2007 and 2006 and
Years Ended September 30, 2007, 2006 and 2005
(1) Summary of Significant Accounting Policies
Liberty Bancorp, Inc. (the “Company” or “Liberty Bancorp”) was organized as a Missouri corporation at the direction of BankLiberty, formerly “Liberty Savings Bank, F.S.B.” (the “Bank” or “BankLiberty”), in February 2006 to become the holding company for the Bank upon the completion of the “second-step” mutual-to-stock conversion (the “Conversion”) of Liberty Savings Mutual Holding Company (the “MHC”). The Conversion was completed on July 21, 2006. As part of the Conversion, the MHC merged into the Bank, thereby ceasing to exist, and Liberty Savings Bank, F.S.B. changed its name to “BankLiberty.” A total of 2,807,383 shares of common stock were sold in the stock offering at the price of $10.00 per share. In addition, a total of 1,952,754 shares of common stock were issued to the minority shareholders of the former Liberty Savings Bank, F.S.B. representing an exchange ratio of 3.5004 shares of Company common stock for each share of Liberty Savings Bank, F.S.B. common stock. Fractional shares in the aggregate, or 36 shares, were redeemed for cash. Total shares outstanding after the stock offering and the exchange totaled 4,760,137 shares. Net proceeds of $25.6 million were raised in the stock offering, excluding $1.2 million which was loaned by the Company to a trust for the Employee Stock Ownership Plan (the “ESOP”), enabling it to finance 153,263 shares of common stock in the offering and exchange. Direct offering costs totaled approximately $1.3 million. In addition, as part of the Conversion and dissolution of Liberty Savings Mutual Holding Company, the Bank received approximately $694,000 of cash previously held by the MHC.
The following comprise the significant accounting policies, which the Company and Bank follow in preparing and presenting their consolidated financial statements:
| a. | The consolidated financial statements include the accounts of the Company and its wholly-owned subsidiary, BankLiberty. The Company’s principal business is the business of the Bank. All significant intercompany accounts and transactions have been eliminated. |
| b. | For purposes of reporting cash flows, cash and cash equivalents include cash and due from banks and interest-bearing funds in other banks with original maturities of three months or less. Interest-bearing funds in other banks were $7,175,110 and $11,442,192 at September 30, 2007 and 2006, respectively. A restricted cash deposit of $560,510 related to clearing of checks was held in a correspondent bank at September 30, 2007 and 2006. |
| c. | Certificates of deposit are carried at cost and have original maturities of more than three months. |
| d. | Securities and mortgage-backed securities that the Bank has the positive intent and ability to hold to maturity are classified as held to maturity securities and reported at cost, adjusted for amortization of premiums and accretion of discounts over the life of the security using the interest method. Securities and mortgage-backed securities not classified as held to maturity securities are classified as available for sale securities and are reported at fair value, with unrealized gains and losses excluded from net earnings and reported as a separate component of stockholders' equity. The bank does not purchase securities and mortgage-backed securities for trading purposes. |
LIBERTY BANCORP, INC.
Notes to Consolidated Financial Statements
The cost of securities sold is determined by specific identification. Declines in fair value of securities and mortgage-backed securities available for sale that are deemed to be other-than-temporary are charged to earnings as a realized loss. In estimating other-than-temporary impairment losses, management of the Bank considers the length of time and the extent to which the fair value has been less than cost, the financial condition and near-term prospects of the issuer, and the intent and ability of the Bank to retain its investment in the issuer for a period of time to allow for any anticipated recovery in fair value. Stock in the Federal Home Loan Bank of Des Moines is recorded at cost, which represents redemption value. Dividends received on such stock are reported as income. The Bank is a member of the Federal Home Loan Bank system. The required investment in the common stock is based upon a certain percentage of the Bank’s assets and FHLB advances.
Collateralized mortgage obligations (“CMOs”) are mortgage derivatives and the type owned by the Bank is classified as “low risk” under regulatory guidelines. CMOs are subject to the effects of interest rate risk. The Bank does not purchase CMOs at any significant premium over par value to limit certain prepayment risks.
| e. | Loans receivable, net are carried at unpaid principal balances, less loans in process, net deferred loan fees, unearned discount and allowance for losses. |
Loans originated and held for sale in the secondary market are carried at the lower of cost or estimated market value in the aggregate. Net unrealized losses are recognized through a valuation allowance by charges to income. Gain on sale of loans is recognized once title has passed to the purchaser, substantially all risks and rewards of ownership have irrevocably passed to the purchaser and recourse obligations, if any, are minor and can be reasonably estimated. Loan origination and commitment fees and certain direct loan origination costs are deferred and amortized to interest income over the contractual life of the loan using the interest method.
| f. | Valuation allowances are established for impaired loans for the difference between the loan amount and the fair value of collateral less estimated selling costs. The Bank considers a loan to be impaired when, based on current information and events, it is probable that the Bank will be unable to collect all amounts due according to the contractual terms of the loan agreement on a timely basis. The types of loans for which impairment is measured include nonaccrual income property loans (excluding those loans included in the homogenous portfolio which are collectively reviewed for impairment), large, nonaccrual single-family loans and troubled debt restructurings. Such loans are generally placed on nonaccrual status at the point deemed uncollectible. Impairment losses are recognized through an increase in the allowance for loan losses. A loan is considered delinquent when a payment has not been made by the contractual due date. See note 5 for information regarding impaired loans at September 30, 2007, 2006 and 2005. |
| g. | Allowances for losses are available to absorb losses incurred on loans and foreclosed real estate held for sale and represent additions charged to expense, less net charge-offs. Loans are charged-off in the period deemed uncollectible. Recoveries of loans previously charged off are recorded when received. The allowances are evaluated on a regular basis by management and are based on management's periodic review of the collectibility of loans, in light of historical experience, fair value of the underlying collateral, changes in the types and mix of loans originated and prevailing economic conditions. |
| h. | Premises and equipment are carried at cost, less accumulated depreciation. Depreciation of premises and equipment is computed using the straight-line method based on the estimated useful lives of the related assets. Estimated lives are five to forty years for buildings and improvements, and three to ten years for furniture and equipment. |
LIBERTY BANCORP, INC.
Notes to Consolidated Financial Statements
| i. | Foreclosed real estate is carried at the lower of cost or fair value less estimated selling costs based upon an appraisal of the property. Costs related to improvement of real estate are capitalized. Foreclosed assets also include properties for which the Bank has taken physical possession, even though formal foreclosure proceedings have not taken place. |
| j. | Interest on securities, mortgage-backed securities and loans receivable is accrued as earned. Interest on loans receivable contractually delinquent is excluded from income when deemed uncollectible. When a loan is classified as nonaccrual, accrued interest is reversed against current income. Subsequent collection of interest on nonaccrual loans is recorded as income when received or applied to reduce the loan balance. Accrual of interest is resumed on previously classified nonaccrual loans, when there is no longer any reasonable doubt as to the timely collection of interest. Accrued interest receivable as of September 30, 2007 and 2006 is summarized as follows: |
| | | 2007 | | 2006 | |
| | | | | | |
| Securities | | $ | 578,482 | | | 326,186 | |
| Mortgage-backed securities | | | 82,152 | | | 103,751 | |
| Loans receivable | | | 1,395,180 | | | 1,056,418 | |
| | | $ | 2,055,814 | | | 1,486,355 | |
| k. | Bank owned life insurance is carried at the cash surrender value. Changes in the cash surrender value, including interest income, increases and decreases in value and policy expenses, are recognized as a component of noninterest income. |
| l. | Deferred income tax assets and liabilities are computed for differences between the financial statement and tax bases of assets and liabilities which will result in taxable or deductible amounts in the future based on enacted tax laws and rates applicable to the periods in which the differences are expected to affect income. Valuation allowances are established when necessary to reduce deferred tax assets to the amount that will more likely than not be realized. Income tax expense is the tax payable or refundable for the period plus or minus the net change in the deferred tax assets and liabilities. |
| m. | On October 1, 2006, the Company adopted Statement of Financial Accounting Standards (“SFAS”) No. 123 (revised 2004) (SFAS No. 123 (R)), “Share-Based Payment,” using the modified prospective method. Prior periods have not been restated. |
Under this method, compensation expense is recognized based on the fair value of unvested stock awards at the implementation date of SFAS No. 123 (R) and new awards granted thereafter, which includes restricted stock and stock options, at the grant date and is recognized on a straight-line basis over the requisite service period. The fair value of stock options is estimated at the date of grant using the Black-Scholes pricing model and related assumptions. The risk-free rate is based on the U.S. Treasury zero-coupon issue with a remaining term equal to the expected term used as an assumption in the model. The expected term is based upon the average of the original contractual term and the vesting term. Since the Company is a relatively new, fully public entity, the expected volatility is based upon the expected volatility of similar fully public entities.
Prior to October 1, 2006, the Company applied the intrinsic value method of accounting for stock-based compensation expense under APB 25 and adopted the disclosure requirements under SFAS No. 123. Under the intrinsic value method no compensation expense was recognized in the financial statements since the exercise price of the Company’s stock was equal to the market price of the stock at the grant date. See also note 12.
LIBERTY BANCORP, INC.
Notes to Consolidated Financial Statements
| n. | For ESOP shares committed to be released, the Bank recognizes compensation expense equal to the average fair value of the shares committed to be released during the period in accordance with the provisions of Statement of Position 93-6. |
| o. | Earnings per share are based upon the weighted-average shares outstanding. Weighted-average shares outstanding for periods prior to the July 21, 2006 conversion date have been adjusted by the exchange ratio of 3.5004 to calculate earnings per share. ESOP shares, which have been committed to be released, are considered outstanding and stock options to the extent dilutive. |
| | | | Following is a summary of basic and diluted earnings per common share for the years ended September 30, 2007, 2006 and 2005. |
| | | 2007 | | 2006 | | 2005 | |
| | | | | | | | |
| Net earnings | | $ | 1,944,394 | | | 1,462,935 | | | 1,504,662 | |
| | | | | | | | | | | |
| Weighted-average shares - Basic EPS | | | 4,618,323 | | | 4,611,910 | | | 4,659,718 | |
| Stock options - treasury stock method | | | 42,980 | | | 65,280 | | | 17,437 | |
| Weighted-average shares - Diluted EPS | | | 4,661,303 | | | 4,677,190 | | | 4,677,155 | |
| | | | | | | | | | | |
| Basic earnings per common share | | $ | 0.42 | | | 0.32 | | | 0.32 | |
| Diluted earnings per common share | | $ | 0.42 | | | 0.31 | | | 0.32 | |
| Anti-dilutive shares | | | 51,551 | | | | | | | |
The following table illustrates the effect on net earnings and earnings per share as if the fair value based method had been applied in each year.
| | | 2006 | | 2005 | |
| | | | | | |
| Net earnings | | $ | 1,462,935 | | | 1,504,662 | |
| | | | | | | | |
| Total stock-based employee compensation expense determined under fair value based method for stock options, net of related tax effects | | | (94,194 | ) | | (26,546 | ) |
| Pro-forma net earnings | | $ | 1,368,741 | | | 1,478,116 | |
| Earnings per share: | | | | | | | |
| Basic - as reported | | $ | 0.32 | | | 0.32 | |
| Diluted - as reported | | $ | 0.31 | | | 0.32 | |
| Basic - pro forma | | $ | 0.30 | | | 0.32 | |
| Diluted - pro forma | | $ | 0.29 | | | 0.32 | |
The options to purchase 38,504 shares granted in 2005 were not included in the computation of diluted earnings per share for the year ended September 30, 2005, since the exercise price was greater than the average market price of the common stock.
LIBERTY BANCORP, INC.
Notes to Consolidated Financial Statements
| p. | The following paragraphs summarize the impact of new accounting pronouncements: |
In June 2006, the FASB issued FASB Interpretation No. 48, “Accounting for Uncertainty in Income Taxes – an interpretation of FASB No. 109.” This Interpretation prescribes a recognition threshold and measurement attribute for financial statement recognition and measurement of a tax position taken or expected to be taken in a tax return, and provides guidance on derecognition, classification, interest and penalties, accounting in interim periods, disclosure and transition. This Interpretation is effective for fiscal years beginning after December 15, 2006. The Company does not expect FASB Interpretation No. 48 to have a material impact on the Company’s financial position or results of operation.
In September 2006, the FASB issued SFAS No. 157 “Fair Value Measurements,” to define fair value, establish a framework for measuring fair value and expand disclosures about fair values. The Statement is effective for financial statements issued for fiscal years beginning after November 15, 2007, and interim periods within those fiscal years. The Company does not expect SFAS No. 157 to have a material impact on the Company’s financial position or results of operation.
In February 2007, the FASB issued SFAS No. 159 “The Fair Value Option for Financial Assets and Financial Liabilities.” SFAS No. 159 permits entities to choose to measure many financial instruments and certain items at fair value. Entities shall report unrealized gains and losses on those items which the fair value option has been elected in earnings. SFAS No. 159 is effective as of the beginning of an entity’s first fiscal year that begins after November 15, 2007. The Company is currently evaluating the requirements of the Statement and impact on the Company’s financial position and results of operation.
In November 2007, the Securities and Exchange Commission (“the SEC”) issued Staff Accounting Bulletin (“SAB”) No. 109, “Written Loan Commitments Recorded at Fair Value Through Earnings.” SAB No. 109 supersedes SAB No. 105, “Application of Accounting Principles to Loan Commitments,” and indicates that the expected net future cash flows related to the associated servicing of the loan should be included in the measurement of all written loan commitments that are accounted for at fair value through earnings. The guidance in SAB No. 109 is applied on a prospective basis to derivative loan commitments issued or modified in fiscal quarters beginning after December 15, 2007. The Company does not expect SAB No. 109 will have a material impact on the Company’s financial position or results of operation.
(2) Risks and Uncertainties
The Bank is a community oriented financial institution, which provides traditional financial services within the areas it serves. The Bank is engaged primarily in the business of attracting deposits from the general public and using these funds to originate residential real estate loans, commercial business, commercial real estate and consumer loans primarily to customers located in Clay, Clinton, Jackson and Platte Counties of Missouri. Senior management of the Bank monitors the level of net interest income and noninterest income from various products and services. Further, operations of the Bank are managed and financial performance is evaluated on an institution-wide basis. As a result, all of the Bank's operations are considered by management to be aggregated in one reportable operating segment.
The financial statements have been prepared in conformity with U.S. generally accepted accounting principles. In preparing the financial statements, management is required to make estimates and assumptions, which affect the reported amounts of assets and liabilities as of the balance sheet dates and income and expenses for the periods covered. Actual results could differ significantly from these estimates and assumptions.
LIBERTY BANCORP, INC.
Notes to Consolidated Financial Statements
The Bank's operations are affected by interest rate risk, credit risk, market risk and regulations by the Office of Thrift Supervision (“OTS”). The Bank is subject to interest rate risk to the degree that its interest-bearing liabilities mature or reprice more rapidly, or on a different basis, than its interest-earning assets. To better control the impact of changes in interest rates, the Bank has sought to improve the match between asset and liability maturities or repricing periods and rates by emphasizing the origination of adjustable-rate mortgage loans, and maintaining a securities and advances from FHLB portfolio primarily with maturities of less than ten years. The Bank is also emphasizing transaction accounts, which are core deposits and are treated favorably in measurement of interest rate risk.
The Bank uses a net market value methodology provided by the OTS to measure its interest rate risk exposure. This exposure is a measure of the potential decline in the net portfolio value of the Bank based upon the effect of an assumed increase or decrease in interest rates in 100 basis point increments. Net portfolio value is the expected net cash flows from the institution's assets, liabilities and off-balance sheet contracts. Credit risk is the risk of default on the Bank's loan portfolio that results from the borrowers' inability or unwillingness to make contractually required payments. Market risk reflects changes in the value of collateral underlying loans receivable and the valuation of real estate held by the Bank. The Bank is subject to periodic examination by regulatory agencies, which may require the Bank to record increases in the allowance based on their evaluation of available information. There can be no assurance that the Bank’s regulators will not require further increases to the allowances.
LIBERTY BANCORP, INC.
Notes to Consolidated Financial Statements
(3) Securities:
Securities are summarized as follows:
| | | 2007 | |
| | | | | Gross | | Gross | | | |
| | | Amortized | | Unrealized | | Unrealized | | Market | |
| | | Cost | | Gains | | Losses | | Value | |
| | | | | | | | | | |
| Available for sale - debt securities: | | | | | | | | | |
| Federal agency obligations | | $ | 34,555,418 | | | 320,918 | | | (28,288 | ) | | 34,848,048 | |
| State and municipal obligations | | | 12,839,161 | | | 2,016 | | | (100,590 | ) | | 12,740,587 | |
| | | | 47,394,579 | | | 322,934 | | | (128,878 | ) | | 47,588,635 | |
| | | | | | | | | | | | | | |
| Available for sale - equity securities | | | 394,623 | | | - | | | (739 | ) | | 393,884 | |
| | | | | | | | | | | | | | |
| | | $ | 47,789,202 | | | 322,934 | | | (129,617 | ) | | 47,982,519 | |
| | | | | | | | | | | | | | |
| Weighted-average rate | | | 4.72 | % | | | | | | | | | |
| | | 2006 | |
| | | | | Gross | | Gross | | | |
| | | Amortized | | Unrealized | | Unrealized | | Market | |
| | | Cost | | Gains | | Losses | | Value | |
| | | | | | | | | | |
| Available for sale - debt securities: | | | | | | | | | |
| Federal agency obligations | | $ | 29,710,739 | | | 47,251 | | | (214,897 | ) | | 29,543,093 | |
| State and municipal obligations | | | 6,435,496 | | | 2,112 | | | (98,071 | ) | | 6,339,537 | |
| | | $ | 36,146,235 | | | 49,363 | | | (312,968 | ) | | 35,882,630 | |
| | | | | | | | | | | | | | |
| Weighted-average rate | | | 4.44 | % | | | | | | | | | |
Weighted-average rates are based on the coupon rate at the balance sheet date.
Securities having a continuous unrealized loss position for less than twelve months or twelve months or longer as follows:
| | | Less than 12 Months | | 12 Months or Longer | | Total | |
| | | Market | | Unrealized | | Market | | Unrealized | | Market | | Unrealized | |
| | | Value | | Loss | | Value | | Loss | | Value | | Loss | |
| September 30, 2007 | | | | | | | | | | | | | |
| Available for sale- debt securities: | | | | | | | | | | | | | |
| Federal agency obligations | | $ | - | | | - | | | 5,993,047 | | | (28,288 | ) | | 5,993,047 | | | (28,288 | ) |
| State and municipal obligations | | | 2,777,801 | | | (21,951 | ) | | 5,326,202 | | | (78,639 | ) | | 8,104,003 | | | (100,590 | ) |
| Available for sale- equity securities | | | 393,884 | | | (739 | ) | | - | | | - | | | 393,884 | | | (739 | ) |
| | | $ | 3,171,685 | | | (22,690 | ) | | 11,319,249 | | | (106,927 | ) | | 14,490,934 | | | (129,617 | ) |
| | | | | | | | | | | | | | | | | | | | |
| September 30, 2006 | | | | | | | | | | | | | | | | | | | |
| Available for sale- debt securities: | | | | | | | | | | | | | | | | | | | |
| Federal agency obligations | | $ | 8,374,951 | | | (46,158 | ) | | 11,695,124 | | | (168,739 | ) | | 20,070,075 | | | (214,897 | ) |
| State and municipal obligations | | | 2,059,406 | | | (29,293 | ) | | 3,440,664 | | | (68,778 | ) | | 5,500,070 | | | (98,071 | ) |
| | | $ | 10,434,357 | | | (75,451 | ) | | 15,135,788 | | | (237,517 | ) | | 25,570,145 | | | (312,968 | ) |
LIBERTY BANCORP, INC.
Notes to Consolidated Financial Statements
The Company believes that the decline in value is related to changes in market interest rates and not credit quality of the issuers.
Maturities of debt securities at September 30, 2007 are summarized as follows:
| | | Available for Sale | |
| | | Amortized | | Market | |
| | | Cost | | Value | |
| | | | | | |
| Due within one year | | $ | 4,294,525 | | | 4,287,250 | |
| Due after one through five years | | | 29,301,961 | | | 29,559,122 | |
| Due after five through ten years | | | 7,648,617 | | | 7,632,427 | |
| Due after ten years | | | 6,149,476 | | | 6,109,836 | |
| | | $ | 47,394,579 | | | 47,588,635 | |
At September 30, 2007 securities with a carrying value of approximately $23,062,000 are callable at the discretion of the issuer prior to the maturity date. Securities in the amount of $20,967,000 were pledged to secure certain deposits at September 30, 2007.
(4) Mortgage-Backed Securities:
Mortgage-backed securities (“MBSs”) are summarized as follows:
| | | 2007 | |
| | | | | Gross | | Gross | | | |
| | | Amortized | | Unrealized | | Unrealized | | Market | |
| | | Cost | | Gains | | Losses | | Value | |
| Available for sale: | | | | | | | | | | | | | |
| FHLMC | | $ | 12,779,279 | | | 6,525 | | | (198,673 | ) | | 12,587,131 | |
| FNMA | | | 6,213,053 | | | 192 | | | (135,059 | ) | | 6,078,186 | |
| GNMA | | | 37,454 | | | 287 | | | - | | | 37,741 | |
| GNMA - CMO | | | 400,055 | | | - | | | (7,989 | ) | | 392,066 | |
| FHLMC - CMO | | | 43,780 | | | - | | | (98 | ) | | 43,682 | |
| FNMA - CMO | | | 147,204 | | | - | | | (9,014 | ) | | 138,190 | |
| | | $ | 19,620,825 | | | 7,004 | | | (350,833 | ) | | 19,276,996 | |
| | | | | | | | | | | | | | |
| Weighted-average rate | | | 4.31 | % | | | | | | | | | |
LIBERTY BANCORP, INC.
Notes to Consolidated Financial Statements
| | | 2006 | |
| | | | | Gross | | Gross | | | |
| | | Amortized | | Unrealized | | Unrealized | | Market | |
| | | Cost | | Gains | | Losses | | Value | |
| Available for sale: | | | | | | | | | |
| FHLMC | | $ | 17,364,792 | | | 6,636 | | | (422,637 | ) | | 16,948,791 | |
| FNMA | | | 6,486,588 | | | - | | | (197,399 | ) | | 6,289,189 | |
| GNMA | | | 46,349 | | | 189 | | | - | | | 46,538 | |
| GNMA - CMO | | | 620,515 | | | - | | | (20,756 | ) | | 599,759 | |
| FHLMC - CMO | | | 166,975 | | | - | | | (1,595 | ) | | 165,380 | |
| FNMA - CMO | | | 178,227 | | | - | | | (10,563 | ) | | 167,664 | |
| | | $ | 24,863,446 | | | 6,825 | | | (652,950 | ) | | 24,217,321 | |
| | | | | | | | | | | | | | |
| Weighted-average rate | | | 4.29 | % | | | | | | | | | |
Weighted-average rates are based on the coupon rate at the balance sheet date. Actual yield is expected to be lower and is affected by prepayments and related premium amortization. At September 30, 2007 and 2006 MBSs included adjustable-rate mortgage loans of $6,384,358 and $8,133,330, respectively. MBSs pledged to secure certain deposits were $1,996,000 at September 30, 2007.
Gross proceeds, gross realized gains and gross realized losses from sale of available for sale mortgage-backed securities are summarized as follows:
| | | 2007 | | 2006 | | 2005 | |
| | | | | | | | |
| Gross proceeds | | $ | - | | | - | | | 1,883,700 | |
| | | | | | | | | | | |
| Gross realized gains | | $ | - | | | - | | | 9,711 | |
| Gross realized losses | | | - | | | - | | | - | |
| | | $ | - | | | - | | | 9,711 | |
LIBERTY BANCORP, INC.
Notes to Consolidated Financial Statements
Mortgage-backed securities having a continuous unrealized loss position for less than twelve months or twelve months or longer are summarized as follows:
| | | Less than 12 Months | | 12 Months or Longer | | Total | |
| | | Market | | Unrealized | | Market | | Unrealized | | Market | | Unrealized | |
| | | Value | | Loss | | Value | | Loss | | Value | | Loss | |
| September 30, 2007 | | | | | | | | | | | | | |
| Available for sale: | | | | | | | | | | | | | |
| FHLMC | | $ | 828,941 | | | (3,036 | ) | | 10,146,180 | | | (195,637 | ) | | 10,975,121 | | | (198,673 | ) |
| FNMA | | | - | | | - | | | 5,891,129 | | | (135,059 | ) | | 5,891,129 | | | (135,059 | ) |
| GNMA - CMO | | | - | | | - | | | 392,066 | | | (7,989 | ) | | 392,066 | | | (7,989 | ) |
| FHLMC - CMO | | | - | | | - | | | 43,682 | | | (98 | ) | | 43,682 | | | (98 | ) |
| FNMA - CMO | | | - | | | - | | | 138,190 | | | (9,014 | ) | | 138,190 | | | (9,014 | ) |
| | | $ | 828,941 | | | (3,036 | ) | | 16,611,247 | | | (347,797 | ) | | 17,440,188 | | | (350,833 | ) |
| | | | | | | | | | | | | | | | | | | | |
| September 30, 2006 | | | | | | | | | | | | | | | | | | | |
| Available for sale: | | | | | | | | | | | | | | | | | | | |
| FHLMC | | $ | 597,299 | | | (5,522 | ) | | 13,651,788 | | | (417,115 | ) | | 14,249,087 | | | (422,637 | ) |
| FNMA | | | 726,437 | | | (15,474 | ) | | 5,562,752 | | | (181,925 | ) | | 6,289,189 | | | (197,399 | ) |
| GNMA - CMO | | | - | | | - | | | 599,759 | | | (20,756 | ) | | 599,759 | | | (20,756 | ) |
| FHLMC - CMO | | | 165,380 | | | (1,595 | ) | | - | | | - | | | 165,380 | | | (1,595 | ) |
| FNMA - CMO | | | - | | | - | | | 167,664 | | | (10,563 | ) | | 167,664 | | | (10,563 | ) |
| | | $ | 1,489,116 | | | (22,591 | ) | | 19,981,963 | | | (630,359 | ) | | 21,471,079 | | | (652,950 | ) |
The Company believes that the decline in value is related to changes in market interest rates and not credit quality of the issuers.
(5) Loans Receivable, Net
Loans receivable, net are summarized as follows:
| | | 2007 | | 2006 | |
| | | | | | |
| Real estate loans: | | | | | | | |
| Single-family, 1-4 units | | $ | 41,749,549 | | | 42,623,176 | |
| Multi-family, 5 or more units | | | 12,197,677 | | | 10,415,654 | |
| Construction | | | 125,797,037 | | | 99,758,557 | |
| Commercial | | | 57,240,734 | | | 53,360,110 | |
| Commercial business loans | | | 17,950,717 | | | 11,270,301 | |
| Consumer loans | | | 12,038,005 | | | 13,219,410 | |
| | | | 266,973,719 | | | 230,647,208 | |
| Allowance for losses | | | (3,010,904 | ) | | (2,144,121 | ) |
| Loans in process | | | (31,315,742 | ) | | (27,962,170 | ) |
| Unearned discounts | | | - | | | (4,451 | ) |
| Deferred loan fees, net | | | (339,148 | ) | | (314,088 | ) |
| | | $ | 232,307,925 | | | 200,222,378 | |
| | | | | | | | |
| Weighted-average rate | | | 7.83 | % | | 8.06 | % |
LIBERTY BANCORP, INC.
Notes to Consolidated Financial Statements
Adjustable-rate loans included in the loan portfolio amounted to $111,674,667 and $118,181,541 at September 30, 2007 and 2006, respectively. Loans serviced for the benefits of others amounted to $5,550,066, $7,312,931 and $9,239,956 at September 30, 2007, 2006 and 2005, respectively.
Real estate construction loans are secured by the following:
| | | 2007 | | 2006 | |
| | | | | | |
| Single-family, spec | | $ | 29,331,087 | | | 37,764,930 | |
| Single-family, custom built | | | 7,097,700 | | | 12,252,030 | |
| Multi-family, 5 or more units | | | 1,494,997 | | | - | |
| Development | | | 36,407,723 | | | 23,960,853 | |
| Commercial | | | 51,020,155 | | | 25,173,449 | |
| Other | | | 445,375 | | | 607,295 | |
| | | $ | 125,797,037 | | | 99,758,557 | |
Following is a summary of activity in allowance for losses:
| | | 2007 | | 2006 | | 2005 | |
| | | | | | | | |
| Balance, beginning of year | | $ | 2,144,121 | | | 1,762,066 | | | 2,024,298 | |
| Loan charge-offs | | | (267,581 | ) | | (471,692 | ) | | (695,226 | ) |
| Loan recoveries | | | 532,275 | | | 1,747 | | | 2,994 | |
| Provision charged to expense | | | 602,089 | | | 852,000 | | | 430,000 | |
| Balance, end of year | | $ | 3,010,904 | | | 2,144,121 | | | 1,762,066 | |
A summary of impaired loans follows:
| | | 2007 | | 2006 | | 2005 | |
| | | | | | | | |
| Nonaccrual loans | | $ | 3,422,257 | | | 1,481,222 | | | 906,934 | |
| Accruing loans past due 90 days or more | | | - | | | 58,156 | | | - | |
| Other impaired loans | | | - | | | 2,681,561 | | | 403,172 | |
| Total impaired loans | | $ | 3,422,257 | | | 4,220,939 | | | 1,310,106 | |
| | | | | | | | | | | |
| Allowance for losses on impaired loans | | $ | 370,116 | | | 257,609 | | | 199,103 | |
| | | | | | | | | | | |
| Impaired loans with no allowance for loan losses | | $ | - | | | 58,156 | | | 116,414 | |
| | | | | | | | | | | |
| Average balance of impaired loans | | $ | 1,331,696 | | | 1,350,018 | | | 2,607,301 | |
| | | | | | | | | | | |
| Interest income that would have been recognized | | $ | 70,389 | | | 108,139 | | | 97,652 | |
| | | | | | | | | | | |
| Interest income recognized | | $ | - | | | 72,433 | | | 73,439 | |
On occasion, the Bank originates single-family loans with high loan to value ratios exceeding 90 percent. The Bank does not consider the level of such loans to be a significant concentration of credit risk as of the balance sheet dates presented within the financial statements.
LIBERTY BANCORP, INC.
Notes to Consolidated Financial Statements
Following is a summary of loans to directors, executive officers and associates of such persons in excess of $60,000 in the aggregate for the year ended September 30, 2007:
| Balance, beginning of year | | $ | 713,146 | |
| Additions | | | 314,971 | |
| Repayments | | | (412,946 | ) |
| Balance, end of year | | $ | 615,171 | |
These loans were made on substantially the same terms as those prevailing at the time for comparable transactions with unaffiliated persons.
(6) Premises and Equipment, Net
Premises and equipment, net are summarized as follows:
| | | 2007 | | 2006 | |
| | | | | | |
| Land | | $ | 2,405,041 | | | 1,511,277 | |
| Office buildings | | | 6,731,896 | | | 5,330,549 | |
| Furniture and equipment | | | 3,075,123 | | | 2,863,800 | |
| Building-in-progress | | | 11,974 | | | 59,314 | |
| | | | 12,224,034 | | | 9,764,940 | |
| Less accumulated depreciation | | | 3,479,188 | | | 3,064,751 | |
| | | $ | 8,744,846 | | | 6,700,189 | |
Depreciation expense for 2007, 2006 and 2005 was $463,259, $444,591 and $405,246 respectively.
The Bank leases the land for one branch office located in Kansas City. The lease expires in November, 2021. The Bank has four successive options to extend the lease term for five years each and a fifth option for a three year period. Rent expense for 2007, 2006 and 2005 amounted to $91,622, $91,622 and $83,987 respectively. Future minimum lease payments are summarized as follows:
| October 1, 2007 to September 30, 2008 | | $ | 91,622 | |
| October 1, 2008 to September 30, 2009 | | | 91,622 | |
| October 1, 2009 to September 30, 2010 | | | 91,622 | |
| October 1, 2010 to September 30, 2011 | | | 92,386 | |
| October 1, 2011 to September 30, 2012 | | | 100,784 | |
| After September 30, 2012 | | | 923,855 | |
| | | $ | 1,391,891 | |
LIBERTY BANCORP, INC.
Notes to Consolidated Financial Statements
(7) Foreclosed Real Estate, Net
Foreclosed real estate, net is summarized as follows:
| | | 2007 | | 2006 | |
| | | | | | |
| Foreclosed real estate | | $ | 1,675,871 | | | 1,579,848 | |
| Allowance for losses | | | - | | | - | |
| | | $ | 1,675,871 | | | 1,579,848 | |
Following is a summary of activity in allowance for losses:
| | | 2007 | | 2006 | | 2005 | |
| | | | | | | | |
| Balance, beginning of year | | $ | - | | | - | | | - | |
| Gain on sale | | | 58,676 | | | 23,846 | | | 205,265 | |
| Charge-offs | | | (346,721 | ) | | (113,016 | ) | | (127,848 | ) |
| Provision charged to expense | | | 288,045 | | | 89,170 | | | (77,417 | ) |
| Balance, end of year | | $ | - | | | - | | | - | |
Deposits are summarized as follows:
| | | 2007 | | 2006 | |
Description and interest rate | | | | | |
| Non-interest bearing NOW accounts | | $ | 13,616,861 | | | 11,895,575 | |
| NOW accounts, 1.71% and 1.84%, respectively | | | 21,368,449 | | | 25,234,161 | |
| Statement accounts, .31% and .31% | | | 7,200,644 | | | 7,701,414 | |
| Money market accounts, 4.59% and 2.66%, respectively | | | 68,481,779 | | | 13,617,376 | |
| Total transaction accounts | | | 110,667,733 | | | 58,448,526 | |
| Certificates: | | | | | | | |
| 1.00 - 1.99% | | | - | | | 5,175 | |
| 2.00 - 2.99% | | | 300,179 | | | 2,254,455 | |
| 3.00 - 3.99% | | | 9,249,218 | | | 33,373,048 | |
| 4.00 - 4.99% | | | 60,151,774 | | | 44,344,132 | |
| 5.00 - 5.99% | | | 71,936,578 | | | 60,045,643 | |
| Total certificates, 4.81% and 4.52%, respectively | | | 141,637,749 | | | 140,022,453 | |
| Total deposits, 4.10% and 3.62%, respectively | | $ | 252,305,482 | | | 198,470,979 | |
At September 30, 2007 and 2006 deposits included brokered certificates of $14,000,000 and $0, respectively.
LIBERTY BANCORP, INC.
Notes to Consolidated Financial Statements
Certificate maturities are summarized as follows:
| | | 2007 | | 2006 | |
| | | | | | |
| First year | | $ | 126,634,196 | | | 118,206,304 | |
| Second year | | | 7,495,054 | | | 10,727,310 | |
| Third year | | | 3,913,756 | | | 5,825,725 | |
| Fourth year | | | 1,903,419 | | | 3,460,833 | |
| Fifth year | | | 1,691,324 | | | 1,802,281 | |
| | | $ | 141,637,749 | | | 140,022,453 | |
Transaction accounts and certificates in denominations of $100,000 or more amounted to $48,643,943 and $47,732,829, at September 30, 2007, respectively, and $18,070,065 and $37,251,130 at September 30, 2006, respectively.
Interest on deposits is summarized as follows:
| | | 2007 | | 2006 | | 2005 | |
| | | | | | | | | | | |
| NOW accounts | | $ | 458,246 | | | 461,254 | | | 208,753 | |
| Passbook accounts | | | 22,544 | | | 30,846 | | | 27,952 | |
| Money market accounts | | | 1,700,437 | | | 506,441 | | | 449,249 | |
| Certificates | | | 6,903,051 | | | 5,008,419 | | | 3,292,614 | |
| | | $ | 9,084,278 | | | 6,006,960 | | | 3,978,568 | |
(9) Advances from Federal Home Loan Bank of Des Moines
Fixed-rate advances from Federal Home Loan Bank (“FHLB”) of Des Moines are summarized as follows:
Final | | Average Interest Rate | | | | | |
Maturity Date | | at September 30, 2007 | | 2007 | | 2006 | |
| | | | | | | | |
| Within one year | | | 4.89% | | $ | 21,955,516 | | | 23,700,000 | |
| After one through three years | | | - | | | - | | | 3,788,852 | |
| After three through five years | | | 6.01% | | | 4,474,878 | | | 5,000,000 | |
| After five through ten | | | - | | | - | | | 1,574,886 | |
| | | | | | $ | 26,430,394 | | | 34,063,738 | |
| | | | | | | | | | | |
| Weighted-average rate | | | | | | 5.08 | % | | 4.48 | % |
LIBERTY BANCORP, INC.
Notes to Consolidated Financial Statements
| Principal maturities at September 30, 2007 are summarized as follows: | |
| October 1, 2007 to September 30, 2008 | | $ | 22,055,524 | |
| October 1, 2008 to September 30, 2009 | | | 100,008 | |
| October 1, 2009 to September 30, 2010 | | | 100,008 | |
| October 1, 2010 to September 30, 2011 | | | 3,100,008 | |
| October 1, 2011 to September 30, 2012 | | | 1,074,846 | |
| After September 30, 2012 | | | - | |
| | | $ | 26,430,394 | |
At September 30, 2007 advances from the FHLB of Des Moines are secured by FHLB stock and one-to-four family, home equity, multi-family, commercial real estate and non-real estate loans amounting to $64,356,000.
(10) Securities Sold Under Agreement to Repurchase
Securities sold under agreement to repurchase, which are classified as borrowings, are reflected at the amount of cash received in connection with the transaction, plus interest credited. The Bank may be required to provide additional collateral based on the fair value of the underlying securities. The securities sold under agreement to repurchase are under the Bank's control. These agreements to repurchase are summarized as follows:
| | | Rate at | | | | | |
| | | September 30, | | | | | |
Maturity Date | | 2007 | | 2007 | | 2006 | |
| | | | | | | | |
| | | | | | | | |
| Feburary 26, 2009 | | | 5.21% | | $ | 540,136 | | | 516,173 | |
| | | | | | | | | | | |
| Open line | | | 3.41% | | | 681,048 | | | 2,867,824 | |
| | | | | | | | | | | |
| Total, 4.21% and 3.44% | | | | | $ | 1,221,184 | | | 3,383,997 | |
| | | | | | | | | | | |
| Market value of securities | | | | | $ | 6,996,954 | | | 6,618,484 | |
| | | | | | | | | | | |
| Average balance of borrowings | | | | | $ | 2,097,002 | | | 2,224,280 | |
| | | | | | | | | | | |
| Maximum balance at any month end | | | | | $ | 5,690,307 | | | 4,400,146 | |
LIBERTY BANCORP, INC.
Notes to Consolidated Financial Statements
The Bank is permitted to make additions to the tax bad debt reserve using the experience method.
The components of the net deferred tax asset are summarized as follows:
| | | 2007 | | 2006 | |
| | | | | | |
| Deferred tax liabilities: | | | | | |
| FHLB stock dividends | | $ | (140,625 | ) | | (138,750 | ) |
| | | | | | | | |
| Deferred tax assets: | | | | | | | |
| Accrued income and expense and deferred loan fees | | | 304,977 | | | 362,039 | |
| Allowance for losses on loans and foreclosed real estate | | | 1,129,089 | | | 793,325 | |
| Unrealized loss on securities available for sale | | | 55,690 | | | 336,600 | |
| Other | | | 184,295 | | | 121,386 | |
| Total deferred tax assets | | | 1,674,051 | | | 1,613,350 | |
| Net deferred tax asset | | $ | 1,533,426 | | | 1,474,600 | |
The provisions of SFAS No. 109 require the Bank to establish a deferred tax liability for the effect of the tax bad debt reserves over the amounts at September 30, 1988. The Bank's tax bad debt reserves were $3,588,000 at September 30, 1988. The estimated deferred tax liability on such amount is approximately $1,220,000, which has not been recorded in the accompanying financial statements. If these tax bad debt reserves are used for other than loan losses, the amount used will be subject to Federal income taxes at the then prevailing corporate rate.
Income taxes are summarized as follows:
| | | 2007 | | 2006 | | 2005 | |
| Current: | | | | | | | |
| Federal | | $ | 1,160,000 | | | 814,000 | | | 630,000 | |
| State | | | 178,000 | | | 112,000 | | | 45,000 | |
| | | | 1,338,000 | | | 926,000 | | | 675,000 | |
| Deferred: | | | | | | | | | | |
| Federal | | | (335,000 | ) | | (125,000 | ) | | 145,000 | |
| State | | | (49,000 | ) | | (18,000 | ) | | 21,000 | |
| | | | (384,000 | ) | | (143,000 | ) | | 166,000 | |
| | | $ | 954,000 | | | 783,000 | | | 841,000 | |
LIBERTY BANCORP, INC.
Notes to Consolidated Financial Statements
The provision for income taxes differs from the Federal statutory corporate tax rate as follows:
| | | Percentage of Earnings | |
| | | Before Income Taxes | |
| | | 2007 | | 2006 | | 2005 | |
| Federal statutory income tax rate | | | 34.0 | % | | 34.0 | % | | 34.0 | % |
| Increases (decreases) in tax rate: | | | | | | | | | | |
| Tax exempt income | | | (3.5 | ) | | (2.9 | ) | | (1.1 | ) |
| Change in cash surrender value of BOLI | | | (1.2 | ) | | - | | | - | |
| Nondeductible stock option expense | | | 0.7 | | | - | | | - | |
| State taxes, net of Federal tax benefit | | | 2.9 | | | 2.8 | | | 1.9 | |
| Average fair value versus cost of ESOP shares | | | 1.2 | | | 1.1 | | | 0.7 | |
| Other, net | | | (1.2 | ) | | (0.1 | ) | | 0.4 | |
| Tax rate | | | 32.9 | % | | 34.9 | % | | 35.9 | % |
Defined Contribution Pension Plan (401-K Plan)
The Bank maintains a defined contribution pension plan, which covers substantially all employees. Participants can contribute from 2% to 15% of their salary of which the Bank will match 50% of the employee contribution, up to a maximum of 5% of the employee's salary. Participants are fully vested after five years of service. Pension plan expense was $53,752, $49,439 and $34,461 for 2007, 2006 and 2005, respectively.
Directors’ Postretirement Medical Benefits
The Bank provides postretirement medical benefits to directors, elected before 1994, and their spouses. The liability for such benefits is unfunded. The accumulated postretirement benefit obligation, which represents the present value of the estimated future benefits payable to plan participants attributed to service rendered to date, will be recognized on a delayed basis as a component of net periodic cost for postretirement medical benefits.
Postretirement medical benefits for three directors and their spouses have been amended from the current plan of lifetime health insurance coverage to benefits of $500 per month for each of the directors and spouses, not to exceed twenty years.
The following table sets forth the Plan's funded status and amounts recognized in other liabilities in the financial statements:
| | | 2007 | | 2006 | |
| | | | | | |
| Accumulated postretirement benefit obligations | | $ | (257,426 | ) | | (318,823 | ) |
| Unrecognized transition obligation | | | - | | | 87,752 | |
| Unrecognized prior service cost | | | - | | | (67,653 | ) |
| Unrecognized actuarial gain | | | - | | | (117,300 | ) |
| Under (over) accrual | | | 11,230 | | | 11,230 | |
| Accrued postretirement benefit cost | | $ | (246,196 | ) | | (404,794 | ) |
LIBERTY BANCORP, INC.
Notes to Consolidated Financial Statements
A reconciliation of the accumulated postretirement benefit obligation is summarized as follows:
| | | 2007 | | 2006 | |
| | | | | | |
| Balance, beginning of year | | $ | (318,823 | ) | | (369,957 | ) |
| Service cost | | | (6,685 | ) | | (6,685 | ) |
| Interest cost | | | (18,306 | ) | | (22,105 | ) |
| Benefits paid | | | 37,538 | | | 29,873 | |
| Actuarial gain | | | 48,850 | | | 50,051 | |
| Balance, end of year | | $ | (257,426 | ) | | (318,823 | ) |
The weighted average annual assumed rate of increase in the per capita cost of covered benefits for the medical plan is 10% for 2007 and thereafter. The effect of increasing the assumed health care trend rates by one percentage point on the accumulated postretirement benefit obligation and the components of the net periodic cost for postretirement medical benefits at or for the years ended September 30, 2007, 2006 and 2005 was considered immaterial. The weighted-average discount rate used in determining the accumulated postretirement benefit obligation was 6.00% at September 30, 2007 and 2006, and 6.00% for the year ended September 30, 2007 and 6.50% for the years ended September 30, 2006 and 2005.
The components of the net periodic cost for postretirement medical benefits are summarized as follows:
| | | 2007 | | 2006 | | 2005 | |
| | | | | | | | |
| Service cost | | $ | 6,685 | | | 6,685 | | | 6,685 | |
| Interest cost | | | 18,306 | | | 22,105 | | | 23,253 | |
| Amortization of transition obligation | | | 12,538 | | | 12,538 | | | 12,538 | |
| Amortization of prior service cost | | | (9,665 | ) | | (9,665 | ) | | (9,665 | ) |
| Amortization of actuarial gain | | | (12,203 | ) | | (4,321 | ) | | (6,311 | ) |
| Over (under) accrual | | | - | | | (11,742 | ) | | 500 | |
| Net periodic cost | | $ | 15,661 | | | 15,600 | | | 27,000 | |
Postretirement medical benefits expected to be paid in each of the next five years and in the aggregate for the five years thereafter are summarized as follows:
| October 1, 2007 to September 30, 2008 | | $ | 36,456 | |
| October 1, 2008 to September 30, 2009 | | | 38,902 | |
| October 1, 2009 to September 30, 2010 | | | 41,592 | |
| October 1, 2010 to September 30, 2011 | | | 44,551 | |
| October 1, 2011 to September 30, 2012 | | | 47,806 | |
| October 1, 2012 to September 30, 2017 | | | 60,000 | |
| | | $ | 269,307 | |
LIBERTY BANCORP, INC.
Notes to Consolidated Financial Statements
On September 30, 2007, the Bank adopted the recognition and disclosure provisions of SFAS No. 158, “Employers’ Accounting for Defined Benefit Pension and Other Postretirement Plans.” SFAS No. 158 requires the Bank to recognize the funded status of its defined benefit pension plan and other postretirement plan as liabilities in its balance sheet, with a corresponding adjustment to accumulated other comprehensive earnings, net of taxes. The adjustment to accumulated other comprehensive earnings at adoption represents the unrecognized transition obligation, unrecognized prior service cost and net unrecognized actuarial gains. These amounts were previously netted against the funded status of its plans as liabilities. The amounts will be subsequently recognized as net periodic costs. Further, actuarial gains and losses that arise in subsequent periods will be recognized as a component of accumulated other comprehensive earnings. The incremental effect of applying SFAS No. 158 on other liabilities and stockholders equity was considered immaterial.
Amounts recognized in accumulated other comprehensive earnings, net are summarized as follows:
| | | 2007 | | 2006 | |
| | | | | | |
| Unrecognized transition obligation | | $ | 75,214 | | | - | |
| Unrecognized prior service cost | | | (57,988 | ) | | - | |
| Unrecognized actuarial gain | | | (153,948 | ) | | - | |
| | | | (136,722 | ) | | - | |
| | | | | | | | |
| Tax effect | | | 47,853 | | | - | |
| | | | | | | | |
| Unrecognized gain, net of taxes | | $ | (88,869 | ) | | - | |
The estimated amounts that will be amortized from accumulated other comprehensive earnings into net periodic cost for 2008 are as follows:
| Unrecognized transition obligation | | $ | 12,538 | |
| Unrecognized prior service cost | | | (9,665 | ) |
| Unrecognized actuarial gain | | | (21,368 | ) |
| | | $ | (18,495 | ) |
Employee Stock Ownership Plan (ESOP)
The Bank has established an ESOP for the benefit of participating employees. Participating employees are employees who are normally scheduled to work at least twenty hours a week. Participant benefits become 20% vested after one year of service, and 20% for each additional year of service until benefits are 100% vested after 5 years for participants hired prior to January 1, 2004. For participants hired after January 1, 2004 benefits become 100% vested after 5 years of service with no vesting prior to that date. The Bank makes annual contributions to the ESOP equal to the ESOP's debt service less dividends on unallocated ESOP shares used to repay the ESOP loan. Dividends on allocated ESOP shares are paid to participants of the ESOP and charged to retained earnings. The ESOP shares are pledged as collateral on the ESOP loan. As the loan is repaid, shares are released from collateral and allocated to participating employees, based on the proportion of loan repaid and compensation of the participants. The Plan permits offsetting forfeitures against employer contributions. Benefits become payable upon a participant's retirement, death, disability or separation from service. ESOP expense for 2007, 2006 and 2005 was $332,735, $306,947 and $128,804, respectively.
LIBERTY BANCORP, INC.
Notes to Consolidated Financial Statements
ESOP shares prior to the July 21, 2006 conversion date have been adjusted by the exchange ratio of 3.5004. The number of ESOP shares allocated, shares released for allocation and unreleased shares at September 30, 2007 were 146,960, 31,134 and 90,853 respectively. The number of ESOP shares allocated, shares released for allocation and unreleased shares at September 30, 2006 was 146,809, 31,275, and 121,987, respectively.
The fair value of unreleased ESOP shares at September 30, 2007 and 2006 was $973,000 and $1,248,000, respectively. The ESOP loan from the Company is secured solely by the common stock at an interest rate of 8.25%.
Stock Options
As authorized by the 2003 Incentive Equity and Deferred Compensation Plan (the “2003 Plan”), the Board of Directors granted 78,760 options to non-employee directors and 96,260 to certain officers and employees during fiscal year 2004. The Plan authorizes the award of up to 258,063 shares of common stock, subject to restrictions, to be issued to directors, officers and employees of the Bank. The Plan provides for the grant of stock options, stock appreciation rights, restricted stock and unrestricted stock. Options expire ten years from the date of the grant. Stock options to directors are fully vested on the grant date of June 16, 2004. Options granted to the Bank’s CEO are vested over three years and three months and options granted to certain other officers and employees are vested over a five-year period. On January 27, 2005 the Board of Directors granted an additional 38,504 options to certain officers and employees. Options granted to the CEO are vested over a period of three years and eight months and options granted to certain officers and employees are vested over a five-year period. On November 23, 2005 the Board of Directors granted an additional 42,440 options to directors and officers. Options granted to the board, CEO, and certain officers, were vested over a ten-month period. At October 1, 2006 there were 57,594 unvested stock options outstanding.
In connection with the completion of the Conversion in July 2006, the Company assumed the Plan and all outstanding options and shares were adjusted based on the 3.5004 exchange ratio. The exercise prices were adjusted to reflect the proportional change in values that resulted from the exchange.
As authorized by the Liberty Bancorp, Inc. 2007 Equity Incentive Plan (the “2007 Plan”), the Board of Directors granted 25,150 options to non-employee directors and 65,500 options to certain officers and employees on February 27, 2007. The 2007 Plan authorizes the award of up to 100,691 options to purchase shares of common stock, subject to restrictions, to be issued to directors, officers and employees of the Bank. The Plan provides for the grant of stock options, stock appreciation rights, restricted stock and unrestricted stock. Options expire ten years from the date of the grant. All 90,650 options granted are vested over a five-year period.
The Company has estimated the fair value of awards granted for the years ended September 30, 2007, 2006 and 2005 under its stock option plan utilizing the Black-Scholes pricing model to be $3.00, $1.70, and $1.83, respectively. The assumptions used in the Black-Scholes pricing model were as follows:
| | | 2007 | | 2006 | | 2005 | |
| Expected dividend yield | | | 2.00% | | | 3.00% | | | 3.00% | |
| Risk-free interest rate | | | 4.53% | | | 4.23% | | | 3.71% | |
| Expected life of options | | | 7.50 years | | | 5.00 years | | | 6.00 years | |
| Expected volatility | | | 21.70% | | | 25.13% | | | 25.93% | |
LIBERTY BANCORP, INC.
Notes to Consolidated Financial Statements
Stock option compensation expense, as a result of the adoption of SFAS 123R is as follows:
| | | 2007 | | 2006 | | 2005 | |
| | | | | | | | |
| Pretax | | $ | 67,553 | | | - | | | - | |
| | | | | | | | | | | |
| After tax | | | 43,234 | | | - | | | - | |
| | | | | | | | | | | |
| Basic and diluted earnings per share | | $ | 0.01 | | | - | | | - | |
At September 30, 2007, the total unrecognized compensation expense related to nonvested stock options was approximately $219,000 and is expected to be recognized over the weighted-average period of 3.40 years.
Stock options granted, exercised or forfeited are as follows:
| | | | | | | Weighted - | | | |
| | | | | Weighted- | | Average | | | |
| | | Number | | Average | | Contractual | | Aggregate | |
| | | of | | Exercise | | Term in | | Intrinsic | |
| | | Shares | | Price | | Years | | Value | |
| | | | | | | | | | |
| Outstanding at September 30, 2004 | | | 173,970 | | $ | 6.84 | | $ | 9.71 | | | - | |
| Granted | | | 38,504 | | | 8.28 | | | - | | | - | |
| Exercised | | | (11,201 | ) | | 6.63 | | | - | | | - | |
| Expired | | | - | | | - | | | - | | | - | |
| Forfeited | | | (3,500 | ) | | 6.86 | | | - | | | - | |
| Outstanding at September 30, 2005 | | | 197,773 | | $ | 7.13 | | $ | 8.86 | | | 152,107 | |
| Granted | | | 42,440 | | | 8.07 | | | - | | | - | |
| Exercised | | | (350 | ) | | 6.86 | | | - | | | - | |
| Expired | | | - | | | - | | | - | | | - | |
| Forfeited | | | (4,900 | ) | | 6.86 | | | - | | | - | |
| Outstanding at September 30, 2006 | | | 234,963 | | $ | 7.31 | | $ | 8.07 | | | 686,092 | |
| Granted | | | 90,650 | | | 11.27 | | | - | | | - | |
| Exercised | | | (1,050 | ) | | 8.28 | | | - | | | - | |
| Expired | | | - | | | - | | | - | | | - | |
| Forfeited | | | (1,500 | ) | | 11.27 | | | - | | | - | |
| Outstanding at September 30, 2007 | | | 323,063 | | $ | 8.42 | | $ | 7.75 | | | 797,568 | |
| Exercisable at September 30, 2007 | | | 194,005 | | | 7.20 | | | 7.10 | | | 681,567 | |
| Vested and expected to vest at | | | | | | | | | | | | | |
| September 30, 2007 | | | 194,005 | | $ | 7.20 | | | 7.10 | | | 681,567 | |
LIBERTY BANCORP, INC.
Notes to Consolidated Financial Statements
A summary of the total value of options exercised, the amount of cash received from the exercise of stock options, and the fair value of shares vested is as follows for the years indicated.
| | | 2007 | | 2006 | | 2005 | |
| | | | | | | | |
| Intrinsic value of options exercised | | $ | 2,909 | | | 500 | | | 15,747 | |
| | | | | | | | | | | |
| Cash received from the exercise of options | | | 8,695 | | | 2,400 | | | 74,275 | |
| | | | | | | | | | | |
| Fair value of shares vested | | | 268,769 | | | 636,465 | | | 163,955 | |
Shares exercisable and weighted average exercise prices were 194,005 and $7.20 at September 30, 2007, respectively, 170,208 and $7.19 at September 30, 2006, respectively, and 104,662 and $6.86 at September 30, 2005, respectively.
Restricted Stock Awards
During fiscal year 2004, as authorized by the 2003 Plan, two directors each received a restricted stock award of 6,125 shares as adjusted by the exchange ratio of 3.5004, which vests over three years. On February 27, 2007, as authorized by the 2007 Plan, the Board of Directors granted 31,400 restricted stock awards to non-employee directors and 78,000 awards to certain officers and employees. The 2007 Plan authorizes the award of up to 125,649 shares of common stock, subject to restrictions, to be issued to directors, officers and employees of the Bank. Subsequently, 125,649 shares were repurchased by a trust to fund the restricted stock awards. All awards are vested over a five-year period. A summary of the Company’s restricted stock compensation expense is as follows:
| | | 2007 | | 2006 | | 2005 | |
| | | | | | | | |
| Restricted Compensation Expense | | $ | 162,519 | | | 27,996 | | | 27,996 | |
At September 30, 2007, the total unrecognized expense was $1.1 million and is expected to be recognized over the next 4.4 years.
A summary of the Company’s nonvested stock award activity for 2007 is as follows:
| | | Number | | Weighted- | |
| | | of | | Average | |
| | | Nonvested | | Grant Date | |
| | | Shares | | Fair Value | |
| Nonvested at October 1, 2006 | | | 4,080 | | $ | 6.86 | |
| Granted | | | 109,400 | | | 11.27 | |
| Vested | | | (4,080 | ) | | 6.86 | |
| Forfeited | | | - | | | - | |
| Nonvested at September 30, 2007 | | | 109,400 | | $ | 11.27 | |
LIBERTY BANCORP, INC.
Notes to Consolidated Financial Statements
Directors’ Retirement Plan
The Bank has adopted a retirement plan for directors elected before 1994. The plan provides that each non-employee director (participant) shall receive upon retirement a benefit in equal annual installments over a ten-year period. The annual benefit will be based upon the product of the participant's vesting percentage and $8,000 for currently retired directors and surviving spouses. For three directors covered under the plan, the annual benefit was amended and will be based upon the product of the participant’s vesting percentage and $15,000.
The vesting percentage shall be determined based upon the participant's years of service on the Board, whether before or after the reorganization date, according to the following schedule:
| Full Years of Service | | Non-Employee Director's |
| on the Board | | Vested Percentage |
| Less than 10 | | | 0% |
| 10 to 14 | | | 25% |
| 15 to 19 | | | 50% |
| 20 to 24 | | | 75% |
| 25 or more | | | 100% |
If an active director covered under the plan terminates service of the Board due to disability, the director's annual benefit for ten years will be $15,000. In the event that the participant dies before collecting any or all of the benefits, the Bank shall pay the participant's surviving spouse. No benefits shall be payable to anyone other than the surviving spouse, and shall terminate on the death of the surviving spouse.
The following table sets forth the plan's funded status and amounts recognized in other liabilities in the financial statements:
| | | 2007 | | 2006 | |
Actuarial present value of benefit obligations - vested accumulated benefits | | $ | (222,934 | ) | | (234,288 | ) |
| Unrecognized prior service cost | | | - | | | 52,681 | |
| Unrecognized actuarial gain | | | - | | | (38,811 | ) |
| Overaccrual | | | (4,994 | ) | | (1,856 | ) |
| Accrued directors' retirement plan | | $ | (227,928 | ) | | (222,274 | ) |
A reconciliation of the accumulated benefit obligation is summarized as follows:
| | | 2007 | | 2006 | |
| | | | | | |
| Balance, beginning of year | | $ | (234,288 | ) | | (243,936 | ) |
| Service cost | | | (2,597 | ) | | (2,597 | ) |
| Interest cost | | | (14,057 | ) | | (15,336 | ) |
| Benefits paid | | | 31,000 | | | 16,000 | |
| Actuarial gain (loss) | | | (2,992 | ) | | 11,581 | |
| Balance, end of year | | $ | (222,934 | ) | | (234,288 | ) |
The average discount rate used in determining the accumulated benefit obligation was 6.00% at September 30, 2007 and 2006, and 6.00% for the year ended September 30, 2007 and 6.50% for the years ended September 30, 2006 and 2005.
LIBERTY BANCORP, INC.
Notes to Consolidated Financial Statements
Net pension cost includes the following components:
| | | 2007 | | 2006 | | 2005 | |
| | | | | | | | |
| Service costs - benefits earned during the year | | $ | 2,597 | | | 2,597 | | | 2,597 | |
| Interest cost on benefit obligation | | | 14,057 | | | 15,336 | | | 15,706 | |
| Amortization of prior service cost | | | 7,526 | | | 7,526 | | | 9,431 | |
| Amortization of actuarial gain | | | (918 | ) | | (405 | ) | | (234 | ) |
| Overaccrual | | | 3,138 | | | 1,346 | | | 500 | |
| Net pension cost | | $ | 26,400 | | | 26,400 | | | 28,000 | |
Retirement benefits under the plan expected to be paid in each of the next five years and in the aggregate for the five years thereafter are summarized as follows:
| October 1, 2007 to September 30, 2008 | | $ | 31,000 | |
| October 1, 2008 to September 30, 2009 | | | 31,000 | |
| October 1, 2009 to September 30, 2010 | | | 23,000 | |
| October 1, 2010 to September 30, 2011 | | | 15,000 | |
| October 1, 2011 to September 30, 2012 | | | 15,000 | |
| October 1, 2012 to September 30, 2017 | | | 75,000 | |
| | | $ | 190,000 | |
Amounts recognized in accumulated other comprehensive earnings, net are summarized as follows:
| | | 2007 | | 2006 | |
| | | | | | |
| Unrecognized prior service cost | | $ | 45,155 | | | - | |
| Unrecognized actuarial gain | | | (34,901 | ) | | - | |
| | | | 10,254 | | | - | |
| | | | | | | | |
| Tax effect | | | (3,589 | ) | | - | |
| | | | | | | | |
| Unrecognized loss, net of taxes | | $ | 6,665 | | | - | |
The estimated amounts that will be amortized from accumulated other comprehensive earnings into net periodic cost for 2008 are as follows:
| Unrecognized prior service cost | | $ | 7,526 | |
| Unrecognized gain | | | (2,101 | ) |
| | | $ | 5,425 | |
LIBERTY BANCORP, INC.
Notes to Consolidated Financial Statements
(13) Stockholders’ Equity, Minimum Regulatory Capital Requirements and Subsequent Event
On August 23, 1993 the Bank completed its reorganization from a state-chartered mutual savings bank into a Federal mutual holding company. The reorganization was accomplished through a purchase and assumption of assets and liabilities whereby the Bank (i) incorporated a Missouri-chartered stock savings bank; (ii) converted the Bank's charter to a Federally-chartered mutual holding company; (iii) transferred substantially all of the Bank's assets and liabilities to the newly formed stock savings bank in exchange for 800,000 shares of common stock; and (iv) adopted a new charter issued by the Office of Thrift Supervision (OTS) changing its form to that of a Federally-chartered mutual holding company known as Liberty Savings Mutual Holding Company (MHC).
Concurrent with the reorganization, 500,000 shares of the Bank's common stock were issued in an offering to the Bank's ESOP and MRPs established for the benefit of officers and employees of the Bank, certain members of the Bank and members of the general public. Each share of common stock was sold at a price of $10.00 per share. The MHC owned 800,000 of the Bank's outstanding common stock. Subsequent to the offering an additional 14,276 shares of the Bank's common stock were issued to the MRPs.
Effective February 8, 1995 the Bank converted from a state-chartered stock savings bank into a federally-chartered stock savings bank.
On July 21, 2006 our organization converted from the partially public mutual holding company form to the fully public stock holding company structure. In the stock holding company structure, all of the Bank’s stock is owned by Liberty Bancorp, Inc., and all of Liberty Bancorp’s stock is owned by the public and our employee stock ownership plan. Liberty Savings Mutual Holding Company no longer exists and the name of the bank, Liberty Savings Bank, F.S.B., was changed to BankLiberty. Depositors and borrowers do not have voting rights in the Bank. Voting rights were vested exclusively with stockholders of the Company. A liquidation account was established at the time of Conversion in an amount equal to $21.1 million, the capital of the Bank as of the date of the latest balance sheet contained in the final prospectus. Each eligible account holder or supplemental account holder is entitled to a proportionate share of this account in the event of a complete liquidation of the Bank, and only in such event. This share will be reduced if the account holder’s or supplemental account holder’s deposit balance falls below the amount on the date of record and will cease to exist if the account is closed. The liquidation account will never be increased despite any increase in the related deposit balance.
As part of the conversion, we sold 2,807,383 shares of common stock at a price of $10.00 per share representing the majority ownership of Liberty Savings Bank that was held by Liberty Savings Mutual Holding Company. At the conclusion of the conversion, existing public stockholders of Liberty Savings Bank were issued 3.5004 shares of Liberty Bancorp, Inc. in exchange for each share of Liberty Savings Bank common stock, or 1,952,754 shares. Fractional shares in the aggregate, or 36 shares, were redeemed for cash. Total shares outstanding after the offering and the exchange totaled 4,760,137 shares. Net proceeds from the sale of common stock in the offering were $25,647,944, after deduction of conversion costs of $1,257,890, and unearned compensation related to shares issued to the ESOP of $1,167,996. In addition, as part of the Conversion and dissolution of Liberty Savings Mutual Holding Company, the Bank received $694,397 of cash previously held by the MHC. The Company retained 50% of the net conversion proceeds less funds to originate a loan to a trust for the ESOP, and used the balance of the net proceeds to purchase all of the stock in the Bank in the Conversion.
On August 6, 2007 the Company announced a stock repurchase program to acquire 476,119 shares, or 10%, of the Company’s outstanding common stock. No repurchased shares were held in treasury at September 30, 2007.
LIBERTY BANCORP, INC.
Notes to Consolidated Financial Statements
On December 20, 2007, the Company announced a second stock repurchase program to acquire up to 222,048 shares or 5%, of the Company’s common stock. Subsequent to September 30, 2007, the Company has repurchased 320,230 shares at an average price of $10.57 per share. Repurchases will be conducted through open market purchases or privately negotiated transactions, from time to time depending on market conditions and other factors. There is no guarantee as to the exact number of shares to be repurchased by the Company.
The Bank is subject to various regulatory capital requirements administered by the federal banking agencies. Failure to meet minimum capital requirements can result in certain mandatory and possibly additional discretionary actions by regulators, which, if undertaken, could have a direct material effect on the Bank's financial statements. Under capital adequacy guidelines, the Bank must meet specific guidelines, which involve quantitative measures of assets, liabilities, and certain off-balance sheet items as calculated under regulatory accounting practices. The Bank's capital amounts and classifications are also subject to judgments by the regulators about components, risk-weightings and other factors. At September 30, 2007, the Bank met all capital adequacy requirements.
The Bank is also subject to the regulatory framework for prompt corrective action. At September 30, 2007 and 2006, the most recent notification from the regulatory agencies categorized the Bank as well capitalized. To be categorized as well capitalized, the Bank must maintain minimum total risk-based, Tier 1 risk-based and Tier 1 leverage ratios as set forth in the following table. There are no conditions or events since the dates of the aforementioned notifications which management believes have changed the Bank's category.
The Bank's actual and required capital amounts and ratios at September 30, 2007 are as follows:
| | | | | | | Minimum Required | |
| | | | | | | for Capital | | to be "Well | |
| | | Actual | | Adequacy | | Capitalized" | |
| | | Amount | | Ratio | | Amount | | Ratio | | Amount | | Ratio | |
| | | (Dollars in Thousands) | |
| Stockholders' equity | | $ | 35,969 | | | | | | | | | | | | | | | | |
| Computer software costs | | | (39 | ) | | | | | | | | | | | | | | | |
| Unrealized gain, net - SFAS No. 158 | | | (82 | ) | | | | | | | | | | | | | | | |
| Unrealized loss on securities AFS, net | | | 94 | | | | | | | | | | | | | | | | |
| Tangible capital | | $ | 35,942 | | | 10.8 | % | $ | 4,973 | | | 1.5 | % | | | | | | |
| General valuation allowance | | | 3,011 | | | | | | | | | | | | | | | | |
| | | | | | | | | | | | | | | | | | | | |
| Total capital to risk-weighted assets | | $ | 38,953 | | | 15.1 | % | $ | 20,669 | | | 8.0 | % | $ | 25,837 | | | 10.0 | % |
| | | | | | | | | | | | | | | | | | | | |
| Tier 1 capital to risk-weighted assets | | $ | 35,942 | | | 13.9 | % | $ | 10,335 | | | 4.0 | % | $ | 15,502 | | | 6.0 | % |
| | | | | | | | | | | | | | | | | | | | |
| Tier 1 capital to total assets | | $ | 35,942 | | | 10.8 | % | $ | 13,260 | | | 4.0 | % | $ | 16,576 | | | 5.0 | % |
LIBERTY BANCORP, INC.
Notes to Consolidated Financial Statements
The Bank's actual and required capital amounts and ratios at September 30, 2006 are as follows:
| | | | | | | Minimum Required | |
| | | | | | | for Capital | | to be "Well | |
| | | Actual | | Adequacy | | Capitalized" | |
| | | Amount | | Ratio | | Amount | | Ratio | | Amount | | Ratio | |
| | | (Dollars in Thousands) | |
| Stockholders' equity | | $ | 35,623 | | | | | | | | | | | | | | | | |
| Computer software costs | | | (79 | ) | | | | | | | | | | | | | | | |
| Unrealized loss on securities AFS, net | | | 573 | | | | | | | | | | | | | | | | |
| Tangible capital | | $ | 36,117 | | | 12.7 | % | $ | 4,257 | | | 1.5 | % | | | | | | |
| General valuation allowance | | | 2,144 | | | | | | | | | | | | | | | | |
| | | | | | | | | | | | | | | | | | | | |
| Total capital to risk-weighted assets | | $ | 38,261 | | | 18.1 | % | $ | 16,874 | | | 8.0 | % | $ | 21,093 | | | 10.0 | % |
| | | | | | | | | | | | | | | | | | | | |
| Tier 1 capital to risk-weighted assets | | $ | 36,117 | | | 17.1 | % | $ | 8,437 | | | 4.0 | % | $ | 12,656 | | | 6.0 | % |
| | | | | | | | | | | | | | | | | | | | |
| Tier 1 capital to total assets | | $ | 36,117 | | | 12.7 | % | $ | 11,351 | | | 4.0 | % | $ | 14,189 | | | 5.0 | % |
An OTS regulation restricts the Bank's ability to make capital distributions, including paying dividends. The regulations do not permit cash dividend payments if the Bank's capital would be reduced below the amount of the minimum capital requirements or the liquidation account. The OTS may impose other restrictions.
During the years ended September 30, 2007, 2006 and 2005, the Bank paid cash dividends of $463,842, $436,876 and $425,181, respectively.
(14) Off-Balance Sheet Risk, Commitments and Contingencies
The Company is a party to financial instruments with off-balance sheet risk in the normal course of business to meet the financing needs of its customers. These financial instruments include commitments to originate loans and unused lines of credit. Those instruments involve, to varying degrees, elements of credit and interest rate risk in excess of the amount recognized in the balance sheet. The Company’s maximum exposure to credit loss in the event of nonperformance by the borrower is represented by the contractual amount and related accrued interest receivable of those instruments. The Company minimizes this risk by evaluating each borrower's creditworthiness on a case-by-case basis. Collateral held by the Company generally consists of a first or second mortgage on the borrower's property. The amount of collateral obtained is based upon an appraisal of the property.
Commitments to originate loans are legally binding agreements to lend to the Company's customers. Letters of credit are unconditional commitments issued by the Company to guarantee the performance of the borrower to a third party.
LIBERTY BANCORP, INC.
Notes to Consolidated Financial Statement
The following table sets forth information regarding off-balance sheet financial instruments as of September 30, 2007:
| | | Fixed-Rate | | Adjustable-Rate | |
| Off-balance sheet financial instruments: | | | | | | | |
| Commitments to originate loans | | $ | 21,678,960 | | | 11,558,145 | |
| | | | | | | | |
| Commitments for unused lines of credit | | $ | 568,156 | | | 12,660,525 | |
| | | | | | | | |
| Commitments for undisbursed loans | | $ | 10,687,728 | | | 20,628,014 | |
| | | | | | | | |
| Commitments for letters of credit | | $ | 356,840 | | | - | |
Interest rates on these fixed-rate loans generally ranged from 6.38% to 9.25%.
At September 30, 2007, there was no known pending litigation or other claims that management believes will be material to the Company’s financial position.
(15) Fair Value of Financial Instruments
The carrying amounts and estimated fair values of the Company's financial instruments are summarized as follows:
| | | 2007 | | 2006 | |
| | | Carrying | | Fair | | Carrying | | Fair | |
| | | Amount | | Value | | Amount | | Value | |
| | | | | | | | | | | | | | |
Non-trading instruments and nonderivatives: | | | | | | | | | | | | | |
| Cash and cash equivalents | | $ | 9,042,289 | | | 9,042,289 | | | 13,403,701 | | | 13,403,701 | |
| Securities available for sale | | | 47,982,519 | | | 47,982,519 | | | 35,882,630 | | | 35,882,630 | |
| Stock in FHLB of Des Moines | | | 1,531,200 | | | 1,531,200 | | | 1,952,900 | | | 1,952,900 | |
Mortgage-backed securities - available for sale | | | 19,276,996 | | | 19,276,996 | | | 24,217,321 | | | 24,217,321 | |
| Loans receivable, net | | | 232,307,925 | | | 234,510,039 | | | 200,222,378 | | | 200,225,932 | |
| Loans held for sale | | | 719,086 | | | 719,086 | | | 459,201 | | | 459,201 | |
| Accrued interest receivable | | | 2,055,814 | | | 2,055,814 | | | 1,486,355 | | | 1,486,355 | |
| Deposits | | | 252,305,482 | | | 252,323,699 | | | 198,470,979 | | | 198,212,238 | |
| Accrued interest on deposits | | | 601,285 | | | 601,285 | | | 316,366 | | | 316,366 | |
| Advances from FHLB | | | 26,430,394 | | | 26,670,801 | | | 34,063,738 | | | 34,148,662 | |
Securities sold under agreement to repurchase | | $ | 1,221,184 | | | 1,220,451 | | | 3,383,997 | | | 3,424,605 | |
The following methods and assumptions were used in estimating the fair values of financial instruments:
Cash and cash equivalents are valued at their carrying amounts due to the relatively short period to maturity of the instruments. Fair values of securities and mortgage-backed securities are based on quoted market prices or, if unavailable, quoted market prices of similar securities.
The carrying amounts of accrued interest receivable and payable approximate fair value. Stock in FHLB of Des Moines is valued at cost, which represents redemption value and approximates fair value.
LIBERTY BANCORP, INC.
Notes to Consolidated Financial Statement
Fair values are computed for each loan category using market spreads to treasury securities for similar existing loans in the portfolio and management's estimates of prepayments.
Deposits with no defined maturities, such as NOW accounts, passbook accounts and money market deposit accounts, are valued at the amount payable on demand at the reporting date. The fair value of certificates of deposit, advances from FHLB of Des Moines and securities sold under agreement to repurchase is computed at fixed spreads to treasury securities with similar maturities.
Off-balance sheet assets include commitments to extend credit and unused lines of credit for which fair values were estimated based on interest rates and fees currently charged to enter into similar transactions and commitments to sell loans for which fair values were estimated based on current secondary market prices for commitments with similar terms. As a result of the short-term nature of the outstanding commitments, the fair values of fees on such commitments are considered immaterial to the Company’s financial condition.
(16) Parent Company Only Financial Statements
The following balance sheets and statements of earnings and cash flows for Liberty Bancorp, Inc. should be read in conjunction with the consolidated financial statements and the notes thereto.
Balance Sheets
September 30, 2007 and 2006
| | | 2007 | | 2006 | |
Assets | | | | | | | |
| Cash and cash equivalents | | $ | 11,556,962 | | | 8,061,893 | |
| Investment in subsidiary | | | 35,968,431 | | | 35,622,895 | |
| Securities available for sale | | | 393,884 | | | - | |
| ESOP note receivable | | | 706,935 | | | 917,906 | |
| Loans receivable, net of allowance for loan losses of $0 | | | 1,600,000 | | | 4,399,902 | |
| Accrued interest receivable - loans | | | 7,700 | | | 4,583 | |
| Accrued interest receivable - other | | | 2,240 | | | - | |
| Other assets | | | 12,039 | | | 8,397 | |
| Total assets | | $ | 50,248,191 | | | 49,015,576 | |
| | | | | | | | |
Liabilities and Stockholders' Equity | | | | | | | |
| Other liabilities | | $ | 13,500 | | | - | |
| Accrued income taxes | | | 40,158 | | | 34,000 | |
| Total liabilities | | | 53,658 | | | 34,000 | |
| Stockholders' equity: | | | | | | | |
| Common stock | | | 47,612 | | | 47,601 | |
| Additional paid-in capital | | | 31,923,288 | | | 33,001,965 | |
| Common stock acquired by ESOP | | | (701,308 | ) | | (933,192 | ) |
| Common stock acquired by Incentive Plan | | | - | | | (18,676 | ) |
| Accumulated other comprehensive earnings, net | | | (12,619 | ) | | (573,130 | ) |
| Retained earnings - substantially restricted | | | 18,937,560 | | | 17,457,008 | |
| Total stockholders' equity | | | 50,194,533 | | | 48,981,576 | |
| Total liabilities and stockholders' equity | | $ | 50,248,191 | | | 49,015,576 | |
LIBERTY BANCORP, INC.
Notes to Consolidated Financial Statement
Statements of Earnings
Years Ended September 30, 2007 and 2006
| | | 2007 | | 2006 | |
| Interest income and dividend income | | | | | | | |
| Loans receivable | | $ | 78,390 | | | 60,486 | |
| ESOP note receivable | | | 75,727 | | | 19,148 | |
| Other interest-earning assets | | | 498,003 | | | 43,078 | |
| Total interest income | | | 652,120 | | | 122,712 | |
| Dividend income - BankLiberty | | | 2,500,000 | | | - | |
| Total interest and dividend income | | | 3,152,120 | | | - | |
| Noninterest expense | | | 298,477 | | | 31,572 | |
Earnings before income taxes and equity in undistributed earnings of the Bank | | | 2,853,643 | | | 91,140 | |
| Income taxes | | | 131,000 | | | 34,000 | |
| Net earnings before equity in earnings of Bank | | | 2,722,643 | | | 57,140 | (1) |
| Equity in undistributed earnings of subsidiary (dividends received in excess of earnings of subsidiary) | | | (778,249 | ) | | 1,405,795 | |
| Net earnings | | $ | 1,944,394 | | | 1,462,935 | |
(1) Includes operations of the stand-alone Company for the time period July 21,2006 through September 30, 2006.
LIBERTY BANCORP, INC.
Notes to Consolidated Financial Statement
Statements of Cash Flows
Years Ended September 30, 2007 and 2006
| | | 2007 | | 2006 (1) | |
| Cash flows from operating activities: | | | | | | | |
| Net earnings | | $ | 1,944,394 | | | 1,462,935 | |
Adjustments to reconcile net earnings to net cash provided by (used for) operating activities: | | | | | | | |
| Equity in undistributed net earnings of BankLiberty | | | (1,721,751 | ) | | (1,405,795 | ) |
| ESOP expense | | | 332,735 | | | 306,947 | |
| Incentive Plan expense | | | 230,072 | | | 27,996 | |
| Decrease (increase) in: | | | | | | | |
| Accrued interest receivable | | | (5,357 | ) | | (4,583 | ) |
| Other assets | | | (3,368 | ) | | (8,397 | ) |
| Increase (decrease) in; | | | | | | | |
| Other liabilities | | | 13,500 | | | - | |
| Accrued income taxes | | | 6,158 | | | 34,000 | |
| Net cash provided by (used for) operating activities | | | 796,383 | | | 413,103 | |
| Cash flows from investing activities: | | | | | | | |
| Net change in loans receivable | | | 2,799,902 | | | (4,399,902 | ) |
| Purchase of subsidiary | | | (562,809 | ) | | (12,941,266 | ) |
| Dividend from subsidiary | | | 2,500,000 | | | - | |
| Purchase of securities | | | (394,623 | ) | | - | |
| Loan to ESOP to finance shares | | | - | | | (1,167,996 | ) |
| Repayment of ESOP loan | | | 210,971 | | | 250,089 | |
| Net cash provided by (used for) investing activities | | | 4,553,441 | | | (18,259,075 | ) |
| Cash flows from financing activities: | | | | | | | |
| Issuance and exchange of common stock | | | - | | | 26,342,341 | |
| Proceeds from exercise of stock options | | | 8,695 | | | 2,400 | |
| Cash dividends | | | (463,842 | ) | | (436,876 | ) |
| Repurchase of common stock for stock award plan | | | (1,399,608 | ) | | - | |
| Net cash provided by (used for) financing activities | | | (1,854,755 | ) | | 25,907,865 | |
| Net increase (decrease) in cash and cash equivalents | | | 3,495,069 | | | 8,061,893 | |
| Cash and cash equivalents at beginning of period | | | 8,061,893 | | | - | |
| Cash and cash equivalents at end of period | | $ | 11,556,962 | | | 8,061,893 | |
(1) Includes operations of the stand-alone company for the time period July 21, 2006 through September 30, 2006.
LIBERTY BANCORP, INC.
Notes to Consolidated Financial Statement
(17) Selected Quarterly Financial Data (Unaudited)
The results of operations by quarter for the years ended September 30, 2007 and 2006 were as follows:
| | | First | | Second | | Third | | Fourth | |
Year Ended September 30, 2007 | | Quarter | | Quarter | | Quarter | | Quarter | |
| | | | | | | | | | |
| Income income | | $ | 4,875,692 | | $ | 4,910,595 | | $ | 5,243,653 | | $ | 5,533,234 | |
| Interest expense | | | (2,332,378 | ) | | (2,436,057 | ) | | (2,692,641 | ) | | (3,033,052 | ) |
| Net interest income | | | 2,543,314 | | | 2,474,538 | | | 2,551,012 | | | 2,500,182 | |
| Provision for loan losses | | | (32,000 | ) | | (166,202 | ) | | (267,105 | ) | | (136,782 | ) |
| Net interest income after provision for loan losses | | | 2,511,314 | | | 2,308,336 | | | 2,283,907 | | | 2,363,400 | |
| Noninterest income | | | 329,870 | | | 310,189 | | | 363,227 | | | 474,164 | |
| Noninterest expense | | | (1,966,408 | ) | | (2,055,220 | ) | | (2,033,136 | ) | | (1,991,249 | ) |
| Earnings before income taxes | | | 874,776 | | | 563,305 | | | 613,998 | | | 846,315 | |
| Income taxes | | | (315,000 | ) | | (190,000 | ) | | (208,000 | ) | | (241,000 | ) |
| Net earnings | | $ | 559,776 | | $ | 373,305 | | $ | 405,998 | | $ | 605,315 | |
| Basic and diluted earnings per share | | $ | 0.12 | | $ | 0.08 | | $ | 0.09 | | $ | 0.13 | |
| | | First | | Second | | Third | | Fourth | |
Year Ended September 30, 2006 | | Quarter | | Quarter | | Quarter | | Quarter | |
| | | | | | | | | | |
| Income income | | $ | 3,577,313 | | $ | 3,908,588 | | $ | 4,416,814 | | $ | 4,761,126 | |
| Interest expense | | | (1,602,744 | ) | | (1,819,463 | ) | | (2,098,179 | ) | | (2,079,293 | ) |
| Net interest income | | | 1,974,569 | | | 2,089,125 | | | 2,318,635 | | | 2,681,833 | |
| Provision for loan losses | | | (220,000 | ) | | (250,000 | ) | | (215,000 | ) | | (167,000 | ) |
| Net interest income after provision for loan losses | | | 1,754,569 | | | 1,839,125 | | | 2,103,635 | | | 2,514,833 | |
| Noninterest income | | | 302,513 | | | 273,879 | | | 332,538 | | | 327,996 | |
| Noninterest expense | | | (1,564,486 | ) | | (1,690,158 | ) | | (1,832,800 | ) | | (2,115,709 | ) |
| Earnings before income taxes | | | 492,596 | | | 422,846 | | | 603,373 | | | 727,120 | |
| Income taxes | | | (168,000 | ) | | (143,000 | ) | | (213,000 | ) | | (259,000 | ) |
| Net earnings | | $ | 324,596 | | $ | 279,846 | | $ | 390,373 | | $ | 468,120 | |
| Basic and diluted earnings per share | | $ | 0.07 | | $ | 0.06 | | $ | 0.08 | | $ | 0.10 | |
LIBERTY BANCORP, INC.
Board of Directors of Liberty Bancorp, Inc. and BankLiberty
Daniel G. O’Dell Chairman of the Board President O’Dell Publishing, Inc. | | Steven K. Havens Secretary/Treasurer President Havens Construction Company, Inc. | | Ralph W. Brant, Jr. President Brant’s Clothing |
| | | | | |
Robert T. Sevier Recorder of Deeds Clay County | | Brent M. Giles President & Chief Executive Officer Liberty Bancorp, Inc. and BankLiberty | | |
Officers of Liberty Bancorp, Inc.
Brent M. Giles President and Chief Executive Officer | | Marc J. Weishaar Senior Vice President and Chief Financial Officer | | Mark E. Hecker Senior Vice President and Chief Lending Officer |
| | | | | |
Cathy Trusler Secretary | | | | |
Officers of BankLiberty
Brent M. Giles President and Chief Executive Officer | | Marc J. Weishaar Senior Vice President and
Chief Financial Officer | | Mark E. Hecker Senior Vice President and Chief Lending Officer |
| | | | | |
Martin J. Weishaar Senior Vice President and General Counsel | | Kenneth M. Honeck Senior Vice President Retail Banking | | |
LIBERTY BANCORP, INC.
Branch Offices
Headquarters 16 W. Franklin Liberty, MO 64068-1637 (816) 781-4822 | | Platte City Branch 92 Highway & Bellmondo Drive Platte City, MO 64079 (816) 858-5200 | | Plattsburg Branch 1206 Clay Plattsburg, MO 64477 (816) 930-2513 |
| | | | | |
Shoal Creek Branch 9200 N.E. Barry Road Kansas City, MO 64157 (816) 407-9200 | | Independence Branch 4315 South Noland Road Independence, MO 64055 (816) 350-4477 | | Boardwalk Branch 8740 N. Ambassador Drive Kansas City, MO 64154 (816) 741-7979 |
| | | | | |
Gladstone Branch 6410 N. Prospect Gladstone, MO 64119 (816) 452-7300 | | | | |
LIBERTY BANCORP, INC.
Investor Information
ANNUAL MEETING OF STOCKHOLDERS
The Annual Meeting of Stockholders will be held on Wednesday, February 6, 2008 at 5:30 p.m., local time, at 9200 N.E. Barry Road, Kansas City, Missouri.
LEGAL COUNSEL
Muldoon Murphy & Aguggia LLP
5101 Wisconsin Avenue, N.W.
Washington, DC 20016
STOCK TRANSFER AGENT AND REGISTRAR
Registrar and Transfer Company
10 Commerce Drive
Cranford, New Jersey 07016
AUDITORS
Michael Trokey & Company, P.C.
Certified Public Accountants
10411 Clayton Road
St. Louis, Missouri 63131
Form 10-K
A COPY OF THE COMPANY’S FORM 10-K, INCLUDING FINANCIAL STATEMENT SCHEDULES, WILL BE FURNISHED WITHOUT CHARGE TO STOCKHOLDERS AS OF THE ANNUAL MEETING RECORD DATE UPON WRITTEN REQUEST TO THE SECRETARY, LIBERTY BANCORP, INC., 16 W. FRANKLIN, LIBERTY, MISSOURI 64068.