Exhibit 99.2

Q1’22 Investor Presentation May 11, 2022
This presentation contains certain forward - looking statements within the meaning of Section 21E of the Securities Exchange Act of 1934, as amended, and Section 27A of the Securities Act of 1933, as amended. Statements that do not relate strictly to historical or current facts are forward - looking and can be identified by the use of words such as “anticipate,” “estimate,” “could,” “would,” “should,” “will,” “may,” “forecast,” “approximate,” “expect,” “project,” “seek,” “predict,” “potential,” “intend,” “plan,” “believe,” the negatives of such terms and other words of similar meaning. Without limiting the generality of the foregoing, forward - looking statements contained in this presentation include statements regarding Appgate and its industry relating to matters such as anticipated future financial and operational performance and business prospects. The forward - looking statements involve risks and uncertainties that could cause actual results to differ materially from projected results. Accordingly, investors should not place undue reliance on forward - looking statements as a prediction of actual results. Appgate has based these forward - looking statements on current expectations and assumptions about future events, taking into account all information currently known by Appgate. While Appgate considers these expectations and assumptions to be reasonable, they are inherently subject to significant business, economic, competitive, regulatory and other risks and uncertainties, many of which are difficult to predict and beyond Appgate’s control. These risks and uncertainties include, but are not limited to: Appgate’s future financial performance, including Appgate’s expectations regarding its annual recurring revenue and other key business metrics, total revenue, cost of revenue, gross profit or gross margin, operating expenses, including changes in operating expenses and our ability to achieve and maintain future profitability; the effects of increased competition in Appgate’s markets and Appgate’s ability to compete effectively; growth in the total addressable market for Appgate’s products and services; market acceptance of Zero Trust solutions and technology generally; market acceptance of Appgate’s products and services and Appgate’s ability to increase adoption of its products; Appgate’s ability to maintain the security and availability of its products; Appgate’s ability to develop new products, or enhancements to existing products, and bring them to market in a timely manner; Appgate’s ability to maintain and expand its customer base, including by attracting new customers; the potential impact on Appgate’s business of the ongoing COVID - 19 pandemic; Appgate’s ability to maintain, protect and enhance its intellectual property rights; Appgate’s ability to comply with laws and regulations that currently apply or become applicable to its business both in the United States and internationally; Appgate’s ability to maintain an effective system of disclosure controls and internal control over financial reporting; SIS Holdings’ significant influence over Appgate’s business and affairs; the future trading prices and liquidity of Appgate’s common stock; Appgate’s indebtedness, which may increase risk to Appgate’s business; and other risks and uncertainties, including those described under the section entitled “Risk Factors” in Appgate’s Form 10 - K filed with the Securities and Exchange Commission (“SEC”) on March 31, 2022, as updated by any subsequent filings which Appgate makes with the SEC. Should one or more of these risks or uncertainties materialize, or should any of the assumptions prove incorrect, actual results may vary in material respects from those projected in these forward - looking statements. Appgate will not and does not undertake any obligation to update or revise any forward - looking statements, whether as a result of new information, future events or otherwise, except as may be required under applicable securities laws. In this presentation, we present certain financial measures that are not calculated in accordance with accounting principles generally accepted in the United States of America (“GAAP”), such measures are referred to herein as “non - GAAP.” You should review the reconciliation included elsewhere in this presentation carefully in connection with your consideration of such non - GAAP measures and note that the way in which we calculate these measures may not be comparable to similarly titled measures employed by other companies. Specifically, we make use of the non - GAAP financial measures “Non - GAAP Gross Margin,” “Non - GAAP Operating Margin,” “Non - GAAP Gross Profit,” and “Non - GAAP Loss from Operations.” These non - GAAP financial measures are presented for supplemental informational purposes only and should not be considered a substitute for financial information presented in accordance with GAAP and may be different from similarly titled non - GAAP measures used by other companies. A reconciliation is provided elsewhere in this presentation for each non - GAAP financial measure to the most directly comparable financial measure determined in accordance with GAAP. You are encouraged to review the related GAAP financial measures and the reconciliation of these non - GAAP financial measures to their most directly comparable GAAP financial measure. See slide 13 of this presentation. 2 Cautionary Statements
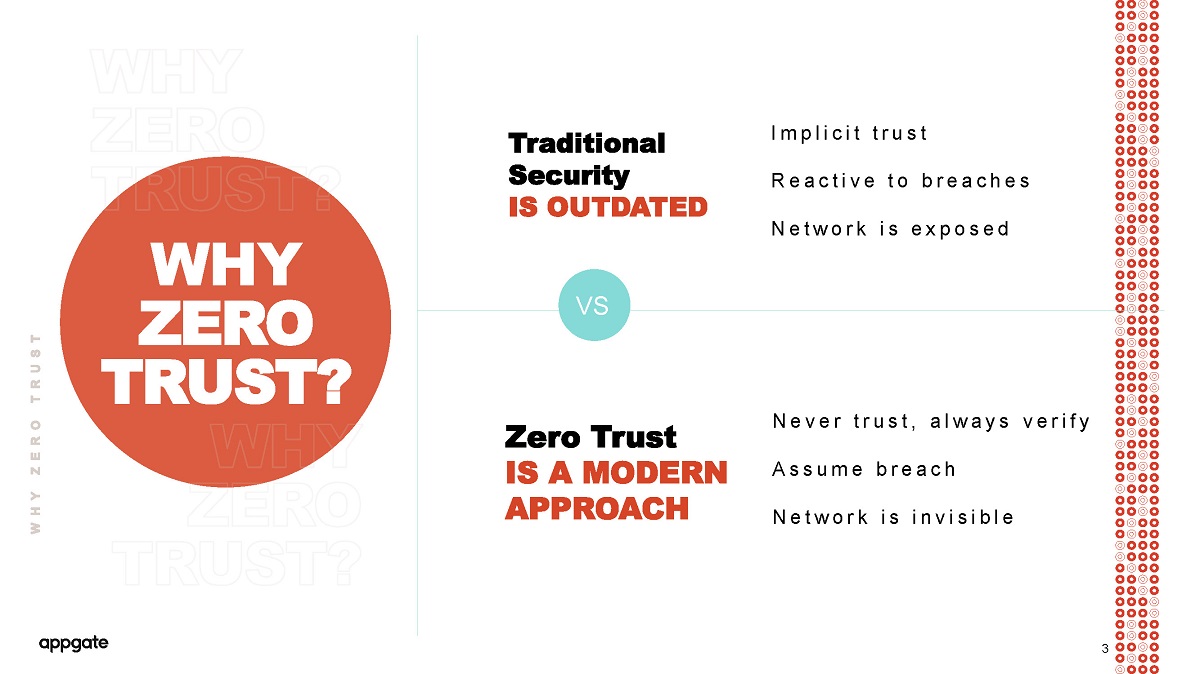
WHY ZERO TRUST? Implicit trust Reactive to breaches Network is exposed Never trust, always verify Assume breach Network is invisible Traditional Security IS OUTDATED Zero Trust IS A MODERN APPROACH VS 3 3

4 To empower and protect how people work and connect We achieve our mission by providing a Pure - play Zero Trust Platform OUR MISSION
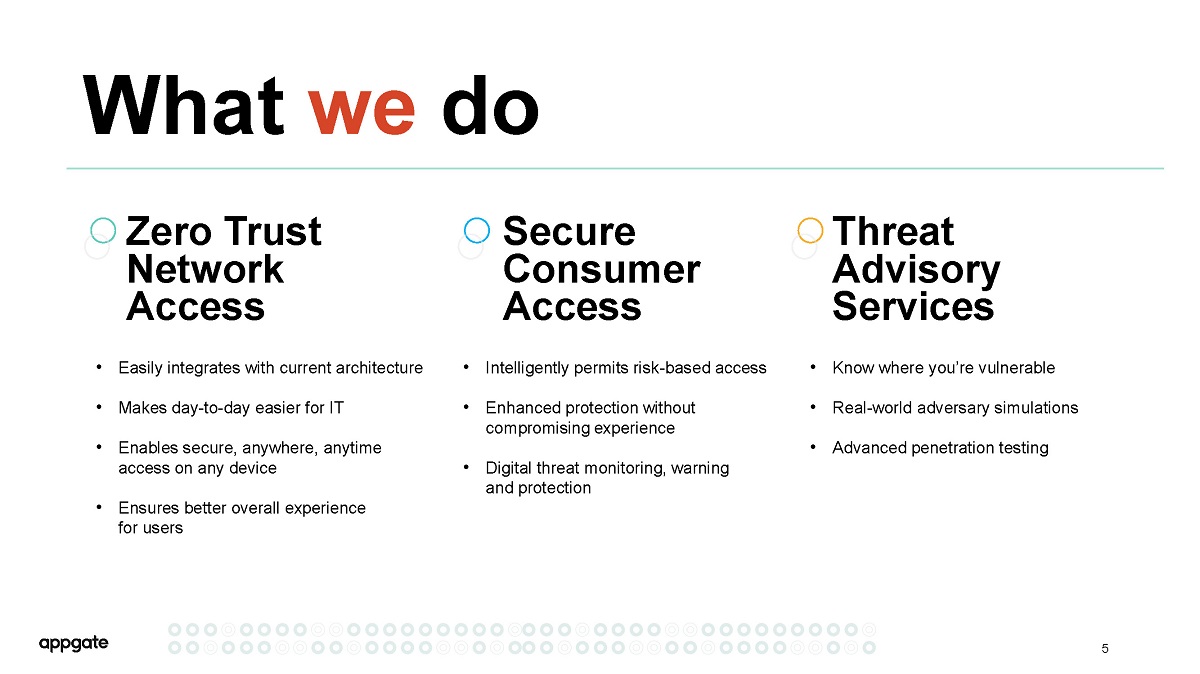
Zero Trust Network Access Secure Consumer Access Threat Advisory Services • Easily integrates with current architecture • Makes day - to - day easier for IT • Enables secure, anywhere, anytime access on any device • Ensures better overall experience for users • Intelligently permits risk - based access • Enhanced protection without compromising experience • Digital threat monitoring, warning and protection • Know where you’re vulnerable • Real - world adversary simulations • Advanced penetration testing What we do 5
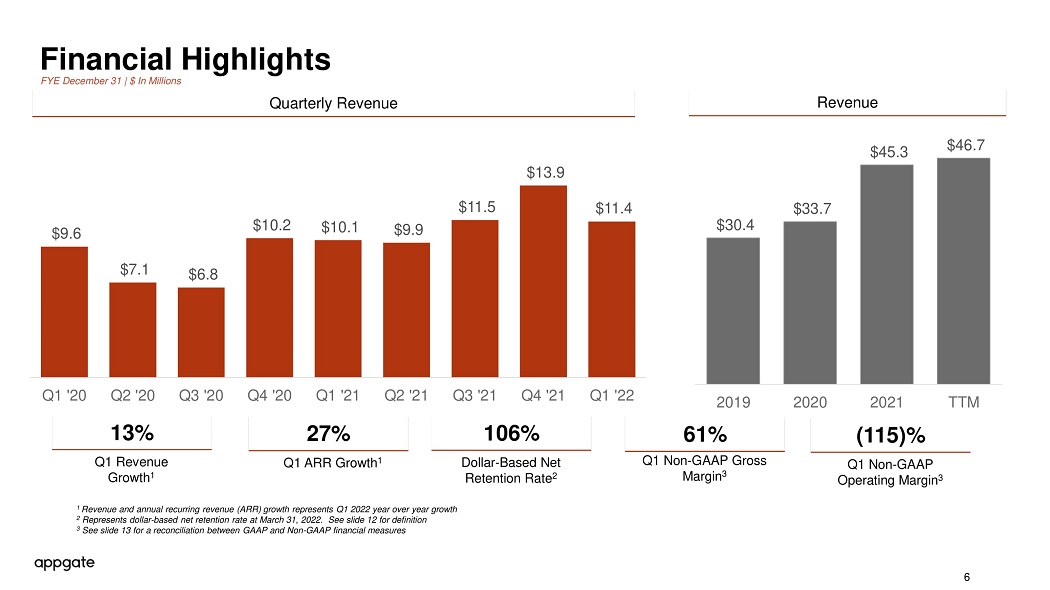
Quarterly Revenue 6 13% Financial Highlights FYE December 31 | $ In Millions 1 Revenue and annual recurring revenue (ARR) growth represents Q1 2022 year over year growth 2 Represents dollar - based net retention rate at March 31, 2022. See slide 12 for definition 3 See slide 13 for a reconciliation between GAAP and Non - GAAP financial measures $9.6 $7.1 $6.8 $10.2 $10.1 $9.9 $11.5 $13.9 $11.4 Q1 '20 Q2 '20 Q3 '20 Q4 '20 Q1 '21 Q2 '21 Q3 '21 Q4 '21 Q1 '22 Revenue Q1 Revenue Growth 1 27% Q1 ARR Growth 1 61% Q1 Non - GAAP Gross Margin 3 (115)% Q1 Non - GAAP Operating Margin 3 106% Dollar - Based Net Retention Rate 2 $30.4 $33.7 $45.3 $46.7 2019 2020 2021 TTM
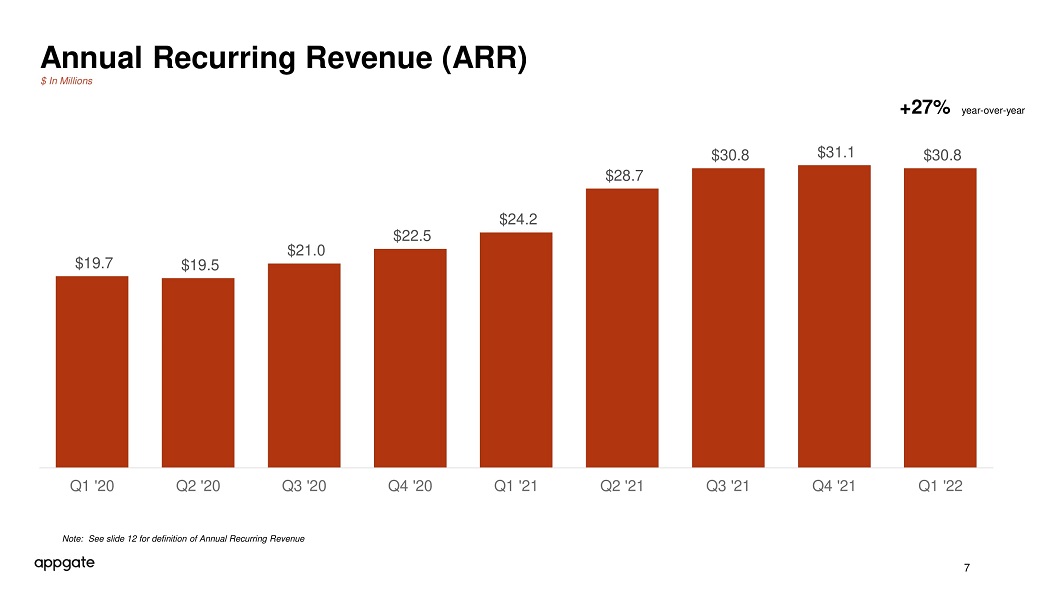
7 Annual Recurring Revenue (ARR) $19.7 $19.5 $21.0 $22.5 $24.2 $28.7 $30.8 $31.1 $30.8 Q1 '20 Q2 '20 Q3 '20 Q4 '20 Q1 '21 Q2 '21 Q3 '21 Q4 '21 Q1 '22 Note: See slide 12 for definition of Annual Recurring Revenue $ In Millions +27% year - over - year
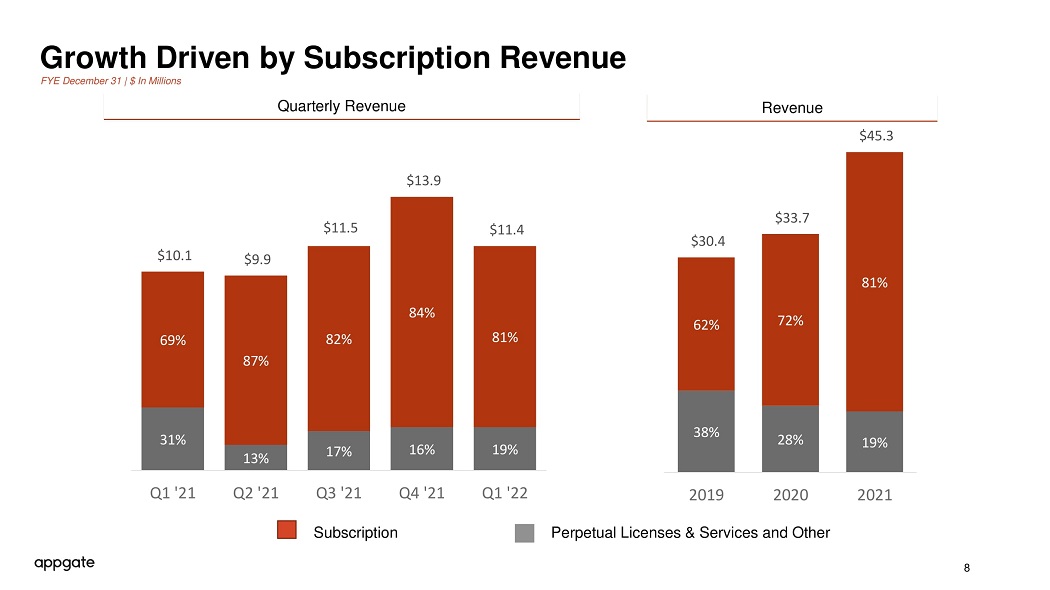
8 Growth Driven by Subscription Revenue 31% 13% 17% 16% 19% 69% 87% 82% 84% 81% $10.1 $9.9 $11.5 $13.9 $11.4 Q1 '21 Q2 '21 Q3 '21 Q4 '21 Q1 '22 38% 28% 19% 62% 72% 81% $30.4 $33.7 $45.3 2019 2020 2021 FYE December 31 | $ In Millions Revenue Quarterly Revenue Subscription Perpetual Licenses & Services and Other
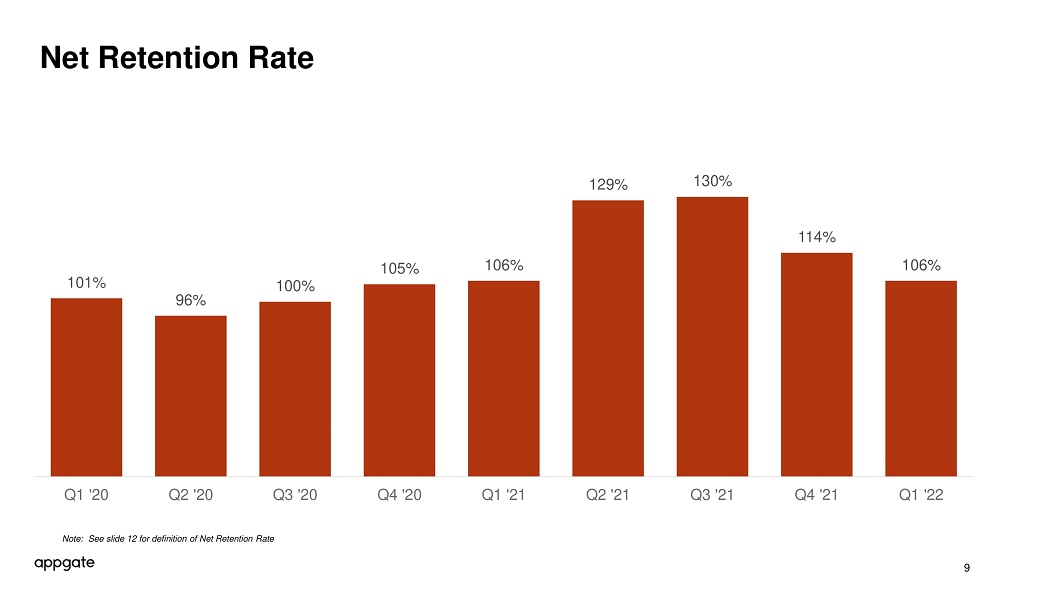
9 Net Retention Rate 101% 96% 100% 105% 106% 129% 130% 114% 106% Q1 '20 Q2 '20 Q3 '20 Q4 '20 Q1 '21 Q2 '21 Q3 '21 Q4 '21 Q1 '22 Note: See slide 12 for definition of Net Retention Rate
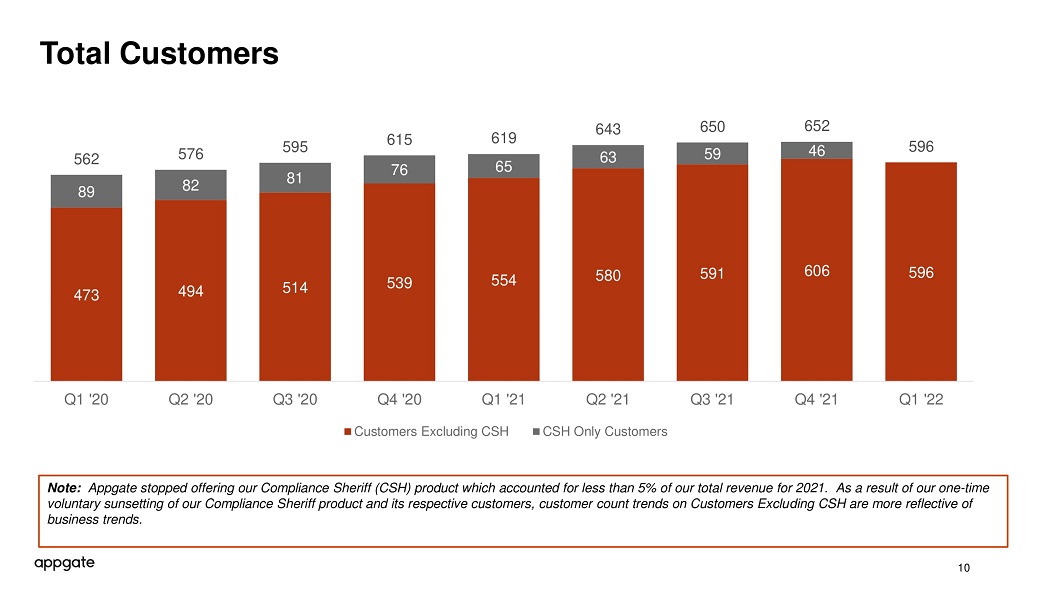
473 494 514 539 554 580 591 606 596 89 82 81 76 65 63 59 46 562 576 595 615 619 643 650 652 596 Q1 '20 Q2 '20 Q3 '20 Q4 '20 Q1 '21 Q2 '21 Q3 '21 Q4 '21 Q1 '22 Customers Excluding CSH CSH Only Customers 10 Total Customers Note: Appgate stopped offering our Compliance Sheriff (CSH) product which accounted for less than 5% of our total revenue for 2021. A s a result of our one - time voluntary sunsetting of our Compliance Sheriff product and its respective customers, customer count trends on Customers Exclu din g CSH are more reflective of business trends.
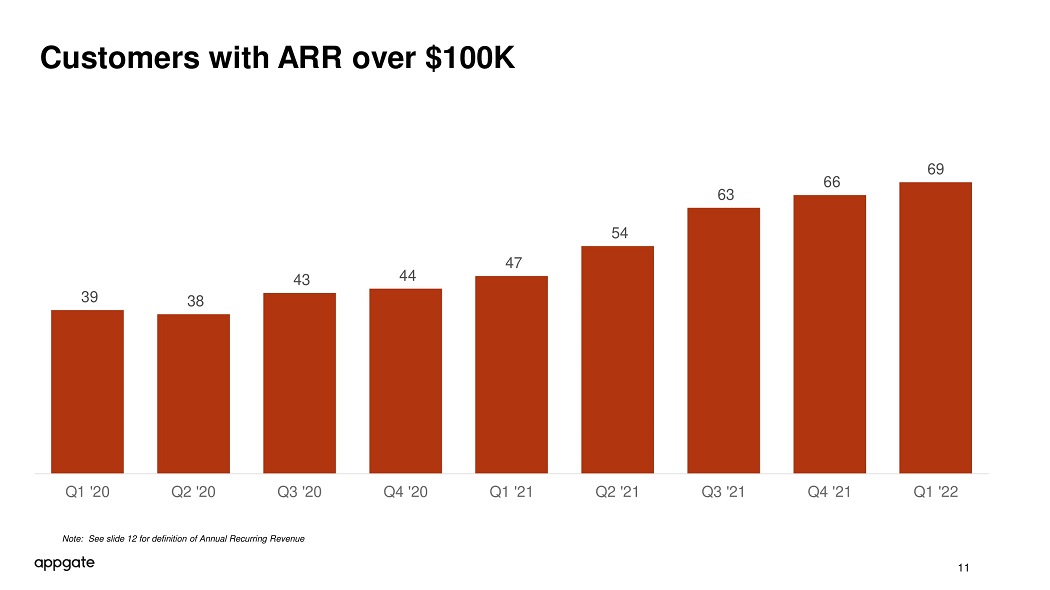
11 Customers with ARR over $100K 39 38 43 44 47 54 63 66 69 Q1 '20 Q2 '20 Q3 '20 Q4 '20 Q1 '21 Q2 '21 Q3 '21 Q4 '21 Q1 '22 Note: See slide 12 for definition of Annual Recurring Revenue
Appgate’s management reviews a number of key performance indicators, each as described below, to evaluate the business of Appgate, measure its performance, identify trends affecting its business, formulate business plans and make strategic decisions. • Annual recurring revenue (ARR) is defined as the annualized value of software - as - a - service (“SaaS”), subscription, and term - based license and maintenance contracts from Appgate’s recurring software products in effect at the end of a given period. • Dollar - based net retention rate (or net retention) reflects customer renewals, expansion, contraction, and customer attrition within Appgate’s ARR base. Appgate calculates dollar - based net retention rate by dividing the numerator by the denominator as set forth below: • Denominator : As of the end of a reporting period, ARR as of the last day of the same reporting period in the prior year. • Numerator : ARR for that same cohort of customers as of the end of the reporting period in the current year, including any expansion and net of contraction and customer attrition over the trailing 12 months, excluding ARR from new subscription customers in the current period. Key Business Metric Definitions 12

13 GAAP to Non - GAAP Reconciliations $ in Thousands Non - GAAP Operating Margin Non - GAAP Gross Margin