Exhibit 99.1
Stock Analyst Presentation November 17, 2011
Forward Looking Statements The foregoing contains forward-looking statements within the meaning of Section 27A of the Securities Act of 1933, as amended, and Section 21E of the Securities Exchange Act of 1934, as amended (the “Exchange Act”), and are intended to be covered by the safe harbor provisions of the Private Securities Litigation Reform Act of 1995. These statements, which are based on certain assumptions and describe our future plans, strategies and expectations, can generally be identified by the use of words such as “may,” “will,” “should,” “could,” “would,” “plan,” “believe,” “expect,” “anticipate,” “intend,” “estimate” or words of similar meaning. These forward-looking statements include statements relating to our anticipated future financial performance, projected growth and management’s long-term performance goals, as well as statements relating to the anticipated effects on results of operations and financial condition from developments or events, our business and growth strategies. These forward-looking statements are subject to significant risks, assumptions and uncertainties, and could be affected by many factors. The following, which is not intended to be an all-encompassing list of risks and uncertainties affecting us, summarizes several factors that could cause our actual results to differ materially from those anticipated or expected in these forward-looking statements: economic conditions (both generally and in our markets) being less favorable than expected; the general decline in the real estate and lending market; inaccuracies in management’s assumptions used in calculating the appropriate amount to be placed into our allowance for loan and lease losses; restrictions or conditions imposed by regulators on our operations; legislative and regulatory changes (including the unexpected impact of the Dodd-Frank Wall Street Reform and Consumer Protection Act and related regulations) that may subject us to additional regulatory oversight; changes in accounting standards and compliance requirements; competitive pressures among depository and other financial institutions increasing significantly; changes in the interest rate environment; competitors having greater financial resources and developing products that enable them to compete more successfully than we can; our ability to attract and retain key personnel; adverse changes occurring in the equity markets; war or terrorist activities causing further deterioration in the economy or instability in credit markets; and economic, governmental or other factors that may prevent the projected population and residential and commercial growth in the markets in which we operate. A detailed discussion of factors that could affect our results is included in our SEC filings, including our Annual Report on Form 10-K for the year ended December31, 2010 and our Quarterly Report on Form 10-Q for the quarterly period ended September 30, 2011 We undertake no duty to update any forward-looking statement to conform the statement to actual results or changes in our expectations. Although we believe that the expectations reflected in the forward-looking statements are reasonable, we cannot guarantee future results, levels of activity, performance or achievements.

Agenda Simsbury Bank’s Strengths Strategic Growth Strategies Competitive Positioning Financial Performance Trends
Corporate Objective Create Value for our Shareholders
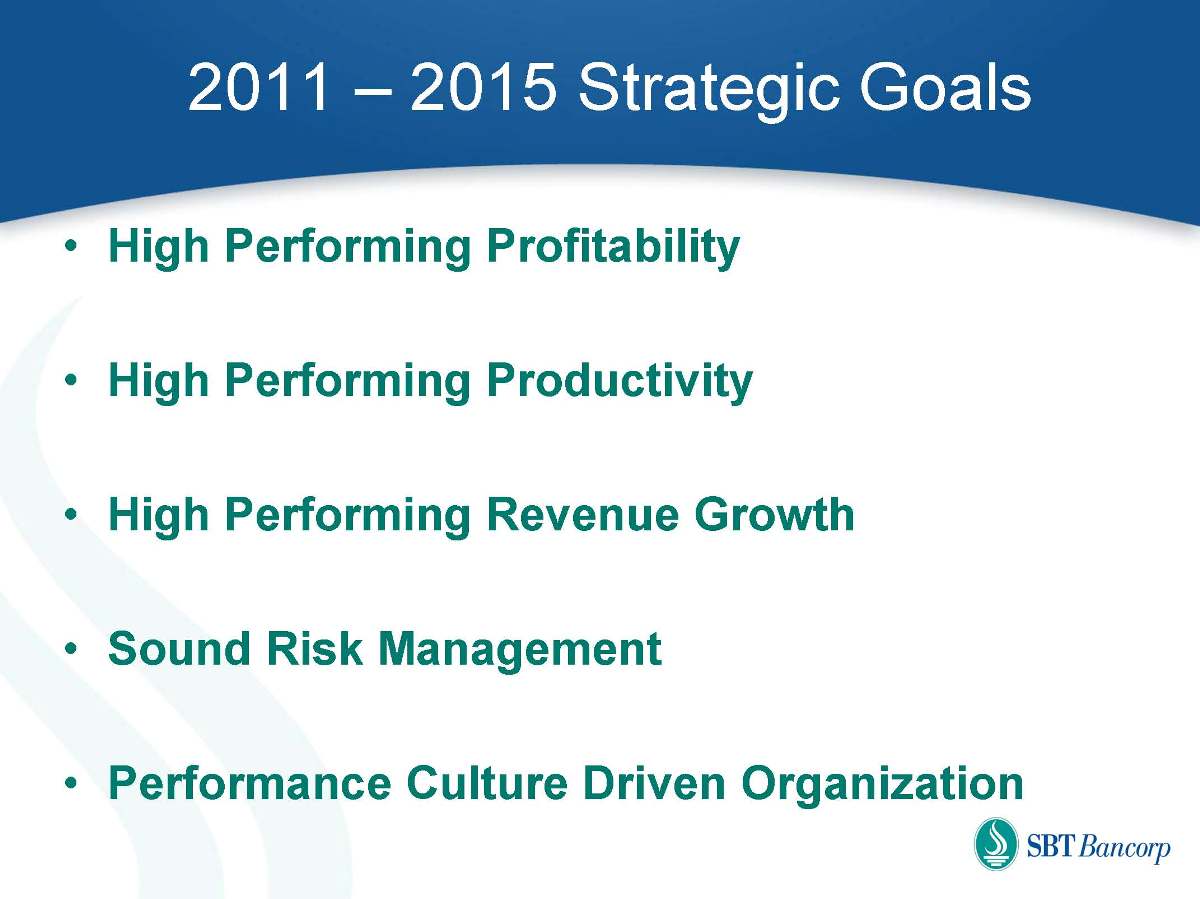
2011 – 2015 Strategic Goals High Performing Profitability High Performing Productivity High Performing Revenue Growth Sound Risk Management Performance Culture Driven Organization
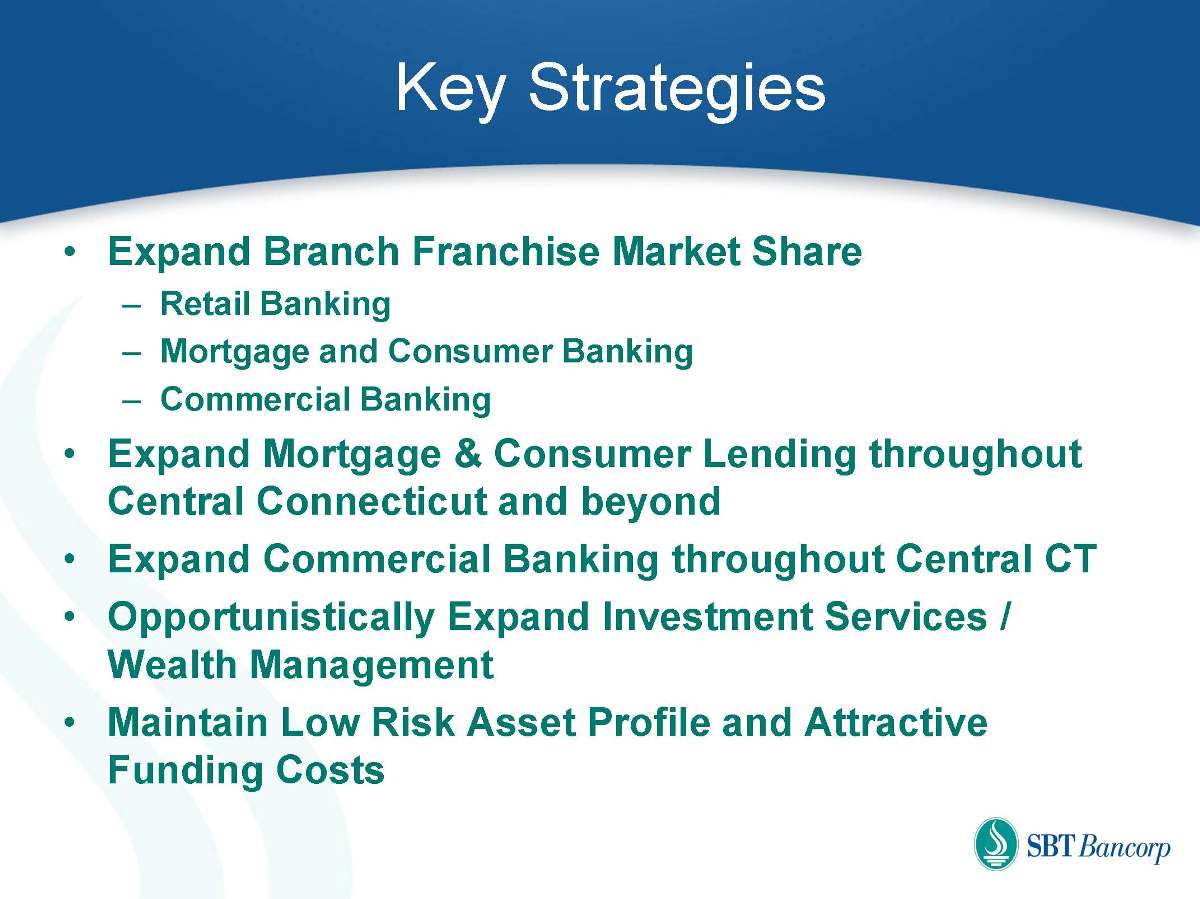
Key Strategies Expand Branch Franchise Market Share Retail Banking Mortgage and Consumer Banking Commercial Banking Expand Mortgage & Consumer Lending throughout Central Connecticut and beyond Expand Commercial Banking throughout Central CT Opportunistically Expand Investment Services / Wealth Management Maintain Low Risk Asset Profile and Attractive Funding Costs
Simsbury Bank’s Strengths
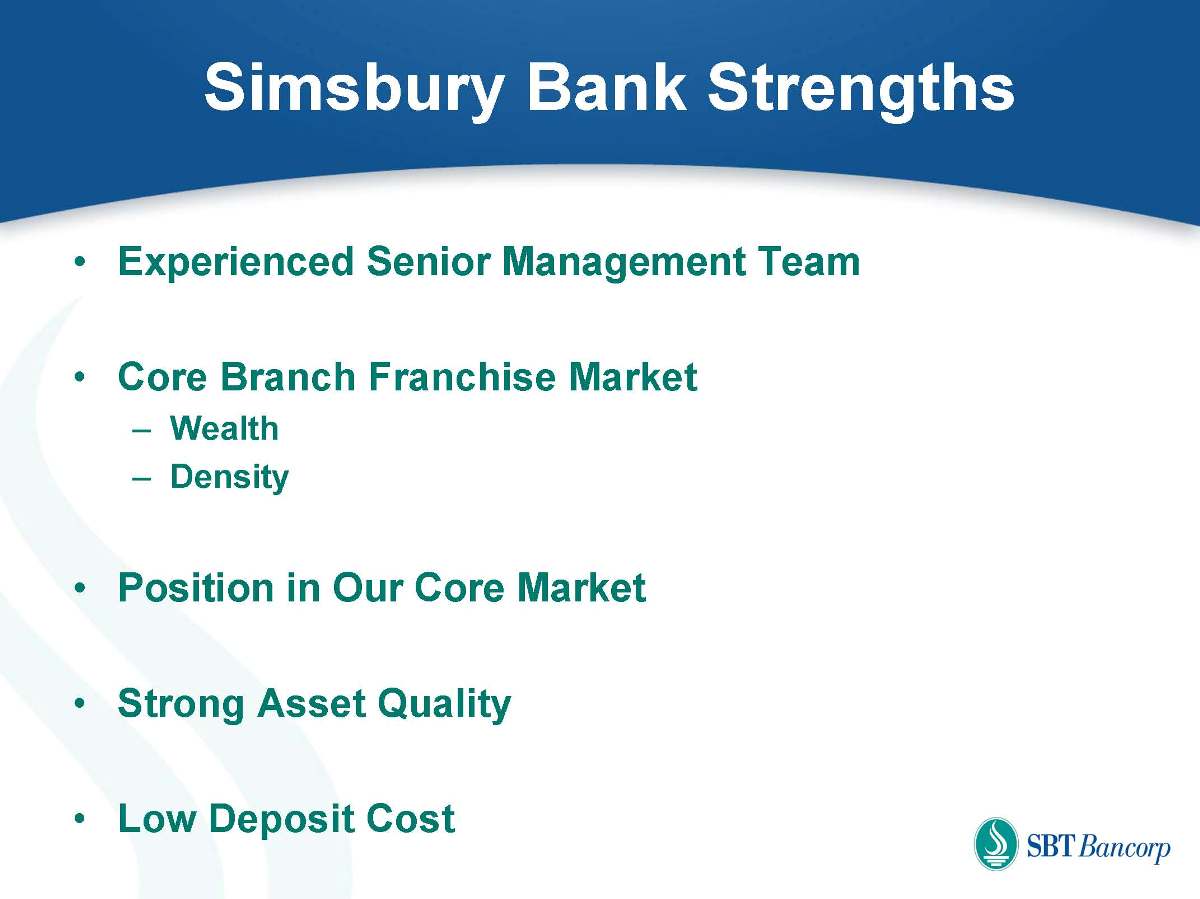
Simsbury Bank Strengths Experienced Senior Management Team Core Branch Franchise Market Wealth Density Position in Our Core Market Strong Asset Quality Low Deposit Cost
Management "If you pick the right people and give them the opportunity to spread their wings—and put compensation as a carrier behind it—you almost don't have to manage them.“ Jack Welch
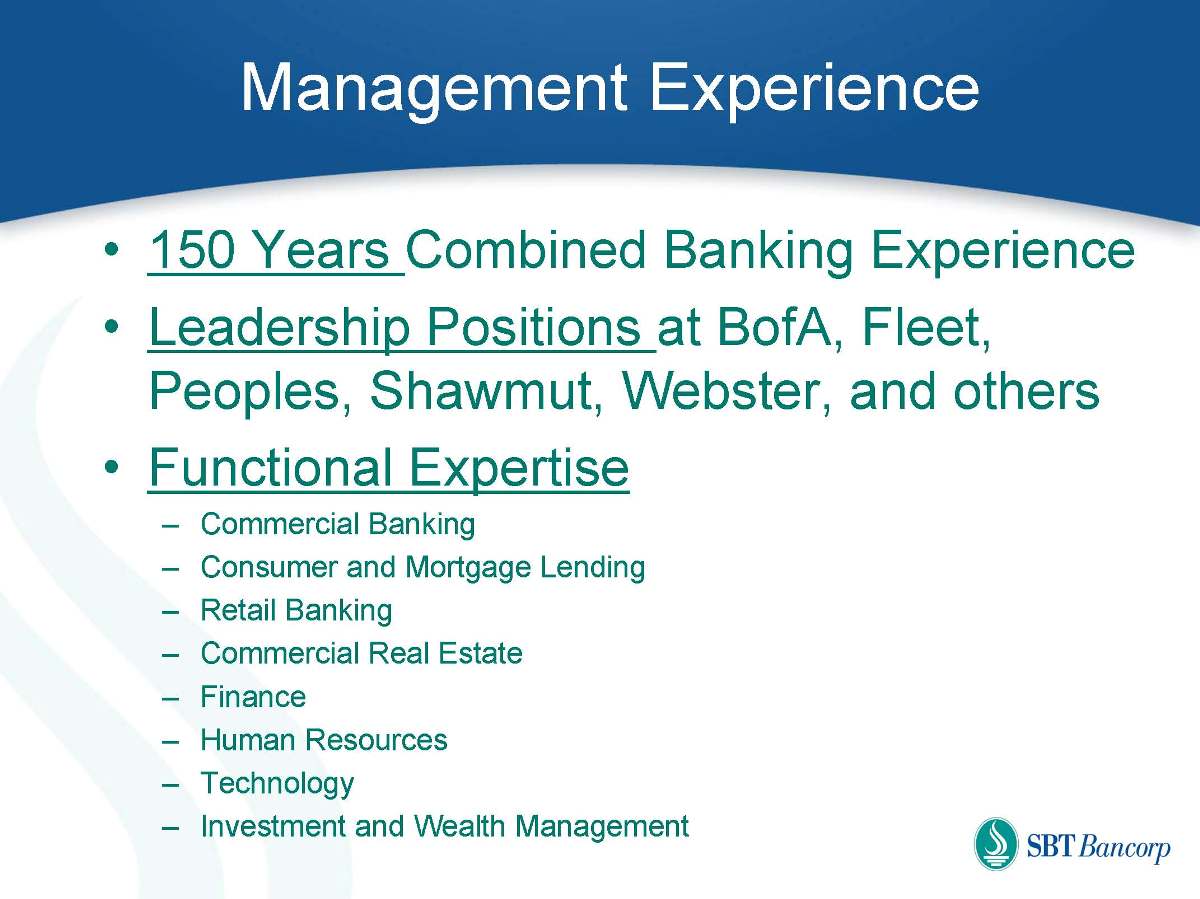
Management Experience 150 Years Combined Banking Experience Leadership Positions at BofA, Fleet, Peoples, Shawmut, Webster, and others Functional Expertise Commercial Banking Consumer and Mortgage Lending Retail Banking Commercial Real Estate Finance Human Resources Technology Investment and Wealth Management
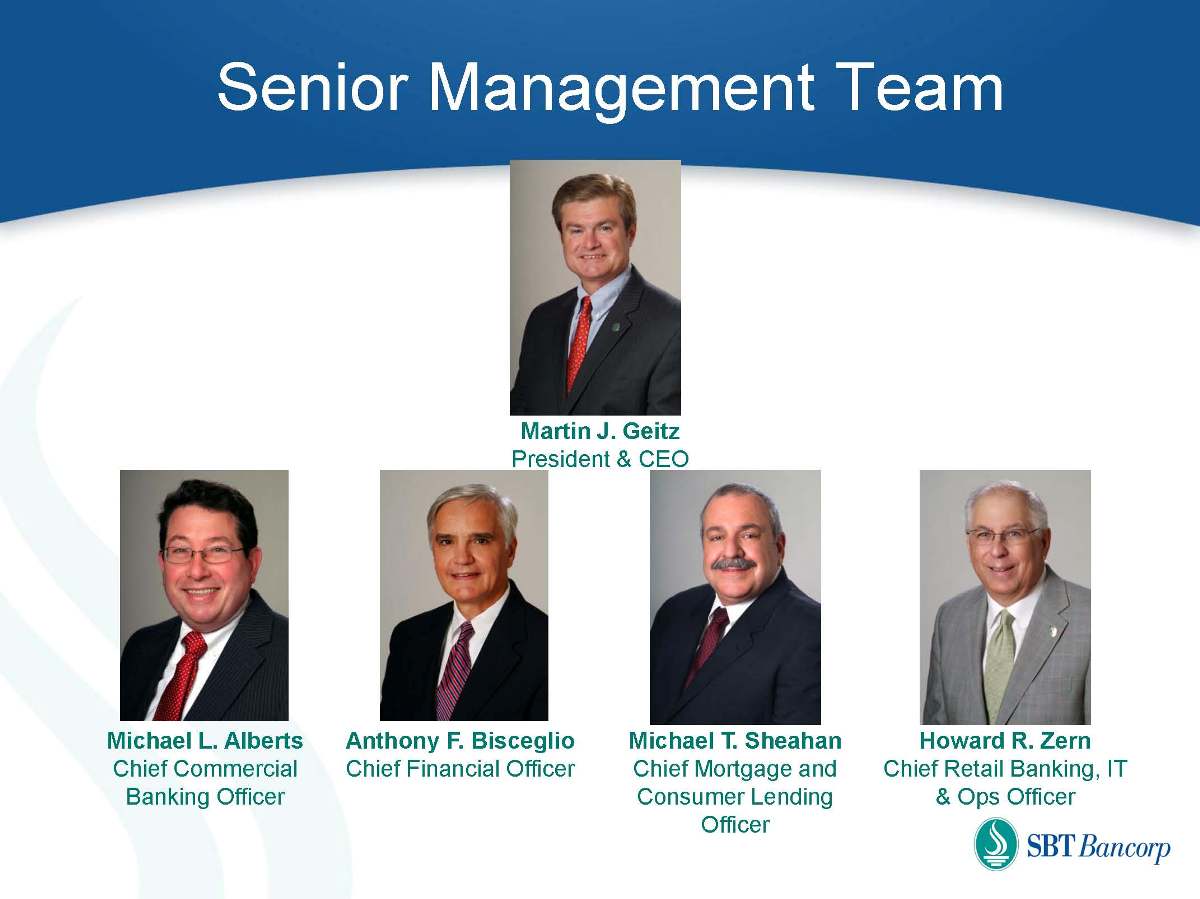
Senior Management Team Martin J. Geitz President & CEO Michael L. Alberts Chief Commercial Banking Officer Anthony F. Bisceglio Chief Financial Officer Michael T. Sheahan Chief Mortgage and Consumer Lending Officer Howard R. Zern Chief Retail Banking, IT & Ops Officer
Market & Position "A market is never saturated with a good product, but it is very quickly saturated with a bad one.” Henry Ford
Market
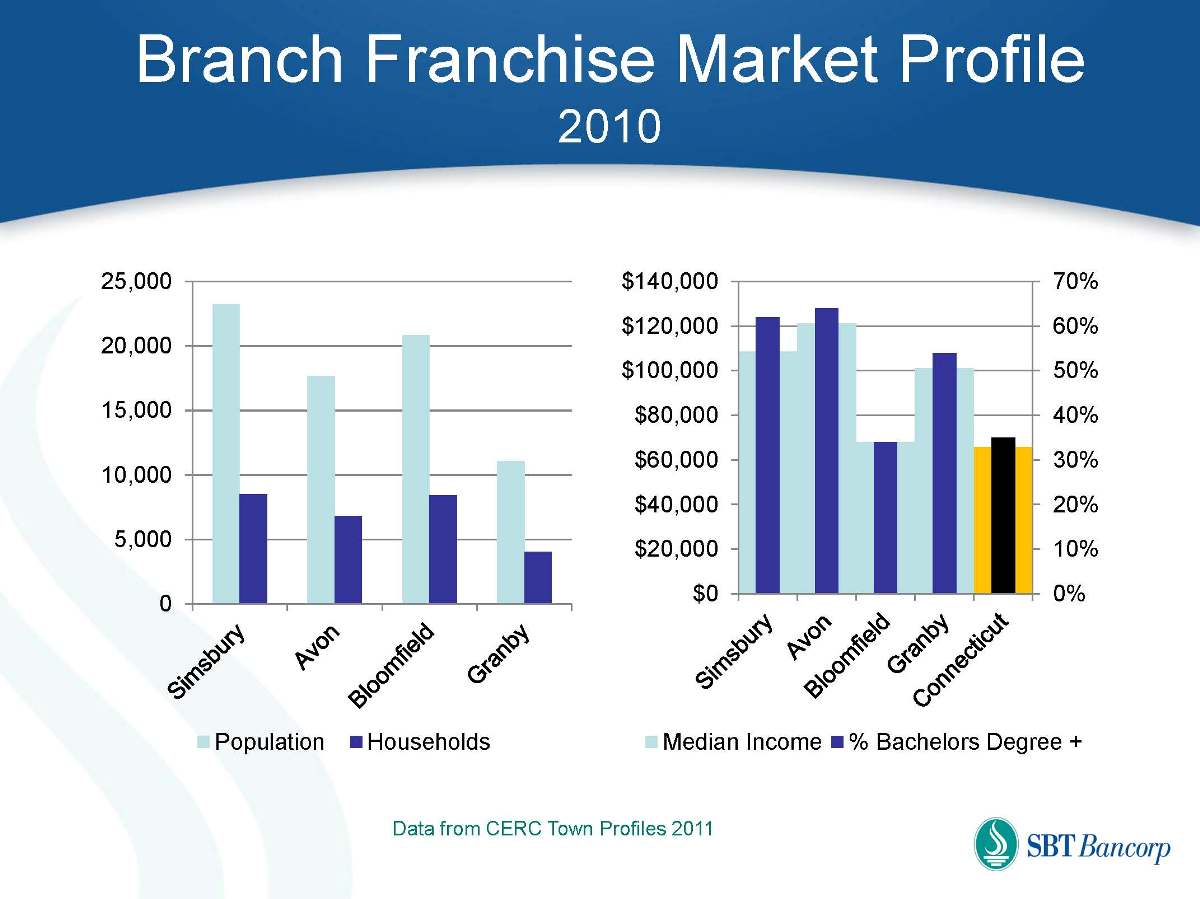
Branch Franchise Market Profile 2010 0 5,000 10,000 15,000 20,000 25,000 Population Households 0% 10% 20% 30% 40% 50% 60% 70% $0 $20,000 $40,000 $60,000 $80,000 $100,000 $120,000 $140,000 Median Income % Bachelors Degree + Data from CERC Town Profiles 2011
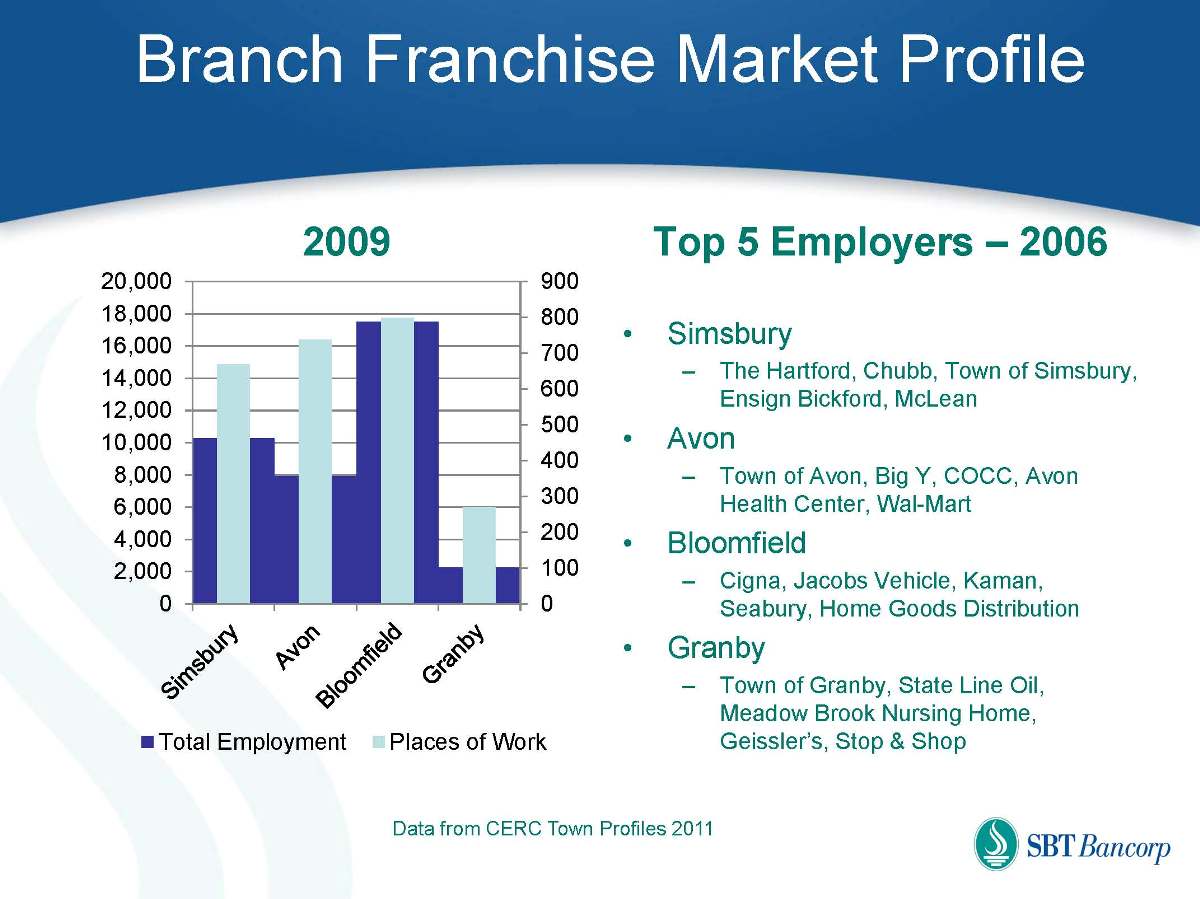
Branch Franchise Market Profile 0 100 200 300 400 500 600 700 800 900 0 2,000 4,000 6,000 8,000 10,000 12,000 14,000 16,000 18,000 20,000 2009 Top 5 Employers – 2006 Simsbury The Hartford, Chubb, Town of Simsbury, Ensign Bickford, McLean Avon Town of Avon, Big Y, COCC, Avon Health Center, Wal-Mart Bloomfield Cigna, Jacobs Vehicle, Kaman, Seabury, Home Goods Distribution Granby Town of Granby, State Line Oil, Meadow Brook Nursing Home, Geissler’s, Stop & Shop Total Employment Places of Work Data from CERC Town Profiles 2011
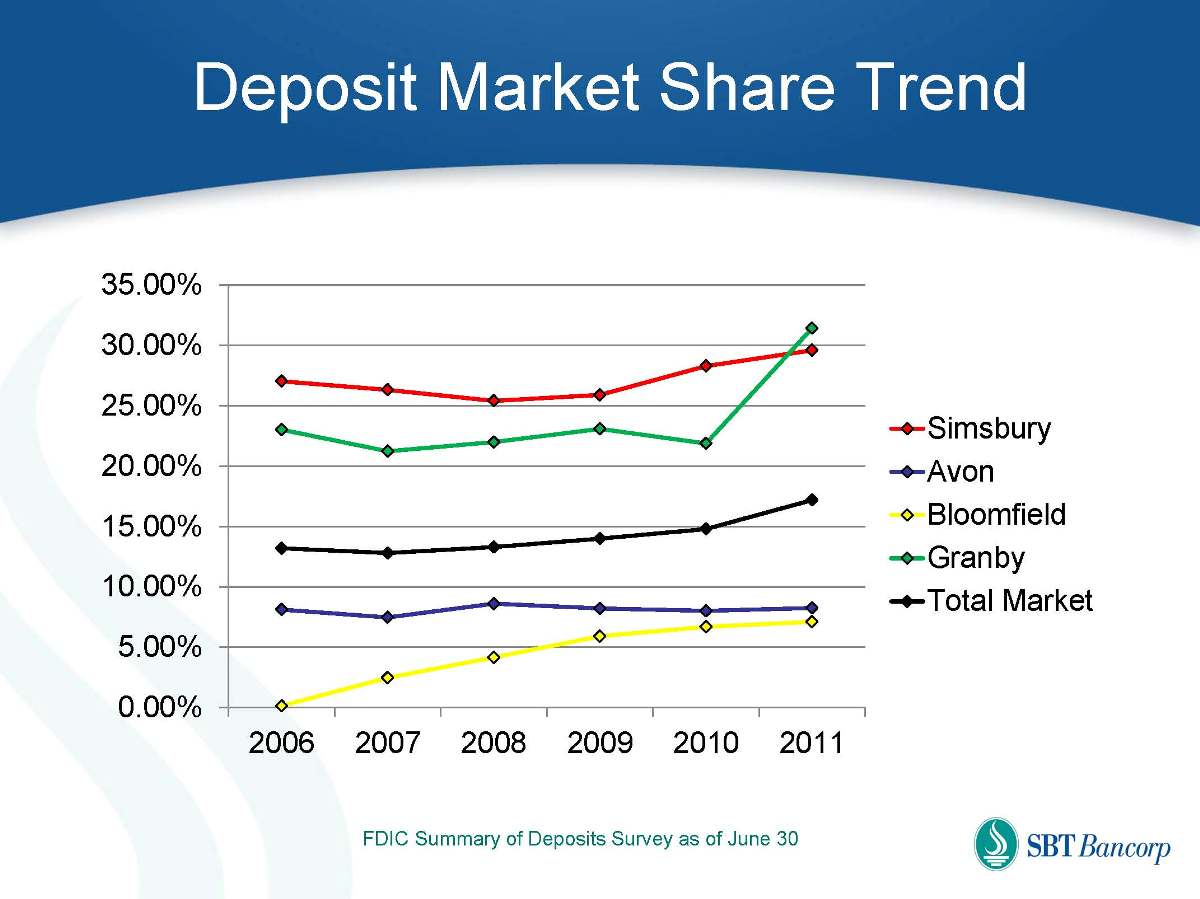
Deposit Market Share Trend 0.00% 5.00% 10.00% 15.00% 20.00% 25.00% 30.00% 35.00% 2006 2007 2008 2009 2010 2011 Simsbury Avon Bloomfield Granby Total Market FDIC Summary of Deposits Survey as of June 30
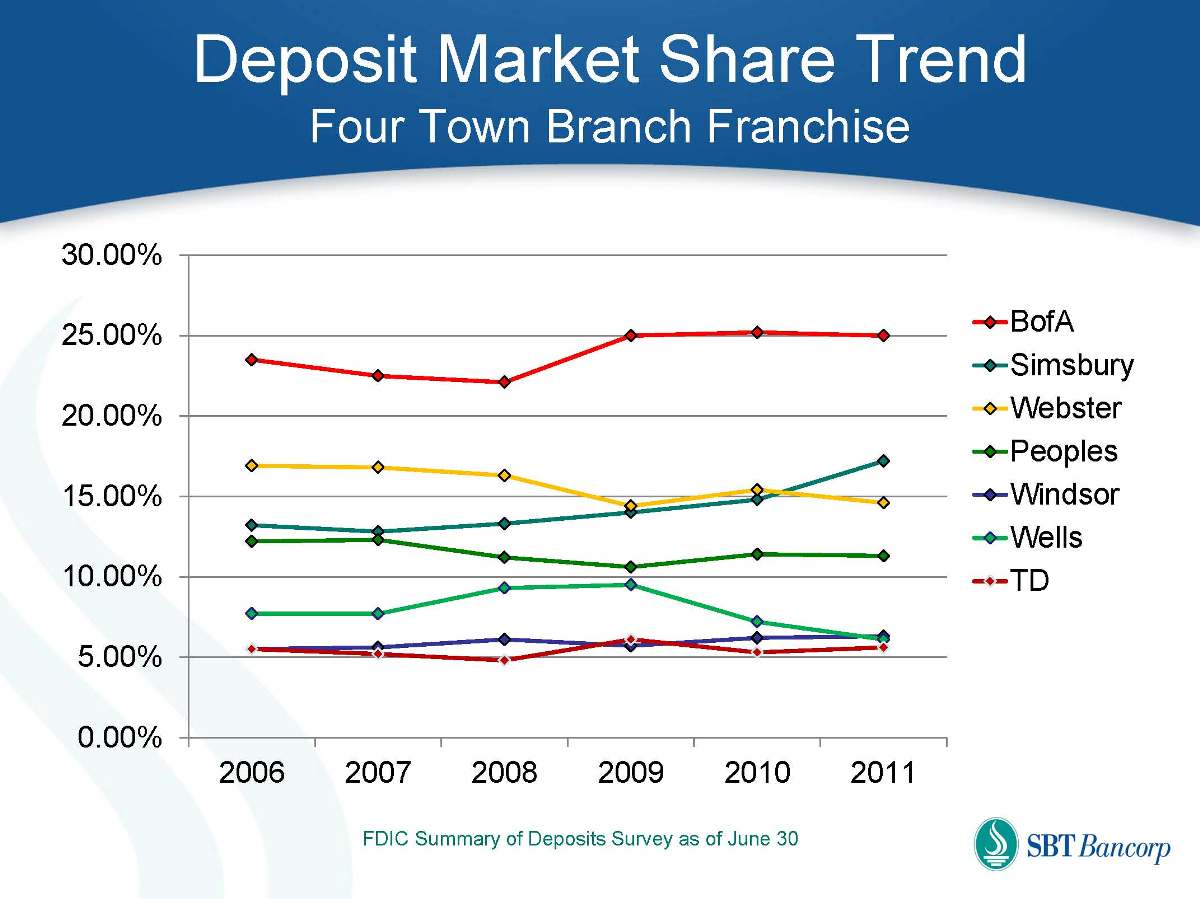
Deposit Market Share Trend Four Town Branch Franchise 0.00% 5.00% 10.00% 15.00% 20.00% 25.00% 30.00% 2006 2007 2008 2009 2010 2011 BofA Simsbury Webster Peoples Windsor Wells TD FDIC Summary of Deposits Survey as of June 30
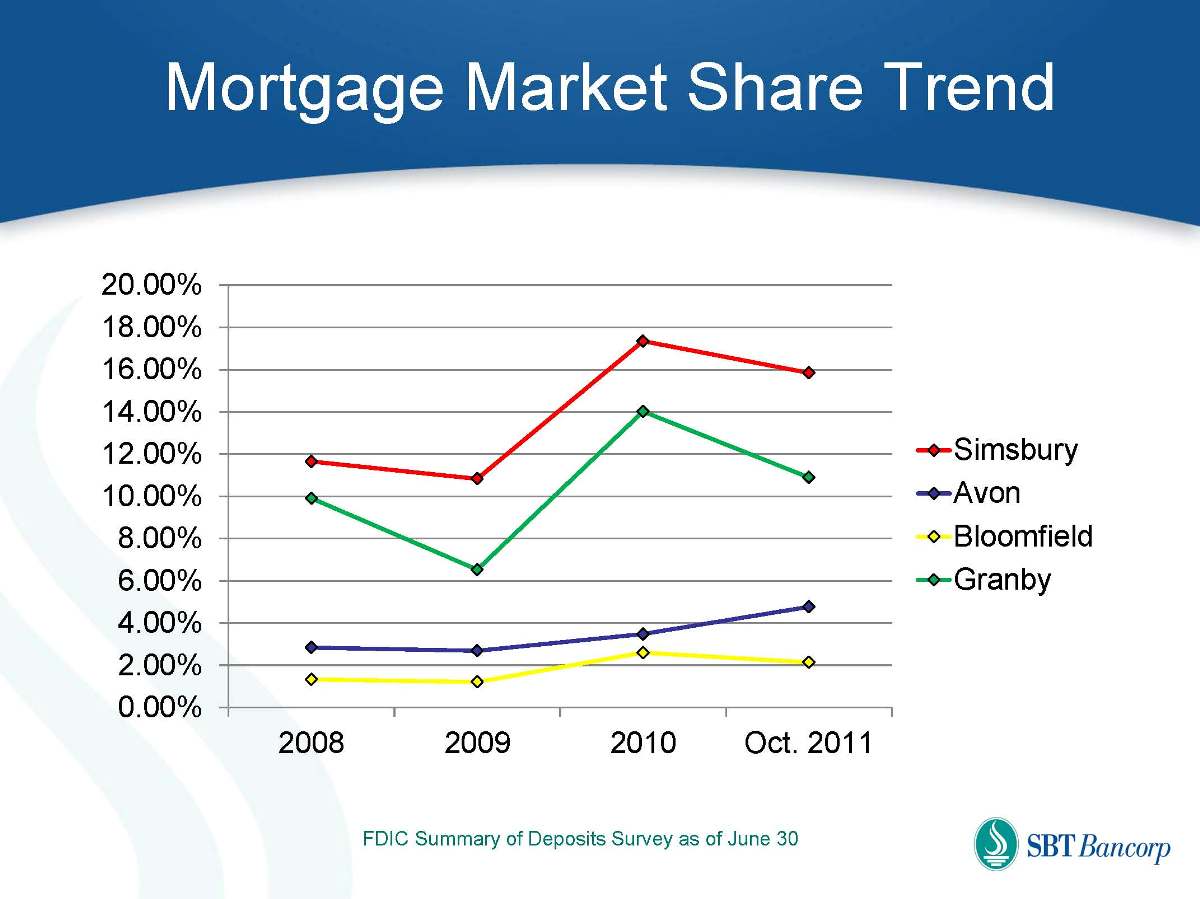
Mortgage Market Share Trend 0.00% 2.00% 4.00% 6.00% 8.00% 10.00% 12.00% 14.00% 16.00% 18.00% 20.00% 2008 2009 2010 Oct. 2011 Simsbury Avon Bloomfield Granby FDIC Summary of Deposits Survey as of June 30
Strong Asset Quality “Never invest in a business you cannot understand.“ Warren Buffett
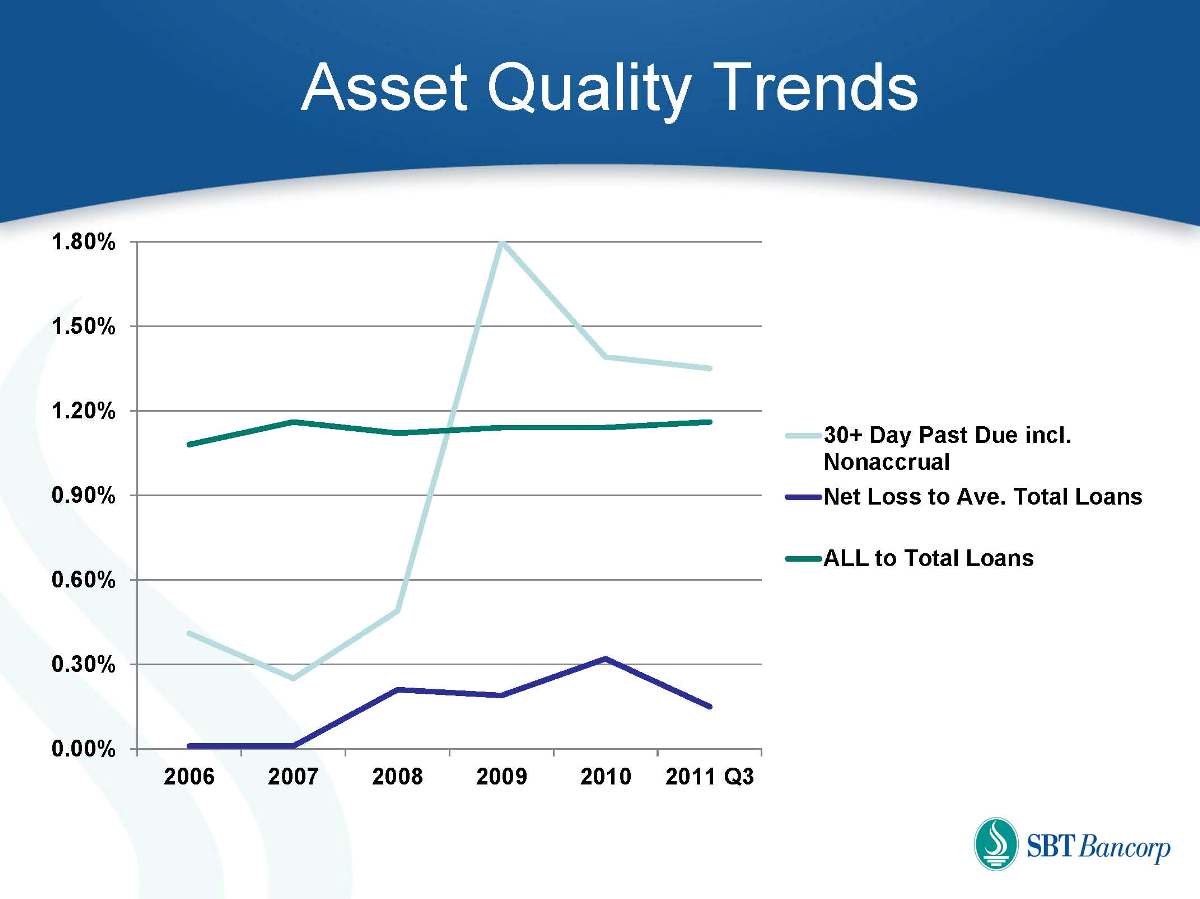
Asset Quality Trends 0.00% 0.30% 0.60% 0.90% 1.20% 1.50% 1.80% 2006 2007 2008 2009 2010 2011 Q3 30+ Day Past Due incl. Nonaccrual Net Loss to Ave. Total Loans ALL to Total Loans
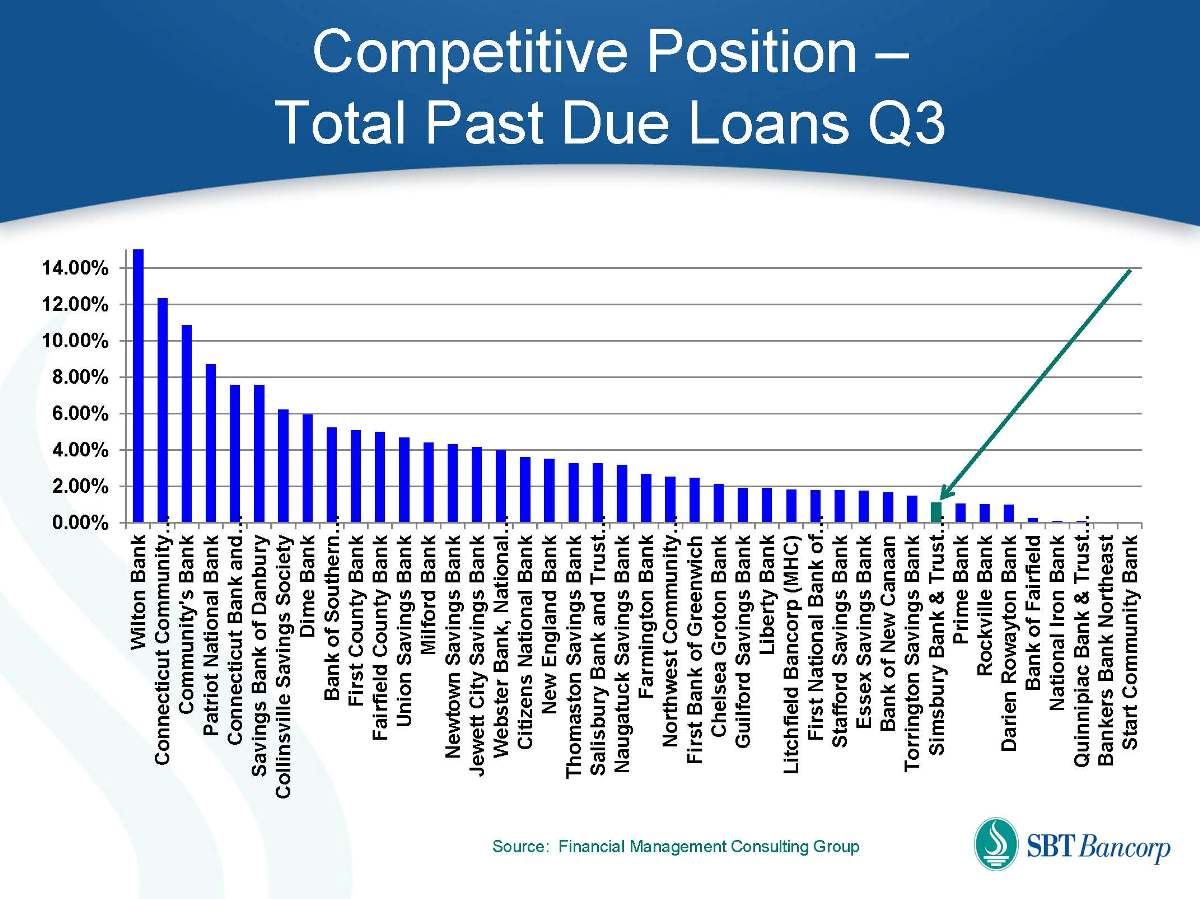
Competitive Position – Total Past Due Loans Q3 0.00% 2.00% 4.00% 6.00% 8.00% 10.00% 12.00% 14.00% Wilton Bank Connecticut Community… Community's Bank Patriot National Bank Connecticut Bank and… Savings Bank of Danbury Collinsville Savings Society Dime Bank Bank of Southern… First County Bank Fairfield County Bank Union Savings Bank Milford Bank Newtown Savings Bank Jewett City Savings Bank Webster Bank, National… Citizens National Bank New England Bank Thomaston Savings Bank Salisbury Bank and Trust… Naugatuck Savings Bank Farmington Bank Northwest Community… First Bank of Greenwich Chelsea Groton Bank Guilford Savings Bank Liberty Bank Litchfield Bancorp (MHC) First National Bank of… Stafford Savings Bank Essex Savings Bank Bank of New Canaan Torrington Savings Bank Simsbury Bank & Trust… Prime Bank Rockville Bank Darien Rowayton Bank Bank of Fairfield National Iron Bank Quinnipiac Bank & Trust… Bankers Bank Northeast Start Community Bank Source: Financial Management Consulting Group

Low Deposit Cost “Baseball is 90% mental. The other half is physical.” Yogi Berra
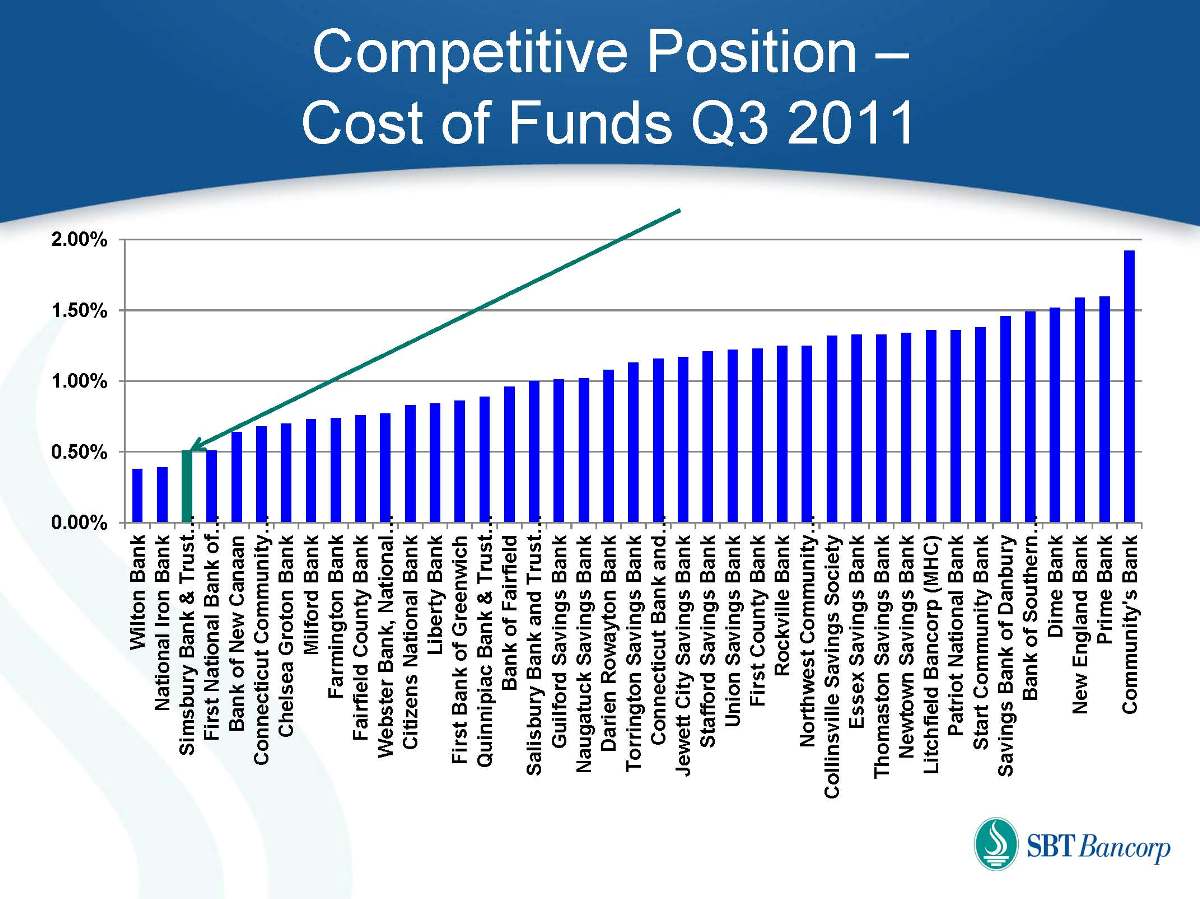
Competitive Position – Cost of Funds Q3 2011 0.00% 0.50% 1.00% 1.50% 2.00% Wilton Bank National Iron Bank Simsbury Bank & Trust… First National Bank of… Bank of New Canaan Connecticut Community… Chelsea Groton Bank Milford Bank Farmington Bank Fairfield County Bank Webster Bank, National… Citizens National Bank Liberty Bank First Bank of Greenwich Quinnipiac Bank & Trust… Bank of Fairfield Salisbury Bank and Trust… Guilford Savings Bank Naugatuck Savings Bank Darien Rowayton Bank Torrington Savings Bank Connecticut Bank and… Jewett City Savings Bank Stafford Savings Bank Union Savings Bank First County Bank Rockville Bank Northwest Community… Collinsville Savings Society Essex Savings Bank Thomaston Savings Bank Newtown Savings Bank Litchfield Bancorp (MHC) Patriot National Bank Start Community Bank Savings Bank of Danbury Bank of Southern… Dime Bank New England Bank Prime Bank Community's Bank
Strategic Growth Strategies
Key Strategies Expand Branch Franchise Market Share Retail Banking Mortgage and Consumer Banking Commercial Banking Expand Mortgage & Consumer Lending throughout Central Connecticut and beyond Expand Commercial Banking throughout Central CT Opportunistically Expand Investment Services / Wealth Management Maintain Low Risk Asset Profile and Attractive Funding Costs
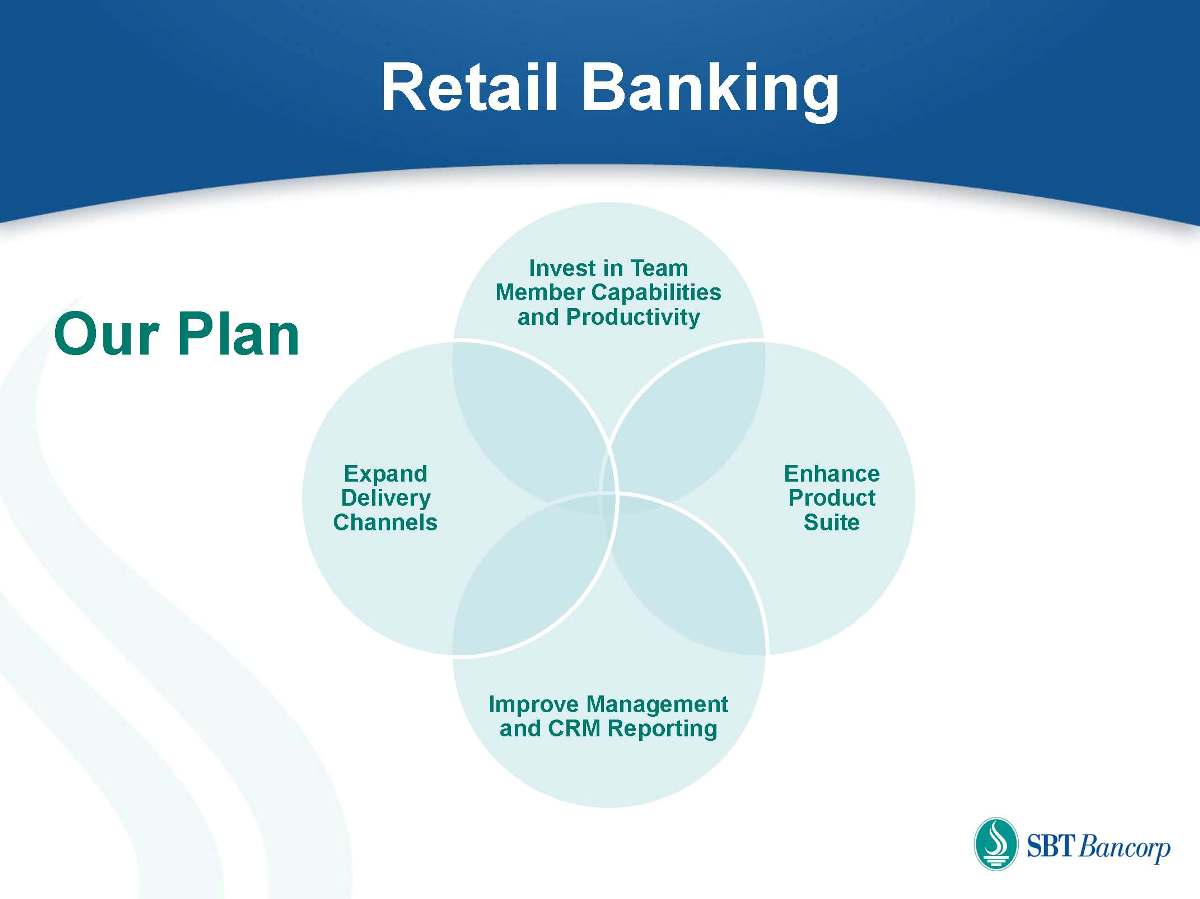
Retail Banking Our Plan Expand Delivery Channels Improve Management and CRM Reporting Enhance Product Suite Invest in Team Member Capabilities and Productivity
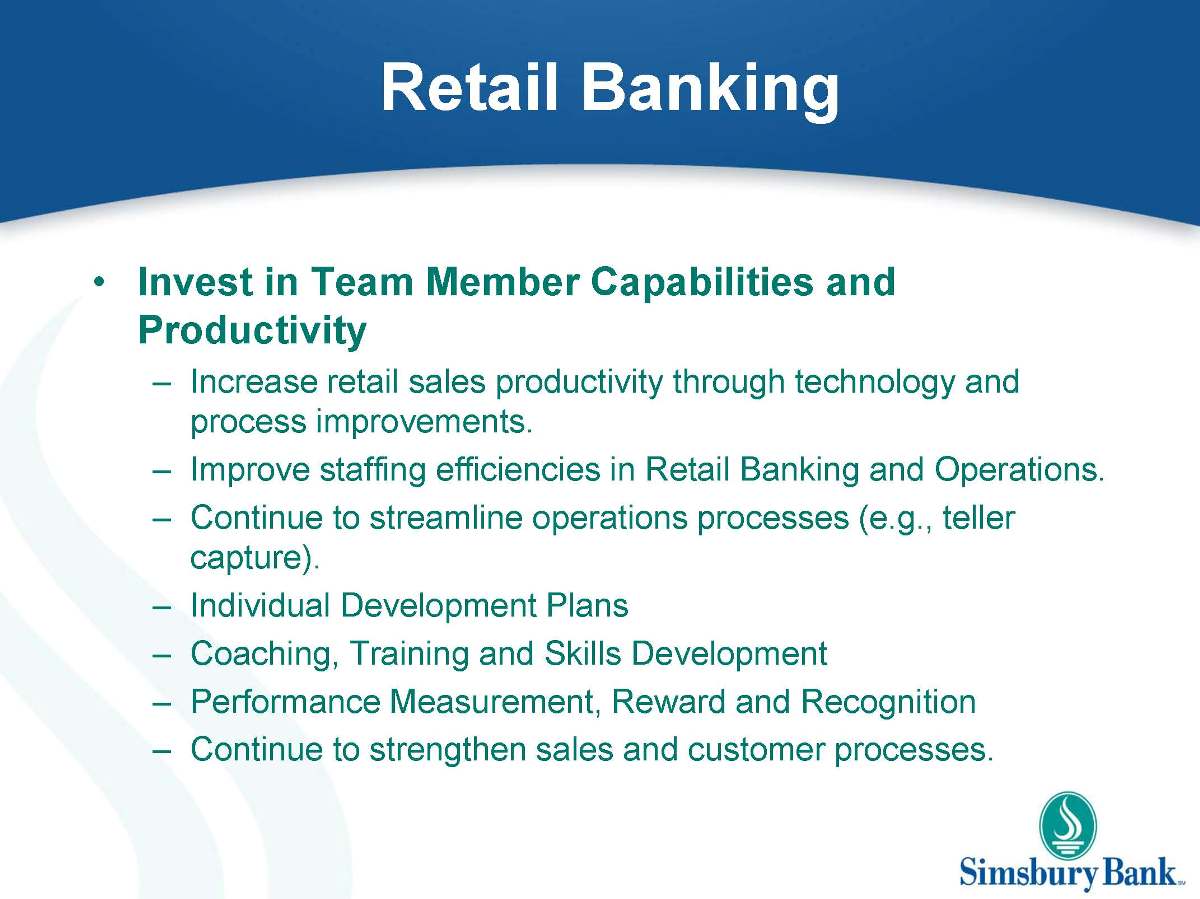
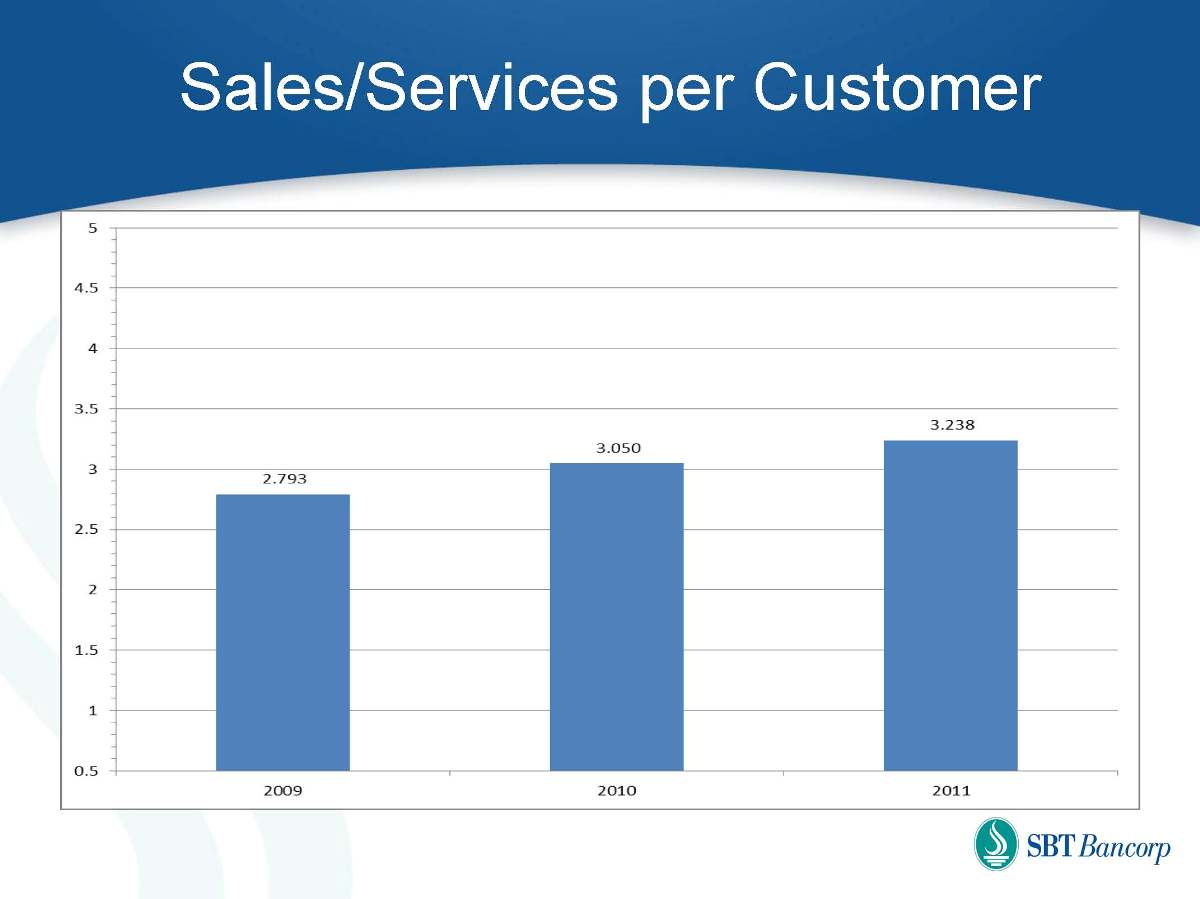
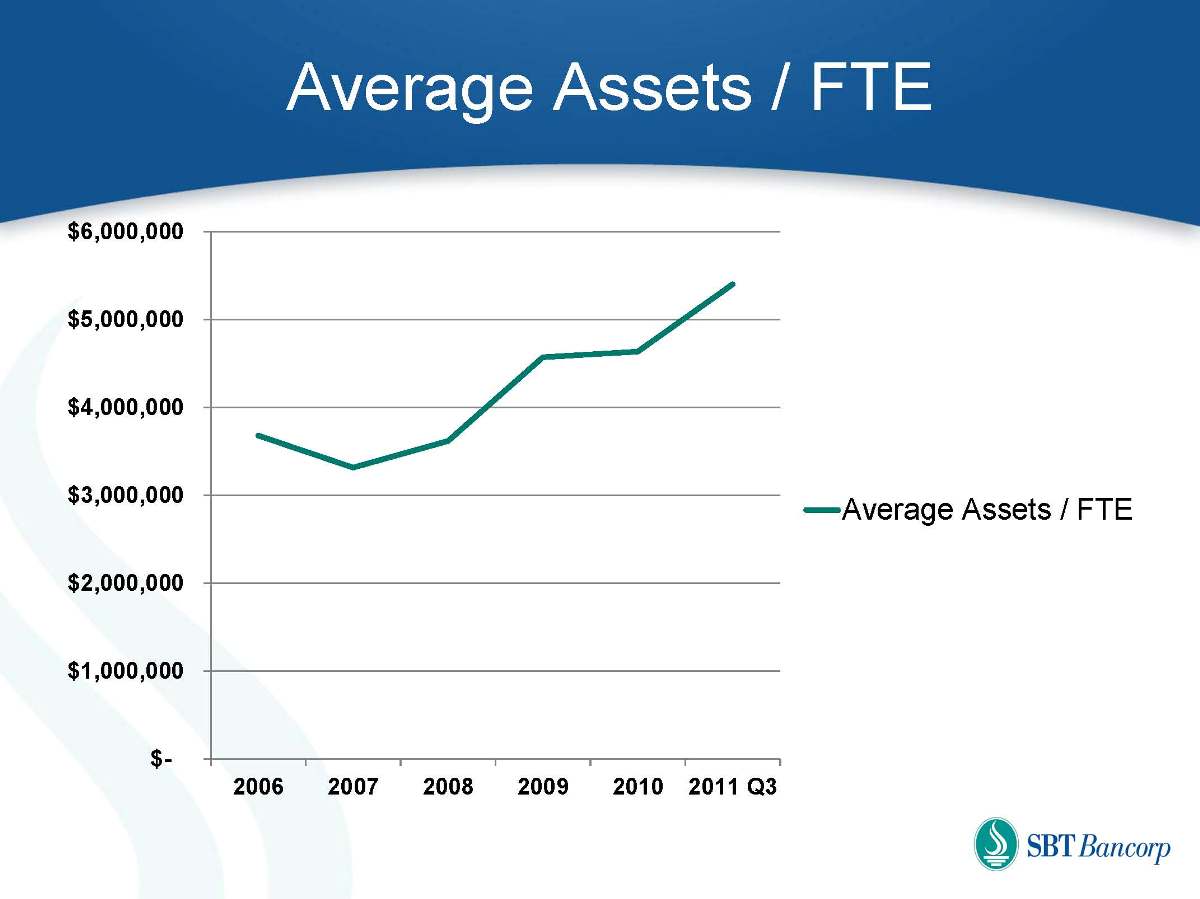
Retail Banking Invest in Team Member Capabilities and Productivity Increase retail sales productivity through technology and process improvements. Improve staffing efficiencies in Retail Banking and Operations. Continue to streamline operations processes (e.g., teller capture). Individual Development Plans Coaching, Training and Skills Development Performance Measurement, Reward and Recognition Continue to strengthen sales and customer processes.
Sales/Services per Customer 2009 2010 2011 2.793 3.050 3.238
Average Assets / FTE $- $1,000,000 $2,000,000 $3,000,000 $4,000,000 $5,000,000 $6,000,000 2006 2007 2008 2009 2010 2011 Q3 Average Assets / FTE
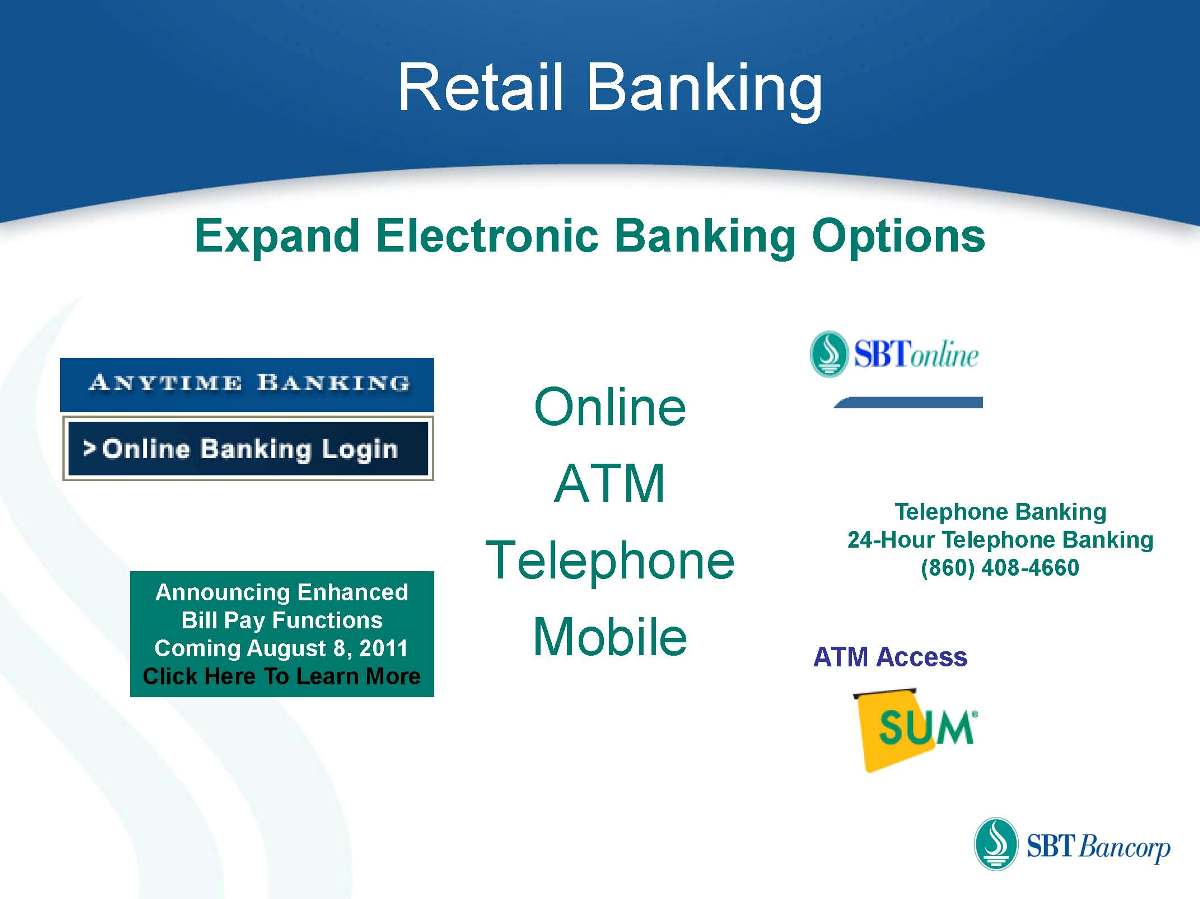
Retail Banking Expand Electronic Banking Options Online ATM Telephone Mobile Announcing Enhanced Bill Pay Functions Coming August 8, 2011 Click Here To Learn More Telephone Banking 24-Hour Telephone Banking (860) 408-4660 ATM Access
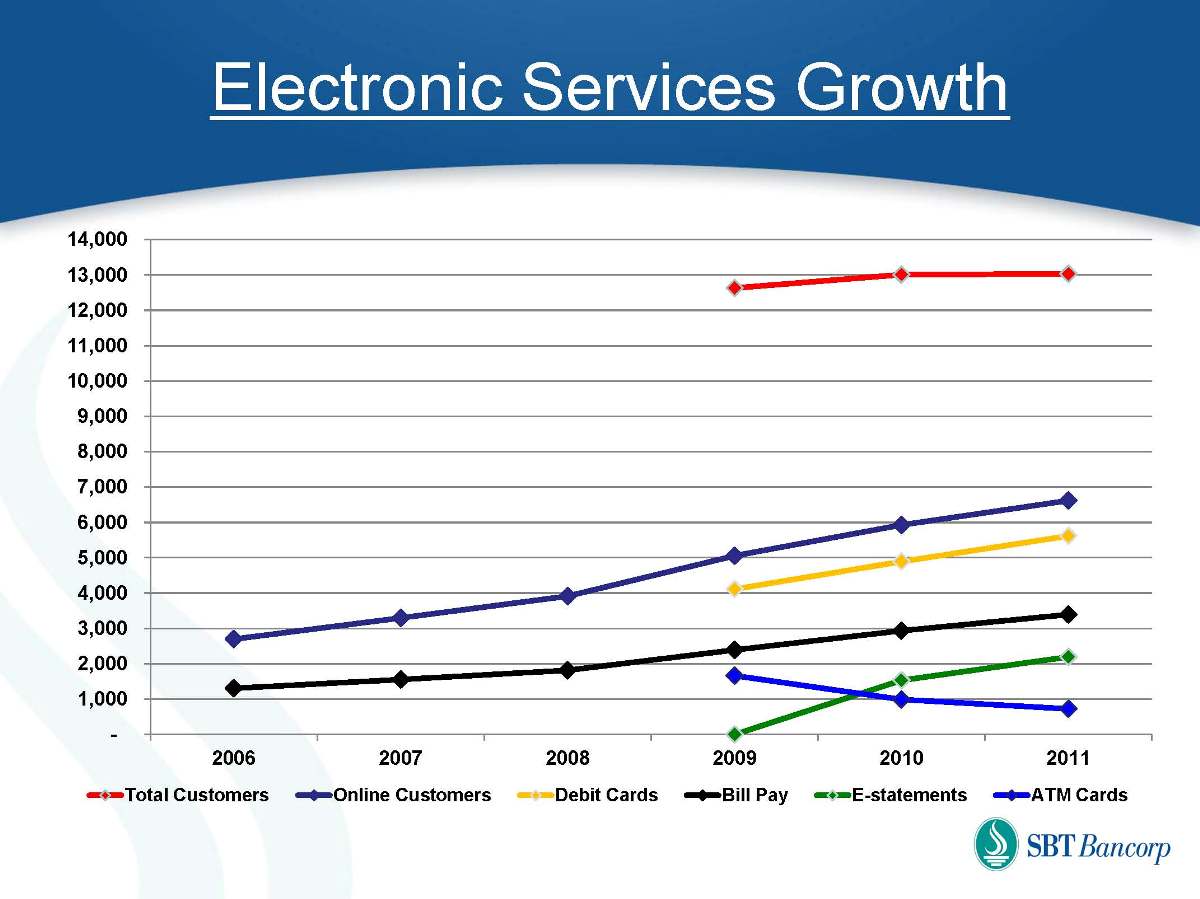
Electronic Services Growth - 1,000 2,000 3,000 4,000 5,000 6,000 7,000 8,000 9,000 10,000 11,000 12,000 13,000 14,000 2006 2007 2008 2009 2010 2011 Total Customers Online Customers Debit Cards Bill Pay E-statements ATM Cards
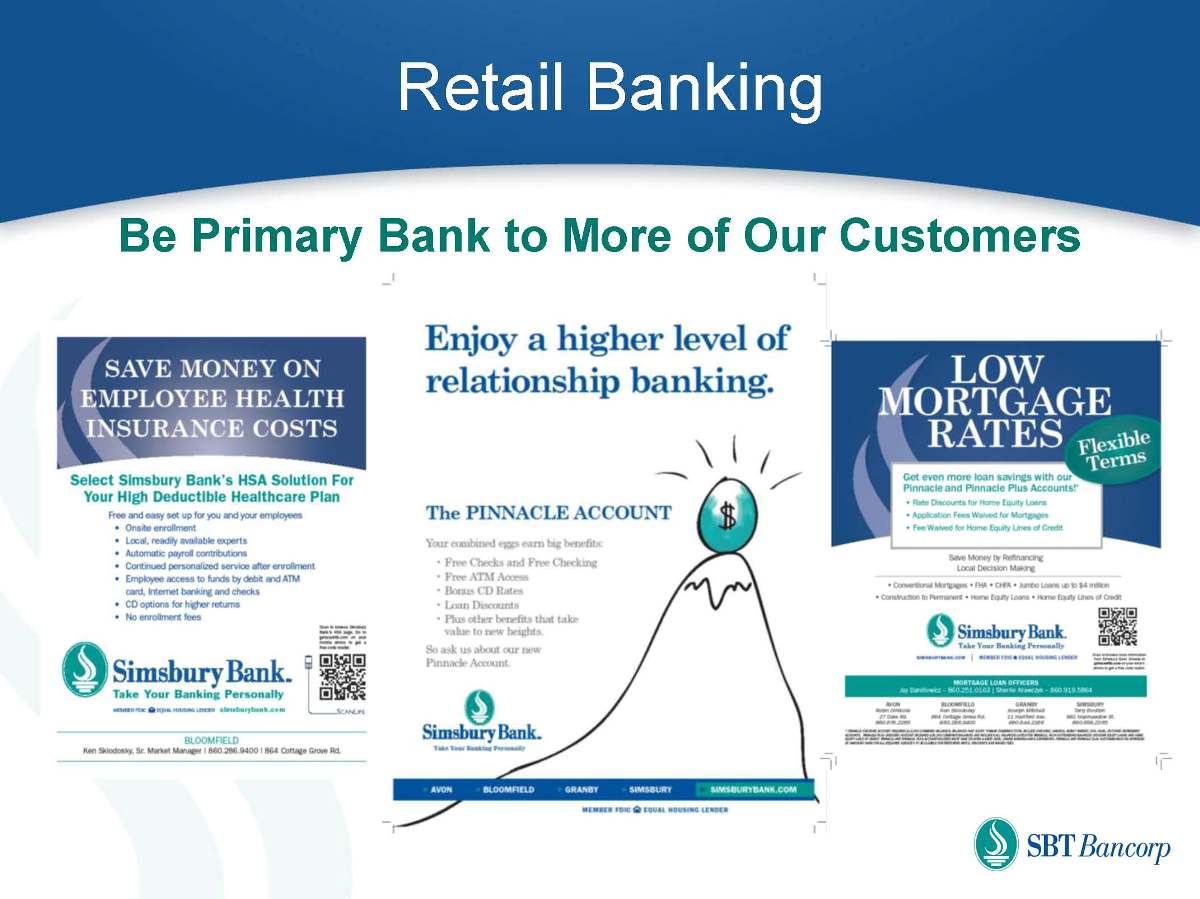
Retail Banking Be Primary Bank to More of Our Customers
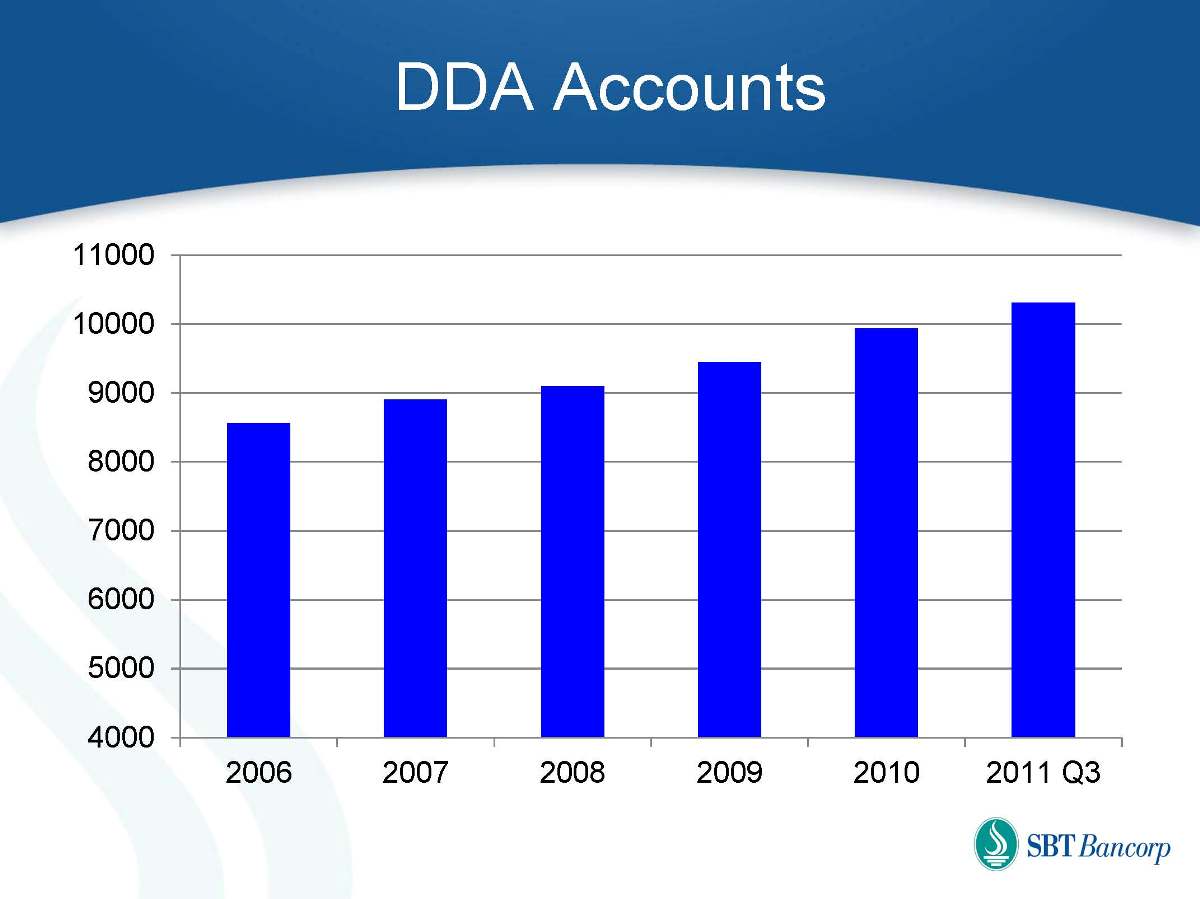
DDA Accounts 4000 5000 6000 7000 8000 9000 10000 11000 2006 2007 2008 2009 2010 2011 Q3
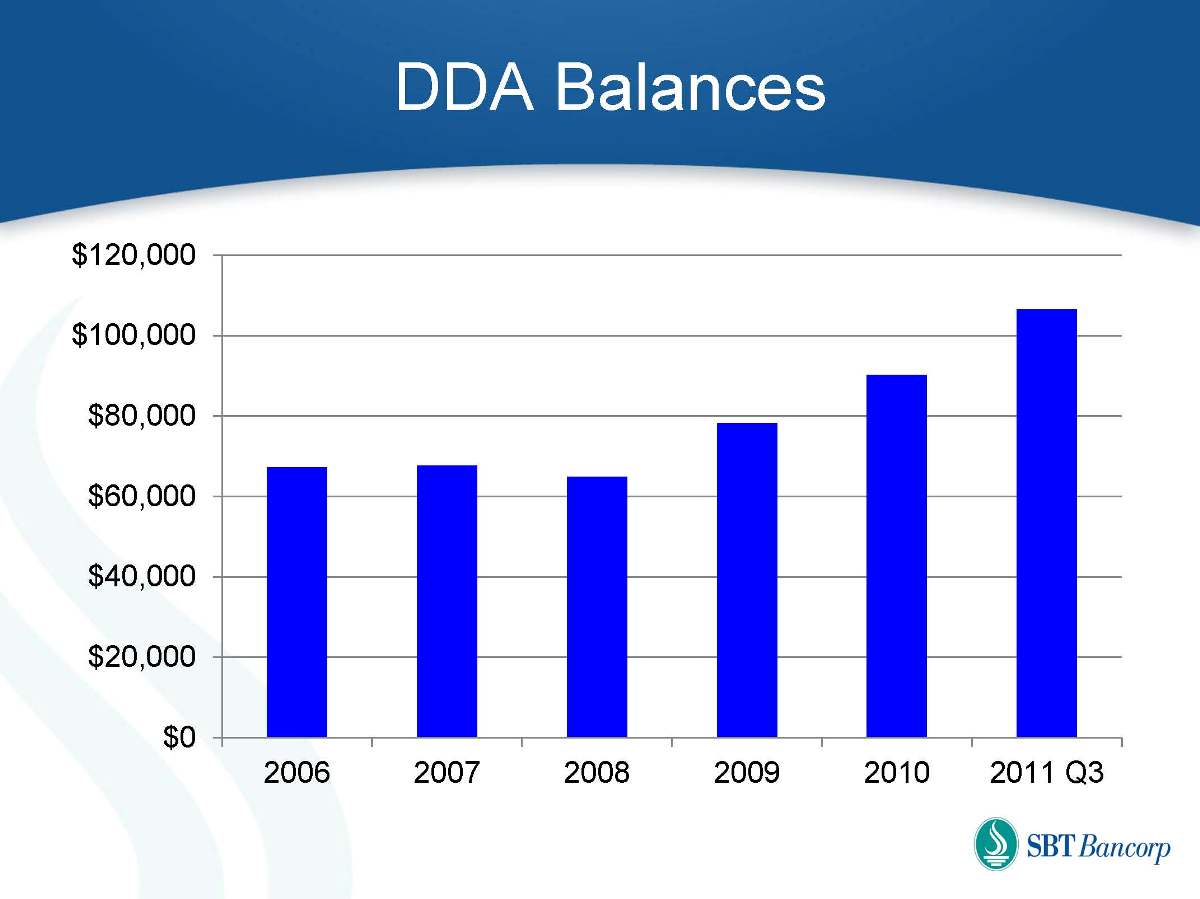
DDA Balances $0 $20,000 $40,000 $60,000 $80,000 $100,000 $120,000 2006 2007 2008 2009 2010 2011 Q3
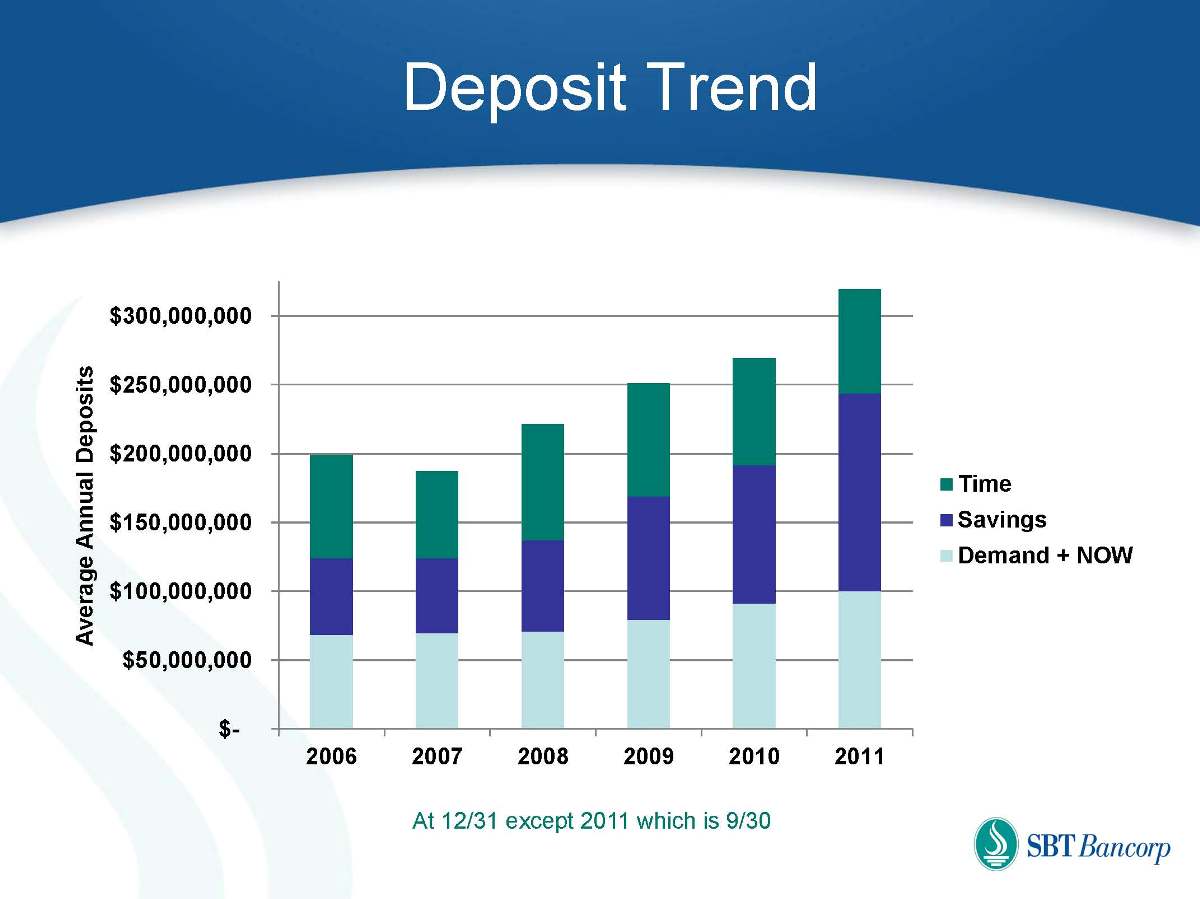
Deposit Trend $- $50,000,000 $100,000,000 $150,000,000 $200,000,000 $250,000,000 $300,000,000 2006 2007 2008 2009 2010 2011 Average Annual Deposits Time Savings Demand + NOW At 12/31 except 2011 which is 9/30
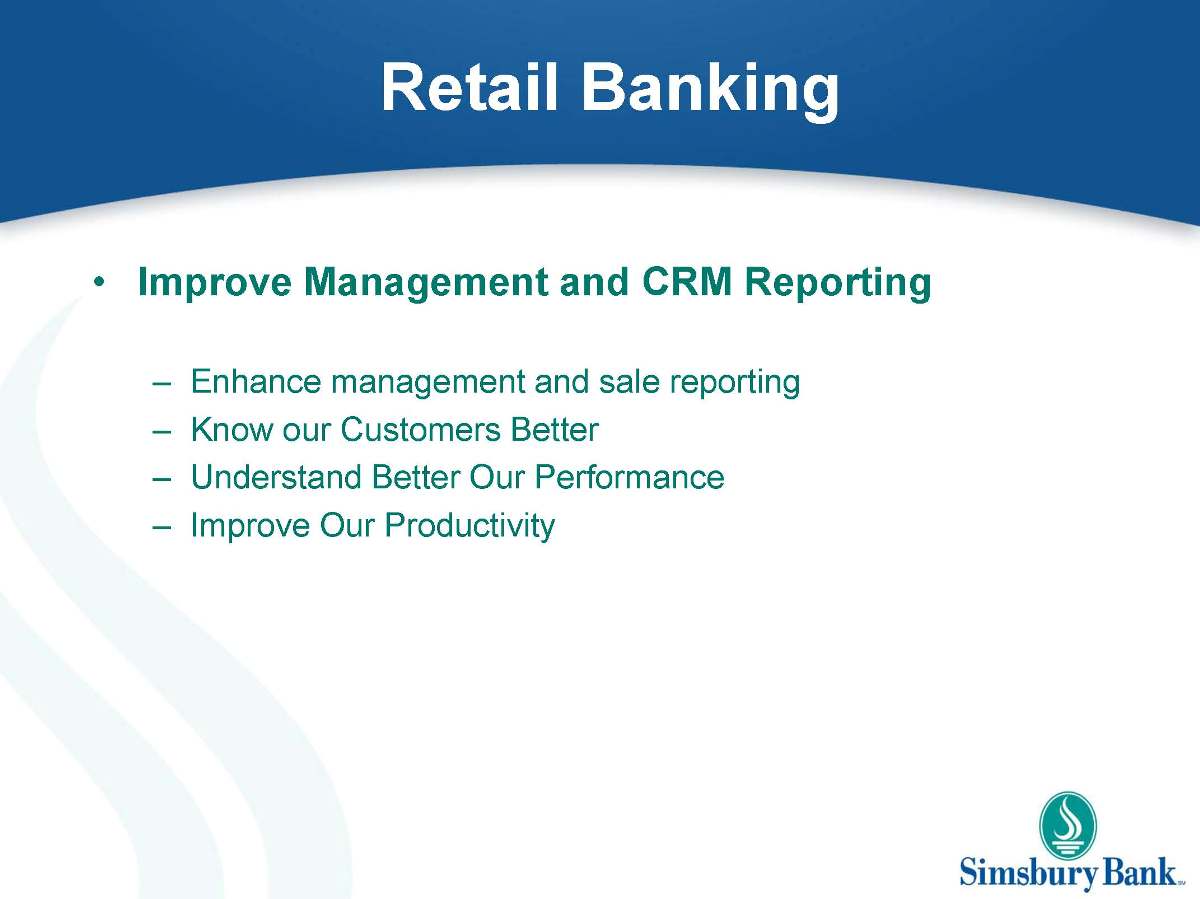
Retail Banking Improve Management and CRM Reporting Enhance management and sale reporting Know our Customers Better Understand Better Our Performance Improve Our Productivity
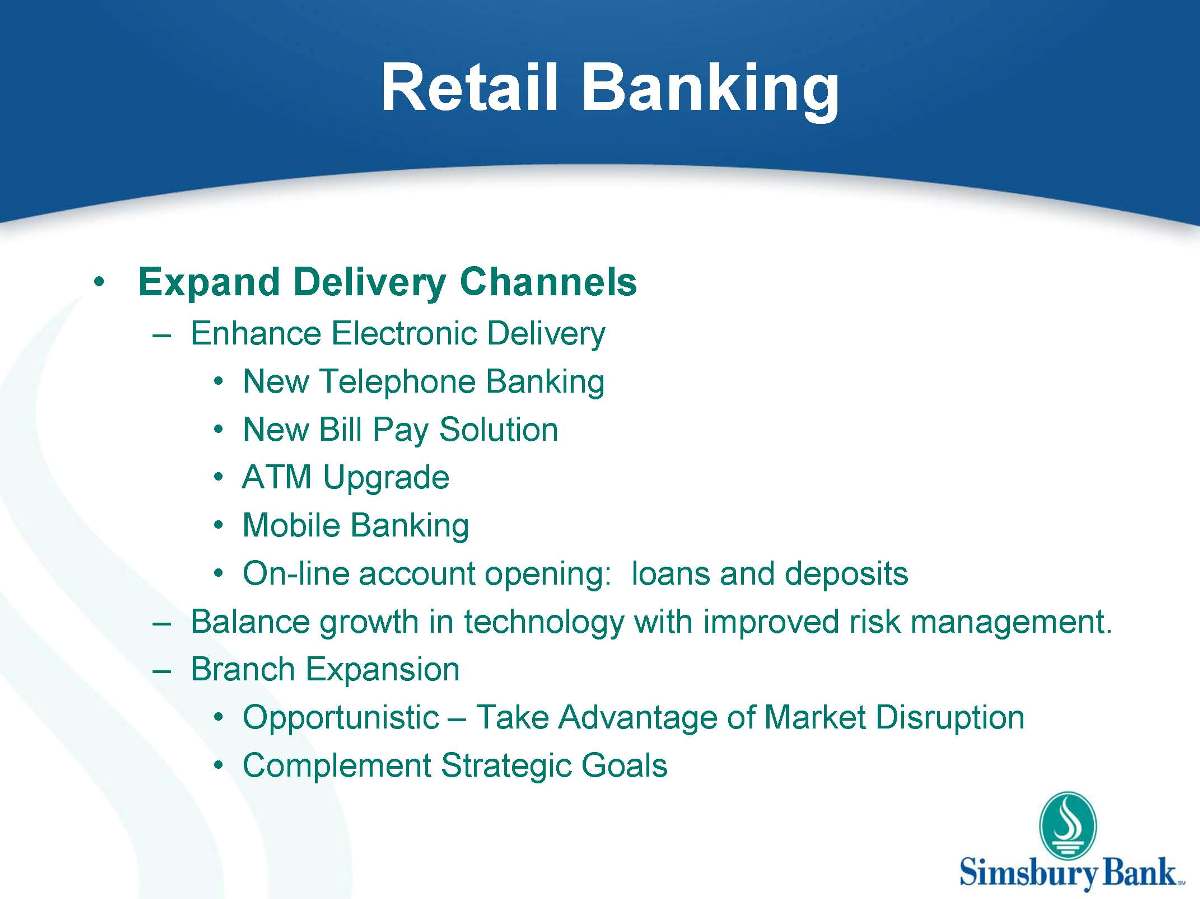
Retail Banking Expand Delivery Channels Enhance Electronic Delivery New Telephone Banking New Bill Pay Solution ATM Upgrade Mobile Banking On-line account opening: loans and deposits Balance growth in technology with improved risk management. Branch Expansion Opportunistic – Take Advantage of Market Disruption Complement Strategic Goals
Transactions by Channel 2006 2007 2008 2009 2010 2011 Projected 2,000 52,000 102,000 152,000 202,000 252,000 302,000 352,000 Teller ATM Online Telephone
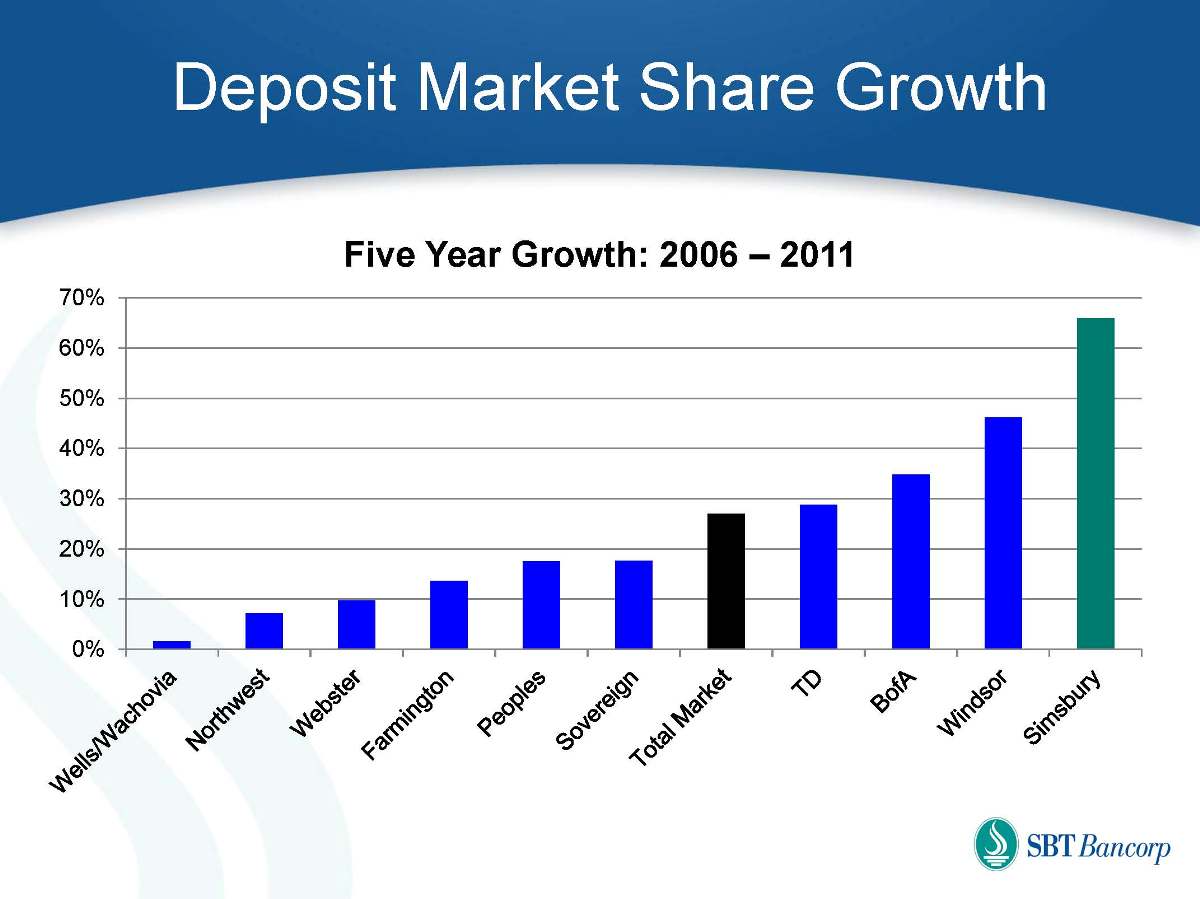
Deposit Market Share Growth Five Year Growth: 2006 – 2011 0% 10% 20% 30% 40% 50% 60% 70% Wells/Wachovia Northwest Webster Farmington Peoples Sovereign Total Market TD BofA Windsor Simsbury
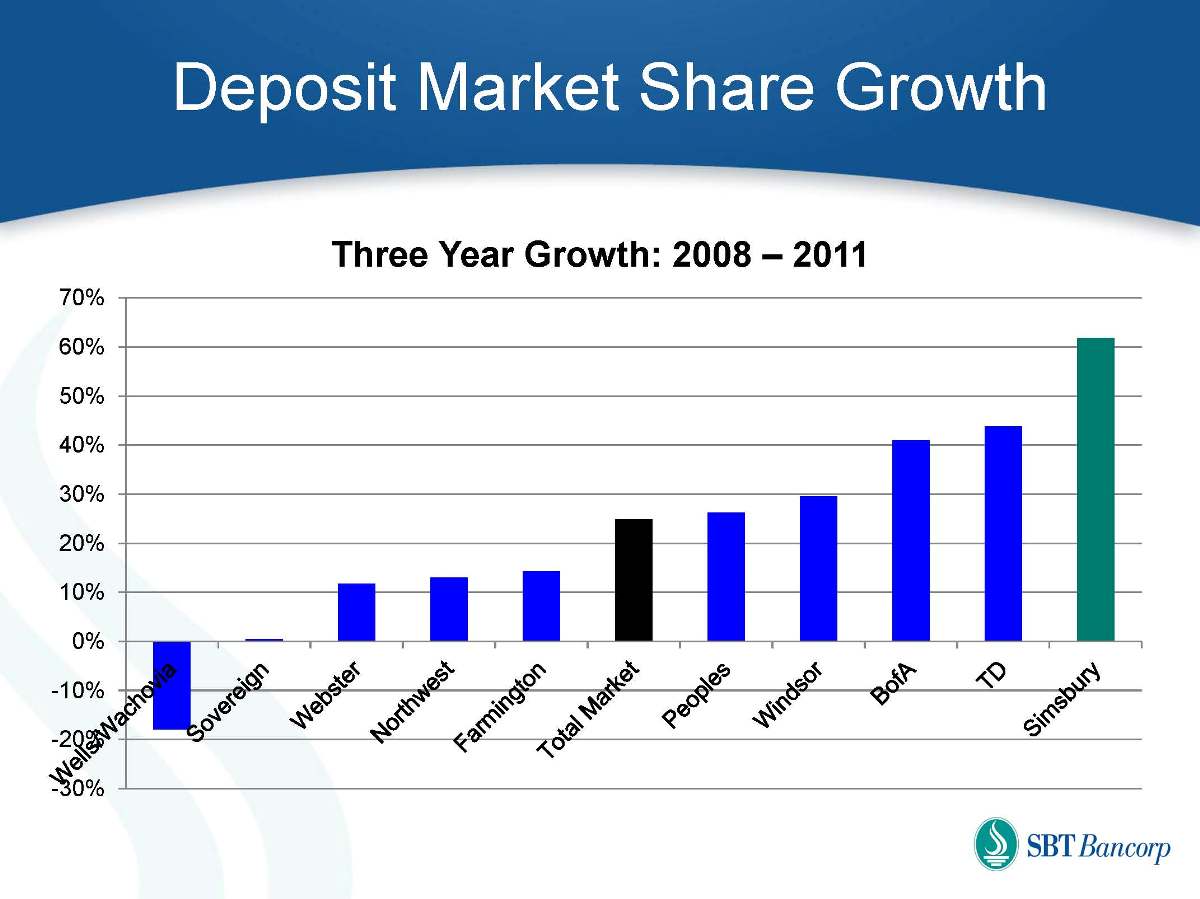
Deposit Market Share Growth Three Year Growth: 2008 – 2011 -30% -20% -10% 0% 10% 20% 30% 40% 50% 60% 70% Wells/Wachovia Sovereign Webster Northwest Farmington Total Market Peoples Windsor BofA TD Simsbury
Mortgage and Consumer Lending
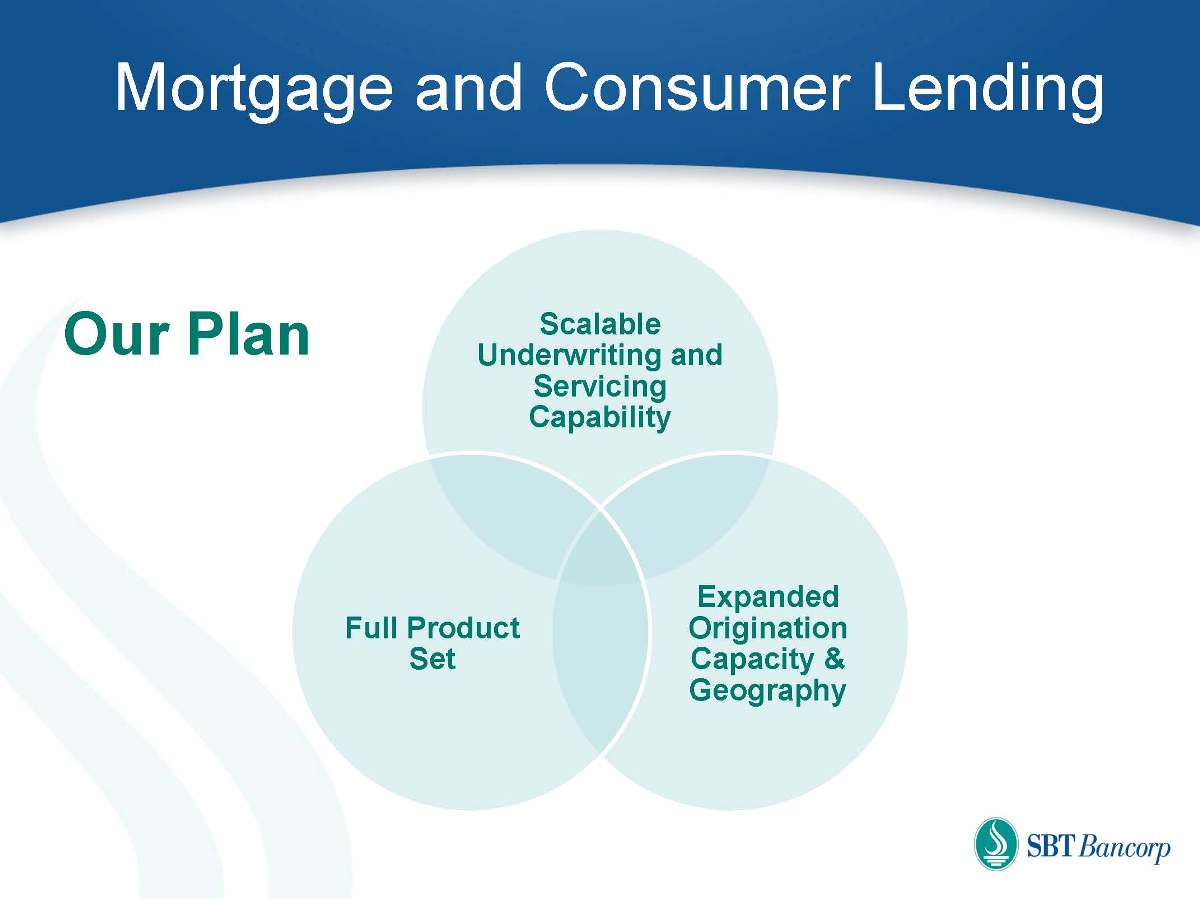
Mortgage and Consumer Lending Our Plan Full Product Set Expanded Origination Capacity & Geography Scalable Underwriting and Servicing Capability
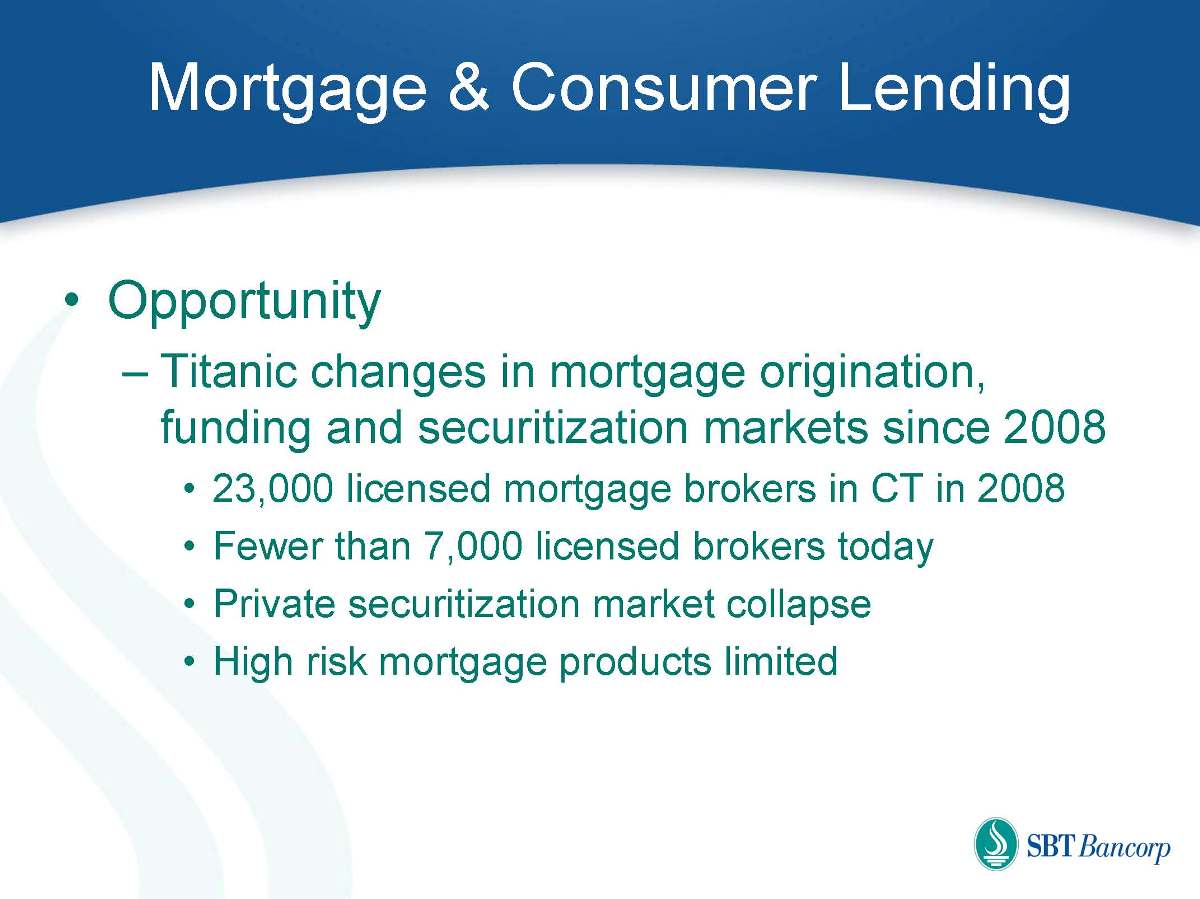
Mortgage & Consumer Lending Opportunity Titanic changes in mortgage origination, funding and securitization markets since 2008 23,000 licensed mortgage brokers in CT in 2008 Fewer than 7,000 licensed brokers today Private securitization market collapse High risk mortgage products limited
Mortgage and Consumer Lending Scalable Underwriting and Servicing Before Now Originated and underwrote solely for Simsbury Bank book of business. Secondary market sales driven by Bank asset / liability management. Serviced only Simsbury Bank loans. Loans that were sold were serviced by buyer. Originate and underwrite for Simsbury Bank book and several mortgage investors. Encompass technology platform implemented. Third party servicing implemented.
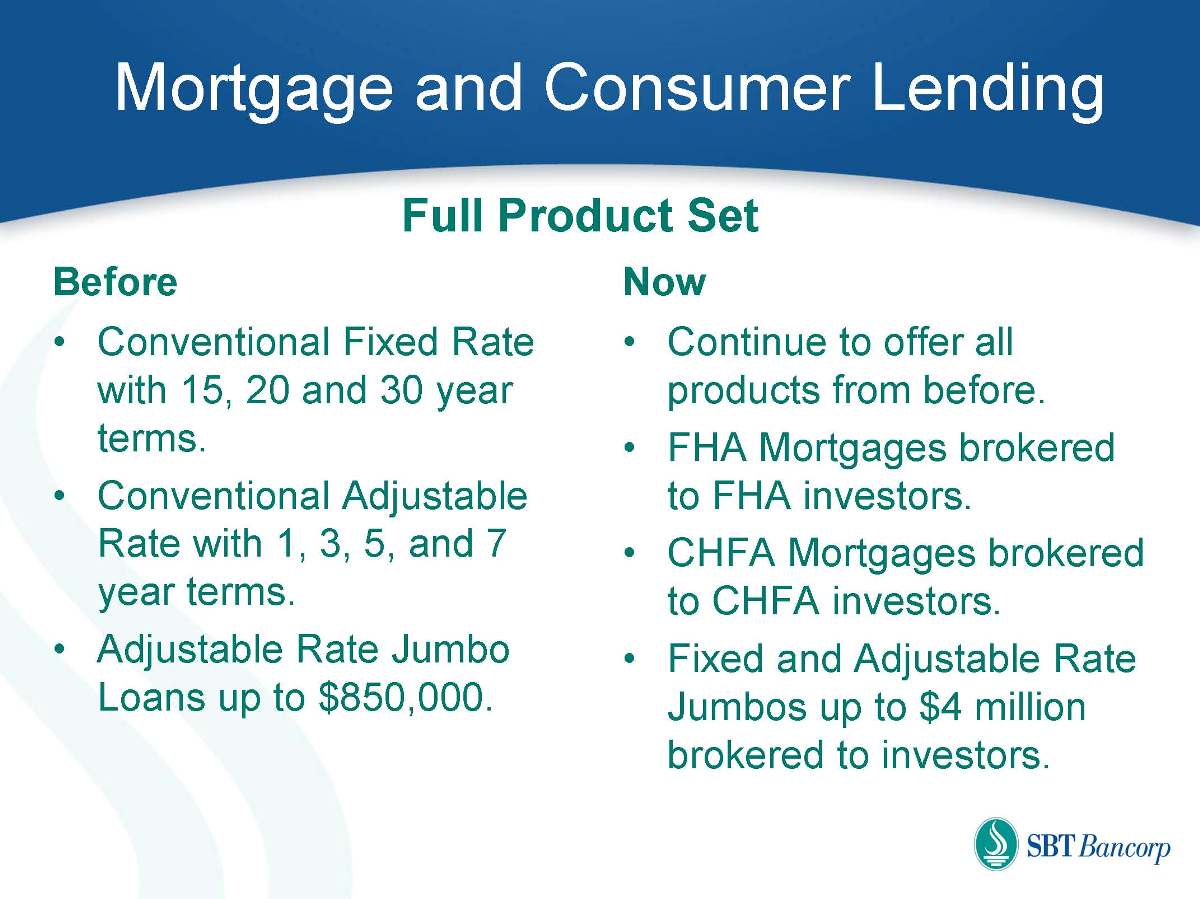
Mortgage and Consumer Lending Full Product Set Before Now Conventional Fixed Rate with 15, 20 and 30 year terms. Conventional Adjustable Rate with 1, 3, 5, and 7 year terms. Adjustable Rate Jumbo Loans up to $850,000. Continue to offer all products from before. FHA Mortgages brokered to FHA investors. CHFA Mortgages brokered to CHFA investors. Fixed and Adjustable Rate Jumbos up to $4 million brokered to investors.
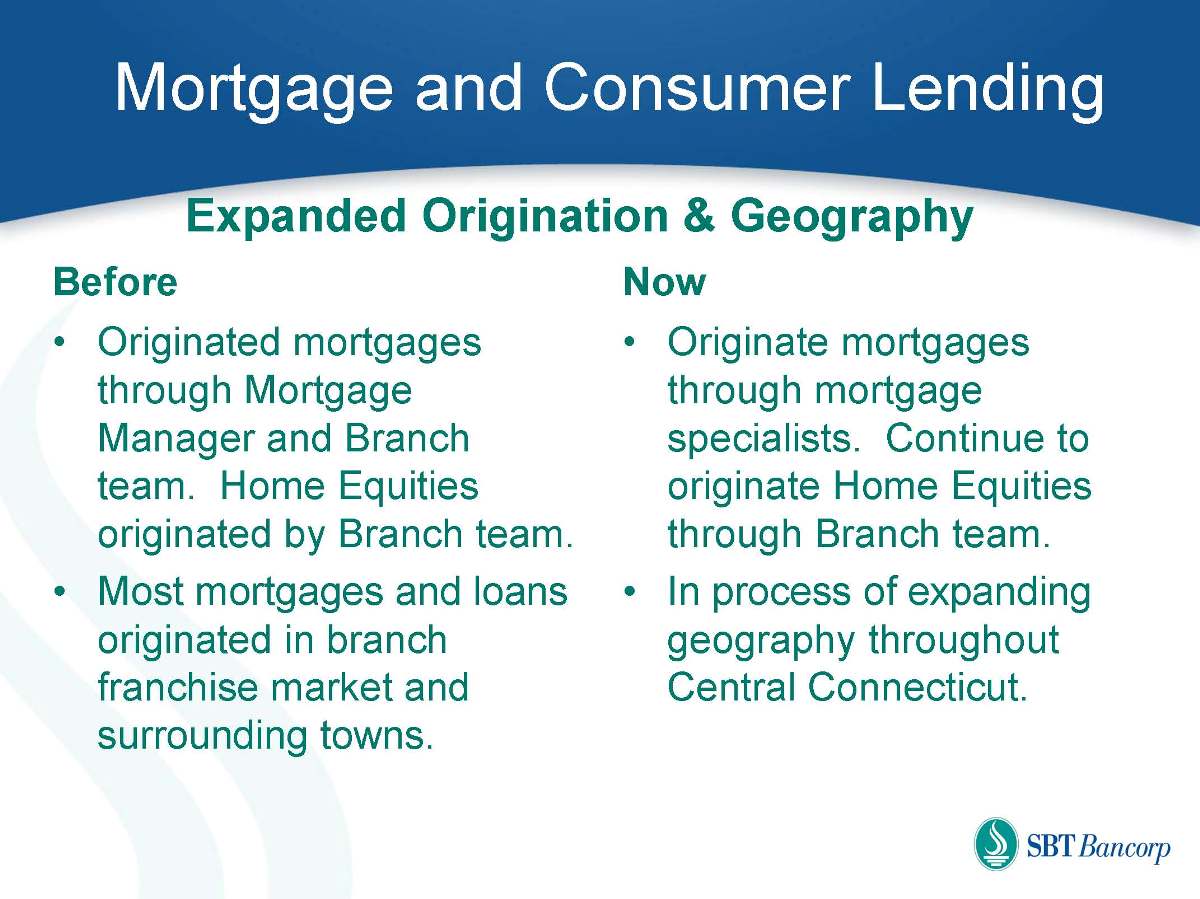
Mortgage and Consumer Lending Expanded Origination & Geography Before Now Originated mortgages through Mortgage Manager and Branch team. Home Equities originated by Branch team. Most mortgages and loans originated in branch franchise market and surrounding towns. Originate mortgages through mortgage specialists. Continue to originate Home Equities through Branch team. In process of expanding geography throughout Central Connecticut.
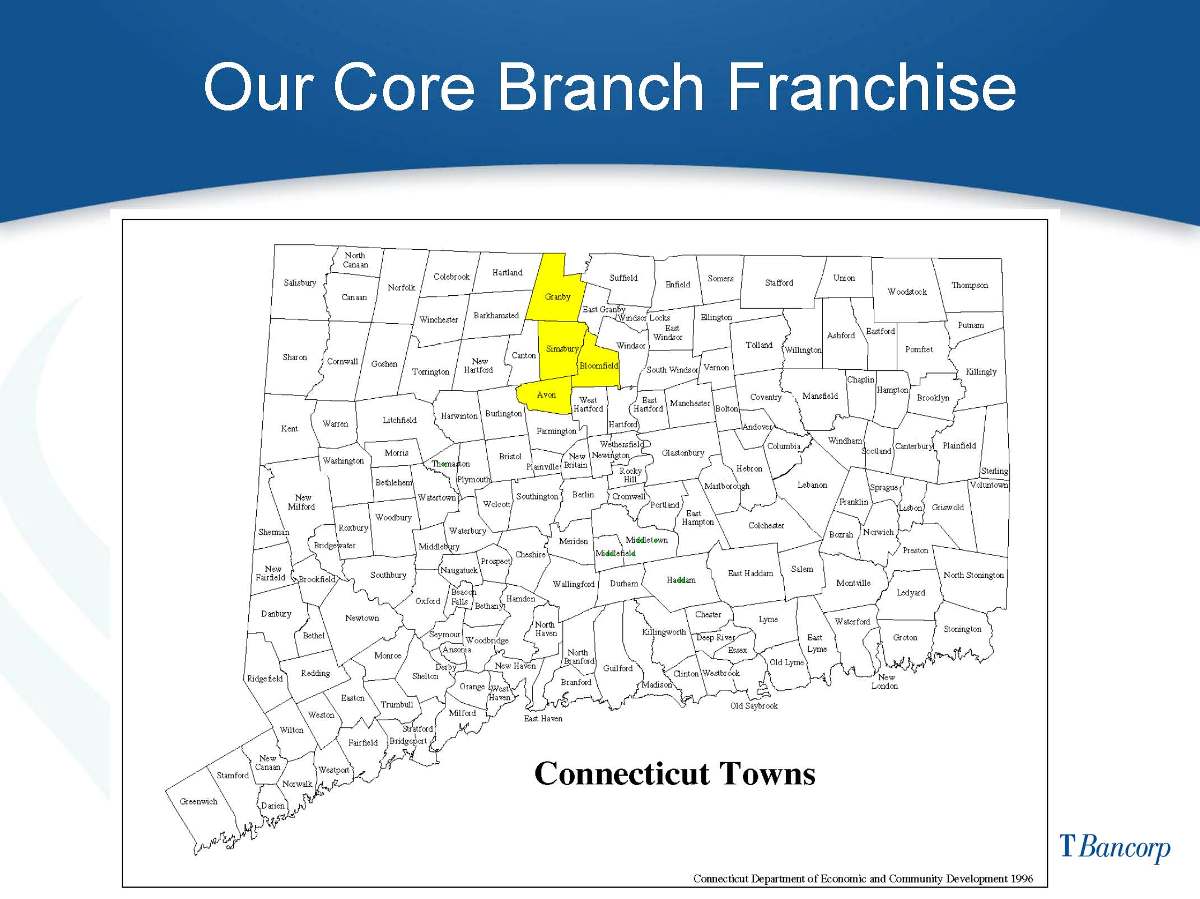
Our Core Branch Franchise Connecticut Towns
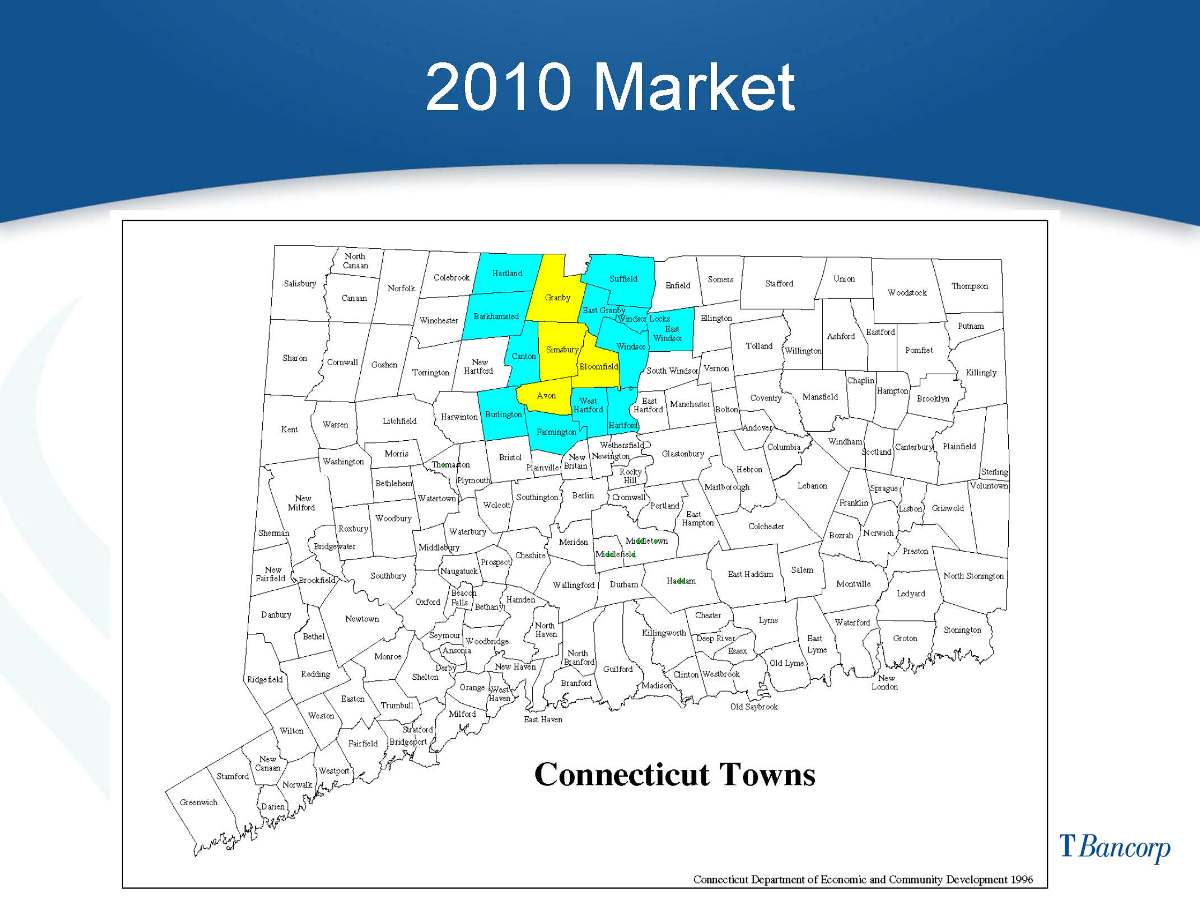
2010 Market Connecticut Towns
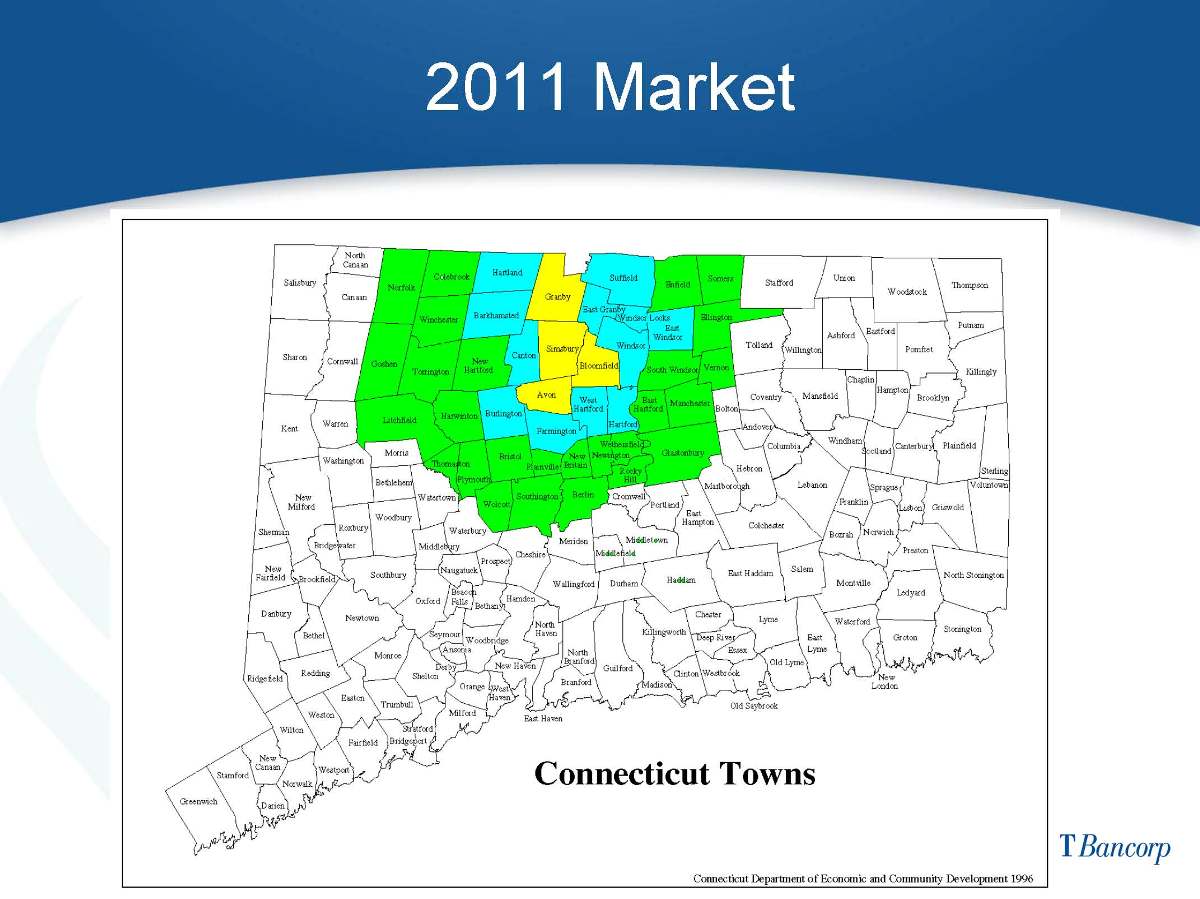
2011 Market Connecticut Towns
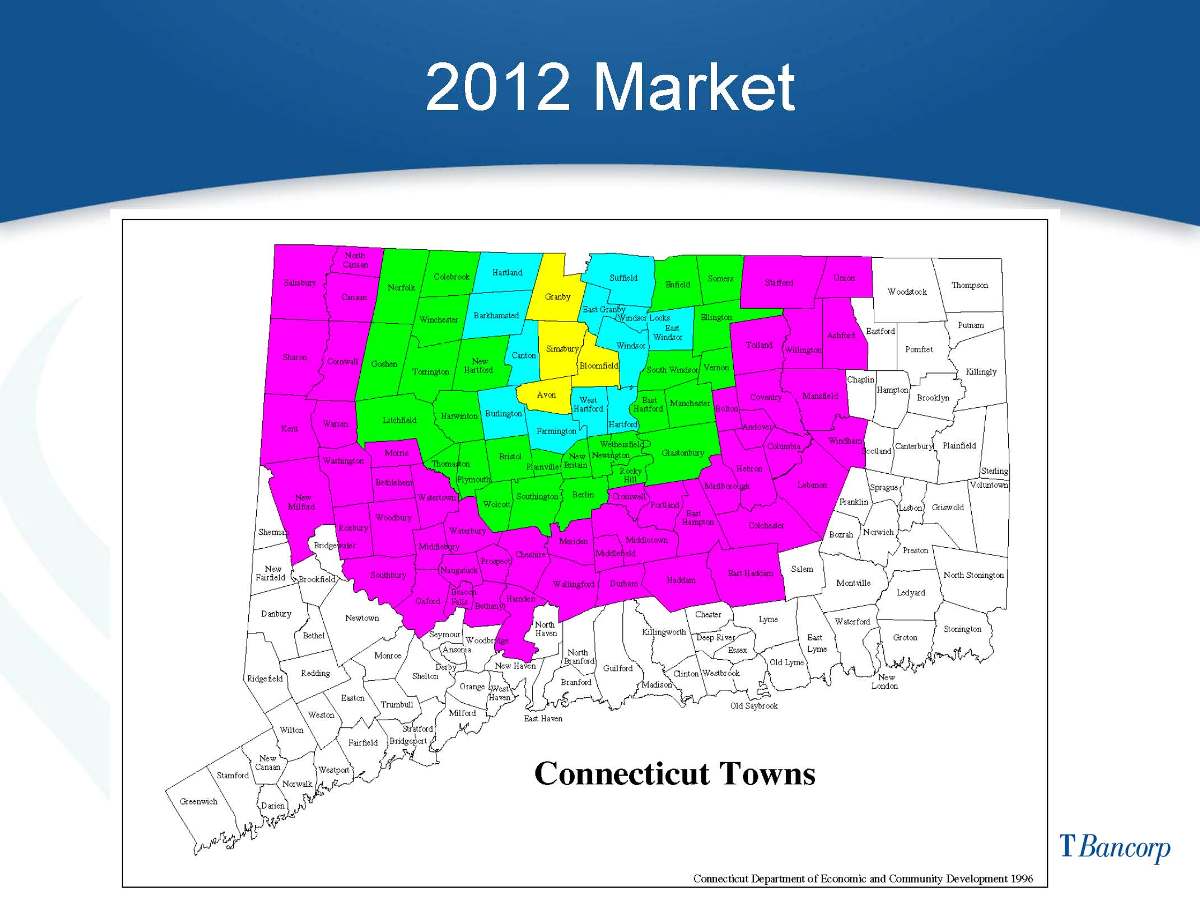
2012 Market Connecticut Towns
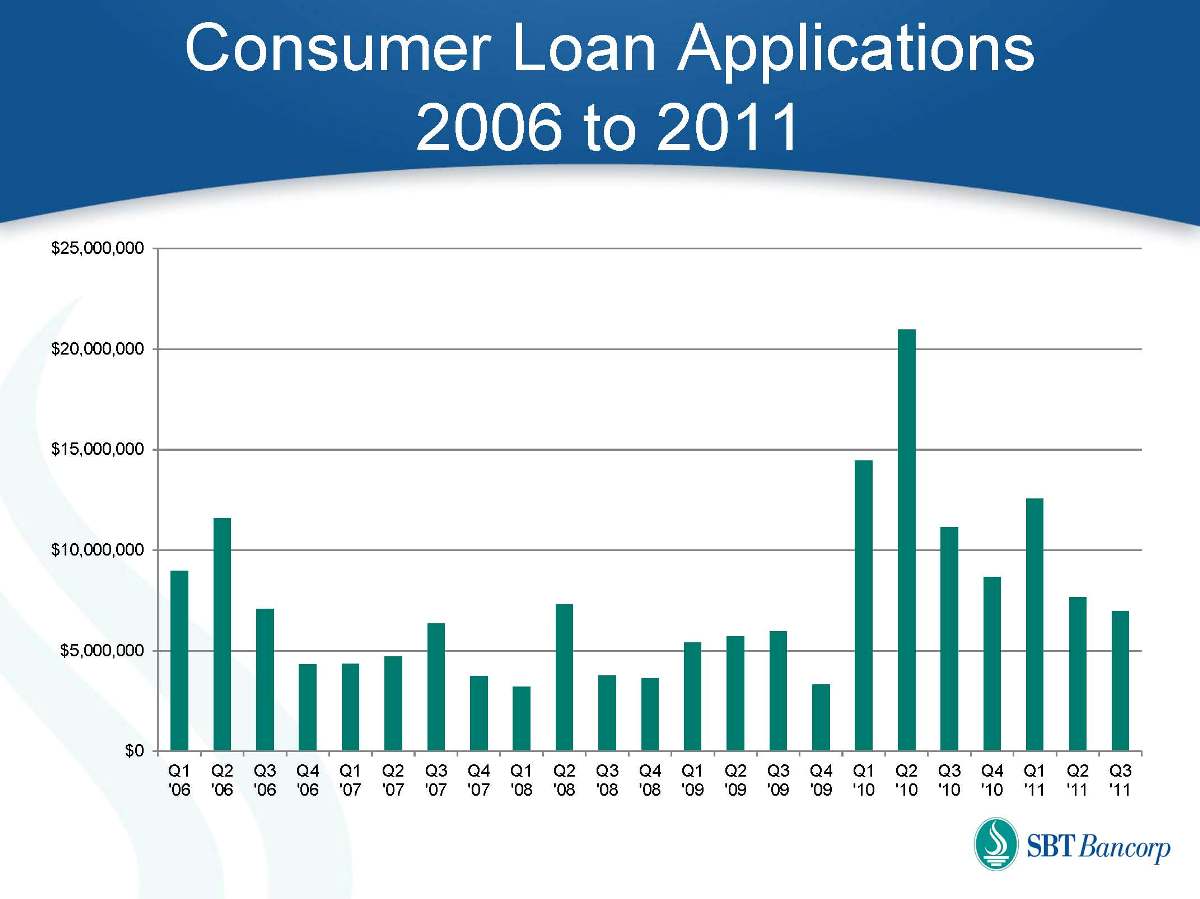
Consumer Loan Applications 2006 to 2011 $0 $5,000,000 $10,000,000 $15,000,000 $20,000,000 $25,000,000 Q1 '06 Q2 '06 Q3 '06 Q4 '06 Q1 '07 Q2 '07 Q3 '07 Q4 '07 Q1 '08 Q2 '08 Q3 '08 Q4 '08 Q1 '09 Q2 '09 Q3 '09 Q4 '09 Q1 '10 Q2 '10 Q3 '10 Q4 '10 Q1 '11 Q2 '11 Q3 '11
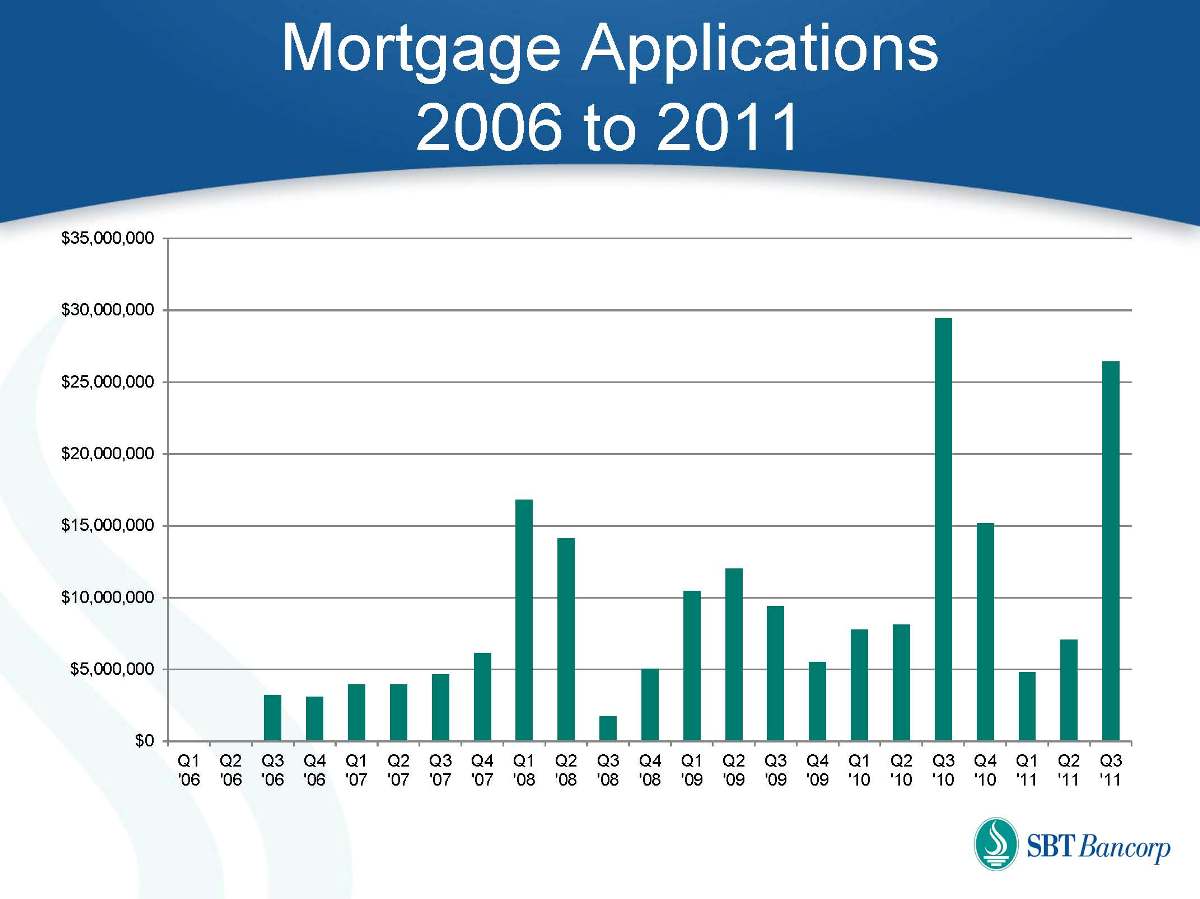
Mortgage Applications 2006 to 2011 $0 $5,000,000 $10,000,000 $15,000,000 $20,000,000 $25,000,000 $30,000,000 $35,000,000 Q1 '06 Q2 '06 Q3 '06 Q4 '06 Q1 '07 Q2 '07 Q3 '07 Q4 '07 Q1 '08 Q2 '08 Q3 '08 Q4 '08 Q1 '09 Q2 '09 Q3 '09 Q4 '09 Q1 '10 Q2 '10 Q3 '10 Q4 '10 Q1 '11 Q2 '11 Q3 '11
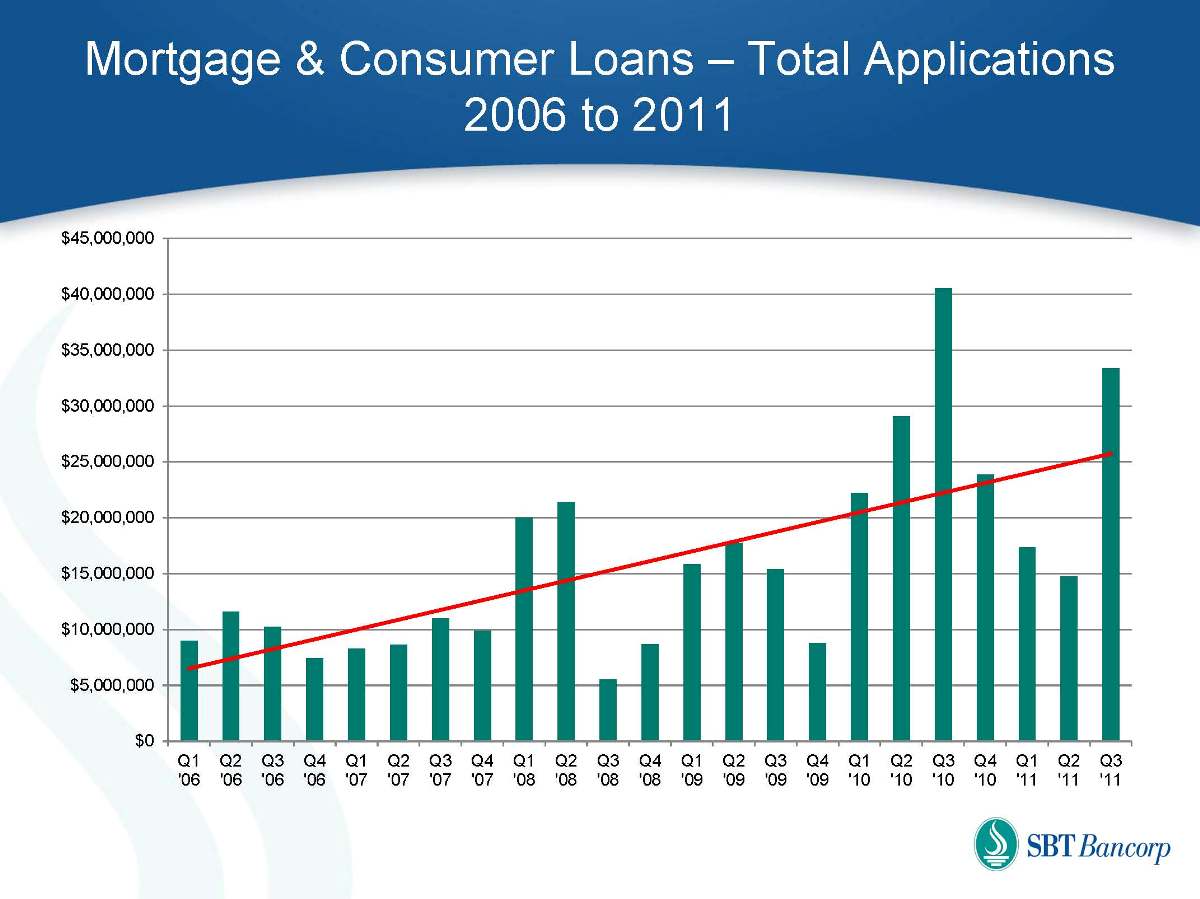
Mortgage & Consumer Loans – Total Applications 2006 to 2011 $0 $5,000,000 $10,000,000 $15,000,000 $20,000,000 $25,000,000 $30,000,000 $35,000,000 $40,000,000 $45,000,000 Q1 '06 Q2 '06 Q3 '06 Q4 '06 Q1 '07 Q2 '07 Q3 '07 Q4 '07 Q1 '08 Q2 '08 Q3 '08 Q4 '08 Q1 '09 Q2 '09 Q3 '09 Q4 '09 Q1 '10 Q2 '10 Q3 '10 Q4 '10 Q1 '11 Q2 '11 Q3 '11
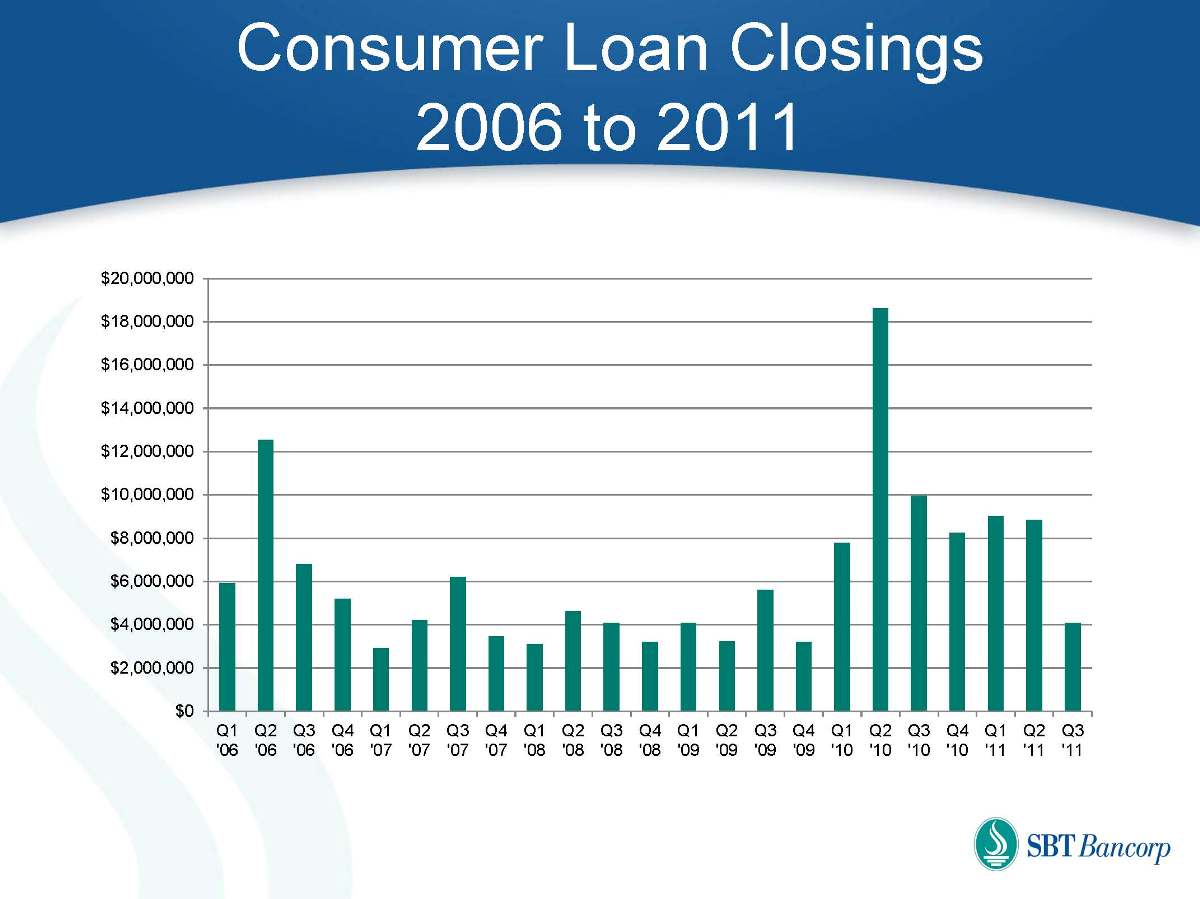
Consumer Loan Closings 2006 to 2011 $0 $2,000,000 $4,000,000 $6,000,000 $8,000,000 $10,000,000 $12,000,000 $14,000,000 $16,000,000 $18,000,000 $20,000,000 Q1 '06 Q2 '06 Q3 '06 Q4 '06 Q1 '07 Q2 '07 Q3 '07 Q4 '07 Q1 '08 Q2 '08 Q3 '08 Q4 '08 Q1 '09 Q2 '09 Q3 '09 Q4 '09 Q1 '10 Q2 '10 Q3 '10 Q4 '10 Q1 '11 Q2 '11 Q3 '11
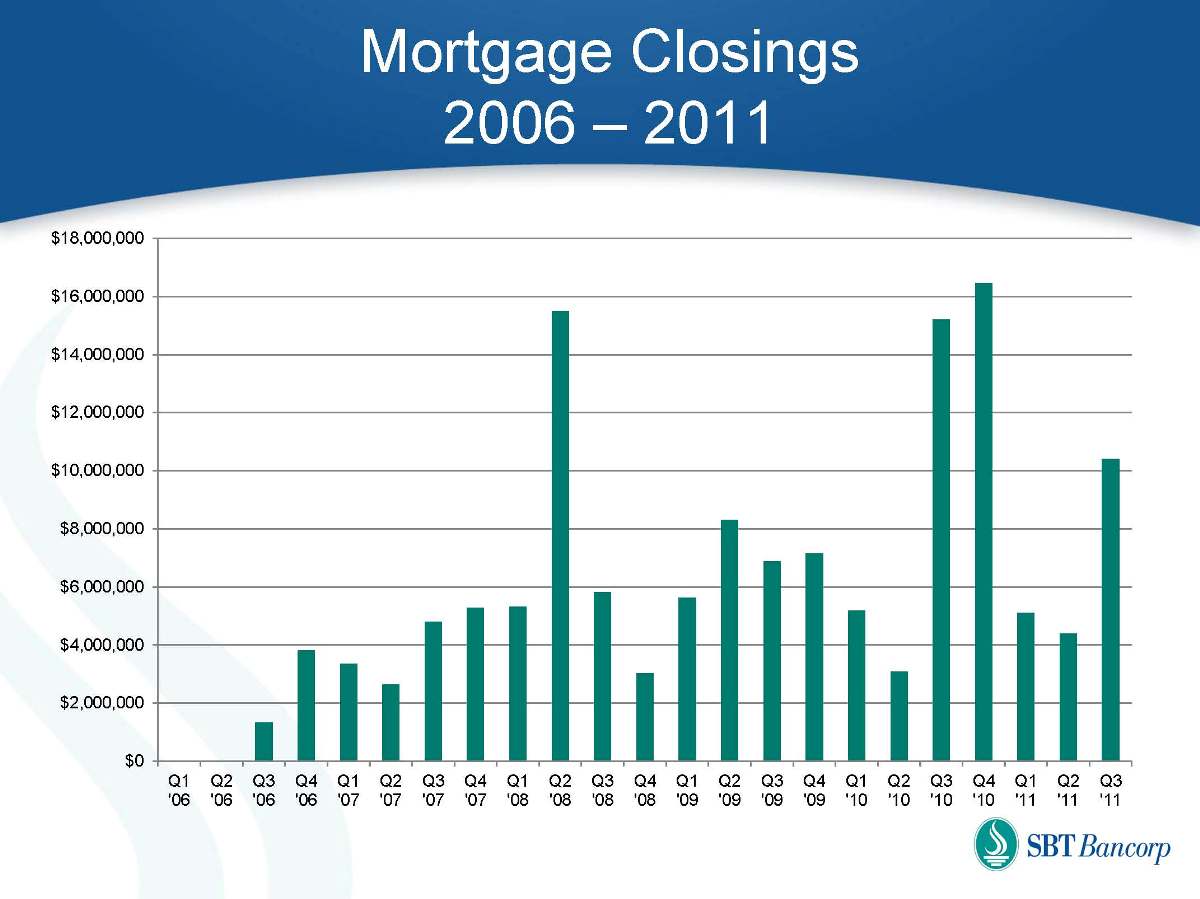
Mortgage Closings 2006 – 2011 $0 $2,000,000 $4,000,000 $6,000,000 $8,000,000 $10,000,000 $12,000,000 $14,000,000 $16,000,000 $18,000,000 Q1 '06 Q2 '06 Q3 '06 Q4 '06 Q1 '07 Q2 '07 Q3 '07 Q4 '07 Q1 '08 Q2 '08 Q3 '08 Q4 '08 Q1 '09 Q2 '09 Q3 '09 Q4 '09 Q1 '10 Q2 '10 Q3 '10 Q4 '10 Q1 '11 Q2 '11 Q3 '11
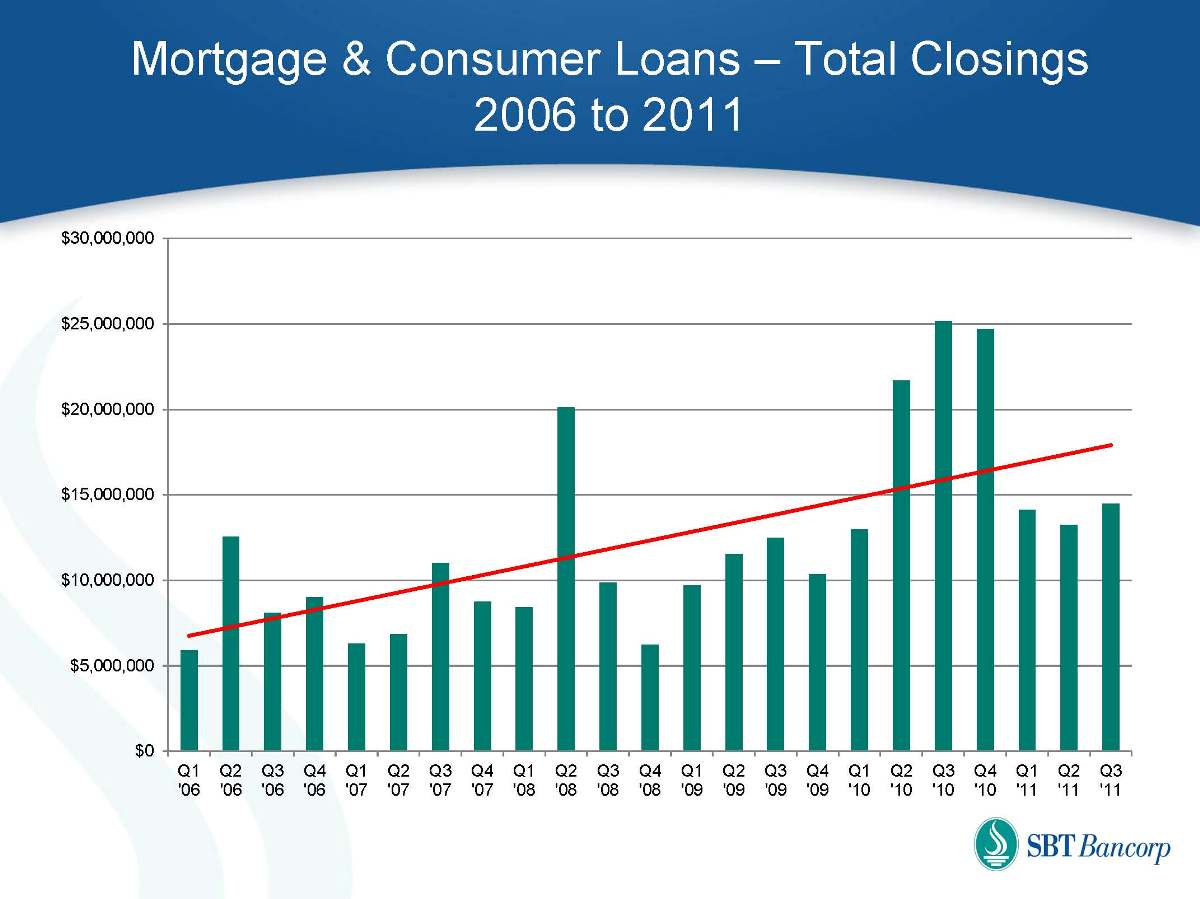
Mortgage & Consumer Loans – Total Closings 2006 to 2011 $0 $5,000,000 $10,000,000 $15,000,000 $20,000,000 $25,000,000 $30,000,000 Q1 '06 Q2 '06 Q3 '06 Q4 '06 Q1 '07 Q2 '07 Q3 '07 Q4 '07 Q1 '08 Q2 '08 Q3 '08 Q4 '08 Q1 '09 Q2 '09 Q3 '09 Q4 '09 Q1 '10 Q2 '10 Q3 '10 Q4 '10 Q1 '11 Q2 '11 Q3 '11
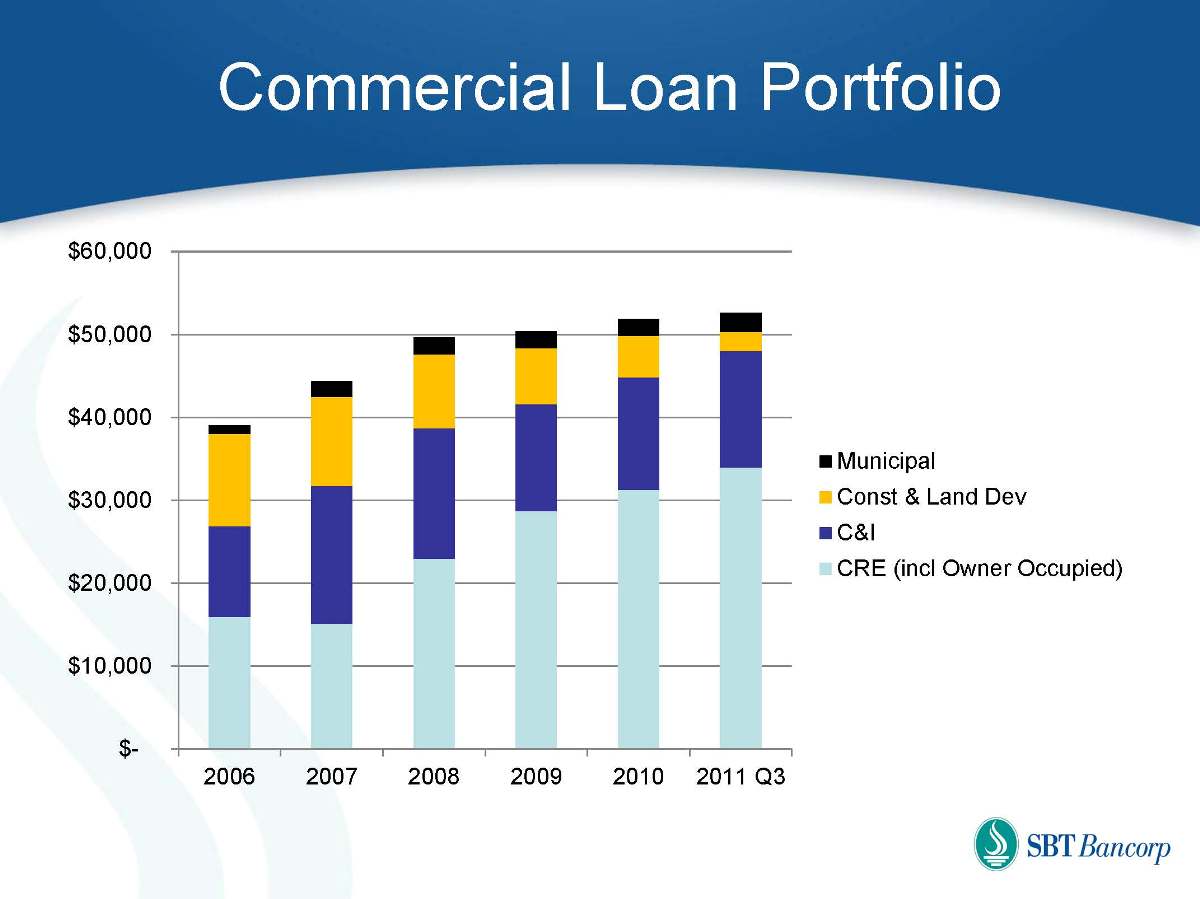
Commercial Loan Portfolio $- $10,000 $20,000 $30,000 $40,000 $50,000 $60,000 2006 2007 2008 2009 2010 2011 Q3 Municipal Const & Land Dev C&I CRE (incl Owner Occupied)
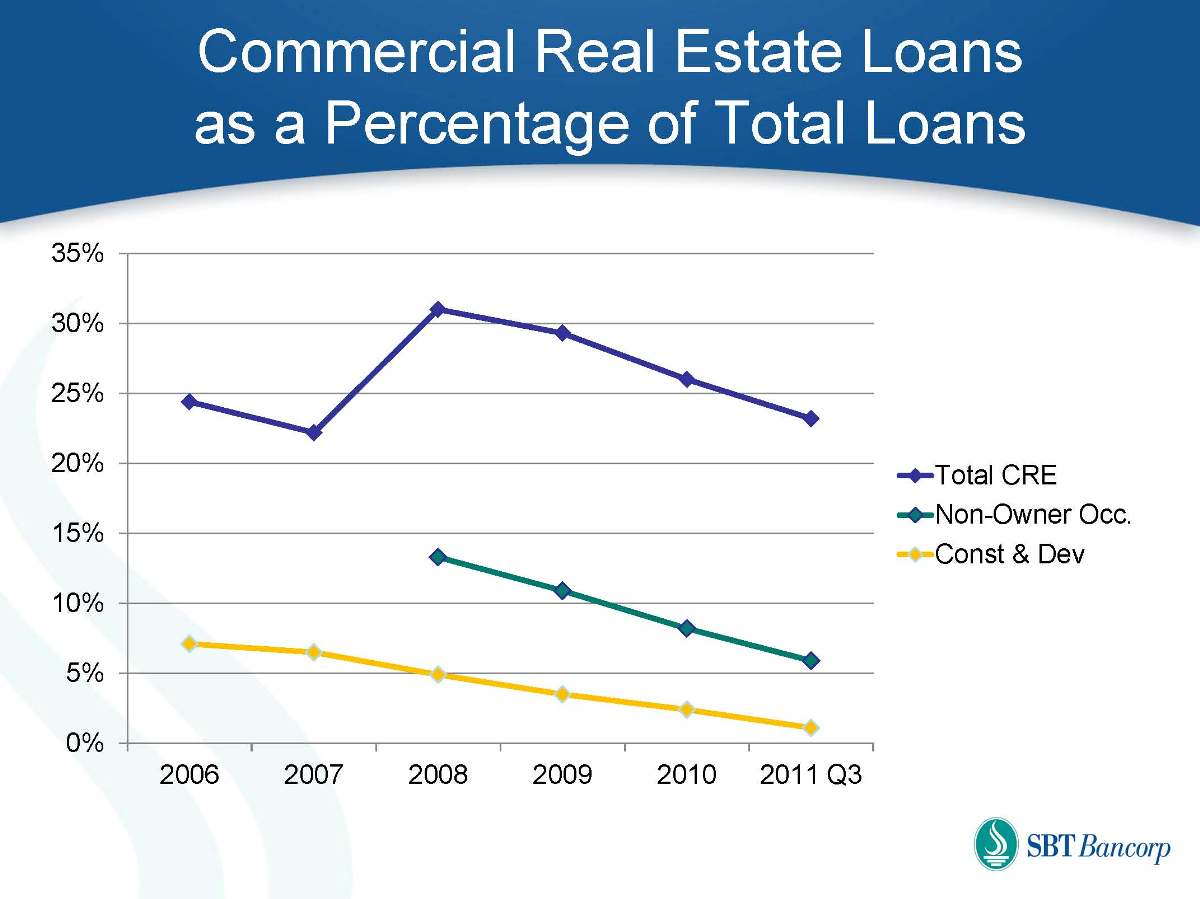
Commercial Real Estate Loans as a Percentage of Total Loans 0% 5% 10% 15% 20% 25% 30% 35% 2006 2007 2008 2009 2010 2011 Q3 Total CRE Non-Owner Occ. Const & Dev
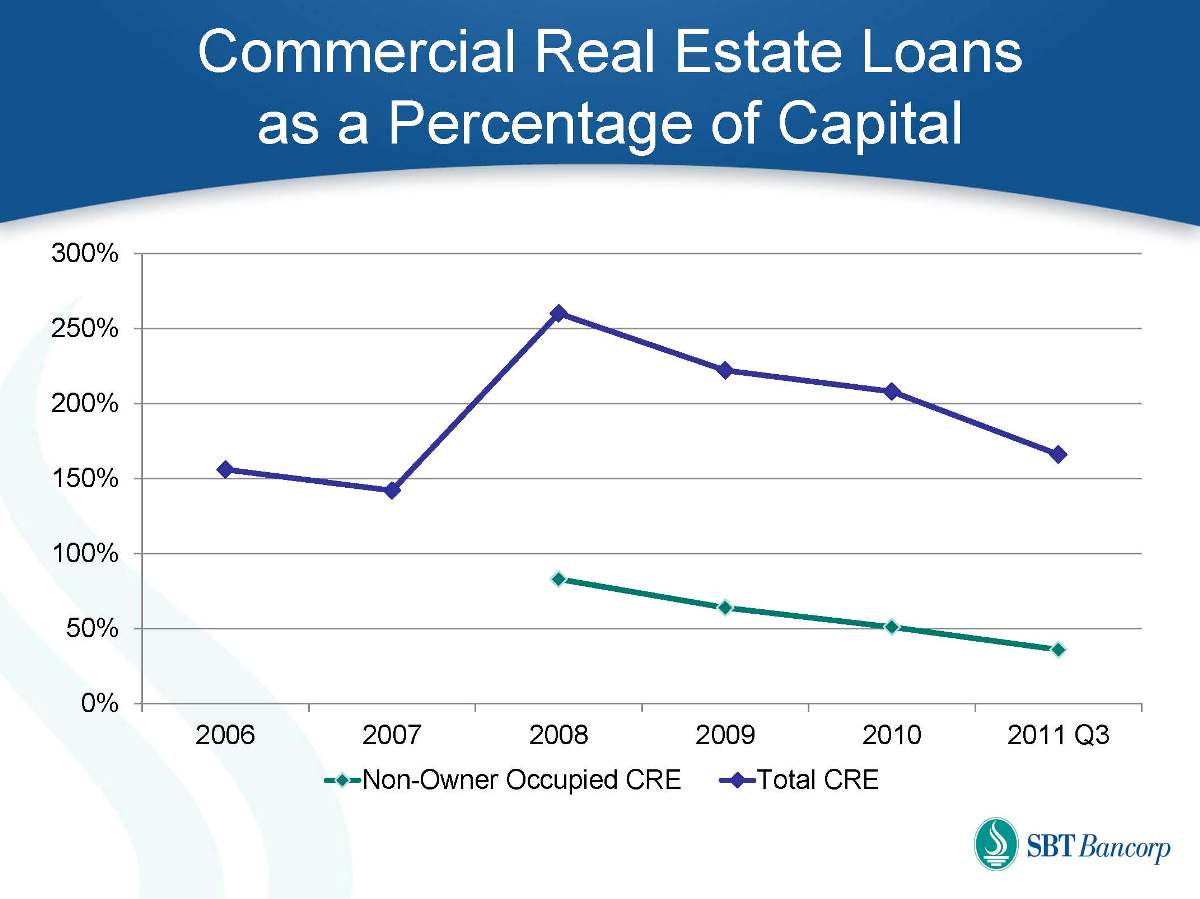
Commercial Real Estate Loans as a Percentage of Capital 0% 50% 100% 150% 200% 250% 300% 2006 2007 2008 2009 2010 2011 Q3 Non-Owner Occupied CRE Total CRE
Investment Services and Wealth Management
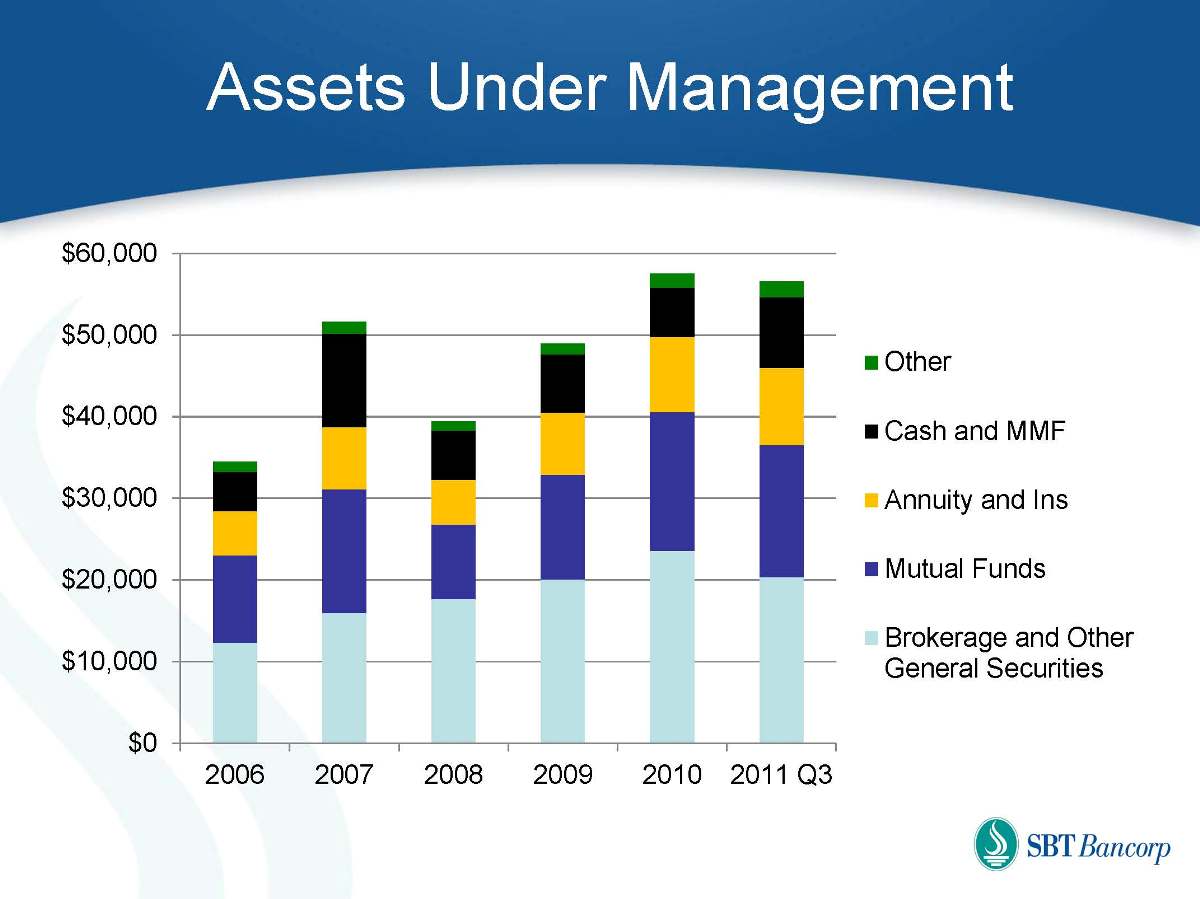
Assets Under Management $0 $10,000 $20,000 $30,000 $40,000 $50,000 $60,000 2006 2007 2008 2009 2010 2011 Q3 Other Cash and MMF Annuity and Ins Mutual Funds Brokerage and Other General Securities
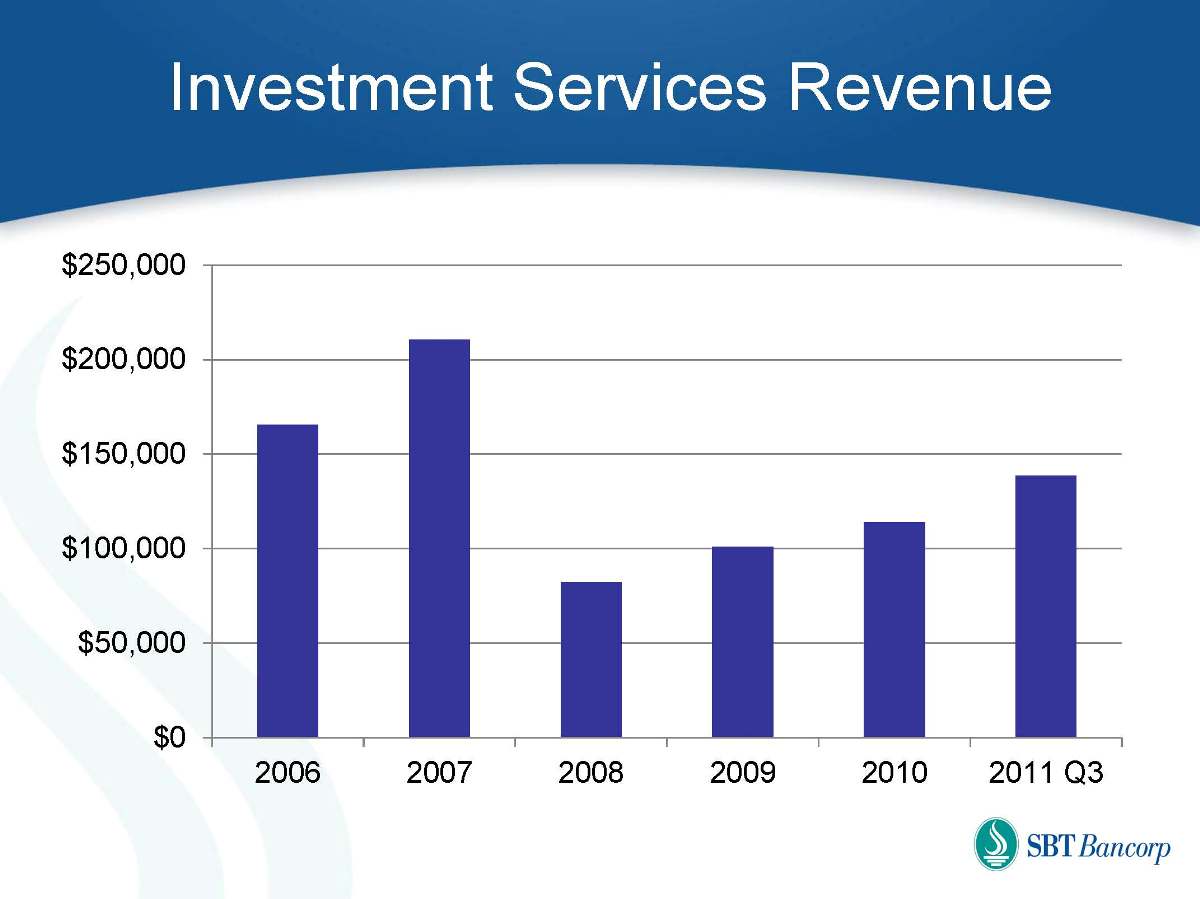
Investment Services Revenue $0 $50,000 $100,000 $150,000 $200,000 $250,000 2006 2007 2008 2009 2010 2011 Q3
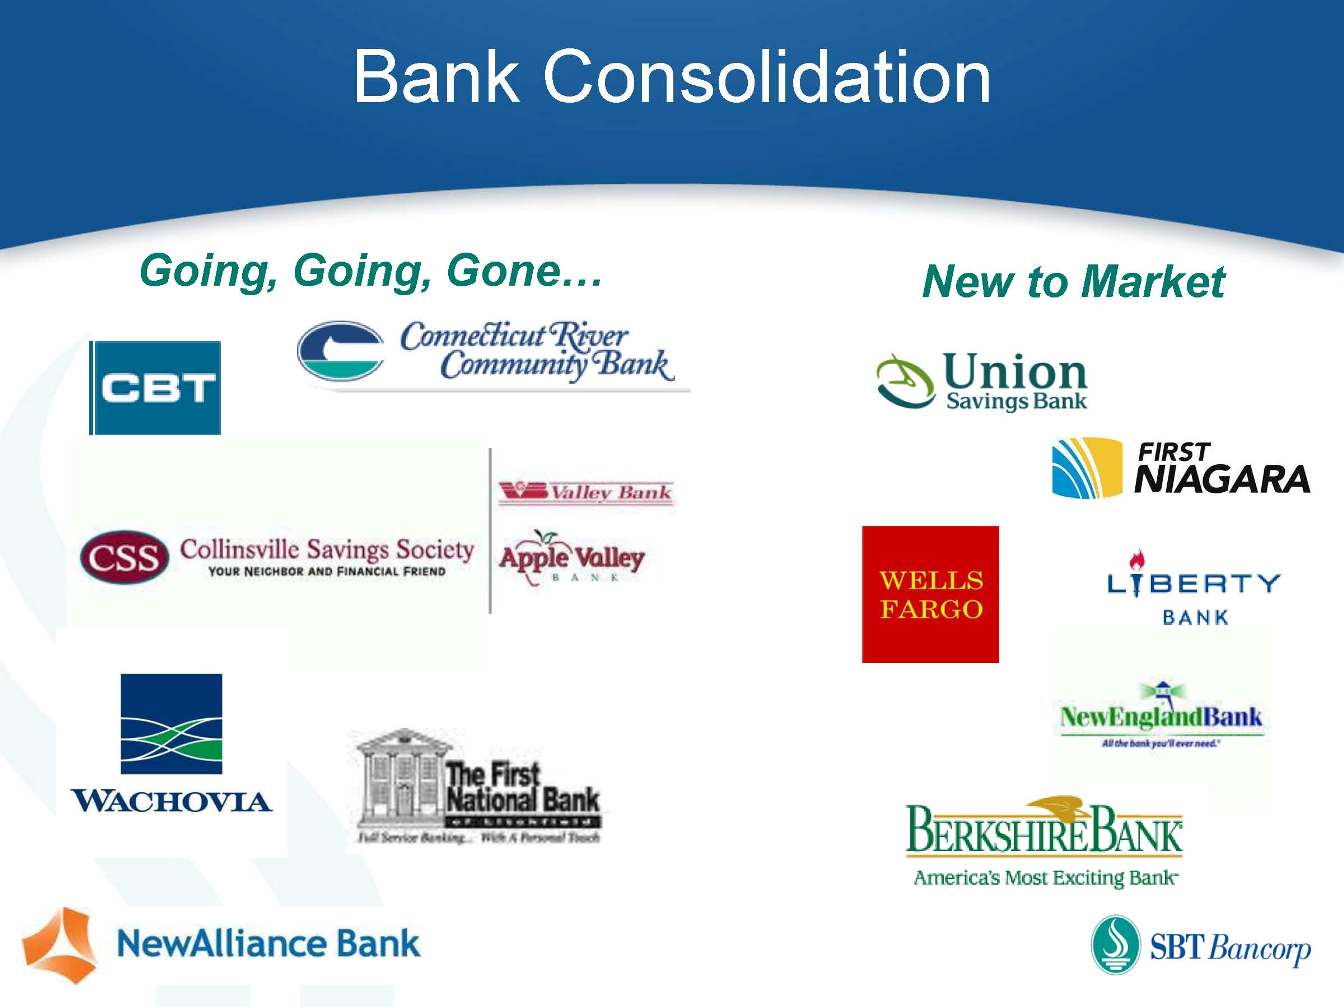
Bank Consolidation Going, Going, Gone… New to Market
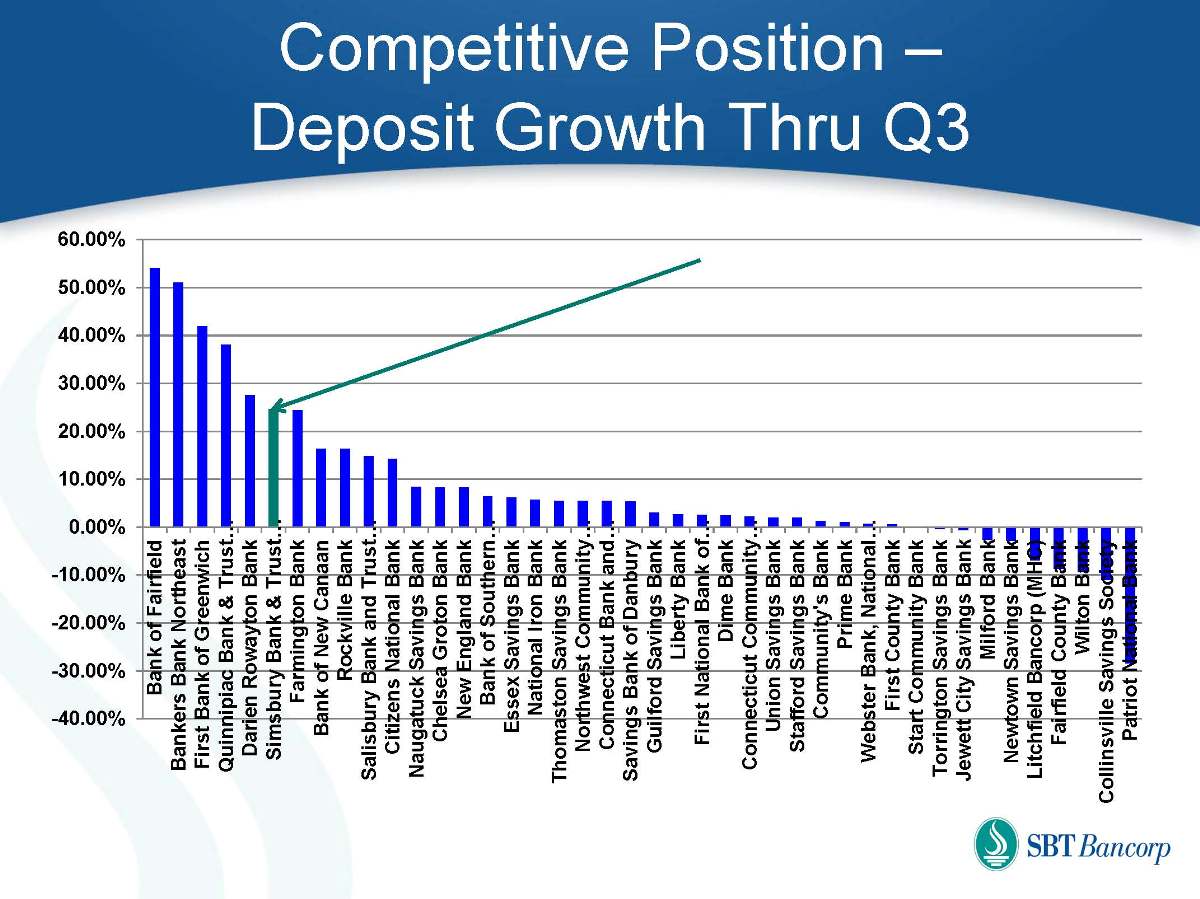
Competitive Position – Deposit Growth Thru Q3 -40.00% -30.00% -20.00% -10.00% 0.00% 10.00% 20.00% 30.00% 40.00% 50.00% 60.00% Bank of Fairfield Bankers Bank Northeast First Bank of Greenwich Quinnipiac Bank & Trust… Darien Rowayton Bank Simsbury Bank & Trust… Farmington Bank Bank of New Canaan Rockville Bank Salisbury Bank and Trust… Citizens National Bank Naugatuck Savings Bank Chelsea Groton Bank New England Bank Bank of Southern… Essex Savings Bank National Iron Bank Thomaston Savings Bank Northwest Community… Connecticut Bank and… Savings Bank of Danbury Guilford Savings Bank Liberty Bank First National Bank of… Dime Bank Connecticut Community… Union Savings Bank Stafford Savings Bank Community's Bank Prime Bank Webster Bank, National… First County Bank Start Community Bank Torrington Savings Bank Jewett City Savings Bank Milford Bank Newtown Savings Bank Litchfield Bancorp (MHC) Fairfield County Bank Wilton Bank Collinsville Savings Society Patriot National Bank
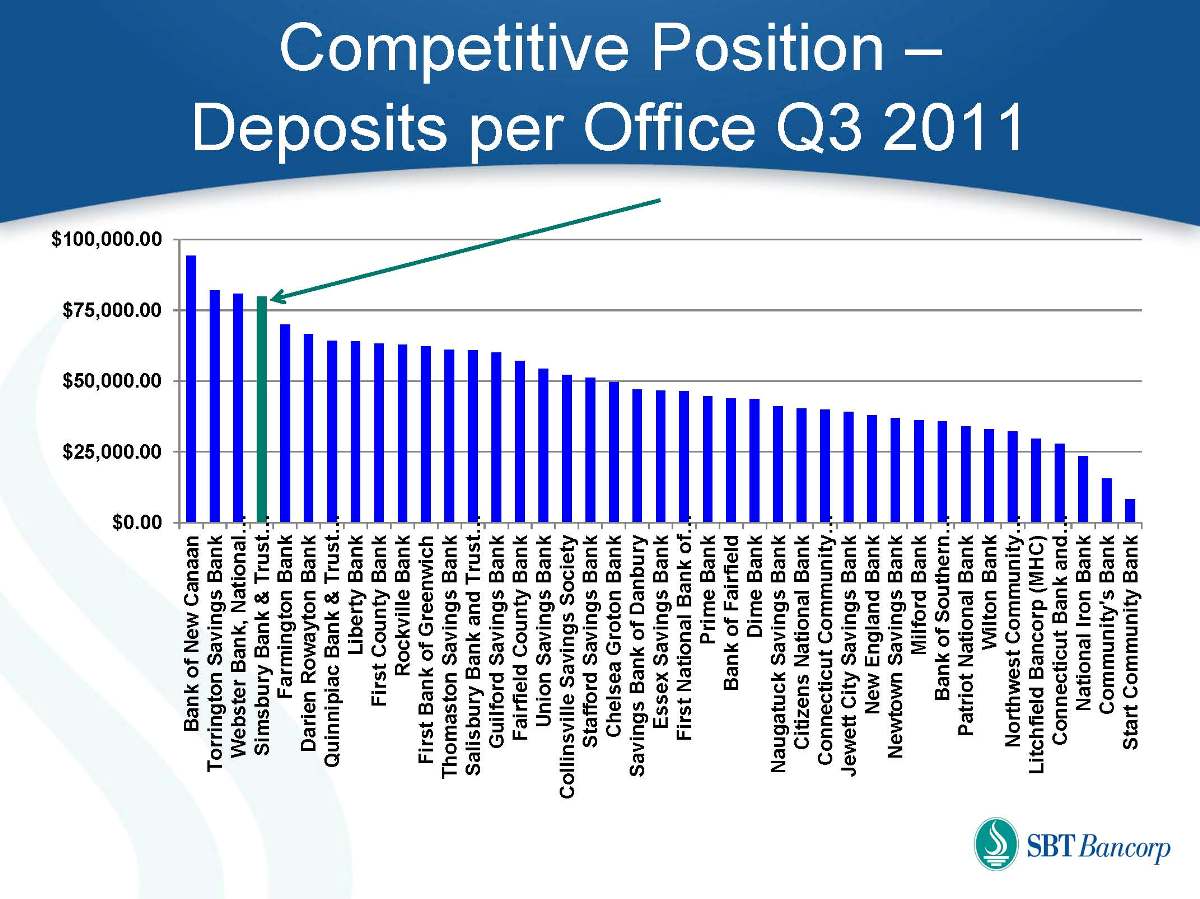
Competitive Position – Deposits per Office Q3 2011 $0.00 $25,000.00 $50,000.00 $75,000.00 $100,000.00 Bank of New Canaan Torrington Savings Bank Webster Bank, National… Simsbury Bank & Trust… Farmington Bank Darien Rowayton Bank Quinnipiac Bank & Trust… Liberty Bank First County Bank Rockville Bank First Bank of Greenwich Thomaston Savings Bank Salisbury Bank and Trust… Guilford Savings Bank Fairfield County Bank Union Savings Bank Collinsville Savings Society Stafford Savings Bank Chelsea Groton Bank Savings Bank of Danbury Essex Savings Bank First National Bank of… Prime Bank Bank of Fairfield Dime Bank Naugatuck Savings Bank Citizens National Bank Connecticut Community… Jewett City Savings Bank New England Bank Newtown Savings Bank Milford Bank Bank of Southern… Patriot National Bank Wilton Bank Northwest Community… Litchfield Bancorp (MHC) Connecticut Bank and… National Iron Bank Community's Bank Start Community Bank
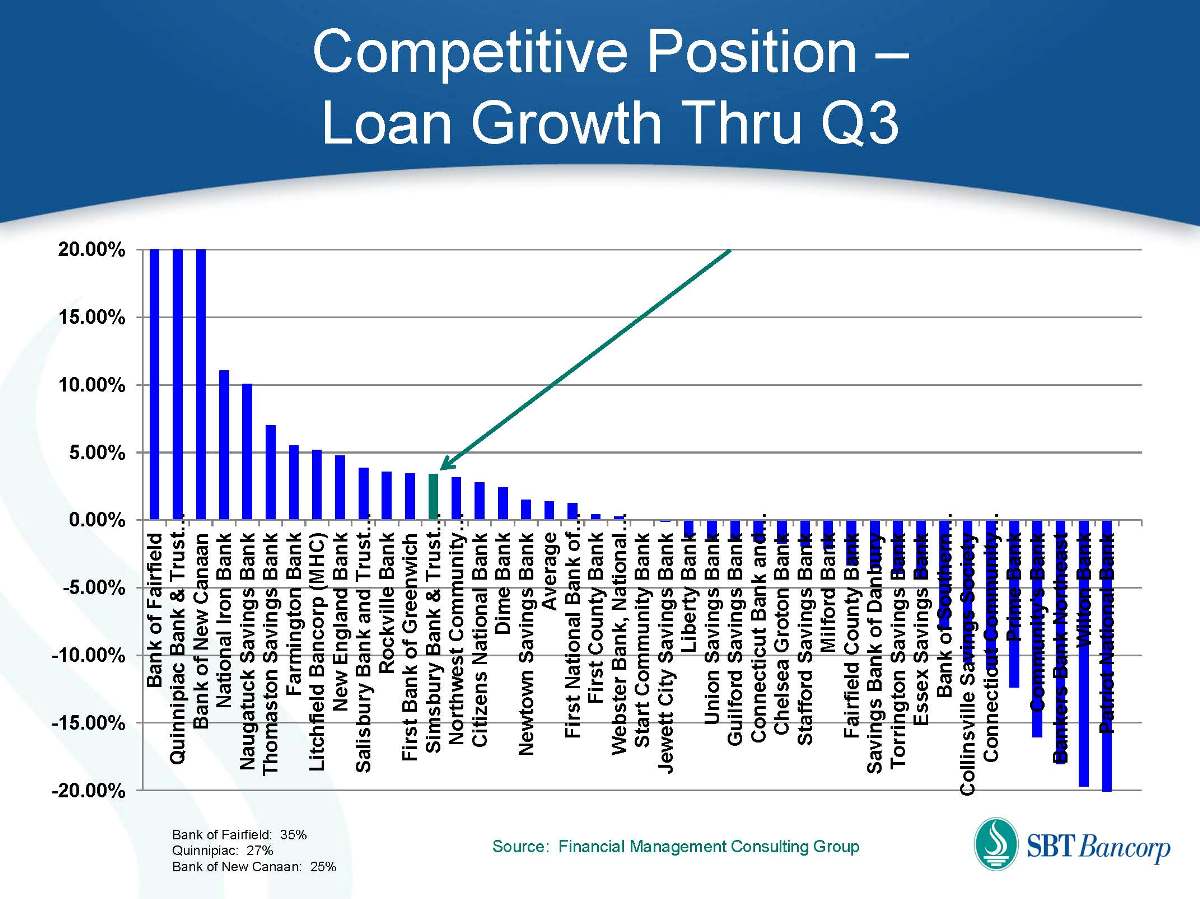
Competitive Position – Loan Growth Thru Q3 -20.00% -15.00% -10.00% -5.00% 0.00% 5.00% 10.00% 15.00% 20.00% Bank of Fairfield Quinnipiac Bank & Trust… Bank of New Canaan National Iron Bank Naugatuck Savings Bank Thomaston Savings Bank Farmington Bank Litchfield Bancorp (MHC) New England Bank Salisbury Bank and Trust… Rockville Bank First Bank of Greenwich Simsbury Bank & Trust… Northwest Community… Citizens National Bank Dime Bank Newtown Savings Bank Average First National Bank of… First County Bank Webster Bank, National… Start Community Bank Jewett City Savings Bank Liberty Bank Union Savings Bank Guilford Savings Bank Connecticut Bank and… Chelsea Groton Bank Stafford Savings Bank Milford Bank Fairfield County Bank Savings Bank of Danbury Torrington Savings Bank Essex Savings Bank Bank of Southern… Collinsville Savings Society Connecticut Community… Prime Bank Community's Bank Bankers Bank Northeast Wilton Bank Patriot National Bank Source: Financial Management Consulting Group Bank of Fairfield: 35% Quinnipiac: 27% Bank of New Canaan: 25%

Competitive Position – Total Past Due Loans Q3 0.00% 2.00% 4.00% 6.00% 8.00% 10.00% 12.00% 14.00% Wilton Bank Connecticut Community… Community's Bank Patriot National Bank Connecticut Bank and… Savings Bank of Danbury Collinsville Savings Society Dime Bank Bank of Southern… First County Bank Fairfield County Bank Union Savings Bank Milford Bank Newtown Savings Bank Jewett City Savings Bank Webster Bank, National… Citizens National Bank New England Bank Thomaston Savings Bank Salisbury Bank and Trust… Naugatuck Savings Bank Farmington Bank Northwest Community… First Bank of Greenwich Chelsea Groton Bank Guilford Savings Bank Liberty Bank Litchfield Bancorp (MHC) First National Bank of… Stafford Savings Bank Essex Savings Bank Bank of New Canaan Torrington Savings Bank Simsbury Bank & Trust… Prime Bank Rockville Bank Darien Rowayton Bank Bank of Fairfield National Iron Bank Quinnipiac Bank & Trust… Bankers Bank Northeast Start Community Bank Source: Financial Management Consulting Group
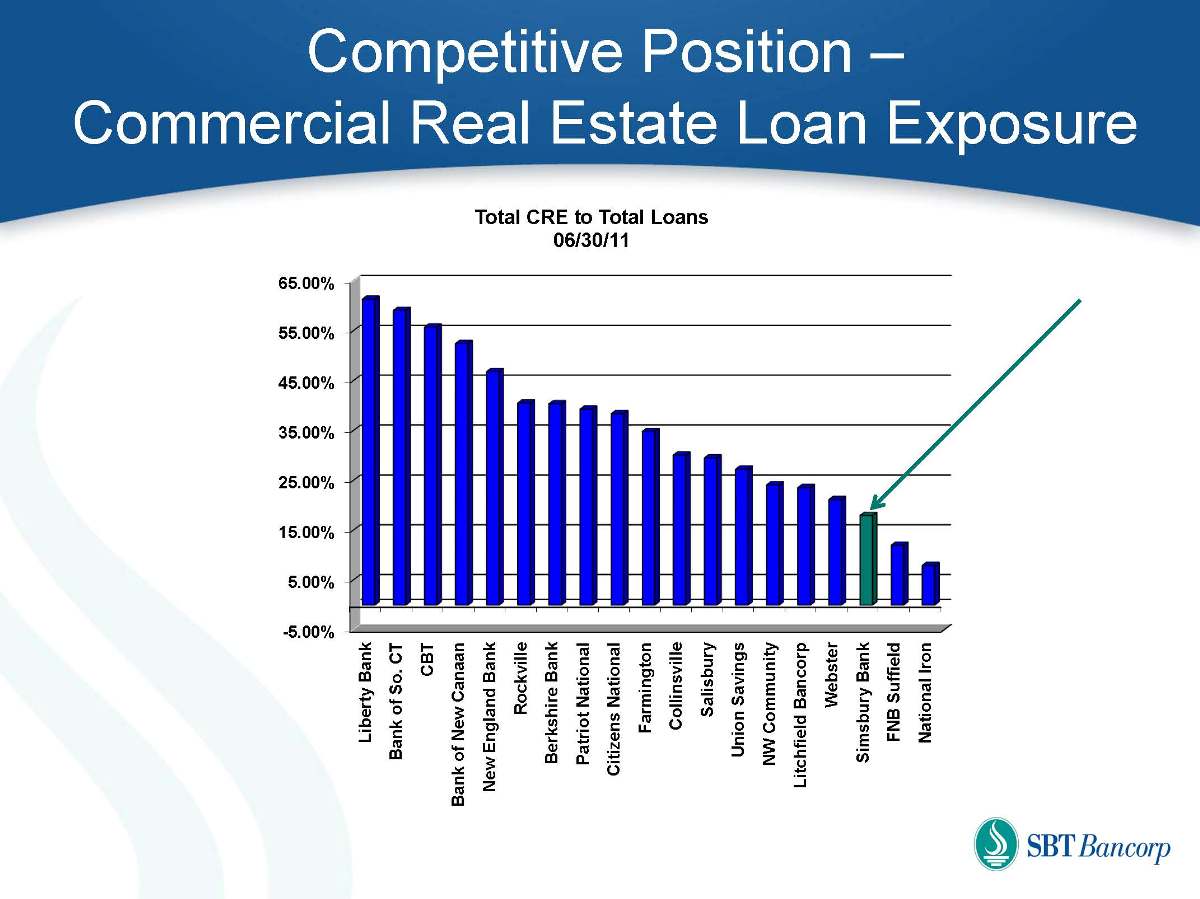
Competitive Position – Commercial Real Estate Loan Exposure Total CRE to Total Loans 06/30/11 -5.00% 5.00% 15.00% 25.00% 35.00% 45.00% 55.00% 65.00% Liberty Bank Bank of So. CT CBT Bank of New Canaan New England Bank Rockville Berkshire Bank Patriot National Citizens National Farmington Collinsville Salisbury Union Savings NW Community Litchfield Bancorp Webster Simsbury Bank FNB Suffield National Iron
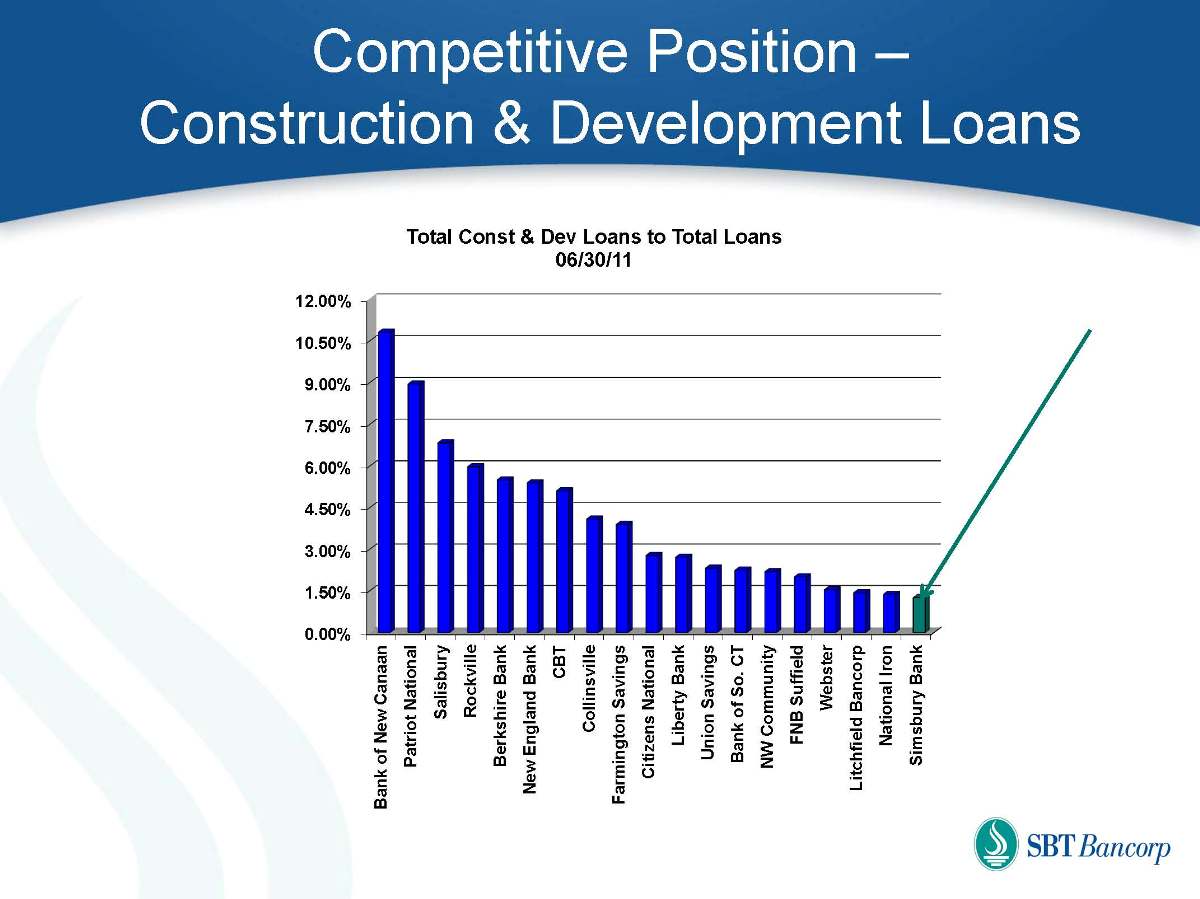
Competitive Position – Construction & Development Loans Total Const & Dev Loans to Total Loans 06/30/11 0.00% 1.50% 3.00% 4.50% 6.00% 7.50% 9.00% 10.50% 12.00% Bank of New Canaan Patriot National Salisbury Rockville Berkshire Bank New England Bank CBT Collinsville Farmington Savings Citizens National Liberty Bank Union Savings Bank of So. CT NW Community FNB Suffield Webster Litchfield Bancorp National Iron Simsbury Bank
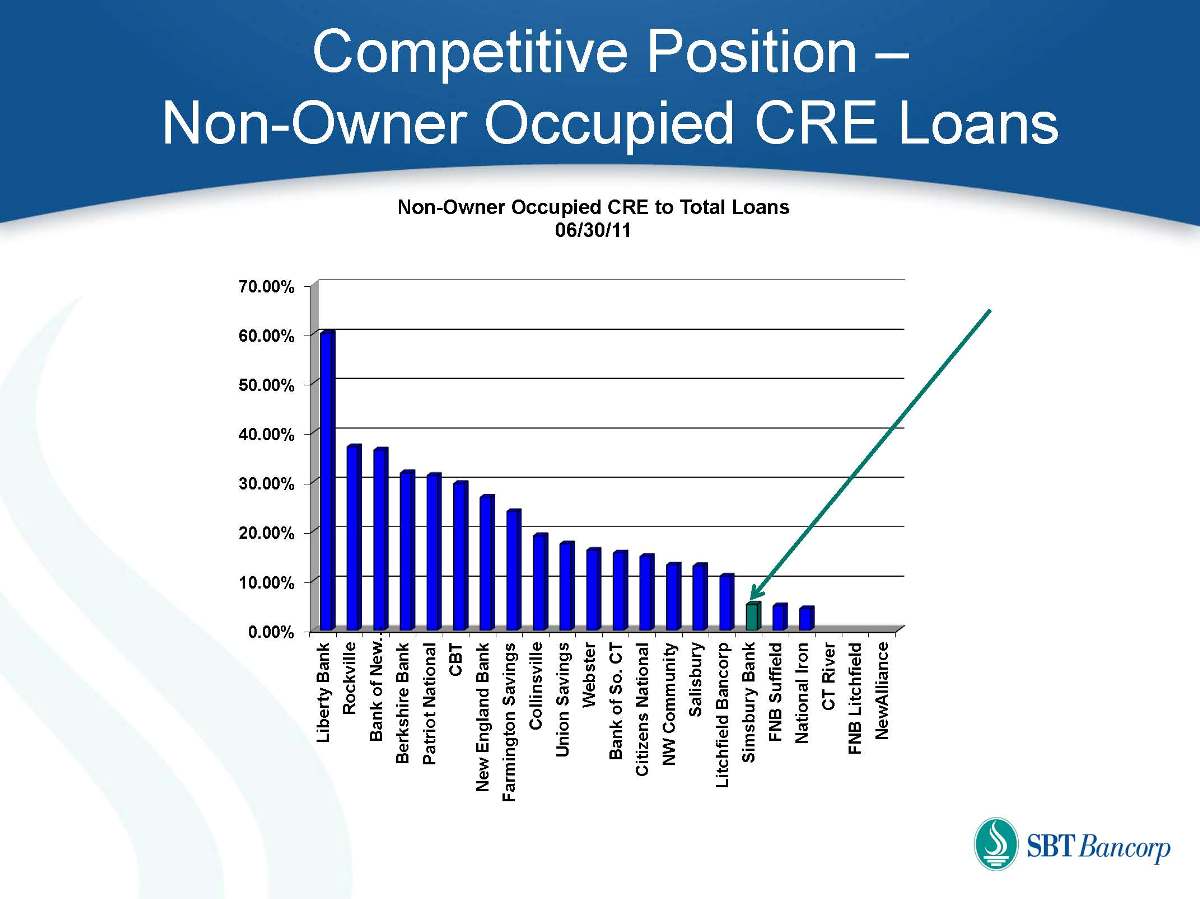
Competitive Position – Non-Owner Occupied CRE Loans Non-Owner Occupied CRE to Total Loans 06/30/11 0.00% 10.00% 20.00% 30.00% 40.00% 50.00% 60.00% 70.00% Liberty Bank Rockville Bank of New… Berkshire Bank Patriot National CBT New England Bank Farmington Savings Collinsville Union Savings Webster Bank of So. CT Citizens National NW Community Salisbury Litchfield Bancorp Simsbury Bank FNB Suffield National Iron CT River FNB Litchfield NewAlliance
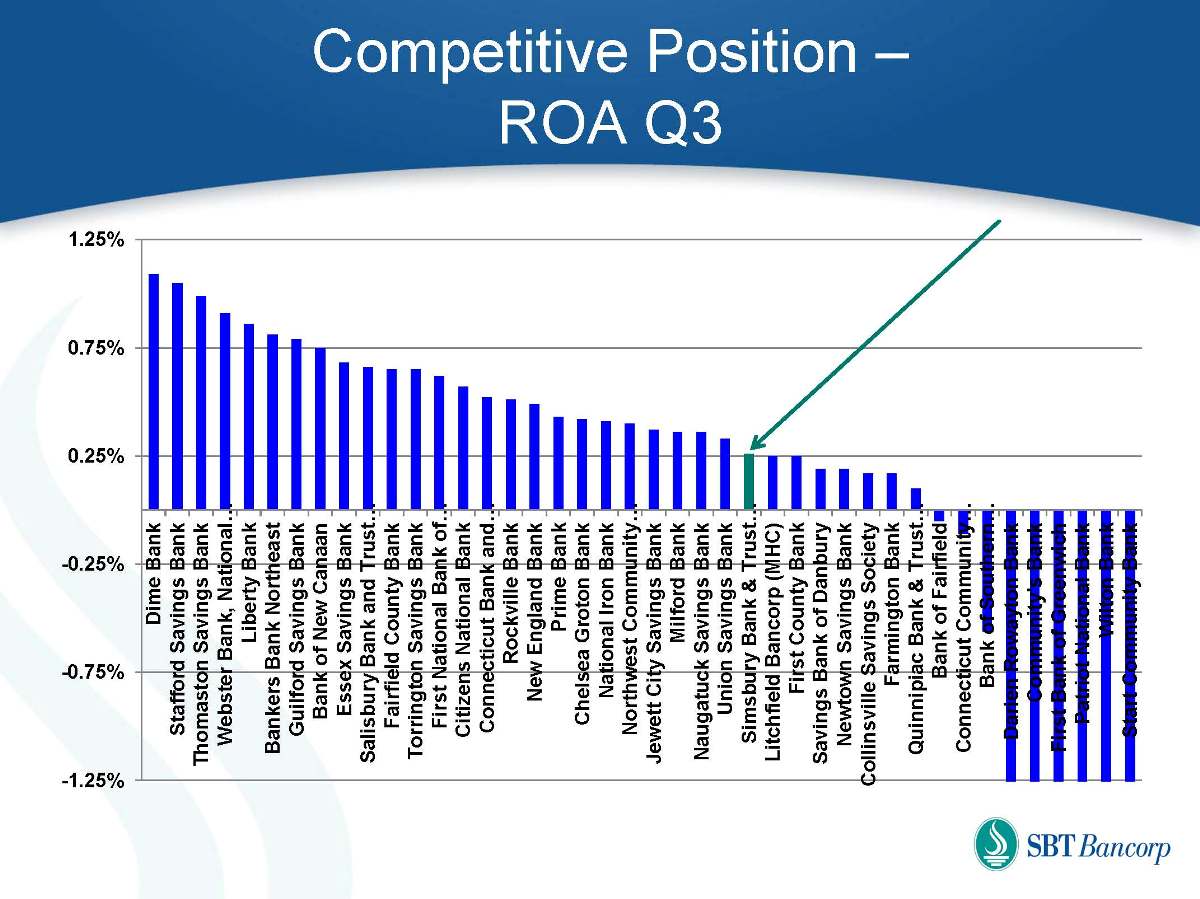
Competitive Position – ROA Q3 -1.25% -0.75% -0.25% 0.25% 0.75% 1.25% Dime Bank Stafford Savings Bank Thomaston Savings Bank Webster Bank, National… Liberty Bank Bankers Bank Northeast Guilford Savings Bank Bank of New Canaan Essex Savings Bank Salisbury Bank and Trust… Fairfield County Bank Torrington Savings Bank First National Bank of… Citizens National Bank Connecticut Bank and… Rockville Bank New England Bank Prime Bank Chelsea Groton Bank National Iron Bank Northwest Community… Jewett City Savings Bank Milford Bank Naugatuck Savings Bank Union Savings Bank Simsbury Bank & Trust… Litchfield Bancorp (MHC) First County Bank Savings Bank of Danbury Newtown Savings Bank Collinsville Savings Society Farmington Bank Quinnipiac Bank & Trust… Bank of Fairfield Connecticut Community… Bank of Southern… Darien Rowayton Bank Community's Bank First Bank of Greenwich Patriot National Bank Wilton Bank Start Community Bank
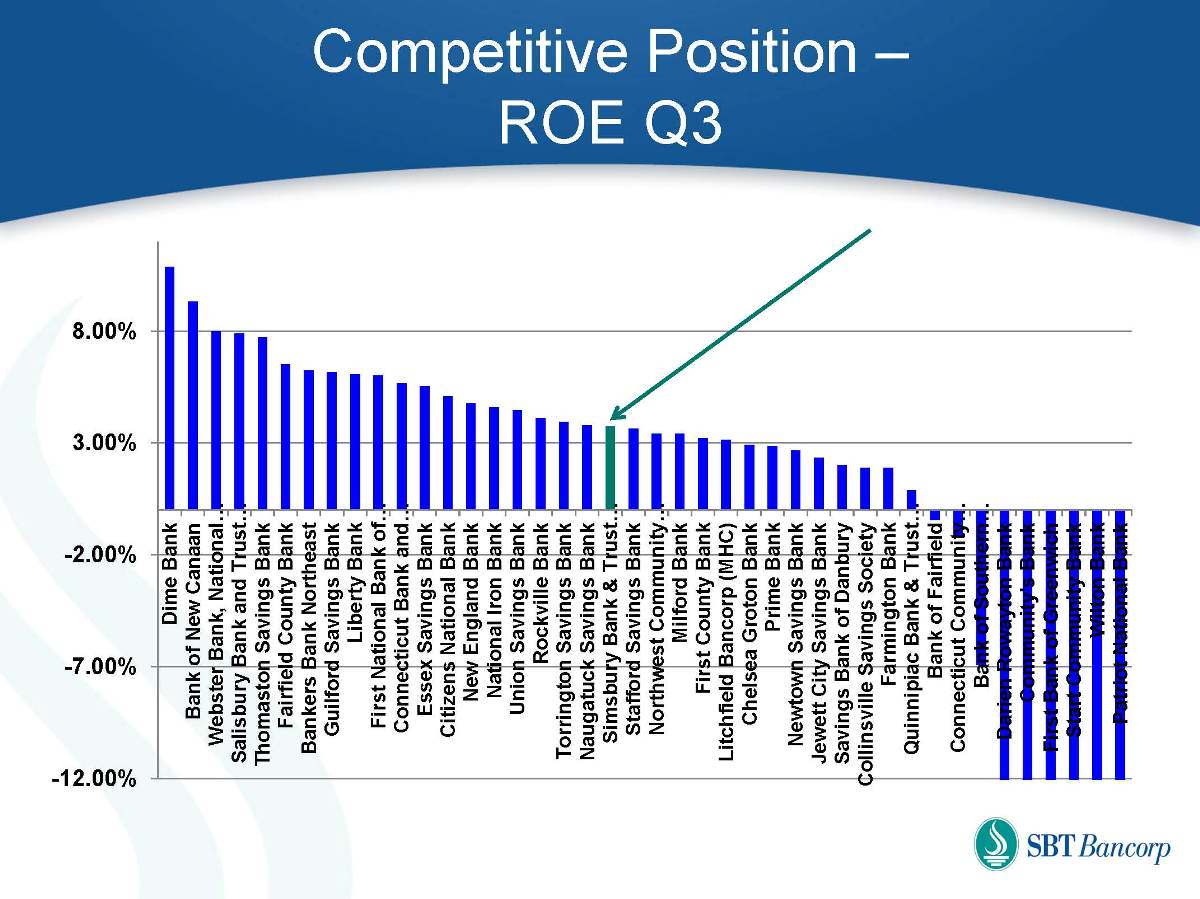
Competitive Position – ROE Q3 -12.00% -7.00% -2.00% 3.00% 8.00% Dime Bank Bank of New Canaan Webster Bank, National… Salisbury Bank and Trust… Thomaston Savings Bank Fairfield County Bank Bankers Bank Northeast Guilford Savings Bank Liberty Bank First National Bank of… Connecticut Bank and… Essex Savings Bank Citizens National Bank New England Bank National Iron Bank Union Savings Bank Rockville Bank Torrington Savings Bank Naugatuck Savings Bank Simsbury Bank & Trust… Stafford Savings Bank Northwest Community… Milford Bank First County Bank Litchfield Bancorp (MHC) Chelsea Groton Bank Prime Bank Newtown Savings Bank Jewett City Savings Bank Savings Bank of Danbury Collinsville Savings Society Farmington Bank Quinnipiac Bank & Trust… Bank of Fairfield Connecticut Community… Bank of Southern… Darien Rowayton Bank Community's Bank First Bank of Greenwich Start Community Bank Wilton Bank Patriot National Bank
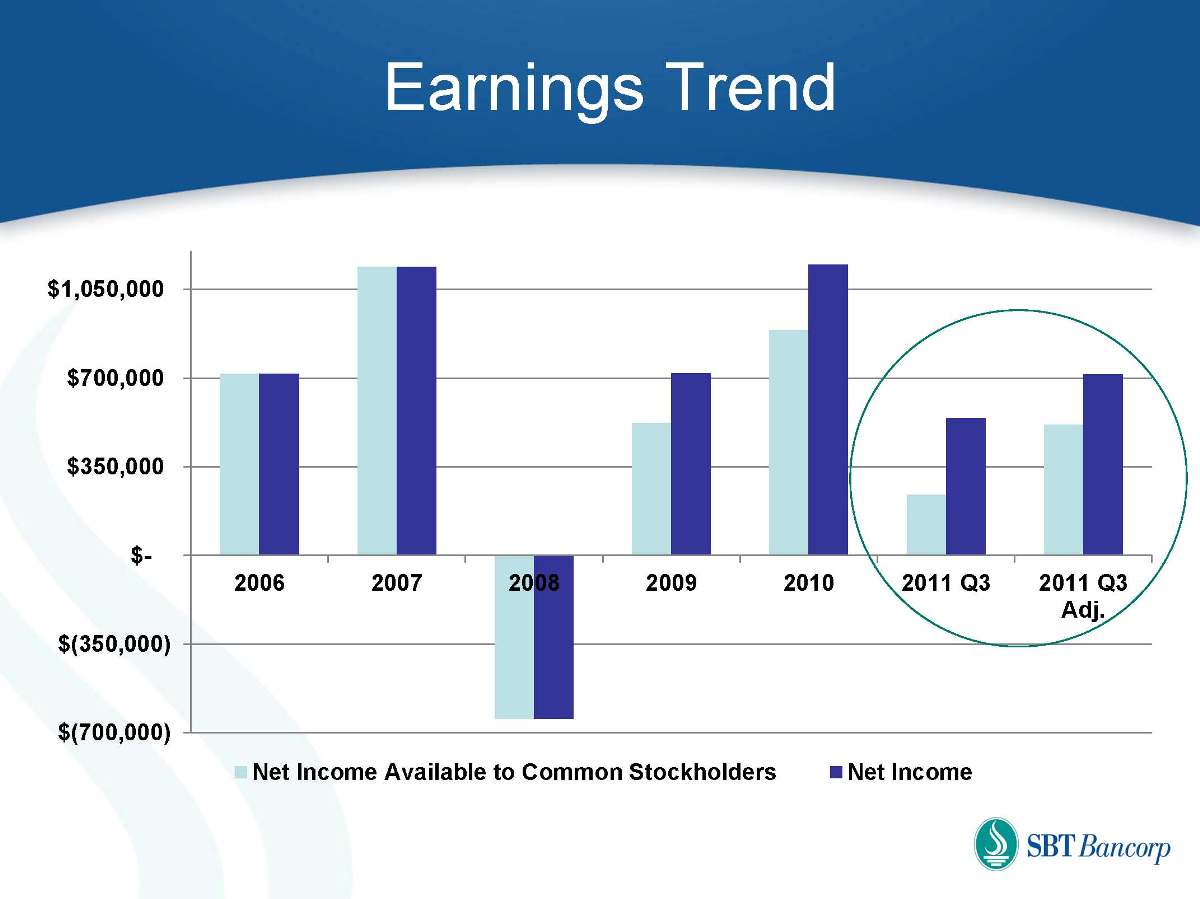
Earnings Trend $(700,000) $(350,000) $- $350,000 $700,000 $1,050,000 2006 2007 2008 2009 2010 2011 Q3 2011 Q3 Adj. Net Income Available to Common Stockholders Net Income
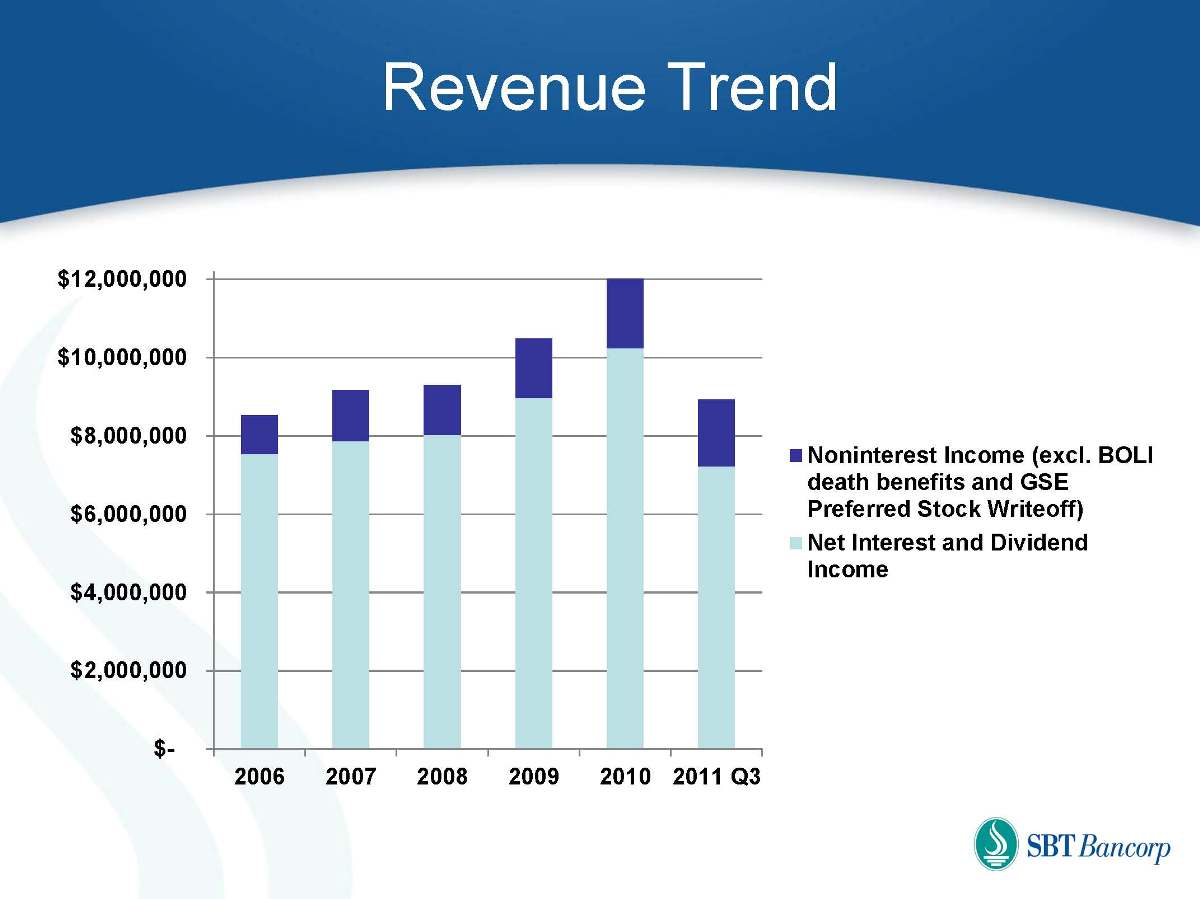
Revenue Trend $- $2,000,000 $4,000,000 $6,000,000 $8,000,000 $10,000,000 $12,000,000 2006 2007 2008 2009 2010 2011 Q3 Noninterest Income (excl. BOLI death benefits and GSE Preferred Stock Writeoff) Net Interest and Dividend Income
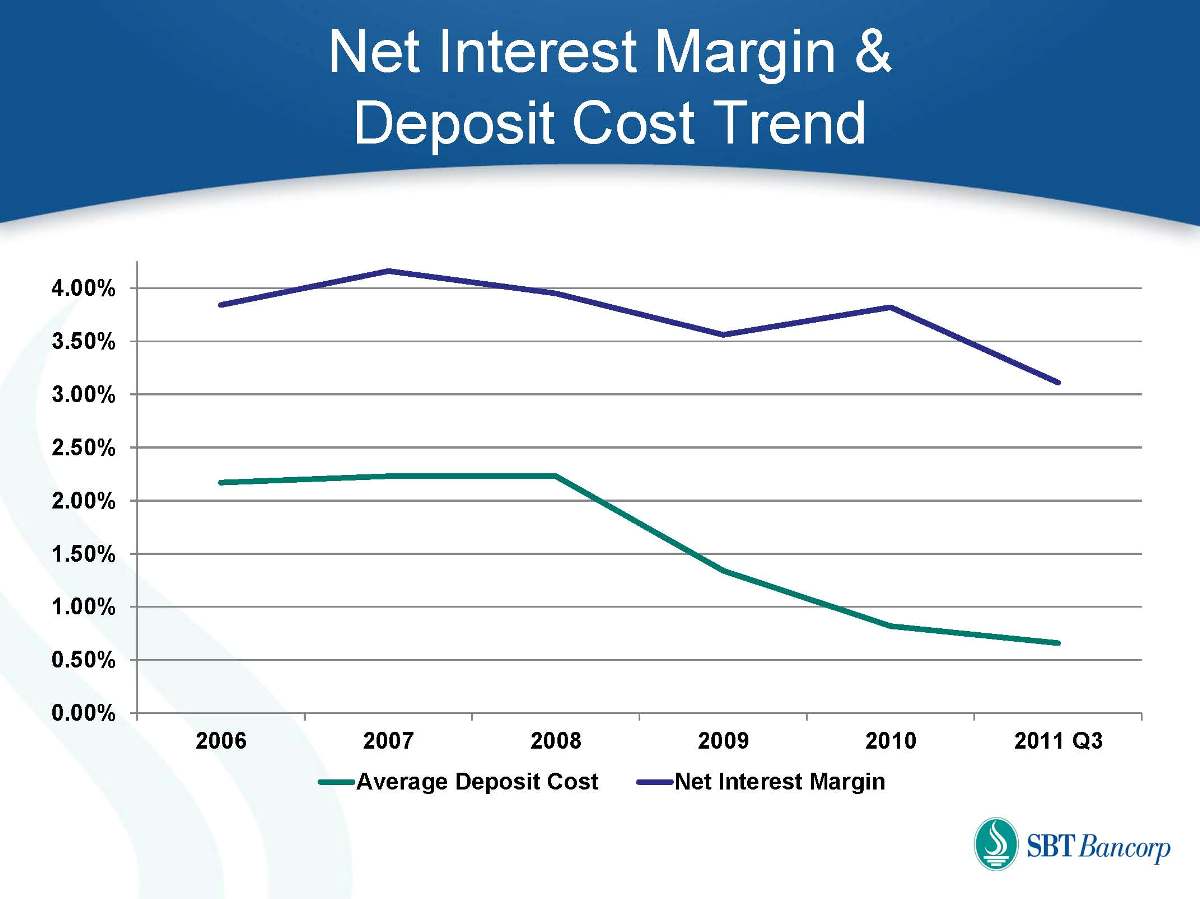
Net Interest Margin & Deposit Cost Trend 0.00% 0.50% 1.00% 1.50% 2.00% 2.50% 3.00% 3.50% 4.00% 2006 2007 2008 2009 2010 2011 Q3 Average Deposit Cost Net Interest Margin
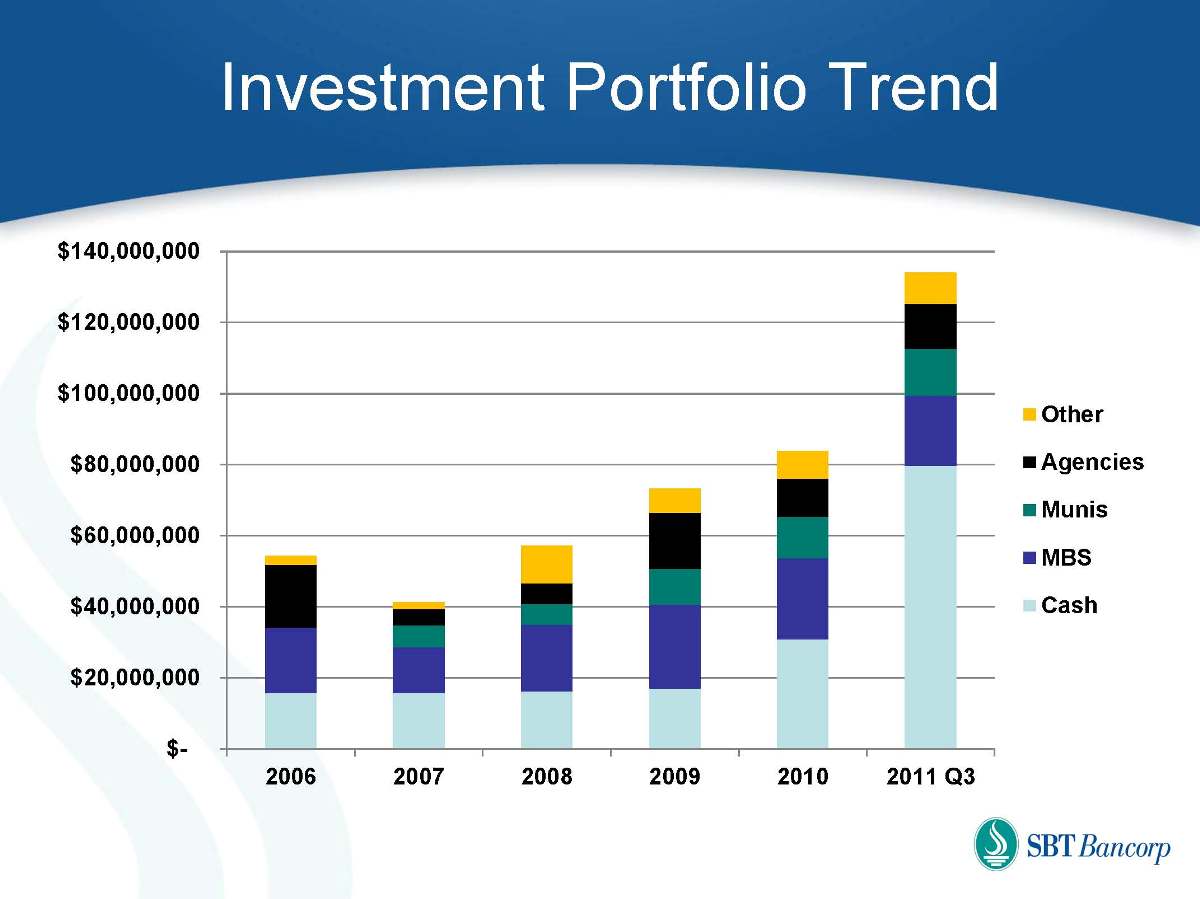
Investment Portfolio Trend $- $20,000,000 $40,000,000 $60,000,000 $80,000,000 $100,000,000 $120,000,000 $140,000,000 2006 2007 2008 2009 2010 2011 Q3 Other Agencies Munis MBS Cash
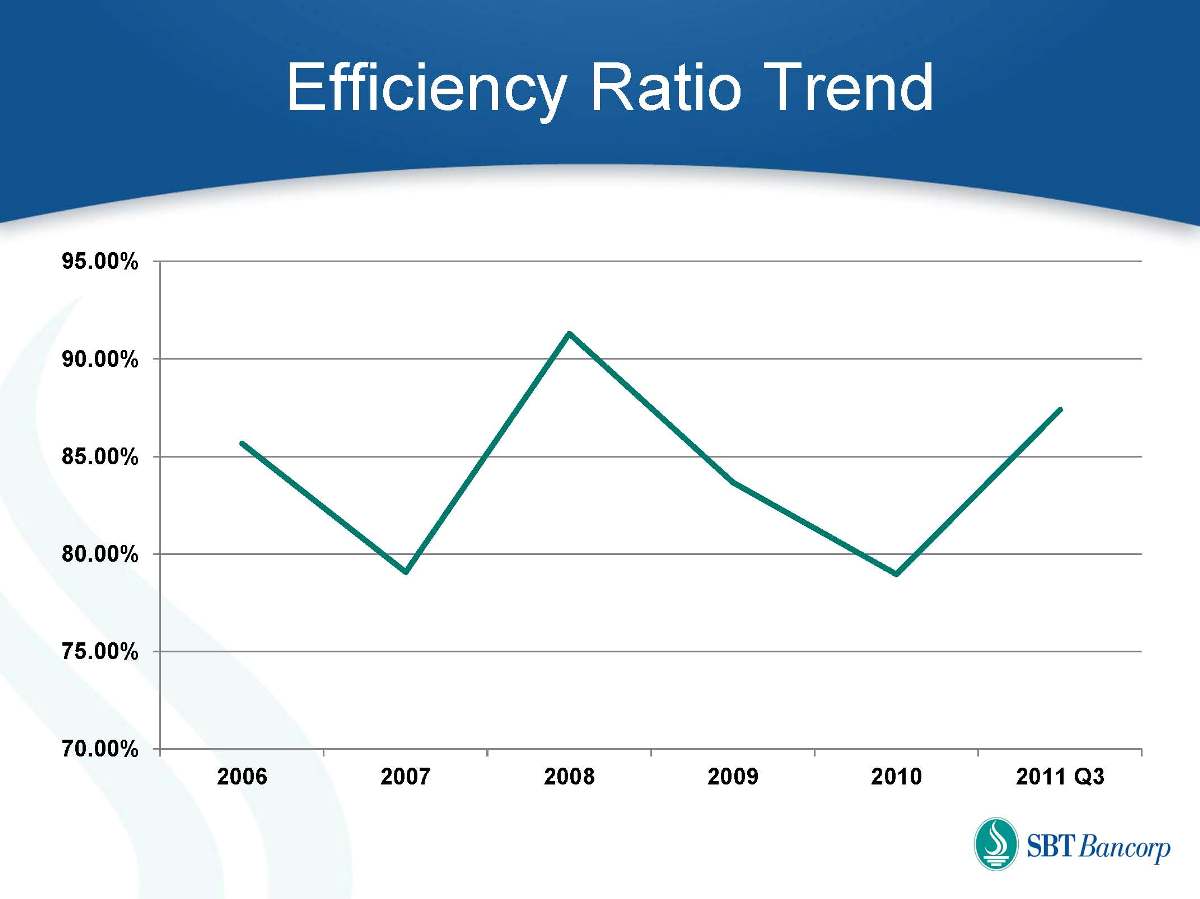
Efficiency Ratio Trend 70.00% 75.00% 80.00% 85.00% 90.00% 95.00% 2006 2007 2008 2009 2010 2011 Q3
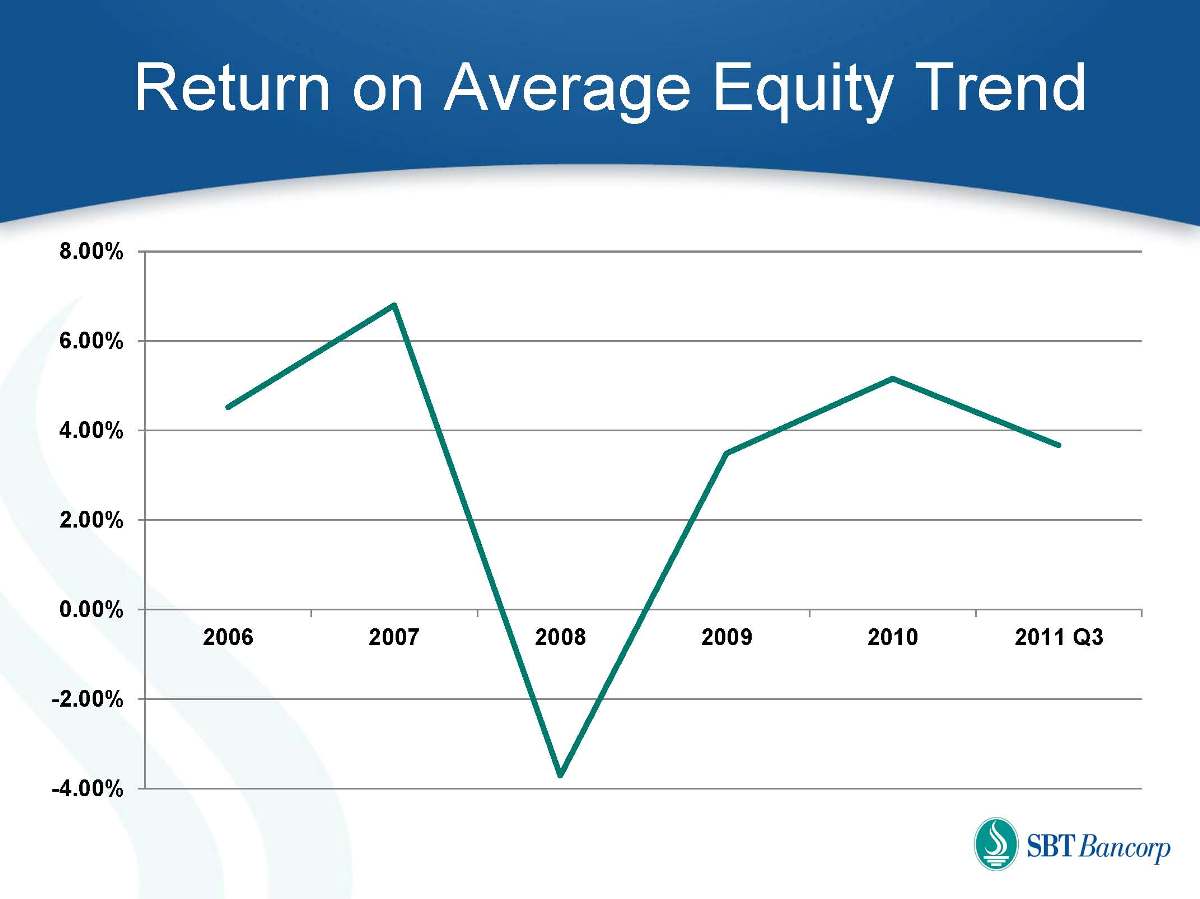
Return on Average Equity Trend -4.00% -2.00% 0.00% 2.00% 4.00% 6.00% 8.00% 2006 2007 2008 2009 2010 2011 Q3
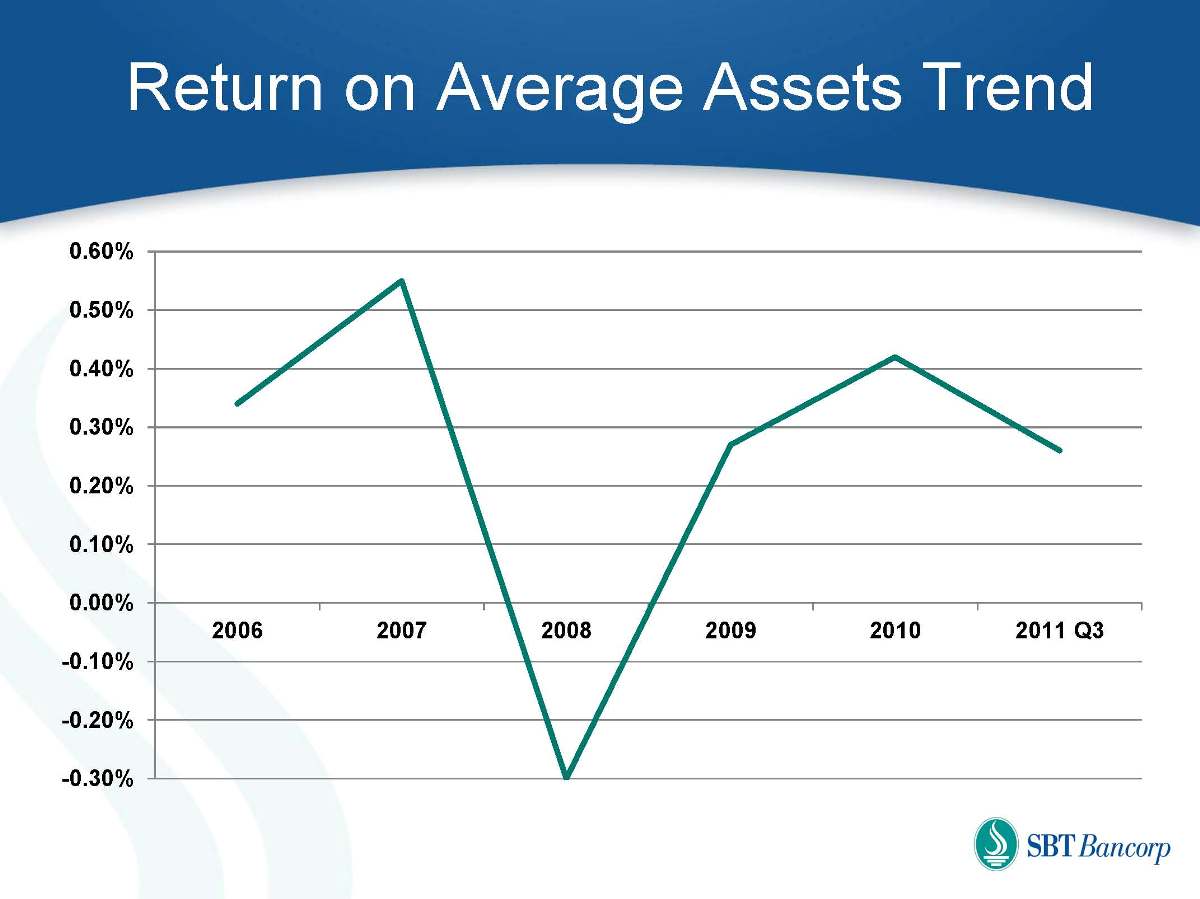
Return on Average Assets Trend -0.30% -0.20% -0.10% 0.00% 0.10% 0.20% 0.30% 0.40% 0.50% 0.60% 2006 2007 2008 2009 2010 2011 Q3
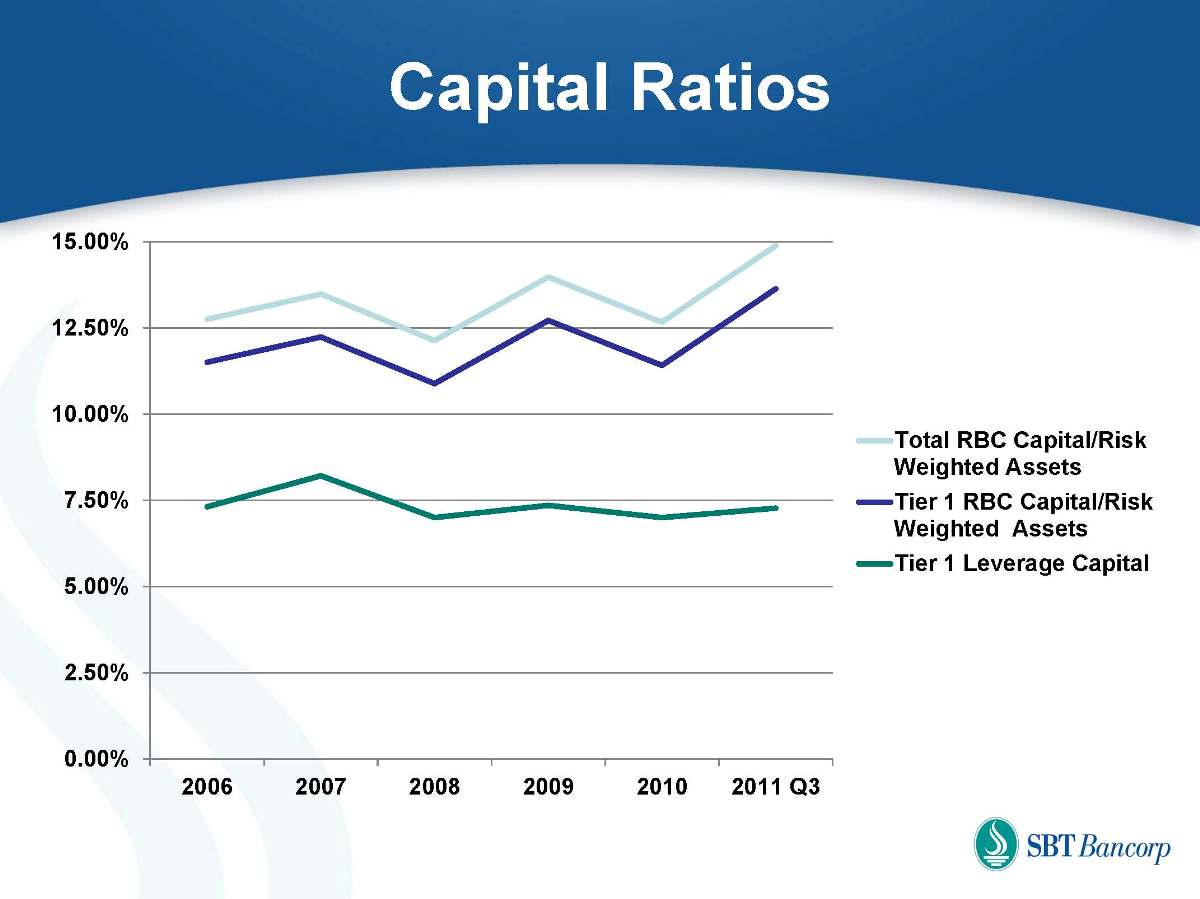
Capital Ratios 0.00% 2.50% 5.00% 7.50% 10.00% 12.50% 15.00% 2006 2007 2008 2009 2010 2011 Q3 Total RBC Capital/Risk Weighted Assets Tier 1 RBC Capital/Risk Weighted Assets Tier 1 Leverage Capital
Recent Enhancements Introduced Dividend Reinvestment Plan Efficient way to raise capital 2% Price Discount Purchase up to $5000 more per quarter Launched SNL Supported Investor Website More convenient access to Company information Analytical tools
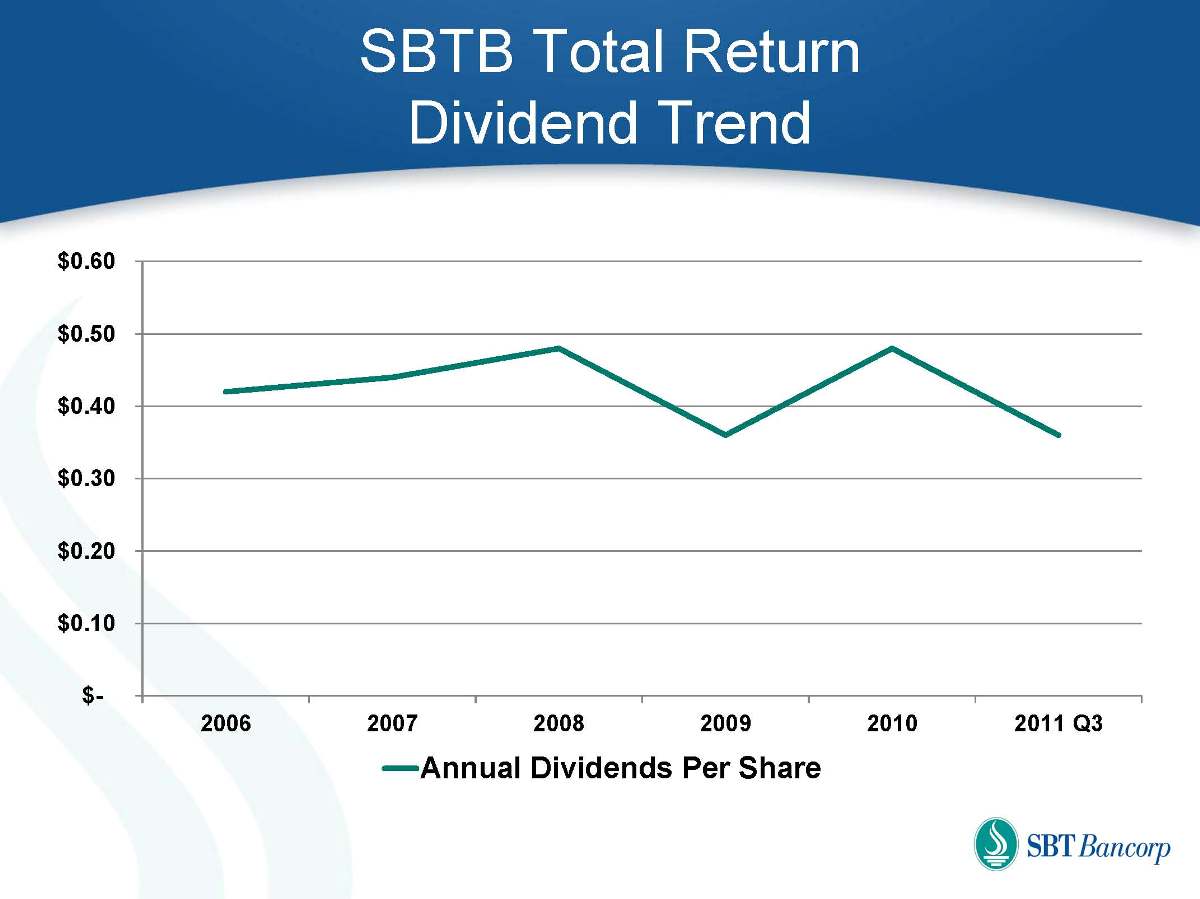
SBTB Total Return Dividend Trend $- $0.10 $0.20 $0.30 $0.40 $0.50 $0.60 2006 2007 2008 2009 2010 2011 Q3 Annual Dividends Per Share
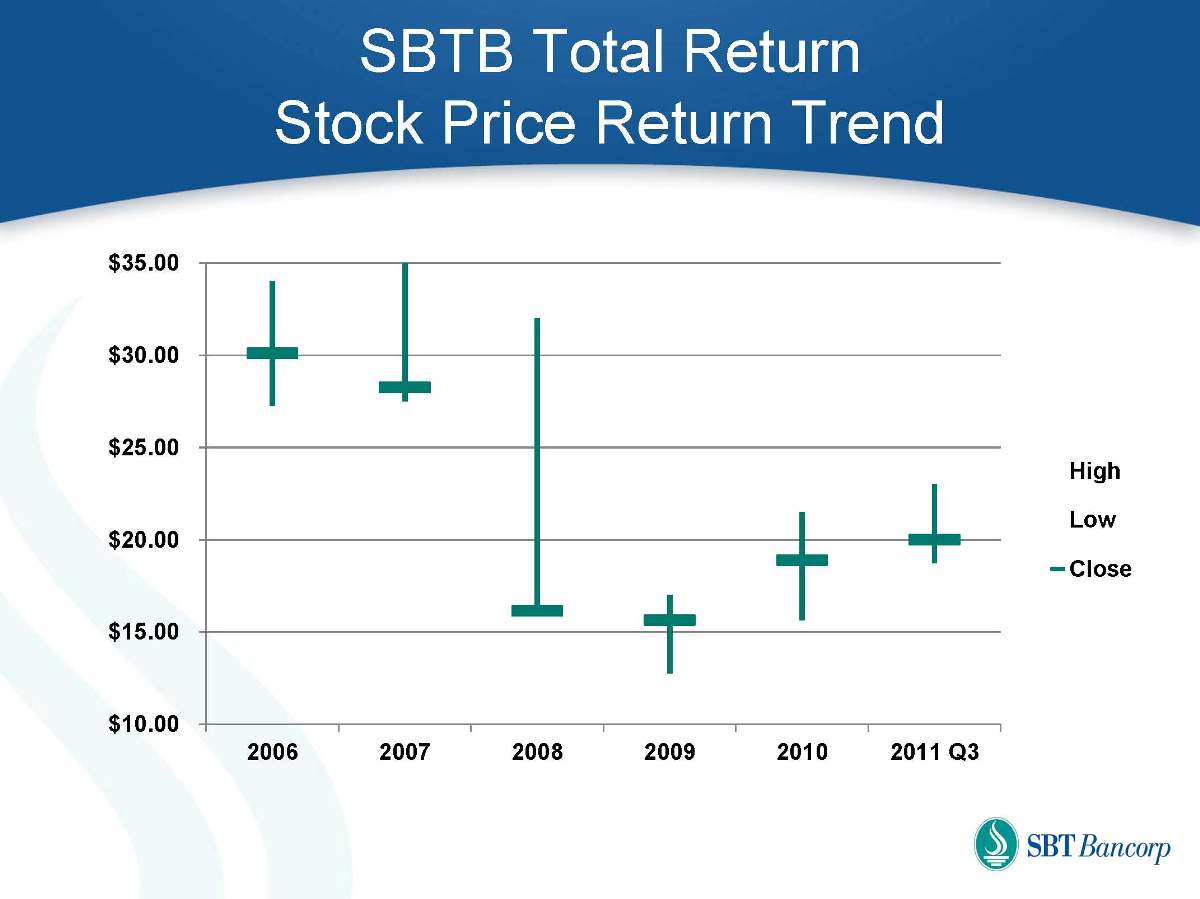
SBTB Total Return Stock Price Return Trend $10.00 $15.00 $20.00 $25.00 $30.00 $35.00 2006 2007 2008 2009 2010 2011 Q3 High Low Close
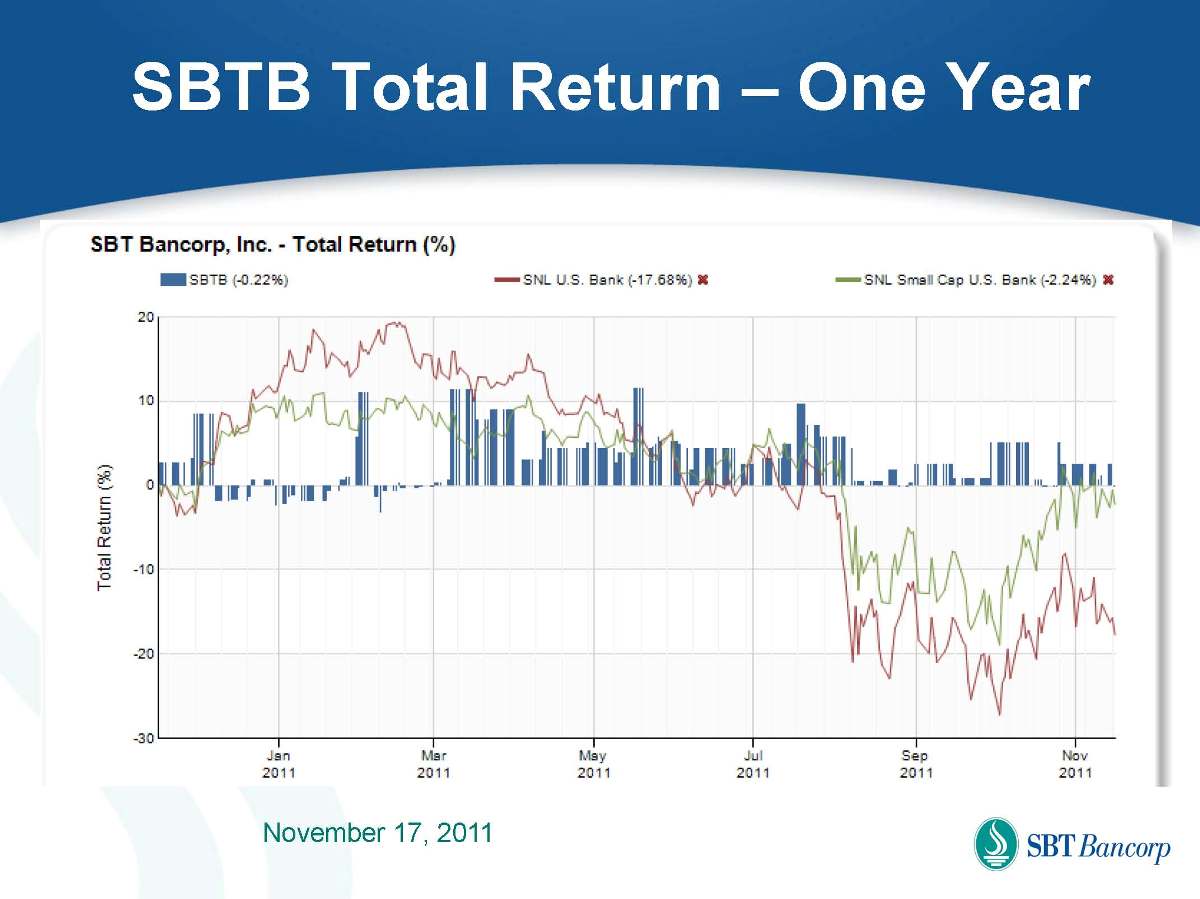
SBTB Total Return – One Year November 17, 2011 Total Return (%)
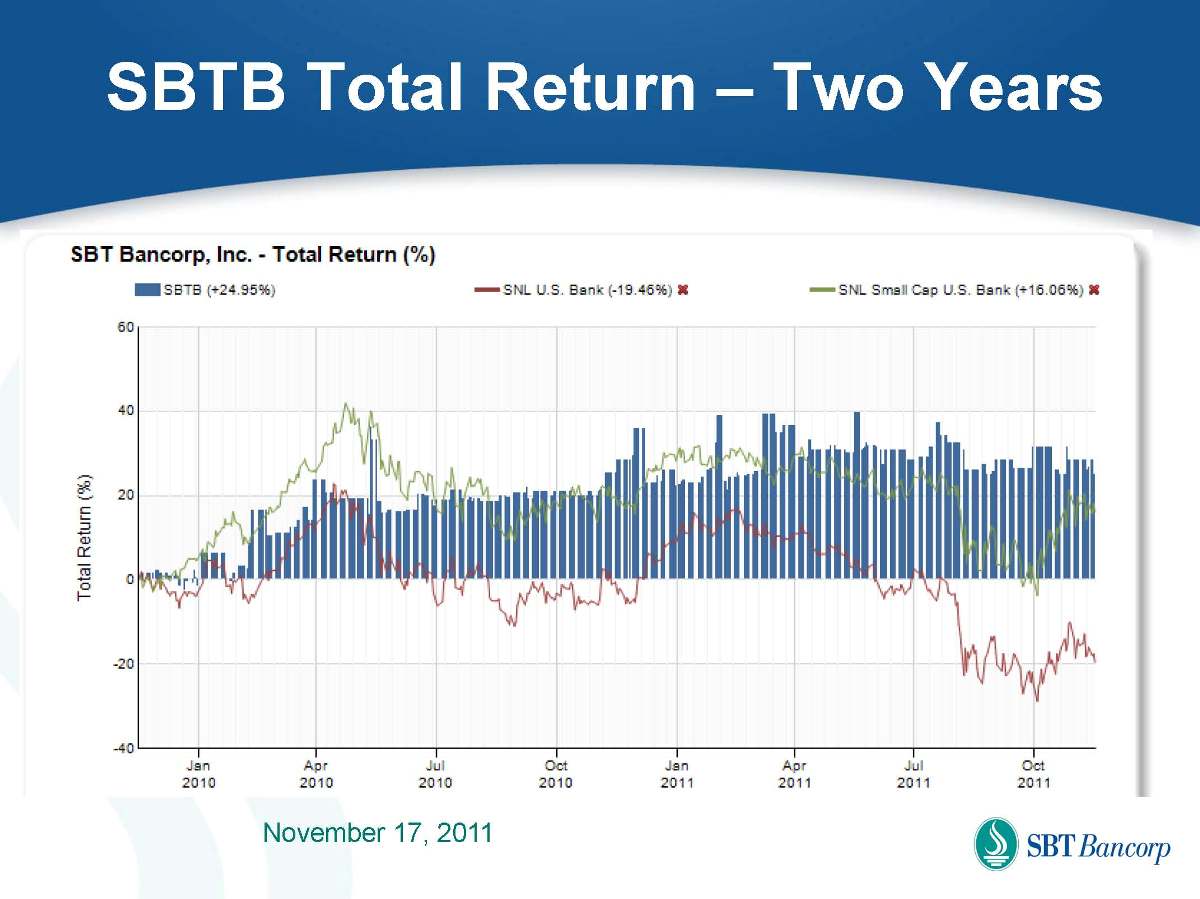
SBTB Total Return – Two Years November 17, 2011 Total Return (%)
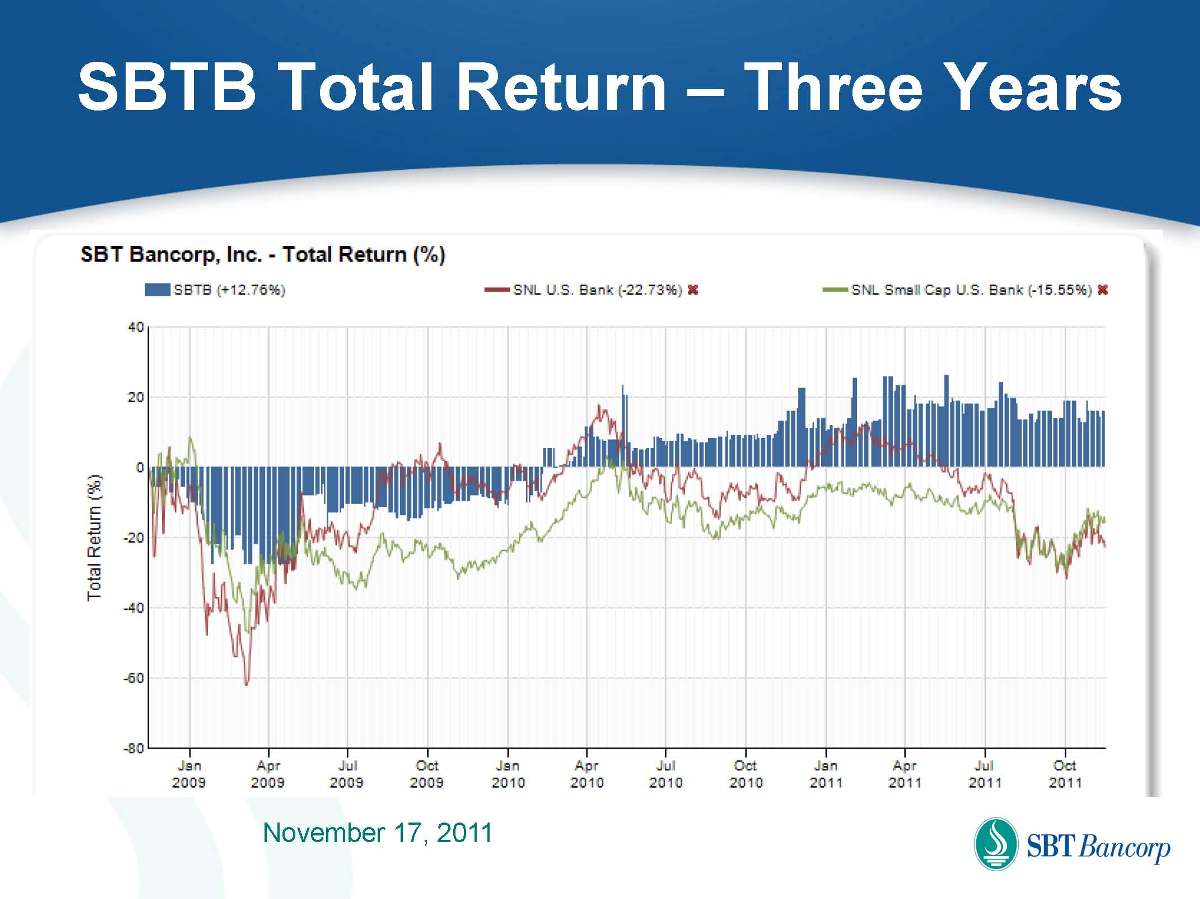
SBTB Total Return – Three Years November 17, 2011 Total Return (%)
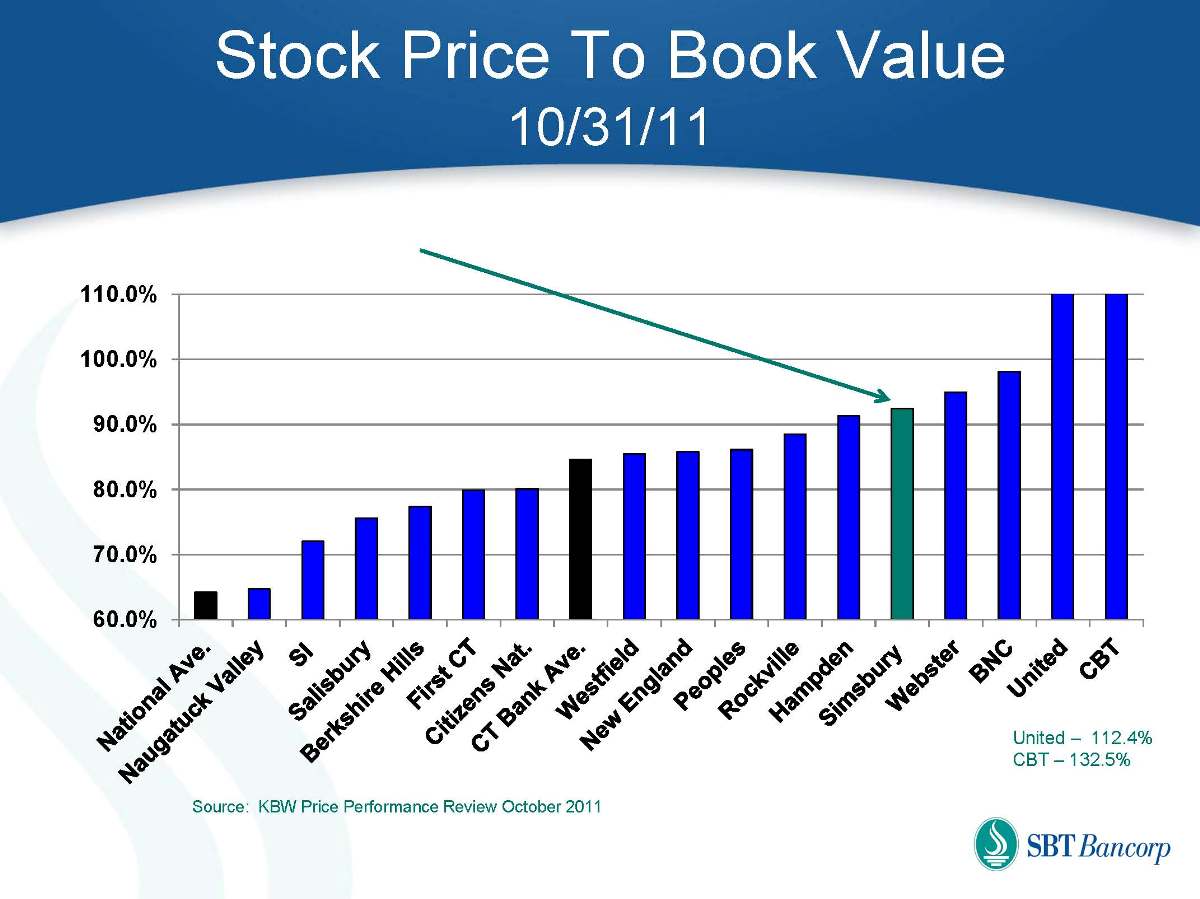
Stock Price To Book Value 10/31/11 60.0% 70.0% 80.0% 90.0% 100.0% 110.0% National Ave. Naugatuck Valley SI Salisbury Berkshire Hills First CT Citizens Ntl. CT Bank Ave. Westfield New England Peoples Rockville Hampden Simsbury Webster BNC United CBT Source: KBW Price Performance Review October 2011 United – 112.4% CBT – 132.5%
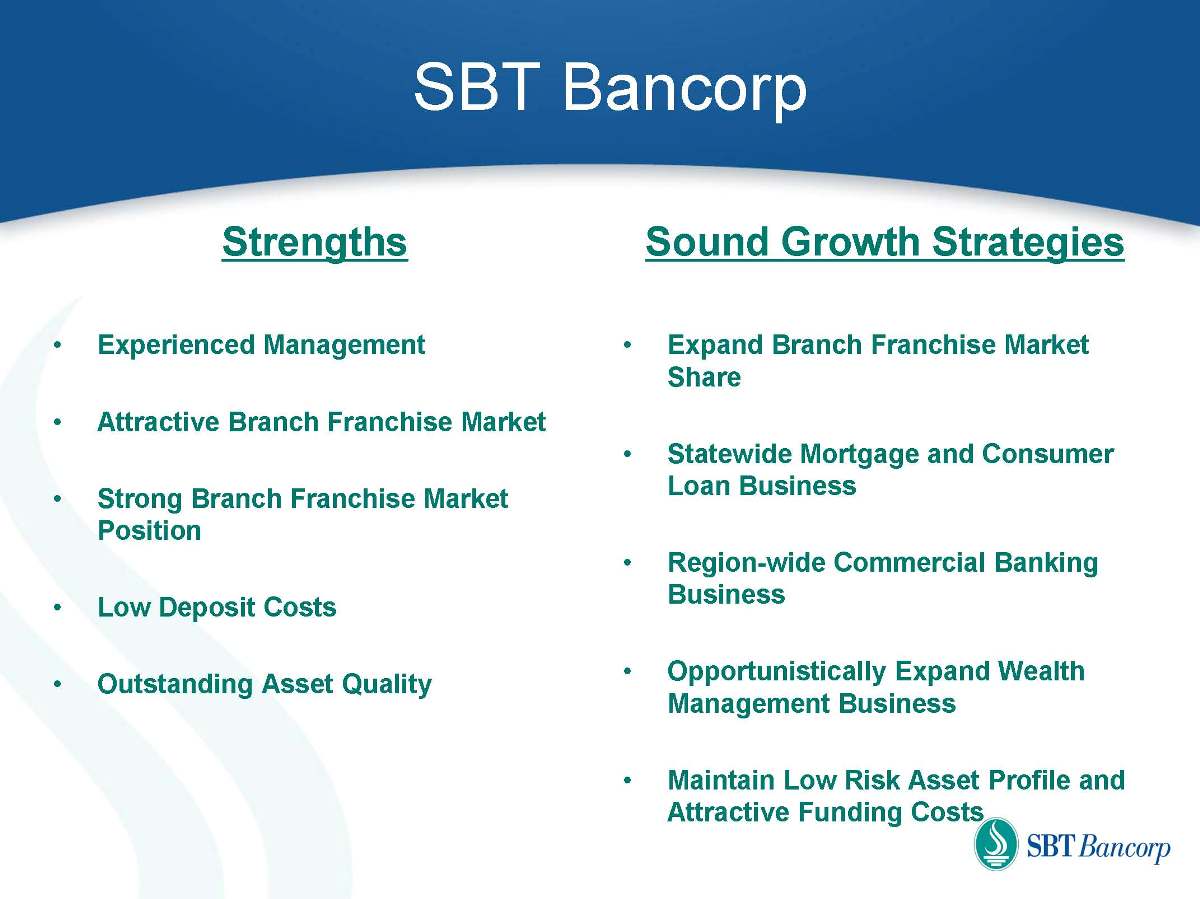
SBT Bancorp Strengths Experienced Management Attractive Branch Franchise Market Strong Branch Franchise Market Position Low Deposit Costs Outstanding Asset Quality Sound Growth Strategies Expand Branch Franchise Market Share Statewide Mortgage and Consumer Loan Business Region-wide Commercial Banking Business Opportunistically Expand Wealth Management Business Maintain Low Risk Asset Profile and Attractive Funding Costs
Thank you!