PGT Innovations to Acquire Western Window Systems Creating a National Leader in the Premium Window and Door Space Exhibit 99.2
FORWARD-LOOKING STATEMENTS This communication contains “forward-looking statements” within the meaning of Section 21E of the Securities Exchange Act of 1934 (the “Exchange Act”) and the Private Securities Litigation Reform Act of 1995. These “forward-looking statements” involve risks and uncertainties which could cause actual results to differ materially from those contained in the forward-looking statements. Such forward-looking statements generally can be identified by the use of forward-looking terminology, such as “may,” “expect,” “expectations,” “outlook,” “forecast,” “guidance,” “intend,” “believe,” “could,” “project,” “estimate,” “anticipate,” “should” and similar terminology. These risks and uncertainties include factors such as: our ability to consummate the transaction on the terms or timeline currently contemplated, or at all; the ability to successfully integrate the Western Window Systems operations into our existing operations and the diversion of management’s attention from ongoing business and regular business responsibilities to effect such integration; the effects of increased expenses or unanticipated liabilities incurred as a result of or due to activities related to, the acquisition; the risk that the anticipated cost savings, synergies, revenue enhancement strategies and other benefits from the acquisition may not be fully realized or may take longer to realize than expected or that our actual integration costs may exceed our estimates; disruption from the acquisition making it more difficult to maintain relationships with customers or suppliers of Western Window Systems; our level of indebtedness, which will increase in connection with the Transaction; adverse changes in new home starts and home remodeling trends, especially in Florida, where the substantial portion of our sales are currently generated and are expected to continue to be generated after the consummation of the acquisition, and in the western United States, where the substantial portion of Western Window Systems sales are generated; macroeconomic conditions in Florida, where the substantial portion of our sales are generated, and in California, Texas, Arizona, Nevada, Colorado, Oregon, Washington and Hawaii, where the substantial portion of the sales of Western Window Systems are generated, and in the U.S. generally; raw material prices, especially for aluminum, glass and vinyl, including, price increases due to the implementation of tariffs and other trade-related restrictions; our dependence on a limited number of suppliers for certain of our key materials; sales fluctuations to and changes in our relationships with key customers, including the customers of Western Window Systems following the consummation of the acquisition of Western Window Systems; in addition to the acquisition, our ability to successfully integrate businesses we may acquire, or that any business we acquire may not perform as we expected at the time we acquired it; transportation costs; our dependence on our impact-resistant product lines and, after the consummation of the acquisition, contemporary indoor/outdoor window and door systems, and on consumer preferences for those types and styles of products; product liability and warranty claims brought against us; federal, state and local laws and regulations, including unfavorable changes in local building codes and environmental and energy code regulations; our dependence on our limited number of geographically concentrated manufacturing facilities; risks associated with our information technology systems, including cybersecurity-related risks, such as unauthorized intrusions into our systems by “hackers” and theft of data and information from our systems, and the risks that our information technology systems, and those of Western Window Systems following the acquisition, do not function as intended or experience temporary or long-term failures to perform as intended; and the other risks and uncertainties discussed in our other filings with the SEC. Statements in this communication that are forward-looking statements include, without limitation, our expectations regarding: (1) demand for our products going forward; (2) the benefits expected from the heightened awareness of impact resistant window and door products resulting from Hurricane Irma and our post-Irma advertising; (3) the Company’s ability to capture a meaningful share of any increased demand for impact-resistant products; (4) our financial and operational performance for our 2018 fiscal year; (5) new housing starts and housing market conditions in 2018 and beyond, especially with respect to the State of Florida; (6) the breadth and innovativeness of our product offerings, and their attractiveness to consumers; (7) the ability of our management team and employees to execute our strategy; and (8) the consummation of and the realization of the expected benefits of the acquisition. You are cautioned not to place undue reliance on these forward-looking statements, which speak only as of the date of this communication. Except as required by law, we undertake no obligation to update these forward-looking statements to reflect subsequent events or circumstances after the date of this communication.
Use of Non-GAAP Financial Measures This presentation includes financial measures and terms not calculated in accordance with U.S. generally accepted accounting principles (GAAP). We believe that presentation of non-GAAP measures such as adjusted EBITDA and free cash flow, provides investors and analysts with an alternative method for assessing our operating results in a manner that enables investors and analysts to more thoroughly evaluate our current performance compared to past performance. We also believe these non-GAAP measures provide investors with a better baseline for assessing our future earnings potential. The non-GAAP measures included in this release are provided to give investors access to types of measures that we use in analyzing our results. Adjusted EBITDA consists of net income, adjusted for the items included in the accompanying reconciliation. Adjusted EBITDA margin is a ratio of adjusted EBITDA as a percentage of our total revenue. We believe that adjusted EBITDA and adjusted EBITDA margin provide useful information to investors and analysts about the Company's performance because they eliminate the effects of period-to-period changes in taxes, costs associated with capital investments and interest expense. Adjusted EBITDA does not give effect to the cash the Company must use to service its debt or pay its income taxes and thus does not reflect the actual funds generated from operations or available for capital investments. Free Cash Flow is defined as Adjusted EBITDA less capital expenditures. Free Cash Flow is used by investors and management to analyze the ability to service and repay debt and return value directly to shareholders. Our calculations of adjusted EBITDA, adjusted EBITDA margin and free cash flow are not necessarily comparable to calculations performed by other companies and reported as similarly titled measures. These non-GAAP measures should be considered in addition to results prepared in accordance with GAAP but should not be considered a substitute for or superior to GAAP measures. No reconciliation of the forecasted adjusted EBITDA, adjusted EBITDA margin and free cash flow to the most comparable GAAP measure for future periods is included in this presentation because we are unable to quantify certain amounts that would be required to be included in the GAAP measure without unreasonable efforts. In addition, the company believes such reconciliations would imply a degree of precision that would be confusing or misleading to investors.
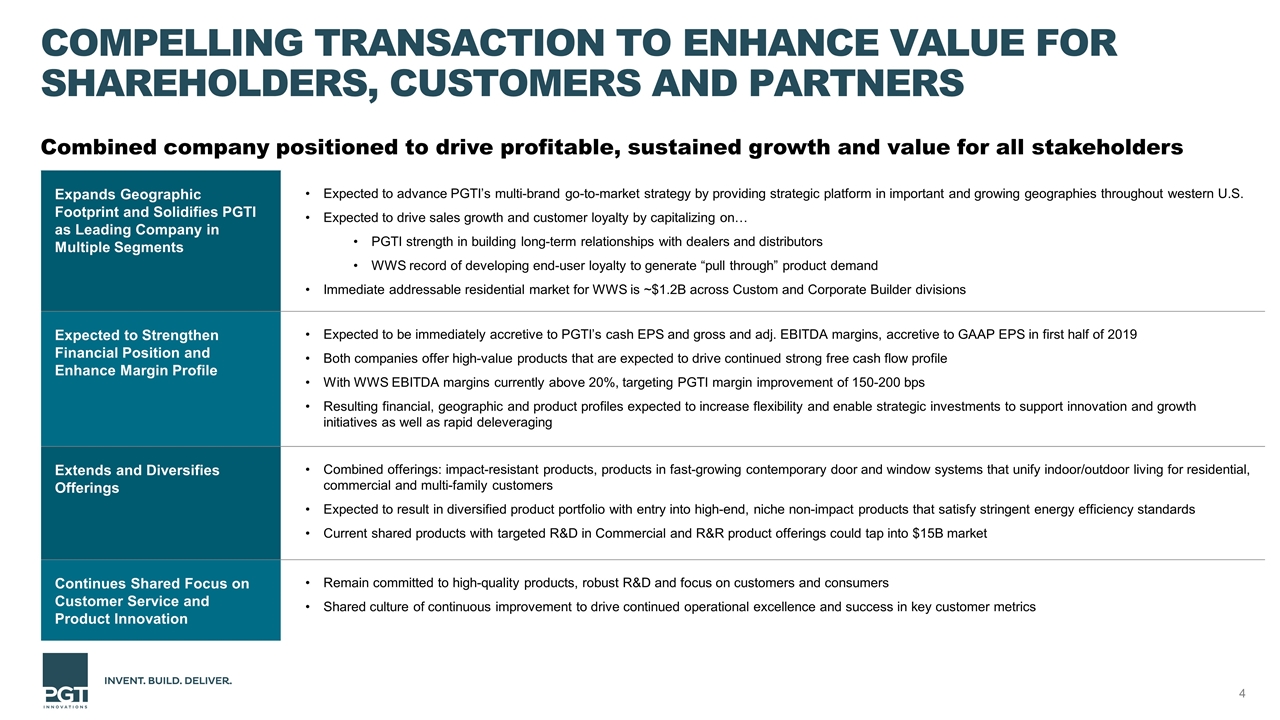
Compelling Transaction to Enhance Value for Shareholders, Customers and Partners Expands Geographic Footprint and Solidifies PGTI as Leading Company in Multiple Segments Expected to advance PGTI’s multi-brand go-to-market strategy by providing strategic platform in important and growing geographies throughout western U.S. Expected to drive sales growth and customer loyalty by capitalizing on… PGTI strength in building long-term relationships with dealers and distributors WWS record of developing end-user loyalty to generate “pull through” product demand Immediate addressable residential market for WWS is ~$1.2B across Custom and Corporate Builder divisions Expected to Strengthen Financial Position and Enhance Margin Profile Expected to be immediately accretive to PGTI’s cash EPS and gross and adj. EBITDA margins, accretive to GAAP EPS in first half of 2019 Both companies offer high-value products that are expected to drive continued strong free cash flow profile With WWS EBITDA margins currently above 20%, targeting PGTI margin improvement of 150-200 bps Resulting financial, geographic and product profiles expected to increase flexibility and enable strategic investments to support innovation and growth initiatives as well as rapid deleveraging Extends and Diversifies Offerings Combined offerings: impact-resistant products, products in fast-growing contemporary door and window systems that unify indoor/outdoor living for residential, commercial and multi-family customers Expected to result in diversified product portfolio with entry into high-end, niche non-impact products that satisfy stringent energy efficiency standards Current shared products with targeted R&D in Commercial and R&R product offerings could tap into $15B market Continues Shared Focus on Customer Service and Product Innovation Remain committed to high-quality products, robust R&D and focus on customers and consumers Shared culture of continuous improvement to drive continued operational excellence and success in key customer metrics Combined company positioned to drive profitable, sustained growth and value for all stakeholders
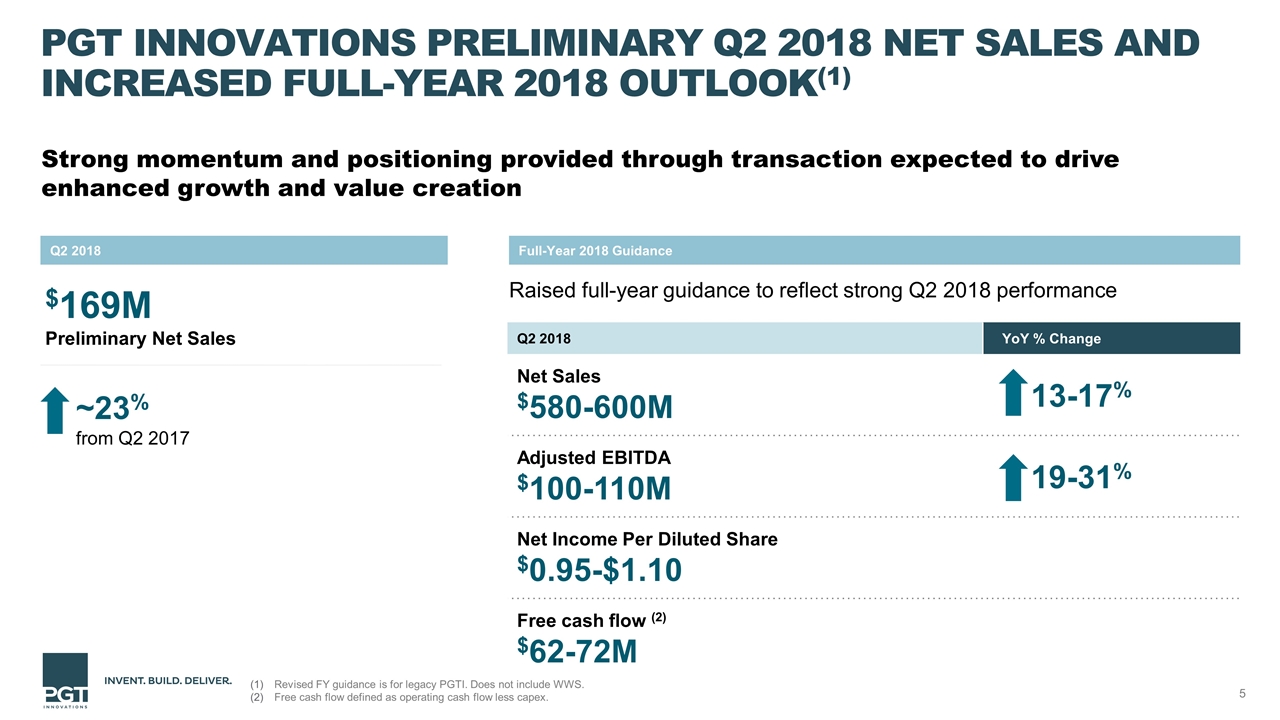
PGT Innovations Preliminary Q2 2018 Net Sales and Increased Full-Year 2018 Outlook(1) Strong momentum and positioning provided through transaction expected to drive enhanced growth and value creation Raised full-year guidance to reflect strong Q2 2018 performance Q2 2018 Full-Year 2018 Guidance $169M Preliminary Net Sales ~23% from Q2 2017 Q2 2018 YoY % Change Net Sales $580-600M 13-17% Adjusted EBITDA $100-110M 19-31% Net Income Per Diluted Share $0.95-$1.10 Free cash flow (2) $62-72M Revised FY guidance is for legacy PGTI. Does not include WWS. Free cash flow defined as operating cash flow less capex.
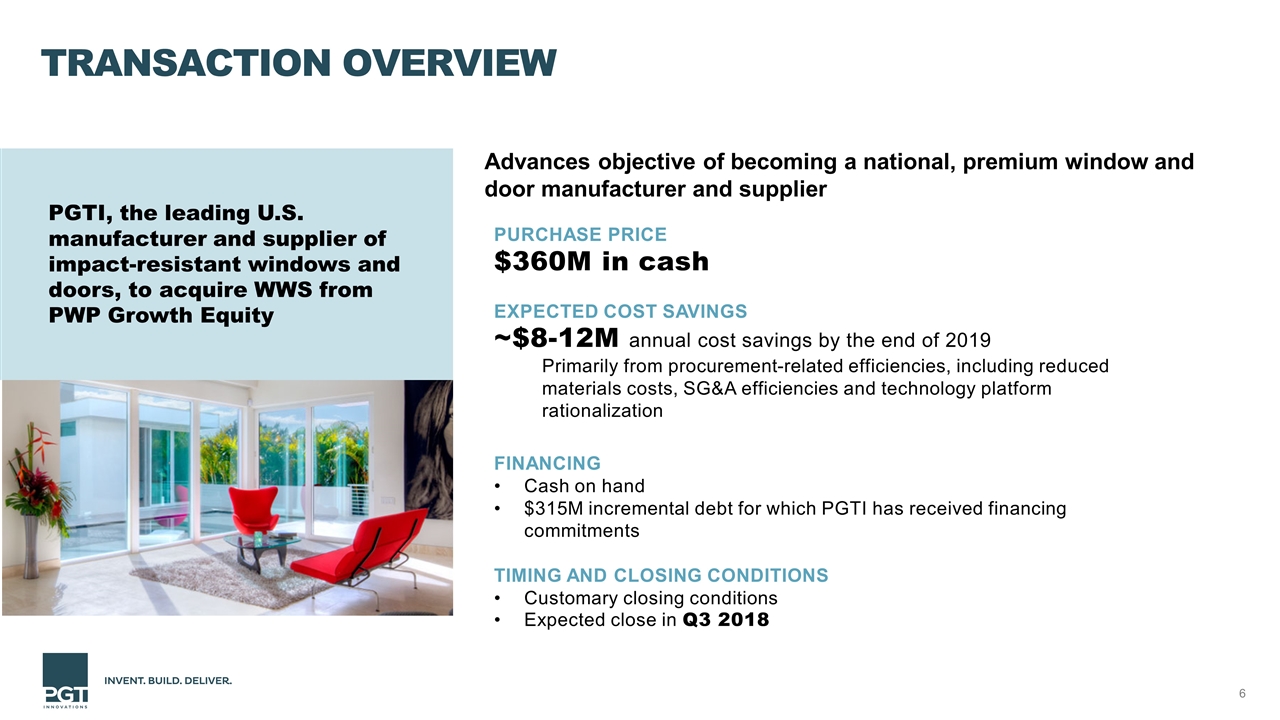
Transaction Overview PURCHASE PRICE $360M in cash EXPECTED COST SAVINGS ~$8-12M annual cost savings by the end of 2019 Primarily from procurement-related efficiencies, including reduced materials costs, SG&A efficiencies and technology platform rationalization FINANCING Cash on hand $315M incremental debt for which PGTI has received financing commitments TIMING AND CLOSING CONDITIONS Customary closing conditions Expected close in Q3 2018 Advances objective of becoming a national, premium window and door manufacturer and supplier PGTI, the leading U.S. manufacturer and supplier of impact-resistant windows and doors, to acquire WWS from PWP Growth Equity
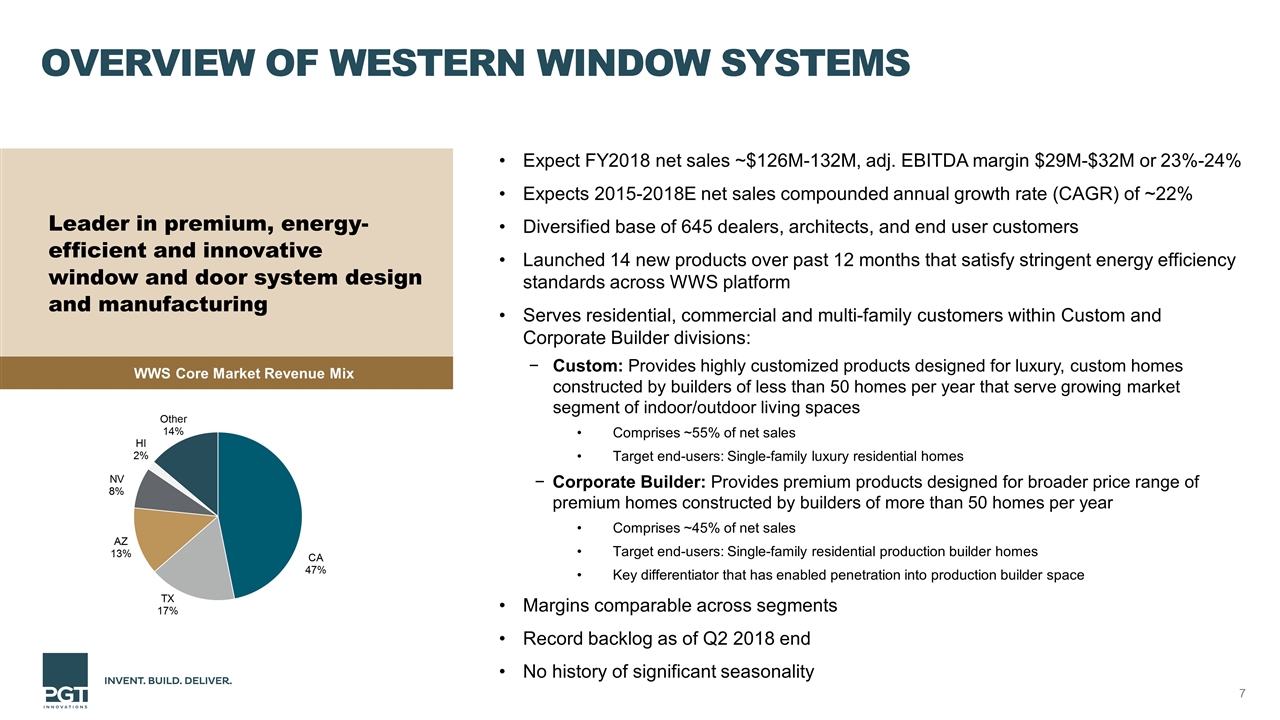
Overview of Western Window Systems Expect FY2018 net sales ~$126M-132M, adj. EBITDA margin $29M-$32M or 23%-24% Expects 2015-2018E net sales compounded annual growth rate (CAGR) of ~22% Diversified base of 645 dealers, architects, and end user customers Launched 14 new products over past 12 months that satisfy stringent energy efficiency standards across WWS platform Serves residential, commercial and multi-family customers within Custom and Corporate Builder divisions: Custom: Provides highly customized products designed for luxury, custom homes constructed by builders of less than 50 homes per year that serve growing market segment of indoor/outdoor living spaces Comprises ~55% of net sales Target end-users: Single-family luxury residential homes Corporate Builder: Provides premium products designed for broader price range of premium homes constructed by builders of more than 50 homes per year Comprises ~45% of net sales Target end-users: Single-family residential production builder homes Key differentiator that has enabled penetration into production builder space Margins comparable across segments Record backlog as of Q2 2018 end No history of significant seasonality Leader in premium, energy-efficient and innovative window and door system design and manufacturing WWS Core Market Revenue Mix

Western Window Systems Financial Summary 8 Revenue Adj. EBITDA & Margin Free Cash Flow (Adj. EBITDA – Capex) CapEx as a % of Revenue ($ in millions) Normalized WWS facility adjustment(1) Normalized WWS facility adjustment(1) Note: See reconciliation of GAAP and non-GAAP financial measures in appendix of presentation. Normalized 2016 and 2017 WWS Capex to $4M to account for WWS facility expansion costs.
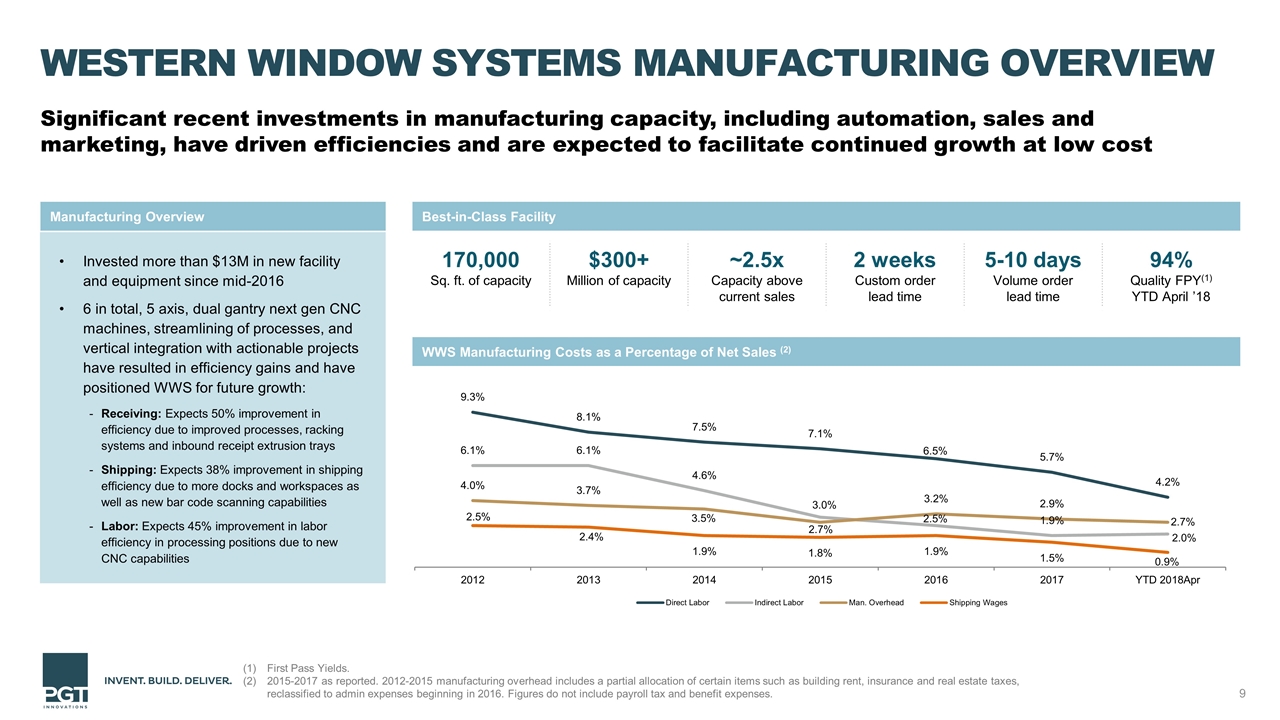
Western Window Systems Manufacturing Overview Significant recent investments in manufacturing capacity, including automation, sales and marketing, have driven efficiencies and are expected to facilitate continued growth at low cost Invested more than $13M in new facility and equipment since mid-2016 6 in total, 5 axis, dual gantry next gen CNC machines, streamlining of processes, and vertical integration with actionable projects have resulted in efficiency gains and have positioned WWS for future growth: Receiving: Expects 50% improvement in efficiency due to improved processes, racking systems and inbound receipt extrusion trays Shipping: Expects 38% improvement in shipping efficiency due to more docks and workspaces as well as new bar code scanning capabilities Labor: Expects 45% improvement in labor efficiency in processing positions due to new CNC capabilities Manufacturing Overview Best-in-Class Facility WWS Manufacturing Costs as a Percentage of Net Sales (2) 170,000 Sq. ft. of capacity $300+ Million of capacity ~2.5x Capacity above current sales 2 weeks Custom order lead time 5-10 days Volume order lead time 94% Quality FPY(1) YTD April ’18 First Pass Yields. 2015-2017 as reported. 2012-2015 manufacturing overhead includes a partial allocation of certain items such as building rent, insurance and real estate taxes, reclassified to admin expenses beginning in 2016. Figures do not include payroll tax and benefit expenses.
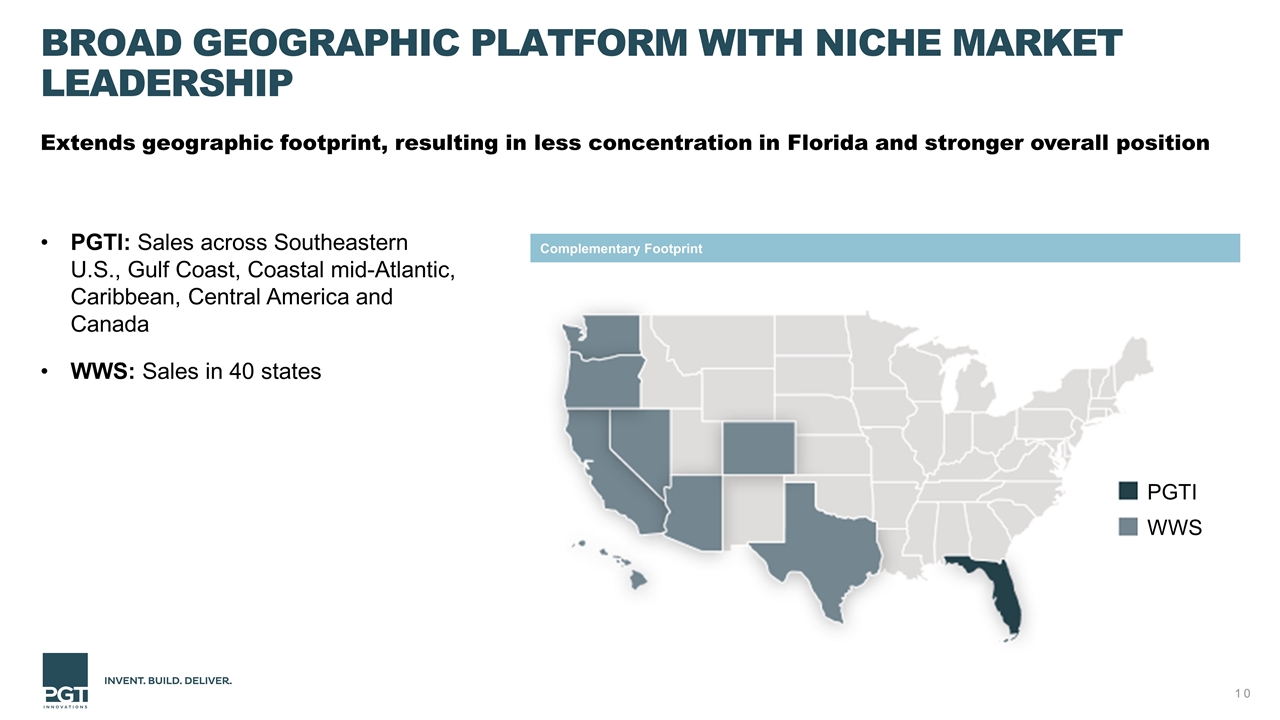
Broad Geographic Platform with Niche Market Leadership PGTI: Sales across Southeastern U.S., Gulf Coast, Coastal mid-Atlantic, Caribbean, Central America and Canada WWS: Sales in 40 states Complementary Footprint Extends geographic footprint, resulting in less concentration in Florida and stronger overall position PGTI WWS
Diversified Customer Base PGTI: Customer base of ~1,300 independently owned window and dealers and distributors, national building supply distributors WWS: Diverse customer base of leading window distributors and production homebuilders, including 18 of the 20 largest homebuilders in the U.S.(1) No single dealer for Custom channel represents +11% of sales Sales in Corporate Builder division to top production builders in U.S., with 23 preferred vendor agreements Dedicated sales team to build relationships with architects and builders to create “pull through” demand and ensure end-user loyalty regardless of dealer Combined company to have innovative product portfolio Complex / highly engineered products with breadth of offerings Strict building codes / certification requirements for products, a key differentiator for both PGTI and WWS that has enabled growth Recognized as industry expert Portfolio of products adds opportunity to expand customer base in respective geographic strongholds (1) As of YE2017.
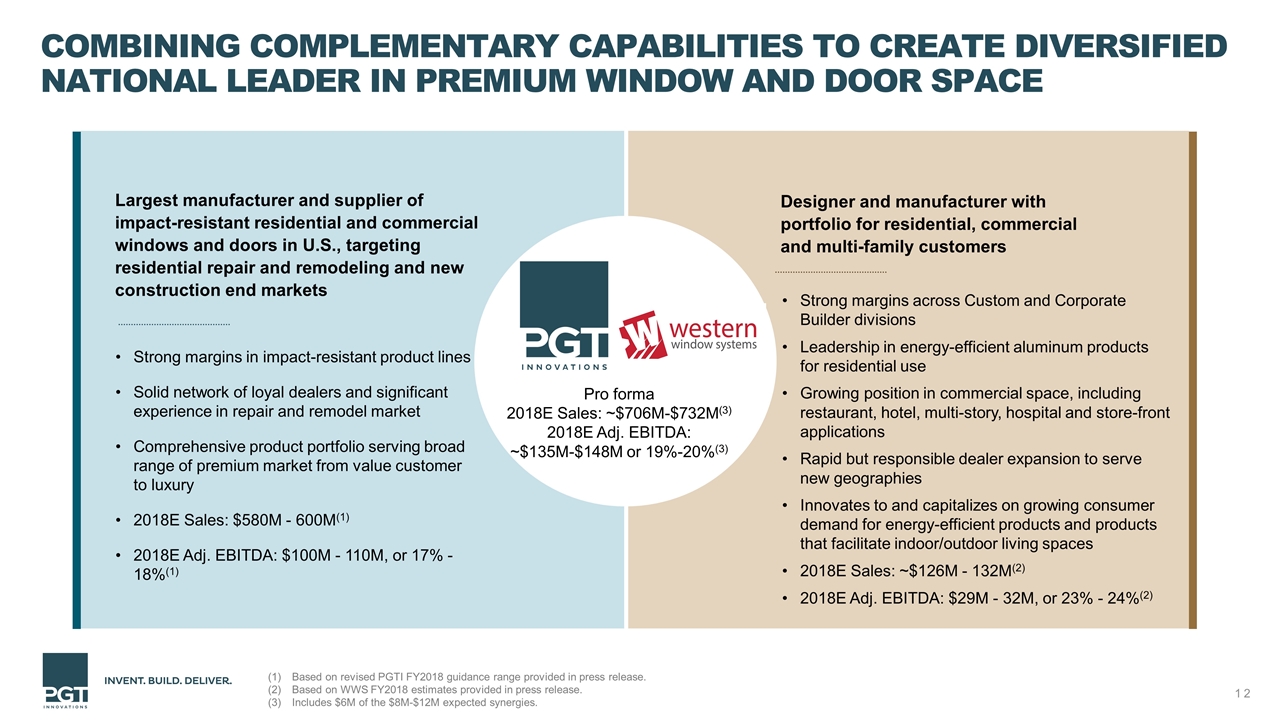
Combining Complementary Capabilities to Create Diversified National Leader in Premium Window and Door Space Strong margins across Custom and Corporate Builder divisions Leadership in energy-efficient aluminum products for residential use Growing position in commercial space, including restaurant, hotel, multi-story, hospital and store-front applications Rapid but responsible dealer expansion to serve new geographies Innovates to and capitalizes on growing consumer demand for energy-efficient products and products that facilitate indoor/outdoor living spaces 2018E Sales: ~$126M - 132M(2) 2018E Adj. EBITDA: $29M - 32M, or 23% - 24%(2) Largest manufacturer and supplier of impact-resistant residential and commercial windows and doors in U.S., targeting residential repair and remodeling and new construction end markets Strong margins in impact-resistant product lines Solid network of loyal dealers and significant experience in repair and remodel market Comprehensive product portfolio serving broad range of premium market from value customer to luxury 2018E Sales: $580M - 600M(1) 2018E Adj. EBITDA: $100M - 110M, or 17% - 18%(1) Designer and manufacturer with portfolio for residential, commercial and multi-family customers Based on revised PGTI FY2018 guidance range provided in press release. Based on WWS FY2018 estimates provided in press release. Includes $6M of the $8M-$12M expected synergies. Pro forma 2018E Sales: ~$706M-$732M(3) 2018E Adj. EBITDA: ~$135M-$148M or 19%-20%(3)
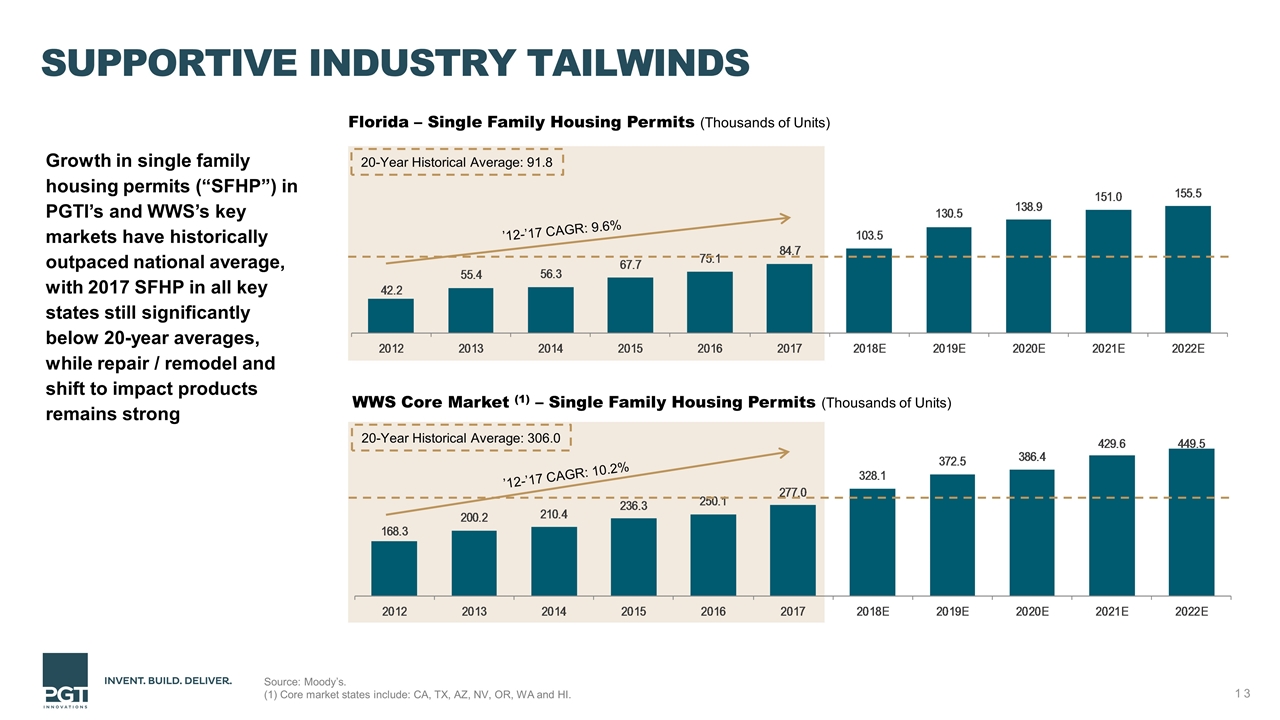
Supportive Industry Tailwinds Source: Moody’s. (1) Core market states include: CA, TX, AZ, NV, OR, WA and HI. Florida – Single Family Housing Permits (Thousands of Units) WWS Core Market (1) – Single Family Housing Permits (Thousands of Units) ’12-’17 CAGR: 9.6% 20-Year Historical Average: 91.8 ’12-’17 CAGR: 10.2% 20-Year Historical Average: 306.0 Growth in single family housing permits (“SFHP”) in PGTI’s and WWS’s key markets have historically outpaced national average, with 2017 SFHP in all key states still significantly below 20-year averages, while repair / remodel and shift to impact products remains strong
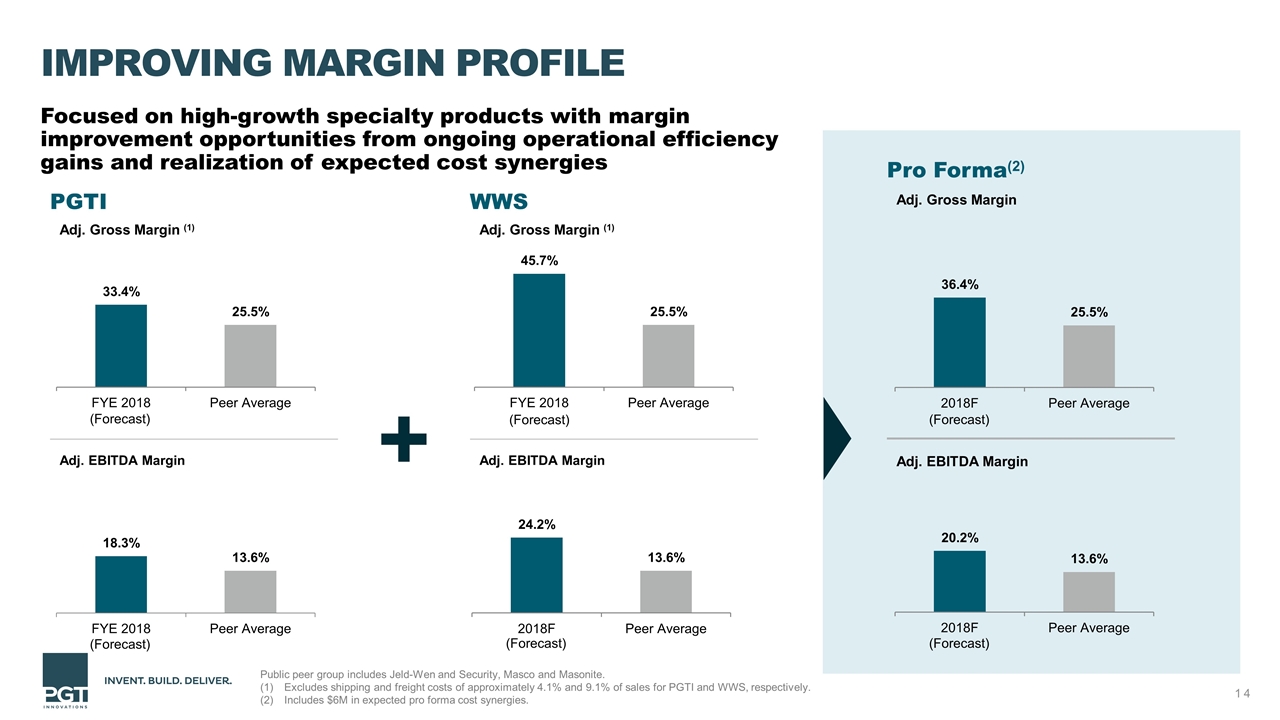
Improving Margin Profile Pro Forma(2) Adj. Gross Margin Adj. EBITDA Margin Purchasing Power Leverage Best Practices PGTI Adj. Gross Margin (1) Adj. EBITDA Margin Shared Services WWS Adj. Gross Margin (1) Adj. EBITDA Margin 14 Focused on high-growth specialty products with margin improvement opportunities from ongoing operational efficiency gains and realization of expected cost synergies Public peer group includes Jeld-Wen and Security, Masco and Masonite. Excludes shipping and freight costs of approximately 4.1% and 9.1% of sales for PGTI and WWS, respectively. Includes $6M in expected pro forma cost synergies. (Forecast) (Forecast) (Forecast) (Forecast) (Forecast) (Forecast)
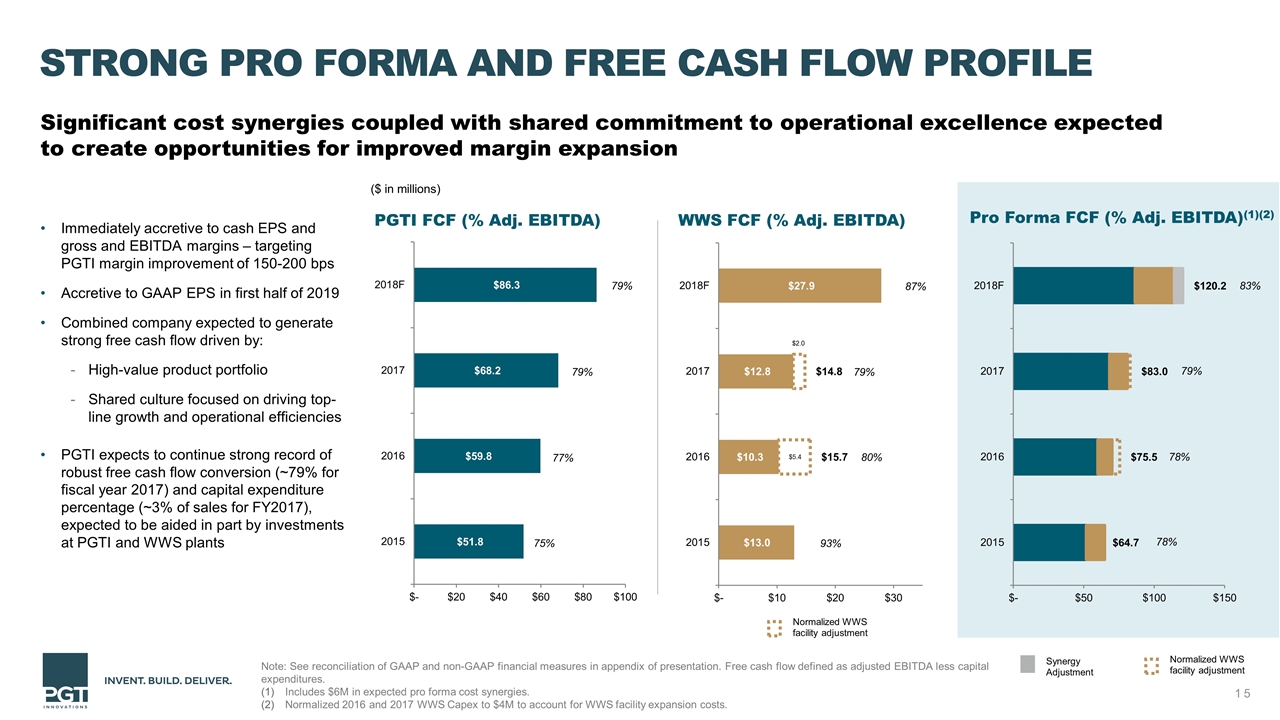
PGTI FCF (% Adj. EBITDA) Strong Pro Forma and Free Cash Flow Profile Immediately accretive to cash EPS and gross and EBITDA margins – targeting PGTI margin improvement of 150-200 bps Accretive to GAAP EPS in first half of 2019 Combined company expected to generate strong free cash flow driven by: High-value product portfolio Shared culture focused on driving top-line growth and operational efficiencies PGTI expects to continue strong record of robust free cash flow conversion (~79% for fiscal year 2017) and capital expenditure percentage (~3% of sales for FY2017), expected to be aided in part by investments at PGTI and WWS plants ($ in millions) Purchasing Power Leverage Best Practices Shared Services Significant cost synergies coupled with shared commitment to operational excellence expected to create opportunities for improved margin expansion 15 Pro Forma FCF (% Adj. EBITDA)(1)(2) 78% 78% WWS FCF (% Adj. EBITDA) Note: See reconciliation of GAAP and non-GAAP financial measures in appendix of presentation. Free cash flow defined as adjusted EBITDA less capital expenditures. Includes $6M in expected pro forma cost synergies. Normalized 2016 and 2017 WWS Capex to $4M to account for WWS facility expansion costs. 79% 79% 77% 75% Normalized WWS facility adjustment Synergy Adjustment 83% 79% Normalized WWS facility adjustment 87% 79% 93% 80%
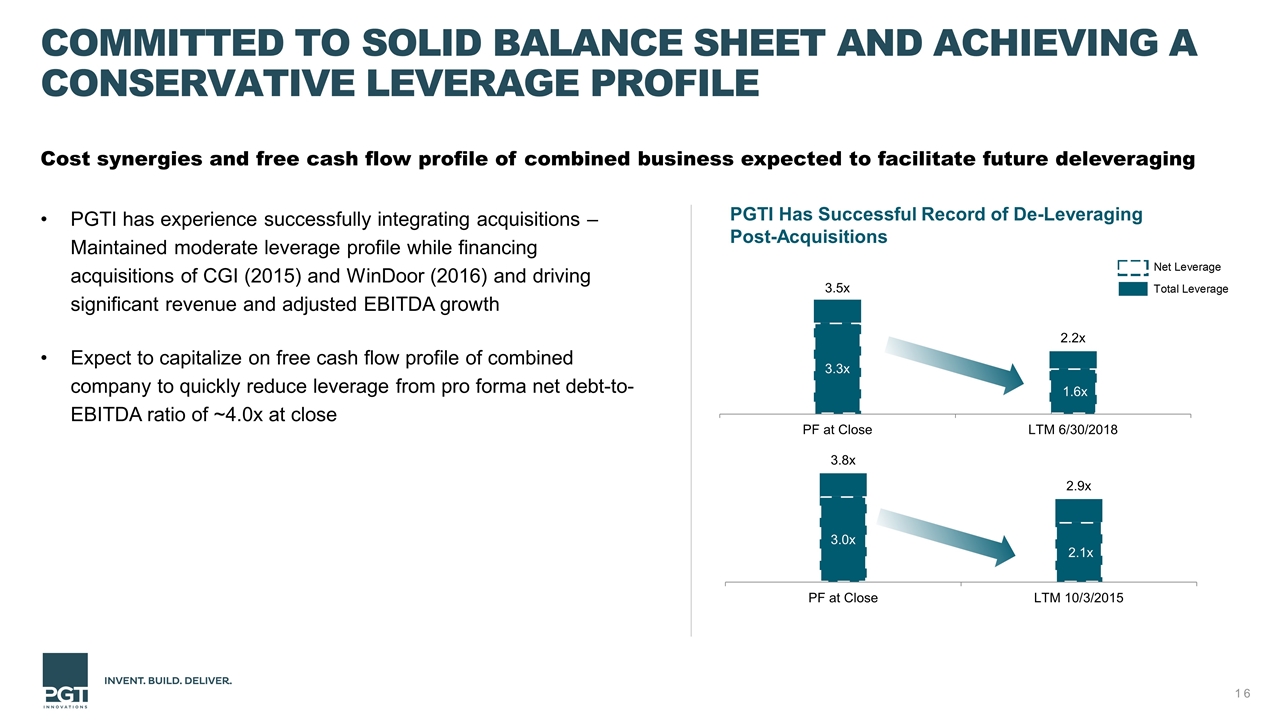
Committed to Solid Balance Sheet and Achieving A Conservative Leverage Profile PGTI has experience successfully integrating acquisitions – Maintained moderate leverage profile while financing acquisitions of CGI (2015) and WinDoor (2016) and driving significant revenue and adjusted EBITDA growth Expect to capitalize on free cash flow profile of combined company to quickly reduce leverage from pro forma net debt-to-EBITDA ratio of ~4.0x at close Cost synergies and free cash flow profile of combined business expected to facilitate future deleveraging PGTI Has Successful Record of De-Leveraging Post-Acquisitions
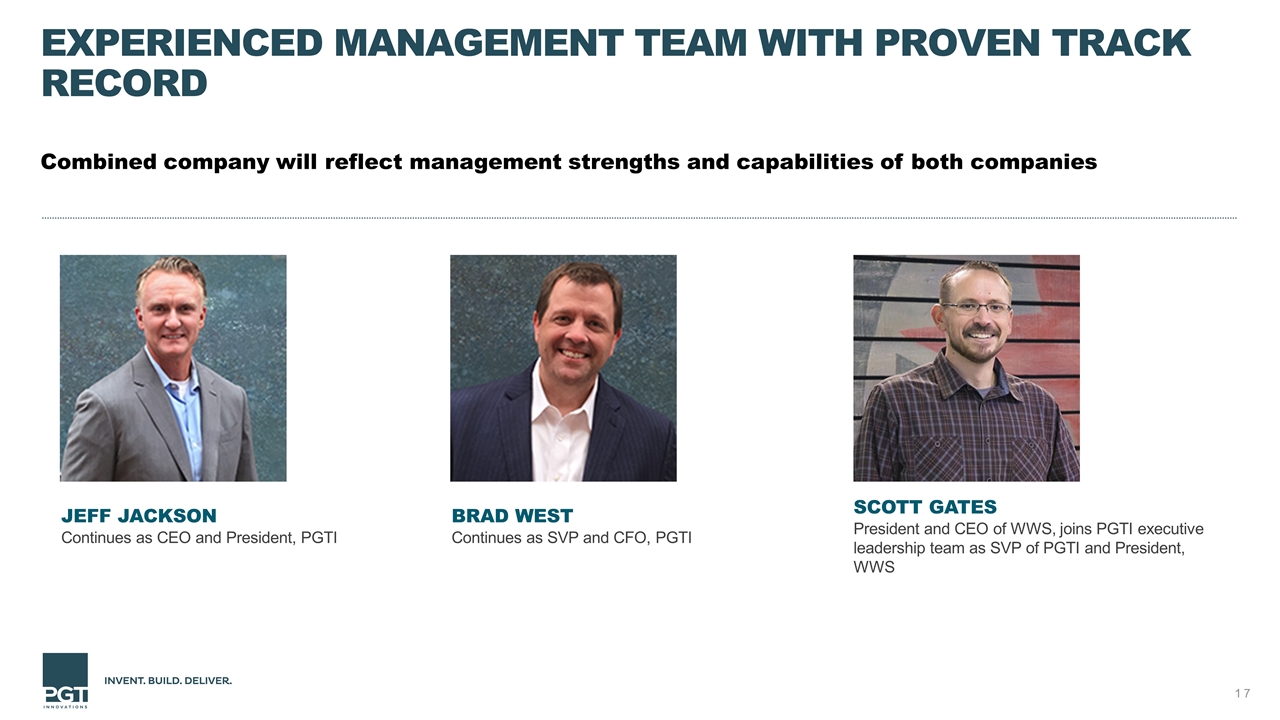
Experienced Management Team with Proven Track Record Combined company will reflect management strengths and capabilities of both companies JEFF JACKSON Continues as CEO and President, PGTI SCOTT GATES President and CEO of WWS, joins PGTI executive leadership team as SVP of PGTI and President, WWS BRAD WEST Continues as SVP and CFO, PGTI
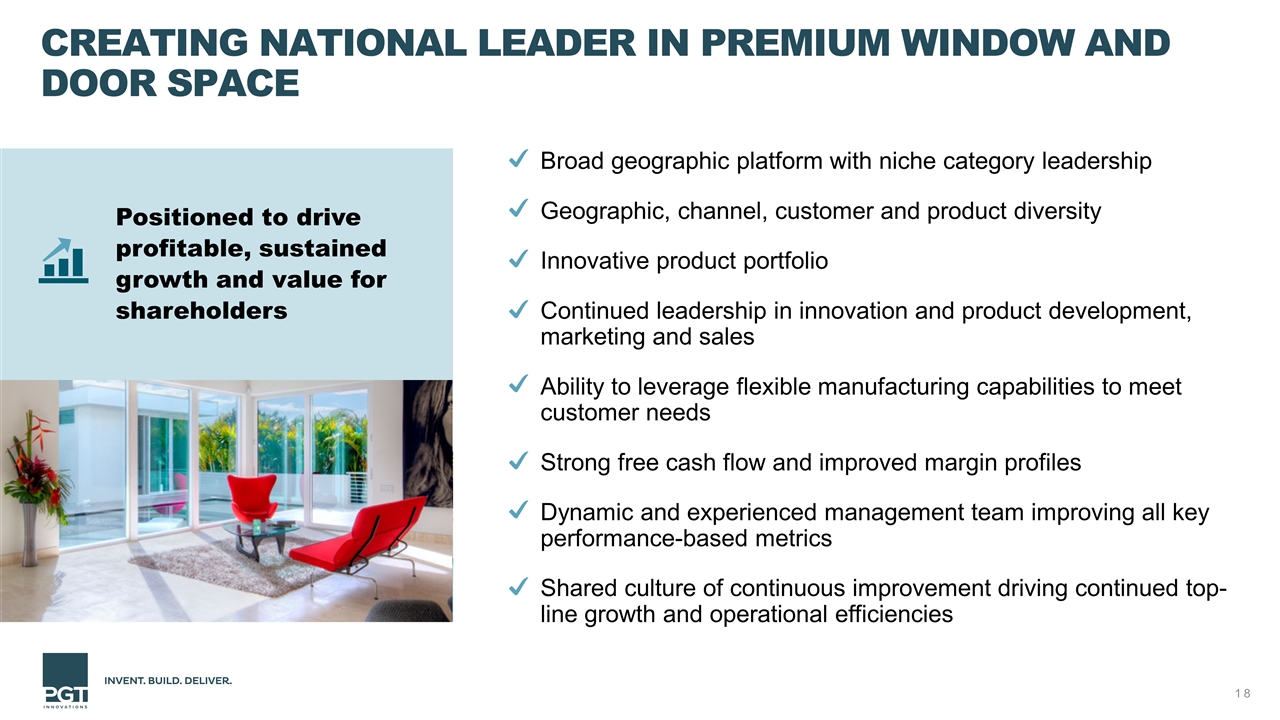
Positioned to drive profitable, sustained growth and value for shareholders Creating National Leader in Premium Window and Door Space Broad geographic platform with niche category leadership Geographic, channel, customer and product diversity Innovative product portfolio Continued leadership in innovation and product development, marketing and sales Ability to leverage flexible manufacturing capabilities to meet customer needs Strong free cash flow and improved margin profiles Dynamic and experienced management team improving all key performance-based metrics Shared culture of continuous improvement driving continued top-line growth and operational efficiencies
Appendix: Reconciliation of GAAP AND non-GAAP FINANCIAL MEASURES
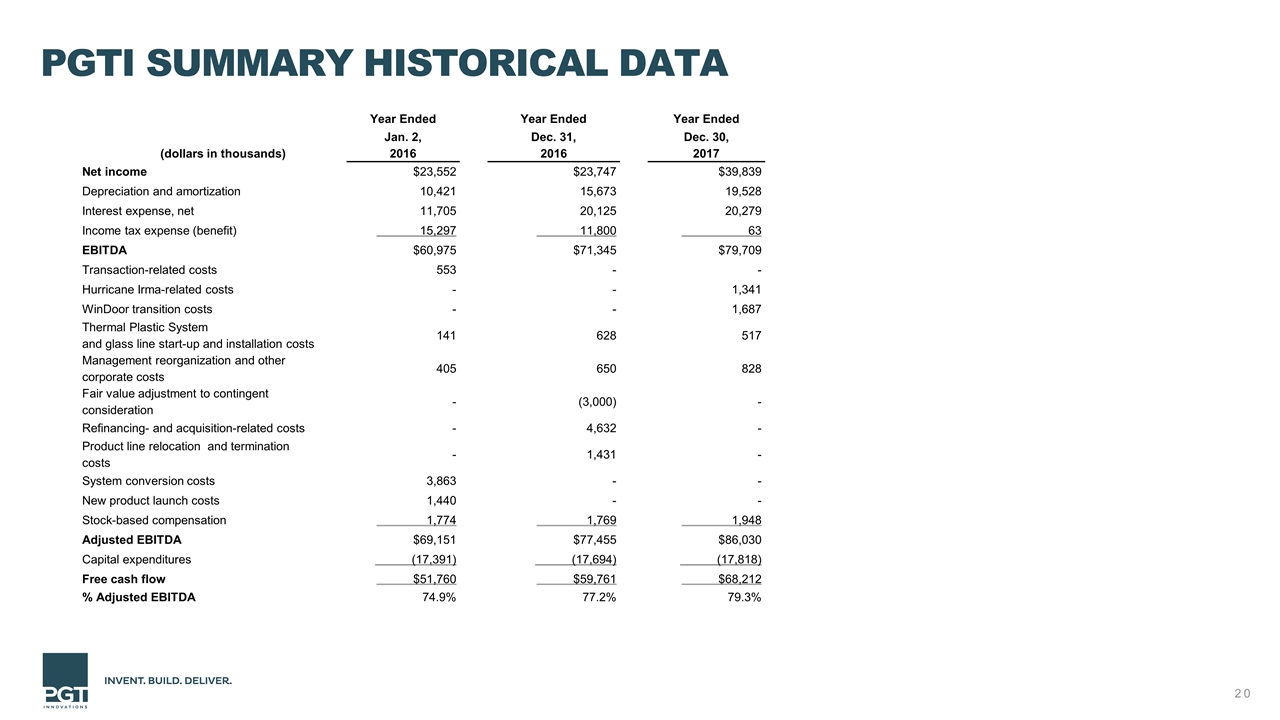
PGTI SUMMARY Historical data Year Ended Year Ended Year Ended Jan. 2, Dec. 31, Dec. 30, (dollars in thousands) 2016 2016 2017 Net income $23,552 $23,747 $39,839 Depreciation and amortization 10,421 15,673 19,528 Interest expense, net 11,705 20,125 20,279 Income tax expense (benefit) 15,297 11,800 63 EBITDA $60,975 $71,345 $79,709 Transaction-related costs 553 - - Hurricane Irma-related costs - - 1,341 WinDoor transition costs - - 1,687 Thermal Plastic System and glass line start-up and installation costs 141 628 517 Management reorganization and other corporate costs 405 650 828 Fair value adjustment to contingent consideration - (3,000) - Refinancing- and acquisition-related costs - 4,632 - Product line relocation and termination costs - 1,431 - System conversion costs 3,863 - - New product launch costs 1,440 - - Stock-based compensation 1,774 1,769 1,948 Adjusted EBITDA $69,151 $77,455 $86,030 Capital expenditures (17,391) (17,694) (17,818) Free cash flow $51,760 $59,761 $68,212 % Adjusted EBITDA 74.9% 77.2% 79.3%
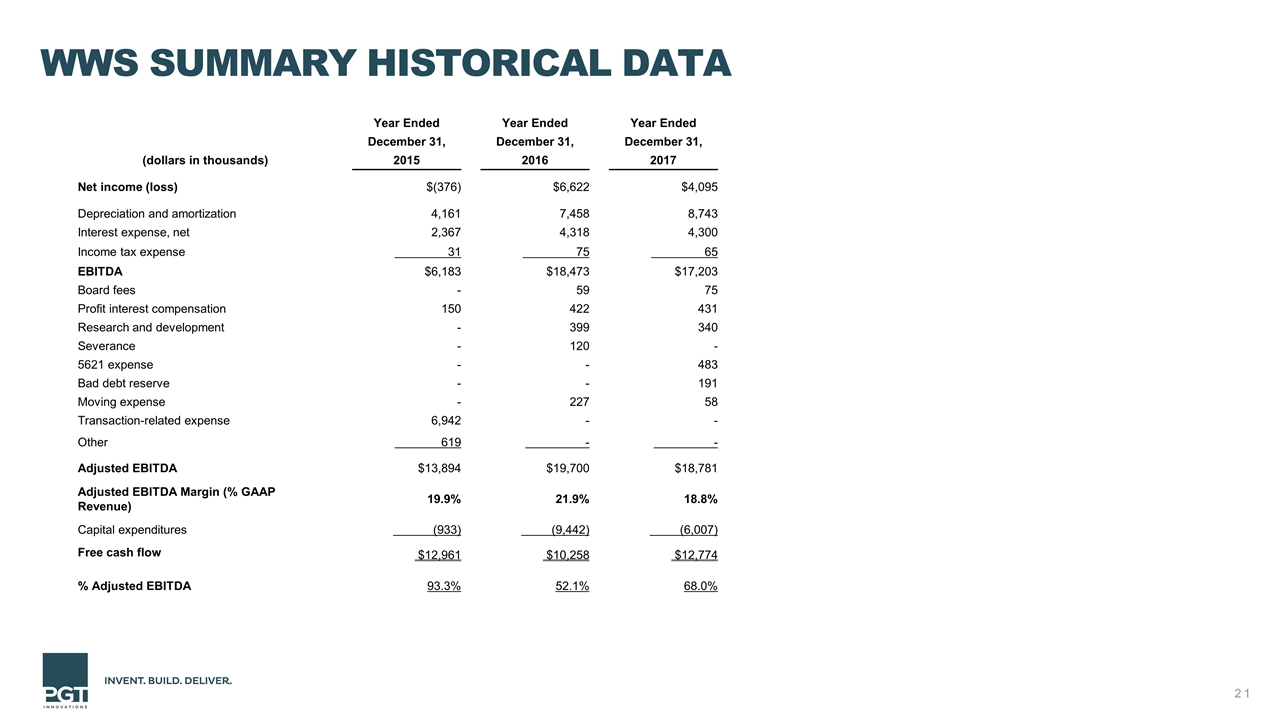
WWS SUMMARY Historical data Year Ended Year Ended Year Ended December 31, December 31, December 31, (dollars in thousands) 2015 2016 2017 Net income (loss) $(376) $6,622 $4,095 Depreciation and amortization 4,161 7,458 8,743 Interest expense, net 2,367 4,318 4,300 Income tax expense 31 75 65 EBITDA $6,183 $18,473 $17,203 Board fees - 59 75 Profit interest compensation 150 422 431 Research and development - 399 340 Severance - 120 - 5621 expense - - 483 Bad debt reserve - - 191 Moving expense - 227 58 Transaction-related expense 6,942 - - Other 619 - - Adjusted EBITDA $13,894 $19,700 $18,781 Adjusted EBITDA Margin (% GAAP Revenue) 19.9% 21.9% 18.8% Capital expenditures (933) (9,442) (6,007) Free cash flow $12,961 $10,258 $12,774 % Adjusted EBITDA 93.3% 52.1% 68.0%
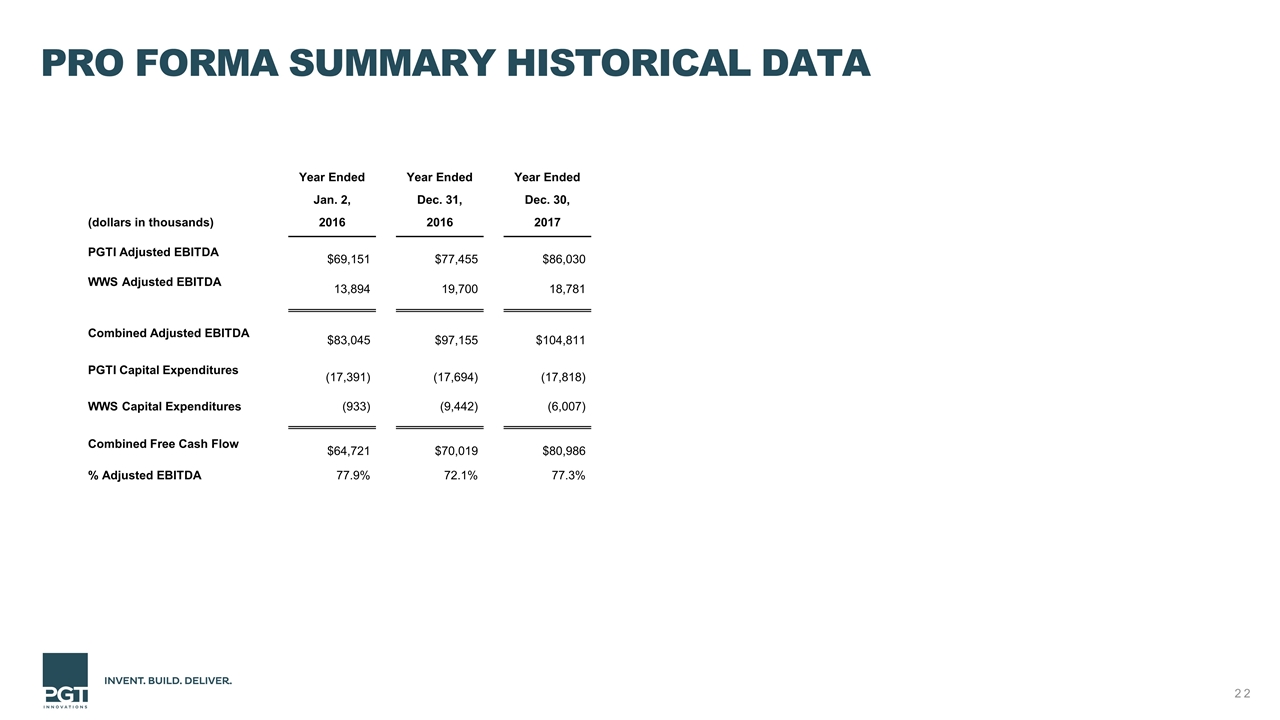
Pro forma summary historical data Year Ended Year Ended Year Ended Jan. 2, Dec. 31, Dec. 30, (dollars in thousands) 2016 2016 2017 PGTI Adjusted EBITDA $69,151 $77,455 $86,030 WWS Adjusted EBITDA 13,894 19,700 18,781 Combined Adjusted EBITDA $83,045 $97,155 $104,811 PGTI Capital Expenditures (17,391) (17,694) (17,818) WWS Capital Expenditures (933) (9,442) (6,007) Combined Free Cash Flow $64,721 $70,019 $80,986 % Adjusted EBITDA 77.9% 72.1% 77.3%


