EXHIBIT 99.2
![](https://capedge.com/proxy/8-K/0001354327-19-000014/ex992q42018slide21.jpg)
PGT Innovations Q4 2018 Financial results February 27, 2019
- 1 -
![](https://capedge.com/proxy/8-K/0001354327-19-000014/ex992q42018slide22.jpg)
FORWARD LOOKING STATEMENTS Statements in this presentation regarding our business that are not historical facts are “forward-looking statements” that involve risks and uncertainties which could cause actual results to differ materially from those contained in the forward-looking statements. Such forward-looking statements generally can be identified by the use of forward-looking terminology, such as “may,” “expect,” “expectations,” “outlook,” “forecast,” “guidance,” “intend,” “believe,” “could,” “project,” “estimate,” “anticipate,” “should” and similar terminology. These risks and uncertainties include factors such as:adverse changes in new home starts and home repair and remodeling trends, especially in the state of Florida, where the substantial portion of our sales are currently generated, and in the western United States, where the substantial portion of the sales of Western Window Systems’ operations are generated, and in the U.S. generally;macroeconomic conditions in Florida, where the substantial portion of our sales are generated, and in California, Texas, Arizona, Nevada, Colorado, Oregon, Washington and Hawaii, where the substantial portion of the sales of Western Window Systems are currently generated, and in the U.S. generally;increases in bad debt owed to us by our customers in the event of a downturn in the home repair and remodeling or new home construction channels in our core markets;our level of indebtedness, which increased in connection with our acquisition of Western Window Systems;the effects of increased expenses or unanticipated liabilities incurred as a result of, or due to activities related to, the Western Window Systems Acquisition;the risk that the anticipated cost savings, synergies, revenue enhancement strategies and other benefits from the Western Window Systems Acquisition may not be fully realized or may take longer to realize than expected or that our actual integration costs may exceed our estimates;raw material prices, especially for aluminum, glass and vinyl, including, price increases due to the implementation of tariffs and other trade-related restrictions;our dependence on a limited number of suppliers for certain of our key materials;sales fluctuations to and changes in our relationships with key customers;in addition to the Western Window Systems Acquisition, our ability to successfully integrate businesses we may acquire, or that any business we acquire may not perform as we expected at the time we acquired it;increases in transportation costs, including due to increases in fuel prices;our dependence on our impact-resistant product lines and contemporary indoor/outdoor window and door systems, and on consumer preferences for those types and styles of products;product liability and warranty claims brought against us;federal, state and local laws and regulations, including unfavorable changes in local building codes and environmental and energy code regulations;our dependence on our limited number of geographically concentrated manufacturing facilities;risks associated with our information technology systems, including cybersecurity-related risks, such as unauthorized intrusions into our systems by “hackers” and theft of data and information from our systems, and the risks that our information technology systems do not function as intended or experience temporary or long-term failures to perform as intended; andthe risks and uncertainties discussed under Part II, Item 1A, “Risk Factors” in the Company’s Quarterly Report on Form 10-Q for the quarter ended June 30, 2018.Statements in this presentation that are forward-looking statements include, without limitation, our expectations regarding: (1) benefits expected from our four strategic pillars, including the creation of long-term customer and shareholder value; (2) benefits expected from our acquisition of Western Window Systems; (3) our ability to leverage our technical expertise and operational capabilities; (4) single family housing starts in 2019 and beyond, including in the State of Florida; (5) our expectations regarding the remaining growth potential for sales of impact products, including in the Florida market, and for growth in the sales of Western Window Systems' products that unify indoor/outdoor living spaces; (6) our capital allocation strategy and priorities, and the benefits expected therefrom; (7) the benefits expected from our research and development efforts; (8) our ability to further improve operational efficiencies and drive margin expansion; and (9) the 2019 guidance set forth in this presentation. 2
- 2 -
![](https://capedge.com/proxy/8-K/0001354327-19-000014/ex992q42018slide23.jpg)
Use of Non-GAAP Financial Measures This presentation and the financial schedules include financial measures and terms not calculated in accordance with U.S. generally accepted accounting principles (GAAP). We believe that presentation of non-GAAP measures such as adjusted net income, adjusted net income per share, and adjusted EBITDA provides investors and analysts with an alternative method for assessing our operating results in a manner that enables investors and analysts to more thoroughly evaluate our current performance compared to past performance. We also believe these non-GAAP measures provide investors with a better baseline for assessing our future earnings potential. The non-GAAP measures included in this release are provided to give investors access to types of measures that we use in analyzing our results.Adjusted net income consists of GAAP net income adjusted for the items included in the accompanying reconciliation. Adjusted net income per share consists of GAAP net income per share adjusted for the items included in the accompanying reconciliation. We believe these measures enable investors and analysts to more thoroughly evaluate our current performance as compared to the past performance and provide a better baseline for assessing the Company's future earnings potential. However, these measures do not provide a complete picture of our operations.Adjusted EBITDA consists of net income, adjusted for the items included in the accompanying reconciliation. We believe that adjusted EBITDA provides useful information to investors and analysts about the Company's performance because they eliminate the effects of period-to-period changes in taxes, costs associated with capital investments and interest expense. Adjusted EBITDA does not give effect to the cash the Company must use to service its debt or pay its income taxes and thus does not reflect the actual funds generated from operations or available for capital investments.Our calculations of adjusted net income, adjusted net income per share, and adjusted EBITDA are not necessarily comparable to calculations performed by other companies and reported as similarly titled measures. These non-GAAP measures should be considered in addition to results prepared in accordance with GAAP but should not be considered a substitute for or superior to GAAP measures. Schedules that reconcile adjusted net income, adjusted net income per share, and adjusted EBITDA to GAAP net income are included in the financial schedules accompanying this release. 3
- 3 -
![](https://capedge.com/proxy/8-K/0001354327-19-000014/ex992q42018slide24.jpg)
PRODUCT GROUP2 END MARKET2 PGT Innovations at a glance (NYSE: PGTI) 4 Driven to Create the Strongest, Safest Building Products with a Customer-First Approach Founded Headquarters Total Employees Market-cap 1980 North Venice, FL ~3,000 ~$1.0B1 1. As of 2/22/2019; 2. Based upon Q4 2018 results 35% 34% Gross Margin $698M 2018 net sales 120+ years combined history >1.4M square feet manufacturing space ~1,500 dealers/distributors
- 4 -
![](https://capedge.com/proxy/8-K/0001354327-19-000014/ex992q42018slide25.jpg)
Executing 4 Strategic Pillars expected to Create Long-Term Customer and Shareholder Value 5 Putting the customer first to build our brands Attracting talented, hardworking leaders and offering benefits to help our team members succeed Investing in our business and scaling our operations to meet increasing demand Strategically allocating capital generated from our free cash flow to support our growth
- 5 -
![](https://capedge.com/proxy/8-K/0001354327-19-000014/ex992q42018slide26.jpg)
Q4 2018 vs. Q4 2017 $190MNet Sales 42% 34.6%Gross Margins 2.6% 34.8%Adjusted Gross Margins 2.3% $0.18Diluted EPS 54% $0.21Adjusted Diluted EPS1 17% $31.5MAdjusted EBITDA1 34% Delivering Strong Q4 and FULL-YEAR 2018 RESULTS HighlightsFirst full quarter of results after completion of acquisition of Western Window SystemsCost synergies primarily from supply chain efficiencies are on scheduleContinuing supportive industry tailwindsQ4 2017 GAAP EPS reflects passage of Tax Cuts and Jobs Act ($0.24 favorable one-time credit) 6 1. Refer to reconciliation to GAAP
- 6 -
![](https://capedge.com/proxy/8-K/0001354327-19-000014/ex992q42018slide27.jpg)
Full-Year 2018 vs. Full-Year 2017 $698MNet Sales 37% 34.9%Gross Margins 3.8% 35.0%Adjusted Gross Margins 3.5% $1.00Diluted EPS 30% $1.18Adjusted Diluted EPS1 93% $127MAdjusted EBITDA1 48% HighlightsCompletion of acquisition of Western Window Systems positions PGTI as national leader in premium window and door spaceFull-year sales growth of 37%—with 27% of year-over-year growth achieved organicallySolid operational execution, including several product and facility relocations 7 Delivering Strong Q4 and FULL-YEAR 2018 RESULTS 1. Refer to reconciliation to GAAP
- 7 -
![](https://capedge.com/proxy/8-K/0001354327-19-000014/ex992q42018slide28.jpg)
Expands geographic footprint and solidifies PGTI as leading company in multiple segmentsStrengthens brand recognition, diversifies product portfolio, creates cross-selling opportunitiesCreates margin improvement opportunities from operational efficiency gains and realization of expected cost synergiesBuilds on culture of innovation, product development, and continuous improvement 8 WWS HQ PGTI HQ PGTI-Southeast’s Core MarketPGTI-West’s Core MarketsPlant Locations Acquisition of WESTERN WINDOW SYSTEMS CreatesA National Leader in Premium Windows and Doors
- 8 -
![](https://capedge.com/proxy/8-K/0001354327-19-000014/ex992q42018slide29.jpg)
Well Positioned With Expanded platform 9 Built Strong Foundation Repositioned Sustained Growth Ahead 1980-2013 2014-2017 2018+ Created leading position in Florida through innovation andstrong customer focus Two acquisitions; company renamed PGT Innovations, with market-leading brands National platform with niche market leadership; leveraging technical expertise, customer focus and operational capabilities Acquired CGI for $110M in September 2014 Acquired WinDoor for $103M in February 2016 Acquired Western Window Systems for $355M in August 2018
- 9 -
![](https://capedge.com/proxy/8-K/0001354327-19-000014/ex992q42018slide30.jpg)
10 Supportive Industry Tailwinds Florida – Single Family Housing Starts (000s) – Moody’s Forecast ’12-’18 CAGR: 14.7% 20-Yr Average = 93.8K Growth in single family housing starts (“SFHS”) in PGTI-Southeast’s and PGTI-West’s Core Markets have historically outpaced national averagePrior to 2018, SFHS in all key states significantly below 20-year averages and expected to revert to above average levelsRepair & Remodel market and demand for Impact products remain strong PGTI expects 2019 FL SFHS of 105,000 vs. Moody’s forecast of 110,900.
- 10 -
![](https://capedge.com/proxy/8-K/0001354327-19-000014/ex992q42018slide31.jpg)
11 Significant Growth Potential Remaining in Florida Market1 >50% of Florida homes DO NOT have impact-resistant protection 18% of Florida homes have storm shutters (indirect competition to us) 18% of Florida homes have impact-resistant windows 13% of Florida homes have impact-resistant doors Impact-Resistant and indoor/outdoor living products in High Demand 1. Data as of 2017; Source: Industry data and Company estimates; 2. Total addressable market (TAM) for high-end homes with home values greater than $750k and have a multi-panel sliding door in back wall. ~$7B Total Addressable Market of New High-End Homes with Multi-sliding Doors in Back Wall ~11% 2012-2017 CAGR2 ~$2B Total Addressable Market for New Homes with Contemporary Design ~24% 2012-2017 CAGR2 $8-9B Growing Market Impact-Resistant indoor/outdoor living
- 11 -
![](https://capedge.com/proxy/8-K/0001354327-19-000014/ex992q42018slide32.jpg)
Q4 2018 statement of operations(unaudited - in thousands, except per share amounts) 12 Three Months Ended Twelve Months Ended 12/29/2018 12/30/2017 12/29/2018 12/30/2017 Net sales $ 189,887 $ 134,100 $ 698,493 $ 511,081 Cost of sales 124,137 91,156 455,025 352,097 Gross profit 65,750 42,944 243,468 158,984 Selling, general and administrative expenses 45,617 26,418 150,910 98,803 Gains on sales of assets under APA - - (2,551) - Income from operations 20,133 16,526 95,109 60,181 Interest expense, net 7,136 5,287 26,529 20,279 Debt extinguishment costs - - 3,375 - Income before income taxes 12,997 11,239 65,205 39,902 Income tax expense (benefit) 2,523 (9,054) 11,272 63 Net income $ 10,474 $ 20,293 $ 53,933 $ 39,839 Basic net income per common share $ 0.18 $ 0.41 $ 1.03 $ 0.80 Diluted net income per common share $ 0.18 $ 0.39 $ 1.00 $ 0.77 Weighted average common shares outstanding: Basic 57,987 49,721 52,461 49,522 Diluted 59,240 51,915 54,106 51,728
- 12 -
![](https://capedge.com/proxy/8-K/0001354327-19-000014/ex992q42018slide33.jpg)
Capital Allocation priorities 13 Internal Investment Debt Reduction Acquisitions 1 2 3 Strategic growth projects are expected to drive shareholder valueAdvertising and marketing investments continue to benefit our growth Committed to solid balance sheet and achieving a conservative leverage profilePaid off $160 million of existing credit facility during second half of 2018 Strategic acquisitions are expected to drive shareholder valueExpansion into new geographies and other niche building products 1. Refer to reconciliation to GAAP
- 13 -
![](https://capedge.com/proxy/8-K/0001354327-19-000014/ex992q42018slide34.jpg)
Full-Year 2019 Guidance 14 Full-Year 2018 Results 2019 Guidance1 as of 2/27/19 2019 Guidance vs. Full-Year 2018 Net Sales$698M Net Sales$775M-$800M 11% – 15% Adjusted EBITDA1$127M Adjusted EBITDA1$143M – $152M 13% – 20% Net Income / Diluted Share$1.00 Net Income / Diluted Share$0.93 – $1.05 2019 Guidance Estimates Interest Expense$7M / quarter Tax Rate26% Depreciation and Amortization$9M / quarter Non-cash Stock Compensation$4.2M / annual Capex as % of Sales3 – 4% 1. Refer to reconciliation to GAAP
- 14 -
![](https://capedge.com/proxy/8-K/0001354327-19-000014/ex992q42018slide35.jpg)
Why Invest in PGT Innovations 15 National leader in growing premium indoor and outdoor window and door category Expect to continue investing in talent and R&D to remain the industry leader in innovation and product development Continued focus on operational efficiencies expected to drive additional margin expansion Focused on continued execution of our strategy expected to create long-term customer and shareholder value Well positioned with diversified product portfolio to capture profitable growth in new construction and repair and remodel channels
- 15 -
![](https://capedge.com/proxy/8-K/0001354327-19-000014/ex992q42018slide36.jpg)
Q&A 16
- 16 -
![](https://capedge.com/proxy/8-K/0001354327-19-000014/ex992q42018slide37.jpg)
Creating National leader in premium windows & doors 17 Positioned to Drive Profitable, Sustained Growth and Value for Shareholders Continued leadership in innovation and product development, marketing and sales Broadened geographic platform with niche category leadership Geographic, channel, customer and product diversity Customer first, innovative product portfolio to build our family of brands Shared culture of continuous improvement driving continued top-line growth and operational efficiencies Dynamic and experienced management team improving all key performance-based metrics Ability to leverage flexible manufacturing capabilities to meet customer needs Strategically allocating capital from strong FCF and improved margin profiles
- 17 -
![](https://capedge.com/proxy/8-K/0001354327-19-000014/ex992q42018slide38.jpg)
Appendix 18 Reconciliation to Adjusted Net Income, Adjusted Net Income per Share-diluted, and Adjusted EBITDA
- 18 -
![](https://capedge.com/proxy/8-K/0001354327-19-000014/ex992q42018slide39.jpg)
Reconciliation of GAAP to NON-gaap MEASURES(unaudited - in thousands, except per share amounts) 19 Three Months Ended Twelve Months Ended 12/29/2018 12/30/2017 12/29/2018 12/30/2017 Reconciliation to Adjusted Net Income and Adjusted Net Income per share (1): Net income $ 10,474 $ 20,293 $ 53,933 $ 39,839 Reconciling items: Debt extinguishment costs (2) - - 3,375 - Facility and equipment relocation costs (3) 398 - 833 - Gains on sales of assets under Cardinal APA (4) - - (2,551) - Transaction-related costs and effects (5) - - 4,144 - Hurricane Irma-related costs (6) - 250 - 1,341 Management reorganization and other corporate costs (7) 1,560 113 1,560 828 WinDoor costs (8) - 994 - 1,687 Write-offs of deferred lenders fees and discount relating to debt prepayments (9) 260 909 5,557 1,889 Thermal Plastic System start-up costs (10) - - - 517 Tax effect of Tax Cuts and Jobs Act (11) 231 (12,408) 231 (12,408) Tax effect of reconciling items (513) (799) (3,271) (2,209) Adjusted net income $ 12,410 $ 9,352 $ 63,811 $ 31,484 Weighted-average diluted shares 59,240 51,915 54,106 51,728 Adjusted net income per share – diluted $0.21 $0.18 $1.18 $0.61 Reconciliation to Adjusted EBITDA (1): Depreciation and amortization expense $ 8,600 $ 5,208 $ 24,450 $ 19,528 Interest expense, net 7,136 5,287 26,529 20,279 Income tax expense (benefit) 2,523 (9,054) 11,272 63 Reversal of tax effect of reconciling items for adjusted net income above 513 799 3,271 2,209 Reconciling item included in interest expense, net (260) (909) (5,557) (1,889) Tax effect of Tax Cuts and Jobs Act (11) (231) 12,408 (231) 12,408 Stock-based compensation expense (12) 840 380 3,383 1,948 Adjusted EBITDA $ 31,531 $ 23,471 $ 126,928 $ 86,030 Adjusted EBITDA as percentage of net sales 16.6% 17.5% 18.2% 16.8%
- 19 -
![](https://capedge.com/proxy/8-K/0001354327-19-000014/ex992q42018slide40.jpg)
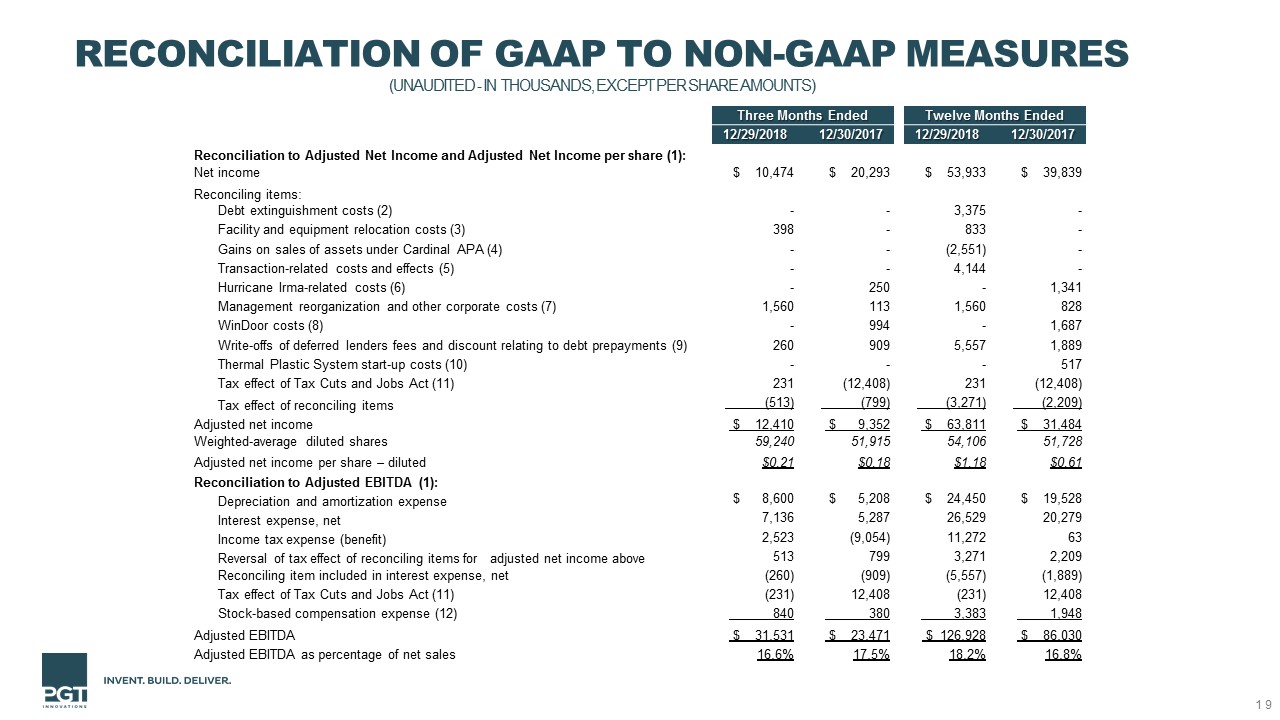
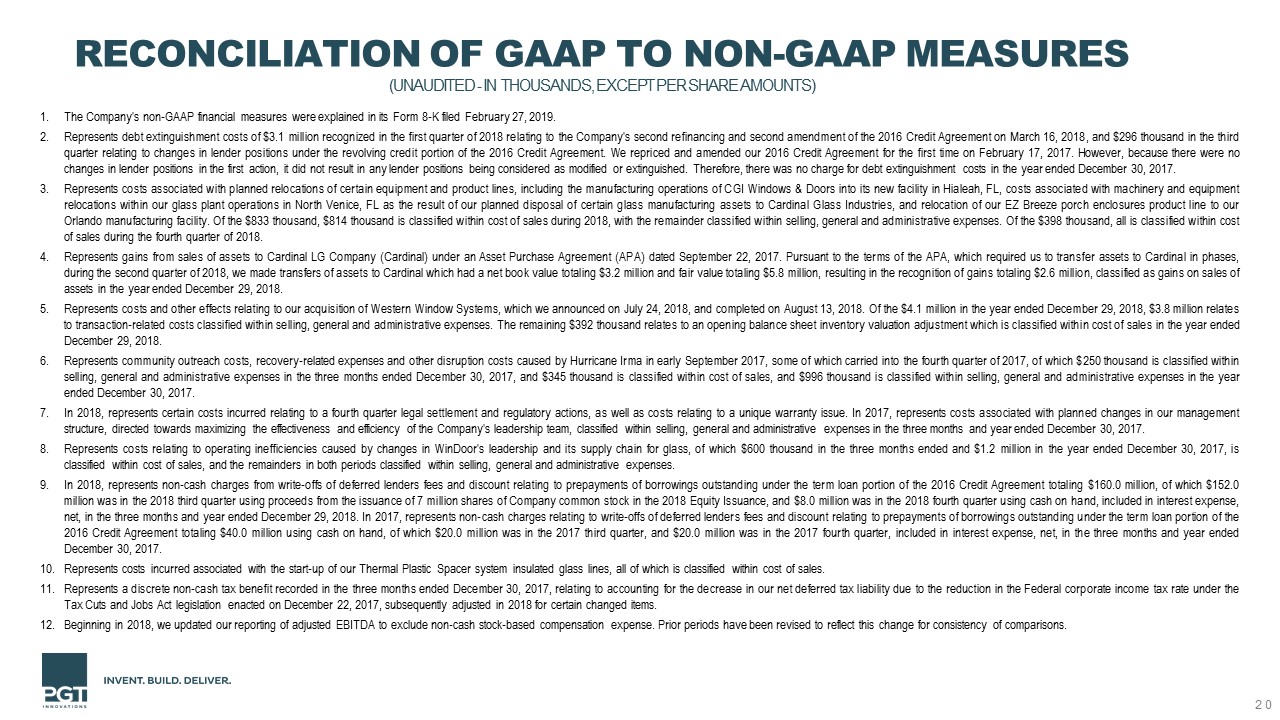
20 The Company's non-GAAP financial measures were explained in its Form 8-K filed February 27, 2019. Represents debt extinguishment costs of $3.1 million recognized in the first quarter of 2018 relating to the Company's second refinancing and second amendment of the 2016 Credit Agreement on March 16, 2018, and $296 thousand in the third quarter relating to changes in lender positions under the revolving credit portion of the 2016 Credit Agreement. We repriced and amended our 2016 Credit Agreement for the first time on February 17, 2017. However, because there were no changes in lender positions in the first action, it did not result in any lender positions being considered as modified or extinguished. Therefore, there was no charge for debt extinguishment costs in the year ended December 30, 2017. Represents costs associated with planned relocations of certain equipment and product lines, including the manufacturing operations of CGI Windows & Doors into its new facility in Hialeah, FL, costs associated with machinery and equipment relocations within our glass plant operations in North Venice, FL as the result of our planned disposal of certain glass manufacturing assets to Cardinal Glass Industries, and relocation of our EZ Breeze porch enclosures product line to our Orlando manufacturing facility. Of the $833 thousand, $814 thousand is classified within cost of sales during 2018, with the remainder classified within selling, general and administrative expenses. Of the $398 thousand, all is classified within cost of sales during the fourth quarter of 2018. Represents gains from sales of assets to Cardinal LG Company (Cardinal) under an Asset Purchase Agreement (APA) dated September 22, 2017. Pursuant to the terms of the APA, which required us to transfer assets to Cardinal in phases, during the second quarter of 2018, we made transfers of assets to Cardinal which had a net book value totaling $3.2 million and fair value totaling $5.8 million, resulting in the recognition of gains totaling $2.6 million, classified as gains on sales of assets in the year ended December 29, 2018. Represents costs and other effects relating to our acquisition of Western Window Systems, which we announced on July 24, 2018, and completed on August 13, 2018. Of the $4.1 million in the year ended December 29, 2018, $3.8 million relates to transaction-related costs classified within selling, general and administrative expenses. The remaining $392 thousand relates to an opening balance sheet inventory valuation adjustment which is classified within cost of sales in the year ended December 29, 2018. Represents community outreach costs, recovery-related expenses and other disruption costs caused by Hurricane Irma in early September 2017, some of which carried into the fourth quarter of 2017, of which $250 thousand is classified within selling, general and administrative expenses in the three months ended December 30, 2017, and $345 thousand is classified within cost of sales, and $996 thousand is classified within selling, general and administrative expenses in the year ended December 30, 2017. In 2018, represents certain costs incurred relating to a fourth quarter legal settlement and regulatory actions, as well as costs relating to a unique warranty issue. In 2017, represents costs associated with planned changes in our management structure, directed towards maximizing the effectiveness and efficiency of the Company's leadership team, classified within selling, general and administrative expenses in the three months and year ended December 30, 2017. Represents costs relating to operating inefficiencies caused by changes in WinDoor's leadership and its supply chain for glass, of which $600 thousand in the three months ended and $1.2 million in the year ended December 30, 2017, is classified within cost of sales, and the remainders in both periods classified within selling, general and administrative expenses. In 2018, represents non-cash charges from write-offs of deferred lenders fees and discount relating to prepayments of borrowings outstanding under the term loan portion of the 2016 Credit Agreement totaling $160.0 million, of which $152.0 million was in the 2018 third quarter using proceeds from the issuance of 7 million shares of Company common stock in the 2018 Equity Issuance, and $8.0 million was in the 2018 fourth quarter using cash on hand, included in interest expense, net, in the three months and year ended December 29, 2018. In 2017, represents non-cash charges relating to write-offs of deferred lenders fees and discount relating to prepayments of borrowings outstanding under the term loan portion of the 2016 Credit Agreement totaling $40.0 million using cash on hand, of which $20.0 million was in the 2017 third quarter, and $20.0 million was in the 2017 fourth quarter, included in interest expense, net, in the three months and year ended December 30, 2017. Represents costs incurred associated with the start-up of our Thermal Plastic Spacer system insulated glass lines, all of which is classified within cost of sales. Represents a discrete non-cash tax benefit recorded in the three months ended December 30, 2017, relating to accounting for the decrease in our net deferred tax liability due to the reduction in the Federal corporate income tax rate under the Tax Cuts and Jobs Act legislation enacted on December 22, 2017, subsequently adjusted in 2018 for certain changed items. Beginning in 2018, we updated our reporting of adjusted EBITDA to exclude non-cash stock-based compensation expense. Prior periods have been revised to reflect this change for consistency of comparisons. Reconciliation of GAAP to NON-gaap MEASURES(unaudited - in thousands, except per share amounts)
- 20 -
- 21 -