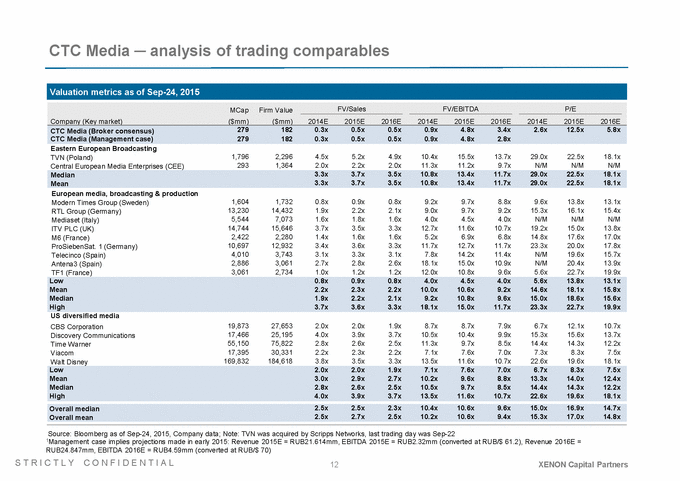
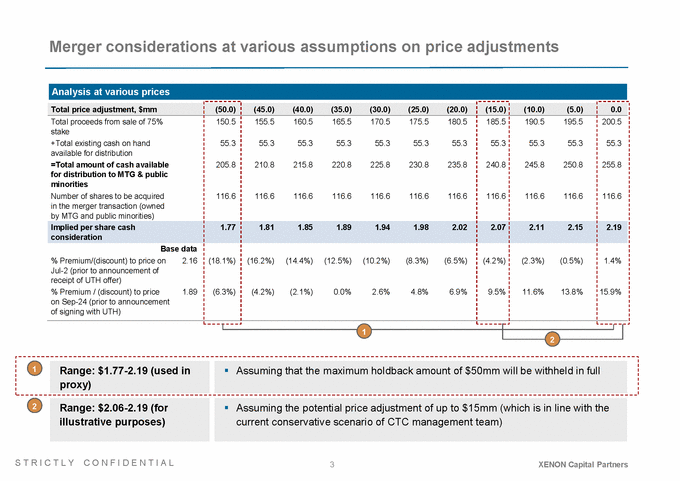
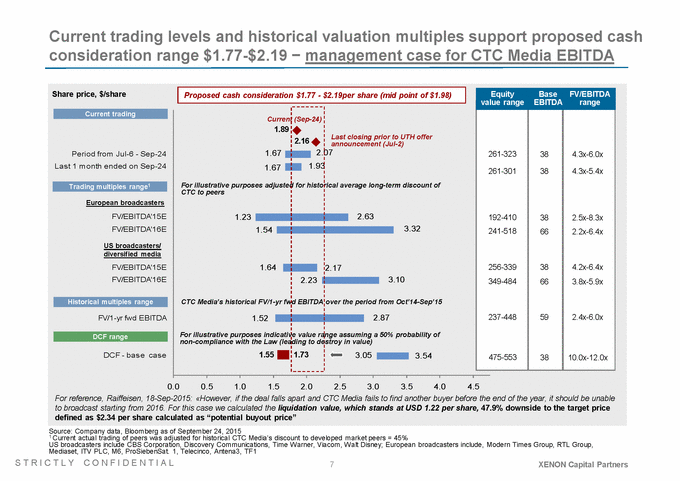
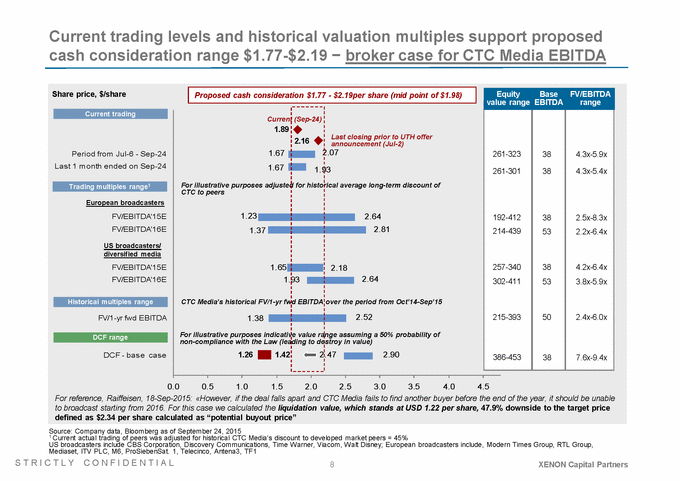
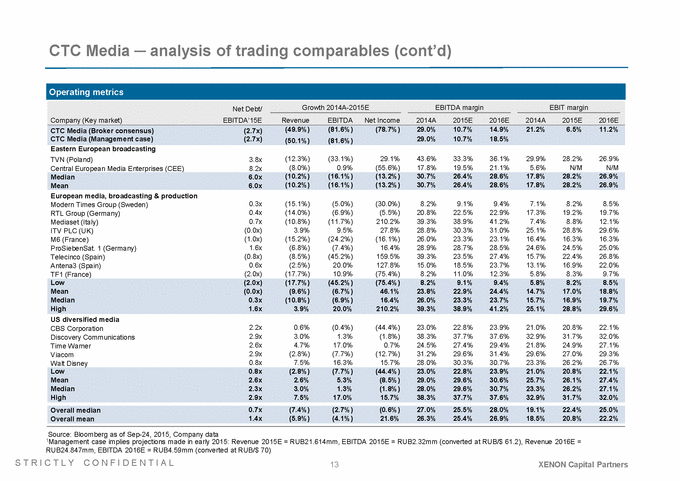
CTC Media analysis of trading comparables Eastern European Broadcasting TVN (Poland) Central European Media Enterprises (CEE) 1,796 293 2,296 1,364 4.5x 2.0x 5.2x 2.2x 4.9x 2.0x 10.4x 11.3x 15.5x 11.2x 13.7x 9.7x 29.0x N/M 22.5x N/M 18.1x N/M European media, broadcasting & production Modern Times Group (Sweden) RTL Group (Germany) Mediaset (Italy) ITV PLC (UK) M6 (France) ProSiebenSat. 1 (Germany) Telecinco (Spain) Antena3 (Spain) TF1 (France) 1,604 13,230 5,544 14,744 2,422 10,697 4,010 2,886 3,061 1,732 14,432 7,073 15,646 2,280 12,932 3,743 3,061 2,734 0.8x 1.9x 1.6x 3.7x 1.4x 3.4x 3.1x 2.7x 1.0x 0.9x 2.2x 1.8x 3.5x 1.6x 3.6x 3.3x 2.8x 1.2x 0.8x 2.1x 1.6x 3.3x 1.6x 3.3x 3.1x 2.6x 1.2x 9.2x 9.0x 4.0x 12.7x 5.2x 11.7x 7.8x 18.1x 12.0x 9.7x 9.7x 4.5x 11.6x 6.9x 12.7x 14.2x 15.0x 10.8x 8.8x 9.2x 4.0x 10.7x 6.8x 11.7x 11.4x 10.9x 9.6x 9.6x 15.3x N/M 19.2x 14.8x 23.3x N/M N/M 5.6x 13.8x 16.1x N/M 15.0x 17.6x 20.0x 19.6x 20.4x 22.7x 13.1x 15.4x N/M 13.8x 17.0x 17.8x 15.7x 13.9x 19.9x US diversified media CBS Corporation Discovery Communications Time Warner Viacom Walt Disney 19,873 17,466 55,150 17,395 169,832 27,653 25,195 75,822 30,331 184,618 2.0x 4.0x 2.8x 2.2x 3.8x 2.0x 3.9x 2.6x 2.3x 3.5x 1.9x 3.7x 2.5x 2.2x 3.3x 8.7x 10.5x 11.3x 7.1x 13.5x 8.7x 10.4x 9.7x 7.6x 11.6x 7.9x 9.9x 8.5x 7.0x 10.7x 6.7x 15.3x 14.4x 7.3x 22.6x 12.1x 15.6x 14.3x 8.3x 19.6x 10.7x 13.7x 12.2x 7.5x 18.1x Source: Bloomberg as of Sep-24, 2015, Company data; Note: TVN was acquired by Scripps Networks, last trading day was Sep-22 1Management case implies projections made in early 2015: Revenue 2015E = RUB21.614mm, EBITDA 2015E = RUB2.32mm (converted at RUB/$ 61.2), Revenue 2016E = RUB24.847mm, EBITDA 2016E = RUB4.59mm (converted at RUB/$ 70) S T R I C T L Y C O N F I D E N T I A L 12 XENON Capital Partners Overall median 2.5x 2.5x 2.3x 10.4x 10.6x 9.6x 15.0x 16.9x 14.7x Overall mean 2.5x 2.7x 2.5x 10.2x 10.6x 9.4x 15.3x 17.0x 14.8x Low 2.0x 2.0x 1.9x 7.1x 7.6x 7.0x 6.7x 8.3x 7.5x Mean 3.0x 2.9x 2.7x 10.2x 9.6x 8.8x 13.3x 14.0x 12.4x Median 2.8x 2.6x 2.5x 10.5x 9.7x 8.5x 14.4x 14.3x 12.2x High 4.0x 3.9x 3.7x 13.5x 11.6x 10.7x 22.6x 19.6x 18.1x Low 0.8x 0.9x 0.8x 4.0x 4.5x 4.0x 5.6x 13.8x 13.1x Mean 2.2x 2.3x 2.2x 10.0x 10.6x 9.2x 14.6x 18.1x 15.8x Median 1.9x 2.2x 2.1x 9.2x 10.8x 9.6x 15.0x 18.6x 15.6x High 3.7x 3.6x 3.3x 18.1x 15.0x 11.7x 23.3x 22.7x 19.9x Median 3.3x 3.7x 3.5x 10.8x 13.4x 11.7x 29.0x 22.5x 18.1x Mean 3.3x 3.7x 3.5x 10.8x 13.4x 11.7x 29.0x 22.5x 18.1x MCap Company (Key market) ($mm) Firm Value ($mm) FV/Sales FV/EBITDA P/E 2014E 2015E 2016E 2014E 2015E 2016E 2014E 2015E 2016E CTC Media (Broker consensus) CTC Media (Management case) 279 182 0.3x 0.5x 0.5x 0.9x 4.8x 3.4x 2.6x 12.5x 5.8x 279 182 0.3x 0.5x 0.5x 0.9x 4.8x 2.8x Valuation metrics as of Sep-24, 2015
