Harland Clarke Holdings Corp.
November 15, 2007

Forward looking statements
Certain information in this presentation may be considered forward-looking information within the earnings of the Private Securities Litigation Reform Act of 1995. This information is based on the Company's current expectations and actual results could vary materially depending on risks and uncertainties that may affect the Company's operations, markets, services, prices and other factors as discussed in filings with the Securities and Exchange Commission. These risks and uncertainties include, but are not limited to, general and economic conditions, failure to complete, integrate and/or realize the cost savings from our acquisition of Harland, and declines in the market in which we participate. There is no assurance that the Company's expectations will be realized. All forward looking statements speak only as of the date of this presentation. All subsequent written and oral forward-looking statements attributable to us or any person acting on our behalf are qualified by the cautionary statements in this section. The Company assumes no obligation to update any forward-looking information contained in this presentation.
2
Introductions
Over 30 years of
experience in the
security printing
industry
Over 14 years with
Clarke
Former Chief Executive
Officer of Rocky
Mountain Bank Note
Spent 16 years at
Harland
Chuck Dawson
President & CEO,
Harland Clarke Holdings
30 years of experience
in technology with over
20 years in the financial
industry
Former President and
CEO positions at Fiserv,
Hogan Systems, MPCT
Capital Markets and
System Corporation
John O’Malley
President,
Harland Financial Solutions
Former Chief Financial
Officer of Honeywell’s
Aircraft Landing
Systems business
Peter Fera
EVP & CFO,
Harland Clarke Holdings
3
World class
operations
Leading market
presence
Diversified,
blue-chip
client portfolio
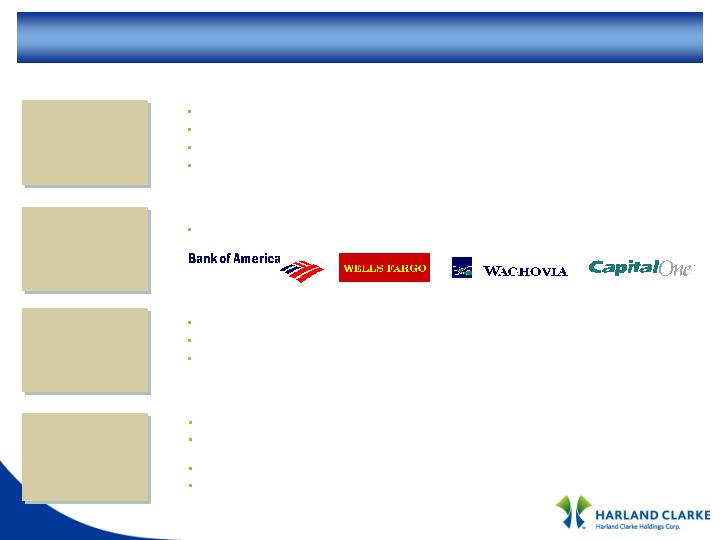
A leading provider of checks & office products and marketing & contact center services
A leading provider of software and services to financial institutions
A leading provider of testing and survey technologies
$1.7 billion in combined LTM revenues
Over 14,000 financial institutions clients such as:
Harland Clarke: 5 contact centers and 16 plants, supported by a national sales organization
Harland Financial Solutions: 16 fully networked facilities focused on customer support and
enhancement of software solutions
Scantron: 2 state-of-the-art facilities supported by a national sales organization
2001 Malcolm Baldrige National Quality Award winner
Strong, long-
term client
relationships
Trusted, integrated relationships with clients
Provider of mission-critical software products
Strong partnerships with long-term contracts – 80% of revenue under long-term contract
Harland Clarke Holdings
4
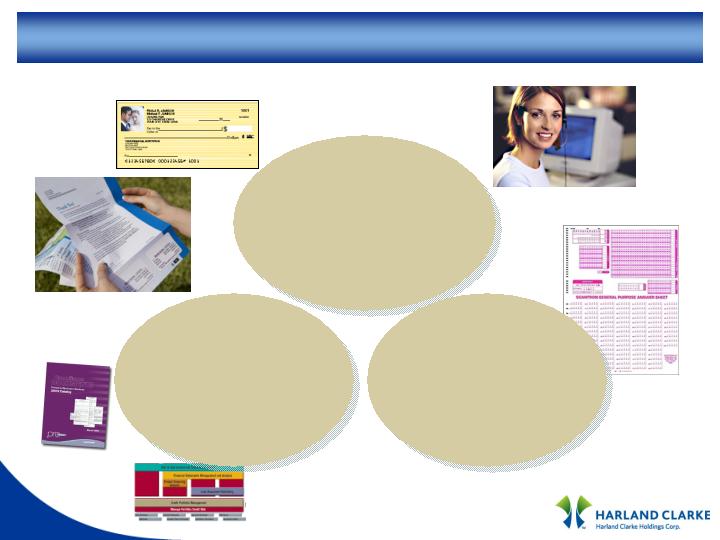
Harland Clarke
Checks and office
products and marketing
and contact center
services for financial and
commercial institutions
Scantron
Testing and surveys for
schools and businesses
Harland Financial
Solutions
Software and services
for banks, credit unions
and thrifts
What we do
5

Harland & Clarke: A compelling strategic combination
Diversified business and product lines
Diversified and expanded client relationships with long-term contracts
Significant cost savings
Strong management team
Strong free cash flow generation
6
Diversified business and product lines
Combined business has four major product lines
Checks and office products
Marketing and contact center services
Software and related services
Testing and survey solutions
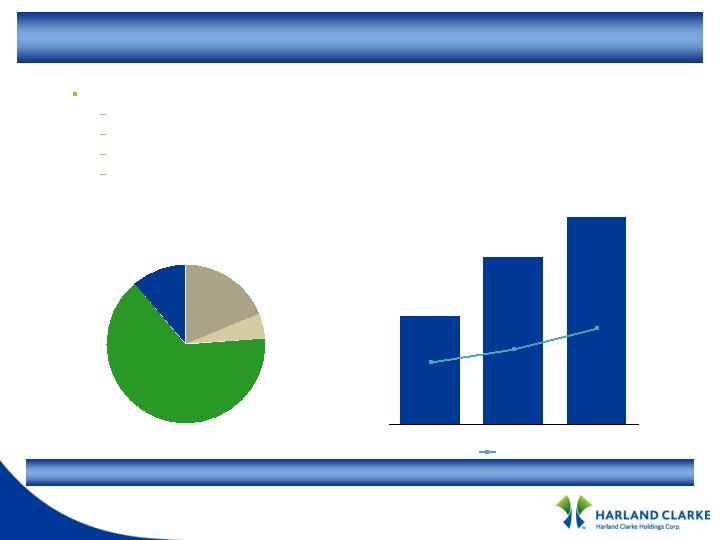
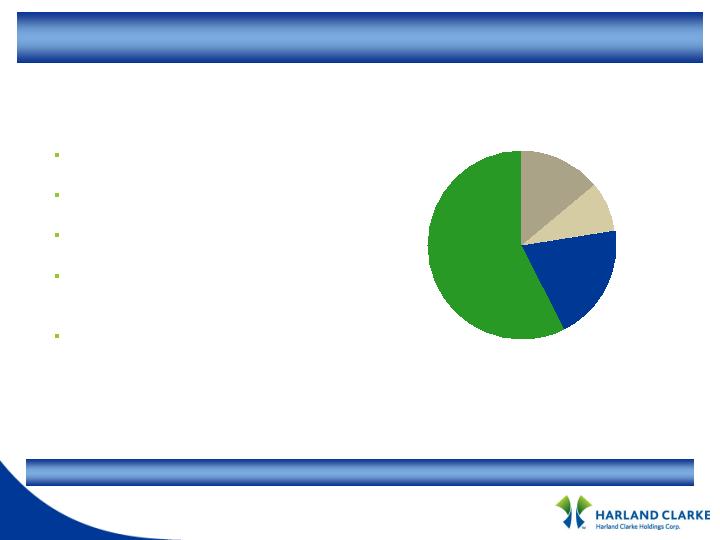
$1.7 billion
Checks
and Office
Products
65%
Testing and
Survey
5%
Software
19%
Marketing &
Contact Centers
and Forms
11%
2006 Revenue
$586
$378
45%
35%
29%
2002
2006
5 Year Target
% of Total Sales
Revenue for Non-Check Products
Value proposition is more than a “check provider” for financial institutions
7
Diversified and expanded client relationships
Approximately 80% of revenue is under long-term contracts
8
Cost savings originally planned
Facilities $15.5 million
Procurement $9.8 million
Shared services $22.7 million
Other SG&A $64.6 million
Total savings $112.6 million
Facilities
14%
Procurement
9%
Shared Services
20%
Other SG&A
57%
On target to achieve $112.6 million in synergies
Significant cost savings
9
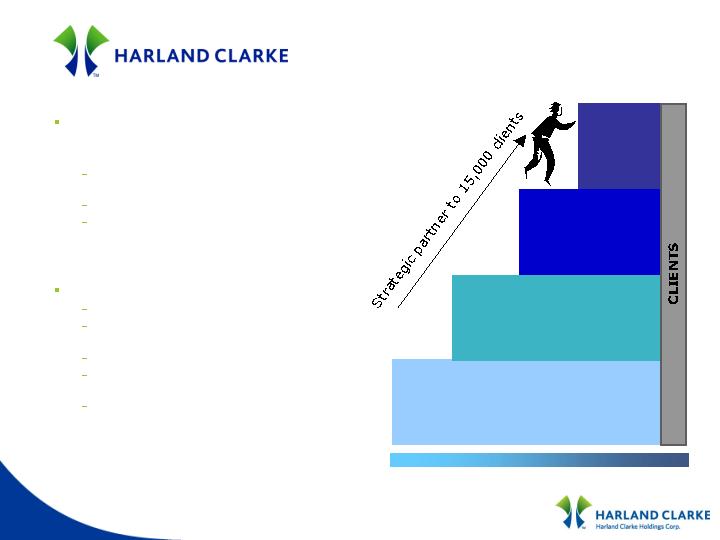
A leading provider of checks and office
products and marketing and contact
center services
15,000 financial and commercial institution
clients
85% of revenues under long-term contract
More than 20 million annual direct customer
contacts through contact centers and
websites
Diverse product and service offerings
Personal and business checks
Address labels, self-inking stamps,
checkbook covers, registers
Financial and business forms
Deposit products including deposit tickets,
security bags, cash straps, coin wraps
Marketing services including onboarding,
direct mail, contact center and agency
solutions
Strategic
partner
Partner
Supplier
Vendor
10
Harland Clarke financial performance
(1) Combined revenue is the sum of the revenues of the Harland Clarke segment (which consists of only Clarke American revenues prior to May 1, 2007), plus revenues of Harland’s Printed Products segment for periods prior to the completion of the Harland Acquisition on May 1, 2007, plus an adjustment to add back $0.5 million purchase accounting fair value adjustments of deferred revenue for LTM 9/30/2007, minus revenue from intersegment transactions.
(2) Combined Adjusted EBITDA is the sum of the operating income of the Harland Clarke segment (which consists of only Clarke American operating income prior to May 1, 2007), plus the operating income of Harland’s Printed Products segment for periods prior to the completion of the Harland Acquisition on May 1, 2007, plus combined depreciation and amortization (other than amortization of upfront contract payments), plus adjustments to add back (i) purchase accounting fair value adjustments of inventory and deferred revenue, (ii) Harland Acquisition-related expenses, (iii) intangible asset impairment (iv) a contingent earnout payment, and (v) restructuring expenses.
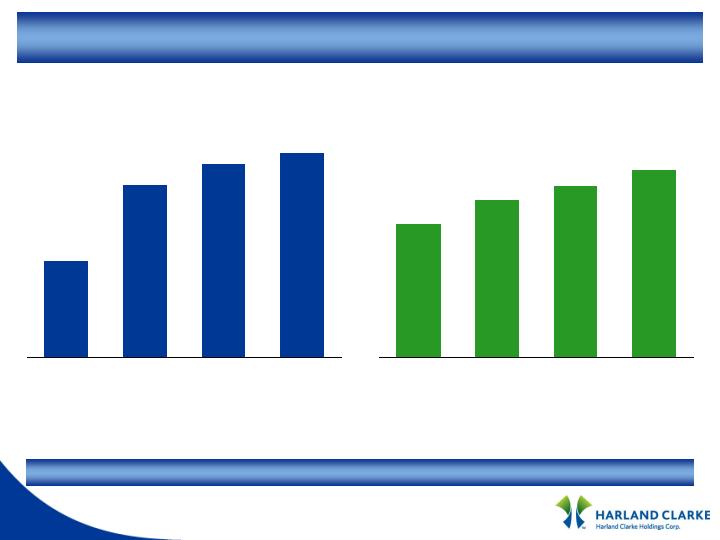
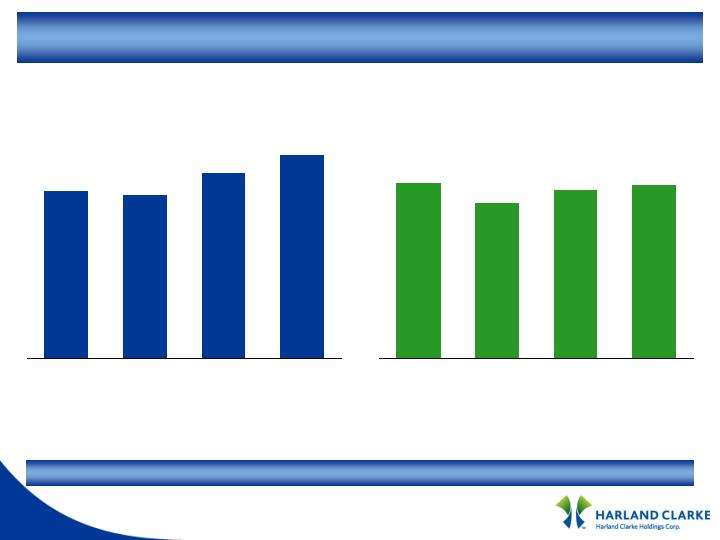
LTM 2007 revenue and adj. EBITDA up 1.7% and 9.9%, respectively
$ in millions
Combined Revenue(1)
$1,088
$1,234
$1,274
$1,296
2004
2005
2006
LTM 9/30/07
$ in millions
Margin 21.0% 22.0% 23.1% 24.9%
Combined Adjusted EBITDA(2)
$229
$271
$294
$323
2004
2005
2006
LTM 9/30/07
11

Harland Clarke
(1) For periods prior to May 1, 2007, consists of the operating income of Clarke American Corp.
(2) Consists of the operating income of the printed products segment of John H. Harland Company for periods prior to May 1, 2007
The table below presents a reconciliation of (x) the combined operating income of the Harland Clarke segment and John H. Harland Company's printed products segment to (y) combined adjusted EBITDA for 2004, 2005, 2006 and the twelve months ended September 30, 2007.
Harland Clarke
2004
2005
2006
LTM 9/30/07
Harland Clarke operating income (1)
$
107.0
$
78.3
$
87.0
$
141.1
Harland Printed Products segment operating income (2)
63.6
98.4
111.7
53.4
Combined operating income
170.6
176.7
198.7
194.5
D&A (other than upfront contract payments amort)
52.0
85.2
89.3
100.8
Purchase accounting related fair value adjustments
-
4.9
1.3
2.0
Harland Acquisition expenses
-
-
-
15.4
Intangible asset impairment costs
-
-
-
3.1
Contingent earnout payment
-
1.9
1.1
0.4
Restructuring expenses
6.5
2.4
3.3
6.4
Combined adjusted EBITDA
$
229.1
$
271.0
$
293.7
$
322.6
12
A leading supplier of software and services
to financial institutions
Core processing
Retail solutions (branch, teller, call center)
Lending compliance
Mortgage origination
High switching costs associated with
switching integrated software providers
Contracts: license (33%); subscriptions
(37%); service (30%)
Sell to 39% of all financial institutions in the
US
Top 20 customers < 6% of revenue
Recurring revenue for 75% of sales
Customer Mix
7%
4%
19%
31%
39%
Banks
3,108
Other
1,449
Credit Unions
2,388
Thrifts
509
Mortgage Co.
310
Total 7,764
Revenue growth is primarily driven by the growth of financial institutions’ assets
13
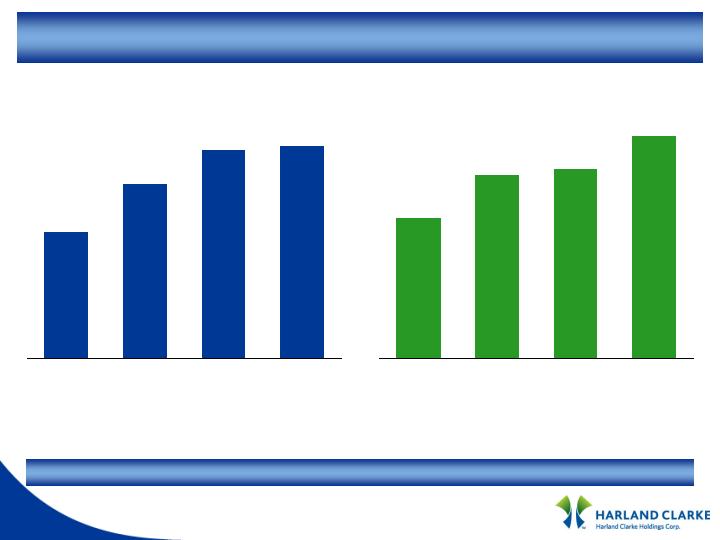
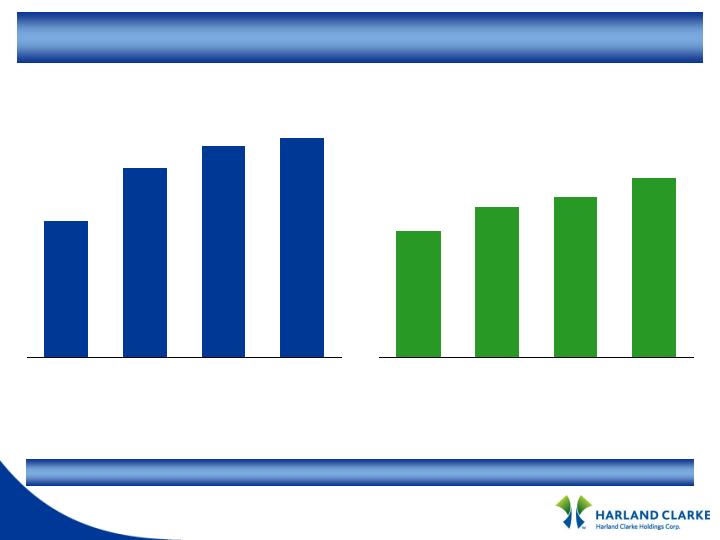
HFS financial performance
$ in millions
$235
$287
$322
$328
2004
2005
2006
LTM 9/30/07
Revenue(1)
$ in millions
$45
$59
$61
$71
2004
2005
2006
LTM 9/30/07
Margin 19.1% 20.6% 18.9% 21.6%
Adjusted EBITDA(2)
LTM 2007 revenue and adj. EBITDA up 1.9% and 16.4%, respectively
(1) Revenue is adjusted to add back $6.4 million purchase accounting fair value adjustments of deferred revenue for LTM 9/30/07, minus revenue from intersegment transactions.
(2) Adjusted EBITDA consists of operating income, plus combined depreciation and amortization, plus adjustments to add back (i) the effect of purchase accounting fair value adjustments of inventory and deferred revenue and (ii) Harland Acquisition-related expenses.
14

HFS
The table below presents a reconciliation of the operating income of the Harland Financial Solutions segment to adjusted EBITDA for 2004, 2005, 2006 and the twelve months ended September 30, 2007.
Consists of the operating income of the Harland Financial Solutions segment (for periods following the completion of the Harland Acquisition on May 1, 2007) and the operating income of Harland’s software and services segment (for periods prior to May 1, 2007)
Harland Financial Solutions
2004
2005
2006
LTM 9/30/07
Operating income (1)
$
32.6
$
42.4
$
42.9
$
18.6
D&A
12.4
16.4
17.9
22.0
Purchase accounting related fair value adjustments
-
-
-
6.4
Harland Acquisition expenses
-
-
-
24.3
Adjusted EBITDA
$
45.0
$
58.8
$
60.8
$
71.3
(1)
15
Strong brand recognition
A leading testing provider for over 34 years
Razor blade model
Provide patent protected scanner to school
Sales of forms create annuity-like revenue
stream
Large installed base
80%+ of all public schools
38,000 scanning machines
Customer diversification
100,000 accounts
Largest account approximately 2% of
revenue
Focus on being a leading provider of
enterprise-wide testing and surveying
technology
School Forms and Testing
Surveys, Forms, and Processing
16
Scantron financial performance
LTM 2007 revenue and adj. EBITDA up 2.6% and 4.0%, respectively
$ in millions
$75
$74
$78
$80
2004
2005
2006
LTM 9/30/07
Revenue(1)
$ in millions
$26
$23
$25
$26
2004
2005
2006
LTM 9/30/07
Margin 34.7% 31.1% 32.1% 32.5%
Adjusted EBITDA(2)
(1) Revenue is adjusted to add back $1.4 million purchase accounting fair value adjustments of deferred revenue for LTM 9/30/07, minus revenue from intersegment transactions.
(2) Adjusted EBITDA consists of operating income, plus combined depreciation and amortization, plus adjustments to add back (i) the effect of purchase accounting fair value adjustments of inventory and deferred revenue and (ii) Harland Acquisition-related expenses.
17

Scantron
The table below presents a reconciliation of the operating income of the Scantron segment to adjusted EBITDA for 2004, 2005, 2006 and the twelve months ended September 30, 2007.
(1) Consists of the operating income of the Scantron segment
Scantron
2004
2005
2006
LTM 9/30/07
Operating income (1)
$
22.7
$
20.3
$
21.9
$
8.3
D&A
3.5
2.9
3.3
8.0
Purchase accounting related fair value adjustments
-
-
-
4.4
Harland Acquisition expenses
-
-
-
5.1
Adjusted EBITDA
$
26.2
$
23.2
$
25.2
$
25.8
18

Harland Clarke Holdings financial highlights
Strong historical financial performance
High EBITDA margins
Low working capital requirements
Efficient deployment of capital
Significant cash flow generation
19

(1) As reported; reflects five months of the Harland acquisition.
(2) Adjustments to EBITDA are net of upfront contract payment amortization and adds back purchase accounting related fair value adjustments to inventory and deferred revenue, restructuring expenses,
transaction-related expense, intangible asset impairment, and a contingent earn-out payment related to a prior transaction. Adjusted EBITDA for these periods is reconciled in Harland Clarke Holdings 8-k
dated November 9, 2007.
Harland Clarke Holdings 3-mos. and 9-mos. 2007
Revenue
$
155.3
$
432.8
$
474.4
$
937.0
Adjusted EBITDA
(2)
$
37.2
$
113.5
$
113.0
$
236.9
Margin
24.0
%
26.2
%
23.8
%
25.3
%
3 mos. ended
9/30/06
3 mos. ended
(1)
9/30/07
9 mos. ended
9/30/06
9 mos. ended
(1)
9/30/07
20
Harland Clarke Holdings financial performance
LTM 2007 revenue and adj. EBITDA up 1.8% and 11.3%, respectively
Combined Revenue(1)
$ in millions
$1,398
$1,595
$1,674
$1,704
2004
2005
2006
LTM 9/30/07
$ in millions
Combined Adjusted EBITDA(2)
(1) Combined revenue is the sum of the revenues of Harland Clarke Holdings (which consists of only Clarke American revenues prior to May 1, 2007), plus revenues of John H. Harland Company for periods prior to the completion of the Harland Acquisition on May 1, 2007, plus an adjustment to add back $8.2 million purchase accounting fair value adjustments of deferred revenue for LTM 9/30/07.
(2) Combined Adjusted EBITDA is the sum of the consolidated net income of Harland Clarke Holdings (which consisted only of Clarke American’s net income prior to May 1, 2007) plus the consolidated net income of John H. Harland Company for periods prior to the completion of the Harland Acquisition on May 1, 2007, before combined net interest expense, combined income taxes and combined depreciation and amortization (other than amortization related to upfront contract payments), plus adjustments to add back (i) purchase accounting fair value adjustments of inventory and deferred revenue, (ii) Harland Acquisition-related expenses, (iii) intangible asset impairment (iv) a contingent earnout payment, and (v) restructuring expenses.
$273
$323
$346
$385
2004
2005
2006
LTM 9/30/07
Margin 19.5% 20.3% 20.7% 22.6%
21

Harland Clarke Holdings Corp.
The table below presents a reconciliation of (x) the combined consolidated net income of Harland Clarke Holdings and John H. Harland Company to (y) combined adjusted EBITDA for 2004, 2005, 2006 and the twelve months ended September 30, 2007.
(1) For periods prior to May 1, 2007, consists of the consolidated net income of Clarke American Corp.
(2) Consists of the consolidated net income of John H. Harland Company for periods prior to May 1, 2007.
Harland Clarke Holdings Corp.
2004
2005
2006
LTM 9/30/07
Harland Clarke Holdings consolidated net income (1)
$
64.4
$
40.7
$
19.5
$
(23.0)
John H. Harland consolidated net income (2)
55.1
75.5
68.1
(37.3)
Combined consolidated net income
119.5
116.2
87.6
(60.3)
Combined net interest expense
23.2
20.8
76.1
132.8
Combined Income tax expense
56.2
73
49.2
(29.4)
Other expenses
(0.9)
(0.4)
3.8
57.7
Combined D&A (other than upfront contract payments amort)
68.2
104.5
110.7
131.1
Purchase accounting related fair value adjustments
-
4.9
1.3
12.8
Harland Acquisition expenses
-
-
12.6
130.9
Intangible asset impairment costs
-
-
-
3.1
Contingent earnout payment
-
1.9
1.1
0.4
Restructuring expenses
6.5
2.4
3.3
6.4
Combined adjusted EBITDA
$
272.7
$
323.3
$
345.7
$
385.5
22

Harland Clarke Holdings credit strength
YTD cash flow from operations(1) $130.0 million
Cash on hand & nbsp; $187.3 million
Net debt(2) &nbs p; $2,227.5 million
LTM Full Synergies Combined Adjusted EBITDA(3) $481.5 million
Net debt / LTM full synergies adj. EBITDA 4.6x
LTM full synergies adj. EBITDA / PF interest(4) 2.3x
9/30/2007
(1) As reported; reflects five months of the Harland acquisition.
(2) Net debt equals total debt of $2,414.8 million less cash on hand.
(3) Combined Adjusted EBITDA for Harland Clarke Holdings Corp. (as reconciled on slide 24) plus an adjustment to reflect the full $112.6 million of annual run-rate synergies described previously. No
pro forma adjustments were made.
(4) PF interest of $210.5 million reflects one year of interest on total debt as of 9/30/2007 at an assumed blended rate of 8.7% per annum.
23