united states
securities and exchange commission
washington, d.c. 20549
form n-csr
certified shareholder report of registered management
investment companies
Investment Company Act file number 811-21872
Mutual Fund Series Trust
(Exact name of registrant as specified in charter)
225 Pictoria Drive, Suite 450, Cincinnati, Ohio 45246
(Address of principal executive offices) (Zip code)
CT CORPORATION SYSTEM
1300 EAST NINTH STREET, CLEVELAND, OH 44114
(Name and address of agent for service)
Registrant's telephone number, including area code: 631-470-2619
Date of fiscal year end: 9/30
Date of reporting period: 9/30/20
ITEM 1. REPORTS TO SHAREHOLDERS.

| Empiric 2500 |
| Fund |
| Annual Report |
| September 30, 2020 |
Beginning January 1, 2021, the Fund intends to meet its shareholder report delivery obligations by posting annual and semi-annual shareholder reports to the Fund’s website, www.empiricfunds.com rather than delivering paper copies. You will be notified by mail each time a report is posted and provided with the website link to access the report. You may elect to receive paper copies of a specific shareholder report or all future shareholder reports free of charge by contacting your financial intermediary (such as a broker-dealer or bank) or, if you are a direct investor, by following the instructions included with this annual report. If you already elected to receive shareholder reports electronically, you will not be affected by this change and you do not need to do anything.
Fellow Shareholders,
The NAV of the Fund’s Class “A” shares on September 30, 2020 was $45.46 per share. Cumulative and annualized returns are below.
| Class A | Class A | |||
| (No Sales | (Max 5.75% | |||
| Ended 09.30.20 | Charges) | Charge | Class C | Benchmark1 |
| Annual Returns % | ||||
| Since Inception (A) | 8.69 | 8.43 | — | 9.31 |
| Since Inception (C) | — | — | 4.87 | 9.40 |
| Last 10 Years | 8.86 | 8.22 | 8.04 | 13.74 |
| Last 5 Years | 9.29 | 8.01 | 8.47 | 14.15 |
| Short-term Returns % | ||||
| Last 3 Months | 7.14 | 0.98 | 6.93 | 6.24 |
| Last 6 Months | 40.31 | 32.23 | 39.79 | 35.72 |
| Last 12 Months | 12.33 | 5.87 | 11.48 | 1.76 |
| Net Expense Ratio | 2.13 | 2.13 | 2.88 | — |
| 1 | Prior to 09/30/2013, the Benchmark Index is the S&P 500. For periods after 09/30/2013, the Benchmark Index is the Bloomberg 2500. For comparisons periods that straddle 09/30/2013, we use the S&P 500. For periods after 09/30/2013, we use the Bloomberg 2500. |
Performance data quoted represents past performance which does not guarantee future results. Investment returns and principal will fluctuate so that an investor’s shares, when redeemed, may be worth more or less than original cost. Current performance may be lower or higher than the performance quoted. To obtain performance to the most recent month-end, please call 1.800.880.0324, or visit our website at www.EmpiricFunds.com. Class C shares redeemed within 12 months of purchase are subject to a maximum CDSC of 1.00%. Performance data shown with Max 5.75% charge reflects the maximum sales charge. Performance data shown with no sales charges does not reflect current maximum sales charge. Had the sales charges been included, the Fund’s returns would have been lower. Inception date for the Class A shares is 11/06/1995 and for the Class C shares 10/07/2005.
9175-NLD-11/03/2020
1
From the peak February 19, 2020 to the trough March 23, 2020—a mere 23 trading days—the S&P 500 dropped 36.2%, marking the fastest bear market in history (bear market is a drop of 20% or more).
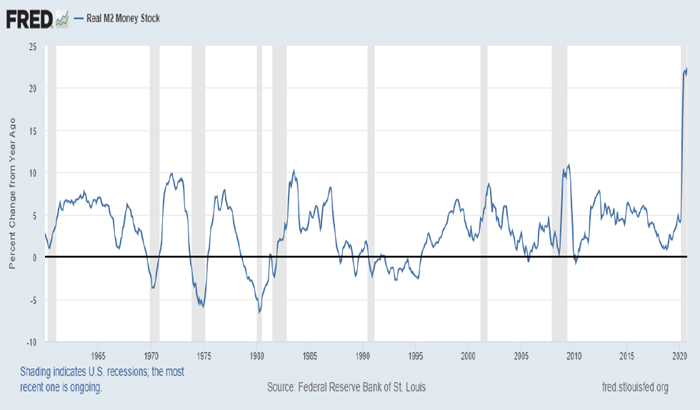
On March 15th, the Federal Reserve went into high gear and cut short interest rates to zero, started buying bonds, increased the frequency of swap lines with other central banks, lowered the Discount Window interest rate encouraging banks to borrow, reduced the Reserve Requirement to zero to support more bank lending, and released guidance for banks to use their buffers in the crisis—all in a single day. In the next seven days, the US Treasury created a Special Purpose Vehicle (SPV) which was leveraged by the Fed to buy commercial paper from US issuers, make loans to primary dealers, make non-recourse loans to money market funds, make direct loans for asset backed securities and buy bonds in the primary market and secondary markets1—all this by March 23, the stock market bottom. Just reading that is exhausting!
Driven by a tsunami of liquidity, the S&P 500 from the trough March 23 through September 30 has risen 50%, marking the fastest recovery in history. Clearly, the Fed’s quick, effective, and heroic actions made the difference. In the chart below, you can see a dramatic year-over-year increase in the money supply, pretty much off the chart.
| 1 | “The Federal Reserve’s Actions to Address the Coronavirus Crisis”, DavisPolk, March 23, 2020. |
9175-NLD-11/03/2020
2
For stocks, we think that the increase in liquidity will overwhelm most other challenges in politics, the economy and COVID-19. Stocks should be on solid footing if the liquidity stays in place. And we think it will. According to the head of the Fed, Jerome Powell, “We’re not even thinking about thinking about raising rates.” Additionally, the Fed has announced that they are targeting an “average” inflation rate of 2%, which indicates inflation may run higher than 2% for extended periods. The liquidity runway looks long!
In a very strange year, the economy is producing some good news—not all the news is negative!
-The overwhelming liquidity along with the work from home movement is driving mortgage demand up by 40%. Sales of newly built homes surged by 32% in October. New homes purchases are followed by new furniture purchases and other spending.
9175-NLD-11/03/2020
3
-Jobless claims while still unacceptably high have fallen dramatically. From a high in late March of almost 7 million, they have fallen to 751,000 in October. Prior to COVID-19 weekly claims were running about 216 thousand a week. More work needs to be done to get back to 216 thousand a week.
-Third quarter GDP rose 32% versus the drop in the second quarter of 31.4%—great, but the economy still has further to go for a complete recovery.
-The latest consumer sentiment reading of 81.2 for October exceeds September’s reading of 80.4, and August’s reading of 74.1 The pandemic low for consumer sentiment was 71.8 in April.
Of course, there is much bad news too, but since bad news is hammered home on the nightly news and in most news articles, we suspect you have had enough.
While the tsunami of liquidity we think will overwhelm just about every unpleasant event, how COVID-19 waxes and wanes will have short-term impacts on the markets.
9175-NLD-11/03/2020
4
The following chart shows that COVID-19 waxing and waning. The most recent data show new virus cases hitting new highs.
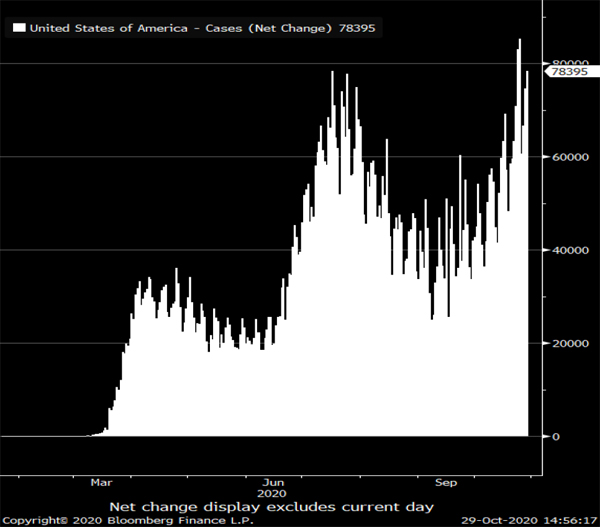
Progress in tamping down COVID-19 infections directly impacts the economy. Currently, we are hitting new highs of reported infections, which seems to be the case with Europe also.
Many, many companies are vying for a vaccine solution to COVID-19. The chart below shows the number of companies trying to create a vaccine and the participants in the clinical trials.
9175-NLD-11/03/2020
5
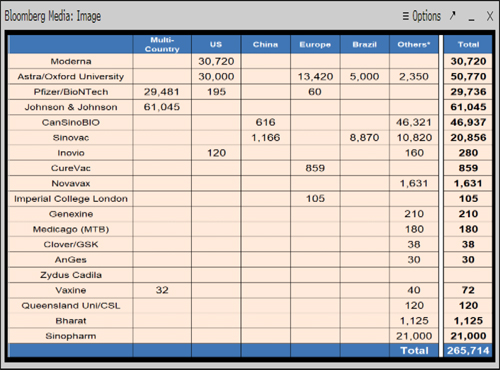
Bloomberg Intelligence, Sam Fazeli, “Disclosed Clinical Trial Participants”, 08/31/2020.
Several of the companies above are already in Phase III clinical trials, the last stage before release if the drug works. With lots of drug companies trying to get out a vaccine, we are optimistic at least one or more will succeed. The odds are good the FDA will approve a vaccine before the end of this year.
Much will be thrown at markets in the next year. We have a possibility of a substantial change in government policies, the Fed’s new inflation experiment, the coarseness of society and politics, COVID-19 and its unpredictable path, and finally, we think, the possibility of an election that may not be decided on election night. That warning comes from
9175-NLD-11/03/2020
6
New York’s primary elections, which after six weeks still had not been fully decided. The culprit—insufficient coordination between the state and the Postal Service, and lack of infrastructure to process huge numbers of mail in ballots. As one New York election official told The Altlantic reporter Edward-Isaac Dovere, “This is what happens when you jury-rig a system that hasn’t been designed or implemented or tested before2.” One in five New York had their votes tossed out. Are other states better prepared than New York for huge numbers of mail in ballots? We certainly hope so, though count us skeptical.
Still, despite several unpleasant possibilities, we think the tsunami of liquidity will keep stocks moving up over the next two or three years, but there will be volatility.
We appreciate you investing along with us.
Respectfully submitted,
| Mark A Coffelt | Loren M Coffelt |
| Co-Portfolio Manager | Co-Portfolio Manager |
| 2 | “The Chaos in New York Is a Warning,” The Atlantic, by Edward-Isaac Dovere, July 24, 2020. |
9175-NLD-11/03/2020
7
| Top 6 Month | Bottom 6 Month | |
| Contributors to Performance | Detractors from Performance | |
| Digital Turbine | Conformis | |
| Waitr Holdings | EventBrite | |
| Chemocentryx | Kura Sushi USA | |
| Generac Holdings | Insperity | |
| Docusign | Gogo |
9175-NLD-11/03/2020
8
| Empiric 2500 Fund |
| PORTFOLIO REVIEW (Unaudited) |
| September 30, 2020 |
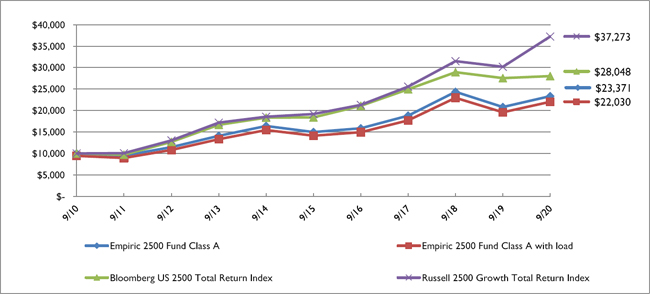
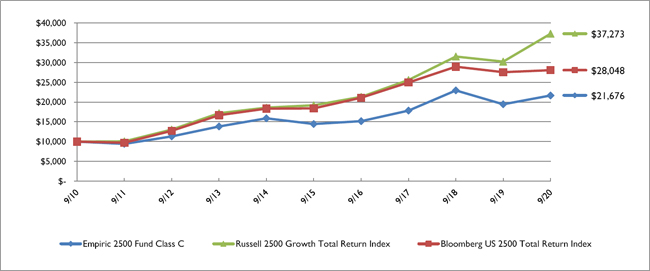
Average Annual Total Return through September 30, 2020*, as compared to its benchmarks:
| 1 Year Return | 5 Year Return | 10 Year Return | Since Inception (a) | |
| Empiric 2500 Fund Class A | 12.33% | 9.29% | 8.86% | 8.69% |
| Empiric 2500 Fund Class A with Load (b) | 5.87% | 8.01% | 8.22% | 8.43% |
| Bloomberg US 2500 Total Return Index(c) | 1.76% | 8.81% | 10.87% | N/A |
| Russell 2500 Growth Total Return Index(d) | 23.37% | 14.19% | 14.06% | 9.13% |
| * | The performance data quoted here represents past performance. Current performance may be lower or higher than the performance data quoted above. Investment return and principal value will fluctuate, so that shares, when redeemed, may be worth more or less than their original cost. The returns shown do not reflect the deduction of taxes that a shareholder would pay on Fund distributions or on the redemptions of Fund shares. Past performance is no guarantee of future results. The Advisor and the Trust, with respect to the Fund, have entered into an Expense Limitation Agreement under which the Advisor has contractually agreed to waive fees and/or reimburse expenses but only to the extent necessary so that total annual operating expenses, excluding front-end or contingent deferred loads, taxes, leverage interest, brokerage fees and commissions, expenses incurred in connection with any merger or reorganization, dividend expense on securities sold short, underlying fund fees and expenses or extraordinary expenses (such as litigation), do not exceed 2.24% for Class A of the Fund’s average daily net assets through January 31, 2021. Fee waivers or reimbursements by the Advisor are subject to repayment by the Fund within the three years after the expense is incurred, if the Fund is able to make the repayment without exceeding the lesser of the expense limitation in effect at the time of the waiver and the expense limitation in place at the time of recapture. Please review the Fund’s most recent prospectus for more detail on the expense waiver. For performance information current to the most recent month-end, please call toll-free 1-888-839-7424. The Fund’s gross expense ratio, as of the February 1, 2020 prospectus, is 2.02% for Class A shares. For more current information on the Fund’s expense ratio, please see the Financial Highlights. |
| (a) | Empiric 2500 Fund Class A commenced operations on November 6, 1995. |
| (b) | Class A shares are subject to a maximum sales load of 5.75%, which decreases depending on the amount invested and a maximum deferred sales charge of 1.00%.. |
| (c) | The Bloomberg US 2500 Total Return Index is a float market-cap-weighted benchmark of the lower 2500 in capitalization of the Bloomberg US 3000 Index. This index is not available back to the inception of Class A shares. Investors cannot invest directly in an index. The Fund has adopted the Bloomberg US 2500 Total Return Index as its primary broad-based securities market index because Fund management believes it aligns with the asset composition of the Fund and is available without payment of a significant licensing fee, which is required by the owner of the Fund’s prior primary broad-based securities market index. |
| (d) | The Russell 2500 Growth Total Return Index refers to a composite that includes mid and small cap companies located in the United States that also exhibit a growth probability. The Russell 2500 Growth Total Return is published and maintained by FTSE Russell. Investors cannot invest directly in an index. |
Comparison of the Change in Value of a $10,000 Investment
9
| Empiric 2500 Fund |
| PORTFOLIO REVIEW (Unaudited) (Continued) |
| September 30, 2020 |
Average Annual Total Return through September 30, 2020*, as compared to its benchmarks:
| 1 Year Return | 5 Year Return | 10 Year Return | Since Inception (a) | |
| Empiric 2500 Fund Class C | 11.48% | 8.47% | 8.04% | 4.87% |
| Bloomberg US 2500 Total Return Index(b) | 1.76% | 8.81% | 10.87% | N/A |
| Russell 2500 Growth Total Return Index(c) | 23.37% | 14.19% | 14.06% | 10.55% |
| * | The performance data quoted here represents past performance. Current performance may be lower or higher than the performance data quoted above. Investment return and principal value will fluctuate, so that shares, when redeemed, may be worth more or less than their original cost. The returns shown do not reflect the deduction of taxes that a shareholder would pay on Fund distributions or on the redemptions of Fund shares. Past performance is no guarantee of future results. The Advisor and the Trust, with respect to the Fund, have entered into an Expense Limitation Agreement under which the Advisor has contractually agreed to waive fees and/or reimburse expenses but only to the extent necessary so that total annual operating expenses, excluding front-end or contingent deferred loads, taxes, leverage interest, brokerage fees and commissions, expenses incurred in connection with any merger or reorganization, dividend expense on securities sold short, underlying fund fees and expenses or extraordinary expenses (such as litigation), do not exceed 2.99% for Class C of the Fund’s average daily net assets through January 31, 2021. Fee waivers or reimbursements by the Advisor are subject to repayment by the Fund within the three years after the expense is incurred, if the Fund is able to make the repayment without exceeding the lesser of the expense limitation in effect at the time of the waiver and the expense limitation in place at the time of recapture. Please review the Fund’s most recent prospectus for more detail on the expense waiver. For performance information current to the most recent month-end, please call toll-free 1-888-839-7424. The Fund’s gross expense ratio, as of the February 1, 2020 prospectus, is 2.77% for Class C shares. For more current information on the Fund’s expense ratio, please see the Financial Highlights. |
| (a) | Empiric 2500 Fund Class C commenced operations on October 7, 2005. |
| (b) | The Bloomberg US 2500 Total Return Index is a float market-cap-weighted benchmark of the lower 2500 in capitalization of the Bloomberg US 3000 Index. This index is not available back to the inception of Class C shares. Investors cannot invest directly in an index. The Fund has adopted the Bloomberg US 2500 Total Return Index as its primary broad-based securities market index because Fund management believes it aligns with the asset composition of the Fund and is available without payment of a significant licensing fee, which is required by the owner of the Fund’s prior primary broad-based securities market index. |
| (c) | The Russell 2500 Growth Total Return Index refers to a composite that includes mid and small cap companies located in the United States that also exhibit a growth probability. The Russell 2500 Growth Total Return is published and maintained by FTSE Russell. Investors cannot invest directly in an index. |
Comparison of the Change in Value of a $10,000 Investment
10
| Empiric 2500 Fund |
| Portfolio Weightings (Unaudited) |
| September 30, 2020 |
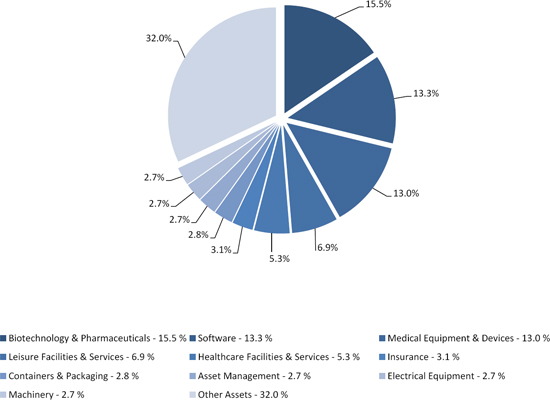
The percentages in the above chart are based on the portfolio holdings as a percentage of net assets of the Fund as of September 30, 2020 and are subject to change.
11
| Empiric 2500 Fund |
| SCHEDULE OF INVESTMENTS |
| September 30, 2020 |
| Shares | Fair Value | |||||||
| COMMON STOCKS - 99.0% | ||||||||
| ADVERTISING & MARKETING - 1.9% | ||||||||
| 19,563 | Interpublic Group of Cos., Inc. | $ | 326,115 | |||||
| 272 | Trade Desk, Inc. * | 141,108 | ||||||
| 467,223 | ||||||||
| AEROSPACE & DEFENSE - 2.4% | ||||||||
| 6,529 | Aerojet Rocketdyne Holdings, Inc. * | 260,442 | ||||||
| 2,201 | Huntington Ingalls Industries, Inc. | 309,791 | ||||||
| 570,233 | ||||||||
| APPAREL & TEXTILE PRODUCTS - 0.0% | ||||||||
| 32 | Carter’s, Inc. | 2,771 | ||||||
| ASSET MANAGEMENT - 2.7% | ||||||||
| 7,700 | Ares Management Corp. | 311,234 | ||||||
| 4,328 | LPL Financial Holdings, Inc. | 331,828 | ||||||
| 643,062 | ||||||||
| BEVERAGES - 1.3% | ||||||||
| 1,307 | Coca-Cola Consolidated, Inc. | 314,569 | ||||||
| BIOTECHNOLOGY & PHARMACEUTICALS - 15.5% | ||||||||
| 6,048 | ACADIA Pharmaceuticals, Inc. * | 249,480 | ||||||
| 16,988 | Alkermes PLC * | 281,491 | ||||||
| 22,080 | Amicus Therapeutics, Inc. * | 311,770 | ||||||
| 4,555 | Biohaven Pharmaceutical Holding Co. Ltd. * | 296,121 | ||||||
| 2,684 | BioSpecifics Technologies Corp. * | 141,796 | ||||||
| 3,311 | Emergent BioSolutions, Inc. * | 342,126 | ||||||
| 3,105 | Guardant Health, Inc. * | 347,077 | ||||||
| 8,208 | Halozyme Therapeutics, Inc. * | 215,706 | ||||||
| 4,201 | Horizon Therapeutics plc * | 326,334 | ||||||
| 13,369 | Intersect ENT, Inc. * | 218,048 | ||||||
| 2,114 | Livongo Health, Inc. * | 296,066 | ||||||
| 537 | Neurocrine Biosciences, Inc. * | 51,638 | ||||||
| 1,944 | Sarepta Therapeutics, Inc. * | 272,996 | ||||||
| 4,831 | Twist Bioscience Corp. * | 367,011 | ||||||
| 3,717,660 | ||||||||
| COMMERCIAL SUPPORT SERVICES - 2.3% | ||||||||
| 3,545 | AMN Healthcare Services, Inc. * | 207,241 | ||||||
| 6,310 | Robert Half International, Inc. | 334,051 | ||||||
| 541,292 | ||||||||
| CONSTRUCTION MATERIALS - 0.1% | ||||||||
| 1,813 | Forterra, Inc. * | 21,430 | ||||||
| CONTAINERS & PACKAGING - 2.8% | ||||||||
| 6,641 | Berry Global Group, Inc. * | 320,893 | ||||||
| 4,527 | Crown Holdings, Inc. * | 347,945 | ||||||
| 668,838 | ||||||||
| ELECTRICAL EQUIPMENT - 2.7% | ||||||||
| 50 | A. O. Smith Corp. | 2,640 | ||||||
| 2,433 | Chase Corp. | 232,108 | ||||||
| 1,828 | Generac Holdings, Inc. * | 353,974 | ||||||
| 437 | Hubbell, Inc. | 59,799 | ||||||
| 648,521 | ||||||||
See accompanying notes to financial statements.
12
| Empiric 2500 Fund |
| SCHEDULE OF INVESTMENTS (Continued) |
| September 30, 2020 |
| Shares | Fair Value | |||||||
| COMMON STOCKS - 99.0% (Continued) | ||||||||
| ENTERTAINMENT CONTENT - 1.3% | ||||||||
| 182 | Sciplay Corp. * | $ | 2,952 | |||||
| 34,098 | Zynga, Inc. * | 310,974 | ||||||
| 313,926 | ||||||||
| FOOD - 0.0% | ||||||||
| 14 | Lancaster Colony Corp. | 2,503 | ||||||
| GAS & WATER UTILITIES - 0.0% | ||||||||
| 838 | Global Water Resources, Inc. | 9,034 | ||||||
| HEALTHCARE FACILITIES & SERVICES - 5.3% | ||||||||
| 982 | Amedisys, Inc. * | 232,174 | ||||||
| 435 | Chemed Corp. | 208,952 | ||||||
| 5,044 | Henry Schein, Inc. * | 296,486 | ||||||
| 1,511 | Medpace Holdings, Inc. * | 168,854 | ||||||
| 1,961 | Molina Healthcare, Inc. * | 358,941 | ||||||
| 1,265,407 | ||||||||
| HOME & OFFICE PRODUCTS - 1.4% | ||||||||
| 3,818 | Tempur Sealy International, Inc. * | 340,527 | ||||||
| INDUSTRIAL SUPPORT SERVICES - 1.4% | ||||||||
| �� | 1,978 | United Rentals, Inc. * | 345,161 | |||||
| INSTITUTIONAL FINANCIAL SERVICES - 0.0% | ||||||||
| 48 | SEI Investments Co. | 2,435 | ||||||
| INSURANCE - 3.1% | ||||||||
| 2,394 | Assurant, Inc. | 290,416 | ||||||
| 509 | Palomar Holdings, Inc. * | 53,058 | ||||||
| 2,769 | Primerica, Inc. | 313,285 | ||||||
| 939 | RLI Corp. | 78,622 | ||||||
| 735,381 | ||||||||
| INTERNET MEDIA & SERVICES - 2.5% | ||||||||
| 26,395 | Boingo Wireless, Inc. * | 269,097 | ||||||
| 6,403 | Shutterstock, Inc. | 333,212 | ||||||
| 602,309 | ||||||||
| LEISURE FACILITIES & SERVICES - 6.9% | ||||||||
| 249 | Caesars Entertainment, Inc. * | 13,959 | ||||||
| 6,256 | Dine Brands Global, Inc. | 341,515 | ||||||
| 4,335 | Dunkin’ Brands Group, Inc. | 355,080 | ||||||
| 4,996 | Shake Shack, Inc. * | 322,142 | ||||||
| 1,394 | Vail Resorts, Inc. | 298,274 | ||||||
| 14,334 | Wendy’s Co. | 319,577 | ||||||
| 1,650,547 | ||||||||
| LEISURE PRODUCTS - 1.0% | ||||||||
| 2,573 | Polaris, Inc. | 242,737 | ||||||
| MACHINERY - 2.7% | ||||||||
| 3,631 | Lincoln Electric Holdings, Inc. | 334,197 | ||||||
| 3,872 | Toro Co. | 325,054 | ||||||
| 659,251 | ||||||||
See accompanying notes to financial statements.
13
| Empiric 2500 Fund |
| SCHEDULE OF INVESTMENTS (Continued) |
| September 30, 2020 |
| Shares | Fair Value | |||||||
| COMMON STOCKS - 99.0% (Continued) | ||||||||
| MEDICAL EQUIPMENT & DEVICES - 13.0% | ||||||||
| 18,175 | Axogen, Inc. * | $ | 211,375 | |||||
| 8,068 | Bruker Corp. | 320,703 | ||||||
| 7,579 | Cardiovascular Systems, Inc. * | 298,234 | ||||||
| 6,366 | Castle Biosciences, Inc. * | 327,531 | ||||||
| 6,486 | Fluidigm Corp. * | 48,191 | ||||||
| 6,536 | Globus Medical, Inc. * | 323,663 | ||||||
| 2,557 | Hill-Rom Holdings, Inc. | 213,535 | ||||||
| 5,430 | LeMaitre Vascular, Inc. | 176,638 | ||||||
| 2,295 | NuVasive, Inc. * | 111,468 | ||||||
| 1,007 | Penumbra, Inc. * | 195,741 | ||||||
| 1,283 | Quidel Corp. * | 281,465 | ||||||
| 105,073 | Surgalign Holdings, Inc. * | 190,182 | ||||||
| 7,128 | Surmodics, Inc. * | 277,350 | ||||||
| 8,412 | Vericel Corp. * | 155,874 | ||||||
| 3,131,950 | ||||||||
| OIL & GAS PRODUCERS - 0.3% | ||||||||
| 640 | Murphy USA, Inc. * | 82,093 | ||||||
| PUBLISHING & BROADCASTING - 0.2% | ||||||||
| 922 | World Wrestling Entertainment, Inc. | 37,313 | ||||||
| REAL ESTATE SERVICES - 0.1% | ||||||||
| 389 | eXp World Holdings, Inc. * | 15,692 | ||||||
| RENEWABLE ENERGY - 1.1% | ||||||||
| 8,889 | TPI Composites, Inc. * | 257,425 | ||||||
| RETAIL-CONSUMER STAPLES - 2.5% | ||||||||
| 1,935 | Casey’s General Stores, Inc. | 343,753 | ||||||
| 12,532 | Sprouts Farmers Market, Inc. * | 262,295 | ||||||
| 606,048 | ||||||||
| RETAIL-DISCRETIONARY - 2.4% | ||||||||
| 1,043 | Carvana Co. * | 232,652 | ||||||
| 3,732 | Williams-Sonoma, Inc. | 337,522 | ||||||
| 570,174 | ||||||||
| SEMICONDUCTORS - 1.7% | ||||||||
| 204 | Coherent, Inc. * | 22,630 | ||||||
| 692 | Inphi Corp. * | 77,677 | ||||||
| 3,912 | Teradyne, Inc. | 310,848 | ||||||
| 15 | Universal Display Corp. | 2,711 | ||||||
| 413,866 | ||||||||
| SOFTWARE - 13.3% | ||||||||
| 13,726 | Agilysys, Inc. * | 331,620 | ||||||
| 20,375 | American Software, Inc. | 286,065 | ||||||
| 1,196 | Avaya Holdings Corp. * | 18,179 | ||||||
| 31,069 | Brightcove, Inc. * | 318,147 | ||||||
| 17,682 | Calix, Inc. * | 314,386 | ||||||
| 357 | CDK Global, Inc. | 15,562 | ||||||
| 8,148 | CommVault Systems, Inc. * | 332,438 | ||||||
| 3,626 | Digital Turbine, Inc. * | 118,715 | ||||||
| 3,704 | Domo, Inc. * | 141,974 | ||||||
| 14,451 | Dropbox, Inc. * | 278,326 | ||||||
See accompanying notes to financial statements.
14
| Empiric 2500 Fund |
| SCHEDULE OF INVESTMENTS (Continued) |
| September 30, 2020 |
| Shares | Fair Value | |||||||
| COMMON STOCKS - 99.0% (Continued) | ||||||||
| SOFTWARE - 13.3% (Continued) | ||||||||
| 4,186 | Envestnet, Inc. * | $ | 322,992 | |||||
| 43 | New Relic, Inc. * | 2,423 | ||||||
| 1,348 | Nuance Communications, Inc. * | 44,740 | ||||||
| 37 | Omnicell, Inc. * | 2,762 | ||||||
| 67 | Progress Software Corp. | 2,458 | ||||||
| 7,891 | QAD, Inc. | 333,000 | ||||||
| 11,073 | Rosetta Stone, Inc. * | 331,969 | ||||||
| 3,195,756 | ||||||||
| SPECIALTY FINANCE - 1.3% | ||||||||
| 10,318 | Fidelity National Financial, Inc. | 323,057 | ||||||
| 49 | First American Financial Corp. | 2,495 | ||||||
| 325,552 | ||||||||
| TECHNOLOGY HARDWARE - 1.8% | ||||||||
| 22,201 | Extreme Networks, Inc. * | 89,248 | ||||||
| 1,065 | FLIR Systems, Inc. | 38,180 | ||||||
| 20,602 | Sonos, Inc. * | 312,738 | ||||||
| 440,166 | ||||||||
| TECHNOLOGY SERVICES - 2.3% | ||||||||
| 748 | Fair Isaac Corp. * | 318,184 | ||||||
| 572 | Green Dot Corp. * | 28,949 | ||||||
| 2,688 | NIC, Inc. | 52,954 | ||||||
| 2,807 | TTEC Holdings, Inc. | 153,122 | ||||||
| 553,209 | ||||||||
| TELECOMMUNICATIONS - 0.5% | ||||||||
| 1,810 | Cogent Communications Holdings, Inc. | 108,690 | ||||||
| TRANSPORTATION & LOGISTICS - 1.2% | ||||||||
| 81 | Copa Holdings SA | 4,078 | ||||||
| 2,160 | Landstar System, Inc. | 271,058 | ||||||
| 225 | XPO Logistics, Inc. * | 19,048 | ||||||
| 294,184 | ||||||||
| TOTAL COMMON STOCKS (Cost $20,098,643) | 23,796,935 | |||||||
| REAL ESTATE INVESTMENT TRUSTS (REITs) - 0.7% | ||||||||
| 4,254 | Americold Realty Trust | 152,081 | ||||||
| 393 | Gaming and Leisure Properties, Inc. | 14,513 | ||||||
| TOTAL REITs (Cost $166,908) | 166,594 | |||||||
| TOTAL INVESTMENTS IN SECURITIES - 99.7% (Cost $20,265,551) | $ | 23,963,529 | ||||||
| ASSETS IN EXCESS OF LIABILITIES - 0.3% | 67,818 | |||||||
| TOTAL NET ASSETS - 100.0% | $ | 24,031,347 | ||||||
PLC - Public Limited Company
| * | Non-Income producing security. |
See accompanying notes to financial statements.
15
| Empiric 2500 Fund |
| STATEMENT OF ASSETS AND LIABILITIES |
| September 30, 2020 |
| ASSETS | ||||
| Investment securities: | ||||
| At cost | $ | 20,265,551 | ||
| At fair value | $ | 23,963,529 | ||
| Cash and cash equivalents | 101,581 | |||
| Dividends receivable | 3,641 | |||
| Receivable for Fund shares sold | 2,619 | |||
| Prepaid expenses and other assets | 12,488 | |||
| TOTAL ASSETS | 24,083,858 | |||
| LIABILITIES | ||||
| Investment advisory fees payable | 20,181 | |||
| Distribution (12b-1) fees payable | 785 | |||
| Payable to related parties | 8,112 | |||
| Accrued expenses and other liabilities | 23,433 | |||
| TOTAL LIABILITIES | 52,511 | |||
| NET ASSETS | $ | 24,031,347 | ||
| Composition of Net Assets: | ||||
| Paid in capital | $ | 18,504,073 | ||
| Accumulated earnings | 5,527,274 | |||
| NET ASSETS | $ | 24,031,347 | ||
| Net Asset Value Per Share: | ||||
| Class A Shares: | ||||
| Net Assets | $ | 22,865,204 | ||
| Shares of beneficial interest outstanding (a) | 503,001 | |||
| Net asset value (Net Assets ÷ Shares Outstanding) and redemption price per share (b) | $ | 45.46 | ||
| Maximum offering price per share (net asset value plus maximum sales charge of 5.75%) | $ | 48.23 | ||
| Class C Shares: | ||||
| Net Assets | $ | 1,166,143 | ||
| Shares of beneficial interest outstanding (a) | 28,868 | |||
| Net asset value (Net Assets ÷ Shares Outstanding), offering price and redemption price per share | $ | 40.40 |
| (a) | Unlimited number of shares of beneficial interest authorized, no par value. |
| (b) | Investments in Class A shares made at or above the $1 million breakpoint are not subject to an initial sales charge and may be subject to a 1.00% contingent deferred sales charge (“CDSC”) on shares redeemed less than 12 months after the date of purchase (excluding shares purchased with reinvested dividends and/or distributions). |
See accompanying notes to financial statements.
16
| Empiric 2500 Fund |
| STATEMENT OF OPERATIONS |
| For the Year Ended September 30, 2020 |
| INVESTMENT INCOME | ||||
| Dividends | $ | 159,155 | ||
| Interest | 937 | |||
| Securities lending income - net | 22,311 | |||
| TOTAL INVESTMENT INCOME | 182,403 | |||
| EXPENSES | ||||
| Investment advisory fees | 232,950 | |||
| Distribution (12b-1) fees: | ||||
| Class A | 55,303 | |||
| Class C | 11,738 | |||
| Administration fees | 75,870 | |||
| Management services fees | 28,295 | |||
| Compliance officer fees | 20,892 | |||
| Legal fees | 15,385 | |||
| Printing and postage expenses | 13,602 | |||
| Audit Fees | 12,500 | |||
| Trustees fees and expenses | 11,591 | |||
| Shareholder service fees | 9,587 | |||
| Registration fees | 9,150 | |||
| Custodian fees | 4,723 | |||
| Insurance expense | 824 | |||
| Other expenses | 2,292 | |||
| TOTAL EXPENSES | 504,702 | |||
| NET INVESTMENT LOSS | (322,299 | ) | ||
| REALIZED AND UNREALIZED GAIN (LOSS) FROM INVESTMENTS | ||||
| Net realized gain from investments | 3,100,170 | |||
| Net realized gain from redemptions in kind | 251,917 | |||
| Net change in unrealized appreciation (depreciation) on investments | (470,405 | ) | ||
| NET REALIZED AND UNREALIZED GAIN FROM INVESTMENTS | 2,881,682 | |||
| NET INCREASE IN NET ASSETS RESULTING FROM OPERATIONS | $ | 2,559,383 |
See accompanying notes to financial statements.
17
| Empiric 2500 Fund |
| STATEMENTS OF CHANGES IN NET ASSETS |
| For the | For the | |||||||
| Year Ended | Year Ended | |||||||
| September 30, 2020 | September 30, 2019 | |||||||
| FROM OPERATIONS | ||||||||
| Net investment loss | $ | (322,299 | ) | $ | (287,897 | ) | ||
| Net realized gain from investments | 3,100,170 | 828,457 | ||||||
| Net realized gain from redemptions in kind | 251,917 | 803,512 | ||||||
| Net change in unrealized appreciation (depreciation) on investments | (470,405 | ) | (5,736,142 | ) | ||||
| Net increase (decrease) in net assets resulting from operations | 2,559,383 | (4,392,070 | ) | |||||
| FROM SHARES OF BENEFICIAL INTEREST | ||||||||
| Proceeds from shares sold: | ||||||||
| Class A | 366,946 | 1,175,492 | ||||||
| Class C | 1,221 | 1,285 | ||||||
| Payments for shares redeemed: | ||||||||
| Class A | (2,284,295 | ) | (4,525,601 | ) | ||||
| Class C | (133,374 | ) | (149,323 | ) | ||||
| Net decrease in net assets from shares of beneficial interest | (2,049,502 | ) | (3,498,147 | ) | ||||
| TOTAL INCREASE (DECREASE) IN NET ASSETS | 509,881 | (7,890,217 | ) | |||||
| NET ASSETS | ||||||||
| Beginning of Year | 23,521,466 | 31,411,683 | ||||||
| End of Year | $ | 24,031,347 | $ | 23,521,466 | ||||
| SHARE ACTIVITY | ||||||||
| Class A: | ||||||||
| Shares Sold | 9,977 | 27,237 | ||||||
| Shares Redeemed | (59,099 | ) | (105,139 | ) | ||||
| Net decrease in shares of beneficial interest outstanding | (49,122 | ) | (77,902 | ) | ||||
| Class C: | ||||||||
| Shares Sold | 34 | 34 | ||||||
| Shares Redeemed | (3,602 | ) | (3,956 | ) | ||||
| Net decrease in shares of beneficial interest outstanding | (3,568 | ) | (3,922 | ) | ||||
See accompanying notes to financial statements.
18
| Empiric 2500 Fund |
| FINANCIAL HIGHLIGHTS |
Per Share Data and Ratios for a Share of Beneficial Interest Outstanding Throughout each of the Years Presented
| Class A | ||||||||||||||||||||
| Year | Year | Year | Year | Year | ||||||||||||||||
| Ended | Ended | Ended | Ended | Ended | ||||||||||||||||
| September 30, | September 30, | September 30, | September 30, | September 30, | ||||||||||||||||
| 2020 | 2019 | 2018 | 2017 | 2016 | ||||||||||||||||
| Net asset value, beginning of year | $ | 40.47 | $ | 47.39 | $ | 36.57 | $ | 30.88 | $ | 29.15 | ||||||||||
| Activity from investment operations: | ||||||||||||||||||||
| Net investment loss (1) | (0.56 | ) | (0.45 | ) | (0.45 | ) | (0.23 | ) | (0.10 | ) | ||||||||||
| Net realized and unrealized gain (loss) on investments | 5.55 | (6.47 | ) | 11.27 | 5.92 | 1.83 | ||||||||||||||
| Total from investment operations | 4.99 | (6.92 | ) | 10.82 | 5.69 | 1.73 | ||||||||||||||
| Net asset value, end of year | $ | 45.46 | $ | 40.47 | $ | 47.39 | $ | 36.57 | $ | 30.88 | ||||||||||
| Total return (2) | 12.33 | % | (14.62 | )% | 29.59 | % | 18.43 | % | 5.93 | % | ||||||||||
| Net assets, at end of year (000s) | $ | 22,865 | $ | 22,346 | $ | 29,857 | $ | 23,644 | $ | 21,495 | ||||||||||
| Ratio of gross expenses to average net assets (3)(4) | 2.13 | % | 2.02 | % | 1.99 | % | 2.06 | % | 2.09 | % | ||||||||||
| Ratio of net expenses to average net assets after reimbursement or recapture (4) | 2.13 | % | 2.02 | % | 1.99 | % | 1.98 | % | 1.98 | % | ||||||||||
| Ratio of net investment loss to average net assets (4)(5) | (1.35 | )% | (1.08 | )% | (1.07 | )% | (0.68 | )% | (0.34 | )% | ||||||||||
| Portfolio Turnover Rate | 119 | % (6) | 50 | % (6) | 11 | % (6) | 150 | % | 171 | % | ||||||||||
| (1) | Per share amounts calculated using the average shares method. |
| (2) | Total return in the above table is historical in nature and represents the rate that the investor would have earned or lost on an investment in the Fund assuming reinvestment of dividends and capital gains distributions, if any, and does not reflect the impact of sales charges. Had the Advisor not waived or recaptured a portion of the Fund’s expenses, total returns would have been lower or higher. |
| (3) | Represents the ratio of expenses to average net assets absent fee waivers and/or expense reimbursements by the Advisor. |
| (4) | The ratios of expenses to average net assets and net investment loss to average net assets do not reflect the expenses of the underlying investment companies in which the Fund invests. |
| (5) | Recognition of net investment income (loss) is affected by the timing and declaration of dividends by the underlying investment companies in which the Fund invests. |
| (6) | In-kind transactions are not included in calculation of turnover. |
See accompanying notes to financial statements.
19
| Empiric 2500 Fund |
| FINANCIAL HIGHLIGHTS |
Per Share Data and Ratios for a Share of Beneficial Interest Outstanding Throughout each of the Years Presented
| Class C | ||||||||||||||||||||
| Year | Year | Year | Year | Year | ||||||||||||||||
| Ended | Ended | Ended | Ended | Ended | ||||||||||||||||
| September 30, | September 30, | September 30, | September 30, | September 30, | ||||||||||||||||
| 2020 | 2019 | 2018 | 2017 | 2016 | ||||||||||||||||
| Net asset value, beginning of year | $ | 36.24 | $ | 42.75 | $ | 33.24 | $ | 28.28 | $ | 26.91 | ||||||||||
| Activity from investment operations: | ||||||||||||||||||||
| Net investment loss (1) | (0.78 | ) | (0.69 | ) | (0.69 | ) | (0.44 | ) | (0.30 | ) | ||||||||||
| Net realized and unrealized gain (loss) on investments | 4.94 | (5.82 | ) | 10.20 | 5.40 | 1.67 | ||||||||||||||
| Total from investment operations | 4.16 | (6.51 | ) | 9.51 | 4.96 | 1.37 | ||||||||||||||
| Net asset value, end of year | $ | 40.40 | $ | 36.24 | $ | 42.75 | $ | 33.24 | $ | 28.28 | ||||||||||
| Total return (2) | 11.48 | % | (15.25 | )% | 28.61 | % | 17.57 | % | 5.09 | % | ||||||||||
| Net assets, at end of year (000s) | $ | 1,166 | $ | 1,175 | $ | 1,554 | $ | 1,262 | $ | 1,183 | ||||||||||
| Ratio of gross expenses to average net assets (3)(4) | 2.88 | % | 2.77 | % | 2.74 | % | 2.81 | % | 2.84 | % | ||||||||||
| Ratio of net expenses to average net assets after reimbursement or recapture (4) | 2.88 | % | 2.77 | % | 2.74 | % | 2.73 | % | 2.73 | % | ||||||||||
| Ratio of net investment loss to average net assets (4)(5) | (2.10 | )% | (1.83 | )% | (1.82 | )% | (1.43 | )% | (1.12 | )% | ||||||||||
| Portfolio Turnover Rate | 119 | % (6) | 50 | % (6) | 11 | % (6) | 150 | % | 171 | % | ||||||||||
| (1) | Per share amounts calculated using the average shares method. |
| (2) | Total return in the above table is historical in nature and represents the rate that the investor would have earned or lost on an investment in the Fund assuming reinvestment of dividends and capital gains distributions, if any. Had the Advisor not waived or recaptured a portion of the Fund’s expenses, total returns would have been lower or higher. |
| (3) | Represents the ratio of expenses to average net assets absent fee waivers and/or expense reimbursements by the Advisor. |
| (4) | The ratios of expenses to average net assets and net investment loss to average net assets do not reflect the expenses of the underlying investment companies in which the Fund invests. |
| (5) | Recognition of net investment loss is affected by the timing and declaration of dividends by the underlying investment companies in which the Fund invests. |
| (6) | In-kind transactions are not included in calculation of turnover. |
See accompanying notes to financial statements.
20
| Empiric 2500 Fund |
| NOTES TO FINANCIAL STATEMENTS |
| September 30, 2020 |
| (1) | ORGANIZATION AND SIGNIFICANT ACCOUNTING POLICIES |
Mutual Fund Series Trust (the “Trust”), was organized as an Ohio business trust on February 27, 2006. The Trust is registered as an open-end management investment company under the Investment Company Act of 1940, as amended, (“1940 Act”). These financial statements include the following series: Empiric 2500 Fund, formerly the Empiric Core Equity Fund, (the “Fund”). The Trust currently consists of thirty-nine series. The Fund is a separate diversified series of the Trust. Empiric Advisors, Inc. (the “Advisor”), acts as the investment advisor to the Fund. The Fund’s Class A shares commenced operations on November 6, 1995. The Fund’s Class C shares commenced operations on October 7, 2005. Prior to October 7, 2005, the shares of the Fund had no specific class designation. As of that date, all of the then outstanding shares were redesignated as Class A shares. The Fund’s investment objective is to achieve capital appreciation.
The Fund offers two classes of shares: Class A and Class C shares. Each share class represents an interest in the same assets of the Fund, has the same rights and is identical in all material respects except that (i) each class of shares may bear different distribution fees; (ii) each class of shares may be subject to different (or no) sales charges; (iii) certain other class specific expenses will be borne solely by the class to which such expenses are attributable; and (iv) each class has exclusive voting rights with respect to matters relating to its own distribution arrangements.
The following is a summary of significant accounting policies consistently followed by the Fund which are in accordance with accounting principles generally accepted in the United States of America (“GAAP”). The Fund is an investment company and accordingly follows the Investment Company accounting and reporting guidance of the Financial Accounting Standards Board (“FASB”) Accounting Standards Codification Topic 946, Financial Services - Investment Companies, including FASB Accounting Standards Update ASU (“ASU”) 2013-08.
a) Securities Valuation – Securities listed on an exchange are valued at the last reported sale price at the close of the regular trading session of the exchange on the business day the value is being determined, or in the case of securities listed on NASDAQ, at the NASDAQ Official Closing Price (“NOCP”). In the absence of a sale, such securities shall be valued at the last bid price on the day of valuation. The Fund may invest in portfolios of open-end or closed-end investment companies and exchange traded funds (the “Underlying Funds”). Open-end funds are valued at their respective net asset values as reported by such investment companies. The Underlying Funds value securities in their portfolios for which market quotations are readily available at their market values (generally the last reported sale price) and all other securities and assets at their fair value by the methods established by the boards of the Underlying Funds. The shares of many closed-end investment companies and exchange traded funds, after their initial public offering, frequently trade at a price per share, which is different than the net asset value per share. The difference represents a market premium or market discount of such shares. There can be no assurances that the market discount or market premium on shares of any closed-end investment company or exchange traded fund purchased by the Fund will not change. The independent pricing service does not distinguish between smaller-sized bond positions known as “odd lots” and larger institutional-sized bond positions known as “round lots”. The Fund may fair value a particular bond if the adviser does not believe that the round lot value provided by the independent pricing service reflects fair value of the Fund’s holding. Short-term debt obligations having 60 days or less remaining until maturity, at time of purchase, may be valued at amortized cost, provided such valuations represent fair value.
In unusual circumstances, instead of valuing securities in the usual manner, the Fund may value securities at “fair value” as determined in good faith by the Board of Trustees of the Trust (the “Board”), pursuant to the procedures (the “Procedures”) approved by the Board. The Procedures consider, among others, the following factors to determine a security’s fair value: the nature and pricing history (if any) of the security; whether any dealer quotations for the security are available; and possible valuation methodologies that could be used to determine the fair value of the security. Fair value may also be used by the Board if extraordinary events occur after the close of the relevant world market but prior to the New York Stock Exchange close.
The Fund utilizes various methods to measure the fair value of most of its investments on a recurring basis. GAAP establishes a hierarchy that prioritizes inputs to valuation methods. The three levels of input are:
Level 1 – Unadjusted quoted prices in active markets for identical assets and liabilities that the Fund has the ability to access.
Level 2 – Observable inputs other than quoted prices included in Level 1 that are observable for the asset or liability, either directly or indirectly. These inputs may include quoted prices for the identical instrument in an inactive market, prices for similar instruments, interest rates, prepayment speeds, credit risk, yield curves, default rates and similar data.
21
| Empiric 2500 Fund |
| NOTES TO FINANCIAL STATEMENTS (Continued) |
| September 30, 2020 |
Level 3 – Unobservable inputs for the asset or liability, to the extent relevant observable inputs are not available, representing the Fund’s own assumptions about the assumptions a market participant would use in valuing the asset or liability, and would be based on the best information available.
The availability of observable inputs can vary from security to security and is affected by a wide variety of factors, including, for example, the type of security, whether the security is new and not yet established in the marketplace, the liquidity of markets, and other characteristics particular to the security. To the extent that valuation is based on models or inputs that are less observable or unobservable in the market, the determination of fair value requires more judgment. Accordingly, the degree of judgment exercised in determining fair value is greatest for instruments categorized in Level 3.
The inputs used to measure fair value may fall into different levels of the fair value hierarchy. In such cases, for disclosure purposes, the level in the fair value hierarchy within which the fair value measurement falls in its entirety, is determined based on the lowest level input that is significant to the fair value measurement in its entirety.
The inputs or methodology used for valuing securities are not necessarily an indication of the risk associated with investing in those securities. The following table summarizes the inputs used as of September 30, 2020, for the Fund’s assets and liabilities measured at fair value:
| Assets | ||||||||||||||||
| Security Classifications (a) | Level 1 | Level 2 | Level 3 | Totals | ||||||||||||
| Common Stocks | $ | 23,796,935 | $ | — | $ | — | $ | 23,796,935 | ||||||||
| Real Estate Investment Trusts | 166,594 | — | — | 166,594 | ||||||||||||
| Total | $ | 23,963,529 | $ | — | $ | — | $ | 23,963,529 | ||||||||
| (a) | As of and during the year ended September 30, 2020, the Fund held no securities that were considered to be “Level 3” securities. Therefore, a reconciliation of assets in which significant unobservable inputs (Level 3) were used in determining fair value is not applicable. |
b) Federal Income Tax – As of and during the year ended September 30, 2020, the Fund did not have a liability for any unrecognized tax expense. The Fund recognizes interest and penalties, if any, related to unrecognized tax expense as income tax expense in the Statement of Operations. As of September 30, 2020, the Fund did not incur any interest or penalties. Management has analyzed the Fund’s tax positions and has concluded that no liability for unrecognized tax benefits should be recorded related to uncertain tax positions taken on returns filed for open tax years September 30, 2017-September 30, 2019, or expected to be taken in the Fund’s September 30, 2020 tax returns. The tax filings are open for examination by applicable taxing authorities, U.S. federal, Ohio and foreign jurisdictions. No examination of the Fund’s tax returns is presently in progress.
c) Distribution to Shareholders – Distributions of net investment income and capital gains to shareholders, which are determined in accordance with income tax regulations and may differ from GAAP, are recorded on the ex-dividend date and are distributed on an annual basis.
d) Multiple Class Allocations – Income, non-class specific expenses and realized or unrealized gains or losses are allocated to each class based on relative net assets. Distribution fees are charged to each respective share class in accordance with the distribution plan. Expenses of the Trust that are directly identifiable to a specific fund are charged to that fund. Expenses, which are not readily identifiable to a specific fund, are allocated in such a manner as deemed equitable, taking into consideration the nature and type of expense and the relative sizes of the funds in the Trust.
e) Other – Investment and shareholder transactions are recorded on the trade date. Interest income is recognized on an accrual basis. Discounts are accreted and premiums are amortized on debt securities using the effective interest method. Dividend income is recorded on the ex-dividend date. Realized gains or losses from sales of securities are determined by comparing the identified cost of the security lot sold with the net sales proceeds.
f) Use of Estimates – The preparation of financial statements in conformity with GAAP requires management to make estimates and assumptions that affect the reported amounts of assets and liabilities and disclosure of contingent assets and liabilities at the date of the financial statements and the reported amounts of increases and decreases in net assets from operations during the reporting period. Actual results could differ from those estimates.
22
| Empiric 2500 Fund |
| NOTES TO FINANCIAL STATEMENTS (Continued) |
| September 30, 2020 |
g) Indemnification – The Trust indemnifies its officers and trustees for certain liabilities that may arise from the performance of their duties to the Trust. Additionally, in the normal course of business, the Fund enters into contracts that contain a variety of representations and warranties and which provide general indemnities. The Fund’s maximum exposure under these arrangements is unknown, as this would involve future claims that may be made against the Fund that have not yet occurred. However, based on experience, the risk of loss due to these warranties and indemnities appears to be remote.
h) Sales charges (loads) – A maximum sales charge of 5.75% is imposed on Class A shares of the Fund. Investments in Class A shares made at or above the $1 million breakpoint are not subject to an initial sales charge and may be subject to a 1.00% contingent deferred sales charge (“CDSC”) on shares redeemed within 12 months of purchase (excluding shares purchased with reinvested dividends and/or distributions). The respective shareholders pay such CDSC charges, which are not an expense of the Fund. For the year ended September 30, 2020, there were no CDSC fees paid.
i) Security Loans – The Fund has entered into a securities lending agreement with U.S. Bank National Association as of October 2018, and previously with Huntington National Bank. The Fund receives compensation in the form of fees, or retains a portion of interest on the investment of any cash received as collateral. The cash collateral is invested in short-term investments as noted in the Fund’s Schedule of Investments. The Fund also continues to receive interest or dividends on the securities loaned. The loans are secured by collateral at least equal, at all times, to 102% of the market value of loaned securities. Gain or loss in the fair value of the securities loaned that may occur during the term of the loan will be for the account of the Fund. The Fund has the right under the lending agreement to recover the securities from the borrower on demand. If the market value of the collateral falls below 102% of market value plus accrued interest of the loaned securities, the lender’s agent shall request additional collateral from the borrowers to bring the collateralization back to 102%. Under the terms of the securities lending agreement, the Fund is indemnified for such losses by the security lending agreement. Should the borrower of the securities fail financially, the Fund has the right to repurchase the securities using the collateral in the open market. Although risk is mitigated by the collateral, the Fund could experience a delay in recovering their securities and possible loss of income or value if the borrower fails to return them.
The Fund receives cash as collateral in return for securities lent as part of the securities lending program. The collateral is invested in the Mount Vernon Liquid Assets Portfolio, LLC of which the investment objective is to seek to maximize current income to the extent with the preservation of capital and liquidity and maintain a stable NAV of $1.00 per unit. There were no securities on loan as of September 30, 2020. The remaining contractual maturity of all securities lending transactions is overnight and continuous. The Fund is not subject to a master netting agreement with respect to securities lending; therefore no additional disclosures are required. The income earned by the Fund on investments of cash collateral received from borrowers for the securities loaned to them are reflected in the Fund’s Statement of Operations.
| (2) | INVESTMENT TRANSACTIONS |
For the year ended September 30, 2020, aggregate purchases and proceeds from sales of investment securities (excluding short-term investments) for the Fund were as follows:
| Purchases | Sales (a) | |
| $ 27,541,102 | $ 29,912,200* |
| (a) | The Fund may participate in a liquidity program operated by ReFlow Fund, LLC (“ReFlow”). The program is designed to provide an alternative liquidity source for mutual funds experiencing redemptions of their shares. In order to pay cash to shareholders who redeem their shares on a given day, a mutual fund typically must hold cash in its portfolio, liquidate portfolio securities, or borrow money, all of which impose certain costs on the Fund. ReFlow provides participating mutual funds with another source of cash by standing ready to purchase shares from a fund equal to the amount of the Fund’s net redemptions on a given day. ReFlow then generally redeems those shares when the Fund experiences net sales. In return for this service, the Fund will pay a fee to ReFlow at a rate determined by a daily auction with other participating mutual funds. The costs to the Fund for participating in ReFlow are expected to be influenced by and comparable to the cost of the other sources of liquidity, such as the Fund’s short-term lending arrangement or the costs of selling portfolio securities to meet redemptions. ReFlow will be prohibited from acquiring more than 3% of the outstanding voting shares of the Fund. The Fund will waive any redemption fee with respect to redemptions by ReFlow. When covering net sales for the Fund, ReFlow normally utilizes Redemptions In-Kind. During the year ended September 30, 2020, the Fund utilized ReFlow. ReFlow subscribed 9,409 shares of the Fund during the period. The resulting fee is recorded in Other expenses on the Statement of Operations. |
| * | Proceeds from sales include $341,443 from redemptions in-kind sales. |
23
| Empiric 2500 Fund |
| NOTES TO FINANCIAL STATEMENTS (Continued) |
| September 30, 2020 |
| (3) | INVESTMENT MANAGEMENT AGREEMENT AND TRANSACTIONS WITH RELATED PARTIES |
The Trust, with respect to the Fund, has entered into an investment advisory agreement (“Advisory Agreement”) with the Advisor, pursuant to which the Advisor receives a fee, computed daily, at an annual rate of 1.00% of the average daily net assets of the Fund. The Advisor pays expenses incurred by it in connection with acting as investment manager to the Fund other than costs (including taxes and brokerage commissions, borrowing costs, costs of investing in underlying funds and extraordinary expenses, if any) of securities purchased for the Fund and certain other expenses paid by the Fund (as detailed in the Advisory Agreement). The Advisor pays for all employees, office space and facilities required by it to provide services under the Advisory Agreement, with the exception of specific items of expense (as detailed in the Advisory Agreement). For the year ended September 30, 2020, investment advisory fees of $232,950 were incurred by the Fund.
The Advisor has contractually agreed to reduce its management fee and/or reimburse the Fund so that the Fund’s total annual operating expenses, excluding brokerage fees and commissions, borrowing costs (such as interest and dividend expenses on securities sold short and liquidity program fees), taxes, acquired fund fees and expenses, and extraordinary expenses, do not exceed 2.24% and 2.99% of Class A and Class C of the Fund’s average daily net assets through January 31, 2021. This expense cap may not be terminated prior to this date except by the Board. For the year ended September 30, 2020, the Advisor waived management fees and/or reimbursed expenses in the amount of $0. Expenses reimbursed and/or fees reduced by the Advisor may be recaptured by the Advisor for a period of three fiscal years following the fiscal year during which such reimbursement or reduction was made if such recoupment can be achieved within the foregoing expense limit.
The Trust has entered into a management services agreement (“Management Services Agreement”) with MFund Services, LLC (“MFund”). Pursuant to the Management Services Agreement, MFund provides sponsorship, management and administration services. For MFund’s services to the Fund, the Fund pays MFund a base fee of $5,000 annually, an annualized asset based fee of 0.10% of average daily net assets up to $50 million, with lower fees at higher asset levels, plus reimbursement of out of pocket expenses. For the year ended September 30, 2020, the Fund incurred $28,295 for such fees.
A Trustee and Officer of the Trust is also the controlling member of MFund, Alphacentric Advisors LLC (“AlphaCentric”), and Catalyst Capital Advisors LLC (“Catalyst”), and each serve as investment advisor to other series of the Trust), and is not paid any fees directly by the Trust for serving in such capacities.
Trustees who are not “interested persons” as that term is defined in the 1940 Act, are paid a quarterly retainer and receive compensation for each special in-person meeting attended. The fees paid to the Independent Trustees for their attendance at a meeting will be shared equally by the funds of the Trust in which the meeting relates. The Lead Independent Trustee of the Trust and the Chairman of the Trust’s Audit Committee receives an additional quarterly retainer. The “interested persons” of the Trust receive no compensation from the Fund. The Trust reimburses each Trustee and Officer for his or her travel and other expenses related to attendance at such meetings.
Empiric Distributors, Inc. acted as the broker of record on executions of purchases and sales of the Fund’s portfolio investments. For those services, Empiric Distributors received $0 in brokerage commissions from the Fund for the year ended September 30, 2020. Certain officers and/or employees of the Advisor have an affiliation with Empiric Distributors. For the year ended September 30, 2020, Empiric Distributors, an affiliated broker, received $0 in underwriter commissions from the sale of shares of the Empiric 2500 Fund.
Northern Lights Distributors, LLC, (“NLD” or “Distributor”) serves as the principal underwriter and national distributor for the shares of the Fund pursuant to an Underwriting Agreement with the Trust. For the year ended September 30, 2020, the Distributor received $720 in underwriter commissions from the sale of Class A shares of the Empiric 2500 Fund, of which they kept $95.
Gemini Fund Services, LLC (“GFS”) provides administrative, fund accounting, and transfer agency services to the Fund pursuant to agreements with the Trust, for which it receives from each Fund: (i) basis points in decreasing amounts as assets reach certain breakpoints; and (ii) any related out-of-pocket expenses.
Certain Officers of the Trust are also employees of GFS, and are not paid any fees directly by the Fund for serving in such capacity.
24
| Empiric 2500 Fund |
| NOTES TO FINANCIAL STATEMENTS (Continued) |
| September 30, 2020 |
Pursuant to the Management Services Agreement, MFund provides chief compliance officer services to the Fund. For these services, the Fund pays MFund an annual base fee plus an annual asset-based fee based upon net assets. In addition, the Fund reimburses MFund for any reasonable out-of-pocket expenses incurred in the performance of its duties under the Management Services Agreement. For the year ended September 30, 2020, the Fund incurred $20,892 for such fees.
The Trust has adopted a Distribution Plan pursuant to Rule 12b-1(the “Plan”), under the 1940 Act for Class A shares and Class C shares, that allows the Fund to pay distribution and shareholder servicing expenses of up to 0.50% per annum for the Class A shares and up to 1.00% for the Class C shares based on average daily net assets of each class. Class A shares are currently paying 0.25% per annum of 12b-1 fees. Class C shares are currently paying 1.00% per annum of 12b-1 fees. The fee may be used for a variety of purposes, including compensating dealers and other financial service organizations for eligible services provided by those parties to the Fund and its shareholders and to reimburse NLD and the Advisor for distribution related expenses.
| (4) | TAX COMPONENTS OF CAPITAL |
The Statement of Assets and Liabilities represents cost for financial reporting purposes. Aggregate cost for federal tax purposes is $20,261,113 for the Empiric 2500 Fund and differs from fair value by net unrealized appreciation (depreciation) of securities as follows:
| Unrealized appreciation: | $ | 4,568,518 | ||
| Unrealized depreciation: | (866,102 | ) | ||
| Net unrealized appreciation: | $ | 3,702,416 |
The Fund did not have distributions for the years ended September 30, 2020 and September 30, 2019.
As of September 30, 2020, the components of accumulated earnings on a tax basis were as follows:
| Undistributed | Undistributed | Post October Loss | Capital Loss | Other | Unrealized | Total | ||||||||||||||||||||
| Ordinary | Long-Term | and | Carry | Book/Tax | Appreciation/ | Accumulated | ||||||||||||||||||||
| Income | Gains | Late Year Loss | Forwards | Differences | (Depreciation) | Earnings | ||||||||||||||||||||
| $ | — | $ | 2,076,564 | $ | (251,706 | ) | $ | — | $ | — | $ | 3,702,416 | $ | 5,527,274 | ||||||||||||
The difference between book basis and tax basis undistributed net investment income/(loss), accumulated net realized gain/(loss), and unrealized appreciation/(depreciation) from investments is primarily attributable to the tax deferral of losses on wash sales and adjustments for C-Corporation return of capital distributions.
Late year losses incurred after December 31 within the fiscal year are deemed to arise on the first business day of the following fiscal year for tax purposes. The Fund incurred and elected to defer such late year losses of $251,706.
At September 30, 2020, the Fund utilized capital loss carryforwards of $985,544.
Permanent book and tax differences, primarily attributable to net operating losses and adjustments for redemption in kind resulted in reclassification for the year ended September 30, 2020 as follows:
| Paid | ||||||
| In | Accumulated | |||||
| Capital | Earnings (Losses) | |||||
| $ | (7,671 | ) | $ | 7,671 | ||
25
| Empiric 2500 Fund |
| NOTES TO FINANCIAL STATEMENTS (Continued) |
| September 30, 2020 |
| (5) | SUBSEQUENT EVENTS |
Subsequent events occurring after the date of the Statement of Assets and Liabilities have been evaluated through the date the financial statements were issued. Management has determined that no events or transactions occurred requiring adjustment or disclosure in the financial statements.
26

REPORT OF INDEPENDENT REGISTERED PUBLIC ACCOUNTING FIRM
To the Shareholders of Empiric 2500 Fund and
Board of Trustees of Mutual Fund Series Trust
Opinion on the Financial Statements
We have audited the accompanying statement of assets and liabilities, including the schedule of investments, of Empiric 2500 Fund (“the Fund”), a series of Mutual Fund Series Trust, as of September 30, 2020, the related statement of operations for the year then ended, the statements of changes in net assets for each of the two years in the period then ended, including the related notes, and the financial highlights for each of the three years in the period then ended (collectively referred to as the “financial statements”). In our opinion, the financial statements present fairly, in all material respects, the financial position of the Fund as of September 30, 2020, the results of its operations for the year then ended, the changes in its net assets for each of the two years in the period then ended, and the financial highlights for each of the three years in the period then ended, in conformity with accounting principles generally accepted in the United States of America.
The Fund’s financial highlights for the years ended September 30, 2017, and prior, were audited by other auditors whose report dated November 28, 2017, expressed an unqualified opinion on those financial highlights.
Basis for Opinion
These financial statements are the responsibility of the Fund’s management. Our responsibility is to express an opinion on the Fund’s financial statements based on our audits. We are a public accounting firm registered with the Public Company Accounting Oversight Board (United States) (“PCAOB”) and are required to be independent with respect to the Fund in accordance with the U.S. federal securities laws and the applicable rules and regulations of the Securities and Exchange Commission and the PCAOB.
We conducted our audits in accordance with the standards of the PCAOB. Those standards require that we plan and perform the audit to obtain reasonable assurance about whether the financial statements are free of material misstatement whether due to error or fraud.
Our audits included performing procedures to assess the risks of material misstatement of the financial statements, whether due to error or fraud, and performing procedures that respond to those risks. Such procedures included examining, on a test basis, evidence regarding the amounts and disclosures in the financial statements. Our procedures included confirmation of securities owned as of September 30, 2020, by correspondence with the custodian. Our audits also included evaluating the accounting principles used and significant estimates made by management, as well as evaluating the overall presentation of the financial statements. We believe that our audits provide a reasonable basis for our opinion.
We have served as the Fund’s auditor since 2018.

COHEN & COMPANY, LTD.
Chicago, Illinois
November 24, 2020
COHEN & COMPANY, LTD.
800.229.1099 | 866.818.4535 fax | cohencpa.com
Registered with the Public Company Accounting Oversight Board
27
| Empiric 2500 Fund |
| ADDITIONAL INFORMATION (Unaudited) |
| September 30, 2020 |
LIQUIDITY RISK MANAGEMENT PROGRAM
The Fund has adopted and implemented a written liquidity risk management program as required by Rule 22e-4 (the “Liquidity Rule”) under the 1940 Act. The program is reasonably designed to assess and manage the Fund’s liquidity risk, taking into consideration, among other factors, the Fund’s investment strategies and the liquidity of its portfolio investments during normal and reasonably foreseeable stressed conditions; its short and long-term cash flow projections; and its cash holdings and access to other funding sources.
During the year ended September 30, 2020, the Board and the Trust’s Liquidity Risk Management Program Committee (the “Committee”) reviewed the Fund’s investments and they determined that the Fund held adequate levels of cash and highly liquid investments to meet shareholder redemption activities in accordance with applicable requirements. Accordingly, the Board and Committee concluded that (i) the Fund’s liquidity risk management program is reasonably designed to prevent violations of the Liquidity Rule and (ii) the Fund’s liquidity risk management program has been effectively implemented.
28
| Empiric 2500 Fund |
| EXPENSE EXAMPLES (Unaudited) |
| September 30, 2020 |
As a shareholder of the Empiric 2500 Fund, you incur two types of costs: (1) transaction costs, including sales charges (loads) on purchases of Class A shares; (2) ongoing costs, including management fees; distribution and/or service (12b-1) fees; and other Fund expenses. This example is intended to help you understand your ongoing costs (in dollars) of investing in the Empiric 2500 Fund and to compare these costs with the ongoing costs of investing in other mutual funds.
The example is based on an investment of $1,000 invested at the beginning of the period and held for the entire period from April 1, 2020 through September 30, 2020.
Actual Expenses
The “Actual” lines in the table below provide information about actual account values and actual expenses. You may use the information below together with the amount you invested, to estimate the expenses that you paid over the period. Simply divide your account value by $1,000 (for example, an $8,600 account value divided by $1,000 = 8.6), then multiply the result by the number in the table under the heading entitled “Expenses Paid During Period” to estimate the expenses you paid on your account during this period.
Hypothetical Example for Comparison Purposes
The “Hypothetical” lines in the table below provide information about hypothetical account values and hypothetical expenses based on the Fund’s actual expense ratio and an assumed rate of return of 5% per year before expenses, which is not the Fund’s actual return. The hypothetical account values and expenses may not be used to estimate the actual ending account balances or expenses you paid for the period. You may use this information to compare this 5% hypothetical example with the 5% hypothetical examples that appear in the shareholder reports of other funds.
Please note that the expenses shown in the table are meant to highlight your ongoing costs only and do not reflect any transactional costs, such as sales charges (loads). Therefore, the table is useful in comparing ongoing costs only, and will not help you determine the relative total costs of owning different funds. In addition, if these transactional costs were included, your costs would have been higher.
| Beginning | Ending | Expenses Paid | Expense Ratio | |||||
| Account Value | Account Value | During Period* | During Period** | |||||
| Actual | 4/1/20 | 9/30/20 | 4/1/20 – 9/30/20 | 4/1/20 – 9/30/20 | ||||
| Class A | $1,000.00 | $1,403.10 | $12.79 | 2.13% | ||||
| Class C | 1,000.00 | 1,397.90 | 17.26 | 2.88% | ||||
| Beginning | Ending | Expenses Paid | Expense Ratio | |||||
| Hypothetical | Account Value | Account Value | During Period* | During Period** | ||||
| (5% return before expenses) | 4/1/20 | 9/30/20 | 4/1/20 – 9/30/20 | 4/1/20 – 9/30/20 | ||||
| Class A | $1,000.00 | $1,014.36 | $10.72 | 2.13% | ||||
| Class C | 1,000.00 | 1,010.60 | 14.47 | 2.88% |
| * | Expenses are equal to the average account value over the period, multiplied by the Fund’s annualized expense ratio, multiplied by the number of days in the period (183) divided by the number of days in the fiscal year (366). |
| ** | Annualized. |
29
| Empiric 2500 Fund |
| ADDITIONAL INFORMATION (Unaudited) |
| September 30, 2020 |
Proxy Voting Policy and Portfolio Holdings
Reference is made to the Prospectus and the Statement of Additional Information for more detailed descriptions of the Management Agreement, Services Agreement and Distribution and/or Service (12b-1) Plan, tax aspects of the Fund and the calculation of the net asset value of shares of the Fund.
The Fund files its complete schedule of portfolio holdings with the Securities and Exchange Commission (the “Commission”) for the first and third quarters of each fiscal year as an exhibit to its reports on Form N-PORT, within sixty days after the end of the period. Form N-PORT reports are available at the SEC’s website at http://www.sec.gov.
Information regarding how the Fund voted proxies relating to portfolio securities during the twelve month period ended June 30 as well as a description of the policies and procedures that the Fund uses to determine how to vote proxies relating to portfolio securities is available without charge, upon request, by calling 1-888-839-7424; and on the Commission’s website at http://www.sec.gov.
30
| Empiric 2500 Fund |
| TRUSTEES AND OFFICERS (Unaudited) |
| September 30, 2020 |
| Independent Trustees |
| Name, Address Year of Birth | Position(s) Held with Registrant | Term and Length Served * | Principal Occupation(s) During Past 5 Years | Number of Portfolios Overseen in the Fund Complex** | Other Directorships Held During Past 5 Years |
| Tobias Caldwell c/o Mutual Fund Series Trust 36N New York Avenue, Huntington, NY 11743 Year of Birth: 1967 | Trustee | Since 6/2006 | Manager of Genovese Family Enterprises LLC & affiliates, a real estate/investment firm, since 1999. Managing Member of PTL Real Estate LLC, 2000 2019; Managing Member of Bear Properties, LLC, a real estate firm, since 2006. | 52 | Trustee of Variable Insurance Trust since 2010; Chairman of the Board of Mutual Fund and Variable Insurance Trust since 2016; Chairman of the Board of Strategy Shares since 2016; Trustee of M3Sixty Funds Trust since 2016; Chairman of the Board of AlphaCentric Prime Meridian Income Fund since 2018 |
| Tiberiu Weisz c/o Mutual Fund Series Trust 36N New York Avenue, Huntington, NY 11743 Year of Birth: 1949 | Trustee | Since 6/2006 | Retired, Attorney with and shareholder of Gottlieb, Rackman & Reisman, P.C., from 1994 to 2015. | 38 | Trustee of Variable Insurance Trust since 2010 |
| Dr. Bert Pariser c/o MITCU Corporation 860 East Broadway, Suite 2D, Long Beach, NY 11561 Year of Birth: 1940 | Trustee | Since 5/2007 | Managing Partner of The MITCU Corporation, a technology consulting firm since 2004. Retired Faculty Member Technical Career Institutes, from 1991 to 2017. | 38 | Trustee of Variable Insurance Trust since 2010 |
31
| Empiric 2500 Fund |
| TRUSTEES AND OFFICERS (Unaudited) (Continued) |
| September 30, 2020 |
| Interested Trustee*** and Officers |
| Name, Address, Year of Birth | Position(s) Held with Registrant | Term and Length Served* | Principal Occupation(s) During Past 5 Years | Number of Portfolios Overseen In The Fund Complex** | Other Directorships Held During Past 5 Years |
| Jerry Szilagyi 53 Palmeras St. Suite 601 San Juan, PR 00901 Year of Birth: 1962 | Chairman of the Board and President | Trustee since 7/2006; President since 2/2012 | President, Rational Advisors, Inc., 1/2016 - present; Chief Executive Officer, Catalyst Capital Advisors LLC, 1/2006- present; Member, AlphaCentric Advisors LLC, 2/2014 to Present; Managing Member, MFund Distributors LLC, 10/2012- present; Managing Member, MFund Services LLC, 1/2012 – Present; President, Abbington Capital Group LLC, 1998-present; CEO, Catalyst Capital International, LLC 2017- present; President, USA Mutuals, Inc., 3/2011 to 7/2016; President, Cross Sound LLC, 6/11 to 7/2016; CEO, Catalyst International Advisors LLC, 11/2019 to present; CEO, Insights Media LLC, 11/2019 to present; CEO, MFund Management LLC, 11/2019 to present. | 38 | Variable Insurance Trust since 2010 |
| Erik Naviloff 4221 North 203rd Street, Suite 100, Elkhorn, Nebraska, 68022 Year of Birth: 1968 | Treasurer | Since 4/2012 | Vice President – Fund Administration, Gemini Fund Services, LLC, since 2011. | N/A | N/A |
| Aaron Smith 4221 North 203rd Street, Suite 100, Elkhorn, Nebraska, 68022 Year of Birth: 1974 | Assistant Treasurer | Since 11/2013 | Assistant Vice President, Gemini Fund Services, LLC, since 2017. Manager -Fund Administration, Gemini Fund Services, LLC, 2012- 2017. | N/A | N/A |
| Brian Curley 4221 North 203rd Street, Suite 100, Elkhorn, Nebraska, 68022 Year of Birth: 1970 | Assistant Treasurer | Since 11/2013 | Vice President, Gemini Fund Services, LLC since 1/2015. | N/A | N/A |
| Sam Singh 4221 North 203rd Street, Suite 100, Elkhorn, Nebraska, 68022 Year of Birth: 1976 | Assistant Treasurer | Since 2/2015 | Vice President, Gemini Fund Services, LLC since 1/2015. | N/A | N/A |
| Frederick J. Schmidt 36 N. New York Avenue Huntington, NY 11743 Year of Birth: 1959 | Chief Compliance Officer | Since 5/2015 | Director, MFund Services LLC since 5/2015. | N/A | N/A |
| Jennifer A. Bailey 36 N. New York Avenue Huntington, NY 11743 Year of Birth: 1968 | Secretary | Secretary since 4/2014 | Director of Legal Services, MFund Services LLC, since 2012. | N/A | N/A |
| Michael Schoonover 53 Palmeras St. Suite 601 San Juan, PR 00901 Year of Birth: 1983 | Vice President | Since 6/2018 | Chief Operating Officer, Catalyst Capital Advisors LLC & Rational Advisors, Inc., June 2017 to present; Portfolio Manager, Catalyst Capital Advisors LLC 12/2013 to present; Portfolio Manager, Rational Advisors, Inc. 1/2016 to 5/2018; President, MFund Distributors LLC, 1/2020 to present; COO, Catalyst International Advisors LLC, 11/2019 to present; COO, Insights Media LLC, 11/2019 to present; COO, MFund Management LLC, 11/2019 to present. | N/A | N/A |
| * | The term of office of each Trustee is indefinite. |
| ** | The ‘Fund Complex’ includes the Trust, Variable Insurance Trust, Mutual Fund and Variable Insurance Trust, Strategy Shares,, and AlphaCentric Prime Meridian Income Fund, each a registered investment company. |
| *** | The Trustee who is an “interested person” of the Trust as defined in the 1940 Act is an interested person by virtue of being an officer of the advisor to certain series of the Trust. |
The Fund’s SAI includes additional information about the Trustees and is available free of charge, upon request, by calling toll-free at 1-888-839-7424.
32
PRIVACY NOTICE
Mutual Fund Series Trust
Rev. June 2011
| FACTS | WHAT DOES MUTUAL FUND SERIES TRUST DO WITH YOUR PERSONAL INFORMATION? |
| Why? | Financial companies choose how they share your personal information. Federal law gives consumers the right to limit some, but not all sharing. Federal law also requires us to tell you how we collect, share, and protect your personal information. Please read this notice carefully to understand what we do. |
| What? | The types of personal information we collect and share depends on the product or service that you have with us. This information can include:
● Social Security number and wire transfer instructions
● account transactions and transaction history
● investment experience and purchase history
When you are no longer our customer, we continue to share your information as described in this notice. |
| How? | All financial companies need to share customers’ personal information to run their everyday business. In the section below, we list the reasons financial companies can share their customers’ personal information; the reasons Mutual Fund Series Trust chooses to share; and whether you can limit this sharing. |
| Reasons we can share your personal information: | Does Mutual Fund Series Trust share information? | Can you limit this sharing? |
| For our everyday business purposes - such as to process your transactions, maintain your account(s), respond to court orders and legal investigations, or report to credit bureaus. | YES | NO |
| For our marketing purposes - to offer our products and services to you. | NO | We don’t share |
| For joint marketing with other financial companies. | NO | We don’t share |
| For our affiliates’ everyday business purposes - information about your transactions and records. | NO | We don’t share |
| For our affiliates’ everyday business purposes - information about your credit worthiness. | NO | We don’t share |
| For our affiliates to market to you | NO | We don’t share |
| For non-affiliates to market to you | NO | We don’t share |
| QUESTIONS? | Call 1-866-447-4228 |
33
PRIVACY NOTICE
Mutual Fund Series Trust
| Page 2 |
| What we do: | |
How does Mutual Fund Series Trust protect my personal information? | To protect your personal information from unauthorized access and use, we use security measures that comply with federal law. These measures include computer safeguards and secured files and buildings.
Our service providers are held accountable for adhering to strict policies and procedures to prevent any misuse of your nonpublic personal information. |
How does Mutual Fund Series Trust collect my personal information? | We collect your personal information, for example, when you ● open an account or deposit money
● direct us to buy securities or direct us to sell your securities
● seek advice about your investments
We also collect your personal information from others, such as credit bureaus, affiliates, or other companies. |
Why can’t I limit all sharing? | Federal law gives you the right to limit only: ● sharing for affiliates’ everyday business purposes – information about your creditworthiness.
● affiliates from using your information to market to you.
● sharing for non-affiliates to market to you.
State laws and individual companies may give you additional rights to limit sharing. |
| Definitions | |
| Affiliates | Companies related by common ownership or control. They can be financial and non-financial companies.
● Mutual Fund Series Trust has no affiliates. |
| Non-affiliates | Companies not related by common ownership or control. They can be financial and non-financial companies.
● Mutual Fund Series Trust does not share with non-affiliates so they can market to you. |
| Joint marketing | A formal agreement between nonaffiliated financial companies that together market financial products or services to you.
● Mutual Fund Series Trust does not jointly market. |
34
| Mutual Fund Series Trust |
| 4221 North 203rd Street, Suite 100 |
| Elkhorn, NE 68022 |
| ADVISOR |
| Empiric Advisors, Inc. |
| 500 N. Capital of Texas Highway |
| Building 8, Suite 150 |
| Austin, TX 78746 |
| ADMINISTRATOR |
| Gemini Fund Services, LLC |
| 4221 North 203rd Street, Suite 100 |
| Elkhorn, NE 68022 |
| TRANSFER AGENT |
| Gemini Fund Services, LLC |
| 4221 North 203rd Street, Suite 100 |
| Elkhorn, NE 68022 |
| DISTRIBUTOR |
| Northern Lights Distributors, LLC |
| 4221 North 203rd Street, Suite 100 |
| Elkhorn, NE 68022 |
| INDEPENDENT REGISTERED PUBLIC ACCOUNTING FIRM |
| Cohen & Company, Ltd. |
| 151 N. Franklin St., |
| Suite 575 |
| Chicago, IL 60606 |
| LEGAL COUNSEL |
| Thompson Hine LLP |
| 41 South High Street |
| Suite 1700 |
| Columbus, OH 43215 |
| CUSTODIAN BANK |
| U.S. Bank |
| 1555 N. Rivercenter Dr. |
| Milwaukee, WI 53212 |
ITEM 2. CODE OF ETHICS.
| (a) | The registrant has, as of the end of the period covered by this report, adopted a code of ethics that applies to the registrant's principal executive officer, principal financial officer, and principal accounting officer or controller, or persons performing similar functions, regardless of whether these individuals are employed by the registrant or a third party. |
| (b) | During the period covered by this report, there were no amendments to any provision of the code of ethics. |
| (c) | During the period covered by this report, there were no waivers or implicit waivers of a provision of the code of ethics. |
ITEM 3. AUDIT COMMITTEE FINANCIAL EXPERT.
| The registrant’s Board of Trustees has determined that it does not have an audit committee financial expert serving on its audit committee. At this time, the registrant believes that the experience provided by each member of the audit committee together offer the registrant adequate oversight for the registrant’s level of financial complexity. |
ITEM 4. PRINCIPAL ACCOUNTANT FEES AND SERVICES.
| (a) | Audit Fees. The aggregate fees billed for each of the last two fiscal years for professional services rendered by the registrant's principal accountant for the audit of the registrant's annual financial statements or services that are normally provided by the accountant in connection with statutory and regulatory filings or engagements for those fiscal years are as follows:
| |||
| Trust Series | 2020 | 2019 | ||
| Empiric 2500 Fund | 10,000 | 10,000 | ||
| (b) | Audit-Related Fees. There were no fees billed in each of the last two fiscal years for assurances and related services by the principal accountant that are reasonably related to the performance of the audit of the registrant’s financial statements and are not reported under paragraph (a) of this item. |
| (c) | Tax Fees. The aggregate fees billed in each of the last two fiscal years for professional services rendered by the principal accountant for tax compliance are as follows: |
| Trust Series | 2020 | 2019 |
| Empiric 2500 Fund | 2,500 | 2,500 |
| (d) | All Other Fees. The aggregate fees billed in each of the last two fiscal years for products and services provided by the registrant’s principal accountant, other than the services reported in paragraphs (a) through (c) of this item were $0 and $0 for the fiscal years ended September 30, 2020 and 2019 respectively. |
| (e)(1) | The audit committee does not have pre-approval policies and procedures. Instead, the audit committee or audit committee chairman approves on a case-by-case basis each audit or non-audit service before the principal accountant is engaged by the registrant. |
| (e)(2) | There were no services described in each of paragraphs (b) through (d) of this Item that were approved by the audit committee pursuant to paragraph (c)(7)(i)(C) of Rule 2-01 of Regulation S-X. |
| f) | Not applicable. The percentage of hours expended on the principal accountant's engagement to audit the registrant's financial statements for the most recent fiscal year that were attributed to work performed by persons other than the principal accountant's full-time, permanent employees was zero percent (0%). |
| (g) | All non-audit fees billed by the registrant's principal accountant for services rendered to the registrant for the fiscal years ended September 30, 2020 and 2019 respectively are disclosed in (b)-(d) above. There were no audit or non-audit services performed by the registrant's principal accountant for the registrant's adviser. |
ITEM 5. AUDIT COMMITTEE OF LISTED REGISTRANTS.
Not applicable
ITEM 6. SCHEDULE OF INVESTMENT
Included in annual report to shareholders filed under item 1 of this form.
ITEM 7. DISCLOSURE OF PROXY VOTING POLICIES AND PROCEDURES FOR CLOSED-END MANAGEMENT INVESTMENT COMPANIES.
Not applicable Fund is an open-end management investment company
ITEM 8. PORTFOLIO MANAGERS OF CLOSED-END MANAGEMENT INVESTMENT COMPANIES
Not applicable Fund is an open-end management investment company
ITEM 9. PURCHASES OF EQUITY SECURITIES BY CLOSED-END MANAGEMENT INVESTMENT COMPANY AND AFFILIATED PURCHASERS.
Not applicable Fund is an open-end management investment company
ITEM 10. SUBMISSION OF MATTERS TO A VOTE OF SECURITY HOLDERS.
Not applicable at this time.
ITEM 11. CONTROLS AND PROCEDURES.
(a) The registrant's principal executive and principal financial officers, or persons performing similar functions, have concluded that the registrant's disclosure controls and procedures (as defined in Rule 30a-3(c) under the 1940 Act, are effective, as of a date within 90 days of the filing date of this report, based on the evaluation of these controls and procedures required by Rule 30a-3(b) under the 1940 Act and Rule 15d-15(b) under the Securities Exchange Act of 1934, as amended.
(b) There were no changes in the registrant's internal control over financial reporting (as defined in Rule 30a-3(d) under the 1940 Act) that occurred during the period covered by this report that have materially affected, or are reasonably likely to materially affect, the registrant's internal control over financial reporting.
ITEM 12. Disclosure of Securities Lending Activities for Closed-End Management Investment Companies.
Not applicable Fund is an open-end management investment company
ITEM 13. EXHIBITS
(1) Code of Ethics for Principal Executive and Senior Financial Officers is attached hereto.
(2) Certifications pursuant to Section 302 of the Sarbanes-Oxley Act of 2002 are filed herewith.
(3) Certifications pursuant to Section 906 of the Sarbanes-Oxley Act of 2002 are filed herewith.
SIGNATURES
Pursuant to the requirements of the Securities Exchange Act of 1934 and the Investment Company Act of 1940, the registrant has duly caused this report to be signed on its behalf by the undersigned, thereunto duly authorized.
Mutual Fund Series Trust
| By Jerry Szilagyi | /s/ Jerry Szilagyi |
| Principal Executive Officer/President | |
| Date: December 8, 2020 | |
Pursuant to the requirements of the Securities Exchange Act of 1934 and the Investment Company Act of 1940, this report has been signed below by the following person on behalf of the registrant and in the capacities and on the date indicated.
| By Jerry Szilagyi | /s/ Jerry Szilagyi ___________ |
| Principal Executive Officer/President | |
| Date: December 8, 2020 | |
Pursuant to the requirements of the Securities Exchange Act of 1934 and the Investment Company Act of 1940, this report has been signed below by the following person on behalf of the registrant and in the capacities and on the date indicated.
| By Erik Naviloff | /s/ Erik Naviloff_____________ |
| Principal Financial Officer/Treasurer | |
| Date: December 8, 2020 | |