united states
securities and exchange commission
washington, d.c. 20549
form n-csr
certified shareholder report of registered management
investment companies
Investment Company Act file number 811-21872
Mutual Fund Series Trust
(Exact name of registrant as specified in charter)
225 Pictoria Drive, Suite 450, Cincinnati, Ohio 45246
(Address of principal executive offices) (Zip code)
CT CORPORATION SYSTEM
1300 EAST NINTH STREET, CLEVELAND, OH 44114
(Name and address of agent for service)
Registrant's telephone number, including area code: 631-490-4300
Date of fiscal year end: 9/30
Date of reporting period: 3/31/22
ITEM 1. REPORTS TO SHAREHOLDERS.

Semi-Annual Report
March 31, 2022
Fellow Shareholders,
The NAV of the Fund’s Class “A” shares on March 31st, 2022 was $55.27 per share. Cumulative and annualized returns are below.
| | Class A | Class A | | |
| | (No Sales | (Max 5.75% | | |
| Ended 03.31.21 | Charges) | Charge | Class C | Benchmark1 |
| Annual Returns % | | | | |
| Since Inception (A) | 9.30% | 9.05% | — | 10.09% |
| Since Inception (C) | — | — | 6.09% | 10.64% |
| Last 10 Years | 10.44% | 9.78% | 9.61% | 12.22% |
| Last 5 Years | 12.36% | 11.04% | 11.53% | 11.39% |
| Short-term Returns % | | | | |
| Last 3 Months | -9.62% | -14.81% | -9.78% | -6.08% |
| Last 6 Months | -7.47% | -12.79% | -7.81% | -2.64% |
| Last 12 Months | -6.52% | -11.90% | -7.21% | 0.07% |
| Net Expense Ratio | 1.96% | — | 2.71% | — |
| 1 | Prior to 09/30/2013, the Benchmark Index is the S&P 500. For periods after 09/30/2013, the Benchmark Index is the Bloomberg 2500. For comparisons periods that straddle 09/30/2013, we use the S&P 500. For periods after 09/30/2013, we use the Bloomberg 2500. |
Performance data quoted represents past performance which does not guarantee future results. Investment returns and principal will fluctuate so that an investor’s shares, when redeemed, may be worth more or less than original cost. Current performance may be lower or higher than the performance quoted. To obtain performance to the most recent month-end, please call 1.800.880.0324, or visit our website at www.EmpiricFunds.com. Class C shares redeemed within 12 months of purchase are subject to a maximum CDSC of 1.00%. Performance data shown with Max 5.75% charge reflects the maximum sales charge. Performance data shown with no sales charges does not reflect current maximum sales charge. Had the sales charges been included, the Fund’s returns would have been lower. Inception date for the Class A shares is 11/06/1995 and for the Class C shares 10/07/2005.
5477-NLD-05122022
Management Commentary
Inflation and the Rare Soft Landing
In our last shareholder update in February, we stated, “For the next one to three years, the investing environment and growth in the economy will rest on how well the Federal Reserve can reduce inflation.”
All signs indicate that the Fed is finally, belatedly taking inflation seriously. On March 16, the Fed approved the first increase in the Fed funds rate since 2018, raising the target from near-zero to 0.25%-0.5%.
We expect several additional interest rate increases this year, starting in May. As higher rates move through the economy, we will see adjustments in the prices of equities and bonds, as well as consumer products such as mortgages and car loans. This will slow the overheated economy and, we hope, generate a “soft landing” to a more sustainable period of growth.
This adjustment is coming at a time when stock valuations have been relatively high, and we think this will present long-term buying opportunities. They haven’t emerged yet, but we’re on the lookout.
5477-NLD-05122022
Inflation at 8.5%
Inflation has been at the top of financial news lately, but this shouldn’t be a surprise to our clients. We’ve been writing about inflation for the past year.
When inflation reached a 40-year high of 7.5% for the 12 months that ended in January, we called this “a stunner for the Federal Reserve and many economists.” Through March 2022, the 12-month average has now increased to 8.5%.
No more can the Fed’s governors call inflation “transitory,” as they were doing as recently as last year when the agency was focused on the COVID-19 economic recovery. It’s time for the Fed to act, and to act decisively.
As of December 15, the Fed indicated that it would implement three modest interest rate hikes in 2022, most likely 0.25% (25 basis points) each. We’re in a different world today. The betting is on a 50-basis point hike at its next meeting in May. But it won’t end there. We expect rates at the end of 2022 won’t be 0.75%-1.0% as expected, but instead will be 3.5% or more. Quite simply, we will see the end of the policy started in August 2020 by Chairman Jerome Powell to prioritize employment over inflation to get the economy back on track.
Investors always look ahead, and they are expecting strong Fed action. This is already rippling through the equities markets, as
5477-NLD-05122022
reflected in weak stock market performance for the first quarter of 2022 despite an economy that’s still quite strong. The S&P 500 ended the quarter down -5.3% and developed international market equities dropped by -5.9%. Emerging markets lost -7.0%.
Market performance
When inflation is rising, investors know that several things will happen. First, newly issued bonds will have to yield greater returns. From a low of about 0.5% in mid-2020, the 10-year Treasury currently yields 2.9%. This better return for bonds will induce some investors to shift assets away from stocks.
On top of the higher bond yields—which are still a losing proposition compared to inflation—investors expect the Fed’s actions will slow down the economy. The point of raising interest rates is to make corporate and consumer borrowing more costly, and thus reduce the demand for goods and services that are driving inflation upward.
If that adjustment is managed well, the economy will enjoy a soft landing. If not, we could face a recession.
We have watched this play out numerous times before. According to investment bank Piper Sandler, in the nine times since 1961 when the Fed has increased interest rates to slow inflation, only once did it achieve a true soft landing. On the eight other attempts, a recession followed the interest rate hikes. Politico calls that “Not a sterling track record.” In fairness, the economist Alan Blinder, Professor of Economics at Princeton, once a member of the President Clinton’s Counsel of
5477-NLD-05122022
Economic Advisors and former Vice Chairman of the Fed’s Board of Governors, says the Fed was successful three times. But whether the Fed’s success is one or three times out of nine, it is still a miserable record.
A slowing economy slows corporate earnings growth. Stocks tend to sniff out recessions six to 12 months prior to the event, and that’s one reason to look carefully at the poor market performance in Q1 and the equally difficult April.
But no one knows if we will suffer through a recession, nor how long or severe it will be. Remember that the COVID-induced recession in 2020 was the shortest on record in the U.S. (two months!), with the Fed’s accommodative policies playing a helpful role. But don’t expect another two-month recession if one occurs.
There are bright spots in the economy. Company earnings for Q1 are coming in, and they are satisfactory. For the roughly one-quarter of S&P 500 corporations reporting earnings through April 22, FactSet said that average earnings growth is 6.6% year-over-year. While that’s slower than much of the COVID recovery period, it’s still a healthy number.
In March, the U.S. economy added 431,000 nonfarm jobs, and unemployment remained at a very comfortable 3.6%.
On the other hand, inflation at 8.5% is troubling, and there are signs of worse to come. Wholesale inflation, which tends to drive consumer inflation as costs move through the economy, is 11.2% for the trailing 12 months. This is because the supply chain problems that emerged during COVID were never fully fixed, and they have been compounded by the
5477-NLD-05122022
surge in oil and natural gas prices created by embargoes in response to Russia’s invasion of Ukraine.
When we think about the causes of inflation, energy tops the list. It’s no coincidence, by the way, that the strongest Q1 2022 earnings were reported by energy companies, which registered average gains of more than 250% compared to a year ago, according to FactSet. And it’s no surprise that energy company stock prices gained 39% in the quarter.
So, we’re seeing a market that is anticipating rising interest rates and adjusting ahead of time—as the market always tries to do. This could be a healthy correction. The price-to-earnings (P/E) ratio of the S&P 500 was about 21.6 in late April, still on the high side historically compared to most of the 21st century. But it’s down from 23.1 on January 1, 2021, and 36 on January 1, 2020.
We are watching the national economic measures and the broad stock market indicators. We are also watching individual companies that are resilient and well-managed and are leaders in their sectors. When strong performers were carried to unreasonable P/E levels by the overall market and relatively weaker companies were buoyed by the economy, buying opportunities have been rare. With the uncertainty about the Fed’s actions and inflation right now, we are still being careful. But we see changes coming, and change brings opportunity. For now, we are buying little, but we think that the next 18 months will provide ample opportunities to buy stocks.
The Advisor to the Fund and family members own a significant portion of the Fund. We eat our own cooking.
We appreciate you investing along with us.
5477-NLD-05122022
Top 6 Month
Contributors to Performance | | Bottom 6 Month
Detractors from Performance |
| Molina Healthcare | | Generac Holdings Inc |
| Coca-Cola Consolidated | | TPI Composites Inc |
| Robert Half Intl Inc | | Agilysys Inc |
| Henry Schein Inc | | Avery Dennison Corp |
| LPL Financial Holdings Inc | | Domo Inc. |
| Respectfully submitted, | |
| | |
| Mark A Coffelt, CFA | Loren M Coffelt |
| Co-Portfolio Manager | Co-Portfolio Manager |
5477-NLD-05122022
| Empiric 2500 Fund |
| PORTFOLIO REVIEW (Unaudited) |
| March 31, 2022 |
| |
Average Annual Total Return through March 31, 2022*, as compared to its benchmarks:
| | 6 Month Return | 1 Year Return | 5 Year Return | 10 Year Return | Since Inception (a) |
| Empiric 2500 Fund Class A | -7.47% | -6.52% | 12.36% | 10.44% | 9.30% |
| Empiric 2500 Fund Class A with Load (b) | -12.79% | -11.90% | 11.04% | 9.78% | 9.05% |
| Bloomberg US 2500 Total Return Index(c) | -2.64% | 0.07% | 11.39% | 12.22% | N/A |
| | | | | | |
| * | The performance data quoted here represents past performance. Current performance may be lower or higher than the performance data quoted above. Investment return and principal value will fluctuate, so that shares, when redeemed, may be worth more or less than their original cost. The returns shown do not reflect the deduction of taxes that a shareholder would pay on Fund distributions or on the redemptions of Fund shares. Past performance is no guarantee of future results. The Advisor and the Trust, with respect to the Fund, entered into an Expense Limitation Agreement under which the Advisor contractually agreed to waive fees and/or reimburse expenses but only to the extent necessary so that total annual operating expenses, excluding front-end or contingent deferred loads, taxes, leverage interest, brokerage fees and commissions, expenses incurred in connection with any merger or reorganization, dividend expense on securities sold short, underlying fund fees and expenses or extraordinary expenses (such as litigation), did not exceed 2.24% for Class A of the Fund’s average daily net assets through January 31, 2021. As of January 31, 2021, the agreement was not extended or renewed. For performance information current to the most recent month-end, please call toll-free 1-888-839-7424. The Fund’s expense ratio, as of the February 1, 2022 prospectus, is 1.96% for Class A shares. For more current information on the Fund’s expense ratio, please see the Financial Highlights. |
| (a) | Empiric 2500 Fund Class A commenced operations on November 6, 1995. |
| (b) | Class A shares are subject to a maximum sales load of 5.75%, which decreases depending on the amount invested and a maximum deferred sales charge of 1.00%. |
| (c) | The Bloomberg US 2500 Total Return Index is a float market-cap-weighted benchmark of the lower 2500 in capitalization of the Bloomberg US 3000 Index. This index is not available back to the inception of Class A shares. Investors cannot invest directly in an index. The Fund has adopted the Bloomberg US 2500 Total Return Index as its primary broad-based securities market index because Fund management believes it aligns with the asset composition of the Fund and is available without payment of a significant licensing fee, which is required by the owner of the Fund’s prior primary broad-based securities market index. |
| Empiric 2500 Fund |
| PORTFOLIO REVIEW (Unaudited) (Continued) |
| March 31, 2022 |
| |
Average Annual Total Return through March 31, 2022*, as compared to its benchmarks:
| | 6 Month Return | 1 Year Return | 5 Year Return | 10 Year Return | Since Inception (a) |
| Empiric 2500 Fund Class C | -7.81% | -7.21% | 11.53% | 9.61% | 6.09% |
| Bloomberg US 2500 Total Return Index(b) | -2.64% | 0.07% | 11.39% | 12.22% | N/A |
| | | | | | |
| * | The performance data quoted here represents past performance. Current performance may be lower or higher than the performance data quoted above. Investment return and principal value will fluctuate, so that shares, when redeemed, may be worth more or less than their original cost. The returns shown do not reflect the deduction of taxes that a shareholder would pay on Fund distributions or on the redemptions of Fund shares. Past performance is no guarantee of future results. The Advisor and the Trust, with respect to the Fund, entered into an Expense Limitation Agreement under which the Advisor contractually agreed to waive fees and/or reimburse expenses but only to the extent necessary so that total annual operating expenses, excluding front-end or contingent deferred loads, taxes, leverage interest, brokerage fees and commissions, expenses incurred in connection with any merger or reorganization, dividend expense on securities sold short, underlying fund fees and expenses or extraordinary expenses (such as litigation), did not exceed 2.99% for Class C of the Fund’s average daily net assets through January 31, 2021. As of January 31, 2021, the agreement was not extended or renewed. For performance information current to the most recent month-end, please call toll-free 1-888-839-7424. The Fund’s expense ratio, as of the February 1, 2022 prospectus, is 2.71% for Class C shares. For more current information on the Fund’s expense ratio, please see the Financial Highlights. |
| (a) | Empiric 2500 Fund Class C commenced operations on October 7, 2005. |
| (b) | The Bloomberg US 2500 Total Return Index is a float market-cap-weighted benchmark of the lower 2500 in capitalization of the Bloomberg US 3000 Index. This index is not available back to the inception of Class C shares. Investors cannot invest directly in an index. The Fund has adopted the Bloomberg US 2500 Total Return Index as its primary broad-based securities market index because Fund management believes it aligns with the asset composition of the Fund and is available without payment of a significant licensing fee, which is required by the owner of the Fund’s prior primary broad-based securities market index. |
| Empiric 2500 Fund |
| Portfolio Weightings (Unaudited) |
| March 31, 2022 |
| |
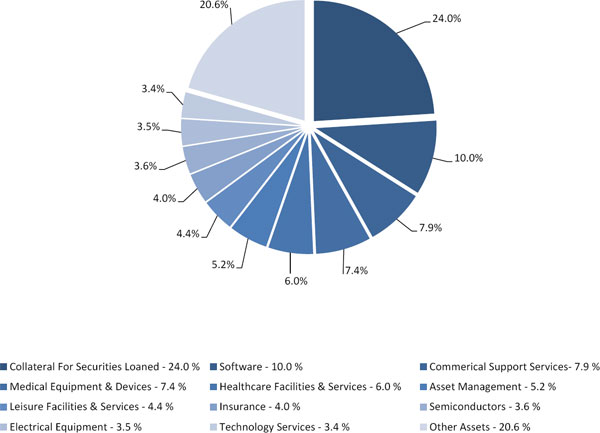
The percentages in the above chart are based on the portfolio holdings as a percentage of net assets of the Fund as of March 31, 2022 and are subject to change.
| EMPIRIC 2500 FUND |
| SCHEDULE OF INVESTMENTS (Unaudited) |
| March 31, 2022 |
| Shares | | | | | Fair Value | |
| | | | | COMMON STOCKS — 98.1% | | | | |
| | | | | ADVERTISING & MARKETING - 2.5% | | | | |
| | 19,563 | | | Interpublic Group of Companies, Inc. | | $ | 693,508 | |
| | | | | | | | | |
| | | | | AEROSPACE & DEFENSE - 0.9% | | | | |
| | 6,529 | | | Aerojet Rocketdyne Holdings, Inc.(a)(d) | | | 256,916 | |
| | | | | | | | | |
| | | | | APPAREL & TEXTILE PRODUCTS - 0.0%(b) | | | | |
| | 32 | | | Carter’s, Inc. (d) | | | 2,944 | |
| | | | | | | | | |
| | | | | ASSET MANAGEMENT - 5.2% | | | | |
| | 7,700 | | | Ares Management Corporation, Class A | | | 625,471 | |
| | 4,250 | | | LPL Financial Holdings, Inc. (d) | | | 776,390 | |
| | | | | | | | 1,401,861 | |
| | | | | BEVERAGES - 2.4% | | | | |
| | 1,307 | | | Coca-Cola Consolidated, Inc. | | | 649,383 | |
| | | | | | | | | |
| | | | | BIOTECH & PHARMA - 3.4% | | | | |
| | 8,166 | | | Halozyme Therapeutics, Inc.(a)(d) | | | 325,660 | |
| | 4,201 | | | Horizon Therapeutics PLC(a) | | | 441,987 | |
| | 537 | | | Neurocrine Biosciences, Inc.(a)(d) | | | 50,344 | |
| | 2,410 | | | Twist Bioscience Corporation(a) | | | 119,006 | |
| | | | | | | | 936,997 | |
| | | | | CHEMICALS - 1.3% | | | | |
| | 1,988 | | | Avery Dennison Corporation | | | 345,852 | |
| | | | | | | | | |
| | | | | COMMERCIAL SUPPORT SERVICES - 7.9% | | | | |
| | 3,545 | | | AMN Healthcare Services, Inc.(a) | | | 369,850 | |
| | 4,205 | | | Brink’s Company (The) | | | 285,940 | |
| | 9,910 | | | Robert Half International, Inc. | | | 1,131,524 | |
| | 3,836 | | | TriNet Group, Inc.(a) | | | 377,309 | |
| | | | | | | | 2,164,623 | |
| | | | | CONTAINERS & PACKAGING - 3.3% | | | | |
| | 6,641 | | | Berry Global Group, Inc.(a) | | | 384,912 | |
| | 4,288 | | | Crown Holdings, Inc. | | | 536,387 | |
| | | | | | | | 921,299 | |
| | | | | | | | | |
See accompanying notes to financial statements.
| EMPIRIC 2500 FUND |
| SCHEDULE OF INVESTMENTS (Unaudited) (Continued) |
| March 31, 2022 |
| Shares | | | | | Fair Value | |
| | | | | COMMON STOCKS — 98.1% (Continued) | | | | |
| | | | | ELECTRICAL EQUIPMENT - 3.5% | | | | |
| | 2,529 | | | A O Smith Corporation | | $ | 161,578 | |
| | 2,433 | | | Chase Corporation(d) | | | 211,452 | |
| | 1,677 | | | Generac Holdings, Inc.(a)(d) | | | 498,505 | |
| | 437 | | | Hubbell, Inc. | | | 80,308 | |
| | | | | | | | 951,843 | |
| | | | | ENGINEERING & CONSTRUCTION - 2.4% | | | | |
| | 2,430 | | | Installed Building Products, Inc. (d) | | | 205,311 | |
| | 3,412 | | | Quanta Services, Inc. | | | 449,053 | |
| | | | | | | | 654,364 | |
| | | | | ENTERTAINMENT CONTENT - 1.2% | | | | |
| | 34,098 | | | Zynga, Inc., Class A(a) | | | 315,066 | |
| | | | | | | | | |
| | | | | GAMING REITS - 0.1% | | | | |
| | 397 | | | Gaming and Leisure Properties, Inc. | | | 18,631 | |
| | | | | | | | | |
| | | | | GAS & WATER UTILITIES - 0.1% | | | | |
| | 838 | | | Global Water Resources, Inc. | | | 13,944 | |
| | | | | | | | | |
| | | | | HEALTH CARE FACILITIES & SERVICES - 6.0% | | | | |
| | 982 | | | Amedisys, Inc.(a)(d) | | | 169,189 | |
| | 435 | | | Chemed Corporation | | | 220,349 | |
| | 5,044 | | | Henry Schein, Inc. | | | 439,786 | |
| | 1,511 | | | Medpace Holdings, Inc.(a)(d) | | | 247,184 | |
| | 1,705 | | | Molina Healthcare, Inc.(a) | | | 568,772 | |
| | | | | | | | 1,645,280 | |
| | | | | HOME & OFFICE PRODUCTS - 0.7% | | | | |
| | 1,087 | | | Whirlpool Corporation.(d) | | | 187,812 | |
| | | | | | | | | |
| | | | | INDUSTRIAL SUPPORT SERVICES - 2.4% | | | | |
| | 1,880 | | | United Rentals, Inc.(a) | | | 667,795 | |
| | | | | | | | | |
| | | | | INSURANCE - 4.0% | | | | |
| | 2,394 | | | Assurant, Inc. | | | 435,301 | |
| | 8,200 | | | Equitable Holdings, Inc. | | | 253,462 | |
| | | | | | | | | |
See accompanying notes to financial statements.
| EMPIRIC 2500 FUND |
| SCHEDULE OF INVESTMENTS (Unaudited) (Continued) |
| March 31, 2022 |
| Shares | | | | | Fair Value | |
| | | | | COMMON STOCKS — 98.1% (Continued) | | | | |
| | | | | INSURANCE - 4.0% (Continued) | | | | |
| | 509 | | | Palomar Holdings, Inc.(a) | | $ | 32,571 | |
| | 2,769 | | | Primerica, Inc. | | | 378,855 | |
| | | | | | | | 1,100,189 | |
| | | | | INTERNET MEDIA & SERVICES - 2.0% | | | | |
| | 5,839 | | | Shutterstock, Inc. | | | 543,494 | |
| | | | | | | | | |
| | | | | LEISURE FACILITIES & SERVICES - 4.4% | | | | |
| | 249 | | | Caesars Entertainment, Inc.(a) | | | 19,263 | |
| | 6,036 | | | Dine Brands Global, Inc. | | | 470,506 | |
| | 4,996 | | | Shake Shack, Inc., Class A(a) | | | 339,228 | |
| | 1,394 | | | Vail Resorts, Inc. | | | 362,816 | |
| | | | | | | | 1,191,813 | |
| | | | | LEISURE PRODUCTS - 2.4% | | | | |
| | 7,460 | | | OneWater Marine, Inc. (d) | | | 256,997 | |
| | 3,876 | | | Polaris, Inc. (d) | | | 408,220 | |
| | | | | | | | 665,217 | |
| | | | | MACHINERY - 3.0% | | | | |
| | 3,496 | | | Lincoln Electric Holdings, Inc. | | | 481,784 | |
| | 3,872 | | | Toro Company (The) | | | 331,017 | |
| | | | | | | | 812,801 | |
| | | | | MEDICAL EQUIPMENT & DEVICES - 7.4% | | | | |
| | 8,068 | | | Bruker Corporation | | | 518,772 | |
| | 6,429 | | | Globus Medical, Inc., Class A(a) | | | 474,332 | |
| | 1,007 | | | Penumbra, Inc.(a) | | | 223,685 | |
| | 1,283 | | | Quidel Corporation(a) | | | 144,286 | |
| | 7,128 | | | Surmodics, Inc.(a) | | | 323,112 | |
| | 8,412 | | | Vericel Corporation(a)(d) | | | 321,507 | |
| | | | | | | | 2,005,694 | |
| | | | | OIL & GAS PRODUCERS - 1.5% | | | | |
| | 3,700 | | | Denbury, Inc.(a) | | | 290,709 | |
| | 640 | | | Murphy USA, Inc. c. (d) | | | 127,974 | |
| | | | | | | | 418,683 | |
| | | | | | | | | |
See accompanying notes to financial statements.
| EMPIRIC 2500 FUND |
| SCHEDULE OF INVESTMENTS (Unaudited) (Continued) |
| March 31, 2022 |
| Shares | | | | | Fair Value | |
| | | | | COMMON STOCKS — 98.1% (Continued) | | | | |
| | | | | OIL & GAS SERVICES & EQUIPMENT - 1.6% | | | | |
| | 13,862 | | | Core Laboratories N.V. (d) | | $ | 438,455 | |
| | | | | | | | | |
| | | | | PUBLISHING & BROADCASTING - 0.3% | | | | |
| | 500 | | | Nexstar Media Group, Inc., Class A.(d) | | | 94,240 | |
| | | | | | | | | |
| | | | | REAL ESTATE SERVICES - 0.2% | | | | |
| | 2,384 | | | eXp World Holdings, Inc. | | | 50,469 | |
| | | | | | | | | |
| | | | | RENEWABLE ENERGY - 0.1% | | | | |
| | 84 | | | Enphase Energy, INC.(a) | | | 16,950 | |
| | | | | | | | | |
| | | | | RETAIL - CONSUMER STAPLES - 3.1% | | | | |
| | 6,800 | | | BJ’s Wholesale Club Holdings, Inc.(a)(d) | | | 459,748 | |
| | 1,935 | | | Casey’s General Stores, Inc. | | | 383,459 | |
| | | | | | | | 843,207 | |
| | | | | RETAIL - DISCRETIONARY - 1.0% | | | | |
| | 352 | | | RH(a) | | | 114,784 | |
| | 1,125 | | | Williams-Sonoma, Inc. (d) | | | 163,125 | |
| | | | | | | | 277,909 | |
| | | | | SEMICONDUCTORS - 3.6% | | | | |
| | 1,607 | | | Marvell Technology, Inc. | | | 115,238 | |
| | 5,476 | | | Semtech Corporation(a) | | | 379,706 | |
| | 4,064 | | | Teradyne, Inc. | | | 480,487 | |
| | 15 | | | Universal Display Corporation(d) | | | 2,504 | |
| | | | | | | | 977,935 | |
| | | | | SOFTWARE - 10.0% | | | | |
| | 13,376 | | | Agilysys, Inc.(a) | | | 533,435 | |
| | 20,375 | | | American Software, Inc., Class A | | | 424,615 | |
| | 1,196 | | | Avaya Holdings Corporation(a) | | | 15,153 | |
| | 16,206 | | | Calix, Inc.(a)(d) | | | 695,399 | |
| | 357 | | | CDK Global, Inc. | | | 17,379 | |
| | 8,148 | | | CommVault Systems, Inc.(a) | | | 540,620 | |
| | 3,704 | | | Domo, Inc.(a) | | | 187,311 | |
| | 4,186 | | | Envestnet, Inc.(a)(d) | | | 311,606 | |
| | | | | | | | | |
See accompanying notes to financial statements.
| EMPIRIC 2500 FUND |
| SCHEDULE OF INVESTMENTS (Unaudited) (Continued) |
| March 31, 2022 |
| Shares | | | | | Fair Value | |
| | | | | COMMON STOCKS — 98.1% (Continued) | | | | |
| | | | | SOFTWARE - 10.0% (Continued) | | | | |
| | 43 | | | New Relic, Inc.(a)(d) | | $ | 2,876 | |
| | 37 | | | Omnicell, Inc.(a) | | | 4,791 | |
| | 67 | | | Progress Software Corporation | | | 3,155 | |
| | | | | | | | 2,736,340 | |
| | | | | SPECIALTY FINANCE - 2.4% | | | | |
| | 290 | | | Credit Acceptance Corporation(a)(d) | | | 159,607 | |
| | 10,318 | | | Fidelity National Financial, Inc. | | | 503,931 | |
| | | | | | | | 663,538 | |
| | | | | TECHNOLOGY HARDWARE - 3.1% | | | | |
| | 22,201 | | | Extreme Networks, Inc.(a) | | | 271,074 | |
| | 20,602 | | | Sonos, Inc.(a)(d) | | | 581,389 | |
| | | | | | | | 852,463 | |
| | | | | TECHNOLOGY SERVICES - 3.4% | | | | |
| | 2,728 | | | Euronet Worldwide, Inc.(a)(d) | | | 355,049 | |
| | 762 | | | Fair Isaac Corporation(a) | | | 355,442 | |
| | 2,807 | | | TTEC Holdings, Inc. (d) | | | 231,634 | |
| | | | | | | | 942,125 | |
| | | | | TRANSPORTATION & LOGISTICS - 1.3% | | | | |
| | 225 | | | GXO Logistics, Inc.(a) | | | 16,052 | |
| | 2,160 | | | Landstar System, Inc. (d) | | | 325,792 | |
| | 225 | | | XPO Logistics, Inc.(a)(d) | | | 16,380 | |
| | | | | | | | 358,224 | |
| | | | | | | | | |
| | | | | TOTAL COMMON STOCKS (Cost $15,781,477) | | | 26,817,864 | |
| | | | | | | | | |
| | | | | SHORT-TERM INVESTMENTS — 24.0% | | | | |
| | | | | COLLATERAL FOR SECURITIES LOANED - 24.0% | | | | |
| | 6,545,796 | | | Mount Vernon Liquid Assets Portfolio, LLC, 0.41% (Cost $6,545,796)(c)(e) | | | 6,545,796 | |
| | | | | | | | | |
| | | | | TOTAL INVESTMENTS - 122.1% (Cost $22,327,273) | | $ | 33,363,660 | |
| | | | | LIABILITIES IN EXCESS OF OTHER ASSETS - (22.1)% | | | (6,050,235 | ) |
| | | | | NET ASSETS - 100.0% | | $ | 27,313,425 | |
| LLC | - Limited Liability Company |
| | |
| NV | - Naamioze Vennootschap |
| | |
| PLC | - Public Limited Company |
| | |
| REIT | - Real Estate Investment Trust |
| | |
| (a) | Non-income producing security. |
| (b) | Percentage rounds to less than 0.1%. |
| (c) | Rate disclosed is the seven day effective yield as of March 31, 2022. |
| (d) | All or a portion of the security is on loan. The total fair value of the securities on loan as of March 31, 2022 was $6,340,398. |
| (e) | Security was purchased with cash received as collateral for securities on loan at March 31, 2022. Total Collateral had a value of $6,545,796 at March 31, 2022. |
See accompanying notes to financial statements.
| Empiric 2500 Fund |
| STATEMENT OF ASSETS AND LIABILITIES (Unaudited) |
| March 31, 2022 |
| ASSETS | | | | |
| Investment securities: | | | | |
| At cost | | $ | 22,327,273 | |
| At fair value | | $ | 33,363,660 | |
| Cash and cash equivalents | | | 520,379 | |
| Dividends receivable | | | 8,800 | |
| Prepaid expenses and other assets | | | 11,539 | |
| TOTAL ASSETS | | | 33,904,378 | |
| | | | | |
| LIABILITIES | | | | |
| Securities lending collateral | | | 6,545,796 | |
| Investment advisory fees payable | | | 20,135 | |
| Distribution (12b-1) fees payable | | | 5,295 | |
| Payable to related parties | | | 17,326 | |
| Accrued expenses and other liabilities | | | 2,401 | |
| TOTAL LIABILITIES | | | 6,590,953 | |
| NET ASSETS | | $ | 27,313,425 | |
| | | | | |
| Composition of Net Assets: | | | | |
| Paid in capital | | $ | 17,255,626 | |
| Accumulated earnings | | | 10,057,799 | |
| NET ASSETS | | $ | 27,313,425 | |
| | | | | |
| Net Asset Value Per Share: | | | | |
| Class A Shares: | | | | |
| Net Assets | | $ | 25,953,789 | |
| Shares of beneficial interest outstanding (a) | | | 469,582 | |
| Net asset value (Net Assets ÷ Shares Outstanding) and redemption price per share (b) | | $ | 55.27 | |
| Maximum offering price per share (net asset value plus maximum sales charge of 5.75%) | | $ | 58.64 | |
| | | | | |
| Class C Shares: | | | | |
| Net Assets | | $ | 1,359,636 | |
| Shares of beneficial interest outstanding (a) | | | 28,287 | |
| Net asset value (Net Assets ÷ Shares Outstanding), offering price and redemption price per share | | $ | 48.07 | |
| | | | | |
| (a) | Unlimited number of shares of beneficial interest authorized, no par value. |
| (b) | Investments in Class A shares made at or above the $1 million breakpoint are not subject to an initial sales charge and may be subject to a 1.00% contingent deferred sales charge (“CDSC”) on shares redeemed within 12 months after the date of purchase (excluding shares purchased with reinvested dividends and/or distributions). |
See accompanying notes to financial statements.
| Empiric 2500 Fund |
| STATEMENT OF OPERATIONS (Unaudited) |
| For the Six Months Ended March 31, 2022 |
| INVESTMENT INCOME | | | | |
| Dividends (net of foreign witholding taxes of $42) | | $ | 110,617 | |
| Securities lending income - net | | | 563 | |
| TOTAL INVESTMENT INCOME | | | 111,180 | |
| | | | | |
| EXPENSES | | | | |
| Investment advisory fees | | | 145,329 | |
| Distribution (12b-1) fees: | | | | |
| Class A | | | 34,468 | |
| Class C | | | 7,457 | |
| Administration fees | | | 35,919 | |
| Management services fees | | | 17,026 | |
| Compliance officer fees | | | 10,445 | |
| Legal fees | | | 9,972 | |
| Registration fees | | | 9,100 | |
| Printing and postage expenses | | | 7,730 | |
| Trustees fees and expenses | | | 6,581 | |
| Audit Fees | | | 6,234 | |
| Shareholder service fees | | | 6,041 | |
| Custodian fees | | | 2,432 | |
| Insurance expense | | | 410 | |
| Other expenses | | | 2,992 | |
| TOTAL EXPENSES | | | 302,136 | |
| | | | | |
| NET INVESTMENT LOSS | | | (190,956 | ) |
| | | | | |
| REALIZED AND UNREALIZED LOSS FROM INVESTMENTS | | | | |
| Net realized loss from investments | | | (481,247 | ) |
| Net change in unrealized depreciation on investments | | | (1,553,695 | ) |
| | | | | |
| NET REALIZED AND UNREALIZED LOSS FROM INVESTMENTS | | | (2,034,942 | ) |
| | | | | |
| NET DECREASE IN NET ASSETS RESULTING FROM OPERATIONS | | $ | (2,225,898 | ) |
| | | | | |
See accompanying notes to financial statements.
| Empiric 2500 Fund |
| STATEMENTS OF CHANGES IN NET ASSETS |
| | | For the | | | For the | |
| | | Six Months Ended | | | Year Ended | |
| | | March 31, 2022 | | | September 30, 2021 | |
| | | (Unaudited) | | | | |
| FROM OPERATIONS | | | | | | | | |
| Net investment loss | | $ | (190,956 | ) | | $ | (377,219 | ) |
| Net realized gain/(loss) from investments | | | (481,247 | ) | | | 139,015 | |
| Net realized gain from redemptions in kind | | | — | | | | 1,393,458 | |
| Net change in unrealized appreciation (depreciation) on investments | | | (1,553,695 | ) | | | 8,892,104 | |
| Net increase/(decrease) in net assets resulting from operations | | | (2,225,898 | ) | | | 10,047,358 | |
| | | | | | | | | |
| DISTRIBUTIONS TO SHAREHOLDERS | | | | | | | | |
| From distributable earnings: | | | | | | | | |
| Class A | | | (146,436 | ) | | | (1,962,496 | ) |
| Class C | | | (9,169 | ) | | | (114,121 | ) |
| Net decrease in net assets from distributions to shareholders | | | (155,605 | ) | | | (2,076,617 | ) |
| | | | | | | | | |
| FROM SHARES OF BENEFICIAL INTEREST | | | | | | | | |
| Proceeds from shares sold: | | | | | | | | |
| Class A | | | 40,658 | | | | 2,513,254 | |
| Class C | | | 500 | | | | 1,200 | |
| Net asset value of shares issued in reinvestment of distributions: | | | | | | | | |
| Class A | | | 134,995 | | | | 1,890,340 | |
| Class C | | | 8,635 | | | | 110,054 | |
| Payments for shares redeemed: | | | | | | | | |
| Class A | | | (698,306 | ) | | | (6,146,123 | ) |
| Class C | | | (65,413 | ) | | | (96,954 | ) |
| Net decrease in net assets from shares of beneficial interest | | | (578,931 | ) | | | (1,728,229 | ) |
| | | | | | | | | |
| TOTAL INCREASE/(DECREASE) IN NET ASSETS | | | (2,960,434 | ) | | | 6,242,512 | |
| | | | | | | | | |
| NET ASSETS | | | | | | | | |
| Beginning of Period/Year | | | 30,273,859 | | | | 24,031,347 | |
| End of Period/Year | | $ | 27,313,425 | | | $ | 30,273,859 | |
| | | | | | | | | |
| SHARE ACTIVITY | | | | | | | | |
| Class A: | | | | | | | | |
| Shares Sold | | | 700 | | | | 41,492 | |
| Shares Reinvested | | | 2,308 | | | | 35,863 | |
| Shares Redeemed | | | (11,651 | ) | | | (102,131 | ) |
| Net decrease in shares of beneficial interest outstanding | | | (8,643 | ) | | | (24,776 | ) |
| | | | | | | | | |
| Class C: | | | | | | | | |
| Shares Sold | | | 10 | | | | 24 | |
| Shares Reinvested | | | 169 | | | | 2,376 | |
| Shares Redeemed | | | (1,384 | ) | | | (1,776 | ) |
| Net increase (decrease) in shares of beneficial interest outstanding | | | (1,205 | ) | | | 624 | |
| | | | | | | | | |
See accompanying notes to financial statements.
| Empiric 2500 Fund |
| FINANCIAL HIGHLIGHTS |
| |
| Per Share Data and Ratios for a Share of Beneficial Interest Outstanding Throughout each of the Period/Years Presented |
| | | Class A | |
| | | Six Months | | | Year | | | Year | | | Year | | | Year | | | Year | |
| | | Ended | | | Ended | | | Ended | | | Ended | | | Ended | | | Ended | |
| | | March 31, | | | September 30, | | | September 30, | | | September 30, | | | September 30, | | | September 30, | |
| | | 2022 | | | 2021 | | | 2020 | | | 2019 | | | 2018 | | | 2017 | |
| | | (Unaudited) | | | | | | | | | | | | | | | | |
| Net asset value, beginning of period/year | | $ | 60.07 | | | $ | 45.46 | | | $ | 40.47 | | | $ | 47.39 | | | $ | 36.57 | | | $ | 30.88 | |
| | | | | | | | | | | | | | | | | | | | | | | | | |
| Activity from investment operations: | | | | | | | | | | | | | | | | | | | | | | | | |
| Net investment loss (1) | | | (0.37 | ) | | | (0.68 | ) | | | (0.56 | ) | | | (0.45 | ) | | | (0.45 | ) | | | (0.23 | ) |
| Net realized and unrealized gain (loss) on investments | | | (4.12 | ) | | | 19.24 | | | | 5.55 | | | | (6.47 | ) | | | 11.27 | | | | 5.92 | |
| Total from investment operations | | | (4.49 | ) | | | 18.56 | | | | 4.99 | | | | (6.92 | ) | | | 10.82 | | | | 5.69 | |
| | | | | | | | | | | | | | | | | | | | | | | | | |
| Less distributions from: | | | | | | | | | | | | | | | | | | | | | | | | |
| Net realized gains | | | (0.31 | ) | | | (3.95 | ) | | | — | | | | — | | | | — | | | | — | |
| Total distributions | | | (0.31 | ) | | | (3.95 | ) | | | — | | | | — | | | | — | | | | — | |
| | | | | | | | | | | | | | | | | | | | | | | | | |
| Net asset value, end of period/year | | $ | 55.27 | | | $ | 60.07 | | | $ | 45.46 | | | $ | 40.47 | | | $ | 47.39 | | | $ | 36.57 | |
| | | | | | | | | | | | | | | | | | | | | | | | | |
| Total return (2) | | | (7.47 | )% (7) | | | 42.05 | % | | | 12.33 | % | | | (14.62 | )% | | | 29.59 | % | | | 18.43 | % |
| | | | | | | | | | | | | | | | | | | | | | | | | |
| Net assets, at end of period/year (000s) | | $ | 25,954 | | | $ | 28,726 | | | $ | 22,865 | | | $ | 22,346 | | | $ | 29,857 | | | $ | 23,644 | |
| | | | �� | | | | | | | | | | | | | | | | | | | | | |
| Ratio of gross expenses to average net assets (3)(4) | | | 2.04 | % (8) | | | 1.96 | % | | | 2.13 | % | | | 2.02 | % | | | 1.99 | % | | | 2.06 | % |
| Ratio of net expenses to average net assets after waiver (4) | | | 2.04 | % (8) | | | 1.96 | % | | | 2.13 | % | | | 2.02 | % | | | 1.99 | % | | | 1.98 | % |
| Ratio of net investment loss to average net assets (4)(5) | | | (1.28 | )% (8) | | | (1.17 | )% | | | (1.35 | )% | | | (1.08 | )% | | | (1.07 | )% | | | (0.68 | )% |
| Portfolio Turnover Rate | | | 4 | % (6)(7) | | | 21 | % (6) | | | 119 | % 6) | | | 50 | % (6) | | | 11 | % (6) | | | 150 | % |
| | | | | | | | | | | | | | | | | | | | | | | | | |
| (1) | Per share amounts calculated using the average shares method. |
| (2) | Total return in the above table is historical in nature and represents the rate that the investor would have earned or lost on an investment in the Fund assuming reinvestment of dividends and capital gains distributions, if any, and does not reflect the impact of sales charges. Had the Advisor not waived a portion of the Fund’s expenses, total returns would have been lower. |
| (3) | Represents the ratio of expenses to average net assets absent fee waivers and/or expense reimbursements by the Advisor. |
| (4) | The ratios of expenses to average net assets and net investment loss to average net assets do not reflect the expenses of the underlying investment companies in which the Fund invests. |
| (5) | Recognition of net investment income (loss) is affected by the timing and declaration of dividends by the underlying investment companies in which the Fund invests. |
| (6) | In-kind transactions are not included in calculation of turnover. |
See accompanying notes to financial statements.
| Empiric 2500 Fund |
| FINANCIAL HIGHLIGHTS |
| |
| Per Share Data and Ratios for a Share of Beneficial Interest Outstanding Throughout each of the Period/Years Presented |
| | | Class C | |
| | | Six Months | | | Year | | | Year | | | Year | | | Year | | | Year | |
| | | Ended | | | Ended | | | Ended | | | Ended | | | Ended | | | Ended | |
| | | March 31, | | | September 30, | | | September 30, | | | September 30, | | | September 30, | | | September 30, | |
| | | 2022 | | | 2021 | | | 2020 | | | 2019 | | | 2018 | | | 2017 | |
| | | (Unaudited) | | | | | | | | | | | | | | | | |
| Net asset value, beginning of period/year | | $ | 52.48 | | | $ | 40.40 | | | $ | 36.24 | | | $ | 42.75 | | | $ | 33.24 | | | $ | 28.28 | |
| | | | | | | | | | | | | | | | | | | | | | | | | |
| Activity from investment operations: | | | | | | | | | | | | | | | | | | | | | | | | |
| Net investment loss (1) | | | (0.51 | ) | | | (0.98 | ) | | | (0.78 | ) | | | (0.69 | ) | | | (0.69 | ) | | | (0.44 | ) |
| Net realized and unrealized gain (loss) on investments | | | (3.59 | ) | | | 17.01 | | | | 4.94 | | | | (5.82 | ) | | | 10.20 | | | | 5.40 | |
| Total from investment operations | | | (4.10 | ) | | | 16.03 | | | | 4.16 | | | | (6.51 | ) | | | 9.51 | | | | 4.96 | |
| | | | | | | | | | | | | | | | | | | | | | | | | |
| Less distributions from: | | | | | | | | | | | | | | | | | | | | | | | | |
| Net realized gains | | | (0.31 | ) | | | (3.95 | ) | | | — | | | | — | | | | — | | | | — | |
| Total distributions | | | (0.31 | ) | | | (3.95 | ) | | | — | | | | — | | | | — | | | | — | |
| | | | | | | | | | | | | | | | | | | | | | | | | |
| Net asset value, end of period/year | | $ | 48.07 | | | $ | 52.48 | | | $ | 40.40 | | | $ | 36.24 | | | $ | 42.75 | | | $ | 33.24 | |
| | | | | | | | | | | | | | | | | | | | | | | | | |
| Total return (2) | | | (7.81 | )% (7) | | | 40.99 | % | | | 11.48 | % | | | (15.25 | )% | | | 28.61 | % | | | 17.57 | % |
| | | | | | | | | | | | | | | | | | | | | | | | | |
| Net assets, at end of period/year (000s) | | $ | 1,360 | | | $ | 1,548 | | | $ | 1,166 | | | $ | 1,175 | | | $ | 1,554 | | | $ | 1,262 | |
| | | | | | | | | | | | | | | | | | | | | | | | | |
| Ratio of gross expenses to average net assets (3)(4) | | | 2.79 | % (8) | | | 2.71 | % | | | 2.88 | % | | | 2.77 | % | | | 2.74 | % | | | 2.81 | % |
| Ratio of net expenses to average net assets after waiver (4) | | | 2.79 | % (8) | | | 2.71 | % | | | 2.88 | % | | | 2.77 | % | | | 2.74 | % | | | 2.73 | % |
| Ratio of net investment loss to average net assets (4)(5) | | | (2.03 | )% (8) | | | (1.92 | )% | | | (2.10 | )% | | | (1.83 | )% | | | (1.82 | )% | | | (1.43 | )% |
| Portfolio Turnover Rate | | | 4 | % (6)(7) | | | 21 | % (6) | | | 119 | % (6) | | | 50 | % (6) | | | 11 | % (6) | | | 150 | % |
| | | | | | | | | | | | | | | | | | | | | | | | | |
| (1) | Per share amounts calculated using the average shares method. |
| (2) | Total return in the above table is historical in nature and represents the rate that the investor would have earned or lost on an investment in the Fund assuming reinvestment of dividends and capital gains distributions, if any. Had the Advisor not waived a portion of the Fund’s expenses, total returns would have been lower. |
| (3) | Represents the ratio of expenses to average net assets absent fee waivers and/or expense reimbursements by the Advisor. |
| (4) | The ratios of expenses to average net assets and net investment loss to average net assets do not reflect the expenses of the underlying investment companies in which the Fund invests. |
| (5) | Recognition of net investment loss is affected by the timing and declaration of dividends by the underlying investment companies in which the Fund invests. |
| (6) | In-kind transactions are not included in calculation of turnover. |
See accompanying notes to financial statements.
| Empiric 2500 Fund |
| NOTES TO FINANCIAL STATEMENTS (Unaudited) |
| March 31, 2022 |
| |
| (1) | ORGANIZATION AND SIGNIFICANT ACCOUNTING POLICIES |
Mutual Fund Series Trust (the “Trust”), was organized as an Ohio business trust on February 27, 2006. The Trust is registered as an open-end management investment company under the Investment Company Act of 1940, as amended, (“1940 Act”). These financial statements include the following series: Empiric 2500 Fund, formerly the Empiric Core Equity Fund, (the “Fund”). The Trust currently consists of thirty-eight series. The Fund is a separate diversified series of the Trust. Empiric Advisors, Inc. (the “Advisor”), acts as the investment advisor to the Fund. The Fund’s Class A shares commenced operations on November 6, 1995. The Fund’s Class C shares commenced operations on October 7, 2005. Prior to October 7, 2005, the shares of the Fund had no specific class designation. As of that date, all of the then outstanding shares were redesignated as Class A shares. The Fund’s investment objective is to achieve capital appreciation.
The Fund offers two classes of shares: Class A and Class C shares. Each share class represents an interest in the same assets of the Fund, has the same rights and is identical in all material respects except that (i) each class of shares may bear different distribution fees; (ii) each class of shares may be subject to different (or no) sales charges; (iii) certain other class specific expenses will be borne solely by the class to which such expenses are attributable; and (iv) each class has exclusive voting rights with respect to matters relating to its own distribution arrangements.
The following is a summary of significant accounting policies consistently followed by the Fund which are in accordance with accounting principles generally accepted in the United States of America (“GAAP”). The Fund is an investment company and accordingly follows the Investment Company accounting and reporting guidance of the Financial Accounting Standards Board (“FASB”) Accounting Standards Codification Topic 946, Financial Services - Investment Companies, including FASB Accounting Standards Update ASU (“ASU”) 2013-08.
a) Securities Valuation – Securities listed on an exchange are valued at the last reported sale price at the close of the regular trading session of the exchange on the business day the value is being determined, or in the case of securities listed on NASDAQ, at the NASDAQ Official Closing Price (“NOCP”). In the absence of a sale, such securities shall be valued at the last bid price on the day of valuation. The Fund may invest in portfolios of open-end or closed-end investment companies and exchange traded funds (the “Underlying Funds”). Open-end funds are valued at their respective net asset values as reported by such investment companies. The Underlying Funds value securities in their portfolios for which market quotations are readily available at their market values (generally the last reported sale price) and all other securities and assets at their fair value by the methods established by the boards of the Underlying Funds. The shares of many closed-end investment companies and exchange traded funds, after their initial public offering, frequently trade at a price per share, which is different than the net asset value per share. The difference represents a market premium or market discount of such shares. There can be no assurances that the market discount or market premium on shares of any closed-end investment company or exchange traded fund purchased by the Fund will not change. Short-term debt obligations having 60 days or less remaining until maturity, at time of purchase, may be valued at amortized cost, provided such valuations represent fair value.
In unusual circumstances, instead of valuing securities in the usual manner, the Fund may value securities at “fair value” as determined in good faith by the Board of Trustees of the Trust (the “Board”), pursuant to the procedures (the “Procedures”) approved by the Board. The Procedures consider, among others, the following factors to determine a security’s fair value: the nature and pricing history (if any) of the security; whether any dealer quotations for the security are available; and possible valuation methodologies that could be used to determine the fair value of the security. Fair value may also be used by the Board if extraordinary events occur after the close of the relevant world market but prior to the New York Stock Exchange close.
The Fund utilizes various methods to measure the fair value of most of its investments on a recurring basis. GAAP establishes a hierarchy that prioritizes inputs to valuation methods. The three levels of input are:
Level 1 – Unadjusted quoted prices in active markets for identical assets and liabilities that the Fund has the ability to access.
Level 2 – Observable inputs other than quoted prices included in Level 1 that are observable for the asset or liability, either directly or indirectly. These inputs may include quoted prices for the identical instrument in an inactive market, prices for similar instruments, interest rates, prepayment speeds, credit risk, yield curves, default rates and similar data.
Level 3 – Unobservable inputs for the asset or liability, to the extent relevant observable inputs are not available, representing the Fund’s own assumptions about the assumptions a market participant would use in valuing the asset or liability, and would be based on the best information available.
| Empiric 2500 Fund |
| NOTES TO FINANCIAL STATEMENTS (Unaudited) (Continued) |
| March 31, 2022 |
| |
The availability of observable inputs can vary from security to security and is affected by a wide variety of factors, including, for example, the type of security, whether the security is new and not yet established in the marketplace, the liquidity of markets, and other characteristics particular to the security. To the extent that valuation is based on models or inputs that are less observable or unobservable in the market, the determination of fair value requires more judgment. Accordingly, the degree of judgment exercised in determining fair value is greatest for instruments categorized in Level 3.
The inputs used to measure fair value may fall into different levels of the fair value hierarchy. In such cases, for disclosure purposes, the level in the fair value hierarchy within which the fair value measurement falls in its entirety, is determined based on the lowest level input that is significant to the fair value measurement in its entirety.
The inputs or methodology used for valuing securities are not necessarily an indication of the risk associated with investing in those securities. The following table summarizes the inputs used as of March 31, 2022, for the Fund’s assets and liabilities measured at fair value:
Assets
| Security Classifications (a) | | Level 1 | | | Level 2 | | | Level 3 | | | Totals | |
| Common Stock | | $ | 26,817,864 | | | $ | — | | | $ | — | | | $ | 26,817,864 | |
| Securities Lending Collateral (b) | | | — | | | | — | | | | — | | | | 6,545,796 | |
| Total | | $ | 26,817,864 | | | $ | — | | | $ | — | | | $ | 33,363,660 | |
| | | | | | | | | | | | | | | | | |
| (a) | As of and during the six months ended March 31, 2022, the Fund held no securities that were considered to be “Level 3” securities. Therefore, a reconciliation of assets in which significant unobservable inputs (Level 3) were used in determining fair value is not applicable. |
| |
| (b) | "Management has elected to adopt ASU 2015-07, Disclosures for Investments in Certain Entities That Calculate Net Asset Value per Share (or Its Equivalent) — a consensus of the Emerging Issues Task Force issued, on May 1, 2015. In accordance with Subtopic 820-10, certain investments that are measured at fair value using the net asset value per share (or its equivalent) have not been classified in the fair value hierarchy. The fair value amount presented in this table is intended to permit reconciliation of the fair value hierarchy to the amounts presented in the statements of assets and liabilities. |
Offsetting of Financial Assets and Derivative Liabilities –
The following table presents the Fund’s financial assets available for offset under a master netting arrangement net of collateral pledged as of March 31, 2022.
| | Asset | | | | | | | Gross Amounts Not Offset in the Statement of Assets & Liabilties | | |
| | Description | Gross Amounts of Recognized Assets | | Gross Amounts Offset in the Statement of Assets & Liabilities | | Net Amounts of Assets Presented in the Statement of Assets & Liabilities | | Financial Instruments | | Cash Collateral Received | | Net Amount |
| | Securities Lending | $ 6,340,398 | | $ - | | $ 6,340,398 | | $ - | | $ 6,340,398 | | $ - |
| | Total | $ 6,340,398 | | $ - | | $ 6,340,398 | | $ - | | $ 6,340,398 | | $ - |
The following table breaks out the holdings received as collateral as of March 31, 2022:
| | Overnight and Continuous | |
| | Mount Vernon Liquid Assets Portfolio, LLC | $ 6,545,796 |
b) Federal Income Tax – As of and during the six months ended March 31, 2022, the Fund did not have a liability for any unrecognized tax expense. The Fund recognizes interest and penalties, if any, related to unrecognized tax expense as income tax expense in the Statement of Operations. As of March 31, 2022, the Fund did not incur any interest or penalties. Management has analyzed the Fund’s tax positions and has concluded that no liability for unrecognized tax benefits should be recorded related to uncertain tax positions taken on returns filed for open tax years September 30, 2019 - September 30, 2021 or expected to be taken in the Fund’s September 30, 2022 tax returns. The tax filings are open for examination by applicable taxing authorities, U.S. federal, Ohio and foreign jurisdictions. No examination of the Fund’s tax returns is presently in progress.
c) Distribution to Shareholders – Distributions of net investment income and capital gains to shareholders, which are determined in accordance with income tax regulations and may differ from GAAP, are recorded on the ex-dividend date and are distributed on an annual basis.
d) Multiple Class Allocations – Income, non-class specific expenses and realized or unrealized gains or losses are allocated to each class based on relative net assets. Distribution fees are charged to each respective share class in accordance with the distribution plan. Expenses of the Trust that are directly identifiable to a specific fund are charged to that fund. Expenses, which are not readily identifiable to a specific fund, are allocated in such a manner as deemed equitable, taking into consideration the nature and type of expense and the relative sizes of the funds in the Trust.
e) Other – Investment and shareholder transactions are recorded on the trade date. Interest income is recognized on an accrual basis. Discounts are accreted and premiums are amortized on debt securities using the effective interest method. Dividend income is recorded on the ex-dividend date. Realized gains or losses from sales of securities are determined by comparing the identified cost of the security lot sold with the net sales proceeds.
f) Use of Estimates – The preparation of financial statements in conformity with GAAP requires management to make estimates and assumptions that affect the reported amounts of assets and liabilities and disclosure of contingent assets and liabilities at the date of the financial statements and the reported amounts of increases and decreases in net assets from operations during the reporting period. Actual results could differ from those estimates.
g) Indemnification – The Trust indemnifies its officers and trustees for certain liabilities that may arise from the performance of their duties to the Trust. Additionally, in the normal course of business, the Fund enters into contracts that contain a variety of representations and warranties and which provide general indemnities. The Fund’s maximum exposure under these arrangements is unknown, as this would involve future claims that may be made against the Fund that have not yet occurred. However, based on experience, the risk of loss due to these warranties and indemnities appears to be remote.
| Empiric 2500 Fund |
| NOTES TO FINANCIAL STATEMENTS (Unaudited) (Continued) |
| March 31, 2022 |
| |
h) Sales charges (loads) – A maximum sales charge of 5.75% is imposed on Class A shares of the Fund. Investments in Class A shares made at or above the $1 million breakpoint are not subject to an initial sales charge and may be subject to a 1.00% contingent deferred sales charge (“CDSC”) on shares redeemed within 12 months of purchase (excluding shares purchased with reinvested dividends and/or distributions). The respective shareholders pay such CDSC charges, which are not an expense of the Fund. For the six months ended March 31, 2022, there were no CDSC fees paid.
i) Foreign Currency – Investment securities and other assets and liabilities denominated in foreign currencies are translated into U.S. dollar amounts at the date of valuation. Purchases and sales of investment securities and income and expense items denominated in foreign currencies are translated into U.S. dollar amounts on the respective dates as such transactions.
The Fund does not isolate that portion of the results of operations resulting from changes in foreign exchange rates on investments from the fluctuations arising from changes in market prices of securities held. Such fluctuations are included with the net realized and unrealized gain or loss from investments.
Reported net realized foreign exchange gains or losses arise from sales of foreign currencies, currency gains or losses realized between the trade and settlement dates on securities transactions, and the difference between the amounts of dividends, interest, and foreign withholding taxes recorded on the Fund’s books and the U.S. dollar equivalent of the amounts actually received or paid. Net unrealized foreign exchange gains and losses arise from changes in the fair values of assets and liabilities, other than investments in securities at fiscal period-end, resulting from changes in exchange rates.
j) Security Loans – The Fund has entered into a securities lending agreement with U.S. Bank National Association as of October 2018, and previously with Huntington National Bank. The Fund receives compensation in the form of fees, or retains a portion of interest on the investment of any cash received as collateral. The cash collateral is invested in short-term investments. The Fund also continues to receive interest or dividends on the securities loaned. The loans are secured by collateral at least equal, at all times, to 102% of the market value of loaned securities. Gain or loss in the fair value of the securities loaned that may occur during the term of the loan will be for the account of the Fund. The Fund has the right under the lending agreement to recover the securities from the borrower on demand. If the market value of the collateral falls below 102% of market value plus accrued interest of the loaned securities, the lender’s agent shall request additional collateral from the borrowers to bring the collateralization back to 102%. Under the terms of the securities lending agreement, the Fund is indemnified for such losses by the security lending agent. Should the borrower of the securities fail financially, the Fund has the right to repurchase the securities using the collateral in the open market. Although risk is mitigated by the collateral, the Fund could experience a delay in recovering their securities and possible loss of income or value if the borrower fails to return them.
The Fund receives cash as collateral in return for securities lent as part of the securities lending program. The collateral is invested in the Mount Vernon Liquid Assets Portfolio, LLC of which the investment objective is to seek to maximize current income to the extent with the preservation of capital and liquidity and maintain a stable NAV of $1.00 per unit. The Fund held $6,545,796 as of March 31, 2022. The remaining contractual maturity of all securities lending transactions is overnight and continuous. The Fund is not subject to a master netting agreement with respect to securities lending; therefore no additional disclosures are required. The income earned by the Fund on investments of cash collateral received from borrowers for the securities loaned to them, if any was received, would be reflected in the Fund’s Statement of Operations.
| (2) | INVESTMENT TRANSACTIONS |
For the six months ended March 31, 2022, aggregate purchases and proceeds from sales of investment securities (excluding short-term investments) for the Fund were as follows:
| Purchases | | Sales (a) |
| $ 560,181 | | $ 1,713,382 |
| | | |
| (a) | The Fund may participate in a liquidity program operated by ReFlow Fund, LLC (“ReFlow”). The program is designed to provide an alternative liquidity source for mutual funds experiencing redemptions of their shares. In order to pay cash to shareholders who redeem their shares on a given day, a mutual fund typically must hold cash in its portfolio, liquidate portfolio securities, or borrow money, all of which impose certain costs on the Fund. ReFlow provides participating mutual funds with another source of cash by standing ready to purchase shares from a fund equal to the amount of the Fund’s net redemptions on a given day. ReFlow then generally redeems those shares when the Fund experiences net sales. In return for this service, the Fund will pay a fee to ReFlow at a rate determined by a daily auction with other participating mutual funds. The costs to the Fund for participating in ReFlow are expected to be influenced by and comparable to the cost of the other sources of liquidity, such as the Fund’s short-term lending arrangement or the costs of selling portfolio securities to meet redemptions. ReFlow will be prohibited from acquiring more than 3% of the outstanding voting shares of the Fund. The Fund will waive any redemption fee with respect to redemptions by ReFlow. When covering net sales for the Fund, ReFlow normally utilizes Redemptions In-Kind. During the six months ended March 31, 2022, the Fund utilized ReFlow. ReFlow subscribed 0 shares of the Fund during the period. The resulting fee is recorded in other expenses on the Statement of Operations. |
Empiric 2500 Fund |
| NOTES TO FINANCIAL STATEMENTS (Unaudited) (Continued) |
| March 31, 2022 |
| |
| (3) | INVESTMENT MANAGEMENT AGREEMENT AND TRANSACTIONS WITH RELATED PARTIES |
The Trust, with respect to the Fund, has entered into an investment advisory agreement (“Advisory Agreement”) with the Advisor, pursuant to which the Advisor receives a fee, computed daily, at an annual rate of 1.00% of the average daily net assets of the Fund. The Advisor pays expenses incurred by it in connection with acting as investment advisor to the Fund other than costs (including taxes and brokerage commissions, borrowing costs, costs of investing in underlying funds and extraordinary expenses, if any) of securities purchased for the Fund and certain other expenses paid by the Fund (as detailed in the Advisory Agreement) . The Advisor pays for all employees, office space and facilities required by it to provide services under the Advisory Agreement, with the exception of specific items of expense (as detailed in the Advisory Agreement). For the six months ended March 31, 2022, investment advisory fees of $145,329 were incurred by the Fund.
The Trust has entered into a management services agreement (“Management Services Agreement”) with MFund Services, LLC (“MFund”). Pursuant to the Management Services Agreement, MFund provides sponsorship, management and legal administration services. For MFund’s services to the Fund, the Fund pays MFund a base fee of $5,000 annually, an annualized asset based fee of 0.10% of average daily net assets up to $ 50 million, with lower fees at higher asset levels, plus reimbursement of out of pocket expenses. The base fee of $5,000 annually was eliminated effective 4/1/22. For the six months ended March 31, 2022, the Fund incurred $17,026 for such fees.
A Trustee of the Trust is also the controlling member of MFund, AlphaCentric Advisors LLC (“AlphaCentric”) and Catalyst Capital Advisors, LLC (“Catalyst”) (each an investment manager to other series of the Trust) and is not paid any fees directly by the Trust for serving in such capacities.
Trustees who are not “interested persons” as that term is defined in the 1940 Act (the “Independent Trustees”), are paid a quarterly retainer and receive compensation for each special in-person meeting attended. The fees paid to the Independent Trustees for their attendance at a meeting will be shared equally by the funds of the Trust in which the meeting relates. The Lead Independent Trustee of the Trust, the Chairman of the Trust’s Audit Committee and the Chairman of the Risk and Compliance Committee receive an additional quarterly retainer. The “interested persons” of the Trust receive no compensation from the Fund. The Trust reimburses each Trustee and Officer for his or her travel and other expenses related to attendance at such meetings.
Empiric Distributors, Inc. acted as the broker of record on executions of purchases and sales of the Fund’s portfolio investments. For those services, Empiric Distributors received $0 in brokerage commissions from the Fund for the six months ended March 31, 2022. Certain officers and/or employees of the Advisor have an affiliation with Empiric Distributors. For the six months ended March 31, 2022, Empiric Distributors, an affiliated broker, received $0 in underwriter commissions from the sale of shares of the Empiric 2500 Fund.
Northern Lights Distributors, LLC, ( “NLD”) or (“Distributor”) serves as the principal underwriter and national distributor for the shares of the Fund pursuant to an Underwriting Agreement with the Trust. For the six months ended March 31, 2022, NLD received $1,755 in underwriter commissions from the sale of Class A shares of the Empiric 2500 Fund, of which they kept $275.
Ultimus Fund Solutions, LLC (“UFS”), an affiliate of the Distributor, provides administrative, fund accounting, and transfer agency services to the Fund pursuant to agreements with the Trust, for which it receives from each Fund: (i) basis points in decreasing amounts as assets reach certain breakpoints; and (ii) any related out-of-pocket expenses.
Certain Officers of the Trust are also employees of UFS, and are not paid any fees directly by the Fund for serving in such capacity.
Pursuant to the Compliance Services Agreement, MFund provides chief compliance officer services to the Funds. For these services, the Funds pay MFund an annual base fee plus an annual asset-based fee based upon net assets. In addition, the
| Empiric 2500 Fund |
| NOTES TO FINANCIAL STATEMENTS (Unaudited) (Continued) |
| March 31, 2022 |
| |
Funds reimburse MFund for any reasonable out-of -pocket expenses incurred in the performance of its duties under the Compliance Services Agreement. The compliance fees for the six months ended March 31, 2022 for the fund was $10,445.
The Trust has adopted a Distribution Plan pursuant to Rule 12b-1(the “Plan”), under the 1940 Act for Class A shares and Class C shares, that allows the Fund to pay distribution and shareholder servicing expenses of up to 0.50% per annum for the Class A shares and up to 1.00% for the Class C shares based on average daily net assets of each class. Class A shares are currently paying 0.25% per annum of 12b-1 fees. Class C shares are currently paying 1.00% per annum of 12b-1 fees. The fee may be used for a variety of purposes, including compensating dealers and other financial service organizations for eligible services provided by those parties to the Fund and its shareholders and to reimburse NLD and the Advisor for distribution related expenses.
| (4) | TAX COMPONENTS OF CAPITAL |
The Statement of Assets and Liabilities represents cost for financial reporting purposes. Aggregate cost for federal tax purposes is $22,309,336 for the Empiric 2500 Fund and differs from fair value by net unrealized appreciation (depreciation) of securities as follows:
| Unrealized appreciation: | | $ | 11,231,718 | |
| Unrealized depreciation: | | | (177,394 | ) |
| Net unrealized appreciation: | | $ | 11,054,324 | |
| | | | | |
The tax character of fund distributions paid for the year ended September 30, 2021 was as follows:
| | | Fiscal Year Ended | |
| | | September 30, 2021 | |
| Ordinary Income | | $ | — | |
| Long-Term Capital Gain | | | 2,076,617 | |
| Return of Capital | | | — | |
| | | $ | 2,076,617 | |
| | | | | |
The Fund did not have distributions for the year ended September 30, 2020.
As of September 30, 2021, the components of accumulated earnings/(deficit) on a tax basis were as follows:
| Undistributed | | | Undistributed | | | Post October Loss | | | Capital Loss | | | Other | | | Unrealized | | | Total | |
| Ordinary | | | Long-Term | | | and | | | Carry | | | Book/Tax | | | Appreciation/ | | | Accumulated | |
| Income | | | Gains | | | Late Year Loss | | | Forwards | | | Differences | | | (Depreciation) | | | Earnings | |
| $ | — | | | $ | 155,082 | | | $ | (323,799 | ) | | $ | — | | | $ | — | | | $ | 12,608,019 | | | $ | 12,439,302 | |
| | | | | | | | | | | | | | | | | | | | | | | | | | | |
The difference between book basis and tax basis undistributed net investment income/(loss), accumulated net realized gain/(loss), and unrealized appreciation/(depreciation) from investments is primarily attributable to the tax deferral of losses on wash sales and adjustments for C-Corporation return of capital distributions.
Late year losses incurred after December 31 within the fiscal year are deemed to arise on the first business day of the following fiscal year for tax purposes. The Fund incurred and elected to defer such late year losses of $323,799.
| Empiric 2500 Fund |
| NOTES TO FINANCIAL STATEMENTS (Unaudited) (Continued) |
| March 31, 2022 |
| |
Permanent book and tax differences, primarily attributable to net operating losses and adjustments for redemptions in-kind, resulted in reclassification for the year ended September 30, 2021 as follows:
| Paid | | | | |
| In | | | Accumulated | |
| Capital | | | Earnings (Losses) | |
| $ | 1,058,713 | | | $ | (1,058,713 | ) |
The beneficial ownership, either directly or indirectly, of more than 25% of the voting securities of a Fund creates a presumption of control of the Fund, under Section 2(a)(9) of the 1940 Act. As of March 31, 2022, John McRoberts trustee for the Marital Trust under the McRoberts Family Trust held 26.72% of the voting securities of the Empiric 2500 Fund and may be deemed to control the Fund.
Subsequent events occurring after the date of the Statement of Assets and Liabilities have been evaluated through the date the financial statements were issued. Management has determined that no events or transactions occurred requiring adjustment or disclosure in the financial statements.
| Empiric 2500 Fund |
| EXPENSE EXAMPLES (Unaudited) |
| March 31, 2022 |
| |
As a shareholder of the Empiric 2500 Fund, you incur two types of costs: (1) transaction costs, including sales charges (loads) on purchases of Class A shares; (2) ongoing costs, including management fees; distribution and/or service (12b-1) fees; and other Fund expenses. This example is intended to help you understand your ongoing costs (in dollars) of investing in the Empiric 2500 Fund and to compare these costs with the ongoing costs of investing in other mutual funds.
The example is based on an investment of $1,000 invested at the beginning of the period and held for the entire period from October 1, 2021 through March 31, 2022.
Actual Expenses
The “Actual” lines in the table below provide information about actual account values and actual expenses. You may use the information below together with the amount you invested, to estimate the expenses that you paid over the period. Simply divide your account value by $ 1,000 (for example, an $8,600 account value divided by $1,000 = 8.6), then multiply the result by the number in the table under the heading entitled “Expenses Paid During Period” to estimate the expenses you paid on your account during this period.
Hypothetical Example for Comparison Purposes
The “Hypothetical” lines in the table below provide information about hypothetical account values and hypothetical expenses based on the Fund’s actual expense ratio and an assumed rate of return of 5% per year before expenses, which is not the Fund’s actual return. The hypothetical account values and expenses may not be used to estimate the actual ending account balances or expenses you paid for the period. You may use this information to compare this 5% hypothetical example with the 5% hypothetical examples that appear in the shareholder reports of other funds.
Please note that the expenses shown in the table are meant to highlight your ongoing costs only and do not reflect any transactional costs, such as sales charges (loads) . Therefore, the table is useful in comparing ongoing costs only, and will not help you determine the relative total costs of owning different funds. In addition, if these transactional costs were included, your costs would have been higher.
| | Beginning | Ending | Expenses Paid | Expense Ratio |
| | Account Value | Account Value | During Period* | During Period** |
| Actual | 10/1/21 | 3/31/22 | 10/1/21 – 3/31/22 | 10/1/21 – 3/31/22 |
| Class A | $1,000.00 | $925.30 | $9.80 | 2.04% |
| Class C | 1,000.00 | 921.90 | 13.38 | 2.79% |
| | | | | |
| | Beginning | Ending | Expenses Paid | Expense Ratio |
| Hypothetical | Account Value | Account Value | During Period* | During Period** |
| (5% return before expenses) | 10/1/21 | 3/31/22 | 10/1/21 – 3/31/22 | 10/1/21 – 3/31/22 |
| Class A | $1,000.00 | $1,014.75 | $10.25 | 2.04% |
| Class C | 1,000.00 | 1,011.01 | 14.00 | 2.79% |
| | | | | |
| * | Expenses are equal to the average account value over the period, multiplied by the Fund’s annualized expense ratio, multiplied by the number of days in the period (182) divided by the number of days in the fiscal year (365). |
| Empiric 2500 Fund |
| ADDITIONAL INFORMATION (Unaudited) (Continued) |
| March 31, 2022 |
| |
Consideration and Renewal of the Management Agreement between the Trust and Empiric Advisors, Inc. with respect to Empiric 2500 Fund
In connection with a meeting held on February 14, 2022, the Board of Trustees (the “Board”) of Mutual Fund Series Trust (the “Trust”), including a majority of the Trustees who are not “interested persons” as that term is defined in the Investment Company Act of 1940, as amended, discussed the renewal of the management agreement (the “Management Agreement”) between the Trust and Empiric Advisors, Inc. (“Empiric”), with respect to Empiric 2500 Fund (the “Empiric 2500”).
The Board examined Empiric’s responses to a series of questions regarding, among other things, its management services provided to Empiric 2500, comparative fee and expense information, and profitability from managing Empiric 2500. The Board was assisted by legal counsel throughout the review process and relied upon the advice of legal counsel and its own business judgment in determining the material factors to be considered in evaluating the Management Agreement and the weight to be given to each factor considered. The conclusions reached by the Board were based on a comprehensive evaluation of all of the information provided and were not the result of any one factor. Moreover, each Trustee may have afforded different weight to the various factors in reaching his conclusions with respect to renewal of the Management Agreement.
Nature, Extent and Quality of Services. The Board recognized the tenure and experience of the key personnel at Empiric serving Empiric 2500. The Board observed that Empiric employed a quantitative methodology and selected securities based on a proprietary factor model. The Board noted that Empiric’s chief compliance officer confirmed that trades were placed on the basis of best execution. The Board commented that Empiric’s pre-trade compliance process included regular review of Empiric’s sub -industry, industry, and sector concentrations. The Board discussed that Empiric monitored liquidity on an ongoing basis to comply with liquidity reporting requirements. The Board remarked that Empiric had reported no material compliance issues, litigation, or code of ethics violations since the Board last renewed the Management Agreement. The Board recognized that Empiric proactively adopted robust cybersecurity and ransomware protocols despite not having had any cybersecurity incidents or material data security breaches during its history. The Board concluded that the nature, extent and quality of services provided by Empiric were satisfactory and in line with its expectations.
Performance. The Board noted that Empiric 2500 had outperformed its peer group over the 5- and 10-year periods, trailed its peer group over the 3-year period and significantly underperformed its peer group over the 1-year period. The Board considered Empiric’s explanation that an outlier fund in the peer group skewed the peer group’s average performance over the 1-year period. The Board acknowledged that Empiric 2500 outperformed the Small Cap Growth Morningstar category over the 1-year period although it underperformed the category across all other periods. The Board observed that Empiric 2500 outperformed the Bloomberg 2500 Total Return Index over the 5-year period. The Board considered Empiric’s explanation that Empiric 2500’s underperformance was due to a strong growth market over the last 10 years as interest rates were low, and that the Morningstar category emphasized high growth strategies. After further discussion, the Board concluded that Empiric 2500’s performance was acceptable.
Fees and Expenses. The Board noted that Empiric charged a management fee of 1.00% which was aligned with the peer group median and average but higher than the Morningstar category median and average. The Board remarked that Empiric 2500’s 1.96% net expense ratio was higher than the averages and medians of its peer group and Morningstar category, but well below the highs of each. The Board concluded that the management fee for Empiric 2500 was not unreasonable.
Profitability. The Board observed that, based on the information Empiric provided, Empiric was managing Empiric 2500 at a modest profit and considered certain additional benefits received by Empiric or its affiliates, including soft dollars and brokerage commissions. The Board concluded that excessive profitability was not a concern for Empiric at this time.
| Empiric 2500 Fund |
| ADDITIONAL INFORMATION (Unaudited) (Continued) |
| March 31, 2022 |
| |
Economies of Scale. The Board considered whether Empiric had realized economies of scale with respect to the management of Empiric 2500 and concluded that, based on the current asset level of Empiric 2500, breakpoints did not appear warranted. The Board agreed that although Empiric did not appear to be benefiting from material economies of scale, it would revisit the issue as the size of Empiric 2500 increased.
Conclusion. Having requested and received such information from Empiric as the Board believed to be reasonably necessary to evaluate the terms of the Management Agreement, and as assisted by the advice of counsel, the Board concluded that renewal of the Management Agreement was in the best interests of the shareholders of Empiric 2500.
| Empiric 2500 Fund |
| ADDITIONAL INFORMATION (Unaudited) |
| March 31, 2022 |
| |
Proxy Voting Policy and Portfolio Holdings
Reference is made to the Prospectus and the Statement of Additional Information for more detailed descriptions of the Management Agreement, Services Agreement and Distribution and/or Service (12b-1) Plan, tax aspects of the Fund and the calculation of the net asset value of shares of the Fund.
The Fund files its complete schedule of portfolio holdings with the Securities and Exchange Commission (the “Commission”) for the first and third quarters of each fiscal year as an exhibit to its reports on Form N-PORT, within sixty days after the end of the period. Form N-PORT reports are available at the SEC’s website at http://www.sec.gov.
Information regarding how the Fund voted proxies relating to portfolio securities during the twelve month period ended June 30 as well as a description of the policies and procedures that the Fund uses to determine how to vote proxies relating to portfolio securities is available without charge, upon request, by calling 1-888-839-7424; and on the Commission’s website at http://www.sec.gov.
PRIVACY NOTICE
Mutual Fund Series Trust
Rev. June 2011
| FACTS | WHAT DOES MUTUAL FUND SERIES TRUST DO WITH YOUR PERSONAL INFORMATION? |
| Why? | Financial companies choose how they share your personal information. Federal law gives consumers the right to limit some, but not all sharing. Federal law also requires us to tell you how we collect, share, and protect your personal information. Please read this notice carefully to understand what we do. |
| What? | The types of personal information we collect and share depends on the product or service that you have with us. This information can include: ● Social Security number and wire transfer instructions ● account transactions and transaction history ● investment experience and purchase history When you are no longer our customer, we continue to share your information as described in this notice. |
| How? | All financial companies need to share customers’ personal information to run their everyday business. In the section below, we list the reasons financial companies can share their customers’ personal information; the reasons Mutual Fund Series Trust chooses to share; and whether you can limit this sharing. |
Reasons we can share your
personal information: | Does Mutual Fund Series
Trust share information? | Can you limit this
sharing? |
| For our everyday business purposes - such as to process your transactions, maintain your account(s), respond to court orders and legal investigations, or report to credit bureaus. | YES | NO |
| For our marketing purposes - to offer our products and services to you. | NO | We don’t share |
| For joint marketing with other financial companies. | NO | We don’t share |
| For our affiliates’ everyday business purposes - information about your transactions and records. | NO | We don’t share |
| For our affiliates’ everyday business purposes - information about your credit worthiness. | NO | We don’t share |
| For our affiliates to market to you | NO | We don’t share |
| For non-affiliates to market to you | NO | We don’t share |
| QUESTIONS? | Call 1-866-447-4228 |
PRIVACY NOTICE
Mutual Fund Series Trust
| What we do: |
How does Mutual Fund Series Trust protect my personal information? | To protect your personal information from unauthorized access and use, we use security measures that comply with federal law. These measures include computer safeguards and secured files and buildings. Our service providers are held accountable for adhering to strict policies and procedures to prevent any misuse of your nonpublic personal information. |
How does Mutual Fund Series Trust collect my personal information? | We collect your personal information, for example, when you ● open an account or deposit money ● direct us to buy securities or direct us to sell your securities ● seek advice about your investments We also collect your personal information from others, such as credit bureaus, affiliates, or other companies. |
Why can’t I limit all sharing? | Federal law gives you the right to limit only: ● sharing for affiliates’ everyday business purposes – information about your creditworthiness. ● affiliates from using your information to market to you. ● sharing for non-affiliates to market to you. State laws and individual companies may give you additional rights to limit sharing. |
| Definitions |
| Affiliates | Companies related by common ownership or control. They can be financial and non-financial companies. ● Mutual Fund Series Trust has no affiliates. |
| Non-affiliates | Companies not related by common ownership or control. They can be financial and non-financial companies. ● Mutual Fund Series Trust does not share with non-affiliates so they can market to you. |
| Joint marketing | A formal agreement between nonaffiliated financial companies that together market financial products or services to you. ● Mutual Fund Series Trust does not jointly market. |
| |
| |
| |
| Mutual Fund Series Trust |
| 4221 North 203rd Street, Suite 100 |
| Elkhorn, NE 68022 |
| |
| ADVISOR |
| Empiric Advisors, Inc. |
| 500 N. Capital of Texas Highway |
| Building 8, Suite 150 |
| Austin, TX 78746 |
| |
| ADMINISTRATOR |
Ultimus Fund Solutions, LLC
225 Pictoria Drive, Suite 450
Cincinnati, OH 45246 |
| |
| TRANSFER AGENT |
Ultimus Fund Solutions, LLC
225 Pictoria Drive, Suite 450
Cincinnati, OH 45246 |
| |
| DISTRIBUTOR |
| Northern Lights Distributors, LLC |
| 4221 North 203rd Street, Suite 100 |
| Elkhorn, NE 68022 |
| |
| INDEPENDENT REGISTERED PUBLIC ACCOUNTING FIRM |
Cohen & Company, Ltd.
1350 Euclid Avenue,
Suite 800
Cleveland, OH 44115 |
| |
| LEGAL COUNSEL |
| Thompson Hine LLP |
| 41 South High Street |
| Suite 1700 |
| Columbus, OH 43215 |
| |
| CUSTODIAN BANK |
| U.S. Bank |
| 1555 N. Rivercenter Dr. |
| Milwaukee, WI 53212 |
| |
| |
| |
| |
| |
| |
| |
| |
| |
| |
| |
| EMPSA-22 |
| |
(b) Not applicable
Item 2. Code of Ethics.
Not applicable for semi-annual reports.
Item 3. Audit Committee Financial Expert.
Not applicable for semi-annual reports.
Item 4. Principal Accountant Fees and Services.
Not applicable for semi-annual reports.
Item 5. Audit Committee of Listed Companies. Not applicable to open-end investment companies.
Item 6. Schedule of Investments. See Item 1.
Item 7. Disclosure of Proxy Voting Policies and Procedures for Closed-End Management Investment Companies. Not applicable to open-end investment companies.
ITEM 8. PORTFOLIO MANAGERS OF CLOSED-END MANAGEMENT INVESTMENT COMPANIES
Item 9. Purchases of Equity Securities by Closed-End Management Investment Company and Affiliated Purchasers. Not applicable to open-end investment companies.
Item 10. Submission of Matters to a Vote of Security Holder. None.
ITEM 11. CONTROLS AND PROCEDURES.
| (a) | The registrant's principal executive and principal financial officers, or persons performing similar functions, have concluded that the registrant's disclosure controls and procedures (as defined in Rule 30a-3(c) under the 1940 Act, are effective, as of a date within 90 days of the filing date of this report, based on the evaluation of these controls and procedures required by Rule 30a-3(b) under the 1940 Act and Rule 15d-15(b) under the Securities Exchange Act of 1934, as amended. |
| (b) | There were no changes in the registrant's internal control over financial reporting (as defined in Rule 30a-3(d) under the 1940 Act) that occurred during the period covered by this report that have materially affected, or are reasonably likely to materially affect, the registrant's internal control over financial reporting. |
| ITEM | 12. DISCLOSURE OF SECURITIES LENDING ACTIVITIES FOR CLOSED-END MANAGEMENT INVESTMENT COMPANIES Not applicable. |
ITEM 13. EXHIBITS
| (1) | Code of Ethics for Principal Executive and Senior Financial Officers is attached hereto. |
ITEM 13. Disclosure of Securities Lending Activities for Closed-End Management Investment Companies. Not applicable to open-end investment companies.
SIGNATURES
Pursuant to the requirements of the Securities Exchange Act of 1934 and the Investment Company Act of 1940, the registrant has duly caused this report to be signed on its behalf by the undersigned, thereunto duly authorized.
Mutual Fund Series Trust
| By Jerry Szilagyi | /s/ Jerry Szilagyi |
| Principal Executive Officer/President |
| Date: June 7, 2022 | |
Pursuant to the requirements of the Securities Exchange Act of 1934 and the Investment Company Act of 1940, this report has been signed below by the following person on behalf of the registrant and in the capacities and on the date indicated.
| By Jerry Szilagyi | /s/ Jerry Szilagyi ___________ |
| Principal Executive Officer/President |
| Date: June 7, 2022 | |
Pursuant to the requirements of the Securities Exchange Act of 1934 and the Investment Company Act of 1940, this report has been signed below by the following person on behalf of the registrant and in the capacities and on the date indicated.
| By Erik Naviloff | /s/ Erik Naviloff_____________ |
| Principal Financial Officer/Treasurer |
| Date: June 7, 2022 | |