united states
securities and exchange commission
washington, d.c. 20549
form n-csr
certified shareholder report of registered management
investment companies
Investment Company Act file number 811-21872
Mutual Fund Series Trust
(Exact name of registrant as specified in charter)
225 Pictoria Drive, Suite 450, Cincinnati, Ohio 45246
(Address of principal executive offices) (Zip code)
CT CORPORATION SYSTEM
1300 EAST NINTH STREET, CLEVELAND, OH 44114
(Name and address of agent for service)
Registrant's telephone number, including area code: 631-490-4300
Date of fiscal year end: 9/30
Date of reporting period: 3/31/23
ITEM 1. REPORTS TO SHAREHOLDERS.

Empiric Fund
(formerly, “Empiric 2500 Fund”)
Semi-Annual Report
March 31, 2023
| | “Despite some severe interruptions, our country’s |
| | economic progress has been breathtaking. Our |
| | unwavering conclusion: Never bet against America.” |
| | |
| | Warren Buffett’s Annual Letter, February 2021 |
The World’s Richest, Most Productive, and Most Innovative Economy
For the six-month period ending March 31, 2023, the Empiric Fund was up 14.90% versus 11.57% for the Bloomberg 2500 and 11.95% for the MSCI Small Cap Index.
Our best performers were Agilysys, United Rentals, Interpublic Group, Fair Isaac, Bruker, Horizon Therapeutics, Ares Management, Coca-Cola Bottling, Lincoln Electric and Extreme Networks. Along the lines of the world’s richest, most productive, and most innovative economy is the story of Agilysys, our largest holding. Agilysys specializes in application software for the hospitality and retail industries worldwide, recently winning Marriott International. Its systems are award-winning, and we think the company can be held for a long, long time. Agilysys fits our process of trying to find the best companies and hold forever.
Commentary
In the world of investing, decisions are rarely simple. There are always many factors to consider and weigh against each other, and even the “right” decision can be undermined by events that nobody could predict. The Covid-19 pandemic and Russia’s invasion of Ukraine are examples from the last three years, and there will be other surprises in the future.
With that said, today is an especially difficult time to make major strategic investment decisions. We have paused on most new stock purchases, precisely because we see elevated market risk right now. We are not in retrenchment or selling mode, but we are patient.
Let’s run through some of the conditions that we are watching closely, and why we are keeping our buying on the sidelines now.
First, stock valuations are still rich, or at levels well above the historic average. The price-to-earnings (PE) ratio of the S&P 500 stocks was 21.91 as of April 26. While this is not particularly high compared to the last 20 years, it’s far above the median PE of 14.93 for the last 100 years. At current PE levels, it’s difficult to buy quality companies at reasonable prices.
Second, the current PE seems tied to investors’ expectations that interest rates will start to decline by the end of this year. Falling interest rates would ease the tightening of the economy that the Federal Reserve has pursued to tame inflation. But Fed officials have been clear that they are not in a rush to cut rates, at least in 2023.
Third, a recession could occur. There’s been so much talk about a recession that it seems like it’s already happened. But it hasn’t. The jittery stock market performance of the last 15 months is without an actual recession, and so a real downturn could send the market down further.
Evidence for a looming recession is easy to find. A survey in March by the National Federation of Independent Businesses (NFIB) found small-business owners’ optimism is as low as it was during the early months of Covid. NFIB members’ outlook for the next six months is a net negative 47%. Another indicator of a possible recession is that initial claims for unemployment are starting to increase.
Fourth, if we do face a recession, company earnings are likely to slip from current forecasts, which is almost always a negative for stock prices. In past recessions, according to the firm D.A. Davidson, “S&P 500 earnings per share declines, from peak to trough, ranged from -4.6% in the 1980 recession, to minus 91.9% during the Global Financial Crisis from 2007 to 2009. The average earnings decline across all ten recessions was -29.5%.”
Finally, we must consider the recent struggles of the banking sector. The bailouts by the federal government of tech-oriented Silicon Valley Bank (SVB) and Signature Bank in March drew the most attention, and with good reason. This week, it’s First Republic Bank, which didn’t have the direct tech exposure of SVB and Signature but is deeply tied into the tech economy as a California lender. The next shoe to drop could be small and mid-sized banks that have big commercial real estate portfolios elsewhere in the country. These banks hold 67.2% of commercial real estate debt, and much of that debt was issued at very low interest rates prior to 2022. Estimates are that $1.5 trillion of that debt will need to be refinanced before 2025, and it’s going to put real estate firms and banks in conflict. Commercial office space owners will be squeezed by higher interest rates and lower occupancy rates as people work from home more than ever. Bloomberg reported this week that Brookfield Corp., one of the world’s largest public real estate companies, defaulted on $161.4 million worth of office building mortgages, mostly in Washington, D.C., in April, after defaulting on $765 million on two trophy office towers in downtown Los Angeles in March.
Banks’ struggles are the most visible impact of rising interest rates so far. Our experience tells us that after two decades of almost zero interest rates, the economy has much adjusting to do with interest rates significantly higher. Some of it will be painful, especially for leveraged individuals and levered companies. Market analysts are starting to take these factors into consideration. For example, earnings estimates have had modest declines. We expect more downward revisions as we cycle through a period of higher-cost and less-available credit.
However, we are also confident that current conditions will not last forever. Market risk will not always be elevated. We opened this shareholder letter with a quote from Warren Buffett that sums up our positive view about the U.S. economy long-term. As he indicates, America’s economic growth has been extraordinary. The United States remains the world’s richest, most productive, and most innovative economy. The ability of innovative minds to obtain capital to build great companies remains unparalleled in the world, and the world’s great ideas gravitate towards America because those ideas are rewarded.
The Economist magazine shared several interesting facts in an article in mid-April titled, “Riding High, the Lessons of America’s Astonishing Economy.” Here are excerpts:
| ● | “Anxiety [on the economy] obscures a stunning success story—one of enduring but underappreciated outperformance. America remains the world’s richest, most productive, and most innovative big economy. Along an impressive number of dimensions, it is leaving its peers ever further in the dust.” |
| ● | “In 1990 America accounted for a quarter of the world’s output, at market exchange rates. Thirty years on, that share is almost unchanged, even as China has gained economic clout.” |
| ● | America accounts for 58% of the G7’s GDP, compared with 40% in 1990. |
| ● | American firms own more than a fifth of patents registered abroad, more than China and Germany put together. |
| ● | America has nearly a third more workers than in 1990, compared with gains of only 10% in western Europe and Japan. And, perhaps surprisingly, more U.S. workers have graduate and postgraduate degrees. |
| ● | Investors who put $100 into the S&P 500 in 1990 would have more than $2,000 today, four times what they would have earned had they invested elsewhere in the wealthy countries of the world at that time. |
When viewing the economy from a long-term perspective, we understand that cycles are normal, occurring about every five-and-a-half years. We have experienced several cycles in our careers and have made it through all of them. And we will get through this one, too!
We appreciate you investing with us.
Respectfully submitted,
| Mark A. Coffelt, CFA | Loren M Coffelt |
| | |
| Co-Portfolio Manager | Co-Portfolio Manger |
5406-NLD-05012023
Empiric Fund
PORTFOLIO REVIEW (Unaudited)
March 31, 2023
Average Annual Total Return through March 31, 2023*, as compared to its benchmarks:
| | 6 Month Return | 1 Year Return | 5 Year Return | 10 Year Return | Since Inception (a) |
| Empiric Fund Class A | 14.90% | -5.28% | 6.68% | 8.84% | 8.73% |
| Empiric Fund Class A with Load (b) | 8.30% | -10.72% | 5.43% | 8.20% | 8.49% |
| MSCI USA Small Cap Index(c) | 11.95% | -8.97% | 6.61% | 9.09% | N/A |
| Bloomberg US 2500 Total Return Index(d) | 11.57% | -10.61% | 6.44% | 9.17% | N/A |
| * | The performance data quoted here represents past performance. Current performance may be lower or higher than the performance data quoted above. Investment return and principal value will fluctuate, so that shares, when redeemed, may be worth more or less than their original cost. The returns shown do not reflect the deduction of taxes that a shareholder would pay on Fund distributions or on the redemptions of Fund shares. Past performance is no guarantee of future results. For performance information current to the most recent month-end, please call toll-free 1-888-839-7424. The Fund’s expense ratio, as of the February 1, 2023 prospectus, is 2.12% for Class A shares. For more current information on the Fund’s expense ratio, please see the Financial Highlights. |
| (a) | Class A commenced operations on November 6, 1995. |
| (b) | Class A shares are subject to a maximum sales load of 5.75%, which decreases depending on the amount invested and a maximum deferred sales charge of 1.00%. |
| (c) | The MSCI USA Small Cap Index is designed to measure the performance of the small cap segment of the U.S equity market. This index is not available back to the inception of Class A shares. Investors cannot invest directly in an index. |
| (d) | The Bloomberg US 2500 Total Return Index is a float market-cap-weighted benchmark of the lower 2500 in capitalization of the Bloomberg US 3000 Index. This index is not available back to the inception of Class A shares. Investors cannot invest directly in an index. |
Empiric Fund
PORTFOLIO REVIEW (Unaudited) (Continued)
March 31, 2023
Average Annual Total Return through March 31, 2023*, as compared to its benchmarks:
| | 6 Month Return | 1 Year Return | 5 Year Return | 10 Year Return | Since Inception (a) |
| Empiric Fund Class C | 14.49% | -5.99% | 5.88% | 8.02% | 5.36% |
| MSCI USA Small Cap Index(b) | 11.95% | -8.97% | 6.61% | 9.09% | N/A |
| Bloomberg US 2500 Total Return Index(c) | 11.57% | -10.61% | 6.44% | 9.17% | N/A |
| * | The performance data quoted here represents past performance. Current performance may be lower or higher than the performance data quoted above. Investment return and principal value will fluctuate, so that shares, when redeemed, may be worth more or less than their original cost. The returns shown do not reflect the deduction of taxes that a shareholder would pay on Fund distributions or on the redemptions of Fund shares. Past performance is no guarantee of future results. For performance information current to the most recent month-end, please call toll-free 1-888-839-7424. The Fund’s expense ratio, as of the February 1, 2023 prospectus, is 2.87% for Class C shares. For more current information on the Fund’s expense ratio, please see the Financial Highlights. |
| (a) | Class C commenced operations on October 7, 2005. |
| (b) | The MSCI USA Small Cap Index is designed to measure the performance of the small cap segment of the U.S equity market. This index is not available back to the inception of Class C shares. Investors cannot invest directly in an index. |
| (c) | The Bloomberg US 2500 Total Return Index is a float market-cap-weighted benchmark of the lower 2500 in capitalization of the Bloomberg US 3000 Index. This index is not available back to the inception of Class C shares. Investors cannot invest directly in an index. |
Empiric Fund Portfolio Weightings (Unaudited)
March 31, 2023
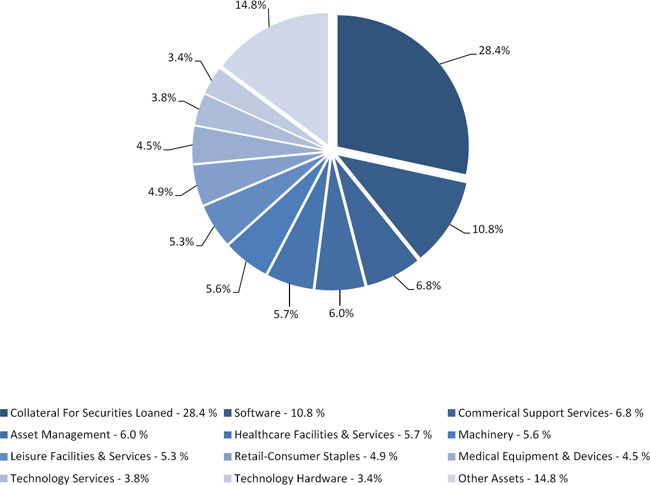
The percentages in the above chart are based on the portfolio holdings as a percentage of net assets of the Fund as of March 31, 2023 and are subject to change.
| Empiric Fund |
| SCHEDULE OF INVESTMENTS (Unaudited) |
| March 31, 2023 |
| Shares | | | | | Fair Value | |
| | | | | COMMON STOCKS — 97.0% | | | | |
| | | | | ADVERTISING & MARKETING - 2.9% | | | | |
| | 19,563 | | | Interpublic Group of Companies, Inc. (The)(a) | | $ | 728,527 | |
| | | | | | | | | |
| | | | | AEROSPACE & DEFENSE - 1.5% | | | | |
| | 6,529 | | | Aerojet Rocketdyne Holdings, Inc.(b) | | | 366,734 | |
| | | | | | | | | |
| | | | | APPAREL & TEXTILE PRODUCTS - 0.0%(c) | | | | |
| | 32 | | | Carter’s, Inc. | | | 2,301 | |
| | | | | | | | | |
| | | | | ASSET MANAGEMENT - 6.0% | | | | |
| | 7,700 | | | Ares Management Corporation, Class A(a) | | | 642,488 | |
| | 4,250 | | | LPL Financial Holdings, Inc.(a) | | | 860,199 | |
| | | | | | | | 1,502,687 | |
| | | | | BEVERAGES - 2.8% | | | | |
| | 1,307 | | | Coca-Cola Consolidated, Inc. | | | 699,350 | |
| | | | | | | | | |
| | | | | BIOTECH & PHARMA - 3.1% | | | | |
| | 8,166 | | | Halozyme Therapeutics, Inc.(b) | | | 311,860 | |
| | 4,201 | | | Horizon Therapeutics plc(b) | | | 458,497 | |
| | | | | | | | 770,357 | |
| | | | | CHEMICALS - 1.4% | | | | |
| | 1,988 | | | Avery Dennison Corporation | | | 355,713 | |
| | | | | | | | | |
| | | | | COMMERCIAL SUPPORT SERVICES - 6.8% | | | | |
| | 3,545 | | | AMN Healthcare Services, Inc.(b) | | | 294,093 | |
| | 4,205 | | | Brink’s Company (The)(a) | | | 280,894 | |
| | 9,910 | | | Robert Half International, Inc.(a) | | | 798,448 | |
| | 3,836 | | | TriNet Group, Inc.(a),(b) | | | 309,220 | |
| | | | | | | | 1,682,655 | |
| | | | | CONTAINERS & PACKAGING - 3.1% | | | | |
| | 6,641 | | | Berry Global Group, Inc. | | | 391,155 | |
| | 4,288 | | | Crown Holdings, Inc. | | | 354,660 | |
| | | | | | | | 745,815 | |
| | | | | ELECTRICAL EQUIPMENT - 2.9% | | | | |
| | 2,529 | | | A O Smith Corporation(a) | | | 174,880 | |
See accompanying notes to financial statements.
| Empiric Fund |
| SCHEDULE OF INVESTMENTS (Unaudited) (Continued) |
| March 31, 2023 |
| Shares | | | | | Fair Value | |
| | | | | COMMON STOCKS — 97.0% (Continued) | | | | |
| | | | | ELECTRICAL EQUIPMENT - 2.9% (Continued) | | | | |
| | 2,433 | | | Chase Corporation | | $ | 254,809 | |
| | 1,677 | | | Generac Holdings, Inc.(a),(b) | | | 181,133 | |
| | 437 | | | Hubbell, Inc.(a) | | | 106,326 | |
| | | | | | | | 717,148 | |
| | | | | ENGINEERING & CONSTRUCTION - 2.3% | | | | |
| | 3,412 | | | Quanta Services, Inc.(a) | | | 568,576 | |
| | | | | | | | | |
| | | | | ENTERTAINMENT CONTENT - 0.7% | | | | |
| | 1,384 | | | Take-Two Interactive Software, Inc.(a),(b) | | | 165,111 | |
| | | | | | | | | |
| | | | | HEALTH CARE FACILITIES & SERVICES - 5.7% | | | | |
| | 435 | | | Chemed Corporation(a) | | | 233,921 | |
| | 5,044 | | | Henry Schein, Inc.(b) | | | 411,288 | |
| | 1,511 | | | Medpace Holdings, Inc.(a),(b) | | | 284,144 | |
| | 1,705 | | | Molina Healthcare, Inc.(a),(b) | | | 456,070 | |
| | | | | | | | 1,385,423 | |
| | | | | INDUSTRIAL SUPPORT SERVICES - 3.0% | | | | |
| | 1,880 | | | United Rentals, Inc.(a) | | | 744,029 | |
| | | | | | | | | |
| | | | | INSURANCE - 1.2% | | | | |
| | 2,394 | | | Assurant, Inc. | | | 287,448 | |
| | | | | | | | | |
| | | | | INTERNET MEDIA & SERVICES - 1.7% | | | | |
| | 5,839 | | | Shutterstock, Inc. | | | 423,911 | |
| | | | | | | | | |
| | | | | LEISURE FACILITIES & SERVICES - 5.3% | | | | |
| | 6,036 | | | Dine Brands Global, Inc.(a) | | | 408,275 | |
| | 860 | | | Domino’s Pizza, Inc. | | | 283,688 | |
| | 3,100 | | | Jack in the Box, Inc. | | | 271,529 | |
| | 1,394 | | | Vail Resorts, Inc. | | | 325,750 | |
| | | | | | | | 1,289,242 | |
| | | | | LEISURE PRODUCTS - 1.7% | | | | |
| | 3,876 | | | Polaris, Inc.(a) | | | 428,802 | |
See accompanying notes to financial statements.
| Empiric Fund |
| SCHEDULE OF INVESTMENTS (Unaudited) (Continued) |
| March 31, 2023 |
| Shares | | | | | Fair Value | |
| | | | | COMMON STOCKS — 97.0% (Continued) | | | | |
| | | | | MACHINERY - 5.6% | | | | |
| | 5,500 | | | Donaldson Company, Inc. | | $ | 359,370 | |
| | 3,496 | | | Lincoln Electric Holdings, Inc.(a) | | | 591,173 | |
| | 3,872 | | | Toro Company (The) | | | 430,412 | |
| | | | | | | | 1,380,955 | |
| | | | | MEDICAL EQUIPMENT & DEVICES - 4.5% | | | | |
| | 8,068 | | | Bruker Corporation | | | 636,081 | |
| | 6,429 | | | Globus Medical, Inc., Class A(a),(b) | | | 364,139 | |
| | 1,283 | | | QuidelOrtho Corporation(b) | | | 114,302 | |
| | | | | | | | 1,114,522 | |
| | | | | OIL & GAS PRODUCERS - 2.0% | | | | |
| | 3,700 | | | Denbury, Inc.(b) | | | 324,231 | |
| | 640 | | | Murphy USA, Inc. | | | 165,152 | |
| | | | | | | | 489,383 | |
| | | | | OIL & GAS SERVICES & EQUIPMENT - 1.2% | | | | |
| | 13,862 | | | Core Laboratories N.V. | | | 305,657 | |
| | | | | | | | | |
| | | | | PUBLISHING & BROADCASTING - 0.4% | | | | |
| | 500 | | | Nexstar Media Group, Inc.(a) | | | 86,330 | |
| | | | | | | | | |
| | | | | RETAIL - CONSUMER STAPLES - 4.9% | | | | |
| | 6,800 | | | BJ’s Wholesale Club Holdings, Inc.(b) | | | 517,276 | |
| | 1,935 | | | Casey’s General Stores, Inc. | | | 418,850 | |
| | 1,200 | | | Dollar General Corporation | | | 252,552 | |
| | | | | | | | 1,188,678 | |
| | | | | RETAIL - DISCRETIONARY - 3.3% | | | | |
| | 140 | | | AutoZone, Inc.(b) | | | 344,141 | |
| | 400 | | | O’Reilly Automotive, Inc.(b) | | | 339,592 | |
| | 1,125 | | | Williams-Sonoma, Inc.(a) | | | 136,867 | |
| | | | | | | | 820,600 | |
| | | | | SEMICONDUCTORS - 1.8% | | | | |
| | 4,064 | | | Teradyne, Inc.(a) | | | 436,921 | |
| | | | | | | | | |
| | | | | SOFTWARE - 10.8% | | | | |
| | 13,376 | | | Agilysys, Inc.(b) | | | 1,103,653 | |
See accompanying notes to financial statements.
| Empiric Fund |
| SCHEDULE OF INVESTMENTS (Unaudited) (Continued) |
| March 31, 2023 |
| Shares | | | | | Fair Value | |
| | | | | COMMON STOCKS — 97.0% (Continued) | | | | |
| | | | | SOFTWARE - 10.8% (Continued) | | | | |
| | 16,206 | | | Calix, Inc.(b) | | $ | 868,479 | |
| | 8,148 | | | CommVault Systems, Inc.(b) | | | 462,318 | |
| | 4,186 | | | Envestnet, Inc.(a),(b) | | | 245,593 | |
| | | | | | | | 2,680,043 | |
| | | | | SPECIALTY FINANCE - 1.5% | | | | |
| | 10,318 | | | Fidelity National Financial, Inc. | | | 360,408 | |
| | | | | | | | | |
| | | | | TECHNOLOGY HARDWARE - 3.4% | | | | |
| | 22,201 | | | Extreme Networks, Inc.(b) | | | 424,483 | |
| | 20,602 | | | Sonos, Inc.(a),(b) | | | 404,211 | |
| | | | | | | | 828,694 | |
| | | | | TECHNOLOGY SERVICES - 3.8% | | | | |
| | 2,728 | | | Euronet Worldwide, Inc.(a),(b) | | | 305,263 | |
| | 762 | | | Fair Isaac Corporation(b) | | | 535,450 | |
| | 2,807 | | | TTEC Holdings, Inc. | | | 104,505 | |
| | | | | | | | 945,218 | |
| | | | | TRANSPORTATION & LOGISTICS - 1.7% | | | | |
| | 225 | | | GXO Logistics, Inc.(a),(b) | | | 11,354 | |
| | 2,160 | | | Landstar System, Inc.(a) | | | 387,201 | |
| | 225 | | | RXO, Inc.(a),(b) | | | 4,419 | |
| | 225 | | | XPO Logistics, Inc.(a),(b) | | | 7,178 | |
| | | | | | | | 410,152 | |
| | | | | | | | | |
| | | | | TOTAL COMMON STOCKS (Cost $13,960,560) | | | 23,911,390 | |
| | | | | | | | | |
| Shares | | | | | Fair Value | |
| | | | | SHORT-TERM INVESTMENTS — 28.4% | | | | |
| | | | | COLLATERAL FOR SECURITIES LOANED - 28.4% | | | | |
| | 6,997,556 | | | Mount Vernon Liquid Assets Portfolio, LLC, 4.93% (Cost $6,997,556)(d),(e) | | | 6,997,556 | |
| | | | | | | | | |
| | | | | TOTAL INVESTMENTS - 125.4% (Cost $20,958,116) | | $ | 30,908,946 | |
| | | | | LIABILITIES IN EXCESS OF OTHER ASSETS - (25.4)% | | | (6,267,906 | ) |
| | | | | NET ASSETS - 100.0% | | $ | 24,641,040 | |
| LLC | - Limited Liability Company |
| NV | - Naamioze Vennootschap |
| PLC | - Public Limited Company |
| (a) | All or a portion of the security is on loan. The total fair value of the securities on loan as of March 31, 2023 was $6,963,388. |
| (b) | Non-income producing security. |
| (c) | Percentage rounds to less than 0.1%. |
| (d) | Rate disclosed is the seven day effective yield as of March 31, 2023. |
| (e) | Security was purchased with cash received as collateral for securities on loan at March 31, 2023. Total Collateral had a value of $6,997,556 at March 31, 2023. |
See accompanying notes to financial statements.
| Empiric Fund |
| STATEMENT OF ASSETS AND LIABILITIES (Unaudited) |
| March 31, 2023 |
| ASSETS | | | | |
| Investment securities: (a) | | | | |
| At cost | | $ | 20,958,116 | |
| At fair value | | $ | 30,908,946 | |
| Cash and cash equivalents | | | 759,017 | |
| Dividends and interest receivable | | | 6,631 | |
| Prepaid expenses and other assets | | | 5,525 | |
| TOTAL ASSETS | | | 31,680,119 | |
| | | | | |
| LIABILITIES | | | | |
| Payable for collateral from securities loaned | | | 6,997,556 | |
| Payable for Fund shares repurchased | | | 50 | |
| Investment advisory fees payable | | | 23,381 | |
| Distribution (12b-1) fees payable | | | 6,282 | |
| Payable to related parties | | | 11,099 | |
| Accrued expenses and other liabilities | | | 711 | |
| TOTAL LIABILITIES | | | 7,039,079 | |
| NET ASSETS | | $ | 24,641,040 | |
| | | | | |
| Composition of Net Assets: | | | | |
| Paid in capital | | $ | 15,669,488 | |
| Accumulated earnings | | | 8,971,552 | |
| NET ASSETS | | $ | 24,641,040 | |
| | | | | |
| Net Asset Value Per Share: | | | | |
| Class A Shares: | | | | |
| Net Assets | | $ | 23,411,044 | |
| Shares of beneficial interest outstanding (b) | | | 447,208 | |
| Net asset value (Net Assets ÷ Shares Outstanding) and redemption price per share (c) | | $ | 52.35 | |
| Maximum offering price per share (net asset value plus maximum sales charge of 5.75%) | | $ | 55.54 | |
| | | | | |
| Class C Shares: | | | | |
| Net Assets | | $ | 1,229,996 | |
| Shares of beneficial interest outstanding (b) | | | 27,221 | |
| Net asset value (Net Assets ÷ Shares Outstanding), offering price and redemption price per share | | $ | 45.19 | |
| (a) | Includes $6,963,388 of securities out on loan. |
| (b) | Unlimited number of shares of beneficial interest authorized, no par value. |
| (c) | Investments in Class A shares made at or above the $1 million breakpoint are not subject to an initial sales charge and may be subject to a 1.00% contingent deferred sales charge (“CDSC”) on shares redeemed within 12 months after the date of purchase (excluding shares purchased with reinvested dividends and/or distributions). |
See accompanying notes to financial statements.
| Empiric Fund |
| STATEMENT OF OPERATIONS (Unaudited) |
| For the Six Months Ended March 31, 2023 |
| INVESTMENT INCOME | | | | |
| Dividends (net of foreign witholding taxes of $42) | | $ | 140,976 | |
| Securities lending income - net | | | 5,511 | |
| TOTAL INVESTMENT INCOME | | | 146,487 | |
| | | | | |
| EXPENSES | | | | |
| Investment advisory fees | | | 122,203 | |
| Distribution (12b-1) fees: | | | | |
| Class A | | | 29,012 | |
| Class C | | | 6,155 | |
| Administration fees | | | 41,906 | |
| Management services fees | | | 12,220 | |
| Compliance officer fees | | | 9,999 | |
| Registration fees | | | 9,100 | |
| Trustees fees and expenses | | | 7,293 | |
| Audit Fees | | | 6,803 | |
| Printing and postage expenses | | | 5,802 | |
| Shareholder service fees | | | 5,221 | |
| Legal fees | | | 878 | |
| Custodian fees | | | 277 | |
| Insurance expense | | | 410 | |
| Other expenses | | | 270 | |
| TOTAL EXPENSES | | | 257,549 | |
| | | | | |
| NET INVESTMENT LOSS | | | (111,062 | ) |
| | | | | |
| REALIZED AND UNREALIZED GAIN (LOSS) FROM INVESTMENTS | | | | |
| Net realized loss from investments | | | (114,887 | ) |
| Net change in unrealized appreciation on investments | | | 3,488,953 | |
| | | | | |
| NET REALIZED AND UNREALIZED GAIN FROM INVESTMENTS | | | 3,374,066 | |
| | | | | |
| NET INCREASE IN NET ASSETS RESULTING FROM OPERATIONS | | $ | 3,263,004 | |
See accompanying notes to financial statements.
| Empiric Fund |
| STATEMENTS OF CHANGES IN NET ASSETS |
| | | For the | | | For the | |
| | | Six Months Ended | | | Year Ended | |
| | | March 31, 2023 | | | September 30, 2022 | |
| | | (Unaudited) | | | | |
| FROM OPERATIONS | | | | | | | | |
| Net investment loss | | $ | (111,062 | ) | | $ | (364,186 | ) |
| Net realized loss from investments | | | (114,887 | ) | | | (511,730 | ) |
| Net change in unrealized appreciation (depreciation) on investments | | | 3,488,953 | | | | (6,128,205 | ) |
| Net increase (decrease) in net assets resulting from operations | | | 3,263,004 | | | | (7,004,121 | ) |
| | | | | | | | | |
| DISTRIBUTIONS TO SHAREHOLDERS | | | | | | | | |
| From distributable earnings: | | | | | | | | |
| Class A | | | — | | | | (147,358 | ) |
| Class C | | | — | | | | (9,226 | ) |
| Net decrease in net assets from distributions to shareholders | | | — | | | | (156,584 | ) |
| | | | | | | | | |
| FROM SHARES OF BENEFICIAL INTEREST | | | | | | | | |
| Proceeds from shares sold: | | | | | | | | |
| Class A | | | 148,935 | | | | 61,129 | |
| Class C | | | — | | | | 500 | |
| Net asset value of shares issued in reinvestment of distributions: | | | | | | | | |
| Class A | | | — | | | | 135,674 | |
| Class C | | | — | | | | 8,689 | |
| Payments for shares redeemed: | | | | | | | | |
| Class A | | | (831,600 | ) | | | (1,145,289 | ) |
| Class C | | | (47,743 | ) | | | (65,413 | ) |
| Net decrease in net assets from shares of beneficial interest | | | (730,408 | ) | | | (1,004,710 | ) |
| | | | | | | | | |
| TOTAL INCREASE (DECREASE) IN NET ASSETS | | | 2,532,596 | | | | (8,165,415 | ) |
| | | | | | | | | |
| NET ASSETS | | | | | | | | |
| Beginning of Period/Year | | | 22,108,444 | | | | 30,273,859 | |
| End of Period/Year | | $ | 24,641,040 | | | $ | 22,108,444 | |
| | | | | | | | | |
| SHARE ACTIVITY | | | | | | | | |
| Class A: | | | | | | | | |
| Shares Sold | | | 2,927 | | | | 1,116 | |
| Shares Reinvested | | | — | | | | 2,323 | |
| Shares Redeemed | | | (16,515 | ) | | | (20,868 | ) |
| Net decrease in shares of beneficial interest outstanding | | | (13,588 | ) | | | (17,429 | ) |
| | | | | | | | | |
| Class C: | | | | | | | | |
| Shares Sold | | | — | | | | 10 | |
| Shares Reinvested | | | — | | | | 171 | |
| Shares Redeemed | | | (1,067 | ) | | | (1,385 | ) |
| Net decrease in shares of beneficial interest outstanding | | | (1,067 | ) | | | (1,204 | ) |
See accompanying notes to financial statements.
| Empiric Fund |
| FINANCIAL HIGHLIGHTS |
Per Share Data and Ratios for a Share of Beneficial Interest Outstanding Throughout each of the Period/Years Presented
| | | Class A | |
| | | Six Months | | | Year | | | Year | | | Year | | | Year | | | Year | |
| | | Ended | | | Ended | | | Ended | | | Ended | | | Ended | | | Ended | |
| | | March 31, | | | September 30, | | | September 30, | | | September 30, | | | September 30, | | | September 30, | |
| | | 2023 | | | 2022 | | | 2021 | | | 2020 | | | 2019 | | | 2018 | |
| | | (Unaudited) | | | | | | | | | | | | | | | | |
| Net asset value, beginning of period/year | | $ | 45.56 | | | $ | 60.07 | | | $ | 45.46 | | | $ | 40.47 | | | $ | 47.39 | | | $ | 36.57 | |
| Activity from investment operations: | | | | | | | | | | | | | | | | | | | | | | | | |
| Net investment loss (1) | | | (0.22 | ) | | | (0.71 | ) | | | (0.68 | ) | | | (0.56 | ) | | | (0.45 | ) | | | (0.45 | ) |
| Net realized and unrealized gain (loss) on investments | | | 7.01 | | | | (13.49 | ) | | | 19.24 | | | | 5.55 | | | | (6.47 | ) | | | 11.27 | |
| Total from investment operations | | | 6.79 | | | | (14.20 | ) | | | 18.56 | | | | 4.99 | | | | (6.92 | ) | | | 10.82 | |
| | | | | | | | | | | | | | | | | | | | | | | | | |
| Less distributions from: | | | | | | | | | | | | | | | | | | | | | | | | |
| Net realized gains | | | — | | | | (0.31 | ) | | | (3.95 | ) | | | — | | | | — | | | | — | |
| Total distributions | | | — | | | | (0.31 | ) | | | (3.95 | ) | | | — | | | | — | | | | — | |
| | | | | | | | | | | | | | | | | | | | | | | | | |
| Net asset value, end of period/year | | $ | 52.35 | | | $ | 45.56 | | | $ | 60.07 | | | $ | 45.46 | | | $ | 40.47 | | | $ | 47.39 | |
| Total return (2) | | | 14.90 | % (7) | | | (23.72 | )% | | | 42.05 | % | | | 12.33 | % | | | (14.62 | )% | | | 29.59 | % |
| Net assets, at end of period/year (000s) | | $ | 23,411 | | | $ | 20,992 | | | $ | 28,726 | | | $ | 22,865 | | | $ | 22,346 | | | $ | 29,857 | |
| Ratio of gross expenses to average net assets (3)(4) | | | 2.07 | % (8) | | | 2.12 | % | | | 1.96 | % | | | 2.13 | % | | | 2.02 | % | | | 1.99 | % |
| Ratio of net expenses to average net assets after waiver (4) | | | 2.07 | % (8) | | | 2.12 | % | | | 1.96 | % | | | 2.13 | % | | | 2.02 | % | | | 1.99 | % |
| Ratio of net investment loss to average net assets (4)(5) | | | (0.87 | )% (8) | | | (1.32 | )% | | | (1.17 | )% | | | (1.35 | )% | | | (1.08 | )% | | | (1.07 | )% |
| Portfolio Turnover Rate (6) | | | 5 | % (7) | | | 5 | % | | | 21 | % | | | 119 | % | | | 50 | % | | | 11 | % |
| | | | | | | | | | | | | | | | | | | | | | | | | |
| (1) | Per share amounts calculated using the average shares method. |
| (2) | Total return in the above table is historical in nature and represents the rate that the investor would have earned or lost on an investment in the Fund assuming reinvestment of dividends and capital gains distributions, if any, and does not reflect the impact of sales charges. Had the Manager not waived a portion of the Fund’s expenses, total returns would have been lower. |
| (3) | Represents the ratio of expenses to average net assets absent fee waivers and/or expense reimbursements by the Manager. |
| (4) | The ratios of expenses to average net assets and net investment loss to average net assets do not reflect the expenses of the underlying investment companies in which the Fund invests. |
| (5) | Recognition of net investment income (loss) is affected by the timing and declaration of dividends by the underlying investment companies in which the Fund invests. |
| (6) | In-kind transactions are not included in calculation of turnover. |
See accompanying notes to financial statements.
| Empiric Fund |
| FINANCIAL HIGHLIGHTS |
Per Share Data and Ratios for a Share of Beneficial Interest Outstanding Throughout each of the Period/Years Presented
| | | Class C | |
| | | Six Months | | | Year Ended | | | Year | | | Year | | | Year | | | Year | |
| | | Ended | | | Ended | | | Ended | | | Ended | | | Ended | | | Ended | |
| | | March 31, | | | September 30, | | | September 30, | | | September 30, | | | September 30, | | | September 30, | |
| | | 2023 | | | 2022 | | | 2021 | | | 2020 | | | 2019 | | | 2018 | |
| | | (Unaudited) | | | | | | | | | | | | | | | | |
| Net asset value, beginning of period/year | | $ | 39.47 | | | $ | 52.48 | | | $ | 40.40 | | | $ | 36.24 | | | $ | 42.75 | | | $ | 33.24 | |
| Activity from investment operations: | | | | | | | | | | | | | | | | | | | | | | | | |
| Net investment loss (1) | | | (0.35 | ) | | | (0.98 | ) | | | (0.98 | ) | | | (0.78 | ) | | | (0.69 | ) | | | (0.69 | ) |
| Net realized and unrealized gain (loss) on investments | | | 6.07 | | | | (11.72 | ) | | | 17.01 | | | | 4.94 | | | | (5.82 | ) | | | 10.20 | |
| Total from investment operations | | | 5.72 | | | | (12.70 | ) | | | 16.03 | | | | 4.16 | | | | (6.51 | ) | | | 9.51 | |
| | | | | | | | | | | | | | | | | | | | | | | | | |
| Less distributions from: | | | | | | | | | | | | | | | | | | | | | | | | |
| Net realized gains | | | — | | | | (0.31 | ) | | | (3.95 | ) | | | — | | | | — | | | | — | |
| Total distributions | | | — | | | | (0.31 | ) | | | (3.95 | ) | | | — | | | | — | | | | — | |
| | | | | | | | | | | | | | | | | | | | | | | | | |
| Net asset value, end of period/year | | $ | 45.19 | | | $ | 39.47 | | | $ | 52.48 | | | $ | 40.40 | | | $ | 36.24 | | | $ | 42.75 | |
| Total return (2) | | | 14.49 | % (7) | | | (24.30 | )% | | | 40.99 | % | | | 11.48 | % | | | (15.25 | )% | | | 28.61 | % |
| Net assets, at end of period/year (000s) | | $ | 1,230 | | | $ | 1,117 | | | $ | 1,548 | | | $ | 1,166 | | | $ | 1,175 | | | $ | 1,554 | |
| Ratio of gross expenses to average net assets (3)(4) | | | 2.82 | % (8) | | | 2.87 | % | | | 2.71 | % | | | 2.88 | % | | | 2.77 | % | | | 2.74 | % |
| Ratio of net expenses to average net assets after waiver (4) | | | 2.82 | % (8) | | | 2.87 | % | | | 2.71 | % | | | 2.88 | % | | | 2.77 | % | | | 2.74 | % |
| Ratio of net investment loss to average net assets (4)(5) | | | (1.62 | )% (8) | | | (2.07 | )% | | | (1.92 | )% | | | (2.10 | )% | | | (1.83 | )% | | | (1.82 | )% |
| Portfolio Turnover Rate (6) | | | 5 | % (7) | | | 5 | % | | | 21 | % | | | 119 | % | | | 50 | % | | | 11 | % |
| | | | | | | | | | | | | | | | | | | | | | | | | |
| (1) | Per share amounts calculated using the average shares method. |
| (2) | Total return in the above table is historical in nature and represents the rate that the investor would have earned or lost on an investment in the Fund assuming reinvestment of dividends and capital gains distributions, if any. Had the Manager not waived a portion of the Fund’s expenses, total returns would have been lower. |
| (3) | Represents the ratio of expenses to average net assets absent fee waivers and/or expense reimbursements by the Manager. |
| (4) | The ratios of expenses to average net assets and net investment loss to average net assets do not reflect the expenses of the underlying investment companies in which the Fund invests. |
| (5) | Recognition of net investment loss is affected by the timing and declaration of dividends by the underlying investment companies in which the Fund invests. |
| (6) | In-kind transactions are not included in calculation of turnover. |
See accompanying notes to financial statements.
| Empiric Fund |
| NOTES TO FINANCIAL STATEMENTS (Unaudited) |
| March 31, 2023 |
| (1) | ORGANIZATION AND SIGNIFICANT ACCOUNTING POLICIES |
Mutual Fund Series Trust (the “Trust”), was organized as an Ohio business trust on February 27, 2006. The Trust is registered as an open-end management investment company under the Investment Company Act of 1940, as amended, (“1940 Act”). These financial statements include the following series: Empiric Fund, formerly the Empiric 2500 Fund (the “Fund”). The Trust currently consists of thirty-four series. The Fund is a separate diversified series of the Trust. Empiric Advisors, Inc. (the “Manager”), acts as the investment advisor to the Fund.
The Fund offers two classes of shares: Class A and Class C shares. Each share class represents an interest in the same assets of the Fund, has the same rights and is identical in all material respects except that (i) each class of shares may bear different distribution fees; (ii) each class of shares may be subject to different (or no) sales charges; (iii) certain other class specific expenses will be borne solely by the class to which such expenses are attributable; and (iv) each class has exclusive voting rights with respect to matters relating to its own distribution arrangements. The Fund’s Class A shares commenced operations on November 6, 1995. The Fund’s Class C shares commenced operations on October 7, 2005. Prior to October 7, 2005, the shares of the Fund had no specific class designation. As of that date, all of the then outstanding shares were redesignated as Class A shares. The Fund’s investment objective is to achieve capital appreciation.
The following is a summary of significant accounting policies consistently followed by the Fund which are in accordance with accounting principles generally accepted in the United States of America (“GAAP”). The Fund is an investment company and accordingly follows the Investment Company accounting and reporting guidance of the Financial Accounting Standards Board (“FASB”) Accounting Standards Codification Topic 946, Financial Services - Investment Companies, including FASB Accounting Standards Update (“ASU”) 2013-08.
a) Securities Valuation – Securities listed on an exchange are valued at the last reported sale price at the close of the regular trading session of the exchange on the business day the value is being determined, or in the case of securities listed on NASDAQ, at the NASDAQ Official Closing Price (“NOCP”). In the absence of a sale, such securities shall be valued at the last bid price on the day of valuation. The Fund may invest in portfolios of open-end or closed-end investment companies and exchange traded funds (the “underlying funds”). Open-end funds are valued at their respective net asset values as reported by such investment companies. The underlying funds value securities in their portfolios for which market quotations are readily available at their market values (generally the last reported sale price) and all other securities and assets at their fair value by the methods established by the boards of the underlying funds. The shares of many closed-end investment companies and exchange traded funds, after their initial public offering, frequently trade at a price per share, which is different than the net asset value per share. The difference represents a market premium or market discount of such shares. There can be no assurances that the market discount or market premium on shares of any closed-end investment company or exchange traded fund purchased by the Fund will not change. Short-term debt obligations having 60 days or less remaining until maturity, at time of purchase, may be valued at amortized cost, provided such valuations represent fair value.
In unusual circumstances, instead of valuing securities in the usual manner, the Fund may value securities at “fair value” as determined in good faith by the Board, pursuant to the procedures (the “Procedures”) approved by the Board. The Board has designated the adviser as its valuation designee (the “Valuation Designee”) to execute these procedures. The Procedures consider, among others, the following factors to determine a security’s fair value: the nature and pricing history (if any) of the security; whether any dealer quotations for the security are available; and possible valuation methodologies that could be used to determine the fair value of the security. Fair value may also be used by the Board if extraordinary events occur after the close of the relevant world market but prior to the New York Stock Exchange close. The Board may also enlist third party consultants such a valuation specialist at a public accounting firm, valuation consultant or financial officer of a security issuer on an as-needed basis to assist the Valuation Designee in determining a security-specific fair value. The Board is responsible for reviewing and approving fair value methodologies utilized by the Valuation Designee, approval of which shall be based upon whether the Valuation Designee followed the valuation procedures established by the Board.
The Fund utilizes various methods to measure the fair value of most of its investments on a recurring basis. GAAP establishes a hierarchy that prioritizes inputs to valuation methods. The three levels of input are:
Level 1 – Unadjusted quoted prices in active markets for identical assets and liabilities that the Fund has the ability to access.
| Empiric Fund |
| NOTES TO FINANCIAL STATEMENTS (Unaudited) (Continued) |
| March 31, 2023 |
Level 2 – Observable inputs other than quoted prices included in Level 1 that are observable for the asset or liability, either directly or indirectly. These inputs may include quoted prices for the identical instrument in an inactive market, prices for similar instruments, interest rates, prepayment speeds, credit risk, yield curves, default rates and similar data.
Level 3 – Unobservable inputs for the asset or liability, to the extent relevant observable inputs are not available, representing the Fund’s own assumptions about the assumptions a market participant would use in valuing the asset or liability, and would be based on the best information available.
The availability of observable inputs can vary from security to security and is affected by a wide variety of factors, including, for example, the type of security, whether the security is new and not yet established in the marketplace, the liquidity of markets, and other characteristics particular to the security. To the extent that valuation is based on models or inputs that are less observable or unobservable in the market, the determination of fair value requires more judgment. Accordingly, the degree of judgment exercised in determining fair value is greatest for instruments categorized in Level 3.
The inputs used to measure fair value may fall into different levels of the fair value hierarchy. In such cases, for disclosure purposes, the level in the fair value hierarchy within which the fair value measurement falls in its entirety, is determined based on the lowest level input that is significant to the fair value measurement in its entirety.
The inputs or methodology used for valuing securities are not necessarily an indication of the risk associated with investing in those securities. The following table summarizes the inputs used as of March 31, 2023, for the Fund’s assets and liabilities measured at fair value:
| Assets | | | | | | | | | | | | |
| | | | | | | | | | | | | |
| Security Classifications (a) | | Level 1 | | | Level 2 | | | Level 3 | | | Totals | |
| Common Stocks | | $ | 23,911,390 | | | $ | — | | | $ | — | | | $ | 23,911,390 | |
| Collateral for Securities Loaned (b) | | | — | | | | — | | | | — | | | | 6,997,556 | |
| Total | | $ | 23,911,390 | | | $ | — | | | $ | — | | | $ | 30,908,946 | |
| (a) | As of and during the six months ended March 31, 2023 the Fund held no securities that were considered to be “Level 3” securities. Therefore, a reconciliation of assets in which significant unobservable inputs (Level 3) were used in determining fair value is not applicable. |
| (b) | Management has elected to adopt ASU 2015-07, Disclosures for Investments in Certain Entities That Calculate Net Asset Value per Share (or Its Equivalent) — a consensus of the Emerging Issues Task Force issued, on May 1, 2015. In accordance with Subtopic 820-10, certain investments that are measured at fair value using the net asset value per share (or its equivalent) have not been classified in the fair value hierarchy. The fair value amount presented in this table is intended to permit reconciliation of the fair value hierarchy to the amounts presented in the Statement of Assets and Liabilities. |
b) Federal Income Tax – As of and during the six months ended March 31, 2023, the Fund did not have a liability for any unrecognized tax expense. The Fund recognizes interest and penalties, if any, related to unrecognized tax expense as income tax expense in the Statement of Operations. As of March 31, 2023 the Fund did not incur any interest or penalties. Management has analyzed the Fund’s tax positions and has concluded that no liability for unrecognized tax benefits should be recorded related to uncertain tax positions taken on returns filed for open tax years September 30, 2020 - September 30, 2022 or expected to be taken in the Fund’s September 30, 2023 tax returns. The tax filings are open for examination by applicable taxing authorities, U.S. federal, Ohio and foreign jurisdictions. No examination of the Fund’s tax returns is presently in progress.
c) Distribution to Shareholders – Distributions of net investment income and capital gains to shareholders, which are determined in accordance with income tax regulations and may differ from GAAP, are recorded on the ex-dividend date and are distributed on an annual basis.
d) Multiple Class Allocations – Income, non-class specific expenses and realized or unrealized gains or losses are allocated to each class based on relative net assets. Distribution fees are charged to each respective share class in accordance with the distribution plan. Expenses of the Trust that are directly identifiable to a specific fund are charged to that fund. Expenses, which are not readily identifiable to a specific fund, are allocated in such a manner as deemed equitable, taking into consideration the nature and type of expense and the relative sizes of the funds in the Trust.
| Empiric Fund |
| NOTES TO FINANCIAL STATEMENTS (Unaudited) (Continued) |
| March 31, 2023 |
e) Other – Investment and shareholder transactions are recorded on the trade date. Interest income is recognized on an accrual basis. Discounts are accreted and premiums are amortized on debt securities using the effective interest method. Dividend income is recorded on the ex-dividend date. Realized gains or losses from sales of securities are determined by comparing the identified cost of the security lot sold with the net sales proceeds.
f) Use of Estimates – The preparation of financial statements in conformity with GAAP requires management to make estimates and assumptions that affect the reported amounts of assets and liabilities and disclosure of contingent assets and liabilities at the date of the financial statements and the reported amounts of increases and decreases in net assets from operations during the reporting period. Actual results could differ from those estimates.
g) Indemnification – The Trust indemnifies its officers and trustees for certain liabilities that may arise from the performance of their duties to the Trust. Additionally, in the normal course of business, the Fund enters into contracts that contain a variety of representations and warranties and which provide general indemnities. The Fund’s maximum exposure under these arrangements is unknown, as this would involve future claims that may be made against the Fund that have not yet occurred. However, based on experience, the risk of loss due to these warranties and indemnities appears to be remote.
h) Sales charges (loads) – A maximum sales charge of 5.75% is imposed on Class A shares of the Fund. Investments in Class A shares made at or above the $1 million breakpoint are not subject to an initial sales charge and may be subject to a 1.00% contingent deferred sales charge (“CDSC”) on shares redeemed within 12 months of purchase (excluding shares purchased with reinvested dividends and/or distributions). The respective shareholders pay such CDSC charges, which are not an expense of the Fund. For the six months ended March 31, 2023, there were no CDSC fees paid.
i) Foreign Currency – Investment securities and other assets and liabilities denominated in foreign currencies are translated into U.S. dollar amounts at the date of valuation. Purchases and sales of investment securities and income and expense items denominated in foreign currencies are translated into U.S. dollar amounts on the respective dates as such transactions.
The Fund does not isolate that portion of the results of operations resulting from changes in foreign exchange rates on investments from the fluctuations arising from changes in market prices of securities held. Such fluctuations are included with the net realized and unrealized gain or loss from investments.
Reported net realized foreign exchange gains or losses arise from sales of foreign currencies, currency gains or losses realized between the trade and settlement dates on securities transactions, and the difference between the amounts of dividends, interest, and foreign withholding taxes recorded on the Fund’s books and the U.S. dollar equivalent of the amounts actually received or paid. Net unrealized foreign exchange gains and losses arise from changes in the fair values of assets and liabilities, other than investments in securities at fiscal period-end, resulting from changes in exchange rates.
j) Security Loans – The Fund has entered into a securities lending agreement with U.S. Bank National Association. The Fund receives compensation in the form of fees, or retains a portion of interest on the investment of any cash received as collateral. The cash collateral is invested in short-term investments. The Fund also continues to receive interest or dividends on the securities loaned. The loans are secured by collateral at least equal, at all times, to 102% of the market value of loaned securities. Gain or loss in the fair value of the securities loaned that may occur during the term of the loan will be for the account of the Fund. The Fund has the right under the lending agreement to recover the securities from the borrower on demand. If the market value of the collateral falls below 102% of market value plus accrued interest of the loaned securities, the lender’s agent shall request additional collateral from the borrowers to bring the collateralization back to 102%. Under the terms of the securities lending agreement, the Fund is indemnified for such losses by the security lending agent. Should the borrower of the securities fail financially, the Fund has the right to repurchase the securities using the collateral in the open market. Although risk is mitigated by the collateral, the Fund could experience a delay in recovering their securities and possible loss of income or value if the borrower fails to return them.
| Empiric Fund |
| NOTES TO FINANCIAL STATEMENTS (Unaudited) (Continued) |
| March 31, 2023 |
The Fund receives cash as collateral in return for securities lent as part of the securities lending program. The collateral is invested in the Mount Vernon Liquid Assets Portfolio, LLC of which the investment objective is to seek to maximize current income to the extent with the preservation of capital and liquidity and maintain a stable NAV of $1.00 per unit. The Fund held $6,997,556 in the Mount Vernon Liquid Assets Portfolio, LLC as of March 31, 2023. The remaining contractual maturity of all securities lending transactions is overnight and continuous. The Fund is not subject to a master netting agreement with respect to securities lending; therefore no additional disclosures are required. The income earned by the Fund on investments of cash collateral received from borrowers for the securities loaned to them, if any was received, would be reflected in the Fund’s Statement of Operations.
The following table is a summary of the Fund’s securities loaned and related collateral which are subject to a netting agreement as of March 31, 2023:
| | | | | | | | | | | | Gross Amounts Not Offset in the | | | | |
| | | | | | | | | | | | Statement of Assets & Liabilities | | | | |
| | | | | | Gross | | | Net Amounts | | | | | | | | | | |
| | | | | | Amounts | | | of Assets | | | | | | | | | | |
| | | Gross | | | Offset in the | | | Presented in | | | | | | | | | | |
| | | Amounts of | | | Statement of | | | the Statement | | | Financial | | | Non-Cash | | | | |
| | | Recognized | | | Assets & | | | of Assets & | | | Instruments | | | Collateral | | | Net Amount of | |
| Assets: | | Assets | | | Liabilities | | | Liabilities | | | Pledged | | | Received * | | | Assets | |
| Empiric Fund | | | | | | | | | | | | | | | | | | | | | | | | |
| Description: | | | | | | | | | | | | | | | | | | | | | | | | |
| Securities Loaned | | $ | 6,963,388 | | | $ | — | | | $ | 6,963,388 | | | | | | | $ | 6,963,388 | * | | $ | — | |
| Total | | $ | 6,963,388 | | | $ | — | | | $ | 6,963,388 | | | $ | — | | | $ | 6,963,388 | | | $ | — | |
| * | The amount is limited to the asset balance and accordingly does not include excess collateral pledged. |
The fair value of the securities loaned for the Empiric Fund totaled $6,963,388 at March 31, 2023. The securities loaned are noted in the Schedules of Investments. The fair value of the “Collateral for Securities Loaned” on the Schedule of Investments includes cash collateral received and reinvested that totaled $6,997,556 for the Empiric Fund at March 31, 2023. This amount is offset by a liability recorded as “Collateral on securities loaned.” The contractual maturity of securities lending transactions is on an overnight and continuous basis. The Fund cannot pledge or resell the collateral.
| (2) | INVESTMENT TRANSACTIONS |
For the six months ended March 31, 2023, aggregate purchases and proceeds from sales of investment securities (excluding short-term investments) for the Fund were as follows:
| Purchases | | | Sales (a) | |
| $ | 1,308,185 | | | $ | 1,224,926 | |
| (a) | The Fund may participate in a liquidity program operated by ReFlow Fund, LLC (“ReFlow”). The program is designed to provide an alternative liquidity source for mutual funds experiencing redemptions of their shares. In order to pay cash to shareholders who redeem their shares on a given day, a mutual fund typically must hold cash in its portfolio, liquidate portfolio securities, or borrow money, all of which impose certain costs on the Fund. ReFlow provides participating mutual funds with another source of cash by standing ready to purchase shares from a fund equal to the amount of the Fund’s net redemptions on a given day. ReFlow then generally redeems those shares when the Fund experiences net sales. In return for this service, the Fund will pay a fee to ReFlow at a rate determined by a daily auction with other participating mutual funds. The costs to the Fund for participating in ReFlow are expected to be influenced by and comparable to the cost of the other sources of liquidity, such as the Fund’s short-term lending arrangement or the costs of selling portfolio securities to meet redemptions. ReFlow will be prohibited from acquiring more than 3% of the outstanding voting shares of the Fund. The Fund will waive any redemption fee with respect to redemptions by ReFlow. When covering net sales for the Fund, ReFlow normally utilizes Redemptions In-Kind. During the six months ended March 31, 2023, the Fund did not utilize ReFlow. ReFlow subscribed zero shares of the Fund during the period. |
| Empiric Fund |
| NOTES TO FINANCIAL STATEMENTS (Unaudited) (Continued) |
| March 31, 2023 |
| (3) | INVESTMENT MANAGEMENT AGREEMENT AND TRANSACTIONS WITH RELATED PARTIES |
The Trust, with respect to the Fund, has entered into a management agreement (the “Management Agreement”) with the Manager, pursuant to which the Manager receives a fee, computed daily, at an annual rate of 1.00% of the average daily net assets of the Fund. The Manager pays expenses incurred by it in connection with acting as an investment manager to the Fund other than costs (including taxes and brokerage commissions, borrowing costs, costs of investing in underlying funds and extraordinary expenses, if any) of securities purchased for the Fund and certain other expenses paid by the Fund (as detailed in the Management Agreement.). The Manager pays for all employees, office space and facilities required by it to provide services under the Management Agreement, with the exception of specific items of expense (as detailed in the Management Agreement). For the six months ended March 31, 2023, management fees of $122,203 were incurred by the Fund.
Pursuant to the Management Services Agreement between the Trust and MFund, MFund provides the Fund with various management and legal administrative services (the “Management Services Agreement”). For these services, the Fund pays MFund as of the last day of each month an annualized asset-based fee based upon net assets. In addition, the Fund reimburses MFund for any reasonable out-of-pocket expenses incurred in the performance of its duties under the Management Services Agreement. The amount due to MFund for the Management Services Agreement is listed in the Statement of Assets and Liabilities under “Payable to related parties” and the amount accrued for the year is shown in the Statement of Operations under “Management service fees.”
Pursuant to the Compliance Services Agreement, MFund provides chief compliance officer services to the Fund. For these services, the Fund pays MFund as of the last day of each month an annualized base fee plus an annualized asset-based fee based upon net assets. In addition, the Fund reimburses MFund for any reasonable out-of-pocket expenses incurred in the performance of its duties under the Compliance Services Agreement. The amount due to MFund for chief compliance officer services is listed in the Statement of Assets and Liabilities under “Compliance officer fees payable” and the amount accrued for the year is shown in the Statement of Operations under “Compliance officer fees.”
A trustee is the controlling member of MFund and of AlphaCentric Advisors LLC and Catalyst Capital Advisors LLC (investments managers to other series of the Trust) and is not paid any fees directly by the Trust for serving in such capacities.
Trustees who are not “interested persons” as that term is defined in the 1940 Act (the “Independent Trustees”), are paid a quarterly retainer and receive compensation for each special in-person meeting attended. The fees paid to the Independent Trustees for their attendance at a meeting will be shared equally by the funds of the Trust in which the meeting relates. The Lead Independent Trustee of the Trust, the Chairman of the Trust’s Audit Committee and the Chairman of the Risk and Compliance Committee receive an additional quarterly retainer. The “interested persons” of the Trust receive no compensation from the Fund. The Trust reimburses each Trustee and Officer for his or her travel and other expenses related to attendance at such meetings.
Northern Lights Distributors, LLC, (“Distributor”) serves as the principal underwriter and national distributor for the shares of the Fund pursuant to an Underwriting Agreement with the Trust. For the six months ended March 31, 2023, NLD received $0 in underwriter commissions from the sale of Class A shares of the Empiric Fund, of which they kept $0.
Ultimus Fund Solutions, LLC (“UFS”), an affiliate of the distributor, provides administrative, fund accounting, and transfer agency services to the Fund pursuant to agreements with the Trust, for which it receives from each Fund: (i) basis points in decreasing amounts as assets reach certain breakpoints; and (ii) any related out-of-pocket expenses.
Blu Giant, LLC (“Blu Giant”) – Blu Giant, an affiliate of the Distributor and UFS, provides EDGAR conversion and filing services as well as print management services for the Funds on an ad-hoc basis. For the provision of these services, Blu Giant receives customary fees from the Funds.
Certain Officers of the Trust are also employees of UFS, and are not paid any fees directly by the Fund for serving in such capacity.
| Empiric Fund |
| NOTES TO FINANCIAL STATEMENTS (Unaudited) (Continued) |
| March 31, 2023 |
The Trust has adopted a Distribution Plan pursuant to Rule 12b-1(the “Plan”), under the 1940 Act for Class A shares and Class C shares, that allows the Fund to pay distribution and shareholder servicing expenses of up to 0.50% per annum for the Class A shares and up to 1.00% for the Class C shares based on average daily net assets of each class. Class A shares are currently paying 0.25% per annum of 12b-1 fees. Class C shares are currently paying 1.00% per annum of 12b-1 fees. The fee may be used for a variety of purposes, including compensating dealers and other financial service organizations for eligible services provided by those parties to the Fund and its shareholders and to reimburse the Distributor and the Manager for distribution related expenses.
| (4) | TAX COMPONENTS OF CAPITAL |
The Statement of Assets and Liabilities represents cost for financial reporting purposes. Aggregate cost for federal tax purposes is $20,933,929 for the Empiric Fund and differs from fair value by net unrealized appreciation (depreciation) of securities as follows:
| Unrealized appreciation: | | $ | 10,056,395 | |
| Unrealized depreciation: | | | (81,378 | ) |
| Net unrealized appreciation: | | $ | 9,975,017 | |
The tax character of fund distributions paid for the years ended September 30, 2022 and September 30, 2021 was as follows:
| | | Fiscal Year Ended | | | Fiscal Year Ended | |
| | | September 30, 2022 | | | September 30, 2021 | |
| Ordinary Income | | $ | — | | | $ | — | |
| Long-Term Capital Gain | | | 156,544 | | | | 2,076,617 | |
| Return of Capital | | | 40 | | | | — | |
| | | $ | 156,584 | | | $ | 2,076,617 | |
As of September 30, 2022, the components of accumulated earnings/(deficit) on a tax basis were as follows:
| Undistributed | | | Undistributed | | | Post October Loss | | | Capital Loss | | | Other | | | Unrealized | | | Total | |
| Ordinary | | | Long-Term | | | and | | | Carry | | | Book/Tax | | | Appreciation/ | | | Accumulated Earnings | |
| Income | | | Gains | | | Late Year Loss | | | Forwards | | | Differences | | | (Depreciation) | | | /(Accumulated Deficit) | |
| $ | — | | | $ | — | | | $ | (639,651 | ) | | $ | (137,865 | ) | | $ | — | | | $ | 6,486,064 | | | $ | 5,708,548 | |
The difference between book basis and tax basis undistributed net investment income/(loss), accumulated net realized gain/(loss), and unrealized appreciation/(depreciation) from investments is primarily attributable to the tax deferral of losses on wash sales and adjustments for C-Corporation return of capital distributions.
Late year losses incurred after December 31 within the fiscal year are deemed to arise on the first business day of the following fiscal year for tax purposes. The Fund incurred and elected to defer such late year losses of $264,338.
Capital losses incurred after October 31 within the fiscal year are deemed to arise on the first business day of the following fiscal year for tax purposes. The Fund incurred and elected to defer such capital losses of $375,313.
At September 30, 2022, the Funds had capital loss carry forwards for federal income tax purposes available to offset future capital gains, as follows:
| Short-Term Non-Expiring | | | Long-Term Non-Expiring | | | Total | | | CLCF Utilized | |
| $ | 114,124 | | | $ | 23,741 | | | $ | 137,865 | | | $ | — | |
| Empiric Fund |
| NOTES TO FINANCIAL STATEMENTS (Unaudited) (Continued) |
| March 31, 2023 |
Permanent book and tax differences, primarily attributable to net operating losses, resulted in reclassification for the year ended September 30, 2022 as follows:
| Paid | | | | |
| In | | | Distributable | |
| Capital | | | Earnings | |
| $ | (429,951 | ) | | $ | 429,951 | |
Subsequent events occurring after the date of the Statement of Assets and Liabilities have been evaluated through the date the financial statements were issued. Management has determined that no events or transactions occurred requiring adjustment or disclosure in the financial statements.
| Empiric Fund |
| EXPENSE EXAMPLES (Unaudited) |
| March 31, 2023 |
As a shareholder of the Empiric Fund, you incur two types of costs: (1) transaction costs, including sales charges (loads) on purchases of Class A shares; (2) ongoing costs, including management fees; distribution and/or service (12b-1) fees; and other Fund expenses. This example is intended to help you understand your ongoing costs (in dollars) of investing in the Empiric Fund and to compare these costs with the ongoing costs of investing in other mutual funds.
The example is based on an investment of $1,000 invested at the beginning of the period and held for the entire period from October 1, 2022 through March 31, 2023.
Actual Expenses
The “Actual” lines in the table below provide information about actual account values and actual expenses. You may use the information below together with the amount you invested, to estimate the expenses that you paid over the period. Simply divide your account value by $1,000 (for example, an $8,600 account value divided by $1,000 = 8.6), then multiply the result by the number in the table under the heading entitled “Expenses Paid During Period” to estimate the expenses you paid on your account during this period.
Hypothetical Example for Comparison Purposes
The “Hypothetical” lines in the table below provide information about hypothetical account values and hypothetical expenses based on the Fund’s actual expense ratio and an assumed rate of return of 5% per year before expenses, which is not the Fund’s actual return. The hypothetical account values and expenses may not be used to estimate the actual ending account balances or expenses you paid for the period. You may use this information to compare this 5% hypothetical example with the 5% hypothetical examples that appear in the shareholder reports of other funds.
Please note that the expenses shown in the table are meant to highlight your ongoing costs only and do not reflect any transactional costs, such as sales charges (loads). Therefore, the table is useful in comparing ongoing costs only, and will not help you determine the relative total costs of owning different funds. In addition, if these transactional costs were included, your costs would have been higher.
| | | Beginning | | Ending | | Expenses Paid | | Expense Ratio |
| | | Account Value | | Account Value | | During Period* | | During Period** |
| Actual | | 10/1/22 | | 3/31/23 | | 10/1/22 – 3/31/23 | | 10/1/22 – 3/31/23 |
| Class A | | $1,000.00 | | $1,149.00 | | $11.08 | | 2.07% |
| Class C | | 1,000.00 | | 1,144.90 | | 15.07 | | 2.82% |
| | | | | | | | | |
| | | Beginning | | Ending | | Expenses Paid | | Expense Ratio |
| Hypothetical | | Account Value | | Account Value | | During Period* | | During Period** |
| (5% return before expenses) | | 10/1/22 | | 3/31/23 | | 10/1/22 – 3/31/23 | | 10/1/22 – 3/31/23 |
| Class A | | $1,000.00 | | $1,014.62 | | $10.39 | | 2.07% |
| Class C | | 1,000.00 | | 1,010.88 | | 14.13 | | 2.82% |
| * | Expenses are equal to the average account value over the period, multiplied by the Fund’s annualized expense ratio, multiplied by the number of days in the period (182) divided by the number of days in the fiscal year (365). |
| Empiric Fund |
| ADDITIONAL INFORMATION (Unaudited) |
| March 31, 2023 |
Approval of the Renewal of the Management Agreement between the Trust and Empiric Advisors, Inc. with respect to Empiric Fund
At a meeting held on February 13, 2023, the Board of Trustees (the “Board”) of Mutual Fund Series Trust (the “Trust”), including a majority of the Trustees who are not “interested persons” as that term is defined in the Investment Company Act of 1940, as amended, each an “Independent Trustee” and collectively the “Independent Trustees”) discussed the renewal of the management agreement (the “Management Agreement”) between the Trust and Empiric Advisors, Inc. (“Empiric”), with respect to Empiric Fund.
The Board examined Empiric’s responses to a series of questions regarding, among other things, its management services provided to Empiric Fund, comparative fee and expense information, and profitability from managing Empiric Fund. The Board was assisted by legal counsel throughout the review process and relied upon the advice of legal counsel and its own business judgment in determining the material factors to be considered in evaluating the Management Agreement and the weight to be given to each factor considered. The conclusions reached by the Board were based on a comprehensive evaluation of all of the information provided and were not the result of any one factor. Moreover, each Trustee may have afforded different weight to the various factors in reaching his conclusions with respect to renewal of the Management Agreement.
Nature, Extent and Quality of Services. The Board acknowledged that the team at Empiric servicing Empiric Fund remained consistent for over 15 years. The Board observed that Empiric provided portfolio management services using quantitative analysis. The Board noted that Empiric’s chief compliance officer verified that trades were placed on the basis of best execution and were reviewed for compliance with Empiric Fund’s investment limitations. The Board commented that Empiric reported that no trades for Empiric Fund were executed through Empiric’s affiliated broker-dealer. The Board remarked that Empiric monitored Empiric Fund’s liquidity on a regular basis and that Empiric was the Board’s valuation designee for Empiric Fund. The Board observed that Empiric reported no material compliance issues, litigation or code of ethics violations during the year, and that Empiric maintained a robust cybersecurity program. The Board concluded that Empiric could be expected to continue providing services to Empiric Fund that were consistent with the Board’s expectations.
Performance. The Board observed that Empiric Fund outperformed its Morningstar category across all periods and outperformed the MSCI USA Small Cap Index over the 1-year, 3-year and 5-year periods. The Board discussed that Empiric Fund outperformed its peer group across al periods except the 1-year period. The Board noted that Empiric attributed Empiric Fund’s underperformance over the 1-year period to value stocks being in favor. After discussion, the Board concluded that Empiric Fund’s performance was acceptable.
Fees and Expenses. The Board noted that Empiric charged a management fee of 1.00% which was higher than the peer group and Morningstar category’s averages and medians, but lower than the highs of each. The Board remarked that Empiric Fund’s 2.12% net expense ratio was also higher than the averages and medians of its peer group and Morningstar category but were well below the highs of each. The Board considered that Empiric Fund could use an affiliated broker to execute trades, and that Empiric benefits from soft dollars to obtain research, both of which is an additional indirect benefit to Empiric. The Board concluded that the management fee for Empiric Fund was not unreasonable.
Profitability. The Board observed that, based on the information Empiric provided, Empiric was managing Empiric Fund at a loss. The Board therefore concluded that excessive profitability was not a concern for Empiric at this time.
| Empiric Fund |
| ADDITIONAL INFORMATION (Unaudited) (Continued) |
| March 31, 2023 |
Economies of Scale. The Board considered whether Empiric had realized economies of scale with respect to the management of Empiric Fund and concluded that, based on the current asset level of Empiric Fund, breakpoints did not appear warranted. The Board agreed that although Empiric did not appear to be benefiting from material economies of scale, it would revisit the issue as the size of Empiric Fund increased.
Conclusion. Having requested and received such information from Empiric as the Board believed to be reasonably necessary to evaluate the terms of the Management Agreement, and as assisted by the advice of counsel, the Board concluded that the renewal of the Management Agreement was in the best interests of Empiric Fund and its shareholders.
| Empiric Fund |
| ADDITIONAL INFORMATION (Unaudited) |
| March 31, 2023 |
Proxy Voting Policy and Portfolio Holdings
Reference is made to the Prospectus and the Statement of Additional Information for more detailed descriptions of the Management Agreement and Services Agreement Plan, tax aspects of the Fund and the calculation of the net asset value of shares of the Fund.
The Fund files its complete schedule of portfolio holdings with the Securities and Exchange Commission (the “Commission”) for the first and third quarters of each fiscal year as an exhibit to its reports on Form N-PORT, within sixty days after the end of the period. Form N-PORT reports are available at the SEC’s website at http://www.sec.gov.
Information regarding how the Fund voted proxies relating to portfolio securities during the twelve month period ended June 30 as well as a description of the policies and procedures that the Fund uses to determine how to vote proxies relating to portfolio securities is available without charge, upon request, by calling 1-888-839-7424; and on the Commission’s website at http://www.sec.gov.
PRIVACY NOTICE
Mutual Fund Series Trust
Rev. August 2021
| FACTS | WHAT DOES MUTUAL FUND SERIES TRUST DO WITH YOUR PERSONAL INFORMATION? |
| Why? | Financial companies choose how they share your personal information. Federal law gives consumers the right to limit some, but not all sharing. Federal law also requires us to tell you how we collect, share, and protect your personal information. Please read this notice carefully to understand what we do. |
| What? | The types of personal information we collect and share depends on the product or service that you have with us. This information can include: ● Social Security number and wire transfer instructions ● account transactions and transaction history ● investment experience and purchase history When you are no longer our customer, we continue to share your information as described in this notice. |
| How? | All financial companies need to share customers’ personal information to run their everyday business. In the section below, we list the reasons financial companies can share their customers’ personal information; the reasons Mutual Fund Series Trust chooses to share; and whether you can limit this sharing. |
Reasons we can share your
personal information: | Does Mutual Fund Series
Trust share information? | Can you limit this
sharing? |
| For our everyday business purposes - such as to process your transactions, maintain your account(s), respond to court orders and legal investigations, or report to credit bureaus. | YES | NO |
| For our marketing purposes - to offer our products and services to you. | NO | We don’t share |
| For joint marketing with other financial companies. | NO | We don’t share |
| For our affiliates’ everyday business purposes - information about your transactions and records. | NO | We don’t share |
| For our affiliates’ everyday business purposes - information about your credit worthiness. | NO | We don’t share |
| For our affiliates to market to you | NO | We don’t share |
| For non-affiliates to market to you | NO | We don’t share |
PRIVACY NOTICE
Mutual Fund Series Trust
| What we do: |
How does Mutual Fund Series Trust protect my personal information? | To protect your personal information from unauthorized access and use, we use security measures that comply with federal law. These measures include computer safeguards and secured files and buildings. Our service providers are held accountable for adhering to strict policies and procedures to prevent any misuse of your nonpublic personal information. |
How does Mutual Fund Series Trust collect my personal information? | We collect your personal information, for example, when you: ● open an account or deposit money ● direct us to buy securities or direct us to sell your securities ● seek advice about your investments We also collect your personal information from others, such as credit bureaus, affiliates, or other companies. |
Why can’t I limit all sharing? | Federal law gives you the right to limit only: ● sharing for affiliates’ everyday business purposes – information about your creditworthiness. ● affiliates from using your information to market to you. ● sharing for non-affiliates to market to you. State laws and individual companies may give you additional rights to limit sharing. |
| Definitions |
| Affiliates | Companies related by common ownership or control. They can be financial and non-financial companies. ● Mutual Fund Series Trust does not share with affiliates. |
| Non-affiliates | Companies not related by common ownership or control. They can be financial and non-financial companies. ● Mutual Fund Series Trust doesn’t share with non-affiliates so they can market to you. |
| Joint marketing | A formal agreement between nonaffiliated financial companies that together market financial products or services to you. ● Mutual Fund Series Trust doesn’t jointly market. |
QUESTIONS?
CALL | Alpha Centric | 844-223-8637 |
| Catalyst | 866-447-4228 |
| Day Hagan | 877-329-4246 |
| Empiric | 888-839-7424 |
| Eventide | 877-771-3836 |
| JAG | 855-552-4596 |
| |
| |
| |
| Mutual Fund Series Trust |
| 4221 North 203rd Street, Suite 100 |
| Elkhorn, NE 68022 |
| |
| ADVISOR |
| Empiric Advisors, Inc. |
| 500 N. Capital of Texas Highway |
| Building 8, Suite 150 |
| Austin, TX 78746 |
| |
| ADMINISTRATOR |
Ultimus Fund Solutions, LLC
225 Pictoria Drive, Suite 450
Cincinnati, OH 45246 |
| |
| TRANSFER AGENT |
Ultimus Fund Solutions, LLC
225 Pictoria Drive, Suite 450
Cincinnati, OH 45246 |
| |
| DISTRIBUTOR |
| Northern Lights Distributors, LLC |
| 4221 North 203rd Street, Suite 100 |
| Elkhorn, NE 68022 |
| |
| INDEPENDENT REGISTERED PUBLIC ACCOUNTING FIRM |
Cohen & Company, Ltd.
1350 Euclid Avenue,
Suite 800
Cleveland, OH 44115 |
| |
| LEGAL COUNSEL |
| Thompson Hine LLP |
| 41 South High Street |
| Suite 1700 |
| Columbus, OH 43215 |
| |
| CUSTODIAN BANK |
| U.S. Bank |
| 1555 N. Rivercenter Dr. |
| Milwaukee, WI 53212 |
| |
| |
| |
| |
| |
| |
| |
| |
| |
| |
| |
| EMP-SAR23 |
| |
(b) Not applicable
Item 2. Code of Ethics.
Not applicable for semi-annual reports.
Item 3. Audit Committee Financial Expert.
Not applicable for semi-annual reports.
Item 4. Principal Accountant Fees and Services.
Not applicable for semi-annual reports.
Item 5. Audit Committee of Listed Companies. Not applicable to open-end investment companies.
Item 6. Schedule of Investments. See Item 1.
Item 7. Disclosure of Proxy Voting Policies and Procedures for Closed-End Management Investment Companies. Not applicable to open-end investment companies.
ITEM 8. PORTFOLIO MANAGERS OF CLOSED-END MANAGEMENT INVESTMENT COMPANIES
Item 9. Purchases of Equity Securities by Closed-End Management Investment Company and Affiliated Purchasers. Not applicable to open-end investment companies.
Item 10. Submission of Matters to a Vote of Security Holder. None.
ITEM 11. CONTROLS AND PROCEDURES.
| (a) | The registrant's principal executive and principal financial officers, or persons performing similar functions, have concluded that the registrant's disclosure controls and procedures (as defined in Rule 30a-3(c) under the 1940 Act, are effective, as of a date within 90 days of the filing date of this report, based on the evaluation of these controls and procedures required by Rule 30a-3(b) under the 1940 Act and Rule 15d-15(b) under the Securities Exchange Act of 1934, as amended. |
| (b) | There were no significant changes in the Registrant’s internal control over financial reporting that occurred during the period covered by this report that have materially affected, or are reasonably likely to materially affect, the Registrant’s internal control over financial reporting.. |
| ITEM | 12. DISCLOSURE OF SECURITIES LENDING ACTIVITIES FOR CLOSED-END MANAGEMENT INVESTMENT COMPANIES Not applicable. |
ITEM 13. EXHIBITS
| (1) | Code of Ethics for Principal Executive and Senior Financial Officers is attached hereto. |
ITEM 13. Disclosure of Securities Lending Activities for Closed-End Management Investment Companies. Not applicable to open-end investment companies.
SIGNATURES
Pursuant to the requirements of the Securities Exchange Act of 1934 and the Investment Company Act of 1940, the registrant has duly caused this report to be signed on its behalf by the undersigned, thereunto duly authorized.
Mutual Fund Series Trust
| By Michael Schoonover | /s/ Michael Schoonover |
| Principal Executive Officer/President |
| Date: June 6, 2023 | |
Pursuant to the requirements of the Securities Exchange Act of 1934 and the Investment Company Act of 1940, this report has been signed below by the following person on behalf of the registrant and in the capacities and on the date indicated.
| By Michael Schoonover | /s/ Michael Schoonover ___________ |
| Principal Executive Officer/President |
| Date: June 6, 2023 | |
Pursuant to the requirements of the Securities Exchange Act of 1934 and the Investment Company Act of 1940, this report has been signed below by the following person on behalf of the registrant and in the capacities and on the date indicated.
| By Erik Naviloff | /s/ Erik Naviloff_____________ |
| Principal Financial Officer/Treasurer |
| Date: June 6, 2023 | |