____________________________________________________
UNITED STATES
SECURITIES AND EXCHANGE COMMISSION
Washington, D.C. 20549
_______________________
FORM 6-K
__________________________________
Report of Foreign Private Issuer
Pursuant to Rule 13a-16 or 15d-16
under the Securities Exchange Act of 1934
For the month of July 2017
Commission File Number: 001-15102
__________________________________
Embraer S.A.
__________________________________
Av. Brigadeiro Faria Lima, 2170
12227-901 São José dos Campos, São Paulo, Brazil
(Address of principal executive offices)
__________________________________
Indicate by check mark whether the registrant files or will file annual reports under cover of Form 20-F or Form 40-F:
Form 20-Fx Form 40-F¨
Indicate by check mark if the registrant is submitting the Form 6-K in paper as permitted by Regulation S-T Rule 101(b)(1):¨
Indicate by check mark if the registrant is submitting the Form 6-K in paper as permitted by Regulation S-T Rule 101(b)(7):¨
HIGHLIGHTS
· In 2Q17, Embraer delivered 35 commercial and 24 executive (16 light and 8 large) jets, compared to the 26 commercial and 26 executive (23 light and 3 large) jet deliveries in 2Q16;
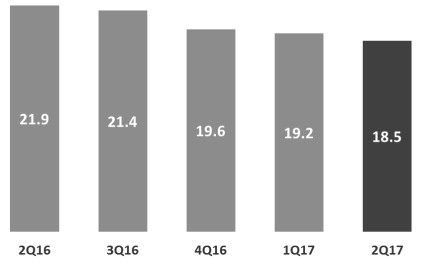
· The Company’s firm order backlog ended the quarter at US$ 18.5 billion;
· Revenues in 2Q17 increased 29.5% year-over-year to US$ 1,769.6 million, with significant growth across all three segments;
· Adjusted EBIT and Adjusted EBITDA1margins were 9.3% and 13.9%, respectively, in 2Q17, representing margin expansion compared to both the 2Q16 and 1Q17 consolidated results. Adjusted EBIT and Adjusted EBITDA exclude US$ 9.4 million in net non-recurring gains in 2Q17 and US$ 200.0 million in non-recurring charges in 2Q16. Adjusted EBIT and Adjusted EBITDA in the quarter were US$ 164.6 million and US$ 245.4 million, respectively;
· In the first half of 2017, Adjusted EBIT and Adjusted EBITDA margins were 7.0% and 12.5%, respectively. Accumulated Adjusted EBIT and EBITDA over the first six months of the year were US$ 195.6 million and US$ 348.8 million;
· 2Q17 Net income attributable to Embraer shareholders and Earnings per ADS were US$ 59.1 million and US$ 0.32, respectively. Adjusted Net income (excluding the impact of FX-related non-cash deferred income tax and social contribution and non-recurring items) for the quarter was US$ 123.0 million, representing Adjusted Earnings per ADS of US$ 0.67 per basic share in 2Q17;
· Embraer generated US$ 220.0 million of Adjusted Free cash flow during 2Q17, and over the first six months of 2017 Adjusted Free cash flow was US$ 20.7 million. The Company’s net debt position improved to US$ 661.5 million at the end of 2Q17 from US$ 805.8 million at the end of 1Q17;
· Embraer reiterates all aspects of its financial and delivery outlook for 2017.
Main financial indicators[2]
| | | | |
| in millions of U.S dollars, except % and earnings per share data |
| IFRS | (1) | (1) | (1) | (1) |
| 1Q17 | 2Q16 | 2Q17 | YTD17 |
| Revenue | 1,026.3 | 1,366.4 | 1,769.6 | 2,795.9 |
| EBIT | 23.4 | (127.4) | 174.0 | 197.4 |
| EBIT Margin % | 2.3% | -9.3% | 9.8% | 7.1% |
| Adjusted EBIT | 31.0 | 72.6 | 164.6 | 195.6 |
| Adjusted EBIT Margin % | 3.0% | 5.3% | 9.3% | 7.0% |
| EBITDA | 95.8 | (56.2) | 254.8 | 350.6 |
| EBITDA Margin % | 9.3% | -4.1% | 14.4% | 12.5% |
| Adjusted EBTIDA | 103.4 | 143.8 | 245.4 | 348.8 |
| Adjusted EBTIDA Margin % | 10.1% | 10.5% | 13.9% | 12.5% |
| Adjusted Net Income2 | 23.2 | 44.1 | 123.0 | 146.2 |
| Adjusted earnings (losses) per share - ADS basic | 0.1263 | 0.2417 | 0.6688 | 0.7951 |
| Net income (loss) attributable to Embraer Shareholders | 42.5 | (99.3) | 59.1 | 101.6 |
| Earnings (losses) per share - ADS basic (US$) | 0.2312 | (0.5448) | 0.3214 | 0.1382 |
| Net debt | (805.8) | (613.3) | (661.5) | (661.5) |
| (1) Derived from unaudited financial information. |
1 EBIT and EBITDA are non-GAAP measures. For more detailed information please refer to page 10.
2 Adjusted Net Income is a non-GAAP measure, calculated by adding Net Income attributable to Embraer Shareholders plus Deferred income tax and social contribution for the period, in addition to adjusting for non-recurring items. Under IFRS for Embraer’s Income Tax benefits (expenses) the Company is required to record taxes resulting from unrealized gains or losses due to the impact of changes in theReal to US Dollar exchange rate over non-monetary assets (primarily Inventory, Intangibles, and PP&E). The taxes resulting from gains or losses over non-monetary assets are considered deferred taxes and are accounted for in the consolidated Cash Flow statement, under Deferred income tax and social contribution, which was US$ (56.5) million in 2Q16, US$ (24.3) million in 1Q17 and US$ 68.9 million in 2Q17. Adjusted Net Income also excludes the after-tax non-recurring items of US$ 200.0 million in 2Q16, US$ 5.0 million in 1Q17, and US$ (5.0) million in 2Q17.

1

São Paulo, Brazil, July 28, 2017- (BM&FBOVESPA: EMBR3, NYSE: ERJ).The Company's operating and financial information is presented, except where otherwise stated, on a consolidated basis in United States dollars (US$) in accordance with IFRS. The financial data presented in this document as of and for the quarters ended June 30, 2016 (2Q16), March 31, 2017 (1Q17) and June 30, 2017 (2Q17), are derived from the unaudited financial statements, except annual financial data and where otherwise stated.
REVENUES and gross margin
The Company’s 2Q17 revenues increased 29.5% to US$ 1,769.6 million, compared to US$ 1,366.4 million in 2Q16, driven by a combination of higher deliveries in the Commercial Aviation segment, a more favorable mix of deliveries in the Executive Jets segment, the launch of the Brazilian Strategic Geostationary Defense & Communications (SGDC) satellite, and growth in services revenues during the quarter. In 2Q17, the Company delivered 35 commercial and 24 executive jets (16 light jets and 8 large jets), for a total of 59 aircraft delivered during the quarter. This compares to deliveries of 52 aircraft in 2Q16, consisting of 26 commercial jets and 26 executive jets (23 light and 3 large). The increase in commercial jet deliveries led to a year-over-year revenue growth of 27.0% in Commercial Aviation, and in Executive Jets, the higher percentage of large jet deliveries (33% in 2Q17 vs. 12% in 2Q16) and growth in services resulted in a 16.0% increase in revenues as compared to last year’s second quarter. The Defense & Security segment’s revenues grew 59.7% in the quarter principally due to the launch of the SGDC satellite in the first week of May.
In the first half of 2017, Embraer’s revenues increased 4.5% to US$ 2,795.9 million, with growth in the Commercial Aviation and Defense & Security segments partially offset by a revenue decline in the Executive Jets segment. During the first six months of 2017, the Company delivered 53 commercial and 39 executive jets (27 light jets and 12 large jets), compared to the same period of 2016 in which Embraer delivered 47 commercial and 49 executive jets (35 light and 14 large). The Company remains confident in its 2017 guidance for 97 to 102 commercial jet deliveries and 105 to 125 total executive jet deliveries (70-80 light jets and 35-45 large jets).
Consolidated gross margin declined from 20.8% in 2Q16 to 17.9% in 2Q17 driven mainly by declines in the Executive Jets and Defense & Security segments. For the first six months of 2017, consolidated gross margin was 16.9%, compared to gross margin of 20.4% in the first six months of 2016.
EBIT
For 2Q17, EBIT and EBIT margin were US$ 174.0 million and 9.8%, respectively, an increase when compared to US$ (127.4) million in EBIT and -9.3% in EBIT margin reported in 2Q16. The Company’s results include non-recurring items in the second quarters of 2016 and 2017. In 2Q17, the reported EBIT includes benefits of US$ 11.7 million related to the conversion of claims from the Republic Airways bankruptcy and US$ 1.2 million of reversals related to the Company’s voluntary dismissal program, as well as the negative impact of US$ 3.5 million related to taxes on remittances executed for payments following the finalization of the FCPA investigation. In 2Q16 results, EBIT included the US$ 200 million loss contingency charge related to the FCPA investigation. Excluding these non-recurring items, Adjusted EBIT and Adjusted EBIT margin in 2Q17 were US$ 164.6 million and 9.3%, respectively, and in 2Q16 were US$ 72.6 million and 5.3%, respectively. The year-over-year increase in revenues and its impact on fixed cost dilution, combined with the Company’s cost reduction program, were the main drivers in the improvement in Adjusted EBIT and Adjusted EBIT margin in the quarter.
In the first six months of 2017, EBIT and EBIT margin were US$ 197.4 million and 7.1%, respectively, compared to EBIT of US$ (41.7) million and EBIT margin of -1.6% in the first six months of 2016. Adjusted EBIT and Adjusted EBIT margin in the first half of 2017 were US$ 195.6 million and 7.0%, respectively, compared to Adjusted EBIT of US$ 158.3 million and Adjusted EBIT margin of 5.9% in the first half of 2016.
Total operating expenses in 2Q17 were US$ 143.1 million, which declined from the US$ 411.1 million reported in 2Q16, with the principal difference due to the US$ 200 million loss contingency related to the FCPA investigation recognized in 2Q16. Excluding non-recurring items, adjusted total operating expenses in2Q17 were US$ 133.7 million and in 2Q16 adjusted total operating expenses were US$ 211.1 million, demonstrating the Company’s commitment to its program to reduce recurring operating expenses.
2
Administrative expenses declined from US$ 48.2 million in 2Q16 to US$ 39.7 million in 2Q17, and in the first six months fell from US$ 87.2 million in the first half of 2016 to US$ 82.3 million. Selling expenses of US$ 84.9 million in 2Q17 represented a decline from the US$ 99.0 million reported in 2Q16, while in the first six months of 2017 were US$ 155.8 million, compared to US$ 200.5 million in the first six months of 2016. Research expenses were slightly down in 2Q17 to US$ 9.3 million versus US$ 10.3 million in 2Q16. For the first half of 2017, research expenses were up slightly to US$ 17.5 million, from the US$ 16.9 million reported in the first half of 2016. Other operating income (expense), net in 2Q17 was an expense of US$ 9.2 million, an improvement from the US$ 253.6 million in expense realized in 2Q16. Excluding the aforementioned non-recurring items, adjusted other operating income (expense), net in 2Q17 was expense of US$ 18.6 million compared to an expense of US$ 53.6 million in 2Q16, with the improvement due largely to lower impairments on the Company’s used aircraft portfolio and lower spending on the corporate level. In the first half of 2017, other operating income (expense) was US$ 18.5 million (US$ 20.3 million excluding non-recurring items), and in the first half of 2016, other operating income (expense), net was US$ 282.1 million (US$ 82.1 million excluding non-recurring items).
net income
Net income (loss) attributable to Embraer shareholders and earnings (losses) per ADS for 2Q17 were US$ 59.1 million and US$ 0.32 per basic share, respectively. This compares to net income (loss) attributable to Embraer shareholders and earnings (losses) per ADS in 2Q16 of US$ (99.3) million and US$ (0.54) per basic share, respectively. In the first six months of 2017, net income (loss) attributable to Embraer shareholders was US$ 101.6 million, compared to net income of US$ 4.5 million in the first six months of 2016. Earnings (loss) per basic ADS in the first half of 2017 was US$ 0.14 versus the US$ 0.02 per share reported in the first half of 2016.
Adjusted net income (loss), excluding deferred income tax and social contribution as well as the impact of the aforementioned non-recurring items, was US$ 123.0 million in 2Q17 as compared to US$ 44.1 million in 2Q16. Adjusted earnings per ADS excluding deferred income tax and social contribution and non-recurring items was US$ 0.67 per basic share in 2Q17, compared to an adjusted earnings per ADS of US$ 0.24 in 2Q16. In the first six months of 2017, adjusted net income attributable to Embraer shareholders was US$ 146.2 million, compared to adjusted net income of US$ 42.4 million in the first six months of 2016. Adjusted earnings per ADS in the first half of 2017 was US$ 0.80 per basic share versus the US$ 0.23 per share reported in the first half of 2016.
monetary balance sheet accounts and other measures
The Company ended 2Q17 with a net debt position of US$ 661.5 million, compared to the net debt position of US$ 805.8 million as of the end of 1Q17, principally due to the positive Free cash flow generation in the quarter. Embraer’s total loans position at the end of the quarter was US$ 4,212.0 million, a decrease of US$ 75.8 million compared to the Company’s loan position at the end of 1Q17.
3
| | | |
| in millions of U.S.dollars |
| FINANCIAL POSITION DATA | (1) | (1) | (1) |
| 1Q17 | 2Q16 | 2Q17 |
| Cash and cash equivalents | 1,030.9 | 1,223.2 | 1,207.4 |
| Financial investments | 2,451.1 | 1,832.8 | 2,343.1 |
| Total cash position | 3,482.0 | 3,056.0 | 3,550.5 |
| Loans short-term | 322.9 | 466.3 | 304.2 |
| Loans long-term | 3,964.9 | 3,203.0 | 3,907.8 |
| Total loans position | 4,287.8 | 3,669.3 | 4,212.0 |
| Net debt* | (805.8) | (613.3) | (661.5) |
| * Net debt = Cash and cash equivalents + Financial investments short-term and long term -Loans short-term and long-term |
|
| (1) Derived from unaudited financial information. |
Adjusted net cash generated by operating activities net of adjustments for financial investments (and excluding cash payments for non-recurring items) was US$ 397.7 million in 2Q17 and adjusted Free cash flow for the quarter was US$ 220.0 million. This compares to Adjusted net cash used by operating activities net of adjustments for financial investments of negative US$ 183.2 million and Free cash flow of negative US$ 422.2 million in 2Q16. In the first six months of 2017, adjusted Free cash flow was positive US$ 20.7 million, compared to adjusted Free cash flow of negative US$ 623.7 million in the first six months of 2016.
| | | | | | |
| in millions of U.S.dollars |
| IFRS | 2Q16 | 3Q16 | 4Q16 | 1Q17 | 2Q17 | YTD17 |
| Net cash generated (used) by operating activities (1) | (183.2) | 235.3 | 249.3 | (64.9) | 361.6 | 296.6 |
| Adjustment for non-recurring cash impacts | - | - | 248.2 | 17.2 | 36.1 | 53.3 |
| Adj. Net cash generated (used) by operating activities | (183.2) | 235.3 | 497.5 | (47.7) | 397.7 | 350.0 |
| |
| Net additions to property, plant and equipment | (112.3) | (125.9) | (75.3) | (34.5) | (60.5) | (95.0) |
| Additions to intangible assets | (126.7) | (129.9) | (137.2) | (117.1) | (117.2) | (234.3) |
| Adjusted Free Cash Flow | (422.2) | (20.5) | 285.0 | (199.3) | 220.0 | 20.7 |
| (1) Net of financial investments: 2Q16 178.2, 3Q16 (66.4), 4Q16 50.2, 1Q17 503.6, 2Q17 (96.2) |
Net additions to total PP&E were US$ 60.5 million in 2Q17, including values related to spare parts pool programs, aircraft under lease or available for lease, CAPEX and proceeds from sale of PP&E. Of the total 2Q17 additions to PP&E, CAPEX amounted to US$ 45.5 million, additions of aircraft available for lease was US$ 4.8 million, additions of pool program spare parts totaled US$ 11.4 million, and proceeds from sale of PP&E was an inflow of US$ 1.2 million. A portion of the reported CAPEX includes investments related to certain contracted capital expenditures in the Defense & Security segment. These expenditures are included in the terms and conditions of their respective contracts and were not considered in the Company’s CAPEX Outlook of US$ 200 million for 2017. This contracted CAPEX totaled US$ 0.5 million in 2Q17. Excluding these expenditures, CAPEX for 2Q17 was US$ 45.0 million, and for the first half of 2017 was US$ 78.0 million. Embraer’s CAPEX outlook for the year continues to be US$ 200 million.
In 2Q17, Embraer invested a total of US$ 117.2 million in product development, related to the development of the E-Jets E2 commercial jet program, which continues to progress according to schedule. During the quarter, the Company did not receive contributions from risk-sharing partners; therefore net development was also US$ 117.2 million in the period. During the first half of the year, Embraer invested US$ 234.3 million in product development and received US$ 86.0 million in contributions from suppliers, yielding development expenditures net of contributions from suppliers of US$ 148.3 million. The Company expects 2017 net development to finish in line with its US$ 400 million Outlook for the year.
4
| | | | | | |
| in millions of U.S.dollars |
| | 2Q16 | 3Q16 | 4Q16 | 1Q17 | 2Q17 | YTD17 |
| CAPEX | 61.5 | 73.6 | 60.7 | 35.4 | 45.5 | 80.9 |
Contracted CAPEX (Included in CAPEX) | 5.8 | 12.5 | 9.8 | 2.4 | 0.5 | 2.9 |
| Additions of aircraft available for or under lease | 31.7 | 27.8 | 9.5 | 4.8 | 4.8 | 9.6 |
| Additions of Pool programs spare parts | 19.2 | 24.5 | 7.9 | 12.3 | 11.4 | 23.7 |
| PP&E | 112.4 | 125.9 | 78.1 | 52.5 | 61.7 | 114.2 |
| Proceeds from sale of PP&E | (0.1) | - | (2.8) | (18.0) | (1.2) | (19.2) |
| Net Additions to PP&E | 112.3 | 125.9 | 75.3 | 34.5 | 60.5 | 95.0 |
| |
| in millions of U.S.dollars |
| | 2Q16 | 3Q16 | 4Q16 | 1Q17 | 2Q17 | YTD17 |
| Additions to intangible | 126.7 | 129.9 | 137.2 | 117.1 | 117.2 | 234.3 |
| Contributions from suppliers | - | (25.0) | - | (86.0) | - | (86.0) |
| Development (Net of contributions from suppliers) | 126.7 | 104.9 | 137.2 | 31.1 | 117.2 | 148.3 |
| Research | 10.3 | 11.9 | 18.8 | 8.2 | 9.3 | 17.5 |
| R&D | 137.0 | 116.8 | 156.0 | 39.3 | 126.5 | 165.8 |
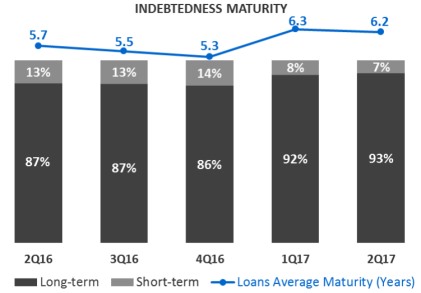
| The Company’s total debt declined US$ 75.8 million to US$ 4,212.0 million in 2Q17 compared to US$ 4,287.8 million in 1Q17. Short-term debt at the end of 2Q17 was US$ 304.2 million and long-term debt was US$ 3,907.8 million. The average loan maturity of the Company’s debt at the end of 2Q17 decreased to 6.2 years from the 6.3 years reported at the end of 1Q17. The cost of Dollar denominated loans at the end of 2Q17 was 5.13% p.a., stable compared to the end of 1Q17. The cost ofReal denominated loans decreased from 4.51% at the end of 1Q17 to 4.45% p.a. at the end of 2Q17. The Company’s EBITDA over the last 12 months (EBITDA LTM) to financial expenses (gross) for 2Q17 improved to 3.46 relative to 1Q17’s value of 2.12. At the end of 2Q17, 18% of total debt was denominated inReais, vs. 19% at the end of 1Q17. |
Embraer’s cash allocation management strategy continues to be an important tool to mitigate exchange rate risks. By balancing cash allocation inRealand Dollardenominated assets, the Company attempts to neutralize its balance sheet exchange rate exposure. Of total cash at the end of 2Q17, 73% was denominated in US Dollars. Complementing its strategy to mitigate exchange rate risks, the Company entered into certain financial hedges in order to reduce its 2017 cash flow exposure. The Company’s cash flow exposure is due to the fact that approximately 10% of its net revenues are denominated inReais while approximately 20% of total costs are denominated inReais. Having moreRealdenominated costs than revenues generates this cash flow exposure. For 2017, around 45% of the Company’sReal cash flow exposure is hedged if the US Dollar depreciates below an average rate floor of R$ 3.40. For exchange rates above this level, the Company will benefit up to an average exchange rate cap of R$ 3.76. Embraer has already constructed more than 80% of its zero cost collar hedges for 2018, with an average floor of R$ 3.32 and an average cap of R$ 3.75. | 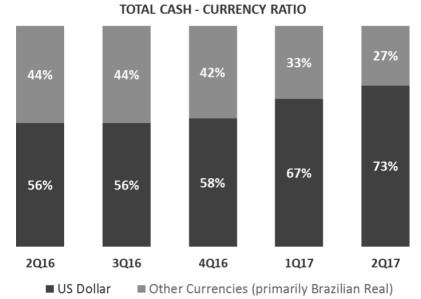
|
5
operational balance sheet accounts
| | | |
| in millions of U.S.dollars |
| FINANCIAL POSITION DATA | (1) | (1) | (1) |
| 1Q17 | 2Q16 | 2Q17 |
| Trade accounts receivable | 678.7 | 824.1 | 752.9 |
| Customer and commercial financing | 37.2 | 41.0 | 33.2 |
| Inventories | 2,658.2 | 2,719.6 | 2,460.9 |
| Property, plant and equipment | 2,183.7 | 2,081.1 | 2,158.9 |
| Intangible | 1,678.2 | 1,498.2 | 1,770.5 |
| Trade accounts payable | 894.8 | 1,068.2 | 923.9 |
| Advances from customers | 841.6 | 956.1 | 848.6 |
| Total shareholders' equity | 3,996.5 | 3,818.8 | 4,054.1 |
| (1) Derived from unaudited financial information. |
During the second quarter, lower working capital positively impacted the Company’s adjusted operating cash flow generation. Inventories ended 2Q17 at US$ 2,460.9 million, a US$ 197.3 million reduction from the US$ 2,658.2 reported at the end of 1Q17, as a result of higher deliveries in the quarter (with 59 total jet deliveries) as well as a reduction in the number of pre-owned commercial and executive jets during the period. A US$ 29.1 million increase in accounts payable to end 2Q17 at US$ 923.9 million and a US$ 7.0 million increase in advances from customers also helped the reduction in net working capital in 2Q17. Accounts receivable offset a portion of this improvement, as the Company’s receivables increased US$ 74.2 million to end 2Q17 at US$ 752.9 million, though this value is lower than the US$ 824.1 million in accounts receivable at the end of 2Q16. Property, plant and equipment ended the quarter US$ 24.8 million lower at US$ 2,158.9 million, and intangible assets increased US$ 92.3 million to end 2Q17 at US$ 1,770.5 million.
Total Backlog
Considering all deliveries as well as firm orders obtained during the period, the Company’s total firm order backlog decreased US$ 0.7 billion during 2Q17 to end the quarter at US$ 18.5 billion.
6
segment Results
The Commercial Aviation segment represented 61.5% of consolidated revenues in 2Q17, as compared to the 62.8% reported in 2Q16, despite year-over-year revenue growth of 27.0%. The portion of Executive Jets revenues decreased from 21.4% in 2Q16 to 19.2% in 2Q17, despite 16.0% year-over-year increase in revenues on improved delivery mix (large jets were 33% of total deliveries in 2Q17 versus 12% in 2Q16) and double digit growth in the segment’s services revenues in the quarter. The share of Defense & Security revenues increased from 15.3% in 2Q16 to 18.9% in 2Q17, as revenues finished with a year-over-year increase of 59.7% in 2Q17. Other segment revenues as a percentage of total 2Q17 revenues were 0.4% versus 0.5% in the prior year period.
| | | | | | | | |
| in millions of U.S.dollars |
| NET REVENUES | (1) | | (1) | | (1) | | (1) | |
| BY SEGMENT | 1Q17 | % | 2Q16 | % | 2Q17 | % | YTD17 | % |
| Commercial Aviation | 636.4 | 62.0 | 857.2 | 62.8 | 1,088.5 | 61.5 | 1,724.9 | 61.7 |
| Executive Jets | 226.0 | 22.0 | 292.7 | 21.4 | 339.5 | 19.2 | 565.5 | 20.2 |
| Defense & Security | 155.7 | 15.2 | 209.5 | 15.3 | 334.6 | 18.9 | 490.3 | 17.5 |
| Others | 8.2 | 0.8 | 7.0 | 0.5 | 6.9 | 0.4 | 15.1 | 0.6 |
| Total | 1,026.3 | 100.0 | 1,366.4 | 100.0 | 1,769.6 | 100.0 | 2,795.9 | 100.0 |
| (1) Derived from unaudited financial information. |
Commercial Aviation
In 2Q17 Embraer delivered 35 commercial jets, rising 35% compared to the previous year, as detailed below:
| | | | |
| DELIVERIES | 1Q17 | 2Q16 | 2Q17 | YTD17 |
| Commercial Aviation | 18 | 26 | 35 | 53 |
| EMBRAER 170 | - | - | - | - |
| EMBRAER 175 | 16 | 21 | 31 | 47 |
| EMBRAER 190 | - | 4 | 2 | 2 |
| EMBRAER 195 | 2 | 1 | 2 | 4 |
In April, Embraer celebrated the longevity of its ERJ Program, reaching 20 years of commercial operation of the 50-seat ERJ 145 jet, receiving 30 operators of the jet family for the two-day Embraer Operators Conference in Rio de Janeiro, Brazil. Across the years, Embraer achieved the impressive mark of more than 900 deliveries of this family of jets in the commercial aviation segment.
During the quarter, Embraer announced total firm orders for 22 E-Jets, including 12 current generation E-Jets from five customers, as well as firm orders for 10 E-Jet E2s from an undisclosed customer. The total value of these orders surpasses US$ 1 billion at current list prices.
The E-Jets customer base has been continuously expanding also through leasing and purchase of used aircraft. During the second quarter of 2017, S7 Airlines placed its 1st of 17 E170s into service, followed by Georgian Airways with E190s. South Africa’s Airlink also took delivery of its 1st E190s, of which it will receive a total of 10 aircraft plus three E170s.
Existing E-Jet customers such as Aeroméxico Connect and Sky Regional have also grown their E190 and E175 fleets in recent months, with the former still awaiting deliveries of more aircraft in 2H2017.
Regarding the next generation E-Jets Program, the E2, 2Q17 was marked by continued progression of the flight test campaign with five prototypes (4 E190-E2 and 1 E195-E2), reaching more than 1,000 flight-test hours and almost 3,000 ground-test hours.
7
The E190-E2 has already accomplished 55% of its test campaign. Also, the wing bending test was successfully completed in May. The E195-E2 had its range increased from 2,450nm to 2,600nm, revealing an even better performance than initially expected.
In the segment of commercial jets with 70 to 130 seats, Embraer maintains its leadership with more than 50% of the sales and 60% of the deliveries in the world market.
At the end of 2Q17, the order book (backlog) and cumulative deliveries for Commercial Aviation were as follows:
| | | | | |
| COMMERCIAL AVIATION | | | | | |
| BACKLOG | Firm Orders | Options | Total | Deliveries | Firm Backlog |
| E170 | 191 | 5 | 196 | 190 | 1 |
| E175 | 533 | 184 | 717 | 468 | 65 |
| E190 | 593 | 55 | 648 | 536 | 57 |
| E195 | 167 | 1 | 168 | 158 | 9 |
| E175-E2 | 100 | 100 | 200 | - | 100 |
| E190-E2 | 83 | 107 | 190 | - | 83 |
| E195-E2 | 102 | 90 | 192 | - | 102 |
| TOTAL E-JETS | 1,769 | 542 | 2,311 | 1,352 | 417 |
Executive JETS
The Executive Jets segment delivered 16 light and 8 large jets, totaling 24 aircraft in 2Q17, compared to 26 deliveries in 2Q16.
| | | | |
| DELIVERIES | 1Q17 | 2Q16 | 2Q17 | YTD17 |
| Executive Aviation | 15 | 26 | 24 | 39 |
| Light Jets | 11 | 23 | 16 | 27 |
| Large Jets | 4 | 3 | 8 | 12 |
During the second quarter of 2017, Embraer sold three Legacy 650Es to Germany’s Air Hamburg, which became the launch customer for this aircraft, and delivered the first Phenom 100 EV to markets such as Brazil and Mexico.
Also during the second quarter, two important milestones took place. Embraer delivered its 1,100th business jet, a Phenom 300 for NetJets, and the European Aviation Safety Agency (EASA) granted type certification for the Phenom 100 EV.
In May, Embraer showcased the newest Lineage 1000E interior at EBACE and announced Surf Air’s selection of the Phenom 300 as the launch platform for its operations in Europe. In June, the Legacy 450 made its first appearance at the Paris Air Show.
Embraer continues to strengthen its global support network, with the appointment of JF services as an authorized Legacy 450/500 Service Center in Russia. The Company also announced during the second quarter that Embraer Executive Jet Services at Paris Le Bourget was approved by the FAA as a Part 145 repair station, allowing all Embraer business jets registered in the U.S. to be serviced at this facility.
Defense & security
In April, during the LAAD Defence & Security fair held in Rio de Janeiro, Savis and Bradar, affiliated companies of Embraer Defense & Security, announced a cooperation agreement with Rockwell Collins to jointly evaluate business opportunities in defense applications. During the Paris Air Show in June, Savis and Bradar also announced an agreement with Thales to jointly evaluate business opportunities for civil andmilitary air traffic control systems. These initiatives will enhance the activities of Savis and Bradar in the global market, searching for existing complementary capabilities in the companies’ product lines.
8
In May, the Brazilian Geostationary Defense and Strategic Communications Satellite (SGDC) was successfully launched at the Guyana Space Center in Kourou, French Guiana. Visiona Tecnología Espacial was responsible for the integration of the SGDC Program which will provide coverage of Internet services throughout the Brazilian territory, as well as provide secure and sovereign means for the strategic communications of the Brazilian government.
In the same month, Embraer, together with its North American partner Sierra Nevada Corporation, was invited to participate in the U.S. Air Force’s (USAF) Capability Assessment of Light Attack Platforms with the A-29 Super Tucano. The assessment for the OA-X program is set to begin in July at Holloman Air Force Base in New Mexico. The OA-X experiment is part of the USAF’s effort to explore the benefits of acquiring a new, low-cost, non-developmental light attack aircraft to provide close air support and other missions in permissive and semi-permissive environments, reduce fighter pilot training costs, and accelerate pilot seasoning.
Regarding the KC-390 program, the development and certification program advanced as planned with the two prototypes exceeding the 1,000-hour mark. The aircraft was also exhibited at major aeronautical events such as the Paris Airshow, at which the aircraft was present with daily demonstration flights, and LAAD in Rio de Janeiro. After the Paris Air Show, the KC-390 started a roadshow for various Air Forces in countries in Europe, Asia-Pacific, Africa and the Middle East.
In June, Saab's next generation Gripen E made its first flight at Saab´s facilities in Linköping, Sweden, reaching a milestone for the aircraft on its way to achieve the 2019 deliveries schedule to both the Swedish and Brazilian Air Forces. Dozens of Embraer engineers remain dedicated, both in Brazil and Sweden, to the training and development activities of the Gripen NG program together with Swedish engineers.
Atech, Embraer´s C4ISR and integrated systems company, continued to implement the program to modernize Brazilian air traffic control systems (SAGITARIO), presented its new smart cities governance solution (Arkhe Governance), and signed contracts for software integration for activities with the Brazilian Navy.
Atech implemented the SAGITARIO (Advanced Air Traffic Information Management System and Reports of Operational Interest) system in the Vitória Approach Control Center. At the Smart City Business America 2017 Congress, the largest event for Smart Cities in Latin America held in the city of Curitiba, Atech presented the Arkhe Governance solution, a set of systems that enable integration and collaboration based on Command and Control systems focused on Governance. Also in 2Q17, Atech signed an addendum related to the H-XBR TDMS program, which will extend the support of software integration activities from the embedded mission system of the naval employment helicopter.
class action UPDATE
In August, 2016, a putative securities class action was filed in a U.S. court against the Company and certain of its former and current executives, asserting claims in connection with allegedly false and misleading statements and omissions concerning the FCPA investigation and related matters. In October 2016, a federal Court in New York appointed a lead plaintiff and a leading counsel for the putative class action. In December 2016, lead plaintiff filed an amended complaint. In June 2017, the Company and the other defendants filed a motion to dismiss all claims asserted in the amended complaint. The Company has no adequate base to estimate provisions related to this matter.
9
��
Reconciliation OF IFRS and “non gaap” information
| | | |
| in millions of U.S.dollars |
| EBITDA RECONCILIATION | (1) | (1) | (1) |
| LTM* (IFRS) | 1Q17 | 2Q16 | 2Q17 |
| Net Income Attributable to Embraer | 104.6 | 6.1 | 263.1 |
| Noncontrolling interest | 1.5 | 7.0 | 14.0 |
| Income tax income | 4.6 | 68.0 | 106.5 |
| Financial income, net | 55.7 | 3.8 | 72.1 |
| Foreign exchange gain (loss), net | (22.8) | 23.1 | (10.7) |
| Depreciation and amortization | 328.7 | 296.6 | 338.3 |
| EBITDA LTM | 472.3 | 404.6 | 783.3 |
| (1) Derived from unaudited financial information. |
| * Last Twelve Months |
We define Free cash flow as operating cash flow less Additions to property, plant and equipment, Additions to intangible assets, Financial investments and Other assets. Free cash flow is not an accounting measure under IFRS. Free cash flow is presented because it is used internally as a measure for evaluating certain aspects of our business. The Company also believes that some investors find it to be a useful tool for measuring Embraer's cash position. Free cash flow should not be considered as a measure of the Company's liquidity or as a measure of its cash flow as reported under IFRS. In addition, Free cash flow should not be interpreted as a measure of residual cash flow available to the Company for discretionary expenditures, since the Company may have mandatory debt service requirements or other nondiscretionary expenditures that are not deducted from this measure. Other companies in the industry may calculate Free cash flow differently from Embraer for purposes of their earnings releases, thus limiting its usefulness for comparing Embraer to other companies in the industry.
EBITDA LTM represents earnings before interest, taxation, depreciation and amortization accumulated over a period of the last 12 months. It is not a financial measure of the Company’s financial performance under IFRS. EBIT as mentioned in this press release refers to earnings before interest and taxes, and for purposes of reporting is the same as that reported on the Income Statement as Operating Profit before Financial Income.
| | | | |
| in millions of U.S.dollars |
| EBITDA RECONCILIATION | (1) | (1) | (1) | (1) |
| 1Q17 | 2Q16 | 2Q17 | YTD17 |
| Net Income (loss) Attributable to Embraer | 42.5 | (99.4) | 59.1 | 101.6 |
| Noncontrolling interest | 1.9 | (2.1) | 10.4 | 12.3 |
| Income tax (expense) income | (18.8) | (16.0) | 85.9 | 67.1 |
| Financial income (expense), net | 4.7 | (4.9) | 11.5 | 16.2 |
| Foreign exchange gain (loss), net | (6.9) | (5.0) | 7.1 | 0.2 |
| Depreciation and amortization | 72.4 | 71.2 | 80.8 | 153.2 |
| EBITDA | 95.8 | (56.2) | 254.8 | 350.6 |
| EBITDA Margin | 9.3% | -4.1% | 14.4% | 12.5% |
| (1) Derived from unaudited financial information. |
EBIT and EBITDA are presented because they are used internally as measures to evaluate certain aspects of the business. The Company also believes that some investors find them to be useful tools for measuring a Company’s financial performance. EBIT and EBITDA should not be considered as alternatives to, in isolation from, or as substitutes for, analysis of the Company’s financial condition or results of operations, as reported under IFRS. Other companies in the industry may calculate EBIT and EBITDA differently from Embraer for the purposes of their earnings releases, limiting EBIT and EBITDA’s usefulness as comparative measures.
| | | | |
| in millions of U.S.dollars |
| ADJUSTED EBIT RECONCILIATION | (1) | (1) | (1) | (1) |
| 1Q17 | 2Q16 | 2Q17 | YTD17 |
| Operating profit (loss) before financial income (EBIT) | 23.4 | (127.4) | 174.0 | 197.4 |
| Provision for voluntary redundancy scheme | 7.6 | - | (1.2) | 6.4 |
| Impact of Penalty Provision | - | 200.0 | 3.5 | 3.5 |
| Republic shares remeasurement (converted from claims) | - | - | (11.7) | (11.7) |
| Adjusted EBIT | 31.0 | 72.6 | 164.6 | 195.6 |
| Adjusted EBIT Margin % | 3.0% | 5.3% | 9.3% | 7.0% |
| (1) Derived from unaudited financial information. |
10
| | | | |
| in millions of U.S.dollars |
| ADJUSTED EBITDA RECONCILIATION | (1) | (1) | (1) | (1) |
| 1Q17 | 2Q16 | 2Q17 | YTD17 |
| EBITDA | 95.8 | (56.2) | 254.8 | 350.6 |
| Provision for voluntary redundancy scheme | 7.6 | - | (1.2) | 6.4 |
| Impact of Penalty Provision | - | 200.0 | 3.5 | 3.5 |
| Republic shares remeasurement (converted from claims) | - | - | (11.7) | (11.7) |
| Adjusted EBITDA | 103.4 | 143.8 | 245.4 | 348.8 |
| Adjusted EBITDA Margin % | 10.1% | 10.5% | 13.9% | 12.5% |
| (1) Derived from unaudited financial information. |
Adjusted EBIT and Adjusted EBITDA are non-GAAP measures, and both exclude the impact of several non-recurring items, as described in the tables above.
| | | | |
| in millions of U.S.dollars |
| ADJUSTED NET INCOME (LOSS) RECONCILIATION | (1) | (1) | (1) | (1) |
| 1Q17 | 2Q16 | 2Q17 | YTD17 |
| Net Income Attributable to Embraer | 42.5 | (99.4) | 59.1 | 101.6 |
| Net change in Deferred income tax & social contribution | (24.3) | (56.5) | 68.9 | 44.6 |
| After-tax provision for voluntary redundancy scheme | 5.0 | - | (0.8) | 4.2 |
| Impact of Penalty Provision | - | 200.0 | 3.5 | 3.5 |
| After-tax Republic shares remeasurement (converted from claims) | - | - | (7.7) | (7.7) |
| Adjusted Net Income | 23.2 | 44.1 | 123.0 | 146.2 |
| Adjusted Net Margin | 2.3% | 3.2% | 6.9% | 5.2% |
| (1) Derived from unaudited financial information. |
Adjusted Net Income is a non-GAAP measure, calculated by adding Net Income attributable to Embraer Shareholders plus Deferred Income tax and social contribution for the period, as well as removing the impact of non-recurring items. Furthermore, under IFRS for purposes of calculating Embraer’s Income Tax benefits (expenses), the Company is required to record taxes resulting from gains or losses due to the impact of the changes in the Real to the US Dollar exchange rate over non-monetary assets (primarily Inventories, Intangibles, and PP&E). It is important to note that taxes resulting from gains or losses over non-monetary assets are considered deferred taxes and are accounted for in the Company’s consolidated Cash Flow statement, under Deferred income tax and social contribution.
Some Financial Ratios based on “non GAAP” information
| | | |
| CERTAIN FINANCIAL RATIOS - IFRS | (1) | (1) | (1) |
| 1Q17 | 2Q16 | 2Q17 |
| Total debt to EBITDA (i) | 9.08 | 9.07 | 5.38 |
| Net debt to EBITDA (ii) | 1.71 | 1.52 | 0.84 |
| Total debt to capitalization (iii) | 0.52 | 0.49 | 0.51 |
| LTM EBITDA to financial expense (gross) (iv) | 2.12 | 2.10 | 3.46 |
| LTM EBITDA (v) | 472.3 | 404.6 | 783.3 |
| LTM Interest and commissions on loans (vi) | 222.6 | 210.1 | 226.2 |
| (1) Derived from unaudited financial information. |
(i) Total debt represents short and long-term loans and financing.
(ii) Net debt represents cash and cash equivalents, plus financial investments, minus short and long-term loans and financing.
(iii) Total capitalization represents short and long-term loans and financing, plus shareholders equity.
(iv) Financial expense (gross) includes only interest and commissions on loans.
(v) The table at the end of this release sets forth the reconciliation of Net income to adjusted EBITDA, calculated on the basis of financial information prepared with IFRS data, for the indicated periods.
(vi) Interest expense (gross) includes only interest and commissions on loans, which are included in Interest income (expense), net presented in the Company’s consolidated Income Statement.
11
FINANCial statements
| | | | |
| EMBRAER S.A. |
| CONSOLIDATED STATEMENTS OF INCOME |
| (in millions of U.S.dollars, except earnings per share) |
| | (1) | (1) |
| | Three months ended on | Six months ended on |
| | 30 Jun, 2016 | 30 Jun, 2017 | 30 Jun, 2016 | 30 Jun, 2017 |
| Revenue | 1,366.4 | 1,769.6 | 2,675.4 | 2,795.9 |
| Cost of sales and services | (1,082.7) | (1,452.5) | (2,130.3) | (2,324.3) |
| |
| Gross profit | 283.7 | 317.1 | 545.1 | 471.6 |
| Operating Income (Expense) | | | | |
| Administrative | (48.2) | (39.7) | (87.2) | (82.3) |
| Selling | (99.0) | (84.9) | (200.5) | (155.8) |
| Research | (10.3) | (9.3) | (16.9) | (17.5) |
| Other operating income (expense), net | (253.6) | (9.2) | (282.1) | (18.5) |
| Equity in gain or losses of associates | - | - | (0.1) | (0.1) |
| |
| Operating profit (loss) before financial income | (127.4) | 174.0 | (41.7) | 197.4 |
| Financial expenses, net | 4.8 | (11.5) | 4.5 | (16.2) |
| Foreign exchange gain (loss), net | 5.1 | (7.1) | (6.4) | (0.2) |
| |
| Profit (loss) before taxes on income | (117.5) | 155.4 | (43.6) | 181.0 |
| Income tax (expense) income | 16.0 | (85.9) | 48.1 | (67.1) |
| |
| Net Income (loss) | (101.5) | 69.5 | 4.5 | 113.9 |
| Attributable to: | | | | |
Owners of Embraer | (99.3) | 59.1 | 4.5 | 101.6 |
Noncontrolling interest | (2.2) | 10.4 | - | 12.3 |
| |
| Weighted average number of shares (in thousands) | | | | |
| Basic | 729.8 | 735.4 | 729.8 | 735.4 |
| Diluted | 731.6 | 735.9 | 732.3 | 736.0 |
| |
| Earnings per share | | | | |
| Basic | (0.1361) | 0.0804 | 0.0062 | 0.1382 |
| Diluted | (0.1358) | 0.0803 | 0.0061 | 0.1380 |
| |
| Earnings per share - ADS basic (US$) | (0.5448) | 0.3214 | 0.0247 | 0.5526 |
| Earnings per share - ADS diluted (US$) | (0.5435) | 0.3212 | 0.0246 | 0.5521 |
| (1) Derived from unaudited financial statements. |
12
| | | | |
| EMBRAER S.A. |
| CONSOLIDATED STATEMENTS OF CASH FLOWS |
| (in millions of U.S.dollars) |
| | (1) | (1) |
| | Three Months Ended | Six Months Ended |
| | 30 Jun, 2016 | 30 Jun, 2017 | 30 Jun, 2016 | 30 Jun, 2017 |
| Operating activities | | | | |
| Net income | (101.5) | 69.5 | 4.5 | 113.9 |
| Items not affecting cash and cash equivalents | | | | |
| Depreciation | 43.0 | 53.2 | 87.0 | 103.4 |
| Government grants amortization | - | (0.8) | - | (1.5) |
| Amortization | 36.7 | 34.5 | 74.6 | 62.4 |
| Amortization contribution from suppliers | (8.5) | (6.9) | (16.6) | (12.6) |
| Allowance (reversal) for inventory obsolescence | (1.0) | 4.2 | 4.5 | 5.4 |
| Provision for adjustment to market value | 60.5 | 11.8 | 62.2 | 15.0 |
| Provision (reversal) allowance for doubtful accounts | 7.4 | 2.6 | 13.6 | 5.7 |
| Gains on fixed assets disposal | 2.7 | 7.4 | 4.6 | 7.3 |
| Deferred income tax and social contribution | (56.5) | 68.9 | (162.1) | 44.6 |
| Accrued interest | (12.0) | 11.5 | 1.7 | 17.8 |
| Interest over marketable securities | (21.0) | (3.9) | (14.0) | (6.8) |
| Equity in the losses of associates | - | 0.1 | 0.1 | 0.1 |
| Share-based remuneration | 0.3 | 0.1 | 0.7 | 0.3 |
| Foreign exchange gain (loss), net | (6.2) | 9.8 | (2.3) | 4.9 |
| Residual value guarantee | 8.5 | (2.2) | 6.1 | (10.3) |
| Accounts payable for penalties | 200.0 | - | 200.0 | - |
| Provision for voluntary redundancy scheme | - | (1.2) | - | 6.4 |
| Other | 1.9 | (10.4) | 0.7 | (11.6) |
| Changes in assets | | | | |
| Financial investments | (178.2) | 96.2 | (323.9) | (407.4) |
| Derivative financial instruments | (14.8) | 12.6 | (25.3) | (0.6) |
| Collateralized accounts receivable and accounts receivable | (13.5) | (95.8) | (4.5) | (103.8) |
| Customer and commercial financing | (6.3) | 4.0 | 15.2 | 4.2 |
| Inventories | (214.0) | 217.3 | (413.9) | 20.5 |
| Other assets | (110.7) | 111.1 | (98.2) | 178.6 |
| Changes in liabilities | | | | |
| Trade accounts payable | 71.9 | 29.9 | 20.8 | (28.2) |
| Non-recourse and recourse debt | 2.0 | 2.4 | 1.3 | 4.9 |
| Other payables | 9.3 | (41.9) | 13.2 | (19.9) |
| Contribution from suppliers | - | - | 98.9 | 86.0 |
| Advances from customers | (32.4) | 17.0 | (0.2) | 0.9 |
| Taxes and payroll charges payable | 35.1 | 13.4 | 22.7 | 8.8 |
| Financial guarantees | (53.0) | (11.3) | (60.1) | (31.1) |
| Other provisions | (11.7) | (13.4) | (20.0) | (19.5) |
| Unearned income | 0.6 | (132.0) | (12.6) | (148.6) |
| Net cash generated (used) by operating activities | (361.4) | 457.7 | (521.3) | (110.8) |
| Investing activities | | | | |
| Additions to property, plant and equipment | (112.4) | (61.7) | (188.5) | (114.2) |
| Proceeds from sale of property, plant and equipment | 0.1 | 1.2 | 0.1 | 19.2 |
| Additions to intangible assets | (126.7) | (117.2) | (237.9) | (234.3) |
| Investments in associates | - | (0.3) | (1.3) | (0.4) |
| Proceeds from held to maturity securities | 16.3 | (12.4) | 3.0 | 8.0 |
| Loans | 2.1 | - | (15.9) | - |
| Dividends Received | 0.1 | - | 0.1 | 0.1 |
| Restricted cash reserved for construction of assets | 0.1 | (2.7) | 4.3 | 1.7 |
| Net cash used in investing activities | (220.4) | (193.1) | (436.1) | (319.9) |
| Financing activities | | | | |
| Proceeds from borrowings | 47.6 | 8.4 | 136.8 | 765.4 |
| Repayment of borrowings | (132.6) | (58.4) | (188.3) | (332.3) |
| Dividends and interest on own capital | (8.4) | (24.9) | (15.9) | (34.2) |
| Proceeds from stock options exercised | 2.6 | 0.9 | 1.5 | 4.8 |
| Acquisition of own shares | (15.9) | (5.0) | (15.9) | (5.0) |
| Net cash generated (used) by financing activities | (106.7) | (79.0) | (81.8) | 398.7 |
| Increase (Decrease) in cash and cash equivalents | (688.5) | 185.6 | (1,039.2) | (32.0) |
| Effects of exchange rate changes on cash and cash equivalents | (47.7) | (9.1) | 96.9 | (2.1) |
| Cash and cash equivalents at the beginning of the period | 1,959.4 | 1,030.9 | 2,165.5 | 1,241.5 |
| Cash and cash equivalents at the end of the period | 1,223.2 | 1,207.4 | 1,223.2 | 1,207.4 |
| (1) Derived from unaudited financial statements. |
13
| | |
| EMBRAER S.A. |
| CONSOLIDATED STATEMENT OF FINANCIAL POSITION |
| (in millions of U.S. dollars) |
| | (1) | (1) |
| A S S E T S | As of March 31, | As of June 30, |
| | 2017 | 2017 |
| Current assets | | |
| Cash and cash equivalents | 1,030.9 | 1,207.4 |
| Financial investments | 2,064.2 | 1,953.8 |
| Trade accounts receivable, net | 678.7 | 752.9 |
| Derivative financial instruments | 38.0 | 22.4 |
| Customer and commercial financing | 6.8 | 5.2 |
| Collateralized accounts receivable | 156.1 | 160.4 |
| Inventories | 2,658.2 | 2,460.9 |
| Income tax and Social Contribution | 97.4 | 111.2 |
| Other assets | 408.0 | 273.8 |
| | 7,138.3 | 6,948.0 |
| Non-current assets | | |
| Financial investments | 386.9 | 389.3 |
| Derivative financial instruments | 12.6 | 8.6 |
| Customer and commercial financing | 30.4 | 28.0 |
| Collateralized accounts receivable | 158.5 | 143.9 |
| Guarantee deposits | 411.2 | 418.2 |
| Deferred income tax | 20.1 | 17.4 |
| Other assets | 123.6 | 115.0 |
| | 1,143.3 | 1,120.4 |
| |
| Investments | 3.9 | 4.0 |
| Property, plant and equipment, net | 2,183.7 | 2,158.9 |
| Intangible assets | 1,678.2 | 1,770.5 |
| | 3,865.8 | 3,933.4 |
| |
| TOTAL ASSETS | 12,147.4 | 12,001.8 |
| (1) Derived from unaudited financial information. |
14
| | |
| EMBRAER S.A. |
| CONSOLIDATED STATEMENT OF FINANCIAL POSITION |
| (in millions of U.S. dollars) |
| | (1) | (1) |
| LIABILITIES | As of March 31, | As of June 30, |
| | 2017 | 2017 |
| Current liabilities | | |
| Trade accounts payable | 894.8 | 923.9 |
| Loans and financing | 322.9 | 304.2 |
| Non-recourse and recourse debt | 26.9 | 22.5 |
| Other payables | 380.2 | 338.5 |
| Advances from customers | 709.6 | 726.9 |
| Derivative financial instruments | 13.6 | 6.6 |
| Taxes and payroll charges payable | 38.1 | 38.6 |
| Income tax and social contribution | 26.8 | 39.4 |
| Financial guarantee and residual value | 32.7 | 25.1 |
| Provisions | 148.7 | 123.4 |
| Dividends payable | 33.9 | 9.5 |
| Unearned income | 294.5 | 172.5 |
| | 2,922.7 | 2,731.1 |
| Non-current liabilities | | |
| Loans and financing | 3,964.9 | 3,907.8 |
| Non-recourse and recourse debt | 349.5 | 356.3 |
| Other payables | 17.3 | 18.1 |
| Advances from customers | 132.0 | 121.7 |
| Taxes and payroll charges payable | 70.9 | 68.7 |
| Deferred income tax and social contribution | 255.1 | 322.0 |
| Financial guarantee and residual value | 150.1 | 144.3 |
| Provisions | 174.8 | 174.9 |
| Unearned income | 113.6 | 102.8 |
| | 5,228.2 | 5,216.6 |
| TOTAL LIABILITIES | 8,150.9 | 7,947.7 |
| |
| Shareholders' equity | | |
| Capital | 1,438.0 | 1,438.0 |
| Treasury shares | (41.1) | (44.1) |
| Revenue reserves | 2,566.6 | 2,566.7 |
| Share-based remuneration | 37.0 | 37.1 |
| Retained earnings (losses) | 28.6 | 77.6 |
| Accumulated Other Comprehensive Loss | (127.5) | (129.6) |
| | 3,901.6 | 3,945.7 |
| Non-controlling interest | 94.9 | 108.4 |
| Total company's shareholders' equity | 3,996.5 | 4,054.1 |
| TOTAL LIABILITIES AND SHAREHOLDERS' EQUITY | 12,147.4 | 12,001.8 |
| (1) Derived from unaudited financial information. |
15
Investor Relations
Eduardo Couto, Chris Thornsberry, Caio Pinez, Nádia Santos, Paulo Ferreira and Viviane Pinheiro.
(+55 12) 3927- 1000
investor.relations@embraer.com.br
http://ri.embraer.com.br
Follow Embraer’s IR Department on twitter: @IREmbraer
CONFERENCE CALL INFORMATION Embraer will host a conference call to present its 2Q17 Results onFriday, July 28, 2017 at 11:30AM (SP) / 10:30AM (NY). The conference call will also be broadcast live over the web athttp://ri.embraer.com.br Telephone numbers: Operator Assisted (US/ Canada) Toll-Free Dial-In Number: (877) 846-1574 Operator Assisted International Dial-In Number: (708) 290-0687 Your own International Toll-Free number for Brazil: 0800 047 4803 (land line) and 0800 047 4801 (cell phone) Code: 35609837 |
ABOUT EMBRAER
Embraer is a global company headquartered in Brazil with businesses in commercial and executive aviation, defense & security. The company designs, develops, manufactures and markets aircraft and systems, providing customer support and services.
Since it was founded in 1969, Embraer has delivered more than 8,000 aircraft. About every 10 seconds an aircraft manufactured by Embraer takes off somewhere in the world, transporting over 145 million passengers a year.
Embraer is the leading manufacturer of commercial jets up to 130 seats. The company maintains industrial units, offices, service and parts distribution centers, among other activities, across the Americas, Africa, Asia and Europe.
For more information, please visit www.embraer.com.br
This document may contain projections, statements and estimates regarding circumstances or events yet to take place. Those projections and estimates are based largely on current expectations, forecasts of future events and financial trends that affect Embraer’s businesses. Those estimates are subject to risks, uncertainties and suppositions that include, among others: general economic, political and trade conditions in Brazil and in those markets where Embraer does business; expectations of industry trends; the Company’s investment plans; its capacity to develop and deliver products on the dates previously agreed upon, and existing and future governmental regulations. The words “believe”, “may”, “is able”, “will be able”, “intend”, “continue”, “anticipate”, “expect” and other similar terms are intended to identify potentialities. Embraer does not undertake any obligation to publish updates nor to revise any estimates due to new information, future events or any other facts. In view of the inherent risks and uncertainties, such estimates, events and circumstances may not take place. The actual results may therefore differ substantially from those previously published as Embraer expectations.
16
SIGNATURES
Pursuant to the requirements of the Securities Exchange Act of 1934, the registrant has duly caused this report to be signed on its behalf by the undersigned, thereunto duly authorized.
Date: July 28, 2017
| | | | |
Embraer S.A. |
| |
By: | | /s/ José Antonio de Almeida Filippo |
| | Name: | | José Antonio de Almeida Filippo |
| | Title: | | Executive Vice-President and Chief Financial and Investor Relations Officer |