____________________________________________________
UNITED STATES
SECURITIES AND EXCHANGE COMMISSION
Washington, D.C. 20549
_______________________
FORM 6-K
__________________________________
Report of Foreign Private Issuer
Pursuant to Rule 13a-16 or 15d-16
under the Securities Exchange Act of 1934
For the month of March 2018
Commission File Number: 001-15102
__________________________________
Embraer S.A.
__________________________________
Av. Brigadeiro Faria Lima, 2170
12227-901 São José dos Campos, São Paulo, Brazil
(Address of principal executive offices)
__________________________________
Indicate by check mark whether the registrant files or will file annual reports under cover of Form 20-F or Form 40-F:
Form 20-Fx Form 40-F¨
Indicate by check mark if the registrant is submitting the Form 6-K in paper as permitted by Regulation S-T Rule 101(b)(1):¨
Indicate by check mark if the registrant is submitting the Form 6-K in paper as permitted by Regulation S-T Rule 101(b)(7):¨

HIGHLIGHTS
· Embraer delivered 23 commercial jets and 50 executive jets (32 light / 18 large) in 4Q17, and in 2017 delivered 101 commercial jets and 109 executive (72 light / 37 large) jets, meeting Guidance for 2017;
· Revenues in 4Q17 reached US$ 1,733.0 million and in 2017 were US$ 5,839.3 million, within the Company’s Guidance range of US$ 5.7 to US$ 6.1 billion;
· Adjusted EBIT and adjusted EBITDA1excluding special items were US$ 132.7 million and US$ 220.3 million, respectively, in 4Q17, yielding margins of 7.7% and 12.7%. Adjusted EBIT and adjusted EBITDA exclude US$ 66.0 million in net non-recurring charges in 4Q17, mostly related to impairments in the Executive Jets and Defense & Security segments;
· For the full year, adjusted EBIT and adjusted EBITDA were US$ 397.1 million and US$ 712.5 million, respectively, excluding US$ 67.8 million in net non-recurring charges. For 2017, adjusted EBIT margin was 6.8% and adjusted EBITDA margin was 12.2%, which were below the Company’s guidance;
· Embraer closed 2017 with adjusted free cash flow generation of US$ 406.7 million in 4Q17, resulting in positive 2017 free cash flow of US$ 404.8 million, significantly above the Company’s initial expectations for the year of free cash flow consumption of US$(150) million or better. Embraer finished 2017 with net debt of US$ 310.8 million, an improved position versus net debt of US$ 574.7 million at the end of 2016;
· 4Q17 Net income attributable to Embraer shareholders and Earnings per ADS were US$ 35.2 million and US$ 0.19, respectively. Adjusted net income (excluding the impact of FX-related non-cash deferred income tax and social contribution and non-recurring items) for the quarter was US$ 58.3 million, representing adjusted earnings per ADS of US$ 0.32 in 4Q17. Adjusted net income for 2017 was US$ 279.7 million, representing adjusted earnings per ADS of US$ 1.52 for the year;
· The Company reaffirms its 2018 guidance first published in the 3Q17 earnings release on October 27, 2017. See further details on the guidance on page 10.
Main financial indicators2
in millions of U.S dollars, except % and earnings per share data | |||||
IFRS | (1) | (1) | (1) | (2) | (2) |
| 3Q17 | 4Q16 | 4Q17 | 2016 | 2017 |
Revenue | 1,310.4 | 2,027.8 | 1,733.0 | 6,217.5 | 5,839.3 |
EBIT | 65.2 | 276.6 | 66.7 | 206.0 | 329.3 |
EBIT Margin % | 5.0% | 13.6% | 3.8% | 3.3% | 5.6% |
Adjusted EBIT | 68.8 | 246.1 | 132.7 | 499.1 | 397.1 |
Adjusted EBIT Margin % | 5.3% | 12.1% | 7.7% | 8.0% | 6.8% |
EBITDA | 139.8 | 378.5 | 154.3 | 536.1 | 644.7 |
EBITDA Margin % | 10.7% | 18.7% | 8.9% | 8.6% | 11.0% |
Adjusted EBITDA | 143.4 | 348.0 | 220.3 | 829.2 | 712.5 |
Adjusted EBITDA Margin % | 10.9% | 17.2% | 12.7% | 13.3% | 12.2% |
Adjusted Net Income2 | 75.2 | 209.1 | 58.3 | 290.5 | 279.7 |
Adjusted earnings per share - ADS basic | 0.4089 | 1.1370 | 0.3177 | 1.5799 | 1.5237 |
Net income attributable to Embraer Shareholders | 110.0 | 195.2 | 35.2 | 166.1 | 246.8 |
Earnings per share - ADS basic (US$) | 0.5982 | 1.0634 | 0.1918 | 0.9032 | 1.3445 |
Adjusted Free Cash Flow | (22.7) | 285.0 | 406.7 | (359.2) | 404.8 |
Net debt | (722.8) | (574.7) | (310.8) | (574.7) | (310.8) |
(1) Derived from unaudited financial information. | |||||
(2) Derived from audited financial information. | |||||
1 EBIT and EBITDA are non-GAAP measures. For more detailed information please refer to page 12.
2 Adjusted Net Income is a non-GAAP measure, calculated by adding Net Income attributable to Embraer Shareholders plus Deferred income tax and social contribution for the period, in addition to adjusting for non-recurring items. Under IFRS for Embraer’s Income Tax benefits (expenses) the Company is required to record taxes resulting from unrealized gains or losses due to the impact of changes in theReal to US Dollar exchange rate over non-monetary assets (primarily Inventory, Intangibles, and PP&E). The taxes resulting from gains or losses over non-monetary assets are considered deferred taxes and are presented in the consolidated Cash Flow statement, under Deferred income tax and social contribution, which was US$ (26.4) million in 4Q16, US$ 21.5 million in 4Q17 and US$ 38.4 million in 3Q17. Adjusted Net Income also excludes the net after-tax special items of US$ 12.5 million in 4Q16, US$ (44.6) million in 4Q17 and US$ (3.6) million in 3Q17.
1 |
São Paulo, Brazil, March 8, 2018- (B3: EMBR3, NYSE: ERJ).The Company's operating and financial information is presented, except where otherwise stated, on a consolidated basis in United States dollars (US$) in accordance with IFRS. The financial data presented in this document as of and for the quarters ended December 31, 2017 (4Q17), September 30, 2017 (3Q17) and December 31, 2016 (4Q16), are derived from the unaudited financial statements, except annual financial data and where otherwise stated.
REVENUES and gross margin
During 4Q17, Embraer delivered 23 commercial and 50 executive aircraft (32 light jets and 18 large jets), for a total of 101 commercial and 109 executive aircraft (72 light and 37 large) delivered in 2017, meeting the Company’s 2017 Guidance for aircraft deliveries. This compares with a total of 32 commercial jets and 43 executive jets (25 light and 18 large) in 4Q16 and total 2016 deliveries of 108 commercial jets and 117 executive jets (73 light and 44 large). Consolidated revenues of US$ 1,733.0 million in 4Q17 represented a 14.5% year-over-year decline, driven primarily by the lower deliveries in the Commercial Aviation segment as well as a 15.0% decrease in Defense & Security segment revenues as compared to 4Q16. For fiscal year 2017, the Company’s consolidated revenues of US$ 5,839.3 million were down 6.1% compared to the US$ 6,217.5 million reported in 2016, driven largely by declines in commercial and executive jet deliveries, while Defense & Security segment revenues increased 1.9% in 2017. Embraer’s consolidated revenues met the Company’s 2017 Guidance range of US$ 5.7 – 6.1 billion in revenues.
The Company’s gross margin of 20.0% in 4Q17 was stable compared to the 20.1% reported in 4Q16 despite the aforementioned decline in revenues in the quarter. For the full year, Embraer’s gross margin was 18.3% in 2017 vs. the 19.9% reported in 2016, reflecting lower executive and commercial jet deliveries and negative cost base revisions on certain Defense & Security contracts.
EBIT AND ADJUSTED EBIT
EBIT and EBIT margin as reported in 4Q17 were US$ 66.7 million and 3.8%, respectively, down from EBIT of US$ 276.6 million and EBIT margin of 13.6% in 4Q16. For the full year, EBIT as reported in 2017 was US$ 329.3 million as compared to US$ 206.0 million in 2016, yielding as reported EBIT margins of 5.6% and 3.3%, respectively.
The reported quarterly and annual results include several special items that impacted operating results in both the current and year-ago periods. Regarding the quarterly results comparison, 4Q17 operating income included US$ 66.0 million in charges, comprised of: 1) US$ 3.1 million in expenses related to taxes on remittances for payments following the FCPA investigation, 2) US$ 8.7 million of impairments in the Defense & Security segment, and 3) US$ 54.2 million of impairments in the Executive Jets segment. The 4Q16 operating results included a net positive non-recurring impact of US$ 30.5 million, which included: 1) a positive impact of US$ 52.2 million related to favorable developments in the Republic Airways Chapter 11 negotiations, 2) a net US$ 0.8 million provision reversal relating to Embraer’s voluntary dismissal program, and 3) a negative impact of US$ 22.5 million in expenses from taxes on remittances for payment of fines following the FCPA finalization.
Excluding these special items, 4Q17 adjusted EBIT and EBIT margin were US$ 132.7 million and 7.7%, respectively. This compares to 4Q16 adjusted EBIT of US$ 246.1 million and adjusted EBIT margin of 12.1%. The major drivers for the decline in the adjusted quarterly operating margin in 4Q17 were a combination of lower revenues leading to a decline in fixed cost absorption and negative cost base revisions on certain contracts in the Defense & Security segment, particularly on the KC-390 development contract.
Full year 2017 results included a net negative impact of US$ 67.8 million in special items, as outlined in the table below. The Company’s reported operating results in 2016 also included several special items, which had a net negative impact of US$ 293.1 million. Excluding these items, Embraer generated US$ 397.1 million in adjusted EBIT in 2017 compared to US$ 499.1 million in adjusted EBIT in 2016. Adjusted EBIT margin in 2017 was 6.8% as compared to last year’s adjusted margin of 8.0%. The Company’s adjusted EBIT andadjusted EBIT margin fell short of its 2017 guidance of US$ 450 – 550 million and 8.0 – 9.0%, respectively, due to a combination of consolidated revenues near the low end of 2017 guidance impacting fixed cost absorption, lower profitability in the Executive Jets segment, and the aforementioned negative cost base revisions on Defense & Security contracts.
 | 2 |
|
|
|
|
|
| in millions of U.S.dollars | |
ADJUSTED EBIT RECONCILIATION | (1) | (2) | (1) | (1) | (1) | (1) | (2) |
| 4Q16 | 2016 | 1Q17 | 2Q17 | 3Q17 | 4Q17 | 2017 |
Operating profit before financial income (EBIT) | 276.6 | 206.0 | 23.4 | 174.0 | 65.2 | 66.7 | 329.3 |
Provision for voluntary redundancy scheme | (0.8) | 117.3 | 7.6 | (1.2) | - | - | 6.4 |
Impact of penalty provision | 22.5 | 228.0 | - | 3.5 | 3.6 | 3.1 | 10.2 |
Non-recurring items related to Republic Airways | (52.2) | (52.2) | - | (11.7) | - | - | (11.7) |
Impairment loss Defense and security business | - | - | - | - | - | 8.7 | 8.7 |
Impairment loss Executive Jet business | - | - | - | - | - | 54.2 | 54.2 |
Adjusted EBIT | 246.1 | 499.1 | 31.0 | 164.6 | 68.8 | 132.7 | 397.1 |
Adjusted EBIT Margin % | 12.1% | 8.0% | 3.0% | 9.3% | 5.3% | 7.7% | 6.8% |
(1) Derived from unaudited financial information. | |||||||
(2) Derived from audited financial information. | |||||||
Administrative expenses for 4Q17 were US$ 49.0 million, up from the US$ 44.0 million reported in 4Q16, and for fiscal year 2017 administrative expenses were US$ 179.1 million compared to US$ 164.3 million in 2016. Selling expenses of US$ 82.8 million in 4Q17 were slightly higher than the US$ 81.4 million in expenses in 4Q16, though for fiscal year 2017 declined 16.7% to US$ 307.0 million, with declines across all three major business units, reflecting efficiency gains despite a less favorable US dollar to BrazilianReal exchange rate in the period. Research expense was down slightly in 4Q17 to US$ 17.5 million vs. US$ 18.8 million in 4Q16, and for the full year was US$ 49.2 million in 2017 compared to US$ 47.6 million in 2016.
Other operating income (expense), net as reported in 4Q17 was expense of US$ 131.3 million compared to income of US$ 13.7 million in 4Q16. For the full year, other operating income (expense), net in 2017 was US$ 202.5 million of expense vs. US$ 450.0 million of expense in 2016. The special items mentioned above are all accounted for in this line item of the income statement. Excluding these non-recurring impacts, other operating income (expense), net in 4Q17 was an expense of US$ 65.3 million compared to expense of US$ 16.8 million in 4Q16 due largely to increases in certain corporate expenses. For the full year other operating income (expense), net excluding special items was an expense of US$ 134.7 million in 2017 versus an expense of US$ 156.9 million in 2016.
net income
Net income attributable to Embraer shareholders and Earnings per ADS for 4Q17 were US$ 35.2 million and US$ 0.19 per share, respectively, bringing total 2017 net income attributable to Embraer shareholders and earnings per ADS to US$ 246.8 million and US$ 1.34 per share, respectively.
Adjusted net income, excluding deferred income tax and social contribution and excluding the total after-tax impacts of the special items described above, was US$ 58.3 million in 4Q17 as compared to US$ 209.1 million in 4Q16. For the full year, adjusted net income excluding deferred income tax and social contribution and excluding the total after-tax impact of special items was US$ 279.7 million in 2017 and US$ 290.5 million in 2016. Adjusted earnings per ADS excluding these items was US$ 0.32 in 4Q17 (versus US$ 1.14 in 4Q16) and US$ 1.52 in 2017 (versus US$ 1.58 in 2016).
monetary balance sheet accounts and other measures
Embraer ended 2017 with a net debt position of US$ 310.8 million, which was an improvement from the US$ 722.8 million net debt position at the end of 3Q17, as well as compared to the net debt position of US$ 574.7 million at year-end 2016. Stronger free cash flow generation in 2017 as compared to 2016 was the principal reason for the Company’s improvement in financial position by the end of the period. Embraer’s total loans position at the end of 2017 stood at US$ 4,198.5 million, while the Company’s total cash position was US$ 3,887.7 million at the end of the same period.
| 3 |
|
| in millions of U.S.dollars | |
FINANCIAL POSITION DATA | (2) | (1) | (2) |
| 2016 | 3Q17 | 2017 |
Cash and cash equivalents | 1,241.5 | 772.5 | 1,270.8 |
Financial investments | 1,943.7 | 2,811.6 | 2,616.9 |
Total cash position | 3,185.2 | 3,584.1 | 3,887.7 |
Loans short-term | 510.3 | 289.0 | 388.9 |
Loans long-term | 3,249.6 | 4,017.9 | 3,809.6 |
Total loans position | 3,759.9 | 4,306.9 | 4,198.5 |
Net debt* | (574.7) | (722.8) | (310.8) |
* Net debt = Cash and cash equivalents + Financial investments short-term and long term - | |||
Loans short-term and long-term |
|
|
|
(1) Derived from unaudited financial information. |
|
|
|
(2) Derived from audited financial information. |
|
|
|
Adjusted net cash generated by operating activities net of adjustments for financial investments (and excluding cash payments for special items) was US$ 608.1 million in 4Q17 and adjusted free cash flow for the quarter was US$ 406.7 million. This compares to adjusted net cash generated by operating activities net of financial investments of US$ 497.5 million and adjusted free cash flow of US$ 285.0 million in 4Q16. In 2017, adjusted free cash flow was US$ 404.8 million, compared to adjusted free cash flow of US$ (359.2) million in 2016 and the Company’s guidance for 2017 of a usage of US$ 150 million or better. The principal factors explaining the better free cash flow generation in 2017 include a marked improvement in working capital (particularly lower inventories and higher advances from customers) and lower net additions to property, plant and equipment.
|
|
|
|
|
| in millions of U.S.dollars | |
IFRS | 4Q16 | 2016 | 1Q17 | 2Q17 | 3Q17 | 4Q17 | 2017 |
Net cash generated (used) by operating activities (1) | 249.3 | 287.2 | (64.9) | 361.6 | 115.3 | 589.9 | 1,001.9 |
Adjustment for non-recurring cash impacts | 248.2 | 248.2 | 17.2 | 36.1 | 20.4 | 18.2 | 92.0 |
Adj. Net cash generated (used) by operating activities | 497.5 | 535.4 | (47.7) | 397.7 | 135.7 | 608.1 | 1,093.9 |
|
|
|
|
|
|
|
|
Net additions to property, plant and equipment | (75.3) | (389.6) | (34.5) | (60.5) | (47.3) | (76.3) | (218.6) |
Additions to intangible assets | (137.2) | (505.0) | (117.1) | (117.2) | (111.1) | (125.1) | (470.5) |
Adjusted Free Cash Flow | 285.0 | (359.2) | (199.3) | 220.0 | (22.7) | 406.7 | 404.8 |
(1) Net of financial investments: 4Q16 50.2, 2016 307.7, 1Q17 (503.6), 2Q17 96.2, 3Q17 30.8 and 4Q17 132.0 |
|
|
| ||||
Net additions to total PP&E for 4Q17 and 2017 were US$ 76.3 million and US$ 218.6 million, respectively. Of the total 4Q17 additions to PP&E, CAPEX amounted to US$ 68.7 million and additions of pool program spare parts was US$ 7.8 million. Excluding contracted CAPEX in the Defense & Security segment, CAPEX for 4Q17 was US$ 68.3 million, and for the full 2017 fiscal year was US$ 175.6 million, which came in below the Company’s outlook for the year of US$ 200 million.
In 4Q17, Embraer invested a total of US$ 125.1 million in product development, principally related to the development of the E-Jets E2 commercial jet program, which continues to progress according to schedule. During the quarter, the Company did not receive any contributions from risk-sharing partners; therefore net development was also US$ 125.1 million in the period. For the full year, the Company invested US$ 470.5 million in product development, partially offset by US$ 86.0 million in contributions from suppliers, yielding net development of US$ 384.5 million in 2017, which was slightly below Embraer’s guidance of US$ 400 million for the year.
| 4 |
|
|
|
|
|
| in millions of U.S.dollars | |
| 4Q16 | 2016 | 1Q17 | 2Q17 | 3Q17 | 4Q17 | 2017 |
CAPEX | 60.7 | 232.3 | 35.4 | 45.5 | 30.1 | 68.7 | 179.7 |
Contracted CAPEX (Included in CAPEX) | 9.8 | 31.3 | 2.4 | 0.5 | 0.8 | 0.4 | 4.1 |
Additions of aircraft available for or under lease | 9.5 | 94.7 | 4.8 | 4.8 | 4.8 | - | 14.4 |
Additions of Pool programs spare parts | 7.9 | 65.5 | 12.3 | 11.4 | 12.1 | 7.8 | 43.6 |
PP&E | 78.1 | 392.5 | 52.5 | 61.7 | 47.0 | 76.5 | 237.7 |
Proceeds from sale of PP&E | (2.8) | (2.9) | (18.0) | (1.2) | 0.3 | (0.2) | (19.1) |
Net Additions to PP&E | 75.3 | 389.6 | 34.5 | 60.5 | 47.3 | 76.3 | 218.6 |
|
|
|
|
|
|
|
|
|
|
|
|
|
| in millions of U.S.dollars | |
| 4Q16 | 2016 | 1Q17 | 2Q17 | 3Q17 | 4Q17 | 2017 |
Additions to intangible | 137.2 | 505.0 | 117.1 | 117.2 | 111.1 | 125.1 | 470.5 |
Contributions from suppliers | - | (123.9) | (86.0) | - | - | - | (86.0) |
Development (Net of contributions from suppliers) | 137.2 | 381.1 | 31.1 | 117.2 | 111.1 | 125.1 | 384.5 |
Research | 18.8 | 47.6 | 8.2 | 9.3 | 14.2 | 17.5 | 49.2 |
R&D | 156.0 | 428.7 | 39.3 | 126.5 | 125.3 | 142.6 | 433.7 |
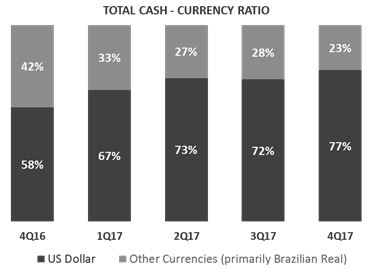
| The Company’s total debt decreased US$ 108.4 million to US$ 4,198.5 million at the end of 4Q17 compared to US$ 4,306.9 million at the end of 3Q17. Short-term debt at the end of 4Q17 was US$ 388.9 million and long-term debt was US$ 3,809.6 million. The average loan maturity of the Company’s debt at the end of 4Q17 reached 6.0 years. The cost of Dollar denominated loans at the end of 4Q17 was 5.18% p.a. compared to 5.19% p.a. at the end of 3Q17. The cost of Real denominated loans also fell, at 3.72% p.a. at the end of 4Q17 vs. 3.83% at the end of 3Q17. Embraer’s EBITDA over the last 12 months (EBITDA LTM) to financial expenses (gross) for 4Q17 declined to 2.78 relative to 3Q17’s value of 3.78. At the end of 4Q17, 15% of total debt was denominated in Reais. Embraer’s cash allocation management strategy continues to be one of its most important tools to mitigate exchange rate risks. By balancing cash allocation inRealand Dollardenominated assets, the Company attempts to neutralize its balance sheet exchange rate exposure. Of total cash at the end of 4Q17, 77% was denominated in US Dollars. | |
|  | |

| 5 |
operational balance sheet accounts
|
| in millions of U.S.dollars | |
SELECT BALANCE SHEET DATA | (2) | (1) | (2) |
| 2016 | 3Q17 | 2017 |
Trade accounts receivable | 665.4 | 708.3 | 717.1 |
Customer and commercial financing | 37.4 | 17.0 | 16.4 |
Inventories | 2,496.4 | 2,443.3 | 2,148.7 |
Property, plant and equipment | 2,154.2 | 2,125.3 | 2,104.9 |
Intangible | 1,664.6 | 1,857.9 | 1,882.4 |
Trade accounts payable | 952.1 | 786.3 | 824.7 |
Advances from customers | 856.2 | 873.0 | 903.3 |
Total shareholders' equity | 3,941.2 | 4,172.8 | 4,182.0 |
(1) Derived from unaudited financial information. |
|
|
|
(2) Derived from audited financial information. |
|
|
|
In addition to the aforementioned factors, better working capital management assisted in the higher free cash flow generation in 2017 as compared to 2016. A US$ 347.7 million decrease in inventories from the end of 2016 to the end of 2017 was the largest contributor, reflecting a better balance between production and deliveries. An additional positive contributor to cash flow in 2017 was the US$ 47.1 million increase in advances from customers, given better order activity in the Commercial Aviation segment. On the other hand, the accounts receivable increased by US$ 51.7 million to end 2017 at US$ 717.1 million, with increases across all segments, while trade accounts payable fell US$ 127.4 million to end 2017 at US$ 824.7 million.
During 2017, intangible assets increased US$ 217.8 million to finish the year at US$ 1,882.4 million, reflecting continued investments in product development. Property, plant, and equipment ended 2017 at US$ 2,104.9 million, compared to US$ 2,154.2 million at the end of 2016.
Total Backlog
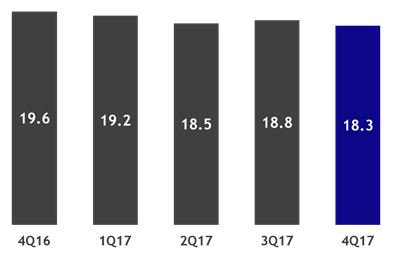
Considering all deliveries as well as firm orders obtained during the period, the Company’s firm order backlog decreased US$ 0.5 billion during 4Q17 to end the year at US$ 18.3 billion.
|
segment Results
The Commercial Aviation segment represented 46.2% of consolidated revenues in 4Q17, lower than the 50.9% reported in the same period last year due to a decline in deliveries during the quarter resulting in a 22.4% drop in revenues on a year-over-year basis. The portion of Executive Jets revenues rose from 33.0% in 4Q16 to 37.7% in 4Q17 despite slightly lower revenues in the current year period, and the share of Defense& Security revenues was stable at 15.6% of consolidated revenues in 4Q17. Other segment revenues as a percentage of the total were 0.5% in 4Q17 vs. 0.4% in 4Q16. For fiscal year 2017, Commercial Aviation revenues constituted 57.7% of the total, Executive Jets revenues were 25.4%, Defense & Security revenues were 16.3%, and Other segment revenues were 0.6% of the Company’s total.
| 6 |
|
|
|
|
|
|
|
| in millions of U.S.dollars | ||
NET REVENUES | (1) | (1) | (1) | (2) | (2) | |||||
BY SEGMENT | 3Q17 | % | 4Q16 | % | 4Q17 | % | 2016 | % | 2017 | % |
Commercial Aviation | 846.1 | 64.6 | 1,031.8 | 50.9 | 800.8 | 46.2 | 3,527.0 | 56.7 | 3,371.8 | 57.7 |
Executive Jets | 266.7 | 20.3 | 669.5 | 33.0 | 652.6 | 37.7 | 1,730.5 | 27.8 | 1,484.8 | 25.4 |
Defense & Security | 189.7 | 14.5 | 318.5 | 15.7 | 270.8 | 15.6 | 932.7 | 15.0 | 950.7 | 16.3 |
Others | 8.0 | 0.6 | 8.0 | 0.4 | 8.8 | 0.5 | 27.3 | 0.5 | 32.0 | 0.6 |
Total | 1,310.4 | 100.0 | 2,027.8 | 100.0 | 1,733.0 | 100.0 | 6,217.5 | 100.0 | 5,839.3 | 100.0 |
(1) Derived from unaudited financial information. |
|
|
|
|
|
|
| |||
(2) Derived from audited financial information. |
|
|
|
|
|
|
| |||
Commercial Aviation
In 4Q17 Embraer delivered 23 commercial aircraft, and in fiscal year 2017 met its deliveries guidance with 101 commercial aircraft delivered, as shown below:
DELIVERIES | 3Q17 | 4Q16 | 4Q17 | 2016 | 2017 |
Commercial Aviation | 25 | 32 | 23 | 108 | 101 |
EMBRAER 175 | 18 | 26 | 14 | 90 | 79 |
EMBRAER 190 | 5 | 3 | 5 | 11 | 12 |
EMBRAER 195 | 2 | 3 | 4 | 7 | 10 |
In October 2017, Embraer and American Airlines signed a firm order for ten E175 jets. Combined with the airline’s two prior orders for the E175, this new contract results in a total of 74 E175s ordered by American Airlines.
In the same month, Embraer announced a firm order from SkyWest, Inc. for 20 E-Jets. SkyWest will receive 15 E175 SC (Special Configuration) aircraft, in a 70-seat configuration. The E175 SC aircraft features an E175 airframe, which can be retrofitted to 76 seats in the future. SkyWest will also receive five E175s in a 76-seat configuration, similar to aircraft SkyWest has previously ordered.
In December 2017, Embraer celebrated the delivery of its 1,400th E-Jet, to American Airlines. This milestone E175 jet will be operated by Envoy Air, a wholly owned subsidiary of American Airlines Group Inc.
The E-Jets E2 development program remains on schedule, on budget and better than initially specified. In February of 2018, the E190-E2 received Type Certification from the Brazilian National Civil Aviation Agency (ANAC), the Federal Aviation Administration (FAA), and the European Aviation Safety Agency (EASA). It is the first time that an aerospace program with the level of complexity of the E2 has received Type Certification from all three agencies simultaneously. Embraer confirmed that in April 2018 it will deliver the first E190-E2 to Widerøe, the launch customer, which will start revenue operations with the E2 at the end of the same month.
Embraer announced some final results from the flight test campaign confirming that the aircraft has surpassed its original specifications and is even more efficient than other single aisle aircraft. Regarding fuel consumption, the E190-E2 proved to be 1.3% better than originally expected, which now represents a 17.3% improvement when compared to the current generation E190, and nearly 10% better than its direct competitor.
The E190-E2 also becomes the most environmentally friendly aircraft in the segment, with the lowest level of external noise and gas emissions. The cumulative margin to ICAO Stage IV noise limit increased from 17 to 20 EPNdB, which is now 2 EPNdB better than its direct competitor.
| 7 |
Flight test results also confirmed the E190-E2 to be better than its original specification in takeoff performance. The aircraft’s range from airports with hot-and-high conditions, such as those in Denver and Mexico City, increased by 600 nm in extreme conditions compared to the current generation aircraft. Its range from airports with short runways such as London City also increased by more than 1,000 nm allowing the E190-E2 to reach markets in Russia, Egypt and Turkey, for instance.
Another key program target in which the E190-E2 obtained better results was in pilot transition training time. Pilots of current generation E-Jets will need only 2.5 days of training and no full flight simulator to fly an E2.
At the end of 4Q17, the backlog and cumulative deliveries for Commercial Aviation were as follows:
COMMERCIAL AVIATION | Firm Orders | Options | Total | Deliveries | Firm Backlog |
BACKLOG |
|
|
|
|
|
E170 | 191 | 5 | 196 | 190 | 1 |
E175 | 603 | 150 | 753 | 500 | 103 |
E190 | 592 | 44 | 636 | 546 | 46 |
E195 | 169 | 1 | 170 | 164 | 5 |
E175-E2 | 100 | 100 | 200 | - | 100 |
E190-E2 | 74 | 97 | 171 | - | 74 |
E195-E2 | 106 | 90 | 196 | - | 106 |
TOTAL E-JETS | 1,835 | 487 | 2,322 | 1,400 | 435 |
The value of the firm order backlog in Commercial Aviation at the end of 2017 was US$ 13.4 billion.
Executive JETS
The Executive Jets segment delivered 32 light and 18 large jets, totaling 50 aircraft in 4Q17, seven units more than 4Q16. Full year 2017 deliveries totaled 109 executive jets versus 117 jets delivered in 2016.
DELIVERIES | 3Q17 | 4Q16 | 4Q17 | 2016 | 2017 |
Executive Aviation | 20 | 43 | 50 | 117 | 109 |
Light Jets | 13 | 25 | 32 | 73 | 72 |
Large Jets | 7 | 18 | 18 | 44 | 37 |
In the fourth quarter, Embraer unveiled its newest aircraft, the Phenom 300E, with enhancements for the segment-leading Phenom 300, which in 2017 was confirmed once again as the most delivered light jet, for the sixth consecutive year. The announcement was made at the 2017 NBAA-BACE (National Business Aviation Association’s Business Aviation Conference and Exhibition), which was held in Las Vegas in October. The new jet has the “E” designation, representing its new interior, and entertainment and cabin management systems nice® HD CMS/IFE, from Lufthansa Technik. The Phenom 300E was showcased for the first time at Embraer’s NBAA-BACE’s static display and its first delivery is expected in the first quarter of 2018.
Also during the fourth quarter, Embraer announced a flight experience enhancement on its Legacy 450 and Legacy 500 mid-cabin jets. The cabin altitude of these already revolutionary aircraft was reduced to 5,800 ft (1,768 m), now offering best-in-class cabin altitude. This announcement was made during a press conference held at the Dubai Air Show, in Dubai, United Arab Emirates.
At the end of 2017, Embraer had US$ 777 million in firm orders of executive jets in its backlog.
| 8 |
Defense & security
By the end of 4Q17, the KC-390 completed a relevant milestone with Embraer demonstrating to the Brazilian Air Force (FAB) the attainment of the Initial Operational Capability (IOC). The achievement of the IOC ensures the necessary conditions have been met for the aircraft to start operations, in accordance with the scope agreed upon with the FAB. As part of the IOC, Embraer obtained a KC-390 Provisional Type Certificate from the Brazilian National Civil Aviation Agency (ANAC), which is a testament to the adequacy of the design in fulfilling the demanding certification requirements for transport aircraft. Prior to this achievement, the KC-390 performed a series of flight trials in the United States as part of its flight test campaign for certification. During these flights the aircraft performed tests related to the avionics systems, measurement of external noise and flight operations with cross winds.
Regarding the A-29 Super Tucano Program, during 4Q17 Embraer announced three firm orders for a total of 18 aircraft. The first firm order was for six A-29 Super Tucano aircraft from an undisclosed customer, which can be used for tactical and advanced training as well as light attack and Intelligence, Surveillance and Reconnaissance (ISR) missions. Deliveries of these planes will conclude in 2018. The second contract was signed with the Philippine Air Force (PAF) as part of its ongoing modernization plan, also for six aircraft, following a comprehensive public bidding process with participation from several manufacturers from around the world. The aircraft will be deployed for close air support, light attack, surveillance, air-to-air interception, and counterinsurgency missions and deliveries will start in 2019. In the third contract, Embraer Defense & Security and its partner Sierra Nevada Corporation (SNC) received orders from the U.S. Air Force’s (USAF) A-29 Afghanistan Program for six more A-29 Super Tucanos. The A-29 is used to conduct advanced flight training, aerial reconnaissance, and other A-29 Afghanistan Program operations. Production of these new aircraft has started in Jacksonville, Florida, and brings the total number of aircraft for the Program to 26.
Also during the fourth quarter, two additional Phenom100s were delivered to Affinity Flying Training Services for the United Kingdom’s Ministry of Defence to support pilot training of its Armed Forces. The sixth and last unit related to this contract will be delivered during the first quarter of 2018.
Embraer Defense & Security closed the year with US$ 4.2 billion in value of its firm order backlog.
DISCUSSIONS WITH BOEING
In 2017, we commenced discussions with Boeing regarding a possible business combination. We already have active partnerships in various areas with Boeing, including engineering, as well as ecological, social and cultural projects.
The negotiations are ongoing. Any business combination between the Company and Boeing would be subject to the approval of the Brazilian federal government, Brazilian and international regulators, Boeing, and Embraer. We cannot assure you that a business combination with Boeing will materialize.
class action UPDATE
In August, 2016, a putative securities class action was filed in a U.S. court against the Company and certain of its former and current executives, asserting claims in connection with allegedly false and misleading statements and omissions concerning the FCPA investigation and related matters. In October, 2016, a federal Court in New York appointed a lead plaintiff and a leading counsel for the putative class action. In December 2016, lead plaintiff filed an amended complaint. In June 2017, the Company filed a motion to dismiss all claims asserted in the amended complaint. At this time, the motion is pending before the court, and the Company believes that there is no adequate basis for estimating provisions related to this matter.
| 9 |
2018 GUIDANCE: NET REVENUES, MARGINS, INVESTMENTS, AND FREE CASH FLOW
The Company is providing additional information regarding its preliminary 2018 guidance released on October 27, 2017. Embraer expects 2018 to be a transition year, as the Company ramps up the production of the first E2 model, the E190-E2, which is on track for entry into service (EIS) in April 2018. Embraer continues its investments in the E-Jets E2 family of commercial jets with the E195-E2 and E175-E2 models on schedule for their respective EIS in the first half of 2019 and in 2021. Embraer will also be ramping up production of its medium-lift cargo and transport jet, the KC-390, with first delivery to the Brazilian Air Force expected in the second half of 2018. Also, Embraer is cautiously optimistic that industry-wide new executive jet deliveries in 2018 could be flat to slightly up relative to 2017, particularly in the context of the potential positive demand impacts of the recently passed Tax Reform Act in the United States, the largest executive jets market in the world.
For 2018, Embraer expects commercial jet deliveries to decline to a range of 85 to 95 jets as the Company goes through the first year of transition from the E1 to the E2 family of commercial jets. Deliveries of the E175 model are likely to continue to represent the vast majority of 2018 deliveries, and the E190-E2 should represent between five and ten deliveries during the year. Guidance for deliveries in the Executive Jets segment remains the same for 2018 as compared to the 2017 deliveries outlook, with total deliveries of 105 to 120 business jets. Light jets are expected to represent 70 to 80 of 2018 executive jet deliveries, with large jets constituting 35 to 45 of the Company’s deliveries for the year.
2018 - DELIVERIES OUTLOOK |
|
| ||
Commercial Aviation | 85 | - | 95 | |
Executive Jets | 105 | - | 125 | |
Light | 70 | - | 80 | |
Large | 35 | - | 45 | |
The Company’s guidance range for consolidated revenues for 2018 is expected to be between US$ 5.4 and US$ 5.9 billion. In addition, 2018 represents the first year that Embraer will report the Services & Support business unit as a separate reporting segment; therefore the segment revenue guidance ranges are lower compared to the 2017 reported revenues given services and support revenues were previously included in segment results for the Commercial Aviation, Executive Jets, and Defense & Security segments. The expected revenue contribution from each of the five reportable business segments in 2018 is as follows: 42% from Commercial Aviation, 25% from Executive Jets, 15% from Defense & Security, 17% from Services & Support, and 1% from Other businesses.
2018 - NET REVENUE OUTLOOK |
|
| |
(US$ BILLION) |
|
|
|
Commercial Aviation | $2.30 | - | $2.45 |
Executive Jets | $1.35 | - | $1.50 |
Defense & Security | $0.80 | - | $0.90 |
Services & Support | $0.90 | - | $1.00 |
Others | $0.05 |
| $0.05 |
EMBRAER | $5.40 | - | $5.90 |
| 10 |
Largely as a result of lower commercial jet deliveries combined with the production ramp and delivery of the first units of the E190-E2 and the KC-390 cargo jet, the Company expects consolidated EBIT for 2018 to be in the range of US$ 270 million to US$ 355 million, yielding an EBIT margin for 2018 of between 5.0% and 6.0%. EBITDA guidance is for US$ 540 million to US$ 650 million for 2018, yielding expected EBITDA margin of 10.0% to 11.0% for the year.
2018 - EBIT & EBITDA OUTLOOK |
| ||
(US$ MILLION) |
|
|
|
EBIT | $270 | - | $355 |
EBIT Margin | 5.0% | - | 6.0% |
EBITDA | $540 | - | $650 |
EBITDA Margin | 10.0% | - | 11.0% |
The Company’s investments for 2018 are still expected to be higher than normal levels given the continued development of the E-Jets E2 family of commercial jets. Total investments for 2018 are projected to be US$ 550 million, with research representing US$ 50 million, product development representing US$ 300 million, and CAPEX representing US$ 200 million. As a result of the aforementioned factors, Embraer now expects free cash flow consumption of US$ (100) million or better in 2018, as lower profitability in the Commercial Aviation segment is partially offset by a decline in investments relative to 2017.
2018 - INVESTMENTS & | |
FREE CASH FLOW OUTLOOK (US$ MILLION) | |
Research | $50 |
Development | $300 |
Capex | $200 |
Total Investments | $550 |
Free Cash Flow | ($100) |
This Outlook is based on assumptions which are subject to various factors, many of which are not and neither will be under the control of the Company.
| 11 |
Reconciliation OF IFRS and “non gaap” information
|
| in millions of U.S.dollars | |
EBITDA RECONCILIATION | (1) | (2) | (2) |
LTM* (IFRS) | 3Q17 | 2016 | 2017 |
Net Income Attributable to Embraer | 406.8 | 166.1 | 246.8 |
Noncontrolling interest | 14.1 | 1.7 | 16.0 |
Income tax income (expense) | 83.5 | (8.7) | 25.5 |
Financial income, net | 49.4 | 51.4 | 47.6 |
Foreign exchange loss, net | (14.7) | (4.5) | (6.6) |
Depreciation and amortization | 329.7 | 330.1 | 315.4 |
EBITDA LTM | 868.8 | 536.1 | 644.7 |
(1) Derived from unaudited financial information. |
|
|
|
(2) Derived from audited financial information. |
|
|
|
* Last Twelve Months |
|
|
|
We define Free cash flow as operating cash flow less Additions to property, plant and equipment, Additions to intangible assets, Financial investments and Other assets. Free cash flow is not an accounting measure under IFRS. Free cash flow is presented because it is used internally as a measure for evaluating certain aspects of our business. The Company also believes that some investors find it to be a useful tool for measuring Embraer's cash position. Free cash flow should not be considered as a measure of the Company's liquidity or as a measure of its cash flow as reported under IFRS. In addition, Free cash flow should not be interpreted as a measure of residual cash flow available to the Company for discretionary expenditures, since the Company may have mandatory debt service requirements or other nondiscretionary expenditures that are not deducted from this measure. Other companies in the industry may calculate Free cash flow differently from Embraer for purposes of their earnings releases, thus limiting its usefulness for comparing Embraer to other companies in the industry.
EBITDA LTM represents earnings before interest, taxation, depreciation and amortization accumulated over a period of the last 12 months. It is not a financial measure of the Company’s financial performance under IFRS. EBIT as mentioned in this press release refers to earnings before interest and taxes, and for purposes of reporting is the same as that reported on the Income Statement as Operating Profit before Financial Income.
|
|
|
| in millions of U.S.dollars | |
EBITDA RECONCILIATION | (1) | (1) | (1) | (2) | (2) |
| 3Q17 | 4Q16 | 4Q17 | 2016 | 2017 |
Net Income attributable to Embraer | 110.0 | 195.2 | 35.2 | 166.1 | 246.8 |
Noncontrolling interest | 1.3 | 0.5 | 2.4 | 1.7 | 16.0 |
Income tax (expense) income | (39.5) | 55.9 | (2.1) | (8.7) | 25.5 |
Financial income (expense), net | (1.7) | 34.9 | 33.1 | 51.4 | 47.6 |
Foreign exchange loss, net | (4.9) | (9.9) | (1.9) | (4.5) | (6.6) |
Depreciation and amortization | 74.6 | 101.9 | 87.6 | 330.1 | 315.4 |
EBITDA | 139.8 | 378.5 | 154.3 | 536.1 | 644.7 |
EBITDA Margin | 10.7% | 18.7% | 8.9% | 8.6% | 11.0% |
(1) Derived from unaudited financial information. | |||||
(2) Derived from audited financial information. | |||||
EBIT and EBITDA are presented because they are used internally as measures to evaluate certain aspects of the business. The Company also believes that some investors find them to be useful tools for measuring a Company’s financial performance. EBIT and EBITDA should not be considered as alternatives to, in isolation from, or as substitutes for, analysis of the Company’s financial condition or results of operations, as reported under IFRS. Other companies in the industry may calculate EBIT and EBITDA differently from Embraer for the purposes of their earnings releases, limiting EBIT and EBITDA’s usefulness as comparative measures.
ADJUSTED EBIT RECONCILIATION | (1) | (2) | (1) | (1) | (1) | (1) | (2) |
| 4Q16 | 2016 | 1Q17 | 2Q17 | 3Q17 | 4Q17 | 2017 |
Operating profit before financial income (EBIT) | 276.6 | 206.0 | 23.4 | 174.0 | 65.2 | 66.7 | 329.3 |
Provision for voluntary redundancy scheme | (0.8) | 117.3 | 7.6 | (1.2) | - | - | 6.4 |
Impact of penalty provision | 22.5 | 228.0 | - | 3.5 | 3.6 | 3.1 | 10.2 |
Non-recurring items related to Republic Airways | (52.2) | (52.2) | - | (11.7) | - | - | (11.7) |
Impairment loss Defense and security business | - | - | - | - | - | 8.7 | 8.7 |
Impairment loss Executive Jet business | - | - | - | - | - | 54.2 | 54.2 |
Adjusted EBIT | 246.1 | 499.1 | 31.0 | 164.6 | 68.8 | 132.7 | 397.1 |
Adjusted EBIT Margin % | 12.1% | 8.0% | 3.0% | 9.3% | 5.3% | 7.7% | 6.8% |
(1) Derived from unaudited financial information. | |||||||
(2) Derived from audited financial information. | |||||||
| 12 |
|
|
|
|
|
| in millions of U.S.dollars | |
ADJUSTED EBITDA RECONCILIATION | (1) | (2) | (1) | (1) | (1) | (1) | (2) |
| 4Q16 | 2016 | 1Q17 | 2Q17 | 3Q17 | 4Q17 | 2017 |
EBITDA | 378.5 | 536.1 | 95.8 | 254.8 | 139.8 | 154.3 | 644.7 |
Provision for voluntary redundancy scheme | (0.8) | 117.3 | 7.6 | (1.2) | - | - | 6.4 |
Impact of penalty provision | 22.5 | 228.0 | - | 3.5 | 3.6 | 3.1 | 10.2 |
Non-recurring items related to Republic Airways | (52.2) | (52.2) | - | (11.7) | - | - | (11.7) |
Impairment loss Defense and security business | - | - | - | - | - | 8.7 | 8.7 |
Impairment loss Executive Jet business | - | - | - | - | - | 54.2 | 54.2 |
Adjusted EBITDA | 348.0 | 829.2 | 103.4 | 245.4 | 143.4 | 220.3 | 712.5 |
Adjusted EBITDA Margin % | 17.2% | 13.3% | 10.1% | 13.9% | 10.9% | 12.7% | 12.2% |
(1) Derived from unaudited financial information. |
|
|
|
|
|
|
|
(2) Derived from audited financial information. |
|
|
|
|
|
|
|
Adjusted EBIT and Adjusted EBITDA are non-GAAP measures, and both exclude the impact of several non-recurring items, as described in the tables above.
|
|
|
|
|
| in millions of U.S.dollars | |
ADJUSTED NET INCOME (LOSS) RECONCILIATION | (1) | (2) | (1) | (1) | (1) | (1) | (2) |
| 4Q16 | 2016 | 1Q17 | 2Q17 | 3Q17 | 4Q17 | 2017 |
Net Income attributable to Embraer | 195.2 | 166.1 | 42.5 | 59.1 | 110.0 | 35.2 | 246.8 |
Net change in Deferred income tax & social contribution | 26.4 | (146.5) | (24.3) | 68.9 | (38.4) | (21.5) | (15.3) |
After-tax provision for voluntary redundancy scheme | (0.6) | 77.4 | 5.0 | (0.8) | - | - | 4.2 |
Impact of penalty provision | 22.5 | 228.0 | - | 3.5 | 3.6 | 3.1 | 10.2 |
After-tax Non-recurring items related to Republic Airways | (34.5) | (34.5) | - | (7.7) | - | - | (7.7) |
After-tax Defense and security business impairment loss | - | - | - | - | - | 5.7 | 5.7 |
After-tax Executive Jet business impairment loss | - | - | - | - | - | 35.8 | 35.8 |
Adjusted Net Income | 209.1 | 290.5 | 23.2 | 123.0 | 75.2 | 58.3 | 279.7 |
Adjusted Net Margin | 10.3% | 4.7% | 2.3% | 6.9% | 5.7% | 0.9% | 4.8% |
(1) Derived from unaudited financial information. |
|
|
|
|
|
|
|
(2) Derived from audited financial information. |
|
|
|
|
|
|
|
Adjusted Net Income is a non-GAAP measure, calculated by adding Net Income attributable to Embraer Shareholders plus Deferred Income tax and social contribution for the period, as well as removing the impact of non-recurring items. Furthermore, under IFRS for purposes of calculating Embraer’s Income Tax benefits (expenses), the Company is required to record taxes resulting from gains or losses due to the impact of the changes in the Real to the US Dollar exchange rate over non-monetary assets (primarily Inventories, Intangibles, and PP&E). It is important to note that taxes resulting from gains or losses over non-monetary assets are considered deferred taxes and are accounted for in the Company’s consolidated Cash Flow statement, under Deferred income tax and social contribution.
Some Financial Ratios based on “non GAAP” information
CERTAIN FINANCIAL RATIOS - IFRS | (2) | (1) | (2) |
| 2016 | 3Q17 | 2017 |
Total debt to EBITDA (i) | 7.01 | 4.96 | 6.51 |
Net debt to EBITDA (ii) | 1.07 | 0.83 | 0.48 |
Total debt to capitalization (iii) | 0.49 | 0.51 | 0.50 |
LTM EBITDA to financial expense (gross) (iv) | 2.46 | 3.78 | 2.78 |
LTM EBITDA (v) | 536.1 | 868.8 | 644.7 |
LTM Interest and commissions on loans (vi) | 218.2 | 229.9 | 231.5 |
(1) Derived from unaudited financial information. |
|
|
|
(2) Derived from audited financial information. |
|
|
|
(i) Total debt represents short and long-term loans and financing.
(ii) Net cash represents cash and cash equivalents, plus financial investments, minus short and long-term loans and financing.
(iii) Total capitalization represents short and long-term loans and financing, plus shareholders equity.
(iv) Financial expense (gross) includes only interest and commissions on loans.
(v) The table at the end of this release sets forth the reconciliation of Net income to adjusted EBITDA, calculated on the basis of financial information prepared with IFRS data, for the indicated periods.
(vi) Interest expense (gross) includes only interest and commissions on loans, which are included in Interest income (expense), net presented in the Company’s consolidated Income Statement.
| 13 |
FINANCial statements
EMBRAER S.A.
CONSOLIDATED STATEMENTS OF INCOME
CONSOLIDATED STATEMENTS OF INCOME
(in milions of U.S.dollars, except earning per share)
| (1) | (2) | ||
| Three months ended on | Twelve months ended on | ||
| 31 Dec, 2016 | 31 Dec, 2017 | 31 Dec, 2016 | 31 Dec, 2017 |
Revenue | 2,027.8 | 1,733.0 | 6,217.5 | 5,839.3 |
Cost of sales and services | (1,620.6) | (1,387.1) | (4,980.7) | (4,773.4) |
|
|
|
|
|
Gross profit | 407.2 | 345.9 | 1,236.8 | 1,065.9 |
Operating Income (Expense) |
|
|
|
|
Administrative | (44.0) | (49.0) | (164.3) | (179.1) |
Selling | (81.4) | (82.8) | (368.6) | (307.0) |
Research | (18.8) | (17.5) | (47.6) | (49.2) |
Other operating income (expense), net | 13.7 | (131.3) | (450.0) | (202.5) |
Equity in gain or losses of associates | (0.1) | 1.4 | (0.3) | 1.2 |
|
|
|
|
|
Operating profit before financial income | 276.6 | 66.7 | 206.0 | 329.3 |
Financial expenses, net | (34.9) | (33.1) | (51.4) | (47.6) |
Foreign exchange gain, net | 9.9 | 1.9 | 4.5 | 6.6 |
|
|
|
|
|
Profit (loss) before taxes on income | 251.6 | 35.5 | 159.1 | 288.3 |
Income tax (expense) income | (55.9) | 2.1 | 8.7 | (25.5) |
|
|
|
|
|
Net Income | 195.7 | 37.6 | 167.8 | 262.8 |
Attributable to: |
| �� |
|
|
Owners of Embraer | 195.2 | 35.2 | 166.1 | 246.8 |
Noncontrolling interest | 0.5 | 2.4 | 1.7 | 16.0 |
|
|
|
|
|
Weighted average number of shares (in thousands) |
|
|
|
|
Basic | 735.6 | 734.3 | 735.6 | 734.3 |
Diluted | 736.3 | 734.9 | 737.3 | 734.8 |
|
|
|
|
|
Earnings per share |
|
|
|
|
Basic | 0.2658 | 0.0479 | 0.2258 | 0.3361 |
Diluted | 0.2652 | 0.0479 | 0.2253 | 0.3359 |
|
|
|
|
|
Earnings per share - ADS basic (US$) | 1.0634 | 0.1918 | 0.9032 | 1.3445 |
Earnings per share - ADS diluted (US$) | 1.0609 | 0.1916 | 0.9012 | 1.3435 |
(1) Derived from unaudited financial statements. |
|
|
|
|
(2) Derived from audited financial statements. |
|
|
|
|
| 14 |
EMBRAER S.A.
CONSOLIDATED STATEMENTS OF CASH FLOW
CONSOLIDATED STATEMENTS OF CASH FLOW
(in milions of U.S.dollars, except earning per share)
| (1) | (2) | ||
| Three Months Ended | Twelve months ended on | ||
| 31 Dec, 2016 | 31 Dec, 2017 | 31 Dec, 2016 | 31 Dec, 2017 |
Operating activities |
|
|
|
|
Net income | 195.7 | 37.6 | 167.8 | 262.8 |
Items not affecting cash and cash equivalents |
|
|
|
|
Depreciation | 57.2 | 45.5 | 194.5 | 196.5 |
Government grants amortization | (3.1) | (1.1) | (3.1) | (3.3) |
Amortization | 57.0 | 52.1 | 173.9 | 146.2 |
Amortization contribution from suppliers | (12.3) | (10.0) | (38.3) | (27.3) |
Allowance (reversal) for inventory obsolescence | (16.0) | 0.8 | (23.9) | 11.7 |
Provision for adjustment to market value | 63.8 | 84.7 | 82.8 | 110.2 |
Provision (reversal) allowance for doubtful accounts | (1.2) | (3.8) | 11.4 | 4.1 |
Gains on fixed assets disposal | 11.7 | 5.5 | 19.6 | 18.6 |
Deferred income tax and social contribution | 26.4 | (21.5) | (146.5) | (15.3) |
Accrued interest | (17.1) | (45.1) | (13.1) | (29.0) |
Interest over marketable securities | (31.9) | (15.7) | (52.5) | (23.6) |
Equity in the losses of associates | 0.1 | (1.5) | 0.3 | (1.2) |
Share-based remuneration | 0.3 | 0.1 | 1.4 | 0.5 |
Foreign exchange gain (loss), net | (9.8) | 4.6 | (12.7) | 6.0 |
Residual value guarantee | 2.9 | 0.5 | 27.5 | (13.3) |
Accounts payable for penalties | (146.9) | - | 58.6 | - |
Provision for voluntary redundancy scheme | (89.8) | - | 28.2 | 6.4 |
Other | (0.5) | 6.6 | (1.1) | (4.3) |
Changes in assets |
|
|
|
|
Financial investments | (50.2) | 132.0 | (307.7) | (244.6) |
Derivative financial instruments | 0.6 | 15.7 | (21.6) | (1.7) |
Collateralized accounts receivable and accounts receivable | 32.4 | (27.8) | 156.0 | (82.9) |
Customer and commercial financing | (9.8) | 0.6 | 18.8 | 21.0 |
Inventories | 368.8 | 344.2 | (136.9) | 404.9 |
Other assets | 242.5 | 65.0 | 103.7 | 249.4 |
Changes in liabilities |
|
|
|
|
Trade accounts payable | (174.0) | 40.9 | (93.8) | (127.3) |
Non-recourse and recourse debt | (7.7) | (17.4) | (10.9) | (9.9) |
Other payables | (40.6) | (10.9) | (30.3) | (19.6) |
Contribution from suppliers | - | - | 123.9 | 86.0 |
Advances from customers | (81.4) | 39.7 | (97.9) | 65.2 |
Taxes and payroll charges payable | (164.5) | (21.9) | (153.1) | 21.1 |
Financial guarantees | (53.1) | (2.9) | (87.6) | (40.7) |
Other provisions | 60.8 | 21.0 | 51.1 | (48.7) |
Unearned income | (11.0) | 4.3 | (9.0) | (160.6) |
Net cash generated (used) by operating activities | 199.3 | 721.8 | (20.5) | 757.3 |
Investing activities |
|
|
|
|
Additions to property, plant and equipment | (78.1) | (76.4) | (392.5) | (237.7) |
Proceeds from sale of property, plant and equipment | 2.8 | 0.2 | 2.9 | 19.1 |
Additions to intangible assets | (137.3) | (125.1) | (505.0) | (470.5) |
Investments in associates | (0.3) | (0.1) | (2.6) | (0.6) |
Proceeds from held to maturity securities | (128.4) | 55.6 | (74.3) | (408.4) |
Loans | 1.5 | - | (12.3) | - |
Dividends Received | - | - | 0.1 | 0.1 |
Restricted cash reserved for construction of assets | - | (0.6) | 4.1 | 1.0 |
Net cash used in investing activities | (339.8) | (146.4) | (979.6) | (1,097.0) |
Financing activities |
|
|
|
|
Proceeds from borrowings | 149.5 | 54.1 | 576.2 | 972.9 |
Repayment of borrowings | (198.0) | (115.6) | (523.7) | (540.2) |
Dividends and interest on own capital | (3.9) | (10.7) | (28.2) | (54.0) |
Proceeds from stock options exercised | 0.2 | 0.8 | 1.7 | 5.9 |
Acquisition of own shares | - | - | (17.1) | (15.0) |
Net cash generated (used) by financing activities | (52.2) | (71.4) | 8.9 | 369.6 |
Increase (Decrease) in cash and cash equivalents | (192.7) | 504.0 | (991.2) | 29.9 |
Effects of exchange rate changes on cash and cash equivalents | (21.3) | (5.7) | 67.2 | (0.6) |
Cash and cash equivalents at the beginning of the period | 1,455.5 | 772.5 | 2,165.5 | 1,241.5 |
Cash and cash equivalents at the end of the period | 1,241.5 | 1,270.8 | 1,241.5 | 1,270.8 |
(1) Derived from unaudited financial statements. |
|
|
|
|
(2) Derived from audited financial statements |
|
|
|
|
| 15 |
EMBRAER S.A.
CONSOLIDATED STATEMENTS OF FINANCIAL POSITION
CONSOLIDATED STATEMENTS OF FINANCIAL POSITION
(in milions of U.S.dollars, except earning per share)
| (1) | (2) |
A S S E T S | As of December 31, | As of December 31, |
| 2016 | 2017 |
Current assets |
|
|
Cash and cash equivalents | 1,241.5 | 1,270.8 |
Financial investments | 1,775.5 | 2,365.6 |
Trade accounts receivable, net | 665.4 | 717.1 |
Derivative financial instruments | 21.0 | 29.5 |
Customer and commercial financing | 8.5 | 2.1 |
Collateralized accounts receivable | 142.8 | 185.6 |
Inventories | 2,496.4 | 2,148.7 |
Income tax and Social Contribution | 80.7 | 76.9 |
Other assets | 349.9 | 255.4 |
| 6,781.7 | 7,051.7 |
Non-current assets |
|
|
Financial investments | 168.2 | 251.3 |
Derivative financial instruments | 11.1 | 4.8 |
Customer and commercial financing | 28.9 | 14.3 |
Collateralized accounts receivable | 180.5 | 103.1 |
Guarantee deposits | 511.4 | 393.8 |
Deferred income tax | 3.4 | 2.8 |
Other assets | 156.7 | 121.5 |
| 1,060.2 | 891.6 |
Investments | 3.9 | 5.6 |
Property, plant and equipment, net | 2,154.2 | 2,104.9 |
Intangible assets | 1,664.6 | 1,882.4 |
| 3,822.7 | 3,992.9 |
TOTAL ASSETS | 11,664.6 | 11,936.2 |
(1) Derived from unaudited financial information. |
|
|
(2)Derived from audited financial information. |
|
|
| 16 |
EMBRAER S.A.
CONSOLIDATED STATEMENTS OF FINANCIAL POSITION
CONSOLIDATED STATEMENTS OF FINANCIAL POSITION
(in milions of U.S.dollars, except earning per share)
| (1) | (2) |
LIABILITIES | As of December 31, | As of December 31, |
| 2016 | 2017 |
Current liabilities |
|
|
Trade accounts payable | 952.1 | 824.7 |
Loans and financing | 510.3 | 388.9 |
Non-recourse and recourse debt | 22.9 | 17.6 |
Other payables | 379.5 | 292.2 |
Advances from customers | 716.4 | 799.2 |
Derivative financial instruments | 8.4 | 8.8 |
Taxes and payroll charges payable | 43.6 | 70.7 |
Income tax and social contribution | 25.9 | 16.1 |
Financial guarantee and residual value | 49.7 | 22.2 |
Provisions | 135.8 | 141.3 |
Dividends payable | 24.8 | 36.8 |
Unearned income | 311.5 | 164.1 |
| 3,180.9 | 2,782.6 |
Non-current liabilities |
|
|
Loans and financing | 3,249.6 | 3,809.6 |
Non-recourse and recourse debt | 351.0 | 346.5 |
Other payables | 16.9 | 21.5 |
Advances from customers | 139.8 | 104.1 |
Derivative financial instruments | - | 0.1 |
Taxes and payroll charges payable | 67.9 | 70.2 |
Deferred income tax and social contribution | 263.3 | 251.3 |
Financial guarantee and residual value | 161.1 | 134.6 |
Provisions | 179.0 | 136.2 |
Unearned income | 113.9 | 97.5 |
| 4,542.5 | 4,971.6 |
TOTAL LIABILITIES | 7,723.4 | 7,754.2 |
Shareholders' equity |
|
|
Capital | 1,438.0 | 1,438.0 |
Treasury shares | (49.1) | (51.8) |
Revenue reserves | 2,566.1 | 2,743.2 |
Share-based remuneration | 36.8 | 37.3 |
Accumulated Other Comprehensive Loss | (143.0) | (98.1) |
| 3,848.8 | 4,068.6 |
Non-controlling interest | 92.4 | 113.4 |
Total company's shareholders' equity | 3,941.2 | 4,182.0 |
TOTAL LIABILITIES AND SHAREHOLDERS' EQUITY | 11,664.6 | 11,936.2 |
(1) Derived from unaudited financial information. |
|
|
(2)Derived from audited financial information. |
|
|
| 17 |
Investor Relations
Eduardo Couto, Chris Thornsberry, Caio Pinez, Nádia Santos, Paulo Ferreira and Viviane Pinheiro.
(+55 12) 3927 1000
investor.relations@embraer.com.br
ri.embraer.com.br
CONFERENCE CALL INFORMATION
Embraer will host a conference call to present its 4Q17 Results onThursday, March 8, 2017 at 12:30 PM (SP) / 10:30 AM (NY). The conference call will also be broadcast live over the web atri.embraer.com.br
Code: 7597888
Telephones:
Operator Assisted (US/ Canada) Toll-Free Dial-In Number: (877) 846-1574
Operator Assisted International Dial-In Number: (708) 290-0687
Your own International Toll-Free number for Brazil: 0800 047 4803 (land line) and 0800 047 4801 (cell phone)
ABOUT EMBRAER
Embraer is a global company headquartered in Brazil with businesses in commercial and executive aviation, defense & security. The company designs, develops, manufactures and markets aircraft and systems, providing customer support and services.
Since it was founded in 1969, Embraer has delivered more than 8,000 aircraft. About every 10 seconds an aircraft manufactured by Embraer takes off somewhere in the world, transporting over 145 million passengers a year.
Embraer is the leading manufacturer of commercial jets up to 150 seats. The company maintains industrial units, offices, service and parts distribution centers, among other activities, across the Americas, Africa, Asia and Europe.
For more information, please visit www.embraer.com.br
This document may contain projections, statements and estimates regarding circumstances or events yet to take place. Those projections and estimates are based largely on current expectations, forecasts of future events and financial trends that affect Embraer’s businesses. Those estimates are subject to risks, uncertainties and suppositions that include, among others: general economic, political and trade conditions in Brazil and in those markets where Embraer does business; expectations of industry trends; the Company’s investment plans; its capacity to develop and deliver products on the dates previously agreed upon, and existing and future governmental regulations. The words “believe”, “may”, “is able”, “will be able”, “intend”, “continue”, “anticipate”, “expect” and other similar terms are intended to identify potentialities. Embraer does not undertake any obligation to publish updates nor to revise any estimates due to new information, future events or any other facts. In view of the inherent risks and uncertainties, such estimates, events and circumstances may not take place. The actual results may therefore differ substantially from those previously published as Embraer expectations.
| 18 |
SIGNATURES
Pursuant to the requirements of the Securities Exchange Act of 1934, the registrant has duly caused this report to be signed on its behalf by the undersigned, thereunto duly authorized.
Date: March 8, 2018
|
|
|
|
|
Embraer S.A. | ||||
|
| |||
By: |
|
/s/ José Antonio de Almeida Filippo | ||
|
|
Name: |
| José Antonio de Almeida Filippo |
|
| Title: |
| Executive Vice-President and Chief Financial and Investor Relations Officer |